Two-Photon Uncaging of Bioactive Thiols in Live Cells at ...
Upload
khangminh22Category
view
3download
0
HAL Id: tel-01929101https://tel.archives-ouvertes.fr/tel-01929101
Submitted on 21 Nov 2018
HAL is a multi-disciplinary open accessarchive for the deposit and dissemination of sci-entific research documents, whether they are pub-lished or not. The documents may come fromteaching and research institutions in France orabroad, or from public or private research centers.
L’archive ouverte pluridisciplinaire HAL, estdestinée au dépôt et à la diffusion de documentsscientifiques de niveau recherche, publiés ou non,émanant des établissements d’enseignement et derecherche français ou étrangers, des laboratoirespublics ou privés.
Triphenylmethylium-based multitopic two-photonabsorbers : synthesis and characterization
Nicolas Ripoche
To cite this version:Nicolas Ripoche. Triphenylmethylium-based multitopic two-photon absorbers : synthesis and charac-terization. Optics [physics.optics]. Université Rennes 1; Australian national university, 2015. English.�NNT : 2015REN1S149�. �tel-01929101�

ANNÉE 2015
THÈSE / UNIVERSITÉ DE RENNES 1
sous le sceau de l’Université Européenne de Bretagne
En Cotutelle internationale avec The Australian National University, Australie
pour le grade de
DOCTEUR DE L’UNIVERSITÉ DE RENNES 1 Mention : Chimie
Ecole doctorale Sciences de la Matière
présentée par
Nicolas Ripoche Préparée à l’unité de recherche UMR 6226 Institut des Sciences Chimiques de Rennes UFR Sciences de Propriétés de la Matière
Triphenylmethylium-Based Multitopic Two-Photon Absorbers: Synthesis and Characterization
Thèse soutenue à Rennes le 20 Novembre 2015 devant le jury composé de :
Mireille BLANCHARD-DESCE Directeur de recherche CNRS (Université de Bordeaux 1) / rapporteur
Todd B. MARDER Professeur (University of Würzburg) / rapporteur
Olivier MONGIN Maître de conférences (Université de Rennes 1) / examinateur
Marie P. CIFUENTES Professeur associé (Australian National University) / examinateur
Frédéric PAUL Directeur de recherche CNRS (Université de Rennes 1 / directeur de thèse
Mark G. HUMPHREY Professeur (Australian National University) / co-directeur de thèse

i
ii
Contents
Summary ............................................................................................................................................. iv
Acknowledgements ............................................................................................................................ vi
Abbreviations ................................................................................................................................... viii
Introduction: Triphenylmethane-based derivatives for third-order nonlinear optics ...................... 1
Chapter I: All-organic triphenylmethane-based derivatives ............................................................ 59
Chapter II: Organometallic derivatives of malachite green ............................................................. 99
Chapter III: Organometallic derivatives of crystal violet ............................................................... 155
General conclusion ........................................................................................................................ 189
Experimental .................................................................................................................................. 197

iii

iv
Summary
Triphenylmethane dyes have attracted considerable attention since the beginning of the 20th
century. They have first drawn the interest of the scientific community for their remarkable dyeing
and medicinal properties. This interest led in turn to the publication of a vast pool of synthetic
publications and comparatively much fewer theoretical studies. Unfortunately, this interest
decreased in the 1970s, possibly due to a lack of proper understanding of their electronic structure
and difficulties in modeling it. The recent advances in lasers and in nonlinear optics (NLO) have
renewed this interest by opening new ways of investigation and delineating new potential uses for
these dyes. The work reported in this thesis focus on two triphenylmethane-based dyes; Malachite
Green (MG+) and Crystal Violet (CV+). Selected organic and organometallic derivatives have been
targeted for investigation of their third-order NLO properties.
In the introduction, NLO theory is presented with a focus on third-order properties, NLO
phenomena and the relevant experimental techniques. Selected examples of third-order NLO-active
molecules are then described in order to illustrate the general design criteria commonly adopted for
third-order NLO-active molecules and to emphasize the interest in incorporating a metal center in
this type of structure. The potential of MG+- and CV+-based structures to behave as two-photon
absorbers (TPA) is highlighted, followed by a review of the scientific work in this field. Finally, the
aims of this thesis are given at the end of the introduction, along with a work plan.
The first chapter presents the synthesis and characterization of relevant fully organic
derivatives of MG+ and CV+. The introduction of 9-anthracenyl or 2-fluorenyl groups as “two-photon
antennas” as well as the use of a rigidified fluorenium structure or the enlargement of the π-manifold
and their impact on the linear and nonlinear optical properties are then discussed.
The introduction of ferrocenyl and iron/ruthenium alkynyl complexes as substituents is
presented in the second chapter, followed by a description of the targeted MG+-based derivatives.
We show by cyclic votammetry that the use of these redox-active synthons affords access to
additional reversible redox states that have been studied by spectroelectrochemistry. The
physicochemical behavior as a function of the oxidation state of these compounds is discussed after
a description of their synthesis and characterization. Perspectives for electroswitching their NLO
response are discussed.

v
The final chapter is focused on related octupolar CV+-based derivatives in which the
organometallic substituents replace or reinforce the donor power of the peripheral amino
substituents. The increase in symmetry of their structure is responsible for various modifications of
their properties, which are studied and discussed in the same way as in the previous chapters. Again,
after presenting their synthesis and extensive characterization, perspectives to obtain efficient
nonlinear electrophores from these new organometallic dyes are discussed.

vi
Acknowledgments
The work presented here has been undertaken cooperatively between the "Organometallic
Chemistry and Molecular Materials" group of the Australian National University and the "Functional
Organometallic Systems" group at the University of Rennes 1. This PhD has been made possible
thanks to the financial support from "Region Bretagne" and the Australian Research Council-funded
scholarships; they are both greatly acknowledged for their support.
Foremost, I would like to thanks my supervisors, Dr. Frédéric Paul and Prof. Mark G.
Humphrey, for having offered me the opportunity to carry out this PhD in their respective groups as
well as their excellent guidance and encouragement throughout these three years. Assoc. Prof. Marie
Cifuentes is also greatly thanked for her support as well as the help provided while moving to
Australia.
Thanks to Thierry Roisnel, Vincent Dorcet and Dr. Graeme Moxey for running the X-ray
diffraction analyses on the crystals in this work. I am also greatly indebted to Dr. Mahbod Morshedi
for all his help in chemistry and wise advice during my time in Australia. Many thanks also to Dr.
Guillaume Grelaud and Dr. Gilles Argouarch for the initial impulse they gave me and to Prof. Marek
Samoc and Dr. Katarzyna Matczyszyn for their warm welcome and their help with Z-scan
measurements during the few weeks I spent in Poland. Thanks also to Dr. Anissa Amar and Prof.
Abdou Boucekkine for the DFT calculations they have performed on my compounds. I also want to
thank Dr. Christine Paul, Dr. Carole Daiguebonne, Dr. Philippe Gall and Laurence Lohezic for trusting
and helping me for this first experience of teaching at the INSA of Rennes.
I am also thankful to Dr. Mireille Blanchard-Desce, Prof. Todd B. Marder and Dr. Olivier
Mongin for reviewing this manuscript and comprising my evaluation panel.
This work involved quite a lot of people from both universities, and even if working in two
different environments is not always that easy, they have facilitated the realization of this project in
the best possible conditions for me. In this respect, I would like to thank the different members of
both groups with whom I have had the pleasure to work: Dr. Ayham Thome, Amédée Triadon, Dr.
Alison Barnes, Dr. Areej Merhi, Dr. Dandan Yao, Xu Zhang, Seyfallah Abid; and Dr. Adam Barlow, Dr.
Prue Guest, Richard Dexter, Dr. Caterina Gruenwaldt, Suzannah Streatfield, Junhong (Nate) Fu,
Anthony Nolan, Aradhana Dissanayake, Noor Aisyah Ahmad Shah, Huajian Zhao, Xinwei Yang and

vii
Fazira Ilyana binte Abdul Razak. I am also thankful to Cécile Valter for making the various glassware,
Alison Scott and Cécile Peron for the support they gave me while doing the paperwork involved in
this PhD and to Gwenaël Colombel, the "man in blue", who always knows how to share his joy of
living.
Finally, I want to thanks my family and friends from France and Australia who have always
been supportive during these three years, and their presence throughout these three years despite
the distance.
viii
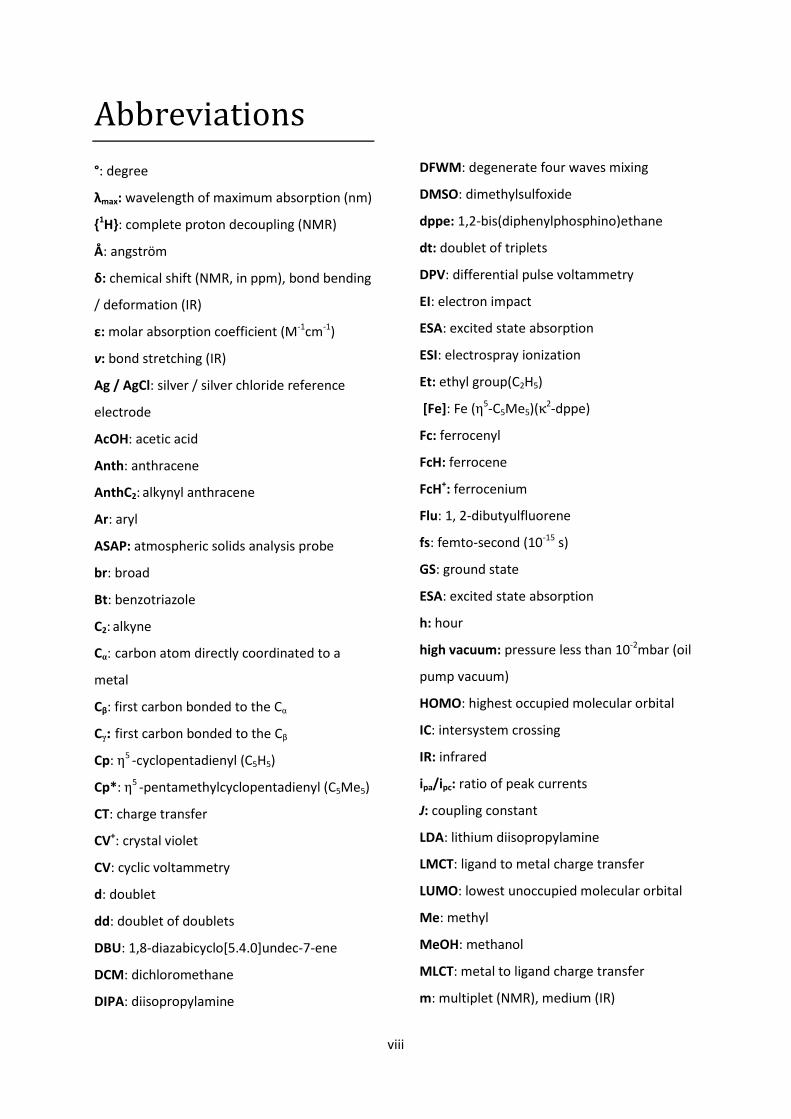
Abbreviations
°: degree
λmax: wavelength of maximum absorption (nm)
{1H}: complete proton decoupling (NMR)
Å: angström
δ: chemical shift (NMR, in ppm), bond bending
/ deformation (IR)
ε: molar absorption coefficient (M-1cm-1)
ν: bond stretching (IR)
Ag / AgCl: silver / silver chloride reference
electrode
AcOH: acetic acid
Anth: anthracene
AnthC2: alkynyl anthracene
Ar: aryl
ASAP: atmospheric solids analysis probe
br: broad
Bt: benzotriazole
C2: alkyne
Cα: carbon atom directly coordinated to a
metal
Cβ: first carbon bonded to the Cα
Cγ: first carbon bonded to the Cβ
Cp: η5 -cyclopentadienyl (C5H5)
Cp*: η5 -pentamethylcyclopentadienyl (C5Me5)
CT: charge transfer
CV+: crystal violet
CV: cyclic voltammetry
d: doublet
dd: doublet of doublets
DBU: 1,8-diazabicyclo[5.4.0]undec-7-ene
DCM: dichloromethane
DIPA: diisopropylamine
DFWM: degenerate four waves mixing
DMSO: dimethylsulfoxide
dppe: 1,2-bis(diphenylphosphino)ethane
dt: doublet of triplets
DPV: differential pulse voltammetry
EI: electron impact
ESA: excited state absorption
ESI: electrospray ionization
Et: ethyl group(C2H5)
[Fe]: Fe (η5-C5Me5)(κ2-dppe)
Fc: ferrocenyl
FcH: ferrocene
FcH+: ferrocenium
Flu: 1, 2-dibutyulfluorene
fs: femto-second (10-15 s)
GS: ground state
ESA: excited state absorption
h: hour
high vacuum: pressure less than 10-2mbar (oil
pump vacuum)
HOMO: highest occupied molecular orbital
IC: intersystem crossing
IR: infrared
ipa/ipc: ratio of peak currents
J: coupling constant
LDA: lithium diisopropylamine
LMCT: ligand to metal charge transfer
LUMO: lowest unoccupied molecular orbital
Me: methyl
MeOH: methanol
MLCT: metal to ligand charge transfer
m: multiplet (NMR), medium (IR)

ix
mg: milligram
min: minute
m/z: mass to charge ratio
MG+: malachite green
NIR: near-infrared
nm: nanometers
NMR: nuclear magnetic resonance
NLO: nonlinear optics
OTTLE: optically transparent thin layer
electrochemical cell
PPP-MO: Pariser-Parr-Pople molecular orbital
Ph: phenyl
ppm: parts per million
quant.: quantitative
Rf: retention factor
[Ru]: trans- Ru (Cl)(κ2-dppe)2
RSA: reverse saturable absorption
rpm: revolutions per minute
TFA : trifluoroacetic Acid
Tol: toluene
s: singlet
S: strong
SCE: saturated calomel electrode
SA: saturable absorption
sept: septuplet
sh: shoulder
t: triplet
T: temperature
THG: third-harmonic generation
TLC: thin layer chromatography
TMSa: trimethylsilylacetylene
TMS: trimethysilyl
TPMs: triphenylmethane dyes
TPA/2PA: two-photon absorption
TPEF/2PEF: two-photon excited fluorescence
THF: tetrahydrofuran
UV-Vis: ultraviolet-visible
V: volt
vs.: versus
v/v: volume-to-volume ratio
w: weak
w/w: weight-to-weight ratio

1
Introduction:
Triphenylmethane-based derivatives for
third-order nonlinear optics

2

3
Introduction
Triphenylmethane-based derivatives for third-
order nonlinear optics
Contents
1. Nonlinear optics: general comments ................................................................................................. 5
1.1. NLO theory ................................................................................................................................... 5
1.2. Third-order NLO phenomena ...................................................................................................... 6
1.2.1. Two-photon absorption ....................................................................................................... 7
1.2.2. Saturable absorption and reverse saturable absorption ................................................... 10
1.3. Experimental techniques for measuring two-photon absorption ............................................. 11
1.3.1. Two-photon excited fluorescence ..................................................................................... 12
1.3.2. Z-scan ................................................................................................................................. 13
1.4. Third-order NLO materials for TPA or SA/RSA ........................................................................... 16
1.4.1. Structure and nature of the materials ............................................................................... 16
1.4.2. Examples of third-order NLO active materials with high TPA cross-sections .................... 18
2.Triphenymethane dyes ...................................................................................................................... 24
2.1. General comments .................................................................................................................... 24
2.2. Solvolysis .................................................................................................................................... 26
2.3. Remarkable optical properties .................................................................................................. 27
2.4. Nomenclature and examples ..................................................................................................... 28
3. TPMs: synthesis and physico-chemical properties .......................................................................... 31
3.1. Synthesis .................................................................................................................................... 31
3.2. Photophysics of TPMs ................................................................................................................ 33
3.1.1. Electronic absorptions ....................................................................................................... 33
3.2.2. Relaxation processes ......................................................................................................... 37
3.3. Photochemistry .......................................................................................................................... 41
4. Literature review of the cubic NLO properties of TPMs .................................................................. 42
4.1. THG and DFWM measurements ................................................................................................ 43

4
4.2. Z-scan measurements ................................................................................................................ 44
4.3. TPEF measurements .................................................................................................................. 45
4.4. Synopsis ..................................................................................................................................... 46
5. Objectives .......................................................................................................................................... 47
5.1. Organic derivatives .................................................................................................................... 47
5.2. Organometallic derivatives ........................................................................................................ 49
6. Conclusion ......................................................................................................................................... 52
References ............................................................................................................................................. 54

5
1. Nonlinear optics: general comments
1.1. NLO theory
The invention of lasers has brought to science a new area of research and has allowed the
observation of multiple and advanced phenomena. Nonlinear optical (NLO) behaviour is one of them
and is observed when an intense beam of light, such as that generated by lasers, interacts with matter.
The resulting beam is then modified in a nonlinear fashion. Its phase, frequency, amplitude,
polarization, path or other propagation characteristics are no longer effectively proportional to the
incident beam as is the case for less intense light sources. The optimisation of these properties leads to
the development of materials with unique properties that can be used in several fields such as optical
communication, optical computing, data storage, imaging, microfabrication and medicine.[1] Their
development is linked to the increasing demand for more and more efficient optical information
transfer, the need for faster communications, and the progress in healthcare. While most of the actual
commercial applications in optical processing result from bulk inorganic solids/glasses or polymers,
research in this field also focuses more and more on single molecules or nano-sized objects as these
may give rise to more efficient and more compact molecular-based devices. Use of multiphoton
applications in health care is an even more recent domain where there is plenty of room for
improvement. This necessitates a better understanding of the associated phenomena and their
properties at the molecular level.
For a molecular chemist it is often better to consider NLO properties at the molecular scale.
Light, as described by classical Maxwell theory, is an electromagnetic field associated with an electric
field E. When directed toward a material, the light interacts with the polarizable electrons of the
material's molecules. This disturbs the molecules' electric fields and therefore induces a dipole
moment µ at the molecular level. As long as the intensity of the field of E does not reach values similar
to those within the molecule, E is proportional to µ. However, when the light reaches a high enough
intensity, the properties of the material change from the classic (leading to well-known linear optical
properties for the material) to nonlinear, implying new properties and relations. This can be described
by the following power series (Equation1):
µ = µ0 + αE + βE2 + γE3 + … (1)
µ0: static dipole moment
α: linear polarizability

6
β: quadratic hyperpolarizability (second-order polarizability)
γ: cubic hyperpolarizability (third-order polarizability)
Summing the induced dipole moments of the molecules in the material leads to a polarization
equation that describes the macroscopic response (Equation 2).
P = P0 + χ(1)E + χ(2)E2 + χ(3)E3 + ... (2)
P: induced polarization
P0: permanent polarization
χ(1): linear susceptibility
χ(2)and χ(3): quadratic and cubic susceptibilities
These two equations (Equation 1 and 2) can be mathematically developed and each term can
be linked to specific NLO effects. Relationships between the molecular structure and a given NLO
effect can be obtained. Hitherto, NLO effects have been comprehensively described for the second-
order, β or χ(2), but the cubic effects, and beyond, are much more complicated to develop and model.[2]
As a result, structure/property relationships and rules are not always available to predict the best
structural modifications to enhance a specific third-order (or higher) NLO property.[3–8] However, for
these higher-order NLO effects some empirical rules have been established that provide a solid base
for the design of active molecules.
The following work is focused on the third-order properties, as given by χ(3), the cubic
susceptibilities on a macroscopic scale, themselves related to γ, the molecular cubic
hyperpolarizability. In particular, we will be more concerned during this work with processes involving
absorptive NLO properties, i.e. the phenomena affecting the actual absorption of photons by the
molecules, as opposed to the refractive properties, concerning the modifications of the light path
through the matter and its characteristics.
1.2. Third-order NLO phenomena
It is important to note that third-order NLO phenomena exist in every molecule, compared to
second-order phenomena for which particular symmetries nullify the nonlinear effects, specifically in
centro symmetric molecules. Third-order effects are negligible in many materials, but some molecules
are more active than others, and it is possible to tune them by changing the molecular structure.

7
Moreover, the third-order effects are wavelength- and time-dependent and, as mentioned previously,
will result from changes in the refractive or absorptive properties of the medium. At the molecular
scale, refractive and absorptive properties are usually differentiated by developing the complex
number γ (Equation 3) with the real and imaginary parts being responsible for the different effects.
(3)
The real term generates phenomena related to nonlinear modifications of the refractive
properties whereas the imaginary term is responsible for absorptive modifications. Re leads to
effects such as the optical Kerr effect, frequency tripling or four-wave mixing.[9,10] These ultra fast
modifications of the refractive properties are mostly used to manipulate optical data or create a laser
source with selected wavelengths. On the other hand, the imaginary part induces slower effects such
as two-photon absorption (TPA), saturable absorption (SA) or reverse saturable absorption (RSA). The
sign of also has its importance: if >0, TPA or RSA phenomena are occurring and if <0, SA
occurs. These different absorptive properties and their applications are described in more detail in the
next paragraphs.
1.2.1. Two-photon absorption
Two-photon absorption (TPA or 2PA) corresponds to the simultaneous absorption of two
photons through a virtual state.[11] A simplified Jablonski diagram illustrates this phenomenon in Figure
1. The phenomenon can be viewed as the absorption of a first photon to reach a "virtual" state, which
in turn can absorb a second photon to reach the real excited state. Two TPA processes are observed:
one corresponds to the degenerate case with the absorption of two photons of the same energy (a)
and the second to a cascade of photons of different energies (b).[12] The former effect requires a
monochromatic laser beam at the correct energy, while the second process requires a polychromatic
intense light source coming from different sources.

8
Figure 1: TPA of photons of same (a) and different (b) energies
This representation is only a model as the virtual states do not have a real existence, and thus
the two photons need to be absorbed at exactly the same time. In a more practical way, the two
photons usually stem from the same laser source at the half energy, double the wavelength, of the
energy gap that would populate the excited state via one-photon absorption. This requires a high
enough density of photons and a correct phase matching between them for the TPA phenomenon to
occur.
These requirements on photons result in a remarkable spatial localization of this phenomenon:
the density of photon is only high enough at the focal point of the laser beam for the TPA to occur.
Therefore it is possible to obtain a very good spatial resolution in the volume. Compared to the one-
photon absorption process, the photons used for TPA are also less damaging as, at double the
wavelength, they have a much lower energy but induce the same effect in the material (associated
with the population of the excited state). This is of great interest, especially regarding the medicinal
applications, since a beam of lower energy also has a deeper penetration power under the skin while
inducing less collateral cell damage. Furthermore, the high spatial resolution of the phenomenon helps
to target specific tissues, as for instance in the case of photodynamic therapy. It also helps to achieve
better resolution and three-dimensional view when imaging is sought for diagnostic or specific
treatment.
Another field also benefits from these advantages: microfabrication (Figure 2). The spatial
resolution allowing the polymerization, thanks to TPA sensitizers, in nano- to micro-scale sized areas.
These important technological applications explain the huge interest around TPA-active molecules in
the past few years. The applications listed above are the most common but several other important
ones resulting from the TPA phenomenon can be found in the literature.[13,14]

9
Figure 2: Example of use of TPA for microfabrication (a).[15]
Illustration of the spatial resolution of the TPA
phenomenon by comparing two-photon fluorescence (c) with classic (one-photon) fluorescence (b) [16]
The intensity of the TPA phenomenon is usually described by its cross-section σTPA (Equation 4)
which can be either expressed in cm4/GW or more conveniently in Goeppert-Mayer units in honor of
its discoverer (1 GM = 10-50·cm4·s·photon-1·molecule-1).[17]
: Planck's constant h divided by 2π
ω: frequency of photons in Hz
n: refractive index
c: speed of light in a vacuum
N: number density of molecules
Another number is also used: the nonlinear absorption coefficient, often abbreviated as β (not
to be confused with the molecular quadratic hyperpolarizability). When the only nonlinear absorption
phenomenon experienced by a sample at a given wavelength is TPA, the latter can be derived as
shown in Equations 5 and 6. The dependency on λ is worth noting. This implies that when comparison
between molecules is sought for a given family of compounds, TPA measurements should be carried
out at the same wavelength, but this is not always simple since is also wavelength dependent.
When the nonlinear absorption of a sample involves other phenomena such as SA or RSA in addition to
TPA (see below), Equation 5 can also be used to extract a value, but an “effective” TPA coefficient in
this case because it results from the convolution of all absorptive nonlinear optical phenomena taking
place in the sample. To limit the contribution of these other (and temporally slower) effects on ,
the latter should be determined on an ultrashort timescale (e.g. using Z-scan with fs laser pulses).
a b c

10
λ: wavelength in nm
These two quantities σTPA and β are the most commonly used to report TPA efficiency for
molecules in the literature. While β describes the material’s behavior on a macroscopic scale, σTPA is
used at the molecular level. Depending on the technique used for measuring TPA and provided its the
sole nonlinear phenomenon experienced by the sample at a given wavelength, γim or χim(3) can also be
found as alternative measures of TPA since values of σTPA or β can be extrapolated from them.
1.2.2. Saturable absorption and reverse saturable absorption
In the same way as TPA, SA and RSA also imply the absorption of two photons. The main
difference is that they are absorbed one after another via a process called excited-state absorption
(ESA) (Figure3). This is a stepwise process where the first photon is absorbed, generating the first
excited state (not a virtual state as in TPA), and then a second photon is absorbed from this excited
state to generate the second excited state which has different physicochemical properties.
Figure 3: Saturable absorption or reverse saturable absorption
Since the second excited state has different properties to the ground state, it can induce a
"photodarkening" for RSA or a "photobleaching" for SA.[18] For RSA, the excited state has greater
absorptivity (or cross-section) than the ground state and as a result the transmission of the medium
will decrease when the photon density increases. In contrast, for SA the excited state has a lower

11
absorptivity (or cross-section) than the ground-state and the transmission will increase when the
photon density increases. These phenomena can lead to applications such as optical limiting or optical
bleaching.[19] Optical limiting is mostly used to protect devices, apparatus and sensors or even humans
from high light intensities. Albeit slower than purely refractive third-order NLO effects such as the Kerr
effect, these effects might also be used for all-optical computing since they will give rise to "gating"
effects for light concentrated by a pump beam in a pump-probe configuration.[20] Technology where
light is used as a signal is attracting more and more attention, since it allows a faster processing of data
than classic electronic circuits triggered by current pulses.
As mentioned in the previous section, TPA, RSA and SA have different response times, RSA and
SA being slower than TPA (which is nearly instantaneous) as they necessitate the population of an
intermediate (real) excited state. Hence, time-resolved measurements can be used to determine the
contribution of each effect to the third-order NLO response of a given sample experiencing nonlinear
absorption at a selected wavelength. Depending on the targeted applications, it is important to ensure
that these processes are not interfering with each other or in some cases that their effects are
contributing additively. Each one of these phenomena possesses interesting properties that can be
used in different technological applications.
1.3. Experimental techniques for measuring two-photon absorption
The vast number of third-order, and more generally NLO, effects has also given rise to several
techniques for measuring them and various set-ups are encountered depending on the desired
properties. Most of these techniques have already been reviewed and summarized in the previously
mentioned references.[17,18,21,22] They do not always give access to the values of the real or imaginary
parts of the complex numbers γ or χ(3). The most useful techniques for measuring TPA of organic and
organometallic molecules are two-photon excited fluorescence (TPEF) and Z-scan. The first one uses a
set-up that is similar to a normal fluorescence spectrometer but it necessitates a more intense laser
source to observe TPA. In contrast, the Z-scan technique does not require the sample to be
luminescent but is often less accurate, due to the possible existence of other nonlinear absorption
processes contributing to the imaginary parts of χIm(3). Z-scan nevertheless gives access to the
imaginary and real parts of the cubic hyperpolarizability, and was therefore the preferred technique to
determine Im for the weakly fluorescent compounds of the present work. Note also that other
techniques such as degenerate four-wave mixing (DWFM) or third-harmonic generation (THG) allow
one to measure the overall cubic NLO response of a sample. These will not be detailed here since they

12
do not provide any specific estimate of the two-photon processes in the NLO response. Alternatively,
the evaluation of nonlinear absorption processes can be derived from optical-limiting measurements
or pump-probe measurements (conducted on different timescales); with respect to two-photon
processes, these techniques are usually more suited to study slower effects than TPA, and will
therefore also not be detailed here.
It is noteworthy that it can be very difficult to compare the NLO data obtained with different
systems and in different laboratories, even when care is taken to translate them into a uniform set of
units. This is the result of the strong wavelength- and pulse duration- dependence of the measured
NLO responses, due to the vast number of underlying physical processes. Moreover, due to practical
reasons, every set-up and laser are different and can also induce slight specific modifications which
should be taken into account (when identified). Finally, the measurements are always calibrated using
reference materials, but a given reference can be different from one group to another and often
several values can be found in the literature for a single reference, as is the case of silica which is
often used as a reference for Z-scan measurements.[23]
Nevertheless, nowadays, the increasing amount of data in the field of nonlinear optics is giving
a more and more reliable picture of the performances of various molecules or materials, even if some
"old" measurements still have to be considered carefully. In addition, the actual lasers allow a finer
wavelength tuning and generate more stable pulses from nanosecond to femtosecond, free from
residual noise. As a result, the reported values are becoming increasingly accurate and reliable.
1.3.1. Two-photon excited fluorescence
TPEF is similar to the one-photon equivalent: after being excited to one of its excited states the
molecule decays in a non-radiative way to its first excited state (Figure 4). This is known as Kasha's
rule[24] and most compounds follow this empirical rule. Then, if the decay back to the ground state
proceeds via a radiative process, fluorescence can be observed. TPEF measures the global efficiency of
this radiative process σTPA.φ, with φ being the fluorescence quantum yield. The latter needs to be
measured by preliminary studies if not already known.[7]

13
Figure 4: one and two photon fluorescence
The experimental set-up employs a classical fluorimeter (Figure 5), with a specific source to
irradiate the sample at the desired wavelength with short pulses to ensure the detection of a single
phenomenon. The detection is most of the time perpendicular to the incident light. The TPA cross-
section σTPA is then obtained with good accuracy (a few percent error in the best cases) compared to
other methods. The main drawback of TPEF is that it requires fluorescent compounds. Moreover, this
technique does not give access to other contributions (RSA, SA, nonlinear refractive effects) to the
third-order response (χ(3) or γ) of a given sample.
Figure 5: Typical set-up for TPEF
1.3.2. Z-scan
The Z-scan technique is also a relatively simple and convenient method for studying the cubic
NLO response of a sample. It allows the separate measurement of the nonlinear refractive and
absorptive properties of non-fluorescent samples. Since most of the organometallic species are not
fluorescent, Z-scan is probably the most universal technique for studying these molecules. Figure 6
shows a representation of a Z-scan set up. An incident laser beam is focused on a focal plane (z=0).
Then, the sample is moved along this z-axis, perpendicular to the focal plane. The data corresponding
to the transmission of the medium are measured via closed- and open-aperture detectors. The former
allows the measurement of the refractive properties by measuring the shift in the focal point, and the
second measures the absorptive properties, by monitoring the changes in light intensity while the
sample is moving. Figure 6 also shows the typical profile of the data obtained from the open-aperture

14
experiment. In a, as the sample moves toward z=0, the light absorption increases, and TPA results in a
decrease in the light transmission. In b, the previously discussed “photobleaching” occurs: the closer to
the focal point the better the transmission is. In the same way for c, when a certain point is reached
the “photodarkening” process happens and the excited states absorb light. After mathematical
treatment and comparison with the reference beam and the reference material, one obtains both the
real and the imaginary parts of γ or χ(3).
Note that other types of Z-scan setups have been developed these last years. For instance,
instead of having a moving sample, some set-ups present a tunable lens allowing the focal point to be
directly moved without any mechanical movement.[25] Alternatively, double-beam Z-scan setups have
been developed.[26] Such set-ups can drastically increase the speed of measurements or allow diverse
manipulations to be performed on the sample, like electrochemistry, while doing the measurements at
the same time. In this thesis we have focused on measuring the effective TPA cross-sections. The
measurement also gives the refractive part, but the latter has not been made available at the time this
part was written, due to the longer corrections required to treat the raw data.

15
Figure 6: Example of a Z-scan set up and traces obtained for absorptive properties showing light transmission as
a function of the z-axis location

16
1.4. Third-order NLO materials for TPA or SA/RSA
1.4.1. Structure and nature of the materials
As mentioned previously, third-order NLO properties are more complex than second-order
properties. From a computational perspective, due to the large number of effects and electronic levels
involved,[27] modelling is challenging, in spite of progress this past decade. Theoretical computations of
cubic NLO effects are increasingly used to understand/predict the influence of structural modifications
on NLO effects, but primarily for small- to medium-sized organic molecules.[16,17,21] In spite of recent
progress in calculations and theory, structure-activity relationships are still not well-established for all
types of molecules for a given NLO process. So far, only a few general criteria have been empirically
observed to enhance the overall cubic NLO effects, as given by γ or χ(3). First, the more active
molecules usually possess an extended π-system and a multipolar structure with an alternation of
electron-donating and -withdrawing groups. The disposition of donor or acceptor groups also has an
important role and often the NLO response will improve when the symmetry of the molecule
increases, going from dipolar to quadrupolar to octupolar (Figure 7).
Figure 7: Examples of multipolar structures
As a result, the disposition in space, and the number, the conjugation and the distance
between electron-donating and electron-withdrawing groups are crucial factors in the design of highly
active third-order materials. The electron-donating and electron-releasing groups can be either
inorganic, organic or organometallic. As these groups possess different effective electronegativities
and interact differently with the spacers between them, some modifications and combinations are not

17
similarly effective for all geometries/structures and fine tuning is often required, depending on the
exact molecular structure sought.
Among the donors, several types have been used: dialkyl- and diaryl-amino and oxygen-based
groups are the most common. The more donating the group is, the more active the compound is, and
as a first approach, NLO activity can be correlated to the Hammett coefficient values. However, among
amines, an exception is worth mentioning: arylamines, for which the number of π-electrons counter-
balances their weaker donating power compared to dialkylamines. In terms of acceptors, similar
observations can be made based on the Hammett coefficients. The most commonly used acceptors are
the nitro, cyano/malonitrile, sulfonyl, triflyl or organoboryl groups (Chart 1).[4,7,11,28–30]
Chart 1: Examples of classic donors, acceptors or bridging units
An optimal electronic coupling between these groups through the bridge is also necessary to
facilitate the electronic interaction between donors and acceptors. So far, phenylene-vinylene or
ethynyl/phenyl-ethynyl are the most popular hydrocarbon bridges as they provide an effective π-
conjugation pathway for most donor/acceptor couples. Extended π-conjugated bridges like anthracene
or phenanthrene and aromatic heterocycles like thiophene or pyrrole are also commonly encountered
in the design of molecules with large NLO properties. However, as mentioned above, depending on the
targeted structure, fine tuning is required to properly select the best combination of D/bridge/A to

18
optimize the desired NLO response. The stability of the bridging unit and its length are additional
criteria, since chemical stability and "volume efficiency" are often required for applications. Also, while
increasing the number of bridging units, the number of π-electrons also increases, requiring the
system to remain planar to ensure an optimal electronic communication. All these issues have to be
taken into consideration, making the design of the best molecular structure a difficult task.[4,12,17,23,28,31]
1.4.2. Examples of third-order NLO active materials with high TPA cross-sections
The literature contains extensive lists of cubic hyperpolarizability values because every
material is third-order NLO active, regardless of its symmetry and composition, including bulk
materials, molecules in solution, and doped glasses. With the complexity introduced by the existence
of different phenomena, and the variety of experimental setups and conventions used to extract the
relevant parameters, it is sometimes challenging to make reliable comparisons between the third-
order NLO properties of molecules. Some values for classic materials can be found in the Handbook of
Nonlinear Optics written by Sutherland.[21] Some relevant and didactic examples of two-photon
absorbers will be described in the following paragraphs to provide an illustration of typical molecules
of interest and their associated σTPA values.
Inorganic materials were the first to be tested as they are in general robust, transparent and
available in crystalline form. Their main drawbacks are a slow response time, small structural diversity,
and difficulty in synthesizing them in a monocrystalline form. Their NLO activity is usually high and
originates mostly from electronic effects, but also, in many cases, from distortions of the crystal lattice.
The most popular inorganic salts used for third-order nonlinear optics are semiconductors such as
gallium arsenide (GaAs) or cadmium sulfide (CdS), which find applications as saturable absorbers.[32]
Their crystal-growing technology is well developed, allowing for their easy incorporation in various
devices. Inorganic crystals are, for the moment, the only available materials commercially used for
various applications in nonlinear optics, despite the fact that they are not as versatile as organic or
organometallic materials. As multiphoton absorbers, their NLO activity does not originate exclusively
from TPA, unlike the examples given below.
1.4.2.1. Organic compounds
Organic molecules have fast NLO responses and can be easily synthesized with considerable
structural variation fortuning the properties. Their NLO responses originate from electronic effects and

19
are usually essentially instantaneous. Due to the large number of donors/acceptors and geometrical
variations, as discussed previously, it is difficult to give a comprehensive overview of all active
structures. Chart 2 illustrates some examples of organic materials designed for TPA such as 1-3 and 6-
7. In line with the general guidelines previously mentioned, they show an increase of the TPA cross-
sections when increasingly electron-releasing donors are incorporated; from methoxy to alkylamine
and then to arylamine. Moreover, increasing the length of the π-system by incorporating a fluorene
unit within the molecular spacer (e.g. proceeding from 2 to 7) also drastically increases the TPA cross-
section. Finally, compounds 8 and 9 illustrate the fact that peripheral donors are much more effective
than acceptors (by an order of magnitude) in quadrupolar structures built around a 2,7-fluorenyl core.
Chart 2: Examples of organic TPA molecules. a: [16]
, b: [33]
, c: [34]

20
As spacers in these quadrupolar structures, vinylene and ethynylene bridges are similar:
comparing compounds 3 and 4 or 7 and 8 illustrates this point as these compounds possess similar TPA
cross-sections. Although the values of the double bond-containing compounds are expected to be
higher, as double bonds are known to be more “conducting” than triple bonds, the latter having a less
effective bond alternation because of π-π and π*-π* energy mismatches at the C(sp1)-C(sp2)
connections, the optimization of NLO effects does not always obey such simplistic rules.[35] Z-scan
values often appear larger than values obtained by TPEF for a similar compound at a given
wavelength,[36] illustrating the difficulty in comparing results obtained by different kinds of
measurements (e.g. 3 and 4). Triple bonds possess better thermal stability, which makes them more
likely to be used for applications involving thermal stability or high light intensity.
The influence of geometry, when progressing from quadrupoles to octupoles, can be
illustrated with 4 and 5. Although only a three-fold improvement is seen when progressing from 4 to 5,
5 is nevertheless more compact than three equivalents of 4, resulting in a better molecular
performance for 5. Chart 3 shows the influence of the bridging unit’s length, because the TPA cross-
sections increase with the number of π-electrons in the molecule. However, it is only true up to three
phenylene ethynylene units, as the cross-section decreases with further lengthening due to decreasing
electronic communication between the (donor) endgroups. The use of an anthracene spacer, similarly
to 2,7 fluorenyl, tends to enhance TPA response due to the corresponding increase in the π-manifold.
Chart 3: Effect of the increasing number of bridging units on the NLO response. a: [37]

21
1.4.2.2. Organometallic compounds
Similar observations can be made with organometallic molecules, which can be considered as
hybrid structures between organic and inorganic. They often possess the synthetic versatility of
organic compounds, the metal centres being considered as D or A, depending on their electronic
structure. Literature data indicates that they tend to have higher NLO responses than the pure
organics of comparable length as they possess more polarizable electrons. Selected examples can be
seen in Chart 4 with metal centres playing the role of donor substituent. Their molecular third-order
NLO hyperpolarizabilities are reported in Table 1, but only the imaginary part (γIm) should be taken in
consideration for judging their TPA capability. Similar to organics, lengthening the -system (13
compared to 15 and 14 to 16) and the change in symmetry lead to an increase in the NLO response (17
and 18, respectively, compared to 15 and 16). Progressing from dipolar to octupolar results in a much
larger than threefold improvement. Note also that a similar improvement is not seen for γ, illustrating
than these structural variations impact the various NLO properties.
Chart 4: Examples of organometallic NLO-active compounds
22
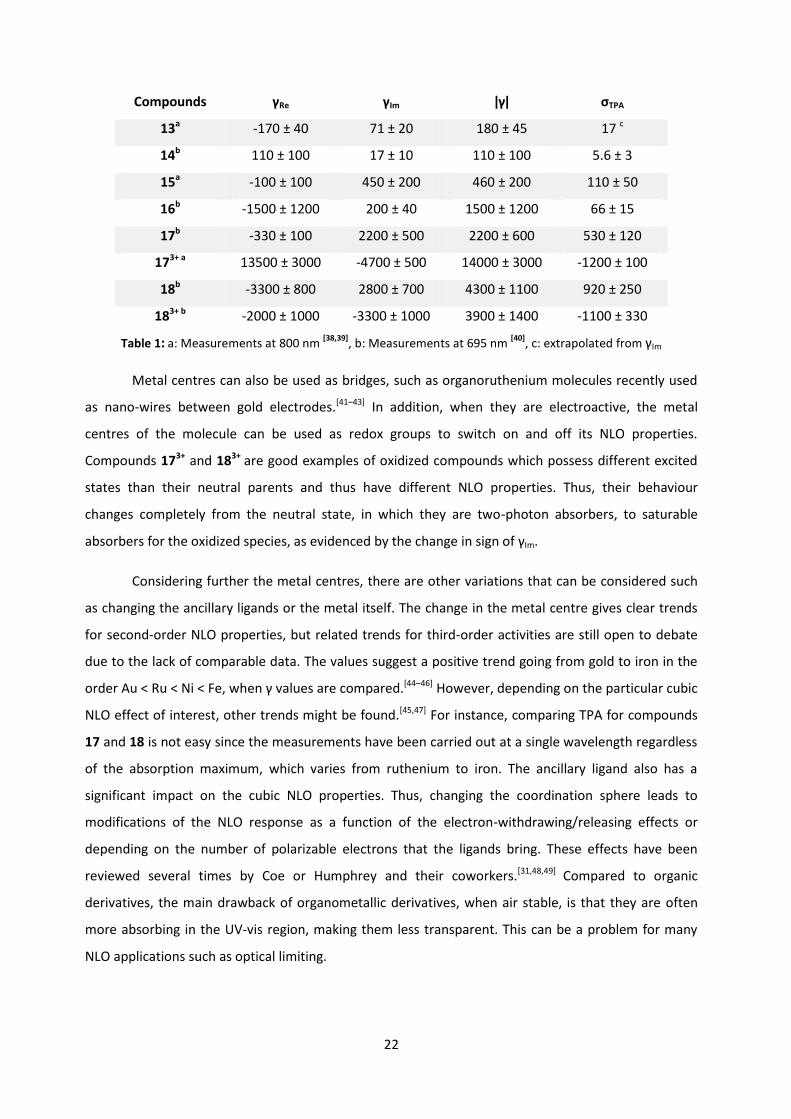
Compounds γRe γIm ǀγǀ σTPA
13a -170 ± 40 71 ± 20 180 ± 45 17 c
14b 110 ± 100 17 ± 10 110 ± 100 5.6 ± 3
15a -100 ± 100 450 ± 200 460 ± 200 110 ± 50
16b -1500 ± 1200 200 ± 40 1500 ± 1200 66 ± 15
17b -330 ± 100 2200 ± 500 2200 ± 600 530 ± 120
173+ a 13500 ± 3000 -4700 ± 500 14000 ± 3000 -1200 ± 100
18b -3300 ± 800 2800 ± 700 4300 ± 1100 920 ± 250
183+ b -2000 ± 1000 -3300 ± 1000 3900 ± 1400 -1100 ± 330
Table 1: a: Measurements at 800 nm [38,39]
, b: Measurements at 695 nm [40]
, c: extrapolated from γIm
Metal centres can also be used as bridges, such as organoruthenium molecules recently used
as nano-wires between gold electrodes.[41–43] In addition, when they are electroactive, the metal
centres of the molecule can be used as redox groups to switch on and off its NLO properties.
Compounds 173+ and 183+ are good examples of oxidized compounds which possess different excited
states than their neutral parents and thus have different NLO properties. Thus, their behaviour
changes completely from the neutral state, in which they are two-photon absorbers, to saturable
absorbers for the oxidized species, as evidenced by the change in sign of γIm.
Considering further the metal centres, there are other variations that can be considered such
as changing the ancillary ligands or the metal itself. The change in the metal centre gives clear trends
for second-order NLO properties, but related trends for third-order activities are still open to debate
due to the lack of comparable data. The values suggest a positive trend going from gold to iron in the
order Au < Ru < Ni < Fe, when γ values are compared.[44–46] However, depending on the particular cubic
NLO effect of interest, other trends might be found.[45,47] For instance, comparing TPA for compounds
17 and 18 is not easy since the measurements have been carried out at a single wavelength regardless
of the absorption maximum, which varies from ruthenium to iron. The ancillary ligand also has a
significant impact on the cubic NLO properties. Thus, changing the coordination sphere leads to
modifications of the NLO response as a function of the electron-withdrawing/releasing effects or
depending on the number of polarizable electrons that the ligands bring. These effects have been
reviewed several times by Coe or Humphrey and their coworkers.[31,48,49] Compared to organic
derivatives, the main drawback of organometallic derivatives, when air stable, is that they are often
more absorbing in the UV-vis region, making them less transparent. This can be a problem for many
NLO applications such as optical limiting.

23
1.4.2.3. Dendritic effects
Another category of molecules that is also of interest is dendrimers and polymers, as these
architectures are closer to macroscopic size and thus to bulk materials. These structures usually
possess a huge number of π-electrons and consequently exhibit third-order nonlinearities, which
increase with generations and at a greater rate than expected based on the sum of their linear
components.[50–52] The cause of the phenomenon is not very well understood, but empirical results
clearly reveal a more than ten-fold increase in the cubic NLO χ(3) values for each generation for several
types of organometallic dendrimers.[50,53,54] In contrast, for organic dendrimers, the branching does not
always have a positive effect: instead of cooperative (additive) enhancement, a weakening of the NLO
response can sometimes be observed when progressing to the next generation. Symmetry breaking or
interferences brought by the extra generation have been invoked to rationalize these observations.[4,55]
1.4.2.4. Synopsis and new perspectives
To summarize, the more-active molecules for TPA also obey the general structural criteria
delineated for cubic NLO effects which are to (i) possess an extended π-system, (ii) to be polarized with
an overall quadrupolar (or octupolar) symmetry, and incorporating strong electron-donating and
accepting groups at the periphery. The symmetry of the system is of great importance as this third-
order NLO response follows most often an increasing trend from dipolar to quadrupolar to octupolar.
The choice of the donors and acceptors as well as the bridging units has to be made in order to favour
a good overlap between fragment orbitals, to ensure electronic communication. Finally, the chosen
system has to be synthetically accessible. Evidently, depending on the targeted applications, additional
considerations add to these general rules. As shown in the previous sections, organometallics also
follow the same rules as organic molecules. The d6 metals presented here can replace donors, due to
their donating power but also can be used as bridging units. The synthetic versatility of metal alkynyl
complexes allows for a great variety of compounds and structures, and is augmented by redox-
switchability, with properties that can be tuned by varying the ancillary ligands at a metal centre in a
given geometry. Finally, dendritic architectures open a further dimension in the quest for strong two-
photon absorbers.
All these molecules and the related molecular materials possess advantages and drawbacks
depending on the targeted application, and interest continues to grow, as evidenced with the
increasing amount of data.[11,16] Surprisingly, considering the number of molecular structures screened

24
so far, only a few papers have investigated the use of triphenylmethane (TPM)-based dyes, such as
crystal violet (CV+), for their third-order NLO properties, in spite of the fact that this moiety (Chart 5)
fulfils many of the structural criteria enumerated above (conjugated and multipolar structure,
octupolar symmetry, etc.). In 1994,[23] a computational contribution of Brédas and co-workers pointed
out the huge potential for CV+ and related derivatives such as Malachite Green (MG+) to behave as
remarkable two-photon absorbing materials in the NIR range, a spectral domain appealing both from
the perspective of telecom-based and medicinal applications. However, despite the obvious promise of
this type of compound and the numerous investigations concerned with the second-order NLO
properties of CV+,[27,56,57] little research has been devoted to investigate the two-photon absorption
properties of TPM-based dyes. In the next paragraphs, we will now briefly outline the synthesis and
physico-chemical properties of these fascinating molecules, followed by a review concerning the rare
reports of their third-order NLO properties.
Chart 5: Crystal violet (CV+) and Malachite green (MG
+)
2.Triphenymethane dyes
2.1. General comments
Triphenylmethane (TPM) dyes and more generally triarylmethane (TAM) dyes form a large and
diversified family of compounds, not so much for their structures as for their properties and
applications (Chart 6). They were amongst the first organic commercial dyes to be used by the textile
industry and they have also spread to fields like medicine, probing and even catalysis.[58] Due to these
widely diversified uses, TPM dyes are often found in waste waters. Given that some of these
derivatives have been found to be carcinogenic and genotoxic, the accent in current research is
directed at ways to detect and remove them from many industrial processes.[59–62] However, as
mentioned above they have generated increasing interest in the field of nonlinear optics, as their
unique structure and properties make them good candidates, especially for applications based on
third-order NLO properties.

25
Chart 6: Examples of TPM-based carbocations
TPMs are related to the structure in Chart 6, a substituted tritylcation, the latter being the first
isolated poly-aromatic carbocation (in 1901).[63–65] Carbocations are usually poorly stable as they are
strong electron-accepting groups and therefore highly electrophilic. For example, the trityl carbocation
is air, moisture and light sensitive due to its high electrophilicity. Most of the carbocations used in
chemistry are less stable. As a result, most often they are only considered as reaction intermediates
which can only be isolated at low temperature.[66] The instability of carbocations has been widely
investigated and their use as reaction intermediates has allowed great progress in organic synthesis
from academia to industry. Well-known reactions involving carbocations are, for example,
polymerization processes or the formation of branched hydrocarbons, or more common reactions, like
the pinacol rearrangement and Friedel-Crafts alkylation. For a full overview of the uses of carbocations
in synthesis or catalysis, one can consult the recent review from Naredla et al. or the book from Olah
and Prakash.[67,68] Note that typical "non-stabilized" carbocations are far too reactive to be interesting
in the context of this work, as the stability and robustness of TPMs is much higher. This stability is a
prerequisite for "usable" compounds in solution under high laser intensities.
In TPM derivatives, the presence of the phenyl groups, sometimes supplemented by electron-
releasing groups such as amines, as in CV+ or MG+, tremendously increases their stability. Thanks to
charge delocalization, as exemplified by the different mesomeric forms of Scheme 1, such dyes can be
manipulated, to some extent, as classical organic compounds. More generally, the stability of TPM-
based dyes strongly depends on the number and π-donating power of the different R groups.
Accordingly, each structural variation of the peripheral substituents will strongly influence their
electronic structure, stability and properties, and can potentially lead to uses in widely different
applications.

26
Scheme 1: CV+- or MG
+-type carbocations and associated mesomeric forms
2.2. Solvolysis
In TPM-based dyes, peripheral donors are essential to stabilize the positive charge. This
stabilization, due to charge delocalization, is crucial for obtaining long-lived carbocationic species, as
these species are quite reactive. Their stability is often evaluated by the rate constant of solvolysis,
generally by hydroxyl ions originating from traces of water (Equation 3).[69,70] This reversible reaction
takes place with water, under alkaline conditions or, for the less stabilized TPM-based dyes, in polar
solvents like alcohols.[71] As a result, TPM dyes can be used as pH indicators. For example, the
ionization constant (pK) of MG+ is 6.90 and this carbinol is 100% ionized at pH 4.0, 50% at pH 6.9, 25%
at 7.4 and 0% at pH 10.1.[72] This means that in most applications, in polar media at neutral pH, TPM
dyes are actually mixtures of carbinols and carbocations. Formation of the carbinol is most often
responsible for the colour fading, as the carbinol is most often colourless, no longer possessing a sp3-
hybridized central carbon, and thereby reducing electron delocalization and shifting the electronic
absorption into the UV range.
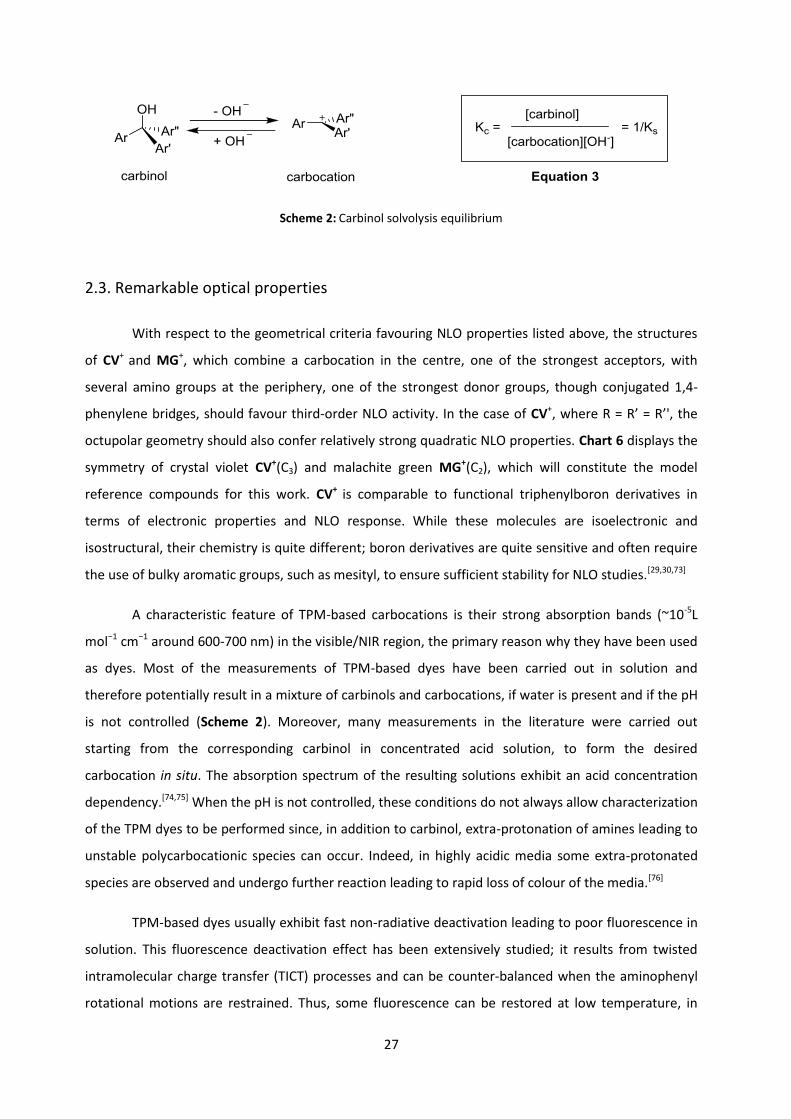
27
Scheme 2: Carbinol solvolysis equilibrium
2.3. Remarkable optical properties
With respect to the geometrical criteria favouring NLO properties listed above, the structures
of CV+ and MG+, which combine a carbocation in the centre, one of the strongest acceptors, with
several amino groups at the periphery, one of the strongest donor groups, though conjugated 1,4-
phenylene bridges, should favour third-order NLO activity. In the case of CV+, where R = R’ = R’', the
octupolar geometry should also confer relatively strong quadratic NLO properties. Chart 6 displays the
symmetry of crystal violet CV+(C3) and malachite green MG+(C2), which will constitute the model
reference compounds for this work. CV+ is comparable to functional triphenylboron derivatives in
terms of electronic properties and NLO response. While these molecules are isoelectronic and
isostructural, their chemistry is quite different; boron derivatives are quite sensitive and often require
the use of bulky aromatic groups, such as mesityl, to ensure sufficient stability for NLO studies.[29,30,73]
A characteristic feature of TPM-based carbocations is their strong absorption bands (~10-5L
mol−1 cm−1 around 600-700 nm) in the visible/NIR region, the primary reason why they have been used
as dyes. Most of the measurements of TPM-based dyes have been carried out in solution and
therefore potentially result in a mixture of carbinols and carbocations, if water is present and if the pH
is not controlled (Scheme 2). Moreover, many measurements in the literature were carried out
starting from the corresponding carbinol in concentrated acid solution, to form the desired
carbocation in situ. The absorption spectrum of the resulting solutions exhibit an acid concentration
dependency.[74,75] When the pH is not controlled, these conditions do not always allow characterization
of the TPM dyes to be performed since, in addition to carbinol, extra-protonation of amines leading to
unstable polycarbocationic species can occur. Indeed, in highly acidic media some extra-protonated
species are observed and undergo further reaction leading to rapid loss of colour of the media.[76]
TPM-based dyes usually exhibit fast non-radiative deactivation leading to poor fluorescence in
solution. This fluorescence deactivation effect has been extensively studied; it results from twisted
intramolecular charge transfer (TICT) processes and can be counter-balanced when the aminophenyl
rotational motions are restrained. Thus, some fluorescence can be restored at low temperature, in

28
very viscous media, or via chemical modifications to properly rigidified derivatives (such as, for
instance, in rhodamine derivatives, as we shall see later on).
TPM-based dyes have been used in many other applications other than dyeing. Non-rigidified
derivatives were sometime used as viscosity probes, and they form fluorescent aptamers with DNA or
RNA, which makes them perfect candidates for imaging or in vivo/vitro visualization.[77] Crystal violet
CV+ and malachite green MG+, which possess good bio-compatibility, are probably the most popular
choices for such applications. CV+ derivatives have also been extensively used in biology as coloured
markers (for instance to differentiate Gram+ and Gram- cell types), while MG+ has been employed as
an antiseptic agent.[78,79] Another recent interest is TPA, as described below, and such dyes can
generate TPA in the NIR region, a strategic wavelength range for telecommunications or in medical
application. Finally, in line with their fast relaxation properties and multiphoton-absorption properties,
TPM-based dyes have also been used for the generation and optical rectification of sub-picosecond
laser pulses.[58]
2.4. Nomenclature and examples
The relatively large presence of TPMs across many fields is not always noticed due to the
various names that each derivative possesses in everyday life. Indeed, four different methods are used
to name these dyes and several different commercial designations exist for the same TMP dye. This
clearly does not help when it comes to list all the uses of a given chemical. The first two proposed
nomenclatures derived from their colour or were related to their use as dyes, and are listed in the
Colour Index[80] or designated by their IUPAC name[81]. The CAS Registry Number has allowed a
standardization of names but the commercial names remain for most of them, and more than one
name can still be found for a single TPM carbocationic derivative. Table 2 lists some classical TPM dyes
and their different names. The IUPAC name is not listed as it is quite lengthy and most often
inconvenient to use, compared with the more common names or the CAS number which fully
describes the molecule.[82,83] For example, the IUPAC name for the chloride salt of crystal violet is tris(4-
(dimethylamino)phenyl)methylium chloride, and for malachite green the IUPAC name is 4-[(4-
dimethylaminophenyl)phenylmethylium]-N,N-dimethylaniline chloride.

29
# C.I. generic name
C.I.
constitution
number
CAS
registry
number
Possible commercial name or usual names
CV+ Basic violet 3 C.I. 42555 548-62-9 Crystal violet, methyl violet 5BO
19 Basic violet 4 C.I. 42600 2390-59-2 Ethyl violet, ethyl violet AX
20 Basic violet 14 C.I. 42510 632-99-5 Magenta, fuchsine, fuchsin
21 Acid violet 19 C.I. 42685 3244-88-0 Acid fuchsine S, acid magenta, acid rubin
22 Acid green 9 C.I. 42100 4857-81-2 Brilliant acid green B, merantine green B,
xylene fast green 6B
23 Basic green 1 C.I. 42040 633-03-4 Brilliant green, diamond green G, fast green
JJO
MG+ Basic green 4 C.I. 42000 569-64-2 Malachite green, Victoria green B
Table 2: Examples of TPM and their different names
Chart 7 shows the chemical structures of the compounds in Table 2. In everyday life
applications, TPM dyes can be found as their (so-called) “acid” or “basic” structures. The basic
structure is zwitterionic and neutral, such as for 21 and 22, while the acid structure corresponds to a
pair of ions with the chromophore unit a cation, the counter anion being most of the time inorganic,
such as for CV+, MG+, 19-20 and 23.

30
Chart 7: Selected examples of TPMs
Other related derivatives worth mentioning here, as they correspond to important TPM-dye
precursors, are the leuco-TPMs and carbinols (Chart 8). Both species are neutral molecules possessing
a coordinatively saturated central carbon atom. Leuco-TPMs have a hydrogen substituent on the
central carbon whereas carbinols have a hydroxyl group. For MG+, for instance, MGH and MGOH,
respectively, will correspond to the leuco-MG and to the corresponding carbinol.

31
Chart 8: Leuco-dye and carbinol of MG+
3. TPMs: synthesis and physico-chemical properties
3.1. Synthesis
TPM dyes have been extensively used in the textile industry and biology, and consequently
several pathways have been developed to synthesize these compounds. Depending on the symmetry
of the dye and its functionalization, the synthetic pathways can vary, but all of them proceed through
carbinol or leuco-dye intermediates (Scheme 3). These precursors lead to the desired carbocations by
addition of oxidant, such as DDQ or PbO2, followed by acid for the leuco-derivatives, and by addition of
protons (acidic solution) for the carbinols, as the hydroxyl group is very labile in e.g. MGOH (Chart 8).
Both synthetic approaches can in principle be used to access a given carbocation, but carbinols are far
more sensitive when the peripheral substituent groups are strongly donating (e.g. amines). Leuco-dyes
were extensively used in the early development of this chemistry [84,85] but nowadays the preferred
pathway proceeds through carbinol intermediates, since carbocations are easily generated from these
species. In contrast, for leuco-dyes harsher oxidizing conditions are always required which most often
results in lower yields. This is probably why the carbinol route is most often used when applications
are targeted, as there can be high-purity requirements for the carbocationic species (see part 2.3).[77,86]
Scheme 3: Carbocation formation from carbinol and leuco-dye
Scheme 5 summarizes the different routes that can be found for obtaining TPM-based
carbocationic derivatives. Most of them can be extended to TAM-based derivatives. Carbinols are

32
usually formed by addition of a Grignard or lithiated reagent to a ketone, and have usually higher
yields and allow more diversity than the corresponding leuco-based pathways.[77,87] The latter are
usually obtained by aromatic electrophilic substitution in acidic media. Quite recently, catalysts have
greatly improved the range of the precursors that can be synthesized. Thus, Lewis acids like FeCl3, [88]
ytterbium triflate,[89][90] SbCl3,[91,92] or palladium catalysts[93–95] facilitate the isolation of leuco dyes from
a range of commercially available precursors, such as aromatic ketones (like benzophenone and its
derivatives), under smoother reaction conditions. For instance, a remarkable tandem regioselective
electrophilic aromatic substitution reaction is given in Scheme 4.
Scheme 4: Lewis acid-catalyzed synthesis of new leuco dyes
Other less common catalysts have been used for related reactions e.g. o-benzenedisulfonimide
and a nickel catalyst combined with a chelating leaving group,[96] or NbCl5.[97] Nickel catalysts have also
been used to form enantio-enriched non-symmetrical leuco-dyes.[98] Some aspect of this recent work
can be found in the comprehensive review of S. Mondal et al. which focuses on diaryl- and triaryl-
methanes.[99] Alternatively, the use of diarylmethane precursors with new leaving groups such as, for
instance, benzotriazole (Bt) has allowed the introduction of electron-withdrawing groups, like nitro
groups, onto one of the phenyl rings of leuco dyes. However, for many of these new leuco dyes,
conversion to the carbocation has not been attempted, and therefore no information is available
regarding their propensity to behave as useful intermediates. For fully symmetrical (octupolar) TPM
dyes, fully symmetric precursors are required. In this respect, reactions involving dimethyl carbonate,
triethyl orthoformate or even chloroform with arene nucleophiles are often used.[65,100]
33
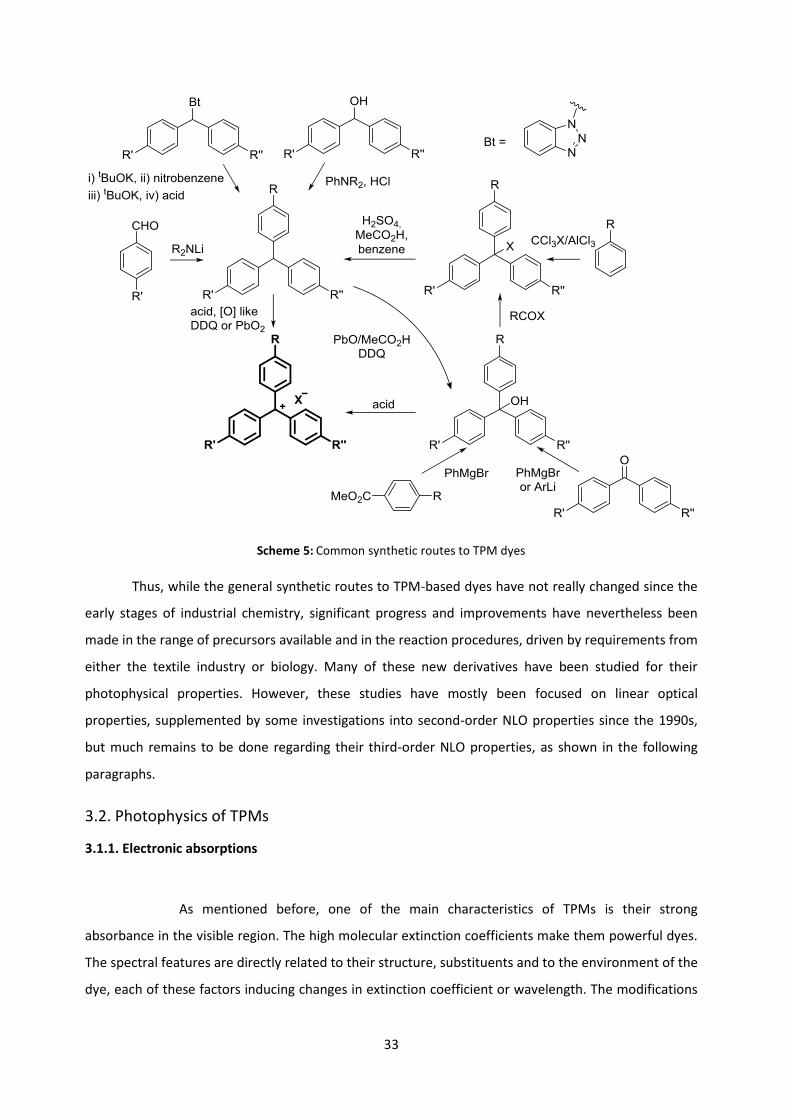
Scheme 5: Common synthetic routes to TPM dyes
Thus, while the general synthetic routes to TPM-based dyes have not really changed since the
early stages of industrial chemistry, significant progress and improvements have nevertheless been
made in the range of precursors available and in the reaction procedures, driven by requirements from
either the textile industry or biology. Many of these new derivatives have been studied for their
photophysical properties. However, these studies have mostly been focused on linear optical
properties, supplemented by some investigations into second-order NLO properties since the 1990s,
but much remains to be done regarding their third-order NLO properties, as shown in the following
paragraphs.
3.2. Photophysics of TPMs
3.1.1. Electronic absorptions
As mentioned before, one of the main characteristics of TPMs is their strong
absorbance in the visible region. The high molecular extinction coefficients make them powerful dyes.
The spectral features are directly related to their structure, substituents and to the environment of the
dye, each of these factors inducing changes in extinction coefficient or wavelength. The modifications

34
induced by structural changes on the absorptive properties have been listed and rationalized mostly in
an empirical way, as the excited-state manifold of TPM dyes is not fully understood.[101] Their
excitation and relaxation processes have been intensively debated for the last seventy years. Charge-
transfer (CT) transitions from the peripheral electron-rich arms to the carbocationic centre are
expected with this kind of structure. Depending on the overall symmetry, exclusion rules predict the
existence of two distinct transitions at low energy in the D3 case (as considered in this paper), one of
them being allowed and doubly degenerate and the other forbidden, and three distinct ones in the C2
case, one among them also being forbidden. However, for some derivatives, the forbidden band can
sometime be weakly observed in D3 symmetry and similar number of transitions might therefore be
observed in each case.
Figure 8 shows the spectrum of MG+ and CV+, our reference compounds for this work. They
have an absorption maximum (λmax) at lowest energy around 590 nm for CV+ and 625 nm for MG+ and
exhibit rather intense bands (ε ca. 105 L.mol-1.cm-1). An important point to note is the shoulder
appearing on the optical absorption bands for both compounds on their lowest energy side. Despite
several theories, it still remains unclear which phenomenon is at the origin of these shoulders. This
shoulder can either arise from a partially resolved vibronic structure or could result from another
electronic transition overlapped with the main one. In the second case, this new transition might
originate either from a conformer or from another closely related species generated from the pure
starting compound, such as an adduct with itself (exciplex or excimer) or with the solvent. The
hypothesis of a vibronic structure was rapidly eliminated since at low temperature the expected
increase in resolution for the fine structure was not observed. Instead, the shoulder is decreasing,
suggesting an independent species as the explanation. Also, the behaviour upon dilution was not
supportive of the formation of a weakly bonded self-adduct (oligomer) in solution forming an exciplex
as the origin of the second band.

35
Figure 8: CV+(purple) and MG
+(green) spectra in DCM
One of the first interpretations for this second species was proposed by Lewis and co-workers.
According to these researchers there is an equilibrium between two rotational conformers, one with a
propeller structure (D3 symmetry) and the other with a less symmetric conformation (C2 symmetry) (A;
Figure 9).[102] This was supported by the fact that the intensity of the shoulder diminishes at low
temperature and in low polarity solvents, suggesting that an equilibrium was operative between the
two species at the origin of the different peaks. However, up to the early 1990s, this C2 conformer of
CV+ had never been observed and several calculations had demonstrated that such a distorted isomer
would not lead to a stable species corresponding to a minimum in energy. Based on these statements,
McHale proposed that the shoulder was due to a symmetry breaking-deformation (B; Figure 9)
induced by the solvent, the dye itself or even the counter ion.[58] The last-mentioned, interacting with
one of the amino groups, was expected to lift the degeneracy of the degenerate S1 excited state of the
original octupolar structure.[103] Note that, as mentioned above, a lowering of the symmetry of the
absorbing species from D3 to C2 will change the number and energy of the first allowed transitions in
the case of CV+. Maruyama later proposed that the shoulder on the low energy side of the transition
stemmed from a "solvation isomer", featuring a solvent molecule "coordinated" to the central carbon
atom (C; Figure 9) in rapid equilibrium (~500 fs at 295 K) with the non-coordinated species. This
solvation isomer would have its central carbon out of plane with an overall C3 symmetry due to the
0
20 000
40 000
60 000
80 000
100 000
120 000
140 000
230 330 430 530 630 730
ε (
L.m
ol-1
.cm
-1)
λ (nm)

36
solvent molecule interacting with the central carbocation. Unfortunately no experimental observations
of such solvent adducts have ever been reported so far. [104–106]
Figure 9: Envisaged structures for the second species at the origin of the shoulder on the first allowed absorption
band of CV+
In 1999, Lovell and coworkers reviewed this topic and, with the help of new crystallographic
data (co-crystallization of CV+ with phthalic acid) and additional calculations, proposed that any of
these adducts (B and C) were indeed conceivable, but proposed that the latter forms in the excited
state and not in the ground state (i.e. as excimers, but formed with the solvent), somewhat supporting
Murayama's hypothesis.[107] However, they could not definitively eliminate the possible existence of a
less symmetrical adduct in the ground state similar to that proposed by McHale (B). In favour of the
presence of these two species in solution was the fact that the calculated ground states were quasi
iso-energetic (ΔG < 1kcal mol-1) and these species could therefore easily isomerize at room
temperature.
While this contribution clarified the problem, it did not end the debate. Thus, more recently,
Ghanadzadeh et al. in 2007, with measurements in liquid crystal matrices, obtained evidence that
solute-solute interactions (ion pairing or dye aggregation) were influencing the main band and that
anisotropic solvation had an even larger influence on the observed shoulder.[108] In 2008, Loison and

37
co-workers carried out single molecule measurements and only observed a single band, strengthening
the fact that the second absorption band indeed originates from a different species and not from a
vibronic structure or a true excimer.[109] This also eliminates the hypothesis of a spontaneous Jahn-
Teller distortion, as the shoulder would still have been observed.[110] Thus, the environment must be
responsible for the shoulder and there is clear evidence that the appearance of the shoulder originates
from intermolecular interactions as well as the broadening of the lowest energy peak. Furthermore,
with new calculations following geometric optimizations, Loison and coworkers rehabilitated the
hypothesis of an adduct with a molecule of water interacting with the central carbocation.[109] While
such a proposal found additional support in the very recent work of Macovez and co-workers,[111] the
existence of a less symmetrical structure for this adduct also found computational support from
Terenzani and coworkers.[57] It now seems that some consensus has been reached in the shoulder
originating from a second species of lower symmetry formed in the medium due to interaction with
either the counter-anion or solvent. However, whether this adduct has a structure closer to that
proposed by McHale (structure B) or Mukayama (structure C) has not been definitively clarified.
3.2.2. Relaxation processes
In parallel to the investigations related to the absorption spectra delineated above, the
relaxation behaviour of TPMs was also extensively studied. Figure 10 shows a general representation
of TPM dye relaxation processes subsequent to excitation into their two singlet states at lowest
energy. Different experiments were conducted throughout the twentieth century and different
theories were proposed to rationalize these phenomena. Most TPM dyes present a fast (sub pico-
second) non-radiative relaxation process and become fluorescent (and sometime) phosphorescent
only in a viscous medium or/at low temperature, with a viscosity dependency from 0.33 % to 0.66 %
and up to 35% fluorescence for some TPMs, which explains their use as sensors and probes.[112]
Rigidification of the system by the formation of dimers, aggregates or even incorporation in a matrix,
has the same effect. It has also been proven that there is a solute concentration dependency of the
fluorescence, i.e. the concentration of the dye influences its relaxation behaviour.[113] This is not really
surprising since TPMs are known to form aggregates at high concentrations, opening intermolecular
non radiative deactivation pathways. Finally, chemical rigidification of the chromophore also partially
restores their fluorescence.
In addition to their first excited state, TPM dyes can also fluoresce from a second allowed
excited state S2, making TPMs some of the few organic molecules that are exceptions to Kasha’s
rule.[114] Accordingly, for CV+, two-photon fluorescence from S2->S0 has been observed.[115] It is
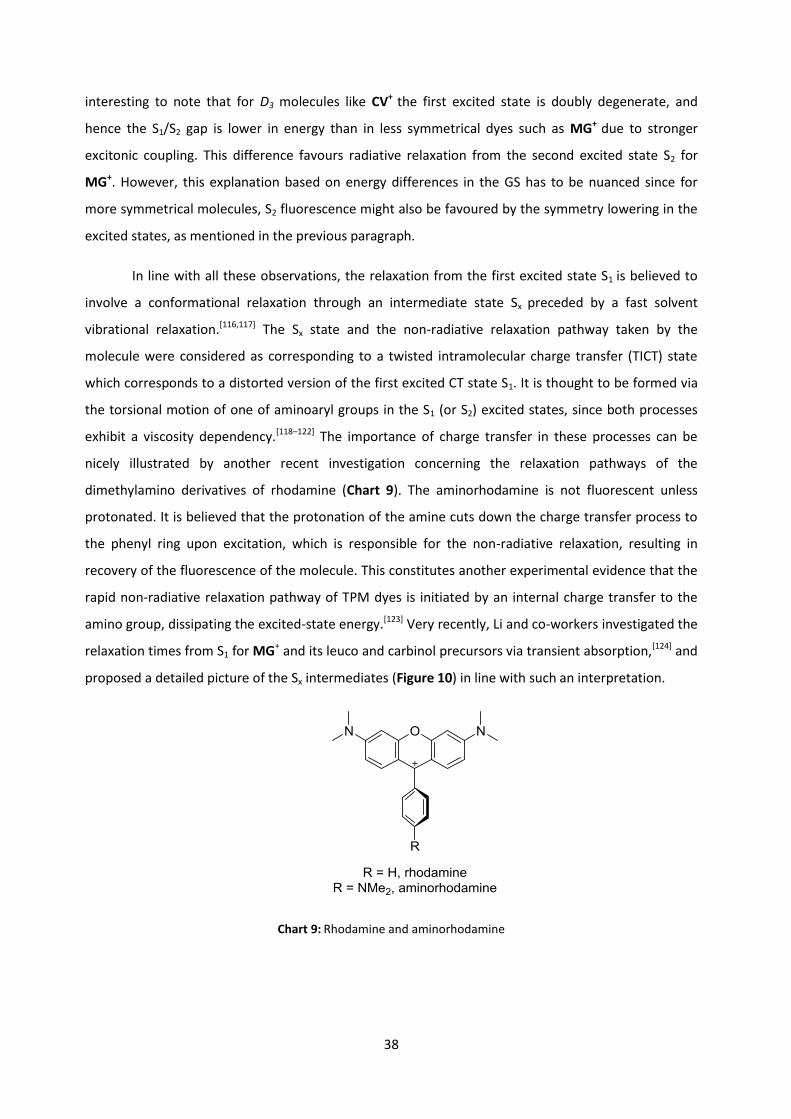
38
interesting to note that for D3 molecules like CV+ the first excited state is doubly degenerate, and
hence the S1/S2 gap is lower in energy than in less symmetrical dyes such as MG+ due to stronger
excitonic coupling. This difference favours radiative relaxation from the second excited state S2 for
MG+. However, this explanation based on energy differences in the GS has to be nuanced since for
more symmetrical molecules, S2 fluorescence might also be favoured by the symmetry lowering in the
excited states, as mentioned in the previous paragraph.
In line with all these observations, the relaxation from the first excited state S1 is believed to
involve a conformational relaxation through an intermediate state Sx preceded by a fast solvent
vibrational relaxation.[116,117] The Sx state and the non-radiative relaxation pathway taken by the
molecule were considered as corresponding to a twisted intramolecular charge transfer (TICT) state
which corresponds to a distorted version of the first excited CT state S1. It is thought to be formed via
the torsional motion of one of aminoaryl groups in the S1 (or S2) excited states, since both processes
exhibit a viscosity dependency.[118–122] The importance of charge transfer in these processes can be
nicely illustrated by another recent investigation concerning the relaxation pathways of the
dimethylamino derivatives of rhodamine (Chart 9). The aminorhodamine is not fluorescent unless
protonated. It is believed that the protonation of the amine cuts down the charge transfer process to
the phenyl ring upon excitation, which is responsible for the non-radiative relaxation, resulting in
recovery of the fluorescence of the molecule. This constitutes another experimental evidence that the
rapid non-radiative relaxation pathway of TPM dyes is initiated by an internal charge transfer to the
amino group, dissipating the excited-state energy.[123] Very recently, Li and co-workers investigated the
relaxation times from S1 for MG+ and its leuco and carbinol precursors via transient absorption,[124] and
proposed a detailed picture of the Sx intermediates (Figure 10) in line with such an interpretation.
Chart 9: Rhodamine and aminorhodamine

39
Older studies by Yoshizawa et al. have highlighted the fact that there is also a direct relaxation
pathway from S2 to S0.[125] Researchers have discussed at length the possibility of conical intersection
between either S2->S1 or S1->S0[126] and even both at the same time [127,128] involving the twist of the
aminophenyls as the contributing vibrational motion. A recent paper from Laptenok et al. shows that
S2->S1 and S1->S0 are dependent on the solvent viscosity, while relaxation from the Franck-Condon
state corresponding to S2 is viscosity independent for MG+. Thus, S2->S0 is the preferred relaxation
pathway for that dye.[129] This last observation has also been verified for other TPM dyes functionalized
with bromides and hydroxyl groups.[130] Finally, in some derivatives, S2 was shown to undergo an
unusual intersystem crossing (ISC) to T2 and phosphorescence from this triplet state was also
evidenced, revealing a fairly complex photochemistry.[131]
The relaxation dynamics of TPM dyes are clearly complex and the current lack of experimental
investigations on these compounds, as pointed out by Grabowski et al., does not help in obtaining a
comprehensive picture of the precise role of TICT for all derivatives.[132] Nonetheless, the recent papers
tend to agree on some points. The first excited state S1 seems to relax via a conical insertion to an
intermediate state S1 that is a TICT state, which decays to the ground state by either simultaneous
rotation of the substituted phenyls in a frontward or backward fashion or by rotation of only one
substituted phenyl. The exact way the charge is spread around the molecule upon excitation is still not
known. The higher excited state S2 may also involve a conical insertion to S1, but it is probably not the
preferred pathway. Regarding the luminescence of these compounds, it has been shown that
rigidification of the system might favour the radiative decay of S1 and increase their fluorescence
quantum yield under ambient conditions. The excitation of S2 and fluorescence from this state might
also be observable in some cases.

40
Figure 10: Commonly accepted excitation and relaxation pathways for symmetric (D3) TPM dyes

41
3.3. Photochemistry
While much more stable than non-stabilized carbocations, TPM dyes can nevertheless
decompose under various conditions. Driven by their use in the textile industry, these carbocationic
species have been extensively studied in the context of dye fading, which was demonstrated to
depend on the type of medium on which the dyes are deposited and on their exposure to light under
different conditions.[58] As previously mentioned, nucleophilic addition of H2O in the ground state
contributes to this phenomenon in polar media at neutral pH. However, it has also been shown that
TPM dyes can undergo reactions when excited by light, or exposed to heat, oxygen and various
chemicals. It was also stated that the rates of these detrimental photo-reactions, which are mostly
irreversible, strongly depend on the stability of the carbocation in the ground state. A dependency on
concentration has also been demonstrated, in line with the existence of self-reaction in the excited
state.
Photo-oxidation and photo-reduction are commonly observed transformations with TPM
dyes in powdered form, in solution or even when incorporated into a medium. Known side-reactions
under light irradiation are N-dealkylation processes, conversion to ketones, radical formation and
carbinol formation. These reactions are provoked by singlet oxygen or hydrogen donating solvents.
They always lead to colour fading, as the resulting products are no longer charged. The central
carbon of the former dye is now sp3-hybridized, cutting down any -delocalization, resulting in a shift
of the strong electronic absorption responsible for their characteristic colour into the UV range. The
formation of singlet oxygen under light exposure has also been investigated but appears to be only a
minor photochemical process compared to the afore mentioned ones. Indeed, most often,
triphenylmethane dyes will behave as oxidizing agents in their excited state(s). This phenomenon
also happens even under anaerobic conditions. It has been observed on protein substrates like wool.
The active species is suggested to be the triplet state, based on photo-reduction of CV+ usually
occurring with immobilized dyes on substrates, which have a greater propensity to decay via their
excited triplet states due to motional restrictions limiting their relaxation via TICT states. Scheme 6
gives an overall picture of these detrimental photochemical processes in the case of MG+.
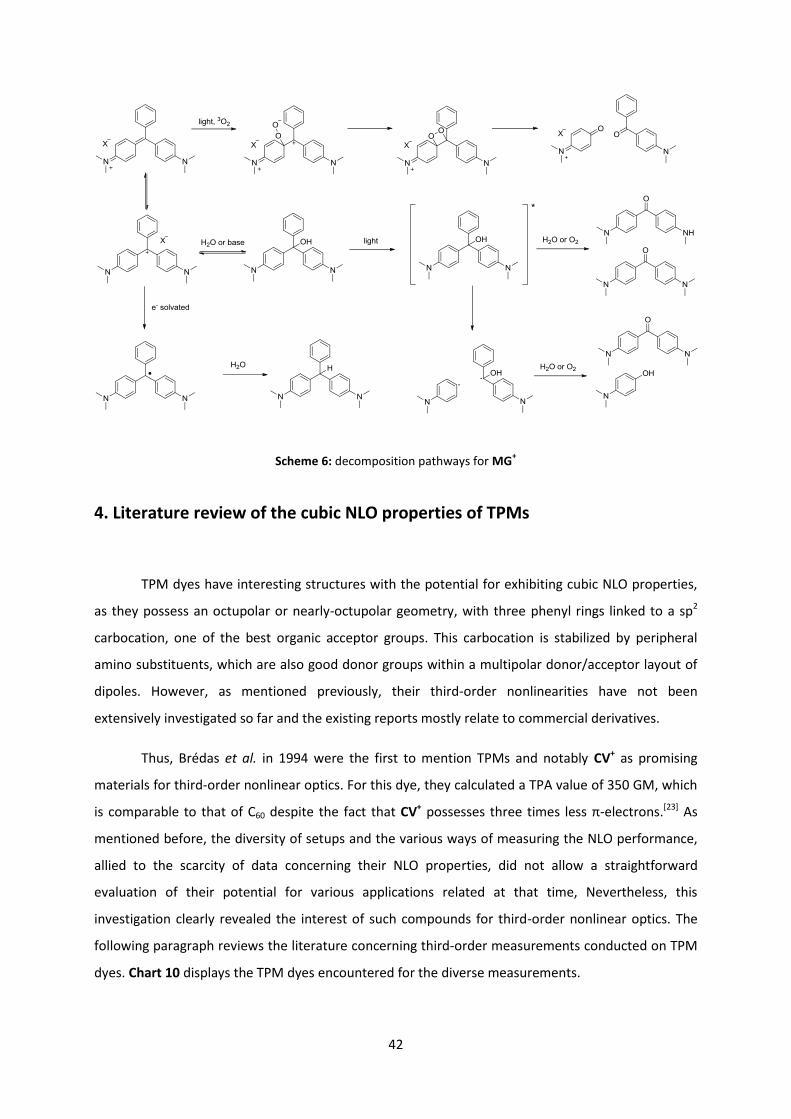
42
Scheme 6: decomposition pathways for MG+
4. Literature review of the cubic NLO properties of TPMs
TPM dyes have interesting structures with the potential for exhibiting cubic NLO properties,
as they possess an octupolar or nearly-octupolar geometry, with three phenyl rings linked to a sp2
carbocation, one of the best organic acceptor groups. This carbocation is stabilized by peripheral
amino substituents, which are also good donor groups within a multipolar donor/acceptor layout of
dipoles. However, as mentioned previously, their third-order nonlinearities have not been
extensively investigated so far and the existing reports mostly relate to commercial derivatives.
Thus, Brédas et al. in 1994 were the first to mention TPMs and notably CV+ as promising
materials for third-order nonlinear optics. For this dye, they calculated a TPA value of 350 GM, which
is comparable to that of C60 despite the fact that CV+ possesses three times less π-electrons.[23] As
mentioned before, the diversity of setups and the various ways of measuring the NLO performance,
allied to the scarcity of data concerning their NLO properties, did not allow a straightforward
evaluation of their potential for various applications related at that time, Nevertheless, this
investigation clearly revealed the interest of such compounds for third-order nonlinear optics. The
following paragraph reviews the literature concerning third-order measurements conducted on TPM
dyes. Chart 10 displays the TPM dyes encountered for the diverse measurements.
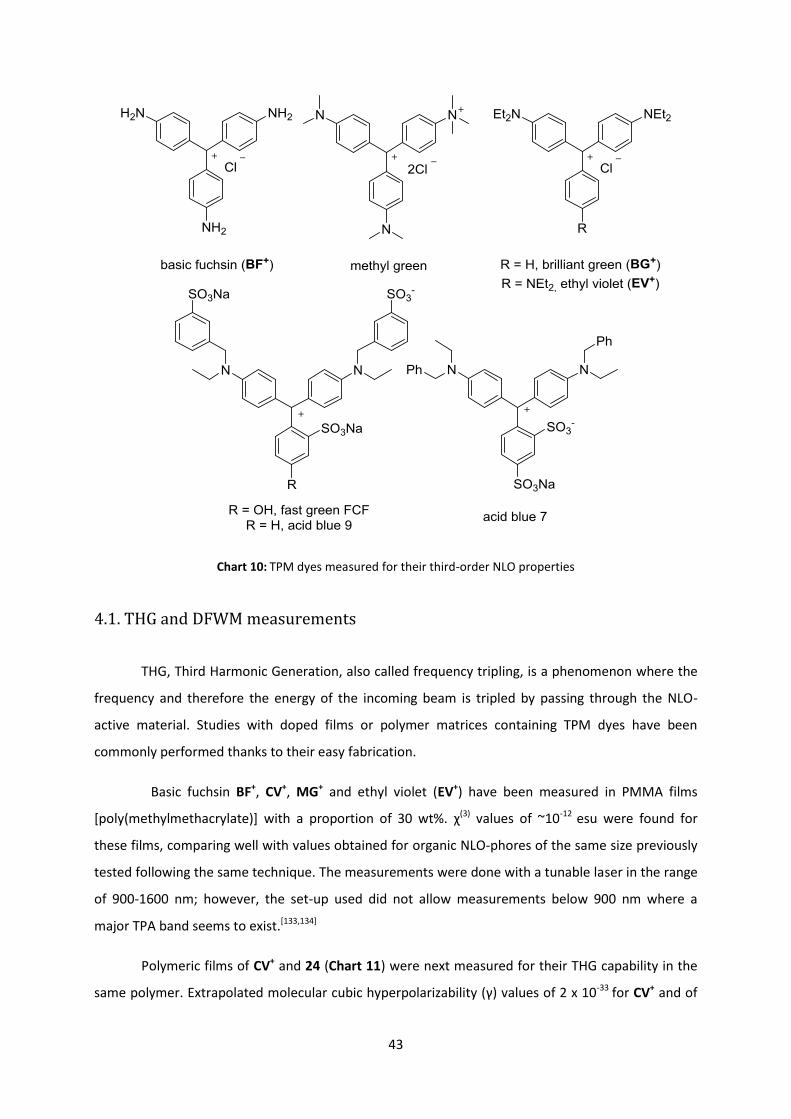
43
Chart 10: TPM dyes measured for their third-order NLO properties
4.1. THG and DFWM measurements
THG, Third Harmonic Generation, also called frequency tripling, is a phenomenon where the
frequency and therefore the energy of the incoming beam is tripled by passing through the NLO-
active material. Studies with doped films or polymer matrices containing TPM dyes have been
commonly performed thanks to their easy fabrication.
Basic fuchsin BF+, CV+, MG+ and ethyl violet (EV+) have been measured in PMMA films
[poly(methylmethacrylate)] with a proportion of 30 wt%. χ(3) values of ~10-12 esu were found for
these films, comparing well with values obtained for organic NLO-phores of the same size previously
tested following the same technique. The measurements were done with a tunable laser in the range
of 900-1600 nm; however, the set-up used did not allow measurements below 900 nm where a
major TPA band seems to exist.[133,134]
Polymeric films of CV+ and 24 (Chart 11) were next measured for their THG capability in the
same polymer. Extrapolated molecular cubic hyperpolarizability (γ) values of 2 x 10-33 for CV+ and of
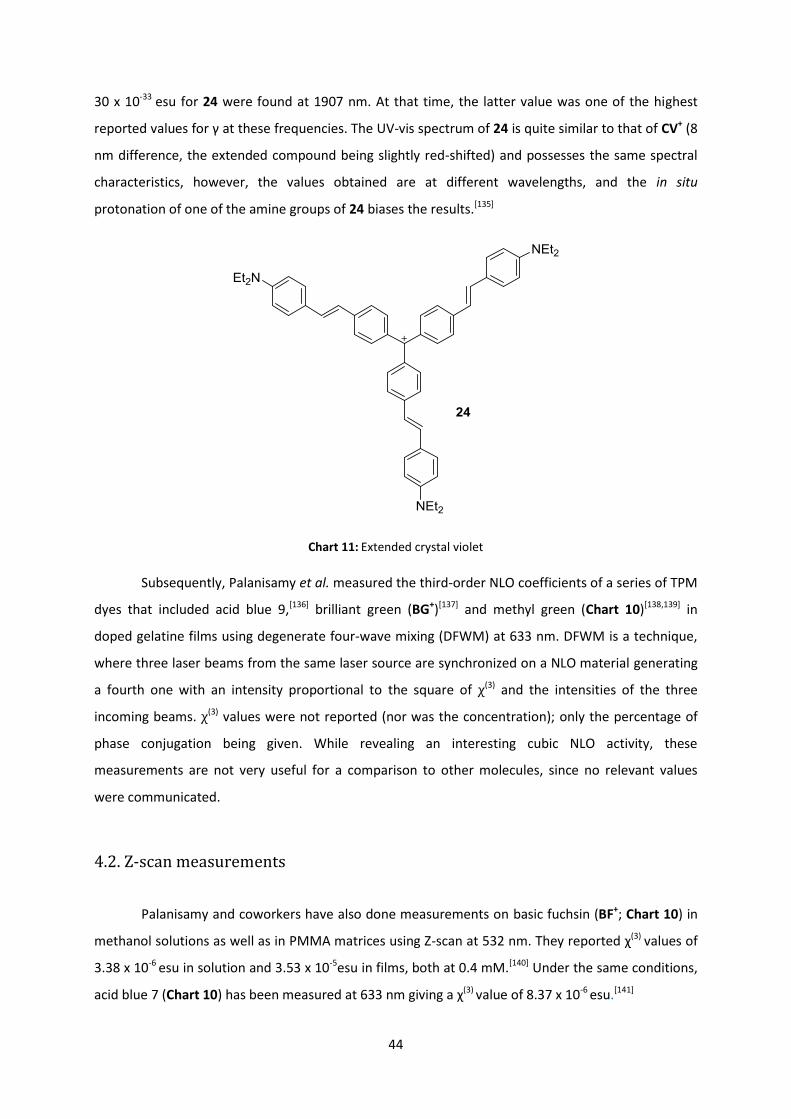
44
30 x 10-33 esu for 24 were found at 1907 nm. At that time, the latter value was one of the highest
reported values for γ at these frequencies. The UV-vis spectrum of 24 is quite similar to that of CV+ (8
nm difference, the extended compound being slightly red-shifted) and possesses the same spectral
characteristics, however, the values obtained are at different wavelengths, and the in situ
protonation of one of the amine groups of 24 biases the results.[135]
Chart 11: Extended crystal violet
Subsequently, Palanisamy et al. measured the third-order NLO coefficients of a series of TPM
dyes that included acid blue 9,[136] brilliant green (BG+)[137] and methyl green (Chart 10)[138,139] in
doped gelatine films using degenerate four-wave mixing (DFWM) at 633 nm. DFWM is a technique,
where three laser beams from the same laser source are synchronized on a NLO material generating
a fourth one with an intensity proportional to the square of χ(3) and the intensities of the three
incoming beams. χ(3) values were not reported (nor was the concentration); only the percentage of
phase conjugation being given. While revealing an interesting cubic NLO activity, these
measurements are not very useful for a comparison to other molecules, since no relevant values
were communicated.
4.2. Z-scan measurements
Palanisamy and coworkers have also done measurements on basic fuchsin (BF+; Chart 10) in
methanol solutions as well as in PMMA matrices using Z-scan at 532 nm. They reported χ(3) values of
3.38 x 10⁻⁶ esu in solution and 3.53 x 10⁻⁵esu in films, both at 0.4 mM.[140] Under the same conditions,
acid blue 7 (Chart 10) has been measured at 633 nm giving a χ(3) value of 8.37 x 10⁻⁶ esu.[141]

45
Solutions of fast green FCF (Chart 10) in water have also been measured by Z-scan in order
to determine their optical limiting power, a phenomenon due to both ESA and TPA, and in gelatine
films to determine their four-wave mixing capability at 632 nm. However, it is not clear which of the
phenomena was dominant, and only output values were given for the measurements.[142] The
nonlinear refractive index of acid blue 9 (Chart 10) has also been measured using this technique and
highly self-defocusing (negative value) power was evidenced.[143] Even if no TPA values were
measured here, there is a strong correlation between materials with high nonlinear indexes and their
two-photon absorbing capabilities.[144] Optical limiting properties of BF+ in PMMA [145] and doped MG+
films at 532 nm[146] have been also measured with this technique resulting in a modification of n2
from 0.1 x 10⁻⁸ cm2·W-1 to 3.2 x 10⁻⁸ cm2·W-1 with concentrations increasing from 10-5 to 2 x 10⁻⁴ mol/L
also proving their third-order nonlinear interest.
Two other groups have measured BG+ with the Z-scan technique in solution at 632.8 nm and
found χ(3) values of 1.16 x 10⁻³ esu in a water/ethanol solution at a concentration of 0.42 mmol/L [147]
and 4.10 x 10⁻⁷ esu at a concentration of 0.05 mmol/L in aqueous solution.[148] When corrected for
concentration, the values are very different, although similar set-ups were used here. These
discrepancies seems too large for invoking nonlinear solvatochromism and might rather be explained
by self-aggregation or photo-induced decomposition of the dye.
4.3. TPEF measurements
Subsequent to the review of Brédas et al. in 1994, the first experimental observation of TPA
for CV+ was reported by Chui et al., in 1998, who tried to find a way to suppress the corresponding
fluorescence in order to perform HRS measurements of the hyperpolarizability of that compound at
1064 nm.[149]
While TPA-induced fluorescence was mentioned in this work, the first measurement of TPA
cross-sections for TPM dyes was only reported in 2002 on brilliant green (BG+; Chart 10) and CV+. A
cross-section of 762 GM (at 840 nm) was found for BG+, which is very similar to that of MG+, and a
cross-section of 1980 GM (at 752 nm) was found for CV+. Note that these TPA peaks occur at twice
the wavelength of the second lowest energy transition for these TPM dyes. These values have been
obtained by TPEF in glycerol and there is a rather good match with their calculated values: 2041 GM
for CV+ and 852 GM for BG+.[150] However, these values have to be taken carefully as these
compounds have relatively low fluorescence quantum yields under ambient conditions (3.07 % for
CV+ and 1.85 % for BG+) and very concentrated solutions were used to determine their TPA cross-

46
sections by TPEF, resulting in more than 40 % error on these measurements. Moreover, the
calculated TPA cross-sections are also not very reliable for such large compounds. These initial results
seem to be confirmed by a more recent paper by Brédas and co-workers in which the full visible
spectral range is covered by TPA. These TPEF measurements have been supplemented by non-
degenerate-TPEF measurements. This alternative technique suffers from the same problems
previously encountered with CV+ and BG+ and pertaining to their low fluorescence yields. BG+ could
not be measured using this technique.[151] The calculated σTPA maximum values found are ca. 1700
GM for BG+ and 100 000 GM for CV+ values, quite far away from experimental values from Beljonne's
paper. This full spectral range measurement has now revealed that the two lowest energy transitions
were indeed active in TPA, but the lowest energy transition is far less active than the second-lowest
one. In line with selection rules operative for octupolar molecules, the transition at lowest energy,
which has the highest extinction coefficient, is the less active in the two-photon spectrum for both
CV+ and BG+.
4.4. Synopsis
TPM-based dyes have proven to be active third-order NLO compounds. However, the few
third-order NLO measurements reported for TPM dyes do not afford a complete picture of their
potential for NLO-related applications, especially considering the absence of standardization
between experimental measurements performed in the different studies, although promising results
have been shown for two-photon absorption. These molecules are synthetically readily accessible, as
demonstrated by the many derivatives commercially available, and they also present a great
structural versatility owing to the great flexibility associated with their syntheses. However, their
poor fluorescence complicates the study of their TPA capabilities by TPEF and has possibly
discouraged more detailed investigations until now. This lack of data and interest is illustrated with
the recent review of Pawlicki et al.[16] which, albeit referencing the most studied/promising two-
photon absorbers, completely overlooks Brédas and co-worker's seminal work on these compounds,
without any mention of MG+/CV+ derivatives or even carbocationic TPM species.[150,151] MG+ and CV+
derivatives possess a real potential as two-photon absorbers in the NIR range, and measuring the
NLO spectral dependence of appropriate derivatives should lead to a better knowledge of their NLO
properties. Considering organometallic derivatives of TPMs, the situation is even more extreme;
while some have indeed been synthesized and shown to possess similar linear optical absorptions to
purely organic derivatives, to the best of our knowledge they have not been probed for their cubic
NLO activities.

47
5. Objectives
In order to determine structure-cubic NLO property relationships of TPM dyes, relevant
modifications will be performed on the carbocationic core of CV+ or MG+ derivatives. Firstly,
structural variations will be introduced in a series of organic compounds related to MG+ and their
TPA properties will be measured by Z-scan. Secondly, selected organic donor group(s) will be
replaced by organometallic synthons. Relative to organic donors, these redox-active groups should
enhance the NLO response, but could also potentially allow switching of these NLO properties.[31] As
model cores, both CV+ and MG+-based structures have their advantages: the latter ones have less
symmetrical structures and, albeit potentially less active than the latter ones, will allow
determination of how a given structural modification on the third branch impacts the molecular
properties, whereas CV+ based ones, requiring all modifications to be fully symmetrical, will probably
give rise to the most active structures. These structural modifications will be implemented so that
they do not lead to unstable carbocations. Overall, MG+-based derivatives will help to understand the
influence of the third branch on the TPA cross-sections, whereas CV+-based derivatives will provide
information on the symmetry of the system.
5.1. Organic derivatives
One essential factor for a TPA-active compound is to have an extended π-system. In MG+ or
CV+, this latter is not extremely well developed. Hence, the first modification that was envisioned is
to use diphenylamine instead of dimethylamine as donor group (Figure 11) for the reasons
mentioned in paragraph 1.4.1., i.e. despite being less donating, arylamines are often more effective
donors than dialkylamines for TPA. Then, the phenyl group constituting the third branch can, for
example, be replaced by more extended aromatic fragments that might play the role of “antennas”
towards light. Thus, anthracene or fluorene, which are already well known TPA absorbing groups, will
be tested in this work.[16] However, given that the bulkiness of the 9-anthracenyl fragment might
disfavor planar conformations which are desirable to enhance the electronic π-communication
within the three branches of the molecule, the insertion of an ethynyl linker between the
carbocation and the third substituent will also be performed. This modification should in principle
ensure planar conformations and the possibility of probing the influence of π-conjugation in these
derivatives.

48
Figure 11: Envisaged modifications for MG+
Finally, some rigidified compounds for which the two amine-substituted phenyl groups are
linked in a co-planar conformation with the central carbocation have been targeted. We hope that
this fluorene-like rigidification of the π-system will somewhat restrain the non-radiative relaxation
and favour fluorescence. In this respect, and despite its interest, rigidification of the dialkylamino
analogue has been removed for synthetic reasons and we have focused our efforts on the previous
structural modification in order to obtain a first overview of the properties of these systems before
envisioning further changes. All these structural modifications should bring a first insight into the
cubic NLO properties and, more precisely, the TPA properties of TPMs of these carbocations.
Enhancing their fluorescence would provide an alternative mean to measure their TPA cross-sections
by TPEF and would extend their scope for various applications, such as imaging for instance.
For CV+, the replacement of dimethylamines by diphenylamines will lead to the compound
shown in Figure 12. The other structural modifications tested on the third branch of MG+ derivatives
are not applicable here, since they would remove amino groups, resulting in less stable compounds,
while a related rigidification of CV+ would lead to a really constrained, and probably less stable,
structure.

49
Figure 12: Envisaged modification for CV+ derivative
5.2. Organometallic derivatives
In the same way, some organometallic derivatives will next be targeted where one or several
amino groups will have been replaced by organometallic redox-active centres. These metallic cores
have been chosen because of their potential NLO benefits, as well as their redox-switching
properties. The organo-iron and organo-ruthenium alkynyl groups «Fe(η5-C5Me5)(κ2-dppe)C≡C» and
« Ru(Cl)(κ2-dppe)2C≡C» previously presented, as well as the ethynylferrocenyl unit were retained for
these purposes (Chart 12). Indeed, several NLO-active derivatives have already been made using
these synthons and show enhanced third-order NLO responses compared to related all-organic
analogues, as well as remarkable redox-switching properties.[31]
Chart 12: Selected organometallic synthons
All these organometallic derivatives are isolobal d6 group 8 metals in Oh or pseudo-Oh
environments, even if their ancillary ligands are quite different and do not allow a straightforward
comparison between them. Their diversity will allow assessment of a wide panel of modifications
during this screening. First, they present distinct redox potential values (Table 3) and will allow
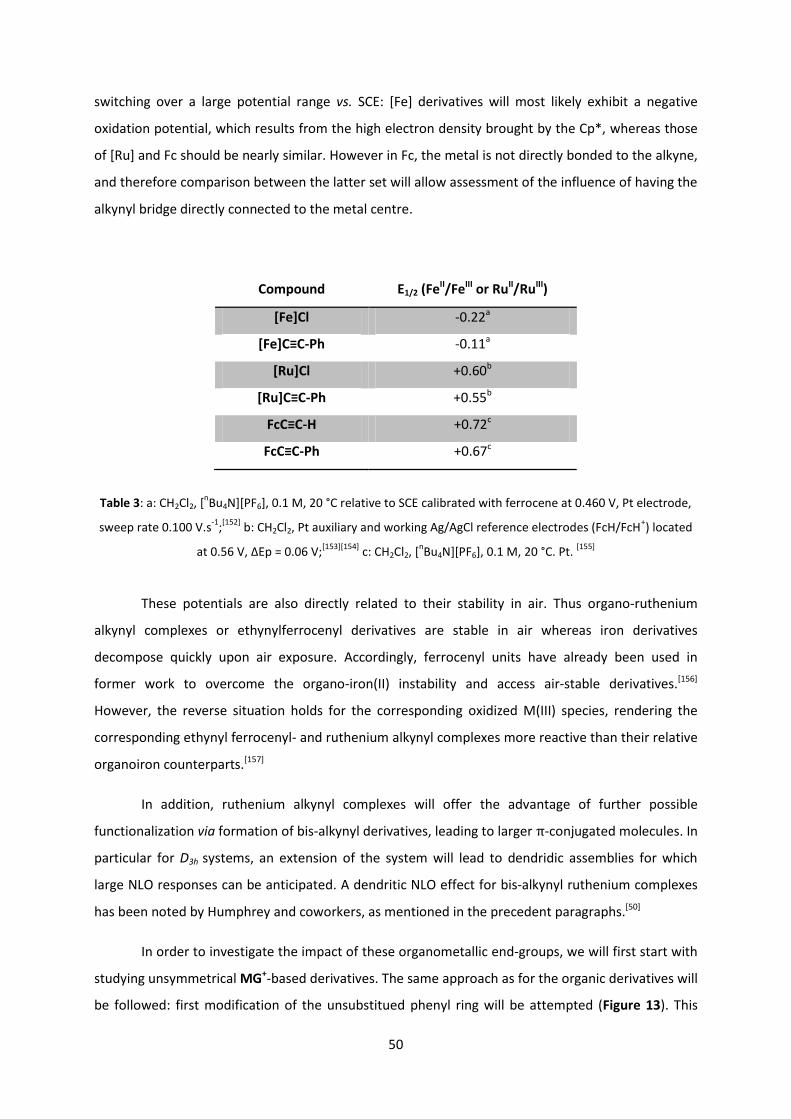
50
switching over a large potential range vs. SCE: [Fe] derivatives will most likely exhibit a negative
oxidation potential, which results from the high electron density brought by the Cp*, whereas those
of [Ru] and Fc should be nearly similar. However in Fc, the metal is not directly bonded to the alkyne,
and therefore comparison between the latter set will allow assessment of the influence of having the
alkynyl bridge directly connected to the metal centre.
Compound E1/2 (FeII/FeIII or RuII/RuIII)
[Fe]Cl -0.22a
[Fe]C≡C-Ph -0.11a
[Ru]Cl +0.60b
[Ru]C≡C-Ph +0.55b
FcC≡C-H +0.72c
FcC≡C-Ph +0.67c
Table 3: a: CH2Cl2, [nBu4N][PF6], 0.1 M, 20 °C relative to SCE calibrated with ferrocene at 0.460 V, Pt electrode,
sweep rate 0.100 V.s-1
;[152]
b: CH2Cl2, Pt auxiliary and working Ag/AgCl reference electrodes (FcH/FcH+) located
at 0.56 V, ΔEp = 0.06 V;[153][154]
c: CH2Cl2, [nBu4N][PF6], 0.1 M, 20 °C. Pt.
[155]
These potentials are also directly related to their stability in air. Thus organo-ruthenium
alkynyl complexes or ethynylferrocenyl derivatives are stable in air whereas iron derivatives
decompose quickly upon air exposure. Accordingly, ferrocenyl units have already been used in
former work to overcome the organo-iron(II) instability and access air-stable derivatives.[156]
However, the reverse situation holds for the corresponding oxidized M(III) species, rendering the
corresponding ethynyl ferrocenyl- and ruthenium alkynyl complexes more reactive than their relative
organoiron counterparts.[157]
In addition, ruthenium alkynyl complexes will offer the advantage of further possible
functionalization via formation of bis-alkynyl derivatives, leading to larger π-conjugated molecules. In
particular for D3h systems, an extension of the system will lead to dendridic assemblies for which
large NLO responses can be anticipated. A dendritic NLO effect for bis-alkynyl ruthenium complexes
has been noted by Humphrey and coworkers, as mentioned in the precedent paragraphs.[50]
In order to investigate the impact of these organometallic end-groups, we will first start with
studying unsymmetrical MG+-based derivatives. The same approach as for the organic derivatives will
be followed: first modification of the unsubstitued phenyl ring will be attempted (Figure 13). This
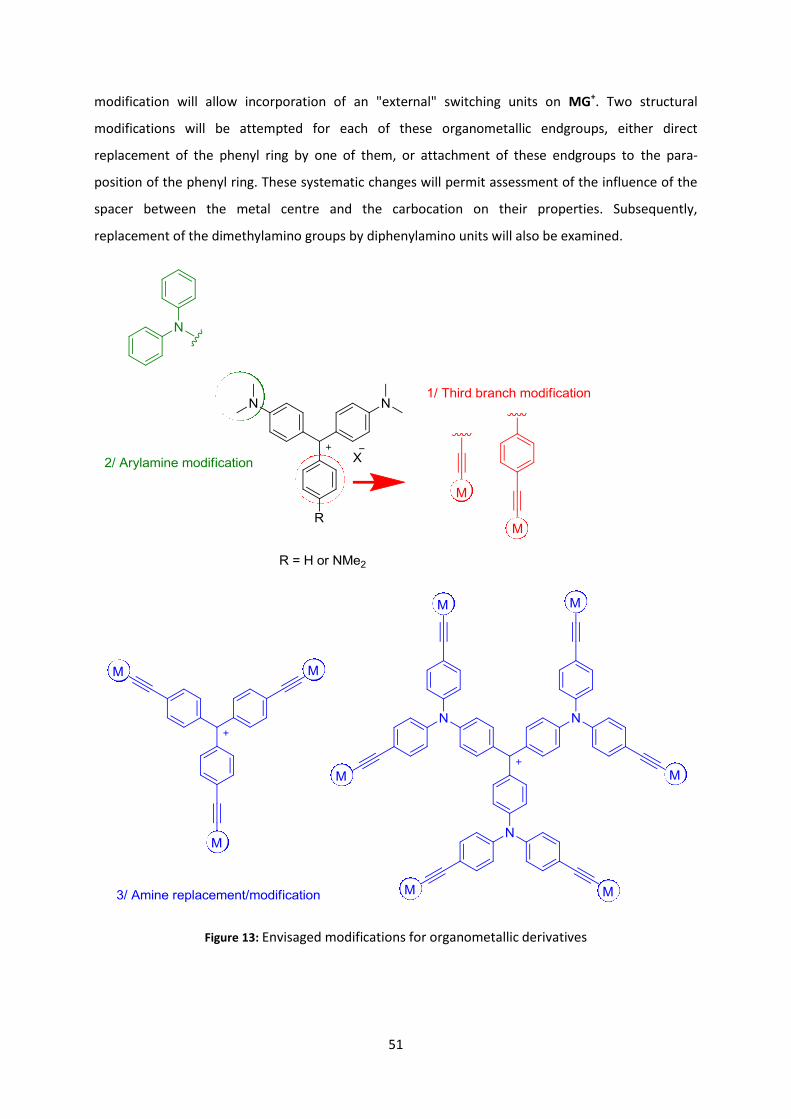
51
modification will allow incorporation of an "external" switching units on MG+. Two structural
modifications will be attempted for each of these organometallic endgroups, either direct
replacement of the phenyl ring by one of them, or attachment of these endgroups to the para-
position of the phenyl ring. These systematic changes will permit assessment of the influence of the
spacer between the metal centre and the carbocation on their properties. Subsequently,
replacement of the dimethylamino groups by diphenylamino units will also be examined.
Figure 13: Envisaged modifications for organometallic derivatives

52
For the more symmetrical CV+ core, again, only two modifications were envisioned: the first
one consists of a direct replacement of all the amino donor groups by one of the organometallic
donors previously tested, and the second one consists of appending this organometallic donor to the
peripheral rings of diphenylamino-based derivatives, leading to a pseudo-dendritic species having six
metal centres. While these organometallic substituents would interact directly with the carbocation
in the first case, they would “tune” the donor power of the diphenylamino donors in the second case.
Both families of compounds should exhibit redox-switchable NLO properties, since this time,
oxidation will affect the donor power of all the peripheral groups, either directly (first compound
targeted) or indirectly (second compound targeted).
6. Conclusion
Nonlinear optics is a growing field of research due to its multiple phenomena and numerous
potential applications in various highly technological domains. It is believed that the development of
nonlinear molecular devices will allow real progress to be made from medicine to data storage and
data processing, with advantages and properties surpassing the current materials.TPA affords many
appealing properties for various applications in these fields, such as a remarkable spatial resolution
and the possible involvement of less energetic light beams. These have led to several applications
such as imaging, micro-fabrication and optical computing. Since its theoretical prediction by Maria
Goeppert-Mayer in 1931, much progress has been made and more effective two-photon absorbers
are developed every year since the start of this century. Initiated with purely inorganic or organic
compounds, the fundamental interest in this field is moving now to organometallic derivatives as
these compounds might bring the best of both sides. For such investigations, the group 8 metal
alkynyl complexes are good candidates that offer considerable scope for structural variations. The
development of active TPM-based organometallics that permit redox-switching will involve
understanding the interplay of complex electronic processes for which preliminary studies of model
complexes will be required.
Accordingly, the work plan presented in here follows from results obtained by the groups of
F. Paul and M. G. Humphrey who investigated the NLO properties of group 8 metal alkynyl
complexes. Given the potential of the well known dyes crystal violet and malachite green as third-
order NLO-phores, it is of interest to generate organometallic analogues of these compounds with
improved cubic NLO responses. Consideration will be given to symmetry-related issues: some
structures possess an octupolar geometry and may therefore be more active than others. Malachite

53
green with reduced symmetry is much more synthetically amenable to various modifications and
constitutes a better model to understand the effect of a given particular structural modification.
The aim of the project will be, firstly, to confirm the potential of such TPM-based derivatives
as TPA-absorbers from synthesis and study of a judicious series of organic compounds analogous to
CV+ and MG+ and, secondly, to screen a series of related organometallic derivatives where the
peripheral amino donor groups are selectively replaced by redox-active alkynyl complexes. The
envisioned modifications of the organic core involve the replacement of dimethylamino donors as
well as rigidification of the system and replacement of the phenyl ring by various π-conjugated units.
Depending on the results obtained, organometallic derivatives consisting of "Fe(η5-C5Me5)(κ2-dppe)",
"Ru(Cl)(κ2-dppe)2" or ferrocene end-groups will subsequently be developed and tested as two-
photon absorbers, before studying the redox-switching properties of these systems.
Accordingly, the first chapter concerns the synthesis of organic derivatives of MG+ and CV+
featuring the previously discussed structural variations, their physico-chemical characterization, and
the study of their TPA response via Z-scan studies.
The second chapter focuses on related organometallic derivatives with the introduction of
one metal-alkynyl centre, either directly connected to the central carbon or via a phenyl linker. The
synthesis and the spectral characterization of these compounds will be discussed as well as the
influence of the metal oxidation on the spectral features.
Finally, the last chapter will deal with the synthesis and characterization of fully symmetric
star-shaped organometallic derivatives based on CV+. In the same way, the synthesis of these
polynuclear structures will be described as well as their spectral features. The effect of oxidation on
their properties will be also discussed.
54
References
[1] I. R. Whittall, A. M. McDonagh, M. G. Humphrey, M. Samoc, Adv. Organomet. Chem. 1999, 43, 349–405.
[2] C. W. Spangler, M. He, E. G. Nickel, J. Laquindanum, L. R. Dalton, N. Tang, R. Hellwarth, Mol. Cryst. Liq. Cryst. Sci. Technol. Sect. Mol. Cryst. Liq. Cryst. 1994, 240, 17–23.
[3] M. G. Kuzyk, K. D. Singer, G. I. Stegeman, Adv. Opt. Photon. 5 2013, 4-82. [4] F. Terenziani, C. Katan, E. Badaeva, S. Tretiak, M. Blanchard-Desce, Adv. Mater. 2008, 20,
4641–4678. [5] A. I. Ciuciu, D. Firmansyah, V. Hugues, M. Blanchard-Desce, D. T. Gryko, L. Flamigni, J. Mater.
Chem. C 2014, 2, 4552–4565. [6] C. Katan, S. Tretiak, M. H. V. Werts, A. J. Bain, R. J. Marsh, N. Leonczek, N. Nicolaou, E.
Badaeva, O. Mongin, M. Blanchard-Desce, J. Phys. Chem. B 2007, 111, 9468–9483. [7] O. Mongin, L. Porrès, M. Charlot, C. Katan, M. Blanchard-Desce, Chem. – Eur. J. 2007, 13,
1481–1498. [8] C. Sissa, V. Parthasarathy, D. Drouin-Kucma, M. H. V. Werts, M. Blanchard-Desce, F.
Terenziani, Phys. Chem. Chem. Phys. 2010, 12, 11715–11727. [9] N. Bloembergen, Nonlinear Optics: Lecture Note and Reprint Volume, Benjamin, 1965. [10] E. Garmire, in Nonlinear Opt. (Ed.: N. Kamanina), InTech, 2012. [11] G. S. He, L.-S. Tan, Q. Zheng, P. N. Prasad, Chem. Rev. 2008, 108, 1245–1330. [12] M. Rumi, J. W. Perry, Adv. Opt. Photonics 2010, 2, 451. [13] F. Kajzar, J. Zyss, Nonlinear optics and Quantum optics 2012, 43, 31-95. [14] H.-B. Sun, S. Kawata, in NMR • 3D Anal. • Photopolymerization, Springer Berlin Heidelberg,
2006, pp. 169–273. [15] A. Ostendorf, B. N. Chichkov, in A New Approach to Micromachining (Ed.: Laurin Publishing),
Photonic Spectra 2006. [16] M. Pawlicki, H. A. Collins, R. G. Denning, H. L. Anderson, Angew. Chem. Int. Ed. 2009, 48,
3244–3266. [17] Z. Hu, V. S. Khadka, W. Wang, D. W. Galipeau, X. Yan, J. Mol. Model. 2012, 18, 3657–3667. [18] D. S. Dudis, A. T. Yeates, D. Kost, Adv. Mater. 1994, 6, 248–251. [19] R. C. Hollins, Curr. Opin. Solid State Mater. Sci. 1999, 4, 189–196. [20] F. Z. Henari, J. Opt. Pure Appl. Opt. 2001, 3, 188–190. [21] R. L. Sutherland, Handbook of Nonlinear Optics, CRC Press, 2003. [22] P. N. Butcher, D. Cotter, The Elements of Nonlinear Optics, Cambridge University Press,
Cambridge, 1990. [23] J. L. Bredas, C. Adant, P. Tackx, A. Persoons, B. M. Pierce, Chem. Rev. 1994, 94, 243–278. [24] M. Kasha, Discuss. Faraday Soc. 1950, 9, 14–19. [25] R. Kolkowski, M. Samoc, J. Opt. 2014, 16, 125202. [26] M. R. Ferdinandus, M. Reichert, T. R. Ensley, H. Hu, D. A. Fishman, S. Webster, D. J. Hagan, E.
W. Van Stryland, Opt. Mater. Express 2012, 2, 1776. [27] J. Zyss, I. Ledoux, Chem. Rev. 1994, 94, 77–105. [28] M. Albota, D. Beljonne, J.-L. Brédas, J. E. Ehrlich, J.-Y. Fu, A. A. Heikal, S. E. Hess, T. Kogej, M. D.
Levin, S. R. Marder, D. McCord-Maughon, J. W. Perry, H. Röckel, M. Rumi, G. Subramaniam, W. W. Webb, X.-L. Wu, C. Xu, Science 1998, 281, 1653–1656.
[29] C. D. Entwistle, T. B. Marder, Angew. Chem. Int. Ed. 2002, 41, 2927–2931. [30] C. D. Entwistle, T. B. Marder, Chem. Mater. 2004, 16, 4574–4585. [31] G. Grelaud, M. P. Cifuentes, F. Paul, M. G. Humphrey, J. Organomet. Chem. 2014, 751, 181–
200. [32] T. Kodaira, A. Watanabe, O. Ito, M. Matsuda, S. Tokura, M. Kira, S.-S. Nagano, K. Mochida,
Adv. Mater. 1995, 7, 917–919.

55
[33] Z. Fang, M. Samoc, R. D. Webster, A. Samoc, Y.-H. Lai, Tetrahedron Lett. 2012, 53, 4885–4888. [34] B. Strehmel, S. Amthor, J. Schelter, C. Lambert, ChemPhysChem 2005, 6, 893–896. [35] J. O. Morley, Int. J. Quantum Chem. 1993, 46, 19–26. [36] R. Signorini, C. Ferrante, D. Pedron, M. Zerbetto, E. Cecchetto, M. Slaviero, I. Fortunati, E.
Collini, R. Bozio, A. Abbotto, L. Beverina, G. A. Pagani, J. Phys. Chem. A 2008, 112, 4224–4234. [37] W. J. Yang, C. H. Kim, M.-Y. Jeong, S. K. Lee, M. J. Piao, S.-J. Jeon, B. R. Cho, Chem. Mater.
2004, 16, 2783–2789. [38] S. K. Hurst, N. T. Lucas, M. P. Cifuentes, M. G. Humphrey, M. Samoc, B. Luther-Davies, I.
Asselberghs, R. Van Boxel, A. Persoons, J. Organomet. Chem. 2001, 633, 114–124. [39] M. P. Cifuentes, C. E. Powell, M. G. Humphrey, G. A. Heath, M. Samoc, B. Luther-Davies, J.
Phys. Chem. A 2001, 105, 9625–9627. [40] G. T. Dalton, M. P. Cifuentes, L. A. Watson, S. Petrie, R. Stranger, M. Samoc, M. G. Humphrey,
Inorg. Chem. 2009, 48, 6534–6547. [41] S. Marqués-González, D. S. Yufit, J. A. K. Howard, S. Martín, H. M. Osorio, V. M. García-Suárez,
R. J. Nichols, S. J. Higgins, P. Cea, P. J. Low, Dalton Trans. 2012, 42, 338–341. [42] E. Wuttke, Y.-M. Hervault, W. Polit, M. Linseis, P. Erler, S. Rigaut, R. F. Winter, Organometallics
2014, 33, 4672–4686. [43] S. Marqués-González, M. Parthey, D. S. Yufit, J. A. K. Howard, M. Kaupp, P. J. Low,
Organometallics 2014, 33, 4947–4963. [44] I. R. Whittall, M. G. Humphrey, A. Persoons, S. Houbrechts, Organometallics 1996, 15, 1935–
1941. [45] I. R. Whittall, M. P. Cifuentes, M. G. Humphrey, B. Luther-Davies, M. Samoc, S. Houbrechts, A.
Persoons, G. A. Heath, D. Bogsányi, Organometallics 1997, 16, 2631–2637. [46] I. R. Whittall, M. P. Cifuentes, M. G. Humphrey, B. Luther-Davies, M. Samoc, S. Houbrechts, A.
Persoons, G. A. Heath, D. C. R. Hockless, J. Organomet. Chem. 1997, 549, 127–137. [47] M. H. Garcia, M. P. Robalo, A. R. Dias, M. T. Duarte, W. Wenseleers, G. Aerts, E. Goovaerts, M.
P. Cifuentes, S. Hurst, M. G. Humphrey, M. Samoc, B. Luther-Davies, Organometallics 2002, 21, 2107–2118.
[48] B. J. Coe, Coord. Chem. Rev. 2013, 257, 1438–1458. [49] K. A. Green, M. P. Cifuentes, M. Samoc, M. G. Humphrey, Coord. Chem. Rev. 2011, 255, 2530–
2541. [50] K. A. Green, M. P. Cifuentes, M. Samoc, M. G. Humphrey, Coord. Chem. Rev. 2011, 255, 2025–
2038. [51] C. K. M. Chan, C.-H. Tao, K.-F. Li, K. M.-C. Wong, N. Zhu, K.-W. Cheah, V. W.-W. Yam, Dalton
Trans. 2011, 40, 10670. [52] M. E. Thompson, P. E. Djurovich, S. Barlow, S. Marder, in Comprehensive Organometallic
Chemistry III (Eds.: D.M.P. Mingos, R. H. Crabtree), Elsevier, Oxford, 2007, pp. 101–194. [53] A. M. McDonagh, M. G. Humphrey, M. Samoc, B. Luther-Davies, Organometallics 1999, 18,
5195–5197. [54] K. A. Green, P. V. Simpson, T. C. Corkery, M. P. Cifuentes, M. Samoc, M. G. Humphrey,
Macromol. Rapid Commun. 2012, 33, 620–620. [55] A.-M. Caminade, in Dendrimers (Eds.: A.-M. Caminade, C.-O. Turrin, R. Laurent, A. Ouali, B.
Delavaux-Nicot), John Wiley & Sons, Chichester, 2011, pp. 67–98. [56] G. Hennrich, I. Asselberghs, K. Clays, A. Persoons, J. Org. Chem. 2004, 69, 5077–5081. [57] J. Campo, A. Painelli, F. Terenziani, T. Van Regemorter, D. Beljonne, E. Goovaerts, W.
Wenseleers, J. Am. Chem. Soc. 2010, 132, 16467–16478. [58] D. F. Duxbury, Chem. Rev. 1993, 93, 381–433. [59] N. Hidayah, F. Abu Bakar, N. A. Mahyudin, S. Faridah, M. S. Nur-Azura, M. Z. Zaman, Int. Food
Res. J. 2013, 20, 1511–1519. [60] W. Azmi, R. K. Sani, U. C. Banerjee, Enzyme Microb. Technol. 1998, 22, 185–191. [61] S. Srivastava, R. Sinha, D. Roy, Aquat. Toxicol. Amst. Neth. 2004, 66, 319–329. [62] E. Sudova, J. Machova, Z. Svobodova, T. Vesely Veterinarni Medicina 2007, 52, 527-539.

56
[63] S. Srivastava, R. Sinha, D. Roy, Aquat. Toxicol. Amst. Neth. 2004, 66, 319–329. [64] F. Kehrmann, F. Wentzel, Berichte Dtsch. Chem. Ges. 1901, 34, 3815–3819. [65] M. S. Shchepinov, V. A. Korshun, Chem. Soc. Rev. 2003, 32, 170–180. [66] V. G. Shubin, Russ. Chem. Bull. 2009, 57, 761–767. [67] R. R. Naredla, D. A. Klumpp, Chem. Rev. 2013, 113, 6905–6948. [68] G. A. Olah, G. K. S. Prakash, in Carbocation Chemistry (Ed.: Wiley-Blackwell), US, 2004. [69] R. M. O’Ferrall, in Adv. Phys. Org. Chem. 2010, 19–122. [70] P. G. Cozzi, F. Benfatti, Angew. Chem. Int. Ed. 2010, 49, 256–259. [71] M. Wada, H. Mishima, T. Watanabe, S. Natsume, H. Konishi, K. Kirishima, S. Hayase, T. Erabi,
Bull. Chem. Soc. Jpn. 1995, 68, 243–249. [72] R. J. Goldacre, J. N. Phillips, J. Chem. Soc. Resumed 1949, 1724–1732. [73] A. Vöge, D. Gabel, in Boron Sci., (Ed: N. S. Hosmane), CRC Press, 2011, pp. 295–318. [74] C. Arbez-Gindre, B. R. Steele, G. A. Heropoulos, C. G. Screttas, J.-E. Communal, W. J. Blau, I.
Ledoux-Rak, J. Organomet. Chem. 2005, 690, 1620–1626. [75] C. Villalonga-Barber, B. R. Steele, V. Kovač, M. Micha-Screttas, C. G. Screttas, J. Organomet.
Chem. 2006, 691, 2785–2792. [76] R. R. Naredla, C. Zheng, S. O. Nilsson Lill, D. A. Klumpp, J. Am. Chem. Soc. 2011, 133, 13169–
13175. [77] J. Lux, E. J. Peña, F. Bolze, M. Heinlein, J.-F. Nicoud, ChemBioChem 2012, 13, 1206–1213. [78] T. J. Beveridge, Biotech. Histochem. 2001, 76, 111–118. [79] A. M. Maley, J. L. Arbiser, Exp. Dermatol. 2013, 22, 775–780. [80] E. Wich, Color Res. Appl. 1977, 2, 77–80. [81] G. P. Moss, P. A. S. Smith, D. Tavernier, Pure Appl. Chem. 1995, 67, 1307–1375. [82] W. Herbst, K. Hunger, G. Wilker, H. Ohleier, R. Winter, in Ind. Org. Pigments, Wiley-VCH Verlag
GmbH & Co. KGaA, 2004, pp. 637–645. [83] M. Clark, Ed. , in Handbook of Textile and Industrial Dyeing, Woodhead Publishing, 2011, pp. i–
iii. [84] E. R. Riegel, J. A. Kent, Riegel’s Handbook of Industrial Chemistry, Van Nostrand Reinhold,
1992. [85] R. Muthyala, A. R. Katritzky, X. Lan, Dyes & Pigments 1994, 25, 303–324. [86] L. Sanguinet, R. J. Twieg, G. Wiggers, G. Mao, K. D. Singer, R. G. Petschek, Tetrahedron Lett.
2005, 46, 5121–5125. [87] A. Noack, A. Schröder, H. Hartmann, Dyes & Pigments 2003, 57, 131–147. [88] Z. Li, Z. Duan, J. Kang, H. Wang, L. Yu, Y. Wu, Tetrahedron 2008, 64, 1924–1930. [89] S. Genovese, F. Epifano, C. Pelucchini, M. Curini, Eur. J. Org. Chem. 2009, 2009, 1132–1135. [90] A. S. Chaudhari, Y. S. Parab, V. Patil, N. Sekar, S. R. Shukla, RSC Adv. 2012, 2, 12112–12117. [91] B. M. Babu, P. B. Thakur, V. M. Bangade, H. M. Meshram, Tetrahedron Lett. 2015, 56, 766–
771. [92] B. M. Babu, P. B. Thakur, N. Nageswara Rao, G. Santosh Kumar, H. M. Meshram, Tetrahedron
Lett. 2014, 55, 1868–1872. [93] S. Lin, X. Lu, J. Org. Chem. 2007, 72, 9757–9760. [94] J.-Y. Yu, R. Kuwano, Org. Lett. 2008, 10, 973–976. [95] S. Tabuchi, K. Hirano, T. Satoh, M. Miura, J. Org. Chem. 2014, 79, 5401–5411. [96] M. Barbero, S. Cadamuro, S. Dughera, C. Magistris, P. Venturello, Org. Biomol. Chem. 2011, 9,
8393–8399. [97] J.-T. Hou, J.-W. Gao, Z.-H. Zhang, Monatshefte Für Chem. - Chem. Mon. 2011, 142, 495–499. [98] B. L. H. Taylor, M. R. Harris, E. R. Jarvo, Angew. Chem. Int. Ed. 2012, 51, 7790–7793. [99] S. Mondal, G. Panda, RSC Adv. 2014, 4, 28317–28358. [100] V. Nair, S. Thomas, S. C. Mathew, K. G. Abhilash, Tetrahedron 2006, 62, 6731–6747. [101] J. Griffiths, K. J. Pender, Dyes & Pigments 1981, 2, 37–48. [102] G. N. Lewis, T. T. Magel, D. Lipkin, J. Am. Chem. Soc. 1942, 64, 1774–1782. [103] H. B. Lueck, J. L. McHale, W. D. Edwards, J. Am. Chem. Soc. 1992, 114, 2342–2348.

57
[104] M. Ishikawa, Y. Maruyama, Chem. Phys. Lett. 1994, 219, 416–420. [105] Y. Maruyama, M. Ishikawa, H. Satozono, J. Am. Chem. Soc. 1996, 118, 6257–6263. [106] Y. Maruyama, O. Magnin, H. Satozono, M. Ishikawa, J. Phys. Chem. A 1999, 103, 5629–5635. [107] S. Lovell, B. J. Marquardt, B. Kahr, J. Chem. Soc. Perkin Trans. 2 1999, 2241–2247. [108] A. Ghanadzadeh, A. Zeini, A. Kashef, J. Mol. Liq. 2007, 133, 61–67. [109] C. Loison, R. Antoine, M. Broyer, P. Dugourd, J. Guthmuller, D. Simon, Chem. – Eur. J. 2008, 14,
7351–7357. [110] L. Angeloni, G. Smulevich, M. P. Marzocchi, J. Mol. Struct. 1980, 61, 331–336. [111] R. Macovez, N. Lopez, M. Mariano, M. Maymò, J. Martorell, J. Phys. Chem. C 2012, 116,
26784–26790. [112] P. Sen, S. Yamaguchi, T. Tahara, Faraday Discuss. 2010, 145, 411–428. [113] R. Miyata, Y. Kimura, M. Terazima, Chem. Phys. Lett. 2002, 365, 406–412. [114] T. Itoh, Chem. Rev. 2012, 112, 4541–4568. [115] Y. Rao, X. Guo, Y.-S. Tao, H. Wang, J. Phys. Chem. A 2004, 108, 7977–7982. [116] A. Mokhtari, A. Chebira, J. Chesnoy, J. Opt. Soc. Am. B 1990, 7, 1551. [117] M. J. Rosker, F. W. Wise, C. L. Tang, Phys. Rev. Lett. 1986, 57, 321–324. [118] Y. Nagasawa, Y. Ando, D. Kataoka, H. Matsuda, H. Miyasaka, T. Okada, J. Phys. Chem. A 2002,
106, 2024–2035. [119] A. C. Bhasikuttan, A. V. Sapre, T. Okada, J. Phys. Chem. A 2003, 107, 3030–3035. [120] Y. Kanematsu, H. Ozawa, I. Tanaka, S. Kinoshita, J. Lumin. 2000, 87–89, 917–919. [121] Y. Nagasawa, Y. Ando, T. Okada, Chem. Phys. Lett. 1999, 312, 161–168. [122] Y. Nagasawa, Y. Ando, T. Okada, J. Chin. Chem. Soc. 2000, 47, 699-704. [123] T. J. Sørensen, K. Kilså, B. W. Laursen, Chem. – Eur. J. 2015, 21, 8521–8529. [124] G. Li, D. Magana, R. B. Dyer, J. Phys. Chem. B 2012, 116, 12590–12596. [125] M. Yoshizawa, K. Suzuki, A. Kubo, S. Saikan, Chem. Phys. Lett. 1998, 290, 43–48. [126] S. Rafiq, R. Yadav, P. Sen, J. Phys. Chem. B 2010, 114, 13988–13994. [127] A. Nakayama, T. Taketsugu, J. Phys. Chem. A 2011, 115, 8808–8815. [128] B.-B. Xie, S.-H. Xia, L.-H. Liu, G. Cui, J. Phys. Chem. A 2015, 119, 5607–5617. [129] S. P. Laptenok, K. Addison, I. A. Heisler, S. R. Meech, Chem. Phys. Lett. 2014, 607, 43–46. [130] P. Singhal, H. N. Ghosh, Phys. Chem. Chem. Phys. 2014, 16, 16824–16831. [131] A. Janowski, J. Rzeszotarska, J. Lumin. 1980, 21, 409–416. [132] Z. R. Grabowski, K. Rotkiewicz, W. Rettig, Chem. Rev. 2003, 103, 3899–4032. [133] G. Ramos-Ortiz, S. Romero, J. L. Maldonado, O. Barbosa-García, M. A. Meneses-Nava, M.
Romero, N. Farfán, Rev. Mex. Fis. 2006, 52, 527–533. [134] G. Ramos-Ortiz, J. L. Maldonado, M. A. Meneses-Nava, O. Barbosa-García, M. Olmos, M. Cha,
Opt. Mater. 2007, 29, 636–641. [135] D. R. Greve, S. B. Schougaard, T. Geisler, J. C. Petersen, T. Biørnholm, Adv. Mater. 1997, 9,
1113–1116. [136] T. Geethakrishnan, P. K. Palanisamy, Pramana 2006, 66, 473–478. [137] Q. M. Ali, P. K. Palanisamy, Opt. Laser Technol. 2007, 39, 1262–1268. [138] T. Geethakrishnan, P. K. Palanisamy, Opt. - Int. J. Light Electron Opt. 2006, 117, 282–286. [139] T. Geethakrishnan, P. K. Palanisamy, Appl. Phys. B 2005, 82, 169–172. [140] G. Vinitha, A. Ramalingam, P. K. Palanisamy, Spectrochim. Acta. A. Mol. Biomol. Spectrosc.
2007, 68, 1–5. [141] T. Geethakrishnan, P. K. Palanisamy, Opt. Commun. 2007, 270, 424–428. [142] K. Jamshidi-Ghaleh, S. Salmani, M. H. Majles Ara, Opt. Commun. 2007, 271, 551–554. [143] E. Koushki, A. Farzaneh, S. H. Mousavi, Appl. Phys. B 2010, 99, 565–570. [144] M. Sheik-Bahae, D. J. Hagan, E. W. Van Stryland, Phys. Rev. Lett. 1990, 65, 96–99. [145] R. K. H. Manshad, Q. M. A. Hassan, Adv. Appl. Sci. Res. 2012, 3, 3696-3702. [146] S. S. Hussain, A. H. Waleed, A. B. Hussain, Adv. Appl. Sci. Res. 2012, 3, 2940-2946. [147] I. Mamedbeili, H. Nasibov, Laser Phys. 2009, 19, 2002–2007.

58
[148] R. K. Choubey, S. Medhekar, R. Kumar, S. Mukherjee, S. Kumar, J. Mater. Sci. Mater. Electron. 2014, 25, 1410–1415.
[149] T. W. Chui, K. Y. Wong, J. Chem. Phys. 1998, 109, 1391–1396. [150] D. Beljonne, W. Wenseleers, E. Zojer, Z. Shuai, H. Vogel, S. J. K. Pond, J. W. Perry, S. R. Marder,
J.-L. Brédas, Adv. Funct. Mater. 2002, 12, 631–641. [151] K. J. Thorley, J. M. Hales, H. Kim, S. Ohira, J.-L. Brédas, J. W. Perry, H. L. Anderson, Chem. – Eur.
J. 2013, 19, 10370–10377. [152] F. Paul, C. Lapinte, Coord. Chem. Rev. 1998, 178–180, Part 1, 431–509. [153] N. Gauthier, C. Olivier, S. Rigaut, D. Touchard, T. Roisnel, M. G. Humphrey, F. Paul,
Organometallics 2008, 27, 1063–1072. [154] C. E. Powell, M. P. Cifuentes, J. P. Morrall, R. Stranger, M. G. Humphrey, M. Samoc, B. Luther-
Davies, G. A. Heath, J. Am. Chem. Soc. 2003, 125, 602–610. [155] L. Cuffe, R. D. A. Hudson, J. F. Gallagher, S. Jennings, C. J. McAdam, R. B. T. Connelly, A. R.
Manning, B. H. Robinson, J. Simpson, Organometallics 2005, 24, 2051–2060. [156] G. Grelaud; PhD thesis, The Australian National University/Université de Rennes 1 2012. [157] N. Gauthier, N. Tchouar, F. Justaud, G. Argouarch, M. P. Cifuentes, L. Toupet, D. Touchard, J.-F.
Halet, S. Rigaut, M. G. Humphrey, K. Costuas, F. Paul, Organometallics 2009, 28, 2253–2266.

59
Chapter I:
All-organic triphenylmethane-based
derivatives

60

61
Chapter I
All-organic triphenylmethane-based derivatives
Contents
1. Introduction ...................................................................................................................................... 62
1.2. Brief literature review ............................................................................................................... 64
2. Synthesis ........................................................................................................................................... 67
2.1. Synthesis of the precursors ....................................................................................................... 68
2.2. Synthesis of the targeted TPM dyes .......................................................................................... 70
3. Characterization ................................................................................................................................ 72
3.1. IR spectroscopy ......................................................................................................................... 72
3.2. NMR spectroscopy .................................................................................................................... 73
3.3. Molecular structures ................................................................................................................. 77
3.4. UV-Visible spectroscopy ............................................................................................................ 81
3.5. Theoretical work ....................................................................................................................... 86
4. Z-scan studies .................................................................................................................................... 91
5. Conclusion ......................................................................................................................................... 95
References............................................................................................................................................. 96
62
1. Introduction
This chapter develops the synthesis of organic molecules based on the MG+ and CV+
architectures (Chart 1), their spectroscopic characterization and presents some of their linear and
nonlinear optical features. The syntheses of the targeted derivatives are discussed in the light of the
existing literature. The isolated derivatives are then characterized using classical methods: IR, NMR,
and UV-Vis spectroscopies. Crystallographic data are subsequently presented: they are relevant for
understanding charge delocalization within the compounds and the extent to which selected
structural modifications influence this property. The structure's influence on the electronic
properties is also discussed and the absorption spectra are examined with the help of DFT
calculations carried out by Anissa Amar in the group of Prof. Abdou Boucekkine. The third-order NLO
properties are measured by Z-scan to determine the TPA cross-sections of these derivatives and
develop structure/property relationships.

63
Chart 1: targeted MG+ derivatives

64
1.2. Brief literature review
As mentioned previously, many TPM dyes have been used around the world for various
applications, the most popular being MG+ and CV+. These interesting molecules have found
widespread use in the dye industry and medicine. Initially, the nature of the low-energy absorptions
at the origin of their deep color was not precisely known. At that time, with the exception of a few
theoretical papers,[1-5] synthetic screening was the method of choice for finding the best molecular
structure for a given need. Hence, many TPM dyes were made, and their absorption maxima were
determined and listed in tables, but until the 1980s, little additional insight into their electronic
structure had been gleaned apart from structural leads to control color. Meanwhile, many synthetic
routes to functional derivatives were developed. The following brief review summarizes the
structural diversity achieved with TPM dyes.
Barker and co-workers synthesized several TPM-based derivatives to develop structure-
property relationships to control color.[6-11] They investigated the influence on the spectral features
of these dyes of rigidification, steric effects and even extension of the π-manifold of CV+ and MG+.
Similar work was undertaken by Hallas et al. on MG+ fluorine-containing derivatives (Chart 2).[12]
Previous studies have been summarized by Griffith and Pender, including calculations rationalizing
the observed trends.[1] For MG+ derivatives, the electronic perturbation induced by the extension of
the π-system by replacing the unsubstituted phenyl ring by naphthalene (also known as Victoria
Blue), fluorene or biphenyl groups is quite minor, as these structural changes only induce a small red-
shift of the first and second (if any) absorption bands.[13] Relative to CV+, this second band is always
present in MG+ derivatives, as it results from symmetry lowering (D3→C2) induced by the removal of
the amine substituent on the third phenyl ring. Likewise, it appears in the less symmetric CV+
derivatives IIIa and IVa and in rigidified derivatives such as Va, VIa. In addition to inducing the
appearance of a second transition at low energy, this last structural modification has a drastic
electronic effect, since it also induces a huge bathochromic shift of about 250 nm of both bands in
the NIR.[14] Their molecular extinction coefficients remain, however, quite similar to those observed
for classical TPM dyes (i.e. around 105 L.mol-1.cm-1).

65
Chart 2: Compounds mentioned in references 1 to 8 in 98 % AcOH. a: EtOH + 1 eq. HCl.
These compounds were derived from Grignard reagents or sodium salts and ketones, to
form carbinol or ether derivatives in a first step, as exemplified in Scheme 1, and then the
carbocation was generated upon addition of acid (see also Introduction; section 3.1).
Characterization consists largely of an elemental analysis and a melting point, which is rather poor,
especially considering that some of these derivatives are not thermally stable and were reported to
decompose over time. Furthermore, the UV-visible electronic absorptions reported for these
carbocations have to be used carefully. Most measurements were on species generated in situ, often
in highly acidic solutions, the actual concentration of mono-cationic dye not always being known.
Accordingly, rapid fading of the solution was often observed during these measurements for the
most reactive compounds, such as those possessing rigidified cores, ascribable to either re-formation
of the starting carbinol or decomposition. The rigidified compounds are more sensitive to
nucleophilic attack, possibly due to their planar structures which do not sterically shield the central
carbocation.
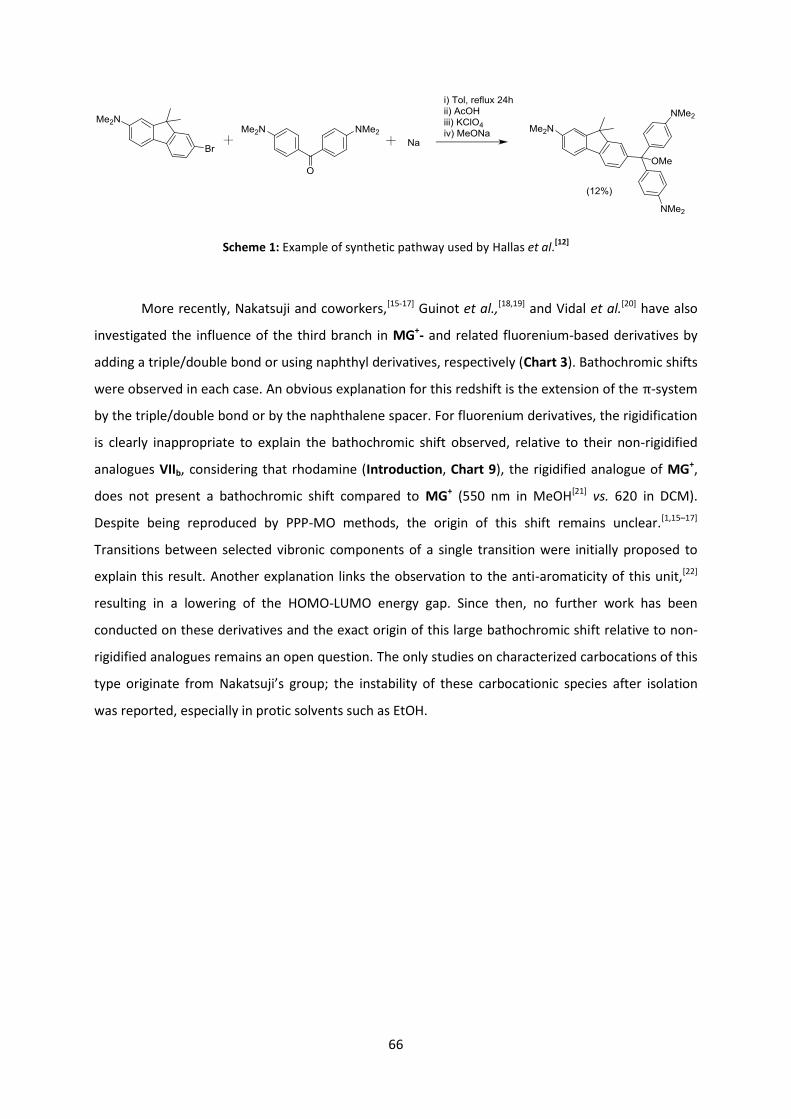
66
Scheme 1: Example of synthetic pathway used by Hallas et al.[12]
More recently, Nakatsuji and coworkers,[15-17] Guinot et al.,[18,19] and Vidal et al.[20] have also
investigated the influence of the third branch in MG+- and related fluorenium-based derivatives by
adding a triple/double bond or using naphthyl derivatives, respectively (Chart 3). Bathochromic shifts
were observed in each case. An obvious explanation for this redshift is the extension of the π-system
by the triple/double bond or by the naphthalene spacer. For fluorenium derivatives, the rigidification
is clearly inappropriate to explain the bathochromic shift observed, relative to their non-rigidified
analogues VIIb, considering that rhodamine (Introduction, Chart 9), the rigidified analogue of MG+,
does not present a bathochromic shift compared to MG+ (550 nm in MeOH[21] vs. 620 in DCM).
Despite being reproduced by PPP-MO methods, the origin of this shift remains unclear.[1,15–17]
Transitions between selected vibronic components of a single transition were initially proposed to
explain this result. Another explanation links the observation to the anti-aromaticity of this unit,[22]
resulting in a lowering of the HOMO-LUMO energy gap. Since then, no further work has been
conducted on these derivatives and the exact origin of this large bathochromic shift relative to non-
rigidified analogues remains an open question. The only studies on characterized carbocations of this
type originate from Nakatsuji’s group; the instability of these carbocationic species after isolation
was reported, especially in protic solvents such as EtOH.

67
Chart 3: Extended version of fluorenium carbocations. a: DCM, b: measured in 98% acetic acid
In conclusion, considerable care must be taken when examining results from in situ
measurements, although such measurements provide a good database from which to analyze the
impact of structural modifications on the electronic structures. Finally, some recent papers describe
innovative and efficient catalyzed syntheses of leuco-TPMs featuring anthracenyl substituents.[23] In
principle, these species constitute synthetic precursors to TPM carbocations closely related to those
presented in the previous chapter. The synthesis of the corresponding TPM dyes was not attempted,
as no guarantee exists that these leuco-dyes constitute convenient precursors to the corresponding
carbocations using an alternative synthetic route to that described here.
2. Synthesis
None of the targeted compounds were previously reported. Several targeted compounds of
this work are, nevertheless, similar to existing species and will allow good comparison of spectral
features. All the targeted molecules possess common synthons, and hence the most obvious way to
access these TPM dyes was by a convergent synthesis. Lithiation is the first step for this convergent
approach (Scheme 2). It is supposedly higher yielding compared to other approaches based on
electrophilic aromatic substitution, in which many side-reactions can occur, and which involve the
use of Lewis acid catalysts (zinc chloride, zeolites, sulfonic acid) or Brønsted acid catalysts (sulfuric
acid, hydrochloric acid, methanesulfonic acid). The last reaction is the preferred pathway in industrial

68
chemistry, purity not being the main requirement for the use of these compounds as stains or dyes.
While the quality of industrial processes has improved, they do not usually provide the same degree
of purity as approaches based on carbanions. Among these, the use of lithium reagents has been
preferentially used in the recent literature to access the carbinols.[24,25] These species can be quite
reactive and the purification of such compounds can be difficult, as mentioned by Costero et al., who
employed this high reactivity to make sensors for chemical warfare such as nerve stimulants (e.g.
Sarin and related phosphonate derivatives). The sensing mechanism involves phosphorylation of the
carbinolhydroxyl group followed by a dephosphatization reaction induced by the electron-donor
amino groups, forming the carbocationic dye.[26] This illustrates well the carbinols's reactivity.
Precautions have therefore to be taken when manipulating these derivatives in order to avoid
decomposition.
Scheme 2: Pathway employed for synthesis of the targeted TPM dyes with a rigidified core
The carbinol intermediates will then be dehydrated upon addition of acid to form the desired
carbocations. As discussed in the introduction (section 3.2), this step will depend on the donating
power of the para-substituents on the peripheral phenyl rings and on their number (2 or 3).
Quantitative use of acid should lead to the monocationic species, which will be isolated as their
inorganic salts, avoiding the problem raised by in situ measurements where large excess of acid
might partly generate extraprotonated species.
2.1. Synthesis of the precursors
The desired ketone precursors have been described in the literature or are commercially
available (Chart 4). Benzophenone substituted with dimethylamino groups is known as Michler's
ketone 28 and is prepared using the Friedel-Crafts acylation of dimethylaniline using triphosgene.[27]
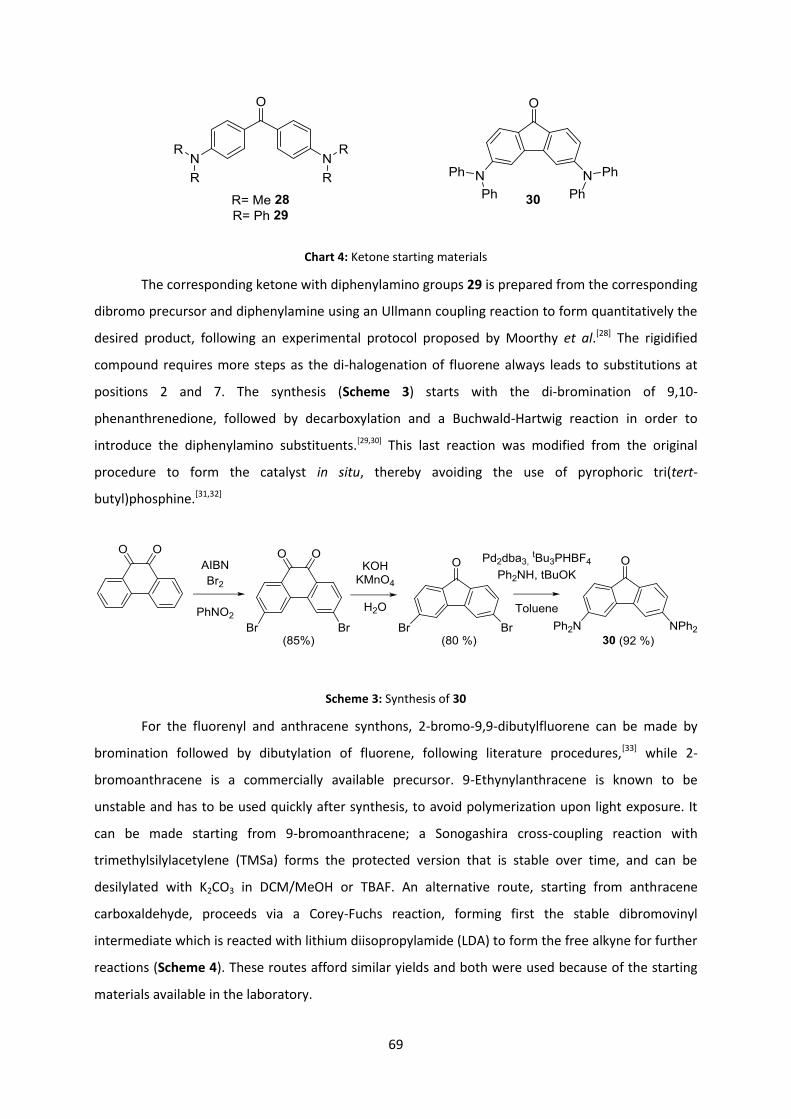
69
Chart 4: Ketone starting materials
The corresponding ketone with diphenylamino groups 29 is prepared from the corresponding
dibromo precursor and diphenylamine using an Ullmann coupling reaction to form quantitatively the
desired product, following an experimental protocol proposed by Moorthy et al.[28] The rigidified
compound requires more steps as the di-halogenation of fluorene always leads to substitutions at
positions 2 and 7. The synthesis (Scheme 3) starts with the di-bromination of 9,10-
phenanthrenedione, followed by decarboxylation and a Buchwald-Hartwig reaction in order to
introduce the diphenylamino substituents.[29,30] This last reaction was modified from the original
procedure to form the catalyst in situ, thereby avoiding the use of pyrophoric tri(tert-
butyl)phosphine.[31,32]
Scheme 3: Synthesis of 30
For the fluorenyl and anthracene synthons, 2-bromo-9,9-dibutylfluorene can be made by
bromination followed by dibutylation of fluorene, following literature procedures,[33] while 2-
bromoanthracene is a commercially available precursor. 9-Ethynylanthracene is known to be
unstable and has to be used quickly after synthesis, to avoid polymerization upon light exposure. It
can be made starting from 9-bromoanthracene; a Sonogashira cross-coupling reaction with
trimethylsilylacetylene (TMSa) forms the protected version that is stable over time, and can be
desilylated with K2CO3 in DCM/MeOH or TBAF. An alternative route, starting from anthracene
carboxaldehyde, proceeds via a Corey-Fuchs reaction, forming first the stable dibromovinyl
intermediate which is reacted with lithium diisopropylamide (LDA) to form the free alkyne for further
reactions (Scheme 4). These routes afford similar yields and both were used because of the starting
materials available in the laboratory.

70
Scheme 4: Synthesis of 9-ethynylanthracene 32
2.2. Synthesis of the targeted TPM dyes
To access the desired carbinols, the reactions followed classical lithiation conditions (THF at
0°C for free alkyne and -78°C for metal/halogen exchange reactions) followed by addition of the
desired ketone in solution (Scheme 5). The difficultly arises in the purification and isolation of these
compounds, as they are quite reactive and can decompose overtime and they dehydrate quickly on
acidic or hot surfaces, if not handled with care. The use of triethylamine is necessary to neutralize
silica while running chromatographic columns, and thereby avoid the formation of carbocationic
species which would remain on the column and lead to loss of material. However, even on a
neutralized column eluted with 1% triethylamine, the dimethylamino compounds are quite reactive
and led to formation of deeply colored deposits on the chromatographic column.
Scheme 5: Synthesis of organic carbinol derivatives O1OH
-O3OH
The carbinols O1OH-O3OH were made in good yields except for O3(anth)OH, which was
observed but could not be purified and isolated as it decomposes too quickly (within an hour in
solution). The steric constraints of the bulky anthracene exerted at the sp3 carbon probably explains
the high reactivity of this particular carbinol. As observed by NMR, a competitive reaction takes place
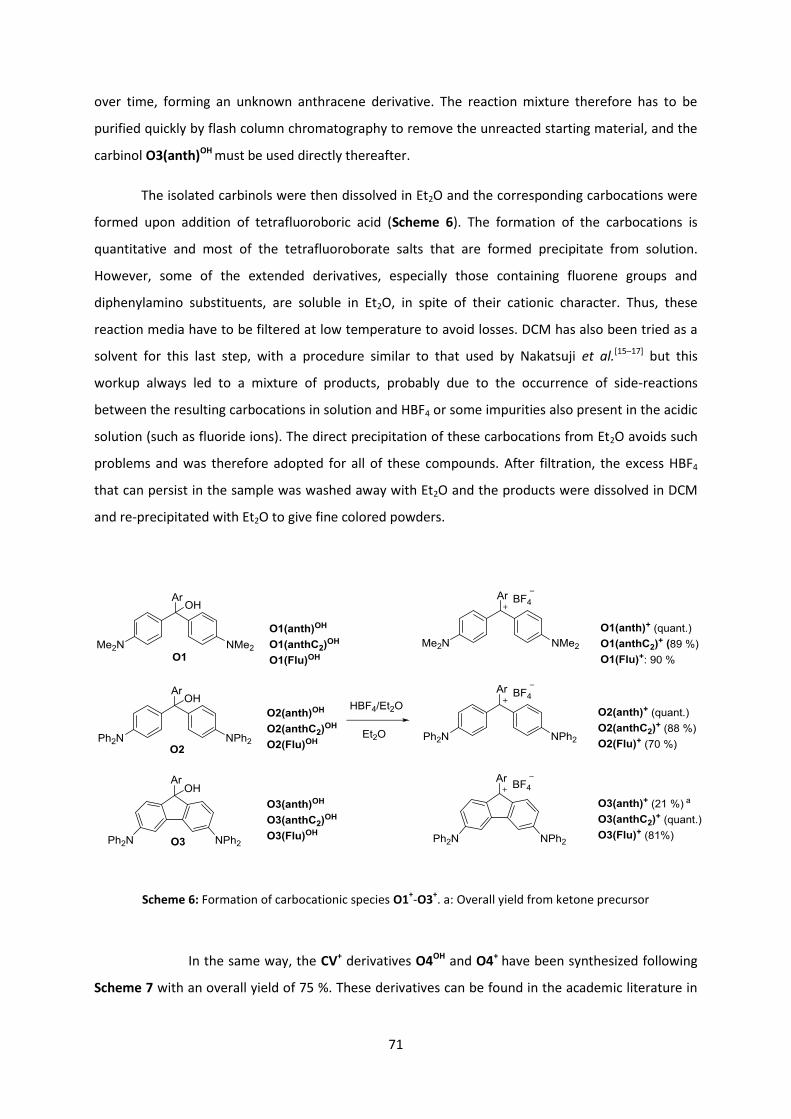
71
over time, forming an unknown anthracene derivative. The reaction mixture therefore has to be
purified quickly by flash column chromatography to remove the unreacted starting material, and the
carbinol O3(anth)OH must be used directly thereafter.
The isolated carbinols were then dissolved in Et2O and the corresponding carbocations were
formed upon addition of tetrafluoroboric acid (Scheme 6). The formation of the carbocations is
quantitative and most of the tetrafluoroborate salts that are formed precipitate from solution.
However, some of the extended derivatives, especially those containing fluorene groups and
diphenylamino substituents, are soluble in Et2O, in spite of their cationic character. Thus, these
reaction media have to be filtered at low temperature to avoid losses. DCM has also been tried as a
solvent for this last step, with a procedure similar to that used by Nakatsuji et al.[15–17] but this
workup always led to a mixture of products, probably due to the occurrence of side-reactions
between the resulting carbocations in solution and HBF4 or some impurities also present in the acidic
solution (such as fluoride ions). The direct precipitation of these carbocations from Et2O avoids such
problems and was therefore adopted for all of these compounds. After filtration, the excess HBF4
that can persist in the sample was washed away with Et2O and the products were dissolved in DCM
and re-precipitated with Et2O to give fine colored powders.
Scheme 6: Formation of carbocationic species O1+-O3
+. a: Overall yield from ketone precursor
In the same way, the CV+ derivatives O4OH and O4+ have been synthesized following
Scheme 7 with an overall yield of 75 %. These derivatives can be found in the academic literature in

72
papers up to the 1980s,[34,35] and in diverse recent patents,[36,37] but there is a clear lack of
spectroscopic characterization and obviously no NLO measurements have been carried out.
Scheme 7: Formation of the targeted CV+ derivatives
The resulting MG+- and CV+-based carbocations were most often isolated as BF4- salts. These
are air-stable salts that can be stored under normal conditions in vials for several months. However,
some of these derivatives can be hydrophilic (as mentioned before) and it is better to avoid moisture
when storing them for extended periods of time. They are also stable in solution over weeks in non-
polar solvents and even in presence of small amounts of water. However, in polar solvents, there is a
rapid fading of the color, most likely caused by re-formation of the starting carbinols. This fading can,
however, easily be prevented by addition of a slight excess acid or by use of dry solvents under inert
atmospheres.
3. Characterization
3.1. IR spectroscopy
IR spectroscopy can be used to follow structural changes depending on specific vibrational
modes of the molecules. The disappearance of the hydroxyl group and the appearance of the
counter anion, here a BF4 and characterized by an intense B-F stretching mode around 1100 cm-1, are
obvious from the spectra of the two compounds. Other typical vibrational modes are also observable
such as the stretching of the triple bonds around 2130 cm-1 for the extended anthracenyl derivatives
(Table 1). The other IR signatures are similar for carbinols and carbocations, with the amine N-C
modes located around 3200 cm-1 and C=C modes of the π-system around 1564 cm-1and 1350 cm-1.
For 9-ethynylanthracenyl derivatives, the triple bond stretching (-C≡C-) is too weak to be observable

73
in the carbinols' case but is clearly noticeable in the corresponding carbocations, probably due to its
increased polarization imposed by the conjugation with the nearby carbocationic center.
The variation between the three sets of compounds featuring the same diaminoaryl group
are, however, too small to draw a sensible trend. This is also true for the O-H stretching modes of the
carbinols at ca. 3300-3500 cm-1 which correspond to a non-labile hydrogen, due to their broadness
and overlap with potential O-H modes of water originating from traces of moisture in the samples.
carbinols νO-H Carbocations νB-F Functional groups
O1(anth)OH 3446 O1(anth)+ 1056 -
O1(anthC2)OH 3407 O1(anthC2)
+ 1162 2140 (-C≡C-)
O1(flu)OH 3455 O1(flu)+ 1168 -
O2(anth)OH 3530 O2(anth)+ 1163 -
O2(anthC2)OH 3421 O2(anthC2)
+ 1249 2135 (-C≡C-)
O2(flu)OH 3449 O2(flu)+ 1167 -
O3(anth)OH - O3(anth)+ 1257 -
O3(anthC2)OH 3406 O3(anthC2)
+ 1169 2132 (-C≡C-)
O3(flu)OH 3447 O3(flu)+ 1279 -
O4OH 3435 O4+ 1172 -
Table 1: Stretching frequencies of carbinols and carbocations (cm-1
, ± 2) for samples in KBr pellets or as neat powders
3.2. NMR spectroscopy
All carbinols, their organic precursors and carbocationic derivatives have been characterized
by 1H and 13C NMR. The spectroscopic details for the known precursors of these compounds have
been reported and will not be presented here, but the carbinols (O1OH-O4OH) with the exception of
O3(anthC2)OH and their corresponding carbocations (O1+-O4+) are new and their NMR data will be
briefly presented in the following paragraphs.
The more significant features in the carbinols' 1H NMR spectra are the peaks of the hydroxyl
group in the range 4.5 - 6 ppm (Table 2), which are sharp for tertiary alcohols; this suggests that the
basicity of the oxygen is high and the hydrogen is not very labile, confirming the energetic O-H

74
observed in the IR spectrum (Table 1). The other signals are unremarkable, with doublets for the AB
system related to the desired aromatic ketonic group (3JH-H = 8.9 Hz for -NMe2,3JH-H = 8.7 Hz for -NPh2)
and corresponding signals for the fluorenium group in compounds O3+. The use of acetone-d6 as a
solvent was favored since the carbinols were far more stable in this polar solvent than in CDCl3. The
latter can be acidic, due to impurities, and leads to partial dehydration of the sample. Moreover,
acetone also avoids signal overlap in the aromatic region and results in clearer spectral signatures for
the compounds.
O1(flu)OH O1(anth)OH O1(anthC2)OH O2(flu)OH O2(anth)OH O2(anthC2)OH
δ (ppm) 4.75 4.72 5.62 5.30 5.41 6.10
O3(flu)OH O3(anth)OH O3(anthC2)
OH O4OH
δ (ppm) 5.20 5.35a 6.00 5.19
Table 2: 1H NMR chemical shifts of hydroxyl groups in acetone-d6. a: shift obtained from a reaction mixture
All hydroxyl groups give clear trends in their 1H NMR signals. Considering the same third
branch, they experience an overall downfield shift going from -NMe2 to rigidified compounds and
finally-NPh2, the latter two families of compounds having rather close values. This shift (Table 2) can
be linked to the electron density present at the hydrogen of the hydroxyl group, since dimethylamino
groups are more electron-releasing than diphenylamino groups, therefore leading to an increased
shielding effect. In the same way, the planar system helps electron donation and shields the hydroxyl
group compared to the non-planarized diphenylamino analogues.
As exemplified in Figure 1, upon formation of the carbocations, the signal related to the
hydroxyl groups disappears and shifts are apparent for the signals of the protons of the aromatic
region. This observation is not surprising since the -system gains planarity and conjugation in the
carbocations. A clear shift is thus noticeable for the 1H signals of the diamino groups and for the
fluorenyl units, but it is less pronounced for other aromatic signals of the various samples. Certainly,
the observed shifts also originate to some extent from the different solvents used for characterizing
the carbocations. Given that acetone-d6 proved to partially reform the carbinol due to traces of water
present in this solvent, CD2Cl2 or CDCl3 were preferred, depending on the carbocations' solubilities.
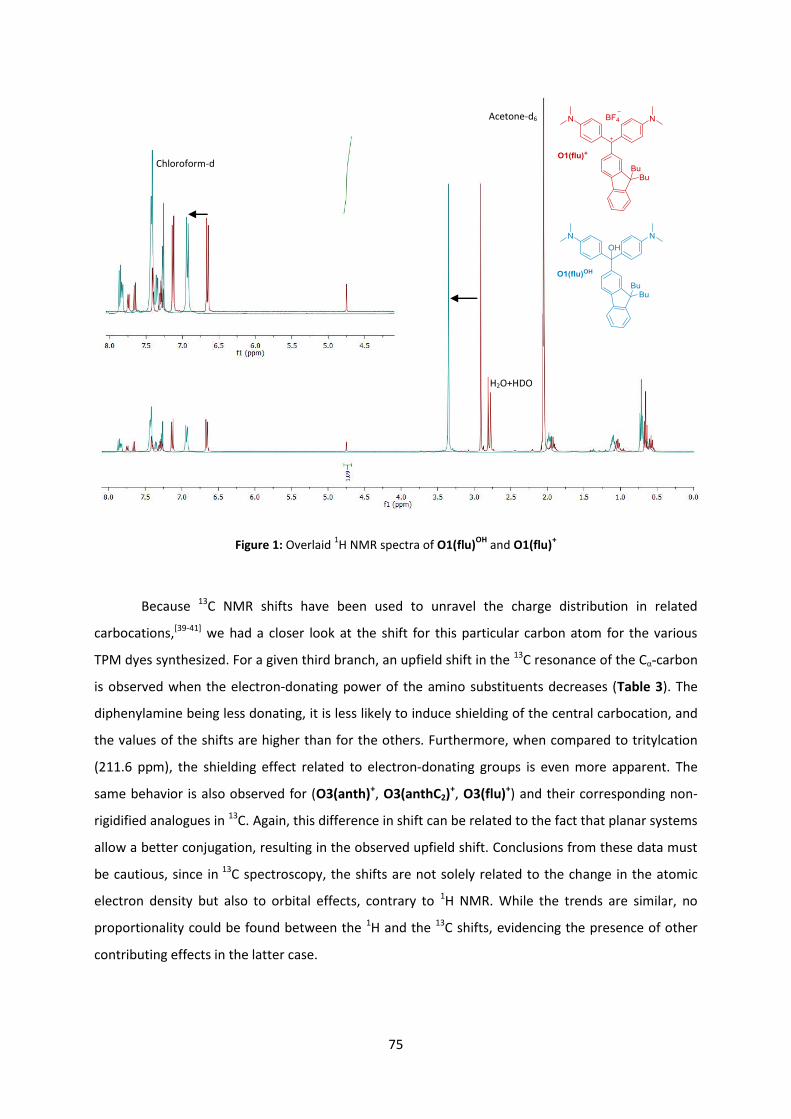
75
Figure 1: Overlaid 1H NMR spectra of O1(flu)
OH and O1(flu)
+
Because 13C NMR shifts have been used to unravel the charge distribution in related
carbocations,[39-41] we had a closer look at the shift for this particular carbon atom for the various
TPM dyes synthesized. For a given third branch, an upfield shift in the 13C resonance of the Cα-carbon
is observed when the electron-donating power of the amino substituents decreases (Table 3). The
diphenylamine being less donating, it is less likely to induce shielding of the central carbocation, and
the values of the shifts are higher than for the others. Furthermore, when compared to tritylcation
(211.6 ppm), the shielding effect related to electron-donating groups is even more apparent. The
same behavior is also observed for (O3(anth)+, O3(anthC2)+, O3(flu)+) and their corresponding non-
rigidified analogues in 13C. Again, this difference in shift can be related to the fact that planar systems
allow a better conjugation, resulting in the observed upfield shift. Conclusions from these data must
be cautious, since in 13C spectroscopy, the shifts are not solely related to the change in the atomic
electron density but also to orbital effects, contrary to 1H NMR. While the trends are similar, no
proportionality could be found between the 1H and the 13C shifts, evidencing the presence of other
contributing effects in the latter case.
Acetone-d6
H2O+HDO
Chloroform-d
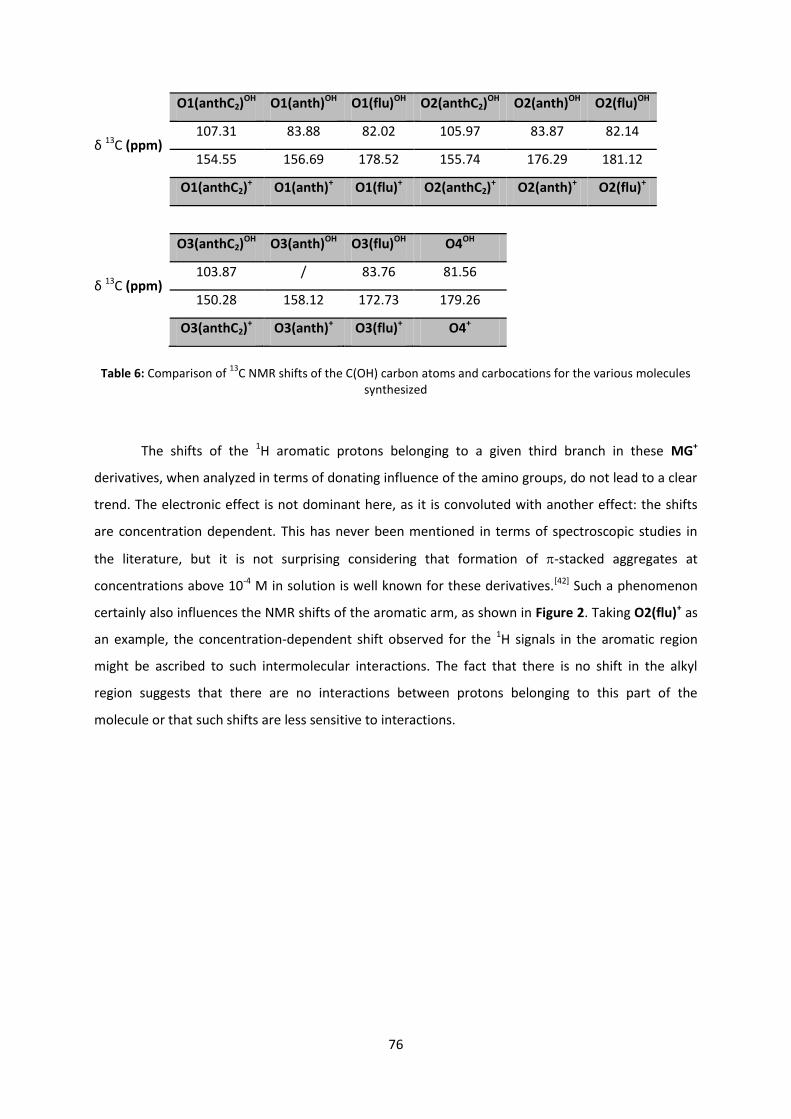
76
O1(anthC2)OH O1(anth)OH O1(flu)OH O2(anthC2)
OH O2(anth)OH O2(flu)OH
δ 13C (ppm) 107.31 83.88 82.02 105.97 83.87 82.14
154.55 156.69 178.52 155.74 176.29 181.12
O1(anthC2)+ O1(anth)+ O1(flu)+ O2(anthC2)
+ O2(anth)+ O2(flu)+
O3(anthC2)OH O3(anth)OH O3(flu)OH O4OH
δ 13C (ppm) 103.87 / 83.76 81.56
150.28 158.12 172.73 179.26
O3(anthC2)+ O3(anth)+ O3(flu)+ O4+
Table 6: Comparison of
13C NMR shifts of the C(OH) carbon atoms and carbocations for the various molecules
synthesized
The shifts of the 1H aromatic protons belonging to a given third branch in these MG+
derivatives, when analyzed in terms of donating influence of the amino groups, do not lead to a clear
trend. The electronic effect is not dominant here, as it is convoluted with another effect: the shifts
are concentration dependent. This has never been mentioned in terms of spectroscopic studies in
the literature, but it is not surprising considering that formation of -stacked aggregates at
concentrations above 10-4 M in solution is well known for these derivatives.[42] Such a phenomenon
certainly also influences the NMR shifts of the aromatic arm, as shown in Figure 2. Taking O2(flu)+ as
an example, the concentration-dependent shift observed for the 1H signals in the aromatic region
might be ascribed to such intermolecular interactions. The fact that there is no shift in the alkyl
region suggests that there are no interactions between protons belonging to this part of the
molecule or that such shifts are less sensitive to interactions.

77
Figure 2: 1H spectrum of O2(fluo)
OH at four different concentrations (5, 14, 20 and 28.10
-3 mol.L
-1) in CDCl3
3.3. Molecular structures
Except for O1(flu)+ and O2(flu)+, the non-rigidified fluorene derivatives, crystals of all these
compounds were obtained and proved to be suitable for X-ray studies. For O1(flu)+ and O2(flu)+, the
bulk of the butyl chains of the molecule probably complicated proper stacking during attempted
crystallizations, an effect possibly compensated by the rigidified fluorenium in O3(flu)+. Most of these
crystals are deeply colored with a shiny metallic glitter. For all derivatives, the asymmetric units are
similar, as they mostly belong to monoclinic systems. More detailed crystallographic data can be
found in the experimental part. Figure 3 presents the adopted numeration scheme for the data in
Table 4, which displays selected bond lengths as well as the torsion angle ϑ. The latter is defined by
the angle between the plane containing the central carbon and the plane defined by the third arm,
providing an indicator about its conjugation with the carbocation in the solid. The contribution of the
mesomeric forms (A, B and C) in the GS can be estimated from the X-ray data. Even if form C appears
H2O

78
disfavored, it should induce a noticeable difference in the C1-C22 bond length compared to the
typical C(sp3)-C(sp3) distance. Reference bond lengths are given in the table for comparison.
Figure 3: ORTEP views of O1(anth)+ and O1(anthC2)
+ with their BF4
- counter anions at 50 % probability (solved
by Dr. Graeme Moxey). Hydrogen atoms and DCM have been omitted for clarity
In the solid state, the charge can be more localized on one side of the molecule due to
interactions with the counter-anion. This can be appreciated by the difference in length between C1-
C2 and C1-C12 as well as by the corresponding C-N bond lengths, and can be correlated to the
distance between one of the nitrogen atoms and the counter anion; this is less noticeable for the
aminophenyl derivatives, as the phenyl, possibly due to its steric bulk, prevents the counter anion
interacting strongly with the nitrogen atoms. The conjugation with the central carbocation is
apparent as the amine-carbon bond is shorter than a strict CAr-N (planar) sp2-sp2 length, and hence
possesses a double bond character. The same trend is also observed with the C1-C2 and C1-C12
bonds, which are shorter than typical Csp2-Csp2 bonds. According to these criteria, O1(anth)+ and
C1 C22 C12
C2
C15
N2
C5
N1
C22
C1 C2
C15 N2
C5
N1
C12

79
O1(anthC2)+ show much more conjugated structures than the other TPM dyes which crystallize with
on average shorter bond lengths.
C1-C2 C1-C12 Δ a C1-C22 C5-N1 C15-N2 Δ a Torsion angle ϑb
O1(anth)+ 1.426(2) 1.414(2) 12 1.497(2) 1.343(2) 1.348(2) 5 -71.79 (1)
O2(anth)+ 1.405(3) 1.448(3) 43 1.488(3) 1.351(3) 1.379(3) 28 76.45 (2)
O3(anth)+ 1.400(5) 1.450(5) 50 1.477(5) 1.371(5) 1.396(5) 25 -69.52 (2)
O1(anthC2)+ 1.426(3) 1.433(3) 7 1.423(2) 1.341(3) 1.348(3) 7 -3.39 (3)
O2(anthC2)+ 1.436(3) 1.437(3) 1 1.412(2) 1.360(3) 1.378(3) 18 11.24 (2)
O3(anthC2)+ 1.425(3) 1.439(3) 14 1.392(3) 1.364(3) 1.374(3) 10 1.62 (2)
O3(flu)+ 1.404(4) 1.466(5) 22 1.485(6) 1.348(5) 1.408(4) 60 -40.30 (5)
Typical bond length c Csp3-Car
1.513
Csp2-Car
1.483
Csp2-Csp2
1.460
Car-N(planar)
1.371
Csp2=N
1.279
Counter anion distance to
N1 N2 Δdd C1
O1(anth)+ 7.053(2) 6.236(2) 0.83 4.950(2) O2(anth)+ 5.224(4) 5.312(4) 0.09 6.558(3) O3(anth)+ 7.103(6) 4.195(6) 2.9 6.033(6)
O1(anthC2)+ 4.043(3) 4.596(3) 5.55 7.484(3)
O2(anthC2)+ 5.279(3) 7.694(3) 2.4 9.062(3)
O3(anthC2)+ 6.532(4) 6.130(4) 0.4 7.379(4)
O3(flu)+ 4.724(9) 7.533(9) 2.8 5.937(10) O4+ 5.713(8) 6.192(8) 0.48 5.824(8)
Table 4: Selected bond lengths and angles for the carbocations, errors in bracket. a: Difference between
previous bond lengths in 10-3
Å. b See text for definition. c See ref.
[38] d: Difference between previous bond
lengths in Å.
For all compounds, the C1-C22 bond is shorter than expected for a single aryl-carbon bond,
showing that this aryl substituent is participating in charge delocalization, albeit less than the
aminophenyl groups. This is particularly pronounced with the 9-ethynyl anthracene derivatives
(O1(anthC2)+, O2(anthC2)
+, O3(anthC2)+), possibly because of the planarity of these systems with the
inserted triple bond leading to relief of steric interactions. Comparison with the similar bonds in the
anthracene derivatives (O1(anth)+, O2(anth)+, O3(anth)+) clearly reveals better -conjugation of the
third branch with the rest of the system in the former set of compounds.
While some of the derivatives have more localized positive charge on one of the amines
(possibly due to counter anion interactions in the solid state), the other compounds reveal a
complete conjugation supporting a more symmetrical structure, especially with the diarylamino

80
units. The third branch is also "communicating" with the rest of the system, but to a minor extent
since the C+-C is close to the theoretical Csp2-CAr bond length with the ethynyl systems being the more
delocalized. The structures do not suggest a localized charge since they significantly differ from any
of the three limiting forms (A, B or C); it is more likely that a form intermediate between A
(carbocation) and B (iminium) exists.
In comparison, the only CV+ derivative crystallized does not possess marked dissymmetrical
features, the central carbon being, as expected, planar like the other compounds and the three
branches nearly equivalent and with a propeller shape to preserve the C3 symmetry. A slightly more
pronounced interaction of one of the branches can be observed, possibly due to interaction with the
counter anion, as shown in Figure 4, and probably resulting from packing in the solid state. Also, in
the conformation adopted by the molecules, the peripheral phenyls are twisted at 83° which limits
the communication with the rest of the molecule. In solution, such a molecule most likely adopts a
dynamic structure with a smaller average angle of the peripheral phenyls strengthening the
electronic stabilization of the central carbocation (Table 5).
Figure 4: Structure of [O4+
][BF4-] solved by Dr. Graeme Moxey
C12
C2
C22
C1
N1
C5
N3
C25
N15
N2

81
C1-C2 C1-C12 C1-C22 C5-N1 C15-N2 C25-N3
Torsion
peripheral
phenyl
Torsion
central
phenyl
O4+ 1.417(10) 1.450(10) 1.437(8) 1.379(9) 1.367(10) 1.370(8) 83.63 (1) 31.89 (7)
Table 5: Selected bond length in Å and angles in ° for O4
+
In addition to structurally validating the targeted compounds, the X-ray crystallography
studies confirm the geometries, especially for O1(anth)+, O2(anth)+ and O3(anth)+, the anthracene
derivatives. In these TPM dyes, the anthracenyl group is quasi-perpendicular to the rest of the
molecule which severely limits electronic -interaction with the rest of the molecule. In contrast, the
9-ethynylanthracenyl group, at least in the solid state, is coplanar with the mean plane of the sp2
carbocation, justifying a posteriori the extension of the system in order to increase the conjugation.
The amino substituents are coplanar with the 1,4-phenylene rings, indicating charge delocalization.
There is no evidence for an “out of the plane” distortion of the central carbon for the molecule in the
solid state, such as for the solvent adducts hypothesized by Murayama.
3.4. UV-Visible spectroscopy
The spectra of carbinols and carbocations were recorded as solutions in DCM in the range
230 - 2000 nm. When compared to those of the corresponding carbocations, the absorption spectra
of carbinol precursors reveal the absence of low-energy absorptions in line with the significant color
difference between them. This provides a simple experimental means to ensure the purity of each
solution. The sp3 character of the carbinol disrupts the π-manifold, resulting in no charge-transfer
process in the visible region. As a result the carbinols are slightly yellow due to absorbing mostly in
the UV region due to π - π* and n - π* transitions of the aromatics. As soon as the carbocation is
formed, a huge absorption in the visible region appears, resulting from the charge-transfer (CT)
process taking place from the peripheral (4-arylamino and aryl) groups toward the central
carbocation, as also revealed by theoretical calculations. The two transitions usually observed at
lowest energy for MG+ derivatives correspond to two different polarizations of this CT process. They
are degenerate in the more symmetrical CV+ derivatives, for which they correspond to the band at
lowest energy.

82
Figure 5 displays a good illustration of the spectral difference between the CV+-based
carbocations and carbinols O4OH and O4+. The carbinol O4OH absorbs in the UV range at wavelengths
below 350 nm, while the carbocation possesses an intense band at 638 nm (CV+ is at 586 nm) with a
molecular extinction coefficient around 10-5·L·mol-1·cm-1, similar to CV+. Note that O4+ is shifted in a
bathochromic way compared to CV+, illustrating the effect of arylamino substituents instead of
alkylamino ones. From purely charge-transfer considerations, a weaker donor should increase the
HOMO-LUMO gap and the band should be blue-shifted upon replacement of dimethylamino by
diphenylamino substituents. However, the observed effect is the opposite. The effect of a lower
donicity is possibly compensated by the bathochromic shift resulting from the overall extension of
the conjugated π-system across the amine when progressing from dimethylamino to diphenylamino
substituents. The other noticeable thing is that the shoulder on this transition in CV+ seems to have
disappeared, but given that the band is broader, such a shoulder might not be resolved and indeed
be hidden beneath. Despite being forbidden for this fully symmetrical chromophore, the S0->S3
transition is also weakly observable near 410 nm for O4+.
Figure 5: Spectra of O4OH
and [O4+
][BF4-]
0
20000
40000
60000
80000
100000
120000
230 330 430 530 630 730 830 930
ε (m
ol.
L-1
cm-1
)
λ (nm)

83
Regarding the MG+ derivatives, the data can be analyzed in two ways, either by studying the
influence of the third branch, or by studying the influence of the various diaminophenyl parts. Table
6 displays the spectral features of these compounds. They all possess a characteristic set of two
bands at low energy, with the first one between 620 and 702 nm for the non-rigidified derivatives
(similar to MG+) and extinction coefficients around 105·L·mol-1·cm-1. These absorption bands always
possess a shoulder, which is barely noticeable for the diaminophenyl derivatives (series of
compounds O4+). All these compounds also possess a second excited state around 450 nm, similar to
MG+, the fluorene derivatives exhibiting a larger intensity for this second transition. These values are
consistent with those reported in literature for similar derivatives, as listed in the previous
paragraph.[12] DFT calculations were conducted on model molecules by Dr. A. Amar and Prof. A.
Boucekkine (University of Rennes 1) in order to help understand more precisely the origin of the
different transitions observed for all these compounds. These results will be briefly presented in
section 4.5.
Compound O1(Anth)+ O1(AnthC2)+ O1(fluo)+ O2(Anth)+ O2(AnthC2)
+ O2(flu)+
λS0->S1 (nm)
ε (10-5·L·mol-1·cm-1)
637
(1.06)
702
(1.17)
620
(1.30)
692
(0.91)
731
(1.25)
668
(0.89)
λS0->S2 (nm)
ε (10-5·L·mol-1·cm-1)
498
(0.16)
432
(0.13)
490
(0.48)
430
(0.09)
443
(0.09)
534
(0.48)
Δλ (nm) 139 270 130 262 288 134
O3(Anth)+ O3(AnthC2)+ O3(flu)+ O4+ CV+ MG+
λS0->S1 (nm)
ε (10-5·L·mol-1·cm-1)
1068
(0.25)
1141
(0.13)
1020
(0.33)
630
(10.6)
582
(1.26)
620
(1.02)
λS0->S2 (nm)
ε (10-5·L·mol-1·cm-1)
510
(0.13)
786
(0.32)
622
(0.54)
405a
(0.03) -
427
(0.18)
Δλ(nm) 558 355 398 225 193
Table 9: Main absorption bands for MG
+ and CV
+-type carbocations. a: λS0->S3
The influence of the third branch is illustrated in Figure 6 for the dimethylamino
derivatives, but the same trend is observed with the other series. There is a bathochromic shift in
proceeding from fluorenylto anthracenyl to the 9-ethynylanthracenyl compounds. This apparently
follows the number of electrons taking part in the conjugated π-system for each molecule. Indeed,
O1(anthC2)+ has thirty electrons, O1(anth)+ twenty-eight and O1(flu)+ twenty-six. Unexpectedly, this
shows that despite the anthracenyl groups being nearly perpendicular to the π-system, the
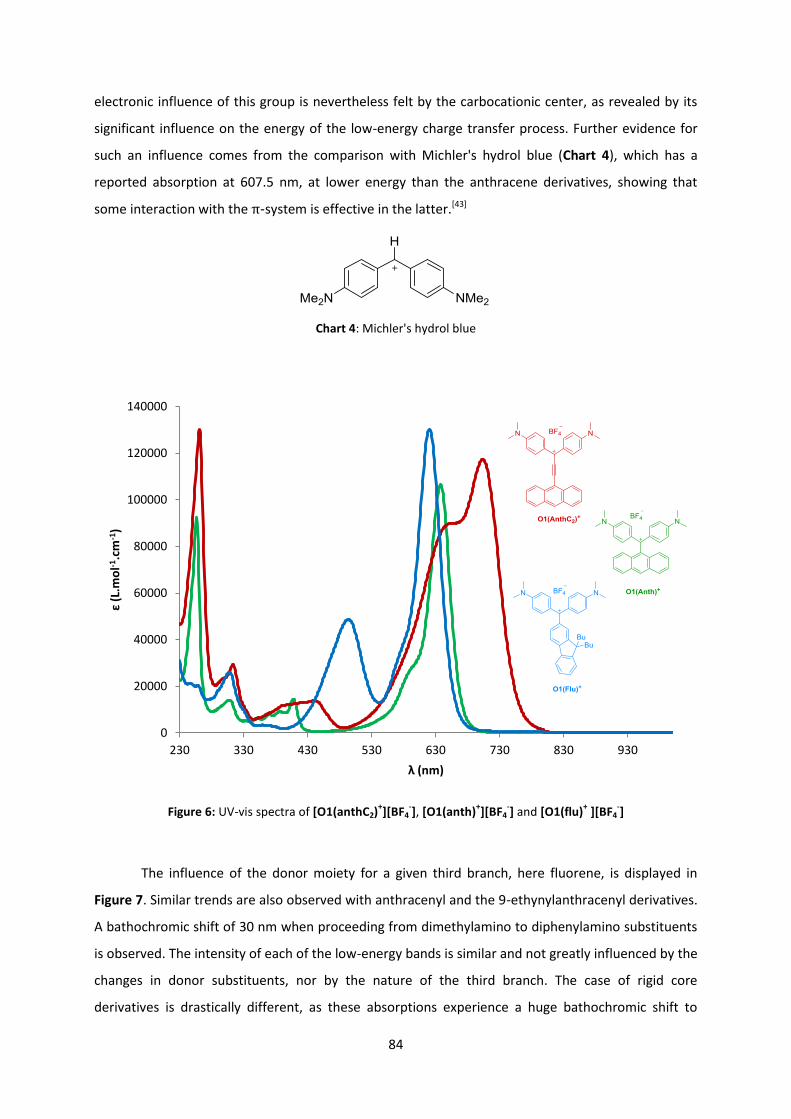
84
electronic influence of this group is nevertheless felt by the carbocationic center, as revealed by its
significant influence on the energy of the low-energy charge transfer process. Further evidence for
such an influence comes from the comparison with Michler's hydrol blue (Chart 4), which has a
reported absorption at 607.5 nm, at lower energy than the anthracene derivatives, showing that
some interaction with the π-system is effective in the latter.[43]
Chart 4: Michler's hydrol blue
Figure 6: UV-vis spectra of [O1(anthC2)+][BF4
-], [O1(anth)
+][BF4
-] and [O1(flu)
+ ][BF4
-]
The influence of the donor moiety for a given third branch, here fluorene, is displayed in
Figure 7. Similar trends are also observed with anthracenyl and the 9-ethynylanthracenyl derivatives.
A bathochromic shift of 30 nm when proceeding from dimethylamino to diphenylamino substituents
is observed. The intensity of each of the low-energy bands is similar and not greatly influenced by the
changes in donor substituents, nor by the nature of the third branch. The case of rigid core
derivatives is drastically different, as these absorptions experience a huge bathochromic shift to
0
20000
40000
60000
80000
100000
120000
140000
230 330 430 530 630 730 830 930
ε (L
.mo
l-1.c
m-1
)
λ (nm)

85
appear around 1060 nm (in the NIR) for the absorption at lowest energy and near 630 nm for the
second one. Furthermore, the low energy band is now less intense than the second one, and a
vibronic progression seems to be present. Computational studies are needed to clarify the origin of
this. The rigidification of the system maximizing the overlap between the -manifolds of the two
aminophenyl rings and the central carbocation is perhaps not the only origin of this important shift. It
may also be partly due to the antiaromatic nature of the fluorenylium acceptor in this particular
derivative which completely changes the system and therefore the absorptive properties.[22] Indeed,
rhodamines[44] or other rigidified systems,[45] do not experience a bathochromic shift compared to
MG+ (Introduction, Chart 9), therefore the origin of such dramatically different spectral features
cannot only be ascribed to the better π-overlap operative in the rigidified analogues.
Figure 7: UV-Vis spectra of [O1(flu)+][BF4
-], [O2(flu)
+][BF4
-] and [O3(flu)
+][BF4
-]
In conclusion, the newly synthesized organic derivatives of CV+ and MG+ possess spectral
features very similar to their parents, at least for the non-rigidified compounds. This is a good omen
for the TPA measurements by Z-scan, since significant nonlinear properties can be expected for these
derivatives. Moreover, for the other derivatives, the low-energy absorptions can be fine-tuned in
energy either via a change of the donor amino substituents, as might have been expected, but also in
quite a significant way by changing the nature of the third branch in the MG+-type derivatives. This is
0
20000
40000
60000
80000
100000
120000
140000
230 430 630 830 1030 1230 1430
ε (L
.mo
l-1.c
m-1
)
λ (nm)

86
more surprising given the poor overlap seen between this branch and the central carbocation in
many derivatives. Another point to be mentioned is that O2(anth)+, O2(anthC2)+ and O2(flu)+ are not
fluorescent. Similar to the rhodamine derivatives cited in the Introduction (sect. 3.2.2.; Chart 9) for
which rigidification of the central part (and protonation of the amine of the third branch) leads to
faster radiative decays and induces some fluorescence at higher temperatures, such derivatives
might be more fluorescent than their non-rigidified analogues.[46] However, given the low energy of
their first excited state, their fluorescence should take place at even lower energy and may not be
simply detectable by sight. It will require a fluorimeter with infrared detector which was not available
in Rennes or Canberra during this work.
3.5. Theoretical work
Figure 8: TD-DFT spectra computed for selected MG+-based derivatives
Modeling of selected MG+ derivatives by DFT and calculation of their electronic absorption
spectra by the TD-DFT method have been done by Dr. A. Amar and Prof. A. Boucekkine to provide
additional insight into the nature of the transitions observed at lowest energy. As expected, for all
O1(flu)+
O2(flu)+
O3(flu)+
O1(AnthC2)+
O2(AnthC2)+
O3(AnthC2)+
ε (L
.mo
l-1.c
m-1
)
160000
140000
120000
100000
80000
60000
40000
20000
0
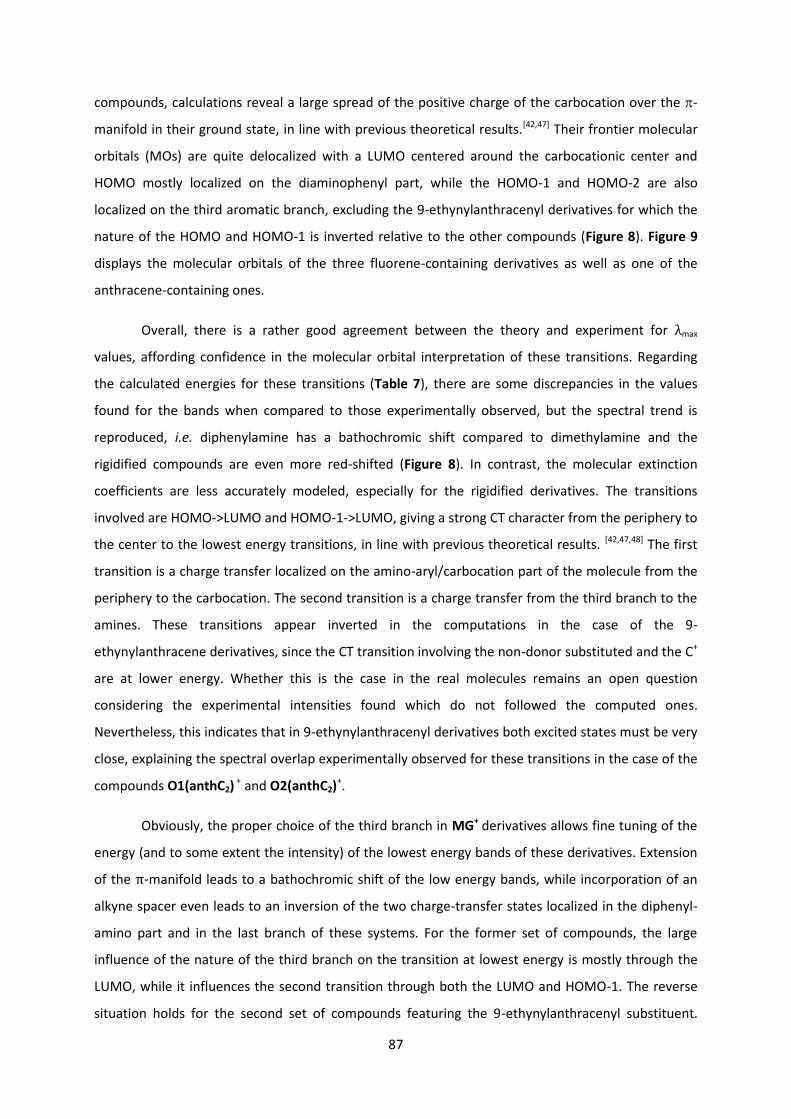
87
compounds, calculations reveal a large spread of the positive charge of the carbocation over the -
manifold in their ground state, in line with previous theoretical results.[42,47] Their frontier molecular
orbitals (MOs) are quite delocalized with a LUMO centered around the carbocationic center and
HOMO mostly localized on the diaminophenyl part, while the HOMO-1 and HOMO-2 are also
localized on the third aromatic branch, excluding the 9-ethynylanthracenyl derivatives for which the
nature of the HOMO and HOMO-1 is inverted relative to the other compounds (Figure 8). Figure 9
displays the molecular orbitals of the three fluorene-containing derivatives as well as one of the
anthracene-containing ones.
Overall, there is a rather good agreement between the theory and experiment for λmax
values, affording confidence in the molecular orbital interpretation of these transitions. Regarding
the calculated energies for these transitions (Table 7), there are some discrepancies in the values
found for the bands when compared to those experimentally observed, but the spectral trend is
reproduced, i.e. diphenylamine has a bathochromic shift compared to dimethylamine and the
rigidified compounds are even more red-shifted (Figure 8). In contrast, the molecular extinction
coefficients are less accurately modeled, especially for the rigidified derivatives. The transitions
involved are HOMO->LUMO and HOMO-1->LUMO, giving a strong CT character from the periphery to
the center to the lowest energy transitions, in line with previous theoretical results. [42,47,48] The first
transition is a charge transfer localized on the amino-aryl/carbocation part of the molecule from the
periphery to the carbocation. The second transition is a charge transfer from the third branch to the
amines. These transitions appear inverted in the computations in the case of the 9-
ethynylanthracene derivatives, since the CT transition involving the non-donor substituted and the C+
are at lower energy. Whether this is the case in the real molecules remains an open question
considering the experimental intensities found which do not followed the computed ones.
Nevertheless, this indicates that in 9-ethynylanthracenyl derivatives both excited states must be very
close, explaining the spectral overlap experimentally observed for these transitions in the case of the
compounds O1(anthC2) + and O2(anthC2)
+.
Obviously, the proper choice of the third branch in MG+ derivatives allows fine tuning of the
energy (and to some extent the intensity) of the lowest energy bands of these derivatives. Extension
of the π-manifold leads to a bathochromic shift of the low energy bands, while incorporation of an
alkyne spacer even leads to an inversion of the two charge-transfer states localized in the diphenyl-
amino part and in the last branch of these systems. For the former set of compounds, the large
influence of the nature of the third branch on the transition at lowest energy is mostly through the
LUMO, while it influences the second transition through both the LUMO and HOMO-1. The reverse
situation holds for the second set of compounds featuring the 9-ethynylanthracenyl substituent.

88
HOMO-1 HOMO-2 HOMO LUMO LUMO+1 LUMO+2
O1(flu)+
O2(flu)+
O3(flu)+
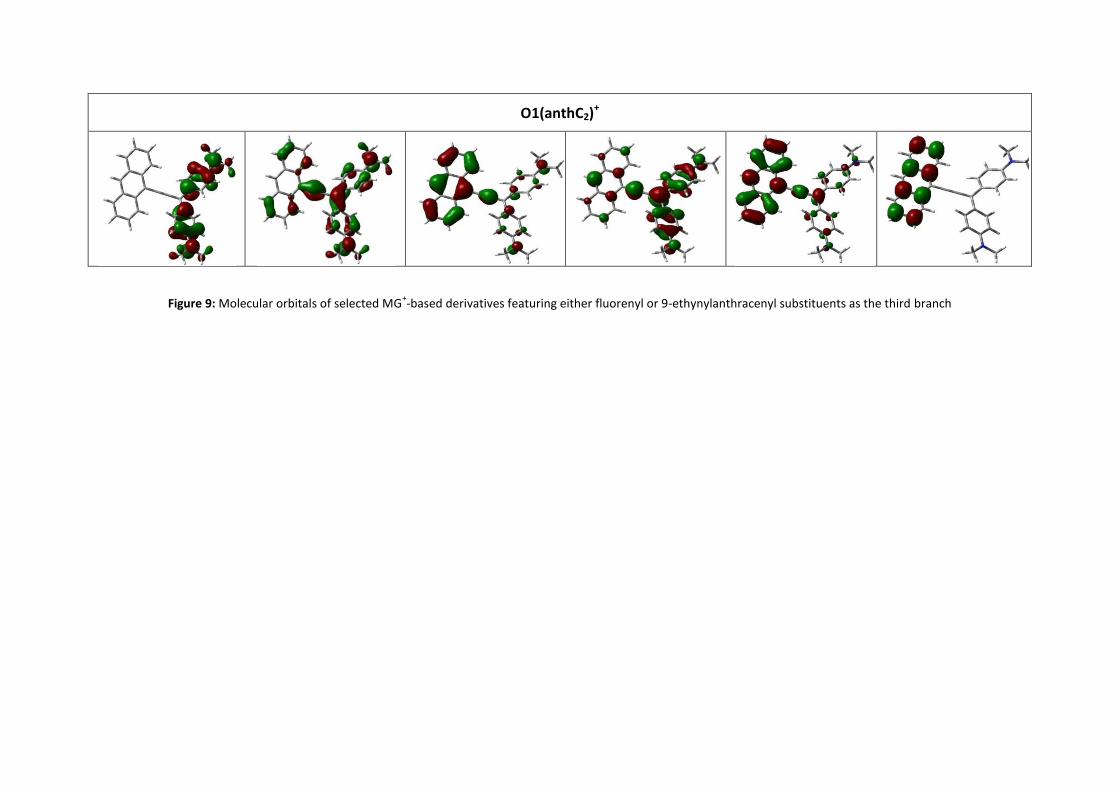
89
O1(anthC2)+
Figure 9: Molecular orbitals of selected MG+-based derivatives featuring either fluorenyl or 9-ethynylanthracenyl substituents as the third branch

90
EXP max (nm) cal (nm) Oscillator strength Main transitions (weight)
O1(Flu)+
281 281 0.2300 H-7->L+0(+59%)
H-1->L+1(26%)
371 371 (sh) 0.0305 H-2->L+0(+82%)
628 510 528
488 0.9222 0.7600
H-0->L+0(+101%)
H-1->L+0(+99%)
O2(Flu)+
280 288 300 0.2675 H-0->L+3(+66%)
H-0->L+2(+23%)
320 323 323 (sh) 0.1488 H-0->L+1(+97%)
400 438 438 0.0388 H-2->L+0(+96%)
530 553 551 0.7708 H-1->L+0(+98%)
650 621 631 1.1050 H-0->L+0(+100%)
O3(Flu)+
380 296 297 0.2638 H-1->L+0(+48%)
H-0->L+3(+22%)
630 353 353 0.2950 H-0->L+1(+82%)
780 513 513 0.2169 H-3->L+0(+94%)
920 635 635 1.0133 H-1->L+0(+99%)
1030 873 873 0.3887 H-0->L+0(+97%)
O1(AnthC2)+
402 400 0.2503 H-1->L+1(+54%)
H-3->L+0(45%)
445 438 0.136 H-2->L+0(+77%) H-0->L+1(21%)
630 610 599 0.7332 H-1->L+0(+101%)
720 645 663 0.7050 H-0->L+0(+100%)
O3(AnthC2)+
400 421 0.1678 H-0->L+1(+96%)
730 724 728
717 0.8219 0.9686
H-1->L+0(+100%)
H-0->L+0(+100%)
O3(AnthC2)+
810 543 543 0.1506 H-3->L+0(+95%)
1010 788 788 1.1773 H-1->L+0(+101%)
1140 968 968 0.3292 H-0->L+0(+98%)
Table 10: Computed absorption wavelengths at the B3LYP/6-31G* level in DCM

91
4. Z-scan studies
Z-scan measurements have been performed very recently in collaboration with Dr. Katarzyna
Matczyszyn and Prof. Marek Samoc at Wroclaw University of Technology (WUT) and preliminary TPA
cross-section data are reported here, measured by open aperture measurements. These give a better
understanding of the potential of these compounds to behave as two-photon absorbers. The Z-scan
measurements were carried out with a femtosecond laser in the range 300 - 2000 nm. The
measurements were carried out on isolated TPM dyes dissolved in a slightly acidified solution of
DMSO. This solvent was chosen for solubility reasons and to avoid any photo-induced side reactions
often observed between chlorinated solvents and the amines. The addition of acid was done in order
to ensure stability over time of the desired carbocation and avoid any carbinol formation due to
adventitious traces of water. The use of Z-scan can provide information on both real and imaginary
parts of χ(3) but only σTPA is described in this work. The rigidified compounds were not measured
because their stability in the solvent turned out to be problematic in the strong laser beam used.
Nonetheless, all the compounds show relatively large third-order NLO responses. Table 11
summarizes the maxima for the TPA cross-sections of these compounds, along with some figures of
merit. Every compound of the series shows the same TPA behavior, the transition corresponding to
the second lowest absorptive band being far more active than the transition at lower energy, in
contrast to what was observed in the linear spectrum, but in line with previous theoretical
predictions and experimental measurements.[47-49] The higher intensity of the second TPA band can
indeed be ascribed to a smaller detuning with the first absorption band leading to the observed
improvement,[48] a situation often encountered with octupolar chromophores.[50] As a result, the TPA
band is located between 800 nm and 1100 nm for the second absorption and around 1200 nm for
that at lowest energy.
CV+ and MG+ measured under similar conditions to the other compounds provide reference
values permitting evaluation of the impact of the structural modifications on the cross-sections.
Figure 10 displays the linear absorption spectrum of MG+ and its two-photon equivalent, where the
two transitions are clearly apparent. These measurements constitute the first measurements of MG+
and CV+ using fs Z-scan at several wavelengths. For CV+, only the cross-section values corresponding
to the one-photon allowed (i.e. TPA-forbidden) transition have been obtained, to avoid any
interference with linear absorption, but it is legitimate to suppose that the σTPA max of CV+ is higher (>
230 GM) than the one found for MG+ for this second TPA transition, based on symmetry
considerations. Significantly lower cross-sections were found for these compounds in the present

92
studies than those reported by Beljonne et al. by TPEF (762 GM and 673 GM at respectively, 840 and
880 nm for MG+ and 1980 GM at 752 nm for CV+).[47] This is somewhat surprising, since Z-scan is
generally accepted as less accurate, and usually leads to higher cross-section values than TPEF.
However, these TPEF measurements were of compounds with very low fluorescence quantum yields,
so large concentrations had to be used, leading to experimental uncertainties as large as 40 % for
MG+.[47] Such a large experimental uncertainly is still insufficient to explain the discrepancy with our
values. The good agreement found with computed cross-sections in the earlier report cannot be
considered as conclusive given the large uncertainties of computed third-order NLO values. In this
respect, this first cross section computed for CV+ (of 300 GM)[51] is less relevant than the last values
calculated (2041 GM).[47] Whatever the reason for the differences, our values can be considered as
lower bounds of the actual TPA activities, and the fair internal consistency between values obtained
for different TPM derivatives allows us to discuss the impact of structural modifications among these
derivatives.
Thus, among the MG+ derivatives, the more active compounds are the fluorenyl derivatives,
notably the diphenylamine derivative O2(flu)+ (Figure 11). The figure of merit used (here with
molecular mass) decreases due to the butyl chains, which are inert in terms of NLO merit. The
fluorene derivatives tend also to be more photo-stable under the high laser fluence used. By
comparison the anthracene derivatives seem to decompose slowly during the measurement, with
the experimental setup used. This is not surprising, since anthracene derivatives can be quite
photochemically unstable and the high light intensity probably results here in photochemical side-
reactions. Figures of merit where these values have been divided by the molecular mass of the
molecules are also provided in the Table.
The diphenylamino analogue of CV+, O4+, possesses a much larger cross-section (785 GM)
than CV+. consistent with the use of diphenylamine as an electron-donating substituent favorably
influencing the TPA cross-sections.

93
Figure 10: linear (green) and TPA (red) spectra of [MG+][Cl
-]
Figure 11: linear (green) and TPA (red) spectra of [O2(flu)+][BF4
-]
and [O4
+][BF4
-]
O2(Flu)+ O4
+

94
MG+ CV+ O1(anthC2)+ O1(anth)+ O1(flu)+
λ (nm) 850
1250 1283
900
1300
800
1200
1080
1290
σTPA(GM)a 209 (36)
64 (9) 119 (8)
228 (6)
161 (8)
178 (3)
75 (3)
261 (8)
40 (2)
Figure of merit (Mw) 0.50
0.15 0.29
0.42
0.30
0.34
0.16
0.42
0.06
O2(anthC2)+ O2(anth)+ O2(flu)+ O4+
λ (nm) 1100
1400
950
1300
1050
1290
850
1250
σTPA(GM)a 205 (10)
100 (5)
351 (57)
229 (58)
717 (97)
157 (10)
785 (15)
413 (33)
Figure of merit (Mw) 0.26
0.13
0.46
0.30
0.83
0.18
0.94
0.50
Table 11: TPA of the synthesized compounds in acidic DMSO. a: error in brackets
To sum up our observations, there is a clear positive effect of replacing the dimethylamino by
diphenylamino substituents for generation of TP-absorbers. In line with our expectations, the values
found here for the TPA cross-sections are hundreds of GM units, good for molecules of that size.
Maximal TPA values occur at low energies, a remarkable feature of interest for several applications.
There is nearly a two-fold increase when switching to the arylamino derivatives. For MG+ derivatives,
the extension of the π-system and resulting planarity when progressing between O1(anthC2)+ and
O1(anth)+ also results in an increase in the TPA cross-sections. Despite having less -electrons than
the other groups tested as "antennas" on the MG+ derivatives, the fluorene leads to the most
interesting derivatives, and possesses good photo-stability with the highest TPA cross-sections. The
CV+ derivative is more active than MG+. While it possesses an extended π-system, its octupolar
symmetry is also at the origin of this performance relative to less symmetrical MG+-based
derivatives. Re-measuring the rest of the series in a more suitable solvent (if any can be found)
should afford further conclusions about the effect of the rigidification in these TPM-based systems.

95
5. Conclusion
The targeted all-organic TPM dyes have been synthesized following a convergent synthesis
via the formation of carbinols formed subsequent to lithiation reactions. Upon addition of acid to
these carbinol precursors, isolation of the desired carbocations was achieved in good yields. These
species have been characterized with the usual methods, and in many cases by X-ray crystallography.
Their structures were thus confirmed, and their geometries in the solid state provide key information
on their electronic structure in the ground state (GS). Finally, their linear absorption spectra have
been recorded. Their UV-vis spectra resemble that of MG+ (or of CV+ for O4+) with compounds
exhibiting two (or one) main transitions at low energy in the NIR range.
Based on these data and on DFT calculations, the positive charge on these compounds
appears strongly delocalized along the π-manifold between the diamino groups in the GS. The
dominant VB mesomer imparts a carbocationic character to the central carbon while a comparably
lower iminium character is distributed over the nitrogen atoms. The third branch has only a small
impact on the electronic structure in the GS except when a triple bond is added. Despite this small
impact of the third branch in the GS, its influence on the excited states is stronger, as extension of
the π-system, with fluorene, anthracene or 9-ethynylanthracene, leads to a pronounced
bathochromic effect on the corresponding absorption spectra. Replacement of the dimethylamino
substituents by diphenylamino substituents followed by partial rigidification of the carbocationic
system have an even more dramatic effect, especially in the latter case, which induces red-shifts of
the lowest absorption up to 200 nm in the NIR region.
Finally, in line with our expectations, Z-scan measurements confirmed the potential of these
compounds as two-photon absorbers with relatively large σTPA cross-sections for such small
derivatives. Moreover, these TPA processes take place at quite low energies, a remarkable feature
that can be interesting for several applications. A significant increase of the TPA-response with
diphenylamine derivatives as well as fluorene has been observed. Fluorene-containing compounds
also possess a better photo-stability under the laser fluence compared to the anthracene series,
which partially decomposed in the experimental conditions. The octupolar derivative O4+ is the most
active of the series, confirming the interest in this specific geometry.

96
References
[1] J. Griffiths, K. J. Pender, Dyes & Pigments 1981, 2, 37–48. [2] J. Fabian, H. Hartmann, Light Absorption of Organic Colorants, Springer, Berlin, Heidelberg,
1980. [3] G. N. Lewis, J. Bigeleisen, J. Am. Chem. Soc. 1943, 65, 2102–2106. [4] G. N. Lewis, T. T. Magel, D. Lipkin, J. Am. Chem. Soc. 1942, 64, 1774–1782. [5] G. N. Lewis, M. Calvin, Chem. Rev. 1939, 25, 273–328. [6] A. Barker, C. C. Barker, J. Chem. Soc. 1954, 1307–1309. [7] C. C. Barker, G. Hallas, A. Stamp, J. Chem. Soc. 1960, 3790–3800. [8] C. C. Barker, G. Hallas, J. Chem. Soc. 1961, 2642–2644. [9] C. C. Barker, G. Hallas, J. Chem. Soc. 1961, 1529–1531. [10] C. C. Barker, G. Hallas, J. Chem. Soc. B Phys. Org. 1969, 1068–1071. [11] C. Aaron, C. C. Barker, J. Chem. Soc. B Phys. Org. 1971, 319–324. [12] G. Hallas, J. D. Hepworth, D. R. Waring, J. Chem. Soc. B Phys. Org. 1970, 975–979. [13] G. Hallas, K. N. Paskins, D. R. Waring, J. Chem. Soc. Perkin Trans. 2 1972, 2281–2286. [14] D. A. Brown, M. J. S. Dewar, J. Chem. Soc. Resumed 1954, 2134–2136. [15] S. Nakatsuji, H. Nakazumi, H. Fukuma, T. Yahiro, K. Nakashima, M. Iyoda, S. Akiyama, J. Chem.
Soc., Perkin 1, 1991, 1881–1886. [16] S. Nakatsuji, H. Nakazumi, H. Fukuma, T. Yahiro, K. Nakashima, M. Iyoda, S. Akiyama, J. Chem.
Soc. Chem. Commun. 1990, 489–491. [17] S. Nakatsuji, K. Nakashima, M. Iyoda, S. Akiyama, Bull. Chem. Soc. Jpn 1988, 61, 2253–2255. [18] S. G. R. Guinot, J. D. Hepworth, M. Wainwright, Dyes & Pigments 1999, 40, 151–156. [19] S. G. R. Guinot, J. D. Hepworth, M. Wainwright, Dyes & Pigments 2000, 47, 129–142. [20] X. Vidal, J. R. Herance, J. Marquet, J. L. Bourdelande, J. Martorell, Appl. Phys. Lett. 2007, 91,
081116. [21] J. E. Whitaker, P. L. Moore, R. P. Haugland, R. P. Haugland, Biochem. Biophys. Res. Commun.
1991, 175, 387–393. [22] P. Costa, I. Trosien, M. Fernandez-Oliva, E. Sanchez-Garcia, W. Sander, Angew. Chem. 2015,
127, 2694–2698. [23] G. R. Bardajee, Beilstein J. Org. Chem. 2011, 7, 135–144. [24] A. Noack, A. Schröder, H. Hartmann, Dyes & Pigments 2003, 57, 131–147. [25] J. Lux, E. J. Peña, F. Bolze, M. Heinlein, J.-F. Nicoud, ChemBioChem 2012, 13, 1206–1213. [26] A. M. Costero, M. Parra, S. Gil, R. Gotor, R. Martínez-Mañez, F. Sancenón, S. Royo, Eur. J. Org.
Chem. 2012, 2012, 4937–4946. [27] M. J. Hannon, P. C. Mayers, P. C. Taylor, Tetrahedron Lett. 1998, 39, 8509–8512. [28] J. N. Moorthy, A. L. Koner, S. Samanta, A. Roy, W. M. Nau, Chem. – Eur. J. 2009, 15, 4289–
4300. [29] J. Ipaktschi, R. Hosseinzadeh, P. Schlaf, E. Dreiseidler, R. Goddard, Helv. Chim. Acta 1998, 81,
1821–1834. [30] B. Kobin, L. Grubert, S. Blumstengel, F. Henneberger, S. Hecht, J. Mater. Chem. 2012, 22,
4383–4390. [31] Z. Q. Gao, P. F. Xia, P. K. Lo, B. X. Mi, H. L. Tam, M. S. Wong, K. W. Cheah, C. H. Chen, Org.
Electron. 2009, 10, 666–673. [32] M. R. Netherton, G. C. Fu, Org. Lett. 2001, 3, 4295–4298. [33] M. Chandrasekharam, G. Rajkumar, C. S. Rao, T. Suresh, P. Y. Reddy, J.-H. Yum, M. K.
Nazeeruddin, M. Graetzel, Adv. Nat. Sci. Nanosci. Nanotechnol. 2011, 2, 035016. [34] D. Hellwinkel, H. Stahl, H. G. Gaa, Angew. Chem. 1987, 99, 822–823.
97
[35] D. Hellwinkel, H. Stahl, H. G. Gaa, R. Gottfried, Phosphorus Sulfur Relat. Elem. 1983, 18, 121–124.
[36] M. S. Kim, H. Y. Oh, J. W. Kyung, S. K. Kim, J. M. Lee, Y. S. Han, C. G. Park, J. G. Yoon, United States Patent Application: 0050037234 - Organic EL Device, A1, 20050037234.
[37] S. Egusa, Semiconductor Luminescent Device Having Organic/inorganic Junction. 1991, EP0448268 (A2).
[38] F. H. Allen, D. G. Watson, L. Brammer, A. G. Orpen, R. Taylor, in Int. Tables Crystallogr. (Ed.: E. Prince), International Union Of Crystallography, Chester, England, 2006, pp. 790–811.
[39] G. A. Olah, E. B. Baker, M. B. Comisarow, J. Am. Chem. Soc. 1964, 86, 1265–1265. [40] D. A. Forsyth, R. J. Spear, G. A. Olah, J. Am. Chem. Soc. 1976, 98, 2512–2518. [41] R. R. Naredla, C. Zheng, S. O. Nilsson Lill, D. A. Klumpp, J. Am. Chem. Soc. 2011, 133, 13169–
13175. [42] S. Lovell, B. J. Marquardt, B. Kahr, J. Chem. Soc. Perkin Trans. 2 1999, 2241–2247. [43] F. Dietz, N. Tyutyulkov, M. Rabinovitz, J. Chem. Soc. Perkin Trans. 2 1993, 157–164. [44] T. J. Sørensen, K. Kilså, B. W. Laursen, Chem. – Eur. J. 2015, 21, 8521–8529. [45] T. Pastierik, P. Šebej, J. Medalová, P. Štacko, P. Klán, J. Org. Chem. 2014, 79, 3374–3382. [46] T. J. Sørensen, K. Kilså, B. W. Laursen, Chem. – Eur. J. 2015, 21, 8521–8529. [47] D. Beljonne, W. Wenseleers, E. Zojer, Z. Shuai, H. Vogel, S. J. K. Pond, J. W. Perry, S. R. Marder,
J.-L. Brédas, Adv. Funct. Mater. 2002, 12, 631–641. [48] J. Campo, A. Painelli, F. Terenziani, T. Van Regemorter, D. Beljonne, E. Goovaerts, W.
Wenseleers, J. Am. Chem. Soc. 2010, 132, 16467–16478. [49] K. J. Thorley, J. M. Hales, H. Kim, S. Ohira, J.-L. Brédas, J. W. Perry, H. L. Anderson, Chem. – Eur.
J. 2013, 19, 10370–10377. [50] C. Katan, S. Tretiak, M. H. V. Werts, A. J. Bain, R. J. Marsh, N. Leonczek, N. Nicolaou, E.
Badaeva, O. Mongin, M. Blanchard-Desce, J. Phys. Chem. B 2007, 111, 9468–9483. [51] J. L. Bredas, C. Adant, P. Tackx, A. Persoons, B. M. Pierce, Chem. Rev. 1994, 94, 243–278.

98

99
Chapter II:
Organometallic derivatives of malachite
green

100

101
Chapter II
Organometallic derivatives of malachite green
Contents
1. Introduction .................................................................................................................................... 103
1.1. Literature review ...................................................................................................................... 105
1.1.1. Ferrocene derivatives ........................................................................................................ 105
1.1.2. Metal alkynyl derivatives ................................................................................................... 108
1.1.3. Allenylidene derivatives .................................................................................................... 110
1.1.4. Other organometallic derivatives ...................................................................................... 112
2. Synthesis ......................................................................................................................................... 113
2.1. Synthesis of organic precursors ............................................................................................... 115
2.2. Synthesis of ethynylferrocene derivatives ............................................................................... 116
2.3. Synthesis of alkynyl complexes ................................................................................................ 117
3. Characterization .............................................................................................................................. 120
3.1. Ferrocene derivatives ............................................................................................................... 121
3.1.1. IR spectroscopy ................................................................................................................. 121
3.1.2. NMR spectroscopy ............................................................................................................ 121
3.2. Organometallic derivatives ...................................................................................................... 122
3.2.1. IR spectroscopy ................................................................................................................. 122
3.2.2. NMR spectroscopy ............................................................................................................ 124
3.3. X-ray crystallography ................................................................................................................ 125
3.3.1. Carbinols ............................................................................................................................ 125
3.3.2. Metal allenylidene/metal alkynyl derivatives .................................................................. 126
3.3.3. Metal bis-alkynyl derivatives ............................................................................................ 128
3.3.4. Conclusion ........................................................................................................................ 129
3.4. UV-Vis spectroscopy ................................................................................................................. 130
3.4.1. Ethynylferrocene derivatives............................................................................................. 130
3.4.2. Metal allenylidene derivatives .......................................................................................... 133
3.4.3. Ruthenium alkynyl derivatives .......................................................................................... 134
3.4.4. Conclusion ......................................................................................................................... 136
3.5. Cyclic voltammetry ................................................................................................................... 137

102
3.5.1. Ethynylferrocene derivatives............................................................................................. 137
3.5.2. Metal alkynyl or allenylidene derivatives .......................................................................... 139
3.5.3. Conclusion ......................................................................................................................... 142
3.6. Spectroelectrochemistry .......................................................................................................... 143
3.6.1. MG+-based derivatives ...................................................................................................... 144
3.6.2. Allenylidene derivatives .................................................................................................... 147
3.6.3. Conclusions on spectroelectrochemical studies ............................................................... 150
4. Conclusion ....................................................................................................................................... 150
References........................................................................................................................................... 153
103
1. Introduction
This chapter describes the synthesis of several organometallic derivatives (Chart 1) based on
MG+(C2) architectures and is aimed at introducing a redox-active metal center on the branch that is
not functionalized with an amino group. These modifications should lead to an enhancement of the
third-order NLO properties and provide the opportunity to tune them, depending on the metal's
oxidation state and on the wavelength of the incident light. A literature review focused on related
organometallic complexes is presented first. The synthesis of the targeted molecules is then
described, followed by their characterization using diverse analytical techniques: NMR, IR, and UV-Vis
spectroscopies, and cyclic voltammetry. These data are then discussed and compared. The last-
mentioned technique will reveal if the complexes undergo reversible redox processes and will
provide useful information on their chemical stability in states featuring additional positive charge on
the metal center. In order to investigate further the influence of the metal oxidation on the linear
absorptive properties, some spectroelectrochemical studies were also conducted. Based on these
studies, the possible influence of oxidation on the NLO properties will be briefly discussed.

104
Chart 1: Targeted organometallic derivatives of MG+

105
1.1. Literature review
Redox-active organometallic TPM dyes are not often encountered among third-order NLO-
active substances as their synthesis can be difficult and often leads to reactive/sensitive compounds.
In the same way as for organics, these compounds can be accessed via their carbinol precursors,
which must be synthesized first. The desired carbocations are then generated in situ from these
precursors in acidic media. This part is mostly focused on the synthesis of such organometallic
derivatives involving a d6 transition metal and possessing a structure similar to MG+ and CV+. These
two structures are very close and their optical properties are often compared in the literature.
Accordingly, the corresponding compounds featuring similar organometallic endgroups will be
reviewed at the same time in the following sections.
1.1.1. Ferrocene derivatives
The most commonly used redox-active organometallic synthon is certainly ferrocenyl (Fc). It
can be manipulated like an organic moiety as it is inert to most of the classic reactions and can
usually sustain an aerobic work-up. It is oxidized at a potential near 0.5 V vs. SCE. Chart 2 displays
some derivatives built on the MG+ or CV+ cores that were reported in the literature. For instance, the
symmetric complex XI made by Sengupta et al. on a CV+ core features vinyl ferrocene termini in place
of the amino groups.[1,2] The corresponding symmetrical halogenated CV+ derivative IX was firstly
synthesized from commercial derivatives and vinyl ferrocene was then coupled to the halogenated
positions via a Heck reaction (Scheme 1).
Scheme 1: Synthesis of XI starting from basic fuchsin
The carbocation XI was then formed in situ upon addition of HBF4 but was not isolated. The
UV-Vis spectrum reveals that the organometallic group acts as a mild donor explaining the intense
absorption band observed at low energy (λ= 1068 nm). The latter possesses a significant
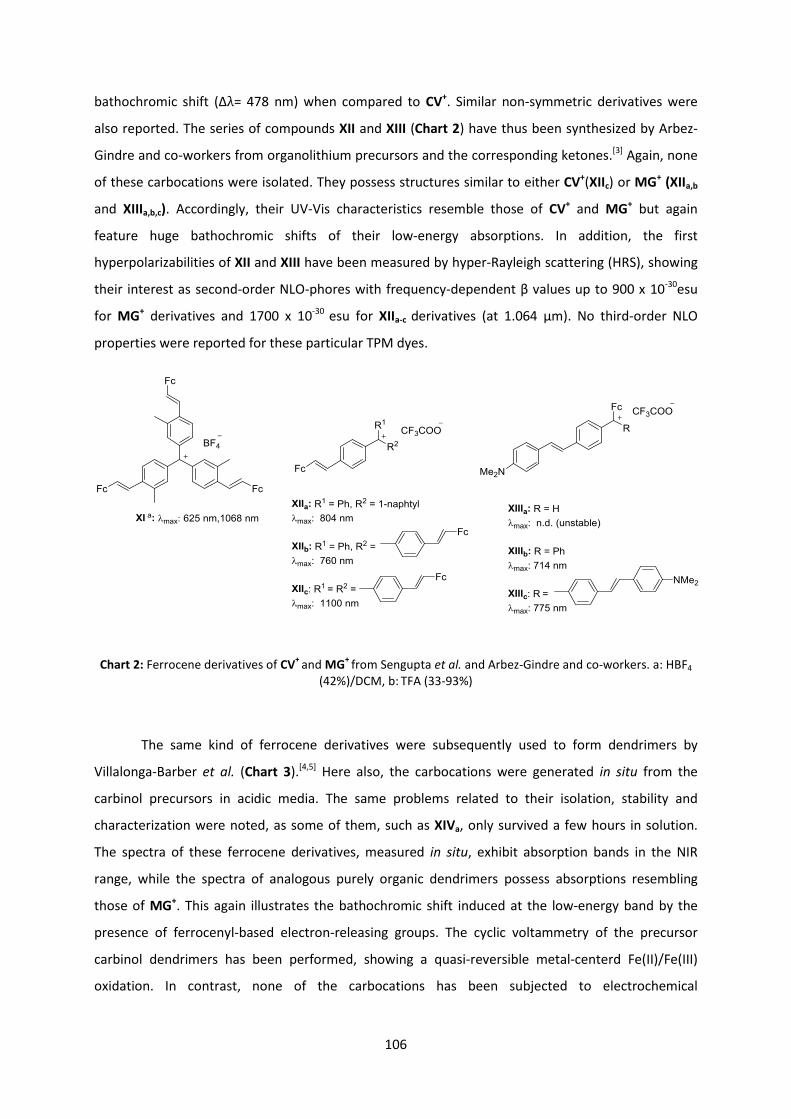
106
bathochromic shift (Δλ= 478 nm) when compared to CV+. Similar non-symmetric derivatives were
also reported. The series of compounds XII and XIII (Chart 2) have thus been synthesized by Arbez-
Gindre and co-workers from organolithium precursors and the corresponding ketones.[3] Again, none
of these carbocations were isolated. They possess structures similar to either CV+(XIIc) or MG+ (XIIa,b
and XIIIa,b,c). Accordingly, their UV-Vis characteristics resemble those of CV+ and MG+ but again
feature huge bathochromic shifts of their low-energy absorptions. In addition, the first
hyperpolarizabilities of XII and XIII have been measured by hyper-Rayleigh scattering (HRS), showing
their interest as second-order NLO-phores with frequency-dependent β values up to 900 x 10-30esu
for MG+ derivatives and 1700 x 10-30 esu for XIIa-c derivatives (at 1.064 µm). No third-order NLO
properties were reported for these particular TPM dyes.
Chart 2: Ferrocene derivatives of CV+
and MG+
from Sengupta et al. and Arbez-Gindre and co-workers. a: HBF4
(42%)/DCM, b: TFA (33-93%)
The same kind of ferrocene derivatives were subsequently used to form dendrimers by
Villalonga-Barber et al. (Chart 3).[4,5] Here also, the carbocations were generated in situ from the
carbinol precursors in acidic media. The same problems related to their isolation, stability and
characterization were noted, as some of them, such as XIVa, only survived a few hours in solution.
The spectra of these ferrocene derivatives, measured in situ, exhibit absorption bands in the NIR
range, while the spectra of analogous purely organic dendrimers possess absorptions resembling
those of MG+. This again illustrates the bathochromic shift induced at the low-energy band by the
presence of ferrocenyl-based electron-releasing groups. The cyclic voltammetry of the precursor
carbinol dendrimers has been performed, showing a quasi-reversible metal-centerd Fe(II)/Fe(III)
oxidation. In contrast, none of the carbocations has been subjected to electrochemical

107
investigations. Thus, the influence on the Fc+/Fc redox interconversion on the linear optical
properties of these dyes has not been quantified.
Chart 3: Dendrimers synthesized by Villalonga-Barber et al.
Two other groups studied related ferrocenyl carbocations. The derivatives XVI-XVIII (Chart 4)
were obtained using the same lithiation-based synthetic approach as that used for XII and XIII. While
XVI proved to be fairly unstable, with a lifetime of about 5 min (and could only be characterized by
NMR spectroscopy at low temperature),[6] XVII and XVIII were less reactive and could be

108
characterized in situ at room temperature.[7] All these ferrocenyl-based carbocationic species
formally possess a redox tautomer with a FeII 16-electron structure stabilized by the bridgehead
carbon. Such a VB description reveals the allenylidene-type character of these derivatives (A and B,
Figure 1).[8] Despite not being directly related to TPM dyes, such a VB description helps one to
understand the chemistry of these ferrocenyl carbocations, and shows how iron helps stabilize the
positive charge. This also explains the large bathochromic shifts of the low-energy bands observed
for these derivatives. No cyclic voltammetry has been reported for these systems. However, even if
interesting as dyes, they are too unstable to be used for NLO-based applications. The use of
dimethyl- or diphenylamino substituents, as in M1 and M2, should help in stabilizing them and
facilitate their isolation.
Figure 1: Ferrocenyl derivatives. a: DCM + HBF4, -70°C, b: in situ measurement with TFA
Ferrocenyl groups act as stabilizing electron-releasing groups in the examples above, as all
these derivatives are significantly more stable than the (unsubstituted) tritylcation. All these
compounds also possess NIR absorptions that are of interest for this project. Furthermore, their
carbinol precursors can be reversibly oxidized, although no measurements on the carbocations have
been reported thus far. Most of the carbocationic species are formed in situ and there is no simple
way to measure them. Finally, it appears that no ethynyl ferrocene derivatives of MG+ have been
reported, although such species would certainly be more stable than species such as XIV.
1.1.2. Metal alkynyl derivatives
Derivatives of this kind, featuring group 8 (redox-active) metal alkynyl substituents in place of
the ethynyl ferrocene groups, are even less frequent in the literature.

109
Chart 4: CV+ and MG
+ organoruthenium derivatives. a:
in DCM
The compounds XIX and XX (Chart 4) made by Wu et al. are the only ones of this kind
reported thus far. They illustrates the gain of stability brought to the TPM carbocations by the use of
more donating organometallic synthons than ferrocenyl, such as "Ru(Cp)(PPh3)2", which can also
efficiently replace some of the dialkylamino groups in CV+-based structures.[9] Thus, XIXa and XIXb are
quite unstable (as we shall see later, XIXa is a typical allenylidene complex), but as soon as additional
dialkylamino groups are added at the para positions of the unsubstituted phenyl rings, the resulting
compounds become sufficiently stable to survive under ambient conditions in air.
Two different pathways were used to obtain these complexes. The first route (A, Scheme 2)
proceeds by synthesis of carbinols from lithio-precursors and ketone, followed by addition of HBF4.
The acetylide is then formed by addition of Et3N. However, due to the steric crowding around the
metal centers limiting access of the base, as well as reactivity problems encountered with the
resulting carbinols, a second route toward these compounds has been explored (B, Scheme 2). The
latter proceeds by formation of the methoxy-substituted metal alkynyl precursor and formation of
the desired metal acetylide carbocation, via a vinylidene intermediate. An internal dehydration
process was observed during the first step (i), preventing clean isolation of the vinylidene
intermediate. This alternative approach allows access to the desired carbocations in one step from
the methoxy precursor upon addition of acid followed by Et3N, and was preferred, most likely due to
an easier purification of the products (XIXa-e). This synthesis route was quite effective and the back
formation of the carbinol was not observed. Curiously, this reaction was not much exploited for
synthesis of related derivatives.

110
Scheme 2: Example of synthetic pathways to Ru(II) alkynyl-based TPM dyes
These new organometallic derivatives of TPM dyes were characterized by NMR, IR and UV-
vis spectroscopies. The influence of charge delocalization was observed, notably in the 13C NMR
spectra, with a characteristic upfield shift of the α-carbon atom of the alkynyl ligand compared to
that of the corresponding phenylalkynyl complex. The UV-vis spectral features are similar to those of
the corresponding organic TPMs, but again with large bathochromic shifts of the absorptions at
lowest energy, due to the presence of alkynyl ruthenium(II) centers. Thus, the lowest energy band
appears at 974 nm for XIXe and at 897 nm for XX. These compounds clearly possess an interesting
potential for NLO-based applications in the NIR range due to these intense absorptions in the visible-
NIR region. However, neither the NLO properties nor their electrochemistry were investigated.
1.1.3. Allenylidene derivatives
Closely related derivatives of the "shorter" alkynyl derivatives (M1 and M2) targeted in the
present study have been known for a long time. These are diarylallenylidene complexes,[10–12]
cumulenic species originally synthesized from the corresponding propargylic alcohols XXII via internal
dehydration by Selegue in 1982 (Scheme 3).[13]

111
Scheme 3: Formation of a cumulene via Selegue's method
However, para-amino substituted derivatives of this type are rare and, except for chromium
and tungsten non-redox-active examples developed by Fischer's group (XXIII; Chart 5),[14,15] we are
not aware of other examples.[16] Albeit largely cumulenic, these species nevertheless possess a
marked triple bond character (form A and B, Scheme 3) that is emphasized by the dimethylamino
substituents, as shown by Fischer: the carbon Cγ was, in the latter case, more electrophilic than Cα,
reactivity that was corroborated by crystallographic studies.
Chart 5: Chromium and tungsten derivatives synthesized by Fischer et al. and organoruthenium and iron cumulenes
The unsubstituted analogues (XXIVa-b) of M1 and M2 are known.[11,17] The low-energy
transitions in their electronic spectra are mostly metal-to-ligand charge-transfer (MLCT) in nature.
However, in derivatives such as XXIIIa the influence of the dimethylamino substituents on the low-
energy transitions has not been investigated. Their electrochemistry has seldom been studied, the
metal being difficult to oxidize reversibly due to its positive charge. Accordingly, the extant cyclic

112
voltammetric studies of organoruthenium derivatives such as XXIVb focus on their reduction, which
involves two one-electron processes with only the first reduction being reversible (at -1.03 V, with
the latter irreversible process at -2.11 V vs FcH+/FcH).
1.1.4. Other organometallic derivatives
Albeit non-redox active, organotellurium derivatives XXV (Chart 6) are also noteworthy. In
these organometallic rhodamine-like structures, the rigidification of the system is achieved by
complexation of a tellurium atom between two of the TPM rings (at their 2 and 2’ positions).[18]
Remarkably, these compounds become fluorescent upon addition of water or oxygen to the
tellurium, which deactivates any non-radiative pathways that were previously operative due to the
presence of this metalloid. The rigidification of the TPM dye increases its reactivity towards
nucleophilic reagents and leads to bonding between the central carbon and water or between
oxygen and the tellurium. This coordination quenches the deactivation process that is detrimental to
luminescence in the absence of water. Interestingly, the introduction of the metal at this position, in
addition to inducing a rigidification of the TPM core, also induces a bathochromic shift of the lowest-
energy transitions. As a result, the intense bands at lowest energy are located between 600 and 700
nm (λmax) for these compounds whereas they appear at 550 nm for the corresponding
dimethylamino-rhodamine analogue XXVI (rosamine).[19,20]

113
Chart 6: Organotellurium derivatives and rosamine. a: In phosphate buffer (0.012 M)
To the best of our knowledge, these are the only reports of synthesis and use of
organometallic derivatives related to MG+ and CV+. Most of these compounds have not been
extensively characterized, since many of them were generated in situ and not isolated. In this
respect, apart from the numerous allenylidene derivatives reported so far suggesting that M3-M4
will be viable targets, the work of Wu and coworkers is certainly the most complete and the closest
to our ultimate aims. It supports expectations of the viability of the targeted molecules M3-M4 and
suggests promising linear and nonlinear optical properties in the cationic state for these
organometallic TPM dyes.
2. Synthesis
Different syntheses were considered for M1-M4 (Chart 1), which depend on the
organometallic endgroup present.
Because the ferrocene derivatives are inert to most of the reactions, a procedure similar to
that used for the organic compounds can be followed. These most often start by addition of a
lithiated species to a ketone, followed by a dehydration triggered by addition of acid.

114
For the organoruthenium "Ru(Cl)(κ2-dppe)2" and organoiron "Fe(η5-C5Me5)(κ2-dppe)" alkynyl-
based derivatives, the strategy adopted was to introduce the metal at the end of the synthesis via a
vinylidene intermediate, followed by deprotonation, to form the desired acetylide (Path A, Scheme
4).[21] In these reactions, all the reactants can be combined to form vinylidene complexes via a
chloride abstraction followed by a 1,2-prototropic shift.[22] Moreover, in the case of ruthenium
alkynyl complexes, the stable 5-coordinate precursor [Ru(Cl)(κ2-dppe)2][PF6] can also be used in place
of [Ru(Cl)2(κ2-dppe)2] to speed up the synthesis and avoid the formation of bis-alkynyl complexes, as
side-reactions occur when excess of alkyne is present (Path B). According to Wu's work and to the
numerous publications on allenylidene complexes, the chemistry at these compounds must be
carried out under air-free conditions, using Schlenk techniques, as the compounds can undergo rapid
oxidation upon air exposure. Given that for the known organometallic TPM derivatives, the
corresponding vinylidene complexes were seldom isolated, we will not attempt to isolate and
characterize these species; they are often not stable for these particular derivatives and are prone to
undergo nucleophilic attack or cleavage in the presence of oxygen, to form metal carbonyl
complexes.
Scheme 4: Formation of organometallic acetylides
Characterization of the compounds of type M1-M4, especially employing X-ray structural
studies, IR and NMR spectroscopies, will help to understand their electronic structure and charge
delocalization in the ground state (GS). In particular, the cumulenic character of the derivatives M1-
M2 might be somewhat depressed relative to classic allenylidene complexes of this kind
characterized previously, due to the presence of the diamino groups which favor the build up of
charge on the central carbon, as shown by Fischer and coworkers.[14,15] The electrochemistry of these
cationic species will then be investigated by cyclic voltammetry (CV), particular attention being paid
to their linear optical properties in each of their stable redox states.

115
2.1. Synthesis of organic precursors
Ethynylferrocene 35 was synthesized from acetylferrocene 34 according to a modified
procedure of Balavoine's group which converts a methyl ketone to a terminal acetylene (Scheme
5).[23] Compound 35 constitutes a versatile precursor for various reactions such as lithiation or
Sonogashira reactions. The latter was used to afford 36 by a cross-coupling.[24,25]
Scheme 5: Synthesis of ethynyl ferrocene derivatives
The corresponding propargylic alcohols 37-38 and the extended terminal alkyne 39-40 were
then prepared. The trimethylsilyl-protected precursors 37-40 were synthesized using the usual
lithiation-addition-dehydration procedure, preceded in the case of 39-40 by a Sonogashira cross-
coupling reaction to install the alkyne on the phenyl ring. These species were subsequently
deprotected with potassium carbonate in order to form the terminal alkynes 41-44. Some of these
derivatives are known in the literature, e.g. 41[26–28] or 42[29] (Scheme 6) but have not been fully
characterized. Similar to the fully organic propargylic alcohols, they decompose quite easily when
ionized, especially the deprotected ones, and their characterization has therefore to be performed
immediately after their isolation. Accordingly, the present work has now allowed their more
complete characterization. In these derivatives, the alkyne function is more activated towards
nucleophiles than in other aromatic alkynes, and so their purity was always assessed before using
them in the following steps.

116
Scheme 6: Deprotection of the organic alkynes
2.2. Synthesis of ethynylferrocene derivatives
Lithiation of 35 and 36 and addition to the ketones 28 and 29 forms the desired carbinols
M1OH-M4OH. Addition of HBF4 then generates the desired ferrocenyl carbocations M1+-M4+ (Scheme
7). The first of these reactions proceeds in moderate yields, mostly due to losses coming during
purification of the carbinol precursors by column chromatography. The final step is quantitative as
the desired products precipitate from solution as dark powders. For the first time with such
ferrocenyl complexes, the corresponding carbocations were isolated and could be extensively
characterized.

117
Scheme 7: Synthesis of ferrocenyl derivatives M1-M4
2.3. Synthesis of alkynyl complexes
Precursors 41-44 were reacted with the 5-coordinate ruthenium precursor 45 in DCM
overnight at RT or with the organo-iron precursor 46 in the presence of the non-coordinating anion
hexafluorophosphate as its potassium salt in MeOH at 40°C over 12 h (Scheme 8). The dark
compounds obtained are reactive, especially in solution when exposed to air as has been reported
for similar derivatives.[16,30–32] Moreover, the starting complex and the carbonyl complex have similar
solubilities due to their cationic nature, and it proved impossible to separate the desired product
from this decomposition product. In the solid state, however, the alkynyl complexes appear
sufficiently stable to allow their manipulation in air for short periods of time (<10 min). The yields of
these compounds are variable, as their synthesis was undertaken on small scales using Schlenk
techniques. The allenylidene complex is always the main compound present in the crude reaction
mixture at the end of the reaction, losses mostly coming from work up and subsequent purifications.
Overall, the isolated yields were always superior to 70 %.

118
Scheme 8: Formation of the Ru(II) and Fe(II) alkynyl and allenylidene species M1-M2
In accordance with Wu’s observations,[9] the phenyl derivatives behave similarly to the
allenylidene ones (M1 and M2, Scheme 3),leading to direct formation of the alkynyl complexes with
the ruthenium Ru(κ2-dppe)2Cl endgroup. While allenylidene complexes were proposed to be formed
via an intramolecular deprotonation process, a similar but intermolecular dehydration process is
favored here because of the comparably larger distance separating the carbon atoms being
deprotonated and de-hydroxylated: another equivalent of precursor certainly acts as a base and
relays the deprotonation process of the vinylidene. This was good news for us, since the synthesis of
these alkynyl compounds was anticipated to be difficult due to the possible competitive formation of
the vinylidene complex and of the desired carbocation.
However, although formed nearly selectively, the purification turned out to be more difficult
than expected, especially for the ruthenium derivatives. Indeed, ruthenium bis-acetylides can be
formed in presence of excess of base, as shown by Touchard and coworkers or Humphrey and
coworkers.[33,34] This subsequent reaction depends on the basicity of the propargylic precursor, itself
related to the donating power of the amines. Thus, the activation reaction of the second alkyne is
slower in the case of diphenylamine derivatives as they are less basic than dimethyamine ones,
allowing for isolation of the mono-acetylide before extensive formation of the bis-acetylide has taken

119
place. In contrast, with analogous dimethylamino alkynes a mixture of M3(Ru)+ and the bis-acetylide
M5(Ru)2+ was always obtained, regardless of experimental conditions employed (Scheme 9).
Scheme 9: Synthesis of Ru(II) alkynyl derivatives M3(Ru)+
A method to purify one of these two complexes (M5(Ru)2+ and M3(Ru)+) was nevertheless
found, based on their solubility: the bis-acetylide is insoluble in cold chloroform. Hence, it is possible
to enrich the mixture in solution in M3(Ru)+ by selectively precipitating compound M5(Ru)2+.
However, this procedure is not practical from a quantitative point of view, since it takes time to
isolate a pure sample of compound M3(Ru)+. A second route, which was more successful, involved
generating the corresponding carbocation in situ at low temperature by direct reaction between the
carbinol precursor 43 and the 5-coordinate ruthenium precursor 45 to form the vinylidene species.
The vinylidene is then deprotonated upon addition of Et3N to form the desired acetylide M3(Ru)+.
The addition of NEt3 did not result in the formation of the carbinol complex.
The corresponding iron derivatives (Scheme 10) were much more problematic to isolate.
Possibly due to the larger basicity of the alkynyl complexes, the spontaneous dehydration observed
with ruthenium did not occur, regardless of the alkyne used. Thus, vinylidenes (45: 85.35 ppm and
46: 87.46 ppm) were predominantly formed, in addition to the desired carbocations. The reaction

120
can be monitored by following the disappearance of the hydroxyl group by 1H NMR. Addition of a
non-nucleophilic base, such as tBuOK or DBU, to this mixture of dicationic vinylidene-carbocations
and carbocations always led to decomposition of these products and formation of several
unidentified species. Due to time limitations, further work on these derivatives was stopped in order
to concentrate on the other derivatives.
Scheme 10: attempts at formation of Fe(II)-alkynyl derivatives M3(Fe)+ and M4(Fe)
+
3. Characterization
All new organometallic species were characterized using the conventional techniques: IR and
NMR spectroscopies and X-ray crystallography. The dicationic bis-acetylide complex M5(Ru)2+ was
also characterized similar to the other mono-alkynyl compounds; it possesses a multipolar structure
and is expected to exhibit cubic NLO properties. The derivatives M3(Fe)+ and M4(Fe)+ could not be
isolated. These characterization techniques provide insight into the electronic structure of the
carbon-rich bridge of these compounds in the GS, especially for the allenylidene derivatives. These
compounds were then subjected to cyclic voltammetry and UV-Vis spectroscopy to investigate their
optical and redox properties. Their spectroelectrochemistry was finally recorded in order to afford
insight into the possibility to use such molecules for NLO switching. Because of the structural
differences between ethynyl ferrocene-based derivatives and metal-alkynyl based TPM dyes, these
rather distinct families of complexes will be discussed separately.

121
3.1. Ferrocene derivatives
3.1.1. IR spectroscopy
The ferrocene C-H stretching band is at approximately the same frequency for carbinols or
carbocations, evidencing the poor communication between the metallocene and the -system.
Although no difference in the ferrocene δC-H can be seen after formation of the TPM dye, the notable
shift in the νC≡C of about 100 cm-1 is an evidence of its formation. It results from a large electronic
interaction between the triple bond and the carbocationic carbon atom. Note that this stretching
frequency is too high to correspond to a true allenylidene linkage, indicating that the alkynyl
character certainly dominates in these conjugated species.
Compounds νC≡C νB-F νO-H δC-H Fc
M1(Fc)OH 2222 - 3191 820
M2(Fc)OH 2224 - 3574 822
M3(Fc)OH 2206 - 3205 820
M4(Fc)OH 2207 - 3446 826
M1(Fc)+ 2144 1167 - 827
M2(Fc)+ 2136 1173 - 838
M3(Fc)+ 2198 1171 - 830
M4(Fc)+ 2196 1173 - 833
36 2205 - - 822
Table 1: IR signatures of ferrocene derivatives in cm-1
(± 2)
3.1.2. NMR spectroscopy
1H NMR spectra of the carbinols are similar to those of the organic derivatives, i.e.
resonances for the diphenylamine derivatives are less shielded than the dimethylamino analogues
(Table 2). This is more obvious with the shift of the hydroxyl group (compounds M1(Fc)OH-M4(Fc)OH)
but less noticeable for the ferrocene shifts which are similar through the series of carbinols. The sp3
carbon atom of the carbinol reduces the electronic interaction with the two para-aminoaryl groups
of the molecule.
Related trends are also apparent in the shifts of the carbocations (M1(Fc)+-M4(Fc)+): the
dimethylamino resonances (M1(Fc)+ and M3(Fc)+) are more shielded than those of the

122
diphenylamino (M2(Fc)+ and M4(Fc)+) derivatives. The extension of the -system with the phenyl
linker also has a screening effect and chemical shifts are decreased between M1(Fc)+ and M3(Fc)+;
the same effect should be observed with M2(Fc)+ and M4(Fc)+ but the broadening of the signals of
M4(Fc)+ does not allow this comparison to be made. This broadened ferrocenyl peak could originate
from self-exchange with traces of oxidized molecules with their cationic parents or from the
presence of aggregates in solution.
Compounds δ-OH δ-Fc
M1(Fc)OH a 5.33 4.48 (s, 2H), 4.24 (s,7H)
M2(Fc)OH b 5.49 4.49 (t, J = 1.8 Hz, 2H), 4.27 – 4.23 (t, J = 1.8 Hz, 2H), 4.22 (s, 5H)
M3(Fc)OH b 4.79 4.54 – 4.46 (m, 2H), 4.30 – 4.27 (m, 2H), 4.24 (s, 5H)
M4(Fc)OH b 5.22 4.39 – 4.35 (m, 2H), 4.17 – 4.14 (m, 2H), 4.11 (s, 5H)
M1(Fc)+ c - 4.79 (s, 2H), 4.70 (s, 2H), 4.37 (s, 5H)
M2(Fc)+ d - 4.91 (s, 2H), 4.86 (s, 2H), 4.41 (s, 5H)
M3(Fc)+ e - 4.59 (s, 2H), 4.35 (s, 2H), 4.29 (s, 5H)
M4(Fc)+ d - 4.83 (broad s, 9H)
Table 2: Selected 1H NMR shifts (in ppm) for ferrocene derivatives. a: CD2Cl2 (400 MHz), b: acetone-d6 (400
MHz), c: CDCl3 (800 MHz), e: CDCl3 (300 MHz)
3.2. Organometallic derivatives
3.2.1. IR spectroscopy
Characteristic signatures of the carbinols and corresponding carbocations were observed, in
particular those corresponding to the stretching motion of the cumulenic carbon-carbon bond. Thus,
very similar signatures can be found for the triple bond stretching mode for the various carbinol
derivatives. In contrast, for the O-H stretching mode, the difference is noticeable between
diphenylamino and dimethylamino analogues, this difference being larger for the former
compounds. This illustrates again the observations already made in the previous chapter (O1+-O4+)
with the organic compounds. For the various carbocations, more significant differences exist
between the νC≡C or νC=C=C modes. For the organo-iron and organo-ruthenium complexes of M1+-M4+
type, the values are well below those expected for triple bonds (2100-2260 cm-1), even for the
extended derivatives M3+ and M4+ (Table 3). The "shorter" compounds M1+ and M2+ have
characteristic values for allenylidene complexes of iron (XXIa)[17] or ruthenium (XXIb).[11]
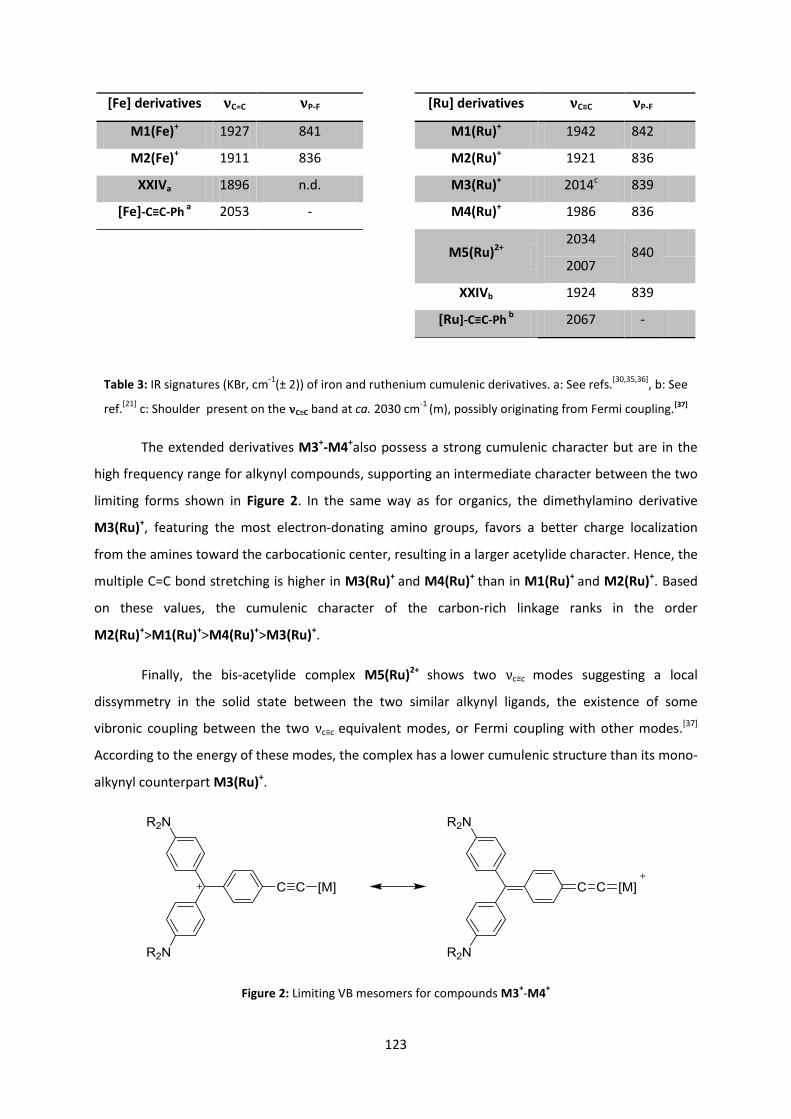
123
[Fe] derivatives νC=C νP-F [Ru] derivatives νC≡C νP-F
M1(Fe)+ 1927 841 M1(Ru)+ 1942 842
M2(Fe)+ 1911 836 M2(Ru)+ 1921 836
XXIVa 1896 n.d. M3(Ru)+ 2014c 839
[Fe]-C≡C-Ph a 2053 - M4(Ru)+ 1986 836
M5(Ru)2+
2034
2007 840
XXIVb 1924 839
[Ru]-C≡C-Ph b 2067 -
Table 3: IR signatures (KBr, cm-1
(± 2)) of iron and ruthenium cumulenic derivatives. a: See refs.[30,35,36]
, b: See
ref.[21]
c: Shoulder present on the νC≡C band at ca. 2030 cm-1
(m), possibly originating from Fermi coupling.[37]
The extended derivatives M3+-M4+also possess a strong cumulenic character but are in the
high frequency range for alkynyl compounds, supporting an intermediate character between the two
limiting forms shown in Figure 2. In the same way as for organics, the dimethylamino derivative
M3(Ru)+, featuring the most electron-donating amino groups, favors a better charge localization
from the amines toward the carbocationic center, resulting in a larger acetylide character. Hence, the
multiple C=C bond stretching is higher in M3(Ru)+ and M4(Ru)+ than in M1(Ru)+ and M2(Ru)+. Based
on these values, the cumulenic character of the carbon-rich linkage ranks in the order
M2(Ru)+>M1(Ru)+>M4(Ru)+>M3(Ru)+.
Finally, the bis-acetylide complex M5(Ru)2+ shows two νc≡c modes suggesting a local
dissymmetry in the solid state between the two similar alkynyl ligands, the existence of some
vibronic coupling between the two νc≡c equivalent modes, or Fermi coupling with other modes.[37]
According to the energy of these modes, the complex has a lower cumulenic structure than its mono-
alkynyl counterpart M3(Ru)+.
Figure 2: Limiting VB mesomers for compounds M3+-M4
+

124
IR spectroscopy confirms that in the metal alkynyl-based dyes, the organometallic branch is
(strongly) interacting with carbocationic center and takes part in the charge delocalization process,
competing thereby with the dimethyl/diphenyl amino donors appended in para-positions of the
phenylene rings on the carbocationic center. π-ligated ferrocenyl endgroups interact much less with
the carbocationic center than do organoiron and organoruthenium alkynyl units, as expected from
the direct -ligation of their metal center with the carbon-rich bridge in the latter complexes.
3.2.2. NMR spectroscopy
For organoiron and organoruthenium alkynyl complexes the 31P chemical shifts confirm the
observations from the IR relating to the bonding to the metal (Table 4). For allenylidene derivatives
M1+-M2+, the shifts observed are below those expected for typical organoiron (100 ppm) or
organoruthenium (49.44 ppm) acetylide complexes and above those for purely cumulenic species
(92.1 ppm and 38.4 ppm, respectively), while confirming a structure with dominant cumulenic
character. For extended derivatives M3(Ru)+-M4(Ru)+, the shifts are observed at comparatively lower
fields compared to M1(Ru)+-M2(Ru)+ but still below those of classic acetylide complexes, in good
accordance with the trend shown by νc≡c values.
[Fe] complex 31P [Ru] complex 31P
M1(Fe)+ a 95.1 M1(Ru)+b 40.9
M2(Fe)+ a 93.6 M2(Ru)+b 40.3
45a 85.3c M3(Ru)+b 47.6 (PF6)
48.4 (BF4)
46a 87.4c M4(Ru)+b 47.3
XXIVaf 92.1 M5(Ru)+a 52.0
[Fe]-C≡C-Phd 100.0 XXIVb 38.4
[Ru]-C≡C-Phe 49.4
Table 4: Selected 31
P NMR shifts (ppm) for organoruthenium and organoiron derivatives. a: 162 MHz, CD2Cl2. b:
162 MHz, CDCl3. c: Vinylidene. d: See Refs.
[30,35,36] e: (121.50 MHz, CD2Cl2).
[21] f: (CDCl3).
[17]

125
3.3. X-ray crystallography
Crystals of two extended carbinol precursors (39 and 43) as well as the shorter derivative
(M1+) with each of the three organometallic endgroups and the bis-acetylide complexes (M5(Ru)2+)
were obtained and proved to be suitable for X-ray studies.
3.3.1. Carbinols
Despite being less interesting, the structures of the carbinol precursors clearly reveal the sp3
character of the carbon atom linked to the hydroxyl group, with an angle close to 109.5° (Figure 3).
The bonding parameters are not uncommon, as every value is close to the standard values, in spite of
some hydrogen bonding interactions between the oxygen and one amine/hydroxyl group depending
on the molecule. The structures of 39 and 43 also provide reference values for other carbinol
derivatives.
Figure 1: X-ray structure of 39 solved by Dr. Graeme Moxey
O1-C1 O1-C1-C2 C1-C2 C5-N1 C2-C7 C28-C29
39 1.444(4) 105.61 (3) 1.540(5) 1.412(5) 1.386(5) 1.186(6)
43 1.469(4) 107.12 (3) 1.529(5) 1.397(6) 1.370(6) 1.048(8)
Refa O-Csp3
1.440
109.5 Csp3 -CAr
1.506
Car-N(2)
1.390
CAr-CAr
1.384
Csp1-Csp1
1.183
Table 5: Selected bond lengths (Å) and angles (°) for the carbinol precursors. a: See Ref.[38]
O1
C1
C2
C5
N1
C7
C28
C29
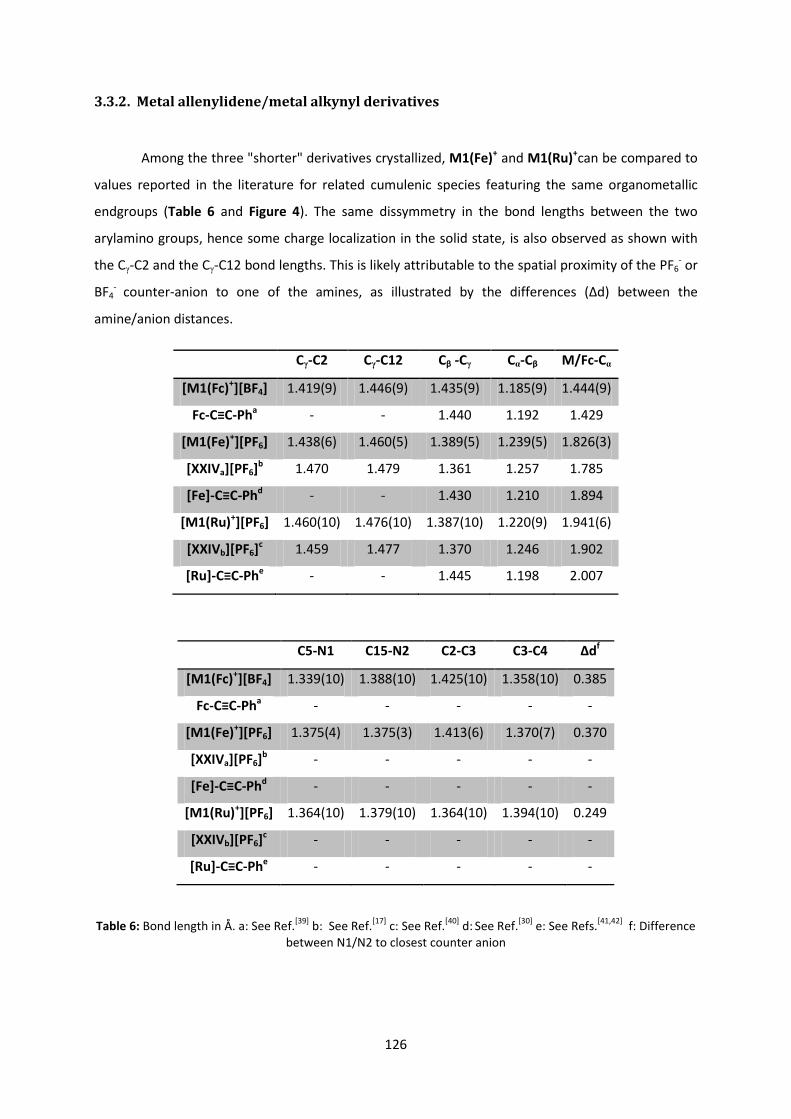
126
3.3.2. Metal allenylidene/metal alkynyl derivatives
Among the three "shorter" derivatives crystallized, M1(Fe)+ and M1(Ru)+can be compared to
values reported in the literature for related cumulenic species featuring the same organometallic
endgroups (Table 6 and Figure 4). The same dissymmetry in the bond lengths between the two
arylamino groups, hence some charge localization in the solid state, is also observed as shown with
the Cγ-C2 and the Cγ-C12 bond lengths. This is likely attributable to the spatial proximity of the PF6- or
BF4- counter-anion to one of the amines, as illustrated by the differences (Δd) between the
amine/anion distances.
Cγ-C2 Cγ-C12 Cβ -Cγ Cα-Cβ M/Fc-Cα
[M1(Fc)+][BF4] 1.419(9) 1.446(9) 1.435(9) 1.185(9) 1.444(9)
Fc-C≡C-Pha - - 1.440 1.192 1.429
[M1(Fe)+][PF6] 1.438(6) 1.460(5) 1.389(5) 1.239(5) 1.826(3)
[XXIVa][PF6]b 1.470 1.479 1.361 1.257 1.785
[Fe]-C≡C-Phd - - 1.430 1.210 1.894
[M1(Ru)+][PF6] 1.460(10) 1.476(10) 1.387(10) 1.220(9) 1.941(6)
[XXIVb][PF6]c 1.459 1.477 1.370 1.246 1.902
[Ru]-C≡C-Phe - - 1.445 1.198 2.007
C5-N1 C15-N2 C2-C3 C3-C4 Δdf
[M1(Fc)+][BF4] 1.339(10) 1.388(10) 1.425(10) 1.358(10) 0.385
Fc-C≡C-Pha - - - - -
[M1(Fe)+][PF6] 1.375(4) 1.375(3) 1.413(6) 1.370(7) 0.370
[XXIVa][PF6]b - - - - -
[Fe]-C≡C-Phd - - - - -
[M1(Ru)+][PF6] 1.364(10) 1.379(10) 1.364(10) 1.394(10) 0.249
[XXIVb][PF6]c - - - - -
[Ru]-C≡C-Phe - - - - -
Table 6: Bond length in Å. a: See Ref.[39]
b: See Ref.[17]
c: See Ref.[40]
d: See Ref.
[30] e: See Refs.
[41,42] f: Difference
between N1/N2 to closest counter anion

127
The cumulenic character results from charge delocalization via mesomeric effects (Figure 4).
As a consequence, the CM-Cα and the Cβ-Cγ distances should be shorter than their typical bond length
equivalents (such as found in [XXIVa][PF6] and [XXIVb][PF6] derivatives) and Cα-Cβ should be longer
than a typical C(sp)-C(sp) triple bond (such as found in Fc-C≡C-Ph, [Fe]-C≡C-Ph and [Ru]-C≡C-Ph
derivatives). For an ideal cumulenic structure all these bond lengths should be closer to the
corresponding double bonds (such as found in the corresponding allenylidene complexes of
ruthenium XXIVb and iron XXIVa). For the ferrocene derivative M1(Fc)+ the difference with Fc-C≡C-Ph
taken as a benchmark for an alkynyl complex is minor confirming the dominant alkynyl character of
the bonding. In contrast, the bonding parameters of the two structures of M1(Fe)+ and M1(Ru)+ are
much closer to those of the allenylidene complexes XXIVb and XXIVa, respectively, again revealing a
less pronounced cumulenic character. For M1(Fe)+and M1(Ru)+, this might be attributed to the
presence of the dimethylamino substituents which are favoring the competitive charge delocalization
between them and the carbocation, and therefore disfavoring its mesomeric interaction with the
metal center (B; Figure 4). Accordingly, the middle bond of the cumulene is shorter. The comparably
lower cumulenic character of the ferrocenyl derivatives is attributable to the -ligation of the metal
center to the manifold in these complexes, disfavoring mesomeric interactions with the
carbocationic carbon in comparison to -ligated metal alkynyl endgroups.

128
Figure 4: Structures and numeration of compounds [M1(Fc)+][BF4], [M1(Fe)
+][PF6] (solved by Dr. Thierry Roisnel)
and [M1(Ru)+][PF6] (solved by Dr. Graeme Moxey). Insert: VB representation giving the various mesomeric forms
3.3.3. Metal bis-alkynyl derivatives
The solid-state structure of the bis-acetylide derivative M5(Ru)2+ is also interesting as it
provides information on extended metal-alkynyl derivatives such as M3+ or M4+ (Figure 5 and Table
7). The two acetylide ligands are equivalent in the crystal (as suggested by IR if no vibronic or Fermi
coupling is considered). A closer examination of the bonding parameters reveals that the bond
lengths do not correspond to a strong cumulenic character and that the alkynyl character dominates.
Thus, the stabilization of positive charge of the two carbocationic ligands seems to takes place
through the two amino substituents. Whether this is a solid state (averaging) effect or an actual
molecular feature remains to be sorted out.
Cγ
Cγ
Cγ
Cβ
Cβ
Cβ
Cα
Cα
Cα
Fe Fe
Ru
C2
C2
C2
C12
C12
C12
C3
C4
C5
N1
N2
C15
N2
C15
C15
N2
C3
C4
C5
N1
C4
C3
C5
N1

129
Figure 5: structure of bis-acetylide [M5(Ru)2+
][PF6-]2 solved by Dr. Graeme Moxey
C1-C2 C1-C12 Cβ-Cγ Cα-Cβ Ru-Cα C5-N1 C15-N2 Cγ -C23
[M5(Ru)2+][PF6-]2 1.391(2) 1.391(3) 1.494(2) 1.202(2) 2.020(2) 1.397(2) 1.403(3) 1.405(2)
[Ru](-C≡C-Ph)2a
- - 1.449
1.434
1.207
1.194
2.064
2.061 - -
1.399
1.394
Table 7: Selected bond lengths (Å) for the X-ray structure of [M5(Ru)2+
][PF6-]2. a: See Refs.
[42–44]
3.3.4. Conclusion
All these crystallographic studies confirm that most of the targeted organometallic dyes in
the series M1+-M4+ have indeed been isolated. Based on these structural data and consistent with
the spectroscopic data summarized previously, it appears that these dyes exhibit a cationic charge
delocalized over all of the structure, resulting in a carbon-rich unit with a structure intermediate
between purely cumulenic and poly-ynic in the ground state. While the shorter metal alkynyl
derivatives M1+ and M2+ have a nearly typical allenylidene structure, the longer M3+ and M4+
derivatives with a 1,4-phenylene unit inserted into the carbon-rich bridge are closer to metal-alkynyl
complexes. In strong contrast with M1(Ru)+, compound M5(Ru)2+ has a dominant bis-alkynyl
character in its structure likely attributable to the presence of the additional 1.4-phenylene unit in
the carbon-rich spacer separating the carbocation from the metal center; the aromaticity of this unit
certainly mitigates against mesomeric effects. Furthermore, the counter-anion appears to favor an
unsymmetrical charge distribution in the solid state for some of these derivatives, similarly to that
seen with organic molecules. For the ferrocenyl complexes the same trend is also obeyed, except
that all these derivatives present a dominant alkynyl character. Thus, depending on its connectivity
Cβ Cα Ru
C12
C3
C4
C5
N1
N2
C15
Cγ
C2
C1
C23

130
( vs. ), the metal center interacts differently with the carbocationic center through the π-manifold
of the carbon-rich bridge. Its oxidation state should therefore have a significant impact on the optical
properties, as we shall investigate hereafter.
3.4. UV-Vis spectroscopy
The electronic spectra of the compounds M1+-M52+ were recorded in DCM in the range 230-
1500 nm along with those of their carbinol precursors. The absorptions at lowest energy are
summarized in Table 8 and discussed hereafter. Ferrocene derivatives are described first, followed by
cumulenic species and ruthenium-based MG+ derivatives at the end.
M1(Fc)+ M2(Fc)+ M3(Fc)+ M4(Fc)+ M1(Fe)+ M2(Fe)+ M1(Ru)+ M2(Ru)+
λ (nm) ε (105·M-1·cm-1)
486 (0.15) 667
(0.59)
524 (0.20) 720
(0.65)
450 (0.22) 626
(0.94)
481 (0.19) 681
(0.66)
516 (0.45) 660
(0.35)
546 (0.32) 660
(0.30)
597 (0.59) 692 (0.5)
574 (0.65) 621
(0.76)
ΔE(104.cm-1) 5.6 5.2 6.2 6.1 4.2 3.2 2.3 1.3
M3(Ru)+ M4(Ru)+ M5(Ru)2+ MG+ VIIb
λ (nm) ε (105·M-1·cm-1)
600 (1.02) 748
(0.56)
634 (0.54) 854
(0.60)
606 (2.20) 752
(1.03)
620 (1.02) 427
(0.18)
688 (1.01) 493
(0.36) ΔE(104·cm-1) 3.3 4.1 3.2 7.3 5.7
Table 8: Spectral data for the two lowest-energy absorption bands of the organometallic dyes M1+-M5
2+ and
MG+ with ΔE corresponding to the difference in energy between the two main bands
3.4.1. Ethynylferrocene derivatives
The ferrocene carbinol precursors M1(Fc)OH-M4(Fc)OH have been measured under identical
conditions and, in a similar fashion to the all-organic carbinols investigated in chapter I, their
absorptions are mainly located in the UV region. Hence, to avoid repetition this part is not described
but the corresponding data can be consulted in the experimental section. The UV-vis spectra of the
ferrocene-based carbocations M1(Fc)+- M4(Fc)+ are displayed in Figure 6.

131
Figure 6: UV-vis spectra of the ferrocene-based carbocationic derivatives [M1(Fc)+
- M4(Fc)+][BF4
-] and MG
+
The spectral features are similar to MG+ with two main absorption bands. As discussed in the
last two chapters from consideration of IR and NMR data, ferrocene interacts little with the rest of
the system. From looking at M3(Fc)+, the closest derivatives to MG+, it is even more obvious: the two
bands are really similar in wavelength (630 and 450 nm for M3(Fc)+ and 621 and 430 nm for MG+).
From the calculations described in the previous chapter, the lowest absorption (HOMO->LUMO) is
primarily charge transfer in character from the diamino groups to the central carbon, while the
second lowest band (HOMO-1->LUMO) corresponds to a dominant charge transfer from the third
branch to the core. This can explain the larger shift experienced by the second band of this
compound due to the presence of an ethynyl ferrocene substituent in the para position.
The direct replacement of the phenyl ring by an ethynylferrocene unit (M1(Fc)+ and M2(Fc)+)
has a more dramatic effect, with a red-shift of 30 nm of both bands compared to MG+, possibly
corresponding to the increase in the π-system supporting the transitions when a triple bond is
directly attached to the carbocation (A, Figure 7), as opposed to phenyl-extended derivatives for
which the corresponding excited state (B) is comparably more energetic since the energetic cost of
disruption of aromaticity in the phenyl ring compensates for the gain in delocalizing the charge.
0
20000
40000
60000
80000
100000
120000
230 330 430 530 630 730 830 930 1030 1130
ε (L
.mo
l-1. c
m-1
)
λ (nm)

132
Figure 7: Dominant CT in the first excited state of [M1(Fc)+][BF4
-] and [M3(Fc)
+][BF4
-]
Diphenylamino substituents, similar to observations with the organic analogues, induce a
bathochromic shift of 30-60 nm on the lowest energy absorptions, this shift being slightly less
pronounced for the second band. This indicates that both transitions involve charge transfer to the
diaminophenyl fragments. The shift of the first band must therefore correspond to extension of the
manifold involved in the CT underlying the first absorption band. Moreover, diphenylamino
substituents being less electron-donating than dimethylamino ones, the competitive charge transfer
toward the third branch (A or B) is somewhat favored in the excited state, hence explaining the
bathochromic shift observed for the second bands of M2(Fc)+ and M4(Fc)+
Additional bands corresponding to transitions possessing a large metal-to-ligand charge-
transfer (MLCT) character are also likely to exist, as the carbocation is electron deficient and
ferrocene electron rich. However these transitions are probably weaker as the iron is poorly
conjugated with the system and the bands are possibly present at higher energies, overlapped by the
more intense ligand centered (LC) bands present in this spectral region.

133
3.4.2. Metal allenylidene derivatives
The spectra of the metal allenylidene species M1+-M2+ also possess intense visible absorption
bands with extinction coefficients of ca. 5·104 M-1·cm-1 (Table 8 and Figure 8). These intensities are
slightly smaller than those of the corresponding absorptions in the related organic derivative
O1(AntC2)+ discussed earlier (and used here as a reference compound) but represent the spectral
signature of the carbocationic fragment. The lowest energy band for the Fe derivatives M1(Fe)+ and
M2(Fe)+ appears at 660 nm for both, which suggests that this transition is somewhat decorrelated
from the amino substituents and more likely dominated by a strong MLCT character. The second
lowest energy band is red-shifted for the diphenylamine, as expected for a transition involving the
amino substituents. As before, this shift possibly originates from the extended π-system. By analogy
with the organics, and based on its larger intensity, it is tempting to attribute it to the CT transfer
involving mostly the amino groups, which was previously located at lower energy that the other band
dominated by the MLCT process. Therefore, in these compounds, the electronic transitions at lowest
energy seem to have been energetically inverted relative to MG+, similar to what had been
theoretically predicted for 9-ethynylanthracene derivatives such as O1(AntC2)+ (Chapter I-4.5).
Accordingly, we tentatively propose that for the allenylidene complexes M1(Fe)+ and M2(Fe)+, the
HOMO->LUMO band corresponds to a charge transfer process from the metal to the organic core
(the MLCT) and the second-lowest-energy band to the HOMO-1->LUMO transition, with a dominant
charge transfer character from the amine to the central carbon. Such an assignment would explain
the larger half width and lower intensity of the first transition (more compatible with its metal-
containing character) and correspond to the literature on related metal allenylidene complexes for
which the moderate to intense electronic absorption at lowest energy was often attributed to a
MLCT process.[16]
For the ruthenium derivatives M1(Ru)+ and M2(Ru)+, two intense bands are also observed at
low energies. These are closer in energy, and both bands seem to experience a bathochromic shift
when progressing from the dimethylamino derivative (M1(Ru)+) to the diphenylamino one (M2(Ru)+).
Consistent with the spectrum of O1(AntC2)+ used as reference, the lowest energy band possesses the
highest extinction coefficient. Therefore, the suspected band inversion observed with M1(Fe)+ and
M2(Fe)+ has probably not happened for these ruthenium species. The large overlap of these two
bands in M2(Ru)+ dyes suggests, however, that the "inversion" limit, which depends on the electron
releasing-power of the allenylidene branch (i.e. the metal center) compared to that of the branches
featuring the amino substituents, may be close. Finally, for M1(Ru)+ and M2(Ru)+, two broad bands

134
of low intensity appear as shoulders on the most intense band in the visible range at ca. 700 nm and
800 nm, respectively. The origin of these absorptions, which resemble those observed in the
ferrocenyl analogues M1(Fc)+ and M2(Fc)+, is presently unknown. They might be tentatively
attributed to MLCT processes but will necessitate theoretical calculations to be definitively assigned.
Figure 8: UV-vis spectra of the metal allenylidene derivatives ([PF6-] salts) and [O1(AntC2)
+][BF4
-]
3.4.3. Ruthenium alkynyl derivatives
The UV-vis spectra of the ruthenium-alkynyl derivatives M3(Ru)+, M4(Ru)+ and M5(Ru)2+
(Figure 9) differ from that of MG+. Again, two comparably intense bands are present at low energy,
but with inverted intensities. Upon progressing from M3(Ru)+ to M4(Ru)+, both bands experience the
usual bathochromic shift observed for diphenyl derivatives (100 nm for the lowest energy band and
60 nm for the second one). Again, based on its lower intensity and shape, we would propose that the
broad transition at lowest energy corresponds to the CT transition within the TPM fragment (which
possesses the largest MLCT character). Compared to MG+, for which the CT process originating from
the electron-donating amino groups occurs at lower energy than that predominantly involving the
phenyl substituent, it seems that the same phenomenon as observed for the iron-based allenylidene
0
20 000
40 000
60 000
80 000
100 000
120 000
230 330 430 530 630 730 830 930 1030
ε (L
.mo
l-1.c
m-1
)
λ(nm)

135
species M1(Fe)+ and M2(Fe)+ is taking place here: both CT bands are inverted, that with the largest
MLCT character now being found at lowest energy. Note, however, that contrary to what was
observed for M1(Fe)+ and M2(Fe)+, the low energy band remains influenced by a change in
peripheral amino groups, in line with its admixed CT character. In addition, for M3(Ru)+, spectra of
the two different salts with PF6- and BF4
- counter ions have also been recorded. Upon comparison, no
difference at all was observable, suggesting no interactions (ion-pair formation for instance) of these
dyes with their counter ions in DCM, as expected for such non-coordinating and spectroscopically
silent ions.
Apart for a very small red-shift and a rough doubling of the extinction coefficients of the two
bands at low energy, the bis-acetylide derivative M5(Ru)2+ has a spectrum nearly identical to that of
M4(Ru)+. This might have been expected, given that this compound possesses two identical TPM-
based chromophores (in contrast to M4(Ru)+ which possesses one). Hence, it seems that the
transitions of this dicationic compound are identical in nature to those observed for M4(Ru)+, which
mainly consist of transitions involving the TPM fragment. Similar observations have already been
made concerning the electronic absorption spectra of related mono- and bis-alkynyl ruthenium
derivatives.[45,46]
Figure 9: UV-vis spectra of the ruthenium alkynyl derivatives [M3(Ru)+][PF6
-], [M4(Ru)
+][PF6
-] and [M5(Ru)
2+][PF6
-]2
0
50000
100000
150000
200000
230 430 630 830 1030 1230
ε (L
.mo
l-1.c
m-1
)
λ (nm)

136
3.4.4. Conclusion
All these organometallic derivatives possess NIR absorption bands with intense extinction
coefficients of comparable magnitudes (0.5 to 2 x 10⁵ M-1·cm-1). The diphenylamino substituents
always induce a red-shift for these bands, as previously seen for the purely organic MG+ derivatives
studied in chapter I. When comparing organometallic endgroups with -bonded d6 transition metals
(metal alkynyl derivatives) to organometallic endgroups with -bonded d6 metal centers
(ethynylferrocene derivatives) in these dyes, the red-shift of the absorptions appears always more
pronounced in the former, albeit noticeable in both cases. This can be ascribed to a stronger
electronic interaction with the d metal MOs in the first excited states for -bonded metals.
Then, among the metal alkynyl and metal allenylidene derivatives, depending on the nature
of the metal center and the amino substituents present on the peripheral phenyl rings, different
relative intensities (and half-widths) are observed for the two low lying transitions characteristic of
the carbocationic fragment. We thus tentatively propose that an inversion of the low energy
transitions observed in MG+ takes place for dyes featuring strongly electron-rich metal centers and
comparably less electron-releasing peripheral amino substituents. For organometallic MG+-based
dyes, such an inversion always places the CT transition with the largest metal-ligand character (i.e.
polarized along the third branch) at lowest energy. It is interesting to note that larger bathochromic
shifts have been obtained for alkynyl compounds than for their corresponding allenylidene
counterparts (e.g. compare M3(Ru)+ and M1(Ru)+ or M4(Ru)+ and M2(Ru)+), and this is in spite of the
fact that the metal center is more spatially remote from the central carbocation in the former dyes.
TD-DFT calculations would be particularly helpful for shedding light on the nature of the low-lying
transitions and to confirm our hypotheses.
Finally, the bis-alkynyl derivatives M5(Ru)2+ possesses a similar UV-vis spectrum to its mono
alkynyl counterpart M4(Ru)+, with only a small bathochromic shift of 6 nm and a doubling of the
extinction coefficients. Overall, the absorption properties of the organometallic derivatives
synthesized so far are encouraging, as the spectra possess intense spectral features in the NIR range.
Similar to organic derivatives, these first absorption bands, regardless of their MLCT character,
should give rise to TPA activity deep into the NIR range.

137
3.5. Cyclic voltammetry
Cyclic voltammetry (CV) studies of the organometallic dyes M1+-M52+ provide information
about the reversibility of a given redox process undergone by the complexes, notably about the
metal-centered processes which are of major interest in this work aimed at identifying redox-
switchable NLO-phores. CV also provides a better understanding of their electronic properties and
can even reveal the existence of interactions between the various redox sites of these compounds in
favourable cases. For instance, if there is some electronic interaction between the carbocationic sites
and the metal centers in M1+-M52+, the latter should be oxidized at higher potentials than in model
compounds featuring only one of these redox sites (and vice versa).
3.5.1. Ethynylferrocene derivatives
Cyclic voltammograms of the complexes were recorded in DCM in the range -1.6 – 1.6 V.
Ferrocene carbinols have also been measured (Table 9), Figure 10 showing the cyclic voltammogram
obtained for M2(Fc)OH. All the other ferrocene carbinols display a similar voltammogram: a reversible
oxidation process that occurs at 0.56 V and which can be attributed to the Fc+/Fc couple.
Unsurprisingly, these values are close to that of the external reference used (FcH+/FcH). This
proximity indicates the absence of strong intermolecular electronic interactions between the amines
and the ferrocene through the sp3 carbon atom carrying the hydroxyl group. A second chemically
irreversible process corresponds to the simultaneous oxidation of amines (and their stepwise
reduction on the return sweep). This is not so surprising since the oxidation of alkyl[47] and aryl[48]
amines are known to result in polymer formation. These detrimental processes must be considered if
redox-switching is planned with these dyes, as they occur at potentials close to that corresponding to
the ferrocenyl group.

138
Figure 10: Cyclic voltammograms of M2(Fc)OH
and [M2(Fc)+][BF4
-] in DCM containing 0.10 M [n-Bu4N][PF6]
(Abscissa in V and ordinate in nA; E1/2, ΔE1/2 and ΔEp in V vs. SCE)
Reduction (carbocation)
Oxidation(metal) Oxidation (amine)
Complex Epa(V)b E1/2 (V) ΔEp (V) ipc/ipa Epc (V) M1(Fc)OH - 0.55 0.06 0.98 0.83 M2(Fc)OH - 0.56 0.02 1.0 0.94 M3(Fc)OH - 0.52 0.08 0.98 0.74 M4(Fc)OH - 0.56 0.02 1.0 0.95
M1(Fc)+ -0.35 0.59 0.04 1.0 1.02 M2(Fc)+ -0.06 0.79 0.04 0.98 1.10
M3(Fc)+ a -0.40 0.55 0.04 0.90 1.28 M4(Fc)+ a -0.23 0.68 0.02 0.84 1.31
Table 9: Cyclic voltammetric data for M1(Fc)OH
- M4(Fc)OH
in DCM containing 0.10 M [n-Bu4N][PF6] (E1/2, ΔE1/2
and ΔEp in V vs. SCE). a: Corrected values. b: Non reversible
The corresponding ethynylferrocene carbocations M1+-M4+ were investigated next. The
oxidation of the ferrocenyl unit is chemically reversible and occurs first, and is followed by that of the
amino substituent. For M4(Fc)+, the metal oxidation potential is close to that corresponding to amine
oxidation and both phenomena can take place simultaneously resulting in a poorly reversible
process; hence, the voltage sweep has to monitored carefully to ensure that only the metal is
-1.6 -1.1 -0.6 -0.1 0.4 0.9 1.4
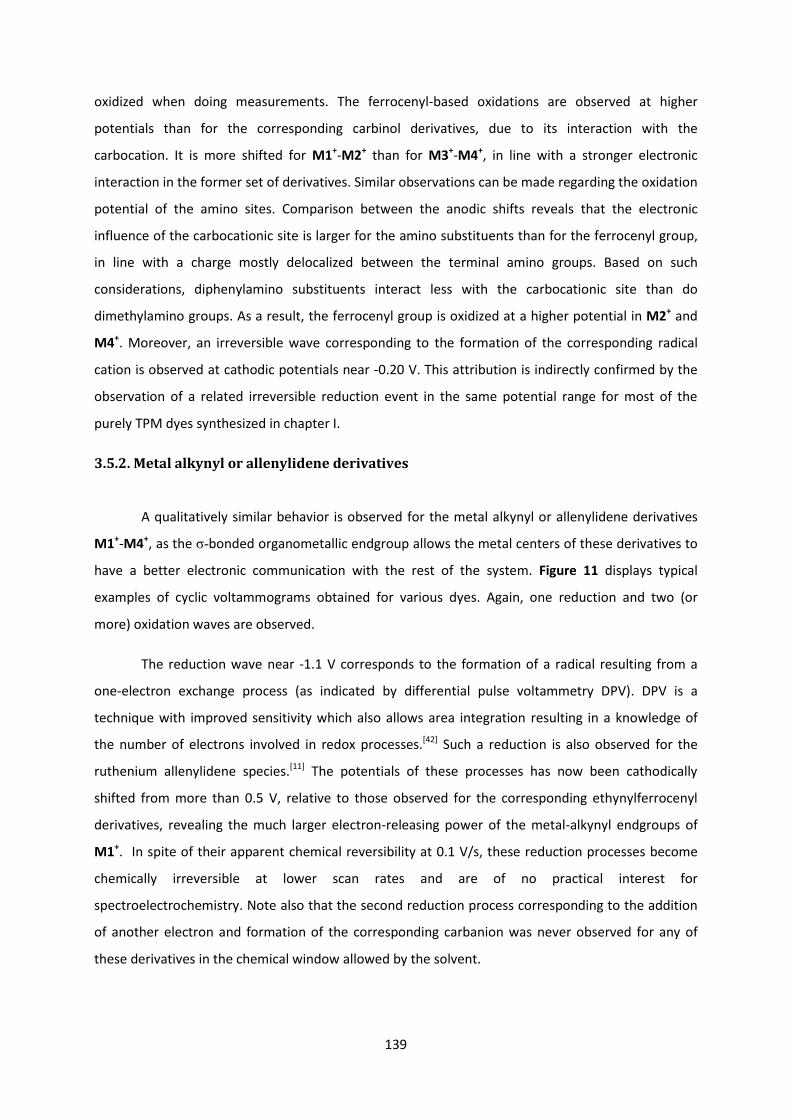
139
oxidized when doing measurements. The ferrocenyl-based oxidations are observed at higher
potentials than for the corresponding carbinol derivatives, due to its interaction with the
carbocation. It is more shifted for M1+-M2+ than for M3+-M4+, in line with a stronger electronic
interaction in the former set of derivatives. Similar observations can be made regarding the oxidation
potential of the amino sites. Comparison between the anodic shifts reveals that the electronic
influence of the carbocationic site is larger for the amino substituents than for the ferrocenyl group,
in line with a charge mostly delocalized between the terminal amino groups. Based on such
considerations, diphenylamino substituents interact less with the carbocationic site than do
dimethylamino groups. As a result, the ferrocenyl group is oxidized at a higher potential in M2+ and
M4+. Moreover, an irreversible wave corresponding to the formation of the corresponding radical
cation is observed at cathodic potentials near -0.20 V. This attribution is indirectly confirmed by the
observation of a related irreversible reduction event in the same potential range for most of the
purely TPM dyes synthesized in chapter I.
3.5.2. Metal alkynyl or allenylidene derivatives
A qualitatively similar behavior is observed for the metal alkynyl or allenylidene derivatives
M1+-M4+, as the σ-bonded organometallic endgroup allows the metal centers of these derivatives to
have a better electronic communication with the rest of the system. Figure 11 displays typical
examples of cyclic voltammograms obtained for various dyes. Again, one reduction and two (or
more) oxidation waves are observed.
The reduction wave near -1.1 V corresponds to the formation of a radical resulting from a
one-electron exchange process (as indicated by differential pulse voltammetry DPV). DPV is a
technique with improved sensitivity which also allows area integration resulting in a knowledge of
the number of electrons involved in redox processes.[42] Such a reduction is also observed for the
ruthenium allenylidene species.[11] The potentials of these processes has now been cathodically
shifted from more than 0.5 V, relative to those observed for the corresponding ethynylferrocenyl
derivatives, revealing the much larger electron-releasing power of the metal-alkynyl endgroups of
M1+. In spite of their apparent chemical reversibility at 0.1 V/s, these reduction processes become
chemically irreversible at lower scan rates and are of no practical interest for
spectroelectrochemistry. Note also that the second reduction process corresponding to the addition
of another electron and formation of the corresponding carbanion was never observed for any of
these derivatives in the chemical window allowed by the solvent.

140
For M1(Fe)+, the first oxidation process (near 0.3 V) presumably corresponds to oxidation of
the metal center, while the second oxidation corresponds to a stepwise oxidation of one amine, as
observed for ferrocene derivatives. Albeit seemingly reversible at these scan rates, it becomes
irreversible at lower sweep rates. Note that the metal-centered potential has been anodically shifted
from ca. 0.4 V compared to that of the corresponding phenyl alkynyl complex[30] due to the effect of
the partial cationic charge delocalized from the carbocation. Similar features are observed in
oxidation for M1(Ru)+, but the metal-centered oxidation now occurs at higher potentials (near 0.9 V),
closer to the first oxidation of the amino substituent. Again, this corresponds to an anodic shift of ca.
0.4 V compared to that of the corresponding phenylalkynyl complex.[45]
Similar cyclic voltammograms can be observed for the diphenylamino derivatives M2(Fe)+and
M2(Ru)+, except that the irreversible amino substituent oxidation now occurs at higher potentials, a
result of diphenylamino groups being less electron rich, to the extent that it is no longer observed in
the potential window.
Similar features are also present in the voltammograms of the metal alkynyl derivatives
M3(Ru)+ and M4(Ru)+ (c-d; Figure 11). The chemically pseudo-reversible reduction in the
corresponding radical cation now takes place between -0.7 V and -0.5 V depending on the amino
substituents present, while the Ru-centered oxidation takes place around 0.5-0.6 V, the potential
being again a little higher for the diphenylamino derivative. Note that this potential range is much
closer to that of the corresponding phenylalkynyl complex (0.55 V),[45] in line with a much weaker
interaction with the carbocation through the 4-phenylenethynylene spacer. In this respect, M5(Ru)2+
(e; Figure 11) gives rise to a very similar voltammogram to M4(Ru)+, except that the metal-centered
oxidation is slightly more anodic (+0.12 V) due to the presence of two positive charges on this bis-
alkynyl derivative, and that the reduction of the two carbocationic TPM sites takes place in a
stepwise fashion at E°1 = - 0.8 V, in line with the existence of an electronic interaction between these
electrochemical events.

141
-1.6 -1.1 -0.6 -0.1 0.4 0.9 1.4
-1.6 -1.1 -0.6 -0.1 0.4 0.9 1.4
-1.6 -1.1 -0.6 -0.1 0.4 0.9 1.4
-1.6 -1.1 -0.6 -0.1 0.4 0.9 1.4
a
b
c
d
e
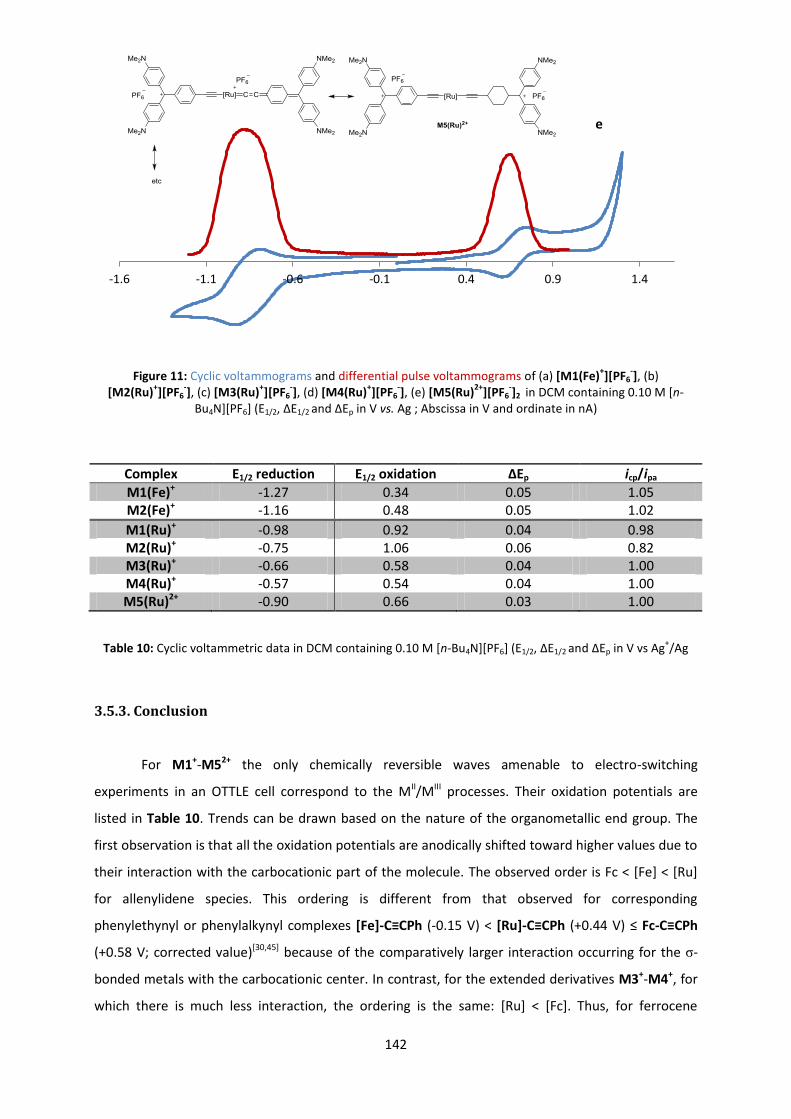
142
Figure 11: Cyclic voltammograms and differential pulse voltammograms of (a) [M1(Fe)+][PF6
-], (b)
[M2(Ru)+][PF6
-], (c) [M3(Ru)
+][PF6
-], (d) [M4(Ru)
+][PF6
-], (e) [M5(Ru)
2+][PF6
-]2
in DCM containing 0.10 M [n-
Bu4N][PF6] (E1/2, ΔE1/2 and ΔEp in V vs. Ag ; Abscissa in V and ordinate in nA)
Complex E1/2 reduction E1/2 oxidation ΔEp icp/ipa
M1(Fe)+ -1.27 0.34 0.05 1.05 M2(Fe)+ -1.16 0.48 0.05 1.02
M1(Ru)+ -0.98 0.92 0.04 0.98 M2(Ru)+ -0.75 1.06 0.06 0.82 M3(Ru)+ -0.66 0.58 0.04 1.00 M4(Ru)+ -0.57 0.54 0.04 1.00 M5(Ru)2+ -0.90 0.66 0.03 1.00
Table 10: Cyclic voltammetric data in DCM containing 0.10 M [n-Bu4N][PF6] (E1/2, ΔE1/2 and ΔEp in V vs Ag+/Ag
3.5.3. Conclusion
For M1+-M52+ the only chemically reversible waves amenable to electro-switching
experiments in an OTTLE cell correspond to the MII/MIII processes. Their oxidation potentials are
listed in Table 10. Trends can be drawn based on the nature of the organometallic end group. The
first observation is that all the oxidation potentials are anodically shifted toward higher values due to
their interaction with the carbocationic part of the molecule. The observed order is Fc < [Fe] < [Ru]
for allenylidene species. This ordering is different from that observed for corresponding
phenylethynyl or phenylalkynyl complexes [Fe]-C≡CPh (-0.15 V) < [Ru]-C≡CPh (+0.44 V) ≤ Fc-C≡CPh
(+0.58 V; corrected value)[30,45] because of the comparatively larger interaction occurring for the σ-
bonded metals with the carbocationic center. In contrast, for the extended derivatives M3+-M4+, for
which there is much less interaction, the ordering is the same: [Ru] < [Fc]. Thus, for ferrocene
-1.6 -1.1 -0.6 -0.1 0.4 0.9 1.4
e

143
derivatives, when the metal is not σ-bonded to the rest of the system, the oxidation potential is not
significantly influenced by the nearby charge. In contrast, for Fe(II) and Ru(II) alkynyl endgroups, a
non-negligible shift (hundreds of mV) is observed.
The remarkable feature of organometallic dyes such as M1+ or M2+ is that whereas the
corresponding diphenylallenylidene complexes are very hard to oxidize[16] and give rise to irreversible
follow-up chemical events, introduction of dimethyl- or diphenylamino substituents at the para-
positions of the peripheral phenyl rings cathodically shifts the metal-centered oxidation potential. In
this respect, dimethylamino substituents in M1(Fe)+, M1(Ru)+ and M3(Ru)+ and to a lesser extent
diphenylamino substituents in M2(Ru)+ and M4(Ru)+are helping to stabilize the positive charge and
remove it partially from the metal center. Thanks to these substituents, M1+ and M2+ present a
chemically reversible oxidation, amenable to switching experiments in an OTTLE cell.
3.6. Spectroelectrochemistry
Spectroelectrochemistry is a technique coupling UV-Vis spectroscopic detection and a
potentiostat: the cell is equipped with an electrode that can oxidize/reduce the compound in situ.
This technique can be helpful for spectroscopically characterizing in situ redox isomers that cannot
be chemically isolated due to their high reactivity. The setup used for this work also permits work at
low temperature, which can be helpful for very sensitive species. The only requirement is that the
redox isomers are sufficiently stable over a timescale allowing for their coulometric generation in the
spectroelectrochemical (OTTLE) cell.
Spectroelectrochemistry of M1+-M4+ and M52+ has thus been performed upon oxidizing the
metal center. In order to ensure the reversibility of the process, reduction of the radical cation was
continued until the spectrum matched that of the starting compound. Spectra presented here are an
overlay of the oxidation and reduction process as sometimes the phenomena are too rapid to obtain
proper isosbestic points. Depending on the compound's sensitivity, the measurements were carried
out either at room temperature or at low temperature (-40°C). UV-Vis spectra of the oxidized metal
center should enhance understanding of the electronic excited states of the oxidized species and give
some indication about the absorptive nonlinear processes that might be operative.
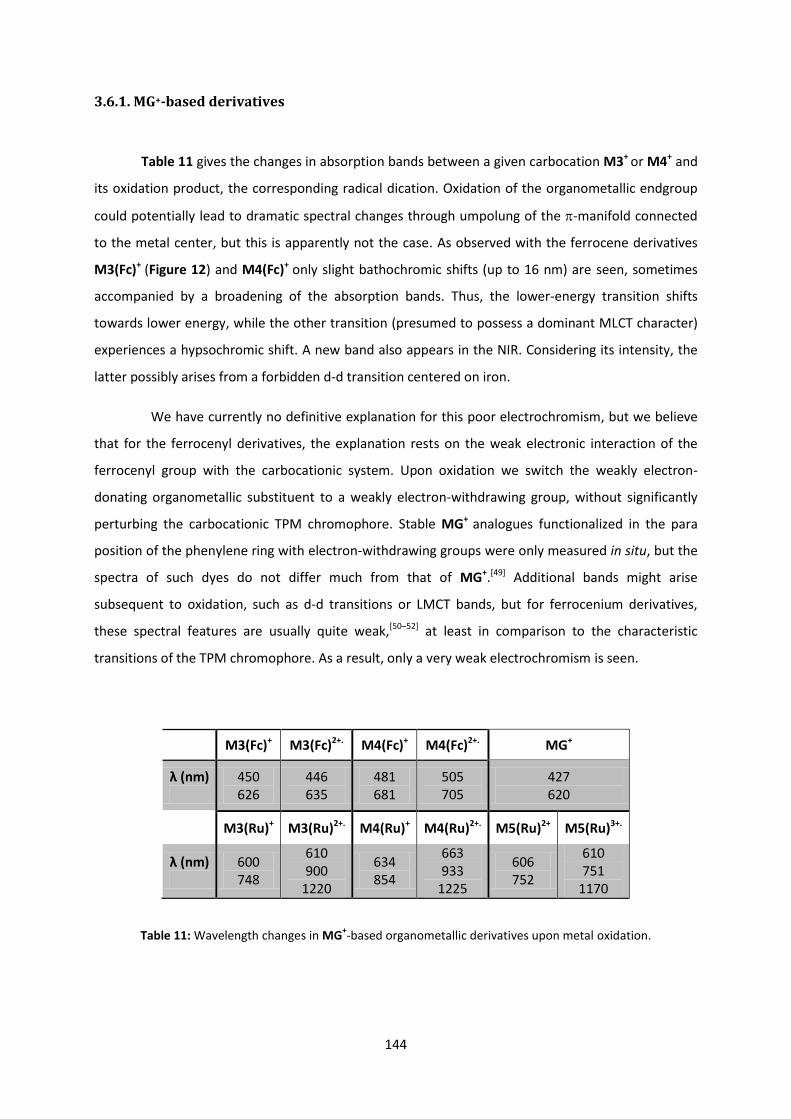
144
3.6.1. MG+-based derivatives
Table 11 gives the changes in absorption bands between a given carbocation M3+ or M4+ and
its oxidation product, the corresponding radical dication. Oxidation of the organometallic endgroup
could potentially lead to dramatic spectral changes through umpolung of the -manifold connected
to the metal center, but this is apparently not the case. As observed with the ferrocene derivatives
M3(Fc)+ (Figure 12) and M4(Fc)+ only slight bathochromic shifts (up to 16 nm) are seen, sometimes
accompanied by a broadening of the absorption bands. Thus, the lower-energy transition shifts
towards lower energy, while the other transition (presumed to possess a dominant MLCT character)
experiences a hypsochromic shift. A new band also appears in the NIR. Considering its intensity, the
latter possibly arises from a forbidden d-d transition centered on iron.
We have currently no definitive explanation for this poor electrochromism, but we believe
that for the ferrocenyl derivatives, the explanation rests on the weak electronic interaction of the
ferrocenyl group with the carbocationic system. Upon oxidation we switch the weakly electron-
donating organometallic substituent to a weakly electron-withdrawing group, without significantly
perturbing the carbocationic TPM chromophore. Stable MG+ analogues functionalized in the para
position of the phenylene ring with electron-withdrawing groups were only measured in situ, but the
spectra of such dyes do not differ much from that of MG+.[49] Additional bands might arise
subsequent to oxidation, such as d-d transitions or LMCT bands, but for ferrocenium derivatives,
these spectral features are usually quite weak,[50–52] at least in comparison to the characteristic
transitions of the TPM chromophore. As a result, only a very weak electrochromism is seen.
M3(Fc)+ M3(Fc)2+. M4(Fc)+ M4(Fc)2+. MG+
λ (nm)
450 626
446 635
481 681
505 705
427 620
M3(Ru)+ M3(Ru)2+. M4(Ru)+ M4(Ru)2+. M5(Ru)2+ M5(Ru)3+.
λ (nm)
600 748
610 900
1220
634 854
663 933
1225
606 752
610 751
1170
Table 11: Wavelength changes in MG+-based organometallic derivatives upon metal oxidation.

145
Figure 12: Spectral changes observed for M3(Fc)+ [BF4
-] upon oxidation
Similar observations pertaining to an overall weak electrochromism can also be made for
the ruthenium alkynylderivatives M3(Ru)+, M4(Ru)+ and M5(Ru)2+, as shown with the example of
M3(Ru)+ (Figure 13). The spectra of the other compounds which are relatively similar. Again,
oxidation of the metal center induces a decrease of the band previously attributed to the MLCT,
while two new absorption bands appear in the NIR range.
The decrease of the low-energy absorption is in line with our tentative attribution as a
band with a strong MLCT character. Accordingly, upon oxidation of the metal center, such a band
should disappear or shift hypsochromically. The new but moderately intense band that appears near
900 nm might correspond to a MLCT process subsequent to oxidation, while its weak shoulder at low
energy could correspond to a forbidden d-d process, similar to the one observed with the ferricinium
derivative. While the electrochromism is now more pronounced than for ferrocene derivatives, as
was to be expected for these organometallic groups interacting more with the TPM unit, it is
nevertheless not strong. The linear optical spectrum is still dominated by the intense peak near 600
nm corresponding to the TPM chromophore in both redox states, which are apparently not much
affected by the oxidative umpolung of the third branch.
Ab
sorb
ance
λ (nm)

146
Figure 13: Spectral changes observed for [M3(Ru)+][PF6
-] upon oxidation
For comparison, an overlay of all the mono-oxidized compounds can be found below on
Figure 14.
Figure 14: UV-Vis spectra of the mono-oxidized MG+-type derivatives against that of MG
+. For comparison
purpose the spectra have been normalized on the intense low-energy band excepted for [M5(Ru)3+.
][PF6-]
0
0.2
0.4
0.6
0.8
1
1.2
1.4
1.6
1.8
2
230 430 630 830 1030 1230 1430
Ab
sorb
ance
λ (nm)
MG +
M4(Fc)2+.
M3(Fc)2+.
M3(Ru)2+.
M4(Ru)2+.
M5(Ru)3+.
λ (nm)
Ab
sorb
ance

147
3.6.2. Allenylidene derivatives
Table 12 gives the changes in absorption bands for the all the cumulenic species/ethynyl
ferrocene derivatives and their oxidized states but they are discussed separately.
3.6.2.1. Ethynylferrocene derivatives
Figure 15 displays the spectroelectrochemistry of M1(Fc)+. Upon oxidation the main band
decreases and a new but weaker one appears at 712 nm (compared to 667 nm) along with a shoulder
on its low energy side. The second band is far less affected by oxidation and exhibits only a slight
bathochromic shift. The small band (appearing as a shoulder) in the NIR range also disappears. The
presence of isosbestic points evidence the overall reversibility of the process, although a slight
decomposition of the sample was also observed. The final spectrum strongly resembles that of MG+.
Likewise to the proposal above for ferrocene derivative, we believe that the weak electrochromism
observed results from the poor electronic interaction of the ferrocenyl substituent with the cationic
center. Once oxidized, its electronic influence on the rest of the chromophore is shut down, leaving
basically the equivalent of a Michler’s blue analog (Chap. I; Chart 4) which still has a strong
absorption in this spectral range. The remaining absorptions, more specific to the ferricinium
chromophore, are indeed much weaker in comparison.
M1(Fc)+ M1(Fc)2+. M2(Fc)+ M2(Fc)2+. MG+
λ (nm)
486 667
488 712
524 720
524 784
427 620
M2(Fe)+ M2(Fe)2+. M1(Ru)+ M1(Ru)2+. M2(Ru)+ M2(Ru)2+.
λ (nm)
427 620
662 692
1160
597 692
633 1028
574 621
574 631
1500
Table 12: Wavelength changes in allenylidene-based derivatives upon metal oxidation
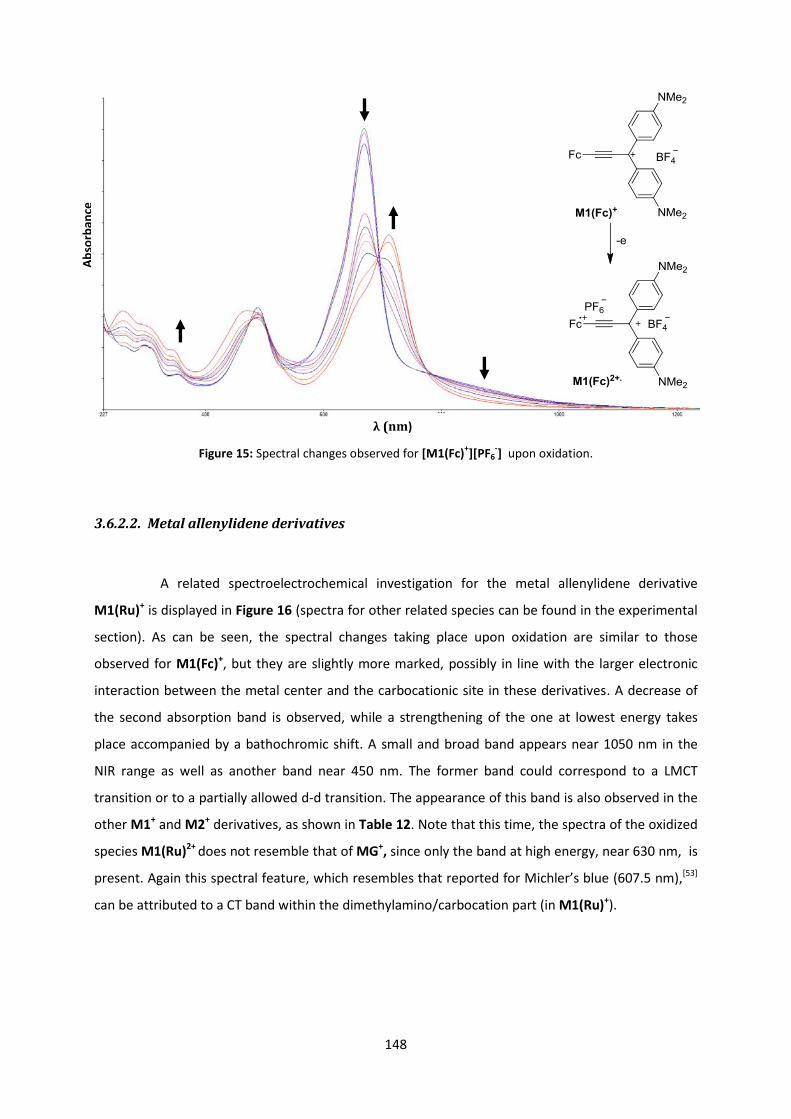
148
Figure 15: Spectral changes observed for [M1(Fc)+][PF6
-] upon oxidation.
3.6.2.2. Metal allenylidene derivatives
A related spectroelectrochemical investigation for the metal allenylidene derivative
M1(Ru)+ is displayed in Figure 16 (spectra for other related species can be found in the experimental
section). As can be seen, the spectral changes taking place upon oxidation are similar to those
observed for M1(Fc)+, but they are slightly more marked, possibly in line with the larger electronic
interaction between the metal center and the carbocationic site in these derivatives. A decrease of
the second absorption band is observed, while a strengthening of the one at lowest energy takes
place accompanied by a bathochromic shift. A small and broad band appears near 1050 nm in the
NIR range as well as another band near 450 nm. The former band could correspond to a LMCT
transition or to a partially allowed d-d transition. The appearance of this band is also observed in the
other M1+ and M2+ derivatives, as shown in Table 12. Note that this time, the spectra of the oxidized
species M1(Ru)2+ does not resemble that of MG+, since only the band at high energy, near 630 nm, is
present. Again this spectral feature, which resembles that reported for Michler’s blue (607.5 nm),[53]
can be attributed to a CT band within the dimethylamino/carbocation part (in M1(Ru)+).
Ab
sorb
ance
λ (nm)

149
Figure 16: Spectral changes observed for [M1(Ru)+][PF6
-] upon oxidation
For comparison, an overlay of all the mono-oxidized compounds can be found below on Figure 17.
Figure 17: UV-Vis spectra of the mono-oxidized MG+-type derivatives against that of MG
+. For comparison
purpose the spectra have been normalized on the intense low-energy band.
0
0.2
0.4
0.6
0.8
1
1.2
230 430 630 830 1030 1230 1430 1630 1830
Ab
sorb
ance
λ (nm)
M1(Fc)2+.
M2(Fc)2+.
M1(Fe)2+.
M2(fe)2+.
M1(Ru)2+.
M2(Ru)2+.
Ab
sorb
ance
λ (nm)

150
3.6.3. Conclusions on spectroelectrochemical studies
Usually, spectra of metal-alkynyl or metal-allenylidene complexes are governed by MLCT or
LMCT transitions at low energies. MLCT usually occurs in the neutral state as the metal center tends
to be more electron-rich than the ligand, but in the oxidized state LMCT are often present. However,
as we shall see, the interpretation of the data presented in this section is not trivial, especially in the
absence of TD-DFT calculations, since TPM dyes have several low-energy bands originating from their
carbocationic moiety which can combine with the MLCT/LMCT transitions previously mentioned and
mostly affected by oxidation, complicating their identification.
In regard of their spectoelectrochemical behavior upon oxidation, the compounds M1+-
M52+ can be separated in two different groups: cumulenic derivatives (M1+-M2+) and TPM-based
derivatives (M3+-M52+). Thus, for each set of compounds, contrary to our expectations, only a
moderate electrochromism was stated.
Not surprisingly, the largest spectral contrast between the two redox states probed is
obtained each time with metal alkynyl derivatives, for which the electronic coupling with the organic
core is stronger than for ethynylferrocenyl derivatives. For the cumulenic derivatives, oxidation of
the metal seems to sever the electronic interaction between the metal and the organic fragment,
leaving an organic chromophore resembling Michler's blue and an appended radical cation exhibiting
a weak LMCT or d-d transitions at lower energy, in the NIR range. The same situation prevails for the
TPM derivatives, except that after oxidation the organic chromophore resembles MG+. In both cases,
due to the spectral dominance of this organic chromophore in the visible range and to the small
changes occasioned to its linear absorptions by oxidation, only a moderate linear electrochromism
will result for many spectral regions in the visible range. However, for most of the metal alkynyl
derivatives some spectral regions in the NIR range undergo important changes in absorption that
might be exploited for inducing large nonlinear electrochromic effects.
4. Conclusion
The synthesis of most of the new organometallic derivatives of MG+(M1+-M4+) have been
performed successfully. Two different synthetic routes were followed: one similar to that used for
the organic derivatives was applied to the synthesis of ferrocene-containing dyes and another one,
based on the intermediacy of alkyne or polyyne precursors was used for accessing the desired metal-

151
alkynyl-containing dyes. The latter synthetic route led sometimes to selectivity issues due to the high
reactivity of the vinylidene compounds formed as intermediates. However, thanks to the
development of purification procedures based on the solubility of these compounds, most of the
targeted alkynyl complexes could be isolated, except for the iron alkynyl derivatives of MG+ (M3+-4+),
for which decomposition was observed. Apart from these two compounds, most of the targeted
organometallic dyes were eventually isolated (including the new bis-alkynyl ruthenium derivative
M5(Ru)2+).
The compounds M1+-M52+ were fully characterized using conventional methods and their
electronic and structural features in the GS were discussed. Along with crystallographic studies and
observations previously made on related organic molecules, it appears that these dyes exhibit a
cationic charge delocalized all over their structure, resulting in a carbon-rich part with a structure
intermediate between purely cumulenic and polyynic in the ground state. While the shorter metal
alkynyl derivatives M1+ and M2+ have a nearly typical allenylidene structure, the longer M3+ and M4+
derivatives with a 1,4-phenylene unit inserted in the carbon-rich bridge are closer to metal-alkynyl
complexes. The metal allenylidene derivatives M1+-M2+ possess a more marked triple-bond character
than the related diphenyl allenylidene complexes due to the presence of the para-amino
substituents. Reciprocally, the TPM-based metal alkynyl derivatives M3+-M4+ possess a more marked
cumulenic character than the related phenyl alkynyl complexes due to the presence of the
carbocationic moiety. These structural features are comparatively less marked for the
ethynylferrocenyl derivatives, because the d6 transition metal center is not σ-bonded to the rest of
the system. Thus all the ethynylferrocene derivatives present a dominant alkynyl character.
Depending on its connectivity ( vs. ), the metal center is clearly interacting with the carbocationic
center through the π-system of the carbon-rich bridge. Thus, cyclic voltammetry further confirmed
that stronger interactions were operative between the metal center and the organic carbocationic
core for organometallic substituents presenting a -bonded metal.
Concerning their optical properties, the presence of the organometallic endgroups induce
strong bathochromic shifts on the intense low lying absorptions present in the visible range which
are characteristic of the carbocationic chromophore. These shifts depend on the particular structure
of each dye, an effect also perceptible for the ferrocenyl derivatives, but to a lesser extent than for
the metal alkynyl or metal allenylidene species. This opens a way to tune structurally the linear
spectra of these compounds in a given spectral range. Further progress will certainly result from the
assignment of the various transitions observed, which is currently not possible in the absence of
theoretical modelling. Furthermore, the intense absorptions of these organometallic dyes in the

152
visible range suggest that large nonlinear effects such as TPA might occur in the NIR range.
Accordingly, their cubic nonlinear properties will be investigated soon by Z-scan.
Finally, concerning the possibility of redox-switching their optical properties, cyclic
voltammetry reveals that these organometallic dyes can be either reduced to the corresponding
neutral radicals or oxidized at their organometallic substituent, first, and then on their amino
substituents. However, while some of these redox processes appeared chemically reversible at the
electrode, only the metal-centered oxidation of the organometallic substituents turned out to be
amenable to practical control of their redox state in an OTTLE cell for switching their linear optical
properties. In this respect, spectroelectrochemical investigations afforded more information about
the spectra of their mono-oxidized state. Contrary to our initial expectations, the linear spectra do
not vary much upon oxidation of most of the derivatives. The origin of this behavior rests on the fact
that the spectrum of these dyes is dominated in both redox states by the intense absorptions of the
carbocationic part of the dye and the latter is not significantly affected by the metal-centered
oxidation. Nevertheless, with selected metal alkynyl derivatives some spectral regions in the NIR
range undergo important changes in absorption which might translate to large nonlinear
electrochromic effects.[54,55] The latter remain to be measured by Z-scan in an OTTLE cell .

153
References
[1] S. Sengupta, S. K. Sadhukhan, J. Mater. Chem. 2000, 10, 1997–1999. [2] S. Sengupta, Tetrahedron Lett. 2003, 44, 307–310. [3] C. Arbez-Gindre, B. R. Steele, G. A. Heropoulos, C. G. Screttas, J.-E. Communal, W. J. Blau, I.
Ledoux-Rak, J. Organomet. Chem. 2005, 690, 1620–1626. [4] C. Villalonga-Barber, B. R. Steele, V. Kovač, M. Micha-Screttas, C. G. Screttas, J. Organomet.
Chem. 2006, 691, 2785–2792. [5] C. Villalonga-Barber, K. Vallianatou, S. Georgakopoulos, B. R. Steele, M. Micha-Screttas, E. Levin,
N. G. Lemcoff, Tetrahedron 2013, 69, 3885–3895. [6] M. Ansorge, K. Polborn, T. J. J. Müller, Eur. J. Inorg. Chem. 2000, 2000, 2003–2009. [7] C. Arisandy, E. Fullam, S. Barlow, J. Organomet. Chem. 2006, 691, 3285–3292. [8] K. L. Rinehart, C. J. Michejda, P. A. Kittle, J. Am. Chem. Soc. 1959, 81, 3162–3163. [9] I.-Y. Wu, J. T. Lin, Y. S. Wen, Organometallics 1999, 18, 320–327. [10] S. Szafert, P. Haquette, S. B. Falloon, J. A. Gladysz, J. Organomet. Chem. 2000, 604, 52–58. [11] S. Rigaut, O. Maury, D. Touchard, P. H. Dixneuf, Chem. Commun. 2001, 373–374. [12] R. W. Lass, P. Steinert, J. Wolf, H. Werner, Chem. – Eur. J. 1996, 2, 19–23. [13] J. P. Selegue, Organometallics 1982, 1, 217–218. [14] H. Fischer, D. Reindl, G. Roth, Z. Für Naturforschung B 1994, 49, 1207–1214. [15] B. Reichmann, M. Drexler, B. Weibert, N. Szesni, T. Strittmatter, H. Fischer, Organometallics
2011, 30, 1215–1223. [16] M. I. Bruce, Chem. Rev. 1998, 98, 2797–2858. [17] G. Argouarch, P. Thominot, F. Paul, L. Toupet, C. Lapinte, C. R. Chim. 2003, 6, 209–222. [18] M. W. Kryman, G. A. Schamerhorn, K. Yung, B. Sathyamoorthy, D. K. Sukumaran, T. Y.
Ohulchanskyy, J. B. Benedict, M. R. Detty, Organometallics 2013, 32, 4321–4333. [19] I. C. S. Cardoso, A. L. Amorim, C. Queirós, S. C. Lopes, P. Gameiro, B. de Castro, M. Rangel, A. M.
G. Silva, Eur. J. Org. Chem. 2012, 2012, 5810–5817. [20] J. E. Whitaker, P. L. Moore, R. P. Haugland, R. P. Haugland, Biochem. Biophys. Res. Commun.
1991, 175, 387–393. [21] D. Touchard, P. Haquette, S. Guesmi, L. Le Pichon, A. Daridor, L. Toupet, P. H. Dixneuf,
Organometallics 1997, 16, 3640–3648. [22] J. Silvestre, R. Hoffmann, Helv. Chim. Acta 1985, 68, 1461–1506. [23] G. Doisneau, G. Balavoine, T. Fillebeen-Khan, J. Organomet. Chem. 1992, 425, 113–117. [24] T. M. Keller, S. B. Qadri, Chem. Mater. 2004, 16, 1091–1097. [25] V. N. Okulov, M. A. Dyadchenko, A. V. Churakov, E. V. Polunin, D. A. Lemenovskii, H. Yu, L. Wang,
V. P. Dyadchenko, Mendeleev Commun. 2015, 25, 171–173. [26] S. Nakatsuji, K. Nakashima, M. Iyoda, S. Akiyama, Bull. Chem. Soc. Jpn. 1988, 61, 2253–2255. [27] Z. Wang, Q. Meng, Z. Zhang, D. Fu, W. Zhang, Tetrahedron 2011, 67, 2246–2250. [28] A. J. Curtis, C. D. Gabbutt, B. Mark Heron, C. Kilner, Tetrahedron Lett. 2011, 52, 708–710. [29] J. N. Moorthy, A. L. Koner, S. Samanta, A. Roy, W. M. Nau, Chem. – Eur. J. 2009, 15, 4289–4300. [30] R. Denis, L. Toupet, F. Paul, C. Lapinte, Organometallics 2000, 19, 4240–4251. [31] C. Bianchini, P. Innocenti, M. Peruzzini, A. Romerosa, F. Zanobini, Organometallics 1996, 15, 272–
285. [32] F. Paul, C. Lapinte, Coord. Chem. Rev. 1998, 178–180, Part 1, 431–509. [33] D. Touchard, C. Morice, V. Cadierno, P. Haquette, L. Toupet, P. H. Dixneuf, J. Chem. Soc. Chem.
Commun. 1994, 859–860. [34] A. M. McDonagh, M. P. Cifuentes, I. R. Whittall, M. G. Humphrey, M. Samoc, B. Luther-Davies, D.
C. R. Hockless, J. Organomet. Chem. 1996, 526, 99–103. [35] F. de Montigny, G. Argouarch, T. Roisnel, L. Toupet, C. Lapinte, S. C.-F. Lam, C.-H. Tao, V. W.-W.
Yam, Organometallics 2008, 27, 1912–1923.

154
[36] N. G. Connelly, M. P. Gamasa, J. Gimeno, C. Lapinte, E. Lastra, J. P. Maher, N. L. Narvor, A. L. Rieger, P. H. Rieger, J. Chem. Soc. Dalton Trans. 1993, 2575–2578.
[37] F. Paul, J.-Y. Mevellec, C. Lapinte, J. Chem. Soc., Dalton Trans. 2002, 1783–1790. [38] F. H. Allen, D. G. Watson, L. Brammer, A. G. Orpen, R. Taylor, in Int. Tables Crystallogr. (Ed.: E.
Prince), International Union Of Crystallography, Chester, England, 2006, pp. 790–811. [39] M. Zora, C. Açıkgöz, T. A. Tumay, M. Odabaşoğlu, O. Büyükgüngör, Acta Crystallogr. 2006, 62,
m327–m330. [40] G. Grelaud; PhD Thesis, The Australian National University/Université de Rennes 1 2012. [41] M. A. Fox, J. E. Harris, S. Heider, V. Pérez-Gregorio, M. E. Zakrzewska, J. D. Farmer, D. S. Yufit, J.
A. K. Howard, P. J. Low, J. Organomet. Chem. 2009, 694, 2350–2358. [42] C. W. Faulkner, S. L. Ingham, M. S. Khan, J. Lewis, N. J. Long, P. R. Raithby, J. Organomet. Chem.
1994, 482, 139–145. [43] S. Marqués-González, M. Parthey, D. S. Yufit, J. A. K. Howard, M. Kaupp, P. J. Low,
Organometallics 2014, 33, 4947–4963. [44] Z. Atherton, C. W. Faulkner, S. L. Ingham, A. K. Kakkar, M. S. Khan, J. Lewis, N. J. Long, P. R.
Raithby, J. Organomet. Chem. 1993, 462, 265–270. [45] C. E. Powell, M. P. Cifuentes, J. P. Morrall, R. Stranger, M. G. Humphrey, M. Samoc, B. Luther-
Davies, G. A. Heath, J. Am. Chem. Soc. 2003, 125, 602–610. [46] N. Gauthier, N. Tchouar, F. Justaud, G. Argouarch, M. P. Cifuentes, L. Toupet, D. Touchard, J.-F.
Halet, S. Rigaut, M. G. Humphrey, et al., Organometallics 2009, 28, 2253–2266. [47] A. Adenier, M. M. Chehimi, I. Gallardo, J. Pinson, N. Vilà, Langmuir 2004, 20, 8243–8253. [48] K. Izutsu, Electrochemistry in Nonaqueous Solutions, John Wiley & Sons, New York, 2009. [49] I. Brindle, A. M. Jones, Dyes Pigments 2000, 47, 117–127. [50] Y. S. Sohn, D. N. Hendrickson, H. B. Gray, J. Am. Chem. Soc. 1970, 92, 3233–3234. [51] D. M. Duggan, D. N. Hendrickson, Inorg. Chem. 1975, 14, 955–970. [52] D. N. Hendrickson, Y. S. Sohn, D. M. Duggan, H. B. Gray, J. Chem. Phys. 1973, 58, 4666–4675. [53] F. Dietz, N. Tyutyulkov, M. Rabinovitz, J. Chem. Soc. Perkin Trans. 2 1993, 157–164. [54] M. P. Cifuentes, C. E. Powell, M. G. Humphrey, G. A. Heath, M. Samoc, B. Luther-Davies, J. Phys.
Chem. A 2001, 105, 9625–9627. [55] N. Gauthier, G. Argouarch, F. Paul, L. Toupet, A. Ladjarafi, K. Costuas, J.-F. Halet, M. Samoc, M. P.
Cifuentes, T. C. Corkery, et al., Chem. – Eur. J. 2011, 17, 5561–5577.

155
Chapter III:
Organometallic derivatives of crystal
violet

156

157
Chapter III
Organometallic derivatives of crystal violet
Contents
1. Introduction .................................................................................................................................... 158
2. Synthesis and characterization ...................................................................................................... 161
2.1. Direct replacement of amines to access molecular architectures such as S1 ......................... 161
2.1.1. Ethynylferrocene derivatives............................................................................................. 161
2.1.2. Metal alkynyl derivatives ................................................................................................... 164
2.2. Attempts to access molecular architectures such as S2 .......................................................... 168
2.2.1. Common organic precursor ............................................................................................... 168
2.2.2. Ethynylferrocenyl derivatives ............................................................................................ 168
2.2.3. Metal alkynyl derivatives ................................................................................................... 171
3. Electronic and optical properties ................................................................................................... 174
3.1. UV-Vis spectroscopy ................................................................................................................. 175
3.1.1. Trimetallic S1(Ru)+ compound........................................................................................... 175
3.1.2. Hexametallic S2(Fc)+ compound ........................................................................................ 176
3.1.3. Conclusion ......................................................................................................................... 177
3.2. Cyclic voltammetry ................................................................................................................... 178
3.2.1. Trimetallic S1(Ru)+ compound........................................................................................... 178
3.2.2. Hexametallic S2(Fc)+ compound ........................................................................................ 179
3.2.3. Conclusion ......................................................................................................................... 181
3.3. Spectroelectrochemistry .......................................................................................................... 182
3.3.1. Trimetallic S1(Ru)+ compound........................................................................................... 182
3.3.2. Hexametallic S2(Fc)+ compound ........................................................................................ 183
3.3.3. Conclusion ......................................................................................................................... 184
4. Conclusion ....................................................................................................................................... 185
References........................................................................................................................................... 187

158
1. Introduction
Following the encouraging results presented in the previous chapters, investigations on
related CV+-based organometallic derivatives will now be undertaken. While maintaining the
symmetric octupolar geometry that should increase the TPA cross-sections, electron-rich
organometallic centers can be introduced either as a direct replacement of amino donors (S1, Chart
1) or by reinforcing the donating power of the diphenylamino donors by grafting the redox-active
organometallic substituents in the para positions of the peripheral phenyl groups, leading to an
extended version of CV+ (S2). This dendritic structure should lead to even more active compounds in
terms of third-order NLO response and also to larger σTPA cross-sections.
Chart 1: Targeted organometallic derivatives based on CV+

159
This chapter is therefore mostly focused on the synthesis of these derivatives. As the
previous chapter mentions, derivatives similar to S1 have already been reported with either vinyl
ferrocenyl endgroups or ruthenium alkynyl "Ru(Cp)(PPh3)2C≡C-" endgroups, so that molecules based
on S1 and its extended versions (S2) can be considered as synthetically accessible targets.
Several synthetic strategies can be envisaged to reach these derivatives. Scheme 1 displays
the different synthetic routes that might be envisioned for S1.
Paths A and A' depict two of the routes previously reported for accessing the
organoruthenium species reported by Wu et al.[1] This synthesis necessitates metal centers resistant
to lithiation and able to support a subsequent classical aerobic work up, hence it is more likely to be
used with air-stable species such as ethynylferrocene or ruthenium alkynyl complexes, given that
iron alkynyl derivatives are air sensitive and will therefore present a greater challenge in work up. For
alkynyl complexes, an attractive alternative is through the formation of an acetylide complex via
alkyne activation and vinylidene formation/deprotection (route B), as used in the last chapter.[2–4]
With organic carbinols featuring three alkyne termini, a Sonogashira reaction involving iodo-
ferrocene can also be envisioned to access the corresponding tris-ethynylferrocenyl derivatives.[5,6]
Route C is similar to route B, but with inverted halogen-based and alkynyl-based synthons. Hence,
this reaction may be used with ethynylferrocene. Such an approach was used by Sengupta et al. with
vinyl ferrocene to access an analogue of S1 featuring alkene bridges via a Heck cross-coupling
reaction.[7,8] Route C might also be performed with "Fe(η5-C5Me5)(κ2-dppe)-C≡C-H" or related
terminal alkynyl complexes used as the alkyne.[9] Such a "metalla-Sonogashira" can be sometimes
useful when synthetic problems are encountered in the more classic approach B.[10–14] However, it is
usually limited to smaller scale reactions and not applicable when strongly electron-donating
substituents are appended to the halogenated aryl ring. Moreover, the "[M]C≡C-H" reactant has to
be prepared beforehand, usually from a more common [M]Cl precursor (e.g. for [M] = [Fe(η5-
C5Me5)(κ2-dppe)]).

160
Scheme 1: Four possible synthetic routes to access CV+-based derivatives such as S1
For accessing larger derivatives such as S2, similar reactions might be envisioned to install the
six peripheral organometallic groups based either (i) on nucleophilic reactions with ketones or
carbonates using appropriately functionalized organometallic synthons or (ii) on alkyne activation
reactions/Sonogashira cross-couplings protocols, from suitable central organic synthons peripherally
functionalized with six halogen or six alkyne groups.
In the next paragraphs, the synthesis and structural characterization of these organometallic
derivatives will be described. The first part will discuss the direct replacement of amines to reach
derivatives such as S1 and the second part will summarize the synthesis of larger amine-
functionalized derivatives such as S2. The physical properties of the isolated compounds will then be
described in a third part.

161
2. Synthesis and characterization
2.1. Direct replacement of amines to access molecular architectures such as
S1
2.1.1. Ethynylferrocene derivatives
Ferrocene derivatives are inert chemically. Thus, any of the routes (A, B or C) proposed in
Scheme 1 are possible and might lead to the desired compounds. Because of the starting compounds
available in the laboratory, route A' was tried first (Scheme 2) as it provided the shortest access to
the desired carbinol derivative S1(Fc)OH. However, reaction of the ethynylferrocene-functionalized
lithioaryl base 48 with diethyl carbonate 50 or with triphosgene 49[15] led each time to an inseparable
mixture of products in which only traces of the desired compounds could be detected (mass
evidence).
Scheme 2: Synthetic routes tested for accessing ethynylferrocene carbinols
Route A was tested next. It required the formation of the dimetallated ketone
precursor 47. The latter was obtained via a Sonogashira cross-coupling reaction from 52,[16] itself
prepared using a modified literature procedure from the 4-bromobenzaldehyde and para-
bromoiodobenzene (Scheme 3).[17] The ketone 47 has a poor solubility in classical organic solvents,
which explains the purification issues encountered and the recurrent presence of starting material
when testing path A'. Crystals of the new ketone 47 were obtained, confirming its structure (Figure
2). The structural study reveals the expected bond lengths and angles for this type of derivative.

162
Scheme 3: Synthetic pathway for accessing the ketone derivative 47
Figure 1: structure of 47 solved by Dr. Graeme Moxey
Subsequent reaction of the lithiated ferrocenyl derivative 48 with 47 formed the
desired compound S1(Fc)OH which was isolated in 20 % yield. This yield is low because of the poor
solubility of 47 in THF or Et2O, the two solvents tested for this lithiation reaction.
Crystals of S1(Fc)OH were also obtained (Figure 2). For this carbinol compound, the bond
lengths and angles are characteristic of a tetrahedral (sp3) central carbon and of three triple bonds in
the para positions (Table 1). The C-O is also "normal" compared to literature value of 1.440 Å.[18]
Complex angle C≡C C-O C1-C2 C=O
47 - 1.198(3) - 1.493(3) 1.222(3)
S1(Fc)OH 108.5 1.194(9) 1.442(5) 1.533(5) -
Table 1: Selected bond lengths (Å) and angles (°) for 47 and for S1(Fc)OH (averaged over the three arms)
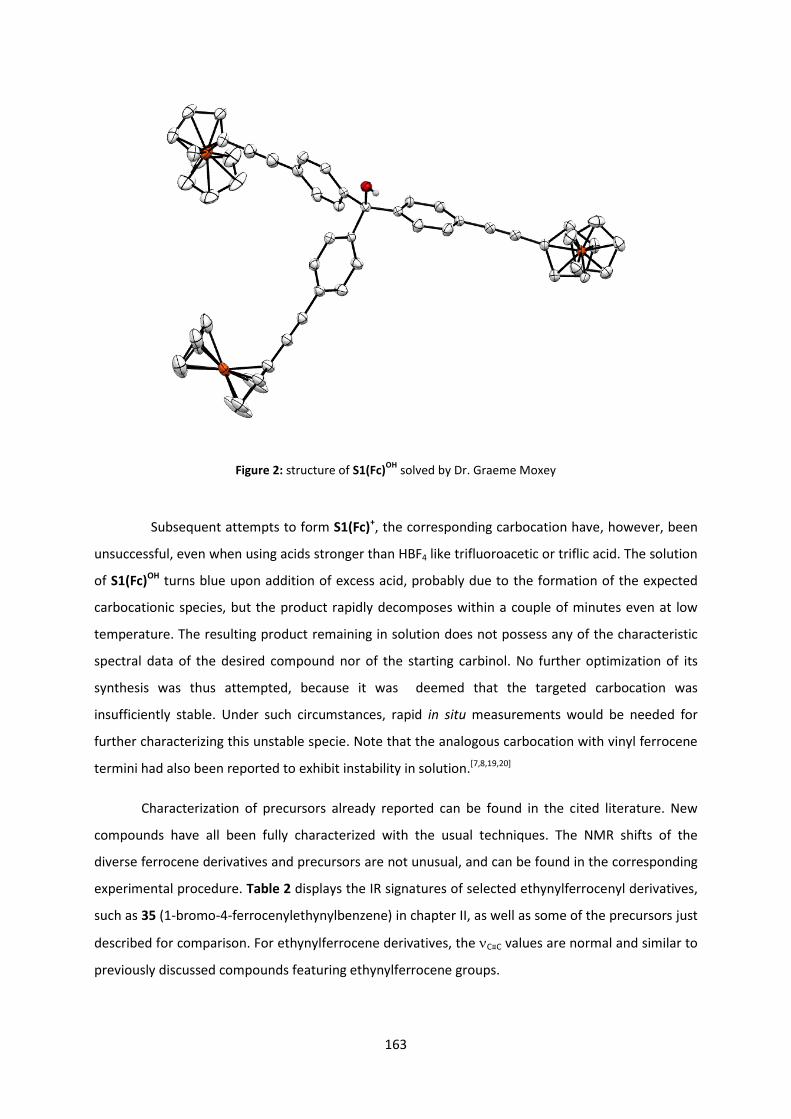
163
Figure 2: structure of S1(Fc)OH
solved by Dr. Graeme Moxey
Subsequent attempts to form S1(Fc)+, the corresponding carbocation have, however, been
unsuccessful, even when using acids stronger than HBF4 like trifluoroacetic or triflic acid. The solution
of S1(Fc)OH turns blue upon addition of excess acid, probably due to the formation of the expected
carbocationic species, but the product rapidly decomposes within a couple of minutes even at low
temperature. The resulting product remaining in solution does not possess any of the characteristic
spectral data of the desired compound nor of the starting carbinol. No further optimization of its
synthesis was thus attempted, because it was deemed that the targeted carbocation was
insufficiently stable. Under such circumstances, rapid in situ measurements would be needed for
further characterizing this unstable specie. Note that the analogous carbocation with vinyl ferrocene
termini had also been reported to exhibit instability in solution.[7,8,19,20]
Characterization of precursors already reported can be found in the cited literature. New
compounds have all been fully characterized with the usual techniques. The NMR shifts of the
diverse ferrocene derivatives and precursors are not unusual, and can be found in the corresponding
experimental procedure. Table 2 displays the IR signatures of selected ethynylferrocenyl derivatives,
such as 35 (1-bromo-4-ferrocenylethynylbenzene) in chapter II, as well as some of the precursors just
described for comparison. For ethynylferrocene derivatives, the C≡C values are normal and similar to
previously discussed compounds featuring ethynylferrocene groups.

164
Complex νO-H νC≡C δC-H Fc νC=0
47 - 2199 838 1640
S1(Fc)OH 3538 2205 825 -
Table 2: IR data (cm-1
± 2) for ethynylferrocene derivatives
2.1.2. Metal alkynyl derivatives
For iron(II) and ruthenium(II) alkynyl-based derivatives, compound 55 was synthesized in four
steps from 53 (Scheme 4). 55 has already been reported.[21]
Scheme 4: Synthesis of the triyne precursor for accessing the targeted Fe(II) and Ru(II) alkynyl complexes
The organic triyne 55 was then reacted with the ruthenium 5-coordinate precursor 45 in
DCM (Scheme 5). Surprisingly, spontaneous dehydration of the tris-vinylidene carbinol intermediate
occurs, in spite of the absence of base or amino-donating groups, to form eventually the
corresponding bis-vinylidene carbocationic complex 56 as the dominant species in solution. This
compound was characterized by 31P and 1H NMR spectroscopies; a 1/2 ratio of acetylide/vinylidene in
the 31P NMR spectrum and concomitant disappearance of the carbinol signature in the 1H NMR
spectrum were observed. The two remaining vinylidene moieties were then deprotonated upon
addition of base (Et3N) to form the desired CV+ analogue. Fortunately, the addition of Et3N did not re-
form the carbinol species; such a reaction was also observed by Wu et al.[1]

165
Scheme 5: Synthesis of the CV+ analogue [S1(Ru)
+][PF6
-]
Similar reactions starting from 55 were also undertaken with [Fe(η5-C5Me5)(κ2-dppe)Cl] to
isolate the corresponding Fe(II) derivative, but these attempts were unsuccessful, failing even to
form cleanly the corresponding tris-vinylidene complex.
These ruthenium alkynyl derivatives possess the expected IR signatures (Table 3). Their
carbinol derivatives exhibit lower values for the alkynyl stretching modes, in line with the literature
data.[18,22] A much more marked decrease in the νC≡C mode(s) is apparent when converting the
carbinol 55 to its carbocation S1(Ru)+, in line with a pronounced charge delocalization in the GS, and
evidencing a larger cumulenic character due to the three resonance forms (Scheme 6) than for the
ethynylferrocene analogue. The C≡C is also lower than for the related organoruthenium MG+-based
derivatives M3(Ru)+ and M4(Ru)+ (Chart 3) studied in the previous chapter, suggesting more charge
delocalization in the GS for the symmetric carbocation S1(Ru)+, or at least the existence of some
vibronic coupling between the various C≡C modes of each branch.
Chart 2: Organoruthenium compounds previously synthesized

166
Complex νO-H νC≡C νC≡H νP-F
54 3597 2159 - -
55 3538 2116 3281 -
S1(Ru)+ - 1958 - 834
M3(Ru)+ - 2014 - 839
M4(Ru)+ - 1986 - 836
Table 3: IR data for selected Ru(II) alkynyl derivatives and their carbinol precursors (cm-1
± 2)
The cumulenic character is also observed by 31P NMR, as the ruthenium derivative S1(Ru)+
has a shift very close to those of M3(Ru)+ and M4(Ru)+, confirming the strong charge delocalization
along the three arms.
compounds 31P (ppm)
S1(Ru)+ 47.6
M3(Ru)+ 47.6 (PF6)
48.4 (BF4)
M4(Ru)+ 47.4
Table 4: 31
P NMR data (ppm) of organoruthenium derivatives (162 MHz, CDCl3)
Crystals of S1(Ru)+ were eventually obtained (Figure 3) with a chloride counter ion.
Unfortunately, the crystallographic dataset obtained for the S1(Ru)+ crystals is not of sufficiently
good quality to extract accurate values for the geometrical parameters, so a detailed discussion of
the bonding within the molecule will not be supplied. Nevertheless, the connectivity of the molecule
confirms that the desired target was obtained. The bond distances suggest a slightly dissymmetric
structure for this compound in the solid state. Also, remarkably, the central triphenylene part of the
molecule tends to adopt the most coplanar conformation achievable (the torsion angles of peripheral
phenyl with mean plane of the carbocation are in between 20 and 40°), as expected from strong
intermolecular interactions (in line with the various mesomers B1-B3 given in the VB Scheme 6) and
intermolecular stacking interactions.

167
Scheme 6: VB scheme for S1(Ru)+
Figure 3: Structure of [S1(Ru)+
][Cl-] (connectivity only, Cl
- as a counter anion) obtained by Dr. Graeme Moxey
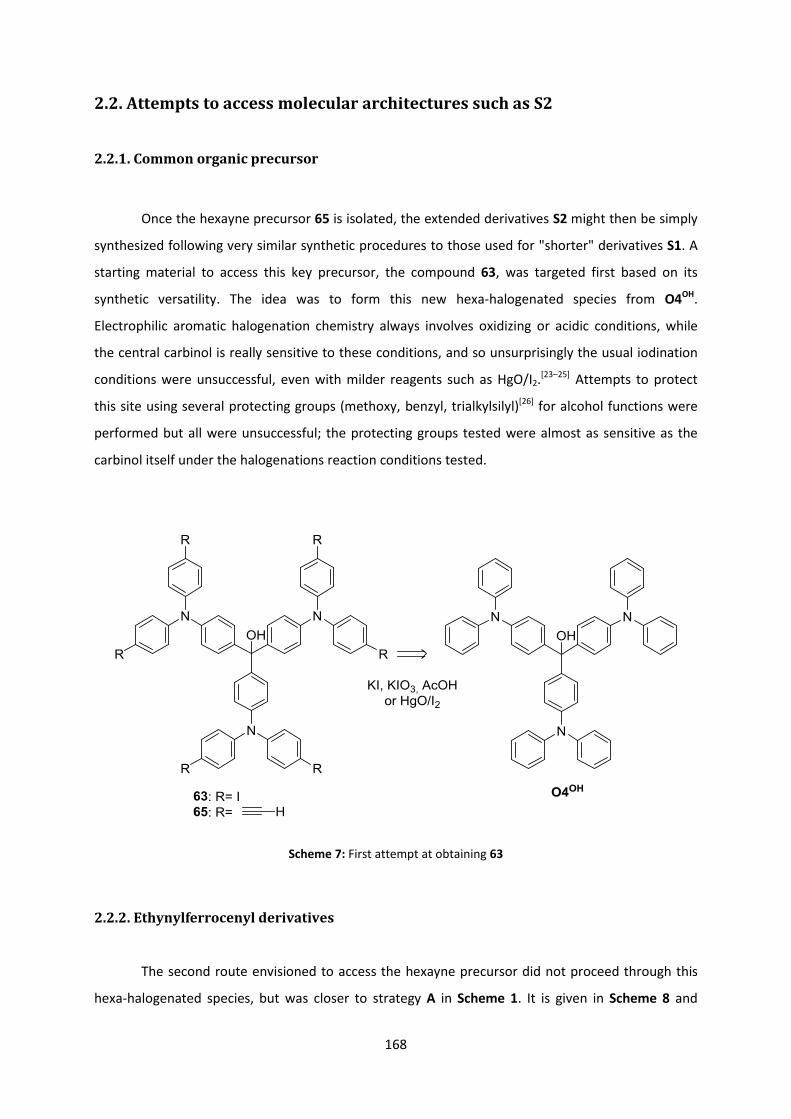
168
2.2. Attempts to access molecular architectures such as S2
2.2.1. Common organic precursor
Once the hexayne precursor 65 is isolated, the extended derivatives S2 might then be simply
synthesized following very similar synthetic procedures to those used for "shorter" derivatives S1. A
starting material to access this key precursor, the compound 63, was targeted first based on its
synthetic versatility. The idea was to form this new hexa-halogenated species from O4OH.
Electrophilic aromatic halogenation chemistry always involves oxidizing or acidic conditions, while
the central carbinol is really sensitive to these conditions, and so unsurprisingly the usual iodination
conditions were unsuccessful, even with milder reagents such as HgO/I2.[23–25] Attempts to protect
this site using several protecting groups (methoxy, benzyl, trialkylsilyl)[26] for alcohol functions were
performed but all were unsuccessful; the protecting groups tested were almost as sensitive as the
carbinol itself under the halogenations reaction conditions tested.
Scheme 7: First attempt at obtaining 63
2.2.2. Ethynylferrocenyl derivatives
The second route envisioned to access the hexayne precursor did not proceed through this
hexa-halogenated species, but was closer to strategy A in Scheme 1. It is given in Scheme 8 and

169
permits direct access to the hexa-ferrocenyl species S2(Fc)OH. It starts with the addition of the
lithiated derivative of triarylamine 61 to the substituted ketone 58. This reaction requires first the
isolation of the triphenylamine derivative 61 and of the ketone 57. Triphenylamine derivatives are
well known and the derivative 61 can be synthesized using well-known procedures starting from
tri(4-iodophenyl)amine, itself obtained in one step from triphenylamine.[25] From tri(4-
iodophenyl)amine, bis-functionalization by ethynylferrocene was effected using a Sonogashira
coupling reaction with the alkyne in sub-stoichiometric conditions (2/3 ratio) (Scheme 8).
Scheme 8: Synthesis of 60 and 61
Despite lowering the yields, such an approach avoids the additional steps that would be
required for achieving the symmetry-lowering at a triarylamine required to access this particular
precursor in a more efficient synthetic approach. However, in terms of overall yield, the limiting
reaction is that leading to the new tetra-iodo derivative 57, which allows access to the required tetra-
functional derivatives after further functionalization. 57 was obtained in good yields (83 %) following
a literature report from 2004.[27] From this compound, the synthesis of the corresponding tetra-
ethynylferrocene analogue was achieved in good yields via Sonogashira cross-coupling reactions
(Scheme 9).
Scheme 9: Synthesis of 57-58
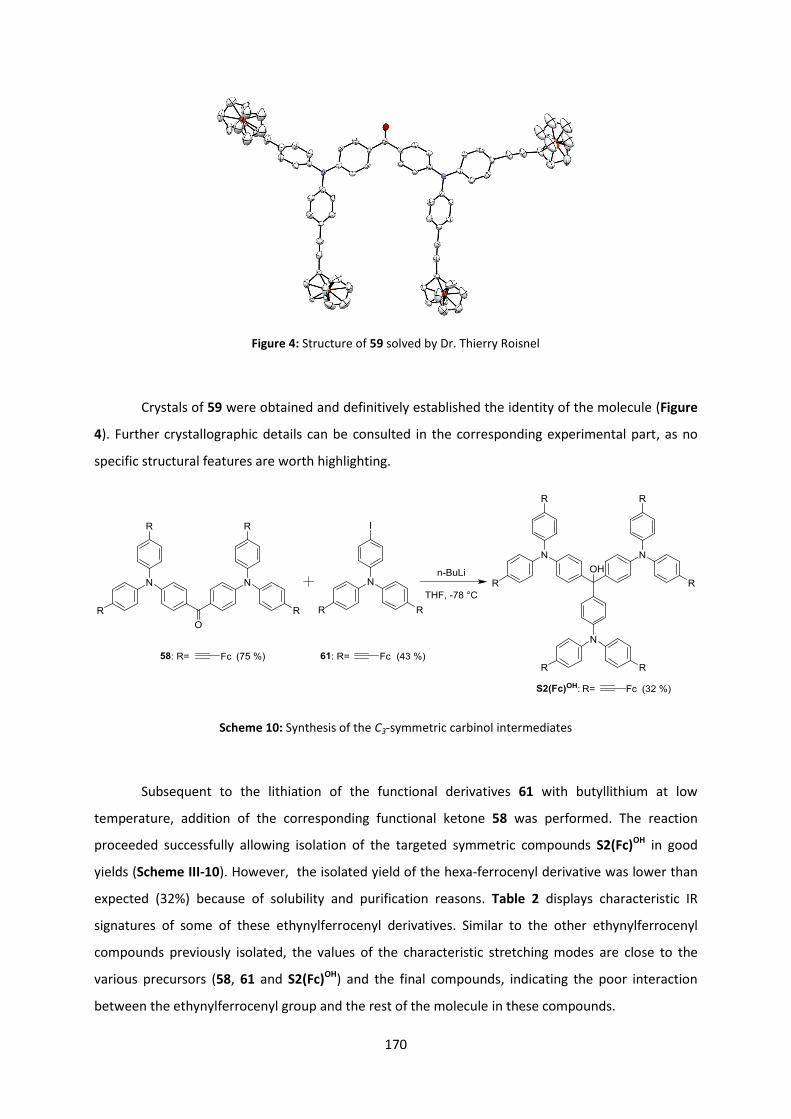
170
Figure 4: Structure of 59 solved by Dr. Thierry Roisnel
Crystals of 59 were obtained and definitively established the identity of the molecule (Figure
4). Further crystallographic details can be consulted in the corresponding experimental part, as no
specific structural features are worth highlighting.
Scheme 10: Synthesis of the C3-symmetric carbinol intermediates
Subsequent to the lithiation of the functional derivatives 61 with butyllithium at low
temperature, addition of the corresponding functional ketone 58 was performed. The reaction
proceeded successfully allowing isolation of the targeted symmetric compounds S2(Fc)OH in good
yields (Scheme III-10). However, the isolated yield of the hexa-ferrocenyl derivative was lower than
expected (32%) because of solubility and purification reasons. Table 2 displays characteristic IR
signatures of some of these ethynylferrocenyl derivatives. Similar to the other ethynylferrocenyl
compounds previously isolated, the values of the characteristic stretching modes are close to the
various precursors (58, 61 and S2(Fc)OH) and the final compounds, indicating the poor interaction
between the ethynylferrocenyl group and the rest of the molecule in these compounds.

171
Complex νO-H νC≡C δC-H Fc νC=0 νB-F
M4(Fc)OH 3446 2207 826 - -
M4(Fc)+ - 2196 833 - 1174
58 - 2204 821 1646 -
61 - 2209 817 - -
S2(Fc)OH 3563 2206 819 - -
S2(Fc)+ - 2204 820 - 1172
Table 5: Selected IR (cm-1
± 2) signatures for the ferrocenyl compounds
At this stage, a similar addition reaction between the tetra-iodo ketone 57 and a di-iodo
lithiated triaryl amine 60 was also attempted, in order to check if the hexa-iodo species previously
targeted (63) might be obtained by this new route. This compound was actually obtained and could
be characterized by NMR and mass spectroscopy, but its solubility was very low and resulted in low
isolated yields (<5%), making this new approach not attractive as a synthetic procedure.
Addition of HBF4 to a solution of S2(Fc)OH in Et2O gave the corresponding tris-ferrocenyl
carbocation S2(Fc)+. This species, analogous to O4+ (Chapter I), is stable in solution, due to the
presence of the peripheral arylamine groups which stabilize the central carbocation much more
efficiently than did previously the ethynylferrocenyl groups in S1(Fc)+.
2.2.3. Metal alkynyl derivatives
The synthesis of the corresponding hexa-yne precursor to the related metal-alkynyl species
was achieved in good yields, following a route similar to that used to obtain the ferrocene derivative
from the ketone 58. Thus, a Sonogashira cross-coupling reaction afforded 59 from this compound.
Addition of the lithiated species derived from 62 to 59 formed 63, which could be isolated in good
yields after chromatographic purification. The desired hexa-yne 64 was then obtained after removal
of trimethylsilyl protecting groups using potassium carbonate.

172
Scheme 11: Synthesis of the hexayne precursor 64
Reaction with the ruthenium 5-coordinate precursor complex 45 was attempted first
because the resulting Ru(II) alkynyl complexes are usually air-stable, in contrast to their Fe(II)
analogues with the [Fe(η5-C5Me5)(κ2-dppe)] endgroups, which are much more electron rich.
Furthermore, the vinylidene carbinol organoiron derivatives previously synthesized (Chap. II; sect
2.3.) turned out to be more difficult to deprotonate than their ruthenium counterparts and led to
unstable mixtures of carbocationic species.
As previously stated with 56 (Scheme 5), this reaction also led to a carbinol/hexavinylidene
species which underwent a spontaneous dehydration, leading to the formation of a hexa-ruthenium
carbocation with one of its vinylidene groups deprotonated. Subsequent addition of Et3N cleanly led
to formation of the desired dye S2(Ru)+ with a PF6- counter anion (Chart 4). The overall
transformation could be easily monitored by 31P NMR spectroscopy. Figure 5 shows this unusual
behavior upon comparing the spectra of the penta-vinylidene intermediate and the final S2(Ru)+
derivative with a 31P NMR shift of 49.58 ppm, close to the value expected for a classic Ru(II) alkynyl
complex, as seen for other derivatives presented in chapter II. Unfortunately, this last derivative
turned out to be quite sensitive and slowly decomposed (in the solid state) after these NMR
measurements were performed. It will therefore require synthesis again for further characterization.
Ruthenium derivatives are usually stable over time, even in air. This slow spontaneous
decomposition is unusual and may be linked to charge delocalization taking place on the peripheral
amine, activating the acetylide bond toward external nucleophilic attacks or electron-transfer
reactions, causing its decomposition upon aerial exposure. Under such conditions and due to time
limitations, the related reaction with [Fe(η5-C5Me5)(κ2-dppe)] was not attempted.

173
Chart 4: The extended CV+ analogue [S2(Ru)
+][PF6
-]
Figure 5: 31
P NMR spectra of [S2(Ru)+][PF6
-] and its penta-vinylidene precursor
Characterization of the new precursors was also performed using NMR and IR
spectroscopies. They all possess the expected characteristic stretching modes for such compounds,

174
as shown in the Table 6. The X-ray structure of compound 59 has also been solved (Figure 6). The
bonding parameters are not unusual and can be consulted in the experimental part, and likewise for
the other experimental characterizations obtained for these compounds.
Complex νO-H νC≡C νC≡H νSi-Me νC=O
59 - 2159 - 1272 1672
62 - 2154 - 1248 -
63 n.d. a 2153 - 1272 -
64 3300 2104 3287 - -
Table 6: IR (cm-1
± 2) data for selected Ru(II) alkynyl derivatives and their precursors. a: Too weak to be detected
Figure 6: Crystal structure of 59 solved by Dr. Graeme Moxey
3. Electronic and optical properties
The synthesis of the targeted organometallic CV+ derivatives S1+ and S2+ turned out to be
more difficult than expected and stability issues as well as solubility issues were encountered. Some
of them were eventually overcome, but only one short S1+-type carbocation and one extended S2+-
type carbocation were isolated: the ruthenium derivative S1(Ru)+ and the extended ferrocene
derivative S2(Fc)+. These species were actually stable enough for further characterization. To unravel
their electronic and optical properties, these new organometallic TPM dyes were then also
characterized by cyclic voltammetry, UV-vis spectroscopy and spectroelectrochemistry.

175
3.1. UV-Vis spectroscopy
3.1.1. Trimetallic S1(Ru)+ compound
Figure 9 presents the UV-vis spectra of the Ru(II) alkynyl carbocation S1(Ru)+ and the
key data are summarized in Table 7. For this ruthenium tris-alkynyl compound, values very similar to
those reported for the derivative XIXe (Chart 4) synthesized by Wu et al. were found.[1]
Chart 4: Analogue of S1(Ru)+ synthesized by Wu et al. a: In DCM
The lowest energy absorption found for S1(Ru)+ is shifted further into the NIR range
compared with XVIIe ( = 145 cm-1) (Figure 7), probably due to a better d-π-overlap for [Ru(κ2-
dppe)2] compared to that of [Ru(η5-C5H5)(PPh3)2], as the electron-richness of these endgroups is
similar, at least based on the first oxidation potentials of the bis-chloro complex [Ru(κ2-dppe)2Cl2]
(+0.600 V) and [Ru(η5-C5H5)(PPh3)2Cl] (+0.595 V).[28] There is an even more significant shift of ~400 nm
(4800 cm-1) between these ruthenium derivatives and CV+ accompanied by a remarkable increase in
intensity of the low-energy band. This shift can be explained firstly by the much larger electron-
donating power of the ruthenium metal center in the excited state compared to diphenylamine and
also (partly) by the increase of the π-system due to the presence of the additional alkynyl bonds. The
absorption due to the charge transfer (CT) transition in CV+ most likely corresponds to a metal-to-
ligand charge transfer (MLCT) process in S1(Ru)+. Unsurprisingly, the latter compound exhibits very
similar spectral features such as a shoulder on the high-energy side of the lowest-energy band, a

176
fairly similar extinction coefficient for this band, and a second set of bands near 620 nm likely
attributable to the forbidden A→A band observed near 300 nm in CV+.
Figure 7: UV-Vis spectra of the ruthenium derivative [S1(Ru)+][PF6
-] and [CV
+][Cl
-]
3.1.2. Hexametallic S2(Fc)+ compound
The UV-vis spectrum of the hexa-ferrocene derivative S2(Fc)+ is presented in Figure 8, along
with that of its carbinol precursor. The spectrum of the all-organic diphenylamino analogue of CV+
(O4+) (Chapter I, 2.2) is also given in that figure for comparison. The key electronic absorption data is
collected in Table 7 for these three compounds. Regardless of the presence of the ethynylferrocene
endgroups, the carbinol S2(Fc)OH has most of its electronic absorptions located at wavelengths
shorter than 430 nm, in line with amine- and ferrocene-based transitions (at 340 nm), while the
carbocation S2(Fc)+ presents a band at much lower energy (690 nm), responsible for its deep green
color. In spite of the poor influence of the peripheral ferrocenyl groups in the GS evidenced by CV+,
these organometallic substituents seem nevertheless to exert an influence on the first excited state
of this dye, since its intense low-energy band in the visible range appears red-shifted (60 nm, 1380
cm-1) when compared to the non-substituted derivative 37+. This significant bathochromic shift
possibly results from increased polarizability of the π-manifold induced by these organometallic
0
50000
100000
150000
200000
250000
230 430 630 830 1030 1230 1430
ε (L
.mo
l-1.c
m-1
)
λ(nm)

177
electron-releasing groups. The shift (48 nm, 1309 cm-1) between O4+ and CV+ largely results from the
extension of the -manifold.
Figure 8: UV-vis spectra of the ferrocene derivatives S2(Fc)OH
, [S2(Fc)+][BF4
-] and [O4
+][BF4
-] (used as reference)
Complex O4+ S2(Fc)+ CV+ S1(Ru)+ Ref
λmax (ε 105·M-1·cm-1) 630 (1.1)
405 (0.003)
690 (0.92)
445 (0.001)
582 (1.26)
360 a
988 (1.4)
627 (0.001)
974 (1.2) b
n.d.
ΔE(cm-1) 8818 7979 10595 5827 -
Table 7: UV-Vis data for ruthenium alkynyl- and ethynylferrocene-based TPM dyes, [CV+][Cl
-] and [O4
+][BF4
-]
(used as reference values. a: Not observable. b: ref [1]
3.1.3. Conclusion
In conclusion, these new organometallic TPM dyes present strong absorptive properties in
the visible-NIR range. Their lowest energy bands possess similar extinction coefficients to their
organic analogues CV+ and 37+, but are significantly red-shifted, especially in the case of the Ru(II)
alkynyl derivatives, for which direct conjugation with the carbocationic center is possible. These
0
20 000
40 000
60 000
80 000
100 000
120 000
140 000
160 000
180 000
200 000
230 430 630 830 1030 1230 1430
ε (L
.mo
l-1.c
m-1
)
λ (nm)

178
observations suggest that large absorptive third-order NLO effects might be observed, located deep
in the NIR range, prompting us to undertake the Z-scan measurements for the organometallic
octupoles. To assign the absorptions observed at higher energy for these organometallic dyes or to
draw additional conclusions on the effect of the metal centers on their linear optical absorption
spectra, some TD-DFT calculations are needed. We will now investigate the redox properties of these
new derivatives.
3.2. Cyclic voltammetry
3.2.1. Trimetallic S1(Ru)+ compound
In the case of the ruthenium tris-alkynyl derivative S1(Ru)+, an interesting situation is
encountered: upon reduction, there is a one-electron irreversible reduction of the central
carbocation, and upon oxidation, a reversible oxidation process takes place at 0.66 V, followed by
another quasi-reversible event at higher potentials (1.09 V). When compared to the oxidation
potential of the corresponding phenylacetylene analogue (E1/2 = 0.41 V under these conditions, i.e. Δ
E1/2 = 0.25 V)[29], the first oxidation occurs at 0.25 V more positive potential (Table 8). This potential
shift is likely due to the positive charge. Notably, this oxidation potential is also higher than those
previously found for the related MG+-based dyes in the previous chapter (Table 8), indicating that
part of the cationic charge was efficiently delocalized on the two amino-substituents in these
monometallic derivatives. Thus, M3(Ru)+ and M4(Ru)+ (Chart 2) undergo metal-centred oxidation at
0.58 V and 0.54 V, respectively. Furthermore, integration reveals that this oxidation is a two-electron
process with the oxidation of two ruthenium centers probably leading to a di-radical compound such
as that represented in Figure 9, with the remaining arm stabilizing the cationic charge. As such, the
resulting trication should have a less symmetrical structure than CV+, closer to that of MG+
derivatives. This trication can actually be considered as an allenylidene complex with two weakly π-
attracting substituents in the para-positions on the terminal rings. Also, due to the much lower
electron-releasing power of these endgroups, it will exhibit an increased chemical reactivity in
solution, resembling that of non-stabilized TPM carbocations. According to the cyclic voltammogram,
the third ruthenium-containing endgroup can also be oxidized at even higher potentials but this
oxidation is not fully chemically reversible this time. Based on DPV experiments (Table 8), only the
first oxidized state S1(Ru)3+ might exhibit sufficient stability in solution for electrochemical
generation by electrolysis.

179
Figure 9: Cyclic voltammetry and DPV data for Ru derivative [S1(Ru)+][PF6
-] in DCM containing 0.10 M [n-
Bu4N][PF6] (E1/2, ΔE1/2 and ΔEp in V vs. SCE)
complex E1/2 ΔEp ipc/ipa integration
[Ru]-C≡C-Ph 0.44 - - - M3(Ru)+ 0.58 0.04 1.0 1 M4(Ru)+ 0.54 0.04 1.0 1
S1(Ru)+ (redI) -0.41 0.04 0.83 1 S1(Ru)+ (oxI-oxII) 0.66 0.04 1.0 2
S1(Ru)+ (oxIII) 1.09 0.07 0.64 1
Table 8: Cyclic voltammetric and DPV data for Ru derivatives in DCM containing 0.10 M [n-Bu4N][PF6] (E1/2, ΔE1/2
and ΔEp in V vs. SCE)
3.2.2. Hexametallic S2(Fc)+ compound
The extended S2(Fc)+ derivative and of its carbinol precursor S2(Fc)OH reveal quite similar
voltammograms, similar to those obtained for previously isolated ethynylferrocene derivatives such
as M3(Fe)+ or M4(Fc)+ (Chapter II-3.5. and Figure 10 and Table 9). In line with previous data, this
indicates that there is not much electronic interaction between the carbocationic TPM core and the
-1 -0.5 0 0.5 1 1.5

180
peripheral ethynylferrocene groups. This lack of interaction is emphasized for the extended CV+-
based derivative S2(Fc)+ for which the metallic center is spatially even further away from the central
carbon atom. The absence of interaction between the ferrocenyl groups and the cationic core is
more pronounced in this derivative due to the presence of the nitrogen atoms at intermediate
distances which stabilize the central charge without any strong involvement of the terminal metal
centers. One single wave integrating for six simultaneous oxidations is thus found when compared to
the one-electron reduction process of the central carbocation. This quasi-reversible reduction is
clearly linked to the carbocation as the carbinols do not possess this reduction wave. Thus, this
compound featuring six equivalent redox-active ferrocenyl groups possesses only three distinct redox
states; the monocationic state corresponding to the starting compound, the mono-reduced state,
corresponding to the carbon radical and the heptacationic state corresponding to the cation with all
ferrocene moieties oxidized (Scheme 12). Relative to E26+, E1.+ possesses limited stability in solution,
based on DPV experiments (Table 9).
Scheme 12: Oxidation states of S2(Fc)+
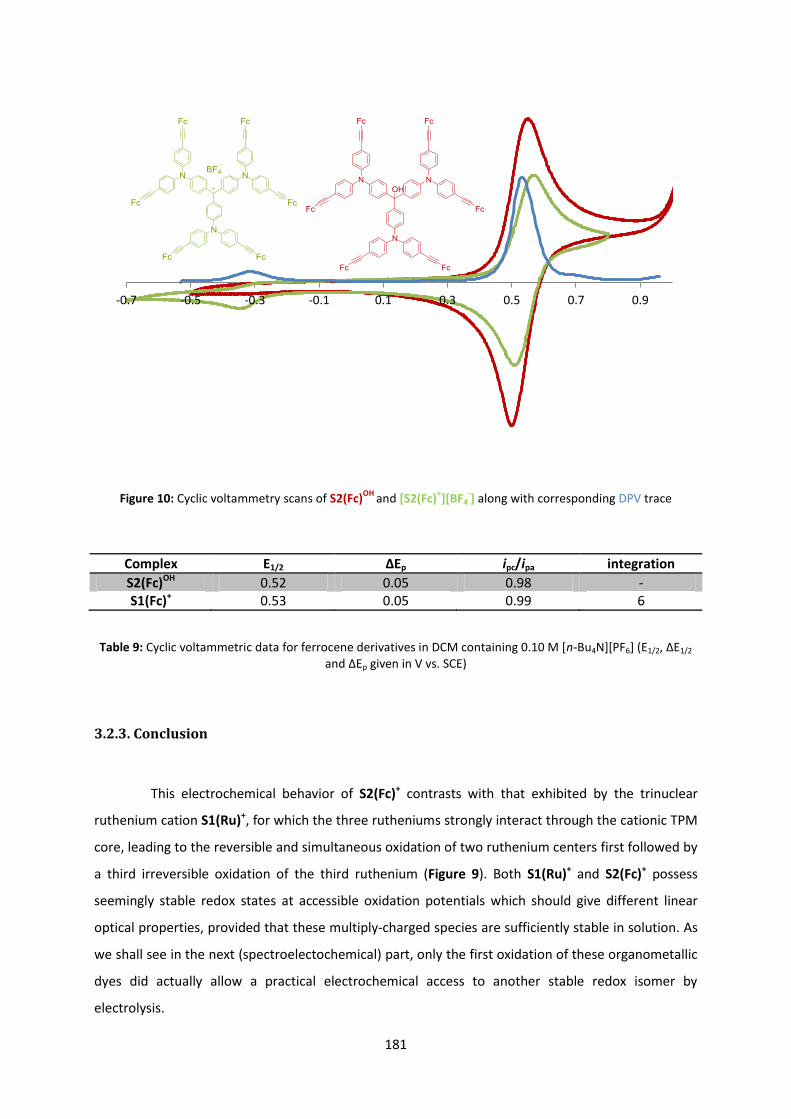
181
Figure 10: Cyclic voltammetry scans of S2(Fc)OH
and [S2(Fc)+][BF4
-] along with corresponding DPV trace
Complex E1/2 ΔEp ipc/ipa integration
S2(Fc)OH 0.52 0.05 0.98 - S1(Fc)+ 0.53 0.05 0.99 6
Table 9: Cyclic voltammetric data for ferrocene derivatives in DCM containing 0.10 M [n-Bu4N][PF6] (E1/2, ΔE1/2
and ΔEp given in V vs. SCE)
3.2.3. Conclusion
This electrochemical behavior of S2(Fc)+ contrasts with that exhibited by the trinuclear
ruthenium cation S1(Ru)+, for which the three rutheniums strongly interact through the cationic TPM
core, leading to the reversible and simultaneous oxidation of two ruthenium centers first followed by
a third irreversible oxidation of the third ruthenium (Figure 9). Both S1(Ru)+ and S2(Fc)+ possess
seemingly stable redox states at accessible oxidation potentials which should give different linear
optical properties, provided that these multiply-charged species are sufficiently stable in solution. As
we shall see in the next (spectroelectochemical) part, only the first oxidation of these organometallic
dyes did actually allow a practical electrochemical access to another stable redox isomer by
electrolysis.
-0.7 -0.5 -0.3 -0.1 0.1 0.3 0.5 0.7 0.9

182
3.3. Spectroelectrochemistry
3.3.1. Trimetallic S1(Ru)+ compound
The spectroelectrochemistry of these organometallic dyes has been investigated to delineate
the influence of oxidation on their linear absorptive properties and also to ascertain at which
particular wavelength they might exhibit the most pronounced third-order nonlinear optical effects
regarding the new absorption maxima in the electronic spectra of their oxidized species.[30–32]
For the trinuclear ruthenium(II) derivative S1(Ru)+, only the first (tricationic) oxidized state is
chemically accessible at the electrode and could be investigated in the spectroelectrochemical cell.
The resulting spectral changes are given in Figure 11. Curiously, only small spectral changes
accompany this two-electron oxidation: a broadening of the absorption band located in the NIR
range, along with a slight weakening in intensity. Overall, these changes recall those observed during
the oxidation of the related MG+ derivatives M3(Ru)+ and M4(Ru)+, but far less pronounced. The
amino substituents that afford very similar linear absorptions for the carbocationic chromophores in
the M3+ and M4+ dyes, regardless of the oxidation state of the metallic centre, have been replaced
by oxidizable metal centers in S1(Ru)+; based on the VB scheme previously discussed, only
dioxidation of S1(Ru)+ takes place and leads to a redox isomer possessing a symmetry similar to that
of MG+, and hence to the splitting of the low-energy absorption into two bands, possibly at the origin
of the spectral broadening observed. Moreover, for this particular trication (S1(Ru)3+), it seems that
the new LMCT bands formed after oxidation of the two metallic termini overlap with the remaining
MLCT band originating from the last Ru(II) endgroup, and thus are less differentiated than in the case
of M3(Ru)+ or M4(Ru)+. More dramatic changes might have been observed in the case of the
tetracation S1(Ru)4+ in which all the metallic endgroups are oxidized, but unfortunately this species is
insufficiently stable to be cleanly generated in the OTTLE cell.

183
Figure 11: Spectroelectrochemistry of [S1(Ru)+][PF6
-]
3.3.2. Hexametallic S2(Fc)+ compound
Very weak spectral changes are also seen upon hexa-electronic oxidation of the tris-
ferrocene derivative S2(Fc)+ (Figure 9). Because the oxidation was previously demonstrated not to
impact the electronic structure of the carbocationic core to an appreciable extent (see section 3.2.2
describing the cyclic voltammetry study) nor to lower the symmetry of this dye (as all ferrocenyl
groups are oxidized at the same time), only slight spectral changes were expected. These are
consistent with the weak electronic influence of the peripheral ethynylferrocenyl substituents
already observed in the linear optical spectrum of S2(Fc)+ relative to that of the organic reference
carbocation O4+. Thus the main absorption band undergoes a slight hypsochromic shift of 10 nm (213
cm-1) and new (weak) contributions grow in at ca. 400 and 950 nm. This blue-shift is understandable
as oxidation of the ferrocene weakens the donating power of the amine, hence reducing the donor-
acceptor character of this CT transition. The latter is very broad and recalls similar bands previously
observed during the spectroelectrochemical oxidation of related ethynylferrocene-containing dyes
such as M4(Fc)+, although the ferrocenyl groups are interacting more strongly with the carbocationic
chromophore in these compounds because they are spatially closer to it.
Ab
sorb
ance
λ (nm)

184
Figure 9: Spectroelectrochemistry of [S2(Fc)+
][BF4-]
3.3.3. Conclusion
Both star-shaped organometallic dyes S1(Ru)+ and S2(Fc)+ possess similar spectra in their
starting (cationic) state and in their first oxidized state. While such a weak linear electrochromism
had been anticipated for S2(Fc)+, based on spectroelectrochemical results previously obtained for
M4(Fc)+ and on the fact that the ferrocenyl substituents are more remote from the carbocationic
center in the extended derivative S2(Fc)+, the weak electrochromism exhibited by S1(Ru)+ was more
surprising to us. While several hypotheses have been made to explain this, a deeper understanding
of this phenomenon will require a proper assignment of the most intense underlying transitions and
of their actual metallic character (i.e. MLCT vs. LMCT contribution upon oxidation). This will require
TD-DFT calculations to be performed on these derivatives. From the perspective of redox-controlling
their third-order NLO properties, the strongest switching effects might be seen for the spectral
regions where the largest absorptive changes take place. These are centered either around 750 nm
and 1100 nm for S1(Ru)+, and around 500 nm and 900 nm for S2(Fc)+. Overall, based on TPA vs. RSA
effects, only moderate changes in their cubic NLO responses are nevertheless anticipated for these
TPM dyes upon oxidation.
Ab
sorb
ance
λ (nm)

185
4. Conclusion
New synthesic routes have been developed to reach the targeted octupolar TPM dyes, with
either a small (S1+) or extended (S2+) carbocationic core. While several of our targets are unstable in
solution, we were nevertheless able to isolate one representative of each kind. Thus the tris-Ru(II)
alkynyl derivative S1(Ru)+ was isolated for the minimal structure S1+, in which all peripheral amino
substituents are replaced by trans-[Ru(κ2-dppe)2(Cl)C≡C] donor groups, and the hexa-
ethynylferrocene derivative S2(Fc)+ was isolated as a representative structure of S2+, with an
extended core featuring peripheral functionalization of the aminoaryl rings. These two carbocations
were extensively characterized and a poor quality crystal structure was determined [S1(Ru)+][Cl-]. In
addition, preliminary results also suggest that some of the other targeted organometallic derivatives
might be amenable to study after generation in situ from the corresponding carbinols. This is the
case for the tris-ethynyl ferrocenyl dye [S1(Fc)+][BF4-], the smaller version of [S2(Fc)+][BF4
-], and the
hexa-Ru(II) alkynyl dye [S2(Ru)+][PF6-], corresponding to the extended version of [S1(Ru)+][PF6
-].
Compared to the corresponding organic analogues, which are Crystal Violet (CV+) for the
shorter derivatives and O4+ for the larger ones, the introduction of redox-active metal centers led
always to the appearance of a new reversible oxidation largely centered on the metal atoms. This
opens an opportunity for redox modulation of the optical properties, given that the reduced state
(carbon-based radical) of all these dyes is usually not stable at all.
Thus, for the tris-ruthenium(II) alkynyl derivative [S1(Ru)+][PF6-], cyclic voltammetry reveals a
strong electronic interaction in the cationic GS, resulting in a simultaneous and reversible oxidation
of two metal centers, the positive charge being probably delocalized on the remaining arm, followed
by the quasi-reversible oxidation of the last metallic arm, some 430 mV higher in potential. A very
large effect of the metal centers is apparent on the electronic absorption spectrum of this particular
carbocation, resulting in a large bathochromic shift of the first allowed transition compared to CV+, in
line with observations made on related organometallic MG+ derivatives in the previous chapter.
For [S2(Ru)+][PF6-], the oxidation of all ferrocenyl groups is occurring reversibly at once, in
line with a poor conjugation of this metal center with the rest of the system and virtually no metal-
metal interactions in the GS. The introduction of metal centers in this carbocation has nevertheless
an effect on the energy of the lowest allowed excited state, as revealed by the slight but significant
bathochromic shift of its linear absorption band.

186
To our knowledge [S1(Ru)+][PF6-] and [S2(Ru)+][PF6
-] are the first organometallic derivatives
of the TMP dye to be extensively analyzed using these techniques. From this work, one can anticipate
a comparatively larger influence from the metal centers in extended derivatives such as
[S1(Ru)+][PF6-] that could only be partially characterized because of low stability. Such species are
certainly worth further studies after being generated in situ from their stable carbinol precursors.
As stated for organics, the extension of the π-manifold and also the replacement of electron-
releasing substituents by d6 metal centers lead to bathochromic shifts of the linear absorption at
lowest energy. These shifts can be very large as seen for [S1(Ru)+][PF6-]. The effect on the cubic NLO
properties, which should be also important, remains to be probed by Z-scan.
Finally, in relation to the redox switching of these cubic NLO properties, the
spectroelectrochemical experiments performed on these derivatives reveal an overall poorer
electrochromism upon oxidation than that seen for the organometallic MG+ derivatives studied in
the previous chapter. Thus, our observations suggest poorly contrasted cubic NLO responses
between their cationic resting state and the next oxidized state for these organometallic dyes
through much of the visible-NIR region. While largely counter-intuitive with the strong effect on the
linear absorption spectra seen upon introduction of the metal centers, which results in a large
metallic character for the dominant transitions at low energy, this result requires further
investigations. In this respect a precise assignment of the low energy transitions should now be
undertaken for each redox state with the help of TD-DFT calculations.

187
References
[1] I.-Y. Wu, J. T. Lin, Y. S. Wen, Organometallics 1999, 18, 320–327. [2] F. Paul, C. Lapinte, Coord. Chem. Rev. 1998, 178–180, 431–509. [3] D. Touchard, P. Haquette, S. Guesmi, L. Le Pichon, A. Daridor, L. Toupet, P. H. Dixneuf,
Organometallics 1997, 16, 3640–3648. [4] M. A. Fox, J. E. Harris, S. Heider, V. Pérez-Gregorio, M. E. Zakrzewska, J. D. Farmer, D. S. Yufit, J.
A. K. Howard, P. J. Low, J. Organomet. Chem. 2009, 694, 2350–2358. [5] J. C. Goeltz, C. P. Kubiak, Organometallics 2011, 30, 3908–3910. [6] H. Plenio, J. Hermann, A. Sehring, Chem. – Eur. J. 2000, 6, 1820–1829. [7] S. Sengupta, S. K. Sadhukhan, J. Mater. Chem. 2000, 10, 1997–1999. [8] S. Sengupta, Tetrahedron Lett. 2003, 44, 307–310. [9] R. Denis, L. Toupet, F. Paul, C. Lapinte, Organometallics 2000, 19, 4240–4251. [10] S. Le Stang, D. Lenz, F. Paul, C. Lapinte, J. Organomet. Chem. 1999, 572, 189–192. [11] S. Le Stang, F. Paul, C. Lapinte, Inorg. Chim. Acta 1999, 291, 403–425. [12] F. de Montigny, G. Argouarch, T. Roisnel, L. Toupet, C. Lapinte, S. C.-F. Lam, C.-H. Tao, V. W.-W.
Yam, Organometallics 2008, 27, 1912–1923. [13] S. I. Ghazala, N. Gauthier, F. Paul, L. Toupet, C. Lapinte, Organometallics 2007, 26, 2308–2317. [14] F. Paul, S. Goeb, F. Justaud, G. Argouarch, L. Toupet, R. F. Ziessel, C. Lapinte, Inorg. Chem. 2007,
46, 9036–9038. [15] W. Su, W. Zhong, G. Bian, X. Shi, J. Zhang, Org. Prep. Proced. Int. 2004, 36, 499–547. [16] K. Sonogashira, Y. Tohda, N. Hagihara, Tetrahedron Lett. 1975, 16, 4467–4470. [17] E. Akiyama, S. Nishimura, T. Suzuki, Y. Nagase, Trans. Mater. Res. Soc. Jpn. 2012, 37, 459–462. [18] F. H. Allen, D. G. Watson, L. Brammer, A. G. Orpen, R. Taylor, in Int. Tables Crystallogr. (Ed.: E.
Prince), International Union of Crystallography, Chester, England, 2006, pp. 790–811. [19] C. Villalonga-Barber, K. Vallianatou, S. Georgakopoulos, B. R. Steele, M. Micha-Screttas, E. Levin,
N. Gabriel Lemcoff, Tetrahedron 2013, 69, 3885–3895. [20] C. Villalonga-Barber, B. R. Steele, V. Kovač, M. Micha-Screttas, C. G. Screttas, J. Organomet.
Chem. 2006, 691, 2785–2792. [21] O. Plietzsch, A. Schade, A. Hafner, J. Huuskonen, K. Rissanen, M. Nieger, T. Muller, S. Bräse, Eur.
J. Org. Chem. 2013, 2013, 283–299. [22] M. I. Bruce, Chem. Rev. 1998, 98, 2797–2858. [23] K. Orito, T. Hatakeyama, M. Takeo, H. Suginome, Synthesis 1995, 1995, 1273–1277. [24] O. P. Varnavski, J. C. Ostrowski, L. Sukhomlinova, R. J. Twieg, G. C. Bazan, T. Goodson, J. Am.
Chem. Soc. 2002, 124, 1736–1743. [25] C. Sissa, V. Parthasarathy, D. Drouin-Kucma, M. H. V. Werts, M. Blanchard-Desce, F. Terenziani,
Phys. Chem. Chem. Phys. 2010, 12, 11715–11727. [26] P. G. M. Wuts, T. W. Greene, in Greenes Prot. Groups Org. Synth., John Wiley & Sons, Inc.,
Hoboken, New jersey, 2006, pp. 16–366. [27] G. Koeckelberghs, M. Vangheluwe, I. Picard, L. De Groof, T. Verbiest, A. Persoons, C. Samyn,
Macromolecules 2004, 37, 8530–8537. [28] G. J. Perkins, M. I. Bruce, B. W. Skelton, A. H. White, Inorg. Chim. Acta 2006, 359, 2644–2649. [29] N. Gauthier, N. Tchouar, F. Justaud, G. Argouarch, M. P. Cifuentes, L. Toupet, D. Touchard, J.-F.
Halet, S. Rigaut, M. G. Humphrey, K. Costuas, F. Paul Organometallics 2009, 28, 2253–2266. [30] G. Grelaud, M. P. Cifuentes, F. Paul, M. G. Humphrey, J. Organomet. Chem. 2014, 751, 181–200. [31] K. A. Green, M. P. Cifuentes, M. Samoc, M. G. Humphrey, Coord. Chem. Rev. 2011, 255, 2530–
2541. [32] C. E. Powell, M. P. Cifuentes, J. P. Morrall, R. Stranger, M. G. Humphrey, M. Samoc, B. Luther-
Davies, G. A. Heath, J. Am. Chem. Soc. 2003, 125, 602–610.

188

189
General conclusion

190

191
General conclusion
Several objectives were defined for the work presented in this thesis: firstly, the preparation
of new organic derivatives based on the well-known triphenylmethylium (TPM) dyes MG+ and CV+ in
order to confirm their potential as two-photon absorbers; and secondly, the incorporation of redox-
active metal centers into these structures in order to enhance their third-order NLO responses and to
explore their potential as redox-switchable dyes. The potential of TPM dyes as third-order NLO-
phores stems from their architecture: a central carbocation, one of the strongest electron-accepting
groups, and peripheral diamino electron-donating groups, in an octupolar or pseudo-octupolar
geometry. Moreover, these dyes usually possess intense near-infrared absorptions which should
result in two-photon absorptions located in the infrared range, a region interesting for various
applications in fields as diverse as medicine or telecommunications.
The first set of organic derivatives is shown in Chart 1. The structural modifications at MG+ or
CV+ include the extension of the π-manifold with the use of 9-anthracene or 2-fluorene as well as
diphenylamino substituents, synthons already known for promoting TPA activity. Rigidification of the
system has also been investigated to decrease the non-radiative decay of these chromophores. The
series of compounds synthesized possesses the same spectral features as their model compounds,
with two main bands for the less symmetric MG+-based dyes. A bathochromic shift of the
characteristic absorptions at low energy is observed. The latter is largely attributable to the
extension of the π-system. The rigidified systems O3+ resulted in an even more pronounced shift, the
compounds exhibiting absorptions well into the infrared range. Preliminary (open-aperture) Z-scan
studies on these compounds have confirmed their potential as two-photon absorbers. Among MG+-
based dyes, the highest two-photon cross-sections being found for molecules combining 2-fluorenyl
groups and diphenylamino substituents and among CV+-based dyes for the octupolar derivative O4+.
Unfortunately, the rigidified fluorenium molecules could not be measured yet and will require
further work to evaluate their TPA cross-sections. This study constitutes the first two-photon
absorption measurements via Z-scan for a series of triphenylmethane dyes at multiple wavelengths.

192
Chart 1: targeted MG+ derivatives
Thanks to these encouraging preliminary results, the organometallic derivatives of MG+
depicted in Chart 2 were next targeted. These new chromophores feature redox-active endgroups

193
such as ethynylferrocene, "Fe(η5-C5Me5)(κ2-dppe)-C≡C-" and "Ru(Cl)(κ2-dppe)2-C≡C-" appended at the
para-position of the phenyl ring, or directly appended to the carbocationic site. The synthesis of
these derivatives has revealed some unexpected synthetic difficulties induced by their high reactivity.
Thus, some of the targeted "Fe(η5-C5Me5)(κ2-dppe)-C≡C-" alkynyl derivatives could not be obtained.
Nonetheless, the new bis-alkynyl species M5(Ru)2+ (Chart 2) was isolated and structurally
characterized, along with M1(M)+ (M = Fc, Fe, Ru). The electronic and redox properties of these new
compounds were next investigated. Two distinct types of behavior were observed, depending on the
organic end-groups. In the case of the ethynylferrocene derivatives, the electronic communication
with the carbocationic core is rather weak, and their electronic spectrum is only slightly modified
relative to organic reference compounds. In the case of metal alkynyl derivatives, a much larger
interaction takes place resulting in a significant cumulenic character in the GS. In their electronic
spectra, large bathochromic shifts also take place for the low-lying transitions, likely originating from
their increased MLCT character. Third-order nonlinearities have not been measured yet for these
organometallic derivatives, but from the results obtained with the organic derivatives O2(Flu)+ and
O4+, non-negligible two-photon absorption is expected in the NIR range, given that the particular
redox-active end-groups present in these dyes are usually known to enhance the third-order NLO
properties relative to all-organic derivatives of comparable size and structure.
Evaluation of the redox behavior of these organometallic dyes further confirms the stronger
metal-carbocation interaction operative in the metal-alkynyl derivatives, resulting in a significant
shift of the metal-centered oxidation potential to higher values and in a corresponding shift of the
carbocation reduction potential to lower values. Only the reversible metal-centered redox processes
were suitable for electrochemical switching. Spectroelectrochemical investigations were next
performed to investigate the linear absorptions of the first oxidized states for each compound.
Overall, only minor changes were seen for the ethynylferrocene derivatives, consistent with the weak
interaction between the metal center and the carbocationic core previously evidenced. For alkynyl
derivatives, the spectral changes between the two redox states are more noticeable, although no
dramatic change takes place. While moderate-to-weak bands (believed to correspond to LMCT or d-d
bands) appear in the NIR range upon oxidation, the most important bands are only poorly affected.
Thus, while a large nonlinear electrochromism cannot be anticipated in the visible range for most of
these organometallic dyes, the NIR range is possibly the best spectral range for observing such a
behavior with the metal-alkynyl derivatives M1-M5.

194
Chart 2: Targeted organometallic derivatives of MG+ salts
195
Along similar lines, the four octupolar organometallic derivatives of CV+, S1(Fc)+-S2(Ru)+
(Chart 3), have been targeted. The kinetic stability of the derivatives S1(Fc)+ and S2(Ru)+ was
problematic for their full characterzation and only S1(Ru)+ and S2(Fc)+ could be extensively
characterized. These derivatives were investigated by UV-vis spectroscopy, cyclic voltammetry and
spectroelectrochemistry. The influence of the organometallic end-group in the extended
ethynylferrocenyl derivative S2(Fc)+ is again weakly felt by the rest of the system and the linear
absorptions of this compound are very similar to those of its organic equivalent O4+. In contrast, the
influence of the organometallic end-groups for the shorter ruthenium(II) derivative S1(Ru)+ is
comparatively much more important; the transitions at lowest-energy of O4+ are shifted deep into
the NIR range (near ca. 988 nm); the Ru-based redox processes are split into two distinct processes
corresponding to the chemically reversible and simultaneous oxidation of two out of three
ruthenium centers, followed by the quasi-reversible oxidation of the last metallic center. Again, and
unexpectedly in the case of S1(Ru)+, spectroelectrochemistry reveals that the electrochromism of
these new dyes when proceeding to their first oxidized state is rather weak, auguring for weakly
contrasted cubic NLO responses. However, the two-photon absorption cross-sections for these
octupolar polymetallic dyes in their carbocationic state might be quite important in the NIR and will
shortly be measured by Z-scan, as well as their other third-order NLO properties.

196
Chart 3: Targeted organometallic derivatives based on CV+
In conclusion, while purely organic triphenylmethane dyes have confirmed their potential as
two-photon absorbing materials, a further enhancement of this property is more than probable
thanks to the addition of suitable metal centers. Accordingly, the cubic NLO properties of the redox-
active organometallic dyes will now be investigated by Z-scan and, hopefully, a significant nonlinear
electrochromism will be evidenced for some of these derivatives in the NIR range. Finally, further
attempts at better characterizing [S1(Fc)+][BF4-] and [S2(Ru)+][PF6
-] should be made, as well as
isolation of the organoiron analogues of [M1(Ru)+-M4(Ru)+][PF6-] and [S1(Ru)+][PF6
-] .

197
Experimental

198

199
Experimental
Contents
1. Instrumentation .............................................................................................................................. 200
1.1. Nuclear magnetic resonance spectroscopy.............................................................................. 200
1.2. Infrared, near infrared and UV-visible spectroscopy ............................................................... 200
1.3. Spectroelectrochemistry .......................................................................................................... 200
1.4. Cyclic voltammetry ................................................................................................................... 201
1.5. Mass spectrometry and elemental analyses ............................................................................ 201
2. Equipment ....................................................................................................................................... 201
2.1. Glassware ................................................................................................................................. 201
2.2. Temperature control and stirring ............................................................................................. 202
2.3. Chromatography....................................................................................................................... 202
3. Chemicals ........................................................................................................................................ 202
3.1. Solvents .................................................................................................................................... 202
3.2. Inert gases ................................................................................................................................ 203
3.3. Reagents ................................................................................................................................... 203
4. General procedures ........................................................................................................................ 204
5. Synthesis of organic derivatives ..................................................................................................... 206
5.1. Organic carbinols ...................................................................................................................... 206
5.2. Organic carbocations ................................................................................................................ 225
6. Synthesis of organometallic derivatives ........................................................................................ 254
6.1. Ferrocene carbinols .................................................................................................................. 254
6.2. Ferrocene carbocations ............................................................................................................ 262
6.3. Organometallic precursors ....................................................................................................... 270
7. Organometallic derivatives of CV+ ................................................................................................. 313
7.1. S1-type derivatives ................................................................................................................... 313
7.2. S2-type derivatives ................................................................................................................... 322
8. Z-scan traces ................................................................................................................................... 344
References........................................................................................................................................... 348

200
1. Instrumentation
1.1. Nuclear magnetic resonance spectroscopy
Samples were dissolved in CDCl3, CD2Cl2 or acetone-d6, as indicated, filtered, and placed in 5
mm class sample tubes. Spectra were recorded at 298 K.
1HNMR spectra were acquired on a Bruker Avance I 300 (300 MHz), Varian Gemini-300 FT
NMR (300 MHz), a Varian MR-400 FT, Bruker Avance 400-HD or a Chemical 800 MHz Bruker FTNMR
spectrometer. Shifts are given in ppm relative to residual non-deuterated solvent signal (CHCl3: δ
7.26 ppm, DCM: δ 5.32 ppm, acetone: δ 2.05 ppm).[1]
13C NMR spectra were acquired on a Bruker DPX200 (50 MHz) or Varian Gemini-300 FT NMR
(75 MHz), Bruker Avance I 300 (75 MHz), Varian Inova-500 (125 MHz) or Chemical 800 MHz Bruker
FTNMR with total proton decoupling. Chemical shifts are given in ppm relative to residual
deuterated solvent signal (CHCl3: δ 77.2 ppm, DCM: 53.84, δacetone: δ 29.8 ppm).[1]
31P NMR spectra were acquired on a Bruker DPX200 (81 MHz), Bruker Avance I 300 (121
MHz), Varian Gemini-300 (121 MHz) or Bruker Avance-400 HD FTNMR with total proton decoupling
and are referenced to external 85% H3PO4 (0.0 ppm).
1.2. Infrared, near infrared and UV-Visible spectroscopy
Infrared spectra were obtained as KBr pellets (1 % w/w in 100 – 200 mg of dry
spectroscopy grade KBr, pressed under vacuum with a static pressure of 10 tons in a stainless
steel pelletizer) with a Bruker IFS28 FT-IR. Near-IR and UV-visible spectra were recorded as DCM
solutions using a 1 cm path length quartz cell on a Cary 5 double beam spectrophotometer or a
Perkin-Elmer Lambda 950 UV-VIS-NIR spectrophotometer.
1.3. Spectroelectrochemistry
Solution UV-visible / near-IR spectra of the oxidized species were obtained at 298 K or 248 K
by electrogeneration on a platinum mesh electrode in a custom 0.05 mm optically transparent thin-
layer electrochemical (OTTLE) cell, using a silver wire as pseudo-reference and a platinum wire as
counter-electrode. Solutions were made up with 0.30 M [n-Bu4N][PF6] in dry and deoxygenated DCM
and kept under an atmosphere of pure argon.
201
1.4. Cyclic voltammetry
Cyclic voltammograms were recorded at 25°C in DCM solutions (containing 0.10 M [n-
Bu4N][PF6], purged with argon and maintained under inert atmosphere) at 100 mV/s scan rate using
an EG&G-PAR model 263 potentiostat / galvanostat (using a Pt disk as working electrode, a Pt
wire as counter-electrode and the reference electrode was a saturated calomel electrode) or an
e-corder 401 potentiostat system from eDaq Pty Ltd (using a Pt disk as working electrode, a Pt wire
as counter-electrode and the reference electrode was an Ag / AgCl electrode). The FcH / FcH+ couple
was used as an internal calibrant for the potential measurements (0.46 V vs SCE, 0.56 V vs Ag / AgCl,
ΔEp= 0.09 V; ipa/ipc= 1).[2]
1.5. Mass spectrometry and elemental analyses
Electrospray ionization (ESI) mass spectra were recorded at the Research School of
Chemistry, Australian National University, using a LCT-ZMD single quadrupole liquid chromatograph-
MS (Waters-Micromass) and high resolution ESI mass spectra were carried out utilizing a LCT
Premier XE ESI-TOF instrument (Waters-Micromass), or at the ‟Centre Régional de Mesures
Physiques de l’Ouest”, Université de Rennes 1, on a ZAB Spec Q-TOF (Micromass, high resolution),
double quadrupole micro TOF-Q 2 (Bruker) and Q-Tof 2 (Waters). All mass spectrometry peaks are
reported as m/z. Elemental analyses were performed on an EA1112 (Thermo Finnigan) at ‟Centre
Régional de Mesures Physiques de l’Ouest”, Université de Rennes 1 or at London Metropolitan
University.
2. Equipment
2.1. Glassware
All glassware (including NMR tubes) was oven-dried or flame-dried, cooled under high-
vacuum and conditioned under argon prior to use. Single use polyethylene syringes were conditioned
under argon before use. Sintered glass funnels used for filtration were of Buchner type whereas
Hirsch type funnels were used for the collection of solids. Both types were fitted with porosities
adapted to the compound. A water-jet or diaphragm pump was used as the vacuum source.

202
2.2. Temperature control and stirring
Unless otherwise indicated, the temperature refers to the temperature of the external
heating or cooling bath. Reactions performed above room temperature (≈ 20°C) were thermostated
(± 1°C) and heated with stirring in a silicone oil bath. Cooling of reaction mixtures below room
temperature was achieved by immersing the reaction flasks into the following cold baths contained
in Dewar flasks: melting ice (0°C), acetone/solid CO2 (-78°C), ethanol/liquid N2 (-90°C). The
temperature of the cold bath was monitored using low temperature alcohol thermometers.
Reaction mixtures were magnetically stirred with Teflon coated stir bars, at a rate of 250 – 500 rpm
and above (as indicated by ‟vigorous stirring” and during purification by precipitation).
2.3. Chromatography
Flash column chromatography[3] was performed using silica (Merck kieselgel 60 or Scharlau
60, 230 – 400 mesh) wet-packed in glass columns of various sizes depending on the quantity of
product to purify. Deactivated silica refers to silica previously treated with an equal volume of
appropriate eluent (v/v) and 10 % triethylamine packed in the column. The column was then eluted
with 1 % triethylamine (v/v) in the eluent or without, depending of the sensitivity of the compound
to be purified. Silica columns were performed using a slight over-pressure of air. Thin-layer
chromatography was performed using silica. Preparative thin-layer chromatography were carried out
on glass plates (20 x 20 cm) coated with silica (Merck 60 GF254, 0.5 mm thick). Unless otherwise
stated, Rf values were measured on silica plates visualized using a UV lamp (254 nm, 365 nm for
fluorescent compounds) or chemical stains (vanillin or acidic solution) if necessary.
3. Chemicals
3.1. Solvents
All solvents for synthesis (and work-up in the case of air sensitive compounds) were freshly
distilled and sparged with inert gas by for at least 15 min before use. Solvents for column
chromatography and normal work-up were of technical grade and used as received. Deuterated
solvents were used as received but sparged with argon before use for air-sensitive complexes and
filtered through dry basic alumina. Solvents were dried and distilled under inert an atmosphere using
the following dehydrating agents: -Et2O, n-pentane, n-hexane and reagent grade THF:

203
sodium/benzophenone - toluene: sodium -DCM: dried over P2O5, distilled over K2CO3 or dried and
distilled over CaH2-MeOH: Mg/I2- diisopropylamine and triethylamine: KOH- DMSO: dried and stored
over activated 4 Å molecular sieves.[4]
3.2. Inert gases
All reactions and also workup procedures for air-sensitive compounds were carried out
under an atmosphere of dry, high purity argon or nitrogen, using standard Schlenk techniques.[5] In
all cases, an overpressure of inert gas (0.5 bar) was permanently kept in the system during work-up
and reaction period involving sensitive compounds. Air-sensitive samples and distilled solvents were
stored under positive pressures of inert gases in appropriate flasks.
3.3. Reagents
The following compounds were prepared as described in the literature:
- PdCl2(PPh3)2 [6]
- 4,4'-diphenylaminobenzophenone (29)[7]
- 9-(2,2-dibromovinyl)anthracene[8]
- 9-ethynylanthracene (32)[9]
- 2-bromo-9,9-dibutyl-9-fluorene (33)[10]
- 1-bromo-4-ferrocenylethynylbenzene (36)[11]
- 4-bromotriphenylamine[12]
- (η5-C5Me5)(κ2- dppe)FeCl (46)[13]
- cis-(κ2-dppe)Ru(Cl)2 and cis-[(κ2-dppe)Ru(Cl)][PF6] (45)[14]
- tris(p-iodophenyl)amine (60)[15]
Modifications to the literature procedures were applied to the preparation of the
following compounds, as described here or in their respective experimental procedures:

204
- 3,6-bis(diphenylamino)-9H-fluoren-9-one (30)[16–19] (the final Buchwald-Hartwig reaction was carried
with in situ formation of the catalyst Pd(PtBu3)2 from Pd2dba3, tBu3PHBF4 and DIPA; the rest of the
reagents were then added in solution)
- acetylferrocene (34) and ethynylferrocene (35)[20] (the initial deprotonation was carried out at
0°C rather than -78°C and the suspension of the enolate anion was stirred for 1h at 0°C before
electrophilic quenching at 78°C)
- tris(4-((trimethylsilyl)ethynyl)phenyl)methanol (54) and tris(4-ethynylphenyl) methanol (55)[21] (the
initial reaction was performed with a lithiate equivalent instead of a Grignard reagent)
- tBuOK (by solvent extraction with THF)[22]
- lithium diisopropylamide solutions were prepared from n-BuLi (1.10 equivalent) and
diisopropylamine (1.20 equivalent) in THF (1.0 mL per mmol of DiPA at 0 °C)[23]
- zinc dust was freed of oxides by an HCl wash [24]
- copper bronze was freed of oxide by iodine solution and HCl washes [7]
- water present in CBr4 as stabilizer was removed by stirring over anhydrous MgSO4 as a DCM solution
followed by removal of the solvent by rotary evaporation and drying under high vacuum.
All other chemicals were obtained from commercial sources and used as received after
having checked their purity by various analytical methods (TLC, NMR). If necessary, but this was case
specific, purification of the needed compound or reagent was performed according to the
procedures reported by Armarego and Chai.[25]
4. General procedures
General procedure for metal/halogen exchange followed by addition of the desired ketone (GP1)
Reaction: In a Schlenk flask under argon, n-BuLi was added drop wise to a solution of the desired
halogenated or alkynyl compound in dried and distilled THF at -78°C. After stirring for 30 min, the
ketone solution in dried and distilled THF was added drop wise to the solution. The cold bath was
then removed and the mixture was stirred and allowed to warm to room temperature over 3 h.

205
Work-up: 20 mL of water were added to the flask and the two phases were separated. The aqueous
layer was extracted with Et2O (3 x 20 mL) and the combined organic phases were washed with water
(10 mL) and saturated aqueous NaCl (10 mL). The aqueous phase was then back-extracted with Et2O
(20 mL). The organic phase was dried over Na2SO4 and the solvents were removed to give the crude
product as a solid.
General procedure for formation of 9-ethynylanthracene lithiate followed by addition on desired
ketone (GP2)
Reaction: In a Schlenk flask under argon, n-BuLi was added drop wise to a solution of 9-
ethynylanthracene in distilled and deoxygenated THF (15 mL) at 0°C. After stirring for 30 min, the
ketone in distilled and deoxygenated THF (15 mL) was added drop wise to the solution. The cold bath
was then removed and the mixture was stirred and allowed to warm up to room temperature for 3 h.
Work-up: 20 mL of water were added to the flask and the two phases were separated. The aqueous
layer was extracted with Et2O (3 x 20 mL) and the combined organics phases were washed with water
(10 mL) and saturated aqueous NaCl (10 mL). The aqueous phase was then back extracted with Et2O
(20 mL). The organic phases were dried over Na2SO4 and the solvent was removed to give the
expected product as a powdery solid.
General procedure for organic and ethynyl ferrocene carbocations (BF4 salts) (GP3)
Reaction: In a Schlenk flask under argon, HBF4·Et2O was added drop wise to a solution of carbinol in
distilled and deoxygenated Et2O at room temperature. After stirring for 2 h, the precipitate was
filtered by cannula.
Work-up: The precipitate was washed with distilled and deoxygenated Et2O (3 x 10 mL) and dried in
vacuum. The solid was then dissolved in a minimum of distilled and deoxygenated DCM and
precipitated with distilled and deoxygenated Et2O and washed with distilled pentane. After filtration
and drying in vacuo the expected compound was obtained as a dark powder.
NB: some of the carbinols are slightly soluble in Et2O, and hence precipitations were carried out at
lower temperatures. (-40 °C or -78 °C)

206
5. Synthesis of organic derivatives
5.1. Organic carbinols
9-anthracenyl-bis(4-(dimethylamino)phenyl)methanol (O1(anth)OH)
C31H30N2O, M = 446.58 mol/L
Reagents: 9-bromoanthracene 31 (1.1 eq, 282 mg, 1.1 mmol), Michler’s ketone 28 (1 eq, 268 mg, 1
mmol), n-BuLi (1.1 eq, 400 µL at 2.5 M in hexane, 1.1 mmol).
Reaction and work up: Prepared according to GP1.
Purification: The crude yellow solid was adsorbed on deactivated silica and purified by column
chromatography (neutralized silica gel with 10 % NEt3, 15 x 5 cm) eluting with hexane/Et2O (2/1) with
1 % NEt3 to give 9-anthracenylbis(4-(dimethylamino)phenyl)methanol as a white solid which
decomposed over time (~2 days).
Rf (hexane/Et2O, 2/1): 0.43
Yield: 260 mg (58 %)
1H NMR (400 MHz, (CD3)2CO) δ 8.48 (s, 1H), 8.19 (d, J = 9.3 Hz, 2H), 7.97 (d, J = 8.5 Hz, 2H), 7.28 (m, 2H),
7.14 (d, J = 9.1 Hz, 4H), 6.99 (m, 2H), 6.65 (d, J = 9.0 Hz, 4H), 4.72 (s, 1H,-OH), 2.91 (s, 12H, -NMe2).
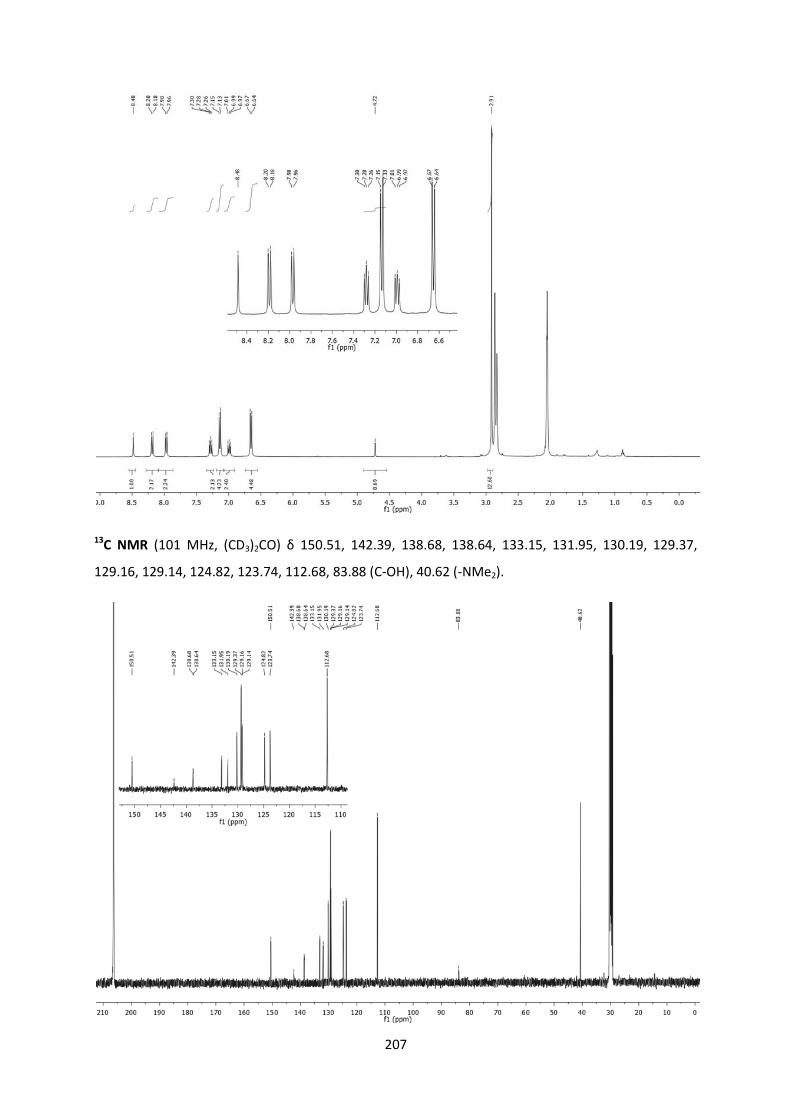
207
13C NMR (101 MHz, (CD3)2CO) δ 150.51, 142.39, 138.68, 138.64, 133.15, 131.95, 130.19, 129.37,
129.16, 129.14, 124.82, 123.74, 112.68, 83.88 (C-OH), 40.62 (-NMe2).

208
HRMS (ESI): calcd.: 447.2438[M-·OH]+, 429.2331 M+. ; found: 447.2436 [M-·OH]+, 429.332 M+.
IR (cm-1): 3446 (νOH).
UV-Vis (DCM): λmax, nm (ε, 10-5·M-1·cm-1): 262 (0.32).
9-anthracenyl-bis(4-(diphenylamino)phenyl)methanol (O2(anth)OH)
C51H38N2O, M = 694.86 g/mol
Reagents: 9-bromoanthracene 31 (1.1 eq, 282 mg, 1.1 mmol), 4, 4’- diphenylaminobenzophenone 29
(1 eq, 516 mg, 1 mmol), n-BuLi (1.1 eq, 400 µL at 2.5 M in hexane, 1.1 mmol).
Reaction and work up: Prepared according to GP1.
Purification: The crude yellow solid was adsorbed on deactivated silica and purified by column
chromatography (neutralized silica gel with 10 % NEt3, 15 x 5 cm) eluting with hexane/Et2O (4/1) with
1 % NEt3 to give 9-anthracenyl-bis(4-(diphenylamino)phenyl)methanol as a yellow solid which
decomposed over time (~2 days). The compound was precipitated from acetone/MeOH.
Rf (hexane/Et2O, 4/1): 0.5
Yield: 560 mg (81%).
1H NMR (400 MHz, (CD3)2CO) δ 8.53 (s, 1H), 8.16 (d, J = 9.3 Hz, 2H), 8.01 (d, J = 8.5 Hz, 2H), 7.43 –
6.93 (m, 32H), 5.41 (s, 1H, -OH).

209
13C NMR (101 MHz, (CD3)2CO) δ 148.85, 147.72, 144.92, 141.21, 133.28, 132.31, 131.97, 130.75,
130.35, 129.90, 129.84, 129.56, 126.94, 125.65, 125.14, 125.03, 124.48, 124.32, 123.87, 120.43,
83.87 (C-OH).

210
HRMS (ESI): 693.29004 [M-H]+, 694.29786 M+., 677.29512 [M-·OH]+; found 693.2893 [M-H]+,
694.2967 M+., 677.2950 [M-·OH]+.
IR (cm-1): 3530 (νOH).
UV-Vis (DCM): λmax, nm (ε, 10-5·M-1·cm-1): 260 (0.50), 304 (0.32).
9-(9-anthracenyl)-3,6-bis(diphenylamino)-9H-fluoren-9-ol (O3(anth)OH)
C51H36N2O, M = 692.84 g/mol
Reagents: 9-bromoanthracene 31 (1.1 eq, 282 mg, 1.1 mmol), 3,6-bis(diphenylamino)-9H-fluoren-9-
one 30 (1 eq, 514 mg, 1 mmol), n-BuLi (1.1 eq, 400 µL at 2.5 M in hexane, 1.1 mmol).
Reaction and work up: Prepared according to GP1.
Purification: Not isolated (not stable in solution or in solid state, crude material was directly used to
next step)
3-(9-anthracenyl)-1,1-bis(4-(dimethylamino)phenyl)prop-2-yn-1-ol (O1(anthC2)OH)
C33H30N2O, M = 470.60 g/mol

211
Reagents: 9-ethynylanthracene 32 (1.1 eq, 222.5 mg, 1.1 mmol), Michler’s ketone 28 (1 eq, 268.35
mg, 1 mmol), n-BuLi (1.1 eq, 687 µL at 1.6 M in hexane, 1.1 mmol)
Reaction and work up: Prepared according to GP2.
Purification: The crude brown solid was adsorbed on deactivated silica and purified by column
chromatography (neutralized silica gel with 10 % NEt3, 15 x 5 cm) eluting with hexane/Et2O (1/1) with
1 % NEt3 to give 3-(9-anthracenyl)-1,1-bis(4-(dimethylamino)phenyl)prop-2-yn-1-ol as a yellow solid.
Rf (hexane/Et2O, 1/1): 0.14
Yield: 450 mg (95 %)
1H NMR (400 MHz, (CD3)2CO) δ 8.61 (d, J = 8.7 Hz, 2H), 8.58 (s, 1H), 8.10 (d, J = 8.3 Hz, 2H), 7.66 (d, J =
8.9 Hz, 4H), 7.57 (m, 4H,), 6.76 (d, J = 8.9 Hz, 4H), 5.62 (s, 1H, -OH), 2.92 (s, 12H,-NMe2).
13C NMR (101 MHz, (CD3)2CO) δ 151.03, 135.85, 133.67, 132.34, 129.79, 128.55, 128.11, 127.80,
127.57, 126.80, 118.21, 112.91, 107.31 (C-OH), 82.65, 75.21, 40.84 (-NMe2).

212
HRMS (ESI): calcd.: 471.2436 [M-H]+, 453.2331 [M-·OH]+; found: 471.2437 [M-H]+, 453.2332 [M-
·OH]+.
IR (KBr, cm-1): 3046 (νOH).
UV-Vis (DCM): λmax, nm (ε, 10-5·M-1·cm-1): 262 (1.50), 386 (0.19), 412 (0.13).
3-(9-anthracenyl)-1,1-bis(4-(diphenylamino)phenyl)prop-2-yn-1-ol (O2(anthC2)OH)
C53H38N2O, M = 718.88 g/mol

213
Reagents: 9-ethynylanthracene 32 (1.1 eq, 313.5 mg, 1.55 mmol), 4 4'-diphenylaminobenzophenone
29 (1 eq, 774.9 mg, 1.5 mmol), n-BuLi (1.1 eq, 968 µL at 1.6 M in hexane, 1.55 mmol).
Reaction and work up: Prepared according to GP2.
Purification: The crude brown solid was adsorbed on deactivated silica and purified by column
chromatography (neutralized silica gel with 10 % NEt3, 15 x 5 cm) eluting with a gradient of
hexane/ethyl acetate from 49/1 to 2/1 with 1 % NEt3 to give 3-(9-anthracenyl)-1,1-bis(4-
(diphenylamino)phenyl)prop-2-yn-1-ol as a light brown solid. The product was precipitated from
acetone/MeOH.
Rf (hexane/ethyl acetate, 2/1): 0.59
Yield: 950 mg (88 %)
1H NMR (400 MHz, (CD3)2CO) δ 8.60 (d, J = 8.6 Hz, 2H), 8.45 (s, 1H), 8.00 (d, J = 8.3 Hz, 2H), 7.83 (d, J =
8.7 Hz, 4H), 7.60 – 7.37 (m, 4H), 7.19 (t, J = 7.9 Hz, 8H), 7.05 (d, J = 8.7 Hz, 4H), 7.00 (d, J = 7.8 Hz, 8H),
6.96 (t, J = 7.4 Hz, 4H), 6.10 (s, 1H, -OH).
13C NMR (101 MHz, (CD3)2CO) δ 148.84, 148.20, 141.64, 133.79, 132.32, 130.42, 129.86, 128.99,
128.41, 128.02, 127.44, 126.88, 125.34, 124.08, 117.59, 105.97 (-OH), 83.73, 75.26.

214
HRMS (ESI): calcd.: 741.28763 [M+Na]+, 757.26157 [M+K]+; found: 741.2870 [M+Na]+, 757.2609
[M+K]+.
IR (KBr, cm-1): 3421 (νOH).
UV-Vis (DCM): λmax, nm (ε, 10-5·M-1·cm-1): 262 (1.80), 304 (0.62), 386 (0.24), 408 (0.24).
9-(9-ethynylanthracenyl)-3,6-bis(diphenylamino)-9H-fluoren-9-ol (O3(anthC2)OH)
C53H36N2O, M = 716.87 g/mol

215
Reagents: 9-ethynylanthracene 32 (1.1 eq, 222.5 mg, 1.1 mmol), 3,6-bis(diphenylamino)-9H-fluoren-
9-one 30 (1 eq, 514 mg, 1 mmol), n-BuLi (1.1 eq, 687 µL at 1.6 M in hexane, 1.1 mmol).
Reaction and work up: Prepared according to GP2.
Purification: The crude brown solid was adsorbed on deactivated silica and purified by column
chromatography (neutralized silica gel with 10 % NEt3, 15 x 5 cm) eluting with a gradient of
hexane/Et2O from 19/1 to 4/1 with 1 % NEt3 to give 9-(9-ethynylanthracenyl)-3,6-bis(diphenylamino)-
9H-fluoren-9-ol as an orange solid. The product was precipitated from acetone/MeOH.
Rf (hexane/Et2O, 4/1): 0.2
Yield: 700 mg (96 %)
1H NMR (400 MHz, (CD3)2CO) δ 8.60 (s, 1H), 8.51 (d, J = 8.5 Hz, 2H), 8.11 (d, J = 8.3 Hz, 2H), 7.92 (d, J =
8.2 Hz, 2H), 7.58 (dt, J = 14.2, 6.8 Hz, 4H), 7.37 (d, J = 1.8 Hz, 2H), 7.28 (t, J = 7.8 Hz, 8H), 7.10 (m, 8H),
7.03 (t, J = 7.3 Hz, 4H), 5.93 (s, 1H, -OH).
13C NMR (101 MHz, (CD3)2CO) δ 150.36, 148.84, 144.30, 141.30, 133.79, 132.20, 130.38, 129.80,
128.98, 127.95, 127.30, 126.80, 126.41, 125.40, 125.21, 124.03, 117.42, 116.79, 103.87 (C-OH),
79.44, 75.28.

216
HRMS (ESI): calcd.: 741.28763 [M+Na]+, 757.26157 [M+K]+ ; found: 741.2870 [M+Na]+, 757.2609
[M+K]+.
IR (cm-1): 3447 (νOH).
UV-Vis (DCM): λmax, nm (ε, 10-5·M-1·cm-1): 262 (1.47), 299 (0.43), 392 (0.19), 415 (0.16).
(9,9-dibutyl-9H-fluoren-2-yl)bis(4-(dimethylamino)phenyl)methanol (O1(Flu)OH)
C38H46N2O, M = 546.78 g/mol
Reagents: 2-bromo-9,9-dibutyl-9H-fluorene 33 (1.2 eq, 857.6 mg, 2.4 mmol), Michler's ketone 28 (1
eq, 536.7 mg, 2 mmol), n-BuLi (1.1 eq, 1.375 mL at 1.6 M in hexane, 2.2 mmol).

217
Reaction and work up: Prepared according to GP1.
Purification: The crude brown solid was adsorbed on deactivated silica and purified by column
chromatography (neutralized silica gel with 10 % NEt3, 20 x 5 cm) eluting with hexane/Et2O (1/1) with
1 % NEt3 to give (9,9-dibutyl-9H-fluoren-2-yl)bis(4-(dimethylamino)phenyl)methanol as a white solid.
Rf (hexane/Et2O, 1/1): 0.29
Yield: 1.05 g (96 %)
1H NMR (400 MHz, (CD3)2CO) δ 7.74 (dd, J = 6.2, 1.9 Hz, 1H), 7.65 (d, J = 7.9 Hz, 1H), 7.41 (dd, J = 9.1,
1.5 Hz, 2H), 7.35 – 7.23 (m, 3H), 7.14 (d, J = 8.9 Hz, 4H), 6.66 (d, J = 8.9 Hz, 4H), 4.74 (s, 1H, OH), 2.91
(s, 12H, -NMe2), 2.01 – 1.84 (m, 4H), 1.12 – 0.99 (m, 4H), 0.71 – 0.50 (m, 10H).
13C NMR (101 MHz, (CD3)2CO) δ 151.93, 150.51, 149.61, 142.21, 140.36, 137.76, 137.72, 129.90,
127.82, 127.80, 127.68, 124.08, 123.80, 120.54, 119.31, 112.42, 82.02 (C-OH), 55.68, 40.84 (-NMe2),
27.06, 23.81, 14.38.

218
HRMS (ESI): calcd.: 547.36884 [M+H]+, 529.35827 [M-·OH]+; found: 547.3685 [M+H]+, 529.3586 [M-
·OH]+.
IR (cm-1): 3455 (νOH).
UV-Vis (DCM): λmax, nm (ε, 10-5·M-1·cm-1): 272 (0.58), 309 (0.26).
(9,9-dibutyl-9H-fluoren-2-yl)bis(4-(diphenylamino)phenyl)methanol (O2(Flu)OH)
C58H54N2O, M = 795.06 g/mol

219
Reagents: 2-bromo-9,9-dibutyl-9H-fluorene 33 (1.2 eq, 428.8 mg, 1.2 mmol), 4,4'-
diphenylaminobenzophenone 29 (1 eq, 516 mg, 1 mmol), n-BuLi (1.1 eq, 687 µL at 1.6 M in hexane,
1.1 mmol).
Reaction and work up: Prepared according to GP1.
Purification: The crude brown solid was adsorbed on deactivated silica and purified by column
chromatography (neutralized silica gel with 10 % NEt3, 15 x 5 cm) eluting with a gradient of
hexane/Et2O from 2/1 to 1/1 with 1 % NEt3 to give (9,9-dibutyl-9H-fluoren-2-yl)bis(4-
(diphenylamino)phenyl)methanol O2(Flu)OH as a white solid. The product was precipitated from
acetone/MeOH.
Rf (hexane/Et2O, 1/1): 0.47
Yield: 750 mg (94 %)
1H NMR (400 MHz, (CD3)2CO) δ 7.78 – 7.74 (m, 1H), 7.71 (d, J = 7.9 Hz, 1H), 7.57 – 7.35 (m, 4H), 7.35-
7.18(m, 14H), 7.18 – 6.88 (m, 15H), 5.29 (s, 1H, -OH), 2.04 – 1.85 (m, 4H), 1.13 – 0.99 (m, 4H), 0.65 –
0.52 (m, 10H).

220
13C NMR (101 MHz, (CD3)2CO) δ 151.94, 150.82, 148.89, 148.50, 147.55, 143.66, 142.00, 140.92,
130.37, 130.20, 128.06, 127.89, 127.48, 125.16, 124.20, 123.95, 123.87, 123.66 (p-Ph), 120.71,
119.70, 82.14 (C-OH), 55.77, 40.83, 27.06 , 23.81, 14.40.
HRMS (ESI): calcd.: 777.42033 [M-·OH]+, 817.41283 [M+Na]+, 501.23252 [M-OH+H]+; found: 777.4211
[M-·OH]+, 817.4121 [M+Na]+, 501.2327 [M-OH+H]+.
IR (cm-1): 3530 (νOH).
UV-Vis (DCM): λmax, nm (ε, 10-5·M-1·cm-1): 312 (0.52).

221
9,9-dibutyl-3',6'-bis(diphenylamino)-9H,9'H-[2,9'-bifluoren]-9'-ol (O3(Flu)OH)
C58H52N2O, M= 793.05 g/mol
Reagents: 2-bromo-9,9-dibutyl-9H-fluorene 33 (1.2 eq, 643.2 mg, 1.8 mmol), 3,6-bis(diphenylamino)-
9H-fluoren-9-one 30 (1 eq, 771 mg, 1.5 mmol), n-BuLi (1.1 eq, 1.03 mL at 1.6 M in hexane, 1.65
mmol).
Reaction and work up: Prepared according to GP1.
Purification: The crude brown solid was adsorbed on deactivated silica and purified by column
chromatography (neutralized silica gel with 10 % NEt3, 15 x 5 cm) eluting with hexane/Et2O (4/1) with
1 % NEt3 to give 9,9-dibutyl-3',6'-bis(diphenylamino)-9H,9'H-[2,9'-bifluoren]-9'-ol O3(Flu)OH as an
orange solid. The product was precipitated in cold MeOH.
Rf (hexane/Et2O, 4/1): 0.2
Yield: 1.05 g (88 %)
1H NMR (400 MHz, (CD3)2CO) δ 7.78 – 7.70 (m, 1H), 7.70 – 7.61 (m, J = 7.6 Hz, 2H), 7.45 – 7.38 (m,
1H), 7.35 (d, J = 1.7 Hz, 2H), 7.34 – 7.14 (m, 13H), 7.12 – 6.95 (m, 12H), 6.92 (dd, J = 8.2, 1.9 Hz, 2H),
5.20 (s, 1H, -OH), 2.03 – 1.95 (m, 4H), 1.11 – 1.00 (m, 4H), 0.70 – 0.47 (m, 10H).
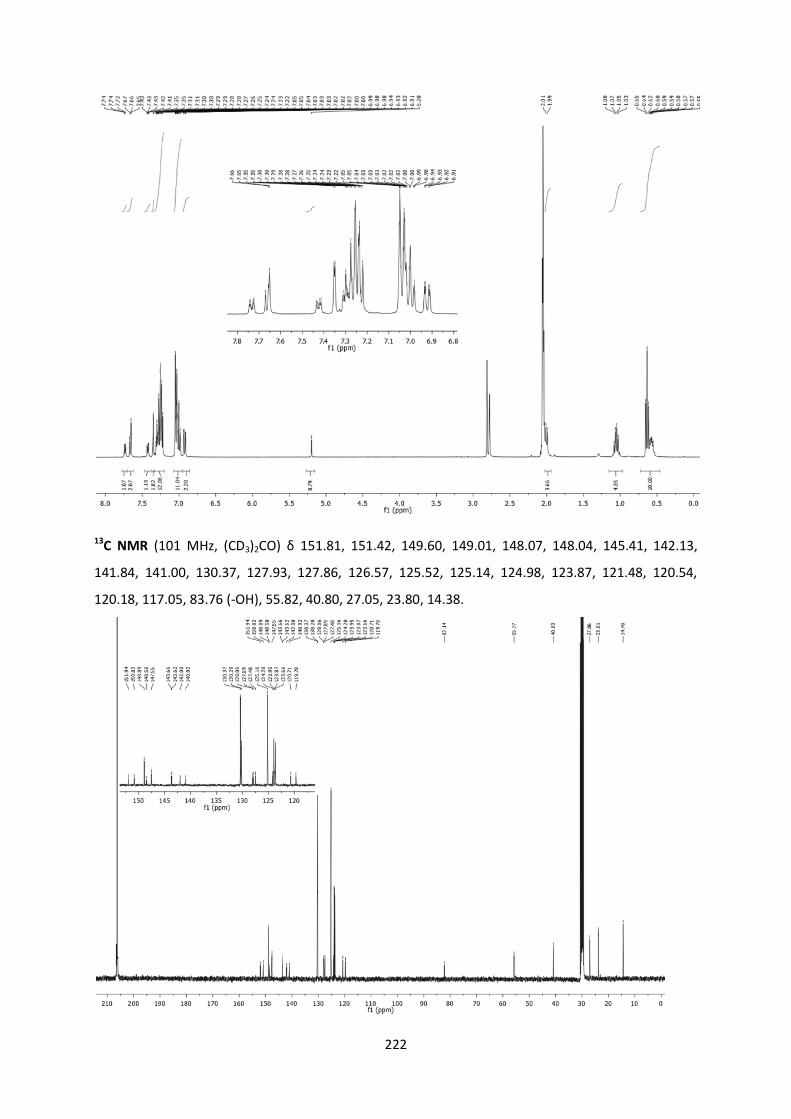
222
13C NMR (101 MHz, (CD3)2CO) δ 151.81, 151.42, 149.60, 149.01, 148.07, 148.04, 145.41, 142.13,
141.84, 141.00, 130.37, 127.93, 127.86, 126.57, 125.52, 125.14, 124.98, 123.87, 121.48, 120.54,
120.18, 117.05, 83.76 (-OH), 55.82, 40.80, 27.05, 23.80, 14.38.

223
HRMS (ESI): Calcd.: 775.40468 [M-·OH]+, 792.40741 M+., 815.39718 [M+Na]+; found: 775.4047 [M-
·OH]+, 792.4065 M+., 815.3970 [M+Na]+.
IR (cm-1): 3447 (νOH).
UV-Vis (DCM): λmax, nm (ε, 10-5·M-1·cm-1): 287 (0.47), 310 (0.43).
tris(4-(diphenylamino)phenyl)methanol (O4OH)
C55H43N3O, M= 761.97 g/mol
Reagents: 4-bromotriphenylamine (1.5 eq, 729 mg, 2.25 mmol), 4,4'-diphenylaminobenzophenone
29 (1 eq, 774 mg, 1.5 mmol), n-BuLi (1.5 eq, 900 µL at 2.5 M in hexane, 2.25 mmol).
Reaction and work up: Prepared according to GP1.
Purification: The crude yellow solid was adsorbed on deactivated silica and purified by column
chromatography (neutralized silica gel with 10 % NEt3, 20 x 5 cm) eluting with hexane/Et2O (4/1) with
1 % NEt3 to give tris(4-(diphenylamino)phenyl)methanol as a white solid.
Rf (hexane/Et2O, 8/2): 0.29
Yield: 852 mg (75 %)
1H NMR (400 MHz, (CD3)2CO) δ 7.31 – 7.20 (m, 18H), 7.10 – 6.99 (m, 18H), 6.96 (d, J = 8.6 Hz, 6H),
5.20 (s, 1H, -OH).
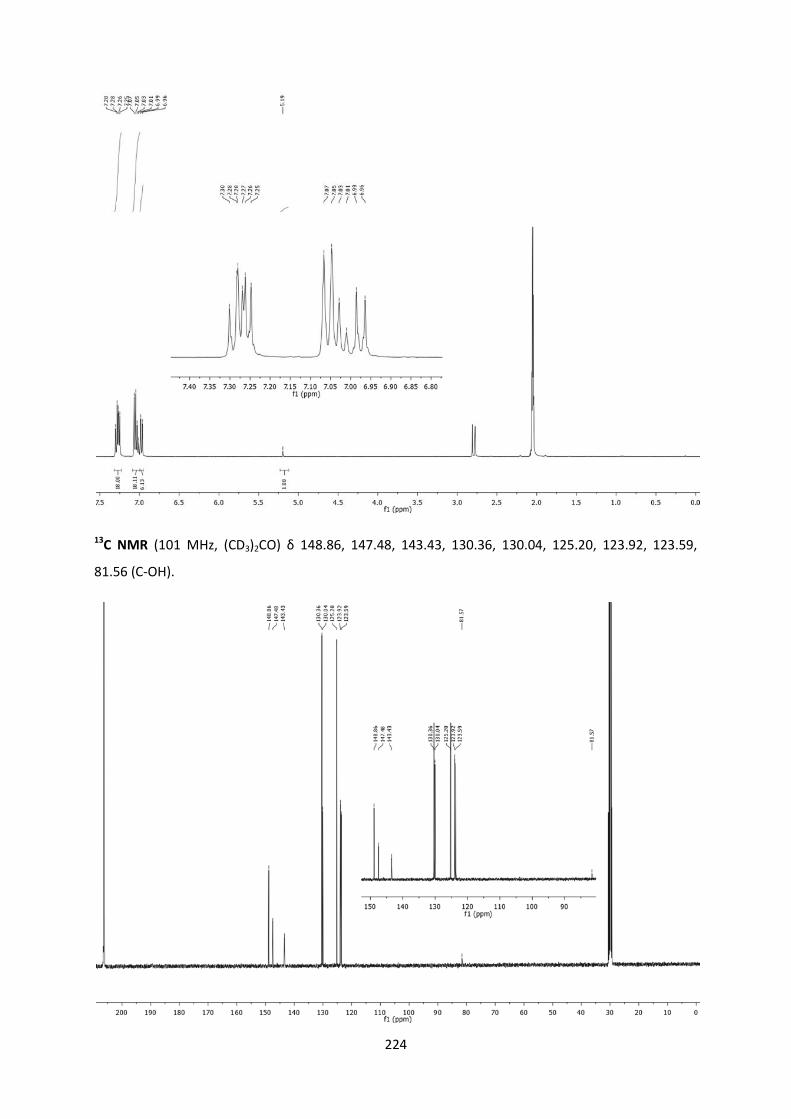
224
13C NMR (101 MHz, (CD3)2CO) δ 148.86, 147.48, 143.43, 130.36, 130.04, 125.20, 123.92, 123.59,
81.56 (C-OH).

225
HRMS: calcld: 784.3304 [M+Na]+, found: 784.3304 [M+Na]+
IR (cm-1): 3435 (νOH).
UV-Vis (DCM): λmax, nm (ε, 10-5·M-1·cm-1): 312 (0.69).
5.2. Organic carbocations
9-anthracenyl-bis(4-(dimethylamino)phenyl)methylium tetrafluoroborate ([O1(anth)+][BF4-])
C31H29BF4N2, M = 516.38 g/mol
Reagents: 9-anthracenyl-bis(4-(dimethylamino)phenyl)methanol O1(anth)OH (1 eq, 115 mg, 0.25
mmol), HBF4·Et2O (1.1 eq, 37 µL, 0.275 mmol).
Reaction and work up: Prepared according to GP3 to obtain 9-anthracenyl-bis(4-
(dimethylamino)phenyl)methylium tetrafluoroborate O1(anth)+ as a violet powder.
1H NMR (400 MHz, CDCl3) δ 8.66 (s, 1H), 8.08 (d, J = 8.4 Hz, 2H), 7.57 – 7.30 (m, 10H), 7.04 – 6.77
(broad d, 4H), 3.32 (s, 12H).

226
13C NMR (101 MHz, CDCl3) δ 156.69 (C+), 139.52, 132.81, 131.26, 131.10, 130.38, 128.90, 127.76,
125.89, 125.78, 115.37, 41.64.

227
HRMS (ESI): calcd.: 429.2331 [M]+; found: 429.331 [M]+.
IR (KBr, cm-1): 1056 (νB-F).
UV-Vis (DCM): λmax, nm (ε, 10-5·M-1·cm-1): 255 (0.88), 642 (1.02).
X-ray diffraction study:
ORTEP view of [O1(anth)+][BF4-] with 50 % thermal ellipsoids solved by Dr. Graeme Moxey
Crystal parameters
Crystal class Orthorhombic
Space group P b c a
Cell angles (°) α= 90
β= 90
γ= 90
Cell length (Ǻ) a= 20.56
Formula C31H29BF4N2 b= 11.65
Molecular weight (g/mol) 516.37 c= 21.99
Dark shiny crystals by slow diffusion of
Et2O vapor in a DCM solution of the
molecule at room temperature.
Cell volume (Ǻ3) 5267.58
Z Z= 8
C22
C12
C2
C15
N2
C5
N1
C1
C23
C27
C3

228
Selected bond length (Ǻ)
C1 - C22 1.497 (2) C2 - C3 1.420 (2)
C1 - C2 1.426 (2) C5 - N1 1.348 (3)
C1 - C12 1.414 (2) C15 - N2 1.343 (3)
C12 - C17 1.426 (2)
Selected angles (°)
C22 - C1 - C2 119.04 (1) C1 - C2/C12 -C13* 25.22 (1)
C plane 0.01 (2) C1 - C2/C22 - C23* 107.29 (2)
*torsion angle
anthracen-9-ylbis(4-(diphenylamino)phenyl)methyliumtetrafluoroborate ([O2(anth)+][BF4-])
C51H37BF4N2, M = 764.66 g/mol
Reagents: 9-anthracenyl-bis(4-(diphenylamino)phenyl)methanol O2(anth)OH (1 eq, 191 mg, 0.25
mmol), HBF4·Et2O (1.1 eq, 37 µL, 0.275 mmol).
Reaction and work up: Prepared according to GP3 to obtained 9-anthracenyl-bis(4-
(diphenylamino)phenyl)methylium tetrafluoroborate O2(anth)+ as a violet powder.
1H NMR (400 MHz, CDCl3) δ 8.64 (s, 1H), 8.06 (d, J = 8.3 Hz, 2H), 7.56 – 7.36 (m, 17H), 7.36 – 7.20 (m,
13H), 6.89 (d, J = 9.0 Hz, 4H).

229
13C NMR (101 MHz, CDCl3) δ 176.29 (C+), 157.48, 143.31, 140.15, 132.82, 132.40, 131.23, 130.99,
130.70, 130.46, 128.80, 128.37, 128.07, 127.21, 126.00, 125.94, 119.29.

230
HRMS (ESI): calcd.: 677.29512 [M]+, found: 677.2949 [M]+.
UV-Vis (DCM): λmax, nm (ε, 10-5·M-1·cm-1): 247 (0.63), 267 (0.33), 702 (0.90).
X-ray diffraction study:
ORTEP view of ([O2(anth)+ ][BF4-]) with 50 % thermal ellipsoids solved by Dr. Thierry Roisnel
Crystal parameters
Crystal class monoclinic
Space group P 21/n
Cell angles (°) α= 90
β= 98
γ= 90
Cell length (Ǻ) a= 16.45
Formula C51H37BF4N2 b= 13.53
Molecular weight (g/mol) 764.66 c= 17.78
Violet shiny crystals by slow diffusion of
Et2O vapor into a DCM solution of the
molecule at room temperature.
Cell volume (Ǻ3) 3921.12
Z Z= 4
C22
C12
C2
C15 N2
C5
N1
C1
C23
C3
C13
C16
C17

231
Selected bond length (Ǻ)
C1- C2 1.488 (3) C2 -C17 1.433 (3)
C1 - C12 1.448 (3) C5 - N1 1.379 (3)
C1 - C22 1.405 (3) C15 - N2 1.351 (3)
C12 - C13 1.414 (3)
Selected angles (°)
C1 - C2 - C22 117.02 (2) C1 - C2/ C22 - C1* 100.03 (3)
C plane 3.69 (2) C14 - C15/ C16 - C17* 64.96 (3)
C1 - C22/C2 -C3* 32.17 (3) C15 - N2/ C16 - C17* 70.32 (3)
*torsion angle
9-(9-anthracenyl)-3,6-bis(diphenylamino)-9H-fluoren-9-ylium tetrafluoroborate ([O3(anth)+][BF4-])
C51H35BF4N2, M = 762.64 g/mol
Reagents: directly from the carbinol's reaction O3(anth)OH
Reaction and work up: Prepared according to GP3 to obtained 9-(9-anthracenyl)-3,6-
bis(diphenylamino)-9H-fluoren-9-ylium tetrafluoroborate ([O3(anth)+ ][BF4-]) as a violet powder.
Overall yield= 21 %.
1H NMR (400 MHz, CDCl3) δ 8.61 (s, 1H), 8.08 (dd, J = 15.2, 8.3 Hz, 4H), 7.56 (dt, J = 15.2, 6.6 Hz, 4H),
7.45 (t, J = 7.6 Hz, 8H), 7.34 (t, J = 7.4 Hz, 4H), 7.28 (s, 5H), 6.87 (s, 2H), 6.51 (d, J = 8.9 Hz, 2H), 6.14
(d, J = 8.7 Hz, 2H).

232
13C NMR (101 MHz, CDCl3) δ 158.12 (C+), 147.21, 143.65, 135.48, 134.72, 131.32, 130.93, 130.36,
129.79, 128.93, 128.57, 127.64, 127.59, 126.21, 126.06, 118.43, 116.79.
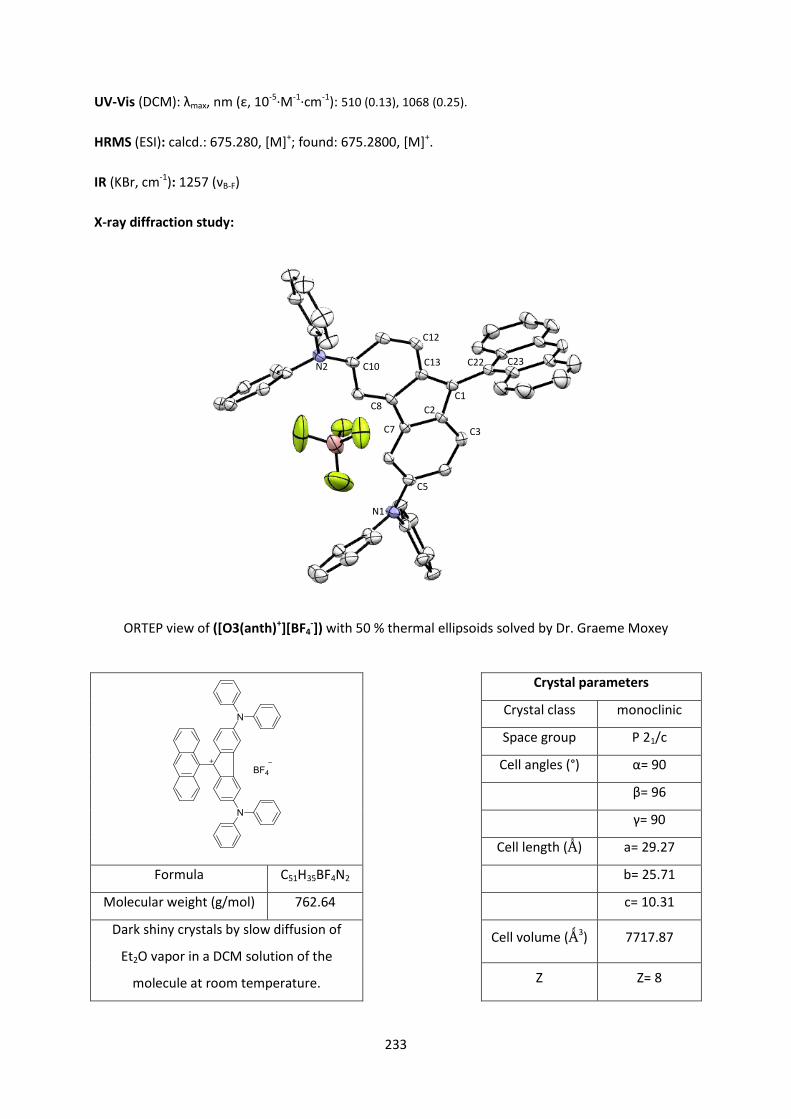
233
UV-Vis (DCM): λmax, nm (ε, 10-5·M-1·cm-1): 510 (0.13), 1068 (0.25).
HRMS (ESI): calcd.: 675.280, [M]+; found: 675.2800, [M]+.
IR (KBr, cm-1): 1257 (νB-F)
X-ray diffraction study:
ORTEP view of ([O3(anth)+][BF4-]) with 50 % thermal ellipsoids solved by Dr. Graeme Moxey
Crystal parameters
Crystal class monoclinic
Space group P 21/c
Cell angles (°) α= 90
β= 96
γ= 90
Cell length (Ǻ) a= 29.27
Formula C51H35BF4N2 b= 25.71
Molecular weight (g/mol) 762.64 c= 10.31
Dark shiny crystals by slow diffusion of
Et2O vapor in a DCM solution of the
molecule at room temperature.
Cell volume (Ǻ3) 7717.87
Z Z= 8
C22 C13
C2
C10 N2
C5
N1
C1 C8
C7
C23
C12
C3

234
Selected bond length (Ǻ)
C1 - C22 1.477 (5) C13 - C12 1.409 (5)
C1 - C2 1.450 (5) C2- C3 1.391 (5)
C13 - C8 1.437 (5) C10- N2 1.371 (5)
C2 - C7 1.415 (5) C5 - N1 1.396 (5)
Selected angles (°)
C plane 2.89 (2) C6- C5/N1 -C47* 27.81 (5)
C13 - C1/C22 - C23 70.37 (2) C6 - C5/ C47 - C48* 63.42 (4)
*torsion angle
3-(9-anthracenyl)-1,1-bis(4-(dimethylamino)phenyl)prop-2-yn-1-ylium tetrafluoroborate
([O1(anthC2)+][BF4
-])
C33H29BF4N2, M = 540.40 g/mol
Reagents: 3-(9-anthracenyl)-1,1-bis(4-(dimethylamino)phenyl)prop-2-yn-1-ol O1(anthC2)OH (1 eq,
470.5 mg, 1 mmol), HBF4·Et2O (1.1 eq, 150 µL, 1.1 mmol).
Reaction and work up: Prepared according to GP3 to obtained 3-(9-anthracenyl)-1,1-bis(4-
(dimethylamino)phenyl)prop-2-yn-1-ylium tetrafluoroborate O1(anthC2)+ as a green powder.
Yield: 480 mg (89 %)
1H NMR (400 MHz, CD2Cl2) δ 8.73 (s, 1H), 8.53 (d, J = 8.6 Hz, 2H), 8.16 (d, J = 8.4 Hz, 3H), 8.09 (d, J =
9.3 Hz, 4H), 7.82 – 7.68 (m, 2H), 7.68 – 7.58 (m, 2H), 7.03 (d, J = 9.2 Hz, 4H), 3.38 (s, 12H).

235
13C NMR (101 MHz, CD2Cl2) δ 157.21, 154.55 (C+), 139.10, 135.18, 134.13, 131.81, 130.17, 129.59,
128.23, 127.06, 126.71, 116.02, 115.23, 114.74, 104.38, 41.53.

236
HRMS (ESI): calcd.: 453.23307 [M]+; found: 453.2334 [M]+.
IR (KBr, cm-1): 2140 (νC≡C) and 1162 (νB-F).
UV-Vis (DCM): λmax, nm (ε, 10-5·M-1·cm-1): 263 (1.16), 317 (0.25), 704 (1.09).
X-ray diffraction study:
ORTEP view of ([O1(anthC2)+][BF4
-]) with 50 % thermal ellipsoids solved by Dr. Graeme Moxey
Crystal parameters
Crystal class monoclinic
Space group P 21/n
Cell angles (°) α= 90
β= 97
γ= 90
Cell length (Ǻ) a= 16.41
Formula C33H29BF4N2 b= 7.29
Molecular weight (g/mol) 540.40 c= 22.75
Dark shiny crystals by slow diffusion of
Et2O vapor into a DCM solution of the
molecule at room temperature.
Cell volume (Ǻ3) 2697.62
Z Z= 4
C22 C12
C2
C15 N2
C5
N1
C1
C23 C24
C25
C17
C16
C3
C4

237
Selected bond length (Ǻ)
C1 - C22 1.423 (2) C3 - C4 1.363 (3)
C1 - C2 1.426 (3) C12 - C17 1.420 (3)
C1 - C12 1.433 (3) C16 - C17 1.361 (3)
C22 - C23 1.203 (3) C15 - N2 1.348 (3)
C1 - C3 1.422 (3) C5 - N1 1.341 (3)
Selected angles (°)
C plan 1.40 (2) C1 - C22 - C23 179.20 (3)
C2-C1/C12 - C13* 23.61 (3) C1 - C12/C24 - C25* 12.84 (3)
*torsion angle
3-(9-anthracenyl)-1,1-bis(4-(diphenylamino)phenyl)prop-2-yn-1-ylium tetrafluoroborate
([O2(anthC2)+][BF4
-])
C53H37BF4N2, M = 788.68 g/mol
Reagents: 3-(9-anthracenyl)-1,1-bis(4-(diphenylamino)phenyl)prop-2-yn-1-ol O2(anthC2)OH (1 eq, 360
mg, 0.5 mmol), HBF4·Et2O (1.1 eq, 75 µL, 0.55 mmol).
Reaction and work up: Prepared according to GP3 to obtained 3-(9-anthracenyl)-1,1-bis(4-
(diphenylamino)phenyl)prop-2-yn-1-ylium tetrafluoroborate ([O2(anthC2)+][BF4
-]) as a green powder.
Yield: 350 mg (88 %)

238
1H NMR (400 MHz, CDCl3) δ 8.71 (s, 1H), 8.41 (d, J = 8.6 Hz, 2H), 8.11 (d, J = 8.4 Hz, 2H), 8.02 (d, J =
9.0 Hz, 4H), 7.71 (t, J = 7.6 Hz, 2H), 7.61 (t, J = 7.6 Hz, 2H), 7.51 (t, J = 7.7 Hz, 8H), 7.37 (t, J = 5.7 Hz,
12H), 7.13 (d, J = 8.9 Hz, 4H).
13C NMR (101 MHz, CDCl3) δ 156.74, 155.74 (C+), 143.76, 138.76, 135.24, 135.14, 131.33, 131.26,
130.56, 130.01, 129.72, 128.27, 127.28, 126.81, 126.36, 120.58, 119.47, 114.59, 106.11.
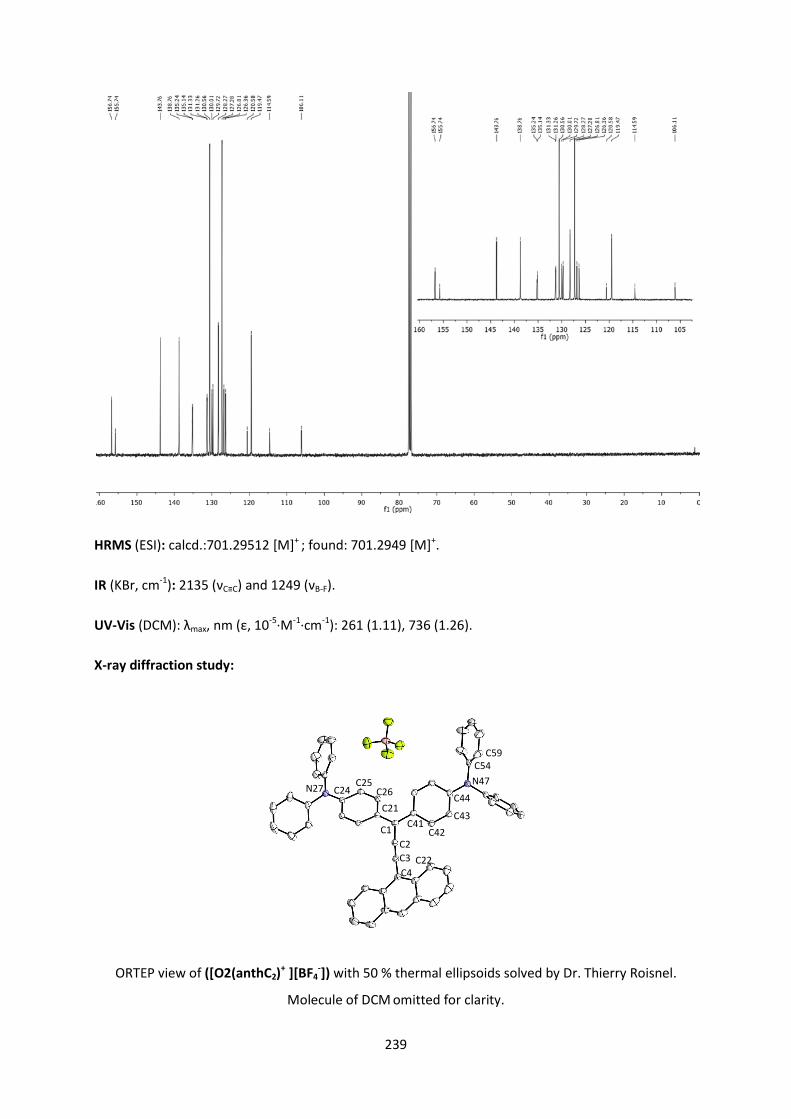
239
HRMS (ESI): calcd.:701.29512 [M]+ ; found: 701.2949 [M]+.
IR (KBr, cm-1): 2135 (νC≡C) and 1249 (νB-F).
UV-Vis (DCM): λmax, nm (ε, 10-5·M-1·cm-1): 261 (1.11), 736 (1.26).
X-ray diffraction study:
ORTEP view of ([O2(anthC2)+ ][BF4
-]) with 50 % thermal ellipsoids solved by Dr. Thierry Roisnel.
Molecule of DCM omitted for clarity.
C2
C21
C41
C24 N27 C44
N47
C1
C3
C4
C43
C42
C22
C25 C26
C54 C59
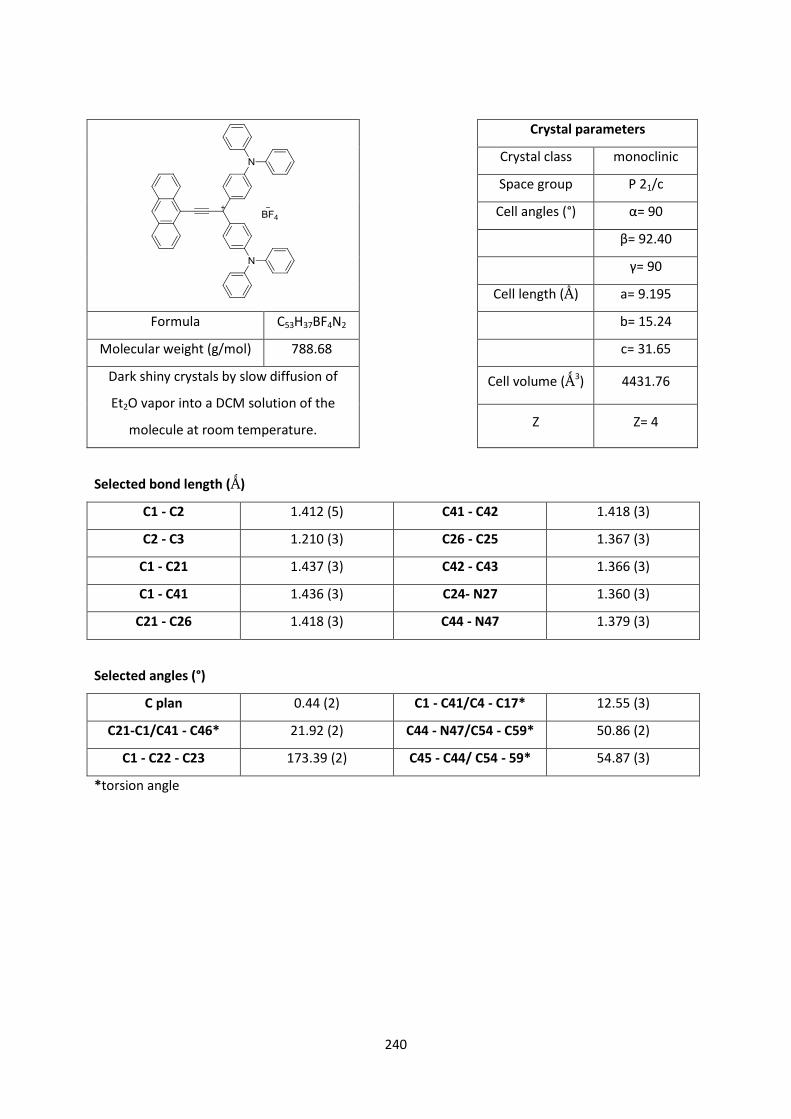
240
Crystal parameters
Crystal class monoclinic
Space group P 21/c
Cell angles (°) α= 90
β= 92.40
γ= 90
Cell length (Ǻ) a= 9.195
Formula C53H37BF4N2 b= 15.24
Molecular weight (g/mol) 788.68 c= 31.65
Dark shiny crystals by slow diffusion of
Et2O vapor into a DCM solution of the
molecule at room temperature.
Cell volume (Ǻ3) 4431.76
Z Z= 4
Selected bond length (Ǻ)
C1 - C2 1.412 (5) C41 - C42 1.418 (3)
C2 - C3 1.210 (3) C26 - C25 1.367 (3)
C1 - C21 1.437 (3) C42 - C43 1.366 (3)
C1 - C41 1.436 (3) C24- N27 1.360 (3)
C21 - C26 1.418 (3) C44 - N47 1.379 (3)
Selected angles (°)
C plan 0.44 (2) C1 - C41/C4 - C17* 12.55 (3)
C21-C1/C41 - C46* 21.92 (2) C44 - N47/C54 - C59* 50.86 (2)
C1 - C22 - C23 173.39 (2) C45 - C44/ C54 - 59* 54.87 (3)
*torsion angle

241
9-(9-ethynylanthracenyl)-3,6-bis(diphenylamino)-9H-fluoren-9-ylium tetrafluoroborate
([O3(anthC2)+][BF4
-])
C53H35BF4N2, M = 786.66 g/mol
Reagents: 9-(9-anthracenylethynyl)-3,6-bis(diphenylamino)-9H-fluoren-9-ol O3(anthC2)OH (1 eq,
358.4 mg, 0.5 mmol), HBF4·Et2O (1.1 eq, 75 µL, 0.55 mmol).
Reaction and work up: Prepared according to GP3 to obtained 9-(anthracen-9-ylethynyl)-3,6-
bis(diphenylamino)-9H-fluoren-9-ylium tetrafluoroborate ([O3(anthC2)+][BF4
-]) as a violet powder.
Yield: 380 mg (96 %)
1H NMR (800 MHz, CDCl3) δ 8.71 (s, 1H), 8.38 (d, J = 8.5 Hz, 2H), 8.06 (d, J = 8.3 Hz, 2H), 7.73 (t, J = 7.6
Hz, 2H), 7.57 (t, J = 7.4 Hz, 2H), 7.47 (t, J = 7.9 Hz, 8H), 7.36 (q, J = 7.4 Hz, 6H), 7.26 (d, J = 7.6 Hz, 9H),
6.80 – 6.74 (m, 2H), 6.55 (d, J = 8.5 Hz, 2H).
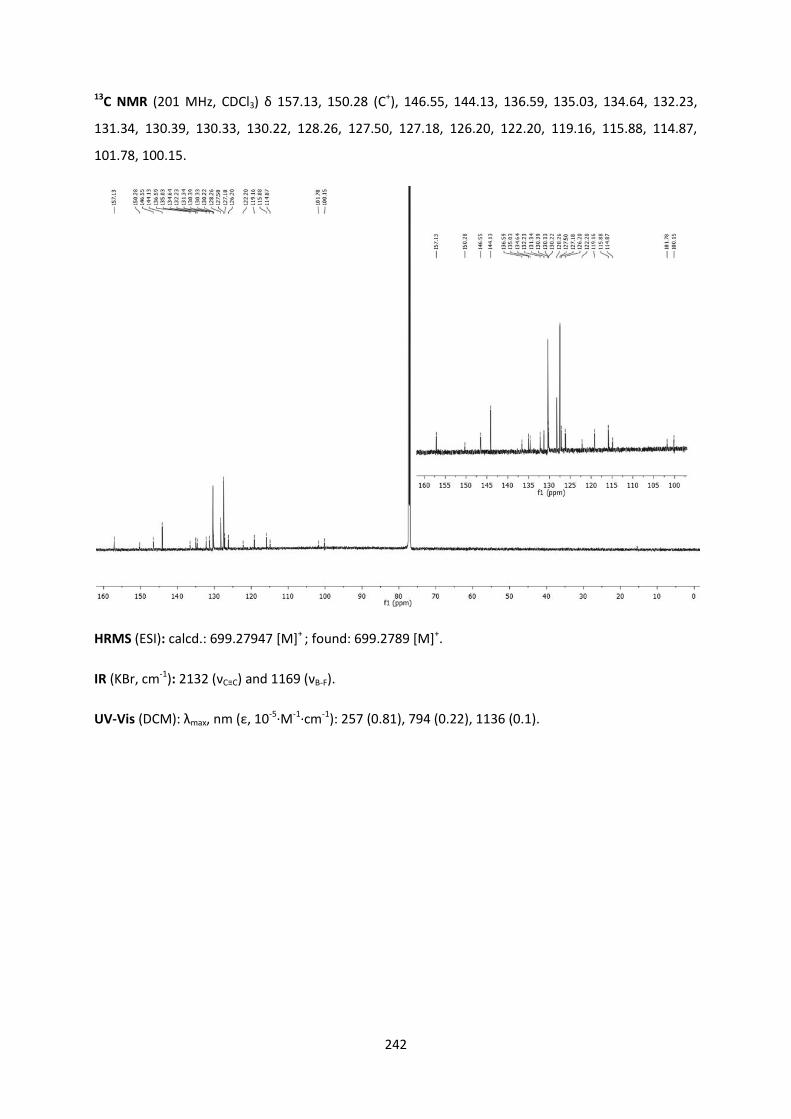
242
13C NMR (201 MHz, CDCl3) δ 157.13, 150.28 (C+), 146.55, 144.13, 136.59, 135.03, 134.64, 132.23,
131.34, 130.39, 130.33, 130.22, 128.26, 127.50, 127.18, 126.20, 122.20, 119.16, 115.88, 114.87,
101.78, 100.15.
HRMS (ESI): calcd.: 699.27947 [M]+ ; found: 699.2789 [M]+.
IR (KBr, cm-1): 2132 (νC≡C) and 1169 (νB-F).
UV-Vis (DCM): λmax, nm (ε, 10-5·M-1·cm-1): 257 (0.81), 794 (0.22), 1136 (0.1).

243
X-ray diffraction study:
ORTEP view of ([O3(anthC2)+][BF4
-]) with 50 % thermal ellipsoids solved by Dr. Graeme Moxey
Crystal parameters
Crystal class triclinic
Space group P - 1
Cell angles (°) α= 66.92
β= 86.09
γ= 69.21
Cell length (Ǻ) a= 11.99
Formula C53H35BF4N2 b= 13.74
Molecular weight (g/mol) 786.66 c= 17.45
Dark shiny crystals by slow evaporation of
CHCl3
Cell volume (Ǻ3) 2466.53
Z Z= 2
Selected bond length (Ǻ)
C1 - C22 1.392 (3) C13 - C12 1.404 (3)
C1 - C13 1.425 (3) C2- C3 1.397 (4)
C1 - C2 1.430 (3) C10- N2 1.364 (3)
C13 - C8 1.424 (4) C5 - N1 1.374 (3)
C2 - C7 1.425 (3) C8 - C7 1.472 (3)
C22
C13
C2
C15 N2
C5
N1
C1
C5
C23
C24
C25
C7
C8
C3
C12
C41 C42

244
Selected angles (°)
C plan 1.84 (2) C5- N1/C41 -C42* 62.45 (4)
C1 - C22 - C23 176.45 (3) C5 - C4/ C41 - C42* 69.11 (3)
C13 - C1/C24 - C25 2.24 (3)
*torsion angle
(9,9-dibutyl-9H-fluoren-2-yl)bis(4-(dimethylamino)phenyl)methylium tetrafluoroborate
([O1(Flu)+][BF4-])
C38H45BF4N2, M = 616.58 g/mol
Reagents: (9,9-dibutyl-9H-fluoren-2-yl)bis(4-(dimethylamino)phenyl)methanol O3(flu)OH (1 eq, 273.4
mg, 0.5 mmol), HBF4·Et2O (1.1 eq, 75 µL, 0.55 mmol).
Reaction and work up: Prepared according to GP3 to obtained (9,9-dibutyl-9H-fluoren-2-yl)bis(4-
(dimethylamino)phenyl)methylium tetrafluoroborate ([O1(Flu)+][BF4-]) as a black powder.
Yield: 277mg (90 %)
1H NMR (400 MHz, CDCl3) δ 7.86 (d, J = 7.9 Hz, 1H), 7.83 (d, J = 6.9 Hz, 1H), 7.42 (m, 7H), 7.35 (d, J =
7.9 Hz, 1H), 7.27 (1H under CDCl3), 6.93 (d, J = 8.9 Hz, 4H), 3.35 (s, 12H, -NMe2), 2.02 – 1.93 (m, 4H),
1.17 – 1.03 (m, 4H), 0.75 – 0.57 (m, 10H).

245
13C NMR (101 MHz, CDCl3) δ 178.52 (C+), 157.02, 152.24, 151.13, 147.22, 141.03, 139.46, 138.29,
135.17, 129.89, 129.43, 127.59, 123.37, 121.29, 119.92, 113.65, 55.42, 41.02 (-NMe2), 39.85, 26.27,
23.07, 14.03.

246
HRMS (ESI): calcd.: 529.35827 [M]+; found: 529.3577 [M]+.
IR (cm-1): 1168 (νB-F)
UV-Vis (DCM): λmax, nm (ε, 10-5·M-1·cm-1): 313 (0.22), 489 (0.47), 624 (1.26).
(9,9-dibutyl-9H-fluoren-2-yl)bis(4-(diphenylamino)phenyl)methylium tetrafluoroborate
([O2(flu)+][BF4-])
C58H53BF4N2, M = 864.86 g/mol
Reagents: (9,9-dibutyl-9H-fluoren-2-yl)bis(4-(diphenylamino)phenyl)methanol O3(flu)OH (1 eq, 425.6
mg, 0.5 mmol), HBF4·Et2O (1.1 eq, 75 µL, 0.55 mmol).
Reaction and work up: Prepared according to GP3 to obtained (9,9-dibutyl-9H-fluoren-2-yl)bis(4-
(diphenylamino)phenyl)methylium tetrafluoroborate ([O2(flu)+][BF4-]) as a violet powder.
Yield: 296mg (70 %)
nb: quantitative but loss of product during washes, partially soluble in Et2O.
1H NMR (400 MHz, (CD3)2CO) δ 8.13 (d, J = 7.9 Hz, 1H), 8.02 (d, J = 7.3 Hz, 1H), 7.61 – 7.42 (m, 29H),
7.06 (d, J = 8.9 Hz, 4H), 2.18 – 2.07 (m, 4H), 1.13 – 1.07 (m, 4H), 0.69 – 0.58 (m, 10H).

247
13C NMR (101 MHz, CDCl3) δ 181.12 (C+), 157.03, 152.35, 151.08, 148.23, 143.65, 141.26, 139.15,
138.35, 135.94, 130.91, 130.34, 129.67, 127.90, 127.57, 127.18, 123.22, 121.50, 120.11, 118.37,
55.31, 39.69, 26.06, 22.83, 13.83.
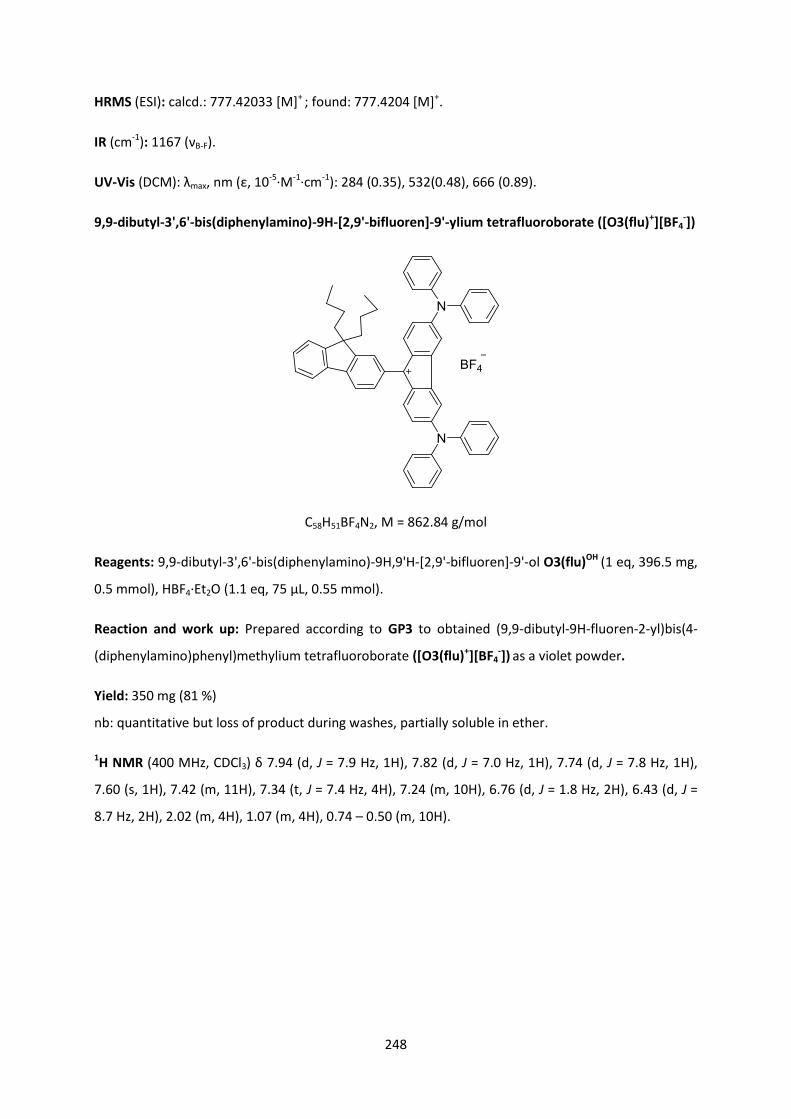
248
HRMS (ESI): calcd.: 777.42033 [M]+ ; found: 777.4204 [M]+.
IR (cm-1): 1167 (νB-F).
UV-Vis (DCM): λmax, nm (ε, 10-5·M-1·cm-1): 284 (0.35), 532(0.48), 666 (0.89).
9,9-dibutyl-3',6'-bis(diphenylamino)-9H-[2,9'-bifluoren]-9'-ylium tetrafluoroborate ([O3(flu)+][BF4-])
C58H51BF4N2, M = 862.84 g/mol
Reagents: 9,9-dibutyl-3',6'-bis(diphenylamino)-9H,9'H-[2,9'-bifluoren]-9'-ol O3(flu)OH (1 eq, 396.5 mg,
0.5 mmol), HBF4·Et2O (1.1 eq, 75 µL, 0.55 mmol).
Reaction and work up: Prepared according to GP3 to obtained (9,9-dibutyl-9H-fluoren-2-yl)bis(4-
(diphenylamino)phenyl)methylium tetrafluoroborate ([O3(flu)+][BF4-]) as a violet powder.
Yield: 350 mg (81 %)
nb: quantitative but loss of product during washes, partially soluble in ether.
1H NMR (400 MHz, CDCl3) δ 7.94 (d, J = 7.9 Hz, 1H), 7.82 (d, J = 7.0 Hz, 1H), 7.74 (d, J = 7.8 Hz, 1H),
7.60 (s, 1H), 7.42 (m, 11H), 7.34 (t, J = 7.4 Hz, 4H), 7.24 (m, 10H), 6.76 (d, J = 1.8 Hz, 2H), 6.43 (d, J =
8.7 Hz, 2H), 2.02 (m, 4H), 1.07 (m, 4H), 0.74 – 0.50 (m, 10H).

249
13C NMR (101 MHz, CDCl3) δ 172.73 (C+), 157.30, 152.24, 152.22, 148.18, 147.50, 143.81, 139.49,
135.01, 131.74, 130.55, 130.35, 130.20, 129.73, 128.27, 127.66, 127.43, 124.23, 123.38, 121.51,
121.26, 118.61, 115.82, 55.63, 40.01, 26.20, 23.08, 13.94.

250
HRMS (ESI): calcd.: 775.4068 [M] +; found: 775.4050 [M]+.
IR (cm-1): 1279 (νB-F).
UV-Vis (DCM): λmax, nm (ε, 10-5·M-1·cm-1): 275 (0.64), 379 (0.25), 637 (0.53), 923 (0.23), 1048 (0.32).
X-ray diffraction study:
ORTEP view of ([O3(flu)+][BF4-])with 50 % thermal ellipsoids solved by Dr. Thierry Roisnel. Molecule
of H2O and butyl chains not displayed for visibility.
Crystal parameters
Crystal class monoclinic
Space group P 21/c
Cell angles (°) α= 90
β= 111.35
γ= 90
Cell length (Ǻ) a= 21.09
Formula C58H51BF4N2 b= 9.35
Molecular weight (g/mol) 862.84 c= 26.28
Dark shiny crystals by slow diffusion of
Et2O vapor into a DCM solution of the
molecule at room temperature.
Cell volume (Ǻ3) 4827.99
Z Z= 4
C41
C4
C2
C14 N7
N27
C1 C22
C34
C24
C25 C26
C21 C42
C6
N5
N19

251
Selected bond length (Ǻ)
C41 - C42 1.465 (4) C21 - C22 1.485 (6)
C41 - C1 1.404 (4) C1 - C2 1.440 (5)
C41 - C21 1.466 (5) C22 - C2 1.471 (5)
C26 - C25 1.387 (5) C24 - N27 1.408 (4)
C6 - C5 1.353 (4) C4 - N7 1.348 (4)
Selected angles (°)
C5 - C4/ C14 - C19* 62.16 (3) C47 - C42/C41 - C1* 35.25 (3)
C5 - C4/ N7 - C14* 7.49 (5) C23 - 24/ N27 - C34* 38.37 (4)
*torsion angle
4,4',4''-methyliumtriyltris(N,N-diphenylaniline) tetrafluoroborate ([O4+][BF4-])
C55H43BF4N3, M = 832.75 g/mol
Reagents: tris(4-(diphenylamino)phenyl)methanol O4OH (1 eq, 190.5 mg, 0.25 mmol), HBF4·Et2O (1.1
eq, 37 µL, 0.275 mmol).
Reaction and work up: Prepared according to GP3 to obtain the desired product tris(4-
(diphenylamino)phenyl)methanol ([O4+][BF4-]) as a blue powder.
Yield: quant.
1H NMR (400 MHz, CDCl3) δ 7.44 (t, J = 7.7 Hz, 12H), 7.37 – 7.28 (m, 22H), 7.00 (d, J = 9.0 Hz, 6H).

252
13C NMR (101 MHz, CDCl3) δ 179.26 (C+), 155.84, 144.36, 140.12, 130.52, 130.38, 127.43, 127.23,
118.24.

253
UV-Vis (DCM): λmax, nm (ε, 10-5·M-1·cm-1): 289 (0.35), 644 (1.05).
HRMS: calcd.: 744.3379 [M]+, found: 744.3400 [M]+.
X-ray diffraction study:
ORTEP view of ([O4+][BF4-]) with 50 % thermal ellipsoids solved by Dr. Graeme Moxey
Crystal parameters
Crystal class triclinic
Space group P 31
Cell angles (°) α= 90
β= 90
γ= 120
Cell length (Ǻ) a= 18.21
Formula C55H43BF4N3 b= 18.21
Molecular weight (g/mol) 832.75 c= 45.57
Dark shiny crystals by slow diffusion of
Et2O vapor in a DCM solution of the
molecule at room temperature
Cell volume (Ǻ3) 13085.7
Z Z= 12
C22
C12
C2
C5
N1
N3 C1
C15
C25
N3
C7
C41
C46

254
Selected bond length (Ǻ)
C1 - C2 1.417 (10) C1 - C22 1.437 (8)
C1 - C12 1.450 (10) N1 - C5 1.379 (9)
C15-N2 1.367 (10) C25-N3 1.370 (8)
Selected angles (°)
C plan 3.29 (1) C5 - N1/C41 - C46* 83.63 (7)
C1 - C12 / C2 - C7* 30.13 (7)
*torsion angle
6. Synthesis of organometallic derivatives
6.1. Ferrocene carbinols
Ferrocene-[3,3-[4-(dimethylamino)phenyl]-3-hydroxy-1-propenyl] (M1(Fc)OH)
C29H30FeN2O, M = 478.41 g/mol
Reagents: Ethynylferrocene 35 (1.1 eq, 682 mg, 3.2 mmol), n-BuLi (1.1 eq, 2 mL at 1.6 M in hexane,
3.2 mmol), Michler's ketone 28 (1 eq, 805 mg, 3 mmol).
Reaction and work up: Prepared according to GP1.
Purification: The crude was dissolved in DCM and precipitated in hexane two times to give the
desired ferrocene-[3,3-[4-(dimethylamino)phenyl]-3-hydroxy-1-propenyl] M1(Fc)OH as an orange
solid.
Yield: 810 mg (56 %).

255
1H NMR (400 MHz, CD2Cl2) δ 7.45 (d, J = 8.7 Hz, 4H), 6.69 (d, J = 8.7 Hz, 4H), 5.33 (s, 1H, -OH), 4.48 (s,
2H,), 4.24 (s, 7H, Cp), 2.93 (s, 12H, -NMe2).
13C NMR (101 MHz, CDCl3) δ 150.04, 133.95, 127.22, 112.19, 89.33, 84.96, 74.62 (C-OH), 71.65, 69.93,
68.72, 65.21, 40.76.

256
HRMS: Calcd: 461.16801 [M-OH]+, 479.17858 [M+H]+, 478.17075 [M]+; found: 461.1675 [M-OH]+,
479.1797 [M+H]+, 478.1733 [M]+.
IR (KBr, cm-1): 3191 (νO-H), 2222 (νC≡C), 820 (δC-H Fc).
UV-Vis: (DCM): λmax, nm (ε, 10-5·M-1·cm-1): 270 (0.40).
CV (DCM, 0.10 M [n-Bu4N][PF6], V vs SCE): MIII/MII: E1/2: 0.55 (ΔEp = 0.06 V; ipc/ipa= 0.98), amine
oxidation: Epc (V): 0.83V.
[3,3-[4-(diphenylamino)phenyl]-3-hydroxy-1-propenyl]ferrocene (M2(Fc)OH)
C49H38FeN2O, M = 726.23 g/mol
Reagents: Ethynylferrocene 35 (1.1 eq, 231 mg, 1 mmol), n-BuLi (1.1 eq, 687.5 µL at 1.6 M in hexane,
1.1 mmol), 4,4'-bisdiphenylaminobenzophenone 29 (1 eq, 516 mg, 1 mmol).
Reaction and work up: Prepared according to GP1.
Purification: The crude orange solid was adsorbed on deactivated silica and purified by column
chromatography (neutralized silica gel with 10 % NEt3, 20 x 5 cm) eluting with hexane/Et2O (4/1) with
1 % NEt3 to give [3,3-[4-(diphenylamino)phenyl]-3-hydroxy -1-propenyl]ferrocene M2(Fc)OH as an
orange solid.
Rf(hexane/Et2O, 4/1): 0.4
Yield: 480 mg (64 %)
1H NMR (400 MHz, (CD3)2CO) δ 7.62 (d, J = 8.7 Hz, 4H), 7.28 (m, J = 8.4, 7.4 Hz, 8H), 7.08 – 6.97 (m,
16H), 5.49 (s, 1H, -OH), 4.49 (t, J = 1.8 Hz, 2H), 4.27 – 4.23 (t, J = 1.8 Hz, 2H), 4.22 (s, 5H, Cp).
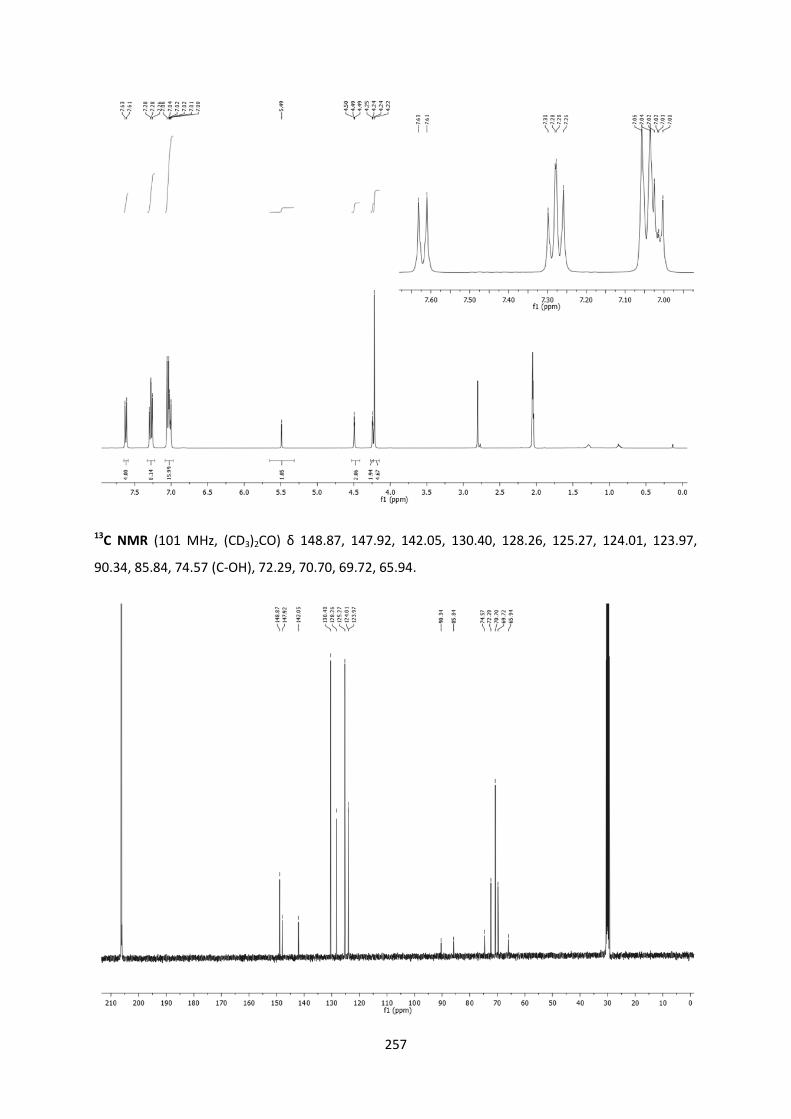
257
13C NMR (101 MHz, (CD3)2CO) δ 148.87, 147.92, 142.05, 130.40, 128.26, 125.27, 124.01, 123.97,
90.34, 85.84, 74.57 (C-OH), 72.29, 70.70, 69.72, 65.94.

258
HRMS(ESI): calcd.: 709.23006[M-.OH]+, 749.22257[M+Na]+, 765.19651[M+K]+; found :709.2299[M-
.OH]+,749.2225[M+Na]+, 765.1975[M+K]+.
IR (KBr.cm-1): 3574.67 (νO-H), 2224.61 (νC≡C), 821.63 (s, δC-H Fc).
EA: calcd. for C49H38FeN2O: C = 80.99; H= 5.27; Fe= 7.68; N= 3.85; O= 2.20, found: C = 80.81; H= 5.19;
N= 3.78.
UV-Vis: (DCM): λmax, nm (ε, 10-5·M-1·cm-1): 302 (0.58).
CV: (DCM, 0.10 M [n-Bu4N][PF6], V vs SCE): MIII/MII: E1/2: 0.56 (ΔEp = 0.02 V, ipc/ipa= 1.0), amine
oxidation: Epc (V): 0.94.
4-ethynylferrocene-[3,3-[4-(dimethylamino)phenyl]-3-hydroxy-1-benzene] (M3(Fc)OH)
C35H34FeN2O, M = 554.50 g/mol
Reagents: p-bromo(ferrocenylethynyl)benzene 36 (1.2 eq, 438 mg, 1.2 mmol), n-BuLi (1.1 eq, 687.5
µL at 1.6 M in hexane, 1.1 mmol), Michler'sketone 28 (1 eq, 268.3 mg, 1 mmol).
Reaction and work up: Prepared according to GP1.
Purification: The crude brown solid was adsorbed on deactivated silica and purified by column
chromatography (neutralized silica gel with 10 % NEt3, 15 x 5 cm) eluting with a gradient of
hexane/Et2O (9/1) to (1/1) with 1 % NEt3 to obtain 4-ethynylferrocene-[3,3-[4-(dimethylamino)
phenyl]-3-hydroxy-1-benzene] M3(Fc)OH as an orange solid. A final precipitation from acetone/H2O
carried out to purify the product.
Rf (hexane): 0.2
Yield: (290 mg) 52 %

259
1H NMR (400 MHz, (CD3)2CO) δ 7.39 (d, J = 8.5 Hz, 2H), 7.33 (d, J = 8.4 Hz, 2H), 7.10 (d, J = 8.9 Hz, 4H),
6.67 (d, J = 8.9 Hz, 4H), 4.79 (s, 1H, -OH), 4.54 – 4.46 (m, 2H), 4.30 – 4.27 (m, 2H), 4.24 (s, 5H, Cp),
2.92 (s, 12H).
13C NMR (101 MHz, (CD3)2CO) δ 150.60, 150.21, 137.00, 131.18, 129.78, 129.12, 122.82, 112.51,
88.84, 86.64, 81.61 (C-OH), 72.22, 70.83, 69.83, 66.44, 40.79 (-NMe2).

260
HRMS (ESI): calcd. : 554.20205 [M]+, 537.19931[M-.OH]+; found: 554.2020 [M]+, 537.20 [M-.OH]+.
IR (KBr.cm-1): 3205 (νO-H), 2206 (νC≡C), 820 (s, δC-H Fc).
UV-VIS: (DCM): λmax, nm (ε, 10-5·M-1·cm-1): 263 (0.60), 292 (0.32).
CV: (DCM, 0.10 M [n-Bu4N][PF6], V vs SCE): MIII/MII: E1/2: 0.52 (ΔEp = 0.08 V, ipc/ipa= 0.98), amine
oxidation: Epc (V): 0.74 V.
4-ethynylferrocene-[3,3-[4-(diphenylamino)phenyl]-3-hydroxy-1-benzene] (M4(Fc)OH)
C55H42FeN2O, M = 802.78 g/mol
Reagents: p-bromo(ferrocenylethynyl)benzene 36 (1.2 eq, 219 mg, 0.6 mmol), n-BuLi (1.1 eq, 344 µL
at 1.6 M in hexane, 0.55 mmol), 4,4'-bisdiphenylaminobenzophenone (1 eq, 258 mg, 0.5 mmol).
Reaction and work up: Prepared according to GP1.
Purification: The crude orange solid was adsorbed on deactivated silica and purified by column
chromatography (neutralized silica gel with 10 % NEt3, 15 x 5 cm) eluting with hexane/Et2O (9/1) with
1 % NEt3 to give 4-ethynylferrocene-[3,3-[4-(diphenylamino)phenyl]-3-hydroxy-1-benzene] M4(Fc)OH
as an orange solid.
Rf(hexane/Et2O, 19/1): 0.34
Yield: 380 mg (94%)
1H NMR (400 MHz, (CD3)2CO) δ 7.31 (d, J = 8.5 Hz, 2H), 7.27 (d, J = 8.6 Hz, 2H), 7.15 (t, J = 7.9 Hz, 8H),
7.11 (d, J = 8.7 Hz, 4H), 6.91 (m, 12H), 6.85 (d, J = 8.7 Hz, 4H), 5.22 (s, 1H,-OH), 4.39 – 4.35 (m, 2H),
4.17 – 4.14 (m, 2H), 4.11 (s, 5H, Cp).
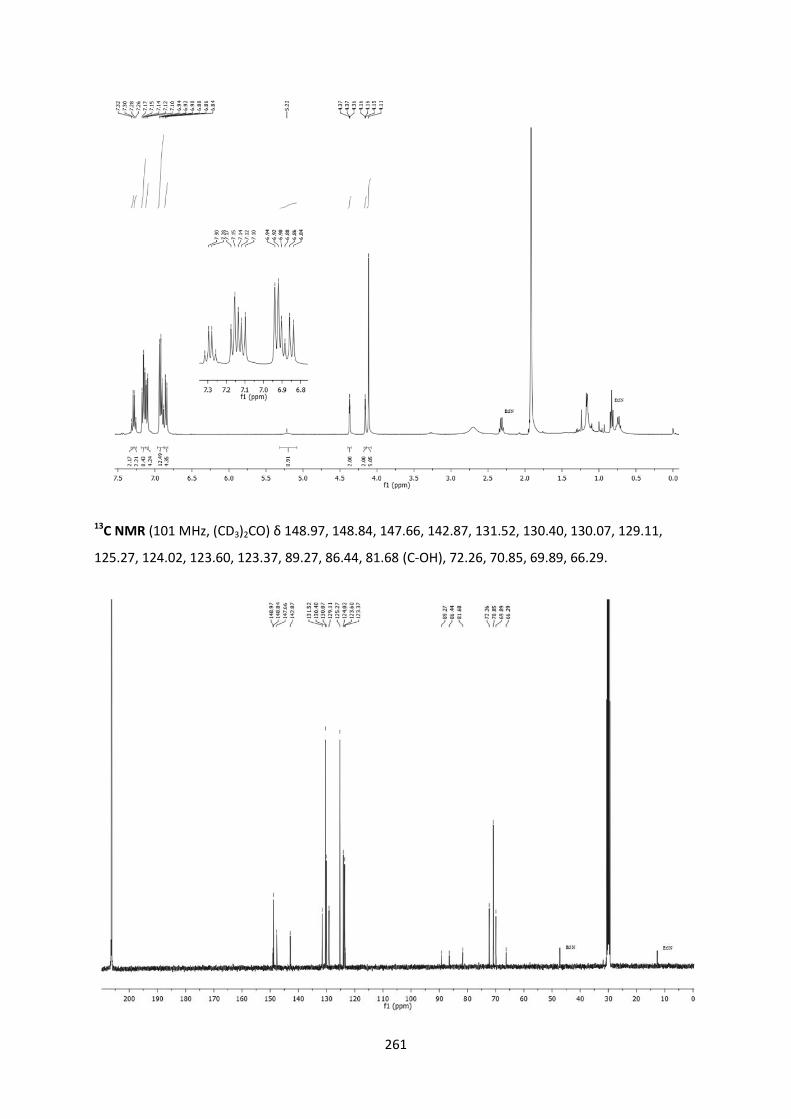
261
13C NMR (101 MHz, (CD3)2CO) δ 148.97, 148.84, 147.66, 142.87, 131.52, 130.40, 130.07, 129.11,
125.27, 124.02, 123.60, 123.37, 89.27, 86.44, 81.68 (C-OH), 72.26, 70.85, 69.89, 66.29.

262
HRMS (ESI): calcd. : 802.2641[M]+, 785.26136 [M-.OH]+; found: 802.2640 [M]+, 785.2610 [M-.OH]+.
IR (KBr, cm-1): 3446 (νO-H), 2206 (νC≡c), 825 (s, δC-H Fc).
UV-VIS: (DCM): λmax, nm (ε, 10-5·M-1·cm-1): 305 (0.62).
CV: (DCM, 0.10 M [n-Bu4N][PF6], V vs SCE): MIII/MII: E1/2: 0.56 (ΔEp = 0.02 V, ipc/ipa= 1.0), amine
oxidation: Epc (V): 0.95 V.
6.2. Ferrocene carbocations
Ferrocene-[bis-3-[4-(dimethylamino)phenyl]-1-propenyl-3-carbenium]tetrafluoroborate
([M1(Fc)+][BF4-])
C29H29BF4FeN2, M = 548.20 g/mol
Reagents: [3,3-[4-(dimethylamino)phenyl]-3-hydroxy-1-propenyl]ferrocene M1(Fc)OH (1 eq, 548 mg,
1 mmol), HBF4·Et2O (1.1 eq, 149 µL, 1.1 mmol)
Reaction and work up: Prepared according to GP3.
Work up and purification: The formed precipitate was cannula filtered and washed with dry and
distilled Et2O (3x10 mL). The dark green solid was then precipitated from DCM/pentane and filtered
to obtain a green fine powder.
Yield: quant.
1H NMR (800 MHz, CDCl3) δ 7.86 (d, J = 8.7 Hz, 4H), 6.99 (d, J = 7.1 Hz, 4H), 4.79 (s, 2H), 4.70 (s, 2H),
4.37 (s, 5H, Cp), 3.34 (s, 12H, -NMe2).

263
13C NMR (201 MHz, CDCl3) δ 156.45 (C+), 154.36, 138.30, 127.52, 124.87, 114.20, 92.25, 73.89, 73.21,
71.42, 70.33, 62.12, 41.25.

264
IR (cm-1): 2143.89 (νC≡C), 1167.73 (νB-F), 827.27 (s, δC-H Fc).
UV-VIS: (DCM): λmax, nm (ε, 10-5·M-1·cm-1): 486 (0.15), 625 (0.23), 667 (0.59)
CV (DCM, 0.10 M [n-Bu4N][PF6], V vs Ag+/Ag): C+/C+.: -0.35; MIII/MII: E1/2: 0.59 V (ΔEp = 0.04 V,
ipc/ipa=1.0), amine oxidation : Epc : 1.02 V
X-ray diffraction study:
ORTEP view of ([M1(Fc)+][BF4-]) with 50 % thermal ellipsoids solved by Dr. Thierry Roisnel
Crystal parameters
Crystal class monoclinic
Space group P 21/c
Cell angles (°) α= 90
β= 95.10
γ= 90
Cell length (Ǻ) a= 8.52
Formula 2(C29H29FeN),2(BF4),CH2Cl2 b= 29.18
Molecular weight
(g/mol) 832.75 c= 22.01
Copper-like shiny crystals by slow diffusion of
pentane vapor into a DCM solution of the molecule
at room temperature
Cell volume (Ǻ3) 5453.96
Z Z= 4
Cγ
C12
Cβ
C15 N2
N1
C2
Cα

265
Selected bond length (Ǻ)
Cγ-C2 1.419 (9) C5-N1 1.339 (10)
Cγ-C12 1.446 (9) C15-N2 1.388 (10)
Cβ -Cγ 1.435 (9) C2-C3 1.425 (10)
Cα-Cβ 1.185 (9) C3-C4 1.458 (10)
M/Fc-Cα 1.444 (9)
Selected angles (°)
C plan 3.32 (4) C2-C3/ C3-C4 33.74 (5)
Ferrocene-[3,3-[4-(diphenylamino)phenyl]-1-propenyl-3-carbenium] ([M2(Fc)+][BF4-])
C49H37BF4FeN2O, M = 796.23 g/mol
Reagents: [3,3-[4-(diphenylamino)phenyl]-3-hydroxy-1-propenyl]-ferrocene M2(Fc)OH (1 eq, 72 mg,
0.1 mmol), HBF4·Et2O (1.1 eq, 14 µL, 0.11 mmol)
Reaction and work up: Prepared according to GP3 and [3,3-[4-(diphenylamino)phenyl]-3-hydroxy-1-
propenyl]-ferrocene ([M2(Fc)+][BF4-]) was obtained as a green powder.
Yield: quant.
1H NMR (400 MHz, CDCl3) δ 7.82 (d, J = 9.2 Hz, 4H), 7.47 (t, J = 7.7 Hz, 8H), 7.36 (t, J = 7.4 Hz, 4H), 7.31
(d, J = 7.5 Hz, 8H), 7.04 (d, J = 9.2 Hz, 4H), 4.91 (s, 2H), 4.86 (s, 2H), 4.41 (s, 5H, Cp).

266
13C NMR (101 MHz, CDCl3) δ 155.96, 155.54 (C+), 144.04, 137.99, 132.90, 131.00, 130.50, 127.94,
127.21, 119.24, 96.94, 75.36, 74.83, 72.40.

267
HRMS (ESI): calcd.: 709.23006 [M]+; found: 709.2299 [M]+.
IR (cm-1): 2136 (νC≡C), 1172 (νB-F), 837 (s, δC-H Fc).
UV-VIS: (DCM): λmax, nm (ε, 10-5·M-1·cm-1): 280 (0.25), 524 (0.20), 720 (0.65)
CV: (DCM, 0.10 M [n-Bu4N][PF6], V vs SCE): C+/C+.: -0.06; E1/2: 0.56 V (ΔEp = 0.04 V, ipc/ipa= 0.98); amine
oxidation: 1.10 V.
4-ethynylferrocene-[3,3-[4-(dimethylamino)phenyl]-1-phenyl-3-carbenium] ([M3(Fc)+][BF4-])
C35H33FeBF4N2O, M = 624.30.50 g/mol
Reagents: [3,3-[4-(diphenylamino)phenyl]-3-hydroxy-1-propenyl]ferrocene (1 eq, 55 mg, 0.1 mmol),
HBF4·Et2O (1.1 eq, 14 µL, 0.11 mmol)
Reaction and work up: Prepared according to GP3 with obtention of 4-ethynylferrocene-[3,3-[4-
(dimethylamino)phenyl]-1-phenyl-3-carbenium] ([M3(Fc)+][BF4-]) as a green powder.
Yield: quant.
1H NMR (300 MHz, CDCl3) δ 7.61 (d, J = 8.3 Hz, 2H), 7.41 (d, J = 9.2 Hz, 4H), 7.30 (d, J = 8.3 Hz, 2H),
7.02 (d, J = 8.9 Hz, 4H), 4.59 (s, 2H), 4.35 (s, 2H), 4.29 (s, 5H, Cp), 3.37 (s, 12H, -NMe2).

268
IR (KBr, cm-1): 2198 (νC≡C), 1171 (νB-F), 830 (δC-H Fc).
UV-VIS (DCM): λmax, nm (ε, 10-5·M-1·cm-1): 306 (0.20), 450 (0.22), 626 (0.94).
CV (DCM, 0.10 M [n-Bu4N][PF6], V vs SCE): C+/C+.: -0.40 V; E1/2: 0.6 (ΔEp = 0.04 V, ipc/ipa= 0.90); amine
oxidation: 1.28 V.
4-ethynylferrocene-[3,3-[4-(diphenylamino)phenyl]-1-phenyl-3-carbenium] ([M4(Fc)+][BF4-])
C55H41BF4FeN2, M = 872,58

269
Reagents: M4(Fc)OH (1 eq, 436 mg, 0.5 mmol), HBF4·Et2O (1.1 eq, 70 µL, 0.55 mmol)
Reaction and work up: Prepared according to GP3 with obtention of ([M4(Fc)+][BF4-]) as a green
powder.
Yield: quant.
1H NMR (300 MHz, CDCl3) δ 7.58 – 7.29 (m, 6H), 6.99 (d, J = 7.9 Hz, 1H), 4.83 (broad s, 9H, Fc).
13C NMR was insufficiently resolved. It may be due to the presence of some oxidized compound or
aggregation.
HRMS (ESI): calcd.: 785.26136 [M]+; found: 785.2608 [M]+.
IR (KBr, cm-1): 2196 (νC≡C), 1173 (νB-F), 833 (δC-H Fc).
CV: (DCM, 0.10 M [n-Bu4N][PF6], V vs SCE): C+/C+.: -0.23 V; MII/MIII: E1/2: 0.73 (ΔEp = 0.02 V, ipc/ipa=
0.84), amine oxidation: 1.31 V.
UV-VIS (DCM): λmax, nm (ε, 10-5·M-1·cm-1): 277 (0.33), 481 (0.19), 681 (0.66).

270
6.3. Organometallic precursors
1,1-bis(4-(dimethylamino)phenyl)-3-(trimethylsilyl)prop-2-yn-1-ol (37)
C22H30N2OSi, M = 366.21 g/mol
Reagents: TMSA (1.5 eq, 622 µL, 4.5 mmol), n-BuLi (1.5 eq, 2.81 mL at 1.6 M in hexane, 4.5mmol),
Michler's ketone 28 (1 eq, 805 mg, 3 mmol).
Reaction: In a Schlenk flask under argon, n-BuLi was added drop wise to a solution of TMSA in 25 mL
of dried and distilled THF at 0°C. After stirring for 15 min, the ketone in 15 ml of dried and distilled
THF was added drop wise to the solution. The cold bath was then removed and the mixture was
stirred and allowed to warm to room temperature for 3h.
Work up: 20 mL of water were added to the flask and the two phases were separated. The aqueous
layer was extracted with Et2O (3 x 20 mL) and the combined organic phases were washed with water
(10 mL) and saturated aqueous NaCl (10 mL). The aqueous phase was then back extracted with Et2O
(20 mL). The organic phase was dried over Na2SO4 and the solvents were removed to give the crude
product as a grayish solid.
Purification: The crude was crystallized from DCM/hexane to give the desired compound as a white
crystalline solid.
Yield: 830 mg (76 %)
1H NMR (400 MHz, (CD3)2CO) δ 7.40 (d, J = 8.8 Hz, 4H), 6.66 (d, J = 8.9 Hz, 4H), 5.00 (s, 1H,-OH), 2.90
(s, 12H,-NMe2), 0.20 (s, 9H,-CH3).

271
13C NMR (101 MHz, (CD3)2CO) δ 150.85, 135.59, 127.85, 112.72, 111.84 (C-OH), 89.39, 74.30, 40.83,
0.28.

272
HRMS(ESI): cacld: 366.21274 [M]+., 349.21000 [M-·OH]+; found: 336.2131 [M]+., 349.2115[M-·OH]+.
IR (KBr, cm-1): 3310 (νO-H), 2166 (νC≡C).
EA: calcd : C: 72.08, H: 8.25, N: 7.64, found : C: 72.38, H: 8.15, N: 7.62.
1,1-bis(4-(dimethylamino)phenyl)prop-2-yn-1-ol (41)
C19H22N2O, M = 294.17 g/mol
Reagents: 1,1-bis(4-(dimethylamino)phenyl)-3-(trimethylsilyl)prop-2-yn-1-ol 37 (1 eq, 478 mg, 1.3
mmol), K2CO3 (1.5 eq, 270 mg, 1.95 mmol)
Reaction: In a round-bottom flask, 1,1-bis(4-(dimethylamino)phenyl)-3-(trimethylsilyl)prop-2-yn-1-ol
37 and K2CO3 were stirred in a mixture of MeOH (15 mL) and DCM (15 mL) for 6 h at room
temperature.
Work-up: Solvents were removed and the residue was treated with water (20 mL) and Et2O (20 mL).
The two layers were separated and the aqueous layer was extracted with Et2O (3x20 mL). The
combined organic layers were washed with water (3x10mL) and saturated aqueous NaCl (10 mL). The
aqueous layer was then back-extracted with Et2O (20 mL). The combined organic layers were dried
over Na2SO4 and evaporated under reduced pressure to give a white solid.
Purification: The solid residue was then recrystallized from DCM/hexane to give the desired
compound as white crystals.
Yield: 310 mg (81 %).
1H NMR (400 MHz, (CD3)2CO) δ 7.39 (d, J = 8.8 Hz, 4H), 6.67 (d, J = 8.9 Hz, 4H), 5.02 (s, 1H,-OH), 3.18
(s, 1H), 2.90 (s, 12H, -NMe2).

273
13C NMR (101 MHz, (CD3)2CO) δ 150.92, 135.50, 127.85, 112.71, 89.40, 74.97, 73.94 (C-OH), 40.82.

274
HRMS (ESI): calcd.:317.16298 [M+Na]+, 277.17047[M-·OH]+, 295.18104 [M+H]+; found: 317.1629
[M+Na]+, 277.1704 [M-·OH]+, 295.1810 [M+H]+.
IR (KBr, cm-1): 3400 (νOH), 3274 (νCH), 2105 (νC≡C).
1,1-bis(4-(diphenylamino)phenyl)-3-(trimethylsilyl)prop-2-yn-1-ol (38)
C42H38N2OSi, M = 614.85 g/mol
Reagents: TMSA (1.5 eq, 207 µL, 1.5 mmol), n-BuLi (1.5 eq, 937 µL at 1.6 M in hexane, 1.5 mmol),
4,4'-diphenylaminebenzophenone 29 (1 eq, 517 mg, 1 mmol).
Reaction: In a Schlenk flask under argon, n-BuLi was added drop wise to a solution of TMSA in 25 mL
of dried and distilled THF at 0°C. After stirring for 15 min, the ketone in 15 ml of dried and distilled
THF was added drop wise to the solution. The cold bath was then removed and the mixture was
stirred and allowed to warm to room temperature for 3h.
Work up: 20 mL of water were added to the flask and the two phases were separated. The aqueous
layer was extracted with Et2O (3 x 20 mL) and the combined organic phases were washed with water
(3 x 10 mL) and saturated aqueous NaCl (10 mL). The aqueous phase was then back extracted with
Et2O (20 mL). The organic phase was dried over Na2SO4and the solvents were removed.
Purification: The crude product was adsorbed onto deactivated silica and purified by column
chromatography (neutralized silica gel with 10 % NEt3, 20 x 3 cm) eluting with hexane/EA (3/1) with 1
% NEt3 to give the desired product as a pale yellow solid.
Rf(hexane/EA, 3/1): 0.3.
Yield: 600 mg (94 %).
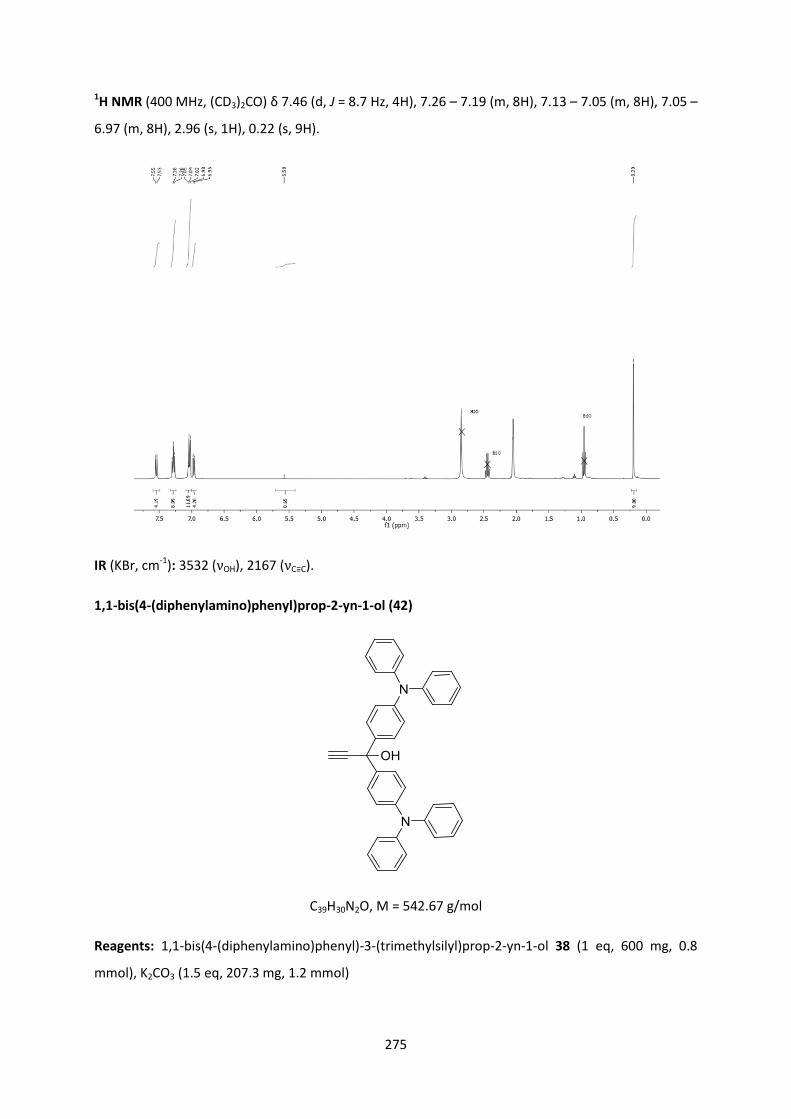
275
1H NMR (400 MHz, (CD3)2CO) δ 7.46 (d, J = 8.7 Hz, 4H), 7.26 – 7.19 (m, 8H), 7.13 – 7.05 (m, 8H), 7.05 –
6.97 (m, 8H), 2.96 (s, 1H), 0.22 (s, 9H).
IR (KBr, cm-1): 3532 (νOH), 2167 (νC≡C).
1,1-bis(4-(diphenylamino)phenyl)prop-2-yn-1-ol (42)
C39H30N2O, M = 542.67 g/mol
Reagents: 1,1-bis(4-(diphenylamino)phenyl)-3-(trimethylsilyl)prop-2-yn-1-ol 38 (1 eq, 600 mg, 0.8
mmol), K2CO3 (1.5 eq, 207.3 mg, 1.2 mmol)
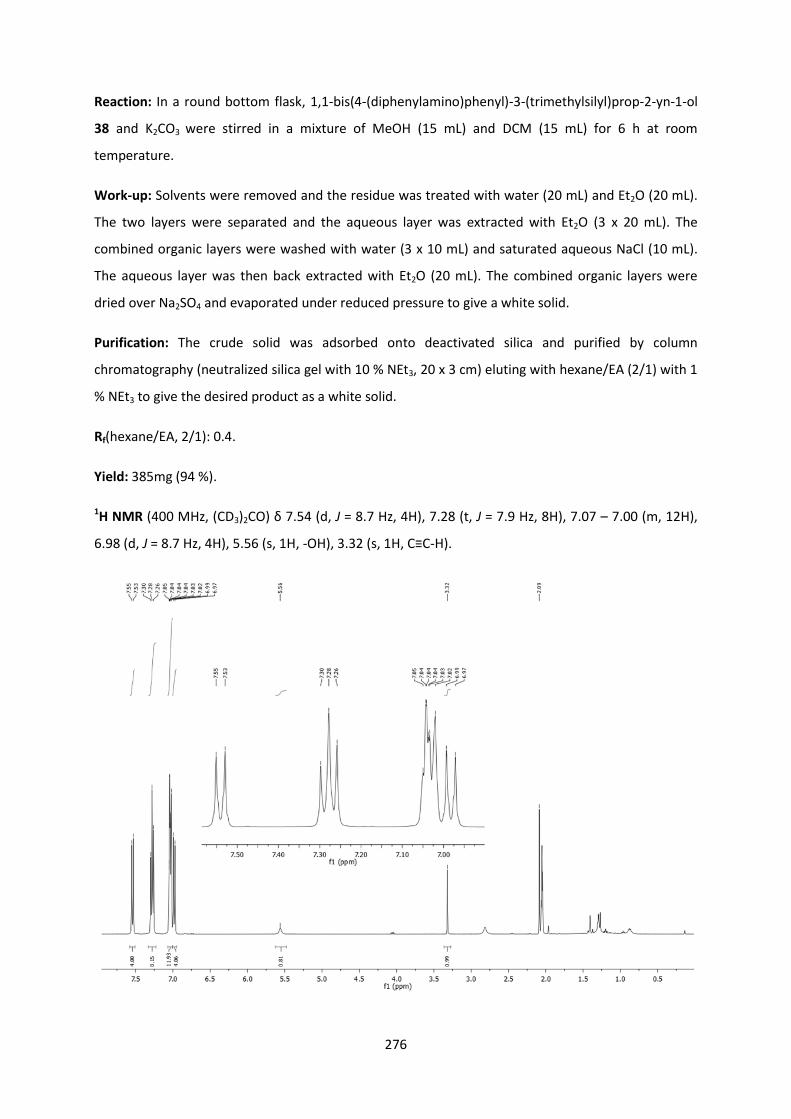
276
Reaction: In a round bottom flask, 1,1-bis(4-(diphenylamino)phenyl)-3-(trimethylsilyl)prop-2-yn-1-ol
38 and K2CO3 were stirred in a mixture of MeOH (15 mL) and DCM (15 mL) for 6 h at room
temperature.
Work-up: Solvents were removed and the residue was treated with water (20 mL) and Et2O (20 mL).
The two layers were separated and the aqueous layer was extracted with Et2O (3 x 20 mL). The
combined organic layers were washed with water (3 x 10 mL) and saturated aqueous NaCl (10 mL).
The aqueous layer was then back extracted with Et2O (20 mL). The combined organic layers were
dried over Na2SO4 and evaporated under reduced pressure to give a white solid.
Purification: The crude solid was adsorbed onto deactivated silica and purified by column
chromatography (neutralized silica gel with 10 % NEt3, 20 x 3 cm) eluting with hexane/EA (2/1) with 1
% NEt3 to give the desired product as a white solid.
Rf(hexane/EA, 2/1): 0.4.
Yield: 385mg (94 %).
1H NMR (400 MHz, (CD3)2CO) δ 7.54 (d, J = 8.7 Hz, 4H), 7.28 (t, J = 7.9 Hz, 8H), 7.07 – 7.00 (m, 12H),
6.98 (d, J = 8.7 Hz, 4H), 5.56 (s, 1H, -OH), 3.32 (s, 1H, C≡C-H).

277
13C NMR (101 MHz, (CD3)2CO) δ 148.81, 148.03, 141.22, 130.39, 128.12, 125.28, 124.04, 123.87,
88.45, 76.11 (C-OH), 73.95.
HRMS (ESI): calcd.: 525.23307 [M-·OH]+, 543.24309 [M+H]+, 541.22744 [M-H]+;found: 317.1629
[M+Na]+, 525.2324 [M-·OH]+, 543.2428 [M+H]+, 541.2273 [M-H]+.
IR (KBr, cm-1): 3535 (νOH), 3278 (νC≡CH), 2107 (νC≡C).
((4-bromophenyl)ethynyl)trimethylsilane
C11H13BrSi, M = 253.21 g/mol
Reagents: p-bromoiodobenzene (1.2 eq, 2.23 g, 7.88 mmol), TMSa (1 eq, 1.09 mL, 7.64 mmol),
PdCl2(PPh3)2 (0.02 eq, 10 mg, 0.014 mmol), CuI (0.04 eq, 6 mg, 0.03 mmol).
Reaction: In a Schlenk tube under argon, p-bromoiodobenzene, PdCl2(PPh3)2 and CuI were dissolved
in NEt3 (20 mL). TMSa was added and the resulting black solution was heated at RT for 3 h.

278
Work-up: After evaporation of the solvents by cryoscopic transfer, the residue was extracted with
Et2O and filtered to remove ammonium salts. The extract was washed with a saturated aqueous
solution of NH4Cl (10 mL), water (3 x 10 mL) and saturated aqueous NaCl (10 mL). the aqueous layer
was then back extracted with Et2O (20 mL). The combined organic layers were dried over MgSO4 and
evaporated under reduced pressure to give a brown solid.
Purification: The crude was carefully filtered through a small pad of silica (10 cm) with hexane to give
a white solid that was dried in vacuo.
Yield: 1.90 g (98 %).
1H NMR (400 MHz, CDCl3) δ 7.43 (d, J = 8.5 Hz, 2H), 7.32 (d, J = 8.5 Hz, 2H), 0.25 (s, 9H,-CH3).
13C NMR (101 MHz, CDCl3) δ 133.53, 131.62, 122.89, 122.25, 104.01, 95.73, 0.02 (CH3).

279
HRMS (ESI): calcd.: 251.99699 [M]+; found: 251.9969 [M]+.
IR (KBr, cm-1): 2155 (νC≡C).
bis(4-(dimethylamino)phenyl)(4-((trimethylsilyl)ethynyl)phenyl)methanol (39)
C28H34N2OSi, M = 442.67 g/mol
Reagents: ((4-bromophenyl)ethynyl)trimethylsilane (1.2 eq, 456 mg, 1.8 mmol), n-BuLi (1.1 eq, 968
µL at 1.6 M in hexane, 1.55 mmol), Michler's ketone 28 (1 eq, 402 mg, 1.5 mmol).
Reaction: In a Schlenk flask under argon, n-BuLi was added drop wise to a solution of ((4-
bromophenyl)ethynyl)trimethylsilane in 20 mL of dried and distilled THF at -78°C. After stirring for 30
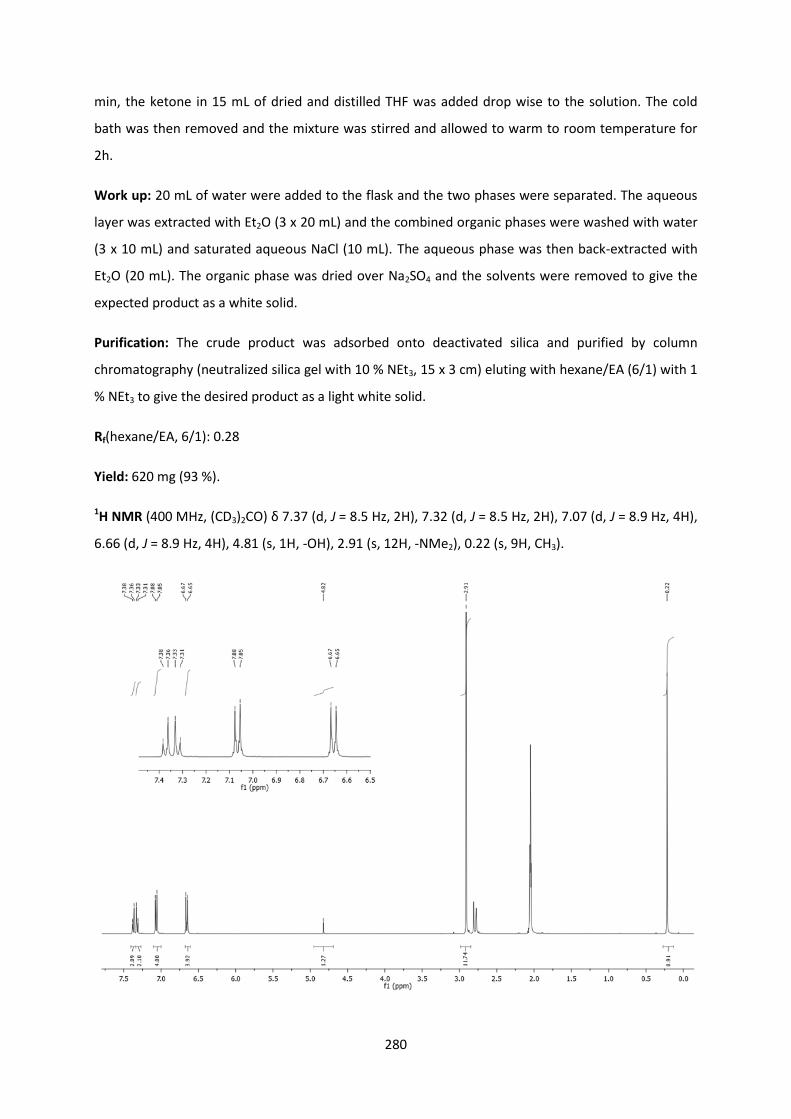
280
min, the ketone in 15 mL of dried and distilled THF was added drop wise to the solution. The cold
bath was then removed and the mixture was stirred and allowed to warm to room temperature for
2h.
Work up: 20 mL of water were added to the flask and the two phases were separated. The aqueous
layer was extracted with Et2O (3 x 20 mL) and the combined organic phases were washed with water
(3 x 10 mL) and saturated aqueous NaCl (10 mL). The aqueous phase was then back-extracted with
Et2O (20 mL). The organic phase was dried over Na2SO4 and the solvents were removed to give the
expected product as a white solid.
Purification: The crude product was adsorbed onto deactivated silica and purified by column
chromatography (neutralized silica gel with 10 % NEt3, 15 x 3 cm) eluting with hexane/EA (6/1) with 1
% NEt3 to give the desired product as a light white solid.
Rf(hexane/EA, 6/1): 0.28
Yield: 620 mg (93 %).
1H NMR (400 MHz, (CD3)2CO) δ 7.37 (d, J = 8.5 Hz, 2H), 7.32 (d, J = 8.5 Hz, 2H), 7.07 (d, J = 8.9 Hz, 4H),
6.66 (d, J = 8.9 Hz, 4H), 4.81 (s, 1H, -OH), 2.91 (s, 12H, -NMe2), 0.22 (s, 9H, CH3).

281
13C NMR (101 MHz, (CD3)2CO) δ 151.19, 150.62, 136.88, 136.85, 131.75, 129.77, 129.10, 121.94,
112.52, 106.48 (C-OH), 94.10, 81.59, 40.80 (-NMe2), 0.22 (-CH3).
HRMS(ESI): calcd: 443.25132 [M+H]+, 222.1293[M+2H]2+, 425.24075 [M-·OH]+; found : 443.2512
[M+H]+, 222.1292 [M+2H]2+, 425.2407 [M-·OH]+.
IR (cm-1): 3400 (νOH), 2155 (νC≡C).
X-ray diffraction study:
ORTEP view of 39 with 50 % thermal ellipsoids solved by Dr. Graeme Moxey
C28
C5 C2
O1 N1
C29
C1
H1
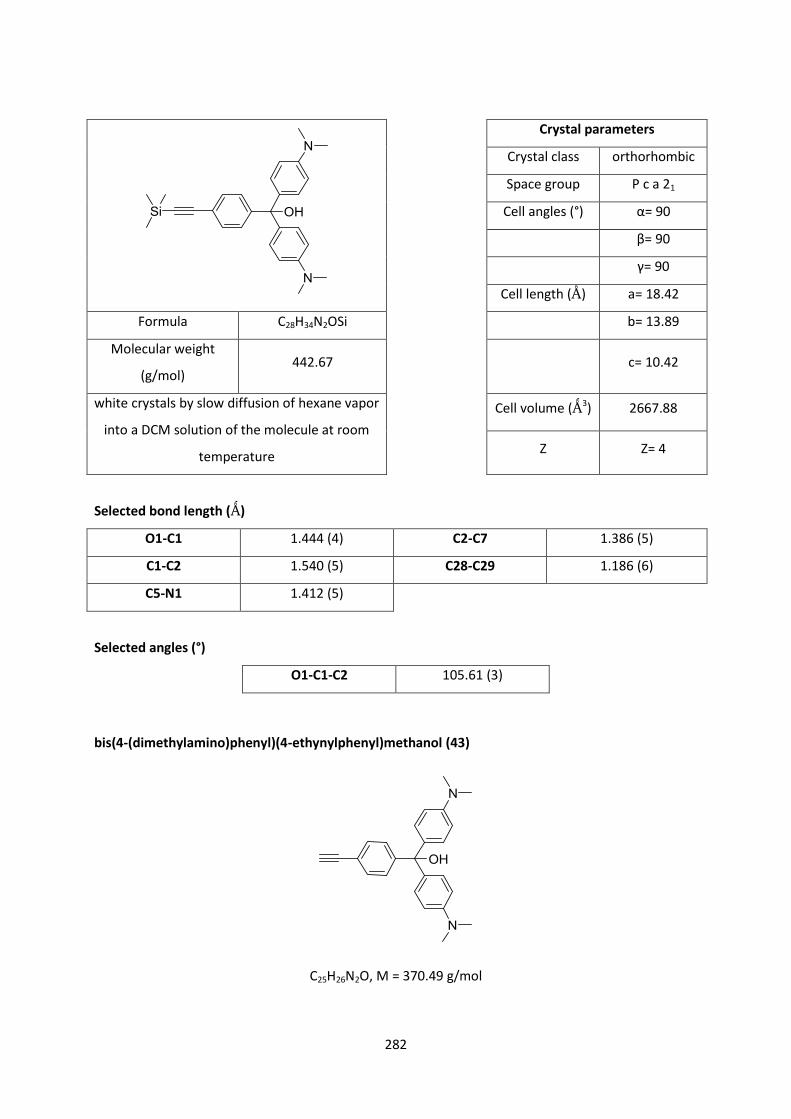
282
Crystal parameters
Crystal class orthorhombic
Space group P c a 21
Cell angles (°) α= 90
β= 90
γ= 90
Cell length (Ǻ) a= 18.42
Formula C28H34N2OSi b= 13.89
Molecular weight
(g/mol) 442.67 c= 10.42
white crystals by slow diffusion of hexane vapor
into a DCM solution of the molecule at room
temperature
Cell volume (Ǻ3) 2667.88
Z Z= 4
Selected bond length (Ǻ)
O1-C1 1.444 (4) C2-C7 1.386 (5)
C1-C2 1.540 (5) C28-C29 1.186 (6)
C5-N1 1.412 (5)
Selected angles (°)
O1-C1-C2 105.61 (3)
bis(4-(dimethylamino)phenyl)(4-ethynylphenyl)methanol (43)
C25H26N2O, M = 370.49 g/mol

283
Reagents: bis(4-(dimethylamino)phenyl)(4-((trimethylsilyl)ethynyl)phenyl)methanol 39 (1 eq, 486
mg, 1.1 mmol), K2CO3 (2 eq, 276 mg, 2.2 mmol).
Reaction: In a round bottom flask, 1,1-bis(4-(diphenylamino)phenyl)-3-(trimethylsilyl)prop-2-yn-1-ol
and K2CO3 were stirred in a mixture of MeOH (20 mL) and DCM (20 mL) for 6 h at room temperature.
Work-up: Solvents were removed and the residue was treated with water (20 mL) and Et2O (20 mL).
The two layers were separated and the aqueous layer was extracted with Et2O (3 x 20 mL). The
combined organic layer was washed with water (3 x 10 mL) and saturated aqueous NaCl (10 mL), The
aqueous layer was then back-extracted with Et2O (20 mL). The combined organic layers were dried
over Na2SO4 and evaporated under reduced pressure to give a white solid.
Purification: Crystallization from DCM/hexane to obtain white needles.
Yield: 320mg (79 %).
1H NMR (400 MHz, (CD3)2CO) δ 7.40 (d, J = 8.3 Hz, 2H), 7.34 (d, J = 8.4 Hz, 2H), 7.08 (d, J = 8.9 Hz, 4H),
6.66 (d, J = 8.9 Hz, 4H), 4.81 (s, 1H, -OH), 3.58 (s, 1H, C≡C-H), 2.91 (s, 12H, -NMe2).
13C NMR (101 MHz, (CD3)2C) δ 151.32, 150.69, 136.93, 131.96, 129.81, 129.16, 121.23, 112.58, 84.61
(C-OH), 81.63, 78.84, 40.83.

284
HRMS (ESI): cacld: 371.21234 [M+H]+, 353.20177 [M-·OH]+; found : 371.2121[M+H]+, 353.2021 [M-
·OH]+.
IR ( cm-1): 3453 (νOH), 3529 (νC≡C-H), νC≡C too weak to be observable
RX: slow diffusion of hexane in a saturated solution of DCM
X-ray diffraction study:
ORTEP view of 39 with 50 % thermal ellipsoids solved by Dr. Thierry Roisnel
C28
C5 C2
O1 N1
N1
C29
C1
H1

285
Crystal parameters
Crystal class orthorhombic
Space group P c a 21
Cell angles (°) α= 90
β= 90
γ= 90
Cell length (Ǻ) a= 10.75
Formula C25H26N2O b= 17.45
Molecular weight
(g/mol) 370.49 c= 21.80
white crystals by slow diffusion of hexane vapor
in a DCM solution of the molecule at room
temperature
Cell volume (Ǻ3) 4095.57
Z Z= 4
Selected bond length (Ǻ)
O1-C1 1.469 (4) C2-C7 1.378 (6)
C1-C2 1.529 (5) C28-C29 1.048 (8)
C5-N1 1.397 (6)
Selected angles (°)
O1-C1-C2 107.12 (3)
bis(4-(diphenylamino)phenyl)(4-((trimethylsilyl)ethynyl)phenyl)methanol (40)
C48H42N2OSi, M = 690.95 g/mol
Reagents: ((4-bromophenyl)ethynyl)trimethylsilane (1.5 eq, 456 mg, 1.8 mmol), n-BuLi (1.1 eq, 968
µL at 1.6 M in hexane, 1.55 mmol), 4,4'-bis(diphenylamino)benzophenone 29 (1 eq, 794 mg,
1.5mmol).
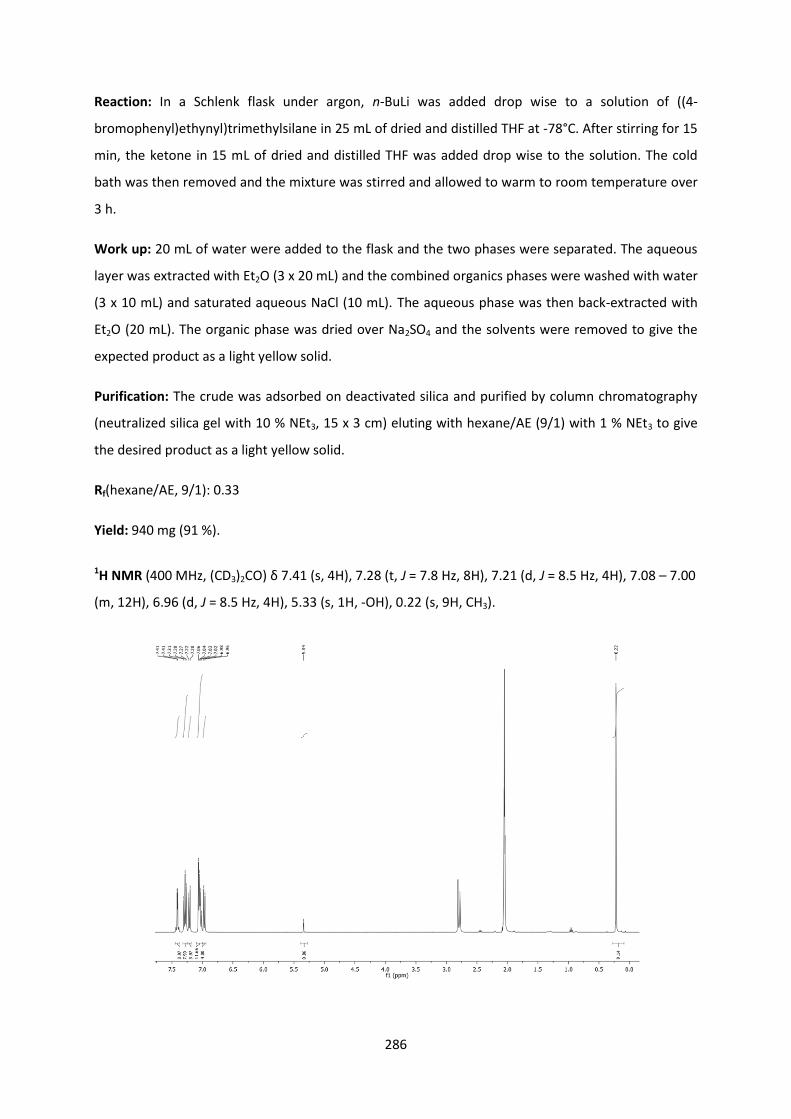
286
Reaction: In a Schlenk flask under argon, n-BuLi was added drop wise to a solution of ((4-
bromophenyl)ethynyl)trimethylsilane in 25 mL of dried and distilled THF at -78°C. After stirring for 15
min, the ketone in 15 mL of dried and distilled THF was added drop wise to the solution. The cold
bath was then removed and the mixture was stirred and allowed to warm to room temperature over
3 h.
Work up: 20 mL of water were added to the flask and the two phases were separated. The aqueous
layer was extracted with Et2O (3 x 20 mL) and the combined organics phases were washed with water
(3 x 10 mL) and saturated aqueous NaCl (10 mL). The aqueous phase was then back-extracted with
Et2O (20 mL). The organic phase was dried over Na2SO4 and the solvents were removed to give the
expected product as a light yellow solid.
Purification: The crude was adsorbed on deactivated silica and purified by column chromatography
(neutralized silica gel with 10 % NEt3, 15 x 3 cm) eluting with hexane/AE (9/1) with 1 % NEt3 to give
the desired product as a light yellow solid.
Rf(hexane/AE, 9/1): 0.33
Yield: 940 mg (91 %).
1H NMR (400 MHz, (CD3)2CO) δ 7.41 (s, 4H), 7.28 (t, J = 7.8 Hz, 8H), 7.21 (d, J = 8.5 Hz, 4H), 7.08 – 7.00
(m, 12H), 6.96 (d, J = 8.5 Hz, 4H), 5.33 (s, 1H, -OH), 0.22 (s, 9H, CH3).

287
13C NMR (101 MHz, (CD3)2CO) δ 148.83, 147.72, 142.72, 132.08, 130.40, 130.05, 129.07, 125.29,
124.05, 123.57, 122.47, 106.21 (C-OH), 94.55, 81.56, 0.16.
HRMS (ASAP): calcd:691.31392 [M+H]+, 690.30609 M+., 690.30609 [M-·OH]+; found : 691.3135
[M+H]+, 690.3060 M+., 690.3060 [M-·OH]+.
IR (KBr,cm-1): 3450 (νOH), 2157 (νC≡C).
bis(4-(diphenylamino)phenyl)(4-ethynylphenyl)methanol (44)
C45H34N2O, M = 618.76 g/mol

288
Reagents: bis(4-(dimethylamino)phenyl)(4-((trimethylsilyl)ethynyl)phenyl)methanol 40 (1 eq, 759
mg, 1.1 mmol), K2CO3 (2 eq, 276 mg, 2.2 mmol).
Reaction: In a round bottom flask, 1,1-bis(4-(diphenylamino)phenyl)-3-(trimethylsilyl)prop-2-yn-1-ol
40 and K2CO3 were stirred in a mixture of MeOH (20 mL) and DCM (20 mL) for 6 h at room
temperature.
Work-up: Solvents were removed and the residue was treated with water (20 mL) and Et2O (20 mL).
The two layers were separated and the aqueous layer was extracted with Et2O (3 x 20 mL). The
combined organic layers were washed with water (3 x 10 mL) and saturated aqueous NaCl (10 mL),
The aqueous layer was then back extracted with Et2O (20 mL). The combined organic layers were
dried over Na2SO4 and evaporated under reduced pressure to give a yellow solid.
Purification: The solid residue was then precipitated with DCM/hexane three times to give the
desired compound as a yellow powder.
Yield: 560 mg (82 %).
1H NMR (400 MHz, (CD3)2CO) δ 7.43 (q, J = 8.3 Hz, 4H), 7.28 (t, J = 7.8 Hz, 8H), 7.22 (d, J = 8.6 Hz, 4H),
7.04 (m, 12H), 6.97 (d, J = 8.6 Hz, 4H), 5.32 (s, 1H, -OH), 3.61 (s, 1H, C≡C-H).

289
13C NMR (101 MHz, (CD3)2CO) δ 150.10, 148.90, 147.79, 142.77, 132.30, 130.45, 130.10, 129.17,
125.36, 124.11, 123.63, 121.80, 84.39 (C-OH), 81.72, 79.23.
HRMS (ASAP): calcld: 619.27439 [M+H]+, 618.26656 [M]+., 601.26382 [M-·OH]+; found : 619.2746
[M+H]+, 618.2670 [M]+., 601.2643 [M-·OH]+.
IR (cm-1): 3550 (νOH), 3279 (νC≡C-H), νC≡C too weak to be observable.
Fe (η5-C5Me5)(κ2-dppe)=C=C=C(4-(dimethylamino)phenyl)2 hexafluorophosphate ([M1(Fe)+][PF6
-])
C53H59F6FeN2P3, M = 986.81 g/mol

290
Reagents: (η5-C5Me5)(κ2-dppe)Fe(Cl) (1.1 eq, 562 mg, 0.9 mmol), KPF6 (1.1eq, 165 mg, 0.9 mmol),
4,4'-(dimethylamino)phenyl)prop-2-yn-1-ol 41 (1 eq, 250 mg, 0.8 mmol).
Reaction: In a Schlenk tube under argon, (η5-C5Me5)(κ2-dppe)Fe(Cl), KPF6 and 1,1-bis(4-
(dimethylamino)phenyl)prop-2-yn-1-ol 41 were dissolved in 15 mL of dry and deoxygenated MeOH.
The resulting solution was stirred at 40°C for 16h.
Work-up and purification: After evaporation of the solvent by cryoscopic transfer, the residue was
extracted with DCM (3 x 10 mL). The resulting solid was then precipitated from DCM/Et2O and
washed with pentane to give the desired compound, after filtration, as a violet powder.
Yield: 740 g (91 %).
1H NMR (400 MHz, CD2Cl2) δ 7.58 – 7.20 (m, 20H), 7.13 (d, J = 7.9 Hz, 4H), 6.48 (d, J = 8.5 Hz, 4H), 3.03
(s, 12H, -NMe2), 2.82 (s, 2H, H-CH2 dppe), 2.32 (s, 2H, H-CH2 dppe), 1.46 (s, 15H, Cp*).
13C NMR (101 MHz, CD2Cl2) δ 185.10, 152.90, 151.81, 136.02, 134.52, 134.22, 133.65, 133.13, 132.33,
131.45, 131.15, 128.86-128.57 (m), 111.80, 97.56, 40.52 (-NMe2), 31.76 (m, CH2 dppe), 10.42 (s, CH3
Cp*).

291
31P NMR (162 MHz, CD2Cl2) δ 95.22, -144.48(q).

292
IR (cm-1): 1926 (νC≡C), 841 (νP-F).
UV-Vis (DCM): λmax, nm (ε, 10-5·M-1·cm-1): 405 (0.07), 516 (0.45), 660 (0.36).
CV: (DCM, 0.10 M [n-Bu4N][PF6], V vs Ag/Ag+): E1/2 C+/C+.: -1.27 V; E1/2: 0.34 V (ΔEp = 0.05 V, ipc/ipa=
1.05).
X-ray diffraction study:
ORTEP view of ([M1(Fe)+][PF6-]) with 50 % thermal ellipsoids solved by Dr. Thierry Roisnel
Cγ
C5
C2
Cα
N1
Cβ
C12
Fe
C15
N2

293
Crystal parameters
Crystal class monoclinic
Space group P 21/n
Cell angles (°) α= 90
β= 92.13
γ= 90
Cell length (Ǻ) a= 23.70
Formula 2(C55H59FeN2P2),2(F6P) b= 17.07
Molecular weight
(g/mol) 1973.62 c= 27.75
Violet crystals by slow diffusion of pentane
vapor into a DCM solution of the molecule at
room temperature
Cell volume (Ǻ3) 11228
Z Z= 4
Selected bond length (Ǻ)
Cγ-C2 1.438 (6) C15-N2 1.375 (4)
Cγ-C12 1.460 (5) C5-N1 1.375 (3)
Cβ -Cγ 1.389 (5) C3-C4 1.415 (6)
Cα-Cβ 1.239 (5) C2-C3 1.370 (7)
Fe-Cα 1.826 (3)
Selected angles (°)
Phenyl torsion 21.88 (2) C plane 0.26 (2)
Fe (η5-C5Me5)(κ2-dppe)=C=C=C(4-(diphenylamino)phenyl)2 hexafluorophosphate ([M2(Fe)+][PF6
-])
C73H67F6FeN2P3, M = 1235,08 g/mol

294
Reagents: (η5-C5Me5)(κ2-dppe)Fe(Cl) (1.1 eq, 68.7 mg, 0.11 mmol), KPF6 (1.1 eq, 20.2 mg, 0.11mmol),
1,1-bis(4-(diphenylamino)phenyl)prop-2-yn-1-ol 42 (1 eq, 61.8 mg, 0.1 mmol).
Reaction: In a Schlenk tube under argon, (η5-C5Me5)(κ2-dppe)Fe(Cl), KPF6 and 1,1-bis(4-
(diphenylamino)phenyl)prop-2-yn-1-ol 42 were dissolved in 15 mL of dry and deoxygenated MeOH.
The resulting solution was stirred at room temperature for 16 h.
Work-up and purification: After evaporation of the solvent by cryoscopic transfer, the residue was
extracted with DCM (3 x 10 mL). The resulting solid was then precipitated with DCM/pentane to give
the desired compound, after filtration, as a violet powder.
1H NMR (400 MHz, CD2Cl2) δ 7.62 – 7.10 (m, 40H), 7.07 (d, J = 7.6 Hz, 4H), 6.73 (d, J = 8.6 Hz, 4H), 2.82
(s, 2H, CH2 dppe), 2.40 (s, 2H, CH2 dppe), 1.40 (s, 15H, CH3 Cp*).
13C NMR (101 MHz, CDCl3) δ 150.49, 146.23, 136.58, 133.69, 132.97, 131.60, 131.15, 131.01, 129.89,
128.67, 128.46, 126.18, 125.23, 119.88, 99.09, 31.73 (dppe), 10.18 (CH3 Cp*).
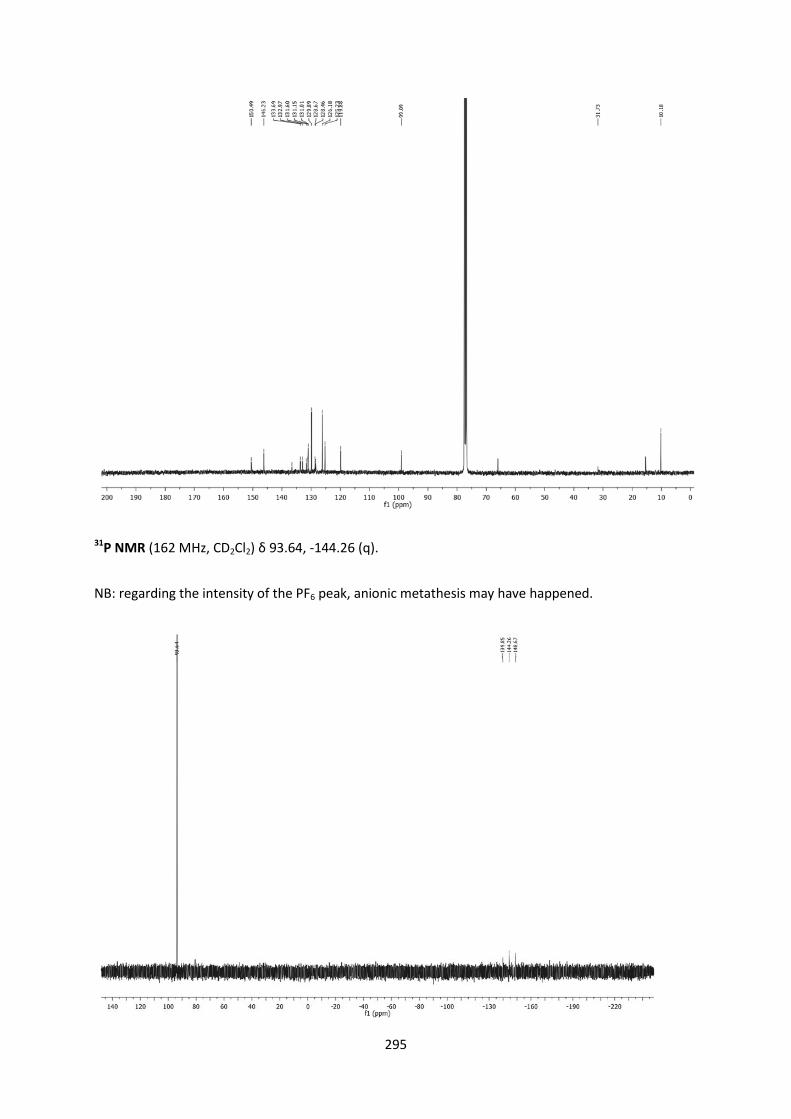
295
31P NMR (162 MHz, CD2Cl2) δ 93.64, -144.26 (q).
NB: regarding the intensity of the PF6 peak, anionic metathesis may have happened.

296
IR (cm-1): 1911 (νC≡C), 836 (νP-F).
UV-Vis (DCM): λmax, nm (ε, 10-5·M-1·cm-1): 274 (0.49), 432 (0.04), 546 (0.32), 655 (0.3).
CV: (DCM, 0.10 M [n-Bu4N][PF6], V vs SCE): C+/C+. E1/2: -0.75 V; E1/2: 0.48 V (ΔEp = 0.05 V, ipc/ipa= 1.02).
Ru(Cl)(κ2-dppe)2=C=C=C(4-(dimetylamino)phenyl)2 hexafluorophosphate ([M1(Ru)+][PF6-])
C71H68F6N2P5Ru, M = 1319.24 g/mol
Reagents: 1,1-bis(4-(dimethylamino)phenyl)prop-2-yn-1-ol 41 (1 eq, 92.6 mg, 0.25 mmol),
[RuCl(dppe)2]PF6 (0.8 eq, 211 mg, 0.2 mmol).
Reaction: In a Schlenk flask under argon, 10 mL of distilled and deoxygenated DCM were added to
1,1-bis(4-(dimethylamino)phenyl)prop-2-yn-1-ol and [RuCl(dppe)2]PF6. The resulting mixture was
stirred for 24h at room temperature.
Work-up: The volume was reduced to a minimum and the desired product was precipitated from
Et2O and washed with dried and deoxygenated pentane to give a violet powder.
1H NMR (400 MHz, CDCl3) δ 7.30 – 7.07 (m, 24H + CDCl3), 7.02 (t, J = 7.6 Hz, 8H), 6.83 (t, J = 7.6 Hz,
8H), 6.74 (d, J = 8.8 Hz, 4H), 6.39 (d, J = 8.8 Hz, 4H), 3.09 (s, 12H, -NMe2), 2.95 (s, 4H, CH2 dppe), 2.80
(s, 4H, CH2 dppe).

297
13C NMR (101 MHz, CDCl3) δ 162.78, 159.52, 153.32, 135.00, 134.07, 133.75, 133.52, 132.93, 131.67,
130.61, 129.83, 128.24, 127.60, 111.24, 40.36 (-NMe2), 28.22 (CH2 dppe).
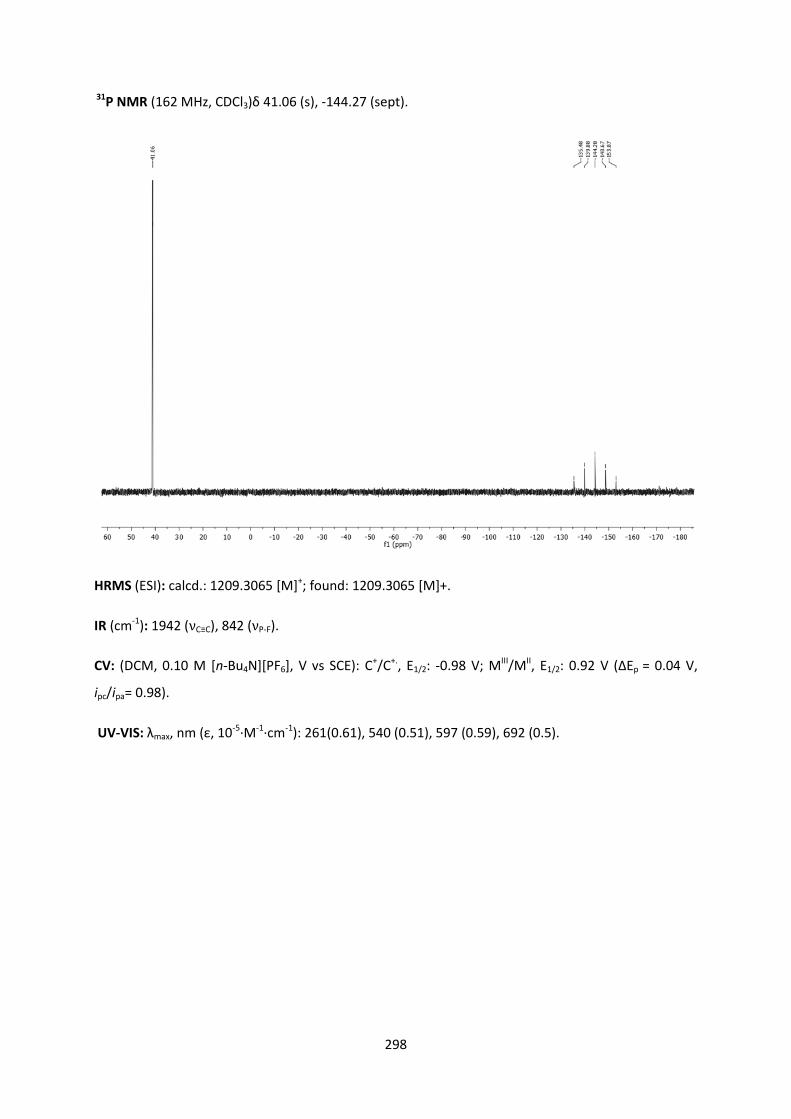
298
31P NMR (162 MHz, CDCl3)δ 41.06 (s), -144.27 (sept).
HRMS (ESI): calcd.: 1209.3065 [M]+; found: 1209.3065 [M]+.
IR (cm-1): 1942 (νC≡C), 842 (νP-F).
CV: (DCM, 0.10 M [n-Bu4N][PF6], V vs SCE): C+/C+., E1/2: -0.98 V; MIII/MII, E1/2: 0.92 V (ΔEp = 0.04 V,
ipc/ipa= 0.98).
UV-VIS: λmax, nm (ε, 10-5·M-1·cm-1): 261(0.61), 540 (0.51), 597 (0.59), 692 (0.5).

299
X-ray diffraction study:
ORTEP view of ([M1(Ru)+][PF6-]) with 50 % thermal ellipsoids solved by Dr. Graeme Moxey
Crystal parameters
Crystal class monoclinic
Space group P 21/c
Cell angles (°) α= 90
β= 107.92
γ= 90
Cell length (Ǻ) a= 12.28
Formula C71H68ClN2P4Ru,F6P b= 35.94
Molecular weight
(g/mol) 1319.24 c= 18.66
Violet crystals by slow evaporation of a
saturated DCM solution of the molecule at
room temperature
Cell volume (Ǻ3) 7842.67
Z Z= 4
Cγ
C5
C2
Cα
N1
Cβ
C12
Ru
C15
N2

300
Selected bond length (Ǻ)
Cγ-C2 1.460 (10) C15-N2 1.379 (10)
Cγ-C12 1.476 (10) C5-N1 1.364 (10)
Cβ -Cγ 1.387 (5) C3-C4 1.394 (10)
Cα-Cβ 1.220 (5) C2-C3 1.364 (10)
Ru-Cα 1.941 (6)
Selected angles (°)
Phenyl torsion 28.70 (3) C plane 1.50 (5)
Ru(Cl)(κ2-dppe)2=C=C=C(4-(diphenylamino)phenyl)2 hexafluorophosphate ([M2(Ru)+][PF6-])
C91H76ClF6N2P5Ru, M = 1603.00 g/mol
Reagents: 1,1-bis(4-(dipheylamino)phenyl)prop-2-yn-1-ol 42 (1 eq, 154.6 mg, 0.25 mmol),
[RuCl(dppe)2]PF6 (1.05 eq, 285.7 mg, 0.625 mmol).
Reaction: In a Schlenk flask under argon, 20 mL of distilled and deoxygenated DCM were added to
1,1-bis(4-(diphenylamino)phenyl)prop-2-yn-1-ol 42 and [RuCl(dppe)2]PF6. The resulting mixture was
stirred for 72h at room temperature.
Work-up: The volume was reduced to a minimum and the desired product was precipitated with
Et2O at - 40 °C and washed with dried and deoxygenated pentane to give a violet powder.

301
1H NMR (400 MHz, CDCl3) δ 7.38 (t, J = 7.8 Hz, 8H), 7.30 – 7.12 (m, 12H), 7.09 – 6.96 (m, 24H), 6.86 (t,
J = 7.6 Hz, 8H), 6.68 (d, J = 9.0 Hz, 4H), 6.62 (d, J = 9.0 Hz, 4H), 2.93 (s, 4H, CH2 dppe), 2.70 (s, 4H, CH2
dppe).
13C NMR (101 MHz, CDCl3) δ 180.48, 158.49, 152.26, 146.01, 136.45, 134.30, 133.98, 133.93, 133.36,
132.46, 131.37, 130.55, 130.37, 128.88, 128.15, 126.79, 126.23, 119.30, 28.48 (dppe).

302
31P NMR (162 MHz, CDCl3) δ 40.29, -144.31 (sept).
IR (cm-1): 1921 (νC≡C), 836 (νP-F).
UV-Vis (DCM): λmax, nm (ε, 10-5·M-1·cm-1): 265 (1.4), 574 (0.65), 621 (0.76).
CV: (DCM, 0.10 M [n-Bu4N][PF6], V vs Ag+/Ag): C+/C+. E1/2: -0.75 V; MIII/MII E1/2: 1.06 V (ΔEp = 0.06 V,
ipc/ipa= 0.82).
Ru(Cl)(κ2-dppe)2-C≡C-(p-C6H4)-C(4-(dimethylamino)phenyl)2 tetrafluoroborate /
hexafluorophosphate ([M3(Ru)+][BF4-/PF6
-])
X= BF4, C77H72BClF4N2P4Ru, M= 1372.66 g/mol
X= PF6, C77H72ClF6N2P5Ru, M= 1430.82 g/mol

303
X= PF6:
Reagents: 1,1-bis(4-(dimethylamino)phenyl)prop-2-yn-1-ol 43 (1 eq, 185 mg, 0.25 mmol),
[RuCl(dppe)2]PF6 (1.05 eq, 285.7 mg, 0.265 mmol).
Reaction: In a Schlenk flask under argon, 20 mL of distilled and deoxygenated DCM were added to
1,1-bis(4-(dimethylamino)phenyl)prop-2-yn-1-ol and [RuCl(dppe)2]PF6. The resulting mixture was
stirred overnight at room temperature.
Work-up and purification: The volume was reduced to a minimum and the desired product was
precipitated with Et2O, filtered and washed with Et2O and pentane to obtain a dark powder. The
obtained mixture of product was then dissolved in CHCl3 and the bis-substituted product (M5(Ru)2+)
was crystallized at -20°C. The crystals were then filtered with a cannula. The same operation was
repeated until the bis-coupled product was removed. (3 or 4 times).
1H NMR (400 MHz, CD2Cl2) δ 7.47 – 7.35 (m, 12H), 7.35 – 7.15 (m, 18H), 7.10 – 7.02 (m, 8H), 6.97 (m,
8H), 6.92 (d, J = 9.3 Hz, 4H), 6.56 (d, J = 8.5 Hz, 2H), 3.29 (s, 12H, -NMe2), 2.73 (s, 8H, CH2 dppe).
13C NMR (101 MHz, CD2Cl2) δ 178.39, 156.64, 140.68, 139.12, 136.95, 136.45, 135.79, 135.01, 134.48,
131.13, 129.88, 129.66, 127.97, 127.85, 127.75, 113.24, 41.07 (-NMe2), 30.99 (dppe).

304
31P NMR (162 MHz, CD2Cl2) δ 47.61 (s), -144.50 (sept).

305
X= BF4:
Reagents: 1,1-bis(4-(dimethylamino)phenyl)prop-2-yn-1-ol 43 (1 eq, 37 mg, 0.15 mmol), HBF4·Et2O
(1.05 eq, 14.4 µL, 0.265 mmol), [RuCl(dppe)2]PF6 (1 eq, 107.8 mg, 0.15 mmol), Et3N (3 eq, 8.3 µL, 0.35
mmol).
Reaction and work up: In a Schlenk flask under argon, to a solution of 1,1-bis(4-
(dimethylamino)phenyl)prop-2-yn-1-ol in 20 mL of distilled and deoxygenated Et2O at 0°C were
added HBF4·Et2O. After stirring for 15 min, the formed precipitate was filtered off and washed with
Et2O three times. [RuCl(dppe)2]PF6 and 5 mL of DCM were added to the obtained solid and the
resulting mixture was stirred overnight at room temperature. The obtained vinylidene solution was
reduced to a minimum and the product precipitated with Et2O, filtered and washed with Et2O and
pentane to obtain a green powder.
The vinylidene was dissolved in died and deoxygenated DCM and Et3N was added to the solution and
stirred for 10 min at room temperature. The dark green solution was reduced and again precipitated
with Et2O, filtered and washed with Et2O and pentane to obtain the desired acetylide as a green
powder.
1H NMR (400 MHz, CDCl3) δ 7.56 – 7.33 (m, 12H), 7.33 – 7.09 (m, 20H + CDCl3), 7.01 (m, 14H), 6.92 (d,
J = 9.1 Hz, 4H), 6.55 (d, J = 8.3 Hz, 2H), 3.32 (s, 12H, -NMe2), 2.72 (s, 4H, CH2 dppe), 2.64 (s, 4H, CH2
dppe).

306
13C NMR (101 MHz, CDCl3) δ 177.48, 156.23, 140.29, 138.42, 136.42, 135.88, 135.03, 134.43, 134.23,
133.51, 130.56, 129.43, 129.29, 127.61, 127.49, 127.30, 124.81, 113.07, 40.86 (-NMe2), 30.67 (dppe).
31P NMR (162 MHz, CDCl3) δ 48.43 (s).

307
IR (cm-1): 2013 (νC≡C), 839 (νP-F)/833 (νB-F).
UV-Vis (DCM): λmax, nm (ε, 10-5·M-1·cm-1): X= BF4: 268 (0.85), 440 (0.14) 600 (1.02), 748 (0.56); X= PF6:
268 (1.1), 440 (0.20) 600 (1.04), 748 (0.59)
HRMS (ESI): calcd.: 1285.3378 [M]+, found: 1285.3384 [M]+.
CV: DCM, 0.10 M [n-Bu4N][PF6], V vs Ag+/Ag): C+/C+. E1/2: -0.66 V; MIII/MII E1/2: 0.58 (ΔEp = 0.04 V,
ipc/ipa= 1.0).
Ru(Cl)(κ2-dppe)2-C≡C-(p-C6H4)-C(4-(diphenylamino)phenyl)2 hexafluorophosphate ([M4(Ru)+][PF6-])
C97H80ClF6N2P5Ru, 1679.10 g/mol
Reagents: bis(4-(diphenylamino)phenyl)(4-ethynylphenyl)methanol 44 (1 eq, 77 mg, 0.125 mmol),
[RuCl(dppe)2]PF6 (1.05 eq, 141.5 mg, 0.13 mmol).
Reaction: In a Schlenk flask under argon, 10 mL of distilled and deoxygenated DCM were added to
bis(4-(diphenylamino)phenyl)(4-ethynylphenyl)methanol 44 and [RuCl(dppe)2]PF6. The resulting
mixture was stirred for 72h at room temperature.
Work-up and purification: The solvent was evaporated. The crude product was taken up in a
minimum of dried and deoxygenated DCM and precipitated with dried and distilled Et2O to give the
product as a violet powder.
1H NMR (400 MHz, CDCl3) δ 7.50 – 7.42 (m, 8H), 7.40 – 7.30 (m, 20H), 7.29-7.20 (m, 22H + CDCl3),
7.03-7.97 (m, 20H), 6.46 (d, J = 8.3 Hz, 2H), 2.78 (s, 4H, CH2 dppe), 2.63 (s, 4H, CH2 dppe).

308
13C NMR (101 MHz, CDCl3) δ 155.56, 144.97, 139.76, 137.78, 135.62, 134.93, 134.66, 134.38, 131.73,
131.59, 130.68, 129.99, 129.76, 128.05, 127.71, 127.59, 127.55, 118.65, 30.79 (dppe).

309
31P NMR (162 MHz, CDCl3) δ 47.38 (s), -144.34 (sept).
IR (cm-1): 1985 (νC≡C), 836 (νP-F).
UV-Vis (DCM) λmax, nm (ε, 10-5·M-1·cm-1): 4.98 (0.18), 634 (0.54), 854 (0.60).
HRMS (ESI): calcd: 1533.4005 [M]+; found: 1533.4004 [M]+.
CV: DCM, 0.10 M [n-Bu4N][PF6], V vs Ag+/Ag): C+/C+. E1/2: -0.57 V; MIII/MII E1/2: 0.54 (ΔEp = 0.04 V,
ipc/ipa= 1.0).
trans-Ru(κ2-dppe)2[-C≡C-(p-C6H4)-C(4-(dimethylamino)phenyl)2]2 bis-hexafluorophosphate
([M5(Ru)2+][PF6-]2)
C102H96F12N4P6Ru, M= 1892.81 g/mol
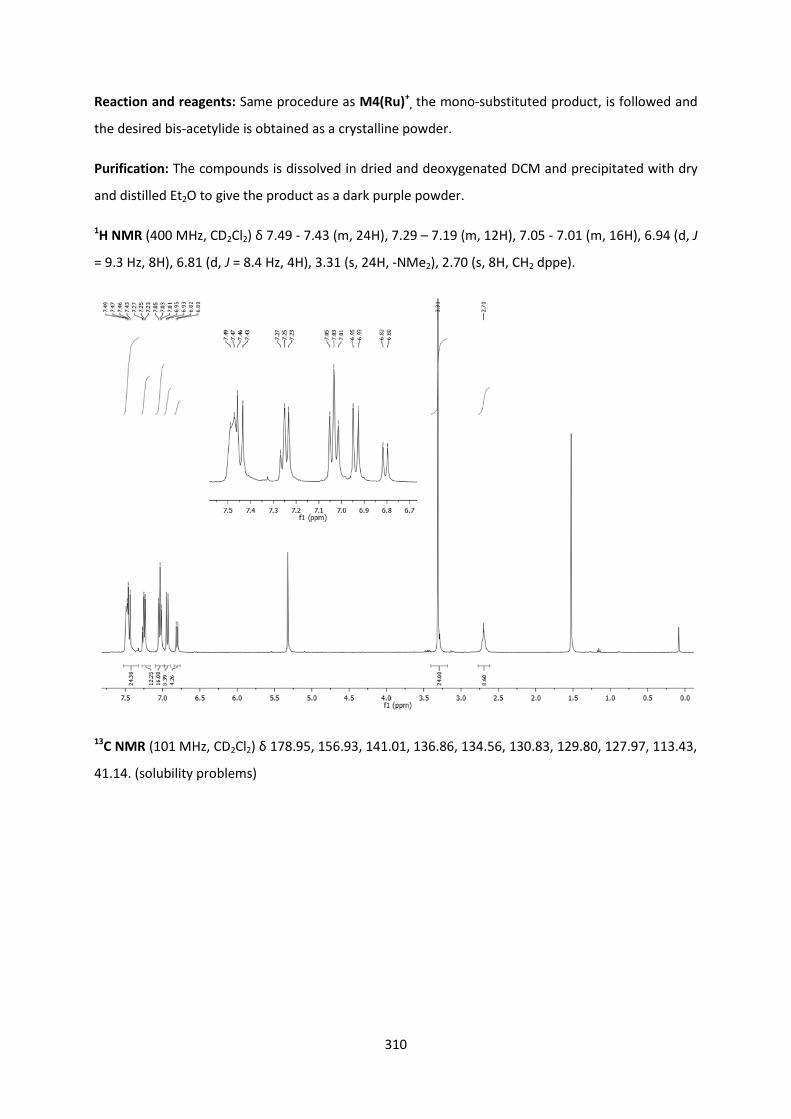
310
Reaction and reagents: Same procedure as M4(Ru)+, the mono-substituted product, is followed and
the desired bis-acetylide is obtained as a crystalline powder.
Purification: The compounds is dissolved in dried and deoxygenated DCM and precipitated with dry
and distilled Et2O to give the product as a dark purple powder.
1H NMR (400 MHz, CD2Cl2) δ 7.49 - 7.43 (m, 24H), 7.29 – 7.19 (m, 12H), 7.05 - 7.01 (m, 16H), 6.94 (d, J
= 9.3 Hz, 8H), 6.81 (d, J = 8.4 Hz, 4H), 3.31 (s, 24H, -NMe2), 2.70 (s, 8H, CH2 dppe).
13C NMR (101 MHz, CD2Cl2) δ 178.95, 156.93, 141.01, 136.86, 134.56, 130.83, 129.80, 127.97, 113.43,
41.14. (solubility problems)
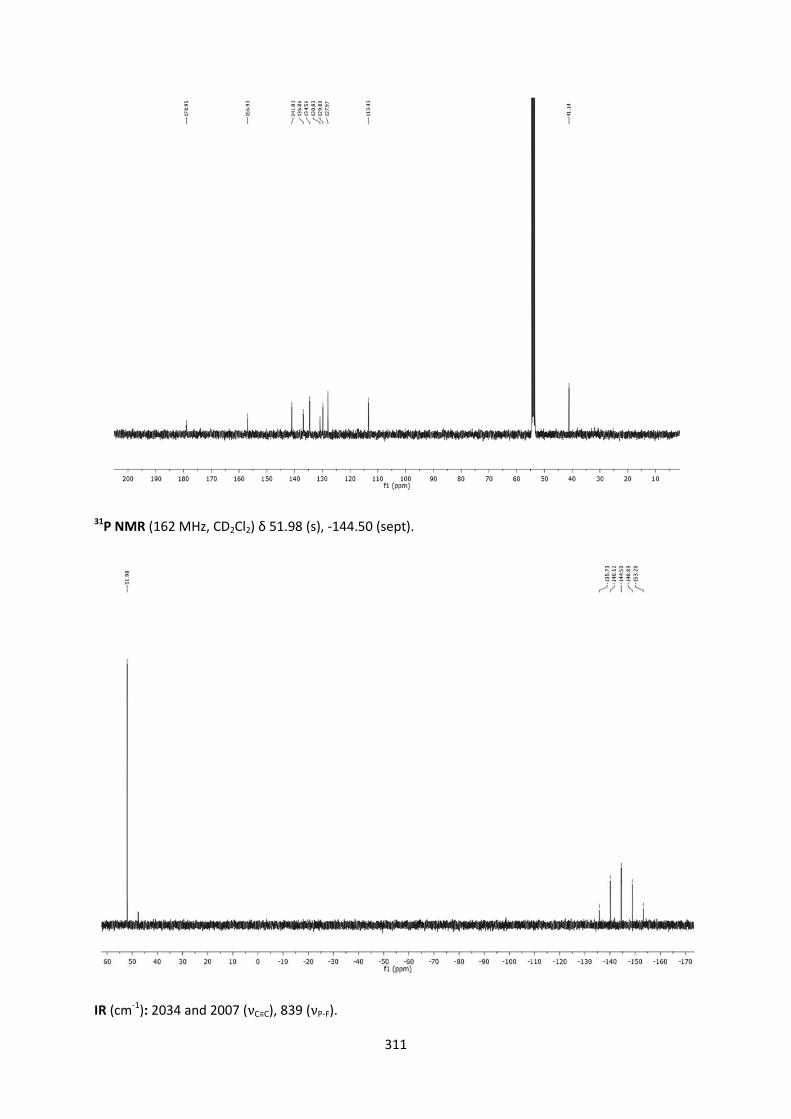
311
31P NMR (162 MHz, CD2Cl2) δ 51.98 (s), -144.50 (sept).
IR (cm-1): 2034 and 2007 (νC≡C), 839 (νP-F).

312
UV-Vis (DCM): λmax, nm (ε, 10-5·M-1·cm-1): 606 (2.20), 752 (1.03)
CV: DCM, 0.10 M [n-Bu4N][PF6], V vs Ag): C+/C+. E1/2: -0.90 V; MIII/MII E1/2: 0.66 (ΔEp = 0.03 V, ipc/ipa=
1.0).
X-ray diffraction study:
ORTEP view of ([M1(Ru)+ ][PF6-]2) with 50 % thermal ellipsoids solved by Dr. Graeme Moxey
Crystal parameters
Crystal class triclinic
Space group P -1
Cell angles (°) α= 81.91
β= 78.84
γ= 83.25
Cell length (Ǻ) a= 11.15
Formula C102H96N4P4Ru,2(F6P),4(CHCl3) b= 14.26
Molecular weight
(g/mol) 1892.81 c= 17.85
Crystals obtained by slow evaporation/cooling of a
saturated CHCl3 solution of the molecule
Cell volume
(Ǻ3) 2750.09
Z Z= 1
Ru
C12
C3
C5
N1
N2
C15
Cγ
C1
C23
Cγ
Cβ Cα
C22
C2
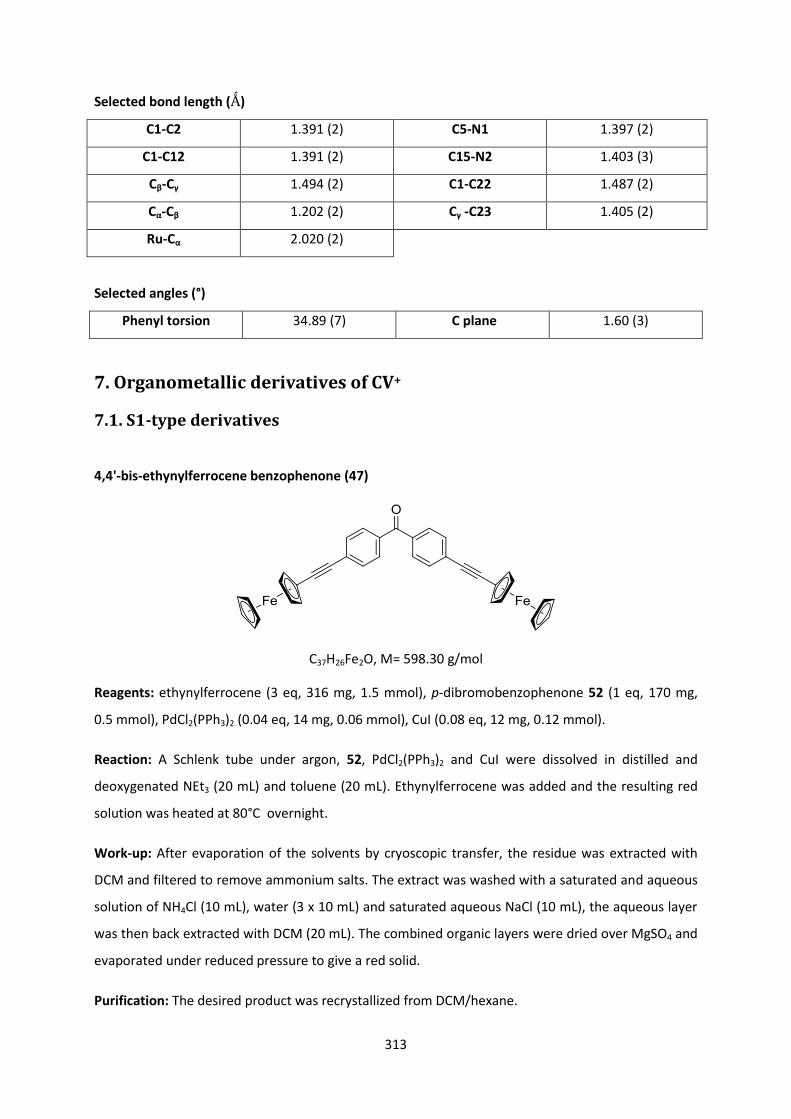
313
Selected bond length (Ǻ)
C1-C2 1.391 (2) C5-N1 1.397 (2)
C1-C12 1.391 (2) C15-N2 1.403 (3)
Cβ-Cγ 1.494 (2) C1-C22 1.487 (2)
Cα-Cβ 1.202 (2) Cγ -C23 1.405 (2)
Ru-Cα 2.020 (2)
Selected angles (°)
Phenyl torsion 34.89 (7) C plane 1.60 (3)
7. Organometallic derivatives of CV+
7.1. S1-type derivatives
4,4'-bis-ethynylferrocene benzophenone (47)
C37H26Fe2O, M= 598.30 g/mol
Reagents: ethynylferrocene (3 eq, 316 mg, 1.5 mmol), p-dibromobenzophenone 52 (1 eq, 170 mg,
0.5 mmol), PdCl2(PPh3)2 (0.04 eq, 14 mg, 0.06 mmol), CuI (0.08 eq, 12 mg, 0.12 mmol).
Reaction: A Schlenk tube under argon, 52, PdCl2(PPh3)2 and CuI were dissolved in distilled and
deoxygenated NEt3 (20 mL) and toluene (20 mL). Ethynylferrocene was added and the resulting red
solution was heated at 80°C overnight.
Work-up: After evaporation of the solvents by cryoscopic transfer, the residue was extracted with
DCM and filtered to remove ammonium salts. The extract was washed with a saturated and aqueous
solution of NH4Cl (10 mL), water (3 x 10 mL) and saturated aqueous NaCl (10 mL), the aqueous layer
was then back extracted with DCM (20 mL). The combined organic layers were dried over MgSO4 and
evaporated under reduced pressure to give a red solid.
Purification: The desired product was recrystallized from DCM/hexane.
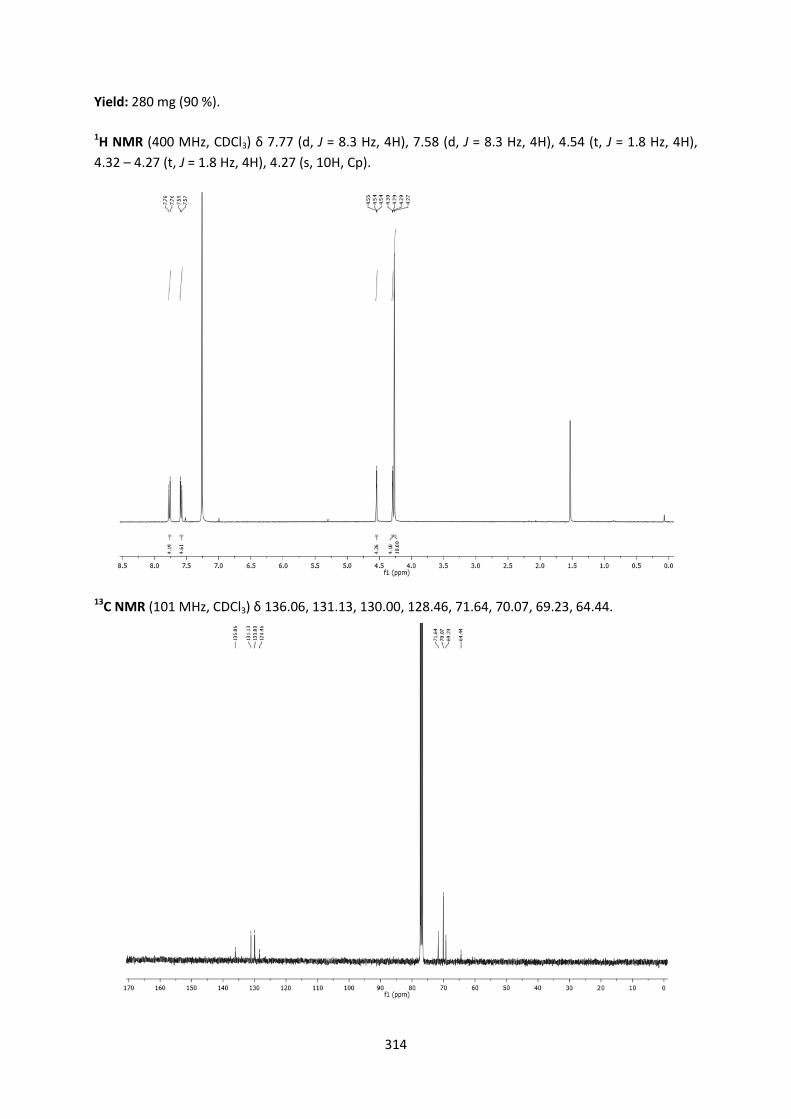
314
Yield: 280 mg (90 %).
1H NMR (400 MHz, CDCl3) δ 7.77 (d, J = 8.3 Hz, 4H), 7.58 (d, J = 8.3 Hz, 4H), 4.54 (t, J = 1.8 Hz, 4H),
4.32 – 4.27 (t, J = 1.8 Hz, 4H), 4.27 (s, 10H, Cp).
13C NMR (101 MHz, CDCl3) δ 136.06, 131.13, 130.00, 128.46, 71.64, 70.07, 69.23, 64.44.

315
IR (cm-1): 2198 (νC≡C), 1640 (νC=O), 856-813 (δC-H Fc).
HRMS (ESI): calc. 599.0761 [M]+; found: 599.0746 [M]+
X-ray diffraction study:
ORTEP view of 47 with 50 % thermal ellipsoids solved by Dr. Graeme Moxey
Crystal parameters
Crystal class monoclinic
Space group P 21/c
Cell angles (°) α= 90
β= 91.07
γ= 90
Cell length (Ǻ) a= 5.86
Formula C37H26Fe2O b= 19.24
Molecular weight
(g/mol) 598.30 c= 22.92
Red crystals obtained by slow
evaporation/cooling of a saturated DCM
solution of the molecule
Cell volume (Ǻ3) 2588.68
Z Z= 4
Selected bond length (Ǻ)
C≡C 1.198 (3) C1-C2 1.493 (3)
C=O 1.222 (3)
Selected angles (°)
Phenyl torsion 19.52 (3)
C3
C1 C2

316
tris(4-ethynylferrocenebenzene) methanol (S1(Fc)OH)
C55H40Fe3O, M= 884.46 g/mol
Reagents: 4,4'-bis-ethynylferrocene benzophenone 47 (1 eq, 300 mg, 0.5 mmol), 1-bromo-4-
ferrocenylethynylbenzene 48 ( 1.2 eq, 219 mg, 0.6 mmol), n-BuLi (1.1 eq, 343 µL at 1.6 M).
Reaction: In a Schlenk flask under argon, n-BuLi was added drop wise to a solution of 48 in dried and
distilled THF at -78°C. After stirring for 30 min, a solution of 47 in dried and distilled THF was added
drop wise to the solution. The mixture was stirred and allowed to warm to room temperature for
16h.
Work-up: 20 mL of water were added to the flask and the two phases were separated. The aqueous
layer was extracted with DCM (3 x 20 mL) and the combined organic phases were washed with water
(10 mL) and saturated aqueous NaCl (10 mL). The aqueous phase was then back-extracted with DCM
(20 mL). The organic phase was dried over MgSO4 and the solvents were removed to give the crude
product as a solid.
Purification: The product was then separated by preparative chromatography with toluene/hexane
(4/1) as eluent. The desired product was then recrystallized from DCM/hexane.
Rf(tol/hexane, 4/1): 0.3
Yield: 40 mg (20 %).
1H NMR (400 MHz, CDCl3) δ 7.45 (d, J = 8.4 Hz, 6H), 7.24 (d, J = 8.5 Hz, 6H + CDCl3), 4.51 (s, 6H), 4.24
(s, 21H, Cp) 2.74 (s, 1H, -OH).

317
13C NMR (101 MHz, CDCl3) δ 145.73, 131.24, 127.97, 123.39, 89.13, 85.53, 81.87, 71.62, 70.15, 69.04,
65.27.

318
IR(cm-1): 3538 (νO-H), 2205 (νC≡C), 825 (δC-H Fc).
HRMS: calc. 884.1127 [M]+; found: 884.1127 [M]+.
EA: calc. C: 74.69 ,H: 4.56; found: C: 74.56, H: 4.47.
X-ray diffraction study:
ORTEP view of 47 with 50 % thermal ellipsoids solved by Dr. Graeme Moxey
Crystal parameters
Crystal class monoclinic
Space group P 21/c
Cell angles (°) α= 90
β= 109.59
γ= 90
Cell length (Ǻ) a= 11.85
Formula C55H40Fe3O b= 36.92
Molecular weight
(g/mol) 884.46 c= 10.23
Orange crystals obtained by slow diffusion of
hexane into a DCM solution of the molecule at
room temperature
Cell volume (Ǻ3) 4218.82
Z Z= 4
C1
C2
O1 H1

319
Selected bond length (Ǻ)
C≡C 1.194 (9) C1-C2 1.533 (7)
C-O 1.442 (5)
Selected angles (°)
O1-C1-C2 108.5 (3)
tris[trans-Ru(κ2-dppe)2[-C≡C-(p-C6H4)-]C+ hexafluorophosphate ([S1(Ru)+][PF6
-])
C181H156Cl3F6P13Ru3, M: 3257.45 g/mol
Reagents: tris(4-ethynylphenyl) methanol 55 (1 eq, 33 mg, 0.1 mmol), [RuCl(dppe)2]PF6 46 (5 eq, 540
mg, 0.5 mmol), Et3N (30 eq., 50 µL).
Reaction: In a Schlenk flask under argon, 10 mL of distilled and deoxygenated DCM were added to 55
and RuCl(dppe)2PF6 46. The resulting blue mixture was stirred for 24h at room temperature. The
crude product was reduced to a minimum of solvent and cannula filtered into a new Schlenk flask
under argon and precipitated with dried and distilled MeOH to give the product as a green powder.
The same procedure was repeated until total removal of the 5-coordinate ruthenium complex in
which was in excess (clear solution). The resulting powder was then washed with distilled and
deoxygenated Et2O. 10 mL of distilled and deoxygenated DCM was then added to the resulting solid
followed by addition of Et3N. The solution was stirred for 10 min and precipitated with distilled and
deoxygenated Et2O, and washed with pentane.
Purification: The resulting green powder was precipitated from DCM/Et2O to afford small green
crystals.
Yield: >70 %.

320
1H NMR (400 MHz, CDCl3) δ 7.47-7.45 (m, 22H), 7.36 (d, J = 8.6 Hz, 22H), 7.30-7.23 (m, 50H + CDCl3),
7.08-7.03 (m, 48H), 6.55 (d, J = 8.5 Hz, 6H), 2.82 (s, 12H, CH2 dppe), 2.68 (s, 12H, CH2 dppe).
13C NMR (101 MHz, CDCl3) δ 173.33 (C+), 139.70, 136.40, 135.82, 135.72, 134.95, 134.67, 134.39,
134.22, 131.33, 129.55, 129.45, 127.73, 127.41, 30.62 (CH2 dppe).

321
31P NMR (162 MHz, CDCl3) δ 47.61 (s), -144.25 (sept).
IR (cm-1): 1958 (νC≡C), 690 (νP-F).
HRMS (ESI): calcd.: 3111.52 [M]+ , found: 3111.63 [M]+.
UV-VIS: DCM λmax, nm (ε, 10-5·M-1·cm-1): 627 (0.01), 988 (14.1).
CV: DCM, 0.10 M [n-Bu4N][PF6], V vs Ag): C+/C+. E1/2: -0.41 V (ΔEp = 0.04 V, ipc/ipa= 0.83); MIII/MII E1/2:
0.66 V (ΔEp = 0.04 V, ipc/ipa= 1.0); E1/2: 1.09 V (ΔEp = 0.07 V, ipc/ipa= 0.64).
X-ray diffraction study: (connectivity only). Crystals obtained from slow diffusion of Et2O vapor into a
DCM solution of the molecule at room temperature.
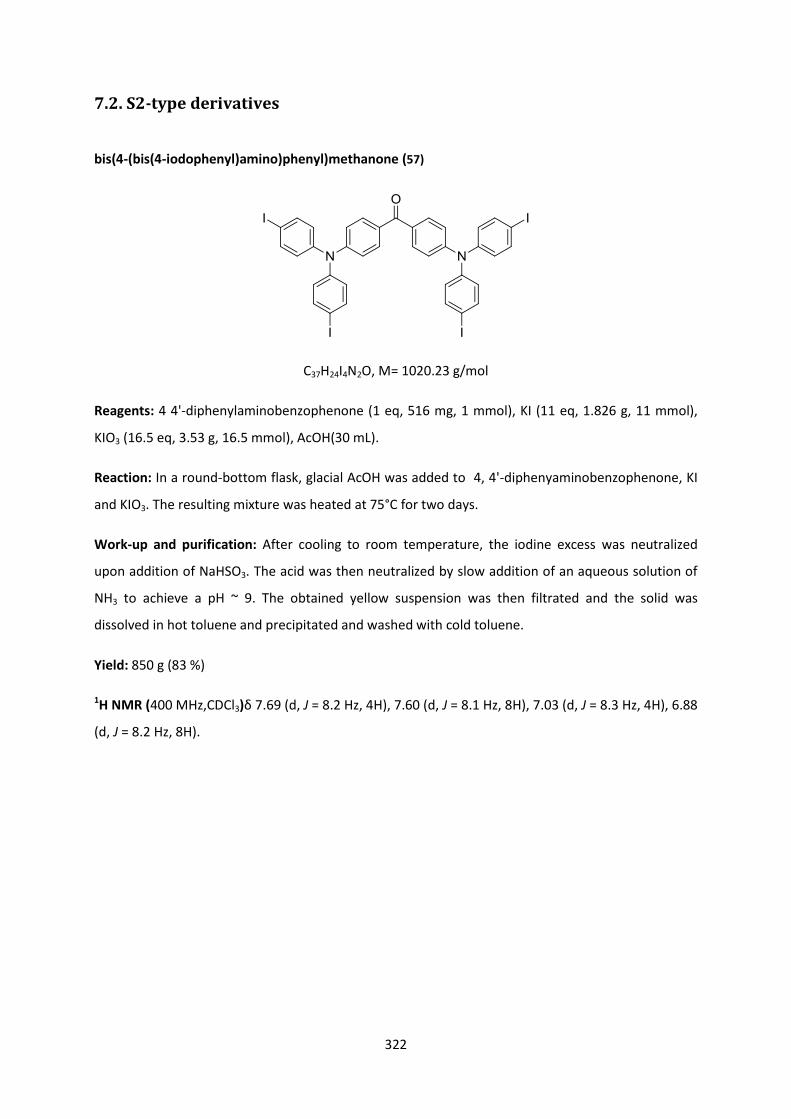
322
7.2. S2-type derivatives
bis(4-(bis(4-iodophenyl)amino)phenyl)methanone (57)
C37H24I4N2O, M= 1020.23 g/mol
Reagents: 4 4'-diphenylaminobenzophenone (1 eq, 516 mg, 1 mmol), KI (11 eq, 1.826 g, 11 mmol),
KIO3 (16.5 eq, 3.53 g, 16.5 mmol), AcOH(30 mL).
Reaction: In a round-bottom flask, glacial AcOH was added to 4, 4'-diphenyaminobenzophenone, KI
and KIO3. The resulting mixture was heated at 75°C for two days.
Work-up and purification: After cooling to room temperature, the iodine excess was neutralized
upon addition of NaHSO3. The acid was then neutralized by slow addition of an aqueous solution of
NH3 to achieve a pH ~ 9. The obtained yellow suspension was then filtrated and the solid was
dissolved in hot toluene and precipitated and washed with cold toluene.
Yield: 850 g (83 %)
1H NMR (400 MHz,CDCl3)δ 7.69 (d, J = 8.2 Hz, 4H), 7.60 (d, J = 8.1 Hz, 8H), 7.03 (d, J = 8.3 Hz, 4H), 6.88
(d, J = 8.2 Hz, 8H).

323
13C NMR (101 MHz, CDCl3) δ 150.56, 146.28, 138.87, 131.85, 131.79, 127.35, 121.31, 88.09. (not
soluble enough to see ketonic carbon)

324
HRMS (ASAP): calcd.: 1020.81405 [M+H]+ , 1019.80622 [M]+.,893.90957[M-·I+H]+.; found : 1020.8150
[M+H]+, 1019.8070 [M]+., 893.9098 [M-·I+H]+.
EA: calcd.: C = 43.56; H = 2.37; N = 2.75; O, 1.57; found: C = 43.61; H = 2.35, N = 2.58.
IR(KBr, cm-1): 1704 (νC=O), 515 (νC-I).
4-iodo-N,N-bis(4-(ethynylferrocene)phenyl)aniline (61)
C42H26Fe2IN, 783.26 g/mol
Reagents: tri(4-iodophenyl)amine (1 eq, 623 mg, 1 mmol), ethynyl ferrocene (2 eq, 420 mg, 2 mmol),
PdCl2(PPh3)2 (0.04 eq, 28 mg, 0.04 mmol), CuI (0.08 eq, 15 mg, 0.08 mmol).
Reaction: In a Schlenk tube under argon PdCl2(PPh3)2 and CuI were dissolved in a mixture of toluene
(10 mL) and Et3N (10 mL). Ethynyl ferrocene was added and the resulting red solution was stirred at
room temperature for 16 h.
Work-up: After evaporation of the solvents by cryoscopic transfer, the residue was dissolved in Et2O
and filtered on a plug of celite to remove salts. The crude extract was washed with water (3 x 10mL)
and saturated aqueous NaCl (10 mL); the aqueous layer was then back-extracted with Et2O (20 mL).
The combined organic layers were dried over MgSO4 and evaporated under reduced pressure to give
an orange solid.
Purification: The obtained solid was then adsorbed onto silica and loaded on the top of a
chromatographic column and eluted with a gradient of hexane/Et2O from 9/1 to 4/1. The second
fraction was collected and solvents were removed under reduced pressure.
Yield: m= 340 mg (43 %)
1H NMR (400 MHz, CDCl3) δ 7.55 (d, J = 8.7 Hz, 2H), 7.37 (d, J = 8.6 Hz, 4H), 7.01 (d, J = 8.6 Hz, 4H),
6.86 (d, J = 8.7 Hz, 2H), 4.53 – 4.44 (m, 4H), 4.24 (s, 14H, Cp).

325
13C NMR (101 MHz, CDCl3) δ 146.90, 146.33, 138.54, 132.69, 126.51, 123.97, 118.77, 88.24, 86.58,
85.63, 71.50, 70.11, 68.93, 65.59.

326
HRMS: (ESI) calcd.: 787.01218 [M]+.; found : 787.0121 [M]+.
EA: calcd.: C = 64.07, H = 3.84, N = 1.78; found: C = 64.00, H = 4.02, N = 1.57.
IR(cm-1): 2209 (νC≡C), 816 (δC-H Fc), 535 (νC-I).
bis(4-(bis(4-(ethynylferrocene)phenyl)amino)phenyl)methanone (58)
C85H60Fe4N2O, M = 1348.81 g/mol
Reagents: bis(4-(bis(4-iodophenyl)amino)phenyl)methanone 57 (1 eq, 2 g, 2 mmol), ethynyl
ferrocene (1.05 eq, 1.76 g, 8.4 mmol), PdCl2(PPh3)2 (0.08 eq, 112.32 mg, 0.16 mmol), CuI (0.16 eq, 61
mg, 0.32 mmol).
Reaction: In a Schlenk tube under argon, 57, PdCl2(PPh3)2 and CuI were dissolved in distilled and
deoxygenated NEt3 (20 mL). Ethynylferrocene was added and the resulting red solution was heated
at 80°C for 16h.
Work-up: After evaporation of the solvents by cryoscopic transfer, the residue was extracted with
DCM (3 x 10 mL) and filtered to remove ammonium salts. The extract was washed with water (3 x 10
mL), saturated aqueous NH4Cl (10 mL) andaqueous NaCl (10 mL); the aqueous layer was then back-
extracted with DCM (10 mL). The combined organic layers were dried over MgSO4 and evaporated
under reduced pressure to give a red solid.
Purification: The obtained solid was absorbed onto silica and loaded on the top of a chromatographic
column. The orange fraction, eluted with a gradient of hexane/DCM from 3/1 to 1/1, was collected

327
and solvents were removed under reduced pressure. The product was then precipitated from
DCM/Et2O.
Yield: m= 1.990 g (75 %).
1H NMR (400 MHz, CDCl3) δ 7.73 (d, J = 8.4 Hz, 4H), 7.43 (d, J = 8.3 Hz, 8H), 7.12 - 7.10 (m, 12H), 4.50
(s, 8 H, Cp), 4.25 (s, 28H, Cp).
13C NMR (101 MHz, CDCl3) δ 193.96 (C=O), 150.71, 145.87, 132.82, 131.83, 125.14, 121.65, 119.82,
88.69, 85.51, 71.54, 70.12, 68.98, 65.44.

328
HRMS (ESI): calcd.: 1348.20977 [M]+.; found: 1348.2116 [M]+.
EA: calcd.: C = 75.69, H = 4.48, N = 2.08; found: C = 75.55, H = 4.54, N = 2.19.
IR(cm-1): 2204 (νC≡C), 1645 (νC=O), 821 (δC-H Fc).
X-ray diffraction study:
ORTEP view of 58 with 50 % thermal ellipsoids solved by Dr. Thierry Roisnel
C1 C3 C2
C5
N1 C16

329
Crystal parameters
Crystal class triclinic
Space group P -1
Cell angles (°) α= 103.70
β= 95.25
γ= 99.83
Cell length (Ǻ) a= 7.18
Formula C85H59Fe4N2O b= 16.31
Molecular weight
(g/mol) 1348.81 c= 28.52
Orange crystals obtained by slow diffusion of
hexane into a DCM solution of the molecule at
room temperature
Cell volume (Ǻ3) 3169.33
Z Z= 2
Selected bond length (Ǻ)
C≡C 1.167 (1) C1-C2 1.481 (1)
C-O 1.229 (1)
Selected angles (°)
C3-C1-C2 27.38 (5) C5-N1-C16 43.00 (5)
tris(4-(bis(4-((ethynylferrocene)phenyl)amino)phenyl)methanol (S2(Fc)OH)
C127H91Fe6N3O, M = 2010.21 g/mol

330
Reagents: bis(4-(bis(4-(ethynylferrocene)phenyl)amino)phenyl)methanone 58 (1 eq, 428 mg, 0.317
mmol), 4-iodo-N,N-bis(4-(ethynylferrocene)phenyl)aniline 61 ( 1.2 eq, 250 mg, 0.381 mmol), n-BuLi
(1.1 eq, 182 µL (1.6 M)).
Reaction: In a Schlenk flask under argon, n-BuLi was added drop-wise to a solution of 61 in dry and
distilled THF at -78°C. After stirring for 30 min, a solution of 58 in dry and distilled THF was added
drop wise to the solution. The mixture was stirred and allowed to warm to room temperature for 16
h.
Work-up: 20 mL of water were added to the flask and the two phases were separated. The aqueous
layer was extracted with DCM (3 x 20 mL) and the combined organics phases were washed with
water (10 mL) and saturated aqueous NaCl (10 mL). The aqueous phase was then back extracted with
DCM (20 mL). The organic phases were dried over MgSO4 and the solvents were removed to give the
crude product as a solid.
Purification: The obtained solid was absorbed onto deactivated silica and loaded on the top of a
chromatographic column. The orange fraction, eluted with toluene/hexane (7/3) + 1% Et3N, was
collected and solvents were removed under reduced pressure. The product was then precipitated
from DCM/Et2O.
Yield: m= 200 mg (32 %).
1H NMR (400 MHz, CDCl3) δ 7.38 (d, J = 8.6 Hz, 12H), 7.21 (d, J = 8.7 Hz, 6H), 7.09 - 7.04 (m, 18H), 4.48
(s, 12H), 4.32 – 4.14 (m, 42H, Cp), 2.77 (s, 1H, -OH).

331
13C NMR (101 MHz, CDCl3) δ 146.56, 145.97, 141.75, 132.50, 128.97, 123.86, 123.64, 118.30, 87.91,
85.60, 81.46, 71.35, 69.96, 68.74, 65.53.
HRMS (ESI) calcd.: 1004.66238 [M]2+, 669.77473 [M]3+., 2009.3253 [M]+., 1992.32256 [M-.OH]+;
found: 1004.6629 [M]2+, 669.7755 [M]3+., 2009.3219 [M]+., 1992.3193 [M-.OH]+
IR: (cm-1): 3563 (νO-H), 2206 (νC≡C), 819 (δC-H Fc).
UV-Vis (DCM): λmax, nm (ε, 10-5·M-1·cm-1): 349 (1.5).
CV: DCM, 0.10 M [n-Bu4N][PF6], V vs ECS): MIII/MII E1/2: 0.52 V (ΔEp = 0.05 V, ipc/ipa= 0.98) (six
ferrocenes at the same time)

332
tris(4-(bis(4-((ethynylferrocene)phenyl)amino)phenyl)methylium tetrafluoroborate ([S2(Fc)+][BF4-])
C127H90BF4Fe6N3, M = 2080.01 g/mol
Reagents: S2(Fc)OH (1 eq, 100 mg, 0.05 mmol), HBF4·Et2O (1.1 eq, 8 µL, 1.1 mmol)
Reaction and work up: Prepared according to GP3.
Work up and purification: The green precipitate was washed with dry and distilled Et2O (3x10 mL).
The dark green solid was then precipitated from DCM/pentane and filtered to obtain a green fine
powder.
Yield: quant.
1H NMR (400 MHz, CDCl3) δ 7.47 (d, J = 8.3 Hz, 12H), 7.36 (d, J = 8.7 Hz, 6H), 7.16 (d, 12H + CDCl3),
7.07 (d, J = 8.6 Hz, 6H), 4.45 (s, 12H, Cp), 4.18 (d, J = 9.1 Hz, 42H, Cp).

333
13C NMR (101 MHz, CDCl3) δ 143.42, 133.23, 126.80, 123.00, 119.73, 90.49, 85.12, 71.78, 70.34,
69.34.
IR: (cm-1): 2204 (νC≡C), 820 (δC-H Fc), 1172 (νB-F).
UV-Vis: (DCM): λmax, nm (ε, 10-5·M-1·cm-1): 341 (1.49), 689 (0.92).
CV: DCM, 0.10 M [n-Bu4N][PF6], V vs ECS): C+/C+. Epc: -0.35 V, MIII/MII E1/2: 0.53 V (ΔEp = 0.05 V, ipc/ipa=
0.99) (six ferrocenes at the same time)
4-iodo-N,N-bis(4-((trimethylsilyl)ethynyl)phenyl)aniline (62)
C28H30INSi2, M= 563.63 g/mol
Reagents: tris(4-iodophenyl)amine (1 eq, 3.115 g, 5 mmol), TMSA (10 eq, 1.413 mL, 10 mmol),
PdCl2(PPh3)2 (0.04 eq, 140 mg, 0.2 mmol), CuI (0.08 eq, 75 mg, 0.4 mmol).

334
Reaction: A Schlenk tube under argon, tri(4-iodophenyl)amine, PdCl2(PPh3)2 and CuI were dissolved
in a mixture of toluene (50 mL) and Et3N (50 mL). TMSA was added and the resulting yellow solution
was stirred at room temperature for 6 h.
Work-up: After evaporation of the solvents by cryoscopic transfer, a saturated aqueous solution of
NH4Cl (30 mL) and DCM (30 mL) was added to the residue. The aqueous layer was extracted with
DCM (3 x 25 mL). The combined organic phases were washed with water (10 mL) and saturated
aqueous NaCl (10 mL), and the aqueous layer was then back-extracted with DCM (25 mL). The
combined organic layers were dried over MgSO4 and evaporated under reduced pressure to give a
light yellow solid.
Purification: The obtained solid was absorbed onto silica and loaded on the top of a chromatographic
column and eluted with hexane. The product was precipitated from DCM/MeOH.
Rf(hexane) = 0.16
Yield: m= 229 mg (40 %)
1H NMR (400 MHz, CDCl3) δ 7.54 (d, J = 8.7 Hz, 2H), 7.34 (d, J = 8.7 Hz, 4H), 6.95 (d, J = 8.6 Hz, 4H),
6.81 (d, J = 8.7 Hz, 2H), 0.24 (s, 18H, CH3 Si).
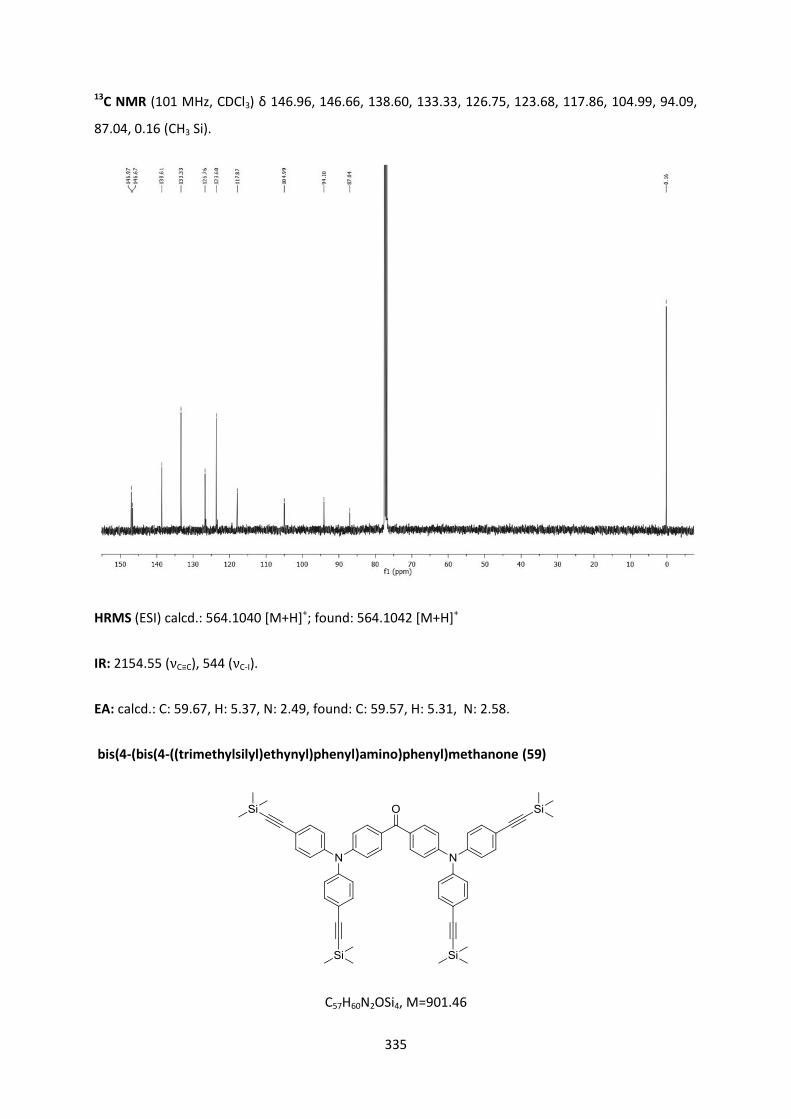
335
13C NMR (101 MHz, CDCl3) δ 146.96, 146.66, 138.60, 133.33, 126.75, 123.68, 117.86, 104.99, 94.09,
87.04, 0.16 (CH3 Si).
HRMS (ESI) calcd.: 564.1040 [M+H]+; found: 564.1042 [M+H]+
IR: 2154.55 (νC≡C), 544 (νC-I).
EA: calcd.: C: 59.67, H: 5.37, N: 2.49, found: C: 59.57, H: 5.31, N: 2.58.
bis(4-(bis(4-((trimethylsilyl)ethynyl)phenyl)amino)phenyl)methanone (59)
C57H60N2OSi4, M=901.46

336
Reagents: bis(4-(bis(4-iodophenyl)amino)phenyl)methanone 57 (1 eq, 1.02 g, 1 mmol), TMSa (9 eq,
1.27 mL, 9 mmol), PdCl2(PPh3)2 (0.16 eq, 112 mg, 0.16 mmol), CuI (0.32 eq, 75 mg, 0.32 mmol).
Reaction: A Schlenk tube under argon, 57, PdCl2(PPh3)2 and CuI were dissolved in a mixture of
toluene (25 mL) and Et3N (25 mL). TMSA was added and the resulting yellow solution was stirred at
40°C for 6 h.
Work-up: After evaporation of the solvents by cryoscopic transfer, a saturated aqueous solution of
NH4Cl (30 mL) and DCM (30 mL) was added to the residue. The aqueous layer was extracted with
DCM (3 x 25 mL). The combined organic phases were washed with water (10 mL) and saturated
aqueous NaCl (10 mL); the aqueous layer was then back-extracted with DCM (25 mL). The combined
organic layers were dried over MgSO4 and evaporated under reduced pressure to give a light yellow
solid.
Purification: The obtained solid was absorbed onto silica and loaded on the top of a chromatographic
column and eluted with a gradient of hexane/DCM from 8/2 to 1/1. Precipitation from DCM/MeOH
afforded the desired compound as a yellow crystalline powder.
Rf(hexane/DCM) = 0.36.
Yield: m= 790 mg (87 %).
1H NMR (400 MHz, CDCl3) δ 7.70 (d, J = 8.8 Hz, 4H), 7.39 (d, J = 8.7 Hz, 8H), 7.07-7.03 (m, 12H), 0.24
(s, 36H).

337
13C NMR (101 MHz, CDCl3) δ 193.92 (C=O), 150.52, 146.57, 133.47, 132.04, 131.80, 124.84, 122.02,
118.88, 104.80, 94.54, 0.13 (CH3 Si).
IR (cm-1): 1672 (νC=O), 2159 (νC≡C), 1272 (νSi-Me).
HRMS (ESI): calcd.: 923.3680 [M+Na]+; found: 923.3681 [M+Na]+
EA: calcd.: C: 75.95, H: 6.71, N: 3.11, found: C: 75.88, H: 6.65, N: 3.19.
X-ray diffraction study:
ORTEP view of 58 with 50 % thermal ellipsoids solved by Dr. Graeme Moxey
C16
N1
C5
C2 C1
C3
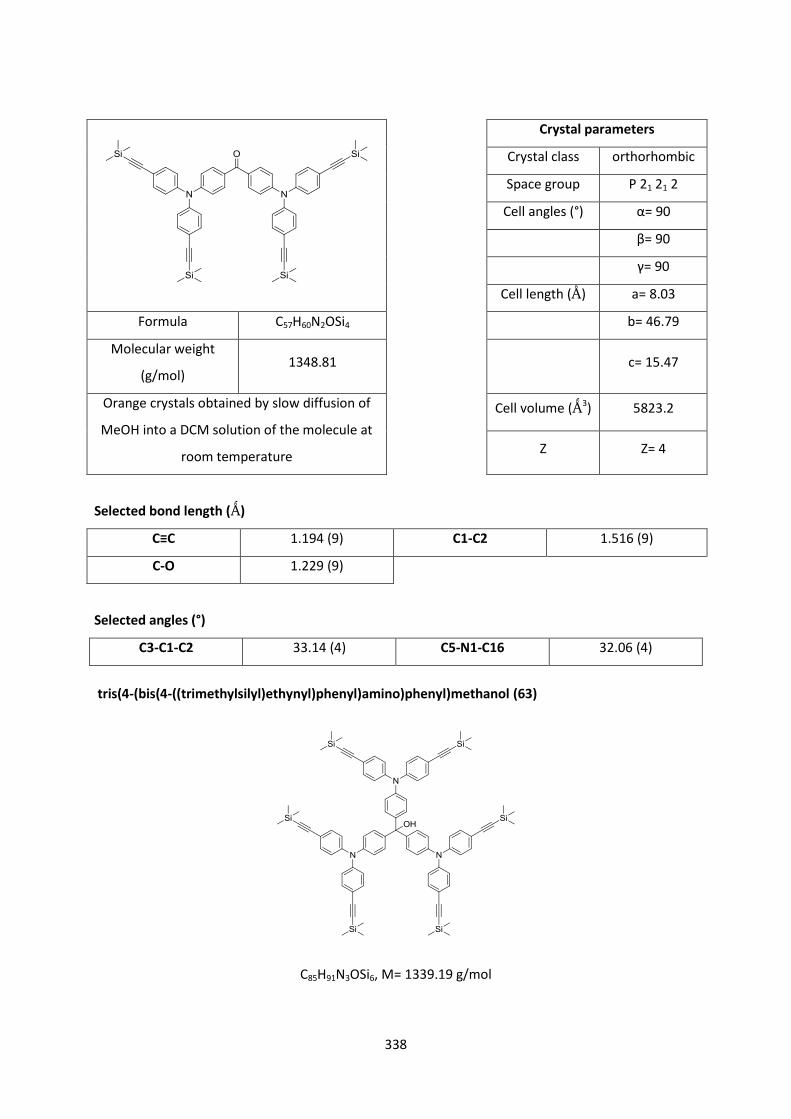
338
Crystal parameters
Crystal class orthorhombic
Space group P 21 21 2
Cell angles (°) α= 90
β= 90
γ= 90
Cell length (Ǻ) a= 8.03
Formula C57H60N2OSi4 b= 46.79
Molecular weight
(g/mol) 1348.81 c= 15.47
Orange crystals obtained by slow diffusion of
MeOH into a DCM solution of the molecule at
room temperature
Cell volume (Ǻ3) 5823.2
Z Z= 4
Selected bond length (Ǻ)
C≡C 1.194 (9) C1-C2 1.516 (9)
C-O 1.229 (9)
Selected angles (°)
C3-C1-C2 33.14 (4) C5-N1-C16 32.06 (4)
tris(4-(bis(4-((trimethylsilyl)ethynyl)phenyl)amino)phenyl)methanol (63)
C85H91N3OSi6, M= 1339.19 g/mol

339
Reagents: bis(4-(bis(4-((trimethylsilyl)ethynyl)phenyl)amino)phenyl)methanone 59 (1 eq, 350 mg, 0.4
mmol), 4-iodo-N,N-bis(4-((trimethylsilyl)ethynyl)phenyl)aniline 62 ( 1.5 eq, 327 mg, 0.582 mmol), n-
BuLi (1.1 eq, 312 µL (1.6 M)).
Reaction: In a Schlenk flask under argon, n-BuLi was added drop-wise to a solution of 62 in dried and
distilled THF at -78°C. After stirring for 30 min, a solution of 59 in dried and distilled THF was added
drop-wise to the solution. The mixture was stirred at -78°C for 16 h and allowed to warm up to room
temperature.
Work-up: 20 mL of water were added to the flask and the two phases were separated. The aqueous
layer was extracted with DCM (3 x 20 mL) and the combined organic phases were washed with water
(10 mL) and saturated aqueous NaCl (10 mL). The aqueous phase was then back extracted with DCM
(20 mL). The organic phase was dried over Na2SO4 and the solvents were removed to give the crude
product as a solid.
Purification: The obtained solid was absorbed onto silica and loaded on the top of a chromatographic
column. The yellow fraction was eluted with a gradient of hexane/Et2O (7/3) + 1% Et3N (with the
gradient ranging from pure hexane to 4/1 hexane/Et2O), and was collected and solvents were
removed under reduced pressure. The product was then precipitated from DCM/MeOH to afford a
light yellow solid.
Yield: m= 380 mg (70 %).
1H NMR (400 MHz, (CD3)2CO) δ 7.38 – 7.29 (m, 18H), 7.08 – 7.02 (d, J = 8.7 Hz, 6H), 7.00 (d, J = 8.6 Hz,
12H), 5.61 (s, 1H, OH), 0.21 (s, 54H, CH3 Si).

340
13C NMR (101 MHz, (CD3)2CO) δ 148.53, 146.29, 144.89, 134.06, 130.47, 125.31, 124.40, 118.29,
106.25, 94.06, 81.59 (C-OH), 0.26 (CH3 Si).
IR (cm-1) 2153 (νC≡C), 1272 (νC-Si), νOH too weak to be detected.
HRMS (ESI): calc. 1320.5750 [M-OH]+, found: 1320.5751 [M-OH]+
tris(4-(bis(4-ethynylphenyl)amino)phenyl)methanol (64)
C67H43N3O, Mw= 906.10 g/Mol

341
Reagents: tris(4-(bis(4-((trimethylsilyl)ethynyl)phenyl)amino)phenyl)methanol 63 (1 eq, 300 mg,
0.224 mmol), K2CO3 (9 eq, 185 mg, 1.3 mmol).
Reaction: In a round bottom flask 63 and K2CO3 were stirred in a mixture of MeOH (20 mL) and DCM
(20 mL) for 16 h at room temperature.
Work-up: Solvents were removed and the residue was treated with water (20 mL) and DCM (20 mL).
The two layers were separated and the aqueous layer was extracted with DCM (3 x 20 mL). The
combined organic layers were washed with water (3 x 10mL) and saturated aqueous NaCl (10 mL),
The aqueous layer was then back-extracted with DCM (20 mL). The combined organic layers were
dried over Na2SO4 and evaporated under reduced pressure to give a yellow solid.
Purification: The solid residue was then precipitated from DCM/MeOH as a yellow powder.
Yield: m= 180 mg (94 %).
1H NMR (400 MHz, CDCl3) δ 7.40 (d, J = 8.6 Hz, 12H), 7.34 (d, J = 8.6 Hz, 16H), 7.08 (d, J = 8.6 Hz, 6H),
7.04 (d, J = 8.6 Hz, 12H), 5.45 (s, 1H, OH), 3.59 (s, 6H, C≡C-H).

342
13C NMR (101 MHz, CDCl3) δ 148.66, 146.35, 144.86, 134.18, 130.46, 125.34, 124.42, 117.50, 84.29
(C-OH), 78.74 (C≡C-H).
IR (cm-1): 3300 (νO-H), 3287 (νC≡CH), 2104 (νC≡C).
HRMS (ESI): calc. 888.3379 [M-OH]+, found: 888.3373 [M-OH]+
([S2(Ru)+][PF6-])
C379H324Cl6F6N3P25Ru6, M= 6628.24 g/mol

343
Reagents: tris(4-(bis(4-ethynylphenyl)amino)phenyl)methanol 64 (1 eq, 50 mg, 0.055 mmol),
[RuCl(dppe)2]PF6 46 (9 eq, 533 mg, 0.5 mmol), Et3N (60 eq., 56 µL).
Reaction: In a Schlenk flask under argon, 5 mL of distilled and deoxygenated DCM were added to 64
and RuCl(dppe)2PF6 46. The resulting green mixture was stirred for 24h at room temperature. The
crude product was reduced to a minimum of solvent and cannula filtered into a clean Schlenk flask
under argon and precipitated with dried and distilled MeOH to give the product as a green powder.
The same procedure was repeated until total removal of the 5-coordinate complex that was present
in excess (affording a clear solution). The resulting powder was then washed with distilled and
deoxygenated Et2O. 10 mL of distilled and deoxygenated DCM was then added to the resulting solid
followed by addition of Et3N. The solution is stirred for 10 min and precipitated with distilled and
deoxygenated Et2O, and washed with pentane.
Purification: The resulting purple powder was precipitated from DCM/Et2O to afford a fine purple
powder.
Yield: >60 %.
1H NMR (400 MHz, CDCl3) δ 7.60 (d, J = 6.3 Hz, 22H), 7.50 (s, 6H), 7.23 – 7.13 (m, 46H), 7.00-6.93 (m,
54H), 6.69 (s, 6H), 2.71 (s, 2H, CH2 dppe), 2.60 (s, 12H, CH2 dppe).

344
31P NMR (162 MHz, CDCl3) δ 49.58 (s), -144.25 (sept).
8. Z-scan traces
Green traces correspond to the linear absorptions and red plot to the two photon spectra.
Error is represented by the bars on the dots.
malachite green ([MG+][Cl-])

345
([O1(anth)+][BF4-])
([O2(anth)+][BF4-])

346
([O1(Flu)+][BF4-])
([O2(Flu)+][BF4-])

347
([O1(anthC2)+][BF4
-])
([O4+][BF4-])

348
References
[1] G. R. Fulmer, A. J. M. Miller, N. H. Sherden, H. E. Gottlieb, A. Nudelman, B. M. Stoltz, J. E. Bercaw, K. I. Goldberg, Organometallics 2010, 29, 2176–2179.
[2] N. G. Connelly, W. E. Geiger, Chem. Rev. 1996, 96, 877–910. [3] W. C. Still, M. Kahn, A. Mitra, J. Org. Chem. 1978, 43, 2923–2925. [4] A. I. Vogel, B. S. Furniss, Vogel’s Textbook of Practical Organic Chemistry, Longman, 1989. [5] D. F. Shriver, M. A. Drezdzon, The Manipulation of Air-Sensitive Compounds, 2nd Edition, Wiley,
1986. [6] S. Komiya, Synthesis of Organometallic Compounds: A Practical Guide, Wiley, 1997. [7] J. N. Moorthy, A. L. Koner, S. Samanta, A. Roy, W. M. Nau, Chem. – Eur. J. 2009, 15, 4289–4300. [8] T. R. Kelly, J. P. Sestelo, I. Tellitu, J. Org. Chem. 1998, 63, 3655–3665. [9] A. Nierth, A. Y. Kobitski, G. U. Nienhaus, A. Jäschke, J. Am. Chem. Soc. 2010, 132, 2646–2654. [10] M. Chandrasekharam, G. Rajkumar, C. S. Rao, T. Suresh, P. Y. Reddy, J.-H. Yum, M. K.
Nazeeruddin, M. Graetzel, Adv. Nat. Sci. Nanosci. Nanotechnol. 2011, 2, 035016. [11] V. N. Okulov, M. A. Dyadchenko, A. V. Churakov, E. V. Polunin, D. A. Lemenovskii, H. Yu, L. Wang,
V. P. Dyadchenko, Mendeleev Commun. 2015, 25, 171–173. [12] L. Shi, C. He, D. Zhu, Q. He, Y. Li, Y. Chen, Y. Sun, Y. Fu, D. Wen, H. Cao, et al., J. Mater. Chem.
2012, 22, 11629–11635. [13] C. Roger, P. Hamon, L. Toupet, H. Rabaa, J. Y. Saillard, J. R. Hamon, C. Lapinte, Organometallics
1991, 10, 1045–1054. [14] K. A. Green, M. P. Cifuentes, T. C. Corkery, M. Samoc, M. G. Humphrey, Angew. Chem. Int. Ed.
2009, 48, 7867–7870. [15] C. Sissa, V. Parthasarathy, D. Drouin-Kucma, M. H. V. Werts, M. Blanchard-Desce, F. Terenziani,
Phys. Chem. Chem. Phys. 2010, 12, 11715–11727. [16] J. Ipaktschi, R. Hosseinzadeh, P. Schlaf, E. Dreiseidler, R. Goddard, Helv. Chim. Acta 1998, 81,
1821–1834. [17] B. Kobin, L. Grubert, S. Blumstengel, F. Henneberger, S. Hecht, J. Mater. Chem. 2012, 22, 4383–
4390. [18] Z. Q. Gao, P. F. Xia, P. K. Lo, B. X. Mi, H. L. Tam, M. S. Wong, K. W. Cheah, C. H. Chen, Org.
Electron. 2009, 10, 666–673. [19] M. R. Netherton, G. C. Fu, Org. Lett. 2001, 3, 4295–4298. [20] G. Doisneau, G. Balavoine, T. Fillebeen-Khan, J. Organomet. Chem. 1992, 425, 113–117. [21] O. Plietzsch, A. Schade, A. Hafner, J. Huuskonen, K. Rissanen, M. Nieger, T. Muller, S. Bräse, Eur.
J. Org. Chem. 2013, 2013, 283–299. [22] T. Glinka, Aldrichimica Acta, 1987, 20, 34. [23] A. P. Smith, J. J. S. Lamba, C. L. Fraser, Org. Synth. 2002, 78, 82-87. [24] F. Wagenknecht, R. Juza, in Handb. Prep. Inorg. Chem. Second Ed. (Ed.: G. Brauer), Academic
Press, 1965, pp. 1067–1124. [25] W. L. F. Armarego, C. L. L. Chai, in Purification of Laboratory Chemicals Sixth Ed. (Ed.: W.L.F.A.L.L.
Chai), Butterworth-Heinemann, Oxford, 2009, pp. xii–xiii.

349

350

351

352
Résumé
Au cours de cette thèse, de nouveaux dérivés organométalliques basés sur une structure
triphénylméthylium ont été synthétisés. Ces composés, notamment grâce à leur structure
multiplolaire, sont pressentis pour avoir des propriétés remarquables en optique non linéaire (ONL)
et pourraient donner lieu à des applications dans plusieurs domaines. Ces caractéristiques, et plus
précisément leur absorption biphotonique (A2P), en font des composés particulièrement
intéressants pour l'industrie de pointe (microfabrication, imagerie, dispositifs optiques, etc.).
Cependant, ces propriétés d'ONL et d'absorption biphotonique n'ont été jusqu’alors que peu
étudiées, malgré leur potentiel prometteur.
Dans un premier temps, une famille de nouveaux composés organiques présentant cette
structure particulière a été synthétisée afin de confirmer le potentiel d'absorption à deux photons de
ces chromophores, notamment par des mesures Z-scan. Dans un second temps, la synthèse
d’analogues organométalliques ayant des groupes donneurs tels que «Fe(η5-C5Me5)(κ2-dppe)C≡C− ,
« Ru(Cl)(κ2-dppe)2C≡C− » ou ethynylferrocene a été réalisée, ainsi que leur caractérisation complète.
Ces dérivés organométalliques devraient présenter des sections efficaces d’A2P (ainsi que des
réponses ONL de troisième ordre) dans le proche-IR bien supérieures à celles de leurs analogues
organiques. De plus, les groupements métalliques redox-actifs utilisés devraient permettre d’obtenir
des chromophores électro-commutables. Les études déjà réalisées sur ces composés, et celles à venir
sur leur propriétés ONL de troisième ordre, permettront de mieux comprendre les phénomènes
électroniques sous-jacents à ces propriétés ainsi que le rôle joué par les parties organiques et
organométalliques de leur structure.
Mots clés: Optique Nonlinéaire - Absorption Biphotonique - Vert Malachite - Cristal Violet -
Organofer - Organoruthénium - Ferrocène - Commutation Redox.
Abstract
During this PhD, new organic and organometallic triphenylmethylium dyes were
synthesized. Due to their multipolar structure, these compounds have been anticipated to possess
strong nonlinear optical (NLO) properties which could be of interest in many fields. These
characteristics, and more precisely their two-photon absorption (TPA) properties, make them
attractive for the design of high technology materials (microfabrication, imaging, optical devices, etc).
However, their multiphoton absorption properties and other related nonlinear optical (NLO) effects
have not been thoroughly investigated to date, in spite of their promising potential.
In this respect, a family of organic derivatives has been synthesized to confirm their potential
as two-photon absorbers, which was established thanks to Z-scan measurements. Organometallic
compounds bearing electron-releasing groups such as «Fe(η5-C5Me5)(κ2-dppe)C≡C−» , « Ru(Cl)(κ2-
dppe)2C≡C− » or ethynylferrocene were then synthesized and fully characterized. These
organometallic dyes should possess larger TPA cross-sections (and also larger third-order NLO
properties) in the NIR range than their organic counterparts. Furthermore, these redox-active metal
centers permit access to electro-switchable molecules. In this respect, along with the data already
gathered on these derivatives, the study of their cubic NLO properties in their different redox states
will now contribute to a better understanding of the underlying electronic phenomena and the role
played by the organic and organometallic moieties in such architectures.
Copyright © 2022 FDOKUMEN