Two-Photon Uncaging of Bioactive Thiols in Live Cells at ...
12
Two-Photon Uncaging of Bioactive Thiols in Live Cells at Wavelengths above 800 nm Journal: Organic & Biomolecular Chemistry Manuscript ID OB-ART-09-2020-001986.R1 Article Type: Paper Date Submitted by the Author: 19-Nov-2020 Complete List of Authors: Hammers, Matt; University of Minnesota, Chemistry Hodny, Michael ; University of Minnesota, Chemistry Bader, Taysir; University of Minnesota, Chemistry Mahmoodi, M.; University of Minnesota, Chemistry Fang, Sifei; University of Minnesota, Chemistry Fenton, Alexander; University of Kentucky, Chemistry Nurie, Kadiro; University of Minnesota, Chemistry Trial, Hallie; Rice University, Department of Chemistry Xu, Feng; University of Minnesota Twin Cities, Department of Chemistry Healy, Andrew; University of Minnesota, Chemistry Ball, Zachary; Rice University, Department of Chemistry Blank, David; University of Minnesota, Chemistry Distefano, Mark; University of Minnesota, Chemistry Organic & Biomolecular Chemistry
-
Upload
khangminh22 -
Category
Documents
-
view
0 -
download
0
Transcript of Two-Photon Uncaging of Bioactive Thiols in Live Cells at ...

Two-Photon Uncaging of Bioactive Thiols in Live Cells at Wavelengths above 800 nm
Journal: Organic & Biomolecular Chemistry
Manuscript ID OB-ART-09-2020-001986.R1
Article Type: Paper
Date Submitted by the Author: 19-Nov-2020
Complete List of Authors: Hammers, Matt; University of Minnesota, ChemistryHodny, Michael ; University of Minnesota, ChemistryBader, Taysir; University of Minnesota, ChemistryMahmoodi, M.; University of Minnesota, ChemistryFang, Sifei; University of Minnesota, ChemistryFenton, Alexander; University of Kentucky, ChemistryNurie, Kadiro; University of Minnesota, ChemistryTrial, Hallie; Rice University, Department of ChemistryXu, Feng; University of Minnesota Twin Cities, Department of ChemistryHealy, Andrew; University of Minnesota, ChemistryBall, Zachary; Rice University, Department of ChemistryBlank, David; University of Minnesota, ChemistryDistefano, Mark; University of Minnesota, Chemistry
Organic & Biomolecular Chemistry

ARTICLE
Please do not adjust margins
Please do not adjust margins
Received 00th January 20xx,Accepted 00th January 20xx
DOI: 10.1039/x0xx00000x
Two-Photon Uncaging of Bioactive Thiols in Live Cells at Wavelengths above 800 nm
Matthew D. Hammers,a Michael H. Hodny,a Taysir K. Bader,a M. Mohsen Mahmoodi,a Sifei Fang,a Alexander D. Fenton,a Kadiro Nurie,a Hallie O. Trial,b Feng Xu,a Andrew T. Healy,a Zachary T. Ball,b David A. Blank,a Mark D. Distefanoa*
Photoactivatable protecting groups (PPGs) are useful for a broad range of applications ranging from biology to materials science. In chemical biology, induction of biological processes via photoactivation is a powerful strategy for achieving spatiotemporal control. The importance of cysteine, glutathione, and other bioactive thiols in regulating protein structure/activity and cell redox homeostasis makes modulation of thiol activity particularly useful. One major objective for enhancing the utility of photoactivatable protecting groups (PPGs) in living systems is creating PPGs with longer wavelength absorption maxima and efficient two-photon (TP) absorption. Toward these objectives, we developed a carboxyl- and dimethylamine-functionalized nitrodibenzofuran PPG scaffold (cDMA-NDBF) for thiol photoactivation, which has a bathochromic shift in the one-photon absorption maximum from λmax = 315 nm with the unfunctionalized NDBF scaffold to λmax = 445 nm. While cDMA-NDBF-protected thiols are stable in the presence of UV irradiation, they undergo efficient broad-spectrum TP photolysis at wavelengths as long as 900 nm. To demonstrate the wavelength orthogonality of cDMA-NDBF and NDBF photolysis in a biological setting, caged farnesyltransferase enzyme inhibitors (FTI) were prepared and selectively photoactivated in live cells using 850-900 nm TP light for cDMA-NDBF-FTI and 300 nm UV light for NDBF-FTI. These experiments represent the first demonstration of thiol photoactivation at wavelengths above 800 nm. Consequently, cDMA-NDBF-caged thiols should have broad applicability in a wide range of experiments in chemical biology and materials science.
IntroductionPhotoactivatable protecting groups (PPGs) are useful for a
broad range of applications;1-5 examples include spatiotemporal control of biological processes6 and the creation of hydrogels with tunable properties.7-9 In general, PPGs are employed to protect or “cage” molecules that are hence stably masked, until irradiation with an exogenous light source exposes a functional group (typically a carboxylate, amine, or thiol) critical for function. In biological studies, photolysis can be used to generate ligands, substrates, or drugs in active form. Since the first example of a caged biomolecule 40 years ago (caged ATP),10 the breadth of photoactivatable substrates has expanded beyond small molecules to include macromolecular DNA/RNA,11, 12 peptides, and even whole proteins.13-18
Considerable effort has been undertaken to enhance PPG utility in live systems. The ortho-nitrobenzyl family of caging groups (ONB, Scheme 1) has classically been the most widely utilized motif,4, 19, 20 but it requires high energy excitation for
photolysis (<350 nm) which is potentially damaging in cell culture and living tissue. Furthermore, ONB has poor absorptivity at more physiologically useful near-IR (NIR) wavelengths amenable for 650-950 nm two-photon (TP) photolysis.21 NIR light penetrates more deeply into tissue than UV light, with greater spatial precision,22 and causes less phototoxicity.23 Thus, creating PPGs with longer wavelength and TP absorptivity is a central driver of current research. More recent scaffolds such as ortho-nitrobiphenyl (ONBP)24 and brominated hydroxycoumarin (Bhc)25 have contributed to this effort by displaying improved TP uncaging efficiencies.
a.Department of Chemistry, University of Minnesota, Minneapolis, MN 55455, USAb.Department of Chemistry, Rice University, Houston, TX, 77005, USAElectronic Supplementary Information (ESI) available: Supplemental figures, NMR spectra, and crystallographic data (CIF) are provided.
Page 1 of 11 Organic & Biomolecular Chemistry

ARTICLE Journal Name
2 | J. Name., 2012, 00, 1-3 This journal is © The Royal Society of Chemistry 20xx
Please do not adjust margins
Please do not adjust margins
The development of long-wavelength caging groups for thiols is particularly desirable because of the importance of cysteine and other bioactive thiols in cellular processes.26 We previously demonstrated that Bhc is generally not ideal for thiol photoactivation because of a non-productive photorearrangement reaction which occurs upon irradiation.27 Fortunately nitrodibenzofuran (NDBF, Scheme 1), a promising class of caging groups with a planar biphenyl-like structure fused through a bridging furanyl ether,28 is more suitable for thiols. NDBF-protected thiols exhibit rapid one-photon (OP) and TP uncaging rates with no observable side reactions.27 Dreuw and Heckel et. al. suggested computationally and demonstrated experimentally that installing a dimethylamine group onto the NDBF core (DMA-NDBF) induces a significant bathochromic shift in the chromophore’s absorption profile because of enhanced push-pull dipolar character within the molecule.29, 30 A follow-up study explored several cyclic amine sutstituents.31 DMA-NDBF was also used by Ball and co-workers for amide nitrogen protection.32 Similarly, Specht et. al. achieved longer
wavelength absorption and enhanced TP sensitivity in the ONBP scaffold (CANBP/EANBP) using dialkylamine functionalization.33
These encouraging discoveries led us to explore dimethylamine-substituted NDBF for long wavelength TP thiol photoactivation. In addition to reduced phototoxicity and deeper tissue penetration, the availability of longer-wavelength-absorbing PPGs may allow for orthogonal photoactivation of different thiols within the same sample, for example in a peptide containing several distinct cysteine residues. Toward this goal, we describe a new dimethylamine-functionalized nitrodibenzofuran containing an α-carboxyl ester (cDMA-NDBF) for thiol photoactivation. We hypothesized that this electron-withdrawing substituent may facilitate more rapid photolysis based on observations with α-carboxy ONB structures;4, 34, 35 in addition, the presence of an ester moiety could be used to increase the water solubility of this protecting group by subsequent hydrolysis to the corresponding acid. Such a strategy has been frequently used in the design of nitrobenzyl- and coumarin-based caging groups.34, 36, 37 cDMA-NDBF absorption is red-shifted significantly from the parent NDBF from 315 nm to 445 nm. We compare the wavelength dependence of OP and TP photolysis kinetics using caged cysteamine compounds and found that cDMA-NDBF and NDBF caging groups can be selectively photoactivated using either 850-900 nm TP irradiation or UV irradiation, respectively. Having established orthogonal irradiation conditions, we demonstrate wavelength-selective photoactivation of a caged farnesyltransferase enzyme inhibitor drug in live cells.
Results and DiscussionThe synthesis of cDMA-NDBF began with commercially available dibenzofuran (Scheme 2), which was acylated using acetyl chloride under Friedel-Crafts conditions to give 1. Oxidative 1,2-aryl migration of the resulting ketone was achieved using
Scheme 2: Synthesis of cDMA-NDBF-Br and conditions for thiol alkylation/protection.
Scheme 1. Photoactivatable protecting group families. LG = leaving group.
Page 2 of 11Organic & Biomolecular Chemistry

Journal Name ARTICLE
This journal is © The Royal Society of Chemistry 20xx J. Name., 2013, 00, 1-3 | 3
Please do not adjust margins
Please do not adjust margins
hypervalent iodine, trimethyl orthoformate, and methanol,38 which ultimately provided the α-methyl ester present in the final protecting group. Nitration of 2 with sodium nitrite was not regioselective and generated an inseparable isomeric mixture of 7- and 3-nitrated products in a 3:1 ratio; however, the desired 7-amino isomer was chromatographically separated after iron-mediated nitro reduction to give pure 4 in moderate yield over two steps. We confirmed the correct isomeric identity using X-ray crystallography (Figure S1). Bis(Boc) protection of the amine allowed for subsequent α-CH2 allylic bromination to give intermediate 7. After Boc-deprotection, the regenerated amine was subjected to reductive amination with paraformaldehyde and sodium cyanoborohydride to give dimethylamine 8. Finally, nitration of the NDBF core’s 3-position produced key intermediate cDMA-NDBF-Br (9). Thiol alkylation of cDMA-NDBF-Br was performed at the end of this synthetic sequence, which allows for modular conjugation with a thiol of choice. Reaction of cDMA-NDBF-Br with cysteamine (CA) was performed in the presence of zinc acetate and mildly acidic conditions to prevent sulfur oxidation39 to give the final protected thiol, cDMA-NDBF-CA (10). Analogous NDBF-CA (11a, Scheme 3) was prepared as previously reported.9 Cysteamine was chosen as a model thiol for comparative photolysis kinetics experiments given its simplicity and resemblance to the amino acid cysteine.
With cDMA-NDBF-CA in hand, we first characterized its OP absorption and photolysis properties and compared them with
those of NDBF-CA. These optical properties are summarized in Table 1. As predicted, dimethylamine functionalization of the NDBF core resulted in a significant bathochromic shift in the UV-vis absorption maximum from λmax(NDBF-CA) = 315 nm to λmax(cDMA-
NDBF-CA) = 445 nm (Figure 1). The molar extinction coefficients of these S-caged NDBF compounds were lower than previously reported O-caged NDBF compounds (~18,000 M-1cm-1), presumably due to substituent effects of the caged sulfur atom.28, 30 In an effort to compare the spectral properties of cDMA-NDBF-CA with the corresponding compound incorporating a methyl group in lieu of a carboxymethyl moiety, we prepared 11b (Scheme 3), a synthetic intermediate previously reported by Becker et al., and recorded its spectrum in aqueous solution (Figure S2). The max value obtained there,
418 nm, was comparable to the value previously reported, measured in DMSO (max = 424 nm). Comparison of the spectrum of 11b with that obtained with cDMA-NDBF-CA (10), showed that the latter manifested a max red-shifted by 23 nm relative to the former. Since the origin of that spectral shift could reflect either the presence of the carboxymethyl group or the thioether substituent in 10, absorption spectra were calculated for 10 along with analogues 11c and 11d using the Dalton quantum chemistry suite.40 Those calculated spectra (Figure S3) suggest that the caged thiol is the major cause of the red-shifted max of 10 relative to 11b and are consistent with previously reported spectral data for simple nitrobenzyl derivatives.34 Finally, simple calculations using ChemDraw indicate that hydrolysis of the carboxymethyl group present in 10 to the corresponding acid increases the total polar surface area by 40 Å2 and decreases CLogP by approximately 4 Log units (Figure S4); thus, the presence of the carboxymethyl moiety in the cDMA-NDBF protecting group offers a potentially simple means for augmenting the water solubility of NDBF-based caged compounds.
To examine the OP photolysis kinetic of caged thiols cDMA-NDBF-CA (10) and NDBF-CA (11a), samples (100 µM, 20% CH3CN/50 mM PB, pH 7.4) were irradiated using 350 nm and 419 nm bulbs in a Rayonet photoreactor, an instrument
commonly found in laboratories studying photochemistry. Photon intensity was controlled to within 3% for each wavelength to directly compare photolysis rates. NDBF-CA underwent rapid photolysis during both 350 and 419 nm UV irradiations, and complete disappearance of starting material was observed after 15 and 90 seconds, respectively (Figure 2a, Figure S5). These results highlight the excellent UV-sensitivity of the parent NDBF caging group for thiol photoactivation. Conversely, OP photolysis of cDMA-NDBF-CA was dramatically slower. Irradiation for 40 minutes at 350 nm produced only 65% deprotection, and 419 nm photolysis was slower yet, with 15% uncaging occurring during the same period. Overall, NDBF-CA photolysis proceeded 700- (350 nm) and 345-fold (419 nm) faster than cDMA-NDBF-CA.
Figure 1. UV-vis absorption spectra of cDMA-NDBF-CA (red) and NDBF-CA (blue) (100 µM, 20% CH3CN/50 mM PB, pH 7.4).
Scheme 3. Additional NDBF-based analogues examined in this study.
Page 3 of 11 Organic & Biomolecular Chemistry
ARTICLE Journal Name
4 | J. Name., 2012, 00, 1-3 This journal is © The Royal Society of Chemistry 20xx
Please do not adjust margins
Please do not adjust margins
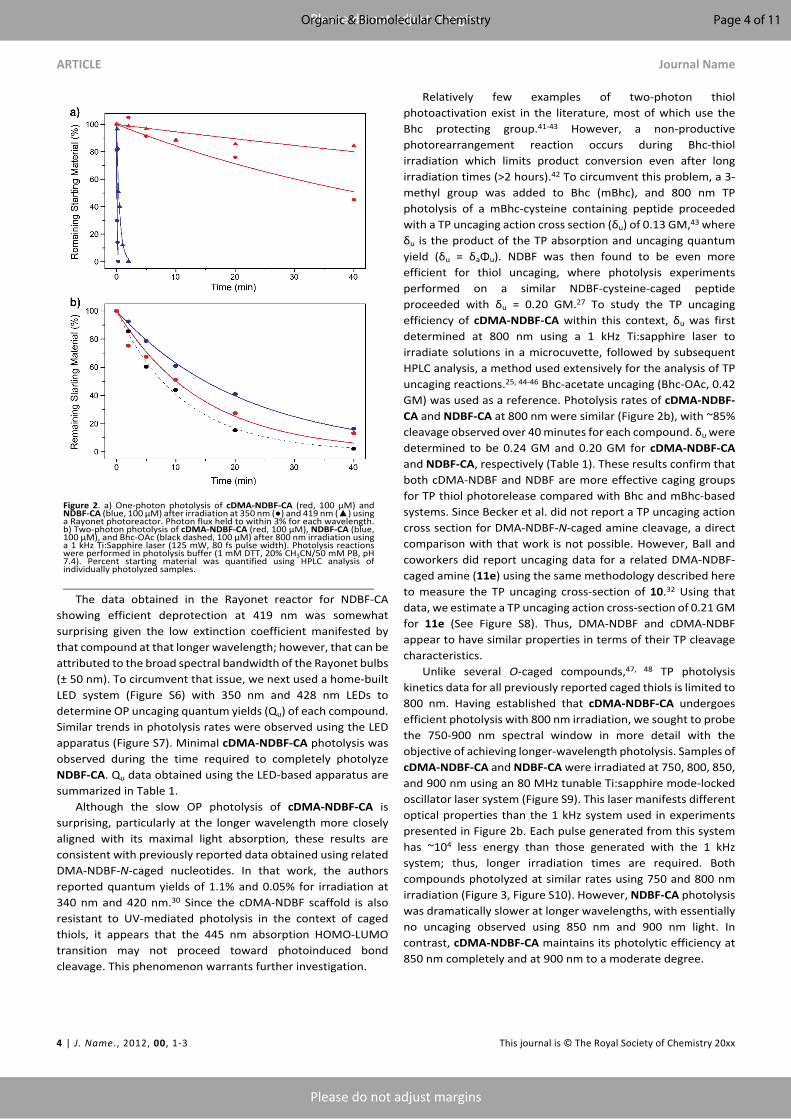
The data obtained in the Rayonet reactor for NDBF-CA showing efficient deprotection at 419 nm was somewhat surprising given the low extinction coefficient manifested by that compound at that longer wavelength; however, that can be attributed to the broad spectral bandwidth of the Rayonet bulbs (± 50 nm). To circumvent that issue, we next used a home-built LED system (Figure S6) with 350 nm and 428 nm LEDs to determine OP uncaging quantum yields (Qu) of each compound. Similar trends in photolysis rates were observed using the LED apparatus (Figure S7). Minimal cDMA-NDBF-CA photolysis was observed during the time required to completely photolyze NDBF-CA. Qu data obtained using the LED-based apparatus are summarized in Table 1.
Although the slow OP photolysis of cDMA-NDBF-CA is surprising, particularly at the longer wavelength more closely aligned with its maximal light absorption, these results are consistent with previously reported data obtained using related DMA-NDBF-N-caged nucleotides. In that work, the authors reported quantum yields of 1.1% and 0.05% for irradiation at 340 nm and 420 nm.30 Since the cDMA-NDBF scaffold is also resistant to UV-mediated photolysis in the context of caged thiols, it appears that the 445 nm absorption HOMO-LUMO transition may not proceed toward photoinduced bond cleavage. This phenomenon warrants further investigation.
Relatively few examples of two-photon thiol photoactivation exist in the literature, most of which use the Bhc protecting group.41-43 However, a non-productive photorearrangement reaction occurs during Bhc-thiol irradiation which limits product conversion even after long irradiation times (>2 hours).42 To circumvent this problem, a 3-methyl group was added to Bhc (mBhc), and 800 nm TP photolysis of a mBhc-cysteine containing peptide proceeded with a TP uncaging action cross section (δu) of 0.13 GM,43 where δu is the product of the TP absorption and uncaging quantum yield (δu = δaΦu). NDBF was then found to be even more efficient for thiol uncaging, where photolysis experiments performed on a similar NDBF-cysteine-caged peptide proceeded with δu = 0.20 GM.27 To study the TP uncaging efficiency of cDMA-NDBF-CA within this context, δu was first determined at 800 nm using a 1 kHz Ti:sapphire laser to irradiate solutions in a microcuvette, followed by subsequent HPLC analysis, a method used extensively for the analysis of TP uncaging reactions.25, 44-46 Bhc-acetate uncaging (Bhc-OAc, 0.42 GM) was used as a reference. Photolysis rates of cDMA-NDBF-CA and NDBF-CA at 800 nm were similar (Figure 2b), with ~85% cleavage observed over 40 minutes for each compound. δu were determined to be 0.24 GM and 0.20 GM for cDMA-NDBF-CA and NDBF-CA, respectively (Table 1). These results confirm that both cDMA-NDBF and NDBF are more effective caging groups for TP thiol photorelease compared with Bhc and mBhc-based systems. Since Becker et al. did not report a TP uncaging action cross section for DMA-NDBF-N-caged amine cleavage, a direct comparison with that work is not possible. However, Ball and coworkers did report uncaging data for a related DMA-NDBF-caged amine (11e) using the same methodology described here to measure the TP uncaging cross-section of 10.32 Using that data, we estimate a TP uncaging action cross-section of 0.21 GM for 11e (See Figure S8). Thus, DMA-NDBF and cDMA-NDBF appear to have similar properties in terms of their TP cleavage characteristics.
Unlike several O-caged compounds,47, 48 TP photolysis kinetics data for all previously reported caged thiols is limited to 800 nm. Having established that cDMA-NDBF-CA undergoes efficient photolysis with 800 nm irradiation, we sought to probe the 750-900 nm spectral window in more detail with the objective of achieving longer-wavelength photolysis. Samples of cDMA-NDBF-CA and NDBF-CA were irradiated at 750, 800, 850, and 900 nm using an 80 MHz tunable Ti:sapphire mode-locked oscillator laser system (Figure S9). This laser manifests different optical properties than the 1 kHz system used in experiments presented in Figure 2b. Each pulse generated from this system has ~104 less energy than those generated with the 1 kHz system; thus, longer irradiation times are required. Both compounds photolyzed at similar rates using 750 and 800 nm irradiation (Figure 3, Figure S10). However, NDBF-CA photolysis was dramatically slower at longer wavelengths, with essentially no uncaging observed using 850 nm and 900 nm light. In contrast, cDMA-NDBF-CA maintains its photolytic efficiency at 850 nm completely and at 900 nm to a moderate degree.
Figure 2. a) One-photon photolysis of cDMA-NDBF-CA (red, 100 µM) and NDBF-CA (blue, 100 µM) after irradiation at 350 nm (●) and 419 nm (▲) using a Rayonet photoreactor. Photon flux held to within 3% for each wavelength. b) Two-photon photolysis of cDMA-NDBF-CA (red, 100 µM), NDBF-CA (blue, 100 µM), and Bhc-OAc (black dashed, 100 μM) after 800 nm irradiation using a 1 kHz Ti:Sapphire laser (125 mW, 80 fs pulse width). Photolysis reactions were performed in photolysis buffer (1 mM DTT, 20% CH3CN/50 mM PB, pH 7.4). Percent starting material was quantified using HPLC analysis of individually photolyzed samples.
Page 4 of 11Organic & Biomolecular Chemistry

ARTICLE
Please do not adjust margins
Please do not adjust margins
Table 1 able 1. One-photon absorption and photolysis properties of cDMA-NDBF-CA and NDBF-CA. Absorption properties were determined in 20% CH3CN/50 mM PB, pH 7.4.
cDMA-NDBF-CA represents the first example of thiol photoactivation at wavelengths above 800 nm. Two-photon excitation initially accesses different electronically excited states than one-photon excitation as a result of different optical selection rules. However, in the absence of directly measured two-photon absorption spectra, it is common to assume correlated energetic shifts in the optically accessible states and to use the one-photon absorption spectrum as a qualitative estimate, or surrogate, for the two-photon spectrum. Within these assumptions our results showing efficient uncaging at 850 and 900 nm are consistent with the red-shifted absorption of the cDMA-NDBF chromophore. Correspondingly, NDBF-CA photolysis rapidly declines at wavelengths longer than twice its OP absorption. Finally, is interesting that the broad dynamic range of cDMA-NDBF allows uncaging over wide a range of wavelengths extending from 750 to 900 nm, suggesting the aforementioned assumption may not always be definitive.
The OP and TP photolysis experiments above identify two possible modes for orthogonal photoactivation in living systems, UV irradiation to photoactivate NDBF-protected thiols and 850-900 nm TP irradiation to photoactivate cDMA-NDBF-protected thiols. To test this hypothesis, we examined the wavelength-dependent release of a thiol-containing drug molecule in live cells. Farnesyltransferase inhibitor (FTI) prevents a posttranslational farnesylation modification of Ras-family proteins, which are potentially oncogenic small GTPase
proteins.49 After several subsequent processing steps, farnesylated Ras translocates to the plasma membrane where it interacts with other key proteins involved in signal transduction. Inhibition by farnesyltransferase causes unfarnesylated Ras to accumulate in the cytosol and hence prevents key protein-protein interactions necessary for cell signaling. Using MDCK cells stably expressing a GFP-H-Ras fusion protein, the presence of FTI can be determined by observing cytosolic GFP-H-Ras fluorescence rather than normal membrane-localized fluorescence (Figure S11).42
The chemical structure of FTI contains a thiol which is critical for its inhibitory activity. Alkylation of this thiol to yield a thioether renders the drug essentially inactive. cDMA-NDBF-FTI (12) and NDBF-FTI (13) compounds (Figure S12) were synthesized using the general thiol alkylation procedure outlined above.
MDCK cells expressing GFP-H-Ras were treated with either cDMA-NDBF-FTI (12) or NDBF-FTI (13) and exposed to different OP and TP irradiation conditions. FTI photoactivation was determined by observing the resulting fluorescence distribution using a confocal microscope. In the absence of irradiation, normal membrane-localized GFP-H-Ras was observed for both compounds (Figure S13), indicating that the caged FTIs were stable in cellular milieu. Consistent with our in vitro UV photolysis kinetics, cells treated with cDMA-NDBF-FTI and irradiated with 300 nm UV light exhibited membrane-localized GFP-H-Ras fluorescence (Figure 4a), indicating that FTI was not photoactivated under these conditions. In contrast, the fluorescence became cytosolic in NDBF-FTI-treated cells after the same 300 nm exposure (Figure 4b), indicating that FTI was efficiently photoactivated using UV light.
λmax (nm)ε (λmax)
(M-1cm-1) ε (350) ε (428) Qu (350) Qu (428)δu
(800, GM)NDBF-CA 315 12,400 10,300 608 0.57 0.70 0.20cDMA-NDBF-CA 445 18,800 13,400 18,100 0.00068 0.00036 0.24
Figure 3. Comparison of TP photolysis rates for cDMA-NDBF-CA (red) and NDBF-CA (blue) using 750-900 nm irradiation. Observed rate constants, kobs, were determined from linear fits to ln(fraction starting material) vs. time.
Page 5 of 11 Organic & Biomolecular Chemistry

ARTICLE Journal Name
6 | J. Name., 2012, 00, 1-3 This journal is © The Royal Society of Chemistry 20xx
Please do not adjust margins
Please do not adjust margins
Cells were then irradiated with NIR TP light using a Nikon A1RMP confocal microscope. At all four wavelengths tested between 750-900 nm, cytosolic localization of GFP-H-Ras was observed in cDMA-NDBF-FTI-treated cells (Figure 4c top row). This broad-spectrum cDMA-NDBF-FTI photoactivation is consistent with the in vitro data presented above. In comparison, NDBF-FTI uncaged efficiently at 750 nm and 800 nm, but longer-wavelength 850 nm and 900 nm irradiation failed to release the caged drug resulting in a membrane-bound localization for GFP-H-Ras (Figure 4d bottom row).
These in cellulo results highlight the utility of the cDMA-NDBF caging group for modulating cellular processes with long-wavelength light. To the best of our knowledge, these experiments are the first demonstration of photoactivation of a bioactive thiol in live cells at wavelengths longer than 800 nm. The parent NDBF scaffold is an efficient tool for thiol photoactivation, but it has significant limitations at longer NIR wavelengths. Although 750 nm light is less phototoxic than UV light, we noticed considerably more GFP photobleaching at this wavelength than we did while using 850 or 900 nm irradiation (Figure S14), indicating that phototoxicity at 750 nm is not completely negligible; similar improvements in biological results have been previously noted with other PPGs activated at 900 nm.50 Thus, extending the excitation wavelength >800 nm accesses a more benign region of the optical spectrum. Finally, modern microscope technology provides for easily tunable TP excitation wavelength and laser power to match desired experimental parameters.
ConclusionsMotivated to access long-wavelength NIR thiol
photoactivation, we installed a dimethylamine group into the NDBF scaffold, thereby achieving a significant bathochromic
shift in the chromophore’s absorption spectrum. The cDMA-NDBF caging group is surprisingly refractory to cleavage upon UV irradiation compared to the parent compound (NDBF), offering a window for orthogonal uncaging. The cDMA-NDBF two-photon uncaging profile is particularly useful at wavelengths longer than 800 nm where NDBF is stable, and we were able to photoactivate a thiol-containing enzyme inhibitor in live cells at wavelengths as long as 900 nm. Given those results, we expect the cDMA-NDBF caging group will have broad applicability for other biological studies involving bioactive thiols. Finally, given the orthogonality manifested by cDMA-NDBF, it is likely that this new protecting group will be useful for experiments where selective thiol uncaging is required.
ExperimentalMaterials & Methods. Solvents and reagents used for
chemical synthesis were purchased from Sigma Aldrich and used as received. High-performance liquid chromatography (HPLC) analysis and purification were performed using a Beckman model 125/166 instrument equipped with a UV detector and C18 columns (Agilent Microsorb-MV 100-5, 4.6 × 250 mm and ZORBAX 300SB PrepHT, 21.2 × 250 mm). LC-MS analysis was performed using an Agilent 1200 series LCMSD SL single quadrupole system equipped with a C3 column (Agilent ZORBAX 300SB-C3, 5 μM, 4.6 × 250 mm) and a variable wavelength detector. An H2O/CH3CN solvent system containing 0.1% HCO2H was used, consisting of solvent A (H2O with 0.1% HCO2H) and solvent B (CH3CN with 0.1% HCO2H). UV-visible spectra were recorded using a Cary 50 Bio spectrometer. UV photolysis experiments were performed either using a Rayonet reactor (8x419 nm or 16x350 nm bulbs) or a home-built LED reactor (Figure S6) equipped with 8 × 350 nm LEDs (FoxUV, 5.5 mm) or 8 × 428 nm LEDs (VISHAY, 5 mm) evenly spaced in a
Figure 4. MDCK cells expressing GFP-H-Ras fusion protein after treatment with cDMA-NDBF-FTI (15 μM, top row) or NDBF-FTI (15 μM, bottom row) and a,b) 300 nm irradiation for three minutes, or c,d) 750 nm (500 mW), 800 nm (500 mW), 850 nm (1000 mW), or 900 nm (1000 mW) irradiation. TP conditions: 32 second irradiation scan, 4 scan repeats. Cells were imaged 17 hours after treatment. Scale bar = 50 μm.
Page 6 of 11Organic & Biomolecular Chemistry

Journal Name ARTICLE
This journal is © The Royal Society of Chemistry 20xx J. Name., 2013, 00, 1-3 | 7
Please do not adjust margins
Please do not adjust margins
radial arrangement with cuvette positioned at the center of the reactor. 1H and 13C{1H} NMR data of synthetic compounds were recorded on a Bruker 500 MHz instrument. Chemical shifts are reported in ppm relative to residual protic solvent resonances. Live-cell images were acquired using a Nikon A1Rsi inverted confocal microscope equipped with SIM super resolution, GaAsP 32-channel spectral detectors, and a Nikon S PlanFluor 40x/0.60NA air objective. Two-photon irradiation of live cell culture samples was performed using a Nikon A1RHD MP upright confocal microscope equipped with a Nikon Fluor 40x/0.80NA water dipping objective.
General procedure for calculation of one-photon spectra. Molecular structures were optimized in Gaussian 1651 at the DFT level using the B3LYP52-54 functional and the 6-31G(d)55, 56 basis set. An IEFPCM57 model was used to model the impact of the water and DMSO solvents on the states. Using the optimized structures, one-photon transition energies and one-photon oscillator strengths were calculated with time dependent DFT (TD-DFT) using the Dalton quantum chemistry suite.40 The same functional and basis set used for the optimization was used for calculating the transitions. For comparison to experimental spectra the calculated transitions were convoluted with a Gaussian broadening function that had a FWHM of 0.4 eV.
Laser apparatus for two-photon (TP) irradiation. Two different laser apparatuses were used in two-photon kinetics experiments. A home-built regeneratively amplified Ti:Sapphire laser operating at 1 kHz with 125 mW pulses centered around 800 nm was used to collect 800 nm photolysis kinetics in Figure 2b. Each pulse had a Gaussian profile with a full width at half maximum of 80 fs. This system is described in detail elsewhere.58 The beam was sent through a 35 cm focusing lens and then through the sample. Samples (30 μL) were irradiated in a quartz microcuvette (Starna 16.10-Q-10/Z15, 1 mm x 1 mm sample window, 10 mm path length) 15 cm after the focal plane of the lens.
The tunable source used for the TP irradiation at multiple wavelengths in Figure 3 was a Spectra-Physics Tsunami mode-locked Ti:Sapphire laser operating at 80 MHz with a power of 450 mW. Each pulse had a Gaussian profile with a full width at half maximum of 80 fs. The beam was sent through a 30 cm focusing lens and then the sample. Sample (30 μL) were irradiated in a quartz microcuvette (Starna 16.10-Q-10/Z15, 1 mm x 1 mm sample window, 10 mm path length) 12 mm behind the focal plane of the lens. After measuring the beam spot size at this cuvette position, it was determined the beam fills the sample volume.
General procedure for UV photolysis of caged thiols using Rayonet reactor. A substrate solution (100 µM, 150 µL) was prepared in photolysis buffer (1 mM DTT, 20% CH3CN/50 mM phosphate buffer (PB), pH 7.4) and transferred to a quartz cuvette. The sample was then irradiated on a rotating platform using a Rayonet photoreactor with either 350 nm or 419 nm UV light. After irradiation for the allotted time, an aliquot (60 µL) was analyzed by HPLC, and integration of 260 nm absorption for the starting material was used to measure the reaction progression (Solvent A: 0.1%TFA/H2O, Solvent B:
0.1%TFA/CH3CN, 0%-B 5 min and ramping to 100%-B over 25 min).
General procedure for UV photolysis of caged thiols using LED reactor and determination of quantum efficiencies. A substrate solution (10 μM, 200 μL) was prepared in photolysis buffer (15 mM DTT, 20% CH3CN/50 mM phosphate buffer (PB), pH 7.4) and transferred to a round quartz tube (10 × 50 mm, 2 mm inner wall thickness). After irradiation for the allotted time, an aliquot (100 µL) was analyzed by LC-MS for determination of remaining starting material via integration of 330 nm (NDBF-CA) or 435 nm (cDMA-NDBF-CA) of peaks displaying the correct m/z (Solvent A: 0.1%HCO2H/H2O, Solvent B: 0.1% HCO2H/CH3CN, 1%-B 5 min and ramping to 100%-B over 10 min. Photolysis rates were determined based on a single exponential decay curve calculated in Origin software (OriginLab Corporation). Quantum efficiencies (Qu) were determined using the following equation: Qu = (Iσt90%)-1, where I is the irradiation intensity in Einstein·cm-2·s-1 as measured by potassium ferrioxalate actinomoetry (See Supplementary Information),59 σ is the decadic extinction coefficient (1000 x ε, molar extinction coefficient) in M-1·cm-1, and t90% is the time required in seconds to reach 90% completion.
General procedure for TP photolysis of caged molecules. A substrate solution (100 µM, 30 µL) was prepared in photolysis buffer (1 mM DTT, 20% CH3CN/50 mM phosphate buffer (PB), pH 7.4) and transferred to a quartz microcuvette (Starna 16.10-Q-10/Z15, 10 x 1 x 1 mm, illuminated volume). The sample was then irradiated using either a 1 kHz or 80 MHz Ti:sapphire laser (see above). After irradiation for the allotted time, an aliquot (20 µL) was analyzed by HPLC in a similar manner to UV photolysis experiments.
Determination of TP uncaging action cross sections (δu, where δu = δaΦu) at 800 nm. Caged substrates were irradiated using the general procedure at 800 nm using a 1 kHz laser. Photolysis rates of cDMA-NDBF-CA, NDBF-CA, and Bhc-OAc were determined from HPLC experiments in a similar manner to UV photolysis experiments. Determination of δu values for cDMA-NDBF-CA and NDBF-CA was calculated by rate comparison with Bhc-OAc reference standard (δaΦu = 0.42 GM) using the following formula: δaΦu(NDBF) = δaΦu(ref) × kobs(NDBF)/ kobs(ref).
NIR photolysis of caged thiols at multiple wavelengths. Caged substrates were irradiated using the general procedure at 740 nm, 800 nm, 850 nm, and 900 nm using an 80 MHz laser, and reaction progression were determined from HPLC. Photolysis rates, kobs, were calculated as linear fits to ln(fraction starting material) vs. time.
Cell culture and two-photon photoactivation of caged farnesyltransferase inhibitor (FTI). MDCK cells stably expressing GFP-H-Ras42 were cultured (10%FBS/DMEM without Phenol Red indicator, 37 °C, 5% CO2 atmosphere) into Ibidi® 35 mm coverslip-bottomed dishes etched with a 500 μm-grid layout for monitoring condition-specific cell groups during the experiment (Cat. No. 81168). Cells were treated with either cDMA-NDBF-FTI or NDBF-FTI (1 mL, 15 μM) and incubated for 2 hr. After washing the cells with PBS to remove excess caged FTIs and replacing with fresh media, groups of cells were
Page 7 of 11 Organic & Biomolecular Chemistry

ARTICLE Journal Name
8 | J. Name., 2012, 00, 1-3 This journal is © The Royal Society of Chemistry 20xx
Please do not adjust margins
Please do not adjust margins
exposed to various TP irradiation conditions. A ~300x300 μm selected region of interest was irradiated using either 750 nm (500 mW), 800 nm (500 mW), 850 nm (1000 mW), or 900 nm (1000 mW) light for 32 sec/frame repeated four times. The cells were then incubated for a period of 17 hours to allow for GFP-H-Ras protein turnover. After incubation, the same irradiated cell groups were imaged using confocal fluorescence microscopy. The fluorescence signal from GFP-H-Ras (λex = 488 nm, λem = 505-515 nm) and localization were acquired. Whereas plasma membrane H-Ras localization indicated normal, prenylated H-Ras, cytosolic H-Ras accumulation indicated FTI photoactivation and inhibition of farnesyltransferase.
Synthesis and Characterization
2-acetyldibenzofuran (1). Compound 1 was synthesized as previously reported.27
Methyl dibenzofuran acetate (2). Compound 1 (9.00 g, 42.9 mmol) was dissolved in CH2Cl2 (5 mL) and then added to CH3OH (140 mL). While stirring, trimethyl orthoformate (35.2 mL, 344 mmol) was added to the solution, followed by slow addition of conc. H2SO4 (18.3 mL, 344 mmol) in an ice bath. PhI(OAc)2 (14.5 g, 46.2 mmol) was added, and the reaction was stirred at rt for 3 h. Water (100 mL) was added to the reaction flask, and the CH3OH was removed under vacuum. After pH neutralization with NaHCO3, the crude product was extracted into CH2Cl2, washed with brine, and dried using Na2SO4. Pure compound 2 was obtained after column chromatography purification (Hex/EtOAc gradient, 19:1 to 1:1) as a yellow oil (9.77 g, 95%). 1H NMR (500 MHz, CDCl3) δ 7.94 (d, J = 7.8 Hz, 1H), 7.87 (s, 1H), 7.56 (d, J = 8.2 Hz, 1H), 7.52 (d, J = 8.4 Hz, 1H), 7.46 (t, J = 7.8 Hz, 1H), 7.37 (d, J = 10.3 Hz, 1H), 7.33 (t, J = 7.6 Hz, 1H), 3.79 (s, 2H), 3.73 (s, 3H). 13C{1H} 38 NMR (126 MHz, CDCl3) δ 172.41, 156.65, 155.50, 128.56, 128.45, 127.39, 124.67, 124.11, 122.85, 121.47, 120.84, 111.81, 111.77, 52.26, 41.17. HRMS (m/z): [M + Na]+ calcd for [C15H12O3Na]+ 263.0679, found 263.0691.
Methyl 2-(nitrodibenzofuran-2-yl)acetate (3). Compound 2 (8.00 g, 33.2 mmol) was dissolved in TFA (100 mL). While stirring, NaNO3 (3.52 g, 41.4 mmol) was slowly added over 5 minutes, and the reaction was stirred at rt for 3 h. H2O (100 mL) was added to the reaction flask, and the crude product was extracted by EtOAc, washed with 10% NaHCO3, brine, and dried using Na2SO4. After removal of solvent, the nitrated material was obtained as a 3:1 isomeric mixture of 7- and 3-nitrodibenzofuran (3a and 3b respectively). The desired 7-nitro isomer was obtained after purification in the following step, and this crude mixture was used without further purification. 1H NMR (500 MHz, CDCl3) δ 8.44 (3a, s, 1H), 8.39 (3b, s 1H), 8.28 (3a, d, J = 8.5 Hz, 1H), 8.03 (3a, d, J = 8.5 Hz, 1H), 7.99 (3b, d, J = 7.8 Hz, 1H), 7.96 (3a, s, 1H), 7.89 (3b, s, 1H), 7.64 (3b, d, J = 8.3 Hz, 1H), 7.61 (3a+3b, m, 2H), 7.51 (3a, d, J = 8.5 Hz, 1H), 7.43 (3b, t, J = 7.5 Hz, 1H), 4.18 (3b, s, 2H), 4.81 (3a, s, 2H), 3.74 (3a+3b, s, 6H). 13C NMR (126 MHz, CDCl3) δ 172.04, 170.99, 158.55, 157.68, 155.54, 154.51, 147.15, 147.06, 146.99, 131.02, 130.12, 129.91, 129.74, 129.33, 124.93, 124.75, 123.96, 122.98, 122.58, 122.44, 121.87, 120.79, 118.67, 112.48, 109.78, 108.19, 52.46, 52.41, 40.99, 40.23. HRMS (m/z): [M + Na]+ calcd for [C15H11NO5Na]+ 308.0529, found 308.0517.
Methyl 2-(7-aminodibenzofuran-2-yl)acetate (4). The isomeric mixture of nitrated products 3a and 3b) (7.52 g, 26.3 mmol) and CaCl2 (2.92, 26.3 mmol) and were added to hot ethanol:H2O (150 mL, 20:1). Iron powder (300 mesh, 4.40 g, 78.9 mmol) was added portionwise whilst vigorously stirring, and the reaction was stirred at reflux overnight. The reaction mixture was filtered through a pad of celite, and the remaining iron residue was thoroughly rinsed with EtOAc. The combined crude product solution was concentrated under vacuum, dissolved in EtOAc, washed with 10% NaHCO3, brine, and dried using Na2SO4. Pure compound 4 was obtained after column chromatography purification (3:2 Hex/EtOAc) as a red-brown solid (3.22 g, 38% over two steps). 1H NMR (500 MHz, DMSO) δ 7.71 (s, 1H), 7.68 (d, J = 8.3 Hz, 1H), 7.44 (d, J = 8.3 Hz, 1H), 7.16 (d, J = 8.1 Hz, 1H), 6.74 (s, 1H), 6.63 (d, J = 8.3 Hz, 1H), 5.59 (s, 2H), 3.77 (s, 2H), 3.62 (s, 3H). 13C NMR (126 MHz, DMSO) δ 171.95, 158.00, 153.86, 149.74, 128.72, 125.70, 124.91, 121.21, 119.77, 119.69, 111.93, 110.86, 110.56, 95.21, 51.69. HRMS (m/z): [M + Na]+ calcd for [C15H13NO3Na]+ 278.0788, found 278.0798.
Methyl 2-(7-((Boc)amino)dibenzofuran-2-yl)acetate (5). Compound 4 (2.20 g, 8.62 mmol) was dissolved in DMF (10 mL). DIPEA (3.00 mL, 17.2 mmol) and Boc anhydride (11.28 g, 51.7 mmol) were then added, and the reaction was stirred at room temperature overnight. After addition of H2O, the crude product was extracted into EtOAc. The combined organic fractions were washed with 5% LiCl, brine, and dried using Na2SO4. Pure compound 5 was obtained after column chromatography purification (Hex/EtOAc gradient, 19:1 to 1:1) as a yellow solid (2.50 g, 82%). 1H NMR (500 MHz, CDCl3) δ 7.81 (s, 1H), 7.75 (m, 2H), 7.46 (d, J = 8.2 Hz, 1H), 7.29 (d, J = 8.3 Hz, 1H), 7.14 (d, J = 8.1 Hz, 1H), 6.79 (s, 1H), 3.76 (s, 2H), 3.72 (s, 3H), 1.55 (s, 9H). 13C{1H} NMR (126 MHz, CDCl3) δ 172.51, 157.44, 155.77, 152.75, 138.24, 128.51, 127.50, 124.66, 120.81, 119.18, 113.97, 111.58, 102.01, 80.92, 52.26, 41.17, 28.48. HRMS (m/z): [M + Na]+ calcd for [C20H21NO5Na]+ 378.1312, found 378.1313.
Methyl 2-(7-(bis(Boc)amino)dibenzofuran-2-yl)acetate (6). Compound 5 (2.50 g, 7.03 mmol) was dissolved in CH3CN (75 mL). Boc anhydride (3.06 g, 14.1 mmol) and DMAP (0.086 g, 0.703 mmol) were added, and the reaction mixture was stirred at rt overnight. After removal of CH3CN under vacuum, water was added, and the crude product was extracted into EtOAc. The combined organics were washed with brine, and dried using Na2SO4. Pure compound 6 was obtained after column chromatography purification (Hex/EtOAc gradient, 19:1 to 1:1) as a yellow solid (3.20 g, >99%). 1H NMR (500 MHz, CDCl3) δ 7.88 (m, 2H), 7.52 (d, J = 8.4 Hz, 1H), 7.38 (d, J = 8.4 Hz, 1H), 7.35 (s, 1H), 7.13 (d, J = 8.2 Hz, 1H), 3.79 (s, 2H), 3.72 (s, 3H), 1.41 (s, 18H). 13C{1H} NMR (126 MHz, CDCl3) δ 172.37, 156.45, 156.21, 151.89, 138.68, 128.88, 128.68, 124.30, 123.37, 123.22, 121.56, 120.43, 111.89, 111.78, 83.05, 52.32, 41.16, 28.06. HRMS (m/z): [M + Na]+ calcd for [C25H29NO7Na]+ 478.1836, found 478.1954.
Methyl 2-bromo-2-(7-(bis(Boc)amino)dibenzofuran-2-yl)acetate (7). Compound 6 (0.126 g, 0.277 mmol) was dissolved in CCl4 (6 mL). Benzoyl peroxide (3 mg, 0.01 mmol) and N-bromosuccinimide (49.0 mg, 0.275 mmol) were added, and the
Page 8 of 11Organic & Biomolecular Chemistry

Journal Name ARTICLE
This journal is © The Royal Society of Chemistry 20xx J. Name., 2013, 00, 1-3 | 9
Please do not adjust margins
Please do not adjust margins
reaction was stirred at reflux for 5 h. The reaction was diluted with CH2Cl2 and washed with 5% NaHCO3, brine, and dried using Na2SO4. Pure compound 7 was obtained after column chromatography purification (3:2 Hex:EtOAc) as a yellow solid (0.149 g, >99%). 1H NMR (500 MHz, CDCl3) δ 8.17 (s, 1H), 7.92 (d, J = 8.3 Hz, 1H), 7.65 (d, J = 8.5 Hz, 1H), 7.55 (d, J = 8.5 Hz, 1H), 7.37 (s, 1H), 7.16 (d, J = 8.2 Hz, 1H), 5.55 (s, 1H), 3.82 (s, 3H), 1.40 (s, 18H). 13C{1H} NMR (126 MHz, CDCl3) δ 169.07, 157.17, 156.63, 151.84, 139.00, 130.77, 128.15, 124.53, 123.55, 123.00, 121.44, 120.65, 112.24, 111.88, 83.23, 53.62, 46.63, 28.02. HRMS (m/z): [M + Na]+ calcd for [C25H28BrNO7Na]+ 556.0941, found 556.0944.
Methyl 2-bromo-2-(7-(dimethylamino)dibenzofuran-2-yl)acetate (8). Compound 7 (0.180 g, 0.337 mmol) was dissolved in CH2Cl2 (1 mL), and TFA (2 mL) was added to the reaction flask. The reaction stirred at rt for 15 mins, after which TFA was removed under vacuum. The product residue was dissolved in a 3:1 mixture AcOH: H2O (4 mL). After addition of paraformaldehyde (0.505 g, 1.68 mmol), the reaction was stirred for 10 min, followed by addition of NaBH3CN (0.106 g, 1.68 mmol). The reaction was stirred at rt for 5 h. The reaction mixture was diluted with H2O, and the pH made slightly basic with K2CO3. The aqueous solution was extracted into CH2Cl2, and the combined organics were washed with brine and dried using Na2SO4. After equilibrating a silica gel column with 0.1% triethylamine (in 5% EtOAc:Hex), the product was purified using a EtOAc:Hex gradient (5-50%) to afford pure 8 as a yellow solid (0.030 g, 0.082 mmol, 24%). 1H NMR (500 MHz, CDCl3) δ 7.99 (s, 1H), 7.74 (d, J = 8.6 Hz, 1H), 7.46 (d, J = 8.4 Hz, 1H), 7.42 (d, J = 8.4 Hz, 1H), 6.81 (s, 1H), 6.77 (d, J = 8.6 Hz, 1H), 5.53 (s, 1H), 3.81 (s, 3H), 3.06 (s, 6H). 13C NMR (126 MHz, CDCl3) δ 169.22, 159.24, 156.33, 151.43, 130.08, 125.94, 125.47, 121.25, 119.74, 112.89, 111.37, 109.18, 94.60, 53.55, 47.38, 41.01. HRMS (m/z): [M + Na]+ calcd for [C17H16 BrNO3Na]+ 384.0206, found 384.0216.
Methyl 2-bromo-2-(7-(dimethylamino)-3-nitrodibenzofuran-2-yl)acetate (cDMA-NDBF-Br, 9). Compound 8 (30 mg, 82 μmol) was dissolved in 1 mL THF. Conc. H2SO4 (4 mL) was added to the reaction flask, and it was set in an ice bath. While stirring, 68% HNO3 (3.5 µL, 80 μmol) was added, and the reaction was stirred at 0 °C for 3 h. Water was then added, and the pH was made slightly basic with K2CO3. The product was extracted into EtOAc, washed with brine, and dried using Na2SO4. After equilibrating a silica gel column with 0.1% triethylamine (in 5% EtOAc:Hex), the product was purified using a EtOAc:Hex gradient (5-50%) to afford pure cDMA-NDBF-Br as a yellow solid (20 mg, 59%). 1H NMR (500 MHz, CDCl3) δ 8.29 (s, 1H), 8.20 (s, 1H), 7.84 (d, 1H), 6.82 (d, 1H), 6.80 (s, 1H), 6.31 (s, 1H), 3.84 (s, 3H), 3.12 (s, 6H). 13C NMR (126 MHz, CDCl3) δ 168.91, 161.59, 154.47, 131.06, 130.76, 126.18, 122.65, 122.56, 121.50, 110.10, 108.58, 93.80, 53.76, 45.10, 43.97, 40.81. HRMS (m/z): [M + H]+ calcd for [C17H16BrN2O5]+ 407.0237, found 407.2229.
General procedure for thiol alkylation with cDMA-NDBF-Br and NDBF-Br. cDMA-NDBF-Br (10 mg, 25 μmol) and cysteamine (2 mg, 36 μmol) were dissolved in DMF (2 mL). A solution of zinc acetate (27 mg, 120 μmol) in 1:1 CH3CN:H2O containing 0.1% TFA (2 mL) was added, and the reaction mixture was stirred at
rt for 24 h. The reaction mixture was diluted with H2O, and the pH was made slightly basic with K2CO3. The product was extracted into CH2Cl2, washed with brine, and dried using Na2SO4. The final product was purified using preparative HPLC (Solvent A: H2O-0.1%TFA, Solvent B: CH3CN-0.1% TFA, Solvent gradient: 0%B-5 min followed by 0-100%B over 60 min) to afford pure cDMA-NDBF-CA (10) as the TFA salt (3 mg, 7 μmol, 30%). 1H NMR (500 MHz, DMSO) δ 8.40 (s, 1H), 8.16 (s, 1H), 8.02 (d, 1H), 7.77 (s, 2H), 6.97 (s, 1H), 6.94 (d, 1H), 5.49 (s, 1H), 3.67 (s, 3H), 3.08 (s, 6H), 3.01 (t, 2H), 2.84 (t, 2H). 13C NMR (126 MHz, DMSO) δ 170.44, 161.30, 153.51, 153.02, 143.57, 130.39, 128.49, 123.26, 121.83, 115.60, 110.62, 110.26, 109.29, 93.88, 93.67, 53.50, 50.25, 40.71, 38.79, 29.90. HRMS (m/z): [M + H]+ calcd for [C19H22N3O5S]+ 404.1275, found 404.1297.
NDBF-CA (11a) was prepared as previously reported.9
cDMA-NDBF-FTI (12). cDMA-NDBF-FTI was prepared according to the general procedure described above from reaction with cDMA-NDBF-Br and FTI (20%). 1H NMR (500 MHz, CDCl3) δ 8.41 (s, 1H), 8.17 (s, 1H), 7.29-7.18 (m, 7H), 6.98 (s, 1H), 6.94 (d, J = 8.4 Hz, 1H), 6.53 (s, 1H), 5.49 (s 1H), 4.90 (m, 1H), 4.39 (m, 1H), 3.68 (s, 3H), 3.09 (s, 6H), 3.07 (d, J = 3.3 Hz, 3H), 3.00 (d, J = 3.3 Hz, 6H), 2.19 (m, 1H), 2.03 (m, 1H), 1.36 (m, 1H), 1.24 (m, 3H), 1.19-1.15 (m, 10H) 0.89-0.71 (m, 8H). HRMS (m/z): [M + H]+ calcd for [C43H60N5O11S2]+ 886.3725, found 886.3717.
NDBF-FTI (13). NDBF-FTI was prepared according to the general procedure described above from reaction with NDBF-Br27 and FTI (20%). 1H NMR (500 MHz, CDCl3) δ 8.66 (d, J = 7.5 Hz, 1H), 8.43 (d, J = 13.4 Hz, 1H), 8.36 (m, 2H), 7.83 (d, J = 8.5 Hz, 1H), 7.69 (d, J = 7.6 Hz, 1H), 7.53 (d, J = 7.6 Hz, 1H), 7.27-7.19 (m, 4H), 4.91 (q, J = 6.0 Hz, 1H), 4.75 (q, J = 7.1 Hz, 1H), 4.40 (q, J = 6.3 Hz, 1H), 4.11 (s, 1H), 4.06 (d, J = 8.6 Hz, 1H), 3.94 (d, J = 10.9 Hz, 1H), 3.83 (m, 1H), 3.78 (m, 2H), 3.72 (d, J = 10.5 Hz, 2H), 3.42 (m, 1H), 3.36 (d, J = 5.2 Hz, 1H), 3.31 (d, J = 5.7 Hz, 1H), 3.14 (m, 2H), 3.03 (m, 1H), 3.00 (d, J = 5.7 Hz, 3H), 2.87 (m, 1H), 2.72 (m, 1H), 2.19 (m, 1H), 2.04 (m, 1H), 1.76 (d, J = 6.4 Hz, 3H), 1.48 (s, 1H), 1.36 (m, 1H), 1.24 (m, 1H), 1.18 (d, J = 5.8 Hz, 6H), 1.09 (s, 1H), 0.85-0.66 (m, 6H). HRMS (m/z): [M + H]+ calcd for [C40H55N4O9S2]+ 799.3405, found 799.3422.
Conflicts of interestThe authors report no competing financial interests.
AcknowledgementsWe thank Dr. Guillermo Marques for valuable microscopy
insights and support. We thank Dr. Viktor Young for solving the X-ray crystal structure of intermediate 6. Microscopy was performed at the University of Minnesota Imaging Center, a Nikon Center of Excellence for confocal microscopy. X-Ray crystallography was performed at the University of Minnesota X-Ray Crystallographic Laboratory supported by The National Science Foundation (CHE-1229400 Mass spectrometry analysis was performed at the University of Minnesota Department of Chemistry Mass Spectrometry Laboratory (MSL), supported by the Office of the Vice President of Research, College of Science
Page 9 of 11 Organic & Biomolecular Chemistry

ARTICLE Journal Name
10 | J. Name., 2012, 00, 1-3 This journal is © The Royal Society of Chemistry 20xx
Please do not adjust margins
Please do not adjust margins
and Engineering, and the Department of Chemistry at the University of Minnesota, as well as The National Science Foundation (CHE-1336940). This work was supported by the National Institute of General Medical Sciences, including F32 GM126862 to M.H. and R01 GM084152 and R21 CA185783 to M.D.
Author Statement M.D.H. and M.M. designed the molecules and carried out
the major experiments reported here. M.H.H., T.K.B., S.F., A.F., K.N., H.T., F.X. and A.H. provided important assistance in synthesis, measurements and calculations. Z.B., D.B. and M.D. supervised the work. M.D.H. and M.D. wrote the manuscript.
Notes and References1. C. G. Bochet, J. Chem. Soc. Perk. T. 1, 2002, 125-142.2. M. Günter and H. Alexander, Angew. Chem. Int. Ed., 2006,
45, 4900-4921.3. D. Warther, S. Gug, A. Specht, F. Bolze, J. F. Nicoud, A.
Mourot and M. Goeldner, Bioorg. Med. Chem., 2010, 18, 7753-7758.
4. P. Klan, T. Solomek, C. G. Bochet, A. Blanc, R. Givens, M. Rubina, V. Popik, A. Kostikov and J. Wirz, Chem. Rev., 2013, 113, 119-191.
5. N. Ankenbruck, T. Courtney, Y. Naro and A. Deiters, Angew. Chem. Int. Ed., 2018, 57, 2768-2798.
6. M. Goeldner and R. Givens, Dynamic Studies in Biology: Phototriggers, Photoswitches and Caged Biomolecules, Wiley-VCH, 2006.
7. C. A. DeForest and K. S. Anseth, Nat. Chem., 2011, 3, 925.8. R. Y. Tam, S. A. Fisher, A. E. G. Baker and M. S. Shoichet,
Chem. Mater., 2016, 28, 3762-3770.9. S. A. Fisher, R. Y. Tam, A. Fokina, M. M. Mahmoodi, M. D.
Distefano and M. S. Shoichet, Biomaterials, 2018, 178, 751-766.
10. J. H. Kaplan, B. Forbush and J. F. Hoffman, Biochemistry, 1978, 17, 1929-1935.
11. I. J. Dmochowski and X. Tang, BioTechniques, 2007, 43, 161-171.
12. X. Tang, J. Zhang, J. Sun, Y. Wang, J. Wu and L. Zhang, Org. Biomol. Chem., 2013, 11, 7814-7824.
13. K. Curley and D. S. Lawrence, Curr. Opin. Chem. Biol., 1999, 3, 84-88.
14. Y. Shigeri, Y. Tatsu and N. Yumoto, Pharmacol. Ther., 2001, 91, 85-92.
15. G. Marriott, P. Roy and K. Jacobson, in Methods in Enzymology, Academic Press, 2003, vol. 360, pp. 274-288.
16. E. J. Petersson, G. S. Brandt, N. M. Zacharias, D. A. Dougherty and H. A. Lester, in Methods in Enzymology, Academic Press, 2003, vol. 360, pp. 258-273.
17. S. Loudwig and H. Bayley, in Dynamic Studies in Biology: Phototriggers, Photoswitches and Caged Biomolecules, Wiley-VCH, 2005, pp. 253-304.
18. D. S. Lawrence, Curr. Opin. Chem. Biol., 2005, 9, 570-575.19. A. Patchornik, B. Amit and R. B. Woodward, J. Am. Chem.
Soc., 1970, 92, 6333-6335.
20. S. R. Adams and R. Y. Tsien, Annu. Rev. Physiol., 1993, 55, 755-784.
21. K. König, J. Microsc., 2000, 200, 83-104.22. S. Lingyan, S. L. A., R.-C. Adrián and A. Robert, J.
Biophotonics, 2016, 9, 38-43.23. G. C. R. Ellis-Davies, Nat. Methods, 2007, 4, 619-628.24. G. Sylvestre, C. Sébastien, S. Alexandre, A. Karine, O. David,
Z. Burkhard, L. Jérémie, H. Stefan, B. Frédéric, N. Jean-François and G. Maurice, ChemBioChem, 2008, 9, 1303-1307.
25. T. Furuta, S. S. H. Wang, J. L. Dantzker, T. M. Dore, W. J. Bybee, E. M. Callaway, W. Denk and R. Y. Tsien, Proc. Natl. Acad. Sci. U. S. A., 1999, 96, 1193-2000.
26. N. J. Pace and E. Weerapana, ACS Chem. Biol., 2013, 8, 283-296.
27. M. M. Mahmoodi, D. Abate-Pella, T. J. Pundsack, C. C. Palsuledesai, P. C. Goff, D. A. Blank and M. D. Distefano, J. Am. Chem. Soc., 2016, 138, 5848-5859.
28. A. Momotake, N. Lindegger, E. Niggli, R. J. Barsotti and G. C. Ellis-Davies, Nat. Methods, 2006, 3, 35-40.
29. A. Dreuw, M. A. Polkehn, R. Binder, A. Heckel and S. Knippenberg, J. Comput. Chem., 2012, 33, 1797-1805.
30. Y. Becker, E. Unger, M. A. H. Fichte, D. A. Gacek, A. Dreuw, J. Wachtveitl, P. J. Walla and A. Heckel, Chem. Sci., 2018, 9, 2797-2802.
31. Y. Becker, S. Roth, M. Scheurer, A. Jakob, D. Gacek, A. Dreuw, J. Wachtveitl and A. Heckel. Chem. Eur. J. 2020, Accepted Manuscript. https://doi.org/10.1002/chem.202003672
32. A. E. Mangubat-Medina, H. O. Trial, R. D. Vargas, M. T. Setegne, T. Bader, M. D. Distefano and Z. T. Ball, Org. Biomol. Chem., 2020, 18, 5110-5114.
33. L. Donato, A. Mourot, C. M. Davenport, C. Herbivo, D. Warther, J. Léonard, F. Bolze, J.-F. Nicoud, R. H. Kramer, M. Goeldner and A. Specht, Angew. Chem. Int. Ed., 2012, 51, 1840-1843.
34. T. Milburn, N. Matsubara, A. P. Billington, J. B. Udgaonkar, J. W. Walker, B. K. Carpenter, W. W. Webb, J. Marque and W. Denk, Biochemistry, 1989, 28, 49-55.
35. A. G. Russell, M.-E. Ragoussi, R. Ramalho, C. W. Wharton, D. Carteau, D. M. Bassani and J. S. Snaith, J. Org. Chem., 2010, 75, 4648-4651.
36. K. Schaper, S. Abdollah M. Mobarekeh and C. Grewer, Eur. J. Org. Chem., 2002, 2002, 1037-1046.
37. V. Hagen, J. Bendig, S. Frings, T. Eckardt, S. Helm, D. Reuter and U. B. Kaupp, Angew. Chem. Int. Ed., 2001, 40, 1045-1048.
38. Y. Tamura, T. Yakura, Y. Shirouchi and J. Haruta, Chem. Pharm. Bull., 1985, 33, 1097-1103.
39. C.-B. Xue, J. M. Becker and F. Naider, Tetrahedron Lett., 1992, 33, 1435-1438.
40. K. Aidas, C. Angeli, K. L. Bak, V. Bakken, R. Bast, L. Boman, O. Christiansen, R. Cimiraglia, S. Coriani, P. Dahle, E. K. Dalskov, U. Ekström, T. Enevoldsen, J. J. Eriksen, P. Ettenhuber, B. Fernández, L. Ferrighi, H. Fliegl, L. Frediani, K. Hald, A. Halkier, C. Hättig, H. Heiberg, T. Helgaker, A. C. Hennum, H. Hettema, E. Hjertenæs, S. Høst, I.-M. Høyvik, M. F. Iozzi, B. Jansík, H. J. A. Jensen, D. Jonsson, P. Jørgensen, J. Kauczor, S. Kirpekar, T. Kjærgaard, W. Klopper, S. Knecht, R. Kobayashi, H. Koch, J. Kongsted, A. Krapp, K. Kristensen, A. Ligabue, O. B. Lutnæs, J. I. Melo, K. V. Mikkelsen, R. H. Myhre, C. Neiss, C. B. Nielsen, P.
Page 10 of 11Organic & Biomolecular Chemistry

Journal Name ARTICLE
This journal is © The Royal Society of Chemistry 20xx J. Name., 2013, 00, 1-3 | 11
Please do not adjust margins
Please do not adjust margins
Norman, J. Olsen, J. M. H. Olsen, A. Osted, M. J. Packer, F. Pawlowski, T. B. Pedersen, P. F. Provasi, S. Reine, Z. Rinkevicius, T. A. Ruden, K. Ruud, V. V. Rybkin, P. Sałek, C. C. M. Samson, A. S. de Merás, T. Saue, S. P. A. Sauer, B. Schimmelpfennig, K. Sneskov, A. H. Steindal, K. O. Sylvester-Hvid, P. R. Taylor, A. M. Teale, E. I. Tellgren, D. P. Tew, A. J. Thorvaldsen, L. Thøgersen, O. Vahtras, M. A. Watson, D. J. D. Wilson, M. Ziolkowski and H. Ågren, Wiley Interdiscip. Rev. Comput. Mol. Sci., 2014, 4, 269-284.
41. R. G. Wylie and M. S. Shoichet, Biomacromolecules, 2011, 12, 3789-3796.
42. D. Abate-Pella, N. A. Zeliadt, J. D. Ochocki, J. K. Warmka, T. M. Dore, D. A. Blank, E. V. Wattenberg and M. D. Distefano, ChemBioChem, 2012, 13, 1009-1016.
43. M. M. Mahmoodi, S. A. Fisher, R. Y. Tam, P. C. Goff, R. B. Anderson, J. E. Wissinger, D. A. Blank, M. S. Shoichet and M. D. Distefano, Org. Biomol. Chem., 2016, 14, 8289-8300.
44. Y. Zhu, C. M. Pavlos, J. P. Toscano and T. M. Dore, J. Am. Chem. Soc., 2006, 128, 4267-4276.
45. A.-L. K. Hennig, D. Deodato, N. Asad, C. Herbivo and T. M. Dore, J. Org. Chem., 2020, 85, 726-744.
46. T. K. Bader, F. Xu, M. H. Hodny, D. A. Blank and M. D. Distefano, J. Org. Chem., 2020, 85, 1614-1625.
47. S. Jakkampudi, M. Abe, N. Komori, R. Takagi, K. Furukawa, C. Katan, W. Sawada, N. Takahashi and H. Kasai, ACS Omega, 2016, 1, 193-201.
48. N. Komori, S. Jakkampudi, R. Motoishi, M. Abe, K. Kamada, K. Furukawa, C. Katan, W. Sawada, N. Takahashi, H. Kasai, B. Xue and T. Kobayashi, Chem. Commun., 2016, 52, 331-334.
49. J. Downward, Nat. Rev. Cancer, 2003, 3, 11-22.50. J. P. Olson, H.-B. Kwon, K. T. Takasaki, C. Q. Chiu, M. J.
Higley, B. L. Sabatini and G. C. R. Ellis-Davies, J. Am. Chem. Soc., 2013, 135, 5954-5957.
51. Gaussian 16, M. J. Frisch, G. W. Trucks, H. B. Schlegel, G. E. Scuseria, M. A. Robb, J. R. Cheeseman, G. Scalmani, V.
Barone, G. A. Petersson, H. Nakatsuji, X. Li, M. Caricato, A. V. Marenich, J. Bloino, B. G. Janesko, R. Gomperts, B. Mennucci, H. P. Hratchian, J. V. Ortiz, A. F. Izmaylov, J. L. Sonnenberg, D. Williams-Young, F. Ding, F. Lipparini, F. Egidi, J. Goings, B. Peng, A. Petrone, T. Henderson, D. Ranasinghe, V. G. Zakrzewski, J. Gao, N. Rega, G. Zheng, W. Liang, M. Hada, M. Ehara, K. Toyota, R. Fukuda, J. Hasegawa, M. Ishida, T. Nakajima, Y. Honda, O. Kitao, H. Nakai, T. Vreven, K. Throssell, J. A. Montgomery, Jr., J. E. Peralta, F. Ogliaro, M. J. Bearpark, J. J. Heyd, E. N. Brothers, K. N. Kudin, V. N. Staroverov, T. A. Keith, R. Kobayashi, J. Normand, K. Raghavachari, A. P. Rendell, J. C. Burant, S. S. Iyengar, J. Tomasi, M. Cossi, J. M. Millam, M. Klene, C. Adamo, R. Cammi, J. W. Ochterski, R. L. Martin, K. Morokuma, O. Farkas, J. B. Foresman, and D. J. Fox, Gaussian, Inc., Wallingford CT, 2016.
52. A. D. Becke, J. Chem. Phys., 1993, 98, 5648-5652.53. P. J. Stephens, F. J. Devlin, C. F. Chabalowski and M. J.
Frisch, J. Phys. Chem. A, 1994, 98, 11623-11627.54. R. H. Hertwig and W. Koch, Chem. Phys. Lett., 1997, 268,
345-351.55. G. A. Petersson, A. Bennett, T. G. Tensfeldt, M. A. Al-Laham,
W. A. Shirley and J. Mantzaris, J. Chem. Phys., 1988, 89, 2193-2218.
56. G. A. Petersson and M. A. Al-Laham, J. Chem. Phys., 1991, 94, 6081-6090.
57. J. B. Foresman, T. A. Keith, K. B. Wiberg, J. Snoonian and M. J. Frisch, J. Phys. Chem., 1996, 100, 16098-16104.
58. D. F. Underwood and D. A. Blank, J. Phys. Chem. A, 2003, 107, 956-961.
59. C. G. Hatchard and C. A. Parker, Proc. Royal Soc. A, 1956, 235, 518-536.
Page 11 of 11 Organic & Biomolecular Chemistry