Oxygen Microscopy by Two-Photon-Excited Phosphorescence
15
Oxygen Microscopy by Two-Photon-Excited Phosphorescence Olga S. Finikova a , Artem Y. Lebedev a , Alexey Aprelev b , Thomas Troxler c , Feng Gao c , Carmen Garnacho d , Silvia Muro d , Robin M. Hochstrasser c , and Sergei A. Vinogradov a,* a Department of Biochemistry and Biophysics, University of Pennsylvannia, Philadelphia PA 19104-6059 (USA), Fax: (+1) 215-573-3787 b Department of Physics, Drexel University, Philadelphia, PA 19104 (USA) c Department of Chemistry and RLBL, University of Pennsylvannia, Philadelphia, PA 19104 (USA) d Department of Pharmacology, University of Pennsylvania, Philadelphia, PA 19104 (USA) Abstract High-resolution images of oxygen distributions in microheterogeneous samples are obtained by two- photon laser scanning microscopy (2P LSM), using a newly developed dendritic nanoprobe with internally enhanced two-photon absorption (2PA) cross-section. In this probe, energy is harvested by a 2PA antenna, which passes excitation onto a phosphorescent metalloporphyrin via intramolecular energy transfer. The 2P LSM allows sectioning of oxygen gradients with near diffraction-limited resolution, and lifetime-based acquisition eliminates dependence on the local probe concentration. The technique is validated on objects with a priori known oxygen distributions and applied to imaging of pO 2 in cells. Keywords dendrimer; energy transfer; oxygen; phosphorescence; porphyrin 1. Introduction Imaging of oxygen distributions is of key importance for several areas of physiology and medicine. For example, in neuroscience, the ability to image brain oxygenation is critical for understanding neuronal activation;[1] in ophthalmology, imaging of retinal pO 2 (partial oxygen pressure) can help elucidating causes of diabetic retinopathy and macular degeneration; [2] in photodynamic therapy of cancer, measuring tumor pO 2 will facilitate optimization of treatment protocols, complementing direct imaging of singlet oxygen.[3] Oxygen levels can vary between individual tissue compartments (intravascular vs interstitial vs intracellular), and the ability to quantify changes in partial oxygen pressure (pO 2 ) between and within these compartments at the microscopic level would provide invaluable information for physiological research. pO 2 in biological systems can be measured optically by the phosphorescence quenching method,[4,5] using probes with controllable quenching parameters and defined bio- distributions. Such probes are delivered directly into the medium of interest, where they serve as molecular sensors for oxygen. Phosphorescence quenching has been widely used to image oxygen in biological objects, including examples of microscopy.[6–9] Wide area illumination E-mail: [email protected]. Supporting information for this article is available on the WWW under http://dx.doi.org/10.1002/cphc.200800296. NIH Public Access Author Manuscript Chemphyschem. Author manuscript; available in PMC 2009 February 19. Published in final edited form as: Chemphyschem. 2008 August 25; 9(12): 1673–1679. doi:10.1002/cphc.200800296. NIH-PA Author Manuscript NIH-PA Author Manuscript NIH-PA Author Manuscript
-
Upload
independent -
Category
Documents
-
view
2 -
download
0
Transcript of Oxygen Microscopy by Two-Photon-Excited Phosphorescence

Oxygen Microscopy by Two-Photon-Excited Phosphorescence
Olga S. Finikovaa, Artem Y. Lebedeva, Alexey Aprelevb, Thomas Troxlerc, Feng Gaoc,Carmen Garnachod, Silvia Murod, Robin M. Hochstrasserc, and Sergei A. Vinogradova,*
a Department of Biochemistry and Biophysics, University of Pennsylvannia, Philadelphia PA 19104-6059(USA), Fax: (+1) 215-573-3787
b Department of Physics, Drexel University, Philadelphia, PA 19104 (USA)
c Department of Chemistry and RLBL, University of Pennsylvannia, Philadelphia, PA 19104 (USA)
d Department of Pharmacology, University of Pennsylvania, Philadelphia, PA 19104 (USA)
AbstractHigh-resolution images of oxygen distributions in microheterogeneous samples are obtained by two-photon laser scanning microscopy (2P LSM), using a newly developed dendritic nanoprobe withinternally enhanced two-photon absorption (2PA) cross-section. In this probe, energy is harvestedby a 2PA antenna, which passes excitation onto a phosphorescent metalloporphyrin viaintramolecular energy transfer. The 2P LSM allows sectioning of oxygen gradients with neardiffraction-limited resolution, and lifetime-based acquisition eliminates dependence on the localprobe concentration. The technique is validated on objects with a priori known oxygen distributionsand applied to imaging of pO2 in cells.
Keywordsdendrimer; energy transfer; oxygen; phosphorescence; porphyrin
1. IntroductionImaging of oxygen distributions is of key importance for several areas of physiology andmedicine. For example, in neuroscience, the ability to image brain oxygenation is critical forunderstanding neuronal activation;[1] in ophthalmology, imaging of retinal pO2 (partialoxygen pressure) can help elucidating causes of diabetic retinopathy and macular degeneration;[2] in photodynamic therapy of cancer, measuring tumor pO2 will facilitate optimization oftreatment protocols, complementing direct imaging of singlet oxygen.[3] Oxygen levels canvary between individual tissue compartments (intravascular vs interstitial vs intracellular), andthe ability to quantify changes in partial oxygen pressure (pO2) between and within thesecompartments at the microscopic level would provide invaluable information for physiologicalresearch.
pO2 in biological systems can be measured optically by the phosphorescence quenchingmethod,[4,5] using probes with controllable quenching parameters and defined bio-distributions. Such probes are delivered directly into the medium of interest, where they serveas molecular sensors for oxygen. Phosphorescence quenching has been widely used to imageoxygen in biological objects, including examples of microscopy.[6–9] Wide area illumination
E-mail: [email protected] information for this article is available on the WWW under http://dx.doi.org/10.1002/cphc.200800296.
NIH Public AccessAuthor ManuscriptChemphyschem. Author manuscript; available in PMC 2009 February 19.
Published in final edited form as:Chemphyschem. 2008 August 25; 9(12): 1673–1679. doi:10.1002/cphc.200800296.
NIH
-PA Author Manuscript
NIH
-PA Author Manuscript
NIH
-PA Author Manuscript

and CCD-based detection are most commonly used in phosphorescence imaging, as they permitfast acquisition, although at the expense of spatial resolution and 3D capability. Confocal laserscanning microscopy has also been applied as an alternative method to image pO2. However,either large pinholes (diameter ≈1 mm) were required to compensate for low rates ofphosphorescence emission,[10] resulting in low spatial resolution; or probes with short tripletlifetimes and, therefore, low oxygen sensitivity, had to be employed.[11]
Herein we report a new approach to oxygen imaging, which combines principles of thephosphorescence quenching method with two-photon laser scanning microscopy (2P LSM).[12] 2P excitation offers several advantages over linear methods, such as improved depthresolution for 3D imaging and reduced risk of photodamage.[13] In principle, combining 2PLSM and phosphorescence quenching should be a straightforward task;[14] however,phosphorescent probes, typically based on Pt and Pd porphyrins, posses extremely low two-photon absorption (2PA) cross-sections (σ2).[15] Using these probes, either exceedingly highexcitation powers would be required to generate adequate signals, or thousands ofphosphorescence decays would have to be averaged in each image pixel, resulting inunacceptably long acquisition periods.
In order to circumvent this problem, an approach to enhance triplet generation via 2P excitationin metalloporphyrins has been proposed,[15,16] whereby excitation energy is captured byseveral 2P-antenna chromophores and transmitted to metalloporphyrin-core by Förster-typeresonance energy transfer (FRET). Recent studies have shown that distances between theantenna and the core, as well as their redox potentials, must be carefully tuned in order toprevent intramolecular quenching of phosphorescence via electron transfer (ET).[17,18]
Herein, we introduce the first practical 2P phosphorescent nanoprobe and demonstrate itsapplication in oxygen imaging. The new technique is validated on microheterogeneouslyoxygenated phantoms with a priori known oxygen distributions and used to obtain pO2 imagesinside endothelial cells.
2. Results and Discussion2.1. 2P-Enhanced Phosphorescent Probe
Phosphorescent probe PtP-C343—whose structure is shown in Figure 1, and its key propertiesare summarized in Figure 2—integrates in a single molecular construct all the characteristicsrequired for biological oxygen imaging. The probe was constructed mainly with intravascularand interstitial applications in mind, assuming that the delivery into these tissue compartmentscan be accomplished by injection. Nevertheless, provided suitable delivery pathways, PtP-C343 can be used in any biological environment, for example to measure intracellular oxygen(vide infra). The size of the probe (~5 nm in folded state) is similar to that of otherphosphorescent agents used in the past for tissue oxygen measurements and imaging.[19,20]
Several coumarin-343 (C343) moieties in the molecule of PtP-C343 act as the 2PA antenna,channeling the excitation energy to the Pt porphyrin (PtP) core. The high fluorescence quantumyield of C343 (ϕfl ≈ 0.8–1.0), combined with the strong absorption of PtP in the Q-band region(λmax = 515 nm, ε = 26,000 M−1 cm−1) and large spectral overlap (Figure 2 a) enable efficientfluorescence resonance energy transfer (FRET). Molecular modeling reveals that even in thefully unfolded state, C343-units are separated from the PtP-core by distances shorter than theFörster radius (r0 = 46 Å). Nevertheless, the experimental FRET efficiency does not exceed75 %, which is likely due to the partial quenching of the C343 singlet state by intramolecularelectron transfer[17] (for detailed photophysical characterization see the SupportingInformation).
Finikova et al. Page 2
Chemphyschem. Author manuscript; available in PMC 2009 February 19.
NIH
-PA Author Manuscript
NIH
-PA Author Manuscript
NIH
-PA Author Manuscript

The choice of C343 (σ2 = 28 GM at 840 nm; 1 GM= 10−50 cm4sphoton−1) as the 2P antennawas based on the overall efficiency of the phosphorescence, 2PA and FRET. Several 2PA dyescapable of FRET onto Pt porphyrins have been considered, including dyes specificallydesigned for 2P applications. However, all these dyes induce strong reductive quenching ofthe porphyrin triplet states by electron transfer,[18] reducing the phosphorescence quantumyield and decreasing the probe’s performance. C343 was found to be the least effectivequencher. In addition, Pt porphyrin was modified with four electron-donor alkoxy groups,making it a less potent oxidant in the triplet state.
To decrease the rate of electron transfer further, C343 fragments in PtP-C343 were placed atthe maximal distance from the PtP core, that is, attached to the termini of the dendritic branches.The folded dendrimer was anticipated to provide an insulating layer between thechromophores.[21] As a result of such redox and distance tuning, the phosphorescencequantum yield of Pt-C343 (ϕp = 0.10) is only slightly below that of the PtP-dendrimer withoutC343-antenna (ϕp = 0.13). Upon 2P excitation (λex = 840 nm, 110 fs, 76 MHz repetition rate,average power 0.5 mW), the C343-antenna in PtP-C343 enhances phosphorescence intensitynearly 25-fold compared to the reference Pt porphyrin (Figure 2 b, inset).
The porphyrin core in PtP-C343 is surrounded by poly(arylglycine) (AG) dendrimer.[22] Themain functions of the dendrimer are to increase the solubility, prevent aggregation and attenuatethe rate of oxygen diffusion in the porphyrin vicinity.[23,24] This rate is represented by thevalue of quenching constant kq in the Stern–Volmer relationship, shown in Equation (1), whichis the basis for oxygen sensing by phosphorescence quenching:
(1)
In Equation (1), τ and τ0 are the phosphorescence lifetimes in the absence of oxygen and atoxygen pressure pO2. Constants kq for unprotected metalloporphyrins in aqueous solutions aretoo high (>1500 mmHg−1 s−1)[24,25] for measurements at physiologically relevant pO2’s(100–160 mm Hg). Hydrophobic dendrimers, such as AG, are capable of attenuating thequenching constants by folding and restricting oxygen diffusion in the porphyrin vicinity.[25]
The periphery of the dendrimer is modified with mono-methyloligoethyleneglycol groups (av.MW 750), which prevent interactions of the probe with proteins and other biological solutes.This is required for maintaining an unambiguous relationship between the phosphorescencelifetime and pO2, making sure that the probe’s signal is specific to oxygen.[25] For example,quenching plots of PtP-C343 remain unchanged in the cell growth medium containing albumin(Figure 2 c), which is known to dramatically affect quenching constants of unprotectedporphyrins.[4,25] The same quenching constants are obtained at different pH values anddifferent probe concentrations. (For calibrations at different temperatures see SupportingInformation). Notably, all calibrations under linear (1P) excitation are directly applicable tothe measurements in the two-photon regime,[15] since phosphorescence emission and oxygenquenching are independent of the pathway by which the probe is promoted to its emitting state.
A convenient feature of PtP-C343 is the residual fluorescence of C343-antenna. C343fluorescence is well spectrally resolved from PtP phosphorescence (Figures 2 a, b) and iscompletely insensitive to oxygen because of its short lifetime (τfl = 0.21 ns). This signal enablesmeasurements of phosphorescence lifetimes by dual-wavelength ratiometric method.[26,27]Emission spectra of PtP-C343 upon two-photon excitation (λex = 840 nm) at different oxygenconcentrations (Figure 2c, inset), show that only phosphorescence responds to changes inpO2.
Finikova et al. Page 3
Chemphyschem. Author manuscript; available in PMC 2009 February 19.
NIH
-PA Author Manuscript
NIH
-PA Author Manuscript
NIH
-PA Author Manuscript

2.2. Imaging MethodFor phosphorescence lifetime measurements in the time domain, excitation pulses must beseparated by at least 5–6 lifetimes, that is, 300–400 μs for probes like PtP-C343 (τ0 =60 μs).Commercial Ti:Sapphire lasers, typically used in 2P LSM, operate at high repetition rates (~100MHz); therefore, for measuring phosphorescence lifetimes their output must be gated. Todetermine the optimal excitation regime, we have modeled the kinetics of phosphorescenceunder 2P excitation which is shown schematically in Figure 3 (see Supporting Information fordetails). In the scheme, A and P are the 2P-antenna and the phosphorescent core of the probe;indexes S0, S1 and T1 designate the ground, the first excited singlet and triplet states; α,kFRET, kfl, and kp are the rate constants of absorption (via 2P mechanism), FRET, decay of theS1 state in the absence of FRET and decay of the T1 state, respectively.
Using the scheme in Figure 3 and the experimentally measured rate constants (kfl = 2.5 ×10⁸ s−1, kp = 1.67 × 10⁴ s−1, kFRET = 2.3 × 10⁹ s−1, σ2 ≈ 100 GM at 840 nm), we have calculatedthe dependencies of the triplet state fraction (PT1) on the number of high repetition rate laserpulses (Figure 3 a, see Supporting Information for details). For example, at the average powerof 10 mW, a gate containing 200 pulses, delivered during 2.5 μs period, fully saturates thephosphorescence of PtP-C343 in the laser focal volume (~2–3 μm3), yielding 99 % of the probein its triplet state.
To achieve the maximal (diffraction-limited) resolution, concentration of the emitting speciesin the vicinity of the focal volume must change in proportion to the square of the excitationflux.[13] Figure 3 b shows the dependence of the triplet state fraction (PT1) on the averagelaser power for the case when the excitation is delivered by a continuous train of high repetitionrate pulses. Deviation from the quadratic dependence becomes apparent when the fraction ofthe emitting species exceeds 15–20% (Figure 3b). For a long-lived triplet state (τ0 = 60 μs),which cannot fully decay between the excitation pulses, this limit is reached already at quitelow powers (<1 mW), or, if the power is sufficiently high, after a small number of pulses (Figure3 a). For example, at the average power of 10 mW, 20% saturation requires only about 30–40pulses (0.4–0.5 μs excitation gate at 76 MHz repetition rate). Notably, beyond the saturationonset, the mechanism of excitation does not change, but the excitation volume increases,resulting in lower spatial resolution.
At the probe concentration of 10−5M and the phosphorescence quantum yield ϕp = 0.10, oneexcitation gate leading to 20% saturation will generate ca. 300 phosphorescent photons, ofwhich only about 10 % reach the detector. Considering shot-noise-limit detection and thedetector quantum yield of ca. 0.10, about 200 gates will be required to achieve the signal-to-noise ratio of 25, suitable for accurate phosphorescence lifetime determination. The setup usedin our experiments was not specifically optimized for 2P imaging, and in order to obtainadequate quality decays we had to use at least 1 μs long excitation gates and average laserpowers up to 100 mW. Under these conditions, ca. 30 photons were obtained per excitationgate per pixel. Presumably, the excitation volume in our experiments was larger than thediffraction-limit.
Unlike phosphorescence, fluorescence of C343 antenna has ample time to decay between thehigh repetition rate pulses. As a result, the onset of the fluorescence saturation occurs at muchhigher average laser powers. This has implications for imaging in dual-wavelength ratiometricmode, in which the ratio of the fluorescence and phosphorescence signals is used to measurephosphorescence lifetime τ.[26] In order for calibrations to be independent of the excitationregime, power dependencies of both signals must be the same, that is, the signals have to changein proportion to one another with changes in the excitation power. Consequently, 2P ratiometricmeasurements are feasible only at very low powers, where both the fluorescence and the
Finikova et al. Page 4
Chemphyschem. Author manuscript; available in PMC 2009 February 19.
NIH
-PA Author Manuscript
NIH
-PA Author Manuscript
NIH
-PA Author Manuscript

phosphorescence signals are strictly proportional to the square of the excitation flux (Figure 3b).
2.3. Imaging Heterogeneously Oxygenated ObjectsTesting the method’s ability to resolve microscopic oxygen gradients requires an object witha priori known oxygen distribution. An ultra-thin glass capillary, filled with a solution of PtP-C343 (10 μM) and containing an excess of enzymatic system for oxygen removal (glucose/glucose oxidase/catalase),[4] was fixed at an angle relative to a microscope coverslip (Figure4), and its tip (0.5 μm in diameter) was covered with the probe solution equilibrated with air.The mixing between the outside and inside medium was slow; and in addition, a large excessof the oxygen-depleting system guaranteed rapid removal of oxygen inside the capillary, whilethe solution outside could freely exchange oxygen with air.
The first indication that the 2P-excited phosphorescence signal contained information aboutoxygen in the object was obtained from the integrated intensity image under pseudo-continuousexcitation by a non-gated train of pulses (Figure 4 b). The capillary appears as a bright stripe(capillary walls are bright because of the back-scattering on the glass/water interface), and thephosphorescence/fluorescence ratios in the spectra from the areas inside and outside thecapillary (Figure 4 c) correspond to the calibrations (Figure 2 c).
The phosphorescence lifetime images were obtained by gating the output of a high repetitionrate Ti:Sapphire laser (840 nm, 110 fs, 76 MHz, 1 μs excitation gate). Figure 4 e clearly showsthe region of lower oxygenation (τ = 40–50 μs) relative to the normally aerated background(τ = 32 μs). The contrast decreases towards the open capillary tip (Figure 4 f), where mixingwith the outside solution is more effective. In a stacked 3D-image, obtained by x,y-raster-scanning at 5 μm steps in the z-direction, the capillary appears as a tube with the cross-sectionelongated in the z-direction. This distortion is caused by the excitation volume asymmetry[28] and by the refraction on the glass/water interface. Nevertheless, this experiment clearlydemonstrates the ability of the method to provide pO2 images throughout the volume depth.
Single-exponential fitting of the decays obtained by averaging of 100 gates results in theaccuracy of ±0.6 μs in lifetime τ, which is equivalent to ±2.5 mm Hg accuracy in pO2 (in thelow oxygen region). Higher accuracy can be reached by increasing the range of measuredlifetimes τ, for example, by increasing constant kq [Eq. (1)].
For a given lifetime τ0, which is intrinsic to the phosphorescent chromophore, the range ofmeasured lifetimes through the range of oxygen concentrations (from 0 to 159 mm Hg inbiological systems) is determined by the value of quenching constant kq [Eq. (1)]; which is, inturn, dependent on the chromophore accessibility to oxygen. For chromophores with shortτ0’s, too low kq’s lead to narrow dynamic ranges. Taking into account relatively short τ0 of Ptporphyrin (60 μs), the dendritic branches in PtP-C343 were attached to the para-positions ofthe meso-aryl rings (Figure 1) in order to keep the core more accessible to oxygen. (A muchstronger protection would be expected for 3,5-meta-orientation[25,29]). Nonetheless, kqappeared to be lower than expected, that is, ~150 mm Hg−1s−1 vs expected 400–500 mmHg−1s−1, resulting in the dynamic lifetime range of 40 μs. Using smaller, more oxygen-permeable shells, for example, polyglutamic[24] or Newkome-type dendrimers,[30] will allowextending the range of τ’s. Alternatively, Pd porphyrins, whose intrinsic phosphorescencelifetimes are much longer (300–700 μs)[4,24] can be used; however, these chromophores havelower phosphorescence quantum yields and therefore necessitate longer acquisition periods.
Finikova et al. Page 5
Chemphyschem. Author manuscript; available in PMC 2009 February 19.
NIH
-PA Author Manuscript
NIH
-PA Author Manuscript
NIH
-PA Author Manuscript

2.4. Imaging Oxygen in CellsMapping of intracellular pO2 provides direct insight into the environment of cellular organellesand compartments, simultaneously helping to define the range of the method’s applicability.Ideally, measurements of intracellular pO2 require the probe to be distributed throughout thecytoplasm volume.[7] However, delivering macromolecular constructs into the cytoplasmwithout affecting the cell viability is a challenging and yet unachieved goal.[31] It is morefeasible to incorporate the probe into the cell by endocytic transport within vesicles,[31,32]whose interiors are separated from the cytoplasm by oxygen-permeable membranes.
We used a method for endocytic delivery[33] into human endothelial cells (ECs), whichemploys intercellular adhesion molecule-1 (ICAM-1).[34] Engagement of ICAM-1 bymultivalent ligands on surfaces of microscopic objects, in our case latex microspheres coatedwith anti-ICAM, triggers formation of endocytic compartments. The probes present in theextracellular milieu become a part of the liquid phase surrounding the microspheres within theendocytic vesicles. The latter pinch off the plasma membrane into the cytosol and trafficintracellularly to the perinuclear region,[32,33] where the probe can function as a pO2-sensor.In addition, microspheres create easily recognizable heterogeneous patterns around the nuclei,facilitating visualization.
Linear fluorescent microscopy (Figure 5 a, b) confirmed that PtP-C343 was co-internalized byECs from the cell medium together with anti-ICAM-modified microspheres. Neither the cellviability nor the efficiency of uptake was affected by the presence of the probe (used at 10μM oncentration). The internalized microspheres form characteristic perinuclear clusters,whereas the non-internalized microspheres remain on the cell periphery and do not co-localizewith the probe (for control experiments see Supporting Information). A fraction of the probewas passively internalized within 100–200 nm endocytic vesicles without spheres, which alsotrafficked to the perinuclear region.
Integrated intensity image of phosphorescence (Figure 5 d), acquired upon 2PA-excitation,reveals that the emission was predominantly co-localized with the signal observed in the red-channel of a regular fluorescent microscope (Figure 5 b). All six microspheres in the image(Figure 5 c, inside the white square) were among the brightest emitters, and some appeared ascharacteristic ring-like objects. These patterns occur when the scanning plane dissects endo-lysosomes, containing non-emissive microspheres surrounded by the probe solution.Phosphorescence decay times (Figure 5 e) are uniformly distributed around τav = 33.1 μs,agreeing well with the calibration measurement (τ=33.9 ± 3 μs). Only the emission from theperinuclear region (area 3, Figure 5 g) contains a characteristic phosphorescence peak in thespectrum (λmax = 680 nm).
The phosphorescence lifetime and the pO2 images of live cells (Figures 5 h, i) revealed thatthe average oxygen pressures in the vicinity of the nuclei [for image shown: pO2(mean) = 156.9mm Hg] are close to the pO2 in air-equilibrated aqueous medium. The value of the intracellularpO2 gradient, although determined by indirect measurements nearly two decades ago,[35] isstill a controversial subject in the literature. Intracellular 2P oxygen imaging in vivo is able todefinitively establish its value.
3. ConclusionsWe have introduced a two-photon enhanced phosphorescent nanoprobe that makes it possibleto combine the 2P LSM with the phosphorescence quenching method. Compared with existingpO2 measurement techniques,[36–39] this approach possesses an unprecedented combinationof high spatial and temporal resolution, minimal invasiveness and 3D capability. The 2Poxygen microscopy is expected to have its largest impact in the studies of intact tissues in vivo,
Finikova et al. Page 6
Chemphyschem. Author manuscript; available in PMC 2009 February 19.
NIH
-PA Author Manuscript
NIH
-PA Author Manuscript
NIH
-PA Author Manuscript

where accurate non-invasive determination of oxygen concentration is the key to understandingphysiological function.
Experimental SectionProbe design—Probe PtP-C343 was synthesized using mixed divergent/convergentapproach. Four butyl-ester-terminated generation 3 arylglycine (AG) dendrons were coupledto the core Pt porphyrin, after which the peripheral ester groups were hydrolyzed. C343-fragments, modified with ethylenediamine linkers, were attached to the dendrimer periphery,and the remaining carboxyl groups were esterified with oligoethyleneglycol residues (Av. MW750). The probe was purified by size exclusion chromatography and multiple re-precipitationsfrom THF by ether. The intermediate compounds and the product were characterizedby 1H, 13C NMR and MALDI-TOF spectroscopy. Details of the photophysical andelectrochemical characterization, calculations, measurements of FRET rates and two-photonabsorption cross-sections can found in the Supporting Information.
Imaging system—Imaging experiments were performed using the system shown in Figure6. The 2P-excitation was achieved by a mode-locked Ti:sapphire oscillator (λex = 840 nm, 110fs, 76 MHz rep. rate, Mira 900, Coherent). An electro-optical modulator (Con-Optics) playedthe role of the beam chopper. The beam was directed into the oil immersion objective (170μm focal distance, NA 1.3, Nikon) of an inverted confocal microscope (Nikon Diaphot 300),equipped with a scanning stage (Queensgate, scanning area 30×30 μm2). The emission signal,after passing through a series of filters, was directed onto one or two single-photon countingAPDs (EG&G). Alternatively, the emission beam was directed through a monochromator(Acton Research) to a cooled CCD camera (Princeton Instruments) for spectral registration.For ratiometric imaging, the emission beam was passed through a dichroic beam splitter(565DCXR, Chroma) in order to separate fluorescence of C343 (λmax = 485 nm) fromphosphorescence of PtP (λmax = 670 nm). For time-gated operation, the software for controlof the scanning stage and the photon counting was custom-designed in LabView 7.0 (NationalInstruments). In a typical run, the frequency of the electro-optical modulator was set to 2 kHz.The pulse-train length of the excitation gate was adjusted between 1 and 2 μs, allowing forseveral hundreds laser pulses to pass through the modulator. The collection period betweenconsecutive excitation gates (0.5 ms) was divided into 50 bins. 5 to 200 averages were used tocollect decays, depending on the experiment.
Preparation of Cells—Mouse monoclonal antibody recognizing the extracellular domainof human ICAM-1 (clone R6.5) was purified by affinity chromatography from thecorresponding hybridoma cell line (American Type Culture Collection, Manassas, VA). Anti-ICAM microspheres were prepared by surface absorption of anti-ICAM R6.5 onto either FITC-labeled or non-fluorescent polystyrene microspheres (2 μm diameter, Polysciences Inc.,Warrington, PA) at 7,000 IgG molecules per μm2 of particle surface. Lack of aggregation andfinal diameter of the coated particles was determined by dynamic light scattering. Humanumbilical vein Endothelial cells, EC (Clonetics, San Diego, CA), were seeded onto gelatin-coated cover slips in plastic well plates, grown in supplemented M199 medium (GibcoBRL,Grand Island, NY) and treated overnight with 10 ngmL−1 TNF-α to stimulate ICAM-1expression. To induce endocytosis in EC, confluent activated cells were first incubated for 30min at 37°C with FITC-labeled anti-ICAM microspheres, either in the absence or presence ofPtP-C343 (10 μM) in the cell media. To permit further intracellular trafficking of theinternalized materials, cells were washed and incubated for 30–120 additional min at 37°C. Toinduce incorporation of PtP-C343 within EC endosomes, EC were incubated with non-fluorescent anti-ICAM microspheres in the presence of PtP-C343. When required, the cellnuclei were stained with blue 4′,6-diamidino-2-phenylindole (DAPI) for 5 min at roomtemperature, and cells were imaged either prior or after fixation in cold 2% paraformaldehyde.
Finikova et al. Page 7
Chemphyschem. Author manuscript; available in PMC 2009 February 19.
NIH
-PA Author Manuscript
NIH
-PA Author Manuscript
NIH
-PA Author Manuscript

AcknowledgementsSupport of the grants EB007279, HL081273 and P41-RR001348 from the NIH USA is gratefully acknowledged. Theauthors thank Prof. D. F. Wilson for many invaluable discussions.
References1. Thompson JK, Peterson MR, Freeman RD. Science 2003;299:1070. [PubMed: 12586942]2. Arden GB, Sidman RL, Arap W, Schlingemann RO. Br J Ophthalmol 2005;89:764. [PubMed:
15923516]3. Skovsen E, Snyder JW, Ogilby PR. Photochem Photobiol 2006;82:1187. [PubMed: 16706601]4. Vanderkooi JM, Maniara G, Green TJ, Wilson DF. J Biol Chem 1987;262:5476. [PubMed: 3571219]5. Rumsey WL, Vanderkooi JM, Wilson DF. Science 1988;241:1649. [PubMed: 3420417]6. Shonat RD, Kight AC. Ann Biomed Eng 2003;31:1084. [PubMed: 14582611]7. Hogan MC. J Appl Physiol 1999;86:720. [PubMed: 9931213]8. Wilson DF, Vinogradov SA, Grosul P, Vaccarezza MN, Kuroki A, Bennett J. Appl Opt 2005;44:5239.
[PubMed: 16149347]9. Golub AS, Barker MC, Pittman RN. Am J Physiol Heart Circ Physiol 2007;293:H1097. [PubMed:
17483242]10. Plant RL, Burns DH. Appl Spectrosc 1993;47:1594.11. Koo YEL, Cao YF, Kopelman R, Koo SM, Brasuel M, Philbert MA. Anal Chem 2004;76:2498.
[PubMed: 15117189]12. Denk W, Strickler JH, Webb WW. Science 1990;248:73. [PubMed: 2321027]13. Denk, W.; Piston, DW.; Webb, WW. Handbook of Biological Confocal Microscopy. Pawley, JB.,
editor. Springer; New York: 2006. p. 535-549.14. Excitation of a Pd porphyrin by 10 ns pulses at 1064 nm (10 Hz repetition rate) has been reported to
produce detectable phosphorescence signals at high excitation powers (0.1–1.0 W) and high probeconcentration (0.5 mM): Mik EG, van Leeuwen TG, Raat NJ, Ince C. J Appl Physiol 2004;97:1962.[PubMed: 15247164]
15. Briñas RP, Troxler T, Hochstrasser RM, Vinogradov SA. J Am Chem Soc 2005;127:11 851.16. Dichtel WR, Serin JM, Edder C, Fréchet JMJ, Matuszewski M, Tan LS, Ohulchanskyy TY, Prasad
PN. J Am Chem Soc 2004;126:5380. [PubMed: 15113208]17. Finikova OS, Troxler T, Senes A, DeGrado WF, Hochstrasser RM, Vinogradov SA. J Phys Chem A
2007;111:6977. [PubMed: 17608457]18. Finikova OS, Chen P, Ou Z, Kadish KM, Vinogradov SA. J Photo-chem Photobiol A 2008;198:75.19. Rietveld IB, Kim E, Vinogradov SA. Tetrahedron 2003;59:3821.20. Wilson DF, Lee WMF, Makonnen S, Finikova O, Apreleva S, Vinogradov SA. J Appl Physiol
2006;101:1648. [PubMed: 16888050]21. Hong YR, Gorman CB. Langmuir 2006;22:10506. [PubMed: 17129022]22. Vinogradov SA. Org Lett 2005;7:1761. [PubMed: 15844900]23. Issberner J, Vögtle F, De Cola L, Balzani V. Chem Eur J 1997;3:706.24. Vinogradov SA, Lo LW, Wilson DF. Chem Eur J 1999;5:1338.25. Rozhkov VV, Wilson DF, Vinogradov SA. Macromolecules 2002;35:1991.26. Kostov Y, Harms P, Pilato RS, Rao G. Analyst 2000;125:1175. [PubMed: 10932860]27. Xu H, Aylott JW, Kopelman R, Miller TJ, Philbert MA. Anal Chem 2001;73:4124. [PubMed:
11569801]28. Sun HB, Tanaka T, Kawata S. Appl Phys Lett 2002;80:3673.29. Tomoyose Y, Jiang DL, Jin RH, Aida T, Yamashita T, Horie K, Yashima E, Okamoto Y.
Macromolecules 1996;29:5236.30. Newkome GR, Lin XF. Macromolecules 1991;24:1443.31. Medina-Kauwe LK, Xie J, Hamm-Alvarez S. Gene Ther 2005;12:1734. [PubMed: 16079885]32. Muro S, Gajewski C, Koval M, Muzykantov VR. Blood 2005;105:650. [PubMed: 15367437]
Finikova et al. Page 8
Chemphyschem. Author manuscript; available in PMC 2009 February 19.
NIH
-PA Author Manuscript
NIH
-PA Author Manuscript
NIH
-PA Author Manuscript

33. Muro S, Wiewrodt R, Thomas A, Koniaris L, Albelda SM, Muzykantov VR, Koval M. J Cell Sci2003;116:1599. [PubMed: 12640043]
34. Dustin ML, Rothlein R, Bhan AK, Dinarello CA, Springer TA. J Immunol 1986;137:245. [PubMed:3086451]
35. Robiolio M, Rumsey WL, Wilson DF. Am J Physiol 1989;256:C1207. [PubMed: 2735396]36. Jobsis FF. Science 1977;198:1264. [PubMed: 929199]37. Koch CJ. Redox Cell Biology and Genetics, Part A. Methods Enzymol 2002;352:3. [PubMed:
12125356]38. Swartz HM, Clarkson RB. Phys Med Biol 1998;43:1957. [PubMed: 9703059]39. Krishna MC, English S, Yamada K, Yoo J, Murugesan R, Devasahayam N, Cook JA, Golman K,
Ardenkjaer-Larsen JH, Subramanian S, Mitchell JB. Proc Natl Acad Sci USA 2002;99:2216.[PubMed: 11854518]
Finikova et al. Page 9
Chemphyschem. Author manuscript; available in PMC 2009 February 19.
NIH
-PA Author Manuscript
NIH
-PA Author Manuscript
NIH
-PA Author Manuscript

Figure 1.Two-photon-enhanced oxygen probe PtP-C343 consisting of phosphorescent Pt meso-tetraarylporphyrin (PtP, red), several coumarin-343 units (C343, blue), polyarylglycinedendrimer (black) and peripheral oligoethylene-glycol residues (green). Arrows in the cartoondepict excitation of the C343 antenna via 2PA (brown), FRET (yellow) and phosphorescenceof PtP-core (red).
Finikova et al. Page 10
Chemphyschem. Author manuscript; available in PMC 2009 February 19.
NIH
-PA Author Manuscript
NIH
-PA Author Manuscript
NIH
-PA Author Manuscript

Figure 2.Properties of nanoprobe PtP-C343. a) Absorption and emission (λex = 460 nm, arbitraryintensity units) spectra of the probe and reference chromophores: PtP and C343. b) 2PA-induced emission spectra (excitation: λex = 840 nm, 110 fs, 76 MHz rep. rate) at differentexcitation powers and power dependence (inset) for phosphorescence of a reference Ptporphyrin (PtP) without the antenna (black squares), PtP-C343 phosphorescence (white circles)and PtP-C343 fluorescence (white triangles). The data points [phosphorescence intensity (I),normalized by concentration, vs excitation power (P)], were fit to quadratic functions: I(P)=aP2 (solid line). The phosphorescence deviates from the quadratic law at higher incidentpowers (see text and Figure 3). The fluorescence rises quadratically throughout the entire powerrange examined. c) Phosphorescence lifetime (τ) vs pO2 calibration plots in pure buffer (black)and in cell growth medium containing 3 % of serum albumin (25 °C, pH 7.2) (white). Inset:2PA-induced emission spectra (λex = 840 nm) of the probe at air saturation (black) and indeoxygenated solution (gray), showing that only the phosphorescence signal (λmax = 680 nm)responds to the change in oxygen pressure.
Finikova et al. Page 11
Chemphyschem. Author manuscript; available in PMC 2009 February 19.
NIH
-PA Author Manuscript
NIH
-PA Author Manuscript
NIH
-PA Author Manuscript
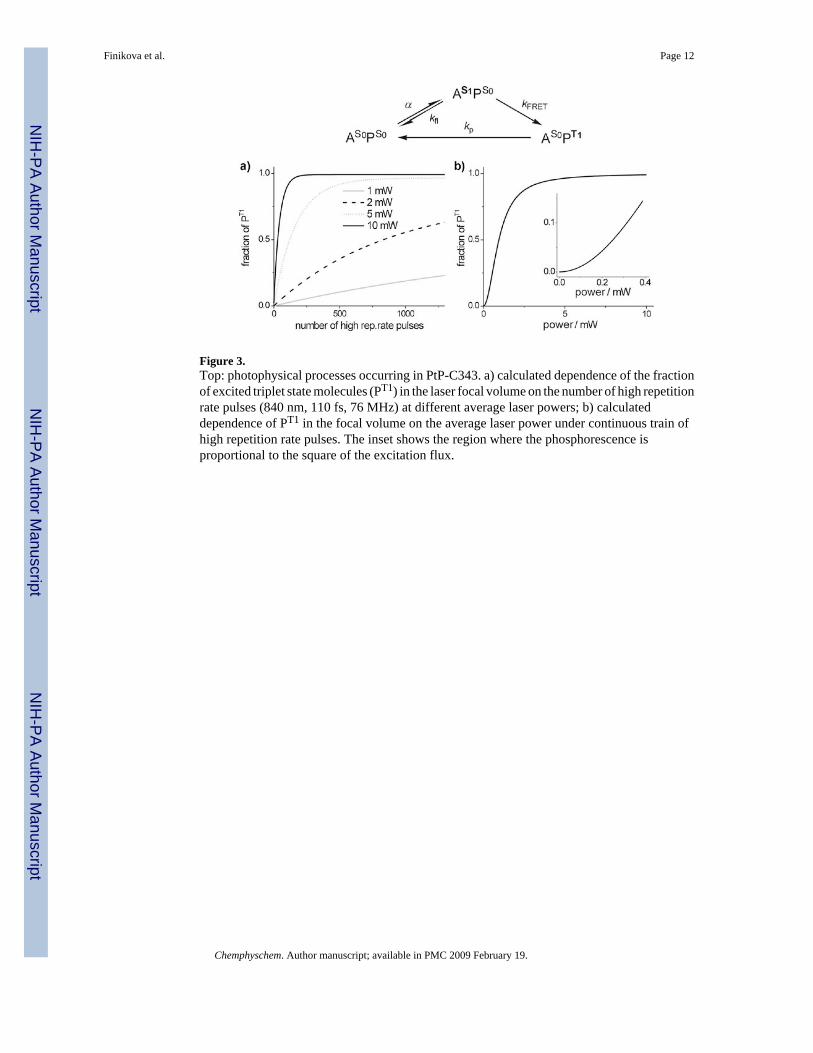
Figure 3.Top: photophysical processes occurring in PtP-C343. a) calculated dependence of the fractionof excited triplet state molecules (PT1) in the laser focal volume on the number of high repetitionrate pulses (840 nm, 110 fs, 76 MHz) at different average laser powers; b) calculateddependence of PT1 in the focal volume on the average laser power under continuous train ofhigh repetition rate pulses. The inset shows the region where the phosphorescence isproportional to the square of the excitation flux.
Finikova et al. Page 12
Chemphyschem. Author manuscript; available in PMC 2009 February 19.
NIH
-PA Author Manuscript
NIH
-PA Author Manuscript
NIH
-PA Author Manuscript
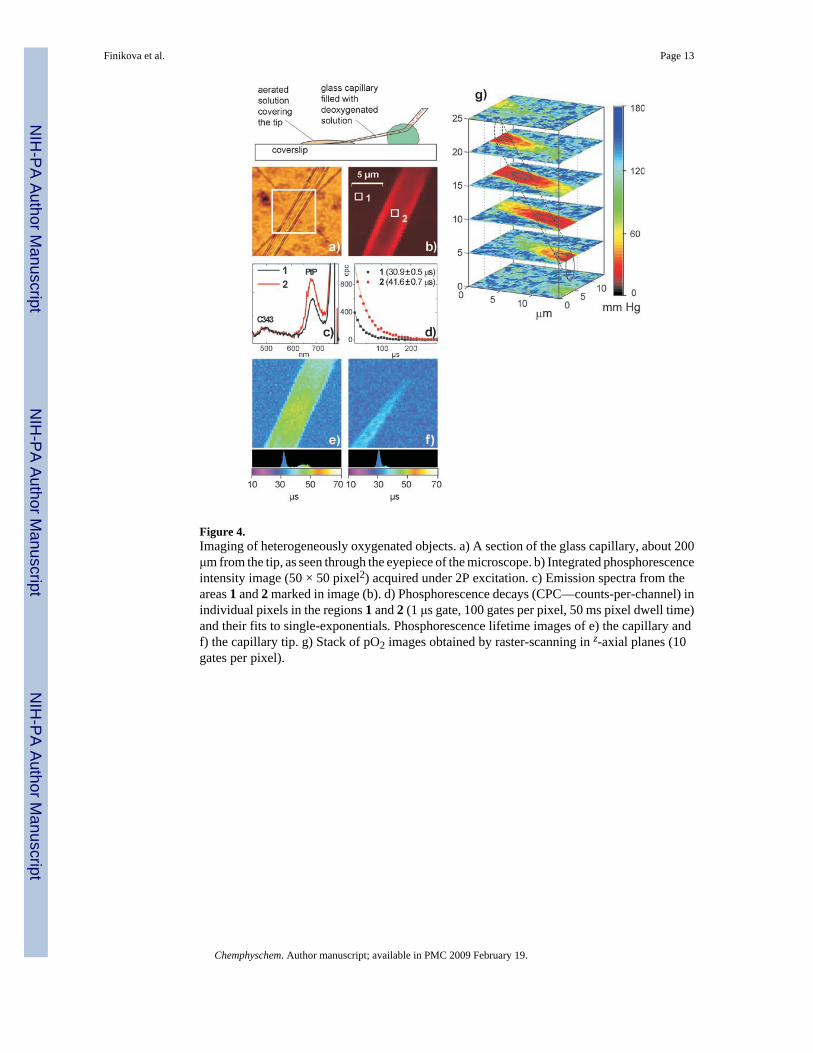
Figure 4.Imaging of heterogeneously oxygenated objects. a) A section of the glass capillary, about 200μm from the tip, as seen through the eyepiece of the microscope. b) Integrated phosphorescenceintensity image (50 × 50 pixel2) acquired under 2P excitation. c) Emission spectra from theareas 1 and 2 marked in image (b). d) Phosphorescence decays (CPC—counts-per-channel) inindividual pixels in the regions 1 and 2 (1 μs gate, 100 gates per pixel, 50 ms pixel dwell time)and their fits to single-exponentials. Phosphorescence lifetime images of e) the capillary andf) the capillary tip. g) Stack of pO2 images obtained by raster-scanning in z-axial planes (10gates per pixel).
Finikova et al. Page 13
Chemphyschem. Author manuscript; available in PMC 2009 February 19.
NIH
-PA Author Manuscript
NIH
-PA Author Manuscript
NIH
-PA Author Manuscript
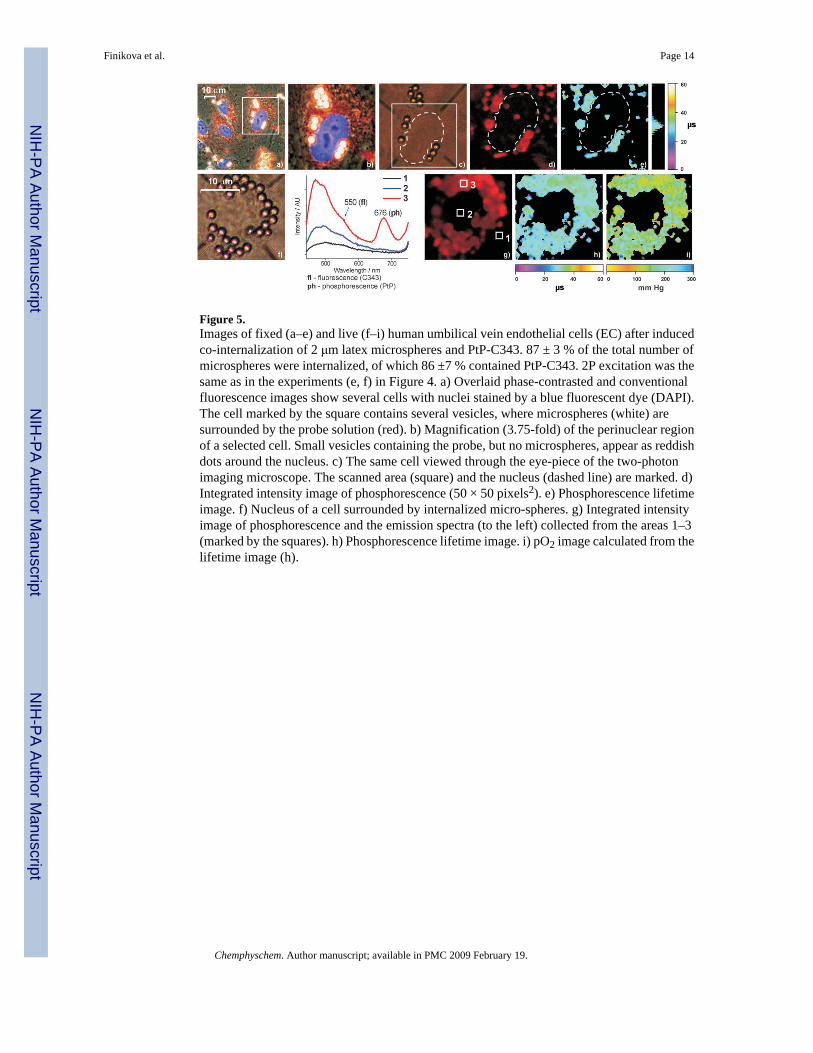
Figure 5.Images of fixed (a–e) and live (f–i) human umbilical vein endothelial cells (EC) after inducedco-internalization of 2 μm latex microspheres and PtP-C343. 87 ± 3 % of the total number ofmicrospheres were internalized, of which 86 ±7 % contained PtP-C343. 2P excitation was thesame as in the experiments (e, f) in Figure 4. a) Overlaid phase-contrasted and conventionalfluorescence images show several cells with nuclei stained by a blue fluorescent dye (DAPI).The cell marked by the square contains several vesicles, where microspheres (white) aresurrounded by the probe solution (red). b) Magnification (3.75-fold) of the perinuclear regionof a selected cell. Small vesicles containing the probe, but no microspheres, appear as reddishdots around the nucleus. c) The same cell viewed through the eye-piece of the two-photonimaging microscope. The scanned area (square) and the nucleus (dashed line) are marked. d)Integrated intensity image of phosphorescence (50 × 50 pixels2). e) Phosphorescence lifetimeimage. f) Nucleus of a cell surrounded by internalized micro-spheres. g) Integrated intensityimage of phosphorescence and the emission spectra (to the left) collected from the areas 1–3(marked by the squares). h) Phosphorescence lifetime image. i) pO2 image calculated from thelifetime image (h).
Finikova et al. Page 14
Chemphyschem. Author manuscript; available in PMC 2009 February 19.
NIH
-PA Author Manuscript
NIH
-PA Author Manuscript
NIH
-PA Author Manuscript

Figure 6.Diagram of the imaging system. APD1 and APD2: avalanche photodiodes; F1–F4: short-pass(SP), long-pass (LP) and notch filters.
Finikova et al. Page 15
Chemphyschem. Author manuscript; available in PMC 2009 February 19.
NIH
-PA Author Manuscript
NIH
-PA Author Manuscript
NIH
-PA Author Manuscript