Thiols in Coastal Waters of the Western North Sea and English Channel
10
Research Thiols in Coastal Waters of the Western North Sea and English Channel RADWAN AL-FARAWATI AND CONSTANT M. G. VAN DEN BERG* Oceanography laboratories, University of Liverpool, Liverpool L69 7ZL, England Thiols were determined in coastal waters of the western North Sea and English Channel. Detection was carried out on-board ship on-line by flow-analysis with detection by cathodic stripping voltammetry and calibration with thiourea. The thiol concentrations ranged from 0.70 to 3.60 nM (thiourea equivalents) and were found to vary over a relatively short distance perpendicular to the coast. Low concentrations in the area of greatest estuarine input (the Humber-Wash area) indicated that the thiols did not originate from low-salinity waters. Instead, variations in the thiol concentration were found to parallel those of chlorophyll. This correlation was confirmed by depth profiles which showed a trend for the thiols similar to that of chlorophyll. The data demonstrates that thiols are more widespread than anticipated, and that marine phytoplankton is an important source of the thiols. In view of their known ability to bind with metals, these data indicate that the thiols could be an important candidate to act as such ligands in the marine system. The measurements gave no evidence for the presence of sulfide in these waters which means that it must be present at less than 20% of the detected thiol levels. Introduction Transformations between the various forms of inorganic and organic sulfur compounds are key factors in the global sulfur cycle (1-4). SO4 2- is the predominant form of inorganic sulfur in the presence of dissolved oxygen, which can be assimilated by marine organisms and subsequently reduced to organic sulfur containing compounds. Sulfide is the predominant species in reduced conditions, but it is unstable with respect to oxidation by hydrogen peroxide and iodate (5, 6) in seawater. Nevertheless, it has been found to occur, at low concentrations (pico to nanomolar), in aerobic conditions (7, 8), presumably stabilized by complexation with metals in addition to in-situ biological production. Similarities in the depth profiles of sulfide and chlorophyll suggest a biological origin for the sulfide (9). COS (carbonyl sulfide) is present in seawater at pico to nanomolar concentrations (10, 11), with diel variations in surface waters thought to be due photochemical reactions (10). A photosensitized reaction of organic sulfur compounds including thiols is a source for COS (12). The spatial variability (i.e., offshore and nearshore) in the COS distribution is associated with the distribution of organic compounds which are photolyzed to COS, and this could be the reason the concentration of COS in the coastal waters is higher than in open seawater (3). Thiols are therefore a source of COS and subsequently of sulfide, mediated by photochemical and biological reactions. Thiols, like sulfide, are important ligands for metals. These compounds could be a major ligand for copper in seawater in view of their high complex stability with that metal (13). Glutathione is thought to be the most abundant nonprotein thiol in animals, plants, and various bacteria (typical concentrations range between 0.1 and 10 mM) (14, 15). Nanomolar levels of particulate glutathione are known to exist in coastal waters, co-varying with chlorophyll (16), and dissolved glutathione has been shown to occur in the water column of the Atlantic (17). Sulfide in seawater can be determined after H2S vola- tilisation from acidified samples with cryogenic trapping followed by detection by gas chromatography with photo- ionization detection (7) or with flame-photometric detection (18, 19) or by cathodic stripping voltammetry (8), which involves a reaction of electrochemically labile sulfide (com- prising free sulfide and sulfide released from complex dissociation in the diffusion layer) with a mercury electrode. The voltammetric method has not been compared to the GC methods, but oceanic concentrations can be compared nevertheless assuming oceanographic consistency: the GC methods have shown oceanic total sulfide concentrations in the upper water column on the order of 100 pM, with very low free sulfide concentrations, below 5 pM (19). Higher total sulfide levels have typically been found by the CSV method: typically 2 nM in the oceanic water column of unknown sulfide species (8). Our preliminary work has demonstrated that although CSV can be used to determine sulfide, this has to be done using a flow-cell because free sulfide, as well as sulfide complexed with certain trace metals, gives an unstable peak which rapidly decreases due to the formation of an insoluble product with mercuric ions from the mercury electrode (present as residues in the voltammetric cell), whereas a stable peak is obtained for various thiol compounds (20). This preliminary work suggested the possibility that the at least part of the stable sulfide-like voltammetric peak in seawater may be due to thiol compounds rather than to sulfide. Here voltammetry is used to obtain thiol concentrations, and check for the presence of sulfide, in coastal water of the western North Sea and English Channel. Flow-analysis was used with detection by CSV (FA-CSV), and the measurements were on-line, in water pumped on-board the ship. Separate measurements using a conventional voltammetric cell were made to confirm whether the peak was stable and due to sulfide or thiols. A data set was obtained of some 7000 thiol measurements in these waters. These data were used to determine relationships of thiols to various other parameters (e.g., salinity, temperature, chlorophyll). Automated volta- mmetric methods, on board ship, have been used before for in-line monitoring of trace metals in surface and coastal waters of the western North Sea (21, 22) but not for sulfide or thiol compounds. Materials and Methods Equipment. Water was pumped at a rate of 4 L min -1 from a depth of ∼4 m on-board ship using a peristaltic pump via * To whom correspondence should be addressed. Phone: +44- 151-7944096; fax: +44-151-7944099; e-mail: [email protected]. 1902 9 ENVIRONMENTAL SCIENCE & TECHNOLOGY / VOL. 35, NO. 10, 2001 10.1021/es000073i CCC: $20.00 2001 American Chemical Society Published on Web 04/13/2001
Transcript of Thiols in Coastal Waters of the Western North Sea and English Channel

Research
Thiols in Coastal Waters of theWestern North Sea and EnglishChannel
R A D W A N A L - F A R A W A T I A N DC O N S T A N T M . G . V A N D E N B E R G *
Oceanography laboratories, University of Liverpool,Liverpool L69 7ZL, England
Thiols were determined in coastal waters of the westernNorth Sea and English Channel. Detection was carried outon-board ship on-line by flow-analysis with detection bycathodic stripping voltammetry and calibration with thiourea.The thiol concentrations ranged from 0.70 to 3.60 nM(thiourea equivalents) and were found to vary over arelatively short distance perpendicular to the coast. Lowconcentrations in the area of greatest estuarine input (theHumber-Wash area) indicated that the thiols did notoriginate from low-salinity waters. Instead, variations inthe thiol concentration were found to parallel those ofchlorophyll. This correlation was confirmed by depth profileswhich showed a trend for the thiols similar to that ofchlorophyll. The data demonstrates that thiols are morewidespread than anticipated, and that marine phytoplanktonis an important source of the thiols. In view of theirknown ability to bind with metals, these data indicate thatthe thiols could be an important candidate to act assuch ligands in the marine system. The measurementsgave no evidence for the presence of sulfide in these waterswhich means that it must be present at less than 20% ofthe detected thiol levels.
IntroductionTransformations between the various forms of inorganic andorganic sulfur compounds are key factors in the global sulfurcycle (1-4). SO4
2- is the predominant form of inorganic sulfurin the presence of dissolved oxygen, which can be assimilatedby marine organisms and subsequently reduced to organicsulfur containing compounds. Sulfide is the predominantspecies in reduced conditions, but it is unstable with respectto oxidation by hydrogen peroxide and iodate (5, 6) inseawater. Nevertheless, it has been found to occur, at lowconcentrations (pico to nanomolar), in aerobic conditions(7, 8), presumably stabilized by complexation with metals inaddition to in-situ biological production. Similarities in thedepth profiles of sulfide and chlorophyll suggest a biologicalorigin for the sulfide (9).
COS (carbonyl sulfide) is present in seawater at pico tonanomolar concentrations (10, 11), with diel variations insurface waters thought to be due photochemical reactions(10). A photosensitized reaction of organic sulfur compoundsincluding thiols is a source for COS (12). The spatial variability
(i.e., offshore and nearshore) in the COS distribution isassociated with the distribution of organic compounds whichare photolyzed to COS, and this could be the reason theconcentration of COS in the coastal waters is higher than inopen seawater (3). Thiols are therefore a source of COS andsubsequently of sulfide, mediated by photochemical andbiological reactions.
Thiols, like sulfide, are important ligands for metals. Thesecompounds could be a major ligand for copper in seawaterin view of their high complex stability with that metal (13).Glutathione is thought to be the most abundant nonproteinthiol in animals, plants, and various bacteria (typicalconcentrations range between 0.1 and 10 mM) (14, 15).Nanomolar levels of particulate glutathione are known toexist in coastal waters, co-varying with chlorophyll (16), anddissolved glutathione has been shown to occur in the watercolumn of the Atlantic (17).
Sulfide in seawater can be determined after H2S vola-tilisation from acidified samples with cryogenic trappingfollowed by detection by gas chromatography with photo-ionization detection (7) or with flame-photometric detection(18, 19) or by cathodic stripping voltammetry (8), whichinvolves a reaction of electrochemically labile sulfide (com-prising free sulfide and sulfide released from complexdissociation in the diffusion layer) with a mercury electrode.The voltammetric method has not been compared to the GCmethods, but oceanic concentrations can be comparednevertheless assuming oceanographic consistency: the GCmethods have shown oceanic total sulfide concentrations inthe upper water column on the order of 100 pM, with verylow free sulfide concentrations, below 5 pM (19). Higher totalsulfide levels have typically been found by the CSV method:typically 2 nM in the oceanic water column of unknownsulfide species (8). Our preliminary work has demonstratedthat although CSV can be used to determine sulfide, this hasto be done using a flow-cell because free sulfide, as well assulfide complexed with certain trace metals, gives an unstablepeak which rapidly decreases due to the formation of aninsoluble product with mercuric ions from the mercuryelectrode (present as residues in the voltammetric cell),whereas a stable peak is obtained for various thiol compounds(20). This preliminary work suggested the possibility that theat least part of the stable sulfide-like voltammetric peak inseawater may be due to thiol compounds rather than tosulfide.
Here voltammetry is used to obtain thiol concentrations,and check for the presence of sulfide, in coastal water of thewestern North Sea and English Channel. Flow-analysis wasused with detection by CSV (FA-CSV), and the measurementswere on-line, in water pumped on-board the ship. Separatemeasurements using a conventional voltammetric cell weremade to confirm whether the peak was stable and due tosulfide or thiols. A data set was obtained of some 7000 thiolmeasurements in these waters. These data were used todetermine relationships of thiols to various other parameters(e.g., salinity, temperature, chlorophyll). Automated volta-mmetric methods, on board ship, have been used before forin-line monitoring of trace metals in surface and coastalwaters of the western North Sea (21, 22) but not for sulfideor thiol compounds.
Materials and MethodsEquipment. Water was pumped at a rate of 4 L min-1 froma depth of ∼4 m on-board ship using a peristaltic pump via
* To whom correspondence should be addressed. Phone: +44-151-7944096; fax: +44-151-7944099; e-mail: [email protected].
1902 9 ENVIRONMENTAL SCIENCE & TECHNOLOGY / VOL. 35, NO. 10, 2001 10.1021/es000073i CCC: $20.00 2001 American Chemical SocietyPublished on Web 04/13/2001

a 20 m poly(vinyl chloride) (PVC) hose of 12 mm internaldiameter. To hold the hose under water, the hose wasattached to a heavy (∼50 kg), epoxy-coated, iron, “fish”. The“fish” was suspended to the left of the bow of the ship at 3m depth. The distance between the “fish” and the hull wasapproximately 3-4 m. A high density polyethylene funnelwas attached to the front of the “fish”, connected to the inletof the hose. In-line filtration of the seawater was achievedusing a homemade filtration unit which was flushed con-tinuously in a cross-flow fashion: the seawater was flowingtangentially along a 0.45 µm membrane filter in a Swinnex47 filter holder (Millipore part SX00 047 00) which was fixedon the side of the hose and cut to allow the water to passdirectly along the filter.
Salinity, transmissometry, temperature, chlorophyll, ni-trate, nitrite, and phosphate data were obtained from theBritish Oceanographic Data Centre (BODC) in Bidston. Thefirst four parameters were determined by members of theProudman Oceanography Laboratory (POL) and nitrate wasmeasured by the Plymouth Marine Laboratories (PML).Chlorophyll was determined on-line using a fluorimetercalibrated using chlorophyll standard.
Discrete samples from the water column of the North Seaand the English Channel were collected using a CTD-rosettesampler with modified precleaned 10 liter FEP-coated Go-Flo bottles, filtered and measured by FA-CSV. For reasons ofcomparison, filtered samples were collected using the in-line pumping system and were measured on-board ship by
FIGURE 1. Study area of the North Sea Cruise. (A) Humber-Wash grid including the Humber, Wash, and part of the East Anglia; (B) northeastcoastal grid between the Humber and the Tweed rivers; (C) East Anglia-English Channel grid.
VOL. 35, NO. 10, 2001 / ENVIRONMENTAL SCIENCE & TECHNOLOGY 9 1903

FA-CSV as well as batch-mode CSV. All discrete samples wereanalyzed in duplicate. A stock solution of 0.1 M thiourea(BDH) was prepared in Milli-Q water.
Voltammetric Procedure To Detect Thiol Compounds.Voltammograms were recorded using an Autolab voltam-meter (Eco Chemie, Netherlands) and a hanging mercurydrop electrode (HMDE) (663 VA stand, Metrohm, Switzer-land). The voltammetric cell was replaced by a homemade,Perspex, flow-cell and in-line purging system to removeoxygen (20). The nozzle of the jet of the flow-cell was adjustedto within ∼1 mm of the mercury drop. The water level in thecell was maintained constant by continuously pumping waterout via a Teflon tube fixed at the water surface. The systemwas controlled by an IBM-compatible computer. The software(EASVDB) was adapted from the original software (EAS fromEco Chemie) to enable continuous on-line analysis. A square-wave modulation (150 Hz) was applied to the CSV scans witha pulse-height of 25 mV and step height of 2.4 mV. Potentialswere set relative to a double-junction, Ag/AgCl, saturatedAgCl, 3 M KCl, reference electrode, with a salt-bridge filledwith 3 M KCl. Purified nitrogen gas was used to flush thecontainer holding the semipermeable tubing for oxygenremoval. The residence time of the seawater in the degassingunit was 20 s.
The following voltammetric parameters were used: thedeposition potential was set to -0.05 V; four mercury dropswere discarded before a new mercury drop was extruded; adeposition time of 30 s was used during which water waspumped through the flow-cell and the bulk solution waspurged. A 3 s quiescent period was allowed before thepotential scan was initiated at -0.2 V and terminated at -0.7.The precision of individual shipboard measurements was(5%. The system was intermittently calibrated at 6-8 hintervals. The sensitivity was calibrated using a freshlycollected, discrete, sample in a 250 mL polyethylene bottle,and a second one to which 2.5 nM thiourea had been added.The sensitivity was calculated from the difference of theaverage peak heights of the two samples (20 scans for eachsample). Thiol concentrations are expressed in nM equiva-lents of thiourea.
Study Area. Figure 1 shows the study area and cruisetrack (RRS Challenger, 1-13 July, 1995) for the North Seaand the English Channel. The area investigated was dividedinto three major regions: (1) Humber-Wash grid startingfrom the north of the Humber Estuary going south to 52.8°N; this followed a box-like pattern (Figure 1A); (2) northeastcoastal grid where the ship followed a zigzag pattern startingfrom the north of the Humber Estuary and going north toTweed (Figure 1B) and then back parallel to the coast; and(3) the East Anglia-English Channel grid where the shipsteamed parallel to the coast from the south of East Angliaalong the southwest of the North Sea to the northern sideof the English Channel (Figure 1C). This cruise was part ofthe Land Ocean Interaction Study (LOIS) project of theNational Environmental Research Council (NERC).
ResultsVerification of the Identity of the Thiol/Sulfide Peak inSeawater. Voltammetry of seawater collected during the RRSChallenger cruise revealed the presence of a sulfide or thiol-type peak at -0.54 V (Figure 2). Batch-mode voltammetry ofseveral (10) filtered samples was used on-board ship to verifywhether the response was due to sulfide or thiol compounds.The voltammetric response was stable for a period of at least10 min, indicating that the response was not due to sulfide[which would have caused a rapidly decreasing responsebut to thiol compounds (20)]. The decrease of the sulfidepeak had been ascribed before to degassing of H2S (23) andto changes in the sample composition (24); however, inaddition to those reactions it has been demonstrated that
the reaction with mercury waste is sufficient to rapidly removethe sulfide contribution to this peak (20).
Several filtered samples of surface water were analyzedon-board ship at selected CTD stations to compare analysesby flow and batch-mode voltammetry (Table 1). Stable peakheights of the batch-mode measurements in all testedsamples demonstrated that the sulfide concentration wasnegligible compared to that of the thiols. In view of an averagestandard deviation of 5% of successive scans in the batchcell, the sulfide concentration amounted to less than 5% ofthat of the thiols. This means that the sulfide levels in thesecoastal waters were less than 0.05-0.15 nM, in line withexpectation for oceanic sulfide levels (9), but are somewhatless than levels of 0.1-1 nM of total sulfide (including metalsulfide complexes) found previously in coastal and surfaceocean waters (7).
Another candidate for the identity of the thiol-type peakis elemental sulfur (25): it is unlikely that a poorly solubleelement like sulfur would occur in natural waters, but in anycase this peak decreases rapidly (20) [confirmed in separateexperiments (Laglera and van den Berg, unpublished data)]just like the sulfide peak, indicating that its contribution (ifany) to the stable peak used here to detect thiols, wasnegligible.
The sulfide and thiols detected by voltammetry are freeconcentrations: complexation by trace metals could con-ceivably mask major amounts of these compounds, as onlythe free sulfide and thiol concentrations are detected by thevoltammetric method, possibly augmented by dissociationof some of the complexed fraction. At the nanomolar levels
FIGURE 2. Voltammetric response of sulfide/thiol compounds inNorth Seawater.
TABLE 1. Comparative Measurements of Thiol Concentrations(nM thiourea equivalents) by Flow and Batch-ModeVoltammetry On-board Ship during a Challenger Cruise(CH119C) on the North Sea in Samples Taken at CTD-Stations
station batch analysis flow analysis
H12 1.51 1.64H13 1.70 1.72H18 1.77 1.80C5 1.52 1.61C10 1.80 1.96C12 3.12 2.99C18 2.37 2.36C21 1.65 1.71C24 1.90 1.73C29 1.86 1.91
1904 9 ENVIRONMENTAL SCIENCE & TECHNOLOGY / VOL. 35, NO. 10, 2001

of trace metals in the coastal waters studied here only copperwould be likely to complex sulfide as the complexes withother metals such as cadmium, lead, aluminum, and others
are too weak to obtain significant complexation at lownanomolar levels. The stability of copper complexes withsulfide [log K′CuHS ) 12.9 (26)] is similar to that for organic
FIGURE 3. Distribution of thiols along the North Sea coast and the Channel in the cruise track. Colors on the map indicate detected thiolconcentrations. (A) the Humber-Wash region. (B) The East Anglia-English Channel region. (C) The Channel.
VOL. 35, NO. 10, 2001 / ENVIRONMENTAL SCIENCE & TECHNOLOGY 9 1905

copper complexes in seawater (27, 28); the organic ligandsoccur at greater levels and in excess in coastal waters,suggesting that these would tend to outcompete low sulfidelevels leaving a major proportion of the sulfide free;nevertheless, it is possible that a significant fraction of sulfideis masked by copper. Similarly, the detected thiol concentra-tions are free thiol concentrations as the thiol peak is loweredby complexation with copper (13). For instance glutathioneforms very stable complexes with copper, log K′CuGS ) 12.4,similar to sulfide, and its free concentration could thereforebe lowered by complexation with copper.
The CSV sensitivity was calibrated using thiourea whichalong with several thiol compounds (like glutathione andthioacetamide) gives a peak indistinguishable from thatapparent in the seawater (20); thiourea was selected forpractical reasons as it gives a stable peak with good sensitivity,and the stock solutions are easy to prepare; its selection doesnot indicate that it is a candidate for the identity of the thiolpeak as it is not clear whether any thiourea occurs naturallyin the environment at all. At present, we do not know whichthiol compound is actually responsible for the thiol peak soin principle any thiol compound could be used for this
FIGURE 4. Concentrations of thiols and other parameters as a function of time in U.K. coastal waters. Vertical lines illustrate the areaswhere a good correlation was found between thiols and chlorophyll. (A) The Humber-Wash region. (B) The north east coastal region.(C) The East Anglia-English Channel region.
1906 9 ENVIRONMENTAL SCIENCE & TECHNOLOGY / VOL. 35, NO. 10, 2001
calibration; however, glutathione is abundant in marinemicroorganisms which makes it a prime candidate (17).Sulfide and sulfur could not be used as calibrant as theirpeak is highly unstable in the batch cell due rapid reactionwith mercury traces.
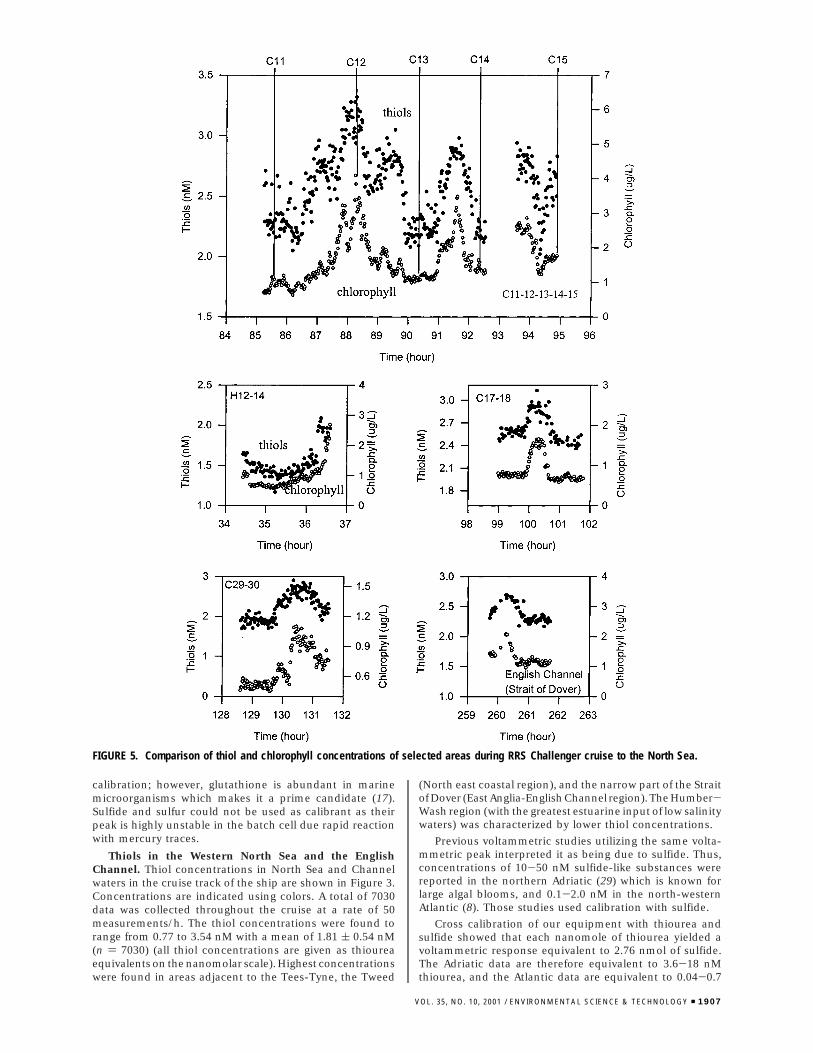
Thiols in the Western North Sea and the EnglishChannel. Thiol concentrations in North Sea and Channelwaters in the cruise track of the ship are shown in Figure 3.Concentrations are indicated using colors. A total of 7030data was collected throughout the cruise at a rate of 50measurements/h. The thiol concentrations were found torange from 0.77 to 3.54 nM with a mean of 1.81 ( 0.54 nM(n ) 7030) (all thiol concentrations are given as thioureaequivalents on the nanomolar scale). Highest concentrationswere found in areas adjacent to the Tees-Tyne, the Tweed
(North east coastal region), and the narrow part of the Straitof Dover (East Anglia-English Channel region). The Humber-Wash region (with the greatest estuarine input of low salinitywaters) was characterized by lower thiol concentrations.
Previous voltammetric studies utilizing the same volta-mmetric peak interpreted it as being due to sulfide. Thus,concentrations of 10-50 nM sulfide-like substances werereported in the northern Adriatic (29) which is known forlarge algal blooms, and 0.1-2.0 nM in the north-westernAtlantic (8). Those studies used calibration with sulfide.
Cross calibration of our equipment with thiourea andsulfide showed that each nanomole of thiourea yielded avoltammetric response equivalent to 2.76 nmol of sulfide.The Adriatic data are therefore equivalent to 3.6-18 nMthiourea, and the Atlantic data are equivalent to 0.04-0.7
FIGURE 5. Comparison of thiol and chlorophyll concentrations of selected areas during RRS Challenger cruise to the North Sea.
VOL. 35, NO. 10, 2001 / ENVIRONMENTAL SCIENCE & TECHNOLOGY 9 1907

nM thiourea. The North sea and Channel thiol concentrationslie between these two levels which makes oceanographicsense as they might be expected to be lower in open oceanwaters and higher in warm, productive, coastal waters.
The distribution of the thiols and its relation to otherparameters [temperature, salinity, chlorophyll, nitrate, nitrite,phosphate, silicate, and suspended particulate material(SPM)] in the three regions of the cruise will be discussed indetail below.
Humber-Wash Grid. The thiol concentrations rangedbetween 0.92 nM and 2.41 nM, with a mean of 1.51 ( 0.26(n ) 1867). There is no systematic, clear, regional trend inthe thiol distribution. The southern part of the Humber-Wash area has a mean concentration of 1.62 ( 0.26 (n )969), which is slightly higher than that in the north (1.39 (0.21, n ) 898), but it is an arbitrary definition, and thedifference is small. Highest concentrations were found inthe Wash area near station H12 between stations H10 andH13 and near the coast of East Anglia.
Northeast Coastal Grid. In this part of the study, the trackfollowed a zigzag pattern 20 mi. to and from the coast. Thedistribution of the thiols along the north east coast is shownin Figure 3B. The thiol concentrations varied over severalnanomolar over relatively short distances due to the ship
traveling to and from the coast. The thiol concentration rangewas 0.88-3.54 nM, with a mean of 2.14 ( 0.48 (n ) 5179).Highest levels occurred in the Tees-Tyne area, and lowest inthe most southerly part (Humber to station 5). Possiblereasons for the variations become apparent when all dataare compared with other parameters below.
East Anglia-English Channel Grid. The thiol distributionalong the coast of East Anglia and through the EnglishChannel region are shown in Figure 3C. The thiol concen-trations ranged from 1.12 to 2.95 nM, with a mean of 2.04( 0.39 (n ) 1867). Highest concentrations were evident inthe Strait of Dover.
DiscussionAbundance of Thiols Compared to Sulfide. This studyindicates that thiols are ubiquitous in shelf and coastal waters,at concentrations much greater than sulfide. The predomi-nance of thiols over sulfide demonstrates the importance oftaking thiols into account when voltammetry is used to detectlow sulfide levels in oxygenated surface waters as the peaksare indiscernible from each other in a square-wave CSV scan.There are electrochemical differences between sulfide andsulfur (30) and various thiol compounds (20) so by varyingan electrochemical parameter like the deposition potential
FIGURE 6. Thiols as a function of chlorophyll in selected areas of the coastal waters in the North Sea.
1908 9 ENVIRONMENTAL SCIENCE & TECHNOLOGY / VOL. 35, NO. 10, 2001

it may be possible to come to a closer characterization of thethiol peak; however, the most simple characterizationbetween sulfide, sulfur, and thiols is the instability (decreasingwith subsequent scans) of the sulfide/sulfur peak in con-ventional (batchwise) CSV. It is possible that greater totalsulfide levels are present than estimated here as the elec-troactive sulfide peak is lowered by complexation with metalsand especially by copper (26, 31); however, such complexedsulfide (if present) does not contribute significantly to theCSV peak used here to estimate the thiol concentrations.
Interestingly, the thiol peak is also lowered by metalcomplexation as evidenced by copper additions to thiolsolutions (32), so it is possible that the total thiol concentra-tion is greater than indicated. Organic copper complexingligands (of which the thiols could be an important compo-
nent) tend to be present in large excess in coastal waters(33); therefore, it is possible that the thiols are largely freeand the underestimate is relatively small; this can beinvestigated in further work by determining the thiolsconcentration in the presence of a competing ligand to freeup any complexed thiols.
Relationships between Thiols and Other Parameters.Thiol concentrations can be compared with data for chlo-rophyll, nitrite, nitrate, phosphate, silicate, temperature,salinity, and SPM, as a function of the cruising time in thethree main regions (Humber-Wash, north east coast andeast Anglia-English Channel) in Figure 4. Variability in theHumber-Wash and north east coast was particularly pro-nounced because of the zigzag or box-like pattern of thecruise track, whereas the variability in the east Anglia-English
FIGURE 7. Depth profiles of thiols (b), temperature (4), salinity (2), chlorophyll (0), and oxygen (9) for CTD stations during the RRSChallenger cruise to the North Sea.
VOL. 35, NO. 10, 2001 / ENVIRONMENTAL SCIENCE & TECHNOLOGY 9 1909

Channel area was less pronounced because the cruise trackwas here parallel to the coast. Where the ship followed atrack which zigzagged to and from the coast, the salinity canbe seen to decrease and increase with this pattern. The originof species dissolved in coastal waters can usually be evaluatedby comparison with salinity: a decrease with increasingsalinity would then suggest a coastal origin. However, thethiol data do not show a systematic co-variation with thesalinity indicating that their distribution is not related to aspecific freshwater or oceanic source. Occasionally anincrease in the thiol concentration was associated withdecreasing salinity and increasing nutrient concentrations(C12), but sometimes the opposite was the case (C14 andC18).
Comparison of the correlation coefficients (r) betweenthiols and the other parameters showed best correlation withchlorophyll. The correlation coefficient with chlorophyll wassmall (0.09) when all data were used, but significant cor-relations were obtained for individual sites indicating thatlocally the thiols co-varied with chlorophyll. Examples of theco-variation of thiol and chlorophyll are shown expanded inFigure 5, and plots of thiol against chlorophyll are shown inFigure 6. The co-variation between chlorophyll and the thiolssuggest that in these waters the main origin of the thiols isfrom phytoplankton.
Thiol and chlorophyll concentrations obtained at CTDstations at the way-points of the cruise track (when the shipwas stationary) showed much stronger correlation at the near-shore stations than at the off-shore stations: the correlationcoefficient of thiols and chlorophyll for the near-shore datawas 0.85, whereas it was 0.18 for the off-shore data. It is likelythat the stronger trend in chlorophyll and thiol concentrationsin the near-shore waters is the cause for the stronger co-variation of these data.
Depth Profiles. The coastal distribution suggests thatmarine phytoplankton plays a major role in the distributionof thiols. It is not ruled out that other processes (e.g.,atmospheric input, in situ degradation of settled phy-toplankton biomass and efflux of thiols across the sediment-water interface) could also affect the vertical distribution ofthiols. Therefore, the vertical distribution of thiols in the NorthSea was determined to verify the importance of suchprocesses.
The depth distribution of thiols, temperature, salinity,oxygen, and chlorophyll at three stations (C30, C5, and EC)is shown in Figure 7. These stations reflect different locationsand hydrographic conditions (see Figure 1). Stratification isweak at all stations due to the tidal mixing of these shallowwaters. However, some stratification is apparent at stationC30; it was less at C5 and absent at station EC. Generally,highest thiol concentrations (around 2.1 nM) were found inthe surface waters while the concentrations decreased withdepth to around 1.5 nM at all stations. The decrease in thethiol concentrations occurred at a depth of 60 m at stationC30, whereas the decrease was more gradual over the top 20m at the other two stations. The water column chlorophyllconcentration also increased toward the surface causing itstrend to be similar to that of the thiols. The surface increaseof the thiols could be due to releases by phytoplankton withor without photochemical inducement.
Stations C30 and EC showed a small increase near thesediments which could be attributable to a release fromporewaters, but the increase was small, much less than thatin the surface waters. Marine porewaters and sediments areknown to contain a variety of organic sulfur compounds (36-41). The interactions between hydrogen sulfide and organiccompounds via Michael addition are thought to play a majorrole in the production of thiols in marine sediments (2, 42,43). The deeper waters of the North Seawater column showlittle evidence for releases from the porewaters but it is
possible that the general background level of 1.5 nM mayreflect porewater releases, evidence for the trend beingremoved by tidal mixing. The thiol compounds in thesecoastal waters may therefore originate from porewaters orfrom in-situ production by microorganisms, or both.
The known ability of thiols to bind metals, in particularcopper, suggests that the abundance of thiols in coastal waterscould represent an important source of metal complexingligands in the marine system.
AcknowledgmentsThe fieldwork of this investigation was carried out as a partof the LOIS program of the NERC (grant G5T/02/1058,publication number 347). The research of R.A.F. was sup-ported by the Saudi Arabian government. The assistance bythe Principal Scientists (R. Howland, PML; D. Prandle, POL;R. Lowry, BODC) and the officers and crew of RRS Challengerare greatly appreciated, as are the nutrient data from PML.
Literature Cited(1) Taylor, B. F.; Gilchrist, D. C. Appl. Environ. Microbiol. 1991, 57,
3581-3584.(2) Vairavamurthy, A.; Mopper, K. Nature 1987, 329, 623-625.(3) Andreae, M. O. Mar. Chem. 1990, 30, 1-29.(4) Flock, O. R.; Andreae, M. O. Mar. Chem. 1996, 54, 11-26.(5) Millero, F. J.; Hubinger, S.; Fernandez, M.; Garnett, S. Environ.
Sci. Technol. 1987, 21, 439-443.(6) Jiazhong, Z.; Whitfield, M. Mar. Chem. 1986, 19, 121-137.(7) Cutter, G. A.; Krahforst, C. F. Geophys. Res. Lett. 1988, 15, 1393-
1396.(8) Luther, G. W., III; Tsamakis, E. Mar. Chem. 1989, 27, 165-177.(9) Radford-Knoery, J.; Cutter, G. A. Geochim. Cosmochim. Acta
1994, 58, 5421-5431.(10) Ferek, R. J.; Andreae, M. O. Nature 1984, 307, 148-150.(11) Turner, S. M.; Liss, P. S. J. Atmos. Chem. 1985, 2, 223-232.(12) Zepp, R. G.; Andreae, M. O. Geophys. Res. Lett. 1994, 21, 2813-
2816.(13) Leal, M. F. C.; van den Berg, C. M. G. Aquat. Geochem. 1998,
4, 49-75.(14) Kosower, E. M. Glutathione: metabolism and functionin. In
Kroc Foundation Series; Arias, I. M.; Jakoby, W. B., Eds.; RavenPress: New York, 1976; Vol. 6, p 1.
(15) Giovanelli, J. Methods Enzymol. 1987, 143, 419-426.(16) Matrai, P. A.; Vetter, R. D. Limnol. Oceanogr. 1988, 33, 624-631.(17) Le Gall, A.-C.; van den Berg, C. M. G. Deep-Sea Res. I 1998, 45,
1903-1918.(18) Radford-Knoery, J.; Cutter, G. A. Anal. Chem. 1993, 65, 976-
982.(19) Cutter, G. A.; Walsh, R. S.; deEchols, C. S. Deep-Sea Res. II 1999,
46, 991-1010.(20) Al-Farawati, R.; van den Berg, C. M. G. Mar. Chem. 1997, 57,
277-286.(21) Achterberg, E. P.; van den Berg, C. M. G. Anal. Chim. Acta 1994,
284, 463-471.(22) Colombo, C.; Daniel, A.; van den Berg, C. M. G. Anal. Chim. Acta
1997, 346, 101-111.(23) Davison, W.; Gabbutt, C. D. J. Electroanal. Chem. 1979, 99, 311-
320.(24) Davison, W.; Buffle, J.; de Vitre, R. Pure Appl. Chem. 1988, 60,
1535-1548.(25) Batina, N.; Ciglenecki, I.; Cosovic, B. Anal. Chim. Acta 1992,
267, 157-164.(26) Al-Farawati, R.; van den Berg, C. M. G. Mar. Chem. 1999, 63,
331-352.(27) Moffett, J. W. Deep-Sea Res. I 1995, 42, 1273-1295.(28) Coale, K. H.; Bruland, K. W. Limnol. Oceanogr. 1988, 33, 1084-
1101.(29) Ciglenecki, I.; Cosovic, B. Mar. Chem. 1996, 52, 87-97.(30) Rozan, T. F.; Theberge, S. M.; Luther, G. W., III Anal. Chim. Acta
2000, 415, 175-184.(31) Zhang, J.-Z.; Millero, F. J. Anal. Chim. Acta 1994, 284, 497-504.(32) Leal, M. F. C.; Vasconcelos, M. T. S. D.; van den Berg, C. M. G.
Limnol. Oceanogr. 1999, 44, 1750-1762.(33) van den Berg, C. M. G. Mar. Chem. 1984, 14, 201-212.(34) Moran, M. A.; Zepp, R. G. Limnol. Oceanogr. 1997, 42, 1307-
1316.(35) Luther, G. W., III; Church, T. M. Mar. Chem. 1988, 23, 295-309.
1910 9 ENVIRONMENTAL SCIENCE & TECHNOLOGY / VOL. 35, NO. 10, 2001

(36) MacCrehan, A.; Shea, D. Geochemical transformations ofsedimentary sulfur; American Chemical Society: Washington,DC, 1995; Vol. 612, p 294.
(37) Luther, G. W., III; Church, T. M.; Scurdlark, J. R.; Cosman, M.Science 1986, 232, 746-749.
(38) Kiene, R. P.; Taylor, B. F. Nature 1988, 332, 148-150.
(39) Henneke, E.; Luther, G. W., III; de Lange, G. J.; Hoefs, J. Geochim.Cosmochim. Acta 1997, 61, 307-321.
(40) Vairavamurthy, A.; Zhou, W. Q.; Eglinton, T.; Manowitz, B.Geochim. Cosmochim. Acta 1994, 58, 4681-4687.
(41) Vandermaarel, M. J. E. C.; Jansen, M.; Hansen, T. A. Appl. Environ.Microbiol. 1995, 61, 48-51.
(42) Boulegue, J.; Lord, C. J., III; Church, T. M. Geochim. Cosmochim.Acta 1982, 46, 453-464.
(43) Mopper, K.; Taylor, B. F. Am. Chem. Soc. Symp. Series 1986, 305,324-339.
Received for review April 3, 2000. Revised manuscript re-ceived February 13, 2001. Accepted February 16, 2001.
ES000073I
VOL. 35, NO. 10, 2001 / ENVIRONMENTAL SCIENCE & TECHNOLOGY 9 1911