jbls Assessment of Faecal Bacteria Contamination in Selected Coastal Waters of Tanzania corrected...
41
Journal of Biology and Life Science ISSN 2157-6076 2013, Vol. 4, No. 2 Assessment of Faecal Bacteria Contamination in Selected Coastal Waters of Tanzania Samson Lazaro’s Mwakalobo University of Dar Es Salaam, P. O. Box 35048, Dar Es Salaam. Tanzania Tel: 255-756-440-173 E-mail: [email protected] Dr. Lucy Namkinga (Corresponding author) Department of Molecular Biology and Biotechnology, University of Dar Es Salaam P. O. Box 35179. Dar Es Salaam. Tanzania Tel: 255-784-772-552 E-mail: [email protected] www.macrothink.org/jbls 1
Transcript of jbls Assessment of Faecal Bacteria Contamination in Selected Coastal Waters of Tanzania corrected...
Journal of Biology and Life ScienceISSN 2157-6076
2013, Vol. 4, No. 2
Assessment of Faecal Bacteria
Contamination in Selected Coastal
Waters of Tanzania
Samson Lazaro’s Mwakalobo
University of Dar Es Salaam, P. O. Box 35048, Dar Es Salaam.
Tanzania
Tel: 255-756-440-173 E-mail: [email protected]
Dr. Lucy Namkinga (Corresponding author)
Department of Molecular Biology and Biotechnology, University
of Dar Es Salaam
P. O. Box 35179. Dar Es Salaam. Tanzania
Tel: 255-784-772-552 E-mail: [email protected]
www.macrothink.org/jbls1
Journal of Biology and Life ScienceISSN 2157-6076
2013, Vol. 4, No. 2
Prof. Thomas Jacob Lyimo
Department of Molecular Biology and Biotechnology, University
of Dar Es Salaam
P. O. Box 35179. Dar Es Salaam. Tanzania
Tel: 255-754-375-924 E-mail: [email protected]
Dr. Charles Lugomela
Department of Aquatic Sciences and Fisheries, University of
Dar Es Salaam
P.O. Box 35064 Dar Es Salaam, Tanzania
Tel: 255-784-230-023 E-mail: [email protected]
Received: December 17 2012 Accepted: January 4 2013
doi:10.5296/xxx.vxix.xxx URL:
http://dx.doi.org/10.5296/xxx.vxix.xxx
www.macrothink.org/jbls2
Journal of Biology and Life ScienceISSN 2157-6076
2013, Vol. 4, No. 2
Abstract
Coastal communities of Tanzania use natural water systems such
as rivers, estuaries and marine for various activities like
drinking, fishing, washing and bathing. However, there is
scanty information on the safety for these water bodies for
the various uses. In this study faecal indicator bacteria were
assessed in three sites along the coast of Tanzania (i.e.
Pangani Estuary in Tanga Region, Ruvu Estuary in Pwani Region
and Mzinga Creek in Dar Es Salaam Region). At each site, three
sampling stations covering fresh, brackish and marine waters
were selected for monthly sampling between July 2009 and June
2010. Faecal bacterial indicators were generally higher in
Mzinga Creek compared to the rest of the study sites with
significant differences between Mzinga Creek and Pangani
Estuary for total coliforms (TC) and faecal coliforms (FC) (P
< 0.05). All faecal indicator bacteria were significantly
higher in fresh waters compared to brackish and marine waters
(P = 0.0001), for TC and FC and P = 0.001 for Enterococcus
www.macrothink.org/jbls3
Journal of Biology and Life ScienceISSN 2157-6076
2013, Vol. 4, No. 2
(ENT). The faecal indicator bacteria correlated positive to
each other and negatively to some environmental parameters
namely pH and Salinity. Results suggest allochthonous sources
of contamination and the influence of environmental factors.
Generally the faecal bacterial indicators in the studied
waters along the coast of Tanzania were within the acceptable
standards according to WHO and USEPA indicating low risks
situation for recreational purposes. However, these levels of
faecal bacteria does not warrant the use in the studied
estuaries for shellfish harvesting and the fresh water is not
suitable for direct drinking. Further studies and monitoring
programs are recommended to substantiate the current results.
Keywords: Faecal bacteria, Coliforms, Coastal aquatic
environment
1. Introduction
In many towns around the world, especially those in densely
populated rural or urban areas the microbiological quality of
waters is frequently threatened by pollution with untreated
domestic wastewater. The risk of exposure to pathogens in drinking orrecreational waters has been well described in the literature (WHO, 1998;
www.macrothink.org/jbls4
Journal of Biology and Life ScienceISSN 2157-6076
2013, Vol. 4, No. 2
1999). Water borne diarrheal diseases, including salmonellosis,
amoebiasis, shigellosis, cholera, or giardiasis are widespread
in areas with contaminated water (Thompson and Khan, 2003; WHO
and UNICEF, 2004; Grabow, 1996). In many developing countries,
diarrheal diseases remain a major killer in children.
Estimates by WHO and UNICEF (2004) indicates that 80% of all
illnesses in developing countries is related to water and
sanitation; and that 15% of all child deaths under the age of
5 years in developing countries are caused by diarrheal
diseases” (WHO and UNICEF 2004; Thompson and Khan 2003). In
developed countries, protection of water sources and treatment
of water are done effectively in such a way that, diarrheal
diseases and their incidences have been reduced greatly
compared to underdeveloped countries. Many towns and villages
in developing countries like in sub-Saharan Africa, do not
have access to hygienic toilets and large amounts of faecal
waste are discharged to the environment without adequate
treatment. Outbreaks have been associated with swimming in
crowded lakes (Ackman et al., 1997), contaminated drinking water
(Olsen et al., 2002) as well as surface water (Effler et al.,
2001).
www.macrothink.org/jbls5
Journal of Biology and Life ScienceISSN 2157-6076
2013, Vol. 4, No. 2
Detection of pathogens in water samples is very difficult, and the use
of indicator organisms to signal the potential presence of organisms thatcause gastrointestinal disease concept has been used successfully for a
long time. The faecal indicator bacteria such as Total coliform (TC),
Faecal coliform (FC), E. coli and enterococci (ENT) or faecal
streptococci are most commonly used today (USEPA, 1986; 1999;
Griesel and Jagals, 2002; Hysko et al., 2010). Faecal indicator
bacteria remains the major and most reliable tool in the
assessment of the health risks posed by pathogens in water
(Byamukama et al., 2000) as most faecal coliform bacteria do not
cause diseases. However, a measure of their concentration
provides an indication of the degree of faecal contamination
and therefore, enlighten on the possibility of being exposed
to disease-carrying organisms, which may be present in water.International standards (e.g. UNEP/WHO, EC, USEPA) have been set toregulate the levels of these faecal indicator bacteria as common indices ofthe suitability of waters (USEPA, 1999; WHO, 1999; 2003). The
recommended limits for water to be used for recreation and
related purposes, in many standards, are <000 CFU/100 ml for
TC and >100 for FC and ENT (WHO 1999). However, among the
three indicators, used in this study, ENT has been recommended
as the most suitable indicator for fresh and marine water (WHO 1999).Using ENT as standard, water may be classified, with 95th percentile, as
(A) excellent, when values are below 10 CFU/100 ml; (B) good, when
www.macrothink.org/jbls6
Journal of Biology and Life ScienceISSN 2157-6076
2013, Vol. 4, No. 2
values are between 11 and 50 CFU/100 ml; (C) fair, between 51 and 200
CFU/100 ml; (D) poor, between 201 and 1000 CFU/100 ml; and (E) very
poor, when values above 1000 CFU/100 ml are obtained (WHO, 1999).
when the water is classified as generally poor , various management‘ ’measures must be taken to minimise health risks.
In Tanzania, water pollution is cited as one of the major
causes of water-borne diseases that kill both children and
adults. Cholera outbreaks are frequent and cause significant
mortalities (Penrose et al., 2010,
http://www.infoforhealth.org,). Indeed, the periodic outbreaks
of cholera, diarrhea and typhoid diseases are mainly caused by
using unsafe water (Lyimo et al., 2007 and the references
therein). Several studies in coastal regions of Tanzania have
associated water pollution with occurrence of various
gastrointestinal diseases. For example Van Bruggen (1990),
Mohammed (2002a & b) and Mmochi and Francis (1999) reported
high levels of coliforms and nutrients in the coastal waters
of Zanzibar, Tanzania. Rubindamayugi (1996) made an attempt to
assess the sanitary quality of River Msimbazi and Coastal
waters in Dar es Salaam and came up with suggestions on
restricting some of the areas for swimming, and shellfish
www.macrothink.org/jbls7
Journal of Biology and Life ScienceISSN 2157-6076
2013, Vol. 4, No. 2
fishery as faecal contamination counts in those areas was
high. Likewise, Abbu and Lyimo (2007) found out that faecal
bacteria contamination was significantly higher at Mtoni
Kijichi, station close to city center than Rasi Dege site
which is away from Dar es Salaam city center. All these
studies were concentrated around Dar es Salaam and Zanzibar
cities but there is scanty information on feacal bacterial
contamination in other coastal areas. Thus, the current study
expanded to other areas with the aim of making comparison and
establishing baseline information to those areas.
2. Methods
2.1 Study Sites and Samplings
The current study was conducted in three sites along the
coastal regions of Tanzania. These were Pangani Estuary in
Tanga Region, Ruvu Estuary in Pwani Region and Mzinga Creek in
Dar Es Salaam Region (Figure 1). In each site, there were
three sampling stations established along a salinity gradient,
i.e. fresh water (below 5‰), brackish water (between 5 and
30‰) and marine water (above 30‰) with an exception of Mzinga
Creek in which there were only two established stations
www.macrothink.org/jbls8
Journal of Biology and Life ScienceISSN 2157-6076
2013, Vol. 4, No. 2
(brackish and marine). Sampling was conducted during spring
high tides on monthly bases from July 2009 to June 2010.
Samples were collected using 500 ml sterile bottles tightened
on a graduated yard stick so as to sample at about 30 cm
depth. Collected samples were immediately transferred to a
cool box containing ice parks until the time of filtration,
which never exceed 6 hours after collection (APHA, 2005).
Environmental parameters (water temperature, salinity and pH),
were measured in situ at each station using a multi-parameter
water quality checker (HoribaU-10, Japan). Rainfall values
were obtained from Tanzania Meteorological Agency in Dar Es
Salaam.
www.macrothink.org/jbls9
Journal of Biology and Life ScienceISSN 2157-6076
2013, Vol. 4, No. 2
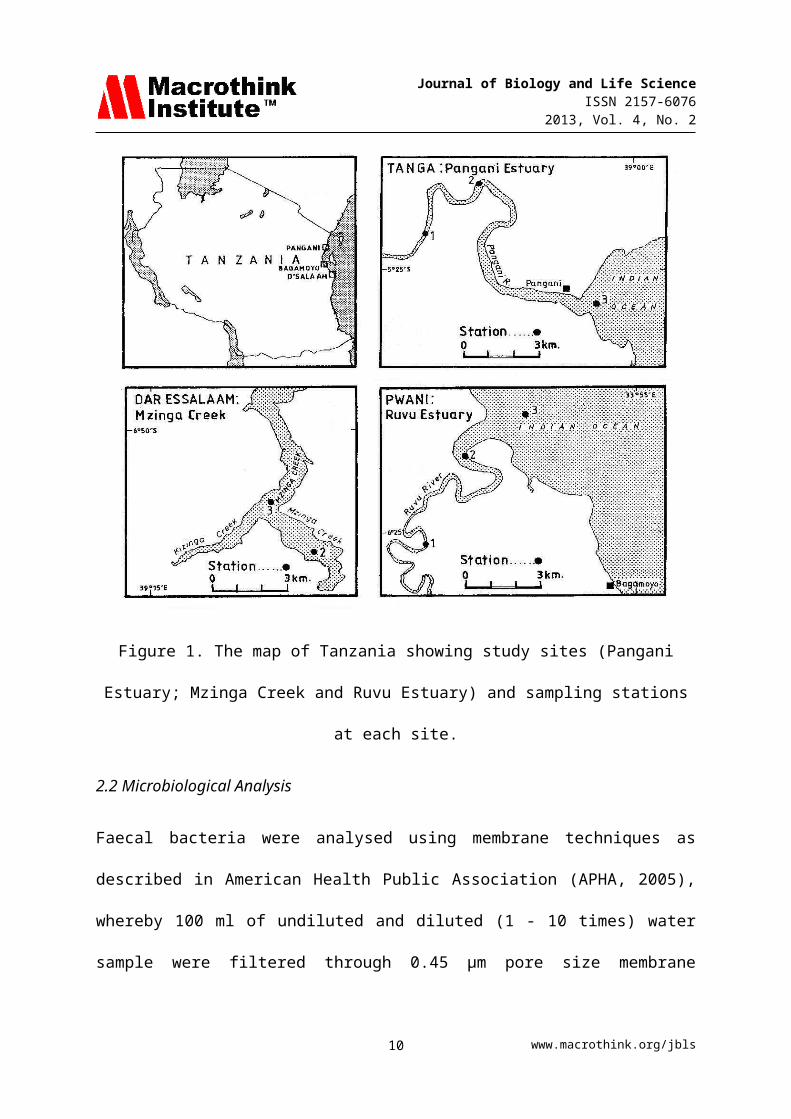
Figure 1. The map of Tanzania showing study sites (Pangani
Estuary; Mzinga Creek and Ruvu Estuary) and sampling stations
at each site.
2.2 Microbiological Analysis
Faecal bacteria were analysed using membrane techniques as
described in American Health Public Association (APHA, 2005),
whereby 100 ml of undiluted and diluted (1 - 10 times) water
sample were filtered through 0.45 µm pore size membrane
www.macrothink.org/jbls10
Journal of Biology and Life ScienceISSN 2157-6076
2013, Vol. 4, No. 2
filters. The filters were transferred to two selective media
i.e. Faecal Coliform Agar Base for coliforms and Slanetz
Bratney Agar for enterococci (Conda Labs, Spain). Plates for
Faecal coliform (FC) bacteria and for enterococci were
incubated at 44.5 ± 0.5 Cº for 24 hrs. FC colonies appeared
blue while enterococci colonies were reddish to brown. Plates
for total coliform (TC) bacteria were incubated at 37 ± 0.5 Cº
for 24 hours, where all brown to reddish colonies were counted
as TC colonies.
2.3 Statistical Analysis of Data
The data collected were statistically analyzed as described by Zar (1999).Data were tested using a parametric two-way analysis of variance with itspost hoc, Tukey-Kramer Multiple Comparison test. Where the assumptionsfor parametric tests were not met, data were analysed using a non-parametric Kruskal-Wallis (KW) test followed by the Dunn s Multiple’Comparison Test. Also, Mann Whitney U test was used to test the–difference between values obtained in two sites. The statistical analysiswere performed using GraphPad Instant tm 1990 1993 software. In all–cases, significance was determined at the 95% confidence level.
3. Results
3.1 Faecal Bacterial Indicator Counts
3.1.1 General Faecal Indicator Bacteria Counts
Among the three types of faecal indicator bacteria studied,
the numbers of Total Coliform (TC) were significantly (KW =
www.macrothink.org/jbls11
Journal of Biology and Life ScienceISSN 2157-6076
2013, Vol. 4, No. 2
29; P = 0.0001) higher than Faecal Coliform (FC) and
Enterococcus (ENT) with a mean value of 86.0 ± 68.3, 56.5 ±
48.6 and 39 ± 32.2 CFU/100 ml, respectively. Dunn’s multiple
comparison test showed significant differences to be between
TC and ENT (P < 0.001) and between TC and FC (P < 0.01) but
not between FC and ENT (P > 0.05). In general freshwater
(stations 1) had higher number of faecal indicator bacteria
compared to brackish (station 2) and marine water (stations 3)
(KW = 86.2; P = 0.0001) with Dunn’s multiple comparison test
showing significant differences to be between freshwater and
brackish water stations (P < 0.05), and between freshwater and
marine water (P < 0.001) as well as between brackish and
marine water (P < 0.001). In addition, faecal bacterial
indicators showed significant differences (KW = 31.553; P <
0.0001) among sites with Dunns Multiple comparison test
showing the significant differences to be between Pangani
Estuary and Mzinga Creek (P < 0.01) and Ruvu Estuary and
Mzinga Creek (P < 0.05) but not between Pangani and Ruvu
Estuaries (P > 0.05).
3.1.2 Total Coliform Counts
www.macrothink.org/jbls12
Journal of Biology and Life ScienceISSN 2157-6076
2013, Vol. 4, No. 2
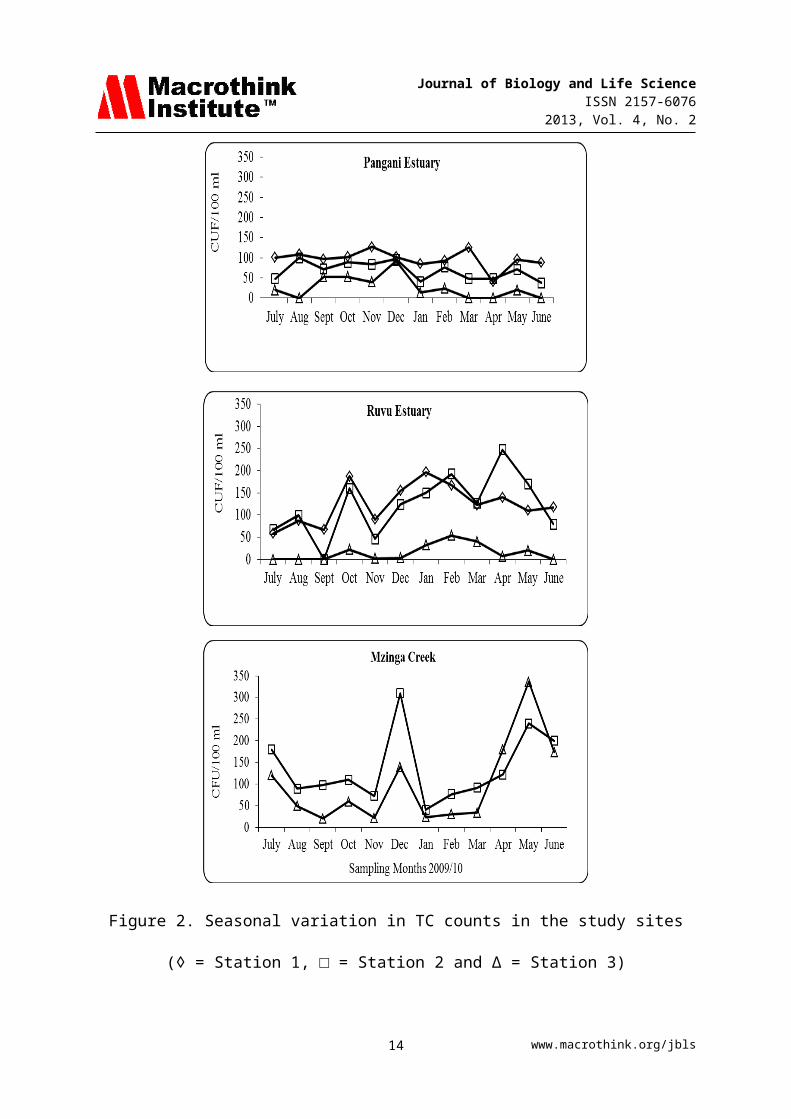
Total Coliform counts ranged from zero (0 CFU/100 ml) in
various samples obtained from marine waters at Pangani and
Ruvu Estuaries to a maximum of 336 CFU/100 ml in brackish
water station at Mzinga Creek site recorded in May 2010
(Figure 2). The counts for TC were not significantly different
among sites (KW = 5.7; P > 0.05). In Pangani Estuary, the
number of TC averaged 63.8 ± 37.9 CFU/100 ml (n = 36) and was
significantly different among sampling stations (F = 25.02;
P<0.0001) with Tukey-Kramer Multiple Comparison Test showing
significant differences to be between each station pair (P < 0.001).
In Ruvu Estuary, the mean TC number was 87.2 ± 70 CFU/100 ml
(n = 36) and was significantly different among stations (KW =
20.1; P < 0.0001) with Dunns Multiple comparison test showing
the significant differences to be between freshwater ad marine
station as well as between brackish water and marine station
(P < 0.001), but not between freshwater and brackish water
stations (P > 0.05). At Mzinga Creek, the mean TC number was
117.7 ± 88.2 CFU/100 ml (n = 24). However, there was no
significant difference in TC between the two sampling stations
at this site (U = 45.5; P = 0.1).
www.macrothink.org/jbls13
Journal of Biology and Life ScienceISSN 2157-6076
2013, Vol. 4, No. 2
Figure 2. Seasonal variation in TC counts in the study sites
(◊ = Station 1, □ = Station 2 and ∆ = Station 3)
www.macrothink.org/jbls14
Journal of Biology and Life ScienceISSN 2157-6076
2013, Vol. 4, No. 2
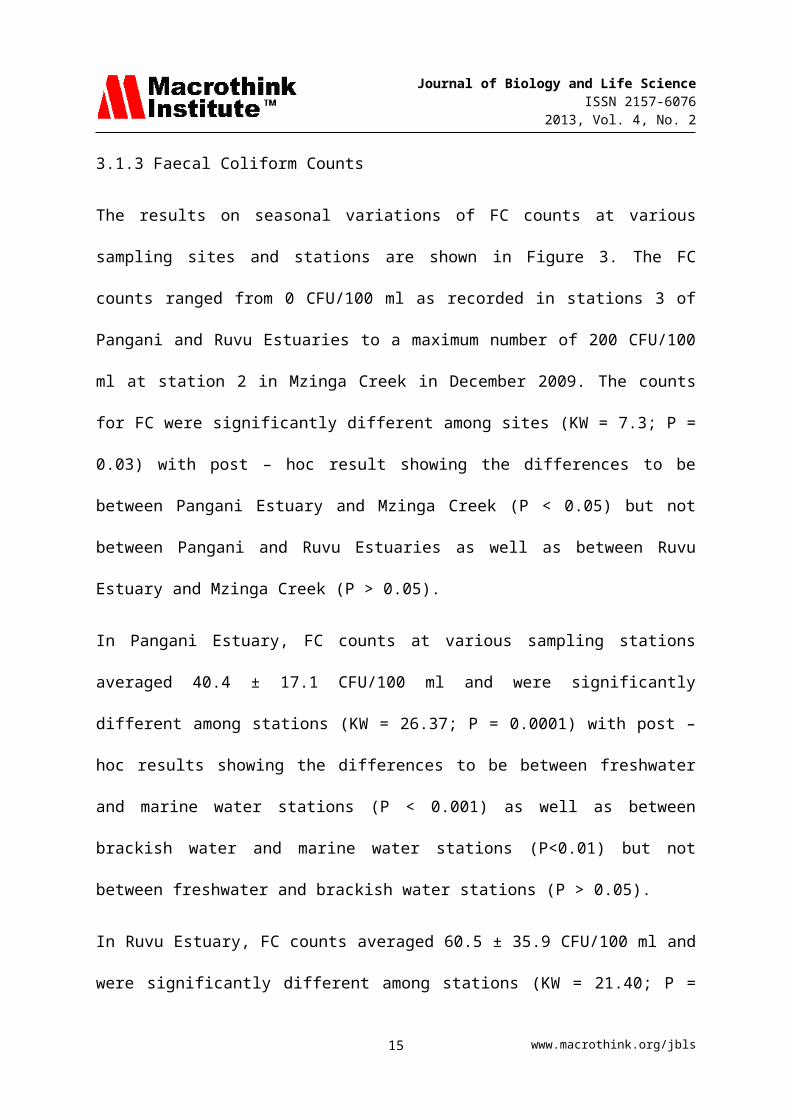
3.1.3 Faecal Coliform Counts
The results on seasonal variations of FC counts at various
sampling sites and stations are shown in Figure 3. The FC
counts ranged from 0 CFU/100 ml as recorded in stations 3 of
Pangani and Ruvu Estuaries to a maximum number of 200 CFU/100
ml at station 2 in Mzinga Creek in December 2009. The counts
for FC were significantly different among sites (KW = 7.3; P =
0.03) with post – hoc result showing the differences to be
between Pangani Estuary and Mzinga Creek (P < 0.05) but not
between Pangani and Ruvu Estuaries as well as between Ruvu
Estuary and Mzinga Creek (P > 0.05).
In Pangani Estuary, FC counts at various sampling stations
averaged 40.4 ± 17.1 CFU/100 ml and were significantly
different among stations (KW = 26.37; P = 0.0001) with post –
hoc results showing the differences to be between freshwater
and marine water stations (P < 0.001) as well as between
brackish water and marine water stations (P<0.01) but not
between freshwater and brackish water stations (P > 0.05).
In Ruvu Estuary, FC counts averaged 60.5 ± 35.9 CFU/100 ml and
were significantly different among stations (KW = 21.40; P =
www.macrothink.org/jbls15

Journal of Biology and Life ScienceISSN 2157-6076
2013, Vol. 4, No. 2
0.0001) with post – hoc result showing the differences to be
between freshwater and marine water stations as well as
between brackish and marine water stations (P < 0.001). There
were no significant differences between freshwater and
brackish water stations (P > 0.05). At Mzinga creek, the FC
counts averaged 74.6 ± 41.7 CFU/100 ml. However, there was no
significant difference between brackish and marine water
stations (P > 0.05).
www.macrothink.org/jbls16
Journal of Biology and Life ScienceISSN 2157-6076
2013, Vol. 4, No. 2
Figure 3. Seasonal variation in FC counts in the study sites
(◊ = Station 1; □ = Station 2 and ∆ = Station 3)
3.1.4 Enterococcus Counts
The results on seasonal variations of Enterococcus counts
(CFU/100 ml) at various sampling sites and stations are shown
in Figure 4. The ENT counts ranged from 0 CFU/100 ml in the
marine water stations at Pangani and Ruvu Estuary during
several sampling occasions to a maximum of 152 CFU/100 ml in
marine water station in Ruvu Estuary. However the numbers of
ENT were not significantly different among sites (KW = 4.393;
P = 0.1).
In the Pangani Estuary, the numbers of ENT indicator bacteria
averaged 37.5 ± 21.2 CFU/100 ml. The average numbers in
different stations were 62.6 ± 24.4, 39.5 ± 28.7 and 10.4 ±
www.macrothink.org/jbls17
Journal of Biology and Life ScienceISSN 2157-6076
2013, Vol. 4, No. 2
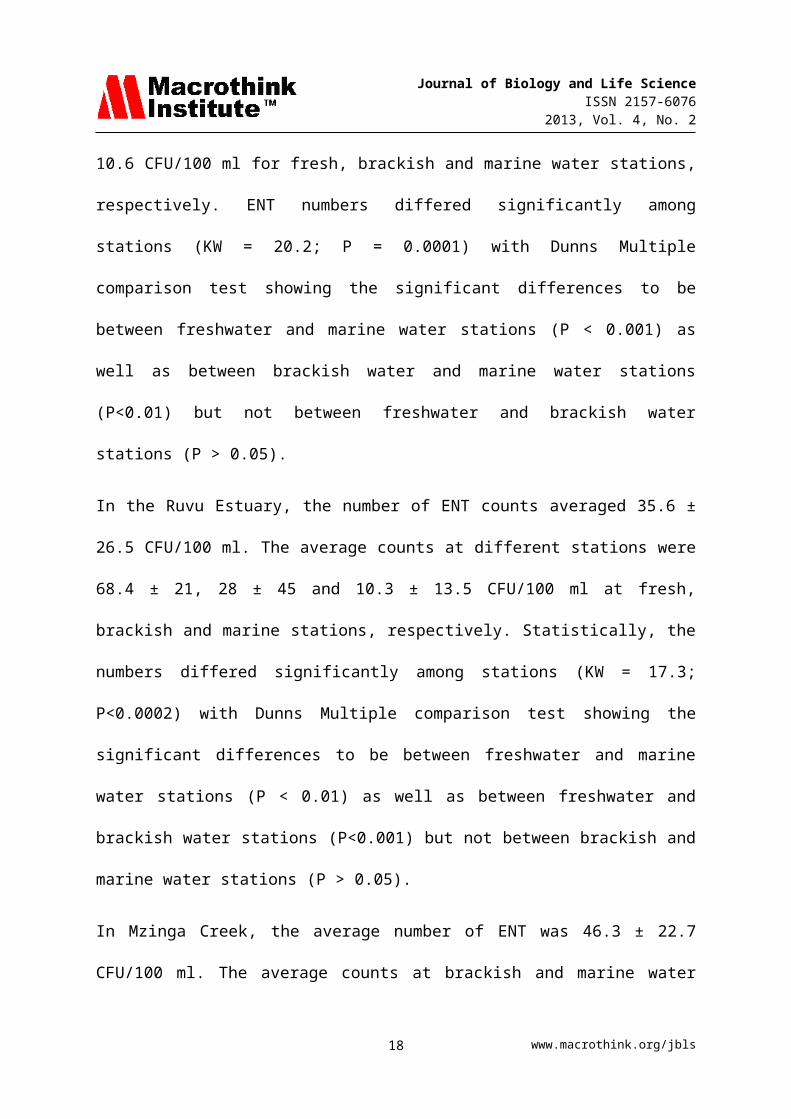
10.6 CFU/100 ml for fresh, brackish and marine water stations,
respectively. ENT numbers differed significantly among
stations (KW = 20.2; P = 0.0001) with Dunns Multiple
comparison test showing the significant differences to be
between freshwater and marine water stations (P < 0.001) as
well as between brackish water and marine water stations
(P<0.01) but not between freshwater and brackish water
stations (P > 0.05).
In the Ruvu Estuary, the number of ENT counts averaged 35.6 ±
26.5 CFU/100 ml. The average counts at different stations were
68.4 ± 21, 28 ± 45 and 10.3 ± 13.5 CFU/100 ml at fresh,
brackish and marine stations, respectively. Statistically, the
numbers differed significantly among stations (KW = 17.3;
P<0.0002) with Dunns Multiple comparison test showing the
significant differences to be between freshwater and marine
water stations (P < 0.01) as well as between freshwater and
brackish water stations (P<0.001) but not between brackish and
marine water stations (P > 0.05).
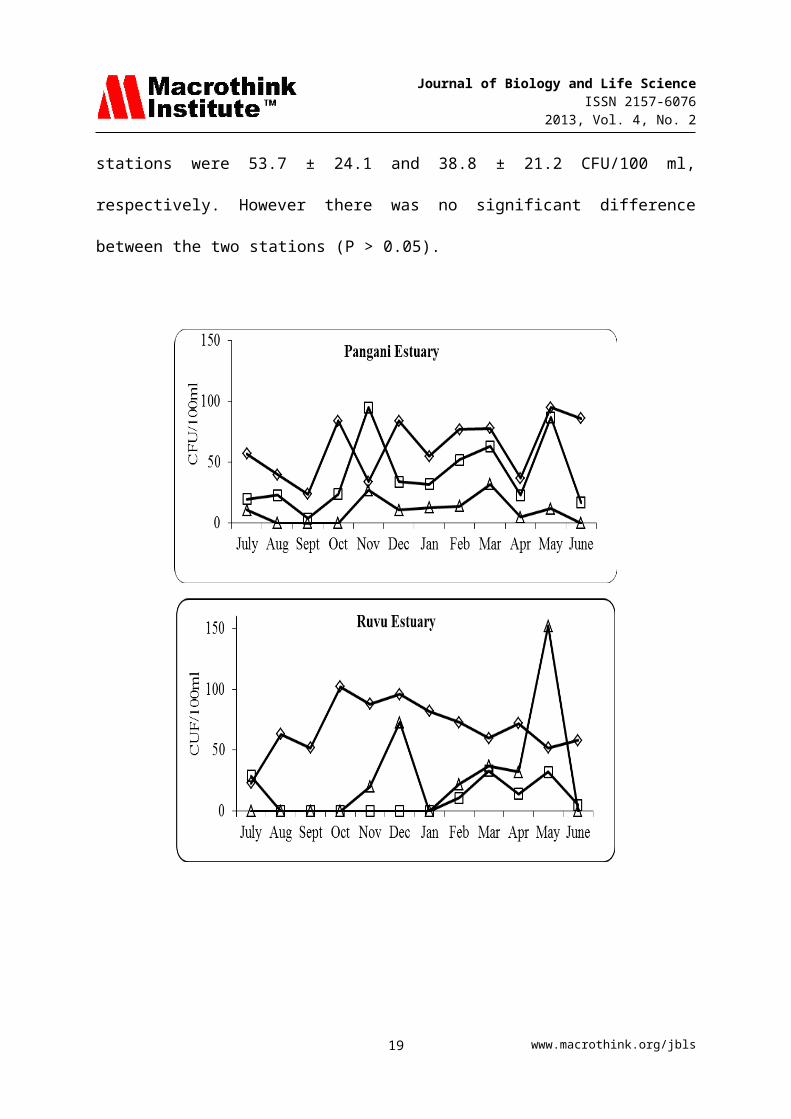
In Mzinga Creek, the average number of ENT was 46.3 ± 22.7
CFU/100 ml. The average counts at brackish and marine water
www.macrothink.org/jbls18
Journal of Biology and Life ScienceISSN 2157-6076
2013, Vol. 4, No. 2
stations were 53.7 ± 24.1 and 38.8 ± 21.2 CFU/100 ml,
respectively. However there was no significant difference
between the two stations (P > 0.05).
www.macrothink.org/jbls19
Journal of Biology and Life ScienceISSN 2157-6076
2013, Vol. 4, No. 2
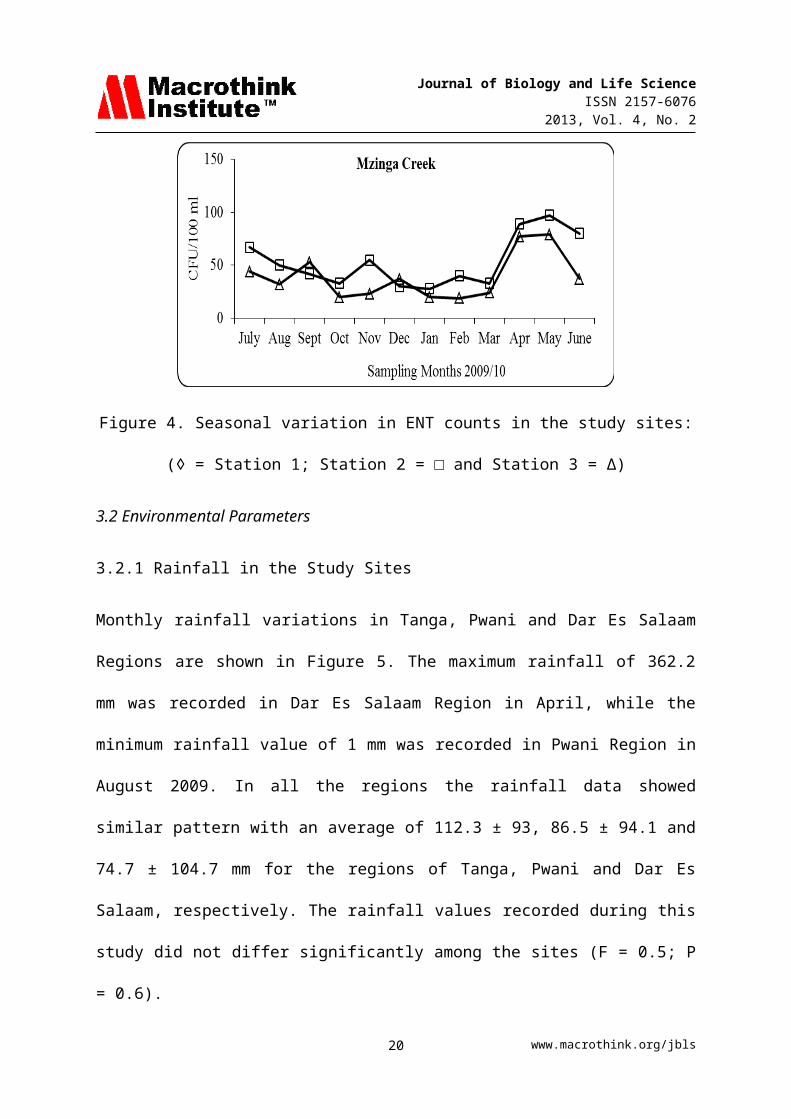
Figure 4. Seasonal variation in ENT counts in the study sites:
(◊ = Station 1; Station 2 = □ and Station 3 = ∆)
3.2 Environmental Parameters
3.2.1 Rainfall in the Study Sites
Monthly rainfall variations in Tanga, Pwani and Dar Es Salaam
Regions are shown in Figure 5. The maximum rainfall of 362.2
mm was recorded in Dar Es Salaam Region in April, while the
minimum rainfall value of 1 mm was recorded in Pwani Region in
August 2009. In all the regions the rainfall data showed
similar pattern with an average of 112.3 ± 93, 86.5 ± 94.1 and
74.7 ± 104.7 mm for the regions of Tanga, Pwani and Dar Es
Salaam, respectively. The rainfall values recorded during this
study did not differ significantly among the sites (F = 0.5; P
= 0.6).
www.macrothink.org/jbls20

Journal of Biology and Life ScienceISSN 2157-6076
2013, Vol. 4, No. 2
Figure 5. Seasonal variations in the amount of rainfall (mm)
in Tanga (∆), Pwani (◊) and Dar es Salaam (□) Region
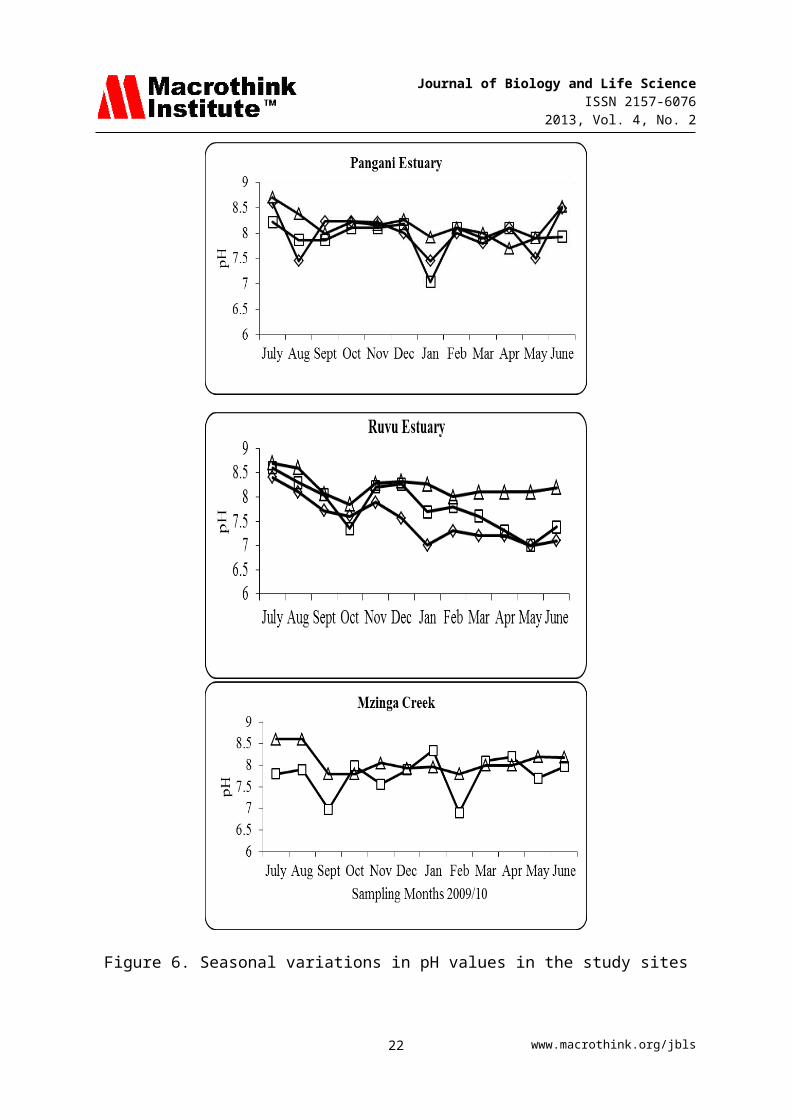
3.2.2 PH in the Study Sites
The pH values in the study sites showed similar pattern
(Figure 6) ranging from 6.9 to 8.7 with an average of 8.03 ±
0.3, 7.8 ± 0.5 and 7.9 ± 0.4 for Tanga, Pwani and Dar es
Salaam, respectively. However, there was no significant
difference in pH values among these sites (KW = 2.8; P >
0.05). In general higher pH values were observed at marine
water than in the Brackish and freshwater stations. However, a
significant difference was observed in Ruvu estuary (F = 10.9;
P < 0.001) but not in Pangani Estuary and Mzinga creek.
www.macrothink.org/jbls21
Journal of Biology and Life ScienceISSN 2157-6076
2013, Vol. 4, No. 2
Figure 6. Seasonal variations in pH values in the study sites
www.macrothink.org/jbls22
Journal of Biology and Life ScienceISSN 2157-6076
2013, Vol. 4, No. 2
(◊ = Station 1, □ = Station 2 and Station 3 = ∆)
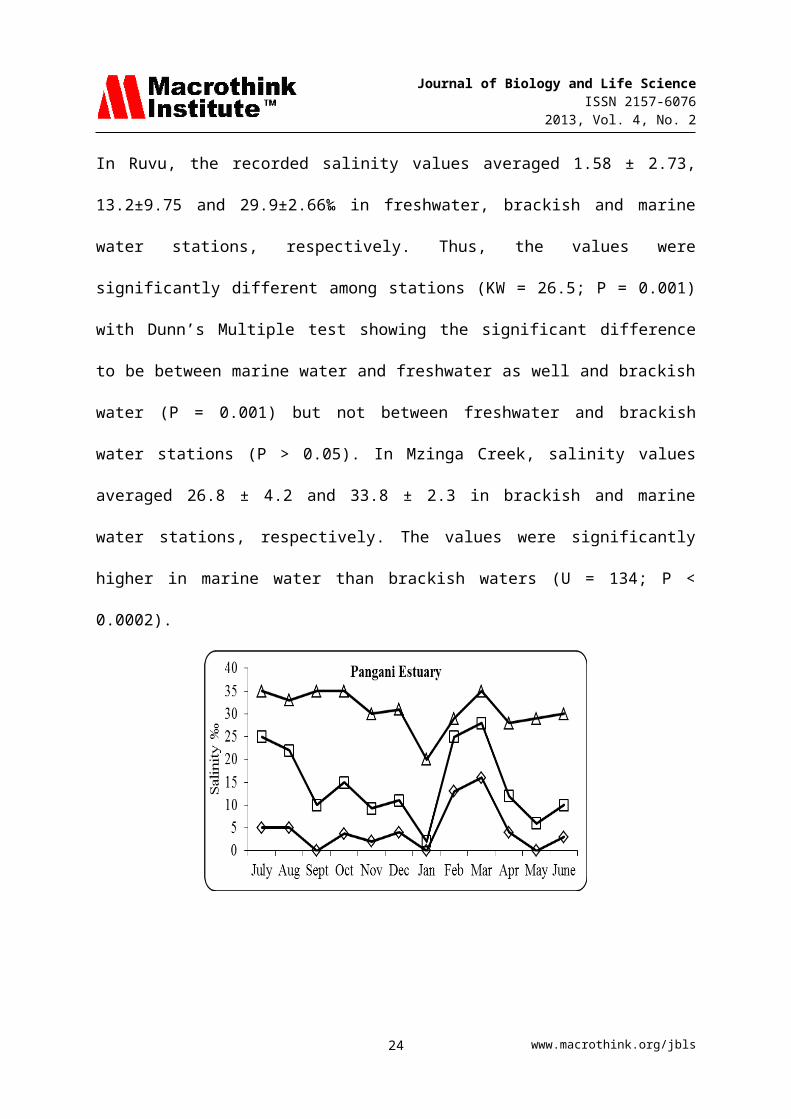
3.2.3 Salinity in the Study Sites
Salinity values consistently increased from freshwater to
marine water stations ranging from 0‰ in freshwater station at
Pangani and Ruvu Estuaries to 35‰ in all marine water stations
(Figure 7). There was significant difference in salinity
values among sites (KW = 18.7; P = 0.0001). The higher values
were recorded at Dar es Salaam and the Dunn’s Multiple test
showed a significant difference between Tanga and Dar es
Salaam as well as Pwani and Dar Es Salaam (P< 0.0001), but not
between Pangani and Ruvu (P > 0.05).
In Pangani salinity values at various stations varied between
samplings giving a mean value of 4.6 ± 5.0, 14.6 ± 8.4 and
30.83 ± 4.4‰ in freshwater, brackish and marine water
stations, respectively. Salinity differed significantly among
stations (KW = 26.2; P 0.001) with Dunn’s Multiple test
showing a significant higher values in marine water compared
to freshwater and brackish water stations (P = 0.001) but
there were no significant difference between freshwater and
brackish water stations (P > 0.05)
www.macrothink.org/jbls23
Journal of Biology and Life ScienceISSN 2157-6076
2013, Vol. 4, No. 2
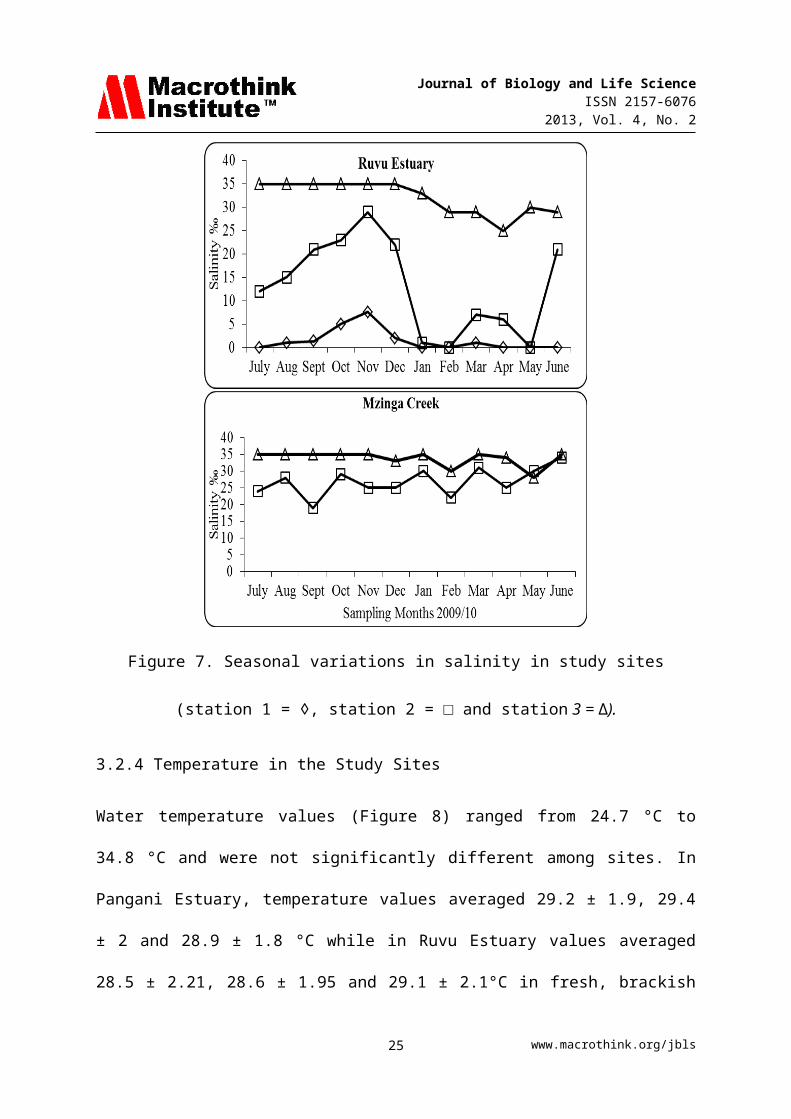
In Ruvu, the recorded salinity values averaged 1.58 ± 2.73,
13.2±9.75 and 29.9±2.66‰ in freshwater, brackish and marine
water stations, respectively. Thus, the values were
significantly different among stations (KW = 26.5; P = 0.001)
with Dunn’s Multiple test showing the significant difference
to be between marine water and freshwater as well and brackish
water (P = 0.001) but not between freshwater and brackish
water stations (P > 0.05). In Mzinga Creek, salinity values
averaged 26.8 ± 4.2 and 33.8 ± 2.3 in brackish and marine
water stations, respectively. The values were significantly
higher in marine water than brackish waters (U = 134; P <
0.0002).
www.macrothink.org/jbls24
Journal of Biology and Life ScienceISSN 2157-6076
2013, Vol. 4, No. 2
Figure 7. Seasonal variations in salinity in study sites
(station 1 = ◊, station 2 = □ and station 3 = ).∆
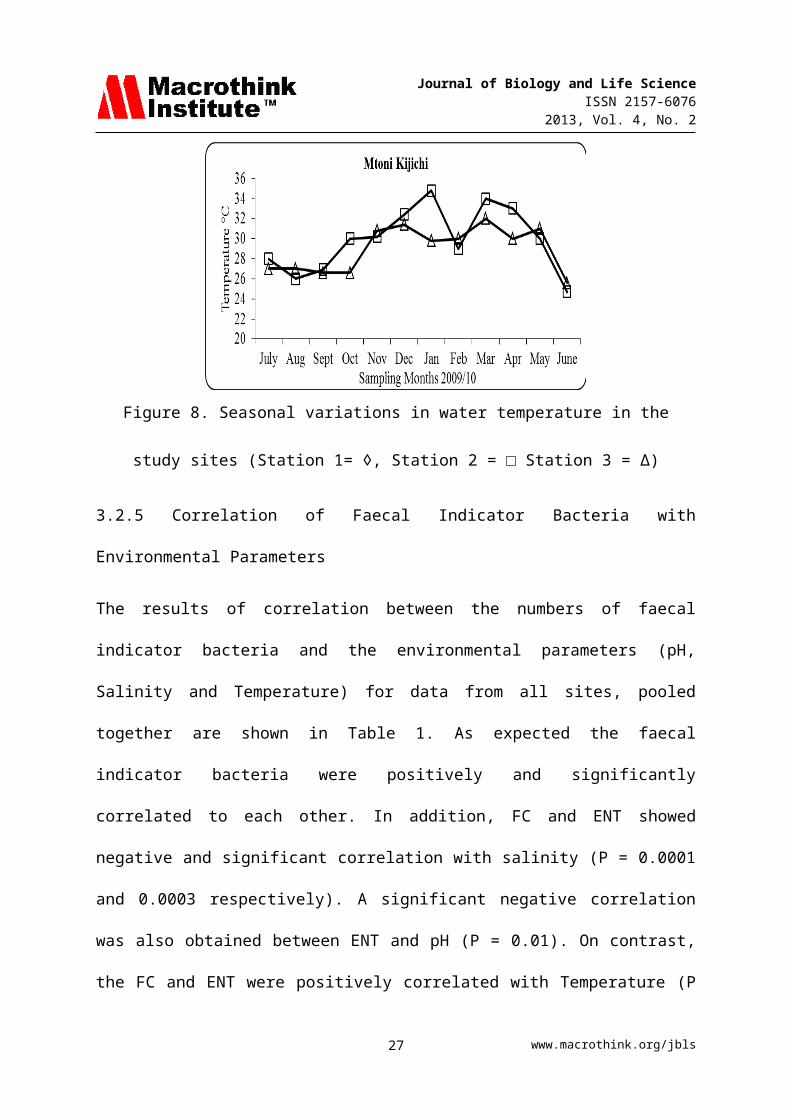
3.2.4 Temperature in the Study Sites
Water temperature values (Figure 8) ranged from 24.7 °C to
34.8 °C and were not significantly different among sites. In
Pangani Estuary, temperature values averaged 29.2 ± 1.9, 29.4
± 2 and 28.9 ± 1.8 °C while in Ruvu Estuary values averaged
28.5 ± 2.21, 28.6 ± 1.95 and 29.1 ± 2.1°C in fresh, brackish
www.macrothink.org/jbls25

Journal of Biology and Life ScienceISSN 2157-6076
2013, Vol. 4, No. 2
and marine water stations, respectively. In Mzinga Creek,
temperature values averaged 29.9 ± 3.2 and 29 ± 2.2°C in
brackish and marine water stations, respectively. In all
cases, there were no significant differences between stations
(P > 0.05).
www.macrothink.org/jbls26
Journal of Biology and Life ScienceISSN 2157-6076
2013, Vol. 4, No. 2
Figure 8. Seasonal variations in water temperature in the
study sites (Station 1= ◊, Station 2 = □ Station 3 = ∆)
3.2.5 Correlation of Faecal Indicator Bacteria with
Environmental Parameters
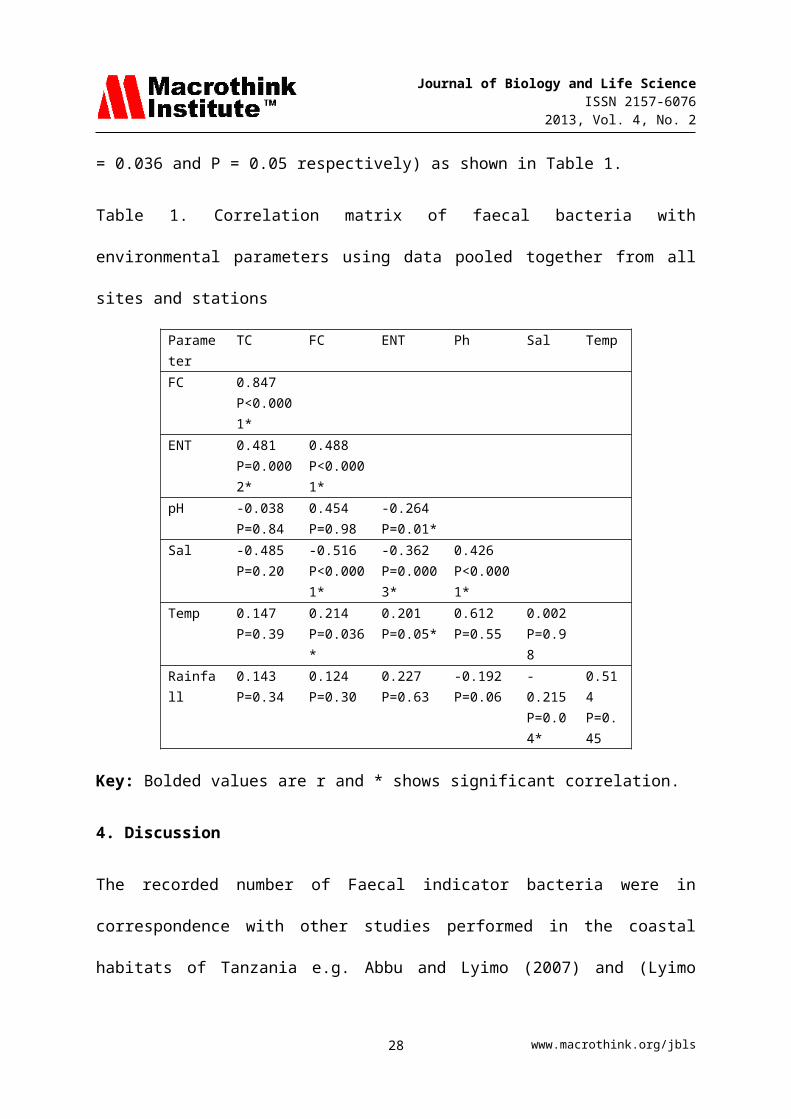
The results of correlation between the numbers of faecal
indicator bacteria and the environmental parameters (pH,
Salinity and Temperature) for data from all sites, pooled
together are shown in Table 1. As expected the faecal
indicator bacteria were positively and significantly
correlated to each other. In addition, FC and ENT showed
negative and significant correlation with salinity (P = 0.0001
and 0.0003 respectively). A significant negative correlation
was also obtained between ENT and pH (P = 0.01). On contrast,
the FC and ENT were positively correlated with Temperature (P
www.macrothink.org/jbls27
Journal of Biology and Life ScienceISSN 2157-6076
2013, Vol. 4, No. 2
= 0.036 and P = 0.05 respectively) as shown in Table 1.
Table 1. Correlation matrix of faecal bacteria with
environmental parameters using data pooled together from all
sites and stations
Parameter
TC FC ENT Ph Sal Temp
FC 0.847P<0.0001*
ENT 0.481P=0.0002*
0.488P<0.0001*
pH -0.038P=0.84
0.454P=0.98
-0.264P=0.01*
Sal -0.485P=0.20
-0.516P<0.0001*
-0.362P=0.0003*
0.426P<0.0001*
Temp 0.147P=0.39
0.214P=0.036*
0.201P=0.05*
0.612P=0.55
0.002P=0.98
Rainfall
0.143P=0.34
0.124P=0.30
0.227P=0.63
-0.192P=0.06
-0.215P=0.04*
0.514P=0.45
Key: Bolded values are r and * shows significant correlation.
4. Discussion
The recorded number of Faecal indicator bacteria were in
correspondence with other studies performed in the coastal
habitats of Tanzania e.g. Abbu and Lyimo (2007) and (Lyimo
www.macrothink.org/jbls28
Journal of Biology and Life ScienceISSN 2157-6076
2013, Vol. 4, No. 2
2009). In general, the maximum number of faecal indicator
bacteria obtained from Mzinga creek was lower than those
obtained by Abbu and Lyimo (2007) at this site. This may be
due to different ways of sampling where by Abbu and Lyimo
(2007) obtained their samples from tidal pools during low tide
while inthis study water samples were obtained during high
tide in the middle of the creek. Therefore, the lower numbers
obtained during our sampling may be as a result of dilution
effect (see also Lyimo 2009). Generally the numbers of Total
Coliform (TC) were higher than Faecal Coliform (FC) and
Enterococcus (ENT) as expected due to the fact that FC is a
subset of TC (Prescott et al. 1996) while ENT is normally less
in number from feces of human and other warm-blooded animals.
In general, freshwater stations showed higher numbers of
faecal indicator bacteria than those obtained in brackish and
marine waters which could be due to the proximity of these
stations to inhabited areas and other human activities like
farming. Since the major cause of bacterial contamination in
coastal waters is urban runoff, it is also possible that
dilution toward the marine water stations also contributed to
www.macrothink.org/jbls29
Journal of Biology and Life ScienceISSN 2157-6076
2013, Vol. 4, No. 2
the observed low numbers of faecal indicator bacteria in the
marine environment. Thus, lack of sewage treatment in
inhabited areas results in storm water drains or seepage
running in adjacent near shore areas and leading to increased
faecal bacterial contamination. This is due to the fact that,
many people living in slums and rural areas have little or no
access to basic necessities, such as clean water, toilet
facilities, and sewage disposal (Mohammed, 2002). Although
humans or sewage effluents can be sources of faecal indicator
bacteria in water, wildlife and waterfowl may also contribute
to the observed faecal bacteria contamination (Choi et al.,
2003).
The results show that Mzinga Creek is more contaminated with
faecal indicator bacteria compared to the other two study
sites. This was due to the fact that Mzinga Creek is located
in a more populated urban area thereby more exposed to direct
sewage disposal and incoming industrial effluents as also
reported by Abbu and Lyimo (2007). Several recreation
activities including swimming along the creek were also
observed, which could also result into further contamination.
www.macrothink.org/jbls30

Journal of Biology and Life ScienceISSN 2157-6076
2013, Vol. 4, No. 2
The use of on-site latrines (Lin and Dushoff, 2001) and other
human activities such as direct bathing (Dwight et al., 002) is
known to contribute to the high amounts of faecal indicator
bacteria loads in the near shore waters. Another possible
source of contamination at Mzinga Creek is the direct
defecation in the mangrove forest in this site as also
reported by Abbu and Lyimo (2007).
The significant positive correlation between the various
faecal bacterial indicators is an expected phenomenon as both
these organisms originate from similar source and are
similarly affected by environmental factors. The significant
negative correlation between pH and ENT as well as between
salinity and ENT and between salinity and FC is possibly due
to the fact that the marine environment which has high pH and
salinity values compared to freshwater does not favour long
survival of the faecal indicator bacteria. The osmotic stress
due to high salinity in marine water is known to affect more
FC and TC but less on ENT (Paul et al., 1995; WHO 1999). The
significant positive correlation between water temperature and
FC as well as ENT suggests that high temperature was more
www.macrothink.org/jbls31

Journal of Biology and Life ScienceISSN 2157-6076
2013, Vol. 4, No. 2
conducive for survival of faecal indicator bacteria.
Based on many standards, recreational water is classified as
poor when TC is higher than 1000 CFU /100 mls and FC as well
as ENT number are higher than 200 CFU/100 ml (WHO 1999).
However, the presence of TC and FC in the environment may not
necessarily indicate presence of human contamination in the water asthese indicator bacteria may be naturally present in tropical aquaticenvironments in the absence of any source of faecal contamination (Paulet al., 1995; Jiang et al., 2007). For this reason ENT may be betterindicators of human faecal contamination (USEPA, 1986, 1999; Paul et al.,1995, WHO, 1999) although some literature has also showed that it can aswell grow in tropical soils. Nevertheless, many directives recommend ENTas a better predictor of the risk to contract gastrointestinal illness, causedmainly by enteric viruses in sewage contaminated waters (USEPA, 1986).In addition, ENT are not affected by salinity levels and have no growthphase in seawater (Paul et al., 1995). Using these ENT as more reliablestandards, our results shows that the waters can be classified as good (11-50 CFU/100 ml) or fair (51-200 CFU/ 100 ml). The marine water station atPangani and Ruvu could be considered as excellent (<11 CFU/100 ml) forrecreational activities while the marine water at Mzinga creek was fair.The brackish water could be classified as good while fresh water wasfair.
USEPA (1986) recommends that faecal coliform bacteria in
portable water should be less than 10 CFU/100 ml. According to
APHA (2005), a level of 200 CFU/100 ml indicates needs for
follow up testing and investigation while levels exceeding 400
CFU/100 ml required posting of warning. In this study some
sites showed values, which call for further monitoring. For
example, at Ruvu Estuary and Mzinga Creek the number of FC
www.macrothink.org/jbls32

Journal of Biology and Life ScienceISSN 2157-6076
2013, Vol. 4, No. 2
exceeded 200 CFU/100 ml in April 2010 and December 2009,
respectively. The high numbers could be due to improper
disposal of wastewater, density of population and through
sewer systems and poorly sited septic tanks. These results
implicates on the probability of people around these areas
being prone to water-borne infections such as diarrhea or
cholera (Esrey et al., 1985; WHO, (2003).
5. Conclusion and Recommendation
In general the numbers of faecal indicator bacteria were low
and do not pose major risks for swimmers. However, the numbers
were high if the water is intended for drinking and shellfish
harvesting. Routine measurements of faecal indicator bacteria
density in coastal waters of Tanzania is hereby recommended so
as to ensure protection of public health.
Acknowledgement
This work was supported by Marine Sciences for Management
Program (MASMA) of the Western Indian Ocean Marine Sciences
Association (WIOMSA) through project number MASMA/OR/01. The
authors are also grateful to the technical staffs of the
department of Molecular Biology and Biotechnology and
www.macrothink.org/jbls33
Journal of Biology and Life ScienceISSN 2157-6076
2013, Vol. 4, No. 2
Department of aquatic science for their technical support and
for providing necessary facilities in sampling and
identification.
References
Abbu, A. A., & Lyimo, T. J. (2007). Assessment of Faecal
Bacteria contamination in sewage and non-sewage impacted
mangroves ecosystem along the coast of Dar Es Salaam. Tanzania
Journal of Science, 33, 27-40.
Ackman, D. S., Mark, S., Mack, P., Caldwell, M., Root, T., &
Birkhead, G. (1997). Swimming associated hemorrhagic colitis
due to Escherichia coli 0159:H7 infection: evidence of
prolonged contamination of a fresh water lake. Epidemiology and
Infections, 199, 1-8. http://dx.doi.org/10.1017/S095026889700770X
APHA. (2005). Standard Methods for the Examination of Water and
Wastewater, 18th Ed., American Public Health Association (APHA),
American Water Works Association (AWWA) and Water Pollution
Control Federation (WPCF), Washington, D.C.
Ashbolt, N. J. (2004). Microbial contamination of drinking
www.macrothink.org/jbls34

Journal of Biology and Life ScienceISSN 2157-6076
2013, Vol. 4, No. 2
water and disease outcomes in developing regions. Toxicolog, 198,
229-238. http://dx.doi.org/10.1016/j.tox.2004.01.030
Byamukama, D., Kansiime, F., Mach, R. L., & Farnleitner, A. H.
(2000). Determination of Escherichia coli contamination with
chromocult coliform agar showed a high level of discrimination
efficiency for differing faecal pollution levels in tropical
waters of Kampala. Uganda Applied Environmental Microbiology, 66,
864-868. http://dx.doi.org/10.1128/AEM.66.2.864-868.2000
Canal of the Irrigation System in the Southwestern of Puerto
Rico University of Puerto Rico-Medical Sciences Campus. XXVIII
Congreso Interamericano de Ingeniería Sanitaria y Ambiental Cancún, México, 27
al 31 de octubre, 2002.
Choi, S., Brown, W. C. J., Becker, S. J., Harwood, V. J., &
Jiang, S. C. (2003). Application of enterococci antibiotic
resistance patterns for contamination source identification at
Huntington Beach, California. Marine Pollution Bulletin, 46, 748-755.
http://dx.doi.org/10.1016/S0025-326X(03)00046-8
Dwight, R., Semenza, J, Barker, D., & Olson, B. (2002).
Association of urban runoff with coastal water quality in
Orange Country, California. Water Environ Res, 74, 82-90.
www.macrothink.org/jbls35
Journal of Biology and Life ScienceISSN 2157-6076
2013, Vol. 4, No. 2
http://dx.doi.org/10.2175/106143002X139776
Effler, P., Isaacson, M., Arntzen, L., Heenan, R., Canter, P.,
Barrett, T., Lee, L., Mamba, C., Levine, W., Zaidi, A., &
Griffin, P. M. (2001). Factors contributing to the emergence
of Escherichia coli O157: H7 in Africa. Emerging Infectious Diseases, 7,
812 – 819.
Esrey, S. A., Feachem, R. G., & Hughes, J. M. (1985).
Interventions for the control of diarrheal diseases among
young children: improving water supplies and excreta disposal
facilities. Bulletin of the World Health Organization, 63(4), 757-772.
Grabow, W. O. K. (1996). Waterborne diseases: Update on water
quality assessment and control. Water SA,22, 193–202.
Griesel, M., & Jagals, P. (2002). Faecal indicator organisms
in the Renoster Spruit system of the Modder-Riet River
catchment and implications for human users of the water. Water
SA, 28, 227-234. http://dx.doi.org/10.4314/wsa.v28i2.4889
Hernández, N. (2002). Evaluation of coliphages and faecal
coliforms densities on the Principal
Water pollution a threat to humanity. Accessed on 2nd February 2012.
www.macrothink.org/jbls36
Journal of Biology and Life ScienceISSN 2157-6076
2013, Vol. 4, No. 2
http://www.infoforhealth.org
Hysko, M., Gace, B. & Puto, K. (2010), “Microbial Water
Pollution of Vjosa River and the Vegetable Contamination by
Irrigation. BALWOS 2010-Ohlid, Republic of Macedonia, 20, 25.
Jiang, S. C., Chu, W., Oslon, B. H., He, J., Choi, S., Zhang, J., Le, J. Y.,& Gedalanga, P. B. (2007). Microbial source tracking in a small southernCalifornia urban watershed indicates wild animals and growth as source
of fecal bacteria. Applied Microbiology and Biotechnology, 76, 927 934.–http://dx.doi.org/10.1007/s00253-007-1047-0
LeChevallier, M. W., & Buckley M. (2007). Clean Water: What is
Acceptable Microbial Risk. American Society for
Microbiology,Washington D.C. pp7.
Lin, B., & Dushoff, J. (2001). Mangrove filtration of
anthropogenic nutrients in the Rio Coco Solo. Rio Coco Solo,
Panama. 12 pp.
Lyimo, C. W., Shayo, R., & Lyimo, T. J. (2007). Community
Awareness on Microbial water pollution and Its Effects on
Health Development in Urban Tanzania: A Case Study of Tabata
and Kiwalani Wards in Ilala District in Dar Es Salaam Region.
Tanzania Journal of Development Studies, 7, 103-114.
Lyimo, T. J. (2009). Microbial and nutrient pollution in the
www.macrothink.org/jbls37
Journal of Biology and Life ScienceISSN 2157-6076
2013, Vol. 4, No. 2
coastal bathing waters of Dar es Salaam, 19, 527-537.
Mmochi, A. J., & Francis, J. (1999). Long term monitoring of
water quality in Zanzibar, Tanzania. The Institute of Marine Sciences,
Zanzibar. Pp. 31.
Mohammed, S. M. (2002a). Pollution management in Zanzibar: the
need for a new Approach. Ocean & Coastal Management, 45, 301-311.
http://dx.doi.org/10.1016/S0964-5691(02)00060-1
Mohammed. S. M. (2002b). A review of water quality and
pollution studies in Tanzania. Ambio, 31, 617-620.
Olsen, S. J., Miller, G., Breuer, T., Kennedy, M., Higgins,
C., Walford, J., McGee, G., Fox, K., Bibb, W. & Mead, P.
(2002). A waterborne outbreak of Escherichia coli 0157:H7
infections and haemolytic uremic syndrome: implications for
rural water systems. Emerging Infectious Diseases, 8, 370-375.
http://dx.doi.org/10.3201/eid0804.000218
Paul, J. H., Rose, J. B., Jiang, S., Kellog, C., & Shinn, E.
A. (1995). Occurrence of faecal indicator bacteria in surface
waters and subsurface aquifer in Key Largo. Applied and
Environmental Microbiology, 61, 2235-2241.
www.macrothink.org/jbls38
Journal of Biology and Life ScienceISSN 2157-6076
2013, Vol. 4, No. 2
Penrose, K., Caldas de Castor, M., Werema, J., & Ryan, E. T.
(2010). Informal Urban Settlements and Cholera Risk in Dar es
Salaam, Tanzania. www.plosntds.org. Viewed on July, 2010.
Prescott, L., Harley, J. & Klein, D. (1996). Microbiology, 3rd edn. WCBPublishers: Chicago.
Rubindamayugi, M. S. T. (1996). Faecal bacteria contamination
of coastal and River Msimbazi waters in Dar Es Salaam. In:
Kivaisi A, Muruke M & Rubindamayugi M (eds.) Economic
development and Environment in Sub- Saharan Africa. Dar es
Salaam University Press, 209-217.
Thompson, T. & Khan, S. (2003). Situation analysis and
epidemiology of infectious disease transmission: a South-Asian
regional perspective. International Journal of Environmental Health Research, 13,
S29-S39. http://dx.doi.org/10.1080/0960312031000102787
USEPA. (1986). Bacteriological ambient water quality criteria
for marine and fresh recreational waters. EPA 440/5-84-002.U.S.
Environmental Protection Agency, Office of Research and Development,
Cincinnati, OH.
USEPA. (1999). Action Plan for Beaches and Recreational Water.EPA/600/R-98/079, Washington, DC.
Van Bruggen, J. J. (1990). A preliminary study on
www.macrothink.org/jbls39
Journal of Biology and Life ScienceISSN 2157-6076
2013, Vol. 4, No. 2
environmental pollution on Zanzibar. Zanzibar Environmental Study
Series No. 6.
Vega, M., Pardo, R, Barrado, E. & Deban, L. (1998). Assessment
of seasonal and polluting effects on the quality of river
water by exploratory data analysis. Water Research, 32, 3581-
3592. http://dx.doi.org/10.1016/S0043-1354(98)00138-9
WHO (1999). Health-based monitoring ofrecreational waters: the feasibilityof a new approach (the Annapolis Protocol ), WHO/SDE/WSH/99.1.‘‘ ’’Geneva: World Health Organization, p. 50.
WHO (2003). Guidelines for safe recreational water environment, volume 1:
coastal and fresh waters. Geneva, Switzerland. Pp 253. Criteria and
other supporting information, Geneva, Switzerland World Health
Organization.
WHO and UNICEF. (2004). Meeting the MDG Drinking Water and
Sanitation: A Mid Term Assessment of Progress. Geneva:
WHO/UNICEF. ISBN 92 4 156278 1
Zar, J. (1999) Biostastical Analysis. 3rd ed. USA, Prentice Hall International
Edition. pp 180-220.
Copyright Disclaimer
Copyright reserved by the author(s).
www.macrothink.org/jbls40
Journal of Biology and Life ScienceISSN 2157-6076
2013, Vol. 4, No. 2
This article is an open-access article distributed under the
terms and conditions of the Creative Commons Attribution
license (http://creativecommons.org/licenses/by/3.0/).
www.macrothink.org/jbls41