pCubee: a perspective-corrected handheld cubic display
10
pCubee: A Perspective-Corrected Handheld Cubic Display Ian Stavness, Billy Lam, Sidney Fels Department of Electrical and Computer Engineering University of British Columbia, Vancouver, Canada stavness | billyl | ssfels @ece.ubc.ca ABSTRACT In this paper, we describe the design of a personal cubic display that offers novel interaction techniques for static and dynamic 3D content. We extended one-screen Fish Tank VR by arranging five small LCD panels into a box shape that is light and compact enough to be handheld. The display uses head-coupled perspective rendering and a real- time physics simulation engine to establish an interaction metaphor of having real objects inside a physical box that a user can hold and manipulate. We evaluated our prototype as a visualization tool and as an input device by comparing it with a conventional LCD display and mouse for a 3D tree-tracing task. We found that bimanual interaction with pCubee and a mouse offered the best performance and was most preferred by users. pCubee has potential in 3D visualization and interactive applications such as games, storytelling and education, as well as viewing 3D maps, medical and architectural data. Author Keywords User interface, 3D visualization, handheld device, Fish Tank VR, multi-screen display, physical interaction, user evaluation ACM Classification Keywords H.5.2. Information Interfaces and Presentation: User Interfaces – Input devices and strategies; I.3.1. Computer Graphics: Hardware architecture – Three-dimensional displays General Terms Design, Human Factors INTRODUCTION The visualization of three-dimensional (3D) information has wide reaching applications. It is becoming more important as advances in computer graphics and camera systems make 3D data sources abundant and accessible. Various types of display technologies for viewing 3D information have been proposed and prototyped; however a widely accessible and commercially viable 3D display technology has yet to be developed. Fish Tank Virtual Reality (FTVR) is a type of 3D display technology that has potential in this area. It uses either head-coupled perspective rendering, stereoscopic techniques, or both, to provide optical cues to improve users’ perception of 3D virtual environments. Traditionally, these FTVR displays consist of only a single screen coupled with a head tracker and LCD shutter glasses to generate stereo images at the user’s perspective. While simple and fairly effective, such displays offer a limited viewing angle of the virtual scene due to the stationary 2D display panel in the setup. We have extended the FTVR concept and created a prototype of a personal, multi-screen Fish Tank display, called pCubee, shown in Figure 1, which arranges five small LCD panels into the shape of a box. Correcting the perspective of each screen to the user’s head position gives the illusion of having real 3D objects within the box. The display shows bright, high-resolution imagery and correct occlusion depth cues from the physical seams between the LCD panels. A compelling feature of pCubee is its ability to allow a user to interact with dynamic virtual scenes that react to display movement with simulated physics in real- time. As a user manipulates, shakes and rotates the display box, objects within the scenes slide and bounce around. Further, pCubee can be held in one hand while using another input device, such as a mouse or a 3D stylus, for bimanual control and performing precision work. We foresee geometric multi-screen configurations like pCubee, or other shapes, becoming a powerful tool in a variety of application areas involving 3D objects, such as medical and architectural model visualization. Permission to make digital or hard copies of all or part of this work for personal or classroom use is granted without fee provided that copies are not made or distributed for profit or commercial advantage and that copies bear this notice and the full citation on the first page. To copy otherwise, or republish, to post on servers or to redistribute to lists, requires prior specific permission and/or a fee. CHI 2010, April 10–15, 2010, Atlanta, Georgia, USA. Copyright 2010 ACM 978-1-60558-929-9/10/04....$10.00. Figure 1. Five screen pCubee showing a 3D model of the globe; also shown are the A/D control boards and the headphones containing the head-tracking sensor. CHI 2010: Pointing and Selecting April 10–15, 2010, Atlanta, GA, USA 1381
Transcript of pCubee: a perspective-corrected handheld cubic display

pCubee: A Perspective-Corrected Handheld Cubic Display Ian Stavness, Billy Lam, Sidney Fels
Department of Electrical and Computer Engineering University of British Columbia, Vancouver, Canada
stavness | billyl | ssfels @ece.ubc.ca
ABSTRACT
In this paper, we describe the design of a personal cubic display that offers novel interaction techniques for static and dynamic 3D content. We extended one-screen Fish Tank VR by arranging five small LCD panels into a box shape that is light and compact enough to be handheld. The display uses head-coupled perspective rendering and a real-time physics simulation engine to establish an interaction metaphor of having real objects inside a physical box that a user can hold and manipulate. We evaluated our prototype as a visualization tool and as an input device by comparing it with a conventional LCD display and mouse for a 3D tree-tracing task. We found that bimanual interaction with pCubee and a mouse offered the best performance and was most preferred by users. pCubee has potential in 3D visualization and interactive applications such as games, storytelling and education, as well as viewing 3D maps, medical and architectural data.
Author Keywords
User interface, 3D visualization, handheld device, Fish Tank VR, multi-screen display, physical interaction, user evaluation
ACM Classification Keywords
H.5.2. Information Interfaces and Presentation: User Interfaces – Input devices and strategies; I.3.1. Computer Graphics: Hardware architecture – Three-dimensional
displays
General Terms
Design, Human Factors
INTRODUCTION
The visualization of three-dimensional (3D) information has wide reaching applications. It is becoming more important as advances in computer graphics and camera systems make 3D data sources abundant and accessible. Various types of display technologies for viewing 3D information have been proposed and prototyped; however a widely accessible and commercially viable 3D display technology has yet to be developed. Fish Tank Virtual
Reality (FTVR) is a type of 3D display technology that has potential in this area. It uses either head-coupled perspective rendering, stereoscopic techniques, or both, to provide optical cues to improve users’ perception of 3D virtual environments. Traditionally, these FTVR displays consist of only a single screen coupled with a head tracker and LCD shutter glasses to generate stereo images at the user’s perspective. While simple and fairly effective, such displays offer a limited viewing angle of the virtual scene due to the stationary 2D display panel in the setup.
We have extended the FTVR concept and created a prototype of a personal, multi-screen Fish Tank display, called pCubee, shown in Figure 1, which arranges five small LCD panels into the shape of a box. Correcting the perspective of each screen to the user’s head position gives the illusion of having real 3D objects within the box. The display shows bright, high-resolution imagery and correct occlusion depth cues from the physical seams between the LCD panels. A compelling feature of pCubee is its ability to allow a user to interact with dynamic virtual scenes that react to display movement with simulated physics in real-time. As a user manipulates, shakes and rotates the display box, objects within the scenes slide and bounce around. Further, pCubee can be held in one hand while using another input device, such as a mouse or a 3D stylus, for bimanual control and performing precision work.
We foresee geometric multi-screen configurations like pCubee, or other shapes, becoming a powerful tool in a variety of application areas involving 3D objects, such as medical and architectural model visualization.
Permission to make digital or hard copies of all or part of this work for personal or classroom use is granted without fee provided that copies are not made or distributed for profit or commercial advantage and that copies bear this notice and the full citation on the first page. To copy otherwise, or republish, to post on servers or to redistribute to lists, requires prior specific permission and/or a fee. CHI 2010, April 10–15, 2010, Atlanta, Georgia, USA. Copyright 2010 ACM 978-1-60558-929-9/10/04....$10.00.
Figure 1. Five screen pCubee showing a 3D model of the
globe; also shown are the A/D control boards and the
headphones containing the head-tracking sensor.
CHI 2010: Pointing and Selecting April 10–15, 2010, Atlanta, GA, USA
1381

pCubee’s ability to show reactive content is particularly suited for interactive games that can be both enjoyable and educational. As thinner and higher quality display technologies like Organic Light Emitting Diode (OLED) panels reach the market, geometric display configurations will further improve in terms of weight, border size, and image quality; therefore, it is important to better understand interaction and performance issues as well as the design characteristics that are important for these displays.
We piloted a user study to evaluate the performance of pCubee as both a visualization tool and an input device, comparing it to a conventional LCD display and mouse setup. A handheld geometric display should allow for intuitive interaction, since people are accustomed to holding and manipulating objects in their hands to locate object features. Thus, we expect that users will perform a tree-tracing task faster and more accurately by rotating and viewing a handheld geometric display as compared to viewing the object on a 2D display. We measured the users’ response times and error rates in a 3D tree-tracing task under different visualization and input conditions, and found that using multi-screen FTVR and bimanual control improves path tracing speed and locating of information in 3D scenes. Coupling a geometric display with an additional input device, such as a mouse, provides a user with multiple degrees of freedom with which to view a virtual scene. A user can move their head and the display independently while using the input device to rotate and fine-tune the scene in order to reach a desired perspective. Handheld geometric displays offer a tangible and compelling way to visualize and interact with 3D information and the technology has potential to become a widely accessible type of 3D display system.
RELATED WORK
3D display technologies can be categorized as volumetric or geometric. Here we review related 3D display systems and studies that have described and evaluated interaction techniques with 3D content.
Volumetric and Geometric Displays
Perception of 3D in the real world is accomplished by a number of visual cues. Volumetric displays convey 3D information by illuminating points in real-world spatial locations and include holographic, swept-volume, and static-volume (solid-state) techniques (see [13] for review). Compelling volumetric display implementations include spherical swept-volume systems [17] and cubic static-volume implementations with visible gas suspended in glass [12] or multi-planar optical elements [31]. Volumetric displays provide perceptually rich 3D information by satisfying all visual depth cues; however they are challenging to implement, and current technologies are limited in resolution, brightness, opaqueness, and/or compactness.
An alternative approach to “true 3D rendering” with volumetric displays is to render an image on one or more
2D displays with a perspective corrected to the user’s view. These displays can be classified as “geometric” as they use projective geometry to establish the illusion of 3D on a 2D surface by satisfying one or more perceptual depth cues. An advantage of geometric displays over volumetric displays is in the recent and ongoing advances in 2D display technology to create bright, high-resolution images in increasingly lighter and thinner form factors.
The arrangement of multiple 2D screens into a particular geometric shape, e.g. a cube, can establish an illusion similar to volumetric displays in that the 3D content is contained within the bounds of the enclosed shape. The illusion is typically only valid for one perspective (or user), as opposed to volumetric displays that by definition provide multiple simultaneous correct views. Special eyewear, such as shutter or polarized lenses, can be used with a geometric display to multiplex multiple perspectives. Such techniques are commonly used to present slightly different perspectives to a user’s right and left eyes for a stereoscopic view and could also be used to provide head-coupled monocular views for two users simultaneously. When used for stereoscopic cues, objects can be made to appear in front of the display. However, when having objects appear in front of the display any disruption in the field of view, such as a display seam or a misaligned set of projectors, will cause visual artifacts that compromise the 3D effect.
One of the earliest geometric displays is the CAVE system [7], which uses the walls of a room as inward-facing back-projection screens. The system is immersive as it allows the tracked user to walk around and receive correct perspective of a surrounding scene in addition to stereoscopic views. pCubee uses the same head-coupled technique as the CAVE, but only for a monocular view, due to synchronization limitations with the current LCD panels. Nevertheless, the empirical work done with the CAVE applies to pCubee as discussed below.
A number of other geometric displays have been proposed utilizing different combinations of projectors and beam-splitters. Cubby [11] used three small rear-projection screens and showed compelling monocular head-coupled 3D through the large motion parallax afforded by the multi-screen setup. Bimber et al. [5] demonstrated projector and mirror arrangements for cubic or cylindrical “virtual showcases.” An advantage of projector-based geometric displays is that they can be made seamless, however it is challenging to make them handheld.
Head mounted displays (HMD) are another variation where small geometric displays are located close to the user’s eyes to provide immersive stereo views. A projector-based HMD system proposed by Brown et al. [6] overlaid virtual images on real world surfaces and included a tangible cube widget that achieved a similar effect as pCubee. While such passive augmented reality widgets are lightweight, HMD systems are cumbersome and can provide a significant mismatch in visual accommodation cues.
CHI 2010: Pointing and Selecting April 10–15, 2010, Atlanta, GA, USA
1382
pCubee uses a different type of setup that arranges self contained 2D screens to face outward; Inami [21] prototyped one of the first outward-facing displays called the MEDIA cube, with which pCubee draws many parallels. Its four screen arrangement allows a user to have a “spatial consciousness” of the virtual objects inside; our pCubee prototype extends the concept by allowing interactive control of the display and is more compact for handheld manipulation. Cubee [30], which is a large-scale version of pCubee, is another reactive outward-facing volumetric display, but its weight and size make it difficult to maneuver (the display itself is supported with ropes from an overhead truss) and is not suitable for dynamic, reactive tasks that require precise and rapid user response. Harish and Narayanan [19] presented an algorithm for per-pixel depth calculation to overcome depth artifacts for synthetic renderings of polyhedral geometric displays, however standard off-axis projection techniques are sufficient for physical geometric displays, such as pCubee.
gCubik [24] is a handheld cubic display that achieves an autostereoscopic effect with integral image rendering and a lens array overlaying the screens. Though it does not require any form of head tracking for its 3D effect, the lens array significantly limits the display’s resolution and it does not currently support physics-based gesture interaction.
Interaction Techniques
Interactions with volumetric displays have been explored both with existing prototypes, such as ray-tracing-based selection [17], and for high fidelity mock-ups including handheld volumetric displays [3]. 3D pointer interaction was demonstrated with Cubby [11] using a stylus, which permits the physical pointer to overlap the virtual scene for selection, but can cause occlusion issues. Such studies have demonstrated that volumetric displays offer more engaging means of interaction as compared to interacting with 3D content on a traditional 2D display with mouse input.
Multi-touch interaction is a natural fit for geometric displays with touch screen technology becoming common place. 3D selection and manipulation with multi-touch interaction offers interesting possibilities that have been explored for volumetric displays [16], spherical displays [4], and a cubic input device controlling a 2D display [8].
Bimanual Interaction
A theoretical model of bimanual human motor behaviour was proposed by Guiard based on observations of motor tasks such as page manipulation by the non-dominant hand in handwriting [18]. Bimanual interaction with computer interfaces is becoming more prevalent with the adoption of touch-screen tablet computers and mobile phones. Bimanual interaction in 3D has been explored with tangible interfaces [20] and dual mouse setups [2] to control the view with the non-dominant hand and cursor or cut-plane manipulation with the dominant hand. These studies have demonstrated that bimanual interaction can be more natural and faster than unimanual mouse input in certain 3D tasks.
Our handheld pCubee display allows for bimanual interaction with the display in one hand and the input device in the other. The multiple degree-of-freedom dynamic interaction capabilities of pCubee lead to a number of interaction techniques that are not possible with other geometric 3D displays, as shown below.
Geometric Display Evaluations
Though various geometric display configurations have been proposed, little formal user evaluation has been reported comparing the performance of handheld, outward-facing geometric displays to conventional 2D monitors. Arthur et al. [1] compared a one-screen FTVR setup to a regular monitor and reported that FTVR significantly improved performance in tree-tracing experiments similar to ours. However, their studies did not involve user controls for rotation, and the top-down spanning trees reduced the search tasks to two dimensions. Ware et al. [32] reported head-coupled stereo rendering gave the best performance in 3D visualization of graph structures, but do not address monocular rendering. Demiralp et al. [10] compared the performance of the CAVE system and traditional FTVR displays using visual search tasks and concluded that users performed better and preferred FTVR for “looking-in” tasks. However, Prabhat et al. [29] reported contrasting results in their work that compared the two virtual environments in more complex scientific visualization tasks, suggesting this area is worthy of more in-depth investigations. A comparison of a volumetric display to a traditional stereo FTVR found better depth perception with the volumetric display, except in a path tracing task, where visual artifacts impeded performance [15].
PCUBEE DESIGN
We have designed pCubee to be a compact, personal multi-screen display. The goals of the design were to minimize the weight of the display for handheld interaction; minimize the width of the physical cube border; and render high-quality virtual scenes while simulating physical behaviors of objects with minimal lag. Here we detail the hardware, tracking, and software components of pCubee.
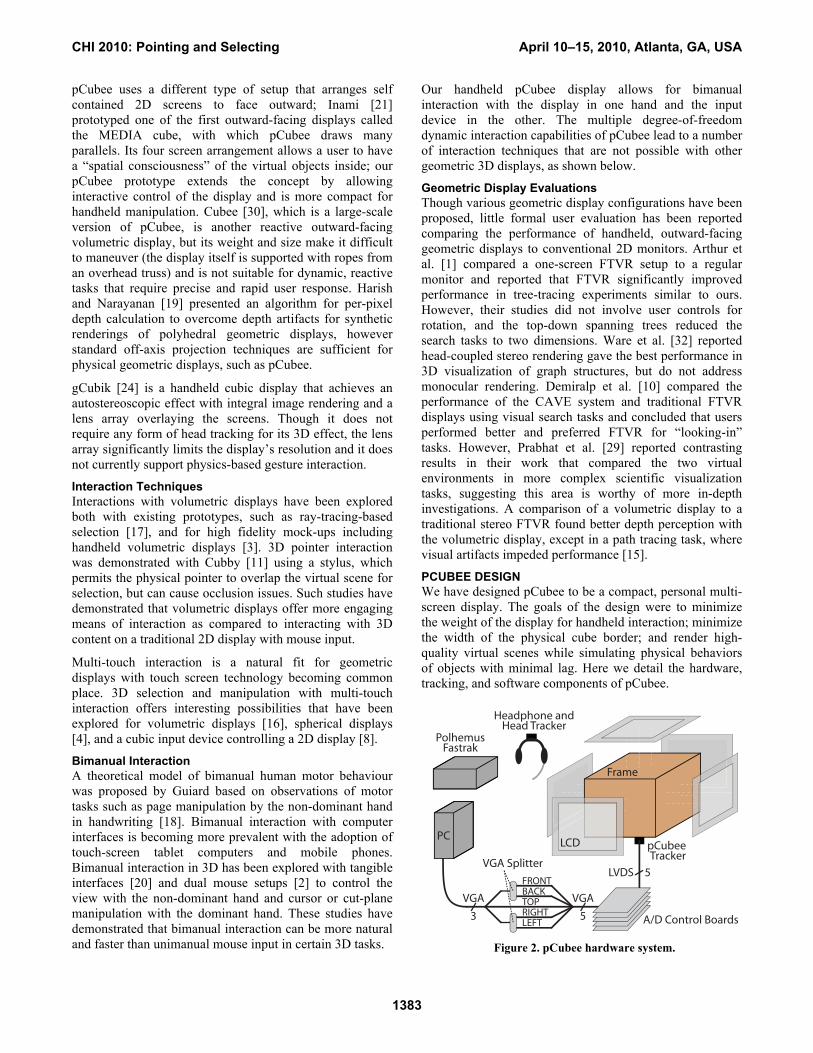
Figure 2. pCubee hardware system.
pCubee Tracker
PC
Headphone andHead Tracker
LCD
Frame
PolhemusFastrak
VGA
3
FRONTBACKTOPRIGHTLEFT A/D Control Boards
VGA Splitter
VGA
5
LVDS 5
CHI 2010: Pointing and Selecting April 10–15, 2010, Atlanta, GA, USA
1383

Display Hardware Setup
The pCubee prototype is shown in Figure 1 and the hardware system is diagrammed in Figure 2. The cubic display consists of five 5-inch VGA (640�480 pixels)
resolution LCD panels [23] that are mounted into a wooden box-shaped frame. The display box measures 146 � 120 �
146 mm. The bottom side of the box is left open for ventilation and cables with a small 120 � 96 � 36 mm base
to make it easier to grasp. The total weight of the frame, base, and screens is measured to be 1.3 kg (2.87 lbs), which is light enough to be held with one hand by an adult user.
We desired small physical borders between screens; however, this is difficult to realize with LCD panels because the border is dependent both on the thickness of the panel and the width of the bezel. Also, while screen brightness is constant at wide viewing angles with the current LCD panels there is noticeable color distortion at extremely oblique viewing angles. New display technologies, such as OLED panels, make a significant improvement over LCD panels in both thinness and wide viewing angle acuity.
Only three graphics pipelines are needed to drive pCubee, as a user can only see three sides of the box at any given time. A host computer, (Intel Quad Core 3.0GHz processor, Windows XP) with two dual-output Nvidia [25] GeForce 9800 GX2 graphics cards, generates three VGA signals. The distribution of separate rendering contexts to graphics card outputs is done using multi-monitor support in the Nvidia graphics driver. The VGA signals for opposite sided screens (front and back, left and right) are routed through signal splitters to get five video signals total. Each VGA signal is converted to low-voltage differential signaling (LVDS) video with an analog-to-digital (A/D) control board [22] and connected to a timing control board on the backside of the LCD panel as shown in Figure 3. The five A/D control boards are housed in a pedestal and connected to pCubee with a bundle of five 1m LVDS cables.
Tracking System
In order to render a perspective-corrected scene to each side of pCubee, we require the position of the user’s eye relative to the cubic display. In addition, we require the absolute position and orientation of the cubic display in space to
allow the physics engine to show a virtual scene inside pCubee that reacts to movement of the display.
A number of alternatives exist for position tracking; however head-coupled rendering requires a low latency solution as lag has been shown to disrupt the 3D effect [32]. We use a wired magnetic tracking system (Polhemus Fastrak [28]) to achieve low latency tracking. With two sensors attached, the update rate is 60Hz with a latency of 2-3msec. The head-tracking sensor is embedded in the top of a set of headphones, making the wired sensor less intrusive as users listen to sound effects and music while using pCubee. We estimate the user’s eye position from the head-tracking sensor with a fixed offset (10 cm below and 5 cm in front of top of user’s head), which works well for most users. We include a graphical user interface to edit the head-tracker-to-eye offset so that it can be tuned for a particular user for better visual calibration. The cube-tracking sensor is embedded on the base of the box, which provides sufficient separation (20 mm) so that the magnetic sensor is not affected by interference from the metal in the LCD panels. We store a pre-computed offset and rotation for each LCD screen relative to the cube-tracking sensor for calculating view frustums for perspective-corrected rendering as detailed in the next section. We can also incorporate other tracked input devices, such as a stylus, to allow users to directly interact with virtual objects inside the display.
Rendering Software
We use OpenSceneGraph (OSG) [27] to render high quality graphics in pCubee, including shadows, multi-texturing and shading, for greater depth cues and realism. To generate perspective-corrected images on each screen of pCubee, we use a standard off-axis projection scheme as described by Deering [9]. This is done in OSG by creating three View objects that correspond to the three visible screens on pCubee. The camera for each View is located at the user’s eye-position, oriented perpendicular to its corresponding virtual screen, and given a view frustum that passes through
Figure 3. LCD panel and control electronics.
Figure 4. Top-down 2D diagram of off-axis view frustums with
the top screen removed used to generate perspective corrected
images for each side of pCubee from the user's viewpoint.
camera
Front frustum Front near
clip-plane
Left
frus
tum
Left nearclip-plane
CHI 2010: Pointing and Selecting April 10–15, 2010, Atlanta, GA, USA
1384

the corners of its virtual screen as shown in Figure 4. Setting the near-clip plane coincident with the screen plane prevents rendering of virtual objects in front of the screens, which would cause occlusion issues at the screen edges. Figure 5 illustrates how the skewed images generated with off-axis projection fuse when viewed obliquely on the sides of the cubic display. Synchronization between screens is handled within OSG: the separate Views are contained within a single CompositeViewer object and the camera parameters in each View are updated before a single call is made to CompositeViewer to update all the Views simultaneously.
To enhance the illusion of looking into a box, we add a virtual pCubee frame to the 3D scene for additional occlusion cues. At oblique view angles, the real seam along the cube edge occludes virtual objects within the cube and the virtual objects occlude the virtual frame that is rendered behind. pCubee shows only monocular views, but stereoscopic rendering could be added to pCubee with stereo-capable, genlocked flat panel displays and synchronized shutter glasses to alternate between left-eye and right-eye views. However, rendering objects to appear in front of the screens would remain a problem due to the seams.
Physics Software
We have integrated a physics simulation engine to create different ways for a user to interact with 3D content in pCubee. In our current prototype, we use the Nvidia PhysX engine [26] for real-time simulation of rigid body, deformable body, and particle system dynamics. Each virtual object in pCubee is represented both in the rendering scene as an OSG Geode object and in the physics simulation scene as a PhysX Actor. For rigid body models the representations are often the same polygonal mesh; however, a high-resolution polygonal mesh could be used for a rendered object while its convex hull is used as the physics Actor. For soft-body models, a coarse tetrahedral mesh could be used as the physics Actor, which is linked to a higher resolution polygonal mesh for rendering.
Objects in the scene can be either static or dynamic. Static
objects appear “attached” to the display as their positions are updated based on the cube-tracker sensor before each simulation step. The virtual pCubee frame, virtual transparent walls surrounding the frame and ground plane are static objects and move with the display. Dynamic objects appear to move freely within the box, i.e. they fall downward under gravity relative to the real world, as their positions are updated by the physics engine after each simulation step. Collisions are computed between dynamic objects and between dynamic and static objects, making dynamic objects appear to bounce off the virtual inner walls as if pCubee was a glass box with real objects inside.
The simulation loop for pCubee is as follows:
• Obtain latest cube and eye position data from tracker;
• Update static object positions in OSG scene graph and physics engine scene based on cube-position;
• Simulate physics for one integration step;
• Update dynamic object positions in OSG scene graph based on physics simulation results;
• Update OSG View frustums based on eye-position;
• Render scene.
We can achieve 60Hz update rates on the current workstation for dynamic scenes with a small number of rigid bodies (e.g. 50 rigid body cow models each with a 5800 triangle mesh for rendering and a 125 triangle convex hull as its physics object).. For more complex physics simulations, such as soft bodies and particle systems, we can achieve 40Hz update rates for modest sized scenes appropriate for the scale of the display (e.g. 2 soft body cow models with 1700 tetrahedra each).
We use the FMOD toolkit [14] to generate collision sound effects and ambient sounds that blend with the virtual scenes in pCubee. Currently, sound effects are pre-recorded and played at a volume corresponding to the magnitudes of the collision events. More realistic collision sounds could be synthesized directly from the collision objects. Sounds are played through headphones to the users.
INTERACTION TECHNIQUES
The handheld form factor of our pCubee prototype enables a number of interesting, tangible interaction techniques that are different from stationary volumetric and geometric display systems. Here we elaborate on four novel interactions with pCubee: i. viewing a static virtual artifact, ii. playing with colliding objects inside the box, iii. navigating through a large landscape, and iv. using a stylus to select objects inside the box.
Figure 5. The images shown on each side of pCubee: the top,
front, and left images appear skewed when viewed face-on;
but fuse to the right perspective on the sides of a cube.
CHI 2010: Pointing and Selecting April 10–15, 2010, Atlanta, GA, USA
1385

i. Viewing Static Objects Inside the Box
A natural interaction for viewing a 3D scene within pCubee is to rotate it to see into different sides of the box. In this case, while objects in the scene are static, i.e. stationary within the display, the perspective of the scene is constantly changing, corresponding to the movements of the user’s head and the pCubee display. Complex 3D shapes can be viewed from different sides in a tangible manner. Figure 6a shows a 3D model of a Japanese Noh mask in pCubee; the artist’s signature stamp is visible on the backside of the mask if the user looks into the back-side screen. High-quality real-time rendering and the visual quality of the LCD panels allow for highly detailed representations of any type of 3D data, including CAD, architectural, or anatomical models. The interaction metaphor requires small sized or miniature virtual objects that fit within the bounds of the physical box.
ii. Objects Reacting to Display Motion
Extending the metaphor of virtual objects inside the box, we can make them react to the movement of the display with simulated physics. In this case, objects in the scene are dynamic, and move within the display due to virtual forces including gravity and collisions with the inner sides of the box and other objects. The interaction between the user and the virtual objects is indirect: the user moves the box, and the box moves the objects through downward sliding under gravity or colliding with the walls of the box. Reactive object interaction is well-suited for games or entertainment applications where dynamic content can be fun to play with. Figure 6b illustrates virtual cows tipping inside pCubee.
iii. Navigating a Landscape through Display Motion
Larger virtual scenes that extend outside the bounds of the physical box present a problem in navigating to see distal parts of the scene. We implement an interaction method for navigating 3D landscapes in pCubee in which the viewpoint translates in the direction that pCubee is tilted. We achieve this affect by placing a virtual ball with simulated gravity inside the scene that reacts to the user’s tilting motion; by centering the virtual cameras on the ball, the user can ‘explore’ around the scene as it rolls through the virtual landscape (see Figure 6c). By adjusting simulated gravity (or other effects), we have control over the effect tilt has on the traversal speed, which is like a control/display ratio. By using simulated earth gravity, users feel they are adjusting the tilt of a hill for the ball to roll down on earth, which is quite natural for pCubee. Alternatively, it is also possible to design a ‘fly-through’ style navigation, in which the displacement of pCubee from its original position constitutes its velocity and the rotation constitutes its angular velocity. These types of navigation interactions may be useful for virtual museums, where users can bring distal exhibits into their perspectives, and also gaming, where users need to go to different places on a large-scale map to accomplish different objectives.
iv. Using an Additional Input Device for Bimanual Interaction
Direct selection and manipulation of objects is needed in applications that require fine-grained user control, such as 3D widget interaction, CAD design, virtual sculpting, or painting. pCubee is small enough to be held in one hand, allowing another input device to be used in tandem. Figure 6d shows a 3D stylus being used to point into pCubee and interact with the scene, creating a bimanual interaction similar to using a physical pointer on an object held in one’s hand. For the study reported in this paper, we use mouse input to rotate static objects relative to the display.
PILOT STUDY: 3D TREE-TRACING TASK
We piloted a user study to evaluate the static visualization capabilities of pCubee using a 3D tree-tracing task to test users’ response time and accuracy under conditions that involve different combinations of visualization and rotational input. As opposed to the top-down branching tree structures used in Arthur et al. [1], we believe that using radial spanning trees more accurately represents searching
(a)
(b)
(c)
(d)
Figure 6. (a) A static Japanese Noh Mask inside pCubee;
(b) dynamic cow models react to display motion;
(c) 3D navigation through a large virtual landscape;
(d) direct selection of a object with a 3D pointer.
CHI 2010: Pointing and Selecting April 10–15, 2010, Atlanta, GA, USA
1386

in a 3D space, as the users not only have to search from top to bottom but in other directions as well.
The goal of the 3D tree-tracing task is to search through two overlapping radial tree structures to determine which pair of spheres are connected starting from the root of the tree, represented by a yellow or blue sphere, to a white sphere on one of the outermost branches. The subjects indicate their answers by pressing keys on the keyboard that are color-coded blue and yellow. The radial tree structures are designed with three levels of branching and shown in Figure 7. The first level of each tree contains seven branches that start off from a center node and the subsequent two levels containing a random case of either three or four branches each. To avoid cluttering and making the trees untraceable, each branch is of a random length from 0.5 to 1.5 units, with a minimal node separation distance of 0.5 units. The spanning direction of each branch is random, as long as it satisfies the separation distance requirement. For our study, both tree structures are randomly generated for each trial of the tracing task across all subjects and conditions; we tested and iterated on the tree generation algorithm to ensure the chosen branching design made the tree-tracing task non-trivial and traceable.
We tested four conditions with each subject. In the first condition (pCubee-only), only pCubee could be used to
visualize the static tree structures; the users could pick up the display and look into different sides to complete the task. In the second condition (pCubee-and-mouse), visualization inside pCubee was coupled with mouse control that could rotate the tree structures relative to the display. In the third condition (LCD-and-pCubee), pCubee was used as an input device, and the visualization of the trees and the virtual pCubee frame was decoupled and displayed on the LCD monitor; the rotation of pCubee was mapped with a one-to-one ratio onto the visualization on the LCD monitor. In the forth condition (LCD-and-mouse), the mouse was used to rotate the visualization on the LCD monitor. To ensure the difficulty of the task remained consistent across visualization conditions, we included the virtual pCubee frame on the LCD monitor visualization, as illustrated in Figure 7, to provide the same occlusion of the tree structures and adjusted the size of the visualization so that it was approximately the same as seen on pCubee. For conditions that involved the mouse as the rotational input, we mapped horizontal mouse movements to yaw (z-axis) rotation and vertical mouse movements to roll (x-axis) rotation. These mappings are similar to existing 3D modeling tools. For conditions that involved the LCD monitor for the visualization, there was no head-coupled rendering, and therefore the subjects could only see movements of the tree structures and the virtual pCubee frame from one fixed perspective. Our test conditions are summarized in Table 1.
The LCD monitor used in the study was a 24-inch 1920�1200 pixel resolution panel with a pixel pitch of
0.27mm, as compared to 0.168mm for the screens on pCubee. Visualization on pCubee is sharper and offers better image quality than the LCD monitor. We adjusted the colors of the screens so the visualizations were similar on both displays. Figure 8 illustrates our experiment setup.
Methods
Ten subjects (7 male, 3 female) were recruited to participate in the study with compensation (UBC ethics code H08-03005). The principal dependent variables for the experiment were response time and accuracy, which were recorded within the pCubee software. All subjects were first given verbal instructions of the task and on how they can interact with pCubee; they were instructed to maintain a high degree of accuracy while completing the task as fast as possible.
The experiment used within subjects design to evaluate performance across the four conditions. All participants performed ten consecutive trials of the tree-tracing task for each condition (for a total of 40 trials) and were allowed to practice before the actual trials begin in each condition. To cope with the limited subject pool, we grouped the conditions based on the type of display used. The pCubee conditions were always done either as the first two conditions or the last two, and vice versa for the LCD monitor conditions. Conditions within a display group and
Figure 7. Visualization of the radial tree structures.
Figure 8. Tree-tracing experiment setup.
CHI 2010: Pointing and Selecting April 10–15, 2010, Atlanta, GA, USA
1387

the ordering of the display groups were balanced between subjects to account for order effects. All subjects were spread across the eight different combinations with two combinations each having an extra subject. Upon completion of the four conditions, we conducted a short interview session with each subject, in which the subject was asked to rank his or her preferences for the different interaction schemes. We also asked some general questions regarding what the subject liked or disliked about pCubee.
Results
Repeated measures one-way ANOVA’s were carried out on both the mean response time and mean error rate for all 10 subjects1. Analysis shows significant difference in response times, F(3,27)=5.604, p<.004, but none in error rates, F(3,27)=1.908, p<.152. Pair-wise t-tests with Bonferroni adjustments on mean response times further revealed that the pCubee-only condition (mean time=27.17s) was significantly slower than the pCubee-mouse condition (mean time=13.70s). Figure 9 and Figure 10 illustrate the mean response time and error rate for each condition respectively. For the preference rankings, nine out of ten subjects indicated they preferred the pCubee and mouse condition the most; a CHI square analysis was performed on the votes given to each condition for the most preferred case, though no significant difference was revealed given the small sample size (X2 = 4.445e-05).
Analysis of Quantitative Results
In spite of the small sample size, we can see interesting and promising trends in the data samples we collected. In particular, observations relating to response times and error rates suggest further investigation.
i. Response Times
Results showed that the bimanual control capability of pCubee offers advantages in accurately choosing viewpoints and tracing information in 3D scenes, as
1 We removed outliers from the experimental data if the response time was 3 times the inter-quartile range (IQR) away from the 1st and 3rd quartiles. In total, there were 10 outliers out of 400 data points spread across five subjects in all four conditions; no visible patterns could be drawn. (pCubee-only: 2 outliers; pCubee and mouse: 4 outliers; screen and pCubee: 1 outlier; screen and mouse: 3 outliers).
subjects appeared to perform the fastest in the pCubee-and-mouse condition, though only significantly faster as compared to the pCubee-only condition. This accords with the findings by Balakrishnan and Kurtenbach [10], in which bimanual interaction techniques offered faster performance. A contributing factor to faster response times may have been that the tree could be rotated independently of the virtual frame in the pCubee-and-mouse condition, which reduced the impact of virtual frame occlusions. Subjects’ response times were relatively slower in the pCubee-only condition versus all the others including the LCD-and-pCubee condition, which was the least-preferred interaction scheme (six subjects ranked it as least preferred). One may attribute the difference to the novelty of the pCubee display, prompting the subjects to spend more time looking from different sides. Additional occlusions may also have played a role in the pCubee-only condition, as the subjects’ hands could have blocked their view during the task as they manipulated pCubee. We attached a small base on the bottom of pCubee so that it could be held without occluding the screens, but observed that users would commonly grasp the sides of the box during the study.
Condition Visualization Rotation Input
pCubee-only pCubee N/A
pCubee-and-mouse pCubee Mouse
LCD-and-pCubee LCD pCubee
LCD-and-mouse LCD Mouse
Table 1. Conditions used in experiment
Figure 9. Mean response times on 3D tree-tracing tasks.
Figure 10. Mean error rates on 3D tree-tracing tasks.
CHI 2010: Pointing and Selecting April 10–15, 2010, Atlanta, GA, USA
1388

ii. Error Rates
Subjects made noticeably more errors when they were using the LCD monitor to visualize the tree structures, suggesting our pCubee prototype might provide a better 3D environment to more accurately perform 3D tasks. Time-accuracy trade-off does not seem to be a dominant factor, as subjects performed the fastest in the pCubee-and-mouse condition while making the least errors, and they were observed not to be rushing to respond during the experiments, though again, a larger subject pool may reveal the true cause. The lower error rate on the pCubee conditions may be attributed to the sharper images and/or the perspective-corrected view on pCubee. Additional experiments with different screen resolutions are required to determine the degree of impact resolution has on 3D information visualization. Understanding this tradeoff would be important, for example, to compare with autostereoscopic techniques since they reduce pixel resolution to achieve multiple viewpoints [24].
Analysis of Observations and User Feedback
Initially, we were concerned that users would solely rely on mouse input when given the opportunity to in the pCubee-and-mouse condition, as they are most accustomed to mouse interaction. It was encouraging to observe the contrary: many subjects utilized the multi-screen aspect of pCubee for large-scale rotations instead of simply using the mouse to do all the manipulations. Compared to the pCubee-only condition, participants seemed to be significantly more focused in completing the 3D tasks when they were given bimanual control. During bimanual interaction, most users held the mouse throughout the task, which allowed them to stay connected to the 3D objects and make precise rotational adjustments as needed. In the pCubee-only condition, participants were observed exploring different ways to interact and connect with the scene to find the right viewing perspectives. Most participants held the display in their hands and turned to the back side multiple times before returning to the front due to the tethered cable, while others chose to put down the display entirely and walk around it to view from different sides. These observations suggest the importance of the bimanual control technique and allowing the user to manipulate objects independently inside the scene.
During the interview sessions, most subjects commented favorably on the high degree of control available to them in the pCubee-and-mouse case. The bimanual combination allowed them to first choose their viewpoints through rapid movement of their head and display while fine-tuning the rotation of the tree structures with the mouse to get the most desired view. A number of subjects commented that the interaction was intuitive to them as if they were holding real objects in their hands, and the display was responsive to their manipulation. On the contrary, subjects felt that using pCubee as an input device without the coupled visualization was unintuitive and cumbersome. Regarding the pCubee prototype, they disliked the weight, thick seams and cables,
which made the display more difficult to rotate. Subjects provided mixed responses regarding preference for a smaller or larger sized prototype, suggesting that different sizes may be appropriate for different users and tasks.
Out of the ten subjects who participated in the study, only one complained about the headphones, which suggests that our design is not overly intrusive. Comments on improvement include enhancing controls and interaction techniques such as the addition of zooming, buttons, touchscreen and a bottom screen. Subjects suggested a variety of application possibilities dealing with 3D visualization such as 3D radar, gaming, maps, storytelling and education. These features and ideas will help to guide future iterations of pCubee.
CONCLUSION AND FUTURE DIRECTIONS
We have presented a handheld geometric display, pCubee, which is capable of novel visualization and interaction techniques in 3D. Our pilot user study elicited promising results: participants indicated preferences for our display over a conventional LCD monitor and performed a 3D tree-tracing task faster and more accurately using our display bimanually with a mouse. The results point to additional avenues of investigation to identify design characteristics that are important in outward-facing geometric displays, including which combinations of input devices are suitable for different 3D manipulation tasks, tradeoffs between screen resolution and multiple perspectives, and also usability of embedded buttons and controls on the display. In future studies, we plan to quantify the magnitude of 3D rotation used with pCubee as compared to a stationary display and mouse input. In addition to static object visualization, it will also be important to evaluate other interaction techniques that our prototype offers, such as dynamic virtual object interactions and navigation of a large virtual landscape. The user feedback process suggests that pCubee still has a number of aspects to be improved, such as slimmer borders and wireless graphics capabilities to enhance visualization and ease of manipulation. Nonetheless, our current prototype demonstrates tremendous potential as a platform for 3D interactive tasks that are not possible with other geometric displays.
ACKNOWLEDGEMENTS
We thank Ryan Barr, Sajeev Kanesanathan, Kazuyoshi Nomura, and the NICT Universal City Group for their help with the prototype as well as the Ritsumeikan Computer Vision Lab for providing the Japanese Noh Mask model. We also thank the CHI reviewers for their helpful comments and suggestions. This work was funded by the Natural Sciences and Engineering Research Council of Canada (NSERC).
REFERENCES
1. Authur, K., Booth, K.S., and Ware, C. Evaluating human performance for Fishtank virtual reality. ACM
Trans. on Information Systems, (1993), 11(3), 216-266.
CHI 2010: Pointing and Selecting April 10–15, 2010, Atlanta, GA, USA
1389

2. Balakrishnan, R. and Kurtenbach, G. Exploring bimanual camera control and object manipulation in 3D graphics interfaces. In Proc. CHI '99, ACM Press (1999), 56-63.
3. Balakrishnan, R., Fitzmaurice, G., and Kurtenbach, G. User interfaces for volumetric displays. IEEE Computer, (2001), 34(3): 37-45.
4. Benko, H., Wilson, A.D., and Balakrishnan, R. Sphere: multi-touch interactions on a spherical display. In Proc.
UIST '08, ACM Press (2008), 77-86.
5. Bimber, O., Fröhlich, B., Schmalstieg, D., Encarnação, L.M. The Virtual Showcase. IEEE Computer Graphics
and Applications, (2001), November, 48-55.
6. Brown, L.D., Hua, H., and Gao, C. A widget framework for augmented interaction in SCAPE. In Proc. UIST '03, ACM Press (2003), 1-10.
7. Cruz-Neira, C., Sandin, J.D., and DeFanti, T.A. Surround-screen projection-based virtual reality: the design and implementation of the CAVE. In Proc.
SIGGRAPH '93, ACM Press (1993), 135-142.
8. de la Riviere, J.B., Kervegant, C., Orvain, E., and Dittlo., N. Cubtile: a multi-touch cubic interface. In Proc. VRST '08, ACM Press (2008), 69-72
9. Deering, M. High resolution virtual reality. ACM SIGGRAPH Computer Graphics, (1992),26(2):195-202.
10. Demiralp, C., Jackson, C.D., Karelitz, D.B., Zhang, S., and Laidlaw, D.H. CAVE and Fishtank virtual-reality displays: A qualitative and quantitative comparison. IEEE Trans. on Visualization and Computer Graphics,
(2006), 12(3), 323-330.
11. Djajadiningrat, J., Smets, G., and Overbeeke, C. Cubby: A multiscreen movement parallax display for direct manual manipulation. Displays, (1997), 17, 191–197.
12. Downing, E., Hesselink, L., Ralston, J., and Macfarlane, R. A three-color, solid-state, three-dimensional display. Science, (1996), 273(5279): 1185-1189.
13. Favalora, G.E. Volumetric 3D displays and application infrastructure. Computer, (2005), 38(8): 37-44.
14. FMOD Toolkit. http://www.fmod.org
15. Grossman, T. and Balakrishnan, R. An evaluation of depth perception on volumetric displays. In Proc. AVI
'06. ACM Press, (2006), 193-200.
16. Grossman, T. and Balakrishnan, R. Multi-finger gestural interaction with 3D volumetric displays. In Proc. UIST
'04, ACM Press (2004), 61-70.
17. Grossman, T. and Balakrishnan, R. The design and evaluation of selection techniques for 3D volumetric displays. In Proc. UIST '06, ACM Press (2006), 3-12.
18. Guiard, Y. Asymmetric division of labor in human skilled bimanual action: the kinematic chain as a model, Journal of Motor Behavior, (1987), 19(4), 486-517.
19. Harish, P. and Narayanan, P.J. A View-Dependent, Polyhedral 3D Display. In Proc. VRCAI '09, ACM Press (2009), online.
20. Hinckley, K., Pausch, R., Goble, J., and Kassell, N. Passive real-world interface props for neurosurgical visualization. In Proc. CHI '94, ACM (1994), 452-458.
21. Inami, M. Media3: the virtual hologram. In Proc.
SIGGRAPH '97 Emerging Technologies, ACM Press (1997), 107.
22. LCD panel controller ADB1024-14LVK, VertexLCD Inc., http://www.vertexlcd.com
23. LCD panel KM050V01-L01, VertexLCD Inc., http://www.vertexlcd.com
24. Lopez-Gulliver, R., Yoshida, S., Yano, S., and Inoue, N. gCubik: real-time integral image rendering for a cubic 3D display. In Proc. SIGGRAPH '09 Emerging
Technologies, ACM Press (2009), 11.
25. Nvidia Corporation. http://www.nvidia.com
26. Nvidia PhysX Engine. http://www.nvidia.com/object/physx_new.html
27. OpenSceneGraph. http://www.openscenegraph.org
28. Polhemus Fastrak. http://www.polhemus.com
29. Prebhat, A.F., Katzourin, M., Wharton, K., and Slater, M. A comparative study of desktop, Fishtank, and CAVE Systems for the exploration of volume rendered confocal data set. IEEE Trans. on Visualization and
Comp. Graphics, (2008), 14(3), 551-563.
30. Stavness, I., Vogt, F., and Fels, S. Cubee: thinking inside the box. In Proc. SIGGRAPH '06 Emerging
Technologies, ACM Press (2006), 5.
31. Sullivan, A. DepthCube solid-state 3D volumetric display. In Proc. SPIE-IS&T Electronic Imaging, (2004), 5291, 279-284.
32. Ware, C. and Franck, G. Evaluation of Stereo and Motion cues for visualising information in three dimensions. ACM Trans. on Graphics, (1996), 15(2), 121–140.
CHI 2010: Pointing and Selecting April 10–15, 2010, Atlanta, GA, USA
1390