Edible Neotropical Blueberries: Antioxidant and Compositional Fingerprint Analysis
Upload
independentCategory
view
2download
0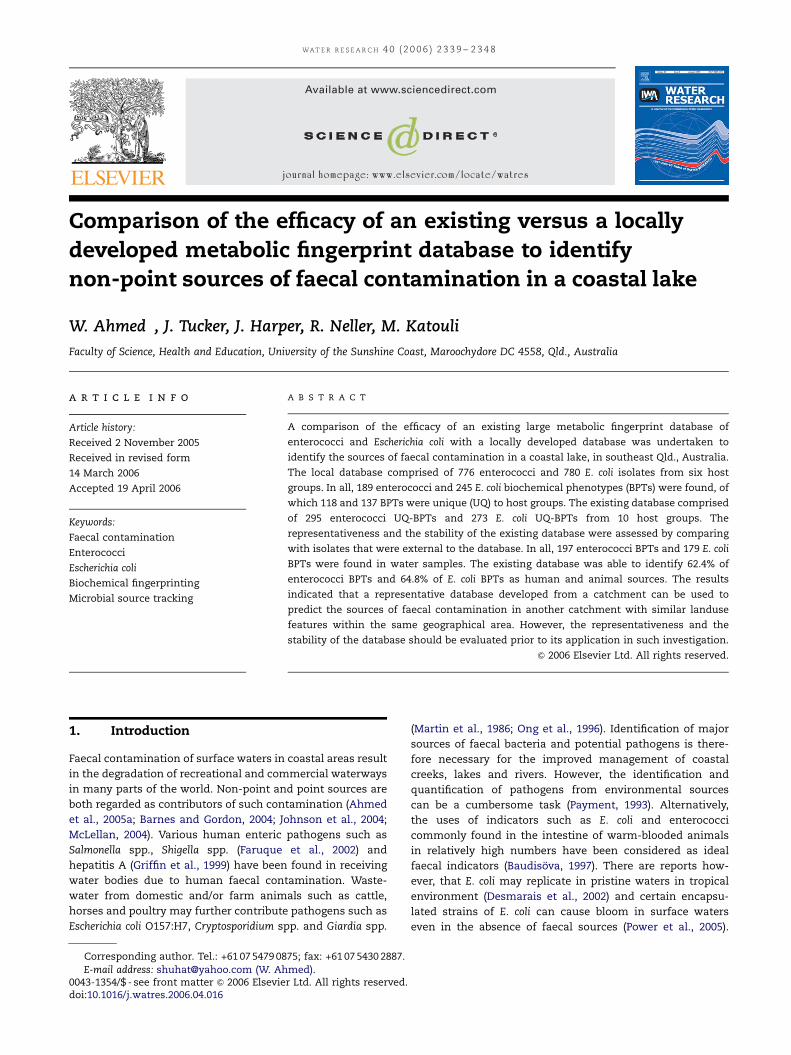
ARTICLE IN PRESS
Available at www.sciencedirect.com
WAT E R R E S E A R C H 4 0 ( 2 0 0 6 ) 2 3 3 9 – 2 3 4 8
0043-1354/$ - see frodoi:10.1016/j.watres
�Corresponding aE-mail address: sh
journal homepage: www.elsevier.com/locate/watres
Comparison of the efficacy of an existing versus a locallydeveloped metabolic fingerprint database to identifynon-point sources of faecal contamination in a coastal lake
W. Ahmed�, J. Tucker, J. Harper, R. Neller, M. Katouli
Faculty of Science, Health and Education, University of the Sunshine Coast, Maroochydore DC 4558, Qld., Australia
a r t i c l e i n f o
Article history:
Received 2 November 2005
Received in revised form
14 March 2006
Accepted 19 April 2006
Keywords:
Faecal contamination
Enterococci
Escherichia coli
Biochemical fingerprinting
Microbial source tracking
nt matter & 2006 Elsevie.2006.04.016
uthor. Tel.: +61 07 5479 [email protected] (W. Ah
A B S T R A C T
A comparison of the efficacy of an existing large metabolic fingerprint database of
enterococci and Escherichia coli with a locally developed database was undertaken to
identify the sources of faecal contamination in a coastal lake, in southeast Qld., Australia.
The local database comprised of 776 enterococci and 780 E. coli isolates from six host
groups. In all, 189 enterococci and 245 E. coli biochemical phenotypes (BPTs) were found, of
which 118 and 137 BPTs were unique (UQ) to host groups. The existing database comprised
of 295 enterococci UQ-BPTs and 273 E. coli UQ-BPTs from 10 host groups. The
representativeness and the stability of the existing database were assessed by comparing
with isolates that were external to the database. In all, 197 enterococci BPTs and 179 E. coli
BPTs were found in water samples. The existing database was able to identify 62.4% of
enterococci BPTs and 64.8% of E. coli BPTs as human and animal sources. The results
indicated that a representative database developed from a catchment can be used to
predict the sources of faecal contamination in another catchment with similar landuse
features within the same geographical area. However, the representativeness and the
stability of the database should be evaluated prior to its application in such investigation.
& 2006 Elsevier Ltd. All rights reserved.
1. Introduction
Faecal contamination of surface waters in coastal areas result
in the degradation of recreational and commercial waterways
in many parts of the world. Non-point and point sources are
both regarded as contributors of such contamination (Ahmed
et al., 2005a; Barnes and Gordon, 2004; Johnson et al., 2004;
McLellan, 2004). Various human enteric pathogens such as
Salmonella spp., Shigella spp. (Faruque et al., 2002) and
hepatitis A (Griffin et al., 1999) have been found in receiving
water bodies due to human faecal contamination. Waste-
water from domestic and/or farm animals such as cattle,
horses and poultry may further contribute pathogens such as
Escherichia coli O157:H7, Cryptosporidium spp. and Giardia spp.
r Ltd. All rights reserved.
75; fax: +61 07 5430 2887.med).
(Martin et al., 1986; Ong et al., 1996). Identification of major
sources of faecal bacteria and potential pathogens is there-
fore necessary for the improved management of coastal
creeks, lakes and rivers. However, the identification and
quantification of pathogens from environmental sources
can be a cumbersome task (Payment, 1993). Alternatively,
the uses of indicators such as E. coli and enterococci
commonly found in the intestine of warm-blooded animals
in relatively high numbers have been considered as ideal
faecal indicators (Baudisova, 1997). There are reports how-
ever, that E. coli may replicate in pristine waters in tropical
environment (Desmarais et al., 2002) and certain encapsu-
lated strains of E. coli can cause bloom in surface waters
even in the absence of faecal sources (Power et al., 2005).

ARTICLE IN PRESS
WAT E R R E S E A R C H 4 0 ( 2 0 0 6 ) 2 3 3 9 – 2 3 4 82340
Nonetheless, the presence of such indicator bacteria in
surface waters can only be seen as a measure of the quality
of the water but does not provide definitive information with
respect to possible sources (McLellan, 2004; Whitlock et al.,
2002). Genotypic and phenotypic methods have been devel-
oped to distinguish the various sources of human and animal
contamination (Carson et al., 2001; Hagedorn et al., 2003;
Wallis and Taylor, 2003) in surface waters. Some of these
methods (i.e. ribotyping, rep-PCR, antibiotic resistance pro-
files) require the development of a known source database
from host groups, based on the hypothesis that phenotypic or
genotypic characteristics of specific bacterial strains are
associated with specific animals (Johnson et al., 2004;
McLellan, 2004). The developed database is then used to
compare fingerprints from these same indicator bacteria
found in surface waters.
Despite the successful application of these database-
dependent methods, several questions have arisen regarding
their utility. For instance, the size and the representativeness
of the database need to be addressed prior to developing a
database for optimal performance. It has further been
reported that temporal and geographical variability exists in
E. coli populations, which may restrict the use of this
organism for a universal database (Hartel et al., 2002). In
response to these factors it has been suggested that a specific
database should be developed for each catchment of interest
(Hartel et al., 2002; Wiggins et al., 2003). This approach,
however, is unlikely to be cost effective and to become an
accepted monitoring tool for regulating authorities.
We have recently reported on the development of a large
metabolic fingerprint database and used that to identify the
sources of faecal contamination in Eudlo Catchment, Qld.,
Australia (Ahmed et al., 2005b). The aim of this study was to
assess the representativeness and stability of this existing
database and therefore, evaluate the efficacy of such database
to trace the sources of faecal contamination in another
catchment with similar landuse patterns within the same
geographical area.
2. Materials and methods
2.1. Host groups sampling
Six host groups (i.e. horses, cattle, ducks, chickens, dogs and
humans) were sampled between March 2005 and May 2005 on
four occasions from a Caloundra City catchment in south-
eastern Qld., Australia. Host groups were carefully chosen as
they were identified as potential contributors. In all, 155
samples were collected, including horses (32 samples from 10
farms), cattle (29 samples from 11 farms), chickens (30
samples from 4 farms), ducks (34 samples), dogs (27 samples)
and humans (3 samples). Faecal samples from domestic farm
animals were collected from farms within the catchment
whilst those for dogs were collected from city dog parks and a
dog kennel within 200 m of the studied lake. Samples
containing bacteria of human origin were collected as
composite samples from the primary influent of a sewerage
treatment plant (STP) servicing residential areas. All samples
(except STP) were collected from fresh defecation of indivi-
dual animals with sterile swabs and inserted into Amies
transport medium (Interpath, Melbourne, Australia) and
transported on ice to the laboratory and tested within 6 h.
2.2. Isolation of enterococci and E. coli
STP samples were suspended in 100 ml of buffered water
(0.0425 g/l KH2PO4 and 0.4055 g/l MgCl2) and vortexed for
3 min. Serial dilutions were made and filtered through a
0.45mm pore size (47 mm-diameter) nitrocellulose mem-
branes (Advantec, Japan) and placed on m-enterococcus
(Difco, UK) and RAPID’ E. coli 2 (REC 2) with supplement
(Bio-rad, USA) agar plates. Faecal samples from animal host
groups were directly streaked on m-enterococcus and REC 2
agar plates. Plates were then incubated at 37 1C for 48 h (for
faecal streptococci) and at 44 1C for 24 h (for E. coli). The REC 2
medium, used for isolation of E. coli is based on the detection
of two enzyme activities; b-D-glucuronidase (b-gluc) and b-D-
galactosidase (b-gal). The hydrolysis of chromogenic sub-
strates results in purple E. coli (b-gluc positive/b-gal positive)
and blue coliform colonies (b-gluc negative/b-gal positive).
The supplement added to the medium inhibits interfering
Gram-negative flora, which can be found in wastewater and
natural waters. Single purple colonies from this medium were
streaked on McConkey agar (Oxoid, USA) for purity and also
tested for indole production and citrate cleavage. Indole
positive and citrate negative isolates were identified as E. coli.
All isolates from m-enterococcus plates were also tested for
esculin hydrolysis on to Bile Esculin Agar (Oxoid, UK) and
incubated at 45 1C for 1 h to confirm their identification as
enterococci (i.e. black coloration) (Manero and Blanch, 1999).
2.3. Biochemical fingerprinting
In this study, we used two types of micro plates specifically
developed for typing of enterococci (PhP-RF plates) and E. coli
strains (PhP-RE plates) (PhPlate system, PhPlate AB, Stock-
holm). The 11 substrates used for enterococci and E.coli have
been described before (Iverson et al., 2002; Kuhn et al., 1995).
The growth medium for PhP-RF and RE was prepared
according to the manufacturer instructions. To maximize
the metabolic fingerprint, from each host up to seven colonies
of E. coli and seven colonies of enterococci were randomly
selected and picked with sterile toothpicks and suspended
into the first well of each row containing only 350 ml of growth
medium. Aliquots of 25ml of bacterial suspension were
transferred into each of the other 11 wells containing 150 ml
growth medium. Plates were then incubated at 37 1C and A620
was measured at 7, 24 and 48 h for E. coli and at 16, 40 and 64 h
for enterococci using a micro plate reader (Lab-systems
Multiskan, Finland). Using the PhPlate software version 4001
(PhPlate system, PhPlate AB, Stockholm), data were trans-
ferred to a computer connected to the reader and multiplied
by 10 to give scores ranging from 0 to 30 for each reaction.
After the final reading the mean value for all three readings
was calculated for each isolate giving scores ranging from 0 to
30 (biochemical fingerprint) as previously described by Kuhn
et al. (1995). Similarities between isolates were determined as
correlation coefficient after pair-wise comparisons of the
isolates using the PhPlate software according to the method

ARTICLE IN PRESS
WAT E R R E S E A R C H 40 (2006) 2339– 2348 2341
described before (Kuhn et al., 1995). This produced a similarity
matrix that contains N (i.e. number of isolates) � (N�1)/2
correlation coefficients which was clustered according to the
UPGMA clustering method (Sneath and Sokal, 1973) to yield a
dendrogram. In the dendrogram, each line represents one
isolate and they are connected to each other at the similarity
level they show to each other. An identity (ID) level of 0.965
was established based on the reproducibility of the system
after testing 20 isolates in duplicates. The mean similarity of
all 20 isolates minus two standard deviations (95% confidence
level) was taken as the ID-level.
Isolates with similarity higher than the ID-level were
regarded as identical and assigned to the same biochemical
phenotype (BPT). The phenotypic diversity among the isolates
was measured with Simpson’s index of diversity (Di) (Atlas,
1984). Di in the present study depends on isolates distribution
into different BPTs. Diversity is high (maximum 1) for a
population consists of different BPTs and is low (minimum 0)
if the population contains of few dominating BPTs. All data
handling, including optical readings, calculations of correla-
tions and coefficients, diversity indexes and as well as
clustering and printing dendrograms, was performed using
the PhPlate software version 4001 (PhPlate system, PhPlate
AB, Stockholm).
2.4. Lake sampling
Water samples were collected from seven sites (CU1–CU7)
from Currimundi Lake (Fig. 1) during March 2005 to April 2005.
Currimundi Lake, being located in the heart of the city, is
mainly used for recreational activities and the surrounding
population of the lake is entirely serviced by STPs. The lake is
subject to tidal inundation from the ocean and the entrance
periodically closes following the formation of sand plugs due
to tidal wave action. Once closed, the entrance will only be re-
opened by storm run-off following heavy rainfall events. The
Fig. 1 – Map of the Currimundi Lake showing sampling sites (CU
sample sites were located at various points along the entire
length of the lake. Sample site CU1 was located in the upper
reaches of the lake borders on rural landuse with both animal
and cultivated practices. Sample site CU2 was located
adjacent to residential landuse connected to a centralized
STP. Sample sites CU3–CU5 are also situated in a residential
area and are proximal to a number of storm water outlets and
serviced by STPs. Sample site CU6 was located close to the
coastal National Park, and is surrounded by non-residential
landuse. Sample site CU7 was located at the mouth of the lake
(being separated from the ocean by a sand plug) and is
extensively used for recreational activities.
In all, 28 samples were collected from these seven sites
(four samples from each site over a two week intervals). Water
samples were collected in 1 l sterile bottles from 30 cm below
the water surface and transported on ice to the laboratory and
tested within 6 h. The membrane filtration method was used
to process all the water samples as described above. The
identification and typing of these isolates with the PhPlate
system were carried out as described earlier. From each water
sample a maximum of 32 (where possible) enterococci and 24
E. coli isolates (where possible) were typed with the PhPlate
system for comparison with the database.
2.5. Bacterial source tracking
To identify the sources of faecal indicator bacteria, a local
database was developed and used that alone and/or in
combination with the larger existing database from a
previous microbial source tracking study (Ahmed et al.,
2005b). This existing database comprised of 4057 enterococci
and 3728 E. coli isolates from 10 host groups including six host
groups (i.e. cattle, horses, humans, chickens, ducks and dogs)
tested for the development of the local database. This existing
database has been successfully used previously in another
1–CU7) and landuse patterns of Currimundi sub-catchment.
ARTICLE IN PRESS
WAT E R R E S E A R C H 4 0 ( 2 0 0 6 ) 2 3 3 9 – 2 3 4 82342
catchment (i.e. Eudlo Catchment) located at a distance of
30 km from the present studied catchment.
2.6. Representativeness and stability of the existingdatabase
The representativeness of the existing database was tested
according to Wiggins et al. (2003). A database could be
considered highly representative, if it can classify more than
95% of non-database isolates into correct host groups. In all,
31 fresh faecal samples were collected from six host groups
(i.e. humans, horses, dogs, ducks cattle and chickens) from
the Eudlo Catchment after 10 months of development of
the existing database. A total of 328 enterococci isolates
and 290 E. coli isolates were typed from these samples and
the BPTs obtained from these non-database isolates were
cross-referenced with the BPTs of the existing database to
determine its representativeness. In addition, the stability of
the existing (i.e. larger database) database was tested after 10
months by comparing with the local database developed for
this study.
3. Results
3.1. Diversity of faecal indicator
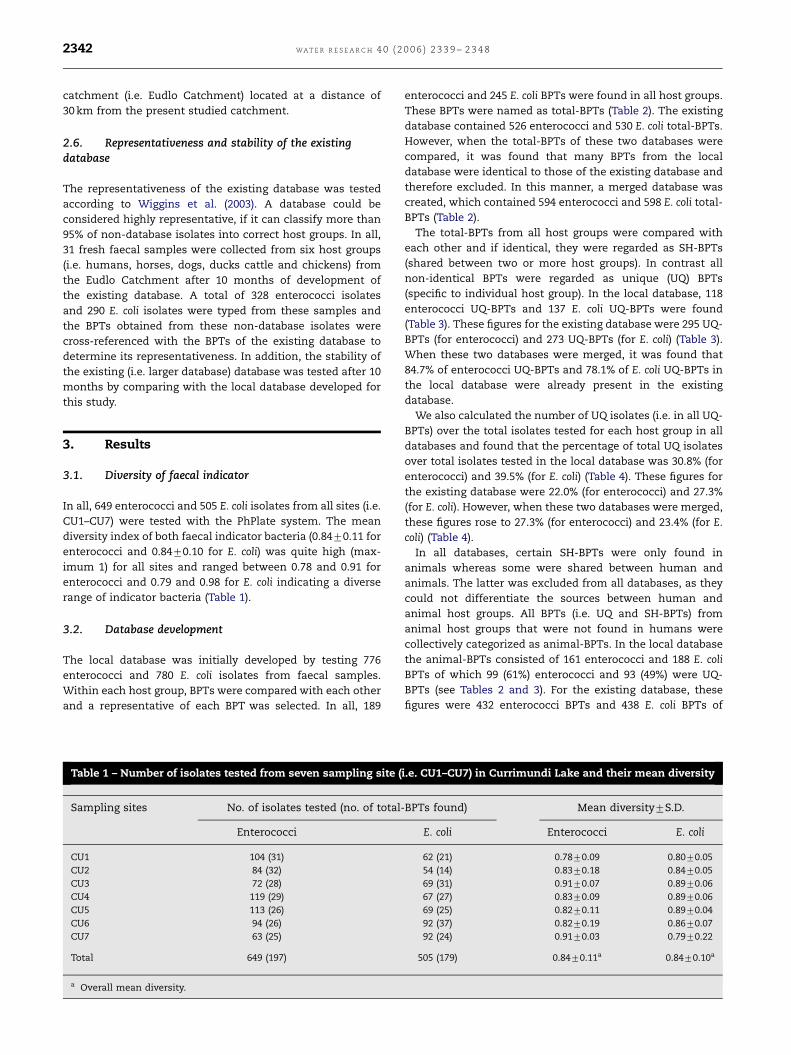
In all, 649 enterococci and 505 E. coli isolates from all sites (i.e.
CU1–CU7) were tested with the PhPlate system. The mean
diversity index of both faecal indicator bacteria (0.8470.11 for
enterococci and 0.8470.10 for E. coli) was quite high (max-
imum 1) for all sites and ranged between 0.78 and 0.91 for
enterococci and 0.79 and 0.98 for E. coli indicating a diverse
range of indicator bacteria (Table 1).
3.2. Database development
The local database was initially developed by testing 776
enterococci and 780 E. coli isolates from faecal samples.
Within each host group, BPTs were compared with each other
and a representative of each BPT was selected. In all, 189
Table 1 – Number of isolates tested from seven sampling site (
Sampling sites No. of isolates tested (no. of total
Enterococci
CU1 104 (31)
CU2 84 (32)
CU3 72 (28)
CU4 119 (29)
CU5 113 (26)
CU6 94 (26)
CU7 63 (25)
Total 649 (197)
a Overall mean diversity.
enterococci and 245 E. coli BPTs were found in all host groups.
These BPTs were named as total-BPTs (Table 2). The existing
database contained 526 enterococci and 530 E. coli total-BPTs.
However, when the total-BPTs of these two databases were
compared, it was found that many BPTs from the local
database were identical to those of the existing database and
therefore excluded. In this manner, a merged database was
created, which contained 594 enterococci and 598 E. coli total-
BPTs (Table 2).
The total-BPTs from all host groups were compared with
each other and if identical, they were regarded as SH-BPTs
(shared between two or more host groups). In contrast all
non-identical BPTs were regarded as unique (UQ) BPTs
(specific to individual host group). In the local database, 118
enterococci UQ-BPTs and 137 E. coli UQ-BPTs were found
(Table 3). These figures for the existing database were 295 UQ-
BPTs (for enterococci) and 273 UQ-BPTs (for E. coli) (Table 3).
When these two databases were merged, it was found that
84.7% of enterococci UQ-BPTs and 78.1% of E. coli UQ-BPTs in
the local database were already present in the existing
database.
We also calculated the number of UQ isolates (i.e. in all UQ-
BPTs) over the total isolates tested for each host group in all
databases and found that the percentage of total UQ isolates
over total isolates tested in the local database was 30.8% (for
enterococci) and 39.5% (for E. coli) (Table 4). These figures for
the existing database were 22.0% (for enterococci) and 27.3%
(for E. coli). However, when these two databases were merged,
these figures rose to 27.3% (for enterococci) and 23.4% (for E.
coli) (Table 4).
In all databases, certain SH-BPTs were only found in
animals whereas some were shared between human and
animals. The latter was excluded from all databases, as they
could not differentiate the sources between human and
animal host groups. All BPTs (i.e. UQ and SH-BPTs) from
animal host groups that were not found in humans were
collectively categorized as animal-BPTs. In the local database
the animal-BPTs consisted of 161 enterococci and 188 E. coli
BPTs of which 99 (61%) enterococci and 93 (49%) were UQ-
BPTs (see Tables 2 and 3). For the existing database, these
figures were 432 enterococci BPTs and 438 E. coli BPTs of
i.e. CU1–CU7) in Currimundi Lake and their mean diversity
-BPTs found) Mean diversity7S.D.
E. coli Enterococci E. coli
62 (21) 0.7870.09 0.8070.05
54 (14) 0.8370.18 0.8470.05
69 (31) 0.9170.07 0.8970.06
67 (27) 0.8370.09 0.8970.06
69 (25) 0.8270.11 0.8970.04
92 (37) 0.8270.19 0.8670.07
92 (24) 0.9170.03 0.7970.22
505 (179) 0.8470.11a 0.8470.10a

ARTICLE IN PRESS
Table 2 – Number of isolates tested from each host group and the number of total-biochemical phenotypes (BPTs) in thelocal, existing and merged databases
Host groups(no. ofsamplestested)
Local database Existing database Merged database
No. of isolates tested (no. oftotal-BPTs found)
No. of isolates tested (no. oftotal BPTs-found)
No. of isolates tested (no. oftotal-BPTs found)
Enterococci E. coli Enterococci E. coli Enterococci E. coli
Human (3) 137 (28) 161 (57) 1072 (94) 621 (92) 1209 (101) 782 (101)
Horses (32) 109 (31) 131 (34) 407 (76) 407 (60) 516 (78) 538 (66)
Dogs (27) 126 (21) 121 (36) 404 (49) 408 (64) 530 (60) 529 (73)
Ducks (34) 136 (42) 110 (33) 408 (58) 404 (69) 544 (72) 514 (74)
Cattle (29) 145 (40) 126 (41) 411 (47) 401 (61) 556 (71) 527 (73)
Chicken (30) 123 (27) 131 (44) 408 (74) 408 (59) 531 (84) 539 (78)
Pigs (NT) NT NT 312 (54) 400 (53) 312 (54) 400 (53)
Sheep (NT) NT NT 287 (21) 367 (30) 287 (21) 367 (30)
Deer (NT) NT NT 204 (28) 200 (31) 204 (28) 200 (31)
Kangaroos (NT) NT NT 144 (25) 112 (19) 144 (25) 112 (19)
Total (155) 776 (189) 780 (245) 4057 (526) 3728 (530) 4833 (594) 4508 (598)
NT: Not tested for the local database.
Table 3 – Number of unique (UQ) and shared (SH) biochemical phenotypes (BPTs) of host groups in the local, existing andmerged databases
Host groups Local database Existing database Merged database
Enterococci E. coli Enterococci E. coli Enterococci E. coli
UQ SH UQ SH UQ SH UQ SH UQ SH UQ SH
Human 19 9 44 13 66 28 69 23 70 31 71 30
Horses 21 10 17 17 54 22 32 28 55 23 36 30
Dogs 16 5 19 17 24 25 32 32 25 35 38 35
Ducks 30 12 11 22 29 29 32 37 34 38 33 41
Cattle 21 19 22 19 23 24 24 29 28 43 31 42
Chicken 11 16 24 20 41 33 33 26 38 46 43 35
Pigs NT NT NT NT 28 26 25 28 28 26 25 28
Sheep NT NT NT NT 7 14 11 19 7 14 11 19
Deer NT NT NT NT 13 15 9 22 13 15 9 22
Kangaroos NT NT NT NT 10 15 6 13 10 15 6 13
Total 118 71 137 108 295 231 273 257 308 286 303 295
NT: Not tested.
WAT E R R E S E A R C H 40 (2006) 2339– 2348 2343
which, 229 (53%) enterococci BPTs and 204 (47%) E. coli BPTs
were UQ-BPTs (see Tables 2 and 3). For the merged database,
these figures were 493 enterococci BPTs and 497 E. coli BPTs of
which, 238 (48.2%) enterococci BPTs and 232 (46.7%) E. coli
BPTs were UQ-BPTs (see Tables 2 and 3).
3.3. Representativeness and stability of the existingdatabase
The representativeness of the existing database was deter-
mined by adding non-database isolates from the same
catchment (i.e. Eudlo Catchment). Of the 328 enterococci
and 290 E. coli isolates tested from six host groups, 79 (92.9%
over total-BPTs found) enterococci BPTs which were repre-
sented by 303 (92.4%) enterococci isolates and 63 (86.3% over
total-BPTs found) were represented by 273 (94.1%) E. coli
isolates were already present in the existing database
indicating a high representativeness.
Stability of the BPTs in the existing database was tested by
comparing the total-BPTs (i.e. UQ and SH-BPTs) from the local
database. The results showed that 121 (64.0% over total-BPTs
found) enterococci total-BPTs which were represented by 665
isolates (85.7% over total isolates tested) and 177 (72.2%) E. coli
total-BPTs which were represented by 683 isolates (87.6%)

ARTICLE IN PRESS
Ta
ble
4–
Th
en
um
ber
of
iso
late
sin
all
un
iqu
e(U
Q)
bio
chem
ica
lp
hen
oty
pes
(BP
Ts)
inea
chh
ost
gro
up
inth
elo
cal,
ex
isti
ng
an
dm
erg
ed
data
ba
ses
Ho
stgro
up
sLo
cal
da
tab
ase
Ex
isti
ng
da
tab
ase
Merg
ed
da
tab
ase
En
tero
cocc
iE
.co
liE
nte
roco
cci
E.
coli
En
tero
cocc
iE
.co
li
No
.o
fis
ola
tes
%o
ver
tota
lis
ola
tes
No
.o
fis
ola
tes
%o
ver
tota
lis
ola
tes
No
.o
fis
ola
tes
%o
ver
tota
lis
ola
tes
No
.o
fis
ola
tes
%o
ver
tota
lis
ola
tes
No
.o
fis
ola
tes
%o
ver
tota
lis
ola
tes
No
.o
fis
ola
tes
%o
ver
tota
lis
ola
tes
Hu
ma
n54
39.4
120
74.5
367
34.2
360
57.9
421
34.8
480
61.4
Ho
rses
37
33.9
21
16.0
91
22.3
80
19.6
128
24.8
101
18.8
Do
gs
18
14.3
53
43.8
59
14.6
81
19.8
77
14.5
134
25.3
Du
cks
43
31.6
19
17.3
41
10.0
136
33.6
84
15.4
155
30.1
Ca
ttle
69
47.6
53
42.0
95
23.1
71
17.7
164
29.5
124
23.5
Ch
ick
en
18
14.6
42
32.0
87
21.3
71
17.4
105
19.8
113
21.0
Pig
sN
TN
TN
TN
T74
23.7
114
28.5
74
23.7
114
28.5
Sh
eep
NT
NT
NT
NT
32
11.1
77
21.0
32
11.1
77
21.0
Deer
NT
NT
NT
NT
30
14.7
13
6.5
30
14.7
13
6.5
0
Ka
nga
roo
NT
NT
NT
NT
16
11.1
13
11.6
16
11.1
13
11.6
To
tal
239
30.8
a308
39.5
a892
22.0
a1016
27.3
a1131
23.4
a1324
29.4
a
NT
:N
ot
test
ed
.a
Mea
np
erc
en
tage
over
tota
lis
ola
tes
test
ed
.
WAT E R R E S E A R C H 4 0 ( 2 0 0 6 ) 2 3 3 9 – 2 3 4 82344

ARTICLE IN PRESS
Ta
ble
5–
So
urc
es
of
hu
ma
na
nd
an
ima
lb
ioch
em
ica
lp
hen
oty
pes
(BP
Ts)
of
en
tero
cocc
ia
nd
Esc
her
ich
iaco
lifo
un
din
sev
en
sam
pli
ng
site
s(i
.e.
CU
1–C
U7
)in
the
Cu
rrim
un
di
La
ke
usi
ng
the
loca
l,ex
isti
ng
an
dm
erg
ed
data
ba
ses
Sa
mp
lin
gsi
tes
Lo
cal
da
tab
ase
Ex
isti
ng
da
tab
ase
Merg
ed
da
tab
ase
No
.of
BP
Ts
un
iqu
eto
hu
ma
n(n
o.
of
iso
late
s)
No
.o
fa
nim
al
BP
Ts
(no
.o
fis
ola
tes)
No
.of
BP
Ts
un
iqu
eto
hu
ma
n(n
o.
of
iso
late
s)
No
.o
fa
nim
al
BP
Ts
(no
.o
fis
ola
tes)
No
.of
BP
Ts
un
iqu
eto
hu
ma
n(n
o.
of
iso
late
s)
No
.o
fa
nim
al
BP
Ts
(no
.o
fis
ola
tes)
En
tE
.co
liE
nt
E.
coli
En
tE
.co
liE
nt
E.
coli
En
tE
.co
liE
nt
E.
coli
CU
14
(18)
1(2
)14
(29)
9(3
2)
2(1
6)
1(2
)19
(65)
14
(41)
2(1
6)
1(2
)22
(76)
16
(49)
CU
21
(2)
0(0
)12
(50)
7(4
2)
0(0
)1
(4)
20
(62)
8(2
8)
0(0
)1
(4)
21
(66)
9(2
9)
CU
31
(2)
3(5
)9
(35)
17
(48)
0(0
)3
(5)
17
(45)
19
(53)
0(0
)4
(6)
21
(53)
21
(57)
CU
42
(4)
2(7
)12
(50)
12
(37)
3(9
)2
(7)
13
(73)
16
(43)
3(9
)2
(7)
15
(83)
17
(48)
CU
51
(1)
3(9
)12
(39)
8(2
1)
1(1
)3
(7)
17
(81)
11
(38)
2(2
)5
(11)
19
(90)
13
(43)
CU
62
(3)
4(4
)16
(30)
17
(35)
3(7
)2
(3)
14
(61)
20
(38)
4(9
)2
(3)
19
(70)
21
(41)
CU
71
(4)
0(0
)12
(32)
12
(27)
5(1
1)
2(6
)9
(31)
14
(65)
7(1
4)
2(6
)12
(38)
16
(73)
To
tal
12
(34)
13
(27)
87
(265)
82
(242)
14
(44)
14
(34)
109
(418)
102
(306)
18
(50)
17
(39)
131
(476)
113
(340)
En
t:E
nte
roco
cci.
WAT E R R E S E A R C H 40 (2006) 2339– 2348 2345
from the local database were present (i.e. same biochemical
pattern) in the existing one (Table 2).
3.4. Source tracking
In order to identify the non-point source(s) of faecal
contamination, BPTs from the local, existing and merged
databases were compared with the BPTs found in water
samples. From all sampling sites, 197 enterococci BPTs
and 179 E. coli BPTs were obtained (see Table 1). Of the 197
enterococci BPTs, 12 (6%) were identical to human (i.e. UQ-
BPTs) and of the 179 E. coli BPTs obtained from the same water
samples, 13 (7.2%) were of human BPTs when compared with
the local database (Table 5). In addition, 87 (44%) enterococci
BPTs and 82 (45.8%) E. coli BPTs belonged to animals (i.e.
animal-BPTs). The remaining 98 (50%) enterococci BPTs and
84 (46.9%) E. coli BPTs could not be identified to any host
groups. These figures for the existing database were 14 (7.1%)
enterococci BPTs and 14 (7.8%) E. coli BPTs for human (i.e.
UQ-BPTs) and 109 (55.3%) enterococci BPTs and 102 (57.0%)
E. coli BPTs for animals (Table 5). In contrast, the ability of the
merged database to identify environmental BPTs was much
higher than that of the local database. Eighteen enterococci
BPTs (9.1%) and 17 (9.5%) E. coli BPTs were identified as
humans, therefore the efficacy of the merged database has
improved 50.0% (for enterococci) and 30.0% (for E. coli) over
the local database. Similar improvements were observed in
identifying animal-BPTs (i.e. 50.0% for enterococci and 37.0%
for E. coli) when compared with the merged database (Table 5).
Comparison of total-BPTs found in water samples over the
sampling period with the local database showed that 44.0%
enterococci and 45.8% E. coli BPTs were identical to animal-
BPTs whereas these figures for the existing database were
55.3% for enterococci and 57.0% for E. coli. The merged
database also showed an improvement over both databases
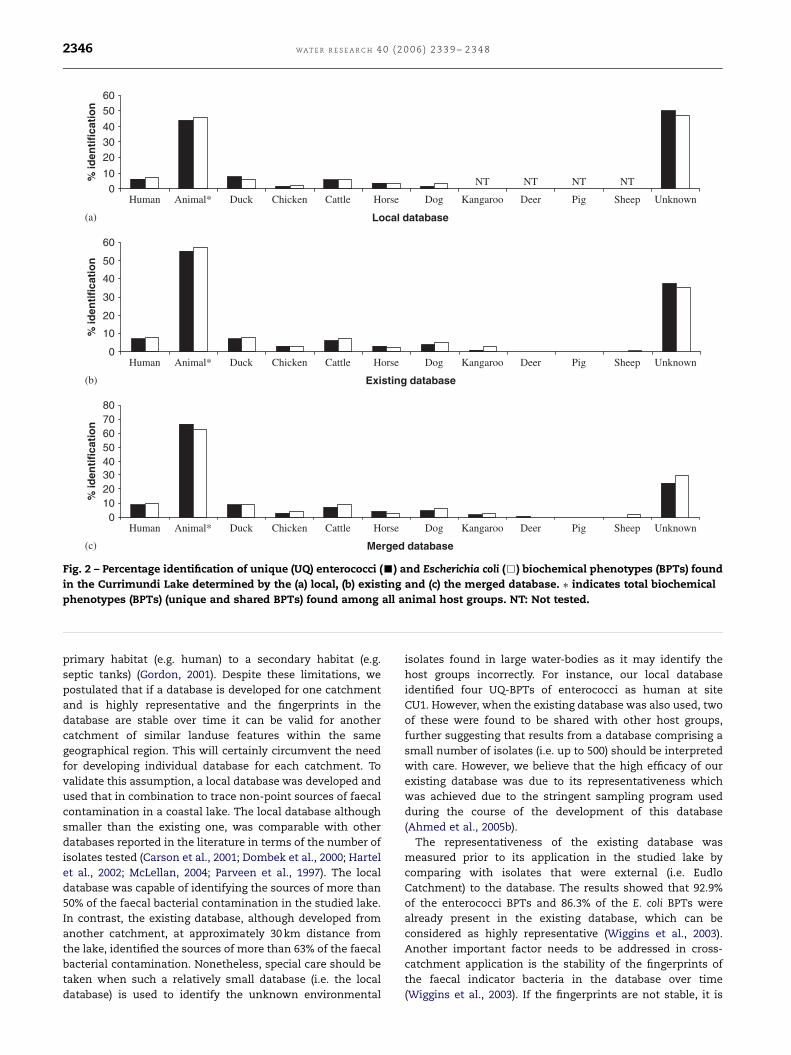
(i.e. 66.0% for enterococci and 63.0% for E. coli) (Fig. 2).
Importantly, certain animal-BPTs were shown to be UQ to
an individual animal group. Distribution of enterococci and E.
coli human UQ-BPTs, animal-BPTs and as well as animal UQ-
BPTs according to the (a) local, (b) existing and (c) merged
database as shown in Fig. 2. The level of human (UQ-BPTs)
contribution was higher than any other animal host groups
with an exception in the local database, where duck (7.6%)
enterococci UQ-BPTs contributed more than those of humans
(6.0%). According to the local database, among animal groups,
ducks contributed more than any others (7.6% for enterococci
and 6.0% for E. coli) followed by cattle and horses. Similar
results were also found with the existing and merged
database, which identified that, the contribution from ducks,
was highest followed by cattle and dogs (Fig. 2).
4. Discussion
Questions have arisen regarding the reliability of currently
used faecal indicators especially E. coli in terms of temporal
and geographical stability (Gordon, 2001). It has been reported
that genetic variation exists in E. coli (Gordon, 1997) and this
may increase with the increased distance for certain host
groups (Hartel et al., 2002) or during the transition from a
ARTICLE IN PRESS
010
203040
5060
Human Animal* Duck Chicken Cattle Horse Dog Kangaroo Deer Pig Sheep Unknown
Chicken Cattle Horse Dog Kangaroo Deer Pig Sheep Unknown
Local database
% id
enti
fica
tio
n
01020304050607080
Merged database
% id
enti
fica
tio
n
0
10
20
30
40
50
60
Human Animal* Duck
Existing database
% id
enti
fica
tio
n
NT NT NT NT
Chicken Cattle Horse Dog Kangaroo Deer Pig Sheep UnknownHuman Animal* Duck
(a)
(b)
(c)
Fig. 2 – Percentage identification of unique (UQ) enterococci (’) and Escherichia coli (&) biochemical phenotypes (BPTs) found
in the Currimundi Lake determined by the (a) local, (b) existing and (c) the merged database. � indicates total biochemical
phenotypes (BPTs) (unique and shared BPTs) found among all animal host groups. NT: Not tested.
WAT E R R E S E A R C H 4 0 ( 2 0 0 6 ) 2 3 3 9 – 2 3 4 82346
primary habitat (e.g. human) to a secondary habitat (e.g.
septic tanks) (Gordon, 2001). Despite these limitations, we
postulated that if a database is developed for one catchment
and is highly representative and the fingerprints in the
database are stable over time it can be valid for another
catchment of similar landuse features within the same
geographical region. This will certainly circumvent the need
for developing individual database for each catchment. To
validate this assumption, a local database was developed and
used that in combination to trace non-point sources of faecal
contamination in a coastal lake. The local database although
smaller than the existing one, was comparable with other
databases reported in the literature in terms of the number of
isolates tested (Carson et al., 2001; Dombek et al., 2000; Hartel
et al., 2002; McLellan, 2004; Parveen et al., 1997). The local
database was capable of identifying the sources of more than
50% of the faecal bacterial contamination in the studied lake.
In contrast, the existing database, although developed from
another catchment, at approximately 30 km distance from
the lake, identified the sources of more than 63% of the faecal
bacterial contamination. Nonetheless, special care should be
taken when such a relatively small database (i.e. the local
database) is used to identify the unknown environmental
isolates found in large water-bodies as it may identify the
host groups incorrectly. For instance, our local database
identified four UQ-BPTs of enterococci as human at site
CU1. However, when the existing database was also used, two
of these were found to be shared with other host groups,
further suggesting that results from a database comprising a
small number of isolates (i.e. up to 500) should be interpreted
with care. However, we believe that the high efficacy of our
existing database was due to its representativeness which
was achieved due to the stringent sampling program used
during the course of the development of this database
(Ahmed et al., 2005b).
The representativeness of the existing database was
measured prior to its application in the studied lake by
comparing with isolates that were external (i.e. Eudlo
Catchment) to the database. The results showed that 92.9%
of the enterococci BPTs and 86.3% of the E. coli BPTs were
already present in the existing database, which can be
considered as highly representative (Wiggins et al., 2003).
Another important factor needs to be addressed in cross-
catchment application is the stability of the fingerprints of
the faecal indicator bacteria in the database over time
(Wiggins et al., 2003). If the fingerprints are not stable, it is

ARTICLE IN PRESS
WAT E R R E S E A R C H 40 (2006) 2339– 2348 2347
not practical to use such database in cross-catchment study.
In the present study, we found that 10 months after the
development of the existing database, more than 85% of
enterococci isolates (i.e. 64% BPTs) and 87% of E. coli isolates
(i.e. 72% BPTs) from the local database were present in the
existing one, indicating a high stability of the fingerprints of
the indicator bacteria used in the existing database.
A previous study has reported that the antibiotic resistance
profile of enterococci isolates is stable up to 12 months
(Wiggins et al., 2003). In addition, the stability of the UQ-BPTs
were also shown to be highly stable as more than 84%
enterococci and 78% E. coli UQ-BPTs from the local database
were identical to the existing database. Furthermore, when
the total-BPTs found in the local database were cross-
referenced with the existing one, the ID of UQ-BPTs within
each host group did not change to SH-BPTs with few
exceptions, also suggesting that these UQ-BPTs were highly
specific to each host group. However, it is known that bacteria
are ubiquitous in the environment and therefore can be found
in many animals. There is a possibility that these UQ-BPTs
can be found in other host groups in wider geographical area.
We are currently investigating this hypothesis by collecting
isolates from wider geographical areas.
Using any of the local, existing or merged databases, it was
shown that there is an agreement between both enterococci
and E. coli databases as they were equally capable of
identifying the sources of faecal bacterial contamination.
This certainly increases the confidence level that the sources
are correctly identified. For example, more than 7% of BPTs
from human host groups for both faecal indicator bacteria
were identical to those found in water samples suggesting
that the sources are correctly identified. Another advantage of
using a combination of both databases was that they can
compliment each other when one database failed to identify
the source at a particular site. For instance, contamination at
sites CU2 and CU3 could not have been identified as human if
only the enterococci database had been used.
The existing database, although developed from host
groups residing in another catchment, identified 7.1% of
enterococci BPTs and 7.8% of E. coli BPTs as being of human
origin, which was higher than that identified by the local
database (i.e. 6% for enterococci and 7.2% for E. coli). Similarly,
the existing database identified more than 55% (for both
faecal indicator bacteria) of the BPTs as animal-BPTs,
which was also higher than that of the local database (i.e.
approx. 45% for both indicator bacteria). As expected,
the overall performance of the existing database was
improved to 75.6% for enterococci and 70.6% for E. coli when
the two databases were merged. However, a recent method
comparison study reported low efficacy of a metabolic
fingerprint database (based on the carbon source utilization)
(Harwood et al., 2003). The author concluded that the size
of the database was small and therefore, comparison
with unknown diverse environmental isolates is difficult in
laboratory condition.
It is notable that all databases identified human faecal
contamination in the lake although the surrounding popula-
tion of the lake is entirely serviced by STPs. The human faecal
contamination was higher than any other individual host
groups. This could be due to the failure of STPs. However,
when percentage contribution from all animal groups was
combined it outnumbered the human contamination. This
was expected as the upstream of the lake is characterized by
intensive farming practices which contributing to the faecal
load in the lake. Our existing database also included samples
from deer, sheep and pigs that were not included in the local
database as these animals either do not exist in this
catchment or their numbers and therefore faecal contribution
to the studied lake was considered negligible. Despite this, we
compared the UQ-BPTs of these host groups with the water
samples and found that only a few UQ-BPTs (one enterococci
BPT from deer and one E. coli from sheep) were identical with
those found in water samples. We postulate that either these
two BPTs are not UQ to deer and sheep or they may have
come from a very small number of these host groups that
may exist in the catchment. Certain BPTs of both faecal
indicator bacteria found in water samples did not match the
database. In all, 50% of the enterococci BPTs and E. coli BPTs
from water samples could not be identified to any host groups
when we used the local database. This could be due to the
fact that the local database was developed from a relatively
small number of isolates and therefore not representative
enough to identify the source of these BPTs. It is possible
that they may have come from other sources such as wild
birds or other wild animals, which are not included in
our database. However, an improvement has been observed
when we used the existing (i.e. around 37% could not be
identified) and the merged database (25% could not be
identified) over the local database indicating that representa-
tive databases are capable of identifying more faecal bacterial
contamination in environmental samples. It has also to be
noted that, certain SH-BPTs in host groups (i.e. shared
between humans and animals), could be found in water
samples. However, these SH-BPTs were excluded during the
development of the database as these cannot be used to
differentiate among humans and animals. Therefore pre-
sence of such BPTs in water samples could not be identified to
any host groups.
5. Conclusions
The efficacy of any database-dependent method for identify-
ing the sources of faecal contamination in cross-catchment
studies has been questioned due to the temporal and
geographical variability that exist among indicator bacteria.
This study, to our knowledge is the first that challenges this
question and propose the concept that a representative
database, such as the one used in this study, developed for
a particular catchment can be used in cross-catchment
studies, at least within the same geographical area. Regional
water quality managers/authorities would be benefited from
this work as a representative database can be in cross-
catchment studies to identify faceal indicator bacterial
contamination and this would circumvent the need for
developing specific database for each catchment. However,
the degree of the reliability of such a database relies on the
stability of the fingerprints of faecal indicators, which should
be assessed before its application in cross-catchment studies.
ARTICLE IN PRESS
WAT E R R E S E A R C H 4 0 ( 2 0 0 6 ) 2 3 3 9 – 2 3 4 82348
Acknowledgments
We thank Mr. Daniel Owen and Mr. Peter MacDougall for their
cooperation in collecting samples. This study was funded by
Caloundra City Council, Qld., Australia.
R E F E R E N C E S
Ahmed, W., Neller, R., Katouli, M., 2005a. Evidence of septicsystems failure determined by a bacterial biochemical finger-printing method. J. Appl. Microbiol. 98 (4), 910–920.
Ahmed, W., Neller, R., Katouli, M., 2005b. Host species-specificmetabolic fingerprint database for enterococci and Escherichiacoli and its application to identify sources of faecal contam-ination in surface waters. Appl. Environ. Microbiol. 71 (8),4461–4468.
Atlas, R., 1984. Use of microbial diversity measurements to assessenvironmental stress. In: Klug, M.J., Reddy, C.A. (Eds.), CurrentPerspective in Microbial Ecology. American Society for Micro-biology, Washington, DC, pp. 540–545.
Barnes, D., Gordon, D.M., 2004. Coliform dynamics and theimplications for source tracking. Environ. Microbiol. 6 (5),501–509.
Baudisova, D., 1997. Evaluation of Escherichia coli as the mainindicator of faecal pollution. Water Sci. Technol. 35 (11–12),333–356.
Carson, S.A., Shear, B.L., Ellersieck, M.R., Afsaw, A.M.H.A., 2001.Identification of Escherichia coli from humans and animals byRibotyping. Appl. Environ. Microbiol. 67 (4), 1503–1507.
Desmarais, T.R., Solo-Gabriele, H.M., Sadowsky, M.J., 2002. Influ-ence of soil on faecal indicator organisms in a tidallyinfluenced subtropical environment. Appl. Environ. Microbiol.68 (3), 1165–1172.
Dombek, P.E., Johnson, L.K., Brown, M.B., Sadowsky, M.J., 2000.Use of repetitive DNA sequences and the PCR to differentiateEscherichia coli isolates from human and animal sources. Appl.Environ. Microbiol. 66 (6), 2572–2577.
Faruque, S.M., Khan, R., Kamruzzaman, M., Yamasaki, S., Ahmed,Q.S., Azim, T., Nair, G.B., Takeda, Y., Sack, D.A., 2002. Isolationof Shigella dysenteriae type I and S. flexneri strains from surfacewaters in Bangladesh: comparative molecular analysis ofenvironmental Shigella isolates versus clinical strains. Appl.Environ. Microbiol. 68 (8), 3908–3913.
Gordon, D.M., 1997. The genetic structure of Escherichiacoli populations in feral house mice. Microbiology 143,2039–2046.
Gordon, D.M., 2001. Geographical structure and host specificity inbacteria and the implications for tracing the source ofcoliform contamination. Microbiology 147, 1079–1085.
Griffin, D.W., Gibson, C.J., Lipp, E.K., Riley, K., Paul, J.H., Rose, J.B.,1999. Detection of viral pathogens by reverse transcriptasePCR and of microbial indicators by standard methods in thecanal of the Florida keys. Appl. Environ. Microbiol. 65 (9),4118–4125.
Hagedorn, C., Crozier, J.B., Mentz, K., Booth, A.M., Graves, A.K.,Nelson, N.J., Reneau Jr., R.B., 2003. Carbon source utilizationprofiles as a method to identify sources of fecal pollution inwater. J. Appl. Microbiol. 94 (5), 792–799.
Hartel, P.G., Summer, J.D., Hill, J.L., Collins, J.C., Entry, J.A., Segers,W.I., 2002. Geographic variability of Escherichia coli isolates
from animals in Idaho and Georgia. J. Environ. Qual. 31 (4),1273–1278.
Harwood, V.J., Wiggins, B., Hagedorn, C., Ellender, R.D., Gooch, J.,Kern, J., Samadpour, M., Chapman, A.C.H., Robinson, B.J.,Thomson, B.C., 2003. Phenotypic library based microbialsource tracking methods: efficacy in the California collabora-tive study. J. Water Health 1 (4), 153–166.
Iverson, A., Kuhn, I., Franklin, A., Mollby, R., 2002. High prevalenceof vancomycin resistant enterococci in Swedish sewage. Appl.Environ. Microbiol. 68 (6), 2838–2842.
Johnson, L.K., Brown, M.B., Carruthers, E.A., Ferguson, J.A.,Dombek, P.E., Sadowsky, M.J., 2004. Sample size, librarycomposition, and genotypic diversity among natural popula-tions if Escherichia coli from different animals influenceaccuracy of determining sources of faecal pollution. Appl.Environ. Microbiol. 70 (8), 4478–4485.
Kuhn, I., Katouli, M., Wallgren, P., Soderlind, O., Mollby, R., 1995.Biochemical fingerprinting as a tool to study the diversity andstability of intestinal micro floras. Microecol. Ther. 23, 140–148.
Manero, A., Blanch, A.R., 1999. Identification of Enterococcus spp.with a biochemical key. Appl. Environ. Microbiol. 65 (10),4425–4430.
Martin, M.L., Shipman, L.D., Wells, J.G., Potter, M.E., Hedberg, K.,Wacksmith, I.K., Tauxe, R.V., Davis, J.P., Arnoldi, J., Tilleli, J.,1986. Isolation of Escherichia coli O157:H7 dairy cattle asso-ciated with two cases of haemolytic uraemic syndrome.Lancet ii, 1043.
McLellan, S.L., 2004. Genetic diversity of Escherichia coli isolatedfrom urban rivers and beach water. Appl. Environ. Microbiol.70 (8), 4658–4665.
Ong, C., Moorehead, W., Ross, A., Isaac-Renton, J., 1996. Studies ofGiardia spp. and Cryptosporidium spp. in two adjacent water-sheds. Appl. Environ. Microbiol. 62 (8), 2798–2805.
Parveen, S., Murphree, R.L., Edmiston, L., Kaspar, C.W., Portier,K.M., Tamplin, M.L., 1997. Association of multiple-antibiotic-resistance profiles with point and non-point sources ofEscherichia coli in Apalachicola Bay. Appl. Environ. Microbiol. 63(7), 2607–2612.
Payment, P., 1993. Viruses: prevalence of disease. Levels andsources. In: Craun, G.F. (Ed.), Safety of Water Disinfection:Balancing Chemical and Microbial Risks. ILSI Press, Washing-ton, DC, pp. 99–113.
Power, M.L., Littlefield-Wyer, J., Gordon, D.M., Veal, D.A., Slade,M.B., 2005. Phenotypic and genotypic characterization ofencapsulated Escherichia coli isolated from blooms in twoAustralian Lakes. Environ. Microbiol. 7, 631–640.
Sneath, P.H.A., Sokal, R.R., 1973. Numerical Taxonomy: ThePrinciples and Practice of Numerical Classification. W. H.Freeman & Co., San Francisco.
Wallis, J.L., Taylor, H.D., 2003. Phenotypic population character-istics of the enterococci in human and animal faeces:implications for the new European directive on the quality ofbathing waters. Wat. Sci. Tech. 47 (3), 27–32.
Whitlock, J.R., Jones, D.T., Harwood, V.J., 2002. Identification of thesources of faecal coliforms in an urban watershed usingantibiotic resistance analysis. Water Res. 36, 4273–4282.
Wiggins, B.A., Cash, P.W., Creamer, W.S., Dart, S.E., Garcia, P.P.,Gerecke, T.M., Han, J., Henry, B.L., Hoover, K.B., Johnson, E.L.,Jones, K.C., McCarthy, J.G., McDonough, J.A., Mercer, S.A., Noto,M.J., Park, H., Phillips, M.S., Purner, S.M., Smith, B.M., Stevens,E.N., Varner, A.K., 2003. Use of antibiotic resistance analysisfor representativeness testing of multi-watershed libraries.Appl. Environ. Microbiol. 69 (6), 3399–3405.
Copyright © 2022 FDOKUMEN