Installation Guide for AC-2100 V3.5 Fingerprint Identification ...
Upload
uni-goettingenCategory
view
3download
0
The proceedings of the BIOSIG 2011 include scientific contributions of the annual conference of the Biometrics Special Interest Group (BIOSIG) of the Gesellschaft für Informatik (GI). The conference took place in Darmstadt, 08.-09. September 2011. Within two days mainly the advances of biometrics research and new developments in the core biometric application field of security have been presented and discussed by biometrics and security professionals.
ISSN 1617-5468ISBN 978-88579-285-7
Gesellschaft für Informatik e.V. (GI)
publishes this series in order to make available to a broad public recent findings in informatics (i.e. computer science and informa-tion systems), to document conferences that are organized in co-operation with GI and to publish the annual GI Award dissertation.
Broken down into• seminars• proceedings• dissertations• thematicscurrent topics are dealt with from the vantage point of research and development, teaching and further training in theory and practice.The Editorial Committee uses an intensive review process in order to ensure high quality contributions.
The volumes are published in German or English.
Information: http://www.gi.de/service/publikationen/lni/
191
GI-EditionLecture Notes in Informatics
Arslan Brömme, Christoph Busch (Eds.)
BIOSIG 2011 Biometrics and Electronic Signatures
Proceedings of the Biometrics Special Interest Group
08.–09. September 2011 Darmstadt, Germany
Proceedings
Ars
lan
Brö
mm
e, C
hri
sto
ph
Bu
sch
(Ed
s.):
BIO
SIG
201
1: B
iom
etri
cs a
nd
Ele
ctro
nic
Sig
nat
ure
s
3018028 GI P_191 Cover.indd 1 24.08.11 15:39


Arslan Brömme, Christoph Busch (Eds.)
BIOSIG 2011
Proceedings - International Conference of theBiometrics Special Interest Group
08.-09. September 2011 inDarmstadt, Germany
Gesellschaft für Informatik e.V. (GI)

Lecture Notes in Informatics (LNI) - ProceedingsSeries of the Gesellschaft für Informatik (GI)
Volume P-191
ISBN 978-3-88579-285-7
ISSN 1617-5468
Volume EditorsArslan Brömme
GI BIOSIG, Gesellschaft für Informatik e.V.
Ahrstraße 45, D-53175 Bonn
Email: [email protected]
Christoph Busch
Hochschule Darmstadt
CASED
Haardtring 100, D-64295 Darmstadt
Series Editorial BoardHeinrich C. Mayr, Alpen-Adria-Universität Klagenfurt, Austria
(Chairman, [email protected])
Hinrich Bonin, Leuphana Universität Lüneburg, Germany
Dieter Fellner, Technische Universität Darmstadt, Germany
Ulrich Flegel, Hochschule Offenburg, Germany
Ulrich Frank, Universität Duisburg-Essen, Germany
Johann-Christoph Freytag, Humboldt-Universität zu Berlin, Germany
Michael Goedicke, Universität Duisburg-Essen, Germany
Ralf Hofestädt, Universität Bielefeld, Germany
Michael Koch, Universität der Bundeswehr München, Germany
Axel Lehmann, Universität der Bundeswehr München, Germany
Ernst W. Mayr, Technische Universität München, Germany
Thomas Roth-Berghofer, DFKI, Germany
Sigrid Schubert, Universität Siegen, Germany
Martin Warnke, Leuphana Universität Lüneburg, Germany
DissertationsSteffen Hölldobler, Technische Universität Dresden, Germany
SeminarsReinhard Wilhelm, Universität des Saarlandes, Germany
ThematicsAndreas Oberweis, Karlsruher Institut für Technologie (KIT), Germany
Gesellschaft für Informatik, Bonn 2011
printed by Köllen Druck+Verlag GmbH, Bonn

Chairs’ Message
Welcome to the annual international conference of the Biometrics Special Interest Group
(BIOSIG) of the Gesellschaft für Informatik (GI) e.V.
GI BIOSIG was founded as an experts’ group for the topics of biometric person identifi-
cation/authentication and electronic signatures and its applications. Over the last nine
years the annual conference in strong partnership with the Competence Center for
Applied Security Technology (CAST) established a well known forum for biometrics
and security professionals from industry, science, representatives of the national gov-
ernmental bodies and European institutions who are working in these areas.
The BIOSIG 2011 international conference is jointly organized by GI BIOSIG, the Com-
petence Center for Applied Security Technology e.V. (CAST), the German Federal
Office for Information Security (BSI), the European Commission Joint Research Centre
(JRC), the European Best network (BEST), the TeleTrusT Deutschland e.V. (Tele-
TrusT), and the Center for Advanced Security Research Darmstadt (CASED).
The international program committee accepted full scientific papers strongly along the
LNI guidelines (acceptance rate ~37%) within a scientific review process of at minimum
five reviews per paper.
Furthermore, the program committee has created a very interesting program including
selected contributions of strong interest (invited and further conference contributions) for
the outlined scope of this conference. We would like to thank all authors for the contri-
butions and the numerous reviewers for their work in the program committee.
Darmstadt, 08th
September 2011
Arslan Brömme
GI BIOSIG, GI e.V.
Christoph Busch
Hochschule Darmstadt

Chairs
Arslan Brömme
GI BIOSIG, GI e.V., Bonn, Germany
Christoph Busch
Hochschule Darmstadt, Germany
Program Committee
Harald Baier, Björn Brecht, Arslan Brömme, Patrick Bours, Julien Bringer,
Christoph Busch, Victor-Philipp Busch, Patrizio Campisi, Henning Daum,
Nicolas Delvaux, Farzin Deravi, Bernadette Dorizzi, Martin Drahansky, Julian Fierrez,
Simone Fischer-Hübner, Lothar Fritsch, Patrick Grother, Daniel Hartung, Olaf Henniger,
Detlef Hühnlein, Heinrich Ihmor, Christiane Kaplan, Klaus Keus, Ulrike Korte,
Bernd Kowalski, Michael Kreutzer, Herbert Leitold, Stan Li, Luigi Lo Iacono,
Jan Löschner, Udo Mahlmeister, Davide Maltoni, Tony Mansfield, Gisela Meister,
Johannes Merkle, Emilio Mordini, Axel Munde, Claudia Nickel, Alexander Nouak,
Hisao Ogata, Michael Peirce, Ioannis Pitas, Fernando Podio, Reinhard Posch,
Nalini Ratha, Kai Rannenberg, Marek Rejman-Greene, Heiko Roßnagel, Raul Sanchez-
Reillo, Stephanie Schuckers, Günter Schumacher, Takashi Shinzaki, Max Snijder, Elham
Tabassi, Cathy Tilton, Massimo Tistarelli, Till Teichmann, Dimitrios Tzovaras, Markus
Ullmann, Michiel van-der-Veen, Raymond Veldhuis, Jim Wayman, Franz Willems,
Andreas Wolf, Haiyun Xu, Bian Yang, Xuebing Zhou
Hosts
Biometrics Special Interest Group (BIOSIG)
of the Gesellschaft für Informatik (GI) e.V.
http://www.biosig.org
Competence Center for Applied Security Technology e.V. (CAST)
http://www.cast-forum.de
Bundesamt für Sicherheit in der Informationstechnik (BSI)
http://www.bsi.bund.de
European Commission Joint Research Centre (JRC)
http://ec.europa.eu/dgs/jrc/index.cfm
BEST network (BEST)
http://www.best-nw.eu/
TeleTrusT Deutschland e.V (TeleTrust)http://www.teletrust.de/
Center for Advanced Security Research Darmstadt (CASED)
http://www.cased.de/

BIOSIG 2011 – Biometrics Special Interest Group
“International Conference of the Biometrics Special Interest Group”
08th
-09th
September 2011
With the increasing deployment of ePassports and citizen cards most European citizens
have already actively participated in a biometric enrolment process. Biometric verifica-
tion at the Schengen Borders with ePassports and the Visa Information System (VIS) are
now introduced on a wider scale.
However, at the same time a number of research topics are yet unsolved and need to be
tackled. Innovation is needed for multimodal biometric systems including new modali-
ties such as 3D-face and 3D-finger, multispectral fingerprint or vein and the observation
of many more behavioural biometric characteristics.
Security analysis of biometric systems and components remains to be essential. This
includes fake resistance of sensors, biometric information protection and crypto-
biometrics to enhance the privacy of data subjects and to protect biometric references.
Moreover security analysis and certification of security properties need to be developed.
Beyond that biometrics can contribute to the security of large scale systems such as the
VIS or numerous widely used systems such as personal mobile devices, e-Banking or e-
Health systems. Critical success factors in those applications are among others the com-
pliance to standards and the early assessment of sample quality with standardized met-
rics.
All of these techniques and applications are expected to have an ethical, social, and legal
impact on our everyday life. Further research and development is needed in order to
improve the state-of-the-art towards higher maturity and better biometric performance,
interoperability, scalability, system reliability and usability.
BIOSIG 2011 offers you a platform for experts’ discussions on biometric research and
the full range of security applications.

Table of Contents
BIOSIG 2011 – Regular Research Papers 1
Michael Schwaiger, Fares Rahmun, Oliver Bausinger, Mathias GrellVISPILOT – Towards European Biometric Visa Border Control
Thomas Hotz, Carsten Gottschlich, Robert Lorenz, Stefanie Bernhardt,Michael Hantschel, Axel MunkStatistical Analyses of Fingerprint Growth
Sebastian Abt, Christoph Busch, Harald BaierA quality score honoring approach to semantic conformance assessment
of minutiae-based feature extractors
Dieter Koller, Leonard Walchshäusl, Georg Eggers, Frank Neudel,Ulrich Kursawe, Peter Kühmstedt, Matthias Heinze, Roland Ramm,Christian Bräuer-Burchard, Gunther Notni, Ricarda Kafka, Ralf Neubert,Helmut Seibert, Margarida Castro-Neves, Alexander Nouak3D Capturing of Fingerprints – On the way to a contactless
certified sensor
Mohammad Omar Derawi, Hewa Balisane, Patrick Bours, Waqar Ahmed,Peter TwiggGait Recognition for Children over a Longer Period
Claudia Nickel, Holger Brandt, Christoph BuschClassification of Acceleration Data for Biometric Gait Recognition on
Mobile Devices
Juliet LodgeTransformative Biometrics and the exercise of arbitrary power
Max Kunz, Klaus Kasper, Herbert Reininger, Manuel Möbius,Jonathan OhmsContinuous Speaker Verification in Realtime
Carlo A. TrugenbergerThe Glass Maze: Hiding Keys in Spin Glasses
Dirk Scheuermann, Bastian Wolfgruber, Olaf HennigerOn biometric key generation from handwritten signatures
3
11
21
33
45
57
67
79
89
103

Christian Böhm, Ines Färber, Sergej Fries, Ulrike Korte, Johannes Merkle,Annahita Oswald, Thomas Seidl, Bianca Wackersreuther,Peter WackersreutherEfficient Database Techniques for Identification with Fuzzy Vault
Templates
Malte WiestStatistische Abhängigkeit der Iris-Merkmale
Petru Radu, Konstantinos Sirlantzis, Gareth Howells, Sanaul Hoque,Farzin DeraviA Versatile Iris Segmentation Algorithm
Stephan PahmeierDesigning a self-service terminal for capturing biometric data for the
German Identity Card and the Electronic Passport
BIOSIG 2011 – Invited Conference Contributions
Oliver Bausinger, Elham TabassiFingerprint Sample Quality Metric NFIQ 2.0
Elham TabassiLarge Scale Iris Image Quality Evaluation
115
127
137
151
165
167
173

BIOSIG 2011 – Further Conference Contributions
Mohammad Omar Derawi, Hazem Ali, Faouzi Alaya CheikhGait Recognition using Time-of-Flight Sensor
Tobias Wirtl, Claudia NickelAktivitätserkennung auf Smartphones
Alberto de Santos Sierra, Carmen Sánchez Ávila, Aitor Mendaza Ormaza,Javier Guerra CasanovaTowards hand biometrics in mobile devices
Pierre Lemaire, Di Huang, Joseph Colineau, Mohsen Ardabilian,Liming Chen3D Face Recognition in the presence of 3D model degradations
Muzaffar Bashir, Georg Scharfenberg, Jürgen KempfPerson Authentication by Handwriting in air using a Biometric Smart Pen
Device
Liming Chen, Di Huang, Hmida Chiheb, Chokri Ben AmarIncreasing the distinctiveness of hand vein images by Oriented Gradient
Maps
Seiichiro Hangai, Asami Hori, Takahiro YoshidaValues of Time-series Data defined in 19794-7 for Signature Verification
Julien Bringer, Hervé ChabanneVisual cryptography applied to fingerprint features as a solution for
pre-alignment
Ramachandra RaghavendraFeature Level Fusion of Face and Palmprint using Gaussian Mixture
Model: Application to Single Sample Analysis
Monika Desoi, Matthias Pocs, Benjamin StachBiometric Systems in Future Crime Prevention Scenarios – How to
Reduce Identifiability of Personal Data
Daniel Hartung, Knut Wold, Kalman Graffi, Slobodan PetrovicTowards a Biometric Random Number Generator – A General Approach
For True Random Extraction From Biometric Samples
Andreas NautschOhr-Erkennung – Stand der Technik
185
187
195
203
211
219
227
235
243
251
259
267
275

Wolfgang Rehak, Alexander Nouak, Jörg KöplinPreBorderLane Embedded in Gate of Trust - Ein erweitertes ganzheitliches
Konzept für den Schutz kritischer Infrastrukturen
Sule Yildirim Yayilgan, Asbjørn Hovstø, Faouzi Alaya Cheikh,Anthony Amodei, Marc Iori, Sandel Zaharia, Dimos Ioannidis,Øystein ThorvaldsenGroup Identification at Border Crossing Points
Chris Stein, Claudia NickelEignung von Smartphone-Kameras zur Fingerabdruckerkennung und
Methoden zur Verbesserung der Qualität der Fingerbilder
Ashot Harutyunyan, Naira Grigoryan, Svyatoslav Voloshynovskiy,Oleksiy KovalA New Biometric Identification Model and the Multiple Hypothesis
Testing for Arbitrarily Varying Objects
Jens Sperling, Fritz-René Grabau, Irina HundtBiometrische Merkmale im wirtschaftlichen Umfeld - Rechts- und
Zulassungsbewertung
BIOSIG 2011 – Panel Contributions
Werner BlessingSecure Mobile Payment thanks to a very safe, comfortable, and
fake-resistant biometric authentication
Catherine Herold, Stéphane Gentric, Nicolas Moënne-LoccozFace on the Fly: How to Track Faces
283
291
305
321
323
325
313
297


BIOSIG 2011
Regular Research Papers


VISPILOT –
Towards European Biometric Visa Border Control
Michael Schwaiger1, Fares Rahmun
2, Oliver Bausinger
3, Mathias Grell
4
1secunet Security Networks AG
Kronprinzenstraße 30, 45128 Essen, Germany
2German Federal Office of Administration (BVA)
Barbarastraße 1, 50735 Köln, Germany
3German Federal Office for Information Security (BSI)
Godesberger Allee 185-189, 53175 Bonn, Germany
4German Federal Police (BPOL)
Roonstraße 13, 56068 Koblenz, Germany
Abstract: To thoroughly prepare the expected start of the European Visa
Information System (VIS) in 2011, Germany has implemented and evaluated the
biometric visa border control process in a dedicated pilot project. In addition to
implementing all necessary software modules for the access to the VIS, the focus
of the project was set on the new feature of fingerprint biometrics. Fingerprint
verification is applied to the primary position during border control where the
process is optimised for fast completion, high throughput and ease of use.
Extended identity checks with a quality-oriented border control process are
conducted at the secondary position, where also a time-consuming fingerprint
identification can be applied. Several tests were conducted during the pilot project
in order to evaluate the VIS border control process. Recommendations regarding
the implementation and operation of VIS related systems on the national level have
been derived based on the evaluation results.
3

1 Introduction
The introduction of the Visa Information System (VIS) based on the European
Regulation No. 767/2008 [EC-767-2008] mandates European member states to issue
biometric visas and check them during the border control process. While issuing of
biometric visas based on captured fingerprints of the visa holder was first implemented
and evaluated in the European BioDEV II pilot project, the project VISPILOT was set
up by the German Federal Office of Administration (BVA), the German Federal Office
for Information Security (BSI), the German Federal Police (BPOL) and the company
secunet Security Networks AG as contractor to design and evaluate the border control
processes of biometric visas.
The first part of the project was dedicated to the specification, implementation and
installation of all necessary software modules for a biometric visa border control check
against the central VIS based on fingerprints. Implementation was done according to the
BSI Technical Guideline Biometrics for Public Sector Applications [TR-03121] which
requires several BioAPI 2.0 [ISO-19784-1] compliant Biometric Service Providers
(BSP) for the acquisition of the fingerprint data during the visa identity check processes.
For fingerprint acquisition the Dermalog ZF1 single-finger-scanner and the Cross Match
Technologies L SCAN Guardian four-finger-scanner were used during the project.
Interoperability and exchangeability of hardware devices was implemented using the
BioAPI Sensor Function Provider Interface abstraction according to [ISO-19784-4].
While single-finger-scanners are only applied in verification scenarios, four-finger-
scanners can be used for enrolment and identification as well. In general, a maximum of
four fingerprints is allowed to be captured for verification. Due to the fact that fast
processing time and high throughput is needed at the primary border control position, no
additional quality assurance is conducted in this situation. For identification, a tenprint of
the visa holder is captured at the secondary position. Additionally, extensive quality
assurance is conducted in order to achieve the best possible fingerprint quality. To
achieve this goal, multiple captures of the same finger are conducted in order to select
the best fingerprint image. Besides stationary border control, verification was also
implemented for full mobile scenarios.
In the second phase of the project, an evaluation environment was designed and
implemented in order to import the results of all visa processes and enable a central
evaluation thereof. The evaluation environment is based on the logging and evaluation
requirements of the BSI Technical Guideline [TR-03121] which defines a general
scheme for logging data of all visa processes. This requires all software modules to
deliver the corresponding information in XML format. Consequently, this information is
used to generate defined diagrams and statistics in order to monitor all visa processes.
Furthermore, the implemented evaluation environment offers the possibility to apply
filtering according to the location and the date of the visa issuance and border control
conducted. This allows German authorities to react on problems and anomalies in the
visa processes as soon as possible. During the VISPILOT project this evaluation
environment was used to generate statistical project results.
4

The application procedure for biometric visas of the voluntary participants in the
VISPILOT project was conducted at the Federal Police site in Swisttal-Heimerzheim.
Until December 2010, the biometric data of about 150 participants was collected. After
the implementation and integration of the software modules for visa border control into
the existing systems, the evaluation of the border control processes was conducted in
February and March 2011. During the pilot project records of all participants were
submitted to the European testing environment, the VIS Playground, which then were
used as a basis for the simulations conducted.
2 Border Control Simulations and Evaluation Results
In order to obtain information about the visa border control process, several simulations
were conducted. The focus was set on evaluating the implemented border control
processes and on gaining practical experience of the technical behaviour of the VIS and
the underlying Biometric Matching System (BMS). For those simulations, several
subgroups of the voluntary participants were invited to simulate visa border controls
under certain circumstances and exceptional scenarios. Both scenarios at the primary
position, where biometric verification is conducted, and at the secondary position, where
biometric identification is used to check the identity of the visa holder, were considered
during the simulations.
One focus of organisational tests was on the two possibilities of conducting biometric
verifications against the VIS: the one- and two-step approach. Using the one-step
approach, fingerprints of the visa holder are captured and directly sent to the VIS for
verification, without knowing in advance if reference fingerprint data is available for the
particular visa holder. In case no fingerprints are stored for this person, an appropriate
error is returned by the VIS. Nevertheless, in such a situation the fingerprint capturing
was dispensable. That could have been avoided by using the two-step approach. As the
name of the approach suggests, two separate messages are sent to the VIS in this case.
The first request does not contain fingerprint images. As an answer to this request, the
information if fingerprints are stored for the according person is returned. Only if
reference fingerprints are stored, live fingerprints are captured and sent to the VIS for
verification.
As expected, the two-step approach takes all in all more time for the verification of the
visa holder (see Figure 1). In average, more than 40 seconds are needed for the two-step
approach if reference fingerprints of the visa holder are stored in the VIS. Using the one-
step approach instead, the average duration is around 30 seconds. This means that there
is a significant difference in duration between both approaches. In the case that no
fingerprints of the visa holder are stored in the VIS, the average duration for such a
transaction is about 18 seconds.
5

However, in the first years of the introduction of the VIS the two-step approach can offer
advantages in duration, as the VIS rollout in the Schengen consulates and the
introduction of fingerprint acquisition is carried out gradually by geographical regions,
implementing a transitional period where not all visa applicants will be affected by the
VIS. It is assumed that fingerprints are captured and stored for nearly all issued visas in a
few years. At this point in time, the one-step approach will be much faster than the two-
step approach.
Duration one-step/two-step approach
0
10
20
30
40
50
60
se
co
nd
s
One-step approach with reference
fingerprints in VIS
30,4 34,3
Two-step approach with reference
fingerprints in VIS
42,7 48,7
Two-step approach without reference
fingerprints in VIS
18 18
Average duration single-finger-scanner Average duration four-finger-scanner
Figure 1: Duration one-step/two-step approach
Another focus was on the analysis of the biometric characteristics of the VIS. One option
to consider is the use of repetitive verification. Repetitive verification means that live
captured fingerprints are compared to all stored fingerprints of the person’s record. If
repetitive verification is not used, live captured fingerprints are only compared to the
reference fingerprints of the indicated finger. The advantage of using repetitive
verification is the decrease in false rejections if visa holders place the wrong fingers or
hand on the scanner. Contrary to the expectations, the use of repetitive verification did
not increase the time needed for verification1.
1 Timing observations are not considered relevant as testing was conducted against the VIS playground.
Therefore, no conclusion regarding the response time of the real VIS in full load could be derived.
6

An important outcome derived from the simulations is that for the VIS/BMS only one
matching fingerprint is necessary for a successful verification of a person. This means
that the use of four-finger-scanners does not bring the expected advantage regarding the
biometric level of security. Though the BMS specification foresees a higher threshold
when verifying with two or four fingers instead of with one, an attacker only needs to
spoof one fingerprint to successfully pass the border control. As a consequence of this
outcome, simple fake finger dummies of some project participants were produced by the
project team in order to demonstrate such fake finger attacks. To detect fake fingers, it is
indispensable that the border control officer has an immediate look on the fingerprint
scanner and, especially, on the fingers of the visa holder. As a result, a corresponding
policy will be set up at the German border control points.
A highly interesting evaluation result is the difference in capture duration of the
fingerprint scanners used (see Figure 2). Both devices support hardware- or software-
based auto-capture of fingerprint images. The average acquisition duration of the four-
finger-scanner was 15 seconds. Using the single-finger-scanner, in average only 6.3
seconds were needed for the fingerprint acquisition. However, there is a big duration
difference among the fingerprint scanners used which was also observed by the
participants of the pilot project. The whole border control process at the primary position
was much faster if the single-finger-scanner was used.
Resulting from the outcome of previously mentioned simulations, the use of four-finger-
scanners does not only miss the expected security enhancement regarding spoofing
attacks, but brings disadvantages with regard to the duration of the fingerprint
acquisition. On the other side, the usage of four-finger-scanners will obviously minimise
false rejections, which might compensate or justify the increased effort, when the system
will have to handle a high traffic volume in production.
All in all, the complete visa border control process starting when the visa is put on the
document reader and waiting until the person is verified using fingerprint recognition
takes about 31 seconds. Again, the complete process takes longer if the four-finger-
scanner is used. Further evaluations showed that any deviations from a regular border
control process (e. g. person has dry hands and produces bad-quality fingerprint images
etc.) increase the overall visa border control duration significantly.
7

Duration primary border control position
0
5
10
15
20
25
30
35
40
seco
nd
s
Acquisition of fingerprints 10,5 6,3 15
Complete visa border control process 31,2 26,9 36,1
Average duration Duration single-finger-scanner Duration four-finger-scanner
Figure 2: Duration at the primary border control position
Further evaluations showed that the verification rate at the primary position was at about
88 percent for the security settings of the VIS Playground. No big differences between
fingerprint scanners used were detected. For all conducted identifications at the
secondary position the appropriate visa application was returned by the VIS.
Nevertheless, statistical significance is not given due to the fact that only few
verifications and identifications were conducted during the pilot project.
3 Conclusions and Recommendations
The integration of all necessary software modules for biometric visa border control was
successfully achieved during the project in compliance to the BSI Technical Guideline
Biometrics for Public Sector Applications [TR-03121]. Outcomes of the project have
influenced the further development of visa profiles of this technical guideline and will be
released as version 2.3 by BSI soon.
8

Finally, recommendations were derived from results of the project. Outcomes of the
project regarding the security of biometric verifications shall be communicated to the
European Commission in order to reduce the chance of spoofing attacks and enhance the
security if multi-finger-scanners are used. Considering the additional time needed for a
more secure verification, this should at least be an option, helping to justify the higher
amount of investment for the four-finger-scanners. Furthermore, the VISPILOT project
has proven once more the importance of a standardized quality monitoring of biometric
processes, as most of the statistical project results were derived from the collected
logging data required by the Technical Guideline [TR-03121]. Therefore, it is highly
recommended to introduce a national central evaluation environment for the VIS in
operation, in order to be able to react on anomalies of visa issuance and border control as
soon as possible. The implemented evaluation environment is intended to serve as a
blueprint for this purpose.
Bibliography
[EC-767-2008] Regulation (EC) No. 767/2008 of the European Parliament and of the council
of 9 July 2008 concerning the Visa Information System (VIS) and the
exchange of data between Member States on short-stay visas (VIS Regulation).
[TR-03121] Federal Office for Information Security (BSI): Technical Guideline TR-03121
Biometrics for Public Sector Applications, Version 2.2, 2011.
[ISO-19784-1] ISO/IEC 19784-1:2006 “Information technology – Biometric application
programming interface – Part 1: BioAPI specification”.
[ISO-19784-4] ISO/IEC 19784-4:2011 “Information technology – Biometric application
programming interface – Part 4: Biometric sensor function provider interface”.
9


Statistical Analyses of Fingerprint Growth
Thomas Hotz∗1, Carsten Gottschlich∗1, Robert Lorenz2,
Stefanie Bernhardt2, Michael Hantschel2, Axel Munk1
1Institute for Mathematical Stochastics, University of Gottingen,
Goldschmidtstrasse 7, 37077 Gottingen, Germany
{hotz,gottschlich,munk}@math.uni-goettingen.de
2Bundeskriminalamt, Wiesbaden, Germany
Abstract: We study the effect of growth on the fingerprints of adolescents, based onwhich we suggest a simple method to adjust for growth when trying to retrieve anadolescent’s fingerprint in a database years later. Here, we focus on the statisticalanalyses used to determine how fingerprints grow: Procrustes analysis allows us to es-tablish that fingerprints grow isotropically, an appropriate mixed effects model showsthat fingerprints essentially grow proportionally to body height. The resulting growthmodel is validated by showing that it brings points of interest as close as if both fin-gerprints were taken from an adult. Further details on this study, in particular resultswhen applying our growth model in verification and identification tests, can be foundin C. Gottschlich, T. Hotz, R. Lorenz, S. Bernhardt, M. Hantschel and A. Munk: Model-ing the Growth of Fingerprints Improves Matching for Adolescents, IEEE Transationson Information Forensics and Security, 2011 (to appear).
1 Introduction
Consider the following scenario: an adolescent at age 11, say, gives his fingerprints which
are entered into an automatic fingerprint identification system (AFIS); later, at age 30, his
fingerprints are again taken, and run against the AFIS database. To find the adolescent
fingerprint matching the adult one is made difficult by the fact that the adolescent has
grown into an adult – as have his fingerprints, compare Figure 1. As these systems are
usually engineered for adults, growth effects are not taken into account appropriately, and
the AFIS will decide that the adolescent print matches the adult print poorly; indeed, the
points of interest (POI), i.e. minutiae and singular points, cannot be brought close by
merely rotating and translating the imprints, see Figure 1 (right).
This study aims at determining how fingerprints grow, such that the effects of growth can
efficiently be taken into account and corrected for. For more background on the political
implications of this question, as well as on the lack of research on fingerprint growth so far,
see the complete study report published in [GHL+11]. Here, we focus on the statistical
∗T. Hotz acknowledges support by DFG CRC 803, C. Gottschlich by DFG RTS 1023.
11

2 mm
Figure 1: Earliest (left) and latest (middle) rolled imprints of right index finger of person 28 withpoints of interest (POI) marked by a human expert. Superimposed POI (right) of earliest rolledimprint without rescaling (blue circles), with rescaling (purple triangles), each brought into optimalposition w.r.t. the POI of latest rolled imprint (red squares).
analyses that allow us to model fingerprint growth, and to validate the proposed model.
In [GHL+11] the authors also describe the dataset which was used for this study. It con-
sisted of 48 persons (35 male, 13 female) whose fingerprints were taken between 2 and
48 times. At the time when the first fingerprint was taken participants were between 6
and 15 (median 12) years old, when the last fingerprint was taken they were between 17
and 34 (median 25) years old. We thus had longitudinal datasets of 48 persons’ finger-
prints through their adolescence at our disposal, in order to answer the question of how
fingerprints grow.
To be able to measure how growth affects fingerprints, for each person a human expert
selected one finger whose imprints were of high quality, showing many POI in all its
imprints; the human expert then marked all corresponding POI in this finger’s imprints.
The remainder of this article is organised as follows: in Section 2, Procrustes analysis is
employed to determine whether fingerprints grow isotropically in all directions. The affir-
mative answer to that question allows to model fingerprint growth by rescaling, the factor
of which may be obtained from growth charts of body height, as detailed in Section 3. This
model allows to effectively predict growth of fingerprints such that adolescent fingerprints
can be transformed into fingerprints which can be treated like adult fingerprints as shown
in Section 4. Finally, we summarise and discuss the results obtained in Section 5. Further
information on this study, including on the model’s performance in practice, can be found
in [GHL+11].
2 Screening for anisotropic growth effects
It was to be expected that fingerprints grow in size. However, it was unclear whether they
grow isotropically, i.e. equally in all directions, which would result in a simple uniform
scale-up of the fingerprint. Indeed, it is known that finger bones tend to grow more in
length than in width, becoming relatively narrower [Mar70].
12

To address the question whether there are any anisotropic growth effects, we employed
techniques from the field of shape analysis (see e.g. [DM98] for more details) where
one considers objects only up to translation, rotation and isotropic rescaling, i.e. up to
similarity transformations. In particular, we used full Procrustes analysis: for this, let us
consider the POI of person i, fixed for the moment, marked in the jth rolled imprint of that
person’s selected finger. Assuming that n POI have been marked in each of the J imprints,
we can represent their coordinates as an n-dimensional complex vector zij ∈ Cn.
Next, we aim to define a mean point configuration for that finger, independent of transla-
tions, rotations and rescaling. Hence, we look for some µi ∈ Cn which minimises the dis-
tances to the zij if the latter are allowed to be translated, rotated and rescaled. Clearly, one
should fix µi’s size and centre of mass, i.e. we require that µi ∈ Sn = {z ∈ Cn : 1
∗nz =
0, ‖z‖ = 1} where 1n represents the column vector comprising n ones, and ‖ · ‖ denotes
the usual Euclidean norm.
Note that rotating and rescaling POI z ∈ Cn can be described by multiplication by some
λ ∈ C∗ = C \ {0}, whereas translation is given by adding τ1n for some τ ∈ C. Hence,
a reasonable choice for µi is
µi = argminµ∈Sn
J∑j=1
minλ∈C∗,τ∈C
‖λzij + τ1n − µ‖2. (1)
µi is called a Procrustes mean of the zij ; it is usually unique up to a rotation which we
assume to be chosen arbitrarily. Let us denote the respective minimisers on the right by
λij and τij ; they represent the rescaling, rotation and translation bringing zij into optimal
position to µi. Then,
zij = λijzij + τij1n
is rescaled, rotated and translated to optimally match µi with respect to (w.r.t.) the Eu-
clidean norm; one might also say that the zij are registered w.r.t. the Procrustes mean.
Figure 2 (left) shows the µi and the zij for the right index finger of person 28.
Now that rescaling, rotation and translation have been fixed, one can apply methods of
classical multivariate data analysis to the zij ; note however, that the registration – and
in fact even the space’s dimension – depends on the finger, i.e. on i. We will thus first
perform intra-finger analyses which will then get aggregated over the study population;
recall that we chose one finger per person.
Assume for a moment that there was an anisotropic growth effect; then, we would expect
to see a trend in the zij , the POI moving in a preferred direction as time progresses. This
growth effect should strongly correlate with the fingerprint’s size; note that time is not a
good predictor since the effect of one year of growth is expected to be larger for younger
persons – for adults there should not be any growth related effects any more.
We therefore need a measure of size of a person’s fingerprint. With the data at hand, this
can only be an intra-finger measure of size which will not enable us to compare different
finger’s sizes, but this will suffice for our intra-finger analysis. As a measure of person i’sfingerprint j’s size, we chose
Sij = ‖zij −1
n1n1
∗nzij‖, (2)
13

14

12.5 13.0 13.5 14.0 14.5 15.0 15.5
−1
.0−
0.5
0.0
0.5
1.0
1.5
size
Sco
re1
12.5 13.0 13.5 14.0 14.5 15.0 15.5
−1
01
2
size
Sco
re1
Figure 3: Full (left) and partial (right) generalised Procrustes analysis of POI for the right indexfinger of person 28: scores (i.e. coordinates in direction) of the respective first PC (vertical axis) vssize (horizontal axis).
total variation. Also, the first PC captures much of this trend, explaining a median 64% of
the variation; thus size is close to explaining as much of the total variation as any linear
predictor, if we do not correct for isotropic growth effects.
3 Modeling fingerprint growth
From the last section, we may assume that, essentially, fingerprints grow isotropically.
What remains to be determined are the factors by which fingerprints get enlarged during
growth. Since it is well known that the lengths of upper limbs and body height exhibit a
strong correlation during growth [McC70, HYM77], we decided to utilise growth charts
of boys’ and girls’ body heights, in particular those given in [KOG+02].
If for two fingerprints to be compared we only know the person’s age and sex at the time
the imprints were taken, we cannot hope to be able to predict that person’s individual
growth – e.g. we do not know whether some imprint was taken immediately before or
after her pubertal growth spurt. Instead we must resort to using the amount a “typical”
person would have grown over the same period. We therefore use growth charts of boys’
and girls’ median body height, given in [KOG+02].
This gives a simple model for fingerprint growth: for person i and imprint j taken at age
xj , look up the population’s median body height at age xj of the corresponding sex; let us
denote that by Gij . If later imprint j′ is taken, we propose to predict how fingerprint j has
grown in the meantime by simply enlarging it by a factor of Gij′/Gij , i.e. by the factor
the “median person” would have grown in body height over the same period.
To check whether growth charts for body height can in fact be used for growth of fin-
gerprints, we compared these to the measure of fingerprint size defined in equation (2).
Recall that this is an intra-finger measure of size, lacking an absolute scale. For person 28,
15

age [years]
siz
e[v
ari
ation
aro
und
mean
on
log−
scale
]
11 15 20 25 30
0.8
50.9
00.9
51.0
01.0
51.1
0
0 50 100 150 200 250 300 350
−0
.05
0.0
00
.05
rank of age
estim
ate
dη
ij[lo
g−
sca
le]
Figure 4: Left: imprints’ sizes (blue circles: rolled, green diamonds: plain control) of person 28’sright index finger, as well as fitted growth according to the growth chart (purple line); right: estimatedηij of the mixed effects model on a log-scale vs rank of age.
we show its fingerprints’ sizes Sij divided by their geometric mean (the arithmetic mean
on the log-scale) in Figure 4 (left). Plotted are the rolled imprints’ sizes as blue circles;
at times, additional plain imprints had been taken as controls at the same occasion, their
sizes are plotted as green diamonds for comparison. Similarly, the Gij , the corresponding
median body heights, were divided by their geometric mean and plotted in violet – in fact,
the entire normalised growth curve for that period is shown.
The growth curve in Figure 4 (left) is seen to fit person 28’s fingerprint growth very well.
To check how good growth charts for body height can predict fingerprint growth in the
entire study population, we used the following linear mixed effects model:
logSijk − logGij = ρk + νi + ηij + εijk,
where the additional index k serves to distinguish between rolled imprints and plain con-
trols. Since we are only interested in relative increases in size, the analysis works on a
log-scale. The outcome on the left is given by the log-ratio of the imprint’s observed size
Sijk and the corresponding median body height Gij . Since size is an intra-finger measure,
there cannot be a universal factor of proportionality between our fingerpint size and body
height, thus νi on the right allows for an individual factor of proportionality, fixed for that
finger. Even if two imprints are taken at the same point in time, like the rolled and the
plain control imprint, there may be variations in the locations of the POI, due to distor-
tions arising from the skin being pressed on a flat surface, and also due to variations in
the process of marking the POI. These random effects are captured by the εijk which we
assume to be independent and to follow a Gaussian distribution with mean 0 and variance
σ2ε . Systematic differences between rolled imprints and plain controls are taken into ac-
count by ρk; note how in Figure 4 (left) the plain controls in green appear systematically
smaller than the rolled imprints in blue. Finally, ηij models deviations of person i at the
time when imprint j was taken from the growth model; the ηij are again assumed to be
random – since persons and times were random as far as the analysis is concerned – and
independently Gaussian distributed with mean zero and variance σ2η .
The standard deviation σε of the εijk represents how much a fingerprint’s size appears
16

to vary between two imprints taken at the same age; this is the measurement noise any
AFIS has to cope with. On the other hand, the model misfit is given by the ηijs’ standard
deviation ση . Comparing these two enables us to determine how well the proposed growth
model fits the data in relation to the noise level. By maximum likelihood, see e.g. [PB00],
we estimated them to be about σε = 0.0225 and ση = 0.0223 on the log-scale, i.e. both
are of similar magnitude; the difference between the fixed effects ρk for rolled imprints and
plain controls was estimated as 0.0242. Bringing them back to the original scale, we obtain
variations in size due to noise of about ±(exp(σε)−1) = ±2.28%, similar to the variations
due to model misfit of about ±(exp(ση)−1) = ±2.26%; for the difference between rolled
ink and plain control we get 2.44% larger rolled imprints than plain controls. This analysis
used a total of 578 imprints (combinations of i, j, and k), taken on 352 occasions (pairs of
i and j) from 48 persons (i). For a visual inspection, we show the estimated ηij sorted by
age in Figure 4 (right); systematic deviations from the growth model would be expected to
result in regions where the ηij are driven away from the horizontal line; however, no large
systematic deviations in comparison to the random noise are discernible.
4 Validating the growth model
The two previous sections established that fingerprints grow isotropically, and proportion-
ally to body height. This led to the proposed strategy of enlarging the younger imprint
prior to comparing it with an older imprint, by a factor to be read off from growth charts
of boys’ and girls’ body height.
To validate this model for use in fingerprint matching, we determine how closely POI
can be registered when the younger imprint is rescaled, in comparison to when it is left
unscaled. To do so, we chose to compare the earliest (j = 1) and the latest (j = J) rolled
imprint for each person i, and determined the square root of the POI’s average squared
Euclidean distance after bringing the last rolled imprint into partially optimal position by
rotation and translation,
δi(µ) =√
minλ∈C∗,|λ|=1,τ∈C
1
n‖λziJ + τ1n − µ‖2.
cf. equation (3); we determine the distance of the last rolled imprint to the first one with
µ = zi1 without rescaling; with rescaling, we use µ = αzi1 where the scale factor is given
by α = GiJ/Gi1; in order to see typical variations when the same imprint is taken twice
on the same occasion, we also use the corresponding last plain control for µ (if available).
Note that this distance does not depend on which of the two imprints was fixed and which
was allowed to be rotated and translated, since λ is required to fulfil |λ| = 1.
The mean distances thus obtained per person are shown in Figure 5 where they are rep-
resented across persons by the respective cumulative distribution functions. The median
over the mean distances without rescaling is found to be about 0.62 mm, which is approx-
imately halved when growth is taken into account by rescaling, resulting in a median of
0.33 mm. In fact, this is the same order of magnitude as the median mean distance of
0.31 mm when comparing with the plain control; see [GHL+11] for box-plots conveying
17

0.0 0.2 0.4 0.6 0.8 1.0 1.2
0.0
0.2
0.4
0.6
0.8
1.0
mean distance [mm]
em
pir
ica
lcu
mu
lative
dis
trib
utio
nfu
nctio
n
Figure 5: Empirical cumulative distribution functions of mean distance from POI of the latest rolledimprint in partially optimal position to the POI of the first rolled imprint without (blue circles) andwith (violet triangles) rescaling, or to latest plain control (green diamonds); horizontal dashed linescorrespond to quartiles.
the same information. There, we also plot the relative improvement against the predicted
factor, showing that they correlate strongly with Spearman’s rank correlation being 0.63.
This clearly demonstrates that one gains the more by rescaling the more growth is pre-
dicted, as was to be expected.
We conclude that the proposed model transforms the younger fingerprint to match the size
of the older one, allowing to compare the two as if they were taken at the same age.
5 Summary and Outlook
Using extensive statistical analyses, we have demonstrated that fingerprints essentially
grow isotropically by an amount proportional to the growth in body height. Furthermore,
the latter can be read off population-based growth charts of boys and girls, whence the
growth model could be successfully constructed without using any training data. We em-
ployed R [R D09] for all statistical analyses; in particular, the Procrustes analysis was car-
ried out using package shapes [Dry09], the mixed effects model using package nlme
[PBD+09]. The findings thus obtained have been corroborated by a series of verification
and identification tests which are described in detail in [GHL+11].
For the future, we plan to repeat the above statistical analyses on an independent data set,
testing the hypothesis that rescaling as proposed leads to a reduction in minutiae distances
and improves upon error rates obtained without rescaling.
Since most of the participants in this study were more than 11 years old, the results ob-
tained only apply to adolescents from that age onwards. It would be most interesting to
18

perform similar analyses using children’s fingerprints; indeed, the different way in which
younger children develop may also lead to anisotropic effects. Another point worth inves-
tigating is whether the growth predictions become more accurate when measurements of
the person’s true body height can be used instead of the population’s median body height
at that age. Otherwise, noting that the growth charts [KOG+02] we used were based on
United States National Health Examination Surveys, it is conceivable that one might ben-
efit from growth charts which are specific for the population under consideration.
References
[DM98] I. L. Dryden and K. V. Mardia. Statistical Shape Analysis. Wiley, Chichester, 1998.
[Dry09] I. L. Dryden. shapes: statistical shape analysis, 2009. R package version 1.1-3,http://CRAN.R-project.org/package=shapes.
[GHL+11] C. Gottschlich, T. Hotz, R. Lorenz, S. Bernhardt, M. Hantschel, and A. Munk. Model-ing the Growth of Fingerprints Improves Matching for Adolescents. IEEE Transationson Information Forensics and Security, 2011. To appear, early access available athttp://ieeexplore.ieee.org/xpls/abs all.jsp?arnumber=5751684.
[HYM77] J. H. Himes, C. Yarbrough, and R. Martorell. Estimation of stature in children fromradiographically determined metacarpal length. J. Forensic Sci., 22(2):452–455, 1977.
[KOG+02] R. J. Kuczmarski, C. L. Ogden, S.S. Guo, et al. 2000 CDC Growth Charts for the UnitedStates: Methods and Development, volume 11 of Vital and Health Statistics. NationalCenter for Health Statistics, May 2002.
[Mar70] M. M. Maresh. Measurements from roentgenograms, heart size, long bone lengths,bone, muscle and fat widths, skeletal maturation. In McCammon [McC70], pages 155–200.
[McC70] R. W. McCammon, editor. Human growth and development. Charles C. Thomas,Springfield, IL, 1970.
[PB00] J. C. Pinheiro and D. M. Bates. Mixed-effects models in S and S-PLUS. Springer, NewYork, NY, 2000.
[PBD+09] J. C. Pinheiro, D. M. Bates, S. DebRoy, D. Sarkar, and R Development Core Team.nlme: linear and nonlinear mixed effects models, 2009. R package version 3.1-96,http://CRAN.R-project.org/package=nlme.
[R D09] R Development Core Team. R: a language and environment for statistical computing.R Foundation for Statistical Computing, 2009. http://www.R-project.org.
19


A quality score honoring approach to semantic conformance
assessment of minutiae-based feature extractors
Sebastian Abt, Christoph Busch, and Harald Baier
Hochschule Darmstadt – University of Applied Sciences
Center for Advanced Security Research Darmstadt (CASED)
{sebastian.abt,christoph.busch,harald.baier}@h-da.de
Abstract: The use of biometric systems is steadily increasing, which leads to het-erogeneity and, thus, possibly interoperability issues. In order to address such issues,standards are developed by ISO/IEC Joint Technical Committee 1. In the case ofminutiae-based fingerprint recognition, for instance, ISO/IEC 19794-2 defines bio-metric data interchange records that vendors should adhere to. To validate adherenceto this standard, ISO/IEC 29109-2 specifies means to perform syntactic conformancetesting. Yet, a specification of semantic conformance testing is missing and is cur-rently being discussed as a working draft amendment of ISO/IEC 29109-2. In orderto contribute to this development, this paper proposes a general semantic conformancetesting framework. Especially, a formal semantic conformance computation modelis proposed that can be used to assess a biometric systems vendor’s semantic con-formance according to a ground-truth data set and to compare different testing ap-proaches. Furthermore, an instance thereof is proposed that honors minutia qualityscores when computing semantic conformance rates. Initial evaluation shows, thatsemantic conformance rates computed using this quality-honoring approach correlatewith inter-vendor performance measures we would expect in a real-world scenario.
1 Introduction
In order to avoid vendor lock-ins within large installations of biometric systems (e.g. in
border control and law enforcement) and to guarantee interoperability between different
vendors’ biometric systems, standardization of a biometric characteristic’s digital repre-
sentation, i.e. biometric samples or biometric templates, is elementary. Currently such
standardization is mainly driven by the International Organization for Standardization
(ISO) and the International Electrotechnical Commission (IEC) and especially their Joint
Technical Committee 1 (JTC1). In ISO/IEC 19794 family of standards, biometric data in-
terchange records (BDIRs) for different biometric characteristics are standardized. Specif-
ically, ISO/IEC 19794-2 [ISO05] specifies a biometric data interchange format for finger
minutiae data. Derived from the informal definition given in ISO/IEC 19794-2 [ISO05],
a minutia m ∈ M, with M denoting the set of all minutiae, can formally be defined as
5-tuple m = 〈x, y, θ, t, q〉, with (x, y) being coordinates of a cartesian coordinate-system
induced by a biometric sample, 0 ≤ θ ≤ 255 being the minutiae direction measured in
units of 360/256 degrees, t being a minutiae type (e.g. ridge line ending, ridge line bi-
furcation, or unknown), and 0 ≤ q ≤ 100 being a quality value expressing a confidence
21

in minutia’s attributes. However, currently no standardized way of determining minutia
quality is defined.
To be able to verify the conformance of BDIRs produced by biometric systems to the base
standard, ISO/IEC 29109 family of standards specifies conformance testing methodologies
for biometric data interchange records as defined in ISO/IEC 19794 family. Among this
ISO/IEC 29109 family of standards, ISO/IEC 29109-1 [ISO09a] defines a general frame-
work for conformance testing and ISO/IEC 29109-2 [ISO09b] specifies a conformance
testing methodology for finger minutiae records according to ISO/IEC 19794-2 [ISO05].
ISO/IEC 29109-1 [ISO09a] currently defines three levels of conformance testing. Level
1 (data format conformance) and level 2 (internal consistency checking) types of tests
can roughly be categorized as being syntactic conformance tests which ensure that BDIRs
exported by one biometric system can be imported and interpreted by another biometric
system and vice versa. Level 3 conformance testing (content checking) on the other hand
can be regarded as semantic conformance testing which, after a BDIR has passed syntac-
tic testing, shall ensure that a BDIR created by an implementation under test (IUT) is a
faithful representation of the input biometric data record (IBDR). Syntactic conformance
testing for finger minutiae records is currently covered in ISO/IEC 29109-2:2010. Yet,
a solid framework for semantic conformance testing is missing. To fill this gap, in this
paper a generic, i.e. modality independent, semantic conformance testing framework is
proposed and a specific modality dependent computation model to assess semantic confor-
mance of minutiae-based feature extractors is introduced. In contrast to other approaches
[BLT+09, LBT+09], the approach described herein honors minutiae quality attributes for
semantic conformance assessment. Initial evaluation of the approach presented in this
paper shows that it is outperforming existing ones by Busch and Lodrova et al. in that
semantic conformance rates achieved correlate with real-world inter-vendor performance
measures.
The remainder of this paper is structured as follows: After this section introduced the
topic, section 2 will give an overview on related work in this field. Section 3 will propose
a semantic conformance testing framework by introducing a semantic conformance com-
putation model. In section 4, a quality score honoring instance of this computation model
will be proposed that can be used to compute an IUT’s semantic conformance rate and its
evaluation will be discussed in section 5. Finally, section 6 summarizes the results and
concludes.
2 Related Work
Semantic conformance testing of minutiae-based feature extractors is a rather new field
of research with limited amount of earlier work. In [BLT+09], Busch et al. propose a
semantic conformance testing methodology and especially highlight the importance of a
reference data set, i.e. ground-truth data, in order to perform semantic conformance test-
ing. In this work, reference data is manually assembled by dactyloscopic experts from the
german federal criminal police office (BKA). Further, two measures, crgtm and cragm, are
proposed which can be used to assess per-sample semantic conformance by measuring the
22

ratio of ground-truth minutiae, i.e. minutiae marked by human experts, for which a mate
was found and the ratio of automatically extracted minutiae, i.e. extracted using a specific
vendor’s feature extractor, placed within the fingerprint area, respectively. Based on this
initial work, in [LBT+09] Lodrova et al. enhance the measures proposed in [BLT+09] by
further adding a score cramf measuring the ratio of mated automatically extracted minu-
tiae within the fingerprint area. Additionally, a hierarchical clustering algorithm to compile
ground-truth minutiae from scattered expert markup is proposed in [LBT+09]. Using this
clustering algorithm a ground-truth data set consisting of pairs (Pi, Ri) of biometric sam-
ples Pi, i.e. fingerprint images, and corresponding biometric references Ri is compiled
from the scattered expert data. An alternative minutiae-clustering algorithm based on the
DBSCAN clustering algorithm has been proposed in [ABN10].
3 Semantic Conformance Testing Framework
In ISO/IEC 29109-1, semantic conformance testing – or content checking – is currently
defined modality independent and informally as “a conformance testing methodology that
tests that a BDIR produced by an IUT is a faithful representation of the IBDR subject to
the constraints of the parameters in the metadata records” [ISO09a]. While this type of
definition is precise enough at an intuitive level on the one hand, from an algorithm devel-
oper’s and a modality dependent point of view a more precise refinement of faithfulness is
necessary, that can be used to describe a generic semantic conformance testing framework.
3.1 A Minutiae-specific Definition of Faithfulness
Intuitively, a faithful representation of a biometric characteristic can be understood as any
kind of biometric template or biometric data interchange record that contains exactly the
same kind and amount of features that as well can be found on the true biometric character-
istic. Unfortunately, however, transforming each and every feature of a specific biometric
characteristic into a biometric template usually is not possible in an unbiased way as this
at least is influenced by varying, usually non-linear, physical effects during data capture
(e.g. moisture of skin, pressure, temporary scars, noise and dust on the capture plate, etc.).
Hence, we define a faithful representation as a biometric template resulting from a noise-
free and linear transformation applied to the input biometric sample’s traits.
In the above proposed definition, a faithful representation is defined by the transformation
of the input biometric sample’s traits into a biometric template. We require this transfor-
mation to be both, noise-free and linear, which we explain using the concept of minutiae
as features. Let M be the set of all minutiae, Pi = {m1, . . . ,mj} ⊆ M denote an input
biometric data record consisting of j minutiae and Tk,i = Ak(Pi) = {m′1, . . . ,m
′n} ⊆ M
denote an biometric data interchange record, or template, produced by vendor k’s feature
extraction process Ak upon input of Pi. Then, for a feature extraction process to create a
faithful representation of IBDR Pi we require that
23

24

rates CR(Ak) as follows:
∀Ak ∈ A : CR(Ak) =1
NGTM
NGTM∑i=1
ωi · F(Ri, Ak(Pi)). (1)
Put informally, the resulting conformance rates CR(Ak) as computed according to
SCM = (A, GTM,F , CRmax) are the average of the faithfulness fk,i of the biomet-
ric data interchange records Tk,i as produced by Ak for the input biometric data records
Pi and reference records Ri, weighted according to ωi.
The model defined in equation (1) is generic in that different functions F can be developed
to assess semantic conformance of different biometric modalities. In order to be able
to compare different instances of this computation model SCM for the same biometric
modality and in order to obtain reasonable results we require instances of this model to
have the following properties:
1. The output values CR(Ak) of the model, i.e. a semantic conformance rate belong-
ing to vendor k’s feature extractor, must fall within the interval [0, CRmax], i.e.
0 ≤ CR(Ak) ≤ CRmax. A higher value CR(Ak) indicates a higher semantic
conformance, while a value of 0 indicates no semantic conformance at all.
2. The weighting parameters ωi specified by the ground-truth data set GTM have to
be from the interval [0, 1], i.e. 0 ≤ wi ≤ 1.
3. Derived from requirements one and two, the values fk,i computed by the helper
function F must fall within the interval [0, CRmax] as well, i.e. 0 ≤ fk,i ≤ CRmax.
4. The helper function F used to quantify the faithfulness of a BDIR Tk,i according to
the given GTM has to be continuous.
The notion of semantic conformance rates according to the above given formal definition
of a semantic conformance computation model deviates from the one given in Busch and
Lodrova’s work. Busch, Lodrova et al. [BLT+09, LBT+09] define semantic conformance
rates for a specific input biometric data record and as a means to calculate semantic con-
formance rates propose three different measures, crgtm, cragm, cramf . In contrast, we
define semantic conformance rates for a specific biometric systems vendor’s implementa-
tion under test and for its computation make use of a function F measuring the faithfulness
of a biometric template Tk,i created by vendor k’s algorithms upon input of a biometric
sample Pi according to a provided reference Ri. Hence, semantic conformance rates in
the sense of Busch, Lodrova et al. relate to what in this work is introduced as measures of
faithfulness. The reason for this difference in notion is that we believe that an IUT specific
conformance rate seems to be more useful. Having a semantic conformance rate indicat-
ing the vendor’s implementation under test capabilities to generate faithful representations
of the input biometric data record enables the possibility to certify IUTs according to a
conformance rate specific threshold CR0. In other words, using the notion of IUT spe-
cific conformance rates introduced in this paper we can attest a vendor k’s conformance if
CR(Ak) > CR0 holds.
25

In order to map the notion and formulae proposed in [BLT+09, LBT+09] to the proposed
computation model, we can define a helper function FBL as follows:
FBL(Ri, Tk,i) = λgtmcrgtm(Ri, Tk,i)+λagmcragm(Tk,i)+λamfcramf (Ri, Tk,i), (2)
with λgtm, λagm, λamf being conformance rate, in the sense of Busch et al., specific
weights and λgtm + λagm + λamf = 1. Using this function, for a given ground-truth
data set GTM and a set of vendor implementations under test A, we derive an instance
SCMBL = (A, GTM,FBL, 1) of the semantic conformance computation model pro-
posed above. Unfortunately, score fusion is not discussed in [BLT+09, LBT+09] and
hence reasonable values for λgtm, λagm, λamf yet have to be determined.
4 Quality-honoring Conformance Rate Computation
In the preceding section a general semantic conformance computation model SCM =(A, GTM,F , CRmax) has been introduced, which heavily depends on a ground-truth
data set GTM and a function F : M × M → R in order to compute semantic confor-
mance rates CR(Ak) for implementations under test Ak ∈ A. What is still missing to
be able to compute conformance rates is the discussion of a function F(Ri, Tk,i) that can
be used to quantify the faithfulness of a biometric template Tk,i = Ak(Pi) generated by
Ak upon input of Pi according to reference Ri. Ideally, this function should be able to
quantify effects due to the following misbehavior as identified in the MINEX [Nat06] and
MTIT [NPL07] projects:
1. Misplacement of minutiae, i.e. incorrect minutia attributes (x, y, θ, t). Assessment
of minutia quality q is excluded in MINEX and MTIT as there’s currently no stan-
dardized process defined which can be used for quality determination.
2. Placement of spurious minutiae, i.e. false addition of artificial minutiae.
As mentioned earlier, semantic conformance testing fundamentally bases on the notion of
faithfulness. In section 3.1, faithfulness has been defined using minutiae attributes. Hence,
this section develops a semantic conformance computation model that quantifies minutiae
misplacement as well as placement of spurious minutiae in order to determine faithfulness
of a biometric template Tk,i with regard to biometric reference Ri. Additionally, this
instance of SCM leverages minutiae quality scores, which are currently being neglected
by other approaches. As this model is inspired by SCMBL and basically is a quality-
honoring version of it, this model is further called SCMQBL = (A, GTM,FQBL, 1).
In order to assess faithfulness of a biometric template Tk,i with regard to a reference Ri,SCMQBL makes use of the following measures:
Minutiae misplacement Let M denote the set of all minutiae, Tk,i ⊆ M, Ri ⊆ M,
mj = (xj , yj , θj , tj , qj) ∈ Ri denote the j-th minutiae in Ri and m′j =
(x′j , y′j , θ
′j , t
′j , q
′j) ∈ Tk,i denote an automatically extracted minutia, according to
26

euclidean distance, spatially closest tomj . If multiple equally distant pairs of minu-
tiae (mj ,m′j) for a given pair (Ri, Tk,i) exist, minutiae pairings have to be chosen
such that the total number of minutiae pairs reaches its maximum. Then minutiae
misplacement is quantified using a helper function γ1(Ri, Tk,i) that is defined as
γ1(Ri, Tk,i) =1
|Ri|
|Ri|∑j=1
(1− (1− faith(mj ,m′j))e
−(1−q′
j
100))2, (3)
with 0 ≤ faith(mj ,m′j) ≤ 1 being a helper function used to quantify the faithful-
ness of minutia m′j with respect to ground-truth minutia mj defined as
faith(mj ,m′j) =
{0, if d2(mj ,m
′j) > told
fj , otherwise, (4)
and fj being the faithfulness score of minutiae m′j that is closest to mj and with
euclidean distance d2(mj ,m′j) ≤ told. We choose told = W/2, with W denoting
the average ridge width in analogy to [LBT+09]. fj is composed of three scores
sΔdj , sΔθj , sΔtj as follows:
fj =sΔdj + sΔθj + sΔtj
3. (5)
The scores sΔdj , sΔθj , sΔtj are computed as follows:
sΔdj =told − d2(mj ,m
′j)
told, (6)
sΔθj =π −min{2π − |θj − θ′j |, |θj − θ′j |}
π, and (7)
sΔtj =
1, if tj = t′j0, 25, if tj ?= t′j and tj is unknown
0, otherwise
. (8)
In order to determine γ1(Ri, Tk,i), i.e. to quantify minutiae misplacement, three
scores are computed that assess spatial differences (sΔdj ), deviations in minutiae
angles (sΔθj ) and differences in minutiae types (sΔtj ). All those scores fall within
the interval [0; 1], with the extrema 0 denoting maximum difference and 1 denoting
no difference. Besides sΔtj , all scores are continuous. sΔtj measures differences
in minutiae types. If type t of a ground-truth minutiae m equals the type t′ of an
automatically generated minutia m′, i.e. if t = t′, then sΔtj reaches maximum. If
the type value of the ground-truth minutia m is set to unknown, or other, then sΔtjis set to 0,25. The rationale behind this is that if dactyloscopic experts, or other
reference feature extractors, are not able to correctly determine a minutia’s type, the
implementation under test should not be penalized rigorously as there’s no reference.
In any other case, sΔtj is set to 0.
27

(a) (b)
Figure 2: This figure illustrates the impact of quality scores and minutia faithfulness on the resultingquality-weighted faithfulness score. Part (a) illustrates scores without dilation due to the raise bypower of two, part (b) depicts results using the formula given in equation (3).
The score fj basically is an unweighted measure of minutiae faithfulness, i.e. sim-
ilarity of two minutiae mj ,m′j . It is composed of the above mentioned scores
sΔdj , sΔθj , sΔtj . For determining this measure, the average of those three scores is
computed, i.e. all three scores influence fj in the same manner. This decision was
made by purpose as while according to experts from the german federal criminal
police office, cartesian coordinates of minutiae are more distinctive than minutiae
angles, which are more distinctive than minutiae type, their influence on the faith-
fulness according to the definition introduced in section 3.1 should be the same.
However, if further research may suggest to assign different weights to the scores
sΔdj , sΔθj , sΔtj , equation (5) can easily be adapted.
Further, to compute γ1(Ri, Tk,i), the penalty imposed due to differences in minutiae
attributes, i.e. (1 − faith(mj ,m′j)), is weighted according to the mated automat-
ically generated minutiae’s quality scores. This is done by using the weight factor
e−(1−q′
j
100). Further on, the thus resulting weighted penalty is subtracted from 1, i.e.
to derive a minutia’s quality-weighted faithfulness, and the the result is raised to
the power of 2. The reason for this is that the non-linearity induced by the use of
the exponential function and the raise to the power of 2 is used to dilate the final
quality-weighted faithfulness scores. This especially leads to a higher resolution of
low-valued scores. The resulting score distribution for varying quality and minu-
tia faithfulness parameters is depicted in figure 2. Especially, figure 2 (a) illustrates
minutia faithfulness if the scores would not have been raised to the power of 2, while
figure 2 (b) shows the dilated result according to the formula given in equation (3).
As can be seen, due to this dilation a higher resolution of low-quality values, i.e.
upper left corner of the images, is achieved.
Spurious minutiae Let M be the set of all minutiae, letRi ⊆ M be a biometric reference
belonging to biometric sample Pi, let Tk,i = Ak(Pi) denote a biometric template
generated by vendor k’s feature extraction algorithm upon input of biometric sample
28

Pi and let m = (x, y, θ, t, q) ∈ Ri, m′ = (x′, y′, θ′, t′, q′) ∈ Tk,i be ground-truth
and automatically extracted minutiae, respectively. Further, let Sk,i ⊆ Tk,i denote
the subset of automatically extracted minutiae that do not fall within a tolerance-
bound defined by told of any ground-truth minutiae, i.e. Sk,i = {m′ ∈ Tk,i|∄m ∈Ri : d2(m,m
′) ≤ told}. In essence, Sk,i denotes the subset of spurious minutiae.
Then, spurious minutiae are quantified as follows:
γ2(Ri, Tk,i) = 1−1
|Tk,i|
|Sk,i|∑j=1
q′j100
, (9)
with q′j specifying the quality score associated with j-th minutia m′j ∈ Sk,i.
Using these measures, FQBL is computed according to
FQBL(Ri, Tk,i) = λ1γ1(Ri, Tk,i) + λ2γ2(Ri, Tk,i). (10)
Terms γ1(Ri, Tk,i) and γ2(Ri, Tk,i) are quality-honoring modifications of rates
crgtm(Ri, Tk,i) and cramf (Ri, Tk,i), respectively, with some further considerations. Most
significantly, both measures utilize minutiae quality scores to weight penalties induced by
misplaced or spurious minutiae. In order to achieve this, the automatically extracted minu-
tia’s quality value q′ is divided by 100, leading to penalty factors in the interval [0,01; 1].
Thus, a higher quality score, i.e. higher confidence, leads to a higher-weighted penalty or
a lower faithfulness score. If a specific minutia’s quality value is set to 0, indicating that
no quality information is available, the minutia is regarded to have a quality value of 100.
The reason for this choice is that if a vendor does not provide minutia quality information,
all minutiae have to be assumed to be of same high confidence. Hence, in these cases,
penalties will be weighted maximally. Furthermore, neither measure distinguishes be-
tween minutiae placed within the fingerprint area, at the border or in the background area
as this information is not available in minutiae-based templates and hence should neither
affect comparison scores, nor has impact on a biometric template’s faithfulness according
to our definition.
Finally, FQBL makes use of weight parameters λ1, λ2 which specify the influence of
γ1(Ri, Tk,i) and γ2(Ri, Tk,i), respectively, on the conformance rates CR(Ak). For the
time writing, we suggest assigning both a value λ1 = λ2 = 0.5 as the different measures’
impact on semantic conformance is yet unclear.
5 Evaluation
In order to draw conclusions on SCMQBL, first an impression of inter-vendor perfor-
mance has to be obtained, which will be discussed in the upcoming section. After that,
plausibility of SCMQBL will be assessed and its performance will be evaluated with re-
gard to SCMBL.
29

avg. EER AVAAVB
AVC
AVA0.0415 0.0459 0.0493
AVB0.0455 0.0428 0.0519
AVC0.0495 0.0516 0.0376
IUT nnEER CRQBL(·) CRBL(·)
AVA0.0476 0.6214 0.6285
AVB0.0488 0.5133 0.6295
AVC0.0506 0.4039 0.6192
(a) (b)
Table 1: (a) lists average EERs of feature extractors AVA, AV
B, AV
Cover all comparators; rows
denote reference generators, columns denote probe generators. (b) lists nnEERs computed accordingto equation (11) and conformance rates of IUTs AV
A, AV
C, AV
Cas computed according to SCMBL
and SCMQBL.
5.1 Inter-Vendor Performance
Three software development kits, AVA, AVB
, AVCfrom different biometric systems ven-
dors that claim conformance to ISO/IEC 19794-2 were available for testing. Using these
SDKs, ISO/IEC 19794-2 conforming biometric templates have been generated and equal
error rates have been computed for every comparator, reference extractor, probe extrac-
tor permutation using the FVC2000 DB11 data set. In order to approximate performance
achieved using a specific feature extractor’s templates in an heterogeneous environment
and to rank the feature extractors according to that, we compute average equal error rates
over all three comparators. The average EER values are comparator independent and listed
in table 1 (a). Based on these values, we calculate feature extractor specific average non-
native equal error rates (nnEER) as follows:
nnEERφ =1
4
∑ψ∈V\{φ}
(EERφ,ψ + EERψ,φ), (11)
with φ, ψ ∈ V = {VA, VB , VC}. The rationale of this is that nnEERs should give an im-
pression of equal error rates in heterogeneous environments – those scenarios we actually
are interested in. From a higher nnEER, we conclude lower performance and vice versa.
As these values are computed on comparator independent EERs, i.e. values listed in table
1 (a), the resulting nnEER values (cf. table 1 (b)) are assumed to give a rough ranking of
the feature extractors’ performances, independent of template comparators’ performances.
Thus, based on the given data, AVCseems to be the worst feature extractor, while AVA
seems to be the best and AVBthe second best performing feature extractors.
5.2 SCMQBL Evaluation
In order to empirically assess the plausibility of semantic conformance rates computed ac-
cording to SCMQBL, the following specific tests were performed. In all cases, parameters
λ1 and λ2 (cf. equation (10)) were set to 0.5:
1. Equality test: Conformance rates were computed using the same set of biometric
1http://bias.csr.unibo.it/fvc2000/
30

templates both, as reference and as probe. The result of this test is that for all
cases a maximum semantic conformance rate of 1 is computed. This is the expected
outcome as if biometric templates under test equal the references in ground-truth,
all biometric templates are faithful.
2. Empty template test: Conformance rates were computed using a modification of the
ground-truth data set as probe data set. In this modified probe data set, no biometric
template contains a single minutia. This results in a conformance rate of 0, which is
the expected outcome.
3. Single mate test: Again, a modification of the ground-truth data set is used as probe
data set. The probe data set is modified such that for each image all but one minutiae
are synthetically misplaced to not mating with any minutiae in the reference data
set. I.e., every biometric probe contains a single faithful minutia and many spurious
minutiae. All quality values were additionally set to 100. This resulted in a rather
small conformance rate (0.0163), which is expected for this type of test.
Based on these empirical analyses we argue that SCMQBL computes plausible seman-
tic conformance rates, such that higher similarity of biometric references and biometric
probes leads to higher semantic conformance rate and vice versa.
Further to this basic plausibility testing, we try to show that semantic conformance rates
computed by SCMQBL correlate with expected real-world inter-vendor performance. Es-
pecially, this means that we try to show that a vendor ranking induced by conformance
rates correlates with the nnEER-based ranking given in table 1 (b). For this, semantic
conformance rates are computed for all feature extractors using the data set described in
[BLT+09], with parameters λ1, λ2 being set to 0.5, each. The results of this computation
are given in table 1 (b). As can be seen, conformance rates resulting from SCMQBL
correlate with nnEER rates, i.e. CRQBL(AVA) > CRQBL(AVB
) > CRQBL(AVC).
In order to get an impression of the performance of SCMQBL in contrast to SCMBL,
the same computations have been performed for SCMBL. The results of this are listed in
column CRBL(·) of table 1 (b). Conformance rates CRBL(·) are derived by specifying
λgtm = λagm = λamf = 1/3. Based on these results SCMQBL seems to outperform
SCMBL for the given data set and feature extractors, as the ranking induced by SCMBL
does not correlate with nnEER values.
6 Summary and Conclusions
In this paper, a semantic conformance testing framework for minutiae-based feature ex-
tractors has been proposed. Especially, a formal and generic semantic conformance com-
putation model SCM = (A, GTM,F , CRmax) has been derived from informal descrip-
tions found in ISO/IEC 29109 family of standards, which can be used to develop and
compare different instances thereof. The basic underlying concept of this general model is
the notion of faithfulness, which has been formally defined for minutiae-based biometric
interchange records specified in ISO/IEC 19794-2 [ISO05]. This computation model has
31

been used to derive a quality-honoring instance, which has been compared to an existing
approach. Initial results show that the quality-honoring approach SCMQBL proposed in
this paper outperforms SCMBL, as the first one correlates with inter-vendor performance
that would be expected in real-world scenarios which the latter does not. However, the
authors are aware that the number of SDKs available for testing was limited and further
analyses should be carried out. For future work, the author’s propose to perform in detail
analyses of the minutiae misplacement problem (MMP), i.e. the impact of minutiae mis-
placement on comparison scores, as this seems to be one of the most pre-dominant issues
with automatic feature extraction.
References
[ABN10] Sebastian Abt, Christoph Busch, and Claudia Nickel. Applikation des DBSCANClustering-Verfahrens zur Generierung von Ground-Truth Fingerabdruck-Minutien. InProceedings of the Special Interest Group on Biometrics and Electronic Signatures(BIOSIG) 2010, pages 95–106, 2010.
[BLT+09] Christoph Busch, Dana Lodrova, Elham Tabassi, Wolfgang Krodel, and Martin Drahan-sky. Semantic Conformance Testing for Finger Minutiae Data. In Proceedings of IEEEInternational Workshop on Security and Communication Networks (IWSCN) 2009, pages17–23, 2009.
[ISO05] ISO/IEC JTC1 SC37 Biometrics. ISO/IEC 19794-2 Information technology – Biometricdata interchange formats – Part 2: Finger minutiae data. International Organization forStandardization, 2005.
[ISO09a] ISO/IEC JTC1 SC37 Biometrics. ISO/IEC 29109-1 Information technology – Confor-mance testing methodology for biometric data interchange formats defined in ISO/IEC19794 – Part 1: Generalized conformance testing methodology. International Organiza-tion for Standardization, 2009.
[ISO09b] ISO/IEC JTC1 SC37 Biometrics. ISO/IEC 29109-2 Information technology – Confor-mance testing methodology for biometric data interchange formats defined in ISO/IEC19794 – Part 2: Finger minutiae data. International Organization for Standardization,2009.
[LBT+09] Dana Lodrova, Christoph Busch, Elham Tabassi, Wolfgang Krodel, and Martin Dra-hansky. Semantic Conformance Testing Methodology for Finger Minutiae Data. In Pro-ceedings of the Special Interest Group on Biometrics and Electronic Signatures (BIOSIG)2009, pages 31–42, 2009.
[Nat06] National Institute of Standards and Technology. MINEX: Performance and Interop-erability of the INCITS 378 Fingerprint Template. NIST Interagency Report 7296(http://fingerprint.nist.gov/minex), 2006.
[NPL07] NPL Management Ltd. / MTIT Project. MTIT Deliverable 6.2: Research report on minu-tiae interoperability tests. http://www.mtitproject.com/DeliverableD62.pdf, 2007.
[TGSW09] Elham Tabassi, Patrick Grother, Wayne Salamon, and Craig Watson. Minutiae Inter-operability. In Proceedings of the Special Interest Group on Biometrics and ElectronicSignatures (BIOSIG) 2009, pages 13–30, 2009.
32

3D Capturing of Fingerprints – On the way to a contactless
certified sensor
D. Koller1, L. Walchshausl1, G. Eggers1, F. Neudel1, U. Kursawe1, P. Kuhmstedt2,
M. Heinze2, R. Ramm2, C. Brauer-Burchardt2, G. Notni2, R. Kafka3, R. Neubert3,
H. Seibert4, M. Castro-Neves4, A. Nouak4
1TST Biometrics, Mohlstraße 39, 80912 Munich
[email protected];[email protected]
2Abteilung Optische Systeme,
Fraunhofer Institut fur Angewandte Optik und Feinmechanik IOF,
Albert-Einstein-Straße 7, 07745 Jena
[email protected];[email protected]
3TRIOPTICS Berlin GmbH,
Schwarzschildstraße 12, 12489 Berlin
[email protected];[email protected]
4Abteilung Identifikation und Biometrie,
Fraunhofer-Institut fur Graphische Datenverarbeitung IGD,
Fraunhoferstraße 5, 64283 Darmstadt
Abstract: The purpose of this paper is to describe the development and performancetests of a contact-free fingerprint sensor, TrueFinger3D (TF3D). This contactless fin-gerprint sensor is designed to be perfectly interoperable with fingerprint image datacaptured with contact-based sensors or ink pads. This is achieved by acquiring a 3Ddataset of the fingertip together with the image of the papillary lines. Based on the 3Ddata, the papillary lines image can be processed to compensate perspective foreshort-ening or even emulate deformation effects caused with contact-based sensors. The3D measurement mechanism and the image processing are described in detail. Theresulting fingerprint images taken by the contactless sensor are then matched with im-ages taken by regular contact-based fingerprint readers at different force levels. Thecomparison shows that the geometric distortion of our contactless sensor TF3D is com-parable to that of contact-based sensors deployed under regular conditions. Our testalso shows that contact-based sensors operated under irregular or strong force condi-tions suffer from a substantial performance degradation, not seen with the contactlesssensor TF3D, which has perfect reproducibility. The results also indicate perfect inter-operability of the TF3D with any contact-based data and should therefore entitle thesensor to a certification for governmental use.
33

34

35

Figure 3: Sample green and blue channel image of the scanner. Please note the grey scale data ofthe camera channels has been matched to a green, resp. blue color scale.
fringe distance is used as a carrier frequency to separate the ideal pattern and the real
deformation of the sample.
The special challenge for the phase calculation in the finger scanner application is the bad
image quality compared with typical interferometric patterns. In Figure 3 it can be seen
that the blue camera channel does not detect the fringe projection only: the fringes are
disturbed by the papillary line patterns as well as from crosstalk between the camera’s
colour channels. The visibility of the fringe pattern is increased in a first analysis step
by a special combination of the images from the blue and the green camera channel. The
interruption of one of the fringes in the middle of the image is caused by an artificial
structure in the pattern generator. We use that to detect the zero height reference needed
to calculate the real 3D topography of the finger scanned (see section 2.2). Caused by the
grazing projection and depending on the actual position of the free floating finger during
the measurement, that fringe interruption is detected on varying camera pixels. But it has
always the same fringe number in the optical system.
The phase image is calculated by a fringe tracking (FTR) method [KBVE93], with some
adaption to the special fringe image types detected by the contactless finger print sen-
sor. A 1D Fourier analysis is used in advance of the FTR to check the fringe direction and
fringe density. Images not fullfilling the system-inherent limits (e.g. empty measurements,
unusual shapes) are sorted out and the relating measurement must be repeated. The follow-
ing FTR looks for the dark fringes (minima of the intensity) using a first order derivation
across the main fringe direction [Sny80]. That results initially in a collection of single data
points each representing a local intensity minimum.
The second step is the most important – and most difficult one in the phase determination: a
highly specialized tracking algorithm connects the single points to fringes giving all points
of the same fringe the same order number. Remaining data points with no connection to
a fringe are deleted and lead to an area where no phase and finally no fingerprint can be
reconstructed.
The last step of the phase determination is the calculation of the phase value at each image
point. For that we simply use all numbered data points in one camera row (in case of
mainly vertical fringes), set the phase difference between two succeeding orders to 2πand calculate the phase of all image points in-between by a spline interpolation. For a
faster processing of the following topography reconstruction we set the zero order to the
36

37

38

camera system has been calibrated in a preparatory step and the corresponding intrinsic
and extrinsic parameters of the projection and camera system have been considered for the
reconstruction process, e.g. the measured surface point coordinates are metrically correct
within the accuracy limits of the sensor.
Interoperability of sensor devices is very important, e.g. the images shall be suitable for
existing minutiae extraction algorithms that were designed to work with fingerprint images
acquired with contact-based systems with capacitive sensors or FTIR sensors. A compari-
son of fingerprint images usually relies on the relative location and orientation of features,
such as ridge endings, bifurcations islands, core points or deltas.
As the images produced by contact-based devices depict planar finger surfaces all measure-
ments such as minutiae positions and orientations are determined within two-dimensional
images.
The perspective projection of the fingerprint introduced in the camera based acquisition
yields distortions by means of decreased distances between feature points depending on
the distance of the observed surface portion. Regarding the shape of a fingertip we can
clearly observe that the density of ridges increases from the image centre towards the
image border. An ideal solution for this problem would require a projection method which
projects the curved finger surface into a plane while preserving both, lengths and angles.
A similar problem is well known in the area of map projection, e.g. to create world maps.
From a theoretical point of view the situation is quite clear: All map projection methods
introduce some amount of distortion, a map projection might preserve distances (equidis-
tant projection) or preserve shapes (conformal projection). Many projection methods have
been introduced which realize an application specific optimum to preserve some properties
of the sphere-like body at the expense of other properties [Sny93].
For our application there are two suitable ways: Use of a map projection providing a
reasonable accuracy or the use of a nonparametric unwrapping to flatten the curved surface.
2.3.1 Map projection
The map projection approach requires some shape model to perform the projective trans-
form of spherical or cylindrical coordinates into a plane. The Winkel-Tripel projection
has been shown as a projection minimizing both errors [GI07]. For testing of the map
projection approach two shape models have been used to approximate the finger shape: A
combination of a quarter of a sphere and a cylinder, and an ellipsoid. The Winkel-Tripel
projection formulas have been adapted by adding a constant scale factor on one axis in
order to fit the cylinder radius. To perform mapping of an ellipsoid surface, the aspect of
the ellipsoid radii has been used additionally to obtain reasonable scaled results.
2.3.2 Nonparametric unwrapping
The nonparametric unwrap approach [CPDSJ06] tries to preserve the distances between
surface points, e.g. curves are stretched such that the distance between two points remains
in the image plane. All points are shifted with respect to their neighbouring points. As
39

40

not exist and that the discussed methods involve approximations of shape models or phys-
ical constraints the numerical evaluation is omitted here.
As the real problem is the interoperability with contact-based systems, the evaluation of the
projection results based on minutiae locations compared to minutiae locations measured
with contact-based sensors might provide most valuable results.
For the following evaluation the datasets have been registered using an ellipsoid fitting to
align the principal axes of the ellipsoid to the coordinate axes. After transformation of all
points according to the registration an optimized nonparametric unwrapping approach has
been used in order to reduce the computational efforts.
3 Evaluation
An important criterion for contactless fingerprint sensors is the geometric compatibility of
captured fingerprint images with images from contact-based sensors, to ensure biometric
matching interoperability. The next sections describe our annotation and comparison ap-
proach to approximate and quantify this geometric compatibility as well as deduced results
in respect of contact-based and contactless interoperability [CCK10] .
3.1 Annotation and comparison approach
We propose a semi-autonomous correspondence annotation scheme to measure the amount
of geometric compatibility between fingerprint images. First, corresponding salient refer-
ence points (i.e. minutiae locations) are labelled in two fingerprint images by a human
operator using a dedicated annotation software (see Figure 7). The human operator is as-
sisted by an automatic generated first guess of corresponding points. Important for a suffi-
cient geometry approximation is a homogenous and complete coverage of the fingerprint
images. In the next step the resulting point clouds of the fingerprint images are aligned
such that the distances of corresponding points are minized. Currently, we align the point
clouds at the mean and determine a rotation angle between the two point clouds, which
ensures minimal average point-to-point distances. Other alignment strategies like spring
models are thinkable. The maximum distance between corresponding points and the av-
erage distance of all corresponding points are useful metrics and are therefore utilized to
approximate for the geometric compatibility of the annotated fingerprint images.
3.2 Data acquisition and results
Fingerprint images were captured of several fingers from a contact-based scanner (we
used a Crossmatch LScan device but any other contact-based sensor excluding swipe sen-
sors would result in comparable distortions) and our contactless scanner (TF3D). For each
41

42

43

References
[ABD+04] Michael Arnold, Christoph Busch, Martin Drahansky, Heinrich Ihmor, Tom Reinefeld,and Alexander Zwiesele. BioFinger - Evaluierung biometrischer Systeme (Fingerab-drucktechnologien). Technical report, 2004.
[BSIa] BSI - Bundesamt fur Sicherheit in der Informationstechnik. BSI TR-03104 – Technis-che Richtlinie zur Produktionsdatenerfassung, -qualitatsprufung und -ubermittlung furPasse, Version 2.1.5.
[BSIb] BSI - Bundesamt fur Sicherheit in der Informationstechnik. BSI TR-03104 Annex 2(QS-Finger) – Technische Richtlinie zur Produktionsdatenerfassung,-qualitatsprufungund -ubermittlung fur Passe, Version 2.1.5 – Qualitatsanforderungen bei der Erfas-sung und Ubertragung der Fingerabdrucke als biometrische Merkmale fur elektronischePasse.
[BSL06] University of Bologna Biometric System Laboratory. FVC2006: the Fourth Interna-tional Fingerprint Verification Competition, Biometric System Laboratory, 2006.
[CCK10] Heeseung Choi, Kyoungtaek Choi, and Jaihie Kim. Mosaicing Touchless and Mirror-Reflected Fingerprint Images. Information Forensics and Security, IEEE Transactionson, 5(1):52 –61, march 2010.
[CPDSJ06] Yi Chen, G. Parziale, E. Diaz-Santana, and A.K. Jain. 3D Touchless Fingerprints:Compatibility with Legacy Rolled Images. In Biometric Consortium Conference, 2006Biometrics Symposium: Special Session on Research at the, pages 1–6, 2006.
[GI07] David M. Goldberg and J. Richard Gott III. Flexion and Skewness in Map Projectionsof the Earth. Cartographica, 42(4):297–318, 2007.
[Gu02] Jens Guhring. 3D-Erfassung und Objektrekonstruktion mittels Streifenprojektion. PhDthesis, Universitat Stuttgart, Holzgartenstr. 16, 70174 Stuttgart, 2002.
[KBVE93] Ricarda Kafka, Thomas Blumel, Andreas Vogel, and Karl-Edmund Elßner. StaticFringe Evaluation of Technical Interferograms. In Physical Research, volume 19, pages88–90. Akademie-Verlag Berlin, 1993.
[MD04] S. Mil’shtein and U. Doshi. Scanning the pressure-induced distortion of fingerprints.Scanning, 26(6):270–272, 2004.
[POE87] P.Hariharan, B.F. Oreb, and T. Eiju. Digital Phase-Shifting Interferometry: A Sim-ple Error-Compemsating Phase Calculation Algorithm. Applied Optics, 26(13):2504––2506, 1987.
[Sch90] Johannes Schwider. Advanced Evaluation Techniques in Interferometry. In E. Wilf,editor, progress in optics, volume XXVIII, pages 271–359. Ed. Elsevier Science Pub-lishers, 1990.
[Sny80] J.J. Snyder. Algorithm for fast digital analysis of interference fringes. Applied Optics,19(8):1223––1225, 1980.
[Sny93] J. P Snyder. Flattening the Earth-Two thousand years of map projections. The Univer-sity of Chicago Press Ltd, London, 1993.
[WHL10] Y. Wang, L. G. Hassebrook, and D. Lau. Data Acquisition and Processing of 3-DFingerprints. IEEE Transactions on Information Forensics and Security, 2010.
44

Gait Recognition for Children over a Longer Period
Mohammad Omar Derawi1, Hewa Balisane2, Patrick Bours1,
Waqar Ahmed3, Peter Twigg2
1 Norwegian Information Security Laboratory,
Gjøvik University College, Norway
{mohammad.derawi,patrick.bours}@hig.no2 School of Engineering,
Manchester Metropolitan University, UK
[email protected] , [email protected] Institute of Nanotechnology and Bioengineering,
University of Central Lancashire, UK
Abstract: In this paper a comparative investigation into the effects of time on gaitrecognition in children’s walking has been carried out. Gait recognition has attractedconsiderable interest recently; however very little work has been reported in the litera-ture which is related to gait recognition in children. It has been suggested ([Kyr02])thatthe gait of children does not stabilize before they are 11 years old. In this papers wewill provide arguments that support this suggestion. When looking at the performanceof gait recognition, which serves as an indicator for the stability of gait, we found arelationship between performance improvement and aging of children. The gait of agroup of children was measured twice with a 6 months period between the two mea-surements. Our analysis showed that the similarity between these two measurementsis significantly lower than the similarity within each of the measurements. Finally wealso report the effect of gender on performance of gait recognition.
1 Introduction
Even though gait analysis has a long history dating back to the time of Aristotle, who
studied animal locomotion using artistic works, it was much later that work on the biome-
chanics of human walking was carried out at the end of the 19th century [Ari04, Pit09]. In
recent years gait analysis has progressed rapidly with the development of more sophisti-
cated electronics, advanced computer technology and more accurate sensors [GHS06]. A
major interest in gait analysis involves its applications to bioengineering, physiotherapy,
rehabilitation, the management of medical problems affecting the locomotor system and
sports performance [YSS+07, SR09, JMOdG05, YMH+06]. More recently, it has also at-
tracted considerable attention of researchers in identification and recognition for security
and safety purposes [MLV+05, BS10]. Gait has a number of advantages over other forms
of biometric features. For example, it is unique as each person has a distinctive walk, it is
unobtrusive as gait avoids physical contact whilst collecting data unlike most other meth-
45

ods which involve physical touching; data can also be collected at a distance without the
need for close proximity [CHH07, BCND01].
For improved security, gait analysis is being used for biometric authentication and iden-
tification [GSB06]. Currently, there are three types of systems being employed, which
are machine vision based (MV), floor sensor based (FS) and wearable sensors (WS). Each
type has its own unique advantages and disadvantages depending on the specific applica-
tion being considered. The MV systems can be used remotely without any user interaction;
however it is expensive and involves the use of background subtraction. FS based is very
accurate but it is expensive to install and maintain. WS are simple, small and inexpensive
devices and are not location dependent [GSB07]. These can be readily incorporated into
mobile devices such as the popular i-Phone.
For adults of both genders, considerable research has been done on gait recognition and
medical applications [DBH10, YTH+09, BS10, BN08]. However, with children very little
work has been reported in the literature [PPW+97, OBC+99]. In previous studies we have
reported an analysis of gait performance in children compared to adults [BDB+11b] and
gait analysis under special circumstances [BDB+11a] such as variations in walking speed
and carrying objects. In this paper we present a study on the effects of time on gait patterns
in children and its relationships to gender and age. The accelerometer sensor was placed
on the left side of hip. A comparative analysis of gait patterns in children and adults both
male and female for the purposes of recognition and identification is presented.
2 Experiment Design
In this study a programmable sensor (Model GP1, see Figure 1(a)) purchased from Sensr
(USA, http://www.sensr.com) was programmed and used to record the motion of
the children in several walking cycles. The GP1 measures the acceleration in three per-
pendicular directions which will be referred to as x, y and z. Figure 1(b) is an example of
the output obtained from the GP1 sensor and shows the signals obtained in the x, y and
z directions. These signals provided the raw data for the subsequent analysis reported in
later sections of this paper. It is converted into a unique pattern for each individual for
comparison. The GP1 can collect acceleration data up to 10g and has a sampling rate of
100 Hz per axis. Acceleration data is filtered inside the GP1 by a 2 pole Butterworth low
pass filter with a cut-off frequency of 45 Hz [Sen07]. The device has a USB interface
for transferring data and a 1 Mbyte memory for storage purposes. An overview of the
specification of the Sensr GP 1 is given in Table 1.
In this study, 46 children (31 boys and 15 girls) with ages ranging between 5 to 16 years
participated. Ethical approval was obtained from the school principal, the university’s eth-
ical approval committee and parents of the children. For each child, the parents formally
approved participation in the study by signing a standard University approval consent form
prior to volunteering. The criteria set for the child to take part of this study were that they
should have no previous history of injury to the lower extremities within the past year, and
no known musculoskeletal or neurological disease.
46

47

(a) (b)
Figure 2: Left: The Sensor Position, Right: Walking Hall
5. Walk 17.5 meters from one end of hall section to the other
6. Stop and wait for 5 seconds
7. Turn around and wait for 5 seconds
8. Walk back 17.5 meters wait for 5 seconds and turn around
9. Repeat procedure
After walking twice the sensor was detached from the volunteer, connected to the computer
and the data inside the GP1 device was downloaded and stored and the filed was named
appropriately.
The main experiment was carried out over a time period of 6 months. First experiment
was performed in September 2010 and the second was performed in March 2011. There
were 20 volunteers who participated in the long term experiment out of an initial group of
46. In September 2010, each subject did 2 sessions, whilst 16 sessions were performed in
March 2011. This means that each subject participated in 18 sessions in total.
3 Feature Extraction
The raw data retrieved from the Sensr sensor needs to be processed in order to create
robust templates for each subject. The feature extraction steps are based on the work of
[DBH10].
Preprocessing: First we apply linear time interpolation on the three axis data (x,y,z) re-
trieved from the sensor to obtain an observation every 1
100second since the time intervals
between two observation points are not always equal. Another potential problem is that
48

the acceleration data from the sensor includes some noise. This noise is removed by using
a weighted moving average filter (WMA) . The formula for WMA with a sliding window
of size 5 is given in Equation 1.
(at−2) + (2at−1) + (3at∗) + (2at+1) + (at+2)
9, (1)
where at is the acceleration-value in position t. The current value we are located at are
given weight 3, the two closest neighbors weight 2 and the next two neighbors weight 1.
Finally we calculate the resultant vector or the so-called magnitude vector by applying the
following formula,
rt =√x2t + y2t + z2t , t = 1, ..., N
where rt, xt, yt and zt are the magnitudes of resulting, vertical, horizontal and lateral
acceleration at time t, respectively and N is the number of recorded observations in the
signal.
Cycle Detection: From the data it is known that one cycle-length varies between 80− 140samples depending on the speed of the person. Therefore we need to get an estimation of
how long one cycle is for each subject. This is done by extracting a small subset of the
data and then comparing the subset with other subsets of similar lengths. Based on the
distance scores between the subsets, the average cycle length is computed, as can be seen
in Figure 3.
The cycle detection starts from a minimum point, Pstart, around the center of the walk.
From this point, cycles are detected in both directions. By adding the average length,
denoted γ to Pstart, the estimated ending pointE = Pstart+γ is retrieved (in the opposite
direction: E = Pstart − γ ). The cycle end is defined to be the minimum in the interval
Neighbour Search from the estimated end point. This is illustrated in Figure 4. This
process is repeated from the new end point, until all the cycles are detected. The end
point in the Neighbour Search is found by starting from point E. From this point we
begin searching 10% of the estimated cycle length, both before and after E for the lowest
point. When the minimum point is found we store it into an array and we begin searching
for the next minimum point by adding the length of one estimated cycle. When forward
searching is complete we repeat this phase by searching backwards so all steps in the data
are identified. We will therefore end up with having an array containing start/end index for
each step. These points will therefore be used for the extraction of cycles, as illustrated in
Figure 5.
Template Creation: Before we create the feature vector template, we ensure that cycles
that are very different from the others are skipped. This is done by taking each cycle
and calculating its distance compared to every other cycle by using dynamic time warping
(DTW),
dtwi,j = dtw(cyclei, cyclej)
49

Figure 3: The yellow baseline area indicates the subset with 70 samples that are extracted, the greenarea is the search area where the baseline is compared against a subset of the search area. The 4black subgraphs are the baseline at those points that has the lowest distance with the search areasubsets, and the difference between them (blue area) indicate the cycle length [DBH10].
Figure 4: Cycle detection showing how each cycle (i.e the steps) in the resultant vector is automati-cally detected [DBH10].
50

51

4 Feature Vector Comparison
A distance metric, named the cyclic rotation metric (CRM) with small changes, is applied
[DBH10]. This metric cross-compares two sets of cycles with a cyclic-rotation mechanism
to find the best matching pair:
Cross Comparison: is used to find the most optimal and best distance score when cross-
comparing two set of cycles, denotedCS = {CS1 , ..., CSN} and CT = {CT1 , ..., C
TM}. This
simply means that each cycle in the set CS is compared to every cycle in the set CT . The
comparative distances are calculated by the cyclic rotation metric (CRM). From the total
number of N × M distance scores calculated, the minimum score is selected,
dmin = min{CRM(CSi , CTj )}
where i=1..N and j=1..M. The pair of cycles with the most minimum similarity score is
considered the best matching pair. Thus, this best (i.e. minimum) similarity score, dmin,
is used as the similarity score between set CS and CT .
Cyclic Rotation Metric (CRM): is a metric that compares a reference cycle and an input
cycle with each other. The reference cycle, i.e. CSi , which is compared against the input
cycle, i.e. CTj , is stepwise cyclical rotated. After each rotation the new distance is calcu-
lated using the Manhattan distance. This is repeated until the input template has done a
full rotation, then the lowest distance value is kept:
d(CSi , CTj ) = minw=1..k{Manh(CSi , C
Tj(w))}
The reason why we use the Manhattan distance when rotating is due to the fact that Man-
hattan runs fast. Furthermore the cyclic rotation is done to minimize the problem when
local extremes among the cycles we create for each input are located at different locations.
5 Analysis and Results
In this section we will present the analysis performed and results. Three different tests
have been performed and these are as follows:
1. The first test analyzes the performance of gait and how it varies with the age of the
children.
2. The second test analyzes the performance of gait and studies its variations over time,
with a 6 months interval measurements.
3. The third test analyzes and compares the performance of gait between boys and
girls.
As mentioned in a previous study by [Kyr02], it was suggested that the gait of children
does not stabilize before they are 11 years old. In order to test this hypothesis, we have split
52

the set of the 46 children into three groups. The first group consisted of 17 children that are
at most 10 years old. The second group consisted of the 11 children in our experiment that
are only 10 years old, whilst the third group consisted of 18 children that were between 11 -
16 years old. The split was done in this way because the size of the three groups is more or
less equal. We do realize that the number of children in each of the three data sets is rather
small, which influences the statistical significance of the results negatively. Nevertheless
we want to present the results of our analysis on all three groups as an indication of the
performance.
The data used for the analysis is the collected gait data from March 2011, i.e. all of the
participants contributed 16 data samples for the analysis. The resulting EER values are
given in Table 2 for each of the three age groups. We also included the analysis results for
the case where the group of 46 children was not split. The resulting EER can be found in
the columns ”All against All”.
5-9 years 10 years 11-16 years All against All
Manh.+Rotation 16.12 13.74 13.21 14.23
Table 2: EER Performance results in % on the collected dataset due to age.
From the results in Table 2 we see that with increasing age the EER value decreases,
indicating an increase in the stability of the walking of children with increaing age. This
seems to confirm the suggestion from [Kyr02]. In order to test this suggestion further we
tested how the walking of children would change over time. As mentioned in Section 2
do we have gait data samples from 20 children who participated in the experiment in both
September 2010 and in March 2011. In September 2010 each of the 20 children provided
only 2 gait data samples, but in March 2011 each of them provided 16 data samples. Of
these 20 children, 18 were below 11 years old, one was exactly 11 years old and one who
was 14 years old.
We have determined the EER for each of these periods separately and we see in Table 3 that
the resulting EER values are rather similar: 18.88% for September 2010 and 18.94% for
March 2011. In order to see if the gait has developed over time we also added a test where
the template was created with the September 2010 data, while the test data came from the
March 2011 data. From Table 3 we see that the EER value increases significantly from
approximately 18.9% to 34.02%. This indicates a major change in the way of walking of
these children, confirming the suggestion from [Kyr02] once again.
September 2010 March 2011 6 Months
Manh.+Rotation 18.88 18.94 34.02
Table 3: EER Performance results in % on the collected dataset due to time.
Although the number of participants in the tests is rather low, we can still clearly see a
change of performance over time. We see that one group of children measured twice,
with 6 months interval between measurements, has a large change in their way of walking,
while we on the other hand there is also an increased stability in walking with growing
53

age. Both these facts support the suggestion that the walking of children stabilizes around
11 years as Kyriazis suggested in [Kyr02].
A final test was performed to see if there are differences in gait recognition between boys
and girls. The results can be found in Table 4. We know from Section 2 that the number
of boys was more than twice the number of girls in the experiment conducted in March
2011. In order to make the results comparable we have used the gait data from all 15 girls
and randomly selected 15 boys. The distance metric used was again the Manhattan with
Rotation metric. The slightly lower EER for girls (13.44% compared to 14.86%) indicates
a that the gait of female subjects is slightly more stable than the gait of male subjects.
The result in Table 4 for the boys is based on a random selection of 15 out of the available
31 boys. In order to make the result independent of the selected boys, this random selection
has been performed 100 times and the presented performance is the average over these 100
results.
Males Females
Manh.+Rotation 14.86 13.44
Table 4: EER Performance results in % on the collected dataset over time due to gender.
6 Conclusions
As far as we know there are no published results on the stability of gait for young children,
except from the suggestion in [Kyr02]. In this paper we have given evidence indicating
the correctness of that suggestion. It has been shown that as the children get older their
gait becomes more stable and that there is a large difference between the gait of a group
of 20 young children measured six months apart; this indicates that the gait of children is
still developing at these young ages.
In addition, a comparison was carried out between the stability of gait from girls and boys
and it was found that the female gait was slightly more stable as indicated by a lower EER.
Whilst the results presented in this study are interesting and in line with previous sug-
gestions, a more comprehensive study with a higher number of participants is required to
confirm the results described in this paper. In addition, research on the stability of gait
from adults over a longer period of time is needed to compare against the results presented
in this paper.
7 Acknowledgments
The authors would like to thank all the (anonymous) participants in this experiment. The
writing of this article would not have been possible without their effort in the data collec-
tion phase.
54

References
[Ari04] Aristotle. On the Gait of Animals. Kessinger Publishing, 2004.
[BCND01] Chiraz BenAbdelkader, Ross Cutler, Harsh Nanda, and Larry S. Davis. EigenGait:Motion-Based Recognition of People Using Image Self-Similarity. In Proceedingsof the Third International Conference on Audio- and Video-Based Biometric PersonAuthentication, AVBPA ’01, pages 284–294, London, UK, 2001. Springer-Verlag.
[BDB+11a] Hewa Balisane, Mohammad Omar Derawi, Patrick Bours, Ahmed Waqar, and PeterTwigg. Gait recognition in children under special circumstances. In Security andCommunication Networks (IWSCN), 2011 2nd International Workshop on, 2011.
[BDB+11b] Hewa Balisane, Mohammad Omar Derawi, Patrick Bours, Ahmed Waqar, and PeterTwigg. Performance of Gait Recognition in Children’s Walking Compared to Adults.In Security and Communication Networks (IWSCN), 2011 2nd International Workshopon, 2011.
[BN08] I. Bouchrika and M.S. Nixon. Exploratory factor analysis of gait recognition. In Au-tomatic Face Gesture Recognition, 2008. FG ’08. 8th IEEE International Conferenceon, pages 1 –6, September 2008.
[BS10] P. Bours and R. Shrestha. Eigensteps: A giant leap for gait recognition. In Securityand Communication Networks (IWSCN), 2010 2nd International Workshop on, pages1 –6, May 2010.
[CHH07] Ming-Hsu Cheng, Meng-Fen Ho, and Chung-Lin Huang. Gait Analysis For HumanIdentification Through Manifold Learning and HMM. In Motion and Video Comput-ing, 2007. WMVC ’07. IEEE Workshop on, page 11, February 2007.
[DBH10] M.O. Derawi, P. Bours, and K. Holien. Improved Cycle Detection for AccelerometerBased Gait Authentication. In Intelligent Information Hiding and Multimedia SignalProcessing (IIH-MSP), 2010 Sixth International Conference on, pages 312 –317, Oc-tober 2010.
[GHS06] D. Gafurov, K. Helkala, and T. Sndrol. Gait recognition using acceleration fromMEMS. In Availability, Reliability and Security (ARES 2006), The First InternationalConference on, pages 432–439, April 2006.
[GSB06] Davrondzhon Gafurov, Einar Snekkenes, and Tor Erik Buvarp. Robustness of Bio-metric Gait Authentication Against Impersonation Attack. In Robert Meersman, ZahirTari, and Pilar Herrero, editors, OTM Workshops (1), volume 4277 of Lecture Notes inComputer Science, pages 479–488. Springer, 2006.
[GSB07] D. Gafurov, E. Snekkenes, and P. Bours. Gait Authentication and Identification UsingWearable Accelerometer Sensor. In Automatic Identification Advanced Technologies,IEEE Workshop on, pages 220–225, June 2007.
[JMOdG05] Emil Jovanov, Aleksandar Milenkovic, Chris Otto, and Piet de Groen. A wirelessbody area network of intelligent motion sensors for computer assisted physical reha-bilitation. Journal of NeuroEngineering and Rehabilitation, 2(1):6+, March 2005.
[Kyr02] V. Kyriazis. Temporal gait analysis of children aged 9-10 years. Journal of Or-thopaedics and Traumatology, 3:31–34, 2002.
55

[MLV+05] J. Mantyjarvi, M. Lindholm, E. Vildjiounaite, S.-M. Makela, and H.A. Ailisto. Iden-tifying users of portable devices from gait pattern with accelerometers. In Acoustics,Speech, and Signal Processing, 2005. Proceedings. (ICASSP ’05). IEEE InternationalConference on, volume 2, pages ii/973 – ii/976 Vol. 2, March 2005.
[OBC+99] Donna Oeffinger, Bridgett Brauch, Shelley Cranfill, Cary Hisle, Cyndi Wynn, RamonaHicks, and Sam Augsburger. Comparison of gait with and without shoes in children.Gait & Posture, 9(2):95 – 100, 1999.
[Pit09] Mark R. Pitkin. Biomechanics of Lower Limb Prosthetics. Springer, 2009.
[PPW+97] D.D. Pascoe, D.E. Pascoe, Y.T. Wang, D.M. Shim, and C. Kim. Influence of carryingbook bags on gait cycle and posture of youths. In Ergonomics, volume 40, pages631–641, 1997.
[Sen07] Sensr. GP1 Programmable Accelerometer User Manual. www.sensr.com, 2007.
[SR09] Mahsa Salehi and Mohammadreza Razzazi. A sensor-based framework for detectinghuman gait cycles using acceleration signals. In Proceedings of the 17th internationalconference on Software, Telecommunications and Computer Networks, SoftCOM’09,pages 328–332, Piscataway, NJ, USA, 2009. IEEE Press.
[YMH+06] T. Yoshida, F. Mizuno, T. Hayasaka, K. Tsubota, S. Wada, and T. Yamaguchi. GaitAnalysis for Detecting a Leg Accident with an Accelerometer. Distributed Diagnosisand Home Healthcare, 0:43–46, 2006.
[YSS+07] H. Ying, C. Silex, A. Schnitzer, S. Leonhardt, and M. Schiek. Automatic step detectionin the accelerometer signal. In Proceedings of the 4th International Workshop onWearable and Implantable Body Sensor Networks (BSN 2007), 2007.
[YTH+09] Shiqi Yu, Tieniu Tan, Kaiqi Huang, Kui Jia, and Xinyu Wu. A Study on Gait-BasedGender Classification. Image Processing, IEEE Transactions on, 18(8):1905 –1910,August 2009.
56

Classification of Acceleration Data for Biometric Gait
Recognition on Mobile Devices
Claudia Nickel, Holger Brandt, Christoph Busch
Hochschule Darmstadt - CASED, Darmstadt, Germany,
Abstract: Ubiquitous mobile devices like smartphones and tablets are often not se-cured against unauthorized access as the users tend to not use passwords because ofconvenience reasons. Therefore, this study proposes an alternative user authentica-tion method for mobile devices based on gait biometrics. The gait characteristics arecaptured using the built-in accelerometer of a smartphone. Various features are ex-tracted from the measured accelerations and utilized to train a support vector machine(SVM). Among the extracted features are the Mel- and Bark-frequency cepstral coef-ficients (MFCC, BFCC) which are commonly used in speech and speaker recognitionand have not been used for gait recognition previously. The proposed approach showedcompetitive recognition performance, yielding 5.9% FMR at 6.3% FNMR in a mixed-day scenario.
1 Introduction
Phone theft is becoming a serious security problem in many countries. For example in
the United Kingdom about 228 mobile phones were reported stolen every hour in 2010,
which lead to a call by the Minister of Crime Prevention to the mobile phone industry to
better protect device owners against theft [CJ10]. A perpetrator having access to private
and business emails, contacts and social networks can easily impersonate the victim. Al-
though well-known technical security measures like PIN, password and strong encryption
would protect the sensitive information, data protection techniques and knowledge based
authentication with PIN and password are often not applied by the owner of the device
even though they are available at essentially no additional cost.
There have been few phones with fingerprint scanners that never really entered mass mar-
ket. The reasons are probably the rather high costs for the extra sensor that is not needed by
the average end-user. Other biometric modalities, namely speaker, face and gait recogni-
tion, do not have this problem as most modern phones are capable of realizing a biometric
verification system using one or more of these modalities. Compared to the mentioned
modalities, gait recognition has one unique advantage: it does not require explicit user
interaction during the verification process as the phone does it literally on-the-go. The
driving motivation for gait recognition is that the device continuously authenticates the
owner, when he is on the move and thus more rarely requires an explicit user authentica-
tion.
57

From a technological point of view research in biometric gait recognition can be catego-
rized into three main approaches (analog to Gafurov in [Gaf07]): Machine Vision Based,
Floor Sensor Based and Wearable Sensor Based Gait Recognition. This study focuses on
the last approach, wearable sensor (WS) based gait recognition.
WS-based gait recognition is the most recent form of gait recognition as lately proposed
as 2005 [ALM+05] and further developed by Gafurov [Gaf08]. WS-based gait signals are
captured by a sensor that is attached to the body, typically an accelerometer. Accelerome-
ters used for gait recognition generally are tri-axial i.e. they measure acceleration in three
spatial dimensions (backward-forward, sideways and vertical). The acceleration signals
acquired are the result of the acceleration of the person’s body, gravity, external forces like
vibration of the accelerometer device and sensor noise.
When research in WS-based gait recognition started, dedicated sensors were used for data
collection. But the interesting aspect of WS-based gait recognition is that accelerometers
are in the meantime a standard component of mobile devices like smartphones and tablets
(e.g. iPad). Because of the ubiquitous nature of mobile smartphones with accelerometers
an ideal “off-the-shelf” hardware platform for gait analysis and recognition is already
available. The strong advantage is that only new software (yet another “app”) needs to be
developed with no additional hardware cost and customizations opposed to biometric-only
sensors like fingerprint readers. Therefore, recently researchers started using smartphone
equipment [DNBB10, FMP10, KWM10, NBRM11, SZ09] for data collection.
2 Data Set
For the experiments the data set used in [DNBB10] and [NBRM11] was employed. The
acceleration data was collected using a G1 smartphone with a customized application to
access the accelerometer measurements and to output the data from the sensor to a file
(40-50 data points per second for each of the three directions x, y and z). While recording
the gait data the phone has been placed in a pouch attached to the belt of the subject (see
figure 1). In total, data of 48 healthy subjects was successfully recorded on two sessions at
two different days with the subjects wearing their usual shoes and walking at normal pace.
Subjects were walking straight on flat floor for around 37 meters, turned around at the end
and walked back (resulting in two data sets called “walk”). Age and gender distribution
are given in table 1.
< 20 20− 24 25− 30 > 30 unknown
male 1 1 25 9 2
female 0 5 4 0 1
total 1 6 29 9 3
Table 1: Age and gender distribution of data subjects.
58

Figure 1: Position of phone during data collection.
3 Feature Extraction
When deriving gait features from the captured signal there are two possible approaches:
cycle-based and non-cycle-based feature extraction. A gait cycle physically corresponds
to two consecutive steps that the subject has taken, i.e. the period after one foot touches the
ground until the same foot touches the ground again. Cycle-based features are computed
by identifying gait cycles in time-series data representing a walking person. Then the
feature extraction is conducted on identified cycles and the resulting features are used for
biometric template creation and sample comparison. Currently this approach for represent-
ing gait is the predominantly used method in gait recognition literature. As an alternative
approach, a non-cycle-based gait representation, was used for this study. Here, features are
extracted from the times-series data from a selected time window without prior identifying
the contained gait cycles.
The collected gait samples are preprocessed such that the feature extraction algorithm
works with consistent and portioned data. The first step is a linear interpolation to a fixed
sampling rate as this is not given with the collected raw data. The average sampling rate of
the raw data is about 40-50 data points per second. After interpolation the signals sx, sy, szare normalized by the mean acceleration µa of the respective acceleration direction sa:
sa(t) = sa(t)− µa, a ∈ x, y, z.
The normalized acceleration signals are then separated into parts of several seconds using
a sliding window approach with overlapping rectangular windows. This means that the
original signal of length l is splitted into segments of length t and distance d between con-
secutive segments. The remaining part is dropped and not used any further. The segmen-
tation is done for all normalized signals. Note that actually three normalized acceleration
signals sx, sy, sz are segmented.
The segments at this stage are still represented as time series. As the intention was to
benefit from the well-performing classification capabilities of SVMs a transformation to a
fixed length vector of discrete values has to be conducted. For each segment one feature
vector is created. As a starting point statistical features were calculated for the acceleration
signals: mean, maximum, minimum, binned distribution (relative histogram distribution in
linear spaced bins between the minimum and the maximum acceleration in the segment),
root mean squared acceleration (rms, the square root of the mean of the squares of the
59

acceleration values of the segment), standard deviation and zero crossings (number of sign
changes in the segment).
Further used features were the Mel-frequency cepstral coefficients (MFCC) and Bark-
frequency cepstral coefficients (BFCC), which belong to the most widely used spectral
representations of audio signals for automatic speech recognition and speaker verification
[GFK05]. The general workflow for creating MFCC is laid out in figure 2. A more elab-
orate discussion can be found in [RJ93]. BFCC are created similar to MFCC, the only
difference is that instead of the Mel-scale the Bark-scale is applied.
Figure 2: MFCC and BFCC feature creation
4 Preliminary Evaluation
We used SVMs as classifiers, which were introduced by Vapnik in 1982 [Vap82] as a
supervised learning method based on the theory of structural risk minimization. A SVM
is a classifier which is inherently a solution for two class problems. The basic idea of the
SVM is to construct a hyperplane as the decision plane, which separates the patterns of
the two classes with the largest margin. The experiments were carried out using the SVM
implementation LIBSVM [CL01]. The Radial Basis Function (RBF) kernel was chosen
and a parameter selection (grid search [HCL03]) was done as part of the optimization
process.
In a first step the discrimination capabilities of single features and of combined features
were investigated. The acceleration directions were also used separately to study their
different contribution to the classification result.
The acceleration signals collected on the first day were used for training and the signals
collected on the second day were used for calculation of the recognition performance
(cross-day scenario). First of all the data was interpolated to 100 Hz. The segment length twas 7500 ms, the segment distance d was 3750 ms (corresponding to an overlap of 50%).
Further interpolation rates and segment lengths are tested later on. Last, the feature ex-
traction was conducted for various feature types. To determine the biometric performance,
cross-validation was conducted calculating the false match rate (FMR) and the false non-
match rate (FNMR).
Five configurations were tested for each feature type using different data sources, namely
the x-, y-, z-acceleration, the resulting acceleration, and all of them combined. The re-
60

X Y Z Magn. Combined
Feature FMR FNMR FMR FNMR FMR FNMR FMR FNMR FMR FNMR
max. 0.5% 96.9% 0.5% 98.2% 1.9% 96.7% 1.0% 97.5% 4.2% 82.1%
min. 0.5% 99.3% 0.9% 97.5% 0.4% 97.8% 1.2% 98.2% 4.7% 77.4%
mean 0.0% 99.8% 1.1% 99.1% 0.2% 99.5% 0.5% 98.4% 3.6% 89.4%
std. dev. 0.3% 97.5% 0.6% 96.0% 0.3% 100.0% 0.2% 98.7% 4.2% 81.0%
rms 0.9% 96.2% 0.6% 95.4% 0.3% 100.0% 0.5% 97.4% 4.6% 86.7%
zero cross. 0.2% 99.3% 0.1% 99.1% 0.6% 99.5% 0.0% 100.0% 5.3% 85.8%
bin dist. 6.2% 87.2% 5.7% 90.0% 4.7% 91.1% 4.5% 91.4% 5.2% 76.8%
MFCC 6.1% 76.3% 3.6% 81.4% 4.1% 82.1% 4.2% 78.8% 1.5% 72.1%
BFCC 6.6% 74.5% 4.6% 77.9% 3.5% 82.9% 3.8% 76.3% 1.5% 67.9%
Table 2: Evaluation of discrimination capabilities of single features
Set Used Features Length FMR FNMR
1 BFCC, MFCC 104 1.3% 69.3%
2 BFCC, MFCC, bin dist., min. 128 1.2% 69.0%
3 BFCC, MFCC, bin dist., min., std. dev. 132 1.2% 69.0%
4 BFCC, MFCC, bin dist., min., std. dev., max. 136 1.3% 68.8%
5 BFCC, bin dist., min. 76 1.3% 67.0%
6 BFCC, bin dist., min., std. dev. 80 1.5% 66.2%
7 BFCC, bin dist., min., std. dev., max. 84 1.5% 65.3%
8 BFCC, mean, max., min., std. dev., rms, zero cross., bin dist. 96 1.2% 66.8%
9 BFCC, mean, max., min., std. dev., rms, zero cross. 76 0.9% 67.5%
10 BFCC, mean, max., min., std. dev., rms 72 1.4% 66.6%
11 BFCC, max., min., std. dev., rms 68 1.7% 66.2%
Table 3: Evaluation of combined features’ discrimination capabilities.
sulting vector is also referred to as the magnitude vector and is calculated as follows:
sres(t) =√sx(t)2 + sy(t)2 + sz(t)2. Here sx(t), sy(t), sz(t) are the interpolated and
normalized accelerations measured in the corresponding directions at time t. The results
are given in table 2.
All feature types have a resulting vector length of one. Exceptions are the binned distribu-
tion, were five bins were used and thus a vector of length five is created. For MFCC and
BFCC the common number of 13 coefficients was generated for each segment. Of course,
when the features are combined (generated for each orientation and the magnitude as well)
the length is four times this number.
It is apparent that the best performances are yielded when all sensor orientations and the
magnitude as well is used. Now, various combinations of the features are tested. The
results are presented in table 3. The first four feature sets consist of combinations of the
best performing single features. One can see that the results are basically the same. When
the MFCC coefficients are removed from these feature sets (resulting in sets 5 to 7), the
FNMR decreases while the FMR stays on the same level. Therefore, further combinations
of BFCC and several statistical features were tested (set 8 to 11). The obtained results are
61

5000 7500 10000
Set FMR FNMR FMR FNMR FMR FNMR
5 1.7% 70.3% 1.3% 67.0% 1.2% 64.7%
6 1.8% 70.5% 1.5% 66.2% 1.1% 65.0%
7 1.7% 69.6% 1.5% 65.3% 1.1% 64.7%
8 0.9% 67.8% 1.2% 66.8% 0.9% 64.2%
9 1.1% 66.3% 0.9% 67.5% 1.3% 59.9%
10 1.3% 69.1% 1.4% 66.6% 1.4% 63.6%
11 1.2% 69.3% 1.7% 66.2% 1.3% 62.3%
Table 4: Evaluation results for segments of length 5,000, 7,500 and 10,000 and an overlap of 50%(frequency = 100).
50 100 200
Set FMR FNMR FMR FNMR FMR FNMR
5 1.0% 67.3% 1.2% 64.7% 1.1% 64.4%
6 1.2% 65.7% 1.1% 65.0% 1.1% 64.7%
7 1.0% 65.2% 1.1% 64.7% 1.2% 64.4%
8 0.9% 65.4% 0.9% 64.2% 0.8% 63.9%
9 1.1% 63.0% 1.3% 59.9% 1.2% 61.5%
10 1.4% 64.3% 1.4% 63.6% 1.5% 63.6%
11 1.3% 63.3% 1.3% 62.3% 1.5% 62.8%
Table 5: Evaluation results for interpolation rates of 50, 100 and 200 samples per second and asegment size of 10000 ms.
similar to the ones when combining BFCC with the best performing statistical features,
but feature set 7 remains the best one.
For the seven best performing features sets (set 5 to 11), we evaluated the influence of the
segment size. The overlap of the segments is set to 50%, as before. Table 4 gives the results
for the new segment lengths 5,000 and 10,000, and the previously used length of 7,500 ms.
One can see that the segment length of 10,000 performs best. No further segment lengths
were evaluated as the length is limited by the duration of one walk. 10,000 ms is the
maximal segment length to assure that at least three segments can be extracted from each
walk such that enough testing data is available.
For the same feature sets, the interpolation frequency was varied from 100 to 50 and 200
samples per second. The results are given in table 5. The results of frequency 100 and 200
are nearly the same and slightly better than the ones of frequency 50. The best result is a
FNMR of 59.9% at a FMR of 1.3% obtained when using feature set 9, a segment size of
10,000 ms and an interpolation rate of 100 samples per second.
62

Figure 3: Quorum voting scheme
5 Introduction of Voting Scheme
With the yielded recognition performance it is very likely that a genuine is incorrectly
rejected. An imposter on the other side is rarely mis-classified and thus seldom falsely
accepted. A post-processing approach that reduces the number of false rejects is to use
multiple classifications for one recognition decision while incorporating a different confi-
dence in the classification correctness.
More specifically one uses #V segments of a probe gait signal instead of only one segment
for the recognition. For each segment the classification is carried out as usually. Then, the
#V results are combined. An imaginable straightforward approach is majority voting, but
it is not likely to perform well as there is such a large difference between the two error
rates. Therefore a quorum voting for a genuine is implemented, which is inspired by a
petition quorum.
This quorum requires that at least #GV positive classification results are obtained for an
accept, otherwise the probe signal is rejected. The described concept is visualized in figure
3. Note that #Vg is the number of results that classify the respective segment as stemming
from the genuine, in other words #Vg is the number of votes for genuine.
Of course, while the FNMR is decreased by this approach the number of false accepts and
thus the FMR increases. We conducted a series of experiments with the intention to find a
balanced setting where both error rates are in the same range.
6 Voting Results
The voting results presented in table 6 are reported separated by three experiment setups:
Cross-day Data of the first session is used for training, data from the second session is
used for testing (as in preliminary evaluation)
63

Same-day Half of the data of one session is used for training, the other half from the
same session is used for testing
Mixed Half of the data from both sessions is used for training, the other half of the
data from both sessions is used for testing
Cross-day Same-day Mixed
Set FMR FNMR FMR FNMR FMR FNMR
5 4.7% 35.4% 0.3% 29.2% 3.6% 4.2%
6 4.1% 37.5% 0.5% 14.6% 2.6% 4.2%
7 4.1% 37.5% 0.3% 14.6% 4.6% 4.2%
8 3.2% 37.5% 1.0% 10.4% 4.0% 4.2%
9 5.0% 25.0% 1.0% 16.7% 5.9% 6.3%
10 4.9% 27.1% 1.3% 20.8% 7.0% 6.3%
11 4.7% 25.0% 0.8% 20.8% 6.8% 6.3%
Table 6: Gait recognition performance (with voting)
Various settings were evaluated to identify the optimal combination of votes #V and gen-
uine votes #GV . Best results have been obtained when using #GV = 1 and the maximal
amount of segments for #V . For the cross-day and mixed setting this results in #V = 6,
whereas for the same-day setting #V was only 3 because of the reduced amount of data
available.
The reason for analysing the three different setups is to get an impression of the impact of
time on the recognition results. The most relevant setup for a practical application is the
cross-day performance, as in general the enrolment will take place on a different day than
the authentication. We consider feature set 9 as the best setting, as it performed well in all
evaluations and provides one of the best cross-day performances of 5.0% FMR and 25.0%
FNMR. One can see that the error rates greatly decrease when no separation between the
days of collection is made. For the mixed-day setup we obtained a FNMR of 6.3% at a
FMR of 5.9% which shows the suitability of SVMs for classification of gait data. The
difference to the same-day scenario indicates that having a larger training database with a
greater intra-class variability results in better trained SVMs and hence in better recognition
rates.
The mixed-day results can be compared to some extend to our previous results using the
same database. Unfortunately the partition into training and testing data has not been the
same in the three evaluations. In [DNBB10] a cycle extraction method was applied to
the data. Reference cycles were extracted from the first walk collected on the first day,
probe cycles were extracted from the remaining three walks. In this mixed-day scenario
we obtained an equal error rate (EER) of 20.1%, which is much higher than the SVM
results obtained in this paper. The second evaluation on that database used Hidden Markov
Models for classification [NBRM11]. All data from the first session and parts of the second
session were used for training, the remaining parts of the second session were used for
testing. This resulted in an EER of approximately 10%. These results underline the great
64

performance of the SVMs for classification of biometric gait data. Nevertheless, a fair
comparison of the stated methods is necessary.
7 Conclusion and Future Work
Biometric gait recognition using wearable sensors like accelerometers is a young research
area with promising future applications. It offers the unique advantage of a truly unobtru-
sive capturing of a biometric characteristic and is especially interesting for mobile devices
that nowadays are sold with a suitable sensor already embedded.
With future applications in mind the experiments in this study carefully distinguish be-
tween the recognition performance on the same day and the recognition performance
cross-days. That this distinction is necessary becomes obvious by the good results with
mixed and same-day tests compared to a rather weak performance of cross-day tests. Un-
fortunately this has not been sufficiently addressed in most of the other gait recognition
studies using wearable sensors. Therefore it is questionable if the reported performances
were capable of providing a good cross-day performance.
In regard to the work carried out for this study the next task will be the porting of the
developed program to the Android platform. One limitation of the current approach is that
the training of the SVM requires feature vector instances of imposters which implies that a
complete product would need to ship with a database with the feature instances. Although
this is not impractical, from a privacy point of view it would be preferable to have a pre-
trained SVM that is only further trained with the instances of the genuine user during
enrolment. Therefore incremental SVM learning approaches (e.g. [WZC08]) should be
evaluated as well. I addition, a practical solution should incorporate activity recognition
to use only walking data for classification.
In future we will analyze the performance of SVMs on a larger database, allowing a better
training of the classifier. Another open question is whether the training of the SVMs
can yield a better generalization in terms of a tolerance against inter-day gait variability
when data from several days is used for training. To answer this question a multi-day gait
database is needed. Preferably this database will also contain different walking conditions
(shoes, underground etc.) to analyse their influence on the recognition performance. In
addition, we will focus on a fair comparison of the performance of SVMs, HMMs and
cycle extraction methods.
8 Acknowledgments
This work was kindly supported by CASED (www.cased.de). The authors thank the nu-
merous volunteers that participated in the gait data collection.
65

References
[ALM+05] H.J. Ailisto, M. Lindholm, J. Mantyjarvi, E. Vildjiounaite, and S.-M. Makela. Iden-tifying people from gait pattern with accelerometers. In A. K. Jain and N. K. Ratha,editors, Biometric Technology for Human Identification II, volume 5779, pages 7–14.SPIE, 2005.
[CJ10] R. Cellan-Jones. Government calls for action on mobile phone crime. BBC News,February 2010. Online; http://news.bbc.co.uk/2/hi/technology/8509299.stm; last ac-cessed 30th May 2011.
[CL01] C.-C. Chang and C.-J. Lin. LIBSVM: a library for support vector machines, 2001.Software available at http://www.csie.ntu.edu.tw/ cjlin/libsvm.
[DNBB10] M.O. Derawi, C. Nickel, P. Bours, and C. Busch. Unobtrusive User-Authentication onMobile Phones using Biometric Gait Recognition. In Proceedings of the Sixth Interna-tional Conference on Intelligent Information Hiding and Multimedia Signal Processing,2010.
[FMP10] J. Frank, S. Mannor, and D. Precup. Activity and Gait Recognition with Time-DelayEmbeddings. In Proceedings of the Twenty-Fourth AAAI Conference on Artificial Intel-ligence, 2010.
[Gaf07] D. Gafurov. A Survey of Biometric Gait Recognition: Approaches, Security and Chal-lenges. In Proceedings of Annual Norwegian Computer Science Conference, 2007.
[Gaf08] D. Gafurov. Performance and security analysis of gait-based user authentication. PhDthesis, Faculty of Mathematics and Natural Sciences, University of Oslo, 2008.
[GFK05] T. Ganchev, N. Fakotakis, and G. Kokkinakis. Comparative evaluation of variousMFCC implementations on the speaker verification task. In Proceedings of the In-ternational Conference on Speech and Computer, 2005.
[HCL03] C. W. Hsu, C. C. Chang, and C. J. Lin. A practical guide to support vector classification.Department of Computer Science, National Taiwan University, Taipei, Taiwan, 2003.
[KWM10] J. R. Kwapisz, G. M. Weiss, and S. A. Moore. Cell Phone-Based Biometric Identi-fication. In Proceedings of the IEEE Fourth International Conference on Biometrics:Theory, Applications and Systems, 2010.
[NBRM11] C. Nickel, C. Busch, S. Rangarajan, and M. Mobius. Using Hidden Markov Models forAccelerometer-Based Biometric Gait Recognition. In 7th International Colloquium onSignal Processing & Its Applications, 2011.
[RJ93] L. Rabiner and B.-H. Juang. Fundamentals of speech recognition. Prentice-Hall, Inc.,Upper Saddle River, NJ, USA, 1993.
[SZ09] S. Sprager and D. Zazula. A cumulant-based method for gait identification usingaccelerometer data with principal component analysis and support vector machine.WSEAS Transactions on Signal Processing, 2009.
[Vap82] V. Vapnik. Estimation of Dependences Based on Empirical Data: Springer Series inStatistics (Springer Series in Statistics). Springer-Verlag New York, Inc., Secaucus, NJ,USA, 1982.
[WZC08] Y. Wang, F. Zhang, and L. Chen. An Approach to Incremental SVM Learning Algo-rithm. In ISECS International Colloquium on Computing, Communication, Control,and Management, 2008.
66

Transformative Biometrics and the exercise of arbitrarypower
Juliet Lodge
Jean Monnet European Centre of Excellence, University of Leeds (UK)1
& member of the ohu global internet governance of the internet co:llaboratory, Berlin
Abstract: This paper argues that biometrics have been re-framed in ways that de-
couple them from the discourse of balancing liberty and security with profound
implications for the exercise of democratically legitimated power at a time when
the transformative impact of ICTs on governance and society is obscured by the
pace of change and accelerating mobile forensic applications and policy intent. It
questions the framing of biometrics and the adequacy of law to combat the
negative impact on society in the absence of EU governance and an independent
EU certified quality standards agency for biometrics and associated training.
1 Introduction
Mobile phone biometric security products and services, and the reliability of multi-
biometrics and multi-factor authentication are expected to grow exponentially over the
next few years. Smart borders, registered traveller programmes, entry-exit logging,
mobile e-transactions and rising user acceptance of dual-use biometrics show that
within under ten years, biometrics have been re-framed in ways that de-couple them
from the discourses of balancing liberty and security and those of safeguarding the
public from potentially harmful technological innovations by respecting the
precautionary principle to minimise risk. This has profound implications for both the
exercise of and trust in democratically legitimated power and what it means to be a
person with a right to private life. The transformative power of new and soft biometrics
on the scope and legitimacy of politico-legal authority and innovation governance has
socio-ethical implications for society as well as for individuals. These go beyond
questions of how biometrics might be legitimately used, who owns them, who might be
entitled to enrol and collect them, to how eIDs might help the state fulfil some of its
tasks and how, under what conditions and subject to what quality standards and whose
legal rules the private sector, or public-private partnerships(PPPs) might deliver services
for government and for individuals, or might splice, commodify and commercialise data
1 f7p BEST project, and f7p ICTETHICS 230368.Thanks to anonymous reviewers for helpful comments.
67

containing hard and soft biometrics. Soft biometrics allow, and are part of, the
commodification of the person, of his digital identity, of government and of society, and
the de-privatisation of personal space and data. This is not synonymous with the end of
secrecy, progressive openness or with legitimation. But the way ‘biometrics’ enter into
policy rationales begs questions about their role and impact, especially given the lack of
EU quality tests, standards and certification. Should there be a limit to the legitimate
deployment of biometrics? The first part of this paper explores some of the claims as to
the advantages eID-enabled automated decisionmaking are expected to deliver in
scalable, inter-operable applications. The second considers the tension between the
technical holy grail of inter-operability and the reality of enhanced discriminatory social
sorting and privacy invasiveness; and the third offers a reality check as to the
implications for innovation in governance mediated by biometric apps.
2 Framing and Shaming biometrics: the hard sell of claimsmaking
Public sector bodies, especially governments, have found the hard sell of biometric
applications irresistible as means of overcoming some contemporary problems facing
bureaucracies across the world. The socio-economic framing of the hard sell has been
persuasive. Scalable biometric applications to permit automated decisionmaking, enable
efficiency gains through time and personnel saving, facilitate data pooling, linkage and
information sharing, and boost accuracy and trust in the reliability of identity were
compelling reasons for embracing ‘biometrics’ - however vaguely the term ‘biometrics’
was defined. For citizens, the prospect of a paper-less inter-operable means of
undertaking all manner of transactions when, where and wherever they choose has
proved equally attractive. For both, the primary obstacles to deployment have been
framed in terms of technical feasibility, sufficiently robust security architectures and
cost; and the primary obstacles to wide-scale adoption in terms of ensuring compliance
with legal regulations regarding data protection and data privacy, and trust in the systems
and data handling.
2.1 Framing biometrics
The media, vested interests and public authorities have presented, framed and mixed up
biometrics in much wider discourses about the added-value to public administrations that
ICT enables, notably in respect of identity management. They imply that enrolment is a
one-off process to establish a unique credential that is unvarying over time even though
it is not. User acceptance of biometrics was countered by framing automated identity
management in terms of personal convenience gains to combat the association between
biometrics and criminalisation of individuals as suspects, given the history of biometrics
for forensic purposes (notably detecting and verifying criminals, and profiling). This
created exaggerated expectations of accuracy and reliability among the public when
theft, fraud and data linkage to create fake identities showed that systems were far more
vulnerable than the hype suggested. Capurro (2009:1) argues that historically the Internet
68

moved from being an apparently autonomous sphere independent of the real life of the
people to the very heart of political, economic and cultural life. The same may be said of
biometrics.
2.2 Shaming biometrics
The definition of what constitutes a biometric has serious and extensive implications for
society and for public policymaking. During the past decade, two broad definitions
typified a European and an Atlantic (USA) perspective. For the EU, a biometric was a
distinct digitised symbol that could be linked to a distinct, real ‘whole’ person. This
‘hard’ biometric was presented to the public as if it were an infallible 1:1 match of a
digitised trait, such as a fingerprint, iris or voice print. From this followed the idea that
biometric applications were primarily designed to verify and authenticate the
genuineness of the match between an individual and the ‘biometric’ : in practice on a
one-to-many basis within e-identity management schemes. For US policymakers, a
‘biometric’ was any characteristic that could be observed (such as on cctv) and linked to
an individual. Digitisation assisted in the roll-out, linkage and exchange of such
information, but the biometric per se was not simply a fingerprint, or associated digitised
token. It included ‘behaviour’, associated biological data, (such as DNA, temperature, x-
rays, MRI and body scans etc) and inferences from a given person’s activities. From the
outset, the US linked ‘biometrics’ to data that would be captured and analysed for
forensic and other – may be still to be defined – purposes. Such ‘information’ in the EU
normally was associated with intelligence gathering, including profiling. So the EU had
an implicit purpose limitation focus that contextualised responsibility and accountability
for deriving information, data and biometrics that did not accord with US practice.
The subsequent more general acceptance of the transition from defining biometrics as a
digitised representation of one or two physical characteristics of an individual
(fingerprint, iris scan, palm, voice or vein print, gait) to a definition that includes
behavioural characteristics (incorporated in multimodal soft biometrics) marks a shift in
the technical capabilities and ambition of those developing and selling multi-modal,
scalable, inter-operable applications, as well as in the impact on the nature and scope of
public-private governance. It also reflects a tendency to allow the US government’s
definition of biometrics (that includes behaviour) to trump the EU definition which
focused on a measurable physical attribute of a person rather than on the purposes to
which linkable, biometric data could be put. The shift marked therefore, an erosion of
the pre-cautionary principle, and those of purpose limitation, data specification and data
minimisation traditionally put forward where innovation may incur risk. The potentially
risky impact of biometric applications on individuals and society seems initially to have
been neglected by those grasping them as a panacea for managing modern government.
Little attention has been paid to establishing quality standards and regimes against which
risk and liabilities could be measured and appropriate assessments made as to their
acceptability or otherwise : the EU regulation on passports elicited governments’ interest
in creating centralised biometric databases but not in any EU test databases to set and
provide quality standards and assurances on using different biometric applications.
69

The roll-out of the first generation of biometric passports for territorial border controls
encountered differing levels of largely elite-led controversy and sometimes opposition.
A shaming discourse developed around ethical issues as legislators focused on the scope
and enforceability of existing requirements of compliance with data protection law and
privacy rights, primarily by public authorities. Even the identity-card phobic British and
opponents of body-scanners missed the point about the need for clarity over who could
collate, handle, splice, sell, create and own data potentially containing ‘biometric
information’ broadly defined. Instead, procedural aspects of data handling dominated
while EU quality assurances for technical standard verification were neglected
somewhat. The focus was on: the adequacy of existing data protection rules; robust data
handling and processing architectures; reliability; peer review audit trails; legal redress
against data degradation, fraud, loss, theft; and legal responsibility in the case of out-
sourcing data processing, storage, and handling to private sector companies in third
states (e.g. outside the EU). Later, the issue of individual explicit consent-giving to data
handling and sharing was considered as public awareness of spam from advertising
trackers grew. Yet, the ability to exercise informed consent, a laudable principle derived
from medical ethics, is context and ability dependant. Attempts to use technology to
make its impact more neutral, and to preserve privacy by removing the need for explicit
consent inspired privacy enhancing technology and privacy by design. For example, the
Turbine project developed algorithms to prevent identification without consent: a
fingerprint had to be stored encrypted, and could only be verified when the owner was
present and provided a smartcard and a pincode, thereby putting any system reliant on
biometric identifiers under individual control.
The shaming discourse allowed biometrics to be presented as the problem and deflect
attention from the real problem of how their use permitted linking a person to other
genuine, created or inferred information2. Issues of who owns biometrics, how they
(ab)used them, and how they rely on and deploy them, who has a right to interpret data
(including the ‘soft’ biometric) and in what context deeply affects our understanding of
personal space, legitimate intrusion and collective security. Fuzziness over the concept
of a biometric allowed its conflation with far wider concern over the impact of ICTs on
individuals and society, their role in enabling dataveillance, and commercialisation of
and subsequent ownership, processing and handling of, personal data. Typically,
questions were raised over:
• Access to and usability of ICTs where a biometric was essential to verify or
authenticate the user’s identity in order to validate his access to a given service.
• The cost of initial and subsequent enrolments.
• Social sorting, discrimination, impact on human dignity and the implications for
the disabled, those with mental health problems, children, the elderly.
• (ab)Use of intelligent environments.
• Cost, usability and adequacy of legal redress.
2 Article 29 Data Protection Working Party, Opinion 4/2007 on the concept of personal data, 0128/07/EN/ WP
136. Brussels 20 June 2007.
70

• Difficulties of proving authentic identity and legitimate right to claim it in the
event of error, fakes, fraud, the loss or theft of a biometric eID.
• Ubiquitous multiple eIDs linked to biometric eIDs for purposes other than
territorial border control.
• Commercialisation of citizens (e.g. tracking online transactions and behaviour).
Further issues reinforced civil liberty arguments that the security that ‘biometrics’
allegedly facilitated was neither credible nor altogether legitimate, controllable, desirable
or necessary. This shaming discourse shifted attention from technological quality and
trust to potential or actual negative experiences when seeking to enrol or use a biometric
or to challenge their deployment or adoption. These included: the cost to the individual
of supplying biometrics (e.g. fingerprints for passports: consular office bottle-necks for
families); automated discrimination; generalised social sorting for (il)legitimate
purposes; and the prospect of a surveillance society being coupled with a dataveillance
society. Biometric e-ID enabled inter-operability remained elusive but civil liberty
groups saw the prospect of biometric applications facilitating a surveillance society and
honed in on how their ‘security uses’(e.g. to combat terrorism and international
organised crime) exacerbated societal divisions. For example, the speed gains of
automated biometric gates (such as the Privium iris recognition at Schiphol airport) was
seen as benefitting corporations, the rich, the able-bodied and those within the preferred
18-45 age group in terms of the reliability of their biometrics. Public awareness of the
insufficiency of existing laws grew as biometrics were enrolled for general purposes
(library books, school registers, RFID implants (as in Barcelona bars to pay for drinks),
and as more casual breaches of data protection by public bodies rose. Capacity to prove
who you claimed to be and the ability of government to protect the genuine identity,
safety and security of an individual citizen were doubted. Online fraud and crime seemed
to enhance transactional risks to honest citizens who had been obliged to identify
themselves by providing a fingerprint - an activity associated with criminal suspects.
Many of the claims as to the beneficial and therapeutic effects of hard biometrics for all
manner of transactions were eroded in the public mind, a situation that could have been
worsened had there been more awareness of quality concerns and technical weaknesses.
The credibility of the shaming discourse arose from the uncritical acceptance of
biometric identity management for diverse purposes, and from conflating understanding
of what constituted a biometric with two things: (i) surveillance and dataveillance of all
types by private individuals, private and public agencies (including cctvs; cookies; social
networking behaviour; google earth; street-view, and Facebook tagging; the fusion of the
real and virtual world; risky intrusive hack-tracking in virtual gaming, the fusion of real
and virtual identities and worlds, robotic interfaces and ambient intelligence, ubiquitous
computing and advergames); and (ii) securitisation of the domestic and private spaces by
accepting a definition of a ‘biometric’ to include ‘behaviour’ in the name of security.
The socio-ethical implications of adopting a behavioural definition of biometrics marked
a paradigm shift in the relationship between the state and the citizen. The state could no
longer uphold the classical claim to provide safety and security in return for loyalty. The
71

‘bodification’ of identity (Aas) whereby a person’s ‘marker’ or digitised representation
was used as a short-cut to define, profile, suspect, track and apprehend a physical person
approximating that (possibly fake) digitised token or set of tokens (DNA, fingerprint,
voice pattern and so on) raises serious questions about what it is to be human. A person’s
identity, safety and security are subject to ‘machines’ and non-human automated
‘decisionmakers’ (like entry-exit gates; ATMs; e-card payment systems). These are no
longer solely under the legitimate control of governments and public authorities who can
be held publicly accountable for error. Private sector agencies, or private-public
partnerships handle and process variable quality biometrics, and are responsible for
accuracy and error. The locus of authority and responsibility is often invisible (in the
cloud) or unknowable readily to the citizen (as in the case of sub-contracting through
third party out-sourcing).
The claims made for using biometrics for multiple purposes – or even for the one click
applications proposed by Google and others - pose serious questions over the legitimate
use of power for: the nature of identity; ownership of the self; human-machine
interaction; data protection and privacy; the nature of privacy; the scope of legitimate
intrusion on personal privacy by anyone, anywhere, anytime; the realisability, cost and
credibility of legal redress; privatisation of security (both in the sense of policing and in
the sense of making the individual responsible for their online security and that of their
biometric identity); commodification of individuals; and social division and exclusion.
Multiple eIDs may contain different biometrics. Computer match errors put the onus on
the individual to re-prove their authentic identity, making him ‘guilty’ until he can prove
his ‘innocence’ and allowing authorities to suspend his rights in the meantime.
How and why biometrics are used affects trust in the EU’s values enshrined in the
Charter on Fundamental Rights, the Lisbon treaty and the relevance and enforceability of
EU legislation on data protection and privacy if data handlers and processors escape
public controls, and EU standards on use and behaviour are absent or enforceable
primarily within strict regimes (such as cross-border automated information exchange
for operational reasons – e.g. such as border controls, Schengen, Europol, Eurojust,
Frontex- and so on). The need for biometrics continues to be asserted on realising an EU
space of freedom, security and justice3. While interoperable scalable applications seem
technically and ethically elusive, some states worry about unacceptably high
maintenance and running costs (as in the case of police requests, under the Prum treaty
rules, to certain states’ DNA data bases) and free-rider opportunities for those unable or
unwilling to afford them. Distributive politics in the real world of public policymaking
have eclipsed the need to establish mandatory EU quality standards on biometrics.
2.3 Unethical biometrics?
The idea that biometrics are unethical rests not with the biometric per se but with the use
to which a hard biometric (iris scan) or a soft biometric (behaviour) might be put.
3 Council of the European Union, Presidency Report by the Future Group(Justice), JAI 389, Brussels , 22 July
2008.
72

Policymakers have stretched the definition of what a biometric is to permit them to do
things, in the name of the public good (typically security, safety, efficiency gains etc)
that might the public and legislators might otherwise oppose. Public confidence and trust
in biometrics, in the trustworthiness of public-private partnerships and of private
companies handling personal data, suffer owing to the slack and arbitrary way in which
they have handled personal information, whether it is ‘biometric’ or not. At the same
time, social networking sites’ capacity to mine data, and the ability of individual users to
upload personal information that might be interpreted as biometric data (e.g. behaviour)
has allowed for deeper profiling (by unseen public and private agencies) and eroded
individuals’ ability to retain control over their personal data (e.g. In July 2011, Google
announced the end to private profiles) or realise that they are being ‘watched’, as in the
case (especially of children) in advergames. Under the behaviourally inspired US
definition of a biometric, the data gathered could be considered ‘biometric data’. How it
might be used in future, by whom and for what (il)legitimate purposes, is unknown. EU
law cannot be effective if there is confusion over what a quality, reliable biometric is.
In biometricised society where is the legitimate locus of public authority, and how can it
be made relevant when the transformative impact of technology, applications and
redefinitions of biometrics require the re-thinking of what we mean by identity, trust and
security, and by what it means to be human? It is not the transformative capacity of
technology that raises ethical questions specific to the technology but the way in which
personal information (including biometrics) can be handled and manipulated without the
individual’s knowledge or consent. Public and private space have been reconfigured and
have entirely contingent meanings. Biometric identifiers add a particular frisson to this.
3 Reality Check: biometrics to commercialise and privatise privacy
Advertising and online tracking, whether using biometric ‘keystrokes’ or other
behavioural ‘biometric’ data, are criticised by data protection authorities4
but continue to
grow owing to the linkage of specific biometric information (a facial image) with geo-
locational data (as in speed camera images of car drivers on motorways ), and with social
networking. Such linked information is defined as ‘biometric’ data and used as such for
law enforcement and illegitimate tracking purposes. Obsolete legislation omitting
references to quality standards, ICTs and digital applications allows ill-intended action
to go unchecked, by default. The potential for harm is limitless. For example, after the
British Football Association Cup Final of 14 May 2011, 360Cities.net put a 360 degree
photo of all spectators (including minors) online and claimed global intellectual property
4European Data Protection Supervisor, Calls for respect for safeguards on Online Behavioural advertising ,
press Release, Brussels, 11 July 2011.
73

rights and gave online exclusivity to wembleystadium.com. It allowed over 18s to tag
but not withdraw or amend it. To be removed, a person must notify the company and
provide biometric ‘assurance’ of identity5 (a photo ID, driving licence or passport). By
claiming entitlement over ‘souvenirs’ of an event, a private company was able to
interfere with a person’s ‘right to be forgotten’. While civil liberty guardians assert this,
corporate steps erase private profiles (e.g. Google+ and Mountain View) as social
products are baked-into search and email, social networks and thematic patterns and
ideas to identify clusters for commercial or political exploitation. Online identity trade
growth depends on no concealment of actual identity, and ending personal control over
privacy and self-revelation.
The counterpoint to the commercialisation and privatisation of the right to privacy and to
be forgotten is the arbitrary exercise of power by invisible agencies whose location,
legality and technical quality are unknown or hard to uncover. Power is no longer
visible, transparent or accountable in the public eye. Abuse of an unequal power
relationship therefore endangers both privacy and security, eroding the rationale for
using biometrics in the first place. Those who have supplied hard biometrics and those
whose soft (behavioural) biometric might be inferred from surveillance are now highly
visible. Those (ab)using them are not.
3.1 The right to be forgotten v. Legitimate purpose use
The ‘right to be forgotten’ creates a paradox since history is about memories and
artefacts that are ‘not forgotten’, and in the private space of the family may be valued. In
public space, however, genomic data and other confidential‘biometric’ data allows ‘bad
science’ inferences to be made about individuals, groups and societies that can
undermine privacy and individual security. The transformative capacity of the digital to
embed tracking of the biometric token of a person should elicit deep concern over
conflicts with ethics, and the impact on the EU of not having its own quality standards
and certification. The European Parliament and European Ombudsman supported a
‘right to be forgotten’ in late 2010 when the EU reviewed its data protection legislation
to ensure that data is deleted and not held for longer than necessary to address the
original legitimate purpose for which the data was collected. However laudable the
intention, there are still significant lags and mismatches between the law and technology:
as long ago as 2003, the need to ensure that e-information and e-documents were subject
to EU transparency and openness rules was advocated6.
5 See.www.360geocities.com and [email protected] By Juliet Lodge (2004) and (2006), inter alia. pp.272-3.
74

In 2011 the EU finally accepted the implausibility of separating data and information
handling for judicial cooperation, security and policing purposes from that for e-
commerce and other online transactions. The leitmotifs of proper and legitimate data
handling remain even when invoking distinctions between personal data and personal
information (subject to different handling regulations)7, and balancing ‘confidentiality’
and ‘privacy rights’ against disclosure for legitimate purposes of the state and other
citizens. Purpose limitation and legitimate purpose are context contingent. For example,
the success of operational forensic policing/security purposes may require far longer data
retention, linkage and mining than is foreseen or acceptable to the public. But legitimate
purpose needs to be coupled with quality and certification standards.
The notion of legitimate purpose has been consistently expanded by security derogations
and exceptions that raise serious socio-legal and ethical questions. Biometric, bio-
medical and biopolitical data combinations are growing, and are applied for forensic
purposes as well as commercial transactions, increasingly on mobile phones. DNA,
body-scans, brain scans etc are defined as ‘biometrics’. Such information can be mis-
appropriated and (ab)used by private and public agencies for commercial gain, to invade
privacy, to advance a given public policy goal or for as yet unknowable purposes.
Should the public or public administrations place so much trust in non-standard
biometrics when, apart from impact assessments, non-legislative measures, such as self-
regulation, privacy seals, PETs and privacy by design principles, the only redress to
growing distrust in automated data handling seems to be tighter regulation of data
protection in case scalable inter-operability becomes a reality?
3.2 Biometrics for privatising privacy and compromising the right to be forgotten?
The ‘right to be forgotten’ is highly plausible and attractive to those wanting
transparency for citizens, and personal rights to control and exercise ‘consent’ to the
handling of personal information8. The ‘ right to be forgotten’ is a misnomer and
technically not feasible. The disproportionate use of biometrics derived from or for
mundane purposes - including online gaming data, avatar activity, advergaming and
anything that can be captured as digitised behaviour - enables third party tracking,
market sectorisation and commercialisation of private activity by adults and minors,
intrudes on and shrinks private space, requires individuals to disclose more information
(biometric behaviour) to access any service, including those ostensibly provided by
government; shrinks the public space of government as a consequence of outsourcing
and PPPs; privatises safety (e.g. cctv monitoring of public space); privatises security
(PPPs for policing, and private security firms and military, thereby rendering private
mercenary groups ‘legitimate’ players in implementing public policy); and
commercialises and privatises the supply of privacy to those able to afford the latest
7 See http://www.informationcommissioner.gov.uk8 See the Commission proposal on data protection COM(2010) 609 final at
http://ec.europa.eu/justice/news/consulting_public/0006/com_2010_609_en.pdf
75

ICT advances and applications. The governance of innovative applications of technology
has yet to be developed in ways designed to ensure quality and protect the individual
who has a right to own and amend his personal data. How does this matter?
Biometrics degrade. Their reliability depends on age. Yet a biometric record may
compromise the ability of a person to access their own authentic personal data. The
Passenger Name Record (PNR) rules have been criticised on the grounds of
disproportionality and interference with the right to private life under Article 8 of the
European Convention on Human Rights and Article 7 of the Charter of Fundamental
Rights and Freedoms of the EU. The European Fundamental Rights Agency has insisted
that disproportionate infringement of the right to private life is not allowed ‘even for the
sake of achieving highly desirable outcomes’9. Yet this test is not systematically and
consistently applied to commercial data handling, collection, tracking, mining, re-selling,
splicing and mashing – all of which might appeal to those aiming to exploit inter-
operable scalable applications. Yet PNR is the public sector hook for making biometric
IDs more or less mandatory, ubiquitous and acceptable, especially in Britain. The 2012
London Olympics were to be the occasion for the UK to show its support for the added-
value of the EU’s biometric systems - the Schengen Information System II and Visa
Information System. However, in 2009, the European Parliament deplored the failure of
the contractor to implement state-of-the-art biometric systems. High profile failures,
such as the UK identity card scheme, telemedicine and health personal information
leakages, negatively impact claims to the infallibility and reliability of biometrics against
tampering, fraud and theft, as EU wide polls show.10
Biometrics are valued those seeking to enforce territorial entry-exit controls, and verify
and authenticate identity. But social networking ‘biometrics’ can be misappropriated and
misused. In cyber-space, avatar crime and human fraud are rife. Privacy, security and
safety have been eroded as much by commercially inspired ICT applications as by intent.
Trust and accountability suffer. Not only does the visible locus of traditional political
authority – parliament – seem powerless and irrelevant, but the invisible locus of cyber-
power, seems unknowable, opaque, able to exercise arbitrary power without constraints
against an abuse of its position and so redefine what it is to be an identifiable ‘human’
with legitimate rights and responsibilities in a society lacking borders. Public
accountability comes to be redefined or emptied of meaning. As governments roll out
counter cyber-crime strategies11
, the question remains : have biometric applications for
identity management therefore so eroded the notion of private space enshrined in our
charters of fundamental rights (which accountable public authorities are supposed to be
trusted to uphold) that trust itself is meaningless in a society mediated by ICTs, some of
which rely on biometric applications?
9 European Union Agency for Fundamental Rights (2010)p.7.10 Special Eurobarometer,359 Attitudes on data Protection and Electronic Identity in the EU, June 2011.11 US Department of Defence, Strategy for Operating in Cyberspace, Washington, July 2011.
76

4 Trust and accountability: biometric EU quality regimes and CSR
Making the individual responsible for maintaining privacy, personal data protection and
using data responsibly is unenforceable and socially divisive. Diverse liability and legal
rules and regimes exacerbate discrimination. Commodifying eID management and
privatising privacy protection through private, out-sourced commercial control over the
handling of personal data and personal information means the public has no alternative
to giving personal information to new private and allegedly trustworthy accountable
providers. The ‘corporate social responsibility’ agenda tries to make this ethical.
Google exploited this in its 2011 data collection and mining initiatives permitting the
comparison of financial services to present itself as responsible, and geared to non-
disclosure of personal information. The corporate reality of arbitrary rule-making was
thereby presented as a public good. Recent Eurobarometer findings suggest that contrary
to earlier findings, the public now trust public authorities more than companies to protect
their personal data. Suspicion has risen in tandem with mobile applications12
over private
company intent – whether mining of censoring data, and the accuracy of the claim that
the biometric token is uniquely secure.
Growing public awareness and cynicism over biometrics and their role in facilitating
data linkage by invisible hands, makes the establishment of sustainable robust quality
standards for EU biometric identity management urgent. Identity is not just a biometric
key to access services. How we define our identities and how we interact with each other
as digital beings increasingly dependent on non- human and robotic interfaces in natural,
virtual and personal spaces raises ethical questions. ICT designers may claim that they
bake-in privacy; and legitimate authorities may claim they enforce rules when privacy is
readily breached. Yet the lack of quality guarantees deprives the public of choice when
compelled to provide hard biometric and other digitisable information, such as pseudo
biometrics when tracked online. Do we want a free-for-all to allow the transformative
capacity of ICTs and automated biometric identity management applications (which are
never error-free) free rein in making unregulated, non-standardised, uncertified digi-
tokens of imprecise quality the key to defining who we are for all manner of not always
beneficent purposes? Or should we rethink how their and our capacity for innovation be
captured to design and facilitate ethical standards in EU governance and socio-
commercial biometric applications to avert chaos? An independent EU biometrics
standards, certification and quality agency might be a step to combat the mismatch
between policy goals, content, design and informed strategic action at government,
corporate and technical levels as hierarchical identity engineering undermines the
person’s ability to manage privacy and control his identity.
Bibliography
[Aas06] Aas, K. F.: The Body does not Lie; identity, risk and trust in technoculture‘, Crime,
Media, Culture, 2006; vol.2 (2), pp. 143 -158.
12 Eurobarometer No 359. Apple in July 2011delayed emails and was believed to censor political content.
77

[Aas05] Aas, K. F.: 'Getting ahead of the game': border technologies and the changing space of
governance, In Elia, Zureik & Mark, Salter (ed.), Global Surveillance and Policing:
Borders, security, identity. Willan Publishing, 2005; pp. 194 – 214.
[Bes10] Best Network, Biometrics in Europe: Inventory on politico-legal priorities in EU 27.
Prepared by Lodge J. Brussels, 2010.
[Cap09] Capurro, R.: Constructing (non)human identities, presentation at ICT that makes the
difference. Brussels, November 22-25, 2009. www.ictthatmakesthedifference.eu
Eurobarometer No 359 special survey on Public Attitudes on data protection and
electronic Identity in the European Union, June 2011
[Eur10a] European Commission: A comprehensive approach on personal data protection in the
European Union, COM(2010) 609 final, Brussels, 4.11.2010.
[Eur08] European Parliament: Motion for a resolution on the impact of aviation security
measures and body scanners on human rights, privacy, personal dignity and data
protection, B6-0562/2008, 20 October 2008.
[Eur10b] European Commission: Communication from the Commission to the European
Parliament and the Council on the Use of Security Scanners at EU airports. COM (2010)
311 final, Brussels, 15.6.2010.
[Eur10c] European Union Agency for Fundamental Rights Opinion on the Proposal for a Council
Framework Decision on the use of Passenger Name Record (PNR) data for law
enforcement purposes, 2010.
[Ges06] Gesellschaft fur Informatik, Was ist Informatik?’ Darmstadt: Gesellschaft fur Informatik,
e.V(GI)2006. Retrieved from http://www.gi.de/fileadmin/redaktion/Download/was-ist-
informatik-kurz.pdf
[HG08] Hildebrand, M. and S. Gutwirth (Eds.): Profiling the European Citizen - Cross-
Disciplinary Perspectives, Dordrecht, Springer Netherlands, April 2008; pp. 147-160.
Koops, B.J.: Law, Technology, and Shifting Power Relations, TILT Working Papers.
No. 014/2009
[Lod10] Lodge, J.: Quantum Surveillance and shared secrets: a biometric step too far? CEPS,
Brussels, 2010.
[Log06] Lodge, J.: Transparency, Justice and Territoriality: the EU border challenge.In
(Balzacq,T and Carrera, S. Hrg.) Security versus freedom? Aldershot, Ashgate,2006;
pp.257-78.
[Lod04] Lodge, J.: 'EU homeland security: citizens or suspects?' Journal of European Integration,
2004; vol.26: 3, pp. 253 - 279.
[Lod07] Lodge, J.(Eds.): Are you Who you Say you are? the EU and Biometric Borders.
Nijmegen, Wolf Legal Publishers, 2007.
[PSP08] Papania, L., Shapiro, D. and Peloza, J: Social impact as a measure of fit between firm
activities and stakeholder expectations. In International Journal of Business Governance
and Ethics, 2008; vol.4: 1, pp. 3-16.
[Pri04] Privacy Commissioner of Canada, Organization uses biometrics for authentication
purposes, 2004, CanLII52853(P.C.C.)2004-09-03, http://www.canlii.org/en/ca/pcc/doc/
2004/2004canlii52853/2004/canlii52853.html.
[ZD04] Zwick, D and Dholakia, D.: Whose Identity Is It Anyway? Consumer Representation in
the Age of Database Marketing, In Journal of Macromarketing, 2004, 24: 31-43.
78

Continuous Speaker Verification in Realtime
Max Kunz1, Klaus Kasper², Herbert Reininger1, Manuel Möbius1,
Jonathan Ohms1
1atip GmbH, Daimlerstraße 32, D-60314 Frankfurt am Main2Hochschule Darmstadt, Fachbereich Informatik
{max.kunz, herbert.reininger, manuel.moebius, jonathan.ohms}@atip.de
Abstract: Biometric speaker verification deals with the recognition of voice and
speech features to reliably identify a user and to offer him a comfortable alterna-
tive to knowledge-based authentication methods like passwords. As more and
more personal data is saved on smartphones and other mobile devices, their secu-
rity is in the focus of recent applications. Continuous Speaker Verification during
smartphone phone calls offers a convenient way to improve the protection of these
sensitive data.
This paper describes an approach to realize a system for continuous speaker veri-
fication during an ongoing phone call. The aim of this research was to investigate
the feasibility of such a system by creating a prototype. This prototype shows how
it is possible to use existing technologies for speaker verification and speech rec-
ognition to compute segments of a continuous audio signal in real-time. In line
with experiments, a simulation study was made in which 14 subjects first trained
the system with a freely spoken text and then verified themselves afterwards. Ad-
ditional intruder tests against all other profiles where also simulated.
1. Introduction
The protection of confidential data and the authentication of users to access these data
are recently becoming more and more important. Especially with the growing amount of
offers for different web portals and telephone-based services and the growing number of
mobile devices, personal data tends to be saved in a distributed manner. Mostly, identifi-
cation numbers or passwords are used as authentication method. With growing compu-
ting power and elaborate software to spy on passwords, they have to be longer and more
complex to keep the data safe.
For this reason biometric authentication processes are very promising. They use biome-
tric features like fingerprints, the iris of the eye, the face, the voice or other biometric
features or patterns of behavior for identification. It is presupposed that these features are
unique for a person, even if they are not equally distinctive for everyone.
79

The biometric speaker verification deals with the recognition of voice features to authen-
ticate the user. In common practice the verification is performed with a dedicated voice
application, which explicitly asks the user for certain utterances that were optimally
chosen for speech verification.
An important application for such biometric verification systems is seen in mobile
phones. Usually these devices are only protected by an identification number entered
only at startup. Additional protection against intruders can be provided if voice verifica-
tion is performed concurrent to phone calls. If a speaker cannot be matched to the speech
profile of the authorized user, the device could lock and the user would be asked to enter
his personal identification number once more.
In the investigation described in this paper the application scenario of a continuous real-
time verification is evaluated. The aim is to verify the user during any voice input, for
example during a phone call. During the conversation, a continuous rating of the identity
of the speaker is computed. The text independent verification of freely spoken language
proved to be a particular challenge. In opposite to explicit verification dialogues the
continuous verification system does not know the text of the spoken utterance in ad-
vance.
2. System Configuration
The initial setup for the implementation of the prototype was based on the speech verifi-
cation software VoxGuard created by atip GmbH. The prototype uses VoxGuard for
verification of single audio segments. Therefore the signal of a specific length with a
sample rate of 8 kHz was sampled and quantized with a 16-bit resolution. The features1
that are important for speaker verification were extracted from the audio by means of
spectral analysis. To identify the features, continuous HMMs (Hidden Markov Models)
[1] were used. Every HMM represents a phoneme (the smallest distinctive phone) [2].
Altogether 41 different phoneme models were used. This allowed verification not just of
known passphrases, but also of any possible utterance. To calculate Scores of the fea-
tures with the help of HMMs, the Viterbi algorithm was used and a likelihood that a
series of features build a certain HMM was determined.
Before every verification the single phonemes were individually trained for every sub-
ject. Here, several samples that contain an utterance with the needed phoneme were
recorded. The extracted features were projected onto an initial model. During this, the
free parameters were calculated: the emission probability (as Gaussian density), the
transition probability and the start probability of the HMM. This procedure was repeated
with every training data set, so that the model adopted more and more trained data.
1As feature for the verification, Mel- Cepstrum coefficients were used.
80

While it is still possible to give the speaker a certain text during training (and to tran-
scribe this text in advance into phonemes), it is much more difficult to do so during the
verification of a free text, as the system does not know the utterance before it is spoken.
This problem was solved by using a phoneme recognizer before the verification system.
This recognizer uses speaker independent models to recognize any phoneme well. In
order to recognize an arbitrary sequence of phonemes, a loop grammar was defined.
Inside this grammar, at every time, the occurrence of every phoneme of the inventory is
allowed. In figure 1, the principle of this loop grammar is illustrated.
Figure 1: Loop-Grammar for recognition of phoneme sequences.
At every point in time t the scores for every phoneme model in the inventory is com-
puted. With that, it is possible to build a two-dimensional Viterbi pattern which has
exactly the width of the combined inventory of the phonemes and the length T. T is
defined as the amount of blocks that were created during block-wise computing and the
features that were extracted of them [3]. Then, the most probable path through this pat-
tern is computed with the backtracking algorithm [4]. This path goes backwards along
the states with the best score at any point in time.
With this loop grammar and the speech recognizer it is possible to retrieve the most
probable series of phonemes for an utterance. The recognition rate for single phonemes
is quite low though. It usually reaches only 30-50%, so in most cases the transcription
will not be correct for the spoken utterance. Only an approximation of the voices in the
audio signal to the phonemes is possible.
81

3. Implementation
The prototype of the continuous verification system consists of three modules. In these
steps the aforementioned methods for the speaker recognition and verification are used.
The following illustration shows the processing chain which comprises the speaker rec-
ognition and speaker verification. The basis for continuous verification is the audio seg-
mentation, which cuts the running signal into smaller audio segments for the subsequent
steps.
When the user makes a phone call, the audio signal is permanently recorded by the sys-
tem. For further processing it is split into segments.
Figure 2: Modular setup of the continuous speaker verification
The phonemes contained in the audio segments are determined with the speech recog-
nizer.
In a second step, this sequence of phonemes and the original audio segment is passed to
the speaker verification system VoxGuard. In this module the verification is performed
and a score is computed.
For every segment of the whole audio signal a score is computed. The continuous se-
quence of scores is analyzed and used to make a decision about acceptance or rejection.
82

4. Evaluation
During the evaluation, parameters setting are varied in order to investigate the influence.
The aim is to measure the quality of the verification and the influence of different para-
meter settings to the quality of the verification. A closer look at the verification algo-
rithms or the recognition of the phonemes is not part of this evaluation and will be done
in further investigations.
To estimate the performance of the verification system, a simulation study with 14 sub-
jects was made. In a controlled environment, speech samples of the subjects were rec-
orded. Three different, freely spoken texts were recorded resulting in 3.5 minutes of
audio material per subject.
Using the recordings, the 14 speech profiles of the different subjects were trained. After
that every speaker attempted verification with a text of approximately 1.5 minutes
length. Additionally, each of these 1.5 minute samples was used to simulate an intruder
attack against all 13 profiles of the other users. In this way, 196 verifications could be
simulated and the achieved scores could be logged. From these 196 trials, 14 were from
authorized users and 182 were the intruder attacks, which should lead to a rejection by
the system.
Figure 3 gives an example of the scores of a user whose audio is verified against his own
profile. The other graph shows the score distribution of an intruder who tries to verify
against the same profile. There is an obvious tendency, that the authorized user usually
achieves better values. In the figure can be seen that the scores of the two speakers clear-
ly overlap partially.
Figure 3: Score distribution of two speakers with an audio segment length of two seconds
83

The evaluation showed that the length of the audio segment has a significant influence
on the variance of the scores. Although short segments allow a much higher frequency of
retrieving verification scores for a user, fewer phonemes are included in the audio seg-
ments, which lead to a higher sensibility to variations in the pronunciation or background
noise.
A further possibility to increase the robustness of the system is to use several scores and
not just a single one to make a decision. As the acceptance/rejection decision does not
have to be based on just a single score at any point of time, a time window that includes
recent scores can be considered for the decision. As can be seen in figure 4, the variation
of the score distribution of the aforementioned two speakers can be drastically reduced if
an average over the last 6 scores is taken.
Figure 4: Average score distribution in a time window of 6 scores
The evaluation aims not only to measure the efficiency of the verification and its depen-
dence on the segment length, but also to compare these results with the efficiency by
using different window sizes.
5. Results
To rate the performance of the verification system, the Detection Error Tradeoff method
(DET) was used. The DET graph shows the comparison between the „False Acceptance
Rate“ (FAR) and the „False Rejection Rate“ (FRR). In this graph you can see the possi-
ble error rates independent from any decision threshold.
The following graph shows the comparison between the efficiency of the verification
system and different audio segment lengths. Audio segments with lengths from 1 to 4
seconds were investigated.
84

Figure 5: Comparison of rates achieved with different segment lengths
The DET graphs demonstrate that with a larger segment length a higher verification
performance is achieved. Additionally, one can remark, that with a length of 2 seconds
no significant improvements can be seen. Larger audio segment lengths achieve only a
very little increase of the verification performance.
The last figure shows that the performance of the acceptance/rejection decision of the
system is dependent on the length of the audio segments. To allow objective evaluation
of system efficiency/performance, a decision strategy based on the average scores is
used by averaging scores within a time window of 12 sec. For example if the segment
length is 4 seconds, three scores are needed for one average value, if the segment length
is two seconds, 6 values are needed to calculate an average score of 12 seconds of
speech. The achieved verification performance can be seen in figure 6.
85

Figure 6: Comparison between the audio segment lengths for an average value of 12 seconds
It becomes obvious from this figure that it is not always an advantage to use a larger
segment length to calculate the average scores. It turned out that with short segment
lengths a similiar verification performance can be achieved as with larger ones.
The last evaluation shows that especially with a segment length of 2 seconds and an
average value over 6 scores extraordinarily good performance can be achieved. Every
two seconds the system calculates a new score and determines the distribution of the
score in the 12-second time windows. In this way, an Equal Error Rate (EER) of 15%
was achieved.
6. Summary and Perspectives
To evaluate on the feasibility of a continuous speaker verification system a prototype
based on existing speech recognition and speaker verification technologies was imple-
mented. This prototype allows to continuously verify a speaker in real-time. The focus of
this research was the evaluation of the system's performance and its connection to vary-
ing parameter settings.
86

With the prototype and its evaluation it could be shown that the continuous verification
of utterances with arbitrary content is feasible with existing speech recognizers and veri-
fication algorithms. Further, two parameters, segment length and frame size, were inves-
tigated. During this, some advantages of a continuous verification system became ob-
vious: The system does not have to determine a decision about acceptance or rejection
based on a single score but is able to use a score distribution over a certain time window.
This way, it achieves additional robustness against intermittent bad scores as they hap-
pen in periods of loud background noises or differences in the speakers pronunciation.
In a further investigation the phoneme inventory will be optimized for verification. In
opposite to a verification of a single passphrase, free spoken speech contains additional
variations like e.g. the intake of breath before new sentences or longer breaks between
sentences and single words. These variations can be recognized and eliminated for the
following computation with help of the preceding speech recognizer. Additionally the
phoneme inventory can be investigated as to whether certain phonemes are particularly
well-suited for certain speakers so that the model inventory can be adapted to the speak-
er.
Bibliography
[1] B.H. Juang, L.R. Rabiner. Hidden Markov Models for Speech Recognition. Technometrics.
1991, Aug.
[2] Lyon, John. Einführung in die moderne Linguistik. s.l.: C.H. Beck. Bd. 8.
[3] Beat Pfister, Tobias Kaufmann. Sprachverarbeitung - Grundlagen und Methoden der
Sprachsynthese und Spracherkennung. s.l.: Springer, 2008.
[4] John R. Deller, John G. Proakis, John H. L. Hansen. Discrete-Time Processing of Speech
Signals. s.l.: Prentice Hall, 1993.
[5] Fink, Gernot A. Mustererkennung mit Markov-Modellen - Theorie, Praxis,
Anwendungsgebiete. s.l.: Vieweg+Teubner, 2003. Bd. 1.
[6] Wendemuth, Andreas. Grundlagen der stochastischen Sprachverarbeitung. s.l.: Oldenbourg,
2004.
[7] Manfred R. Schroeder, H. W. Strube, H. Quast. Computer Speech - Recognition,
Compression, Synthesis. s.l.: Springer, 2004. Bd. 2.
87


The Glass Maze: Hiding Keys in Spin Glasses
Carlo A. Trugenberger
SwissScientific, chemin Diodati 10, CH-1223 Cologny, Switzerland
Abstract: Key-binding mechanisms allow to use one’s biometric features as a univer-sal digital key without having them ever stored anywhere. Security, ease of use andprivacy concerns are addressed in one stroke. The best known proposal for such amechanism, the Fingerprint Vault, treats biometric data as projections of a polynomialencoding the key. Its security is based on the difficulty of polynomial reconstruction.Here I propose a new key-binding mechanism based on associative pattern recall andmaking use of a totally different security principle, that of the difficulty of energy opti-mization of spin glasses. The idea is to exploit the mixed ferromagnetic and spin glassphase of the Hopfield neural network to encode the key as a local minimum config-uration of the energy functional, ”lost” amidst the exponentially growing number ofvalleys and minima representing the spin glass. The correct fingerprint will be able toretrieve the key by dynamical evolution to the nearest attractor. Other fingerprints willbe driven far away from the key. Known vulnerabilities of the Fingerprint Vault areeliminated by this new security principle.
1 Introduction: Biometric Cryptosystems
Traditional cryptography uses keys to encipher messages. Achieving a high degree of
security with this approach requires that keys are long and random, which makes them
also difficult to memorize, maintain and share. In addition, every service typically wants
to issue its own key, thereby compounding the problem for end customers. Finally, the
authentication process is based on keys and not on users and cannot thus provide a basis
for non-repudiation.
All these problems can be solved by biometric cryptosystems [Ul04], in which cryptog-
raphy and biometrics are combined. Cryptography provides the necessary security, while
biometrics ties this security to a specific user: anatomical traits cannot be lost or forgotten,
are difficult to copy and share, can be used as a unique hub for multiple keys related to
different services and provide non-repudiation. The resulting systems benefit thus from
the strengths of both fields.
In biometric cryptosystems, a cryptographic key is combined with the biometric template
of a user in such a way that the key cannot be revealed without a concomitant successful
biometric authentication. Biometric cryptosystems can operate in one of the following
three modes: key release, key binding or key generation.
In the key release mode, biometric authentication is completely decoupled from the key
89

release mechanism. The biometric template and the key are both stored in a central repos-
itory, but they constitute completely separate entities: the key is released only if and after
the biometric matching is successful. Because of its simplicity this is the most common
approach. Simplicity, however comes at the price of two weaknesses. First, the biometric
template is not secure: template security is a critical issue in biometric systems because
stolen templates cannot be revoked. Secondly, since authentication and key release are
decoupled, it is possible to override the biometric matcher using a Trojan horse program.
In the key binding mode, the key and the template are monolithically bound within a cryp-
tographic framework. It is impossible to decode the key without any knowledge of the
user’s biometric data. An appropriately designed matching algorithm is used to perform
authentication and key release in a single step, thus removing any possibility of Trojan
horse attacks. Since no ”naked” template is ever stored, the privacy issue is also solved.
In the key generation mode, neither the key nor the template are stored in any form. The
key is derived directly from the live biometric data provided by a user.
Though it is easy to implement a biometric cryptosystem in the key release mode, such a
system is not appropriate for high security applications because of its major vulnerabilities.
Biometric cryptosystems that work in the key binding/generation modes are much more
secure but difficult to implement due to large intra-class variations in biometric data.
One of the best studied and well accepted key binding approaches is the Fingerprint
Vault [CKL03], which specializes to fingerprint minutiae the generic Fuzzy Vault scheme
[JS02]. The idea is to encode a key in the coefficients of a given polynomial P , use the
abscissa xi of fingerprint minutiae to generate the set T of points (xi, P (xi)) and add ran-
dom chaff points forming the set F . The union V of T and F constitutes the fingerprint
vault. The principle of the vault is that only the genuine fingerprint will be able to separate
the true set T from the chaff points F and thereby reconstruct the polynomial P , and thus
the key, by suitable error correcting codes.
The Fingerprint Vault makes use only of the position of fingerprint minutiae for the vault
locking set. Intra-class variance is dealt with by computing average minutiae locations
over multiple scans at enrollment and quantizing positions by using pixel coordinates.
Chaff points have to be placed outside regions determined by the statistical variance of
minutiae locations.
The security of the Fuzzy Vault idea is based on the difficulty of polynomial reconstruc-
tion. While the idea is brilliant, it has been claimed [Mi07] that it is vulnerable to brute
force attacks (at least in its original formulation based on the data of one single finger-
print), and to cross-matching, surreptitious key inversion and blended substitution attacks
[SB07]. It is therefore crucial to find also alternative key binding schemes which lack these
vulnerabilities. In this paper I propose such a completely new scheme, which is based on a
totally different security principle, that of the difficulty of optimizing the energy functional
of a spin glass [MPV87].
90

2 Spin Glasses
Spin glasses [MPV87] are networks of spins, i.e. binary variables, with symmetric random
(positive and negative) interactions. They are characterized by an energy function
E = −1
2
∑i&=j
wij sisj , si = ±1 , i, j = 1 . . . N . (1)
The presence of both positive and negative random interactions wij leads to strong frus-
tration. This means that, in any configuration, there are many triplets of spins for which it
is not possible to minimize the energy of all pairwise bonds at the same time. As a conse-
quence, the energy landscape of spin glasses becomes extremely complex, with a number
of local minima growing exponentially with the number N of spins [Ta80, TE80]. Finding
energy minima of a spin glass is a ”hard” computational problem: from the point of view
of complexity theory this problem is NP complete.
Given the exponential number of local minima, the new idea is to hide the key as the
spin configuration corresponding to one specific minimum of the energy landscape of a
spin glass. Finding the exact position of this minimum with no a priori information on
its approximate location is a NP complete problem. All known algorithms to solve this
problem are highly inefficient and require at least super-polynomial, if not exponential,
running time in system size. Typical combinatorial optimization heuristics, such as sim-
ulated annealing, branch and bound or evolutionary techniques cannot help, they require
only polynomial computing resources but they provide only approximate solutions for the
ground state [MPV87, PIM06, Ba91]. While approximate solutions may be sufficient for
engineering problems, they are of no use in the present cryptographic framework. More-
over, the key will typically not correspond to the global minimum of the energy landscape
but only to a local minimum: this excludes also the recently developed quantum adiabatic
optimization techniques [Ka11]. Exhaustive search is essentially the only attack option
and choosing a sufficiently large N should guarantee the cryptographic security of the
model.
Not any spin glass will do, however. If the generic complexity of such systems guarantees
the cryptographic security of hidden keys, it will also prevent the legitimate retrieval of
the key by its owner. The natural retrieval mechanism is a hill-descent dynamics starting
from an initial configuration close enough to the key, a configuration provided by the key
owner, e.g. the position of his fingerprint minutiae. The system should allow the efficient
associative retrieval of the key from a similar (albeit different) configuration while still be
complex enough to render any guessing attempt hopeless. In statistical mechanics terms,
an efficient associative retrieval of information corresponds to a ferromagnetic phase of the
system. Therefore, what is needed is a system with mixed ferromagnetic and spin glass
phases. Fortunately, exactly such a system exists: it is the Hopfield neural network model
of associative memory [MR90]. The new proposal for a key-binding scheme presented
here is based on this model or variants thereof.
91

3 Neural Networks for Associative Memory: the Hopfield Model
Historically, the interest in neural networks [MR90] has been driven by the desire to build
machines capable of performing tasks for which the sequential circuit model of Babbage
and von Neumann are not well suited, like pattern recognition, categorization and gen-
eralization. The Hopfield model is one of the best studied and most successful neural
networks. It was designed to model one particular higher cognitive function of the human
brain, that of associative pattern retrieval or associative memory.
Contrary to traditional computers, which require a lookup table (RAM), biological infor-
mation retrieval is possible on the basis of a partial knowledge of the memory content,
without knowing an exact storage location: noisy or incomplete inputs are permitted.
The Hopfield model consists in an assembly of N binary neurons si, i = 1 . . . N , which
can take the values ±1 representing their firing (+1) and resting (-1) states. The neurons
are fully connected by symmetric synapses with coupling strengths wij = wji (wii = 0).
Depending on the signs of these synaptic strengths, the couplings will be excitatory (> 0)
or inhibitory (< 0). The dynamical evolution of the network state is defined by the random
sequential updating (in time t) of the neurons according to the rule
si(t + 1) = sign (hi(t)) , (2)
hi(t) =∑i &=j
wijsj(t) , (3)
where hi is called the local magnetization.
The synaptic coupling strengths are chosen according to the Hebb rule
wij =1
N
∑µ=1...p
σµi σµj , (4)
where σµi , µ = 1 . . . p are p binary patterns to be memorized. An associative memory
is now defined as a dynamical mechanism that, upon preparing the network in an initial
state s0i retrieves the stored pattern σλi that most closely resembles the presented pattern
s0i , where resemblance is determined by minimizing the Hamming distance, i.e. the total
number of different bits in the two patterns. As emerges clearly from this definition, all
the memory information in a Hopfield neural network is encoded in the synaptic strengths,
which correspond to the spin interactions of the spin glass model above.
It can be easily shown that the dynamical evolution (2) of the Hopfield model satisfies
exactly this requirement for an associative memory. This is because:
• The dynamical evolution (2) minimizes the energy functional (1), i.e. this energy
functional never increases when the network state is updated according to the evo-
lution rule (2). Since the energy functional is bounded by below, this implies that
the network dynamics must eventually reach a stationary point corresponding to a,
possibly local, minimum of the energy functional.
92

• The stored patterns σµi correspond to, possibly local, minima of the energy func-
tional. This implies that the stored patterns are attractors for the network dynamics
(2). An initial pattern will evolve till it overlaps with the closest (in Hamming dis-
tance) stored pattern, after which it will not change anymore.
Actually the second of these statements must be qualified. Indeed, the detailed behavior of
the Hopfield model depends crucially upon the loading factor α = p/N , the ratio between
the number of stored memories and the number of available bits. This is best analyzed in
the thermodynamic limit p → ∞, N → ∞, in which the different regimes can be studied
by statistical mechanics techniques and characterized formally by the values of critical
parameters.
For α < α1crit ≃ 0.051, the system is in a ferromagnetic (F ) phase in which there are
global energy minima corresponding to all stored memories. The former differ from the
original input memories only in a few percent of the total number of bits. Mixing be-
tween patterns leads to spurious local energy minima. These, however are destabilized
at sufficiently high temperatures (see below) and thus an exhaustive search for all stored
memories can be efficiently organized by optimization heuristics such as simulated an-
nealing.
For α > α2crit ≃ 0.138, the system is in a spin glass (SG) phase in which all retrieval
capabilities are lost due to an uncontrolled proliferation of spurious memories.
For α1crit ≃ 0.051 < α < α2crit ≃ 0.138 the system is in a mixed spin glass and ferro-
magnetic phase. There are still minima of sizable overlap with the original memories but
they are now only metastable states. The true ground state is the spin glass, with an expo-
nentially increasing number of minima due to the mixing of original memories. The spin
glass phase is orthogonal to all stored memories. If an input pattern is sufficiently near (in
Hamming distance) to one of the original memories it will be trapped by the corresponding
metastable state and the retrieval procedure is successful. On the other hand, if the input
pattern is not sufficiently close to one of the stored memories, the network is confused and
it will end up in a state very far from all original memories. In this phase, pattern retrieval
is still efficient while it is computationally hard to perform exhaustive searches for all en-
ergy minima. This is exactly the property needed to construct a cryptographically secure
fuzzy key retrieval mechanism.
4 The Glass Maze
The spin glass phase limiting the loading factor of the Hopfield model is its main drawback
as an associative memory model of the human brain, its design application. It is, however
an ideal feature for hiding information : exploiting the disorder limiting the intended scope
of the model to one’s advantage one can turn the Hopfield model into a powerful crypto-
graphic tool. Here is how I propose to do so.
I will henceforth specialize to fingerprints, although the model is applicable, mutatis mu-
tandis also to other biometric traits. Fingerprints [Bo04] can be uniquely characterized
93

by features of their print pattern. One of the most popular such set of features are fin-
gerprint minutiae, of which there are three types : ridge endings, bifurcations and short
ridges. Minutiae are typically characterized by their pixel coordinates (xi, yi) on the two-
dimensional plane and by a direction unit vector ri (or equivalently by an angle φi with
respect to a fixed axe). As in the original Fingerprint Vault [CKL03], I will consider only
minutiae positions as the relevant variables, although the whole model can be easily ex-
tended to include minutiae directions.
Each fingerprint is thus characterized by a variable set of M minutiae points with pixel
coordinates (xi, yi), i = 1 . . . M , on the fingerprint image. The first step in setting up
the model consists in choosing an appropriate quantization of the fingerprint image in
N squares. Each such square will be considered as a neuron in a Hopfield model, and
this neuron takes the value +1 if a minutiae point is contained within the square and −1otherwise. This way, a fingerprint becomes one particular state configuration σfp
i in a
Hopfield model.
Intra-class variance, however, invariably adds noise to minutiae coordinates. When com-
paring multiple scans of the same finger, two types of variability of feature coordinates
can be established : global, rigid transformations due to translations and/or rotations of
the finger (I neglect scale transformations assuming that the same scanner is used for the
enrolling and key release processes) and additional local deformations due to elastic non-
linear deformations. The magnitude of both has been analyzed by [UJ04, UJ06, UPJ05] in
data from the IBM GTDB database, images of 300 X 400 pixels with 500 DPI resolution.
The average coordinate difference of the same features in mated fingerprint pairs due to
global transformations is of about 20 pixels, with values as large as 45 pixels occuring
with non negligible probability 0.09. After fingerprints have been aligned by eliminating
translational and rotational transformations, a residual average coordinate difference of 4
pixels has been detected : this corresponds to the local noise component.
Neither global nor local transformations should pose a problem for the new model if the
quantization is chosen appropriately. Indeed, the key-binding scheme is, by construction,
an associative memory, capable to reconstruct and retrieve also noisy and corrupted inputs.
A certain degree of intra-class variability is automatically tolerated by the associative na-
ture of the Hopfield model. For example, choosing N=256, the horizontal and vertical
pixels are aggregated in 16 groups that, for the IBM GTDB database would contain 19
or 25 pixels each. This is exactly the average variability due to global transformations
[UJ04, UJ06, UPJ05]. The residual average local deformations are well below the dimen-
sion of the quantization window. With such a choice of parameters, it is to be expected
that local deformations are eliminated by the quantization, whereas global deformations
are corrected by the associative pattern recognition. Only experiments, however, can re-
ally decide if an alignment (elimination of global transformations) is needed before the
Hopfield dynamical retrieval for a given quantization window. This can be a standard
alignment procedure or a dynamical alignment. Indeed, contrary to the fingerprint vault,
alignment can be obtained as a self-organizing, dynamical process within the model (see
below).
At enrollment, a fingerprint is assigned to a particular neuron configuration as described
above. The key (for example a 256-bit key) to be bound to this fingerprint is now chosen
94

by modifying randomly a certain number k of components of this fingerprint neuron con-
figuration. Let us call the resulting neuron configuration σkeyi : this is the reference to be
stored for comparison. The Hopfield model realizing the desired key-binding mechanism
is then defined by the interaction parameters:
wij =1
N
∑µ=1...p
σµi σµj , (5)
σ1i = σkey
i , (6)
σµi = random patterns, µ = 2 . . . p . (7)
The total number p of patterns must be chosen in such a way that the loading factor α =p/N satisfies the relation α1crit ≃ 0.051 < α < α2crit ≃ 0.138, so that the addition of
random noise to the key pattern creates a spin glass phase mixed in with the ferromagnetic
recall phase. A loading factor near 0.1 is e.g. a good choice. Notice that the addition
of random noise at this loading factor typically modifies the desired key pattern in a few
percent of its bits [MR90]. The actual key corresponds to this modified pattern and it must
be checked that the original fingerprint pattern still lies in the basin of attraction of the true
key. Otherwhise the number of modified bits k has to be lowered. The synaptic coupling
strengths wij are the data needed by the retrieval algorithm.
When a live fingerprint is presented to the system, its minutiae coordinates are extracted
and matched to a corresponding initial neuron configuration s0i . Starting from this initial
configuration, the network is evolved according to the Hopfield dynamics (2). Under this
evolution, the neuron configuration corresponding to the fingerprint evolves towards one of
the many minima of the Hopfield energy landscape. If the live fingerprint is the correct one,
the fixed point will correspond to the key. If another fingerprint is presented, which differs
enough from the correct one, the evolution will drive the network towards a completely
different energy minimum and the key will not be retrieved.
5 Performance and Security
The False Accept Rate (FAR) and False Reject Rate (FRR) of the proposed system depend
on the two model parameters N and α. Choosing a coarse quantization grid (low N )
will lower the FRR, since the quantization window will tend to encompass all coordinate
variations due to local noise. Lowering N will also increase the FAR, since the probability
that two different fingerprints are matched to very near neuron configurations is enhanced.
Increasing N , on the contrary, will increase the FRR and lower the FAR. Detailed tests
are necessary to establish a Receiver Operating Characteristic (ROC) curve that plots the
genuine accept rate (GAR) against the FAR. This curve can be established by varying Nat fixed loading α.
FAR and FRR are also influenced by the size of the basin of attraction of the key pattern
and this depends on the loading factor α. The larger this size, the more local variations in
the presented fingerprint minutiae features are tolerated, which decreases the FRR. On the
95

other side a larger basin of attraction increases the probability that a genuinely different
fingerprint configuration is evolved to the same key, i.e. it increases the FAR. The average
radius of the basins of attraction can be estimated by statistical mechanics methods [ZC89].
In the thermodynamic limit it depends only on the loading factor α = p/N and permits
approximately 10% of wrong bits in the limit α → 0, while approching zero when α →α2crit ≃ 0.138. Numerical studies in finite size samples of some thousand bits [ZC89,
YD09], however, have revealed considerably larger basins of attraction. The best value of
α for the model has to be established by testing on realistic finite-size samples.
The number N of neurons and the loading factor α determine also the model security
complexity. Two different measures for the model security can be established. The first
is the difficulty of FAR attacks, in which random fingerprints are sequentially submitted
for key release. These are brute force attacks, in which the whole configuration space is
sequentially explored in search of an input that evolves to the key. Relevant for this security
measure is the size of the basins of attraction. A realistic basin of attraction permitting to
retrieve the key with less than 5% different bits in the input, would contain, in our example
N=256, about 2.5 × 10²¹ configurations. The total number of possible configurations is
2256 ≃ 1.16× 1077. Of these not all are realistic fingerprints, though. Taking into account
that typical fingerprints have 20-40 minutiae, one can estimate that the quantization implies
that realistic configurations have a maximum of, say, 35 positive neurons. Of these there
are about 2 × 1043. This gives a probability of about 1.25 × 10⁻²² ≃ 2−73 of retrieving
the key from a random input.
Instead of a blind search through all configuration space, one can try to crack the model
by optimization heuristics that are able to find minima in polynomial time in system size
N . To this end one must explore, on average, all the minima, local and global in the
energy landscape. A second measure of the model security complexity is thus given by
the average number of such minima at a given N . This can be estimated as follows. The
spin glass phase of the Hopfield model is in the same universality class as the Sherrington-
Kirckpatrick model [KS78]. The average number of minima for this spin glass model has
been computed [Ta80, TE80] as exp(0.2×N). While this result is, strictly speaking, valid
only in the thermodynamic limit N → ∞, it can be used as an analytical estimate of the
ground state complexity. In our example N = 256 it would imply 1.7×10²² ≃ 274 minima
in the spin glass phase, a figure remarkably close to the previously computed security
against brute force FAR attacks. Note also that, since the key memory is metastable, all
attack algorithms based on thermal noise would never find the key : after a certain time
spent around the key configuration they would inevitably get confused and driven far away
from it. The security complexities 273 and 274 for a 256-bit key have to be compared with
the security complexity 269 for a 128-bit key of the Fingerprint Vault [CKL03].
A definite advantage of the present model over the Fingerprint Vault is its security against
cross-matching attacks. This arises because, contrary to the Fingerprint Vault [SB07],
different implementations of the glass maze for the same fingerprint do not share any
model data. Disorder is not simply added to fixed data but templates are actually embedded
non-linearly in an energy landscape which is both inaccessible to exhaustive analysis and
chaotic [Par02].
Furthermore, the Glass Maze, contrary to the Fingerprint Vault [SB07], is resistant against
96

surreptitious key inversion attacks. Even if the key is stolen, there are still about 2.5 ×10²¹ (in the example above) configurations in the key basin of attraction that could all
correspond to the original fingerprint template. The probability of guessing the biometric
data from a stolen key is thus negligibly small.
Finally, the Glass Maze is also secure against blended substitution attacks, another weak-
ness of the Fingerprint Vault [SB07]. There is simply no systematic way to insert an at-
tacker’s fingerprint template into the same basin of attraction of a legitimate user without
altering severely the chaotic energy landscape and thus also the key.
I would like to conclude this section by pointing out that the model storage requirement
is also determined by the neuron number N and the loading factor α. Let me compute it
explicitly for the example of a 256-bit key and a loading factor α = 0.1. Each interaction
term wij is a number in the interval [−p, +p] (the factor 1/N is not important here). For
N=256 and α = 0.1 one needs 6 bits to represent such a number. Since there are a total
of 2562 = 65′536 of them in the definition of the corresponding model one obtains a total
storage requirement of around 50 kbyte, without taking into account possible space saving
by compression. This is about 100 times more than the storage requirement for a standard
fingerprint template. Note however, that multiple fingerprints can easily be encoded in
the same network by using their neuron configurations as memories : each fingerprint
configuration will act as noise for all others. In our example N= 256, up to about 25
fingerprints can be encoded, which would give a storage requirement of about 2 kbyte per
fingerprint without sensibly altering the security complexities.
6 Dynamical Alignment
Alignment is the process of elimination of rigid rotations and translations between enrolled
and live fingerprint templates prior to comparison (again I neglect scale transformations
assuming that the same device is used for enrollment and key release). As explained
above, the choice of an appropriate quantization is probably sufficient to eliminate the
need for pre-alignment in the Glass Maze model, since local deformations fall well within
the quantization window and typical rigid, global transformations are compatible with the
natural error-correcting nature of the associative retrieval process.
For small quantization grids, instead, a pre-alignment step is needed and two possibilities
are available. Either one resorts to standard alignment techniques or one exploits the nature
of the model itself. Indeed, contrary to other biometric authentication systems, in which
special alignment techniques are unavoidable, the present model contains in itself a natural
mechanism for dynamically aligning minutiae prior to key search.
In order to explain this mechanism I have to introduce first two generalizations of the
Hopfield model. The first concerns stochastic neurons and is realized by turning the deter-
ministic evolution law (2) into a stochastic law by adding thermal noise :
Prob [si(t + 1) = +1] = f [hi(t)] , (8)
97

where the activation function f is the Fermi function
f(h) =1
1 + exp(−2βh), (9)
and the parameter β plays thus the role of an inverse temperature, β = 1/T . This has
to be understood as a fictitious temperature for the evolution law and not as the physical
temperature at which the network operates. In the limit of zero temperature, β → ∞, the
Fermi function approaches the unit step function and the stochastic neural network goes
over into the original deterministic one.
In a deterministic network, neurons are either permanently active or permanently dormant,
depending on the sign of the local magnetization field h. In a stochastic network, the
neuron activities fluctuate due to thermal noise. Even for positive local magnetization h,
there is a non-vanishing probability that the neuron will flip in the next evolution step :
Prob [si(t + 1) = si(t)] =exp [βhi(t)si(t)]
2 cosh[βhi(t)si(t)], (10)
Prob [si(t + 1) = −si(t)] =exp [−βhi(t)si(t)]
2 cosh[βhi(t)si(t)]. (11)
As a consequence, the network acquires a non-vanishing probability of jumping out of a
local energy minimum.
The second generalization we need consists of non-vanishing thresholds θi in the local
magnetization,
hi(t) =∑i &=j
wijsj(t) + θi , (12)
These play the role of an external magnetic field acting on the spins.
To dynamically align a live fingerprint one must construct an algorithm that matches the
neuron configuration s0i of its minutiae to a configuration as close as possible to the orig-
inal minutiae configuration σfpi of the enrolled fingerprint. I shall assume here that the
same device is used for enrollment and key release, so that scale transformations can be
neglected and the two neuron configurations s0i and σfp
i differ only by global rotations and
translations.
Following an idea of Dotsenko [Do88] I shall consider a stochastic Hopfield model with
thresholds determined by the neuron configuration s0i corresponding to the live fingerprint.
For ease of presentation I shall henceforth change notation and label neurons not by a
sequential integer index i, but rather by the discrete coordinate vectors r of the square
lattice defined by the quantization of the two-dimensional plane of the print, si(t) →s(r, t). The thresholds are thus given by
θ(r, t) = h0 s0(r, t) , (13)
and describe an external magnetic field proportional to the live fingerprint configuration :
the parameter h0 describes the strength of this magnetic field.
98

The idea is to introduce rotations φ(t) and discrete translations a(t) of the square lattice
as dynamical, slow variables and to minimize the energy
E = −1
2
∑r&=r
′
wrr′ s(r)s(r′) −
∑r
h0 s0 ([φ(t)r] + a(t)) s(r) , (14)
of a generalized Hopfield model with external magnetic field with respect to these slow
variables. Here, [. . .] denotes the whole part, so that the arguments of s0 are always discrete
lattice vectors.
To this end one imposes, e.g. periodic boundary conditions on the lattice and one chooses
initial values φ(t = 0) and a(t = 0) for the rigid transformations. Then the stochastic
neurons are thermalized according to the fast dynamics (8). Finally, the slow variables are
evolved according to the standard steepest descent relaxation equations
φ(t + 1) − φ(t) = −λφ ∂E/∂φ + ζ(t) , (15)
a(t + 1) − a(t) = −λa δE/δa + η(t) , (16)
where λφ, λa denote the descent steps, ζ and η are possible ordinary temperature noise
terms and δ denotes finite differences. Then, the whole process is repeated : neurons are
thermalized and the global transformation parameters are changed so that the total energy
is decreased again.
The important point is that, as long as all overlaps
Mµ =1
N
∑r
σµ(r)s0 ([φr] + a) , (17)
with the stored memories are small, Mµ ≪ h0, the external magnetic field in (14) dom-
inates the thermalization dynamics and, as a consequence, the neurons follow rigidly the
external field
< s(r, t) >= tanh(βh0) s0([φ(t)r] + a(t)) , (18)
Therefore, at this stage, the search for the correct pattern is a wandering over neuron
configurations corresponding to rigid transformations of the initial live fingerprint config-
uration: this is what I call dynamical alignment.
Dotsenko [Do88] has shown that, if the following conditions are satisfied:
• For some φ∗ and a∗ the pattern s0 ([φ∗r] + a
∗) has a finite overlap Mkey = O(1)with one of the stored memories, in our case the key configuration, and has no finite
overlaps with any other memory, Mµ = O(1/N2) for µ )= key;
• All stored memories (and the initial fingerprint configuration) have a finite spatial
correlation length Rc, (1/N)∑
rσµ(r)σµ(r + R) ∝ exp(−|R|/Rc) ,
• 1/N < h0 < 1
99

• The temperature T lies in the range 1 > T > Tc with Tc given by the solution of
the transcendental equation Tc/tanh2(h0/Tc) = 1,
then the network will localize efficiently around the configuration σkey, i.e. the steepest
descent will drive the network toward σkey until the overlap Mkey ≃ h0.
Operating the network at a finite temperature T in the range above guarantees that the
evolution does not get trapped around an undesired minimum while still guaranteeing the
convergence toward the key pattern. Since, in this stage, the search is limited to rotations
and translations of the live fingerprint configuration, the result must be very close to the
enrolled fingerprint configuration σfp, the only remaining difference is due to possible
local variability. In any case, this process should guarantee that an initial configuration
corresponding to a correct fingerprint is brought into the basin of attraction of the key. Af-
ter this dynamical alignement, the key can be retrieved by the standard Hopfield dynamics
described previously. In this final step the search takes place over independent variations
of all neurons till Mkey ≃ h0 → Mkey = 1.
7 Conclusion
In conclusion, I have shown how the Hopfield model of associative memory can be used
as an efficient key-binding biometric cryptosystem. Its pattern-retrieving capabilities are
exploited to bind a fingerprint minutiae configuration to a corresponding key configuration
which represents a specific minimum in an energy landscape. The spin glass phase limiting
the original application as a biological information storage model, instead, provides the
disorder and complexity necessary to hide the key configuration in a ”maze” of valleys
and minima so that the resulting cryptosystem is robust against attacks.
Detailed tests are necessary to evaluate the performance and security of this new model
and, in particular, to find optimal parameters for concrete applications.
References
[Ba91] Banzhaf, W.: Finding the Global Minimum of a Low-Dimensional Spin-Glass Model. In(Becker, J. D.; Eisele, I.; Mundemann, F. D. eds.): Parallelism, Learning, Evolution, LecturesNotes in Artificial Intelligence, Springer Verlag, Berlin, 1991.
[Bo04] For a review see: Bolle, R. M.; Connell, J. H.; Pankanti, S.; Ratha N. K.; Senior A. W. :Guide to Biometrics, Springer Verlag, Berlin, 2004.
[CKL03] Clancy, T. C.; Kiyavash, N.; Lin, D. J. : Secure Smartcard-Based Fingerprint Authenti-cation. In: Proceedings of the ACM SIGMM Workshop on Biometric Methods and Applica-tions, 2003, pp. 45-52.
[Do88] Dotsenko, V. S.: Neural Networks: Translation-, Rotation- ans Scale-Invariant PatternRecognition, J. Phys. A: Math. Gen. 21, 1988, p. L783.
100

[JS02] Juels A.; Sudan, M. : A Fuzzy Vault Scheme. In ( Lapidoth, A.; Teletar, E. eds.): Proceedingsof the IEEE International Symposium on Information Theory, 2002, p. 408.
[Ka11] Karimi K.; Dickson N. G.; Hamze F.; Amin M. H. S.; Drew-Brook M.; Chudak F. A.; BunykP. I.; Macready W. G.; Rose G. : Investigating the Performance of an Adiabatic QuantumOptimization Processor, arXiv:1006.4147v4, 2011.
[KS78] Kirkpatrick, S.; Sherrington, D. : Infinite-Ranged Models of Spin Glasses, Phys. Rev. B17,1978, pp. 4384-4403.
[MPV87] For a review see: Mezard, M.; Parisi, G.; Virasoro, M. A. : Spin Glass Theory andBeyond, World Scientific, Singapore,1987.
[Mi07] Mihailescu, P. : The Fuzzy Vault for Fingerprints is Vulnerable to Brute Force Attacks,eprint arXiv:0708.2974.
[MR90] For a review see: Muller, M.; Reinhard, J. : Neural Networks, Springer Verlag, Berlin,1990.
[Par02] For a review see Pardo M. S. : Large Scale Excitations in Disordered Systems, DoctoralThesis, University of Barcelona, 2002.
[PIM06] Percus, A.; Istrate, G.; Moore, C. : Computational Complexity and Statistical Physics,Oxford University Press, Oxford, 2006.
[SB07] Scheirer, W. J.; Boult, T. E. : Cracking Fuzzy Vaults and Biometric Encryption. In: Pro-ceedings of the Biometric Symposium, 2007, pp. 1-6.
[Ta80] Tanaka, F. : Ground-State Properties of the Infinite-Range Model of a Spin Glass, J. Phys.C13, 1980, pp. 1951-1955.
[TE80] Tanaka F.; Edwards, S. F. : Analytic Theory of Ground State Properties of a Spin Glass: I.Ising Spin Glass, J. Phys. F10, 1980, pp. 2769-2778.
[UJ04] Uludag U.; Jain, A. : Fuzzy Vault for Fingerprints. In: Proceedings of the Workshop onBiometrics: Challenges Arising from Theory and Practice, 2004, pp. 13-16.
[UJ06] Uludag U.; Jain, A. : Securing Fingerprint Templates: Fuzzy Vault with Helper Data. In:Proceedings of the IEEE Workshop on Privacy Research in Vision, New York, 2006.
[UPJ05] Uludag, U.; Pankanti S.; Jain, A. : Fuzzy Vault for Fingerprints. In: Proceedings of AVBPA2005 Workshop, Lecture Notes in Computer Science, Springer Verlag, Berlin, 2005, pp. 310-319.
[Ul04] Uludag, U.; Pankanti S.; Prabhakar S.; Jain, A. : Biometric Cryptosystems: Issues andChallenges. In: Proceedings of the IEEE International Workshop, 2004, pp. 948-960.
[YV05] Yang S.; Verbauwhede I. : Automatic Secure Fingerprint Verification System Based onFuzzy Vault Scheme. In: Proceedings of the IEEE International Conference on Acoustics,Speech and Signal Processing, 2005, pp. 609-612.
[YD09] Yasar F.; Dilaver M. : The Systematic Simulation of the Hopfield Model by MulticanonicalAlgorithm, Chinese Journal of Physics 47, 2009, pp. 226-237.
[ZC89] Zagrebnov V. A.; Chyrkov, A. S. : The Little-Hopfield Model: Recurrence Relations forRetrieval Pattern Errors, Sov. Phys. JETP 68, 1989, p. 153.
101


On biometric key generation from handwritten signatures
Dirk Scheuermann, Bastian Wolfgruber, Olaf Henniger
{dirk.scheuermann | olaf.henniger}@sit.fraunhofer.de
Bastian [email protected]
Abstract: This paper investigates the extraction of a reproducible bit string referredto as biometric key from biometric data. This is difficult due to the natural variabil-ity of biometric data. If the biometric-key generation process were sufficiently re-sistant against attacks, a biometric key may be used e.g. as basis for the generation ofapplication-specific user passwords. Handwritten signatures or handwritten signs havebeen chosen because of their high level of user acceptance and because the exchangeof compromised keys is possible by using other phrases to write. The experimentalresults show an insufficient reproducibility of the biometric keys if no auxiliary data isused for smoothing out the natural variability of the presented data.
1 Introduction
Many existing security solutions are based on knowledge-based user authentication using
PINs (Personal Identification Numbers) or passwords. Many users are overwhelmed by the
task of memorizing PINs and passwords for a growing number of applications. “Single
sign-on” systems and password safes provide solutions for the administration of PINs and
passwords. The PasswordSitter [SIT06], for instance, is a kind of password safe; however,
it does not store individual passwords, but computes them each time anew from a master
password, which is not stored either in the system. The users have to memorize strong
master passwords. When they forget or reveal the master passwords, they should renew
the password for every individual application as soon as possible.
Biometric methods may be an alternative to knowledge-based user authentication meth-
ods because biometric characteristics are more strongly bound to a person than PINs and
passwords are and cannot easily be forgotten or passed on to other people, be it intention-
ally or unintentionally. Like PINs and passwords, biometric reference data must be stored
securely and be protected against unauthorized use. However, many users are troubled
by the risks associated with storing biometric reference data in computer systems: Once
compromised, biometric reference data can only a limited number of times be replaced by
new biometric reference data of the same person. Furthermore, biometric data often con-
tain information beyond what is needed for authentication (e.g. information about body
conditions and diseases), which one would like to keep private. This has been shown also
for signature dynamics [HGS06].
Due to the natural variability of biometric data (data captured via a biometric sensor from
the same person are never completely the same), a biometric reference cannot serve as a
103

direct replacement for a password or for a cryptographic key. There exist key regeneration
systems (such as the fuzzy commitment scheme [JW99] or the fuzzy vault scheme [JS02])
where a key is bound with the biometric data of a user and can be regenerated only by
providing matching biometric data from the same user. These methods work with error-
correcting codes to smooth out the differences when the encoded key is bound with slightly
different biometric data belonging to the same user. However, these concepts require the
secure storage of the security-sensitive key in encoded form. A solution without the need
for storing any security-sensitive data on the user’s side would be advantageous.
Biometric data contain highly redundant information. It may be possible to consistently
extract a relatively small number of bits out of the information contained in biometric data.
This paper investigates the extraction of a reproducible bit string (referred to as biometric
key) from biometric data, in particular from handwritten signatures. Theoretical work on
the information content of such biometric keys has already been performed [Pla09].
The remainder of this paper is organized as follows: Section 2 describes the use case
considered. Section 3 lists requirements that the biometric key generation system must
satisfy in order to be useful in this use case. Section 4 describes our specific approach
based on handwritten signatures with all its considered aspects. Section 5 presents some
experimental results obtained with the described approach. Section 6 summarizes the
results and gives an outlook.
2 Use case
The goal is to generate application passwords on demand based on a biometric key and
some other parameters that do not necessarily have to be kept secret. The biometric key
should be generated directly from presented biometric characteristics without comparison
with a stored biometric reference (see Figure 1). If necessary, some auxiliary data may
be used to always reconstruct the same biometric key. The biometric key then serves as
a “master password” from which application-specific passwords are derived using further
data like application names and password rules.
Biometric characteristics
Auxiliary data Biometric key generation
Biometric keyApplication name
Password rules
User name
Password generation
Password
Application
❄
❄
❄
✲
❍❍❥✲
✟✟✯❍❍❥
Figure 1: Block diagram
104

3 Requirements
In order to be useful for the protection of application passwords, a biometric key generation
system should satisfy a couple of requirements. Many of these requirements are related to
the aspect of security. However, there are further requirements, e.g. related to usability, that
have an impact on the choice of biometric method if several biometric methods provide
the same level of security.
Security requirements
• Distinguishability of biometric keys of different persons: The biometric keys gener-
ated from any two persons must be different.
• Reproducibility of the biometric key of the same person: For the same person always
(or at least almost always over a long period of time) the same biometric key must
be computed.
• Resistance against “brute force” attacks: The biometric keys must have sufficient
length to withstand “brute force” attacks (where an attacker systematically tries pos-
sible values one after the other).
• Resistance against spoofing: It must be difficult to fake or imitate the biometric
characteristics e.g. using gummy fingers or handwritten signature forgeries.
• Revocability: Changing the biometric key in case of compromise must be possi-
ble. For instance, in case of biometric key generation from keystroke dynamics
[MRW02] and from voice [MRLW01] revocability is achieved by changing the
typed or spoken password, respectively.
• No storage of sensitive data: The privacy of biometric data may best be protected
when they are not stored at all. Therefore, no biometric data shall be stored. Auxil-
iary data, if stored, shall not allow to reconstruct biometric data.
Further requirements
• Availability of the biometric sensor: The biometric sensor used for capturing the
biometric characteristics should be suitable for integration into devices used for log-
in procedures, i.e. PCs, notebooks, or smart phones.
• Short run time: The biometric key generation algorithm must be fast because users
will not accept much longer processing times than for conventional user authentica-
tion when using biometric key generation.
• Vendor independence: The biometric key generation algorithm should be indepen-
dent of specific vendor solutions, i.e. it should be interoperable with systems offered
by different vendors for capturing and extracting certain types of biometric data.
105

• Scalability: Depending on the targeted applications, different password lengths may
be desired by the user or required by corresponding application policies. The length
of a biometric key will be related to the amount of information contained in the bio-
metric data. Therefore, the size of the biometric data being captured and processed
should be easily scalable by the choice of the user.
4 Biometric key generation approach
4.1 Choice of handwritten signatures/signs
A major advantage of handwritten signatures over other biometric features is their high
level of user acceptance. Handwritten signatures have long been accepted in many places
as a means for authenticating persons. By choosing different signature lengths (e.g. first
name and last name, last name only, paraph, etc.), the length of the biometric key is easily
scalable. In case of compromise, an exchange of the generated biometric key is possible
by using other phrases to write or changing the style of writing.
The field of application of signatures/signs may be large since capture devices cannot
only be connected to PCs, but are already integrated in many devices (e.g. PDAs or tablet
PCs) used for login. Furthermore, there are standardized data formats for signature/sign
time series data [ISO07]. Normalized time series data may either be used directly for
comparison or for deriving further feature data. Altogether, the dynamics of handwritten
signatures/signs seem to be a promising starting point for generating biometric keys.
4.2 General design
As the biometric key generation would be easier to use without auxiliary data, this study
takes up the challenge of generating a biometric key without the use of any auxiliary
data (cf. Figure 1). Related work on biometric key generation, including that related to
handwritten signatures [VSM02, TY09], makes use of auxiliary data.
In general, biometric key generation methods include the following two stages [MRLW01]:
1. Feature extraction: First, a set of features is extracted from presented biometric
characteristics. Such features must be chosen that are sufficiently similar if extracted
from the biometric characteristics of the same user and that are sufficiently different
if extracted from the biometric characteristics of different users.
2. Key generation from the extracted features: Then, a key is generated from the fea-
tures set. Keys generated from sufficiently similar features sets must be identical.
Features of handwritten on-line signatures can be classified into statistical, spatial, tempo-
ral, and spectral features. For this study, different signature features have been tried and
106

compared with respect to their reproducibility. The chosen approach is based on signa-
ture/sign time series data per [ISO07] containing x and y coordinates and time informa-
tion (either time information per sample point or based on a uniform sampling rate). The
availability of pen-up and pen-down information from the capture device is required. This
may be achieved in different ways, e.g. using the optional tip-switch state channel or the
pen-tip force channel or by analysis of technical events such as mouse events.
The signature is first divided into segments in a canonical way by considering different
parts of the signature separated by lifting up the pen. Afterwards, each segment is divided
into more abstract subsegments. These subsegments are classified into four different curve
types. Different considerations how to identify curve types like “line”, “right-hand bend”,
or “left-hand bend” finally lead to a specific algorithm.
4.3 Design details
4.3.1 Signature normalization
The first preprocessing step consists of normalizing the vertical size of the signature/sign
and translating the signature/sign to non-negative x and y coordinates with a minimum
value of 0 (with the aid of the maximum and minimum values of x and y). This means
that the signature/sign is placed into a bounding box just open to the right side to allow
different lengths of signatures/signs (see Figure 2).
Figure 2: Normalization process applied to a signature/sign
4.3.2 Segmentation
The normalized signature/sign is divided into segments with the aid of the pen-up and
pen-down information. An example of a segmented signature/sign is given in Figure 3.
107

Figure 3: Segmentation of a signature/sign
4.3.3 Normalization of individual segments
The segments are individually normalized in preparation for further analysis. For each
segment, the starting point is moved into the origin and the whole segment is rotated such
that the endpoint is located on the positive x axis.
Figure 4: Normalization process applied to segments
This normalization step (illustrated in Figure 4) provides a abstract transformation not pre-
serving the natural signature/sign image. It serves as a preparation for later consideration
of the subsegments as uniquely aligned functional graphs, i.e. the y values as a function of
the x values.
4.3.4 Determination of subsegments
Be Nseg the total number of segments and ns the number of pixels of segment s. We
denote the x and y components of the segments normalized according to Section 4.3.3 by
(xsks , ysks), s = 0, . . . , Nseg − 1, k = 0, . . . , ns − 1.
This more complicated notation is used to clearly distinguish these values from the original
x and y values of the captured signature. We now analyze these data for sequences of
strictly monotonic increasing and monotonic decreasing sequences of x values. For this
purpose, we start from the starting point (xs0s, ys0s) of the whole segment and determine
108

starting points (xsks , ysks) of new subsegments in the following way: Be (xsls, ys
ls) the
starting point of the previously determined subsegment; search for index
k = min{m|(∃(i, l < i ≤ m)(xsis ≥ xsi−1s ) ∧ (∃(i, l < i ≤ m)(xsis ≤ xsi−1
s )}.
This leads to a sequence of subsegments for each segment. Each subsegment consists of
its starting point and the points up to the starting point of the next subsegment.
4.3.5 Analysis and coding of subsegments
In the following, we consider a subsegment that is determined by the steps described in
Section 4.3.4. The procedure for analysis is the same for all subsegments. We denote
the subsegment’s components by (xui, yui), i = 0, . . . , nu − 1 whereby nu denotes the
number of pixels of the subsegment. Furthermore, we introduce the identifiers Usegrs for
subsegment r of segment s and Nus for the number of subsegments of segment s.
The monotony property of the x values inside a subsegment guarantees that for each x
value there only exists one corresponding y value, i.e. there exists a unique function f with
the property yui = f(xui)∀i = 0, . . . , nu − 1. Our goal consists in an approximation of
this function with a preferably simple analytic function whose parameters may be used to
classify the subsegment. Since the subsegments may be expected to be rather small curves,
we use the approximation with quadratic polynomials with minimal average quadratic
distance to the functional values delivered by our subsegments (least square method). This
means that every subsegment gets assigned a polynomial P2(x) = k1 · x2 + k2 · x + k3.
Depending on the functional parameters, i.e. the type of the quadratic function, we classify
the subsegments into four types. It would be self-evident to look for the fundamental
curve types “right curve” and “left curve”. However, these types only depend on the sign
of the quadratic term and completely neglect the two other parameters. Therefore, we
use a classification of the subsegments into more abstract curve types which also takes
into account the linear term. Furthermore, a subsegment with too few pixels cannot be
reasonably represented by a quadratic polynomial. Therefore, we treat subsegments with
less than g pixels as an exceptional case denoted by the type “point”. This leads to the
following coding of the subsegments:
Code(Usegrs) =
1 if |k1| < h (line – very small quadratic part)
2 if k2 < 0 and line condition not satisfied (negative linear part)
3 if k2 ≥ 0 and line condition not satisfied (positive linear part)
4 if nu < g (point – exceptional case)
This way, we have 2 bit information per subsegment available. Additional information
is provided by the numbers of subsegments Nus for each segment s = 0, . . . , Nseg − 1since a given sequence of subsegment codes may be derived from different divisions of
segments. The values of g and h are adjustable thresholds. For the prototype values of
g = 5 and h = 0.002 have been chosen.
109

4.3.6 Additional dynamics features
The derivation method for biometric keys developed within the previous sections pro-
vides features of a human signature as input for biometric key generation. In particular,
the segment and subsegment features are robust against certain variabilities like signature
size, horizontal or vertical alignment or the exact number of sample points. However,
the method only considers static signature features, and the robustness against change of
pixel numbers in particular allows the reconstruction of the biometric key from a printed
signature image.
To enhance the security of the method, it is beneficial to also include some dynamic fea-
tures of the subsegments. For this purpose, we enrich the subsegment information by
velocity information available from the captured x, y, and time values. We now return to
the segment information considered in Section 4.3.2, i.e. the information from the normal-
ized signature/sign image (now together with the corresponding time values that remained
unchanged during the normalization procedure).
As a first step, we assign a speed value vks to each point except the first and last points of
a segment. If the software directly delivers speed values (as an optional part of [ISO07]),
we can take these values and just scale the speed components by the scaling value used for
normalization in Section 4.3.1. Otherwise, we calculate the speed values with the aid of
the time relations to the right and left neighbor points, with duplication of previous speed
value if time difference zero occurs. Therefore, it is reasonable to omit the speed values of
the first and last segment point.
For the next steps, we need the following two auxiliary functions to determine indices of
points inside segments and subsegments where the numbering of points and subsegments
always starts from 0 for each segment:
Lowindex (s, r) = index of first pixel of subsegment r inside segment s
Highindex (s, r) = index of last pixel of subsegment r inside segment s
Since no speed values exist for the first pixel of each first subsegment as well as for the
last pixel of the last subsegment, we define the following additional auxiliary values:
Low(s, r) =
{1 if r = 0
Lowindex (s, r) else
High(s, r) =
{Highindex (s, r)− 1 if r = Nus − 1Highindex (s, r) else
Next, we calculate the average speed value for each subsegment, followed by the maxi-
mum and minimum values of average speeds over the whole signature:
For(s = 0, . . . , Nseg − 1)
For(r = 0, . . . ,Nus − 1){
110

vrs =1
High(s, r)− Low(s, r) + 1·
High(s,r)∑k=Low(s,r)
vks
vmin = min {vrs |s = 0, . . . , Nseg − 1, r = 0, . . . ,Nus − 1}
vmax = max {vrs |s = 0, . . . , Nseg − 1, r = 0, . . . ,Nus − 1}
diff = vmax − vmin
}
According to these minimum and maximum values, the average speeds are now quantified
in the following way:
Quant(vrs) =
1 if vrs < vmin + diff4
2 if vmin + diff4
≤ vrs < vmin + diff2
3 if vmin + diff2
≤ vrs < vmin + 3·diff4
4 if vrs ≥ vmin + 3·diff4
These quantified speed values offer an additional 2 bit code per subsegment. The subseg-
ment codes are not equally distributed, i.e. the perfect entropy of 2 bits per subsegment
is slightly disturbed. However, there is no strong mutual strong dependency between the
speed codes except that a minimum and a maximum value (resulting in speed codes 1
and 4) must occur at least once. Furthermore, none of the curve types tends to be typi-
cally drawn slower or faster than the other ones, i.e. there is also no direct dependence of
the speed codes on the corresponding curve codes. Hence, we now practically have 4 bit
information per subsegment.
The speed codes do not depend on particular speed values of the writer but represent
the writer’s behavior in writing particular parts faster or slower than others. Hence, they
provide robust features against variability in individual speeds.
5 Prototype and experimental results
5.1 Static features
For a first prototype, a Wacom Intuous 3 tablet with a resolution of 5080 lpi was used.
The testing program was designed with the GUI framework QT (V4.7.1) that allows the
operation of the Intous tablet in mouse mode. This way, the separation of pen-up and
pen-down may be recognized with the aid of mouse events.
With this technology combination, the capturing of data points works asynchronously.
Therefore, time values are captured (with the aid of QT standard functions) with a measur-
ing unit of 1 ms. As mentioned in Section 4.3.6, the speed values are calculated according
to the time difference between the left and right neighbor points also under consideration
of exceptional cases with time differences of zero (which really occurred some times in
case of fast movement).
111

It turns out that the algorithm works better for people with the habit to present a very exact
appearance of their handwritten signature and whose signature is more similar to printed
characters than to cursive writing.
For our tests, several series of live data were captured from different persons. The first data
generated more than once was considered as “reference data” to determine the acceptance
rate, i.e. the rate of complete matching of two password data strings. The test persons
could all decide about the type of their signature (e.g. only last name, first name and last
name, without full stop in between, etc.). However, they were instructed to always keep
their writing habits and to present their signature along the horizontal direction of the
tablet. First tests were performed with static features only (before the implementation
and testing of the enlargement with dynamic features). The best results were reached by
a very experienced test person frequently operating signature tablets and also involved
in the initial implementation phase. This person reached an acceptance rate of 18.4%
with a first test series of 30 samples which could be increased to over 50% in the third
test series. For unexperienced persons, it also became obvious that the acceptance rate
increases with further test series. However, the rates were much lower. The best achieved
results consisted in an acceptance rate of 13% within the first test series (30 samples) and
33% within the second test series (33 samples).
5.2 Additional dynamics features
After these first results, the testing program was extended with the dynamic velocity fea-
ture whereby the static curve feature are still visible, i.e. the success for static and dynamic
features can be determined separately. During the tests of this extension with further test
persons, it was confirmed that the method really works with only few experienced persons
since no one could reach again the same rates stated before.
At a later stage, another tablet was integrated into the test program, namely a Wacom STU-
500 tablet. This device only provides a resolution of 2540 lpi, but it is better to handle for
the user in particular due to the direct optical feedback on the tablet itself. The STU-500
tablet cannot be operated in mouse mode with QT. Instead, a special capturing software
needed to be integrated. This software directly delivers signature templates compliant
with [ISO07] containing information about x, y, time, and pressure. Explicit pen-up and
pen-down information (with the aid of the switch-state channel) are not given, but the
separation of segments may be discovered by points with the pressure value 0. A time
channel is also not present, but a unique sampling rate of 200 samples per second is used.
All test users in fact felt more comfortable with this type of tablet, and the signature images
already looked more stable than with Wacom Intuous. However, no more stable results
could be reached for the final biometric keys.
Furthermore, the algorithm was tested with publicly available sample data of the Signa-
ture Verification Competition (SVC) 2004 [YCX+04]. No complete matching of biometric
keys – for static as well as for dynamic features – obtained from SVC files were reached.
The best achieved results were recognition rates of 10% for the static features only. But
112

the resulting curve and speed codes contained some larger matching parts. In total, the cur-
rently implemented version of the biometric key generation algorithm only provided a few
real success cases, otherwise only partially usable results. Therefore, no more reasonable
quantitative results (e.g. ROC curves) may be given at the current state.
6 Conclusions
We discussed a method for deriving characteristic codes of signature/sign segments to
be used as biometric keys. It becomes obvious that an acceptable reproducibility of the
biometric keys may only be achieved for few persons who practised writing their signa-
ture/sign on a tablet for a long time. In addition, a clear and exact signature appearance
is needed. This means that the method will work better for people writing block letters
than for people with joined-up handwriting [Sch11]. This also means that signatures/signs
yielding reproducible biometric keys will be easier to forge.
Considered separately, the dynamics features with velocity codes appear with similar sta-
bility and variability as the static curve codes. The method is not accurate enough to deliver
biometric keys ready to be used for applications. Nevertheless, the test series with cap-
tured live data as well as SVC 2004 data always contained stable, frequently re-occurring
partial number sequences. The investigations have shown the difficulty of directly extract-
ing passwords from biometric data without the storage of helper data. Such methods may
only work under certain ideal conditions and with special experienced people.
Acknowledgements
This work has been part of the Fraunhofer “Challenge” programme for projects with high
risk and high attractiveness in case of success. The authors are very grateful to Ankit Singh
for assistance in coding and testing the biometric key generation algorithm.
References
[HGS06] J. Hofer, C. Gruber, and B. Sick. Biometric analysis of handwriting dynamics using ascript generator model. In IEEE Montain Workshop on Adaptive and Learning Systems,pages 36–41, Logan, UT, USA, 2006.
[ISO07] Information technology – Biometric data interchange formats – Part 7: Signature/signtime series data. International Standard ISO/IEC 19794-7, 2007.
[JS02] A. Juels and M. Sudan. A fuzzy vault scheme. In IEEE International Symposium onInformation Theory, Lausanne, Switzerland, 2002.
[JW99] A. Juels and M. Wattenberg. A fuzzy commitment scheme. In Sixth ACM Conferenceon Computer and Communications Security, Singapore, 1999.
113

[MRLW01] F. Monrose, M.K. Reiter, Q. Li, and S. Wetzel. Cryptographic key generation fromvoice. In IEEE Symposium on Security and Privacy, Oakland, CA, USA, 2001.
[MRW02] F. Monrose, M.K. Reiter, and S. Wetzel. Password hardening based on keystroke dy-namics. International Journal of Information Security, 1(2):69–83, 2002.
[Pla09] R. Plaga. Biometric keys: Suitable use cases and achievable information content. In-ternational Journal of Information Security, 8(6):447–454, 2009.
[Sch11] B. Schneier. Decline in Cursive Writing Leads to Increase in Forgery Risk?http://www.schneier.com/blog/archives/2011/05/decline in curs.html, May 2011.
[SIT06] The PasswordSitter. White paper, Fraunhofer Institute SIT, 2006.
[TY09] A.B.J. Teoh and W.K. Yip. Secure Dynamic Signature-Crypto Key Generation. InL. Wang and X. Geng, editors, Behavioural Biometrics For Human Identification: In-telligent Applications. IGI Global, 2009.
[VSM02] C. Vielhauer, R. Steinmetz, and A. Mayerhofer. Biometric hash based on statistical fea-tures of online signatures. In IEEE International Conference on Pattern Recognition,2002.
[YCX+04] D.-Y. Yeung, H. Chang, Y. Xiong, S. George, R. Kashi, T. Matsumoto, and G. Rigoll.SVC2004: First International Signature Verification Competition. In D. Zhang andA.K. Jain, editors, 1st International Conference on Biometric Authentication, HongKong, China, 2004.
114

Efficient Database Techniques for Identification with Fuzzy
Vault Templates
Christian Bohma, Ines Farberb, Sergej Friesb, Ulrike Kortec, Johannes Merkled,
Annahita Oswalda, Thomas Seidlb, Bianca Wackersreuthera, Peter Wackersreuthera
a LMU Munchen, {boehm|oswald|wackersb|wackersr}@dbs.ifi.lmu.deb RWTH Aachen, {faerber|fries|seidl}@cs.rwth-aachen.de
c BSI Bonn, [email protected] secunet Essen, [email protected]
Abstract: The authentication based on biometric information has several advantagescompared to solely password-based systems, which has led to a growing interest of in-dustry and of public authorities in biometric-based systems. To meet the high securitystandards concerning biometric data, template protection systems such as the fuzzyvault are indispensable to maintain the secrecy of the critical information. Severalpublications have discussed the application of fuzzy vault to fingerprint authentica-tion systems. However, for identification purposes in large databases the fuzzy vaultprotection of the biometric reference data poses severe efficiency challenges.
In this work, we examine and compare the performance of three different ap-proaches to enable the identification based on protected fingerprint minutiae templatesalso for large databases. All three approaches calculate a prioritization of the databaseentries exploiting filtering techniques and indexing structures. Based on this prior-itization a search performing the complex exact comparison of database and querytemplate is steered and thus will faster find a match.
1 Introduction
The need for reliable information security systems is present in all levels of society to
prevent unauthorized system access or information theft. Cryptographic techniques are
widely implemented and current algorithms (e.g. AES and RSA) excel in a very high
proven security [Sta02]. Cryptosystems use one or more encryption keys to transform the
critical information (plain text) into cipher text. Without the correct decrypting keys it is
infeasible to reverse the encryption and convert the cipher text into the original informa-
tion. The weakness of these systems is the underlying assumption that the cryptographic
keys belong exclusively to authorized users. Consequently, the protection of the keys’
secrecy has a very high priority for all cryptosystems. As these keys usually are very com-
plex to be able to guarantee a certain security level, they cannot easily be memorized by
users but are securely stored, i.e., the access is protected by an alternative security system.
Overall, the security of the whole system is only as high as the security guaranteed by
the weakest link, which, usually, is this second, alternative security system. Most popular
are password-based systems. Passwords, however, can be easily lost, forgotten, stolen, or
attacked, which motivates the application of biometrics for authentication purposes.
115

In biometric systems the identity verification is based on a person’s anatomical and behav-
ioral traits. An advantage over password-based authentication is that biometric features
are persistent, personal, and cannot easily be forged. However, these systems require
the storage of biometric reference data, which poses high privacy risks itself. Beside be-
ing personal data, biometric features can potentially reveal additional information, like
health or ethnic aspects of a person [DBHO10, Mor07, Sei06], which are unnecessary for
identity verification. The security of biometric templates is a fortiori crucial since once
being corrupted a biometric trait cannot be revoked or reissued. Biometric cryptosystems
[JNN08, BBGK08] can considerably mitigate these risks by using reference data that do
not reveal significant information on the biometric trait. In case of successful authentica-
tion a key is extracted from or released by the biometric data presented. Hence, no key
needs to be explicitly stored or presented for authentication. Out of the various biomet-
ric template protection systems, the fuzzy vault scheme is a very prominent one [JS02].
What qualifies the fuzzy vault scheme for the construction of biometric cryptosystems, is
the ability to deal with unordered sets, which are commonly encountered in biometrics,
and its error-tolerance, which is necessary because even two samples of the same biomet-
ric trait can differ substantially. Basically, the transformation of a biometric template is
realized through a generation of random artificial attributes, which are interspersed to ob-
fuscate the actual template. Only this transformed template will be stored and, therefore,
a remaining challenge is the matching procedure to identify two corresponding templates.
Several approaches already proposed the application of the fuzzy vault scheme to fin-
gerprint minutiae [UPJ05, NJP07, MNS+10]. These approaches, however, describe the
application for authentication processes, where a claim of the subject’s identity is made
a priori. A naive transfer of these techniques to identification systems will not work ef-
ficiently for large databases, because in addition to an efficient verification process the
number of potentially matching templates needs to be narrowed down significantly. In
[BFF+11] we presented two first approaches for supporting the identification process for
fuzzy vault transformed minutiae sets by efficient database techniques. In the present pa-
per, these approaches are further evaluated along with a third approach. While there are
proposals for biometric identification with encrypted templates (e.g. [BCK09]), to the best
of our knowledge, besides our approaches no efficient algorithms for biometric identifica-
tion with biometric cryptosystems do exist so far. The problem of identification systems in
this setting is the impossibility to rule out any database entry with certainty due to the fuzzy
vault transformation and the intraclass variations of biometric templates. Hence, our goal
is a good prioritization of the present candidate set by utilizing efficient filtering techniques
and indexing structures. The higher the approximated similarity of a protected template
compared to a query is, the higher is the priority assigned to it by these techniques. In this
work we discuss three approaches for efficient prioritization of the protected templates and
evaluate them on the publicly available datasets FVC [MMC+02] and MCYT [OGFAS+].
The rest of the paper is organized as follows. In Section 2 we introduce the underlying
fuzzy vault construction and formalize the problem setting. The description of the different
filtering techniques follows in section 3. In section 4 we describe the databases and their
preprocessing on which the experimental evaluation, presented in section 5, is based on.
Section 6 summarizes our work and gives an outlook for possible future work.
116

2 Background
In this work we examine three approaches to support the efficient identification in large
fingerprint minutiae databases protected through the fuzzy vault system. In the following
we shortly introduce the basic notions for our approaches.
2.1 Fingerprint Feature
The biometric template for our study is a fingerprint’s minutiae set. Minutiae of a fin-
gerprint denote local ridge characteristics, of which the most prominent ones are ridge
endings and ridge bifurcations. Typically minutiae are represented as triplets (x, y, φ),denoting their x- and y-position in the fingerprint image together with the angle φ of the
associated ridges. In the present paper however, we follow the majority of constructions
for the fuzzy fingerprints vault and use only the positions (x, y) of the minutiae. In or-
der to determine the agreement between two fingerprints, the minutiae-based fingerprint
matching basically calculates an alignment between the minutiae sets of two fingers that
results in the maximum number of minutiae pairings. The difficulty here is that even two
samples of the same fingerprint can vary to a very high extent. For example, translation,
rotation, nonlinear distortion of the minutiae, spurious and missing minutiae can lead to
high intraclass variations, which can lead to high false-positive and false-negative rates in
authentication systems.
2.2 Fuzzy Vault
The fuzzy vault is a cryptographic scheme that is perfectly qualified to work with biometric
features as it allows to deal with unordered sets of different cardinalities and moreover it
is error tolerant - a necessary criteria for the mentioned intraclass variances.
Enrollment. To hide a secret K, we use a biometric template X , which is an unordered
set of t (pairwise distinct) attributes (minutiae) m1, · · · ,mt. As secret key a random poly-
nomial p over the finite field Fq with degree k, where k ≤ t ≤ q, is chosen. All attributes
mi ∈ X have to be mapped to an element xi = f(mi) of the field Fq , where f is an
arbitrary injective function from the attribute space to the finite field. The elements xirepresent the supporting points for the chosen polynomial p, which later on will serve
for reconstructing the secret polynomial. Instead of the polynomial, we, therefore, only
store a list of (pairwise distinct) pairs (xi, p(xi)) ∈ F 2q . To conceal the secret-revealing
support points, we intersperse a large number (c) of chaff points (xj , yj) ∈ F 2q , where
t < j ≤ (c+t), ∀1 ≤ i, j ≤ (c+t) : xj ?= xi ⇔ i ?= j, and ∀t < j ≤ (c+t) : yj ?= p(xj)(the chaff points do not lay on the polynomial p). The randomly ordered list of all tuples
(x1, y1), · · · , (xc+t, yc+t) represents the vault, and is added as reference template R to the
database.
Authentication. In order to recover the secret polynomial and, thereby, to verify its iden-
tity, a user has to present another set Q of attributes (query), which then will be compared
117

with the stored reference template R. The set of all pairs in R having a matching attribute
in the query set ({(xi, yi) ∈ R|∃qj ∈ Q.xi = qj}) is used for the reconstruction of the
polynomial using the Reed-Solomon decoding. Only if the template Q shares a sufficient
amount of attributes with the genuine attributes of R, the polynomial reconstruction can
be successful and, thus, the secret K be released.
2.3 Biometric Identification
In the identification process the user does not explicitly claim an identity and the system
recognizes an individual by searching the entire template database for a match to the query
template. Since an application of the authentication process to all entities of a database will
be computationally expensive for large databases, we aim at a pre-selection such that only
the most promising database candidates have to be matched against the query. Litera-
ture does, so far, not discuss solutions for template protected databases, which pose new
challenges. One approach is, e.g., to classify a query into one of the pre-specified types
(arch, tented arch, left loop, right loop, whorl) (natural proportion of fingerprints in these
classes (3.7%,2.9%,33.8%,31.7%,29.7%) [WCW94]) and only compare it to the subset
of the database corresponding to this type. Assigning each database template its accord-
ing class, reveals this important and useful information to any attacker, which cannot be
recommended.
3 Efficient Filtering Techniques
In this section, we discuss three different approaches, which reduce the database search
space DB = {P1, · · · , P|DB|} for an individual PQ to be identified in the database DB.
For this purpose, all approaches determine a prioritization of the database, where the en-
tries are ordered in descending order based on their similarity with the querying individ-
ual. The most promising entries in the database are thus favored for the exact verification,
which accelerates the identification process. Based on the work of [MNS+10], we as-
sume that an individual is identified through multiple fingers. A query PQ and a database
entry Pj ∈ DB, thus, generally consist of |θ| many templates, where θ ⊆ {1, · · · , 10}:
PQ = {Qf |f ∈ θ} and Pj = {Rj,f |f ∈ θ}. A template is represented by its set of
coordinates mi = (xi, yi). While these coordinates for the query templates Qf ∈ PQ de-
scribe only real minutiae, the coordinates for the database templates Rj,f ∈ Pj consist of
genuine minutiae as well as of chaff points. As for each templateRj,f the according finger
type f is known, we, for simplicity, assume that each finger type is treated separately.
3.1 GeoMatch
The comparison of the two templatesQf andRj,f of a given finger type f is a challenging
task due to the intraclass variances and the interspersed noise in the form of chaff points.
Usually, for the alignment of the coordinate sets, a large number of transformations has to
118

be considered, which is too complex for an efficient filter technique. For the GeoMatch
approach, we avail ourself of the principles of the related docking problem of proteins in
biology. There, a common approach is to decompose the problem into small units, on
which individual matchings are performed. Afterwards, these local solutions are checked
for global consistency to build a solution for the original problem [Len95].
For the comparison of two coordinate setsQf andRj,f , GeoMatch calculates a set of trian-
gles for both sets, which are defined by those coordinate triplets, whose pairwise Euclidean
distances exceed a threshold bl and, as well, fall below a threshold bu. In the following a
triangle t is represented as a triplet of its edge lengths t = (e1, e2, e3), where, beginning
with the shortest side, all edges are enumerated clockwise. Note, that the set of triangles
TRj,ffor the database templates has to be computed only once and is stored for following
identifications. The triangles of the query template TQfare compared with the ones TRj,f
of the database template based on their edge lengths. To compensate the influence of local
misplacements of minutiae caused by inaccuracies during the enrollment, the similarity
check of two edges considers a tolerance of δ. The comparison of these local patterns is
independent of the global positioning or rotation and therefore translation invariant, an im-
portant criteria to deal with intraclass variances. If two triangles ta ∈ TQfand tb ∈ TRj,f
are similar to each other, GeoMatch determines their relative rotation γ to each other. After
all triangles have been compared, GeoMatch checks for global consistency by determining
the maximal number of triangles in TQffor which matching triangles with same relative
orientation γ have been found in TRj,f. The larger this number of similar rotated match-
ings, the higher is the consensus that Rj,f is a rotated version of Qf and, thus, the higher
is the probability for the similarity of both templates. The similarity of two templates Qfand Rj,f is defined as:
sim(TQf, TRj,f
) = maxγ∈A
{∣∣{ta ∈ TQf| ∃tb ∈ TRj,f
. ||ta − tb||∞ ≤ δ ∧ ∠(ta, tb) ≈ γ}∣∣}
where A = {0◦, · · · , 360◦} is the set of all angles for a given discretization (e.g. 2◦-
steps). The similarity of sim(TQf, TRj,f
) is calculated for all reference templates j and
for all finger types f ∈ θ. Overall, the similarity between two individuals is determined
through |θ| many of their fingers: sim(PQ, Pj) =∑f∈θ sim(TQf
, TRj,f). Subsequently
the database entries Pj are sorted in descending order based on their similarity score and,
thus, are prioritized for the verification process.
3.2 DistMatch
The approach DistMatch is based on [JY00] and [CCG06], which are techniques for local
structure matching. Here local structures, consisting of one central minutia m and k addi-
tional minutiae {m1,m2, · · · ,mk} of its neighborhood, are used to compare two minutiae
sets. For our problem setting, where the reference templates are protected, we have to ex-
pect a large number of chaff points in the neighborhood of a genuine minutia. Therefore,
these structures, where the neighborhood is restricted to a size k or to a certain distance
range [RPBV00], is not expedient. Instead, DistMatch determines for each minutia mi
119

query template reference template
mqmr
Figure 1: Comparing minutiae for DistMatch.
person 1
m1
m2
m3
person 2person 1
person 2
person 3
person 1
person 1
r
Figure 2: Identification for BioSimJoin.
of a template T a sorted list li = (d1, · · · , d|T |−1) of the Euclidean distances of mi to
all remaining |T | − 1 minutiae. For each template T we yield a set LT of |T | such lists
of neighborhood distances li, one for each minutia in the template. The similarity of two
minutiae mq and mr is determined based on the agreement between their neighborhood
distances, which is illustrated in Figure 1. All distances (represented as circles) of the
query mq , which find matches for mr in the reference template, are colored green in the
reference template. Here, not only distances to genuine minutiae (black) but also distances
to the large amount of chaff points (grey) will match the query distances, which leads to
high agreements between the minutiae. Analogously to GeoMatch, also DistMatch applies
an error tolerance δ for considering two distances as equal. The similarity of a template
Rj,f given the template Qf , is defined as the degree to which minutiae of LQf are recov-
ered in LRj,f :
sim(Qf , Rj,f ) = sim(LQf , LRj,f ) =∑
lq∈LQ
f
maxli∈L
Rj,f
|{dv ∈ lq|∃dw ∈ li.|dv−dw| ≤ δ}|
The similarity sim(LQf , LRj,f ) is determined for all reference templates j and for all
finger types f ∈ θ. The similarity of two individuals PQ and Pj is determined based
on all fingers f ∈ θ: sim(PQ, Pj) =∑f∈θ sim(LQf , LRj,f ). Based on this similarity
score, all entries Pj in the database are prioritized for the verification process. Similarly
to GeoMatch, also DistMatch is robust against linear transformations of two templates Qfand Rj,f as the comparison is only based on distances. The complexity of sim(Qf , Rj,f )is in O(|Qf | ·max{|Qf |, |Rj,f |} · |Rj,f |), where O(max{|Qf |, |Rj,f |}) is the complexity
for comparing two sorted lists lq ∈ LQf and li ∈ LRj,f .
3.3 BioSimJoin
GeoMatch and DistMatch suffer from the drawback, that the comparison of the query
Qf ∈ PQ to a reference template Rj,f ∈ Pj is very time-consuming. Therefore, in
the approach BioSimJoin, the coded fingerprint information, including minutiae and chaff
points are stored in an index structure, i.e. the R-tree [Gut84]. However, the minutiae of
different fingers, e.g. thumb and index, are stored in different data spaces.
120

In a first step, a range query is performed for each minutia mi ∈ Qf for the query person
PQ with radius r. In this way, we want to answer questions like “Find all minutiae/chaff
points in the database that are located in the range r around the query minutia”. This pro-
cedure is illustrated in Figure 2. The query fingerprint consists of three different minutiae
m1,m2 andm3. For each of these minutiaemi ∈ Qf , we determine allmk ∈ Rj,f , where
1 ≤ j ≤ |DB| that are located within a range of radius r around mi. Genuine minutiae
are illustrated as black points, whereas grey points indicate chaff points. However, this
information is not used during the identification process. Finally, we determine a list of
minutiae/chaff points that are located within the specific range of each minutia mi. For
each of these minutia/chaff points the corresponding individual P is known. In our exam-
ple, for minutia m3 of the query two genuine minutiae and one chaff point within a range
r are identified. The grey chaff point, as well as the minutia on the right belong to the
finger of person 1. The minutia on the left refers person 3. Finally, we get the following
list of candidates (w.r.t. all three minutiae of the query person): Four hits for person 1, two
hits for person 2, and one hit for person 3. This ordering corresponds to the result of the
approach BioSimJoin. Supported by an index structure, this can be done very efficiently.
Note that rotations and translations are not handled explicitly by BioSimJoin. However,
these effects are offset by an adequate parameterisation for the radius r.
4 Biometric Databases
We used the two publicly available data sets FVC [MMC+02] and MCYT [OGFAS+] to
test the effectiveness and efficiency of GeoMatch, DistMatch, and BioSimJoin. In order to
guarantee a realistic identification scenario, we followed the suggestions in [MNS+10]. To
ensure high protection of the biometric data against brute force attacks, we used the same
approach as formulated in [MMT09]. We obtained the minutiae of each fingerprint using
the minutiae extraction algorithm MINDTCT [WGT+07]. Each data set contains multiple
records of the same fingerprint. Thus, we used BOZORTH [WGT+07] to find the three
best matching records according to the BOZORTH matching score. The first record is used
as query and the remaining two records as reference. We discarded those minutiae having a
quality value below 0.25 and encoded the remaining minutiae using the template protection
method Fuzzy Vault [JS02]. For each person we used three fingers for identification as this
exponentially increases the safety against brute force attacks [MNS+10].
Feature Selection and Encoding of the Reference Template. Caused by inaccuracies
during the scan process, it may occur that some minutiae are missing or are newly com-
pared to the other records of the same finger. Therefore, we applied the comparison al-
gorithm by Merkle et al. [MNS+10] to determine those minutiae that are present in all
reference records of the same finger, to get one final reference template. Those reliable
minutiae are filtered according to the quality value determined by MINDTCT so that the
final reference template for one person contains the best 90 minutiae over three fingers. At
last, we obfuscated these 90 minutiae by 120 chaff points. These parameters guarantee a
security level of 270 against attacks that try to uncover the genuine minutiae in a reference
template [MNS+10].
121

Feature Selection of the Query Template. As in real application scenarios there is only
one record as query available, we used the first record that best matches the remaining
records according to the BOZORTH matching score. Those minutiae whose quality value
is below a threshold 0.25, were discarded.
The original database MCYT contains 12 optical (dp) and capacitive (pb) fingerprints for
each finger of 330 persons. For identification, we used the index, middle and ring finger
of the left and right hand separately to get a set of 660 different persons for dp and pb
respectively. After preprocessing, the database for the optical fingerprints contains 57.387
minutiae and 73.696 chaff points, and the database for capacitive fingerprints contains
47.058 minutiae and 73.472 chaff points. The original database FVC comprises eight
records for 110 fingers. After preprocessing, we result in a database, where three fingers
are combined to a total number of 27 persons. More precisely, the database contains 2.430
minutiae and 3.024 chaff points.
5 Experiments
In a first step, we determined the optimal parameters of all methods on a subset of 100
persons for the databases MCYT-dp and MCYT-pb. This includes the parameters bl, bu,
and δ of GeoMatch, the parameter δ of DistMatch, and for BioSimJoin, the optimal range
r and the capacity c of each index unit. The optimal parameters are then used to evaluate
all methods in terms of efficiency and effectiveness. Due to the small size of the data set
FVC, we use the parameters determined for MCYT-dp for the evaluation. For each data
set, we report the average result over |DB| runs, where we use each person once as query.
The runtime was measured parallelized for each finger on following workstations: Intel
Dual Core Xeon 7120 M CPUs and Intel XEON E5345 CPUs with each 2.33 to 3.0 GHz
and 16 GB RAM. All approaches were implemented in Java 6.0.
5.1 Evaluation of Parameters
For the approach GeoMatch, the edge length restrictions bl and bu serve the purpose of
considerably reducing the resulting amount of triangles for one template. Therefore, we
choose these parameters such that, on the one hand, we do not lose information for any
minutia and, on the other hand, get as few triangles as possible. On a sample of 100
individuals, these criteria are fulfilled for (bl, bu) = (55, 123) (avg. 1462 triangles per
reference template) in MCYT-dp and for (bl, bu) = (28, 120) (avg. 2660 triangles per
reference template) in MCYT-pb. For the error tolerance parameter a value of δ = 1showed best quality results for both databases.
For the approach DistMatch, similarly to GeoMatch, low values for the error tolerance
parameter δ of δ = 2 for MCYT-dp and δ = 1 for MCYT-pb showed best results regarding
the quality of the prioritization.
122

with index position without index200200.0
s)
p
20150150.0
tio
n
(m
ropt = 20
50
100
50 0
100.0
osi
t
me
0
50
0 0
50.0 po
unti
00.0
0 20 40
ru
0 20 40
r
(a) Runtime and effectivity w.r.t. r.
4 P 8 P 16 P 32 P 64 P
4096
32768
ms)
512
4096
e(m
8
64
tim
e
1
8
run
tr
capacity
(b) Runtime for index construction
w.r.t. c.
304 P 8 P 16 P 32 P 64 P
2530
ms) 16ø copt ø 256
1520
e(m
510
time
05
runt
r
capacity(c) Runtime for search w.r.t. c.
Figure 3: Optimal Parameters for BioSimJoin.
For BioSimJoin, the radius of the range query r and the maximum capacity c of an index
unit have to be optimized. As the parameter settings for MCYT-dp and MCYT-pb are
equal, we discuss the results for both databases simultaneously. The curves marked by
yellow and red squares in Figure 3(a) illustrate the runtime to generate the candidate list
for different radius values in a range of [0 − 40]. The runtime is depicted on the left side
of the diagram. Higher radius values implicate higher runtimes, as more candidates have
to be tested in this case. The curve marked by blue diamonds illustrates the average posi-
tion of the query in the resulting list of candidates. Extremely small radius values result
in candidate lists where the reference of the actual query person is located at relatively
backmost position, as small radius values do not tolerate rotated or translated data. With
r=20 a trade-off between runtime and effectivity can be achieved.
In Figure 3(b), we evaluate the impact of different capacity values on the runtime for the
index construction based on different database sizes. The capacity is the amount of data
that can be stored in an index unit of the R-tree. We tested the runtime for databases that
consist of 4, 8, 16, 32 and 64 persons which refers to an actual database size of 808, 1.613,
3.217, 6.449 and 12.844 database entries for minutiae and chaff points. Higher capacity
values implicate a higher effort for the index construction, as the split of an index unit
is based on a sequential scan. Extremely high capacities lead to a significant decrease of
runtime, as in this case all database entries are stored in only one index unit. However, no
index support is given for the subsequent search. Figure 3(c) shows the time for generating
the candidates list w.r.t. different capacities. Thus, optimal runtime for index construction
and search can be achieved with a capacity in a range of [16, 256] independently of the
database size. Using a 6-stage weighted mean value of the runtime for different capacity
values in the range of [16− 256], a significant optimum can be found at c=102. Therefore,
we use r=20 and c=102 for all experiments.
5.2 Effectivity
Table 1 denotes the results of GeoMatch, DistMatch, and BioSimJoin on the database
FVC. It specifies the position of a query person in the candidates list and the runtime to
construct the candidates list each averaged over 27 queries. GeoMatch is able to achieve a
database reduction of 92.03% for the exact verification, wheras DistMatch and BioSimJoin
123

GEOMATCH DISTMATCH BIOSIMJOIN
Position 2.15 11.67 11.44
Runtime 162.4 ms 295.23ms 16.29 ms
Table 1: Effectivity on database FVC.
0
100
200
300
400
posi
tion
|DB|
GeoMatch DistMatch BioSimJoin
(a) Result on MCYT-dp.
0
100
200
300
400
po
siti
on
|DB|
GeoMatch DistMatch BioSimJoin
(b) Result on MCYT-pb.
Figure 4: Effectivity on MCYT-dp and MCYT-pb.
only achieve a datareduction of 56.78% and 57.63%, respectively. However, in terms of
runtime, the index supported BioSimJoin clearly outperforms GeoMatch and DistMatch.
Figure 4(a) and 4(b) illustrate the results for both MCYT databases. Whereas the results of
BioSimJoin and of DistMatch for both databases are comparable, GeoMatch benefits from
the better quality of the optical records in MCYT-dp and achieves here better results than
on MCYT-pb. GeoMatch averagely ranks the query at 11% of MCYT-dp and at 27% of
MCYT-pb, which is significantly better than DistMatch (25% and 30%) and BioSimJoin
(45% and 46%). One explanation is that the comparison based on triangles, especially,
with the global consistency check considering the relative angle γ, is more selective than
the mere distance comparison in DistMatch. Due to the intraclass variances, BioSimJoin
is not able to achieve a good prioritization as it considers the actual coordinate values.
5.3 Efficiency
Figure 5 denotes the scalability of GeoMatch, DistMatch and BioSimJoin. As the database
size is the same for MCYT-dp and MCYT-pb, all methods, except for GeoMatch, re-
sult in similar runtimes for both data sets. Because of the less restrictive parameter
setting (bl, bu, δ) = (28, 120, 1) of GeoMatch for MCYT-pb compared to (bl, bu, δ) =(55, 123, 1) for MCYT-dp, a reference template has on average more triangles in MCYT-
dp than in MCYT-pb, which results in a higher runtime for MCYT-pb. GeoMatch and Dist-
Match show linear runtime with increasing database size. Supported by an index structure,
BioSimJoin yields significantly lower runtime. Thus, to request a database comprising 650
database objects in MCYT-dp takes only 1429 ms with BioSimJoin, whereas GeoMatch
takes 3294 ms and DistMatch takes even 13144 ms. Due to its quadratic complexity for
the comparison of two templates, DistMatch has the worst runtime of our approaches.
124

0
5000
10000
15000
runti
me
(ms)
|DB|
GeoMatch DistMatch BioSimJoin
(a) Result on MCYT-dp.
0
5000
10000
15000
runti
me
(ms)
|DB|
GeoMatch DistMatch BioSimJoin
(b) Result on MCYT-pb.
Figure 5: Efficiency on MCYT-dp and MCYT-pb.
6 Conclusion
We discussed our first approaches, which realize an efficient identification process based
on fuzzy vault protected templates. Existing approaches, so far, only support identification
for unprotected templates or realize authentication systems. Our developed filter tech-
niques determine a prioritization for the database entries, based on which a subsequent
verification processes the database. Our experiments showed that the approach GeoMatch,
which is translation and rotation invariant, achieves high data reduction rates, but solely
the index supported approach BioSimJoin is able to perform efficiently on large databases.
As future work we plan to combine the two approaches GeoMatch and BioSimJoin, to
achieve a high quality and, simultaneously, a low runtime.
Acknowledgment: This work was funded by the Bundesamt fur Sicherheit in der In-
formationstechnik (BSI) within the project BioKeyS-Testing. We want to thank all part-
ners, namely Sebastian Abt, Christoph Busch, Heinrich Imohr, Claudia Nickel, Alexander
Nouak, Alexander Opel, and Xuebing Zhou for successful discussions and their support.
References
[BBGK08] J. Breebaart, C. Busch, J. Grave, and E. Kindt. A Reference Architecture for BiometricTemplate Protection based on Pseudo Identities. In BIOSIG, pages 25–38, 2008.
[BCK09] J. Bringer, H. Chabanne, and B. Kindarji. Error-Tolerant Searchable Encryption. InIEEE Int. Conf. on Communications, pages 1–6, 2009.
[BFF+11] C. Bohm, I. Farber, S. Fries, U. Korte, J. Merkle, A. Oswald, T. Seidl, B. Wacker-sreuther, and P. Wackersreuther. Filtertechniken fur geschutzte biometrische Daten-banken. In BTW, pages 379–389, 2011.
[CCG06] S. Chikkerur, A.N. Cartwright, and V. Govindaraju. K-plet and Coupled BFS: A GraphBased Fingerprint Representation and Matching Algorithm. In Proc. Int. Conf. onBiometrics, volume 3832 of LNCS, pages 309–315. 2006.
125

[DBHO10] M. Drahansky, E. Brezinova, D. Hejtmankova, and F. Orsag. Fingerprint RecognitionInfluenced by Skin Diseases. Int. Journal of Bio-Science and Bio-Technology, 3(4):11–22, 2010.
[Gut84] A. Guttman. R-Trees: A Dynamic Index Structure for Spatial Searching. In SIGMODConference, pages 47–57, 1984.
[JNN08] A. Jain, K. Nandakumar, and A. Nagar. Biometric template security. EURASIP Journalon Advances in Signal Process, 8(2):113:1–113:17, January 2008.
[JS02] A. Juels and M. Sudan. A Fuzzy Vault Scheme. Proc. Int. Symp. on InformationTheory, page 408, 2002.
[JY00] X. Jiang and W.Y. Yau. Fingerprint Minutiae Matching Based on the Local and GlobalStructures. Proc. Int. Conf. on Pattern Recognition (15th), vol. 2:1042–1045, 2000.
[Len95] H.-P. Lenhof. An Algorithm for the Protein Docking Problem. In Bioinformatics:From Nucleic Acids and Proteins to Cell Metabolism, pages 125–139, 1995.
[MMC+02] D. Maio, D. Maltoni, R. Cappelli, J. L. Wayman, and A. K. Jain. FVC2002: SecondFingerprint Verification Competition. Proc. Int. Conf. on Pattern Recognition (16th),3:30811, 2002.
[MMT09] P. Mihailescu, A. Munk, and B. Tams. The Fuzzy Vault for Fingerprints is Vulnerableto Brute Force Attack. In BIOSIG, pages 43–54, 2009.
[MNS+10] J. Merkle, M. Niesing, M. Schwaiger, H. Ihmor, and U. Korte. Performance of theFuzzy Vault for Multiple Fingerprints. In BIOSIG, pages 57–72, 2010.
[Mor07] R. Morelle. 3d face scans spot gene syndromes. BBC News, 2007.
[NJP07] K. Nandakumar, A. Jain, and S. Pankanti. Fingerprint-Based Fuzzy Vault: Implemen-tation and Performance. IEEE Transactions on Information Forensics and Security,2(4):744–757, 2007.
[OGFAS+] J. Ortega-Garcia, J. Fierrez-Aguilar, D. Simon, J. Gonzalez, M. Faundez-Zanuy, V. Es-pinosa, A. Satue, I. Hernaez, J.-J. Igarza, C. Vivaracho, D. Escudero, and Q.-I. Moro.MCYT baseline corpus: a bimodal biometric database. IEE Proc. on Vision Image andSignal Processing.
[RPBV00] N.K. Ratha, V.D. Pandit, R.M. Bolle, and V. Vaish. Robust fingerprint authentica-tion using local structural similarity. In Proc. Workshop on Applications of ComputerVision, pages 29 –34, 2000.
[Sei06] J. Seidel. Zusatzinformationen in Fingerbildern. Master’s thesis, Hochschule Darm-stadt, September 2006.
[Sta02] W. Stallings. Cryptography and Network Security: Principles and Practices. PearsonEducation, 3rd edition, 2002.
[UPJ05] U. Uludag, S. Pankanti, and A. Jain. Fuzzy Vault for Fingerprints. In Proc. Int. Conf. onAudio- and Video-Based Biometric Person Authentication (5th), pages 310–319. 2005.
[WCW94] C.L. Wilson, G.T. Candela, and C.I. Watson. Neural Network fingerprint classification.In Journal of Artificial Neural Networks, volume 1, pages 203–228, 1994.
[WGT+07] C.I. Watson, M.D. Garris, E. Tabassi, C.L. Wilson, R.M. McCabe, S. Janet, and K. Ko.User‘s Guide to NIST Biometric Image Software (NBIS), National Institute of Stan-dards and Technology, 2007.
126

30-0*(0*(&$" FC$A=;*;:"*0 7"5 25*(/,"5:)-'"
mlkjh echaj
_><:a<:8kh 6l5NajlMj
Ll<:Kh5hc<: JIH>5NljcG
FchajNlkjhEsNrqMh
FC(05-:0% 6chah p5Khcj Kha<:oHjcsj ac<: Ncj Mh5 L5lsh! cIFchFhcj ac<: Mch ∀j58Gj85<>Mch5jh5 J5ca#∃ckMh5 %cN Fhcjh5hI l8<: J5ca#&hN∋kljha shIlIIj( Ncjjhka hcIh5ml5G>)#∗hjjh Kha<:5hcKhI klaahIq +_p6,−. Kh:l8∋jhj cI pKa<:Icjj /q0 Mlaa 1Fl5ajljcajca<:h ∗>55hkljc>IhI cN J5ca<>Mh hrcajch5hI! NlI lKh5 Ic<:j Fhc2 Fch Mchahl8aah:hI! FhII NlI Ic<:j MhI J5ca<>Mh Kh5hcja GhIIjqq JN 3l:NhI Mchah5 p5KhcjFc5M sh1hcsj! Mlaa Mch J5ca#&hN∋kljha a>F>:k 1hckhIFhcah lka l8<: a∋lkjhIFhcahshkhahI hcIh5 ml5G>)#∗hjjh h5ajh5 45MI8Is hIja∋5h<:hIq 6haFhcjh5hI Fc5Msh1hcsj! Mlaa Mh5 J5ca<>Mh M85<: 1FhcMcNhIac>Ilkh ml5G>)GhjjhI Ic<:j Khaah5Kha<:5chKhI Fc5Mq _ch5H55 Fc5M 18Io<:aj 658IMkhshIMha 5Kh5 ml5G>)#∗hjjhI cIhcIh5 8IM Nh:5h5hI 6cNhIac>IhI h5ko8jh5jq pIa<:kch2hIM Fc5M hcI m>Mhkk l8H658IMklsh )>I J5ca#∃ckMh5I l8a 7p∀Jp 80 h5ajhkkj 8IM Ncjjhka hcIha 9cGkc:>>M#3ljc>#&haja 5Kh5∋55Hjq 6chah5 &haj Khajojcsj Mch ml5G>)GhjjhI h5ajh5 45MI8Is cIMhI :hckhI 8IM ∀∋lkjhI hcIha J5ca#&hN∋kljhaq
# !*=ED$5@=;
JI Mh5 :h8jcshI :hcj Fc5M ha cNNh5 Fc<:jcsh5! Mlaa ac<: ;hMh <h5a>I hcIMh8jcscMhIjcHc1ch5hI GlIIq =N :8slIs 18 6hKo8MhI 18 h5:lkjhI Fh5MhI ∀<:k5aahk 8IM<laaF>5jh5 )h5shKhIq ?cIhI ∀<:k5aahk ;hM><: GlII NlI )h5kch5hI 8IM hcI <laaF>5j)h5shaahIq ?cIhI p8aFhs :ch5H55 KchjhI Kc>Nhj5ca<:h ∀≅ajhNh 185 JMhIjcHc1ch58Isq 6chshK5o8<:kc<:ajhI ∀≅ajhNh :ch5Khc Klach5hI l8H LcIsh5lKM55<GhI 8IM 6hac<:jah5GhII8Isq∃hc LcIsh5lKM55<GhI Khajh:j ;hM><: Mla <5>KkhN! Mlaa Mchah Ic<:j cNNh5 cIl8a5hc<:hIMh5 Α8lkcjoj h5Hlaaj Fh5MhI G>IIhIq 685<: o82h5h ?cIHk5aah G>IIhI Mch 3ckkhIMh5 LcIsh5lKM55<Gh a>Fhcj lKsha<:kcHHhI Fh5MhI! Mlaa NlI Mchah Ic<:j Nh:5 cIl8a5hc<:hIMh5 Α8lkcjoj khahI GlIIq ∃hc Mh5 6hac<:jah5GhII8Is FchMh58N GlII hcIhlIMh5h L5ca85! hcI lIMh5ha mlGh8∋ >Mh5 Khc moIIh5I hcI ∃l5j Mch JMhIjcHc1ch58Ish5a<:Fh5hIq
?cIhI p8aFhs KchjhI Mch J5ca#∀<lIIh5q 6la J5ca#∃ckM koaaj ac<: 5hkljc) hcIHl<: h5HlaahIq∃h5hcja hcIh hcIHl<:h ∗lNh5l GlII :ch5H55 )h5FhIMhj Fh5MhIq p8<: caj Mch J5ca M85<: Mch_>5I:l8j )>5 o82h5hI ?cIHk5aahI sha<:5j1jq 6ha Fhcjh5hI caj Mch ∀j58Gj85 Mh5 J5ca o:Ikc<:Fch LcIsh5lKM55<Gh H55 ;hMhI mhIa<:hI hcINlkcsq 6chah ∀j58Gj85 KkhcKj l8<: 5Kh5 hcIhIah:5 klIshI :hcj5l8N G>IajlIjq
6chah p5Khcj Kha<:oHjcsj ac<: Ncj Mh5 p8aFh5j8Is )>I a>sq J5ca#&hN∋kljhaq 6chah&hN∋kljha Fh5MhI l8a MhI l8HshI>NNhIhI J5ca#∃ckMh5I h5ajhkkj 8IM 185 JMhIjcHc1ch58Is8IM 8h5cHc1ch58Is )h5FhIMhjq pKh5 Fch )chk JIH>5Nljc>I caj cI hcIhN a>k<:hI &hN∋kljhhIj:lkjhIΒ +_p6,−. Kh:l8∋jhj! Mlaa I85 FhIcsh a≅ajhNljca<:h ∗>55hkljc>IhI cIIh5:lkK
127

hcIha J5ca#∃ckMha hrcajch5hIq JN 3l:NhI Mchah5 p5Khcj Fc5M Mch ∀j58Gj85 Mchah5 &hN∋kljhacN _cIKkc<G l8H Mch ml5G>)#?cshIa<:lHj 8Ijh5a8<:jq JN 8h5kl8H Mchah5 =Ijh5a8<:8IsFc5M sh1hcsj! Mlaa ac<: Mch :hckhI 8IM Mch ∀∋lkjhI hcIha J5ca#&hN∋kljha lka ml5G>)#∗hjjhh5ajh5 45MI8Is cIjh5∋5hjch5hI klaahIq
JI pKa<:Icjj Χ Fc5M hcI lkkshNhcIha L5lNhF>5G )>5shajhkkj! Fhk<:ha 185 ?5Hlaa8Is 8IMp8aFh5j8Is )>I J5ca#∃ckMh5I )h5FhIMhj Fh5MhI GlIIq JI pKa<:Icjj 0 Fh5MhI hcIcsh658IMklshI 5Kh5 ml5G>)#?cshIa<:lHj 8IM ml5G>)#∗hjjhI h5ko8jh5jq pKa<:Icjj 0qAKha<:5hcKj lIa<:kch2hIM! Fch NlI Mch <l5lNhjh5 hcIh5 ml5G>)#∗hjjh KhajcNNhI GlIIq JIpKa<:Icjj 0q0 Fc5M MlII hcI &haj )>5shajhkkj! Ncj MhN NlI 5Kh5∋55HhI GlII! >K MlashFo:kjh m>Mhkk 18j5hHHhIM cajq JN lIa<:kch2hIMhI pKa<:Icjj / Fc5M MlII 5Kh5∋55Hj! >KMch J5ca#&hN∋kljha hcIh5 ml5G>)#∗hjjh shI5shIq JN Εq pKa<:Icjj Fh5MhI a<:kch2kc<: I><:Fhcjh5h ml5G>)#m>Mhkkh )>5shajhkkj! l8H Mch NlI Mch J5ca#&hN∋kljha I><: 8Ijh5a8<:hIGlIIq
> !*= -'';")"*="( <5-)"!∀5: #@5 25*(/!5:"==@=;
∃hc Mh5 ?5Hlaa8Is 8IM p8aFh5j8Is )>I J5ca#∃ckMh5I Khajh:hI hcIcsh ∀<:Fch5csGhcjhIq:8N hcIhI G>IIhI o82h5h ?cIHk5aah Fch 3hHkhGjc>IhI l8H MhN p8sh a>Fch Mla p8shIkcM)h5a<:chMhIh &hckh Mh5 J5ca )h5Mh<GhIq pkkh5McIsa GlII ac<: ahkKaj hcI J5ca#∃ckM Fhk<:ha8Ijh5 ∋h5HhGjhI ∃hMcIs8IshI l8HshI>NNhI F85Mh )>I MhN 3hHh5hI1KckM 8Ijh5a<:hcMhIq6cha kchsj Ml5lI! Mlaa Mch J5ca hcI HkhrcKkha 45slI caj! Fhk<:ha ac<: 8Ijh58Ijh5a<:chMkc<:hN 9c<:jhcIHlkk 8Ijh5a<:chMkc<: ajl5G MhH>5Nch5hI GlIIq
=N MchahN <5>KkhN hIjshshI18Fc5GhI Fc5M Mla J5ca#∃ckM Il<: Mh5 p8HIl:Nh 18Io<:ajI>5Nlkcach5jq _ch5Khc Fc5M 18Io<:aj Mh5 p8shINcjjhk∋8IGj Hcrch5jq pIa<:kch2hIM Fc5M Mh53cIs Mh5 J5ca MhjhGjch5j 8IM Hcrch5jq pIa<:kch2hIM Fh5MhI Mch ∗>>5McIljhI )>NGl5j:haca<:hI ∀≅ajhN cI hcI <>kl5G>>5McIljhIa≅ajhN 8Nsh5h<:Ihjq p8H MchahaI>5Nlkcach5jhI J5ca#∃ckM GlII NlI I8I )h5a<:chMhIh Lckjh5 l8a Mh5 7>N∋8jh5#8cac>IlIFhIMhIq Φh Il<:MhN Fhk<:h Lckjh5 NlI )h5FhIMhj! h5:okj NlI 8Ijh5a<:chMkc<:l8HshKl8jh mhaah5shKIcaahq 6chah mhaah5shKIcaah Fh5MhI I8I lI:lIM )>I HhajshkhsjhI∗5cjh5chI cI KcIo5h 6ljhI 8Nsh5h<:Ihjq Φh Il<:MhN Fhk<:h Lckjh5 8IM Fhk<:h ∗5cjh5chINlI )h5FhIMhj! h5:okj NlI 8Ijh5a<:chMkc<: <>Mch5jh J5ca#&hN∋kljhaq
∃ca:h5 F85Mh H55 ;hMha 8h5Hl:5hI hcI hcshIha L5lNhF>5G l8HshKl8jq Γ8I :lj +:&e,/.Mchah 8Ijh5a<:chMkc<:hI 8h5Hl:5hI 8Ijh5a8<:j! 8IM Hhajshajhkkj! Mlaa ac<: lkkh 8h5Hl:5hI cIhcIhN L5lNhF>5G 18alNNhIHlaahI klaahIq pkkh )>I +:&e,/. 8Ijh5a8<:jhI 8h5Hl:5hI:ljjhI Mla H>kshIMh 8>5sh:hI shNhcIalNΗ
pKKckM8Is AΗ pKkl8H Mh5 7>Mch58Is hcIha J5ca#∃ckMha
128

:8 pIHlIs F85MhI Mch J5ca#∃ckMh5 Fch )>5:h5 h5Fo:Ij I>5Nlkcach5jq JN Io<:ajhI ∀<:5cjjF85MhI Mchah I>5Nlkcach5jhI J5ca#∃ckMh5 shHckjh5jq p8a MhI shHckjh5jhI J5ca#∃ckMh5I F85MhIMlII lI HhajshkhsjhI <8IGjhI k>Glkh mhaaFh5jh h5Ncjjhkjq JN Io<:ajhI ∀<:5cjj F85MhIMchah mhaaFh5jh lI:lIM Hhajshkhsjh5 ∀<:5lIGhI cI hcIhI ∃cIo5<>Mh 5Kh5H5:5jq ∃hc Mh58h5cHc1ch58Is Fc5M Mchaha <>Mch5jh J5ca#∃ckM Ncj MhN Kh5hcja sha∋hc<:h5jhI J5ca#∃ckMh5I)h5skc<:hIq
6l lkkh 8h5Hl:5hI ac<: I85 cI Mh5 8h5FhIM8Is 8Ijh5a<:chMkc<:h5 Lckjh5 8Ijh5a<:hcMhI!a>kkjh NlI 8Ijh5a8<:hI! >K ac<: Mch ?5shKIcaah cI L>5N Mh5 <>Mch5jhI J5ca#∃ckMh5 l8<:o:IhkIq ?cI h5ajh5 pIalj1 Khajh:j Ml5cI! ac<: Mch ∀j58Gj85 8IM MhI p8HKl8 Mchah5 J5ca#∃ckMh5 Io:h5 lI18ah:hIq JI MhI Γl<:H>kshIMhI pKa<:IcjjhI Fh5MhI Mch J5ca#∃ckMh5 cN_cIKkc<G l8H )h5a<:chMhIh ml5G>)#m>Mhkkh :cI 8Ijh5a8<:jq
∃ !*=ED$5@=; ,-5:∀%/&"00"=
6h5 ∃hs5cHH ml5G>)#∗hjjhI MhHcIch5j hcI aj><:lajca<:ha m>Mhkkq 6chaha m>Mhkk Khajh:jl8a M5hc &hckhIΗ
:8ajlIMa5l8NΗ p8Hkcaj8Is lkkh5 N>skc<:hI :8ajoIMh! Fhk<:h Mch ml5G>)#∗hjjh 18 hcIhN :hcj∋8IGj j :lKhI GlII %Ml5shajhkkj lka :l:khI)>I A Kca k(
:8ajlIMa)h5jhck8IsΗ ?cI 8hGj>5 % ( Mh5 ?cIj5cjjaFl:5a<:hcIkc<:GhcjhI H55 ;hMhI:8ajlIM
ΙKh5slIsaNlj5crΗ ?cIh mlj5cr Ncj lkkhI ΙKh5slIsaFl:5a<:hcIkc<:GhcjhI )>I:8ajlIM c cI :8ajlIM ;
L55 MhI 8hGj>5 Mh5 :8ajlIMa)h5jhck8Is sckjΗ
!6",
3
6"A
L55 Mch ΙKh5slIsaNlj5cr sckjΗ
1 6 . +#, 8IM !(",
+
1 6 . +"A
mcj lIMh5hI e>5jhIΗ :8 ;hMhN :hcj∋8IGj j 8IM cI ;hMhN :8ajlIM GlII NlI hcIIl<:H>kshIMha ?khNhIj KhajcNNhIqL5:5j NlI Mcha lkkha 18alNNhI! a> h5:okj NlI Mch H>kshIMh L>5Nlkh 6hHcIcjc>I hcIh5ml5G>)#∗hjjhΗ
$ ∀hc hcIh L>ksh )>I :8Hlkka)l5clKkhI! Mch 5Kh5 hcI 8IM
MhNahkKhI el:5a<:hcIkc<:Ghcja5l8N MhHcIch5j acIM 8IM c:5h eh5jh
cI Mh5 mhIsh lIIh:NhIq
$ 6lII :hc2j %:>N>shIh( %#!(JFDB@>>@ Ncj Mh5 pIHlIsa)h5jhck8Is
129

8IM Mh5 ΙKh5slIsaNlj5cr ="% 16+& ! Hlkka
H55 KhkchKcsh 8IM sckjq
?cIh Fhcjh5h ?cshIa<:lHj )>I ml5G>)#∗hjjhI Khajh:j Ml5cI! Mlaa NlI MhI :8ajlIM cϑAl8a MhI )>5:h5sh:hIMhI :8ajoIMhI KhajcNNhI GlIIq ?a sckjΗ
H55 KhkchKcsh 8IM Ncj
?cI Fhcjh5ha 7:l5lGjh5cajcG8N H55 ml5G>)#∗hjjhI caj Mh5hI 45MI8Isq 6ch 45MI8Is hcIh5ml5G>)#∗hjjh scKj lI! cIFchFhcj )>5:h5sh:hIMh :8ajoIMh ?cIHk8aa l8H MhIIl<:H>kshIMhI :8ajlIM :lKhIq ∃hc hcIh5 ml5G>)#∗hjjh Aq 45MI8Is sckjΗ
= %: 8"68': 8(A"68(A . : 8(Χ"6 8(Χ . qqq . : ,"6,&"= %: 8"6 8': 8(A"6 8(A&
6q:q I85 Mh5 lGj8hkkh :8ajlIM Mh5 ml5G>)#∗hjjh : 8(A KhajcNNj Mch
el:5a<:hcIkc<:Ghcja#8h5jhck8Is Mha Γl<:H>kshIMhI :8ajlIMha : 8 ! Fo:5hIM lkkh
)>5:h5sh:hIMhI :8ajoIMh Κ8lac cN lGj8hkkhI :8ajlIM 18alNNhIshHlaaj Fh5MhIq 6chah?cshIa<:lHj Kh1hc<:Ihj NlI lka 6hMo<:jIcak>acsGhcj >Mh5 ml5G>)#?cshIa<:lHj hcIhaaj><:lajca<:hI <5>1haahaq
ehII NlI Mch 6l5ajhkk8Is hcIh5 hcIMcNhIac>IlkhI ml5G>)#∗hjjh l8H Nh:5h5h6cNhIac>IhI h5Fhcjh5j! N8aa NlI Mla m>Mhkk Il<: +7:Γ,Λ. H>kshIMh5Nl2hI 8NKl8hIq
?a sckjΗ
: 8( ahc Mch :8ajlIMa)h5jhck8Is Mh5 G#jhI ml5G>)#∗hjjh 18N :hcj∋8IGj I
=% ++& ahc Mch ΙKh5slIsaNlj5cr Mh5 ;#jhI ml5G>)#∗hjjh
JN Nh:5McNhIac>IlkhI m>Mhkk hcIh5 ml5G>)#∗hjjh Fc5M Mh5 :8ajlIM Mha Il<:H>kshIMhI
?khNhIja : 8 Ic<:j I85 )>N lGj8hkkhI :8ajlIM : 8(A Mh5 ml5G>)#∗hjjh
KhhcIHk8aaj! a>IMh5I l8<: )>I MhI :8ajoIMhI Mh5 lIMh5hI ml5G>)#∗hjjhIq 6h5 ?cIHk8aa!Fhk<:hI Mch ml5G>)#∗hjjhI l8HhcIlIMh5 :lKhI! Fc5M Ncjjhka Mha 6hFc<:ja∋l5lNhjh5a9lNMl Kha<:5chKhIq 6ch ∃h5h<:I8Is Mha Ih8hI :8ajlIMha hcIh5 ml5G>)#∗hjjh Fc5MMl:h5 5Kh5 hcIh 6hFc<:j8Is lkkh5 ΙKh5slIsaNlj5c1hI lkkh5 ml5G>)#∗hjjhI Kh5h<:Ihjq
?a sckj Ml:h5Η
130

: 8+ ") ++*=% ++&* : 8(A+ + !
("A! (, +
5
) +(* : 8(A(
20! +"A!qqq . 5
>Mh5 cI mlj5cra<:5hcKFhcahΗ
'8-%'8A
'8Χ
qqq'85
&"%)AA*=
% ++& )AΧ*$ qqq )Aa*$
)ΧA*$ )*= %ΧΧ& qqq )Χa
. . . .) 5" ) 5H qqq ) 55*=
%55&&*%'8(AA
'8(AΧ
qqq' 8(A5
&-G*'8(A
F>Khc J Mh5 ?cI:hcjaNlj5cr hIja∋5c<:jq
876 54240.->-= <42 ;:2:94H42
L55 Mch ∃h5h<:I8Is Mh5 <l5lNhjh5 hcIh5 hcIHl<:hI ml5G>)#∗hjjh GlII NlI Mch mhj:>MhMha mlrcN8N#9cGkc:>>M#∀<:oj1h5a )h5FhIMhIq
ehII NlI hcIh ml5G>)#∗hjjh : ,!qqq : 8 Kh>Kl<:jhj! h5scKj ac<: Mch Ml5l8a
5ha8kjch5hIMh 9cGkc:>>M#L8IGjc>I lka <5>M8Gj Mh5 hcI1hkIhI el:5a<:hcIkc<:GhcjhIΗ
∀hc 6 Mch el:5a<:hcIkc<:Ghcj MlH55! Mlaa ac<: Mch ml5G>)#∗hjjh 18 KhscII cN
:8ajlIM c KhHcIMhjq
ehcjh5 ahc 1 %68(A!6 8& Mch ΙKh5slIsaFl:5a<:hcIkc<:Ghcj )>I :8ajlIM 68(A Il<:
68
6lII sckjΗE% 6 .= &" 6*1%6,! 6A&* 1%6A! 6Χ&*qqq*1 %68(A .6 8&
6l ha 185 ∀<:oj18Is Mha <l5lNhjh5a 6 I85 hcIh ∃h>Kl<:j8Is hrcajch5j! )h5FhIMhj
NlI 185 ∃hajcNN8Is Mh5 1 %6 ((A . 6( & Mch KhMcIsjh 9cGkc:>>M#L8IGjc>I
E%=&"/6 . +
1 6 . +86 . +
Ncj 8 6 . + Μ pI1l:k Mh5 Kh>Kl<:jhjhI ΙKh5soIsh )>I :8ajlIM c Il<: :8ajlIM ;
_ch5l8a h5scKj ac<: MlII Mh5 ∀<:oj1h5 H55 Mch ΙKh5slIsaFl:5a<:hcIkc<:GhcjhI lka Mch5hkljc)hI _o8HcsGhcjhI Mh5 ΙKh5soIsh cI Mh5 Kh>Kl<:jhjhI ml5G>)#∗hjjhΗ
1 6 . +"8 6+
86pka ∀<:oj1h5 H55 Mch :8ajlIMaFl:5a<:hcIkc<:GhcjhI GlII NlI Il<: +7:Γ,Λ. Mch5hkljc)hI _o8HcsGhcjhI Mha p8Hj5hjhIa Mh5 hcI1hkIhI :8ajoIMh cI Mh5 Kh>Kl<:jhjhIml5G>)#∗hjjh )h5FhIMhIqJN Nh:5McNhIac>IlkhI m>Mhkk Fh5MhI Mch 18aoj1kc<:hI <l5lNhjh5 ) Il<: +7:Γ,Λ.Mh5l5j KhajcNNj! Mlaa Mchah MhI H>kshIMhI p8aM58<G NcIcNch5hIΗ
131

0G*C( C0F>Khc C"% A' Χ& Ncj 6 Mh5 8hGj>5 Mh5 KhjhckcsjhI ml5G>)#∗hjjhIq
=Ijh5 8h5FhIM8Is Mh5 0q01 H5:5j Mcha 18 H>kshIMhN 4∋jcNch58Isa∋5>KkhNΗ
A68)A#'
6
'2) ++*= % ++&* :+ + !("A! (, +
A
) +(* :( ( :+ 36'
?8>@! !@! ∀@!68#?8#
!("A
5
) +("A?8! ) +(4,
87G F4EH D>2 C@42?2"!>-= :>! 4L-<L94-ELK-:J4 I:2!K∀#∃4HH4
:85 ΙKh5∋55H8Is >K hcIh Kh>Kl<:jhjh ∀jc<:∋5>Kh hcIh5 ml5G>)#∗hjjh Mh5 45MI8Is IshI5sj! GlII NlI hcIhI 9cGkc:>>M#3ljc>#&haj )h5FhIMhIq _ch5Khc Fc5M Mch cN)>5:h5sh:hIMhI pKa<:Icjj )h5FhIMhjh 9cGkc:>>M#L8IGjc>I H55 Mch ;hFhckcsh _≅∋>j:hahNlrcNch5j! 8IM Ml5l8a Mch &hajs5>2h Kh5h<:Ihjq
JN hcI1hkIhI caj Mh5 &haj H>kshIMh5Nl2hI l8HshKl8jΗ
&haj:≅∋>j:hahIΗ
∃ , Η ∀jc<:∋5>Kh hIja∋5c<:j hcIh5 ml5G>)#∗hjjh Mh5 45MI8Is I
∃ A Η ∀jc<:∋5>Kh hIja∋5c<:j hcIh5 ml5G>)#∗hjjh Mh5 45MI8Is IϑA
∃h5h<:I8Is Mh5 &hajs5>2hΗ
3 %5∃ A& Μ k>sl5cj:Nch5jh 9cGkc:>>M#L8IGjc>I NlrcNch5j 8Ijh5 ∃ ,
3 %5∃ A& Μ k>sl5cj:Nch5jh 9cGkc:>>M#L8IGjc>I NlrcNch5j 8Ijh5 ∃ A
%"Χ*%3 %5∃ A&(3 %5∃ ,
&&
8Ijh5 ∃ , hIja∋5c<:j & hcIh5 6 8
Χ # 8h5jhck8Is! F>Khc I Mh5 6cHHh5hI1 Mh5
sha<:oj1jhI <l5lNhjh5I hIja∋5c<:jq ?cI eh5j Mh5 &hajs5>2h! Fhk<:h5 8Ijh5 Mchah58h5jhck8Is 8IFl:5a<:hcIkc<: caj! a∋5c<:j MlH55! Mlaa Mch Γ8kk:≅∋>j:hah Hlka<: cajq eh5 lIhcIh5 l8aH5:5kc<:hI _h5khcj8Is Mh5 8h5jhck8Is Mh5 &hajs5>2h cIjh5haach5j caj! ahc l8H Α8hkkh+∀<:A,. )h5FchahIq :8N ∀csIcHcGlI1Ic)hl8 )h5FhIMhj NlI lka 8h5skhc<:aFh5j Mla
%A( & # Α8lIjck Mh5 hIja∋5h<:hIMhI 7Χ # 8h5jhck8Isq Jaj Mch &hajs5>2h s5>2h5
lka Mchaha Α8lIjck! a> caj Mch el:5a<:hcIkc<:Ghcj Mlaa _Ν, G>55hGj caj ah:5 sh5cIs! 8IMNlI GlII Mch Γ8kk:≅∋>j:hah )h5Fh5HhIq
% &-H42E>0.>-= ∀K- ∋2LE#F49?J:H4E :>! I:2!K∀#∃4HH4
JN )>5:h5sh:hIMhI pKa<:Icjj F85MhI h5ko8jh5j! F>5l8H ha Khc Mh5 =Ijh5a8<:8Is hcIh5∀jc<:∋5>Kh l8H Mch L5lsh >K Mchah hcIh5 ml5G>)#∗hjjh hIja∋5c<:j lIG>NNjq Γ8I Fh5MhIMchah j:h>5hjca<:hI ΙKh5khs8IshI l8H J5ca#&hN∋kljha lIshFhIMhj! Fhk<:h Mh5 6ljhIKlIG
132

7p∀Jp 80 hIjI>NNhI F85MhIq 6ch =Ijh5a8<:8Is Mh5 :hckhI Mh5 J5ca#&hN∋kljha kchHh5jhMch H>kshIMh ΙKh5slIsaNlj5crΗ
%,qΛ/,Ο ,q,AΧ0 ,qΧ/Χ− ,q,,/Χ,qΧ0/Χ ,qΛ/ΠΕ ,q,,0Ο ,q,AAΠ,q,A,Λ ,q,,// ,qΛ−,Ο ,qΧΧ/Λ,q,,/, ,qΧAΕΟ ,q,AΧΛ ,qΛ−ΛΕ
&JN 3l:NhI Mchah5 p5Khcj F85Mh I8I 8Ijh5a8<:j! >K ac<: Mla 8h5:lkjhI Mh5 ∀∋lkjhI hcIhaJ5ca#&hN∋kljha l8<: Ncjjhka hcIh5 ml5G>)#∗hjjh Ml5ajhkkhI koaajq _ch5H55 F85MhI l8a MhI&hN∋kljha Mh5 )h5FhIMhjhI J5ca#∃ckMh5 I85 ;hIh ∀∋lkjhI )h5FhIMhj! Fhk<:h 18 NcIq Ε,Θac<:jKl5 acIM! lka> H55 Mch p8aFh5j8Is lI hcIhN J5ca#∀<lIIh5 18 Ε,Θ )h5FhIMKl5acIMq6la m>Mhkk Mh5 ml5G>)#∗hjjh F85Mh 8Ijh5 8h5FhIM8Is )>I A,, J5ca#&hN∋kljhaj5lcIch5j! 8IM H55 Mch 5hajkc<:hI ∃ckMh5 shjhajhjq =Ijh5 8h5FhIM8Is Mh5 mhj:>Mh l8a MhN)>5:h5sh:hIMhI pKa<:Icjj h5slK ac<: H>kshIMh ΙKh5slIsaNlj5crΗ
%,q/ΟΧ, ,qΧ,−A ,qΧAΛA ,q,Π/Ο,qΧ,ΠA ,q/ΟΕΛ ,q,Π−Χ ,qΧ,Π,,qAΠΛ, ,q,ΟΕA ,qΕ,−/ ,qΧAA−,q,Ο/− ,qAΠΛ/ ,qΧ,Ε/ ,qΕAΧ−
&mlI GlII lI Mchah5 mlj5cr h5GhIIhI! Mlaa ac<: shIl8 Fch Khc Mh5 :hckhIFhcahI∃hj5l<:j8Is Mh5 :8ajlIM Mha Il<:H>kshIMhI ?khNhIjha Ncj s5>2h5 el:5a<:hcIkc<:Ghcj%<lq Ε,Θ( MhN :8ajlIM Mha )>5:h5sh:hIMhI ?khNhIjha hIja∋5c<:jq JN 6hshIalj1 1851hckhIFhcahI ∃hj5l<:j8Is Mh5 J5ca#&hN∋kljha GlII NlI lkkh5McIsa GhcIh pKH>ksh cI Mh53hc:hIH>ksh Mh5 hcI1hkIhI :8ajoIMh h5GhIIhIq 6chah5 ?HHhGj G>IIjh Ml5l8H1855<G18H5:5hI ahcI! Mlaa NlI Khc Mh5 :hckhIFhcahI ∃hj5l<:j8Is Mh5 &hN∋kljhalIIo:h5IM Mh5 Ilj55kc<:hI ∀j58Gj85 Mh5 J5ca H>ksj! Fo:5hIM NlI Khc Mh5 ∀∋lkjhIFhcahI∃hj5l<:j8Is h:h5 ahIG5h<:j 185 ∀j58Gj85 Mh5 J5ca sh:jq
:85 ΙKh5∋55H8Is F85Mh Mh5 9cGkc:>>M#3ljc>#&haj l8a MhN )>5:h5sh:hIMhI pKa<:IcjjM85<:shH5:5jq 6hjhajhj F85MhI Mch H>kshIMhI _≅∋>j:hahIΗ
_,Η 6ch ∀∋lkjhI hIja∋5h<:hI hcIh5 ml5G>)#∗hjjh Mh5 45MI8Is , %Mq:q pkkh ?cIj5oshacIM 8IlK:oIscs )>IhcIlIMh5(
shshI
_AΗ 6ch ∀∋lkjhI hIja∋5h<:hI hcIh5 ml5G>)#∗hjjh Mh5 45MI8Is A
=Ijh5 _, Fh5MhI lka <l5lNhjh5 Mch ?cIj5cjjaFl:5a<:hcIkc<:Ghcj Mh5 hcI1hkIhI :8ajoIMhsha<:oj1jq 6ch 18sh:>5csh k>sl5cj:Nch5jh 9cGkc:>>M#L8IGjc>I IcNNj lka mlrcN8N MhIH>kshIMhI eh5j lIΗ
E%5,&"(AqΧΟ−*A,−
=Ijh5 _A F85MhI Mch ΙKh5slIsaFl:5a<:hcIkc<:GhcjhI l8a Mh5 >KhI l8HshH5:5jhI mlj5crsha<:oj1jq 6ch :ch518 sh:>5hIMh k>sl5cj:Nch5jh 9cGkc:>>M#L8IGjc>I IcNNj lka mlrcN8NMhI H>kshIMhI eh5j lIΗ
133

E%5A&"(AqA/−Χ*A,Λ
p8a MchahI 65>2hI Kh5h<:Ihj ac<: Mch &hajs5>2h & 18 H>kshIMhN eh5jΗ
%"Χ*%3 %5A&(3 %5,&&"ΧqΟ,Ε−*A,−
pka pI1l:k Mh5 L5hc:hcjas5lMh Mh5 7:c#Α8lM5lj#8h5jhck8Is h5scKj ac<:
IΜA−#/ΜAΧ
6h5 eh5j Mha Α8lIjcka 18N ∀csIcHcGlI1Ic)hl8 ",q,,Ε Khj5osj ΧΟq0q
6l Mch &hajs5>2h Mh8jkc<: s5>2h5 caj lka ΧΟq0 N8aa Mch Γ8kk:≅∋>j:hah )h5F>5HhI Fh5MhIq6l5l8a h5scKj ac<:! Mlaa ac<: Mch ∀∋lkjhI hcIha J5ca#&hN∋kljha hIja∋5h<:hIM hcIh5ml5G>)#∗hjjh Aq 45MI8Is )h5:lkjhIq
∃hc Mh5 ∗>NKcIljc>I Mh5 1hckhIFhcahI ml5G>)#∗hjjh 8IM Mh5 a∋lkjhIFhcahI ml5G>)#∗hjjh 18 hcIh5 1FhcMcNhIac>IlkhI ml5G>)#∗hjjh Il<: MhN m>Mhkk )>I +7:Γ,Λ.! F85Mh
)h5a8<:j Ncjjhka )h5a<:chMhIh5 8hGj>5I>5NhI Mch <l5lNhjh5 ) 6+ 18 Kh5h<:IhIq L55 Mch
9>a8Is Mha 4∋jcNch58Isa∋5>KkhNa F85Mh Mch mljklK#L8IGjc>I ΡGj5kcIGΣ )h5FhIMhjq 6ch8h5FhIMhjhI 8hGj>5I>5NhI Fl5hI Mch cI +7:Γ,Λ. )h5FhIMhjh mlrcN8N#Γ>5N 8IM Mch∋#Γ>5NhI Ncj 189A!Χ !0:
pkkh 4∋jcNch58IshI GlNhI 18 MhN ?5shKIca! Mlaa cI MchahN Llkk)AΧ"A?8! )ΧA"A q 6l Mcha Mch <l5lNhjh5 acIM! Fhk<:h lka 6hFc<:j8Is Mh5
?cI:hcjaNlj5cr )h5FhIMhj Fh5MhI! F55MhI Mch hcI1hkIh ΙKh5slIsaNlj5c1hI Mh5KhjhckcsjhI hcIMcNhIac>IlkhI ml5G>)#∗hjjhI Ic<:j Kh55<Gac<:jcsj Fh5MhIq 6cha koaaj I85MhI ∀<:k8aa 18! Mlaa ac<: Mch J5ca#&hN∋kljha Ic<:j lka 1FhcMcNhIac>Ilkh ml5G>)#∗hjjhIl<: MhN m>Mhkk )>I +7:Γ,Λ. Ml5ajhkkhI klaahIq
:8G5IHjcsh =Ijh5a8<:8IshI a>kkjhI ac<: Ml:h5 l8H lIMh5h m>Mhkkh 8Ijh5 8h5FhIM8Is Mh5ml5G>)#?cshIa<:lHj G>I1hIj5ch5hIq ?cIcsh Mchah5 m>Mhkkh Fh5MhI cN Il<:H>kshIMhIpKa<:Icjj Kha<:5chKhIq ?cIh Fhcjh5h m>skc<:Ghcj Khajh:j Ml5cI! Mch :hckhI 8IM ∀∋lkjhIMh5 J5ca#&hN∋kljha Ic<:j lka 1Fhc 8IlK:oIscsh ml5G>)#∗hjjhI 18 Khj5l<:jhI! a>IMh5I H55hcI ?khNhIj MhI Mc5hGjhI 8>5soIsh5 cI Mh5 :hckh 8IM cI Mh5 ∀∋lkjh lka ?khNhIjh Ncj?cIHk8aa l8H MhI :8ajlIM Mha lGj8hkkhI 18 Khj5l<:jhIq
( I:2!K∀#):-<K9#∗L4J< >-< +L<<4-#I:2!K∀#IK<4JJ4
?cIh lIMh5h L>5N Mch ml5G>)#?cshIa<:lHj 18 Kha<:5hcKhI caj Mla ml5G>)#3lIM>N#LchkMq eo:5hIM Khc hcIh5 hcIMcNhIac>IlkhI ml5G>)#∗hjjh I85 )>5:h5sh:hIMh ?khNhIjhcI hcIh5 6cNhIac>I MhI :8ajlIM hcIha Il<:H>kshIMhI ?khNhIjha KhhcIHk8aahI! Fc5M Mh5:8ajlIM hcIha ?khNhIjha cI hcIhN ml5G>)#3lIM>N#LchkM )>I lkkhI KhIl<:Kl5jhI<8IGjhI KhhcIHk8aajq 6lNcj NlI KhIl<:Kl5jh <8IGjh Khaah5 MhHcIch5hI GlII! Fc5M hcIml5G>)#3lIM>N#LchkM lka hcI 65l∋: Ml5shajhkkjq 6ch ∗I>jhI Mha 65l∋:hI hIja∋5h<:hIMhI ?khNhIjhI hcIh5 ml5G>)#∗hjjh! 8IM Mch ∗lIjhI MhHcIch5hI Mch Γl<:Kl5a<:lHjq ?cIa>k<:ha ml5G>)#3lIM>N#LchkM MhHcIch5j Ml:h5 hcI Γhl5haj#Γhcs:K>5#m>Mhkk! Fch ha cIMh5 ∃ckMKhl5Khcj8Is 185 ∀hsNhIjch58Is )h5FhIMhj Fh5MhI GlIIq 6l NlI Mch J5ca#&hN∋kljha 5Kh5 hcIh ∀hsNhIjch58Is Mha J5ca#∃ckMha h5Ncjjhkj! GlII NlI 18G5IHjcs
134

8h5a8<:hI! >K NlI Ncj hcIhN ml5G>)#3lIM>N#LchkM hcIh Khaah5h 6l5ajhkk8Is hcIha J5ca#&hN∋kljha h5:okj lka Ncj hcIh5 ml5G>)#∗hjjhq
?cI ∀∋h1clkHlkk Mha ml5G>)#3lIM>N#LchkMa caj Mla JacIs#m>Mhkkq 6chaha m>Mhkk GlIINlI )h5FhIMhI! FhII NlI Mch J5ca#∃ckMh5 cI hcIh5 5hcIhI ∃cIo5Ml5ajhkk8Is a∋hc<:h5jq JIpKa<:Icjj hcIa F85Mh h5Fo:Ij! Mlaa Mcha 185 8h5cHc1ch58Is l8a5hc<:hIM cajq 6la JacIs#m>Mhkk F85Mh hIjFc<Ghkj! 8N Mch eh<:ahkFc5G8Is )>I ?khNhIjl5NlsIhjhI8Ijh5hcIlIMh5 18 Kha<:5hcKhIq _ch518 F85MhI lka :8ajoIMh Mh5 ?khNhIjl5NlsIhjhI Mchp8a5c<:j8Is 18hcIlIMh5 )h5FhIMhjq 6ch mlsIhjhI G>IIjhI hIjFhMh5 skhc<: >Mh5shshIaoj1kc<: l8ash5c<:jhj ahcIq ?a F85Mh lka> hcIh 5hcIh ∃cIo5<>Mch58Is )h5FhIMhjq 6h58>5jhck Mha JacIs#m>Mhkka shshI5Kh5 MhN 5hcIhI ml5G>)#3lIM>N#LchkM Khajh:j cI h5ajh59cIch Ml5cI! Mlaa NlI l8<: Mch p8aFc5G8Is )>I Fhcjh5 hIjHh5IjhI <8IGjhI cI shFc<:jhjh5L>5N l8H MhI lGj8hkk Khj5l<:jhjhI <8IGj Kh55<Gac<:jcshI GlIIq eh5 ac<: Fhcjh5 5Kh5ml5G>)#3lIM>N#LchkM 8IM Mla JacIs#m>Mhkk cIH>5Nch5hI N><:jh ahc l8H Α8hkkh+∗39Ο,. )h5FchahIq
?cIh Fhcjh5h L>5N Mch ml5G>)#?cshIa<:lHj 18 8Ijh5a8<:hI Kchjhj Mla _cMMhI#ml5G>)#m>Mhkk %_mm(q ?cI _mm Khacj1j Fch ;hMha ml5G>)#m>Mhkk hcIhI hIMkc<:hI:8ajlIMa5l8N ; q ΦhM><: acIM Ic<:j Mch 5hlkhI :8ajoIMh Mh5 hcI1hkIhI ?khNhIjhKhGlIIj! a>IMh5I I85 eh5jh l8a MhN mhaa5l8N :q Γ8I caj H55 MhI :8alNNhI:lIs1Fca<:hI ; 8IM : Ml5cI shshKhI! Mlaa NlI H55 ;hMh mhaa8Is : Ncj hcIh5
KhajcNNjhI el:5a<:hcIkc<:Ghcj hcIhI :8ajlIM l8a ; Fo:kjq JN 6hshIalj1 18N5hcIhI ml5G>)#m>Mhkk GlII NlI lka> I85 hcIh el:5a<:hcIkc<:Ghcj H55 MhI :8ajlIM hcIhaKh>Kl<:jhjhI ?khNhIjha shKhIq 6l NlI 185 ?5ajhkk8Is hcIha J5ca#&hN∋kljha 18Io<:aj I85mhaaFh5jh l8a MhN ;hFhcka )h5FhIMhjhI Lckjh5 h5:okj 8IM Mcha mhaaFh5jh lIa<:kch2hIMcI hcIhI :8ajlIM Mha ;hFhckcshI ?khNhIjha 5Kh5ahj1j! Kchjhj Mla _mm hcIhI N>skc<:hIpIalj1 H55 Fhcjh5h =Ijh5a8<:8IshI Mh5 J5ca#&hN∋kljha! Mh5 h)hIj8hkk a>sl5 a<:>I Khc MhImhaaFh5jhI lIahj1hI GlIIq
, ∗:DLH
6ch )h5a<:chMhIhI ml5G>)#m>Mhkkh KchjhI Mc)h5ah pIalj1N>skc<:GhcjhI 8N MhI p8HKl8)>I J5ca#&hN∋kljha 18 8Ijh5a8<:hIq mcjjhka hcIha 9cGkc:>>M#3ljc>#&hajha Fhk<:h5 cIpKa<:Icjj ΧqΧ Kha<:5chKhI Fc5M! F85Mh Il<:shFchahI! Mlaa J5ca#&hN∋kljha a>F>:k1hckhIFhcah lka l8<: a∋lkjhIFhcah shkhahI hcIh5 ml5G>)#∗hjjh h5ajh5 45MI8Is shI5shIq6ch &ljal<:h Mlaa Mch :hckhI 8IM Mch ∀∋lkjhI hcIha a>k<:hI &hN∋kljha ;hFhcka hcIhml5G>)#∗hjjh h5ajh5 45MI8Is KckMhI! KhMh8jhj! Mlaa Mh5 p8HKl8 Mh5 J5ca KhajcNNjhI6hahj1No2csGhcjhI 8Ijh5F>5HhI cajq p8<: Mch ∃h:l8∋j8Is )>I +_p6,−.! Mlaa NlIIc<:ja 5Kh5 Mch ∗>55hkljc>IhI cIIh5:lkK hcIha J5ca#&hN∋kljha alshI GlII! FhII NlI MhIJ5ca#7>Mh Ic<:j GhIIj ! Fc5M M85<: Mch &ljal<:h FcMh5khsj! Mlaa a>F>:k :hckhI lka l8<:∀∋lkjhI hcIha J5ca#&hN∋kljha hcIh5 ml5G>)#∗hjjh h5ajh5 45MI8Is shI5shIq 6chah&ljal<:h N8aa NlI Khc 18G5IHjcshI 8h5a<:k5aahk8Isa)h5Hl:5hI H55 J5ca#∃ckMh5Kh55<Gac<:jcshIq 6chah 6hahj1No2csGhcjhI I><: shIl8h5 18 KhajcNNhI! caj Mch p8HslKh!Fhk<:h cI 18G5IHjcshI p5KhcjhI M85<:shH5:5j Fh5MhI N8aaq Φh Nh:5 NlI 5Kh5 MhIp8HKl8 Mh5 J5ca#∃ckMh5 8IM J5ca#&hN∋kljha :h5l8aHcIMhj! Mhaj> Khaah5h mhj:>MhI Mchahac<:h5 18 )h5a<:k5aahkI GlII NlI HcIMhIq ehII NlI Khc Mh5 8h5a<:k5aahk8Is Mch ∀j58Gj85Mh5 &hN∋kljha Kh55<Gac<:jcsj! GlII NlI h)jkq Ncj FhIcsh5 sha∋hc<:h5jhI 6ljhI
135

l8aG>NNhI lka Kca:h5q p8<: GlII NlI Khaah5h m>skc<:GhcjhI H55 MhI 8h5skhc<: 1Fhch5J5ca#∃ckMh5 h5l5KhcjhIq
−LH42:H>2∀42D4L0.-LE
+∃h:ΠΠ. ?q ∃h:5hIMa∋ JIj5>M8<jc>I j> ml5G>) 7:lcIa∋6@(@# ∋@!3## AΠΠΠ
+7:Γ,Λ. eq 7:cIs! ∀q ::lIs lIM mq Γsq 4I m8kjc#McNhIac>Ilk ml5G>) 7:lcI m>Mhka<l<cHc< Φ>85Ilk >H 4∋jcNc1ljc>I! Χ,,Λ
+∗39Ο,. ∗cIMh5NlII! 3>aa! 9l85chq ml5G>) 3lIM>N LchkMa lIM &:hc5 p∋∋kc<ljc>Iapm∀ %AΠΟ,(
+_63&,/. _hc;MhI! 68cI! 3cMMh5! &lrq 7klaacHcGljc>I! <l5lNhjh5 ?ajcNljc>I lIM ∀jljh ?ajcNljc>Ieckh≅ 8h5kls %Χ,,/(
+:&e,/. :q ∀8I! &q &lI! Τq elIs! 3>K8aj ?I<>McIs >H 9><lk 45McIlk mhla85haΗ p 6hIh5lkL5lNhF>5G >H J5ca 3h<>sIcjc>I<5><hhMcIsa >H JIjh5Iljc>Ilk e>5Ga:>∋ >I ∃c>Nhj5c< p8j:hIjc<ljc>I %∃c>pe(9h<j85h Γ>jha cI 7>N∋8jh5 ∀<chI<h! 8>kq0,ΟΛ! Χ,,/
+_p6,−. Lq _l>! 3q pIMh5a>I! Φq 6l8sNlIq7>NKcIcIs <5≅∋j> Fcj: Kc>Nhj5c<a hHHh<jc)hk≅
$))) %!#85#∗>6J85 J8 +JA1?>@!5! 8>kq ΕΕ! Γ>q Π! Χ,,−
+∀<:A,. Lq ∀<:Fhcsh5q 9cGhkc:>>M#Klach5jh mhj:>MhI H55 Mla &hajhI hcIh5 hIMkc<:hI pI1l:k )>I:8ajoIMhI cI 8IlK:oIscshI 8IM ml5G>)lK:oIscshI mca<:8IsaN>MhkkhI6c∋k>Nl5Khcj Ll<:Kh5hc<: mlj:hNljcG! <:ckc∋∋a#=Ic)h5acjoj ml5K85s! Χ,A,
136

A Versatile Iris Segmentation Algorithm
P. Radu, K. Sirlantzis, G. Howells, S. Hoque, F. Deravi
School of Engineering and Digital Arts
University of Kent
Canterbury
United Kingdom
Abstract: In biometric authentication, iris recognition was shown to be one of the
most accurate techniques. In unconstrained environment and capture conditions
(e.g. with hand-held devices used outdoors), the iris image may be contaminated
by noise and distortions which makes the iris segmentation and recognition process
difficult. This paper presents a novel iris segmentation algorithm that addresses
some of the issues raised by unconstrained iris recognition. There are two main
contributions in the present work: first, the proposed segmentation algorithm is
able to cope efficiently with both near infra red and visible spectrum images;
second, the algorithm speed can be increased significantly with a minimal
reduction in accuracy. The versatility of the algorithm has been tested using both
near infrared iris images acquired with a hand-held device and colour iris images
acquired in unconstrained environment.
1 Introduction
The iris was shown to be a strong biometric modality, remaining stable over many
decades. Iris Recognition systems with high accuracy have been built [Da04] since the
early 90’s. Although high accuracy can be obtained using iris biometrics, there are no
implementations yet on common portable devices, such as laptops or cellphones, mainly
because of the constraints required for the capture and recognition process. Generally,
these constraints refer to the need for near infra red illumination and the high degree of
cooperation from the user. Usually the user is asked to stay very close to the acquisition
device, to align his eyes with the device and to stand still for a few moments.
An Iris Recognition system may be considered as consisting of five main stages:
acquisition, segmentation, normalization, feature extraction and classification or
matching. In the recent past, several iris recognition techniques have been proposed
[Ma06], where the distance between the user and the device may exceed 1 meter and the
degree of cooperation from the user does not have to be large. At present, the research in
iris recognition is focused on non-cooperative and unconstrained operations of these
biometric systems. In such systems, the ‘segmentation’ stage of iris recognition plays a
vital role because feature extraction from non-iris texture will be useless.
137

Iris recognition from hand-held devices, where the device could have near infra red
illumination or on wall-mounted devices, where the user is semi-cooperative can be
considered unconstrained. In this paper we present a novel iris segmentation algorithm
that is able to work in both near infra red and visible spectrum with good performance.
As far as we know, this is one of the first iris segmentation algorithms capable of
achieving acceptable accuracy in both wavelengths spectrums. The difficulty with which
a segmentation algorithm performs well in different spectrums is mentioned in [PA05],
where the UBIRISv1 [PA04], a colour iris image database is presented. The authors of
[PA05] have implemented several iris segmentation techniques and tested them on
UBIRISv1 database and on CASIA v1 database [In04], which has near infra red iris
images. They observed and reported numerically that the algorithms were performing
well either on visible spectrum or on near infrared iris images, but not on both
wavelength domains. The importance of a segmentation algorithm performing
acceptably on both kinds of data consists in making the iris detector adaptable for
different types of iris recognition systems deployed either in a constrained environment
or in a more non-cooperative scenario.
A second contribution of this paper is the speed at which this algorithm is capable of
roughly segmenting both the iris and the pupil. With only approximately 3% reduction
accuracy comparing to normal operation, the proposed algorithm is capable to segment 2
images per second when running on an entry-level computer, i.e. single core processor
with 2-4 GB of RAM. This processing time places the proposed method among the
fastest iris segmentation algorithms available in the literature for colour iris images.
To encourage the efforts of researchers in segmenting noisy iris images, acquired in less
constrained environment and visible light, a worldwide competition has been organized.
This competition was called Noisy Iris Challenge Evaluation (NICE) [PA07] and it took
place in 2 parts: Part 1 assessed only the segmentation of a subset of UBIRISv2 [Pr10]
and Part 2 the classification algorithms were assessed on the same images. The winning
algorithm for segmentation is depicted in [THS10] and for part 2 the algorithms will be
published soon.
Among the iris segmentation algorithms that have been reported the most popular is the
integro-differential operator used in [Da04], which is being implemented on the most of
the commercial iris recognition systems. Another well-known iris detection method is
described in [Wi97], where Canny edge detector and Hough Transform were used in a 2
steps approach. Inspired by the principle of the integro-differential operator, new
operators have been developed for iris segmentation in [CW04], [MSS02] and [Tu94].
In the literature, usually an iris segmentation algorithm is said to be robust if its
performance does not decrease as the noise and distortions in the images is increased
[PA06]. However, the term robust is wider for an iris segmentation method. For
example, the robustness could include the versatility of the algorithm in segmenting both
near infra red and colour iris images with comparable accuracy. Moreover, the
segmentation algorithm is robust if it can be adapted to improve its throughput with a
minimal reduction in accuracy. The method described in this paper was designed
according to this extended definition for the robustness of a segmentation algorithm.
138

The remainder of this paper is organized as follows: in section 2 the details of iris and
pupil segmentation are given. In section 3 an enhancement to the pupil segmentation is
described and in section 4 the experimental results are reported. Conclusions are given in
section 5.
2 Proposed Segmentation Algorithm
Both the iris and pupil have approximately the shape of a circle if the image of the eye
does not include strong off-angle deformation. Therefore a circle detection method could
be used to segment the iris and pupil. According to [Da04] the minimum radius of the
iris has to be 70 pixels, so that the iris texture from the image is useful for recognition.
The iris image dimensions should, therefore, be high enough to include an iris diameter
of at least 140 pixels, but if they are very large, then the possible iris radius will lie in a
range from 70 to a high value. This will make the segmentation process very time
consuming. To avoid such situation, circle detection algorithms are usually provided as
parameters the upper and lower limits of the radius of the iris and the pupil. For a certain
dataset, these limits are known. The algorithm depicted in this paper uses the same
approach.
The iris segmentation method proposed in this paper is able to work both on near infra
red images and colour images with similar performance. The segmentation of the iris and
pupil described in this section will be exemplified on colour images from UBIRISv1
dataset [PA04]. For a better understanding, a block diagram of the system is presented in
Figure 1.
Figure 1: Block diagram of the segmentation algorithm
139

2.1 Iris Detection
In an un-constrained environment, where near infra red illumination is not possible, only
visible spectrum (e.g. colour RGB) iris images are available. For iris segmentation we
have used only the red channel. To cope with illumination variations of the iris image, a
dynamic contrast adjustment was made. The adjustment parameters depend on the
average intensity of all pixels from the red channel iris image. The image was then
binarized using a threshold depending on the average intensity of all pixels. The effects
of these transformations are shown in Figure 2. After binarization, a spur morphological
transformation has been applied to the image in order to eliminate the isolated white
pixels from the iris region and black pixels in the sclera.
a) b) c) d)
Figure 2: Iris image transformations: a) original RGB image from UBIRISv1 dataset; b) red channel
image; c) image after contrast adjustment; d) binarized iris image.
Now the iris is a black circular disc and clearly separated from the rest of the image. To
determine accurately where the centre is and the corresponding radius, a simple
geometrically-based method is used. Any pixel within the rectangle obtained by
subtracting the minimum iris radius from each side of the image is considered a potential
candidate to the centre of the iris. The reduced search space was chosen such as the iris
is not partially out of the image and for increased speed. The centre of the iris is insured
to be inside the rectangle. Still, this approach enables the method to detect the iris even if
it is not centred or the user is looking to the left or right.
The underlying principle behind the proposed segmentation algorithm is a simple one:
the distances from the centre of the iris to its boundary should be equal. Each pixel
within the isolated rectangle is considered the intersection point of 3 lines at predefined
slopes. One line was drawn out in the horizontal direction and the other two were
symmetric to the first line, as shown in Figure 3. For each pixel that is the intersection of
3 lines, 6 line segments are scanned along, starting at a distance from the maximum iris
radius to the minimal iris radius, measured from the intersection. The scanning directions
are from the end points of the lines towards the intersecting pixel. Then the Euclidean
distances are computed from the white to black transition to the intersecting pixel. The
transition from white to black along a line segment is considered to be the transition
from the longest white segment to black, when scanning towards the intersection pixel.
In total there are 6 distances. To speed up the segmentation process, the original image is
downsized by a factor of 4.
140

In our implementation, the slopes of the line segments used are within ± 30o
about the
horizontal. The slopes were chosen so that occlusions from the top and bottom of the iris
are avoided. Exact slopes of the lines are not very important and small variations do not
have any significant effect on the performance of the algorithm.
Figure 3: Potential iris centre locations are the intersection of 3 lines
After obtaining the 6 distances, the centre of the iris is assigned to the pixel which is
located at an approximately equal distance from all the 6 white to black transitions. If we
denote the 6 distances with disti, where i=1,...,6, and (k, l) є S, where S is the reduced
search space, the coordinates of the iris centre (ir, ic) are chosen according to equation
(1).
(1)
The iris radius irisRad is obtained with the following equation, considering that the 6
distances correspond to the pixel found with equation (1):
(2)
141

The rationale behind having 3 lines, respectively 6 segments is to avoid confusing the
algorithm when black isolated regions are located in the sclera. If only 2 lines are
considered and some isolated black pixels are in the sclera, the method will incorrectly
detect the iris. Other variations of this method could be obtained by enlarging the
number of lines and segments to be scanned. When speed is not essential, more than 3
lines could be considered to improve the segmentation accuracy. Also, the speed may be
increased by enhancing the search method for the centre pixel. If only the black pixels
are considered in the algorithm, the number of pixels that are potential centres of the iris
is significantly reduced. Another way of reducing the search space is to consider every
other pixel instead of repeating the process for all the pixels within the rectangle. Time
execution could be also reduced by starting with the pixels from the centre of the
rectangle and stop when it is observed that the value returned by (1) is increasing
repeatedly for the following pixels.
2.2 Pupil Detection
When acquiring iris images in the near infrared spectrum, the pupil’s colour is almost
black and it is very easy to segment if there are no occlusions present. This is due mainly
to the fact that under near infrared lighting, specular and difuse reflections are normally
not present in the image. The reflections are not captured under near infrared
illumination because of melanin pigment present in the iris, which is not visible in near
infrared spectrum. For iris images captured under visible wavelength the boundary
between the pupil and the iris is less distinguishable than in near infrared and moreover,
the pupil becomes more difficult to segment because of the reflections that are present in
the image. Therefore, a segmentation method designed for near infra red iris images is
likely to perform worse on visible wavelength images and vice versa.
Usually, in colour iris images a specular reflection is present in the pupil or at the
boundary between the pupil and the iris. The algorithm uses only the region from the
image that is inside the detected iris. In this way we ensure that the pupil will not be
detected outside the iris. We employed as a first step a threshold-based technique that is
used to detect specular reflections inside the iris. After the specular reflections have been
detected, the average of the intensity of the remaining pixels from inside the iris was
calculated. This average value was then used to dynamically adjust the parameters of a
contrast adjustment operation, as described in subsection 2.1. The parameters were
obtained empirically. Bearing in mind that the iris and pupil are not concentric but their
centres are located close one to each other, the search area for the pupil centre can be
significantly reduced. A rectangular region of interest is formed having the centre of
mass the centre of the iris and the width and length obtained with Equation (3). The
parameters in equation (3) have been obtained experimentally. The results of these steps
are shown in Figure 4.
(3)
where irisRad is the radius of the detected iris.
142

a)b)
Figure 4: Pupil segmentation: a) cropped iris image from red channel; b) iris after contrast
adjustment and the rectangle containing the pupil’s centre.
This considerably speeds up the pupil segmentation process. The problem that may
occur using this approach is when the iris is not correctly located. If the iris is not
correctly roughly segmented, the pupil segmentation will not be successful, as our
algorithm will try to locate the pupil only inside the iris. This will rarely happen, since
the method proposed for iris detection yields a very high accuracy in roughly locating
the iris, i.e. over 99%, as reported in experimental results section.
It can be observed from Figure 4 that after contrast adjustment the pupil became very
well separated from the iris texture. For segmenting the pupil, we consider all the pixels
inside the rectangle defined with (3) as possible centres of the pupil. Each of these pixels
is considered the centre of two concentric circles, one with a radius smaller with two
pixels than the other. The 2 circles will have a radius ranging from the minimum to the
maximum possible pupil radius. Figure 5 illustrates this scheme. For each pair of circles,
the difference between the values of the pixel intensities of the larger circle and the
pixels of the smaller circle is computed. To speed up the process, only 30 corresponding
pixel positions along the arcs of the circles are considered, i.e. with a step of 12 degrees.
Figure 5: Pairs of concentric circles used for pupil segmentation.
143

For each pair of circles there are 30 differences. Let these be denoted by diffi, where
i=1,...,30 and the centre of the pupil be (cr, cc). If rmin and rmax are the minimum and
maximum possible radiuses of the pupil, (k, l) є S and S is the area defined by (3), the
coordinates of the centre of the pupil will then be determined according to equation (4).
(4)
The rationale behind this approach is to maximize the sum of differences of pixels
intensities, between pixels that are positioned on two concentric circles. The centre of
the circles with the maximum difference will be the pupil’s centre.
2.3 Near infrared operation
The operation of the proposed algorithm in near infra red domain is slightly different
than that in colour domain. First, the pupil is detected in a near infra red iris image, not
the iris, as in colour images, because the pupil in near infra red spectrum is very dark and
easy to segment. The interesting thing is that the method described in section 2.1 for iris
segmentation is used for pupil segmentation in near infra red images and the method
described for pupil segmentation in Section 2.2 is used for iris segmentation.
For pupil detection, a simple contrast adjustment operation is sufficient to leave only the
pupil and eyelids and eyelashes in the image. The region of interest for pupil is restricted
to a rectangle obtained by subtracting the minimum iris radius from each side of the
image. Then, the method described in subsection 2.1 is applied to find the pupil.
After finding the pupil’s centre and radius, the search space for iris centre will be
reduced only to the pixels inside the detected pupil. Those pixels will become the centres
of the two concentric circles and the iris-sclera boundary is found by applying equation
(4). Based on the image, the correct mode (color or infrared) is chosen by the algorithm.
3 Pupil Segmentation Enhancement
For further improving the segmentation algorithm, some additional operations were
incorporated to cope with more ‘difficult to segment’ iris images. In visible spectrum
some iris images are captured under poor illumination and the boundary between the iris
and the pupil are almost unnoticeable. Also strong reflections could have the similar
effect. An iris image from UBIRISv1 dataset, Session 2, affected by these types of
noises is shown in Figure 6a.
144

a) b)
Figure 6: a) Noisy iris image, where the iris-pupil boundary is difficult to distinguish; b) Contrast
adjustment for pupil detection in noisy iris images
As noticeable from Figure 6a, the intensity values of the pixels inside the pupil are not
very different from those belonging to the iris texture. This fact will make the contrast
adjustment operation not so effective in highlighting the pupil as it was before. The
effect of the contrast adjustment for pupil detection for the image from Figure 6a is
shown in Figure 6b.
To make the algorithm robust to imperfections such as noise and occlusions, especially
to images captured under poor illumination, we propose an enhancement based on other
colour spaces than RGB. When converting from RGB colour space to HSI, we observed
that in hue and in saturation channels, the area pf the pupil from the original RGB image
is clearly distinguishable. The gray-scale images of hue channels of the same image from
Figure 6a is shown in Figure 7a.
a) b)
Figure 7: a) Iris image in hue channel; b) Contrast adjustment augmented with information from
HSI colour space for pupil segmentation
The hue channel has also been used for pupil segmentation in [PA06] and in [FC10], but
in the present algorithm we use the information from saturation channel also.
Empirically observing that the pupil in the hue channel has values between 130 and 170
and in the saturation channel has values between 70 and 130, we created a binary mask
of the pupil from both hue and saturation channels. A combined mask for the pupil was
obtained by AND operation of the 2 masks. The combined mask was used then to assign
to the corresponding pixels from the red channel a low value. The contrast adjusting
from Figure 6b was complemented with the information from hue and saturation
channels, yielding the images shown in Figure 7b. Using the information from HSI
colour space, the pupil becomes visibly easier to segment.
145

4 Experimental Results
4.1 Databases
The robustness of the proposed segmentation algorithm was assessed by using it to
segment both near infra red and colour images. The near infra red dataset used in our
experiments is CASIAv3 [In06], the Lamp subset, which has 16213 images from 411
users. The images were acquired using a hand-held device with a lamp turned on and off
to make the pupil to dilate. We ran the experiments on CASIAv1 [In04] also, for
comparison with other reported accuracies.
The second database used in our experiments is UBIRISv1 [PA04]. This database
consists of 1877 800x600 pixles, colour RGB images collected from 241 individuals in 2
sessions. The enrollment has been made using only the right eye with 5 images for each
user. In the first session the images are captured in a constrained environment, with
minimized noise factors. In the second session the environment is one with reduced
constraints and noise factors are present in the images, such as reflections, luminosity
variations and poor focus. In the first session, all 241 users have been enrolled, resulting
in a total of 1205 images, while in the second session, only 132 users out of the 241 are
enrolled.
4.2 Results
The proposed algorithm was implemented in Matlab environment. The machine used to
run the experiments had an Intel Core 2 Duo processor running at a frequency of 2.4
GHz and 4 GB of RAM. In order to be able to compare our results with other published
segmentation algorithms in terms of speed, only one core of the Intel processor has been
used.
The assesment of the algorithm was done by visually inspecting the segmented images.
The images have been reduced in size by a factor of 4 to increase the speed of the
algorithm. One iris image is considered correctly segmented if both the iris and the pupil
were segmented correctly, i.e. the circles are falling exactly on the edges of the iris and
pupil. For CASIA v3 dataset, Lamp subset, the obtained segmentation accuracy is
92.04%. The pupil segmentation accuracy is 98.15%.
For UBIRISv1 the segmentation accuracies for both Session 1 and 2 are comparable
with other reported results in the literature. For Session 1 we obtained 95.46% accuracy
and for Session 2 we obtained 87.03%. In [PA05] the authors have implemented a
number of iris segmentation algorithms to compare with their own. In Table 1 we
present their best 2 reported segmentation accuracies for the most popular algorithms for
UBIRISv1 and CASIAv1 datasets. The table shows that the algorithms are not
performing well on both near infrared images and colour images, while the proposed
algorithm does. The execution time for our algorithm is aproximately 2.97 seconds. This
time is comparable to the execution time needed by Daugman’s integro-differential
operator, which implementation we ran in aproximately 2.6 seconds.
146

Methodology UBIRISv1 CASIAv1
Daugman [Da04] 93.53 % 54.44 %Wildes [Wi97] 89.12 % 84.27 %
Proposed Methodology 92.46 % 91.97 %Table 1: Iris segmentation algorithms accuracies
Usually, segmentation is the most time consuming of all the stages in an Iris Recognition
system. The algorithm proposed in this paper can be adapted to work a faster with a
minimal reduction in accuracy by resizing the iris image. For iris boundary detection, the
image is reduced in size by a factor of 10 for UBIRIS v1 dataset, and for pupil
segmentation, the image is downsized 6 times.
In iris recognition the part of the iris texture that is closer to the pupil is richer and less
redundant in radial direction than the texture close to the outter boundary [Da04].
Therefore, the efforts in detecting very accurately the iris-sclera boundary could be
minimized by detecting it less accurately when speed is a critical requirement of the
application. When resizing an iris image 10 times, the proposed algorithm detects the
outer iris boundary in the smaller image, but when the circle coordinates are multiplied
by 10 to get to the original size, some of the circles do not fit exactly the outer iris
boundary. However, in pupil segmentation, the downsizing factor used was 6, as the
pupil segmentation accuracy is much more important in extracting useful features. In this
size reduction, the pupilary boundary can still be detected very accurately in most of
UBIRIS v1 images with original resolution 800 by 600 pixels.
After these modifications, the accuracy obtained for session 1 is 92.36% and for session
2 is 83.96%, with an average segmentation time of only 0.48 seconds. Therefore, with
approximately only 3% decrease of accuracy, the segmentation algorithm is almost 6
times faster, being suitable for realistic scenarios implementations.
5 Conclusions
Research in Iris Recognition is focusing more and more on unconstrained and non-
cooperative operation of these type of biometric systems. The noisy iris images coming
from an unconstrained environment are often difficult to segment and match. The need
for robust and fast segmentation algorithms determined the research community to
develop new methods to segment noisy iris images.
147

This paper proposes a novel iris segmentation method which is able to cope with noisy
images from both visible and near infra red spectrum with good performance. The
segmentation accuracies obtained are similar for the two wavelength domains. For iris
detection, the red channel was used in colour images. For pupil detection, the same red
channel of the original colour image is used, with additional information from hue and
saturation channels of HSI colour space. By resizing the image, the algorithm performs a
few times faster with a minimal reduction in accuracy. This makes the proposed
algorithm a good choice for embedded or hand-held devices. Experimental results on
UBIRIS v1 and CASIA v3 datasets prove the versatility of this algorithm. The methods
for iris and pupil detection could be also used as generic circle detection methods.
Acknowledgment
This work is part of the NOmad Biometric Authentication (NOBA) project funded by
ERDF under the Interreg IVA program (Ref. No. 4051) in collaboration with
ESIGELEC/IRSEEM.
References
[CW04] Camus, T. A.; Wildes, R. P.: Reliable and fast eye finding in close-up images. IEEE 16th
International Conference on Pattern Recognition, Quebec, Canada, 2004, pp. 389 – 394.
[Da04] Daugman, J.: How Iris Recognition Works. IEEE Transactions on Circuits and Systems
for Video Technology, vol 14, 2004, pp. 21-30.
[FC10] Filho, C. F. F. C.; Costa, M. G. F.: Iris segmentation exploring colour spaces. Image and
Signal Processing (CISP) 2010, 3rd International Congress on, pp: 1878 – 1882.
[In04] Inst. of Automation, Chinese Academy of Sciences: CASIA Iris Image Database.
http://www.idealtest.org/dbDetailForUser.do?id=1, May 2011.
[In06] Inst. of Automation, Chinese Academy of Sciences: CASIA Iris Image Database Version
3.0. http://www.idealtest.org/dbDetailForUser.do?id=3, May 2011.
[Ma06] Matey, J.R.; Naroditsky, O.; Hanna, K.; Kolczynski, R.; Lolacono, D. J.; Mangru, S.;
Tinker, M.; Zappia, T. M.; Zhao, W.Y.: Iris on the Move: Acquisition of Images for Iris
Recognition in Less Constrained Environments. Proceedings of IEEE, vol. 94, 2006, pp.
1936-1947.
[MSS02] Martin-Roche, D., Sanchez-Avila, C., Sanchez-Reillo, R.: Iris recognition for biometric
identification using dyadic wavelet transform zero-crossing. IEEE Aerosp. Electron.
Syst. Mag., 2002, 17(10), pp. 3–6.
[PA04] Proenca, H.; Alexandre, L. A.: UBIRIS Iris Image Database. http://iris.di.ubi.pl, May
2011.
[PA05] Proenca, H.; Alexandre, L. A.: UBIRIS: A Noisy Iris Image Database.
[PA06] Proenca, H.; Alexandre, L. A.: Iris segmentation methodology for non-cooperative
recognition. Vision, Image and Signal Processing, IEE Proceedings, vol 153, 2006, pp.
199-205.
[PA07] Proenca, H.; Alexandre, L. A.: Noisy Iris Challenge Evaluation – Part I.
http://nice1.di.ubi.pt/index.html, May 2011.
[Pr10] Proenca, H.; Filipe S.; Santos, R.; Oliveira, J.; Alexandre, L.A.: A Database of Visible
Wavelength Iris Images Captured On-the-Move and At-a-Distance. IEEE Transactions
on Pattern Analysis and Machine Intelligence, vol 32, 2010, pp. 1529 – 1535.
148

[THS10] Tan, T.; He, Z.; Sun, Z.: Efficient and robust segmentation of noisy iris images for non-
cooperative iris recognition. Image and Vision Computing, vol. 28, 2010, pp. 223 – 230.
[Tu94] Tuceryan, M.: Moment based texture segmentation. Pattern Recognition Letters, 1994,
v.15, pp. 659–668.
[Wi97] Wildes, R. P.: Iris Recognition: an emerging biometric technology. Proceedings of IEEE,
vol. 85 (9), 1997, pp. 1348 – 1363.
149


Designing a self-service terminal for capturing biometricdata for the German Identity Card and the Electronic
Passport
Stefan Pahmeier
Speed Intraproc GmbHWallstr. 16
40878 Ratingen
Germany
Abstract: Speed Intraproc has developed and is marketing a self-service terminalfor capturing biometric data for the German Identity Card and the ElectronicPassport. The Speed Capture Station is based on a solution being used in Sweden
since 2005 to capture photo, fingerprints and signature for the national passport. InSweden, the terminal is completely operated by an official, whereas the solutionfor Germany is a self-service terminal being used by the applicant independently,while the official is just retrieving the captured data during the application process.
During the design and the development of the self-service terminal several aspectshad to be considered. Among these were the compliance with national regulationslike Technical Guidelines by the Federal Office for Information Security and the
German Data Privacy Act, but also the requirement to provide an interface
allowing an easy integration of the data retrieval into the software in use at theidentity card and passport authorities. In this paper the main requirements, theirimplications and the related solutions which were implemented in the SpeedCapture Station are described, followed by a report about the first pilot operationof the terminal during the second half of 2010 in the city of Monheim am Rhein.
Final conclusions are drawn based on the information presented herein, including a
closer look at the benefits for different stakeholders like citizens, municipalitiesand others.
151

1 Introduction
About eight (8) million German Identity Cards1 and additional Electronic Passports are
issued per year. To apply for such a document, the applicant needs to provide a passport
photo, which needs to be a full frontal image for both, passport (since November, 2005)
and identity card (since November, 2010). Fingerprint capturing is mandatory for the
rcuurqtv. qrvkqpcn cpf fgrgpfgpv qp vjg crrnkecpvÓu fgekukqp hqt vjg kfgpvkv{ ectf0 VjgcrrnkecpvÓu ukipcvwtg pggfu vq dg ecrvwtgf hqt dqvj fqewogpts.
Usually, the passport photo is taken at a photographer or in a photo kiosk and printed
onto paper. At the identity card or passport authorities this photo is visually checked, cut,
pasted onto a corresponding form and scanned. This process already includes two media
breaks Î one at the photographers and one at the authorities Î and thereby a loss of
quality. It also makes the process vulnerable because the photo can be manipulated
before it is handed over to the official. Last but not least the process explained above
combined with the process of fingerprint capturing is quite time consuming.
Solutions to capture all biometric resp. image data digitally at the authorities have
already been implemented in other European countries some years ago. The solution
being used in Sweden since 2005 has been selected as a basis for the design and the
development of the new self-service terminal for capturing biometric data for the
German Identity Card and the Electronic Passport.
Hereafter, the main requirements and their implications on the design and development
of the terminal as well as the final product are described. Also a report about the first
pilot operation of the terminal in the city of Monheim am Rhein is given.
2 Solution in Sweden2
Since October 2005 the Swedish Police Board (Rikspolisstyrelsen) has been using the
Speed Capture Station, a terminal to capture biometric data digitally, developed and
operated by Speed Identity AB, Stockholm/Sweden.
Its introduction dates back to 2003 when the Swedish Police Board was asked to prepare
for the implementation of national passports including biometric information by the
Swedish government. The required solution was not only meant to respond to the
requirements concerning passports kpenwfkpi KECQÓu *International Civil Aviation
Organization) standards for biometric data as described in [ISO/IEC 19794-4] and
[ISO/IEC 19794-5], but should also cover forthcoming documents with biometric
information and make the application process easier, more efficient and secure. Forsecurity reasons an intact digital chain was requested where the image would be
1[MarXX], chapter 1 Einleitung
2Based on information provided by Speed Identity AB, e.g. [SI_Ref_SPB]
152

transferred directly and digitally from the camera to the official to decrease the risk of
manipulation and the loss of quality through media breaks. Furthermore it was required
that the whole capturing process could be monitored by an official. Every applicant
including children, elderly and disabled people needed to be able to use the solution.
The first prototype was tested in 2004 and as of October 1st, 2005 the Speed Capture
Station was up and running at about 100 different locations across Sweden.
When applying for a new document today, the whole process is carried out at one single
place without facing the need to go to a photographer or to use a photo kiosk. Applicants
go directly to the authorities, where they just step into a Speed Capture Station next to
vjg qhhkekcnÓu eqwpvgt yjgtg rjqvq. hkpigtrtkpvu cpf ukipcvwtg ctg ecrvwtgf yjkng vjgapplicants are guided through the whole process by an official. Having captured and
received the data, the official finalizes the application.
3 Situation in Germany and solution
In German municipalities, applications for national identity cards and passports are often
handled in service centres ecnngf ÐBürgerämterÑ qt ÐD¯tigtd¯tquÑ0 These facilities are
intended to offer citizens the possibility to deal with a number of regular administrative
issues at one central location. They enable citizens to deal with situations like for
example Ðpgy kp vqypÑ cv qpg ukping nqeation, often by dealing with only one official,
which saves citizens time and effort.3
Given that, just taking the solution being used in Sweden was not an option. Neither is
there enough space to place a Speed Capture Station next to each desk in such facilities
nor would each unit be fully utilized, as applications for national identity cards and
passports are just part of the issues handled by each official. Using centralized operated
units to be shared by several desks or officials was also not an option, as performing data
capture during the application process at a different location would disturb the
application process significantly and increase the time needed per application.
Thus the most reasonable approach was to completely decouple the biometric data
capturing from the application process in a way that the data capturing would be done by
the citizen himself prior to the application for a pgy fqewogpv cv vjg qhhkekcnÓu fgum0 Vjkurequired a self-service solution allowing the citizen to capture photo, fingerprints and
signature independently without being guided and monitored by an official.
4 Hardware configuration and necessary changes
4.1 Standard hardware configuration
3[D_HwiDLZ]
153

The Speed Capture Station is shown in Illustration 1 below. It consists of a vertical pole,
mounted onto a floor plate or directly on the floor. A roof is mounted on top of the pole,
holding a back wall on its other end. The main unit is attached to a lift inside the pole
and contains camera, fingerprint scanner, signature pad, computer and touchscreen.
Illustration 1: Speed Capture Station
The terminal is designed to capture the applicant while standing. The illumination is
optimized for capturing passport photos according to [ISO/IEC 19794-5]. Two light
sources are placed above the camera and another two light sources are placed in the
lower part of the main unit. All light sources are equipped with diffusors to spread the
light and reduce the risk of hot spots. The back wall is illuminated as well. Thusallowing vq knnwokpcvg vjg crrnkecpvÓu hceg gxgpn{ cpf vq cxqkf ujcfqyu rctvkewnctn{beneath the chin and in the background. For photo capturing itself a high-quality digital
compact camera is used. The height of the main unit including the camera is
automatically adjusted to the correct height for image capturing.
Different fingerprint scanners have been integrated and are available based on local
requirements. A signature tablet with LCD display is integrated for signature capturing.
The electric lift allows to adjust the main unit to a comfortable height for all steps during
the capturing process.
4.2 Necessity for changes to the standard configuration
Hard- and software being used to capture biometric data for the German Identity Card
and the Electronic Passport needs to fulfill certain requirements. For example § 3 I
154

[PAuswV] says, that the system components of the identity card awvjqtkvkgu ]È_. vjgcertification of which is mandatory or optional, are listed in Annex 5. Way and details of
the certification can be found in the Technical Guidelines by the Federal Office for
Information Security. [PAuswV], Annex 5 mentions, among others, fingerprint readers,
software for the capturing and the quality assurance of photos and fingerprints, capturing
stations for acquiring photos. The relevant Technical Guideline in this context is [TR-
25343_ ÐDkqogvtkeu hqt Rwdnke Ugevqt CrrnkccvkqpuÑ0
Concerning the hardware, [TR-03121] required two main changes to the standard
configuration. The first one was to change the illumination in order to avoid mirroring
effects of glasses. The second change was to select a fingerprint scanner already certified
to comply with [TR-03121], part 3, chapter 3.1 AH-FP-FTR resp. [TR-03104], [TR-
03118-1].
4.3 Changing the illumination
[TR-03121], part 3, chapter 3.4 AH-PH-VID, Requirements, General Requirements,
sixth bullet point fgocpfu. vjcv Ð]È_. okttqtkpi ghhgevu qh incuugu jcxg vq dg cxqkfgf0Ñ
Mirroring effects could be avoided completely by asking applicants to take off their
glasses during capturing. Yet this would neither conform to [TR-03121] or correspond
with its intention nor would it be advantageous for the self-service capturing process
itself if people are taking off their glasses and are not able to follow further instructions
on the screen.
Due to the compact and light design of the Speed Capture Station the possibilities to re-
arrange the light sources, e.g. to increase the angle between the straight line through the
centre of the upper light sources and the applicantÓs head and the straight line through
the camera lens and the crrnkecpvÓu head are limited.
In order to avoid mirroring effects to a substantial extend, different measurements have
been identified to be necessary. The existing light source was replaced through a new
board with 12 power LEDs. Due to the high light yield per area the total area needed was
reduced, allowing to move the light source upwards and hence increasing the anglementioned above without changing the housing of the main unit. Crossed polarization
filters have been added to the main light sources and the camera lens. The loss of light
caused by these filters is compensated by the luminosity of the power LEDs. In order not
to dazzle the applicant the new illumination solution has been realized as a soft-flash,
increasing the light intensity just during photo capturing and decreasing it afterwards.
4.4 Selecting the fingerprint scanner
In order to avoid the conformance testing of the fingerprint scanner itself, it was obvious
to select a fingerprint scanner already certified according to [TR-03121], part 3, chapter
3.1 AH-FP-FTR resp. [TR-03104], [TR-03118-1]. Additional criteria to select the
155

fingerprint scanner to be integrated have been the form factor, the ease of use, and here
in particular the correct finger placement without explicit guidance, and references.
Among others, the Dermalog ZF1 and the Crossmatch LSCAN 100 have been certified
by the Federal Office for Information Security. With over 14,500 units in operation in
German identity card and passport authorities the Dermalog ZF1 is the most widespreadfingerprint scanner in the relevant market. Regarding the form factor the Dermalog ZF1
is much smaller. The small scanning area does not allow to place more than one finger,
besides it is nearly impossible to place a finger with a significant rotation, hence there is
no necessity for segmentation and de-rotation after capturing, simplifying the
integration. These advantages qualified the Dermalog ZF1 to be used for fingerprint
capturing within the Speed Capture Station.
5 Software development Î challenges and requirements
5.1 Overview
Several aspects had to be considered during the software development phase. In
particular, the software needed to comply with national regulations. The most important
ones are
‚ [TR-03121] defining precise requirements and general conditions for biometric
methods used in and offering a basis for consistent and comparable quality of
public sector applications4 and
‚ the German Data Protection Act ([BDSG]), regulating the handling of personal
data to protect the individual person against the infringement of his personal
rights.
[TR-03121] had a high impact on the realization of the fingerprint capturing process asthis process implies certain decisions and considerations by the official.
The [BDSG] influenced the extent of the data being captured as well as storing,
transmitting and deleting this data.
Another important aspect was the design of an interface to the software in use at theidentity card and passport authorities.
5.2 Fingerprint capturing process
The process of capturing fingerprints implies certain decisions and considerations by
officials. Among these are the following:
4[TR-03121], part 1, chapter 1.1 Motivation and Objectives of Technical Guideline Biometrics
156

1. ÐKh vjg ceswkukvkqp qh c hkpigtrtkpv ku wpuweeguuhwn. vjg ceswkukvkqp qh vjg ucoghkpigt ecp dg tgrgcvgf ctdkvtctkn{ ]È_0Ñ5
2. ÐVjg qhhkekcn jcu vq gpuwtg vjcv vjgtg ku pq rgtowvcvkqp dgvyggp vjg hkpigtrequested for the image acquisition and the finger actually placed on the
sensor.Ñ6
3. ÐVjg qhhkekcn owuv cuuwtg vjcv vjg crrnkecpv fqgu pqv wug cp{ hkpigt fwookgu.fakes or something similar.Ñ7
As the official is not present during the capturing process in a self-service environment,
he is not able to consider the issues mentioned above or to make any decision at the timeof capturing. Hence, the official has to be given the possibility to consider the issues
above at the time of data retrieval and to check, that the capturing process was executed
correctly. As far as decisions are necessary during the capturing process, there are
basically two alternatives, either to delegate these decisions to the applicant or to
automate these decisions by anticipating them based on assumptions and actual results
during the capturing process. The latter alternative is to be preferred over delegating
these decisions, because one cannot expect from applicants to have sufficient experience
and knowledge necessary to make these decisions.
Regarding no. 1: Relevant decisions are concerning the repetition of a single scan or the
whole acquisition of the same finger. It was defined, that every single scan is repeated
once in case no image is captured successfully until timeout. If this second scan also
does not deliver an image, the acquisition of this finger is ended. Further it was defined,
that the whole acquisition is repeated in case the rating is lower than the threshold of 50
as defined in [TR-03121], part 3, chapter 6.1 QA-FP-APPD, Requirements, no. 5, but
higher than a second threshold to be defined. In this case it seems likely, that a second
acquisition may result in a higher and sufficient rating. For the start, this second
threshold has been set to 30, but might be adjusted based on future experiences.
Regarding no. 2 and 3: The official has to be given the possibility to consider the issues
mentioned at the time of data retrieval instead of data capturing. To fulfill the above
requirements and to not nkokv vjg qhhkekcnÓu cwvjqtkv{. vjg hqnnqykpi hgcvwtgu jcxg dggpimplemented.
1. All relevant actions and results during the fingerprint capturing process arelogged. This log is more extensive than the data to be encoded as per [TR-
03121], part 3, chapter 8.1 COD-FP-GID. It enables the official to see easily, if
a finger has been captured successfully or with insufficient quality, if even a
repeated scan has not delivered an image at all (timeout during single scan), if
the finger has been marked as not existing by the applicant or if the acquisition
of the same finger has been repeated. The official can check, if the process
5[TR-03121], part 3, chapter 2.1 P-FP-GID, Acquisition of an individual finger, No. 5
6[TR-03121], part 3, chapter 9.1 O-FP-GID, Requirements, Quality Assurance, first bullet point
7[TR-03121], part 3, chapter 9.1 O-FP-GID, Requirements, Quality Assurance, second bullet point
157

passed is reasonable or if, for example, fingers are existing although having
been marked as not existing.
2. It is mandatory that verifications are performed for those two fingerprint images
which have been retrieved from the terminal. As, together with the fingerprint
images, the terminal delivers the information, which fingers have been capturedand stored, just two quick scans in total (compared to a minimum of six single
scans for reference capturing8) are necessary to verify, that the correct fingers
have been placed without using dummies, fakes or similar. Regarding the usage
of dummies, fakes or similar, the official remains responsible for checking
ectghwnn{ vjcv uwej ctg pqv cvvcejgf vq vjg crrnkecpvÓu hkpigtu fwtkpi vjgverification. This is no change compared to the current process, within which
the official has to check the same prior to capturing the fingerprints at his desk.
5.3 Data privacy and security
The [BSDG] requires that the extent of personal data being handled is limited to the
extent necessary for a given purpose.9 It also defines a number of security requirements
when handling personal data.10
At the beginning of the capturing process the applicant is asked, for which document he
would like to capture his data. Based on this decision, the data to be captured is defined.
For an electronic passport the data to be captured includes photo, fingerprints, signature
and possibly day and month of the date of birth, being used as a search criterion during
data lookup by the official; no further personal data is acquired.
All data remain in volatile memory until the applicant decides to save this data not
before the end of the capturing process. A XML document is generated, encrypted using
state-of-the-art technologies and stored into a database. It is retrieved from the database
d{ c ygd ugtxkeg eqpuwogf d{ c enkgpv eqorqpgpv qp vjg qhhkekcnÓu RE0 Vjg ZONdocument remains encrypted until decrypted d{ vjg enkgpv eqorqpgpv qp vjg qhhkekcnÓuPC.
Furthermore the storage duration inside the terminal resp. its database is reduced to areasonable minimum, which may vary between municipalities due to differing
workflows. Retrieved data is being deleted after a short period of time after the last
retrieval, e.g. 1 hour, while data not having been retrieved is being deleted after a longer
period of time after the end of the capturing process, e.g. 24 hours. Both intervals can be
configured individually based on the requirements of each municipality. Not deleting
retrieved data at the time of retrieval immediately allows multiple retrievals if, e.g., an
applicant applies for an identity card and a passport at the same time.
8[TR-03121], part 3, chapter 2.1 P-FP-GID
9[BDSG], § 3a
10[BDSG], § 9
158

5.4 Standardized interface to communal and other software
There are several vendors of communal software offering different solutions to handle
applications for identity cards and passports. It is essential that the data retrieval from the
terminal is integrated in these solutions as the terminal is designed to deliver digital data
only, i.e. can only be used when the captured data can be retrieved from the communalsoftware.
In order to comply with [TR-03121] and to not define a proprietary interface, but rely on
existing standards, the data retrieval has been designed as a Biometric Service Provider
(BSP) and developed by secunet Security Networks AG in Essen. The most relevant
standard in the field of biometric data capturing is BioAPI 2.0. Therefore it was defined
to develop a single BioAPI 2.0-compatible BSP being able to deliver a XML according
to [TR-03121], part 3, chapter 8.4 COD-PH-GID including the record with the facialimage, additional quality information and the signature image (with the latter to be
stored in the aux-element) as well as a XML according to [TR-03121], part 3, chapter
8.1 COD-FP-GID including the records with the fingerprint images and additional
quality information. The XML and thus the data to be returned either including facial
and signature image or fingerprint images are selected by using the BioAPI 2.0
parameter defining the output format.
The BSP includes all relevant functionality and user interfaces: It allows to browse the
available data sets and to select the correct one. It shows the facial image including QAresults, indicates errors where appropriate and allows to veto and to override the
software decision. The signature is displayed as well. The BSP also includes the
fingerprint verification and returns the corresponding XML only after successful
verification. Including the functionality described before, the effort for software
integrators is very limited as they just have to integrate one single BSP, but no additional
functionality like fingerprint verification which is already included in the BSP. To
ensure interoperability and in order to be able to proof such, the BSP has been developed
to conform to the software architecture as defined in [TR-03121], part 2, which will be
confirmed through an extended certification by the Federal Office for Information
Security shortly.
6 Pilot operation in the city of Monheim am Rhein
During the ongoing product development a pilot operation of the Speed Capture Station
took place from mid of August until end of December, 2010 in the city of Monheim am
Rhein. For this operation, an intermediate version of the software running on the
terminal was used, which allowed to capture photo and signature, to perform the quality
assurance of the photo and to store photo and signature as image files to be retrieved by
the software used to handle applications for the German Identity Card and the Electronic
Passport. The terminal was placed in the waiting area of the Bürgerbüro and latentlymonitored by some of the officials present who were able to see the terminal from their
desks with a distance of about 10 meters to the terminal. Due to this distance, no official
159

has been directly available for the applicant during the capturing process if not
accompanied by an official which happened only in very rare cases.
The unit was available for public usage from August 19th to December 1st, 2010. A press
conference was held on August 31st and on Sept 1st the relevant local and regional
newspapers published articles about the terminal11
. When calling the Bürgerbüro prior toapplying for a new document, citizens were informed about the possibility to capture the
necessary passport photo using the terminal. The citizens were not charged for using the
terminal, i.e. capturing their photos.
The terminal was used by about 223 persons in September, 359 persons in October and
195 persons in November. During the same time, citizens applied for 525 documents
(German Identity Card or Electronic Passport) in September, 875 documents in October
and 477 documents in November 2010. The usage ratio per document amounts to 42,5%for September, 41,0% for October and 40,1% for November, 2010. The usage ratio per
person applying for one or more documents at the same time is naturally higher, but
could not be calculated due to missing figures.
During September and October 2010, 293 users of the terminal took part in a voluntary
survey. They were asked to complete a questionnaire consisting mainly of a number of
closed-ended questions. Vjg swguvkqp ÐJqy fq {qw cssess the time needed for the
eqorngvg ecrvwtg rtqeguuAÑ could be answered by selecting one of four given options
*Ðxgt{ ujqtvÑ. ÐujqtvÑ. ÐnqpiÑ. Ðxgt{ nqpiÑ+ cpf ycu cpuygtgf ykvj Ðxgt{ ujqtvÑ orÐujqtvÑ d{ ;2.:' qh vjg rctvkekrcpvu0 Vjg swguvkqp ÐJqy fq you judge handling and user
iwkfcpeg qh vjg vgtokpcnAÑ could be answered by selecting one of four given options
*Ðxgt{ gcu{Ñ. Ðgcu{Ñ. ÐeqornkecvgfÑ. Ðxgt{ eqornkecvgfÑ+ cpf ycu cpuygtgf ykvj Ðxgt{gcu{Ñ qt Ðgcu{Ñ by 90,8% as well. 94,9% ugngevgf Ð{guÑ cu one of the two given options
Ð{guÑ cpf ÐpqÑ yjgp cumgf ÐYknn {qw tgeqoogpf vjg wucig qh vjg vgtokpcn ]È_AÑ037,2% of the participants have been of the age of 60 or older.
The time needed to finish a capturing process including entering the ID, capturing the
photo, capturing the signature and storing the data, was logged since November 5th,2010. During the first complete calendar week from November 8th until November 12th,
this time amounted to an arithmetic mean of 191 seconds, i.e. 3:11 minutes.
Sibille Hanenberg, head of the department Bürgerservice, stated that the Speed Capture
Station has been accepted very well during the testing period and that the citizens have
been using the Speed Capture Station independently most of the time, only rarely
assistance was necessary. As the advantage of the terminal she states the time savings
during the application process, since cutting and pasting the passport photos as well asscanning the application forms become obsolete in most cases.
11http://www.wz-newsline.de/?redid=929966,
http://www.rp-online.de/duesseldorf/langenfeld/nachrichten/monheim/Stadt-erprobt-Fotokabine-fuer-neuen-
Pass_aid_900827.html
160

7 Conclusions and benefits for stakeholders
7.1 Conclusions
The finalized product development and the results of the pilot operation in the city of
Monheim am Rhein have shown, that it is challenging but possible to design a self-service terminal for capturing biometric data for the German Identity Card and the
Electronic Passport in compliance with national regulations as well as being easy to
operate by applicants. The compliance with national regulations has been proven by the
certification through the Federal Office for Information Security (Certificate ID: BSI-K-
TR-0091-2011, date of certification: March 18th, 2011). The ease of use has been proven
during the pilot operation in the city of Monheim am Rhein and is likely to be confirmed
by upcoming installations in various municipalities of different size. The pilot operation
has confirmed the estimations and expectations regarding the benefits such a solution
offers to citizens and municipalities.
7.2 Benefits for citizens
The most obvious benefit for citizens is, that they do not need to provide passport photosanymore. Thus, they save time and money for visiting a photographer or using a photo
kiosk. Furthermore, due to the fact, that the binding quality assurance takes place already
during the capturing process, the applicants get final feedback regarding the acceptance
of their photos at the time of capturing and not at a later time, when there is no
possibility to easily repeat the photo capture.
7.3 Benefits for municipalities
With the introduction of the new German Identity Card the time needed for handling an
application has been increased significantly. A substantial part of this time is needed for
the capturing of biometric data. Typically, this means a visual inspection of the
photograph supplied by the applicant using a photo guideline and a photo template,
cutting the photograph, pasting it onto the corresponding form, having the applicant
signing on this form, scanning this form and performing the software-based qualityassurance. Furthermore, if required, this includes the additional capturing of fingerprints,
which has to be performed in accordance with [TR-03121], part 3, chapter 2.1 P-FP-
GID. Calculations and estimations regarding the average amount of time needed to
capture biometric data vary between municipalities. Without being proven by a
representative survey, it seems reasonable to estimate an average of about five (5)
okpwvgu0 Wpfqwdvgfn{. lwuv ugngevkpi cpf tgvtkgxkpi vjg crrnkecpvÓu dataset, visually
checking photo and signature and performing a verification of the two fingerprints
delivered by the terminal is much faster.
Nonetheless, not a few municipalities are quite reluctant when it comes to make an
investment. These days there usually is no budgetary flexibility for investments that are
not absolutely necessary, regardless of their dimensions. This concerns also the Speed
161

Capture Station, although being judged as beneficial for both, municipalities and
citizens. An answer to this situation is a business model where the supplier operates the
Speed Capture Station on its own account and risk, including leaving of hardware and
software as well as providing service. The supplier charges either municipality or citizen
directly, in both cases per-click, i.e. per completed and retrieved dataset. In case the
municipality is charged, it is up to them to decide if they will in return charge the
citizens for this service. In this case the service fee is defined by the municipality, but
should typically not exceed the cost for getting a passport photo at a photographer or a
photo kiosk.
7.4 Further benefits
Live self-service enrolment of biometric data offers benefits beyond those for citizens
and municipalities. Capturing data digitally at the identity card and passport authorities
prevents alteration and manipulation of photos. There is no media break and thus no loss
of quality. Data is transferred digitally from the terminal directly to the official and is not
accessible by the applicant at any time, thus cannot be altered or manipulated.
Solutions like the Speed Capture Station have been designed only for the purpose ofcapturing biometric data. Therefore everything has been optimized to fulfil the given
requirements. A uniform environment avoids tolerances occurring today when photos
are taken within different environments and printed on various hardware to be scanned
using several different types and models of scanners.
Bibliography
[BDSG] Bundesdatenschutzgesetz in der Fassung der Bekanntmachung vom 14. Januar 2003(BGBl. I S. 66), das zuletzt durch Artikel 1 des Gesetzes vom 14. August 2009 (BGBl. IS. 2814) geändert worden ist
[D_HwiDLZ] Landeshauptstadt Düsseldorf. Herzlich willkommen imDienstleistungszentrum. (http://www.duesseldorf.de/dienstleistungszentrum/index.shtml,as of 2011-05-25)
[ISO/IEC 19794-4]ISO/IEC 19794-6<4227 ÐKphqtocvkqp vgejpqnqi{ - Biometric data interchange
formats - Rctv 6< Hkpigt kocig fcvcÑ[ISO/IEC 19794-5]ISO/IEC 19794-7<4227 ÐKphqtocvkqp vgejpqnqi{ - Biometric data interchange
formats - Rctv 7< Hceg kocig fcvcÑ[MarXX]Marian Margraf, Federal Ministry of the Interior (Bundesministerium des Innern). Der
elektronische Identitätsnachweis des zukünftigen Personalausweises.(http://www.cio.bund.de/SharedDocs/Publikationen/DE/Aktuelles/neuer_personalausweis_elektronischer_identitaetsnachweis_download.pdf?__blob=publicationFile)
[PAuswV] Personalausweisverordnung vom 1. November 2010 (BGBl. I S. 1460)[SI_Ref_SPB] Speed Identity AB. Reference Î Swedish Police Board.
(http://www.speed-identity.com/sidor/referens-rikspolisstyrelsen.aspx, as of 2011-05-24)[TR-03104] Federal Office for Information Security (Bundesamt für Sicherheit in der
Informationstechnik). Technische Richtlinie zur Produktionsdatenerfassung,-qualitätsprüfung und -übermittlung für Pässe.
162

[TR-03118-1] Federal Office for Information Security (Bundesamt für Sicherheit in derInformationstechnik). Prüfspezifikationen zur Technische Richtlinie zurProduktionsdatenerfassung, -qualitätsprüfung und -übermittlung für Pässe,
Prüfspezifikation Biometrie I: Hardwarekomponenten (PS Biometrie I)[TR-03121] Federal Office for Information Security (Bundesamt für Sicherheit in der
Informationstechnik). Technical Guideline TR-03121 Biometrics for Public Sector
Applications, Version 2.2
163


BIOSIG 2011
Invited Conference Contributions


Fingerprint Sample Quality Metric NFIQ 2.0
Oliver Bausinger1 and Elham Tabassi2
1Federal Office for Information Security (BSI)
2National Institute of Standards and Technology (NIST)
Abstract: At the NIST March 2010 workshop on “The Future of NFIQ”, the
development of a new (open source) version of NFIQ in consultation and
collaboration with users and industry was recommended.
Following this recommendation, NIST and BSI set up a joint project for the
development of a successor version of NFIQ. This paper explains the reasons and
needs for the development and details the planned approach and development
process.
1 Introduction and timeline
Quality measurement plays a vital role in improving biometric system accuracy and
efficiency during the capture process (as a control-loop variable to initiate reacquisition),
in database maintenance (sample update), in enterprise-wide quality assurance
surveying, and in invocation of quality-directed processing of samples in multimodal
systems. If quality can be improved, either by sensor design, by user interface design, or
by standards compliance, better performance can be realized. For those aspects of quality
that cannot be designed-in, an ability to analyze the quality of a live sample is needed.
Biometric quality analysis is a technical challenge because it is most helpful when the
quality measures reflect the performance sensitivities of one or more target biometric
comparison subsystems. NIST addressed this problem in August 2004 when it issued
NIST Fingerprint Image Quality (NFIQ) algorithm. NFIQ is a fingerprint quality
measurement tool; it is implemented as open-source software; and is used today in very
large government both in U.S. and worldwide, and commercial deployments. NFIQ’s
key innovation is to produce a quality value from a fingerprint image that is directly
predictive of expected recognition performance. NFIQ serves as a publicly available
reference implementation. With advances in fingerprint technology since 2004, an
update to NFIQ is needed.
At the NIST March 2010 workshop on “The Future of NFIQ”, workshop participants
overwhelmingly recommended the development of a new (open source) version of NFIQ
in consultation and collaboration with users and industry.
In February 2011, NIST and BSI issued a Call for Participation (CfP), inviting research
organizations and industry members to support development of NFIQ 2.0. Specifically,
NIST and BSI requested
167

‚ Submission of matchers whose comparison scores will be used for training of
NFIQ 2.0 (by May 2, 2011),
‚ Suggestions and technical contributions towards composition and computation
of NFIQ 2.0 features (by August 29, 2011),
‚ Fingerprint images demonstrating NFIQ 1.0 anomalies (by September 30,
2011).
In parallel, internal developments at NIST and BSI started with the preparation of
interface specifications, database selection and feature examination.
2 Proposed approach for development of NFIQ 2.0
2.1 NFIQ 2.0
We propose development of a set of standardized finger image quality components plus
multivariate statistics techniques to relate biometric performance metrics such as false
non-match to the standardized quality components (i.e. features). The outcome will be
an open source quality assessment algorithm for finger image. Same as NFIQ 1.0, the
new NFIQ 2.0 will have two major computation steps:
‚ Feature extraction, and
‚ Training of a machine-learning algorithm.
2.2 Feature Extraction
Feature extraction consists of measuring appropriate image characteristics that convey
information for comparison algorithms. The feature set may be comprised of elements
such as local noise, continuity of ridge flow, area of the finger image impression, and
number of minutiae. A feature vector is computed from each image and its components
are combined using a trained machine-learning algorithm so that the image quality score
is reflective of positive or negative contribution of the sample to the overall performance
of the system. Part 4 of ISO/IEC 29794 [ISO-29794-4] defines defect factors for finger
images and recommends features and characteristics of finger images at both local and
global structures that are related to performance of fingerprint recognition systems.
Additionally parts 2 [ISO-19794-2] and 4 [ISO-19794-4] of ISO/IEC 19794 Biometric
data format standard define features such as zonal quality or minutiae quality.
In collaboration with industry, a set of quality components will be defined and perhaps
formally standardized. These quality components shall model failure modes and
sensitivities of current fingerprint recognition algorithms. Examples include: zonal
quality, clarity of ridges, size of fingerprint, or number of minutiae. Technical comments
and contributions towards the formation and computation of features are requested.
168

NIST and BSI will develop open-source reference implementations for standardized
quality components.
2.3 Training a machine leaning algorithm
Training looks for structure in the data and ultimately building a model to relate the
response variable (e.g. performance as false non-match rate, or area-under-ROC-curve)
to the exploratory variables (i.e. features or quality components). We explore different
multivariate statistical techniques to obtain the optimal model. Training could be
customized to a comparison algorithm or generalized to a class of comparison
algorithms. NIST and BSI will train a machine-learning algorithm to predict
performance of a particular comparison algorithm (i.e. customized NFIQ 2.0) or a
general class of comparison algorithms (generalized NFIQ 2.0).
For customized NFIQ 2.0, the training parameters on the machine-learning algorithm
will be returned to the provider of the biometric comparison subsystem (matcher) used
for training.
The outcome will be a family of quality algorithms that could be application-
independent or tuned to particular applications. Interoperability is achieved by uniform
interpretation of quality scores; therefore, it expands a marketplace of interoperable
products.
2.4 Generalized vs. Customized
NFIQ has been designed to be agnostic to biometric comparison algorithms. For
applications where the comparison algorithm is not known a priori or subject to change,
a generalized (i.e. biometric comparison independent) image quality assessment
algorithm (IQAA) is needed. However, when the comparison algorithm is known, use of
an IQAA that is tuned to predict the performance of the deployed comparison algorithm
is more suitable. Therefore the next generation of finger image quality, should provide
both options of “generalized” (i.e. comparison algorithm-independent) or “customized”
(i.e. comparison algorithm dependent).
2.5 Calibration
Interoperability of quality scores is another challenge in exchange of quality scores. Part
1 of the multipart ISO/IEC 29794 Biometric sample quality standard [ISO-29794-1]
defines a binary record structure for the storage of a sample’s quality data. It establishes
requirements on the syntax and semantic content of the structure. Specifically, it states
that the purpose of assigning a quality score to a biometric sample shall be to indicate the
expected utility of that sample in an automated comparison environment. That is, a
quality algorithm should produce quality scores that target application-specific
performance variables. For verification, the default metric would usually be false-non-
match rates that are likely to be realized when the sample is verified. This, by itself, is
not sufficient for accurate interpretation of quality scores generated by different quality
assessment algorithms and therefore some normalization or calibration is needed.
169

3 Software development framework
As a part of the proposed approach, a software development framework has been
specified and developed as a flexible test bed for different feature vectors and machine
learning algorithms.
The framework is designed to serve as a layer between modules and applications that use
the framework and the available modules. Figure 1 shows a schematic representation of
the framework design. It consists of four module interfaces and is used for the
development of the NFIQ 2.0 and the final implementation of the algorithm as well.
Furthermore, it allows for easy implementation of several versions of the NFIQ 2.0.
Figure 1: Software development framework design
170

4 Current Status
The project has seen broad participation from the side of the biometrics industry. All
major biometric algorithm providers are active in the development of NFIQ 2.0 and
submitted a current version of the SDK for training.
At the time of writing, the software development framework is available for internal
testing and a first set of candidate features (using NFIQ 1 features and features proposed
in [ISO-29794-4]) has been proposed and preliminarily evaluated.
First detailed results will be available and presented at the NIST IBPC conference in
March 2012.
Bibliography
[ISO-19794-2] ISO/IEC 19794-2:2005 “Information technology – Biometric data interchange
formats – Part 2: Finger minutiae data”.
[ISO-19794-4] ISO/IEC 19794-4:2005 “Information technology – Biometric data interchange
formats – Part 4: Finger image data”.
[ISO-29794-1] ISO/IEC 29794-1:2009 “Information technology – Biometric sample quality –
Part 1: Framework”.
[ISO-29794-4] ISO/IEC 29794-1:2010 “Information technology – Biometric sample quality –
Part 4: Finger image data”.
171


Large Scale Iris Image Quality Evaluation
Elham Tabassi
Information Access Division - Image GroupNational Institute of Standards and Technology
100 Bureau Drive MS 89403Gaithersburg, MD [email protected]
Abstract:Several recent studies have shown that while iris images captured at near infrared are viable
biometrics for verification and identification, similar to other biometrics, its performance dropswhen comparing images from imperfect sources (e.g. subject blinking), under imperfect con-ditions (e.g. out of focus) or non-ideal capture device. The immediate question to ask is whatfactors and to what degree are most influential on iris recognition performance. Motivated bythis need, National Institute of Standards and Technology (NIST) initiated Iris Quality Evalu-ation and Calibration (IQCE). IQCE aims to define and quantify iris image properties that areinfluential on performance of iris recognition. This paper gives an overview of the IQCE.
1 Introduction
Automatically and consistently determining the quality of a given biometric sample for identifi-cation and/or verification is a problem with far-reaching ramifications. If one can identify low-quality biometric samples, the information can be used to improve the acquisition of new data.The same quality measure can be used to selectively improve an archival biometric database byreplacing low quality biometric samples with high quality samples. Weights for multimodal bio-metric fusion can be selected to allow high quality biometric samples to dominate the fusion. Allof these applications require that the quality of the biometric sample be determined prior to iden-tification or verification. Most of these applications also require that the quality of the biometricsample be computed in real time during data acquisition.
Current state-of-the-art biometric recognition systems perform at reasonably low error rates. How-ever, the performance degrades substantially as the quality of the input samples drop. Althoughonly a small fraction of input data are of poor quality, the bulk of recognition errors can be at-tributed to poor quality samples. Poor quality samples decrease the likelihood of a correct verifi-cation and/or identification, while extremely poor-quality samples might be impossible to verifyand/or identify. If quality can be improved, either by sensor design, by user interface design, orby standards compliance, better performance can be realized. For those aspects of quality thatcannot be designed in, an ability to analyze the quality of a live sample is needed. This is use-ful primarily in initiating the reacquisition from a user, but also for the real-time selection of thebest sample, the selective invocation of different processing methods, or fusion. Accordingly, bio-metric quality measurement algorithms are increasingly deployed in operational systems [GT06].US-VISIT, PIV, EU VIS, and India’s UID each mandate the measurement and reporting of qualityscores of captured images. With the increase in deployment of quality algorithms, the need tostandardize an interoperable way to store and exchange biometric quality scores and methods forevaluating the effectiveness of quality algorithms, increases.
173

2 Iris Quality Evaluation and Calibration
Motivated by this need, National Institute of Standards and Technology (NIST) initiated Iris Qual-ity Evaluation and Calibration (IQCE). IQCE aims to define and quantify iris image properties thatare influential on performance of iris recognition. Iris is rapidly gaining acceptance and supportas a viable biometric. US-VISIT, PIV and India’s UID are using iris as their secondary or primarybiometric for verification. While there are several academic publications on iris image quality,IQCE is the first public challenge in iris image quality aiming at identifying iris image qualitycomponents that are algorithm or camera agnostic.
IQCE is the second activity under IREX. NIST’s iris interoperability program, IREX, was initiatedto support an expanded marketplace of iris recognition applications in identity management de-ployments.
IREX I was conducted to give quantitative support to the recently completed ISO/IEC 19794-6standard which regulates cross-party interchange of iris imagery. The IREX I test engaged ten irisrecognition vendors in implementing the standard and testing various proposed formats. The testestablished safe size limits for storage of iris data on credentials (e.g., PIV), and for transmissionon networks.
While IREX I showed that iris images captured at near infrared are viable biometrics for verifi-cation and identification, it also confirmed findings in related studies [VDF05, Dau07, NZSC10,ZZB09] that similar to other biometrics, its performance drops when comparing images from im-perfect sources (e.g., subject blinking) or under imperfect conditions (e.g., out of focus). IQCE
is motivated by a need to quantitatively define iris image quality and seeks to identify imageproperties that are influential on recognition accuracy.
NIST invited commercial providers, universities, and non-profit research laboratories with capa-bilities in producing quality score, either overall scalar quality or specific aspects of quality (e.g.,sharpness) to participate. Furthermore, organizations who implemented biometric verificationsoftwares using iris images were invited to participate in IQCE. The comparison scores generatedby such submissions were used to quantify the goodness of quality scores. Subsequently, NISTreceived fourteen IQAAs from nine organizations. Additionally, six out of the nine participants,submitted iris verification SDKs (comparators). Comparison scores of these submissions wereused to quantify the predictive power of quality components generated by submitted IQAAs.
This paper gives an overview of IQCE evaluation of the scalar quality scores using only one of thethree IQCE test data sets. Due to space limitation, results on evaluation of the quality componentsor other datasets is not included here.
The rest of the paper is organized as follows: Section 3 presents the metrics employed for evalua-tion of the IQAAS. It is followed by a brief introduction of the imagery used. Section 5 summarizesIQCE evaluation of the scalar quality scores. Relevance and relation to the development of the in-ternational iris image quality standard is discussed in section 6.
3 Quantitative evaluation of quality scores
The quality measurement algorithm, whether generating a scalar summary of a biometric sam-ple’s quality or a measurement of a specific aspect of quality (quality component), is regarded asa black box that takes an input iris image and outputs a scalar quality and/or a vector of qualitycomponents.
Evaluations are done by quantifying the association between quality scores of each quality com-ponent and the observed matching results.
IQCE deployed several metrics to assess the predictive power of the quality scores. In this paper,we overview the two most prominent ones, namely, error (false non-match) vs reject curves andranked order DET . Results are presented in section 5.
174

3.1 Error vs reject curve
One metric for comparative evaluation of IQAAS is the error versus reject curves that is introducedin [GT07]. The goal is to demonstate how efficiently rejection of low-quality samples results inimproved performance. This models the operational case in which quality is maintained by reac-quisition after a low-quality sample is detected. Consider that a pair of samples (from the same
eye), with qualities q(1)
i and q(2)
i , are compared to produce a geuine score, and this is repeated forN such pairs.
We introduce thresholds u and v that define levels of acceptable quality and define the set oflow-quality entries as
R(u, v) ={
j : q(1)
j < u, q(2)
j < v}
(1)
We compute FNMR as the fraction of genuine scores above threshold computed for those samplesnot in this set
FNMR(τ) =Mψ(τ)
Mψ(−∞)(2)
Mψ(τ, u, v) =∑
s∈G∩RC
H(s − τ) (3)
where RC is the complement of R.
If the quality values are perfectly correlated with the genuine comparison scores, setting thresholdτ to give an overall FNMR of x and then rejecting x percent with the lowest qualities should resultin FNMR of zero after recomputing FNMR.
For an effective IQAA FNMR should decrease quickly with the fraction rejected. An almost flatcurve suggests that the quality algorithm is not effective in prediction of performance. The IQAA
with the largest negative derivative at the low rejection rate is the most effective, hence the bestperformer.
The most operationally relevant part of the error vs. reject curves is usually on the left side wherea small fraction, x, of low-quality rejections would be tolerable from the perspective of forcinga second enrollment attempt. However, for the ICE2006 data sets, the appropriate fraction isprobably larger because the camera’s own quality measurement apparatus was suppressed.
Error vs reject curve allows for quantifying the generalizability of an IQAA to other comparatorsthan its mated one. It is a common contention that the efficacy of a quality algorithm is neces-sarily tied to a particular comparator. We observe that this one-comparator case is commonplaceand useful in a limited fashion and should therefore be subject to evaluation. However, we alsoobserve that it is possible and perhaps desirable for an IQAA to be capable of generalizing acrossall (or a class of) matchers, and this too should be evaluated. Generality to multiple comparatorscan be thought of as an interoperability issue: can IQAA As quality measure be used with com-parator Bs matcher? Such a capability will exist to the extent that pathological samples do presentproblems to both A and Bs matching algorithms.
3.2 Ranked-ordered detection error trade-off (DET ) curves
DET characteristic curves are the primary performance metric for offline testing of biometricsrecognition algorithms [MDK+97], [505]. Each point on a DET curve exhibits the false matchand false non-match rates associated with a certain threshold value. The DET curve spans thewhole range of possible threshold values, which is normally the range of the comparison scores.An IQAA is useful if it can at least give an ordered indication of an eventual performance. Forexample, for L distinct quality levels, there should notionally be L DET characteristics that do notcross.
175

Using the geometric mean of the two samples (√
q1 ∗ q2) as their pairwise quality, we divide eachcomparator’s comparison scores into three groups based on the pairwise quality of the imagesbeing compared. The set of the lowest quality contains comparison scores with pairwise qualitiesin the lowest 15 percentile. Comparisons with pairwise quality in the middle 70 percent comprisethe second or medium quality set. Finally, comparison scores of images whose pairwise qualityare in the highest 15 percentile make up the third or best quality set. Three DET characteristiccurves, one for each set above, are generated, as shown in figure 1. Each cell in figure 1 showsthree DET curves where quality scores of the identified IQAA are used to partition the comparisonscores generated by comparator Hz1. To reveal the dependance of FNMR and FMR on quality at afixed threshold, τ , the DET curves of each cell are connected at false non-match and false matchrates that are observed at the “same threshold” values.
The proper behavior is to observe lower FNMR and FMR as quality improves. An IQAA is effectiveif the DET curves are separated, with the DET curve corresponding to the lowest quality imagesappearing at the top (i.e. higher FNMR ), and the DET curve of highest quality images at the bottom(i.e. lower FNMR ). Overlapping DET curves indicate poor IQAA performance. A higher separationamong these three curves indicates a more effective IQAA .
The ranking and the separation of the DET curves, as explained above, will reveal the effect ofquality on FNMR . Effect of quality on FMR is demonstrated by the lines connecting the DET curves(the brown lines of figure 1). Assuming the correct ranking, a positive slope is expected meaninghigh quality images produce low FMR. A negative slope means that high quality images producehigher FMR than the low quality images, which is not desired.
Another observation to make is which IQAA is the best predictor of the comparator whose com-parison score was used to generated the graph, in case of figure 1, comparators Hz1 and E2a. Itis rightly assumed that an IQAA would be the best predictor of its mated comparator, but it is notalways the case. As we can see in figure 1, IQAA F1 provide a better separation of the DET curvesof the comparator E2a than E2a’s mated IQAA.
4 Data
IQCE deployed three different datasets. For the sake of space and time, only results on one of them,ICE2006 is presented in this paper. Specifically, we used a subset of ICE2006 dataset providedto NIST by the MBGC program[ea08]. The subset we used contains 56871 images of right and leftirises from 193 subjects collected from a university population over six semesters within 2004 -2006 time frame. The images were acquired using an LG EOU 2200 iris scanner.
All images are 640∗480 pixels with a median iris diameter of 240 pixels. The variation in iris sizesis mostly due to the subjects iris sizes and their distance from camera at the time of capture.
Because of the collection protocol used for ICE2006 dataset, it contains images of various quality,per description in [PBF07]:
The images are stored with 8 bits of intensity, but every third intensity level is unused. Thisis the result of a contrast stretching automatically applied within the LG EOU 2200 system. Inour acquisitions, the subject was seated in front of the system. The system provides 32 recordedvoice prompts to aid the subject to position their eye at the appropriate distance from the sensor.The system takes images in “shots” of three, with each image corresponding to illumination ofone of the three infrared (IR) light emitting diodes (LED)s used to illuminate the iris.
For a given subject at a given iris acquisition session, two “shots” of three images each are takenfor each eye, for a total of 12 images. The system provides a feedback sound when an acceptableshot of images is taken. An acceptable shot has one or more images that pass the LG EOU 2200’sbuilt-in quality checks, but all three images are saved. If none of the three images pass the built-in quality checks, then none of the three images are saved. At least one third of the iris imagesdo pass the Iridian quality control checks, and up to two thirds do not pass.
A manual quality control step at Notre Dame was performed to remove images in which, for
example, the eye was not visible at all due to the subject having turned their head.
176

The ICE2006 images are useful for comparative analysis of IQAAS. Its range and diversity ofimage impairments makes it suitable for investigating the causes of failure and viability of algo-rithms on the core iris feature extraction and matching problem.
The test data set was divided into two sets, namely enrollment and verification. IQCE receivedten submissions from six organizations that compare two iris images and generate a dissimilarityscore. These comparators were used to compare all images in the enrollment set with all theimages in the verification set. As a result, using the ICE2006 images, slightly over 4 milliongenuine and more than 7 million impostor comparison scores were generated for each of thecomparators.
5 Results
DET curves of two comparators for images with low, medium and high SCALAR QUALITY qualityscores of nine IQAAS are shown in figure 1.
The first observation is that the performance of either comparator is significantly affected by thequality of the images. High false non-match and false match rates are observed when the qualityof the images being compared are low. In other words, the SCALAR QUALITY scores of IQAAS A2a,C4x, E2a, F1 and Hx are reasonable predictors of performance.
The second observation is on the dependance of performance evaluation of IQAAS on the com-parators used for the evaluation.
The DET curves of the mid and high quality images cross for IQAAS B3, C4x, G1 and E2a forcomparator Hz1 but not for E2a.
All the IQAAS give a better performance ranking for comparator E2a than Hz1, suggesting thatcomparator E2a is more sensitive to image quality than Hz1. However, the rankings of the IQAAS
remain the same. IQAAS A2a, C4x, E2a, F1 and Hx are the best performers for both comparators.IQAA I1 gives the worst performance ranking, for both comparators.
Lastly, note that, except for IQAA D3, the DET curves of the high quality images are flat.
The ranked-ordered DET curves are useful for comparative analysis of IQAAS. It demonstratesthe error rates achieved when comparing low quality images, or high quality images. However,a finer quantification of the effect of quality on performance is not possible at least because suffi-cient quantity of genuine and impostor comparison scores of certain quality levels are needed togenerate a DET curve.
IQCE employed error vs reject curves to investigate the dependance of false non-match rate onquality. Specifically, we examined how quickly FNMR is improved when the lowest quality imagesare rejected, which is ultimately the most operationally relevant use of quality scores.
Figure 2 shows the error vs reject curves of all fourteen IQCE IQAAS for six different comparators.IQAAS are identified by different line type and color. The threshold is set to give initial FNMR =0.1. The gray dotted line shows the ideal case where the rejection of the comparisons with thelowest ten percent quality results in zero FNMR.
IQAAs E2a, F1, and Hx are generally the best performer for their mated comparators as well asother comparators (i.e. they are generalizable). E2a slightly outperforms the other two, and per-forms close to the ideal case (gray dotted line) for its mated comparator. IQAAS A2a and B3 arethe best predictor of performance for their mated comparators, but not for other comparators (i.e.they are not generalizable).
The least effective IQAAS are I1, and G2.
177

Fig
ure
1:R
ank
edD
ET
curv
esfo
rco
mp
arat
or
Hz1
on
dat
ase
tIC
E2
00
6T
he
set
of
all
com
par
iso
ns
are
par
titi
on
edin
toth
ree
gro
up
sb
ased
on
the
pai
r-w
ise
SC
AL
AR
QU
AL
ITY
sco
res
of
the
imag
esb
ein
gco
mp
ared
.T
he
low
est
qu
alit
yse
tco
nta
ins
com
par
iso
ns
wit
hp
airw
ise
qu
alit
yin
the
low
est
15p
erce
nti
le.
Th
eh
igh
est
qu
alit
yse
t
con
tain
sco
mp
aris
on
sw
ith
pai
rwis
eq
ual
ity
inth
eh
igh
est
15p
erce
nti
le.
Th
ere
sto
fth
eco
mp
aris
on
s,n
amel
yth
em
idd
le70
%,
mak
eu
pth
eth
ird
set.
Th
eD
ET
sar
e
con
nec
ted
atth
esa
me
sco
reth
resh
old
val
ues
(bro
wn
lin
es).
Lo
wer
FN
MR
and
FM
Rra
tes
are
exp
ecte
dfo
rh
igh
erq
ual
ity
imag
es.
Th
atm
ean
sw
ell
sep
arat
edcu
rves
in
each
cell
,w
ith
the
DE
Tcu
rve
corr
esp
on
din
gto
the
low
est
qu
alit
yap
pea
rin
gab
ov
e,an
dth
eD
ET
curv
eo
fh
igh
est
qu
alit
yb
elo
wal
lth
eo
ther
curv
es.
Inad
dit
ion
the
lin
es
con
nec
tin
gth
eD
ET
curv
esm
ust
hav
ea
po
siti
ve
slo
pe.
178

Figure 2: FNMR vs reject curves for SCALAR QUALITY scores on datasets and ICE2006 . The threshold is set to
give an initial FNMR = 0.1. The gray dotted line shows the ideal case where the rejection of the comparisons
with the lowest ten percent quality results in zero FNMR. IQAA E2a is the best performer, followed by Hx and
F1, followed by C4x. IQAAs B3 and A2a perform better for their mated comparators than other comparators.
The lowest performance is observed for IQAAs I1 and G2.
179

6 Support to standard development process
The IQCE activity supports a new, formal, standard addressing iris quality. The standard, ISO/IEC29794-6 Iris Image Quality [311], was initiated by the Working Group 3 of the ISO SC 37 committeein July 2009. The standard will define a vector of quality components each of which is somequantitative measure of a subject-specific or image-specific covariate. The current working draft(SC 37 N 4302) defines 19 image acquisition or subject covariates and 17 metrics for assessing theutility of an iris image. Furthermore, ISO/IEC 29794-6 aims to establish precise statements of howto compute each of the quality metrics.
A summary of quality components identified in ISO/IEC 29794-6 which IQCE examined, follows.
• scalar quality An overall quality score that is an estimate of the matchability of the image.Per ISO/IEC 29794-1 [310] Biometric sample quality – Part 1: Framework, the scalar qualityshall an integer between 0 and 100, where 0 indicates the lowest quality and 100 the bestquality. Lower recognition error is expected for images with low scalar quality scores.
• gray level spread shall measure the overall iris image for evidence of a spread of intensityvalues in iris data. An “underexposed” image would have too few high intensity pixels,and conversely for “overexposed”. An image with a high score (good quality) indicates aproperly exposed image, with a wide, well distributed spread of intensity values.
• iris size shall be a measure in the image plane, representing half the distance across the irisalong the horizontal.
• pupil iris ratio shall represent the degree to which the pupil is dilated or constricted. It isa dimensionless term, being the ratio or pupil radius to iris radius.
• usable iris is the percent of the iris portion of the image that is not occluded by eyelids,eyelashes, or saturating specular reflections, expressed as percentage of area of an annulusmodelling the iris without such occlusions.
• iris-sclera contrast shall represent the image characteristics at the boundary between theiris region and the sclera. Sufficient contrast is needed in many implementations of irissegmentation algorithms. Low or insufficient contrast may result in a failure to process aniris image during feature extraction.
• iris-pupil contrast shall represent the image characteristics at the boundary between the irisregion and the pupil. Sufficient iris-pupil contrast is needed in many implementations ofiris segmentation algorithms. Low or insufficient contrast may result in a failure to processan iris image during feature extraction.
• iris shape should be mathematical expression of the iris-sclera boundary. Note that theeffect of this component on performance depends on the sensitivity of the segmentationalgorithm to the deviation from circularity in iris-sclera and iris-pupil boundary.
• pupil shape should be mathematical expression of iris-pupil boundary. Deviation from cir-cularity in the iris-pupil boundary can affect segmentation accuracy. The effect of this metricon performance depends on the sensitivity of the segmentation algorithm to the deviationfrom circularity in iris-pupil boundaries.
• margin shall quantify the degree to which the image achieves positioning of the iris portionof this image relative to the edges of the entire image. The maximum quality value forthis metric shall be achieved when the margin requirements of ISO/IEC 19794-6:2011 aresatisfied.
• sharpness shall measure the degree of defocus present in the image.
• motion blur shall measure the degree of distortion in the image due to motion.
180

• signal to noise ratio
• gaze angle shall be an estimate of the direction of displacement between the optical axis ofthe eye and the optical axis of the camera. This measure is inclusive of both head angularorientation and eye-gaze angle relative to the head.
IQCE examined the effectiveness of these quality components in prediction of performance withthe goal to produce a refined list of image quality components that significantly affect the irisrecognition performance. To ensure that the above list includes all the possible image impair-ments that could affect performance, IQCE encouraged submission of, and consequently evalu-ated, other quality components not included above, or any other proprietary component.
The result of the evaluation is not included here due to space limitation, except for comparativeanalysis of quality components of one of the IQAAS, which follows.
6.1 Predictive power of quality components
Before proceeding to quantifying the predictive power of the quality components of the IQAAS, itis important to emphasize the dependance of this analysis on the imagery used for the evaluation.The effect of a quality component will not be observed if the test data does not represent varyingdegree of the impairment. For example, ICE2006 data set lacks severely dilated or constricted(probably because lighting condition did change during the capture sessions) or compared toother IQCE data sets, it lacks a wide range of sharpness, as a result sharpness is not a significantfactor for ICE2006 images, but its effect on performance is comparable to usable iris area for theIQCE data set that contains images with varying level of sharpness.
Figure 3 shows a variant of the error vs reject curve discussed in 3 that compares the predictivepower of different quality components generated by IQAA C4x, and using comparison scores ofits mated comparator. The threshold is set to give initial FNMR = 0.1. The gray dotted line showsthe ideal case where the rejection of the comparisons with the lowest ten percent quality resultsin zero FNMR. The most effective IQAA is the one with the biggest negative derivative at the lowrejection rate.
For ICE2006 images, with its existing range of defects, the most effective quality components arethe scalar quality and the proprietary metric gravitas, followed closely by usable iris area andthe proprietary metric auctoritas. Its second most effective tier of quality components consists ofproprietary component dignitas, iris-pupil contrasts, proprietary component pietas and iris-scleracontrast.
As mentioned, the ranking of the quality components slightly changes for other data set. Scalarquality, usable iris, iris-pupil contrasts, and iris-sclera contrast, sharpness and gaze angle seem tohave the most influence on performance.
7 Summary
An overview of NIST IQCE was presented along with results on the performance evaluation ofscalar quality scores. We discuss two metrics for comparative analysis of image quality assess-ment algorithms.
Predictive power of scalar quality scores generated by different IQAAS vary. For the best perform-ers, the difference between FNMR and FMR of the images in the lowest fifteen percentile and thosein the upper fifteen percentile can be as high as an order of magnitude.
181

References
[310] Working Group 3. ISO/IEC 29794-1 Information Technology - Biometric Sample Quality - Part 1:Framework. JTC1 :: SC37, is edition, 2010. http://isotc.iso.org/isotcportal.
[311] Working Group 3. ISO/IEC 29794-6 Information Technology - Biometric Sample Quality - Part 6: Irisimage. JTC1 :: SC37, working draft 4 edition, 2011. http://isotc.iso.org/isotcportal.
[505] Working Group 5. ISO/IEC 19795-1 Biometric Performance Testing and Reporting: Prin-ciples and Framework. JTC1 :: SC37, international standard edition, August 2005.http://isotc.iso.org/isotcportal.
[Dau07] John Daugman. New Methods in Iris Recognition. IEEE Transactions on Systems, Man, and Cyber-netics Part B:Cybernetics, 37(5):1167–1175, 2007.
[ea08] P. J. Phillips et al. Overview of the Multiple Biometrics Grand Challenge. Technical report,National Institute of Standards and Technology, www.nd.edu/ kwb/PhillipsEtAlICB 2009.pdf[on June 24, 2009], 2008.
[GT06] P. Grother and E. Tabassi. In Proceedings of the NIST Biometric Quality Workshop, March 2006.http://www.itl.nist.gov/iad/894.03/quality/workshop/presentations.htm.
[GT07] P.J. Grother and E. Tabassi. Performance of Biometric Quality Measures. IEEE Trans. PatternAnal. Mach. Intelligence (PAMI), 29(4):531–543, April 2007.
[MDK+97] A. Martin, G. Doddington, T. Kamm, M. Ordowski, and M. Przybocki. The DET Curve in As-sessment of Detection Task Performance. In Proceedings of Eurospeech 97, pages 1895–1898, 1997.
[NZSC10] N.Kalka, J. Zuo, N. Schmid, and B. Cukic. Estimating and fusing quality factors for iris biometricimages. IEEE Transactions on Systems, Man, and Cybernetics Part A:Systems and Humans, 40(3):509–524, 2010.
[PBF07] P. Jonathon Phillips, Kevin W. Bowyer, and Patrick J. Flynn. Comments on the CASIA version1.0 Iris Data Set. IEEE Transactions on Pattern Analysis and Machine Intelligence, 29(10):1869–1870,2007.
[VDF05] N. Schmid V. Dorairaj and G. Fahmy. Performance evaluation of non? ideal iris based recognitionsystem implementing global ICA encoding. In IEEE International Conference on Image ProcessingICIP-05, pages 285–288, Genoa, Italy, September 2005.
[ZZB09] Y. Du Z. Zhou and C. Belcher. Transforming traditional iris recognition systems to work innonideal situations. In IEEE Transaction on Industrial Electronics, volume 56, August 2009.
182

183


BIOSIG 2011
Further Conference Contributions


Gait Recognition using Time-of-Flight Sensor
Mohammad Omar Derawi1, Hazem Ali2, Faouzi Alaya Cheikh2
1 Norwegian Information Security Laboratory, Gjøvik University College, Norway2 Media Technology Lab, Gjøvik University College, Norway
{mohammad.derawi,hazem.ali,faouzi.cheikh}@hig.no
Abstract: This paper develops a biometric gait recognition system based on 3D videoacquired by a Time-of-Flight (ToF) sensor providing depth and intensity frames. Afirst step of the proposed gait analysis is the automatic extraction of the silhouette ofthe person via segmentation. The segmentation of the silhouette is performed on thedepth frame which provide information which describes the distance from the cameraof every pixel in the intensity frame. The range data is sensitive to noise thus we applymorphological filtering operations to enhance the segmented object and eliminate thebackground noise. The positions of the joint angles are estimated based on the splittingof the silhouette into several body segments, based on anatomical knowledge, andellipse fitting. The resulting parameters from this analysis of the silhouette are used forfeature extraction from each frame. The evolutions of these features in time are used tocharacterise the gait patterns of the test subjects. Finally, we do biometric performanceevaluation for the whole system. To the best of our knowledge, this article is the firstarticle that introduces biometric gait recognition based on ToF Sensor.
1 Introduction
The ability to use gait for people recognition and identification has been known for a long
time. The earliest research started in the sixties of the twentieth century, where studies
from medicine [MYN09] and psychology [Joh73] proved that human gait has discrimina-
tive patterns from which individuals can be identified. It is however just in the last decade
that gait as a biometric feature has been introduced, and from a technical point of view
gait recognition can be grouped in three different classes. Machine vision (MV) which
uses video from one or more cameras, to capture gait data and video/image processing to
extract its features. Floor sensors (FS), that use sensors installed in the floor, are able to
measure gait features such as ground reaction forces and heel-to-toe ratio when a person
walks on them. The third class uses wearable sensors (WS) where the gait data is collected
using body-worn sensors.
MV based gait recognition is mainly used in surveillance and forensics applications [LSL08,
HTWM04]. In MV image processing techniques are used to extract static like stride length
which are determined by body geometry [BJ01], and dynamic features from body silhou-
ettes. The MV based gait analysis techniques can be classified as model-based [BN07] and
model free [HL10]. The main advantage of model based approaches is the direct extrac-
tion of gait signatures from model parameters, but it is computationally expensive. Model
187

free techniques characterize the body motion independently from body structure. MV gait
analysis can also be categorized according to the technology used, as marker-based or
marker-less. In marker based systems specific points in the subject’s body are labelled by
markers. By tracking these points in the video sequence the body motion can be tracked
and analysed [Cut77, KN10]. MV based gait recognition provides wide range of gait
features and many works utilized different sets of features and classification techniques.
Benabdelkader et. al. [BCD02] used stride length and cadence as features extracted from
17 subjects’ silhouettes walking in outdoor environment for 30 meters in a straight line
at fixed speed to achieve EER of 11%, using linear regression for classification. Wang
et. al. [WTNH03] utilized silhouette structure evolution over time to characterize gait,
by calculating the silhouette centre and obtaining its contour they converted the 2D sil-
houette into 1D signal by calculating the distance between the centroid and every pixel on
the contour. Principal component analysis (PCA) were used for dimensionality reduction
of normalized distance signals using normalized Euclidean distance (NED) as similarity
measure and nearest neighbour classifier with respect to class exemplars (ENN) classifi-
cation approach. They achieved an EER of 20%, 13%, and 9% for 20 subjects filmed at 0,
45, and 90 degrees view respectively. The most related work to ours was done by He and
Le [HL10], in which temporal leg angles was used as gait features for 4 walking styles
slow, fast, incline and walking with a ball, on a running machine. They achieved wide
range of CCR for the different walk styles using NN and ENN classification techniques.
The best result for 9 subjects were in worst case 74,91% using NN for the shin parameters
alone in fast walk and best case 100% using NN for merging thigh the shin parameters
alone in ball walk, running the test over the whole CMU database 96.39 % was achieved
for fast walk. Jensen et. al [JPL09] used ToF camera to analyse gait, in their work step
and stride length, speead, cadence and angles of joints were extracted as extracted as gait
features. They used model fitting technique to extract the joint angles. To the best of our
knowledge, this article is the first article that introduces biometric gait recognition with
the use of ToF Sensor.
2 Experiment Design
In order to verify the usefulness of the proposed system, we performed an individual gait
identification experiment. In this section we will go through the different issues related to
our experiment.
We used the Swiss ranger SR-4000 CW10 sensor by Mesa technologies [Mes] seen in Fig-
ure 1(a). The SR4000 is an optical imaging system housed in an anodized aluminium en-
closure. The camera operates with 24 LED emitting infra-red in the 850nm range, it mod-
ulates the illumination light emitting diodes (LED) at modulation frequency of 15MHz.
Range measurements are obtained at each pixel using the phase shift principle, with non-
ambiguity range of 10 meters. The camera has USB port for data acquisition and supplied
with software library for C and Matlab.
The subject’s motion was filmed from the side by means of a ToF camera at 30 frames/sec,
while the subject was walking on a track in front of the camera as shown in Figure 1(b).
188

189

3 Feature Extraction
The image sequences of the subjects were acquired while walking in front of the camera.
Followed by segmentation to extract the subjects body silhouette, morphological opera-
tions are applied to reduce background noise and fill holes in the extracted human silhou-
ettes. Next, each of the enhanced human silhouettes is divided into six body segments
based on human anatomical knowledge [NTT+09]. Ellipse fitting is applied to each of the
six segments, and the orientation of each of the ellipses is used to calculate the orienta-
tion of each of the lower body parts for further analysis. The following steps are hereby
described in more details:
Video segmentation is the process of partitioning a video spatially or temporally. It is
an integral part of many video analysis and coding systems, including video indexing and
retrieval, video coding, motion analysis and surveillance. In order to perform gait analysis
of a person from image sequence, the subject needs to be extracted from the background
of the video sequence. Image segmentation is used to separate foreground objects like
people, from the background of the image sequence. Thresholding is the simplest image
segmentation technique, in which each pixel of the original image is compared to a speci-
fied threshold, if the pixel’s value is greater than the threshold value it is set as foreground
pixel with value 1 if not it is set to zero as background pixel producing a binary image.
In some complex images the operation can be iterated using two thresholds, in this case
threshold works like band pass filtering. Histograms can be used to find the proper thresh-
old values [Ots79], where peaks correspond to foreground objects are used to determine
the threshold values. If the image’s histogram shows no clear peaks, then, thresholding
can not produce acceptable segmentation.
Morphological operations are shape based technique for processing of digital images
[HSZ87]. Morphological operations are used to simplify image data preserving their main
shape characteristics and eliminating irrelevant details. Morphological operations have
two inputs the original image and structuring element to be applied to the input image,
creating an output image of the same size. In a morphological operation, the value of
each pixel in the output image is based on a comparison of the corresponding pixel in the
input image with its neighbours. The shape and size of the structuring element constructs
a morphological operation that is sensitive to specific shapes in the input image. The most
basic morphological operations are dilation and erosion.
Ellipse fitting is used next to find the characteristics of the body parts. Having extracted
body silhouette, the subject body are segmented into six parts [NTT+09] as illustrated in
Figure 2. First, the centroid of the silhouette is determined by calculating its centre of
mass. The area above the centroid is considered to be made of the upper body, head, neck
and torso. The area below the centroid is considered made of the lower body, legs and
feet. Next, one third of the upper body is divided into the head and neck. The remaining
two thirds of the upper body are classified as the torso. The lower body is divided into
two portions thighs and shins. Fitting an ellipse to each of the six body parts and find-
ing their centres of mass, orientations, and major axes length we can characterize these
body parts. Evolution of these parameters in the video sequence describes the human gait
characteristics in time.
190

191

192

Several performance evaluations were calculated. Table 1 shows the performance of the
first session with 30 subjects (second column) and the subset of 20 users (third column)
who also participated at the second session. The first column indicates which template
and test input were applied for performance testing. We notice that if we apply all the
four types of legs as feature vector for one subject, we obtain an better EER than when
applying them separately. This is due to the fact that more information is stored for a
given subject. Since only a subset of users participated at the second session the EER
has not changed significantly. With the performances for the second session we observe a
significant change of the performance and the reason is that the users are more used to the
walking in the second session and more comfortable with the experiment.
Template/Test 30 Participants 20 Participants - 1st 20 Participants - 2nd
Back thigh 8.42 7.48 4.72
Front thigh 7.39 6.62 6.02
Back shin 12.31 11.16 6.28
Front shin 11.32 10.24 9.41
All above 4.63 4.08 2.62
Table 1: EER Performance Results in % on the collected dataset. Second column is first session.Last column is session session
An interesting performance analysis is to investigate the change between the two session
as can be seen in Table 2. We are analysing what will happen if we apply the first sessions
data as training set and the second sessions data as test input. What we observe here is
that the change over time becomes worse. Different shoe-type, clothes may have also an
impact, and we realized that unfortunately not all participants came back for the second
session.
Session 1 Session 2 Session 1 + Session 2
4.09 2.48 9.25
Table 2: EER Performance Results in % where session 1 as reference template and session 2 as testinput (20 users).
5 Conclusion
In this paper we presented the first known results on gait recognition using the 3D ToF Sen-
sor. When analysing the data we could already visually see that gait cycles were detectable
for each subject which are dissimilar from others’. The experiment was performed over
two different days (sessions) where each of the subjects (first session 30 subjects, second
session 20 subjects) walked a track within the camera field of view. The best equal error
rate obtained was 2.66 % for a separate session where the change over time we retrieve an
equal error rate of about 9.25 %. Although the last mentioned result is not so low, this pa-
per presents a first step towards a better performance in the future. Future work includes to
work with multiple session over multiple days, and more cycles person to see the stability
over time.
193

6 Acknowledgments
The authors would like to thank all the (anonymous) participants in this experiment. The
writing of this article would not have been possible without their effort in the data collec-
tion phase.
References
[BCD02] C. BenAbdelkader, R. Cutler, and L. Davis. Stride and cadence as a biometric inautomatic person identification and verification. In FG’02, pages 372–377, 2002.
[BJ01] A. F. Bobick and A. Y. Johnson. Gait recognition using static, activity-specific param-eters. In CVPR 2001, volume 1, 2001.
[BN07] I Bouchrika and M S Nixon. Model-Based Feature Extraction for Gait Analysis andRecognition. In Mirage: Computer Vision ? Computer Graphics Collaboration Tech-niques and Applications, volume 4418, pages 150–160, March 2007.
[Cut77] & Kozlowski L. Cutting, J. Recognizing friends by their walk: Gait perception withoutfamiliarity cues. Bull. Psychon. Soc., Vol. 9:pp. 353–356, 1977.
[GXT94] Y. Guo, G. Xu, and S. Tsuji. Tracking Human Body Motion Based on a Stick FigureModel. 5:1–9, 1994.
[HL10] Weihua He and Ping Li. Gait recognition using the temporal information of leg angles.In ICCSIT 2010, volume 5, pages 78 –83, 2010.
[HSZ87] Robert M. Haralick, Stanley R. Sternberg, and Xinhua Zhuang. Image Analysis UsingMathematical Morphology. IEEE PAMI, 9(4):532 –550, july 1987.
[HTWM04] Weiming Hu, Tieniu Tan, Liang Wang, and S. Maybank. A survey on visual surveil-lance of object motion and behaviors. IEEE–J–SMCC, 34(3):334–352, 2004.
[Joh73] Gunnar Johansson. Visual perception of biological motion and a model for its analysis.Perception & Psychophysics, 14:201–211, 1973.
[JPL09] Rasmus Jensen, Rasmus Paulsen, and Rasmus Larsen. Analyzing Gait Using a Time-of-Flight Camera. In Image Analysis, volume 5575 of LNCS, pages 21–30. SpringerBerlin / Heidelberg, 2009.
[KN10] Kumar Amod Sohi B S Kumar Neelesh, Kunju Nissan. Active marker based kine-matic and spatio-temporal gait measurement system using LabVIEW vision. JSIR,Vol.69(08):600–605, 2010.
[LSL08] Peter K. Larsen, Erik B. Simonsen, and Niels Lynnerup. Gait Analysis in ForensicMedicine. Journal of Forensic Sciences, 53(5):1149–1153, 2008.
[Mes] Mesa. http://www.mesa-imaging.ch/.
[MYN09] A. Murai, K. Yamane, and Y. Nakamura. Characterization of motor skill based onmusculoskeletal model. In EMBC 2009, pages 6542–6545, 2009.
[NTT+09] Hu Ng, Wooi-Haw Tan, Hau-Lee Tong, Junaidi Abdullah, and Ryoichi Komiya. Ex-traction and Classification of Human Gait Features. In Visual Informatics: Bridg-ing Research and Practice, volume 5857 of LNCS, pages 596–606. Springer Berlin-eidelberg, 2009.
[Ots79] N. Otsu. A Threshold Selection Method from Gray-Level Histograms. Systems, Manand Cybernetics, IEEE Transactions on, 9(1):62 –66, jan. 1979.
[WTNH03] Liang Wang, Tieniu Tan, Huazhong Ning, and Weiming Hu. Silhouette analysis-basedgait recognition for human identification. 25(12):1505–1518, 2003.
194

Aktivitatserkennung auf Smartphones
Tobias Wirtl, Claudia Nickel
Hochschule Darmstadt
[email protected], [email protected]
Abstract: Mobile Gerate wie Handys haben seit Jahren einen festen Platz in unse-rem Alltag. In den letzten Jahren hat sich auf diesem Sektor daher viel verandert undeine neue Gerateklasse, die sogenannten Smartphones, halten Einzug in den Massen-markt. Da die Gerate nicht mehr nur zum Telefonieren genutzt werden, sind in einemmodernen Smartphone allerlei Sensoren integriert. Unter anderem auch Beschleuni-gungsmesser, die beispielweise fur die Gangerkennung genutzt werden konnen. Die-ser Artikel beschaftigt sich mit einer Erganzung zur Verbesserung der Gangerkennung,es wird eine Moglichkeit geschaffen, uber Beschleunigungssensoren in Smartphonesverschiedene Aktivitaten zu unterscheiden, die der Benutzer wahrend des Tragens desGerats ausfuhrt. Im Gegensatz zu anderen Arbeiten wurde hierbei die Erkennung di-rekt auf dem Endgerat implementiert. Es konnte eine Moglichkeit gefunden werden,die Aktivitatserkennung auf einem Smartphone so zu realisieren, dass die benotigteZeit zur Erkennung, sowie die Zuverlassigkeit im akzeptablen Bereich liegen.
1 Einleitung
In den letzten Jahren hat sich die Rolle des Mobiltelefons stark verandert. Die Gerate
werden nicht mehr nur zum Telefonieren und Nachrichten schreiben verwendet, sondern
dienen auch der Unterhaltung. Ein Nebeneffekt dieser Entwicklung ist die Integration di-
verser Sensoren in die Gerate. Besonders die Klasse der Smartphones besitzt hierbei eine
große Auswahl. Neben Sensoren zum Messen von Temperatur, Licht, Schwerkraft, Luft-
druck etc., befindet sich fast in jedem dieser Gerate ein 3-Achsen-Beschleunigungsmesser.
Andere Projekte haben gezeigt, dass es moglich ist, mit solchen Sensoren beispielsweise
eine Gangerkennung zu realisieren [NDBB11]. Ein Problem hierbei ist, dass zunachst er-
kannt werden muss, ob der Benutzer uberhaupt lauft oder eine andere Aktivitat ausfuhrt.
Diese Arbeit beschaftigt sich mit genau dieser Aktivitatserkennung. Es wird im Folgenden
besonders auf die Aktivitaten schnelles, normales und langsames Gehen eingegangen und
versucht, diese von anderen Aktivitaten zu unterscheiden. Durch die Berucksichtigung der
Klassifikationsergebnisse in der Gangerkennung (z.B. bei der Parameterwahl) kann diese
weiter verbessert werden.
Als Ausgangspunkt diente eine Arbeit der Fordham University [KWM10]. Hier wurden
verschiedene Aktivitaten (laufen, joggen, treppensteigen (auf/ab), sitzen und stehen) mit
den Beschleunigungssensoren verschiedener mobiler Gerate erfasst. Im Gegensatz zu un-
serem Ziel, die Daten direkt auf dem Gerat auszuwerten, wurden die Daten nach der Er-
fassung allerdings mit Hilfe anderer Computer ausgewertet. Da auf einem mobilen Gerat
195

weniger Rechenleistung zur Verfugung steht, muss es der Algorithmus zur Klassifizie-
rung ermoglichen, schnell eine Aktivitatserkennung durchzufuhren, auch wenn nur gerin-
ge Hardware-Ressourcen verfugbar sind.
2 Umfeld und Werkzeuge
Zur Realisierung stehen zwei Android-basierte Smartphones zur Verfugung. Zum einen
ein HTC G1 (2008) und zum anderen ein Motorola Defy (2010). Das HTC G1 hat eine
durchschnittliche Samplerate von 43Hz, das Motorola Defy erreicht 137Hz. Beide Gerate
verwenden unterschiedliche Versionen des Android Betriebssystems. Das etwas altere G1
verwendet die Version 1.6, wahrend das neuere Defy die aktuellere Version 2.1 nutzt.
Abbildung 1: Trageposition.
Zur Klassifikation der Aktivitaten wurde die Data Mining Software”Weka“ der Univer-
sitat von Waikato [wek11] ausgewahlt. Die Quellen wurden basierend auf der bestehenden
Android Bibliothek [and11] auf Android 1.6 portiert.
Fur die Untersuchung standen 151 Datensatze zur Verfugung: 51 x schnelles Gehen, 49 x
normales Gehen und 51 x langsames Gehen. Die Daten wurden von 51 Probanden mit dem
HTC G1 auf einer geraden Strecke mit ebenem Untergrund erfasst. Die Erfassungsdauer
liegt bei ca. 17 Sekunden. Dabei wurde das Telefon waagerecht am Gurtel der Probanden
getragen (siehe Abbildung 1).
3 Merkmale
Um eine Verarbeitung der erfassten Daten zu ermoglichen, wurden sechs Merkmale heran-
gezogen, die auch bei ahnlichen Projekten angewendet wurden [KWM10]. Es handelt sich
hierbei hauptsachlich um Werte, die zum Gebiet der beschreibenden Statistik gehoren. Bis
auf das Merkmal”durchschnittliche resultierende Beschleunigung“, werden alle Merkma-
le getrennt fur die jeweilige Sensorachse (x, y, z) ermittelt.
196

Da die Android API bei der Erfassung keine feste Samplerate ermoglicht, wurden die Da-
ten vor der Merkmalsextraktion interpoliert. Hierbei kamen zwei Verfahren zum Einsatz:
Die Ubernahme des nachstgelegenen Wertes sowie eine lineare Interpolation der Werte.
Die Auswirkungen werden in Abschnitt 4 behandelt.
• Zeit zwischen Extremwerten (TBP)
Hierbei werden zunachst alle Extremwerte der erfassten Werte ermittelt. Dies ge-
schieht mit Hilfe der Berechnung der Steigung. Ein Wechsel von positiver zu nega-
tiver Steigung wird als Maximum, ein Wechsel von negativer zu positiver Steigung
wird als Minimum vermerkt.
Nach der Erfassung aller Maxima (A) und Minima (I) wird die absolute Differenz
vonAmax und Imin berechnet, woraus ein Grenzwert zur Auffindung interessierender
negativer bzw. positiver Extremwerte bestimmt wird.
g = 5% · (Amax − Imin)
Grenzwertmax = Amax − g
Grenzwertmin = Imin + g
Extremwerte uber der Maxima-Grenze und Extremwerte unter der Minima-Grenze
werden getrennt gespeichert. Findet man hierbei jeweils weniger als drei Punkte,
wird die Grenze um g verkleinert bzw. vergroßert. Wenn mindestens drei Werte
gefunden werden konnen, wird ein Mittelwert der zeitlichen Abstande der Punkte
gebildet. Dies geschieht pro Achse getrennt fur Maxima und Minima.
• Mittelwert (AVG) getrennt fur alle Achsen (a ∈ x, y, z)
AV G = a =1
n
n∑i=1
ai (1)
• Standardabweichung (STD) getrennt fur alle Achsen
STD = s =
√√√√ 1
n
n∑i=1
(ai − a)2 (2)
• Durchschnittliche absolute Differenz (AAD) getrennt fur alle Achsen
AAD =1
n
n∑i=1
|ai − a| (3)
• Durchschnittliche resultierende Beschleunigung (ARA)
ARA =1
n
n∑i=1
√x2i + y2i + z2i (4)
197

• Klasseneinteilung (BIN)
Fur jede Achse wird die Spanne (Amax −Imin) ihrer Werte in zehn gleichgroße Klas-
sen geteilt. Anschließend wird gezahlt, wie viele der Werte der jeweiligen Achse
den einzelnen Klassen zugeordnet werden konnen.
4 Untersuchung
Um die Klassifizierung von Aktivitaten moglichst effizient zu realisieren, wurde zunachst
eine Untersuchung mit den vorhandenen Testdaten auf einem PC-System durchgefuhrt.
Hierbei wurden die Parameter Klassifizierungsalgorithmus, Merkmale, interpolierte Samp-
lerate, Dauer der Datenerfassung und Art der Interpolation herangezogen. Um zu sehen,
ob sich die Aufbereitung der erfassten Daten uberhaupt positiv auswirkt, wurden auch Er-
gebnisse ohne Vorverarbeitung, d.h. erfasste Rohdaten variabler Erfassungsdauer und ohne
feste Samplerate untersucht.
Fur alle Tests wurden zwei Drittel (34 x schnelles Gehen, 32 x normales Gehen, 34 x
langsames Gehen) der Daten zum trainieren des Klassifizierungsalgorithmus verwendet.
Anhand des restlichen Drittels (17 x schnelles Gehen, 17 x normales Gehen, 17 x langsa-
mes Gehen) wurde die Genauigkeit der Algorithmen uberpruft.
Es wurden alle Kombinationen der folgenden Parameter getestet:
• Klassifizierungsalgorithmus (18 Algorithmen)
• Alle Merkmalskombinationen
• Interpolierte Samplerate (50Hz, 100Hz, 150Hz)
• Dauer der Datenerfassung (2s, 5s, 10s, 15s)
• Interpolation (nachstgelegener Wert, linear)
Hieraus resultieren 27216 (= 18 · (26 − 1) · 3 · 4 · 2) Einzeltests. Die gewahlten Klassifi-
zierungsalgorithmen entsprechen den auf Android 1.6 lauffahigen Algorithmen der Weka
Data Mining-Software. Es wurden die Standardparameter verwendet.
Nach der Datenerfassung wurde zunachst die Grenze der geforderten minimalen Erfolgs-
rate bei der Klassifizierung auf 95% festgelegt. Die Erfolgsrate entspricht hierbei richtig
klassifizierten Datensatzen innerhalb eines Tests. Der Algorithmus darf also um diese Ra-
te zu erreichen, maximal zwei der 51 Testdatensatze falsch klassifizieren. Innerhalb dieser
Grenze stellten sich zwei Algorithmen als besonders effizient heraus und konnten bei vie-
len Tests die geforderte Erfolgsrate erreichen (siehe Tabelle 1). Zum einen SimpleLogistic,
der auf logistischer Regression basiert, zum anderen der REPTree Algorithmus, der Ent-
scheidungsbaume nutzt. Bei beiden Algorithmen konnte zudem eine hohe durchschnittli-
che Erfolgsrate innerhalb aller Tests gemessen werden (siehe Tabelle 1).
198

Anzahl der Tests mit einer
Erfolgsrate > 95%
Durchschnittliche Erfolgs-
rate
REPTree 296 82,16%
SimpleLogistic 215 82,19%
LMT 194 82,23%
... ... ...
Gesamt/Mittelwert 1287 (von 27216) 75,74%
Tabelle 1: Untersuchung verschiedener Weka Klassifizierungsalgorithmen.
Bei der weiteren Untersuchung dieser zwei Algorithmen wurde die Auswirkung der Ander-
ung von Erfassungsdauer und interpolierter Samplerate naher betrachtet. Sowohl bei REP-
Tree als auch bei SimpleLogistic konnten die besten Ergebnisse bei einer Erfassungsdau-
er von zehn Sekunden erreicht werden. Die Anderung der Samplerate wirkte sich unter-
schiedlich auf die Algorithmen aus. Bei REPTree war das Ergebnis fur alle Frequenzen
gleich, bei SimpleLogistic hingegen gab es große Unterschiede (siehe Tabelle 2). Ein Ver-
gleich mit der Verarbeitung der Rohdaten zeigt, dass die Vorverarbeitung (Interpolation)
besonders bei REPTree wesentliche Vorteile bringt. Ohne Vorverarbeitung gab es hier kei-
ne Tests mit Erfolgsraten uber 95%, bei SimpleLogistic war das Ergebnis mit 25 Tests in
einem guten Bereich.
nachstgelegener Wert lineare Interpolation
REPTree SimpleLogistic REPTree SimpleLogistic
50Hz 32 13 32 16
100Hz 32 8 32 9
150Hz 32 22 32 30
Tabelle 2: Tests mit einer Erfolgsrate uber 95% bei einer Erfassungsdauer von 10 Sekunden
Aufgrund der vorliegenden Ergebnisse wurde im weiteren der REPTree Algorithmus ver-
wendet. Bezuglich der Auswirkung der Kombination von Merkmalen konnten kaum Un-
terschiede festgestellt werden. Die Erkennung scheint hauptsachlich vom Merkmal STD
abhangig zu sein. Jede Kombination dieses Merkmals mit anderen ergab eine Erkennungs-
leistung von uber 95% innerhalb der Testdaten. Ein Blick auf den resultierenden Such-
baum, der unter Verwendung aller Merkmale entstand, zeigt den Grund hierfur. Der Algo-
rithmus hat lediglich die Merkmale”Standardabweichung der x-Achse“ und die
”durch-
schnittliche absolute Differenz der x-Achse“ zur Klassifizierung verwendet.
5 Implementierung auf dem Smartphone
Mit Hilfe der gewonnenen Erkenntnisse wurde eine Applikation erstellt, die es ermoglicht,
ohne weitere Hardware Daten zu erfassen und diese mit der Weka-Bibliothek zu klassifi-
199

200

6 Evaluation
Die erstellte Applikation wurde mit verschiedenen Probanden getestet. Hierbei wurde der
Klassifizierer mit allen zur Verfugung stehenden Datensatzen fur schnelles, normales und
langsames gehen trainiert und zudem eine weitere Aktivitat angelegt, die es ermoglichen
soll, gehen von anderen Aktivitaten zu unterscheiden. Da bisher keine Daten fur diese
”keine“-Aktivitat zur Verfugung standen, wurde jeweils ein Beispiel fur Stehen,
”in der
Hand halten“,”in der Hand halten und Touchscreen verwenden“,
”abgelegtes Handy mit
Display oben“,”abgelegtes Handy mit Display unten“ von einer Person erfasst.
SollDefy
l n s k
7 0 0 0 l
Ist3 7 0 0 n
0 3 10 0 s
0 0 0 0 k
SollG1
l n s k
10 4 0 0 l
Ist0 5 3 0 n
0 1 7 0 s
0 0 0 0 k
Soll Einzeltest
l n s Defy
15 1 1 l
Ist
0 14 4 n
0 0 10 s
Tabelle 4: Ergebnisse der Evaluation(l=langsam, n=normal, s=schnell, k=keine).
Getestet wurde mit 20 Probanden. Bei 10 Erfassungen wurde das HTC G1 mit einer Samp-
lerate von 43Hz verwendet, bei den restlichen 10 das Motorola Defy mit einer Samplerate
von 137Hz. Das Upsampling bzw. Downsampling wurde auf 100Hz festgelegt, die Erfas-
sungsdauer betrug 10 Sekunden (siehe Abschnitt 5). Jeder Proband lief eine gerade Strecke
auf ebenem Boden, jeweils einmal langsam, normal und schnell.
Die Erkennungsleistung lag bei 80% (Motorola Defy) bzw. 73% (HTC G1) (siehe Tabelle
4). Die Abweichung von schnell ⇔ normal oder normal ⇔ langsam kann durch die von
Person zu Person unterschiedliche Auffassung der Geschwindigkeiten erklart werden. Ei-
ne starke Abweichung von schnell ⇔ langsam kam innerhalb des Tests nicht vor (siehe
Tabelle 4).
Ein weiterer Test sollte zeigen, ob eine Erkennung der Aktivitaten schnelles, normales
und langsames Gehen durch wenige Daten einer Testperson moglich ist. Hierzu wurden
12 Datensatze erfasst (4 x schnell, 4 x normal, 4 x langsam) und hieraus ein Klassifizierer
erstellt. In 45 Laufen (15 x schnell, 15 x normal, 15 x langsam) konnte eine Erkennungs-
leistung von etwa 86% gemessen werden (siehe Tabelle 4). Auffallig war die schlechte
Erkennung des schnellen Gehens, wobei dieses sogar als langsam gewertet wurde.
201

7 Fazit
Es konnte gezeigt werden, dass eine Erkennung der Aktivitaten langsames, normales und
schnelles Gehen auf einem Smartphone realisiert werden kann. Selbst auf alteren Geraten,
wie dem HTC G1 stehen genugend Hardwareressourcen zur Verfugung.
Bei Feldversuchen war es moglich, Erkennungsraten von uber 80% zu erreichen. Ein
Vergleich mit den Ergebnissen anderer Untersuchungen zum Thema Aktivitatserkennung
[KWM10] zeigt, dass diese Erkennungsraten trotz der nahen Verwandschaft der untersuch-
ten Aktivitaten (langsames, schnelles und normales Gehen), bereits in einem sehr guten
Bereich liegen. Diese Ergebnisse sowie die kurzen Klassifizierungszeiten zeigen, dass das
beschriebene Verfahren in der biometrischen Gangerkennung als Vorverarbeitungsschritt
eingesetzt werden kann. Verschiedene Geschwindigkeiten konnen identifiziert werden, um
ein fur die entsprechende Geschwindigkeit optimiertes Gangerkennungsverfahren zur Au-
thentisierung auszuwahlen.
In Zukunft muss die Auswirkung der Aufnahme anderer Aktivitaten auf die Erkennungs-
leistung untersucht werden. Zudem mussen Daten gesammelt werden, die es ermoglichen
die interessierenden Aktivitaten von anderen zu unterscheiden. Die erstellte Applikation,
sowie die portierte Weka-Bibliothek bilden hierfur bereits eine sehr gute Grundlage.
Literatur
[and11] https://github.com/rjmarsan/Weka-for-Android, 17.05.2011.
[BI04] Ling Bao und Stephen Intille. Activity Recognition from User-Annotated AccelerationData. In Pervasive Computing, Lecture Notes in Computer Science. Springer, Heidel-berg, 2004.
[BP09] Arno Becker und Marcus Pant. Android, Grundlagen und Programmierung. dpunkt,Heidelberg, 1. Auflage, 2009.
[BVU09] Gerald Bieber, Joerg Voskamp und Bodo Urban. Activity Recognition for Everyday Lifeon Mobile Phones. In Universal Access in Human-Computer Interaction. Intelligent andUbiquitous Interaction Environments, Lecture Notes in Computer Science. Springer,Heidelberg, 2009.
[KWM10] Jennifer Kwapisz, Gary Weiss und Samuel Moore. Activity recognition using cell phoneaccelerometers. SIGKDD Explorations, 12, 2010.
[May06] Horst Mayer. Beschreibende Statistik. Hanser, Munchen, 4. Auflage, 2006.
[NDBB11] Claudia Nickel, Mohammad Derawi, Patrick Bours und Christoph Busch. ScenarioTest of Accelerometer-Based Biometric Gait Recognition. International Workshop onSecurity and Communication Networks (IWSCN), 3, 2011.
[wek11] http://www.cs.waikato.ac.nz/ml/weka/, 17.05.2011.
[WF00] Ian Witten und Eibe Frank. Data Mining, Practical Machine Learning Tools and Tech-niques with Java Implementations. Morgan Kaufman Publishers, San Francisco, 4. Auf-lage, 2000.
202

Towards hand biometrics in mobile devices
A. de Santos Sierra1 C. Sanchez Avila1 A. Mendaza Ormaza2
J. Guerra Casanova1
1{alberto, csa, jguerra}@cedint.upm.esGroup of Biometrics, Biosignals and Security (GB2S)
Polytechnical University of MadridCampus de Montegancedo, 28223 Pozuelo de Alarcon, Madrid
[email protected] Group for Identification Technologies (GUTI)
Universidad Carlos III de Madrid28918, Leganes, Madrid
Abstract: The increasing demand of security oriented to mobile applications has rai-sed the attention to biometrics, as a proper and suitable solution for providing secureenvironment to mobile devices.
With this aim, this document presents a biometric system based on hand geometryoriented to mobile devices, involving a high degree of freedom in terms of illuminati-on, hand rotation and distance to camera. The user takes a picture of their own handin the free space, without requiring any flat surface to locate the hand, and withoutremovals of rings, bracelets or watches.
The proposed biometric system relies on an accurate segmentation procedure, ableto isolate hands from any background; a feature extraction, invariant to orientation,illumination, distance to camera and background; and a user classification, based onk-Nearest Neighbor approach, able to provide an accurate results on individual identi-fication. Previous schemes combine simplicity, low computational cost and efficiency,so that their implementation in mobile devices is feasible. The proposed method hasbeen evaluated with two own databases collected with a HTC mobile. First databasecontains 120 individuals, with 20 acquisitions of both hands. Second database is a syn-thetic database, containing 408000 images of hand samples in different backgrounds:tiles, grass, water, sand, soil and the like.
The system is able to identify individuals properly with False Reject Rate of 5.78%and False Acceptance Rate of 0.089%, using 60 features (15 features per finger).
1 Introduction
This paper presents a method to identify individuals based on hand geometry features byusing mobile devices, not only during the acquisition procedure but also when carryingout the individual identification.
Hand biometrics applied to mobile devices allow a contact-less approach for this biometrictechnique without requiring any additional hardware or sensor, combining the strengths of
203

hand biometrics in terms of identification with the extended use of mobile devices.
The proposed biometric technique is performed by acquiring a hand picture of the userwith a mobile devices, having the palm up facing the camera. In other words, the ideaconsists that user could take a picture of his/her own hand with the mobile phone. Thechallenge of this biometric technique lies in the variability existing in changes like cameradistance, orientation and hand openness.
The segmentation algorithm implies slight constraints on backgrounds where hand ac-quisitions can take place, and the features conforming template are invariant to previouschanges.
In addition, the k Nearest Neighbor classification algorithm is suitable for mobile imple-mentation combining simplicity and high rates in identification performance. The systemaccuracy has been evaluated with two own public databases: first database, of 120 in-dividuals, contains 20 samples of both hands per user and is oriented to assess systembehaviour in relation to individual identification accuracy; second database, with 408000pictures of hand with different backgrounds (grass, tiles, parquet, wood and the like) isaimed to evaluation system performance in terms of segmentation.
2 Literature Review
The idea of extracting unique information from hand with the aim of personal identifica-tion was early already proposed [SRSAGM00]. In fact, the quantity of works presentedunder the topic of hand biometrics makes intractable to provide a fair overview withinthis document [FS09]. Therefore, the main interest of this literature review gets down tocontact-less approaches, where hand is not located on a flat surface [FS09].
Most common scenarios consider image acquisition on free-space with visible light re-quiring few constraints on the background with standard CCD cameras. In contrast, inorder to avoid background effects on segmentation, infrared illumination was proposed asa suitable solution to meet this goal [MFAT08], achieving better results when compared tovisible light.
With regard to mobile devices, biometrics attempt to respond to the huge and increasingdemand in security applications oriented to mobile devices covering from daily scenarios[LGYC10] to government environments [ADA10].
Finally, some works have assessed to what extent hand biometrics are accepted by indi-viduals [KEGD07], concluding that users react very positively to hand biometric sensors.Moreover, none of the individuals thought the device could invade their personal activity,preferring this biometric technique to the existing card-based access system.
204

3 Segmentation by means of Gaussian Multiscale Aggregation
The proposed method is based on multiscale aggregation [MnAdSSC10], considering animage I as a graph G = (V,E,W ) were V represents nodes in graph corresponding topixels in image, E stands for the edges connecting pairs of previous nodes V and W theweight of previous edges, measuring the similarity between two nodes (pixels) in V .
The similarity between nodes in first scale will be set based on their neighbourhood ofeach pixel, which is a 4-neighbourhood structure for the first scale. These two parametersare collected into a single function φ
[s]vi (µ
[s]vi , σ
[s]vi ) representing the degree of being similar
to node vi, where s represents the scale. For simplicity sake, φ[s]vi (µ
[s]vi , σ
[s]vi ) = φ
[s]vi , to
avoid and excessive complicated notation.
Thus, the similarity between two neighbour nodes vi and vj at scale s is defined as inEquation 1.
w[s]ij =
∫φ[s]viφ[s]vjdζ (1)
where ζ makes reference to the complete color space. The more similarity between mem-bership functions, the higher weight w[s]
ij . Moreover, functions φvi[s] are normalized by
definition so that∫φ[s]vi dζ = 1, for every scale s. Notice that wij is only calculated for
neighbour pixels, according to the neighbourhood provided by each scale s.
This method iterates along all weights sorted in W so that every node is associated witha subgraph. Next step consists on extracting the new membership functions for each sub-graph, based on the functions associated with the nodes within such a subgraph.
For a given subgraph in the subsequent scale, G[s+1]
k , the membership function is definedas follows in Equation 2.
φ[s+1]
Gk=
⋃Nj φ
[s]Gj∫ ⋃N
j φ[s]Gj
dζ(2)
where N represents the number of nodes gathered by subgraph G[s+1]
k . Notice φ[s+1]
Gkis
normalized according to definition, so that∫φ[s+1]
Gkdζ = 1.
However, a new structure must be provided efficiently to these scattered nodes, since theinitial structure of 4-neighbourhood grid is lost with this aggregation method. Moreover,in addition to function φ
[s]vj , every node vj is provided with their location within image I in
terms of vertical and horizontal cartesian coordinates. When obtaining G[s+1]
k , the centroidof those gathered nodes is calculated, so that each subgraph on subsequent scales have aposition within image. This centroid, ξ, allows to provide a structure in subsequent scalesby means of Delaunay triangularization [dBvKOS08].
This operation represents the final step in the loop, since at this moment, there exist a newsubgraph G[s+1] =
⋃k G
[s+1]
k at scale s + 1 where each G[s+1]
k represents a node, and
205

edges E[s+1] are provided by Delaunay triangulation, and weights W [s+1] are obtainedbased on Equations 1 and 2.
The whole loop is repeated until only two subgraphs remain, as stated at the begining ofthis section (G = Gh ∪Gb).
The computational cost of this algorithm is quasi-linear with the number of pixels, sinceeach scale gathers nodes in the sense that nodes in subsequent scales are reduced by (inpractice) a three times factor. Therefore, the total time is comparable to two times theprocessing time to aggregate first scale.
4 Feature Extraction
Hand image acquisition with a mobile devices implies a wide variability in terms of handrotation, distance to camera and pose orientation. During the acquisition procedure, usersare said to take their hand picture, with the mobile camera facing completely the hand,avoiding changes in pose orientation. However, users are free to choose distance to cameraand hand rotation. Therefore, features extracted from segmentation must be invariant tothese former changes in order to ensure a proper accuracy in terms of identification.
Let S be the segmentation result provided by previous Section 3. First of all, the algorithmseparates fingers from palm, given that the whole information of posterior features will beextracted from fingers only by carrying out a morphological opening with a disk structuralelement of size 40, so that fingers are completely erased from the original image, being thepalm mostly conserved. At this point, those with lower area are selected as candidate to bewhether thumb or little, being the criteria to distinguished between then the ratio betweenlength and width. To put it another way, the algorithm associates thumb to the dickest andsmallest finger.
Having detected little and thumb, the classification of the rest fingers is straightforward.
Due to the acquisition procedure, fingers could point at any direction and could have diffe-rence lengths and widths even among intra-class samples because of the distance to cameravariability.
Therefore, normalization must be considered to ensure invariance to these former chan-ges. Concretely, the presented approach proposes a normalization scheme based on fingerlength, dividing each extracted feature by their corresponding finger length. Mathemati-cally, let F = {fi, fm, fr, fl} be the set of possible fingers, namely index, middle, ring andlittle, respectively. Then, finger lengths are represented by the set Λ = {λfi , λfm , λfr , λfl}.Lengths are measured in terms of euclidean distance between the corresponding tip pointto the bases of the finger.
In addition, thumb finger is not considered on the template, due to their noticeable move-ment freedom within hand plane.
Concerning width features, a different approach to literature is proposed considering avera-ge values to describe every feature. In other words, m distances are taken along the finger,
206

measuring the existent width between finger sides. Afterwards, these former measures aresplitted into n (with n < m) sets, containing the average values of the corresponding
⌊mn
⌋parts gathered by each set. For each set, average µ and standard deviation σ is calculated.
Furthermore, each n component is normalized according to the corresponding finger length,based on former discussion about normalization.
In other words, each finger fk is divided into m parts from basis to top, resulting in theset of widths Ωfk = {ω1, . . . , ωm}. Considering set Ω, the template is represented by
Δfk =
{δfk1
λfk
, . . . , δfkn
λfk
}, where each δfkt is defined as the average value of at least %m
n &components in Ωfk .
Final step in biometrics systems design regards template comparison, which means todecide whether two provided templates belong to a same individual.
A suitable solution is k Nearest Neighbor as a simple, effective and nonparametric classi-fication method, which has been extensively used in a wide number of biometric applica-tions [LCW09]. In addition, their computational cost is adequate for mobile applications,and the results (Section 6) justify this selection. The specific parameters are k = 3 (thenumber of nearest neighbors used in the classification) and the euclidean distance as me-tric.
5 Databases
The proposed biometric technique is oriented to mobile applications and therefore, thealgorithm must be tested with images acquired from a mobile device. Two databases arecollected: First database assesses (train, validate and test) the whole system in terms ofidentification efficiency. Second was created synthetically based on first database to eva-luate only the performance of segmentation, with the aim of evaluating the proposed al-gorithms in different environments and scenarios. These databases are both available athttp://www.gb2s.es.
First database contains hand acquisitions of 120 different individuals of an age range from16 to 60 years old, gathering males and females in similar proportion.
Second database represents the tool to evaluate segmentation, assessing to what extent thesegmentation algorithm can satisfactory isolates hand from background on real scenarios.Different backgrounds are considered in an attempt to cover all possible real scenarios,containing textures from carpets, fabric, glass, grass, mud, different objects, paper, parquet,pavement, plastic, skin and fur, sky, soil, stones, tiles, tree, walls and wood. Five differentimages from every texture were considered to ensure more realistic environments. Allprevious texture backgrounds were taken from http://mayang.com/textures/. This databasecontains a total of 408000 images.
207

Tabelle 1: Segmentation evaluation by means of factor F in a synthetic database with 17 differentbackground textures.
Texture F (%) Texture F (%) Texture F (%)Carpets 92.3±0.2 Paper 91.3±0.2 Stones 91.4±0.1Fabric 89.1±0.1 Parquet 88.4±0.3 Tiles 90.3±0.2Glass 94.3±0.1 Pavement 89.1±0.2 Tree 96.3±0.2Grass 93.7±0.1 Skin and Fur 95.7±0.2 Wall 94.2±0.1Mud 89.8±0.1 Sky 96.4±0.2 Wood 93.8±0.1
Objects 92.1±0.2 Soil 89.4±0.1
6 Results
The scope of this paper describes hand segmentation on mobile devices from hand ac-quisition with the camera embedded on a mobile phone to the individual classificationindicating whom the hand image belongs to. A global evaluation must consider completeassessment of each steps in hand biometrics.
In order to evaluate segmentation performance, a supervised evaluation method was con-sidered. This method compares the result provided by the segmentation method with aground-truth image. Furthermore, in order to measure to what extent the result is similarto ground-truth, factor F [AGBB07] is proposed, providing a suitable manner to assesssegmentation and accuracy.
The former factor F is defined as F = 2RPR+P where R stands for Recall and P for Precision.
The results of factor F obtained for second database are presented in Table 1.
There exist two parameters which affect the performance in terms of identification andverification: the number of features extracted per finger and the number of samples to trainthe classifier based on k-NN.
In addition, the criteria to evaluate is defined by the following rates [KEGD07]: False-NonMatch Rate (FNMR), False Match Rate (FMR), Failure-to-enroll rate (FTE), Failure-to-acquire (FTA), False Reject Rate (FRR), False Accept Rate (FAR).
Best value is obtained with N = 12 and Δn=15 which implies 12 samples for trainingand a total of 60 features per hand (15×4). However, competitive results can be obtainedby reducing both values. It is remarkable, the low value of FMR in every configuration,which means that the proportion of users that are accepted wrongly is almost negligible,ensuring that only enrolled users can access the system.
In addition, the value for FRR and FAR can be obtained for the best system. This valuescoincides with FRR = 5.98% and FAR = 0.089%.
The proposed system has been implemented on two different arquitectures: a MATLABimplementation (running in a PC Computer @2.4GHz) and a JAVA-Android implementa-tion oriented to an HTC Desire @1GHz and 576 MB RAM. Due to the obvious differencesin hardware, the implementation was tackled differently in each situation.
208

Tabelle 2: Temporal performance of both implementation measured in seconds.
Operation PC @2.4GHz (seconds) HTC @1GHz (seconds)Acquisition < 0.1 < 0.1
Segmentation 0.7±0.08 1.5±0.2Feature Extraction 0.4±0.1 0.8±0.2
Matching 0.1±0.01 0.4±0.05
In order to compare both implementations, Table 2 is provided. Despite of the differencein the hardware, the HTC implementation is able to provide individual identification inless than 3 seconds, which is a reasonable time performance for a mobile application.
7 Conclusions
A biometric system based on hand geometry recognition oriented to mobile devices isproposed within this document.
Users can take a picture of their hands by holding the mobile phone with the remaininghand, providing a high degree of freedom in terms of rotation and distance to camera.Therefore, this biometric technique solves the identification problem in a more challengingenvironment, given that there are few limitations and constraints on the background whichis behind the hand.
The idea is to provide a non-invasive and comfortable biometric technique on mobile de-vices to final users.
The segmentation algorithm is based on multiscale aggregation, by using L*a*b* colorspace, very suitable for mobile applications due to their combination of computationalcost and efficiency.
The template which describes univocally the individuals is based on N samples extractedfrom the user, obtaining best results when N = 12 samples are required. Furthermore,the classification is based on a k-Nearest Neighbor approach which provides the biometricsystem with competitive identification rates (FRR = 5.78% and FAR = 0.089%), with lowcomputational cost, for a mobile implementation.
Concerning future work, authors would like to explore the variation of FAR and FRRrates under different backgrounds, the effect of blur and the inclusion/removal of ringsin identification performance and the improvement of the segmentation algorithm, so thatbetter results could be obtained, reducing the Failure-to-acquire (FTA) rate. In addition, anevaluation in terms of user acceptability is also considered as future work.
209

Literatur
[ADA10] T. Alhussain, S. Drew und O. Alfarraj. Biometric authentication for mobile govern-ment security. In Intelligent Computing and Intelligent Systems (ICIS), 2010 IEEEInternational Conference on, Jgg. 2, Seiten 114–118, 2010. ID: 1.
[AGBB07] S. Alpert, M. Galun, R. Basri und A. Brandt. Image Segmentation by ProbabilisticBottom-Up Aggregation and Cue Integration. In IEEE Conference on ComputerVision and Pattern Recognition, 2007. CVPR ’07., Seiten 1–8, june 2007.
[dBvKOS08] Mark de Berg, Marc van Kreveld, Mark Overmars und Otfried Schwarzkopf. Com-putational Geometry: Algorithms and Applications. Springer, 3rd. Auflage, April2008.
[FS09] Leong Lai Fong und Woo Chaw Seng. A Comparison Study on Hand Recogniti-on Approaches. In Soft Computing and Pattern Recognition, 2009. SOCPAR ’09.International Conference of, Seiten 364–368, 2009. ID: 1.
[KE06] E. Kukula und S. Elliott. Implementation of hand geometry: an analysis of userperspectives and system performance. Aerospace and Electronic Systems Magazine,IEEE, 21(3):3–9, march 2006.
[KEGD07] E.P. Kukula, S.J. Elliott, B.P. Gresock und N.W. Dunning. Defining Habituationusing Hand Geometry. In Automatic Identification Advanced Technologies, 2007IEEE Workshop on, Seiten 242–246, 7-8 2007.
[LCW09] Haitao Liu, Yang Cao und Zengfu Wang. A novel algorithm of gait recognition. InWireless Communications and Signal Processing, 2009. WCSP 2009. InternationalConference on, Seiten 1–5, 2009. ID: 1.
[LGYC10] Huiqi Lu, S. Gheitanchi, R. Young und C. Chatwin. A symbian based mobile userauthorization system using mobile networks. In Wireless Advanced (WiAD), 20106th Conference on, Seiten 1–5, 2010. ID: 1.
[MFAT08] A. Morales, M.A. Ferrer, J.B. Alonso und C.M. Travieso. Comparing infrared andvisible illumination for contactless hand based biometric scheme. In Security Tech-nology, 2008. ICCST 2008. 42nd Annual IEEE International Carnahan Conferenceon, Seiten 191 –197, 2008.
[MnAdSSC10] Angel Garcıa-Casarrubios Munoz, Carmen Sanchez Avila, Alberto de Santos Sierraund Javier Guerra Casanova. A mobile-oriented hand segmentation algorithm basedon fuzzy multiscale aggregation. In Proceedings of the 6th international conferenceon Advances in visual computing - Volume Part I, ISVC’10, Seiten 479–488, Berlin,Heidelberg, 2010. Springer-Verlag.
[SRSAGM00] R. Sanchez-Reillo, C. Sanchez-Avila und A. Gonzalez-Marcos. Biometric iden-tification through hand geometry measurements. Pattern Analysis and MachineIntelligence, IEEE Transactions on, 22(10):1168–1171, oct 2000.
210

3D Face Recognition in the presence of 3D modeldegradations
Pierre Lemaire1
Di Huang1
Joseph Colineau2
Mohsen Ardabilian1
Liming Chen1
1Université de Lyon, CNRS, Ecole Centrale
Lyon
LIRIS UMR 5205
69134, Ecully, France
{f irst_name.last_name}@ec-lyon.fr
2Thales Research & Technology
France
1, Av Augustin Fresnel
91767 PALAISEAU Cedex, France
Abstract: The problem of 3D face recognition has received a growing interest in
the past decades. While proposed approaches have proven their efficiency over re-
nowned databases as FRGC, little work has been conducted on the robustness of
such algorithm to the quality of 3D models. In this work, we present a study of the
robustness of our 3D face recognition algorithm, namely MS-ELBP+SIFT, to face
model degradations. Those degradations include Gaussian noise, decimation, and
holes. Degradations are generated on a subset of the FRGC database, hence enabl-
ing us to compare the robustness of our approach to them. Results are provided
through a comparative study with the baseline ICP method.
1 Introduction
While studies have proven the effectiveness of current approaches to 3D face recogni-
tion, few of them have evaluated the impact of 3D model degradations. Those degrada-
tions may have several origins. At first, some degradation may be issued from the 3D
acquisition itself. 3D laser scanners have been reported to be sensitive to the wave-
lengths of artificial lightings. In some cases, a high reflectance of the acquired surface
can also generate holes or spikes on the resulting model. Since they are electronic devic-
es, binocular sensors also suffer from thermal noise (Nyquist-Johnson noise), Schottky
noise, etc. We shall count the acquisition conditions as a source of degradations also,
since occlusions, self-occlusions or movements resulting in a blur might occur during the
acquisition process. A short study of those model degradations for 3D Face Recognition
within the FRGC database [Ph05] was conducted in [Fa07], as well as in [Ka07]. Com-
pression might also be useful for storage capacity matters, as well as sampling (resolu-
tion reduction of the 3D model). The distance of the subject to the 3D scanner also has
an impact on the resolution of the 3D model. Those considerations are to be taken into
account especially in the case of asymmetric biometric scenarios, in which the enrolment
step can benefit from high quality acquisition conditions, while the verification step is
often to be conducted with light gear, in rather unconstrained conditions. Analyzing the
behavior of recognition algorithms in the presence of such degradations is a necessary
step before using such methods into a real environment application.
211

A majority of authors in the domain of 3D face analysis seem to have, often implicitly,
admitted the existence of such issues in their work; hence the use of pre-processing steps
[Fa07][DHu10][Dr10]. Those pre-processing steps include peaks, and more generally
noise removal with the help of mean, median or Gaussian filters over the Z coordinates.
Resampling, remeshing techniques are also used [Dr10]. Pre-processing methods also
include hole filling algorithms by the mean of interpolation techniques. Authors have
also dedicated works, and developed techniques relative to occlusion handling [Co06],
which is in some cases equivalent to holes handling.
Despite 3D model degradations are generally admitted to have an impact over face rec-
ognition algorithms performances [Ro09][Po09], to our knowledge little to none work
has been presented to measure it. In this paper, we propose a study on the performances
of our state of the art face recognition approach, MS-ELBP + SIFT [DHu11], under var-
ious canonical model degradations such as noise, decimation and holes. Results were
compared with ICP [Be92], which is generally considered as a baseline algorithm for the
problem of 3D face recognition.
This paper is organized as follows. The second section exposes our method for 3D Face
Recognition, providing results on the FRGC database. The third section exposes our me-
thod for measuring the robustness of 3D Face Recognition algorithms to degradations.
Experimental are provided. Section 4 concludes the paper.
2 Our 3D Face Recognition Algorithm: MS-ELBP + SIFT.
In this section, we describe our method for 3D face recognition, also detailed in
[DHu11]. The first step is based on a novel approach for representing the 3D face depth-
map, called Multi Scale Extended Local Binary Patterns (MS-ELBP). The second step is
using the rather classical Scale Invariant Feature Transform (SIFT) approach.
In the state-of-the-art, block-based 3DLBP histograms [YHu06] and LBP based range
faces [DHu10] were investigated for 3D facial representation, while they do not provide
accurate description of local shape variations. In this section, we first recall the basics of
LBP. We then introduce Extended Local Binary Patterns (ELBP) and Multi-Scale strate-
gy to generate the new 3D geometric facial representation, called MS-ELBP Depth Fac-
es (MS-ELBP-DFs), which accurately encodes local shape variations of range faces.
Results are eventually exposed and prove the effectiveness of our approach.
2.1 LBP and its descriptive power of local shape variations
LBP [Oj02] is a non-parametric algorithm, and was first proposed to describe local tex-
ture of 2D images. The most important properties of LBP are its tolerance to monotonic
illumination variations and computational simplicity. So, it has been extensively adopted
for 2D face recognition in the last several years [Ah04].
212

Specifically, the original LBP operator labels each pixel of a given image by threshold-
ing in a 3×3 neighborhood. Each of the 256 LBP code can be regarded as a microtexton.
LBP can describe local shape structures, such as flat, concave, convex etc. when operat-
ed on depth images. However, the direct application of LBP on range images potentially
results in unexpected confusion to similar but different local shapes. To address this
problem, we considered two complementary solutions. The first one aims at improving
the discriminative ability of LBP with Extended LBP coding approach, and the other one
focuses on providing a more comprehensive geometric description of the neighborhood
by exploiting Multi-Scale strategy. Both solutions are discussed in the two following
subsections respectively.
2.1.1 Extended Local Binary Patterns
The reason why LBP cannot be competent to recognize similar shapes is caused by its
operational mode. It only compares relative differences between the central pixel and its
neighbors. Instead of LBP, ELBP not only extracts relative gray value difference be-
tween the central pixel and its neighboring pixels, but also focuses on their absolute dif-
ference. ELBP is a generalized version of 3DLBP [YHu06].
Specifically, the ELBP code consists of several LBP codes at multiple layers which en-
code the exact gray value difference (GD) between the central pixel and its neighboring
pixels. The first layer of ELBP is actually the original LBP code, encoding the sign of
GD. The following layers of ELBP then encode the absolute value of GD (Fig. 1). The
first layer of the ELBP simply encodes the sign of GD. The absolute values of GD, i.e. 1,
5, 3, 2, 1, 2, 3, 0, are then encoded in their binary numbers: (001)2, (101)2, (011)2, (010)2,
etc. Using a LBP scheme on all the binary bits, we finally generate the corresponding
ELBP code for each layer. As a result, the information encoded in the additional layers
can be used to distinguish shapes described as similar by the first layer (original LBP).
Theoretically, in one image, the maximum value of GDs is 255 (between 0 and 255),
which means that 8 additional layers are required to encode GDs. However, range faces
are pretty smooth; and the GDs in a local surface generally do not vary dramatically. It
was also proven by the work in [YHu06] that more than 93% of GDs are smaller than 7
between points within two pixels. Hence, we set the number of additional layers to 3.
2.1.2 Multi-Scale Strategy
LBP facial representation can be achieved in two ways: one is LBP histogram [Sh08];
another is LBP face. The latter approach, as investigated in our method, regards the cor-
responding decimal number of the LBP binary code as the intensity value of each pixel,
and generates the LBP face.
MS-ELBP-DFs of range face image can be achieved by varying the neighborhood size
of LBP operator, by first down-sampling the range image and then adopting the LBP
operator with a fixed radius (Fig. 2). The number of sampling points is 8, and the value
213

of radius varies from 1 to 8. As we can see in Figure 2, the original range image is very
smooth, while the resulting MS-ELBP-DFs contain many more details of local shapes.
2.2 SIFT BASED LOCAL FEATURE MATCHING
Local feature extraction operated directly on smooth 3D face images leads to few local
features with low distinctiveness. Meanwhile, the produced MS-ELBP-DFs contain
many more details of local shapes, and thus enhance their distinctiveness. Once the MS-
ELBP-DFs are achieved, the widely-used SIFT based features [Lo04] are extracted from
them for similarity score calculation and final decision.
We use the SIFT operator on each MS-ELBP-DF separately. Because MS-ELBP-DFs
highlight local shape characteristics of smooth range images, many more SIFT-based
keypoints can be detected for the following matching step than those in the original
range images. From statistical work done on the FRGC database, the average number of
feature points extracted from each of MS-ELBP-DFs is 553, while that of each range
image is limited to 41.
Figure 1. An example of the ELBP Operator.
Figure 2. MS-ELBP-DFs of a range face image with different radii from 1 to 8 (from left to
right).
214

Given the local features extracted from each MS-ELBP-DF pair of the gallery and probe
face scan respectively, two facial keypoint sets can be matched. Matching one keypoint
to another is accepted only if the matching distance is less than a predefined threshold t
times the distance to the second closest match. In this research, t is empirically set at 0.6
as in [Lo04]. A bigger number of matched keypoints means a better matching relation-
ship. A face in the probe set is matched with every face in the gallery. The multi-scale
analysis is then achieved by fusing the matching scores of all scales by using a basic
weighted sum rule. More details about that step are provided in [DHu11].
2.3 Performances
We have conducted experiments over the FRGC v2.0 database [Ph05]. This database is
one of the most popular datasets, containing 4007 3D face models of 466 different sub-
jects. Table I provides comparative results of the Rank One experiment with other state
of the art approaches.
TABLE I. RANK-ONE RECOGNITION RATES ON FRGC V2.0.
Rank-One Recognition Rate
ICP 72.2%
Mian et al. [Mi07] 96.2%
Kakadiaris et al. [Ka07] 97.0%
MS-ELBP-DFs 97.2%
Extended results and analysis are provided in [DHu11].
In the following section, we are looking forward to analyze the behavior of our approach
in the presence of original model degradations.
3 Robustness to Degradations
As stated in the introduction, 3D models can suffer from various types of degradations,
from various origins. It seems difficult to acquire ground-truth over model degradations
or to model degradations precisely. Hence, in this experiment, we decided to generate
degraded data from original 3D scans. That choice allows us to keep mastery over the
parameters of the degradations. The degradations we applied may be considered as ca-
nonical degradations, namely Gaussian noise, Decimation and Holes.
Our experimental protocol is the following. We first randomly picked 100 different sub-
jects within the FRGC v2.0 database. For each subject, one model is randomly picked as
a gallery model, which expression is neutral. Also 100 different models were randomly
picked for each subject, as probe models. From there, we are looking forward to analyze
the performance loss in our algorithm under model degradations. For that purpose we
applied basic degradations to our probe models set to generate new, degraded sets. At
that point, the first concern we should have is that the original data we are working with
215

(gallery, probe) are as little degraded as possible. We chose to apply to both gallery and
probe sets a pre-processing inspired by the method exposed in [Fa07]. More precisely,
we cropped the faces based on the nose-tip within a sphere of diameter 100mm. Nose-
tips were manually located on every face. Then, we applied a median filtering within a
5x5 square for every pixel in the depth image. The probe face set was then altered to
some extent to create new, degraded sets, according to the following degradations:
‚ Gaussian noise corresponds to the injection of an error within a Gaussian distribution
on the Z coordinates on the depth image. This tends to emulate the behavior of elec-
tronic noise of acquisition devices, albeit a simplistic manner. In our experiments, we
set the RMS value of the error to 0.4mm.
‚ Decimation corresponds to removing vertices from the original data. In this experi-
ment, vertices are picked randomly and removed from a ratio of x4. That means that
the decimated model includes 4x fewer vertexes than the original ones.
‚ Holes are generated at random locations on the face. At first, we pick a random ver-
tex on the surface of the face. Then, we crop the hole according to a 1 centimeter ra-
dius sphere centered on the latter vertex.
Figure 3 shows examples of those degradations.
We judged several measures to be interesting. The Rank-One Recognition Rate; the
Rank-Five Recognition Rate; the Equal Error Rate (EER) appeared to us like good indi-
cators of the decrease in performances relative to models degradations. Experiments
were conducted with both the baseline algorithm ICP [Be92] and our MS-ELBP+SIFT
method. Results are exposed in Tables II and III. In those tables, “Rank-1 RR” lines
stand for Rank One Recognition Rate, “Rank-5 RR” stand for “Rank Five Recognition
Rate” and “EER” for Equal Error Rate.
TABLE II. BEHAVIOUR OF THE BASELINE ICP ALGORITHM IN THE PRESENCE OF DEGRADATIONS
Original Noise Decimation Holes
Rank-1 RR 0.712895 0.693431 0.669100 0.720195
Rank-5 RR 0.824818 0.817518 0.793187 0.836983
EER 0.1350 0.1392 0.1977 0.1353
Figure 3. An example of degradations applied to one model. From left to right: the Original face,
Noise applied, Decimation applied, Holes applied. On the decimation picture, no interpolation w
conducted. Then, blank parts correspond to a lack of pixels.
as
216

TABLE III. BEHAVIOUR OF OUR MS-ELBP + SIFT ALGORITHM IN THE PRESENCE OF DEGRADATIONS.
Original Noise Decimation Holes
Rank-1 RR 0.934307 0.905109 0.927007 0.927007
Rank-5 RR 0.963504 0.944039 0.956204 0.958637
EER 0.0546 0.0638 0.0559 0.0592
Interestingly enough, in our case holes did not produce any performance decrease on the
baseline ICP algorithm (almost no change in EER, slight improvement in recognition
rates). While both performances are consistently lowered, the ICP algorithm seems to
suffer more from decimation than from Gaussian noise. While our algorithm is affected
by every type of degradation, this experiment shows its robustness to decimation and
holes, for both the EER and recognition rates. Our algorithm is slightly less robust to
Gaussian noise, while maintaining rather high performance rates and EER. Overall, this
experiment shows the overall good robustness of our algorithm to various kinds of mod-
el degradations.
4 Conclusion and Perspectives
In this paper, we presented a novel experiment, aimed at analyzing the behavior of state
of the art techniques in the field of 3D face recognition techniques in the presence of
model degradations. More precisely, we compared the impact of canonical degradations
such as noise, decimation and holes, on both our state of the art approach, namely MS-
ELBP + SIFT, and the baseline algorithm ICP. We show that, while providing far
stronger performances than the baseline ICP algorithm, our method also proves to be
globally more robust to degradations such as noise, decimation and holes. Interestingly,
our algorithm showed some sensitivity to noisy data. This study proves that, for real ap-
plications, pre-processing tools specifically designed for dealing with noise, or noise
detection algorithms may be required. This study also proves that, depending on the al-
gorithm used, data sampling may be employed to reduce the computational time, while
affecting only slightly the overall performances. We are currently working on enhancing
the results of this experiment by varying the parameters of each type of degradations.
Acknowledgement
This work has been supported in part by the French National Research Agency (ANR)
through the FAR 3D project under the grant ANR-07-SESU-003.
217

References
[YHu06] Y. Huang, Y. Wang, T. Tan: Combining statistics of geometrical and correlative featuresfor 3D face recognition, BMVC, 2006.
[DHu10] D. Huang, G. Zhang, M. Ardabilian, Y. Wang, L. Chen: 3D face recognition using dis-tinctiveness enhanced facial representations and local feature hybrid matching, BTAS,2010.
[Oj02] T. Ojala, M. Pietikäinen, T. Maenpaa: Multiresolution gray-scale and rotation invarianttexture classification with local binary patterns, PAMI, vol. 24, no. 7, pp. 971-987,2002.
[Ah04] T. Ahonen, A. Hadid, M. Pietikäinen: Face recognition with local binary patterns, ECCV,2004.
[Sh08] C. Shan and T. Gritti: Learning discriminative LBP-histogram bins for facial expressionrecognition, BMVC, 2008.
[Lo04] D.G. Lowe et al.: Distinctive image features from scale-invariant key-points, IJCV, vol. 60,no. 4, pp. 91-110, 2004.
[Ph05] P. J. Phillips, P. J. Flynn, T. Scruggs, K. W. Bowyer, K. I. Chang, K. Hoffman, J. Marques,J. Min, W. Worek: Overview of the face recognition grand challenge. CVPR, vol. I, pp.947-954, 2005.
[Ka07] I. A. Kakadiaris, G. Passalis, G. Toderici, M. N. Murtuza, Y. Lu, N. Karampatziakis, andT. Theoharis: Three-dimensional face recognition in the presence of facial expressions:an annotated deformable model approach, PAMI, vol. 29, no. 4, pp. 640-649, 2007.
[Mi07] A. S. Mian, M. Bennamoun, and R. Owens, An efficient multimodal 2D-3D hybrid ap-proach to automatic face recognition, PAMI, vol. 29, no. 11, pp. 1927-1943, 2007.
[Fa07] T. C. Faltemier, Flexible and Robust 3D Face Recognition Dissertation, University of No-tre Dame, M.S., 2007.
[Be92] P. Besl and N. McKay., A method for Registration of 3-D Shapes, IEEE Transactions onPattern Analysis and Machine Intelligence (PAMI), 14(2):239 - 256, February 1992.
[Ro09] R. N. Rodrigues et al.: Robustness of multimodal biometric fusion methods against spoofattacks, Journal of Visual Language and Computing, doi:10.1016/j. jvlc.2009.01.010,2009.
[Po09] N. Poh et al., Benchmarking Quality-dependent and Cost-sensitive Score-level MultimodalBiometric Fusion Algorithms, IEEE Transactions on Information Forensics and Securi-ty archive Volume 4 , Issue 4 (December 2009), Pages: 849-866, 2009.
[Dr10] Hassen Drira, B. Ben Amor, Mohamed Daoudi, Anuj Srivastava: Pose and expression-invariant 3d face recognition using elastic radial curves. In Proc. BMVC, pages 90.1-11, 2010.
[Co06] A. Colombo, C. Cusano, R. Schettini: Detection and Restoration of Occlusions for 3D FaceRecognition, IEEE International Conference on Multimedia and Expo, pp. 1541-1544,2006.
[Ch05] K. I. Chang, K. W. Bowyer, P. J. Flynn: Adaptive rigid multi-region selection for handlingexpression variation in 3D face recognition, IEEE workshop on FRGC Experiments,2005.
[DHu11] D. Huang, M. Ardabilian, Y. Wang, L. Chen: A Novel Geometric Facial Representationbased on Multi-Scale Extended Local Binary Patterns, Proc of IEEE International Con-ference on Automatic Face and Gesture Recognition, 2011.
218

Person Authentication by Handwriting in air using aBiometric Smart Pen Device
Muzaffar Bashir1,2
, Georg Scharfenberg1, Jürgen Kempf
1
University of Applied Sciences, Regensburg, Germany1.
University of the Punjab, Lahore, Pakistan2.
Abstract: The phenomenon of writing reflects developed fine motor skills of a
person. Specially, the dynamics of writing can be used for the characterization of
the individual writer or written object. Person authentication based on the
dynamics of handwriting on pad and in air using biometric Smart Pen (BiSP)
device are presented in this paper. We regard hand movement with pen in space as
handwriting (or hand gesturing) in air. The acquisition device BiSP is a ballpoint
pen equipped with a diversity of sensors, measuring the acceleration and tilt angle
of the pen, the grip forces of fingers holding the pen, and the forces and vibrations
in the refill during writing, drawing and hand gesturing in air or on any solid pad.
For classification, queries and references of multi-dimensional time-series
provided by BiSP are matched by fast dynamic time warping DTW. To judge the
biometric authentication of a writer, the recognition score rates of PIN words and
single characters are computed. It was found that the score rates of performance
are better 99.99% and the response time is below 2 seconds for a population of 40
enrolled persons. The proposed handwriting in air is a promising authentication
method because performance of writing on paper pad and in air differ marginally.
It can create a new dimension of freedom in unconstrained data input, and access
control and can compete with the emerging hand gesture recognition methods.
1 Introduction
Key mouse and a touch sensitive screen can be considered emerging alternatives to the
keyboard as input devices now. Especially, a touch sensitive screen is becoming more
useful input device in downsized mobile units like notebooks, personal digital assistants
(PDAs), cell phones or flash–memories. Hand gesture is another promising data input
method. This inspired us to advance the Biometric Smart Pen BiSP [BIS] which is a
device for online digital input of handwritten characters and words, drawings and gesture
movements. In previous studies, many software methods have been used for the analysis
of BiSP multidimensional time-series data [MJ09][MJ10]. Variants of dynamic time
warping DTW [RV05][VLOK01] had been applied successfully for recognition of single
characters, signatures [SL09] and PIN words [MJ09][MJ10] handwritten on a paper pad.
With the diverse sensors embedded, the BiSP device allows to capture handwritten
movement not only on solid pad but also free in air. The domain of handwriting in air is
a huge research which has been of interest to many researchers over the past decades.
219

Because gesture based handwriting in air is a prerequisite to design methods allowing
human–computer interaction (HCI). The area of gesture based HCI shows a high
diversity with respect to the modalities. It addresses the problem of recognition of textual
content of handwritten items like letters, digits or words. Approaches exist by either
video-based tracking or data gloves or the analysis of hand held object (pen tip, cell
phone) movements resulting from well-defined gestures like those used in handwriting.
The kinematics of handheld objects is mostly captured by miniature 3-axis
accelerometers, gyroscopes and magnetometers. The sensors embedded in the pen device
BiSP also allows to assess the dynamics of the person specific fine motor skills of
fingers in terms of force or pressure generated during writing. Other pen based
approaches capture and analyzes dynamic features of handwriting by using a graphic
tablet or a pad that samples the position coordinates of the pen tip [RV05][WAC]. An
advanced graphic tablet, where in addition, the pen tilt and the grip pressure of fingers
holding the pen are measured, proofed enhanced performance in biometric handwriting
recognition [MJ11]. However, in practice, pen-based tablets obviously are inconvenient
due to limited mobility and extended hardware sources are required.
This paper deals with the biometric person authentication based on handwriting in air by
using DTW classifier. To create an advanced biometric input system for handwriting in
air various issues of BiSP were studied from sensing to signal analysis, from feature
extraction to classification, and much more to improve their performance. This paper
will be a further step towards the implementation of our two-factor authentication
method proposed in [MJ09], where biometric PIN word or writer recognition will be
combined with the verification of biometrically recognized PIN code.
2 Biometric Smart Pen Device for Data Acquisition
The advanced BiSP is a ballpoint like pen system which allows the record and analysis
of handwriting, drawing and gesture movements on a solid pad or free in air [BIS]. For a
comprehensive assessment of pen movements, the device is equipped with a diversity of
sensors measuring the acceleration and tilt angle of the pen, the grip forces of fingers
holding the pen and the forces and vibrations generated in the refill during writing,
drawing and hand gesturing on a paper pad or in air (see figure 1). The change of stylus
forces and vibrations resulting from handwriting on paper pad and transferred by the
refill are monitored simultaneously (1) across and (2) longitudinal to the refill axis by a
piezoelectric polymer film and a piezoelectric ceramic stack placed in close contact to
the front part and the end of the refill, respectively. The superimposed vibration which is
mainly determined by the surface roughness and writing speed [SK03] is obtained from
the piezoelectric ceramic signal high-pass filtered above 100Hz. The (3) grip pressure of
the fingers holding the pen is detected by a piezoelectric foil wrapped around the case of
pen at the griping area. There are two different versions of grip pressure detection
available:
The first one measures the grip pressure (1) averaged over all three fingers (middle
finger, index finger and thumb) and the second the pressure (2) of index finger and
thumb separately by using two subdivided piezoelectric sensing foils.
220

Figure 1: a view of the Biometric Smart Pen “BiSP” equipped with a diversity of sensors for
monitoring handwriting movements on paper pad and in air.
The latter version is unique and provides more detailed information of fine motor skill of
fingers during writing. At last a three axes micro-electro-mechanical (MEMS) sensor
measures the acceleration and inclination of the device.
3 Biometric Authentication Method
A biometric person authentication system is proposed where single characters or PIN
words as a sequence of seven characters handwritten by BiSP are recognized for writer
identification. Handwriting words instead of signatures leads to better performance in
person identification or verification [MJ09][MJ10]. Further advantages arise from
handwriting in air, because it requires no solid pad and leaves no visible image of the
PIN word, which is easily copied or guessed otherwise. The DTW based classifier is
useful for classifying single characters or words based on a similarity match of time
series [RV05][VLOK01][MJ11]. The modified fast DTW method used in the paper is
described in [MJ09]. In order to judge quantitatively the performance of classification or
authentication two criteria established in [MJ11] are used in the paper: (a) the score of
recognition (SR) and (b) the certainty of best match decision (CM).
4 Experiments and Result
This study evaluates the person authentication based on handwritten single characters
and PIN words. For this, the data is captured by BiSP device for handwriting on paper
pad and in air and performance rates are compared.
221

4.1 Databases
The datasets used in the experiments was collected from 40 writers. Each of them has
written ten times on paper pad and in air single characters and a private PIN word for all
enrolled persons. The PIN word (e.g. 3WüKQ45) used is a sequence of seven single
characters selected from a set of captical letters, digits and symbols. Using BiSP device,
for writing in air the elbow is resting on a desk to nearly exclude arm and shoulder
movements (Figure 1). Writing in air enables the items handwritten in a small frame at
the same position of space. Therefore, the collected samples were neither affected
considerably by a displacement and rotation of the instrument nor by repositioning or
moving the involved arm and wrist. Data processing and classification of time series
were done by using a computer with a Pentium 4 processor (2.4 GHz, 3 GB RAM).
4.2 Pre-processing of multi-dimensional time series
Data analysis was performed after an adequate pre-processing of the original signal data
without discarding valuable information, including the fusion of multi-dimensional time
series, re-and down-sampling, smoothing, segmentation and normalization. The pre-
processing steps used in the paper were established and discussed in more detail in
former study work [MJ09][MJ10].
4.3 Results and Discussion
A) Handwriting in air
Writing in air activates only the sensor channels of finger grip pressure and tilt–
acceleration, whereas vibration and refill pressure signals are extra generated by writing
on paper pad. The movement of the pen tip over the paper fibers generates vibrations
with excitation frequencies and amplitudes controlled by the roughness, hardness and the
velocity. It was found in former study work [SK03] that vibration data can provide high
performance rates of handwriting recognition. The writing movements are more or less
controlled by the biomechanics of fingers, wrist, arm and shoulder joints so that the
diverse writing modalities lead to quite different movement patterns. For comparison
typical handwriting parameters of writing on pad and in air are listed in Table 1.
Table 1 typical values of parameters in comparison estimated for handwriting on paper pad and in
air, ‘g’ terms the gravitational acceleration (9.81 m/s2).
Typical
values
Angular
tilt ΔφWriting
speed
Acceleration Writing
size
Grip
forces
refill
force
On pad ±5° ~2cm/s 0.05g 0.5-1cm <10N <10N
In air ±10° ~2cm/s >0.05g 1-2cm <10N -------
222

The values estimated by own observations in the laboratory are close to such found in
literature [Th96]. Force levels of finger grip and refill impact of both modalities vary in
the range of about 10 Newton. The inclination is characterized by the angles measured
between the longitudinal axis of the pen and the gravity direction.
It can be recorded with a resolution of less than 0.5 degree. Acceleration varies in the
range of about 0.05g, where g stands for gravitational acceleration. The common size of
writing on paper pad is about 0.5-1 cm. Writing in air requires less biomechanical
constraints due to increased degree of freedom and more flexion and extension of joints.
This results in higher writing sizes (typ. 1-2cm) and angular values of tilt (up to 10
degree) and more pronounced acceleration effects.
Note: neglecting the joint of elbow and shoulder, which generally is not actively
involved in handwriting on pad, the hand-finger system has in total ten effective degrees
of freedom [Th96]. Even though features and properties of writing on pad and in air
differ considerly, both provide quite similar performance rates of person authentication
or character recognition as shown below.
The movement patterns are the result of an abstract neuro-motor program for controlling
the fine motors of fingers, wrist, etc., which can be executed largely independent of
visual feedback. As a consequence a high reproducibility of signal features is obtained
even if the item is written in air many times in succession without optical feedback. As
seen in Figure 2 the grip pressure and tilt signals obtained for character “5” after
handwritten in air up to twenty times in succession are very similar., i.e. reflect a high
reproducibility in wave shape.
Figure 2: Grip pressure and tilt signals obtained from character “5” handwritten in air up to twenty
times in succession.
B) Person authentication
Single character recognition
223

For single character recognition, the intra-individual DTW similarity match is
accomplished for all enrolled persons. The performance averaged SR values calculated
for each single character presents writer independent scores. They are obtained from data
generated by writing on pad and in air and down-sampled by a factor M value of 10 as
shown in Figure 3.
Figure 3: bar chart of performance rates of single character recognition based on writing on pad
(blue) and in air (red). The values are averaged over all enrolled persons
The bar charts in Figure 3 reveal comparable results of performance for both writing
modalities. Further single characters handwritten by the same person are recognized at
an excellent character independent score with an algebraic mean above 99% and with a
response time of less than 0.5 seconds. It indicates that the short length of a single
character encodes an amazing amount of person and item specific information.
Person or PIN word identification
In [MJ09] better score rates were obtained with PIN words than with individual
signatures so, here PIN word identification is considered.
Table 2: Performance parameters (SR and CM) of Person or PIN word identification based on 40
enrolled persons. Non separated finger grip pressure is measured.
Score SR Certainty CM Run time (s)M
On pad In air On pad In air On pad In air
20 100 100 84.94 65.89 10.5 14.5
40 99.989 99.97 41.74 45.16 3.8 4.9
80 99.138 99.83 18.20 23.83 1.6 2.0
224

For comparison SR, CM and run time are determined. The values averaged over all 40
persons enrolled by writing on pad and in air and determined at different M are listed in
Table 2. Table 2 shows comparable performance scores in writing on pad and in air and
reflect a very high quality of performance. It is shown that in air data requires higher
computing time because of larger size of writing leads to more data points per entry. A
drawback is the computing time of a few seconds needed to identify a PIN word among
its population. To cope with this problem the speed up methods as described in
[EM00][VLOK01][SC07] for DTW can be helpful especially for a larger population.
Due to the highly scored recognition down-sampling allows us to tailor the computing
time down to less than two seconds without a rigorous degradation of performance. We
conclude that handwritten single characters and PIN words in air can be recognized at an
excellent performance (better 99%) with a response time of less than two seconds.
5 Summary and outlook
Apparently, the authentication method based on the multi-sensor acquisition device BiSP
for writing in air is a promising approach to increase user’s acceptance, level of security
and enhance reliability of biometric person authentication. Preliminary results have
shown better identification score 99.9% and the response time can be less than 2
seconds. In further respects writing, drawing or gesturing in air is creating a new
dimension of freedom in unconstrained data input and access control especially for more
and more downsized mobile units like cellular phones, PDA’s, mobile flash memories,
etc. An application seen for the BiSP device is the biometrical protection of the mobile
USB memory stick. For this, the stick is plugged on the USB port of the pen device. The
biometrical data needed are generated during handwriting free in space. This pen based
technique is a compelling alternative for fingerprint to secure a USB stick. An objective
of our ongoing future work is to implement two-factor authentication method where
biometric PIN word recognition is combined with biometric PIN code verification.
Further, to investigate the feasibility of the proposed system based on movements of any
handheld body. It is to understand whether any handhold mobile system like, cell phone,
etc., can recognize its owner by how the person performs a particular gesture, acting as a
gesture signature, password or PIN in air. The gesture in air can be used for access to the
mobile device, but the handheld device can also act as an intelligent key to provide
access to services in an ambient intelligence scenario. For these modalities well-defined
gesturing patterns has to be captured, analyzed and classified using the sensor and
software techniques developed for the BiSP system.
AcknowledgmentThe support given by the BiSP team from the University of Applied Sciences
Regensburg is highly acknowledged. We thank Florian Kempf of University of
Wuerzburg, Germany for his useful comments and discussions on this work.
References
[BIS] www.bisp-regensburg.de
225

[SK03] Šoule M., Kempf J. ”Handwritten Text Analysis through Sound. A New Device for
Handwriting Analysis”, In Proceedings IWSSIP, Prague, (2003) 254-257
[MJ09] Muzaffar Bashir, Jürgen Kempf.: Person Authentication with RDTW using
Handwritten PIN and signature with a Novel Biometric Smart Pen Device. In SSCI
Computational Intelligence in Biometrics, IEEE, Nashville (2009).
[MJ10] Muzaffar Bashir, Jürgen Kempf.: DTW based classification of diverse preprocessed
time series obtained from handwritten PIN words and signatures. In journal of signal
processing system, Springer 2010.
[EM00] Eamonn J. Keogh, Michael J. Pazzani.: Scaling up dynamic Time Warping for Data
mining Applications. In Proc. 6th Int. Conf. on Knowledge Discovery and Data
Mining.KDD (2000).
[RV05] R. Niels, L. Vuurpijl, “Dynamic Time Warping Applied to Tamil Character
Recognition”. Proceedings of the 8th International Conference on Document Analysis
and Recognition, 2005.
[VLOK01] V. Vuori, J. Laaksonen, E. Oja, J. Kangas, “Speeding up On-line Recognition of
Handwritten Characters by Pruning the Prototype Set” In Proc.Of (ICDAR’01),
pp.501-505.
[SC07] Salvador S., Chan P.: “FastDTW: Toward Accurate Dynamic Time Warping in Linear
Time and Space”, Intelligent Data Analysis, 2007.
[JRP06] Jain A. K., Ross A., and Pankanti S., “Biometrics: A Tool for Information Security”.
In IEEE transactions on information forensics and security, vol. 1, NO. 2 June 2006.
[WAC] www.wacom.com
[MJ11] M. Bashir and J.Kempf, “Advanced Biometric Pen System for Recording and
Analyzing Handwriting”, In journal of signal processing system, Springer 2011.
[PY08] S.Palanivel, B. Yegnanarayana, “Multimodal person authentication using speech, face
and visual speech”, In Computer Vision and Image Understanding 109, 44-55, 2008.
[SVJ09] T. Scheidat, C. Vielhauer, D. Jana, “Handwriting verification—Comparison of multi-
algorithmic and a multi-semantic approach”. Imange and Vision Computing 27, 269-
278, Elsevier 2009.
[Th96] Teulings, H.L., “Handwriting movement control”. In S.W. Keele and H. Heuer (Eds.),
Handbook of perception and action. Vol.2: Motor Skills (pp. 561-613). London:
Academic Press, 1996.
[SL09] Shandong Wu, Y. F. Li., “Flexible signature descriptions for adaptive motion
trajectory representation, perception and recognition”. In Pattern Recognition
Elsevier, 194-214, 2009.
Muzaffar Bashir received his PhD (January 2011) from University of Regensburg and University of Applied
Sciences, Regensburg, Germany. He received his MSc (Physics) from University of the Punjab and MSc
(Computer Science) from UET Lahore, Pakistan. Since 2002, he is employed as Lecturer at the University of
the Punjab, Lahore, Pakistan. His research interests are pattern recognition, biometrics, bio-sensing, biophysics
and computational physics.
Prof. Georg Scharfenberg is Professor of Computer Science at the faculty of Electronics and informatics,
University of Applied Sciences, Regensburg, Germany. He has been Dean of the same faculty for many years.
He holds many positions of director level and had practical work experience at industry. His research interests
are biometrics, information security, pattern recognition and sensorics.
Prof. Dr. Jürgen Kempf received his PhD in Physics from University of Heidelberg, Germany. He was a
scientist at Max Planck Institute MPI Heidelberg, in IBM research laboratories for many years and a
Professor and co director of BiSP project at the University of Applied Sciences, Regensburg, Germany. His
research interests are biometrics, information security, pattern recognition and sensorics.
226

Increasing the distinctiveness of hand vein images by
Oriented Gradient Maps
Liming Chen1
Di Huang1
1Université de Lyon, Ecole Centrale Lyon
CNRS, LIRIS UMR 5205
36 Avenue Guy de Collongue
69134, Ecully, France
{firstname.lastname}@ec-lyon.fr
Hmida Chiheb1
Chokri Ben Amar2
2Université de Sfax
Ecole Nationale d’Ingénieur de Sfax
REGIM
3038, Sfax, Tunisie
Abstract: Hand vein pattern as a biometric trait for people identification has at-
tracted an increasing interest in the recent years thanks to its properties of unique-
ness, permanence, non-invasiveness and strong immunity to forgery. In this paper,
we propose to make use of Oriented Gradient Maps (OGMs), that we previously
proposed for face recognition using the term of Perceived Facial Images (PFIs), to
represent Near-Infrared (NIR) hand dorsa vein images and to highlight the distinc-
tiveness of hand vein patterns. Using a holistic approach through both the popular
PCA and LDA, we benchmarked the proposed hand vein representations on the
NCUT dataset of 2040 hand vein images and demonstrated the effectiveness of the
proposed hand vein representations.
1 Introduction
Reliable people identification is a key issue for greater security in today’s societies. Dri-
ven mainly by an increasing need for security against terrorist activity, sophisticated
crimes and electronic frauds, biometrics-based solutions, which consist of utilizing
people physiological characteristics (e.g. face, iris, fingerprint, etc.) or behavioral fea-
tures (e.g. voiceprint, gait, etc.), have witnessed an accelerated pace of growth in the
global market of security over the last decades. As compared to traditional methods for
people identification (ID card, swipe-card, PIN code, etc.), biometric solutions generally
offer the advantages such as uniqueness, permanence and difficulty of falsification.
In this paper, we propose to study an emerging biometric trait, namely dorsal hand veins,
for the purpose of people identification. Anatomically, veins are the blood carrying ves-
sels interweaved with muscles and bones; the prime function of vascular system is to
supply oxygen to the body parts; the spatial arrangement of the vascular network in the
human body is quite stable and unique, the pattern of vein is unique to every individual,
even between identical twins [KuHG09]. In this work, we are interested by the vein pat-
terns on the dorsal part of the hand for people identification as they are distinctly visible
and easy to acquire and process. As compared to other popular biometric traits, such as
face or fingerprint, hand vein patterns as biometric trait offer some unmatched advantag-
es, in particular the following ones:
/ Direct liveness test. As hand veins are imaged using far or near infrared light to
capture temperature differences between the flow of hot blood in the veins and
227

the surrounding skin, they can only be imaged on live body and images taken
on a non live hand cannot capture its vein spatial arrangement ;
/ Safety. As the patterns of blood vessels are hardwired underneath the skin at
birth. They are much harder for intruders to forge.
Vein pattern as biometric trait is relatively recent. It was not exploited until 1990 when
MacGregor and Welford [MaWe91] came up with a system called “vein check” for
people identification. Despite the vast vascular network in the human body, hand veins
are largely favored for their simplicity of processing and there exists an increasing body
of work over the past decade, using hand vein patterns of the palmer part [MaSp07], the
dorsal part [LiFa04, ZhWW08, KuPr09] or finger veins [MiNM04].
Most work in the literature propose first to segment the region of interest (ROI) and the
hand subcutaneous vascular network from hand vein images, and then to extract local
geometric features for matching, making use of the positions and angles of short straight
vectors [CrSm95], dominant points [LiFa04], endpoints and crossing points [WZYZ06],
vein minutiae and knuckle shape [KuHF09]. While all these approaches demonstrate
reasonable recognition accuracy on small datasets ranging from 32 [LiFa04] to 100 sub-
jects [KuVe09, KuHG09], they suffer from the fact that local geometric features don’t
capture the full differences of vein networks among subjects. In this paper, we propose a
holistic approach to account for the variations of hand-dorsa vein patterns. NIR images
are used to capture vascular arrangement of hand veins on the back part of the hand for
NIR imaging technique is shown to be relatively tolerant to the external environment and
the subject’s medical condition [WaLe06][ZhWW07]. Furthermore, as raw NIR hand
dorsa vein images are rather rough and unclear on the spatial arrangement of hand veins,
we also propose a new texture descriptor, subsequently called Oriented Gradient Maps
(OGM), to highlight their network structures. Significant experiments were carried out
on a dataset of 102 subjects having left and right hand dorsa vein images and the results
demonstrate that the proposed OGMs significantly improve the recognition accuracies as
compared to direct use of raw NIR hand vein images.
This paper is organized as follows. Section 2 describes the principle and the system se-
tup for the acquisition of hand-dorsa vein images. Section 3 introduces our human vision
inspired Oriented Gradient Maps (OGMs) as a suitable intermediate representation of
hand vein images. Section 4 presents and discusses the experimental results. Section 5
concludes the paper.
2 Acquisition of hand dorsa vein images.
Hand veins can be imaged either using Far-Infrared (FIR) Imaging techniques or Near-
Infrared (NIR) Imaging techniques, thereby providing a contact-less and non-invasive
data acquisition approach. Wang and Leedham [WaLe06] conducted a study in depth
comparing FIR and NIR imaging techniques for vein pattern biometrics and concluded
that FIR imaging techniques are sensitive to ambient conditions, i.e. temperature and
humidity, and human body condition and does not provide a stable image quality. On the
other hand, they showed that NIR imaging produces good quality images and is more
tolerant to changes in environmental and body condition. In this work, hand dorsa vein
images were captured using a NIR based system developed by [ZhWW07, WLCS10].
228

(a) (b)
Figure 1 – (a) The NIR imaging-based system setup; (b) a sample image of hand dorsa vein.
Fig.1 (a) illustrates the system setup where an array of LED lamps is used to shine infra-
red light onto the back of the hand. Because the incident infrared light can penetrate into
the biological tissue to approximately 3 mm depth and the venous blood absorbs and
scatters more the incident infrared radiation than the surrounding tissue, vein patterns
can be imaged by a CCD camera with an attached IR filter where vein appears darker.
To avoid major hand vein image registration issues, a handle is also defined at the bot-
tom of the device to position the hand. The hand vein images are thus roughly aligned.
Fig.1 (b) illustrates a hand dorsa vein image so captured with a resolution of 640 by 480.
Using such a setup, a dataset of 2040 hand vein images was acquired under natural light-
ing condition (indoor office environment) implemented by Wang et al. [ZhWW08]. In
the subsequent, this dataset is called North China University of Technology hand-dorsa
vein dataset or in short NCUT hand-dorsa vein dataset. Specifically, both 10 right and
left hand vein images were acquired from 102 subjects, aged from 18 to 29, of which 50
were male and 52 female. This makes the dataset one of the largest ones in the field of
hand vein biometrics. As the vein pattern is best defined when the skin on the back of the
hand is taut, subjects were asked to clench their fist when acquiring their hand dorsa vein
patterns. While there are no major lighting condition changes, slight lighting variations
still can occur for hand-dorsa vein images were acquired at different time moment.
As we can see from Fig.1 (b), major hand vein patterns are captured and appear darker
within the image. Widths of these vein profiles vary in the range of 30 to 50 pixels.
Though the vein spatial arrangements are visible but they are not so distinguishable from
the background of bio-tissue. Furthermore, local features, in terms of edge points and
cross points, are very few and vary from 5 to 10, thus making local feature-based ap-
proach questionable for their discrimination power.
3 Oriented Gradient Maps (OGMs)
To increase the distinctiveness of hand-dorsa vein patterns, we propose to use Oriented
Gradient Maps (OGM), previously named Perceived Facial Images (PFIs), proposed and
applied successfully to 3D face recognition [HWAW11].
The goal of OGMs is to give a visual representation simulating the human visual percep-
tion. OGMs were inspired by the study of Edelman et al. [EdIP97], who proposed a re-
presentation method of complex neurons in primary visual cortex. The complex neurons
respond to a gradient at a particular orientation and spatial frequency, but the gradient
location is allowed to shift in a small receptive field rather than being precisely localized.
229

3.1 Representation of the complex neuron response
The proposed representation aims at simulating the response of complex neurons and it
is based on a convolution of gradients in specific directions in a given circular neighbor-
hood R. The precise radius value of the circular area needs to be fixed experimentally.
The response of a complex neuron at a given pixel location is its gradient maps in differ-
ent orientations convolved with a Gaussian kernel.
Specifically, given an input image I, a certain number of gradient maps G1, G2, …, Go,
one for each quantized direction o, are first computed. They are defined as:
o
IG
o
*4$ %) " #49 !
(1)
The ‘+’ sign means that only positive values are kept to preserve the polarity of the in-
tensity changes, while the negative ones are set to zero.
Each gradient map describes gradient norms of the input image in a direction o at every
pixel location. We then simulate the response of complex neurons by convolving its gra-
dient maps with a Gaussian kernel G. The standard deviation of G is proportional to the
radius of the given neighborhood area, R, as in (2).
oR
R
o GG *)( (2)
The purpose of the convolution with Gaussian kernels is to allow the gradients to shift
within a neighborhood without abrupt changes.
At a given pixel location (x, y), we collect all values of the convolved gradient maps at
that location and form the vector (R(x, y) thus having a response value of complex neu-
rons for each orientation o.
1( , ) ( , ), , ( , )t
R R R
Ox y x y x y( ( (3 8) 0 5( ,R
O x y( ,,O, ,, ( ,( ,( ,, ,, (3)
This vector, (R(x, y), is further normalized to unit norm vector, that is called in the sub-
sequent response vector and denoted by (R.
3.2 Oriented Gradient Maps (OGMs) by response vectors
Now a raw image can be represented by its perceived values of complex neurons accord-
ing to the response vectors. Specifically, given a raw NIR hand-dorsa hand vein image I,
we generate an Oriented Gradient Map (OGM) Jo using complex neurons for each orien-
tation o defined as in (4).
( , ) ( , )R
o oJ x y x y() (4)
Fig.2 illustrates such a process applied to a NIR hand-dorsa vein image. In our work, we
generate 8 OGMs for 8 quantized directions. Instead of original NIR hand-dorsa images,
these OGMs are thus used for matching in identification based on hand vein biometrics.
3.3 The properties of distinctiveness and invariance
The proposed OGMs potentially offer high distinctiveness as they highlight the details of
local shape or texture changes. Meanwhile, they also possess some interesting properties
of robustness to affine lighting variations as well as affine shape transformations.
When applied to texture images, e.g. NIR hand dorsa-vein images, the proposed OGMs
offer the property of being robust to affine lighting transformations. Indeed, an OGM Jo
230

is simply the normalized convolved texture gradient map at the orientation o according
to (4), while monotonic lighting changes often adds a constant intensity value, as a result,
it does not affect the computation of gradients. Moreover, a change in image contrast in
which the intensities of all pixels are multiplied by a constant will result in the multipli-
cation of gradient computation; however, this contrast change will be also cancelled by
the normalization of the response vector. Similarly, when applied to range data, OGMs
are invariant to affine geometric transformations leading to tolerance to pose changes.
Figure 2 - OGMs describing the perceived a NIR hand-dorsa vein image in 8 orientations
The proposed OGMs can be made even rotation invariant if we quantize the directions
starting from the principal gradient direction of all the gradients within a certain neigh-
borhood. Nevertheless, we don’t perform such rotation normalization for saving compu-
tational cost as NIR hand vein images in the NCUT dataset were already roughly aligned.
4 Experiments
The discrimination power of OGMs for NIR hand-dorsa vein images was experimentally
evaluated using the NCUT dataset. Recall that this dataset is one of the largest datasets
on NIR hand-dorsa vein images as it encompasses 10 right hand vein images and 10 left
hand vein images for each of the 102 subjects, thus making up a dataset of 2040 images.
4.1 Experimental setup
As it was found that the hand vein pattern is unique to some level for each person and
each hand [Bada06], we thus considered three different experimental setups, namely, i)
left hand vein images are only used for the gallery and probes, ii) right hand vein images
are only used for the gallery and probes, iii) left and right hand vein images are both
used for the gallery an probes but as if we had 204 subjects each of which has 10 images.
As described already in section 2, all the hand-dorsa vein images were roughly aligned
due to the system setup. They also have very small lighting variations as they were rec-
orded on indoor office environment. Furthermore, each hand vein image displays very
little number of local features in terms of edge points and cross points, ranging from 5 to
10. We thus propose to apply a holistic approach to analyze the discrimination power of
the OGMs as compared to the original raw hand-dorsa vein images. Specifically, the
popular PCA and LDA [DuHS01] were directly applied to hand vein images and their
OGMs, respectively. Then their individual performances were analyzed and compared,
231

thereby giving light on their respective discrimination power. Recall that PCA (Principal
Component Analysis) seeks an optimal subspace maximizing the data variance while
LDA (Linear Discriminant Analysis) finds a subspace that best discriminates among
classes and requires class labels. They were widely applied to face recognition, giving
birth to eigenfaces and Fischer faces, respectively, as holistic facial representation.
PCA and LDA both require learning data to seek the optimal subspace. In this work,
vein image data from 51 subjects, thus half of the 102 subjects composing the dataset,
were used for identifying the optimized subspace in which final matching was carried
out using simple Euclidean distance. The remaining vein images from the other 51 sub-
jects were then used for testing. Specifically, for each of the three experimental setup,
both identification (one-to-many matching) and verification (one-to-one matching) sce-
narios were evaluated. For the identification scenario, two vein images out of ten were
arbitrarily selected and placed in the gallery, the remaining 8 vein images for testing,
thereby generating a rank one recognition rate as the indicator of performance. Now for
verification scenario, all matching pairs from the testing data were evaluated, thus using
ROC curve as the indicator of performance.
Furthermore, to check the generalization skill of the proposed method, each experimen-
tal setup was cross-validated 100 times, using each time vein data from different 51 sub-
jects for training and the remaining vein data for testing.
4.2 The results
Tables 1 to 3 give the recognition rates of PCA compared with LDA for the aforemen-
tioned three setups, when they are applied to left hand vein images, right hand vein im-
ages and left and right hand vein images as if they were different persons, respectively.
Remark that the optimization of the LDA subspace generally requires to apply first PCA
so that computation of generalized eigen values are feasible. We thus also compared the
performance of PCA with LDA when the variance kept from the learning dataset is
increased from 80% to 95%. Meanwhile, for reason of space limitation, we only give in
the following tables best results achieved when 95% variance of learning data is kept.
PCA LDA
Variance Recognition RateStandard
Deviation
Accuracy at
FAR = 0,1 %
Recognition
Rate
Standard
Deviation
Accuracy at
FAR = 0,1 %
95 % 67.28 % 1.69 65 % 78.99 % 1.49 89 %
Table 1 - Recognition rates of PCA and LDA applied to left hand vein images.
PCA LDA
Variance Recognition RateStandard
Deviation
Accuracy at
FAR = 0,1 %
Recognition
Rate
Standard
Deviation
Accuracy at
FAR = 0,1 %
95 % 66.65 % 1.94 65 % 79.47 % 1.36 78 %
Table 2 - Recognition rates of PCA and LDA applied to right hand vein images.
LDA demonstrates its effectiveness as compared to PCA as it improves more than 10%
of the performance of PCA and reaches 79% recognition rate for both left and right hand
232

vein images. In verification scenario, the best performance, 89% verification rate with
FAR fixed at 0.1%, is also attained by LDA when keeping 95% variance of learning data.
PCA LDA
Variance Recognition RateStandard
Deviation
Accuracy at
FAR = 0,1 %
Recognition
Rate
Standard
Deviation
Accuracy at
FAR = 0,1 %
95 % 65.96 % 1.75 65 % 77.99% 1.50 89 %
Table 3 - Recognition rates of PCA and LDA applied to left and right hand vein imagesas if they were different persons.
PCA LDA
Orientation Left hand Right handL and R hand
as diff. pers.Left hand
Right
hand
L and R hand
as diff. pers.
1 61.26 % 62.00 % 61.12 % 71.98 % 77.87 % 73.40 %
2 66.24 % 68.78 % 65.36 % 72.82 % 79.55 % 74.28 %
3 71.26 % 78.55 % 72.21 % 75.63 % 81.79 % 77.45 %
4 65.21 % 67.62 % 64.12 % 74.79 % 78.43% 74.03 %
5 60.24 % 61.34 % 59.32 % 70.86 % 72.97% 71.91 %
6 62.48 % 63.02 % 60.32 % 73.38 % 77.87% 73.28 %
7 70.64 % 72.54 % 70.06 % 75.07 % 77.26% 75.73 %
8 62.18 % 64.34 % 60.87 % 72.55 % 74.79% 72.67 %
Fusion 69.84 % 71.86 % 69.36 % 83.27 % 82.34% 82.96 %
Table 4 - Recognition rates of PCA and LDA applied to left and right hand vein OGMswhile keeping 95% variance of learning data.
Now we come to analyze the performance of the proposed OGMs compared with the
ones by PCA and LDA. As the best performance is achieved with 95% variance of learn-
ing data kept both for PCA and LDA, we carried out PCA and LDA on OGMs only us-
ing this configuration, thus setting up the kept variance to 95% as well. As we can see
from the table, all the performances when fusing the scores from the 8 orientations are
improved by 4 to 5 points in the three experimental setups as compared to the figures
displayed by PCA and LDA when they were directly applied to the raw hand vein im-
ages. These performances highlight that OGMs improve indeed the distinctiveness of
hand vein images. The experiments with the verification scenario further demonstrate the
benefit of OGMs instead of the raw original hand vein images.
5 Conclusion
In this paper, we introduce Oriented Gradient Maps as effective representations of NIR
hand vein images in order to increase their distinctiveness. Using a holistic approach
through both popular PCA and LDA, we carried out extensive experiments on the NCUT
dataset and demonstrated the effectiveness of the proposed approach for the increase of
discrimination power of vein patterns under the OGMs. In our future work, we are im-
233

proving the matching scheme, for instance making use of both global and local features
of hand vein patterns, to further bolster the recognition performance.
Acknowledgement
This work has been supported in part by the French National Research Agency (ANR)
through the FAR 3D project under grant ANR-07-SESU-003.
References
[KuHG09] A. Kumar, M. Hanmandlu, and H. M. Gupta, “Online biometric authentication usinghand vein pattern”, IEEE Symposium on Computational Intelligence in Security andDefense Applications, 2009.
[MaWe91] P. MacGregor and R. Welford, “Veincheck: imaging for security and personal identi-fication”, Adv. Imaging, vol.6, no. 7, pp.52-56, 1991
[MaSp07] S. Malki and L. Spaanenburg, “Hand vein feature extracting using DT-CNNS”, SPIE,vol.6590, 2007.
[LiFa04] C. Lin and K. Fan, “Biometric verification using thermal images of palm-dorsa veinpatterns”, IEEE Transaction on Circuits and Systems for Video Technology, vol.14,no.2, 2004.
[ZhWW08] S. Zhao, Y. Wang, and Y. Wang, “Biometric identification based on low quality handvein pattern images”, International Conference on Machine Learning and Cybernetics,vol.2, pp.1172-1177, 2008.
[KuVe09] A. Kumar, and K. V. Prathyusha, “Personal authentication using hand vein triangula-tion and knucle shape”, IEEE Transactions on Image Processing, vol.18, no.9, pp.2127-2136, 2009.
[MiNM04] N. Miura, A. Nagasaka, and T. Miyatake, “Feature extraction of finger-vein patternbased on repeated line tracking and its application to personal identification”, Ma-chine Vision and Applications, vol.15, pp.194-203, 2004.
[CrSm95] J. M. Cross and C. L. Smith, “Thermographic imaging of the subcutaneous vascularnetwork of the back of the hand for biometric identification”, 29th Annual Interna-tional Carnahan Conference on Security Technology, Sanderstead, UK, 1995.
[WZYZ06] K. Wang, Y. Yuan, Z. Zhang, and D. Zhuang, “Hand vein recognition based on mul-tisupplemental features of multi-classifier fusion decision”, IEEE International Con-ference on Mechatronics and Automation, 2006
[WaLe06] L. Wang and G. Leedham, “Near- and far-infrared imaging for vein pattern biome-trics”, IEEE International Conference on Video Signal Based Surveillance, 2006.
[ZhWW07] S. Zhao, Y. Wang, and Y. Wang, “Extracting hand vein patterns from low-qualityimages: a new biometric technique using low-cost devices”, 4th International Confe-rence on Image and Graphics, pp.667-671, 2007.
[WLCS10] Y. Wang, K. Li, J. Cui, L. Shark, and M. Varley, “Study of hand-dorsa vein recogni-tion”, International Conference on Intelligent Computing, 2010.
[HWAW11] D. Huang, W. Ben Soltana, M. Ardabilian, Y. Wang, and L.Chen, “Textured 3D facerecognition using biological vision-based facial representation and optimizedweighted sum fusion,” CVPR Workshop on Biometrics, 2011.
[EdIP97] S. Edelman, N. Intrator, and T. Poggio, T, “Complex cells and object recognition,”Unpublished manuscript: http://kybele.psych.cornell.edu/~edelman/archive.html,1997.
[Bada06] A. M. Badawi, “Hand vein biometric verification prototype: a testing performanceand patterns similarity, International Conference on Image Processing, Computer Vi-sion, and Pattern Recognition, 2006.
[DuHS01] R. O. Duda, P. E. Hart, and D. G. Stork, “Pattern classification”, Wiley-Interscience,2nd edition, 2001.
234

Values of Time-series Data defined in 19794-7
for Signature VerificationSeiichiro Hangai, Asami Hori, Takahiro Yoshida
Dept. of Electrical Engineering, Tokyo University of Science,
1-14-6 Kudankita, Chiyoda-ku, Tokyo, 102-0073, Japan
{hangai, yoshida}@ee.kagu.tus.ac.jp, [email protected]
Abstract. The signature/sign time-series data format 19794-7:2007 was
standardized in ISO/IEC JTC1 SC37 WG3. The format handles various data
such as pen tip position (x,y,z), pen tip velocity (vx,vy), pen tip acceleration
(ax,ay), pen tip force (f), pen azimuth (a), pen elevation (e) and so on. It is
valuable that this data format enables different types of input devices to be used
in signature/sign verification. However, there is no comparison of verification
performance by these data, and no idea in mixing multiple data for improving
verification performance. In this paper, nine kinds of time series data (x, y, vx,
vy, ax, ay, f, a, e) calculated from the data acquired by WACOM tablet are used
to signature verification for comparing their values by false rejection rate (FRR)
and false acceptance rate (FAR) with changing decision threshold. In the
verification, non-linear matching is used in making a template and calculating
the distance between two signatures. The relationship between FRR and FAR
with and without forgery is also given by experimental results of 11 Japanese
signatures.
1 Introduction
In 2000, we have proposed the signature verification method which uses three
features such as pen position, pen pressure and pen inclination [HYH00]. In the paper,
we have shown that the pen inclination is robust to forgery signatures after non-linear
matching. By some investigations regarding intersession variability of signature time
series data, we have pointed out that periodical template updating is effective to keep
the error rate of signature verification system to low[YKH01][KHH02]. Since 2003,
our group has contributed to the standardization of 19794-7:2007 and its revised
version which is signature/sign time-series data format and the format is now the way
to be standardized. The format handles various data such as pen tip position (x,y,z),
pen tip velocity (vx,vy), pen tip acceleration (ax,ay), pen tip force (f), pen azimuth
(a), pen elevation (e) and so on[ISO11]. It is, of course, valuable that this data format
enables different types of input device to be used and is flexible with any signature
verification algorithm. As seen in signature verification competition SVC2004
235

[YCH04], the best EER against skilled forgeries was 2.84% using (x,y) and 2.89%
using (x,y,f,a,e) respectively. In BMEC2007 [TEL07], the best EER against skilled
forgeries was 13.43% using (x,y,f,a,e). Obviously, we are not satisfied with these
error rates because the error of fingerprint verification is very low. In order to solve
this problem, global features which use multiple data up to 100 were proposed
[GFF07][TBa05].
In this paper, individuality included in nine kinds of time series data (x, y, vx, vy,
ax, ay, f, a, e) calculated from the data acquired by WACOM tablet and the
categorized data set such as pen tip position, pen tip force, pen inclination, pen tip
velocity and pen tip acceleration are examined. The robustness against forgery
signatures is also investigated based on FRR and FAR using two types of forgery, i.e.,
simulation and tracing.
2 Writing Data Acquired by Tablet and Errors to be used in
Verification process
Fig. 1 shows acquired five writing data, i.e., pen tip position x(n) and y(n), pen tip
force f(n), pen azimuth a(n), and pen elevation e(n) from a tablet with the
specification given in Table 1.
Pressure:p
Altitude:2
Y-axis
X-axis
azimuth:θ
Fig. 1. Acquired five writing data.
Table 1 Specification of tablet and pen
Tablet GD-0405-R:product of WACOM
Dimensions 127 x 99 mm
Force levels 1024
x-y Resolution 0.01mm
Max. data rate 200 pps
Azimuth range 0 - 359 degree
Elevation range 27 - 90 degrees
Tilt Resolution 1.0 degree
Velocity and acceleration are calculated by the following equations,
)1()()(
)1()()(
'')
'')
nynynvy
nxnxnvx(1)
azimuth:aelevation:e
force: f
236

)1()()(
)1()()(
'')
'')
nvynvynay
nvxnvxnax(2)
Fig. 2 shows an example of 5 kinds of time series data obtained by tablet.
Fig.2 An example of acquired data by tablet
Respective errors in matching the i-th test signature Si ={xi, yi, fi, ai, ei, vxi,vyi,axi, ayi}
to the template signature ST ={xT, yT, fT, aT, eT, vxT, vyT, axT, ayT} are calculated by
the following equations,
)()()( nxnxne Tix ') , )()()( nynyne Tiy ') ,
)()()( nfnfne Tif ') , )()()( nanane Tia ')
)()()( nenene Tie ') , )()()( nvxnvxne Tivx ') , (3.1)
)()()( nvynvyne Tivy ') , )()()( naxnaxne Tiax ') ,
)()()( naynayne Tiay ') .
The categorized errors, i.e., pen position error eP(n), pen force error eF(n), pen
inclination error eI(n), pen velocity error eV(n), and pen acceleration error eA(n) are
calculated by the following equations,
, + , + , +. - , + , +. -22nynynxnxne TiTiP '*') (3.2)
, + , + , +nfnfne TiF ') (3.3)
, + , + , +, + , + ##
#
!
%
"""
9
$6
) '
nVnV
nVnVne
Ti
TiI !!
!!
1cos (3.4)
237

. - . -22)()()()()( nvynvynvxnvxne TiTiV '*') (3.5)
. - . -22)()()()()( naynaynaxnaxne TiTiA '*') (3.6)
,where , +nV is a 3D vector, which gives the feature of pen inclination as follows,
, +, + , +, + , +, + 7
77
5
8
111
0
3
')
ne
nena
nena
nV
sin
coscos
cossin!
.
(3.7)
In making template and/or verifying signature, we use the individual accumulated
errors and the categorized accumulated errors as shown in following equations,
&'
)
)1
0
)(
N
n
xx neE , &'
)
)1
0
)(
N
n
yy neE , &'
)
)1
0
)(
N
n
ff neE , &'
)
)1
0
)(
N
n
aa neE , &'
)
)1
0
)(
N
n
ee neE ,
&'
)
)1
0
)(
N
n
vxvx neE , &'
)
)1
0
)(
N
n
vyvy neE , &'
)
)1
0
)(
N
n
axax neE , &'
)
)1
0
)(N
n
ayay neE ,
&'
)
)1
0
)(
N
n
PP neE , &'
)
)1
0
)(
N
n
FF neE , &'
)
)1
0
)(
N
n
II neE , &'
)
)1
0
)(
N
n
VV neE , &'
)
)1
0
)(
N
n
AA neE (4)
3 Experimental Results
3.1 Experimental Method
Fig. 3 shows the schematic
diagram for testing features in
signature verification system.
The number of writers is 11,
and each writer is requested to
make genuine signature 10 times.
Four of genuine signatures are
used to make the template by the
following process.
1) Inspect matching part in
signatures for registration,
and define the data that has
the longest writing time as
'parent' data. Others are
defined as 'child' data.
2) Compress or expand the time
axis of child data to fit the
time axis of parent data by
Dynamic Programming (DP)
Registration Verification
Template
DP
matching
DP matching
Genuine/Forgery signature
Decision
Accept/Reject
Decision
threshold
Fig. 3 signature verification system for feature
testing.
238

matching. In DP matching, the path which relates corresponding samples of
parent data with those of child data is determined with minimizing pen position
error given by Eq.(3.2).
3) After DP matching, make the template data set by averaging in each time slot.
Six genuine signatures are matched to the template, and matching error is used for
deriving the relationship between decision threshold and false rejection rate (FRR).
11 Japanese writers are also requested to make two kinds of forgery signature of 10
another writers. One is simulated forgery signature, and the other is traced forgery
signature. The former is made by simulating signature with looking another genuine
signature, and the later is made by tracing another genuine signature written on a
paper. These signatures are matched to the template, and the matching error is used
for deriving the relationship between decision threshold and false acceptance rate
(FAR).
FRR and FAR characteristics are used to present the performance of features in the
signature verification system, and equal error rate (EER) which is the error rate at that
point where FRR and FAR characteristic curves intersect is also a measure of
performance.
In the following sections, FRR, FAR and EER in two kinds of verification system
using individual accumulated error or categorized error are compared.
3.2 Error Rate using individual accumulated error
Fig. 4 (a)-(i) shows the relationship between FRR and FAR by changing decision
threshold for the error defined by nine equations in Eq.(4) with and without forgery.
From these figures, three kinds of data, i.e., y-position, force, and velocity y, have
a margin in the threshold for EER=0 in case of no forgery. On the other hand, each of
elevation, acceleration-x and acceleration-y shows 20% or more EER, even if no
forgery exists.
Forgery affects FAR of x-position and y-position. But azimuth and velocity-y is
robust to forgery.
(a) x-position x(n) (b) y-position y(n)
Ex,th Ey,th
--- FRR ---FAR
--- FAR.sim --- FAR.tra
--- FRR ---FAR
--- FAR.sim --- FAR.tra
239

(c) force f(n) (d) azimuth a(n)
(e) elevation e(n) (f) velocity-x vx(n)
(g) velocity-y vy(n) (h) acceleration-x ax(n)
(i)acceleration-y ay(n)
Fig.4 Relationship between FRR and FAR with and without forgery
Ef,th Ea,th
Ee,th Evx,th
Evy,th Eax,th
Eay,th
--- FRR ---FAR
--- FAR.sim --- FAR.tra
--- FRR ---FAR
--- FAR.sim --- FAR.tra
--- FRR ---FAR
--- FAR.sim --- FAR.tra
--- FRR ---FAR
--- FAR.sim --- FAR.tra
--- FRR ---FAR
--- FAR.sim --- FAR.tra
--- FRR ---FAR
--- FAR.sim --- FAR.tra
--- FRR ---FAR
--- FAR.sim --- FAR.tra
240

3.2 Error Rate using categorized accumulated error
Fig. 5 (a)-(e) shows the relationship between FRR and FAR using the error defined
by five equations in Eq.(4) with and without forgery. From the figure, it is shown that
force and velocity are good features for verifying signature including forgery.
(a) position (b) force
(c) inclination (d) velocity
(e) acceleration
Fig.5 Relationship between FRR and FAR with and without forgery
3.3 EER based evaluation
Table 2 shows the summary of EER for 9 individual data which is involved in the
ISO/IEC 19794-7 format and 5 categorized data with and without forgery.
From the table, x channel data, y channel data, f channel data, vx channel data and vy
channel data are valuable for Japanese signature verification if there is no forgery.
--- FRR ---FAR
--- FAR.sim --- FAR.tra--- FRR ---FAR
--- FAR.sim --- FAR.tra
--- FRR ---FAR
--- FAR.sim --- FAR.tra
--- FRR ---FAR
--- FAR.sim --- FAR.tra
--- FRR ---FAR
--- FAR.sim --- FAR.tra
EP,th EF,th
EI,th EV,th
EA,th
241

This tendency is also found in remaking data set based on five categories such as
position, force, inclination, velocity and acceleration. Although these results are
obtained by DP matching algorithm and very limited samples, it is found that
acceleration is bad features for verification if no post process is applied.
Table 2 Summary of EER of each dataForgery Forgery
Non simulated tracing Non simulated tracing
Ex 0 30 40 EP 0 30 30
Ey 0 10 10 EF 0 10 10
Ef 0 10 10 EI 10 10 10
Ea 10 20 20 EV 0 10 10
Ee 30 20 20 EA 20 50 40
Evx 0 10 10
Evy 0 10 10
Eax 30 40 40
Eay 20 40 40 unit: in %
4 Conclusion
In this paper, we have shown the robustness of signature verification system using
nine kinds of data and five categorized data which are involved in ISO/IEC 19794-
7:2007 data format against forgery. Although the number of signature is not
sufficient, it has been found that pen tip acceleration and pen elevation angle are bad
features for verification, and further research on pen tip force, pen tip velocity and
pen inclination which showed good results might be focused on those to confirm the
results on a larger test base. Increasing data size for reliable results and inter
operability using different tablets are subjects in future works.
Bibliography
[BSK08] N.Bierhals, S.Hangai, G.Scharfenberg, J.Kempf, C.Hook, ‘Extraction of Target Areas
based on Turning Points for Signature Verification!A Study on Signature/Sign Processed
Dynamic Data Format SC37 N2442!’, Technical Report of BS Group, June, 2008
[GFF07] J. Galbally, J. Fierrez, M. R. Freire, and J. Ortega-Garcia. Feature Selection Based on
Genetic Algorithms for On-Line Signature Verification, IEEE AIAT, pp198-203, 2007
[HYH00] S.Hangai, S.Yamanaka and T.Hamamoto, 'On-Line Signature Verification Based On
Altitude and Direction of Pen Movement', IEEE ICME2000, Aug. 2000.
[ISO11] ISO/IEC JTC1 /SC37 N 4273, 2011
[KHH02] M. Kawamoto, T. Hamamoto, S. Hangai., Improvement of On-line Signature
Verification System Robust to Intersession Variability, Biometric Authentication,
LNCS2359, pp168-175, 2002
[TBa05] M. Tanaka, A. Bargiela. Authentication Model of Dynamic Signatures using Global
and Local Features, IEEE 7th workshop on Multimedia Signal Processing, pp1-4, 2005
[TEL07] TELECOM/Manag.Sud.Paris,’Biosecure Multimodal Evaluation Campaign’, 2007
[YCH04] D.Y.Yeung, H.Chang, Y.Xiong, S.George, R.Kashi, T.Matsumoto, G. Rigoll,
‘SVC2004:First int. signature verification competition’, Proc. of ICBA, pp16-22,
LNCS3072, 2004
[YKH01] S.Yamanaka, Masato Kawamoto, T.Hamamoto, and S.Hangai, 'Signature
Verification Adapting to Intersession Variability', IEEE ICME2001, Aug. 2001.
242

Visual cryptography applied to fingerprint features as a
solution for pre-alignment ∗
Julien Bringer
Morpho
Herve Chabanne
Morpho, Telecom ParisTech
Abstract: Visual cryptography enables to derive from an image two shares that giveseparately no information on the original image while leading back to the image bysuperimposition of the shares.
In this work, we apply this technique to fingerprint features for enabling an align-ment of a reference and a fresh images. The idea is to use an encrypted share derivedfrom the reference data as a kind of reference grid for pre-alignment of the fresh dataon it. Following the principle of visual cryptography, it also ensures a storage protec-tion when data are stored in separate locations.
Keywords. Fingerprint, Alignment, Visual Cryptography
1 Introduction
When quantizing biometric data (from images or templates), one important issue is the
difference of alignment between the capture at enrollment and the verification’s one. This
is even critical for modality such as fingerprints where there is almost none reliable in-
formation that can be used to pre-align the image at the encoding step. Several methods
of fingerprints quantization (based on images or on minutiae templates) are suggested in
state-of-the-art, as for instance [JPHP99,TAK+05]. Unfortunately, most of them gets poor
performances in misalignment situation. They then need either exhaustive search on the
orientation/translation or a preliminary registration step before comparison.
Related to those works on the protection of biometric data, we here present a solution for
a user to align two fingerprint “visually” by having only a portion of the reference image.
This solution aims at allowing to pre-align two fingerprints without using of techniques
directly bound to the biometrics. Note that although the main motivation is fingerprint,
this can be applied to other modality that are captured at some step as an image.
Our technique can be applied as a visual help to a user who can see on a dedicated screen
the effect of the superimposition of one stored share with his freshly capture finger and
react accordingly to improve the quality of this image. We can also think to an automatic
treatment of the image.
Within the context of protection of biometric data, for instance for secure sketches tech-
nique where the noise introduced from a biometric measure to the other one is corrected
∗Part of this work has been funded by the ANR project BMOS
243

by means of correcting codes of errors, the alignment of the data is often critical.
In particular, this problem arises in the case of fingerprints because there is no natural
binary vector representation directly usable – contrary to the case of the iris where the
format of iriscodes is compatible as it is. The main difficulty in the alignment is due to
the fact that during verification check, we do not have, contrary to the case of classical
matching, a reference fingerprint “in clear” such that the fresh capture can be aligned
with. These problems of alignment between several measures of the same fingerprint are
due, in particular, to the positioning of the finger (global translations / rotations) and to
the exercised pressure (local distortion). This alignment issue for protection techniques
is underlined in [TAK+05, UPJ05] without being effectively resolved even in the recent
advances.
For example, on the 2 images of Figure 1 which result obviously from the same finger-
print, we can notice that the gap is very important (important translation, low rotation and
distortion), while the score of matching will be relatively good. If we use these images
without any pre-alignment in most quantization algorithms for secure sketches, it will not
then be possible to correct the noise, because the noise introduced by the lack of alignment
is very high: it is thus useful to be capable of pre-aligning these 2 images to process them
correctly.
(a) Reference
image
(b) Fresh image
Figure 1: Example of difference between reference and verification images
A first idea could be to store a part of the left image as the reference (for example a small
portion of the center of the image or several sub-images) to pre-align globally the right
image above. But this technique does not allow to pre-align finely the points of the image
situated outside the reference portion. Moreover, this forces to store some information in
clear. Other techniques exist, based for instance on reference points (core, delta, UCX,
. . . [SOISO05]) or more complete description (e.g. high curvature points as in [NRV10]),
but they are either non universal, non stable enough or directly leak some information on
the global shape.
244

2 Visual Cryptography
The visual cryptography notion, as introduced by [NS94], is to ensure the protection in
confidentiality of an image while allowing a simple and visual reconstruction. The general
principle is to split an image I in m pieces (s1, . . . , sm) so that the knowledge of k pieces
among these m pieces (with k < m) gives no information on I . The knowledge of mpieces allows to build a new version of the image I (according to the employed techniques,
the resultant image will be a version of I that is more or less degraded). It thus corresponds
to a sharing of secrets with visual reconstruction.
An example of visual cryptographic scheme, in the case of the sharing of an image in
black and white in 2 pieces, is the following one. Every pixel of the original image I is
subdivided into a sub-pixel of 4 pixels in the shares s1 and s2 where every sub-pixel has
one of the forms given by Figure 2. A white pixel is shared in 2 identical forms and a black
Figure 2: Sharing of a pixel in 2 shares (sub-blocks of 4 pixels)
pixel is shared in two complementary forms. Every couple (f1, f2) of forms obtained is
separated to store the first constituent f1 in the first share s1 and second constituent f2 in
s2. In both cases (white pixel and black pixel), the forms to be used are chosen randomly.
This thus implies that a share alone leaks no information about the original image. Finally,
when 2 shares are superimposed, we obtain by transparency an image representing the
original image with grey sub-pixels (blocks of 2 white and 2 black pixels represent a white
pixel in the original image) and of black sub-pixels (for the black pixels of the original
image).
The operation of transparency corresponds in fact to a OR following the rules: white OR
white = white, black OR white = black, black OR black = black and white OR black =
black.
Several applications of visual cryptography, and more generally secret sharing techniques,
to biometric data are already known. [BDD04] described an architecture where secret shar-
ing is applied on a biometric template to split the storage between different locations (basi-
cally, a random mask m is stored at one place and a masked version b⊕m of the template
b is stored at another place). [LT03] suggested a similar solution with visual cryptography
on face images. More recently, [RO11] provided a detailed study on the use of visual cryp-
tography to store data – splitted in two shares – on two separate databases and described
experiments on face images, fingerprint images and iris templates (iriscodes). In all cases,
the shares are combined to reconstruct the reference data before matching it against the
fresh capture.
245

3 Visual cryptography for fingerprint alignment
Given a reference biometric data bref at enrollment, we split it in two share (s1, s2) ac-
cording to a principle of sharing of secrets, as explained in Section 2, to obtain a safe
splitting (no single share will reveal information on bref ). During the verification check,
the fresh biometric data bfresh is divided in two shares (s′1, s′2) so that we will be able to
combine properly s1 and s′2 to realign bfresh on bref without revealing completely bref .
More exactly, the principle is the following one.
Enrollment:
• Capture a reference biometric data bref ;
• construct a method Γ randomly that consists of a vector of couples that can be used
to represent a white pixel and a black pixel (in fact for each position in the image,
a couple of valid representation as in Figure 2 of a white pixel and a black pixel is
chosen randomly to construct Γ) ;
• split the image in two shares s1 and s2 following the method Γ;
• store s1 in one database DB1, and Γ in a second one DB2.
Γ is in fact a vector of size the size of the image and at position i, Γ[i] is a couple (W,B)that corresponds to the representatives chosen respectively for a white pixel and a black
pixel. We have W = (W1,W2) and B = (B1, B2) with Wj (resp. Bj) corresponds
to the block (4 sub-pixels in the case of Figure 2) to be inserted in the share sj if the
original image has a white pixel (resp. a black pixel) at position i. The method Γ is chosen
randomly in particular so that from s1 or s2 it is not possible to find bref , i.e. Γ distributes
well the information in s1 and s2.
Verification check:
• Capture a fresh biometric data bfresh;
• retrieve the method Γ of the claimed identity in the second database DB2;
• split bfresh in two shares s′1 and s′2 according to this method;
• retrieve the share s1 of the claimed identity in the first database DB1;
• combine s1 and s′2 to determine the geometrical transformation that leads to the
image of best quality.
The phase of verification check requires a means of control, automatic or manual, of the
quality of an image: we can use for example the neatness of the image. Once this geo-
metrical transformation determined (for instance by semi-exhaustive search, starting with
a large step and fine-tuning the step of the search progressively), we apply it on bfreshbefore passing in a next stage (e.g. secure comparison, key extraction, . . .).
246

The specificity of this algorithm within the context of biometrics compared to classical
application of visual cryptography techniques is that the reconstruction is made from an
original share s1 and a fresh share s′2 that is not s2 but a noisy version of the original share
s2.
Remark 1 Note that, as our main goal is to provide an assistance for alignment, we can
even imagine to use a visual feedback on a sensor where a user will be able to modify the
position and pressure of the finger to improve the neatness of the obtained result.
Remark 2 From a practical point of view, we can also make the alignment in a symmet-
rical way by using the two original shares. Indeed, if we have the shares s′1 and s′2 of the
fresh capture, we can try to combine simultaneously s1 with s′2 and s′1 with s2 to refine the
determination of the optimal alignment.
4 Examples
To illustrate our idea, we give here some examples of search for a translation between two
fingerprints according to the method of sharing based on the visual cryptographic scheme
from Figure 2. Note that this can also be used to determine geometrical transformations
different from the translation (e.g. a rotation).
4.1 Applications to fingerprint images
For two different captures (here fingerprint images) coming from the same finger, we first
convert the images in black and white and applied the algorithms (for enrollment and
verification check) described in Section 3. We obtain the two shares s1, s2 from the image
of Figure 1a (where only s1 will be kept) and we obtain the share s′2 from the image of
Figure 1b. We then combine s1 and s′2 to search for the best translation according to the
quality of the reconstructed image: this is illustrated by Figure 3.
To verify the efficiency of the method, we can use a classic matcher to find the best trans-
lation between the sets of minutiae extracted from those images. From Figure 3, the trans-
lation obtained for the clearest result corresponds well to that returned by a matcher.
Remark 3 The noise appearing at the external boundaries of the image is an effect of the
translation, it corresponds to areas outside the second fingerprint image where a constant
white image has been combined according to Γ.
Now, we try to combine the share s1 with a share coming from a non matching fingerprint,
we then obtain less clear images, whatever the translation is – cf. Figure 4. Without trans-
lation fingerprints do not correspond at all, and even with the ideal translation calculated
by a minutiae matcher, there are still areas of important noise.
247

(a) Image
reconstituted
without
translation
(b) With a
temporary
translation
(c) With the final
translation
Figure 3: Different translation applied for reconstruction of the superimposed image from
s1 and s′2
(a)
Non-matching
fingerprint with
fingerprint from
Figure 1a
(b) Image
reconstituted
without
translation
(c) With an ideal
translation
estimated thanks
to a minutiae
comparator
Figure 4: Different translation applied for reconstruction of the superimposed image from
the shares of two non-matching fingerprint images
4.2 Applications to ridge flow matrices
To improve the neatness of the obtained images, and thus facilitate the search for the trans-
formations, we can try to work on images less detailed than those of fingerprint images.
For example, the use of ridge flow matrices can be interesting. The ridge flow matrices of
the previous fingerprints (from Figure 1 and Figure 4a) are given in Figure 5.
We play then the same scenario as in the previous part but, although there exist techniques
of visual cryptography for grey or color images, we use here a method of sharing based on
a XOR and masked values to facilitate the processing of the levels of grey.
For the combination of the shares from two matching captures, the quality of the obtained
images becomes easier to see as underlined by Figure 6.
For the shares coming from two different fingerprints, cf. Figure 7, the obtained results, as
in the case of direct use of fingerprint images, are still not neat.
248

(a) Direction
field of
fingerprint from
Figure 1a
(b) Direction
field of
fingerprint from
Figure 1b
(c) Direction
field of
fingerprint from
Figure 4a
Figure 5: The direction fields associated to three fingerprints
(a) Image
reconstituted
without
translation
(b) Image
reconstituted
with a
temporary
translation
(c) Image
reconstituted
with the final
translation
Figure 6: The superimposition of direction fields shares for two matching fingerprints
(a) Image
reconstituted
without
translation
(b) Image
reconstituted
with the ideal
translation
Figure 7: The superimposition of direction fields shares from two non-matching finger-
prints
The difference with the case of fingerprint image is that the neatness is much easier to see
and the difference (for the best found translation) between the case of the same fingerprint
249

and the case of two different fingerprint is still visible. We can imagine then for example
to make a first search on the direction fields then secondly to work on fingerprint images
to obtain a finer precision.
5 Conclusion
This work describes how to use visual cryptography or secret sharing techniques to fa-
cilitate the alignment of two fingerprint without using the reference data directly in clear.
Moreover it also take advantages of these techniques to achieve a protection at the storage
level (if the splitting method is constructed to this aim). From the point of view of the
translations and the global rotations, the discussed examples underline the feasibility. In
further studies, it will be interesting to analyze more precisely how to automatically search
the best transformation and to absorb at best the local distortions of the fingerprints.
References
[BDD04] Madalina Baltatu, Rosalia D’Alessandro, and Roberta D’Amico. Toward UbiquitousAcceptance of Biometric Authentication: Template Protection Techniques. In ECCVWorkshop BioAW, pages 171–183, 2004.
[ISO05] ISO/IEC 19794-2:2005. Information Technology, Biometric Data Interchange Formats,Part 2: Finger Minutiae Data. Technical report, ISO/IEC, 2005.
[JPHP99] Anil K. Jain, Salil Prabhakar, Lin Hong, and Sharath Pankanti. FingerCode: A Fil-terbank for Fingerprint Representation and Matching. In CVPR, pages 2187–. IEEEComputer Society, 1999.
[LT03] Chang-Chou Lin and Wen-Hsiang Tsai. Visual cryptography for gray-level images bydithering techniques. Pattern Recognition Letters, 24(1-3):349–358, 2003.
[NRV10] Abhishek Nagar, Shantanu Rane, and Anthony Vetro. Alignment and bit extraction forsecure fingerprint biometrics. In Media Forensics and Security, page 75410, 2010.
[NS94] Moni Naor and Adi Shamir. Visual Cryptography. In EUROCRYPT, pages 1–12, 1994.
[RO11] Arun Ross and Asem A. Othman. Visual Cryptography for Biometric Privacy. IEEETransactions on Information Forensics and Security, 6(1):70–81, 2011.
[TAK+05] Pim Tuyls, Anton H. M. Akkermans, Tom A. M. Kevenaar, Geert Jan Schrijen, Asker M.Bazen, and Raymond N. J. Veldhuis. Practical Biometric Authentication with TemplateProtection. In AVBPA, pages 436–446, 2005.
[UPJ05] Umut Uludag, Sharath Pankanti, and Anil K. Jain. Fuzzy Vault for Fingerprints. InAVBPA, pages 310–319, 2005.
250

Feature Level Fusion of Face and Palmprint using Gaussian
Mixture Model: Application to Single Sample Analysis
R.Raghavendra,
Italian Institute of Technology (IIT),
Via Morego 30, 16163, Genova, Italy.
Abstract: With growing concern about the security, the world over, biometric basedperson verification is gaining more and more attention. One of the major limitation inBiometric authentication is single sample biometric recognition (unimodal) problem.In this paper, we combine two biometrics namely face and palmprint at feature levelusing the novel approach based on Log Gabor transform and Gaussian Mixture Mo-del to address this problem. The proposed technique consists of three important steps:First, we vertically fuse the texture features of face and palmprint that are extractedseparately using Log-Gabor transform. Second, we model the fused texture data usingGaussian Mixture Model (GMM) to obtain more than one texture transformation ma-trices. Third, we analyze each of these texture transformation matrices using PrincipleComponent Analysis (PCA) / Independent Component Analysis (ICA) separately. Ex-tensive experiments are carried out on large face and Palmprint databases to prove theefficacy of the proposed method. The experimental results show the superiority of theproposed method compared to some of the existing schemes.
1 Introduction
Traditional methods of establishing a person’s identity include knowledge-based (ex. Pass-
word) and token based (ex. ID Card) mechanisms, but these representations can be easily
manipulated, shared, lost or stolen, thereby undermining the intended security. The need
for reliable identification of Legitimate user is obvious. Biometrics offers a natural and
reliable solution to many aspects of identity management by the use of fully automated or
semi-automated schemes to recognize individuals based on their inherent physical and/or
behavioral characteristics [AKJ06]. The most challenging problem in biometric authenti-
cation is the single sample biometric recognition. This is a common problem of real world
application as it leads to bad recognition results.
Many unimodal biometric (face) algorithms are reported in literature [TCZZ06] [WZ02]
to solve the single sample analysis(SSA). But their performance is greatly hindered and
few of them like fisherface and its variants completely collapse. Even though improved Li-
near Discriminate Analysis (LDA) are reported [CLZ02] [YFM06] to solve this problem,
but still good performance is not achieved. Recently, the multimodal biometric approaches
are used to address this issue [YJW07] [JYY+07]. Unlike unimodal biometrics that use
only one trait for person Identification/Verification, the multimodal biometric uses more
than one biometric trait to make the decision about Accept/Reject. In [YJW07], the mul-
251

timodal biometric system using face and palmprint is used to address SSA. Each of these
modalities are analyzed separately using Gabor transform and PCA then, feature level fu-
sion is carried out by vertically concatenating the features obtained from PCA. Finally, the
classification is carried out using Nearest Neighbor Classifier. In [JYY+07], multimodal
biometrics using face and palmprint is proposed. Here, Gabor transform is carried out in-
dependently to analyze face and palmprint images and then they are fused. Finally, Kernel
Discriminate Common Vector followed by Radial Basis Function network (KDCV-RBF)
is used for classification.
In this paper, we propose a novel approach using Log Gabor transform and Gaussian Mix-
ture Model (GMM) to address the problem of SSA. The main idea of using GMM is to
obtain more than one texture transformation matrix and then we analyze each of them
separately using popular subspace methods such as PCA/ICA to make the decision about
accept/reject. Thus, as opposed to conventional combination of Log Gabor (or even Gabor)
transform with PCA, the proposed method will give more than one texture transformation
matrix using GMM, whose parameters are learned using Expectation-Maximization (EM)
algorithm.
The rest of the paper is organized as follows: Section 2 describes the proposed method,
Section 3 describes the experimental results & discussion and Section 4 draws conclusion.
2 Proposed Method
Abbildung 1: Block Diagram of the Proposed Method
Figure 1 shows the block diagram of the proposed method for SSA. The basic idea of
the proposed method can be visualized in five different steps: (1) we separately extract
the texture features of face and palmprint (2) we do feature level fusion by vertically
concatenating the texture features of palmprint and face (3) we model this fused texture
features using GMM which in turn gives ’k’ (where ’k’ denotes the number of mixtures
in GMM) different transformed texture matrices (4) we use linear projection techniques
such as PCA and ICA(separately) to reduce the dimensionality of ’k’ different transformed
texture matrices (5) Finally, we do classification using Nearest Neighbor Classifier (NNC).
252

To extract texture features of face and palmprint, we use Log Gabor transform as it is
suitable for analyzing gradually changing data such as face, iris and palmprint [YJW07]
and also it is described in [Dav87] that Log Gabor transform can reflect the frequency
response of image more realistically. On the linear frequency scale, the transfer function
of Log Gabor function has the form [ZCMQ02]:
G(ω) = exp
{− log(ω/ωo)
2
2 × log(k/ωo)2
}(1)
Where, ωo is the filter center frequency. To obtain constant shape filter, the ratio k/ωo must
also be held constant for varying ωo.
The Log Gabor filter used in our experiments has 4 different scale and 8 orientations.
Thus, each facial image is analyzed using 32 different Log Gabor filters that results in 32different filtered images. So, each sample (face/palmprint) image is represented using 32
different images.
After representing each face and palmprint images using Log Gabor filter; we implement
the feature level fusion as follows: Let Xface and Ypalm represents the face and palmprint
image sample sets and let xface represents a sample of Xface with size 60×60. Performing
the Log Gabor filtering on xface, we get 32 (4× 8) different images and then we combine
them to get a Log Gabor image sample xLogGaborFace which is of size 240 × 480. To
reduce the computation cost, transformed image is downsampled by a ratio equal to 4.
Thus, the final size of xLogGaborFace is reduced to 60 × 120. Similar procedure is also
applied on palmprint Ypalm to obtain Log Gabor transformed feature set yLogGaborPalm.
Then, combine xLogGaborFace and its corresponding yLogGaborPalm vertically to get a
fused image sample xfuse that is of size 120 × 120 and repeat this for all the samples of
face and palmprint to obtain complete fused set Xfuse. Figure 2 shows a sample fused
image which combines Log-Gabor transform features (expressed by magnitude values) of
face and palmprint vertically. As the imaging conditions of face and palmprint are different
feature vector normalization is carried out as follows:
xfusenorm =xfuse − µface
σface(2)
Where µface and σface indicates the mean and variance value of Xfuse. We then obtain
the normalized sample set Xfusenorm.
In the next step, GMM is used to model the fused texture data Xfusenorm. Given a N-
dimensional data set Xfusenorm = [xfusenorm1, xfusenorm2........xfusenormN ] ∈ ℜN is
partitioned into k different clusters and each of these clusters are represented by a linear
combination of component density as[MP00]:
f(x) =k∑i=1
piG(Xfusenorm/ µiΣi) (3)
where Pi represents the mixing coefficients or weights for ith term and G(Xfusenorm/µiΣi)represents the multinormal or Gaussian density function. Thus, G(Xfusenorm/µiΣi) can be
written
253

Abbildung 2: Fused Sample Image
as:
G(Xfusenorm/µiΣi) =1
(2π)n
2 | Σi |1
2
exp
{−
1
2
(Xfusenorm − µi)TΣ−1
i (Xfusenorm − µi)
(4)
where Xfusenorm is the N-dimensional vector, µi is the N-dimensional vector of means
and Σi is a N × N covariance matrix of ith mixture. In employing the GMM, we first
learn the different Gaussian mixtures as done classically in the literature[MP00]: in prac-
tice after determining the right number of mixtures, we use the EM algorithm in order to
learn the GMM parameters using learning(training) database. In majority of analysis, the
GMM is used to obtain the likelihood ratio, but, in our proposed method, we use square
symmetric (covariance) matrices(Σi) given by GMM for further analysis. Thus, a GMM
with k mixtures will give k different square symmetric matrices. For each square symme-
tric matrix, we then determine the associated PCA/ICA transformation separately. Thus,
we have two different approaches: First, the approach based on Log-Gabor, GMM and
PCA (LG-GMM-PCA) in which PCA is used to reduce the dimension of texture trans-
formation data. More details of PCA can be find in [MA91]. Second, the approach based
on Log-Gabor, GMM and ICA (LG-GMM-ICA). According to literature [BMS02], there
are two ways in which ICA architecture can be implemented in image recognition task.
In Architecture I (ICA I) input images in Xfusenorm are considered as a linear mixture
of image of a statistically independent basis S combined with an unknown mixing matrix
254

M . The ICA I algorithm learns the weight matrix w that corresponds to the coefficients
of the linear mixture [BMS02]. Architecture II (ICA II) finds the statistically independent
coefficients for input data. In practice, ICA II separates the data taking into account hig-
her statistics while ICA I addresses the variation up to second order statistics. Here, we
have two methods such as LG-GMM-ICA I and LG-GMM-ICA II. After projecting the ktransformation matrices using PCA/ ICA (ICA I & ICA II separately), the classification
is carried out using Nearest Neighbor Classifier (NNC). That is, for each test and training
images, we calculate k distances (k is the number of mixtures) using NNC and, at the end,
we select the transformation matrix that gives the minimal distance.
2.1 Model Order
Before using the Mixture model, one has to determine the number of mixture components
i.e. number of mixtures. Choosing few components may not accurately model the distin-
guishing features present in our fused data. Also, choosing too many components may
over fit the data and reduce the performance and also result in excessive computational
complexity both in training and classification. In our experiments, we find the model order
by cross validation. Given a training dataset, we evaluate the performance over different
numbers of mixture components. We then select the number of mixture components which
give the best performance.
3 Experimental Results and Discussion
This section describes the results obtained using proposed algorithm on feature level fusi-
on of Face and Palmprint. Here, we first introduce face and palmprint databases and then
provide the feature level fusion results. We use the public face database, the AR databa-
se [ard]. The AR database contains over 4000 images corresponding to 126 users under
conditions where there is a variation over time, in lighting variation, in facial expression
and in occlusion conditions. The pictures of most persons are taken in two sessions sepa-
rated by two weeks. Each session contains 13 images and 119 individual (65 men and 54women) were participated in both session. The images of these 119 users are selected and
used in our experiments. All image samples are with resize to the resolution of 60 × 60pixels. We use PoluU palmprint database (version 2) provided by Hong Kong Polytechnic
university[pol]. This database consists of 7752 images captured from 386 different palms.
The samples of each palm are collected in two sessions where average between first and
second session is about two months and each palmprint has 20 images. For our experi-
ments, we extract the Region of Interest (ROI) as mentioned in [HJZ08]with a fixed size
of 60 × 60.
To a build a chimeric multimodal biometric database for our SSA, we take sample set of
same size from these two databases. We use all 119 face classes with each class containing
the first 20 sample and use first 119 palmprint classes with each other containing all 20
255
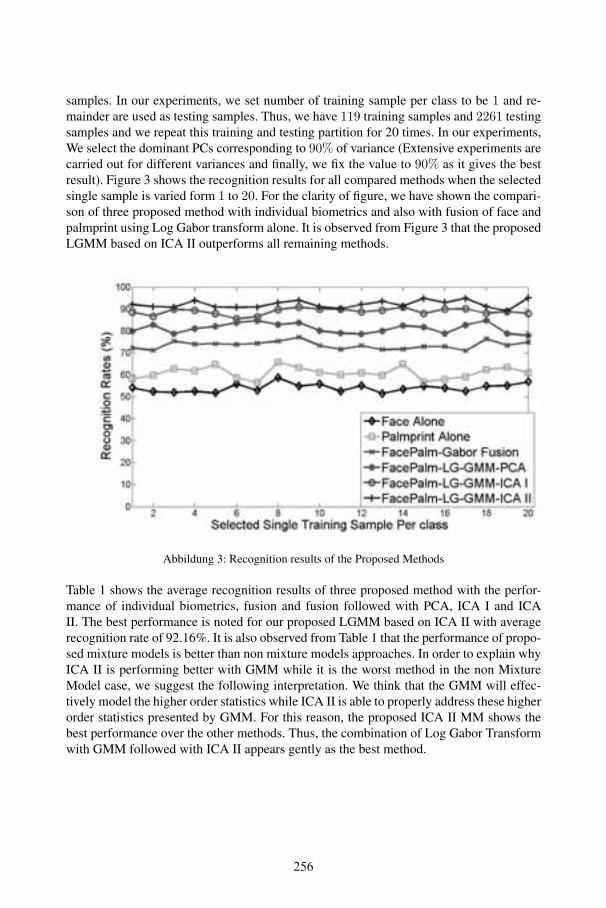
samples. In our experiments, we set number of training sample per class to be 1 and re-
mainder are used as testing samples. Thus, we have 119 training samples and 2261 testing
samples and we repeat this training and testing partition for 20 times. In our experiments,
We select the dominant PCs corresponding to 90% of variance (Extensive experiments are
carried out for different variances and finally, we fix the value to 90% as it gives the best
result). Figure 3 shows the recognition results for all compared methods when the selected
single sample is varied form 1 to 20. For the clarity of figure, we have shown the compari-
son of three proposed method with individual biometrics and also with fusion of face and
palmprint using Log Gabor transform alone. It is observed from Figure 3 that the proposed
LGMM based on ICA II outperforms all remaining methods.
Abbildung 3: Recognition results of the Proposed Methods
Table 1 shows the average recognition results of three proposed method with the perfor-
mance of individual biometrics, fusion and fusion followed with PCA, ICA I and ICA
II. The best performance is noted for our proposed LGMM based on ICA II with average
recognition rate of 92.16%. It is also observed from Table 1 that the performance of propo-
sed mixture models is better than non mixture models approaches. In order to explain why
ICA II is performing better with GMM while it is the worst method in the non Mixture
Model case, we suggest the following interpretation. We think that the GMM will effec-
tively model the higher order statistics while ICA II is able to properly address these higher
order statistics presented by GMM. For this reason, the proposed ICA II MM shows the
best performance over the other methods. Thus, the combination of Log Gabor Transform
with GMM followed with ICA II appears gently as the best method.
256

Tabelle 1: Average Recognition Results of Proposed Methods
Methods Recognition Rates (%)
Mean Value and Variance Standard Error
Face-Log Gabor Alone 54.07 ± 3.56 0.42Palm-Log Gabor Alone 60.95 ± 7.13 0.60
FacePalm-Log Gabor-Fusion 73.54 ± 2.99 0.38FacePalm-Log Gabor-Fusion-PCA 76.62 ± 6.95 0.58FacePalm-Log Gabor-Fusion-ICA I 80.75 ± 5.14 0.50FacePalm-Log Gabor-Fusion-ICA II 74.04 ± 6.13 0.55
FacePalm-LG-GMM-PCA 81.21 ± 4.91 0.49FacePalm-LG-GMM-ICA I 88.86 ± 2.97 0.38
FacePalm-LG-GMM-ICA II 92.16 ± 2.08 0.32
4 Conclusion
In this paper, we propose a possible solution for single sample biometric recognition using
Log Gabor transform and GMM. The main advantage of proposed method is that, it gives
more than one set of texture transformation matrices. Based on the extensive experiments
carried out on large database of face and palmprint following can be concluded:
1. In general Mixture Models and Multimodal features perform better than non Mix-
ture model and Unimodal biometric based authentication systems.
2. Specifically the proposed GMM based approaches such as LG-GMM based on PCA,
ICA I and ICA II outperforms non mixture model approaches such as PCA, ICA I
and ICA II.
3. Proposed LG-GMM based on ICA II shows the best result with recognition rate of
92.16% with lowest standard error of 0.32%.
Literatur
[AKJ06] A.Ross, K.Nandakumar und A.K. Jain. Handbook of Multibiometrics. Springer-Verlag. Auflage, 2006.
[ard] The AR Face Database. www.rvl1.ecn.purdue.edu/aleixfaceDB.html/.
[BMS02] M. S. Bartlett, J. R. Movrllan und T. J. Sejnowski. Face Recognition by IndependentComponent Analysis. IEEE Transaction on neural networks, 13(06):1450–1464, 2002.
[CLZ02] S. Chen, J. Liu und Z.H. Zhou. Making FLDA applicable to face recognition with onesample per person. Pattern Recognition Letters, 23:1711–1719, 2002.
257

[Dav87] F. J. David. Relations between the statistics of natural images and the response pro-perties of cortical cells. Journal of the Optical Society of America, 4(12):2379 – 2394,1987.
[HJZ08] D.S. Huang, W. Jia und D. Zhang. Palmprint verification based on Principal lines.Pattern Recognition, 41:1316–1328, 2008.
[JYY+07] X.Y. Jing, Y.F. Yao, J.Y. Yang, M. Li und D. Zhang. Face and palmprint pixel levelfusion and kernel DCV-RBF classifier for small sample biometric recognition. PatternRecognition, 40(3):3209–3224, 2007.
[MA91] M.Turk und A.Pentland. Eigenfaces for Recognition. Journal of Cognitive Neuros-cience, 31(1):71–86, 1991.
[MP00] G.J. McLachlan und D. Peel. Finite Mixture Models. Wiley series in probability andstatistics i. Auflage, 2000.
[pol] polyU palmprint Database. www.comp.polyu.edu.hk/˜biometrics/.
[TCZZ06] X. Tan, S. Chen, Z.H. Zhou und F. Zhang. Face recognition from a single image perperson: A survey. Pattern Recognition, 39(9):1725–1745, 2006.
[WZ02] J. Wu und Z.H. Zhou. Face recognition with one training image per person. PatternRecognition Letters, 23:1711–1719, 2002.
[YFM06] H. Yin, P. Fu und S. Meng. Sampled FLDA for face recognition with single trainingimage per person. Nerocomputing, 69(16-18):2443–2445, 2006.
[YJW07] Y.Yao, X. Jing und H. Wong. Face and palmprint feature level fusion for single samplebiometric recognition. Neurocomputing, 70(7-9):1582–1586, 2007.
[ZCMQ02] X. Zhitao, G. Chengming, Y. Ming und L. Qiang. Research on log Gabor wavelet andits application in image edge detection. In Proceedings of 6th International Conferenceon Signal Processing (ICSP-2002), USA, Seiten 592– 595, 2002.
258

Biometric Systems in Future Crime Prevention Scenarios –How to Reduce Identifiability of Personal Data
Monika Desoi, Matthias Pocs, LL.M., Benjamin Stach
Projektgruppe verfassungsverträgliche Technikgestaltung (provet) im Forschungszen-
trum für Informationstechnikgestaltung (ITeG)
- Project Group Constitutionally Compatible Technology Design (provet) Member at the
Interdisciplinary Research Center for Information System Design (ITeG) -
Universität Kassel, Wilhelmshöher Allee 64-66, 34109 Kassel
{ m.desoi, matthias.pocs, benjamin.stach }@uni-kassel.de
Abstract:Biometric technology for crime prevention is emerging. The design of a biometric
system is decisive for the protection of fundamental rights. This paper analyses the
necessary reduction of identifiability of biometric data. By outlining the German
legal framework, the paper assesses a technical design proposal for future biomet-
ric systems. In this context, a Three-Step-Model is suggested.1
1 Introduction
A passenger jumps out of a taxi and runs through the departure hall to the counter of the
airline she is going to fly with. Meanwhile, she is observed by a video surveillance cam-
era: The observation system’s program alerts the airport security firm because of her
rush. After having seen the video footage, the security officer classifies her correctly as
no risk for security. Without being concerned by this the passenger checks in her lug-
gage. Then her luggage is scanned for fingerprints, once just after the check-in and once
before being loaded into the airplane. Checked with the database, the system says there
are more fingerprints on the luggage at the second scan. The security personnel scans
those fingerprints again and double-checks them manually. It turns out that all of the
fingerprints belong to the passenger herself, so no further steps are taken.
This is a possible future scenario in which biometric data play a significant role. Police
authorities have already deployed biometric systems in practice, e.g. face recognition
[BK07] or iris scans at airports [DM04]. Respective research projects are funded, like
3D facial recognition [BN08], fingerprint scanning from luggage [Hi11] or behavioural
pattern analysis by video surveillance. At the same time, existing biometric databases
1 Acknowledgement: The work in this paper has been funded in part by the German Federal Ministry of Educa-
tion and Science (Bundesministerium für Bildung und Forschung, BMBF) through the Research Programmes
under Contract No. 13N10820 – “Digitale Fingerspuren” (Digi-Dak), http://omen.cs.uni-magdeburg.de/digi-
dak/, and Contract No. 13N10814 – “Verteilte, vernetzte Kamerasysteme zur in situ-Erkennung Personen-
induzierter Gefahrensituationen (CamInSens)”.
259

that contain data about crime scene traces as well as fingerprints and photographs from
criminal records, are interconnected [PC05] and extended [ED07].
Due to these developments, it is possible that in the future laws will be enacted that for
example allow the deployment of biometric systems at international airports for finding
potential terrorists. Such a precautionary data capture, that is, before a danger is caused
or a crime is committed, poses new challenges to the law [WP09] [He10] [Ho10] [Hi11],
particularly because biometric characteristics are captured without the data subject hav-
ing given cause for the capture and a large number of persons are subject to it. This pa-
per focuses on the lawful deployment of biometric systems for future crime prevention
scenarios. While this might not be realised in the short term, apparently, the fundamental
rights involved will have to be addressed in the future. Therefore, this paper assesses
whether or not the fundamental rights to privacy and data protection require the identifi-
ability of biometric data to be reduced and how a biometric system has to be designed
accordingly.
2 Opportunities and threats
New surveillance technologies provide the opportunity to prevent human failure due to
long term operations (e.g. “monitor-blindness”) in handling such systems. The gap be-
tween the occurrence of a threat, it’s recognition on the screen and the intervention of
police-forces can be shortened. On the one hand, this helps to avoid the risks of success-
ful crimes. On the other hand, damage can be minimized and the chances of intelligence
are improved.
Aside the great chances there are also risks. Primarily, there is a huge risk of violating
the individual’s right to informational self-determination. Due to the technologies a so
called “total surveillance” is possible. The data obtained by new technologies can be
matched with other reference data. Due to the growing amount of information and the
development of analysis technologies, every information becomes richer in content.
Biometric face recognition for examples allows automated identification of individuals
based only on pictures taken by normal cameras in real time. Movement and personality
profiles can be composed out of communication data, camera surveillance material – that
is obtained at nearly every important traffic interchange and a huge number of other
reference data sets. Even objects contain the information who handled them, e. g. when
sophisticated analysis technology is able to read the fingerprints on them.
Technology design is a great opportunity to challenge those risks. The old copyright
saying “the answer to the machine is in the machine” [Cl96] may not be the only way to
abolish those risks, but is a huge part of that way.
3 Legal Framework
For the purpose of this paper, German law is considered. Firstly the concerned constitu-
tional rights and secondly the sub-constitutional rights will be described.
260

3.1 General personality right (arts. 2 I i.c.w. 1 I GG)
The value and dignity of the person based on free self-determination as a member of a
free society is a focal point of the order established by the Basic Law (GG, Grundge-
setz). The general personality right as laid down in arts. 2 I i.c.w. 1 I GG serves to pro-
tect these values – apart from other more specific guarantees of freedom – and gains in
importance if one bears in mind modern developments with attendant dangers to human
personality [BV83] [Si84]. The general personality right is based on two fundamental
constitutional rights: the right to inviolable 'dignity' in art. 1 I 1 GG and the right to 'self-
development' enacted in art. 2 I GG. It contains amongst others the right to informational
self-determination.
3.2 Right to informational self-determination
This right is understood as the authority of the individual to decide themself, on the basis
of the idea of self-determination, when and within what limits information about their
private life should be communicated to others [BV83]. The German Constitutional Court
explicitly acknowledges that it is a prerequisite of free development of the personality
under modern conditions of data processing; the individual needs protection against
unlimited collection, storage and transmission of data relating to that individual [BV83].
However, the individual does not possess a right in a sense of an absolute mastery of
their rights though. Rather they are a personality dependant on communication develop-
ing within the social community [Si84]. Information, even if personality based, is a re-
flection of social reality and cannot be associated exclusively with the individual con-
cerned [BV83]. The tension between the individual and society has been decided by the
Basic Law in favour of the individual being community related and community bound
[BV83] [Si84].
Due to the principle of proportionality, deployment of a biometric system has to pursue a
legitimate and lawful purpose, while no other means shall be available, which are as
efficient as surveillance, but less intrusive. In particular, the danger for the right to in-
formational self-determination must be adequate to the purpose pursued. Hence, the
balancing here has one result: The bigger the danger for the involved rights, the more
they interfere with the right to informational self-determination. In contrary this means,
that the controller shall not deploy any intrusive methods, as long as there is no concrete
danger.
Due to the limitation, that the deployment of a biometric system must pursue a legitimate
purpose, all obtained data are bound to be processed only in compliance with this pur-
pose [Al05]. Further, the principles of “data avoidance” and “data frugality” according to
§ 3a of the German Federal Data Protection Act (BDSG) provide that data processing
systems be designed in a way that if possible (depending on the purpose and appropri-
ateness) data are collected that cannot identify persons, their processing is little and their
storage period is short [Ro11]. Removing identifiability may be pursued by means of
separation of informational powers [BV83] according to which personal data as well as
their processing must be split up so that control of data processing is limited according to
the purpose of that processing.
261

To reduce the identifiability of personal data obtained by the biometric system, the sys-
tem has to be designed in a way that all data are pseudonymized and protected against
unlawful access. Following the principle that personal data should only be obtained and
processed if necessary to pursue the legitimate purpose, those data should be impersonal
(e.g. aggregated or non-person related) as long as possible. When the pursued purpose is
fulfilled, those data shall be deleted or anonymized.
3.3 Are biometric data personally identifiable information?
The data protection principles apply if personal data are processed. Even for anonymous
or pseudonymous data, precautionary rules are necessary to safeguard that those data
stay anonymous or pseudonymous [Ro01]. It has been concluded that in biometric iden-
tification systems, biometric data are in general personal data [WP03] [Ho04]. Some
even consider the biometric characteristic, the bodily material as such personal data
[By10].
The definition of personal data needs to be interpreted in the light of the EU Data Protec-
tion Directive 95/46/EC (DPD) according to its art. 2 (a) i.c.w. Rec. 26 DPD. This defi-
nition has further been construed by the Art. 29 Working Party [WP07]. Pursuant to
art. 30 DPD, this body is responsible for contributing to the uniform application of na-
tional implementations of the DPD. Biometric data are data about biological predisposi-
tion such as fingerprints and behaviour such as gait. Both categories are “any informa-
tion”; indeed, they are a special data category because they are content information about
a certain person as well as an element for connecting information and that person
[WP07]. Biometric data derive from a “natural person” and are “relating to” [WP07] that
person because they describe a person’s health, ethnicity, etc., are used to treat suspects
different from non-suspects as well as their use affects the interests due to error rates,
insufficient distinction between data subjects [Po11], etc.
For assessing whether or not the person is “identifiable”, one has to consider all the
means likely reasonably to be used either by the controller or a third person. Criteria for
this test may be the “lifetime” [WP07] of the biometric system, extent of the investment
in the deployment of the biometric system, gravity of the possible interference, and exis-
tence of additional knowledge of the controller or third persons. The additional knowl-
edge does not have to be a person’s particulars; image and sound data are sufficient
[WP04]. Reference databases such as wanted lists and criminal records may be used for
the biometric comparison. Therefore, one may conclude that also systems for automated
capture of biometric characteristics and comparison with wanted lists or deviant behav-
iour that aim at tracking down criminals, process personally identifiable information.
Consistently, biometric systems have to be designed in a way that reduces identifiability
of biometric data.
262

4 Design Proposal: Three-Step-System
To fulfil the legal requirements a Three-Step-Model has been developed as a technical
and organisational design proposal [ ]. The proposed model is a way to meet the consti-
tutional and legal requirements of data protection law. Those are especially the principle
of proportionality and the principle, that all data should only be obtained and processed
for specific and lawful purpose. The Three-Step-Model is a legally optimized routine for
the operation of biometric surveillance systems. The main aim of the model is to reduce
the intensity of the impact on fundamental rights, particularly the right to informational
self-determination of a person monitored without any reason. Moreover, a scheme is
given to the controller of the system for support in complex situations and difficult deci-
sions to minimize any legal uncertainty.
The right to informational self-determination might be infringed by the acquisition, stor-
age, or processing of personal data [Al03]. Processing involves the analysis of the data
as well as their use for visual means (e.g. by displaying the monitored person on a visual
display unit).
Therefore, the intensity of the impact can be reduced either by not storing the obtained
raw data or by reducing the identifiability of a person as far as possible. As biometric
data are important evidence in criminal proceedings – on which operating companies
would most likely not relinquish – the Three-Step-Model makes use of the latter one.
According to the Three-Step-Model, intelligent biometric surveillance units should avoid
the identifiability of persons by the supervision personnel as much as possible. Hence,
the basic setting provides the biometric data only in composed form (pseudonymised),
e.g. pixelated on a visual display unit. The identifiability may only be restored stepwise
according to reasonable grounds for suspicion; this depends on the extent of suspicion
and the significance of the endangered legal asset as well as the degree of that endan-
germent. The identifiability of the observed person may only be restored to the degree
that is essential for the investigation (of a crime).
The Three-Step-Model can be adapted to every automated surveillance system which
supervises broad areas without any reason (such as airports or dangerous spots in rural
areas) for suspicious behaviour and possible suspects by biometric means. On the first
step the surveillance system monitors every person without any reason in the designated
area. The aggregated biometric data are provided only in composed (pseudonymised)
form to the supervision personnel. The identifiability of the monitored persons is not
necessary for the outcome of the first step. If a person may be considered suspicious,
they will be monitored selectively and if applicable classified (e.g. passenger of a flight).
Only if this closer look confirms the suspicion, the ciphering will be lifted and the identi-
fiability will be restored entirely.
263

4.1 Step 1: Observing Surveillance (depending on scenario, preferably broad collec-tion of biometric data)
The first step is the basic setting. The scene will be under observing surveillance and the
biometric data is broadly collected by special software.
As the system monitors without any reason, the personal data is pseudonymised. A vis-
ual display unit, for instance, could show the persons pixelated by point clouds or styl-
ised as stick figures. The pseudonymisation is the default setting and can only be abro-
gated in particular cases.
The transition to the next step occurs automatically, if an accordant situation is detected
by the software, or manually by the supervising personnel.
4.2 Step 2: Selective Monitoring
In the second step persons who give probable cause for suspicion because of their bio-
metric data (e.g. because of their behaviour) are being monitored selectively. This might
happen, for instance, by flagging the person concerned so that linked camera systems are
able to track their behaviour or their routes. The purpose of this is to identify any current
personal or collective danger.
As in step 1, the impact on the right to informational self-determination has to be re-
duced as much as possible. This is also ensured by pseudonymising the personal data.
Moreover, the pseudonymisation itself is reduced to the necessary need to identify the
legally relevant facts of a case. The biometric data that could identify a specific person
(e.g. special proportions or tattoos) should be garbled as much as possible.
The transition to the third step occurs automatically only as an exception where a non-
ambiguous situation occurs. As a matter of principle this step is taken manually by in-
structed supervision personnel.
4.3 Step 3: Identification (reconfiguration for preservation of evidence)
The third step conduces to the preservation of evidence. Therefore, the biometric data of
the monitored person is displayed in an identifiable way to the supervision personnel.
Hence, identification for the purpose of evidence is subsequently possible. A matching
with (search) data bases is not yet allowed. When a person is identified within this third
step, it can only be left to chance, for example where the identified person is linked with
additional knowledge of the supervision personnel.
5 Conclusion
Concerning the surveillance system which use biometric data without any reason the
Three-Step-Model is a necessary technical precaution to protect fundamental rights.
264

The complex process of balancing individual rights to informational self-determination
on the one hand and danger to individual or public rights on the other hand can be struc-
tured and simplified by using the Three-Step-Model. Providing three precisely defined
steps, describing a certain level of danger, the controller is utilizing different means,
which are adequate to the level of danger. For controllers with no legal schooling, it is
often difficult to decide in every situation, which kind of method is appropriate. The
intensity of the intervention to informational self-determination, the legitimate purpose
and further factors like the location of the systems are part of this balancing. For a lawful
system deployment it is crucial to keep the intrusion to informational self-determination
as little as possible. When a certain step of danger is reached, the controller progresses to
a more sophisticated and more intrusive method.
The scenario at the beginning shows the feasibility of the Three-Step-System. Without it,
personally identifiable information of the passenger would have been collected from the
beginning. By implementing it, the identifiability of personal data is generally reduced.
Bibliography
[Al03] Albrecht, A.: Biometrische Verfahren im Spannungsfeld von Authentizität im
elektronischen Rechtsverkehr und Persönlichkeitsschutz, Nomos, Baden-Baden
2003.
[Al05] Albers, M.: Informationelle Selbstbestimmung, Nomos, Baden-Baden 2005.
[BK07] Bundeskriminalamt (BKA): final report „Fotofahndung“, http://www.bka.de/
kriminalwissenschaften/fotofahndung/pdf/fotofahndung_final_report.pdf.
[BN08] Busch, C.; Nouak, A.: 3-D Face Recognition for Unattended Access Control,
Datenschutz und Datensicherheit (DuD) 2008, 393.
[BV83] Bundesverfassungsgericht: BVerfGE 65, 1.
[By10] Bygrave, L.A.: The Body as Data? Biobank Regulation via the ‘Back Door’ of
Data Protection Law, Law, Innovation & Technology 2010, 1.
[Cl96] Clark, C.: The Answer to the Machine is in the Machine, in: Hugenholtz, P. B.
(ed.): The Future of Copyright in the Digital Environment, The Hague 1996.
[DM04] Daugman, J.; Malhas, I.: Iris Recognition border-crossing System in the UAE,
International Airport Review 2004 (2), 49.
[ED07] Commission Drafts on Eurodac, 9/2009 & 10/2010; EU Council Conclusions
11004/07, 12.6.2007; EC Reg 2725/2000/EC, OJ EU 15.12.2000 L 316.
[Hi11] Hildebrandt, M.; Dittmann, J.; Pocs, M.; Ulrich, M.; Merkel, R.; Fries, T.: Pri-
vacy preserving challenges: New Design Aspects for Latent Fingerprint Detec-
265

tion Systems with contact-less Sensors for Preventive Applications in Airport
Luggage Handling, in: Vielhauer, C. et al. (Eds): BioID 2011, LNCS 6583, 286,
Springer-Verlag Berlin, 2011.
[Ho04] Hornung, G.: Der Personenbezug biometrischer Daten, Datenschutz und Daten-
sicherheit (DuD) 2004, 429.
[Ho10] Hornung, G.; Desoi, M.; Pocs, M.: Biometric systems in future preventive Sce-
narios – Legal Issues and Challenges, in: Brömme, A.; Busch, C.: Conference
Proceedings BIOSIG 2010, 83.
[HD11] Hornung, G.; Desoi, M.: "Smart Cameras" und automatische Verhaltensanalyse.
Verfassungs- und datenschutzrechtliche Probleme der nächsten Generation der
Videoüberwachung, Kommunikation & Recht 2011, 153.
[PC05] Prüm Convention, EU Council Doc. 10900/05; EU Council Decisions
2008/615/JHA and 2008/616/JHA, OJ EU L 210, pp. 1 and 12; 2010/482/EU,
OJ EU L 238, p. 1.
[Po11] Pocs, M.: Gestaltung von Fahndungsdateien – Verfassungsverträglichkeit bio-
metrischer Systeme, Datenschutz und Datensicherheit (DuD) 2011, 163.
[Ro01] Roßnagel, A.; Pfitzmann, A.; Garstka, H.: Modernisierung des Datenschutz-
rechts, Study for German Ministry of the Interior, Berlin 2001, pp. 107f.
[Ro11] Roßnagel, A.: Das Gebot der Datenvermeidung und –sparsamkeit als Ansatz
wirksamen technikbarsierten Persönlichkeitsrechtsschutzes?, in: Eifert, M.;
Hoffmann-Riem, W.: Innovation, Recht und öffentliche Kommunikation, Berlin
2011, 41.
[Si84] Simitis, S.: Die informationelle Selbstbestimmung – Grundbedingung einer
verfassungskonformen Informationsordnung, Neue Juristische Wochenschrift
(NJW) 1984, 398.
[WP03] Article 29 Data Protection Working Party: Working document on biometrics
(WP 80), Brussels 2003.
[WP07] Article 29 Data Protection Working Party: Opinion on the Concept of Personal
Data (WP 136), Brussels 2007.
[WP09] Article 29 Data Protection Working Party: The Future of Privacy: Joint contri-
bution to the Consultation of the European Commission on the legal framework
for the fundamental right to protection of personal data (WP 168), Brussels
2009.
266

Towards a Biometric Random Number Generator – A
General Approach For True Random Extraction From
Biometric Samples
Daniel Hartung
Knut Wold
Kalman Graffi
Slobodan Petrovic
Abstract: Biometric systems are per definition used to identify individuals or verify anidentity claim – one difficulty of getting reliable decisions is the inherent noise that makesit difficult to extract stable features from biometric data. This paper describes how bio-metric samples can be used to generate strong random numbers which form the basis ofmany security protocols. Independent from the biometric modality, the only requirementof the proposed solution are feature vectors of fixed length and structure. Each element ofsuch a feature vector is analyzed for its reliability – only unreliable positions, that cannotbe reproduced coherently from one source, are extracted as bits to form the final randombit sequences. Optionally a strong hash-based random extraction can be used. The prac-ticability is shown testing vascular patterns against the NIST-recommended test suite forrandom number generators.
1 INTRODUCTION
One observation with biometric systems is that they deal with noisy physiological or behav-
ioral data. Another observation is that the extraction of reliable features, which allows to dis-
criminate between imposter and genuine attempts, is usually a non-trivial and difficult task.
Both observations contribute to the motivation of this work. The common strategy in a bio-
metric system is to extract a compact representation that includes only the most stable, reliable
and distinctive information from the raw sensorial data.
On the other hand cryptographic protocols are used more and more widely in nowadays every-
day applications as e.g. authentication in online banking. One major building block of those
protocols is the proof of freshness. Such a proof is usually done by inserting a cryptographic
nonce – a freshly generated random number that is only used once – in a message, which
makes a simple message replay detectable. Such random numbers have to be unpredictable
for an attacker in order to not compromise the whole protocol. Therefore strong random
number generators are needed. The sources of true randomness are often physical processes
while randomness from deterministic and highly non-chaotic systems like computers is often
very limited. One example of a security protocol using a biometric transaction authentication
with the need for strong random numbers for enrollment is the BTAP [HB10, HB11].
In this paper, we present and evaluate the idea to use physical, biometric data to generate
strong random numbers. This paper investigates how to combine biometric feature extraction
267

and random number generation , how to generate the random numbers and how to verify the
claimed randomness properties. Simulation results are presented before the paper concludes.
1.1 Noise and Biometrics
Noise is inherently existent in biometric data – data from alive individuals. The term biometric
noise is not yet clearly defined and it is often used to describe the variability in the signals due
to changes in the biometric (e.g. dirty or torn off finger tips in fingerprint systems, different
hair style in face recognition systems), inaccuracies of the sensorial subsystem (e.g. camera
noise, dust on fingerprint sensor, pose towards camera), or varying environmental conditions
(e.g. lighting, humidity). Here, we use these variations and the noise to generate random
sequences.
1.2 Vein Patterns
Vein patterns evolve during the embryonic vasculogenesis and their final structure is mostly
influenced by random factors [EYM+05]. Even identical twins can be distinguished. The
pattern is available at every healthy human, making it an interesting research objective. Com-
mercial applications evolved out of this research, nowadays many ATMs in Japan and Brazil
are secured using this biometric modality. The patterns are commonly extracted from images
of the palm, the back of the hand or fingers. The International Biometrics Group (IBG) 6th
report 2006 confirms recognition rates fairly at the same level for two different vein and one
iris-based authentication system [Int06]. An interesting aspect of vein recognition is the fact
that the information is not visible, it is hidden inside the body. Unlike fingerprints it is not
possible to leave a vein pattern representation unintentionally in public places and thus it is
not possible for an attacker to acquire the pattern in daily life or to replicate it. Furthermore
there is no relation to criminal prosecution.
The imaging approach makes use of the absorption capacity of particular substances in the
blood running through the veins. To capture the image, the region of interest is illuminated
with a near-infrared (NIR) light source with wavelengths around 700 to 1,000 nm. A reflection
or transmission technique can be used. Deoxygenized hemoglobin highly absorbs rays within
this wavelength band while the surrounding tissue does not. NIR-sensitive optical sensors are
used to capture the image of the vein pattern.
1.2.1 Feature Extraction Examples
The following images will be used during later stages of the random extraction: figure 1(a)
shows an example vein pattern image and a STRESS [Øyv11] contrast enhanced version in
Fig. 1(b), its segmented version in Fig. 1(c) produced using a local thresholding algorithm.
The image is then transformed to a skeleton representing the topology of the vein pattern (Fig.
1(d)) by using morphological operators. The database consists of 10800 finger vein images
from all 10 fingers of 45 data subjects acquired in 12 sessions, each image having a size of
268

111× 401 pixels. Throughout the paper only the left middle fingers will be considered.
(a) Raw, cropped vein image IRaw . (b) Contrast enhanced image IOpt.
(c) Segmentation of a vein pattern image ISeg . (d) Skeletonization of segmented image ISkl.
Figure 1: A sample finger vein image and its representations within the pipeline. Note: an unstablesegmentation and skeletonization method was chosen.
2 BIOMETRIC RANDOM NUMBER GENERATOR
2.1 Random Number Generation
Random numbers have various important applications in computer science, from computer
simulations, statistical sampling to cryptology. This section will describe some properties of
randomness and the general classification into two distinctive classes: True random number
generators (TRNG) are based on measurements of physical processes that are expected to be
random like coin flipping, chemical processes including radioactive decay and atmospheric
radio noise or processes based on quantum mechanics. Pseudo random number generators
(PRNG) are based on deterministic computations where the output is predictable, but initial-
ized with a true random seed or key makes the PRNG output difficult to predict.
In order to verify the before mentioned and additional properties, statistical tests can be per-
formed on random numbers. The NIST suite “A Statistical Test Suite for Random and Pseudo
random Number Generators for Cryptographic Applications” based on [And] is a complete
and commonly used test suite. It will be the basis for the evaluation of the generated random
numbers in section 3.
2.2 State of the Art
Very limited work has yet been done on the field of biometric random generation. During
the literature search only a hand full of papers was focusing on biometric random number
generation. Often the terms were used incorrectly, in [CRNF06], the title indicated a ran-
dom key generation from iris data, instead the extraction of non-random keys from the same
biometric trait was discussed, related to a biometric key release or extraction. The research
work in [KvM07] was focusing on the sources of randomness in mobile devices, focusing on
269

Source Entropy (bits)
IRaw 25165
IOpt 26930
ISeg 19211
ISkl 8003
Table 1: Entropy estimation for the different stages of the pipeline.
hardware sensorial noise from the camera or the microphone, not considering the use of the
built-in sensors as sensors for biometric traits like voice or face recognition.
The work in [SWA+04], was closest to the scope of this paper. In there, the use of biometric
data in the medical sense – in example animal neurophysical brain responses and human
galvanic skin responses – were examined as sources of randomness. An approach was used,
where physical measurement data was binarized and the last fluctuating digit was used as
random bit sequence over time. Their true random generator passed successfully the NIST
test suite as well as other statistical tests, whereas the brain signals come along with complex
data measurement and the skin response did not show a sufficiently fast sampling rate.
Basis for the verification of the approach presented in this paper is a subsection of the database
described in section 1.2.1.
2.3 Entropy Estimation
Entropy is an important measure in random number generators to estimate the quality of ran-
domness. The amount of information – or entropy – H, that can be extracted from K oc-
currences, each having the probability pi with i = 1, 2, ...,K can be computed using the
Shannon-Entropy:
H = −K∑i=1
pi · log2(pi), (1)
In practice the probabilities are not known, the concept of the maximum-likelihood estimator
pi, that estimates the probabilities by using absolute frequencies ni over N observations, can
help out. Where occurrence i is approximated with: pi = ni/N . The resulting formula is
given by:
H = −K∑i=1
pi · log2(pi) (2)
The entropy is estimated for our test database, the average entropy of the skeletal vein images
is given in Table 1, not considering the correlation between the single pixels. That means
according to the estimator theoretically about that many bits of information can be extracted
in average from one vein pattern image. A more refined estimation for the biometric entropy
in finger vein images is currently under development and will be published soon.
270

2.4 Image Based Biometric Random Number Generation (BRNG)
Having discussed the motivation and requirements for a biometric random number generator,
next, we present our approach for a BRNG. Data from different stages of a biometric pipeline
are used as input to the proposed BRNG. The generic approach only requires a fixed length
and a fixed structure of the feature vector. Here we will use images from the vein patterns,
every other kind of features would also work. In order to find the most appropriate stage of
the feature vector, first the raw image itself (IRaw), followed by an enhanced and contrast
optimized image is taken into account (IOpt). After that the segmented and binarized repre-
sentation (ISeg) is considered as well as the skeletonized version (ISkl).
The idea is that lower level features (in earlier stages of the pipeline) yield higher degrees
of noise e.g. from the sensor, and recent work shows that using the Photo-Response Non-
Uniformity (PRNU) of sample images the imaging sensors can be distinguished [FFG08]. The
randomness in higher level features is more and more based on the biometric information since
unnecessary information is being removed during the preprocessing steps. One assumption is
that these features have a better statistical quality and are more difficult to predict even though
the amount of information in the images is reduced. The hypothesis that is tested later on:
low level features produce lower quality random sequences than higher level features.
All real-valued feature vectors or images can be binarized using the interclass mean image
(I) of a training set (one / two dimensional case). One advantage of the binarization is that
the amount of ones and zeros is approximately equal. The bit value IBin(x, y) of every pixel
I(x, y) at position (x,y) in the source image I is computed as:
IBin(x, y) =
0, if I(x, y) < I(x, y)
1, if I(x, y) ≥ I(x, y)
(3)
Note the feature vector F is derived as concatenation from the image I’s columns:
F = [I(1, 1), I(2, 1), . . . , I(end, 1), I(1, 2), I(2, 2), . . . , I(end, 2), . . . , I(end, end)] (4)
The binarized feature vector FBin is derived from IBin in the same way.
During the next step of the BRNG, every position in the feature vector F – which is defined
in Equation 4 – is analyzed for its reliability, meaning that single positions can be reproduced
very accurately over many captures. The idea is based on work from Tuyls et al. [TG04],
where the helper data scheme (HDS) is introduced that combines cryptography with biomet-
rics to secure the privacy and the templates. Following this approach we could use the same
mechanism used there to estimate the reliability of positions in the feature vector to estimate
the inverse, the least reliable positions, and to use those bits for our random sequence. Using
the inverse measure, we can select positions that are not reproduced accurately over many cap-
tures and that are being close to the mean value used for the binarization, resulting in random
and flipping bits.
ReliabilityR(i) (data subject specific) on position i of a fixed length and structured real-valued
feature vector F , in the context of the HDS is estimated using the fraction of the inter-class
271

varinter and the intra-class varintra variance:
R(i) =varintervarintra
=(F (i)− inter(i))2
(F (i)− intra(i))2, (5)
using the mean value of the class intra (calculated from a fixed number of samples of the
same biometric trait – called training set) and the mean value of the whole population inter(mean of all training sets together).
Here we introduce the unreliability measure:
U(i) =1
R(i). (6)
Border zones in the image that are always set to zero or one are resulting in high values for U ,
since they are very close to the inter class mean. Those positions are not interesting for the bit
extraction since they are constant over the samples and occur in blocks, therefore U(i) is set
to zero for those positions.
In order to make an extraction of bits more efficient the indexing vector Uidx contains the
indexes i sorted in descending order of U(i).
A variable κ < |F | is introduced to define the amount of unreliable bits that are to be extracted
from and used for the random sequence Δ:
Δ = [F (Uidx(1), F (Uidx(2)), . . . , F (Uidx(κ))], (7)
A further degree of freedom is given when using the help of a hash function h as a random
extractor. Depending on the needed length of the random bit vector and the quality of random-
ness a variable λ is introduced splitting the random sequence Δ into k chunks Ci of length
⌊κ/λ⌋. If λ is set to one, the whole sequence is used as input to a hash function, the larger it
gets, the more chunks are created. Each chunk itself can be used to create a new hashvalue
h(Ci). The length of each chunk Ci should be larger or equal to the output length of the hash
function.
Δh = [h(C1), h(C2), . . . , h(Ck)]. (8)
The final sequences Δ and Δh are xor-ed with its inverse order version to enhance the distri-
bution of biased features, since mainly positions containing logical zeros are selected as most
unreliable bits.
3 SIMULATIONS
The simulations cover the statistical test of NIST based on the data that was extracted as
described in section 2.1. The database was divided into two distinct sets each containing 540
samples – 12 samples from 6 sessions of each of middle left finger of 45 data subjects: the
odd numbered sessions are taking as training set and the even numbered ones for verification.
272

Source κ λ Length Bitstream # Bitstreams Result
IRaw 25165 x 135000 100 5.6%
IRaw 25165 157 135000 100 87.9%
IRaw 25165 78 67000 100 93.4%
IOpt 26930 x 145000 100 69.3%
IOpt 26930 168 145000 100 98.2%
IOpt 26930 84 72000 100 98.2%
ISeg 19211 x 100000 100 66.9%
ISeg 19211 120 100000 100 98.1%
ISeg 19211 60 50000 100 97.2%
ISkl 8003 x 43000 100 1.4%
ISkl 8003 50 43000 100 95.3%
ISkl 8003 25 21000 100 97.9%
Table 2: Experimental results of NIST test suite (standard parameters) applied to the random sequencesextracted from the vein database. Hash function used: SHA-1. x = no hashing. Result: ratio of howmany of the NIST tests successfully passed.
In order to run the NIST test suite several Mbit of data are needed, therefore the resulting
random sequences will be concatenated and presented to the test suite. The maximal amount
of unreliable bits κ extracted from the various samples is set to the estimated entropy value
from table 1.
3.1 NIST Results
The unreliable bits from the raw images are not qualified for the random extraction, but after a
strong random extraction using a hash function very good NIST test results are achieved. With
more than 95% of successfully passed tests, hashed unreliable bits from higher level features
(IOpt, ISeg and ISkl) are especially qualified. The amount of successfully passed tests is
peaking with more than 98% for the hashed unreliable bits extracted from the optimized or
segmented images (see table 2). Lower values for λ, resulting in bigger chunks as input for
the hash function, are not effective to improve the random properties for higher level features.
4 CONCLUSIONS AND FUTURE WORKS
The results are quite diverse – on the one hand the pure unhashed versions of the data are not
useful as a basis for BRNG, as they pass only a minor amount of the tests . On the other hand,
good randomness properties are seen in case of the hashed version of all images, in particular
higher level images.
273

The hypothesis cannot be verified; the quality of the random sequence extracted, measured
in successful runs over the NIST test suite, is increasing from the raw level to the more ab-
stract ones (IRaw, IOpt, ISeg), but the skeletonized features pass only few of the NIST test if
unhashed. The influence of hashing on passing the NIST test is too large to claim the hypoth-
esis that abstract biometric information offers a higher entropy and thus better randomness
characteristics.
Future works will focus on an improved quality of random bits generated from one biometric
sample and on the statistical properties. In addition future research will focus on a more
sophisticated model for the biometric finger vein entropy estimation which may lead to quality
metric for single samples as well as for capturing devices and feature extraction algorithms.
References
[And] Andrew Rukhin, Juan Soto, James Nechvatal, Miles Smid, Elaine Barker, Stefan Leigh,Mark Levenson, Mark Vangel, David Banks, Alan Heckert, James Dray, San Vo. NationalInstitute for Standards and Technology, NIST Special Publication 800-22 Revision 1a. Re-vised: April 2010,.
[CRNF06] Luis Castanon, MariCarmen Reigosa, and Juan Nolazco-Flores. Biometric-Iris RandomKey Generator Using Generalized Regression Neural Networks. In Moonis Ali and RichardDapoigny, editors, Advances in Applied Artificial Intelligence, volume 4031 of LectureNotes in Computer Science, pages 530–539. Springer Berlin / Heidelberg, 2006.
[EYM+05] Anne Eichmann, Li Yuan, Delphine Moyon, Ferdinand Lenoble, Luc Pardanaud, and Chin-stiane Breant. Vascular Development: From Precursor Cells to Branched Arterial and Ve-nous Networks. International Journal of Developmental Biology, 49:259–267, 2005.
[FFG08] Tomas Filler, Jessica J. Fridrich, and Miroslav Goljan. Using sensor pattern noise for cam-era model identification. In ICIP, pages 1296–1299, 2008.
[HB10] Daniel Hartung and Christoph Busch. Biometric Transaction Authentication Protocol.Emerging Security Information, Systems, and Technologies, The International Conferenceon, 0:207–215, 2010.
[HB11] Daniel Hartung and Christoph Busch. Biometric Transaction Authentication Protocol: For-mal Model Verification and ”Four-Eyes” Principle Extension. In Financial Crypto, 2ndWorkshop on Real-Life Cryptographic Protocols and Standardization, 2011.
[Int06] International Biometrics Group (IBG). Comparative Biometric Testing Round 6 PublicReport, Sep 2006.
[KvM07] Jan KRHOVJAK, Petr SVENDA, and Vaclav MATYAS. The Sources of Randomnessin Mobile Devices. In Proceeding of the 12th Nordic Workshop on Secure IT Systems,Reykjavik, pages 73–84, 2007.
[SWA+04] J. Szczepanski, E. Wajnryb, J. M. Amigo, Maria V. Sanchez-Vives, and M. Slater. Biometricrandom number generators. Computers & Security, 23(1):77 – 84, 2004.
[TG04] Pim Tuyls and Jasper Goseling. Capacity and Examples of Template-Protecting BiometricAuthentication Systems. In Biometric Authentication, volume 3087 of Lecture Notes inComputer Science, pages 158–170. Springer Berlin / Heidelberg, 2004.
[Øyv11] Øyvind Kolas, Ivar Farup, Alessandro Rizzi. STRESS: A new spatial colour algorithm.Journal of Imaging Science and Technology (in press), 2011.
274

Ohr-Erkennung – Stand der Technik
Andreas Nautsch
Hochschule Darmstadt – Fachbereich Informatik
Abstract: Das Ohr bietet viele Möglichkeiten für die Extraktion biometrischer Merk-male. Hierbei haben sich in den letzten Jahrzehnten sehr viele Ansätze für die 2D-Erkennung ergeben, in den letzten Jahren wurden auch 3D-Verfahren für die Ohr-Erkennung entwickelt. Akustische Methoden basieren auf den verschiedenen Aus-prägungen des Innenohres, dabei wird ein akustisches Signal wie Musik ausgestrahltund die Reflexion der Schallwellen aufgezeichnet. Dieser Beitrag gibt einen Überblicküber verschiedene Verfahren der Ohr-Erkennung, zeigt den aktuellen Stand der Tech-nik, sowie Probleme der Ohr-Erkennung.
1 Einleitung
Biometrische Systeme lösen mehr und mehr unkomfortablere Identifikations- und Veri-
fikations-Varianten wie Passwörter oder RFID-Karten ab. Diese Systeme nutzen biome-
trische Charakteristika, um verschiedene Individuen voneinander zu unterscheiden. Zu
den bekanntesten Methoden zählen unter anderem der Fingerabdruck, die DNA, das Ge-
sicht, die Iris, die Signatur oder die Stimme. In den letzten Jahren wurden auch andere
biometrische Charakteristika Ziel der Forschung wie die Hand-Venen-, Gang- oder Ohr-
Erkennung.
Abbildung 1: links: Ohr Anatomie: 1. Helix Rim, 2. Lobule, 3. Antihelix, 4. Concha, 5. Targus, 6.Antitargus, 7. Crus Helix, 8. Triangular Fossa, 9. Incisura Intertragica; rechts: Iannarelli System mitzwölf Abmessungen (Quelle: [Mid09])
Das menschliche Ohr ist aufgrund seiner Anatomie (Abb. 1) bei jedem Menschen einzig-
artig. Imhofer konnte 1906 anhand von vier Merkmalen 500 Ohren von einander unter-
scheiden. Alfred Iannarelli sammelte von 1949 bis 1989 über 10.000 Bilder von Ohren. In
seiner ersten Studie erstellte er das Iannarelli System (Abb. 1), welches mittels zwölf Ab-
messungen ein Ohr beschreibt. In seiner zweiten Studie betrachtete er ein- und zweieiige
275

Zwillinge mit dem Ergebnis, dass diese zwar ähnliche aber dennoch verschiedene Ohren
haben.
Mit dem Verlauf der Zeit verändert sich das Ohr durch Wachstum, Verletzungen und Al-
terungen. Des Weiteren sind Ohren nicht immer symmetrisch (siehe Abb. 2), daher kann
man nicht das rechte Ohr eines Menschen mit dessen linken vergleichen.
Abbildung 2: Beispiel asymmetrischer Ohren (Quelle: [YB07])
Ohrabdrücke wurden als Beweismittel vor Gericht verwendet. Dies geschah im US-
Bundesstaat Washington und in England ([MHH99], [Bam01]). In den Niederlanden hin-
gegen befand 2000 ein Gericht in einem Tankstellenüberfall-Prozess, dass Ohrabdrücke
nicht vor Gericht als Beweismittel zugelassen sind, da die Ohren nicht genügend De-
tails böten für eine aussagekräftige Identifikation. Das forensische Institut dieses Gerichts
arbeitete mit Video-Aufnahmen der Tankstelle und einer entsprechend schlechten VHS-
Bildqualität ([Moe00]).
2 Ohr-Detektion
Die Detektion eines Ohres ist eine wesentliche Voraussetzung für die spätere Erkennung.
Dieses Kapitel soll einen kurzen Überblick darüber geben.
He et al. [HST00] verwendeten ein Radial Basis Function Network (RBFN). Sie vermute-
ten die Stelle des Ohres dort, wo ein Mapping Surface die meisten Erhebungen aufweist.
Um die entsprechenden Faltungen zu ermitteln, wurde eine Laplace-Maske verwendet.
Bei 600 Samples von 100 Subjekten wurden alle Ohr-Regionen korrekt erkannt (keine
Verdeckung, kein Ohrschmuck).
Choras et al. [Cho05] nutzten die verschiedenen Beleuchtungssituationen in einem Ohr
aus, so dass es bestimmte Schwellwerte für den Mittelwert und die Standardabweichung
der Differenz zwischen Maximum und Minimum der Intensität innerhalb einer Region
gibt. Nach diesem Verfahren konnten 240 Bilder trotz Teilverdeckung und Ohrschmuck
korrekt extrahiert werden.
Mittels dem Adaptive Boosting Verfahren (AdaBoost), einem maschinell lernenden Al-
gorithmus, der die Unterschiede benachbarter Regionen untersucht, erzielten Islam et al.
[IBD08] eine Detektionsrate von 99,9% bei 830 Bildern.
Cummings et al. [CNC10] stellten ein Verfahren vor, dass mit Ray-Tracing arbeitet. Die-
ses versucht mittels Ray-Transformationen die Helix zu detektieren, darüber das Ohr zu
lokalisieren und normalisiert zu extrahieren. Abb. 3 zeigt vereinfacht die Verfahrensschrit-
te des Prozesses. In einem Versuch mit 252 Bildern von 63 Test-Personen wurden 99, 6%
276

Abbildung 3: links: Beispiel für die Extraktion eines Ohres mittels Ray-Transformation; rechts: Fehl-geschlagener Extraktionsversuch (Quelle: [CNC10])
der Ohren korrekt extrahiert und 98, 4% korrekt normalisiert.
Yan und Bowyer [YB07] detektierten zuerst die Nasenspitze, von dieser ausgehend wur-
de in ±30◦ innerhalb eines 20cm Radius die Concha bzw. das Ohrloch gesucht. Voran-
gestellt sorgte eine Haut-Erkennung dafür, dass Haare und Kleidung von dem weiteren
Extraktionsprozess ausgeschlossen wurden. Das Ohrloch wurde mit Gauß-Glättung und
Kurvenschätzung bestimmt. Mit diesem wurde ein Active Contour Growing Algorithmus
initialisiert, der Kontur der äußeren Helix sukzessiv ermitteln soll. Er endet sobald die Ohr-
kontur sich stabilisiert. Durch das Nutzen von Farb- und Tiefeninformationen konnte eine
100%-ige Akkuratheit erreicht werden. Jedoch schlägt dieser Algorithmus fehl, sobald die
Nasenspitze oder das Ohrloch verdeckt sind.
3 Ohr-Erkennung
3.1 2D-Verfahren
In diesem Kapitel werden mehrere Verfahren vorgestellt, die mit geometrischen Ansätzen,
genetischen Algorithmen, neuralen Netzen und Bild-Transformationen arbeiten.
Yuizono et al. führten ein Experiment mit 110 Test-Personen und 660 Bildern durch. Für
den genetischen Algorithmus (GA) erstellten sie eine Galerie, die mehrere Bilder zu einem
neuen Bild verband und normalisierte. Diese Galerie enthielt 10x5 Bilder. Jedes Chromo-
som des GA bestand aus 21 Bits: elf repräsentierten das linke Ende des Ohren-Bildes und
zehn das obere Ende. Für jede Generation wurde eine Mutation derart vorgenommen, dass
die Pixel horizontal um ±6 und vertikal um ±10 verändert wurden. Die Test-Galerie be-
stand aus 50 Bildern von Test-Personen der GA-Galerie und 30 Bildern von untrainierten
Test-Personen. Bei 39 Generationen und 800 Chromosomen wurde eine Rang-1 Erken-
nungsrate von 100% erreicht ([Mid09]).
Gutiérrez et al. [GML10] erstellten ein modulares neurales Netzwerk (MNN) mit 77 Test-
Personen, von denen jeweils vier Bilder mit Licht- und Haltungsveränderung aufgenom-
men wurden. Die Bilder wurden als Wavelet gespeichert (nur mit den größten Koeffizi-
enten). Es wurden drei Module mit je drei Untermodulen erstellt für den oberen (Helix),
277

mittleren (Concha) und unteren (Lobule) Part eines Ohres. Dabei wurde ein Erkennungs-
rate von 97.42% erzielt.
Choras [Cho06] entwarf mehrere geometrische Verfahren. Hier werden die Triangle Ratio
Method (TRM) und die Shape Ratio Method (SRM) kurz vorgestellt. TRM verwendet
eine Kantenerkennung und setzt vier Punkte (A, B, C, D). Die Strecke BD stellt dabei
die längste Kurve dar, die Punkte A und C liegen am weitesten von dieser entfernt. Dabei
füllen die Dreiecke ΔABD und ΔBCD den Merkmalsvektor mit Informationen über
die einzelnen Seitenlängen und die Höhe des jeweiligen Dreiecks. SRM betrachtet das
Verhältnis der Kurvenlänge zum Abstand der beiden Kurven-Endpunkte. Ein hybrider Test
von TRM und SRM mit 80 Test-Personen, je zehn Bildern und einer Test-Galerie von 104
Bildern ergab eine Rang-1 Erkennungsrate von 100% ([Mid09]).
Xie et al. [XM08] untersuchten den Locally Linear Embedding Algorithmus (LLE). LLE
hat zum Ziel, einen hochdimensionalen Input auf eine niederdimensionale Informations-
menge zu reduzieren, die sich dann in einem System darstellen lässt. Der Input wird als
ein Vektor {X1, X2, · · · , XD} der DimensionD angenommen, der Output soll ein Vektor
{Y1, Y2, · · · , Yd} mit der Dimension d sein (mit d << D). Der Algorithmus besteht aus
drei Schritten. Im ersten werden die k Nachbarn eines jeden Inputs Xi ermittelt. Dann
werden die linearen Gewichtungen Wij berechnet, aus denen am besten anhand der Nach-
barn das jeweilige Xi rekonstruiert werden kann. Im dritten Schritt werden anhand der
Gewichtungen Wij die Input-Daten in ein niederdimensionales System eingebettet. Ein
Output Yi wird entsprechend so gewählt, dass die Kosten der Einbettungsfunktion mög-
lichst gering sind. Die verwendeten Test-Daten beinhalten Bilder von 79 Test-Personen
mit je 19 verschiedenen Posen (insgesamt 1501 Bilder, Drehungen um je 5◦). Die Trai-
ningsmenge besteht aus je einem Bild einer Person (ohne Pose), der Wert von k beträgt
12. Es wurde eine Erkennungsrate von 98,8% erreicht (geringe Rotation).
Cervantes et al. [CSL+05] beschrieben eine Variante, die auf einer Kantendetektion mit
dem Canny-Operator aufbaut. Nach der Kantenerkennung wird das Bild mit verschiedenen
Shapes bearbeitet, sodass man „Zd Density Zoning Features“, „Zα Angle Zoning Featu-
res“, „C Contour Axis Crossings“ und eine „E Elongination (Major Minor Axis Ratio)“
erhält (Abb. 4a). Zd lässt sich über die „Zoning Mask“ (Abb. 4b) ermitteln. Der Merk-
Abbildung 4: a: Ohr Achsen; b: Zoning Mask (zwölf Sektoren je 30◦ in sechs konzentrischen Krei-
sen); c: Contour-Axes-Crossings (Quelle: [CSL+05])
malswert wird anhand des Verhältnisses der Pixel in den Sektoren zu allen Pixeln im Bild
normalisiert. Zα ist der durchschnittliche Winkel der Kanteneckpunkte jedes Sektors. Das
MerkmalC ergibt sich wie in Abb. 4c anhand des Abstandes der einzelnen Punkte zum Ur-
sprung der Shape-Linien. Es wurde mit einem Datensatz von 14 Test-Personen und je zehn
278

Bildern eine experimentelle Untersuchung verschiedener Deskriptoren und verschiedener
nächster Nachbarklassen (NClass) durchgeführt. Bei 1-NClass wurde eine Erkennungsrate
von über 85% erzielt, bei 2-NClass 97% und bei 3-NClass 99%.
Hurley et al. [Hur01], [HNC05] haben eine invertierbare lineare Transformation entwi-
ckelt, die das Bild eines Ohres in ein Kraftfeld (Force Field) umwandelt. Der Ausgangs-
punkt eines solchen Verfahrens ist, dass einzelne Pixel zu einander eine Anziehungskraft
haben, die sich proportional zu ihrer Intensität und antiproportional zu dem Quadrat der
Entfernung verhält. Das Kraftfeld F kann mit
F (rj =N−1∑i=0
(P (ri
ri − rj
|ri − rj |3)
)∀i ?= j, 0∀i = j
berechnet werden, P (r) steht hier für den Pixel. Diesem Kraftfeld liegt ein Energiefeld
zu Grunde. Die Spitzen des Energiefeldes stellen sog. „Wells“ dar, von denen Kanäle sog.
„Ridges“ ausgehen. Zwischenergebnisse des Verfahrens werden in Abb. 5 grob dargestellt.
Die FFT gilt als invers und ohne Informationsverlust, da die Transformationen des Bildes
Abbildung 5: von links nach rechts: Original Bild; Energiefeld des Bildes; „Force Field“ mit Wellsund Channels; Grenzwert Karte; Grenzwert Karte mit Feldlinien; „Force Direction Field“ des Aus-schnittes (Quellen: [Hur01], [HNC05], [HAZN08])
in ein Kraft- oder Energiefeld als eine lineare Matrizen-Gleichung der Art Ax = b auf-
gefasst werden kann. Es besteht die Annahme, hier ein sehr gutes biometrisches Merkmal
extrahieren zu können. Das Energiefeld eines MxN Pixel großen Ausgangsbildes kann
sehr effizient und speicherfreundlich mit einer Faltung der Fast Fourier Transformation
aus dem Potential und dem Bild berechnet werden. Um eine allgemeine Beschreibung der
Channels und Wells zu erhalten, wird eine Grenzwert-Karte aus dem Kraftfeld ermittelt.
Die Merkmal-Extrahierung erfolgt durch die Binarisierung der Grenzwert-Karte. Die Er-
kennungsrate in Tests mit 252 Bildern liegt bei 99, 2%.
3.2 3D-Verfahren
Für die 3D-Ohr-Erkennung reichte Geng 2006 ein sehr allgemein verfasstes Patent ein
[Gen06], ohne genauer auf Algorithmen und Methoden der Erkennungs- und Speiche-
rungsprozesse einzugehen. In diesem Kapitel werden zwei Verfahren zur 3D-Ohr-Erken-
nung vorgestellt.
279

Iterative Closest Point (ICP) arbeitet mit einer 3D-Modellaufnahme des Ohres der Test-
Person. In dem 3D-Modell und der 3D-Testaufnahme sind die Ohrlöcher die initialen
Punkte des Algorithmus. Es wird eine starre Transformation von den Aufnahmepunkten zu
den Modellpunkten gesucht, sodass diese einen möglichst kleinen mittleren quadratischen
Abstand besitzen. Die Punkte werden mit jeder Iteration durch die Transformation aktua-
lisiert. Yan et al. [YB07] beschrieben ein Verfahren zur Ohr-Erkennung, das ICP und PCA
verwendet. Bei 415 Test-Personen wurde eine Erkennungsrate von 97, 5% in der ersten
Iteration mit einer EER von 1.2% erzielt.
Der Local Surface Patch (LSP) beschreibt die Region um einen Merkmalspunkt als die Art
der Fläche und die dreidimensionalen Koordinaten des Punktes in einem 2D-Histogramm.
Chen et al. [BC08] untersuchten LSP als Verfahren für die drei dimensionale Ohr-Er-
kennung. Als erstes werden Merkmalspunkte anhand der Maxima und Minima der Helix
und Antihelix bestimmt. Der Erkennungsprozess wird mit einer modifizierten ICP Metho-
de durchgeführt. Die Test-Resultate haben eine kumulative Rang-1 Erkennungsrate von
94, 84% und eine EER von 4, 0%. Das Verhalten bei Teil-Verdeckung des Ohres wurde
ebenfalls untersucht. Bei einer Verdeckung von 50% liegt die Rang-1 Erkennungsrate bei
84, 52% und die EER bei 14%.
3.3 Akustische Erkennung
Akkermans et al. [AKS05], [Akk05] beschäftigten sich mit der akustischen Ohr-Erkenn-
ung. Ihr Ausgangspunkt ist die Signalreflexion von Pinna und Ohrkanal, die bei jedem
Menschen variiert. Eine Resonanz des Ohrkanals hat eine Frequenz von ca. 2500Hz ent-
sprechend der Länge und den Krümmungen von Ohrkanal und Pinna. Daraus resultie-
ren unterschiedliche Wellenlängen in den Resonanzen der gesendeten Signale. Es wurden
Versuche mit drei Testplattformen (Mobiltelefon, Kopfhörer & Ohrhörer) durchgeführt,
dabei wurden Geräusche im Bereich von 100Hz bis 15kHz erzeugt und gemessen. Der
Kostenaufwand für die Realisierung der Versuche wird explizit als gering bezeichnet, da
eher billigere Lautsprecher und Mikrophone verwendet wurden. Die Messung der Trans-
ferfunktion H (ω) = Hspeaker (ω) + Hear (ω) + Hmicrophone (ω) ist für die Aufnahme
des biometrischen Samples (Hear (ω)) notwendig. Ein adaptiver Filter minimiert Fehler
durch Störgeräusche und durch weiter gesendete Probesignale. Eine nachgeschaltete Fi-
scher lineare Diskriminantenanalyse verbesserte die FAR und FRR. In einem Test mit 31
Personen erzielten die Ohrhörer bei einer FRR von 0, 1% eine FAR von unter 0, 1% das
beste Ergebnis vor den Kopfhörern und weit vor dem Mobiltelefon. Insgesamt wurde eine
Erkennungsrate von über 99% erreicht. Weiterhin wurden als Probesignal verschiedene
Frequenzen mit einem Rauschton und mit Musik unterlegt, die zu einer bessere Perfor-
mance führten. Bei einer Testung des rechten und linken Ohres einer Person wichen die
Messwerte nur 10% von einander ab.
Für die akustische Ohr-Erkennung wurde 1998 in Sandia Corporation USA ein US Patent
„5,787,187, Systems and methods for biometric identification using the acoustic properties
of the ear canal“ ausgestellt ([AKS05]).
280

4 Zusammenfassung und Ausblick
Dieser Beitrag skizzierte Methoden zur Ohr-Detektion und -Erkennung, die mit zwei,
drei dimensionalen und akustischen Datenverfahren arbeiten. Die 2D- und 3D-Verfahr-
en sind sehr stark an die der Gesicht-Erkennung angelehnt. Die problematischen Themen
der Detektion und Erkennung sind Drehung/Rotation, Lichtverhältnisse, zusätzliche Licht-
Reflexionen durch Körper-Sekrete im Ohr, Teil- oder Verdeckung des Ohres, Verletzungen
und wechselnder Ohrschmuck (Piercings, Ohrringe, . . . ). In den Tabellen 1 und 2 werden
die Verfahren der Ohr-Detektion und der Ohr-Erkennung verglichen.
Detektions- Proben- Detektions-
Verfahren Umfang Rate (in%)
RBFN 600 100,0
Intensität 240 100,0
AdaBoost 830 99,9
Ray-Tracing 252 99,6
Nasenspitze 415 100,0
Tabelle 1: Vergleich der Detektions-Verfahrennach Probenumfang und Detektions-Rate
Verfahren Rate (in %) EER (in %)
GA 100, 00 0, 00MNN 97, 42 *
TRM & SRM 100, 00 0, 00LLE ≈ 98, 8 *
Line Shapes 99, 00 *
FFT 99, 20 *
ICP 97, 50 1, 20LSP 94, 84 4, 00akustisch > 99, 00 < 1, 00
Tabelle 2: Vergleich der Erkennungs-Verfahren nachErkennungsrate (Rate) und Equal Error Rate (EER),* ohne konkrete Angabe
In zukünftigen Arbeiten kann die Verwendung der Ray-Transformation für die Ohr-Er-
kennung eine Rolle spielen oder auch die Sample-Erfassung trotz einer Teil- oder Verde-
ckung des Ohres z.B. mit thermographischen Ansätzen. Für die akustische Ohr-Erkennung
mit Musik gilt es eine akkuratere Messung der Phasen-Informationen zu finden. Auch die
Angriffssicherheit jeglicher Varianten der Ohr-Erkennung bedarf einer genaueren Betrach-
tung, wie die Nachmodellierung von 3D-Ohren oder des Ohrkanals.
Literatur
[AG07] Saeeduddin Ansari und Phalguni Gupta. Localization of Ear Using Outer Helix Curveof the Ear. In ICCTA’07, Seiten 688–692, 2007.
[Akk05] Ton Akkermans. Secure and Private Biometrics. Presentation Confidential, PhilipsResearch, TA, Safe-NL, 2005. http://www.safe-nl.org/meetings/24-6-2005/ton.pdf.
[AKS05] Ton H.M. Akkermans, Tom A.M. Kevenaar und Daniel W.E. Schobben. Acoustic EarRecognition, Seiten 697–705. Springer-Verlag Berlin Heidelberg, 2005.
[Bam01] David Bamber. Prisoners to appeal as unique ’earprint’ evidence is discredited. The Te-legraph, 2001. http://www.telegraph.co.uk/news/uknews/1364060/Prisoners-to-appeal-as-unique-earprint-evidence-is-discredited.html.
281

[BC08] Bir Bhanu und Hui Chen. Human Ear Recognition by Computer. Springer-Verlag BerlinHeidelberg, 2008.
[Cho05] Michal Choras. Ear biometrics based on geometrical feature extraction. In Letters onComputer Vision and Image Analysis, Seiten 84–95, 2005.
[Cho06] Michal Choras. Further developments in geometrical algorithms for ear biometrics. In4th International Conference on Articulated Motion and Deformable Objects, Seiten58–67, 2006.
[CNC10] Alastair H. Cummings, Mark S. Nixon und John N. Carter. A Novel Ray Analogy forEnrolment of Ear Biometrics. IEEE Fourth International Conference on Biometrics:Theory, Applications and Systems, 2010.
[CSL+05] A. Cervantes, G. Sanchez, J. Llados, A. Borras und A. Rodriguez. Biometric Recogni-tion Based on Line Shape Descriptors, Seiten 346–357. Springer-Verlag Berlin Heidel-berg, 2005.
[Gen06] Jason Z. Geng. Three-dimensional ear biometrics system and method. Patent, 2006.http://www.patentgenius.com/patent/7826643.html.
[GML10] Lizette Gutiérrez, Patricia Melin und Miguel López. Soft Computing for RecognitionBased on Biometrics, Kapitel Modular Neural Network for Human Recognition fromEar Images Using Wavelets, Seiten 121–135. Springer-Verlag Berlin Heidelberg, 2010.
[HAZN08] D. J. Hurley, B. Arbab-Zavar und M. S. Nixon. Handbook of Biometrics, Kapitel TheEar as a Biometric, Seiten 130–150. Springer-Verlag Berlin Heidelberg, 2008.
[HNC05] David J. Hurley, Mark S. Nixon und John N. Carter. Ear Biometrics by Force FieldConvergence, Seiten 386–394. Springer-Verlag Berlin Heidelberg, 2005.
[HST00] Nan He, Kiminori Sato und Yukitoshi Takahashi. Partial Face Extraction and Reco-gnition Using Radial Basis Function Networks. In IAPR Workshop on Machine VisionApplications, Seiten 144–147, 2000.
[Hur01] David J. Hurley. Force Field Feature Extraction for Ear Biometrics. Dissertation, Uni-versity of Southampton, 2001.
[IBD08] S. M. S. Islam, M. Bennamoun und R. Davies. Fast and Fully Automatic Ear DetectionUsing Cascaded AdaBoost, Seiten 1–6. University of Western Australia, 2008.
[IBOD10] Syed M. S. Islam, Mohammed Bennamoun, Robyn A. Owens und Rowan Davies. AReview of Recent Advances in 3D Ear and Expression Invariant Face Biometrics. InACM Computing Surveys, Vol. V, Seiten 1–41, 2010.
[MHH99] J. Morgan, J. Houghton und J. Hunt. State v. David Wayne Kunze. Court of Appeals ofWashington, Division 2. 97 Wash.App. 832, 988 P.2d 977, 1999.
[Mid09] Christopher Middendorff. Multi-Biometric approaches to ear biometrics and soft bio-metrics. Dissertation, University of Notre Dame, Indiana, 2009.
[Moe00] Andre A. Moenssens. Netherlands Court Of Appeal At Amsterdam Rejects Ear Relia-bility. http://www.forensic-evidence.com/site/ID/IDearNews.html, 2000.
[XM08] Zhaoxia Xie und Zhichun Mu. Ear Recognition with Variant Poses Using Locally LinearEmbedding, Seiten 460–465. Springer-Verlag Berlin Heidelberg, 2008.
[YB07] Ping Yan und Kevin W. Bowyer. Biometric Recognition Using Three-Dimensional EarShape. IEEE Transaction on Pattern Analysis and Machine Intelligence, 2007.
282

PreBorderLane Embedded
in Gate of TrustTM
Ein erweitertes ganzheitliches Konzept fur den Schutz
kritischer Infrastrukturen
Wolfgang Rehak1, Alexander Nouak2
Jorg Koplin3
1eascSchonhagen e.V. (easc)
2Fraunhofer-Institut fur Graphische Datenverarbeitung IGD
3Bundespolizei
Abstract: Biometrische Verfahren zum Schutz von kritischen Infrastrukturen sind inder heutigen Zeit geeignet, den Prozess der Gefahrenabwehr im Bereich der Grenz-abfertigung und der Luftsicherheitskontrolle signifikant zu unterstutzen. Angesichtsder stetig weiter steigenden Passagieranzahl im Luftverkehr und neuer Bedrohungs-szenarien, wie beispielsweise korperintegrierte Bomben, werden aktuell verschiedeneLosungsstrategien und -ansatze, zu den notwendigen Grenz- und Sicherheitskontrol-len in den entsprechenden Expertenkreisen, diskutiert. IATA hat beginnend mit demSimplified Passenger Travel Programm (SPT) und aktuell mit Secure Checkpoint ofthe Future [BTM11] versucht dieser Komplexitat Rechnung zu tragen. Frontex als eu-ropaische Grenzschutzagentur begleitet aktiv mit
”New Ideas on Border Management“
[BK08] interessante Entwicklungen auf diesem Gebiet. Beispiele fur automatisierteGrenzkontrollen (Automatic Border Control – ABC) reichen von miSense Großbri-tannien uber Speed Hongkong und EasyPass Deutschland bis Vision-Box Portugal[VB11]. Maschinenlesbare Ausweise mit biometrischen Merkmalen (Machine Rea-dable Travel Documents – MRTD) verbunden mit einer interaktiven Passagierinfor-mation (interactive Advance Passenger Information – iAPI) und einem risikobasiertenPassagierkontrollverfahren sollen die Grundlagen bilden.Eine fehlende Harmonisierung, eine nicht vorhandene globale Interoperabilitat undmangelndes zwischenstaatliches Vertrauen haben eine internationale Umsetzung bis-her behindert. Die Herausforderung besteht darin, sich weiteren kunftigen Szenarienzu stellen, effiziente Abfertigungs- und Kontrollinfrastrukturen vorzuhalten, die imEinklang mit den Sicherheitsbestimmungen, der Menschenwurde der Passagiere aberauch der Mitarbeiter der Behorden und beauftragten Unternehmen. Eine nachhaltigebelastbare Vertrauensbildung sollte hier Richtlinie sein. Das Konzept der
”PreBorder-
Lane Embedded in Gate of TrustTM“ reiht sich hiermit sinnvoll in diese Aktivitaten ein[MKH08]. Es versteht sich als biometrisch–grenzpolizeiliches Modul des ganzheitli-chen Gate of TrustTM Konzeptes, das sich als internationale Forschungsplattform furnachhaltige Losungen in diesem Umfeld anbieten mochte.
283

1 Einleitung
Eine Harmonisierung, einerseits der notwendigen Sicherheitsprozesse und andererseits
hinsichtlich des Befindens der Passagiere, ist von hochster Bedeutung fur den Flugbe-
trieb. Zukunftsweisende Ansatze liegen in kosteneffizienten, flexiblen, pro-aktiven, ganz-
heitlichen und vor allem nicht beeintrachtigenden Losungen, die die gesamte Prozess-
kette berucksichtigen. Ausgehend von der derzeitigen Praxis der fur jeden transparenten
und damit kalkulierbaren Kontrolle, besteht die Notwendigkeit, ein vollig neues Konzept
der Gefahrenabwehr aufzustellen. Dieser hohe Anspruch an einen neuen Sicherheitsstan-
dard muss, im Sinne der menschlichen Wurde, der Effizienz und der Nachhaltigkeit der
durchzufuhrenden Sicherheitsmaßnahmen, mit einer grundlegenden Analyse der bisheri-
gen Standards verbunden werden. Das Grundprinzip sollte auf einer intelligenten Integra-
tion neuester Technologien zur effizienten Unterstutzung der menschlichen Fahigkeiten
und Fertigkeiten innerhalb der Sicherheitsarchitektur beruhen. Hierbei besteht die Not-
wendigkeit, die Erfahrung und das Beurteilungsvermogen der Sicherheitskrafte durch neue
technologische Ablaufe einschließlich biometrischer Verfahren zu unterstutzen, nachhal-
tig zu optimieren und positiv zu beeinflussen. Dabei ist wesentlich, dass nicht der Mensch
sich der Technologie anpasst, sondern die Technologie an den Menschen angepasst wird
[Nou10b, Nou10a, Nou11].
2 Der Konflikt
Der derzeitige Sicherheitsanspruch an kritischen Infrastrukturen, wie Flughafen, hat dazu
gefuhrt, dass die Kontrollmaßnahmen und damit die Kontrollzeiten stetig steigen. In ei-
ner Zeit, wo das Passagieraufkommen rasant wachst und die Bedrohungslage sich standig
verscharft, ist eine grundlegende Evaluierung der Verhaltnismaßigkeit der Schutz- und
Kontrollmaßnahmen unerlasslich. Diese Uberlegungen stehen im Einklang mit den Grund-
lagen fur die Forderung von Projekten auf dem Gebiet der zivilen Sicherheit, die vorran-
gig dem Ziel dienen sollen, den Schutz von Personen, Gesellschaften, Organisationen,
Gutern und Infrastrukturen zu verbessern [BMB11]. Letztlich geht es um die Integration
von Innovationen, die zu mehr Sicherheit fuhren, ohne die Freiheit der Burger zu beein-
trachtigen. So bilden die Sicherheitsforschungsprogramme sowohl auf nationaler als auch
auf europaischer Ebene den Grundstein fur den Aufbau der entsprechenden Infrastruktur
und fur die Entwicklung des Gate of TrustTM Konzeptes. In diesem Zusammenhang ist
ein internationaler Ansatz geboten, dem bisher jedoch Grenzen, bezuglich des jeweiligen
nationalen Rechts und der Verantwortlichkeiten, unterliegen. Diesen Ansatz der gemein-
samen Sicherheitsforschung unterstutzen die bilateralen Vereinbarungen mit Frankreich,
Israel, aber in besonderem Maße mit den USA. Der internationalen Konsensbildung bei
der Implementierung einer neuen Sicherheitsphilosophie wird dabei erfahrungsgemaß eine
geschwindigkeits- und damit letztlich die erfolgsbestimmende Rolle zukommen.
284

Beispiel Luftsicherheitskontrolle Gegenwartig beginnt der Prozess Sicherheitskontrol-
le erst weit im Inneren eines Flughafengebaudes, mit dem Sicherheitscheck der Passagie-
re. Ereignisse der jungsten Vergangenheit haben aufgezeigt, dass nicht fruh genug mit der
Uberprufung der Besucher an Flughafen begonnen werden kann, um die Sicherheit im ge-
samten Prozessablauf zu gewahrleisten. Hierbei ist die Balance zwischen Aufwand und
Nutzen der Kontrollen mitunter schwer zu erkennen.
Beispiel Grenzkontrolle Mit der Einfuhrung des VIS II [Eur09] wird, fur die bisherige
Grenzabfertigung im europaische Raum, eine grundlegende Veranderung der Prufungsver-
fahren schrittweise verbindlich. Bei deren Umsetzung wird der erfolgskritische Faktor eng
mit dem zusatzlich erforderlichen Mehraufwand verbunden sein. Denn die zur Verfugung
stehende Zeit fur die geforderte eingehende Einreisebefragung (und Ausreisebeurteilung)
fur Nicht-EU-Burger, wird empfindlich durch zusatzliche biometrische Prufungsverfahren
negativ beeinflusst. Hierbei ist zu konstatieren, dass nicht die biometrische Technologie
den Zeitfaktor maßgeblich bestimmt, sondern die Interaktion des Passagiers mit ebendieser
Technik. Die Identifikation der Reisenden, die Beurteilung der Echtheit von Dokumenten,
die elektronischen Prufungsverfahren sowie die Plausibilitatsuberprufungen der individu-
ellen Reiseabsichten stellen heute bereits eine erhebliche zeitliche Herausforderung fur
den Gesamtprozess der Grenzkontrolle dar.
3 Motivation
Die Bedrohung des Luftverkehrs durch den Terrorismus erfordert, dass die Staatenge-
meinschaft ihre Sicherheitsstrategien standig entsprechend anpassen und koordinieren.
Flughafen, Luftfahrtunternehmen und Luftsicherheitsbehorden mussen sich auf wechseln-
de Bedrohungslagen einstellen und Techniken sowie Verfahren stetig weiterentwickeln.
Dennoch beschranken sich die derzeitigen Reaktionen im Wesentlichen auf eine exzessive
Aufstockung der Kontrollprozeduren, um dem jeweils neuesten Anschlagsmodus Rech-
nung zu tragen. Die meist unter Zeitdruck, aufgrund des drohenden Vertrauensverlustes in
die Maßnahmen der Flughafensicherheit, gewahlten und implementierten Losungen sind
jedoch, hinsichtlich des realen Gewinns an Sicherheit, teilweise fragwurdig. Das trifft un-
ter anderem auf die Maßnahmen zu, die auf die Grenzkontrollen und auf die Luftsicher-
heitskontrollen, aber auch auf die den Gesamtprozess der Sicherheitskette wirken.
Eingehend auf die oben genannten Herausforderungen haben die Autoren, zur umfassen-
den Gewahrleistung eines sicheren Flugbetriebes, das Sicherheitskonzept Gate of TrustTM
entwickelt. Im Mittelpunkt steht die Verbesserung der bisherigen Sicherheitsphilosophie,
unter Einbeziehung neuer Technologien. In modifizierter Form konnte dieses Konzept
auch in anderen kritischen Infrastrukturen, wie etwa in Bahnhofen, Schiffsterminals oder
auch Veranstaltungshallen, zum Einsatz kommen.
285

Abbildung 1: Das Konzept des Gate of TrustTM (Quelle: easc/INTER OFFICE GmbH)
4 Was beinhaltet das Konzept Gate of TrustTM im Bezug auf die Luft-
sicherheitskontrolle?
Das Konzept beinhaltet sowohl die Einbeziehung der notwendigen Komponenten fur den
Vertrauensbildungsprozess zwischen den verantwortlichen Autoritaten und dem Passa-
gier, als auch die Komponenten fur eine glaubwurdige und reale Gefahrenabwehr. Da-
bei geht es grundlegend darum, die Passagierstrome am Flughafen zu optimieren, um
die langst uberfallige Differenzierung der Kontrollintensitat einzelner Personen so zu ge-
stalten, dass es einerseits zu einer Verbesserung des Sicherheitsgefuhls kommt und zum
anderen zu einer deutlichen Steigerung der Prozessgeschwindigkeit. Der konzeptionelle
Ansatz besteht (siehe Abbildung 1) in einem dualen Ansatz, der realen und der virtuellen
Sicherheitsuberprufung. Die reale Prufung besteht zum Beispiel aus einem mit attraktiven
flachigen OLEDs illuminierten Durchgang (OLED-Gate), hinter dessen Wanden verschie-
denste, fur den Passagier nicht zuordenbare passive Detektionstechnologien verborgen
sind. In der virtuellen Sicherheitsprufung hingegen werden fur den Passagier nicht erkenn-
bare Detektionstechnologien uber das gesamte Terminal verteilt. Dabei werden grundsatz-
lich nur gesundheitlich unbedenkliche passive Messgerate verwendet. Alle Messergebnis-
se aus der realen und der virtuellen Prufung werden in einem Operations- und Koordinie-
rungszentrum zusammengefuhrt und ausgewertet. Eine weitere Besonderheit des Ansatzes
ist die Koppelung der Detektionstechnologien mit der Gebaudeleittechnik. Hierfur geeig-
nete mobile und stationare Detektionstechnologien fur chemische, biologische, radiolo-
286

gische, nukleare und explosive Substanzen (CBRNE) sind am Markt partiell vorhanden.
In zahlreichen nationalen und internationalen Forschungsprojekten werden diese Techno-
logien weiterentwickelt und sollen im Rahmen von Tests in diesem Konzept eingebunden
werden. Durch den dualen Ansatz ist es moglich, im Vorfeld des realen Security Check am
OLED-Gate verdachtige Personen zu erkennen, zu beobachten und gegebenenfalls uber
die Kopplung mit der Gebaudeleittechnik vor dem OLED-Gate an einem den Flughafenbe-
trieb nicht gefahrdenden Ort ohne direkte Einwirkung zu isolieren. Dabei ist der zeitliche
und raumliche Faktor von entscheidender Bedeutung, gegenuber der zurzeit stattfinden-
den Kontrolle. Im virtuellen Teil des Gate of TrustTM kann zudem durch zu definierende
Points of Interests (Check-In, Grenzkontrolle) gewahrleistet werden, dass eine Vor- und
Nachverifizierung stattfinden kann. Hierbei ist das Ziel, dass das Uberraschungsmoment
bei einer realen Gefahrdungslage vom Tater zu den Responsekraften transferiert wird. Die
Mehrstufigkeit der Sicherheitsprufungen mit den Messwiederholungen hilft, die Anzahl
von Falschalarmen erheblich zu reduzieren.
5 Was beinhaltet das Konzept Gate of TrustTM im Bezug auf die Grenz-
kontrolle?
Der ganzheitliche Ansatz des Gate of TrustTM berucksichtigt neben der Luftsicherheits-
kontrolle auch die spezifischen Herausforderungen an eine optimierte und differenzierte
Grenzkontrolle auf Grundlage des”PreBorderLane Embedded“ Konzeptes. Es beinhaltet
die Aufteilung der Grenzkontrolle in eine vorgelagerte und eine nachgelagerte Kontrol-
le, wie in Abbildung 2 dargestellt. Die Wartezeit ist faktisch und zwangslaufig immer
vorhanden - genau hier setzen wir mit unserem Konzept an, indem die PreBorderLane
die technischen Anwendungen schon vor der eigentlichen Grenzkontrolle nutzt und so-
mit der Grenzkontrollprozess bereits in der Warteposition beginnt. Bei der vorgelagerten
Kontrolle handelt es sich um technische Anlagen (Self Kiosk), an die mehrere Passagiere
parallel herantreten konnen um zum Beispiel die maschinenlesbaren Elemente der ICAO–
konformen Passe (vor)auszuwerten. Dadurch, wird die unvermeidliche Wartezeit aktiv zur
Entzerrung und Differenzierung des Passagierstromes genutzt, indem der Reisende die
Option erhalt, mit Auflage seines Reisedokumentes, den Prozessablauf zu beschleunigen.
Wahrend dieser vorgelagerten Kontrolle werden bereits zwingend erforderliche und zei-
tintensive Prufungen durchgefuhrt.
Der besondere Vorteil an der”PreBorderLane Embedded“ liegt darin, dass der Mensch,
unabhangig von der Nationalitat, Alter, Herkunft, registrierte oder nicht registrierte Rei-
sende - jede vorgelagerte Kontrollspur wahlen kann, da die eigentliche Zuordnung zum
jeweiligen optimalen Grenzkontrollschalter durch die PreBorderLane dynamisch gesteu-
ert wird. Uber biometrische Verfahren wie die Gesichtserkennung, und/oder den Finger-
abdruck, der von der zukunftigen Implementierung des Visa Informations Systems II (VI-
SII) [Eur09] zur Verifikation von Drittstaatenangehorigen zwingend schrittweise vorge-
schrieben wird, konnen notwendige grenzpolizeiliche Abfertigungshandlungen gesondert
und gezielt aufgeteilt werden. Der Einsatz von biometrischen Verfahren wird sowohl auf
das 3D Face Verfahren, sowie auf die technischen Moglichkeit der Lebenderkennung
287

Abbildung 2:”PreBorderLane Embedded“ in Gate of TrustTM
(Quelle: Koplin, http://preborderlane.eu)
von Fingerabdrucksensoren gesetzt. Damit soll der Nachteil der zweidimensionale Ge-
sichtserkennung und die Probleme der Verifikation von Finger–Attrappen in Bezug auf
die Uberwindungssicherheit Rechnung getragen werden[BNZ+07]. Auf diesem Gebiet
sieht sich dieses Konzept als Trager neuer technologischer Entwicklungen im Bereich der
Uberwindungssicherheit von biometrischen Systemen. Die stetige Entwicklung neuer Ver-
fahren konnen hierbei unkompliziert und zukunftsweisend integriert werden.
Abbildung 3: Details”PreBorderLane Embedded“ in Gate of TrustTM
(Quelle: Koplin, http://preborderlane.eu)
Fur den Passagier von Vorteil ist letztendlich die automatische Zuweisung an einen freien
und fur ihn individuell optimierten Grenzkontrollschalter fur EU-Burger oder nicht EU-
Burger. Der Reisende wird sozusagen bestmoglich platziert. Anders als bei bislang ge-
testeten Systemen wie beispielsweise EasyPass [Nup10]wird die Benutzung des Systems
nicht auf Besitzer elektronischer Passe oder auf Burger der Europaischen Union einge-
schrankt, sondern jeder Pass, jedes Dokument wird ausgelesen und mit Hilfe der erfassba-
ren Daten werden dann Sicherheitsuberprufungen zur ersten Bewertung durchgefuhrt. Da-
288

bei werden Verfahren implementiert, die Dokumente anhand der maschinenlesbaren Zeile
erkennen, als auch Verfahren, welche per OCR in der Lage sind, Dokumente geeignet aus-
zuwerten. Die konzentriert eingesetzten Erkennungstechnologien Dokumentenerkennung,
3D Gesichtsverifikation, und/oder Fingerprintverifikation sowie Gefahrenstoffensensorik
konnen in ihrer Gesamtheit bereits in der Warteposition des Passagiers wertvolle Informa-
tionen zur weiteren beschleunigten Grenzabfertigung bereitstellen. Der Grenzbeamte wird
durch den gezielten Einsatz neuer Technologien maßgeblich entlastet - sein Fokus kann
verstarkt auf den Bereich der eingehenden Kontrolle (Plausibilitatsprufung) gerichtet wer-
den. Das wird dadurch erreicht, dass bevor der Reisende die eigentliche Grenzabfertigung
betritt, der Grenzbeamte uber wesentliche Informationen zum zu kontrollierenden Reisen-
den bereits verfugt - dieses Verfahren ist besonders geeignet den zunehmenden Forderun-
gen des Schengener Grenzkodexes gerecht zu werden. Der technische Perfektionsdruck
bei Vollautomatisierung wird durch den Einsatz der nachgelagerten Kontrollen (Grenzbe-
amten) minimiert. Im Gegensatz zur angedachten vollautomatischen Grenzkontrolle bie-
tet ein intelligentes Wartemanagement mehrere Vorzuge ohne den Verlust an Sicherheit,
mehr Kundenorientierung, Verbesserung des Datenschutzes, Qualitatssteigerung der Kon-
trolle, bessere Hilfestellung fur spezielle Reisenden, wie Personen mit physischen Beein-
trachtigungen, Reisegruppen und Andere (siehe auch Abbildung 3). Auch interkulturelle
Aspekte konnen hier strikt eingehalten und der dynamische Reisefluss besser gesteuert
werden.
6 Aussichten
Es geht nicht um ein neues”Traveller Program“ - sondern um einen vollig neuen An-
satz zur Optimierung von Reisestromen unter Beachtung der Qualitat und der Quantitat
wahrend der Risikobewertung einzelner Passagiere im Kontrollabschnitt. Die Integration
dieser Sensoren in automatisierte Prozesse konnte es ermoglichen, das Aufmerksamkeits-
niveau permanent hoch zu halten, das Sicherheitspersonal zielgerichtet zu informieren so-
wie geeignete Sicherheitsmaßnahmen einzuleiten. Der Kern des Konzeptes wird in Abbil-
dung 1 skizziert und ist die bewusste Abkehr von der historisch gewachsenen One-Stop-
Strategie der Sicherheitskontrolle hin zu einem flexiblen mehrstufigen Kontrollprozess,
spezifisch fur die Passagierstrome Airside/Landside und umgekehrt, unter Einbeziehung
des gesamten Flughafens inklusive seines Umfeldes.”
PreBorderLane Embedded“ in Gate
of TrustTM, das ein erweitertes ganzheitliches Konzept fur den Schutz kritischer Infrastruk-
turen ist, bietet dem Anwender drei wesentliche Vorteile: eine Prozessbeschleunigung,
einen verbesserten Sicherheitsstandard und mehr Betriebssicherheit (Business Continui-
ty). Ein potenzieller Attentater konnte sich nicht optimal auf die Kontrollen vorbereiten,
um sie zu uberlisten, da ihm weder bekannt ist, welche Art von Kontrollen noch an wel-
chen Stellen sie durchgefuhrt werden. Business Continuity ist fur Flughafen ein zentrales
Anliegen in Krisensituationen, denn ein Ausweichen auf andere Flughafen ist nur in ganz
wenigen Stadten der Welt moglich. Weltweit werden aktuell einzelne Elemente des Gate
of TrustTM-Konzepts schon verwendet, vorrangig mit dem Ziel Personal einzusparen. Der
hier vorgestellte Ansatz setzt sich jedoch zum Ziel, einerseits die Intelligenz des Perso-
289

nals durch eine optimale technologische Unterstutzung zu befahigen, Gefahren rechtzeitig
zu erkennen, und zum anderen den Burgern einen Vertrauensbildungsprozess entgegen zu
bringen. Bei der Verwirklichung dieses Konzepts mussen vor allem die messtechnischen,
rechtlichen, ethischen und strukturellen Rahmenbedingungen sowie die Auswirkungen auf
die Flughafenprozesse umfanglich betrachtet werden. Neben den Initiatoren – den Auto-
ren dieses Beitrags – sind alle nationalen und internationalen interessierten Stakeholder
aufgerufen, sich an der Entwicklung des Konzeptes zu beteiligen.
Literatur
[BK08] Erik Berglund und Rasa Karbauskaite. Frontex Perspectives on Biometrics for BorderChecks. In Arslan Bromme, Christoph Busch und Detlef Huhnlein, Hrsg., BIOSIG, Jgg.137 of LNI, Seiten 107–116. GI, 2008.
[BMB11] BMBF – Bundesministerium fur Bildung und Forschung. Forschungsprogramm fur diezivile Sicherheit. http://www.bmbf.de/de/11773.php, 2011.
[BNZ+07] Christoph Busch, Alexander Nouak, Xuebing Zhou, Michiel van der Veen, Farzin Dera-vi und Jean-Marc Suchier. Towards Unattended and Privacy Protected Border Control.In Institute of Electrical and Electronics Engineers (IEEE), Hrsg., Biometrics Symposi-um 2007. The Biometric Consortium Conference (BCC), 2007.
[BTM11] Bernama Business Times Malaysia. IATA Reveals Checkpoint of the Fu-ture. http://www.btimes.com.my/Current_News/BTIMES/articles/
20110607131126/20110607131126.pdf, Juni 2011.
[Eur09] European Commission. Commission Decision of 30 November 2009 Determining theFirst Regions for the Start of Operations of the Visa Information System (VIS) (notifiedunder document C(2009) 8542). http://eur-lex.europa.eu/LexUriServ/
LexUriServ.do?uri=CELEX:32010D0049:EN:NOT, November 2009.
[MKH08] Heinz-Dieter Meier, Jorg Koplin und Kurt Hops. Secure Border Control Processes. InArslan Bromme, Christoph Busch und Detlef Huhnlein, Hrsg., BIOSIG, Jgg. 137 of LNI,Seiten 117–122. GI, 2008.
[Nou10a] Alexander Nouak. PreBorderLane – Technology Must Adapt to People, Not Peo-ple to Technology UK, London. http://www.scribd.com/doc/36283837/Biometrics-Conference-2010, Oktober 2010.
[Nou10b] Alexander Nouak. Technology Must Adapt to People, Not People to Technology.Prasentation bei SMI Conference Border Security 2010, Marz 2010.
[Nou11] Alexander Nouak. PreBorderLane – Technology Must Adapt to People, Not People toTechnology. In Proceedings of the Biometrics Conference 2010, Oktober 2011.
[Nup10] Markus Nuppeney. EasyPASS — Grenzkontrolle einfach und schnell mit demelektronischen Reisepass. https://www.bsi.bund.de/SharedDocs/
Downloads/DE/BSI/ElekAusweise/EasyPASS/EasyPASS_pdf.pdf?
__blob=publicationFile, 2010.
[VB11] Vision-Box. Vision-Box’s systems enrol almost 5 million citizens in Portugal.http://www.vision-box.com/company-news/news/2011/05/19/
vision-boxs-systems-enrol-almost-5-million-citizens/, May2011.
290

Group Identification at Border Crossing Points
S. Yildirim Yayilgan1, A. Hovstø2, A. Cheikh1, A. Amodei3, M. Iori3,
S. Zaharia4, D. Ioannidis5, Ø. Thorvaldsen3
1Gjøvik University College, Norway2portAhead, Norway3BATS AS, Belgium
4MIRA TELECOM, Romania5CERT/ITI, Greece
6National Police Computing and Material Service (NPCM), Norway
Abstract: Increasing Passenger flow at Border Crossing Points is an important
kuuwg cv vqfc{Óu dqtfgt etquukpi rqkpvu *DERu+ qh ncpf. ugc cpf cktrqtv0 ItqwrAccess Control and utilizing biometrics information will help increase passenger
throughput and reduce human error in handling passengers erroneously. Using
multi modal information for (biometric) group id can provide more robust handling
of passengers. On the other hand, connecting various BCPs will help solve some
problems related to illegal entries from non-Schengen to Schengen space, laws and
health. This paper presents the first relevant concepts and issues of using
(biometric) group idea and connecting BCPs.
1 Introduction
A common challenge for customs and border control authorities is to improve the
processes related to the increasing flow of cargo and people crossing borders, without
undue delay and with minimal intrusion when meeting the same security requirement,
whilst employing affordable technical and human resources. Each type of Border
Crossing Point (BCP) presents particular challenges (for example, airports have
constraints of available time and space, sea ports of available time and perimeter
security, land BPCs of infrastructure/space availability and connection with land
BCP/road network of neighbouring countries) which affects the workflows for
performing checks. Moreover, the ability of border guards to perform checks will be
constrained by the environment in which they work (human factors).
291

This Research Paper addresses the need to improve the design of land and maritime
checkpoint infrastructure, technologies and processes at border crossings so that checks
may be carried out in a more reliable, convenient and efficient manner. This paper
identifies and analyses relevant constraints affecting security and efficiency of land and
maritime checks (ID and detection) for each type of BCP and propose an innovative
model solution for each and considers the combination of existing and new technologies
and redesigned processes in order to solve several unsolved problems and new
paradigms related to the detection of illicit material and to the introduction of new
electronic travel documents and visas for third country nationals entering the Schengen
space. A study [INDIGO] includes a human factors analysis of the ergonomics of
equipment used and their effect on efficiency at each type of BCP (influence of quality
of images from CCTV/scanning equipment on while e.g. realizing security background
check of the person at the BCP by face recognition)
Identifying key infrastructure and ergonomic constraints at each type of BCP the ideal
solution is to aid planning and efficient, speedy performance of border checks. The
compliances of the proposed processes will be met with the privacy protection regulation
and with the ethical principles.
One of the constraints affecting security and efficiency of land and maritime checks at
the border crossing points is the unavailability of an infrastructure which connects
various processes and ICT solutions at various BCPs in Schengen and non-Schengen
countries. This is a challenging task to do since existing and new technologies as well as
existing and newly designed processes need to be combined within such an
infrastructure. The processes and ICT solutions are related to identification, detection of
illicit material, and introduction of new travel documents and visas for third country
nationals entering the Schengen space, using better ergonomic equipment and also how
to offer mobile solutions.
Due to such a constraint, some problems occur and these problems are related to illegal
entries, inapplicability of laws, undeliverable papers from police or court, and infectious
diseases. These problems can be overcome if the travellers can be tracked for which
BCP they have just entered or left and if this information can be passed onto other BCPs.
Hence, our first aim in this paper is to introduce an overall concept of how various BCPs
can be connected.
Our second aim is to introduce the concept of group based identification at BCPs while
current practices are based on individual identification. A group id which represents an
kpfkxkfwcnÓu eqppgevkxkv{ vq c itqwr yknn ucxg vjg eqttgurqpfkpi dqtfer crossing police
from asking group specific information to each member in the group repeatedly since
this information will be known to the police officer from before due to pre-registration of
the particular group. In such an approach, the time required for handling per passenger
will be reduced and this will sum up to considerable time savings at border crossing
point controls.
292

2 Connected BCPs
The loose or non-existing communication among various BCPs result in some problems
and these problems can be grouped into three categories:
1) Problems due to illegal entries: These are problems resulting from attempts of
non-Schengen country citizens to enter the Schengen space without the required
permissions e.g visas, papers.
2) Problems due to inapplicability of laws or problems related to undeliverable
papers from police or court: Several of the example situations that can occur
within this category are as follows:
a) A traveller commits a traffic crime in a foreign country, due to that, it is
forbidden to use his driving license for 3 months due to international law.
This information can be passed onto the other BCPs such that if the person
leaves the foreign country and enters a new one, it will still be known to
the authorities in the new country that he is not allowed to drive.
b) A person has a work and residence permit in a foreign country. Loans
money in the foreign country and leaves the country after a while. Never
pays the money back and the foreign country does not know in which
country the person is.
c) A person buys a car and after a while leaves his country to live and work in
a foreign country. Meantime a family member or a friend continues to use
the car. The person who leaves for a foreign country still owns the car. The
car receives a ticket for speed or another reason. The current user of the car
neither pays the ticket nor informs the actual owner about the ticket.
3) Health related problems: A traveller has an infectious disease but noone is
aware of the situation in the foreign country he visits and he spreads the
disease.
3 A new concept: Group based identification
Currently, border crossing point controls for individuals require the identification of each
individual either by an alpha-numeric id and/or by face and/or finger recognition. The
same approach can also be used for group identification, either an alphanumeric id
and/or an id based on the groupuÓ social footprint (Figure 1 below).
293

BCP Individual Group
Application
1
Alpha-numeric
id
Group footprint
Application
2
face and/or
finger
recognition
(biometric) group id
Figure 1: Individual and group identification at BCPs
The Social footprint1 or the Sustainability Performance is defined d{ vjg swqvkgpv qh Òcogcuwtg qh korcev qp c xkvcn ecrkvcnÓ cpf Òc uvcpfctf qt pqto hqt yjcv vjg korcev qp vjgsame vital capital ought to be in order to ensure stakeholder well-dgkpiÓ.
In an identity document e.g. passport, there is alpha-numeric id that describes some
background information about the individual who holds the identity document. There is
also biometric information stored in the identity document. At the BCP, the real time
biometric information of the individual (e.g. face or fingerprint) is captured and
compared against the biometric information of the individual stored earlier in the identity
document. This way the verification of the alpha-numeric id for the individual is
achieved. In the same manner, there is alpha-numeric id for a group which is called as
group footprint in the identification document that each individual member of a group
holds. At the BCP, the biometric information for an individual is captured and is
compared against a stored group id. That is, a group id is constructed from biometric
information of all individual members in a group.
The concept of the social footprint check is a more robust check and a more certain
means of preventing people from pretending to be someone other than their true identity.
Allied to other checks that are carried out in the normal process of an application for a
vtcxgn fqewogpv. kv ku c yc{ qh wukpi vjg crrnkecpvÓu enckogf dkqitcrjkecn kfgpvkv{ vqcheck against their claimed identity. Social footprint evidence is evidence that an
individual uses their claimed identity in the community; for example, this may include
evidence such as driver licences and tax numbers. The social footprint is based on the
premise that everyone has dealings with a variety of organizations in their daily life,
many of whom maintain records about this engagement that are publicly available.
By integrating a social footprint check within the application process for a travel
document, it is possible to deter potential fraudsters from attempting to make false
applications. As the applicant does not know what information is held by the
interviewing officer or the questions that they will have to answer, there is a greater
likelihood that either the fraudster will not try to obtain a document by this means or
their attempted deception will be picked up at interview.
1 The Quotients Approach Î A General Specification for context-Based Sustainability Metrics
www.sustainableorganizations.org [2011]
294

The use of the social footprint is based on the availability of publicly available
information about citizens.
Ordinarily, face and/or fingerprint recognition [1] is used at Automated Border Control
Systems in addition to or in place of alpha-numeric id, in order to verify that the person
who actually holds a passport or a travel document is actually the person him/herself.
The same reasoning might apply also for group identification where a social footprint is
given to each member in the group even from the time of applying for a travel document,
or visa. It might also be possible to define a common footprint for a particular group.
This social footprint is verified by biometric group id.
Such an approach based on group identification will be an augmentation to the existing
ABC (Automatic Border Crossing) systems rather an alternative to it. Further vision is
also to connect each augmented border crossing point with various others in order to
make flow of information more efficient among various Schengen and non-Schengen
country BCPs.
Developing an architecture for connecting BCPs in various countries and developing
further the concept of (biometric) group id requires collaborating with various
authorities, namely Border Crossing Point Police, research units which would further
work on group biometrics as a means of improving flow of control at border crossing
points and companies which understand the issues at border crossing points and can
provide technical solutions and test equipment. Also, the involvement of cruise operators
at sea borders, and transportation authorities (e.g. bus, train) are required. We have the
collaboration with the mentioned authorizes and developed an architecture called
ÐKPFKIQÑ kp qtfgt vq cuuguu cpf kortqxg ejgemu cv Dqtfgt Eqpvtqn Rqkpvu *DER+0 The
architecture proposes a modular scalable system of the systems based on various sensors
and intelligent algorithms that helps in escalating the current procedures for handling
higher volumes of passengers and increasing flows of goods.
4 Conclusion
In this paper, we introduced two new concepts: connecting border crossing points for
dealing with problems related to illegal entries, laws and health and using (biometric)
group id. We suggest that using biometric group id might increase the throughput at the
border crossing points which can be used to verify social footprints of pre-registered
groups. These two concepts will be complementary to the existing ABC systems instead
of being an alternative to them. Further research is required to define what kind of
information can be representative of storing social footprint of individuals and groups
and what can a (biometric) group id be like.
Literature
[1] Ncpfcku T0. Dtgfkp J0. ¥qwctk N0. cpf Ejqnngv I0. ÐXfitkhkecvkqp cwfkqxkuwgnng fg nÓkfgpvkvfi.Ñ kpProc0 Vtckvgogpv gv Cpcn{ug fg nÓKphqtocvkqp< Ofivjqfgu gv Crrnkecvkqpu *VCKOC+. Jcoocogv.Tunisia, 2007.
295


Eignung von Smartphone-Kameras zurFingerabdruckerkennung und Methoden zur Verbesserung
der Qualität der Fingerbilder
Chris Stein, Claudia Nickel
Fachbereich Informatik
Hochschule Darmstadt
Haardtring 100
D-64295 Darmstadt
[email protected], [email protected]
Abstract: Diese Arbeit befasst sich mit der Untersuchung auf die Eignung von
Smartphone-Kameras für eine Fingerabdruckerkennung. Es werden unter Alltags-
bedingungen Fingerfotos mit den Kameras von verschiedenen Smartphones mit
mehreren Personen gemacht und ausgewertet. Vier der fünf untersuchten Geräte
stellen sich bei der Aufnahme von Fingerfotos als untauglich dar. Die Aufnahmen
des tauglichen Gerätes werden weiter auf ihre Qualität untersucht und mit welchen
Methoden diese erhöht werden kann, um die Erkennungsleistung zu verbessern.
1 Einführung
Smartphones erfreuen sich einer immer höheren Beliebtheit unter den Nutzern. Der
Marktanteil der Smartphones wird zukünftig weiter ansteigen und klassische Handys
nach und nach verdrängen. Jedes Smartphone ist mit mindestens einer integrierten
Kamera, die eine hohe räumliche Auflösung hat, ausgestattet. Durch die hohe Auflösung
des Kamerasensors, ist es möglich, viele Details der Umwelt zu erfassen. Dadurch sind
die Sensoren auch in der Lage, feine Strukturen eines Fingers zu erfassen, wie dies bei
der Fingerabdruckerkennung erforderlich ist. Es ist aber zu beachten, dass mehr
Megapixel bei den Aufnahmen nicht zwangsläufig zu detailreicheren Bildern führen.
Zwar sind die Auflösungen der Chips in den letzten Jahren gestiegen, aber aufgrund der
kompakten Bauweise der Smartphones sind die verbauten Sensoren in den Kameras in
der Regel nicht größer geworden. Dieser Umstand macht die Sensoren besonders
anfällig für hohes Grundrauschen, was sich auf den Detailgrad der Bilder negativ
auswirkt. Diese Arbeit beschäftigt sich mit der Frage, ob die Qualität der Bilder
ausreicht, die mit solchen Kameras unter Alltagsbedingungen gemacht wurden. Kann die
Funktionalität eines teuren Fingerabdruckscanners mit einer günstigen und stets
verfügbaren Smartphone-Kamera erfüllt werden? Die Identifizierung über ein
biometrisches Merkmal bietet im Vergleich zur klassischen PIN einen erhöhten Schutz
vor Unbefugten, da dieses nicht vergessen, verloren oder gestohlen werden kann. Eine
Gegenüberstellung von Biometrie und Passwort kann unter [SK08] nachgelesen werden.
297

2 Verwandte Arbeiten
Derawi et al. verfolgen in [DYB11] ein ähnliches Ziel und überprüfen die
Fingerabdruckerkennung von Bildern, die mit zwei verschiedenen Smartphones gemacht
wurden. Die angegebenen Erkennungsraten sind vielversprechend, da sie ohne jegliche
Nachbearbeitung der Bilder sehr hoch waren. Die Ergebnisse wurden jedoch teils unter
Laborbedingungen erzielt und sind aufgrund der verschiedenen Rahmenbedingungen
nicht mit den Ergebnissen in dieser Arbeit vergleichbar. In [HJY10] wurde eine
niedrigauflösende Digitalkamera genutzt und die Bilder mit verschiedenen Algorithmen
nachbearbeitet, um deren Qualitätsauswirkungen zu untersuchen. Die Aufnahmen
wurden unter Laborbedingungen erstellt. Durch Nachbearbeitungen der Bilder, konnte
die Qualität deutlich verbessert und so eine hohe Erkennungsleistung erreicht werden.
Dass eine Fingerabdruckerkennung auch mittels niedrigauflösenden Webcams möglich
ist, stellt [MS09] dar. Es wurde eine False Acceptance Rate (FAR) von 0,18% und eine
False Rejection Rate (FRR) von 10,29% erreicht. Aufgrund des optimierten Fokus auf
Nahaufnahmen von Webcams, ist jedoch auch eine wesentlich niedrigere Auflösung
ausreichend, da der Abstand von Kamera und Finger hier sehr klein sein kann.
3 Vorgehensweise
Es werden zunächst einzelne Fingerfotos mit den Smartphones Apple iPhone 4, HTC
Hero, Motorola Milestone, Nokia C7 und Samsung Nexus S mit unterschiedlichen
Einstellungen gemacht. Anschließend werden die Bilder im Enrollment-Prozess in die
Software VeriFinger 6.3 Extended SDK von Neurotechnology [Web1] geladen. Die
Software enthält Identifikationsalgorithmen für Fingerabdrücke. Es wird versucht,
Merkmale aus den Aufnahmen zu extrahieren und ein Template zu generieren.
Es stellt sich heraus, dass die Geräte von Apple, HTC,
Motorola und Nokia nicht zur Aufnahme von
Fingerbildern geeignet sind. Der Autofokus dieser
Geräte ist nicht in der Lage, auf sehr nahe Objekte zu
fokussieren, wie dies bei den Fingerbildern erforderlich
ist. Erst ab einer gewissen Distanz zwischen Kamera
und Finger, sind die Kameras in der Lage zu
fokussieren. Durch die große Distanz zum Finger ist der
Detailgrad der aufgenommenen Finger jedoch zu
gering. Eine zuverlässige Extraktion der Merkmale aus
diesen Bildern ist nicht möglich. Diese Geräte scheiden
somit vorzeitig aus und werden nicht weiter in dieser
Arbeit betrachtet. Als einziges taugliches Gerät für diese
Untersuchung erwies sich das Nexus S, das für die
weiteren Untersuchungen verwendet wird. Aber auch
bei diesem Gerät musste ein gewisser Abstand der
Finger zur Kamera eingehalten werden, was die
effektive Auflösung der aufgenommenen Finger senkt.
298

Als nächster Schritt werden Fingerbilder von mehreren Personen mit dem Nexus S
aufgenommen. Diese Bilder werden in mehreren Schritten nachbearbeitet, mit dem Ziel
die Qualität zu erhöhen. Mit der VeriFinger Software wird zunächst ein Qualitätswert
von jedem Bild im unbearbeiteten und nachbearbeiteten Zustand errechnet. Der nächste
Schritt ist die Extraktion der Merkmale und die Generierung der Templates aus den
Aufnahmen. Hierbei wird jeweils ein Template aus den unbearbeiteten und
nachbearbeiteten Bildern erstellt. Zum Schluss werden die Templates gegeneinander
geprüft um die Ähnlichkeitswerte zu berechnen und die Ergebnisse evaluiert. Diese
Schritte werden in den nächsten Kapiteln näher beschrieben.
4 Datenerhebung
Es wurde eine Datenbank mit Fingerabdrücken von neun, an der Datenerhebung
freiwillig teilnehmenden, Personen erstellt. Dazu wurden die Testpersonen aufgefordert,
die Unterseite des Mittel- und Zeigefingers mit dem Nexus S zu fotografieren. Die
Durchführung erfolgte an zwei Terminen. An jedem Termin wurde von den Teilnehmern
mit dem Nexus S jeweils ein Bild vom Mittel- und vom Zeigefinger erstellt. Die
Testpersonen konnten frei wählen, wie sie das Smartphone beim Fotografieren halten
und von welcher Hand sie die Finger fotografieren wollten. Der Abstand von Kamera
und Finger sollte so gering wie möglich sein, um die bestmögliche Auflösung der
Fingerstruktur zu erhalten. Die aufgenommenen Bilder wurden vor Ort in Augenschein
genommen und bei sichtbarer mangelnder Qualität (z.B. bei Verwackelungen, Finger
nicht korrekt erfasst) erneut aufgenommen.
Die Datenbank umfasst insgesamt 36 Fingerbilder: Von jeder der neun Personen sind
zwei Bilder vom Zeige- und Mittelfinger vorhanden.
Die Bilder wurden mit der höchstmöglichen Qualitätseinstellung des Samsung Nexus S
erstellt. Das Gerät erzeugt hierbei Bilder mit etwa 5 Megapixel (Dimensionen der Bilder
betragen 1920x2560). Alle Fotos wurden mit eingeschaltetem Blitz aufgenommen. Der
Blitz erhöht die Stabilität der Bilder gegenüber Verwacklungen, indem kürzere
Belichtungszeiten erreicht werden. Des Weiteren kann damit die Schärfe der Bilder
angehoben werden und das Grundrauschen der Kamera vermindert werden, da durch den
Blitz eine bessere Beleuchtung herrscht und die Kamera die Lichtempfindlichkeit (ISO)
automatisch runterregelt. Ein weiterer Vorteil ist die homogenere Ausleuchtung der
Bilder durch den Blitz.
5 Nachbearbeitung der Aufnahmen
Es werden fünf Nachbearbeitungsschritte durchgeführt, um die Qualität der Bilder zu
verbessern. Die Bilder nach Schritt 4 und 5 werden anschließend bezüglich Qualität und
Erkennungsleistung untersucht und mit denen der unbearbeiteten Aufnahmen verglichen.
Die fünf Nachbearbeitungsschritte werden manuell in folgender Reihenfolge
durchgeführt:
299

1. Zuschneiden des Bildes: Die Dimensionen des Bildes werden auf den Finger
beschränkt (von der Fingerkuppe bis zum ersten Fingerknochen)
2. Reduzierung des Farbraums: Grauwertumwandlung des Bildes
3. Kontrastspreizung: Nutzung der maximalen Bandbreite der Helligkeitswerte
4. Ausrichtung des Bildes: Rotierung des Bildes, so dass der Finger möglichst
“nach oben” zeigt
5. Lokaler Normalisationsfilter1: Die Qualität der Fingerstrukturen wird
verbessert.
6 Auswertung
In diesem Kapitel werden die Qualitätswerte der Bilder, die Ähnlichkeitswerte aus den
erstellten Templates und die Auswirkungen der Nachbearbeitungsstufen (siehe Kapitel
5) dargestellt. Es wurden bei der Auswertung 32 der 36 Fingerbilder verarbeitet. Vier
Fingerbilder von vier verschiedenen Personen waren leider aufgrund falscher
Fokussierung der Kamera unbrauchbar.
1 Für die Anwendung des lokalen Normalisationsfilters wurde die Software Filter Forge 2.0 [Web2] benutzt.
Der Filter ist als Plug-In für die Software Filter Forge 2.0 verfügbar. Die Einstellungen des Filters, mit denen
er angewandt wurde, sind folgende: HDRI Mode: No, White Color: , Black Color: , RGB Mode: No, Filter
Opacity: 100, Sampling Radius: 50, Sampling Percentile: 50, High Precision: No, Shadow Edge: 11, Light
Edge: 11, Flat Edge: No, Lowpass Treshold: 2, Lowpass Tone: 10, Shadow Blend: 10, Hilight Blend: 10,
Shadow Saturation: 100, Contrast: 100, Gamma: 100, Size, Pixels: 73% horizontal dimension of the image,
Seamless Tiling: No
300

6.1 Qualitätswerte
Der Qualitätswert (Quality Score) wird beim Enrollment-Prozess berechnet. Er gibt an,
in wie weit das Bild geeignet ist, um Muster des Fingerabdrucks mittels des Algorithmus
der VeriFinger Software zu erkennen und daraus extrahieren zu können. Die Skala reicht
von 0 bis 255. Je höher der Wert ist, desto höher ist die Qualität.
Quality Scores
unbearbeitet Nachbearbeitungsstufe 4 Nachbearbeitungsstufe 5
Die Qualität der Bilder schwankt sehr und kann mit Nachbearbeitungen meistens
verbessert werden. Eine Qualitätssteigerung nach jeder Nachbearbeitungsstufe ist bei
vielen Bildern ersichtlich. Bei wenigen Bildern ist keine Qualitätssteigerung oder gar
eine Senkung der Qualität zu beobachten. Insgesamt jedoch, kann man einen klaren
Trend zur Steigerung der Qualität nach jeder Nachbearbeitungsstufe feststellen.
301

6.2 Ähnlichkeitswerte
Beim Enrollment-Prozess werden aus den Bildern Templates erzeugt. Die Templates
von den Bildern vom 1. Termin dienen als Referenz, die vom 2. Termin als Probe. Alle
Templates eines bestimmten Fingertyps werden in der Datenbank beim Vergleichs-
Prozess gegeneinander geprüft. Bei der Prüfung wird ein Ähnlichkeitswert (Similarity
Score) berechnet, der angibt wie genau zwei Templates übereinstimmen. Je höher der
Wert ist, desto höher ist die Übereinstimmung.
Similarity Scores
hohe2
Genuine Scores Genuine Scores Imposter Scores
Die Similarity Scores sind allgemein sehr niedrig. In drei Fällen kann ein erhöhter
Genuine Score festgestellt werden. Durch Nachbearbeitungen kann dieser Score weiter
gesteigert werden. Ansonsten haben die Nachbearbeitungen keine Auswirkungen erzielt.
2 Mindestens doppelt so hoch wie der höchste Imposter-Score
302

7 Evaluation der Ergebnisse
Die Ergebnisse für die Qualitätssteigerung der Bilder durch verschiedene
Nachbearbeitungsprozesse sind vielversprechend und zeigen, dass sich die Bilder
dadurch in der Regel verbessern lassen. Enttäuschende Ergebnisse werden jedoch bei
dem Vergleichsprozess erreicht. Viele der Templates von Bildern mit gutem Quality
Score erreichen bei der Überprüfung einen schlechten Genuine Score. Zwei Aufnahmen
des gleichen Fingers mit guten Quality Scores garantieren also keine hohe Ähnlichkeit.
Daraus lässt sich folgern, dass die Qualität nicht das Problem ist, sondern andere
Faktoren. Da die Aufnahme solcher Bilder nicht standardisiert ist, bestehen sehr viele
Freiheitsgrade, die Probleme verursachen können.
Folgende Freiheitsgrade gibt es bei der Aufnahme von Fingerfotos, die die Qualität der
Aufnahmen beeinflussen und für Probleme beim Vergleichsprozess sorgen können,
wenn die Aufnahmen aufgrund dieser Variablen zu verschieden sind:
- Aufnahmegerät (Kamera): Auflösung, Rauschverhalten, Fokus, Blitz
- Entfernung der Kamera zum Finger
- Drehung und Winkel des Fingers zur Kamera
- Hintergrund
- Beleuchtung und Lichtreflexionen
- Beschaffenheit des Fingers: Wölbung, Abrieb und Verschmutzungen
Daraus können folgende Probleme bei der Extraktion von Merkmalen entstehen:
- Merkmale werden nicht erkannt
- Merkmale werden extrahiert, die keine sind
- Merkmale mit falschen Informationen (Lage, Orientierung) werden extrahiert
- Abstände der extrahierten Merkmale werden verfälscht
8 Fazit
Die Untersuchung hat gezeigt, dass die Fingerabdruckerkennung mit Smartphone-
Kameras in alltäglichen Situationen noch nicht zuverlässig einsetzbar ist. Schon bei der
Aufnahme von nahen Objekten scheitern einige Smartphone-Kameras und
disqualifizieren sich für die Eignung für die Fingerabdruckerkennung. Der Vorteil der
hohen Auflösung der Kameras wird durch die mangelhafte Fokussierung zunichte
gemacht, da der große notwendige Abstand von Finger und Kamera die effektive
genutzte Auflösung der Fingerstruktur verringert. Bei der Selektion eines geeigneten
Smartphones für die Fingerabdruckerkennung stellt sich also vielmehr die Frage der
Fähigkeit der Kamera auf nahe Objekte fokussieren zu können. Dies macht es besonders
schwierig, geeignete Modelle zu identifizieren, da sich dieses Kriterium nicht vorab
feststellen lässt und erst Testaufnahmen gemacht werden müssen.
303

Eine weitere Erkenntnis ist, dass die Auflösung der Kamera eine eher untergeordnete
Rolle spielt. Dies wird durch den Ergebnissen der Arbeiten [HJY10] und [MS09]
deutlich, da dort mittels niedrig auflösenden Kameras gute Ergebnisse erzielt werden
konnten. Des Weiteren stellte es sich als schwierig heraus in alltags ähnlichen
Situationen konstant gute Aufnahmen von den Fingern zu erreichen, was die
schwankenden Quality Scores beweisen. Mithilfe von Nachbearbeitungen lassen sich die
Bilder jedoch verbessern. Aber schon die Tatsache, dass mehrere Versuche gemacht
werden müssen, um ein Foto von angemessener Qualität zu erstellen, stellt die
Nutzerfreundlichkeit in Frage. Das Hauptproblem ist aber vielmehr die optische, nicht
standardisierte Erfassung des Fingers. Die Aufnahme eines Fingers kann sehr
unterschiedlich sein – das Ergebnis ist es schließlich dann auch, was zu nicht
zuverlässigen Wiedererkennungsraten führt.
In dieser Arbeit wurde eine relativ kleine Datenbank an Fingerbildern erstellt, auf der die
Ergebnisse dieser Arbeit basieren. Weitere Forschungsarbeiten von größerem Ausmaß
sind notwendig, um weitere genauere Analysen zu erstellen und um mehr über die
Randbedingungen für die Fingerabdruckerkennung mittels Smartphone-Kameras zu
erfahren.
Literaturverzeichnis
[DYB11] Derawi M. O.; Yang B.; Busch C.: Fingerprint Recognition with Embedded
Cameras on Mobile Phones.
In: MobiSec 2011, 3rd International ICST Conference on Security and Privacy in
Mobile Information and Communication Systems, 2011
[HJY10] Hiew B. Y.; Jin Teoh A. B.; Yin O. S.: A Secure Digital Camera Based Fingerprint
Verification System.
In: Journal of Visual Communication and Image Representation, Volume 21 Issue 3,
April 2010, S. 219-231, 2010
[MS09] Mueller R.; Sanchez-Reillo R.: An Approach to Biometric Identity Management Using
Low Cost Equipment.
In: Intelligent Information Hiding and Multimedia Signal Processing, IIH-MSP '09,
5th International Conference, S. 1096-1100, 2009
[SK08] Scheuermann D.; Kniess, T.: Biometrie vs. Passwort - Advantage Biometrie.
In: IT-Sicherheit (2008), Nr. 2, S. 46-48, 2008
[Web1] Neurotechnology: http://www.neurotechnology.com/verifinger.html
Zuletzt besucht am 26.07.2011
[Web2] Filter Forge: http://www.filterforge.com/
Zuletzt besucht am 26.07.2011
304

A New Biometric Identification Model and the Multiple
Hypothesis Testing for Arbitrarily Varying Objects
Ashot Harutyunyan∗, Naira Grigoryan†, Svyatoslav Voloshynovskiy‡, and Oleksiy Koval§
Abstract: We introduce a new interpretation for the biometric enrollment and identi-fication paradigms and show how the problem of multiple hypothesis testing (HT) forarbitrarily varying sources (AVS) in a special case relates to it. The traditional stud-ies on biometric systems from communication perspectives assume the noisy channelmodel. If suppose that the process of the biometric data enrollment for a person canbe performed several times and at each time both the person and the detector havesome arbitrary “state”, then those observations characterized according to their em-pirical distributions can be treated as family distributions of an AVS. It means thatM persons enrollment indicate M different AVS’s. Then the problem of biometricidentification based on a new observation turns to be a detection of true AVS with anadditional option of rejecting the existing M hypotheses. In this context, the biometricidentification over noisy channels converts to one in an arbitrarily varying stochasticenvironment. We consider the problem within a fundamental framework of HT and in-formation theory. The asymptotic tradeoffs among error probability exponents associ-ated with false acceptance of rejection decision and false rejection of true distributionfamily are investigated and the optimal decision strategies are outlined. It is provedthat for an optimal discrimination of M hypothetical distribution families/persons theideal detector permits always lower error than in deciding in favor of the rejection.
1 Introduction
The scientific and technological interest in fundamental frameworks of biometric identifi-
cation/authentication systems design rapidly grows with security needs of modern society.
One of those fundamental frameworks from information-theoretic perspectives was dis-
closed by Willems el al. [5]. Its innovation is that the authors transfer a biometric identi-
fication problem to a communication problem over discrete memoryless channels (DMC)
and thus reveal the concept of identification capacity (in other words, theoretically achiev-
able maximum number of persons that can be reliably identified within a given system
defined by DMC’s). The latter is a fundamental limit and a performance target for any
such biometric identification system. At the same time, characterization of performance
bounds of identification systems in the setting of optimal hypothesis testing (HT) (see [7],
[8]) are also highly important both from practical and theoretical considerations. In this
∗Institute for Informatics and Automation Problems (IIAP), Armenian National Academy of Sciences (NAS),
[email protected]. The first two authors’ research was supported by national grant 11-1b255.†IIAP, Armenian NAS, [email protected].‡University of Geneva, [email protected].§University of Geneva, [email protected].
305

context, keeping the general information-theoretic framework, we propose an alternative
model of biometric identification (that naturally implies for the authentication) within the
multiple HT for information sources. Here, when we make the model transform against
the classical views, the discrete arbitrarily varying sources (AVS) play a central role.
The current analysis primarily relies on the paper [10] (see also the other references
therein) and on the classical works in HT by Blahut [1], Haroutunian [2], Fu and Shen
[4], as well as on the recent developments [6] and [9]. We briefly recall that, in particu-
lar, [1] characterizes the optimum relation between two kinds of error exponents in binary
HT for discrete memoryless sources (DMS). The papers [2] and [6] study the multiple
(M > 2) HT for DMS’s in terms of logarithmically asymptotically optimality (LAO) and
error exponents achievability, respectively. The subjects of [4] and [9] (also [10]) are the
binary and M -ary HT for AVS’s (a rather more practical model of source than the abstract
DMS), respectively.
According to this model it is assumed that the source enrollment or registration is con-
ditioned by a certain parameter further referred to as state. Under the state one can, for
instance, imagine geometrical orientation of the object during its registration. It is further
agreed that the state remains unchanged during entire registration. In such a scenario we
say that that we deal with an arbitrarily varying object, a special case of an AVS. Perfor-
mance analysis of optimal identification of such objects in terms of the best achievable
error exponents represents the main research challenge of this paper.
In Section 2 the proposed model and the relevant mathematical concepts are introduced.
Section 3 demonstrates the main result. Its further elaboration in view of optimal identifi-
cation or HT strategies is the topic of Section 4.
2 Models of biometric identification, information source, and HT
Following modern trends of multi-biometric identification, it is assumed that we are al-
lowed to acquire several samples from the same person (to enhance the accuracy of the
identification system benefiting from multiple observations) which can result in different
records. It means that at enrollment and identification the person stays at different “states”
s (from finite set S) during the registration and those states are arbitrary (coming, for in-
stance, from physical and other conditions of the enrollment device, human interaction
with it, etc.). For each person m among M possible, an N -length vector of observations
x△= (x1, ..., xN ) ∈ XN (X being the enrollment or information source alphabet, also
finite) or x(s) depending on a state has its own statistics of signals, or, in other words,
its own type/emprical distribution (ED) [3], denote it by Gm,s△= {Gm,s(x), x ∈ X}.
The latter is computed by an extractor of empirical distributions (Fig. 1). Moreover,
the enrollment state does not change during a particular sampling or feature extraction.
Those distributions collected for all possible states of the enroller create a family Gm△=
{Gm,s, s ∈ S} of probability distributions (PD) which is saved in a database. Therefore,
each of possible M persons can be characterized by his/her specific family of PD’s (over
306

arbitrarily varying states) which constitute an AVS. Within this model the biometric iden-
tification becomes a problem of multiple HT (making a decision on the true distribution
family or a person m among M or on the rejection of all M ’s) based on an observation
made at an unknown state for an identifiable person (Fig. 2). Note that the genuine statis-
tical characteristics (type family) of an enrolled person remains unknown, denote it by G∗m
for person m. So in the phase of identification the identifier has to match the outcome of
the extractor of distributions for an observation (at unknown state) with the M hypotheses
available in the biometric database and make a decision in favor of one of them or the
rejection alternative:
Hm : G∗ = Gm, HR : none of Hm’s is true, m = 1,M .
As a typical HT problem this decision making can be performed applying a test ϕN as a
partition of XN intoM+1 disjoint subsets AmN , m = 1,M , and AR
N . If x ∈ AmN then the
test adopts the hypothesis Hm. If x ∈ ARN , the test rejects all those M hypotheses. Below
we categorize the errors occurring in the decision making. (M + 1)M different kinds
of errors are possible. We treat the problem in the memoryless formulation. Therefore,
the probability of x according to PD G∗ is G∗N (x)△=
∏N
n=1G∗(xn). Furthermore, the
probability of a subset AN ⊂ XN is measured by the sum G∗N (AN )△=
∑x∈AN
G∗(x).
Person
Enroller,
Enroller,
Enroller,
Extractor of
Empirical
Distributions
DB of Family
Distributions
m
1s
2s
||"s
)( 1sx
)( ||"sx
)( 2sx!#
Fig. 1. Enrollment of person m.
DB of Family
Distributions
Biometric Reader,
unknown
Identifierm
)(sx
s
Person )(sxED ofExtractor of
Empirical
Distributions
Fig. 2. Identification of a person.
Now, the probability of an erroneous acceptance of hypothesis Hl when Hm was true is
αl,m(ϕN )△= max
s∈SGNm,s(A
lN ), 1 ≤ l ?= m ≤M. (1)
307

And the error probability of false rejection (a false accept of rejection decision) when Hm
was true is defined by
αR,m(ϕN )△= max
s∈SGNm,s(A
RN ), m = 1,M. (2)
In case of true Hm the probability of wrong decision (false reject of true hypothesis) will
be
αm(ϕN )△= max
s∈SGNm,s(A
m
N ) =
M∑
l 5=m
αl,m(ϕN ) + αR,m(ϕN ), m = 1,M. (3)
Therefore, the following sort of error probability exponents/reliabilities (log-s and exp-s
being to the base 2) of (1) and (2) are of interest:
El|m(ϕ)△= lim sup
N→∞−
1
NlogαNl|m(ϕN ), l ?= m = 1,M, (4)
ER,m(ϕ)△= lim sup
N→∞−
1
NlogαNR,m(ϕN ), m = 1,M, (5)
where ϕ△= {ϕN}∞N=1
. From (3) and (4) it follows that
Em(ϕ) = minl 5=m
[El|m(ϕ), ER,m(ϕ)
]. (6)
Now the question is: which collection (trade-offs) of error exponents can be theoreti-
cally achieved for the given identification or HT problem? Consider the M(M + 1)-
dimensional point E△= {ER,m, Em}
m=1,Mwith respect to the error exponent pairs
(− 1
NlogαR,m(ϕN ),− 1
Nlogαm(ϕN )), where the decision regions Am
N (m = 1,M ) and
ARN satisfy Am
N ∩ AlN = ∅ for m ?= l, Am
N ∩ ARN = ∅ and
⋃m
AmN = XN/AR
N .
Definition 1 The collection of error exponents (reliabilities) E is called achievable if for
all ε > 0 there exists a decision scheme {AmN}Mm=1 plus AR
N such that
−1
NlogαR,m(ϕN ) > ER,m − ε, −
1
Nlogαm(ϕN ) > Em − ε
for N large enough. Let Rb(M) denotes the set of all achievable reliabilities.
3 Error exponents: achievable tradeoffs
The method of typical sequences [3] is underlying for proofs of achievable error bounds.
Let G(X )△= {G(x), x ∈ X} be the collection of all PD’s on X . Each observation x ∈ XN
308

has a type defined by its composition or empirical PD Gx(x)△= G
△= 1
NN(x|x), where
N(x|x) is the number of occurrences of x in x. Denote the set of all possible types of such
N -length vectors by GN (X ). Additionally, denote by T NG (X) the type class of G, the
set of G-type vectors x. Let H(G) stands for the Shannon entropy of G and D(G ‖ Gm)for the KL divergence between distributions G and Gm. In the sequel we use several
properties of types. First of all,
|GN (X )| < (N + 1)|X |, (7)
|T NG (X)| ≤ exp{NH(G)}. (8)
For a PD Gm,s ∈ G(X ), the sequence x ∈ T NG (X) has the probability
GNm,s(x) = exp{−N [H(G) +D(G ‖ Gm,s)]}. (9)
The equations (8) and (9) imply estimates for the probability of a type class:
GNm,s(TNG (X)) ≥ (N + 1)−|X| exp{−ND(G ‖ Gm,s)}, (10)
GNm,s(TNG (X)) ≤ exp{−ND(G ‖ Gm,s)}. (11)
In the theorem and its proof below we show that the following collection of exponents
characterizes the unknown region Rb(M):
Eb(M)△= {E : ∀G ∃m s. t. min
s∈SD(G ‖ Gm,s) > Em and
∃G s. t. mins∈S
D(G ‖ Gm,s)>ER,m for all m}. (12)
Theorem 1 The set Eb(M) is an achievable region of reliabilities: Eb(M) ⊂ Rb(M).Additionally, if E ∈ Rb(M), then for any δ > 0 it follows that Eδ ∈ Eb(M), where
Eδ△= {ER,m − δ, Em − δ}
m=1,M.
The proof of the theorem consists of direct and converse parts. For the direct part, we
observe that if E ∈ Eb(M), then from (8), (9), and (11) for any s ∈ S we have
GNm,s(Am
N |s) =∑
x∈Am
N
GNm,s(x|s)
≤∑
T N
G(X)⊂A
m
N
exp{−ND(G ‖ Gm,s)}
≤ |GN (X )|exp{−ND(G ‖ Gm,s)}. (13)
Applying (13) and (7) we derive
αm(ϕN ) ≤ |GN (X )|exp{−N mins∈S
D(G ‖ Gm,s)} ≤ exp{−N(Em − δ)}.
309

Similar steps can lead us to other desirable inequalities:
αR,m(ϕN ) ≤ exp{−N(ER,m − δ)}. (14)
In the converse part we assume that E ∈ Rb(M). It means that for every ε > 0 there
exists a decision scheme {AmN ,A
RN}Mm=1 that provides the following inequalities for all
m’s with large enough N > N0(ε):
−1
NlogαR,m(ϕN ) > ER,m − ε, −
1
Nlogαm(ϕN ) > Em − ε, (15)
We pick a δ > 0 and show that
∀G ∃m s. t.mins∈S
D(G ‖ Gm,s) > Em − δ, (16)
∃G s. t.mins∈S
D(G ‖ Gm,s) > ER,m − δ for all m. (17)
For the equation (16), by the continuity of D(· ‖ Gm,s) there exists a type Q ∈ GN (X )that for N > N1(ε) and a fixed m satisfies
D(Q ‖ Gm,s) ≤ D(G ‖ Gm,s) + δ/2. (18)
Let Gm△= argmin
s∈SD(Q ‖ Gm,s) > Em − δ/2, then in light of (8) we have
αm(ϕN ) ≥ GN
m(Am
N )
≥ GN
m(Am
N ∩ T NQ (X))
=∑
Am
N∩T N
Q(X)
exp{−N [H(Q) +D(Q ‖ Gm)]}
≥ |Am
N ∩ T NQ (X)| exp{−NH(Q)} exp{−ND(Q ‖ Gm)}.
Note that for N > N2(δ),
|Am
N ∩ T NQ (X)| exp{−NH(Q)} ≥ exp{−Nδ/4}, (19)
Whence, for N > max{N1(δ), N2(δ)} we conclude that
αm(ϕN ) ≥ exp{−N [D(Q ‖ Gm)− δ/4]} ≥ exp{−N [D(G ‖ Gm) + δ/4]}
which with (15) and ε = 3δ/4 gives Em − δ < − 1
Nlogαm(ϕN ) < D(G ‖ Gm) for
N > max{N0(ε), N1(δ), N2(δ)} and for every m = 1,M .
310

Now we proceed to the equation (17). Pick a δ > 0. If Eδ /∈ Eb(M) then for arbitrary Gthere exists m satisfying D(G ‖ Gm) ≤ ER,m − δ. In view of (8), (18), and (19) we get
αR,m(ϕN ) ≥ GN
m(ARN )
≥ GN
m(ARN ∩ T N
Q (X))
=∑
AR
N∩T N
Q(X)
exp{−N [H(Q) +D(Q ‖ Gm)]}
≥ |ARN ∩ T N
Q (X)| exp{−NH(Q)} exp{−ND(Q ‖ Gm)}
≥ exp{−N [D(G ‖ Gm)− δ/4]}
≥ exp{−N [ER,m − δ/4]}.
However, the last inequality contradicts to (15) for ε < δ/4 and N large enough.
4 Optimal decision schemes
Theorem 1 specifies all possible reliability trade-offs for the identification system of Figs.
1-2. It contains also optimal relations between those error exponents in sense of LAO
testing of hypotheses. In other words, let Em, m = 1,M, be fixed: what are the “maxi-
mum” values {E∗l,m, E
∗R,m}
l 5=m=1,Mfor the rest of reliabilities such that there is no other
collection {E′l,m, E
′R,m}
l 5=m=1,Msatisfying E′
l,m > E∗l,m and E′
R,m > E∗R,m for all
l ?= m = 1,M?
Let ϕ∗ be a test sequence defined by the following decision regions:
BR△= {G : min
s∈SD(G ‖ Gm,s) > Em for all m}, (20)
Bm△= {G : min
s∈SD(G ‖ Gm,s) < Em}, m = 1,M. (21)
For l ?= m = 1,M we define:
ER,m(ϕ∗)△= E∗
R,m
△= minG∈BR
mins∈S
D(G ‖ Gm,s), (22)
El,m(ϕ∗)△= E∗
l,m
△= minG∈Bl
mins∈S
D(G ‖ Gm,s). (23)
A detailed analysis of this decision scheme results in the next assertion.
Theorem 2 Let the inequalities
E1 < minm
{ mins,s′∈S
D(Gm,s ‖ G1,s′)},
311

Em < minl 5=m
{ minl=1,m−1
El,m, minl=m+1,M
mins,s′∈S
D(Gl,s ‖ Gm,s)}, m = 1,M,
hold, then the optimum collection of error exponents are defined by (20)–(23).
Theorem 2 implies an interesting observation.
Remark 1 Further analysis shows that minl=1,M, l 5=m
[E∗l,m, E
∗R,m
]= E∗
R,m, for all m =
1,M . This statement means that discriminating among M families is always easier than
voting for the rejection. Its biometric reflection within the above introduced identification
model is that the persons can be recognized easier than claimed unfamiliar.
Conclusion. We introduced a novel mathematical interpretation and model for the biomet-
ric identification and showed its relation to the multiple HT for arbitrarily varying objects
within an information-theoretic framework. The achievable performance bounds for this
identification system are specified including special optimality tradeoffs.
References
[1] R.E. Blahut, “Hypothesis testing and information theory”, IEEE Trans. Inform. Theory, vol.IT-20, no. 4, pp. 405–417, 1974.
[2] E.A. Haroutunian, “Logarithmically asymptotically optimal testing of multiple statistical hy-potheses”, Problems of Control and Inform. Theory, vol. 19, no. 5-6, pp. 413–421, 1990.
[3] T.M. Cover and J.A. Thomas, Elements of Information Theory, New York, Wiley, 1991.
[4] F.-W. Fu and S.-Y. Shen, “Hypothesis testing for arbitrarily varying source with exponential-type constraint”, IEEE Trans. Inform. Theory, vol. 44, no. 2, pp. 892–895, 1998.
[5] F. Willems, T. Kalker, J. Goseling, and J.P. Linnartz, “On the capacity of a biometrical identifi-cation system”, Proc. IEEE Intern. Symp. Inf. Theory, p. 82, Yokohama, Japan, June 29 – July4, 2003.
[6] E. Tuncel, “On error exponents in hypothesis testing”, IEEE Trans. Inform. Theory, vol. 51,no. 8, pp. 2945–2950, 2005.
[7] A.L. Varna, A. Swaminathan, and M. Wu, “A decision theoretic framework for analyzing hash-based content identification systems”, Proc. ACM Digital Rights Management Workshop, pp.67–76, Oct. 27, 2008.
[8] S. Voloshynovskiy, O. Koval, F. Beekhof, F. Farhadzadeh, and T. Holotyak, “Information-theoretical analysis of private content identification”, Proc. IEEE Workshop Inform. Theory,Dublin, Ireland, August 30 – September 3, 5 p., 2010.
[9] N.M. Grigoryan and A.N. Harutyunyan, “Error exponents in multiple hypothesis testing forarbitrarily varying sources,” Proc. IEEE Workshop Inform. Theory, Dublin, Ireland, August 30– September 3, 5 p., 2010.
[10] N. Grigoryan, A. Harutyunyan, S. Voloshynovsky, and O. Koval, “On multiple hypothesis test-ing with rejection option,” accepted, IEEE Workshop Inform. Theory, Paraty, Brazil, October16–20, 5 p., 2011.
312

Biometrische Merkmale im wirtschaftlichen Umfeld -Rechts- und Zulassungsbewertung
Jens Sperling
Joachim-Karnatz-Allee 27
D-10557 Berlin
Fritz-René Grabau
FH Magdeburg / Stendal
Osterburger Straße 25
D-39576 Stendal
Irina Hundt
Hochschule für Technik und Wirtschaft Dresden
Friedrich-List-Platz 1
D-01069 Dresden
Abstract: Die Einsatzfähigkeit biometrischer Verfahren und biometrischer Sys-
teme wurde bereits vielfach bewiesen. Praxisanwendungen sind keine Seltenheit
mehr. Einen großen Durchbruch haben biometrische Authentifikationsverfahren
gegenüber anderen Systemen aber nur teilweise erreicht. Beispielsweise ist in der
Kreditwirtschaft weltweit immer noch die 2-Faktor-Authentifizierung aus Karte
und PIN relevant. Dieser Beitrag klärt aus einer wirtschaftlichen Perspektive auf,
welche Vorraussetzungen erfüllt sein sollten, damit Biometrie allgemein wie juris-
tisch anerkannt ist. Dabei wird auf CC-Evaluierungen und Zertifizierungen einge-
gangen und versucht dies mit Willenserklärungen und deren Verbindlichkeit zu
kombinieren, um Rechtssicherheit zu erzielen.
1. Einleitung
In der Untersuchung wird davon ausgegangen, dass Biometrie als Verfahren und die
damit ausgebildeten Systeme geeignet sind, Personen zu identifizieren bzw. zu verifizie-
ren und somit in dieser Form eingesetzt werden. Einzelne technische Aspekte und spe-
zielle Systemkonfigurationen zur Anonymisierung von biometrischen Daten werden
nicht speziell ausgeführt. Datensicherheit und Datenschutz wird bewusst ausgeblendet,
ebenso die Herstellung der Vertraulichkeit innerhalb der Systeme und Zusicherung der
Privatsphäre durch die Anbieter biometrischer Lösungen.
313

Der Fokus liegt ausschließlich auf der Verbindung zwischen dem technischen biometri-
schen System und der Bewertung der betriebswirtschaftlichen Eignung. Somit wird ein
marktrelevanter Ansatz betrachtet und zwischen Technik und Recht verknüpft. Als
wesentlich wird erachtet, dass die Akzeptanz biometrischer Systeme in der Wirtschaft
einen juristischen Beweiswert bezüglich der Identifikation und deren Nachweises
bedingt. Daher wird u. a. zwischen elektronischer Signatur und Biometrie verglichen.
Die Prüfung bezieht sich aufbauend hierauf auf die Vergleichbarkeit und Ausgestaltung
der Systeme und auch auf die erzielte Transaktionssicherheit.
2. Welchen Nutzen brauchen die Prozessbeteiligen wirklich?
Die Wirtschaft legt zunehmend Wert darauf, durch biometrische Systeme die im Feld
vorhandenen herkömmlichen Authentifikationsinstrumente abzulösen. Grund dafür ist
die mit der Biometrie wesentlich bessere Zuordenbarkeit der handelnden Person.
Gleichwohl fehlt es der Biometrie an einem Durchbruch bezüglich des Flächeneinsatzes.
In der Vergangenheit wurde daher das Augenmerk darauf gelegt, die biometrischen
Systeme weiter zu entwickeln. Hier wurden vor allem die technische Erkennungsleistung
und die Lebenderkennung sowie das Erschließen neuer Verfahren und Merkmale be-
trachtet. Folglich konnte fortwährend die Leistungsfähigkeit der Biometrieanwendungen
erhöht werden. Dies ging einher mit der Nachweisbarkeit der Eignung der Systeme
durch die Hersteller für die Verbraucher und Anwender.
Der wirtschaftliche Zweck und Nutzen einer Biometrieanwendung ergibt sich jedoch
nicht nur aus dem Erschließen abgeschlossener Anwendungsbereiche (Closed Loop) im
Feld. Vielmehr ist die große Herausforderung die Substitution der bestehenden her-
kömmlichen und nicht immer nachweislich geeigneten Infrastruktur von 2-Faktor-
Authentifikationen. Der eigentliche wirtschaftliche Nutzen ergibt sich aber nicht nur aus
der Ablösung solcher Verfahren, sondern aus der zusätzlichen Rechtssicherheit bei
Willenserklärungen und Willensäußerungen. Hierunter ist im Besonderen der Rechtsbe-
zug zu verstehen, den eine elektronische Authentifizierung erzeugt. Dies kann zum einen
der Sicherheitsanker des „Beweises des ersten Anscheins“ oder der Beweis kraft Rechts-
norm wie bei der elektronischen Signatur sein.
Die Biometrie muss daher über die bisherigen technischen Ansätze hinaus beweisen, wie
die Anwendung mit rechtlichen Normen und juristischen Hilfskonstrukten verzahnt
werden kann. Hierzu gehört insbesondere der Nachweis, einen Missbrauch von Iden-
tifikationen durch Biometrie ausschließen zu können. Zusätzlich muss aber auch daran
gedacht werden, wie nicht nur der einzelne Anbieter die Kompromittierung eines
Merkmals verhindert, sondern wie eine Merkmalskompromittierungen auf die
biometrischen Systeme in ihrer Gesamtheit wirkt.
314

Biometrie muss somit für die Etablierung eines elektronischen Identitätsmanagements in
Verbindung mit der wirtschaftlich so dringend notwendigen rechtlich anerkannten Form
des Vertragsabschlusses stehen. So zeigt beispielsweise der Markt des kartengestützten
Zahlungsverkehrs recht deutlich, wie Entwicklungen mit Wettbewerb und Innovationen
einhergehen, gleichwohl aber immer noch keine Rahmenrichtlinien bestehen, wie ein
biometrischer Markt erschlossen werden kann. Die begründen sich nicht allein mit dem
Vertrauen in die Systeme und die unterschiedliche Eignung bestimmter Verfahren in
Bezug zu dem Nutzer. Es ist auch hier vielmehr die noch nicht ausreichend dargestellte
Nachweisbarkeit einer biometrischen Handlung bezogen auf die Rechtsicherheit des
damit ausgelösten Geschäftsvorfalls.
3. Rechtliche Einschätzungen und Signaturvergleich
Bezogen auf die unterschiedlichen am Markt auffindbaren Authentifizierungsformen
lässt sich feststellen, dass auch heute noch in vielen Gerichtsprozessen und Gutachten
ein Hilfskonstrukt des Beweises über die Nachweisbarkeit des Handelns einer bestimm-
ten Person herangezogen wird. Hierbei handelt es sich um den sogenannten prima-facie-
Beweis. Hierunter wird juristisch der Beweis über die Korrektheit der technischen Leis-
tungsmerkmale in Verbindung mit dem Nutzer verstanden, wenn der Vorgang sich aus
den Lebenserfahrungen herleiten lässt. Folglich geht es im Speziellen nicht darum, dass
der technische Nachweis der Verbindung zwischen einer Person und dem von ihm ver-
wendeten Authentifikationsinstrument faktisch besteht. Es geht vielmehr um die An-
nahme, dass die Lebensumstände aus dem Wissen über die Systeme kein anderes Han-
deln zulassen. Insofern dieser juristische Grundsatz auch auf die biometrischen Systeme
übertragbar ist, sind die rechtlich notwendigen Beweissituationen erfüllt. Genau dies gilt
es einerseits jedoch nachzuweisen und andererseits möglichst außerhalb des juristischen
Hilfskonstruktes zu fixieren. Folglich wäre es hilfreich, wenn unter bestimmten Umstän-
den der kraft Gesetz gültige Beweis der Systemintegrität anerkannt und belegt ist, wenn
bestimmte Annahmen erfüllt sind.
Im Bereich der elektronischen Signatur gibt es solch einen gesetzlichen Beweis für die
qualifizierten Signaturen und Signaturzertifikate, die auf einer sicheren Signaturerstel-
lungseinheit beruhen. Hier wird aber nicht nur kraft Gesetz eine Signaturform anerkannt.
Es werden vielmehr auch klare gesetzliche und evaluatorische Anforderungen an die
Signaturkomponenten gestellt. Folglich ist es dann möglich, eine qualifizierte
elektronische Signatur gegenüber der Form der händischen Unterschrift mit der gleichen
Rechtswirkung auszustatten.
Für den Biometriemarkt muss es daher darum gehen, je Anwendungsfall und -technik
und je nach System nachweisen zu können, dass die funktionalen und sicher-
heitsrelevanten Bestandteile eine rechtliche Beweisaufnahme aus Systemsicht zulassen.
Denn nur dann ist auch dieses rechtliche Risikofeld im elektronischen Geschäftsverkehr
mit der Biometrie begrenzbar und ein Mehrwert gegenüber anderen elektronischen For-
men der Authentifikation gegeben.
315

Anderenfalls besteht die Gefahr, dass die biometrischen Systeme im heutigen rechtlichen
Verständnis, im Vergleich zu alternativen Authentifikationsverfahren und in
Gegenüberstellung zur herkömmlichen Unterschrift in ihrer Entwicklung stocken. Die
Biometrie verliert daher eher an technisch fortschrittlichem Wert, da sie sich im
rechtlichen Nachweisverhältnis nicht auf eine andere Stufe der gerichtlichen
Anerkennung stellt. Folglich kann und wird es vorkommen, dass ohne weitere
Fortentwicklung des extern gespannten Beweises der inneren Sicherheit eines
Biometriesystems nur eine systemrelevante einzelgutachterliche Beweisaufnahme
Klarheit über das rechtsgeschäftliche Handeln gibt.
Aber auch die gutachterlichen Einzelentscheidungen werden immer wieder zu dem
Schluss kommen, mit der Biometrie keine Technologie vorzufinden, die eine
100prozentige Sicherheit gewährleisten kann. Dies wird auch dann gelten, wenn noch so
ausgefeilte Lebenderkennungssysteme in die biometrischen Erkennungsprozesse
eingebunden sind. Aus dieser Unsicherheit heraus muss somit die Forderung bestehen,
jederzeit für ein biometrisches System die rechtliche Akzeptanz und Stabilität bezogen
auf eine biometrisch legitimierte Transaktion beweisen zu können. In den weiteren
Betrachtungen geht es daher darum, sich auf den Grenzbereich zwischen Technik und
juristisch belegbarer Transaktionssicherheit zu bewegen. Insbesondere wird es um die
juristisch brauchbare einheitliche Messbarkeit und Normung biometrischer Systeme und
Verfahren gehen, um die Biometrie in Verbindung mit einer nicht abstreitbaren
juristischen Willensäußerung zu bringen.
4. Vergleichbarkeit der Systeme und Systemevaluierungen
Ein sehr wesentlicher und brauchbarer Ansatzpunkt ist die Evaluierung biometrischer
Systeme entsprechend dem Common Criteria (CC) Katalog in Verbindung mit definier-
ten Schutzprofilen. CC ist auch bei Biometrieanwendungen ein kritisch zu bewertendes
aber durchaus begrüßenswertes Modell. Die CC-Evaluierung ist bereits bei der elektro-
nischen Signatur bekannt, angewandt und aus der Rechtsnorm heraus vorgeschrieben.
Daher ist diese Form der Evaluierung auch bei biometrischer Authentifikation zu begrü-
ßen. Probleme die sich für den Biometriemarkt hiermit ergeben, sind allerdings bis jetzt
negative Kosten-Nutzen-Betrachtungen. Diese resultieren vor allem aus den Aufwänden
der CC-Evaluierungen in Verbindung mit dem für den Nutzer nicht gleichzeitig
verbundenen monetären wie ideellen Mehrwerten. Hinzu kommt, dass die
Systemhersteller in der Regel den Aufwand für die CC-Evaluierung auf die
Produktpreise umlegen müssen. Dies wiederum wird sich unter heutigen
Rahmenbedingungen kein Hersteller leisten können und wollen, da es sich bei dem
Biometriemarkt immer noch frisch herausbildendes Marktsegment handelt. Dieses
Marktsegment ist davon gekennzeichnet, dass einer Vielzahl von Anbietern eine
kritische Masse von Nutzern und Anwendern gegenübersteht, die derzeit die
wirtschaftliche Notwendigkeit nicht belegt sieht. Daher kann derzeit, abgesehen von
proprietären Einzelanwendungen, von einer Marktsituation gesprochen werden, in der
Mehrwerte zu herkömmlichen Verfahren nicht ausreichend greifbar sind.
316

Mangels einheitlicher Messverfahren und Normen fällt es aber auch schwer, bio-
metrische Systeme zu vergleichen. Dies kann durch eine CC-Evaluierung der bio-
metrischen Systemkomponenten teilweise erreicht werden. So ist ein gewisses Maß an
Einheitlichkeit über die Schutzprofile und CC-konforme Evaluierung biometrischer
Verfahren und Systeme möglich, denn auch biometrische Systeme lassen sich in ähnli-
cher Art und Weise wie vergleichbare IT-Systeme evaluieren. Dies trifft insbesondere
dann zu, wenn eine enge Anlehnung an die Regelungen der Evaluierung von
elektronischen Signaturkomponenten erfolgt. Somit wäre eine standardisierte und
anerkannte Möglichkeit zur Prüfung und Darstellung der Sicherheit biometrischer
Produkte gegeben, die gleichzeitig Vergleiche zu den verschiedenen Verfahren zulässt.
Als Zielsetzungen der Evaluierung könnte beispielsweise formuliert werden, bei
Anwendung von CC auf biometrische Verfahren folgendes erfüllt sehen zu wollen:
− Internationale Vergleichbarkeit der Ergebnisse von Prüfungen und Bewertungen
biometrischer Verfahren.
− Stringenz der Vorgaben.
− Größtmögliche Freiheit, durch Kombination der Kriterien nach eigenen Erforder-
nissen.
− Bilden von Klassen von Sicherheitsfunktionalitäten.
− Internationale Basis für die Hersteller von biometrischen Systemen.
− Berücksichtigung der Interessen des Anwenders. [BS03, S. 112]
Darüber hinaus sollten aber auch die Kombinationen der verschiedenen Komponenten
innerhalb und außerhalb eines biometrischen Systems zusammengefasst und bezüglich
der Gesamtsicherheit des Systems bewertet werden. [BS03, S. 118]
Über die Schutzprofile (Protection Profiles) wird beispielsweise ein Sicherheitsniveau
bezüglich der Einsatzfelder, der Sicherheitsziele und potentiellen Gefährdungslage be-
zogen auf das zu bewertende System beschrieben. [He04, S. 120] Egal auf welches der
bestehenden Schutzprofile für die Biometrie zurückgegriffen wird, beziehen sich diese in
erster Linie auf die systemischen „Assets“. [Si02, S. 54] Theoretisch ergibt sich hieraus
eine Festschreibung für die Evaluierung von biometrischen Systemen in Anlehnung an
die möglichen Protection Profiles und Technical Reports. Ziel und Stoßrichtung bei
diesem Vorgehen muss aber sein, auch die praktisch einheitliche Bewertung durch die
Evaluatoren herzustellen, damit in Bezug auf die juristische Wirkungsweise einer bio-
metrischen Authentifikation eine Rechtsnorm gestaltet werden kann. Der zu lösende
Ansatzpunkt ist somit nicht nur die allgemeine Sicherheit eines biometrischen Systems,
sondern der Nachweis über die Rechtssicherheit dieser Anwendung.
Demzufolge sind einheitlich und über die verschiedenen Systeme folgende technische
Evaluierungskriterien festzustellen:
317

− physikalische Robustheit (Test)
− Hard- und Softwarebeschreibung
− Erweiterbarkeit - oder Modularisierung
− Erkennungsleistung (Test)
− Problemfälle / Sicherheitslücken (Test)
− Klassifizierung der Überwindungsversuche (Test)
− Zugriffs- und Sabotageschutz (Test) [BS03, S. 116 f.]
Grundsätzlich wird dieses Vorgehen bezüglich der CC-Evaluierung nicht die Akzep-
tanzprobleme der Praxis lösen, da bereits heute die Systeme unter diesen beschrieben
Kriterien evaluiert werden können. Problematisch ist jedoch zu sehen, dass die hohen
Evaluierungskosten sich recht schnell amortisieren müssen und nicht zu einer wesent-
lichen Verteuerung der Systeme beitragen dürfen. Hierbei darf auch nicht unbeachtet
bleiben, dass die Bewertung nach generischen Schutzprofilen je nach Evaluator und
Zertifizierungsstelle dehnbar ist und somit eine Gefahr bezüglich der Vergleichbarkeit
besteht.
Lösbar ist dies u.a. durch zwei Ansätze:
− Eine zentrale Evaluierungseinrichtung für biometrische Systeme in Deutschland und
vergleichbar einheitliche Anwendung in Europa. Hierbei wird auf einen
überschaubaren Katalog von Schutzprofilen gesetzt, der durch die Regulatoren be-
züglich der Anwendung vorgeschrieben ist.
− Ausprägung eines freien wirtschaftlichen Biometrieschemes, bei dem eine zentrale
Institution den Betrieb und die Bewertung der Systeme im Feld überwacht und die
Zertifizierungen nach einheitlichen Kriterien vergibt.
5. Wirtschaftliche und regulatorische Betrachtung
Sofern eine CC-Evaluierung biometrischer Systeme vorausgesetzt wird, bleiben
folgende offene Punkte zu lösen:
− Wer zahlt die Mehrkosten CC-evaluierter biometrischer Systeme?
− Ist die Wirtschaftlichkeit somit noch gegeben oder biometrische Systeme in eine Art
Schattendasein gedrängt?
− Kann sinnvoll die Einsatzbreite der Biometrie erweitert werden um Skaleneffekte zu
erzeugen?
318

Insofern regulatorische Vorgaben zu einer Verpflichtung bezüglich der Evaluierung
biometrischer Systeme führen, ergibt sich der gleichzeitig damit verbundene Vorteil der
nachweisbaren rechtssicheren Willenserklärung durch den Nutzer. Nachteilig dabei ist
jedoch, dass die Biometrie ein Schattendasein fristen könnte, wie es teilweise bei der
elektronischen Signatur der Fall ist.
Dem kann nur dann vorgebeugt werden, wenn die biometrische Welt bezüglich der Ver-
pflichtung zur Evaluierung offen gestaltet wird. Hierbei ist insbesondere zu beachten,
dass eine Art Sicherheitsklasse je Anwendungsfall zu definieren ist. Wird beispielsweise
ein biometrisches System lediglich zu einer einfachen Zugangskontrolle oder für eine
Zeiterfassung eingesetzt und bezieht sich das unternehmerische wie anwenderorientierte
Risiko lediglich auf eine interne Unternehmensbetrachtung, so sind Evaluierungen wün-
schenswert aber nicht vorgeschrieben. Soll jedoch mit einem biometrischen System eine
Außenwirkung wie eine Willenserklärung oder ein Vertragsabschluss erzeugt werden, ist
eine Evaluierung erforderlich und vorgeschrieben.
Mit dieser Aufspaltung lässt sich der heute etablierte Biometriemarkt recht gut auch zur
bestehenden Kostenstruktur weiter betreiben. Insofern neue Marktteile mit der Biometrie
erschlossen werden sollen, die heute adäquat dem Ersatz der händischen Unterschrift im
Rechts- und Geschäftsverkehr sind, ist eine regulatorische Vorgabe einzuhalten.
Unter dieser Betrachtung wird davon ausgegangen, dass die Wirtschaft bereit ist, die
Mehrkosten für evaluierte Systeme zu tragen, da ein rechtsicherer Raum geschaffen ist
in dem agiert werden kann. Weiterhin lassen sich hierdurch wirtschaftlich wertvolle
Skaleneffekte erzeugen, da die Verbreitung der Biometrie und der Komponenten
wirkungsvoll steigen sollte. Somit lassen sich nicht nur die Effekte bezüglich der
Lesermengen sondern bei der generellen Verbreitung der Systeme einholen.
6. Fazit
Der Gesetzgeber wie auch die Industrie sind gefordert, sich gemeinsam auf eine
technische Anerkennung biometrischer Systeme vor dem Hintergrund der
Rechtssicherheit zu verständigen. Erst hiermit ist die Voraussetzung geschaffen, eine
Rechtsnorm auch für die biometrische Authentifikation auszurufen und damit der
Technologie einen Vortrieb in der wirtschaftlichen und vertragsrechtlichen Eignung zu
geben.
Hierbei sollte jedoch nicht unbeachtet gelassen werden, dass biometrische Systeme in
Sicherheitsklassen aufzuteilen sind, um nicht per se eine Verpflichtung für eine Evaluie-
rung auszusprechen. Denn erst hiermit lässt sich anhand der wirtschaftlichen Notwen-
digkeit des Einsatzes biometrischer Systeme eine vernunftvolle Kosten-Nutzen-Struktur
schaffen und damit eine entsprechende Marktakzeptanz herstellen.
319

Literaturverzeichnis
[BS03] BSI - Bundesamt für Sicherheit in der Informationstechnik (Herausgeber): IT-Sicherheit
im verteilten Chaos - Tagungsband. SecuMedia-Verl., Ingelheim, 2003.
[He04] Heuer, Julia (Herausgeber): Biometrische Identifikation - Eine übersetzungsbezogene
Terminologiearbeit - Zugl.: Heidelberg, Univ., Diplomarbeit, 2004, Band 36 der Reihe
Lighthouse unlimited. WVT, Trier, 2004.
[Si02] Sietmann, Richard: Chipkarten mit Fingerabdruck - Kompetenzgerangel um neue
biometrische Systemstandards. Computer und Technik, (23):Seiten 54-56, 2002.
320

BIOSIG 2011
Panel Contributions


Secure Mobile Payment thanks to a very safe, comfortable,and fake-resistant biometric authentication
Werner Blessing
BIOMETRY
Chilcherlistrasse 1
CH - 6055 Alpnach, Schwitzerland
Abstract: This unique solution will ensure that only the authorized person has
access to the respective mobile applications, unauthorized access will be denied. It
is very safe and very easy to use.
Mobile Communication Biometrics - how it works and where it canbe used
By pressing a specific soft button or icon on the mobile phone, four randomly selected
numerals appear successively on the mobile phone display. The user speaks these
numerals into front camera and microphone. The video and audio data are then securely
transmitted to the provider (the so-called “Trust Center”) where every numeral is
verified with biometric face, -voice (speaker), -speech recognition and lip movement. All
is verified simultaneously and hereby none fake able. Since the requested numerals are
Random Challenge Response (OTP – One-Time Password), this will protect the mobile
phone from replay attacks and spoofing attacks. If the data matches, the user of the cell
phone is uniquely authenticated with the fusion of four biometric procedures for each
number that is asked, which results in 16 fused authentication procedures.
This very high level of authentication will resolve in a trust level of 100%, enabling the
user to pay the maximum amount which his bank has agreed with him or to open doors
with the highest level of security. Since there is the risk of theft and fraudulous use, the
trust level would drop very rapidly over the first quarter of hour reducing this risk
enormously. The lower the remaining level of trust is, the less it`s reduction will be,
levering out at 10% remaining trust level, thereby allowing micro payments. For each
phone call that the user does, his voice would have a biometric verification and
recognized as the proper user this would raise the trust level. Should the user be in a
noisy environment he could trigger of biometric face verification by using specific icon
for that. This individual biometric verification could raise the level of trust only to a
specific height.
323

By displaying the remaining level of trust on the screen of the mobile phone the user
would always know by this percentage of trust level how much money he can pay or
which door he can open. Speaking four numbers into the mobile phone in the morning
and using the phone only normally with phone calls and voice verifications or SMS and
face verification the whole procedure becomes very comfortable for the user. The
communication towards the payment equipment or doors could be done optically with a
2D barcode or later on with NFC (near field communication). Since our mobile and
fixed hardware is more and more connected to the cloud, one could imagine that this
authentication procedure could run on all sorts of various hardware, even with different
processes of authentication. Highest security, of course, is obtained with “ComBiom”,
the four numbers, i.e. the 16 fused processes, voice only face only or even simple Pin
could be used for low level security. Since the trust center would know the sequence of
various authentication procedures happening during the day, a plausibility check could
be easily done at the trust center verifying geographic plausibility or behavioral
plausibility i.e. weekday or holidays etc.
In summary this procedure obtains a very high level of security and yet is a very
comfortable process, such as the user simply uses his mobile phone as he would have
done in old days.
324

Face on the Fly: How to Track Faces
Catherine Herold, Stephane Gentric, Nicolas Moenne-Loccoz
Morpho, Safran Group
catherine.herold, [email protected]
A great challenge for border-control gates is to maintain good biometric performances, even with
less cooperative subjects. We present here a novel method to simultaneously track and estimate the
3D head pose of people walking in an authentication gate (Fig. 1), from video sequences acquired by
a multi-view system. A 3D head model is adapted to each individual at the beginning of the sequence
and is then used during the tracking process to generate images of the face under any pose.
From 3D face to 2D views. A main issue concerning tracking is the way to describe the face. Due
to appearance changes under large pose variations, using 2D descriptors from the initial frame may
lead to tracking failure. Given a 3D pose x to evaluate, we render the corresponding views of the 3D
model (Fig. 2) and compare them to the observations.
Fig 1. Authentification system Fig 2. Synthesized views
3D Multiview tracking by particle filter. In a Bayesian framework, tracking consists of estimating
the density of the current state p(xt|y0:t) in a recursive way, given the observations y0:t. This density
is approximated by a set of N pose samples x(i), called particles, affected by a weight w(i). The
weight of a particle is defined as a likelihood score between the corresponding synthesized views
and the observations, leading to the following density approximation: p(xt|y0:t) =∑N
i=1w
(i)x(i).
A multi-layer sampling approach leads to an improvment of the tracker performances.
Results. Our 3D model-based algorithm is compared to two particle filter methods using 2D-patches
extracted from the first frame. With the first one, the weights are computed with a color histogram
distance, while the second one uses a ZNCC score. Both of them show tracking failures after a
few frames due to appearance changes. In our algorithm, the likelihood is computed with evolving
descriptors adapted to the observations, thus improving the accuracy.
Fig 3. Error with/without 3D model views Fig 4. Results with (NL layers, N particles)
Fig. 4 illustrates the tracking performances for different parameters, all of them needing similar
computation times. Multi-layer methods outperform the one-layer method due to an improved state-
space exploration. The remaining error is about 1cm in the 3D space for the best parametrization.
325


P-1 GregorEngels,AndreasOberweis,AlbertZündorf(Hrsg.):Modellierung2001.
P-2 MikhailGodlevsky,HeinrichC.Mayr(Hrsg.):InformationSystemsTechnologyanditsApplications,ISTA’2001.
P-3 AnaM.Moreno,ReindP.vandeRiet(Hrsg.):ApplicationsofNaturalLan-guagetoInformationSystems,NLDB’2001.
P-4 H.Wörn,J.Mühling,C.Vahl,H.-P.Meinzer(Hrsg.):Rechner-undsensor-gestützteChirurgie;WorkshopdesSFB414.
P-5 AndySchürr(Hg.):OMER–Object-OrientedModelingofEmbeddedReal-TimeSystems.
P-6 Hans-JürgenAppelrath,RolfBeyer,UweMarquardt,HeinrichC.Mayr,ClaudiaSteinberger(Hrsg.):UnternehmenHoch-schule,UH’2001.
P-7 AndyEvans,RobertFrance,AnaMoreira,BernhardRumpe(Hrsg.):PracticalUML-BasedRigorousDevelopmentMethods–CounteringorIntegratingtheextremists,pUML’2001.
P-8 ReinhardKeil-Slawik,JohannesMagen-heim(Hrsg.):InformatikunterrichtundMedienbildung,INFOS’2001.
P-9 JanvonKnop,WilhelmHaverkamp(Hrsg.):InnovativeAnwendungeninKommunikationsnetzen,15.DFNArbeits-tagung.
P-10 MirjamMinor,SteffenStaab(Hrsg.):1stGermanWorkshoponExperienceMan-agement:SharingExperiencesabouttheSharingExperience.
P-11 MichaelWeber,FrankKargl(Hrsg.):MobileAd-HocNetzwerke,WMAN2002.
P-12 MartinGlinz,GüntherMüller-Luschnat(Hrsg.):Modellierung2002.
P-13 JanvonKnop,PeterSchirmbacherandViljanMahni_(Hrsg.):TheChangingUniversities–TheRoleofTechnology.
P-14 RobertTolksdorf,RainerEckstein(Hrsg.):XML-TechnologienfürdasSe-manticWeb–XSW2002.
P-15 Hans-BerndBludau,AndreasKoop(Hrsg.):MobileComputinginMedicine.
P-16 J.FelixHampe,GerhardSchwabe(Hrsg.):MobileandCollaborativeBusi-ness2002.
P-17 JanvonKnop,WilhelmHaverkamp(Hrsg.):ZukunftderNetze–DieVerletz-barkeitmeistern,16.DFNArbeitstagung.
P-18 ElmarJ.Sinz,MarkusPlaha(Hrsg.):ModellierungbetrieblicherInformations-systeme–MobIS2002.
P-19 SigridSchubert,BerndReusch,NorbertJesse(Hrsg.):Informatikbewegt–Infor-matik2002–32.JahrestagungderGesell-schaftfürInformatike.V.(GI)30.Sept.-3.Okt.2002inDortmund.
P-20 SigridSchubert,BerndReusch,NorbertJesse(Hrsg.):Informatikbewegt–Infor-matik2002–32.JahrestagungderGesell-schaftfürInformatike.V.(GI)30.Sept.-3.Okt.2002inDortmund(Ergänzungs-band).
P-21 JörgDesel,MathiasWeske(Hrsg.):Promise2002:ProzessorientierteMetho-denundWerkzeugefürdieEntwicklungvonInformationssystemen.
P-22 SigridSchubert,JohannesMagenheim,PeterHubwieser,TorstenBrinda(Hrsg.):Forschungsbeiträgezur“DidaktikderInformatik”–Theorie,Praxis,Evaluation.
P-23 ThorstenSpitta,JensBorchers,HarryM.Sneed(Hrsg.):SoftwareManagement2002–FortschrittdurchBeständigkeit
P-24 RainerEckstein,RobertTolksdorf(Hrsg.):XMIDX2003–XML-TechnologienfürMiddleware–Middle-warefürXML-Anwendungen
P-25 KeyPousttchi,KlausTurowski(Hrsg.):MobileCommerce–AnwendungenundPerspektiven–3.WorkshopMobileCommerce,UniversitätAugsburg,04.02.2003
P-26 GerhardWeikum,HaraldSchöning,ErhardRahm(Hrsg.):BTW2003:Daten-banksystemefürBusiness,TechnologieundWeb
P-27 MichaelKroll,Hans-GerdLipinski,KayMelzer(Hrsg.):MobilesComputinginderMedizin
P-28 UlrichReimer,AndreasAbecker,SteffenStaab,GerdStumme(Hrsg.):WM2003:ProfessionellesWissensmanagement–Er-fahrungenundVisionen
P-29 AntjeDüsterhöft,BernhardThalheim(Eds.):NLDB’2003:NaturalLanguageProcessingandInformationSystems
P-30 MikhailGodlevsky,StephenLiddle,HeinrichC.Mayr(Eds.):InformationSystemsTechnologyanditsApplications
P-31 ArslanBrömme,ChristophBusch(Eds.):BIOSIG2003:BiometricsandElectronicSignatures
GI-Edition Lecture Notes in Informatics
3018028 GI P_191 Baende.indd 169 26.08.11 11:24

P-32 PeterHubwieser(Hrsg.):InformatischeFachkonzepteimUnterricht–INFOS2003
P-33 AndreasGeyer-Schulz,AlfredTaudes(Hrsg.):Informationswirtschaft:EinSektormitZukunft
P-34 KlausDittrich,WolfgangKönig,AndreasOberweis,KaiRannenberg,WolfgangWahlster(Hrsg.):Informatik2003–InnovativeInformatikanwendungen(Band1)
P-35 KlausDittrich,WolfgangKönig,AndreasOberweis,KaiRannenberg,WolfgangWahlster(Hrsg.):Informatik2003–InnovativeInformatikanwendungen(Band2)
P-36 RüdigerGrimm,HubertB.Keller,KaiRannenberg(Hrsg.):Informatik2003–MitSicherheitInformatik
P-37 ArndtBode,JörgDesel,SabineRath-mayer,MartinWessner(Hrsg.):DeLFI2003:e-LearningFachtagungInformatik
P-38 E.J.Sinz,M.Plaha,P.Neckel(Hrsg.):ModellierungbetrieblicherInformations-systeme–MobIS2003
P-39 JensNedon,SandraFrings,OliverGöbel(Hrsg.):IT-IncidentManagement&IT-Forensics–IMF2003
P-40 MichaelRebstock(Hrsg.):ModellierungbetrieblicherInformationssysteme–Mo-bIS2004
P-41 UweBrinkschulte,JürgenBecker,Diet-marFey,Karl-ErwinGroßpietsch,Chris-tianHochberger,ErikMaehle,ThomasRunkler(Edts.):ARCS2004–OrganicandPervasiveComputing
P-42 KeyPousttchi,KlausTurowski(Hrsg.):MobileEconomy–TransaktionenundProzesse,AnwendungenundDienste
P-43 BirgittaKönig-Ries,MichaelKlein,PhilippObreiter(Hrsg.):Persistance,Scalability,Transactions–DatabaseMe-chanismsforMobileApplications
P-44 JanvonKnop,WilhelmHaverkamp,EikeJessen(Hrsg.):Security,E-Learning.E-Services
P-45 BernhardRumpe,WofgangHesse(Hrsg.):Modellierung2004
P-46 UlrichFlegel,MichaelMeier(Hrsg.):DetectionofIntrusionsofMalware&VulnerabilityAssessment
P-47 AlexanderProsser,RobertKrimmer(Hrsg.):ElectronicVotinginEurope–Technology,Law,PoliticsandSociety
P-48 AnatolyDoroshenko,TerryHalpin,StephenW.Liddle,HeinrichC.Mayr(Hrsg.):InformationSystemsTechnologyanditsApplications
P-49 G.Schiefer,P.Wagner,M.Morgenstern,U.Rickert(Hrsg.):IntegrationundDaten-sicherheit–Anforderungen,KonflikteundPerspektiven
P-50 PeterDadam,ManfredReichert(Hrsg.):INFORMATIK2004–Informatikver-bindet(Band1)Beiträgeder34.Jahresta-gungderGesellschaftfürInformatike.V.(GI),20.-24.September2004inUlm
P-51 PeterDadam,ManfredReichert(Hrsg.):INFORMATIK2004–Informatikver-bindet(Band2)Beiträgeder34.Jahresta-gungderGesellschaftfürInformatike.V.(GI),20.-24.September2004inUlm
P-52 GregorEngels,SilkeSeehusen(Hrsg.):DELFI2004–Tagungsbandder2.e-LearningFachtagungInformatik
P-53 RobertGiegerich,JensStoye(Hrsg.):GermanConferenceonBioinformatics–GCB2004
P-54 JensBorchers,RalfKneuper(Hrsg.):Softwaremanagement2004–OutsourcingundIntegration
P-55 JanvonKnop,WilhelmHaverkamp,EikeJessen(Hrsg.):E-ScienceundGridAd-hoc-NetzeMedienintegration
P-56 FernandFeltz,AndreasOberweis,BenoitOtjacques(Hrsg.):EMISA2004–Infor-mationssystemeimE-BusinessundE-Government
P-57 KlausTurowski(Hrsg.):Architekturen,Komponenten,Anwendungen
P-58 SamiBeydeda,VolkerGruhn,JohannesMayer,RalfReussner,FranzSchweiggert(Hrsg.):TestingofComponent-BasedSystemsandSoftwareQuality
P-59 J.FelixHampe,FranzLehner,KeyPousttchi,KaiRanneberg,KlausTurowski(Hrsg.):MobileBusiness–Processes,Platforms,Payments
P-60 SteffenFriedrich(Hrsg.):Unterrichtskon-zeptefürinforrmatischeBildung
P-61 PaulMüller,ReinhardGotzhein,JensB.Schmitt(Hrsg.):Kommunikationinver-teiltenSystemen
P-62 Federrath,Hannes(Hrsg.):„Sicherheit2005“–Sicherheit–SchutzundZuver-lässigkeit
P-63 RolandKaschek,HeinrichC.Mayr,StephenLiddle(Hrsg.):InformationSys-tems–TechnologyandistApplications
3018028 GI P_191 Baende.indd 170 26.08.11 11:24

P-64 PeterLiggesmeyer,KlausPohl,MichaelGoedicke(Hrsg.):SoftwareEngineering2005
P-65 GottfriedVossen,FrankLeymann,PeterLockemann,WolffriedStucky(Hrsg.):DatenbanksystemeinBusiness,Techno-logieundWeb
P-66 JörgM.Haake,UlrikeLucke,DjamshidTavangarian(Hrsg.):DeLFI2005:3.deutschee-LearningFachtagungInfor-matik
P-67 ArminB.Cremers,RainerManthey,PeterMartini,VolkerSteinhage(Hrsg.):INFORMATIK2005–InformatikLIVE(Band1)
P-68 ArminB.Cremers,RainerManthey,PeterMartini,VolkerSteinhage(Hrsg.):INFORMATIK2005–InformatikLIVE(Band2)
P-69 RobertHirschfeld,RyszardKowalcyk,AndreasPolze,MatthiasWeske(Hrsg.):NODe2005,GSEM2005
P-70 KlausTurowski,Johannes-MariaZaha(Hrsg.):Component-orientedEnterpriseApplication(COAE2005)
P-71 AndrewTorda,StefanKurz,MatthiasRarey(Hrsg.):GermanConferenceonBioinformatics2005
P-72 KlausP.Jantke,Klaus-PeterFähnrich,WolfgangS.Wittig(Hrsg.):MarktplatzInternet:Vone-Learningbise-Payment
P-73 JanvonKnop,WilhelmHaverkamp,EikeJessen(Hrsg.):“HeuteschondasMorgensehen“
P-74 ChristopherWolf,StefanLucks,Po-WahYau(Hrsg.):WEWoRC2005–WesternEuropeanWorkshoponResearchinCryptology
P-75 JörgDesel,UlrichFrank(Hrsg.):Enter-priseModellingandInformationSystemsArchitecture
P-76 ThomasKirste,BirgittaKönig-Riess,KeyPousttchi,KlausTurowski(Hrsg.):Mo-bileInformationssysteme–Potentiale,Hindernisse,Einsatz
P-77 JanaDittmann(Hrsg.):SICHERHEIT2006
P-78 K.-O.Wenkel,P.Wagner,M.Morgens-tern,K.Luzi,P.Eisermann(Hrsg.):Land-undErnährungswirtschaftimWandel
P-79 BettinaBiel,MatthiasBook,VolkerGruhn(Hrsg.):Softwareengineering2006
P-80 MareikeSchoop,ChristianHuemer,MichaelRebstock,MartinBichler(Hrsg.):Service-OrientedElectronicCommerce
P-81 WolfgangKarl,JürgenBecker,Karl-ErwinGroßpietsch,ChristianHochberger,ErikMaehle(Hrsg.):ARCS´06
P-82 HeinrichC.Mayr,RuthBreu(Hrsg.):Modellierung2006
P-83 DanielHuson,OliverKohlbacher,AndreiLupas,KayNieseltandAndreasZell(eds.):GermanConferenceonBioinfor-matics
P-84 DimitrisKaragiannis,HeinrichC.Mayr,(Hrsg.):InformationSystemsTechnologyanditsApplications
P-85 WitoldAbramowicz,HeinrichC.Mayr,(Hrsg.):BusinessInformationSystems
P-86 RobertKrimmer(Ed.):ElectronicVoting2006
P-87 MaxMühlhäuser,GuidoRößling,RalfSteinmetz(Hrsg.):DELFI2006:4.e-LearningFachtagungInformatik
P-88 RobertHirschfeld,AndreasPolze,RyszardKowalczyk(Hrsg.):NODe2006,GSEM2006
P-90 JoachimSchelp,RobertWinter,UlrichFrank,BodoRieger,KlausTurowski(Hrsg.):Integration,InformationslogistikundArchitektur
P-91 HenrikStormer,AndreasMeier,MichaelSchumacher(Eds.):EuropeanConferenceoneHealth2006
P-92 FernandFeltz,BenoîtOtjacques,AndreasOberweis,NicolasPoussing(Eds.):AIM2006
P-93 ChristianHochberger,RüdigerLiskowsky(Eds.):INFORMATIK2006–InformatikfürMenschen,Band1
P-94 ChristianHochberger,RüdigerLiskowsky(Eds.):INFORMATIK2006–InformatikfürMenschen,Band2
P-95 MatthiasWeske,MarkusNüttgens(Eds.):EMISA2005:Methoden,KonzepteundTechnologienfürdieEntwicklungvondienstbasiertenInformationssystemen
P-96 SaartjeBrockmans,JürgenJung,YorkSure(Eds.):Meta-ModellingandOntolo-gies
P-97 OliverGöbel,DirkSchadt,SandraFrings,HardoHase,DetlefGünther,JensNedon(Eds.):IT-IncidentMangament&IT-Forensics–IMF2006
3018028 GI P_191 Baende.indd 171 26.08.11 11:24

P-98 HansBrandt-Pook,WernerSimonsmeierundThorstenSpitta(Hrsg.):BeratunginderSoftwareentwicklung–Modelle,Methoden,BestPractices
P-99 AndreasSchwill,CarstenSchulte,MarcoThomas(Hrsg.):DidaktikderInformatik
P-100 PeterForbrig,GünterSiegel,MarkusSchneider(Hrsg.):HDI2006:Hochschul-didaktikderInformatik
P-101 StefanBöttinger,LudwigTheuvsen,SusanneRank,MarliesMorgenstern(Hrsg.):AgrarinformatikimSpannungsfeldzwischenRegionalisierungundglobalenWertschöpfungsketten
P-102 OttoSpaniol(Eds.):MobileServicesandPersonalizedEnvironments
P-103 AlfonsKemper,HaraldSchöning,ThomasRose,MatthiasJarke,ThomasSeidl,ChristophQuix,ChristophBrochhaus(Hrsg.):DatenbanksystemeinBusiness,TechnologieundWeb(BTW2007)
P-104 BirgittaKönig-Ries,FranzLehner,RainerMalaka,CanTürker(Hrsg.)MMS2007:MobilitätundmobileInformationssysteme
P-105 Wolf-GideonBleek,JörgRaasch,HeinzZüllighoven(Hrsg.)SoftwareEngineering2007
P-106 Wolf-GideonBleek,HenningSchwentner,HeinzZüllighoven(Hrsg.)SoftwareEngineering2007–BeiträgezudenWorkshops
P-107 HeinrichC.Mayr,DimitrisKaragiannis(eds.)InformationSystemsTechnologyanditsApplications
P-108 ArslanBrömme,ChristophBusch,DetlefHühnlein(eds.)BIOSIG2007:BiometricsandElectronicSignatures
P-109 RainerKoschke,OttheinHerzog,Karl-HeinzRödiger,MarcRonthaler(Hrsg.)INFORMATIK2007InformatiktrifftLogistikBand1
P-110 RainerKoschke,OttheinHerzog,Karl-HeinzRödiger,MarcRonthaler(Hrsg.)INFORMATIK2007InformatiktrifftLogistikBand2
P-111 ChristianEibl,JohannesMagenheim,SigridSchubert,MartinWessner(Hrsg.)DeLFI2007:5.e-LearningFachtagungInformatik
P-112 SigridSchubert(Hrsg.)DidaktikderInformatikinTheorieundPraxis
P-113 SörenAuer,ChristianBizer,ClaudiaMüller,AnnaV.Zhdanova(Eds.)TheSocialSemanticWeb2007Proceedingsofthe1stConferenceonSocialSemanticWeb(CSSW)
P-114 SandraFrings,OliverGöbel,DetlefGünther,HardoG.Hase,JensNedon,DirkSchadt,ArslanBrömme(Eds.)IMF2007IT-incidentmanagement&IT-forensicsProceedingsofthe3rdInternationalConferenceonIT-IncidentManagement&IT-Forensics
P-115 ClaudiaFalter,AlexanderSchliep,JoachimSelbig,MartinVingronandDirkWalther(Eds.)GermanconferenceonbioinformaticsGCB2007
P-116 WitoldAbramowicz,LeszekMaciszek(Eds.)BusinessProcessandServicesComputing1stInternationalWorkingConferenceonBusinessProcessandServicesComputingBPSC2007
P-117 RyszardKowalczyk(Ed.)GridserviceengineeringandmanegementThe4thInternationalConferenceonGridServiceEngineeringandManagementGSEM2007
P-118 AndreasHein,WilfriedThoben,Hans-JürgenAppelrath,PeterJensch(Eds.)EuropeanConferenceonehealth2007
P-119 ManfredReichert,StefanStrecker,KlausTurowski(Eds.)EnterpriseModellingandInformationSystemsArchitecturesConceptsandApplications
P-120 AdamPawlak,KurtSandkuhl,WojciechCholewa,LeandroSoaresIndrusiak(Eds.)CoordinationofCollaborativeEngineering-StateoftheArtandFutureChallenges
P-121 KorbinianHerrmann,BerndBruegge(Hrsg.)SoftwareEngineering2008FachtagungdesGI-FachbereichsSoftwaretechnik
P-122 WalidMaalej,BerndBruegge(Hrsg.)SoftwareEngineering2008-WorkshopbandFachtagungdesGI-FachbereichsSoftwaretechnik
3018028 GI P_191 Baende.indd 172 26.08.11 11:24

P-123 MichaelH.Breitner,MartinBreunig,ElgarFleisch,LeyPousttchi,KlausTurowski(Hrsg.)MobileundUbiquitäreInformationssysteme–Technologien,Prozesse,MarktfähigkeitProceedingszur3.KonferenzMobileundUbiquitäreInformationssysteme(MMS2008)
P-124 WolfgangE.Nagel,RolfHoffmann,AndreasKoch(Eds.)9thWorkshoponParallelSystemsandAlgorithms(PASA)WorkshopoftheGI/ITGSpecielInterestGroupsPARSandPARVA
P-125 RolfA.E.Müller,Hans-H.Sundermeier,LudwigTheuvsen,StephanieSchütze,MarliesMorgenstern(Hrsg.)Unternehmens-IT:FührungsinstrumentoderVerwaltungsbürdeReferateder28.GILJahrestagung
P-126 RainerGimnich,UweKaiser,JochenQuante,AndreasWinter(Hrsg.)10thWorkshopSoftwareReengineering(WSR2008)
P-127 ThomasKühne,WolfgangReisig,FriedrichSteimann(Hrsg.)Modellierung2008
P-128 AmmarAlkassar,JörgSiekmann(Hrsg.)Sicherheit2008Sicherheit,SchutzundZuverlässigkeitBeiträgeder4.JahrestagungdesFachbereichsSicherheitderGesellschaftfürInformatike.V.(GI)2.-4.April2008Saarbrücken,Germany
P-129 WolfgangHesse,AndreasOberweis(Eds.)Sigsand-Europe2008ProceedingsoftheThirdAISSIGSANDEuropeanSymposiumonAnalysis,Design,UseandSocietalImpactofInformationSystems
P-130 PaulMüller,BernhardNeumair,GabiDreoRodosek(Hrsg.)1.DFN-ForumKommunikations-technologienBeiträgederFachtagung
P-131 RobertKrimmer,RüdigerGrimm(Eds.)3rdInternationalConferenceonElectronicVoting2008Co-organizedbyCouncilofEurope,GesellschaftfürInformatikandE-Voting.CC
P-132 SilkeSeehusen,UlrikeLucke,StefanFischer(Hrsg.)DeLFI2008:Die6.e-LearningFachtagungInformatik
P-133 Heinz-GerdHegering,AxelLehmann,HansJürgenOhlbach,ChristianScheideler(Hrsg.)INFORMATIK2008BeherrschbareSysteme–dankInformatikBand1
P-134 Heinz-GerdHegering,AxelLehmann,HansJürgenOhlbach,ChristianScheideler(Hrsg.)INFORMATIK2008BeherrschbareSysteme–dankInformatikBand2
P-135 TorstenBrinda,MichaelFothe,PeterHubwieser,KirstenSchlüter(Hrsg.)DidaktikderInformatik–AktuelleForschungsergebnisse
P-136 AndreasBeyer,MichaelSchroeder(Eds.)GermanConferenceonBioinformaticsGCB2008
P-137 ArslanBrömme,ChristophBusch,DetlefHühnlein(Eds.)BIOSIG2008:BiometricsandElectronicSignatures
P-138 BarbaraDinter,RobertWinter,PeterChamoni,NorbertGronau,KlausTurowski(Hrsg.)SynergiendurchIntegrationundInformationslogistikProceedingszurDW2008
P-139 GeorgHerzwurm,MartinMikusz(Hrsg.)IndustrialisierungdesSoftware-ManagementsFachtagungdesGI-FachausschussesManagementderAnwendungsentwick-lungund-wartungimFachbereichWirtschaftsinformatik
P-140 OliverGöbel,SandraFrings,DetlefGünther,JensNedon,DirkSchadt(Eds.)IMF2008-ITIncidentManagement&ITForensics
P-141 PeterLoos,MarkusNüttgens,KlausTurowski,DirkWerth(Hrsg.)ModellierungbetrieblicherInformations-systeme(MobIS2008)ModellierungzwischenSOAundComplianceManagement
P-142 R.Bill,P.Korduan,L.Theuvsen,M.Morgenstern(Hrsg.)AnforderungenandieAgrarinformatikdurchGlobalisierungundKlimaveränderung
P-143 PeterLiggesmeyer,GregorEngels,JürgenMünch,JörgDörr,NormanRiegel(Hrsg.)SoftwareEngineering2009FachtagungdesGI-FachbereichsSoftwaretechnik
3018028 GI P_191 Baende.indd 173 26.08.11 11:24

P-144 Johann-ChristophFreytag,ThomasRuf,WolfgangLehner,GottfriedVossen(Hrsg.)DatenbanksystemeinBusiness,TechnologieundWeb(BTW)
P-145 KnutHinkelmann,HolgerWache(Eds.)WM2009:5thConferenceonProfessionalKnowledgeManagement
P-146 MarkusBick,MartinBreunig,HagenHöpfner(Hrsg.)MobileundUbiquitäreInformationssysteme–Entwicklung,ImplementierungundAnwendung4.KonferenzMobileundUbiquitäreInformationssysteme(MMS2009)
P-147 WitoldAbramowicz,LeszekMaciaszek,RyszardKowalczyk,AndreasSpeck(Eds.)BusinessProcess,ServicesComputingandIntelligentServiceManagementBPSC2009·ISM2009·YRW-MBP2009
P-148 ChristianErfurth,GeraldEichler,VolkmarSchau(Eds.)9thInternationalConferenceonInnovativeInternetCommunitySystemsI2CS2009
P-149 PaulMüller,BernhardNeumair,GabiDreoRodosek(Hrsg.)2.DFN-ForumKommunikationstechnologienBeiträgederFachtagung
P-150 JürgenMünch,PeterLiggesmeyer(Hrsg.)SoftwareEngineering2009-Workshopband
P-151 ArminHeinzl,PeterDadam,StefanKirn,PeterLockemann(Eds.)PRIMIUMProcessInnovationforEnterpriseSoftware
P-152 JanMendling,StefanieRinderle-Ma, WernerEsswein(Eds.) EnterpriseModellingandInformation
SystemsArchitectures Proceedingsofthe3rdInt‘lWorkshop
EMISA2009
P-153 AndreasSchwill,NicolasApostolopoulos(Hrsg.)LernenimDigitalenZeitalterDeLFI2009–Die7.E-LearningFachtagungInformatik
P-154 StefanFischer,ErikMaehleRüdigerReischuk(Hrsg.)INFORMATIK2009ImFocusdasLeben
P-155 ArslanBrömme,ChristophBusch,DetlefHühnlein(Eds.)BIOSIG2009:BiometricsandElectronicSignaturesProceedingsoftheSpecialInterestGrouponBiometricsandElectronicSignatures
P-156 BernhardKoerber(Hrsg.)ZukunftbrauchtHerkunft25Jahre»INFOS–InformatikundSchule«
P-157 IvoGrosse,SteffenNeumann,StefanPosch,FalkSchreiber,PeterStadler(Eds.)GermanConferenceonBioinformatics2009
P-158 W.Claupein,L.Theuvsen,A.Kämpf,M.Morgenstern(Hrsg.)PrecisionAgricultureReloaded–InformationsgestützteLandwirtschaft
P-159 GregorEngels,MarkusLuckey,WilhelmSchäfer(Hrsg.)SoftwareEngineering2010
P-160 GregorEngels,MarkusLuckey,AlexanderPretschner,RalfReussner(Hrsg.)SoftwareEngineering2010–Workshopband(inkl.Doktorandensymposium)
P-161 GregorEngels,DimitrisKaragiannisHeinrichC.Mayr(Hrsg.)Modellierung2010
P-162 MariaA.Wimmer,UweBrinkhoff,SiegfriedKaiser,DagmarLück-Schneider,ErichSchweighofer,AndreasWiebe(Hrsg.)VernetzteITfüreineneffektivenStaatGemeinsameFachtagungVerwaltungsinformatik(FTVI)undFachtagungRechtsinformatik(FTRI)2010
P-163 MarkusBick,StefanEulgem,ElgarFleisch,J.FelixHampe,BirgittaKönig-Ries,FranzLehner,KeyPousttchi,KaiRannenberg(Hrsg.)MobileundUbiquitäreInformationssystemeTechnologien,AnwendungenundDienstezurUnterstützungvonmobilerKollaboration
P-164 ArslanBrömme,ChristophBusch(Eds.)BIOSIG2010:BiometricsandElectronicSignaturesProceedingsoftheSpecialInterestGrouponBiometricsandElectronicSignatures
3018028 GI P_191 Baende.indd 174 26.08.11 11:24

P-165 GeraldEichler,PeterKropf,UlrikeLechner,PhayungMeesad,HerwigUnger(Eds.)10thInternationalConferenceonInnovativeInternetCommunitySystems(I2CS)–JubileeEdition2010–
P-166 PaulMüller,BernhardNeumair,GabiDreoRodosek(Hrsg.)3.DFN-ForumKommunikationstechnologienBeiträgederFachtagung
P-167 RobertKrimmer,RüdigerGrimm(Eds.)4thInternationalConferenceonElectronicVoting2010co-organizedbytheCouncilofEurope,GesellschaftfürInformatikandE-Voting.CC
P-168 IraDiethelm,ChristinaDörge,ClaudiaHildebrandt,CarstenSchulte(Hrsg.)DidaktikderInformatikMöglichkeitenempirischerForschungsmethodenundPerspektivenderFachdidaktik
P-169 MichaelKerres,NadineOjstersekUlrikSchroeder,UlrichHoppe(Hrsg.)DeLFI2010-8.TagungderFachgruppeE-LearningderGesellschaftfürInformatike.V.
P-170 FelixC.Freiling(Hrsg.)Sicherheit2010Sicherheit,SchutzundZuverlässigkeit
P-171 WernerEsswein,KlausTurowski,MartinJuhrisch(Hrsg.)ModellierungbetrieblicherInformationssysteme(MobIS2010)ModellgestütztesManagement
P-172 StefanKlink,AgnesKoschmiderMarcoMevius,AndreasOberweis(Hrsg.)EMISA2010EinflussfaktorenaufdieEntwicklungflexibler,integrierterInformationssystemeBeiträgedesWorkshopsderGI-FachgruppeEMISA(EntwicklungsmethodenfürInfor-mationssystemeundderenAnwendung)
P-173 DietmarSchomburg,AndreasGrote(Eds.)GermanConferenceonBioinformatics2010
P-174 ArslanBrömme,TorstenEymann,DetlefHühnlein,HeikoRoßnagel,PaulSchmücker(Hrsg.)perspeGKtive2010Workshop„InnovativeundsichereInformationstechnologiefürdasGesundheitswesenvonmorgen“
P-175 Klaus-PeterFähnrich,BogdanFranczyk(Hrsg.)INFORMATIK2010ServiceScience–NeuePerspektivenfürdieInformatikBand1
P-176 Klaus-PeterFähnrich,BogdanFranczyk(Hrsg.)INFORMATIK2010ServiceScience–NeuePerspektivenfürdieInformatikBand2
P-177 WitoldAbramowicz,RainerAlt,Klaus-PeterFähnrich,BogdanFranczyk,LeszekA.Maciaszek(Eds.)INFORMATIK2010BusinessProcessandServiceScience–ProceedingsofISSSandBPSC
P-178 WolframPietsch,BenediktKrams(Hrsg.) VomProjektzumProdukt FachtagungdesGI-
FachausschussesManagementderAnwendungsentwicklungund-wartungimFachbereichWirtschafts-informatik(WI-MAW),Aachen,2010
P-179 StefanGruner,BernhardRumpe(Eds.)FM+AM`2010SecondInternationalWorkshoponFormalMethodsandAgileMethods
P-180 TheoHärder,WolfgangLehner,BernhardMitschang,HaraldSchöning,HolgerSchwarz(Hrsg.)DatenbanksystemefürBusiness,TechnologieundWeb(BTW)14.FachtagungdesGI-Fachbereichs„DatenbankenundInformationssysteme“(DBIS)
P-181 MichaelClasen,OttoSchätzel,BrigitteTheuvsen(Hrsg.)QualitätundEffizienzdurchinformationsgestützteLandwirtschaft,Fokus:ModerneWeinwirtschaft
P-182 RonaldMaier(Hrsg.)6thConferenceonProfessionalKnowledgeManagementFromKnowledgetoAction
P-183 RalfReussner,MatthiasGrund,AndreasOberweis,WalterTichy(Hrsg.)SoftwareEngineering2011FachtagungdesGI-FachbereichsSoftwaretechnik
P-184 RalfReussner,AlexanderPretschner,StefanJähnichen(Hrsg.)SoftwareEngineering2011Workshopband(inkl.Doktorandensymposium)
3018028 GI P_191 Baende.indd 175 26.08.11 11:24

P-185 HagenHöpfner,GüntherSpecht,ThomasRitz,ChristianBunse(Hrsg.)MMS2011:MobileundubiquitäreInformationssystemeProceedingszur6.KonferenzMobileundUbiquitäreInformationssysteme(MMS2011)
P-186 GeraldEichler,AxelKüpper,VolkmarSchau,HacèneFouchal,HerwigUnger(Eds.)11thInternationalConferenceonInnovativeInternetCommunitySystems(I2CS)
P-187 PaulMüller,BernhardNeumair,GabiDreoRodosek(Hrsg.)4.DFN-ForumKommunikations-technologien,BeiträgederFachtagung20.Junibis21.Juni2011Bonn
P-188 HolgerRohland,AndreaKienle,SteffenFriedrich(Hrsg.)DeLFI2011–Die9.e-LearningFachtagungInformatikderGesellschaftfürInformatike.V.5.–8.September2011,Dresden
P-189 Thomas,Marco(Hrsg.)InformatikinBildungundBerufINFOS201114.GI-FachtagungInformatikundSchule
P-190 MarkusNüttgens,OliverThomas,BarbaraWeber(Eds.)EnterpriseModellingandInformationSystemsArchitectures(EMISA2011)
P-191 ArslanBrömme,ChristophBusch(Eds.)BIOSIG2011InternationalConferenceoftheBiometricsSpecialInterestGroup
Thetitlescanbepurchasedat:
Köllen Druck + Verlag GmbHErnst-Robert-Curtius-Str.14·D-53117BonnFax:+49(0)228/9898222E-Mail:[email protected]
3018028 GI P_191 Baende.indd 176 26.08.11 11:24
Copyright © 2022 FDOKUMEN