PSR83B -Introduction aux analyses multidimensionnelles 3 Analyse Factorielle des Correspondances
Upload
khangminh22Category
view
0download
0
43
The Standard Analysis, sometimes called the Basic Analysis, is sup-
plied with SAP to derive a standard analysis from the delivered infor-
mation structure. The basic analysis lets the user view the data from
the information structure using the selection criteria defined in the
analysis.
3 Standard Analyses
In Chapter 2, I discussed the standard information structures that are avail-
able for the different SAP areas. The basic method to retrieve data from the
SAP-defined information structures is via the standard analyses. There are a
number of tools that can be used with the standard analysis, such as versions,
drilldown, ABC analysis, and classification, that will be explained later on in
this chapter and in subsequent chapters.
3.1 Basic Analyses
The SAP system is delivered with standard information structures and basic
analyses for these structures. The analyses are predefined and allow any user
to quickly run an analysis on a structure with minimum effort. For example,
in the Purchasing Information System, there are a number of analyses for the
Purchasing information structure (S012) that allow for various reviews of the
information of that structure.
For the information structure S012, an analysis of the data can be made by
Material, Material Group, or Vendor. For example, in Figure 3.1, the basic
analysis is of purchasing values for vendors. The selection criteria are pre-
defined, and any user who enters values for the purchasing organization,
vendor, and period to review will instantly receive the analysis of the data, as
shown in Figure 3.2. The transaction can be run by using transaction code
MCE3, or by using the navigation path: SAP Menu � Logistics � Logistics Con-
trolling � Logistics Information System � Standard Analyses � Purchasing �
Vendor.

Standard Analyses3
44
The information in Figure 3.2 is directly derived from the information struc-
ture. It shows that for the selected Purchase Organizations during period
05/2006 to 06/2006 there were four vendors with a total purchase order
value of $ 5,044.00.
If a user performs the same analysis many times, the analysis selection crite-
ria can be saved so the analysis can be run without the user having to enter
the selection data again. This is known as a selection version. The analysis can
be saved as a selection version after the results of the analysis are returned as
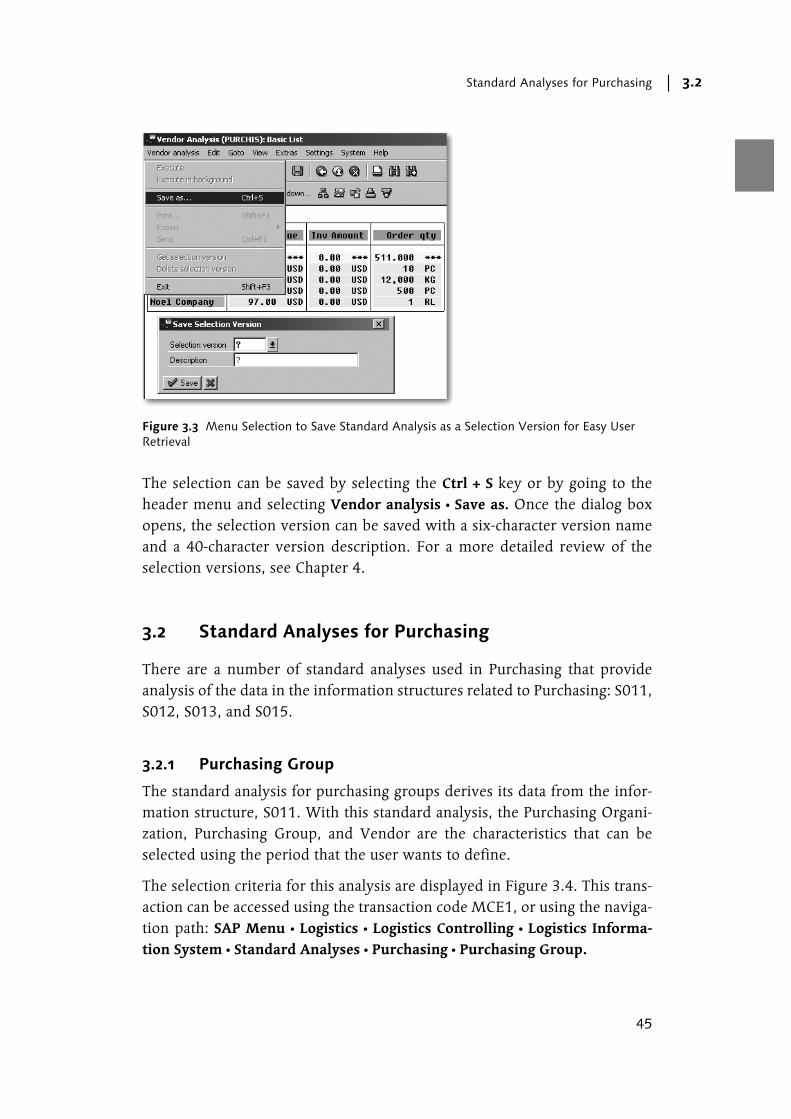
shown in Figure 3.3.
Figure 3.1 Basic Analysis Selection Criteria for Transaction MCE3 (Vendor Analysis of Pur-chasing Information Structure)
Figure 3.2 Basic Analysis of Data in Information Structure Defined by Selection Criteria Entered, Transaction MCE3
Standard Analyses for Purchasing 3.2
45
The selection can be saved by selecting the Ctrl + S key or by going to the
header menu and selecting Vendor analysis � Save as. Once the dialog box
opens, the selection version can be saved with a six-character version name
and a 40-character version description. For a more detailed review of the
selection versions, see Chapter 4.
3.2 Standard Analyses for Purchasing
There are a number of standard analyses used in Purchasing that provide
analysis of the data in the information structures related to Purchasing: S011,
S012, S013, and S015.
3.2.1 Purchasing Group
The standard analysis for purchasing groups derives its data from the infor-
mation structure, S011. With this standard analysis, the Purchasing Organi-
zation, Purchasing Group, and Vendor are the characteristics that can be
selected using the period that the user wants to define.
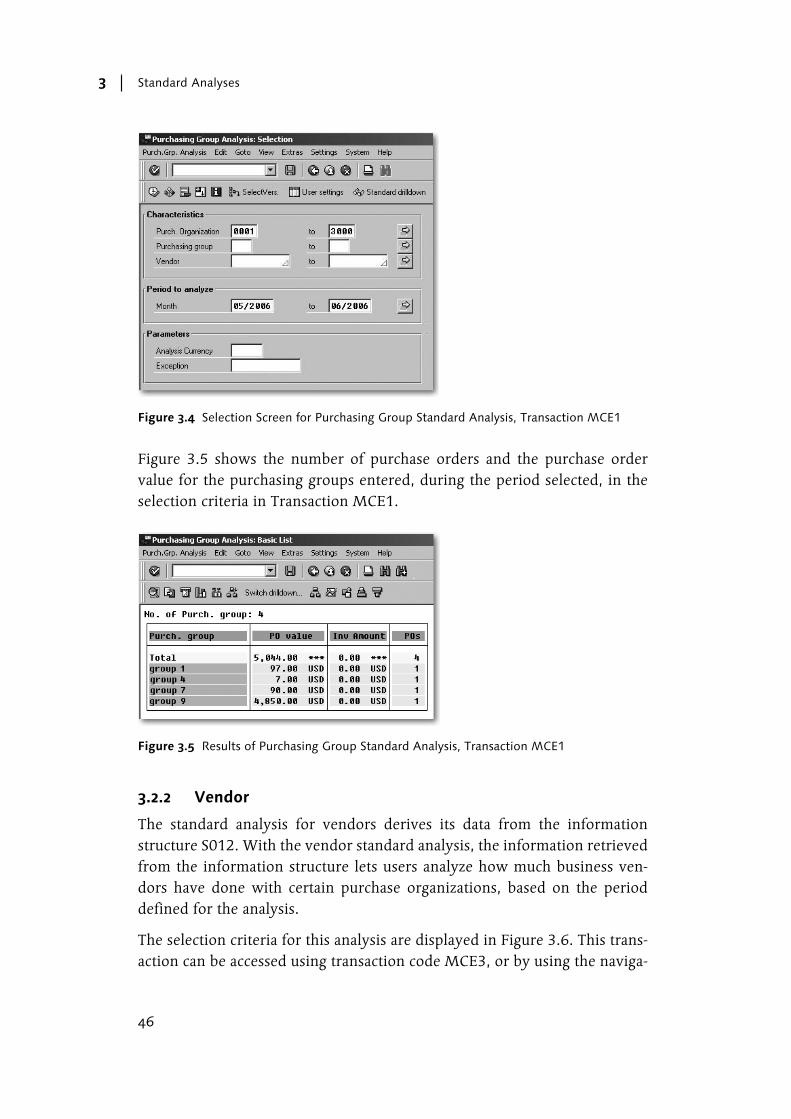
The selection criteria for this analysis are displayed in Figure 3.4. This trans-
action can be accessed using the transaction code MCE1, or using the naviga-
tion path: SAP Menu � Logistics � Logistics Controlling � Logistics Informa-
tion System � Standard Analyses � Purchasing � Purchasing Group.
Figure 3.3 Menu Selection to Save Standard Analysis as a Selection Version for Easy User Retrieval
Standard Analyses3
46
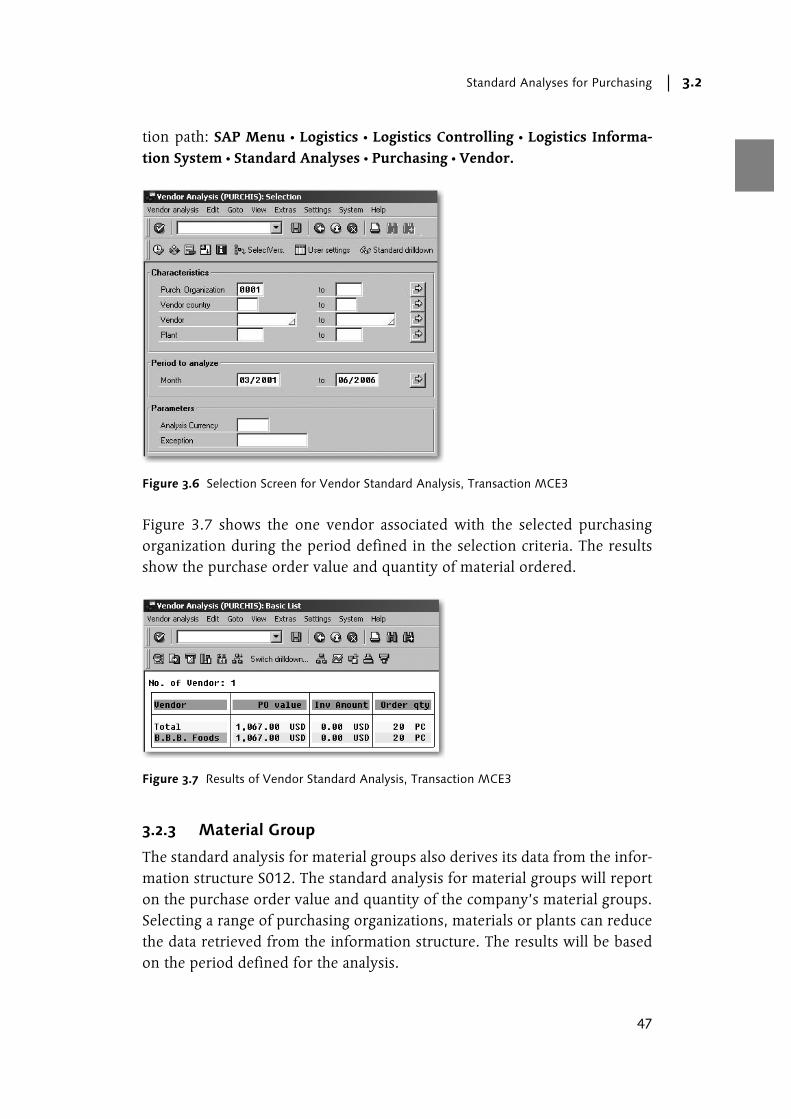
Figure 3.5 shows the number of purchase orders and the purchase order
value for the purchasing groups entered, during the period selected, in the
selection criteria in Transaction MCE1.
3.2.2 Vendor
The standard analysis for vendors derives its data from the information
structure S012. With the vendor standard analysis, the information retrieved
from the information structure lets users analyze how much business ven-
dors have done with certain purchase organizations, based on the period
defined for the analysis.
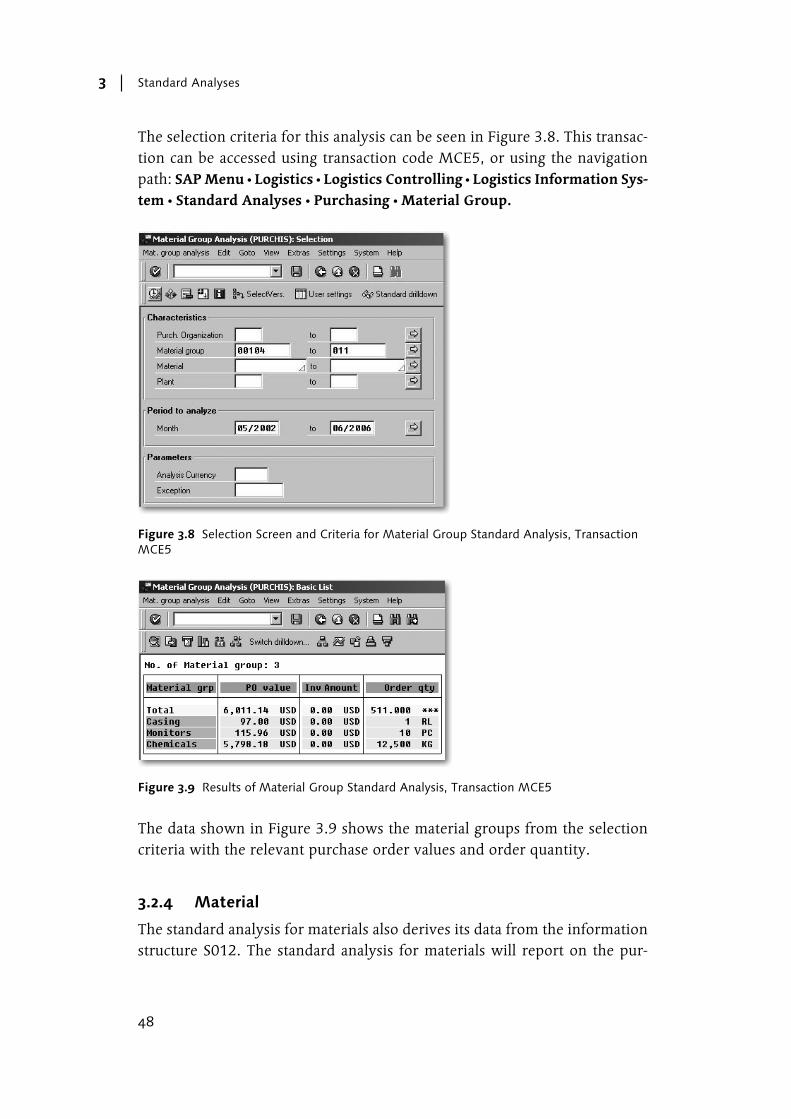
The selection criteria for this analysis are displayed in Figure 3.6. This trans-
action can be accessed using transaction code MCE3, or by using the naviga-
Figure 3.4 Selection Screen for Purchasing Group Standard Analysis, Transaction MCE1
Figure 3.5 Results of Purchasing Group Standard Analysis, Transaction MCE1
Standard Analyses for Purchasing 3.2
47
tion path: SAP Menu � Logistics � Logistics Controlling � Logistics Informa-
tion System � Standard Analyses � Purchasing � Vendor.
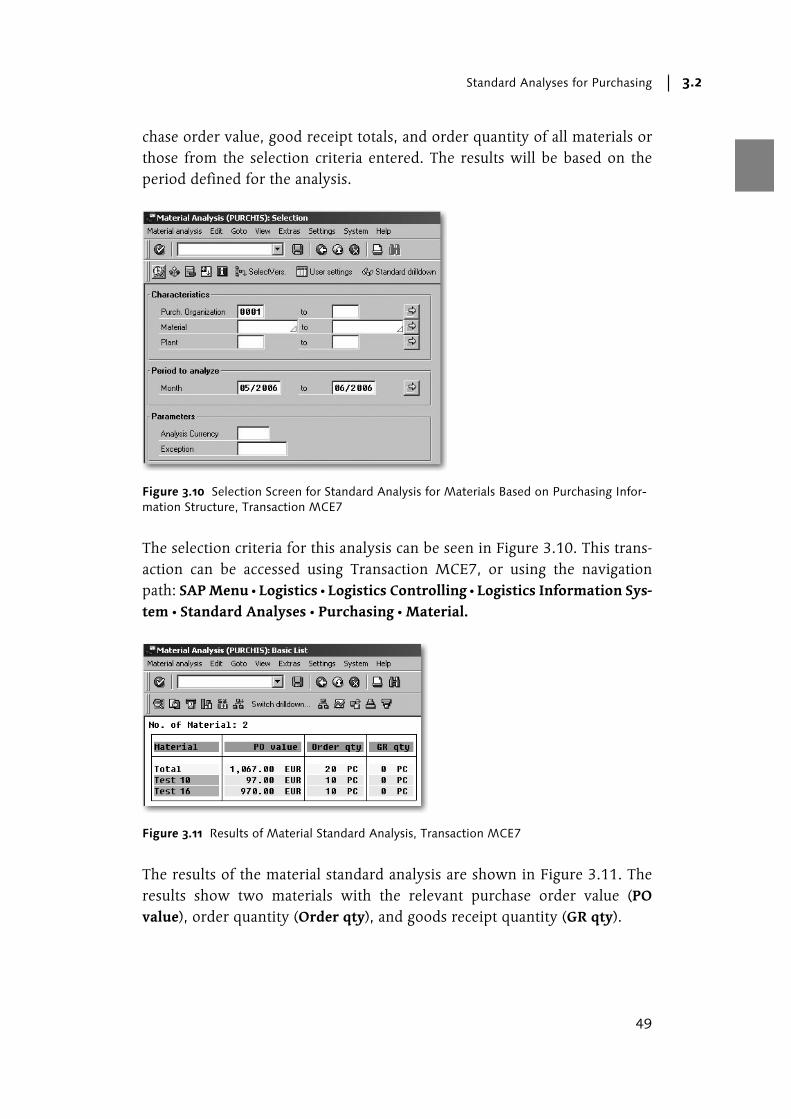
Figure 3.7 shows the one vendor associated with the selected purchasing
organization during the period defined in the selection criteria. The results
show the purchase order value and quantity of material ordered.
3.2.3 Material Group
The standard analysis for material groups also derives its data from the infor-
mation structure S012. The standard analysis for material groups will report
on the purchase order value and quantity of the company’s material groups.
Selecting a range of purchasing organizations, materials or plants can reduce
the data retrieved from the information structure. The results will be based
on the period defined for the analysis.
Figure 3.6 Selection Screen for Vendor Standard Analysis, Transaction MCE3
Figure 3.7 Results of Vendor Standard Analysis, Transaction MCE3
Standard Analyses3
48
The selection criteria for this analysis can be seen in Figure 3.8. This transac-
tion can be accessed using transaction code MCE5, or using the navigation
path: SAP Menu � Logistics � Logistics Controlling � Logistics Information Sys-
tem � Standard Analyses � Purchasing � Material Group.
The data shown in Figure 3.9 shows the material groups from the selection
criteria with the relevant purchase order values and order quantity.
3.2.4 Material
The standard analysis for materials also derives its data from the information
structure S012. The standard analysis for materials will report on the pur-
Figure 3.8 Selection Screen and Criteria for Material Group Standard Analysis, Transaction MCE5
Figure 3.9 Results of Material Group Standard Analysis, Transaction MCE5
Standard Analyses for Purchasing 3.2
49
chase order value, good receipt totals, and order quantity of all materials or
those from the selection criteria entered. The results will be based on the
period defined for the analysis.
The selection criteria for this analysis can be seen in Figure 3.10. This trans-
action can be accessed using Transaction MCE7, or using the navigation
path: SAP Menu � Logistics � Logistics Controlling � Logistics Information Sys-
tem � Standard Analyses � Purchasing � Material.
The results of the material standard analysis are shown in Figure 3.11. The
results show two materials with the relevant purchase order value (PO
value), order quantity (Order qty), and goods receipt quantity (GR qty).
Figure 3.10 Selection Screen for Standard Analysis for Materials Based on Purchasing Infor-mation Structure, Transaction MCE7
Figure 3.11 Results of Material Standard Analysis, Transaction MCE7
Standard Analyses3
50
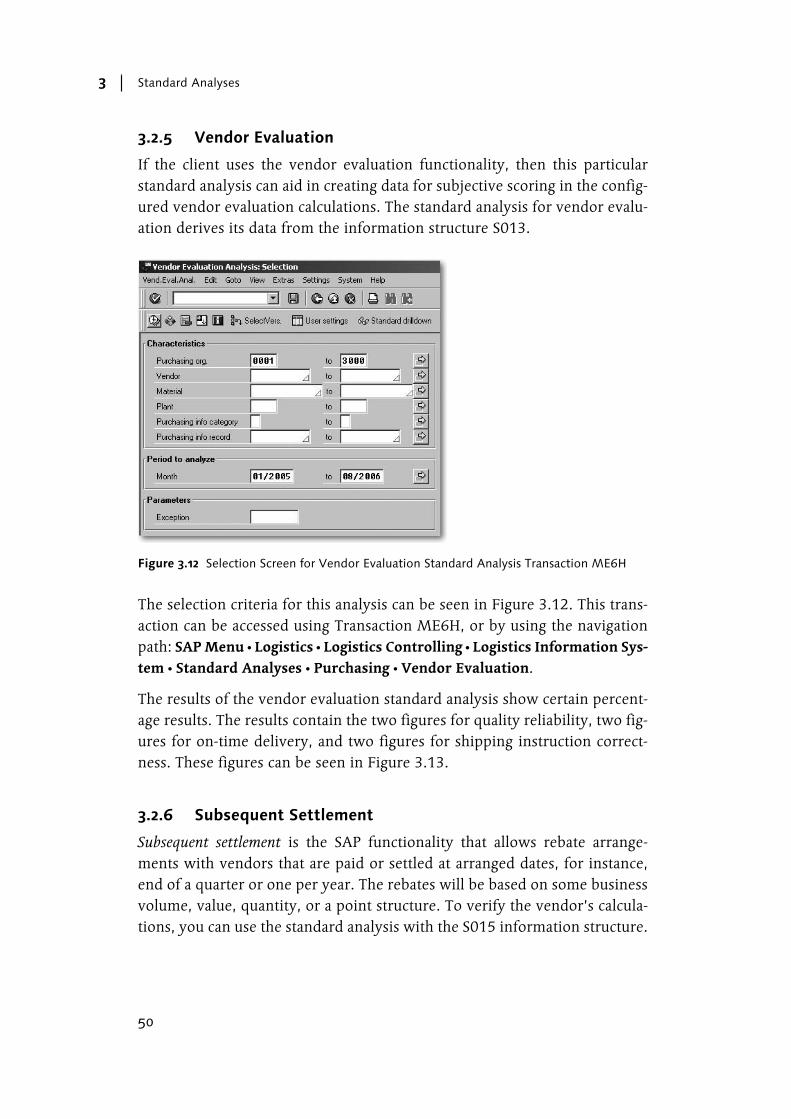
3.2.5 Vendor Evaluation
If the client uses the vendor evaluation functionality, then this particular
standard analysis can aid in creating data for subjective scoring in the config-
ured vendor evaluation calculations. The standard analysis for vendor evalu-
ation derives its data from the information structure S013.
The selection criteria for this analysis can be seen in Figure 3.12. This trans-
action can be accessed using Transaction ME6H, or by using the navigation
path: SAP Menu � Logistics � Logistics Controlling � Logistics Information Sys-
tem � Standard Analyses � Purchasing � Vendor Evaluation.
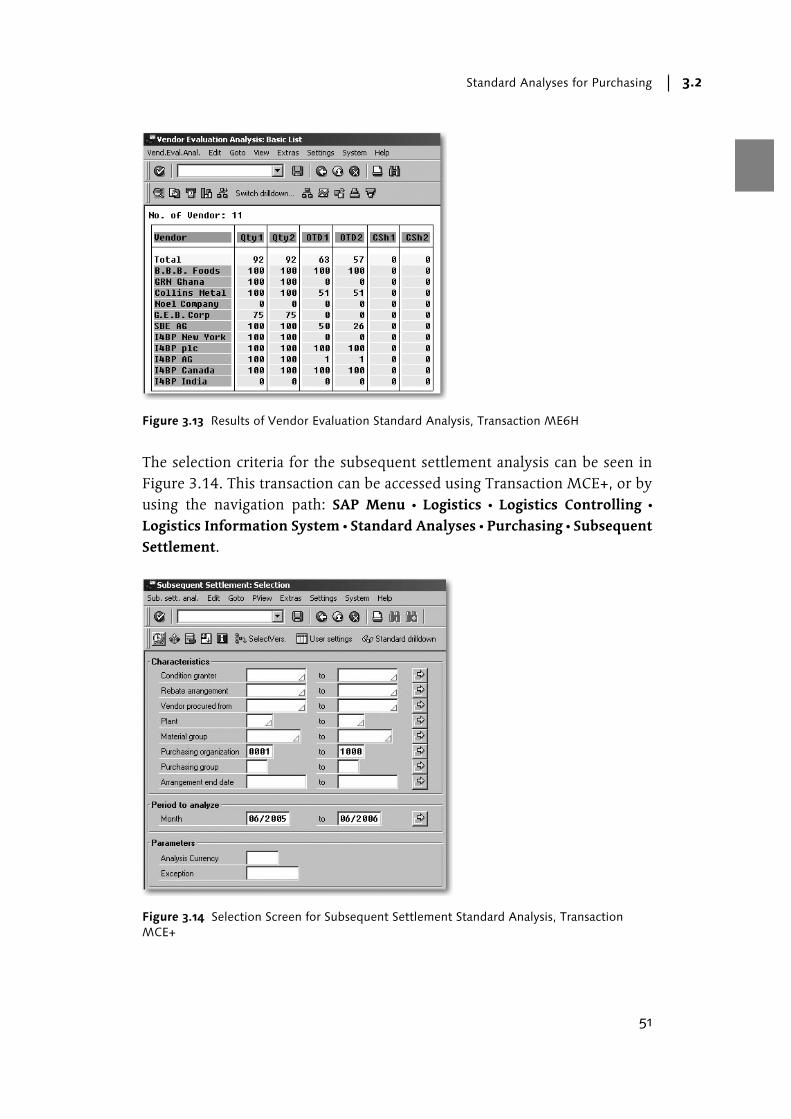
The results of the vendor evaluation standard analysis show certain percent-
age results. The results contain the two figures for quality reliability, two fig-
ures for on-time delivery, and two figures for shipping instruction correct-
ness. These figures can be seen in Figure 3.13.
3.2.6 Subsequent Settlement
Subsequent settlement is the SAP functionality that allows rebate arrange-
ments with vendors that are paid or settled at arranged dates, for instance,
end of a quarter or one per year. The rebates will be based on some business
volume, value, quantity, or a point structure. To verify the vendor’s calcula-
tions, you can use the standard analysis with the S015 information structure.
Figure 3.12 Selection Screen for Vendor Evaluation Standard Analysis Transaction ME6H
Standard Analyses for Purchasing 3.2
51
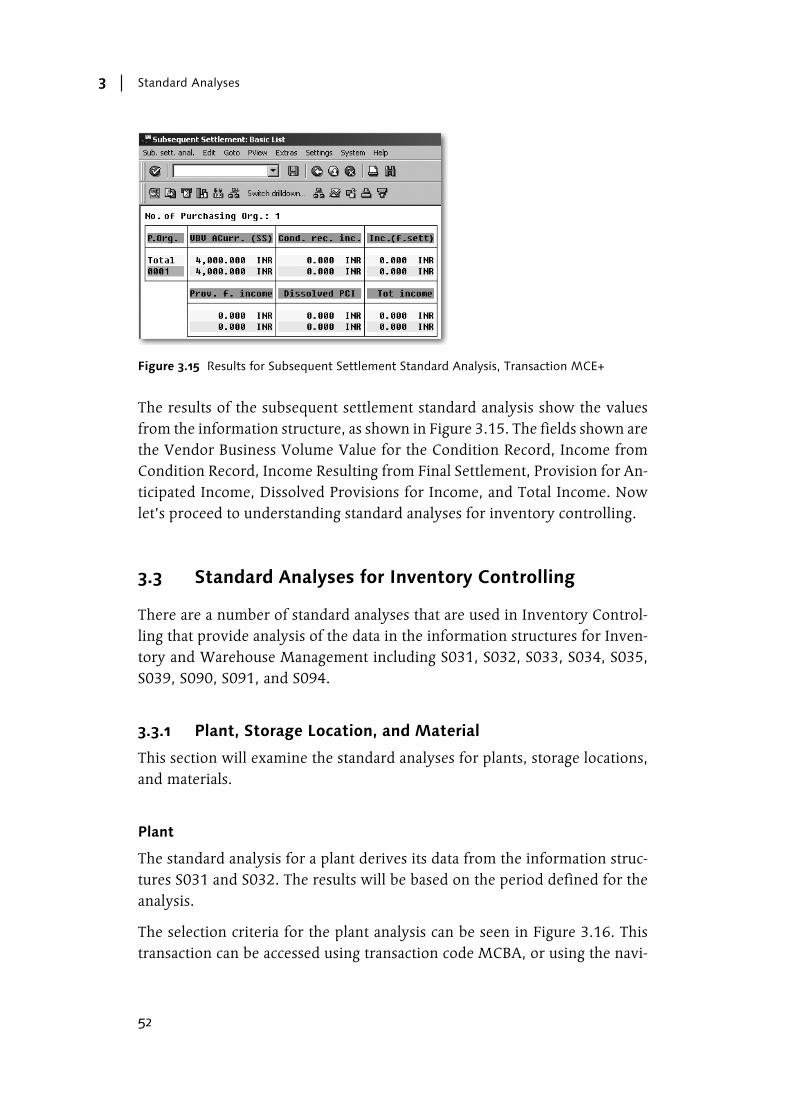
The selection criteria for the subsequent settlement analysis can be seen in
Figure 3.14. This transaction can be accessed using Transaction MCE+, or by
using the navigation path: SAP Menu � Logistics � Logistics Controlling �
Logistics Information System � Standard Analyses � Purchasing � Subsequent
Settlement.
Figure 3.13 Results of Vendor Evaluation Standard Analysis, Transaction ME6H
Figure 3.14 Selection Screen for Subsequent Settlement Standard Analysis, Transaction MCE+
Standard Analyses3
52
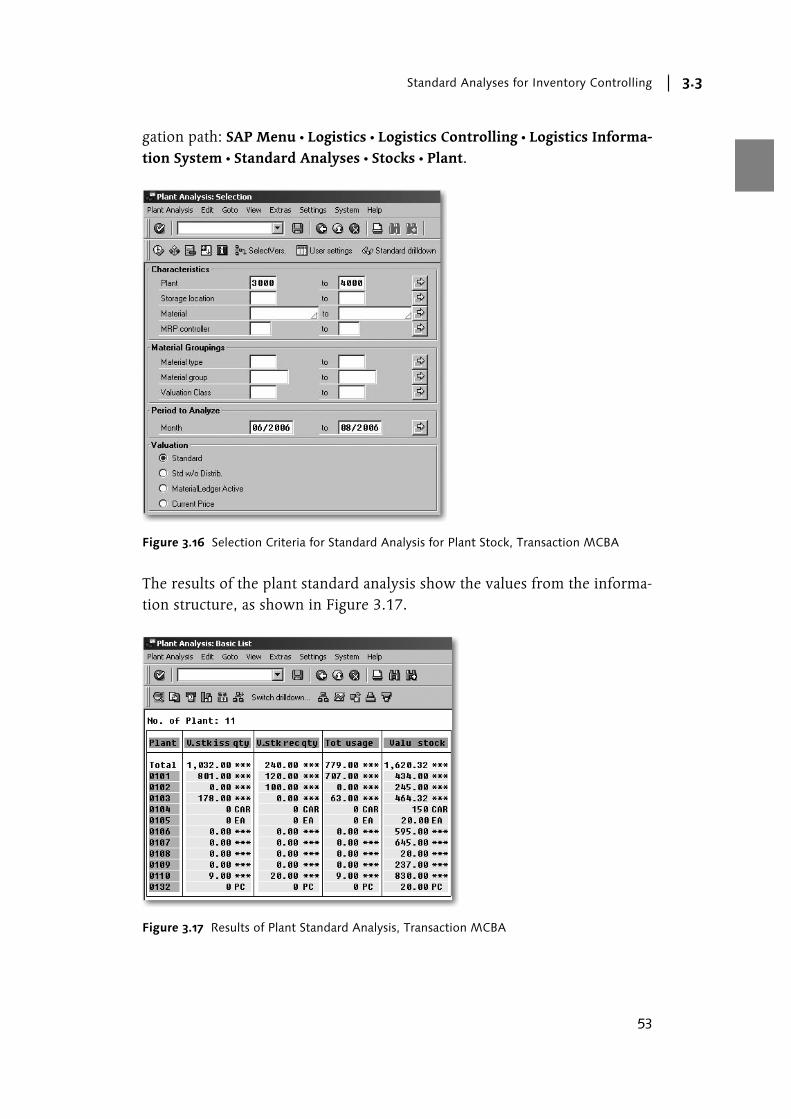
The results of the subsequent settlement standard analysis show the values
from the information structure, as shown in Figure 3.15. The fields shown are
the Vendor Business Volume Value for the Condition Record, Income from
Condition Record, Income Resulting from Final Settlement, Provision for An-
ticipated Income, Dissolved Provisions for Income, and Total Income. Now
let’s proceed to understanding standard analyses for inventory controlling.
3.3 Standard Analyses for Inventory Controlling
There are a number of standard analyses that are used in Inventory Control-
ling that provide analysis of the data in the information structures for Inven-
tory and Warehouse Management including S031, S032, S033, S034, S035,
S039, S090, S091, and S094.
3.3.1 Plant, Storage Location, and Material
This section will examine the standard analyses for plants, storage locations,
and materials.
Plant
The standard analysis for a plant derives its data from the information struc-
tures S031 and S032. The results will be based on the period defined for the
analysis.
The selection criteria for the plant analysis can be seen in Figure 3.16. This
transaction can be accessed using transaction code MCBA, or using the navi-
Figure 3.15 Results for Subsequent Settlement Standard Analysis, Transaction MCE+
Standard Analyses for Inventory Controlling 3.3
53
gation path: SAP Menu � Logistics � Logistics Controlling � Logistics Informa-
tion System � Standard Analyses � Stocks � Plant.
The results of the plant standard analysis show the values from the informa-
tion structure, as shown in Figure 3.17.
Figure 3.16 Selection Criteria for Standard Analysis for Plant Stock, Transaction MCBA
Figure 3.17 Results of Plant Standard Analysis, Transaction MCBA
Standard Analyses3
54
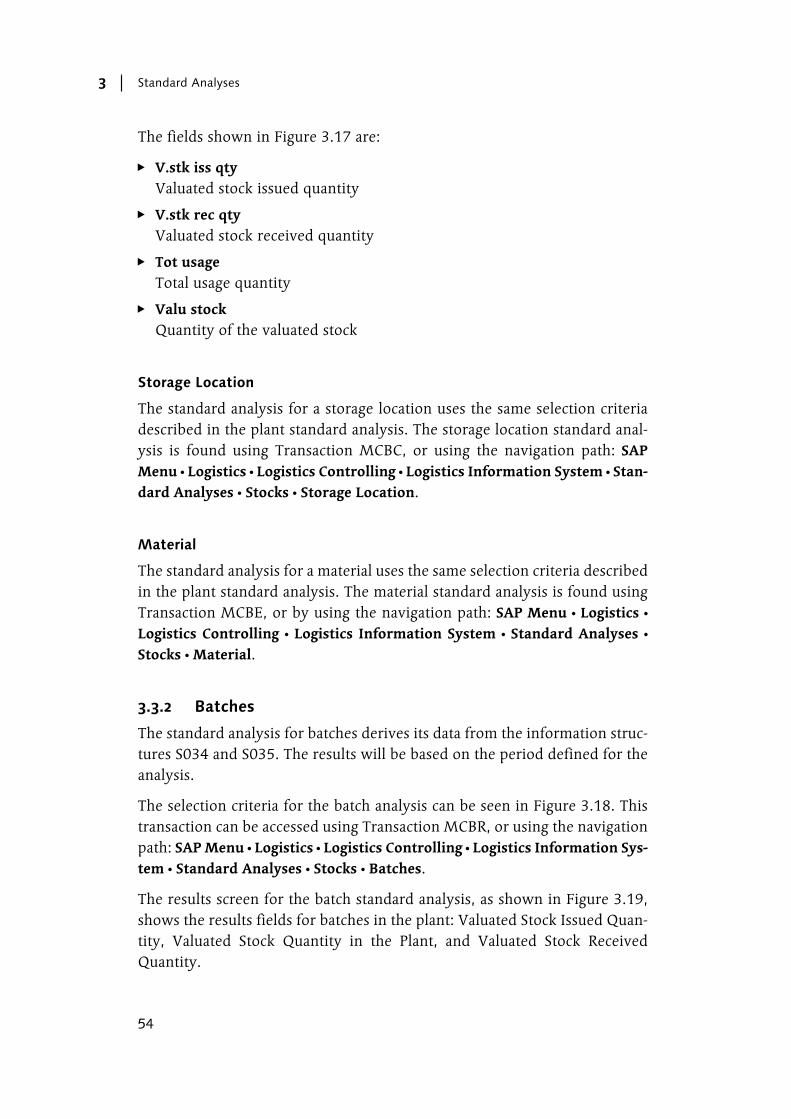
The fields shown in Figure 3.17 are:
� V.stk iss qty
Valuated stock issued quantity
� V.stk rec qty
Valuated stock received quantity
� Tot usage
Total usage quantity
� Valu stock
Quantity of the valuated stock
Storage Location
The standard analysis for a storage location uses the same selection criteria
described in the plant standard analysis. The storage location standard anal-
ysis is found using Transaction MCBC, or using the navigation path: SAP
Menu � Logistics � Logistics Controlling � Logistics Information System � Stan-
dard Analyses � Stocks � Storage Location.
Material
The standard analysis for a material uses the same selection criteria described
in the plant standard analysis. The material standard analysis is found using
Transaction MCBE, or by using the navigation path: SAP Menu � Logistics �
Logistics Controlling � Logistics Information System � Standard Analyses �
Stocks � Material.
3.3.2 Batches
The standard analysis for batches derives its data from the information struc-
tures S034 and S035. The results will be based on the period defined for the
analysis.
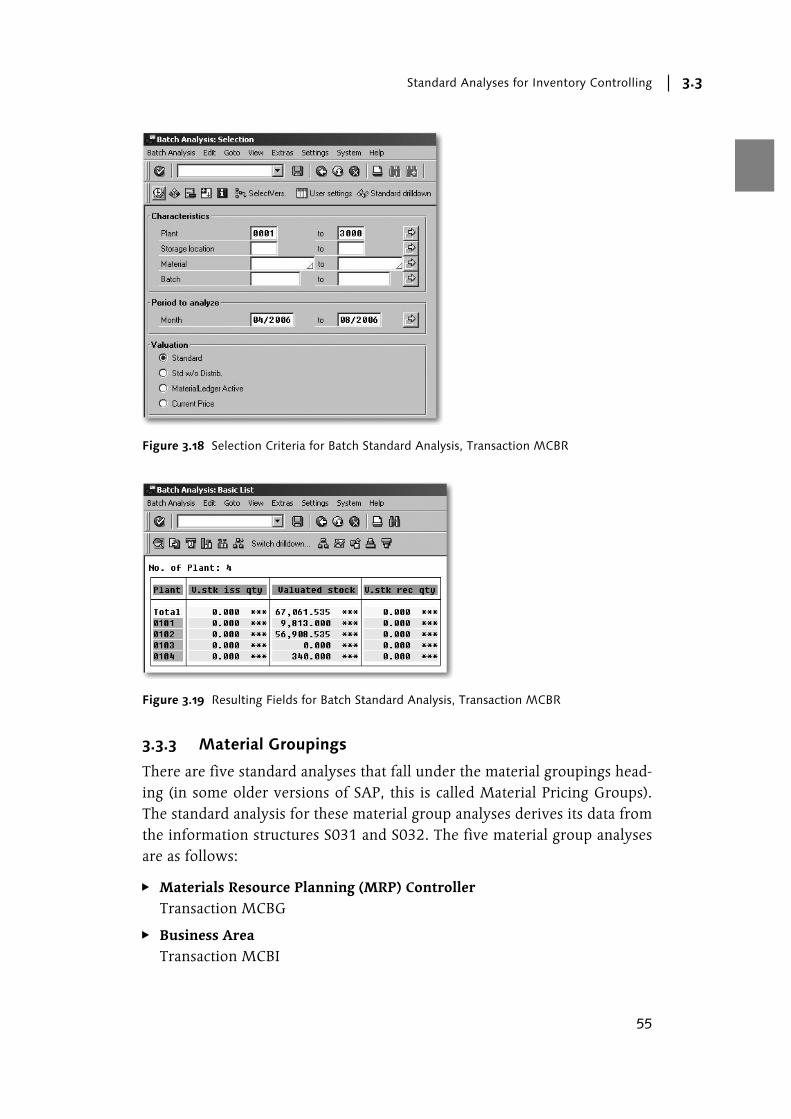
The selection criteria for the batch analysis can be seen in Figure 3.18. This
transaction can be accessed using Transaction MCBR, or using the navigation
path: SAP Menu � Logistics � Logistics Controlling � Logistics Information Sys-
tem � Standard Analyses � Stocks � Batches.
The results screen for the batch standard analysis, as shown in Figure 3.19,
shows the results fields for batches in the plant: Valuated Stock Issued Quan-
tity, Valuated Stock Quantity in the Plant, and Valuated Stock Received
Quantity.
Standard Analyses for Inventory Controlling 3.3
55
3.3.3 Material Groupings
There are five standard analyses that fall under the material groupings head-
ing (in some older versions of SAP, this is called Material Pricing Groups).
The standard analysis for these material group analyses derives its data from
the information structures S031 and S032. The five material group analyses
are as follows:
� Materials Resource Planning (MRP) Controller
Transaction MCBG
� Business Area
Transaction MCBI
Figure 3.18 Selection Criteria for Batch Standard Analysis, Transaction MCBR
Figure 3.19 Resulting Fields for Batch Standard Analysis, Transaction MCBR
Standard Analyses3
56
� Material Group
Transaction MCBK
� Division
Transaction MCBM
� Material Type
Transaction MCBO
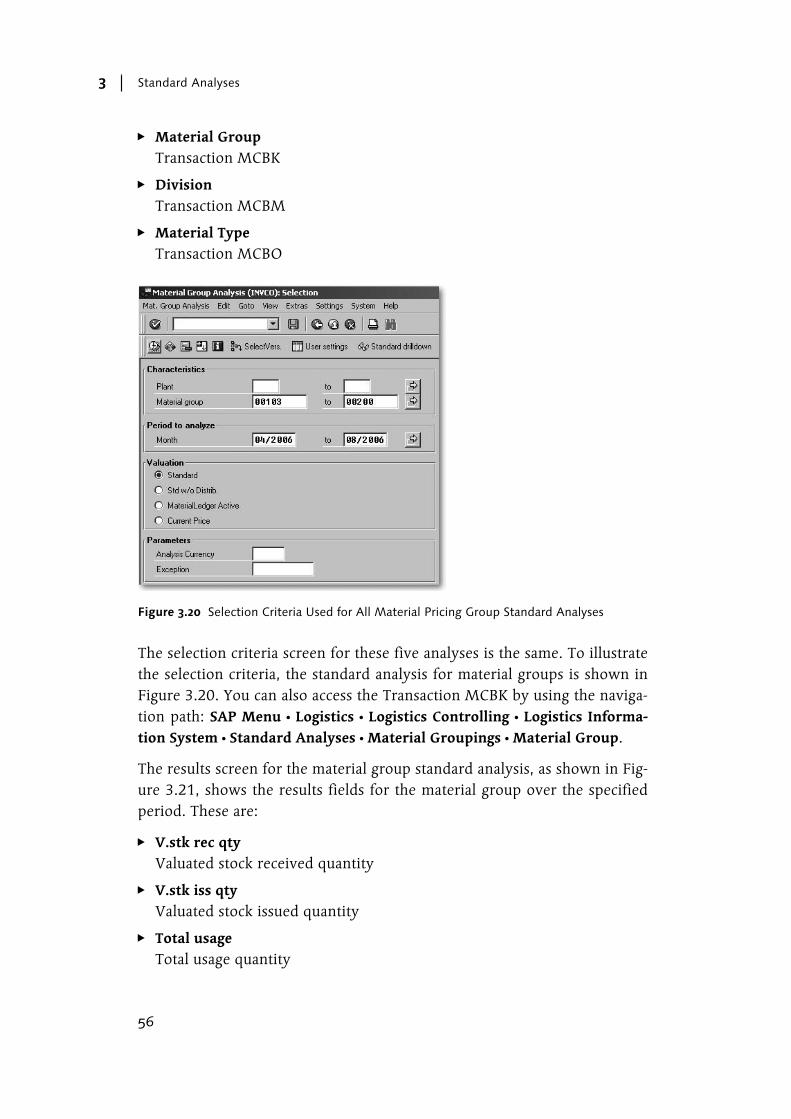
The selection criteria screen for these five analyses is the same. To illustrate
the selection criteria, the standard analysis for material groups is shown in
Figure 3.20. You can also access the Transaction MCBK by using the naviga-
tion path: SAP Menu � Logistics � Logistics Controlling � Logistics Informa-
tion System � Standard Analyses � Material Groupings � Material Group.
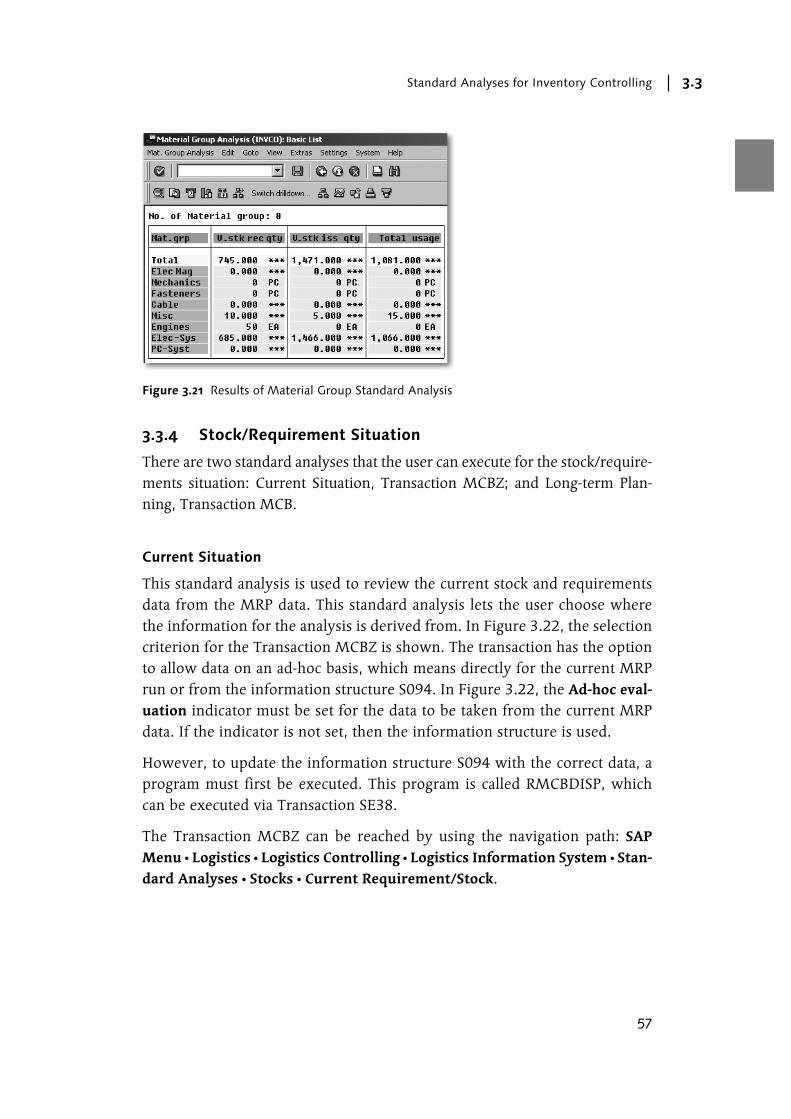
The results screen for the material group standard analysis, as shown in Fig-
ure 3.21, shows the results fields for the material group over the specified
period. These are:
� V.stk rec qty
Valuated stock received quantity
� V.stk iss qty
Valuated stock issued quantity
� Total usage
Total usage quantity
Figure 3.20 Selection Criteria Used for All Material Pricing Group Standard Analyses
Standard Analyses for Inventory Controlling 3.3
57
3.3.4 Stock/Requirement Situation
There are two standard analyses that the user can execute for the stock/require-
ments situation: Current Situation, Transaction MCBZ; and Long-term Plan-
ning, Transaction MCB.
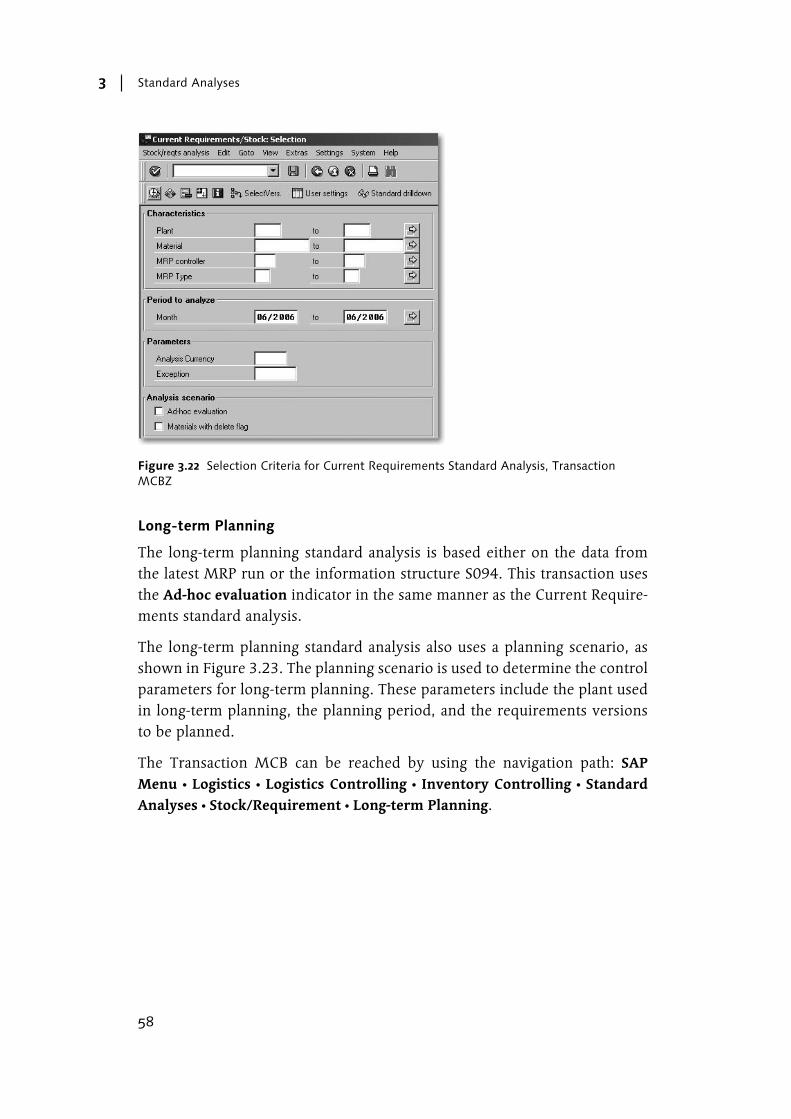
Current Situation
This standard analysis is used to review the current stock and requirements
data from the MRP data. This standard analysis lets the user choose where
the information for the analysis is derived from. In Figure 3.22, the selection
criterion for the Transaction MCBZ is shown. The transaction has the option
to allow data on an ad-hoc basis, which means directly for the current MRP
run or from the information structure S094. In Figure 3.22, the Ad-hoc eval-
uation indicator must be set for the data to be taken from the current MRP
data. If the indicator is not set, then the information structure is used.
However, to update the information structure S094 with the correct data, a
program must first be executed. This program is called RMCBDISP, which
can be executed via Transaction SE38.
The Transaction MCBZ can be reached by using the navigation path: SAP
Menu � Logistics � Logistics Controlling � Logistics Information System � Stan-
dard Analyses � Stocks � Current Requirement/Stock.
Figure 3.21 Results of Material Group Standard Analysis
Standard Analyses3
58
Long-term Planning
The long-term planning standard analysis is based either on the data from
the latest MRP run or the information structure S094. This transaction uses
the Ad-hoc evaluation indicator in the same manner as the Current Require-
ments standard analysis.
The long-term planning standard analysis also uses a planning scenario, as
shown in Figure 3.23. The planning scenario is used to determine the control
parameters for long-term planning. These parameters include the plant used
in long-term planning, the planning period, and the requirements versions
to be planned.
The Transaction MCB can be reached by using the navigation path: SAP
Menu � Logistics � Logistics Controlling � Inventory Controlling � Standard
Analyses � Stock/Requirement � Long-term Planning.
Figure 3.22 Selection Criteria for Current Requirements Standard Analysis, Transaction MCBZ

Standard Analyses for Inventory Controlling 3.3
59
3.3.5 Warehouse Management
The standard analyses for Warehouse Management allow for a view of stock
placement and removal and also for material placement and removal. There
are five standard analyses for Warehouse Management and all of them use
the information structure S091:
� Stock Placements and Removals
Transaction MCL1
� Quantities Flows
Transaction MCL5
� Material Placements and Removals
Transaction MCL9
� Material Flows
Transaction MCLD
� Movement Types
Transaction MCLH
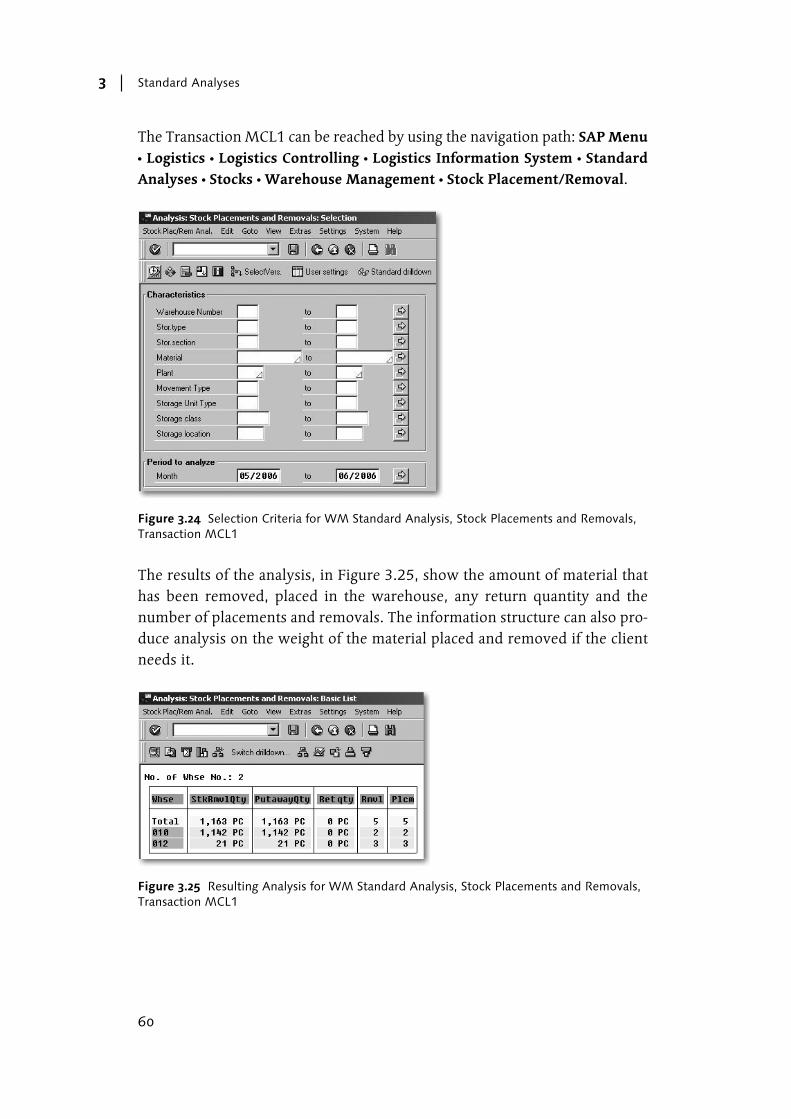
The standard analyses use the same selection criteria for querying the infor-
mation structure S091. Figure 3.24 shows the selection criteria for Transac-
tion MCL1, Stock Placements and Removals. This analysis allows the review
of stock placements and removals for a warehouse, a material, or a move-
ment type, etc.
Figure 3.23 Selection Criteria for Long-Term Planning Standard Analysis, Transaction MCB
Standard Analyses3
60
The Transaction MCL1 can be reached by using the navigation path: SAP Menu
� Logistics � Logistics Controlling � Logistics Information System � Standard
Analyses � Stocks � Warehouse Management � Stock Placement/Removal.
The results of the analysis, in Figure 3.25, show the amount of material that
has been removed, placed in the warehouse, any return quantity and the
number of placements and removals. The information structure can also pro-
duce analysis on the weight of the material placed and removed if the client
needs it.
Figure 3.24 Selection Criteria for WM Standard Analysis, Stock Placements and Removals, Transaction MCL1
Figure 3.25 Resulting Analysis for WM Standard Analysis, Stock Placements and Removals, Transaction MCL1
Standard Analyses for Production 3.4
61
3.4 Standard Analyses for Production
There are a number of standard analyses that are used for reviewing data in
Production. These standard analyses review the data in the information
structures related to Work Centers, Operations, Production Orders, etc. The
relevant information structures are S021 through S029.
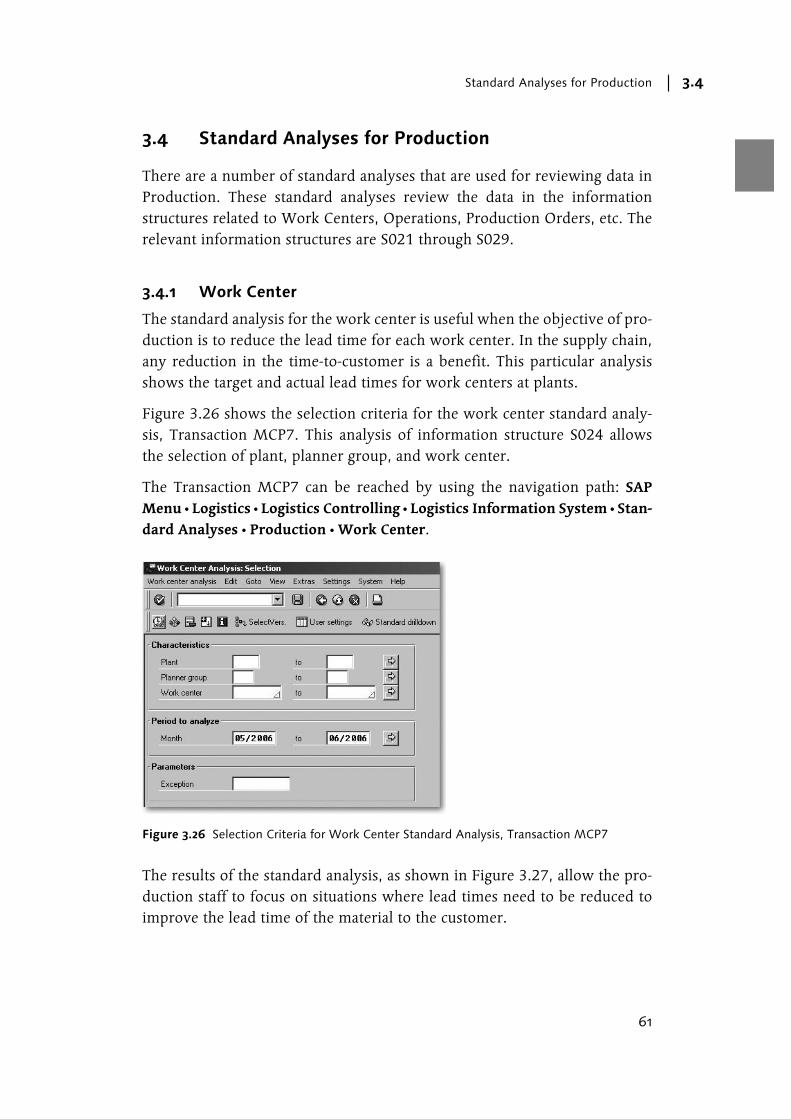
3.4.1 Work Center
The standard analysis for the work center is useful when the objective of pro-
duction is to reduce the lead time for each work center. In the supply chain,
any reduction in the time-to-customer is a benefit. This particular analysis
shows the target and actual lead times for work centers at plants.
Figure 3.26 shows the selection criteria for the work center standard analy-
sis, Transaction MCP7. This analysis of information structure S024 allows
the selection of plant, planner group, and work center.
The Transaction MCP7 can be reached by using the navigation path: SAP
Menu � Logistics � Logistics Controlling � Logistics Information System � Stan-
dard Analyses � Production � Work Center.
The results of the standard analysis, as shown in Figure 3.27, allow the pro-
duction staff to focus on situations where lead times need to be reduced to
improve the lead time of the material to the customer.
Figure 3.26 Selection Criteria for Work Center Standard Analysis, Transaction MCP7
Standard Analyses3
62
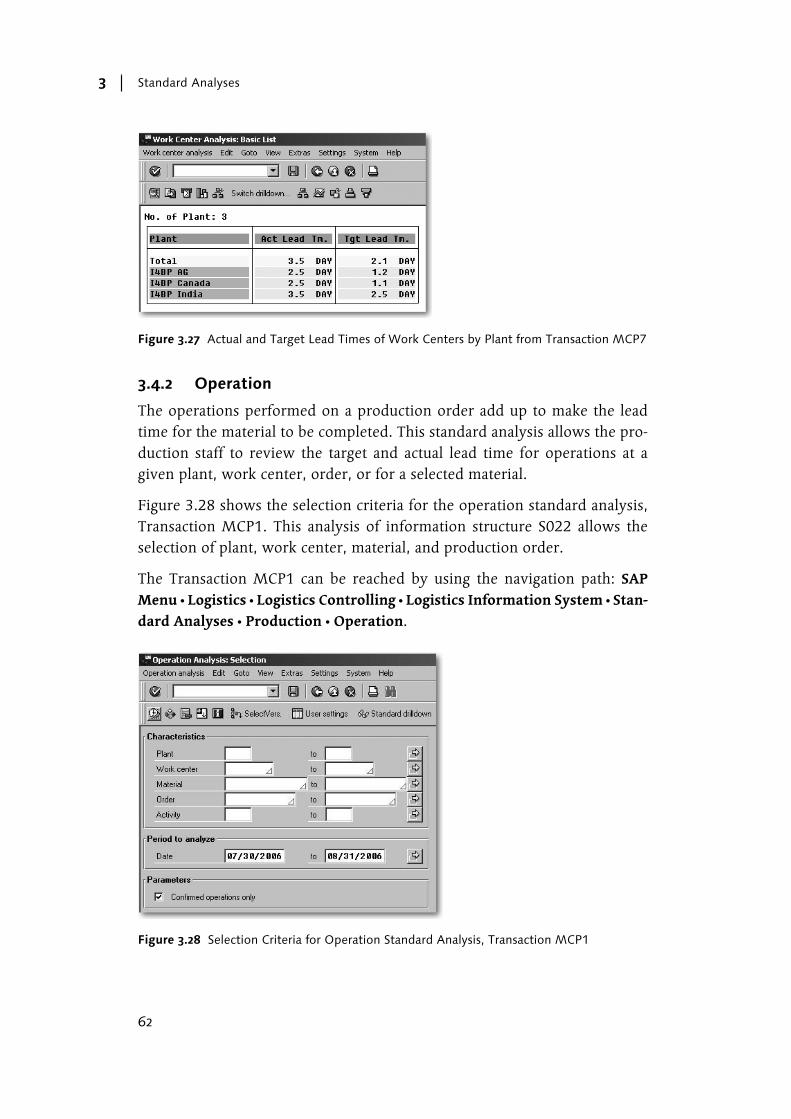
3.4.2 Operation
The operations performed on a production order add up to make the lead
time for the material to be completed. This standard analysis allows the pro-
duction staff to review the target and actual lead time for operations at a
given plant, work center, order, or for a selected material.
Figure 3.28 shows the selection criteria for the operation standard analysis,
Transaction MCP1. This analysis of information structure S022 allows the
selection of plant, work center, material, and production order.
The Transaction MCP1 can be reached by using the navigation path: SAP
Menu � Logistics � Logistics Controlling � Logistics Information System � Stan-
dard Analyses � Production � Operation.
Figure 3.27 Actual and Target Lead Times of Work Centers by Plant from Transaction MCP7
Figure 3.28 Selection Criteria for Operation Standard Analysis, Transaction MCP1
Standard Analyses for Production 3.4
63
The resulting standard analysis for operations is similar to that in Figure 3.27
for work centers, in that it shows target and actual lead time for operations
per plant.
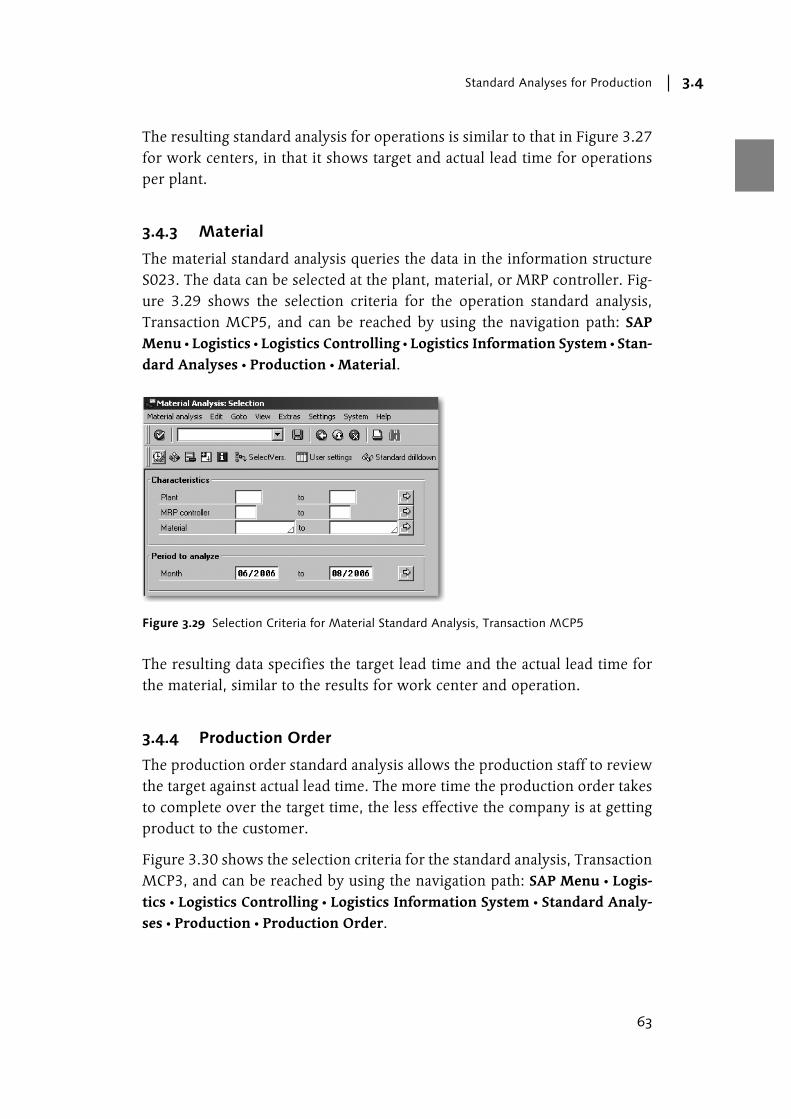
3.4.3 Material
The material standard analysis queries the data in the information structure
S023. The data can be selected at the plant, material, or MRP controller. Fig-
ure 3.29 shows the selection criteria for the operation standard analysis,
Transaction MCP5, and can be reached by using the navigation path: SAP
Menu � Logistics � Logistics Controlling � Logistics Information System � Stan-
dard Analyses � Production � Material.
The resulting data specifies the target lead time and the actual lead time for
the material, similar to the results for work center and operation.
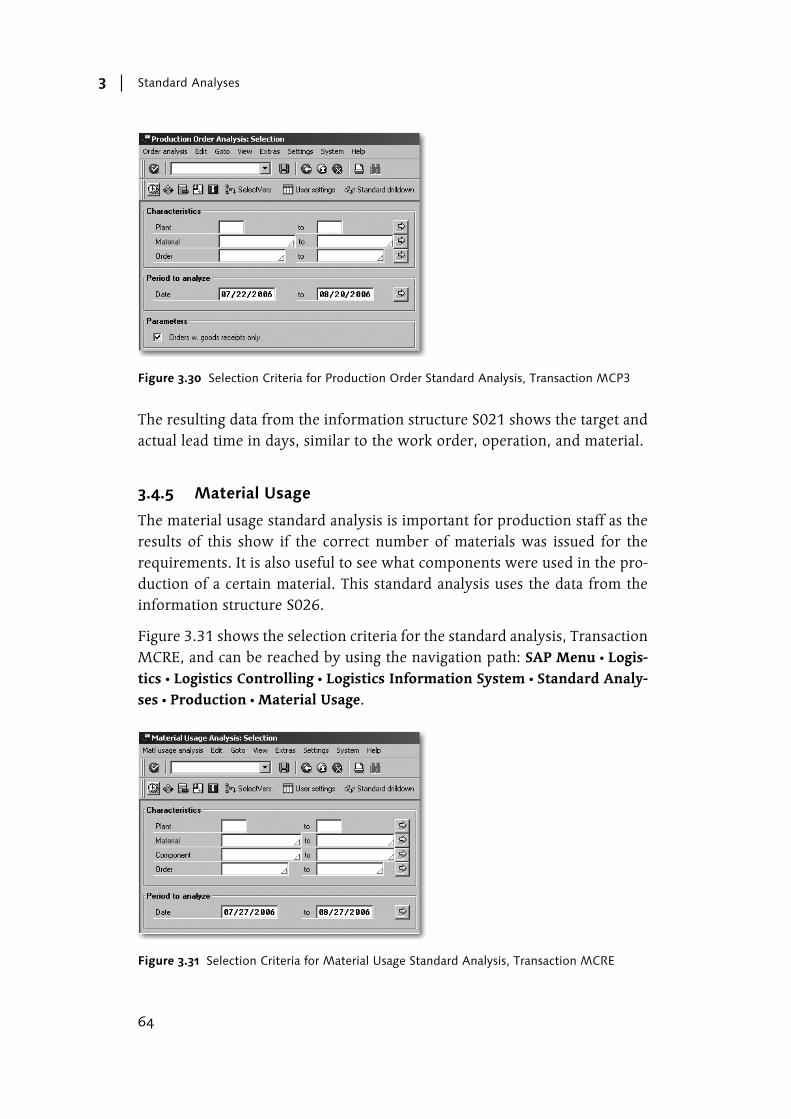
3.4.4 Production Order
The production order standard analysis allows the production staff to review
the target against actual lead time. The more time the production order takes
to complete over the target time, the less effective the company is at getting
product to the customer.
Figure 3.30 shows the selection criteria for the standard analysis, Transaction
MCP3, and can be reached by using the navigation path: SAP Menu � Logis-
tics � Logistics Controlling � Logistics Information System � Standard Analy-
ses � Production � Production Order.
Figure 3.29 Selection Criteria for Material Standard Analysis, Transaction MCP5
Standard Analyses3
64
The resulting data from the information structure S021 shows the target and
actual lead time in days, similar to the work order, operation, and material.
3.4.5 Material Usage
The material usage standard analysis is important for production staff as the
results of this show if the correct number of materials was issued for the
requirements. It is also useful to see what components were used in the pro-
duction of a certain material. This standard analysis uses the data from the
information structure S026.
Figure 3.31 shows the selection criteria for the standard analysis, Transaction
MCRE, and can be reached by using the navigation path: SAP Menu � Logis-
tics � Logistics Controlling � Logistics Information System � Standard Analy-
ses � Production � Material Usage.
Figure 3.30 Selection Criteria for Production Order Standard Analysis, Transaction MCP3
Figure 3.31 Selection Criteria for Material Usage Standard Analysis, Transaction MCRE

Standard Analyses for Production 3.4
65
The results of the material usage standard analysis, as shown in Figure 3.32,
allow the production staff to review the requirements and the withdrawal of
materials to monitor production validity.
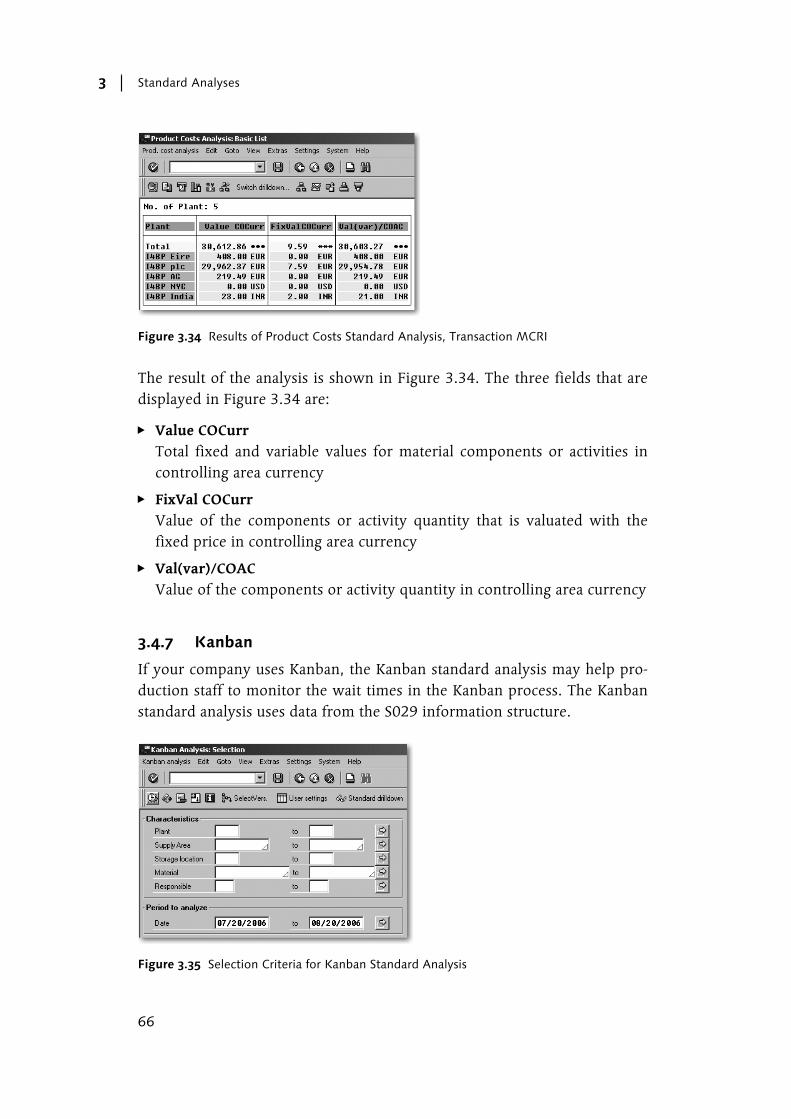
3.4.6 Product Costs
The product costs standard analysis reviews the data in the information
structure, S027. The analysis allows the costing department to review the
material costs using the selection criteria of plant, material, or production
order.
Figure 3.33 shows the selection criteria for the product costs standard analy-
sis, Transaction MCRI, and can be reached by using the navigation path: SAP
Menu � Logistics � Logistics Controlling � Logistics Information System � Stan-
dard Analyses � Production � Product Costs.
Figure 3.32 Results for Material Usage Standard Analysis, Transaction MCRE
Figure 3.33 Selection Criteria for Product Costs Standard Analysis, Transaction MCRI
Standard Analyses3
66
The result of the analysis is shown in Figure 3.34. The three fields that are
displayed in Figure 3.34 are:
� Value COCurr
Total fixed and variable values for material components or activities in
controlling area currency
� FixVal COCurr
Value of the components or activity quantity that is valuated with the
fixed price in controlling area currency
� Val(var)/COAC
Value of the components or activity quantity in controlling area currency
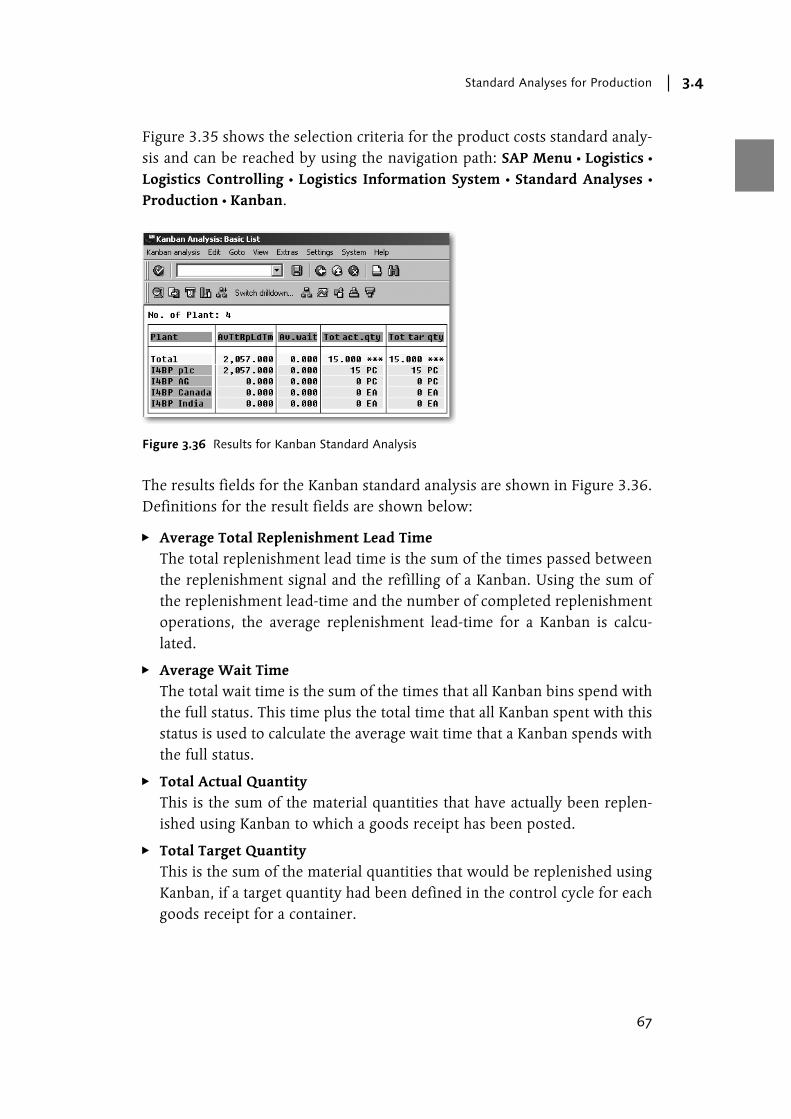
3.4.7 Kanban
If your company uses Kanban, the Kanban standard analysis may help pro-
duction staff to monitor the wait times in the Kanban process. The Kanban
standard analysis uses data from the S029 information structure.
Figure 3.34 Results of Product Costs Standard Analysis, Transaction MCRI
Figure 3.35 Selection Criteria for Kanban Standard Analysis
Standard Analyses for Production 3.4
67
Figure 3.35 shows the selection criteria for the product costs standard analy-
sis and can be reached by using the navigation path: SAP Menu � Logistics �
Logistics Controlling � Logistics Information System � Standard Analyses �
Production � Kanban.
The results fields for the Kanban standard analysis are shown in Figure 3.36.
Definitions for the result fields are shown below:
� Average Total Replenishment Lead Time
The total replenishment lead time is the sum of the times passed between
the replenishment signal and the refilling of a Kanban. Using the sum of
the replenishment lead-time and the number of completed replenishment
operations, the average replenishment lead-time for a Kanban is calcu-
lated.
� Average Wait Time
The total wait time is the sum of the times that all Kanban bins spend with
the full status. This time plus the total time that all Kanban spent with this
status is used to calculate the average wait time that a Kanban spends with
the full status.
� Total Actual Quantity
This is the sum of the material quantities that have actually been replen-
ished using Kanban to which a goods receipt has been posted.
� Total Target Quantity
This is the sum of the material quantities that would be replenished using
Kanban, if a target quantity had been defined in the control cycle for each
goods receipt for a container.
Figure 3.36 Results for Kanban Standard Analysis
Standard Analyses3
68
3.5 Standard Analyses for Plant Maintenance
There are a number of standard analyses that are defined for reviewing data
in Plant Maintenance (PM). These standard analyses review the data in the
information structures related to manufacturers, locations, damage analysis,
breakdowns, etc. The relevant information structures in Plant Maintenance
are S061, S062, S063, S065, S070, S115, and S116.
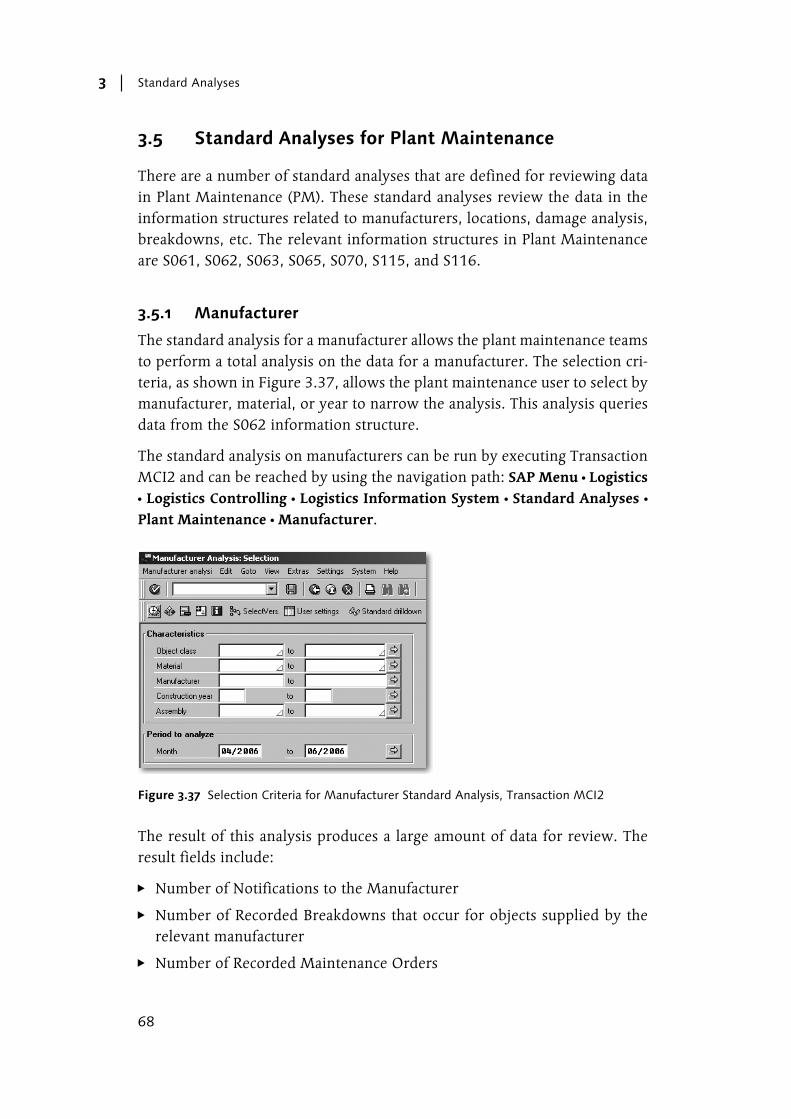
3.5.1 Manufacturer
The standard analysis for a manufacturer allows the plant maintenance teams
to perform a total analysis on the data for a manufacturer. The selection cri-
teria, as shown in Figure 3.37, allows the plant maintenance user to select by
manufacturer, material, or year to narrow the analysis. This analysis queries
data from the S062 information structure.
The standard analysis on manufacturers can be run by executing Transaction
MCI2 and can be reached by using the navigation path: SAP Menu � Logistics
� Logistics Controlling � Logistics Information System � Standard Analyses �
Plant Maintenance � Manufacturer.
The result of this analysis produces a large amount of data for review. The
result fields include:
� Number of Notifications to the Manufacturer
� Number of Recorded Breakdowns that occur for objects supplied by the
relevant manufacturer
� Number of Recorded Maintenance Orders
Figure 3.37 Selection Criteria for Manufacturer Standard Analysis, Transaction MCI2
Standard Analyses for Plant Maintenance 3.5
69
� Sum of the Planned Costs for Maintenance Orders
� Total Actual Costs of Maintenance Services
� Total Plant Maintenance Costs for Internal Personnel
� Total Plant Maintenance Costs for External Contractors
� Total Plant Maintenance Costs for Internal Materials
� Total Plant Maintenance Costs for External Materials
� Sum of Plant Maintenance Costs that result from Services
� Total of Miscellaneous Plant Maintenance Costs
� Sum of the Actual Revenues for Plant Maintenance Services
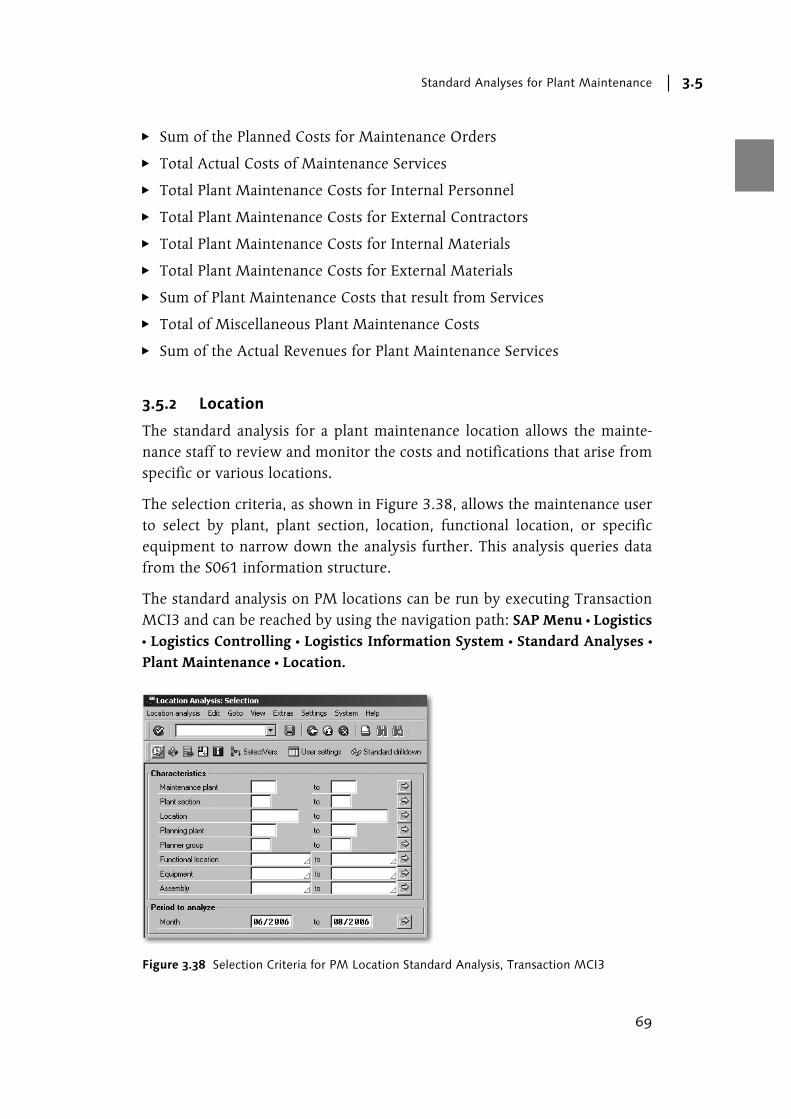
3.5.2 Location
The standard analysis for a plant maintenance location allows the mainte-
nance staff to review and monitor the costs and notifications that arise from
specific or various locations.
The selection criteria, as shown in Figure 3.38, allows the maintenance user
to select by plant, plant section, location, functional location, or specific
equipment to narrow down the analysis further. This analysis queries data
from the S061 information structure.
The standard analysis on PM locations can be run by executing Transaction
MCI3 and can be reached by using the navigation path: SAP Menu � Logistics
� Logistics Controlling � Logistics Information System � Standard Analyses �
Plant Maintenance � Location.
Figure 3.38 Selection Criteria for PM Location Standard Analysis, Transaction MCI3
Standard Analyses3
70
The resulting analysis produces a significant quantity of data to review. The
result fields are the same as those found for the standard analysis for a man-
ufacturer, described in Section 3.5.1.
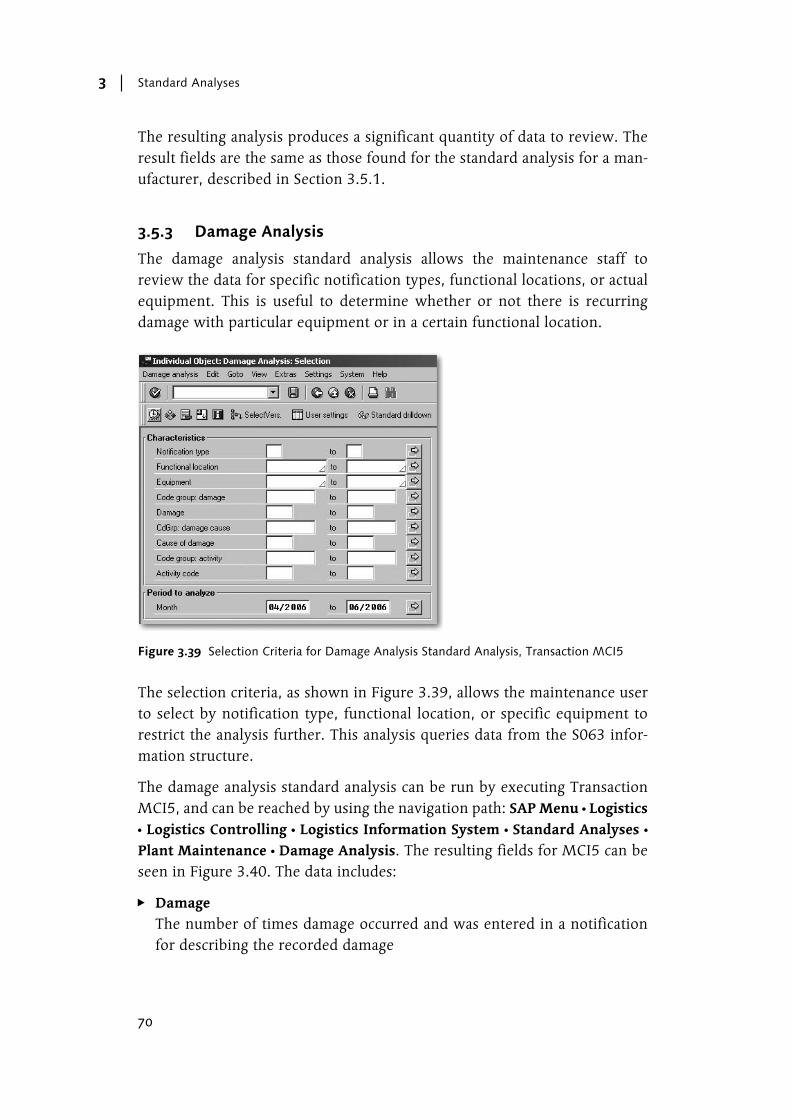
3.5.3 Damage Analysis
The damage analysis standard analysis allows the maintenance staff to
review the data for specific notification types, functional locations, or actual
equipment. This is useful to determine whether or not there is recurring
damage with particular equipment or in a certain functional location.
The selection criteria, as shown in Figure 3.39, allows the maintenance user
to select by notification type, functional location, or specific equipment to
restrict the analysis further. This analysis queries data from the S063 infor-
mation structure.
The damage analysis standard analysis can be run by executing Transaction
MCI5, and can be reached by using the navigation path: SAP Menu � Logistics
� Logistics Controlling � Logistics Information System � Standard Analyses �
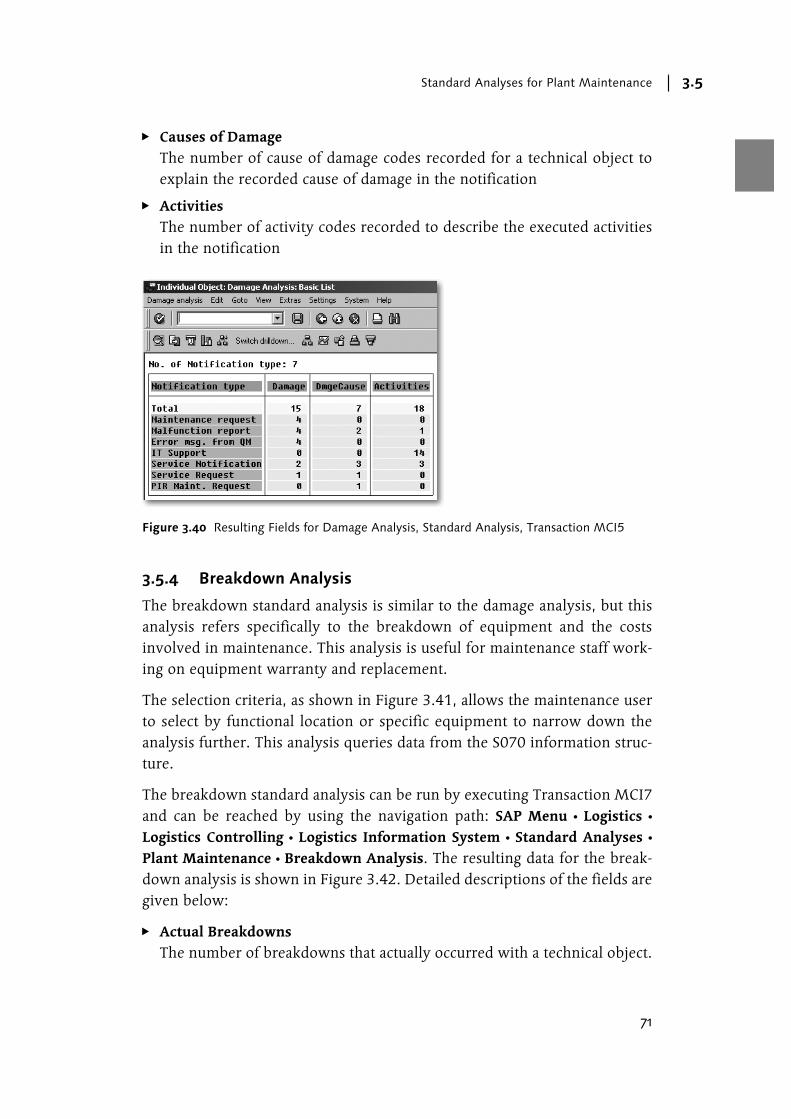
Plant Maintenance � Damage Analysis. The resulting fields for MCI5 can be
seen in Figure 3.40. The data includes:
� Damage
The number of times damage occurred and was entered in a notification
for describing the recorded damage
Figure 3.39 Selection Criteria for Damage Analysis Standard Analysis, Transaction MCI5
Standard Analyses for Plant Maintenance 3.5
71
� Causes of Damage
The number of cause of damage codes recorded for a technical object to
explain the recorded cause of damage in the notification
� Activities
The number of activity codes recorded to describe the executed activities
in the notification
3.5.4 Breakdown Analysis
The breakdown standard analysis is similar to the damage analysis, but this
analysis refers specifically to the breakdown of equipment and the costs
involved in maintenance. This analysis is useful for maintenance staff work-
ing on equipment warranty and replacement.
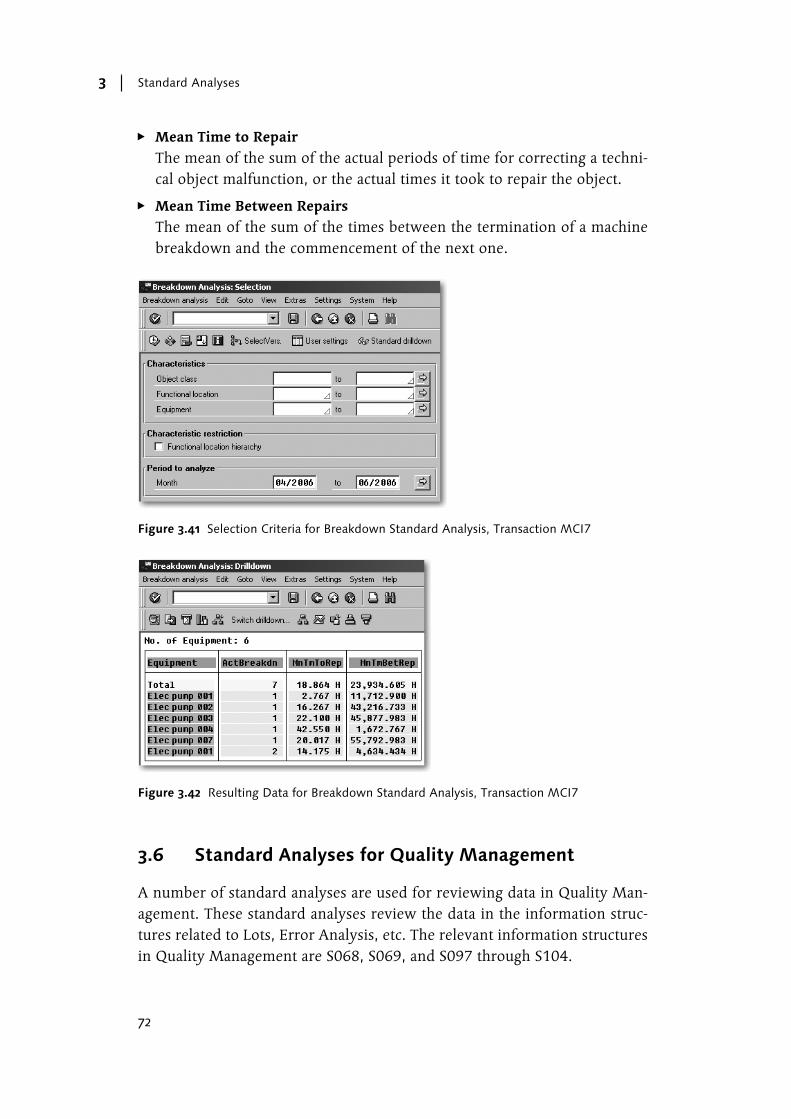
The selection criteria, as shown in Figure 3.41, allows the maintenance user
to select by functional location or specific equipment to narrow down the
analysis further. This analysis queries data from the S070 information struc-
ture.
The breakdown standard analysis can be run by executing Transaction MCI7
and can be reached by using the navigation path: SAP Menu � Logistics �
Logistics Controlling � Logistics Information System � Standard Analyses �
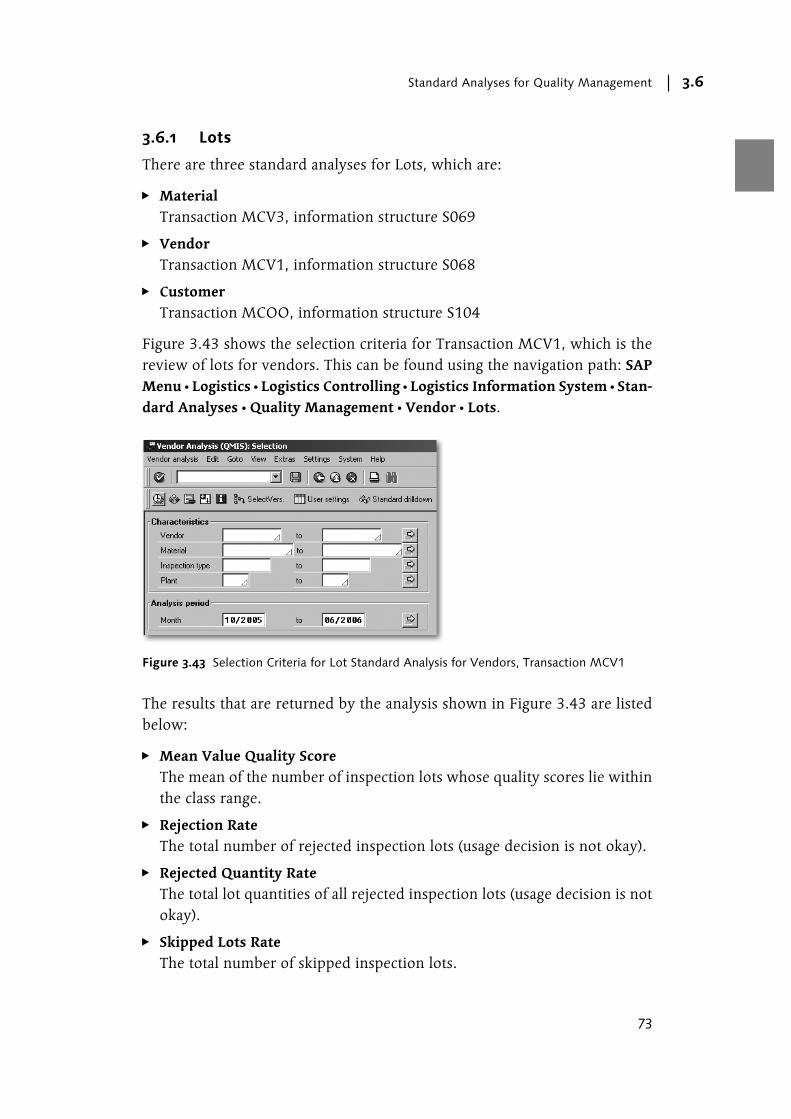
Plant Maintenance � Breakdown Analysis. The resulting data for the break-
down analysis is shown in Figure 3.42. Detailed descriptions of the fields are
given below:
� Actual Breakdowns
The number of breakdowns that actually occurred with a technical object.
Figure 3.40 Resulting Fields for Damage Analysis, Standard Analysis, Transaction MCI5
Standard Analyses3
72
� Mean Time to Repair
The mean of the sum of the actual periods of time for correcting a techni-
cal object malfunction, or the actual times it took to repair the object.
� Mean Time Between Repairs
The mean of the sum of the times between the termination of a machine
breakdown and the commencement of the next one.
3.6 Standard Analyses for Quality Management
A number of standard analyses are used for reviewing data in Quality Man-
agement. These standard analyses review the data in the information struc-
tures related to Lots, Error Analysis, etc. The relevant information structures
in Quality Management are S068, S069, and S097 through S104.
Figure 3.41 Selection Criteria for Breakdown Standard Analysis, Transaction MCI7
Figure 3.42 Resulting Data for Breakdown Standard Analysis, Transaction MCI7
Standard Analyses for Quality Management 3.6
73
3.6.1 Lots
There are three standard analyses for Lots, which are:
� Material
Transaction MCV3, information structure S069
� Vendor
Transaction MCV1, information structure S068
� Customer
Transaction MCOO, information structure S104
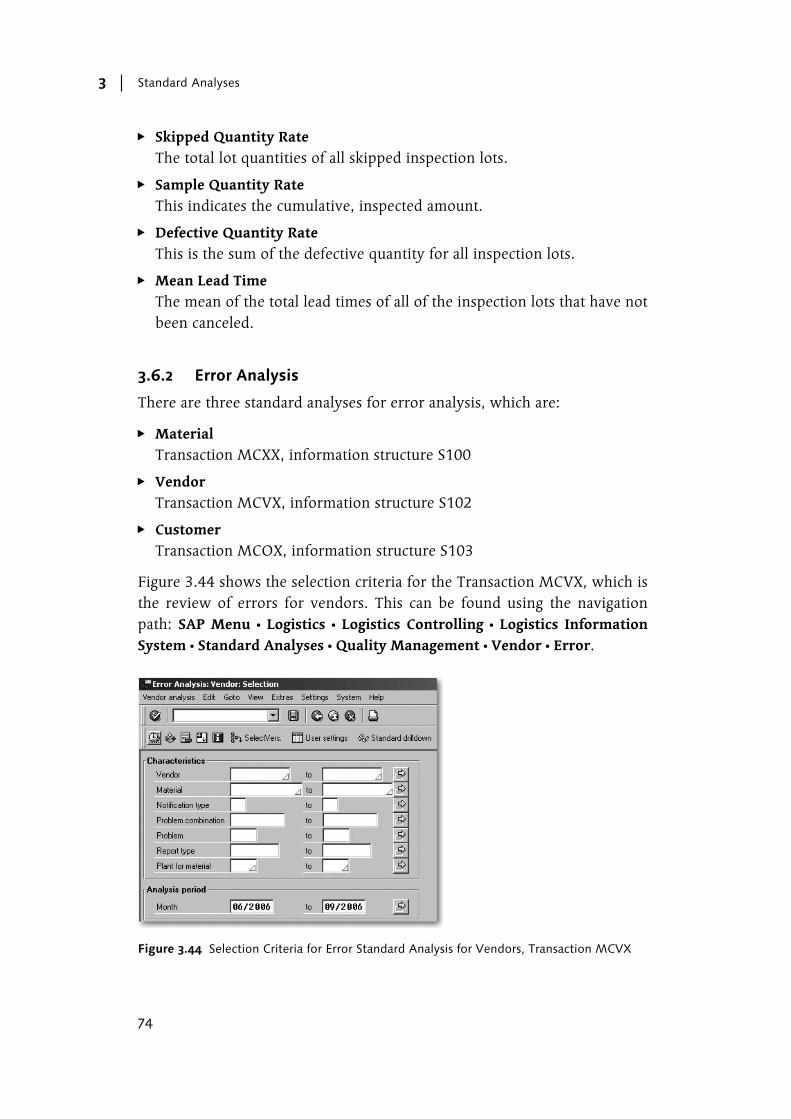
Figure 3.43 shows the selection criteria for Transaction MCV1, which is the
review of lots for vendors. This can be found using the navigation path: SAP
Menu � Logistics � Logistics Controlling � Logistics Information System � Stan-
dard Analyses � Quality Management � Vendor � Lots.
The results that are returned by the analysis shown in Figure 3.43 are listed
below:
� Mean Value Quality Score
The mean of the number of inspection lots whose quality scores lie within
the class range.
� Rejection Rate
The total number of rejected inspection lots (usage decision is not okay).
� Rejected Quantity Rate
The total lot quantities of all rejected inspection lots (usage decision is not
okay).
� Skipped Lots Rate
The total number of skipped inspection lots.
Figure 3.43 Selection Criteria for Lot Standard Analysis for Vendors, Transaction MCV1
Standard Analyses3
74
� Skipped Quantity Rate
The total lot quantities of all skipped inspection lots.
� Sample Quantity Rate
This indicates the cumulative, inspected amount.
� Defective Quantity Rate
This is the sum of the defective quantity for all inspection lots.
� Mean Lead Time
The mean of the total lead times of all of the inspection lots that have not
been canceled.
3.6.2 Error Analysis
There are three standard analyses for error analysis, which are:
� Material
Transaction MCXX, information structure S100
� Vendor
Transaction MCVX, information structure S102
� Customer
Transaction MCOX, information structure S103
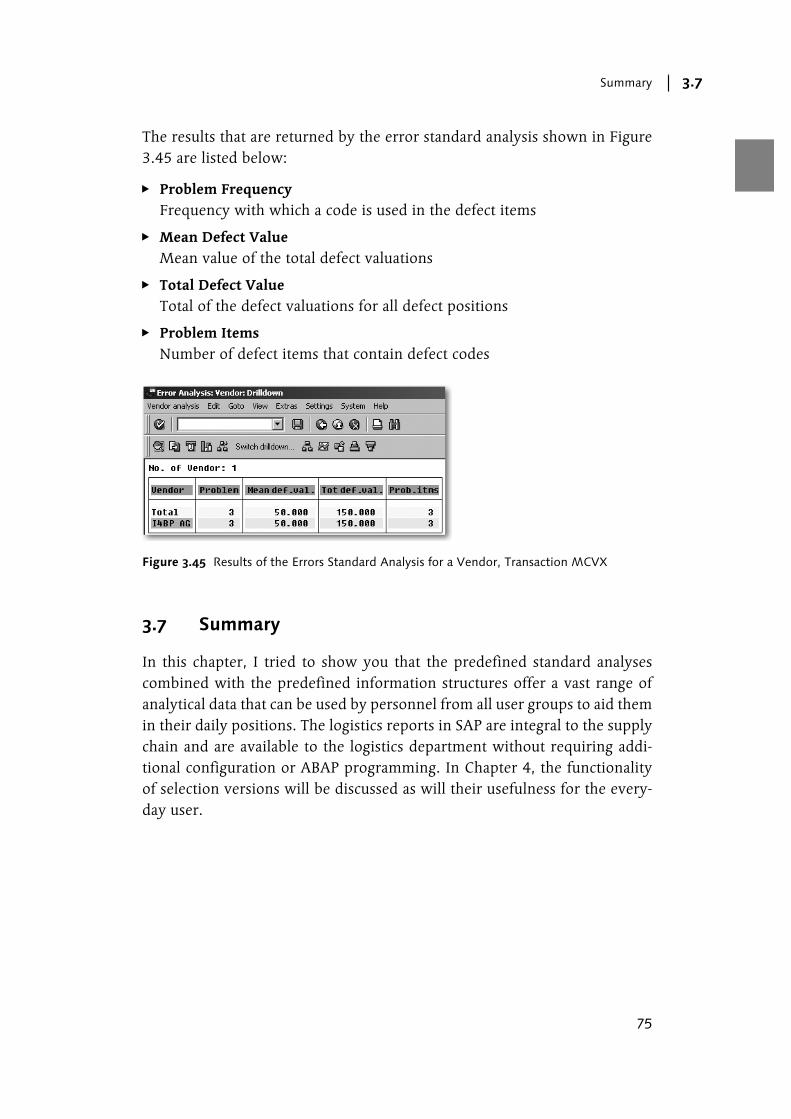
Figure 3.44 shows the selection criteria for the Transaction MCVX, which is
the review of errors for vendors. This can be found using the navigation
path: SAP Menu � Logistics � Logistics Controlling � Logistics Information
System � Standard Analyses � Quality Management � Vendor � Error.
Figure 3.44 Selection Criteria for Error Standard Analysis for Vendors, Transaction MCVX
Summary 3.7
75
The results that are returned by the error standard analysis shown in Figure
3.45 are listed below:
� Problem Frequency
Frequency with which a code is used in the defect items
� Mean Defect Value
Mean value of the total defect valuations
� Total Defect Value
Total of the defect valuations for all defect positions
� Problem Items
Number of defect items that contain defect codes
3.7 Summary
In this chapter, I tried to show you that the predefined standard analyses
combined with the predefined information structures offer a vast range of
analytical data that can be used by personnel from all user groups to aid them
in their daily positions. The logistics reports in SAP are integral to the supply
chain and are available to the logistics department without requiring addi-
tional configuration or ABAP programming. In Chapter 4, the functionality
of selection versions will be discussed as will their usefulness for the every-
day user.
Figure 3.45 Results of the Errors Standard Analysis for a Vendor, Transaction MCVX
325
Index
A
ABAP 31, 75, 153, 270
ABAP Workbench 122
ABC Analysis 97
Absolute Key Figure 99
Actual lead times 239
Analysis 117
Analysis Currency 78, 254, 289
Application Component 122
Asset Location 265
Asynchronous Update 182
B
Basic List 103
Batch 209
Batches 54
Bill of Materials 246
Breakdown 259
Breakdown Analysis 71, 269
Business Area 55, 216, 217
Business Information Warehouse 35
C
Calculations 140
Characteristic Display 80
Characteristic Values 99
Characteristics 35, 80, 114, 117, 131,
133, 170, 191, 250, 273
C-Kanban 255
Class Boundaries 105, 106
Class Limits 106
Class limits 111
Class List 105
Classes 103
Classification 102, 153, 260, 303, 307
Code Group 266
Collective Update 182
Column Width 80
Columnar Comparison 137
Commission 170
Configuration 181, 311
Consumer Products 113
Continuous Flow 250
Contract 193
Costing 250
Costing Department 65
Country of Origin 154
Current Bank Rate 289
Current Comparison 202
Customer 21, 73
Customer analysis 171
Customer Satisfaction 273
Customer service 170
Customers 169, 237
D
Damage Analysis 70, 266
Data administration 288
Data Dictionary 117
Data dictionary 114
Data Dictionary Table 131
Data element 155
Data retrieval 113
Demand forecasts 191
Discounts 169
Display Type 134
Distribution Channel 176
Division 56
Drilldown 86, 87, 96, 171, 201, 230,
239, 241, 252, 265, 268, 278, 281
Dual card Kanban 255
Dual Characterisitics 223
Dual classification 108
Dual Classifications 224
E
Early Warning System 286, 287, 315
Enterprise Resource Planning 19
Equipment 108, 273
Error Analysis 72, 74
Evaluation 117, 131, 151
Evaluation Description 116
Evaluation Name 116, 132
Evaluation Structure 113, 117, 128, 129,
131
326
Index
Evaluations 113
Event-driven analysis 297, 298
Exception 287
Exception analysis 301
Exception group 295
Exception name 287
Exchange Rate Type 79
F
Financial Flow 18
Finished Goods 226
Fix Indicator for Planning 38
Flexible Analyses 113
Flexible Analysis 113
Flexible Planning 210
Formula 140
Functional Location 260, 270
Functional Locations 123
G
Goods Issues 237
Goods Receipt 250, 275
Goods Receipts 237
Graphic Display 99
Graphical Display 104
H
Hierarchy 91, 92, 123, 153, 155, 157,
161, 283, 308
I
Incoming Orders 174
Info Sets 303
Information Flow 18
Information Structure 27, 32, 42, 68, 75,
85, 93, 113, 117, 155, 156, 170, 171,
181, 191, 210, 260, 274, 287
Inspection Lots 274
Inventory Controlling 17, 52, 91, 207,
209
Inventory Controlling Information Sys-
tem 22
Inventory Management 209
Invoice Amount 29
Invoice receipt 192
K
Kanban 25, 30, 66, 67, 237
Key Figures 28, 36, 81, 82, 98, 117, 127,
128, 131, 170, 191, 277, 290, 293,
303, 306
Key Figure Comparison 203
L
Layout Control 140
Layout Parameters 120
Layout Report 120
Library 120
Local Daily Rate 289
Logistics Functions 42
Logistics Information Library 302
Logistics Monitoring 153
Long-term Planning 58, 196, 226
Lot Size 224, 225
Lots 72
M
Maintenance Orders 261
Maintenance Plant 265
Maintenance Programs 259
Malfunction 268
Manufacturer 68, 260
Manufacturing 237, 273
Material 21, 43, 48, 54, 73, 88, 196,
201, 213
Material Analysis 172
Material Class 92
Material Consumption 246
Material Flow 18
Material Group 43, 47, 56, 196, 211
Material Groupings 55
Material Hierarchies 154
Material Pricing Groups 216
Material Type 56, 210, 216, 221
Material Usage 64
Mean Defect Value 75
Methodology 287
Movement Types 234
MRP 227
MRP Controller 55, 216
327
Index
N
Nodes 153
Notification 282
Notification Type 268, 282
Notifications 108
Number of Purchase Orders 29
O
Object 270
Object Class 260
Object Statistics 268
Operation 237, 238
Order Information Structures 25
P
Parameter Controlling 223
Period Unit 181
Periodic Analysis 297, 299
P-Kanban 255
Planner Group 265
Planning Plant 265
Planning Scenario 197, 228
Plant Maintenance 17, 68, 108, 111,
123, 257, 259, 265, 287
Plant Maintenance Information System
22, 91, 259
Preventative Maintenance 259
Price Fluctuations 191
Pricing Decisions 169
Proactive Maintenance 259
Problem Code 283
Problem Frequency 75
Problem Items 75
Process Orders 237
Product Cost 238, 253
Product Group 92, 154
Production 61, 129, 259
Production Line 264
Production Order 63, 161, 237
Promotional Campaigns 169
Purchase Order 193
Purchase Order Detail 153
Purchase Order Value 29
Purchase Organization 195
Purchase Organizations 44
Purchasing 17, 21, 117, 129, 132, 191,
285
Purchasing Department 191
Purchasing Group 21, 28, 45, 84, 125,
192
Purchasing Group Information Struc-
ture 28, 30, 34
Purchasing Information System 43, 91,
191, 195
Purchasing Organization 28, 47, 135
Q
Quality Inspection 161
Quality Management 17, 72, 285, 286
Quality Management Information System
23, 91, 273
Quality Notifications 274
Quotation 193
R
Recorded Notifications 261
Regulations 237
Repetitive Manufacturing 237
Report Writer 113, 114
Reported Data 102
Reporting Point Statistics 238
Retail Information System 21
Rework 273
RFQ 193
Run Schedule Headers 237
S
Safety Stock 224
Safety Stock Buffer 224
Sales 17
Sales and Distribution 169
Sales Employee 21, 169
Sales Information System 21, 91, 169,
170
Sales Management 169
Sales Office 21, 169
Sales Organization 21, 170
Sales Planning 169
Sales Targets 169
SAP ECC 5.0 29
SAP ERP Core Component 184
328
Index
SAP R/3 System 17
Scheduling Agreements 193
Scrap 246, 273, 297
Segment Data 110
Segment Lists 101
Selection Criteria 71
Selection Log 95
Selection Version 77, 79, 82
Set 147
Set ID 147
Set Type 148
Shipping Point 21, 170
Shop Floor 17, 237
Shop Floor Information System 24, 91
Single Card Kanban 255
Single Classification 111
Slow Moving Items 224, 226
Standard Analysis 91, 96, 97, 103, 108,
113, 115, 161, 195, 210, 213, 237,
260, 275, 285, 310
Standard Display Type 135
Standard Drilldown Hierarchy 173
Standard Layouts 120
Statistical Test 290, 294
Statistics Group 183
Stock Placement 230
Storage Location 54, 210, 212
Strategy Parameters 99
Structure 153
Subordinate Sets 148
Subsequent Settlement 22, 50, 192, 196
Sum Indicator 38
Supply Agreements 191
Supply Chain 17, 113, 169, 257, 259,
273
Supply Chain Data 20
Supply Chain Management 206
Supply Chain Planning 191
Supply Chain Visibility 19
Synchronous Update 182
System-driven Analysis 297
T
Target Lead Rime 239
Target Value 139
Threshold Value 291
Time of Analysis 79
Tolerance 279
Total Defect Value 75
Total List 110
Transfer Order 233
Transfer Request 233
Trend Analysis 293
U
Unit Field 37
Update Group 184, 185
User Defined Information Structure
31, 38, 41
User Parameter 84
V
Validity Date 159, 160
Valuated Stock 209
Variant 83, 84, 298, 313
Variant Configuration 170
Variation 139
Vendor 28, 43, 46, 73, 88, 103, 285, 298
Vendor Analysis 89
Vendor Business Volume 52
Vendor Class 92
Vendor Consignment Stock 209
Vendor Evaluation 22, 50, 192, 196
Vendor Rationalization 197
Vendors 139, 195
W
Warehouse Management 22, 59, 207,
209, 229
Warranty 273
Work Center 61, 238, 239, 241, 274
Workshop 264
Copyright © 2022 FDOKUMEN