
Caractérisation à la rupture de matériaux ductiles ... - UMMTO
Upload
khangminh22Category
view
0download
0
THÈSE
Pour obtenir le grade de
DOCTEUR DE LA COMMUNAUTE UNIVERSITE GRENOBLE ALPES
Spécialité : Matériaux, Mécanique, Génie civil, Electrochimie
Arrêté ministériel : 25 mai 2016
Présentée par
Guillaume LEFEVRE Thèse dirigée par Sébastien MARTINET, et codirigée par Jean-Baptiste DUCROS,
préparée au sein du Laboratoire des Matériaux (CEA) dans l'École Doctorale Ingénierie - Matériaux, Mécanique, Environnement, Energétique, Procédés, Production (IMEP-2)
Synthèse et étude électrochimique de matériaux silicates utilisés en tant qu'électrode positive pour les accumulateurs Li-ion
Synthesis and electrochemical study of silicate materials for Li-ion batteries
Thèse soutenue publiquement le 23 Février 2018, devant le jury composé de :
Mme. Elisabeth DJURADO Professeur des Universités, Grenoble INP, Examinateur
Mme. Laurence CROGUENNEC Directeur de Recherche, CNRS, Rapporteur
M. Robert DOMINKO Professeur, National Institute of Chemistry , Rapporteur
M. Sylvain FRANGER Professeur des Universités, Université Paris-Sud XI, Président
M. Jean-Baptiste DUCROS Ingénieur-chercheur, CEA-LITEN, Co-directeur de thèse
Mme. Maria NESTORIDI Docteur, Agence Spatiale Européenne, Membre invitée

2

Acknowledgement
3
J’aimerais commencer ces remerciements en exprimant ma gratitude envers les membres du jury qui ont ajouté beaucoup de valeur à cette soutenance de thèse et au résultat de ces trois années de travail. Plus particulièrement, j’ai apprécié les remarques et les questions très pertinentes des rapporteurs qui contribueront sans aucun doute à m’améliorer dans le cadre de mon avenir professionnel.
Sébastien, JB, merci pour votre encadrement et m’avoir fait confiance. J’ai eu l’occasion de tester, d’explorer et de me tromper. Sans cela, cette thèse n’aurait pas été le reflet de mon travail et de mon investissement. On apprend beaucoup par soi-même, surtout dans le cadre d’un doctorat. Vous m’avez donné un cadre qui a largement favorisé cet apprentissage. Je vous en suis extrêmement reconnaissant. Humainement, je ne pouvais pas tomber sur une meilleure équipe d’encadrants. Vous m’avez toujours soutenu, même dans mes activités extra-doctorales. La rédaction n’a pas toujours été facile et j’apprécie toute l’énergie que vous avez mis dans les corrections, des fois en période de vacances et de weekends. JB, clin d’œil à Thessalonique. C’était difficile de rentrer en boîte avec des runnings, n’est-ce pas. J’aimerais remercier Claude Delmas pour avoir été un mentor scientifique dont j’ai beaucoup appris. Je me rappellerai toujours des anecdotes entre deux slides. Je ne peux pas manquer de mentionner tous mes anciens collègues, « les permanents » du CEA. Merci à tous pour avoir été mon quotidien pendant ces trois années. J’ai beaucoup appris auprès de vous. Ma thèse est certes la somme de tous mes efforts mais aussi de toutes vos connaissances, idées et coups de main dans les « manips ».
Carole, te croiser dans les labos va me manquer, merci pour ta gentillesse et ton aide, si je n’oublie pas je t’enverrais du Palanchou. Jean-François, tu as su me supporter et mes questions incessantes pendant tout ce temps, ça ne mérite pas une légion d’honneur mais cela n’en est pas loin ! J’espère que le prochain thésard dans ton bureau te « fichera » la paix. Merci pour tout ce que tu m’as appris en chimie, en « cristallo », etc. Thibaut, ravi d’avoir été ton « padawan » des fours tubulaires et merci pour ton coup de pouce qui a probablement aidé à mon embauche chez JM. Sébastien (L.), ça a toujours été un plaisir de passer dans ton bureau pour te demander un tas de choses. Tu as toujours été très disponible. Claude, je ne compte plus les créneaux DRX que j’ai effectué. C’était toujours un plaisir de t’y voir. Merci pour ta gentillesse et ton aide qui m’ont toujours touché. Spéciale dédicace à l’équipe « carac » : Adrien, Anass et Hélène. Vos analyses ont été indispensables, merci pour votre implication. Je n’oublie pas les David, Jean-Fred, Djamel, Lise, Céline, Marlène et Didier, avec qui j’ai toujours eu du plaisir à échanger. Un petit clin d’œil à Sébastien (P.) grâce à qui j’ai pu aller à Arcachon en juin 2017. J’en oublie probablement beaucoup d’autres… Kim !!! Merci pour ta bonne humeur, ton accueil au CEA (je me souviens encore de mon premier jour !). Tu as été comme une maman pour beaucoup d’entre nous.
I am switching to English to thank all the TEC-EP team at ESTEC. Maria, you are fabulously kind. Thank you for your warm welcome in the Netherlands. I felt like at home. I hope we will keep in contact. You are welcome in Reading. Chris, it was so interesting to meet somebody like “me ten years later”. I hope I am going to be as successful as you are. Narimane, it was great to work with you. You were my French anchor in this European world. I forget many others…
C’est au tour de remercier toute l’équipe d’InnoEnergy chez qui j’ai suivi la PhD School. Merci
Isabelle, Christine et Fabien. J’ai énormément apprécié votre confiance, votre générosité et vous
Acknowledgement
4
implication dans le programme. Je n’ai pas encore terminé de rédiger l’EIB thesis, mais ça arrivera je vous le promets !
Maintenant il est temps de remercier les amis qui m’ont accompagné dans mes journées au
labo mais aussi dans les soirées, les weekends ou les vacances. Commençons par la dream team CEA. Comment ne pas oublier tous ces moments de folies
passés ensemble. La thèse n’aura pas été ce qu’elle était sans vous !!! Ces quelques mots ne sont évidemment pas assez pour résumer ces trois années, mais j’espère qu’ils vous parleront. Je commence dans le désordre.
Adriana, on est passé à côté de l’opportunité de travailler ensemble. C’est dommage mais il ne faut jamais dire jamais. Merci pour ton aide à l’époque où tu étais au CEA. Juju, mon compagnon de route au labo mais aussi en dehors. Arrivé le même jour, ça a été un plaisir d’évoluer à tes côtés. Ta simplicité et ta personnalité vont me manquer. Vivement qu’on se retrouve pour faire la fête !!! Xav, la coolitude incarné et le roi du mix « les copains + barberousse ». Toujours à organiser des traquenards ! Camille, ce qui s’est passé au Barberousse me marquera toute ma vie. Dadou, toujours aussi posé, merci pour ces conseils pour rejoindre les British. Gaëlle, le « Mister » s’en va, merci pour tous ces bons moments. Quentin, la DRX c’est la vie ! J’espère qu’on refera le monde de temps à autres. Lauréline, ta méchanceté est salvatrice. Isabelle, non ce n’était pas du cannabis ! Merci pour l’alcool de poire. Claire, toujours un plaisir de te mettre une baffe. Raphafou, je débarque à Göteborg ! Fiston, je t’adore mec, c’est tout. Binta. On a encore plein plein d’aventures à faire. Virginie, Simone elle est b…. ! Ce qui se passe au G5 ne reste pas au G5. L’alcool c’est de l’eau ! Pierre, on n’est pas allé au Mark XIII, mais on a bu un sacré Châteauneuf du Pape. Arnaud, entre le badminton, les Pays-Bas et les TPs on en aura vécu des choses. Ogi, coup de coude (ou de couteau, je ne me souviens plus) dans la glotte ! Philippe, I am moving in your country, I expect to become as classy as you are. Lucie, Baby I like your style. Natacha, reine de la danse. Trop bien tous ces weekends à droite à gauche, et c’est pas fini. Laurent et Guigui, Grenoble-Vizille on l’a fait. Spécial merci Guigui pour ta gentillesse. Alice, de très bons moments passés avec toi, souvenirs de Stroopwafel et de Gouda aux truffes.
Now, my Dutch friends, who are not all Dutch by the way. Renato, thank you for having hosted
me. Tim, damned I did not use Latec and I suffered with Word. Jarla, it was great to have met you, Berkeley or not? Stefan, you are a NPI now! Toni (siesta), my Spanish flatmate. We saw billions of things (volleyball players?) there.
Mes amis “hors CEA” comme je les appelle, Apo, Marine, Vincent, Leslie, Rasmey. Ça a été
génial de se retrouver tous sur Grenoble. J’ai l’impression de ne pas avoir assez profité de vous c’est frustrant. Jérôme, le Pôle comm’, le label, les terrasses. Faut qu’on reste en contact mec.
Un gros merci à toute ma famille qui m’a toujours soutenu. Je pense plus particulièrement à
mes parents qui m’auraient plus vu dans un métier manuel. C’est néanmoins grâce à vous que j’en suis arrivé là. Merci Papa pour m’avoir donné le goût du travail bien et la rigueur dans ce que je fais. Merci Maman pour m’avoir donné cette confiance dans la vie et dans les choses. Je suis tellement fier d’être vos fils et d’en être où j’en suis, ça n’a pas de valeur.
Bisous à la Célinette, Fraulein, ma vache folle. Pensée à Papi, que tu trouves l’apaisement.

Table of contents
5
Table of contents
General introduction ................................................................................................................ 11
Chapter 1 – Literature review .................................................................................................. 17
1.1 Generalities on Lithium-ion batteries .................................................................................................... 18
1.1.1 Basic principles of Lithium-ion batteries ..................................................................................... 18
1.1.2 Electrolyte ............................................................................................................................................... 19
1.1.3 Negative electrode ................................................................................................................................ 19
1.1.4 Positive electrode ................................................................................................................................ 20
1.2 Polyanionic materials as positive electrode ......................................................................................... 22
1.2.1 Molecular weight and inductive effect of polyanions ............................................................. 23
1.2.2 Phosphates and mixed phosphates ................................................................................................ 24
1.2.3 Pyrophosphates .................................................................................................................................... 25
1.2.4 Fluorophosphates.................................................................................................................................27
1.2.5 Borates..................................................................................................................................................... 28
1.2.6 Sulfates and fluorosulfates ............................................................................................................... 30
1.2.7 Summary of electrochemical performance of polyanionic materials ............................... 32
1.3 Silicate materials ........................................................................................................................................... 33
1.3.1 Geology of silicates ............................................................................................................................. 33
1.3.2 Generalities about lithium metal orthosilicates ....................................................................... 35
1.3.3 Lithium cobalt orthosilicate ............................................................................................................ 38
1.3.4 Lithium nickel orthosilicate ............................................................................................................ 39
1.3.5 Lithium iron orthosilicate ............................................................................................................... 39
1.3.6 Lithium manganese orthosilicate .................................................................................................. 44
1.3.7 Olivine silicates .................................................................................................................................... 54
1.4 Discussions and conclusion ....................................................................................................................... 58
Chapter 2 – Experimental techniques ................................................................................... 63
2.1 Sol-gel process ................................................................................................................................................ 64
2.1.1 Principles ............................................................................................................................................... 64
2.1.2 Sol-gel reactions ................................................................................................................................... 65
2.1.3 Sol-gel precursors ................................................................................................................................ 65
2.1.4 Reaction parameters ............................................................................................................................66
2.1.5 Sol-gel routes for multicomponent gels ........................................................................................ 67

Table of contents
6
2.2 X-Ray diffraction .......................................................................................................................................... 68
2.2.1 Equipment ..............................................................................................................................................68
2.2.2 Samples preparation ............................................................................................................................69
2.2.3 Data acquisition and processing ..................................................................................................... 70
2.3 X-ray Photoelectron Spectroscopy .......................................................................................................... 70
2.3.1 Sample preparation and equipment ............................................................................................. 70
2.3.2 Fitting methods .................................................................................................................................... 71
2.4 Other techniques ............................................................................................................................................ 71
2.4.1 Thermo-Gravimetric Analysis ........................................................................................................ 71
2.4.2 CHNS/O elementary analysis ........................................................................................................... 71
2.4.3 Nitrogen adsorption ............................................................................................................................72
2.4.4 Infrared Spectroscopy .........................................................................................................................72
2.4.5 Scanning Electron Microscopy ........................................................................................................72
2.4.6 Scanning Transmission Electron Microscopy and derivations ............................................72
2.5 Electrochemical characterization techniques ..................................................................................... 73
2.5.1 Electrodes preparation .......................................................................................................................73
2.5.2 Coin cells assembly ..............................................................................................................................74
2.5.3 Electrochemical characteristics .......................................................................................................75
2.5.4 Electrochemical characterizations .................................................................................................75
Chapter 3 – Li2MnSiO4: Synthesis, characterization and electrochemical properties 77
3.1 Sol-gel synthesis and characterization of Li2MnSiO4/C materials ................................................78
3.1.1 Preparation of the sol and formation of the gel ......................................................................... 78
3.1.2 Optimization of the pyrolysis step ................................................................................................ 84
3.1.3 Effect of the carbon content on Li2MnSiO4/C structure ......................................................... 91
3.1.4 Optimized synthesis protocol and materials specifications .................................................. 97
3.2 Firsts galvanostatic cycles of Li2MnSiO4 and Li2MnSiO4/C materials ....................................... 98
3.3 Cycling performance of Li2MnSiO4/C composites .......................................................................... 101
3.3.1 Effect of carbon content .................................................................................................................. 101
3.3.2 Structural stability upon cycling .................................................................................................. 102
3.4 Electrochemical behavior as a function of cut-off voltages .......................................................... 103
3.4.1 Effect of lower cut-off voltage ....................................................................................................... 103
3.4.2 Effect of upper cut-off voltage on electrochemical behavior ............................................. 104
3.4.3 Effect of the upper cut-off voltage on the Li2MnSiO4/C structure ................................... 108
3.4.4 Discussion about the evidences of Li2MnSiO4/C degradation upon cycling ................. 110
Table of contents
7
3.5 Aluminum doping of Li2MnSiO4/C ...................................................................................................... 111
3.5.1 Doping strategy ...................................................................................................................................111
3.5.2 Sol-gel synthesis ..................................................................................................................................111
3.5.3 Structural characterization ............................................................................................................ 113
3.5.4 Morphological characterization ................................................................................................... 114
3.5.5 Infra-red spectroscopy ..................................................................................................................... 115
3.5.6 Electrochemical performance ....................................................................................................... 116
3.6 Reactivity to air of Li2MnSiO4/C ........................................................................................................... 118
3.6.1 Introduction ........................................................................................................................................ 118
3.6.2 Sample preparation........................................................................................................................... 118
3.6.3 X-ray diffraction ................................................................................................................................ 119
3.6.4 Infra-red spectroscopy ..................................................................................................................... 121
3.6.5 CHNS/O elementary analysis ........................................................................................................ 122
3.6.6 X-ray photoelectron spectroscopy ............................................................................................... 123
3.6.7 Electronic microscopies .................................................................................................................. 126
3.6.8 Reactivity mechanism ..................................................................................................................... 129
3.6.9 Impact on electrochemical performance .................................................................................. 130
3.7 Conclusion ..................................................................................................................................................... 131
Chapter 4 – Olivine silicates: from MgMnSiO4/C to LiMnSiO4/C .............................. 135
4.1 Preparation of the MgMnSiO4/C materials as precursors of LiMnSiO4/C .............................. 137
4.1.1 Sol-gel synthesis ................................................................................................................................. 137
4.1.2 Heat treatment ................................................................................................................................... 139
4.1.3 Chemical oxidation ........................................................................................................................... 141
4.2 Characterization of MgMnSiO4/C ......................................................................................................... 142
4.2.1 Structural characterization ............................................................................................................ 142
4.2.2 Morphology ......................................................................................................................................... 152
4.2.3 Chemical analyses ............................................................................................................................. 152
4.2.4 Electrochemical performance ....................................................................................................... 154
4.3 Characterization of chemical oxidized Mg1-xMnSiO4/C................................................................ 157
4.3.1 Structural characterization ............................................................................................................ 158
4.3.2 Morphology ......................................................................................................................................... 160
4.3.3 Surface analysis .................................................................................................................................. 161
4.3.4 Electrochemical performance ....................................................................................................... 165
4.4 Comprehension of the electrochemical phenomena in Mg1-xMnSiO4/C ................................. 167
Table of contents
8
4.4.1 Cyclic voltammetry .......................................................................................................................... 167
4.4.2 Determination of the diffusion and capacitive contributions........................................... 171
4.5 Ex-situ characterizations of electrodes upon discharge ................................................................. 172
4.5.1 Ex-situ X-Ray Diffraction ............................................................................................................... 173
4.5.2 Ex-situ X-ray Photoelectron Spectroscopy ............................................................................... 175
4.6 Summary of the olivine silicates study ................................................................................................ 176
4.7 Testing for space applications ................................................................................................................. 177
4.7.1 Introduction ........................................................................................................................................ 177
4.7.2 Low Earth Orbit and Geostationary Earth Orbit satellites battery cycling profiles... 178
4.7.3 Testing results..................................................................................................................................... 180
4.7.4 Conclusion ........................................................................................................................................... 185
General conclusions and prospects ..................................................................................... 187
Résumé (français) .................................................................................................................... 191
References ................................................................................................................................. 199

9

10

General introduction
11
General introduction
General introduction
12
General introduction
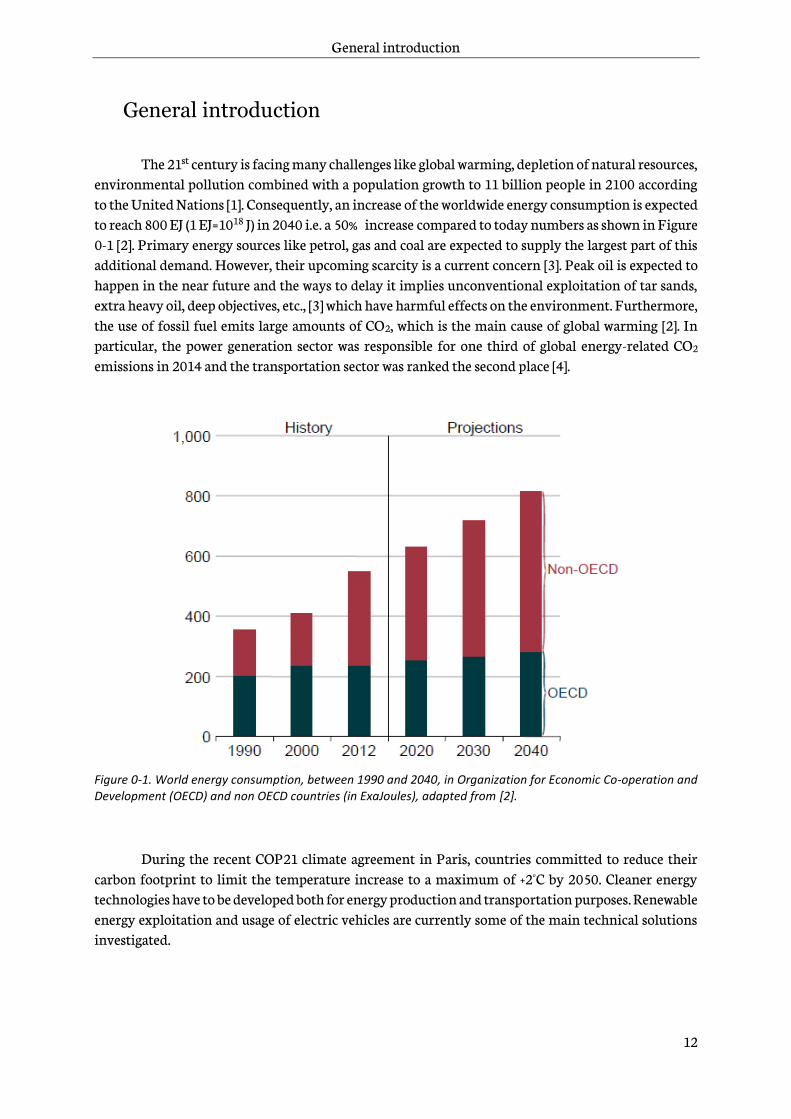
The 21st century is facing many challenges like global warming, depletion of natural resources, environmental pollution combined with a population growth to 11 billion people in 2100 according to the United Nations [1]. Consequently, an increase of the worldwide energy consumption is expected to reach 800 EJ (1 EJ=1018 J) in 2040 i.e. a 50% increase compared to today numbers as shown in Figure 0-1 [2]. Primary energy sources like petrol, gas and coal are expected to supply the largest part of this additional demand. However, their upcoming scarcity is a current concern [3]. Peak oil is expected to happen in the near future and the ways to delay it implies unconventional exploitation of tar sands, extra heavy oil, deep objectives, etc., [3] which have harmful effects on the environment. Furthermore, the use of fossil fuel emits large amounts of CO2, which is the main cause of global warming [2]. In particular, the power generation sector was responsible for one third of global energy-related CO2 emissions in 2014 and the transportation sector was ranked the second place [4].
Figure 0-1. World energy consumption, between 1990 and 2040, in Organization for Economic Co-operation and Development (OECD) and non OECD countries (in ExaJoules), adapted from [2].
During the recent COP21 climate agreement in Paris, countries committed to reduce their carbon footprint to limit the temperature increase to a maximum of +2°C by 2050. Cleaner energy technologies have to be developed both for energy production and transportation purposes. Renewable energy exploitation and usage of electric vehicles are currently some of the main technical solutions investigated.
General introduction
13
Renewables power, including hydroelectricity, accounted for only 20% of the global energy mix in 2012 according to the International Energy Agency (IEA) [2]. They could be the first type of energy generation in 2040 in accordance with the 450 Scenario of the IEA [4]. However, the intermittency of wind, solar, and other renewables, is a drawback for their integration in the electricity grid. A smooth and predictable supply is required to meet electricity demand. One solution is to store electricity from renewable energy during production peaks and deliver it during consumption demands. Different technologies of energy storage are available. Among them, electrochemical storage and generation systems are a solution of interest because of their versatility for demand-response applications. Furthermore, they are highly scalable and can be installed everywhere. Studies showed that their installed power capacity is expected rise from 360MW in 2014 to 14GW in 2023 [5].
As this PhD thesis is co-funded by European Space Agency (ESA) and Prayon, a Belgian company leader in the phosphate chemistry, also involved in the field of energy storage for transportation, automotive and space applications are considered here.
Electrification of terrestrial vehicles is driven by the governmental regulations set to reduce CO2, NOx and SOx emissions and fine particles releases in urban areas. Automotive industry is now moving toward electrified vehicles (EVs) and electrochemical storage or conversion systems are the key technologies for this application. Starting from 2 million vehicles in stock in 2016, global electric vehicles fleet is predicted to reach 60 to 200 million units in 2030 [6].
The space sector is currently impacted as well by these upcoming challenges. Demand of strong phone network and large access to broadband internet will be driven by a large population growth in Africa and Asia [1]. The current telecommunication systems in these countries rely partly on satellites orbiting around Earth, but their coverage is limited. Recently, constellations of microsatellites have been proposed by companies like OneWeb to cover larger areas aiming “bringing the web to the whole world” [7], [8]. Economies of scale will significantly decrease the cost of these microsatellites. The lower criticality and replaceability of single units will shorten the long and expensive certification processes of conventional satellites.
When it comes to satellite power supply, the system includes a Power Control Unit, solar panels and an electrochemical storage or conversion system. During eclipse phases, photovoltaic panels do not generate electricity. The electrochemical storage or conversion system powers the satellite with solar energy previously stored during solstice. Therefore, these systems are also the center of future innovations in the space sector.
Electrochemical storage and conversion systems could be divided into three families: fuel cells, capacitors and batteries. The specific Energy (Wh.kg-1) and the specific Power (W.kg-1) of the different electrochemical systems can be compared using a Ragone plot, as displayed in Figure 0-2.

General introduction
14
Figure 0-2. Ragone plot of electrochemical devices according to their specific energy (Wh.kg-1) and specific power (W.kg-1), adapted from [9].
Capacitors are able to store and deliver energy in short periods but with a limited energy density. On the opposite, fuel cells have very high energy density but associated with low power capabilities. Considering the application of the electric vehicle, supercapacitors and fuel cells could theoretically meet the requirements of the acceleration phase and the long term cruise respectively. However, for several concerns such as cost [10] or lack of hydrogen infrastructure [11], none of the technologies is ready for wide scale commercialization. Finally, batteries are a trade-off between energy and power densities. A vast panel of batteries is available. In a chronological order of invention, the Lead-Acid, Nickel Metal-Hydrides (Ni-MH) and Lithium-ion batteries are shown on the Ragone plot. (Figure 0-2).The advantages of a storage system based on lithium-ion batteries are highlighted. They exhibit high energy density up to 270Wh.kg-1 and deliver high power density up to 30kW.kg-1. This trend clearly shows why lithium-ion batteries are particularly adapted to power terrestrial electrified vehicles. However, safer, cost-effective, scalable lithium-ion batteries based on abundant elements are required to face supply and adoption issues that would impede long term exploitation of the technology.
Concerning space applications, lithium-ion batteries have the highest energy density among commercial secondary batteries and are therefore the lightest rechargeable batteries; reducing significantly the satellite launch cost. In the case of small satellites, both gravimetric and volumetric energy densities are carefully considered due to their obvious limited size. One big issue of those constellations is their passivation which is usually achieved by fully discharging the battery and disconnecting it from the power system to avoid future charging [12]. Passivation is necessary to avoid debris generation that could jeopardize other spacecrafts in case of battery explosion. Therefore, intrinsic safety of the battery is important for space applications as well.
General introduction
15
The positive electrode of lithium-ion batteries is the major cost at the cell level [13]. It relies heavily on materials based on cobalt and nickel elements which are considered as toxic [14]. Furthermore, cobalt is a scarce metal. Its extraction is available in very few locations what causes risks of supply and volatility of prices [15]. Finally, these materials are not thermally stable raising safety issues [16], [17]. Therefore, improving the positive electrode is a major concern for future batteries in both terrestrial and space transportation applications.
Alternative positive electrodes materials are required. Polyanionic materials such as the commercialized LiFePO4, LFP, enable the use of cheap, non-toxic and widespread elements such as iron and manganese and exhibit much stable chemistry that makes them particularly interesting for transport applications. However, LFP has a lower practical energy density than nickel and cobalt based oxide materials [18], what limits its market to low-medium range applications like e-bikes, buses or city cars fleet (BluecarTM). To fulfill the requirements of energy-dense applications, polyanionic materials with either higher voltage or higher capacity while maintaining low cost, raw materials abundance and good safety behavior need to be considered. Therefore, silicates Li2MnSiO4 and LiMnSiO4, positive electrode materials have been chosen as the topic of this study.
Chapter 0 is dedicated to a literature review. First, lithium-ion battery basics are addressed. Then, among the polyanionic materials, the phosphate, borate and sulfate families are described to highlight the choices that made the silicates the core of this investigation.
In Chapter 2, the synthesis and characterization techniques used in this study is detailed.
In Chapter 3, a focus on Li2MnSiO4 materials is done. The synthesis by a sol-gel process and the characterization of Li2MnSiO4/C composites are addressed in a first part. Then an evaluation of electrochemical performance and structural stability of the synthesized material is performed as a function of cycle number and upper cut-off voltage. It brings insights about the electrochemical and structural cycling behavior of Li2MnSiO4/C. A stability study of Li2MnSiO4/C composite in air is introduced, which has so far never been reported in the literature. Finally, an attempt of a new substitution strategy in Li2MnSiO4 is addressed to overcome the current limitations.
Chapter 4 is dedicated to the study of manganese olivine silicates. The synthesis of MgMnSiO4 as a precursor of LiMnSiO4 using a sol-gel process is first introduced. A focus on reduction of antisite
defects and removal of Mg2+ by chemical oxidation follows and then a characterization by physico-chemical and structural techniques is addressed. Finally, the last part deals with an analysis of the electrochemical behavior of this new material. Its performance in lithium-ion cells is then assessed.
At the end of this thesis, a general conclusion followed by some prospects is proposed.

16

Chapter 1 – Literature review
17
Chapter 1 – Literature review
Chapter 1 – Literature review .................................................................................................. 17
1.1 Generalities on Lithium-ion batteries .................................................................................................... 18
1.2 Polyanionic materials as positive electrode ......................................................................................... 22
1.3 Silicate materials ........................................................................................................................................... 33
1.4 Discussions and conclusions ..................................................................................................................... 58

Chapter 1 – Literature review
18
1 Literature review
1.1 Generalities on Lithium-ion batteries 1.1.1 Basic principles of Lithium-ion batteries
A lithium-ion battery is mainly composed of two electrodes separated by a separator. The whole system is impregnated by an electrolyte. The scheme of a Li-ion secondary battery is shown in Figure 1-1.
Figure 1-1. Scheme of a lithium-ion secondary battery, adapted from [19].
The positive electrode operates at high potential and is generally a transition metal oxide, whereas the negative electrode has a low potential and consists of graphite. The separator is an electronic insulator that avoids short-circuits between the two electrodes. The electrolyte is an ionic conductor that facilitates the diffusion of ions, Li+ here, between the two electrodes. During the charge of the battery, the positive electrode is oxidized while the negative electrode is reduced leading to an exchange of Li+ ions and electrons. Reaction 1-1 and Reaction 1-2 respectively take place at each electrode.
Reaction 1-1. Redox reaction taking place at the positive electrode (Host 1) of a lithium-ion cell upon charge.
𝐿𝑖𝑥𝐻𝑜𝑠𝑡 1 → 𝐿𝑖𝑥−𝑦𝐻𝑜𝑠𝑡 1 + 𝑦𝐿𝑖+ + 𝑦𝑒−
Reaction 1-2. Redox reaction taking place at the negative electrode (Host 2) of a lithium-ion cell upon charge.
𝐿𝑖𝑧𝐻𝑜𝑠𝑡 2 + 𝑦𝐿𝑖+ + 𝑦𝑒− → 𝐿𝑖𝑧+𝑦𝐻𝑜𝑠𝑡 2
The capacity is proportional to the amount of charges involved in the redox reactions. A distinction is made between the theoretical capacity that is related to the maximum amount of charges stored by an electrode and the capacity of the system that corresponds to the quantity of charges reversibly exchanged between the two electrodes. Capacity is commonly expressed in Ampere-hour
Chapter 1 – Literature review
19
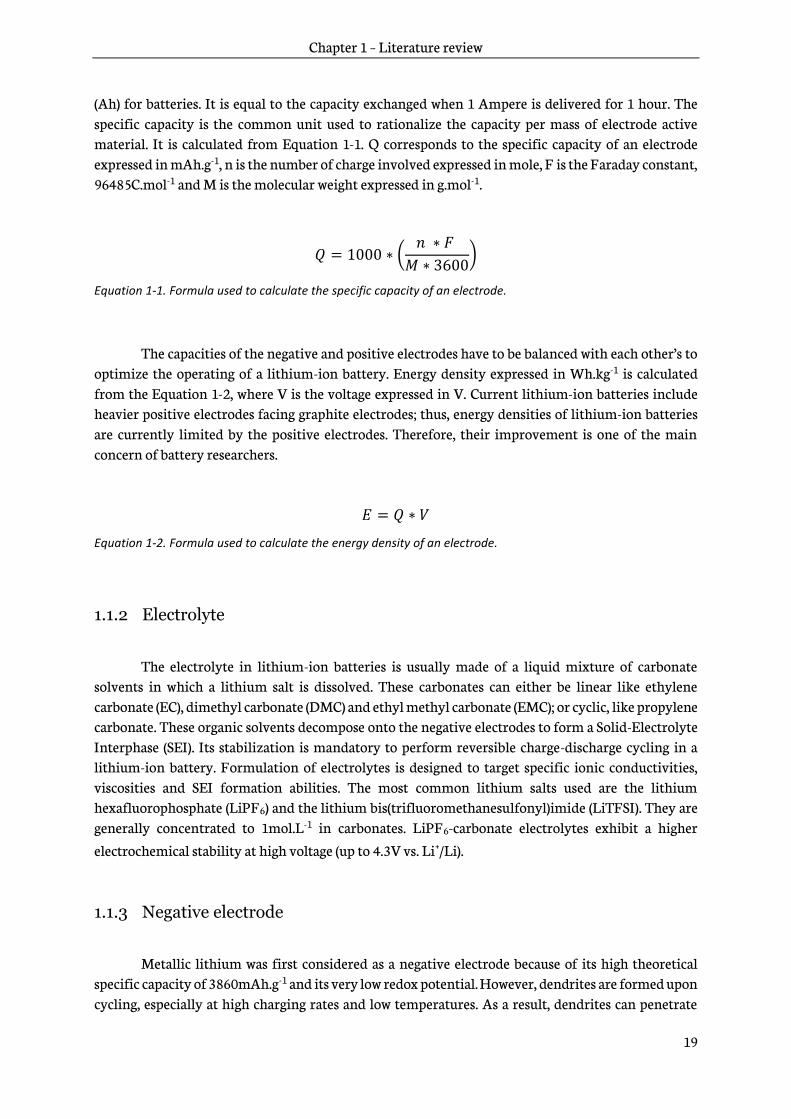
(Ah) for batteries. It is equal to the capacity exchanged when 1 Ampere is delivered for 1 hour. The specific capacity is the common unit used to rationalize the capacity per mass of electrode active material. It is calculated from Equation 1-1. Q corresponds to the specific capacity of an electrode expressed in mAh.g-1, n is the number of charge involved expressed in mole, F is the Faraday constant, 96485C.mol-1 and M is the molecular weight expressed in g.mol-1.
𝑄 = 1000 ∗ (𝑛 ∗ 𝐹
𝑀 ∗ 3600)
Equation 1-1. Formula used to calculate the specific capacity of an electrode.
The capacities of the negative and positive electrodes have to be balanced with each other’s to optimize the operating of a lithium-ion battery. Energy density expressed in Wh.kg-1 is calculated from the Equation 1-2, where V is the voltage expressed in V. Current lithium-ion batteries include heavier positive electrodes facing graphite electrodes; thus, energy densities of lithium-ion batteries are currently limited by the positive electrodes. Therefore, their improvement is one of the main concern of battery researchers.
𝐸 = 𝑄 ∗ 𝑉
Equation 1-2. Formula used to calculate the energy density of an electrode.
1.1.2 Electrolyte
The electrolyte in lithium-ion batteries is usually made of a liquid mixture of carbonate solvents in which a lithium salt is dissolved. These carbonates can either be linear like ethylene carbonate (EC), dimethyl carbonate (DMC) and ethyl methyl carbonate (EMC); or cyclic, like propylene carbonate. These organic solvents decompose onto the negative electrodes to form a Solid-Electrolyte Interphase (SEI). Its stabilization is mandatory to perform reversible charge-discharge cycling in a lithium-ion battery. Formulation of electrolytes is designed to target specific ionic conductivities, viscosities and SEI formation abilities. The most common lithium salts used are the lithium hexafluorophosphate (LiPF6) and the lithium bis(trifluoromethanesulfonyl)imide (LiTFSI). They are generally concentrated to 1mol.L-1 in carbonates. LiPF6-carbonate electrolytes exhibit a higher electrochemical stability at high voltage (up to 4.3V vs. Li+/Li).
1.1.3 Negative electrode
Metallic lithium was first considered as a negative electrode because of its high theoretical specific capacity of 3860mAh.g-1 and its very low redox potential. However, dendrites are formed upon cycling, especially at high charging rates and low temperatures. As a result, dendrites can penetrate

Chapter 1 – Literature review
20
through the separator, grow toward the positive electrode and cause electrical shorts. The intrinsic safety issues of Li-metal technology precluded its wide application.
Since, graphite was investigated as a negative electrode to replace metallic lithium. Its development opened the way toward lithium-ion batteries also called “ rocking-chair ” batteries because of the reversible exchange of lithium ions between two intercalation electrodes, as illustrated in Figure 1-1. In graphite, intercalation of up to one lithium atom is possible for every six carbon atoms at low potentials, according to Reaction 1-2. The theoretical specific capacity of graphite reaches 372mAh.g-1 that is almost the double of positive electrodes used today in lithium-ion batteries (see Table 1-1).
Other negative electrodes are investigated as alternatives to graphite. Silicon exhibits a
theoretical specific capacity of 4200mAh.g-1 and its redox voltage around 0.4V vs. Li+/Li avoids the formation of Li dendrites via Li plating [20], [21]. However, a swelling higher than 300% is observed after its full lithiation to Li22Si5. The high volume growth cracks the formed SEI, what leads to continuous SEI formation upon cycling. Finally, it increases the cell resistance and lithium ions consumption from the electrolyte. Research and development are ongoing to alleviate this drawbacks.
Lithium titanate Li4Ti5O12 (LTO) has a spinel structure and can store up to three additional Li+ ions during its reduction, to form Li7Ti5O12. Its specific capacity is equivalent to 175mAh.g-1 but its redox voltage is rather high, around 1.55V vs. Li+/Li. Thus, it cannot compete with graphite for energy-dense applications. The main interests of LTO lie in its high power capabilities, long cycle life and the low risk of dendrites formation at high charging rates.
1.1.4 Positive electrode
The requirements to design viable positive electrode materials can be summarized as follows [22]. Available redox centers are required to operate the redox reactions at each electrode. These reactions involving Li+ ions as charge carriers need to be reversible. The electrodes host materials must be stable upon successive intercalation/de-intercalation steps. The redox reactions must deliver high specific capacity at a high operating voltage, but below the stability limit of electrolytes. The host materials must have high ionic and electronic conductivities to provide sufficient power capability and exhibit low polarization. Finally, to a lesser extent the materials in these positive electrodes need to be low-cost, non-toxic, not harmful for the environment, abundant and well distributed around the globe.
The first active material considered for lithium-metal batteries was TiS2 in 1975 [23]. It is a disulfide compound belonging to the family of chalcogenides. Its layered structure favors the
diffusion of Li+. TiS2 exhibits a high specific capacity of 239mAh.g-1 with an average voltage of 2.35V
vs. Li+/Li. Nevertheless, safety issues relative to the lithium metal negative electrode in the 1980’s stopped most of the development projects on lithium-metal batteries. The shift to the graphite negative electrode required the development of positive active materials containing lithium in their pristine state.
Chapter 1 – Literature review
21
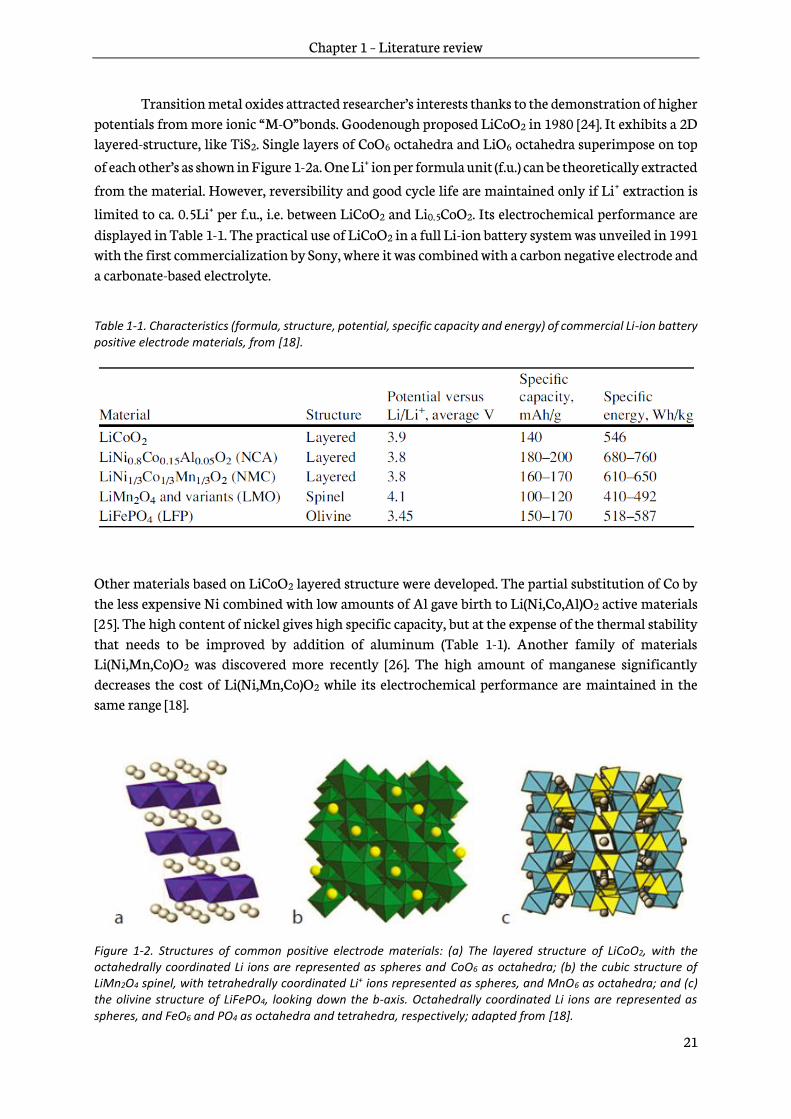
Transition metal oxides attracted researcher’s interests thanks to the demonstration of higher potentials from more ionic “ M-O” bonds. Goodenough proposed LiCoO2 in 1980 [24]. It exhibits a 2D layered-structure, like TiS2. Single layers of CoO6 octahedra and LiO6 octahedra superimpose on top
of each other’s as shown in Figure 1-2a. One Li+ ion per formula unit (f.u.) can be theoretically extracted
from the material. However, reversibility and good cycle life are maintained only if Li+ extraction is
limited to ca. 0.5Li+ per f.u., i.e. between LiCoO2 and Li0.5CoO2. Its electrochemical performance are displayed in Table 1-1. The practical use of LiCoO2 in a full Li-ion battery system was unveiled in 1991 with the first commercialization by Sony, where it was combined with a carbon negative electrode and a carbonate-based electrolyte.
Table 1-1. Characteristics (formula, structure, potential, specific capacity and energy) of commercial Li-ion battery positive electrode materials, from [18].
Other materials based on LiCoO2 layered structure were developed. The partial substitution of Co by the less expensive Ni combined with low amounts of Al gave birth to Li(Ni,Co,Al)O2 active materials [25]. The high content of nickel gives high specific capacity, but at the expense of the thermal stability that needs to be improved by addition of aluminum (Table 1-1). Another family of materials Li(Ni,Mn,Co)O2 was discovered more recently [26]. The high amount of manganese significantly decreases the cost of Li(Ni,Mn,Co)O2 while its electrochemical performance are maintained in the same range [18].
Figure 1-2. Structures of common positive electrode materials: (a) The layered structure of LiCoO2, with the octahedrally coordinated Li ions are represented as spheres and CoO6 as octahedra; (b) the cubic structure of LiMn2O4 spinel, with tetrahedrally coordinated Li+ ions represented as spheres, and MnO6 as octahedra; and (c) the olivine structure of LiFePO4, looking down the b-axis. Octahedrally coordinated Li ions are represented as spheres, and FeO6 and PO4 as octahedra and tetrahedra, respectively; adapted from [18].
Chapter 1 – Literature review
22
Besides layered frameworks, another structure has been studied and is exclusively based on the less expensive manganese as redox center. The spinel LiMn2O4 exhibits 3D lithium-ion diffusion pathways as shown in Figure 1-2b, thus it delivers high power. However, its practical specific capacity of 100-120mAh.g-1 is rather low despite its high operating voltage of 4.1V (see Table 1-1). Therefore, the energy density is below that of layered oxide materials. Furthermore, manganese ions are prone to dissolve into the electrolyte what limits the cycle life of LiMn2O4, especially at high temperature.
Generally, the common feature of transition metal oxides is the ionic metal-oxygen, M-O, bond. During overcharge these bonds can break and release oxygen out of the lattice [18]. The gas produced can strongly react with the electrolyte, leading to a thermal runaway of the battery [16], [17]. It is obviously the main drawback of this family of positive electrode materials.
LiFePO4 (LFP) is the latest material introduced to the market. It belongs to the family of polyanionic materials. Oxygen atoms are not only linked to transition metals through ionic bonds but also bound to phosphorus through covalent ones, as shown in Figure 1-2c. Thus, contrary to metal oxide materials, it does not suffer from oxygen release in abuse conditions. LFP is much safer than other positive electrode material families [27], what makes the polyanionic materials attractive.
1.2 Polyanionic materials as positive electrode
A polyanion is an anion constituted of several chemical elements connected by covalent bonds. This chemical group behaves like a single anion. Phosphorus and oxygen form the phosphate polyanions (PO4
3-, P2O74-), sulfur and oxygen form the sulfate (SO4
2-) one, etc. Thanks to their strong bonds they cannot be easily dissociated from each other. Polyanionic materials caught battery researchers’ interest since Padhi et al. unveiled LiFePO4 in 1996 [28] and Armand [29] suggested the use of carbon coating to increase the poor electronic conductivity of the material. The olivine structure is very stable thanks to the pillaring effect of PO4
3- groups. Therefore, LFP demonstrates long cycle life without significant capacity fading [30]. Thanks to the inductive effect introduced by Goodenough [31], [32], the potential of Fe3+/Fe2+ redox couple in LiFePO4 (3.45V vs. Li+/Li) is raised above that in
layered iron oxide LiFeO2 (2.0-2.5V vs. Li+/Li) [33]. The inductive effect enables the practical usage of low-cost and abundant iron as redox center in positive electrodes. Despite the energy density of LiFePO4 is lower than that layered oxides such as LiCoO2, Li(Ni,Co,Al)O2 and Li(Ni,Mn,Co)O2 (see Table 1-1), its discovery paved the way to the research of a new generation of polyanionic positive electrode materials. Other polyanionic families such as alternative phosphates, pyrophosphates, fluorophosphates, borates, sulfates, fluorosulfates and finally silicates are investigated [34]. The literature review hereafter is oriented toward the seeking of polyanionic materials that can surpass performance of LiFePO4 through higher voltage and/or higher specific capacity.

Chapter 1 – Literature review
23
1.2.1 Molecular weight and inductive effect of polyanions
Compared to oxides, polyanionic materials suffer from the weight penalty of polyanion groups that do not participate to redox processes. Taking the example of LiFeO2 and LiFePO4, theoretical
specific capacities (see Equation 1-1) based on Fe3+/Fe2+ redox couple are 283mAh.g-1 and 170mAh.g-1 respectively. However, the variety of chemistries opened the way to new structures with ratios of lithium to transition metal greater than one, thereby exhibiting higher specific capacities than those of current positive electrode materials.
From a voltage point of view, the inductive effect enables the tuning of M(n+1)+/Mn+ redox
couple for a same transition metal. The redox potential increases with the ionic character of M-O bond, what is valid for a same structure. It is evidenced by a comparison between Fe2(MoO4)3 and Fe2(SO4)3, where the potential raised from 3.0 to 3.6V by replacing MoO4
2- by SO42- [35], [36]. The higher
electronegativity of sulfur increases the covalent character of Fe-O bonds. Comparison between structures also helped the rationalization of the inductive effect. Gutierrez et al. attempted to
summarize these explanations [37]. A comparison of M3+/M2+ was done between pyrophosphates (Li2MP2O7), phosphates (LiMPO4), borates (LiMBO3) and silicates (Li2MSiO4). The experimental trend for these redox couples is shown in Figure 1-3. The redox potential usually follows the evolution SiO4 < BO4 < PO4 < P2O7 for a single transition metal and Fe < Mn < Co < Ni considering a single polyanion.
Figure 1-3. Potentials of M2+/M3+ (M=Fe, Mn, Co and Ni) redox couples considering LiMBO3, Li2MSiO4, LiMPO4 and Li2MP2O7 materials, from [37].
Empirical rules can explain most of the observed trends, as listed below:
- Formation of covalent (M-O) bond leads to quantum mechanical repulsion between bonding
and antibonding molecular orbitals, what lowers the potential of M(n+1)+/Mn+ redox couple;
- A high Madelung electric field at the transition metal site shortens the M-O bond i.e. increases covalent character;
- An ionic bond exhibits a longer M-O distance resulting in lower Madelung electric field.

Chapter 1 – Literature review
24
1.2.2 Phosphates and mixed phosphates
Apart from LiFePO4, phosphate compounds are mainly composed of Mn, mixed Mn-Fe, Ni and Co redox centers. LiMnPO4 (LMP) is a true alternative to LiFePO4 through a voltage of 4.1V vs.
Li+/Li and a similar theoretical specific capacity [38], as shown in Figure 1-4a. Its electronic and ionic conductivities are well below those of LFP. Electrical conductivities and activation energies of 3.10−9S.cm−1, 10-9S.cm-1 and 1.1eV, 0.6eV were respectively measured at 573K for LiMnPO4 and 298K for LiFePO4 [39]. Implementation of nanosizing and carbon coating is required to exacerbate LiMnPO4 performance [40]. Lithium manganese phosphate undergoes structural distortion induced by a Jahn-Teller effect of Mn3+ in octahedral environment [41]. Furthermore, LiMnPO4 was reported to spontaneously react with electrolytes because of its higher potential [42]. A passivation film layer is formed while the electrolyte is oxidized. Its thermal stability is also lower than that of LiFePO4. Oxygen loss arises from 200°C and leads to partial decomposition of LiMnPO4 in Mn2P2O7 [43].
Figure 1-4. (a) Discharge profiles and (b) cycle-life of the LiFe1-xMnxPO4 solid solution, x=0, 0.25, 0.50, 0.75 and 1, at C/20 [44].
Researchers investigated the solid-solution between LiFePO4 and LiMnPO4, LiFe1-xMnxPO4. The objective was the combination of the stability and higher kinetics of LFP with the higher potential of LMP. Its voltage profile is composed of two plateaus, each one respectively proportional to iron (E ⋍ 3.5V vs Li+/Li) and manganese (E ⋍ 4.1V vs. Li+/Li) contents, as shown in Figure 1-4 [44]. However, rate capabilities of LiFe1-xMnxPO4 are lower than those of LFP because of the presence of Mn that limits its conductivity. Yamada et al. demonstrated a LiFe1-xMnxPO4 material reaching a specific capacity of 160mAh.g-1 for x=0.6 [45]. Compositions with x ≥ 0.8 are not suitable, because of low conductivity and structural instability after complete delithiation [46], what is illustrated by poorer electrochemical performance in Figure 1-4a-b. Deeper efforts are required to adapt LiFe1-xMnxPO4 for a practical application and make it a suitable successor of LiFePO4.
Chapter 1 – Literature review
25
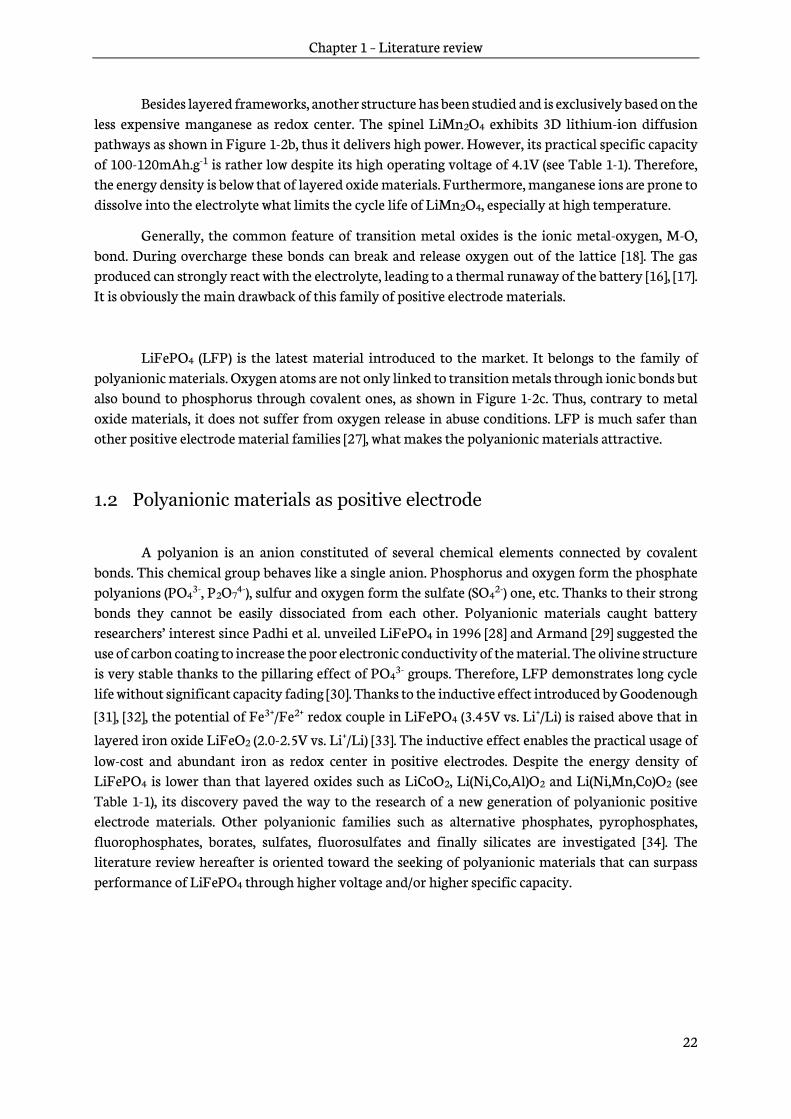
LiCoPO4 exhibits a high voltage of 4.9V vs. Li+/Li as shown in Figure 1-5a. An intermediate phase, Li0.7CoPO4, is formed upon oxidation, deviating from the usual LiMPO4-MPO4 (M = Fe, Mn, Fe/Mn) phase transition illustrated by a plateau on galvanostatic curve [47]. Specific capacity values as high as 120mAh.g-1 were reversibly obtained after charging to 5.1V vs. Li+/Li [48], as shown in Figure 1-5a. There are still challenges on the electrolyte side to exploit LiCoPO4 above 5V. Currently, it cannot be considered as the next generation of polyanionic material for positive electrode.
Figure 1-5. Galvanostatic charge-discharge cycles of (a) LiCoPO4 at 0.1mA.cm-2 and (b) LiNiPO4/C at C/10, respectively adapted from [48] and [49].
LiNiPO4 exhibits a high theoretical redox potential (⋍5.1V vs. Li+/Li) and very low electronic conductivity, resulting in low specific capacities of ⋍90mAh.g-1 [49], [50], as shown in Figure 1-5b. A recent study reported a discharge capacity of 157mAh.g-1 at C/10 in a LiPF3(CF2CF3)3-based electrolyte after a charge to 5.8V [51]. A confirmation of these unique results are required since the voltage stability of LiPF3(CF2CF3)3 salt has been reported until 5V only [52]. Currently, practical utilization of nickel-based phosphate is rather unlikely.
To conclude, none of the other phosphate compounds is close to replace LiFePO4 when both safety and performance are considered.
1.2.3 Pyrophosphates
Pyrophosphates are investigated for their higher potential than that of phosphates through the inductive effect, and for the hypothetical utilization of two lithium ions per f.u.. They are constituted of P2O7
4- dimers and are described in three subgroups: M4(P2O7)3, LiMP2O7 and Li2MP2O7. Fe4(P2O7)3 first was investigated by Masquelier et al. who prepared this material in a charged state[53].
Its operating voltage lies around 3.1V vs. Li+/Li. Up to 3 Li+ per f.u. can be inserted, leading to a practical specific capacity of 108mAh.g-1.
The second group is described with the formula LiMP2O7 (M=Ti, V, Cr, Mn, Fe) and their investigation was pioneered by Goodenough’s group in 1990’s [54]. These compounds are synthesized
(a)
(b)
Chapter 1 – Literature review
26
at the discharged state. Practical voltage below 3V vs. Li+/Li, combined with high molecular weight of P2O7
4- leads to average electrochemical performance. Exceptions can be made for LiVP2O7 and
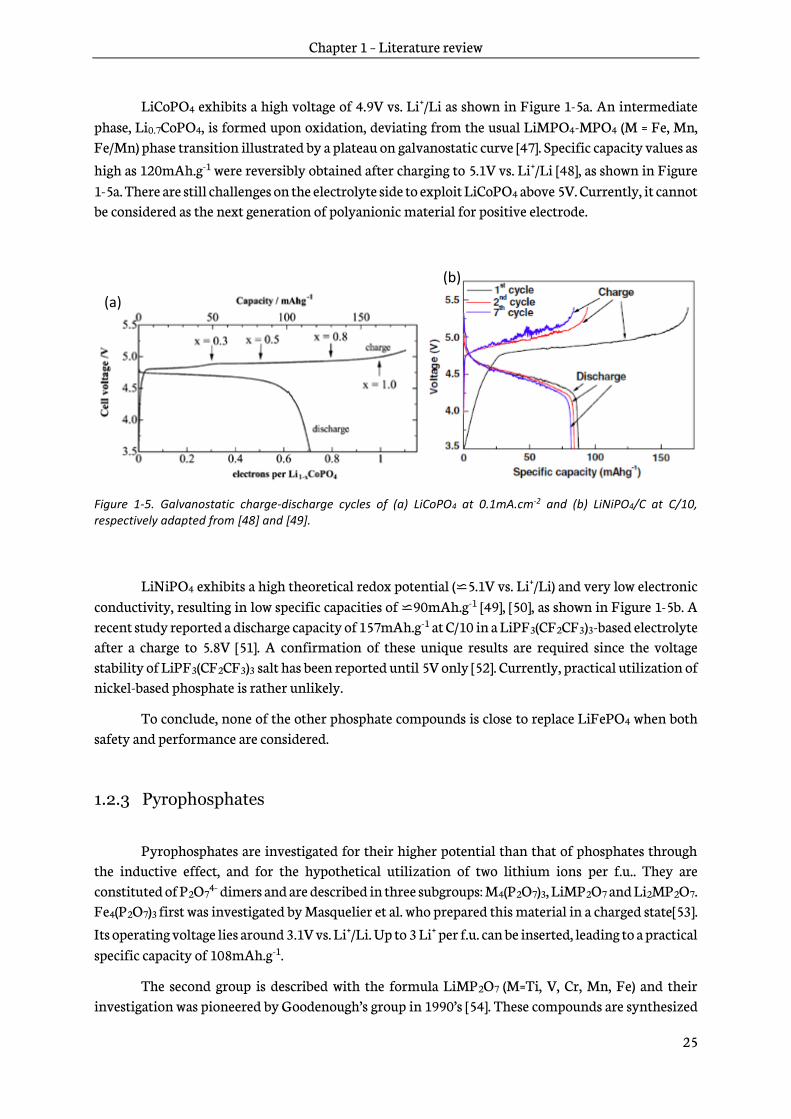
LiFe1.5P2O7. The first compound exhibited a capacity of 100mAh.g-1 with a V4+/V3+ working redox
couple at 4.26V vs Li+/Li [55], as shown in Figure 1-6a.
Figure 1-6. Reversible electrochemical capacity close to 90mAh.g-1 depicted for carbothermally produced LiVP2O7 positive electrode material using V3+/4+ redox reaction at high voltage of 4.1V [55], (b) first charge-discharge profile for LiFe1.5P2O7 at C/20, the inset shows the cyclic voltamogram recorded at a 0.1 mV.s-1 sweep rate for the 1st and 10th charge-discharge cycle [56].
The second compound showed a similar practical capacity, slightly above 100mAh.g-1, and a
voltage of the order of 3.3V for Fe3+/Fe2+ redox couple [56], as shown in Figure 1-6b. These two materials are both well below the energy density of LiFePO4 (590Wh.kg-1), with 426Wh.kg-1 and 330Wh.kg-1 respectively for LiVP2O7 and LiFe1.5P2O7.
The last group consisting of Li2MP2O7 (M=VO, Mn, Fe, Co) materials is more promising. It opens the possibility to exploit two electrons per formula unit, using both M3+/M2+ and M4+/M3+ redox
couples. The M3+/M2+ redox potentials surpass that of phosphates. Li2FeP2O7 and Li2MnP2O7
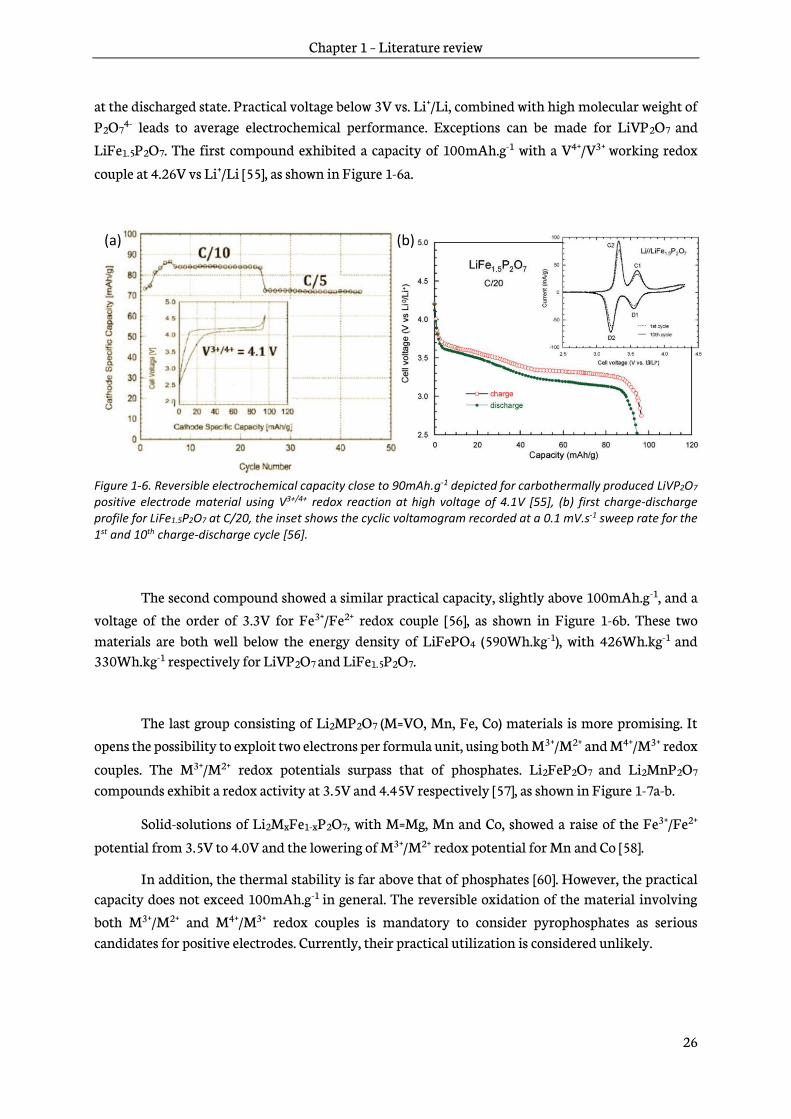
compounds exhibit a redox activity at 3.5V and 4.45V respectively [57], as shown in Figure 1-7a-b.
Solid-solutions of Li2MxFe1-xP2O7, with M=Mg, Mn and Co, showed a raise of the Fe3+/Fe2+
potential from 3.5V to 4.0V and the lowering of M3+/M2+ redox potential for Mn and Co [58].
In addition, the thermal stability is far above that of phosphates [60]. However, the practical capacity does not exceed 100mAh.g-1 in general. The reversible oxidation of the material involving
both M3+/M2+ and M4+/M3+ redox couples is mandatory to consider pyrophosphates as serious candidates for positive electrodes. Currently, their practical utilization is considered unlikely.
(a) (b)
Chapter 1 – Literature review
27
Figure 1-7. (a) Galvanostatic charge–discharge curves for Li2FeP2O7 positive electrode at C/20 [57], Galvanostatic voltage-composition curve of Li2MnP2O7 at a rate of C/50 obtained at 40°C, the corresponding dQ/dV plot is shown in inset [59].
1.2.4 Fluorophosphates
Fluorophosphates were first investigated to raise the voltage of phosphates by replacing O2- by F-. The similar size of the two anions facilitates their substitution. The redox potential is raised thanks to the inductive effect. A 0.5V-difference was observed between Li3V2(PO4)3 and LiVPO4F. The latter
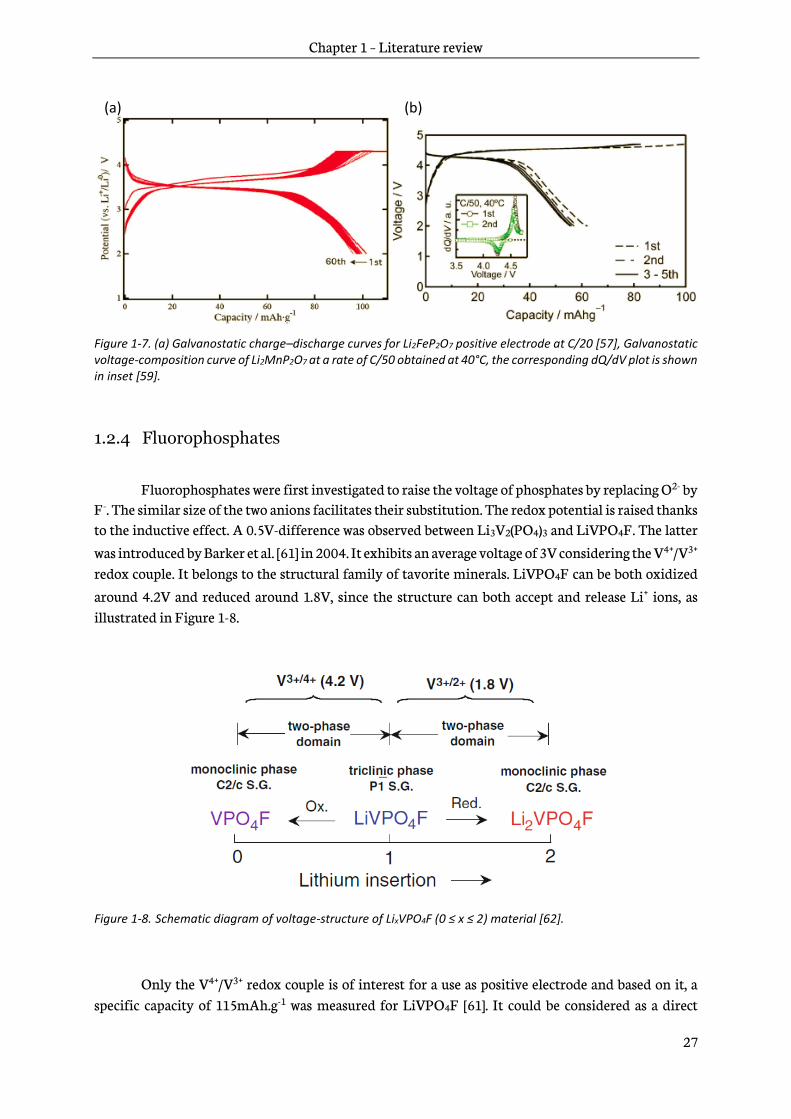
was introduced by Barker et al. [61] in 2004. It exhibits an average voltage of 3V considering the V4+/V3+ redox couple. It belongs to the structural family of tavorite minerals. LiVPO4F can be both oxidized
around 4.2V and reduced around 1.8V, since the structure can both accept and release Li+ ions, as illustrated in Figure 1-8.
Figure 1-8. Schematic diagram of voltage-structure of LixVPO4F (0 ≤ x ≤ 2) material [62].
Only the V4+/V3+ redox couple is of interest for a use as positive electrode and based on it, a specific capacity of 115mAh.g-1 was measured for LiVPO4F [61]. It could be considered as a direct
(a) (b)
Chapter 1 – Literature review
28
competitor of LiFePO4 if the practical specific capacity achieves the theoretical one (155mAh.g-1). However, this material exhibits air and moisture reactivity leading to structural changes and degradation of its electrochemical performance [63]. Furthermore, usage of toxic and scarce vanadium limits its adoption.
Other transition metals were explored. Despite a practical capacity of 145mAh.g-1, LiFePO4F operates at only 2.8Vwhat highly limits its energy density [64]. LiNiPO4F exhibits a working voltage above 5V that is not compatible with the commercial liquid electrolytes [65].
Another family, A2MPO4F, contains transition metals occupying octahedral sites. The connectivity between MO4F2 octahedra may vary from face-sharing, to corner, to edge-sharing, which are respectively associated to tavorite, layered and 3D structures in the case of Li2FePO4F. The structure has a direct impact on the potential. It increases with the dimensionality of the framework, from 1D to 3D, and so is the ionic conductivity. The maximum redox potential reported in the literature was as low as 3.4V vs. Li+/Li for the extraction of the 1st Li+ per f.u.. Extraction of the second
Li+ ion has never been reached within the stability window of the commercial liquid electrolytes [66].
Li2MnPO4F is prepared by an ion-exchange of Na2MnPO4F. A practical specific capacity of 140mAh.g-1 was obtained and the Mn3+/Mn2+ redox couple lied at 3.85V vs. Li+/Li [67]. Li2CoPO4F has
a redox potential close to 5V vs. Li+/Li but the reported corresponding specific capacity is generally lower than 60mAh.g-1 [68].
To conclude, despite the higher theoretical energy densities of LiVPO4F and Li2MnPO4F compared to LiFePO4, fluorophosphates are not considered as the next generation of polyanionic materials because of complex synthesis processes and use of toxic vanadium.
1.2.5 Borates
Borates (BO33-) are the less studied family among polyanionic materials. Boron is one of the
lightest elements; therefore, the molecular weight of BO33- of the order of 59g.mol-1 is almost half that
of PO43-, SiO4
4- or SO42-. A theoretical capacity of 220mAh.g-1 is possible for LiMBO3 (M=Fe, Mn, Co)
through the exploitation of 1Li+ per f.u. [69]. Lithium metal borates are built of BO3 triangles and MO5
bipyramids. Electrochemical properties of LiFeBO3 were first studied in 2001 [70]. The investigations in the last fifteen years demonstrated poor electronic conductivities, slow kinetics, chemical
instability and rapid surface poisoning in contact with moisture (Figure 1-9). Tendency of Fe2+ to
oxidize makes synthesis of pure LiFeBO3 difficult. Furthermore, the Fe3+/Fe2+ redox couple lies at a
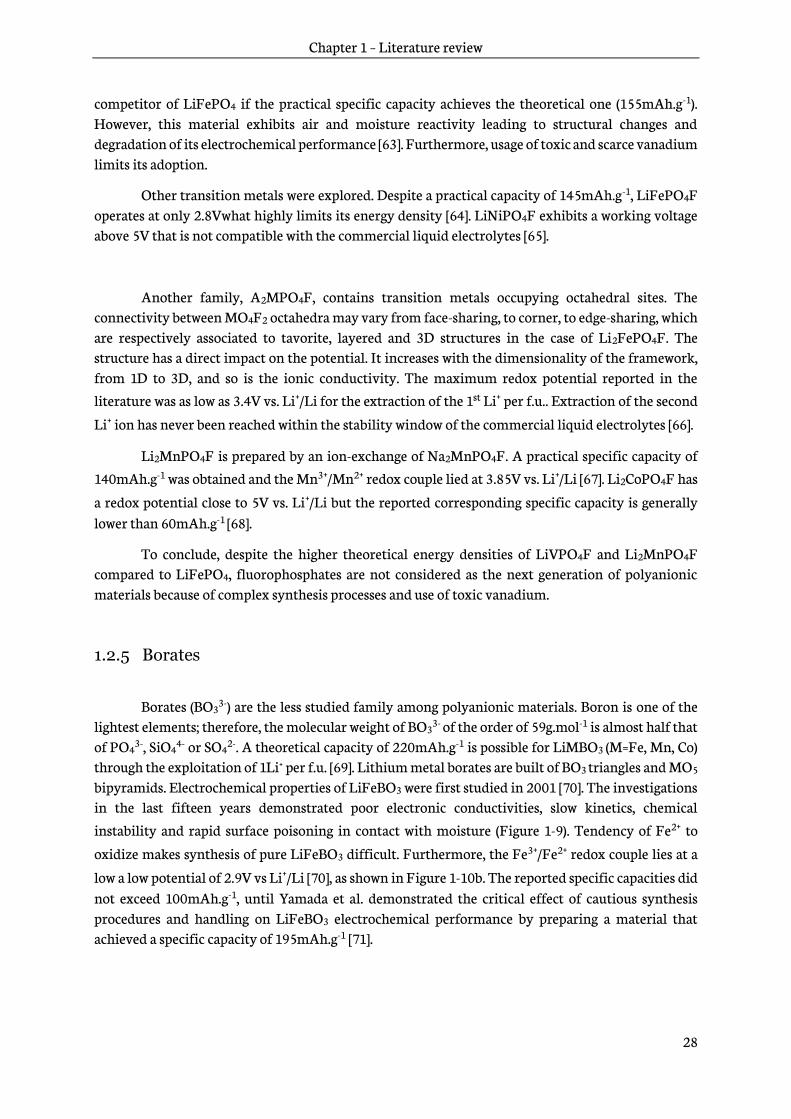
low a low potential of 2.9V vs Li+/Li [70], as shown in Figure 1-10b. The reported specific capacities did not exceed 100mAh.g-1, until Yamada et al. demonstrated the critical effect of cautious synthesis procedures and handling on LiFeBO3 electrochemical performance by preparing a material that achieved a specific capacity of 195mAh.g-1 [71].
Chapter 1 – Literature review
29
Figure 1-9. Evolution of iron oxidation state with exposure of LiFeBO3 to air over time [72]. The green share is related to Fe2+ content while the red one to Fe3+ content.
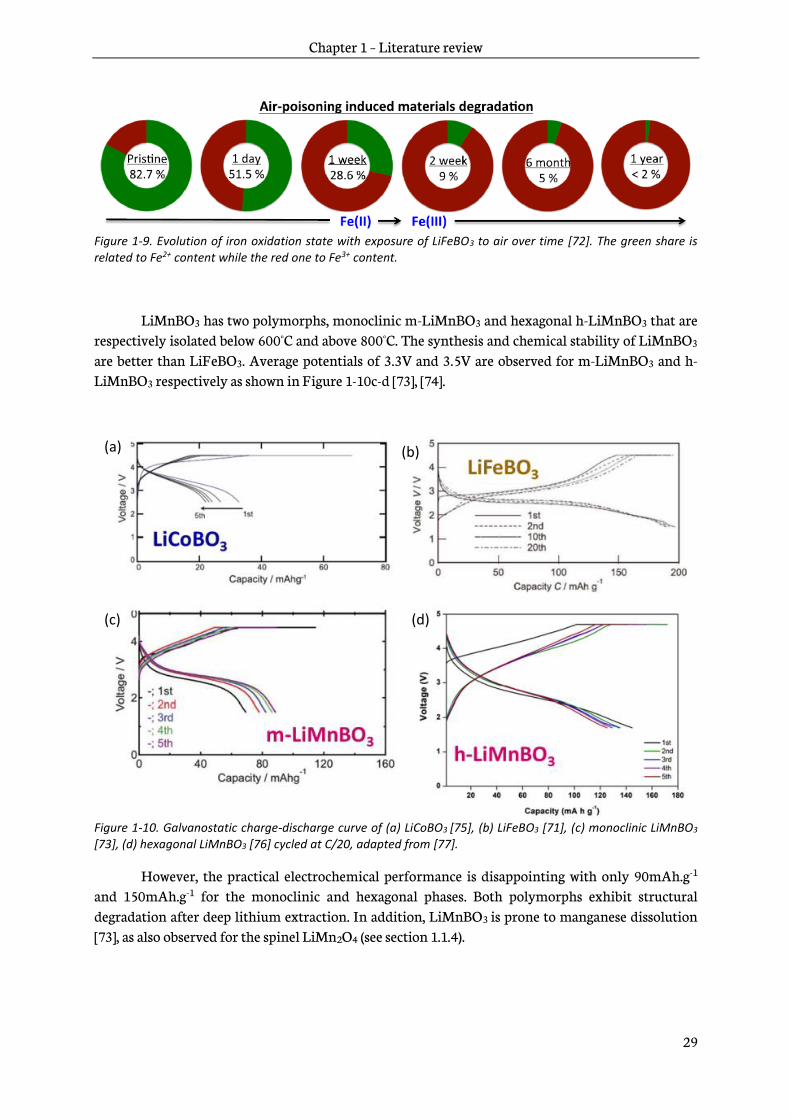
LiMnBO3 has two polymorphs, monoclinic m-LiMnBO3 and hexagonal h-LiMnBO3 that are respectively isolated below 600°C and above 800°C. The synthesis and chemical stability of LiMnBO3 are better than LiFeBO3. Average potentials of 3.3V and 3.5V are observed for m-LiMnBO3 and h-LiMnBO3 respectively as shown in Figure 1-10c-d [73], [74].
Figure 1-10. Galvanostatic charge-discharge curve of (a) LiCoBO3 [75], (b) LiFeBO3 [71], (c) monoclinic LiMnBO3 [73], (d) hexagonal LiMnBO3 [76] cycled at C/20, adapted from [77].
However, the practical electrochemical performance is disappointing with only 90mAh.g-1 and 150mAh.g-1 for the monoclinic and hexagonal phases. Both polymorphs exhibit structural degradation after deep lithium extraction. In addition, LiMnBO3 is prone to manganese dissolution [73], as also observed for the spinel LiMn2O4 (see section 1.1.4).
(a) (b)
(c) (d)
Chapter 1 – Literature review
30
LiCoBO3 has 1D Li+ diffusion pathways and is prone to Li-Co antisite defects. Poor electronic conductivity combined with low diffusivity resulted in a maximum performance of the order of 40mAh.g-1 at a redox voltage of 4V [75], [78]. In addition, capacity fading was observed, as shown in Figure 1-10a.
Despite recent interesting results about LiFeBO3 showing an energy density competing with that of LiFePO4 [71], the restrictive synthesis conditions and its high reactivity strongly impedes the practical utilization of borate materials as positive electrodes.
1.2.6 Sulfates and fluorosulfates
Sulfates and fluorosulfates were considered very recently for their electrochemical properties [79]. One can note the exception of NASICON Fe2(SO4)3 which was unveiled by Goodenough and Manthiram in the late 1980’s [36]. The specific capacity of 134mAh.g-1 and average potential of 3.6V vs. Li+/Li are too low for any practical utilization.
Tarascon’s group focused on fluorosulfates LiMSO4F from 2010 aiming to raise the redox potential through substitution of O2- by F- [80]. Because of the high chemical instability of LiFeSO4F with water and above 400°C, they cannot be prepared by low-cost solid state or hydrothermal routes. As a result, the synthesis of LiFeSO4F was enabled by the preparation of FeSO4.H2O by solution routes in ionic liquids or glycols followed by a solvothermal reaction with LiF at 300°C [80]. LiFeSO4F exhibits a tavorite structure. Up to 0.9Li+ (i.e. 140mAh.g-1) can be reversibly exchanged at a promising voltage of 3.6V, as shown in Figure 1-11a. Another polymorph adopting a triplite structure was discovered. A high voltage of 3.9V was evidenced as one of the highest among iron based positive electrode materials [81], as shown in Figure 1-11b. A specific capacity up to 130mAh.g-1
was reached with a small volume expansion of 0.5% , far below the 8% observed in tavorite LiFeSO4F [82]. However, the triplite structure exhibits zig-zag diffusion pathways that leads to slow diffusivity [82]. Only iron-based fluorosulfates have shown an electrochemical activity so far.
Bisulfates Li2M(SO4)2 were more recently investigated to exploit the maximum extraction of 2 lithium ions per f.u.. Only the following iron-based compositions are electrochemically active like in the fluorosulfates. Two polymorphs of Li2Fe(SO4)2 were isolated in orthorhombic and monoclinic systems respectively. Only moderate specific capacity of 95mAh.g-1 at 3.8V vs Li+/Li were measured [83], as shown in Figure 1-11c.

Chapter 1 – Literature review
31
Figure 1-11. Galvanostatic charge-discharge of (a) tavorite LiFeSO4F, (b) triplite LiFeSO4F at C/10 [85] and (c) Li2Fe(SO4)2 [82].
The reversible extraction of the second lithium ion is considered unachievable because of the
unfavorable formation of Fe4+.
Finally, iron oxysulfate, Fe(SO4)2O, offers higher stability against moisture and high temperatures [84]. However, its specific capacity and potential respectively of 125mAh.g-1 and 3V vs.
Li+/Li are too low for any practical application.
There are still many issues to overcome before a practical positive electrode material based on the sulfate chemistry is developed.
(c)

Chapter 1 – Literature review
32
1.2.7 Summary of electrochemical performance of polyanionic materials
The practical electrochemical performance of phosphates, pyrophosphates, fluorophosphates, borates, sulfates, fluorosulfates and silicates families is given in Figure 1-12. Few contenders surpass in practice the energy density of 590Wh.kg-1 of LiFePO4. Only LiMn0.6Fe0.4PO4 [45], LiFeBO3 [71] and the silicates materials [86], [87] are worth-mentioning. The two first materials exhibit performance that are considered too close to that of LiFePO4 while they exhibit some practical limitations. However, Li2MnSiO4 (LMS) and Li2FeSiO4 opened the way to the exchange of two lithium ions per f.u., leading to capacity of the order of 330mAh.g-1. A multiplication by two of the energy density of polyanionic positive electrodes is possible. Furthermore, they are made of abundant silicon, iron, and manganese elements. Therefore, they are the focus of the next part of this literature review.
Figure 1-12. Practical voltage (V vs. Li+/Li) of polyanionic materials as a function of practical specific capacity (mAh.g-1) inspired from [88], the isovalue lines represent the energy density of the positive electrode (Wh.kg-1).
Chapter 1 – Literature review
33
1.3 Silicate materials
1.3.1 Geology of silicates
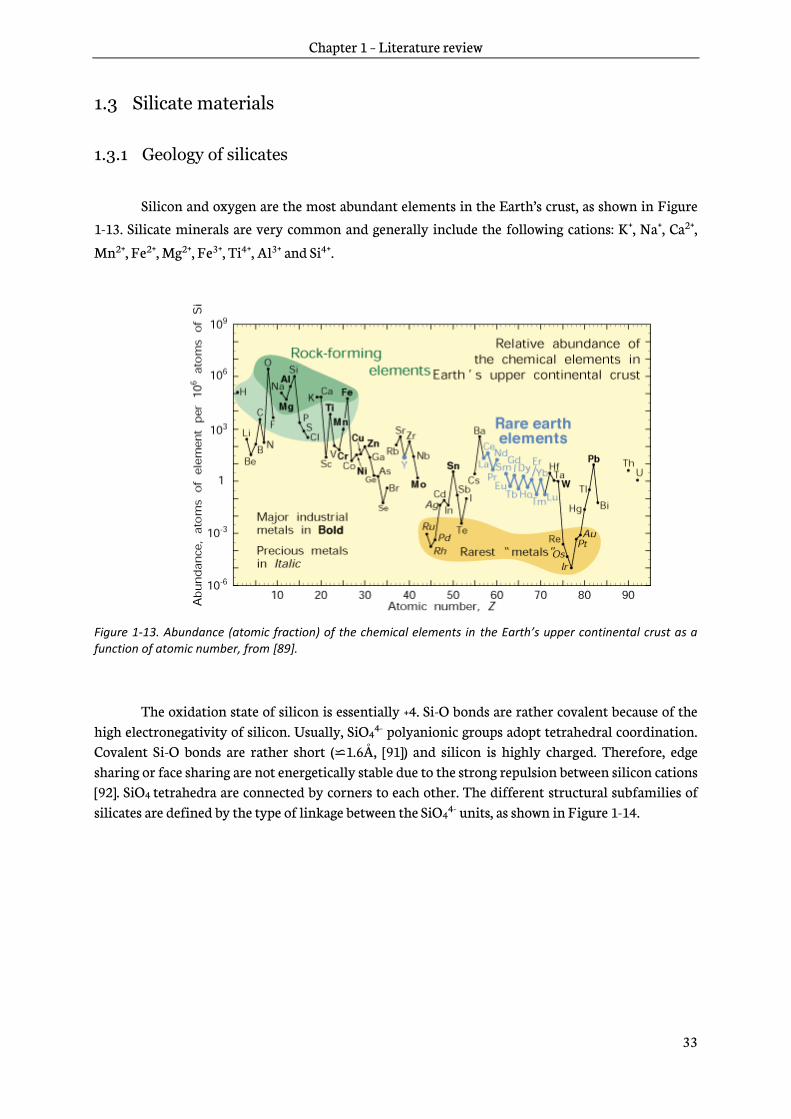
Silicon and oxygen are the most abundant elements in the Earth’s crust, as shown in Figure
1-13. Silicate minerals are very common and generally include the following cations: K+, Na+, Ca2+,
Mn2+, Fe2+, Mg2+, Fe3+, Ti4+, Al3+ and Si4+.
Figure 1-13. Abundance (atomic fraction) of the chemical elements in the Earth’s upper continental crust as a function of atomic number, from [89].
The oxidation state of silicon is essentially +4. Si-O bonds are rather covalent because of the high electronegativity of silicon. Usually, SiO4
4- polyanionic groups adopt tetrahedral coordination. Covalent Si-O bonds are rather short (⋍1.6Å, [91]) and silicon is highly charged. Therefore, edge sharing or face sharing are not energetically stable due to the strong repulsion between silicon cations [92]. SiO4 tetrahedra are connected by corners to each other. The different structural subfamilies of silicates are defined by the type of linkage between the SiO4
4- units, as shown in Figure 1-14.
Chapter 1 – Literature review
34
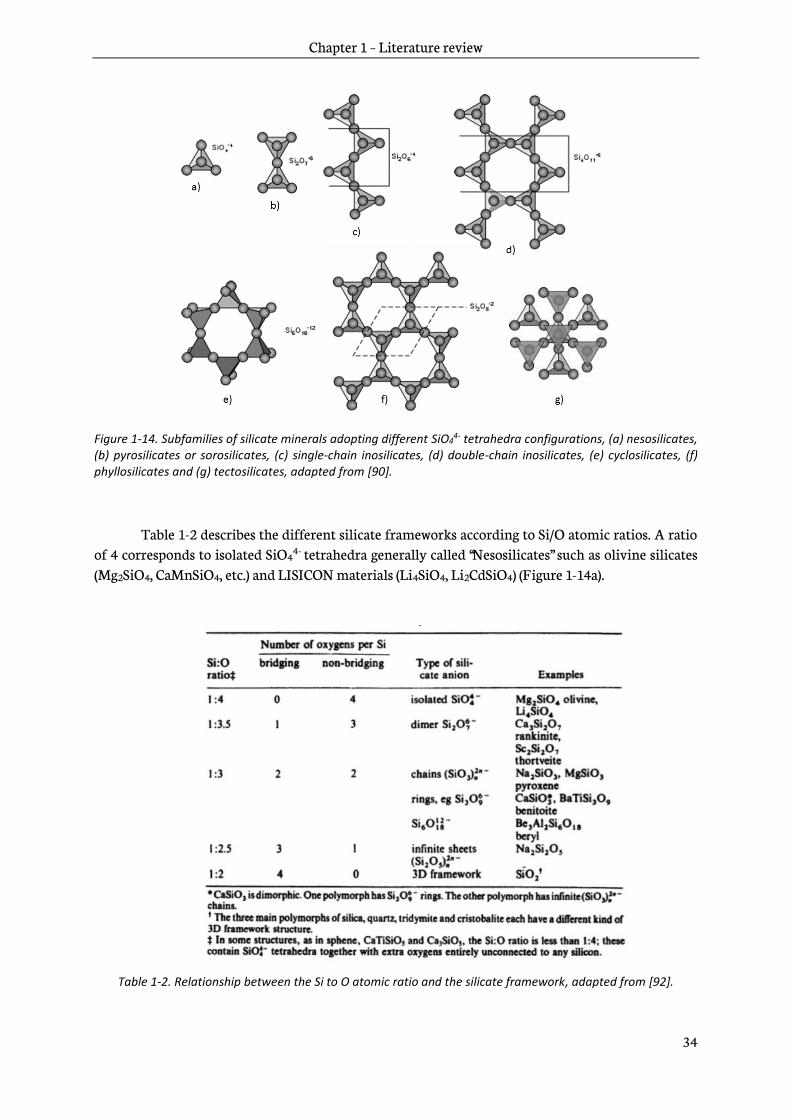
Figure 1-14. Subfamilies of silicate minerals adopting different SiO44- tetrahedra configurations, (a) nesosilicates,
(b) pyrosilicates or sorosilicates, (c) single-chain inosilicates, (d) double-chain inosilicates, (e) cyclosilicates, (f) phyllosilicates and (g) tectosilicates, adapted from [90].
Table 1-2 describes the different silicate frameworks according to Si/O atomic ratios. A ratio of 4 corresponds to isolated SiO4
4- tetrahedra generally called “Nesosilicates” such as olivine silicates
(Mg2SiO4, CaMnSiO4, etc.) and LISICON materials (Li4SiO4, Li2CdSiO4) (Figure 1-14a).
Table 1-2. Relationship between the Si to O atomic ratio and the silicate framework, adapted from [92].
Chapter 1 – Literature review
35
Dimers Si2O76- belong to “ Pyrosilicates” or “ Sorosilicates” where only one oxygen is bridging i.e. shared
between several tetrahedra (Figure 1-14b). The next family exhibits two bridging oxygens per SiO44-
unit and adopts a polymeric chain configuration. Metasilicates SiO32- (Li2SiO3, etc.) or pyroxene Si2O6
4- (LiFeSi2O6, etc.) are single chain silicates that belong to the group of “ Inosilicates” (Figure 1-14c). Amphiboles are double chain silicates and belong to the “ Inosilicates” family as well (Figure 1-14d). The last group bearing two bridging oxygen anions are cyclosilicates where SiO4
4- units form rings (beryl Be3Al2Si6O18, etc.) (Figure 1-14e). The next group is that of phyllosilicates including as clays, talc and micas and it is formed by infinite sheets of (Si2O5)n2n- (Figure 1-14f). Finally, silicates with 3D-framework have only bridging oxygens and are called “ Tectosilicates” (Figure 1-14g). Their major members are the silica polymorphs (quartz, cristoballite, tridymite, etc.).
Among the variety of silicates groups described above, only one is interesting for positive electrode materials purpose. Nesosilicates, also called orthosilicates, exhibit the higher Si/O atomic ratio (Si/O=4). As silicate polyanions are built of SiO4
4- tetrahedra and bear four negative charges, several combinations of number of lithium ions and oxidation states of the transition metal are possible to compensate the charge of SiO4
4- in orthosilicates. One of them includes a relatively high amount of lithium and a relatively low oxidation state of the transition metal. It corresponds to high specific capacity material of the formula Li2MSiO4, M=Mn, Fe, Co and Ni; and is mentioned in the literature as lithium metal orthosilicate. The second combination includes a relatively low amount of lithium and a relatively high oxidation state of the transition metal. It corresponds to potential high-voltage materials of the formula AMSiO4, A=Mg, Li; M=Mn, Fe, Co and Ni; named olivine silicates. Applications of these two families in secondary batteries are the focus of the next sections.
1.3.2 Generalities about lithium metal orthosilicates
In 2000, Armand et al. proposed for the first time the use of Li2MSiO4 as positive electrode materials for lithium-ion batteries in the US patent 6,085,015 [93]. Orthosilicates are very promising because of a large specific capacity, up to 330mAh.g-1, achievable through the use of two lithium ions per formula unit. Five years later, a research group from Uppsala University in collaboration with M. Armand published the first study about Li2FeSiO4 [94]. Then, Dominko et al. published a co-investigation on Li2FeSiO4 and Li2MnSiO4 [95]. Finally, two main groups pioneered the research on orthosilicates, Uppsala University and the ALISTORE-ERI network with teams coming from the Institute Jozef Stefan in Slovenia, Université de Picardie Jules Verne in France, Universities of St. Andrews and Bath in United Kingdom and Universidad Complutense de Madrid in Spain. Until now more than 500 papers were released on Li2MSiO4 with M= Fe, Mn, Co, Ni and their mixtures.
1.3.2.1 Polymorphism
Lithium metal orthosilicates belong to tetrahedral structures related to LISICON (LIthium Super Ionic CONductor). Li2MSiO4 exhibits a rich polymorphism that is related to low and high temperature phases of Li3PO4, respectively β and γ as introduced by West and Glasser [96]. A representation of the two phases is given in Figure 1-15.
Chapter 1 – Literature review
36
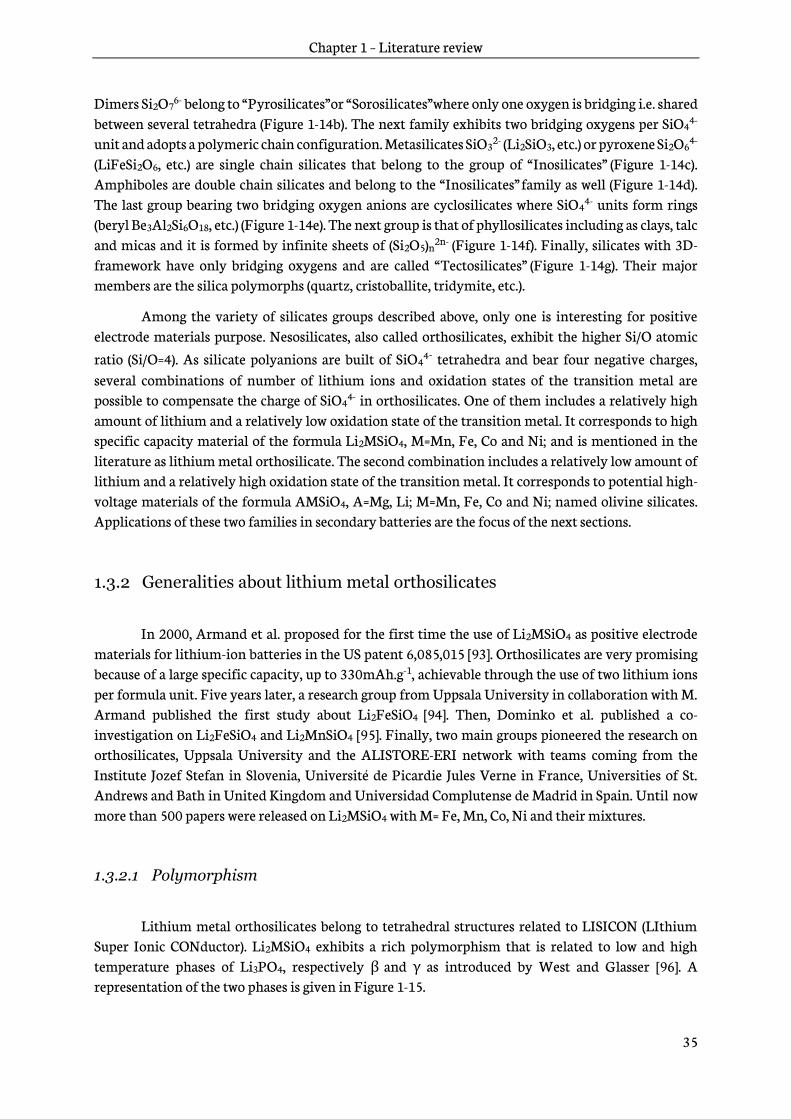
All the polymorphs exhibit a hexagonal close-packing of oxygen anions. The β phase shows a basic würtzite structure where tetrahedra are linked by corner-sharing and occupy one set of the tetrahedral sites. The oxygens in tetrahedral units are linked along the c axis to three oxygens of the upper layer and one oxygen on the lower layer, as shown in Figure 1-15. In the γ -phase, tetrahedra are connected by both corners and edges and are distributed over two sets of tetrahedral sites.
Figure 1-15. Illustration of the relationship between β (left) and γ (right) phases where tetrahedra units are stacked along the c axis following an ABAB sequence, adapted from [96].
Starting from the β -phase, the γ -phase involves a mirror operation versus the (bc) plane of one-half of the tetrahedra from the lower layer to the upper layer, as demonstrated in Figure 1-15. Other variants of the two main β and γ phases were reported and differ from the nature of transition metals involved in Li2MSiO4. They are generally described in orthorhombic and monoclinic systems.
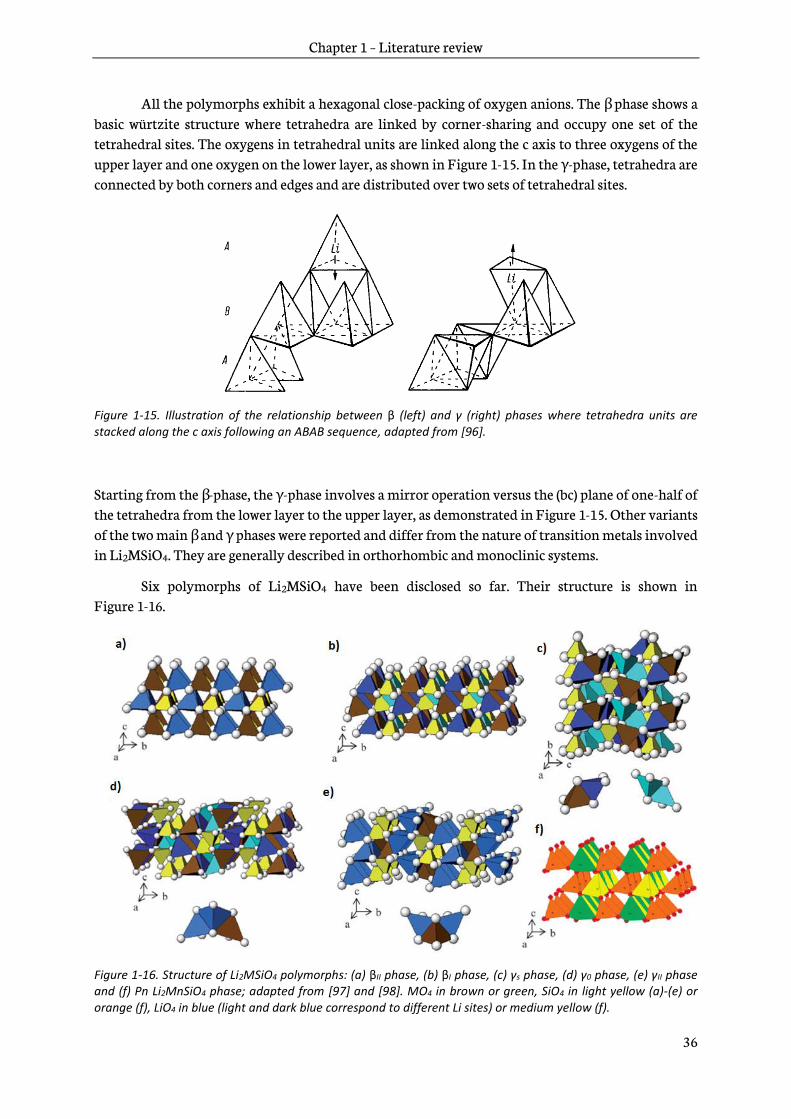
Six polymorphs of Li2MSiO4 have been disclosed so far. Their structure is shown in Figure 1-16.
Figure 1-16. Structure of Li2MSiO4 polymorphs: (a) βII phase, (b) βI phase, (c) γs phase, (d) γ0 phase, (e) γII phase and (f) Pn Li2MnSiO4 phase; adapted from [97] and [98]. MO4 in brown or green, SiO4 in light yellow (a)-(e) or orange (f), LiO4 in blue (light and dark blue correspond to different Li sites) or medium yellow (f).
Chapter 1 – Literature review
37
The β II phase is described in the Pmn21 space group. All the tetrahedra exhibit one face parallel to the (ab) plane as shown in Figure 1-16a. The opposite vertices point toward the c axis. Corrugated layers of LiO4 are parallel to alternating layers of MO4-SiO4 along the (ac) plan. The β I phase adopts a Pbn21 space group. It differs from the β II phase by chains of alternating LiO4-MO4 facing chains of alternating LiO4-SiO4 along the a axis as shown in Figure 1-16b. This original pattern is repeated throughout the (ab) plan. The γ s polymorph belongs to the P21/n space group. Half of the cation polyhedra points down. They respectively form pairs of edge-shared LiO4-MO4 and LiO4-LiO4. The γ 0
phase is described in the same space group than γ s. Half of the cation polyhedra points down and form a single LiO4-LiO4-MO4 pattern (Figure 1-16d). The two successive LiO4 units are described with a mirror-image orientation compared to the (ab) plane. The γ II polymorph is described by a Pmnb space group and is isostructural to orthorhombic Li2CdSiO4. This structure has edge-shared LiO4-MO4-LiO4
units where half of the cation polyhedra exhibits mirror-image orientation versus the (ab) plane, as shown in Figure 1-16e. Finally, the last polymorph has not been denoted according to the low and high temperature phases of Li3PO4, β and γ . It adopts a Pn space group (Figure 1-16f) from its parent Na2MnSiO4 [98]. All the tetrahedra point in the same direction parallel to the c axis. Contrary to β II-Pmn21, the chains of SiO4 are parallel to the chains of alternating MO4-LiO4 along the a axis.
1.3.2.2 Redox potential
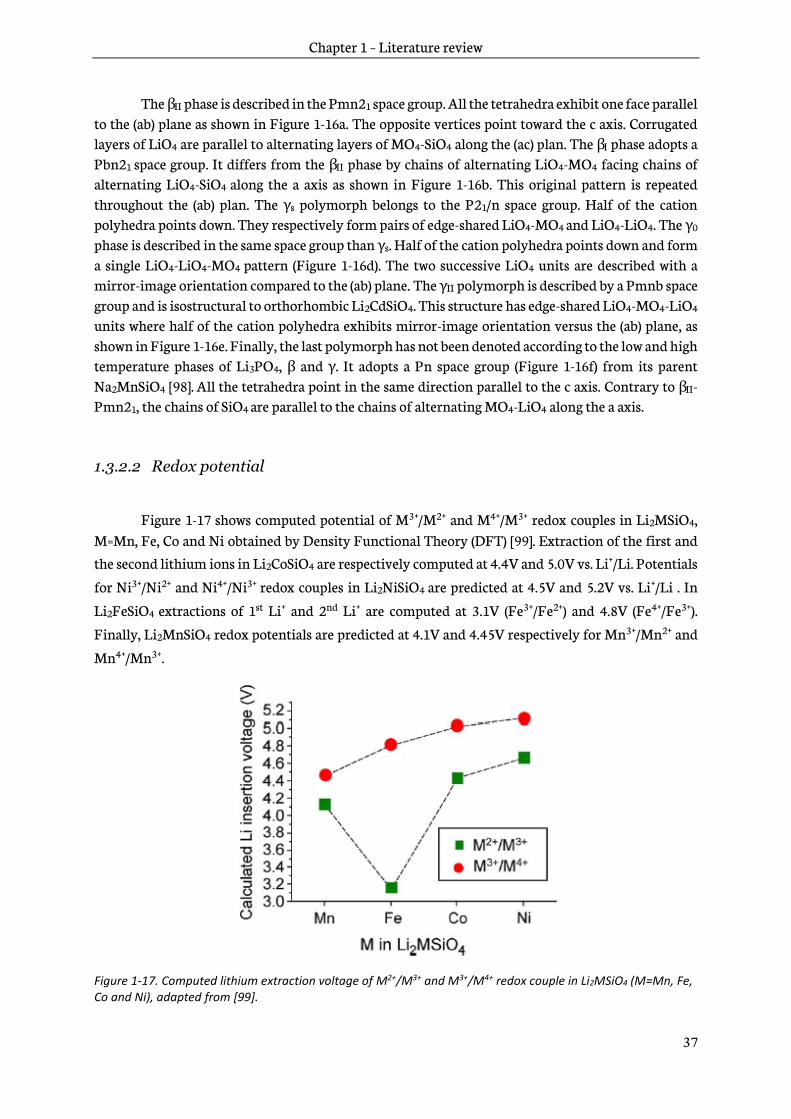
Figure 1-17 shows computed potential of M3+/M2+ and M4+/M3+ redox couples in Li2MSiO4, M=Mn, Fe, Co and Ni obtained by Density Functional Theory (DFT) [99]. Extraction of the first and the second lithium ions in Li2CoSiO4 are respectively computed at 4.4V and 5.0V vs. Li+/Li. Potentials
for Ni3+/Ni2+ and Ni4+/Ni3+ redox couples in Li2NiSiO4 are predicted at 4.5V and 5.2V vs. Li+/Li . In
Li2FeSiO4 extractions of 1st Li+ and 2nd Li+ are computed at 3.1V (Fe3+/Fe2+) and 4.8V (Fe4+/Fe3+).
Finally, Li2MnSiO4 redox potentials are predicted at 4.1V and 4.45V respectively for Mn3+/Mn2+ and
Mn4+/Mn3+.
Figure 1-17. Computed lithium extraction voltage of M2+/M3+ and M3+/M4+ redox couple in Li2MSiO4 (M=Mn, Fe, Co and Ni), adapted from [99].
Chapter 1 – Literature review
38
The extraction of the second Li+ in Li2MSiO4 materials lies above the voltage stability of commercial
electrolytes for M=Ni, Co and Fe. Only Li2MnSiO4 exhibits the theoretical possibility to utilize two Li+ per f.u. within the voltage stability window of organic electrolytes.
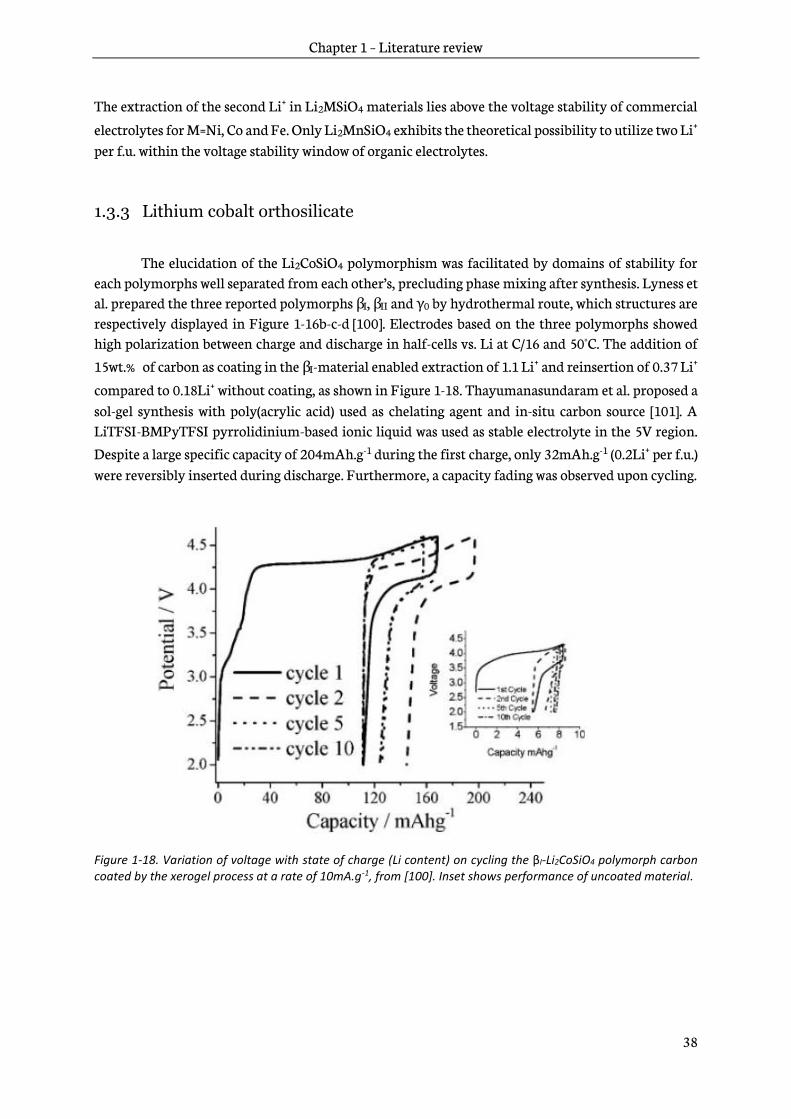
1.3.3 Lithium cobalt orthosilicate
The elucidation of the Li2CoSiO4 polymorphism was facilitated by domains of stability for each polymorphs well separated from each other’s, precluding phase mixing after synthesis. Lyness et al. prepared the three reported polymorphs β I, β II and γ 0 by hydrothermal route, which structures are respectively displayed in Figure 1-16b-c-d [100]. Electrodes based on the three polymorphs showed high polarization between charge and discharge in half-cells vs. Li at C/16 and 50°C. The addition of
15wt.% of carbon as coating in the β I-material enabled extraction of 1.1 Li+ and reinsertion of 0.37 Li+
compared to 0.18Li+ without coating, as shown in Figure 1-18. Thayumanasundaram et al. proposed a sol-gel synthesis with poly(acrylic acid) used as chelating agent and in-situ carbon source [101]. A LiTFSI-BMPyTFSI pyrrolidinium-based ionic liquid was used as stable electrolyte in the 5V region. Despite a large specific capacity of 204mAh.g-1 during the first charge, only 32mAh.g-1 (0.2Li+ per f.u.)
were reversibly inserted during discharge. Furthermore, a capacity fading was observed upon cycling.
Figure 1-18. Variation of voltage with state of charge (Li content) on cycling the βI-Li2CoSiO4 polymorph carbon coated by the xerogel process at a rate of 10mA.g-1, from [100]. Inset shows performance of uncoated material.

Chapter 1 – Literature review
39
1.3.4 Lithium nickel orthosilicate
Li2NiSiO4 was only reported with a β II-Pmn21 structure (Figure 1-16a) [102], [103]. Furthermore, nickel is prone to be reduced by carbon during the preparation of Li2NiSiO4/C composite, what precludes its synthesis. Its electrochemical performance have not been disclosed yet in the literature.
1.3.5 Lithium iron orthosilicate
1.3.5.1 Synthesis and handling
Li2FeSiO4 is the most studied orthosilicate material. It is based on abundant iron and exhibits
a high theoretical specific capacity (331mAh.g-1) through the utilization of both Fe3+/Fe2+ and
Fe4+/Fe3+ redox couples.
The different synthesis processes of Li2FeSiO4 often led to a mixture of polymorphs and impurities. Nytén et al. noticed that Li2FeSiO4 reacts with air [94] according to a similar oxidation
phenomenon observed in LiFeBO3 (see section 1.2.5). Significant amounts of Li2CO3 and Fe3+ on the surface of Li2FeSiO4 were identified after storage in air by X-ray Photoelectron Spectroscopy [104]. It is thus frequent to observe higher capacity measured at the end of first discharge than at the end of first charge, due to oxidation of iron in air.
1.3.5.2 Polymorphs
All the Li2FeSiO4 polymorphs are predicted to be thermodynamically stable [105], [106]. Their energy formation values are very close to each other’s and so is their structure. The sensitiveness to local chemical environments of both 6Li Magic Angle Spinning Nuclear Magnetic Resonance, MAS NMR, and 57Fe Mossbauer spectroscopy made their combined use a helpful tool to identify Li2FeSiO4
polymorphs [107]. It guided researchers toward ingenious synthesis routes to isolate each polymorph. Dominko et al. prepared a β II-polymorph with the same structure than its cobalt counterpart (Figure 1-16a) by a hydrothermal treatment at 200°C [108], [109]. An unreported γ II polymorph (Figure 1-16e) was isolated by Quoirin using a quench from 900°C [108]–[110]. Finally, the last Li2FeSiO4 polymorph was observed upon cycling and it crystallizes in an inverse-β II structure. This latter is close to the β II
phase but M sites are occupied by Li+ and Li sites are equally shared between Li+ and Fe2+ [111]. Significant differences in terms of electrochemical performance have not been reported between the polymorphs. However, the electrochemical phenomena occurring in Li2FeSiO4 during cycling differ according to the polymorphs. Generally, a low electronic conductivity of the order of 10-14S.cm-1 is reported for Li2FeSiO4 [112]. The next section focuses on the electrochemical phenomena taking place upon the extraction of first lithium ion in Li2FeSiO4.

Chapter 1 – Literature review
40
1.3.5.3 Fe3+/Fe2+ redox phenomena
Generally, downsizing and carbon-coating are required to utilize Li2FeSiO4. Among the delithiated phases of Li2FeSiO4, LiFeSiO4 is predicted by DFT to be more stable than Li0FeSiO4 [105], [113]. The electronic structure of Fe2+ is [Ar]3d54s1. The 1st lithium extraction results in a very stable
electronic configuration of [Ar]3d54s0 for Fe3+. It is coherent with the both low energy formation of
Li1FeSiO4 and Fe3+/Fe2+ redox potential.
Figure 1-19. Cyclic voltammetry curve of first cycles of Li2FeSiO4/C at 20mV.h-1 [94].
Figure 1-19 shows cyclic voltammetry of first cycles of a Li2FeSiO4/C electrode at 20mV.h-1. The first charge exhibits a voltage centered on 3.1V. The first discharge shows a lower voltage of 2.8V that is maintained afterwards in the second charge. As the original voltage of the first charge is not recovered, a shift of the redox peak from 3.1V to 2.8V is evidenced. Furthermore, this shift is irreversible over cycling [94].
Figure 1-20a shows the first galvanostatic cycle of Li2FeSiO4/C at C/30. The voltage drop is also well evidenced. The second and third cycles are similar what demonstrates the reversibility of the voltage profile. The reversibility of the redox activity of iron and the stability of its environment have also been confirmed by Mossbauer spectroscopy [114] and X-ray Absorption Spectroscopy (XAS) [115]–[117].
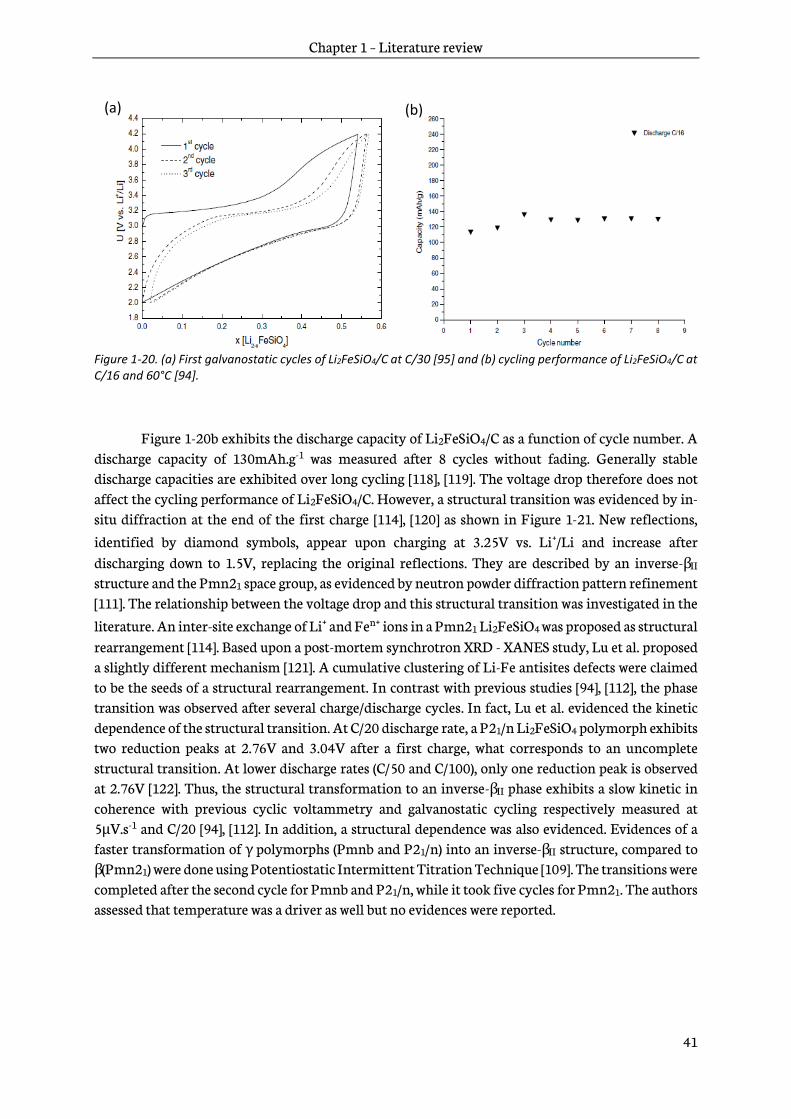
Chapter 1 – Literature review
41
Figure 1-20. (a) First galvanostatic cycles of Li2FeSiO4/C at C/30 [95] and (b) cycling performance of Li2FeSiO4/C at C/16 and 60°C [94].
Figure 1-20b exhibits the discharge capacity of Li2FeSiO4/C as a function of cycle number. A discharge capacity of 130mAh.g-1 was measured after 8 cycles without fading. Generally stable discharge capacities are exhibited over long cycling [118], [119]. The voltage drop therefore does not affect the cycling performance of Li2FeSiO4/C. However, a structural transition was evidenced by in-situ diffraction at the end of the first charge [114], [120] as shown in Figure 1-21. New reflections, identified by diamond symbols, appear upon charging at 3.25V vs. Li+/Li and increase after discharging down to 1.5V, replacing the original reflections. They are described by an inverse-β II structure and the Pmn21 space group, as evidenced by neutron powder diffraction pattern refinement [111]. The relationship between the voltage drop and this structural transition was investigated in the
literature. An inter-site exchange of Li+ and Fen+ ions in a Pmn21 Li2FeSiO4 was proposed as structural rearrangement [114]. Based upon a post-mortem synchrotron XRD - XANES study, Lu et al. proposed a slightly different mechanism [121]. A cumulative clustering of Li-Fe antisites defects were claimed to be the seeds of a structural rearrangement. In contrast with previous studies [94], [112], the phase transition was observed after several charge/discharge cycles. In fact, Lu et al. evidenced the kinetic dependence of the structural transition. At C/20 discharge rate, a P21/n Li2FeSiO4 polymorph exhibits two reduction peaks at 2.76V and 3.04V after a first charge, what corresponds to an uncomplete structural transition. At lower discharge rates (C/50 and C/100), only one reduction peak is observed at 2.76V [122]. Thus, the structural transformation to an inverse-β II phase exhibits a slow kinetic in coherence with previous cyclic voltammetry and galvanostatic cycling respectively measured at 5µV.s-1 and C/20 [94], [112]. In addition, a structural dependence was also evidenced. Evidences of a faster transformation of γ polymorphs (Pmnb and P21/n) into an inverse-β II structure, compared to β (Pmn21) were done using Potentiostatic Intermittent Titration Technique [109]. The transitions were completed after the second cycle for Pmnb and P21/n, while it took five cycles for Pmn21. The authors assessed that temperature was a driver as well but no evidences were reported.
(a) (b)
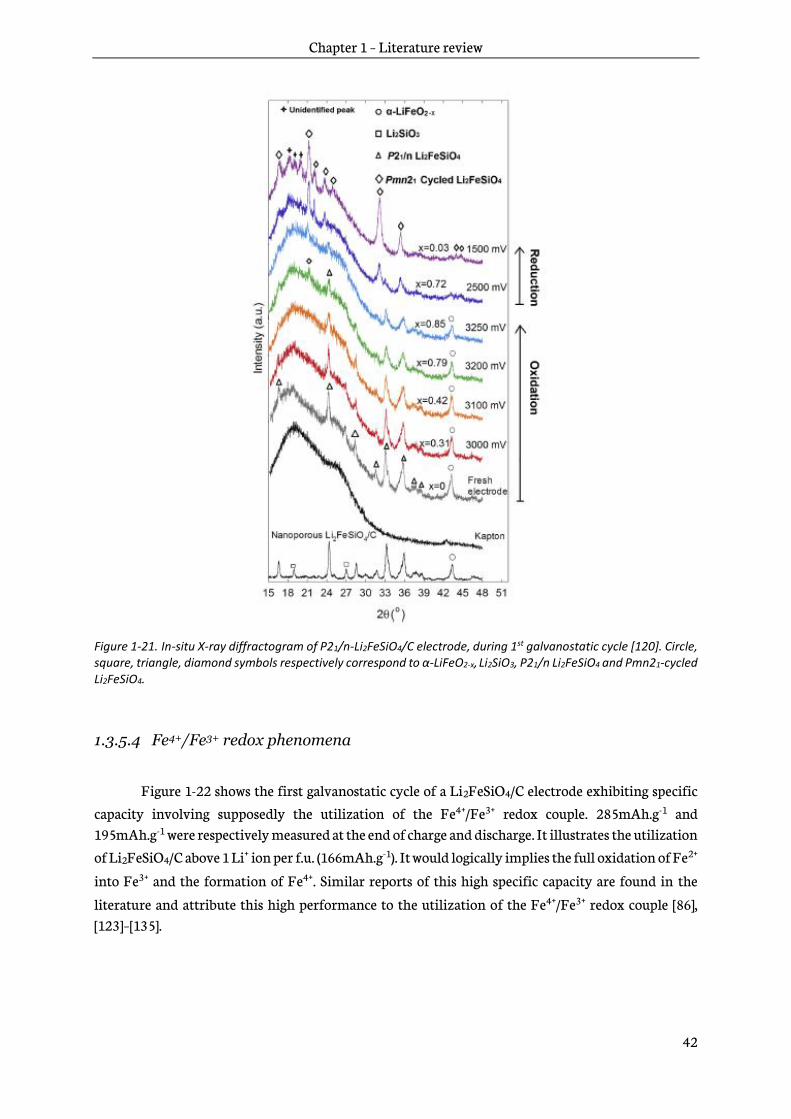
Chapter 1 – Literature review
42
Figure 1-21. In-situ X-ray diffractogram of P21/n-Li2FeSiO4/C electrode, during 1st galvanostatic cycle [120]. Circle, square, triangle, diamond symbols respectively correspond to α-LiFeO2-x, Li2SiO3, P21/n Li2FeSiO4 and Pmn21-cycled Li2FeSiO4.
1.3.5.4 Fe4+/Fe3+ redox phenomena
Figure 1-22 shows the first galvanostatic cycle of a Li2FeSiO4/C electrode exhibiting specific capacity involving supposedly the utilization of the Fe4+/Fe3+ redox couple. 285mAh.g-1 and 195mAh.g-1 were respectively measured at the end of charge and discharge. It illustrates the utilization of Li2FeSiO4/C above 1 Li+ ion per f.u. (166mAh.g-1). It would logically implies the full oxidation of Fe2+
into Fe3+ and the formation of Fe4+. Similar reports of this high specific capacity are found in the
literature and attribute this high performance to the utilization of the Fe4+/Fe3+ redox couple [86], [123]–[135].

Chapter 1 – Literature review
43
Figure 1-22. First galvanostatic cycle performed at 15mA.g-1, between 1.5V and 4.8 V, on Li2FeSiO4/C material, adapted from [136].
However, other literature studies strongly disagree with the identification of Fe4+ cations in
the previous reports. First, the formation of Li0Fe4+SiO4 was concluded as not favorable according to DFT computations [99], [105] as it would lead to severe structural distortions based on large electrostatic repulsion between Fe4+ and Si4+ cations [105]. Furthermore, it would require a high voltage 4.8V what is considered not achievable using conventional liquid electrolytes [99].
The observation of Fe4+ was claimed from the observation of XANES [136], [137] and
Mossbauer spectra [124], [127], [138]. However, Liivat et al. highlighted that Fe4+ Mossbauer spectrum
overlaps with that of Fe2+ and Fe3+ [139] what explains the discrepancies observed in the literature. A chemical delithiation of Li2FeSiO4 material by K2S2O8, a strong oxidant agent operating at 5V vs.
Li+/Li, yielded an amorphous phase, as confirmed by XRD, SAED and FT-IR spectroscopy [137].
Furthermore, XANES spectra did not show any traces of Fe4+ in the delithiated sample, but Atomic
Absorption Spectroscopy revealed an almost full delithiation of Li2FeSiO4.
This last observation could be explained by studies about the participation of oxygen in the electrochemical process of Li2FeSiO4/C. Both probing of Fe and O K-edges with XAS, after extraction
of the first Li+ ion from Li2FeSiO4, evidenced a shortening of Fe-O bonds concomitantly with oxidation of oxygen [116]. The latter was demonstrated in Figure 1-23, where the pre-edge peak at 530eV increasing with lithium extraction was interpreted as an increase of hybridized state between O2p and Fe3d orbitals and an electronic transfer from orbital O1s to O2p-ligand hole instead of
participation of redox couple Fe4+/Fe3+ [121], [139]. A DFT study corroborated the likeliness of O2p
orbitals participation rather than oxidation of Fe3+ to Fe4+ [113].
Nevertheless, the Fe4+/Fe3+ transition in Li2FeSiO4 is still a topic of discussion within the scientific community.
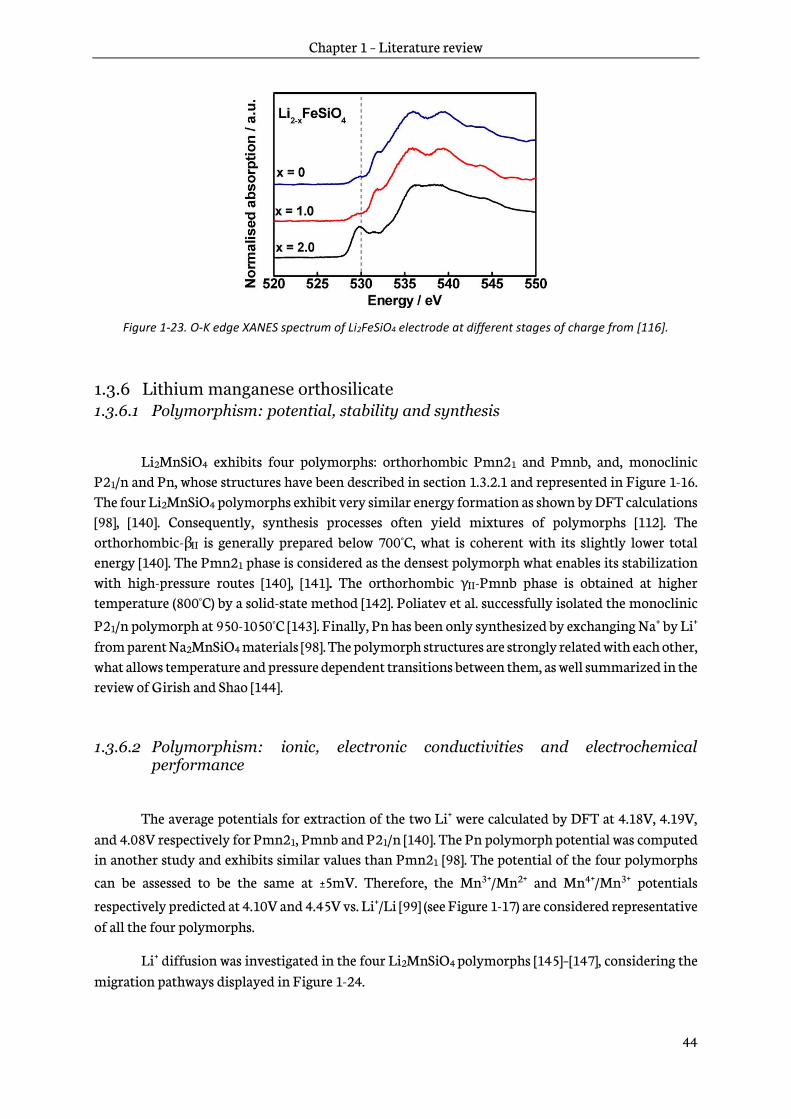
Chapter 1 – Literature review
44
Figure 1-23. O-K edge XANES spectrum of Li2FeSiO4 electrode at different stages of charge from [116].
1.3.6 Lithium manganese orthosilicate
1.3.6.1 Polymorphism: potential, stability and synthesis
Li2MnSiO4 exhibits four polymorphs: orthorhombic Pmn21 and Pmnb, and, monoclinic P21/n and Pn, whose structures have been described in section 1.3.2.1 and represented in Figure 1-16. The four Li2MnSiO4 polymorphs exhibit very similar energy formation as shown by DFT calculations [98], [140]. Consequently, synthesis processes often yield mixtures of polymorphs [112]. The orthorhombic-β II is generally prepared below 700°C, what is coherent with its slightly lower total energy [140]. The Pmn21 phase is considered as the densest polymorph what enables its stabilization with high-pressure routes [140], [141]. The orthorhombic γ II-Pmnb phase is obtained at higher temperature (800°C) by a solid-state method [142]. Poliatev et al. successfully isolated the monoclinic
P21/n polymorph at 950-1050°C [143]. Finally, Pn has been only synthesized by exchanging Na+ by Li+ from parent Na2MnSiO4 materials [98]. The polymorph structures are strongly related with each other, what allows temperature and pressure dependent transitions between them, as well summarized in the review of Girish and Shao [144].
1.3.6.2 Polymorphism: ionic, electronic conductivities and electrochemical performance
The average potentials for extraction of the two Li+ were calculated by DFT at 4.18V, 4.19V, and 4.08V respectively for Pmn21, Pmnb and P21/n [140]. The Pn polymorph potential was computed in another study and exhibits similar values than Pmn21 [98]. The potential of the four polymorphs
can be assessed to be the same at ±5mV. Therefore, the Mn3+/Mn2+ and Mn4+/Mn3+ potentials
respectively predicted at 4.10V and 4.45V vs. Li+/Li [99] (see Figure 1-17) are considered representative of all the four polymorphs.
Li+ diffusion was investigated in the four Li2MnSiO4 polymorphs [145]–[147], considering the migration pathways displayed in Figure 1-24.
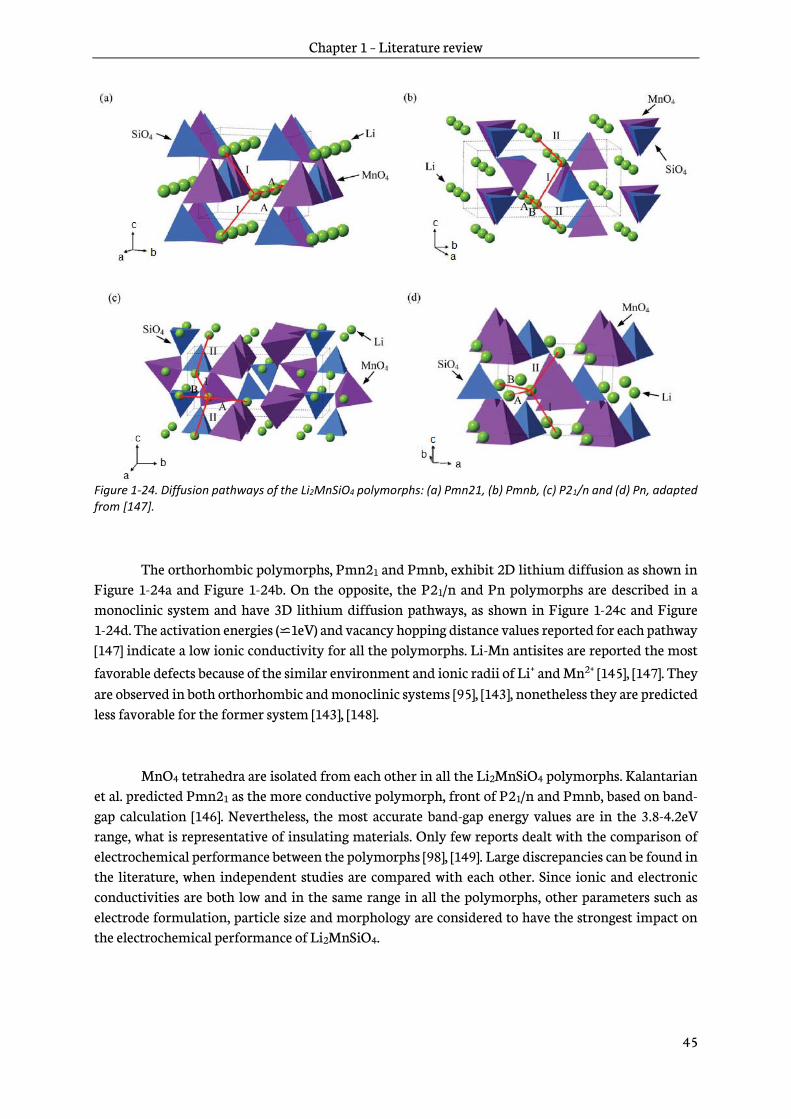
Chapter 1 – Literature review
45
Figure 1-24. Diffusion pathways of the Li2MnSiO4 polymorphs: (a) Pmn21, (b) Pmnb, (c) P21/n and (d) Pn, adapted from [147].
The orthorhombic polymorphs, Pmn21 and Pmnb, exhibit 2D lithium diffusion as shown in Figure 1-24a and Figure 1-24b. On the opposite, the P21/n and Pn polymorphs are described in a monoclinic system and have 3D lithium diffusion pathways, as shown in Figure 1-24c and Figure 1-24d. The activation energies (⋍1eV) and vacancy hopping distance values reported for each pathway [147] indicate a low ionic conductivity for all the polymorphs. Li-Mn antisites are reported the most favorable defects because of the similar environment and ionic radii of Li+ and Mn2+ [145], [147]. They are observed in both orthorhombic and monoclinic systems [95], [143], nonetheless they are predicted less favorable for the former system [143], [148].
MnO4 tetrahedra are isolated from each other in all the Li2MnSiO4 polymorphs. Kalantarian et al. predicted Pmn21 as the more conductive polymorph, front of P21/n and Pmnb, based on band-gap calculation [146]. Nevertheless, the most accurate band-gap energy values are in the 3.8-4.2eV range, what is representative of insulating materials. Only few reports dealt with the comparison of electrochemical performance between the polymorphs [98], [149]. Large discrepancies can be found in the literature, when independent studies are compared with each other. Since ionic and electronic conductivities are both low and in the same range in all the polymorphs, other parameters such as electrode formulation, particle size and morphology are considered to have the strongest impact on the electrochemical performance of Li2MnSiO4.

Chapter 1 – Literature review
46
1.3.6.3 Synthesis strategies
Surface and nano-engineering are proposed to exploit the large theoretical capacity of Li2MnSiO4. Researchers used the same strategies that are beneficial for LiFePO4: nanosizing and coating with a thin layer of conductive carbon [150]. For instance, in the first published study of Li2MnSiO4, Dominko et al. designed a modified Pechini sol–gel process to synthesize 70nm primary particles [95]. Varying the precursor concentration in hydrothermal route enabled the preparation of Li2MnSiO4 particles from 0.6 to 1.7µm [151]. By reducing the particle size by three, the initial discharge capacity measured was twofold. Carbon coating is also widely used to enhance electronic conductivity of Li2MnSiO4. Belharouak et al. highlighted the significant impact of carbon coating on the electrochemical performance of a sub-micrometer material [152], as shown in Figure 1-25.
Figure 1-25. Galvanostatic first cycle of Li2MnSiO4 (a) and Li2MnSiO4/C with 7wt.% of carbon (b), at 10mA.g-1 between 1.5V and 4.8V, adapted from [152].
Discharge capacities of 4mAh.g-1 and 135mAh.g-1 are obtained respectively for Li2MnSiO4 and Li2MnSiO4/C materials, containing 7wt.% of carbon. The carbon coating improves the overall electronic conductivity of the electrode, as illustrated in Figure 1-26. A fast conductive network connects the particles between themselves, what improves the electronic conductivity of the electrode. Finally, lithium ions can be extracted and inserted from a higher number of particles.
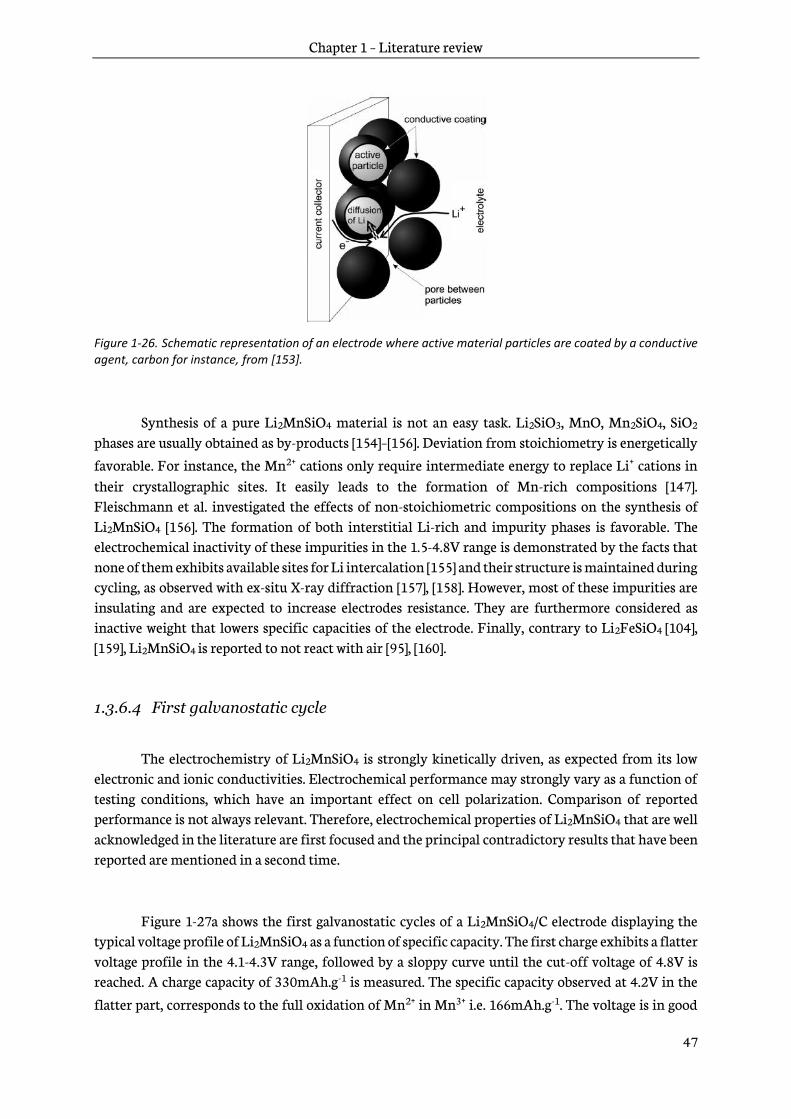
Chapter 1 – Literature review
47
Figure 1-26. Schematic representation of an electrode where active material particles are coated by a conductive agent, carbon for instance, from [153].
Synthesis of a pure Li2MnSiO4 material is not an easy task. Li2SiO3, MnO, Mn2SiO4, SiO2 phases are usually obtained as by-products [154]–[156]. Deviation from stoichiometry is energetically favorable. For instance, the Mn2+ cations only require intermediate energy to replace Li+ cations in their crystallographic sites. It easily leads to the formation of Mn-rich compositions [147]. Fleischmann et al. investigated the effects of non-stoichiometric compositions on the synthesis of Li2MnSiO4 [156]. The formation of both interstitial Li-rich and impurity phases is favorable. The electrochemical inactivity of these impurities in the 1.5-4.8V range is demonstrated by the facts that none of them exhibits available sites for Li intercalation [155] and their structure is maintained during cycling, as observed with ex-situ X-ray diffraction [157], [158]. However, most of these impurities are insulating and are expected to increase electrodes resistance. They are furthermore considered as inactive weight that lowers specific capacities of the electrode. Finally, contrary to Li2FeSiO4 [104], [159], Li2MnSiO4 is reported to not react with air [95], [160].
1.3.6.4 First galvanostatic cycle
The electrochemistry of Li2MnSiO4 is strongly kinetically driven, as expected from its low electronic and ionic conductivities. Electrochemical performance may strongly vary as a function of testing conditions, which have an important effect on cell polarization. Comparison of reported performance is not always relevant. Therefore, electrochemical properties of Li2MnSiO4 that are well acknowledged in the literature are first focused and the principal contradictory results that have been reported are mentioned in a second time.
Figure 1-27a shows the first galvanostatic cycles of a Li2MnSiO4/C electrode displaying the typical voltage profile of Li2MnSiO4 as a function of specific capacity. The first charge exhibits a flatter voltage profile in the 4.1-4.3V range, followed by a sloppy curve until the cut-off voltage of 4.8V is reached. A charge capacity of 330mAh.g-1 is measured. The specific capacity observed at 4.2V in the
flatter part, corresponds to the full oxidation of Mn2+ in Mn3+ i.e. 166mAh.g-1. The voltage is in good

Chapter 1 – Literature review
48
agreement with DFT computation, previously shown in Figure 1-17 [99]. The charge capacity
measured at high voltage can be attributed to both Mn4+/Mn3+ oxidation and electrolyte degradation.
Figure 1-27. Galvanostatic cycles of a Li2MnSiO4/C material between 1.5V and 4.8V at C/50 and room temperature (a), and associated discharge capacity as a function of cycle number (b), adapted from [161].
During the first discharge process, the shape of the galvanostatic curve does not show an almost flat profile, contrary to the first charge. On the opposite, a steep voltage curve is generally observed [94], [118], [154], [162]. The reduction process occurs at a much lower average voltage around 3.5V. Furthermore, the first discharge exhibits a specific capacity of only 185mAh.g-1 compared to 330mAh.g-1 at end of charge. Thus, the irreversible capacity is about 140mAh.g-1. Such a high irreversible capacity can be partly explained only by the irreversible oxidation process of the electrolyte during the first charge. The first discharge capacity evidences a full utilization of the first lithium ion in Li2MnSiO4 i.e. ≥ 166mAh.g-1. Whatever the operating conditions of the first charge, the shape of the discharge curve remains similar [112], [162] and is maintained in the subsequent cycles [163], [164]. After the first cycle, the second oxidation process differs from the first one. The plateau-like charge is no longer observed and the average charge voltage is decreased to around 3.9V vs. Li. Then, the shape of the charge/discharge curves remains similar for the subsequent cycles (see Figure 1-27a). It is also confirmed by cyclic voltammetry (CV) [165]. The change of the shape of the charge/discharge curves is generally attributed to an irreversible structural change. This structural modification was also considered as partly responsible for the large irreversible capacity evidenced in first cycle. A gradual capacity fading was often reported as shown in Figure 1-27b, where 33% of the capacity is lost after 10 cycles. It is generally attributed to the consequences of the irreversibility of the first cycle.
However, opposite results are given in some studies. For instance, Figure 1-28a and Figure 1-28b respectively show the 2nd galvanostatic cycle of Li2MnSiO4/C exhibiting an expected steep voltage profile but almost without capacity fading [149]. The Li2MnSiO4/C composite exhibits a discharge capacity of ca. 250mAh.g-1 for 30 cycles, with a capacity retention of 90% . Other papers
(a) (b)

Chapter 1 – Literature review
49
reported a similar cycling behavior [132], [166]–[174]. A series of hypotheses from the review of the mentioned studies is listed here. In some cases, capacity retention was imputed to the unique morphology of Li2MnSiO4/C showing at least one dimension at the nanoscale [168], [173], [174]. The small size of primary particles was reported to exhibit electrochemical and structural stabilities [132], [170], [171], [173]. Controlled lithium extraction was also reported to show good promises [132], [170]. Finally, protection of graphene or reduced graphene oxide [169], [171]–[173] and buffering effect of in-situ carbon network [132], [149], [166], [169], [170], [173] were also reported as potential solutions to mitigate the capacity fading.
Figure 1-28. Second galvanostatic cycle of a Li2MnSiO4/C electrode between 1.5V and 4.8V at C/10 (a) and the associated reversible discharge capacity behavior as function of cycle number (b), adapted from [149].
1.3.6.5 Mechanisms of charge/discharge
The mechanisms of charge and discharge of Li2MnSiO4 were particularly studied by following the oxidation state of manganese upon cycling. Ex-situ XPS was performed on Li2MnSiO4/C electrodes
charged to 4.8V vs. Li+/Li. Two research teams reported the observation of Mn4+ cations based on the fitting of Mn2p core peaks [157], [175], [176]. Mn3s core spectra were also used to estimate the oxidation state of manganese. Mn3s splitting enables an estimation of manganese oxidation state with a formula disclosed by Świętosławski et al. based on the difference of binding energy between the two split peaks [177]. An overall oxidation state of +3 was determined by XPS while a specific capacity of 331mAh.g-1 equivalent to full formation of Mn4+ was measured. After discharge, other XPS analyses showed that a part of manganese cations remains in the +3 state highlighting an irreversible electrochemical process [157], [175]–[177] as illustrated in Figure 1-29 [176].
(a) (b)
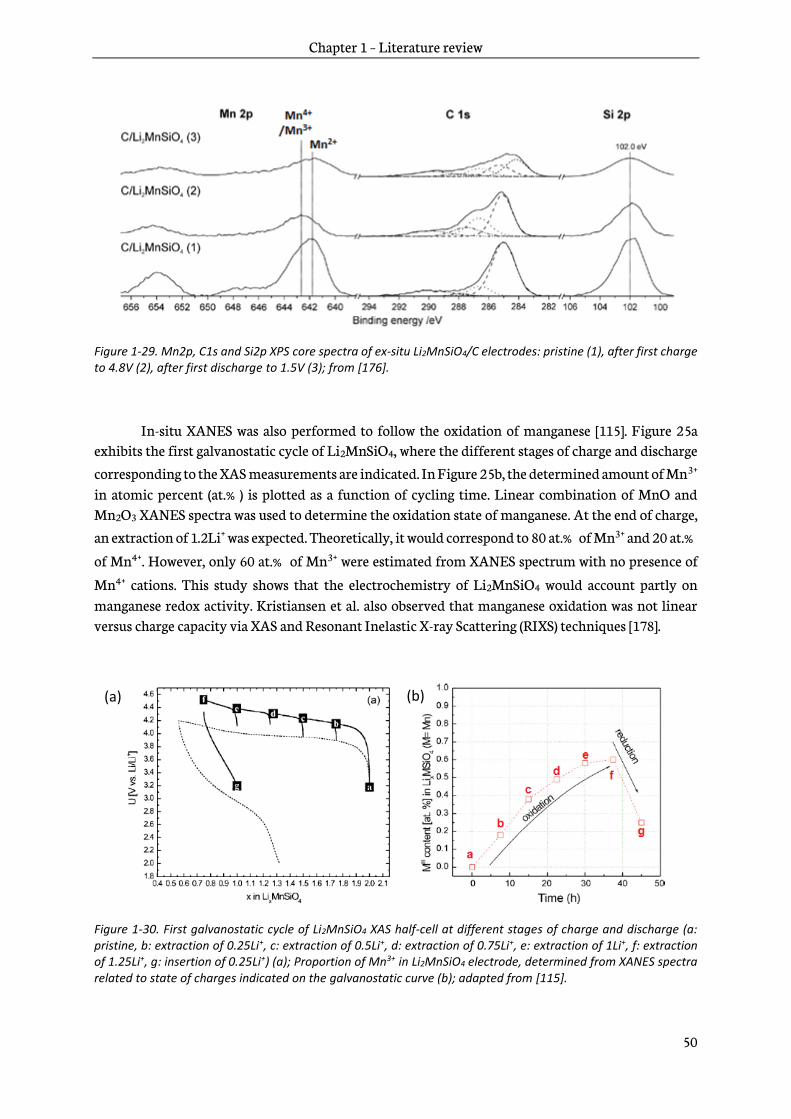
Chapter 1 – Literature review
50
Figure 1-29. Mn2p, C1s and Si2p XPS core spectra of ex-situ Li2MnSiO4/C electrodes: pristine (1), after first charge to 4.8V (2), after first discharge to 1.5V (3); from [176].
In-situ XANES was also performed to follow the oxidation of manganese [115]. Figure 25a exhibits the first galvanostatic cycle of Li2MnSiO4, where the different stages of charge and discharge
corresponding to the XAS measurements are indicated. In Figure 25b, the determined amount of Mn3+ in atomic percent (at.% ) is plotted as a function of cycling time. Linear combination of MnO and Mn2O3 XANES spectra was used to determine the oxidation state of manganese. At the end of charge, an extraction of 1.2Li+ was expected. Theoretically, it would correspond to 80 at.% of Mn3+ and 20 at.%
of Mn4+. However, only 60 at.% of Mn3+ were estimated from XANES spectrum with no presence of
Mn4+ cations. This study shows that the electrochemistry of Li2MnSiO4 would account partly on manganese redox activity. Kristiansen et al. also observed that manganese oxidation was not linear versus charge capacity via XAS and Resonant Inelastic X-ray Scattering (RIXS) techniques [178].
Figure 1-30. First galvanostatic cycle of Li2MnSiO4 XAS half-cell at different stages of charge and discharge (a: pristine, b: extraction of 0.25Li+, c: extraction of 0.5Li+, d: extraction of 0.75Li+, e: extraction of 1Li+, f: extraction of 1.25Li+, g: insertion of 0.25Li+) (a); Proportion of Mn3+ in Li2MnSiO4 electrode, determined from XANES spectra related to state of charges indicated on the galvanostatic curve (b); adapted from [115].
(a) (b)
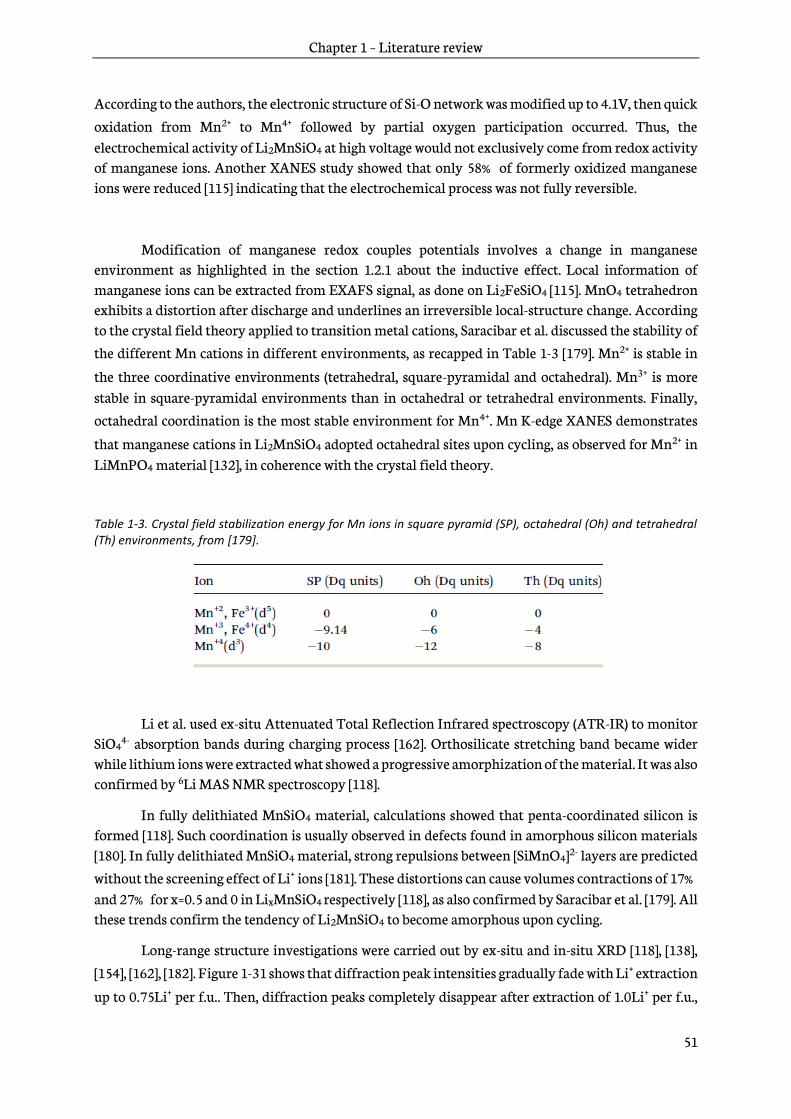
Chapter 1 – Literature review
51
According to the authors, the electronic structure of Si-O network was modified up to 4.1V, then quick
oxidation from Mn2+ to Mn4+ followed by partial oxygen participation occurred. Thus, the electrochemical activity of Li2MnSiO4 at high voltage would not exclusively come from redox activity of manganese ions. Another XANES study showed that only 58% of formerly oxidized manganese ions were reduced [115] indicating that the electrochemical process was not fully reversible.
Modification of manganese redox couples potentials involves a change in manganese environment as highlighted in the section 1.2.1 about the inductive effect. Local information of manganese ions can be extracted from EXAFS signal, as done on Li2FeSiO4 [115]. MnO4 tetrahedron exhibits a distortion after discharge and underlines an irreversible local-structure change. According to the crystal field theory applied to transition metal cations, Saracibar et al. discussed the stability of the different Mn cations in different environments, as recapped in Table 1-3 [179]. Mn2+ is stable in
the three coordinative environments (tetrahedral, square-pyramidal and octahedral). Mn3+ is more stable in square-pyramidal environments than in octahedral or tetrahedral environments. Finally, octahedral coordination is the most stable environment for Mn4+. Mn K-edge XANES demonstrates
that manganese cations in Li2MnSiO4 adopted octahedral sites upon cycling, as observed for Mn2+ in LiMnPO4 material [132], in coherence with the crystal field theory.
Table 1-3. Crystal field stabilization energy for Mn ions in square pyramid (SP), octahedral (Oh) and tetrahedral (Th) environments, from [179].
Li et al. used ex-situ Attenuated Total Reflection Infrared spectroscopy (ATR-IR) to monitor SiO4
4- absorption bands during charging process [162]. Orthosilicate stretching band became wider while lithium ions were extracted what showed a progressive amorphization of the material. It was also confirmed by 6Li MAS NMR spectroscopy [118].
In fully delithiated MnSiO4 material, calculations showed that penta-coordinated silicon is formed [118]. Such coordination is usually observed in defects found in amorphous silicon materials [180]. In fully delithiated MnSiO4 material, strong repulsions between [SiMnO4]2- layers are predicted
without the screening effect of Li+ ions [181]. These distortions can cause volumes contractions of 17% and 27% for x=0.5 and 0 in LixMnSiO4 respectively [118], as also confirmed by Saracibar et al. [179]. All these trends confirm the tendency of Li2MnSiO4 to become amorphous upon cycling.
Long-range structure investigations were carried out by ex-situ and in-situ XRD [118], [138],
[154], [162], [182]. Figure 1-31 shows that diffraction peak intensities gradually fade with Li+ extraction
up to 0.75Li+ per f.u.. Then, diffraction peaks completely disappear after extraction of 1.0Li+ per f.u.,
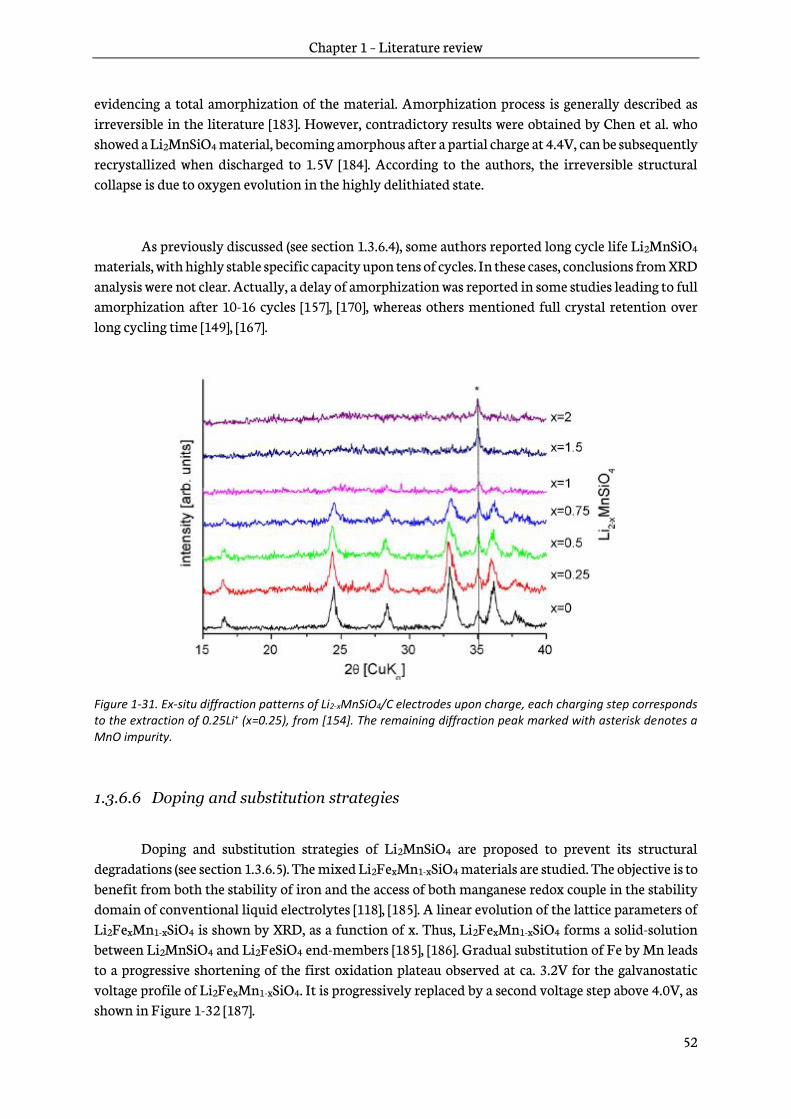
Chapter 1 – Literature review
52
evidencing a total amorphization of the material. Amorphization process is generally described as irreversible in the literature [183]. However, contradictory results were obtained by Chen et al. who showed a Li2MnSiO4 material, becoming amorphous after a partial charge at 4.4V, can be subsequently recrystallized when discharged to 1.5V [184]. According to the authors, the irreversible structural collapse is due to oxygen evolution in the highly delithiated state.
As previously discussed (see section 1.3.6.4), some authors reported long cycle life Li2MnSiO4 materials, with highly stable specific capacity upon tens of cycles. In these cases, conclusions from XRD analysis were not clear. Actually, a delay of amorphization was reported in some studies leading to full amorphization after 10-16 cycles [157], [170], whereas others mentioned full crystal retention over long cycling time [149], [167].
Figure 1-31. Ex-situ diffraction patterns of Li2-xMnSiO4/C electrodes upon charge, each charging step corresponds to the extraction of 0.25Li+ (x=0.25), from [154]. The remaining diffraction peak marked with asterisk denotes a MnO impurity.
1.3.6.6 Doping and substitution strategies
Doping and substitution strategies of Li2MnSiO4 are proposed to prevent its structural degradations (see section 1.3.6.5). The mixed Li2FexMn1-xSiO4 materials are studied. The objective is to benefit from both the stability of iron and the access of both manganese redox couple in the stability domain of conventional liquid electrolytes [118], [185]. A linear evolution of the lattice parameters of Li2FexMn1-xSiO4 is shown by XRD, as a function of x. Thus, Li2FexMn1-xSiO4 forms a solid-solution between Li2MnSiO4 and Li2FeSiO4 end-members [185], [186]. Gradual substitution of Fe by Mn leads to a progressive shortening of the first oxidation plateau observed at ca. 3.2V for the galvanostatic voltage profile of Li2FexMn1-xSiO4. It is progressively replaced by a second voltage step above 4.0V, as shown in Figure 1-32 [187].

Chapter 1 – Literature review
53
High iron-content Li2Fe0.8Mn0.2SiO4 adopting a P21/n space group, transforms into an inverse-β II polymorph after the first charge, as it has been observed in Li2FeSiO4 [138]. A material with a higher content of manganese, Li2Fe0.5Mn0.5SiO4, becomes amorphous at the end of the first charge, as it is usually observed for Li2MnSiO4 [154].
Figure 1-32. Firsts galvanostatic cycles of Li2Fe1-yMnySiO4/C (y=0, 0.2, 0.5, 1), from [138]. The indications on the curves correspond to ex-situ experiments that are not described here.
In terms of cycling ability, Li2FexMn1-xSiO4 is more stable than Li2MnSiO4 [112], [138], [187]. Local environments of both Fe and Mn have been probed by XAS. In all investigations, reversibility of manganese was shown to be partial while that of iron is fully reversible [138], [188], [189]. As in Li2MnSiO4, manganese ions cannot recover their original oxidation state and their coordinative environment becomes distorted upon cycling. Chen et al. observed that Mn ions contributed to electrochemical process in the first cycles, while Fe ions took over this role in the subsequent cycles [138].
Many other substitution and doping strategies were proposed for Li2MnSiO4 and are listed in Table 1-4, excluding the binary Li2FexMn1-xSiO4 previously mentioned. One of the main strategies is
the addition of electrochemically inactive cations in the structure, such as Ti4+, Mg2+ and Al3+. They were employed as structural pillars to strengthen the Li2MnSiO4 framework as they can be considered as structural pillars. However, the stabilization of the structure has not been demonstrated yet by any of these strategies. Some improvements compared to the raw material were reported, but their origin appears still not fully understood.
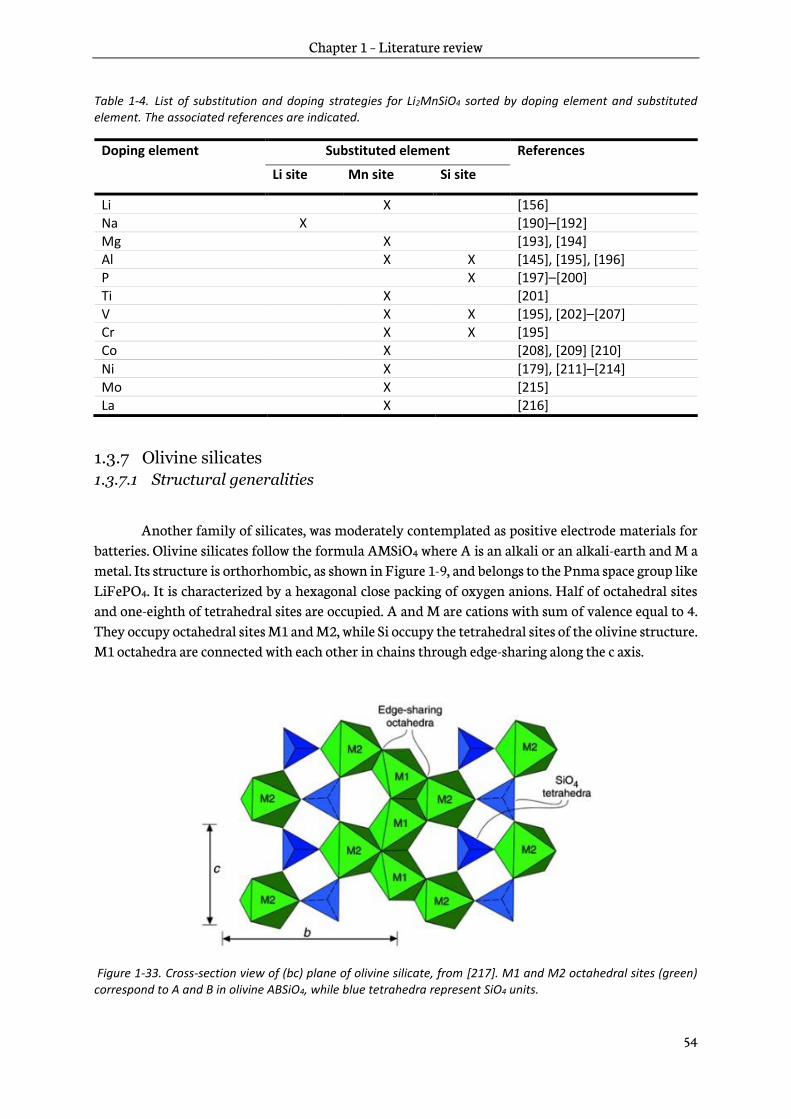
Chapter 1 – Literature review
54
Table 1-4. List of substitution and doping strategies for Li2MnSiO4 sorted by doping element and substituted element. The associated references are indicated.
Doping element Substituted element References
Li site Mn site Si site
Li X [156] Na X [190]–[192] Mg X [193], [194] Al X X [145], [195], [196] P X [197]–[200] Ti X [201] V X X [195], [202]–[207] Cr X X [195] Co X [208], [209] [210]
Ni X [179], [211]–[214] Mo X [215] La X [216]
1.3.7 Olivine silicates
1.3.7.1 Structural generalities
Another family of silicates, was moderately contemplated as positive electrode materials for batteries. Olivine silicates follow the formula AMSiO4 where A is an alkali or an alkali-earth and M a metal. Its structure is orthorhombic, as shown in Figure 1-9, and belongs to the Pnma space group like LiFePO4. It is characterized by a hexagonal close packing of oxygen anions. Half of octahedral sites and one-eighth of tetrahedral sites are occupied. A and M are cations with sum of valence equal to 4. They occupy octahedral sites M1 and M2, while Si occupy the tetrahedral sites of the olivine structure. M1 octahedra are connected with each other in chains through edge-sharing along the c axis.
Figure 1-33. Cross-section view of (bc) plane of olivine silicate, from [217]. M1 and M2 octahedral sites (green) correspond to A and B in olivine ABSiO4, while blue tetrahedra represent SiO4 units.
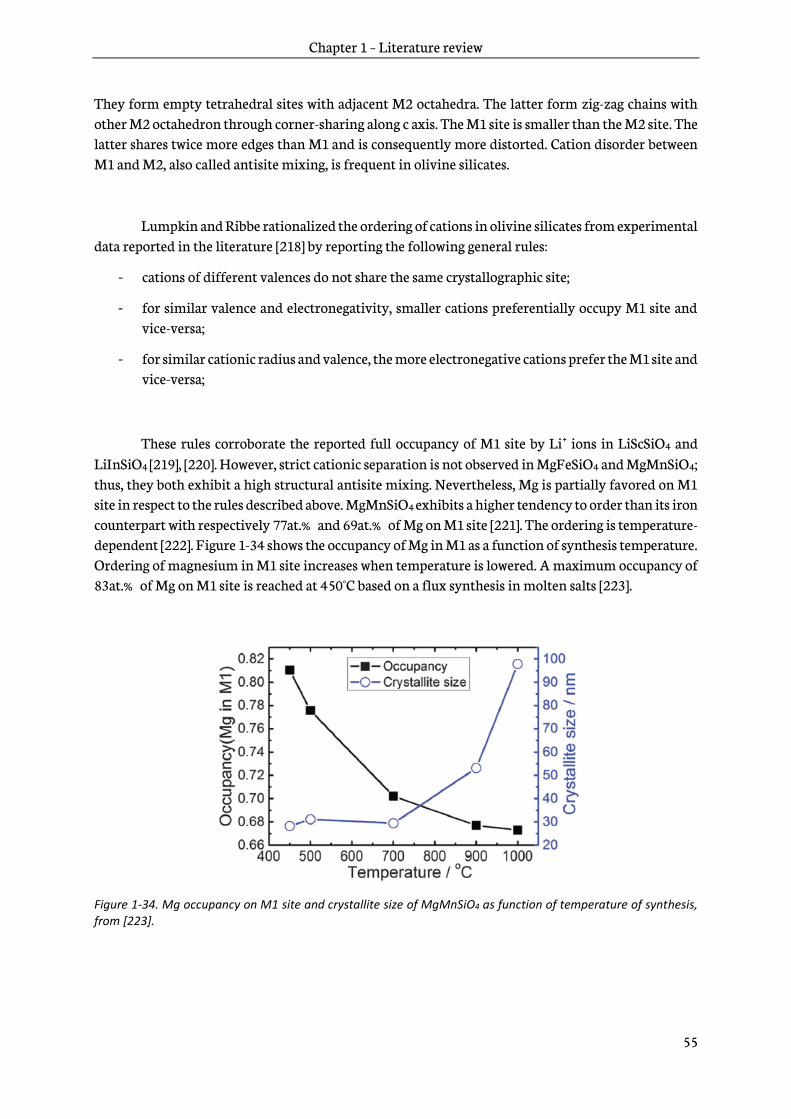
Chapter 1 – Literature review
55
They form empty tetrahedral sites with adjacent M2 octahedra. The latter form zig-zag chains with other M2 octahedron through corner-sharing along c axis. The M1 site is smaller than the M2 site. The latter shares twice more edges than M1 and is consequently more distorted. Cation disorder between M1 and M2, also called antisite mixing, is frequent in olivine silicates.
Lumpkin and Ribbe rationalized the ordering of cations in olivine silicates from experimental data reported in the literature [218] by reporting the following general rules:
- cations of different valences do not share the same crystallographic site;
- for similar valence and electronegativity, smaller cations preferentially occupy M1 site and vice-versa;
- for similar cationic radius and valence, the more electronegative cations prefer the M1 site and vice-versa;
These rules corroborate the reported full occupancy of M1 site by Li+ ions in LiScSiO4 and LiInSiO4 [219], [220]. However, strict cationic separation is not observed in MgFeSiO4 and MgMnSiO4; thus, they both exhibit a high structural antisite mixing. Nevertheless, Mg is partially favored on M1 site in respect to the rules described above. MgMnSiO4 exhibits a higher tendency to order than its iron counterpart with respectively 77at.% and 69at.% of Mg on M1 site [221]. The ordering is temperature-dependent [222]. Figure 1-34 shows the occupancy of Mg in M1 as a function of synthesis temperature. Ordering of magnesium in M1 site increases when temperature is lowered. A maximum occupancy of 83at.% of Mg on M1 site is reached at 450°C based on a flux synthesis in molten salts [223].
Figure 1-34. Mg occupancy on M1 site and crystallite size of MgMnSiO4 as function of temperature of synthesis, from [223].
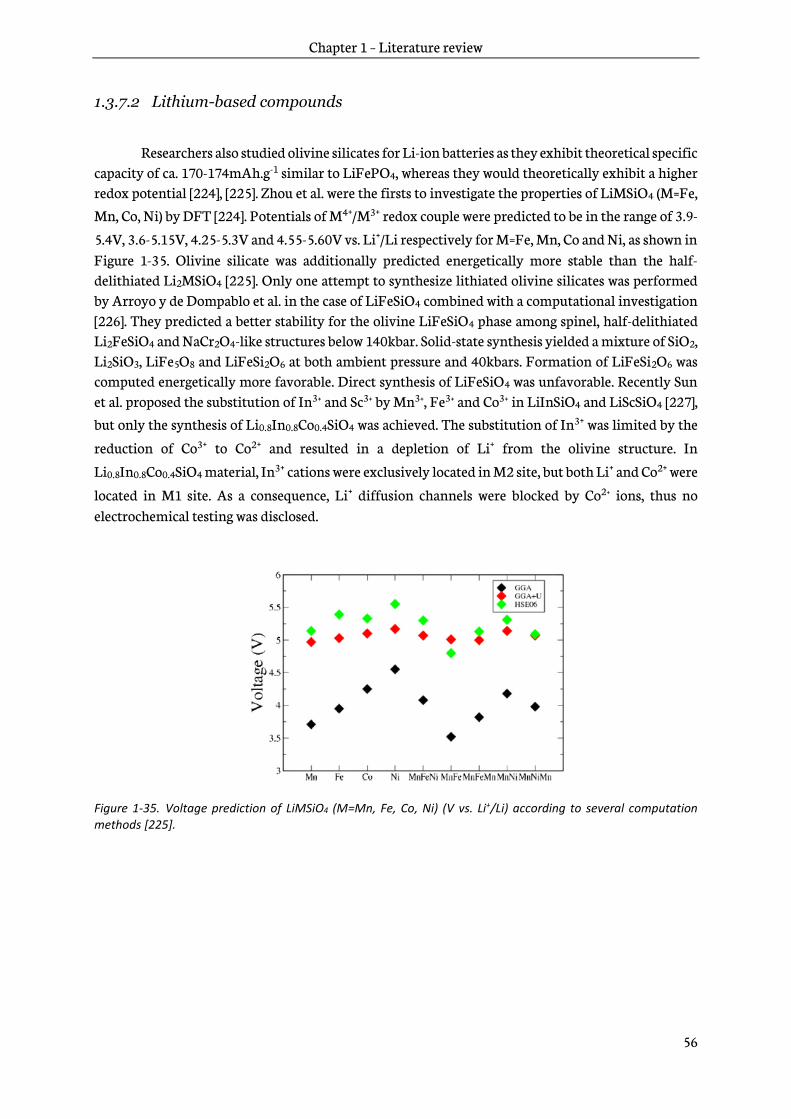
Chapter 1 – Literature review
56
1.3.7.2 Lithium-based compounds
Researchers also studied olivine silicates for Li-ion batteries as they exhibit theoretical specific capacity of ca. 170-174mAh.g-1 similar to LiFePO4, whereas they would theoretically exhibit a higher redox potential [224], [225]. Zhou et al. were the firsts to investigate the properties of LiMSiO4 (M=Fe,
Mn, Co, Ni) by DFT [224]. Potentials of M4+/M3+ redox couple were predicted to be in the range of 3.9-
5.4V, 3.6-5.15V, 4.25-5.3V and 4.55-5.60V vs. Li+/Li respectively for M=Fe, Mn, Co and Ni, as shown in Figure 1-35. Olivine silicate was additionally predicted energetically more stable than the half-delithiated Li2MSiO4 [225]. Only one attempt to synthesize lithiated olivine silicates was performed by Arroyo y de Dompablo et al. in the case of LiFeSiO4 combined with a computational investigation [226]. They predicted a better stability for the olivine LiFeSiO4 phase among spinel, half-delithiated Li2FeSiO4 and NaCr2O4-like structures below 140kbar. Solid-state synthesis yielded a mixture of SiO2, Li2SiO3, LiFe5O8 and LiFeSi2O6 at both ambient pressure and 40kbars. Formation of LiFeSi2O6 was computed energetically more favorable. Direct synthesis of LiFeSiO4 was unfavorable. Recently Sun et al. proposed the substitution of In3+ and Sc3+ by Mn3+, Fe3+ and Co3+ in LiInSiO4 and LiScSiO4 [227], but only the synthesis of Li0.8In0.8Co0.4SiO4 was achieved. The substitution of In3+ was limited by the
reduction of Co3+ to Co2+ and resulted in a depletion of Li+ from the olivine structure. In
Li0.8In0.8Co0.4SiO4 material, In3+ cations were exclusively located in M2 site, but both Li+ and Co2+ were
located in M1 site. As a consequence, Li+ diffusion channels were blocked by Co2+ ions, thus no electrochemical testing was disclosed.
Figure 1-35. Voltage prediction of LiMSiO4 (M=Mn, Fe, Co, Ni) (V vs. Li+/Li) according to several computation methods [225].
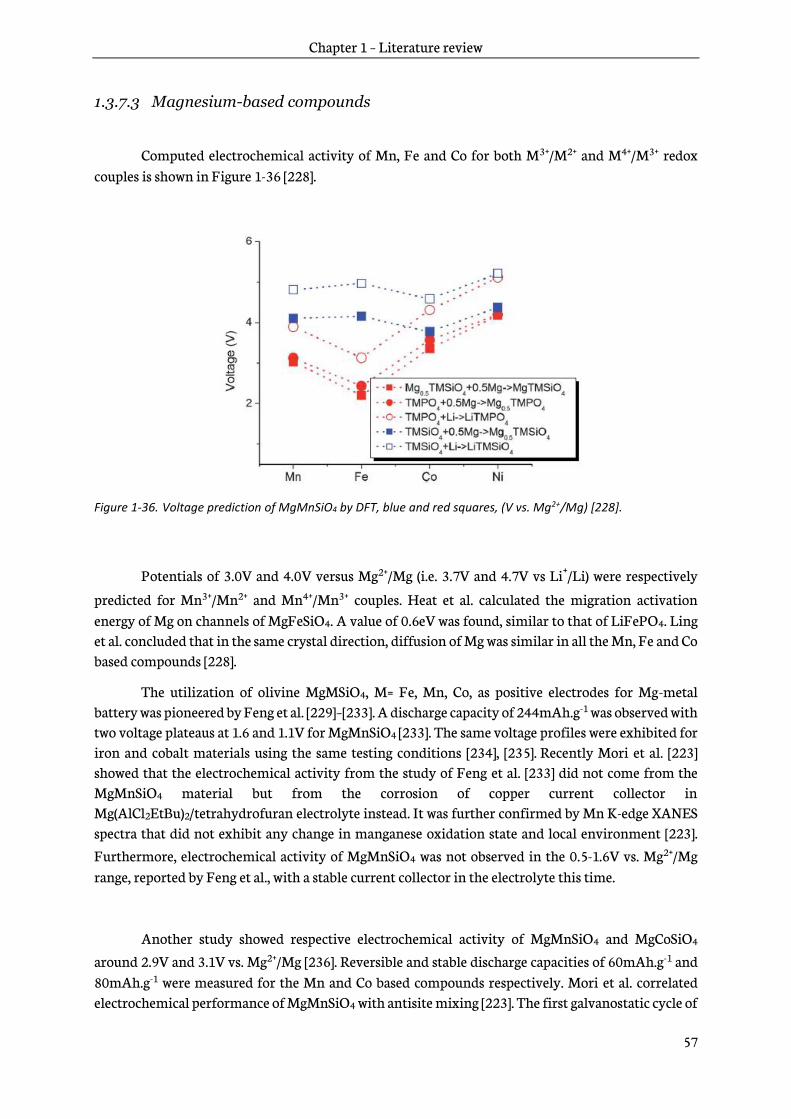
Chapter 1 – Literature review
57
1.3.7.3 Magnesium-based compounds
Computed electrochemical activity of Mn, Fe and Co for both M3+/M2+ and M4+/M3+ redox couples is shown in Figure 1-36 [228].
Figure 1-36. Voltage prediction of MgMnSiO4 by DFT, blue and red squares, (V vs. Mg2+/Mg) [228].
Potentials of 3.0V and 4.0V versus Mg2+/Mg (i.e. 3.7V and 4.7V vs Li+/Li) were respectively
predicted for Mn3+/Mn2+ and Mn4+/Mn3+ couples. Heat et al. calculated the migration activation energy of Mg on channels of MgFeSiO4. A value of 0.6eV was found, similar to that of LiFePO4. Ling et al. concluded that in the same crystal direction, diffusion of Mg was similar in all the Mn, Fe and Co based compounds [228].
The utilization of olivine MgMSiO4, M= Fe, Mn, Co, as positive electrodes for Mg-metal battery was pioneered by Feng et al. [229]–[233]. A discharge capacity of 244mAh.g-1 was observed with two voltage plateaus at 1.6 and 1.1V for MgMnSiO4 [233]. The same voltage profiles were exhibited for iron and cobalt materials using the same testing conditions [234], [235]. Recently Mori et al. [223] showed that the electrochemical activity from the study of Feng et al. [233] did not come from the MgMnSiO4 material but from the corrosion of copper current collector in Mg(AlCl2EtBu)2/tetrahydrofuran electrolyte instead. It was further confirmed by Mn K-edge XANES spectra that did not exhibit any change in manganese oxidation state and local environment [223]. Furthermore, electrochemical activity of MgMnSiO4 was not observed in the 0.5-1.6V vs. Mg2+/Mg range, reported by Feng et al., with a stable current collector in the electrolyte this time.
Another study showed respective electrochemical activity of MgMnSiO4 and MgCoSiO4
around 2.9V and 3.1V vs. Mg2+/Mg [236]. Reversible and stable discharge capacities of 60mAh.g-1 and 80mAh.g-1 were measured for the Mn and Co based compounds respectively. Mori et al. correlated electrochemical performance of MgMnSiO4 with antisite mixing [223]. The first galvanostatic cycle of

Chapter 1 – Literature review
58
MgMnSiO4 materials synthesized at different temperatures to obtain different antisite contents in the
material is shown on Figure 1-37. Mg2+ insertion capacities of 111mAh.g-1, 23mAh.g-1 and 5mAh.g-1 are respectively measured at 450°C, 700°C and 1000°C, respectively corresponding to antisite mixing of 19% , 30% and 33% . It evidences that diffusion of Mg is promoted when less Mn ions are located on M1 sites. XANES spectra of Mg1-xMnSiO4 evidenced the reversible oxidation/reduction of manganese ions through the shift of the absorption-edge energy. In the same study, the lattice parameters of the structure changed upon cycling demonstrating a single-phase behavior from ex-situ diffraction data.
Figure 1-37. Galvanostatic first charge and first discharge of MgMnSiO4 material synthesized at different temperatures, 1000°C (black), 700°C (red) and 450°C (blue), from [223].
Truong et al. observed a reversible oxidation/reduction process of manganese ions and they associated demagnesiation/magnesiation of MgMnSiO4/C by XPS studies [236]. However, some discrepancies between these results and electrochemical performance were not explained. Furthermore, the authors assessed that only the surface is electrochemically active.
1.4 Discussions and conclusion
The utilization of both Li2NiSiO4 and Li2CoSiO4 is impossible because of their high redox potentials lying above 4.4V.
The first drawback of Li2FeSiO4 is being reactive to air. Furthermore, the synthesis of pure polymorph is difficult. All the polymorphs exhibit a gradual transition toward an inverse-β II Pmn21 structure and a concomitant decrease of the average voltage from 3.1V to 2.8V upon cycling. Several
studies reported full utilization of Fe3+/Fe2+ redox couple through discharge capacities above
166mAh.g-1. The scientific community disagrees on the Fe4+/Fe3+ transition in Li2FeSiO4. In some studies, participation of oxygen in the electrochemical process is even suggested instead [113], [116], [121], [139]. Consequently, Li2FeSiO4 is not considered here as a promising candidate to surpass LiFePO4 performance and thus is not worth investigating.

Chapter 1 – Literature review
59
The extraction of first and second Li+ ions in Li2MnSiO4 are calculated to occur at 4.1V and
4.45V. vs. Li+/Li [99]. They are compatible with the stability window of most of the conventional liquid electrolytes. The four polymorphs exhibit similar electrochemical properties. Their electronic conductivity is quite low (5x10⁻¹⁶S.cm−1) [112], [146]. Therefore, the morphology i.e. the synthesis routes are considered to have a stronger impact than structure on electrochemical performance. Meanwhile, Pmn21 seems a reasonable object of study because of it easier preparation and lower crystallization temperature. Downsizing particles to the nano-size and carbon-coating are efficient ways to exacerbate Li2MnSiO4 electrochemical properties. Furthermore, reactivity of Li2MnSiO4 to air has not been reported so far, contrary to Li2FeSiO4.
Li2MnSiO4 exhibits a structural transition during its first charge, as observed for Li2FeSiO4
[120]. However, it involves an amorphization process [154] that is irreversible [115]. A gradual capacity fading is generally observed. The main origin of amorphization comes from the instability of Mn ions at +3 and +4 states in tetrahedral environment. The octahedral coordination is the most stable for Mn3+
and Mn4+ considering the crystal field theory [179]. Deep delithiation i.e. Li2MnSiO4 oxidation involves strong manganese distortion that leads to volume expansion and amorphization. Nevertheless, some studies claimed that amorphization observed during charge of the material is reversible upon discharge and resulted in stable electrochemical performance [132], [166]–[174].
Researchers attempted the stabilization of Li2MnSiO4 structure by different substitution strategies. The solid solution Li2FexMn1-xSiO4 actually exhibit drawbacks of both manganese and iron
parent compounds, amorphization of the material and utilization of Fe3+/Fe2+ low redox potential.
Substitution of manganese by pillar ions like Mg2+, Al3+ and Ti4+ was proposed [145], [193]–[196], [201]. However, none of the studies evidenced the stabilization of Li2MnSiO4 structure during cycling.
Li2MnSiO4 shows better promises than Li2FeSiO4, especially looking toward the reports that claimed capacity retention. Furthermore, still new substitution/doping strategies can be attempted to stabilize Li2MnSiO4 structure.
The olivine silicates AMSiO4, A as alkali or alkali-earth and M transition metal, exhibit an octahedral environment for metallic cations. These structures are well-known minerals and are prone to antisite mixing between A and M. Only lithium-based compounds for which transition metal does not exhibit electrochemical activity for batteries have been reported, such as LiScSiO4, LiInSiO4 and LiYSiO4 [219], [220], [237]. Attempts to synthesize redox active cobalt and iron based lithium olivine silicates for batteries failed [226], [227]. Nevertheless, LiMSiO4 material exhibit theoretical specific capacity and computed redox voltage of ⋍170mAh.g-1 and 4.0-5.0V respectively that make them promising if a synthesis route is found.
Magnesium-based olivine silicates have been investigated for the purpose of positive electrode materials for magnesium batteries. MgMnSiO4 is the most studied compound. Its electrochemical performance has been correlated with antisite mixing [223]. The lowering of synthesis temperature to 450°C enabled the reduction of antisite mixing to 19at.% and an improvement of electrochemical performance. However, the mechanism of insertion of magnesium and associated electrochemical activity in this compound have not been fully characterized and fully understood [223], [236]. Substituting Mg2+ by Li+ in MgMnSiO4 could open the possibility to prepare LiMnSiO4.

Chapter 1 – Literature review
60
To conclude, manganese-based silicates, Li2MnSiO4 and LiMnSiO4, offer theoretically good prospects to surpass LiFePO4 in terms of electrochemical performance. Furthermore, they are both based on abundant and environmental-friendly silicon and manganese elements. Nevertheless, some bottlenecks are still unresolved before considering a practical application and are the focus of the next chapters.

61

62
Chapter 2 – Experimental techniques
63
Chapter 2 – Experimental techniques
Chapter 2 – Experimental techniques ................................................................................... 63
2.1 Sol-gel process ................................................................................................................................................ 64
2.2 X-Ray diffraction .......................................................................................................................................... 68
2.3 X-ray Photoelectron Spectroscopy .......................................................................................................... 70
2.4 Other techniques ............................................................................................................................................ 71
2.5 Electrochemical characterization techniques ..................................................................................... 73
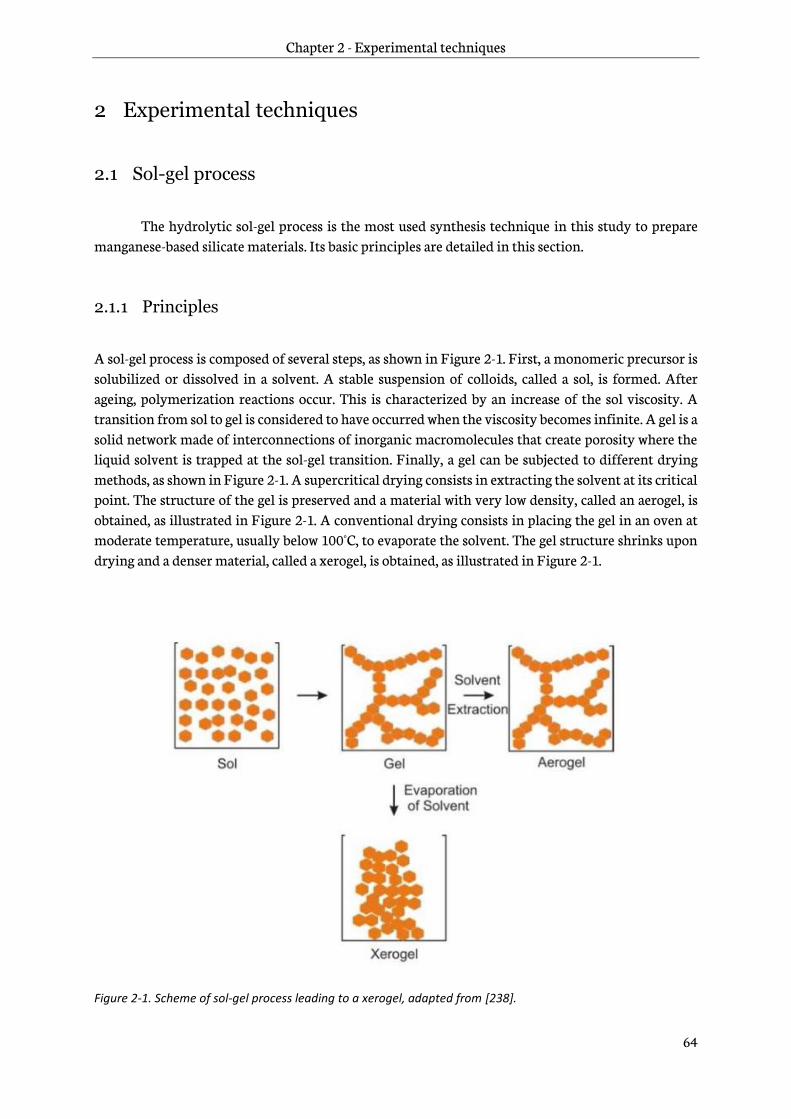
Chapter 2 - Experimental techniques
64
2 Experimental techniques
2.1 Sol-gel process
The hydrolytic sol-gel process is the most used synthesis technique in this study to prepare manganese-based silicate materials. Its basic principles are detailed in this section.
2.1.1 Principles
A sol-gel process is composed of several steps, as shown in Figure 2-1. First, a monomeric precursor is solubilized or dissolved in a solvent. A stable suspension of colloids, called a sol, is formed. After ageing, polymerization reactions occur. This is characterized by an increase of the sol viscosity. A transition from sol to gel is considered to have occurred when the viscosity becomes infinite. A gel is a solid network made of interconnections of inorganic macromolecules that create porosity where the liquid solvent is trapped at the sol-gel transition. Finally, a gel can be subjected to different drying methods, as shown in Figure 2-1. A supercritical drying consists in extracting the solvent at its critical point. The structure of the gel is preserved and a material with very low density, called an aerogel, is obtained, as illustrated in Figure 2-1. A conventional drying consists in placing the gel in an oven at moderate temperature, usually below 100°C, to evaporate the solvent. The gel structure shrinks upon drying and a denser material, called a xerogel, is obtained, as illustrated in Figure 2-1.
Figure 2-1. Scheme of sol-gel process leading to a xerogel, adapted from [238].
Chapter 2 - Experimental techniques
65
2.1.2 Sol-gel reactions
The precursors in the hydrolytic sol-gel process are metal-organic compounds. They exhibit metal-oxygen bonds, M-O. The chemical process from a sol to a gel occurs in two main steps called hydrolysis and condensation reactions, as shown in Reaction 2-1 and Reaction 2-2 respectively.
Reaction 2-1. Hydrolysis reaction of a M(OR)n precursor, with M a metallic element and R a ligand.
𝑀(𝑂𝑅)𝑛 + 𝐻2𝑂 ⇌ 𝑀(𝑂𝑅)𝑛−1(𝑂𝐻) + 𝑅𝑂𝐻
Reaction 2-2. Alcohol (a) and water (b) condensation also called alcoxolation and oxolation respectively.
𝑀(𝑂𝑅)𝑛−1(𝑂𝐻) + 𝑀′(𝑂𝑅′)𝑚 ⇌ 𝑀(𝑂𝑅)𝑛−1𝑂𝑀′(𝑂𝑅′)𝑚−1 + 𝑅′𝑂𝐻 (a)
M(𝑂𝑅)𝑛−1(𝑂𝐻) + 𝑀"(𝑂𝑅")𝑝−1(𝑂𝐻) ⇌ 𝑀(𝑂𝑅)𝑛−1𝑂𝑀(𝑂𝑅")𝑝−1 + 𝐻2𝑂 (b)
The hydrolysis consists in the reaction of the metalorganic precursor, M(OR)n, with H2O. The alkoxy group, -OR, is replaced by a hydroxyl group, -OH, and an alcohol is formed as a by-product.
They are two types of condensation reactions. They require both the participation of hydrolyzed groups, -OH. An alcoxolation reaction occurs between a metalorganic precursor M’(OR’)m and a partially hydrolyzed precursor M(OR)n-1(OH). An oxo bridge, M-O-M’ is formed and an alcohol, R’OH, is released, as shown in Reaction 2-2a. The second condensation mechanism, called olation, involves two partially hydrolyzed metalorganic precursors, M(OR)n-1(OH) and M” (OR” )p-1(OH). Their reaction releases H2O, through the formation of a metal-oxygen-metal bonds as shown in Reaction 2-2b. Inorganic monomers are produced in the polycondensation reaction, combining alcoxolation and oxolation mechanisms. Progressively, an inorganic polymer is formed from cumulative polycondensation reactions.
2.1.3 Sol-gel precursors
Several families of metalorganic precursors can be used to prepare gels. They are discriminated by their ligand OR. The most used one is the alkoxide family M(OR)n, where R is an alkyl group. In this study, the silicon alkoxides, Si(OR)n are of interest. As silicon is slightly electropositive. The hydrolysis and condensation kinetics of silicon alkoxides are slower than those of the other metal alkoxides that are more electropositive. Silicon alkoxide’s reactions require consequently a control by tuning the experimental conditions. They are also less reactive to moisture, thus they can be easily handled in ambient atmosphere.
The most known silicon alkoxide is the tetraethoxysilane, also called TEOS. Its formula is Si(OC2H5)4, where the alkyl group is an ethyl. Its chemistry has been extensively studied [239], [240]. Therefore, it is used as a model of silicon precursor in the hydrolytic sol-gel process.
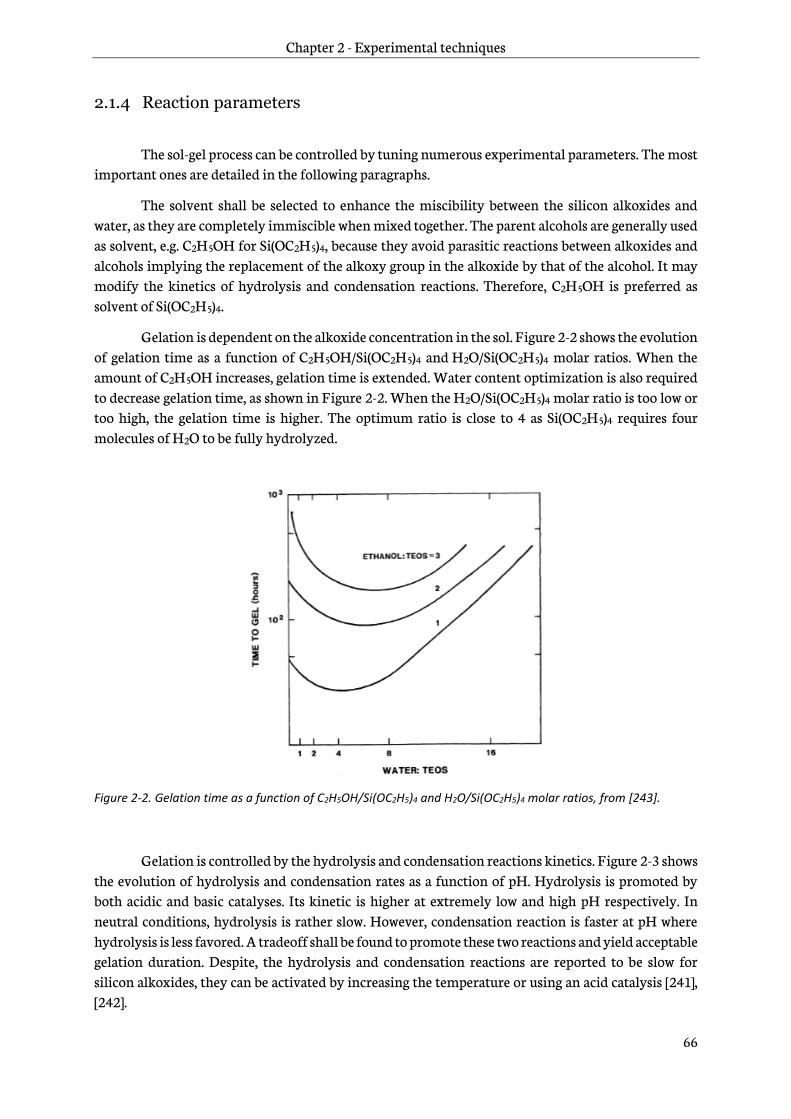
Chapter 2 - Experimental techniques
66
2.1.4 Reaction parameters
The sol-gel process can be controlled by tuning numerous experimental parameters. The most important ones are detailed in the following paragraphs.
The solvent shall be selected to enhance the miscibility between the silicon alkoxides and water, as they are completely immiscible when mixed together. The parent alcohols are generally used as solvent, e.g. C2H5OH for Si(OC2H5)4, because they avoid parasitic reactions between alkoxides and alcohols implying the replacement of the alkoxy group in the alkoxide by that of the alcohol. It may modify the kinetics of hydrolysis and condensation reactions. Therefore, C2H5OH is preferred as solvent of Si(OC2H5)4.
Gelation is dependent on the alkoxide concentration in the sol. Figure 2-2 shows the evolution of gelation time as a function of C2H5OH/Si(OC2H5)4 and H2O/Si(OC2H5)4 molar ratios. When the amount of C2H5OH increases, gelation time is extended. Water content optimization is also required to decrease gelation time, as shown in Figure 2-2. When the H2O/Si(OC2H5)4 molar ratio is too low or too high, the gelation time is higher. The optimum ratio is close to 4 as Si(OC2H5)4 requires four molecules of H2O to be fully hydrolyzed.
Figure 2-2. Gelation time as a function of C2H5OH/Si(OC2H5)4 and H2O/Si(OC2H5)4 molar ratios, from [243].
Gelation is controlled by the hydrolysis and condensation reactions kinetics. Figure 2-3 shows the evolution of hydrolysis and condensation rates as a function of pH. Hydrolysis is promoted by both acidic and basic catalyses. Its kinetic is higher at extremely low and high pH respectively. In neutral conditions, hydrolysis is rather slow. However, condensation reaction is faster at pH where hydrolysis is less favored. A tradeoff shall be found to promote these two reactions and yield acceptable gelation duration. Despite, the hydrolysis and condensation reactions are reported to be slow for silicon alkoxides, they can be activated by increasing the temperature or using an acid catalysis [241], [242].
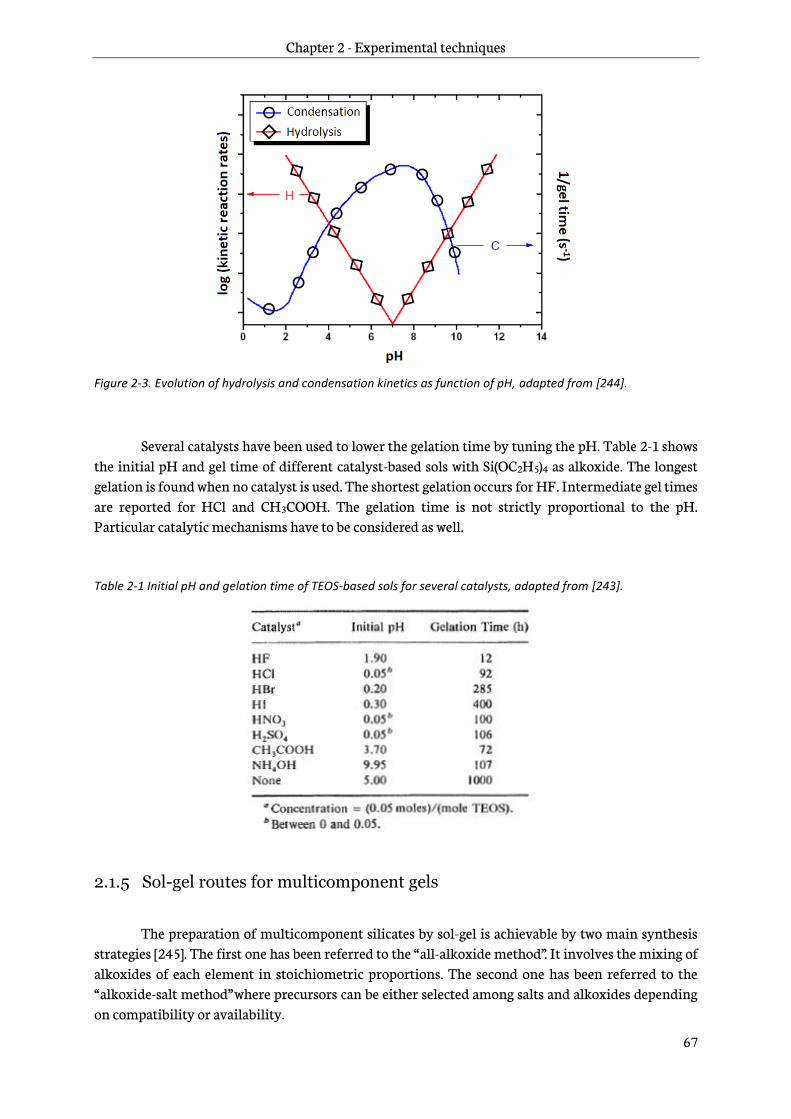
Chapter 2 - Experimental techniques
67
Figure 2-3. Evolution of hydrolysis and condensation kinetics as function of pH, adapted from [244].
Several catalysts have been used to lower the gelation time by tuning the pH. Table 2-1 shows the initial pH and gel time of different catalyst-based sols with Si(OC2H5)4 as alkoxide. The longest gelation is found when no catalyst is used. The shortest gelation occurs for HF. Intermediate gel times are reported for HCl and CH3COOH. The gelation time is not strictly proportional to the pH. Particular catalytic mechanisms have to be considered as well.
Table 2-1 Initial pH and gelation time of TEOS-based sols for several catalysts, adapted from [243].
2.1.5 Sol-gel routes for multicomponent gels
The preparation of multicomponent silicates by sol-gel is achievable by two main synthesis strategies [245]. The first one has been referred to the “ all-alkoxide method”. It involves the mixing of alkoxides of each element in stoichiometric proportions. The second one has been referred to the “ alkoxide-salt method” where precursors can be either selected among salts and alkoxides depending on compatibility or availability.

Chapter 2 - Experimental techniques
68
The “ all-alkoxide” route enables the preparation of mixed alkoxides, where the chemical elements are homogeneously distributed within a single monomeric precursor. Double alkoxides are common [246]. However, the preparation of triple or quadruple alkoxides is not usual. Furthermore, the probability a multicomponent monomer behaves as a single unit upon hydrolysis and condensation reaction is rather low [239]. Chemical inhomogeneity may arise in the multicomponent gels mainly because of different reactions kinetics between the different functional groups.
A more common approach is to let the alkoxide precursors hydrolyze and react with each other to give cross-linked multicomponent polymers. However, attention has to be paid on the functionality of the M(OR)n precursor. Low functional groups (n=1, n=2) lead respectively to chain termination and linear polymer, while functionalities of three or four generally enable the synthesis of branching polymers. This factor is critical to the ability of a multicomponent gel to be homogeneous.
Considering the synthesis of homogeneous mixed compounds, the hydrolysis and condensation kinetics of the different alkoxides must be similar. If this is not the case, homocondensation reactions are favored and lead to formation of a mixture of two inorganic polymers instead of one single mixed polymer. One solution is to prehydrolyze the less reactive alkoxide and let it react with the second less reactive alkoxide and so forth [247]. One application of the prehydrolysis is the synthesis of aluminosilicates [248].
The “ salt-alkoxide method” enables the preparation of multicomponents gel with a wide panel of compositions [245]. It is a more versatile strategy since only one alkoxide is required. It acts as the gel-former, although its concentration must be high enough to incorporate the others elements within its network during the gelation. The use of salts with organic and inorganic counter-anion instead of costly alkoxides makes this strategy less expensive. Only nitrates are suitable as inorganic salts [245]. But they have to be considered with caution because of their high oxidizing ability that can both lead to exothermic reaction and to oxidation of other precursors in the sol. Acetates are the most widely used organic salts in the sol-gel process [245]. They are widely available and soluble in alcohol solvents. The only drawbacks are the formation of carbon residues upon heat treatment and the increase of pH due to basic acetates groups. However, the first consideration has no consequences when carbon composites are targeted. The second one can be alleviated by buffering with acetic acid for instance [245].
2.2 X-Ray diffraction 2.2.1 Equipment
The diffractometer used at the laboratory is a D8 Advance modelTM (Brüker) as shown in Figure 2-4. X-Rays are produced from a copper anticathode. The Cu Kα radiation, λ =1.5406Å, is used as X-Ray source for the diffraction measurements. A 2mm slit is placed at the exit-end of the X-Ray tube. A nickel filter is used to suppress the Kβ radiation. A one-dimension LYNXEYETM based on the silicon strip technology is used as detector. The diffractometer has a Bragg-Brentano geometry. Therefore, the data acquisition is θ -2θ . It implies that the X-Ray source is fixed. The detector rotates of a 2θ angle value, when the sample rotates of a θ angle value.

Chapter 2 - Experimental techniques
69
Figure 2-4. Picture of Brüker D8 Advance diffractometer at CEA.
2.2.2 Samples preparation
Two kinds of XRD acquisitions were employed along this study. First Powder X-Ray Diffraction was performed using a quartz sample holder. It is filled with the powder material. The powder in excess is removed and the surface is flatten with a microscope glass slice. Thus, the sample height corresponds to the focal plane of the diffractometer. Specific care was taken to avoid creation of surface roughness and preferential orientations.
The second acquisition method was carried out for the ex-situ diffraction analysis of positive electrodes. To do so, the coin cells were disassembled in an argon-filled glovebox. The electrodes were washed in DMC for several minutes and let dry. Afterwards, they were placed onto a microscope glass slice and stuck by an air-tight Kapton® scotch tape onto the glass, as illustrated in Figure 2-5. The slice was then stuck onto an aluminum sample holder and adjusted at the focal plane of the diffractometer. The contribution of the Kapton® scotch tape scattering to XRD pattern in the 12-30° 2θ region needs to be taken into consideration.
Figure 2-5. Picture of a positive electrode stuck onto a microscope glass slice for the purpose of ex-situ XRD measurements.
Chapter 2 - Experimental techniques
70
2.2.3 Data acquisition and processing
2.2.3.1 Phase analysis, structure visualization and pattern matching
Phase analysis was performed with the EVA software based on the ICDD PDF2, PDF4+, PDF4 Minerals and PDF4 Organics databases. The visualization of three-dimension crystallographic structures was done with the VESTA software. Experimental and theoretical lattice reflections were extracted by loading CIF files found on the Crystallography Open Database [249]. Pattern matching, also called Le Bail refinement method, was performed using WinPLOTR program of the Fullprof software suite [250].
2.2.3.2 Crystallite size estimation
The estimation of crystallites size was carried out by using the Scherrer equation [251] as shown in Equation 2-1:
𝛽 =𝜆
𝐿 ∗ cos 𝜃
Equation 2-1. Scherrer equation where β is the line broadening at half the maximum intensity (rad); λ the wavelength of X-Ray source (nm); L the average crystallite size (nm), and θ the Bragg angle (rad).
The line broadening at half the maximum intensity, β , was corrected by subtracting that of the diffractometer, β inst, as shown in Equation 2-2:
𝛽 = 𝛽𝑒𝑥𝑝 − 𝛽𝑖𝑛𝑠𝑡
Equation 2-2. Equation of the line broadening at half the maximum intensity linking its experimental and instrumental contributions, in the case of pseudo-Voigt function with major Lorentzian contribution.
The experimental line broadening at half the maximum intensity, β exp, was extracted from X-ray powder diffraction data with the Kα 2 radiation contribution removed with the EVA software. The instrumental broadening was determined as a function of 2θ angle from the diffraction peaks of an electrolytic ZrO2 plate exhibiting large grains.
2.3 X-ray Photoelectron Spectroscopy
2.3.1 Sample preparation and equipment
XPS characterization was performed at CEA with the helpful collaboration of Dr. Anass Benayad for sample analyses and data interpretation. A PHI 5000 VersaProbeTM II spectrometer (ULVAC PHI) was employed using an Al Kα X-ray radiation, 1486.6eV. The penetration-depth of the XPS beam is estimated to 2-5nm.

Chapter 2 - Experimental techniques
71
Samples were prepared in an argon-filled glovebox to avoid any contamination with air and moisture. Powder or electrodes were pressed onto copper tape placed onto the sample holder (turntable). An air-tight XPS chamber was used to transfer samples to the spectrometer.
2.3.2 Fitting methods
The XPS data were fitted with the help of the CasaXPS© software. The binding energies were calibrated with the C1s peak of adventitious carbon at 284.8eV for samples that did not contain carbon. In the cases where carbon is a major part of sample’s composition, C1s peak cannot be considered as a reference. Therefore, others internal reference are required, such as O1s peak of SiO4 component at 530.5eV [104] or Si2p peak of SiO4 component at 101.7eV [252] of silicates, as used in this study. Core peaks were analyzed using a non-linear Shirley-type background. The experimental core spectra were fitted with model functions as combination of Gaussian and Lorentzian functions in order to extract the peaks positions and peak areas. A similar Full Width at Half Maximum, FWHM, was used to fit the core spectra components that exhibit the same oxidation state.
2.4 Other techniques
2.4.1 Thermo-Gravimetric Analysis
A SetsysTM 16/18 TG-DSC ThermoGravimetric-Differential Scanning Calorimetry Analyzer, TG-DSC (SETARAM) was used. Both mass loss and heat flow were recorded, while the heat treatment was performed under argon flow or static air atmosphere. Approximatively 20mg of powder were placed in an alumina crucible sample holder. Calibration was done by performing blank measurement on an empty crucible in the similar temperature and heating/cooling rate conditions. The resulting reference thermal profile was subtracted from the experimental measurements to yield interpretable data.
2.4.2 CHNS/O elementary analysis
A Vario El-cubeTM CHNS/O analyzer (Elementar) was used, at CEA with the helpful collaboration of Hélène Miller, to determine both carbon and oxygen contents in powder samples. Three measurements per sample were done to give assessable measurement error.
A heat treatment of the sample was first performed at 1100°C under helium to perform the quantitative analysis of carbon. Then, oxygen is injected react with the sample by forming COx gas. It is reduced to form CO2 and latter analyzed by a thermal conductivity detector to determinate the carbon content in the sample.
A similar process was applied to the quantitative analysis of oxygen. In a pyrolysis tube, the oxygen gas formed by heating samples at 1100°C is pushed by a helium flux through an activated

Chapter 2 - Experimental techniques
72
carbon column where it is converted in CO gas. Finally, the oxygen content was determined as before by thermal conductivity.
2.4.3 Nitrogen adsorption
A TristarTM II (Micromeritics) analyzer was used to determine the specific surface area of powder samples by the adsorption/desorption of N2 gas. A quantity of powder sufficient to represent a developed surface area of 20cm2 was placed in a tube and desorbed at 180°C and 20mbar prior analysis. Five isotherm points were recorded to extract specific surface area values (m2.g-1) based on the BET theory [253].
2.4.4 Infrared Spectroscopy
A NicoletTM 6700 Attenuated Total Reflection – Fourier Transform Infrared, ATR-FTIR, spectrometer (Thermo Scientific) was used for powder samples. Experimental spectra were collected with a diamond ATR crystal. The powder was filled in an Ar-filled glove box, using a hermetic sample holder designed for air sensitive materials.
FTIR spectra were collected between 400 and 4000cm-1. For each acquisition, 64 scans were performed to obtain data with high signal to noise ratio. The background analysis was performed just after the experiment, in the same conditions and is subsequently subtracted from the sample spectra. The depth of analysis was estimated between 2µm and 8µm, depending on the wave number and the refraction index of the sample.
2.4.5 Scanning Electron Microscopy
A LeoTM 1530 Scanning Electron Microscope (Zeiss) with Field-Emission Gun, FEG, was used at CEA. Images were taken at an accelerating voltage of 5kV and a 5mm-working distance. Only secondary electrons were collected.
The samples were prepared by sticking a carbon scotch on a sample holder and dispersing the powder onto it. For all silicate-based samples, carbon was sputtered onto their surface to avoid the charging effect of non-conductive samples during observation in the microscope.
2.4.6 Scanning Transmission Electron Microscopy and derivations
All the Scanning Transmission Electron Microscopy, STEM, characterizations were performed and interpreted by Dr. Adrien Boulineau at CEA. High-resolution STEM images, HRSTEM, were recorded using a TEM Titan Themis (FEI) in the STEM mode at an accelerating voltage of 200kV. Energy Electron Loss Spectroscopy, EELS, spectra were collected in STEM mode with a Gatan Imaging

Chapter 2 - Experimental techniques
73
Filter using a dispersion of 0.2 eV per channel and a 2 mm aperture. Elemental mappings were obtained exploiting Energy Dispersion X-Ray, EDX, spectra recorded using a TEM Osiris (FEI) in STEM mode at an accelerating voltage of 200kV.
Samples were prepared in glovebox by dispersing powder with DMC and dripping the mixture onto copper carbon-coated TEM grids.
2.5 Electrochemical characterization techniques
2.5.1 Electrodes preparation
All the steps of electrodes preparation was carried out in inert atmosphere. Inks were prepared according to the following formulation 80/10/10 corresponding to the weight fractions of active material, conductive carbon additive and binder respectively. In the case of carbon-coated active material, the weight fraction of active material also includes the content of carbon in the composite materials. This is electrode formulation is commonly used at CEA.
Active materials were generally synthesized in inert atmosphere and stored in argon-filled glovebox, without having been in contact with air and moisture. Before implementation in an electrode, they were vacuum dried in a Büchi® glass oven at 80°C for 24h and then thoroughly ground in a mortar with a pillow. C-NERGYTM SUPER C65 (Timcal) carbon black was chosen as conductive agent. Its specific surface area is of the order of 62m2.g-1. It was dried at 150°C under vacuum for 24°C in a Büchi® glass oven. PolyVinylidene Fluoride, PVDF, Solef® 5130 (Solvay) was used as binder to mechanically hold the components together in the electrodes. Prior to use, it was dried at 80°C under vacuum for 24h in a Büchi® glass oven.
The active material and SUPER C65 were weighted in glovebox. Anhydrous cyclohexane was added to improve the mixing of the two components. Before adding the PVDF, the cyclohexane was evaporated during ⋍30 minutes at room temperature. Prior to use, PVDF was dissolved in anhydrous N-methyl-2-pyrrolidone, NMP at a 6wt.% concentration. It was added to the mixture of active material and SUPER C65. Then, NMP was added in the slurry to adjust its viscosity for the deposition step via a tape casting method. The dry extract of the slurry was adjusted between 15% and 25 % depending on the specific surface area of the active material. All the components were manually mixed in a beaker. In parallel, an aluminum current collector foil was taped onto a glass plate as mechanical substrate. It was cleaned with acetone and let dry for 12h in an oven at 55°C before introduction in the glovebox. The ink was coated on the top of the aluminum foil. A doctor blade knife was used to spread manually the ink onto the aluminum foil with a coating thickness of 100µm. Finally, the coated foil was dried at 60°C under vacuum for 24h to remove the solvent in an oven Vacucenter VC20 (Salvislab) embedded in the glovebox.
14mm-diameter electrodes were punched in the glovebox and pressed arbitrarily at 6.5tons.cm-2 according to CEA standards. It enables a good cohesion of the electrodes components with the aluminum current collector. The electrodes were weighted and finally they were vacuum dried at 80°C for 48h in a Büchi® glass oven before the coin cells assembly.
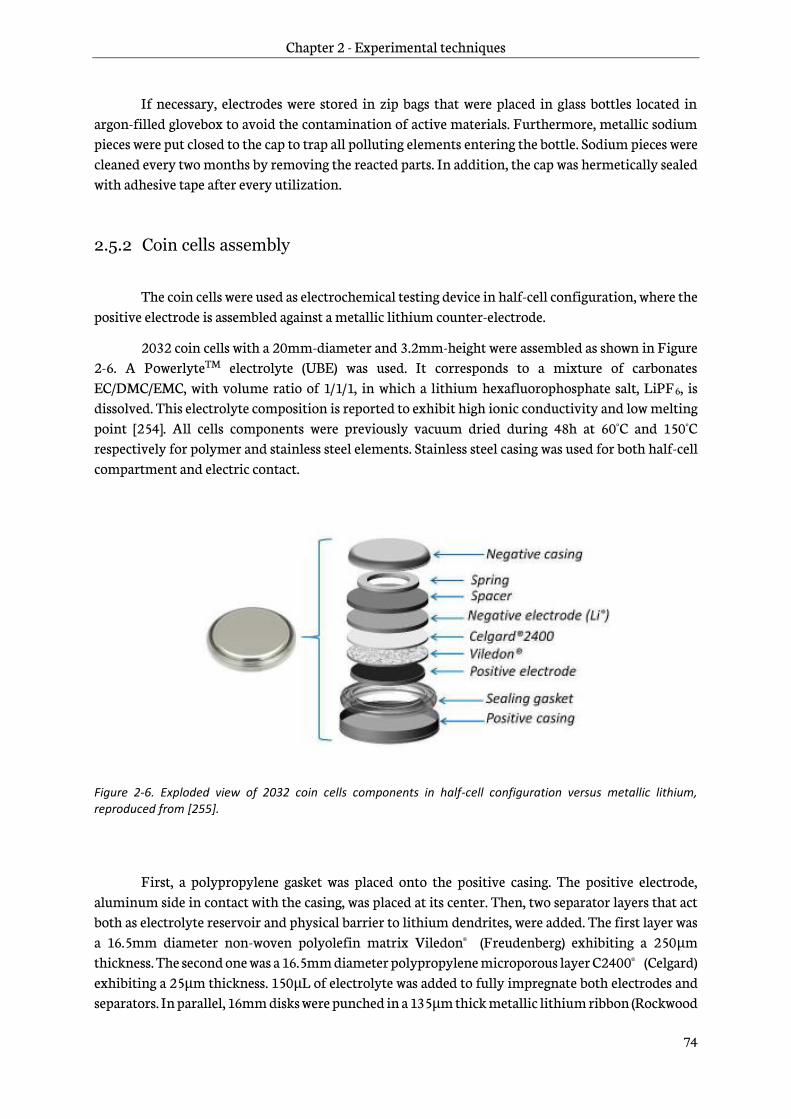
Chapter 2 - Experimental techniques
74
If necessary, electrodes were stored in zip bags that were placed in glass bottles located in argon-filled glovebox to avoid the contamination of active materials. Furthermore, metallic sodium pieces were put closed to the cap to trap all polluting elements entering the bottle. Sodium pieces were cleaned every two months by removing the reacted parts. In addition, the cap was hermetically sealed with adhesive tape after every utilization.
2.5.2 Coin cells assembly
The coin cells were used as electrochemical testing device in half-cell configuration, where the positive electrode is assembled against a metallic lithium counter-electrode.
2032 coin cells with a 20mm-diameter and 3.2mm-height were assembled as shown in Figure 2-6. A PowerlyteTM electrolyte (UBE) was used. It corresponds to a mixture of carbonates EC/DMC/EMC, with volume ratio of 1/1/1, in which a lithium hexafluorophosphate salt, LiPF6, is dissolved. This electrolyte composition is reported to exhibit high ionic conductivity and low melting point [254]. All cells components were previously vacuum dried during 48h at 60°C and 150°C respectively for polymer and stainless steel elements. Stainless steel casing was used for both half-cell compartment and electric contact.
Figure 2-6. Exploded view of 2032 coin cells components in half-cell configuration versus metallic lithium, reproduced from [255].
First, a polypropylene gasket was placed onto the positive casing. The positive electrode, aluminum side in contact with the casing, was placed at its center. Then, two separator layers that act both as electrolyte reservoir and physical barrier to lithium dendrites, were added. The first layer was a 16.5mm diameter non-woven polyolefin matrix Viledon® (Freudenberg) exhibiting a 250µm thickness. The second one was a 16.5mm diameter polypropylene microporous layer C2400® (Celgard) exhibiting a 25µm thickness. 150µL of electrolyte was added to fully impregnate both electrodes and separators. In parallel, 16mm disks were punched in a 135µm thick metallic lithium ribbon (Rockwood

Chapter 2 - Experimental techniques
75
Lithium) and pressed onto 1mm stainless steel spacers. The metallic lithium side is placed on top of the separators. Finally, a stainless steel spring was placed between the spacer and the negative casing. The whole coin cell was hermetically sealed thanks to a manual crimping machine (Hohsen). After cleaning the external casing with isopropanol, the coin cells were taken out of the glovebox.
2.5.3 Electrochemical characteristics
In all the manuscript, the redox potential values are always expressed in volts according to Li+/Li reference potential implicitly, V vs. Li+/Li, if not stated otherwise. The specific capacity is expressed in milliampere hour per gram of active material, mAh.g-1. The mass of active material does not contain the mass of carbon coating, if any. The C/rate, C/n, designates the current to apply to fully charge/discharge the material in “n” hours.
2.5.4 Electrochemical characterizations
2.5.4.1 Galvanostatic cycling
The galvanostatic cycling corresponds to successive charge/discharge cycles at a constant current between two cut-off voltages. Charge and discharge capacities values are extracted from this technique, as well as the evolution of the voltage with time during charge and discharge and the estimation of cell polarization. Differential capacity, also expressed by the notation dq/dV, is obtained by differentiating the capacity q as a function of voltage. It is obtained here by using an average of five data points for one calculation of differentiation. Its accuracy depends on the C/rate and the stability of the electrochemical curve. The differential capacity curve is better defined when the galvanostatic cycling performed in temperature-controlled chamber to avoid fluctuations. The galvanostatic cycling of coin cells was performed on Arbin battery cyclers, controlled by the MITS PRO® software. The testing temperature used was 25±2°C if not stated otherwise.
2.5.4.2 Cyclic voltammetry
The Cycling voltammetry is an electrochemical technique consisting in measuring the resulting current while the voltage is swept at a fixed rate, mV.s-1, between two cut-off voltages. The evolution of peak currents with sweep rates allows the determination of the electrochemical nature of electrochemical processes, particularly diffusion and capacitive processes. This technique was employed on VMP-2® , VMP-3® and MPG-2® battery testers (Bio-Logic) controlled by the EC-Lab® software
.

76
Chapter 3 – Li2MnSiO4: Synthesis, characterization and electrochemical properties
77
Chapter 3 – Li2MnSiO4: Synthesis, characterization
and electrochemical properties
Chapter 3 – Li2MnSiO4: Synthesis, characterization and electrochemical properties 77
3.1 Sol-gel ynthesis and characterization of Li2MnSiO4/C materials .................................................78
3.2 Firsts galvanostatic cycles of Li2MnSiO4 and Li2MnSiO4/C .......................................................... 98
3.3 Cycling performance of Li2MnSiO4/C composites .......................................................................... 101
3.4 Electrochemical behavior as a function of cut-off voltages .......................................................... 103
3.5 Aluminum doping of Li2MnSiO4/C ...................................................................................................... 111
3.6 Reactivity to air of Li2MnSiO4/C ........................................................................................................... 118
3.7 Conclusion ..................................................................................................................................................... 131
Chapter 3 - Li2MnSiO4: Synthesis, characterization and electrochemical properties
78
3 Li2MnSiO4: Synthesis, characterization and electrochemical properties
This chapter focuses on the Li2MnSiO4/C composites. First, the synthesis and characterization of the materials are presented. Then, the electrochemical behavior of the materials is studied and a doping strategy with aluminum is applied to improve the electrochemical performance. Finally, the reactivity to air is assessed as it appeared to be a concern during the developments.
A sol-gel route has been already developed for the synthesis of Li2MnSiO4/C composite materials [162], [187], [256]. This process is versatile thanks to a large panel of parameters that controls the chemistry and the morphology of the material (see section 2.1).
It generally consists in a first step in solution followed by a heat treatment. The precursors are dissolved together in a solvent, at room or moderate temperatures to form a sol. They react with each other to form a solid network. After a proper ageing a gel is formed. The subsequent drying of the gel leads to a dry and open structure called a xerogel. A second step, consisting in a heat treatment, is usually required to crystallize the material. This heat treatment is shorter and performed at much lower temperature than solid-state routes, thanks to a pre-ordering of atoms during the initial step in solution.
The optimization of these steps is discussed in the two next sections. The objective consists in the synthesis of Li2MnSiO4/C composites made of nanosized primary particles and adopting a Pmn21 structure as advised in the literature (see section 1.3.6). In particular, the combination of a nanometric morphology and a carbon network has been reported to improve the capacity retention of Li2MnSiO4/C, as highlighted in section 1.3.6.4.
3.1 Sol-gel synthesis and characterization of Li2MnSiO4/C materials
3.1.1 Preparation of the sol and formation of the gel
3.1.1.1 Selection of precursors
A salt-alkoxide route was selected, as introduced in section 2.1. Tetraethoxysilane, TEOS (≥99.0% , Sigma-Aldrich), was chosen as gel-former, as introduced in section 2.1.3.
Manganese acetate, Mn(OAc)2.4H2O (99.99% , Sigma-Aldrich) and lithium acetate, LiOAc.H2O (99.95% , Sigma-Aldrich) were respectively chosen as Mn and Li precursors. They both completely dissolve in polar solvents (water, ethanol, etc.) which is important to insure a good homogeneity of the sol. The acetate counterpart is expected to be completely removed during the heat treatment. A good homogeneity of Li, Mn and Si in the sol is aimed [257], [258]. The hydration number of the purchased precursors was checked by ThermoGravimetric Analysis, TGA, to monitor their molecular weight. Lithium acetate has been characterized to be monohydrated. A pre-drying step, performed at 120°C,
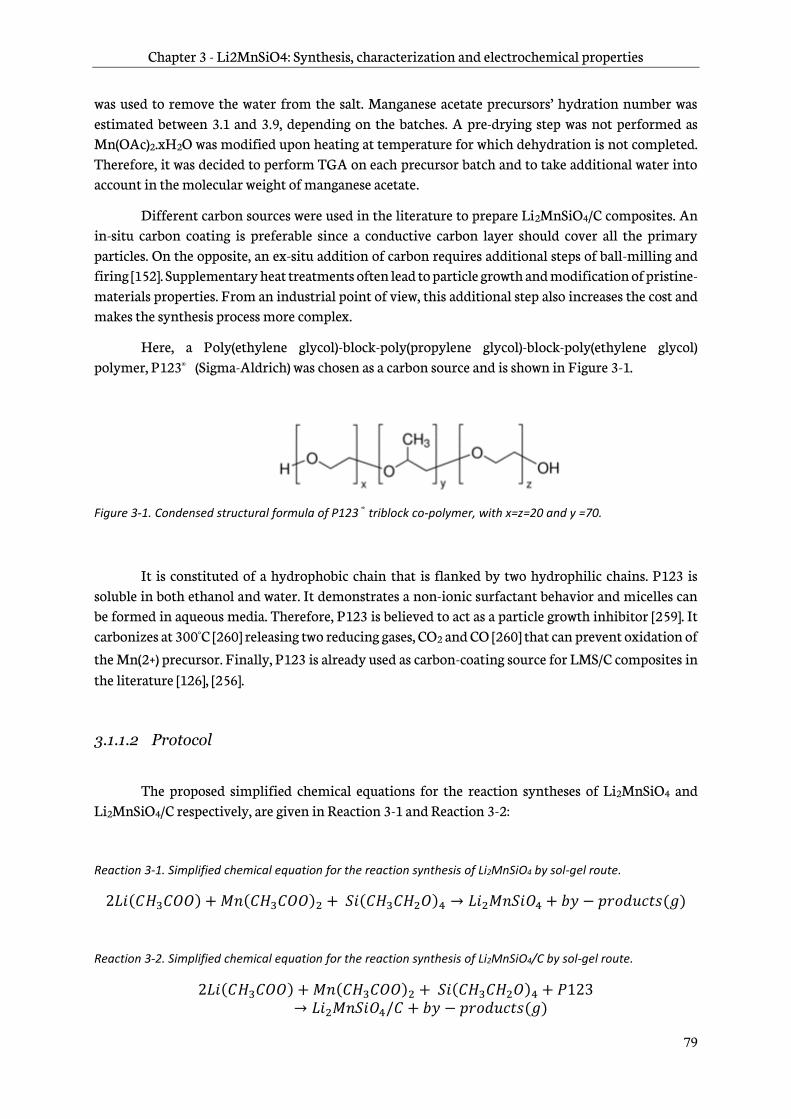
Chapter 3 - Li2MnSiO4: Synthesis, characterization and electrochemical properties
79
was used to remove the water from the salt. Manganese acetate precursors’ hydration number was estimated between 3.1 and 3.9, depending on the batches. A pre-drying step was not performed as Mn(OAc)2.xH2O was modified upon heating at temperature for which dehydration is not completed. Therefore, it was decided to perform TGA on each precursor batch and to take additional water into account in the molecular weight of manganese acetate.
Different carbon sources were used in the literature to prepare Li2MnSiO4/C composites. An in-situ carbon coating is preferable since a conductive carbon layer should cover all the primary particles. On the opposite, an ex-situ addition of carbon requires additional steps of ball-milling and firing [152]. Supplementary heat treatments often lead to particle growth and modification of pristine-materials properties. From an industrial point of view, this additional step also increases the cost and makes the synthesis process more complex.
Here, a Poly(ethylene glycol)-block-poly(propylene glycol)-block-poly(ethylene glycol) polymer, P123® (Sigma-Aldrich) was chosen as a carbon source and is shown in Figure 3-1.
Figure 3-1. Condensed structural formula of P123® triblock co-polymer, with x=z=20 and y =70.
It is constituted of a hydrophobic chain that is flanked by two hydrophilic chains. P123 is soluble in both ethanol and water. It demonstrates a non-ionic surfactant behavior and micelles can be formed in aqueous media. Therefore, P123 is believed to act as a particle growth inhibitor [259]. It carbonizes at 300°C [260] releasing two reducing gases, CO2 and CO [260] that can prevent oxidation of the Mn(2+) precursor. Finally, P123 is already used as carbon-coating source for LMS/C composites in the literature [126], [256].
3.1.1.2 Protocol
The proposed simplified chemical equations for the reaction syntheses of Li2MnSiO4 and Li2MnSiO4/C respectively, are given in Reaction 3-1 and Reaction 3-2:
Reaction 3-1. Simplified chemical equation for the reaction synthesis of Li2MnSiO4 by sol-gel route.
2𝐿𝑖(𝐶𝐻3𝐶𝑂𝑂) + 𝑀𝑛(𝐶𝐻3𝐶𝑂𝑂)2 + 𝑆𝑖(𝐶𝐻3𝐶𝐻2𝑂)4 → 𝐿𝑖2𝑀𝑛𝑆𝑖𝑂4 + 𝑏𝑦 − 𝑝𝑟𝑜𝑑𝑢𝑐𝑡𝑠(𝑔)
Reaction 3-2. Simplified chemical equation for the reaction synthesis of Li2MnSiO4/C by sol-gel route.
2𝐿𝑖(𝐶𝐻3𝐶𝑂𝑂) + 𝑀𝑛(𝐶𝐻3𝐶𝑂𝑂)2 + 𝑆𝑖(𝐶𝐻3𝐶𝐻2𝑂)4 + 𝑃123→ 𝐿𝑖2𝑀𝑛𝑆𝑖𝑂4/𝐶 + 𝑏𝑦 − 𝑝𝑟𝑜𝑑𝑢𝑐𝑡𝑠(𝑔)

Chapter 3 - Li2MnSiO4: Synthesis, characterization and electrochemical properties
80
The sol was prepared from two solutions. Solution 1 consisted in a dispersion of P123 in ethanol, followed by the addition of TEOS. Solution 2 consisted in a dissolution of acetates salts in deionized water, followed by the addition of the catalyst (acidic or basic). Water was used as both reagent of the hydrolysis reaction and solvent for the dissolution of the acetate salts. Several parameters were considered for the preparation and optimization of the sol:
- the alkoxide-ethanol ratio, nTEOS/nEtOH, which corresponds to the molar ratio of TEOS to EtOH;
- the hydrolysis ratio, nH2O/nTEOS, which corresponds to the molar ratio of H2O to TEOS. It chemically expresses the number of H2O molecules per Si atoms;
- the concentration of the sol, [precursor]total, corresponds to the concentration of cumulated lithium, manganese and silicon precursors as shown in Equation 3-1.
- the catalyst ratio, ncatalyst/nTEOS, which corresponds to the molar ratio of catalyst to TEOS. It chemically expresses the number of catalyst molecules per Si atoms;
[𝑝𝑟𝑒𝑐𝑢𝑟𝑠𝑜𝑟]𝑡𝑜𝑡𝑎𝑙 = [𝐿𝑖 − 𝑝𝑟𝑒𝑐] + [𝑀𝑛 − 𝑝𝑟𝑒𝑐] + [𝑆𝑖 − 𝑝𝑟𝑒𝑐] ;
Equation 3-1. Formula of the total concentration of the sol as a function of concentrations of each precursor.
Figure 3-2 represents a scheme of the sol-gel process adopted for the synthesis of Li2MnSiO4 and Li2MnSiO4/C materials. Solutions 1 and 2 were first mixed together at room temperature (RT) to form a sol. Then, a gel was obtained after an appropriate aging at room temperature. Finally, the drying step was performed at 80°C in air during 7 days to remove most of the organic solvents and by-products. A volume shrinkage was observed leading to the formation of a xerogel.
Figure 3-2. Scheme of the sol-gel process used for Li2MnSiO4 and Li2MnSiO4/C materials synthesis. Illustrations are adapted from [239]. RT corresponds to room temperature.
3.1.1.3 Effect of the pH
Several acidic and basic catalysts (hydrochloric acid, HCl, formic acid, HCOOH, acetic acid, CH3COOH, ammonium/ammonia buffer and ammonia) were respectively used to cover a wide range of pH, from 0 to 10. For simplicity, P123 was not added in this study. A stoichiometric amount of TEOS was solubilized in 50mL of absolute ethanol in a first beaker (solution 1). Stoichiometric amounts of LiOAc.H2O and Mn(OAc)2.nH2O (n=3.38 in this experiment) were dissolved in water in a second beaker (solution 2). Subsequently, 1mL of catalyst was added to solution 2. pH values obtained
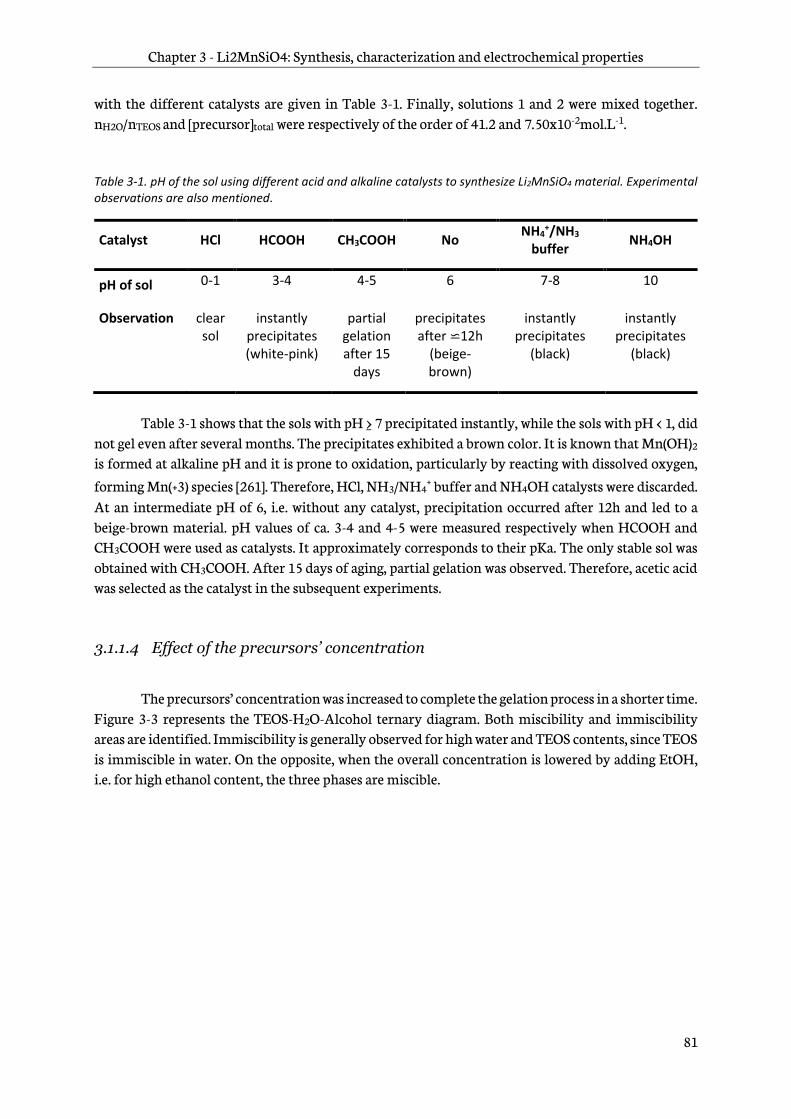
Chapter 3 - Li2MnSiO4: Synthesis, characterization and electrochemical properties
81
with the different catalysts are given in Table 3-1. Finally, solutions 1 and 2 were mixed together. nH2O/nTEOS and [precursor]total were respectively of the order of 41.2 and 7.50x10⁻²mol.L-1.
Table 3-1. pH of the sol using different acid and alkaline catalysts to synthesize Li2MnSiO4 material. Experimental observations are also mentioned.
Catalyst HCl HCOOH CH3COOH No NH4
+/NH3 buffer
NH4OH
pH of sol 0-1 3-4 4-5 6 7-8 10
Observation clear sol
instantly precipitates (white-pink)
partial gelation after 15
days
precipitates after ⋍12h
(beige-brown)
instantly precipitates
(black)
instantly precipitates
(black)
Table 3-1 shows that the sols with pH ≥ 7 precipitated instantly, while the sols with pH < 1, did not gel even after several months. The precipitates exhibited a brown color. It is known that Mn(OH)2 is formed at alkaline pH and it is prone to oxidation, particularly by reacting with dissolved oxygen,
forming Mn(+3) species [261]. Therefore, HCl, NH3/NH4+ buffer and NH4OH catalysts were discarded.
At an intermediate pH of 6, i.e. without any catalyst, precipitation occurred after 12h and led to a beige-brown material. pH values of ca. 3-4 and 4-5 were measured respectively when HCOOH and CH3COOH were used as catalysts. It approximately corresponds to their pKa. The only stable sol was obtained with CH3COOH. After 15 days of aging, partial gelation was observed. Therefore, acetic acid was selected as the catalyst in the subsequent experiments.
3.1.1.4 Effect of the precursors’ concentration
The precursors’ concentration was increased to complete the gelation process in a shorter time. Figure 3-3 represents the TEOS-H2O-Alcohol ternary diagram. Both miscibility and immiscibility areas are identified. Immiscibility is generally observed for high water and TEOS contents, since TEOS is immiscible in water. On the opposite, when the overall concentration is lowered by adding EtOH, i.e. for high ethanol content, the three phases are miscible.

Chapter 3 - Li2MnSiO4: Synthesis, characterization and electrochemical properties
82
Figure 3-3. Ternary phase diagram TEOS-H2O-Alcohol at 25°C displaying miscibility and immiscibility areas, adapted from [239]. The additional information in red corresponds to the experiments performed in this study.
Table 3-2 summarizes the characteristics of the sol for different alkoxide-ethanol, catalyst and hydrolysis ratios and precursors’ concentration. The alkoxide-ethanol ratio was lowered from 215 down to 3.00 in order to increase the precursors’ concentration from 7.50x10⁻²mol.L-1 to 1.17mol.L-1. In a first experiment, the precursors’ concentration was multiplied by ⋍15, from 0.0750 to 1.17mol.L-1. To reach such a high concentration, the volume of EtOH was increased. Thus, the alkoxide-ethanol ratio was lowered from 215 to 3.00. The corresponding experimental conditions are illustrated by a red triangle in Figure 3-3. As a result, phase separation was observed, in good agreement with the ternary diagram (see Figure 3-3). Therefore, the volume of EtOH was decreased to reach the miscibility shown in Figure 3-1. It resulted in the increase of the alkoxyde-ethanol ratio from 3.00 to 41.9 and a precursors’ concentration of 0.320 mol.L-1. Such experimental conditions are illustrated by the red circle indicated in Figure 3-3. A precipitation occurred within a day without catalyst, as mentioned in Table 3-1. Finally, acetic acid was introduced by setting the catalyst ratio to 0.840 to yield a pH ⋍6. This pH value is known to promote both hydrolysis and condensation reactions of TEOS (see section 2.1.4). Gelation was observed within 12h and lead to a homogeneous and transparent gel, as shown in Figure 3-4.

Chapter 3 - Li2MnSiO4: Synthesis, characterization and electrochemical properties
83
Table 3-2. Alkoxide-ethanol, catalyst, hydrolysis ratios and concentration of the sol parameters used within the optimization of the concentration of the sol. Experimental observations are also mentioned.
Experimental
condition
Low precursors concentration
+ catalyst
High precursors concentration
Medium precursors concentration
Medium precursors
concentration + catalyst
[precursor]total (mol.L-1)
0.0750 1.17 0.320 0.320
Alkoxide-ethanol ratio nEtOH/nTEOS
215 3.00 41.9 41.9
Catalyst ratio nCH3COOH/nTEOS
4.39 0.00 0.00 0.840
Hydrolysis ratio nH2O/nTEOS
41.2 41.2 41.2 41.2
Observations Partial gelation after 15 days
Phase separation
within the sol
Precipitation
after 1 day
Gelation
within 12h
Figure 3-4. Picture of a Li,Mn,Si gel catalyzed by acetic acid with medium precursors’ concentration condition (see Table 3-2).
3.1.1.5 Addition of the carbon source
In the following experiments, the previous parameters were kept. In addition, a polymer, P123, was introduced as the carbon source. P123 exhibits a grey translucent color and a greasy texture. It was added in Solution 1 under magnetic stirring until its dissolution was completed. Table 3-3 summarizes the different experiments of polymer addition in the sol, for which the pH, the gelation times and observations are given.
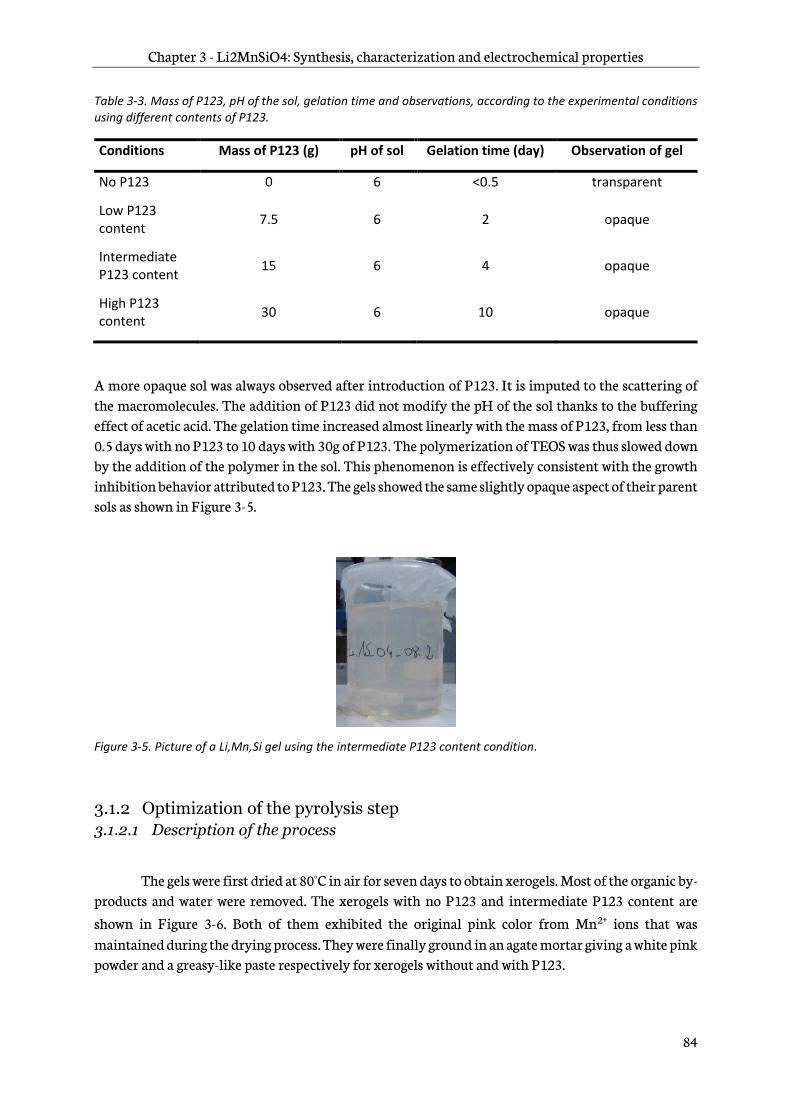
Chapter 3 - Li2MnSiO4: Synthesis, characterization and electrochemical properties
84
Table 3-3. Mass of P123, pH of the sol, gelation time and observations, according to the experimental conditions using different contents of P123.
Conditions Mass of P123 (g) pH of sol Gelation time (day) Observation of gel
No P123 0 6 <0.5 transparent
Low P123 content
7.5 6 2 opaque
Intermediate P123 content
15 6 4 opaque
High P123 content
30 6 10 opaque
A more opaque sol was always observed after introduction of P123. It is imputed to the scattering of the macromolecules. The addition of P123 did not modify the pH of the sol thanks to the buffering effect of acetic acid. The gelation time increased almost linearly with the mass of P123, from less than 0.5 days with no P123 to 10 days with 30g of P123. The polymerization of TEOS was thus slowed down by the addition of the polymer in the sol. This phenomenon is effectively consistent with the growth inhibition behavior attributed to P123. The gels showed the same slightly opaque aspect of their parent sols as shown in Figure 3-5.
Figure 3-5. Picture of a Li,Mn,Si gel using the intermediate P123 content condition.
3.1.2 Optimization of the pyrolysis step
3.1.2.1 Description of the process
The gels were first dried at 80°C in air for seven days to obtain xerogels. Most of the organic by-products and water were removed. The xerogels with no P123 and intermediate P123 content are shown in Figure 3-6. Both of them exhibited the original pink color from Mn2+ ions that was maintained during the drying process. They were finally ground in an agate mortar giving a white pink powder and a greasy-like paste respectively for xerogels without and with P123.

Chapter 3 - Li2MnSiO4: Synthesis, characterization and electrochemical properties
85
Figure 3-6. Pictures of the xerogels (a) from a sol without P123 polymer and (b) from a sol with intermediate P123 content.
The next step consisted in a pyrolysis under argon flow to crystallize Li2MnSiO4. This step was performed in a quartz half-tube, with only one opened end, placed in a tubular oven (see Figure 3-7). A dual entry system, controlled by two valves, was connected by a clamp to the half-tube at its opened end. It enables a gas to flow inside the half-tube and go out. After heat treatment, the valves were closed and the half tube was transferred inside the glovebox where the material was ground in an agate mortar. The full process enables the use and characterization of the materials without any risk of contamination from air and moisture.
Figure 3-7. (a) Side and (b) top views of an in-house manufactured half-tube system that isolates the sample from air during and after pyrolysis.
(b) (a)
(b) (a)
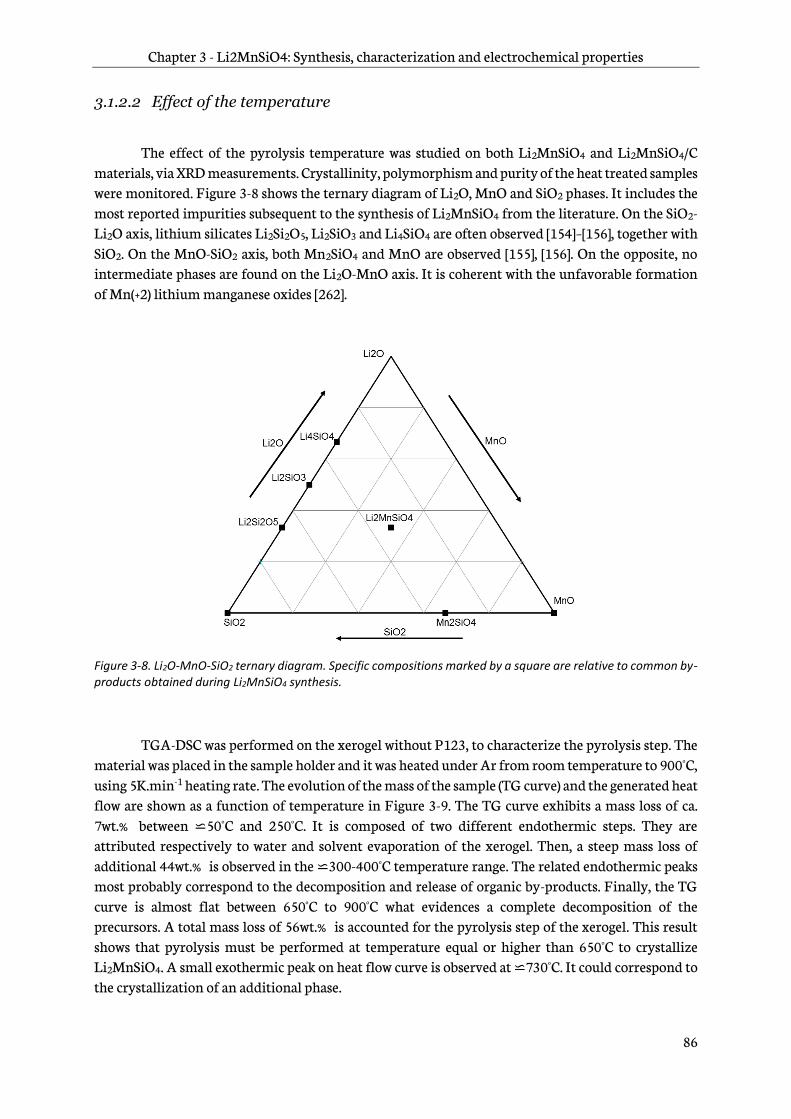
Chapter 3 - Li2MnSiO4: Synthesis, characterization and electrochemical properties
86
3.1.2.2 Effect of the temperature
The effect of the pyrolysis temperature was studied on both Li2MnSiO4 and Li2MnSiO4/C materials, via XRD measurements. Crystallinity, polymorphism and purity of the heat treated samples were monitored. Figure 3-8 shows the ternary diagram of Li2O, MnO and SiO2 phases. It includes the most reported impurities subsequent to the synthesis of Li2MnSiO4 from the literature. On the SiO2-Li2O axis, lithium silicates Li2Si2O5, Li2SiO3 and Li4SiO4 are often observed [154]–[156], together with SiO2. On the MnO-SiO2 axis, both Mn2SiO4 and MnO are observed [155], [156]. On the opposite, no intermediate phases are found on the Li2O-MnO axis. It is coherent with the unfavorable formation of Mn(+2) lithium manganese oxides [262].
Figure 3-8. Li2O-MnO-SiO2 ternary diagram. Specific compositions marked by a square are relative to common by-products obtained during Li2MnSiO4 synthesis.
TGA-DSC was performed on the xerogel without P123, to characterize the pyrolysis step. The material was placed in the sample holder and it was heated under Ar from room temperature to 900°C, using 5K.min-1 heating rate. The evolution of the mass of the sample (TG curve) and the generated heat flow are shown as a function of temperature in Figure 3-9. The TG curve exhibits a mass loss of ca. 7wt.% between ⋍50°C and 250°C. It is composed of two different endothermic steps. They are attributed respectively to water and solvent evaporation of the xerogel. Then, a steep mass loss of additional 44wt.% is observed in the ⋍300-400°C temperature range. The related endothermic peaks most probably correspond to the decomposition and release of organic by-products. Finally, the TG curve is almost flat between 650°C to 900°C what evidences a complete decomposition of the precursors. A total mass loss of 56wt.% is accounted for the pyrolysis step of the xerogel. This result shows that pyrolysis must be performed at temperature equal or higher than 650°C to crystallize Li2MnSiO4. A small exothermic peak on heat flow curve is observed at ⋍730°C. It could correspond to the crystallization of an additional phase.

Chapter 3 - Li2MnSiO4: Synthesis, characterization and electrochemical properties
87
Figure 3-9. Evolution of the mass of the xerogel without P123 (straight line) and generated heat flow (dotted line) as a function of temperature, from RT to 900°C, under Ar, with heating rate of 5 K.min-1.
The pyrolysis of the xerogels was performed between 450°C and 750°C, using heating and cooling rates of 5K.min-1. The XRD patterns are shown in Figure 3-10.
Figure 3-10. Powder X-Ray Diffraction patterns of Li2MnSiO4 after pyrolysis performed at 450°C, 550°C, 650°C and 750°C under Ar flow, during 0.5h. The three main peaks of each impurity are displayed and denoted as the following: Li2SiO3 (*), Mn2SiO4 (+) and MnO (x). The reflections of Pmn21-Li2MnSiO4 are indicated by dotted vertical lines and Miller indexes at the top of the diffractograms. In addition, the reflections of a second polymorph Pmnb (^) are evidenced in the sample pyrolyzed at 750°C.

Chapter 3 - Li2MnSiO4: Synthesis, characterization and electrochemical properties
88
The samples prepared at 450°C and 550°C show broad peaks, evidencing the low crystallinity of the materials. The nature of these peaks could not be assigned.
At 650°C, the main diffraction peaks correspond to a phase with an orthorhombic structure and Pmn21 space group (n°31), commonly attributed to Li2MnSiO4 in the literature. In addition, small peak intensities are observed, mainly at 19°, 27°, 31°, 34-35°, 39°, 41° and 59° in 2 They were imputed to Li2SiO3 (*), Mn2SiO4 (+) and MnO (x) impurities.
At 750°C, the XRD pattern exhibits peaks with lower FWHM what evidences a growth of crystallites. New reflections appear at 21-23°, 31° and 33° 2θ (^) and were attributed to the Pmnb orthorhombic polymorph, space group n°62. This is in good agreement with literature data that showed the formation of Pmnb polymorph above 650°C using a solid-state route [142]. It can also be related to the exothermic peak observed in the DSC curves (see Figure 3-9) which showed an extra exothermic peak at ⋍730°C that may correspond to the formation of the Pmnb polymorph. Consequently, a mixture of orthorhombic Pmn21 and Pmnb polymorphs is observed at 750°C.
The comparison of XRD patterns of Li2MnSiO4 pyrolyzed at 650°C and 750°C given in Figure 3-11 is discussed in detail. The materials are respectively described in orthorhombic Pmn21 and Pmnb space groups. The both structures share many reflections. Pmnb polymorph mainly differentiates from Pmn21, by additional reflections corresponding to (120), (101), (031), (211), (012), (231), (112), (212) and (213) lattice planes.
Figure 3-11. Powder X-Ray Diffraction patterns of Li2MnSiO4 after pyrolysis performed, at 650°C and 750°C under Ar flow, during 0.5h. The main peaks of each impurity are displayed and denoted as the following: Li2SiO3 (*), Mn2SiO4 (+) and MnO (x). The reflections of Pmn21 and Pmnb Li2MnSiO4 are indicated by dotted vertical lines, respectively in black and red. The Miller indexes of the Pmnb phase are only indicated at the top of the diffractograms. An apostrophe (‘) is added when the reflection is shared with the Pmn21 phase.
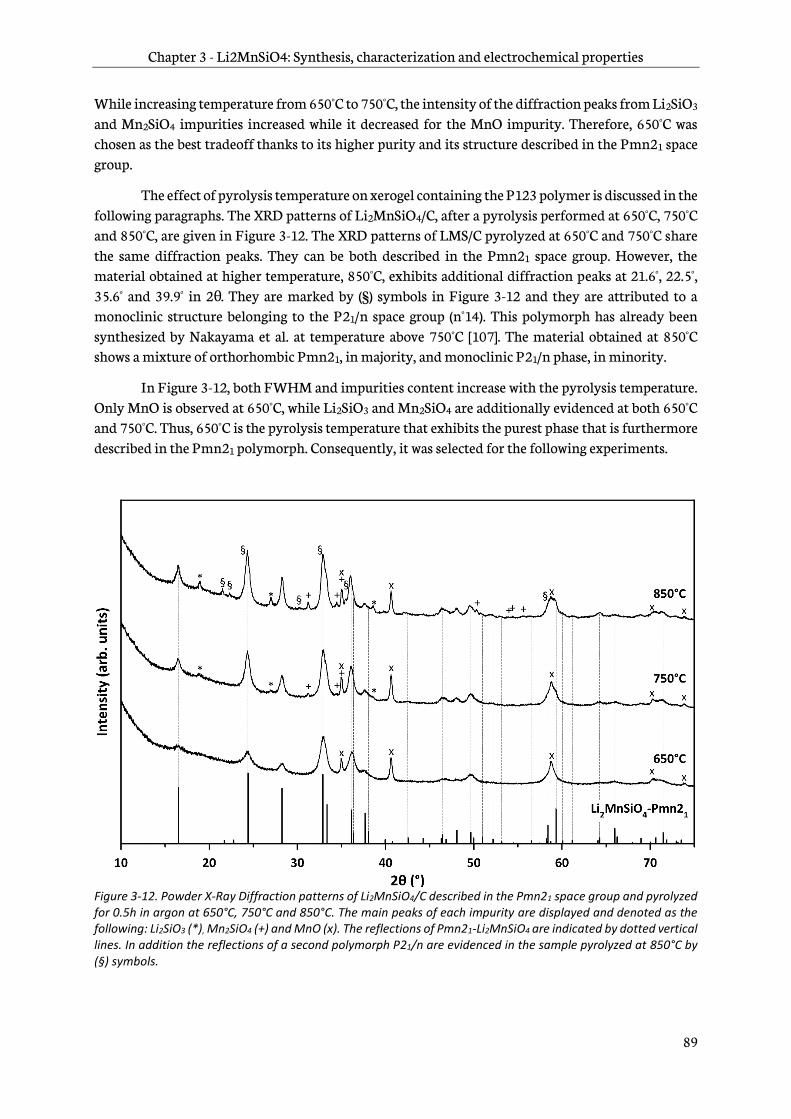
Chapter 3 - Li2MnSiO4: Synthesis, characterization and electrochemical properties
89
While increasing temperature from 650°C to 750°C, the intensity of the diffraction peaks from Li2SiO3 and Mn2SiO4 impurities increased while it decreased for the MnO impurity. Therefore, 650°C was chosen as the best tradeoff thanks to its higher purity and its structure described in the Pmn21 space group.
The effect of pyrolysis temperature on xerogel containing the P123 polymer is discussed in the following paragraphs. The XRD patterns of Li2MnSiO4/C, after a pyrolysis performed at 650°C, 750°C and 850°C, are given in Figure 3-12. The XRD patterns of LMS/C pyrolyzed at 650°C and 750°C share the same diffraction peaks. They can be both described in the Pmn21 space group. However, the material obtained at higher temperature, 850°C, exhibits additional diffraction peaks at 21.6°, 22.5°, 35.6° and 39.9° in 2θ . They are marked by (§) symbols in Figure 3-12 and they are attributed to a monoclinic structure belonging to the P21/n space group (n°14). This polymorph has already been synthesized by Nakayama et al. at temperature above 750°C [107]. The material obtained at 850°C shows a mixture of orthorhombic Pmn21, in majority, and monoclinic P21/n phase, in minority.
In Figure 3-12, both FWHM and impurities content increase with the pyrolysis temperature. Only MnO is observed at 650°C, while Li2SiO3 and Mn2SiO4 are additionally evidenced at both 650°C and 750°C. Thus, 650°C is the pyrolysis temperature that exhibits the purest phase that is furthermore described in the Pmn21 polymorph. Consequently, it was selected for the following experiments.
Figure 3-12. Powder X-Ray Diffraction patterns of Li2MnSiO4/C described in the Pmn21 space group and pyrolyzed for 0.5h in argon at 650°C, 750°C and 850°C. The main peaks of each impurity are displayed and denoted as the following: Li2SiO3 (*), Mn2SiO4 (+) and MnO (x). The reflections of Pmn21-Li2MnSiO4 are indicated by dotted vertical lines. In addition the reflections of a second polymorph P21/n are evidenced in the sample pyrolyzed at 850°C by (§) symbols.

Chapter 3 - Li2MnSiO4: Synthesis, characterization and electrochemical properties
90
Figure 3-13 shows XRD patterns of Li2MnSiO4 and Li2MnSiO4/C obtained after a pyrolysis at 750°C and 850°C respectively. The presence of P123 in the sol, as the carbon source, implies structural changes of the material obtained after pyrolysis. Actually, an additional Pmnb polymorph is observed in Li2MnSiO4 at 750°C whereas it was not observed for the carbon-coated Li2MnSiO4 material. However, the carbon-coated Li2MnSiO4 pyrolyzed at 750°C, still belongs to the Pmn21 space group (see Figure 3-12). Additionnally, when the temperature is increased to 850°C, a new P21/n polymorph is observed in the LMS/C material. This polymorph is not observed when P123 is not added in the sol. Therefore there is an effect of carbon-coating on the formation of Li2MnSiO4 polymorphs.
Figure 3-13. Powder X-Ray Diffraction patterns of Li2MnSiO4 pyrolyzed at 750°C and Li2MnSiO4/C pyrolyzed at 850°C, for 0.5h in argon. The two materials exhibit a mixture of a major orthorhombic Pmn21 phase and respectively a minor orthorhombic Pmnb and a monoclinic P21/n phases. The reflections of P21/n, Pmnb and Pmn21-Li2MnSiO4 phases are indicated respectively by green, red and black Dirac distributions at the bottom of the diffractograms. Furthermore, the green and red vertical dotted lines respectively illustrate exacerbated the reflections of Pmnb in the Li2MnSiO4_750°C and P21/n in Li2MnSiO4/C_850°C patterns. The Miller indexes of the P21/n space group are shown.
3.1.2.3 Effect of the duration of the pyrolysis
Figure 3-14 shows the XRD patterns of the samples after pyrolysis performed at 650°C during 0.5h, 10h and 24h. The diffraction peaks are in good agreement with the Pmn21 space group for all the samples. As expected, the crystallinity of the LMS/C materials increases with the duration of the pyrolysis. Diffraction peaks of the MnO impurity (x), respectively at 35.0°, 40.6°, 58.8°, 70.2° and 73.9° in 2θ are found in all the samples. However, additional diffraction peaks are observed for longer
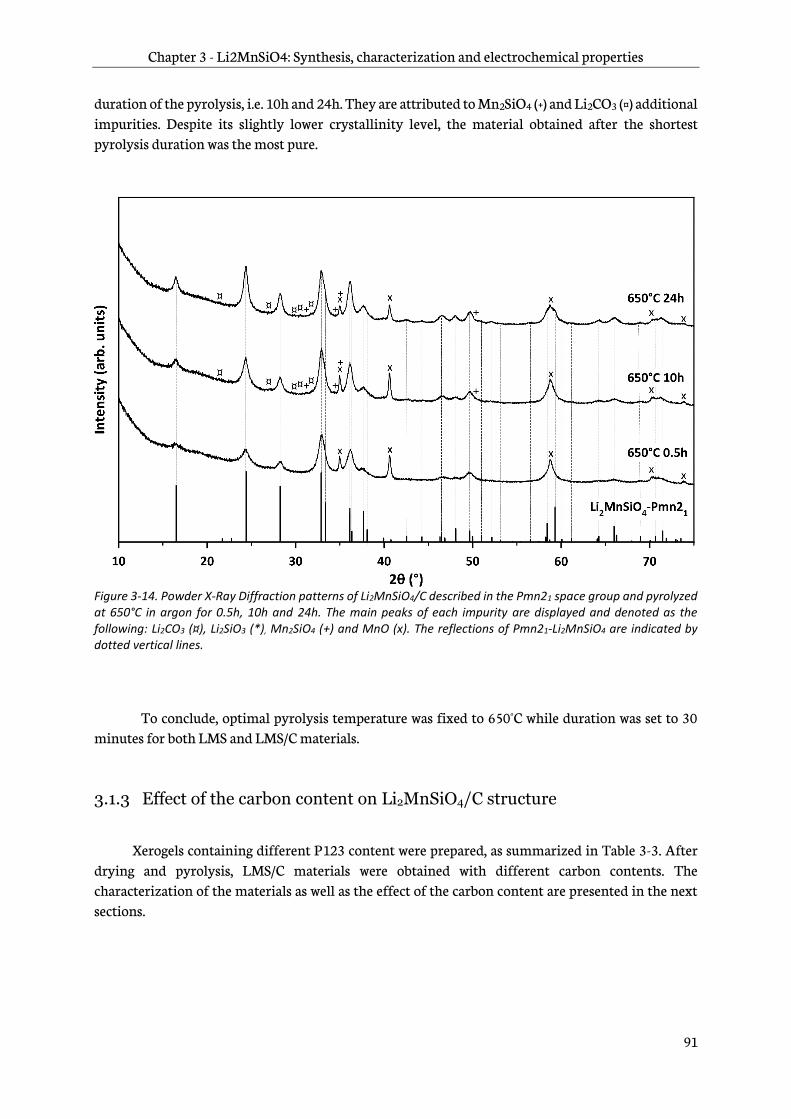
Chapter 3 - Li2MnSiO4: Synthesis, characterization and electrochemical properties
91
duration of the pyrolysis, i.e. 10h and 24h. They are attributed to Mn2SiO4 (+) and Li2CO3 (¤) additional impurities. Despite its slightly lower crystallinity level, the material obtained after the shortest pyrolysis duration was the most pure.
Figure 3-14. Powder X-Ray Diffraction patterns of Li2MnSiO4/C described in the Pmn21 space group and pyrolyzed at 650°C in argon for 0.5h, 10h and 24h. The main peaks of each impurity are displayed and denoted as the following: Li2CO3 (¤), Li2SiO3 (*), Mn2SiO4 (+) and MnO (x). The reflections of Pmn21-Li2MnSiO4 are indicated by dotted vertical lines.
To conclude, optimal pyrolysis temperature was fixed to 650°C while duration was set to 30 minutes for both LMS and LMS/C materials.
3.1.3 Effect of the carbon content on Li2MnSiO4/C structure
Xerogels containing different P123 content were prepared, as summarized in Table 3-3. After drying and pyrolysis, LMS/C materials were obtained with different carbon contents. The characterization of the materials as well as the effect of the carbon content are presented in the next sections.

Chapter 3 - Li2MnSiO4: Synthesis, characterization and electrochemical properties
92
3.1.3.1 Determination of carbon content in Li2MnSiO4/C materials
As a first approximation, TGA-DSC of LMS/C composites was performed under air, from room temperature to 900°C, using a ramping rate of 3K.min-1 to determine the content of carbon. Carbon is expected to react with oxygen and release CO(g) and CO2(g). Thus, the resulting mass loss observed on TG curves can be related to the carbon content in the composite material. Figure 3-15, shows the evolution of the mass loss of the Li2MnSiO4/C material coming from a xerogel with intermediate P123 content as function of temperature. The mass loss observed between RT and 200°C, of ca. 4 % , is attributed to the desorption of water and other organic species.
Figure 3-15. Evolution of the mass of a Li2MnSiO4/C material (straight line) and generated heat flow (dotted line) as a function of temperature, from RT to 900°C, under air, with heating rate of 3K.min-1.
The second mass loss observed between 200°C and 320°C is attributed to the carbonization of carbon by the oxygen from air. Thus, the carbon content in the sample is estimated to be ca. 7.5wt.% . The carbonization process of P123 in air is also characterized by a strong exothermic peak, as shown on the DSC curve. The subsequent thermal events observed between 320°C and 600°C are probably related to material oxidation in air, which is evidenced by a mass gain. Above 600°C a mass loss is observed. It could be attributed to a degradation of the material at high temperature in air, such as a lithium loss. Finally, the estimation by TGA of the carbon content in Li2MnSiO4/C is not considered as very accurate since two thermal events, carbonization and material oxidation in air, overlap at 300-320°C.
The elemental analysis of carbon was performed using a CHNS/O analyzer as complementary technique. Table 3-4 summarizes the carbon content and experimental conditions of each composite material. A value of 8.12 ± 0.03wt.% of carbon was measured for the sample from a xerogel with intermediate P123 content. The carbon content is higher by 0.6wt.% compared to that measured by TGA. The variation of carbon content is only 0.03wt.% by CHNS/O analysis. Therefore, this technique was considered much more accurate than TGA.

Chapter 3 - Li2MnSiO4: Synthesis, characterization and electrochemical properties
93
The composite material from a xerogel with low P123 content experiment exhibits 5.68wt.% of carbon. Consequently, it is named LMS/C_57. The other composites are named in the same manner. Finally, high-P123 content xerogels yield 16.90wt% of carbon after pyrolysis.
Table 3-4. Carbon contents of LMS/C samples, pyrolyzed at 650C for 0.5h under argon flow, measured by CHNS/O analysis, for different P123 contents in the xerogel.
Reference materials Xerogel Mass of P123 (g) C-content by CHNS/O (wt.%)
LMS/C_57 low P123 content
7.5 5.68 ± 0.05
LMS/C_81 intermediate P123 content
15 8.12 ± 0.03
LMS/C_169 high P123 content
30 16.90 ± 0.01
3.1.3.2 Effect of the carbon content on the structure of Li2MnSiO4
XRD patterns of Li2MnSiO4 and Li2MnSiO4/C materials are shown in Figure 3-16. All samples exhibit the reflections of the Pmn21 space group. Sharper peaks are observed for the Li2MnSiO4
material without carbon. It demonstrated a higher crystallinity than Li2MnSiO4/C. The Li2MnSiO4/C materials with high carbon-content are less crystallized. The intensity ratio between (011) peak at 25° in 2 and the double-peak corresponding to (210) and (020) reflections, at ⋍33° in 2 is almost equal to one. This ratio decreases by increasing the amount of carbon in the composites. Similarly, intensity from all the peaks decreases accordingly. Li2SiO3 and Mn2SiO4 impurities are observed in LMS and LMS/C_57 but disappear in the other composite materials. However, MnO is still observed in all the samples, especially in LMS/C_57 but its content decreases by increasing the carbon content in the composite samples.
The intensity ratio I(011)/I(210)(020) decreases, as also observed in Li2MnSiO4 and Li2MnSiO4/C materials when the pyrolysis temperature is lowered (Figure 3-10 and Figure 3-12) and the pyrolysis dwell time is shortened (Figure 3-14). They were explained by a decrease of crystallinity. Therefore, an estimation of the crystallite size was performed to assess the role of carbon content on the structure of Li2MnSiO4.
The average crystallite size of Li2MnSiO4 and Li2MnSiO4/C material was calculated from FWHM values of XRD reflections with the Scherrer equation (see section 2.2.3.2). They were estimated to be 17-18nm, 13-15nm, 11-12nm and 6-7nm respectively for LMS, LMS/C_57, LMS/C_81 and LMS/C_169. The crystallite size decreases when the carbon content increases; thus, it is evidenced that P123 inhibits the crystallization of Li2MnSiO4 primary particles.

Chapter 3 - Li2MnSiO4: Synthesis, characterization and electrochemical properties
94
Figure 3-16. Powder X-Ray Diffraction patterns of Li2MnSiO4/C composites and Li2MnSiO4 pyrolyzed at 650°C for 0.5h in argon. The main peaks of each impurity are displayed and denoted as the following: Li2SiO3 (*), Mn2SiO4 (+) and MnO (x). The Miller indexes of the main reflections of Pmn21 Li2MnSiO4 are exhibited on the top.
3.1.3.3 Morphological characterization
Figure 3-17 shows the SEM images of LMS and the Li2MnSiO4/C materials with different carbon contents. For all the materials, nanosized primary particles with round shape and built in larger micrometric agglomerates (not shown) are observed. The primary particle size was estimated below 50nm for all the Li2MnSiO4/C materials. On the opposite, LMS exhibits larger primary particles, in the range of 40-100nm (Figure 3-17a). A large open porosity is observed in Li2MnSiO4 (Figure 3-17a) and in all Li2MnSiO4/C composites (Figure 3-17b-d). BET measurements were also performed to assess the porosity of LMS and Li2MnSiO4/C materials. Specific surface areas were calculated from the Brunauer, Emmett and Teller (BET) method. Values of 44.3 m2.g-1, 75.7 m2.g-1, 122 m2.g-1 and 108m2.g-1 are obtained, respectively for LMS, LMS/C_57, LMS/C_81 and LMS/C_169 materials. These high specific surface areas values corroborate the large porosity observed by SEM (Figure 3-17a-d).
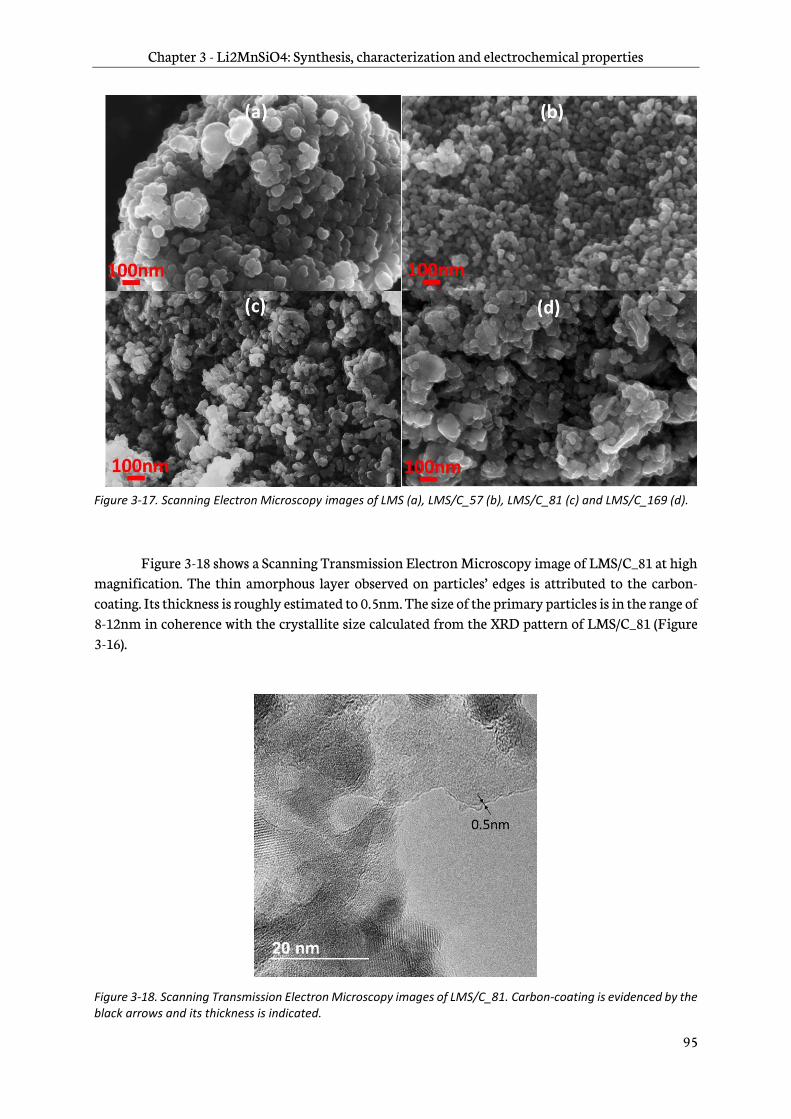
Chapter 3 - Li2MnSiO4: Synthesis, characterization and electrochemical properties
95
Figure 3-17. Scanning Electron Microscopy images of LMS (a), LMS/C_57 (b), LMS/C_81 (c) and LMS/C_169 (d).
Figure 3-18 shows a Scanning Transmission Electron Microscopy image of LMS/C_81 at high magnification. The thin amorphous layer observed on particles’ edges is attributed to the carbon-coating. Its thickness is roughly estimated to 0.5nm. The size of the primary particles is in the range of 8-12nm in coherence with the crystallite size calculated from the XRD pattern of LMS/C_81 (Figure 3-16).
Figure 3-18. Scanning Transmission Electron Microscopy images of LMS/C_81. Carbon-coating is evidenced by the black arrows and its thickness is indicated.
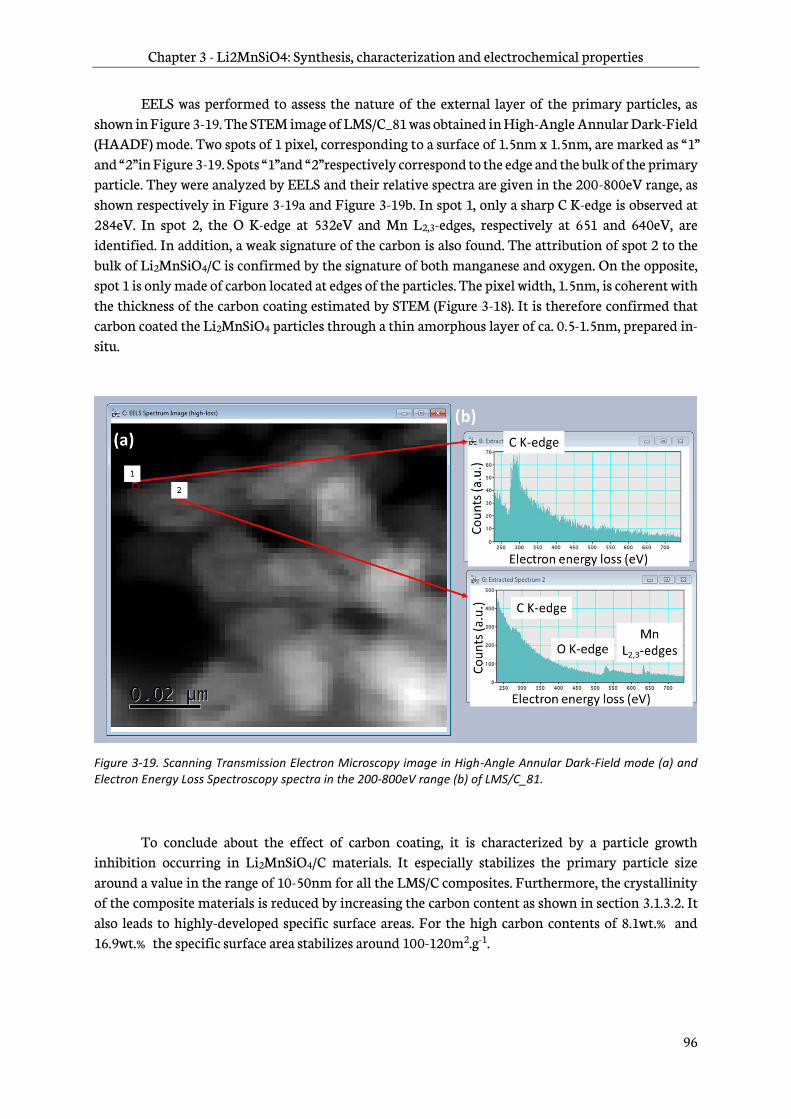
Chapter 3 - Li2MnSiO4: Synthesis, characterization and electrochemical properties
96
EELS was performed to assess the nature of the external layer of the primary particles, as shown in Figure 3-19. The STEM image of LMS/C_81 was obtained in High-Angle Annular Dark-Field (HAADF) mode. Two spots of 1 pixel, corresponding to a surface of 1.5nm x 1.5nm, are marked as “ 1” and “ 2” in Figure 3-19. Spots “ 1” and “ 2” respectively correspond to the edge and the bulk of the primary particle. They were analyzed by EELS and their relative spectra are given in the 200-800eV range, as shown respectively in Figure 3-19a and Figure 3-19b. In spot 1, only a sharp C K-edge is observed at 284eV. In spot 2, the O K-edge at 532eV and Mn L2,3-edges, respectively at 651 and 640eV, are identified. In addition, a weak signature of the carbon is also found. The attribution of spot 2 to the bulk of Li2MnSiO4/C is confirmed by the signature of both manganese and oxygen. On the opposite, spot 1 is only made of carbon located at edges of the particles. The pixel width, 1.5nm, is coherent with the thickness of the carbon coating estimated by STEM (Figure 3-18). It is therefore confirmed that carbon coated the Li2MnSiO4 particles through a thin amorphous layer of ca. 0.5-1.5nm, prepared in-situ.
Figure 3-19. Scanning Transmission Electron Microscopy image in High-Angle Annular Dark-Field mode (a) and Electron Energy Loss Spectroscopy spectra in the 200-800eV range (b) of LMS/C_81.
To conclude about the effect of carbon coating, it is characterized by a particle growth inhibition occurring in Li2MnSiO4/C materials. It especially stabilizes the primary particle size around a value in the range of 10-50nm for all the LMS/C composites. Furthermore, the crystallinity of the composite materials is reduced by increasing the carbon content as shown in section 3.1.3.2. It also leads to highly-developed specific surface areas. For the high carbon contents of 8.1wt.% and 16.9wt.% the specific surface area stabilizes around 100-120m2.g-1.
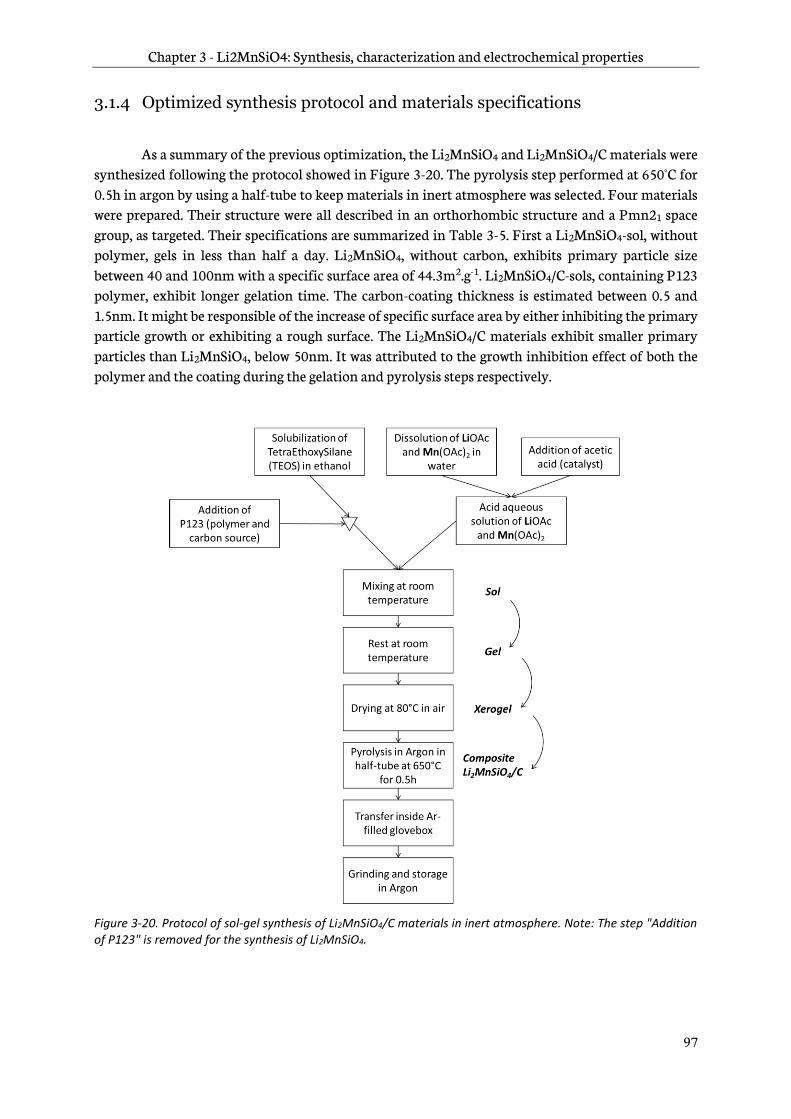
Chapter 3 - Li2MnSiO4: Synthesis, characterization and electrochemical properties
97
3.1.4 Optimized synthesis protocol and materials specifications
As a summary of the previous optimization, the Li2MnSiO4 and Li2MnSiO4/C materials were synthesized following the protocol showed in Figure 3-20. The pyrolysis step performed at 650°C for 0.5h in argon by using a half-tube to keep materials in inert atmosphere was selected. Four materials were prepared. Their structure were all described in an orthorhombic structure and a Pmn21 space group, as targeted. Their specifications are summarized in Table 3-5. First a Li2MnSiO4-sol, without polymer, gels in less than half a day. Li2MnSiO4, without carbon, exhibits primary particle size between 40 and 100nm with a specific surface area of 44.3m2.g-1. Li2MnSiO4/C-sols, containing P123 polymer, exhibit longer gelation time. The carbon-coating thickness is estimated between 0.5 and 1.5nm. It might be responsible of the increase of specific surface area by either inhibiting the primary particle growth or exhibiting a rough surface. The Li2MnSiO4/C materials exhibit smaller primary particles than Li2MnSiO4, below 50nm. It was attributed to the growth inhibition effect of both the polymer and the coating during the gelation and pyrolysis steps respectively.
Figure 3-20. Protocol of sol-gel synthesis of Li2MnSiO4/C materials in inert atmosphere. Note: The step "Addition of P123" is removed for the synthesis of Li2MnSiO4.
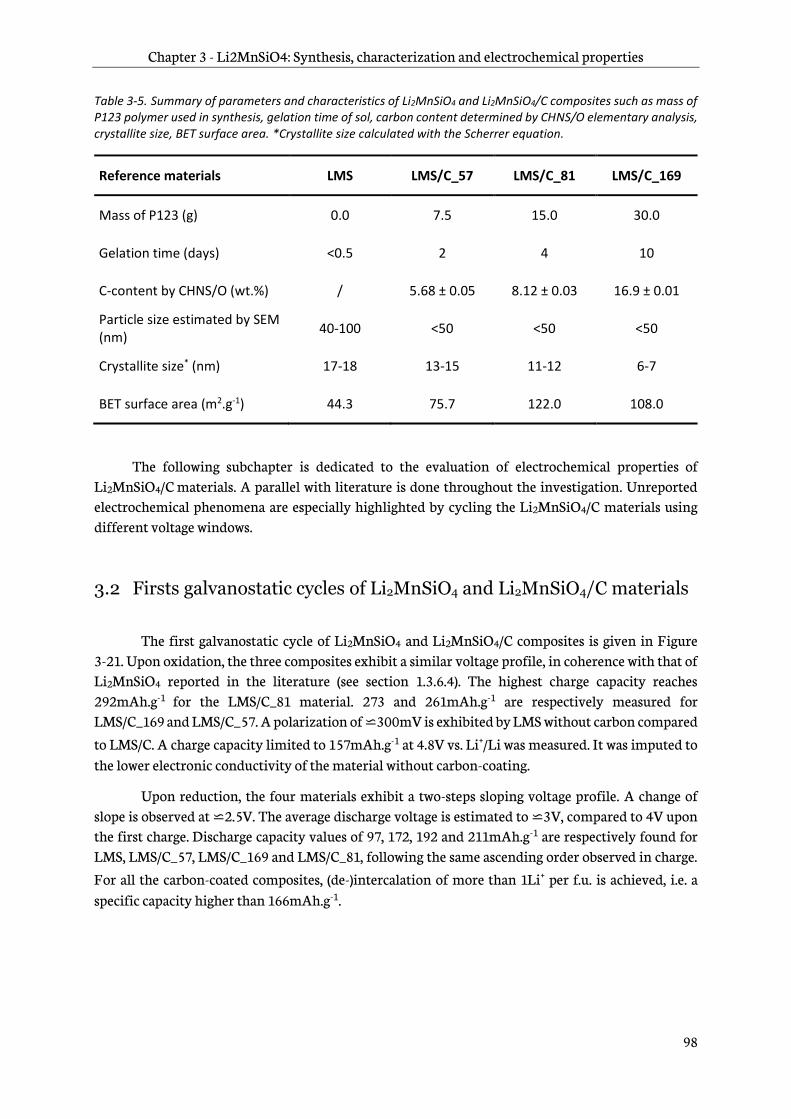
Chapter 3 - Li2MnSiO4: Synthesis, characterization and electrochemical properties
98
Table 3-5. Summary of parameters and characteristics of Li2MnSiO4 and Li2MnSiO4/C composites such as mass of P123 polymer used in synthesis, gelation time of sol, carbon content determined by CHNS/O elementary analysis, crystallite size, BET surface area. *Crystallite size calculated with the Scherrer equation.
Reference materials LMS LMS/C_57 LMS/C_81 LMS/C_169
Mass of P123 (g) 0.0 7.5 15.0 30.0
Gelation time (days) <0.5 2 4 10
C-content by CHNS/O (wt.%) / 5.68 ± 0.05 8.12 ± 0.03 16.9 ± 0.01
Particle size estimated by SEM (nm)
40-100 <50 <50 <50
Crystallite size* (nm) 17-18 13-15 11-12 6-7
BET surface area (m2.g-1) 44.3 75.7 122.0 108.0
The following subchapter is dedicated to the evaluation of electrochemical properties of Li2MnSiO4/C materials. A parallel with literature is done throughout the investigation. Unreported electrochemical phenomena are especially highlighted by cycling the Li2MnSiO4/C materials using different voltage windows.
3.2 Firsts galvanostatic cycles of Li2MnSiO4 and Li2MnSiO4/C materials
The first galvanostatic cycle of Li2MnSiO4 and Li2MnSiO4/C composites is given in Figure 3-21. Upon oxidation, the three composites exhibit a similar voltage profile, in coherence with that of Li2MnSiO4 reported in the literature (see section 1.3.6.4). The highest charge capacity reaches 292mAh.g-1
for the LMS/C_81 material. 273 and 261mAh.g-1 are respectively measured for LMS/C_169 and LMS/C_57. A polarization of ⋍300mV is exhibited by LMS without carbon compared
to LMS/C. A charge capacity limited to 157mAh.g-1 at 4.8V vs. Li+/Li was measured. It was imputed to the lower electronic conductivity of the material without carbon-coating.
Upon reduction, the four materials exhibit a two-steps sloping voltage profile. A change of slope is observed at ⋍2.5V. The average discharge voltage is estimated to ⋍3V, compared to 4V upon the first charge. Discharge capacity values of 97, 172, 192 and 211mAh.g-1 are respectively found for LMS, LMS/C_57, LMS/C_169 and LMS/C_81, following the same ascending order observed in charge.
For all the carbon-coated composites, (de-)intercalation of more than 1Li+ per f.u. is achieved, i.e. a specific capacity higher than 166mAh.g-1.

Chapter 3 - Li2MnSiO4: Synthesis, characterization and electrochemical properties
99
Figure 3-21. First galvanostatic cycles of LMS, LMS/C_57, LMS/C_81 and LMS/C_169 electrodes at C/20 and room temperature between 1.5V and 4.8V. Dotted line, dashed line, dotted-dashed mixed line and straight line correspond to LMS, LMS/C_57, LMS/C_81 and LMS/C_169 materials respectively.
Figure 3-22 shows the second galvanostatic cycle. A specific capacity of 182mAh.g-1 is measured during the second discharge of LMS/C_81, while 211mAh.g-1 are obtained in the first discharge. This specific capacity fading is observed for all the materials. A high polarization of ca. 1V is maintained between the charge and discharge phases, as highlighted by the differential capacity curves, namely dq/dV plot, shown in Figure 3-23.
Figure 3-22. Second galvanostatic cycles of LMS, LMS/C_57, LMS/C_81 and LMS/C_169 electrodes at C/20 and room temperature between 1.5V and 4.8V. Dotted line, dashed line, dotter-dashed mixed line and straight line correspond to LMS, LMS/C_57, LMS/C_81 and LMS/C_169 materials respectively.

Chapter 3 - Li2MnSiO4: Synthesis, characterization and electrochemical properties
100
The sloping profiles observed in both oxidation and reduction are similar to those found during the first discharge of Li2MnSiO4 materials in Figure 3-21. The initial voltage profile of the first oxidation is not recovered.
The differential capacity curves of LMS/C_81 material are shown in Figure 3-23 for the two first cycles. An average voltage above 4V is evidenced on the dq/dV plot of LMS/C_81 by two sharp oxidation peaks respectively at 4.0V and 4.2V that overlap with each other. A third oxidation phenomenon is evidenced at 4.6V and probably starts from 4.4V where it overlaps with the second oxidation peak. Two broad reduction peaks, respectively at 4.1V and 2.9V are observed, contrasting with the oxidation processes upon charge. They highlight a modification of the voltage profile of Li2MnSiO4/C, i.e. its electrochemical behavior.
Figure 3-23. dq/dV plots of first and second galvanostatic cycles of LMS/C_81 electrodes at C/20 and room temperature between 1.5V and 4.8V. Filled and empty circles correspond to first and second cycles respectively. Black arrows indicate the oxidation peaks upon first oxidation/charge.
The voltage profiles recorded here are very similar to the ones reported in the literature. The two oxidation processes identified at 4.0V and 4.2V, on the dq/dV plot in Figure 3-23, are coherent with Mn3+/Mn2+ and Mn4+/Mn3+ voltages predicted by DFT in the literature at 4.1V and 4.45V
respectively (Chapter I Figure 1-17, [99]). Because of the high voltage of the Mn4+/Mn3+ redox couple, an electrolyte oxidation inevitably occurs concomitant with deep lithium extraction. An irreversible phenomena occurs during the first charge (see Figure 3-21), in good agreement with the literature reviewed in Chapter I (see section 1.3.6.5). The LMS and LMS/C_81 materials respectively exhibit a first discharge capacity of 97mAh.g-1 and 211mAh.g-1. These values are among the highest found in the literature. These results confirm the benefits of synthesizing nanostructured (carbon-coated) Li2MnSiO4 materials by sol-gel method and justify the experimental conditions selected in section 3.1.4 as well. However, the strategy of combining nanosized particles and carbon network does not retain the initial voltage profile of Li2MnSiO4/C.

Chapter 3 - Li2MnSiO4: Synthesis, characterization and electrochemical properties
101
3.3 Cycling performance of Li2MnSiO4/C composites
3.3.1 Effect of carbon content
The cycling performance of Li2MnSiO4 materials with different carbon contents is given in Figure 3-24. All the materials exhibit a capacity fading and a high first irreversible capacity. They are both higher for Li2MnSiO4/C composites than for Li2MnSiO4. It is probably related to the specific surface area and the catalytic effect of carbon.
Figure 3-24. Cycling performance of LMS (a), LMS/C_57 (b), LMS/C_81 (c) and LMS/C_169 (d) electrodes at C/20 and room temperature between 1.5V and 4.8V. The empty and filled symbols respectively correspond to charge and discharge specific capacities.
The irreversible capacity of LMS decreases with cycle number, while that of the Li2MnSiO4/C materials remains for a longer cycling. Nonetheless, among the Li2MnSiO4/C materials, LMS/C_169 exhibits the best cycling stability while losing 27% of its discharge capacity after 10 cycles at C/20. A discharge capacity of 141mAh.g-1 is measured at the 10th cycle for this sample.
(a) (b)
(c) (d)
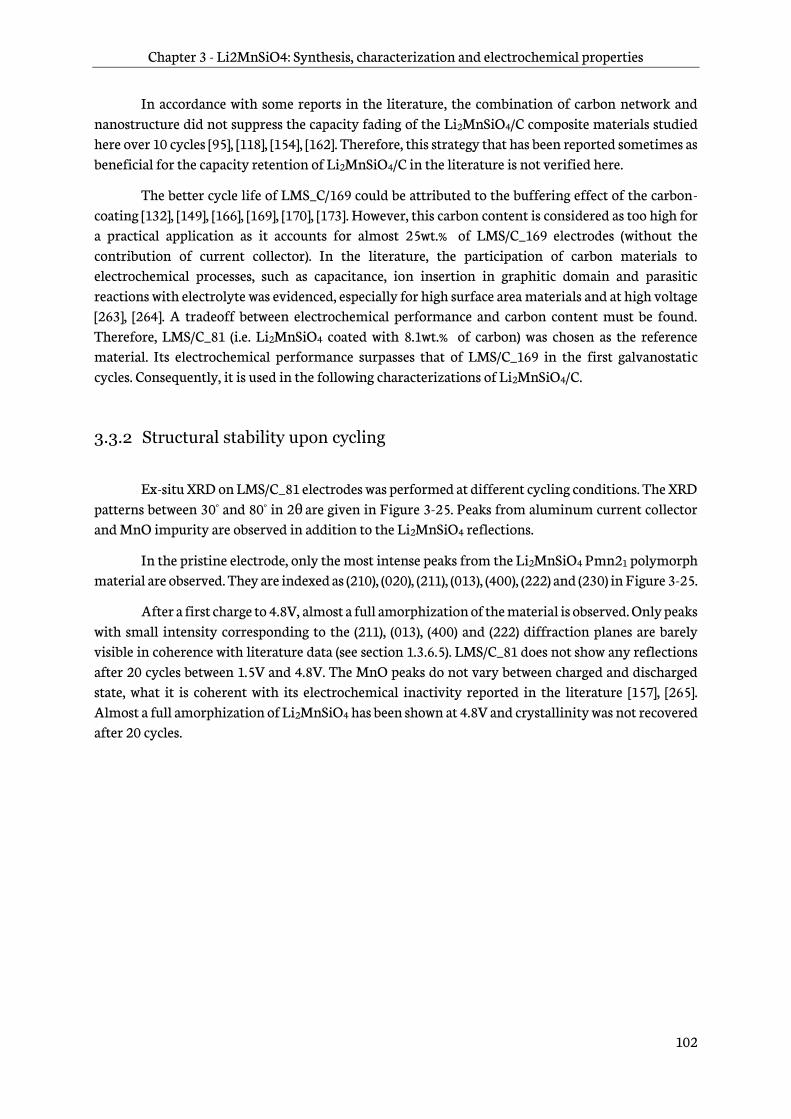
Chapter 3 - Li2MnSiO4: Synthesis, characterization and electrochemical properties
102
In accordance with some reports in the literature, the combination of carbon network and nanostructure did not suppress the capacity fading of the Li2MnSiO4/C composite materials studied here over 10 cycles [95], [118], [154], [162]. Therefore, this strategy that has been reported sometimes as beneficial for the capacity retention of Li2MnSiO4/C in the literature is not verified here.
The better cycle life of LMS_C/169 could be attributed to the buffering effect of the carbon-coating [132], [149], [166], [169], [170], [173]. However, this carbon content is considered as too high for a practical application as it accounts for almost 25wt.% of LMS/C_169 electrodes (without the contribution of current collector). In the literature, the participation of carbon materials to electrochemical processes, such as capacitance, ion insertion in graphitic domain and parasitic reactions with electrolyte was evidenced, especially for high surface area materials and at high voltage [263], [264]. A tradeoff between electrochemical performance and carbon content must be found. Therefore, LMS/C_81 (i.e. Li2MnSiO4 coated with 8.1wt.% of carbon) was chosen as the reference material. Its electrochemical performance surpasses that of LMS/C_169 in the first galvanostatic cycles. Consequently, it is used in the following characterizations of Li2MnSiO4/C.
3.3.2 Structural stability upon cycling
Ex-situ XRD on LMS/C_81 electrodes was performed at different cycling conditions. The XRD patterns between 30° and 80° in 2θ are given in Figure 3-25. Peaks from aluminum current collector and MnO impurity are observed in addition to the Li2MnSiO4 reflections.
In the pristine electrode, only the most intense peaks from the Li2MnSiO4 Pmn21 polymorph material are observed. They are indexed as (210), (020), (211), (013), (400), (222) and (230) in Figure 3-25.
After a first charge to 4.8V, almost a full amorphization of the material is observed. Only peaks with small intensity corresponding to the (211), (013), (400) and (222) diffraction planes are barely visible in coherence with literature data (see section 1.3.6.5). LMS/C_81 does not show any reflections after 20 cycles between 1.5V and 4.8V. The MnO peaks do not vary between charged and discharged state, what it is coherent with its electrochemical inactivity reported in the literature [157], [265]. Almost a full amorphization of Li2MnSiO4 has been shown at 4.8V and crystallinity was not recovered after 20 cycles.
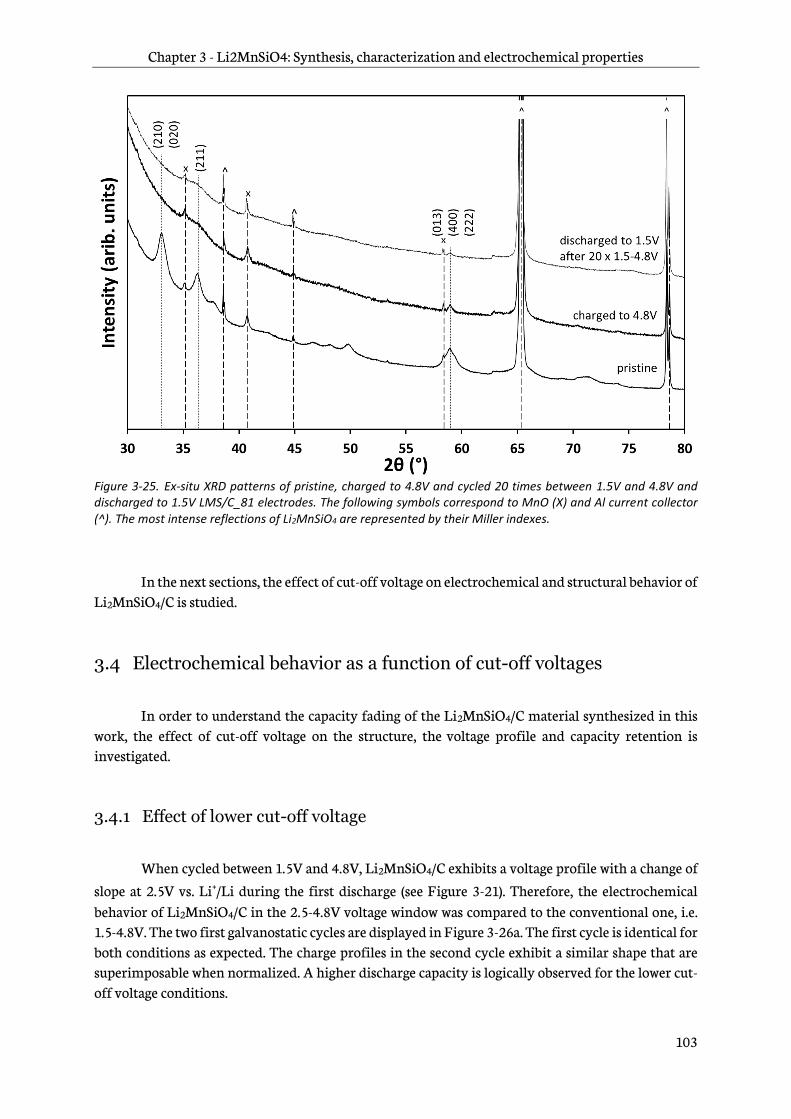
Chapter 3 - Li2MnSiO4: Synthesis, characterization and electrochemical properties
103
Figure 3-25. Ex-situ XRD patterns of pristine, charged to 4.8V and cycled 20 times between 1.5V and 4.8V and discharged to 1.5V LMS/C_81 electrodes. The following symbols correspond to MnO (X) and Al current collector (^). The most intense reflections of Li2MnSiO4 are represented by their Miller indexes.
In the next sections, the effect of cut-off voltage on electrochemical and structural behavior of Li2MnSiO4/C is studied.
3.4 Electrochemical behavior as a function of cut-off voltages
In order to understand the capacity fading of the Li2MnSiO4/C material synthesized in this work, the effect of cut-off voltage on the structure, the voltage profile and capacity retention is investigated.
3.4.1 Effect of lower cut-off voltage
When cycled between 1.5V and 4.8V, Li2MnSiO4/C exhibits a voltage profile with a change of
slope at 2.5V vs. Li+/Li during the first discharge (see Figure 3-21). Therefore, the electrochemical behavior of Li2MnSiO4/C in the 2.5-4.8V voltage window was compared to the conventional one, i.e. 1.5-4.8V. The two first galvanostatic cycles are displayed in Figure 3-26a. The first cycle is identical for both conditions as expected. The charge profiles in the second cycle exhibit a similar shape that are superimposable when normalized. A higher discharge capacity is logically observed for the lower cut-off voltage conditions.
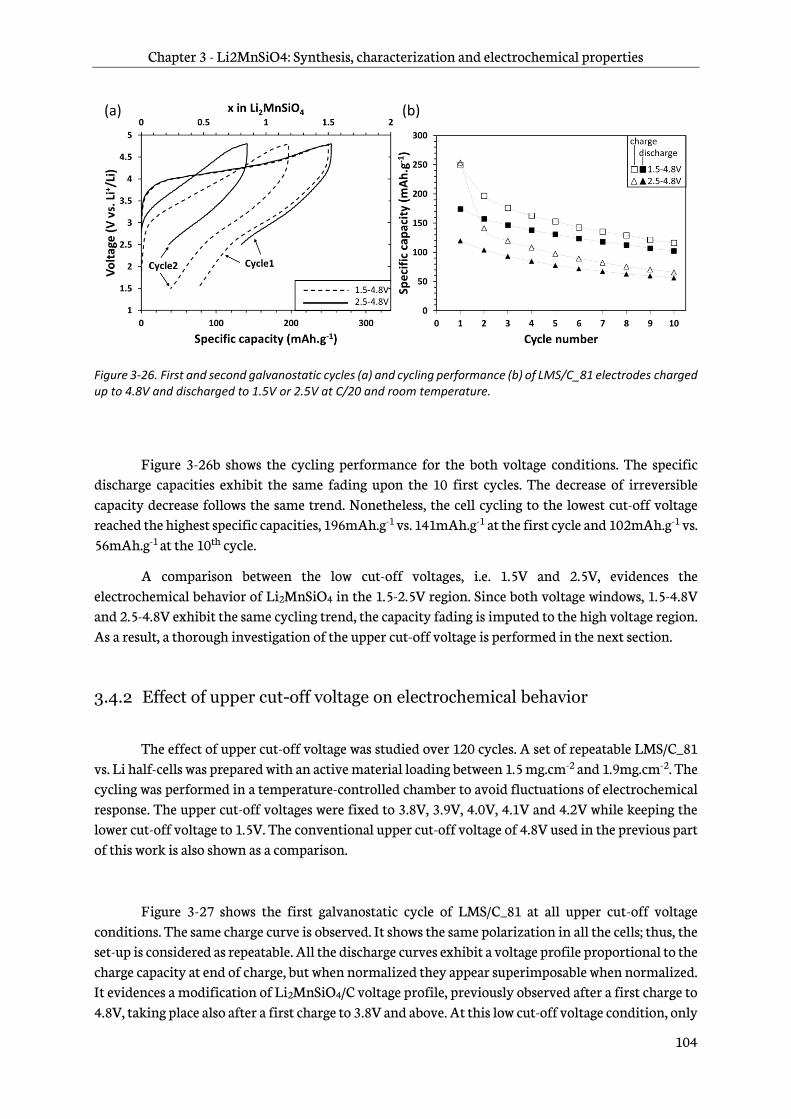
Chapter 3 - Li2MnSiO4: Synthesis, characterization and electrochemical properties
104
Figure 3-26. First and second galvanostatic cycles (a) and cycling performance (b) of LMS/C_81 electrodes charged up to 4.8V and discharged to 1.5V or 2.5V at C/20 and room temperature.
Figure 3-26b shows the cycling performance for the both voltage conditions. The specific discharge capacities exhibit the same fading upon the 10 first cycles. The decrease of irreversible capacity decrease follows the same trend. Nonetheless, the cell cycling to the lowest cut-off voltage reached the highest specific capacities, 196mAh.g-1 vs. 141mAh.g-1 at the first cycle and 102mAh.g-1 vs. 56mAh.g-1 at the 10th cycle.
A comparison between the low cut-off voltages, i.e. 1.5V and 2.5V, evidences the electrochemical behavior of Li2MnSiO4 in the 1.5-2.5V region. Since both voltage windows, 1.5-4.8V and 2.5-4.8V exhibit the same cycling trend, the capacity fading is imputed to the high voltage region. As a result, a thorough investigation of the upper cut-off voltage is performed in the next section.
3.4.2 Effect of upper cut-off voltage on electrochemical behavior
The effect of upper cut-off voltage was studied over 120 cycles. A set of repeatable LMS/C_81 vs. Li half-cells was prepared with an active material loading between 1.5 mg.cm-2 and 1.9mg.cm-2. The cycling was performed in a temperature-controlled chamber to avoid fluctuations of electrochemical response. The upper cut-off voltages were fixed to 3.8V, 3.9V, 4.0V, 4.1V and 4.2V while keeping the lower cut-off voltage to 1.5V. The conventional upper cut-off voltage of 4.8V used in the previous part of this work is also shown as a comparison.
Figure 3-27 shows the first galvanostatic cycle of LMS/C_81 at all upper cut-off voltage conditions. The same charge curve is observed. It shows the same polarization in all the cells; thus, the set-up is considered as repeatable. All the discharge curves exhibit a voltage profile proportional to the charge capacity at end of charge, but when normalized they appear superimposable when normalized. It evidences a modification of Li2MnSiO4/C voltage profile, previously observed after a first charge to 4.8V, taking place also after a first charge to 3.8V and above. At this low cut-off voltage condition, only
(a) (b)
Chapter 3 - Li2MnSiO4: Synthesis, characterization and electrochemical properties
105
0.17Li+ per f.u. are extracted from Li2MnSiO4 in the first cycle. Therefore, an electrochemical reversibility in the Li1.83MnSiO4-Li2MnSiO4 composition range does not occur.
Figure 3-27. First galvanostatic cycle of LMS/C_81 at different upper cut-off voltages (3.8V, 3.9V, 4.0V, 4.1V, 4.2V and 4.8V) at C/20 and room temperature.
Discharge capacities higher than charge capacities are observed for upper cut-off voltages between 3.8V and 4.1V. It can be imputed to a small oxidation of Li2MnSiO4 despite cautious handling in inert atmosphere. On the opposite, a significant irreversible capacity is only observed for upper cut-off voltage of 4.8V, which was imputed to electrolyte decomposition as discussed in section 3.2
The dq/dV plot associated to the first galvanostatic cycle is shown in Figure 3-28. The charge associated to the 4.2V upper cut-off voltage is only displayed for sake of clarity. Two sharp oxidation peaks at 4.0 and 4.2V are observed. They respectively correspond to Mn3+/Mn2+ and Mn4+/Mn3+ redox processes, as shown in section 3.2. These voltages represent specific charge capacities of 141mAh.g-1 and 170mAh.g-1 respectively in the galvanostatic charge curve shown in Figure 3-27. It implies that
the formation of Mn4+ ions occurs before the full extraction of one lithium ion in Li2MnSiO4 i.e. 166mAh.g-1.
Discharge dq/dV plots for upper cut-off voltages of 3.8-4.2V are shown in Figure 3-28. A broad reduction process is observed for all upper cut-off voltage conditions. It progressively shifts from 3.25V to 3.0V, when the upper cut-off voltage increases from 3.8V to 4.2V. One can notice a small broad reduction process occurring at 4.0-4.1V that is only distinguishable when high cut-off voltages (4.1V,
4.2V and 4.8V as shown in Figure 3-23) are used. These three upper cut-off voltages share a Mn4+/Mn3+ oxidation peak at 4.2V upon first charge as observed on dq/dV plot. As these two redox processes occur
in the same voltage range, 4.0-4.2V, the reduction process is attributed to the reduction of Mn4+ to
Mn3+. Therefore, the large reduction peak at 3.0-3.2V is attributed to the reduction of Mn3+ to Mn2+.
Considering the difference of voltage values for both Mn3+/Mn2+ and Mn4+/Mn3+ redox couples
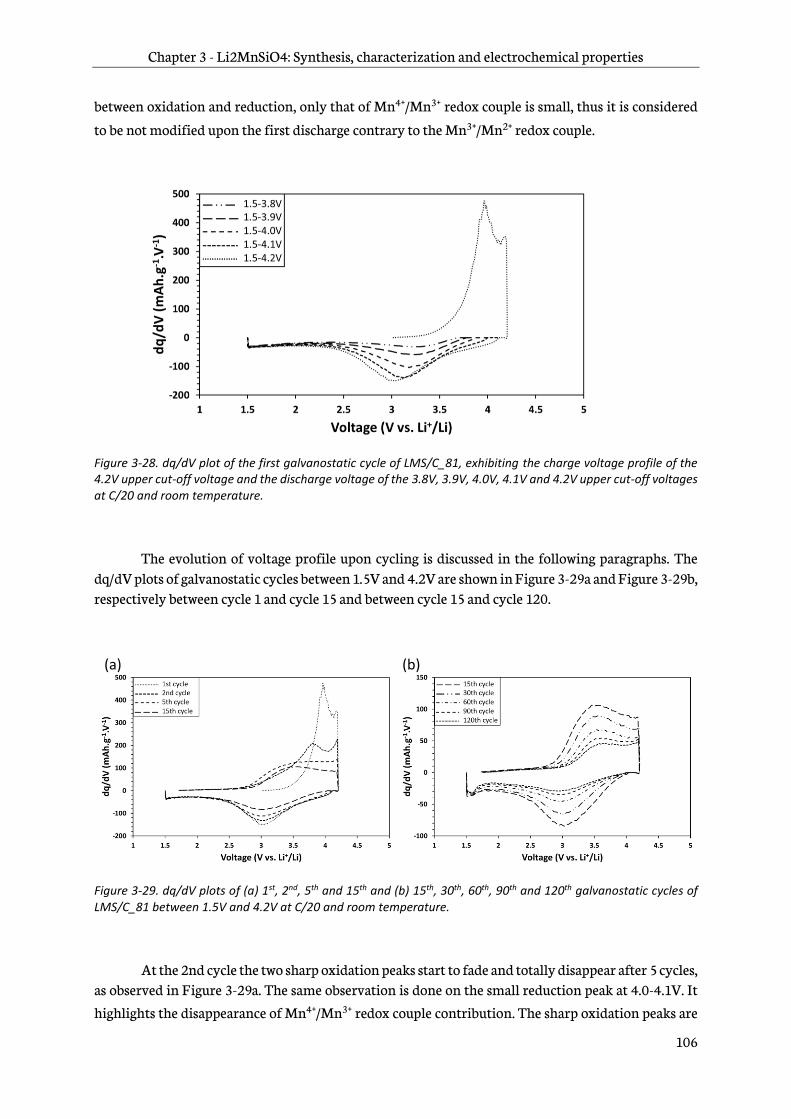
Chapter 3 - Li2MnSiO4: Synthesis, characterization and electrochemical properties
106
between oxidation and reduction, only that of Mn4+/Mn3+ redox couple is small, thus it is considered
to be not modified upon the first discharge contrary to the Mn3+/Mn2+ redox couple.
Figure 3-28. dq/dV plot of the first galvanostatic cycle of LMS/C_81, exhibiting the charge voltage profile of the 4.2V upper cut-off voltage and the discharge voltage of the 3.8V, 3.9V, 4.0V, 4.1V and 4.2V upper cut-off voltages at C/20 and room temperature.
The evolution of voltage profile upon cycling is discussed in the following paragraphs. The dq/dV plots of galvanostatic cycles between 1.5V and 4.2V are shown in Figure 3-29a and Figure 3-29b, respectively between cycle 1 and cycle 15 and between cycle 15 and cycle 120.
Figure 3-29. dq/dV plots of (a) 1st, 2nd, 5th and 15th and (b) 15th, 30th, 60th, 90th and 120th galvanostatic cycles of LMS/C_81 between 1.5V and 4.2V at C/20 and room temperature.
At the 2nd cycle the two sharp oxidation peaks start to fade and totally disappear after 5 cycles, as observed in Figure 3-29a. The same observation is done on the small reduction peak at 4.0-4.1V. It
highlights the disappearance of Mn4+/Mn3+ redox couple contribution. The sharp oxidation peaks are
(a) (b)

Chapter 3 - Li2MnSiO4: Synthesis, characterization and electrochemical properties
107
gradually replaced by a broad oxidation peak around 3.5 V, as observed on the 5th and 15th cycles. It exhibits the same broad voltage profile observed in reduction. Therefore, they are likely related to the same electrochemical phenomenon in Li2MnSiO4.
In Figure 3-29b, the oxidation and reduction processes respectively shift toward high and low voltages upon cycling. It can be explained by an increasing polarization within the cell and evidences the non-reversibility of the new voltage profile exhibited by Li2MnSiO4/C.
Discharge capacities are plotted in Figure 3-30 as a function of cycle number, for the different high cut-off voltages. In all cases, a capacity fading is observed in coherence with the non-reversibility observed in dq/dV peaks over long cycling, as shown in Figure 3-29a-b. The capacity fading increases with the upper cut-off voltage and appears higher for upper cut-off voltage conditions that involved a Mn4+/Mn3+ oxidation process (4.1V, 4.2V and 4.8V) in the first charge.
Figure 3-30. Cycling performance of LMS/C_81 over 120 cycles for different upper cut-off voltages, 3.8V (small dash), 3.9V (triangle), 4.0V (circle), 4.1V (diamond), 4.2V (big dash) and 4.8V (square).
As compared in the Figure 3-31a-b, where the 2nd and 120th galvanostatic cycles are shown, the voltage profile of Li2MnSiO4/C evolves with cycle number toward a unique voltage profile, as evidenced in Figure 3-31b. This phenomenon occurs earlier when high cut-off voltages are used and vice-versa.
To conclude, the initial electrochemical behavior of Li2MnSiO4 as exhibited during the 1st charge is transformed upon cycling whatever the upper cut-off voltages tested. This phenomenon occurs even from very low lithium extraction, 0.17Li+ per f.u.. Therefore, Li2MnSiO4 is not considered
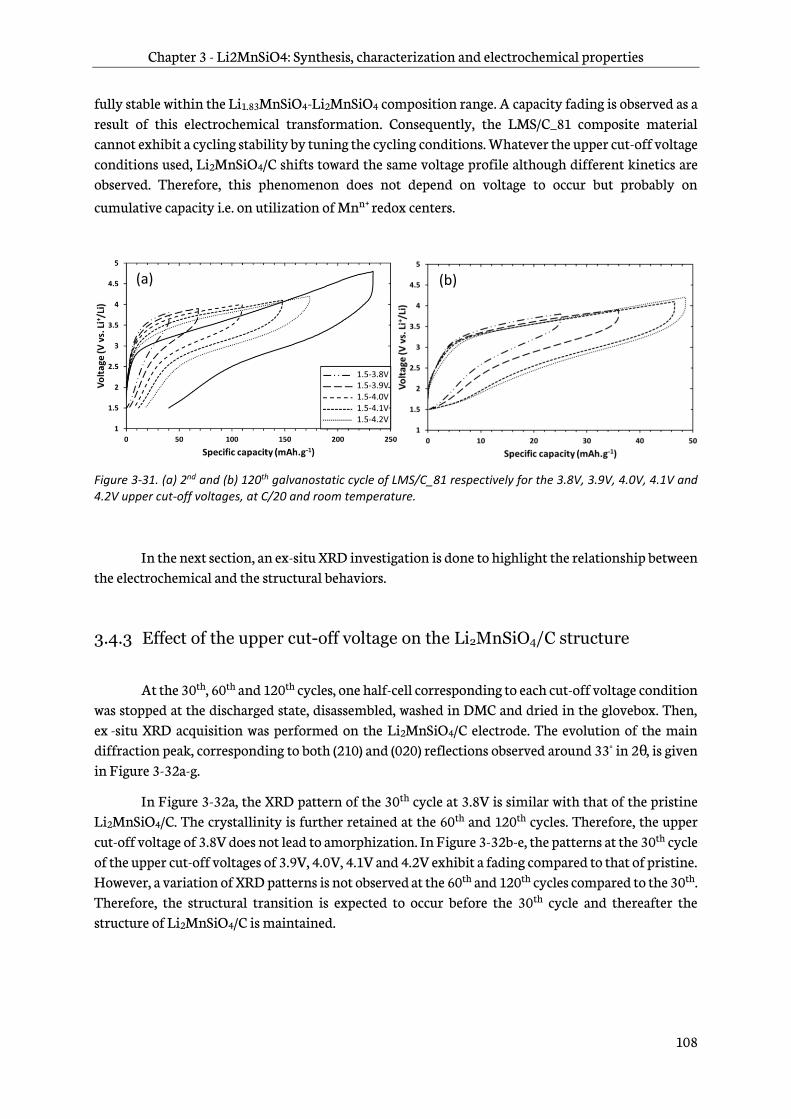
Chapter 3 - Li2MnSiO4: Synthesis, characterization and electrochemical properties
108
fully stable within the Li1.83MnSiO4-Li2MnSiO4 composition range. A capacity fading is observed as a result of this electrochemical transformation. Consequently, the LMS/C_81 composite material
cannot exhibit a cycling stability by tuning the cycling conditions. Whatever the upper cut-off voltage conditions used, Li2MnSiO4/C shifts toward the same voltage profile although different kinetics are observed. Therefore, this phenomenon does not depend on voltage to occur but probably on
cumulative capacity i.e. on utilization of Mnn+ redox centers.
Figure 3-31. (a) 2nd and (b) 120th galvanostatic cycle of LMS/C_81 respectively for the 3.8V, 3.9V, 4.0V, 4.1V and 4.2V upper cut-off voltages, at C/20 and room temperature.
In the next section, an ex-situ XRD investigation is done to highlight the relationship between the electrochemical and the structural behaviors.
3.4.3 Effect of the upper cut-off voltage on the Li2MnSiO4/C structure
At the 30th, 60th and 120th cycles, one half-cell corresponding to each cut-off voltage condition was stopped at the discharged state, disassembled, washed in DMC and dried in the glovebox. Then, ex -situ XRD acquisition was performed on the Li2MnSiO4/C electrode. The evolution of the main diffraction peak, corresponding to both (210) and (020) reflections observed around 33° in 2θ , is given in Figure 3-32a-g.
In Figure 3-32a, the XRD pattern of the 30th cycle at 3.8V is similar with that of the pristine Li2MnSiO4/C. The crystallinity is further retained at the 60th and 120th cycles. Therefore, the upper cut-off voltage of 3.8V does not lead to amorphization. In Figure 3-32b-e, the patterns at the 30th cycle of the upper cut-off voltages of 3.9V, 4.0V, 4.1V and 4.2V exhibit a fading compared to that of pristine. However, a variation of XRD patterns is not observed at the 60th and 120th cycles compared to the 30th. Therefore, the structural transition is expected to occur before the 30th cycle and thereafter the structure of Li2MnSiO4/C is maintained.
(b) (a)
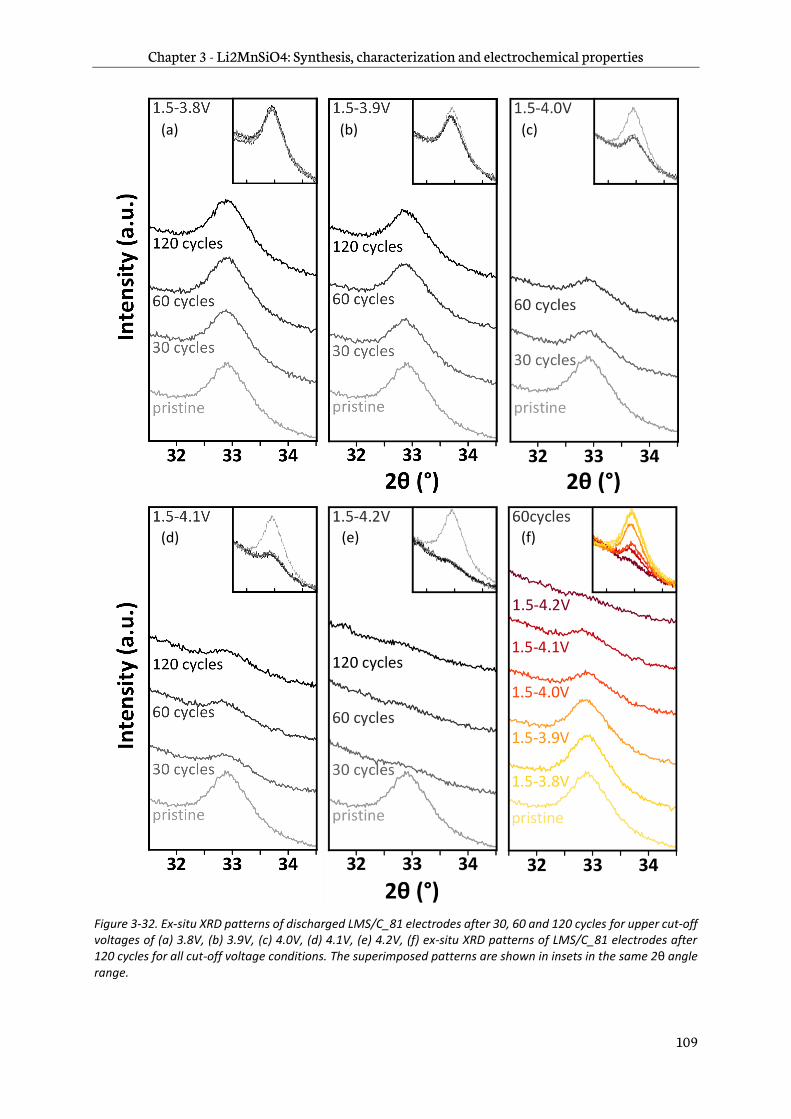
Chapter 3 - Li2MnSiO4: Synthesis, characterization and electrochemical properties
109
Figure 3-32. Ex-situ XRD patterns of discharged LMS/C_81 electrodes after 30, 60 and 120 cycles for upper cut-off voltages of (a) 3.8V, (b) 3.9V, (c) 4.0V, (d) 4.1V, (e) 4.2V, (f) ex-situ XRD patterns of LMS/C_81 electrodes after 120 cycles for all cut-off voltage conditions. The superimposed patterns are shown in insets in the same 2θ angle range.
(d)
(a) (b) (c)
(f) (e)

Chapter 3 - Li2MnSiO4: Synthesis, characterization and electrochemical properties
110
At a fixed cycle number, the crystallinity decreases when the upper cut-off voltage increases, as illustrated in Figure 3-32f for the 60th cycle. The lowest cut-off voltage (3.8V) does not exhibit a crystallinity fading. However, at 4.1V the amorphization is almost completed. Finally at 4.2V, the amorphization is fully completed.
The results of ex-situ XRD showed that a structural transition always occurs upon the first 30 cycles. Beyond, crystallinity is retained until the 120th cycle. In Figure 3-32f, a gradual amorphization is evidenced when the cut-off voltage increases. The results are similar to in-situ diffraction studies of Li2MnSiO4 upon first charge by Dominko et al. who reported a complete amorphization of Li2MnSiO4 when 1Li+/f.u. was extracted [118], [154]. A structural transformation is therefore expected at early cycling. The origin of structure retention observed thereafter remains unexplained.
A large difference of crystallinity loss is observed for a cut-off voltage of 4.0V or higher (Figure 3-32f). It corresponds approximately to the voltage where the strongest capacity-fading trend is evidenced (Figure 3-29) and it also corresponds to the voltage region where the 2nd oxidation peak,
attributed to the formation of Mn4+ started (Figure 3-28). The crystal field theory assesses that Mn3+ is
more stable in coordination 5, square-pyramidal, but Mn4+ is more stable in coordination 6, octahedral [179]. Computation techniques predicted large distortions and volume changes upon the transition from Mn3+ to Mn4+ [118], [179], [181]. Thus, the formation of Mn4+ could accelerate the transformation of electrochemical behavior of Li2MnSiO4 i.e. modification of voltage profile and capacity fading, and the structural transition.
Despite crystallinity retention is observed for a cut-off voltage of 3.8V, it also exhibits capacity fading; thus, amorphization is not considered as the only cause of capacity fading as it has been often reported.
3.4.4 Discussion about the evidences of Li2MnSiO4/C degradation upon cycling
As a summary, the monitoring on Li2MnSiO4/C behavior upon cycling yields three main observations. First, the capacity fading is evidenced whatever the upper cut-off voltage used i.e. from 3.8V to 4.8V and at each cycle from the 1st to 120th cycles, as show in Figure 3-30.
Second, Li2MnSiO4/C evolves toward a unique voltage profile upon cycling whatever the upper cut-off voltage used. Yet, its kinetic, i.e. the number of cycles before it occurs depends of the upper cut-off voltage. When the latter is high e.g. 4.2V, the unique voltage profile is observed at earlier cycle number and vice-versa. It can be interpreted by a gradual transformation of the Li2MnSiO4/C voltage profile that appears stabilized when this unique voltage profile is reached
Third, the ex-situ XRD study for the different cut-off voltages between 3.8V and 4.2V shows at the 30th, 60th and 120th cycles a gradual amorphization increasing from 3.9V to 4.2V (see Figure 3-32). The degradation of the Li2MnSiO4 electrochemical and structural behavior is gradual. The capacity fading is not strictly related to structure retention. It is rather attributed to the incapacity of
Li2MnSiO4 to accommodate reversible Li+ extraction/insertion. It probably provokes an internal
Chapter 3 - Li2MnSiO4: Synthesis, characterization and electrochemical properties
111
transformation of Li2MnSiO4, as illustrated by the change of voltage profile shown in galvanostatic and dq/dV plots that yields in some cases to amorphization (see Figure 3-32).
3.5 Aluminum doping of Li2MnSiO4/C
3.5.1 Doping strategy
The structural instability and electrochemical transformation of Li2MnSiO4 upon the first charge has been evidenced in sections 3.2 and 3.3.2. Several strategies were proposed in the literature to stabilize Li2MnSiO4 framework (Table 1-4, section 1.3.6.6). The attempts of partial substitution of
Mn2+ by Fe2+, addition of pillar ions (Al3+, Mg2+, Ti4+) or substitution of SiO44- by PO4
3-, etc., were not
successful to suppress the capacity fading of Li2MnSiO4.
A new substitution strategy is suggested here to limit or suppress the cycling degradation phenomena. Increasing the manganese content in “ Li2MnSiO4” is believed to decrease the overall oxidation stress on each redox center. Mn-rich lithium manganese orthosilicates have never been reported to our knowledge. The synthesis of a material with the formula Li2-xMn1+xAlxSi1-xO4 is
proposed. The addition of Mn2+ is compensated by the partial substitution of Si4+ and Li+ by
electrochemically inert Al3+ [266] to keep electroneutrality and manganese ions at the +2 state.
Furthermore, Al3+ ions are expected to help the stabilization of Li2MnSiO4 structure upon cycling, via pillaring effect.
Two compositions of Li2-xMn1+xAlxSi1-xO4 coated with carbon are synthesized and electrochemically tested with x=0.05 and x=0.10 to keep a high content of lithium in the structure.
3.5.2 Sol-gel synthesis
3.5.2.1 Selection of aluminum precursor
A sol-gel process was used for the synthesis of Li2-xMn1+xAlxSi1-xO4/C. The aluminum precursor was selected to fit in the sol-gel process developed for Li2MnSiO4/C and summarized in section 3.1.4 (see Figure 3-20). It was chosen among the families of inorganic salts and alkoxides. Its specifications are described as follows and are similar to those used to select lithium and manganese acetates (see section 3.1.1.1):
- solubility in both H2O and ethanol, or at least in water-ethanol mixture; - organic counter-ion; - acidic; - formation of reducing gases upon thermal decomposition;
Aluminum acetates are available in monobasic and dibasic forms, respectively Al(CH3CO2)2(OH) and Al(CH3CO2)(OH)2. Because of the hydroxyl groups, their addition could increase the pH of and make the manganese ions precipitate (see section 3.1.1.1); thus, they were discarded.
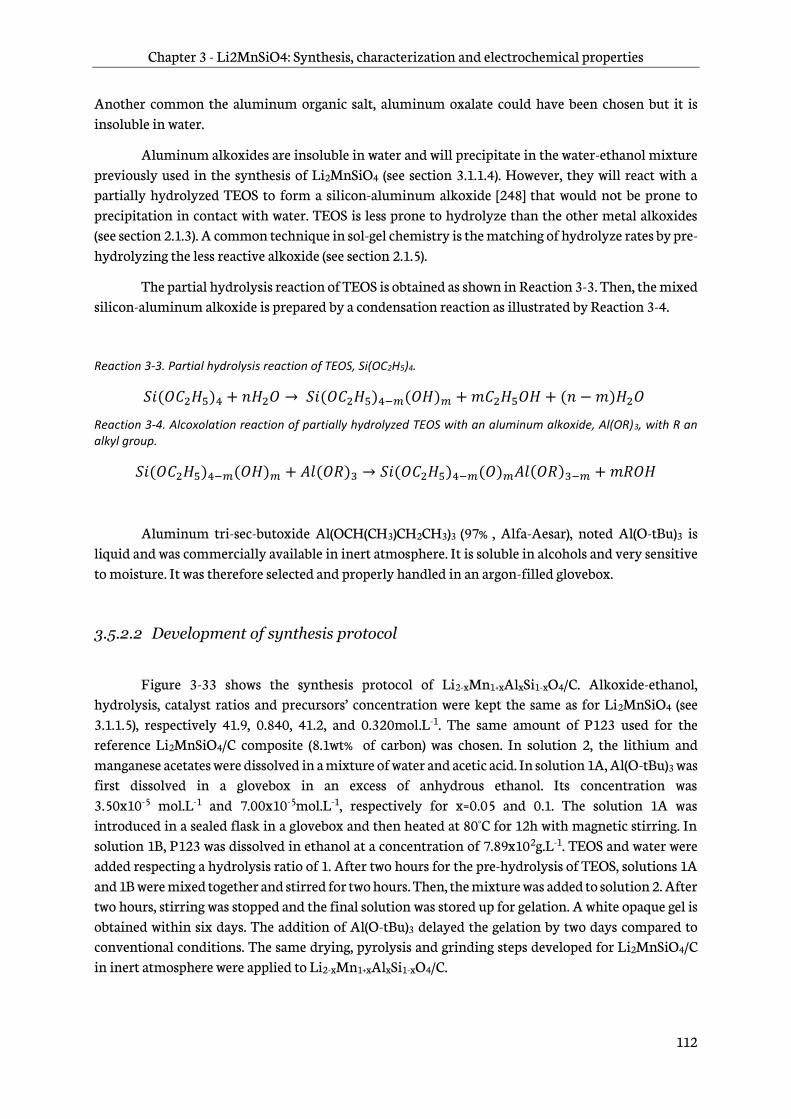
Chapter 3 - Li2MnSiO4: Synthesis, characterization and electrochemical properties
112
Another common the aluminum organic salt, aluminum oxalate could have been chosen but it is insoluble in water.
Aluminum alkoxides are insoluble in water and will precipitate in the water-ethanol mixture previously used in the synthesis of Li2MnSiO4 (see section 3.1.1.4). However, they will react with a partially hydrolyzed TEOS to form a silicon-aluminum alkoxide [248] that would not be prone to precipitation in contact with water. TEOS is less prone to hydrolyze than the other metal alkoxides (see section 2.1.3). A common technique in sol-gel chemistry is the matching of hydrolyze rates by pre-hydrolyzing the less reactive alkoxide (see section 2.1.5).
The partial hydrolysis reaction of TEOS is obtained as shown in Reaction 3-3. Then, the mixed silicon-aluminum alkoxide is prepared by a condensation reaction as illustrated by Reaction 3-4.
Reaction 3-3. Partial hydrolysis reaction of TEOS, Si(OC2H5)4.
𝑆𝑖(𝑂𝐶2𝐻5)4 + 𝑛𝐻2𝑂 → 𝑆𝑖(𝑂𝐶2𝐻5)4−𝑚(𝑂𝐻)𝑚 + 𝑚𝐶2𝐻5𝑂𝐻 + (𝑛 − 𝑚)𝐻2𝑂
Reaction 3-4. Alcoxolation reaction of partially hydrolyzed TEOS with an aluminum alkoxide, Al(OR)3, with R an alkyl group.
𝑆𝑖(𝑂𝐶2𝐻5)4−𝑚(𝑂𝐻)𝑚 + 𝐴𝑙(𝑂𝑅)3 → 𝑆𝑖(𝑂𝐶2𝐻5)4−𝑚(𝑂)𝑚𝐴𝑙(𝑂𝑅)3−𝑚 + 𝑚𝑅𝑂𝐻
Aluminum tri-sec-butoxide Al(OCH(CH3)CH2CH3)3 (97% , Alfa-Aesar), noted Al(O-tBu)3 is liquid and was commercially available in inert atmosphere. It is soluble in alcohols and very sensitive to moisture. It was therefore selected and properly handled in an argon-filled glovebox.
3.5.2.2 Development of synthesis protocol
Figure 3-33 shows the synthesis protocol of Li2-xMn1+xAlxSi1-xO4/C. Alkoxide-ethanol, hydrolysis, catalyst ratios and precursors’ concentration were kept the same as for Li2MnSiO4 (see 3.1.1.5), respectively 41.9, 0.840, 41.2, and 0.320mol.L-1. The same amount of P123 used for the reference Li2MnSiO4/C composite (8.1wt% of carbon) was chosen. In solution 2, the lithium and manganese acetates were dissolved in a mixture of water and acetic acid. In solution 1A, Al(O-tBu)3 was first dissolved in a glovebox in an excess of anhydrous ethanol. Its concentration was 3.50x10⁻⁵ mol.L-1 and 7.00x10⁻⁵mol.L-1, respectively for x=0.05 and 0.1. The solution 1A was introduced in a sealed flask in a glovebox and then heated at 80°C for 12h with magnetic stirring. In solution 1B, P123 was dissolved in ethanol at a concentration of 7.89x10²g.L-1. TEOS and water were added respecting a hydrolysis ratio of 1. After two hours for the pre-hydrolysis of TEOS, solutions 1A and 1B were mixed together and stirred for two hours. Then, the mixture was added to solution 2. After two hours, stirring was stopped and the final solution was stored up for gelation. A white opaque gel is obtained within six days. The addition of Al(O-tBu)3 delayed the gelation by two days compared to conventional conditions. The same drying, pyrolysis and grinding steps developed for Li2MnSiO4/C in inert atmosphere were applied to Li2-xMn1+xAlxSi1-xO4/C.
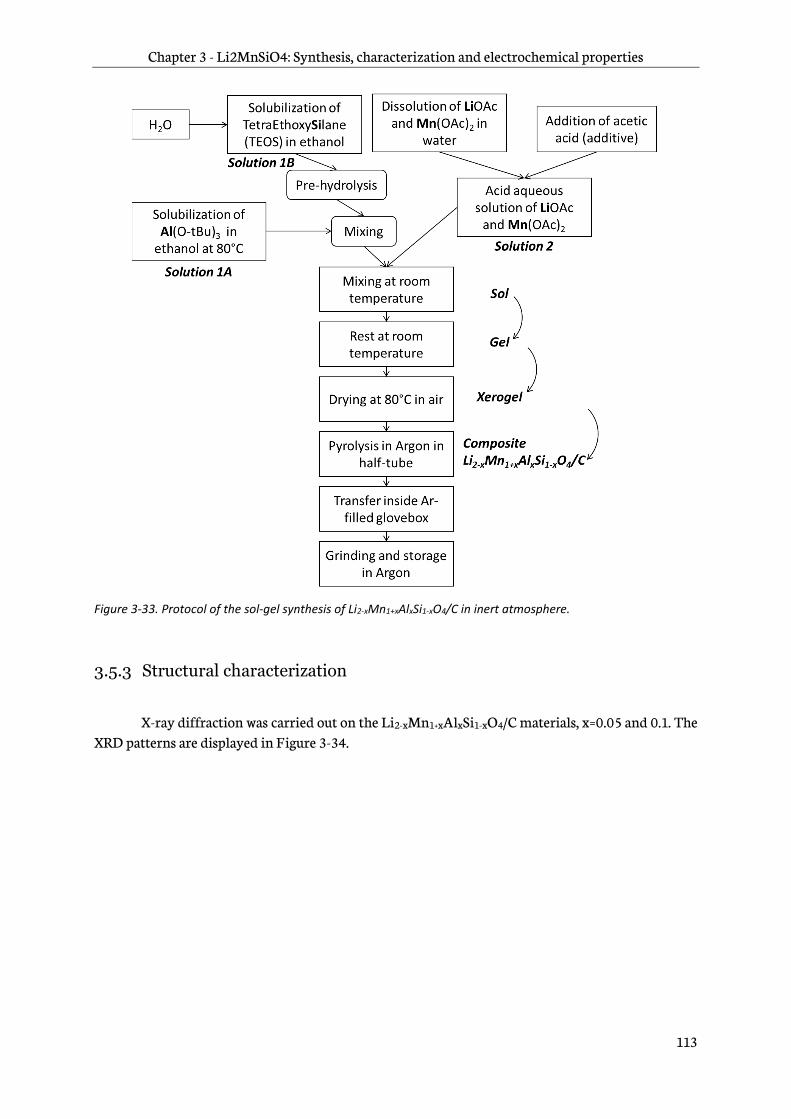
Chapter 3 - Li2MnSiO4: Synthesis, characterization and electrochemical properties
113
Figure 3-33. Protocol of the sol-gel synthesis of Li2-xMn1+xAlxSi1-xO4/C in inert atmosphere.
3.5.3 Structural characterization
X-ray diffraction was carried out on the Li2-xMn1+xAlxSi1-xO4/C materials, x=0.05 and 0.1. The XRD patterns are displayed in Figure 3-34.

Chapter 3 - Li2MnSiO4: Synthesis, characterization and electrochemical properties
114
Figure 3-34. Powder X-Ray Diffraction patterns of Li2-xMn1+xAlxSi1-xO4/C (x=0, 0.05 and 0.1) materials pyrolyzed at 650°C for 0.5h in argon. The main peaks of the MnO impurity are displayed and marked by a symbol (x). The reflections planes of the Pmn21 space group whose position shifts when x is increased are indicated. A superimposition of the XRD patterns are shown in inset to show the shift of reflections toward the low 2θ angles (left black arrow) when x increases (right black arrow).
The diffraction peaks of Li2-xMn1+xAlxSi1-xO4/C material shift toward the low 2θ angles when x increases from 0 to 0.10. It is particularly highlighted in the inset of Figure 3-34 where the XRD patterns are almost superimposed. This shift toward the low 2θ angles evidences an increase of the lattice parameters. No additional reflections are observed in the samples after Al doping. The diffraction peaks exhibit similar FWHM i.e. a similar crystallite size. The reflections of the MnO impurity are observed in the substituted samples. Their intensity increase with x; thus, the structure cannot not fully accommodate the addition of manganese in the substituted compositions.
3.5.4 Morphological characterization
The carbon contents of Li2-xMn1+xAlxSi1-xO4/C, x=0.05 and 0.10 were checked by TGA. The same content of carbon (⋍8wt.% ) as in LMS/C_81 material was measured. Their morphology were observed by SEM and compared to that of reference Li2MnSiO4, as shown in Figure 3-35. Nanosized primary particles with round shape, built in porous micrometric size agglomerates was found similarly to LMS/C_81.

Chapter 3 - Li2MnSiO4: Synthesis, characterization and electrochemical properties
115
Figure 3-35. Scanning Electron Microscopy images of (a) LMS/C_81 (Li2MnSiO4), (b) Li1.95Mn1.05Al0.05Si0.95O4/C and (c) Li1.90Mn1.10Al0.10 Si0.90O4/C.
3.5.5 Infra-red spectroscopy
A FTIR spectrum performed in ATR mode, was recorded for Li1.90Mn1.10Al0.10Si0.90O4/C material. It is given in Figure 3-36 and compared to that of LMS/C_81. The small differences in terms of intensities from the SiO4
4- absorption modes, at 840-900cm-1, show that the orthosilicate framework was slightly modified. It is coherent with the hypothesis of a successful substitution. Al-O stretching (750-850cm-1) and O-Al-O bending (650-700cm-1) modes, generally observed in aluminum oxide materials, are not exacerbated in the spectrum. Therefore, it can be considered that substitution was successful since no aluminum-based impurities are evidenced.
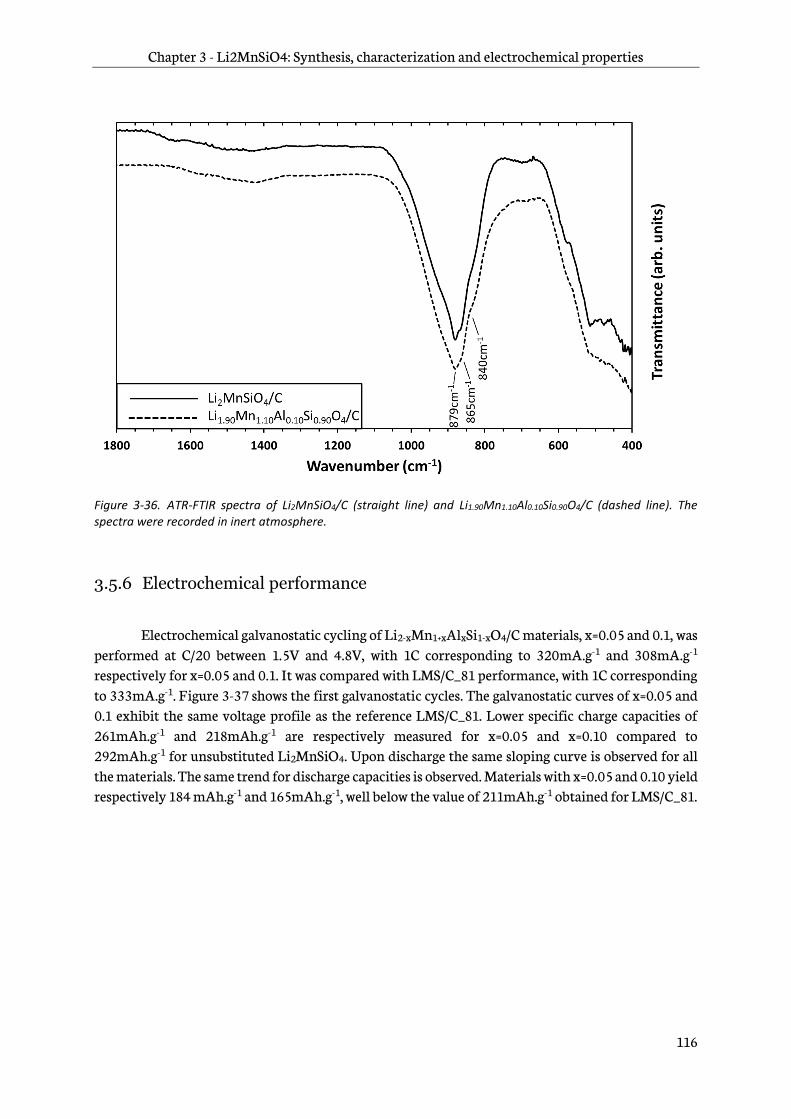
Chapter 3 - Li2MnSiO4: Synthesis, characterization and electrochemical properties
116
Figure 3-36. ATR-FTIR spectra of Li2MnSiO4/C (straight line) and Li1.90Mn1.10Al0.10Si0.90O4/C (dashed line). The spectra were recorded in inert atmosphere.
3.5.6 Electrochemical performance
Electrochemical galvanostatic cycling of Li2-xMn1+xAlxSi1-xO4/C materials, x=0.05 and 0.1, was performed at C/20 between 1.5V and 4.8V, with 1C corresponding to 320mA.g-1 and 308mA.g-1 respectively for x=0.05 and 0.1. It was compared with LMS/C_81 performance, with 1C corresponding to 333mA.g-1. Figure 3-37 shows the first galvanostatic cycles. The galvanostatic curves of x=0.05 and 0.1 exhibit the same voltage profile as the reference LMS/C_81. Lower specific charge capacities of 261mAh.g-1 and 218mAh.g-1 are respectively measured for x=0.05 and x=0.10 compared to 292mAh.g-1 for unsubstituted Li2MnSiO4. Upon discharge the same sloping curve is observed for all the materials. The same trend for discharge capacities is observed. Materials with x=0.05 and 0.10 yield respectively 184 mAh.g-1 and 165mAh.g-1, well below the value of 211mAh.g-1 obtained for LMS/C_81.
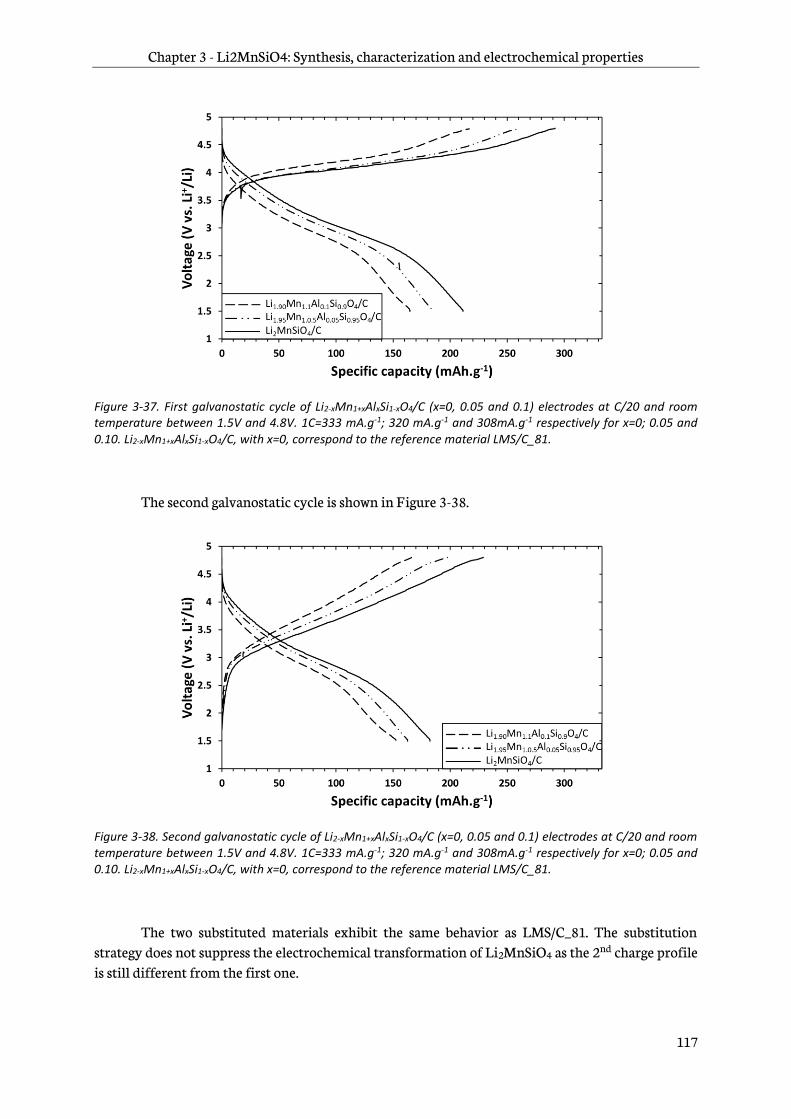
Chapter 3 - Li2MnSiO4: Synthesis, characterization and electrochemical properties
117
Figure 3-37. First galvanostatic cycle of Li2-xMn1+xAlxSi1-xO4/C (x=0, 0.05 and 0.1) electrodes at C/20 and room temperature between 1.5V and 4.8V. 1C=333 mA.g-1; 320 mA.g-1 and 308mA.g-1 respectively for x=0; 0.05 and 0.10. Li2-xMn1+xAlxSi1-xO4/C, with x=0, correspond to the reference material LMS/C_81.
The second galvanostatic cycle is shown in Figure 3-38.
Figure 3-38. Second galvanostatic cycle of Li2-xMn1+xAlxSi1-xO4/C (x=0, 0.05 and 0.1) electrodes at C/20 and room temperature between 1.5V and 4.8V. 1C=333 mA.g-1; 320 mA.g-1 and 308mA.g-1 respectively for x=0; 0.05 and 0.10. Li2-xMn1+xAlxSi1-xO4/C, with x=0, correspond to the reference material LMS/C_81.
The two substituted materials exhibit the same behavior as LMS/C_81. The substitution strategy does not suppress the electrochemical transformation of Li2MnSiO4 as the 2nd charge profile is still different from the first one.

Chapter 3 - Li2MnSiO4: Synthesis, characterization and electrochemical properties
118
Cycling performance over 30 cycles of the three materials is shown in Figure 3-39. In the first 10 cycles, a higher capacity loss is observed for Li2MnSiO4/C compared to the two Al-doped LMS/C. However, after only 10 cycles, the discharge capacities of the three materials are very similar. Furthermore, capacity fading is also similar for both Li2MnSiO4/C and Li2-xMn1+xAlxSi1-xO4/C materials. At the 30th cycle, discharge capacities of only 35mAh.g-1
are measured. Finally, this doping strategy does not succeed in improving significantly the capacity retention of the Li2MnSiO4/C-like materials
Figure 3-39. Cycling performance of Li2-xMn1+xAlxSi1-xO4/C (x=0, 0.05 and 0.1) electrodes at C/20 and room temperature between 1.5V and 4.8V. 1C=333 mA.g-1; 320 mA.g-1 and 308mA.g-1 respectively for x=0; 0.05 and 0.10. Li2-xMn1+xAlxSi1-xO4/C, with x=0, correspond to the LMS/C_81 material.
3.6 Reactivity to air of Li2MnSiO4/C
3.6.1 Introduction
Insensitivity of Li2MnSiO4 to air has been mentioned twice in the literature [95], [160], but it has not been studied to our knowledge. To fulfill the lack in the literature, the stability in air of the reference material, Li2MnSiO4/C (8.1wt.% of carbon), i.e. LMS/C_81, in air was monitored by several characterization techniques. The results of this study are discussed in the following sections.
3.6.2 Sample preparation
A careful preparation of the samples was carried out to evaluate the stability of Li2MnSiO4/C to air. The interface between ambient atmosphere and Li2MnSiO4/C powder was maximized in the following characterizations to make the supposed reaction more homogeneous. Generally, LMS/C_81 powder was spread out on the bottom of a crystallizer vessel and was exposed to air for different

Chapter 3 - Li2MnSiO4: Synthesis, characterization and electrochemical properties
119
durations. Thereafter, the sample was introduced in an argon-filled glovebox to stop the exposition to air before the analyses were carried out. This method was used for XRD quantitative analysis, ATR-FTIR, SEM, STEM-EELS, CHNS/O elemental analysis and TGA. Exceptions were done for XPS and classic XRD measurements. In those cases, the sample holder was filled with LMS/C_81 powder. It was exposed to air for different durations and it was analyzed. Only the outer layer of LMS/C_81 was in contact with ambient atmosphere.
3.6.3 X-ray diffraction
XRD measurements were performed on LMS/C_81 after 4.5, 7, 14 and 30 days of exposition to air. The same sample was used for all the measurements. The obtained XRD patterns are shown in Figure 3-40a between 15 and 34° in 2θ angle.
The Li2MnSiO4 reflections, described in the Pmn21 space group, do not show any evolution after exposition to air. However, after 4.5 days of exposition, additional reflections are observed. They are attributed to a Li2CO3 phase, described in the C2/c space group (n°15). The diffraction peaks respectively correspond to the (110), (111), (202), (002) and (112) planes, as identified in the diffractogram (Figure 3-40). Their intensity slightly increases until 30 days of exposition; thus, the Li2CO3 content increased in the sample.
Figure 3-40. X-ray diffraction patterns of (a) pristine and exposed 4.5, 7, 14 and 30 days to air LMS/C_81, (b) LMS/C_81 exposed 4.5 days to air mixed with different weight fractions of commercial Li2CO3 standard, ccial-Li2CO3-std. All the reflections and Miller indexes of Pmn21-Li2MnSiO4 and C2/c-Li2CO3 are indicated in (a), while only those used for quantitative analysis are displayed in (b).
(a) (b)
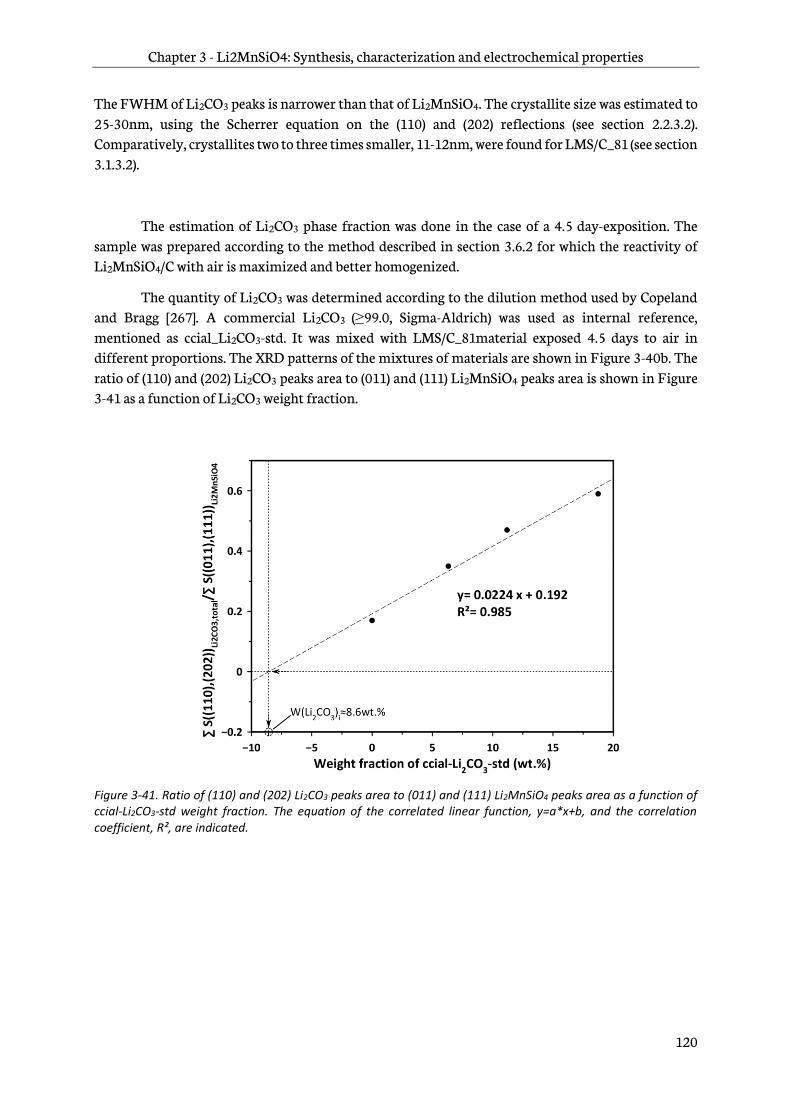
Chapter 3 - Li2MnSiO4: Synthesis, characterization and electrochemical properties
120
The FWHM of Li2CO3 peaks is narrower than that of Li2MnSiO4. The crystallite size was estimated to 25-30nm, using the Scherrer equation on the (110) and (202) reflections (see section 2.2.3.2). Comparatively, crystallites two to three times smaller, 11-12nm, were found for LMS/C_81 (see section 3.1.3.2).
The estimation of Li2CO3 phase fraction was done in the case of a 4.5 day-exposition. The sample was prepared according to the method described in section 3.6.2 for which the reactivity of Li2MnSiO4/C with air is maximized and better homogenized.
The quantity of Li2CO3 was determined according to the dilution method used by Copeland and Bragg [267]. A commercial Li2CO3 (≥99.0, Sigma-Aldrich) was used as internal reference, mentioned as ccial_Li2CO3-std. It was mixed with LMS/C_81material exposed 4.5 days to air in different proportions. The XRD patterns of the mixtures of materials are shown in Figure 3-40b. The ratio of (110) and (202) Li2CO3 peaks area to (011) and (111) Li2MnSiO4 peaks area is shown in Figure 3-41 as a function of Li2CO3 weight fraction.
Figure 3-41. Ratio of (110) and (202) Li2CO3 peaks area to (011) and (111) Li2MnSiO4 peaks area as a function of ccial-Li2CO3-std weight fraction. The equation of the correlated linear function, y=a*x+b, and the correlation coefficient, R², are indicated.
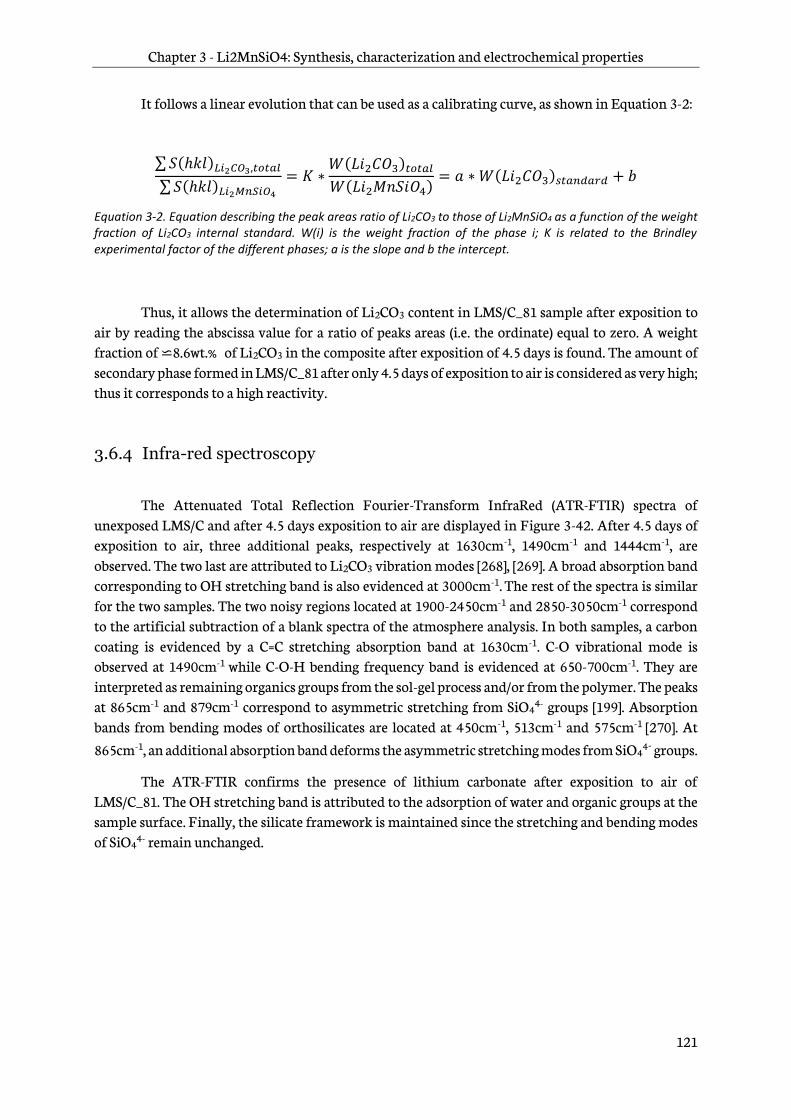
Chapter 3 - Li2MnSiO4: Synthesis, characterization and electrochemical properties
121
It follows a linear evolution that can be used as a calibrating curve, as shown in Equation 3-2:
∑ 𝑆(ℎ𝑘𝑙)𝐿𝑖2𝐶𝑂3,𝑡𝑜𝑡𝑎𝑙
∑ 𝑆(ℎ𝑘𝑙)𝐿𝑖2𝑀𝑛𝑆𝑖𝑂4
= 𝐾 ∗𝑊(𝐿𝑖2𝐶𝑂3)𝑡𝑜𝑡𝑎𝑙
𝑊(𝐿𝑖2𝑀𝑛𝑆𝑖𝑂4)= 𝑎 ∗ 𝑊(𝐿𝑖2𝐶𝑂3)𝑠𝑡𝑎𝑛𝑑𝑎𝑟𝑑 + 𝑏
Equation 3-2. Equation describing the peak areas ratio of Li2CO3 to those of Li2MnSiO4 as a function of the weight fraction of Li2CO3 internal standard. W(i) is the weight fraction of the phase i; K is related to the Brindley experimental factor of the different phases; a is the slope and b the intercept.
Thus, it allows the determination of Li2CO3 content in LMS/C_81 sample after exposition to air by reading the abscissa value for a ratio of peaks areas (i.e. the ordinate) equal to zero. A weight fraction of ⋍8.6wt.% of Li2CO3 in the composite after exposition of 4.5 days is found. The amount of secondary phase formed in LMS/C_81 after only 4.5 days of exposition to air is considered as very high; thus it corresponds to a high reactivity.
3.6.4 Infra-red spectroscopy
The Attenuated Total Reflection Fourier-Transform InfraRed (ATR-FTIR) spectra of unexposed LMS/C and after 4.5 days exposition to air are displayed in Figure 3-42. After 4.5 days of exposition to air, three additional peaks, respectively at 1630cm-1, 1490cm-1 and 1444cm-1, are observed. The two last are attributed to Li2CO3 vibration modes [268], [269]. A broad absorption band corresponding to OH stretching band is also evidenced at 3000cm-1. The rest of the spectra is similar for the two samples. The two noisy regions located at 1900-2450cm-1 and 2850-3050cm-1 correspond to the artificial subtraction of a blank spectra of the atmosphere analysis. In both samples, a carbon coating is evidenced by a C=C stretching absorption band at 1630cm-1. C-O vibrational mode is observed at 1490cm-1 while C-O-H bending frequency band is evidenced at 650-700cm-1. They are interpreted as remaining organics groups from the sol-gel process and/or from the polymer. The peaks at 865cm-1 and 879cm-1 correspond to asymmetric stretching from SiO4
4- groups [199]. Absorption bands from bending modes of orthosilicates are located at 450cm-1, 513cm-1 and 575cm-1 [270]. At 865cm-1, an additional absorption band deforms the asymmetric stretching modes from SiO4
4- groups.
The ATR-FTIR confirms the presence of lithium carbonate after exposition to air of LMS/C_81. The OH stretching band is attributed to the adsorption of water and organic groups at the sample surface. Finally, the silicate framework is maintained since the stretching and bending modes of SiO4
4- remain unchanged.
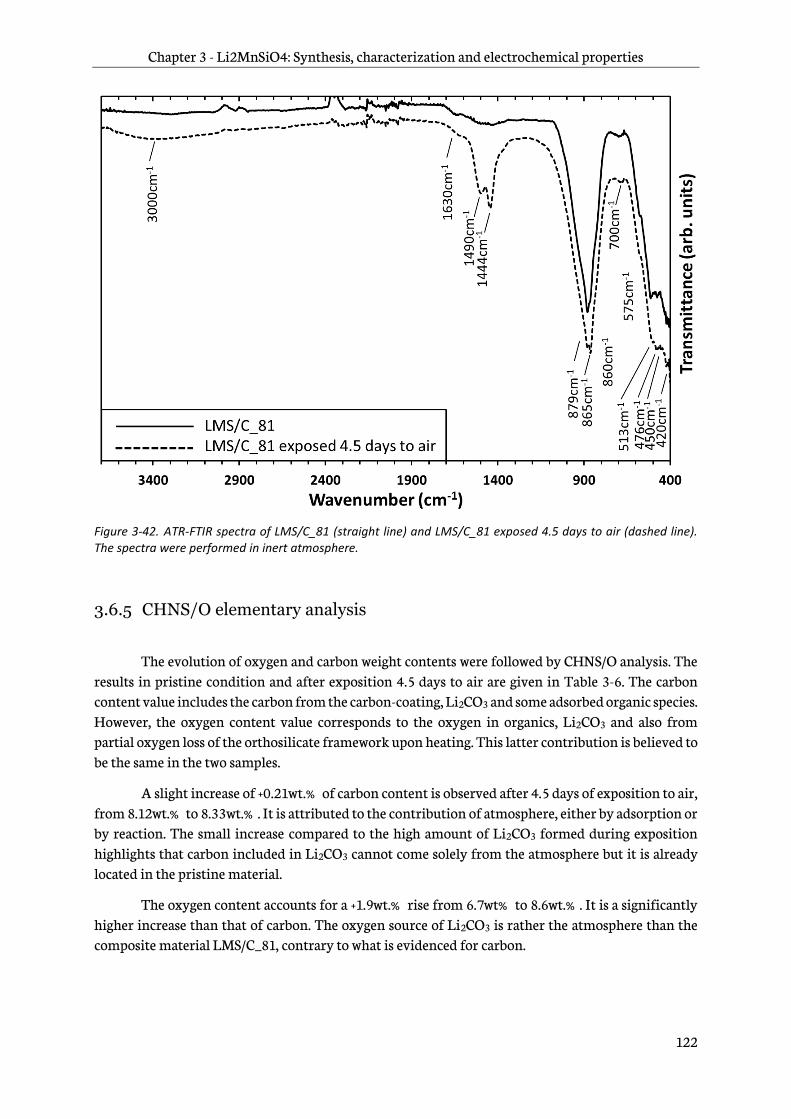
Chapter 3 - Li2MnSiO4: Synthesis, characterization and electrochemical properties
122
Figure 3-42. ATR-FTIR spectra of LMS/C_81 (straight line) and LMS/C_81 exposed 4.5 days to air (dashed line). The spectra were performed in inert atmosphere.
3.6.5 CHNS/O elementary analysis
The evolution of oxygen and carbon weight contents were followed by CHNS/O analysis. The results in pristine condition and after exposition 4.5 days to air are given in Table 3-6. The carbon content value includes the carbon from the carbon-coating, Li2CO3 and some adsorbed organic species. However, the oxygen content value corresponds to the oxygen in organics, Li2CO3 and also from partial oxygen loss of the orthosilicate framework upon heating. This latter contribution is believed to be the same in the two samples.
A slight increase of +0.21wt.% of carbon content is observed after 4.5 days of exposition to air, from 8.12wt.% to 8.33wt.% . It is attributed to the contribution of atmosphere, either by adsorption or by reaction. The small increase compared to the high amount of Li2CO3 formed during exposition highlights that carbon included in Li2CO3 cannot come solely from the atmosphere but it is already located in the pristine material.
The oxygen content accounts for a +1.9wt.% rise from 6.7wt% to 8.6wt.% . It is a significantly higher increase than that of carbon. The oxygen source of Li2CO3 is rather the atmosphere than the composite material LMS/C_81, contrary to what is evidenced for carbon.
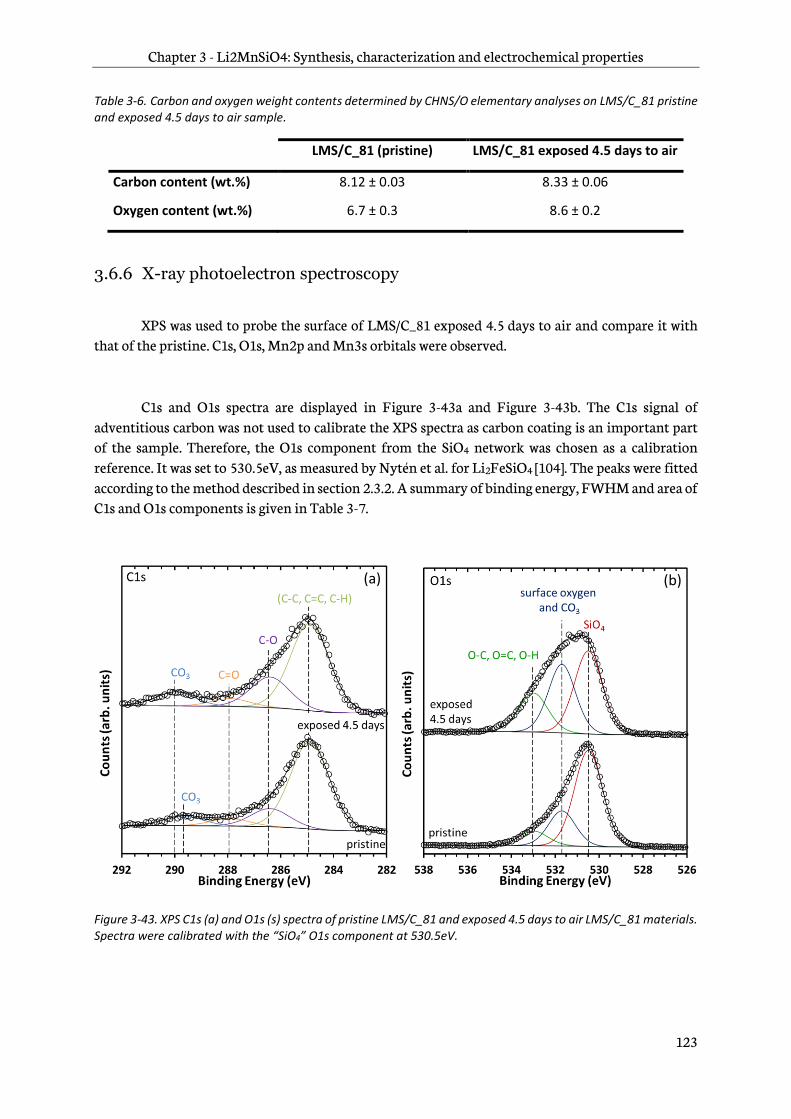
Chapter 3 - Li2MnSiO4: Synthesis, characterization and electrochemical properties
123
Table 3-6. Carbon and oxygen weight contents determined by CHNS/O elementary analyses on LMS/C_81 pristine and exposed 4.5 days to air sample.
LMS/C_81 (pristine) LMS/C_81 exposed 4.5 days to air
Carbon content (wt.%) 8.12 ± 0.03 8.33 ± 0.06
Oxygen content (wt.%) 6.7 ± 0.3 8.6 ± 0.2
3.6.6 X-ray photoelectron spectroscopy
XPS was used to probe the surface of LMS/C_81 exposed 4.5 days to air and compare it with that of the pristine. C1s, O1s, Mn2p and Mn3s orbitals were observed.
C1s and O1s spectra are displayed in Figure 3-43a and Figure 3-43b. The C1s signal of adventitious carbon was not used to calibrate the XPS spectra as carbon coating is an important part of the sample. Therefore, the O1s component from the SiO4 network was chosen as a calibration reference. It was set to 530.5eV, as measured by Nytén et al. for Li2FeSiO4 [104]. The peaks were fitted according to the method described in section 2.3.2. A summary of binding energy, FWHM and area of C1s and O1s components is given in Table 3-7.
Figure 3-43. XPS C1s (a) and O1s (s) spectra of pristine LMS/C_81 and exposed 4.5 days to air LMS/C_81 materials. Spectra were calibrated with the “SiO4” O1s component at 530.5eV.
(a) (b)
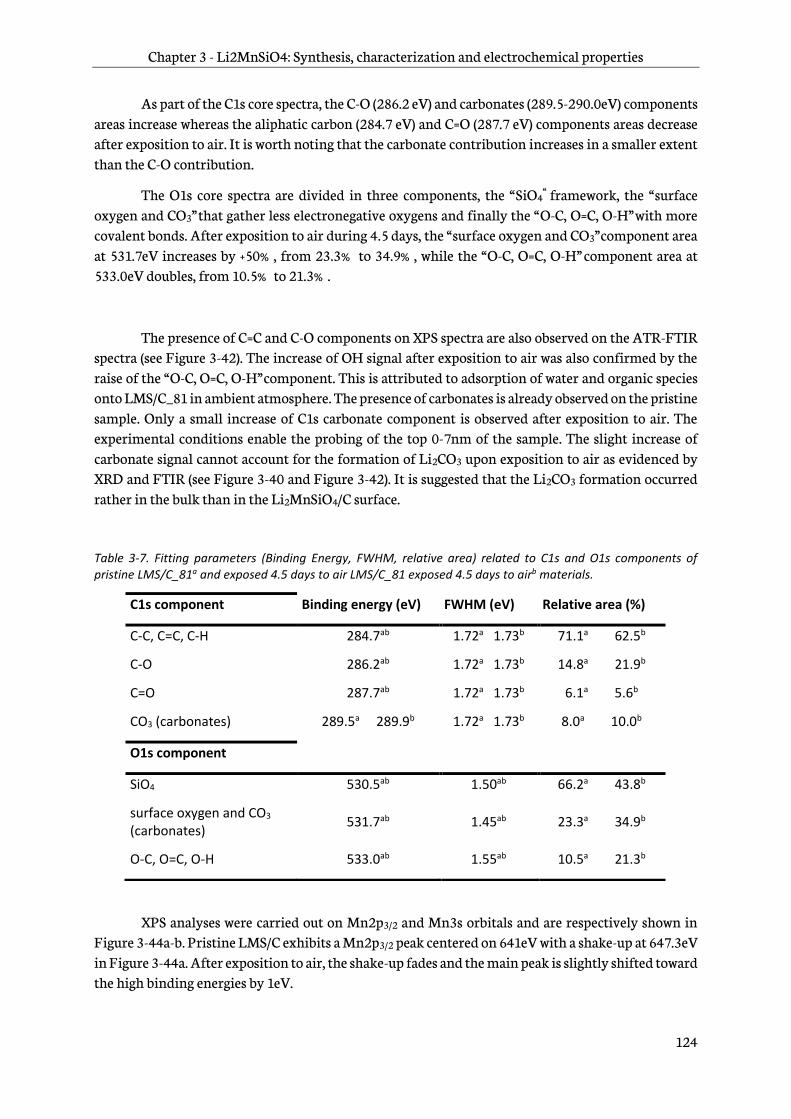
Chapter 3 - Li2MnSiO4: Synthesis, characterization and electrochemical properties
124
As part of the C1s core spectra, the C-O (286.2 eV) and carbonates (289.5-290.0eV) components areas increase whereas the aliphatic carbon (284.7 eV) and C=O (287.7 eV) components areas decrease after exposition to air. It is worth noting that the carbonate contribution increases in a smaller extent than the C-O contribution.
The O1s core spectra are divided in three components, the “ SiO4“ framework, the “ surface
oxygen and CO3” that gather less electronegative oxygens and finally the “ O-C, O=C, O-H” with more covalent bonds. After exposition to air during 4.5 days, the “ surface oxygen and CO3” component area at 531.7eV increases by +50% , from 23.3% to 34.9% , while the “ O-C, O=C, O-H” component area at 533.0eV doubles, from 10.5% to 21.3% .
The presence of C=C and C-O components on XPS spectra are also observed on the ATR-FTIR spectra (see Figure 3-42). The increase of OH signal after exposition to air was also confirmed by the raise of the “ O-C, O=C, O-H” component. This is attributed to adsorption of water and organic species onto LMS/C_81 in ambient atmosphere. The presence of carbonates is already observed on the pristine sample. Only a small increase of C1s carbonate component is observed after exposition to air. The experimental conditions enable the probing of the top 0-7nm of the sample. The slight increase of carbonate signal cannot account for the formation of Li2CO3 upon exposition to air as evidenced by XRD and FTIR (see Figure 3-40 and Figure 3-42). It is suggested that the Li2CO3 formation occurred rather in the bulk than in the Li2MnSiO4/C surface.
Table 3-7. Fitting parameters (Binding Energy, FWHM, relative area) related to C1s and O1s components of pristine LMS/C_81a and exposed 4.5 days to air LMS/C_81 exposed 4.5 days to airb materials.
XPS analyses were carried out on Mn2p3/2 and Mn3s orbitals and are respectively shown in Figure 3-44a-b. Pristine LMS/C exhibits a Mn2p3/2 peak centered on 641eV with a shake-up at 647.3eV in Figure 3-44a. After exposition to air, the shake-up fades and the main peak is slightly shifted toward the high binding energies by 1eV.
C1s component Binding energy (eV) FWHM (eV) Relative area (%)
C-C, C=C, C-H 284.7ab 1.72a 1.73b 71.1a 62.5b
C-O 286.2ab 1.72a 1.73b 14.8a 21.9b
C=O 287.7ab 1.72a 1.73b 6.1a 5.6b
CO3 (carbonates) 289.5a 289.9b 1.72a 1.73b 8.0a 10.0b
O1s component
SiO4 530.5ab 1.50ab 66.2a 43.8b
surface oxygen and CO3 (carbonates)
531.7ab 1.45ab 23.3a 34.9b
O-C, O=C, O-H 533.0ab 1.55ab 10.5a 21.3b

Chapter 3 - Li2MnSiO4: Synthesis, characterization and electrochemical properties
125
The splitting of Mn3s core peak is evidenced in Figure 3-b. It is known that the oxidation state of manganese is linked to the energy value of the gap between the two split Mn3s core peaks and to the ratio between their intensities [271]–[273]. These parameters, named “ Mn3s energy gap” and I3s(2)/I3s(1), were calculated and are summarized in Table 3-8. Mn3s energy gap decreases from 6.21 to 6.10eV and I3s(2)/I3s(1) increases from 2.0 to 2.1 upon exposition to air.
A complete loss of the shake-up peak is observed in Mn2p3/2 core spectra. Furthermore, the main Mn2p3/2 peak is shifted from 1 to 2eV toward the high binding energies. In the literature,
oxidation of Mn2+ to Mn3+, from MnO to MnO(OH) or Mn2O3 [272], [274], resulted in the same observations. Therefore, the presence of Mn(+3) at LMS/C surface after exposition to air is confirmed by the analysis of Mn2p3/2 core spectra.
Mn3s energy gap values of the order of 6-6.1eV and 5.2-5.4V were reported respectively for Mn(+2) and Mn(+3) in the literature [271], [275]. Similarly I3s(2)/I3s(1) increases when Mn is oxidized. The fitting results of Mn3s orbitals in Table 3-8 show the decrease of Mn3s energy gap and the increase of I3s(2)/I3s(1). Therefore, it implies that exposition to air of LMS/C_81 leads to the formation of Mn(+3) as well.
Figure 3-44. XPS Mn2p3/2 (a) and Mn3s (b) spectra of pristine and exposed 4.5 days to air LMS/C_81 materials. Split peaks of Mn3s at high and low binding energies are respectively denoted 3s(1) and 3s(2). Spectra were calibrated with the “SiO4” O1s component at 530.5eV.
(b) (a)
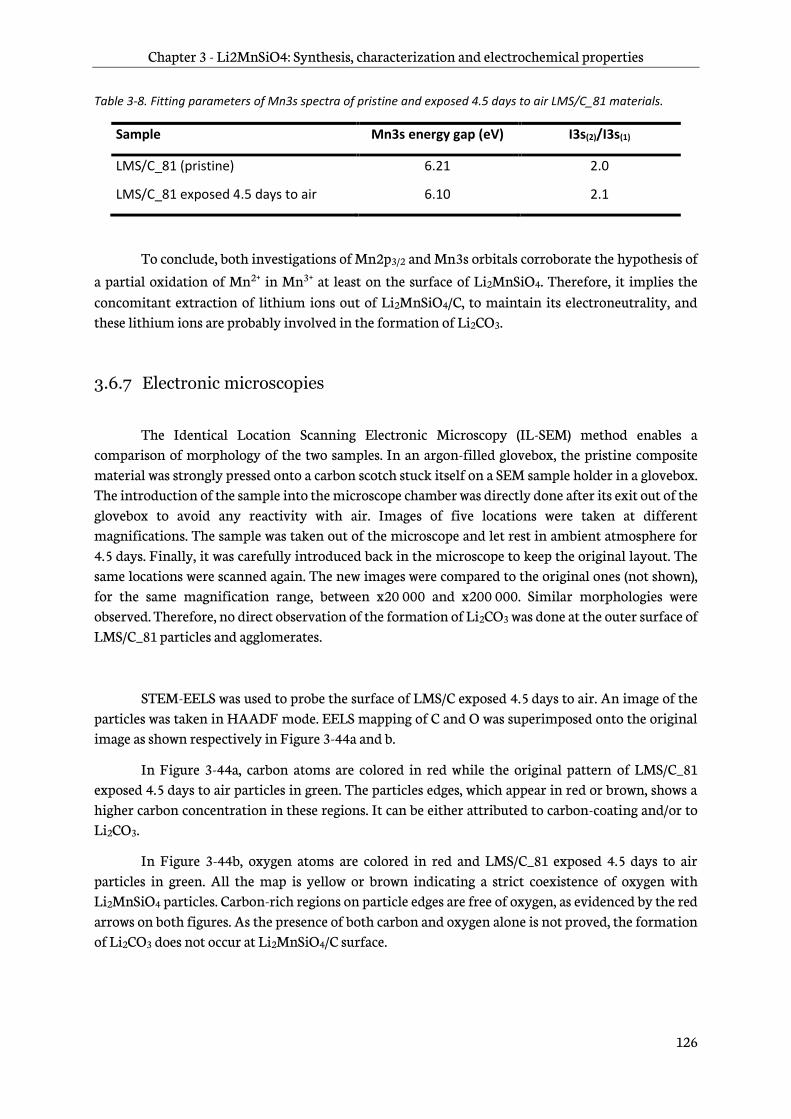
Chapter 3 - Li2MnSiO4: Synthesis, characterization and electrochemical properties
126
Table 3-8. Fitting parameters of Mn3s spectra of pristine and exposed 4.5 days to air LMS/C_81 materials.
Sample Mn3s energy gap (eV) I3s(2)/I3s(1)
LMS/C_81 (pristine) 6.21 2.0
LMS/C_81 exposed 4.5 days to air 6.10 2.1
To conclude, both investigations of Mn2p3/2 and Mn3s orbitals corroborate the hypothesis of a partial oxidation of Mn2+ in Mn3+ at least on the surface of Li2MnSiO4. Therefore, it implies the concomitant extraction of lithium ions out of Li2MnSiO4/C, to maintain its electroneutrality, and these lithium ions are probably involved in the formation of Li2CO3.
3.6.7 Electronic microscopies
The Identical Location Scanning Electronic Microscopy (IL-SEM) method enables a comparison of morphology of the two samples. In an argon-filled glovebox, the pristine composite material was strongly pressed onto a carbon scotch stuck itself on a SEM sample holder in a glovebox. The introduction of the sample into the microscope chamber was directly done after its exit out of the glovebox to avoid any reactivity with air. Images of five locations were taken at different magnifications. The sample was taken out of the microscope and let rest in ambient atmosphere for 4.5 days. Finally, it was carefully introduced back in the microscope to keep the original layout. The same locations were scanned again. The new images were compared to the original ones (not shown), for the same magnification range, between x20 000 and x200 000. Similar morphologies were observed. Therefore, no direct observation of the formation of Li2CO3 was done at the outer surface of LMS/C_81 particles and agglomerates.
STEM-EELS was used to probe the surface of LMS/C exposed 4.5 days to air. An image of the particles was taken in HAADF mode. EELS mapping of C and O was superimposed onto the original image as shown respectively in Figure 3-44a and b.
In Figure 3-44a, carbon atoms are colored in red while the original pattern of LMS/C_81 exposed 4.5 days to air particles in green. The particles edges, which appear in red or brown, shows a higher carbon concentration in these regions. It can be either attributed to carbon-coating and/or to Li2CO3.
In Figure 3-44b, oxygen atoms are colored in red and LMS/C_81 exposed 4.5 days to air particles in green. All the map is yellow or brown indicating a strict coexistence of oxygen with Li2MnSiO4 particles. Carbon-rich regions on particle edges are free of oxygen, as evidenced by the red arrows on both figures. As the presence of both carbon and oxygen alone is not proved, the formation of Li2CO3 does not occur at Li2MnSiO4/C surface.

Chapter 3 - Li2MnSiO4: Synthesis, characterization and electrochemical properties
127
Figure 3-44. STEM-EELS mapping of O (a) and C (b) in HAADF mode of LMS/C_81 exposed 4.5 days to air. C and O are respectively colored in red in (a) and (b), while the LMS/C image are both colored in green.
The bulk of LMS/C_81 exposed 4.5 days to air was probed by STEM-EDX spectroscopy. An image, performed in HAADF mode, is shown in Figure 3-45a. Elemental mapping of C and Si, Mn and O are exhibited on Figure 3-45d, e and f respectively.
Figure 3-45a shows a 1µm2 agglomerate of LMS/C particles. Silicon, manganese and oxygen atoms are well homogenized, respectively in green, blue and yellow in Figure 3-45b, c and d. However, at the center of the Figure 3-45a, a carbon-rich area, 600µm by 600µm in red, is exhibited. It also superimposes with an oxygen-rich region in Figure 3-45d. Two regions, 1 and 2, are indicated by squares in the Figure 3-45b. The region 1 covers a part of the carbon-rich area, while region 2 covers a homogeneous part of the agglomerate.
Quantitative analysis was performed by integrating peaks of C, O and Si from the EDX spectrum of the two regions (not shown). Atomic relative contents are summarized in Table 3-9. Carbon to silicon atomic ratios are of the order of 23.3 and 12.2, respectively in regions 1 and 2. Oxygen over silicon atomic ratios are of the order of 9.0 and 6.8, respectively in regions 1 and 2. The values themselves are not trustworthy since it is difficult to accurately probe oxygen by EDX spectroscopy. Furthermore, because of the nanosized morphology of the sample, multiple scattering of backscattered electrons from another location can happen and give an incorrect composition. However, the trend itself can be taken into consideration. Carbon and oxygen contents normalized over silicon are generally higher in region 1 than in region 2. It likely corresponds to 600µm-agglomerates of Li2CO3.
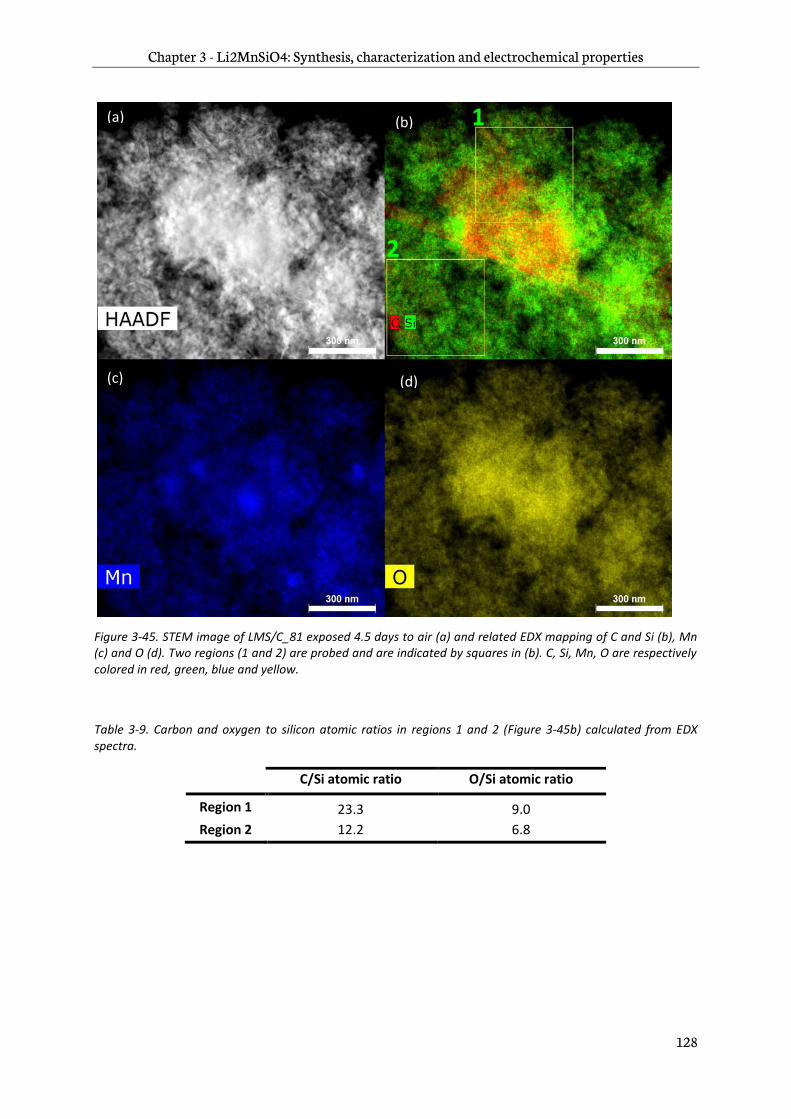
Chapter 3 - Li2MnSiO4: Synthesis, characterization and electrochemical properties
128
Figure 3-45. STEM image of LMS/C_81 exposed 4.5 days to air (a) and related EDX mapping of C and Si (b), Mn (c) and O (d). Two regions (1 and 2) are probed and are indicated by squares in (b). C, Si, Mn, O are respectively colored in red, green, blue and yellow.
Table 3-9. Carbon and oxygen to silicon atomic ratios in regions 1 and 2 (Figure 3-45b) calculated from EDX spectra.
C/Si atomic ratio O/Si atomic ratio
Region 1 23.3 9.0
Region 2 12.2 6.8
(a) (b)
(c) (d)
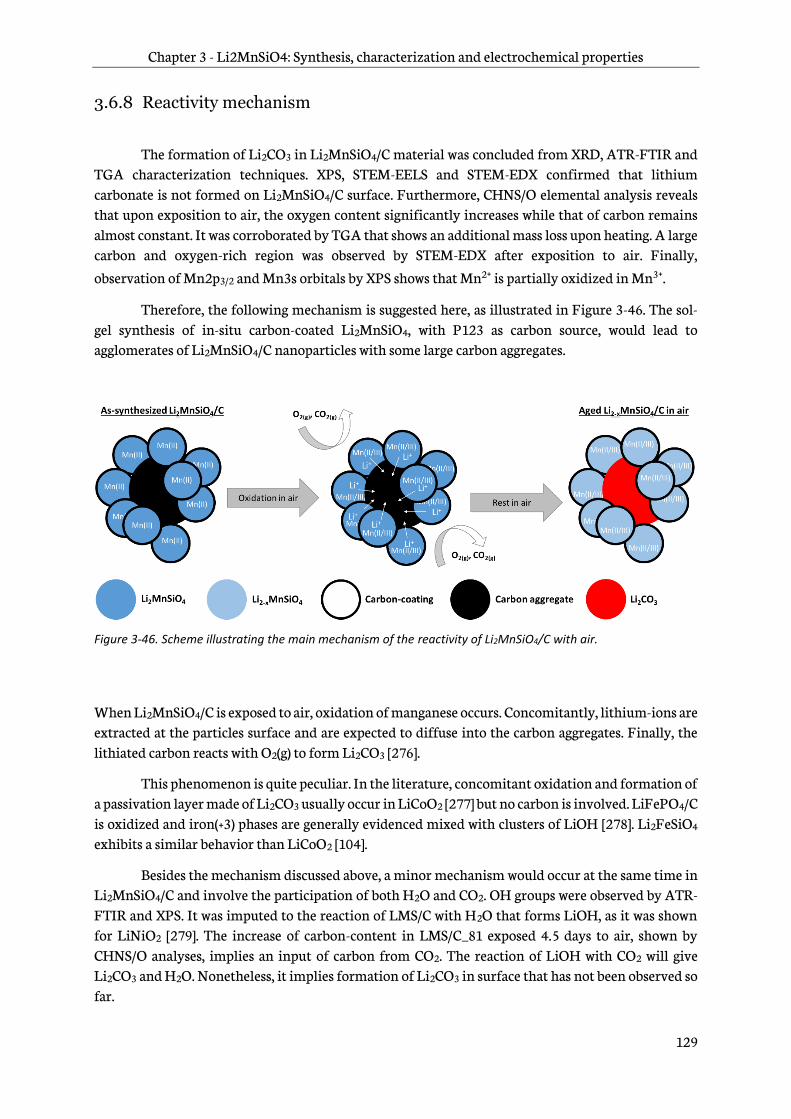
Chapter 3 - Li2MnSiO4: Synthesis, characterization and electrochemical properties
129
3.6.8 Reactivity mechanism
The formation of Li2CO3 in Li2MnSiO4/C material was concluded from XRD, ATR-FTIR and TGA characterization techniques. XPS, STEM-EELS and STEM-EDX confirmed that lithium carbonate is not formed on Li2MnSiO4/C surface. Furthermore, CHNS/O elemental analysis reveals that upon exposition to air, the oxygen content significantly increases while that of carbon remains almost constant. It was corroborated by TGA that shows an additional mass loss upon heating. A large carbon and oxygen-rich region was observed by STEM-EDX after exposition to air. Finally,
observation of Mn2p3/2 and Mn3s orbitals by XPS shows that Mn2+ is partially oxidized in Mn3+.
Therefore, the following mechanism is suggested here, as illustrated in Figure 3-46. The sol-gel synthesis of in-situ carbon-coated Li2MnSiO4, with P123 as carbon source, would lead to agglomerates of Li2MnSiO4/C nanoparticles with some large carbon aggregates.
Figure 3-46. Scheme illustrating the main mechanism of the reactivity of Li2MnSiO4/C with air.
When Li2MnSiO4/C is exposed to air, oxidation of manganese occurs. Concomitantly, lithium-ions are extracted at the particles surface and are expected to diffuse into the carbon aggregates. Finally, the lithiated carbon reacts with O2(g) to form Li2CO3 [276].
This phenomenon is quite peculiar. In the literature, concomitant oxidation and formation of a passivation layer made of Li2CO3 usually occur in LiCoO2 [277] but no carbon is involved. LiFePO4/C
is oxidized and iron(+3) phases are generally evidenced mixed with clusters of LiOH [278]. Li2FeSiO4 exhibits a similar behavior than LiCoO2 [104].
Besides the mechanism discussed above, a minor mechanism would occur at the same time in Li2MnSiO4/C and involve the participation of both H2O and CO2. OH groups were observed by ATR-FTIR and XPS. It was imputed to the reaction of LMS/C with H2O that forms LiOH, as it was shown for LiNiO2 [279]. The increase of carbon-content in LMS/C_81 exposed 4.5 days to air, shown by CHNS/O analyses, implies an input of carbon from CO2. The reaction of LiOH with CO2 will give Li2CO3 and H2O. Nonetheless, it implies formation of Li2CO3 in surface that has not been observed so far.
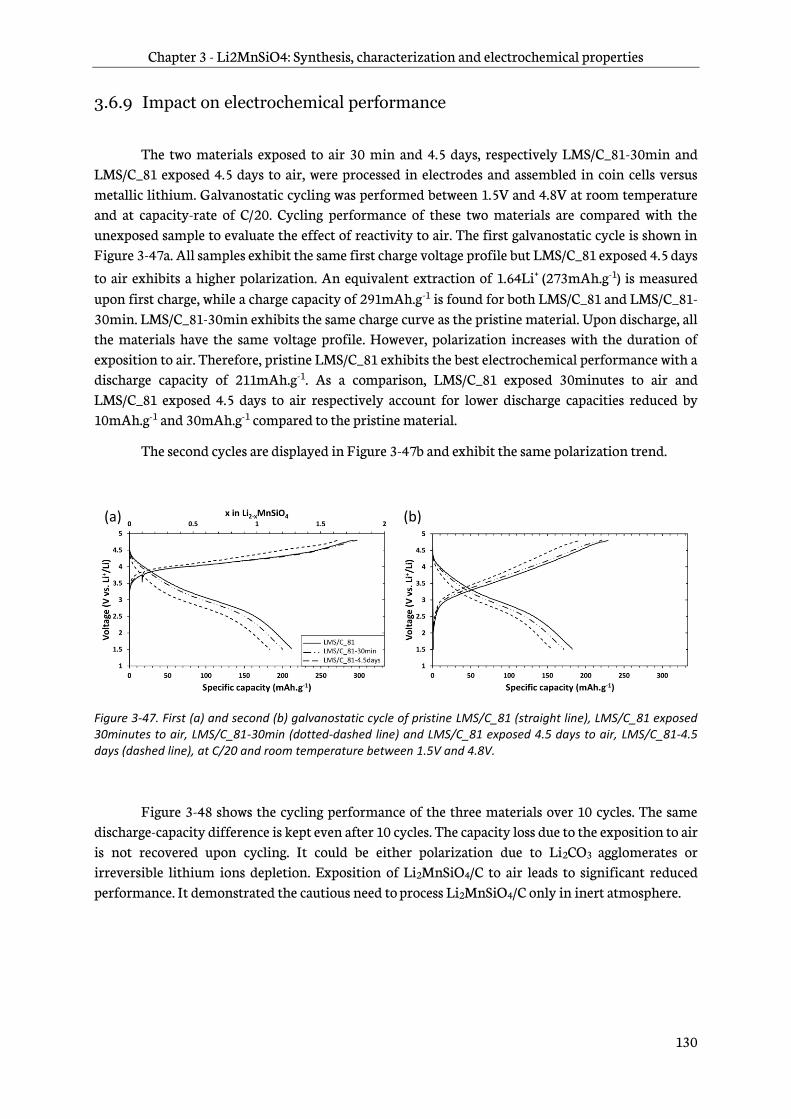
Chapter 3 - Li2MnSiO4: Synthesis, characterization and electrochemical properties
130
3.6.9 Impact on electrochemical performance
The two materials exposed to air 30 min and 4.5 days, respectively LMS/C_81-30min and LMS/C_81 exposed 4.5 days to air, were processed in electrodes and assembled in coin cells versus metallic lithium. Galvanostatic cycling was performed between 1.5V and 4.8V at room temperature and at capacity-rate of C/20. Cycling performance of these two materials are compared with the unexposed sample to evaluate the effect of reactivity to air. The first galvanostatic cycle is shown in Figure 3-47a. All samples exhibit the same first charge voltage profile but LMS/C_81 exposed 4.5 days
to air exhibits a higher polarization. An equivalent extraction of 1.64Li+ (273mAh.g-1) is measured upon first charge, while a charge capacity of 291mAh.g-1 is found for both LMS/C_81 and LMS/C_81-30min. LMS/C_81-30min exhibits the same charge curve as the pristine material. Upon discharge, all the materials have the same voltage profile. However, polarization increases with the duration of exposition to air. Therefore, pristine LMS/C_81 exhibits the best electrochemical performance with a discharge capacity of 211mAh.g-1. As a comparison, LMS/C_81 exposed 30minutes to air and LMS/C_81 exposed 4.5 days to air respectively account for lower discharge capacities reduced by 10mAh.g-1 and 30mAh.g-1 compared to the pristine material.
The second cycles are displayed in Figure 3-47b and exhibit the same polarization trend.
Figure 3-47. First (a) and second (b) galvanostatic cycle of pristine LMS/C_81 (straight line), LMS/C_81 exposed 30minutes to air, LMS/C_81-30min (dotted-dashed line) and LMS/C_81 exposed 4.5 days to air, LMS/C_81-4.5 days (dashed line), at C/20 and room temperature between 1.5V and 4.8V.
Figure 3-48 shows the cycling performance of the three materials over 10 cycles. The same discharge-capacity difference is kept even after 10 cycles. The capacity loss due to the exposition to air is not recovered upon cycling. It could be either polarization due to Li2CO3 agglomerates or irreversible lithium ions depletion. Exposition of Li2MnSiO4/C to air leads to significant reduced performance. It demonstrated the cautious need to process Li2MnSiO4/C only in inert atmosphere.
(a) (b)
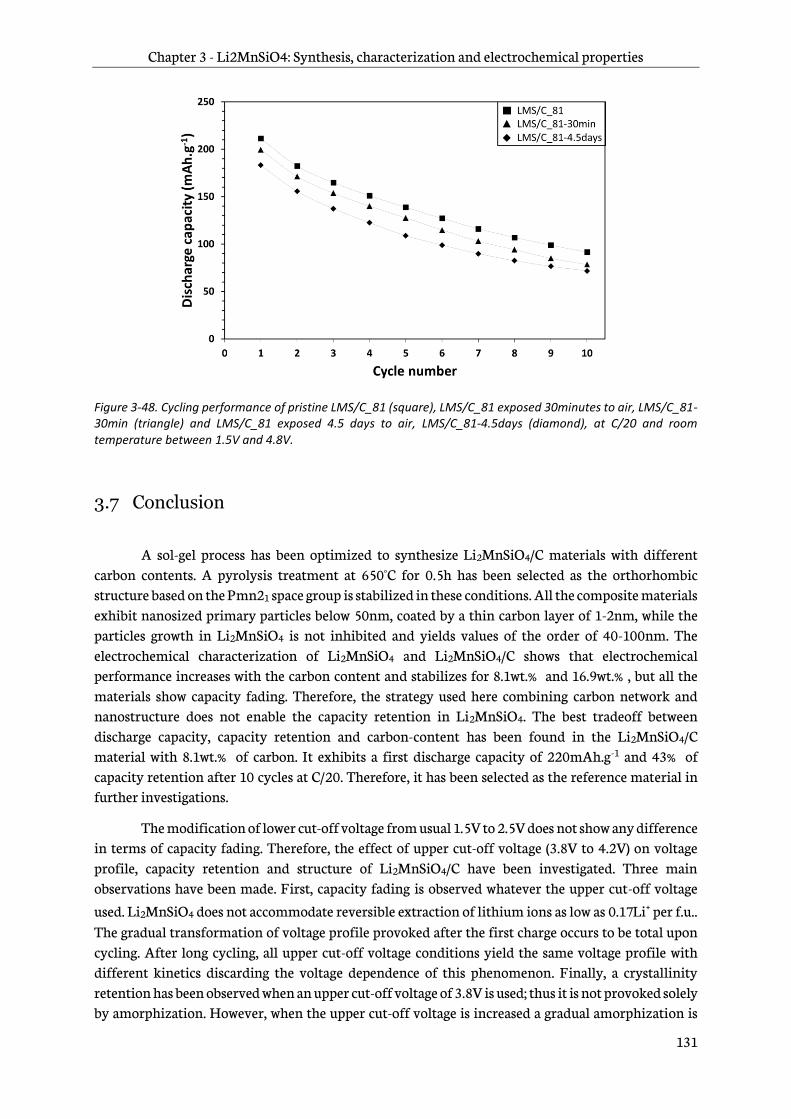
Chapter 3 - Li2MnSiO4: Synthesis, characterization and electrochemical properties
131
Figure 3-48. Cycling performance of pristine LMS/C_81 (square), LMS/C_81 exposed 30minutes to air, LMS/C_81-30min (triangle) and LMS/C_81 exposed 4.5 days to air, LMS/C_81-4.5days (diamond), at C/20 and room temperature between 1.5V and 4.8V.
3.7 Conclusion
A sol-gel process has been optimized to synthesize Li2MnSiO4/C materials with different carbon contents. A pyrolysis treatment at 650°C for 0.5h has been selected as the orthorhombic structure based on the Pmn21 space group is stabilized in these conditions. All the composite materials exhibit nanosized primary particles below 50nm, coated by a thin carbon layer of 1-2nm, while the particles growth in Li2MnSiO4 is not inhibited and yields values of the order of 40-100nm. The electrochemical characterization of Li2MnSiO4 and Li2MnSiO4/C shows that electrochemical performance increases with the carbon content and stabilizes for 8.1wt.% and 16.9wt.% , but all the materials show capacity fading. Therefore, the strategy used here combining carbon network and nanostructure does not enable the capacity retention in Li2MnSiO4. The best tradeoff between discharge capacity, capacity retention and carbon-content has been found in the Li2MnSiO4/C material with 8.1wt.% of carbon. It exhibits a first discharge capacity of 220mAh.g-1 and 43% of capacity retention after 10 cycles at C/20. Therefore, it has been selected as the reference material in further investigations.
The modification of lower cut-off voltage from usual 1.5V to 2.5V does not show any difference in terms of capacity fading. Therefore, the effect of upper cut-off voltage (3.8V to 4.2V) on voltage profile, capacity retention and structure of Li2MnSiO4/C have been investigated. Three main observations have been made. First, capacity fading is observed whatever the upper cut-off voltage
used. Li2MnSiO4 does not accommodate reversible extraction of lithium ions as low as 0.17Li+ per f.u.. The gradual transformation of voltage profile provoked after the first charge occurs to be total upon cycling. After long cycling, all upper cut-off voltage conditions yield the same voltage profile with different kinetics discarding the voltage dependence of this phenomenon. Finally, a crystallinity retention has been observed when an upper cut-off voltage of 3.8V is used; thus it is not provoked solely by amorphization. However, when the upper cut-off voltage is increased a gradual amorphization is
Chapter 3 - Li2MnSiO4: Synthesis, characterization and electrochemical properties
132
observed but this amorphization phenomenon no longer evolves between the 30th and 120th cycles. Again, despite the maintenance of crystallinity, capacity fading is still observed. As a result, the modification of Li2MnSiO4 structure is likely to occur at early cycling (1st-29th cycles) in the conditions used in this study.
An unreported doping strategy has been proposed to limit or suppress the capacity fading of Li2MnSiO4/C with the formula Li2-xMn1+xAlxSi1-xO4/C. The addition of manganese is intended to lower the overall redox stress on manganese. It is completed by addition of Al3+ and removal of Li+ and Si4+ to counter balance electronic charge and site occupancy. It has been synthesized by a sol-gel route. The doping resulted in the shift of reflections toward the low 2θ values and implies an increase of lattice parameters. Yet, the galvanostatic cycling study demonstrates lower discharge capacities and similar capacity retention compared to the reference Li2MnSiO4/C material. Therefore, this strategy is not considered to improve the cycling stability of Li2MnSiO4/C.
Finally, the storage of Li2MnSiO4/C in air has been evaluated for the first time to our knowledge. A formation of Li2CO3 is observed after ⋍4 days by XRD and ATR-FTIR, and yields up to 9wt.% of secondary phase. It has been demonstrated that Li2CO3 is not formed on surface of Li2MnSiO4/C particles but rather in the bulk where large carbon and oxygen-rich areas have been probed by STEM-EDX. Furthermore, oxidation of manganese has been checked by XPS. CHNS/O analyses evidence a large increase of oxygen content in Li2MnSiO4/C material but a rather low for carbon. It is therefore supposed that the carbon in Li2CO3 comes from the composite itself, where large carbon aggregates are formed during its thermal treatment, and oxygen from the atmosphere. A reactivity mechanism has been proposed. The oxidation of manganese ions in Li2MnSiO4 by air results
in the extraction of Li+ ions out of the bulk and their diffusion in carbon agglomerates. The reaction of CO2(g) with the lithiated carbons leads to the formation of Li2CO3. Finally, the galvanostatic cycling of air-exposed-Li2MnSiO4/C shows an irreversible capacity loss up to 30mAh.g-1 in discharge. It cannot be recovered upon cycling leading to much lower performance.

133

134

Chapter 4 – Olivine silicates: from MgMnSiO4/C to LiMnSiO4/C
135
Chapter 4 – Olivine silicates: from
MgMnSiO4/C to LiMnSiO4/C
Chapter 4 – Olivine silicates: from MgMnSiO4/C to LiMnSiO4/C .............................. 135
4.1 Preparation of MgMnSiO4/C materials as precursors of LiMnSiO4/C ..................................... 137
4.2 Characterization of MgMnSiO4/C ......................................................................................................... 142
4.3 Characterization of chemical oxidized Mg1-xMnSiO4/C ................................................................ 157
4.4 Comprehension of electrochemical phenomena in MgMnSiO4/C............................................. 167
4.5 Ex-situ characterizations of electrodes upon discharge ................................................................. 172
4.6 Summary of the olivine silicates study ................................................................................................ 176
4.7 Testing for space applications ................................................................................................................. 177
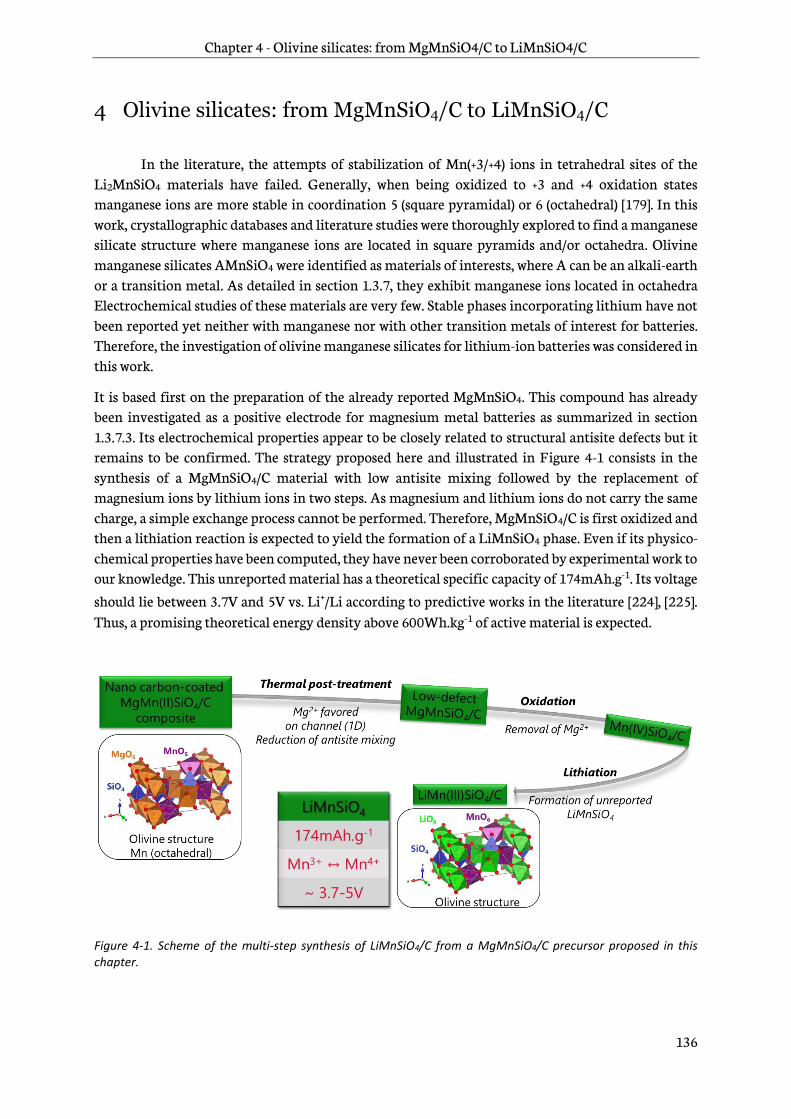
Chapter 4 - Olivine silicates: from MgMnSiO4/C to LiMnSiO4/C
136
4 Olivine silicates: from MgMnSiO4/C to LiMnSiO4/C
In the literature, the attempts of stabilization of Mn(+3/+4) ions in tetrahedral sites of the Li2MnSiO4 materials have failed. Generally, when being oxidized to +3 and +4 oxidation states manganese ions are more stable in coordination 5 (square pyramidal) or 6 (octahedral) [179]. In this work, crystallographic databases and literature studies were thoroughly explored to find a manganese silicate structure where manganese ions are located in square pyramids and/or octahedra. Olivine manganese silicates AMnSiO4 were identified as materials of interests, where A can be an alkali-earth or a transition metal. As detailed in section 1.3.7, they exhibit manganese ions located in octahedra Electrochemical studies of these materials are very few. Stable phases incorporating lithium have not been reported yet neither with manganese nor with other transition metals of interest for batteries. Therefore, the investigation of olivine manganese silicates for lithium-ion batteries was considered in this work.
It is based first on the preparation of the already reported MgMnSiO4. This compound has already been investigated as a positive electrode for magnesium metal batteries as summarized in section 1.3.7.3. Its electrochemical properties appear to be closely related to structural antisite defects but it remains to be confirmed. The strategy proposed here and illustrated in Figure 4-1 consists in the synthesis of a MgMnSiO4/C material with low antisite mixing followed by the replacement of magnesium ions by lithium ions in two steps. As magnesium and lithium ions do not carry the same charge, a simple exchange process cannot be performed. Therefore, MgMnSiO4/C is first oxidized and then a lithiation reaction is expected to yield the formation of a LiMnSiO4 phase. Even if its physico-chemical properties have been computed, they have never been corroborated by experimental work to our knowledge. This unreported material has a theoretical specific capacity of 174mAh.g-1. Its voltage
should lie between 3.7V and 5V vs. Li+/Li according to predictive works in the literature [224], [225]. Thus, a promising theoretical energy density above 600Wh.kg-1 of active material is expected.
Figure 4-1. Scheme of the multi-step synthesis of LiMnSiO4/C from a MgMnSiO4/C precursor proposed in this chapter.
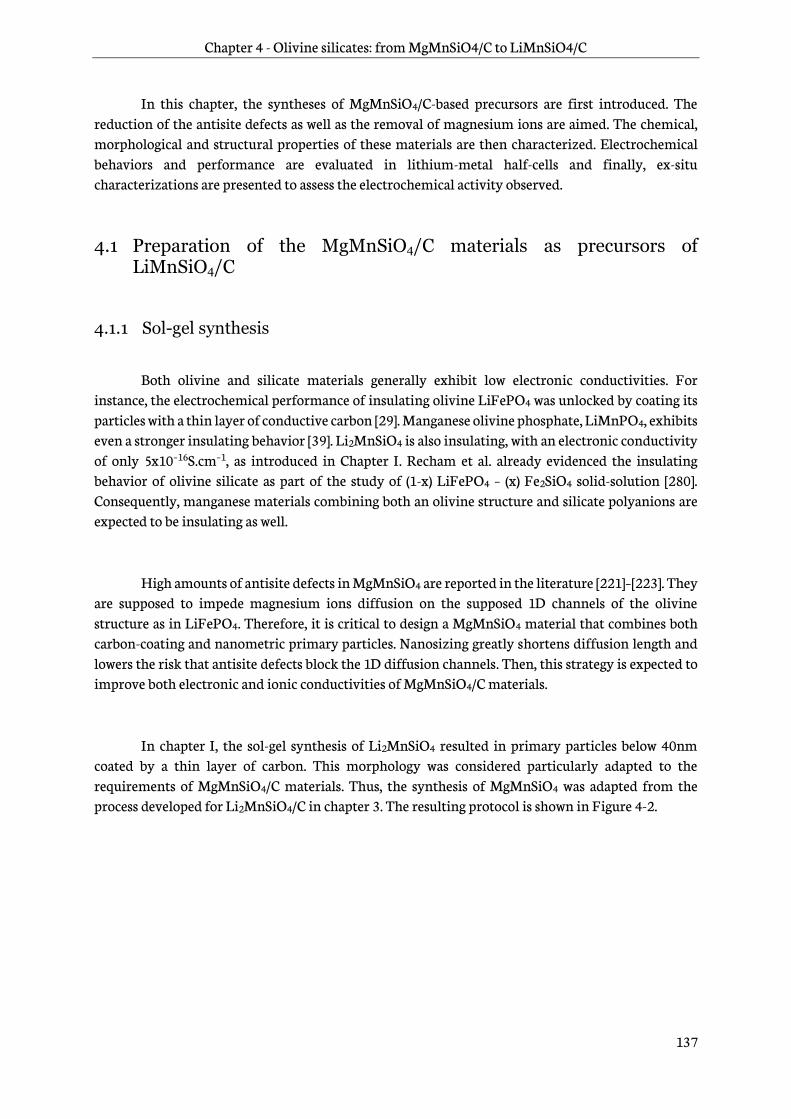
Chapter 4 - Olivine silicates: from MgMnSiO4/C to LiMnSiO4/C
137
In this chapter, the syntheses of MgMnSiO4/C-based precursors are first introduced. The reduction of the antisite defects as well as the removal of magnesium ions are aimed. The chemical, morphological and structural properties of these materials are then characterized. Electrochemical behaviors and performance are evaluated in lithium-metal half-cells and finally, ex-situ characterizations are presented to assess the electrochemical activity observed.
4.1 Preparation of the MgMnSiO4/C materials as precursors of LiMnSiO4/C
4.1.1 Sol-gel synthesis
Both olivine and silicate materials generally exhibit low electronic conductivities. For instance, the electrochemical performance of insulating olivine LiFePO4 was unlocked by coating its particles with a thin layer of conductive carbon [29]. Manganese olivine phosphate, LiMnPO4, exhibits even a stronger insulating behavior [39]. Li2MnSiO4 is also insulating, with an electronic conductivity of only 5x10⁻¹⁶S.cm−1, as introduced in Chapter I. Recham et al. already evidenced the insulating behavior of olivine silicate as part of the study of (1-x) LiFePO4 – (x) Fe2SiO4 solid-solution [280]. Consequently, manganese materials combining both an olivine structure and silicate polyanions are expected to be insulating as well.
High amounts of antisite defects in MgMnSiO4 are reported in the literature [221]–[223]. They are supposed to impede magnesium ions diffusion on the supposed 1D channels of the olivine structure as in LiFePO4. Therefore, it is critical to design a MgMnSiO4 material that combines both carbon-coating and nanometric primary particles. Nanosizing greatly shortens diffusion length and lowers the risk that antisite defects block the 1D diffusion channels. Then, this strategy is expected to improve both electronic and ionic conductivities of MgMnSiO4/C materials.
In chapter I, the sol-gel synthesis of Li2MnSiO4 resulted in primary particles below 40nm coated by a thin layer of carbon. This morphology was considered particularly adapted to the requirements of MgMnSiO4/C materials. Thus, the synthesis of MgMnSiO4 was adapted from the process developed for Li2MnSiO4/C in chapter 3. The resulting protocol is shown in Figure 4-2.
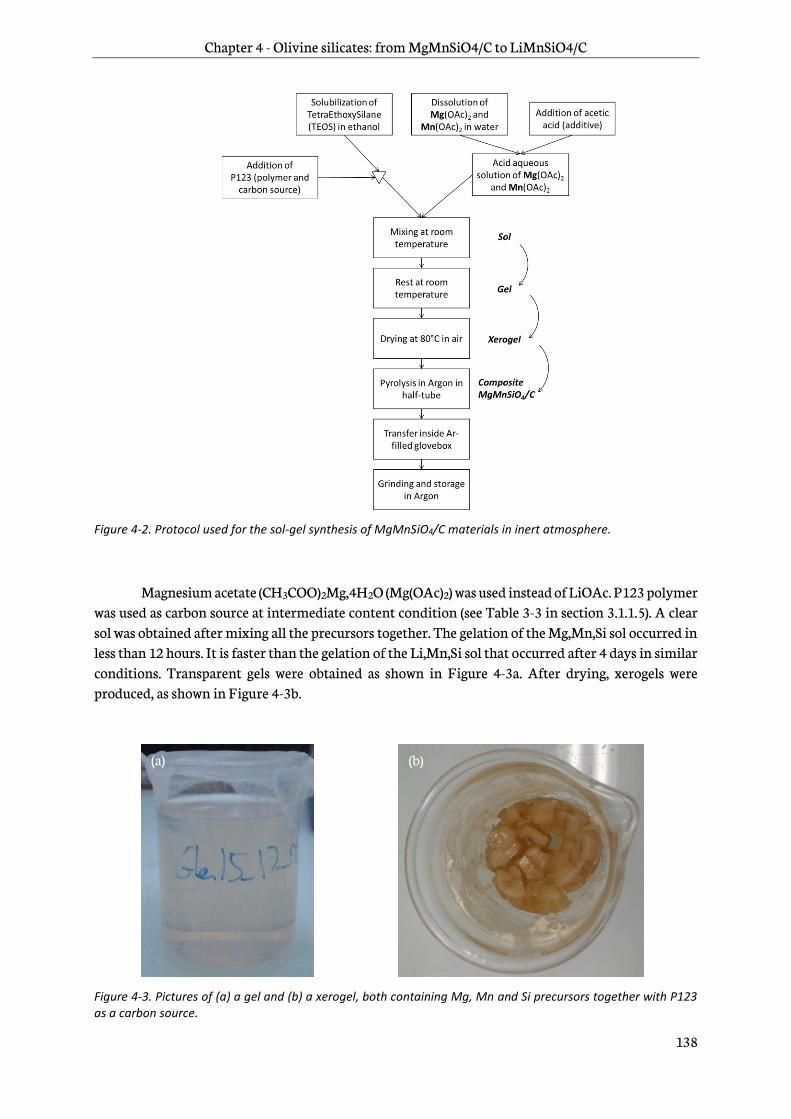
Chapter 4 - Olivine silicates: from MgMnSiO4/C to LiMnSiO4/C
138
Figure 4-2. Protocol used for the sol-gel synthesis of MgMnSiO4/C materials in inert atmosphere.
Magnesium acetate (CH3COO)2Mg,4H2O (Mg(OAc)2) was used instead of LiOAc. P123 polymer was used as carbon source at intermediate content condition (see Table 3-3 in section 3.1.1.5). A clear sol was obtained after mixing all the precursors together. The gelation of the Mg,Mn,Si sol occurred in less than 12 hours. It is faster than the gelation of the Li,Mn,Si sol that occurred after 4 days in similar conditions. Transparent gels were obtained as shown in Figure 4-3a. After drying, xerogels were produced, as shown in Figure 4-3b.
Figure 4-3. Pictures of (a) a gel and (b) a xerogel, both containing Mg, Mn and Si precursors together with P123 as a carbon source.
(a) (b)
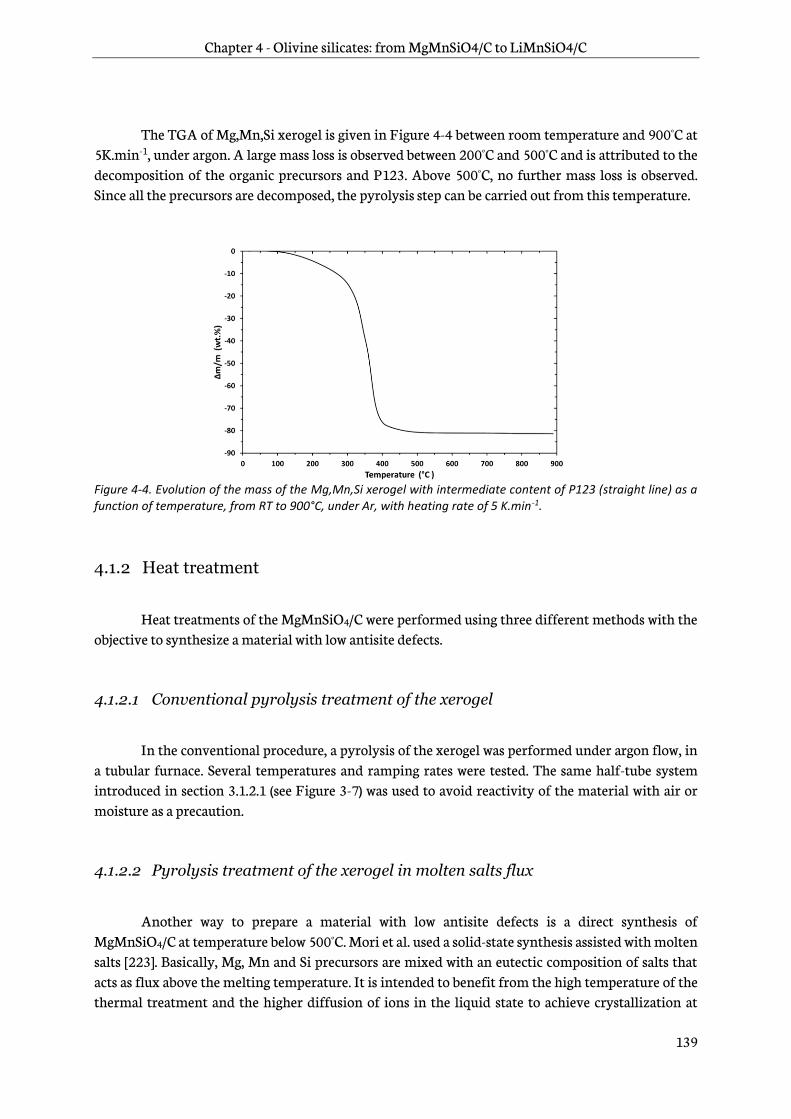
Chapter 4 - Olivine silicates: from MgMnSiO4/C to LiMnSiO4/C
139
The TGA of Mg,Mn,Si xerogel is given in Figure 4-4 between room temperature and 900°C at 5K.min-1, under argon. A large mass loss is observed between 200°C and 500°C and is attributed to the decomposition of the organic precursors and P123. Above 500°C, no further mass loss is observed. Since all the precursors are decomposed, the pyrolysis step can be carried out from this temperature.
Figure 4-4. Evolution of the mass of the Mg,Mn,Si xerogel with intermediate content of P123 (straight line) as a function of temperature, from RT to 900°C, under Ar, with heating rate of 5 K.min-1.
4.1.2 Heat treatment
Heat treatments of the MgMnSiO4/C were performed using three different methods with the objective to synthesize a material with low antisite defects.
4.1.2.1 Conventional pyrolysis treatment of the xerogel
In the conventional procedure, a pyrolysis of the xerogel was performed under argon flow, in a tubular furnace. Several temperatures and ramping rates were tested. The same half-tube system introduced in section 3.1.2.1 (see Figure 3-7) was used to avoid reactivity of the material with air or moisture as a precaution.
4.1.2.2 Pyrolysis treatment of the xerogel in molten salts flux
Another way to prepare a material with low antisite defects is a direct synthesis of MgMnSiO4/C at temperature below 500°C. Mori et al. used a solid-state synthesis assisted with molten salts [223]. Basically, Mg, Mn and Si precursors are mixed with an eutectic composition of salts that acts as flux above the melting temperature. It is intended to benefit from the high temperature of the thermal treatment and the higher diffusion of ions in the liquid state to achieve crystallization at
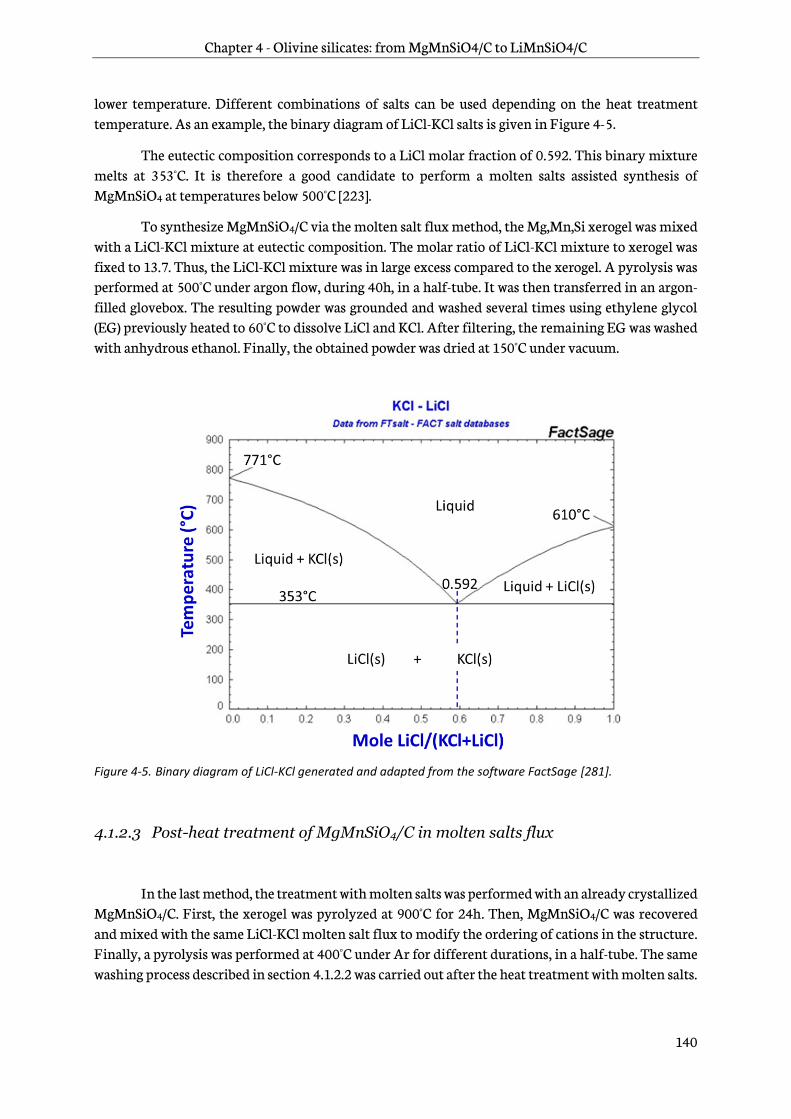
Chapter 4 - Olivine silicates: from MgMnSiO4/C to LiMnSiO4/C
140
lower temperature. Different combinations of salts can be used depending on the heat treatment temperature. As an example, the binary diagram of LiCl-KCl salts is given in Figure 4-5.
The eutectic composition corresponds to a LiCl molar fraction of 0.592. This binary mixture melts at 353°C. It is therefore a good candidate to perform a molten salts assisted synthesis of MgMnSiO4 at temperatures below 500°C [223].
To synthesize MgMnSiO4/C via the molten salt flux method, the Mg,Mn,Si xerogel was mixed with a LiCl-KCl mixture at eutectic composition. The molar ratio of LiCl-KCl mixture to xerogel was fixed to 13.7. Thus, the LiCl-KCl mixture was in large excess compared to the xerogel. A pyrolysis was performed at 500°C under argon flow, during 40h, in a half-tube. It was then transferred in an argon-filled glovebox. The resulting powder was grounded and washed several times using ethylene glycol (EG) previously heated to 60°C to dissolve LiCl and KCl. After filtering, the remaining EG was washed with anhydrous ethanol. Finally, the obtained powder was dried at 150°C under vacuum.
Figure 4-5. Binary diagram of LiCl-KCl generated and adapted from the software FactSage [281].
4.1.2.3 Post-heat treatment of MgMnSiO4/C in molten salts flux
In the last method, the treatment with molten salts was performed with an already crystallized MgMnSiO4/C. First, the xerogel was pyrolyzed at 900°C for 24h. Then, MgMnSiO4/C was recovered and mixed with the same LiCl-KCl molten salt flux to modify the ordering of cations in the structure. Finally, a pyrolysis was performed at 400°C under Ar for different durations, in a half-tube. The same washing process described in section 4.1.2.2 was carried out after the heat treatment with molten salts.
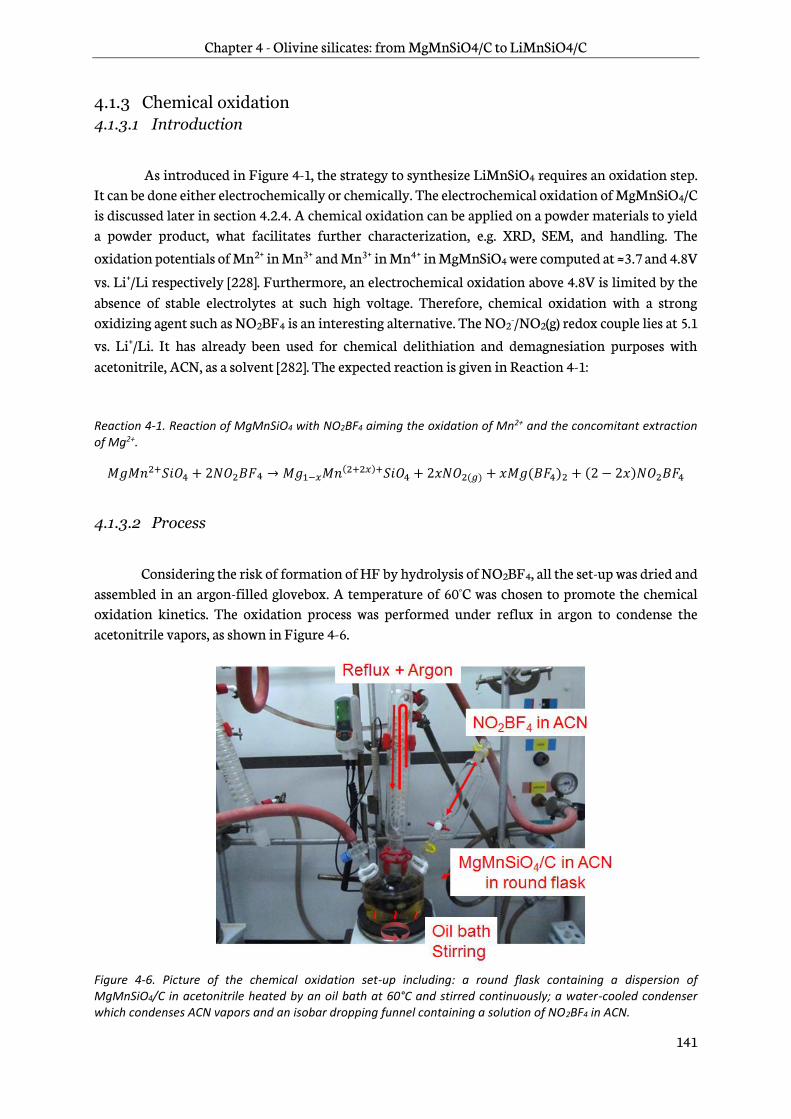
Chapter 4 - Olivine silicates: from MgMnSiO4/C to LiMnSiO4/C
141
4.1.3 Chemical oxidation
4.1.3.1 Introduction
As introduced in Figure 4-1, the strategy to synthesize LiMnSiO4 requires an oxidation step. It can be done either electrochemically or chemically. The electrochemical oxidation of MgMnSiO4/C is discussed later in section 4.2.4. A chemical oxidation can be applied on a powder materials to yield a powder product, what facilitates further characterization, e.g. XRD, SEM, and handling. The oxidation potentials of Mn2+ in Mn3+ and Mn3+ in Mn4+ in MgMnSiO4 were computed at ≈3.7 and 4.8V
vs. Li+/Li respectively [228]. Furthermore, an electrochemical oxidation above 4.8V is limited by the absence of stable electrolytes at such high voltage. Therefore, chemical oxidation with a strong oxidizing agent such as NO2BF4 is an interesting alternative. The NO2
-/NO2(g) redox couple lies at 5.1 vs. Li+/Li. It has already been used for chemical delithiation and demagnesiation purposes with acetonitrile, ACN, as a solvent [282]. The expected reaction is given in Reaction 4-1:
Reaction 4-1. Reaction of MgMnSiO4 with NO2BF4 aiming the oxidation of Mn2+ and the concomitant extraction of Mg2+.
𝑀𝑔𝑀𝑛2+𝑆𝑖𝑂4 + 2𝑁𝑂2𝐵𝐹4 → 𝑀𝑔1−𝑥𝑀𝑛(2+2𝑥)+𝑆𝑖𝑂4 + 2𝑥𝑁𝑂2(𝑔) + 𝑥𝑀𝑔(𝐵𝐹4)2 + (2 − 2𝑥)𝑁𝑂2𝐵𝐹4
4.1.3.2 Process
Considering the risk of formation of HF by hydrolysis of NO2BF4, all the set-up was dried and assembled in an argon-filled glovebox. A temperature of 60°C was chosen to promote the chemical oxidation kinetics. The oxidation process was performed under reflux in argon to condense the acetonitrile vapors, as shown in Figure 4-6.
Figure 4-6. Picture of the chemical oxidation set-up including: a round flask containing a dispersion of MgMnSiO4/C in acetonitrile heated by an oil bath at 60°C and stirred continuously; a water-cooled condenser which condenses ACN vapors and an isobar dropping funnel containing a solution of NO2BF4 in ACN.
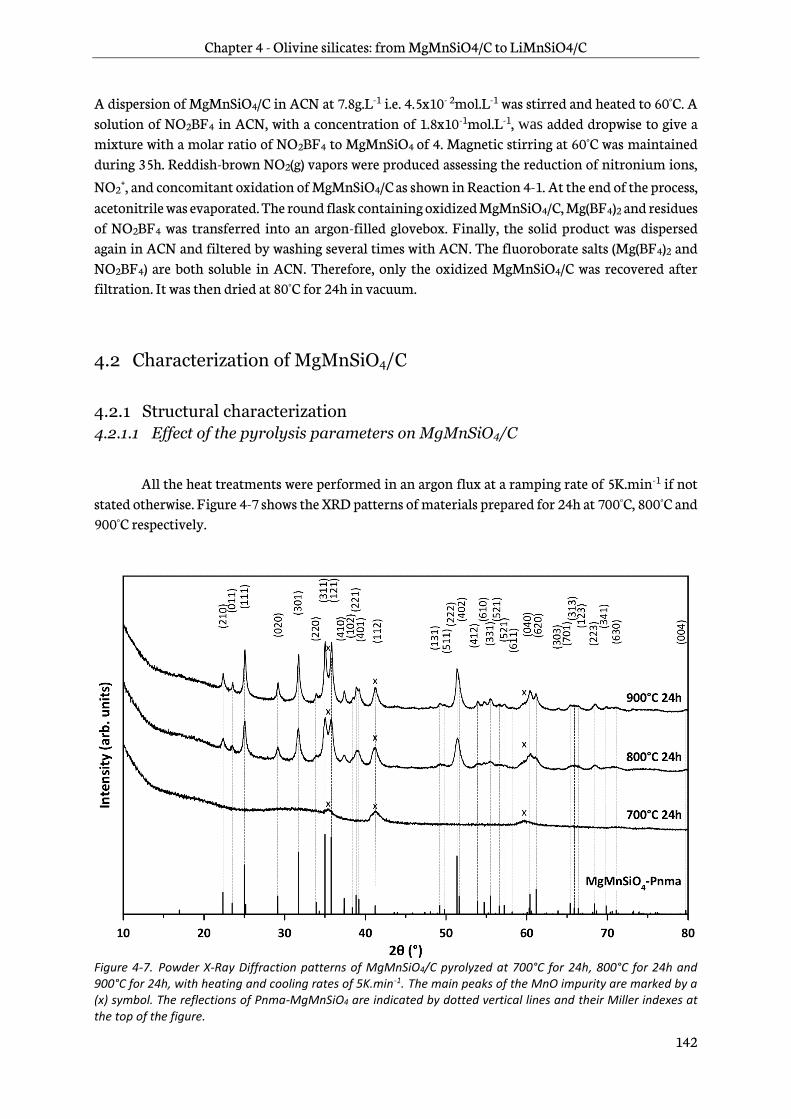
Chapter 4 - Olivine silicates: from MgMnSiO4/C to LiMnSiO4/C
142
A dispersion of MgMnSiO4/C in ACN at 7.8g.L-1 i.e. 4.5x10- 2mol.L-1 was stirred and heated to 60°C. A solution of NO2BF4 in ACN, with a concentration of 1.8x10⁻¹mol.L-1, was added dropwise to give a mixture with a molar ratio of NO2BF4 to MgMnSiO4 of 4. Magnetic stirring at 60°C was maintained during 35h. Reddish-brown NO2(g) vapors were produced assessing the reduction of nitronium ions, NO2
+, and concomitant oxidation of MgMnSiO4/C as shown in Reaction 4-1. At the end of the process, acetonitrile was evaporated. The round flask containing oxidized MgMnSiO4/C, Mg(BF4)2 and residues of NO2BF4 was transferred into an argon-filled glovebox. Finally, the solid product was dispersed again in ACN and filtered by washing several times with ACN. The fluoroborate salts (Mg(BF4)2 and NO2BF4) are both soluble in ACN. Therefore, only the oxidized MgMnSiO4/C was recovered after filtration. It was then dried at 80°C for 24h in vacuum.
4.2 Characterization of MgMnSiO4/C
4.2.1 Structural characterization
4.2.1.1 Effect of the pyrolysis parameters on MgMnSiO4/C
All the heat treatments were performed in an argon flux at a ramping rate of 5K.min-1 if not stated otherwise. Figure 4-7 shows the XRD patterns of materials prepared for 24h at 700°C, 800°C and 900°C respectively.
Figure 4-7. Powder X-Ray Diffraction patterns of MgMnSiO4/C pyrolyzed at 700°C for 24h, 800°C for 24h and 900°C for 24h, with heating and cooling rates of 5K.min-1. The main peaks of the MnO impurity are marked by a (x) symbol. The reflections of Pnma-MgMnSiO4 are indicated by dotted vertical lines and their Miller indexes at the top of the figure.
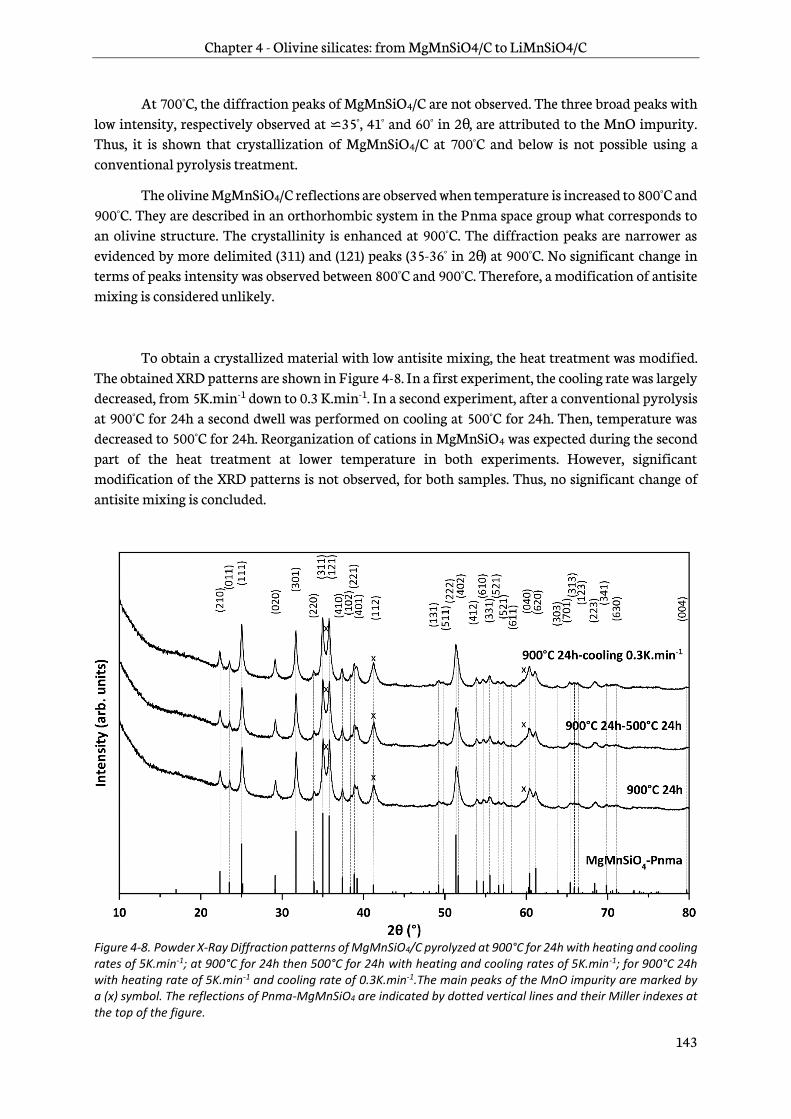
Chapter 4 - Olivine silicates: from MgMnSiO4/C to LiMnSiO4/C
143
At 700°C, the diffraction peaks of MgMnSiO4/C are not observed. The three broad peaks with low intensity, respectively observed at ⋍35°, 41° and 60° in 2θ , are attributed to the MnO impurity. Thus, it is shown that crystallization of MgMnSiO4/C at 700°C and below is not possible using a conventional pyrolysis treatment.
The olivine MgMnSiO4/C reflections are observed when temperature is increased to 800°C and 900°C. They are described in an orthorhombic system in the Pnma space group what corresponds to an olivine structure. The crystallinity is enhanced at 900°C. The diffraction peaks are narrower as evidenced by more delimited (311) and (121) peaks (35-36° in 2θ ) at 900°C. No significant change in terms of peaks intensity was observed between 800°C and 900°C. Therefore, a modification of antisite mixing is considered unlikely.
To obtain a crystallized material with low antisite mixing, the heat treatment was modified. The obtained XRD patterns are shown in Figure 4-8. In a first experiment, the cooling rate was largely decreased, from 5K.min-1 down to 0.3 K.min-1. In a second experiment, after a conventional pyrolysis at 900°C for 24h a second dwell was performed on cooling at 500°C for 24h. Then, temperature was decreased to 500°C for 24h. Reorganization of cations in MgMnSiO4 was expected during the second part of the heat treatment at lower temperature in both experiments. However, significant modification of the XRD patterns is not observed, for both samples. Thus, no significant change of antisite mixing is concluded.
Figure 4-8. Powder X-Ray Diffraction patterns of MgMnSiO4/C pyrolyzed at 900°C for 24h with heating and cooling rates of 5K.min-1; at 900°C for 24h then 500°C for 24h with heating and cooling rates of 5K.min-1; for 900°C 24h with heating rate of 5K.min-1 and cooling rate of 0.3K.min-1.The main peaks of the MnO impurity are marked by a (x) symbol. The reflections of Pnma-MgMnSiO4 are indicated by dotted vertical lines and their Miller indexes at the top of the figure.
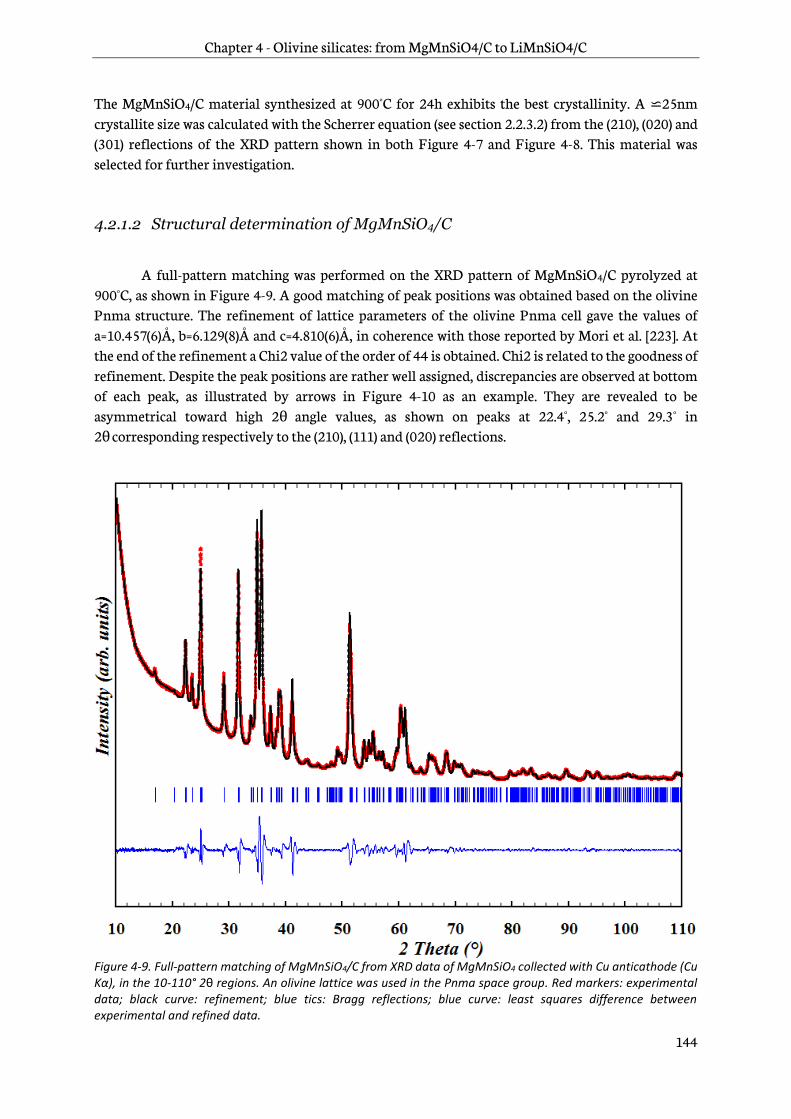
Chapter 4 - Olivine silicates: from MgMnSiO4/C to LiMnSiO4/C
144
The MgMnSiO4/C material synthesized at 900°C for 24h exhibits the best crystallinity. A ⋍25nm crystallite size was calculated with the Scherrer equation (see section 2.2.3.2) from the (210), (020) and (301) reflections of the XRD pattern shown in both Figure 4-7 and Figure 4-8. This material was selected for further investigation.
4.2.1.2 Structural determination of MgMnSiO4/C
A full-pattern matching was performed on the XRD pattern of MgMnSiO4/C pyrolyzed at 900°C, as shown in Figure 4-9. A good matching of peak positions was obtained based on the olivine Pnma structure. The refinement of lattice parameters of the olivine Pnma cell gave the values of a=10.457(6)Å, b=6.129(8)Å and c=4.810(6)Å, in coherence with those reported by Mori et al. [223]. At the end of the refinement a Chi2 value of the order of 44 is obtained. Chi2 is related to the goodness of refinement. Despite the peak positions are rather well assigned, discrepancies are observed at bottom of each peak, as illustrated by arrows in Figure 4-10 as an example. They are revealed to be asymmetrical toward high 2θ angle values, as shown on peaks at 22.4°, 25.2° and 29.3° in 2θ corresponding respectively to the (210), (111) and (020) reflections.
Figure 4-9. Full-pattern matching of MgMnSiO4/C from XRD data of MgMnSiO4 collected with Cu anticathode (Cu Kα), in the 10-110° 2θ regions. An olivine lattice was used in the Pnma space group. Red markers: experimental data; black curve: refinement; blue tics: Bragg reflections; blue curve: least squares difference between experimental and refined data.

Chapter 4 - Olivine silicates: from MgMnSiO4/C to LiMnSiO4/C
145
Several hypotheses may explain these tails. First, they could come from superstructure reflections as they have been reported several times for olivine-type materials [283]–[288]. Second, the sample might not be fully homogeneous. A distribution of lattice parameters related to the MgMnSiO4 olivine structure would lead to the superimposition of several monophasic patterns slightly shifted in 2θ . It might arise from a coexistence of manganese-rich or magnesium-rich MgMnSiO4 phases in the sample. Yet, these hypotheses could not be supported by further characterizations in this work.
Figure 4-10. Full-pattern matching from the XRD data of MgMnSiO4/C collected with Cu anticathode (Cu Kα), in the 15-30° 2θ region. An olivine lattice was used in the Pnma space group. Red markers: experimental data; black curve: refinement; blue tics: Bragg reflections; blue curve: least squares difference between experimental and refined data; the black arrows indicate tails at the bottom of peaks that cannot be matched.
HRSTEM was performed to investigate the structure of MgMnSiO4/C material at atomic level. An image of MgMnSiO4/C was recorded along the [112] zone axis of the olivine structure as shown in Figure 4-11. The arrangement of atoms matches well with that of the olivine structure in this orientation, as compared with the representation of the theoretical structure shown on the right.
A second image was recorded along the [001] zone axis of olivine structure, as shown in Figure 4-12. Again, atomic positions are in agreement with that from an olivine structure in this orientation. The brightness of each spot is proportional to the electronic density i.e. the atomic number (Z) of the considered atom. The brightest spots forming horizontal lines are attributed to the manganese atoms (orange in inset), which are the heaviest. Zig-zag patterns of alternating magnesium (green) and silicon atoms (blue) are also exhibited.

Chapter 4 - Olivine silicates: from MgMnSiO4/C to LiMnSiO4/C
146
Figure 4-11. High-resolution STEM (HRSTEM) image of MgMnSiO4/C particle observed along the [112] orthorhombic zone axis of the olivine structure. The atomic positions of olivine structure are shown as a model along the [112] with O2- in red, Mn2+ in green and Mg2+ in grey.
Figure 4-12. High-resolution STEM image of MgMnSiO4/C particle observed along the [001] orthorhombic zone axis. The general Mg, Mn and Si atomic positions are shown in inset, respectively in green, orange and blue.
[112]
2nm
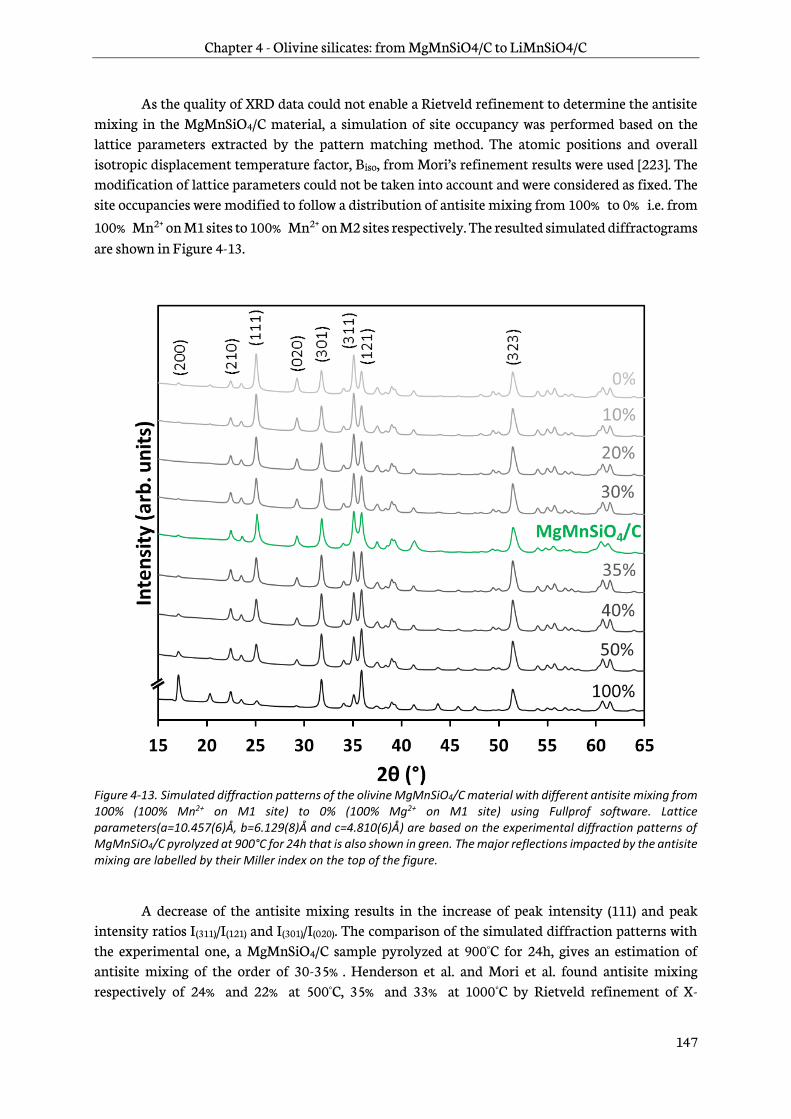
Chapter 4 - Olivine silicates: from MgMnSiO4/C to LiMnSiO4/C
147
As the quality of XRD data could not enable a Rietveld refinement to determine the antisite mixing in the MgMnSiO4/C material, a simulation of site occupancy was performed based on the lattice parameters extracted by the pattern matching method. The atomic positions and overall isotropic displacement temperature factor, Biso, from Mori’s refinement results were used [223]. The modification of lattice parameters could not be taken into account and were considered as fixed. The site occupancies were modified to follow a distribution of antisite mixing from 100% to 0% i.e. from 100% Mn2+ on M1 sites to 100% Mn2+ on M2 sites respectively. The resulted simulated diffractograms are shown in Figure 4-13.
Figure 4-13. Simulated diffraction patterns of the olivine MgMnSiO4/C material with different antisite mixing from 100% (100% Mn2+ on M1 site) to 0% (100% Mg2+ on M1 site) using Fullprof software. Lattice parameters(a=10.457(6)Å, b=6.129(8)Å and c=4.810(6)Å) are based on the experimental diffraction patterns of MgMnSiO4/C pyrolyzed at 900°C for 24h that is also shown in green. The major reflections impacted by the antisite mixing are labelled by their Miller index on the top of the figure.
A decrease of the antisite mixing results in the increase of peak intensity (111) and peak
intensity ratios I(311)/I(121) and I(301)/I(020). The comparison of the simulated diffraction patterns with the experimental one, a MgMnSiO4/C sample pyrolyzed at 900°C for 24h, gives an estimation of antisite mixing of the order of 30-35% . Henderson et al. and Mori et al. found antisite mixing respectively of 24% and 22% at 500°C, 35% and 33% at 1000°C by Rietveld refinement of X-

Chapter 4 - Olivine silicates: from MgMnSiO4/C to LiMnSiO4/C
148
ray/neutron diffraction pattern [221]. The estimation here is in coherence with the results found in the literature.
4.2.1.3 Effect of the pyrolysis treatment in molten salts flux
A pyrolysis of Mg,Mn,Si xerogel in LiCl-KCl molten salts flux was attempted to crystallize MgMnSiO4 at lower temperature [223], here at 500°C for 40h. The XRD pattern is compared with that of MgMnSiO4/C pyrolyzed at 900°C 24h in Figure 4-14. The main reflections from both diffraction patterns match with those of MgMnSiO4 in the olivine structure (Pnma). The peaks positions of the two patterns are similar. However, the material annealed in molten salt exhibits an increase of the peak intensity I(111) and the peak intensity ratios I(311)/I(121) and I(301)/I(020), what evidences a decrease of antisite mixing, as illustrated by the XRD simulation in Figure 4-13. This experiment confirms the lowering of antisite mixing at moderate temperature by molten salt treatment as reported in the literature [223]. Furthermore, the material is more crystallized and the MnO impurity disappears. However, additional reflections at 24.4°, 28.7°, 33.0°, 33.9°, 50.6° and 58.7°, identified with (% ) symbols, matched with an electrochemically active Li2MnSiO4 impurity phase. It is imputed to a certain reactivity of LiCl with the Mg,Mn,Si xerogel in which the elements are not well bound together.
Figure 4-14. Powder X-Ray Diffraction patterns of MgMnSiO4/C pyrolyzed at 900°C for 24h alone and pyrolyzed in presence of LiCl-KCl molten salts flux at 500°C for 40h. The main peaks of MnO and Li2MnSiO4 impurities are respectively marked by (x) and (%) symbols. The reflections of Pnma-MgMnSiO4 are indicated by dotted vertical lines. The major reflections impacted by the antisite mixing are labelled by their Miller index on the top of the figure.
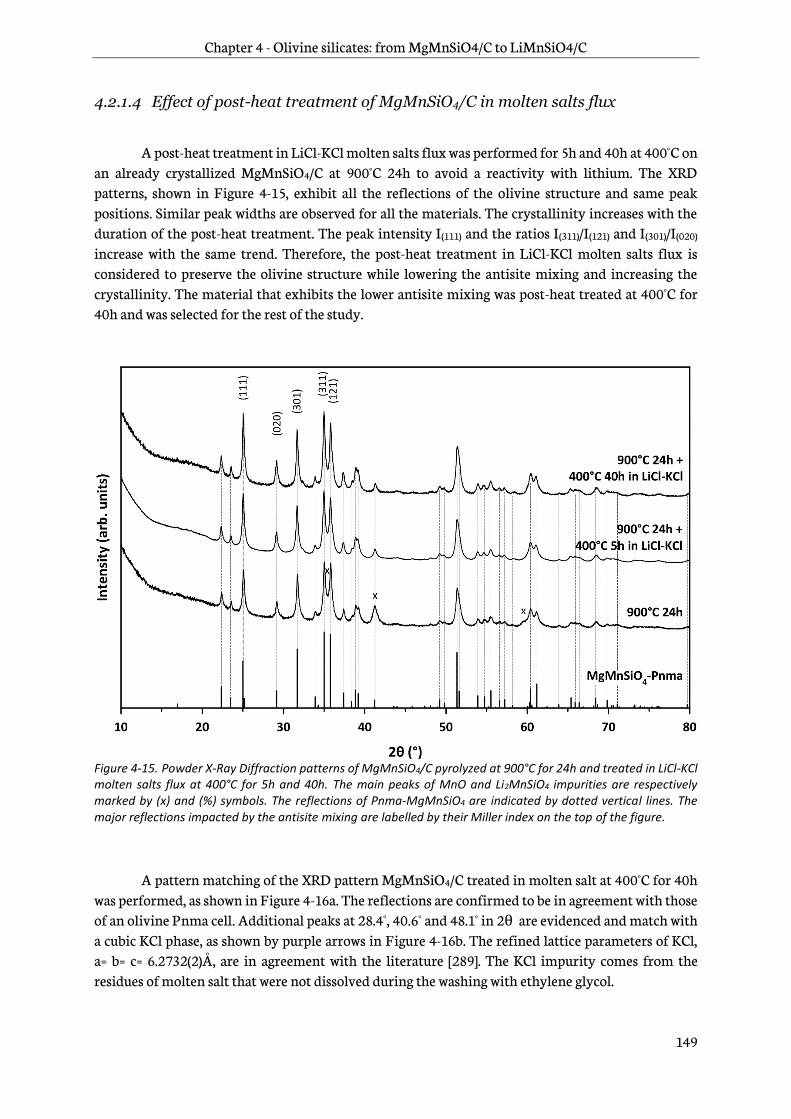
Chapter 4 - Olivine silicates: from MgMnSiO4/C to LiMnSiO4/C
149
4.2.1.4 Effect of post-heat treatment of MgMnSiO4/C in molten salts flux
A post-heat treatment in LiCl-KCl molten salts flux was performed for 5h and 40h at 400°C on an already crystallized MgMnSiO4/C at 900°C 24h to avoid a reactivity with lithium. The XRD patterns, shown in Figure 4-15, exhibit all the reflections of the olivine structure and same peak positions. Similar peak widths are observed for all the materials. The crystallinity increases with the duration of the post-heat treatment. The peak intensity I(111) and the ratios I(311)/I(121) and I(301)/I(020) increase with the same trend. Therefore, the post-heat treatment in LiCl-KCl molten salts flux is considered to preserve the olivine structure while lowering the antisite mixing and increasing the crystallinity. The material that exhibits the lower antisite mixing was post-heat treated at 400°C for 40h and was selected for the rest of the study.
Figure 4-15. Powder X-Ray Diffraction patterns of MgMnSiO4/C pyrolyzed at 900°C for 24h and treated in LiCl-KCl molten salts flux at 400°C for 5h and 40h. The main peaks of MnO and Li2MnSiO4 impurities are respectively marked by (x) and (%) symbols. The reflections of Pnma-MgMnSiO4 are indicated by dotted vertical lines. The major reflections impacted by the antisite mixing are labelled by their Miller index on the top of the figure.
A pattern matching of the XRD pattern MgMnSiO4/C treated in molten salt at 400°C for 40h was performed, as shown in Figure 4-16a. The reflections are confirmed to be in agreement with those of an olivine Pnma cell. Additional peaks at 28.4°, 40.6° and 48.1° in 2θ are evidenced and match with a cubic KCl phase, as shown by purple arrows in Figure 4-16b. The refined lattice parameters of KCl, a= b= c= 6.2732(2)Å, are in agreement with the literature [289]. The KCl impurity comes from the residues of molten salt that were not dissolved during the washing with ethylene glycol.
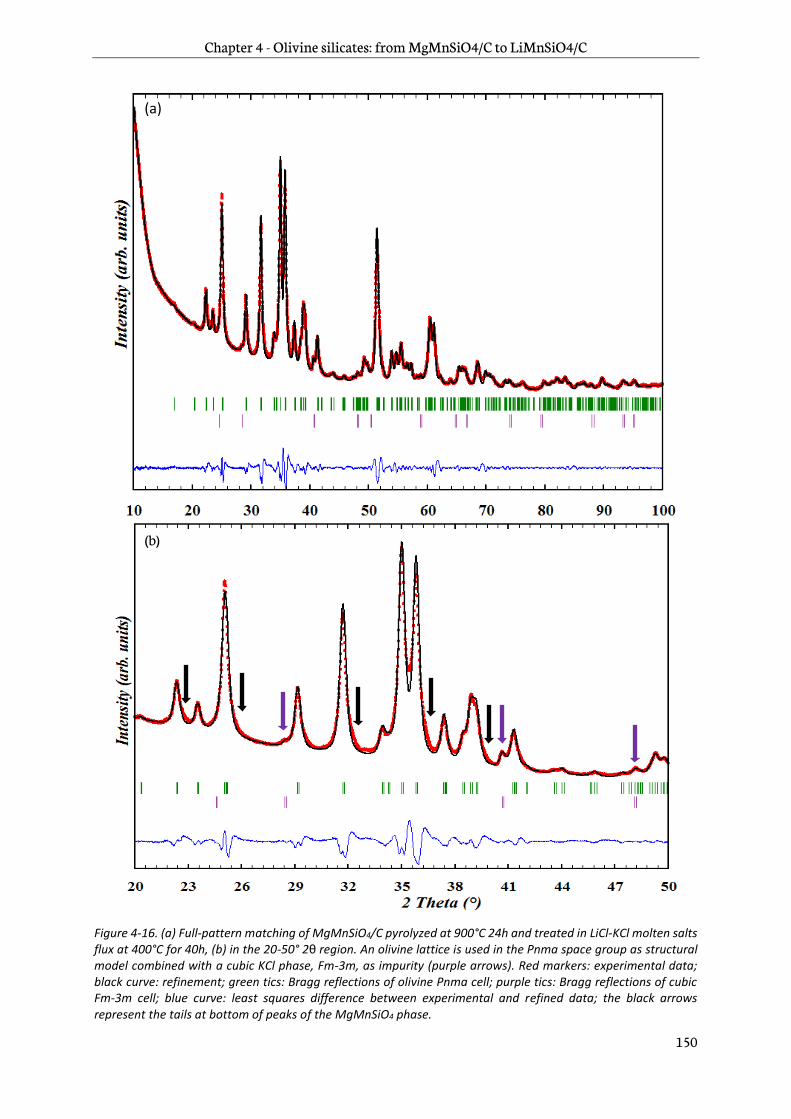
Chapter 4 - Olivine silicates: from MgMnSiO4/C to LiMnSiO4/C
150
Figure 4-16. (a) Full-pattern matching of MgMnSiO4/C pyrolyzed at 900°C 24h and treated in LiCl-KCl molten salts flux at 400°C for 40h, (b) in the 20-50° 2θ region. An olivine lattice is used in the Pnma space group as structural model combined with a cubic KCl phase, Fm-3m, as impurity (purple arrows). Red markers: experimental data; black curve: refinement; green tics: Bragg reflections of olivine Pnma cell; purple tics: Bragg reflections of cubic Fm-3m cell; blue curve: least squares difference between experimental and refined data; the black arrows represent the tails at bottom of peaks of the MgMnSiO4 phase.
(b)
(a)

Chapter 4 - Olivine silicates: from MgMnSiO4/C to LiMnSiO4/C
151
The peaks tails that were already observed in pristine MgMnSiO4/C pyrolyzed at 900°C for 24h are also evidenced in the molten salt-treated sample, as shown by black arrows in Figure 4-16b. Therefore, after a pattern matching refinement, an overall high Chi2 of 45 was obtained. An orthorhombic MgMnSiO4 cell was refined with the following lattice parameters a=10.460(7)Å, b=6.123(2)Å and c=4.803(3)Å. The difference is considered not to be significant compared to the values of pristine MgMnSiO4/C (a=10.457(6)Å, b=6.129(8)Å and c=4.810(6)Å).
The antisite mixing was estimated by comparison of the experimental diffractogram with the simulated ones, as done for pristine MgMnSiO4/C in section 4.2.1.2. An antisite mixing value of the order of 25-30% is found in Figure 4-17. It is lower than the 30-35% found for pristine MgMnSiO4/C, what assesses the benefits of treatment in molten salts at mild temperature (400°C) [223].
Figure 4-17. Simulated diffraction patterns of olivine MgMnSiO4 with different antisite mixing from 100% (100% Mn2+ on M1 site) to 0% (100% Mg2+ on M1 site) using Fullprof software. The lattice parameters(a=10.460(7)Å, b=6.123(2)Å and c=4.803(3)Å) are based on the experimental diffraction patterns of MgMnSiO4/C pyrolyzed at 900°C for 24h and treated in LiCl-KCl molten salt flux at 400°C for 40h, that is also shown in green. The major reflections impacted by the antisite mixing are labelled by their Miller index on the top of the figure.
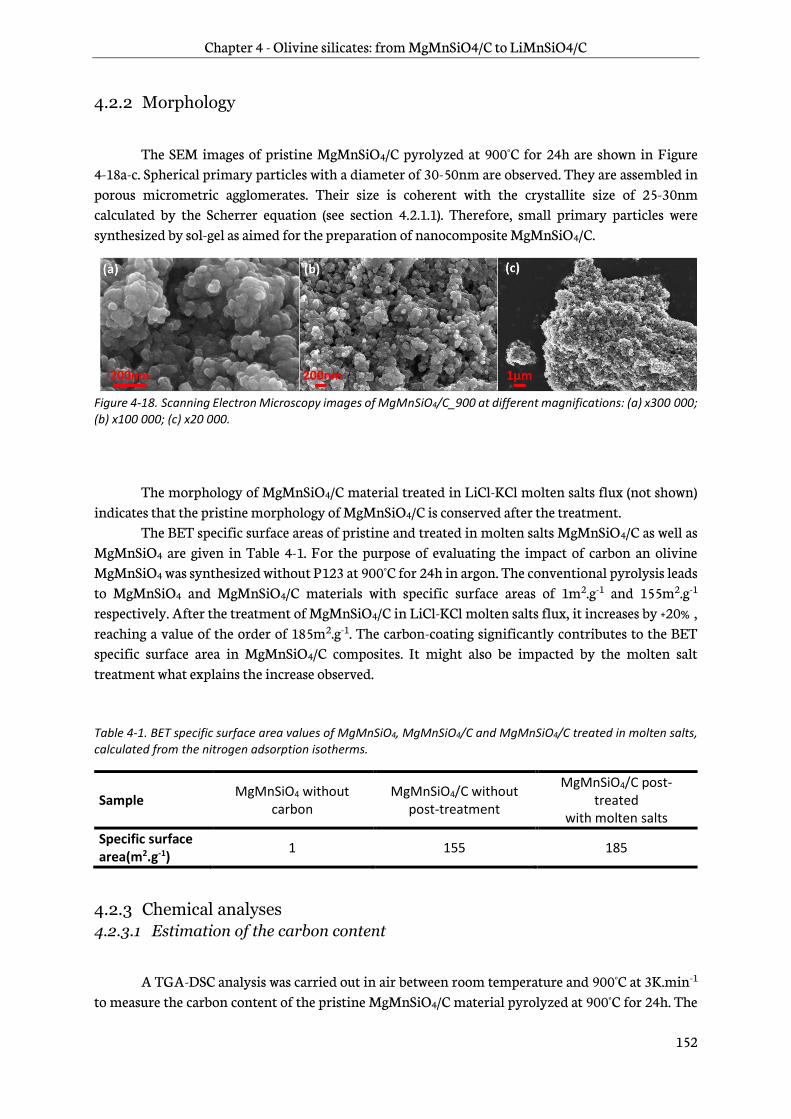
Chapter 4 - Olivine silicates: from MgMnSiO4/C to LiMnSiO4/C
152
4.2.2 Morphology
The SEM images of pristine MgMnSiO4/C pyrolyzed at 900°C for 24h are shown in Figure 4-18a-c. Spherical primary particles with a diameter of 30-50nm are observed. They are assembled in porous micrometric agglomerates. Their size is coherent with the crystallite size of 25-30nm calculated by the Scherrer equation (see section 4.2.1.1). Therefore, small primary particles were synthesized by sol-gel as aimed for the preparation of nanocomposite MgMnSiO4/C.
Figure 4-18. Scanning Electron Microscopy images of MgMnSiO4/C_900 at different magnifications: (a) x300 000; (b) x100 000; (c) x20 000.
The morphology of MgMnSiO4/C material treated in LiCl-KCl molten salts flux (not shown) indicates that the pristine morphology of MgMnSiO4/C is conserved after the treatment.
The BET specific surface areas of pristine and treated in molten salts MgMnSiO4/C as well as MgMnSiO4 are given in Table 4-1. For the purpose of evaluating the impact of carbon an olivine MgMnSiO4 was synthesized without P123 at 900°C for 24h in argon. The conventional pyrolysis leads to MgMnSiO4 and MgMnSiO4/C materials with specific surface areas of 1m2.g-1 and 155m2.g-1 respectively. After the treatment of MgMnSiO4/C in LiCl-KCl molten salts flux, it increases by +20% , reaching a value of the order of 185m2.g-1. The carbon-coating significantly contributes to the BET specific surface area in MgMnSiO4/C composites. It might also be impacted by the molten salt treatment what explains the increase observed.
Table 4-1. BET specific surface area values of MgMnSiO4, MgMnSiO4/C and MgMnSiO4/C treated in molten salts, calculated from the nitrogen adsorption isotherms.
Sample MgMnSiO4 without
carbon MgMnSiO4/C without
post-treatment
MgMnSiO4/C post-treated
with molten salts
Specific surface area(m2.g-1)
1 155 185
4.2.3 Chemical analyses
4.2.3.1 Estimation of the carbon content
A TGA-DSC analysis was carried out in air between room temperature and 900°C at 3K.min-1 to measure the carbon content of the pristine MgMnSiO4/C material pyrolyzed at 900°C for 24h. The

Chapter 4 - Olivine silicates: from MgMnSiO4/C to LiMnSiO4/C
153
evolutions of mass and heat flow as a function of temperature are reported in Figure 4-19. A first thermal phenomenon between room temperature and 200°C accounting for a mass loss of ca. 2.5wt.% is attributed to the water and organics desorptions. Then a large mass loss of 12.8wt.% is observed until 750°C. It is attributed to the oxidation of the carbon-coating in air through the release of carbonaceous gases.
Figure 4-19. Evolution of the mass of MgMnSiO4/C pyrolyzed at 900°C for 24h (straight line) and generated heat flow (dotted line) as a function of temperature, from RT to 900°C, under air, with heating rate of 3K.min-1.
A CHNS/O elementary analysis was performed and yielded the same carbon-content value estimated by TGA. It was also used to check the carbon-content in the treated material in LiCl-KCl molten salts flux. A decrease of carbon content from 12.8wt.% to 11.7wt.% was calculated after the molten salts treatment. The difference is not considered as significant to impact the properties of the composite material. The carbon-coating is probably degraded and its morphology could have changed during the molten salt post-treatment. Thus, even if the carbon content is lower, the carbon coating could still exhibit a higher BET specific surface area as calculated from the nitrogen adsorption isotherms.
4.2.3.2 Surface analysis
C1s and O1s core spectra did not show significant change after the molten salts treatment (not shown). The oxidation state of manganese in MgMnSiO4/C samples was also probed by XPS. However, a quantitative estimation cannot be done from the study of Mn3s orbital (see section 3.6.6), because its splitting overlapped with Mg2s orbital at 89eV. Similarly, Mn3p1/2 overlapped with Mg2p. Therefore, Mn2p3/2 core spectra were used. As the analysis of manganese oxidation state with Mn2p3/2 is only qualitative, a comparison of pristine MgMnSiO4/C was done with Li2MnSiO4 in which manganese has been assessed at the +2 state in Chapter 3 (see section 3.6.6). The two core spectra are shown in Figure 4-20a. Similar Mn2p3/2 peaks and shake-ups are exhibited for the two materials. Therefore, the manganese in MgMnSiO4/C is considered at the +2 state. A comparison of the Mn2p3/2 core spectra of pristine and treated in LiCl-KCl molten salts flux MgMnSiO4/C is shown in Figure 4-20b.

Chapter 4 - Olivine silicates: from MgMnSiO4/C to LiMnSiO4/C
154
The Mn2p3/2 main peak and its shake-up remain the same after the treatment in molten salts. The oxidation state of manganese is thus considered unchanged at +2. Neither presence of lithium nor potassium were observed in Li1s and K2p core spectra (not shown). Finally, it is demonstrated that the treatment in LiCl-KCl molten salts flux did not change the composition of MgMnSiO4/C.
Figure 4-20. XPS Mn2p3/2 core spectra of (a) Li2MnSiO4/C and pristine MgMnSiO4/C and (b) pristine MgMnSiO4/C and MgMnSiO4/C treated in molten salts. Calibration with Si2p orbital at 101.7eV.
4.2.4 Electrochemical performance
In this section, the MgMnSiO4/C materials are always tested in half-cells against a lithium counter-electrode in a LiPF6 salt-based electrolyte (see section 2.5.2) to evaluate their electrochemical performance.
4.2.4.1 Preliminary experiments
Before performing electrochemical characterization of MgMnSiO4/C materials, a test was designed to make sure the magnesium ions released in the electrolyte upon charge do not interfere with the lithium counter-electrode. The standard potential of Mg2+/Mg is 0.66V vs. Li+/Li. Plating of
Mg2+ ions from the electrolyte onto metallic lithium is thermodynamically favorable and may lead to a voltage shift of the counter-electrode.
A charge was performed up to 4.8V on a MgMnSiO4/C versus Li half-cell. The cell was then disassembled and the positive electrode was washed before being reassembled in a new cell with fresh
(a) (b)
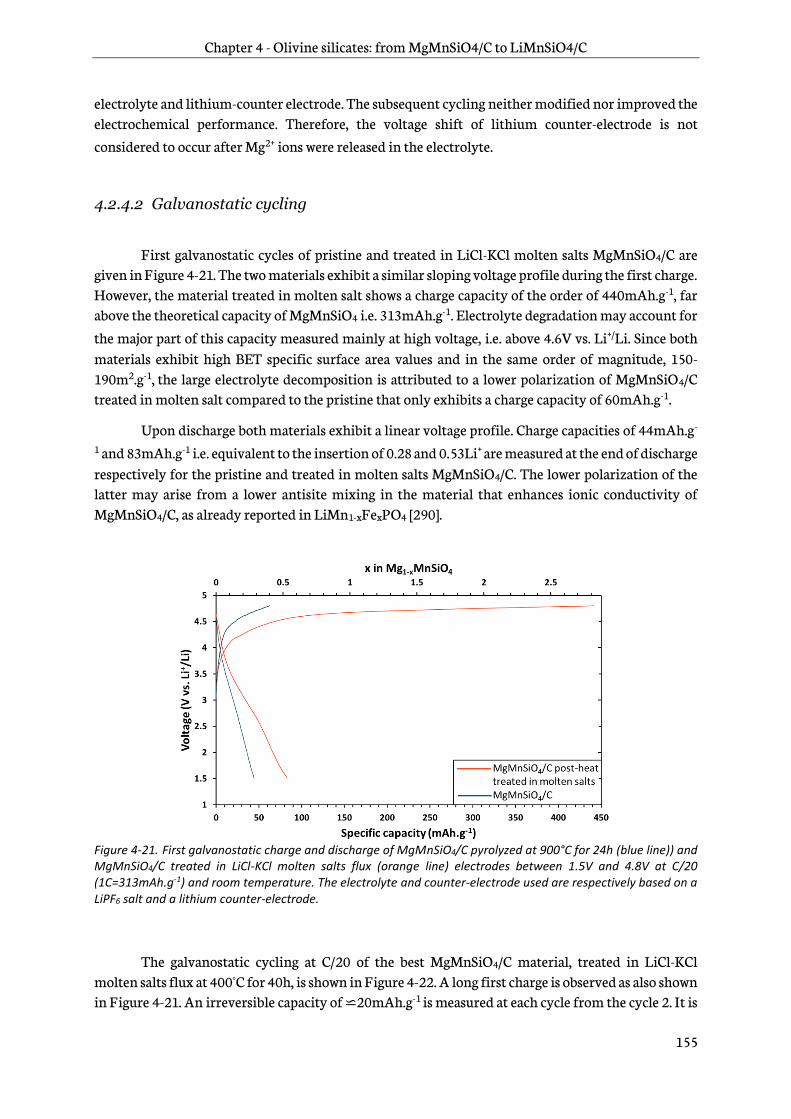
Chapter 4 - Olivine silicates: from MgMnSiO4/C to LiMnSiO4/C
155
electrolyte and lithium-counter electrode. The subsequent cycling neither modified nor improved the electrochemical performance. Therefore, the voltage shift of lithium counter-electrode is not considered to occur after Mg2+ ions were released in the electrolyte.
4.2.4.2 Galvanostatic cycling
First galvanostatic cycles of pristine and treated in LiCl-KCl molten salts MgMnSiO4/C are given in Figure 4-21. The two materials exhibit a similar sloping voltage profile during the first charge. However, the material treated in molten salt shows a charge capacity of the order of 440mAh.g-1, far above the theoretical capacity of MgMnSiO4 i.e. 313mAh.g-1. Electrolyte degradation may account for
the major part of this capacity measured mainly at high voltage, i.e. above 4.6V vs. Li+/Li. Since both materials exhibit high BET specific surface area values and in the same order of magnitude, 150-190m2.g-1, the large electrolyte decomposition is attributed to a lower polarization of MgMnSiO4/C treated in molten salt compared to the pristine that only exhibits a charge capacity of 60mAh.g-1.
Upon discharge both materials exhibit a linear voltage profile. Charge capacities of 44mAh.g-
1 and 83mAh.g-1 i.e. equivalent to the insertion of 0.28 and 0.53Li+ are measured at the end of discharge respectively for the pristine and treated in molten salts MgMnSiO4/C. The lower polarization of the latter may arise from a lower antisite mixing in the material that enhances ionic conductivity of MgMnSiO4/C, as already reported in LiMn1-xFexPO4 [290].
Figure 4-21. First galvanostatic charge and discharge of MgMnSiO4/C pyrolyzed at 900°C for 24h (blue line)) and MgMnSiO4/C treated in LiCl-KCl molten salts flux (orange line) electrodes between 1.5V and 4.8V at C/20 (1C=313mAh.g-1) and room temperature. The electrolyte and counter-electrode used are respectively based on a LiPF6 salt and a lithium counter-electrode.
The galvanostatic cycling at C/20 of the best MgMnSiO4/C material, treated in LiCl-KCl molten salts flux at 400°C for 40h, is shown in Figure 4-22. A long first charge is observed as also shown in Figure 4-21. An irreversible capacity of ⋍20mAh.g-1
is measured at each cycle from the cycle 2. It is
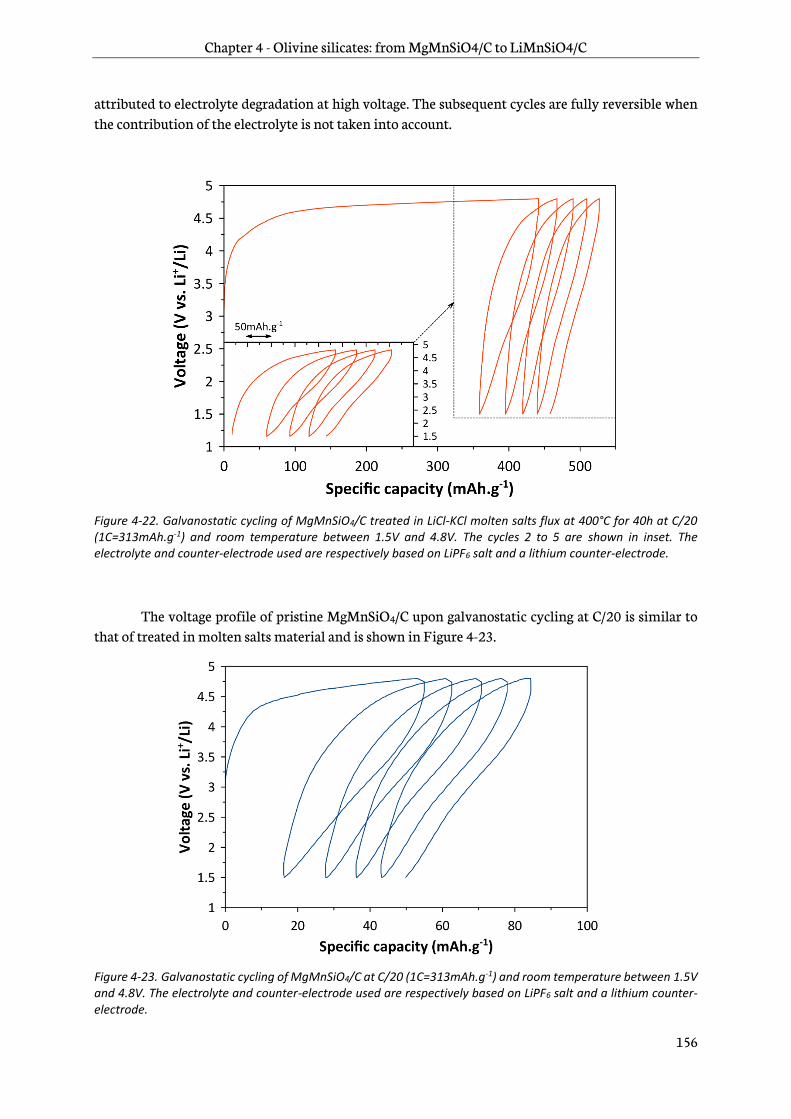
Chapter 4 - Olivine silicates: from MgMnSiO4/C to LiMnSiO4/C
156
attributed to electrolyte degradation at high voltage. The subsequent cycles are fully reversible when the contribution of the electrolyte is not taken into account.
Figure 4-22. Galvanostatic cycling of MgMnSiO4/C treated in LiCl-KCl molten salts flux at 400°C for 40h at C/20 (1C=313mAh.g-1) and room temperature between 1.5V and 4.8V. The cycles 2 to 5 are shown in inset. The electrolyte and counter-electrode used are respectively based on LiPF6 salt and a lithium counter-electrode.
The voltage profile of pristine MgMnSiO4/C upon galvanostatic cycling at C/20 is similar to that of treated in molten salts material and is shown in Figure 4-23.
Figure 4-23. Galvanostatic cycling of MgMnSiO4/C at C/20 (1C=313mAh.g-1) and room temperature between 1.5V and 4.8V. The electrolyte and counter-electrode used are respectively based on LiPF6 salt and a lithium counter-electrode.
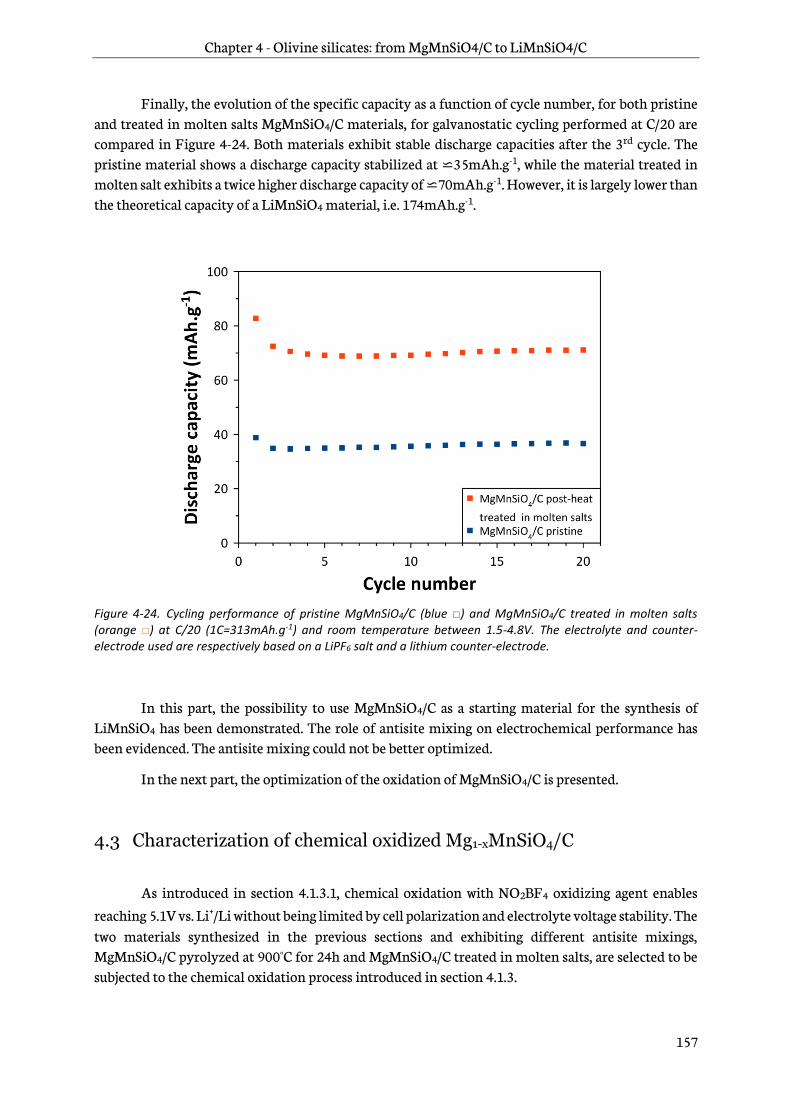
Chapter 4 - Olivine silicates: from MgMnSiO4/C to LiMnSiO4/C
157
Finally, the evolution of the specific capacity as a function of cycle number, for both pristine and treated in molten salts MgMnSiO4/C materials, for galvanostatic cycling performed at C/20 are compared in Figure 4-24. Both materials exhibit stable discharge capacities after the 3rd cycle. The pristine material shows a discharge capacity stabilized at ⋍35mAh.g-1, while the material treated in molten salt exhibits a twice higher discharge capacity of ⋍70mAh.g-1. However, it is largely lower than the theoretical capacity of a LiMnSiO4 material, i.e. 174mAh.g-1.
Figure 4-24. Cycling performance of pristine MgMnSiO4/C (blue □) and MgMnSiO4/C treated in molten salts (orange □) at C/20 (1C=313mAh.g-1) and room temperature between 1.5-4.8V. The electrolyte and counter-electrode used are respectively based on a LiPF6 salt and a lithium counter-electrode.
In this part, the possibility to use MgMnSiO4/C as a starting material for the synthesis of LiMnSiO4 has been demonstrated. The role of antisite mixing on electrochemical performance has been evidenced. The antisite mixing could not be better optimized.
In the next part, the optimization of the oxidation of MgMnSiO4/C is presented.
4.3 Characterization of chemical oxidized Mg1-xMnSiO4/C
As introduced in section 4.1.3.1, chemical oxidation with NO2BF4 oxidizing agent enables reaching 5.1V vs. Li+/Li without being limited by cell polarization and electrolyte voltage stability. The two materials synthesized in the previous sections and exhibiting different antisite mixings, MgMnSiO4/C pyrolyzed at 900°C for 24h and MgMnSiO4/C treated in molten salts, are selected to be subjected to the chemical oxidation process introduced in section 4.1.3.
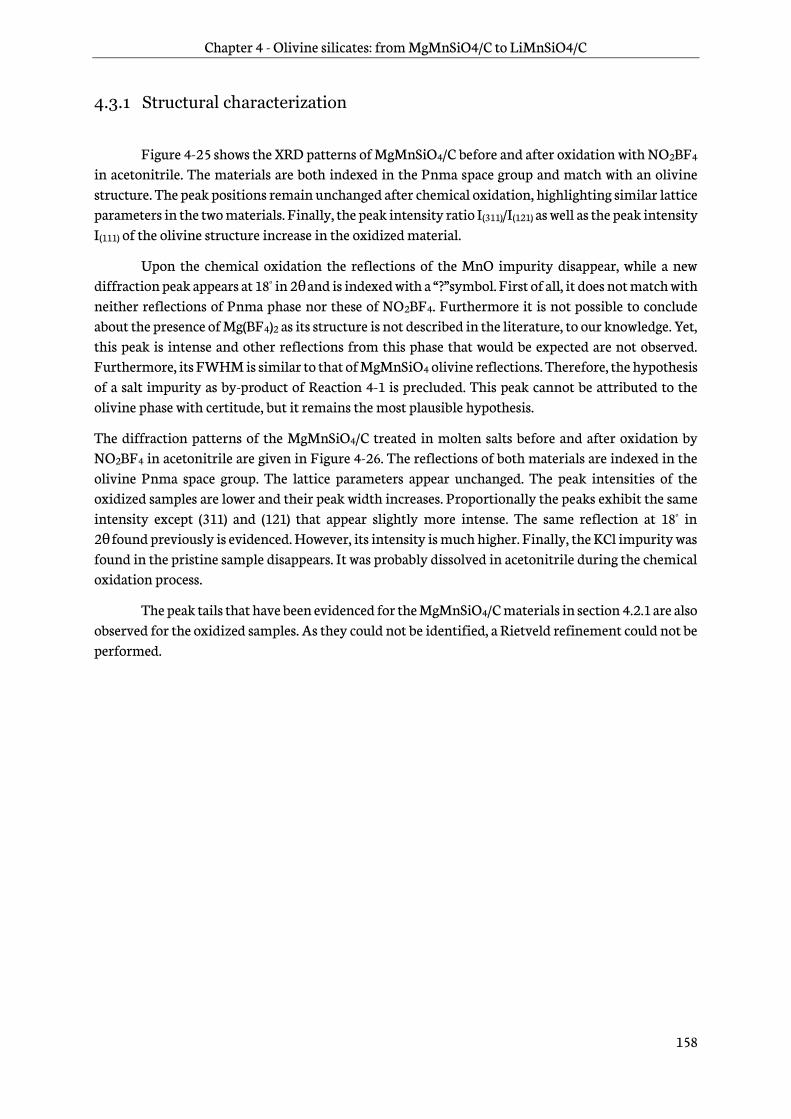
Chapter 4 - Olivine silicates: from MgMnSiO4/C to LiMnSiO4/C
158
4.3.1 Structural characterization
Figure 4-25 shows the XRD patterns of MgMnSiO4/C before and after oxidation with NO2BF4 in acetonitrile. The materials are both indexed in the Pnma space group and match with an olivine structure. The peak positions remain unchanged after chemical oxidation, highlighting similar lattice parameters in the two materials. Finally, the peak intensity ratio I(311)/I(121) as well as the peak intensity I(111) of the olivine structure increase in the oxidized material.
Upon the chemical oxidation the reflections of the MnO impurity disappear, while a new diffraction peak appears at 18° in 2θ and is indexed with a “ ?” symbol. First of all, it does not match with neither reflections of Pnma phase nor these of NO2BF4. Furthermore it is not possible to conclude about the presence of Mg(BF4)2 as its structure is not described in the literature, to our knowledge. Yet, this peak is intense and other reflections from this phase that would be expected are not observed. Furthermore, its FWHM is similar to that of MgMnSiO4 olivine reflections. Therefore, the hypothesis of a salt impurity as by-product of Reaction 4-1 is precluded. This peak cannot be attributed to the olivine phase with certitude, but it remains the most plausible hypothesis.
The diffraction patterns of the MgMnSiO4/C treated in molten salts before and after oxidation by NO2BF4 in acetonitrile are given in Figure 4-26. The reflections of both materials are indexed in the olivine Pnma space group. The lattice parameters appear unchanged. The peak intensities of the oxidized samples are lower and their peak width increases. Proportionally the peaks exhibit the same intensity except (311) and (121) that appear slightly more intense. The same reflection at 18° in 2θ found previously is evidenced. However, its intensity is much higher. Finally, the KCl impurity was found in the pristine sample disappears. It was probably dissolved in acetonitrile during the chemical oxidation process.
The peak tails that have been evidenced for the MgMnSiO4/C materials in section 4.2.1 are also observed for the oxidized samples. As they could not be identified, a Rietveld refinement could not be performed.

Chapter 4 - Olivine silicates: from MgMnSiO4/C to LiMnSiO4/C
159
Figure 4-25. Powder X-Ray Diffraction patterns of pristine MgMnSiO4/C and oxidized MgMnSiO4/C. The additional peak appearing after the chemical oxidation is labelled with a (?) symbol.
Figure 4-26. Powder X-Ray Diffraction patterns of pristine MgMnSiO4/C treated in molten salts and oxidized MgMnSiO4/C treated in molten salts. The KCl impurity peaks are labelled by a ($) symbol. The additional peak appearing after the chemical oxidation is labelled with a (?) symbol.

Chapter 4 - Olivine silicates: from MgMnSiO4/C to LiMnSiO4/C
160
4.3.2 Morphology
The morphologies of the oxidized materials treated in molten salts were characterized by SEM. The images of pristine MgMnSiO4/C and oxidized MgMnSiO4/C treated in molten salts are shown in Figure 4-27 as an example. It evidences the conservation of the initial morphology of MgMnSiO4/C after chemical oxidation with NO2BF4. Images of oxidized MgMnSiO4/C are not shown but lead to the same conclusion.
Figure 4-27. Scanning Electron Microscopy images of (a) MgMnSiO4/C and (b) oxidized MgMnSiO4/C treated in molten salts.
The BET specific surface area values are shown in Table 4-2. The chemical oxidation yields materials with much larger specific surface area. +170% and +310% increases are observed in comparison with the pristine materials, respectively without and with previous treatment in molten salts. The impact of these increased developed surface areas of 270m2.g-1 and 580m2.g-1 on MgMnSiO4/C morphology is not observed by SEM. It is rather imputed to a change of the primary particles microtexture at the nanometer scale.
Table 4-2. Specific surface area values of pristine MgMnSiO4/C a, MgMnSiO4/C treated in molten saltsb, oxidized MgMnSiO4/Cc and oxidized MgMnSiO4/C treated in molten salts d, calculated with the BET method from nitrogen adsorption data.
Specific surface area(m2.g-1)
Sample MgMnSiO4/C without post-
treatment MgMnSiO4/C post-treated with molten
salts
pristine 155a 185b
chemically oxidized 270c 580d
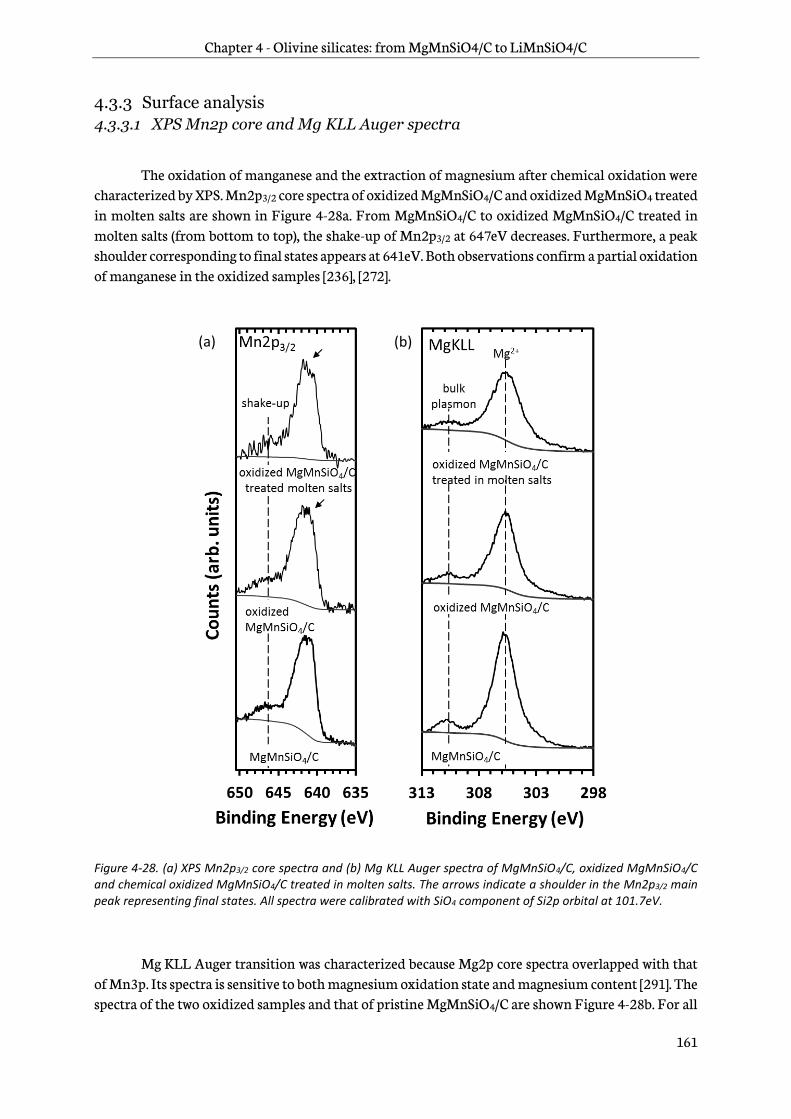
Chapter 4 - Olivine silicates: from MgMnSiO4/C to LiMnSiO4/C
161
4.3.3 Surface analysis
4.3.3.1 XPS Mn2p core and Mg KLL Auger spectra
The oxidation of manganese and the extraction of magnesium after chemical oxidation were characterized by XPS. Mn2p3/2 core spectra of oxidized MgMnSiO4/C and oxidized MgMnSiO4 treated in molten salts are shown in Figure 4-28a. From MgMnSiO4/C to oxidized MgMnSiO4/C treated in molten salts (from bottom to top), the shake-up of Mn2p3/2 at 647eV decreases. Furthermore, a peak shoulder corresponding to final states appears at 641eV. Both observations confirm a partial oxidation of manganese in the oxidized samples [236], [272].
Figure 4-28. (a) XPS Mn2p3/2 core spectra and (b) Mg KLL Auger spectra of MgMnSiO4/C, oxidized MgMnSiO4/C and chemical oxidized MgMnSiO4/C treated in molten salts. The arrows indicate a shoulder in the Mn2p3/2 main peak representing final states. All spectra were calibrated with SiO4 component of Si2p orbital at 101.7eV.
Mg KLL Auger transition was characterized because Mg2p core spectra overlapped with that of Mn3p. Its spectra is sensitive to both magnesium oxidation state and magnesium content [291]. The spectra of the two oxidized samples and that of pristine MgMnSiO4/C are shown Figure 4-28b. For all
(a) (b)
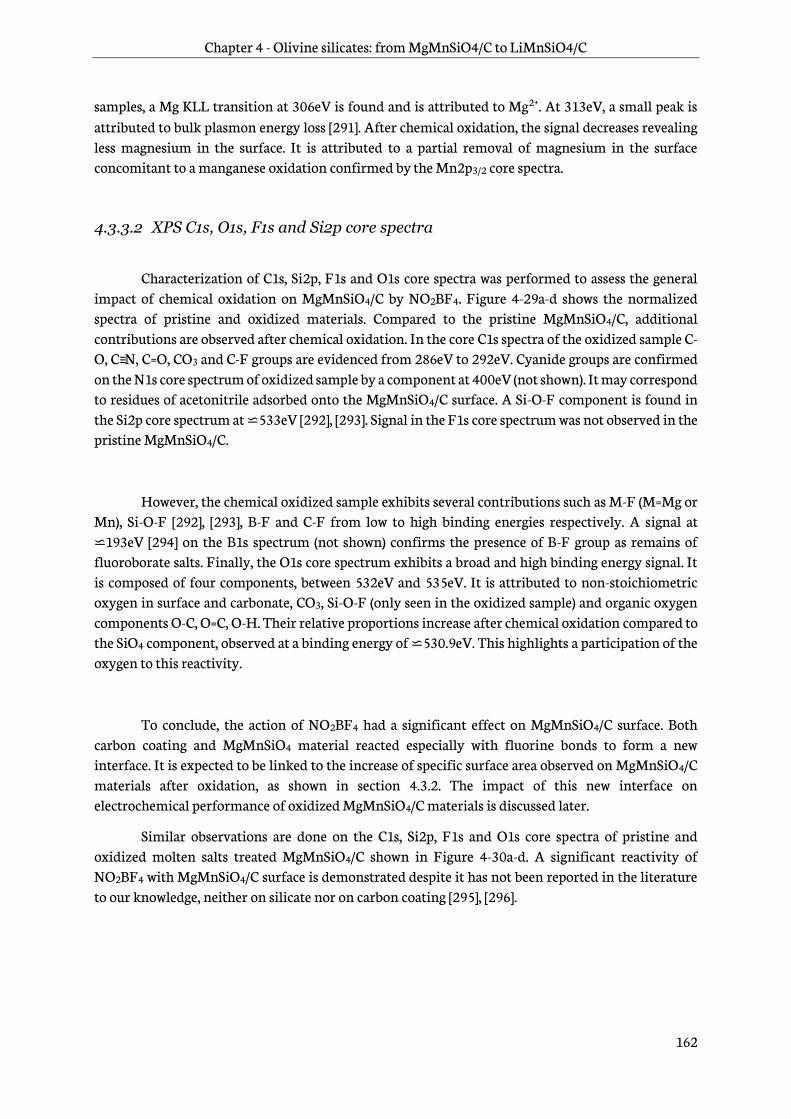
Chapter 4 - Olivine silicates: from MgMnSiO4/C to LiMnSiO4/C
162
samples, a Mg KLL transition at 306eV is found and is attributed to Mg2+. At 313eV, a small peak is attributed to bulk plasmon energy loss [291]. After chemical oxidation, the signal decreases revealing less magnesium in the surface. It is attributed to a partial removal of magnesium in the surface concomitant to a manganese oxidation confirmed by the Mn2p3/2 core spectra.
4.3.3.2 XPS C1s, O1s, F1s and Si2p core spectra
Characterization of C1s, Si2p, F1s and O1s core spectra was performed to assess the general impact of chemical oxidation on MgMnSiO4/C by NO2BF4. Figure 4-29a-d shows the normalized spectra of pristine and oxidized materials. Compared to the pristine MgMnSiO4/C, additional contributions are observed after chemical oxidation. In the core C1s spectra of the oxidized sample C-O, C≡ N, C=O, CO3 and C-F groups are evidenced from 286eV to 292eV. Cyanide groups are confirmed on the N1s core spectrum of oxidized sample by a component at 400eV (not shown). It may correspond to residues of acetonitrile adsorbed onto the MgMnSiO4/C surface. A Si-O-F component is found in the Si2p core spectrum at ⋍533eV [292], [293]. Signal in the F1s core spectrum was not observed in the pristine MgMnSiO4/C.
However, the chemical oxidized sample exhibits several contributions such as M-F (M=Mg or Mn), Si-O-F [292], [293], B-F and C-F from low to high binding energies respectively. A signal at ⋍193eV [294] on the B1s spectrum (not shown) confirms the presence of B-F group as remains of fluoroborate salts. Finally, the O1s core spectrum exhibits a broad and high binding energy signal. It is composed of four components, between 532eV and 535eV. It is attributed to non-stoichiometric oxygen in surface and carbonate, CO3, Si-O-F (only seen in the oxidized sample) and organic oxygen components O-C, O=C, O-H. Their relative proportions increase after chemical oxidation compared to the SiO4 component, observed at a binding energy of ⋍530.9eV. This highlights a participation of the oxygen to this reactivity.
To conclude, the action of NO2BF4 had a significant effect on MgMnSiO4/C surface. Both carbon coating and MgMnSiO4 material reacted especially with fluorine bonds to form a new interface. It is expected to be linked to the increase of specific surface area observed on MgMnSiO4/C materials after oxidation, as shown in section 4.3.2. The impact of this new interface on electrochemical performance of oxidized MgMnSiO4/C materials is discussed later.
Similar observations are done on the C1s, Si2p, F1s and O1s core spectra of pristine and oxidized molten salts treated MgMnSiO4/C shown in Figure 4-30a-d. A significant reactivity of NO2BF4 with MgMnSiO4/C surface is demonstrated despite it has not been reported in the literature to our knowledge, neither on silicate nor on carbon coating [295], [296].
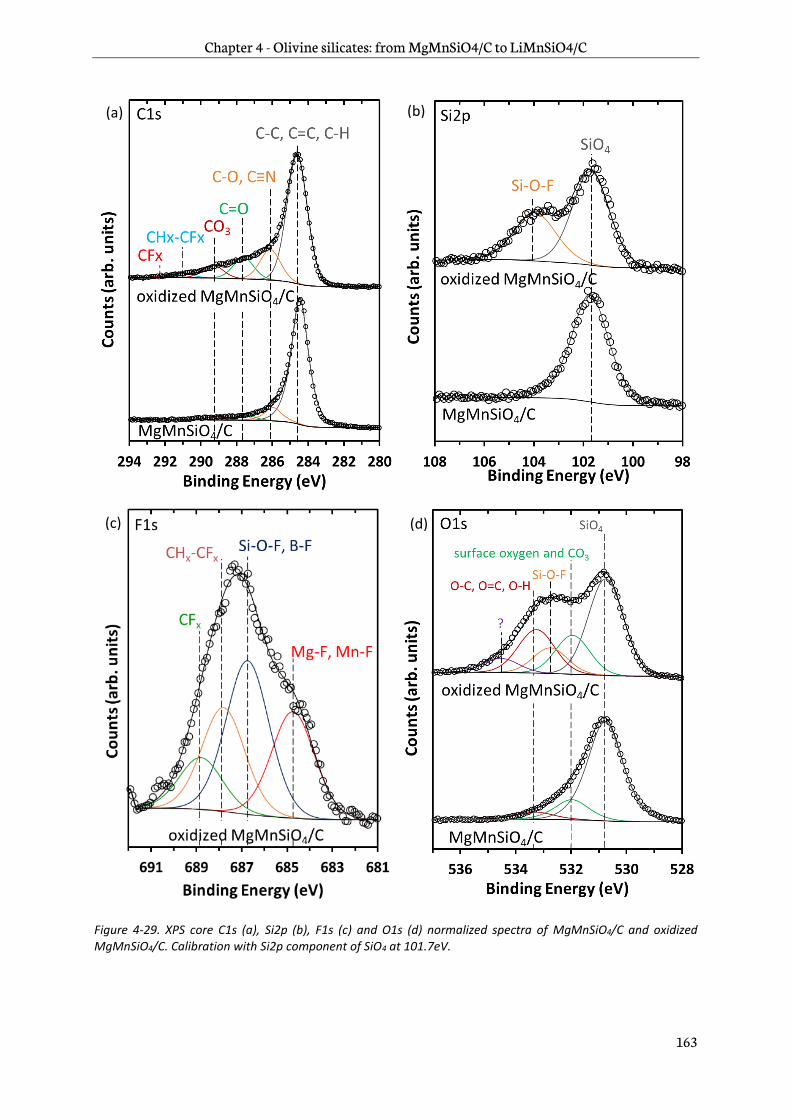
Chapter 4 - Olivine silicates: from MgMnSiO4/C to LiMnSiO4/C
163
Figure 4-29. XPS core C1s (a), Si2p (b), F1s (c) and O1s (d) normalized spectra of MgMnSiO4/C and oxidized MgMnSiO4/C. Calibration with Si2p component of SiO4 at 101.7eV.
(a) (b)
(c) (d)
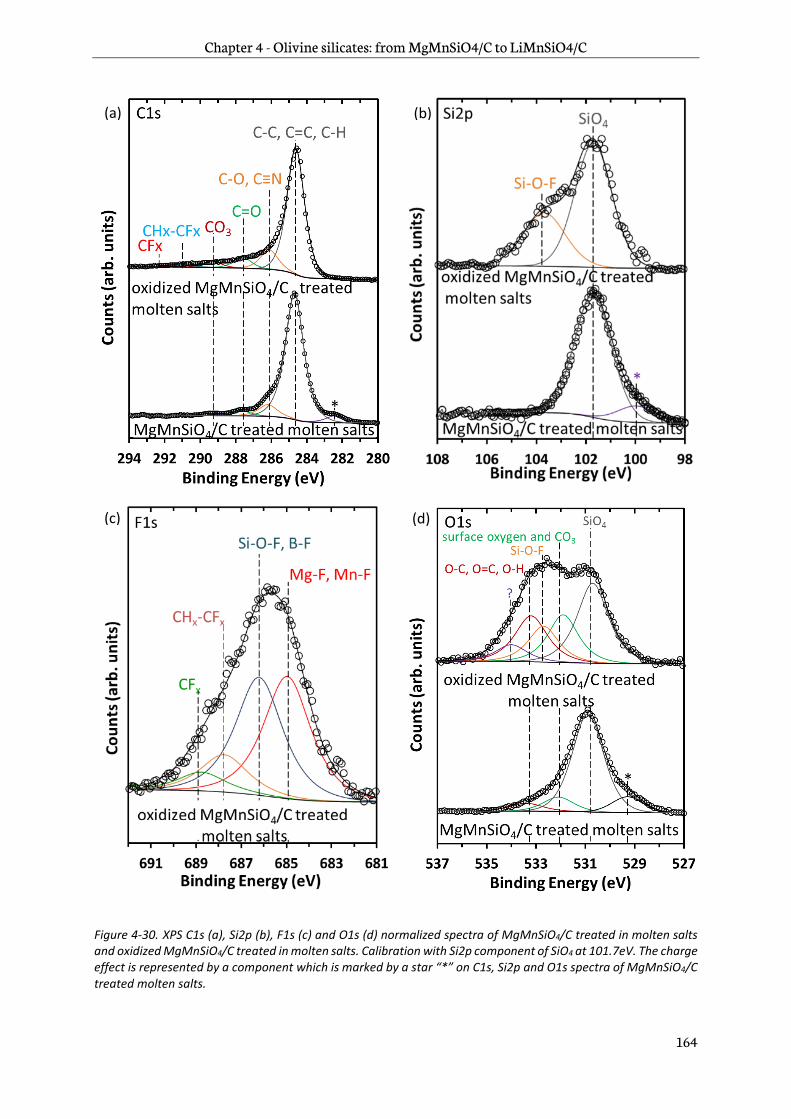
Chapter 4 - Olivine silicates: from MgMnSiO4/C to LiMnSiO4/C
164
Figure 4-30. XPS C1s (a), Si2p (b), F1s (c) and O1s (d) normalized spectra of MgMnSiO4/C treated in molten salts and oxidized MgMnSiO4/C treated in molten salts. Calibration with Si2p component of SiO4 at 101.7eV. The charge effect is represented by a component which is marked by a star “*” on C1s, Si2p and O1s spectra of MgMnSiO4/C treated molten salts.
(b)
(c) (d)
(a)
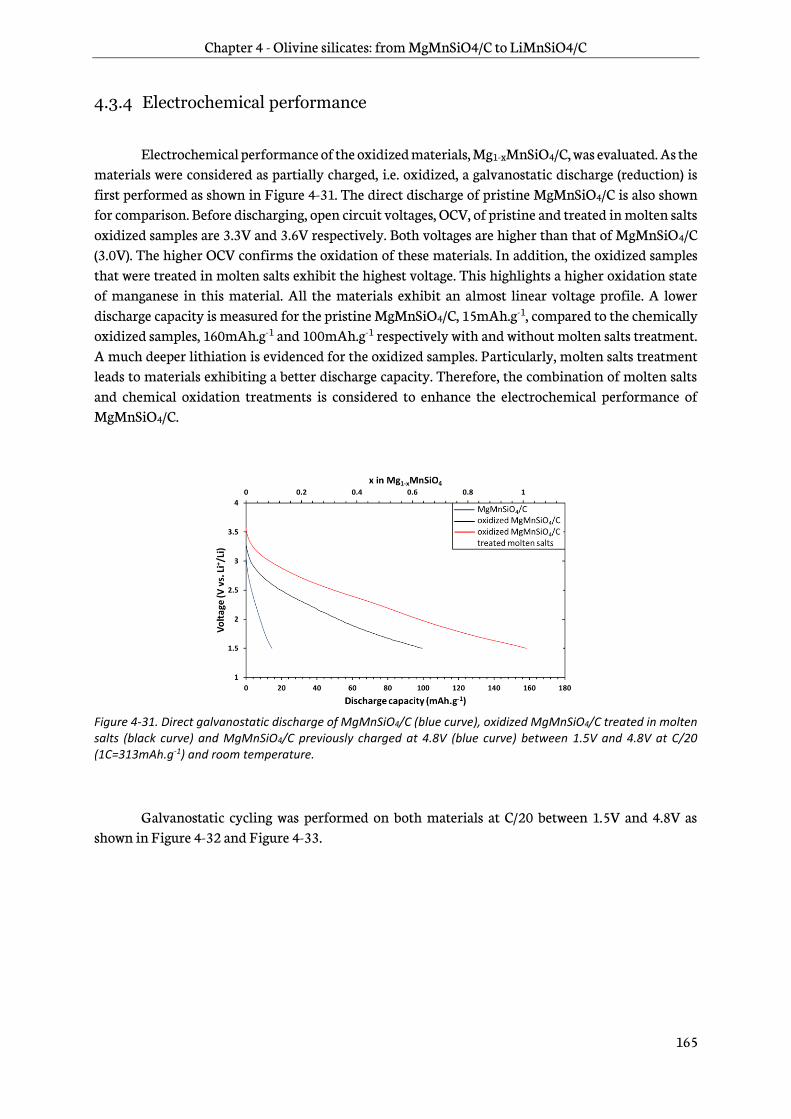
Chapter 4 - Olivine silicates: from MgMnSiO4/C to LiMnSiO4/C
165
4.3.4 Electrochemical performance
Electrochemical performance of the oxidized materials, Mg1-xMnSiO4/C, was evaluated. As the materials were considered as partially charged, i.e. oxidized, a galvanostatic discharge (reduction) is first performed as shown in Figure 4-31. The direct discharge of pristine MgMnSiO4/C is also shown for comparison. Before discharging, open circuit voltages, OCV, of pristine and treated in molten salts oxidized samples are 3.3V and 3.6V respectively. Both voltages are higher than that of MgMnSiO4/C (3.0V). The higher OCV confirms the oxidation of these materials. In addition, the oxidized samples that were treated in molten salts exhibit the highest voltage. This highlights a higher oxidation state of manganese in this material. All the materials exhibit an almost linear voltage profile. A lower discharge capacity is measured for the pristine MgMnSiO4/C, 15mAh.g-1, compared to the chemically oxidized samples, 160mAh.g-1 and 100mAh.g-1 respectively with and without molten salts treatment. A much deeper lithiation is evidenced for the oxidized samples. Particularly, molten salts treatment leads to materials exhibiting a better discharge capacity. Therefore, the combination of molten salts and chemical oxidation treatments is considered to enhance the electrochemical performance of MgMnSiO4/C.
Figure 4-31. Direct galvanostatic discharge of MgMnSiO4/C (blue curve), oxidized MgMnSiO4/C treated in molten salts (black curve) and MgMnSiO4/C previously charged at 4.8V (blue curve) between 1.5V and 4.8V at C/20 (1C=313mAh.g-1) and room temperature.
Galvanostatic cycling was performed on both materials at C/20 between 1.5V and 4.8V as shown in Figure 4-32 and Figure 4-33.

Chapter 4 - Olivine silicates: from MgMnSiO4/C to LiMnSiO4/C
166
Figure 4-32. Galvanostatic cycling of oxidized MgMnSiO4/C at C/20 (1C=313mAh.g-1) and room temperature between 1.5V and 4.8V.
After the first discharge, a long charge is observed in both cases, as also found for MgMnSiO4/C treated in molten salts in section 4.2.4.2. It is again attributed to the electrolyte oxidation at high voltage, i.e. above 4.6V. The following cycles exhibit the same sloping voltage profile as evidenced in the first discharge. Furthermore, they are considered fully reversible when the contribution from the electrolyte is not taken into account.
Figure 4-33. Galvanostatic cycling of oxidized MgMnSiO4/C treated in molten salts, at C/20 (1C=313mAh.g-1) and room temperature between 1.5V and 4.8V.
The evolution of the discharge capacities of oxidized MgMnSiO4/C and oxidized MgMnSiO4/C treated in molten salts upon cycling are shown in Figure 4-34. The second discharge capacities are the highest in both cases, 110mAh.g-1 and 160mAh.g-1 for oxidized materials with and without molten salts treatment respectively. MgMnSiO4/C after a post treatment in molten salt and an oxidation by NO2BF4, exhibits a specific capacity very close to the theoretical value of 170mAh.g-1 for LiMnSiO4.
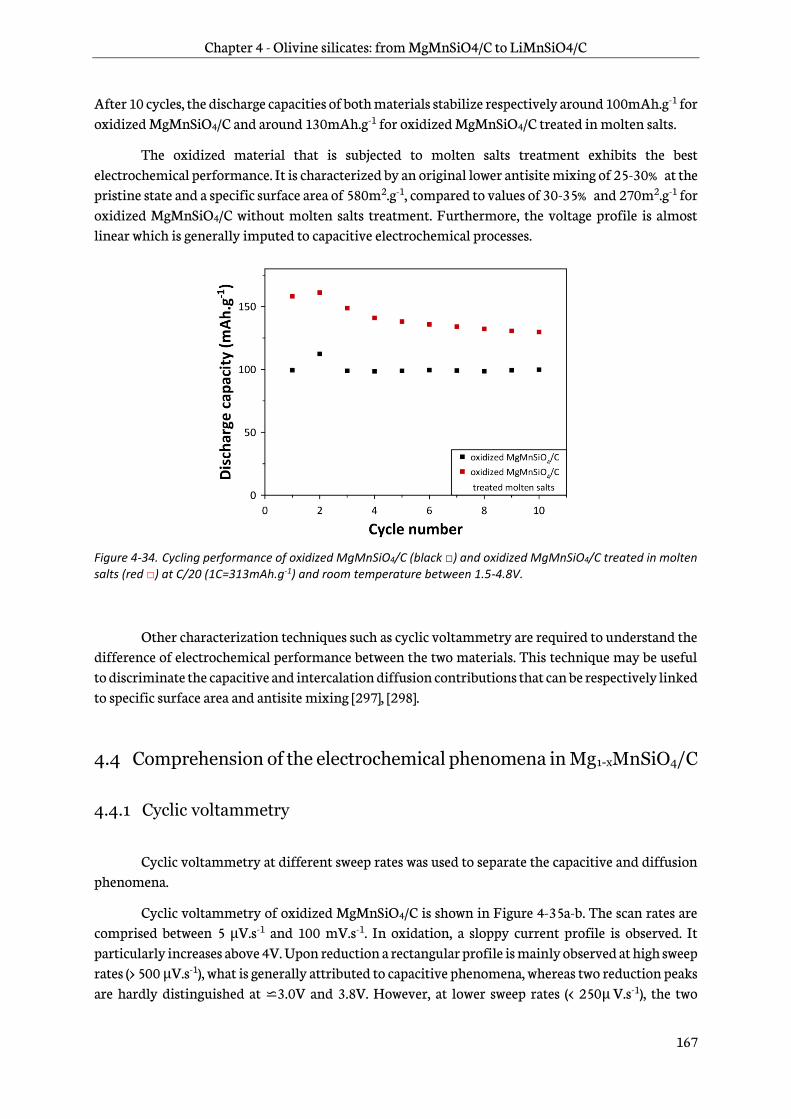
Chapter 4 - Olivine silicates: from MgMnSiO4/C to LiMnSiO4/C
167
After 10 cycles, the discharge capacities of both materials stabilize respectively around 100mAh.g-1 for oxidized MgMnSiO4/C and around 130mAh.g-1 for oxidized MgMnSiO4/C treated in molten salts.
The oxidized material that is subjected to molten salts treatment exhibits the best electrochemical performance. It is characterized by an original lower antisite mixing of 25-30% at the pristine state and a specific surface area of 580m2.g-1, compared to values of 30-35% and 270m2.g-1 for oxidized MgMnSiO4/C without molten salts treatment. Furthermore, the voltage profile is almost linear which is generally imputed to capacitive electrochemical processes.
Figure 4-34. Cycling performance of oxidized MgMnSiO4/C (black □) and oxidized MgMnSiO4/C treated in molten salts (red □) at C/20 (1C=313mAh.g-1) and room temperature between 1.5-4.8V.
Other characterization techniques such as cyclic voltammetry are required to understand the difference of electrochemical performance between the two materials. This technique may be useful to discriminate the capacitive and intercalation diffusion contributions that can be respectively linked to specific surface area and antisite mixing [297], [298].
4.4 Comprehension of the electrochemical phenomena in Mg1-xMnSiO4/C
4.4.1 Cyclic voltammetry
Cyclic voltammetry at different sweep rates was used to separate the capacitive and diffusion phenomena.
Cyclic voltammetry of oxidized MgMnSiO4/C is shown in Figure 4-35a-b. The scan rates are comprised between 5 µV.s-1 and 100 mV.s-1. In oxidation, a sloppy current profile is observed. It particularly increases above 4V. Upon reduction a rectangular profile is mainly observed at high sweep rates (> 500 µV.s-1), what is generally attributed to capacitive phenomena, whereas two reduction peaks are hardly distinguished at ⋍3.0V and 3.8V. However, at lower sweep rates (< 250µ V.s-1), the two
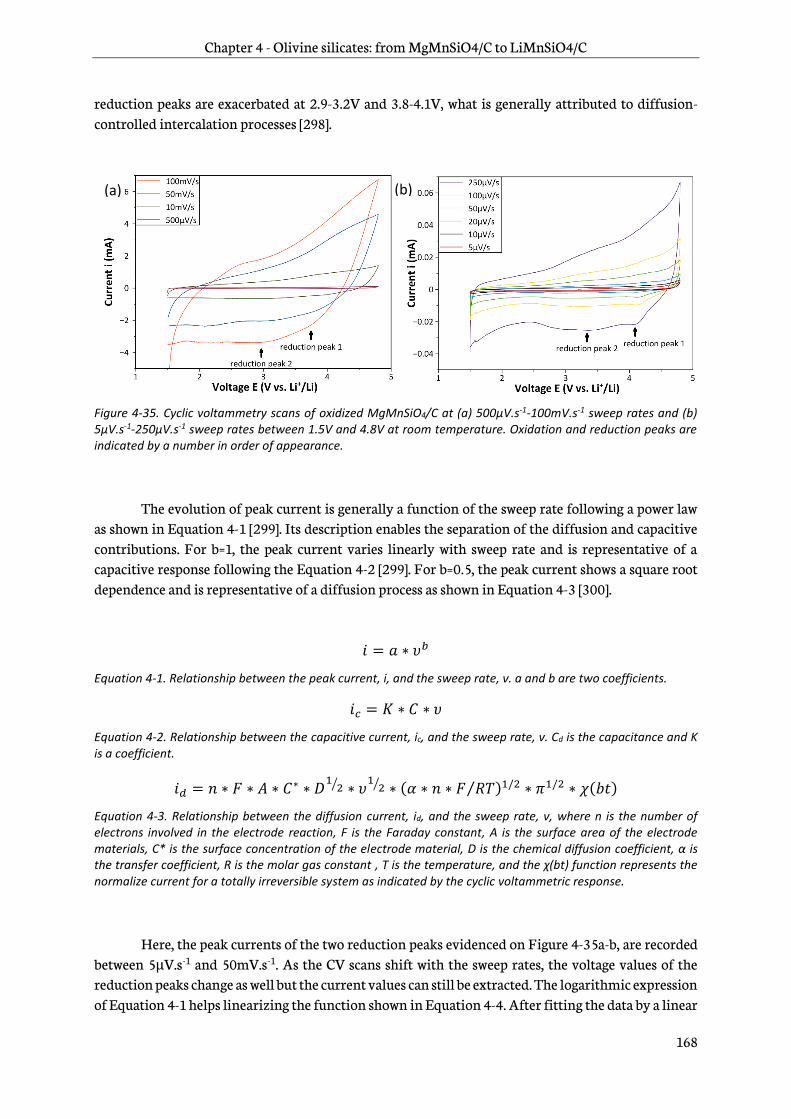
Chapter 4 - Olivine silicates: from MgMnSiO4/C to LiMnSiO4/C
168
reduction peaks are exacerbated at 2.9-3.2V and 3.8-4.1V, what is generally attributed to diffusion-controlled intercalation processes [298].
Figure 4-35. Cyclic voltammetry scans of oxidized MgMnSiO4/C at (a) 500µV.s-1-100mV.s-1 sweep rates and (b) 5µV.s-1-250µV.s-1 sweep rates between 1.5V and 4.8V at room temperature. Oxidation and reduction peaks are indicated by a number in order of appearance.
The evolution of peak current is generally a function of the sweep rate following a power law as shown in Equation 4-1 [299]. Its description enables the separation of the diffusion and capacitive contributions. For b=1, the peak current varies linearly with sweep rate and is representative of a capacitive response following the Equation 4-2 [299]. For b=0.5, the peak current shows a square root dependence and is representative of a diffusion process as shown in Equation 4-3 [300].
𝑖 = 𝑎 ∗ 𝜐𝑏
Equation 4-1. Relationship between the peak current, i, and the sweep rate, ν. a and b are two coefficients.
𝑖𝑐 = 𝐾 ∗ 𝐶 ∗ 𝜐
Equation 4-2. Relationship between the capacitive current, ic, and the sweep rate, ν. Cd is the capacitance and K is a coefficient.
𝑖𝑑 = 𝑛 ∗ 𝐹 ∗ 𝐴 ∗ 𝐶∗ ∗ 𝐷1
2⁄ ∗ 𝜐1
2⁄ ∗ (𝛼 ∗ 𝑛 ∗ 𝐹 𝑅𝑇⁄ )1/2 ∗ 𝜋1/2 ∗ 𝜒(𝑏𝑡)
Equation 4-3. Relationship between the diffusion current, id, and the sweep rate, ν, where n is the number of electrons involved in the electrode reaction, F is the Faraday constant, A is the surface area of the electrode materials, C* is the surface concentration of the electrode material, D is the chemical diffusion coefficient, α is the transfer coefficient, R is the molar gas constant , T is the temperature, and the χ(bt) function represents the normalize current for a totally irreversible system as indicated by the cyclic voltammetric response.
Here, the peak currents of the two reduction peaks evidenced on Figure 4-35a-b, are recorded between 5µV.s-1 and 50mV.s-1. As the CV scans shift with the sweep rates, the voltage values of the reduction peaks change as well but the current values can still be extracted. The logarithmic expression of Equation 4-1 helps linearizing the function shown in Equation 4-4. After fitting the data by a linear
(a) (b)
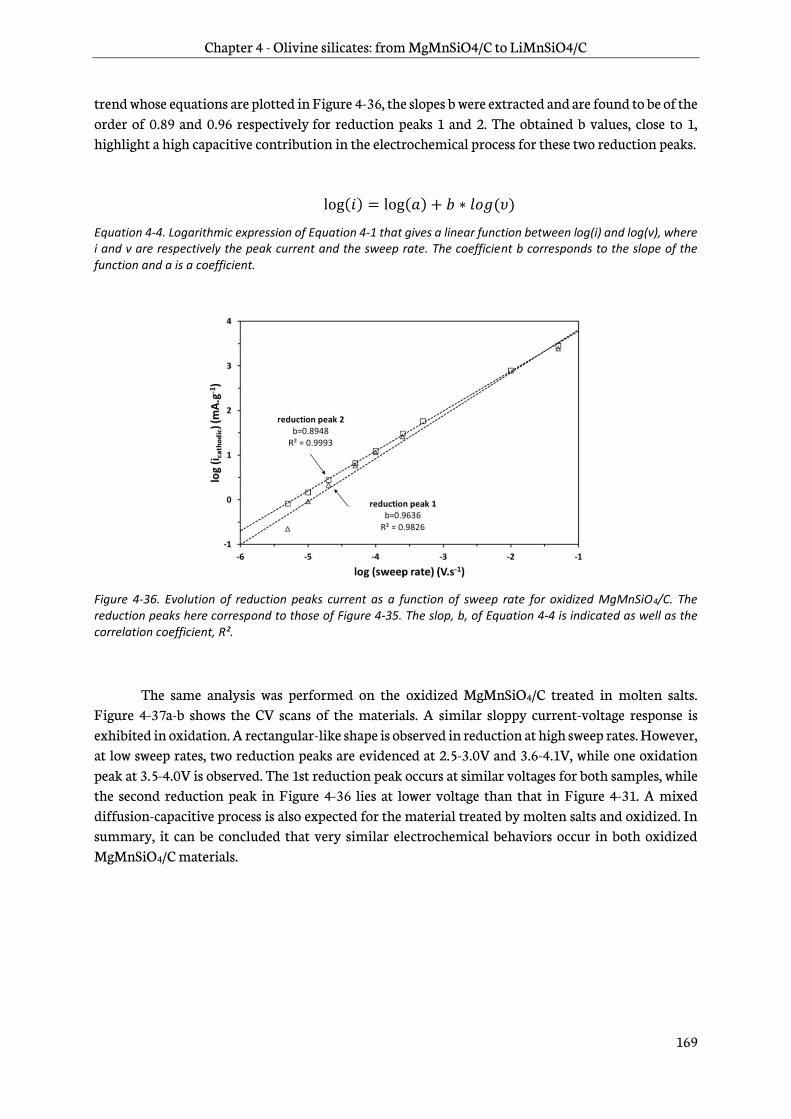
Chapter 4 - Olivine silicates: from MgMnSiO4/C to LiMnSiO4/C
169
trend whose equations are plotted in Figure 4-36, the slopes b were extracted and are found to be of the order of 0.89 and 0.96 respectively for reduction peaks 1 and 2. The obtained b values, close to 1, highlight a high capacitive contribution in the electrochemical process for these two reduction peaks.
log(𝑖) = log(𝑎) + 𝑏 ∗ 𝑙𝑜𝑔(𝜐)
Equation 4-4. Logarithmic expression of Equation 4-1 that gives a linear function between log(i) and log(ν), where i and ν are respectively the peak current and the sweep rate. The coefficient b corresponds to the slope of the function and a is a coefficient.
Figure 4-36. Evolution of reduction peaks current as a function of sweep rate for oxidized MgMnSiO4/C. The reduction peaks here correspond to those of Figure 4-35. The slop, b, of Equation 4-4 is indicated as well as the correlation coefficient, R².
The same analysis was performed on the oxidized MgMnSiO4/C treated in molten salts. Figure 4-37a-b shows the CV scans of the materials. A similar sloppy current-voltage response is exhibited in oxidation. A rectangular-like shape is observed in reduction at high sweep rates. However, at low sweep rates, two reduction peaks are evidenced at 2.5-3.0V and 3.6-4.1V, while one oxidation peak at 3.5-4.0V is observed. The 1st reduction peak occurs at similar voltages for both samples, while the second reduction peak in Figure 4-36 lies at lower voltage than that in Figure 4-31. A mixed diffusion-capacitive process is also expected for the material treated by molten salts and oxidized. In summary, it can be concluded that very similar electrochemical behaviors occur in both oxidized MgMnSiO4/C materials.
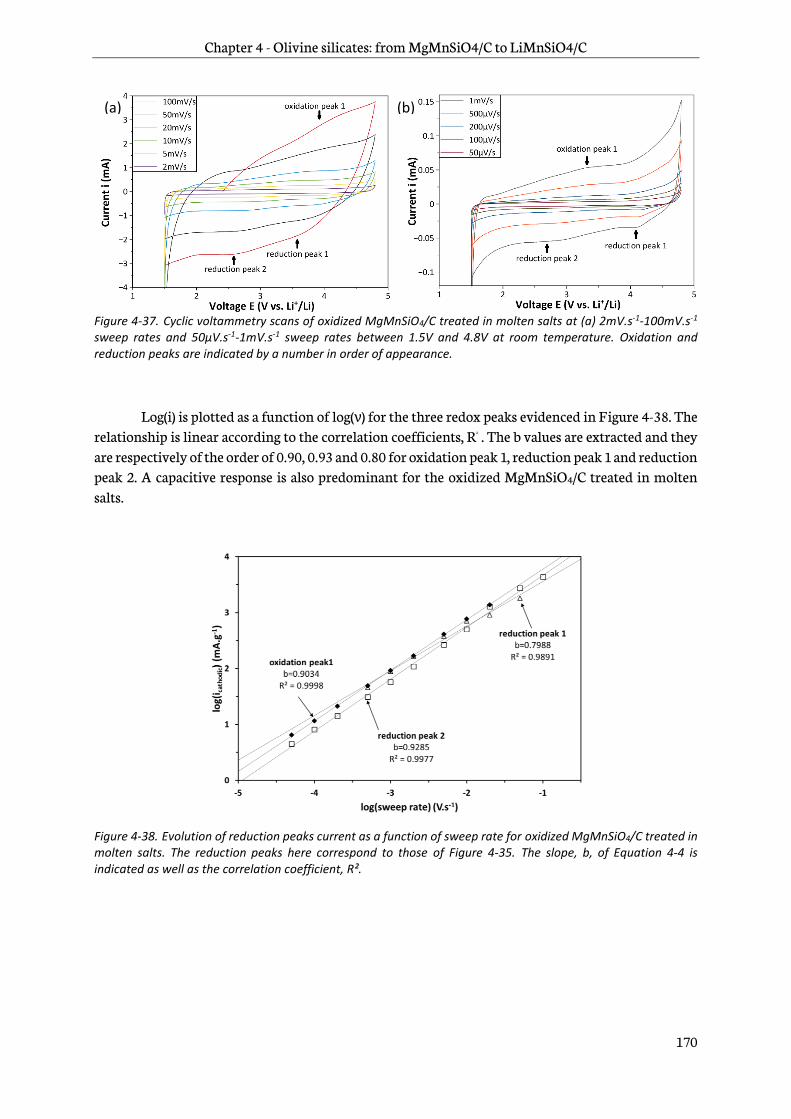
Chapter 4 - Olivine silicates: from MgMnSiO4/C to LiMnSiO4/C
170
Figure 4-37. Cyclic voltammetry scans of oxidized MgMnSiO4/C treated in molten salts at (a) 2mV.s-1-100mV.s-1 sweep rates and 50µV.s-1-1mV.s-1 sweep rates between 1.5V and 4.8V at room temperature. Oxidation and reduction peaks are indicated by a number in order of appearance.
Log(i) is plotted as a function of log(ν ) for the three redox peaks evidenced in Figure 4-38. The relationship is linear according to the correlation coefficients, R² . The b values are extracted and they are respectively of the order of 0.90, 0.93 and 0.80 for oxidation peak 1, reduction peak 1 and reduction peak 2. A capacitive response is also predominant for the oxidized MgMnSiO4/C treated in molten salts.
Figure 4-38. Evolution of reduction peaks current as a function of sweep rate for oxidized MgMnSiO4/C treated in molten salts. The reduction peaks here correspond to those of Figure 4-35. The slope, b, of Equation 4-4 is indicated as well as the correlation coefficient, R².
(a) (b)
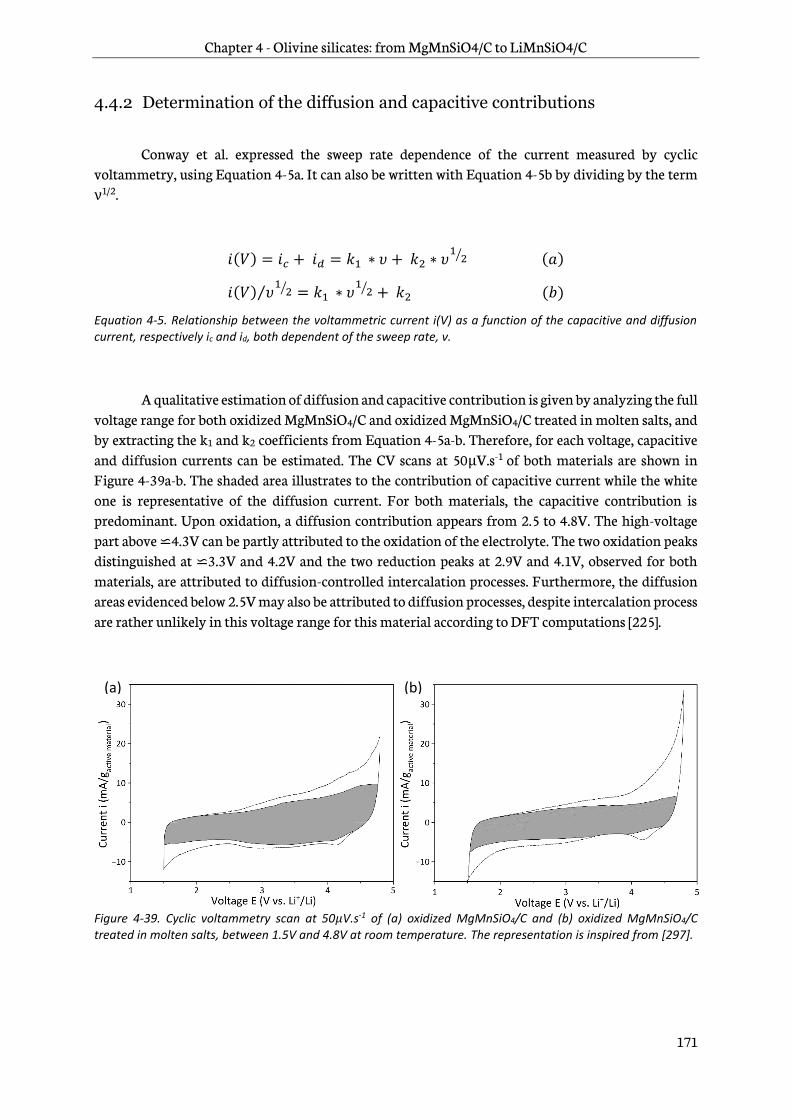
Chapter 4 - Olivine silicates: from MgMnSiO4/C to LiMnSiO4/C
171
4.4.2 Determination of the diffusion and capacitive contributions
Conway et al. expressed the sweep rate dependence of the current measured by cyclic voltammetry, using Equation 4-5a. It can also be written with Equation 4-5b by dividing by the term ν1/2.
𝑖(𝑉) = 𝑖𝑐 + 𝑖𝑑 = 𝑘1 ∗ 𝜐 + 𝑘2 ∗ 𝜐1
2⁄ (𝑎)
𝑖(𝑉) 𝜐1
2⁄⁄ = 𝑘1 ∗ 𝜐1
2⁄ + 𝑘2 (𝑏)
Equation 4-5. Relationship between the voltammetric current i(V) as a function of the capacitive and diffusion current, respectively ic and id, both dependent of the sweep rate, ν.
A qualitative estimation of diffusion and capacitive contribution is given by analyzing the full voltage range for both oxidized MgMnSiO4/C and oxidized MgMnSiO4/C treated in molten salts, and by extracting the k1 and k2 coefficients from Equation 4-5a-b. Therefore, for each voltage, capacitive and diffusion currents can be estimated. The CV scans at 50µV.s-1 of both materials are shown in Figure 4-39a-b. The shaded area illustrates to the contribution of capacitive current while the white one is representative of the diffusion current. For both materials, the capacitive contribution is predominant. Upon oxidation, a diffusion contribution appears from 2.5 to 4.8V. The high-voltage part above ⋍4.3V can be partly attributed to the oxidation of the electrolyte. The two oxidation peaks distinguished at ⋍3.3V and 4.2V and the two reduction peaks at 2.9V and 4.1V, observed for both materials, are attributed to diffusion-controlled intercalation processes. Furthermore, the diffusion areas evidenced below 2.5V may also be attributed to diffusion processes, despite intercalation process are rather unlikely in this voltage range for this material according to DFT computations [225].
Figure 4-39. Cyclic voltammetry scan at 50µV.s-1 of (a) oxidized MgMnSiO4/C and (b) oxidized MgMnSiO4/C treated in molten salts, between 1.5V and 4.8V at room temperature. The representation is inspired from [297].
(a) (b)

Chapter 4 - Olivine silicates: from MgMnSiO4/C to LiMnSiO4/C
172
A quantitative estimation was done by integrating the shaded area for each CV scan and comparing it to the overall signal in percentage of normalized capacity as shown in Figure 4-40.
Capacitive phenomena account for 78% of the capacity of oxidized MgMnSiO4/C, while 58% is calculated for oxidized MgMnSiO4/C treated in molten salts. This difference is clearly evidenced in Figure 4-39 where the first reduction peak at 4.1V is much more pronounced for the material treated
in molten salts. This voltage range is coherent with what was predicted for Mn4+/Mn3+ redox couple in the literature [224], [225]. It is also coherent with the expected deeper chemical oxidation performed on the MgMnSiO4/C materials treated in molten salts.
Figure 4-40. Histogram of normalized capacity contribution of diffusion, white area, and capacitance, shaded area, for oxidized MgMnSiO4/C and oxidized MgMnSiO4/C treated in molten salts.
4.5 Ex-situ characterizations of electrodes upon discharge
The chemical and structural behaviors of the material exhibiting the largest diffusion contribution, i.e. oxidized MgMnSiO4/C treated in molten salts, were investigated during the first discharge. The electrodes were discharged at 50% and 100% depth of discharge, DoD. 100% DoD was fixed to 174mAh.g-1 corresponding to the theoretical capacity of LiMnSiO4. The first discharge curve obtained at C/10 in galvanostatic mode, is shown in Figure 4-41.
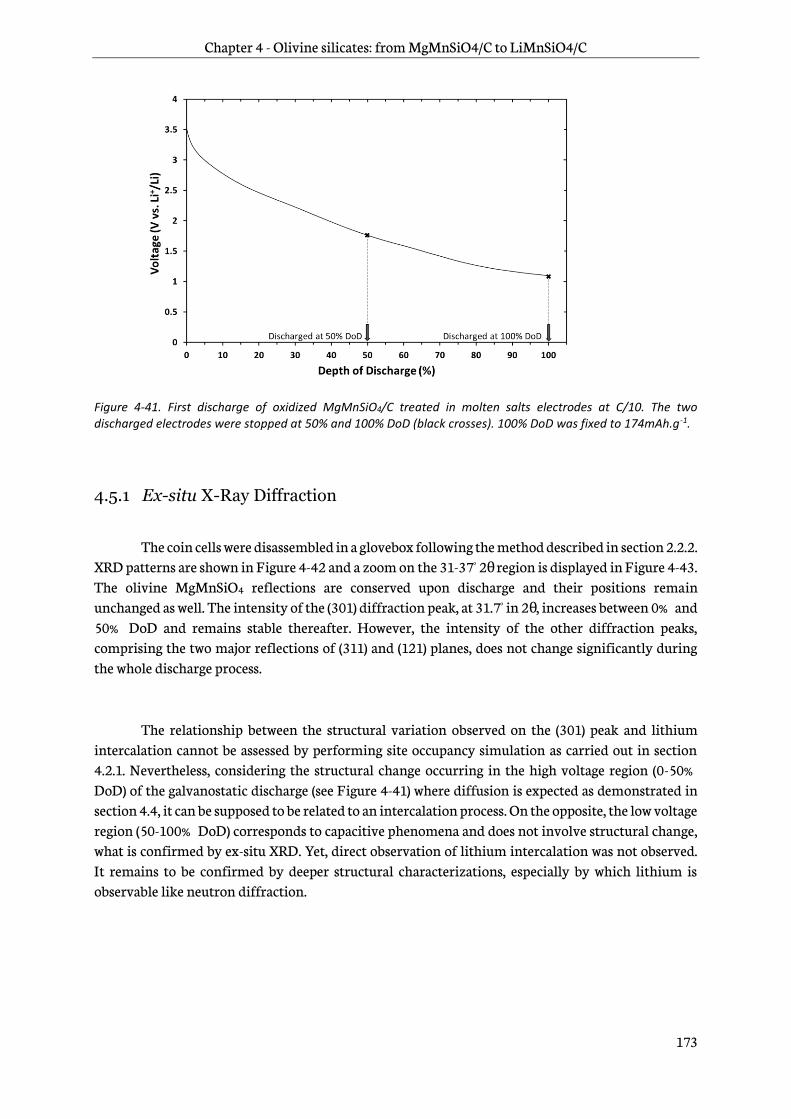
Chapter 4 - Olivine silicates: from MgMnSiO4/C to LiMnSiO4/C
173
Figure 4-41. First discharge of oxidized MgMnSiO4/C treated in molten salts electrodes at C/10. The two discharged electrodes were stopped at 50% and 100% DoD (black crosses). 100% DoD was fixed to 174mAh.g-1.
4.5.1 Ex-situ X-Ray Diffraction
The coin cells were disassembled in a glovebox following the method described in section 2.2.2. XRD patterns are shown in Figure 4-42 and a zoom on the 31-37° 2θ region is displayed in Figure 4-43. The olivine MgMnSiO4 reflections are conserved upon discharge and their positions remain unchanged as well. The intensity of the (301) diffraction peak, at 31.7° in 2θ , increases between 0% and 50% DoD and remains stable thereafter. However, the intensity of the other diffraction peaks, comprising the two major reflections of (311) and (121) planes, does not change significantly during the whole discharge process.
The relationship between the structural variation observed on the (301) peak and lithium intercalation cannot be assessed by performing site occupancy simulation as carried out in section 4.2.1. Nevertheless, considering the structural change occurring in the high voltage region (0-50% DoD) of the galvanostatic discharge (see Figure 4-41) where diffusion is expected as demonstrated in section 4.4, it can be supposed to be related to an intercalation process. On the opposite, the low voltage region (50-100% DoD) corresponds to capacitive phenomena and does not involve structural change, what is confirmed by ex-situ XRD. Yet, direct observation of lithium intercalation was not observed. It remains to be confirmed by deeper structural characterizations, especially by which lithium is observable like neutron diffraction.
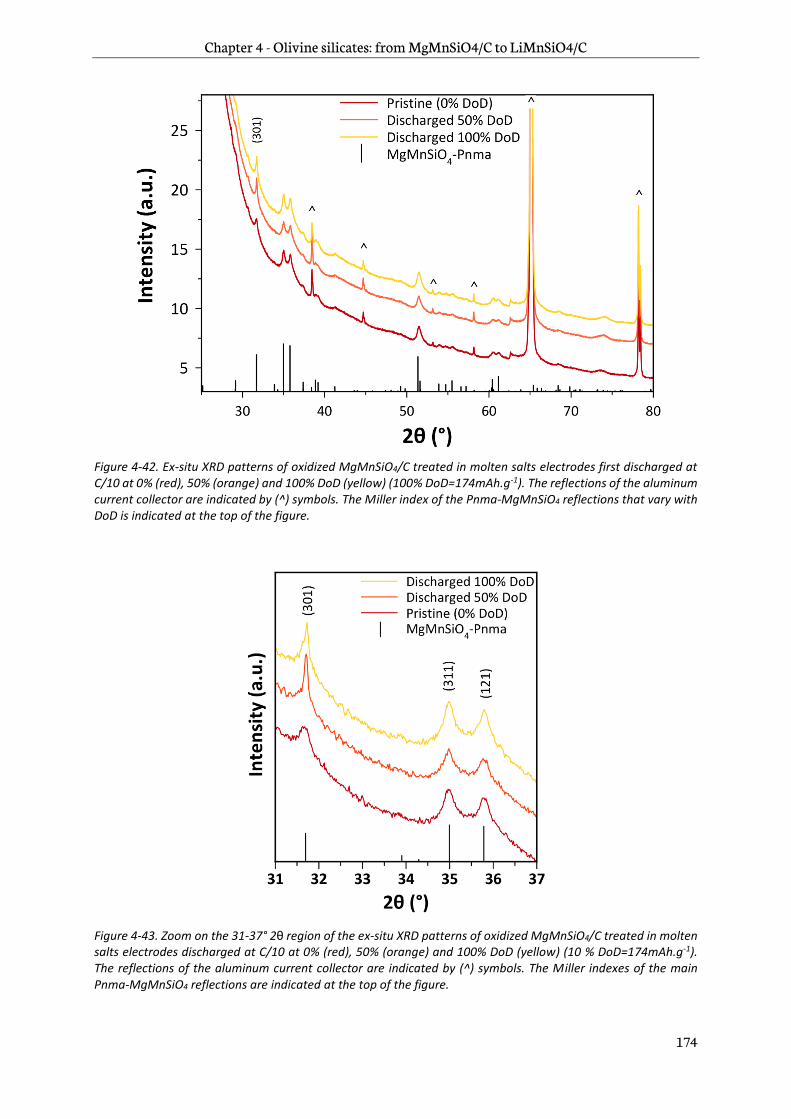
Chapter 4 - Olivine silicates: from MgMnSiO4/C to LiMnSiO4/C
174
Figure 4-42. Ex-situ XRD patterns of oxidized MgMnSiO4/C treated in molten salts electrodes first discharged at C/10 at 0% (red), 50% (orange) and 100% DoD (yellow) (100% DoD=174mAh.g-1). The reflections of the aluminum current collector are indicated by (^) symbols. The Miller index of the Pnma-MgMnSiO4 reflections that vary with DoD is indicated at the top of the figure.
Figure 4-43. Zoom on the 31-37° 2θ region of the ex-situ XRD patterns of oxidized MgMnSiO4/C treated in molten salts electrodes discharged at C/10 at 0% (red), 50% (orange) and 100% DoD (yellow) (10 % DoD=174mAh.g-1). The reflections of the aluminum current collector are indicated by (^) symbols. The Miller indexes of the main Pnma-MgMnSiO4 reflections are indicated at the top of the figure.
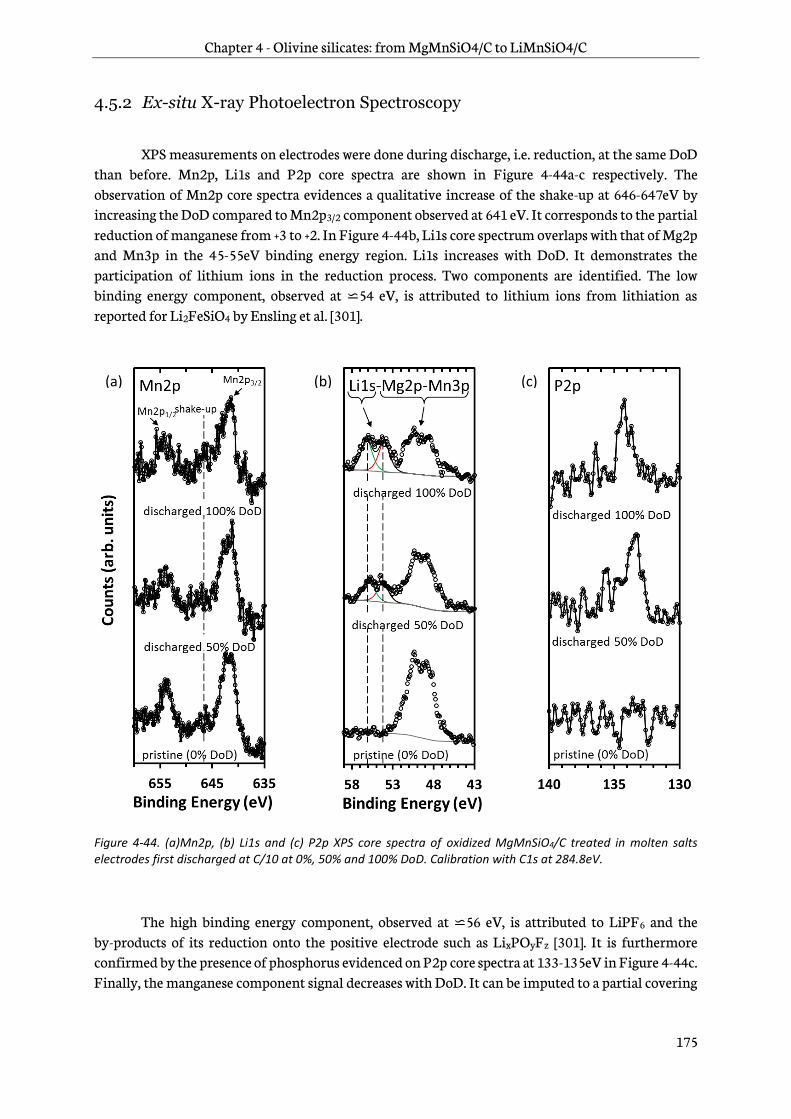
Chapter 4 - Olivine silicates: from MgMnSiO4/C to LiMnSiO4/C
175
4.5.2 Ex-situ X-ray Photoelectron Spectroscopy
XPS measurements on electrodes were done during discharge, i.e. reduction, at the same DoD than before. Mn2p, Li1s and P2p core spectra are shown in Figure 4-44a-c respectively. The observation of Mn2p core spectra evidences a qualitative increase of the shake-up at 646-647eV by increasing the DoD compared to Mn2p3/2 component observed at 641 eV. It corresponds to the partial reduction of manganese from +3 to +2. In Figure 4-44b, Li1s core spectrum overlaps with that of Mg2p and Mn3p in the 45-55eV binding energy region. Li1s increases with DoD. It demonstrates the participation of lithium ions in the reduction process. Two components are identified. The low binding energy component, observed at ⋍54 eV, is attributed to lithium ions from lithiation as reported for Li2FeSiO4 by Ensling et al. [301].
Figure 4-44. (a)Mn2p, (b) Li1s and (c) P2p XPS core spectra of oxidized MgMnSiO4/C treated in molten salts electrodes first discharged at C/10 at 0%, 50% and 100% DoD. Calibration with C1s at 284.8eV.
The high binding energy component, observed at ⋍56 eV, is attributed to LiPF6 and the by-products of its reduction onto the positive electrode such as LixPOyFz [301]. It is furthermore confirmed by the presence of phosphorus evidenced on P2p core spectra at 133-135eV in Figure 4-44c. Finally, the manganese component signal decreases with DoD. It can be imputed to a partial covering
(b) (c) (a)

Chapter 4 - Olivine silicates: from MgMnSiO4/C to LiMnSiO4/C
176
of the electrode with products of LiFP6 salt degradation or Li+ ions from a redox pseudo-capacitance process [301].
To summarize, the redox activity of manganese ions is demonstrated in reduction after having been evidenced upon chemical oxidation (see section 4.3.3.1). This reduction is concomitant to the presence of lithium in the electrode that exhibits two distinct contributions. One may correspond to
either Li+ insertion in the material, either redox pseudo-capacitance in surface of MgMnSiO4/C particles or both the phenomena. The other one may be attributed to LiPF6 and its by-products (e.g. LixPOyFz).
4.6 Summary of the olivine silicates study
A sol-gel process was successfully used for the synthesis of a MgMnSiO4/C nanocomposite. The material pyrolyzed at 900°C for 24h adopted the olivine MgMnSiO4 structure as demonstrated by pattern matching and HRSTEM. A XRD pattern simulation of antisite mixing enables its estimation to 30-35% . A treatment was developed to lower the antisite mixing to 25-30% by heating the former material in LiCl-KCl molten salts at 400°C for 40h, without modifying its composition. The electrochemical performance of the latter material was enhanced compared to the pristine one with a stable discharge capacity of ⋍80mAh.g-1
achievable through a decreased polarization.
A chemical oxidation process with NO2BF4 as oxidizing agent, 5.1V vs. Li+/Li, was set to extract
higher amounts of Mg2+ than in half-cells with lithium counter-electrode and conventional liquid electrolyte. The two pristine materials exhibiting different antisite mixing were chemically oxidized. The chemical oxidation process lead to partial manganese oxidation and magnesium extraction, while a surface of MgMnSiO4/C reactivity to NO2BF4 was evidenced by a covering of fluorine species especially onto the carbon-coating. The latter observation was attributed to the increase of specific surface areas measured after chemical oxidation. Both oxidized materials exhibit enhanced electrochemical performance compared to the pristine materials with stable discharge capacity of 100mAh.g-1 and 130mAh.g-1 over ten cycles.
The best material has the lower original antisite mixing and also the highest specific surface area. An analysis of capacitive and diffusion phenomena was therefore performed by Cyclic Voltammetry. Both oxidized materials exhibit a major capacitive contribution of 60-80% of the recorded capacity. The highest diffusion contribution was found in the oxidized material with both low antisite mixing and high specific surface area. Thus, it is considered that diffusion intercalation process is favored in Mg1-xMnSiO4/C by lowering the antisite mixing and also extracting more magnesium ions by chemical oxidation. Yet, the diffusion intercalation process accounts for a rather small part of the measured capacity.

Chapter 4 - Olivine silicates: from MgMnSiO4/C to LiMnSiO4/C
177
4.7 Testing for space applications
4.7.1 Introduction
In Chapters 3 and 4, it has been shown that the cycling stability of Mg1-xMnSiO4/C was better than that of Li2MnSiO4/C, according to laboratory tests. The objective here is the comparison of the two materials electrochemical performance, using specific charge / discharge profiles, designed for space applications. Two profiles were used for the simulation of Low Earth Orbit (LEO) and Geostationary Earth Orbit (GEO) operating.
The positive electrodes materials Li2MnSiO4/C and Mg1-xMnSiO4/C were prepared at CEA, as described in Chapter 3 and Chapter 4. Coin cells in half cell configuration versus metallic lithium were then assembled using these materials as described in section 2.5.2. The coin cells were then shipped as-prepared to ESA/ESTEC facility in Noordwijk, The Netherlands where life tests were performed.
The general specifications of the cells are shown in Table 4-3. It includes open-circuit voltage and specific capacity values obtained on one control cell at CEA and on cells shipped to ESTEC two months later.
Table 4-3. General specifications of coin cells based on Li2MnSiO4/C and Mg1-xMnSiO4/C positive electrodes, manufactured at CEA (28/04/2017) and tested at ESTEC from (04-13/07/2017). Only discharge capacities were measured for Mg1-x MnSiO4/C.
Test at CEA (28/04/17) Test at ESTEC (04-13/07/17)
Li2MnSiO4/C Mg1-x MnSiO4/C Li2MnSiO4/C Mg1-x MnSiO4/C
Specific charge capacity (mAh.g-1) 171 / 152 / Specific discharge capacity (mAh.g-1) 163 129 146 119
The Li2MnSiO4/C material was charged up to 4.2V and discharged down to 1.5V at C/20 rate as
shown in Figure 4-45a. The limitation of the upper cut-off voltage to 4.2V has been shown to significantly enhance the cycling stability of Li2MnSiO4/C, while delivering a first discharge capacity of 171mAh.g-1 (see section 3.4.2). The shipping and the storage of the coin cells for ⋍2 months had significant effects on the specific capacities that decreased by ⋍20mAh.g-1. The electrolyte leakage that was observed on several coin cells after the shipment might be involved in this phenomenon.
Mg1-xMnSiO4/C was prepared in the charged state, after chemical oxidation by NO2BF4. Therefore, cycling started with a discharge step to 1.5V, performed at C/10, to define its nominal capacity, as shown in Figure 4-45b. The shipping and storage also induced discharge capacity loss by ⋍10mAh.g-1 that could be imputed to electrolyte leakage that was also noticed for few cells.
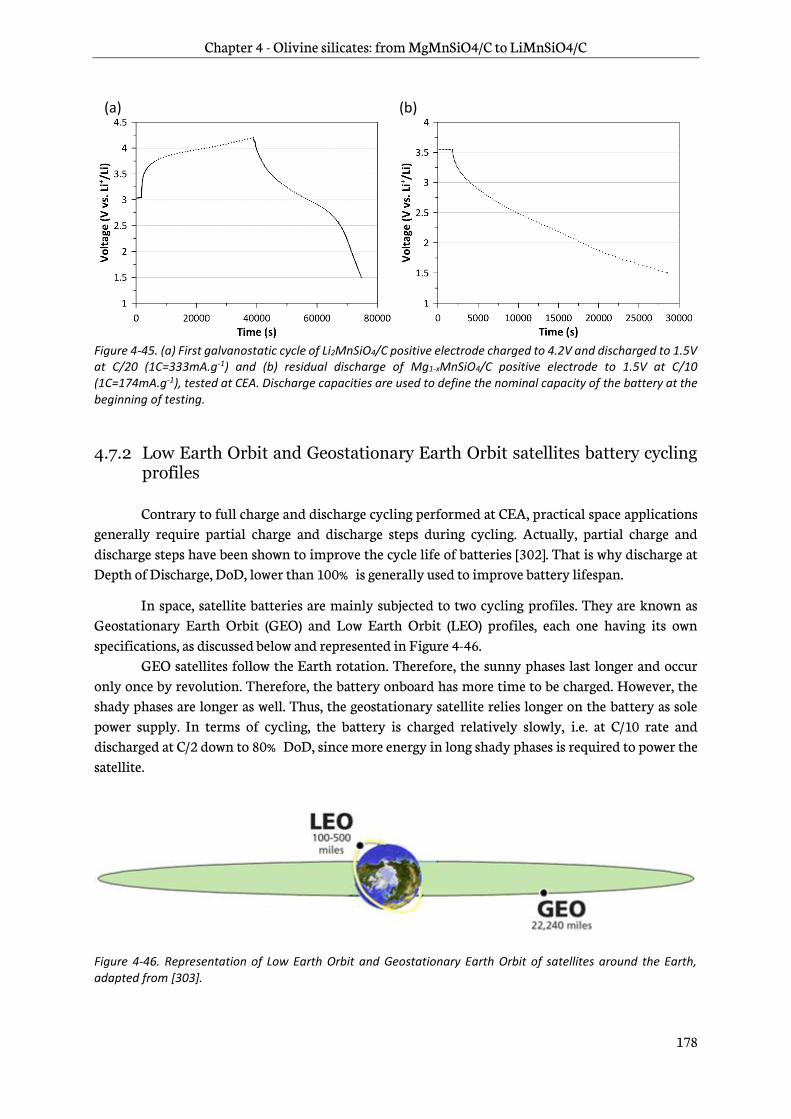
Chapter 4 - Olivine silicates: from MgMnSiO4/C to LiMnSiO4/C
178
Figure 4-45. (a) First galvanostatic cycle of Li2MnSiO4/C positive electrode charged to 4.2V and discharged to 1.5V at C/20 (1C=333mA.g-1) and (b) residual discharge of Mg1-xMnSiO4/C positive electrode to 1.5V at C/10 (1C=174mA.g-1), tested at CEA. Discharge capacities are used to define the nominal capacity of the battery at the beginning of testing.
4.7.2 Low Earth Orbit and Geostationary Earth Orbit satellites battery cycling
profiles
Contrary to full charge and discharge cycling performed at CEA, practical space applications generally require partial charge and discharge steps during cycling. Actually, partial charge and discharge steps have been shown to improve the cycle life of batteries [302]. That is why discharge at Depth of Discharge, DoD, lower than 100% is generally used to improve battery lifespan.
In space, satellite batteries are mainly subjected to two cycling profiles. They are known as Geostationary Earth Orbit (GEO) and Low Earth Orbit (LEO) profiles, each one having its own specifications, as discussed below and represented in Figure 4-46.
GEO satellites follow the Earth rotation. Therefore, the sunny phases last longer and occur only once by revolution. Therefore, the battery onboard has more time to be charged. However, the shady phases are longer as well. Thus, the geostationary satellite relies longer on the battery as sole power supply. In terms of cycling, the battery is charged relatively slowly, i.e. at C/10 rate and discharged at C/2 down to 80% DoD, since more energy in long shady phases is required to power the satellite.
Figure 4-46. Representation of Low Earth Orbit and Geostationary Earth Orbit of satellites around the Earth, adapted from [303].
(a) (b)

Chapter 4 - Olivine silicates: from MgMnSiO4/C to LiMnSiO4/C
179
LEO satellites complete several revolutions around the Earth per day, as shown in Figure 4-46. Therefore, the alternating sunny and shady phases are shorter and more frequent. The battery needs to be charged faster but less energy is required for every sunny phase compared to GEO conditions.
In terms of cycling rates, the battery is charged faster than for GEO satellites, i.e. C/3, and discharged at C/2 rate. Only partial discharges, corresponding to ⋍30% DoD, are performed at LEO conditions, compared to ⋍80% at GEO conditions.
The LEO and GEO cycling profile specifications are summarized in Table 4-4 [304]. The satellites also evolve in different temperature environments, depending on whether they are in sunny or shady phases.
In practice, the battery temperature onboard the satellites will depend on system level requirements and on the presence of battery thermal control. Therefore, when performing LEO and GEO battery life tests, a range of potential battery temperatures, from -5°C to 30°C [305], is usually covered.
Table 4-4. General specifications of LEO and GEO cycling conditions.
LEO GEO
Charge rate C/3 C/10
Upper cut-off voltage 4.2V (Li2MnSiO4/C), 4.8V (Mg1-xMnSiO4/C)
Discharge rate C/2 C/2
Depth of discharge 30% 80%
Lower cut-off voltage (as safety limit)
1.5V
As previously mentioned, charge for Li2MnSiO4/C was limited to 4.2V. The upper cut-off
voltage of Mg1-xMnSiO4/C was kept at 4.8V as used in Chapter IV. For both materials, a minimum lower cut-off voltage of 1.5V was set as a safety limit. The nominal capacity of the cells was determined by a full discharge following a full charge at the designated cut off voltage limits for each material. Following this first capacity check the coin cells including Li2MnSiO4/C and Mg1-xMnSiO4/C positive electrodes were subsequently subjected to one cycle at relevant LEO and GEO C-rates and temperatures, as illustrated by the first galvanostatic cycle of Li2MnSiO4/C cells at 20°C in Figure 4-47a-b as an example. The discharge capacity measured was defined as the Beginning of Life, BoL, capacity. The charge and discharge C-rate values for subsequent LEO and GEO cycling were calculated according to the nominal BoL capacity. The LEO and GEO current rate values, cut off voltages and DoDs are illustrated by the second galvanostatic cycle in Figure 4-47a-b. The relevant conditions are also summarized in Table 4-4.
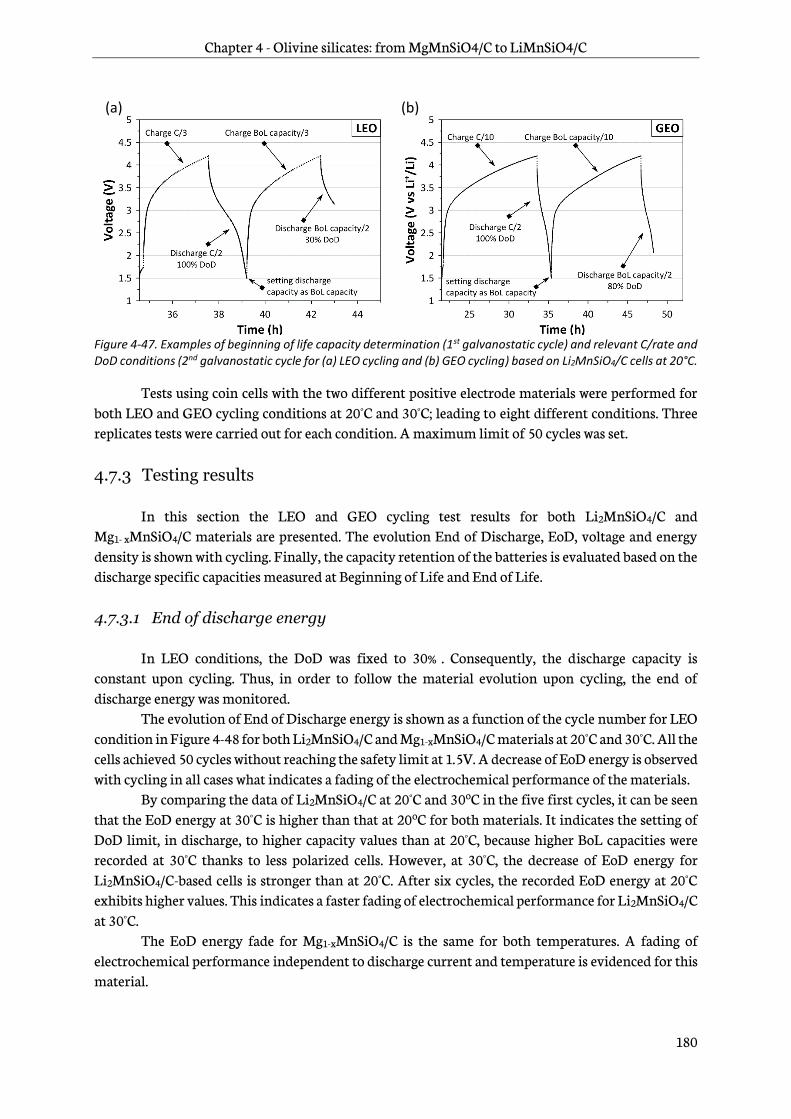
Chapter 4 - Olivine silicates: from MgMnSiO4/C to LiMnSiO4/C
180
Figure 4-47. Examples of beginning of life capacity determination (1st galvanostatic cycle) and relevant C/rate and DoD conditions (2nd galvanostatic cycle for (a) LEO cycling and (b) GEO cycling) based on Li2MnSiO4/C cells at 20°C.
Tests using coin cells with the two different positive electrode materials were performed for both LEO and GEO cycling conditions at 20°C and 30°C; leading to eight different conditions. Three replicates tests were carried out for each condition. A maximum limit of 50 cycles was set. 4.7.3 Testing results
In this section the LEO and GEO cycling test results for both Li2MnSiO4/C and Mg1- xMnSiO4/C materials are presented. The evolution End of Discharge, EoD, voltage and energy density is shown with cycling. Finally, the capacity retention of the batteries is evaluated based on the discharge specific capacities measured at Beginning of Life and End of Life. 4.7.3.1 End of discharge energy
In LEO conditions, the DoD was fixed to 30% . Consequently, the discharge capacity is
constant upon cycling. Thus, in order to follow the material evolution upon cycling, the end of discharge energy was monitored.
The evolution of End of Discharge energy is shown as a function of the cycle number for LEO condition in Figure 4-48 for both Li2MnSiO4/C and Mg1-xMnSiO4/C materials at 20°C and 30°C. All the cells achieved 50 cycles without reaching the safety limit at 1.5V. A decrease of EoD energy is observed with cycling in all cases what indicates a fading of the electrochemical performance of the materials.
By comparing the data of Li2MnSiO4/C at 20°C and 30oC in the five first cycles, it can be seen that the EoD energy at 30°C is higher than that at 20oC for both materials. It indicates the setting of DoD limit, in discharge, to higher capacity values than at 20°C, because higher BoL capacities were recorded at 30°C thanks to less polarized cells. However, at 30°C, the decrease of EoD energy for Li2MnSiO4/C-based cells is stronger than at 20°C. After six cycles, the recorded EoD energy at 20°C exhibits higher values. This indicates a faster fading of electrochemical performance for Li2MnSiO4/C at 30°C.
The EoD energy fade for Mg1-xMnSiO4/C is the same for both temperatures. A fading of electrochemical performance independent to discharge current and temperature is evidenced for this material.
(a) (b)
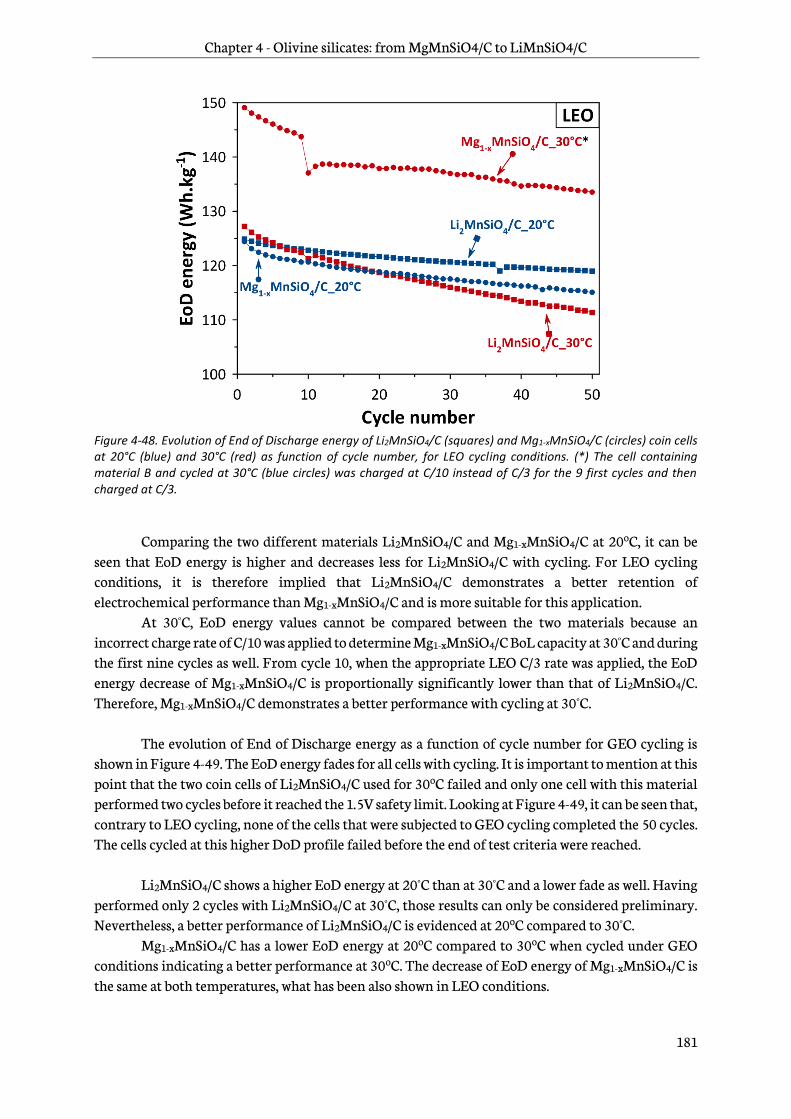
Chapter 4 - Olivine silicates: from MgMnSiO4/C to LiMnSiO4/C
181
Figure 4-48. Evolution of End of Discharge energy of Li2MnSiO4/C (squares) and Mg1-xMnSiO4/C (circles) coin cells at 20°C (blue) and 30°C (red) as function of cycle number, for LEO cycling conditions. (*) The cell containing material B and cycled at 30°C (blue circles) was charged at C/10 instead of C/3 for the 9 first cycles and then charged at C/3.
Comparing the two different materials Li2MnSiO4/C and Mg1-xMnSiO4/C at 20oC, it can be
seen that EoD energy is higher and decreases less for Li2MnSiO4/C with cycling. For LEO cycling conditions, it is therefore implied that Li2MnSiO4/C demonstrates a better retention of electrochemical performance than Mg1-xMnSiO4/C and is more suitable for this application.
At 30°C, EoD energy values cannot be compared between the two materials because an incorrect charge rate of C/10 was applied to determine Mg1-xMnSiO4/C BoL capacity at 30°C and during the first nine cycles as well. From cycle 10, when the appropriate LEO C/3 rate was applied, the EoD energy decrease of Mg1-xMnSiO4/C is proportionally significantly lower than that of Li2MnSiO4/C. Therefore, Mg1-xMnSiO4/C demonstrates a better performance with cycling at 30°C.
The evolution of End of Discharge energy as a function of cycle number for GEO cycling is shown in Figure 4-49. The EoD energy fades for all cells with cycling. It is important to mention at this point that the two coin cells of Li2MnSiO4/C used for 30oC failed and only one cell with this material performed two cycles before it reached the 1.5V safety limit. Looking at Figure 4-49, it can be seen that, contrary to LEO cycling, none of the cells that were subjected to GEO cycling completed the 50 cycles. The cells cycled at this higher DoD profile failed before the end of test criteria were reached.
Li2MnSiO4/C shows a higher EoD energy at 20°C than at 30°C and a lower fade as well. Having
performed only 2 cycles with Li2MnSiO4/C at 30°C, those results can only be considered preliminary. Nevertheless, a better performance of Li2MnSiO4/C is evidenced at 20oC compared to 30°C.
Mg1-xMnSiO4/C has a lower EoD energy at 20oC compared to 30oC when cycled under GEO conditions indicating a better performance at 30oC. The decrease of EoD energy of Mg1-xMnSiO4/C is the same at both temperatures, what has been also shown in LEO conditions.
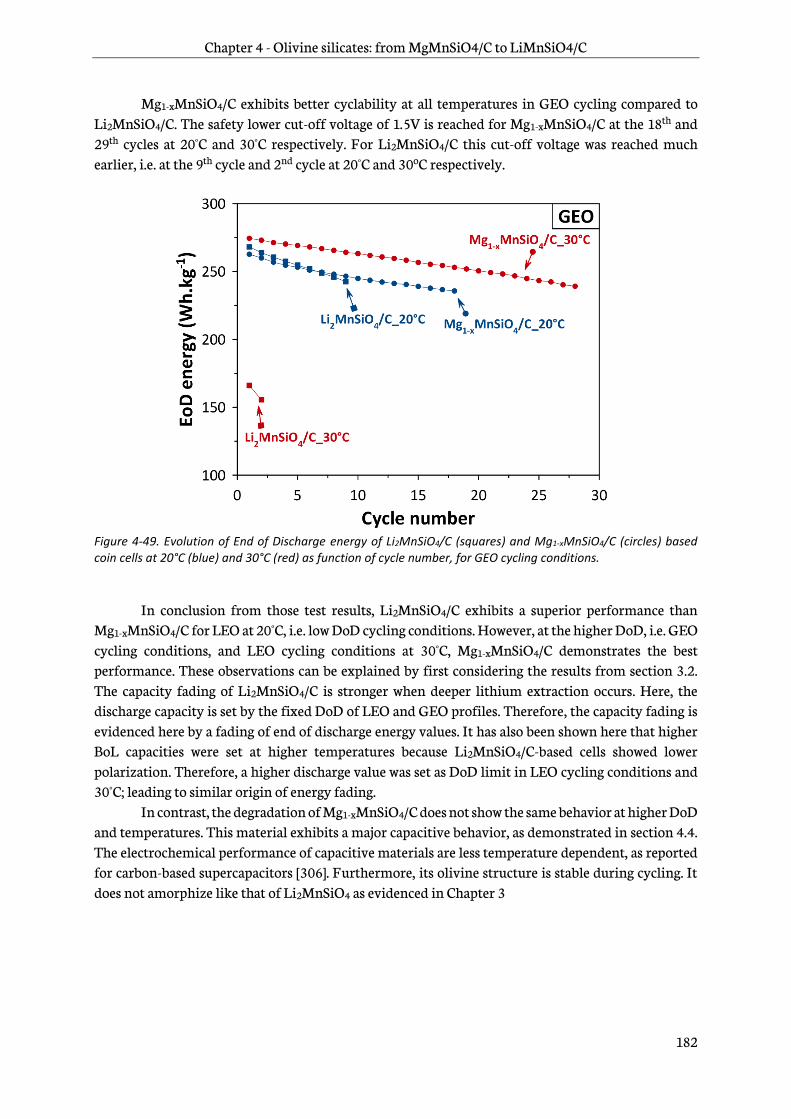
Chapter 4 - Olivine silicates: from MgMnSiO4/C to LiMnSiO4/C
182
Mg1-xMnSiO4/C exhibits better cyclability at all temperatures in GEO cycling compared to Li2MnSiO4/C. The safety lower cut-off voltage of 1.5V is reached for Mg1-xMnSiO4/C at the 18th and 29th cycles at 20°C and 30°C respectively. For Li2MnSiO4/C this cut-off voltage was reached much earlier, i.e. at the 9th cycle and 2nd cycle at 20°C and 30oC respectively.
Figure 4-49. Evolution of End of Discharge energy of Li2MnSiO4/C (squares) and Mg1-xMnSiO4/C (circles) based coin cells at 20°C (blue) and 30°C (red) as function of cycle number, for GEO cycling conditions.
In conclusion from those test results, Li2MnSiO4/C exhibits a superior performance than
Mg1-xMnSiO4/C for LEO at 20°C, i.e. low DoD cycling conditions. However, at the higher DoD, i.e. GEO cycling conditions, and LEO cycling conditions at 30°C, Mg1-xMnSiO4/C demonstrates the best performance. These observations can be explained by first considering the results from section 3.2. The capacity fading of Li2MnSiO4/C is stronger when deeper lithium extraction occurs. Here, the discharge capacity is set by the fixed DoD of LEO and GEO profiles. Therefore, the capacity fading is evidenced here by a fading of end of discharge energy values. It has also been shown here that higher BoL capacities were set at higher temperatures because Li2MnSiO4/C-based cells showed lower polarization. Therefore, a higher discharge value was set as DoD limit in LEO cycling conditions and 30°C; leading to similar origin of energy fading.
In contrast, the degradation of Mg1-xMnSiO4/C does not show the same behavior at higher DoD and temperatures. This material exhibits a major capacitive behavior, as demonstrated in section 4.4. The electrochemical performance of capacitive materials are less temperature dependent, as reported for carbon-based supercapacitors [306]. Furthermore, its olivine structure is stable during cycling. It does not amorphize like that of Li2MnSiO4 as evidenced in Chapter 3

Chapter 4 - Olivine silicates: from MgMnSiO4/C to LiMnSiO4/C
183
4.7.3.2 End of discharge voltage
The evolution of End of Discharge voltage as a function of cycle number for LEO cycling
profiles is shown in Figure 4-50. All the cells exhibit fading as it has also been shown for end of discharge voltage in section 4.7.3.1. In LEO cycling conditions, a higher end of discharge voltage is exhibited by Li2MnSiO4/C at 20°C compared to 30°C. Furthermore, its fade is lower as well.
Figure 4-50. Evolution of End of Discharge voltage of Li2MnSiO4/C (squares) and Mg1-xMnSiO4/C (circles) based coin cells at 20°C (blue) and 30°C (red) as function of cycle number, for LEO cycling conditions. (*) The cell containing Mg1-xMnSiO4/C and cycled at 30°C (blue circles) was charged at C/10 instead of C/3 for the 9 first cycles and then charged at C/3.
For Mg1-xMnSiO4/C, the slopes are similar between the 10th and 50th cycles at both 20°C and
30°C, highlighting a similar fade. The same general observations are also made for GEO cycling conditions shown in
Figure 4-51. Finally, a comparison between the two materials at each cycling condition shows a better
cycling stability for Mg1-xMnSiO4/C at GEO conditions. For LEO conditions, Li2MnSiO4/C exhibits the best behavior at 20°C.
The same fundamental reasons for lower performance of Li2MnSiO4/C can also be used here. It has also been shown in section 3.4, that the voltage fading of Li2MnSiO4/C was stronger when deeper lithium extraction occurred, what explained the lower EoD voltage of Li2MnSiO4/C in GEO conditions and at 30°C compared to 20°C.
An independence of performance of Mg1-xMnSiO4/C toward temperature is also evidenced in GEO conditions, as explained in section 4.7.3.1.
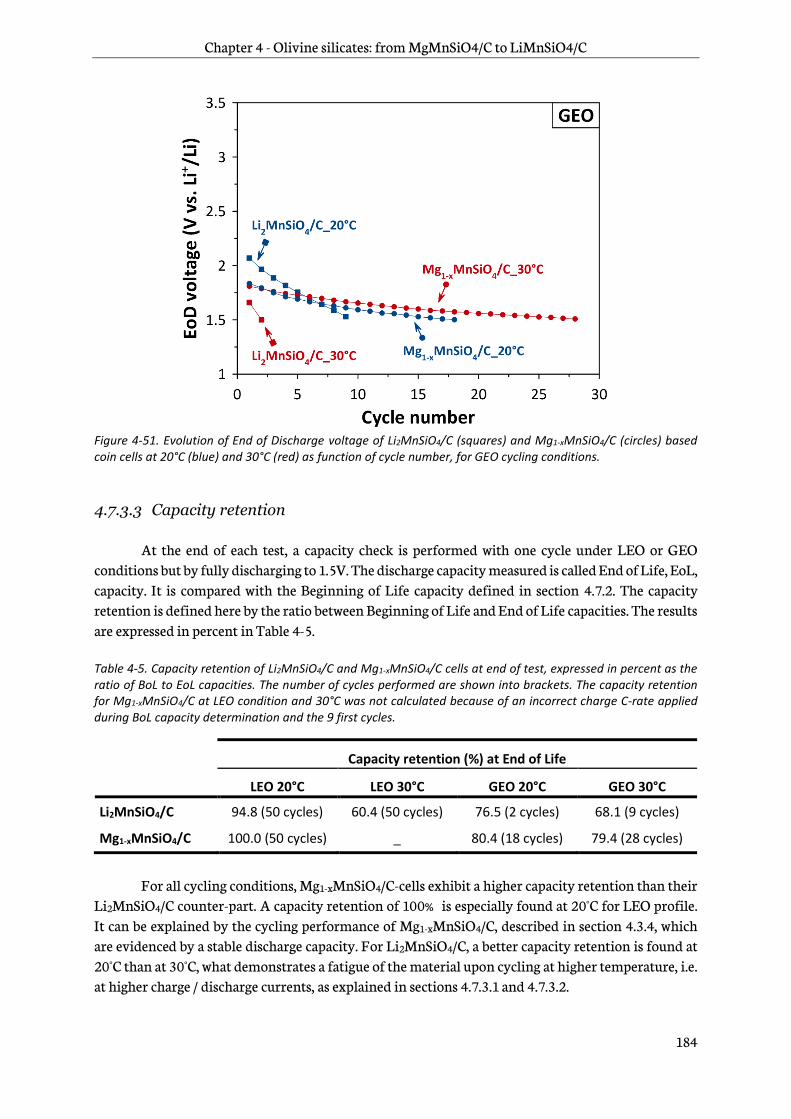
Chapter 4 - Olivine silicates: from MgMnSiO4/C to LiMnSiO4/C
184
Figure 4-51. Evolution of End of Discharge voltage of Li2MnSiO4/C (squares) and Mg1-xMnSiO4/C (circles) based coin cells at 20°C (blue) and 30°C (red) as function of cycle number, for GEO cycling conditions.
4.7.3.3 Capacity retention
At the end of each test, a capacity check is performed with one cycle under LEO or GEO
conditions but by fully discharging to 1.5V. The discharge capacity measured is called End of Life, EoL, capacity. It is compared with the Beginning of Life capacity defined in section 4.7.2. The capacity retention is defined here by the ratio between Beginning of Life and End of Life capacities. The results are expressed in percent in Table 4-5.
Table 4-5. Capacity retention of Li2MnSiO4/C and Mg1-xMnSiO4/C cells at end of test, expressed in percent as the ratio of BoL to EoL capacities. The number of cycles performed are shown into brackets. The capacity retention for Mg1-xMnSiO4/C at LEO condition and 30°C was not calculated because of an incorrect charge C-rate applied during BoL capacity determination and the 9 first cycles.
Capacity retention (%) at End of Life
LEO 20°C LEO 30°C GEO 20°C GEO 30°C
Li2MnSiO4/C 94.8 (50 cycles) 60.4 (50 cycles) 76.5 (2 cycles) 68.1 (9 cycles)
Mg1-xMnSiO4/C 100.0 (50 cycles) _ 80.4 (18 cycles) 79.4 (28 cycles)
For all cycling conditions, Mg1-xMnSiO4/C-cells exhibit a higher capacity retention than their
Li2MnSiO4/C counter-part. A capacity retention of 100% is especially found at 20°C for LEO profile. It can be explained by the cycling performance of Mg1-xMnSiO4/C, described in section 4.3.4, which are evidenced by a stable discharge capacity. For Li2MnSiO4/C, a better capacity retention is found at 20°C than at 30°C, what demonstrates a fatigue of the material upon cycling at higher temperature, i.e. at higher charge / discharge currents, as explained in sections 4.7.3.1 and 4.7.3.2.
Chapter 4 - Olivine silicates: from MgMnSiO4/C to LiMnSiO4/C
185
Li2MnSiO4/C is not adapted to GEO conditions. It cannot sustain deep discharges within the safety limits set in this testing, despite a capacity retention higher than in LEO conditions and 30°C.
Mg1-xMnSiO4/C generally performs better than Li2MnSiO4/C, but not enough to achieve 50 cycles under GEO conditions. 4.7.4 Conclusion
The testing of the Li2MnSiO4/C and Mg1-xMnSiO4/C materials at LEO and GEO profiles showed different sensitivities to the cycling conditions including C-rate, DoD and temperature. Li2MnSiO4/C exhibits superior performance than Mg1-xMnSiO4/C during LEO cycling at 20°C. A higher fading is observed at 30oC for LEO. Mg1-xMnSiO4/C performs better than Li2MnSiO4/C during GEO cycling. The results correspond to different capacity degradation mechanisms in the two materials.
The cycle life of Mg1-xMnSiO4/C especially is promising, but the large operating voltage range of this material makes the cells quickly reach the 1.5V safety voltage limit under GEO conditions, whereas capacity the retention of the cells was still at ⋍80% . Other cycling settings (end of charge and discharge limits) should be set to better evaluate the cycling stability of this material.

186

General conclusions and prospects
187
General conclusions and prospects
General conclusions and prospects
188
General conclusions and prospects
In this doctoral study, two positive electrode materials for lithium-ion batteries have been investigated. The first one, Li2MnSiO4, has been studied with the goal of increasing the energy density of LiFePO4. Nevertheless, facing stability issues, a second alternative, an olivine LiMnSiO4 prepared from a MgMnSiO4 precursor, has been considered to overcome these difficulties. The main results obtained here are presented in two respective parts corresponding to each material.
In the first part of the study, a Li2MnSiO4/C nanocomposite with 8.1wt.% of carbon adopting a orthorhombic Pmn21 structure has been synthesized by a sol-gel process.
Despite some results in the literature demonstrating capacity retention for these morphology and architecture, a modification of voltage profile associated with a capacity fading is evidenced even for low lithium extraction i.e. 0.17Li+ per f.u.. The cycling study of Li2MnSiO4/C, using different cut-off voltages, between 3.8V and 4.2V, shows that the voltage profiles become progressively all the same discarding the voltage dependence of the phenomenon taking place. The kinetics of this transformation increases with the cut-off voltage. Furthermore, it has been demonstrated that capacity fading can be observed even when crystallinity is maintained for long cycling i.e. when cycled up to 3.8V. For the upper cut-off voltages ranged from 3.9V to 4.2V, the structural modification of Li2MnSiO4/C is likely to occur at early cycling (1st-29th cycles in our conditions). Beyond, the structure is maintained (30th-120th cycles).
As further investigations, the study the Li2MnSiO4/C structural behavior upon early cycling is proposed. The objective will be to evaluate the structural transformation as a function of upper cut-off voltage but at short-medium cycling e.g. before 30 cycles. The observation of the Li2MnSiO4/C structure after the 1st cycle at the discharged state is especially sought since a crystallinity recovery has been recently pointed out by Chen et al. at this stage [184].
In parallel, a reactivity of Li2MnSiO4/C when stored in air has been demonstrated leading to the formation of Li2CO3. When Li2MnSiO4/C is oxidized by air, lithium ions are extracted and diffuse into large carbon agglomerates being residues of the polymer decomposition during thermal treatment. Their reaction with CO2 in air finalizes the formation of Li2CO3. To complete the reactivity to air mechanism of Li2MnSiO4/C, a similar investigation is suggested on a material with similar morphology but without carbon.
Finally, a doping strategy with the material Li2-xMn1+xAlxSi1-xO4/C has been proposed to limit or suppress the capacity fading of Li2MnSiO4. A manganese-rich composition was aimed to lower the redox stress on manganese ions. However, the galvanostatic cycling demonstrates lower discharge capacities and similar capacity retention after 10 cycles compared to the reference Li2MnSiO4/C material. Therefore, this strategy is not considered to improve the cycling stability of Li2MnSiO4/C.
General conclusions and prospects
189
In the second part of this PhD study, a synthesis strategy of olivine LiMnSiO4/C has been proposed for the first time. This material is expected to stabilize manganese in stable octahedral environment while exhibiting a theoretical capacity of 174mAh.g-1 and a voltage above 3.7V vs. Li+/Li according to first principle calculations [224], [225]. A multistep synthesis is proposed starting from olivine MgMnSiO4/C, followed by chemical oxidation and electrochemical lithiation to obtain LiMnSiO4/C.
The MgMnSiO4/C precursor material adopts an olivine structure. It has been shown that an
initial antisite mixing between Mg2+ and Mn2+ of 30-35% can be lowered by using a thermal post-treatment in molten salts at mild temperature, i.e. 400°C, to reach values of the order of 25-30% . It results in enhanced electrochemical performance with a discharge capacity measured of 80mAh.g-1 compared to 40mAh.g-1 for the pristine MgMnSiO4/C.
The two MgMnSiO4/C materials exhibiting different antisite mixing are chemically oxidized by NO2BF4. Partial manganese oxidation and magnesium removal have been evidenced by XPS. In addition, a reactivity of NO2BF4 with MgMnSiO4 surface and carbon-coating particularly has been observed. It is attributed to the increase of specific surface area measured after chemical oxidation. The combination of lower antisite mixing and chemical oxidation yields the highest first discharge capacity of ⋍160mAh.g-1 without structure modification, but also the highest specific surface area of 570m2.g-1. A stable reversible capacity of 130mAh.g-1 has been obtained at C/20 between 1.5V and 4.8V. An analysis of capacitive and diffusion contributions by cyclic voltammetry shows that the capacitive one accounts for almost 60% of the capacity recorded for this material, but much less than that of the oxidized material with higher antisite mixing (⋍80% ). The capacitive and diffusion contributions are respectively attributed to redox pseudocapacitance and intercalation processes.
As further investigation, the synthesis and electrochemical study of a MgMnSiO4/C material involving lower specific surface area is proposed. It will enable reducing the capacitive contribution to better observe the diffusion intercalation processes, as well as limiting its surface reactivity during the chemical oxidation process. As the diffusion is expected to be highly limited by the antisite mixing, a molten salt post-treatment strategy is proposed by lowering the antisite mixing and oxidizing MgMnSiO4/C in a single step. It should enable a better cation ordering (Mn3+/4+ and remaining Mg2+) due to the difference of charge and ionic radius, as already shown in LiScSiO4, LiInSiO4 and LiFePO4
[218], [307].
To conclude this study, one material of each family synthesized in this work, Li2MnSiO4/C and Mg1-xMnSiO4/C, has been tested at European Space Agency, ESTEC facility, according to space cycling conditions, LEO and GEO, at 20°C and 30°C. It has been evidenced that Li2MnSiO4/C does not perform well by increasing the depth of discharge and the temperature, what is coherent with its capacity fading characteristics. On the contrary, Mg1-xMnSiO4/C performs better in most of the cycling conditions. However, it is limited by its large voltage profile that makes it reach the lower voltage limit of 1.5V early. At that early stage of development, it appears logically that many improvements are still required for a practical application of the developed compounds in space environment.

190

Résumé (français)
191
Résumé (français)
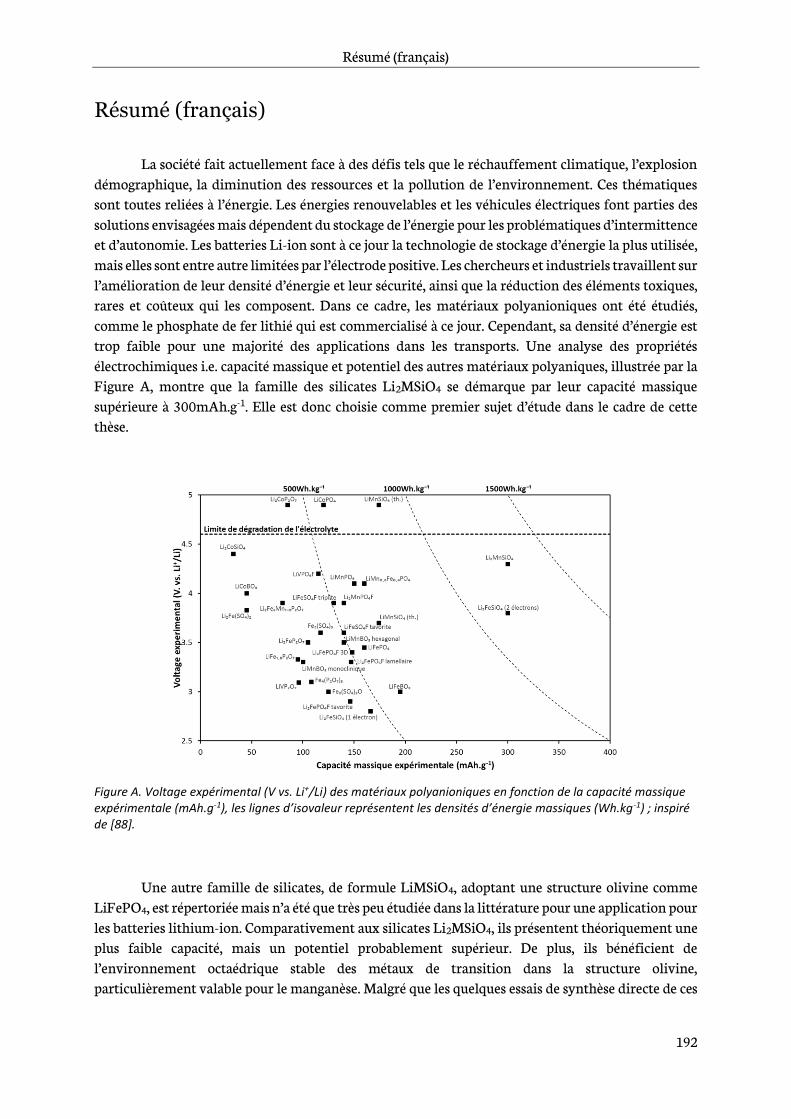
Résumé (français)
192
Résumé (français)
La société fait actuellement face à des défis tels que le réchauffement climatique, l’explosion démographique, la diminution des ressources et la pollution de l’environnement. Ces thématiques sont toutes reliées à l’énergie. Les énergies renouvelables et les véhicules électriques font parties des solutions envisagées mais dépendent du stockage de l’énergie pour les problématiques d’intermittence et d’autonomie. Les batteries Li-ion sont à ce jour la technologie de stockage d’énergie la plus utilisée, mais elles sont entre autre limitées par l’électrode positive. Les chercheurs et industriels travaillent sur l’amélioration de leur densité d’énergie et leur sécurité, ainsi que la réduction des éléments toxiques, rares et coûteux qui les composent. Dans ce cadre, les matériaux polyanioniques ont été étudiés, comme le phosphate de fer lithié qui est commercialisé à ce jour. Cependant, sa densité d’énergie est trop faible pour une majorité des applications dans les transports. Une analyse des propriétés électrochimiques i.e. capacité massique et potentiel des autres matériaux polyaniques, illustrée par la Figure A, montre que la famille des silicates Li2MSiO4 se démarque par leur capacité massique supérieure à 300mAh.g-1. Elle est donc choisie comme premier sujet d’étude dans le cadre de cette thèse.
Figure A. Voltage expérimental (V vs. Li+/Li) des matériaux polyanioniques en fonction de la capacité massique expérimentale (mAh.g-1), les lignes d’isovaleur représentent les densités d’énergie massiques (Wh.kg-1) ; inspiré de [88].
Une autre famille de silicates, de formule LiMSiO4, adoptant une structure olivine comme LiFePO4, est répertoriée mais n’a été que très peu étudiée dans la littérature pour une application pour les batteries lithium-ion. Comparativement aux silicates Li2MSiO4, ils présentent théoriquement une plus faible capacité, mais un potentiel probablement supérieur. De plus, ils bénéficient de l’environnement octaédrique stable des métaux de transition dans la structure olivine, particulièrement valable pour le manganèse. Malgré que les quelques essais de synthèse directe de ces
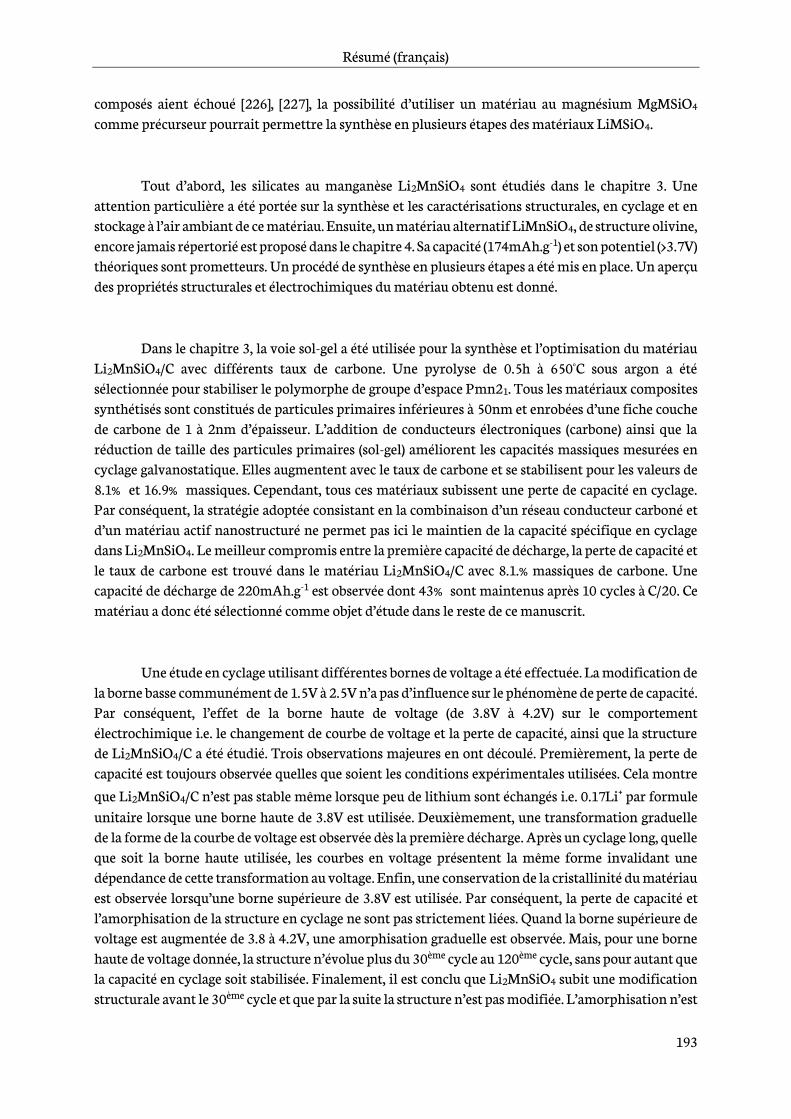
Résumé (français)
193
composés aient échoué [226], [227], la possibilité d’utiliser un matériau au magnésium MgMSiO4 comme précurseur pourrait permettre la synthèse en plusieurs étapes des matériaux LiMSiO4.
Tout d’abord, les silicates au manganèse Li2MnSiO4 sont étudiés dans le chapitre 3. Une attention particulière a été portée sur la synthèse et les caractérisations structurales, en cyclage et en stockage à l’air ambiant de ce matériau. Ensuite, un matériau alternatif LiMnSiO4, de structure olivine, encore jamais répertorié est proposé dans le chapitre 4. Sa capacité (174mAh.g-1) et son potentiel (>3.7V) théoriques sont prometteurs. Un procédé de synthèse en plusieurs étapes a été mis en place. Un aperçu des propriétés structurales et électrochimiques du matériau obtenu est donné.
Dans le chapitre 3, la voie sol-gel a été utilisée pour la synthèse et l’optimisation du matériau Li2MnSiO4/C avec différents taux de carbone. Une pyrolyse de 0.5h à 650°C sous argon a été sélectionnée pour stabiliser le polymorphe de groupe d’espace Pmn21. Tous les matériaux composites synthétisés sont constitués de particules primaires inférieures à 50nm et enrobées d’une fiche couche de carbone de 1 à 2nm d’épaisseur. L’addition de conducteurs électroniques (carbone) ainsi que la réduction de taille des particules primaires (sol-gel) améliorent les capacités massiques mesurées en cyclage galvanostatique. Elles augmentent avec le taux de carbone et se stabilisent pour les valeurs de 8.1% et 16.9% massiques. Cependant, tous ces matériaux subissent une perte de capacité en cyclage. Par conséquent, la stratégie adoptée consistant en la combinaison d’un réseau conducteur carboné et d’un matériau actif nanostructuré ne permet pas ici le maintien de la capacité spécifique en cyclage dans Li2MnSiO4. Le meilleur compromis entre la première capacité de décharge, la perte de capacité et le taux de carbone est trouvé dans le matériau Li2MnSiO4/C avec 8.1.% massiques de carbone. Une capacité de décharge de 220mAh.g-1 est observée dont 43% sont maintenus après 10 cycles à C/20. Ce matériau a donc été sélectionné comme objet d’étude dans le reste de ce manuscrit.
Une étude en cyclage utilisant différentes bornes de voltage a été effectuée. La modification de la borne basse communément de 1.5V à 2.5V n’a pas d’influence sur le phénomène de perte de capacité. Par conséquent, l’effet de la borne haute de voltage (de 3.8V à 4.2V) sur le comportement électrochimique i.e. le changement de courbe de voltage et la perte de capacité, ainsi que la structure de Li2MnSiO4/C a été étudié. Trois observations majeures en ont découlé. Premièrement, la perte de capacité est toujours observée quelles que soient les conditions expérimentales utilisées. Cela montre que Li2MnSiO4/C n’est pas stable même lorsque peu de lithium sont échangés i.e. 0.17Li+ par formule unitaire lorsque une borne haute de 3.8V est utilisée. Deuxièmement, une transformation graduelle de la forme de la courbe de voltage est observée dès la première décharge. Après un cyclage long, quelle que soit la borne haute utilisée, les courbes en voltage présentent la même forme invalidant une dépendance de cette transformation au voltage. Enfin, une conservation de la cristallinité du matériau est observée lorsqu’une borne supérieure de 3.8V est utilisée. Par conséquent, la perte de capacité et l’amorphisation de la structure en cyclage ne sont pas strictement liées. Quand la borne supérieure de voltage est augmentée de 3.8 à 4.2V, une amorphisation graduelle est observée. Mais, pour une borne haute de voltage donnée, la structure n’évolue plus du 30ème cycle au 120ème cycle, sans pour autant que la capacité en cyclage soit stabilisée. Finalement, il est conclu que Li2MnSiO4 subit une modification structurale avant le 30ème cycle et que par la suite la structure n’est pas modifiée. L’amorphisation n’est

Résumé (français)
194
pas la cause de la perte de capacité, mais plutôt des conséquences de la transformation interne du matériau Li2MnSiO4 pendant le cyclage.
Une stratégie de dopage pour limiter ou supprimer la perte de capacité en cyclage de Li2MnSiO4 basée sur la composition Li2-xMn1+xAlxSi1-xO4 est proposée pour la première fois. L’addition de manganèse est destinée à diminuer le stress redox sur cet ion. Afin de contrebalancer la
charge et l’occupation des sites cristallographiques, des ions Li+ et Si4+ sont enlevés tandis que des ions
Al3+ sont ajoutés. Ce nouveau matériau a été synthétisé par voie sol-gel avec un enrobage de carbone tout comme Li2MnSiO4/C au début du chapitre. Le dopage provoque un décalage des raies de diffraction de rayons X vers les faibles valeurs de 2θ et implique une augmentation des paramètres de maille. Le cyclage galvanostatique met en évidence des premières capacités de décharge inférieures au matériau de référence Li2MnSiO4/C et ensuite une perte de capacité similaire après une dizaine de cycles. Par conséquent, cette stratégie de dopage n’est pas considérée comme permettant une amélioration des performances électrochimiques de Li2MnSiO4/C.
Finalement, l’impact du stockage sous air de Li2MnSiO4/C est évalué pour la première fois. La formation de Li2CO3 après ⋍4 jours d’exposition a été observée par DRX et ATR-FTIR et estimée à ⋍9% massiques par le calcul. Il est démontré que Li2CO3 ne se forme pas à la surface des particules de Li2MnSiO4/C mais dans le volume du matériau où des zones riches en carbone et en oxygène ont été sondées par STEM-EDX. L’oxydation du manganèse est vérifiée par XPS. Des analyses CHNS/O mettent en évidence une forte augmentation du taux d’oxygène dans le matériau alors que celui du carbone reste presque constant. Par conséquent, il est supposé que Li2CO3 provient du matériau composite Li2MnSiO4/C, dans lequel de grands agrégats de carbone se forment pendant l’étape de pyrolyse, tandis que l’oxygène provient de l’atmosphère. Un mécanisme de réactivité est donc proposé
comme montré sur la Figure B. L’oxydation des ions Mn2+ dans Li2MnSiO4 par l’air ambient entraîne
l’extraction des ions Li+ du volume vers la surface, qui diffusent ensuite dans les agrégats de carbones présents autour. La réaction du CO2 de l’air avec les agrégats de carbone lithiés mènent à la formation de Li2CO3. Finalement, l’étude du cyclage galvanostatique de Li2MnSiO4/C exposé à l’air montre qu’une perte de capacité de 30mAh.g-1 est observée en décharge. De plus, cette perte n’est jamais récupérée pendant le cyclage, ce qui induit une diminution irréversible des performances électrochimiques.
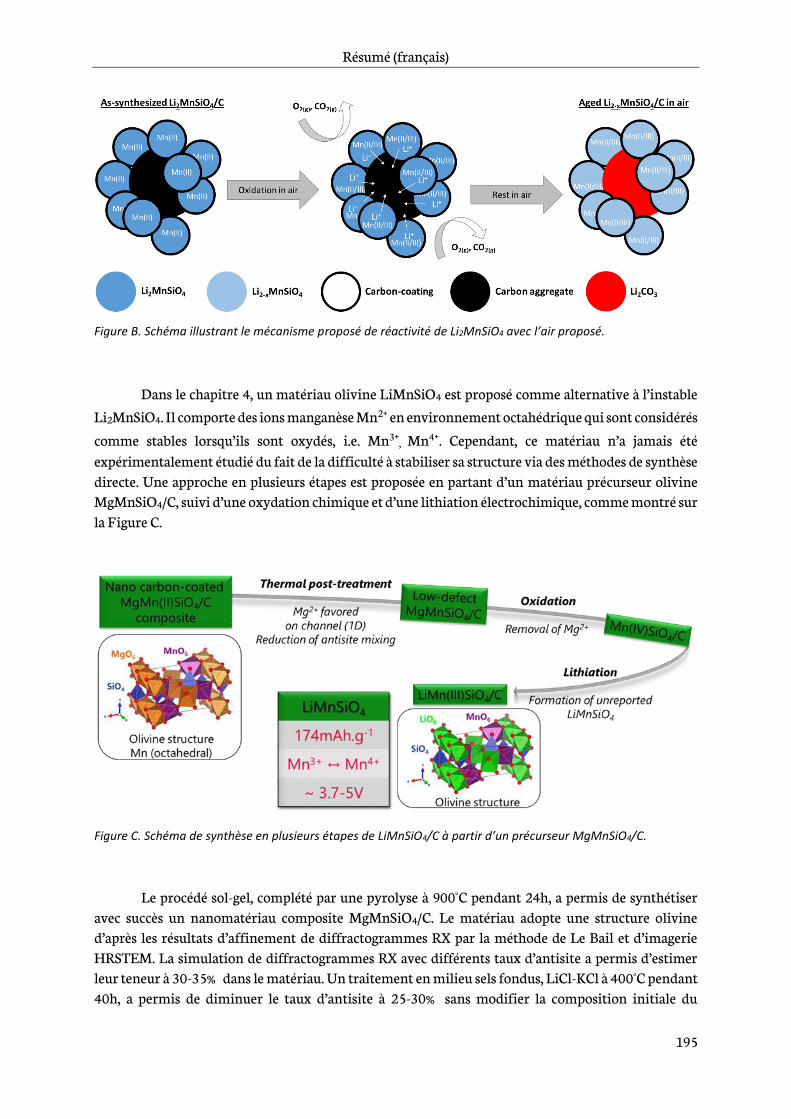
Résumé (français)
195
Figure B. Schéma illustrant le mécanisme proposé de réactivité de Li2MnSiO4 avec l’air proposé.
Dans le chapitre 4, un matériau olivine LiMnSiO4 est proposé comme alternative à l’instable
Li2MnSiO4. Il comporte des ions manganèse Mn2+ en environnement octahédrique qui sont considérés
comme stables lorsqu’ils sont oxydés, i.e. Mn3+, Mn4+. Cependant, ce matériau n’a jamais été
expérimentalement étudié du fait de la difficulté à stabiliser sa structure via des méthodes de synthèse directe. Une approche en plusieurs étapes est proposée en partant d’un matériau précurseur olivine MgMnSiO4/C, suivi d’une oxydation chimique et d’une lithiation électrochimique, comme montré sur la Figure C.
Figure C. Schéma de synthèse en plusieurs étapes de LiMnSiO4/C à partir d’un précurseur MgMnSiO4/C.
Le procédé sol-gel, complété par une pyrolyse à 900°C pendant 24h, a permis de synthétiser avec succès un nanomatériau composite MgMnSiO4/C. Le matériau adopte une structure olivine d’après les résultats d’affinement de diffractogrammes RX par la méthode de Le Bail et d’imagerie HRSTEM. La simulation de diffractogrammes RX avec différents taux d’antisite a permis d’estimer leur teneur à 30-35% dans le matériau. Un traitement en milieu sels fondus, LiCl-KCl à 400°C pendant 40h, a permis de diminuer le taux d’antisite à 25-30% sans modifier la composition initiale du
Résumé (français)
196
matériau. Les performances électrochimiques de ce matériau montre qu’une plus grande capacité de décharge, 80mAh.g-1 au lieu de 40mAh.g-1, a été obtenue grâce une plus faible polarisation.
Un procédé oxydation chimique avec NO2BF4, dont le potentiel redox est de 5.1V vs. Li+/Li, a
été mise en place pour extraire une plus grande quantité d’ions Mg2+ que par voie électrochimique en demi-pile. Cette dernière est limitée par la stabilité à haute potentiel de l’électrolyte liquide. Les deux matériaux MgMnSiO4/C, avec ou sans traitement en sels fondus, ont tous deux été soumis au procédé d’oxydation chimique. Dans les deux cas, une oxydation partielle du manganèse a été observée par XPS ainsi qu’une diminution du signal relatif à la transition Auger KLL du magnésium. De plus, la surface de MgMnSiO4/C réagit avec NO2BF4 en formant une couche d’espèces fluorées majoritairement sur l’enrobage de carbone. L’augmentation de la surface spécifique observée par adsorption de diazote est attribuée à cette réactivité. Les deux matériaux oxydés montrent des performances électrochimiques très améliorées avec respectivement des capacités de décharge stables de 100mAh.g-1 et 130mAh.g-1 sur une dizaine de cycles pour MgMnSiO4/C et MgMnSiO4/C ayant subi un traitement en sels fondus.
Le matériau ayant les meilleurs performances électrochimiques est celui qui possède le taux d’antisite initial le plus faible (20-25% ) ainsi que la surface spécifique la plus élevée (580m2.g-1). Ainsi la discrimination des phénomènes capacitifs et de diffusion dans ce matériau a été effectuée à partir de l’analyse des données de voltammétrie cyclique. Les deux matériaux montrent une contribution capacitive qui atteint 60-80% de la capacité mesurée. La contribution de diffusion la plus élevée (40% ) est attribuée au matériau comportant le taux d’antisite initial le plus faible (25-30% ). Ainsi, il est considéré que le phénomène de diffusion associée au processus d’intercalation est favorisé dans un matériau dont le taux d’antisite est le plus faible et dont plus ions magnésium ont été extraits par oxydation chimique. Cependant, le processus d’intercalation ne représente qu’une faible proportion de la capacité mesurée.
Pour conclure cette étude, les deux matériaux qui y ont été développés et optimisés, Li2MnSiO4/C et Mg1-xMnSiO4/C, ont été testés au centre ESTEC de l’Agence Spatiale Européenne à Noordwijk aux Pays-Bas. Deux profils de cyclage ont été utilisés relatifs aux satellites « Low-Earth Orbit » (LEO) et « Geostationary-Earth Orbit » (GEO) à 20°C et 30°C. Il est montré que les performances électrochimiques de Li2MnSiO4/C diminuent lorsque les profondeurs de décharge et la température sont augmentées, ce qui est en accord avec le phénomène de perte de capacité en cyclage duquel il est sujet. Au contraire, Mg1-xMnSiO4/C soutient mieux les conditions de cyclage LEO et GEO. Cependant, sa large gamme de potentiel implique que la borne inférieure de potentiel utilisée, 1.5V, comme sécurité pendant le test est atteinte prématurément, ce qui arrête le test. Néanmoins, ces tests confirment la meilleure cyclablité de Mg1-xMnSiO4/C et sa légitimité comme alternative intéressante au matériau conventionnel Li2MnSiO4/C. A ce stade amont de développement qui est amont, cela apparaît évident de conclure que de nombreuses améliorations sont encore nécessaires pour une application dans le secteur spatial.
Résumé (français)
197
En perspective, une étude plus poussée est proposée pour d’étudier le comportement structural de Li2MnSiO4/C pour des cyclages courts. L’objectif est d’analyser la transformation structurale du matériau en fonction de la borne haute de voltage utilisée entre le 1er et le 30ème cycle. De plus, cette analyse serait particulièrement intéressante à la fin du 1er cycle, sachant que Chen et al. ont récemment montré à ce stade la récupération de la cristallinité du matériau après amorphisation [184].
Afin de confirmer le mécanisme de réactivité à l’air de Li2MnSiO4/C, une étude similaire à celle présentée ici est proposée sur un matériau adoptant la même morphologie mais sans carbone.
Concernant les silicates olivine, la synthèse et l’étude électrochimique d’un matériau MgMnSiO4/C arborant une surface spécifique plus faible est envisagée. Cela permettrait de diminuer la réactivité de surface du matériau pendant l’oxydation chimique et de réduire la contribution de la surface dans les processus électrochimiques. Ainsi, il serait possible de mieux observer la contribution de la diffusion associée à l’intercalation dans le matériau. Comme celle-ci est intrinsèquement limitée par le taux de défauts d’antisites, un nouveau traitement thermique en sels fondus a posteriori est proposé combinant en une seule étape la diminution des défauts d’antisite et l’oxydation de
MgMnSiO4. Une meilleure séparation entre les cations (Mn3+/4+ et Mg2+ restant) devrait se produire grâce à la différence de charges et de rayons ioniques comme c’est le cas dans LiScSiO4, LiInSiO4 et LiFePO4 [218], [307].

198

References
199
References
References
200
References
[1] ‘Internet in Africa’, Wikipedia. [Online]. Available: https://en.wikipedia.org/wiki/Internet_in_Africa#Internet_access.
[2] U.S. Energy Information Administration, ‘International Energy Outlook 2016’, U.S. Department of Energy, Washington, DC 20585, May 2016.
[3] E. Hache, ‘Lecture for InnoEnergy PhD School: Energy Scene: The new Energy Game’, presented at the Energy Economics, Grenoble, 10-Apr-2017.
[4] M. Wittenstein, ‘Lecture for InnoEnergy PhD School: Drivers of investment in the power sector’, presented at the Energy Economics, Grenoble, 13-Apr-2017.
[5] Aurora Energy Research, ‘Intermittency and the cost of integrating solar in the GB power market’, Solar Trade Association, Great Britain, Sep. 2016.
[6] Energy Technology Policy division of the Directorate of Sustainability, Technology and Outlooks (STO) of the International Energy Agency (IEA), ‘Global EV Outlook 2017’, International Energy Agency, France, Jun. 2017.
[7] J. Foust, ‘How big is the market for small launch vehicles?’, Space News Magazine, 11-Apr-2016. [8] ‘OneWeb’, OneWeb. [Online]. Available: http://oneweb.world/. [9] V. Srinivasan, ‘Batteries for Vehicular Applications’, Lawrence Berkeley National Laboratory, 02-
Mar-2008. [10] M. Conte, ‘Supercapacitors Technical Requirements for New Applications’, Fuel Cells, vol. 10, no.
5, pp. 806–818, Oct. 2010. [11] A. Alaswad, A. Baroutaji, H. Achour, J. Carton, A. Al Makky, and A. G. Olabi, ‘Developments in
fuel cell technologies in the transport sector’, Int. J. Hydrog. Energy, vol. 41, no. 37, pp. 16499–16508, Oct. 2016.
[12] F. Bausier et al., ‘Spacecraft Electrical Passivation: From Study to Reality’, in E3S Web of Conferences, 2017, vol. 16, p. 13002.
[13] C. Pilot, ‘The Rechargeable Battery Market and Main Trends 2015-2025’, presented at the Enjeux de l’électromobilité, ENSAM, Paris France, 21-Sep-2016.
[14] Abt Associates, Inc., ‘Application of Life-Cycle Assessment to Nanoscale Technology: Lithium-ion Batteries for Electric Vehicles’, Environmentral Protectio Agency, United States, EPA 744-R-12-001, Apr. 2013.
[15] A. M. Bradshaw and T. Hamacher, ‘Nonregenerative Natural Resources in a Sustainable System of Energy Supply’, ChemSusChem, vol. 5, no. 3, pp. 550–562, Mar. 2012.
[16] I. Belharouak, W. Lu, D. Vissers, and K. Amine, ‘Safety characteristics of Li(Ni0.8Co0.15Al0.05)O2 and Li(Ni1/3Co1/3Mn1/3)O2’, Electrochem. Commun., vol. 8, no. 2, pp. 329–335, Feb. 2006.
[17] J. Dahn, E. Fuller, M. Obrovac, and U. Vonsacken, ‘Thermal stability of LixCoO2, LixNiO2 and λ-MnO2 and consequences for the safety of Li-ion cells’, Solid State Ion., vol. 69, no. 3–4, pp. 265–270, Aug. 1994.
[18] R. A. Meyers, Ed., Encyclopedia of Sustainability Science and Technology. New York, NY: Springer New York, 2012.
[19] J. M. Tarascon and M. Armand, ‘Issues and challenges facing rechargeable lithium batteries’, Nature, vol. 414, no. 6861, pp. 359–367, Nov. 2001.
[20] W.-J. Zhang, ‘A review of the electrochemical performance of alloy anodes for lithium-ion batteries’, J. Power Sources, vol. 196, no. 1, pp. 13–24, Jan. 2011.
References
201
[21] B. Liang, Y. Liu, and Y. Xu, ‘Silicon-based materials as high capacity anodes for next generation lithium ion batteries’, J. Power Sources, vol. 267, pp. 469–490, Dec. 2014.
[22] M. S. Whittingham, ‘Lithium Batteries and Cathode Materials’, Chem. Rev., vol. 104, no. 10, pp. 4271–4302, Oct. 2004.
[23] M. S. Whittingham, ‘Chalcogenide battery’, 4,009,052, 22-Feb-1977. [24] K. Mizushima, P. C. Jones, P. J. Wiseman, and J. B. Goodenough, ‘LixCoO2 (0< x ≤1): A new cathode
material for batteries of high energy density’, Mater. Res. Bull., vol. 15, no. 6, pp. 783–789, 1980. [25] S. Madhavi, G. S. Rao, B. V. R. Chowdari, and S. F. Y. Li, ‘Effect of aluminium doping on cathodic
behaviour of LiNi0.7Co0.3O2’, J. Power Sources, vol. 93, no. 1, pp. 156–162, 2001. [26] Z. Lu and J. R. Dahn, ‘CATHODE COMPOSITIONS FOR LITHIUM ION BATTERIES’, 6,964,828
B2, 15-Nov-2005. [27] S. K. Martha et al., ‘On the Thermal Stability of Olivine Cathode Materials for Lithium-Ion
Batteries’, J. Electrochem. Soc., vol. 158, no. 10, p. A1115, 2011. [28] A. K. Padhi, ‘Phospho-olivines as Positive-Electrode Materials for Rechargeable Lithium
Batteries’, J. Electrochem. Soc., vol. 144, no. 4, p. 1188, 1997. [29] N. Ravet, S. Besner, M. Simoneau, A. Vallée, M. Armand, and J.-F. Colin, ‘Electrode materials
having increased surface conductivity’, 1 049 182 A2, 11-Feb-2000. [30] T. A. Abera, G. Bekele, T. Walter, and P. Adelman, ‘A Study of Capacity Fade and Life-Cycle
Estimation of LiFePO4 Battery Based On Two Years Field Data’. [31] A. K. Padhi, ‘Mapping of Transition Metal Redox Energies in Phosphates with NASICON
Structure by Lithium Intercalation’, J. Electrochem. Soc., vol. 144, no. 8, p. 2581, 1997. [32] A. K. Padhi, ‘Tuning the Position of the Redox Couples in Materials with NASICON Structure by
Anionic Substitution’, J. Electrochem. Soc., vol. 145, no. 5, p. 1518, 1998. [33] R. Kanno, T. Shirane, Y. Inaba, and Y. Kawamoto, ‘Synthesis and electrochemical properties of
lithium iron oxides with layer-related structures’, J. Power Sources, vol. 68, no. 1, pp. 145–152, Sep. 1997.
[34] C. Masquelier and L. Croguennec, ‘Polyanionic (Phosphates, Silicates, Sulfates) Frameworks as Electrode Materials for Rechargeable Li (or Na) Batteries’, Chem. Rev., vol. 113, no. 8, pp. 6552–6591, Aug. 2013.
[35] A. Manthiram and J. B. Goodenough, ‘Lithium insertion into Fe2(MO4)3 frameworks: Comparison of M = W with M = Mo’, J. Solid State Chem., vol. 71, no. 2, pp. 349–360, Dec. 1987.
[36] A. Manthiram and J. B. Goodenough, ‘Lithium insertion into Fe2(SO4)3 frameworks’, J. Power Sources, vol. 26, no. 3–4, pp. 403–408, May 1989.
[37] A. Gutierrez, N. A. Benedek, and A. Manthiram, ‘Crystal-Chemical Guide for Understanding Redox Energy Variations of M2+/3+ Couples in Polyanion Cathodes for Lithium-Ion Batteries’, Chem. Mater., vol. 25, no. 20, pp. 4010–4016, Oct. 2013.
[38] G. Li, H. Azuma, and M. Tohda, ‘Optimized LiMnyFe1−yPO4 as the Cathode for Lithium Batteries’, J. Electrochem. Soc., vol. 149, no. 6, p. A743, 2002.
[39] C. Delacourt et al., ‘Toward Understanding of Electrical Limitations (Electronic, Ionic) in LiMPO4 (M=Fe, Mn) Electrode Materials’, J. Electrochem. Soc., vol. 152, no. 5, p. A913, 2005.
[40] T. Drezen, N.-H. Kwon, P. Bowen, I. Teerlinck, M. Isono, and I. Exnar, ‘Effect of particle size on LiMnPO4 cathodes’, J. Power Sources, vol. 174, no. 2, pp. 949–953, Dec. 2007.
[41] A. Yamada, Y. Kudo, and K.-Y. Liu, ‘Phase Diagram of LixMnyFe1−yPO4 (0≤x, y≤1)’, J. Electrochem. Soc., vol. 148, no. 10, p. A1153, 2001.
[42] A. Gueguen et al., ‘The Electrode/Electrolyte Reactivity of LiFe0.33Mn0.67PO4 Compared to LiFePO4’, J. Electrochem. Soc., vol. 160, no. 2, pp. A387–A393, Dec. 2012.
References
202
[43] S.-W. Kim, J. Kim, H. Gwon, and K. Kang, ‘Phase Stability Study of LiMnPO4 (0≤x≤1) Cathode for Li Rechargeable Battery’, J. Electrochem. Soc., vol. 156, no. 8, p. A635, 2009.
[44] T. Muraliganth and A. Manthiram, ‘Understanding the Shifts in the Redox Potentials of Olivine LiM1−yMyPO4 (M = Fe, Mn, Co, and Mg) Solid Solution Cathodes’, J. Phys. Chem. C, vol. 114, no. 36, pp. 15530–15540, Sep. 2010.
[45] A. Yamada, Y. Kudo, and K.-Y. Liu, ‘Reaction Mechanism of the Olivine-Type LixMn0.6Fe0.4PO4 (0≤x≤1)’, J. Electrochem. Soc., vol. 148, no. 7, p. A747, 2001.
[46] M. Kope¢ et al., ‘Structural and magnetic properties of Lix(MnyFe1−y)PO4 electrode materials for Li-ion batteries’, J. Power Sources, vol. 189, no. 2, pp. 1154–1163, Apr. 2009.
[47] N. N. Bramnik, K. Nikolowski, C. Baehtz, K. G. Bramnik, and H. Ehrenberg, ‘Phase Transitions Occurring upon Lithium Insertion−Extraction of LiCoPO4’, Chem. Mater., vol. 19, no. 4, pp. 908–915, Feb. 2007.
[48] M. Nakayama, S. Goto, Y. Uchimoto, M. Wakihara, and Y. Kitajima, ‘Changes in Electronic Structure between Cobalt and Oxide Ions of Lithium Cobalt Phosphate as 4.8-V Positive Electrode Material’, Chem. Mater., vol. 16, no. 18, pp. 3399–3401, Sep. 2004.
[49] L. Dimesso, D. Becker, C. Spanheimer, and W. Jaegermann, ‘Investigation of graphitic carbon foams/LiNiPO4 composites’, J. Solid State Electrochem., vol. 16, no. 12, pp. 3791–3798, Dec. 2012.
[50] K. Rissouli, K. Benkhouja, J. R. Ramos-Barrado, and C. Julien, ‘Electrical conductivity in lithium orthophosphates’, Mater. Sci. Eng. B, vol. 98, no. 3, pp. 185–189, 2003.
[51] A. Örnek, ‘Optimization of dielectric heating parameters in the production of high-voltage LiNiPO4-core and carbon-shell ceramics’, J. Am. Ceram. Soc., vol. 100, no. 12, pp. 5668–5680, Dec. 2017.
[52] V. Aravindan, J. Gnanaraj, S. Madhavi, and H.-K. Liu, ‘Lithium-Ion Conducting Electrolyte Salts for Lithium Batteries’, Chem. - Eur. J., vol. 17, no. 51, pp. 14326–14346, Dec. 2011.
[53] C. Masquelier, P. Reale, C. Wurm, M. Morcrette, L. Dupont, and D. Larcher, ‘Hydrated Iron Phosphates FePO4⋅nH2O and Fe4[P2O7]3⋅nH2O as 3 V Positive Electrodes in Rechargeable Lithium Batteries’, J. Electrochem. Soc., vol. 149, no. 8, p. A1037, 2002.
[54] A. K. Padhi, ‘Effect of Structure on the Fe3+∕Fe2+ Redox Couple in Iron Phosphates’, J. Electrochem. Soc., vol. 144, no. 5, p. 1609, 1997.
[55] J. Barker, R. K. B. Gover, P. Burns, and A. Bryan, ‘LiVP2O7: A Viable Lithium-Ion Cathode Material?’, Electrochem. Solid-State Lett., vol. 8, no. 9, p. A446, 2005.
[56] C. V. Ramana, A. Ait-Salah, S. Utsunomiya, A. Mauger, F. Gendron, and C. M. Julien, ‘Novel Lithium Iron Pyrophosphate (LiFe1.5P2O7) as a Positive Electrode for Li-Ion Batteries’, Chem. Mater., vol. 19, no. 22, pp. 5319–5324, Oct. 2007.
[57] P. Barpanda, T. Ye, S.-C. Chung, Y. Yamada, S. Nishimura, and A. Yamada, ‘Eco-efficient splash combustion synthesis of nanoscale pyrophosphate (Li2FeP2O7) positive-electrode using Fe(III) precursors’, J. Mater. Chem., vol. 22, no. 27, p. 13455, 2012.
[58] T. Ye, P. Barpanda, S. Nishimura, N. Furuta, S.-C. Chung, and A. Yamada, ‘General Observation of Fe3+/Fe2+ Redox Couple Close to 4 V in Partially Substituted Li2FeP2O7 Pyrophosphate Solid-Solution Cathodes’, Chem. Mater., vol. 25, no. 18, pp. 3623–3629, Sep. 2013.
[59] M. Tamaru, P. Barpanda, Y. Yamada, S. Nishimura, and A. Yamada, ‘Observation of the highest Mn3+/Mn2+ redox potential of 4.45 V in a Li2MnP2O7 pyrophosphate cathode’, J. Mater. Chem., vol. 22, no. 47, p. 24526, 2012.
[60] P. Barpanda, S. Nishimura, and A. Yamada, ‘High-Voltage Pyrophosphate Cathodes’, Adv. Energy Mater., vol. 2, no. 7, pp. 841–859, Jul. 2012.

References
203
[61] J. Barker, M. Y. Saidi, and J. L. Swoyer, ‘Electrochemical Insertion Properties of the Novel Lithium Vanadium Fluorophosphate, LiVPO4F’, J. Electrochem. Soc., vol. 150, no. 10, p. A1394, 2003.
[62] C. Julien, A. Mauger, A. Vijh, and K. Zaghib, ‘Fluoro-polyanionic Compounds’, in Lithium Batteries, Cham: Springer International Publishing, 2016, pp. 269–293.
[63] R. Ma et al., ‘Effects of oxidation on structure and performance of LiVPO4F as cathode material for lithium-ion batteries’, J. Power Sources, vol. 248, pp. 874–885, Feb. 2014.
[64] T. N. Ramesh, K. T. Lee, B. L. Ellis, and L. F. Nazar, ‘Tavorite lithium iron fluorophosphate cathode materials: phase transition and electrochemistry of LiFePO4F–Li2FePO4F’, Electrochem. Solid-State Lett., vol. 13, no. 4, pp. A43–A47, 2010.
[65] M. Nagahama, N. Hasegawa, and S. Okada, ‘High Voltage Performances of LiNiPO4F Cathode with Dinitrile-Based Electrolytes’, J. Electrochem. Soc., vol. 157, no. 6, p. A748, 2010.
[66] N. R. Khasanova, O. A. Drozhzhin, D. A. Storozhilova, C. Delmas, and E. V. Antipov, ‘New Form of Li2FePO4F as Cathode Material for Li-Ion Batteries’, Chem. Mater., vol. 24, no. 22, pp. 4271–4273, Nov. 2012.
[67] S.-W. Kim, D.-H. Seo, H. Kim, K.-Y. Park, and K. Kang, ‘A comparative study on Na2MnPO4F and Li2MnPO4F for rechargeable battery cathodes’, Phys. Chem. Chem. Phys., vol. 14, no. 10, p. 3299, 2012.
[68] N. R. Khasanova, A. N. Gavrilov, E. V. Antipov, K. G. Bramnik, and H. Hibst, ‘Structural transformation of Li2CoPO4F upon Li-deintercalation’, J. Power Sources, vol. 196, no. 1, pp. 355–360, Jan. 2011.
[69] D.-H. Seo, Y.-U. Park, S.-W. Kim, I. Park, R. A. Shakoor, and K. Kang, ‘First-principles study on lithium metal borate cathodes for lithium rechargeable batteries’, Phys. Rev. B, vol. 83, no. 20, May 2011.
[70] V. Legagneur et al., ‘LiMBO 3 (M= Mn, Fe, Co):: synthesis, crystal structure and lithium deinsertion/insertion properties’, Solid State Ion., vol. 139, no. 1, pp. 37–46, 2001.
[71] A. Yamada, N. Iwane, Y. Harada, S. Nishimura, Y. Koyama, and I. Tanaka, ‘Lithium Iron Borates as High-Capacity Battery Electrodes’, Adv. Mater., vol. 22, no. 32, pp. 3583–3587, Aug. 2010.
[72] P. Barpanda, D. Dwibedi, S. Ghosh, Y. Kee, and S. Okada, ‘Lithium metal borate (LiMBO3) family of insertion materials for Li-ion batteries: a sneak peak’, Ionics, vol. 21, no. 7, pp. 1801–1812, Jul. 2015.
[73] A. Yamada, N. Iwane, S. Nishimura, Y. Koyama, and I. Tanaka, ‘Synthesis and electrochemistry of monoclinic Li(MnxFe1−x)BO3: a combined experimental and computational study’, J. Mater. Chem., vol. 21, no. 29, p. 10690, 2011.
[74] S. Afyon, D. Kundu, A. J. Darbandi, H. Hahn, F. Krumeich, and R. Nesper, ‘A low dimensional composite of hexagonal lithium manganese borate (LiMnBO3), a cathode material for Li-ion batteries’, J Mater Chem A, vol. 2, no. 44, pp. 18946–18951, 2014.
[75] Y. Yamashita, P. Barpanda, Y. Yamada, and A. Yamada, ‘Demonstration of Co3+/Co2+ electrochemical activity in LiCoBO3 cathode at 4.0 V’, ECS Electrochem. Lett., vol. 2, no. 8, pp. A75–A77, 2013.
[76] S. Afyon, D. Kundu, F. Krumeich, and R. Nesper, ‘Nano LiMnBO3, a high-capacity cathode material for Li-ion batteries’, J. Power Sources, vol. 224, pp. 145–151, Feb. 2013.
[77] F. Strauss, ‘Insertion cathode materials based on borate compounds’, Université Pierre et Marie Curie-Paris VI, 2016.
[78] S. Afyon, C. Mensing, F. Krumeich, and R. Nesper, ‘The electrochemical activity for nano-LiCoBO3 as a cathode material for Li-ion batteries’, Solid State Ion., vol. 256, pp. 103–108, Mar. 2014.

References
204
[79] P. Barpanda, ‘Sulfate Chemistry for High-Voltage Insertion Materials: Synthetic, Structural and Electrochemical Insights’, Isr. J. Chem., vol. 55, no. 5, pp. 537–557, May 2015.
[80] N. Recham et al., ‘A 3.6 V lithium-based fluorosulphate insertion positive electrode for lithium-ion batteries’, Nat. Mater., vol. 9, no. 1, pp. 68–74, Jan. 2010.
[81] M. Ati, B. C. Melot, J.-N. Chotard, G. Rousse, M. Reynaud, and J.-M. Tarascon, ‘Synthesis and electrochemical properties of pure LiFeSO4F in the triplite structure’, Electrochem. Commun., vol. 13, no. 11, pp. 1280–1283, Nov. 2011.
[82] G. Rousse and J. M. Tarascon, ‘Sulfate-Based Polyanionic Compounds for Li-Ion Batteries: Synthesis, Crystal Chemistry, and Electrochemistry Aspects’, Chem. Mater., vol. 26, no. 1, pp. 394–406, Jan. 2014.
[83] M. Reynaud et al., ‘Li2Fe(SO4)2 as a 3.83V positive electrode material’, Electrochem. Commun., vol. 21, pp. 77–80, Jul. 2012.
[84] M. Sun et al., ‘An Oxysulfate Fe 2 O(SO 4 ) 2 Electrode for Sustainable Li-Based Batteries’, J. Am. Chem. Soc., vol. 136, no. 36, pp. 12658–12666, Sep. 2014.
[85] R. Tripathi, G. Popov, X. Sun, D. H. Ryan, and L. F. Nazar, ‘Ultra-rapid microwave synthesis of triplite LiFeSO4F’, J. Mater. Chem. A, vol. 1, no. 9, p. 2990, 2013.
[86] J. Yang et al., ‘Li2FeSiO4 nanorods bonded with graphene for high performance batteries’, J Mater Chem A, vol. 3, no. 18, pp. 9601–9608, 2015.
[87] M. K. Devaraju, T. Tomai, A. Unemoto, and I. Honma, ‘Novel processing of lithium manganese silicate nanomaterials for Li-ion battery applications’, RSC Adv, vol. 3, no. 2, pp. 608–615, 2013.
[88] E. Dumont-Botto, ‘La cristallochimie comme outil dans la recherche de nouveaux matérieux pour accumulateur Li-ion’, Université Paul Sabatier, Toulouse, 2011.
[89] G. B. Haxel, J. B. Hedrick, and G. J. Orris, ‘Rare Earth Elements—Critical Resources for High Technology’, U.S. Department of the Interior, U.S. Geological Survey Fact Sheet 087-02, Nov. 2002.
[90] S. A. Nelson, ‘Lecture notes about Silicate Structures, Structural Formula, Neso-, Cyclo-, and Soro- Silicates at Tulane University’. Jun-212AD.
[91] G. E. Brown, G. V. Gibbs, and P. H. Ribbe, ‘THE NATURE AND THE VARIATION IN LENGTH OF THE Si-O AND AI-O BONDS IN FRAMEWORK SILICATES.pdf’, Am. Mineral., vol. 54, pp. 1044–1061, 1969.
[92] A. R. West, Solid state chemistry and its applications, Repr. Chichester: Wiley, 1998. [93] M. Armand, C. Michot, N. Ravet, M. Simoneau, and P. Hovington, ‘Lithium insertion electrode
materials based on orthosilicate derivatives’, 6,085,015, 04-Jul-2000. [94] A. Nytén, A. Abouimrane, M. Armand, T. Gustafsson, and J. O. Thomas, ‘Electrochemical
performance of Li2FeSiO4 as a new Li-battery cathode material’, Electrochem. Commun., vol. 7, no. 2, pp. 156–160, Feb. 2005.
[95] R. Dominko, M. Bele, M. Gaberscek, A. Meden, M. Remškar, and J. Jamnik, ‘Structure and electrochemical performance of Li2MnSiO4 and Li2FeSiO4 as potential Li-battery cathode materials’, Electrochem. Commun., vol. 8, no. 2, pp. 217–222, Feb. 2006.
[96] A. R. West, ‘Crystal chemistry of some tetrahedral oxides’, Z. Für Krist., vol. 141, no. 5–6, pp. 422–436, Oct. 1975.
[97] M. S. Islam, R. Dominko, C. Masquelier, C. Sirisopanaporn, A. R. Armstrong, and P. G. Bruce, ‘Silicate cathodes for lithium batteries: alternatives to phosphates?’, J. Mater. Chem., vol. 21, no. 27, p. 9811, 2011.
[98] H. Duncan et al., ‘Novel Pn Polymorph for Li2MnSiO4 and Its Electrochemical Activity As a Cathode Material in Li-Ion Batteries’, Chem. Mater., vol. 23, no. 24, pp. 5446–5456, Dec. 2011.
References
205
[99] M. E. Arroyo-de Dompablo, M. Armand, J. M. Tarascon, and U. Amador, ‘On-demand design of polyoxianionic cathode materials based on electronegativity correlations: An exploration of the Li2MSiO4 system (M=Fe, Mn, Co, Ni)’, Electrochem. Commun., vol. 8, no. 8, pp. 1292–1298, Aug. 2006.
[100] C. Lyness, B. Delobel, A. R. Armstrong, and P. G. Bruce, ‘The lithium intercalation compound Li2CoSiO4 and its behaviour as a positive electrode for lithium batteries’, Chem. Commun., no. 46, p. 4890, 2007.
[101] S. Thayumanasundaram, V. S. Rangasamy, J. W. Seo, and J.-P. Locquet, ‘Synthesis and electrochemical behavior of Li2CoSiO4 cathode with pyrrolidinium-based ionic liquid electrolyte for lithium ion batteries’, Ionics, vol. 20, no. 7, pp. 935–941, Jul. 2014.
[102] K. M. Bui, V. A. Dinh, and T. Ohno, ‘Hybrid functional study on diffusion of silicate cathode material Li2NiSiO4’, J. Phys. Conf. Ser., vol. 454, p. 012061, Aug. 2013.
[103] M. R. Panda, R. Cheruku, and G. Govindaraj, ‘Investigations on Structural and Electrical Properties of Li2NiSiO4’, 2014.
[104] A. Nytén et al., ‘Surface characterization and stability phenomena in Li2FeSiO4 studied by PES/XPS’, J Mater Chem, vol. 16, no. 34, pp. 3483–3488, 2006.
[105] A. Saracibar, A. Van der Ven, and M. E. Arroyo-de Dompablo, ‘Crystal Structure, Energetics, And Electrochemistry of Li2FeSiO4 Polymorphs from First Principles Calculations’, Chem. Mater., vol. 24, no. 3, pp. 495–503, Feb. 2012.
[106] P. Zhang, C. H. Hu, S. Q. Wu, Z. Z. Zhu, and Y. Yang, ‘Structural properties and energetics of Li2FeSiO4 polymorphs and their delithiated products from first-principles’, Phys. Chem. Chem. Phys., vol. 14, no. 20, p. 7346, 2012.
[107] G. Mali, A. Meden, and R. Dominko, ‘6Li MAS NMR spectroscopy and first-principles calculations as a combined tool for the investigation of Li2MnSiO4 polymorphs’, Chem. Commun., vol. 46, no. 19, p. 3306, 2010.
[108] R. Dominko, D. E. Conte, D. Hanzel, M. Gaberscek, and J. Jamnik, ‘Impact of synthesis conditions on the structure and performance of Li2FeSiO4’, J. Power Sources, vol. 178, no. 2, pp. 842–847, Apr. 2008.
[109] C. Sirisopanaporn, C. Masquelier, P. G. Bruce, A. R. Armstrong, and R. Dominko, ‘Dependence of Li2FeSiO4 Electrochemistry on Structure’, J. Am. Chem. Soc., vol. 133, no. 5, pp. 1263–1265, Feb. 2011.
[110] G. Quoirin, ‘Apport de la résonance magnétique nucléaire à la description structurale et électrochimique de matériaux paramagnétiques. Synthèse, études structurales et électrochimiques du silicate de fer Li2FeSiO4’, University of Picardie Jules Verne, Amiens, 2007.
[111] A. R. Armstrong, N. Kuganathan, M. S. Islam, and P. G. Bruce, ‘Structure and Lithium Transport Pathways in Li2FeSiO4 Cathodes for Lithium Batteries’, J. Am. Chem. Soc., vol. 133, no. 33, pp. 13031–13035, Aug. 2011.
[112] R. Dominko, ‘Li2MSiO4 (M=Fe and/or Mn) cathode materials’, J. Power Sources, vol. 184, no. 2, pp. 462–468, Oct. 2008.
[113] X. Lu, H.-C. Chiu, K. H. Bevan, D.-T. Jiang, K. Zaghib, and G. P. Demopoulos, ‘Density functional theory insights into the structural stability and Li diffusion properties of monoclinic and orthorhombic Li2FeSiO4 cathodes’, J. Power Sources, vol. 318, pp. 136–145, Jun. 2016.
[114] A. Nytén, S. Kamali, L. Häggström, T. Gustafsson, and J. O. Thomas, ‘The lithium extraction/insertion mechanism in Li2FeSiO4’, J Mater Chem, vol. 16, no. 23, pp. 2266–2272, 2006.
References
206
[115] R. Dominko, I. Arcon, A. Kodre, D. Hanzel, and M. Gaberscek, ‘In-situ XAS study on Li2MnSiO4 and Li2FeSiO4 cathode materials’, J. Power Sources, vol. 189, no. 1, pp. 51–58, Apr. 2009.
[116] T. Masese et al., ‘Crystal Structural Changes and Charge Compensation Mechanism during Two Lithium Extraction/Insertion between Li 2 FeSiO 4 and FeSiO 4’, J. Phys. Chem. C, vol. 119, no. 19, pp. 10206–10211, May 2015.
[117] Q. Zhang et al., ‘Synthesis and characterization of pristine Li2MnSiO4 and Li2MnSiO4/C cathode materials for lithium ion batteries’, Ionics, vol. 18, no. 5, pp. 487–494, May 2012.
[118] A. Kokalj, R. Dominko, G. Mali, A. Meden, M. Gaberscek, and J. Jamnik, ‘Beyond One-Electron Reaction in Li Cathode Materials: Designing Li2MnxFe1-xSiO4’, Chem. Mater., vol. 19, no. 15, pp. 3633–3640, Jul. 2007.
[119] X.-Y. Fan et al., ‘Synthesis and electrochemical performance of porous Li2FeSiO4/C cathode material for long-life lithium-ion batteries’, J. Alloys Compd., vol. 493, no. 1–2, pp. 77–80, Mar. 2010.
[120] H. Zhou, M.-A. Einarsrud, and F. Vullum-Bruer, ‘In situ X-ray diffraction and electrochemical impedance spectroscopy of a nanoporous Li2FeSiO4/C cathode during the initial charge/discharge cycle of a Li-ion battery’, J. Power Sources, vol. 238, pp. 478–484, Sep. 2013.
[121] X. Lu et al., ‘Li-ion storage dynamics in metastable nanostructured Li2FeSiO4 cathode: Antisite-induced phase transition and lattice oxygen participation’, J. Power Sources, vol. 329, pp. 355–363, Oct. 2016.
[122] X. Lu et al., ‘Rate-dependent phase transitions in Li2FeSiO4 cathode nanocrystals’, Sci. Rep., vol. 5, no. 1, Aug. 2015.
[123] J. Bai, Z. Gong, D. Lv, Y. Li, H. Zou, and Y. Yang, ‘Nanostructured 0.8Li2FeSiO4/0.4Li2SiO3/C composite cathode material with enhanced electrochemical performance for lithium-ion batteries’, J. Mater. Chem., vol. 22, no. 24, p. 12128, 2012.
[124] X. Wu, X. Jiang, Q. Huo, and Y. Zhang, ‘Facile synthesis of Li2FeSiO4/C composites with triblock copolymer P123 and their application as cathode materials for lithium ion batteries’, Electrochimica Acta, vol. 80, pp. 50–55, Oct. 2012.
[125] D. Rangappa, K. D. Murukanahally, T. Tomai, A. Unemoto, and I. Honma, ‘Ultrathin Nanosheets of Li2MSiO4 (M = Fe, Mn) as High-Capacity Li- Ion Battery Electrode’, Nano Lett., vol. 12, no. 3, pp. 1146–1151, Mar. 2012.
[126] H. Zhu, X. Wu, L. Zan, and Y. Zhang, ‘Superior electrochemical capability of Li2FeSiO4/C/G composite as cathode material for Li-ion batteries’, Electrochimica Acta, vol. 117, pp. 34–40, Jan. 2014.
[127] J. Yang, X. Kang, L. Hu, X. Gong, and S. Mu, ‘Nanocrystalline-Li2FeSiO4 synthesized by carbon frameworks as an advanced cathode material for Li-ion batteries’, J Mater Chem A, vol. 2, no. 19, pp. 6870–6878, 2014.
[128] O. Kamon-in, S. Buakeaw, W. Klysubun, W. Limphirat, S. Srilomsak, and N. Meethong, ‘A Study of Transient Phase Transformation in LFS/C using in-situ Time Resolved X-ray Absorption Spectroscopy’, Int J Electrochem Sci, vol. 9, pp. 4257–4267, 2014.
[129] X. Wang et al., ‘Facile synthesis and enhanced electrochemical performance of Li2FeSiO4/C/reduced graphene oxide nanocomposites’, Electrochimica Acta, vol. 134, pp. 371–376, Jul. 2014.
[130] H. Zhu, X. Wu, L. Zan, and Y. Zhang, ‘Three-Dimensional Macroporous Graphene−Li2FeSiO4 Composite as Cathode Material for Lithium-Ion Batteries with Superior Electrochemical Performances’, ACS Appl. Mater. Interfaces, vol. 6, no. 14, pp. 11724–11733, Jul. 2014.
References
207
[131] Z. Zhang et al., ‘Fabrication and characterization of carbon-coated Li2FeSiO4 nanoparticles reinforced by carbon nanotubes as high performance cathode materials for lithium-ion batteries’, Electrochimica Acta, vol. 168, pp. 8–15, Jun. 2015.
[132] H. Sasaki et al., ‘Destruction behavior of carbon hybridized Li2MnSiO4 and Li2FeSiO4 nanoparticles for cathode materials’, Ceram. Int., vol. 41, pp. S680–S685, Jul. 2015.
[133] H. Sasaki et al., ‘Synthesis of Li2FeSiO4 nanoparticles/carbon composite for cathode materials by spray pyrolysis method’, J. Ceram. Soc. Jpn., vol. 124, no. 9, pp. 963–966, 2016.
[134] Z. Ding et al., ‘Three-dimensionally ordered macroporous Li2FeSiO4/C composite as a high performance cathode for advanced lithium ion batteries’, J. Power Sources, vol. 329, pp. 297–304, Oct. 2016.
[135] A. Kumar, O. D. Jayakumar, V. M. Naik, G. A. Nazri, and R. Naik, ‘Improved electrochemical properties of solvothermally synthesized Li2FeSiO4/C nanocomposites: A comparison between solvothermal and sol-gel methods’, Solid State Ion., vol. 294, pp. 15–20, Oct. 2016.
[136] D. Lv et al., ‘Understanding the High Capacity of Li 2 FeSiO 4 : In Situ XRD/XANES Study Combined with First-Principles Calculations’, Chem. Mater., vol. 25, no. 10, pp. 2014–2020, May 2013.
[137] O. Kamon-in, W. Klysubun, W. Limphirat, S. Srilomsak, and N. Meethong, ‘An insight into crystal, electronic, and local structures of lithium iron silicate (Li2FeSiO4) materials upon lithium extraction’, Phys. B Condens. Matter, vol. 416, pp. 69–75, May 2013.
[138] R. Chen, R. Heinzmann, S. Mangold, V. S. K. Chakravadhanula, H. Hahn, and S. Indris, ‘Structural Evolution of Li2Fe1-yMnySiO4 (y = 0, 0.2, 0.5, 1) Cathode Materials for Li-Ion Batteries upon Electrochemical Cycling’, J. Phys. Chem. C, vol. 117, no. 2, pp. 884–893, Jan. 2013.
[139] A. Liivat, J. Thomas, J. Guo, and Y. Yang, ‘Novel insights into higher capacity from the Li-ion battery cathode material Li2FeSiO4’, Electrochimica Acta, vol. 223, pp. 109–114, Jan. 2017.
[140] M. E. Arroyo-deDompablo et al., ‘On the Energetic Stability and Electrochemistry of Li2MnSiO4 Polymorphs’, Chem. Mater., vol. 20, no. 17, pp. 5574–5584, Sep. 2008.
[141] D. Santamaría-Pérez, U. Amador, J. Tortajada, R. Dominko, and M. E. Arroyo- de Dompablo, ‘High-Pressure Investigation of Li2MnSiO4 and Li2CoSiO4 Electrode Materials for Lithium-Ion Batteries’, Inorg. Chem., vol. 51, no. 10, pp. 5779–5786, May 2012.
[142] N. Nakayama, T. Itoyama, K. Fujiwara, A. Nakatsuka, M. Isobe, and Y. Ueda, ‘Structural Phase Transition of Li2MnSiO4’, Trans. Mater. Res. Soc. Jpn., vol. 37, no. 3, pp. 475–478, 2012.
[143] V. V. Politaev, A. A. Petrenko, V. B. Nalbandyan, B. S. Medvedev, and E. S. Shvetsova, ‘Crystal structure, phase relations and electrochemical properties of monoclinic Li2MnSiO4’, J. Solid State Chem., vol. 180, no. 3, pp. 1045–1050, Mar. 2007.
[144] H.-N. Girish and G.-Q. Shao, ‘Advances in high-capacity Li 2 MSiO 4 (M?= Mn, Fe, Co, Ni, ?) cathode materials for lithium-ion batteries’, RSC Adv, vol. 5, no. 119, pp. 98666–98686, 2015.
[145] N. Kuganathan and M. S. Islam, ‘Li2MnSiO4 Lithium Battery Material: Atomic-Scale Study of Defects, Lithium Mobility, and Trivalent Dopants’, Chem. Mater., vol. 21, no. 21, pp. 5196–5202, Nov. 2009.
[146] M. M. Kalantarian, S. Asgari, and P. Mustarelli, ‘Theoretical investigation of Li2MnSiO4 as a cathode material for Li-ion batteries: a DFT study’, J. Mater. Chem. A, vol. 1, no. 8, p. 2847, 2013.
[147] C. A. J. Fisher, N. Kuganathan, and M. S. Islam, ‘Defect chemistry and lithium-ion migration in polymorphs of the cathode material Li2MnSiO4’, J. Mater. Chem. A, vol. 1, no. 13, p. 4207, 2013.
[148] R. J. Gummow, N. Sharma, V. K. Peterson, and Y. He, ‘Crystal chemistry of the Pmnb polymorph of Li2MnSiO4’, J. Solid State Chem., vol. 188, pp. 32–37, Apr. 2012.
References
208
[149] V. Ramar and P. Balaya, ‘The effect of polymorphism on the lithium storage performance of Li 2 MnSiO 4’, J. Power Sources, vol. 306, pp. 552–558, Feb. 2016.
[150] H. Huang, S.-C. Yin, and L. F. Nazar, ‘Approaching Theoretical Capacity of LiFePO4 at Room Temperature at High Rates’, Electrochem. Solid-State Lett., vol. 4, no. 10, p. A170, 2001.
[151] J. Hwang, S. Park, C. Park, W. Cho, and H. Jang, ‘Hydrothermal synthesis of Li2MnSiO4: Mechanism and influence of precursor concentration on electrochemical properties’, Met. Mater. Int., vol. 19, no. 4, pp. 855–860, Jul. 2013.
[152] I. Belharouak, A. Abouimrane, and K. Amine, ‘Structural and Electrochemical Characterization of Li2MnSiO4 Cathode Material’, J. Phys. Chem. C, vol. 113, no. 48, pp. 20733–20737, Dec. 2009.
[153] J. Moskon, R. Dominko, R. Cerc-Korosec, M. Gaberscek, and J. Jamnik, ‘Morphology and electrical properties of conductive carbon coatings for cathode materials’, J. Power Sources, vol. 174, no. 2, pp. 683–688, Dec. 2007.
[154] R. Dominko, M. Bele, A. Kokalj, M. Gaberscek, and J. Jamnik, ‘Li2MnSiO4 as a potential Li-battery cathode material’, J. Power Sources, vol. 174, no. 2, pp. 457–461, Dec. 2007.
[155] S. Zhang et al., ‘Impacts of in situ carbon coating on the structural, morphological and electrochemical characteristics of Li2MnSiO4 prepared by a citric acid assisted sol–gel method’, J. Electroanal. Chem., vol. 689, pp. 88–95, Jan. 2013.
[156] S. Fleischmann, M. Mancini, P. Axmann, U. Golla-Schindler, U. Kaiser, and M. Wohlfahrt-Mehrens, ‘Insights into the Impact of Impurities and Non-Stoichiometric Effects on the Electrochemical Performance of Li 2 MnSiO 4’, ChemSusChem, vol. 9, no. 20, pp. 2982–2993, Oct. 2016.
[157] S. Devaraj, M. Kuezma, C. T. Ng, and P. Balaya, ‘Sol–gel derived nanostructured Li2MnSiO4/C cathode with high storage capacity’, Electrochimica Acta, vol. 102, pp. 290–298, Jul. 2013.
[158] H. Gao, L. Wang, Y. Zhang, and Y. Song, ‘Effects of solvent composition on the electrochemical performance of Li2FeSiO4/C cathode materials synthesized via tartaric-acid-assisted sol-gel method’, Ionics, vol. 20, no. 6, pp. 817–823, Jun. 2014.
[159] C. Deng et al., ‘Regeneration and characterization of air-exposed Li2FeSiO4’, Electrochimica Acta, vol. 56, no. 21, pp. 7327–7333, Aug. 2011.
[160] N. Wagner, A. M. Svensson, and F. Vullum-Bruer, ‘Flame-made Lithium Transition Metal Orthosilicates’, Electrochimica Acta, vol. 203, pp. 246–256, Jun. 2016.
[161] M. Molenda, M. witosawski, and R. Dziembaj, ‘C/Li2MnSiO4 Nanocomposite Cathode Material for Li-Ion Batteries’, in Composites and Their Properties, N. Hu, Ed. InTech, 2012.
[162] Y.-X. Li, Z.-L. Gong, and Y. Yang, ‘Synthesis and characterization of Li2MnSiO4/C nanocomposite cathode material for lithium ion batteries’, J. Power Sources, vol. 174, no. 2, pp. 528–532, Dec. 2007.
[163] T. Muraliganth, K. R. Stroukoff, and A. Manthiram, ‘Microwave-Solvothermal Synthesis of Nanostructured Li2MnSiO4/C (M = Mn and Fe) Cathodes for Lithium-Ion Batteries’, Chem. Mater., vol. 22, no. 20, pp. 5754–5761, Oct. 2010.
[164] S. Liu, J. Xu, D. Li, Y. Hu, X. Liu, and K. Xie, ‘High capacity Li2MnSiO4/C nanocomposite prepared by sol-gel method for lithium-ion batteries’, J. Power Sources, vol. 232, pp. 258–263, Jun. 2013.
[165] S.-S. Liu, L.-J. Song, B.-J. Yu, C.-Y. Wang, and M.-W. Li, ‘Comparative Study of the Cathode and Anode Performance of Li 2 MnSiO 4 for Lithium-Ion Batteries’, Electrochimica Acta, vol. 188, pp. 145–152, Jan. 2016.

References
209
[166] V. Aravindan, K. Karthikeyan, S. Amaresh, and Y. S. Lee, ‘Superior Lithium Storage Properties of Carbon Coated Li2MnSiO4 Cathodes’, Electrochem. Solid-State Lett., vol. 14, no. 4, p. A33, 2011.
[167] V. Aravindan, K. Karthikeyan, K. S. Kang, W. S. Yoon, W. S. Kim, and Y. S. Lee, ‘Influence of carbon towards improved lithium storage properties of Li2MnSiO4 cathodes’, J. Mater. Chem., vol. 21, no. 8, p. 2470, 2011.
[168] V. Aravindan, K. Karthikeyan, J. W. Lee, S. Madhavi, and Y. S. Lee, ‘Synthesis and improved electrochemical properties of Li2MnSiO4 cathodes’, J. Phys. Appl. Phys., vol. 44, no. 15, p. 152001, Apr. 2011.
[169] Y. Zhao, C. Wu, J. Li, and L. Guan, ‘Long cycling life of Li2MnSiO4 lithium battery cathodes under the double protection from carbon coating and graphene network’, J. Mater. Chem. A, vol. 1, no. 12, p. 3856, 2013.
[170] M. Moriya et al., ‘Synthesis of Hybrid Li2MnSiO4 Nanoparticles with Carbon for Cathode Materials with Stable Charge/Discharge Cycles’, J. Electrochem. Soc., vol. 161, no. 1, pp. A97–A101, Nov. 2013.
[171] D. Bhuvaneswari and N. Kalaiselvi, ‘Custom designed nanocrystalline Li2MSiO4/ reduced graphene oxide (M = Fe, Mn) formulations as high capacity cathodes for rechargeable lithium batteries’, Dalton Trans, vol. 43, no. 48, pp. 18097–18103, 2014.
[172] H. Gong, Y. Zhu, L. Wang, D. Wei, J. Liang, and Y. Qian, ‘Solid-state synthesis of uniform Li2MnSiO4/C/graphene composites and their performance in lithium-ion batteries’, J. Power Sources, vol. 246, pp. 192–197, Jan. 2014.
[173] X.-F. Yang, J.-H. Yang, K. Zaghib, M. L. Trudeau, and J. Y. Ying, ‘Synthesis of phase-pure Li2MnSiO4@C porous nanoboxes for high-capacity Li-ion battery cathodes’, Nano Energy, vol. 12, pp. 305–313, Mar. 2015.
[174] H. J. Song et al., ‘Li2MnSiO4 nanorods-embedded carbon nanofibers for lithium-ion battery electrodes’, Electrochimica Acta, vol. 180, pp. 756–762, Oct. 2015.
[175] M. Kuezma, S. Devaraj, and P. Balaya, ‘Li2MnSiO4 obtained by microwave assisted solvothermal method: electrochemical and surface studies’, J. Mater. Chem., vol. 22, no. 39, p. 21279, 2012.
[176] M. Molenda, M. Świętosławski, A. Wach, D. Majda, P. Kuśtrowski, and R. Dziembaj, ‘Stability of C/Li2MnSiO4 composite cathode material for Li-ion batteries towards LiPF6 based electrolyte’, Solid State Ion., vol. 262, pp. 98–101, Sep. 2014.
[177] M. Swietoslawski, M. Molenda, M. Grabowska, A. Wach, P. Kuśtrowski, and R. Dziembaj, ‘Electrochemical impedance spectroscopy study of C/Li2MnSiO4 composite cathode material at different states of charge’, Solid State Ion., vol. 263, pp. 99–102, Oct. 2014.
[178] P. T. Kristiansen et al., ‘X-ray absorption spectroscopy and resonant inelastic scattering study of the first lithiation cycle of the Li-ion battery cathode Li2-xMnSiO4’, Phys. Chem. Chem. Phys., vol. 16, no. 8, p. 3846, 2014.
[179] A. Saracibar, Z. Wang, K. J. Carroll, Y. S. Meng, and M. E. A. Dompablo, ‘New insights into the electrochemical performance of Li2MnSiO4 : effect of cationic substitutions’, J Mater Chem A, vol. 3, no. 11, pp. 6004–6011, 2015.
[180] S. T. Pantelides, ‘Defects in amorphous silicon: a new perspective’, Phys. Rev. Lett., vol. 57, no. 23, p. 2979, 1986.
[181] H. Lee et al., ‘Origin of Poor Cyclability in Li2MnSiO4 from First-Principles Calculations: Layer Exfoliation and Unstable Cycled Structure’, Chem. Mater., vol. 26, no. 13, pp. 3896–3899, Jul. 2014.

References
210
[182] M. Mancini et al., ‘Study on the stability of Li2MnSiO4 cathode material in different electrolyte systems for Li-ion batteries’, Electrochimica Acta, vol. 176, pp. 679–688, Sep. 2015.
[183] B. Shao, Y. Abe, and I. Taniguchi, ‘Synthesis and electrochemical characterization of Li2FexMn1-xSiO4/C (0≤x≤0.8) nanocomposite cathode for lithium-ion batteries’, Powder Technol., vol. 235, pp. 1–8, Feb. 2013.
[184] Q. Chen et al., ‘Structural transformations in Li2MnSiO4: evidence that a Li intercalation material can reversibly cycle through a disordered phase’, J. Mater. Chem. A, vol. 5, no. 32, pp. 16722–16731, 2017.
[185] Z. L. Gong, Y. X. Li, and Y. Yang, ‘Synthesis and Characterization of Li2MnxFe1-xSiO4 as a Cathode Material for Lithium-Ion Batteries’, Electrochem. Solid-State Lett., vol. 9, no. 12, p. A542, 2006.
[186] R. Dominko, C. Sirisopanaporn, C. Masquelier, D. Hanzel, I. Arcon, and M. Gaberscek, ‘On the Origin of the Electrochemical Capacity of Li2Fe0.8Mn0.2SiO4’, J. Electrochem. Soc., vol. 157, no. 12, p. A1309, 2010.
[187] C. Deng, S. Zhang, and S. Y. Yang, ‘Effect of Mn substitution on the structural, morphological and electrochemical behaviors of Li2Fe1-xMnxSiO4 synthesized via citric acid assisted sol?gel method’, J. Alloys Compd., vol. 487, no. 1–2, pp. L18–L23, Nov. 2009.
[188] R. Dominko, ‘Silicates and titanates as high-energy cathode materials for Li-ion batteries’, 2010, p. 76830J.
[189] J. Billaud et al., ‘Evidence of Enhanced Ion Transport in Li-Rich Silicate Intercalation Materials’, Adv. Energy Mater., vol. 7, no. 11, p. 1601043, Jun. 2017.
[190] M. Wang, M. Yang, L. Ma, and X. Shen, ‘Synthesis and improved electrochemical properties of Na-substituted Li2MnSiO4 nanoparticles as cathode materials for Li-ion batteries’, Chem. Phys. Lett., vol. 619, pp. 39–43, Jan. 2015.
[191] M. Li et al., ‘Synthesis and electrochemical performance of Na-modified Li2Fe0.5Mn0.5SiO4 cathode material for Liion batteries’, RSC Adv, vol. 5, no. 29, pp. 22818–22824, 2015.
[192] Y. Ren et al., ‘Spherical Li1.95Na0.05FeSiO4/C composite as nanoporous cathode material exhibiting high rate capability’, Mater. Lett., vol. 173, pp. 207–210, Jun. 2016.
[193] R. J. Gummow, N. Sharma, V. K. Peterson, and Y. He, ‘Synthesis, structure, and electrochemical performance of magnesium-substituted lithium manganese orthosilicate cathode materials for lithium-ion batteries’, J. Power Sources, vol. 197, pp. 231–237, Jan. 2012.
[194] G. Han, R. Gummow, Y. He, and others, ‘Synthesis and electrochemical evaluation of Li2Mg0. 1Mn0. 9SiO4 for lithium-ion battery cathode applications’, Chemeca 2013 Challenging Tomorrow, p. 838, 2013.
[195] C. Deng, S. Zhang, Y. X. Wu, and B. D. Zhao, ‘Partial substitution of Mn/Si with V, Cr or Al in Li2MnSiO4 nanoparticle: Dependence of the physical and electrochemical properties on the substitution strategy’, J. Electroanal. Chem., vol. 719, pp. 150–157, Apr. 2014.
[196] M. Zhang, S. Zhao, Q. Chen, and G. Yan, ‘Li2+xMnSi1-xAlxO4/C nanoparticles for high capacity lithium-ion battery cathode applications’, RSC Adv., vol. 4, no. 58, p. 30876, Jul. 2014.
[197] P.-Y. Zhai, S.-X. Zhao, H.-M. Cheng, J.-W. Zhao, and C.-W. Nan, ‘Synthesis and structural stability of Li2.1Mn0.9[PO4]0.1[SiO4]0.9/C mixed polyanion cathode material for Li-ion battery’, Electrochimica Acta, vol. 153, pp. 217–224, Jan. 2015.
[198] S. Zhang, C. Deng, H. Gao, F. L. Meng, and M. Zhang, ‘Li2+xMn1-xPxSi1-xO4/C as novel cathode materials for lithium ion batteries’, Electrochimica Acta, vol. 107, pp. 406–412, Sep. 2013.
[199] R. J. Gummow, G. Han, N. Sharma, and Y. He, ‘Li2MnSiO4 cathodes modified by phosphorous substitution and the structural consequences’, Solid State Ion., vol. 259, pp. 29–39, Jun. 2014.
References
211
[200] W. Chen et al., ‘How to synthesize pure Li2-xFeSi 1-x PxO 4/C (x = 0.03-0.15) easily from low-cost Fe3+ as cathode materials for Li-ion batteries’, Dalton Trans, vol. 44, no. 33, pp. 14805–14812, 2015.
[201] M. Wang, M. Yang, L. Ma, and X. Shen, ‘The high capacity and excellent rate capability of Ti-doped Li2MnSiO4 as a cathode material for Li-ion batteries’, RSC Adv, vol. 5, no. 2, pp. 1612–1618, 2015.
[202] H. Hao, J. Wang, J. Liu, T. Huang, and A. Yu, ‘Synthesis, characterization and electrochemical performance of Li2FeSiO4/C cathode materials doped by vanadium at Fe/Si sites for lithium ion batteries’, J. Power Sources, vol. 210, pp. 397–401, Jul. 2012.
[203] A. Liivat and J. O. Thomas, ‘A DFT study of polyanion substitution into the Li-ion battery cathode material Li2FeSiO4’, Comput. Mater. Sci., vol. 50, no. 1, pp. 191–197, Nov. 2010.
[204] T. Toyama and S. Takahashi, ‘Electrochemical properties of vanadium-substituted lithium silicate materials Li 2+xFe0.5-x/2Mn0.5-x/2Si1-xVxO4(x = 0, 0.1, 0.2, 0.3 and 0.4) for lithium-ion battery cathodes’, J. Power Sources, vol. 294, pp. 312–316, Oct. 2015.
[205] N. P. Wagner, A. R. M. Dalod, A. M. Svensson, and F. Vullum-Bruer, ‘Fe and V Substituted Li2MnSiO4/C As Potential Cathode Material for Li-Ion Batteries’, ECS Trans., vol. 64, no. 22, pp. 33–45, Apr. 2015.
[206] C. Hwang et al., ‘Synthesis, characterization, and electrochemical performance of V-doped Li2MnSiO4/C composites for Li-ion battery’, Mater. Lett., vol. 164, pp. 270–273, Feb. 2016.
[207] N. P. Wagner, P. E. Vullum, M. K. Nord, A. M. Svensson, and F. Vullum-Bruer, ‘Vanadium Substitution in Li 2 MnSiO 4 /C as Positive Electrode for Li Ion Batteries’, J. Phys. Chem. C, vol. 120, no. 21, pp. 11359–11371, Jun. 2016.
[208] H. Yamashita, T. Ogami, and K. Kanamura, ‘Hydrothermal Synthesis and Electrochemical Properties of Li2FexMnxCo1−2xSiO4/C Cathode Materials for Lithium-ion Batteries’, Electrochemistry, vol. 83, no. 6, pp. 413–420, 2015.
[209] S. Ferrari, M. C. Mozzati, M. Lantieri, G. Spina, D. Capsoni, and M. Bini, ‘New materials for Li-ion batteries: synthesis and spectroscopic characterization of Li2(FeMnCo)SiO4 cathode materials’, Sci. Rep., vol. 6, no. 1, Sep. 2016.
[210] K. Yamashita, T. Ogami, and K. Kanamura, ‘Solvothermal Synthesis and Electrochemical Properties of Li2Fe0.27Mn0.63Co0.10SiO4/C Cathode Materials for Lithium-ion Batteries’, Taiheiyo Cement Corporation, Tokyo, 2015.
[211] R. Yang, L. Wang, K. Deng, M. Lv, and Y. Xu, ‘A facile synthesis of Li 2 Fe 1/3 Mn 1/3 Ni 1/3 SiO 4 /C composites as cathode materials for lithium-ion batteries’, J. Alloys Compd., vol. 676, pp. 260–264, Aug. 2016.
[212] H. Deng, S.-X. Zhao, X. Wu, L. Wei, Y.-F. Deng, and C.-W. Nan, ‘Effect of Ni substitution on structural stability, micromorphology, and electrochemical performance of Li 2 MnSiO 4 /C cathode materials’, RSC Adv, vol. 6, no. 112, pp. 111539–111548, 2016.
[213] A. Y. Shenouda and N. Munichandraih, ‘The Electrochemical Properties of Li2NixMn1-xSiO4 Cathode Material for Lithium Batteries’, Int. J. Electrochem. Sci., pp. 8123–8131, Oct. 2016.
[214] T. Wu, C. Lai, and Q. Xu, ‘Synthesis of Li2Mn1−xNixSiO4/C nanocomposites with enhanced electrochemical properties via citric acid assisted sol-gel method’, Mater. Lett., vol. 186, pp. 293–297, Jan. 2017.
[215] C. Lai, Z. Wang, Q. Xu, and H. Li, ‘Mo-doped Li2MnSiO4/C nanocomposite synthesized by citric acid-assisted sol-gel method with enhanced electrochemical properties’, Mater. Lett., vol. 139, pp. 134–137, Jan. 2015.

References
212
[216] Y. Dong, W.-L. Zhang, C.-M. Wang, T. Shi, and L. Chen, ‘Synthesis of La-doped Li2MnSiO4 nano-particle with high-capacity via polyol-assisted hydrothermal method’, Electrochimica Acta, vol. 166, pp. 40–46, Jun. 2015.
[217] J. S. Manley, ‘Synthesis and carbonation of nanocrystalline fayalite (Fe2SiO4)’, PhD Thesis, University of Arkansas at Little Rock, 2016.
[218] G. R. Lumpkin and P. H. Ribbe, ‘Composition, order disorder and lattice parameters of olivines determinative methods for Mg-Mn and Mg-Ca silicate olivines’, Am. Mineral., vol. 68, pp. 1174–1182, 1983.
[219] G. J. Redhammer and G. Roth, ‘LiInSiO4 : a new monovalent–trivalent olivine’, Acta Crystallogr. C, vol. 59, no. 5, pp. i38–i40, May 2003.
[220] I. M. Steele, J. J. Pluth, and J. Ito, ‘Crystal structure of synthetic LiScSiO4 olivine and comparison with isotypic Mg2SiO4’, Z. Für Krist. - Cryst. Mater., vol. 147, no. 1–4, Jan. 1978.
[221] S. A. T. Redfern, C. M. B. Henderson, K. S. Knight, and B. J. Wood, ‘High-temperature order-disorder in (Fe0.5Mn0.5)2SiO4 and (Mg0.5Mn0.5)2SiO4 olivines: an in situ neutron diffraction study’, Eur. J. Mineral., vol. 9, no. 2, pp. 287–300, Jun. 1997.
[222] C. M. B. Henderson, K. S. Knight, S. A. T. Redfern, and B. J. Wood, ‘High-Temperature Study of Octahedral Cation Exchange in Olivine by Neutron Powder Diffraction’, Science, vol. 271, no. 5256, pp. 1713–1715, Mar. 1996.
[223] T. Mori et al., ‘Anti-site mixing governs the electrochemical performances of olivine-type MgMnSiO 4 cathodes for rechargeable magnesium batteries’, Phys Chem Chem Phys, vol. 18, no. 19, pp. 13524–13529, 2016.
[224] F. Zhou, M. Cococcioni, K. Kang, and G. Ceder, ‘The Li intercalation potential of LiMPO4 and LiMSiO4 olivines with M=Fe, Mn, Co, Ni’, Electrochem. Commun., vol. 6, no. 11, pp. 1144–1148, Nov. 2004.
[225] R. C. Longo, K. Xiong, W. Wang, and K. Cho, ‘Influence of the exchange-correlation potential on the electrochemical properties of multicomponent silicate cathode materials’, Electrochimica Acta, vol. 80, pp. 84–89, Oct. 2012.
[226] M. E. Arroyo y de Dompablo, J. M. Gallardo-Amores, J. García-Martínez, E. Morán, J.-M. Tarascon, and M. Armand, ‘Is it possible to prepare olivine-type LiFeSiO4?A joint computational and experimental investigation’, Solid State Ion., vol. 179, no. 27–32, pp. 1758–1762, Sep. 2008.
[227] X. Sun, R. Tripathi, G. Popov, M. Balasubramanian, and L. F. Nazar, ‘Stabilization of Lithium Transition Metal Silicates in the Olivine Structure’, Inorg. Chem., vol. 56, no. 16, pp. 9931–9937, Aug. 2017.
[228] C. Ling, D. Banerjee, W. Song, M. Zhang, and M. Matsui, ‘First-principles study of the magnesiation of olivines: redox reaction mechanism, electrochemical and thermodynamic properties’, J. Mater. Chem., vol. 22, no. 27, p. 13517, 2012.
[229] Z. Feng, J. Yang, Y. NuLi, and J. Wang, ‘Sol-gel synthesis of Mg1.03Mn0.97SiO4 and its electrochemical intercalation behavior’, J. Power Sources, vol. 184, no. 2, pp. 604–609, Oct. 2008.
[230] Y. NuLi, J. Yang, Y. Li, and J. Wang, ‘Mesoporous magnesium manganese silicate as cathode materials for rechargeable magnesium batteries’, Chem. Commun., vol. 46, no. 21, p. 3794, 2010.
[231] Y. NuLi, J. Yang, J. Wang, and Y. Li, ‘Electrochemical Intercalation of Mg2+ in Magnesium Manganese Silicate and Its Application as High-Energy Rechargeable Magnesium Battery Cathode’, J. Phys. Chem. C, vol. 113, no. 28, pp. 12594–12597, Jul. 2009.
[232] Y. NuLi et al., ‘MWNT/C/Mg1.03Mn0.97SiO4 hierarchical nanostructure for superior reversible magnesium ion storage’, Electrochem. Commun., vol. 13, no. 10, pp. 1143–1146, Oct. 2011.

References
213
[233] Z. Feng, J. Yang, Y. NuLi, J. Wang, X. Wang, and Z. Wang, ‘Preparation and electrochemical study of a new magnesium intercalation material Mg1.03Mn0.97SiO4’, Electrochem. Commun., vol. 10, no. 9, pp. 1291–1294, Sep. 2008.
[234] Y. Li, Y. Nuli, J. Yang, T. Yilinuer, and J. Wang, ‘MgFeSiO4 prepared via a molten salt method as a new cathode material for rechargeable magnesium batteries’, Chin. Sci. Bull., vol. 56, no. 4–5, pp. 386–390, Feb. 2011.
[235] Y. Zheng, Y. NuLi, Q. Chen, Y. Wang, J. Yang, and J. Wang, ‘Magnesium cobalt silicate materials for reversible magnesium ion storage’, Electrochimica Acta, vol. 66, pp. 75–81, Apr. 2012.
[236] Q. D. Truong, M. K. Devaraju, and I. Honma, ‘Nanocrystalline MgMnSiO4 and MgCoSiO4 particles for rechargeable Mg-ion batteries’, J. Power Sources, vol. 361, pp. 195–202, Sep. 2017.
[237] G. Blasse and J. de Vries, ‘A new family of lanthanide compounds: lithium lanthanide silicates and germanates’, J. Inorg. Nucl. Chem., vol. 29, no. 6, pp. 1541–1542, Jun. 1967.
[238] B. J. Melde, B. J. Johnson, and P. T. Charles, ‘Mesoporous Silicate Materials in Sensing’, Sensors, vol. 8, no. 8, pp. 5202–5228, Aug. 2008.
[239] C. J. Brinker and G. W. Scherer, Sol-gel science: the physics and chemistry of sol-gel processing. Boston: Academic Press, 1990.
[240] R. K. Iler, The chemistry of silica: solubility, polymerization, colloid and surface properties, and biochemistry. New York: Wiley, 1979.
[241] M. Nabavi, S. Doeuff, C. Sanchez, and J. Livage, ‘Chemical modification of metal alkoxides by solvents: A way to control sol-gel chemistry’, J. Non-Cryst. Solids, vol. 121, no. 1–3, pp. 31–34, 1990.
[242] J. C. Pouxviel, J. P. Boilot, J. C. Beloeil, and J. Y. Lallemand, ‘NMR study of the sol/gel polymerization’, J. Non-Cryst. Solids, vol. 89, no. 3, pp. 345–360, 1987.
[243] L. C. Klein, ‘Sol-Gel Processing of Silicates’, Annu. Rev. Mater. Sci., vol. 15, no. 1, pp. 227–248, Aug. 1985.
[244] B. Didier, ‘Synthèse d’un Matériau Hybride Polyimide/Silice-Etude Structure-Proprietes’, Université de Savoie, 2005.
[245] L. C. Klein, Ed., Sol-Gel technology for thin films, fibers, preforms, electronics, and specialty shapes. Park Ridge, N.J., U.S.A: Noyes Publications, 1988.
[246] R. C. Mehrota and A. Mehrotra, ‘Chemistry of double alkoxides of various elements’, Inorganica Chim. Acta Rev., vol. 5, pp. 127–136, 1971.
[247] L. Levene and I. M. Thomas, ‘Process of converting metalorganic compounds and high purity products obtained therefrom’, 3640093, Feb-1972.
[248] S. H. Hakim and B. H. Shanks, ‘Synthesis and characterization of hierarchically structured aluminosilicates’, J. Mater. Chem., vol. 21, no. 20, p. 7364, 2011.
[249] ‘Crystallography Open Database’, Crystallography Open Database. [Online]. Available: http://www.crystallography.net/cod/index.php.
[250] T. Roisnel and J. Rodriguez-Carvajal, ‘WinPLOTR: a Windows tool for powder diffraction patterns analysis Materials Science Forum’, presented at the Proceedings of the Seventh European Powder Diffraction Conference (EPDIC 7), 2000, p. p.118-123.
[251] P. Scherrer, ‘Bestimmung der inneren Struktur und der Größe von Kolloidteilchen mittels Röntgenstrahlen’, in Kolloidchemie Ein Lehrbuch, Berlin, Heidelberg: Springer Berlin Heidelberg, 1912, pp. 387–409.
[252] V. P. Zakaznova-Herzog, H. W. Nesbitt, G. M. Bancroft, J. S. Tse, X. Gao, and W. Skinner, ‘High-resolution valence-band XPS spectra of the nonconductors quartz and olivine’, Phys. Rev. B, vol. 72, no. 20, Nov. 2005.
References
214
[253] J. J. Carberry, Chemical and catalytic reaction engineering, Dover ed. Mineola, N.Y: Dover Publications, 2001.
[254] M. Ue, Y. Sasaki, Y. Tanaka, and M. Morita, ‘Nonaqueous Electrolytes with Advances in Solvents’, in Electrolytes for Lithium and Lithium-Ion Batteries, vol. 58, T. R. Jow, K. Xu, O. Borodin, and M. Ue, Eds. New York, NY: Springer New York, 2014, pp. 93–165.
[255] S. Walus, ‘Lithium/Sulfur batteries : development and understanding of the working mechanisms’, Université Grenoble-Alpes, Grenoble, 2015.
[256] H. Zhu, H. He, X. Xin, X. Ma, L. Zan, and Y. Zhang, ‘Facile synthesis of Li2MnSiO4/C/graphene composite with superior high-rate performances as cathode materials for Li-ion batteries’, Electrochimica Acta, vol. 155, pp. 116–124, Feb. 2015.
[257] P. Li, B. A. Ferguson, and L. F. Francis, ‘Sol-gel processing of lithium disilicate’, J. Mater. Sci., vol. 30, no. 16, pp. 4076–4086, 1995.
[258] J. Wang et al., ‘Selective Synthesis of Manganese/Silicon Complexes in Supercritical Water’, J. Nanomater., vol. 2014, pp. 1–8, 2014.
[259] E. Yamamoto and K. Kuroda, ‘Colloidal Mesoporous Silica Nanoparticles’, Bull. Chem. Soc. Jpn., vol. 89, no. 5, pp. 501–539, May 2016.
[260] F. Bérubé and S. Kaliaguine, ‘Calcination and thermal degradation mechanisms of triblock copolymer template in SBA-15 materials’, Microporous Mesoporous Mater., vol. 115, no. 3, pp. 469–479, Nov. 2008.
[261] F. A. Cotton and F. A. Cotton, Eds., Advanced inorganic chemistry, 6th ed. New York: Wiley, 1999.
[262] R. C. Longo et al., ‘Phase stability of Li–Mn–O oxides as cathode materials for Li-ion batteries: Insights from ab initio calculations’, Phys. Chem. Chem. Phys., vol. 16, no. 23, pp. 11233–11242, 2014.
[263] R. Younesi et al., ‘Analysis of the interphase on carbon black formed in high voltage batteries’, J. Electrochem. Soc., vol. 162, no. 7, pp. A1289–A1296, 2015.
[264] J. Zheng et al., ‘Surface and structural stabilities of carbon additives in high voltage lithium ion batteries’, J. Power Sources, vol. 227, pp. 211–217, Apr. 2013.
[265] N. Wagner, A. M. Svensson, and F. Vullum-Bruer, ‘Liquid-feed flame spray pyrolysis as alternative synthesis for electrochemically active nano-sized Li 2 MnSiO 4’, Transl. Mater. Res., vol. 3, no. 2, p. 025001, May 2016.
[266] T. Ohzuku, ‘Synthesis and Characterization of LiAl1∕4Ni3∕4O2 (R3m) for Lithium-Ion (Shuttlecock) Batteries’, J. Electrochem. Soc., vol. 142, no. 12, p. 4033, 1995.
[267] L. E. Copeland and R. H. Bragg, ‘Quantitative X-ray diffraction analysis’, Anal. Chem., vol. 30, no. 2, pp. 196–201, 1958.
[268] M. H. Brooker and J. B. Bates, ‘Raman and Infrared Spectral Studies of Anhydrous Li2CO3 and Na2CO3’, J. Chem. Phys., vol. 54, no. 11, pp. 4788–4796, Jun. 1971.
[269] M. H. Brooker and J. Wang, ‘Raman and infrared studies of lithium and cesium carbonates’, Spectrochim. Acta Part Mol. Spectrosc., vol. 48, no. 7, pp. 999–1008, 1992.
[270] P. Tarte, ‘Etude infra-rouge des orthosilicates et des orthogermanates—II’, Spectrochim. Acta, vol. 19, no. 1, pp. 25–47, Jan. 1963.
[271] M. Toupin, T. Brousse, and D. Bélanger, ‘Influence of Microstucture on the Charge Storage Properties of Chemically Synthesized Manganese Dioxide’, Chem. Mater., vol. 14, no. 9, pp. 3946–3952, Sep. 2002.
[272] E. S. Ilton, J. E. Post, P. J. Heaney, F. T. Ling, and S. N. Kerisit, ‘XPS determination of Mn oxidation states in Mn (hydr)oxides’, Appl. Surf. Sci., vol. 366, pp. 475–485, Mar. 2016.

References
215
[273] C. S. Fadley, D. A. Shirley, A. J. Freeman, P. S. Bagus, and J. V. Mallow, ‘Multiplet splitting of core-electron binding energies in transition-metal ions’, Phys. Rev. Lett., vol. 23, no. 24, p. 1397, 1969.
[274] M. C. Biesinger, B. P. Payne, A. P. Grosvenor, L. W. M. Lau, A. R. Gerson, and R. S. C. Smart, ‘Resolving surface chemical states in XPS analysis of first row transition metals, oxides and hydroxides: Cr, Mn, Fe, Co and Ni’, Appl. Surf. Sci., vol. 257, no. 7, pp. 2717–2730, Jan. 2011.
[275] M. Toupin, T. Brousse, and D. Bélanger, ‘Charge Storage Mechanism of MnO2 Electrode Used in Aqueous Electrochemical Capacitor’, Chem. Mater., vol. 16, no. 16, pp. 3184–3190, Aug. 2004.
[276] I. M. Kotina et al., ‘Lithium in Nanoporous Carbon Materials Produced from SiC’, in Hydrogen Materials Science and Chemistry of Carbon Nanomaterials, Springer, 2004, pp. 391–398.
[277] D. Ensling, A. Thissen, and W. Jaegermann, ‘On the formation of lithium oxides and carbonates on Li metal electrodes in comparison to LiCoO2 surface phases investigated by photoelectron spectroscopy’, Appl. Surf. Sci., vol. 255, no. 5, pp. 2517–2523, Dec. 2008.
[278] J.-F. Martin, ‘Evolution de la surface de matériaux d’électrode positive pour accumulateurs au lithium au cours du vieillissement et du cyclage électrochimique’, Université de Nantes, Nantes, 2008.
[279] R. Moshtev, P. Zlatilova, S. Vasilev, I. Bakalova, and A. Kozawa, ‘Synthesis, XRD characterization and electrochemical performance of overlithiated LiNiO2’, J. Power Sources, vol. 81, pp. 434–441, 1999.
[280] N. Recham et al., ‘Formation of a Complete Solid Solution between the Triphylite and Fayalite Olivine Structures’, Chem. Mater., vol. 20, no. 21, pp. 6798–6809, Nov. 2008.
[281] C. W. Bale et al., FactSage Thermochemical Software and Databases. 2010. [282] J. C. Knight, S. Therese, and A. Manthiram, ‘On the Utility of Spinel Oxide Hosts for
Magnesium-Ion Batteries’, ACS Appl. Mater. Interfaces, vol. 7, no. 41, pp. 22953–22961, Oct. 2015. [283] S. Hamelet, M. Casas-Cabanas, L. Dupont, C. Davoisne, J. M. Tarascon, and C. Masquelier,
‘Existence of Superstructures Due to Large Amounts of Fe Vacancies in the LiFePO4-Type Framework’, Chem. Mater., vol. 23, no. 1, pp. 32–38, Jan. 2011.
[284] S. Nishimura, R. Natsui, and A. Yamada, ‘Superstructure in the Metastable Intermediate-Phase Li2/3FePO4 Accelerating the Lithium Battery Cathode Reaction’, Angew. Chem. Int. Ed., vol. 54, no. 31, pp. 8939–8942, Jul. 2015.
[285] F. Boucher, J. Gaubicher, M. Cuisinier, D. Guyomard, and P. Moreau, ‘Elucidation of the Na2/3FePO4 and Li2/3FePO4 Intermediate Superstructure Revealing a Pseudouniform Ordering in 2D’, J. Am. Chem. Soc., vol. 136, no. 25, pp. 9144–9157, Jun. 2014.
[286] B. Shen, O. Tanada, M. Kitamura, and N. Morimoto, ‘Superstructure of laihunite-3M ( 0.40Fe2+0.80Fe3+0.80SiO4)’, Am. Mineral., vol. 71, no. 11/12, pp. 1455–1460, 1986.
[287] O. Tamada, B. Shen, and N. Morimoto, ‘The crystal structure of laihunite (□0.40Fe2+0.80Fe3+0.80SiO4). Nonstoichiometric olivine-type mineral.’, Mineral. J., vol. 11, no. 8, pp. 382–391, 1983.
[288] M. Casas-Cabanas et al., ‘Crystal chemistry of Na insertion/deinsertion in FePO4–NaFePO4’, J. Mater. Chem., vol. 22, no. 34, p. 17421, 2012.
[289] H. Ott, ‘Die Strukturen von MnO, MnS, AgF, NiS, SnJ4, SrCl2, BaF2; Präzisionsmessungen einiger Alkalihalogenide’, Z. Für Krist. - Cryst. Mater., vol. 63, no. 1–6, Jan. 1926.
[290] J. Hu et al., ‘Tuning Li-Ion Diffusion in α-LiMn 1– x Fe x PO 4 Nanocrystals by Antisite Defects and Embedded β-Phase for Advanced Li-Ion Batteries’, Nano Lett., vol. 17, no. 8, pp. 4934–4940, Aug. 2017.
References
216
[291] I. J. T. Jensen, ‘Combined experimental and computational study of the meta-stable Mg-Ti-H system’, 2013.
[292] F. J. Garcia-Garcia et al., ‘Low refractive index SiOF thin films prepared by reactive magnetron sputtering’, Thin Solid Films, vol. 542, pp. 332–337, 2013.
[293] C. Cardinaud, A. Rhounna, G. Turban, and B. Grolleau, ‘Analyse XPS des surfaces de Si et SiO2 exposées aux plasmas de CHF3 et CHF3—C2F6. Polymérisation et gravure’, Rev. Phys. Appliquée, vol. 24, no. 3, pp. 309–321, 1989.
[294] Z. Mu, F. Zhou, S. Zhang, Y. Liang, and W. Liu, ‘Effect of the functional groups in ionic liquid molecules on the friction and wear behavior of aluminum alloy in lubricated aluminum-on-steel contact’, Tribol. Int., vol. 38, no. 8, pp. 725–731, Aug. 2005.
[295] J.-S. Park, S.-M. Oh, Y.-K. Sun, and S.-T. Myung, ‘Thermal properties of fully delithiated olivines’, J. Power Sources, vol. 256, pp. 479–484, Jun. 2014.
[296] A. S. Prakash, P. Rozier, L. Dupont, H. Vezin, F. Sauvage, and J.-M. Tarascon, ‘Electrochemical Reactivity of Li2VOSiO4 toward Li’, Chem. Mater., vol. 18, no. 2, pp. 407–412, Jan. 2006.
[297] J. Wang, J. Polleux, J. Lim, and B. Dunn, ‘Pseudocapacitive Contributions to Electrochemical Energy Storage in TiO2 (Anatase) Nanoparticles’, J. Phys. Chem. C, vol. 111, no. 40, pp. 14925–14931, Oct. 2007.
[298] V. Augustyn, P. Simon, and B. Dunn, ‘Pseudocapacitive oxide materials for high-rate electrochemical energy storage’, Energy Environ. Sci., vol. 7, no. 5, p. 1597, 2014.
[299] H. Lindström et al., ‘Li+ ion insertion in TiO2 (anatase). 2. Voltammetry on nanoporous films’, J. Phys. Chem. B, vol. 101, no. 39, pp. 7717–7722, 1997.
[300] A. J. Bard and L. R. Faulkner, Electrochemical methods: fundamentals and applications, 2nd ed. New York: Wiley, 2001.
[301] D. Ensling, M. Stjerndahl, A. Nytén, T. Gustafsson, and J. O. Thomas, ‘A comparative XPS surface study of Li2FeSiO4/C cycled with LiTFSI and LiPF6-based electrolytes’, J Mater Chem, vol. 19, no. 1, pp. 82–88, 2009.
[302] J. Wang et al., ‘Degradation of lithium ion batteries employing graphite negatives and nickel–cobalt–manganese oxide + spinel manganese oxide positives: Part 1, aging mechanisms and life estimation’, J. Power Sources, vol. 269, pp. 937–948, Dec. 2014.
[303] T. Guillemin, ‘LEO and GEO Constellations: 7 Elements to Consider Before Joining the Debate’, Intelsat. [Online]. Available: http://www.intelsat.com/newsletter/Intelsat-Insider/2nd_Quarter_2015/Article_1.html.
[304] M. Broussely and G. Pistoia, Industrial applications of batteries from cars to aerospace and energy storage. Amsterdam; Boston: Elsevier, 2007.
[305] Lithium-ion batteries: fundamentals and applications. Boca Raton: CRC Press, 2015. [306] P. Liu, M. Verbrugge, and S. Soukiazian, ‘Influence of temperature and electrolyte on the
performance of activated-carbon supercapacitors’, J. Power Sources, vol. 156, no. 2, pp. 712–718, Jun. 2006.
[307] R. D. Shannon, ‘Revised effective ionic radii and systematic studies of interatomic distances in halides and chalcogenides’, Acta Crystallogr. A, vol. 32, no. 5, pp. 751–767, 1976.

217
Abstract / Résumé
218
Abstract
The society is currently facing challenges such as global warming and rarefaction of resources. These issues have a factor in common, energy, and more specifically its storage, for which lithium-ion batteries are today the state-of-the-art technology. Researchers and industries are focusing on the increase of energy density and safety as well as the reduction of toxic, costly and rare elements. In this study, positive electrodes based on silicate polyanionic materials are considered to fulfill these requirements. Two materials are studied, Li2MnSiO4 that exhibits an appealing large capacity (>300mAh.g-1) and an unreported LiMnSiO4 with olivine structure that would have a medium capacity (174mAh.g-1) but associated with a high voltage (>3.7V).
In a first part, a nanocomposite material Li2MnSiO4/C is synthesized by sol-gel route. Its electrochemical and structural properties are studied. The different degradation phenomena are discussed thereafter. Al-doped and Mn-rich Li2-xMn1+xAlxSi1-xO4/C is also proposed to lower the structural collapse during cycling. Finally, the impact of the storage of Li2MnSiO4 in air is assessed and a mechanism is proposed to explain the formation of Li2CO3.
In a second part, a multistep synthesis is designed starting from olivine MgMnSiO4/C, followed by chemical oxidation and electrochemical lithiation to obtain LiMnSiO4/C. Each step is characterized to assess structure, oxidation state and electrochemical behavior of the final material.
Finally, the testing of the two materials for space applications (LEO and GEO satellites profiles) confirms the better cyclability of LiMnSiO4/C and its validity as promising alternative to the conventional unstable Li2MnSiO4 compound.
Keywords: Li-ion battery; silicate; olivine; Li2MnSiO4; MgMnSiO4; LiMnSiO4
Résumé
La société fait face à des défis tels que le réchauffement climatique et la diminution des ressources. Ils sont intimement liés à l’énergie et à son stockage, dont les batteries Li-ion sont à ce jour la technologie la plus utilisée. L’amélioration de la densité d’énergie et la sécurité, ainsi que la réduction des éléments toxiques, rares et coûteux sont visées. Durant cette étude, les électrodes positives basées sur des matériaux polyanioniques silicates sont considérées pour répondre à ces demandes. Deux composés sont particulièrement étudiés, Li2MnSiO4, dont la capacité spécifique est supérieure à 300mAh.g-1 et LiMnSiO4, de structure olivine, encore jamais répertorié, dont la capacité (174mAh.g-1) et le potentiel (>3.7V) théoriques sont prometteurs.
Dans un premier volet, un nanomatériau Li2MnSiO4/C est synthétisé par voie sol-gel. Ses propriétés électrochimiques et structurales sont étudiées. Les différents phénomènes de dégradation observés sont discutés par la suite. Une stratégie de dopage est proposée pour limiter la perte de capacité en cyclage via le composé Li2-xMn1+xAlxSi1-xO4/C. Enfin l’influence du stockage à l’air de Li2MnSiO4/C est mise en évidence et un mécanisme concernant la formation de Li2CO3 est proposé.
En seconde partie, une synthèse de LiMnSiO4/C en plusieurs étapes est proposée à partir de l’olivine MgMnSiO4/C, suivie d’une oxydation chimique et d’une lithiation électrochimique. Chaque étape est caractérisée pour déterminer la structure, l’état d’oxydation et le comportement électrochimique du matériau obtenu.
Pour conclure cette étude, les deux matériaux optimisés ont été testés suivant les profils d’applications spatiales (satellites LEO et GEO). La meilleure cyclablité de LiMnSiO4/C est confirmée ainsi que sa légitimité en tant qu’alternative prometteuse au matériau conventionnel Li2MnSiO4/C.
Mots-clés: batterie Li-ion; silicate; olivine; Li2MnSiO4; MgMnSiO4; LiMnSiO4
Copyright © 2022 FDOKUMEN