Effect of Sodium Silicate and Salicylic Acid ... - Research Square
Upload
independentCategory
view
0download
0
s
rehighrderin
lowor
itic materiales of maficces,
hesetwn spectral
Icarus 172 (2004) 233–254www.elsevier.com/locate/icaru
Mafic silicate mapping on Mars: effects of palagonitic material, multiplemafic silicates, and spectral resolution
Edward A. Cloutisa,∗, James F. Bell IIIb
a Department of Geography, University of Winnipeg, 515 Portage Avenue, Winnipeg, MB, Canada R3B 2E9b Department of Astronomy, Cornell University,402 Space Sciences Building, Ithaca, NY 14853-6801, USA
Received 14 November 2003; revised 20 April 2004
Available online 4 August 2004
Abstract
The visible to near-infrared spectral reflectance properties of intimate and areal pyroxene+ palagonitic material mixtures as well as pumafic silicates (low-calcium pyroxene, high-calcium pyroxene, pigeonite, olivine) and mixtures of these minerals were analyzed atspectral resolution (5 nm) as well as with non-contiguous band passes equivalent to recent HST observations and the Pathfinder IMP in oto determine the quality and quantity of mineralogical information (end member compositions, abundances, and grain sizes) derivablethe presence of palagonitic material. In the case of pyroxene+ palagonitic material mixtures, pyroxene is detectable at abundances asas 10 wt%, and its composition can be constrained because (a) its diagnostic absorption feature (located near 1000 nm) persists even fhigh palagonitic material abundances, and (b) palagonitic material does not appreciablyalter the wavelength position of this band (< 4 nmvariation). For broad band data (such as Pathfinder IMP band passes), different mafic silicates can be discriminated and palagonabundances constrained using a variety of reflectance ratios and three-point “absorption band depths.” However, other propertisilicate± palagonitic material assemblages, such asmafic silicate major element compositions, grain sizes, and end member abundangenerally cannot be rigorously quantified. The use of multiple reflectanceratios can, however, be used to identify relative changes in tproperties, as most changes in mafic silicate± palagonitic material assemblage properties are characterized by aunique corresponding seof reflectance ratio variations. The observed spectral-assemblage property trends are consistent with those expected from the knoproperties of the end members. 2004 Elsevier Inc. All rights reserved.
Keywords:Mars surface; Regoliths; Mineralogy; Spectrophotometry
sili-;ltical.,et
.g.,fey,nd
son-.g.,83;
face
ush00;
.,98;ss-fic
1. Introduction
Pyroxenes are among the most widespread maficcates in the inner Solar System (e.g.,McCord et al., 1970McCord and Clark, 1979; Feierberg et al., 1980; BasaVolcanism Study Project, 1981; Dodd, 1981; Surkov et1983; Huguenin, 1987; Cruikshank et al., 1991; Gaffeyal., 1993a, 1993b; McSween and Treiman, 1998) and oneof the most well-characterized minerals spectrally (eAdams, 1974; Hazen et al., 1978; Cloutis and Gaf1991a). A knowledge of the compositional, structural, a
* Corresponding author. Fax: (204)-774-4134.E-mail address:[email protected](E.A. Cloutis).
0019-1035/$ – see front matter 2004 Elsevier Inc. All rights reserved.doi:10.1016/j.icarus.2004.06.002
textural properties of mafic silicate-bearing assemblagecan provide important constraints on the formation cditions of targets in which these minerals reside (eWood and Banno, 1973; Morse, 1980; Lindsley, 19Lindsley and Andersen, 1983).
Pyroxenes are thought to be widespread on the surof Mars on the basis of spectral studies (e.g.,Singer, 1985;Pinet and Chevrel, 1990; Mustard et al., 1993b; Roet al., 1993; Bell, 1996; Christensen et al., 1998, 20Bandfield et al., 2000; Morris et al., 2000) and known to bepresent from direct examination of martian meteorites (e.gWood and Ashwal, 1981; McSween and Treiman, 19Folco et al., 1999). Spectral deconvolution has been succefully applied to martian meteorite spectra to derive ma

234 E.A. Cloutis, J.F. Bell III / Icarus 172 (2004) 233–254
;
Ca)ndof
red,e o
for-;al.,79;al,
983;90;
canad-dgeex-
Kil--88olu-dm-tro-
.iumndsil-
andtheey
in-on
rey be
ve-afic
seate
7;
m-
-sentlan-te-
99;
-spa-r-ally
e
spa-ly aet-ap-s oftiveser-
um-re-ion,ionrial;s-thatub-ra 2r
s
-nces,
con-tudyatathe
0;cn-
s ofnti-ded.y-s asnesuc-
ma-it isin
silicate compositional information(Sunshine et al., 1993Bishop et al., 1998a).
For the martian meteorites, major element (Mg, Fe,composition, relative proportions of mafic silicates, agrain size/textural observations all allow the compositionparental magmas and formation conditions to be infersuch as late stage differentiation, oxidation state, degrepartial melting, parental magma composition, cumulusmation, and degree of fractionation(Mason et al., 1975Boctor et al., 1976; Floran et al., 1978; McSween et1979; Smith and Hervig, 1979; Stolper and McSween, 19Stolper et al., 1979; Berkley et al., 1980; Wood and Ashw1981; Smith et al., 1984; McSween and Jarosewich, 1McSween, 1985; Lundberg et al., 1990; Treiman, 19Murchie et al., 1993; Mikouchi et al., 1998). Conditions offormation as well as subsequent alteration/weatheringalso be augmented with information from analysis ofditional mineral phases that may be present. A knowleof the mineralogy of martian extrusive lava flows and (posed) intrusive igneous bodies (e.g.,Mustard et al., 1997)can augment geomorphological (e.g.,Mouginis-Mark, 1981;Cattermole, 1990; Greeley and Crown, 1990; Lopes andburn, 1990; Greggand Williams, 1996) and modeling studies (e.g.,Solomon and Head, 1982; Finnerty et al., 19)of these targets to help place constraints on mantle evtion, heat loss, viscosities, effusion conditions, rheology, andensity. A more detailed knowledge of the mineralogy coprising these features would help to further constrain pegenetic conditions derivable from geomorphology alone
On Earth, economic deposits of metals such as chromplatinum and platinum group metals, titanium, iron, acopper-nickel-iron are frequently associated with maficicate minerals (e.g.,Evans, 1980; Eckstrand, 1984). Conse-quently an ability to detect mafic silicate occurrencesderive some compositional information could assist indetection and mapping of similar deposits on Mars if thexist.
One of the major uncertainties inherent in constraing the composition and abundance of mafic silicatesMars from analysis of reflectance spectroscopic data athe spectrum-altering effects of other phases which mapresent (e.g.,Cloutis and Gaffey, 1991b). A related problemis determining the minimum spectral resolution and walength coverage necessary for quantitative analysis of msilicate compositions from reflectance spectra. In the caof Mars, the major phase which may affect mafic silicreflectance spectra is poorly crystalline ferric iron-bearingmaterial (e.g.,Bell et al., 1993; Morris et al., 1993, 199Murchie et al., 1993; Morris and Golden, 1998) which isspectrally similar to terrestrial palagonitic material, a comon weathering product of basaltic tuffs(Moore, 1966;Hay and Iijima, 1968). A material spectrally similar to terrestrial palagonitic material has been found to be preacross much of the martian surface and commonly bkets (partially or fully) outcrops of basaltic/andesitic ma
f
,
rials (Johnson et al., 1999; McSween and Murchie, 19McSween et al., 1999; Bell et al., 2000).
Few visible to near-infrared (VIS-NIR) spectral reflectance studies of Mars have combined high spectral andtial resolution on a planetary scale. Planetary-scale neainfrared observations at high spatial resolution generhave been conducted at low spectral resolution (e.g.,Bellet al., 1997) or over only limited regions of the surfac(Murchie et al., 1993; Mustard et al., 1993a). Similarly, lan-ders such as Viking and Pathfinder have acquired hightial resolution data around their landing sites but at onfew discrete wavelengths(Adams et al., 1986; McSweenal., 1999; Bell et al., 2000). For future lander/rover or orbiter regional- or global-scale multispectral geological mping studies, it would be useful to determine what typecompositional information can be derived from quantitaanalysis of existing or planned low spectral resolution obvational data sets.
This study was designed to: (1) study the spectraltering effects of palagonitic material on pyroxeneflectance spectra, particularly in the 300–1000 nm regin order to determine whether compositional informatcan still be derived in the presence of palagonitic mate(2) determine whether different mafic silicates can be dicriminated using lower spectral resolution data such asavailable from recent observations of Mars using the Hble Space Telescope (HST) Wide Field/Planetary Came(WFPC2)(Bell et al., 1997), the Imager for Mars Pathfinde(IMP) camera(Smith et al., 1997), and the upcoming MarExploration Rover Pancam investigation(Bell et al., 2003);and (3) determine whether mafic silicate±palagonitic material assemblage properties, such as end member abundacompositions, and grain sizes, can be quantified orstrained using this lower spectral resolution data. This sextends the work done on analysis of Pathfinder IMP dfor constraining the nature of Mars surface materials atPathfinder site (e.g.,McSween et al., 1999; Bell et al., 200Morris et al., 2000) by examining in more detail mafisilicates± palagonitic material and terrestrial ferric irobearing minerals.
2. Experimental procedure
In order to understand the spectrum-altering effectpalagonitic material on mafic silicates, a series of imate mixtures of orthopyroxene+ palagonitic material anorthopyroxene+ hematite were spectrally characterizWe retain the convention of referring to low-calcium proxenes as orthopyroxenes and high-calcium pyroxeneclinopyroxenes, even though some low-calcium pyroxemay have a monoclinic rather than orthorhombic strture. A representative orthopyroxene (PYX110,Table 1)was used to produce intimate mixtures with palagoniticterial or hematite. This pyroxene was used becausespectrally most similar to martian meteorite pyroxenes

Mafic silicate-palagonitic material spectra 235
f
,89;
i-werm-
ple
plehis-
inaow-
ac-ay
050nd
ered-wasofks,
ewnedthe
orted
te inti-
red
ec-thethe
untilm-ringus,s arebedmentter.rface
orec-ethe
ec-andea-
rela-931858pec-nmnm,
Table 1Compositions of the main samples used in this study
wt% PYX110 PAL101a PAL102b
SiO2 56.65 41.24 45.5Al2O3 0.03 25 18.4FeO 9.19 2.77Fe2O3 0.44 12.58 13.1c
MgO 33.92 3.52 3.91CaO 0.30 5.11 6.02Na2O 0.00 2.74 3.24TiO2 0.03 3.24Cr2O3 0.05 0.01V2O5 0.01 0.02CoO 0.01NiO 0.02MnO 0.04 0.29 0.22K2O 0.67 1.07P2O5 1.34 0.59LOId 13.89 4.77Total 100.69 99.19 100.4
a analysis of 5–53 µm size fraction fromMorris et al. (2000).b analysis of< 2 mm size fraction fromBanin et al. (1997).c All Fe reported as Fe2O3.d loss on ignition. Sample PAL101 was heated in air at 950◦C for one
hour and samples PAL102 was heated to 950◦C for an unknown period otime to determine volatile content.
the 300- to 800-nm region(Salisbury et al., 1975; Gaffey1976; McFadden, 1987; Wagner et al., 1987; Morris, 19Sunshine et al., 1993; Schade and Wäsch, 1999). It wascharacterized compositionally and structurally(Cloutis andGaffey, 1991a)and was found to be free of any contamnating weathered phases. Palagonitic material sampleskindly made available by Dick Morris at JSC (sample nuber HWMK 600; PAL101 in this study)(Morris et al., 2000)and Ted Roush at NASA Ames Research Center (samnumber 91-16; PAL102 in this study)(Banin et al., 1997).Dick Morris also provided the synthetic hematite samused in this study (sample number HMS3; HEM101 in tstudy)(Morris et al., 1985). The palagonitic material samples were dry sieved, without crushing, to obtain a< 45 µmfraction. The pyroxene sample was crushed in an alummortar and pestle and dry sieved to produce the various pdered size fractions.
The various samples were characterized by X-ray diffrtion at the University of Manitoba. Continuous scan X-rdiffraction data were collected from 3◦–65◦ 2-θ on a PhilipsPW1710 automated powder diffractometer, using a PW1Bragg-Brentano goniometer equipped with incident- adiffracted-beam Soller slits, 1.0◦ divergence and anti-scattslits, a 0.2 mm receiving slit and a curved graphite diffractbeam monochromator. The normal focus Cu X-ray tubeoperated at 40 kV and 40 mA, using a take-off angle6◦. The pyroxene XRD trace showed only pyroxene peawhile the palagonitic material XRD traces showed a fbroad diffuse peaks which could not be uniquely assigwith any confidence to any particular mineral phases;closest match being to plagioclase feldspar.
Reflectance spectra were acquired at the NASA-suppRELAB spectrometer facility at Brown University(Pieters,
e
Table 2End member abundances and grain sizes of minerals used to generamate mixtures
Sample No. PYX110 PAL101 PAL102 HEM101
Size wt% Size wt% Size wt% Size wt%(µm) (µm) (µm) (µm)
MIX501 45–90 90 < 45 10MIX502 45–90 80 < 45 20MIX503 45–90 70 < 45 30MIX504 45–90 60 < 45 40MIX505 45–90 50 < 45 50MIX506 45–90 40 < 45 60MIX507 45–90 30 < 45 70MIX508 45–90 20 < 45 80MIX509 45–90 10 < 45 90
MIX510 < 45 80 < 45 20MIX511 < 45 60 < 45 40MIX512 < 45 40 < 45 60
MIX515 45–90 80 < 45 20MIX516 45–90 60 < 45 40
MIX517 45–90 80 < 0.14 20MIX518 45–90 60 < 0.14 40
See Table 1 for composition of the end members. PYX110= ortho-pyroxene; PAL101, PAL102= palagonite; HEM101= hematite.
1983; RELAB, 1996). Reflectance spectra were measufrom 0.3- to 2.6-µm at 5 nm spectral resolution withi = 30◦ande = 0◦, and were measured relative to halon The sptra were acquired under dry air conditions. Heating ofpalagonitic material samples was undertaken in air andsamples were placed in sealedcontainers immediately af-ter heating and weighing, and kept in these containersthey were spectrally characterized. It is likely that the saples adsorbed some moisture from the atmosphere duthe short times that they were out of their containers. Ththe absorption bands seen in the 1.4- and 1.9-µm regionlikely due to a combination of structural water and adsorwater, as spectral measurements under dry air measureconditions probably did not liberate all the adsorbed waWe intend to remeasure these samples under Mars suconditions in the future.
Intimate mixtures of PYX110 and palagonitic materialhematite were prepared at various wt% intervals for sptral measurements (Table 2). Equivalent areal mixtures wergenerated by applying appropriate weighting factors toend member spectra in an additive (linear) fashion. As anexample, a 20/80 areal mixture of pyroxene+ palagoniticmaterial would be the sum of 0.2 times the pyroxene sptrum plus 0.8 times the palagonitic material spectrum. Bdepths(Db) for the high-spectral resolution data were msured using Eq. (32) ofClark and Roush (1984). Band depthsfor the broad-band data were measured using the sametionship. For the Pathfinder data, the continua for theand 531 nm “bands” were straight lines connecting theand 1003 nm, and the 480 and 600 nm data points, restively; for the HST data, the continua for the 955 and 501“bands” were straight lines connecting the 860 and 1044

236 E.A. Cloutis, J.F. Bell III / Icarus 172 (2004) 233–254
min-g aon
ng-de-lessntedsil-dox-aof
ingtheonlyare
nder to(andve-;en,bles ofimi-
uchectra
he-0esir-eric
simgo-
-aksreif-
ifiede
t%
0
ples0
nves-tedentin
theluteme
hese
l.,
7 at
theeot
tion-ived
atc
and the 409 and 673 nm data points, respectively. Bandima for the high resolution data were determined by fittinthird order polynomial to between 10 and 20 data pointseither side of a visually determined band minimum. Chaing the number of data points used for band minimumtermination caused band minimum positions to vary bythan±2 nm. The spectra used in this study were augmeby additional spectra available in the literature for maficicates, mafic silicate-bearing mixtures, Mars Pathfinder antelescopic Mars spectra, and various ferric iron-bearingides and hydroxides. Band widths (full width half maxim(FWHM)) are the width, in nanometers, at half the depththe band after removal of a straight line continuum.
3. Palagonitic material as a martian bright region or“dust” spectral analog
Analysis of pyroxene reflectance spectra for derivcompositional information is most robust when both1000 nm and 2000 nm region absorption bands (commreferred to as Band I and Band II regions, respectively)available(Adams, 1974; Cloutis et al., 1986; Cloutis aGaffey, 1991a). Palagonitic materials, containing nanophasiron oxides as a pigmenting agent, are spectrally similamartian bright region spectra and serve as a spectralperhaps compositional) analog for martian fines at walengths below∼ 1000 nm (e.g.,Morris et al., 1989, 1993Bell et al., 1993; Golden et al., 1993; Morris and Gold1998). Both the PAL101 and PAL102 samples are suitaspectral analogues for the shorter wavelength portionmartian bright region spectra and both are spectrally slar (Fig. 1). Both sample spectra exhibit H2O/OH-associatedabsorption features in the 1400 and 1900 nm regions. Sbands are weak or non-existent in martian surface sp(Murchie et al., 1993).
Attempts to remove or diminish the intensities of t1400 and 1900 nm region bandsfrom the palagonitic material spectra by heating the samples (to 160 and 60◦Cfor 2 hours) were unsuccessful and produced other undable spectral changes (Fig. 1), probably due to recrystallization, incomplete dehydration, and resorption of atmosphmoisture, similar to the results found byBruckenthal (1987).Many of the spectral changes accompanying heating areilar to those found in a naturally thermally altered palanitic tephra(Bell et al., 1993). X-ray diffractograms of theheated and unheated samples showed no significant differences in terms of the appearance of new diffraction pethe only noticeable changesaccompanying heating wereductions in the FWHM of some of the broad and dfuse peaks. The only mineral phase that could be identwith certainty in all of the diffractograms was plagioclasfeldspar.
Total weight losses upon heating were 9.6 and 6.7 wfor PAL101 and PAL102 heated to 160◦C, respectively, and16.4 and 14.8% for the same samples heated to 60◦C.
-
-
;
(a)
(b)
Fig. 1. 300–4300 nm reflectance spectra of palagonitic material samPAL101 (a) and PAL102 (b), unheated and heated in air to 160 and 60◦Cfor 2 hours. SeeTable 1for compositional information.
These values exceed those measured by the original itigators, likely due to the fact that volatiles are expecto be concentrated in the finer fractions; volatile contmeasurements for the originalsamples involved larger grasize fractions than those used here (Table 1). The< 45 µmfractions of both samples exhibit overall reflectance in1000 nm region that is similar in both shape and absovalue to the martian bright regions, as well as to soPathfinder bright soil spectra; absolute reflectance of tmartian spectra generally range from∼ 0.3 to ∼ 0.4 at800 nm (Murchie et al., 1993; Bell, 1996; Bell et a1997, 2000; McSween et al., 1999), while the palagoniticmaterial spectra have absolute reflectance of 0.35–0.3this wavelength.
Due to the persistence of a 1900 nm feature inpalagonitic material spectra, the 2000 nm region of thpyroxene+ palagonitic material mixture spectra was nused for derivation of spectral-assemblage property relaships. However mafic silicate compositions can be dersolely from the 1000 nm absorption feature(Cloutis andGaffey, 1991a, 1991b), so omission of the 2000 nm regionthis stage is not a significant impediment to analysis of mafi

Mafic silicate-palagonitic material spectra 237
niticrtianf theeu-
edµm
ealor-.,
e
02
om-ili-s fo
tive
owny re-
en-ateaticptionmalcon-
-101,sing
sethe
othatndthe
ionsnal
)ene-)
h ofes a2,eas-the
n
allyral,
si-he
er:net be
osi-
dowillis
nd
glethese-py-usede ofandrenes
e.g.,tis
res-trialve-I
ter-
silicate-bearing assemblages. In addition, while palagomaterial may be a reasonable spectral analogue for mafines, it would be useful to have a better understanding ooptical properties of this material, as even spectrally “ntral” components can affect band area ratios(Moroz andArnold, 1999).
4. Pyroxene + palagonitic material mixture spectra
Pyroxene+ palagonitic material mixtures were producat 10 wt% intervals for the main series involving 45–90fractions of pyroxene (PYX110) and< 45 µm fractions ofpalagonitic material (PAL101), as both intimate and armixtures as described above (Fig. 2). This was designed tsimulate expected differencesin grain size between the finegrained martian “dust”(Pollack et al., 1977; Clancy et al1995)and coarser-grained martian pyroxene(McSween andTreiman, 1998). Additional, but more limited, series werproduced using a smaller grain size of PYX110 (< 45 µm)with PAL101, and 45–90 µm sized PYX110 with PAL1and hematite (HEM101) (Table 2).
Quantitative analysis of reflectance spectra to derive cpositional information for pyroxenes and other mafic scates is based on absorption band wavelength positionmajor element composition(Cloutis and Gaffey, 1991a), andband depths for the coupled effects of grain size and relaabundance in the presence of other phases(Cloutis et al.,1986). In cases where absolute reflectance values are kngrain size and relative abundance effects may be partiallsolvable.
The wavelength position of the pyroxene Band I cter varies between 911 and 914 nm for all of the intimmixture series (10–100 wt% pyroxene) with no systemtrends apparent. The areal mixture series exhibits absorband center positions between 912 and 916 nm, with a s(1–2 nm) increase in band position for those samples
Fig. 2. Reflectance spectra of 10 wt% interval intimate mixtures of orthopyroxene (PYX110, 45–90 µm grain size) and palagonitic material (PAL< 45 µm grain size). wt% palagonitic material increases with decreaband depth in the 900 and 1900 nm regions.
r
,
l
taining> 80 wt% palagonitic material. This slight increain band position at high palagonite abundances is due tofact that the palagonitic materials used in this study bexhibit a weak (Db = 2–3%) absorption feature located926 nm (PAL101) or 958 nm (PAL102). The range of baposition variations is less than the spectral resolution oflaboratory data (5 nm) and much less than the variatin band positions associated with pyroxene compositiochanges (> 100 nm for Band I)(Cloutis and Gaffey, 1991a.
Full width half-maxima (FWHM) values of Band I havbeen found to be relatively constant for orthopyroxeclinopyroxene mixture series(Sunshine and Pieters, 1993.In our study, where the orthopyroxene has a band widteither 200 (for the< 45 µm size fraction) or 250 nm (for th45–90 µm size fraction), and the palagonitic material haband width of 225 nm for PAL101 and 240 nm for PAL10decreases in band width were generally found for decring pyroxene content for all pyroxene abundance for bothintimate and areal mixture series; the only major exceptiobeing the pure palagonitic materials (Fig. 3). This is consis-tent with the behavior associated with dilution of a spectrfeatured material mixed with a relatively spectrally neutand bright, component(Cloutis and Bell, 2000). It was alsofound that the FWHM is a function of pyroxene compotion. FWHM of < 45 and 45–90 µm size samples of torthopyroxenes fromCloutis and Gaffey (1991a)range from190–270 nm; the range for clinopyroxenes is slightly larg180–297 nm. Since FWHM is also a function of pyroxegrain size and palagonitic material abundance, it cannoused in isolation to uniquely constrain pyroxene comption, abundance, or grain size.
Band depths for the orthopyroxene+ palagonitic ma-terial spectra (Fig. 4) converge rapidly to a single trenfor the intimate mixture series, while the areal series shmore scatter. The trends are as expected because fines wdominate the spectral properties. This kind of mixtureoften non-linear for greatly different particle sizes. Badepths for theCloutis and Gaffey (1991a)orthopyroxenesrange from 47 to 82%, close to the range of the sinpyroxene used in the intimate mixtures. The fact thatband depth values for the palagonitic material-bearingries rapidly converge to a single trend with decreasingroxene abundance suggests that band depths can beto constrain orthopyroxene abundances across a rangcompositions and grain sizes, assuming that pyroxenepalagonitic material are (optically) intimately mixed and athe spectrally dominant phases. Terrestrial clinopyroxeare more spectrally diverse than martian pyroxenes (Adams, 1974, 1975; Cloutis, 1985; Morris, 1989, Clouand Gaffey, 1991a, 1991b; Morris et al., 2000), largely asa result of greater compositional variations and the pence of appreciable amounts of ferric iron in many terresclinopyroxenes, which has its major effect at shorter walengths (� 1000 nm); this results in clinopyroxene Banddepths ranging between 3 and 74% for all the availablerestrial samples used in this study. The data shown inFig. 4

238 E.A. Cloutis, J.F. Bell III / Icarus 172 (2004) 233–254
re,
101,1,
or-
nce10)am-
ap-m-ptionl issult
be,ce
er-n-ugh
andrial
hosethan
ing;
ve-to
lag-la-
re-erterei-
-7;
any)teused;
(a)
(b)
Fig. 3. Variation in full width half maxima of the Band I featuin the intimate (a) and areal (b) mixtures of orthopyroxene (PYX110< 45 and 45–90 µm grain sizes) and palagonitic material (PAL< 45 µm grain size; PAL102,< 45 µm grain size) or hematite (HEM10< 140 nm grain size).2—PYX110 (45–90 µm)+ PAL101;"—PYX110(45–90 µm)+ PAL102;a—PYX110 (< 45 µm)+ PAL101;Q—PYX110(45–90 µm)+ HEM101. End member abundances are provided inTable 2.Interpolating values between points separated by more than 20 wt%thopyroxene may not be valid.
can be used to place a lower limit on pyroxene abundagiven the fact that the pyroxene used in this study (PYX1exhibits the largest band depth of all the pyroxenes exined.
4.1. Systematic spectral variations
Analysis of martian reflectance spectra for pyroxene mping would ideally provide information on pyroxene coposition, abundance, and grain size. Under the assumthat a material spectrally similar to palagonitic materiathe major spectrally-dominant accessory phase, the reof this study suggest that pyroxene composition shouldderivable from the position of Band I(Cloutis and Gaffey1991a), since it is relatively unaffected by the presenof palagonitic material (up to 90 wt% palagonitic matial) in either intimate or areal mixtures. Additional costraints could be placed on pyroxene abundance thro
s
(a)
(b)
Fig. 4. Variations in depth of the Band I feature in the intimate (a)areal (b) mixtures of orthopyroxene (PYX110) and palagonitic mate(PAL101, PAL102) or hematite (HEM101). Symbols are the same as tin Fig. 3. Interpolating values between points separated by more20 wt% orthopyroxene may not be valid.
the use of Band I depth determinations, if intimate mixwith palagonitic material is assumed(Mustard et al., 1993aMustard and Sunshine, 1995).
The relative constancy of the pyroxene Band I walength position at palagonitic material abundances up90 wt% is related to the decreasing optical density of paonitic material with increasing wavelength and the retively flat slope of palagonitic material in the 1000 nmgion (Singer and Roush, 1983). Palagonitic material morstrongly affects spectral properties at progressively showavelengths, when palagonitic material is present asther a surface coating or intimately mixed with other materials (e.g.,Singer and Roush, 1983; Morris et al., 199Johnson and Grundy, 2000). A similar invariance in bandpositions for features near 1000 nm is also seen in mnaturally weathered basalts(Singer, 1980; Pieters, 1989.These results collectively suggest that where mafic silicabands are resolvable, their wavelength position can beto constrain mafic silicate composition(Cloutis et al., 1986King and Ridley, 1987; Cloutis and Gaffey, 1991b).

Mafic silicate-palagonitic material spectra 239
nsin-n
me o,
nmer--tro-pre-een
erial
glyorpth-ctors,nthode ofofow-r-ores
;
s ofgly
p-nceicke.g.undynate-ctraate
p-tralo-
.g.,-ofcal
tory-nerth-ectraweres
uldab-ointsag-orp-llylti-ctrabun-
py-rals-ns
993;
ngesment
sesli-es ofIMPs-
by
Complications in deriving mafic silicate compositiofrom absorption band positions will arise when other merals with absorption bands inthe same wavelength regioare present. This appears to be the case for at least sothe Pathfinder IMP spectra(Bell et al., 2000; Morris et al.2000). Possible candidate minerals identified byMorris etal. (2000)that possess an absorption feature near 930(and which could affect mafic silicate compositional detminations) include nanophase goethite, maghemite, akagenite, and schwertmannite. The possible complications induced by the presence of such a material on the intertation of rock type diversity at the Pathfinder site has bdescribed byYingst and Smith (2000). The ability to dis-criminate spectral variationsassociated with mafic silicatcompositional variations as opposed to palagonitic mateabundance variations is discussed more fully below.
Band depths and widths did not appear to be stroncorrelated with composition for either orthopyroxenesclinopyroxenes. The available data suggest that band deand widths increase with increasing iron and calcium contents, however, grain size variations are the dominant facontrolling these spectral parameters(Sunshine and Pieter1993; Cooper and Mustard, 1999). Therefore, absorptioband wavelength position remains the most reliable mefor determining pyroxene chemistry even in the presencpalagonitic material. If a moreaccurate spectral analoguemartian fines beyond 1200 nm is identified, in terms of shing no resolvable water-associated absorption bands, intepretation of reflectance spectra to 2500 nm may allow a mcomprehensive and robust interpretation of mafic silicate+martian fines to be undertaken (e.g.,Cloutis et al., 1986Cloutis and Gaffey, 1991b).
The results for our intimate mixtures of pyroxene+palagonitic material are broadly consistent with the resultprevious investigations. Palagonitic material is increasintransparent at longer wavelengths and mafic silicate absortion band positions are largely unaffected by the preseof palagonitic material coatings until the coatings are thenough to obscure the mafic silicate absorption bands (Singer and Roush, 1983; Pieters, 1989; Johnson and Gr2000; Morris et al., 2001b). The major difference betweethe intimate mixtures and palagonitic material-coated mrials is that the palagonitic material-coated sample spegenerally show negative spectral slopes while the intimmixture spectra do not (Fig. 2).
5. Effects of degraded spectral resolution
To date, most VIS-NIR spectral reflectance-based maping of the martian surface has involved either high specresolution for limited areas (e.g., Mariner 6, 7 IRS, Phbos ISM) or low spectral resolution for larger regions (eViking Orbiter, Mars Odyssey THEMIS/VIS). We examined the quantity of information derivable from analysismultispectral data for mapping of mafic silicate geologi
f
s
,,
variations by degrading the spectral resolution of laborareflectance spectra of mafic silicates, ferric iron-bearing oxides and hydroxides, mixtures of these phases, pyroxe+palagonitic material mixtures, Marts meteorites, and Eabased Mars telescopic spectra; approximately 700 spwere used in the analysis. The specific band passes thatchosen were those used for recent global mapping of Marwith the WFPC2 on the Hubble Space Telescope(Bell etal., 1997), and the imager on Mars Pathfinder(Smith et al.,1997)(Table 3). The general approach outlined here shobe applicable to any multispectral observations in whichsorption features are represented by only a few data pand for limited wavelength coverage. Compositionally dinostic spectral properties of mafic silicates, such as abstion band wavelength positions or band widths will generanot be obtainable with a high degree of precision from muspectral data. Ideally, we would like to analyze such speto derive composition, grain sizes, and end member adances for mafic silicates and any accessory phases.
The mafic silicate mineralogyof Mars, inferred fromSNC meteorites, consists largely of orthopyroxene, clinoroxene, and olivine, with lesser amounts of other mine(McSween and Treiman, 1998). This is consistent with spectroscopic studies of Mars, particularly in the dark regio(Soderblom, 1992; Mustard et al., 1993a; Roush et al., 1Bell, 1996; Christensen et al., 1998, 2000). Therefore, wefocused on the spectral variations accompanying chain end member abundances, grain sizes, and major elecompositions of these materials.
5.1. Spectral trends for individual mineral parameters
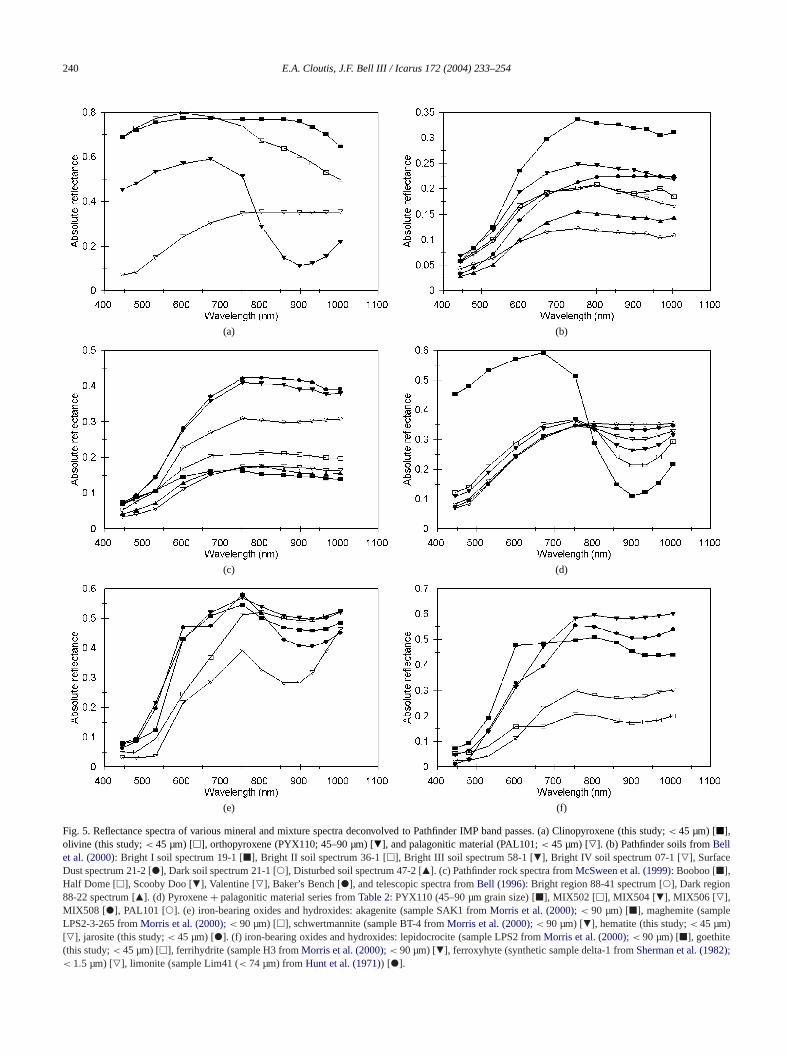
An examination of the spectral properties of pure phaand mixtures involving orthopyroxene, clinopyroxene, ovine, and palagonitic material degraded to the bandpassa recent HST observational campaign and Pathfinder(Table 3; Fig. 5) failed to reveal a full suite of unique sy
Table 3Band centers and full width half maxima of HST WFPC2 observationsBell et al. (1997)and of Pathfinder IMP(Smith et al., 1997)
HST WFPC2 Pathfinder IMP
Centerwavelength,nm
Full widthhalf maximum,nm
Filter Centerwavelength,nm
Full widthhalf maximum,nm
256 41 L0, R0 443.3 26.2333 37 R10 479.9 27.0409 15 R9 530.8 29.6501 3 R8 599.5 21.0673 5 R5 671.2 19.5740 10 L5 671.4 19.7860 11 R6 752.0 18.9955 5 L6 801.6 21.0
1044 61 L7 858.4 34.4L8 897.9 40.8L9 931.1 27.0R11 966.8 29.6L11 968.0 31.4L10 1002.9 29.1
240 E.A. Cloutis, J.F. Bell III / Icarus 172 (2004) 233–254
(a) (b)
(c) (d)
(e) (f)
Fig. 5. Reflectance spectra of various mineral and mixture spectra deconvolved to Pathfinder IMP band passes. (a) Clinopyroxene (this study;< 45 µm) [2],olivine (this study;< 45 µm) [1], orthopyroxene (PYX110; 45–90 µm) [a], and palagonitic material (PAL101;< 45 µm) [e]. (b) Pathfinder soils fromBellet al. (2000): Bright I soil spectrum 19-1 [2], Bright II soil spectrum 36-1 [1], Bright III soil spectrum 58-1 [a], Bright IV soil spectrum 07-1 [e], SurfaceDust spectrum 21-2 ["], Dark soil spectrum 21-1 [!], Disturbed soil spectrum 47-2 [Q]. (c) Pathfinder rock spectra fromMcSween et al. (1999): Booboo [2],Half Dome [1], Scooby Doo [a], Valentine [e], Baker’s Bench ["], and telescopic spectra fromBell (1996): Bright region 88-41 spectrum [!], Dark region88-22 spectrum [Q]. (d) Pyroxene+ palagonitic material series fromTable 2: PYX110 (45–90 µm grain size) [2], MIX502 [1], MIX504 [a], MIX506 [e],MIX508 ["], PAL101 [!]. (e) iron-bearing oxides and hydroxides: akagenite (sample SAK1 fromMorris et al. (2000); < 90 µm) [2], maghemite (sampleLPS2-3-265 fromMorris et al. (2000); < 90 µm) [1], schwertmannite (sample BT-4 fromMorris et al. (2000); < 90 µm) [a], hematite (this study;< 45 µm)[e], jarosite (this study;< 45 µm) ["]. (f) iron-bearing oxides and hydroxides: lepidocrocite (sample LPS2 fromMorris et al. (2000); < 90 µm) [2], goethite(this study;< 45 µm) [1], ferrihydrite (sample H3 fromMorris et al. (2000); < 90 µm) [a], ferroxyhyte (synthetic sample delta-1 fromSherman et al. (1982);< 1.5 µm) [e], limonite (sample Lim41 (< 74 µm) fromHunt et al. (1971)) ["].
Mafic silicate-palagonitic material spectra 241
allficere to
ses,ctralina-at-r-
dit
p-ath-tionbe-89;n
thee rathre-.792ingratioortsrti--rial-fac
nal, weabil-ndain
nde rerel-tryce
,
cehick
re-esit-nmely,
ces
ectsbutwill
of
thebothand
eing
f band
d in00
rcesen-
ha-d byxam-
eneineene).
er told aine
oachs toties
ying
ve-d
sticafice-andbe
alueom
pec-
93;
hts of
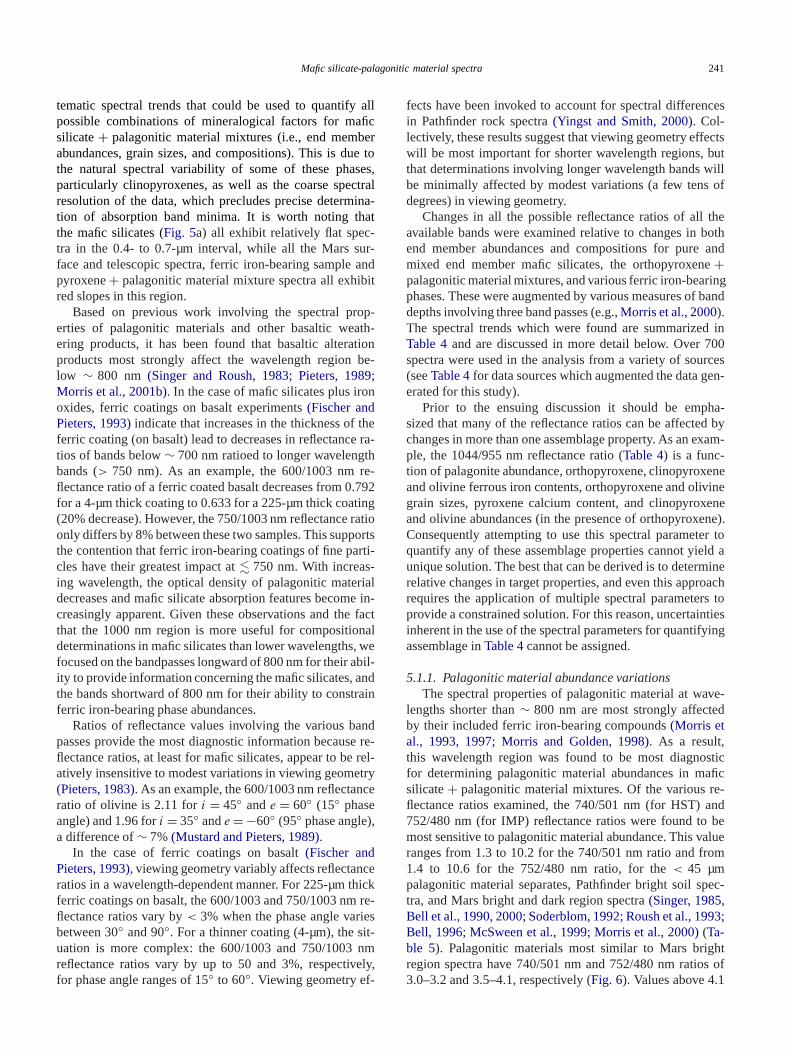
tematic spectral trends that could be used to quantifypossible combinations of mineralogical factors for masilicate+ palagonitic material mixtures (i.e., end membabundances, grain sizes, and compositions). This is duthe natural spectral variability of some of these phaparticularly clinopyroxenes, as well as the coarse speresolution of the data, which precludes precise determtion of absorption band minima. It is worth noting ththe mafic silicates (Fig. 5a) all exhibit relatively flat spectra in the 0.4- to 0.7-µm interval, while all the Mars suface and telescopic spectra, ferric iron-bearing sample anpyroxene+ palagonitic material mixture spectra all exhibred slopes in this region.
Based on previous work involving the spectral proerties of palagonitic materials and other basaltic weering products, it has been found that basaltic alteraproducts most strongly affect the wavelength regionlow ∼ 800 nm (Singer and Roush, 1983; Pieters, 19Morris et al., 2001b). In the case of mafic silicates plus irooxides, ferric coatings on basalt experiments(Fischer andPieters, 1993)indicate that increases in the thickness offerric coating (on basalt) lead to decreases in reflectanctios of bands below∼ 700 nm ratioed to longer wavelengbands (> 750 nm). As an example, the 600/1003 nmflectance ratio of a ferric coated basalt decreases from 0for a 4-µm thick coating to 0.633 for a 225-µm thick coat(20% decrease). However, the 750/1003 nm reflectanceonly differs by 8% between these two samples. This suppthe contention that ferric iron-bearing coatings of fine pacles have their greatest impact at� 750 nm. With increasing wavelength, the optical density of palagonitic matedecreases and mafic silicate absorption features become increasingly apparent. Given these observations and thethat the 1000 nm region is more useful for compositiodeterminations in mafic silicates than lower wavelengthsfocused on the bandpasses longward of 800 nm for theirity to provide information concerning the mafic silicates, athe bands shortward of 800 nm for their ability to constrferric iron-bearing phase abundances.
Ratios of reflectance values involving the various bapasses provide the most diagnostic information becausflectance ratios, at least for mafic silicates, appear to beatively insensitive to modest variations in viewing geome(Pieters, 1983). As an example, the 600/1003 nm reflectanratio of olivine is 2.11 fori = 45◦ ande = 60◦ (15◦ phaseangle) and 1.96 fori = 35◦ ande = −60◦ (95◦ phase angle)a difference of∼ 7%(Mustard and Pieters, 1989).
In the case of ferric coatings on basalt(Fischer andPieters, 1993), viewing geometry variably affects reflectanratios in a wavelength-dependent manner. For 225-µm tferric coatings on basalt, the 600/1003 and 750/1003 nmflectance ratios vary by< 3% when the phase angle varibetween 30◦ and 90◦. For a thinner coating (4-µm), the suation is more complex: the 600/1003 and 750/1003reflectance ratios vary by up to 50 and 3%, respectivfor phase angle ranges of 15◦ to 60◦. Viewing geometry ef-
-
t
-
fects have been invoked to account for spectral differenin Pathfinder rock spectra(Yingst and Smith, 2000). Col-lectively, these results suggest that viewing geometry effwill be most important for shorter wavelength regions,that determinations involving longer wavelength bandsbe minimally affected by modest variations (a few tensdegrees) in viewing geometry.
Changes in all the possible reflectance ratios of allavailable bands were examined relative to changes inend member abundances and compositions for puremixed end member mafic silicates, the orthopyroxen+palagonitic material mixtures, and various ferric iron-bearphases. These were augmented by various measures odepths involving three band passes (e.g.,Morris et al., 2000).The spectral trends which were found are summarizeTable 4and are discussed in more detail below. Over 7spectra were used in the analysis from a variety of sou(seeTable 4for data sources which augmented the data gerated for this study).
Prior to the ensuing discussion it should be empsized that many of the reflectance ratios can be affectechanges in more than one assemblage property. As an eple, the 1044/955 nm reflectance ratio (Table 4) is a func-tion of palagonite abundance, orthopyroxene, clinopyroxand olivine ferrous iron contents, orthopyroxene and olivgrain sizes, pyroxene calciumcontent, and clinopyroxenand olivine abundances (in the presence of orthopyroxeConsequently attempting to use this spectral parametquantify any of these assemblage properties cannot yieunique solution. The best that can be derived is to determrelative changes in target properties, and even this apprrequires the application of multiple spectral parameterprovide a constrained solution. For this reason, uncertaininherent in the use of the spectral parameters for quantifassemblage inTable 4cannot be assigned.
5.1.1. Palagonitic material abundance variationsThe spectral properties of palagonitic material at wa
lengths shorter than∼ 800 nm are most strongly affecteby their included ferric iron-bearing compounds(Morris etal., 1993, 1997; Morris and Golden, 1998). As a result,this wavelength region was found to be most diagnofor determining palagonitic material abundances in msilicate+ palagonitic material mixtures. Of the various rflectance ratios examined, the 740/501 nm (for HST)752/480 nm (for IMP) reflectance ratios were found tomost sensitive to palagonitic material abundance. This vranges from 1.3 to 10.2 for the 740/501 nm ratio and fr1.4 to 10.6 for the 752/480 nm ratio, for the< 45 µmpalagonitic material separates, Pathfinder bright soil stra, and Mars bright and dark region spectra(Singer, 1985,Bell et al., 1990, 2000; Soderblom, 1992; Roush et al., 19Bell, 1996; McSween et al., 1999; Morris et al., 2000)(Ta-ble 5). Palagonitic materials most similar to Mars brigregion spectra have 740/501 nm and 752/480 nm ratio3.0–3.2 and 3.5–4.1, respectively (Fig. 6). Values above 4.1

242 E.A. Cloutis, J.F. Bell III / Icarus 172 (2004) 233–254
7
aX—
l., 1981;
9;990;et
19998;
Table 4Summary of systematic spectral variations for mafic silicates and palagonitic material
Petrologic variable (increasing) Reflectance ratio (values in nm)
HST740/501 860/955 1044/955 860/1044 740/955 740/1044 740/860
PAL content + n.t. → 1 → 1 → 1 → 1 → 1OPX Fe2+ content n.c. + − n.t. n.t. n.t. n.t.OPX grain size n.c. n.t. + − + + +CPX grain size n.c. + n.c. + + + n.t.CPX Fe2+ content n.t. n.t. + − + n.t. n.t.PYX Ca content n.c. n.t. − + − n.t. n.t.CPX content (+OPX) n.t. + − + − n.t. −OLV grain size n.t. + − + + + +OLV Fe2+ content + n.t. + − n.t. n.t. −OLV content (+CPX) − − n.t. − n.t. n.t. −OLV content (+OPX) n.t. n.t. − + − + −Pathfinder IMP
752/480 1003/931 1003/967 858/1003 752/967 752/1003 752/858 858/96PAL content + → 1 → 1 → 1 → 1 → 1 → 1 n.t.OPX Fe2+ content n.t. − − n.t. n.t. n.t. n.t. +OPX grain size n.t. + + − + + + n.t.CPX grain size n.t. − n.c. + + + n.t. +CPX Fe2+ content n.t. + + − + n.t. n.t. n.t.PYX Ca content n.t. − − + − n.t. n.t. n.t.CPX content (+OPX) n.t. − − + − n.t. − +OLV grain size n.t. − − + + + + +OLV Fe2+ content + + + − n.t. n.t. − n.t.OLV content (+CPX) n.a. n.t. n.t. − + + + n.t.OLV content (+OPX) n.t. − − + n.t. n.t. n.t. n.t.
+—reflectance ratio increases with increase in petrologic variable;−—reflectance ratio decreases with increase in petrologic variable;→ 1—approachesvalue of 1; n.t.—no systematic trend; n.c.—no or minor change; n.a.—not available (insufficient data to establish a trend). OPX—orthopyroxene; CPclinopyroxene; OLV—olivine; PAL—palagonitic material; PYX—pyroxene (orthopyroxene and clinopyroxene).Sources of data: this study;Hunt et al., 1971, 1973; Gaffey, 1974; Adams et al., 1979, 1986; Gaffey and McCord, 1979; King et al., 1981; Miyamoto et aSherman et al., 1982; Miyamoto et al., 1983; Morris et al., 1983, 1985, 1986, 1989; Hiroi et al., 1985; Singer, 1985; Crown and Pieters, 1987; King and Ridley,1987; Mustard and Pieters, 1987, 1989; Roush et al., 1987; Wagner et al., 1987; Azuma and Fujii, 1989; Bartels and Burns, 1989; Hiroi and Takeda, 198Taranik and Kruse, 1989; Bell et al., 1990, 1993, 2000; Clark et al., 1990; Kinoshita and Miyamoto, 1990; Morris and Lauer, 1990; Sunshine et al., 1Besancon et al., 1991; Cloutis and Gaffey, 1991a, and references therein; Farrand and Singer, 1991; Straub et al., 1991; Grove et al., 1992; Johnsonal., 1992; Allen et al., 1993; Golden et al., 1993; Mustard et al., 1993b; Sunshine and Pieters, 1993, 1998; Sunshine et al., 1993; Hiroi and Pieters,94;Bishop and Pieters, 1995; Bell, 1996; Bishop and Murad, 1996; Mustardand Hays, 1997; Lucey, 1998; Bishop et al., 1998a, 2001; Buemi et al., 1McSween et al., 1999; Schade and Wäsch, 1999; Morris et al., 2000, 2001a.
ec-e.g.,
lesmaringmalloth
od-op-fted
hence,tion,en,ctra
ionin-
e.g.,
ttedandsago-mra-
ag-fts
oftes.n bepec-
sesft toina-
were found for some of the Pathfinder soil and rock sptra and some Mars bright region telescopic spectra (Bell, 1996) and most pure ferric iron-bearing minerals (Ta-ble 5); this indicates that the palagonitic material sampused as spectral analogues for telescopic spectra oftian bright regions may not be appropriate for simulatthe spectral properties of all occurrences of dust at s(landing site) scales. However, it should be noted that bMars bright region spectra and volcanic alteration pructs are highly variable in composition and spectral prerties (Bell et al., 1990); consequently, the full range opossible spectral variability of Mars is under-represenhere.
The magnitude of these reflectance ratios decreases in tlaboratory spectra with increasing mafic silicate abundaregardless of mafic silicate grain size, type, and composiranging between∼ 0.7 and 1.7 (740/501 nm) and betwe∼ 0.6 and 2.0 (752/480 nm) for all terrestrial mafic silicatesmartian meteorites, and a few of the Pathfinder rock spe
-
(Fig. 6). These ratios are also lower for Mars dark regspectra than bright region spectra, consistent with theterpretation that the dark regions are more dust-free (Singer, 1985; Soderblom, 1992; Roush et al., 1993).
When the short wavelength reflectance ratios are ploagainst a reflectance ratio based on longer wavelength b(which should be less affected by the presence of palnitic material), such as the 1044/955 nm versus 740/501 nratios (Fig. 6a), and 1003/931 nm versus 752/480 nmtios (Fig. 6b), the presence of as little as 10 wt% palonitic material intimately mixed with mafic silicates shithe 740/501 or 752/480 nm reflectance ratios outsidethe field of the pure mafic silicates and Mars meteoriThus the 740/501 or 752/480 nm reflectance ratios caused to detect the presence of palagonitic material (or stral equivalent) and constrain its abundance (Fig. 6, Ta-ble 4). Increasing palagonitic material abundance cauthe 740/501 and 752/480 nm reflectance ratios to shihigher values. The reflectance ratios involving any comb

Mafic silicate-palagonitic material spectra 243
)
Table 5Reflectance ratios for Pathfinder, telescopic spectra, and ferric iron-bearing minerals
Category 740/501 nm ratio 752/480 nm ratio Source of data
Pathfinder soils n.a. 2.3–6.0 1Pathfinder rocks n.a. 1.8–4.5 2Mars bright regions 3.2–3.6 3.6–4.4 3, 4, 5Mars intermediate regions 2.5–3.4 2.8–3.9 5Mars dark regions 2.0–2.7 2.3–3.1 3, 4, 5Akagenite 6.4–7.5 6.1–8.1 6, 7Maghemite 2.4–11.5 2.4–15.6 6–9Schwertmannite 4.9–5.6 6.0–7.0 6, 29Hematite 0.9–17.0 0.9–18.9 6–9, 10–17Jarosite 2.1–5.3 2.4–7.1 6, 10, 11, 14, 18Lepidocrocite 4.3–7.1 5.3–9.7 6, 7Goethite 1.3–9.1 1.3–10.8 6, 7, 9–14Ferrihydrite 3.9–13.8 5.2–14.6 6–8, 19Ferroxyhyte 8.0–8.1 9.4–11.7 7Limonite 6.8–14.5 7.5–14.6 14Hematite+ silica gel 1.1–33.2 1.2–33.5 20–21Palagonitic material 1.3–10.2 1.4–10.6 6, 10, 13, 19, 22–28
n.a.= not available.Sources of data: 1: Bell et al. (2000); 2: McSween et al. (1999); 3: Singer (1985); 4: Bell (1996); 5: Bell et al. (1990); 6: Morris et al. (2000); 7: Sherman etal. (1982); 8: Bishop et al. (2000); 9: Morris et al. (1985); 10: this study; 11:Grove et al. (1992); 12: Adams (1974); 13: Adams et al. (1986); 14: Hunt andSalisbury (1971); 15:Morris et al. (1983); 16: Taranik and Kruse (1989); 17: Wagner et al. (1987); 18: Clark et al. (1990); 19: Bishop and Pieters (1995;20: Morris et al. (1989); 21: Morris and Lauer (1990); 22: Bell et al. (1993); 23: Bishop et al. (1998); 24:Buemi et al. (1998); 25: Bishop et al. (2001);26: Farrand and Singer (1991); 27:Golden et al. (1993); 28: Morris et al. (2001); 29:Bishop and Murad (1996).
ne-
ial
inginthelueeforetail
r aidth
ncehichon-fors forrainns,ra-ctinOcon-ari-
ari-Fs
wnpths,re--
ondsat-
1;Fu-4)-itive
nds,in
de-fact-e-the/967,easeac-n inand
atiotions
tions of the bands above∼ 880 nm generally range betwee∼ 0.95 and∼ 1.1 for pure palagonitic materials and btween∼ 0.92 and 1.09 for Mars bright regions(Bell, 1996)and Pathfinder bright soils(Bell et al., 2000); exceptionsoccur for some iron oxides such as hematite (e.g.,Bell etal., 1990). Consequently, mixtures of palagonitic materand mafic silicates approach a value of∼ 1 with increasingpalagonitic material content for reflectance ratios involvonly longer wavelength (� 800 nm) bands. This is seenFig. 6 where the long wavelength reflectance ratios oforthopyroxene+palagoniticmaterial series approach a vaof ∼ 1 with increasing palagoniticmaterial abundance. Thutility of the 1044/955 nm and 1003/931 nm band ratiosmafic silicate characterization are discussed in more dbelow.
5.1.2. Orthopyroxene compositional variationsIt is known that an increase in ferrous iron content, fo
fixed grain size, results in an increase in the depth and wof Band I (e.g.,Cloutis and Gaffey, 1991a). This relationshipmanifests itself in changes in a number of the reflectaratios in the broad band data. The reflectance ratios wshowed correlations with orthopyroxene ferrous iron ctent (Table 4) were the 860/955 and 1044/955 nm ratiosHST, and the 858/967, 1003/931, and 1003/967 nm ratioPathfinder. However other factors such as changes in gsize, degree of crystallinity, cation site occupancy variatioand the presence of additional cations will also affect thistio. Thus, changes in these ratios are best applied to deterelative changes in orthopyroxene ferrosilite (Fs, FeSi3)content but are less reliable for determining absolute Fstents because of the confounding effects of grain size v
g
ations and the presence of additional mafic silicates. Vations in these reflectance ratios reliably attributable tocontent variations account for∼ 50% of the total variationin these reflectance ratios.
5.1.3. Orthopyroxene grain size variationsVariations in the grain size of mafic silicates are kno
to produce changes in overall reflectance and band deboth of which will manifest themselves in broad bandflectance ratios. The depth of Band I increases with increasing grain size up to a size of approximately 150 µm, beywhich trends are less systematic, probably due to banduration effects(Hunt and Salisbury, 1970; King et al., 198Cloutis, 1985; Crown and Pieters, 1987; Azuma andjii, 1989; Mustard et al., 1993b; Hiroi and Pieters, 199.This increase in band depth with increasing grain size results in increases in the reflectance ratios that are sensto band depth, most prominently those involving the banear the Band I center position (Table 4). In the HST dataincreasing orthopyroxene grain size results in increasesthe 1044/955, 740/955, and 740/1044 nm ratios and acrease in the 860/1044 nm ratio. This is due to thethat reflectance at 860 nm, being closer to the orthopyroxene band minimum, decreases ata greater rate than the rflectance at 1044 nm. Equivalent relationships exist forPathfinder band passes: increases in the 1003/931, 1003752/967, 752/1003, and 752/858 nm ratios, and a decrin the 858/1003 nm ratio. Grain size variations generallycount for between 80 and 100% of the total variation seethese reflectance ratios (50% in the case of the 1003/9311044/955 nm ratios). The combination of reflectance rchanges associated with orthopyroxene grain size varia

244 E.A. Cloutis, J.F. Bell III / Icarus 172 (2004) 233–254
rsuss,nd
ccu--, 40,
e or-s.
ca-rel-te
um-ria-
ve-ges
easeap-are
ffectat
pec-ga-I is
band
si-y
asigh--g
ner-ndernsab-
iontion
nceela-lute
vari-
ear-
ter-ith
mevari-s,ngerria-o,
%.son-f the
(inareareoth0 nm-
rend
(a)
(b)
Fig. 6. 740/501 nm versus 1044/955 nm (a) and 752/480 nm ve1003/931 nm (b) reflectance ratios of laboratory spectra of orthopyroxenepigeonites, clinopyroxenes, olivines, Mars meteorites, Mars telescopic aPathfinder IMP rock and soil spectra, and orthopyroxene+ palagonitic ma-terial intimate mixture spectra (points connected by line). The fields opied by each of these groups are delineated by ellipses. The vertical lines indicate the values of the 740/501 nm (a) and 752/480 nm (b) ratios for 2060 and 80 wt% palagonitic material in the main orthopyroxene+palagoniticmaterial intimate mixture series. The pure palagonitic material and purthopyroxene are the rightmost and leftmost points, respectively in the serie
is unique (Table 4). Once again, because of the complitions introduced by compositional and structural factors,ative changes in grain sizes are more tractable than absoluvalues.
5.1.4. Clinopyroxene grain size variationsReflectance ratios for clinopyroxenes also exhibit a n
ber of systematic variations as a function of grain size vations. With increasing grain size, the ratios involving walength bands in the 750–930 nm range versus the lonwavelength bands (1044 and 1003 nm) all generally incrwith increasing grain size for a fixed composition up toproximately 150 µm grain size, beyond which the trendsless systematic, again probably due to band saturation ein some cases (Table 4). This is expected from the fact thincreasing grain size leads to increasing band depth(Azuma
t
s
and Fujii, 1989; Mustard et al., 1993b; Lucey, 1998). Thedifferences between orthopyroxene and clinopyroxene stra in terms of the sign of the correlations (positive or netive) are related to the fact that the clinopyroxene Bandlocated at longer wavelengths than the correspondingin orthopyroxenes(Cloutis and Gaffey, 1991a, 1991b). Onceagain, the combination of reflectance ratio variations for thiparameter is unique (Table 4). Clinopyroxene grain size varations can account for∼ 80% of the total range exhibited bthese reflectance ratios.
5.1.5. Clinopyroxene iron content variationsThe wavelength position of Band I in clinopyroxenes h
been found to decrease with increasing iron content in hresolution spectra(Cloutis and Gaffey, 1991a). When deconvolved to the HST and Pathfinder band passes, increasiniron content results in a number of trends that are geally consistent between the equivalent HST and Pathfiband passes (Table 4). These trends are in the directioexpected from the relationship between iron content andsorption band position. Approximately 100% of the variatin the 1044/955 and 1003/967 nm and 50% of the variain the other ratios for which trends were found (Table 4) canbe attributed to clinopyroxene iron content variations. Oagain, these trends are most reliable for determining rtive changes in iron content as opposed to deriving absovalues because of the confounding effects of grain sizeations and the presence ofadditional mafic silicates.
5.1.6. Pyroxene calcium content variationsMost martian meteorites contain abundant calcium-b
ing pyroxenes such as pigeonite and augite(McSween andTreiman, 1998). Previous studies of pyroxene spectra demined that the wavelength position of Band I increases wincreasing calcium content(Cloutis and Gaffey, 1991a). Thisrelationship manifests itself in systematic variations in soof the reflectance ratios of the broad-band data. Theous trends found (Table 4) are consistent with expectationas the absorption band moves progressively toward lowavelengths with increasing calcium content. The vation in reflectance ratios attributable to wollastonite (WCaSiO3) content variations is in the neighborhood of 50Once again, relative changes in the various reflectance ratioare more robust for determining relative changes in Wo ctent as opposed to deriving absolute values because oconfounding effects of other assemblage parameters.
5.1.7. Clinopyroxene abundance variationsThe effects of increasing clinopyroxene abundance
clinopyroxene+ orthopyroxene mixtures) are quite similto the trends found for olivine+orthopyroxenemixtures (sebelow) due to the fact that clinopyroxene and olivinespectrally rather similar in the 400–1050 nm region: bare characterized by a broad absorption band in the 105region. With increasing clinopyroxene, the Band I absorption feature moves toward longer wavelengths, and this t

Mafic silicate-palagonitic material spectra 245
riousngesther
nmos
alagnd
ial-
the,s,ncere-elysys-latedfea-
85;et97;
nmh in-edear-(ainr
onal
ntioniron
y-fer-un-es.
e,het-neserebe
per-
e-bun-e. Ineta-andceem-all of
re-eener-
forrsari-ngesoluteirsn
ar-endhile
sep-e ofap-atffectncile
atiorties.h-
mi-lti-rsedallds
tetivendec-belag-es inonlyaspo-
is expressed in the relevant reflectance ratios. The vasystematic trends that were found enable relative chain clinopyroxene abundance to be discriminated from ovariations in assemblage properties (Table 4). In addition,it was also found that the 673/740 (HST) and 671/752reflectance ratios allow for discrimination of olivine (ratigenerally> 1) versus clinopyroxene (ratios generally< 1)as pure end members. However, in the presence of ponitic material or other mafic silicates, the two ratios teto converge to values of< 1, reducing its utility for dis-criminating these two mafic silicates in palagonitic materbearing mixtures.
5.1.8. Olivine grain size variationsOlivine is present in many martian meteorites and is
dominant phase in chassignites(McSween and Treiman1998; Folco et al., 1999). As was the case with pyroxeneolivine shows a number of systematic changes in reflectaratios involving the absorption feature in the 1050 nmgion (Table 4). These trends are valid up to approximat150-µm grain size, beyond which the trends are nottematic. Once again these systematic variations are reto the increase in the depth of the main absorptionture located near 1050 nm with increasing grain size(Huntand Salisbury, 1970; Miyamoto et al., 1981; Cloutis, 19King and Ridley, 1987; Azuma and Fujii, 1989; Mustardal., 1993b; Hiroi and Pieters, 1994; Mustard and Hays, 19Sunshine and Pieters, 1998).
5.1.9. Olivine iron content variationsThe absorption feature of olivine located near 1050
moves to longer wavelengths and becomes broader witcreasing iron content. This trend is expressed in expecttrends in various reflectance ratios involving the bands nest the major absorption feature located near 1050 nmTa-ble 4). The variations of the ratios for an increase in grsize of a single olivine from< 45 to 45–90 µm are greatethan the same variations across the olivine compositispace. In addition, the 740/501 nm (HST) and 752/480 nm(Pathfinder) reflectance ratios increase with increasing irocontent. This is probably due to the increase in absorpin the 300–500 nm region that accompanies increasingcontent.
5.1.10. Olivine abundance variationsBoth orthopyroxene+olivineand clinopyroxene+olivine
mixtures were available for this study. Olivine, clinoproxene, and orthopyroxene exhibit enough spectral difences to allow for detection of increases in olivine abdances in mixtures with one or both of types of pyroxenGenerally, less systematic trends were found for olivin+clinopyroxene mixtures versus olivine+ orthopyroxeneprobably because clinopyroxenes are more spectrallyerogeneous and similar to olivines than are orthopyroxe(Table 4). Once again the various systematic trends that wfound allow for relative changes in olivine abundance to
-
discriminated from other variations in assemblage proties.
5.2. Systematic spectral variations
Systematic variations were found for all of the paramters of interest (compositional changes, end member adances, and grain size variations), as discussed abovorder to reduce ambiguities and uncertainties in interprtion, robust analysis should include all of the relevant bratios presented inTable 4. This is because most reflectanratios show variations as a function of changes in end mber compositions, abundances, and grain sizes, but notthe variations are systematic.
Given the large number of factors which can influenceflectance ratios and the limited number of useful reflectancratios and band depth measurements which can be gated from broad band data, deriving absolute quantitiesall mafic silicate± palagonitic material mixture parameteis not robust. Consequently, the greatest utility of the vous trends described above is to determine relative chain assemblage parameters as opposed to deriving absvalues.Figure 7shows the relationship between the paof reflectance ratios that permit the greatest discriminatioof mafic silicates as well as expected trends (shown byrows) with changes in mafic silicate parameters such asmember abundances, grain sizes and compositions. Wthe fields for most of the pure end members are largelyarable, mineral mixtures (not shown) and the presencpalagonitic material (which causes the band ratios toproach a value of∼ 1) complicate the analysis. Note thmany of these changes are similar in terms of how they athese band ratios, and, as mentioned, in order to recoambiguities, the full range of available band ratios (Table 4)should be utilized. As an example, the 1044/955 nm rincreases as a function of multiple assemblage propeAdditional reflectance ratios arerequired to determine whicof these parameters may be thelikeliest cause of this variation.
Extending these results to deriving quantitative or sequantitative mineralogical information requires that muple spectral parameters be considered simultaneously and/othat certain simplifying assumptions be made. As discuspreviously increasing palagonitic material content affectsof the spectral ratios, including those involving the banbeyond∼ 700 nm which are most useful for mafic silicamineralogical determinations. In order to derive quantitamineralogical information, the 740/501 nm (for HST) a752/480 nm (for Pathfinder) ratios (which are most efftive for deriving palagonitic material abundances) mustcoupled to the analysis so that the effects of changing paonitic material abundance can be separated from changmafic silicate mineralogy. The data presented here arestrictly valid for the spectra included in this study since,noted, palagonitic materials are highly variable both comsitionally and spectrally.

246 E.A. Cloutis, J.F. Bell III / Icarus 172 (2004) 233–254
r-yrox-
bynsingpy-g:atancet,
eh-
edave
on
aretheyns,ands.atios
x-lerialoniticapplyrxenere forsedn, as-tails
tes
eeneon-e ra-
5–.ds fororox-
/955
(a)
(b)
Fig. 7. (a) 1044/955 nm versus 860/1044 nm reflectance ratios of othopyroxenes, clinopyroxenes, pigeonites, and olivines, and orthopene+ palagonitic material intimate mixture series (points connectedlines). Arrows indicate trends in reflectance ratios that are tabulated iTa-ble 4: arrow 1: increasing clinopyroxene Fs content; arrow 2: increapyroxene Wo content, olivine grain size, olivine content (with orthoroxene), clinopyroxene content (withorthopyroxene); arrow 3: increasinclinopyroxene grain size, olivine content (with orthopyroxene); arrow 4increasing orthopyroxene Fs content, orthopyroxene grain size, olivine Fcontent. (b) Same as (a) for the 1003/931 nm versus 858/1003 reflecratios. Arrow 1: increasing clinopyroxene Fs content, olivine Fa contenolivine content (with clinopyroxene); arrow 2: increasing clinopyroxengrain size, pyroxene Wo content, olivine grain size, olivine content (witorthopyroxene), clinopyroxene content (with orthopyroxene); arrow 3: increasing orthopyroxene grain size.
Dark region spectra and less bright soils (presumto contain some contributions from mafic silicates) h752/480 nm ratios as low as 1.8, suggestive of up to∼ 90%mafic silicates (Fig. 6). This is based on the assumptithat the intimate mixtures of pyroxene+ palagonitic ma-terial are spectrally representative of Mars fines+ maficsilicates. As discussed previously, intimate mixturesreasonable analogs of dust coatings in terms of howaffect mafic silicate absorption band wavelength positioand they also simulate the reductions in mafic silicate bdepths that accompany increasing thicknesses of coatingMartian meteorite spectra have 740/501 reflectance r
(a)
(b)
Fig. 8. Same asFig. 6, with the addition of dashed lines indicating the epected trends for orthopyroxene or clinopyroxene+ palagonitic materiaseries. The intersection of the vertical lines (showing palagonitic matabundance) with the dashed lines can be used to constrain both palagmaterial abundance and pyroxene composition. The Wo abundancesto the orthopyroxenes, pigeonites, and clinopyroxenes, while the top foudashed lines in (a) and top three dashed lines in (b) are for orthopyroFs compositions, and the bottom three dashed lines in (a) and (b) aclinopyroxene Fs compositions. A point plotting in this field can be uto constrain palagonitic material abundance and pyroxene compositiosuming a pyroxene+ palagonitic material assemblage. See text for deon its application and constraints.
of between 1.0 and 1.7, well within the pure mafic silicafield (Fig. 6).
The 1044/955 nm ratio shows correlations with the F2+and Wo contents of both orthopyroxene and clinopyrox(Table 4), consequently Wo and Fs contours can be cstructed in the 1044/955 versus 740/501 nm reflectanctios field of Fig. 6a (Fig. 8a). The main orthopyroxene+palagonitic material series used in this study involving 490 µm sized orthopyroxene (Fs 13;Table 1) is also shownThe dashed lines are the expected reflectance ratio trenmixtures of pyroxene+palagonitic material involving 45- t90-µm sized mafic silicates. Note that the pure orthopyene point for this suggests that its Fs content is< 5. This isattributable to the scatter in the data relating the 1044
Mafic silicate-palagonitic material spectra 247
tedlex-mf theioneen
-tesbou
eraineains
inema-rlap
intwoar-
nmandsere0 ores
cu-ands atwoxene
bandialibly
vail-the
m-pec.,eom-there-lds
ghtasthe
bandepth
n ofT)
pro-andThe
sSTe
ra-drossfper-ec-
two-lthe
n-ne).
ratio to Fs content and the variations in this ratio attributo grain size variations (and other factors for more compassemblages) (Table 4); the data inFig. 8are generally accurate to within± 5% Fs with the assumption of 45- to 90-µsized pyroxene. This example serves to illustrate some oambiguities which can arise from incomplete interpretatof broad band spectral data. Similar relationships have bestablished for the Pathfinder IMP band passes (Fig. 8b). Thelimited data for mixtures involving< 45-µm sized mafic silicates (Table 2) suggests that for fine-grained mafic silicamafic silicate abundances would be underestimated by a20% using the trends presented inFig. 8. This is probablydue to the fact that finer-grainedmafic silicates have a greatsurface area than a comparable abundance of coarse-grsamples, resulting in a thinner average coating of the grby palagonitic material.
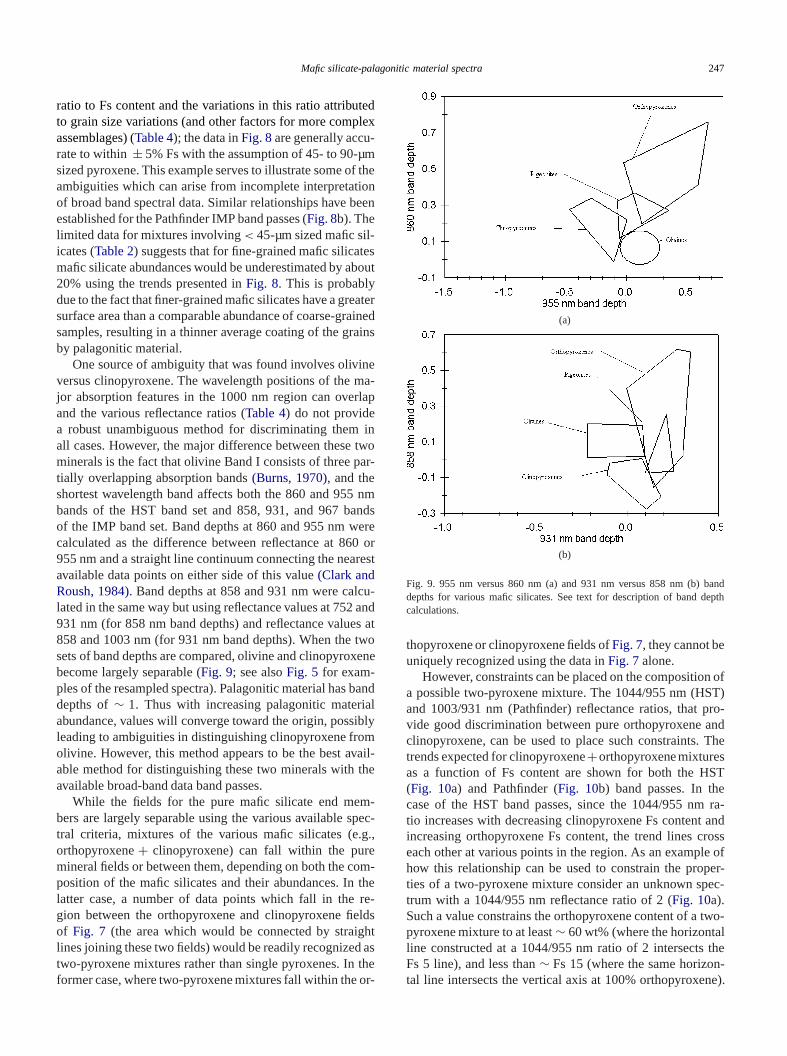
One source of ambiguity that was found involves olivversus clinopyroxene. The wavelength positions of thejor absorption features in the 1000 nm region can oveand the various reflectance ratios (Table 4) do not providea robust unambiguous method for discriminating themall cases. However, the major difference between theseminerals is the fact that olivine Band I consists of three ptially overlapping absorption bands(Burns, 1970), and theshortest wavelength band affects both the 860 and 955bands of the HST band set and 858, 931, and 967 bof the IMP band set. Band depths at 860 and 955 nm wcalculated as the difference between reflectance at 86955 nm and a straight line continuum connecting the neaavailable data points on either side of this value(Clark andRoush, 1984). Band depths at 858 and 931 nm were callated in the same way but using reflectance values at 752931 nm (for 858 nm band depths) and reflectance value858 and 1003 nm (for 931 nm band depths). When thesets of band depths are compared, olivine and clinopyrobecome largely separable (Fig. 9; see alsoFig. 5 for exam-ples of the resampled spectra). Palagonitic material hasdepths of∼ 1. Thus with increasing palagonitic materabundance, values will converge toward the origin, possleading to ambiguities in distinguishing clinopyroxene fromolivine. However, this method appears to be the best aable method for distinguishing these two minerals withavailable broad-band data band passes.
While the fields for the pure mafic silicate end mebers are largely separable using the various available stral criteria, mixtures of the various mafic silicates (e.gorthopyroxene+ clinopyroxene) can fall within the purmineral fields or between them, depending on both the cposition of the mafic silicates and their abundances. Inlatter case, a number of data points which fall in thegion between the orthopyroxene and clinopyroxene fieof Fig. 7 (the area which would be connected by strailines joining these two fields) would be readily recognizedtwo-pyroxene mixtures rather than single pyroxenes. Informer case, where two-pyroxene mixtures fall within the or-
t
d
rt
t
-
(a)
(b)
Fig. 9. 955 nm versus 860 nm (a) and 931 nm versus 858 nm (b)depths for various mafic silicates. See text for description of band dcalculations.
thopyroxene or clinopyroxene fields ofFig. 7, they cannot beuniquely recognized using the data inFig. 7alone.
However, constraints can be placed on the compositioa possible two-pyroxene mixture. The 1044/955 nm (HSand 1003/931 nm (Pathfinder) reflectance ratios, thatvide good discrimination between pure orthopyroxeneclinopyroxene, can be used to place such constraints.trends expected for clinopyroxene+orthopyroxenemixtureas a function of Fs content are shown for both the H(Fig. 10a) and Pathfinder (Fig. 10b) band passes. In thcase of the HST band passes, since the 1044/955 nmtio increases with decreasing clinopyroxene Fs content anincreasing orthopyroxene Fs content, the trend lines ceach other at various points in the region. As an example ohow this relationship can be used to constrain the proties of a two-pyroxene mixture consider an unknown sptrum with a 1044/955 nm reflectance ratio of 2 (Fig. 10a).Such a value constrains the orthopyroxene content of apyroxene mixture to at least∼ 60 wt% (where the horizontaline constructed at a 1044/955 nm ratio of 2 intersectsFs 5 line), and less than∼ Fs 15 (where the same horizotal line intersects the vertical axis at 100% orthopyroxe

248 E.A. Cloutis, J.F. Bell III / Icarus 172 (2004) 233–254
forent.uilib-
eas-in Fr-for afor
de-ions, anningtheed i-
ve
-tive
ncetha
t toe as-ne,ed,four-ber
forberances
pa-end
e ra-ein-neralostoci-rainned,ughrge
sis,ara-s isnds.
thate in
ysistotar-
hibitsil-s inte-
man-ibitould
er-f thisorp-
wheseatios
e-o ofeance
orring
(a)
(b)
Fig. 10. 1044/955 nm (a) and 1003/931 nm (b) reflectance ratiosorthopyroxene+ clinopyroxene mixtures versus orthopyroxene contThe dashed lines are the reflectance ratio trends for two-pyroxene eqrium assemblages (for a given orthopyroxene Fs content).
A reflectance ratio of 2 can be accommodated by incring orthopyroxene content accompanied by a decreasecontent because an inverse relationship exists between othopyroxene Fs content and orthopyroxene abundancegiven 1044/955 nm value. A similar relationship existsthe Pathfinder band passes (Fig. 10b).
As noted earlier, the most robust application of therived spectral trends is for ascertaining probable variatin end member properties (abundances, compositionsgrain size variations) in a relative sense; e.g., determiwhether one area is more orthopyroxene-rich than anoarea. Reflectance ratios have been successfully employthe past for examining spectral (and geological) variability on a hemispheric/global basis on Mars (e.g.,Pinet andChevrel, 1990), while differences in spectral properties habeen used to infer geological variability on Mars(McSweenet al., 1999; Bell et al., 2000). The rest of this discussion focuses on the use of multiple band ratios for deriving relachanges in target properties.
Of the mafic silicate parameters, end member abundamay be the most tractable parameter due to the fact
s
d
rn
st
the end member group spectra are sufficiently differenallow changes in relative end member abundances to bcertained. If a four-component mixture of orthopyroxeclinopyroxene, olivine, and palagonitic material is assumthe effects of changes in the relative abundances of thephases are largely separable (Table 4). However the spectral variability of the end members and the limited numof useful band ratios precludes the use of such ratiosrigorous quantitative characterization of either end memabundances or absolute changes in end member abundfor such four-component mixtures.
Increasing grain sizes result in changes in spectralrameters that are different from those associated withmember abundance variations when multiple reflectanctios are considered together (Table 4). The signs of thesvariations (positive or negative) are different for each meral because of the unique spectral properties of each miclass. Mafic silicate compositional variations are the mdifficult parameter to derive due to the fact that the assated spectral changes are of lower magnitude than for gsize and end member abundance variations. As mentioinferred mineralogical variations are strengthened throthe application of multiple reflectance ratio trends. The lanumber of non-systematic trends that were found (Table 4)add a level of complexity and uncertainty to the analysince these can affect the interpretation. While many pmeters do not show trends when the full suite of sampleconsidered, smaller subsets of samples may exhibit treTherefore the data presented inFigs. 6, 7, and 8and Ta-ble 4should be used with caution and with an awarenessunique mineralogical interpretations may not be possiblall cases.
One of the major assumptions inherent in this analis that terrestrial palagonitic material is optically similarthe martian surface fines.Bell et al. (2000) and Morris eal. (2000)have shown that the spectral properties of mtian surface fines, at least at the Pathfinder site, exsome diversity. From the perspective of deriving maficicate compositions from analysis of absorption featurethe 1000 nm region, a number of ferric iron-bearing marials, such as hematite, maghemite, akagenite, schwertnite, jarosite, lepidocrocite, goethite, and ferrihydrite exhan absorption feature in the 800–950 nm region that csuperficially be confused with pyroxene. However asBellet al. (2000)noted, if this feature is attributed to these fric iron-bearing phases, an increase in the abundance omaterial should also be accompanied by increasing abstion shortward of∼ 700 nm. With the exception of a feof the hematite and goethite samples, the spectra of tphases exhibit 740/501 and 752/480 nm reflectance rof > 2. By contrast, pure mafic silicates and martian mteorites have 740/501 or 752/480 nm reflectance rati< 2 (Fig. 11). As a result, increasing band depths in th900–1000 nm region due to increasing pyroxene abundwill be accompanied by a decrease in the 740/501 nm752/480 nm ratios, whereas increasing ferric iron-bea

Mafic silicate-palagonitic material spectra 249
ds
il-nectra
ed by
in-d by
ys-cultsr-nes
thend
lapd
th
pless. Inatiosort-and
e forficex-
a-m
ad-
tone-
(a)
(b)
Fig. 11. 955 nm band depth versus740/501 nm reflectance ratio (a) an931 nm band depth versus 752/480 nm reflectance ratio (b) for the variouspectra used in this study.2—orthopyroxene+ palagonitic material inti-mate mixture series;1—akagenite;e—maghemite;P—schwertmannite;+—hematite; ×—jarosite; �—lepidocrocite; !—goethite; �—ferri-hydrite; |—ferroxyhyte;�—limonite. The regions occupied by mafic sicates (orthopyroxenes, pigeonites, clinopyroxenes, olivines) and martiameteorites, and Pathfinder IMP soil and rock spectra and telescopic spare delineated by polygons. The main orthopyroxene+ palagonitic mater-ial intimate mixture series is represented by the solid squares connectthe solid line.
phase abundance will generally be accompanied by ancrease in these ratios. Such a relationship was also founBell et al. (2000)from analysis of Pathfinder IMP spectra.
These results are consistent with the interpretation ofBellet al. (2000)for Pathfinder soils presumed to contain crtalline ferric oxides. Hematite appears to be the most diffiferric iron-bearing phase todistinguish from mafic silicateusing reflectance ratios beyond∼ 750 nm because its oveall spectral shape in this region is most similar to pyroxe(e.g.,McSween et al., 1999; Bell et al., 2000). The most re-liable spectral discriminators which were found involvedepth of the “bands” at 530 nm (IMP) and 501 nm (HST) areflectance ratios of the longer wavelength bands (Fig. 12).All of the hematite samples, including those which overthe mafic silicate fields ofFig. 11, have larger 530 nm ban
(a)
(b)
Fig. 12. 501 nm band depth versus740/1044 nm (a) and 530 nm band depversus 752/1003 nm (b) reflectance ratios for hematite (P), and mafic sili-cates and martian meteorites (!).
depths than the mafic silicates; most of the hematite samhave larger 501 nm band depths than the mafic silicatethe case of the longer wavelength bands, reflectance rinvolving the longest wavelength band with the next shest bands (e.g., 1003/967 nm and 1003/931 nm for HST,1044/955 for Pathfinder) have ratios of generally> 1 for themafic silicates versus generally< 1 for hematite, providinga second reliable spectral discriminator.
The various reflectance ratios that are described abovdiscriminating crystalline ferric oxide minerals from masilicates complement those of other investigators. As anample,Bishop et al. (1998b)used Pathfinder reflectance rtios in the 600 nm region to discriminate ferrihydrite- froschwertmannite-bearing soils.Morris et al. (2000)advocatesthe use of the peak band (at either 752 or 801 nm) as anditional indicator of ferric mineralogy.
6. Summary and conclusions
The simplified geology of large regions of Mars seemsconsist of mafic silicates (primarily pyroxenes) and a fi

250 E.A. Cloutis, J.F. Bell III / Icarus 172 (2004) 233–254
lr thi
s islogte-
lonthebeate
ineturelog-
lify-blagncesulti-s inun-hile
gicaocomgend
res-fer-
ssesili-sffer-ptionn beide
busin reto athears
rchcenal
ticthisersRE-nts.ugh
orne-ankatadis-
re-y ofaryFB.heirmeshort-
tra ofSolar
re-. In:
in-
theLunar
odel-ite.
oferals.
f Ol,roc.
of630.
the
icr
rres-
s.ec-ew
461.-ars.
M.,97.the
L.,.J.,ou,, S.,
, L.,
grained, windblown dust component. Palagonitic materiahas been found to be a reasonable spectral analogue fodust component at wavelengths below∼ 1200 nm. The in-ferred widespread presence of mafic silicates on Marstrengthened by the fact that mafic silicates are the petroically and spectrally dominant component of martian meorites. Laboratory spectra of pyroxene+palagoniticmateriamixtures show that palagonitic material has little effectthe wavelength position of pyroxene absorption bands in1000 nm region, and allows pyroxene composition todetermined even in the presence of 90% linear or intimmixtures of palagonitic material.
When remote sensing measurements of Mars are obtausing broad band passes typical of past or planned fumultispectral imaging systems, the uniqueness of mineraical information that can be derived decreases. Simping assumptions are required to enable absolute assemproperties such as mafic silicate compositions, abundaand grain sizes to be derived. However the use of mple reflectance ratio trends still allows relative changemineralogy, particularly mafic silicate end member abdances, to be determined. This is due to the fact that wsome trends are common to more than one mineraloparameter, the full suite oftrends is generally unique ta particular assemblage parameter (e.g., end-memberpositions, end-member abundances, grain sizes). Ineral, reflectance ratios involving the lowest wavelength banpasses (� 750 nm) are most useful for assessing the pence and relative abundance of palagonitic material-likeric alteration products, while longer wavelength band pa(� 750 nm) are most useful for characterizing mafic scates. Our results indicate that ferric iron-bearing materialcan be discriminated from mafic silicates based on the diences in spectral slope below about 750 nm and absorfeatures in the 500–550 nm region. These differences caused in conjunction with other reflectance ratios to provdiscrimination of these two groups of materials.
Spectral analysis using broad band data is most rowhen these various trends are used together to ascertaative changes in assemblage parameters as opposedsolute variations. These results could also help optimizeselection of wavelengths and band widths on future MVIS-NIR multispectral remote sensing instruments.
Acknowledgments
We thank Dr. Ted Roush at the NASA Ames ReseaCenter and Dr. Dick Morris at the NASA Johnson SpaCenter, and the staff at the Smithsonian Institution NatioMuseum of Natural History for providing the palagonimaterials and some of the mineral samples used instudy. We also thank Dr. Takahiro Hiroi and Dr. Carlé Pietfor providing generous access to the NASA-supportedLAB spectrometer facility for the spectral measuremeX-ray diffraction data were acquired and analyzed thro
s
-
d
e,
l
--
tl-b-
the generous support and assistance of Dr. Frank Hawthand Mr. Neil Ball of the Department of Geological Sciences at the University of Manitoba. The authors also thMr. Trevor Mueller for his assistance with the spectral danalysis. This study was supported by a start-up andcretionary grant from the University of Winnipeg, andsearch grants from Sigma Xi and the Geological SocietAmerica to EAC, and by a grant from the NASA PlanetGeology and Geophysics Program (NAG5-10636) to JSincere thanks to Janice Bishop and Scott Murchie for tthorough reviews and thoughtful comments on a sometidense manuscript and for pointing out some apparent scomings.
References
Adams, J.B., 1974. Visible and near-infrared diffuse reflectance specpyroxenes as applied to remote sensing of solid objects in theSystem. J. Geophys. Res. 79, 4829–4836.
Adams, J.B., 1975. Interpretation of visible and near-infrared diffuseflectance spectra of pyroxenes and other rock-forming mineralsKarr Jr., C. (Ed.), Infrared and Raman Spectroscopy of Terrestrial Merals. Academic Press, New York, pp. 91–116.
Adams, J.B., Hörz, F., Gibbons, R.V., 1979. Effects of shock-loading onreflectance spectra of plagioclase, pyroxene, and glass. In: Proc.Planet. Sci. Conf. 10th, pp. 1–3. Abstract.
Adams, J.B., Smith, M.O., Johnson, P.E., 1986. Spectral mixture ming: a new analysis of rock and soil types at the Viking 1 Lander sJ. Geophys. Res. 91, 8098–8112.
Allen, C.C., Morris, R.V., Lauer Jr., H.V., McKay, D.S., 1993. Effectsmicroscopic iron metal on the reflectance spectra of glass and minIn: Proc. Lunar Planet. Sci. Conf. 24th, pp. 17–18. Abstract.
Azuma, H., Fujii, N., 1989. Grain size effects on spectral reflectance oOpx and Cpx minerals applied to the Hull quotient method. In: PLunar Planet. Sci. Conf. 20th, pp. 32–33. Abstract.
Bandfield, J.L., Hamilton, V.E., Christensen, P.R., 2000. A global viewmartian surface composition from MGS-TES. Science 287, 1626–1
Banin, A., Han, F.X., Kan, I., Cicelsky, A., 1997. Acidic volatiles andMars soil. J. Geophys. Res. 102, 13341–13356.
Bartels, K.S., Burns, R.G., 1989. Oxidized olivines on Mars: spectroscopinvestigations of heat-induced aerial oxidation products. In: Proc. LunaPlanet. Sci. Conf. 20th, pp. 44–45. Abstract.
Basaltic Volcanism Study Project, 1981. Basaltic Volcanism on the Tetrial Planets. Pergamon, New York.
Bell III, J.F., 1996. Iron, sulfate, carbonate, and hydrated minerals on MarIn: Dyar, M.D., McCammon, C., Schaefer, M.W. (Eds.), Mineral Sptroscopy: A Tribute to Roger G. Burns. Geochemical Society, NYork, pp. 359–380.
Bell III, J.F., McCord, T.B., Owensby,P.D., 1990. Observational evidenceof crystalline iron oxides on Mars. J. Geophys. Res. 95, 14447–14
Bell III, J.F., Morris, R.V., Adams, J.B., 1993. Thermally altered palagonitic tephra: a spectral and process analog to the soil and dust of MJ. Geophys. Res. 98, 3373–3385.
Bell III, J.F., Klassen, D.R., Moersch, J.E., Golisch, W.F., Griep, D.Kaminski, C.D., Martin, P., Dumas, C., Clark, R.N., Cloutis, E.A., 19High spatial resolution near-IR imaging spectroscopy of Mars fromIRTF during 1996–97. Bull. Am. Astron. Soc. 29, 963.
Bell III, J.F., McSween Jr., H.Y., Crisp, J.A., Morris, R.V., Murchie, S.Bridges, N.T., Johnson, J.R., Britt, D.T., Golombek, M.P., Moore, HGhosh, A., Bishop, J.L., Anderson, R.C., Brückner, J., EconomT., Greenwood, J.P., Gunnlaugsson, H.P., Hargraves, R.M., HviidKnudsen, J.M., Madsen, M.B., Reid, R., Rieder, R., Soderblom
Mafic silicate-palagonitic material spectra 251
55.M.,.,, K.,rd,
T.,mic
nnet.
Fera of–96.
opicand.D.,rib-58.ericrials
icica-n
ie,f
f.
00.lica-1st.
as aSci.
:
go-etry.
n.ng in
ars.
R.N.,.,
yor
rk,sur-. 105
T.,is ofnd
atives.
hs.
fic
s:-
ited:e-
themote
ra-n fors.
re-570.d2,
,of the
-
-l.
ofes.
picska
andhys.
-s.
ne,rous42,
lired
rac-tionhD
te
-oids.
ed,
py:
2000. Mineralogical and compositional properties of martian soil anddust: results from Mars Pathfinder. J. Geophys. Res. 105, 1721–17
Bell III, J.F., Squyres, S.W., Herkenhoff, K.E., Maki, J.N., Arneson, H.Brown, D., Collins, S.A., Dingizian, A., Elliot, S.T., Hagerott, E.CHayes, A.G., Johnson, M.J., Johnson, J.R., Joseph, J., KinchLemmon, M.T., Morris, R.V., Scherr, L., Schwochert, M., ShepaM.K., Smith, G.H., Sohl-Dickstein, J.N., Sullivan, R., Sullivan, W.Wadsworth, M., 2003. The Mars Exploration Rover Athena PanoraCamera (Pancam) investigation. J. Geophys. Res. In press.
Berkley, J.L., Keil, K., Prinz, M., 1980.Comparative petrology and origiof Governador Valadares and other nakhlites. In: Proc. Lunar PlaSci. Conf. 11th, pp. 1089–1102.
Besancon, J.R., Burns, R.G., Pratt, S.F., 1991. Reflectance spectra of2+–Mg2+ disordered pyroxenes: implications to remote-sensed spectplanetary surfaces. In: Proc. Lunar Planet. Sci. Conf. 22nd, pp. 95Abstract.
Bishop, J.L., Murad, E., 1996. Schwertmannite on Mars? Spectroscanalysis of schwertmannite, its relationship to other ferric minerals,its possible presence in the surface material on Mars. In: Dyar, MMcCammon, C., Schaeffer, M.W. (Eds.), Mineral Spectroscopy: A Tute to Roger G. Burns. Geochemical Society, New York, pp. 337–3
Bishop, J.L., Pieters, C.M., 1995. Low-temperature and low atmosphpressure infrared reflectance spectroscopy of Mars soil analog mateJ. Geophys. Res. 100, 5369–5379.
Bishop, J.L., Pieters, C.M., Hiroi, T., Mustard, J.F., 1998a. Spectroscopanalysis of martian meteorite Allan Hills 84001 powder and appltions for spectral identification of mineral and other soil components oMars. Meteorit. Planet. Sci. 33, 699–707.
Bishop, J.L., Scheinost, A., Bell III, J.F., Britt, D., Johnson, J.R., MurchS., 1998b. Ferrihydrite–schwertmannite–silicate mixtures as a model omartian soils measured by Pathfinder.In: Proc. Lunar Planet. Sci. Con29th. Abstract #1803 [CD-ROM].
Bishop, J.L., Mancinelli, R.L., Olsen, M., Wagner, P.A., Zent, A.P., 20Ferrihydrite alteration to magnetite, maghemite and hematite: imptions for iron oxides on Mars. In: Proc. Lunar Planet. Sci. Conf. 3Abstract #1946 [CD-ROM].
Bishop, J.L., Schiffman, P., Murad, E., Southard, R., 2001. Icelandmodel for chemical alteration on Mars. In: Proc. Lunar Planet.Conf. 32nd. Abstract #1435 [CD-ROM].
Boctor, N.Z., Meyer, H.O.A., Kullerud, G., 1976. Lafayette meteoritepetrology and opaque mineralogy. Earth Planet. Sci. Lett. 32, 69–76.
Bruckenthal, E.A., 1987. The dehydration of phyllosilicates and palanites: reflectance spectroscopy and differential scanning calorimMSc thesis. Univ. Hawaii, Honolulu.
Buemi, A., Cimino, G., Strazzulla, G., 1998. Characterization of Etneasoils and application to Mars. J. Geophys. Res. 103, 13667–13674
Burns, R.G., 1970. Crystal field spectra and evidence of cation orderiolivine minerals. Am. Mineral. 55, 1608–1632.
Cattermole, P., 1990. Volcanic flow development at Alba Patera, MIcarus 83, 453–493.
Christensen, P.R., Anderson, D.L., Chase, S.C., Clancy, R.T., Clark,Conrath, B.J., Kieffer, H.H., Kuzmin, R.O., Malin, M.C., Pearl, J.CRoush, T.L., Smith, M.D., 1998. Results from the Mars Global SurveThermal Emission Spectrometer. Science 279, 1692–1697.
Christensen, P.R., Bandfield, J.L., Smith, M.D., Hamilton, V.E., ClaR.N., 2000. Identification of a basaltic component on the martianface from Thermal Emission Spectrometer data. J. Geophys. Res9609–9621.
Clancy, R.T., Lee, S.W., Gladstone, G.R., McMillan, W.W., Roush,1995. A new model for Mars atmospheric dust based upon analysultraviolet through infrared observations from Mariner 9, Viking, aPhobos. J. Geophys. Res. 100, 5251–5263.
Clark, R.N., Roush, T.L., 1984. Reflectance spectroscopy: quantitanalysis techniques for remote sensing applications. J. GeophyRes. 89, 6329–6340.
.
,
Clark, R.N., King, T.V.V., Klejwa, M., Swayze, G.A., Vergo, N., 1990. Higspectral resolution reflectance spectroscopy of minerals. J. GeophyRes. 95, 12653–12680.
Cloutis, E.A., 1985. Interpretive techniques for reflectance spectra of masilicates. MSc thesis. Univ. Hawaii, Honolulu.
Cloutis, E.A., Bell III, J.F., 2000.Diaspores and related hydroxidespectral–compositional properties and implications for Mars. J. Geophys. Res. 105, 7053–7070.
Cloutis, E.A., Gaffey, M.J., 1991a. Pyroxene spectroscopy revisspectral–compositional correlationsand relationship to geothermomtry. J. Geophys. Res. 96, 22809–22826.
Cloutis, E.A., Gaffey, M.J., 1991b. Spectral–compositional variations inconstituent minerals of mafic and ultramafic assemblages and resensing implications. Earth Moon Planets 53, 11–53.
Cloutis, E.A., Gaffey, M.J., Jackowski, T.L., Reed, K.L., 1986. Calibtions of phase abundance, composition, and particle size distributioolivine–orthopyroxene mixturesfrom reflectance spectra. J. GeophyRes. 91, 11641–11653.
Cooper, C.D., Mustard, J.F., 1999. Effects of very fine particle size onflectance spectra of smectite and palagonitic soil. Icarus 142, 557–
Crown, D.A., Pieters, C.M., 1987. Spectral properties of plagioclase anpyroxene mixtures and the interpretation of lunar soil spectra. Icarus 7492–506.
Cruikshank, D.P., Tholen, D.J., Hartmann, W.K., Bell, J.F., Brown, R.H.1991. Three basaltic Earth-approaching asteroids and the sourcebasaltic meteorites. Icarus 89, 1–13.
Dodd, R.T., 1981. Meteorites: A Chemical-Petrologic Synthesis. Cambridge Univ. Press, New York.
Eckstrand, O.R. (Ed.), 1984. CanadianMineral Deposit Types: A Geological Synopsis. Canadian GovernmentPublishing Centre, Ottawa. GeoSurv. Canada, Economic Geology Report 36.
Evans, A.M., 1980. An Introduction to Ore Geology. Blackwell, Oxford,UK.
Farrand, W.H., Singer, R.B., 1991.Spectral analysis and mappingpalagonite tuffs of Pavant Butte, Millard County, Utah. Geophys. RLett. 18, 2237–2240.
Feierberg, M.A., Larson, H.P., Fink, U., Smith, H.A., 1980. Spectroscoevidence for two achondrite parent bodies: Asteroids 349 Dembowand 4 Vesta. Geochim. Cosmochim. Acta 44, 513–524.
Finnerty, A.A., Phillips, R.J., Banerdt, W.B., 1988. Igneous processesclosed system evolution of the Tharsis region of Mars. J. GeopRes. 93, 10225–10235.
Fischer, E.M., Pieters, C.M., 1993.The continuum slope of Mars: bidirectional reflectance investigations and applications to Olympus MonIcarus 102, 185–202.
Floran, R.J., Prinz, M., Hlava, P.F., Keil, K., Nehru, C.E., HinthorJ.R., 1978. The Chassigny meteorite: a cumulate dunite with hydamphibole-bearing melt inclusions. Geochim. Cosmochim. Acta1213–1229.
Folco, L., Franchi, I.A., Scherer, P., Schultz, L., Pillinger, C.T., 1999. Dar aGani 489 basaltic shergottite: a new find from the Sahara likely pawith Dar al Gani 476. Meteorit.Planet. Sci. Suppl. 34, A36–A37.
Gaffey, M.J., 1974. A systematic study of the spectral reflectivity chateristics of the meteorite classes with applications to the interpretaof asteroid spectra for mineralogical and petrological information. Pdissertation. MIT, Cambridge, MA.
Gaffey, M.J., 1976. Spectral reflectance characteristics of the meteoriclasses. J. Geophys. Res. 81, 905–920.
Gaffey, M.J., McCord, T.B., 1979. Mineralogical and petrological characterizations of asteroid surface materials. In: Gehrels, T. (Ed.), AsterUniv. of Arizona Press, Tucson, pp. 688–723.
Gaffey, M.J., Bell, J.F., Brown, R.H., Burbine, T.H., Piatek, J.L., ReK.L., Chaky, D.A., 1993a. Mineralogical variations within the S-typeasteroid class. Icarus 106, 573–602.
Gaffey, M.J., Burbine, T.H., Binzel, R.P., 1993b. Asteroid spectroscoprogress and perspectives. Meteoritics 28, 161–187.
252 E.A. Cloutis, J.F. Bell III / Icarus 172 (2004) 233–254
93.rom1.era,
ars397
pec-ry
he.ri-t.
intoas-,
ab-d.tioshys.
70,
n-
red2,
red,
ear-soil
r re-e-
.T.,er-nn,
cGeo-
nceons.
ix-th. In
re-s 3,
3.. In:8,
ap-95,
-713.
entsar-,
f the
ctral7.-
ureand
-
ntttite
and-
Pa-ica,
5:
on,u,
oore,999.itions.
s to.
ceg on
rites,
5–roc.0,
nt to
etions104,
ites.
ofion to
cen of
tralidest..A.,b-
Golden, D.C., Morris, R.V., Ming, D.W., Lauer Jr., H.V., Yang, S.R., 19Mineralogy of three slightly palagonitized basaltic tephra samples fthe summit of Mauna Kea, Hawaii. J. Geophys. Res. 98, 3401–341
Greeley, R., Crown, D.A., 1990. Volcanic geology of Tyrrhena PatMars. J. Geophys. Res. 95, 7133–7149.
Gregg, T.K.P., Williams, S.N., 1996. Explosive mafic volcanoes on Mand Earth: deep magma sources and rapid rise rate. Icarus 122,405.
Grove, C.I., Hook, S.J., Paylor II, E.D., 1992. Laboratory Reflectance Stra of 160 Minerals, 0.4 to 2.5 micrometers. Jet Propulsion LaboratoPubl. 92-2. Jet Propulsion Laboratory, Pasadena, CA.
Hay, R.L., Iijima, A., 1968. Nature and origin of palagonite tuffs of tHonolulu Group on Oahu, Hawaii. Geol. Soc. Am. Mem. 116, 331–376
Hazen, R.M., Bell, P.M., Mao, H.K., 1978. Effects of compositional vaation on absorption spectra of lunar pyroxenes. In: Proc. Lunar PlaneSci. Conf. 9th, pp. 2919–2934.
Hiroi, T., Takeda, H., 1989. A method of converting reflectance spectraabsorption coefficient spectra of mineral mixtures for application toteroidal surface mineralogy. In: Proc. Lunar Planet. Sci. Conf. 20thpp. 418–419. Abstract.
Hiroi, T., Miyamoto, M., Takano, Y., 1985. An assignment of photonsorptions to Fe2+ and Cr3+ in pyroxenes and olivine by crystal fieltheory. In: Proc. Lunar Planet. Sci. Conf. 16th, pp. 356–357. Abstract
Hiroi, T., Pieters, C.M., 1994. Estimation of grain sizes and mixing raof fine powder mixtures of common geologic materials. J. GeopRes. 99, 10867–10879.
Huguenin, R.L., 1987. The silicate component of martian dust. Icarus162–188.
Hunt, G.R., Salisbury, J.W., 1970. Visible and near-infrared spectra of mierals and rocks. I. Silicate minerals. Mod. Geol. 1, 283–300.
Hunt, G.R., Salisbury, J.W., Lenhoff, C.J., 1971. Visible and near-infraspectra of minerals and rocks. III. Oxides and hydroxides. Mod. Geol.195–205.
Hunt, G.R., Salisbury, J.W., Lenhoff, C.J., 1973. Visible and near-infraspectra of minerals and rocks. VI.Additional silicates. Mod. Geol. 485–106.
Johnson, J.R., Grundy, W.M., 2000. Two-layer modeling of visible/ninfrared reflectance spectra of basalts coated with JSC-1 palagoniteIn: Proc. Lunar Planet. Sci. Conf. 31st. Abstract #1724 [CD-ROM].
Johnson, P.E., Smith, M.O., Adams, J.B., 1992. Simple algorithm fomote determination of mineral abundances and particle sizes from rflectance spectra. J. Geophys. Res. 97, 2649–2657.
Johnson, J.R., Kirk, R., Soderblom, L.A., Gaddis, L., Reid, R.J., Britt, DSmith, P., Lemmon, M., Thomas, N., Bell III, J.F., Bridges, N.T., Andson, R., Herkenhoff, K.E., Maki, J., Murchie, S., Dummel, A., JaumaR., Trauthan, F., Arnold, G., 1999. Preliminary results on photometriproperties of materials at the Sagan Memorial Station, Mars. J.phys. Res. 104, 8809–8830.
King, T.V.V., Ridley, W.I., 1987. Relation of the spectroscopic reflectaof olivine to mineral chemistry and some remote sensing implicatiJ. Geophys. Res. 92, 11457–11469.
King, T.V.V., Pieters, C.M., Sandlin, D.L., 1981. Particulate mineral mtures: the relation of albedo and apparent absorption band strengProc. Lunar Planet. Sci. Conf. 12th, pp. 547–549. Abstract.
Kinoshita, M., Miyamoto, M., 1990. A model for analysis of the spectralflectance of mineral mixtures. Proc. NIPR Symp. Antarct. Meteorite230–239.
Lindsley, D.H., 1983. Pyroxene thermometry. Am. Mineral. 68, 477–49Lindsley, D.H., Andersen, D.J., 1983. A two-pyroxene thermometer
Proc. Lunar Planet. Sci. Conf. 13th, Part 2, J. Geophys. Res. Suppl. 8A887–A906.
Lopes, R.M.C., Kilburn, C.R.J., 1990. Emplacement of lava flow fields:plication of terrestrial studies toAlba Patera, Mars. J. Geophys. Res.14383–14497.
Lucey, P.G., 1998. Model near-infraredoptical constants of olivine and pyroxene as a function of iron content. J. Geophys. Res. 103, 1703–1
–
.
:
Lundberg, L.L., Crozaz, G., McSween Jr., H.Y., 1990. Rare Earth elemin minerals of the ALHA77005 shergottite and implications for its pent magma and crystallization history. Geochim. Cosmochim. Acta 542535–2547.
Mason, B., Nelen, J.A., Muir, P., Taylor, S.R., 1975. The composition oChassigny meteorite. Meteoritics 11, 21–27.
McCord, T.B., Clark, R.N., 1979. The Mercury soil: presence of Fe2+.J. Geophys. Res. 84, 7664–7668.
McCord, T.B., Adams, J.B., Johnson, T.V., 1970. Asteroid Vesta: spereflectivity and compositional implications. Science 168, 1445–144
McFadden, L.A., 1987. Spectral reflectance of SNC meteorites: relationship to martian surface composition. In: MEVTV Workshop on Natand Composition of Surface of Mars, LPI Tech. Rep. 88-05. LunarPlanetary Institute, Houston, pp. 88–90. Abstract.
McSween Jr., H.Y., 1985. SNC meteorites: clues to martian petrologic evolution? Rev. Geophys. 23, 391–416.
McSween Jr., H.Y., Jarosewich, E., 1983. Petrogenesis of the ElephaMoraine A79001 meteorite: multiple magma pulses on the shergoparent body. Geochim. Cosmochim. Acta 47, 1501–1513.
McSween Jr., H.Y., Murchie, S.L., 1999. Rocks at the Mars Pathfinder ling site. Am. Sci. 87, 36–45.
McSween Jr., H.Y., Treiman, A.H., 1998. Martian meteorites. In:pike, J.J. (Ed.), Planetary Materials. Mineralogical Society of AmerWashington, DC. Chapter 6.
McSween Jr., H.Y., Taylor, L.A., Stolper, E.M., 1979. Allan Hills 7700a new meteorite type found inAntarctica. Science 204, 1201–1203.
McSween Jr., H.Y., Murchie, S.L., Crisp, J.A., Bridges, N.T., AndersR.C., Bell III, J.F., Britt, D.T., Brückner, J., Dreibus, G., EconomoT., Ghosh, A., Golombek, M.P., Greenwood, J.P., Johnson, J.R., MH.J., Morris, R.V., Parker, T.J., Rieder, R., Singer, R., Wänke, H., 1Chemical, multispectral, and textural constraints on the composand origin of rocks at the Mars Pathfinder landing site. J. GeophyRes. 104, 8679–8715.
Mikouchi, T., Miyamoto, M., McKay, G.A., 1998. Mineralogy of Antarc-tic basaltic shergottite Queen Alexandra Range 94201: similaritieElephant Moraine A79001 (lithology B)martian meteorite. MeteoritPlanet. Sci. 33, 181–189.
Miyamoto, M., Mito, A., Takano, Y., Fujii, N., 1981. Spectral reflectan(0.25–25 µm) of powdered olivines and meteorites, and their bearinsurface materials of asteroids. In: Proc. 6th Symp. Antarct. MeteoMem. Natl. Inst. Polar Res. Spec. Iss. 20, 345–361.
Miyamoto, M., Kinoshita, M., Takano,Y., 1983. Spectral reflectance (0.22.5 µm) of olivine and pyroxene from an ordinary chondrite. In: P8th Symp. Antarct. Meteor., Mem.Natl. Inst. Polar Res. Spec. Iss. 3367–377.
Moore, J.G., 1966. Rate of palagonitization of submarine basalt adjaceHawaii. US Geol. Surv. Prof. Paper D 550, D163–D171.
Moroz, L., Arnold, G., 1999. Influenceof neutral components on relativband contrasts in reflectance spectra of intimate mixtures: Implicafor remote sensing 1. Nonlinear mixing modeling. J. Geophys. Res.14109–14121.
Morris, R.V., 1989. Reflectivity spectra (350–2200 nm) of SNC meteorIn: Proc. Lunar Planet. Sci. Conf. 20th, pp. 719–720. Abstract.
Morris, R.V., Lauer Jr., H.V., 1990. Matrix effects for reflectivity spectradispersed nanophase (superparamagnetic) hematite with applicatmartian spectral data. J. Geophys. Res. 95, 5101–5109.
Morris, R.V., Golden, D.C., 1998. Goldenrod pigments and the occurrenof hematite and possibly goethite in the Olympus–Amazonis regioMars. Icarus 134, 1–10.
Morris, R.V., Lauer Jr., H.V., Gooding, J.L., Mendell, W.W., 1983. Specevidence and implications for the occurrence of aluminous iron oxon Mars. In: Proc. Lunar Planet. Sci. Conf. 14th, pp. 526–527. Abstrac
Morris, R.V., Lauer Jr., H.V., Lawson, C.A., Gibson Jr., E.K., Nace, GStewart, C., 1985. Spectral and other physicochemical properties of sumicron powders of hematite (α-Fe2O3), maghemite (γ -Fe2O3), mag-netite (Fe3O4), goethite (α-FeOOH), and lepidocrocite (γ -FeOOH).J. Geophys. Res. 90, 3126–3144.

Mafic silicate-palagonitic material spectra 253
tralust
D.,sednetic
3.auer,n
-102,
C.,W.,onele-d
C.,orcal5083fectraing-
993..
e
fromSci.
neral
rtian7,
n,om-soil.
b.ns-
po-ys.
smit--
of
aseds.
in,d
ion
f se-Sci.
n of-
Min-–
red
lkorit.
s of.
omProc.
es. 5,
-bilityt.gra-
ip-rgot-igini.
U.,ud-W.,rs
tian.H.,
. of
e ofl-
ttite
of.
dGeo-
hed
vine8.eral955–
c-
Morris, R.V., Lauer Jr., H.V., Agresti, D.G., Newcomb, J.A., 1986. Specproperties of “dust” produced in the dry valleys of Antarctica. In: Don Mars II. LPI Publ. 86-09, 56–57. Abstract.
Morris, R.V., Agresti, D.G., Lauer Jr., H.V., Newcomb, J.A., Shelfer, T.Murali, A.V., 1989. Evidence for pigmentary hematite on Mars baon optical, magnetic, and Mossbauer studies of superparamag(nanocrystalline) hematite 1989. J. Geophys. Res. 94, 2760–2778.
Morris, R.V., Golden, D.C., Bell III, J.F., Lauer Jr., H.V., Adams, J.B., 199Pigmenting agents in martian soil: inferences from spectral, Mössband magnetic properties of nanophaseand other iron oxides in Hawaiiapalagonitic soil PN-9. Geochim. Cosmochim. Acta 57, 4597–4609.
Morris, R.V., Golden, D.C., Bell III, J.F., 1997. Low-temperature reflectivity spectra of red hematite and the color of Mars. J. Geophys. Res.9125–9133.
Morris, R.V., Golden, D.C., Bell III, J.F., Shelfer, T.D., Scheinost, A.Hinman, N.W., Furness, G., Mertzman, S.A., Bishop, J.L., Ming, D.Allen, C.C., Britt, D.T., 2000. Mineralogy, composition, and alteratiof Mars Pathfinder rocks and soils: evidence from multispectral,mental, and magnetic data on terrestrial analogue, SNC meteorites, anPathfinder samples. J. Geophys. Res. 105, 1757–1817.
Morris, R.V., Golden, D.C., Ming, D.W., Shelfer, T.D., Jorgensen, L.Bell III, J.F., Graff, T.G., Mertzman, S.A., 2001a. Phyllosilicate-popalagonitic dust from Mauna Kea Volcano (Hawaii): a mineralogianalogue for magnetic martian dust? J. Geophys. Res. 106, 5057–
Morris, R.V., Graff, T.G., Shelfer,T.D., Bell III, J.F., 2001b. Effects opalagonitic dust coatings on visible, near-IR, and Mossbauer spof rocks and minerals: implications for mineralogical remote sensof Mars. In: Proc. Lunar Planet.Sci. Conf. 32nd. Abstract #1912 [CDROM].
Morse, S.A., 1980. Basalts and PhaseDiagrams. Springer-Verlag, NewYork.
Mouginis-Mark, P.J., 1981. Late-stagesummit activity of martian shieldvolcanoes. In: Proc. Lunar Planet. Sci. Conf. 12th, pp. 1431–1447.
Murchie, S., Mustard, J., Bishop, J., Head, C., Pieters, Erard, S., 1Spatial variations in the spectral properties of bright regions on MarsIcarus 105, 454–468.
Mustard, J.F., Hays, J.E., 1997. Effects of hyperfine particles on reflectancspectra from 0.3 to 25 µm. Icarus 125, 145–163.
Mustard, J.F., Pieters, C.M., 1987. Quantitative abundance estimatesbidirectional reflectance measurements. In: Proc. Lunar Planet.Conf. 17th, J. Geophys. Res. 92, E617–E626.
Mustard, J.F., Pieters, C.M., 1989. Photometric phase function of commogeologic minerals and applications to quantitative analysis of minmixture reflectance spectra. J. Geophys. Res. 94, 13619–13634.
Mustard, J.F., Sunshine, J.M., 1995. Seeing through the dust: macrustal heterogeneity and links tothe SNC meteorites. Science 261623–1626.
Mustard, J.F., Erard, S., Bibring, J.-P., Head, J.W., Hurtrez, S., LangeviY., Pieters, C.M., Sotin, C.J., 1993a. The surface of Syrtis Major: cposition of the volcanic substrate and mixing with altered dust andJ. Geophys. Res. 98, 3387–3400.
Mustard, J.F., Sunshine, J.M., Pieters, C.M., Hoppin, A., Pratt, S.F., 1993From minerals to rocks: toward modeling lithologies with remote seing. In: Proc. Lunar Planet. Sci. Conf. 24th, pp. 1041–1042. Abstract.
Mustard, J.F., Murchie, S., Erard, S., Sunshine, J., 1997. In situ comsitions of martian volcanics: implications for the mantle. J. GeophRes. 102, 25605–25615.
Pieters, C.M., 1983. Strength of mineral absorption features in the tranted component of near-infrared light: first results from RELAB. J. Geophys. Res. 88, 9534–9544.
Pieters, C.M., 1989. Seeing throughthe dust and alteration productsMars. In: Proc. Lunar Planet. Sci. Conf. 20th, pp. 850–851. Abstract.
Pinet, P., Chevrel, S., 1990. Spectral identification of geological units onthe surface of Mars related to the presence of silicates from Earth-bnear-infrared telescopic charged-couple device imaging. J. GeophyRes. 95, 14435–14446.
.
Pollack, J.B., Colburn, D., Kahn, R., Hunter, J., Van Camp, W., BaldwB., 1977. Properties of aerosols in themartian atmosphere, as inferrefrom Viking Lander data. J. Geophys. Res. 82, 4479–4496.
RELAB, 1996. Reflectance Experiment Laboratory (RELAB) Descriptand User’s Manual. Brown Univ. Press, Providence, RI.
Roush, T.L., Singer, R.B., McCord, T.B., 1987. Reflectance spectra olected mafic silicates from 0.6 to 4.6 µm. In: Proc. Lunar Planet.Conf. 18th, pp. 854–855. Abstract.
Roush, T.L., Blaney, D.L., Singer, R.B., 1993. The surface compositioMars as inferred from spectroscopicobservations. In: Pieters, C.M., Englert, P.A.J. (Eds.), Remote Geochemical Analysis: Elemental anderal Composition. Cambridge Univ. Press, Cambridge, UK, pp. 367393.
Salisbury, J.W., Hunt, G.R., Lenhoff, C.J., 1975. Visible and near-infraspectra. X. Stony meteorites. Mod. Geol. 5, 115–126.
Schade, U., Wäsch, R., 1999. Near-infrared reflectance spectra from busamples of the two martian meteorites Zagami and Nakhla. MetePlanet. Sci. 34, 417–424.
Sherman, D.M., Burns, R.G., Burns, V.M., 1982. Spectral characteristicthe iron oxides with application to the martian bright region mineralogyJ. Geophys. Res. 87, 10169–10180.
Singer, R.B., 1980. The dark materials on Mars. I. New information frreflectance spectroscopy on the extent and mode of oxidation. In:Lunar Planet. Sci. Conf. 11th, pp. 1045–1047. Abstract.
Singer, R.B., 1985. Spectroscopic observation of Mars. Adv. Space R59–68.
Singer, R.B., Roush, T.L., 1983. Spectral reflectance properties of particulate weathered coatings on rocks: laboratory modeling and applicato Mars. In: Proc. Lunar Planet. Sci. Conf. 14th, pp. 708–709. Abstrac
Smith, J.V., Hervig, R.L., 1979. Shergotty meteorite: mineralogy, petrophy and minor elements. Meteoritics 14, 121–142.
Smith, M.R., Laul, J.C., Ma, M.S., Huston, T., Verkouteren, R.M., Lschutz, M.E., Schmitt, R.A., 1984. Petrogenesis of the SNC (shetites, nakhlites, chassignites) meteorites: implications for their orfrom a large dynamic planet, possibly Mars. In: Proc. Lunar Planet. ScConf. 14th, Part 2, J. Geophys. Res. Suppl. 89, B612–B630.
Smith, P.H., Tomasko, M.G., Britt, D., Crowe, D.G., Reid, R., Keller, H.Thomas, N., Gliem, F., Rueffer, P., Sullivan, R., Greeley, R., Knsen, J.M., Madsen, M.B., Gunnlaugsson, H.P., Hviid, S.F., Goetz,Soderblom, L.A., Gaddis, L., Kirk, R., 1997. The imager for MaPathfinder experiment. J. Geophys. Res. 102, 4003–4025.
Soderblom, L.A., 1992. The composition and mineralogy of the marsurface from spectroscopic observations: 0.3 to 50 µm. In: Kieffer, HJakosky, B.M., Snyder, C.W., Matthews, M.S. (Eds.), Mars. UnivArizona Press, Tucson, pp. 557–593.
Solomon, S.C., Head, J.W., 1982. Evolution of the Tharsis provincMars: the importance of heterogeneous lithospheric thickness and vocanic construction. J. Geophys. Res. 87, 9755–9774.
Stolper, E., McSween Jr., H.Y., 1979. Petrology and origin of the shergometeorites. Geochim.Cosmochim. Acta 43, 1475–1498.
Stolper, E., McSween Jr., H.Y., Hays, J.F., 1979. A petrogenetic modelthe relationships among achondritic meteorites. Geochim. CosmochimActa 43, 589–602.
Straub, D.W., Burns, R.G., Pratt, S.F., 1991. Spectral signature of oxidizepyroxenes: implications to remote sensing of terrestrial planets. J.phys. Res. 96, 18819–18830.
Sunshine, J.M., Pieters, C.M., 1993.Estimating modal abundances from tspectra of natural and laboratory pyroxene mixtures using the modifieGaussian method. J. Geophys. Res. 98, 9075–9087.
Sunshine, J.M., Pieters, C.M., 1998. Determining the composition of olifrom reflectance spectroscopy. J. Geophys. Res. 103, 13675–1368
Sunshine, J.M., Pieters, C.M., Pratt, S.F., 1990. Deconvolution of minabsorption bands: an improved approach. J. Geophys. Res. 95, 66966.
Sunshine, J.M., McFadden, L.A., Pieters, C.M., 1993. Reflectance spetra of the Elephant Moraine A7001 meteorite: implications for remotesensing of planetary bodies. Icarus 105, 79–91.

254 E.A. Cloutis, J.F. Bell III / Icarus 172 (2004) 233–254
an-elimi-s.
ysi-data.ogy,
e-r
ctra800
rom
ene–trib.
ocki.
Surkov, Y.A., Moskalyeva, L.P., Shcheglov, O.P., Kharyukovo, V.P., Mvelyan, O.S., Kirichenko, V.S., Dudin, A.D., 1983. Determination of thelemental composition of rocks on Venus by Venera 13 and 14 (Prenary results). In: Proc. Lunar Planet Sci. Conf. 13th, Part 1, J. GeophyRes. Suppl. 88, A481–A492.
Taranik, D.L., Kruse, F.A., 1989. Iron mineral reflectance in Geophcal and Environmental Research Imaging Spectrometer (GERIS)In: Proc. 7th Thematic Conf. Remote Sens. for Exploration Geolpp. 445–458.
Treiman, A.H., 1990. Complex petrogenesis of the Nakhla (SNC) metorite: evidence from petrography and mineral chemistry. In: Proc. LunaPlanet. Sci. Conf. 20th, pp. 273–280.
Wagner, J.K., Hapke, B.W., Wells, E.N., 1987. Atlas of reflectance speof terrestrial, lunar, and meteoritic powders and frosts from 92 to 1nm. Icarus 69, 14–28.
Wood, C.A., Ashwal, L.D., 1981. SNC meteorites: igneous rocks fMars? In: Proc. Lunar Planet. Sci. Conf. 12th, pp. 1359–1375.
Wood, B.J., Banno, S., 1973. Garnet-orthopyroxene and orthopyroxclinopyroxene relationships in simple and complex systems. ConMineral. Petrol. 42, 109–142.
Yingst, R.A., Smith, P.H., 2000. Multispectral evidence for a single rtype at the Mars Pathfinder landingsite. In: Proc. Lunar Planet. ScConf. 31st. Abstract #1422 [CD-ROM].
Copyright © 2022 FDOKUMEN