A Late Holocene explosive mafic eruption of Villarrica volcano, Southern Andes: The Chaimilla...
16
A Late Holocene explosive mafic eruption of Villarrica volcano, Southern Andes: The Chaimilla deposit L. Costantini a, ⁎, L. Pioli a , C. Bonadonna a , J. Clavero b , C. Longchamp c a Département de Minéralogie, Section des sciences de la Terre et de l'environnement, Université de Genève. Rue des Maraichers 13, 1205 Genève, Switzerland b Energía Andina, Darío Urzúa 2165, Providencia, Chile c Institute of Geomatics and Risk Analysis, Université de Lausanne, Switzerland abstract article info Article history: Received 20 May 2010 Accepted 19 December 2010 Available online 24 December 2010 Keywords: basaltic explosive volcanism Villarrica volcano clast microtextures basaltic explosive volcanism tephra deposits Villarrica (Chile) is one of the most active volcanoes in South America having erupted about 60 times in the last 460 years. Although its historical eruptive activity has been mainly effusive and weakly explosive, it had strong explosive behaviour in postglacial times. Chaimilla (b 3.1 ka) is one of the best exposed and widely dispersed pyroclastic deposits, related to both fall and flow activity. The deposit is dispersed over an area of 250 km 2 and consists of 8 units (A–H) which were grouped into four sequences. Stratigraphic data suggest that the eruption had a relatively short duration and evolved from i) an Opening phase, dispersing ash, lapilli clasts, accretionary lapilli, blocks and bombs, to ii) a Pulsatory phase, originating a series of magmatic explosions, to iii) a Collapsing phase, characterised by unstable plumes which emplaced a series of pyroclastic density currents intercalated with thin fallout layers and finally to iv) a Climactic phase forming a more sustained plume which eventually collapsed generating the final pyroclastic density currents. The deposit (fall and flow) has a minimum cumulative volume of 0.6 km 3 , with the main sustained phase being associated with a VEI 4 and the flow units having a minimum estimated total volume of 0.04 km 3 . The erupted material has a homogenous chemical composition but displays a remarkable variability in both textural and physical properties. The density distribution of juvenile products shows a clear bimodality characterised by two main populations: P1 and P2. Population P1 consists of highly vesicular clasts (modal density around 1000 kg m −3 ) with mostly sub-spherical bubbles and moderately crystallised groundmass with large-sized microlites. Clasts from population P2 are poorly vesicular (modal density around 1600 kg m −3 ) with irregular to collapsed bubbles and numerous smaller microlites. The variability of both vesicularity and microlite characteristics suggests the involvement of two magma batches with distinct pre-eruptive degassing and rising histories. Our eruption conceptual model implies the arrival of new magma (represented in the deposit by P1 clasts) into a small, outgassed magma body which was accumulated at shallow level (mainly represented by P2 clasts). A new Chaimilla-type eruption could significantly affect the communities that have recently developed around Villarrica volcano and subsist mainly on tourism and forestry. As a result, a better understanding of the dynamics and evolution of the Chaimilla eruption is necessary for the identification of potential hazard scenarios at Villarrica volcano and, ultimately, for the risk mitigation of this populated area of Southern Chile. © 2010 Elsevier B.V. All rights reserved. 1. Introduction Villarrica is a 600 ka old, 2847 m-high, mainly basaltic to basaltic– andesitic stratovolcano located in the southern Chilean Andes (Moreno and Clavero, 2006; Fig. 1). It is one of the most active volcanoes in South America, with more than 30 known eruptions in the last century (Lara and Clavero, 2004). The summit crater has a diameter of around 200 m and variable depth (from tens of meters up to ~150 m) and it is covered by a perennial glacier (Rivera et al., 2006). Its recent activity consists of open-conduit degassing, alternating with mild explosions (Strombolian and Hawaiian styles) and lava flows. After the last large eruption (1984–85), the magma surface has remained high with occasional formation of a lava lake (Witter et al., 2004). Although its historical eruptive activity has been mainly effusive and weakly explosive, Villarrica volcano also had postglacial (b 14 ka) highly explosive behaviour, which produced pyroclastic density currents (PDCs) and dispersed tephra from both the central vent and flank parasitic pyroclastic cones (Clavero and Moreno, 2004). The two known largest-volume eruptions are related to the Licán and Pucón Ignimbrites (13.8 and 3.6 ka respectively), which produced widespread PDCs and are likely associated to caldera formation (Clavero and Moreno, 2004; Lohmar et al., 2007; Moreno and Clavero, Journal of Volcanology and Geothermal Research 200 (2011) 143–158 ⁎ Corresponding author. Tel.: + 41 022 3796660; fax: + 41 022 3793210. E-mail address: [email protected] (L. Costantini). 0377-0273/$ – see front matter © 2010 Elsevier B.V. All rights reserved. doi:10.1016/j.jvolgeores.2010.12.010 Contents lists available at ScienceDirect Journal of Volcanology and Geothermal Research journal homepage: www.elsevier.com/locate/jvolgeores
-
Upload
independent -
Category
Documents
-
view
0 -
download
0
Transcript of A Late Holocene explosive mafic eruption of Villarrica volcano, Southern Andes: The Chaimilla...
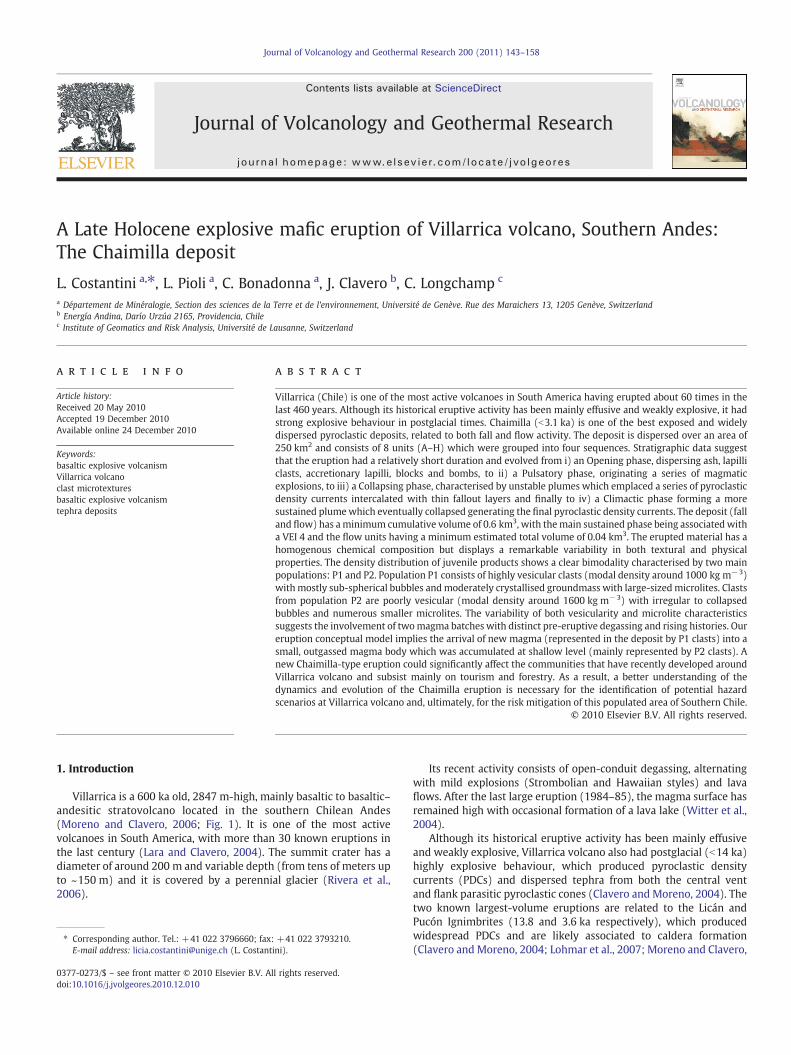
Journal of Volcanology and Geothermal Research 200 (2011) 143–158
Contents lists available at ScienceDirect
Journal of Volcanology and Geothermal Research
j ourna l homepage: www.e lsev ie r.com/ locate / jvo lgeores
A Late Holocene explosive mafic eruption of Villarrica volcano, Southern Andes:The Chaimilla deposit
L. Costantini a,⁎, L. Pioli a, C. Bonadonna a, J. Clavero b, C. Longchamp c
a Département de Minéralogie, Section des sciences de la Terre et de l'environnement, Université de Genève. Rue des Maraichers 13, 1205 Genève, Switzerlandb Energía Andina, Darío Urzúa 2165, Providencia, Chilec Institute of Geomatics and Risk Analysis, Université de Lausanne, Switzerland
⁎ Corresponding author. Tel.: +41 022 3796660; fax:E-mail address: [email protected] (L. Costant
0377-0273/$ – see front matter © 2010 Elsevier B.V. Aldoi:10.1016/j.jvolgeores.2010.12.010
a b s t r a c t
a r t i c l e i n f oArticle history:Received 20 May 2010Accepted 19 December 2010Available online 24 December 2010
Keywords:basaltic explosive volcanismVillarrica volcanoclast microtexturesbasaltic explosive volcanismtephra deposits
Villarrica (Chile) is one of the most active volcanoes in South America having erupted about 60 times in thelast 460 years. Although its historical eruptive activity has been mainly effusive and weakly explosive, it hadstrong explosive behaviour in postglacial times. Chaimilla (b3.1 ka) is one of the best exposed and widelydispersed pyroclastic deposits, related to both fall and flow activity. The deposit is dispersed over an area of250 km2 and consists of 8 units (A–H) which were grouped into four sequences. Stratigraphic data suggestthat the eruption had a relatively short duration and evolved from i) an Opening phase, dispersing ash, lapilliclasts, accretionary lapilli, blocks and bombs, to ii) a Pulsatory phase, originating a series of magmaticexplosions, to iii) a Collapsing phase, characterised by unstable plumes which emplaced a series of pyroclasticdensity currents intercalated with thin fallout layers and finally to iv) a Climactic phase forming a moresustained plumewhich eventually collapsed generating the final pyroclastic density currents. The deposit (falland flow) has aminimum cumulative volume of 0.6 km3, with themain sustained phase being associated witha VEI 4 and the flow units having a minimum estimated total volume of 0.04 km3. The erupted material has ahomogenous chemical composition but displays a remarkable variability in both textural and physicalproperties. The density distribution of juvenile products shows a clear bimodality characterised by two mainpopulations: P1 and P2. Population P1 consists of highly vesicular clasts (modal density around 1000 kg m−3)withmostly sub-spherical bubbles andmoderately crystallised groundmass with large-sizedmicrolites. Clastsfrom population P2 are poorly vesicular (modal density around 1600 kg m−3) with irregular to collapsedbubbles and numerous smaller microlites. The variability of both vesicularity and microlite characteristicssuggests the involvement of twomagma batches with distinct pre-eruptive degassing and rising histories. Oureruption conceptual model implies the arrival of new magma (represented in the deposit by P1 clasts) into asmall, outgassed magma body which was accumulated at shallow level (mainly represented by P2 clasts). Anew Chaimilla-type eruption could significantly affect the communities that have recently developed aroundVillarrica volcano and subsist mainly on tourism and forestry. As a result, a better understanding of thedynamics and evolution of the Chaimilla eruption is necessary for the identification of potential hazardscenarios at Villarrica volcano and, ultimately, for the risk mitigation of this populated area of Southern Chile.
+41 022 3793210.ini).
l rights reserved.
© 2010 Elsevier B.V. All rights reserved.
1. Introduction
Villarrica is a 600 ka old, 2847 m-high, mainly basaltic to basaltic–andesitic stratovolcano located in the southern Chilean Andes(Moreno and Clavero, 2006; Fig. 1). It is one of the most activevolcanoes in South America, with more than 30 known eruptions inthe last century (Lara and Clavero, 2004). The summit crater has adiameter of around 200 m and variable depth (from tens of meters upto ~150 m) and it is covered by a perennial glacier (Rivera et al.,2006).
Its recent activity consists of open-conduit degassing, alternatingwith mild explosions (Strombolian and Hawaiian styles) and lavaflows. After the last large eruption (1984–85), the magma surface hasremained high with occasional formation of a lava lake (Witter et al.,2004).
Although its historical eruptive activity has been mainly effusiveand weakly explosive, Villarrica volcano also had postglacial (b14 ka)highly explosive behaviour, which produced pyroclastic densitycurrents (PDCs) and dispersed tephra from both the central ventand flank parasitic pyroclastic cones (Clavero and Moreno, 2004). Thetwo known largest-volume eruptions are related to the Licán andPucón Ignimbrites (13.8 and 3.6 ka respectively), which producedwidespread PDCs and are likely associated to caldera formation(Clavero and Moreno, 2004; Lohmar et al., 2007; Moreno and Clavero,
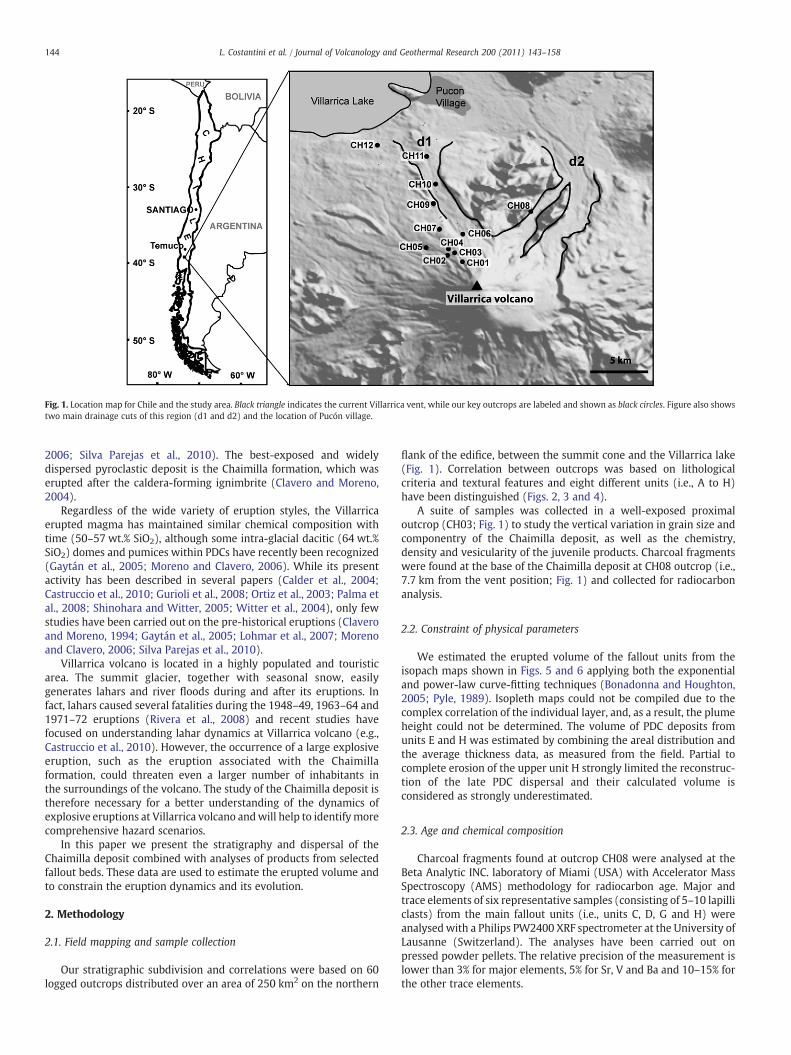
Fig. 1. Location map for Chile and the study area. Black triangle indicates the current Villarrica vent, while our key outcrops are labeled and shown as black circles. Figure also showstwo main drainage cuts of this region (d1 and d2) and the location of Pucón village.
144 L. Costantini et al. / Journal of Volcanology and Geothermal Research 200 (2011) 143–158
2006; Silva Parejas et al., 2010). The best-exposed and widelydispersed pyroclastic deposit is the Chaimilla formation, which waserupted after the caldera-forming ignimbrite (Clavero and Moreno,2004).
Regardless of the wide variety of eruption styles, the Villarricaerupted magma has maintained similar chemical composition withtime (50–57 wt.% SiO2), although some intra-glacial dacitic (64 wt.%SiO2) domes and pumices within PDCs have recently been recognized(Gaytán et al., 2005; Moreno and Clavero, 2006). While its presentactivity has been described in several papers (Calder et al., 2004;Castruccio et al., 2010; Gurioli et al., 2008; Ortiz et al., 2003; Palma etal., 2008; Shinohara and Witter, 2005; Witter et al., 2004), only fewstudies have been carried out on the pre-historical eruptions (Claveroand Moreno, 1994; Gaytán et al., 2005; Lohmar et al., 2007; Morenoand Clavero, 2006; Silva Parejas et al., 2010).
Villarrica volcano is located in a highly populated and touristicarea. The summit glacier, together with seasonal snow, easilygenerates lahars and river floods during and after its eruptions. Infact, lahars caused several fatalities during the 1948–49, 1963–64 and1971–72 eruptions (Rivera et al., 2008) and recent studies havefocused on understanding lahar dynamics at Villarrica volcano (e.g.,Castruccio et al., 2010). However, the occurrence of a large explosiveeruption, such as the eruption associated with the Chaimillaformation, could threaten even a larger number of inhabitants inthe surroundings of the volcano. The study of the Chaimilla deposit istherefore necessary for a better understanding of the dynamics ofexplosive eruptions at Villarrica volcano andwill help to identifymorecomprehensive hazard scenarios.
In this paper we present the stratigraphy and dispersal of theChaimilla deposit combined with analyses of products from selectedfallout beds. These data are used to estimate the erupted volume andto constrain the eruption dynamics and its evolution.
2. Methodology
2.1. Field mapping and sample collection
Our stratigraphic subdivision and correlations were based on 60logged outcrops distributed over an area of 250 km2 on the northern
flank of the edifice, between the summit cone and the Villarrica lake(Fig. 1). Correlation between outcrops was based on lithologicalcriteria and textural features and eight different units (i.e., A to H)have been distinguished (Figs. 2, 3 and 4).
A suite of samples was collected in a well-exposed proximaloutcrop (CH03; Fig. 1) to study the vertical variation in grain size andcomponentry of the Chaimilla deposit, as well as the chemistry,density and vesicularity of the juvenile products. Charcoal fragmentswere found at the base of the Chaimilla deposit at CH08 outcrop (i.e.,7.7 km from the vent position; Fig. 1) and collected for radiocarbonanalysis.
2.2. Constraint of physical parameters
We estimated the erupted volume of the fallout units from theisopach maps shown in Figs. 5 and 6 applying both the exponentialand power-law curve-fitting techniques (Bonadonna and Houghton,2005; Pyle, 1989). Isopleth maps could not be compiled due to thecomplex correlation of the individual layer, and, as a result, the plumeheight could not be determined. The volume of PDC deposits fromunits E and H was estimated by combining the areal distribution andthe average thickness data, as measured from the field. Partial tocomplete erosion of the upper unit H strongly limited the reconstruc-tion of the late PDC dispersal and their calculated volume isconsidered as strongly underestimated.
2.3. Age and chemical composition
Charcoal fragments found at outcrop CH08 were analysed at theBeta Analytic INC. laboratory of Miami (USA) with Accelerator MassSpectroscopy (AMS) methodology for radiocarbon age. Major andtrace elements of six representative samples (consisting of 5–10 lapilliclasts) from the main fallout units (i.e., units C, D, G and H) wereanalysedwith a Philips PW2400 XRF spectrometer at the University ofLausanne (Switzerland). The analyses have been carried out onpressed powder pellets. The relative precision of the measurement islower than 3% for major elements, 5% for Sr, V and Ba and 10–15% forthe other trace elements.
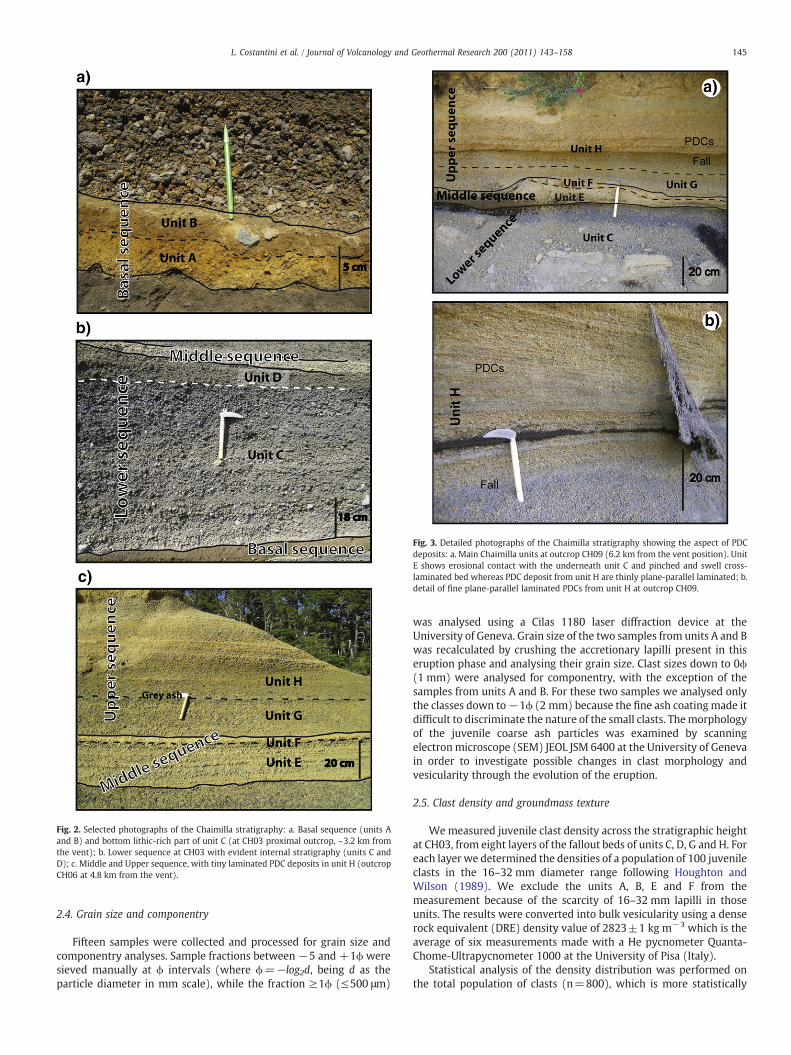
Fig. 2. Selected photographs of the Chaimilla stratigraphy: a. Basal sequence (units Aand B) and bottom lithic-rich part of unit C (at CH03 proximal outcrop, ~3.2 km fromthe vent); b. Lower sequence at CH03 with evident internal stratigraphy (units C andD); c. Middle and Upper sequence, with tiny laminated PDC deposits in unit H (outcropCH06 at 4.8 km from the vent).
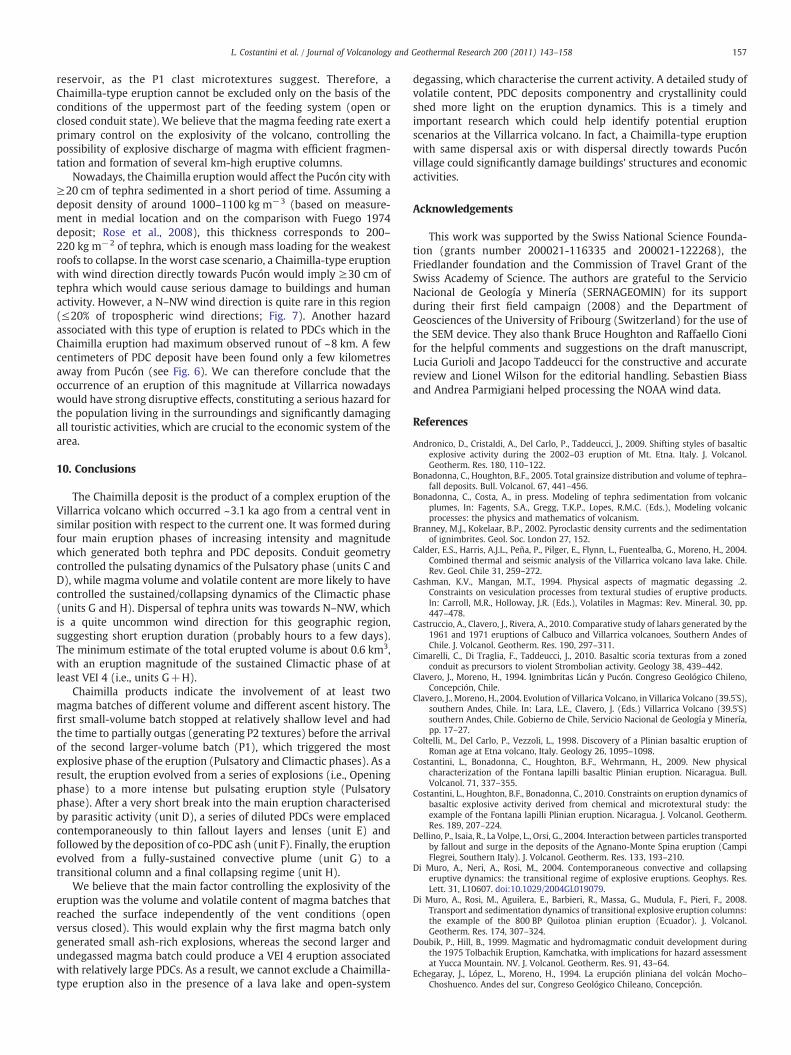
Fig. 3. Detailed photographs of the Chaimilla stratigraphy showing the aspect of PDCdeposits: a. Main Chaimilla units at outcrop CH09 (6.2 km from the vent position). UnitE shows erosional contact with the underneath unit C and pinched and swell cross-laminated bed whereas PDC deposit from unit H are thinly plane-parallel laminated; b.detail of fine plane-parallel laminated PDCs from unit H at outcrop CH09.
145L. Costantini et al. / Journal of Volcanology and Geothermal Research 200 (2011) 143–158
2.4. Grain size and componentry
Fifteen samples were collected and processed for grain size andcomponentry analyses. Sample fractions between −5 and +1ϕ weresieved manually at ϕ intervals (where ϕ=−log2d, being d as theparticle diameter in mm scale), while the fraction ≥1ϕ (≤500 μm)
was analysed using a Cilas 1180 laser diffraction device at theUniversity of Geneva. Grain size of the two samples from units A and Bwas recalculated by crushing the accretionary lapilli present in thiseruption phase and analysing their grain size. Clast sizes down to 0ϕ(1 mm) were analysed for componentry, with the exception of thesamples from units A and B. For these two samples we analysed onlythe classes down to−1ϕ (2 mm) because the fine ash coating made itdifficult to discriminate the nature of the small clasts. Themorphologyof the juvenile coarse ash particles was examined by scanningelectron microscope (SEM) JEOL JSM 6400 at the University of Genevain order to investigate possible changes in clast morphology andvesicularity through the evolution of the eruption.
2.5. Clast density and groundmass texture
Wemeasured juvenile clast density across the stratigraphic heightat CH03, from eight layers of the fallout beds of units C, D, G and H. Foreach layer we determined the densities of a population of 100 juvenileclasts in the 16–32 mm diameter range following Houghton andWilson (1989). We exclude the units A, B, E and F from themeasurement because of the scarcity of 16–32 mm lapilli in thoseunits. The results were converted into bulk vesicularity using a denserock equivalent (DRE) density value of 2823±1 kg m−3 which is theaverage of six measurements made with a He pycnometer Quanta-Chome-Ultrapycnometer 1000 at the University of Pisa (Italy).
Statistical analysis of the density distribution was performed onthe total population of clasts (n=800), which is more statistically

Fig. 4. Locationmap and stratigraphic correlation of six representative sections of the Chaimilla deposit. Section CH03 show the stratigraphic height of the samples collected. Sectionsare labeled as the outcrops and their positions are shown in Fig. 1.
146 L. Costantini et al. / Journal of Volcanology and Geothermal Research 200 (2011) 143–158
representative than the density distribution of single layers because ofthe limited number of clasts analysed (Polacci et al., 2003). Modes ofP1 and P2 populations have been determined from the analysis of thetotal data and later have been kept fixed in order to identify thefraction and standard deviation of these populations in the density
Fig. 5. Isopach maps of the Basal sequence of the Chaimilla deposit with thickness incm: a. unit A; b. unit B; dashed lines are extrapolated contours.
distribution of single units. Coefficient of determination (R2) has beencalculated, which is a measure of the proportion of variability in a dataset that is accounted for by statistical model. In this case, R2 is equal tothe square between the outcomes and their predicted values. Forcomparison, statistical analysis of clast density distribution of singleunits has also been performed. However, single unit distributionsreflect only the local proportion of the clasts deposited at CH03, andnot necessarily the distribution of the clast erupted during each pulse,as suggested by the progressive enrichment of less dense clasts in thetephra with increasing distance from the vent, as described insection 3.
The bulk density data were used to select forty clasts for polishedthin sections for qualitative study of microtextures. Clasts of differentdensity were selected and observations were done both with opticaland SEM microscopes at the University of Geneva and with FEI XL30Sirion FEG SEM at the University of Fribourg (Switzerland). In thispaper we use the term phenocrysts to describe crystal with lengthN0.5 mm,microphenocrysts for those crystals with length between 0.1and 0.5 mmandmicrolites for crystals b0.1 mm in length. Quantitativestudy of microlites abundance was performed on nine representativeclasts of different density following the method described inCostantini et al. (2010).
3. Stratigraphy
The Chaimilla deposit is well exposed in several locations,distributed over an area of 250 km2 on the northern flank of theedifice, between the summit cone and the Villarrica lake (Fig.1). Basedon lithological and textural features, we divided the Chaimilla depositinto 4 main sequences: Basal, Lower, Middle and Upper, which consistof several units (A to H; Figs. 2, 3 and 4). The basal contact with theunderlying Pucón Ignimbrite is usually plane-parallel, even though infew locations an angular unconformity, sometimes with reworkedbeds in between, separates the two deposits.
3.1. Basal sequence: units A and B
The Basal sequence is composed of two main ash and lapilli beds(units A and B), typically marked by different colours (Fig. 2a). Bothunits were deposited NW of the cone. Unit A changes in thicknessfrom 23 cm at outcrop CH01 (~2.2 km N of the summit crater; Fig. 1)to 1 cm in distal areas, whereas unit B displays limited variations in

Fig. 6. Deposit dispersal maps of the Lower, Middle and Upper sequences of the Chaimillaeruptionunitswith thickness in cm: a. isopachmapofunitCwithunitD isopachmap in thesmall box; b. isopachmap of the Upper sequence (fallout units G+H). Grey points indicatethe outcropswhere the Chaimilla deposit consists of only a single,massive fallout bed (i.e.,Lower+Upper sequences) and thickness of the Upper units cannot be discriminated;c. outcrops location of the unit E PDC deposit (Middle sequence)with thickness in cm. Thearea coloured in green indicates the region where this bed is thicker than 20 cm. The twomaindrainagecuts of this regionare also shown(d1 andd2).Dashed lines are extrapolatedcontours.
147L. Costantini et al. / Journal of Volcanology and Geothermal Research 200 (2011) 143–158
thickness, ranging from 2–3 cm in proximal and medial locations and1–2 cm in distal areas.
The bottom unit A is an orange, moderately to poorly sorted ashlayer, with scattered juvenile and lithic lapilli, whose abundance andmean size decrease with distance from the vent. In very proximallocations it also includes ballistic blocks which can have diameters
larger than the unit thickness (up to 1 m) and display markedlamination. In proximal locations a thin (~1 mm thick), well-sorted,coarse-ash layer is interbedded between the two units but itdisappears rapidly with increasing distance from the vent. Theoverlaying unit B is brown in colour, usually better sorted than unitA, having a significantly lower abundance of lapilli-sized fragments.The top part of unit B contains some cm-sized dense scoria fragmentsfrom unit C (Lower sequence) embedded in the ash matrix (Fig. 2a).Accretionary lapilli (2–3 mm in diameter) are discontinuouslydispersed in both units in some locations in medial areas.
3.2. Lower sequence: units C and D
The Lower sequence consists of two fallout units: C and D (Fig. 2aand b). Unit C is widely dispersed. Its total thickness decreases rapidlyin proximal area (from 5.4 m at CH01, 2.2 km from the summit crater,down to 1.3 m at CH03, 3.2 km from the vent; Fig. 1). At CH01, wedistinguishedmore than 20 different layers based on grain size and/orvariations in lithic content. These layers are moderately to poorlysorted, with average grain size ranging from coarse ash to bombs withdiameters up to 10 cm. The contact between layers is gradational tosharp. Non uniform thinning and grain size variations of the layersprevent their correlation at large scale, but stratification becomesmore subtle with increasing distance from the vent and the unit ismassive in distal locations. In proximal to medial locations juvenilelapilli mostly consist of poorly vesicular, sub-angular to sub-rounded,dark grey scoria and less abundant, usually altered, highly vesicularscoria clasts. The proportion of highly vesicular scoria increases withdistance from the vent. Lithic fragments mainly consist of poorly tonon-vesicular grey lava but rare red oxidized scoria clasts and granitefragments have also been found. Lithic clasts concentrate in thebottom layer(s) where they constitute up to 25 vol.% and decreaseupward, reaching around 5 vol.% in the upper layers.
Unit D is a massive, moderately sorted, lithic-free lapilli layer(Fig. 2b), formed by glassy and shiny, highly vesicular scoriafragments with a ragged aspect, and rare dense scoria clasts. Itreaches a maximum thickness of 50 cm at CH01 and is dispersed up to6 km from the vent (Fig. 4). Non continuous exposure in medial areassuggests local removal due to erosion by the succeeding PDCs(Fig. 3a). The contact with unit C is sharp except in very proximallocations, where it is marked by a transitional lapilli layer containingscoria from both units.
3.3. Middle sequence: units E and F
The Middle sequence consists of a series of PDC deposits (unit E)overlain by a well sorted ash tephra layer (unit F). In topographichighs unit E is reduced to a few cm thick dune bedded tuff (ashcontent N75%; Fisher, 1966), whereas in paleovalleys it has a morecomplex stratigraphy comprising massive, faintly stratified andlaminated beds (Figs. 2c, 3a and 4). Juvenile lapilli display a widerange of vesicularity and shapes, from highly to poorly vesiculated,and angular to sub-rounded. Lithic clasts predominantly consist oflava fragments. Contact with the Lower sequence can be plane-parallel or erosional.
The PDC deposits are overlain by a massive, well sorted, andwidely dispersed ash layer which has been labeled as unit F (Figs. 2cand 3a). The colour varies from light grey to light brown. Thethickness is constant (3–5 cm) in medial areas and reaches amaximum of 9 cm in proximal locations (near CH03; Fig. 1) and aminimum of 1 cm at 13.8 km from the vent (CH12; Fig. 1).
3.4. Upper sequence: units G and H
The Upper sequence consists of 2 units, G and H. Unit G is amassive, scoria lapilli fallout bed while unit H consists of a complex

148 L. Costantini et al. / Journal of Volcanology and Geothermal Research 200 (2011) 143–158
series of fallout and PDC beds. A grey, 1–2 cm-thick coarse ash layeroccurring at the base of unit H permits discrimination of the two unitsat most locations.
In both units G and H lapilli fallout beds are lithic-poor, massive,moderately sorted and reach maximum thicknesses at CH02, ~3.3 kmfrom the vent (142 cm for unit G and 135 cm for unit H). Juvenileclasts consist of moderately to highly vesicular, yellow to grey scoriafragments. In general, scoria clasts in unit G are less vesicular than inunit H. The yellow clasts display higher vesicularities and largervesicles and an inner dark grey core, suggesting preferential alterationof the external glassy portion.
In very proximal locations and on topographic highs, but also ondistal locations (≥7 km from the actual vent) unit H is reduced to asingle fallout bed overlain by PDC deposits (Figs. 2c, 3a and b). Inpaleovalleys and in medial locations NW of the summit cone, at thebreak in slope between the summit cone and the main edifice, thestratigraphy becomesmore complex because of the occurrence of PDCdeposits not only at the top but also variably intercalated in the upperpart of the fallout layer (Fig. 4). However, a finely stratified PDCdeposit occurs at the top of the sequence in all distal outcrops inpaleovalleys (Figs. 3b and 4) suggesting that the final PDCs had largerrunout and probably ended the eruption.
The PDC deposits consist of tuffs and lapilli-tuffs (ash and lapillideposits), and display a variety of facies, from parallel to crossstratified, laminated to diffuse stratified (Figs. 2c, 3a and b). The PDCdeposits reach a maximum thickness of a few m in the proximity ofthe upper cone break in slope (outcrop CH04 at 3.7 km from the vent;Fig. 1).
The top of unit H is often eroded or overlain by a pink, laminated,lithic-rich, lapilli and ash bed (in the northern sector). This bed is inangular conformity with the Chaimilla deposit in most locations, andthe contact is locally erosional. This is the basal bed of the Pedregrososurge deposits, dated at 2.6 ka ago (Clavero and Moreno, 2004).
In distal locations (N12 km from the vent) the top part of theChaimilla deposit is reduced to a single massive lapilli fallout bed dueto the disappearance of the ash layer at the base of unit H and any PDCdeposits in unit H, making the distinction between unit G and H verydifficult.
4. Tephra dispersal and typical wind profiles at Villarrica volcano
The Chaimilla tephra units were mainly dispersed towards N andNW of the Villarrica volcano (Figs. 5 and 6). The basal units havesimilar dispersal axis to the Upper sequence (NW), whereas bothunits C and D are dispersed to the N, with unit D being characterisedby rapid thinning. The distribution of unit E (Middle sequence) isstrongly controlled by topography and follows the two main drainage
Fig. 7.Wind profiles at the Villarrica volcano in six recent years (2003–2008) (wind data fromvariation of wind direction and b. variation of wind velocity profiles with altitude. Data ardegrees from the north where the wind blows to; c. probability of daily N ±45° wind direc
cuts d1 and d2 (Fig. 6c), confirming the interpretation of this unit asbeing mainly characterised by the emplacement of PDCs.
The N–NW dispersion characteristic of the Chaimilla formation isuncommon for South America. In fact, east-directed winds areprevailing in the middle latitudes (Westerlies winds) blowing fromthe high pressure area in the horse latitudes towards the poles. Inaddition, wind data at the Villarrica volcano also show a clear westprovenance (Fig. 7). In fact, average wind direction is clearly towardsE with values mainly ranging between NE and SE (Fig. 7a) and withnot obvious seasonal fluctuation. Wind velocity varies between 0 and40 m s−1 with a monotonic tropospheric increase (i.e., up to 12 km;Fig. 7b). The first few kilometres and altitudes higher than 20 kmabove sea level (a.s.l.) show slightly larger variations inwind direction(i.e., between N and S; Fig. 7a). Specifically, the probability of havingwind blowing towards N ±45 degrees is b20% up to 20 km a.s.l. andb30% for higher altitudes (Fig. 7c).
Most of the Chilean volcanoes generated big eruptions withplumes spreading eastward–southeastward which therefore weredispersed mainly in Argentina territory, such as the main phases ofthe Quizapu 1932 eruption (Hildreth and Drake, 1992), the Plinianphase of the Hudson 1991 eruption (Scasso et al., 1994) and the firstdays of the May 2008 Chaitén eruption (Watt et al., 2009).Nonetheless, some examples of short-lived eruptions or individualeruption phases dispersed towards N–NW have also been reported inthe past, e.g., the Neltume eruption of neighbouring Mocho–Choshuenco volcano ca. 9 ka ago (Echegaray et al., 1994), the firstphase of the Hudson 1991 eruption (Naranjo et al., 1993) and somephases of the long-lasting eruption of Lonquimay volcano in 1988–1989 (Moreno and Gardeweg, 1989).
5. Erupted volume and eruption classification
The erupted volume of fallout beds was estimated from theisopach maps shown in Figs. 5 and 6. Isopach maps well characterisethe Chaimilla dispersal but are also affected by some limitations. First,a cumulative map of units G+H has been drawn because, asmentioned before, units G and H are not distinguishable in distalareas. In addition, the isopach map of units G+H underestimates thetotal-deposit thickness as unit H could not be well constrained inproximal areas due to erosion and intercalation with PDC deposits.Therefore, the associated volume has to be considered as a minimumvalue. Second, due to the disappearance of units E and F, the Chaimilladeposit in the distal N–NW sector consists of a single fallout bed withuniform componentry and, as a result, unit C and units G+H aredifficult to distinguish (see the grey points in Fig. 6b). They could onlybe distinguished based on the different dispersal axes (Figs. 5 and 6).Third, it is important to bear in mind that unit C consists of an
NOAA, U.S. National Oceanic and Atmospheric Administration, www.cdc.noaa.gov): a.e presented as median value with associated error bar. Wind direction is expressed astion at different altitudes during the period 2003–2008.

Table 1Volume estimates and thinning half-distance values (bt) of the Basal, Lower and Upperfallout sequences of the Chaimilla deposit. Exp: exponential method from Pyle (1989)(only one segment was identified for all deposits); Power-law: power-law methodfrom Bonadonna and Houghton (2005) with power-law exponent (m) and theproximal and the outer integration limit (A0
1/2 and Adist1/2 ). For the units with m b2, two
estimates of outer limits have been considered. For the units with m≥2, two values ofA01/2 have been considered.
Exp Power-law bt(km)
Eruptionsequence
Eruptionunit
Volume(M3)
m A01/2
(km)Adist1/2
(km)Volume(m3)
Basal A 1.3×10⁷ 0.65 1.9 2025
8.6×10⁶
1.2×1073.8
B 6.42×10⁶ 1.79 3.30.3
15 4.7×10⁶
9.7×1062.0
Lower C 0.8×10⁸ 1.52 2.3 50100
1.3×10⁸
2.0×1081.8
D 5.7×10⁶ 2.69 1.30.3
10 5.5×10⁶
1.9×1070.5
Upper G+H 1.8×10⁸ 1.29 2.2 50100
3.1×10⁸
5.4×1082.2
149L. Costantini et al. / Journal of Volcanology and Geothermal Research 200 (2011) 143–158
accumulation of several layers, possibly associated with individualexplosions or a pulsating column. Also the Basal sequence waspossibly generated by several ash-rich explosions. However, given theelongation of the isopach maps with the main dispersal in agreementwith an uncommon wind direction for this geographical area, it islikely that most layers were erupted in a short period of time and thatthe volume extrapolated from these maps can be considered as a goodapproximation. In fact, a long-lasting eruption would be more likelycharacterised by a pseudo-circular isopach map or an isopach mapdispersed towards the main wind direction for this geographicalregion (i.e., east).
All the units can be described with both one exponential segmentor a power-law curve and the estimates of volume calculation areshown in Table 1. For the less dispersed units B and D, the volumedetermined using the power-law technique is sensitive to theproximal integration limit
ffiffiffiffiffiffiA0
p, while for the more widespread
units A, C and G+H (power-law coefficient b2) the volumedetermined using the power-law technique is sensitive to the outer
Fig. 8. Semi-log plot of thickness versus the square root of the area of the Chaimilla deposit coare from: Sparks et al., 1981 [Askja D, 1875]; Costantini et al., 2009 [Fontana Lapilli, 60 ka]; S1932]; Bonadonna and Houghton, 2005 [Ruapehu, 17 June 1996]; Walker et al., 1984 [Tara
integration limitffiffiffiffiffiffiffiffiffiAdist
p(see Bonadonna and Houghton, 2005 and
Bonadonna and Costa, in press, for a review of volume determination).In addition, given the deposit dispersal, the outer power-lawintegration limits of units A, B and D can be better constrained withrespect to those of units C and G+H. For these two units we considertwo different integration limits, 50 and 100 km. In fact, given thatboth C and G+H units show a trend similar to the 18th May 1980Plinian eruption of Mount St. Helens 1980 (MSH 18 May 1980; Fig. 8)and that the MSH 18 May 1980 deposit is 1 cm and 0.1 cm at 170 and340 km (area½) from the vent respectively, we consider 100 km as amaximum outer integration limit.
As a result,we proposefinal estimates of 1.1±0.2×10⁷ m3 for unit A(VEI 2–3), 7.2±2.5×10⁶ m3 for unit B (VEI 2), 1.4±0.6×10⁸ m3 forunit C (VEI 4), 1.3±0.6×10⁷ for unit D (VEI 2–3) and 3.6±1.8×10⁸ m3
for units G+H(VEI 4), for a total estimate of around 0.5 km3 (VEI 4). Forall the fallout units, we also calculate the thinning half-distance bt(Table 1) following Pyle (1989), where bt is the distance over which thedeposit halves in thickness. In the medial region (area½ of around3–15 km), bt is moderately high for most of the units (between 1.8 and3.8 km) with the exception of unit D whose bt is only 0.5 km due to itsrapid thinning. These values are also typical of themedial portions of thedeposits of both basaltic and silicic Plinian eruptions of moderateintensity, e.g., Fontana Lapilli (2.6 km), Etna 122 BC (2.7 km), Mount StHelens 18 May 1980 (3.2 km), Askja D 1875 (3.5 km) and Tarawera1886 (4.3 km; Costantini et al., 2009 and references therein).
Considering the erupted volume (VEI 4) and the thinning trend(Fig. 8 and Table 1), the Chaimilla units C and G+H are thereforecomparable to relatively large eruptions such as Mount St Helens 18May 1980 and Askja D 1875. However, some caveats need to bediscussed. In particular, units A, B and C represent composite-falloutdeposits and, as a result, the associated volume is related to acombination of short-lived events or a pulsating column and cannotbe used to classify individual units. Nonetheless, the Upper sequencetephra (units G+H) was generated by a more sustained column andcan be safely classified as at least VEI 4 (minimum estimate as H is notfully preserved).
The minimum areal dispersal of the PDC deposits corresponds to30 km2 for unit E and 55 km2 for unit H. This is a minimum estimatebased on stratigraphic evidences, which were limited to the tephra
mpared with the thinning trend of other deposits produced by explosive eruptions. Dataarna-Wojcicki et al., 1981 [Mount St. Helens, 1980]; Hildreth and Drake, 1992 [Quizapu,wera, 1886].

Table 2Whole-rock analyses of representative Chaimilla samples. Major element compositionis normalized to 100% volatile-free.
Sequence Lower Upper
Unit: C D G H
Sample 03 05 08 09 12 14
Major and minor elements (oxides wt.%)SiO2 52.93 53.04 53.10 52.83 52.62 51.98TiO2 1.01 1.00 1.00 1.03 0.98 1.01Al2O3 19.40 19.46 19.04 19.68 18.62 19.43Fe2O3 8.93 8.86 8.89 9.03 9.29 9.52MnO 0.15 0.15 0.15 0.15 0.16 0.16MgO 4.03 3.98 4.15 3.88 4.83 4.68CaO 9.96 9.94 9.93 9.86 9.96 9.87Na2O 2.84 2.79 2.90 2.76 2.75 2.62K2O 0.58 0.59 0.65 0.60 0.61 0.54P2O5 0.17 0.18 0.18 0.18 0.18 0.18Total⁎ 99.29 99.73 99.17 99.49 99.21 99.75
Trace elements (ppm)Zr 82 83 82 85 79 81Y 22 22 23 22 21 22Sr 461 460 458 459 443 443Rb 16 16 17 15 15 14Ga 20 21 21 22 21 21Zn 84 87 84 87 83 82Cu 97 106 93 103 87 91Ni 26 24 31 23 36 36Co 26 27 27 26 29 27Cr 74 71 93 71 128 116V 296 293 292 291 277 286Ce 15 12 13 16 15 16Nd 12 11 12 11 11 12Ba 205 197 206 203 195 187La 10 11 8 12 15 12S 173 174 152 209 157 157Sc 32 34 32 35 35 36
⁎ Original value retained.
150 L. Costantini et al. / Journal of Volcanology and Geothermal Research 200 (2011) 143–158
dispersal area and were affected by partial erosion of the Uppersequence. Basing on this dispersal, the volume of the deposits wasestimated to be 5×10⁶ m3 for unit E and 3.6×10⁷ m3 for unit H,accounting for average thickness of 16 and 65 cm respectively.
6. Age and chemical composition
Charcoal fragments were found within a very thin (few mm), darkbrown soil, interbedded between the base of Chaimilla deposit andthe Pucón Ignimbrite. Results give a conventional uncalibratedradiocarbon age of 3180±40 BP. Published uncalibrated dates fromthe Pucón Ignimbrite range between 3.6 and 3.8 ka (Clavero andMoreno, 2004; Moreno and Clavero, 2006; Silva Parejas et al., 2010),which therefore suggests a minimum time gap of 400 years betweenthese two explosive events. Chaimilla juvenile clasts have a uniformbasaltic-andesite bulk composition (52–53 wt.% SiO2), which does notchange significantly with time (Table 2). In addition, Chaimillaproducts have remarkably similar chemistry with respect to samplesof recent activity (Witter et al., 2004).
7. Grain size and componentry
Grain size distributions of all the fallout units are unimodal,ranging from −5ϕ to 9ϕ, even though the fraction N4ϕ (b63 μm) isalways ≤1 wt.%. The grain size of the individual layers of unit C isheterogeneous given the presence of both coarse- and fine-grainedlayers, with a consequent fluctuation of median diameter (Mdϕ) andsorting (σϕ) values (Inman, 1952) and ash content. On the contrary,units G and H fallout beds are homogenous, with unit G better sortedand with narrower grain size distribution with respect to the
overlying unit H, whereas Mdϕ does not vary significantly throughthe two fallout beds (Figs. 9 and 10). Unit E has bimodal grain sizedistribution with a significant amount of fine ash, while the mediandiameter does not differ in the other samples. Samples from units Aand B have instead a bimodal grain size distribution, with apredominance of ash fraction, high Mdϕ and they are poorly sorted(Figs. 9 and 10). Accretionary lapilli are constituted of coarse and fineash, having a unimodal grain size distribution, good sorting andsignificantly high Mdϕ (~5ϕ).
Juvenile component predominates in all the Chaimilla deposit, andlithic content decreases from bottom to top of the deposit, rangingfrom ~25 wt.% in the basal bed of unit C, to≤1 wt.% both in unit D andin the Upper sequence units. Observation of the morphology of thejuvenile coarse ash particles reveals that every unit has a wide rangeof clast shape and vesicularity ranging from poorly vesicular,equidimensional clasts, to highly vesicular, ragged clasts, while fluidalmorphology is quite rare (see Houghton and Wilson, 1989 for thedefinition of vesiculation characteristics). No significant changeamong different clast types occurs among the different layers.However, units A, B and C have abundance of poorly vesicular ashparticles, while highly vesicular fragments are predominant in theupper units (i.e., units G and H). Vesicles are from spherical toirregular-shape. No quenching-cracks affect the surface of the ashfragments.
8. Clast density and groundmass texture of juvenile material
Density results are shown in Fig. 11 and in Table 3. The distributionof individual units can be described as either bimodal (i.e., units C andG) or unimodal with a high-density tail (i.e., units D and H). Units Cand G have the widest density range whereas density distribution issignificantly narrower in both unit D and unit H (Fig. 11a).
All the Chaimilla juvenile clasts have a phenocryst content variablebetween 5 and 15 vol.%. The phenocryst assemblage consists ofplagioclase, olivine and clinopyroxene. No significant variability inboth phenocryst abundance and mineral species has been observedthrough the eruptive sequence. On the contrary, the groundmass isstrongly heterogeneous both within and among clasts.
We identified two different clast types (i.e., P1 and P2)characterised by different density/bulk vesicularity and microtex-tures: the P1 clasts are highly vesicular with sub-spherical tosmoothly irregular-shaped bubbles and a moderate crystallisedgroundmass (~40–60 vol.%), while P2 clasts are denser with irregularto collapsed bubbles (i.e., bubbles with some concave margins) and ahighly crystallised groundmass (~60–90 vol.%; Figs. 12, 13 and 14).Smallest bubbles range from irregular to sub-spherical with diametersof 10–20 μm. Some mm-size olocrystalline xenolithic inclusions havebeen found within the clasts of both microtextural types (e.g.,Fig. 13b). Clasts with intermediate density between P1 and P2 (i.e.,density around 1200–1300 kg m−3) have strongly heterogeneousgroundmass textures. In fact, they contain portions which aremoderately crystalline with sub-spherical to smoothly irregularbubbles similar to the texture of P1 clasts, and other zones highlycrystalline with irregular and collapsed bubbles similar to the textureof P2 clasts (Fig. 13d and e). The patches with higher crystallinity arealways smaller and often completely surrounded by the glassy, P2facies. The contact between these two portions varies from grada-tional to sharp.
The cumulative, total density distribution of all juvenile clastserupted in the different fallout beds (i.e. units C+D+G+H) ischaracterised by a wide density range (630–2500 kg m−3) and alsoshow two main modes, which reflects the two clast types (Fig. 11b).Based on textural observation described above, we computed the totaldensity distribution as the sumof two normally distributed populationshaving: population 1 (P1)with an average density of 1020 kg m−3 (64%vesicularity) and standard deviation of 160 kg m−3 and population 2

Fig. 9. Grain size and componentry histograms offifteen samples fromoutcrop CH03 (Fig. 4). Sample fromunit F is not shown in the graph because this unit is not present in the CH03 outcrop.
151L. Costantini et al. / Journal of Volcanology and Geothermal Research 200 (2011) 143–158

Fig. 10. Variation in median diameter (Mdϕ), sorting (σϕ), ash fraction (wt.% b1 mm and b63 μm) and lithic content with stratigraphic height at CH03. Samples are shown as blackdiamonds.
152 L. Costantini et al. / Journal of Volcanology and Geothermal Research 200 (2011) 143–158
(P2) with an average density of 1630 kg m−3 (43% vesicularity) andstandard deviation of 360 kg m−3 (Fig. 11b and Table 3).
We also elaborated the cumulative density distribution of singleunits in terms of P1 and P2 modes (Fig. 11c). Unit H is characterisedonly by P1 densities, whereas unit C is mainly characterised by P2clasts, which occupy 89% of the entire distribution. P1 clasts arepredominant in unit D, whereas unit G shows a bimodal distributionwith 37% of P1 and 63% of P2 (Fig. 11c and Table 3). However, whenwe consider the density distribution of the single erupted units, thebest-fitted modes are different with respect to the modes of P1 and P2
Fig. 11. a. Clast density histograms resulted from the analysis of eight selected samples frhistogram of juvenile clasts of the whole fallout units with two population modes. Frequenlength, in order to lead the histogram aspect independent of the choice of the bins; c. cumpopulation modes as the ones obtained in the total density distribution histogram.
populations, especially for the units C and G. Unit C has a bimodaldistribution but with best-fit modes of 1200 and 1800 kg m−3 (withthe dense population occupying 60% of the entire distribution). Best-fit mode values of unit G density distribution are similar to the onesfrom unit C (i.e., 1300 and 1900 kg m−3 respectively) with thelightest population being the most abundant (79%). Best-fit modes ofunits D and H are similar to P1 and P2.
A lower degree of heterogeneity occurs in P2 clasts, which maycomprise zones with large, coalesced vesicles (up to 1 mm) and zoneswith irregular-shaped, small (~100 μm as average) vesicles (Fig. 13a
om units C, D, G and H (100 clast in each sample); b. cumulative density distributioncy classes were set dividing each population fraction which lies on each bin by the binulative density distribution histograms of single fallout units with distribution of same

Table 3Clast density distribution statistical analyses expressed as mode, standard deviation(2σ) and abundance fraction of each population. Coefficient of determination (R2) hasalso been calculated. Table also shows the number of clasts and density range of eachdensity distribution.
Sequence Total(Lower+Upper)
Lower Upper
Unit C D G H
No. of clasts 800 400 100 100 200Density range(kg/m3)
630–2500
780–2500
800–2180
860–2410
630–1690
P1 population (mode1020 kg/m3)
Fraction 0.47 0.11 0.84 0.37 1.002σ(kg/m3)
160 150 140 210 220
P2 population (mode1630 kg/m3)
Fraction 0.53 0.89 0.16 0.63 0.002σ(kg/m3)
360 370 300 290 n.d.
R2 0.9989 0.9952 0.9919 0.9602 0.7818
153L. Costantini et al. / Journal of Volcanology and Geothermal Research 200 (2011) 143–158
and b). No systematic differences between clast core and rim havebeen observed, suggesting that this is a primary, pre-fragmentationfeature. In addition, P1 clasts display variations in textural character-istics in deposits of units C+D and fallout from units G+H. P1 clastsfrom the units G and H have in fact larger and spherical bubbles, lowermicrolite content and larger crystal sizes with respect to the P1 clastsfrom units C and D (Figs. 13 and 14). P1 clasts from units C and G havemore heterogeneous textures in comparison with units H and D.
Microlite abundance is shown in Fig. 14. Plagioclase is thepredominant phase in all clasts (40–55 vol.% of the groundmass). Inunits C and D crystals generally show acicular habit and are slightlyoriented, with size ranging between 20 and 30 μm (both P1 and P2clasts). In contrast, in the clasts from units G and H, plagioclasecrystals are generally more equant and larger (~50–100 μm).Clinopyroxene microlites range from skeletal to subhedral and arevery small in units C and D (up to a few microns), to larger (10–
Fig. 12. Selected backscattered SEM images (25× and 250× magnifications) of juvenileclasts of different density from selected units. The clast from unit C is representative ofP2 mode, whereas clasts from unit D, G and H are representative of P1, even though theunit G clast in the figure has a higher density with respect to the P1 mode. Vesicles arein black, while the glass and microlites groundmass are in grey.
20 μm) and with a euhedral to subhedral habit in units G and H. Theirabundance is usually around 20 vol.% but it increases (up to 40 vol.%)in the highly crystallised clasts. Microlites of Fe–Ti oxides locally occur(0.5–2.5 vol.%) in the P1 clasts.
9. Discussion
9.1. Deposit dispersal, vent position and eruption duration
Based on the deposit dispersal shown in Figs. 5 and 6, we suggestthat the vent associated with the Chaimilla eruption was in a similarposition with respect to the current one. Unit D differs significantlyfrom the other fallout units, being characterised by a less elongatedand widespread dispersal and being almost lithic-free. These differentcharacteristics and its proximal intercalation with the underlying unitC suggest that unit D was erupted from a parasitic vent likely locatedalong the NW flank of the volcano and deposited just before the end ofunit C.
The Chaimilla eruption is likely to have occurred after a significanttime gap from the emplacement of the Pucón Ignimbrite eruption. Infact, the contact between the top of the Pucón Ignimbrite and unit A ismarked by unconformity and local occurrence of reworked beds. Inaddition, radiometric ages suggest a minimum gap of 400 yearsbetween these two eruptions. However, it is difficult to assess if this isa major repose period of the volcano or if minor eruptions (such assmall-volume lava flows or Hawaiian or Strombolian explosions) haveoccurred during that period of time. In fact, the associated tephradeposits would have been relatively thin and therefore they are notexpected to be preserved in the stratigraphic record.
The Chaimilla tephra dispersal suggests a wind direction which isunusual with respect to the typical wind direction (i.e., N–NW; Fig. 7)for any heights. Unfortunately, we cannot establish if the N–NWwinddirection was more common ~3 ka ago, but the main dispersal ofother historical fallout deposits suggests that prevailing winds at thattime were likely to be similar to the current ones. However, asdiscussed before, a N–NW wind direction has also been recordedduring short-lived eruption phases at other southern Andes volcanoes(e.g., Moreno and Gardeweg, 1989; Naranjo et al., 1993; Echegaray etal., 1994). It is therefore very likely that the Chaimilla tephra bedswere deposited in a relatively short time (hours to few days). Anotherevidence for a short-lived eruption is given by the fact that no soil andvery limited reworked materials are found in between the differentunits and sequences that form the deposit.
9.2. Conceptual model for eruption dynamics
Based on the stratigraphic data and the results from our sampleanalysis, we have interpreted the Chaimilla units as the products offour eruption phases, as it is shown in Fig. 15.
9.2.1. Opening phase (units A and B)Units A and B are related to the Opening phase of the eruption.
Repeated explosions dispersed ash, lapilli clasts and accretionarylapilli up to several kilometres from the vent, and lithic blocks anddense juvenile bombs in proximal area. This phase led to progressivevent opening.
9.2.2. Pulsatory phase (units C and D)An increase in intensity led to the onset of the Lower sequence,
consisting of pulsatory activity associated with a series of explosionswith different magnitude and intensity or a pulsating column (unit C).The lack of fine ash between layers favours the likelihood of apulsating column or a series of fine-poor explosions. Most pulsesdispersedmaterial only in proximal areas, but some of them dispersedscoria at least up to 15 km from the vent, likely reaching intensitiescomparable to the Upper sequence (units G and H). The very limited

Fig. 13. Optical microscope images of selected clasts of different density: a. high density clast (representative of density population P2) showing a zone characterised by large,irregular-shaped and connected bubbles; b. high density clast (representative of density population P2) showing a zone with very small, irregular-shaped vesicles and the presenceof olocrystalline xenolith; c. clast texture in unit C representative of density population P1; d. and e. mingled clasts present in unit C. Black regions represent the P2magma, while thehoney rim corresponds to the less crystallised P1 magma; f. and g. clast texture in units G and H corresponding to density population P1.
154 L. Costantini et al. / Journal of Volcanology and Geothermal Research 200 (2011) 143–158
lithic content of the medial-upper portion of unit C suggests thatcrater formation was completed before the end of this phase.
The end of the Pulsatory phase was also characterised by thecontemporaneous deposition of unit D probably related to moderateexplosive activity (e.g., Strombolian) at a parasitic vent.
9.2.3. Collapsing phase (units E and F)After the end of sedimentation of unit D, there was the
emplacement of a series of dilute (as suggested by internal featuresstructure; Branney and Kokelaar, 2002), juvenile-rich PDCs along theN slope of the volcano, which were emplaced contemporaneously tothe sedimentation of thin fallout layers (unit E). The dependence ofthe deposit aspect and thickness on the topography suggests that theunit was deposited by a series of PDCs with different concentrationsand runout. The bottom of unit E bears highly vesicular lapilli withsimilar texture to juvenile clasts in unit D suggesting that unit D waseroded and incorporated in the PDCs. The diluted PDCs wereemplaced contemporaneously to the sedimentation of thin falloutlayers suggesting an unstable column probably associatedwith a largemass discharge rate. Unit E was deposited after very local lahars inproximal–medial area which might indicate a short time break in theeruption (tens of minutes–few hours?). The formation of a co-PDC ashcloud was associated with the PDCs and deposited the brown ashlayer of unit F in the entire sector.
9.2.4. Climactic phase (units G and H)After the PDCs and co-PDC ash cloud deposition, the eruption
shifted to a more sustained phase which deposited a massive fall bed
with uniform grain size characteristics (i.e., unit G). The eruptiondynamics changed again with the deposition of unit H, which consistsof multiple fallout beds with discontinuous distribution, overlain andlocally intercalated by PDC deposits. The discontinuous distributionsuggests syneruptive erosion or contemporaneous depositions offallout beds with the PDCs deposit during the final stage of theeruption (Dellino et al., 2004; Valentine and Giannetti, 1994). Thisstratigraphy can be interpreted as the result of progressive instabilityof the eruption column shifting from partial collapse to a final totalcollapse dynamics (Di Muro et al., 2004). The final total collapse thatgenerated the upper portion of unit H was associated with increasedflow runout (up to 8 km) and larger dispersal which suggest a furtherincrease of the mass discharge rate and/or a decrease in volatilecontent. In fact, unit H has a very low lithic content and therefore theconduit geometry is not expected to have changed significantly. Inaddition, clast morphology and microtextures do not suggestinvolvement of external water.
The transitional collapsing/buoyant behaviour of volcanic plumeshas already been observed in Plinian eruptions fed by silica-richmagmas and often explained by a significant variation in massdischarge rate and/or water contents (e.g., Di Muro et al., 2008;Fierstein and Hildreth, 1992;Melnik, 2000; Neri et al., 2002; Rosi et al.,2001, Wilson and Hildreth, 1997). In contrast, the waning phase ofbasaltic explosive eruptions is more commonly characterised byeffusive activity (e.g., Andronico et al., 2009; Doubik and Hill, 1999;Höskuldsson et al., 2007; Pioli et al., 2008; Scollo et al., 2007), or byfurther explosivity sustained by magma–water interaction (Coltelliet al., 1998; Perez et al., 2009; Taddeucci et al., 2002, Walker et al.,

Fig. 14. Abundance of mineral phases (microlites) and glass matrix in selected mean density clasts expressed as vol.%. On the right, 1000× backscattered SEM images showing thevariability of microlite content shape throughout the eruption stratigraphy. Vesicles are in black, plagioclase microlites in dark grey, while glass and clinopyroxene are in pale grey.
I) Opening Phase
IV) Climactic Phase
III) Collapsing Phase
II) Pulsatory Phase
Fig. 15. Schematic cartoon showing the four Chaimilla eruption phases: I) Opening phase: several fine-rich explosions and ballistic ejection; II) Pulsatory phase: further vent openingassociated with pulsating plumes; III) Collapsing phase: diluted PDCs combined with tephra fall; IV) Climactic phase: closing phase evolving from fully convective to fully collapsingcolumn passing through an intermediate transitional regime.
155L. Costantini et al. / Journal of Volcanology and Geothermal Research 200 (2011) 143–158

156 L. Costantini et al. / Journal of Volcanology and Geothermal Research 200 (2011) 143–158
1984) or by a series of weak explosions (Mannen, 2006; Nye et al.,2002). In addition, dilute, long runout PDCs are not commonlyassociated with dry basaltic explosive eruptions. As an example, thePDC deposits associated with the 2.1 ka Masaya Triple Layer eruptionat the Masaya volcano (Nicaragua) were interpreted as resulting fromwater–magma interaction (Perez et al., 2009). We therefore infer thatthe final (recorded) phases of the Chaimilla eruption attest anuncommon eruption dynamics for low viscosity magma whichmight have been marked by an increase of mass discharge rate and/or a decrease in water in the eruptive mixture.
9.3. Significance of the density/microtextural data on eruption dynamics
The Chaimilla scoria fragments were distinguished on the basis ofvesicularity and groundmass texture into two textural-types havingsame chemical and phenocrysts composition: P1 clasts which arehighly vesicular with the less numerous microlites and P2 clastswhich are denser with irregular to collapsed bubbles and morenumerous microlites. The textural heterogeneity of clasts of interme-diate density (whose density also correspond to the best-fit modes ofunits C and G), suggests that those clasts are mostly formed bymingling of P1 and P2 textures with the low vesicularity portions (P2)dispersed within a highly vesicular (P1) matrix. This in turn impliesthat the mathematical best-fit modes of the single units do notnecessarily correspond to any real clast population, whereas texturalobservations on P1 and P2 populations confirm different and peculiartextural characteristics.
Field and clast density data also suggest that the proportion of P1clasts increased with time reaching about 100 vol.% of the eruptedmaterial at the end of the Climactic phase. We cannot quantify thedensity distribution of the clasts erupted during the whole eruptionfrom our analysis of outcrop CH03 because it cannot be considered asrepresentative of the whole Chaimilla deposit. In fact, our analysis isbased on a limited grain size range and not all the layers of CH03extend to distal area. In addition, componentry varies with distancefrom the vent. As a result, calculated volumes of the individual unitsand the variation of the proportions of the two clast types in thesequence at different locations suggest that the density distribution atCH03 underestimates P1 clast population with respect to the wholedeposit, which is, instead, the main juvenile component of theChaimilla deposit.
In general, dense pyroclasts can be interpreted as formed by apartially degassed magma body residing in the shallow portion of themagmatic system or rising very slowly (Hammer et al., 1999;Houghton et al., 2004; Pioli et al., 2008, Sable et al., 2006). In fact,collapsed vesicles are commonly interpreted to be the result ofshrinkage due to gas loss after significant growth and coalescence(Cashman and Mangan, 1994). In addition, the small size of P2microlites suggests open-system degassing conditions associatedwith rapid cooling of a small magma batch. On the contrary, highervesicularities and smaller groundmass crystallinity suggest fast risefrom depth with no significant residence time at shallow depthsbefore the eruption.
Textural heterogeneity of basaltic scoria textures (i.e., differentvesicularity and groundmass crystallinity) is a common feature whichhas been found in deposits from eruptions with different magnitudes.These variations often reflect physical mingling between differentmagma types derived from the same source and evolved underdistinct degassing and crystallisation histories. Contemporaneouseruption of the two magma types has been interpreted as related tovelocity gradients in the volcanic conduit or by involvement ofdifferentmagma batches (Cimarelli et al., 2010; Costantini et al., 2010;Lautze and Houghton, 2007; Pioli et al., 2008; Polacci et al., 2006; Rosiet al., 2006; Sable et al., 2006; Taddeucci et al., 2004). In the first case,the proportion between P1 and P2 clasts reflects the lateral velocitygradient in the conduit and is primarily controlled by shallow magma
rise rate. In the second case, the proportion is also depending ondeeper dynamics (magma feeding rate). In addition, in the first casethe transition between textures would be more gradual than in thesecond case.
In the Chaimilla eruption, stratigraphic data indicate a generalincrease of the proportion of the P1 clasts with time which is notnecessarily accompanied by an increase of the mass discharge rate. Infact, if magma rise rate would primarily control the P1/P2 ratio, itshould be maximum in unit D, and strongly oscillatory in unit C beds.Also, they indicate that the Opening phase should have had thelongest duration within the eruption. In addition, P1 and P2 texturesare strongly different without the presence of transitional featuresand the mingled clasts reveal sharp contacts between the twotextures. We therefore suggest a model in which the arrival of asmall batch of magmawhich intruded at shallow level and underwentrapid cooling, outgassing and crystallisation (transforming into P2),caused a prolonged (days) activity of scattered ash emission andprogressive conduit opening, with eruption of large wall rock blocks(opening phase). The fast rise of a larger volume of magma(represented by P1 texture) and its arrival into the outgassedmagma body (P2 texture) triggered the highly explosive eruptionphases (Pulsatory, Collapsing and Climactic). The increasing contentof P1 clasts from bottom to top unit and a progressive increase ineruption magnitude and intensity suggest that P1 magma had aprimary role in controlling eruption explosivity.
A further complication is the larger microlite size of P1 clasts fromClimactic phase with respect to P1 clasts from Pulsatory phase. Thismight be related to different decompression or cooling rates of the P1magmas feeding the two phases, and therefore the arrival of at leasttwo differentmagma batches from depth. However, further studies onmicrolite size distribution and composition are needed to validate thishypothesis.
9.4. Hazard implications
Villarrica is one the most active volcanoes in South America and isa very popular destination for tourists for both skiing and hikingactivities. The population of its closest city, Pucón has doubled in thelast 10 years due to the growing economy. The main volcanic risk inhistorical times has been associated to lahar formation due to ice andsnowmelting during eruptive events (Castruccio et al., 2010; Naranjoand Moreno, 2004). In fact, historic eruptive activity at Villarrica hasbeen mainly characterised by the emission of lava flows, mildexplosive activity (Hawaiian to Strombolian) and by the generationof lahars. The last PDC recognized so far occurred ca. 600 yearBP(small-volume PDC on the northern flank of the volcano; Moreno andClavero, 2006).
However, the possible occurrence of a major explosive eruptioncould threaten much larger areas than those that have been affectedby lahars in recent times and therefore it is important to discuss: i) if aChaimilla-like eruption could occur nowadays ii) what are thesimilarities and differences between the conditions prior theChaimilla eruption and today's conditions and iii) the potentialimpact of an eruption with similar dynamics.
At the present time, the Villarrica volcano is an open, continuouslydegassing system with a very shallow reservoir. In fact, the study ofWitter et al. (2004) on melt inclusions from recent eruptive productshas shown amaximumH2O content in olivine-bearingmelt inclusionsequal to 0.30 wt.% and undetectable CO2. In contrast, in the Chaimillacase features of units A and B and the high lithic content of the base ofunit C suggest that the vent was likely to be closed at the onset of theeruption. The presence of a lava lake at the summit of the cone is infact not compatible with the widespread, lithic-rich ash layers at thebottom of the eruptive sequence.
Regardless of the vent condition, the Chaimilla eruption was likelydriven by fast rise of a large batch of undegassed magma from a deep
157L. Costantini et al. / Journal of Volcanology and Geothermal Research 200 (2011) 143–158
reservoir, as the P1 clast microtextures suggest. Therefore, aChaimilla-type eruption cannot be excluded only on the basis of theconditions of the uppermost part of the feeding system (open orclosed conduit state). We believe that the magma feeding rate exert aprimary control on the explosivity of the volcano, controlling thepossibility of explosive discharge of magma with efficient fragmen-tation and formation of several km-high eruptive columns.
Nowadays, the Chaimilla eruptionwould affect the Pucón city with≥20 cm of tephra sedimented in a short period of time. Assuming adeposit density of around 1000–1100 kg m−3 (based on measure-ment in medial location and on the comparison with Fuego 1974deposit; Rose et al., 2008), this thickness corresponds to 200–220 kg m−2 of tephra, which is enough mass loading for the weakestroofs to collapse. In the worst case scenario, a Chaimilla-type eruptionwith wind direction directly towards Pucón would imply ≥30 cm oftephra which would cause serious damage to buildings and humanactivity. However, a N–NW wind direction is quite rare in this region(≤20% of tropospheric wind directions; Fig. 7). Another hazardassociated with this type of eruption is related to PDCs which in theChaimilla eruption had maximum observed runout of ~8 km. A fewcentimeters of PDC deposit have been found only a few kilometresaway from Pucón (see Fig. 6). We can therefore conclude that theoccurrence of an eruption of this magnitude at Villarrica nowadayswould have strong disruptive effects, constituting a serious hazard forthe population living in the surroundings and significantly damagingall touristic activities, which are crucial to the economic system of thearea.
10. Conclusions
The Chaimilla deposit is the product of a complex eruption of theVillarrica volcano which occurred ~3.1 ka ago from a central vent insimilar position with respect to the current one. It was formed duringfour main eruption phases of increasing intensity and magnitudewhich generated both tephra and PDC deposits. Conduit geometrycontrolled the pulsating dynamics of the Pulsatory phase (units C andD), while magma volume and volatile content are more likely to havecontrolled the sustained/collapsing dynamics of the Climactic phase(units G and H). Dispersal of tephra units was towards N–NW, whichis a quite uncommon wind direction for this geographic region,suggesting short eruption duration (probably hours to a few days).The minimum estimate of the total erupted volume is about 0.6 km3,with an eruption magnitude of the sustained Climactic phase of atleast VEI 4 (i.e., units G+H).
Chaimilla products indicate the involvement of at least twomagma batches of different volume and different ascent history. Thefirst small-volume batch stopped at relatively shallow level and hadthe time to partially outgas (generating P2 textures) before the arrivalof the second larger-volume batch (P1), which triggered the mostexplosive phase of the eruption (Pulsatory and Climactic phases). As aresult, the eruption evolved from a series of explosions (i.e., Openingphase) to a more intense but pulsating eruption style (Pulsatoryphase). After a very short break into the main eruption characterisedby parasitic activity (unit D), a series of diluted PDCs were emplacedcontemporaneously to thin fallout layers and lenses (unit E) andfollowed by the deposition of co-PDC ash (unit F). Finally, the eruptionevolved from a fully-sustained convective plume (unit G) to atransitional column and a final collapsing regime (unit H).
We believe that the main factor controlling the explosivity of theeruption was the volume and volatile content of magma batches thatreached the surface independently of the vent conditions (openversus closed). This would explain why the first magma batch onlygenerated small ash-rich explosions, whereas the second larger andundegassed magma batch could produce a VEI 4 eruption associatedwith relatively large PDCs. As a result, we cannot exclude a Chaimilla-type eruption also in the presence of a lava lake and open-system
degassing, which characterise the current activity. A detailed study ofvolatile content, PDC deposits componentry and crystallinity couldshed more light on the eruption dynamics. This is a timely andimportant research which could help identify potential eruptionscenarios at the Villarrica volcano. In fact, a Chaimilla-type eruptionwith same dispersal axis or with dispersal directly towards Pucónvillage could significantly damage buildings' structures and economicactivities.
Acknowledgements
This work was supported by the Swiss National Science Founda-tion (grants number 200021-116335 and 200021-122268), theFriedlander foundation and the Commission of Travel Grant of theSwiss Academy of Science. The authors are grateful to the ServicioNacional de Geología y Minería (SERNAGEOMIN) for its supportduring their first field campaign (2008) and the Department ofGeosciences of the University of Fribourg (Switzerland) for the use ofthe SEM device. They also thank Bruce Houghton and Raffaello Cionifor the helpful comments and suggestions on the draft manuscript,Lucia Gurioli and Jacopo Taddeucci for the constructive and accuratereview and Lionel Wilson for the editorial handling. Sebastien Biassand Andrea Parmigiani helped processing the NOAA wind data.
References
Andronico, D., Cristaldi, A., Del Carlo, P., Taddeucci, J., 2009. Shifting styles of basalticexplosive activity during the 2002–03 eruption of Mt. Etna. Italy. J. Volcanol.Geotherm. Res. 180, 110–122.
Bonadonna, C., Houghton, B.F., 2005. Total grainsize distribution and volume of tephra–fall deposits. Bull. Volcanol. 67, 441–456.
Bonadonna, C., Costa, A., in press. Modeling of tephra sedimentation from volcanicplumes, In: Fagents, S.A., Gregg, T.K.P., Lopes, R.M.C. (Eds.), Modeling volcanicprocesses: the physics and mathematics of volcanism.
Branney, M.J., Kokelaar, B.P., 2002. Pyroclastic density currents and the sedimentationof ignimbrites. Geol. Soc. London 27, 152.
Calder, E.S., Harris, A.J.L., Peña, P., Pilger, E., Flynn, L., Fuentealba, G., Moreno, H., 2004.Combined thermal and seismic analysis of the Villarrica volcano lava lake. Chile.Rev. Geol. Chile 31, 259–272.
Cashman, K.V., Mangan, M.T., 1994. Physical aspects of magmatic degassing .2.Constraints on vesiculation processes from textural studies of eruptive products.In: Carroll, M.R., Holloway, J.R. (Eds.), Volatiles in Magmas: Rev. Mineral. 30, pp.447–478.
Castruccio, A., Clavero, J., Rivera, A., 2010. Comparative study of lahars generated by the1961 and 1971 eruptions of Calbuco and Villarrica volcanoes, Southern Andes ofChile. J. Volcanol. Geotherm. Res. 190, 297–311.
Cimarelli, C., Di Traglia, F., Taddeucci, J., 2010. Basaltic scoria texturas from a zonedconduit as precursors to violent Strombolian activity. Geology 38, 439–442.
Clavero, J., Moreno, H., 1994. Ignimbritas Licán y Pucón. Congreso Geológico Chileno,Concepción, Chile.
Clavero, J., Moreno, H., 2004. Evolution of Villarica Volcano, in Villarica Volcano (39.5˚S),southern Andes, Chile. In: Lara, L.E., Clavero, J. (Eds.) Villarrica Volcano (39.5˚S)southern Andes, Chile. Gobierno de Chile, Servicio Nacional de Geología y Minería,pp. 17–27.
Coltelli, M., Del Carlo, P., Vezzoli, L., 1998. Discovery of a Plinian basaltic eruption ofRoman age at Etna volcano, Italy. Geology 26, 1095–1098.
Costantini, L., Bonadonna, C., Houghton, B.F., Wehrmann, H., 2009. New physicalcharacterization of the Fontana lapilli basaltic Plinian eruption. Nicaragua. Bull.Volcanol. 71, 337–355.
Costantini, L., Houghton, B.F., Bonadonna, C., 2010. Constraints on eruption dynamics ofbasaltic explosive activity derived from chemical and microtextural study: theexample of the Fontana lapilli Plinian eruption. Nicaragua. J. Volcanol. Geotherm.Res. 189, 207–224.
Dellino, P., Isaia, R., La Volpe, L., Orsi, G., 2004. Interaction between particles transportedby fallout and surge in the deposits of the Agnano-Monte Spina eruption (CampiFlegrei, Southern Italy). J. Volcanol. Geotherm. Res. 133, 193–210.
Di Muro, A., Neri, A., Rosi, M., 2004. Contemporaneous convective and collapsingeruptive dynamics: the transitional regime of explosive eruptions. Geophys. Res.Lett. 31, L10607. doi:10.1029/2004GL019079.
Di Muro, A., Rosi, M., Aguilera, E., Barbieri, R., Massa, G., Mudula, F., Pieri, F., 2008.Transport and sedimentation dynamics of transitional explosive eruption columns:the example of the 800 BP Quilotoa plinian eruption (Ecuador). J. Volcanol.Geotherm. Res. 174, 307–324.
Doubik, P., Hill, B., 1999. Magmatic and hydromagmatic conduit development duringthe 1975 Tolbachik Eruption, Kamchatka, with implications for hazard assessmentat Yucca Mountain. NV. J. Volcanol. Geotherm. Res. 91, 43–64.
Echegaray, J., López, L., Moreno, H., 1994. La erupción pliniana del volcán Mocho–Choshuenco. Andes del sur, Congreso Geológico Chileano, Concepción.
158 L. Costantini et al. / Journal of Volcanology and Geothermal Research 200 (2011) 143–158
Fierstein, J., Hildreth, W., 1992. The Plinian eruptions of 1912 at Novarupta, KatmaiNational Park. Alaska. Bull. Volcanol. 54, 646–684.
Fisher, R.V., 1966. Rocks composed of volcanic fragments. Earth-Sci. Rev. 1, 287–298.Gaytán, D., Clavero, J., Rivera, A., 2005. Actividad eruptiva explosiva del Volcán
Villarrica, Andes del Sur (39.5°S), durante la glaciación Llanquihue. In: CongresoGeológico Argentino, no. 16, CD-ROM. La Plata.
Gurioli, L., Harris, A.J.L., Houghton, B.F., Polacci, M., Ripepe, M., 2008. Textural andgeophysical characterization of explosive basaltic activity at Villarrica volcano.J. Geophys. Res. 113, B08206. doi:10.1029/2007JB005328.
Hammer, J.E., Cashman, K.V., Hoblitt, R., Newman, S., 1999. Degassing and microlitecrystallization during pre-climactic events on the 1991 eruption of Mt Pinatubo.Philippines. Bull. Volcanol. 60, 355–380.
Hildreth, W., Drake, R.E., 1992. Volcano Quizapu, Chilean Andes. Bull. Volcanol. 54,93–125.
Höskuldsson, À., Óskarsson, N., Pedersen, R., Grönvold, K., Vogfjörð, K., Ólafsdóttir, R.,2007. The millennium eruption of Hekla in February 2000. Bull. Volcanol. 70,169–182.
Houghton, B.F., Wilson, C.J.N., 1989. A vesicularity index for pyroclastic deposits. Bull.Volcanol. 51, 451–462.
Houghton, B.F., Wilson, C.J.N., Del Carlo, P., Coltelli, M., Sable, J.E., Carey, R.J., 2004. Theinfluence of conduit processes on changes in style of basaltic Plinian eruptions:Tarawera 1886 and Etna 122 BC. J. Volcanol. Geotherm. Res. 137, 1–14.
Inman, D.L., 1952. Measures for describing the size distribution of sediments. J. Sediment.Petrol. 22, 125–145.
Lara, L., Clavero, J., 2004. Villarrica Volcano. Southern Andes, Servicio Nacional deGeología y Minería, Boletín. 64.
Lautze, N.C., Houghton, B.F., 2007. Linking variable explosion style and magma texturesduring 2002 at Stromboli volcano. Italy. Bull. Volcanol. 69, 445–460.
Lohmar, S., Robin, C., Gourgaud, A., Clavero, J., Parada, M.A., Moreno, H., 2007. Evidenceof magma–water interaction during the 13, 800 years BP explosive cycle of theLicán Ignimbrite, Villarrica volcano (southern Chile). Rev. Geol. Chile 34, 233–247.
Mannen, K., 2006. Total grain size distribution of a mafic subplinian tephra, TB-2, fromthe 1986 Izu-Oshima eruption, Japan: an estimation based on a theoretical model oftephra dispersal. J. Volcanol. Geotherm. Res. 155, 1–17.
Melnik, O., 2000. Dynamics of two-phase conduit flow of high-viscosity gas-saturatedmagma: large variations of sustained explosive eruption intensity. Bull. Volcanol.62, 153–170.
Moreno, H., Gardeweg, M., 1989. La erupción en el complejo volcanico Lonquimay(diciembre 1988). Andes del Sur. Rev. Geol. Chile 16, 93–117.
Moreno, H., Clavero, J., 2006. Geología del volcán Villarrica, Andes del Sur. Servicionacional de Geología y Minería, Chile, Serie Geología Básica, Carta Geológica deChile 98. Escala 1:50000.
Naranjo, J., Moreno, H., Banks, N.G., 1993. La erupción del volcán Hudson en 1991(46°S), Región XI, Aisèn, Chile. Servicio Nacional de Geología y Minería, Chile,Boletín 44, 1–50.
Naranjo, J., Moreno, H., 2004. Laharic debris-flows from Villarrica volcano. In: Lara, L.E.,Clavero, J. (Eds.) Villarrica Volcano (39.5˚S) southern Andes, Chile. Gobierno deChile, Servicio Nacional de Geología y Minería, pp. 28–38.
Neri, A., Di Muro, A., Rosi, M., 2002. Mass partition during collapsing and transitionalcolumns by using numerical simulations. J. Volcanol. Geotherm. Res. 115, 1–18.
Nye, C., Keith, T., Eichelberger, J., Miller, T., McNutt, S., Moran, S., Schneider, D., Dehn, J.,Schaefer, J., 2002. The 1999 eruption of Shishaldin volcano, Alaska: monitoring adistant eruption. Bull. Volcanol. 64, 507–519.
Ortiz, R., Moreno, H., García, A., Fuentealba, G., Astiz, M., Peña, P., Sánchez, N., Tárraga,M., 2003. Villarrica volcano (Chile): characteristics of the volcanic tremor andforecasting of small explosions by means of a material failure method. J. Volcanol.Geotherm. Res. 128, 247–259.
Palma, J.L., Calder, E.S., Basualto, D., Blake, S., Rothery, D.A., 2008. Correlation betweenSO2 flux, seismicity, and outgassing activity at the open vent of Villarrica volcano.Chile. J. Geophys. Res. 113, B1020. doi:10.1029/2008JB005577.
Perez, W., Freundt, A., Kutterolf, S., Schmincke, H.U., 2009. The Masaya Triple Layer: a2100 year old basaltic multi-episodic Plinian eruption from the Masaya CalderaComplex (Nicaragua). J. Volcanol. Geotherm. Res. 179, 191–205.
Pioli, L., Erlund, E., Johnson, E., Cashman, K.V., Wallace, P.J., Rosi, M., Delgado Granados,H., 2008. Explosive dynamics of violent Strombolian eruptions: the eruption ofParícutin Volcano 1943–1952 (Mexico). Earth Planet. Sci. Lett. 271, 359–368.
Polacci, M., Pioli, L., Rosi, M., 2003. The plinian phase of the Campanian Ignimbriteeruption (Phlegrean Field, Italy): evidence from density measurements andtextural characterization of pumice. Bull. Volcanol. 65, 418–432.
Polacci, M., Corsaro, R.A., Andronico, D., 2006. Coupled textural and compositionalcharacterization of basaltic scoria: insights into the transition from Strombolian tofire fountain activity at Mount Etna, Italy. Geology 34, 201–204.
Pyle, D.M., 1989. The thickness, volume and grainsize of tephra fall deposits. Bull.Volcanol. 51, 1–15.
Rivera, A., Bown, F., Mella, R., Wendt, J., Casassa, G., Acuña, C., Rignot, E., Clavero, J.,Brock, B., 2006. Ice volumetric changes on active volcanoes in southern Chile. Ann.Glaciol. 43, 111–122.
Rivera, A., Corripio, J.G., Brock, B., Clavero, J., 2008. Monitoring ice-capped active volcanVillarrica, southern Chile, using terrestrial photography, combined with automaticweather stations and global positioning systems. J. Glaciol. 54, 920–930.
Rose, W.I., Self, S., Murrow, P.J., Bonadonna, C., Durant, A.J., Ernst, G.G.J., 2008. Natureand significance of small volume fall deposits at composite volcanoes: insights fromthe October 14, 1974 Fuego eruption. Guatemala. Bull. Volcanol. 70, 1043–1067.
Rosi, M., Paladio-Melosantos, M.L., Di Muro, A., Leoni, R., Bacolcol, T., 2001. Fall vs flowactivity during the 1991 climactic eruption of Pinatubo volcano (Philippines). Bull.Volcanol. 62, 549–566.
Rosi, M., Bertagnini, A., Harris, A.J.L., Pioli, L., Pistolesi, M., Ripepe, M., 2006. A casehistory of paroxysmal explosion at Stromboli: timing and dynamics of the April 5,2003, event. Earth Planet. Sci. Lett. 243, 594–606.
Sable, J.E., Houghton, B.F., Del Carlo, P., Coltelli, M., 2006. Changing conditions of magmaascent and fragmentation during the Etna 122 BC basaltic Plinian eruption:evidence from clasts microtextures. J. Volcanol. Geotherm. Res. 158, 333–354.
Sarna-Wojcicki, A.M., Shipley, S., Waitt, J.R., Dzurisin, D., Wood, S.H., 1981. Arealdistribution thickness, mass, volume, and grain-size of airfall ash from the sixmajoreruptions of 1980. In: Lipman, W.P., Mullineaux, D.R. (Eds.), Eruptions of Mount St.Helens. Geological Survey Professional Paper Washington, D.C, Washington. U.S,pp. 577–600.
Scasso, R., Corbella, H., Tiberi, P., 1994. Sedimentological analysis of the tephra from 12–15 August 1991 eruption of Hudson volcano. Bull. Volcanol. 56, 121–132.
Scollo, S., Del Carlo, P., Coltelli, M., 2007. Tephra fallout of 2001 Etna flank eruption:analysis of the deposit and plume dispersion. J. Volcanol. Geotherm. Res. 160,147–164.
Shinohara, H., Witter, J.B., 2005. Volcanic gases emitted during mild Strombolianactivity of Villarrica volcano. Chile. Geophys. Res. Lett. 32, L20308. doi:10.1029/2005GL024131.
Silva Parejas, C., Druitt, T.H., Robin, C., Moreno, H., Naranjo, J.A., 2010. The HolocenePucón eruption of Volcàn Villarrica, Chile: deposit architecture and eruptionchronology. Bull. Volcanol. doi:10.1007/s00445-010-0348-9.
Sparks, R.S.J., Wilson, L., Sigurdsson, H., 1981. The pyroclastic deposits of the 1875eruption of Askja. Iceland. Philos. Trans. R. Soc. London 229, 241–273.
Taddeucci, J., Pompilio, M., Scarlato, P., 2002. Monitoring the explosive activity of theJuly–August 2001 eruption of Mt. Etna (Italy) by ash characterization. Geophys.Res. Lett. 29, 1230. doi:10.1029/2001GL014372.
Taddeucci, J., Pompilio, M., Scarlato, P., 2004. Conduit processes during the July–August2001 explosive activity of Mt. Etna (Italy): inferences from glass chemistry andcrystal size distribution of ash particles. J. Volcanol. Geotherm. Res. 137, 33–54.
Valentine, G.A., Giannetti, B., 1994. Single pyroclastic beds deposited by simultaneousfallout and surge processes: Roccamonfina volcano. J. Volcanol. Geotherm. Res. 64,129–137.
Walker, G.P.L., Self, S., Wilson, L., 1984. Tarawera, 1886, New Zealand—a basaltic Plinianfissure eruption. J. Volcanol. Geotherm. Res. 21, 61–78.
Watt, S.F.L., Pyle, D.M., Mather, T.A., Martin, R.S., Matthews, N.E., 2009. Fallout anddistribution of volcanic ash over Argentina following theMay 2008 explosive eruptionof Chaiten. Chile. J. Geophys. Res. 114, B04207. doi:10.1029/2008JB006219.
Wilson, C.J.N., Hildreth, W., 1997. The Bishop Tuff: new insights from eruptivestratigraphy. Geology 105, 407–439.
Witter, J.B., Kress, V.C., Delmelle, P., Stix, J., 2004. Volatile degassing, petrology, andmagma dynamics of the Villarrica lava lake, southern Chile. J. Volcanol. Geotherm.Res. 134, 303–337.