Silicate glass Ion-exchange
7
This article appeared in a journal published by Elsevier. The attached copy is furnished to the author for internal non-commercial research and education use, including for instruction at the authors institution and sharing with colleagues. Other uses, including reproduction and distribution, or selling or licensing copies, or posting to personal, institutional or third party websites are prohibited. In most cases authors are permitted to post their version of the article (e.g. in Word or Tex form) to their personal website or institutional repository. Authors requiring further information regarding Elsevier’s archiving and manuscript policies are encouraged to visit: http://www.elsevier.com/authorsrights
-
Upload
independent -
Category
Documents
-
view
1 -
download
0
Transcript of Silicate glass Ion-exchange

This article appeared in a journal published by Elsevier. The attachedcopy is furnished to the author for internal non-commercial researchand education use, including for instruction at the authors institution
and sharing with colleagues.
Other uses, including reproduction and distribution, or selling orlicensing copies, or posting to personal, institutional or third party
websites are prohibited.
In most cases authors are permitted to post their version of thearticle (e.g. in Word or Tex form) to their personal website orinstitutional repository. Authors requiring further information
regarding Elsevier’s archiving and manuscript policies areencouraged to visit:
http://www.elsevier.com/authorsrights

Author's personal copy
Effect of gamma rays absorbed doses and heat treatment on the opticalabsorption spectra of silver ion-exchanged silicate glass
Khaled Farah a,b,⇑, Faouzi Hosni a,c, Arbi Mejri a, Bruno Boizot d, Ahmed Hichem Hamzaoui e,Hafedh Ben Ouada f
a Unité de recherche: Maîtrise et développement des techniques nucléaires à caractère pacifique, Centre National des Sciences et Technologie Nucléaires, 2020 Sidi-Thabet, Tunisiab ISTLS, University of Sousse, Tunisiac Academie Militaire de Fondouk Jedid, 8012 Nabeul, Tunisiad Laboratoire des Solides Irradiés, Ecole Polytechnique, Route de Saclay, 91128 Palaiseau Cedex, Francee Centre National de Recherche en Sciences des Matériaux, B.P. 95, Hammam-Lif 2050, Tunisiaf Laboratoire des Interfaces et Matériaux Avancés, Faculté des Sciences, University of Monastir, Avenue de l’environnement, 5019 Monastir, Tunisia
a r t i c l e i n f o
Article history:Received 10 May 2013Received in revised form 28 December 2013Available online 7 February 2014
Keywords:Silicate glassIon-exchangeGamma raysAbsorbed doses thermal annealingOptical absorption spectraSilver nanoparticles
a b s t r a c t
Samples of a commercial silicate glass have been subjected to ion exchange at 320 �C in a molten mixtureof AgNO3 and NaNO3 with molar ratio of 1:99 and 5:95 for 60 min. The ion exchange process was fol-lowed by gamma irradiation in the dose range of 1–250 kGy and heating at the temperature of 550 �Cfor different time periods ranging from 10 to 582 min. The spectral absorption in UV–Vis range of theAg–Na ion exchanged glass was measured and used to determine the states of silver prevailing in theglass during the ion exchange, the gamma irradiation and the heat treatment. The gamma irradiationinduced holes and electrons in the glass structure leading to the creation of a brown colour, and silverions trapped electrons to form silver atoms. We observed the first stage of aggregation after irradiation,as well as after heating. The silver atoms diffused and then aggregated to form nanoclusters after heatingat 550 �C. A characteristic band at about 430 nm was induced. The surface Plasmon absorption of silvernanoclusters in the glass indicated that the nanoclusters radius grew between 0.9 and 1.43 nm withincreasing of annealing time from 10 to 242 min and then saturated. We also found that the size of aggre-gates depends on the value of gamma radiation absorbed dose. Contrary to what was expected, we foundthat 20 kGy is the optimal absorbed dose corresponding to the larger size of the aggregates whichdecreases for absorbed doses above 20 kGy.
� 2014 Elsevier B.V. All rights reserved.
1. Introduction
Small silver particles embedded in glass matrix are widely stud-ied because of their potential applications for glass colouration[1,2] for ionizing radiation dosimetry [3] and recently for fabricat-ing optical devices [4]. The ion exchange has been considered oneof the most important techniques to introduce noble metals inglass surface. This technique is simple, and does not requiresophisticated equipments. Combined with a heat treatment, theion exchange technique has received an increase attention as itcan be used to introduce metallic nanosize particles such silver,gold and copper into glass matrix [5–7]. Recently ionizing radiationsuch as gamma rays, electrons, heavy ions, X-ray or laser beam, hasbeen used, with or instead of the heat treatment, to produce silver
colloids after the ion exchange in glass [8–11]. Ionizing radiationproduces in insulating materials electron hole pairs (excitons)which lead to the production of stable defects and changes of thevalence state of doping and impurities ions in the glasses. The pro-duction of irradiation defects cause preferential light absorptionand consequently these defects are called ‘‘colour centres’’. Thesecentres are of many types and depending on the glass compositionand can be analyzed using optical absorption bands and EPR lines.
Gamma irradiation effects in silicate glass have been studied inour previous papers [12,13].
Only few works have been reported in the literature about thecombined role of gamma irradiation and heat treatment on the for-mation of silver nanoparticles in ion exchanged glass.
Further investigations will be necessary to shed light on therelationship between the absorbed dose of gamma radiation andthe properties of UV–visible spectra of silver ion-exchanged silicateglass. Our observations indicate that the first stage of aggregationcan occur after irradiation before the heat treatment. We have
http://dx.doi.org/10.1016/j.nimb.2014.01.0190168-583X/� 2014 Elsevier B.V. All rights reserved.
⇑ Corresponding author at: ISTLS, University of Sousse, Tunisia. Tel.: +21655257099.
E-mail address: [email protected] (K. Farah).
Nuclear Instruments and Methods in Physics Research B 323 (2014) 36–41
Contents lists available at ScienceDirect
Nuclear Instruments and Methods in Physics Research B
journal homepage: www.elsevier .com/locate /n imb

Author's personal copy
observed that gamma irradiation followed by the heat treatment ofan ion exchanged silicate glass can effectively promote silvermigration and aggregation of metallic nanocluster. The effect of ab-sorbed dose variation on the size of the aggregates has also inves-tigated. In our knowledge, this effect had not been reported inprevious work.
2. Experimental
2.1. Glass composition
The glass samples were obtained from the same glass sheetspurchased from the local market and were cut into pieces of11 � 30 � 1.5 mm3 dimensions for optical measurements. Thechemical composition of the glass samples were determined bythe Prompt Gamma Activation Analysis technique [14] in theBudapest Neutron centre (constituents in wt%: 68.52 SiO2, 13.77Na2O, 8.19 CaO, 4.34 MgO, 1.003 Al2O3, 0.588 K2O, 0.105 Fe2O3
and about 3.5% of other components).
2.2. Procedure of ion exchange
Glass samples were dipped in a molten salt bath formed by amixture of AgNO3 and NaNO3 with molar ratio of 1:99, 5:90 and10:90 for 60 min in crucible of Al203. The ion exchange has beencarried out at a temperature of 320 �C for 1 h. During this step,the silver ions of the salt bath diffuse inside the glass matrix. Theion exchange samples are cleaned with distilled water and acetoneto remove any silver nitrate adhering to their surface.
2.3. Gamma irradiation and heat treatment
Glass samples were irradiated at the Tunisian pilot plant 60Cogamma irradiation facility [15] at a dose rate of 8.5 kGy/h and atroom temperature with doses varying from 1 to 250 kGy.
Thermal annealing was performed in electrical furnace in air atthe temperature of 550 �C for different time periods ranging from10 to 582 min.
2.4. Optical absorption spectra
Optical absorption spectra of the glass samples were measuredin the range of 300–700 nm with a Shimadzu UV–VIS spectropho-tometer (model PharmaSpec UV-1700). The measurements werecarried out against a glass sample subjected neither to ion ex-change nor to gamma irradiation.
3. Results and discussion
3.1. Effect of ion-exchange
Glass samples were subjected to ion exchange procedure, withmolar ratio of 5:95, at a temperature of 320 �C for 1 h. After ion ex-change, the absorption spectrum showed significant differencefrom that before the ion exchange. As illustrated in Fig. 1, thespectrum is characterized by a sharp asymmetrical absorptionband located at 305 nm. The asymmetric shape of this band maybe due to the fact that the maximum measured does not matchthe maximum of the band but only to the loss of sensitivity ofthe spectrophotometer below 300 nm.
When samples of silicate glass are immersed in molten silvernitrate, sodium ions diffuse from the glass surfaces to the moltensalt, and silver ions diffuse from the molten salt to the glasssurfaces where they replace sodium ions. The exchanged glass iscolourless or very faint yellow state. Accordingly, changes in the
spectrum of glass after ion exchange could be ascribed to modifica-tion of the composition of the glass surface by replacement ofsodium ions by silver according to the reaction:
� Si—O—Naþ þ AgþNO�3 !� Si—O—Agþ þ NaþNO�3 ð1Þ
The absorption band having a maximum at 305 nm wasassigned to Ag+ ion. The information available in the literatureabout the origin of this band was reviewed in details by Ahmedet al. [16] and Paje et al. [17].
3.2. Effect of gamma irradiation
Silver exchanged as well as non-exchanged silicate glass sampleswere gamma-irradiated to 250 kGy. Optical absorption spectrawere measured several days after irradiation are shown Fig. 2. The
Fig. 1. Absorption optical spectra of silicate glass before and after ion-exchange.
Fig. 2. Absorption spectra of the glass irradiated with c rays at 250 kGy (a)spectrum of a 10% AgNO3 exchanged glass; (b) spectrum of non-exchanged glass;(c) = (a) � (b).
K. Farah et al. / Nuclear Instruments and Methods in Physics Research B 323 (2014) 36–41 37

Author's personal copy
optical absorption spectrum of the non-exchanged sample (b) dis-play overlapping three characteristic bands with maxima at about312, 400 and 610 nm respectively. Its spectrum was fitted by Gauss-ian curves whose parameters are given in Table 1. According to whatreported by many authors [18,19] the absorption bands at around400 and at 610 nm have been attributed to ‘‘non-bridging oxygenhole centres’’ ðNBOHCs :� Si—O�Þ, where the trapped hole corre-lated to the absorption at 400 nm denoted as HC1 is a hole trappedin the 2p orbital of one and HC2 is a hole trapped on two or threenon-bridging oxygen bonded to the same silicon and correlatingabsorption band around 610 nm. The absorption band at about312 nm have been attributed to trapped electrons ðTE : \ � "Þ [20].
An additional absorption band was developed as a result of sil-ver-exchange at about 354 nm. This band has been evidenced bycomparing the optical absorption spectrum of the non-exchangedglass to that of gamma-irradiated silver-exchanged glass (subtrac-tion spectrum (c)). The characteristics of the subtracted spectrumwere determined by Lorentzian adjustment (Table 2). This bandwas attributed by many authors [10,21] to neutral silver atomsAg0. The observation of neutral silver means that a fraction of the
photoelectron population has reduced silver ions directly byreactions:
Glass !crayshþ þ e� ð2Þ
Agþ þ e� ! Ag0 ð3Þ
where hþ a hole is centre and e� is an electron.As shown in Fig. 3, irradiation of the silver exchanged sample at
1 kGy led to the significant decrease of the intensity of the Agþ
band at 305 nm and the appearance of the new band at 354 nm as-signed to Ag0.
3.3. Effect of gamma irradiation and heat treatment
The only effect of c irradiation at 250 kGy and annealing at550 �C for 60 min or their combined effects on glass samples ex-changed at 1% AgNO3 were shown in Fig. 4. A new absorption bandappears around 430 nm in the spectra of the exchanged samples (band c). According to several authors [6,8], this absorption peak cor-responds to the Surface-Plasmon Resonance (SPR) of the silveraggregates in glass. The formation of these aggregates is due to dif-fusion and agglomeration of neutral silver atoms in the glass ma-trix during gamma irradiation and/or heat treatment according tothe reaction:
nAg0 ! Agn ð4Þ
For spherical aggregates, the average aggregate radius R of iscalculated from the FWHM, Dk of the optical absorption peak usingthe formula:
R ¼ Vf :k2m
2pDkð5Þ
where Vf is the Fermi velocity of the electron in the bulk metal (sil-ver = 1.39 � 108 cm/s), Dk is the full width at half maximum of theabsorption band (FWHM) and km is the characteristic wavelength atwhich SPR occurs.
We clearly observe that the spectrum (c) has a FWHM muchnarrower than that of the spectrum (b), the maximum absorbanceis increased by a factor of 2 and the peak position is blueshiftedfrom 430 to 421 nm (Table 3). It is also seen in Table 3 that
Table 1Gaussian fitting parameters of the optical spectrum (Fig. 2(b)) from non exchangedsilicate glass after gamma irradiation at 250 kGy.
Peakposition (nm)
FWHMa
(nm)Area underthe band
Max. absorbance(u.a.)
Assignment
312 31.13 11.2 0.287 TE400 190.7 88.4 0.37 HC1
610 155 24.2 0.125 HC2
a FWHM is the full width at half maximum.
Table 2Lorentzian fitting parameters of subtracted spectrum (Fig. 2(c)).
Peak position(nm)
FWHM(nm)
Area of theband
Max. absorbance(a.u.)
Assignment
315 19.4 9.4 0.31 Agþ2354 144.3 37.4 0.165 Ag0
Fig. 3. Absorption spectra of ion-exchanged silicate glass (10% AgNO3) and thenirradiated at 1 kGy.
Fig. 4. Absorption spectra of ion-exchanged silicate glass, under the followingconditions: (a) irradiated with c rays at 250 kGy; (b) annealed at 550 �C for 60 min;and (c) irradiated at 250 kGy and annealed at 550 �C for 60 min.
38 K. Farah et al. / Nuclear Instruments and Methods in Physics Research B 323 (2014) 36–41

Author's personal copy
aggregate size increased significantly by about 43% in the irradi-ated sample. The increase in intensity of the absorption band inthe irradiated sample is attributed to the increase in the total num-ber of silver atoms constituting the aggregates. The conventionalsynthesis of silver nanoparticles in ion-exchanged glass requiresthe action of reducing agents present in the glass and enhanceddiffusivity which is achieved only by thermal treatment at temper-ature well above 450 �C. By this procedure, only a few percent ofthe Ag+ ions introduced are converted to silver atoms [8]. Theimproved formation process of silver nanoparticles by gamma
irradiation is explained by the fact that the diffusion of silver inthe glass increases by several orders of magnitude when the sam-ple is irradiated by gamma rays before undergoing heat treatment.
The gamma irradiation with 250 kGy of ion-exchange silicateglass was followed by annealing at the temperature of 550 �C fordifferent time periods ranging from 10 to 582 min (Fig. 5). Theintensity (or area under the band), shape and peak position ofthe absorption band at about 440 nm were found to be signifi-cantly by the increase of the annealing time.
The characteristics of this band as a function of increasingannealing time, obtained by Lorentzian fitting, are shown in Ta-ble 4. The area under the peak increases with increasing annealingtime and its peak position is blueshifted from 440 to 418 nm. Atthe same time the band becomes more sharp, the full width at halfmaximum (FWHM) decrease from 161 to 88 nm.
Since this band has been associated with the formation of silveraggregates, it is expected that changes in the shape and size of the-ses aggregates induced by increasing of annealing time would af-fect the position, intensity or area under the band and FWHM ofthe induced absorption band. With increasing of annealing time,the number of neutral silver atoms increased leading to the in-crease in the number and dimensions of the aggregates. In Fig. 6the proportionality between aggregates radius and area underthe band is shown. This result is in good agreement with data pub-lished by Doremus [6]. Indeed, the total amount of silver constitut-ing the aggregates was described by Doremus to be proportional tothe area under the band. The proportionality between the recipro-cal of the absorption band width and the radius of silver aggregateswas also evidenced by Doremus, as long as the size distribution ofthe aggregates is narrow. Accordingly, Doremus attribute thisabsorption band to very small, spherical silver aggregates. If theaggregates were not spherical, the absorption peak position wouldbe at longer wavelengths and would gradually shift to shorterwavelengths as the aggregates become more spherical withincreasing time of annealing.
The dependence of the FWHM and the peak position of theabsorption band on the size and the shape (eccentricity of the ellip-soid) of aggregate were also studied by Mennig and Berg [22]. Theyfound that the FWHM is heavily dependent on the aggregate sizebut nearly independent of the (shape and the peak positions aresignificantly dependent on aggregate shape but nearly indepen-dent of the size.
The aggregates radius is plotted as a function of annealing timein Fig. 7. We observe that the aggregates radius grew between 0.9and 1.43 nm with increasing of annealing time from 10 to 242 minand then saturated. Kowal et al. [8] suggest that the saturation ofthe absorption band for long annealing times may be due to thefact that all silver ions embedded in the samples have yet beenreduced.
On the other hand, the precipitation of silver decreases the en-ergy system, and therefore the silver atoms tend to precipitate toform aggregates [23]. The aggregation is accelerated at elevatedtemperature (550 �C) and continued growth by increasing of theannealed time up to critical size.
TEM images (Transmission Electron Microscopy) performed byZhang et al. [11] on a silicate glass ion-exchanged to 2% AgNO3
and annealed, show that the distances between neighboring aggre-gates remains high. Accordingly, once the precipitation completed,
Table 3Characteristics of the plasmon resonance band, obtained by Lorentzian fitting, of two glass samples exchanged at 1% AgNO3 and subjected to different treatments.
Treatment undergone by the glass sample Peak position (nm) FWHM (nm) Max. absorbance (u.a.) Average radius of the cluster (nm)
Annealed at 550 �C for 60 min 429.6 140.3 1.48 0.97Irradiated at 250 kGy and annealed at 550 �C for 60 min 421.4 94.0 2.99 1.40
Fig. 5. Absorption spectra of ion-exchanged silicate glass, irradiated with c rays at250 kGy and annealed at 550 �C for the indicated times.
Table 4Characteristics of the plasmon resonance band as a function of annealing time at550 �C, obtained by Lorentzian fitting, of glass samples exchanged to 5% AgNO3 andirradiated to 250 kGy.
Annealing time(min)
Peak position(nm)
FWHM(nm)
Ra
(nm)Area under band(a.u.)
10 439.71 161.00 0.89 145.4215 439.77 153.72 0.93 158.1620 438.44 151.72 0.94 180.8930 437.95 143.20 0.99 211.4440 435.57 137.20 1.02 240.5160 434.18 127.60 1.09 297.44
120 426.98 116.82 1.15 381.50182 422.94 101.18 1.31 465.83242 421.3 91.82 1.43 523.56582 417.7 87.76 1.47 591.39
a The average aggregate radius R.
K. Farah et al. / Nuclear Instruments and Methods in Physics Research B 323 (2014) 36–41 39

Author's personal copy
an aggregate of larger size cannot grow by intergranular diffusionprocess. These images show also that the aggregates have a spher-ical shape.
3.4. Effect of absorbed doses
In order to investigate the effect of absorbed dose variation onthe characteristics of the absorption band attributed to the SPR,glasses samples exchanged at 1% AgNO3 were irradiated in thedose range of 1–100 kGy. The samples were then annealed at550 �C for 60 min. The results are shown in (Fig. 8). It shows that,for a dose of 1 kGy, the absorption spectrum appear to be due tothe superposition of two absorption bands around 350 and
450 nm. However, when the dose exceeds 1 kGy, the band at350 nm disappears and that at 450 nm has good resolution. Thecharacteristics of this band as a function of increasing dose, ob-tained by Lorentzian fitting, are shown in Table 5.
For doses below 20 kGy, we observed a shift of the absorptionpeak to shorter wavelengths (from about 448 to 425 nm), a signif-icant increase in its area under the absorption band (or intensity)and a reduction in its FWHM (from about 172 to 103 nm). It is alsonoted that these changes can be related to the increase in aggre-gate size as it has been shown previously. As well, no significantvariation in the peak position was recorded for doses above5 kGy, indicating that increasing absorbed doses above this limithas no effect on the shape of the aggregates. As mentioned previ-ously [6,22], the peak position depends largely on the aggregateshape, while the FWHM depends mainly on the aggregate size.Therefore, perfectly spherical aggregates could be synthesized byirradiation at this dose level.
In other hand, based on spectroscopic calculations and data andelectron microscopic studies, many authors [6,16,22] confirm thatsilver aggregates formed in glass treated by irradiation and/or heattreatment, which develop only a single absorption band, are spher-ical and very small size.
Moreover, it is noteworthy that for doses above 20 kGy, animportant reduction in the area under the absorption band and
Fig. 6. Average aggregate radius as a function of area under the SPR absorptionband.
Fig. 7. Growth of silver aggregates as a function of annealed time (550 �C) in a glassexchanged to 5% AgNO3 and irradiated by c radiation to 250 kGy. Fig. 8. Absorption spectra of ion-exchanged silicate glass, irradiated with c rays in
the dose range of 1–100 kGy and annealed at 550 �C for 60 min.
Table 5Characteristics of the plasmon resonance band as a function of gamma irradiationdose, obtained by Lorentzian fitting, of glass samples exchanged to 1% AgNO3.
Dose(kGy)
Peak position(nm)
FWHM(nm)
Ra
(nm)Area under band(a.u.)
1 448.03 171.86 0.86 101.505 425.5 122.64 1.09 205.93
10 427 121.46 1.11 319.3820 425 103.46 1.29 401.4140 426.5 118.54 1.14 368.4960 428 132.22 1.03 347.67
100 422.5 155.40 0.85 146.95
a The average aggregates radius R.
40 K. Farah et al. / Nuclear Instruments and Methods in Physics Research B 323 (2014) 36–41
Author's personal copy
an increase in its FWHM, from about 103 to 155 nm, were ob-served. These observations can be explained by the partial neutral-ization of silver by c radiation in a first step (D 6 20 kGy). Theincreasing of the absorbed dose resulted in the observation of thefirst stage of silver aggregation, after irradiation and before theheat treatment, in silver ion exchanged silicate glass by convertingAgþ ions into Agþ2 by the reaction:
Ag0 þ Agþ ! Agþ2 ð6Þ
The decrease in the area under the absorption band (or inten-sity) and the increase of its FWHM from 20 to 100 kGy can be ex-plained by the decrease of Ag0 concentration.
Because for doses D > 20 kGy, neutral silver atoms (Ag0) formedby reduction of Agþ (reaction 2), convert to Agþ2 ions (reaction 6). Itseems that for doses below 20 kGy the concentration of Ag0 is notsufficient to activate the conversion reaction 6.
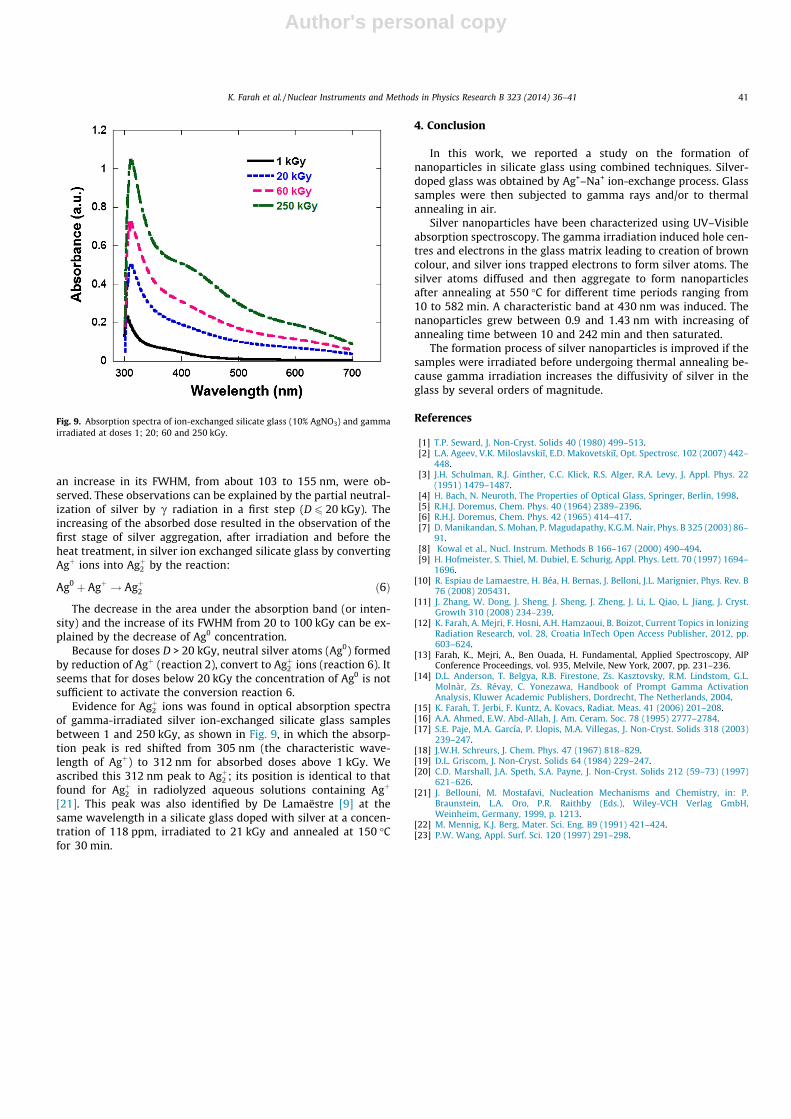
Evidence for Agþ2 ions was found in optical absorption spectraof gamma-irradiated silver ion-exchanged silicate glass samplesbetween 1 and 250 kGy, as shown in Fig. 9, in which the absorp-tion peak is red shifted from 305 nm (the characteristic wave-length of Agþ) to 312 nm for absorbed doses above 1 kGy. Weascribed this 312 nm peak to Agþ2 ; its position is identical to thatfound for Agþ2 in radiolyzed aqueous solutions containing Agþ
[21]. This peak was also identified by De Lamaëstre [9] at thesame wavelength in a silicate glass doped with silver at a concen-tration of 118 ppm, irradiated to 21 kGy and annealed at 150 �Cfor 30 min.
4. Conclusion
In this work, we reported a study on the formation ofnanoparticles in silicate glass using combined techniques. Silver-doped glass was obtained by Ag+–Na+ ion-exchange process. Glasssamples were then subjected to gamma rays and/or to thermalannealing in air.
Silver nanoparticles have been characterized using UV–Visibleabsorption spectroscopy. The gamma irradiation induced hole cen-tres and electrons in the glass matrix leading to creation of browncolour, and silver ions trapped electrons to form silver atoms. Thesilver atoms diffused and then aggregate to form nanoparticlesafter annealing at 550 �C for different time periods ranging from10 to 582 min. A characteristic band at 430 nm was induced. Thenanoparticles grew between 0.9 and 1.43 nm with increasing ofannealing time between 10 and 242 min and then saturated.
The formation process of silver nanoparticles is improved if thesamples were irradiated before undergoing thermal annealing be-cause gamma irradiation increases the diffusivity of silver in theglass by several orders of magnitude.
References
[1] T.P. Seward, J. Non-Cryst. Solids 40 (1980) 499–513.[2] L.A. Ageev, V.K. Miloslavskiı̆, E.D. Makovetskiı̆, Opt. Spectrosc. 102 (2007) 442–
448.[3] J.H. Schulman, R.J. Ginther, C.C. Klick, R.S. Alger, R.A. Levy, J. Appl. Phys. 22
(1951) 1479–1487.[4] H. Bach, N. Neuroth, The Properties of Optical Glass, Springer, Berlin, 1998.[5] R.H.J. Doremus, Chem. Phys. 40 (1964) 2389–2396.[6] R.H.J. Doremus, Chem. Phys. 42 (1965) 414–417.[7] D. Manikandan, S. Mohan, P. Magudapathy, K.G.M. Nair, Phys. B 325 (2003) 86–
91.[8] Kowal et al., Nucl. Instrum. Methods B 166–167 (2000) 490–494.[9] H. Hofmeister, S. Thiel, M. Dubiel, E. Schurig, Appl. Phys. Lett. 70 (1997) 1694–
1696.[10] R. Espiau de Lamaestre, H. Béa, H. Bernas, J. Belloni, J.L. Marignier, Phys. Rev. B
76 (2008) 205431.[11] J. Zhang, W. Dong, J. Sheng, J. Sheng, J. Zheng, J. Li, L. Qiao, L. Jiang, J. Cryst.
Growth 310 (2008) 234–239.[12] K. Farah, A. Mejri, F. Hosni, A.H. Hamzaoui, B. Boizot, Current Topics in Ionizing
Radiation Research, vol. 28, Croatia InTech Open Access Publisher, 2012, pp.603–624.
[13] Farah, K., Mejri, A., Ben Ouada, H. Fundamental, Applied Spectroscopy, AIPConference Proceedings, vol. 935, Melvile, New York, 2007, pp. 231–236.
[14] D.L. Anderson, T. Belgya, R.B. Firestone, Zs. Kasztovsky, R.M. Lindstom, G.L.Molnàr, Zs. Révay, C. Yonezawa, Handbook of Prompt Gamma ActivationAnalysis, Kluwer Academic Publishers, Dordrecht, The Netherlands, 2004.
[15] K. Farah, T. Jerbi, F. Kuntz, A. Kovacs, Radiat. Meas. 41 (2006) 201–208.[16] A.A. Ahmed, E.W. Abd-Allah, J. Am. Ceram. Soc. 78 (1995) 2777–2784.[17] S.E. Paje, M.A. García, P. Llopis, M.A. Villegas, J. Non-Cryst. Solids 318 (2003)
239–247.[18] J.W.H. Schreurs, J. Chem. Phys. 47 (1967) 818–829.[19] D.L. Griscom, J. Non-Cryst. Solids 64 (1984) 229–247.[20] C.D. Marshall, J.A. Speth, S.A. Payne, J. Non-Cryst. Solids 212 (59–73) (1997)
621–626.[21] J. Bellouni, M. Mostafavi, Nucleation Mechanisms and Chemistry, in: P.
Braunstein, L.A. Oro, P.R. Raithby (Eds.), Wiley-VCH Verlag GmbH,Weinheim, Germany, 1999, p. 1213.
[22] M. Mennig, K.J. Berg, Mater. Sci. Eng. B9 (1991) 421–424.[23] P.W. Wang, Appl. Surf. Sci. 120 (1997) 291–298.
Fig. 9. Absorption spectra of ion-exchanged silicate glass (10% AgNO3) and gammairradiated at doses 1; 20; 60 and 250 kGy.
K. Farah et al. / Nuclear Instruments and Methods in Physics Research B 323 (2014) 36–41 41