Trace element analysis of scheelite by excimer laser ablation-inductively coupled plasma-mass...
17
CHEMICAL GEOLOGY lhtZ”DlNG ISOTOPE GEOSCIENCE Chemical Geology 141(1997) 49-65 ELSEVIER Trac’e element analysis of scheelite by excimer laser ablation-inductively coupled plasma-mass spectrometry (ELA-ICP-MS) using a synthetic silicate glass standard Paul J. Sylvester *, Majid Ghaderi Research School of Earth Sciences, The Australian National University, Canberra, ACT 0200, Australia Received 15 June 1996; accepted 10 April 1997 Abstract Concentrations of ‘W and trace elements in scheelites (CaWO,) associated with Archean lode-gold deposits in Western Australia were detcrrnined by ArF (193 mn) excimer laser ablation-ICP-MS with external calibration against a silicate glass standard reference material, NIST 610. The excimer laser beam drilled well-defined pits in both scheelite and silicate glass. With internal standardization against Ca alone, W measurements for the scheelites fall within 5% of the concentrations expected from electron microprobe measurements. A matrix effect between scheelite and silicate glass is apparent in the behaviour of W during laser ablation: W is progressively fractionated from Ca in the glass but not in the scheelite. Proper data reduction, therefore, requires use of the early maximum count rates for W and Ca rather than the mean count rates during ablation. W isotopic ratios measured in the scheelites and an in-house generated silicate glass, ANU 252, are both within N 2.5% of the accepted values for the natural ratios and are reproducible to N 1%, if data for the first _ 11 s of ablation are excluded. Using the same data reduction techniques employed for W, concentrations of Sr, Y, MO, BEE and Pb, present at ppm levels in the scheelites, were measured with a precision of 4% or less. Measurements on Th and U, present at the 5-10 ppb level, and P, Mn, Nb and Ta are less precise (- 5-40%) and concentrations of Rb, Zr, Ba, Sn, Hf, Tl and Bi are, for the most part, below detection limits. For Sr, Sm and Nd, replicate ELA-ICP-MS measurements made on 80-pm wide spots in scheelite largely encompass the concentrations determined by ID-TlMS on bulk samples. BEE patterns determined by ELA-ICP-MS for the scheelites vary smoothly as a function of atomic number. Most of the patterns are hump-shaped but others are rather flat except for positive Eu anomalies. This suggests that the hydrothermal fluids that formed the scheelites did not have a common composition and source. 0 1997 Elsevier Science B.V. Keywords: laser methods; trace elements; standard materials; scheelite: isotopes; gold 1. Introduction introducing the ablated material into an inductively Gray (1985) showed that it should be possible to measure trace element concentrations of minerals with a high degree of precision and accuracy by firing a laser beam at the flat surface of a sample and * Corresponding author. E-mail: [email protected] coupled plasma-mass spectrometer (ICP-MS). Yet, since then, there have been disappointingly few de- tailed demonstrations of quantitative trace element analyses of minerals by laser ablation-ICP-MS. Early attempts at analyses were made using Nd- YAG (Y, Al& garnet) lasers emitting at the; fun- damental frequency (1064 nm) in the infra-red (IR). 0009-2541/97/$17.00 C 1997 Elsevier Science B.V. All rights reserved. PII SOOOS-2541(97)00057-O
Transcript of Trace element analysis of scheelite by excimer laser ablation-inductively coupled plasma-mass...
CHEMICAL GEOLOGY lhtZ”DlNG
ISOTOPE GEOSCIENCE Chemical Geology 141(1997) 49-65 ELSEVIER
Trac’e element analysis of scheelite by excimer laser ablation-inductively coupled plasma-mass spectrometry (ELA-ICP-MS) using a synthetic silicate glass standard
Paul J. Sylvester * , Majid Ghaderi Research School of Earth Sciences, The Australian National University, Canberra, ACT 0200, Australia
Received 15 June 1996; accepted 10 April 1997
Abstract
Concentrations of ‘W and trace elements in scheelites (CaWO,) associated with Archean lode-gold deposits in Western Australia were detcrrnined by ArF (193 mn) excimer laser ablation-ICP-MS with external calibration against a silicate glass standard reference material, NIST 610. The excimer laser beam drilled well-defined pits in both scheelite and silicate glass. With internal standardization against Ca alone, W measurements for the scheelites fall within 5% of the concentrations expected from electron microprobe measurements. A matrix effect between scheelite and silicate glass is apparent in the behaviour of W during laser ablation: W is progressively fractionated from Ca in the glass but not in the scheelite. Proper data reduction, therefore, requires use of the early maximum count rates for W and Ca rather than the mean count rates during ablation. W isotopic ratios measured in the scheelites and an in-house generated silicate glass, ANU 252, are both within N 2.5% of the accepted values for the natural ratios and are reproducible to N 1%, if data for the first _ 11 s of ablation are excluded. Using the same data reduction techniques employed for W, concentrations of Sr, Y, MO, BEE and Pb, present at ppm levels in the scheelites, were measured with a precision of 4% or less. Measurements on Th and U, present at the 5-10 ppb level, and P, Mn, Nb and Ta are less precise (- 5-40%) and concentrations of Rb, Zr, Ba, Sn, Hf, Tl and Bi are, for the most part, below detection limits. For Sr, Sm and Nd, replicate ELA-ICP-MS measurements made on 80-pm wide spots in scheelite largely encompass the concentrations determined by ID-TlMS on bulk samples. BEE patterns determined by ELA-ICP-MS for the scheelites vary smoothly as a function of atomic number. Most of the patterns are hump-shaped but others are rather flat except for positive Eu anomalies. This suggests that the hydrothermal fluids that formed the scheelites did not have a common composition and source. 0 1997 Elsevier Science B.V.
Keywords: laser methods; trace elements; standard materials; scheelite: isotopes; gold
1. Introduction introducing the ablated material into an inductively
Gray (1985) showed that it should be possible to measure trace element concentrations of minerals with a high degree of precision and accuracy by firing a laser beam at the flat surface of a sample and
* Corresponding author. E-mail: [email protected]
coupled plasma-mass spectrometer (ICP-MS). Yet, since then, there have been disappointingly few de- tailed demonstrations of quantitative trace element analyses of minerals by laser ablation-ICP-MS.
Early attempts at analyses were made using Nd- YAG (Y, Al& garnet) lasers emitting at the; fun- damental frequency (1064 nm) in the infra-red (IR).
0009-2541/97/$17.00 C 1997 Elsevier Science B.V. All rights reserved. PII SOOOS-2541(97)00057-O
50 P.J. Syluester, M. Ghaderi/Chemical Geology 141 (1997) 49-65
Such systems provided much of the basic informa- tion we have today about laser ablation-ICP-MS and, when used properly, have produced accurate and precise concentration measurements for some minerals (e.g., Jackson et al., 1992). IR-based laser- ICP-MS systems, however, have limitations. For instance, it is difficult to bore uniform, steep-walled, flat-bottomed holes in transition-element-poor miner- als, such as calcite, apatite and plagioclase, which are weakly absorbing in the IR. Rupturing and flak- ing of material from the walls and flanks of the holes, in many cases along cracks or cleavage planes, is common (Jackson et al., 1992). The result can be a non-uniform size and density distribution of mi- croparticulates in the ablated sample delivered to the ICP, resulting in the production of erratic analyte signal intensities (Anderson et al., 1992). Also, melt- ing within IR laser-drilled holes is common, some- times producing an ejecta field of splattered melt globules around the crater (Jackson et al., 1992). Non-uniform partitioning of elements between melt and solid phases can produce ablated material with a composition quite different from that of the original mineral (Chenery et al., 1992; Watling et al., 1995; Outridge et al., 1996).
Fortunately, many of the problems with IR-laser ablation seem to be less severe when minerals are ablated with ultraviolet (UV) radiation (Chenery and Cook, 1993; Geertsen et al., 1994). Hence, in the last few years, several geochemical laboratories equipped with Nd-YAG lasers have quadrupled the fundamen- tal frequency of those lasers to emit at 266 nm, which is in the UV ( < 400 nm> (Chenery and Cook, 1993; Jenner et al., 1994). An alternative approach, used for some time with ICP-atomic emission spec- trometry (Chan and Russo, 1991; Hwang et al., 1991) and adopted for ICP-MS by Loucks et al. (1995) at the Australian National University (ANU), is to ablate using excimer lasers, which emit with fundamental frequencies in the UV. Excimer lasers are generally considered to have less predictable beam profiles than Nd-YAG lasers, so their applica- bility to quantitative trace element analysis of miner- als remains to be demonstrated (Perkins and Pearce, 1995).
Another problem with quantitative mineral analy- ses by laser ablation-ICP-MS has been the choice of standard material used for external calibration.
One approach is to use matrix-matched calibration standards for mineral analysis (Pearce et al., 1992; Perkins et al., 1992) but, unfortunately, very few well-analyzed, homogeneous mineral standards are currently available. A different strategy, employed by Jackson et al. (1992), Jenner et al. (19941, Jeffries et al. (1995) and Foley et al. (1996), is standardiza- tion against a synthetic silicate glass of known com- position. The concern with this procedure is that gross differences in chemical composition, ablation behaviour, and processes of material transport to, and excitation in, the ICP may result in substantially different patterns of concentration-normalized ana- lyte intensities from low to high mass (commonly referred to as ‘response curves’) between minerals and glasses. In particular, it is well known from conventional solution nebulization-ICP-MS that an element present in large concentrations ( > 1000 ppm) in a solution may cause suppression or enhancement of the signal intensities of accompanying trace ele- ments compared to when that same element is pre- sent at lower concentration levels (Beauchemin et al., 1987; Tan and Horlick, 1987).
If significant errors result from these so-called ‘matrix effects’, they can be greatly attenuated only by using multiple internal standards that match un- known elements in terms of mass/charge ratio and ionization efficiency (Beauchemin et al., 1987; Tan and Horlick, 1987). In solution-based ICP-MS, it is a straightforward matter to add the appropriate inter- nal standards to both standard and unknown solu- tions, but this is not so for laser ablation-ICP-MS. Instead, internal standardization in laser ablation- ICP-MS is commonly performed by normalizing measured intensities of trace elements to that of a major element of known concentration in both the standard and mineral unknown (Perkins and Pearce, 1995). Most minerals, however, are composed of major elements with only low masses ( < 57 amu), whereas the large majority of their trace elements have high masses (58-238 amu>. Hence, internal standardization across precisely the mass range of analytical interest is not commonly possible using this procedure. To date, no definitive evidence has been presented that matrix effects between silicate glass and minerals do in fact produce significant errors in laser ablation-ICP-MS. Williams and Jarvis (1993) and Morrison et al. (1995), however, reported
P.J. Sylvester, A4. Ghaderi/Chemical Geology 141 (1997) 49-65 51
substantial differences in the response curves of vari- ous rocks of knowln composition made into pressed powder pellets and! analyzed by IR-laser ablation- ICP-MS. Stix et al (1995) reported differences in the responses of Zr, Y and Ce in natural and syn- thetic silicate glasses with a wide range of iron and trace element contents. Also, in almost all studies reported so far, significant discrepancies (> 10%) are found between the trace element contents of minerals measured by glass-calibrated laser abla- tion-ICP-MS and conventional solution nebuliza- tion-ICP-MS (e.g., Jackson et al., 1992; Foley et al., 1996). Although the discrepancies may be at- tributable to the inherently heterogeneous distribu- tion of trace elements in minerals, the possibility that they are due to uncorrected matrix effects cannot yet be ruled out.
In an attempt to address the foregoing issues, we report quantitative trace element analyses of the rnin- eral scheelite (CaWO,) by excimer laser ablation (ELA)-ICP-MS with external calibration against a synthetic silicate glass standard. Scheelite is an ideal mineral with which to demonstrate the utility of this technique because it is of geologic interest, being associated with several important hydrothermal gold deposits (Anglin et al., 1987); it is preferably ana- lyzed by a solid sampling method, as the mineral is resistant to acid attack and tends to be unstable in solution; it contains a large number of trace ele- ments, each with a wide range in concentration; and it possesses a major element composition completely different than that of silicate glass. Most importantly, however, scheelite is composed of both a light (Cal and a heavy (W) m,ajor element, which, unlike trace elements, are commonly distributed homogeneously within single grams in near-stoichiometric propor- tions. Thus, electron probe measurements of the concentrations of Ca and W in scheelite can be used to assess quantitatively whether matrix effects at- tending ELA-ICP-MS require internal standardiza- tion with both low- and high-mass elements. To further assess the accuracy of our data, concentra- tions of Sr, Nd and Elm determined by ELA-ICP-MS in scheelite are compared to those measured by conventional, solutieon-based, isotope dilution-ther- mal ionization mas,s spectrometry (ID-TIM@. In addition to this work, we examine the capability of the ANU ELA-ICI’-MS system to make accurate
isotopic measurements by determining the isotopic composition of W in scheelite and silicate glass.
The scheelites analyzed in this study were col- lected from hydrothermal, gold-bearing quartz veins in various underground gold mines from the Norse- man-Kambalda region of Western Australia as part of a project to understand the sources and processes of Archean greenstone-belt lode-gold mineralization. Complete details and results of that project, includ- ing all scheelite analyses made by ELA-ICP-MS, will be presented elsewhere.
2. Instrumentation and analytical procedures
The ELA-ICP-MS system developed at the ANU has been described by Loucks et al. (1995) and its essential elements are as follows. Sample ablation is carried out using a pulsed ArF excimer laser (Lambda Physik LPX 12Oi) emitting at 193 nm with a nominal pulse width of 17 ns, FWHM, and a pulse-to-pulse stability of f 5%. The laser is capable of a maxi- mum repetition rate of 200 Hz and a pulse energy of 200 ml but, for scheelite analyses, was operated at 5 Hz and 100 mJ, providing an energy density of N 5 J/cm2. The beam spot can be varied in diameter between about 5 and 500 pm by inserting masks with apertures of various sizes in the beam path. In this study, all analyses were made on an 80-pm diameter spot, except where noted otherwise. Beam focussing on the sample is performed using a long working distance lens system. Laser gas processing is accomplished with a Lambda Physik GP 2000 XR unit, which uses liquid nitrogen as the cryogen.
Geologic samples, which in this work were mounted in epoxy, cut to expose a fresh surface, polished, and cleaned with methanol, are ablated while being held in a translational stage that is encased within an air-tight sample cell. A video camera allows magnified viewing of the sample via a television monitor. Once the sample is loaded, he- lium and argon gases are fed into the bottom and top, respectively, of the sample cell. A mass-flow con- troller keeps the flow rates of the argon and helium gases constant. Compared to ablation in pure argon, ablation in a mixed argon-helium atmosphere re- tards condensation and reprecipitation of ablated ma- terial around the excavated crater (Loucks et al.,
Tabl
e 1
Day
-to-
day
repr
oduc
ibili
ty o
f E
LA-I
CPM
S co
ncen
trat
ion
(ppm
) m
easu
rem
ents
Ele
men
t Is
otop
e Pr
efer
red l
iter
atur
e ave
rage
s a
ELA
-IC
PMS
mea
sure
men
ts of
NIS
T 61
2 us
ing
MST
610
as
stan
dard
b
% d
iffer
ence
%
tot
al S
D =
mea
sure
d M
ST
%SD
M
ST
%SD
da
y %
SD
day
%SD
da
y %
SD
mea
n %
SD
NIS
T 61
2 M
ST
610
612
1 2
3 m
ean
610+
n=
5 n=
5 ?Z
=5
n=3
mea
s. v
s.
MST
612
pr
efer
red
P 31
34
2.5
15.5
55
.16
41.2
41
.13
6.1
41.1
8 8.
2 40
.97
5.2
41.0
9 0.
3 -3
4 44
Ti
49
43
4.0
3.4
48.1
1 6.
3 37
.63
6.6
37.1
0 5.
5 37
.85
6.8
37.5
3 1.
0 -2
8 7.
1 M
n 55
43
3.3
7.3
38.4
3 2.
6 37
.09
1.5
36.5
6 2.
5 36
.28
3.0
36.6
4 1.
1 -4
.9
7.8
Rb
85
431.
1 2.
6 31
.63
1.9
30.9
9 1.
2 31
.43
1.1
29.9
5 3.
5 30
.79
2.5
-2.7
3.
2 Sr
88
49
7.4
3.7
76.1
5 3.
0 75
.48
1.0
74.9
7 0.
9 73
.60
1.1
74.6
8 1.
3 -
2.0
4.8
Y 89
44
9.9
4.3
38.2
5 5.
6 37
.83
1.1
36.1
1 0.
8 36
.69
2.2
36.8
8 2.
4 -3
.7
7.1
zr
90
439.
9 1.
8 35
.99
3.5
37.5
1 0.
4 36
.26
2.0
37.2
0 1.
4 36
.99
1.8
2.7
3.9
Nb
93
419.
4 13
.7
38.0
6 2.
3 34
.62
1.1
34.2
3 1.
9 34
.04
1.7
34.3
0 0.
9 -1
1 14
M
O
98
376.
8 11
.9
38.3
0 4.
3 32
.98
2.5
31.9
9 3.
2 30
.99
2.1
31.9
9 3.
1 -2
0 13
Sn
12
0 39
6.3
4.5
37.9
6 4.
6 41
.17
3.3
38.0
9 2.
9 40
.60
2.6
39.9
5 4.
1 5.
0 6.
5 Sb
12
1 36
8.5
7.5
38.4
4 5.
9 30
.53
1.2
30.1
2 2.
0 29
.54
3.2
30.0
6 1.
7 -2
8 9.
5 B
a 13
8 42
4.1
6.9
37.7
4 3.
3 37
.35
0.6
36.5
1 0.
7 35
.26
2.5
36.3
7 2.
9 -3
.8
7.7
La
139
457.
4 15
.8
35.7
7 6.
0 37
.81
1.0
36.4
1 0.
8 36
.02
1.4
36.7
5 2.
6 2.
7 17
C
e 14
0 44
7.8
3.8
38.3
5 4.
3 37
.84
0.5
37.0
3 0.
9 36
.33
1.5
37.0
7 2.
0 -3
.5
5.7
Pr
141
429.
8 7.
0 37
.16
2.5
36.3
9 0.
6 35
.39
0.8
35.0
2 1.
2 35
.60
2.0
-4.4
7.
4 N
d 14
6 43
0.8
8.7
35.2
4 6.
9 35
.28
1.4
34.3
1 1.
0 34
.10
1.4
34.5
6 1.
8 -
2.0
11
Sm
147
450.
5 4.
6 36
.72
7.2
37.2
3 1.
0 36
.23
1.2
36.3
0 1.
9 36
.59
1.5
-0.4
8.
5 E
u 15
1 46
1.1
11.3
34
.44
4.6
37.2
4 0.
9 36
.09
0.8
35.1
0 2.
2 36
.14
3.0
4.7
12
Gd
157
419.
9 6.
0 36
.95
2.9
35.9
6 1.
3 33
.93
1.3
34.5
7 1.
6 34
.82
3.0
-6.1
6.
7
Det
ecti
on
7
limit
B
E
. (p
pm)
d s 5 8
3.6
F
1.8
2
2.3
s
0.73
2
0.16
3 2
0.02
8 0.
11
F
0.03
4 3
0.49
1.
00
0.05
0 0.
059
0.12
0.
014
0.01
2 0.
033
0.05
6 0.
022
0.11
-I%
159
DY
16
3 H
o 16
5 E!
r 16
7 Tm
16
9 Y
b 17
2 LU
17
5 H
f *_
n II
8 Ta
18
1 W
18
4 Tl
20
5 Pb
20
8 B
i 20
9 Th
23
2 U
23
8
442.
8 5.
1 35
.92
7.5
426.
5 4.
2 35
.97
2.3
449.
4 5.
5 37
.87
2.9
426.
0 5.
6 37
.43
4.0
420.
1 4.
6 37
.55
3.3
461.
5 6.
6 39
.95
7.2
434.
7 7.
1 37
.71
5.2
.I_
_ 41
1.1
6.8
_ --
54
.11
io.5
376.
6 20
.6
39.7
7 5.
4 44
5.3
5.6
39.5
5 2.
0 61
.2
3.4
15.0
7 4.
4 41
3.3
3.7
38.9
6 4.
7 35
1.1
13.7
29
.84
20.0
45
0.6
6.2
37.2
3 1.
9 45
7.1
3.0
37.1
5 3.
3
38.1
1 0.
8 36
.43
0.5
36.3
5 2.
0 36
.96
2.7
2.8
9.0
0.00
7 34
.93
1.3
33.3
3 1.
0 33
.77
2.2
34.0
1 2.
4 -5
.8
4.8
0.01
9 38
.54
0.7
36.5
1 0.
6 36
.95
1.1
37.3
3 2.
9 -
1.4
6.2
0.00
7 36
.24
1.1
34.5
7 0.
7 34
.33
1.4
35.0
5 3.
0 -6
.8
6.9
0.02
9 36
.05
0.8
34.2
8 0.
5 34
.58
0.7
34.9
7 2.
7 -
7.4
5.7
0.00
7 39
.88
0.4
37.7
8 0.
9 37
.58
1.4
38.4
1 3.
3 -4
.0
9.8
0.03
2 36
.91
0.6
34.9
7 0.
5 35
.12
1.1
35.6
7 3.
0 -5
.7
8.8
0.00
9 36
.10
0.7
34.0
0 0.
5 34
.11
1.5
34.7
4 3.
4 -0
.1
12
0.02
3 31
.84
0.8
30.3
5 0.
4 29
.99
0.8
30.7
3 3.
2 -2
9 21
0.
006
37.8
1 1.
4 37
.65
1.0
36.4
8 4.
0 37
.31
1.9
- 6.
0 6.
0 0.
025
15.5
5 3.
2 16
.45
2.1
11.9
1 21
14
.64
16
- 3.
0 5.
6 0.
015
37.4
5 1.
2 37
.13
0.9
35.7
3 2.
0 36
.77
2.5
-6.0
6.
0 0.
023
31.2
9 1.
4 31
.18
0.4
29.1
2 1.
3 30
.53
4.0
2.3
24
0.01
1 37
.65
1.2
35.8
8 0.
8 35
.19
1.2
36.2
4 3.
5 -
2.7
6.5
0.00
5 37
.25
1.0
36.7
8 0.
5 34
.59
3.1
36.2
1 3.
9 -2
.6
4.5
0.00
3
a Pr
efer
red
aver
ages
fro
m
Pear
ce
et a
l. (1
997)
. b
Inte
rnal
st
anda
rdiz
atio
n us
ing
Ca4
3;
assu
min
g C
aO
= 11
.46
and
11.8
5 w
t%,
resp
ectiv
ely,
in
NIS
T 61
0 an
d 61
2 (N
orm
an
et a
t.,
1996
). SD
= l
a/zm
sr.
’ To
tal
SD=
(lo/~
~sT6
,0)2
+(l~
/jZN
IsT6
,2)2
. d
Det
ectio
n lim
it ca
lcul
ated
as
3 t
imes
th
e sta
ndar
d de
viat
ion
of a
sam
ple
cont
aini
ng
zero
an
alyt
e (L
onge
rich
et a
l.,
1996
).

54 P.J. Sylvester, M. Ghaderi/Chemical Geology 141 (1997) 49-65
1995). The carrier gas and its sample-derived con- stituents are transported to the ICP through plastic tubing and via a gas-expansion chamber that homog- enizes the gas-sample mixture.
Elemental analysis is carried out using a Fisons PlasmaQuad PQ2+ ICP-MS. In this work, the in- strument was operated with a forward power of 1200 W and a reflected power of < 2 W. Gas flows were 0.99 l/min for argon and 0.30 l/min for helium in the carrier gas, 0.90 l/min for the auxiliary gas and 13 l/min for the cooling gas. Ion lens settings were: extraction, 4.0; collector, 8.1; Ll, 8.0; L2, 5.0; L3, 5.3; and L4, 5.0. The lenses were focused to give large, stable signals for the La139 and U238 peaks, low background counts (< 20 cps) and low oxide production (Th2320’6/Th232 _ 0.2%) during abla- tion of NIST (National Institute of Standards and Technology, formerly NBS) 610 synthetic silicate glass.
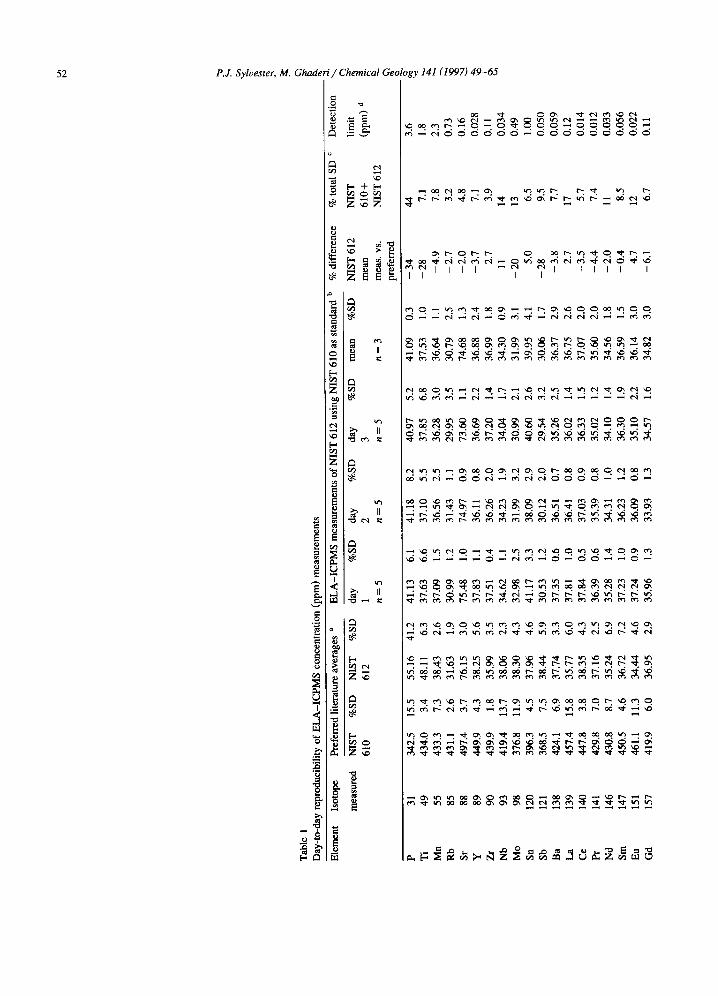
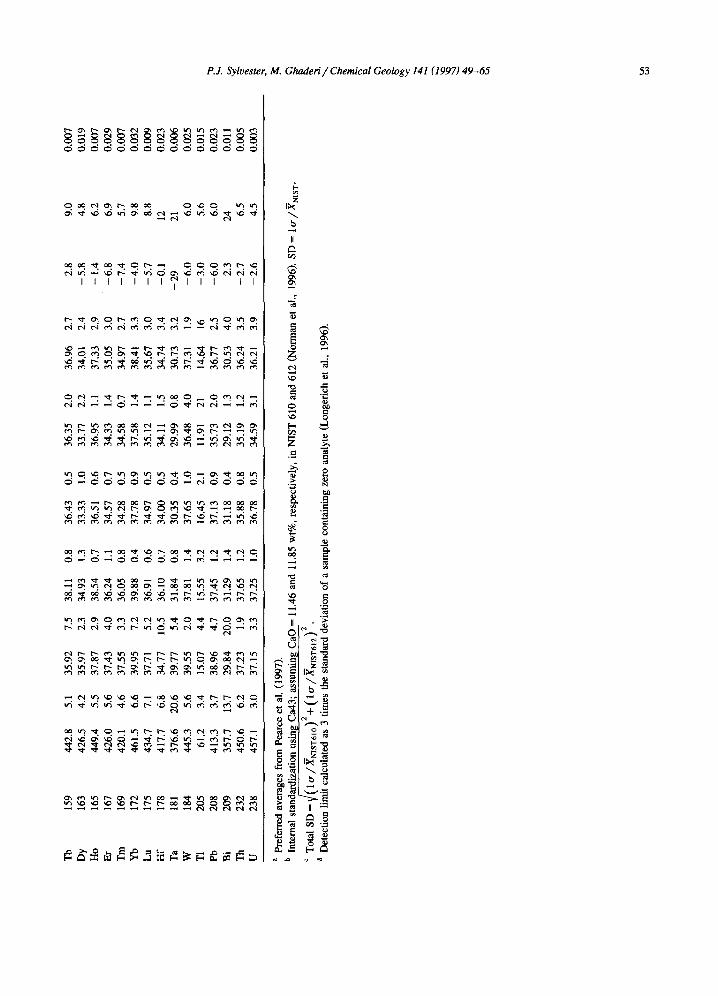
NIST 610 was used as an external calibration standard for the scheelite unknowns, employing the preferred element concentrations of Pearce et al. (19971, which are based on a critical evaluation of all data in the literature. The preferred values for the elements of interest and their associated uncertain- ties, which range from N 2 to 21%, are shown in Table 1. For W, a common isotope could not be measured precisely in both the scheelite and NIST 610 glass under a common set of operating condi- tions. For scheelite, the only isotope measurable without saturating the detector was the minor 180 peak ( _ 0.12% of total W). However, for NIST 610, there is a large (99%) isobaric interference from Hf”’ on W’*‘, which precludes use of that W isotope for accurate standardization of W concentra- tion measurements in scheelite unknowns. Thus, the Wls4 peak (N 30.6% of total W) in NIST 610 was measured and converted to an intensity for the WtBo peak by multiplication by the natural W 18o/W184 ratio of Lee and Halliday (1995). The natural ratio was corrected for an instrument mass bias of 2.56%, as determined by W isotopic measurements (dis- cussed later) on one of the scheelites, K206, studied here. For the W isotopic measurements made on silicate glass in this study, an in-house generated, Hf-poor basalt glass, ANU 252, spiked with 177 ppm W, was used. Although the isobaric interference from Hf 18’ on W”’ seen in ANU 252 is large
(40%), it is still significantly smaller than that found in NIST 610.
The procedure adopted for concentration measure- ments involved the analysis of NIST 610 glass, followed by the analysis of five to seven scheelite unknowns, a repeat analysis of the NIST 610 glass, another five to seven scheelite unknowns, and so on. The Ca43 peak (0.13% of total Ca) was used as an internal standard to correct for differences in ablation yield from analysis-to-analysis and temporal varia- tions in instrument signal intensity (or ‘drift’). A secondary correction for the mass dependency of signal drift (e.g., Eggins et al., 1997) was made by linear interpolation between analyses of the NIST 610 glass made at the start of an analytical session and repeated after each set of five to seven analyses of unknowns. Each standard and unknown analysis lasted 2 min; the first minute measuring gas back- ground with the laser off, the second minute measur- ing analyte intensities produced during laser ablation.
A total of 35 elements were analyzed during each 60 s of ablation; the isotopes measured for each element are given in Table 1. Ion collection was in peak-hopping mode (3 points per peak) with a dwell time of N 25 ms and quad settle time of 5 ms per peak. Raw counts were automatically converted to counts-per-second (cps) data for each of _ 1. l-s-long ‘time slices’ by Fisons time-resolved computer soft- ware package. The time-sliced cps data were copied to a computer spreadsheet program for subtraction of mean gas background intensities from time-resolved signal intensities for each analyte (in NIST 610, < 1% for all elements except 3-15% for P, Ca, Ti, Mn, Rb, MO and Sn; in scheelite, < 6% for all elements except lo-50% for P, Ba, Ta, Bi, Th and U, and 80-95% for, Mn, Rb, Zr, Sn, Hf and Tl), application of the secondary drift correction ( < 14%), and interference corrections of 22-81% in scheelite and 0.4% in silicate glass for overlap of La138 and Ce13* on Ba13*. Based on the low ThO/Th ratios found for NIST 610 glass in this experiment, correc- tions for interferences by molecular oxide species on the analytes of interest were determined to be negli- gible and ignored.
ID-TIMS analyses were performed using the fol- lowing procedures. Scheelite separates were prepared using standard heavy liquid and magnetic separation methods. Final purification was achieved by hand-
P.J. Syluester, M. Ghaderi/Chemical Geology 141 (1997) 49-65 55
picking under a binocular microscope with ultravio- let light. The separates were then cleaned in an ultrasonic bath, first with ethanol and then with Milli-Q water. The scheelite separates were pow- dered in an agate mill. For Sm-Nd and Rb-Sr isotopic analyses, 10-30 mg of sample powder were spiked with 150Nd-147Sm and s5Rb-84Sr tracers prior to HF-HNO, and HF-HCl dissolutions in pressur- ized Teflon bombs. After dissolution, Sr, Sm and Nd were separated using cation and HDEHP column procedures as described in Mass (1991). Procedural blanks throughout this study averaged 150 pg for Nd and 400 pg for Sr and were negligible for all sam- ples. The analytical in-run precision for the Sr, Nd and Sm concentrations was better than 0.3%. Precipi- tated tungsten oxide commonly remains after bomb dissolution. For two samples this precipitate was dissolved using NH,OH and analyzed indepen- dently; in all cases the concentrations and isotopic compositions of Sr and Nd of the precipitate were identical to those of the dissolved fraction, indicating that equilibration had been achieved in the bomb. Furthermore, the analysis of the samples dissolved only by NH,OH yielded indistinguishable results to the above-mentioned experiments. Concentrations and isotopic compositions were measured at RSES on a Finnigan-MAT 261 multicollector mass spec- trometer in static mode.
Electron microprobe analyses for Ca and W were made by wavelength-dispersive spectrometry using a Cameca Camebax Microbeam instrument at RSES. The probe was operated with a 15 kV accelerating voltage, 13.5 nA beam current and lo-pm-wide beam. Plagioclase and pure tungsten metal were employed as standards.
3. Results and discussion
3.1. Excimer laser drilling performance in silicate glass and scheelite
The drilling performance of the excimer laser in our experiments was excellent. As shown in Fig. 1, steep-walled, flat-bottomed holes of nearly uniform shape were drilled in both silicate glass (ANU 252 shown) and scheelite, using a common pulse energy. Even where drilling intersected a pre-existing crack in a mineral grain, the integrity of the pit was
retained. Scanning electron micrograph images of craters in scheelite formed during N 60 s of laser ablation at 5 Hz are about 30 pm deep, suggesting that N 0.1 pm of material was removed per laser pulse.
The most tangible result of the outstanding drilling performance of the excimer laser for analytical geo- chemistry is a more-or-less stable, continuous, spike-free analyte signal produced by the ICP. Fig. 2A shows the time-resolved, gas-background-sub tracted intensities of Ca43, Sr**, W”’ and W184 in ANU 252 silicate glass and scheelite during laser ablation. In a matter of several seconds, analyte signals increase from background levels to a maxi- mum and then begin a slow and steady decline until ablation ceases. The gradual decrease in signal inten- sity with time reflects progressive reduction in abla- tion yield as laser drilling deepens the pit. Internal standardization corrects for this gradual signal loss.
For some element pairs, such as Ca and Sr in the glass and scheelite, the shapes of their time-resolved intensity profiles are nearly identical and, after the fmt few seconds of ablation during which there is significant fractionation of heavier and lighter iso- topes due to the combination of rapidly increasing signal intensities and the sequential nature of quadrupole analysis, their gas-background-subtracted cps ratios vary by less than 10% (la) (Fig. 2B). For other element pairs, such as Ca and W in the glass, gas-background-subtracted cps ratios are progres- sively fractionated during ablation. Thus, in contrast to the study of Bea et al. (19961, we find that element fractionation can occur during excimer laser ablation. It has been known for some time that element fractionations occur during Nd-YAG-laser ablation (Fryer et al., 1995). The origin of these fractionations is poorly understood and they repre- sent a challenge to quantitative analysis by LA- ICP-MS (see below).
3.2. Derivation of element concentrations from ELA-ICP-MS spectra
For the ELA-ICP-MS analyses, element concen- trations in unknowns (C,,,) were calculated using the relation

56 P.J. Sylvester, M. Ghaderi/Chemical Geology 141 (1997) 49-65
where C,,, = the concentration of the internal stan- dard element, in this case Ca, in the unknown;
ZW”/I,,” = the ratio in the unknown of the measured cps of an isotope of the element to be determined in the unknown relative to that of an isotope of the internal standard element, in this case Ca43; C,,,/C,,, = the ratio in the standard of the concen- tration of the element to be determined in the un-
known relative to that of the chosen internal standard element; and Z,,,/Z,,, = the ratio in the standard of the measured cps of an isotope of the element to be determined in the unknown relative to that of the chosen isotope of the internal standard element.
Because of progressive, element fractionation dur- ing laser ablation, there may be a large range of measured values for Z,,JZ,,, or Z,,,/Z,,, produced
Fig. 1. Scanning electron micrographs of craters drilled into (A) silicate glass, ANU 252, and (B) scheelite, using the excimer laser. Crater in the glass drilled with a 250~pm spot: that in scheelite with an 8O-fim spot. Images made using a Cambridge S360 scanning electron microscope operated at 20 kV.

P.J. Sylvester, M. Ghaderi/Chemical Geology 141(1997) 49-65 57
during a single 60-s acquisition of data. Thus, there is some question as to which of the measured values represents the actual, intrinsic ratio in an analyzed material. The approach commonly adopted for the reduction of laser ablation-ICP-MS data, developed largely before the extent and nature of element frac- tionations had become recognized (e.g., Jackson et al., 1992), is the ‘mean count rate’ method. This approach assumes that the intrinsic Z,,,/Z,,, or Z,,,/Z,,, ratios in an analyzed material are best ap- proximated by the .mean of all the ratios produced during ablation. If, however, laser-induced element fractionations seen in an unknown are not present to the same degree in the standard, or vice versa, inaccurate data will be produced using this tech- nique.
An alternative data-reduction approach, adopted and tested here, is to assume that the intrinsic value for ZW”/I,,” or Z”,,./Z,,, in an analyzed material is that which is measured at the start of laser ablation (‘time 0’ or t,) and1 all subsequent measured ratios are progressively fractionated. In principle, t, is the
time at which the laser began firing but in practice we have found that, until analyte signal intensities reach their early maximum, usually after about the first 10 time slices (- 11 s) of ablation, values of Z,,,/Z,,, and Z,,,/Z,,, are fractionated. Hence, in this work, ?a was taken as the time slice at which Ca43 had reached its early maximum count rate (Fig. 2A). The ratio of the signal intensity for each isotope of interest to that of Ca43 during laser ablation was calculated using an ‘intercept’ method. Thus, the ratios of Z,,,/Z,,, and Z,,,/Z,,, used in the concen- tration calculation are those found at the origin of a line fit by the method of least squares to the array of individual time-sliced cps ratios plotted against time, beginning with the t, time slice (Fig. 2B). Using this approach, rather than simply taking the value for Z,,,/Z,,, or Z&Z,,, measured at t,,, allows one to more tightly constrain that value by using the entire set of measurements and to calculate realistic analyt- ical uncertainties (see below).
The intercept method assumes that progressive changes in Z,,,/Z,,, or Z&Z,,, during ablation, as
K206 Scheelite
‘“WL
s e
B
s&l f ANU 252 . 9
. 10 :
“time 0” Silicate Glass wl%Ka43
5 : ca43 _ A
: a ANU 252 Silicate Glass : P . .* . ...+ . .
..&A ,F.- . +. ..a. . .
.++=.A# - - . . . . . . r,
,0+-+--------J 1’ ’ 1
110 90 100 110 120 130 140 M) 70 80 90 100 110 120 130 140
Time (set) after start of background counting Time (set) after start of background counting
Fig. 2. Time-resolved background-subtracted Ca43, Srs8, W’*’ and Wls4 cps intensity (A) and ratio (B) data for ANU 252 silicate glass (filled symbols) and scheelite K206 (open symbols). Each time slice shown is u 1.1 s long. Both analyses made on an 80-Frn diameter spot. See text for discussion.
58 P. .I. Sylvester, M. Ghaderi / Chemical Geology 141 (1997) 49-65
seen in the scheelite (Fig. 2B), are due solely to laser-induced fractionation. If, instead, progressive changes in &,/I,,, or I,,,/&,, during ablation re- flect continuous compositional zoning, then the ratio derived by the intercept method would be appropri- ate only for the material analyzed at the t0 time slice. Where I,,,/&, or &,,/I,,, vary erratically during ablation, reflecting compositional heterogene- ity on a small scale, the intercept method cannot be used and it would be more appropriate to simply employ the value measured at t, for concentration calculations, or use the mean count rate method.
With the intercept approach, analytical uncertain- ties ( ~~~~~~~~~ on th e concentration measurements of unknowns (C,,,) may be derived from the standard error on the cps ratio at t, (Sb) for each analyte species in both the unknown and glass standard. This is calculated as:
rp unknown/Cueu
= J( ~~““known/~““known)* + ( qlass/bglaJs)*
and
6b = /[(l/n) + (X2/D)] * [Cdf/( n - 2)]
where n = number of time slices in the linear regres- sion; x = mean time recorded by those time slices; D = C(x, - x)*; xi = time elapsed since t, recorded by slice i; dj = yi - mri - b, yi = cps ratio at time slice i; m = slope of the linear regression; and b = cps ratio at t,. Note that this treatment accounts for error only in the ELA-ICP-MS analysis. It does not include errors in the measurement of the concentra- tion of the internal standard element or uncertainties in the element concentrations employed for the glass standard. At the same time, the treatment assumes that the material analyzed is completely homoge- neous; any heterogeneity in composition that is actu- ally present is attributed to analytical error.
3.3. Day-to-day reproducibility and detection limits of ELA-ICP-MS analyses
It is well known that the beam profile of an excimer laser changes, sometimes dramatically, as the gas fill ages and the resonator optics becomes dust-coated and misaligned. These changes have the potential to significantly reduce analytical precision
and accuracy from day to day but, in our work, we found no such result. For instance, as shown in Table 1, we measured tbe element concentrations of NIST 612 glass in live, 35 pm-wide spots on each of three separate days over the course of a week. NIST 610 glass was used as the external calibration standard and Ca43 was the internal standard. For all elements measured except Tl, the lo standard deviation of the mean concentration, calculated from the mean concentrations determined on each of the three days, was N 4% or less. The anomalous result for Tl may reflect sample heterogeneity for this element in one or both of the NIST glasses.
Except for Ti, MO, Sb, Dy, Tm and Ta, the 3-day mean concentrations of elements measured for the NIST 612 glass agree with the preferred concentra- tions of Pearce et al. (1997) within the lo uncertain- ties combined for NIST 610 and 612. For MO, Dy, Tm and Ta, the measured values fall within the combined uncertainties at the 2~ level. This is evidence that, except for Ti and Sb, the ELA-ICP- MS system may be used to accurately measure con- centrations of these elements in unknown materials using NIST 610 glass as an external standard. The large discrepancies for Ti and Sb suggest that the preferred concentrations of Pearce et al. (1997) for these elements in one or both of the NIST glasses are grossly in error.
Typical calculated detection limits for ELA-ICP- MS analyses using a 35pm wide spot, a repetition rate of 5 Hz and a pulse energy of 100 mJ are shown in Table 1. For many elements, the detection limits are at the 10 s of ppb level. Using a larger laser beam spot size ( > 35 pm> and greater repetition rate
Table 2 Electron microprobe analyses (wt.%,,) of scheelites
Mean SD %SD
KlOl (n = 21) CaO 19.40 0.13 0.66
wo3 80.27 0.24 0.30
K102 (n = 24) CaO 19.31 0.10 0.53
wo3 80.25 0.3 1 0.39
K206 (n = 26) CaO 19.09 0.13 0.67
wo3 80.01 0.45 0.56

Tabl
e 3
ELA
-IC
P-M
S an
alys
es (p
pm)
of s
chee
lite
Ele
men
t Is
otop
e K
lOl
Err
or
KlO
l m
easu
red
spot
#l
P Mn
Rb
Sr
Y zr
Nb
MO
Sn
B
a La
C
e Pr
Nd
Sm
EU
G
d Tb
D
Y
Ho
Er
Tm
Yb
LU
Hf
W
Ta
Tl
Pb
Bi
Th
U
Sm/N
d
31
55
85
88
89
90
93
98
120
138
139
140
141
146
147
151
157
159
163
165
167
169
172
175
178
180
181
205
208
209
232
238
23
3 13
.6
7.9
0.8
4.5
1.21
0.
50
< 0.
8 72
0 20
77
0 33
0 10
65
0 <
0.4
< 1.
4 4.
9 0.
2 5.
5 19
1 6
196
< 1.
0 <
1.0
<O.ll
<0
.8
5.7
0.2
7.5
29.0
0.
8 39
.0
7.8
0.2
11.7
68
2
112
45
2 88
39
1
47
103
3 21
0 20
.3
0.6
41.9
12
0 4
241
21.0
0.
6 38
.3
36
1 61
2.
7 0.
1 4.
5 7.
5 0.
4 12
.1
0.39
0.
03
0.50
<
0.02
<
0.02
62
8000
18
000
6420
00
0.08
6 0.
009
0.12
4 <
0.00
6 <
0.00
6 20
.4
0.6
18.8
<
0.01
0 <
0.00
8 0.
005
0.00
2 0.
006
0.00
6 0.
002
0.00
7 0.
66
0.03
0.
79
spot
#2
Err
or
KlO
l E
rror
K
102
Err
or
K10
2 E
rror
K
102
Err
or
K20
6 E
rror
K
206
Err
or
spot
sp
ot
spot
sp
ot
spot
sp
ot
#3
#l
#2
#3
#l
#2
4.2
0.7 20
20
0.3 5 0.2
0.9
0.3 3 2 1 5 0.9 5 0.8 2 0.1
0.4
0.03
1800
0 0.
011
0.6
0.00
2 0.
002
0.03
17.3
3.
4 16
.0
4.1
0.6
4.0
< 0.
8 <
0.8
730
20
1100
61
0 20
50
0 <
0.3
< 0.
3 2.
9 0.
2 0.
30
173
4 20
<
1.0
< 0.
08
< 0.
06
0.97
5.
9 0.
2 15
.8
30.7
0.
8 11
5 8.
3 0.
2 37
.5
70
2 32
6 52
2
199
44
1 96
12
0 3
247
26.4
0.
7 39
.6
172
5 20
1 31
.3
0.9
32.2
64
2
60
6.2
0.2
5.3
22.8
0.
9 21
.0
1.56
0.
06
1.85
<
0.02
<
0.02
61
5000
17
000
6200
00
0.04
3 0.
006
0.02
9 <
0.00
4 <
0.00
8 21
.0
0.6
31.2
0.
012
0.00
4 <
0.01
2 0.
009
0.00
4 0.
007
0.01
7 0.
003
< 0.
004
0.75
0.
03
0.61
3.6
0.7 30
10
0.04
0.09
0.5 2 0.8 8 5 2 6 0.9 4 0.7 2 0.2
0.7
0.07
1800
0 0.
005
0.9
0.00
3
0.02
14.1
5.
4 <
0.8
870
373
< 0.
3 0.
5 10
6 <
1.0
<O.ll
1.
50
12.9
5.
5 65
60
26
120
22.9
13
1 23
.5
46
4.2
16.7
1.
46
< 0.
02
6170
00
0.03
5 <
0.00
4 18
.8
< 0.
008
0.00
8 0.
006
0.93
3.6
0.7 20
9 0.1 3
0.07
0.
3 0.
2 2 2 4 0.6 3 0.6 1 0.1
0.5
0.05
1800
0 0.
007
0.6
0.00
3 0.
002
0.04
16.1
4.
3 <
0.8
690
420
< 0.
3 1.
86
182
< 0.
9 <
0.10
3.
6 24
.6
8.6 84
60
32
107
20.7
12
7 22
.4
45
4.4
16.6
1.
16
< 0.
02
6200
00
0.06
7 <
0.00
6 17
.4
< 0.
008
0.00
6 0.
007
0.71
3.0
0.7 20
10
0.12
5 0.2
0.7
0.2 2 2 1 3 0.5 3 0.5 1 0.1
0.5
0.04
1800
0 0.
008
0.5
0.00
2 0.
002
0.03
7 2.3
< 0.
4 36
60
75
< 0.
10
0.63
21
80
< 0.
2 0.
5 21
57
7.6 29
7.1
11.6
10
.7
2.0
12.7
3.
7 9.
5 1.5
7.5
1.27
<
0.01
63
5000
0.
020
< 0.
002
29.7
0.
047
0.01
5 0.
010
0.24
1 0.4 80
3
0.04
60
0.1 3 4 0.3 1 0.3
0.3
0.4
0.1
0.5
0.1
0.3
0.1
0.3
0.05
24O
Oil
0.00
2
0.7
0.00
8 0.
003
0.00
3 0.
01
12.7
3.
4 5.
4 0.
5 <
0.4
3350
90
53
1
< 0.
2 9.
34
0.04
70
0 20
<
0.4
0.17
0.
04
30.0
0.
8 57
1
5.4
0.2
23
1 6.
6 0.
3 8.
2 0.
3 4.
9 0.
2 1.
17
0.04
8.
7 0.
3 2.
6 0.
1 7.
3 0.
3 0.
87
0.04
4.
9 0.
2 0.
82
0.04
<
0.01
60
4000
18
000
0.04
2 0.
009
< 0.
002
18.1
0.
6 0.
030
0.00
6 0.
005
0.00
2 <
0.00
2 0.
29
0.02

60 P.J. Sylvester, M. Ghaderi/Chemical Geology 141 (1997) 49-65
Table 4 ID-TIMS analyses (ppm) of scheelite
Element KlOl K102 K206
Sr 768 867 3188 Nd 57.41 139.4 30.74 Sm 39.42 86.3 7.39 Sm/Nd 0.6874 0.6192 0.2405
(> 5 Hz) than those used here, it would be possible to reduce those limits even further.
3.4. Chemical composition and major element homo- geneity of scheelite
Table 2 shows the mean concentrations of multi- ple analyses of Ca and W in three scheelite grains, KlOl, K102 and K206, measured with the electron microprobe. The lo standard deviations on the means of each of the scheelites is less than 1%. This indicates that Ca and W are distributed very homo- geneously within each of the grains.
Table 3 shows the W and trace element concentra- tions in KlOl, K102 and K206 determined by ELA- ICP-MS analysis. Concentrations of Sr, Nd and Sm determined by ID-TIMS analysis are given in Table 4. For each scheelite, the Ca concentration measured
ov I 0 loo0 2000 3lxa 4cm
Sr (ppm) D-T&IS
100 150 200 250 300 350 Nd (ppm) ID-TIMS
by electron microprobe was used to calculate the element concentrations determined by ELA-ICP- MS. Calculated uncertainties on the scheelite mea- surements amount to I 4% for Sr, Y, MO, REE (rare earth elements), W and Pb; 5-20% for Mn, Nb and Ta; 20-50% for P, Ba, Bi, Th and U; and > 50% for Rb, Zr, Sn and Hf. Element concentra- tions with errors in excess of 50% are reported in Table 3 as upper limits of twice the absolute value of the error.
3.5. Concentrations of W in scheelite and the ques- tion of matrix eflects
Concentrations of W in the scheelites, as mea- sured by ELA-ICP-MS, fall within 5% of the mean W concentrations of the same samples determined by electron microprobe (KlOl = 636500 ppm, K102 = 636400 ppm, K206 = 634500 ppm). This difference is within the uncertainty ( N 6%) in the W concentra- tion for the NIST 610 standard (Table 1) and only slightly greater than the ELA-ICP-MS analytical uncertainty calculated for the W measurements in the scheelites ( _ 4%). This demonstrates that the ELA- ICP-MS system is capable of producing accurate element concentration data for minerals with external
0 50 I
100 150 200 250 Sm (ppm) ID-TIMS
SmMd ID-TIh4S
Fig. 3. ELA-ICP-MS measurements for Sr, Sm, Nd and Sm/Nd made at various SO-pm wide spots in scheelites KlOl, K102 and IQ06 plotted against the corresponding measurements made on bulk separates of the same samples by ID-TlMS.
P.J. Sylvester, M. Ghaderi/Chemical Geology 141 (1997) 49-65 61
calibration against a synthetic silicate glass standard and internal standardization with a single low-mass major element. The demonstration is rather robust in that Ca and W have. different mass/charge ratios (43 vs 180/ 184 isotopes measured) and first ionization potentials (6.11 vs 7.98 volts), as well as strikingly different W concentrations in the NIST 610 glass and scheelite (N 445 vs _ 636000 ppm).
As shown by the: time-resolved patterns of W/Ca intensity ratios in Fig. 2B, however, substantial ma- trix effects between scheelite and ANU 252 (and NIST 610, not shown) silicate glass are present during ELA-ICP-MS analysis. Apparently, during laser ablation, the intensity of the signal for W in silicate glass decreases much more slowly than that for W in scheelite, even though intensities for Ca in glass and scheelite decrease at similar rates. Thus, Ca and W are rather strongly fractionated from each other during ablation of silicate glass but remain comparatively unfractionated during ablation of scheelite. The origin of this difference in fractiona- tion behaviour is not known but it would seem to be related to concentration differences as the scheelite contains much more W than does the glass (N 3600 and 1400 times more than ANU 252 and NIST 610, respectively). Fryer et al. (1995) reported fractiona- tion between Ca and W in NIST 610 glass during Nd-YAG laser ablation similar to that seen in this study, so this phenomenon is not restricted to ex- timer lasers.
Remarkably, deslpite the contrasting temporal evo- lution of the signal intensity of W in glass and scheelite during ablation, the W intensity generated immediately after the first u 11 s (N 10 time slices) of ablation corresponds to the value measured by electron microprobe:, as shown by our W concentra- tion results in Table 3. In contrast, use of the mean value of time-resolved W/Ca ratios in the glass and scheelite, following the approach adopted in most laser ablation-ICP-MS studies to date, would yield inaccurately low W concentration measurements for the scheelites, even if the first 11 s of ablation are excluded. For instance, in the example shown in Fig. 2, scheelite sample K206 spot #2 (Table 31, a W concentration of 528000 ppm, some 17% less than the electron microprobe-derived value, is calculated if the mean W/Ca cps ratios of glass and scheelite (after the first 11 s ablation) are used. This phe-
nomenon may explain some of the analytical prob- lems encountered in the studies of Williams and Jarvis (19931, Morrison et al. (1995) and Stix et al. (1995) and attributed by them to matrix effects.
3.6. Concentrations of trace elements in scheelite
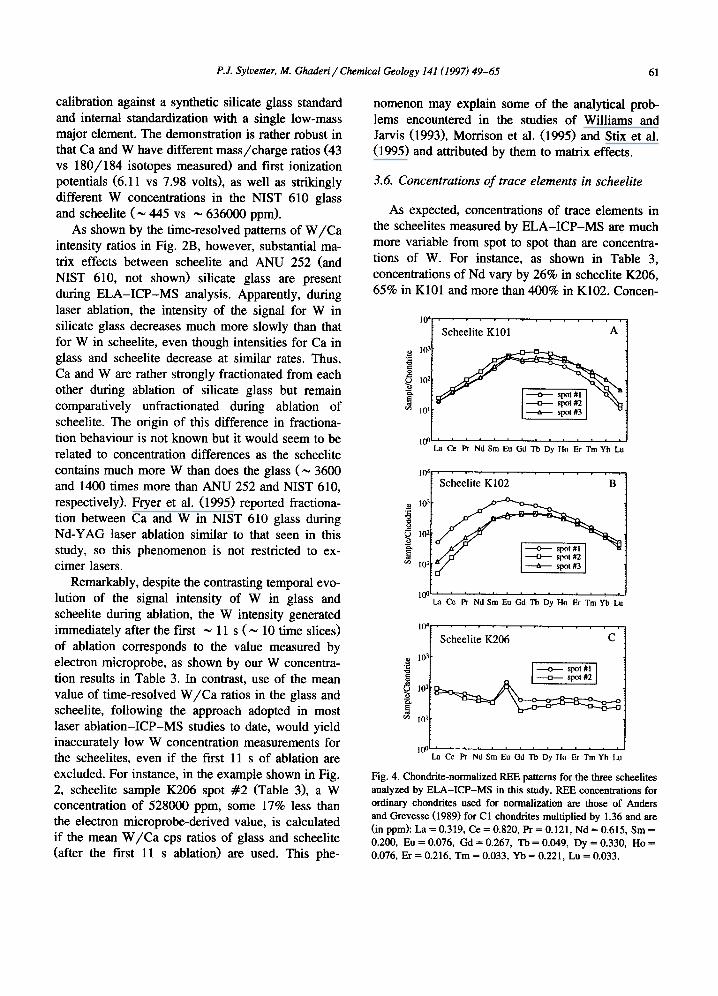
As expected, concentrations of trace elements in the scheelites measured by ELA-ICP-MS are much more variable from spot to spot than are concentra- tions of W. For instance, as shown in Table 3, concentrations of Nd vary by 26% in scheelite K206, 65% in KlOl and more than 400% in K102. Concen-
104. v, ‘. *. a.,. . . .
Scheelite KlOl A
’ ’ . s ’ ’ . ’ ’ * ’ La Ce R Nd Sm Eu Gd Tb Dy Ho Er Tm Yh Lu
Itif. , , . . . . . . . I
i Scheelite K102 B
I@!
loo-~ * ’ ’ ’ . ’ * ’ ’ . La Ce R Nd Sm ELI Cd Tb Dy Ho Er Tm Yb Lu
Scheelite K206
La Cc PI Nd Sm Eu Gd Tb Dy Ho Er Tm Yh Lu
Fig. 4. Chondrite-normalized REE patterns for the three scheelites analyzed by ELA-ICP-MS in tbis study. REE concentrations for ordinary chondrites used for normalization are those of Anders and Grevesse (1989) for Cl chondrites multiplied by 1.36 and are (in ppm): La = 0.319, Ce = 0.820, Pr = 0.121, Nd = 0.615, Sm = 0.200, Eu=0.076, Gd=0.267, Tb=O.O49, Dy =0.330, Ho= 0.076, Er = 0.216, Tm = 0.033, Yb = 0.221, Lu = 0.033.
62 P.J. Syluester, M. Ghaderi/ Chemical Geology 141 (1997) 49-65
trations of Pb vary by 12% in KlOl, 64% in K206 and 79% in K102. The amount of scheelite analyzed at each spot by ELA-ICP-MS in this work can be assumed, based on images such as those in Fig. 1, to be the volume of material that resided in a crater 30 pm deep and 80 pm wide. This equals N 1.5~10-~ cm3 or, assuming a density of 6 g/cm3 for scheelite, only * 0.0009 mg. The ELA-ICP-MS measure- ments demonstrate quite clearly, therefore, that trace elements are distributed extremely heterogeneously on a very small scale in these scheelites.
Fig. 3 plots the ELA-ICP-MS measurements for Sr, Sm, Nd and Sm/Nd at separate spots in the scheelites against those determined in bulk samples by ID-TIMS. In general, the two data sets compare favourably, although there are discrepancies that are probably related to the heterogeneous distribution of trace elements in this mineral. For scheelite K102, the range of concentrations determined for Sr, Sm and Nd by ELA-ICP-MS encompasses the ID- TIMS values for the same elements. This is also true for Sr and Sm/Nd in KlOl, but the Sm and Nd concentrations determined by ELA-ICP-MS are 15 to 125% higher than those measured by ID-TIMS. For K206, the ID-TIMS value for Sr is lower than the two ELA-ICP-MS determinations, by 5 and 14%, whereas the ID-TIMS values for Sm and Nd are higher than the ELA-ICP-MS Sm and Nd mea- surements by 4 to 26%. One would expect the ID-TIMS measurements to be more representative of the bulk composition of the scheelites than the ELA-ICP-MS measurements because lo4 (lo-30 mg vs 0.0009 mg) more material was analyzed in each ID-TIMS analysis than in each ELA-ICP-MS measurement.
Chondrite-normalized REE patterns for the ana- lyzed scheelites are plotted in Fig. 4. As expected for accurate data, enrichment factors for the trivalent REE (those other than Eu) vary fairly smoothly as a function of atomic number. The REE patterns of scheelites KlOl and K102 are hump-shaped with the largest enrichment factors for the middle REE. In contrast, REE patterns for scheelite K206 are com- pletely different, being fairly flat except for a moder- ate degree of light KEE enrichment and a positive Eu anomaly. In addition to the differences in PEE, concentrations of Sr and MO in K206 are also much higher than those in KlOl and K102 (Sr N 3500
wm vs N 690- 1100 ppm; MO N 700-2180 ppm vs N 20-200 ppm). The striking trace element differ- ences seen between the scheelites suggest that they, and presumably the gold associated with them, formed from hydrothermal fluids of quite variable composition and, perhaps, source.
The same two types of REE patterns found in this study have been reported previously in scheelites associated with lode-gold deposits in Canadian greenstone belts by Anglin et al. (1987) using instru- mental neutron activation analysis (INAA) of bulk samples. The REE patterns determined by Anglin et al. (1987) generally do not vary smoothly as a function of atomic number, however, attesting to the significant improvement that ELA-ICP-MS can make to studies of the trace element contents of minerals.
3.7. Isotopic measurements of W in silicate glass and scheelite
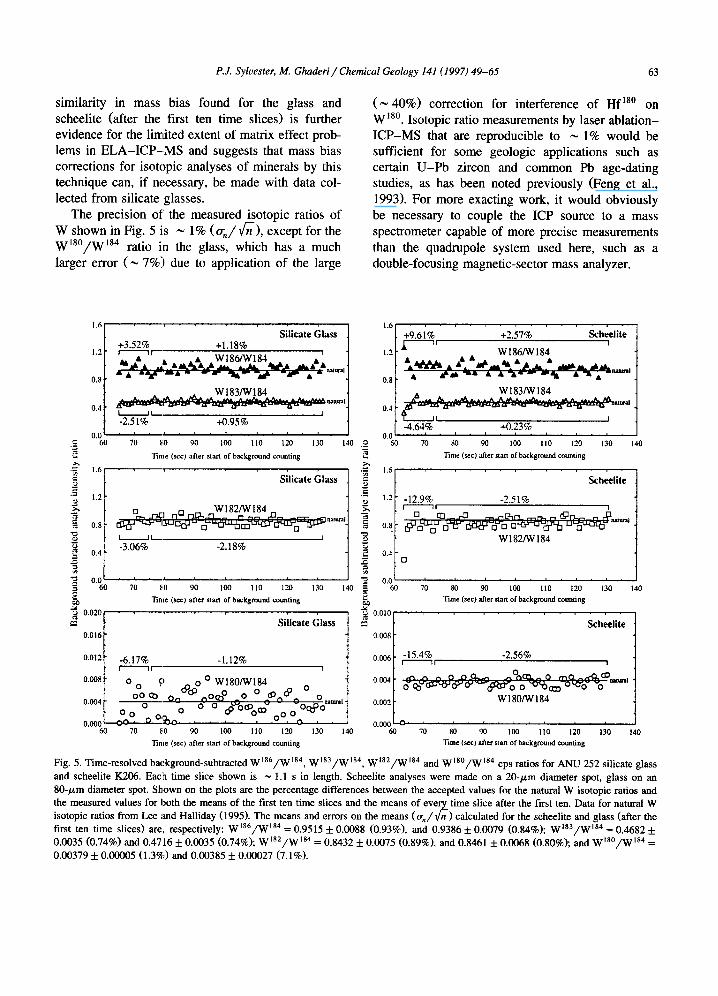
In addition to measuring the concentrations of elements in minerals, laser ablation-ICP-MS instru- ments may be used to determine the isotopic compo- sition of those elements. Fig. 5 demonstrates the ability of the ANU ELA-ICP-MS system to pre- cisely and accurately measure the isotopic composi- tion of W in both silicate glass and scheelite. Tung- sten has five naturally occurring stable isotopes, 180 (0.1193%), 182 (26.5027%), 183 (14.3132%), 184 (30.6411%) and 186 (28.4237%) (Lee and Halliday, 1995). At the very beginning of ablation, the mea- sured isotopic ratios in the scheelite are fractionated by 5% or more compared to the accepted values with heavier W isotopes enriched over lighter ones. The fractionation presumably reflects the same phe- nomenon seen between elements during the initial stages of glass and scheelite ablation. However, the isotopic fractionation is not seen to the same degree in silicate glass, suggesting that, during the initial stages of scheelite ablation, mass discrimination er- rors have been exacerbated by undetermined matrix effects. In contrast, after the first ten time slices (N 11 s) of ablation, the measured ratios are essen- tially constant and the difference between them and the accepted W isotopic ratios is only N 2.5% or less in both glass and scheelite, amounts more typi- cal of those reported for quadrupole mass bias. The
P.J. Sylvester, M. Ghaderi/Chemical Geology 141 (1997) 49-65 63
similarity in mass bias found for the glass and scheelite (after the first ten time slices) is further evidence for the limited extent of matrix effect prob- lems in ELA-ICP-MS and suggests that mass bias corrections for isotopic analyses of minerals by this technique can, if necessary, be made with data col- lected from silicate glasses.
The precision of the measured isotopic ratios of W shown in Fig. 5 is N 1% (a,,/&>, except for the W180/W184 ratio in the glass, which has a much larger error (N 7%:) due to application of the large
Silicate Glass +1.18%
.s 60 70 I.0 90 IW 110 120 130 I40
2 lime (WC) after stan ofbackgmund counting x .= ="
1.6
3 .9 .~ 1.2 5
2 0.8- & s UL I t 2 0.4 - -3.06% -2,18%
3 -ii 0.0-J ’ I 9 60 70 EO 90 loo 110 120 130 140
z! lime (ret) after stan ofbackgnxlnd counting
60 70 EO 90 100 110 120 130 140
(N 40%) correction for interference of Hf ‘so on W18’. Isotopic ratio measurements by laser ablation- ICP-MS that are reproducible to _ 1% would be sufficient for some geologic applications such as certain U-Pb zircon and common Pb age-dating studies, as has been noted previously (Feng et al., 1993). For more exacting work, it would obviously be necessary to couple the ICP source to a mass spectrometer capable of more precise measurements than the quadrupole system used here, such as a double-focusing magnetic-sector mass analyzer.
1.6 +9.61% +2.57% Scheelite
,
1 . 1
.z 60 70 so w loo II0 120 130 140
f Tm~c(ssc) afternan ofbackgmund counting h .Z ; 1.6 2 Scheelite
omo = I 64 70 80 90 loo 110 120 130 140
~me(sec)alterslanofba=kgrmndcounling
Fig. 5. Time-resolved background-subtracted W’s6/W’s4, W’s3/W’s4, W’s2/W’s4 and W’s”/W’s4 cps ratios for AND 252 silicate glass and scheelite K206. Each time slice shown is _ 1.1 s in length. Scheelite analyses were made on a ZO-/em diameter spot, glass on an 80-pm diameter spot. Shown on the plots are the percentage differences between tbe accepted values for the natural W isotopic ratios and the measured values for both the means of the first ten time slices and the means of every time slice after the first ten. Data for natural W isotopic ratios from Lee and Halliday (1995). Tbe means and errors on the means (Us/&) calculated for the scheelite and glass (after the first ten time slices) are, respectively: Wus6/W Is4 = 0 9515 f 0.0088 (0.93%), and 0.9386 + 0.0079 (0.84%); W’*3/W’84 = 0.4682 + 0.0035 (0.74%) and 0.4716 * 0.0035 (0.74%); W’s2/W ‘s4 = 0 8432 f 0.0075 (0.89%), and 0.8461 + 0.0068 (0.80%); and W’so/W’84 = . 0.00379 + 0.00005 (1.3%) and 0.00385 f 0.00027 (7.1%).
64 P.J. Sylvester, M. Ghaderi/Chemical Geology 14I (1997) 49-65
4. Conclusions
Analysis of scheelite by ArF excimer laser abla- tion-ICP-MS with external calibration against a silicate glass of known composition and internal standardization using a single, low-mass major ele- ment (Cal yields precise data for W and a wide range of trace elements, including the REE, at the ppm concentration level. The accuracy of method is demonstrated by the close similarity in W concentra- tion measurements made by ELA-ICP-MS and electron microprobe analyses on the same scheelite grain. Matrix-dependent element fractionation effects are apparent during ablation of silicate glass and scheelite but do not degrade analytical accuracy if data reduction is handled properly. In particular, it is preferable to use the count-rate present at the early maximum of analyte signal intensity rather than the mean count-rate of the entire ablation period.
The ArF excimer laser used in this study drilled beautiful, steep-walled, flat-bottomed holes of fairly uniform shape in both scheelite and silicate glass. For many elements, day-to-day reproducibility of concentration measurements in silicate glass is u 4% or less and, using a 35-pm wide ablation spot, detection limits are at the 10 s of ppb level. Thus, ArF excimer lasers are a viable alternative to fre- quency-quadrupled Nd-YAG lasers for laser abla- tion-ICP-MS.
Acknowledgements
Development of the ANU ELA-ICP-MS system has been a team effort with major contributions from S. Eggins, L. Kinsley, R. Loucks, M. Shelley and N. Ware. In particular, S. Eggins suggested to us that the ‘intercept’ method of reducing ELA-ICP-MS cps-ratio data might be superior to the ‘mean’ method. The geologists and mine staff at St. Ives Gold Mines, Western Mining Corporation Ltd., par- ticularly R. Watchom, T. Sugden and K. Hein, are thanked for their assistance with the fieldwork. V. Bennett, L. Kinsley, C. Martin, G. Mortimer and N. Ware helped with the analyses. F. Brink and R. Heady assisted with the SEM imaging. M.G. was supported by a PhD scholarship from the Ministry of
Culture and Higher Education of Iran. G. Gautbier and S. Jackson provided helpful reviews.
References
Anders, E., Grevesse, N., 1989. Abundances of the elements: meteoritic and solar. Geochim. Cosmochim. Acta 53.197-214.
Anderson, S.T.G., Robert, R.V.D., Farrer, H.N., 1992. Determina- tion of trace impurities in tantalum oxide and niobium oxide by laser ablation inductively coupled plasma mass spectrome- try. J. Anal. Atom. Spectrom. 7, 1195-1199.
Anglin, C.D., Franklin, J.M., Jonasson, I.R., Bell, K., Hoffman, E., 1987. Geochemistry of scheelites associated with Archean gold deposits: implications for their direct age determination. In: Current Research, Part A, Geological Survey of Canada, Paper 87-lA, pp. 591-596.
Bea, F., Montero, P., Stroh, A., Baasner, J., 1996. Microanalysis of minerals by an Excimer W-LA-ICP-MS system. Chem. Geol. 133, 145-156.
Beauchemin, D., McLamn, J.W., Be-, S.S., 1987. Study of the effects of concomitant elements in inductively coupled plasma mass spectrometty. Spectrochim. Acta 42 (B), 467-490.
Chart, W.T., Russo, R.E., 1991. Study of laser-material interac- tions using inductively coupled plasma-atomic emission spec- trometry. Spectrochim. Acta 46 (B), 1471-1486.
Chenery, S., Cook, J.M., 1993. Determination of rare earth ele- ments in single mineral grains by laser ablation microprobe- inductively coupled plasma mass spcctrometry preliminary study. J. Anal. Atom. Spectrom. 8, 299-303.
Chenery, S., Hunt, A., Thompson, M., 1992. Laser ablation of minerals and chemical differentiation of the ejecta. J. Anal. Atom. Spectrom. 7, 647-652.
Eggins, S.M., Woodhead, J.D., Kinsley, L.P.J., Sylvester, P., McCulloch, M.T., Hergt, J.M., Handler, M.R., 1997. A simple method for the precise determination of 40 or more trace elements in geological samples by ICPMS using enriched isotope internal standardisation. Chem. Geol. 134, 311-323.
Feng, R., Machado, N., Ludden, J., 1993. Lead geocbronology of zircon by LaserProbe-inductively coupled plasma mass spec- trometry (LP-ICPMS). Geochim. Cosmochim. Acta 57, 3479-3486.
Foley, S.F., Jackson, SE., Fryer, B.J., Greenough, J.D., Jenner, G.A., 1996. Trace element partition coefficients for clinopy- roxene and phlogopite in alkaline lamprophyre from New- foundland by LAM-ICP-MS. Geochim. Cosmochim. Acta 60, 629-638.
Fryer, B.J., Jackson, S.E., Longerich, H.P., 1995. The design, operation and role of the laser-ablation microprobe coupled with an inductively coupled plasma-mass spectrometer (LAM-ICP-MS) in the earth sciences. Can. Mineral. 33, 303-312.
Geertsen, C., Briand, A., Chartier, F., Lacour, J.-L., Mauchien, P., Sjostrom, S., Mermet, J.-M., 1994. Comparison between in- frared and ultraviolet laser ablation at atmospheric pressure-
P.J. Sylvester, M. Ghaderi/ Chemical Geology I41 (1997) 49-65 65
implications for solid sampling inductively coupled plasma spectrometry. J. Anal. Atom. Spectrom. 9, 17-22.
Gray, A.L., 1985. Solid sample introduction by laser ablation for inductively coupled plasma source mass spectrometry. Analyst 110, 551-556.
Hwang, Z.W., Teng, Y.Y., Sneddon, J., 1991. A modified torch system for direct solid analysis by laser ablation inductively coupled plasma atomic emission spectrometry. Microchem. J. 43,42-45.
Jackson, SE., Longerich, H.P., Dunning, C.R., Fryer, B.J., 1992. The application of la.ser ablation microprobe-inductively cou- pled plasma-mass spectrometry (LAM-ICP-MS) to in-situ trace element determinations in minerals. Can. Mineral. 30, 1049-1064.
Jefhies, T.E., Perkins, W.T., Pearce, N.J.G., 1995. Measurements of trace elements in basalts and their phenocrysts by laser probe microanalysis inductively coupled plasma mass spec- trometry (LPMA-ICI?-MS). Chem. Geol. 121, 131-144.
Jenner, GA., Foley, S.F., Jackson, S.E., Green, T.H., Fryer, B.J., Longerich, H.P., 1994. Determination of partition coefficients for trace elements in high pressure-temperature experimental run products by laser ablation microprobe-inductively coupled plasma-mass spectrometry (LAM-ICP-MS). Geochim. Cos- mochim. Acta 58, 5099-5103.
Lee, D.-C., Halliday, A.N., 1995. Precise determinations of the isotopic compositions and atomic weights of molybdenum, tellurium, tin and tungsten using ICP magnetic sector multiple collector mass spectrometry. Int. J. Mass. Spectrom. Ion Pro- cess. 146/147, 35-46.
Longerich, H.P., Jackson, S.E., Gunther, D., 1996. Laser abla- tion-inductively coupled plasma-mass spectrometric transient signal data acquisition and analyte concentration calculation. J. Anal. Atom. Spectrom. 11, 899-904.
Loucks, R.R., Eggins, S.M., Shelley, L.M.G., Kinsley, L.P.J., Ware, N.G., 1995. Development of the inductively-coupled- plasma mass-spectrometry ultraviolet laser trace-element mi- cro-analyzer (ICPMS-ULTEMA). Res. School Earth Sci. Annu. Rept. 1995, pp 138-140.
Mass, R., 1991. The provenance of Archean elastic metasediments in the Narryer Gneiss Complex, Western Australi-a: trace element geochemistry, Nd isotopes, and U-Pb ages for detrital zircons. Geochim. Cosmochim. Acta 55, 1915-1932.
Morrison, C.A., Lambert, D.D., Morrison, R.J.S., Ahlers, W.W.,
Nicholls, LA., 1995. Laser ablation-inductively coupled plasma-mass spectrometry: an investigation of elemental re- sponses and matrix effects in the analysis of geostandard materials. Chem. Geol. 119, 13-29.
Norman, M.D., Pearson, N.J., Sharma, A., Griffin, W.L., 1996. Quantitative analysis of trace elements in geological materials by laser ablation ICPMS: instrumental operating conditions and calibration values of NIST glasses. Geostand. Newsl. 20, 247-261.
Gutridge, P.M., Doherty, W., Gregoire, D.C., 1996. The formation of trace element-enriched particulates during laser ablation of refractory materials. Spectrochim. Acta 51 (Bl, 1451-1462.
Pearce, N.J.G., Perkins, W.T., Abell, I., Duller, G.A.T., Fuge, R., 1992. Mineral microanalysis by laser ablation inductively coupled plasma mass spectrometry. J. Anal. Atom. Spectrom. 7, 53-57.
Pearce, N.J.G., Perkins, W.T., Westgate, J.A., Gorton, M.P., Jackson, SE., Neal, CR., Chenery, S.P., 1997. New data for National Institute of Standards and Technology 610 and 612 glass reference materials. Gcostand. Newsl. in press.
Perkins, W.T., Pearce, N.J.G., 1995. Mineral microanalysis by laserprobe inductively coupled plasma mass spectrometry. In: Potts, P.J., Bowles, J.F.W., Reed, S.J.B., Cave, M.R. (Eds.), Microprobe Techniques in the Earth Sciences. Chapman and Hall, London, pp. 291-325.
Perkins, W.T., Pearce, N.J.G., Fuge, R., 1992. Analysis of zircon by laser ablation and solution inductively coupled plasma mass spectrometry. J. Anal. Atom. Spectrom. 7, 611-616.
Stix, J., Gauthier, G., Ludden, J.N., 1995. A critical look at quantitative laser-ablation ICP-MS analysis of natural and synthetic glasses. Can. Mineral. 33, 435-444.
Tan, S.H., Horlick, G., 1987. Matrix-effect observations in induc- tively-coupled plasma mass spectrometry. J. Anal. Atom. Spectrom. 2, 745-763.
Williams, J.G., Jarvis, K.E., 1993. Preliminary assessment of laser ablation inductively coupled plasma mass spectrometry for quantitative multi-element determination in silicates. J. Anal. Atom. Spectrom. 8, 25-34.
Wading, R.J., Herbert, H.K., Abell, I.D., 1995. The application of laser ablation-inductively coupled plasma-mass spcctrometry (LA-ICP-MS) to the analysis of selected sulphide minerals. Chem. Geol. 124, 67-81.