An unusual temperature induced isostructural phase transition in a scheelite, Li 0.5 Ce 0.5 MoO 4
7
Dalton Transactions PAPER Cite this: Dalton Trans., 2013, 42, 7672 Received 18th December 2012, Accepted 4th March 2013 DOI: 10.1039/c3dt33033h www.rsc.org/dalton An unusual temperature induced isostructural phase transition in a scheelite, Li 0.5 Ce 0.5 MoO 4 † Dipankar Saha, a Rajeev Ranjan, b Diptikanta Swain, c Chandrabhas Narayana c and Tayur N. Guru Row* a High resolution synchrotron X-ray diffraction, dielectric and Raman scattering study of a scheelite com- pound Li 0.5 Ce 0.5 MoO 4 (LCM) revealed that it transformsto a self similar structure above 400 °C. The ther- mally induced isostructural phase transition (IPT), a phenomenon which has rarely been reported in the literature, is preceded by partial softening of the zone centre phonons followed by their hardening above the IPT transition temperature. The high temperature isostructural phase, which exhibits expanded lattice parameters and cell volume, nucleates and grows in the low temperature matrix overa very wide temperature range. Both the phases show nearly identical thermal expansion suggesting similarities in symmetry, unaltered coordination environments around the atoms across the transition. Introduction Phase transitions in materials occur ubiquitously in nature and generally impart functionality to the system eventually leading to great technological innovations. Some of these include materials depicting metal–insulator, ferroelectric– paraelectric, ferromagnetic–paramagnetic, normal–super- conducting transitions. On a microscopic scale, phase transitions originate with the formation of small aggregates of atoms amounting to nano size nuclei which eventually grow in size. Commonly, structural phase transitions (SPTs) are accompanied by change in crystallographic structure across a critical thermodynamic parameter (most often pressure and temperature). Among the innumerable number of materials exhibiting SPTs, there are very few instances in which the tran- sition is accompanied by neither change in the crystallo- graphic space group nor a change in occupied Wyckoff positions. Such transitions have been categorized as “isostruc- tural phase transitions (IPTs), and have mostly been found by mineralogists while investigating minerals, most of them with framework structures/large coordination environment around a cation, 1 under compression. IPTs are also known as “Cowley’s type zero” transition 2 after Cowley postulated the possibility of such a transition based on the behaviour of acoustic phonons within the framework of displacive structural phase transitions. Interestingly, temperature induced IPTs are among the “rarest of rare IPTs” phenomenon reported so far. In this article we report an occurrence of one such phenom- enon in a complex scheelite Li 0.5 Ce 0.5 MoO 4 using high resolu- tion synchrotron X-ray diffraction and Raman scattering techniques. The first report of an IPT appeared in 1949 concerning Ce metal 3,4 followed by reports of Cs, 5,6 SmS, 7 EuO, 8 MnO, 9 (V 1−x Cr x ) 2 O 3 , 10 ThAl 2 , 11 RFeO 3 , 12 PbCrO 3 , 13 EuPd 2 Si 2 , 14 TbPdAl, 15 GdPdAl 16 metallization in solid oxygen 17,18 and most recently in a iron–pictinide superconductor Na 1−x FeAs. 19 In these systems IPTs have been associated with changes in the electronic states and coordination environment around the atoms. IPTs have also been reported in systems which do not involve change in the electronic states, e.g. feldspars such as YbInCu 4 , 20 CsFe II [Cr III (CN) 6 ], 21,22 YbV 4 O 8 , 23 CaAl 2 Si 2 O 8 , 24 NaAlSi 3 O 8 , 25 carbonate minerals such as magnesite and dolo- mite CaMg(CO 3 ) 2 26 and kaoline Al 2 Si 2 O 5 (OH) 4 . 27 IPT associ- ated with alteration in the coordination number (CN) has also been reported in some inorganic compounds such as PbF 2 where CN increased from nine to ten in the high pressure phase, 28 NH 4 PF 6 –CN of the NH 4 ion decreased from 14 to 12 in the high temperature phase, 29 CN increased from 9 to 11 in the high pressure isostructural phase Na 3 MnF 6 , 30 sodium oxalate. 31 Apart from the bulk systems, very recently strain induced isostructural phase transition have been reported to † Electronic supplementary information (ESI) available: Table S1 Intensity ratios between peaks of the main phase and surrogate phase. Table S2 List of oxygen coordinates after Rietveld refinements. Fig. S1 Laboratory powder X-ray diffracto- gram of LCM. Fig. S2 Laboratory powder X-ray diffractogram of LCM in a narrow 2θ interval at different temperature (a) Heating cycle (b) Cooling cycle. See DOI: 10.1039/c3dt33033h a Solid State and Structural Chemistry Unit, Indian Institute of Science, Bangalore 560 012, India. E-mail: [email protected]; Fax: +91-80-3601310; Tel: +91-80-2292796 b Materials Engineering, Indian Institute of Science, Bangalore 560 012, India c Light Scattering Laboratory, Chemistry and Physics of Materials Unit, Jawaharlal Nehru Centre for Advanced Scientific Research (JNCASR), Jakkur P.O., Bangalore 560064, India 7672 | Dalton Trans., 2013, 42, 7672–7678 This journal is © The Royal Society of Chemistry 2013 Published on 04 March 2013. Downloaded by Jawaharlal Nehru Centre for Advanced Scientific Research on 12/06/2013 07:36:47. View Article Online View Journal | View Issue
-
Upload
independent -
Category
Documents
-
view
1 -
download
0
Transcript of An unusual temperature induced isostructural phase transition in a scheelite, Li 0.5 Ce 0.5 MoO 4

DaltonTransactions
PAPER
Cite this: Dalton Trans., 2013, 42, 7672
Received 18th December 2012,Accepted 4th March 2013
DOI: 10.1039/c3dt33033h
www.rsc.org/dalton
An unusual temperature induced isostructural phasetransition in a scheelite, Li0.5Ce0.5MoO4†
Dipankar Saha,a Rajeev Ranjan,b Diptikanta Swain,c Chandrabhas Narayanac andTayur N. Guru Row*a
High resolution synchrotron X-ray diffraction, dielectric and Raman scattering study of a scheelite com-
pound Li0.5Ce0.5MoO4 (LCM) revealed that it transforms to a self similar structure above 400 °C. The ther-
mally induced isostructural phase transition (IPT), a phenomenon which has rarely been reported in the
literature, is preceded by partial softening of the zone centre phonons followed by their hardening
above the IPT transition temperature. The high temperature isostructural phase, which exhibits expanded
lattice parameters and cell volume, nucleates and grows in the low temperature matrix over a very wide
temperature range. Both the phases show nearly identical thermal expansion suggesting similarities in
symmetry, unaltered coordination environments around the atoms across the transition.
Introduction
Phase transitions in materials occur ubiquitously in natureand generally impart functionality to the system eventuallyleading to great technological innovations. Some of theseinclude materials depicting metal–insulator, ferroelectric–paraelectric, ferromagnetic–paramagnetic, normal–super-conducting transitions. On a microscopic scale, phase transitionsoriginate with the formation of small aggregates of atomsamounting to nano size nuclei which eventually grow in size.Commonly, structural phase transitions (SPTs) areaccompanied by change in crystallographic structure across acritical thermodynamic parameter (most often pressure andtemperature). Among the innumerable number of materialsexhibiting SPTs, there are very few instances in which the tran-sition is accompanied by neither change in the crystallo-graphic space group nor a change in occupied Wyckoffpositions. Such transitions have been categorized as “isostruc-tural phase transitions (IPTs), and have mostly been found by
mineralogists while investigating minerals, most of them withframework structures/large coordination environment arounda cation,1 under compression. IPTs are also known as“Cowley’s type zero” transition2 after Cowley postulated thepossibility of such a transition based on the behaviour ofacoustic phonons within the framework of displacive structuralphase transitions. Interestingly, temperature induced IPTs areamong the “rarest of rare IPTs” phenomenon reported so far.In this article we report an occurrence of one such phenom-enon in a complex scheelite Li0.5Ce0.5MoO4 using high resolu-tion synchrotron X-ray diffraction and Raman scatteringtechniques.
The first report of an IPT appeared in 1949 concerning Cemetal3,4 followed by reports of Cs,5,6 SmS,7 EuO,8 MnO,9
(V1−xCrx)2O3,10 ThAl2,
11 RFeO3,12 PbCrO3,
13 EuPd2Si2,14
TbPdAl,15 GdPdAl16 metallization in solid oxygen17,18 andmost recently in a iron–pictinide superconductor Na1−xFeAs.
19
In these systems IPTs have been associated with changes inthe electronic states and coordination environment around theatoms. IPTs have also been reported in systems which do notinvolve change in the electronic states, e.g. feldspars such asYbInCu4,
20 CsFeII[CrIII(CN)6],21,22 YbV4O8,
23 CaAl2Si2O8,24
NaAlSi3O8,25 carbonate minerals such as magnesite and dolo-
mite CaMg(CO3)226 and kaoline Al2Si2O5(OH)4.
27 IPT associ-ated with alteration in the coordination number (CN) has alsobeen reported in some inorganic compounds such as PbF2where CN increased from nine to ten in the high pressurephase,28 NH4PF6 –CN of the NH4 ion decreased from 14 to 12in the high temperature phase,29 CN increased from 9 to 11 inthe high pressure isostructural phase Na3MnF6,
30 sodiumoxalate.31 Apart from the bulk systems, very recently straininduced isostructural phase transition have been reported to
†Electronic supplementary information (ESI) available: Table S1 Intensity ratiosbetween peaks of the main phase and surrogate phase. Table S2 List of oxygencoordinates after Rietveld refinements. Fig. S1 Laboratory powder X-ray diffracto-gram of LCM. Fig. S2 Laboratory powder X-ray diffractogram of LCM in a narrow2θ interval at different temperature (a) Heating cycle (b) Cooling cycle. See DOI:10.1039/c3dt33033h
aSolid State and Structural Chemistry Unit, Indian Institute of Science,
Bangalore 560 012, India. E-mail: [email protected]; Fax: +91-80-3601310;
Tel: +91-80-2292796bMaterials Engineering, Indian Institute of Science, Bangalore 560 012, IndiacLight Scattering Laboratory, Chemistry and Physics of Materials Unit,
Jawaharlal Nehru Centre for Advanced Scientific Research (JNCASR), Jakkur P.O.,
Bangalore 560064, India
7672 | Dalton Trans., 2013, 42, 7672–7678 This journal is © The Royal Society of Chemistry 2013
Publ
ishe
d on
04
Mar
ch 2
013.
Dow
nloa
ded
by J
awah
arla
l Neh
ru C
entr
e fo
r A
dvan
ced
Scie
ntif
ic R
esea
rch
on 1
2/06
/201
3 07
:36:
47.
View Article OnlineView Journal | View Issue

occur in magnetoelectric BiFeO3 films,32,33 a system whichexhibits ferroelectric and magnetic ordering in the samephase. Christy1 has outlined possible mechanisms leading toIPTs in some of these framework structures under com-pression. Phenomenologically, IPT are required to be firstorder in nature. Surprisingly, majority of the reports on IPT arebased on pressure dependent studies and only in a few count-able cases temperature induced IPTs have been reported.29,34–39
In this article, we report the discovery of temperatureinduced IPT in a new class of compound, Li0.5Ce0.5MoO4
(LCM), belonging to scheelite family. This transition has beencharacterized by variable temperature synchrotron diffraction,Raman spectroscopy and dielectric measurements. Unlike allthe previous IPTs reported in the past, the IPT in the presentsystem is remarkable as it exhibits coexisting phases over awide range of temperature thus providing an ample proof forthe formation and subsequent growth of different nucleileading to separate seeds of the compound.
Experimental
Pure polycrystalline phase of Li0.5Ce0.5MoO4 (LCM) was syn-thesized following the method described in an earlier report.40
High-temperature X-ray diffraction studies were carried outusing Cu Kα X-ray source on a Bruker powder diffractometerwith a high temperature attachment (model: D8 Advance withmri TCPU1 high temperature system, Eurotherm temperaturecontroller). Diffraction data were collected from room tempera-ture to 650 °C at intervals of 50 °C. The samples were held for30 min at each temperature to equilibrate the change (±2 °C,Tantalum strip was used as heater) prior to recording. TheX-ray powder data were collected from 5–90° in 2θ with a stepsize of 0.02 with data collection time per step being 7 seconds.
Temperature dependent powder X-ray synchrotron datawere collected the Powder Diffraction Beam line (MCX)equipped with fast scintillator detector (Bede) at ELETTRA Syn-chrotron Light source, Trieste, Italy. The wavelength used forthe experiment was 1.0 Å, calibrated against Silicon(NIST-SRM660a) standards. The data were collected with a stepsize of 0.02° in the range 5–60°. Samples were loaded in acapillary after proper sonication to ensure uniform filling andcapillary was kept rotated during data accumulation. Tempera-ture of the sample was controlled by Hot blower heater (OxfordInstruments). The temperature of the sample was equilibratedfor 15 min prior to each data collection. Rietveld refinementswere carried out using software package FullProf.41
The temperature evolution of the Raman spectra of LCMwas recorded in the 180° back scattering geometry, using a532 nm excitation from a diode pumped frequency doubledNd-YAG solid state laser (model GDLM-5015 L, PhotopSuwtech Inc., China) and a custom-built Raman spectrometerequipped with a SPEX TRIAX 550 monochromator and a liquidnitrogen cooled CCD (Spectrum One with CCD 3000 controller,ISA Jobin Yovn-SPEX). Laser power at the sample was ∼8 mW,and a typical spectral acquisition time was 1–2 min. The
spectral resolution was 2 cm−1. The temperature was con-trolled with an accuracy of (0.1 K by using a temperature-con-troller (Linkam TMS 94) equipped with a heating stage unit(Linkam THMS 600). The spectral profile was fitted usingLorentzian functions with the appropriate background.
Dielectric measurements were carried out using pelletizedsamples using an impedance gain phase analyzer (NovocontrolAlpha-A) in the frequency range (100 Hz to 10 MHz (signalamplitude = 0.05 V) from (30–600) °C. Prior to measurement,the pellets were annealed at 700 °C for 1 h. Silver paste wasapplied on both sides of the pellet for better ohmic contact.Thin silver wires were soldered on both sides of the pellet. Thecoated pellets were heated at 150 °C in vacuum for 1 h toremove any organic component of the Ag-paste. Diameter andthickness of the pellet were approximately 10 mm and 1 mm,respectively.
Results and discussionVariable temperature X-ray powder diffraction studies
Previous structural studies have shown that Li0.5Ce0.5MoO4
(hereafter LCM) crystallizes in a space group I41/a with a struc-ture consisting of MoO4 tetrahedra linked to Ce/LiO8 poly-hedra.40 Fig. 1a shows the synchrotron X-ray powder diffractionpatterns of Li0.5Ce0.5MoO4 at 25 °C and 550 °C in a limited 2θrange. Appearance of additional weak reflections in thepattern of 550 °C (marked with arrows in Fig. 1(a)) suggeststhat the system exhibits structural phase transition (SPT) onheating. For the sake of clear visibility of the new weak reflec-tions, the intensity is shown on a logarithmic scale. These newreflections first become visible between 400 and 450 °C as canbe seen from the temperature evolution of the pattern inFig. 1(b). It is interesting to note that the overall intensity ofthe new peaks remain significantly smaller to those of themain peaks even at 550 °C, i.e. 150 °C above the transform-ation temperature.
Several plausible structural models were examined toexplore the appearance of additional weak reflections at hightemperature. Since the Bragg peaks corresponding to the roomtemperature phase are retained in intensity and the additionalpeaks are of a very low intensity, it was tempting to think ofthe structure of the high temperature phase to be a super-lattice of the low temperature phase, similar to those commonlyobserved in perovskites.42 Such transitions occur via smallreorientation of the octahedra and hence are displacive innature. The superlattice reflections in such cases are observeddue to a lowering of symmetry from the high symmetry parentcubic phase (space group Pm3̄m) on cooling below a criticaltemperature. In contrast to perovskites, in the present caseadditional reflections are observed on heating, rather than oncooling, above the critical temperature. A second model basedon a series of homologous compounds (Li1/2Ln1/2MoO4: Ln =La, Pr, Nd, Sm, Eu, Gd) also does not explain the observationmade in LCM as it represents an entirely different structuralmotif.43 Therefore, both these models were discarded. It is
Dalton Transactions Paper
This journal is © The Royal Society of Chemistry 2013 Dalton Trans., 2013, 42, 7672–7678 | 7673
Publ
ishe
d on
04
Mar
ch 2
013.
Dow
nloa
ded
by J
awah
arla
l Neh
ru C
entr
e fo
r A
dvan
ced
Scie
ntif
ic R
esea
rch
on 1
2/06
/201
3 07
:36:
47.
View Article Online
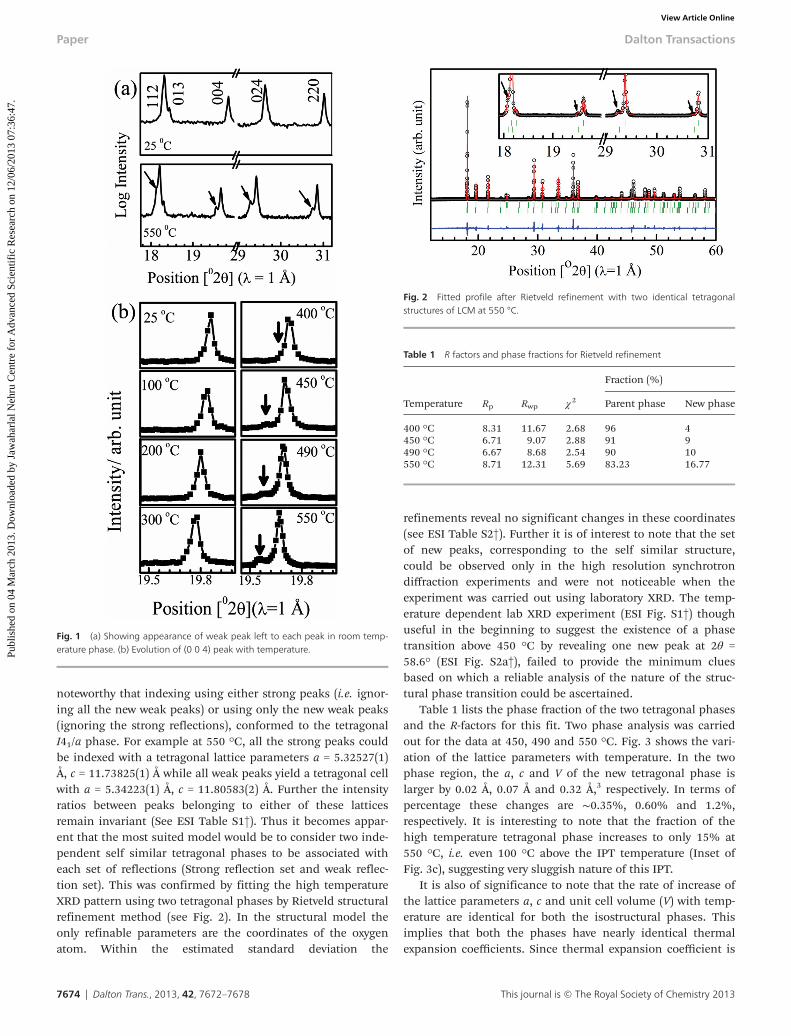
noteworthy that indexing using either strong peaks (i.e. ignor-ing all the new weak peaks) or using only the new weak peaks(ignoring the strong reflections), conformed to the tetragonalI41/a phase. For example at 550 °C, all the strong peaks couldbe indexed with a tetragonal lattice parameters a = 5.32527(1)Å, c = 11.73825(1) Å while all weak peaks yield a tetragonal cellwith a = 5.34223(1) Å, c = 11.80583(2) Å. Further the intensityratios between peaks belonging to either of these latticesremain invariant (See ESI Table S1†). Thus it becomes appar-ent that the most suited model would be to consider two inde-pendent self similar tetragonal phases to be associated witheach set of reflections (Strong reflection set and weak reflec-tion set). This was confirmed by fitting the high temperatureXRD pattern using two tetragonal phases by Rietveld structuralrefinement method (see Fig. 2). In the structural model theonly refinable parameters are the coordinates of the oxygenatom. Within the estimated standard deviation the
refinements reveal no significant changes in these coordinates(see ESI Table S2†). Further it is of interest to note that the setof new peaks, corresponding to the self similar structure,could be observed only in the high resolution synchrotrondiffraction experiments and were not noticeable when theexperiment was carried out using laboratory XRD. The temp-erature dependent lab XRD experiment (ESI Fig. S1†) thoughuseful in the beginning to suggest the existence of a phasetransition above 450 °C by revealing one new peak at 2θ =58.6° (ESI Fig. S2a†), failed to provide the minimum cluesbased on which a reliable analysis of the nature of the struc-tural phase transition could be ascertained.
Table 1 lists the phase fraction of the two tetragonal phasesand the R-factors for this fit. Two phase analysis was carriedout for the data at 450, 490 and 550 °C. Fig. 3 shows the vari-ation of the lattice parameters with temperature. In the twophase region, the a, c and V of the new tetragonal phase islarger by 0.02 Å, 0.07 Å and 0.32 Å,3 respectively. In terms ofpercentage these changes are ∼0.35%, 0.60% and 1.2%,respectively. It is interesting to note that the fraction of thehigh temperature tetragonal phase increases to only 15% at550 °C, i.e. even 100 °C above the IPT temperature (Inset ofFig. 3c), suggesting very sluggish nature of this IPT.
It is also of significance to note that the rate of increase ofthe lattice parameters a, c and unit cell volume (V) with temp-erature are identical for both the isostructural phases. Thisimplies that both the phases have nearly identical thermalexpansion coefficients. Since thermal expansion coefficient is
Fig. 1 (a) Showing appearance of weak peak left to each peak in room temp-erature phase. (b) Evolution of (0 0 4) peak with temperature.
Fig. 2 Fitted profile after Rietveld refinement with two identical tetragonalstructures of LCM at 550 °C.
Table 1 R factors and phase fractions for Rietveld refinement
Temperature Rp Rwp χ 2
Fraction (%)
Parent phase New phase
400 °C 8.31 11.67 2.68 96 4450 °C 6.71 9.07 2.88 91 9490 °C 6.67 8.68 2.54 90 10550 °C 8.71 12.31 5.69 83.23 16.77
Paper Dalton Transactions
7674 | Dalton Trans., 2013, 42, 7672–7678 This journal is © The Royal Society of Chemistry 2013
Publ
ishe
d on
04
Mar
ch 2
013.
Dow
nloa
ded
by J
awah
arla
l Neh
ru C
entr
e fo
r A
dvan
ced
Scie
ntif
ic R
esea
rch
on 1
2/06
/201
3 07
:36:
47.
View Article Online
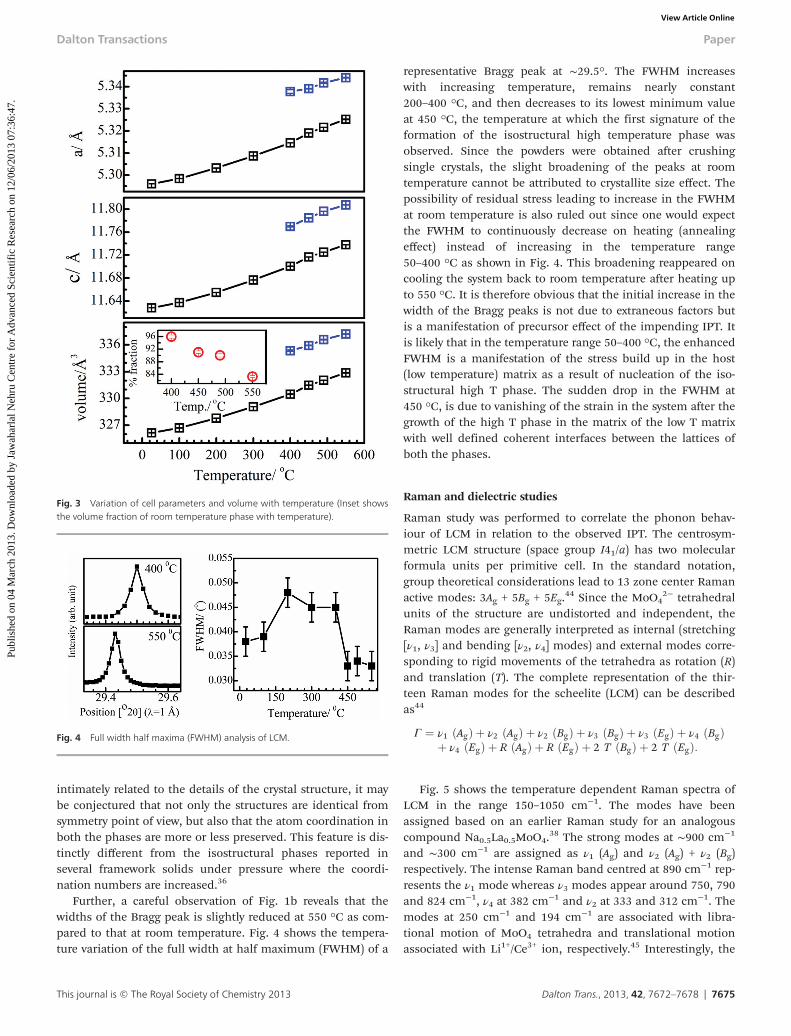
intimately related to the details of the crystal structure, it maybe conjectured that not only the structures are identical fromsymmetry point of view, but also that the atom coordination inboth the phases are more or less preserved. This feature is dis-tinctly different from the isostructural phases reported inseveral framework solids under pressure where the coordi-nation numbers are increased.36
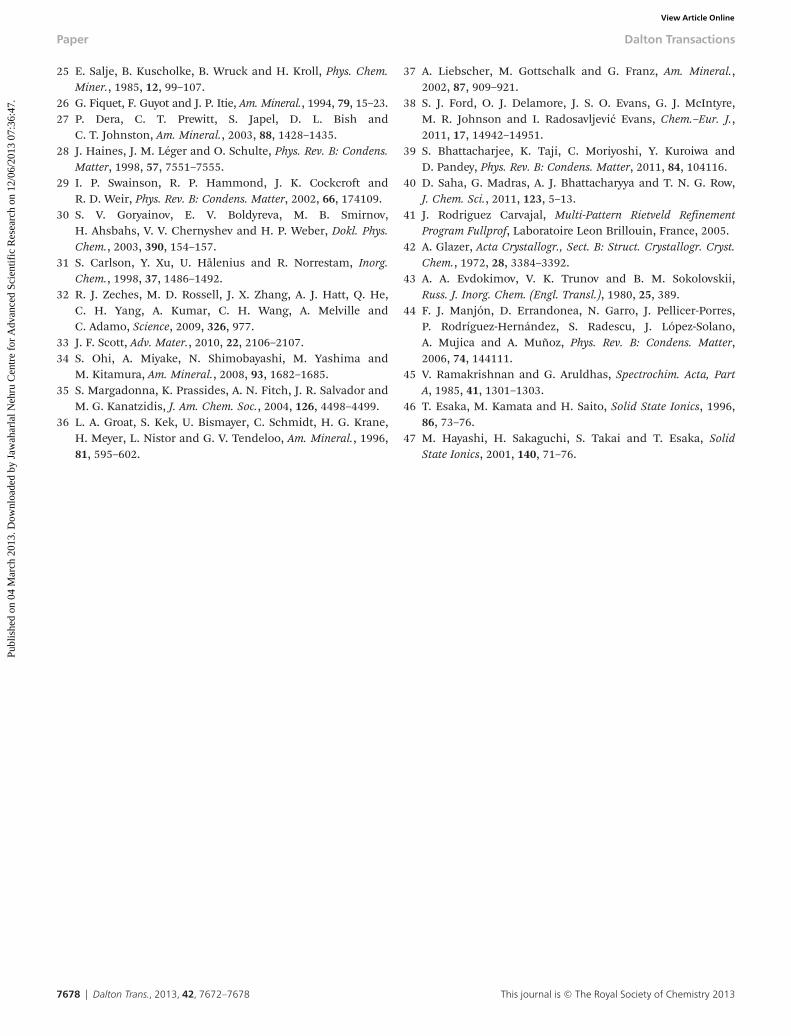
Further, a careful observation of Fig. 1b reveals that thewidths of the Bragg peak is slightly reduced at 550 °C as com-pared to that at room temperature. Fig. 4 shows the tempera-ture variation of the full width at half maximum (FWHM) of a
representative Bragg peak at ∼29.5°. The FWHM increaseswith increasing temperature, remains nearly constant200–400 °C, and then decreases to its lowest minimum valueat 450 °C, the temperature at which the first signature of theformation of the isostructural high temperature phase wasobserved. Since the powders were obtained after crushingsingle crystals, the slight broadening of the peaks at roomtemperature cannot be attributed to crystallite size effect. Thepossibility of residual stress leading to increase in the FWHMat room temperature is also ruled out since one would expectthe FWHM to continuously decrease on heating (annealingeffect) instead of increasing in the temperature range50–400 °C as shown in Fig. 4. This broadening reappeared oncooling the system back to room temperature after heating upto 550 °C. It is therefore obvious that the initial increase in thewidth of the Bragg peaks is not due to extraneous factors butis a manifestation of precursor effect of the impending IPT. Itis likely that in the temperature range 50–400 °C, the enhancedFWHM is a manifestation of the stress build up in the host(low temperature) matrix as a result of nucleation of the iso-structural high T phase. The sudden drop in the FWHM at450 °C, is due to vanishing of the strain in the system after thegrowth of the high T phase in the matrix of the low T matrixwith well defined coherent interfaces between the lattices ofboth the phases.
Raman and dielectric studies
Raman study was performed to correlate the phonon behav-iour of LCM in relation to the observed IPT. The centrosym-metric LCM structure (space group I41/a) has two molecularformula units per primitive cell. In the standard notation,group theoretical considerations lead to 13 zone center Ramanactive modes: 3Ag + 5Bg + 5Eg.
44 Since the MoO42− tetrahedral
units of the structure are undistorted and independent, theRaman modes are generally interpreted as internal (stretching[ν1, ν3] and bending [ν2, ν4] modes) and external modes corre-sponding to rigid movements of the tetrahedra as rotation (R)and translation (T). The complete representation of the thir-teen Raman modes for the scheelite (LCM) can be describedas44
Γ ¼ ν1 ðAgÞ þ ν2 ðAgÞ þ ν2 ðBgÞ þ ν3 ðBgÞ þ ν3 ðEgÞ þ ν4 ðBgÞþ ν4 ðEgÞ þ R ðAgÞ þ R ðEgÞ þ 2 T ðBgÞ þ 2 T ðEgÞ:
Fig. 5 shows the temperature dependent Raman spectra ofLCM in the range 150–1050 cm−1. The modes have beenassigned based on an earlier Raman study for an analogouscompound Na0.5La0.5MoO4.
38 The strong modes at ∼900 cm−1
and ∼300 cm−1 are assigned as ν1 (Ag) and ν2 (Ag) + ν2 (Bg)respectively. The intense Raman band centred at 890 cm−1 rep-resents the ν1 mode whereas ν3 modes appear around 750, 790and 824 cm−1, ν4 at 382 cm−1 and ν2 at 333 and 312 cm−1. Themodes at 250 cm−1 and 194 cm−1 are associated with libra-tional motion of MoO4 tetrahedra and translational motionassociated with Li1+/Ce3+ ion, respectively.45 Interestingly, the
Fig. 3 Variation of cell parameters and volume with temperature (Inset showsthe volume fraction of room temperature phase with temperature).
Fig. 4 Full width half maxima (FWHM) analysis of LCM.
Dalton Transactions Paper
This journal is © The Royal Society of Chemistry 2013 Dalton Trans., 2013, 42, 7672–7678 | 7675
Publ
ishe
d on
04
Mar
ch 2
013.
Dow
nloa
ded
by J
awah
arla
l Neh
ru C
entr
e fo
r A
dvan
ced
Scie
ntif
ic R
esea
rch
on 1
2/06
/201
3 07
:36:
47.
View Article Online

mode around 250 cm−1 broadens considerably with tempera-ture and merges with background at 300 °C, i.e. well below thephase transformation temperature (∼450 °C). Li-modifiedScheelite compounds have been reported to exhibit Li+ ionmobility at elevated temperatures.46,47 Though not verifieddirectly, dielectric measurements of LCM, shown in Fig. 6, alsoshows considerable increase in the conductivity with tempera-ture, presumably due to the increased Li mobility.40 The loss
tangent also exhibits a small hump at ∼450 °C (Fig. 6) at theIPT transition temperature.
The gradual vanishing of the mode at 250 cm−1 is attribu-ted to the increasing dynamic disorder in the librationalmotion of the MoO4 tetrahedra coupled to the Li/Ce motion.For analysis related to the IPT, we have considered only thewell resolved ν1, ν2 and ν4 modes. The three ν3 modes in therange 750–825 cm−1 are difficult to resolve above 150 °C. TheRaman spectra of LCM reveal the following features aroundthe IPT: (a) relatively faster decrease in the frequency of theν1 and ν4 modes as the IPT temperature is approached fromroom temperature, (b) stiffening of the modes above the tran-sition temperature, (c) appearance of a new mode at∼440 cm−1, and (d) anomalous increase in the width of theRaman modes (a typical representative plot is given in Fig. 7(a)). The results suggest that similar to other displacive SPTsinvolving symmetry change, the IPT in LCM is also driven byphonon softening mechanism. It is known that partial
Fig. 5 Temperature evolution of the Raman spectra of Li0.5Ce0.5MoO4.
Fig. 6 Temperature dependence of the relative permittivity and loss tangent ofLi0.5Ce0.5MoO4 at 10 kHz.
Fig. 7 Temperature dependence of (a) Symmetric stretching modes of theMoO4 ion (Inset: FWHM of the ν1 mode of the MoO4 ion). (b) Bending modes.(c) Bending modes and appearance of new bending mode in the temperatureinterval 25–600 °C.
Paper Dalton Transactions
7676 | Dalton Trans., 2013, 42, 7672–7678 This journal is © The Royal Society of Chemistry 2013
Publ
ishe
d on
04
Mar
ch 2
013.
Dow
nloa
ded
by J
awah
arla
l Neh
ru C
entr
e fo
r A
dvan
ced
Scie
ntif
ic R
esea
rch
on 1
2/06
/201
3 07
:36:
47.
View Article Online

softening of modes can as well lead to SPT. In the present casemore than one mode softens to result in an IPT.
Since the high temperature phase is isostructural to thelow-temperature phase with expanded lattice parameters, it isexpected that the Raman modes of the high temperaturephase should be similar to that of the low temperature phasewith slight change in the frequency due to difference in thelattice parameters. Since the lattice parameters of the new iso-structural phase are not very drastically different, and also thevolume fraction of this phase is significantly low even at550 °C, the Raman peaks corresponding to the high tempera-ture isostructural phase would not be visible as a set of separ-ate peaks in the pattern. They would rather be superimposedon the spectra of the low temperature phase, as evident by theincrease in the width of the modes above the IPT temperature.The evolution of the Raman spectra with temperature, shownin Fig. 5, is consistent with the IPT nature of the transition.Given the fact that the lattice parameters and the cell volumeof both the coexisting isostructural phases differ by ∼0.5 and1%, respectively, a local lowering of symmetry is expectedaround the interface of the two phases to accommodate thestrain induced due to the lattice mismatch. The new modeobserved at ∼440 cm−1 could be either due to appearance ofthe one of the symmetries (Bg and Eg) of the ν4 mode or due tolifting of the degeneracy of the two Eg modes due to local low-ering of symmetry near the interface regions.
Conclusions
Temperature dependent high resolution synchrotron X-raypowder diffraction accompanied by Raman and dielectricstudies unambiguously establish this temperature induced IPTin Li0.5Ce0.5MoO4. In contrast to the previously reported IPTs,this temperature induced IPT is uncommon and found to bedriven by nucleation and growth of the new self similar phasein the matrix of the room temperature phase over a wide rangeof temperatures. The observation of a slight softening of someof the zone centre phonons points to the displacive nature ofthis IPT. It may be anticipated that temperature induced IPTmight occur more frequently, particularly in complex non stoi-chiometric oxides. It is worthwhile to explore a special featureby variable temperature synchrotron XRD data analysis inorder to unearth such IPTs in inorganic oxides.
Acknowledgements
Dipankar thanks Lalithalakshmi B. V. for high temperaturelaboratory PXRD measurement and Lalitha K. V. for dielectricmeasurements and DST-India and Sincrotrone Trieste forfinancial support during the synchrotron data collection atTrieste, Italy. Dipankar also thanks Dr Jasper Plaisier for scien-tific assistance during the synchrotron data collection. TNGthanks DST for J. C. Bose fellowship for funding.
References
1 A. Christy, Acta Crystallogr., Sect. B: Struct. Sci., 1995, 51,753–757.
2 R. A. Cowley, Phys. Rev. B: Solid State, 1976, 13, 4877–4885.3 A. W. Lawson and T.-Y. Tang, Phys. Rev., 1949, 76, 301–302.4 M. K. Wilkinson, H. R. Child, C. J. McHargue,
W. C. Koehler and E. O. Wollan, Phys. Rev., 1961, 122,1409–1413.
5 S. G. Louie and M. L. Cohen, Phys. Rev. B: Solid State, 1974,10, 3237–3245.
6 H. T. Hall, L. Merrill and J. D. Barnett, Science, 1964, 146,1297–1299.
7 M. B. Maple and D. Wohlleben, Phys. Rev. Lett., 1971, 27,511–515.
8 A. Jayaraman, Phys. Rev. Lett., 1972, 29, 1674–1676.9 C. S. Yoo, B. Maddox, J. H. P. Klepeis, V. Iota, W. Evans,
A. McMahan, M. Y. Hu, P. Chow, M. Somayazulu,D. Häusermann, R. T. Scalettar and W. E. Pickett, Phys. Rev.Lett., 2005, 94, 115502.
10 A. Jayaraman, D. B. McWhan, J. P. Remeika andP. D. Dernier, Phys. Rev. B: Solid State, 1970, 2, 3751–3756.
11 N. V. Chandra Shekar, P. C. Sahu, M. Sekar, M. Yousuf andK. Govinda Rajan, Phys. Rev. B: Condens. Matter, 1996, 228,369–373.
12 G. K. Rozenberg, M. P. Pasternak, W. M. Xu,L. S. Dubrovinsky, S. Carlson and R. D. Taylor, Europhys.Lett., 2005, 71, 228.
13 W. Xiao, D. Tan, X. Xiong, J. Liu and J. Xu, Proc. Natl. Acad.Sci. U. S. A., 2010, 107, 14026–14029.
14 D. M. Adams, A. E. Heath, H. Jhans, A. Norman andS. Leonard, J. Phys.: Condens. Matter, 1991, 3, 5465–5468.
15 A. Dönni, H. Kitazawa, P. Fischer and F. Fauth, J. AlloysCompd., 1999, 289, 11–17.
16 J. Kusz, H. Böhm, E. Talik, M. Skutecka and J. Deniszczyk,J. Alloys Compd., 2003, 348, 65–71.
17 Y. Akahama, H. Kawamura, D. Häusermann, M. Hanflandand O. Shimomura, Phys. Rev. Lett., 1995, 74, 4690–4693.
18 Y. Ma, A. R. Oganov and C. W. Glass, Phys. Rev. B: Condens.Matter, 2007, 76, 064101–064105.
19 Q. Liu, X. Yu, X. Wang, Z. Deng, Y. Lv, J. Zhu, S. Zhang,H. Liu, W. Yang, L. Wang, H. Mao, G. Shen, Z.-Y. Lu,Y. Ren, Z. Chen, Z. Lin, Y. Zhao and C. Jin, J. Am. Chem.Soc., 2011, 133, 7892–7896.
20 S. R. Garner, J. N. Hancock, Y. W. Rodriguez,Z. Schlesinger, B. Bucher, Z. Fisk and J. L. Sarrao, Phys.Rev. B: Condens. Matter, 2000, 62, R4778–R4781.
21 D. S. Middlemiss, D. Portinari, C. P. Grey, C. A. Morrisonand C. C. Wilson, Phys. Rev. B: Condens. Matter, 2010, 81,184410.
22 B. Le Guennic, S. Borshch and V. Robert, Inorg. Chem.,2007, 46, 11106–11111.
23 K. Friese, Y. Kanke, A. N. Fitch and A. Grzechnik, Chem.Mater., 2007, 19, 4882–4889.
24 S. Redfern and E. Salje, Phys. Chem. Miner., 1992, 18,526–533.
Dalton Transactions Paper
This journal is © The Royal Society of Chemistry 2013 Dalton Trans., 2013, 42, 7672–7678 | 7677
Publ
ishe
d on
04
Mar
ch 2
013.
Dow
nloa
ded
by J
awah
arla
l Neh
ru C
entr
e fo
r A
dvan
ced
Scie
ntif
ic R
esea
rch
on 1
2/06
/201
3 07
:36:
47.
View Article Online
25 E. Salje, B. Kuscholke, B. Wruck and H. Kroll, Phys. Chem.Miner., 1985, 12, 99–107.
26 G. Fiquet, F. Guyot and J. P. Itie, Am. Mineral., 1994, 79, 15–23.27 P. Dera, C. T. Prewitt, S. Japel, D. L. Bish and
C. T. Johnston, Am. Mineral., 2003, 88, 1428–1435.28 J. Haines, J. M. Léger and O. Schulte, Phys. Rev. B: Condens.
Matter, 1998, 57, 7551–7555.29 I. P. Swainson, R. P. Hammond, J. K. Cockcroft and
R. D. Weir, Phys. Rev. B: Condens. Matter, 2002, 66, 174109.30 S. V. Goryainov, E. V. Boldyreva, M. B. Smirnov,
H. Ahsbahs, V. V. Chernyshev and H. P. Weber, Dokl. Phys.Chem., 2003, 390, 154–157.
31 S. Carlson, Y. Xu, U. Hålenius and R. Norrestam, Inorg.Chem., 1998, 37, 1486–1492.
32 R. J. Zeches, M. D. Rossell, J. X. Zhang, A. J. Hatt, Q. He,C. H. Yang, A. Kumar, C. H. Wang, A. Melville andC. Adamo, Science, 2009, 326, 977.
33 J. F. Scott, Adv. Mater., 2010, 22, 2106–2107.34 S. Ohi, A. Miyake, N. Shimobayashi, M. Yashima and
M. Kitamura, Am. Mineral., 2008, 93, 1682–1685.35 S. Margadonna, K. Prassides, A. N. Fitch, J. R. Salvador and
M. G. Kanatzidis, J. Am. Chem. Soc., 2004, 126, 4498–4499.36 L. A. Groat, S. Kek, U. Bismayer, C. Schmidt, H. G. Krane,
H. Meyer, L. Nistor and G. V. Tendeloo, Am. Mineral., 1996,81, 595–602.
37 A. Liebscher, M. Gottschalk and G. Franz, Am. Mineral.,2002, 87, 909–921.
38 S. J. Ford, O. J. Delamore, J. S. O. Evans, G. J. McIntyre,M. R. Johnson and I. Radosavljević Evans, Chem.–Eur. J.,2011, 17, 14942–14951.
39 S. Bhattacharjee, K. Taji, C. Moriyoshi, Y. Kuroiwa andD. Pandey, Phys. Rev. B: Condens. Matter, 2011, 84, 104116.
40 D. Saha, G. Madras, A. J. Bhattacharyya and T. N. G. Row,J. Chem. Sci., 2011, 123, 5–13.
41 J. Rodriguez Carvajal, Multi-Pattern Rietveld RefinementProgram Fullprof, Laboratoire Leon Brillouin, France, 2005.
42 A. Glazer, Acta Crystallogr., Sect. B: Struct. Crystallogr. Cryst.Chem., 1972, 28, 3384–3392.
43 A. A. Evdokimov, V. K. Trunov and B. M. Sokolovskii,Russ. J. Inorg. Chem. (Engl. Transl.), 1980, 25, 389.
44 F. J. Manjón, D. Errandonea, N. Garro, J. Pellicer-Porres,P. Rodríguez-Hernández, S. Radescu, J. López-Solano,A. Mujica and A. Muñoz, Phys. Rev. B: Condens. Matter,2006, 74, 144111.
45 V. Ramakrishnan and G. Aruldhas, Spectrochim. Acta, PartA, 1985, 41, 1301–1303.
46 T. Esaka, M. Kamata and H. Saito, Solid State Ionics, 1996,86, 73–76.
47 M. Hayashi, H. Sakaguchi, S. Takai and T. Esaka, SolidState Ionics, 2001, 140, 71–76.
Paper Dalton Transactions
7678 | Dalton Trans., 2013, 42, 7672–7678 This journal is © The Royal Society of Chemistry 2013
Publ
ishe
d on
04
Mar
ch 2
013.
Dow
nloa
ded
by J
awah
arla
l Neh
ru C
entr
e fo
r A
dvan
ced
Scie
ntif
ic R
esea
rch
on 1
2/06
/201
3 07
:36:
47.
View Article Online
![Phase transitions in the A 2 BX 4 -compound: Tetramethylammonium tetrachlorozincate tetrachlorocuprate, [(CH 3 ) 4 N] 2 Zn 0.5 Cu 0.5 Cl 4 , and room temperature crystal structure](https://static.fdokumen.com/doc/165x107/632340c4807dc363600ace49/phase-transitions-in-the-a-2-bx-4-compound-tetramethylammonium-tetrachlorozincate.jpg)