OPTICAL DETECTION AND EXCITATION OF ... - University of Surrey
171
OPTICAL DETECTION AND EXCITATION OF VIBRATIONS IN ^ILIC O N RESONATOR SENSORS by MICHAEL JOHN TUDOR A thesis submitted to the Faculty of Mathematical and Physical Sciences at the University of Surrey for the Degree of Doctor of Philosophy. 1988
-
Upload
khangminh22 -
Category
Documents
-
view
3 -
download
0
Transcript of OPTICAL DETECTION AND EXCITATION OF ... - University of Surrey

OPTICAL DETECTION AND EXCITATION OF VIBRATIONS
IN^ILICON RESONATOR SENSORS
by
MICHAEL JOHN TUDOR
A thesis submitted to the Faculty of Mathematical
and Physical Sciences at the University of Surrey
fo r the Degree of Doctor of Philosophy.
1988

ProQuest Number: 10804615
All rights reserved
INFORMATION TO ALL USERS The quality of this reproduction is dependent upon the quality of the copy submitted.
In the unlikely event that the author did not send a com p le te manuscript and there are missing pages, these will be noted. Also, if material had to be removed,
a note will indicate the deletion.
uestProQuest 10804615
Published by ProQuest LLC(2018). Copyright of the Dissertation is held by the Author.
All rights reserved.This work is protected against unauthorized copying under Title 17, United States C ode
Microform Edition © ProQuest LLC.
ProQuest LLC.789 East Eisenhower Parkway
P.O. Box 1346 Ann Arbor, Ml 48106- 1346
ABSTRACT
The princip le aim of th is work was to investigate optical techniques
fo r the excitation and detection of v ibrations, a t resonance, in
Silicon resonator sensors.
Two a l l - f ib r e detection techniques have been developed: one is based
on phase modulation and the other on in tensity modulation of the optical
wave tra in . Both detection techniques may be implemented in e ith e r
single mode or multimode f ib re . The choice of measurement technique
is determined by the desired system performance and cost.
The development of these detection systems naturally led to a study
of the properties of the sensors, and the characteristics of a pressure
transducer and an accelerometer were investigated; the la t te r is
reported in more detail here. The main characteristics studied were
modes of resonance, quality facto rs , resonant frequency s h if t with
temperature, resonant frequency s h ift with the measurand and
the non-lin earity of the resonator.
Optical excitation of vibrations a t resonance was achieved by using
a pulsed laser source d ire c tly incident on the resonator. The addition
of a thin Chrome layer to the resonator improved the largest o p tica lly
excited amplitude of vibration by a factor of 9 compared with the
uncoated resonator.

For Venita

ACKNOWLEDGEMENTS
I wish to express thanks to :-
Dr. K. W. H. Foulds fo r his supervision
Dr. M. V. Andres fo r his example and outstanding contribution
Mr. J. Greenwood fo r the provision of samples and helpful discussions
Dr. J. M. Naden fo r helpful discussions
F. Bristow and his colleagues in the mechanical workshop fo r the
manufacture of optical components
My parents fo r th e ir support
PUBLICATIONS ARISING FROM THIS WORK
Optical activation of a Silicon vibrating sensor Electronics L e t t . , 22(21), pp. 1097-1099, 1986
Analysis of an interferom etric optical f ib re detection technique
Electronics L e t t . , 23(15), pp. 774-775
Non-linear vibrations and hysteresis of micromechanical S ilicon
resonators as frequency out sensors
Electronics L e t t . , 23(18), pp. 952-954
S en s itiv ity of a frequency out S ilicon pressure sensor 3rd Eurosensors Conference, Cambridge, 22-24 Sept. 1987
S e n s itiv ity of a frequency out S ilicon pressure sensor
to be published Sensors and Actuators
Silicon resonator sensors: interrogation techniques and characteristics
to be pub!ished Special Issue IEE Proc. D. September 1988
RELATED WORK
A novel frequency out optical fib re sensing technique
5th International Conference Optical Fibre Sensors, New Orleans,Jan. 27-29 1988
A novel frequency out optical fib re sensing technique
to be published J. Lightwave. Tech.
A ll publications in conjunction with Dr. M. V. Andres and
Dr. K. W. H. Foulds
CONTENTS
CHAPTER 1
CHAPTER 2
INTRODUCTION TO OPTICAL FIBRE SENSORS AND SILICON RESONATOR
SENSORS Page1.1 Introduction 11.2 Optical f ib re sensors combined with Silicon resonator
sensors 1
1.3 Objectives and structure of the thesis 2
PROPERTIES OF SILICON RESONATOR SENSORS
2.1 Introduction to S ilicon resonator sensors2.1.1 Introduction 32 .1 .2 Silicon resonator sensors: Fabrication techniques 3
2 .1 .3 S ilicon:A ttractions as a resonator material 4
2.2 Geometry and operating principles of the devices
2.2.1 Introduction 6
2.2 .2 Geometry: Accelerometer batch 2 6
2.2 .3 Geometry: Accelerometer batch 1 72 .2 .4 Geometry: Pressure transducer 7
2.3 Vibrational modes of the accelerometer (both batches)
2.3.1 Introduction 8
2.3 .2 Analysis of the DETF 92.3 .3 Analysis of the device resonances 11
2.3 .4 DETF experimental modes of vibration - batch 2 132.3 .5 DETF experimental modes of vibration - batch 1 162.3 .6 Device: experimental modes of vibration - batch 2 17
2.3 .7 Conclusions 18
Vibrational modes of the pressure transducer
2.4.1 Introduction 182.4 .2 Experimental modes of the pressure transducers
resonator 19
Non lin ea r and hysteretic vibrations2.5.1 Introduction 20
2.5 .2 Theory of non linear vibrations 20
2.5 .3 Accelerometer batch 1 : experimental non lin e a r
vibrations 22
2 .5 .4 Accelerometer batch 2: experimental non lin e a r
vibrations 24
2 .5 .5 Conclusions 25
2.6 The Quality factor2.6.1 Introduction 25
2 .6 .2 Loss mechanisms in S ilicon resonators 26
2 .6 .3 Accelerometer experimental losses batches1 and 2 32
2 .6 .4 Theoretical internal damping 3^2 .6 .5 Conclusions 36
2.7 Accelerometer measurand s e n s itiv ity
2.7.1 Introduction 362 .7 .2 Effect of loading: theoretical 372 .7 .3 Effect of loading: experimental 40
2 .7 .4 Clean mode c r ite r ia : theoretical 40
2 .7 .5 Conclusions 42
2.8 Temperature dependence of the resonant frequency
2.8.1 Introduction 422 .8 .2 Factors influencing the temperature s e n s itiv ity 42
2 .8 .3 Temperature compensation methods 45
2 .8 .4 Conclusions 47
CHAPTER 3 : DETECTION TECHNIQUES FOR SILICON RESONATOR VIBRATIONS3.1 Introduction 73
3.2 E le c tr ic a lly based detection3.2.1 Introduction 733 .2 .2 Capacitative detection 73
3 .2 .3 Piezoresistive detection 74
3 .2 .4 Magnetic/optical detection 753 .2 .5 Piezoelectric detection 763 .2 .6 Conclusions 76
3.3 O ptically based detection3.3.1 Introduction 76
3 .3 .2 Optically based detection: other schemes 77
3.4 A ll fib re Fabry Perot based detection of vibrations
3.4.1 Introduction 78
3 .4 .2 Theory of the Fabry Perot interferom eter 78
3 .4 .3 Fibre Fabry Perot interferom eter 79
3 .4 .4 Vibration Detection System 81
3 .4 .5 Conclusions 84
5 Single mode 2 x 2 coupler based detection
3.5.1 Introduction 84
3 .5 .2 Theory 85
3 .5 .3 Amplitude and phase measurements 87
3 .5 .4 Detector bandwidth requirements 89
3 .5 .5 Optical source requirements and effects 90
3 .5 .6 Requirements of the 2 x 2 coupler 923 .5 .7 In ten sity modulation of the interference pattern 92
3 .5 .8 E ffect of including a glass slide 943 .5 .9 E ffect of including a lens in system 953.5 .10 Resonance locking system 963.5.11 Conclusions 96
6 Multimode and two mode fib re 2 x 2 coupler based detector
3.6.1 Introduction 97
3 .6 .2 Two mode coupler based detection 973 .6 .3 Multimode 2 x 2 coupler based detection 98
3 .6 .4 Inclusion of lenses in the multimode fib re system 102
3 .6 .5 Conclusions 103
7 Detection of vibrations based on in tensity modulation
3.7.1 Introduction 1033 .7 .2 2 x 2 multimode fib re coupler with an LED source 104
3 .7 .3 Single mode f ib re system with a HeNe source 1053 .7 .4 Conclusion 106
8 Multiplexing3.8.1 Introduction 1063 .8 .2 Series or p ara lle l interrogation with a single
variable at each point 107
3 .8 .3 Series of p ara lle l interrogation with manyvariables a t each point 108
3 .8 .4 Conclusion 109
Page
CHAPTER 4 : EXCITATION TECHNIQUES4.1 Introduction 1284.2 E le c tr ic a lly based excitation
4.2 .1 Introduction 128
4 .2 .2 E lectrostatic excitation 129
4 .2 .3 Resistive excitation 130
4 .2 .4 Magnetic/optical excitation 130
4 .2 .5 P iezoelectric excitation 130
4 .2 .6 Conclusions 131
4.3 Optical pulsed excitation4.3 .1 Introduction 1314 .3 .2 Physical mechanisms: uncoated S ilicon
resonator 132
4 .3 .3 Experimental optical powering: uncoated
devices 137
4 .3 .4 Physical mechanisms: coated resonator 141
4 .3 .5 Experimental results: Chromium coatedpressure transducer 142
4 .3 .6 Conclusions 143
4.4 Self excited resonators4.4 .1 Introduction 144
4 .4 .2 Impulse response 144
4 .4 .3 Fabry Per ot 145
4 .4 .4 Selective masking 145
4 .4 .5 Conclusions 146
CHAPTER 5: CONCLUSIONS5.1 Conclusions l£k
References 158
CHAPTER 1
INTRODUCTION TO OPTICAL FIBRE SENSORS AND SILICON RESONATOR SENSORS
1.1 Introduction
This chapter b r ie fly describes the a ttrac tio n of combining optical f ib re sensing techniques with S ilicon resonator sensors and the
perceived advantages of each sensing technique. The objectives of th is
work are then outlined and the structure and contents of the thesis
are previewed.
1.2 Optical Fibre Sensors combined With S ilicon Resonator Sensors
Optical fib re sensing is much reviewed (1 ,2 ) and researched, its main
quoted attractions being in trin s ic safety , immunity to electronmagnetic
in terference, corrosion resistance, lightness and possible remote
operation. However considerable problems are encountered in packaging
such sensors and in avoiding unwanted cross sen s itiv ity to environmental e ffe c ts .
In general there are two classes of fib re sensor: in trin s ic in which
modulation of lig h t guided in the fib re i t s e l f is the sensing mechanism
and ex trins ic in which the fib re merely guides lig h t to and from the
sensor. In trin s ic sensors thus require a d irec t interaction mechanism
between the measurand and the guided lig h t or i f no such mechanism
exists they require a measurand sensitive primary transducer which then
in teracts with the fib re . The former approach is lim ited by known
in teraction mechanisms and the la t te r by the problems of in terfac ing
between the primary transducer and the optical f ib re . A dditionally
in tr in s ic sensors re ly on the s ta b ility of some characteristics of the
optical source which must be maintained or controlled within the f ib re
and thus they may suffer in harsh environments and usually exh ib it cro ss-sen s itiv ity , p articu larly to temperature.
Extrinsic sensors attempt to avoid these problems by using a conventional
sensor with optical links . Thus the conventional sensor design and material are chosen to meet the requirements of s ta b ility and cross-sensitiv ity
in the environment. However the requirement of optical links has u n til
recently lim ited the choice of sensor to passive sensors requiring no power.
Passive sensors which may be interrogated o p tic a lly are lim ited by the
d irec t interaction mechanisms that are known and the s en s itity of such
effects.To overcome the problems of passive sensors the use of resonator
sensors, powered by direct interaction of the lig h t with the resonator
11 0 3 u c c i l p i u p u o c u V '■' / J U J i l l y V I IV. Ju iift. VI u u i i ■ v i v n u i ■ gia w h w u i i i
fo r detection.Resonator sensors re ly on the measurand causing changes in a
mechanical vibrating element maintained at resonance; the vibrating
element may be a simple structure such as a beam or p late or a more
complex structure such as a tuning fo rk . Ideally the measurand a lte rs
the vibrating element’ s resonant frequency thus producing a frequency
output sensor. A1ternatively or add itionally the measurand may modify
the vibrating element's quality facto r or its phase of v ib ra tion .
Resonator sensors have the a ttrac tio n o f good s ta b il i ty , usually a
frequency output and high accuracy. They also allow interaction with
a wide variety of measurands (4 ) . S ilicon resonator sensors have
the fu rther advantages of cheapness, small size and a power requirement
which is of the order of fW of mechanical power.
Thus, in summary, an extrins ic f ib re optic sensor based on a S ilicon
resonator promises to be stable, accurate, in tr in s ic a lly safe, immune
to em interference, l ig h t , small, versa tile and cheap.
1.3 Objectives and Structure of the Thesis
The principle aim of th is work was to op tica lly interrogate and excite
vibrations in Silicon resonator sensors. As a subsidiary aim the
characteristics of a Silicon accelerometer and a S ilicon pressure
sensor were investigated.
The structure of th is thesis thus fa l ls naturally into two sections: mechanical and o p tica l. F irs t in Chapter 2 the mechanical characteristics
of the sensors are discussed with the majority of specific deta ils
being given fo r the accelerometer. Where possible, general conclusions
are drawn which should apply to any Silicon resonator sensor. Chapters
3 and 4 concern optics as applied to Silicon resonator sensors. Chapter 3 focuses on the optical detection techniques which were developed
fo r Silicon resonator vibration sensing. Chapter 4 describes the
basic theory of optical excitation of vibrations and gives some experimental resu lts . F ina lly Chapter 5 gives the conclusions and outlines areas
of fu rther investigation which are required before a commercial optical
Silicon resonator sensor w ill emerge.
_ 2 _
CHAPTER 2
PROPERTIES OF SILICON RESONATOR SENSORS
2.1 Introduction to S ilicon resonator sensors
2.1.1 Introduction
This chapter describes experimental and theoretical results on the
mechanical behaviour of two Silicon sensors, one designed as a pressure
transducer, the other an accelerometer. Speci^icA^ descriptions are
given of the modes of v ib ra tion , th e ir quality factors (Q ), the resonator
n o n -lin earity , the measurand sen s itiv ity and the temperature s e n s itiv ity . Most of the results are fo r the accelerometer of which two d iffe re n t
batches and geometries were studied. However some measurements were
made on the pressure transducer and its temperature s e n s itiv ity has
been studied in d e ta il. F irs tly however the fabrication techniques
availab le fo r S ilicon resonator sensors are described to give an
indication of the geometries which may be produced. The geometries, dimensions and operating principles of the devices are then given,
followed by the device characteristics.
2 .1 .2 Silicon resonator sensors: Fabrication Techniques
The main tools availab le to etch complex shapes in S ilicon wafers
are: anisotropic and isotropic etching, and dopant dependent etching. These are described in detail in reference 5, so only a b r ie f description
is given here.
Etches are availab le fo r Silicon which are isotropic and th is can
be used as a fin a l processing step to provide a smooth surface and
remove any sharp edges. This is desirable since i t is known that fatigue of mechanical structures is p a r t ia lly caused by crack
in it ia t io n at the surface of structures.
- 3 -
Anisotropic etches are also availab le a l l of which in S ilicon attack
(111) crystal!ographic planes more slowly than a ll other planes. Etch
rates ratios may be as high as 1000. Careful alignment of the wafer
allows complicated beam and plate structures, fo r example, to be
produced in Silicon simply by using th is anisotropic etch.
Further v e rs a til ity is added by the etch stop mechanism. This is
usually accomplished by diffusing a layer of Boron into the wafer.At certa in Boron concentrations etching stops completely. This can
be a convenient method o f producing p lates, beams, diaphragms and
other mechanical structures with well defined thicknesses. A
disadvantage of Boron doping is that electronic components can no
longer be fabricated in the wafer.
Using these tools i t is possible to fabricate a wide varie ty of
shapes in S ilicon .
In general, to date, the fabrication of resonator shapes in Silicon
has followed a fa ir ly s im ilar method. The basic steps are as follows.
F irs t ly a thin layer of Silicon Dioxide is deposited on the surface of the S ilicon wafer then a photoresist is deposited on top of the S ilicon
Dioxide. This photoresist has the property that when i t is exposed to-
u ltra v io le t radiation i t becomes resistan t to etching. The photoresist is then exposed to u ltra v io le t radiation but through a photomask which
has some opaque regions. The opaque regions define the areas of the
S ilicon wafer which are la te r to be etched. The unexposed areas ofphotoresist are then removed leaving the Dioxide layer with a pattern of photoresist on i t . Another selective etch then removes the exposed
Dioxide but leaves the photoresist covered Dioxide. The exposed
surfaces of the Silicon are now ready fo r etching.
2 .1 .3 S ilicon: Attractions as a resonator material
A number of attractions are immediately apparent because S ilicon isalready used as the basis fo r integrated c irc u it technology. This
means the basic raw material is cheap, abundant and extremely pure.
This extreme purity is an advantage fo r a resonator since im purities
- 4 -
may e ffe c t the in ternal damping mechanisms in a material and purity
also helps to reduce the fatigue of resonators giving them longer
life tim e s .
Integrated c irc u it technology is a batch process and as resonator
fabrication techniques are derived from i .e . technology resonators
are also fabricated by batch. This fu rther reduces costs and promises
high device y ields with good rep eatab ility between devices a t least
over a single wafer.
Aside from the fabrication attractions of S ilicon as a resonator material
its mechanical properties also make i t a ttra c tiv e . F irs t ly i t is
a c rys ta llin e material which lim its fatigue and creep. I t is also
strong having a ten s ile y ie ld strength three times higher than stainless
steel and a Young's modulus approaching that of s te e l. Its hardness
is comparable with that of Quartz.
In addition to these mechanical properties its e le c tric a l v e rs a t il ity
makes i t even more a ttra c tiv e . The piezoresistive e ffe c t in S ilicon
may become as useful as the piezoelectric e ffec t in Quartz. A dditionally
Silicon has one large advantage over Quartz as a resonator m ateria l.
That is en tire signal processing c ircu its may be produced on the wafer
i t s e l f producing a "smart sensor". The proximity of the signal processing
to the sensor promises large improvements in signal to noise ra tio
and thus sensor performance.
At present Quartz is the dominant material as a frequency standard
and is presently being applied in frequency output resonator sensor research. The reasons why Silicon may not compete with Quartz are
that piezoresistance is not as versatile as p iezo e le c tric ity and th a t,
as y e t, temperature s e n s itiv ity of frequency has not been overcome
in S ilicon . However the p o ss ib ility of on chip signal processing
may outweight these disadvantages. Additionally Silicon sensors should
be considerably cheaper than Quartz and selective etching in S ilicon
is fu rther advanced than in Quartz.
- 5 -

2.2 Geometry and Operating Principles of the devices
2.2.1 Introduction
This section provides deta ils of the geometries and operating principles
of the accelerometer (both batches) and the pressure transducer. No
d eta ils are given of the particu lar fabrication of these sensors and
the reader is referred to reference 6 fo r these d e ta ils .
2 .2 .2 Geometry: Accelerometer Batch 2
Figure 2.1 shows a scale diagram of the accelerometer geometry. The
device consists of a surrounding frame from which extend two beams
supporting a rectangular slab which is the paddle lik e in e rtia l mass of
the accelerometer. The two supporting beams are about 200 pm th ick.
Between A and B and in the same plane as the top of the wafer a resonator
is etched. This can be any mechanical element such as a beam or p la te ,
d iffe re n t structures having d iffe re n t properties. In th is case a Double
Ended Tuning Fork (DETF) was chosen. This DETF may be regarded as two
elo.st ic a lly coupled beams or two tuning forks joined tine to tin e . The
resonator may vibrate in the Y direction in the XY plane and in the Z
d irection in the XZ plane. This structure has two major advantages.
I f large enough displacements are excited, an in tensity modulation based
optical detection technique may be used to detect the vibrations.
However i f smaller displacements are excited the interferom etric technique
(described in Section 3.5) may be used to detect the vibrations in the
XZ plane. Thus the detection technique may be chosen depending on the
type and effic iency of excitation . Secondly, fo r reasons described in
Section 2 .6 .2 , the structure may exh ib it a high Q, in our case a
maximum of 7000 in vacuum.
The operation of the device as an acceleration sensor is as follows.
When the device is subject to an acceleration in the Z direction the
force on the in ertia l mass causes a bending of the supports. This
bending causes a tensile stress to be applied to the resonator.
- 6 -
For a beam the resonant frequency varies with the applied stress and
the two coupled beams of the DETF w ill be A ffected in a s im ilar manner.
The change in frequency is thus a measure of the devices acceleration
in the Z d irection . The dimensions and cross-section of the DETF tines
are shown in Figure 2 .2 . The S ilicon contains only background doping
but the ends of the beams have several piezoresistors fabricated in them.
2 .2 .3 Geometry?Accelerometer Batch 1
The main change in th is device is that the DETF had a s lig h tly d iffe re n t
geometry and the device is s lig h tly smaller overa ll. Fig. 2.3 shows
a plan diagram of the accelerometer. I t can be seen that th is DETF
consists of two tuning forks joined tin e to tine but with the stems
removed making the ultimate structure closer to two coupled beams.
The nominal thickness of the tines is 25pm although the poor processing
of batch 1 is expected to introduce considerable variations. The
cross-section is not rectangular, although the exact section is unknown
and may vary between devices. In addition to these problems some
devices were supplied with a covering layer of S i^N 4 and observation
of th is layer under a microscope showed i t to be ragged and uneven and
to vary between devices.
2 .2 .4 Geometry?Pressure Transducer
Figure 2.4 shows the structure of the pressure transducer. The device
resonator consists of a pair of th in plates which are e la s tic a lly
coupled at the centre. Each plate is attached by two vee shaped ribs
to a vertica l p i l la r e ither side of the plates. These p illa rs are
integral with a thin diaphragm which serves to separate the resonator
from the applied pressure and to iso late the reference vacuum around
the resonator.
When a d iffe re n tia l pressure exists across the diaphragm i t d istorts
and stresses the ribs which support the plates and this modifies th e ir
frequency of resonance.
- 7 -
The thickness of both the resonators plates and the diaphragm is 8pm.
Both faces of the wafer were Boron doped during fabrication and so
both the resonator and the diaphragm are Boron doped.
2.3 Vibrational modes of the accelerometer (both batches)
2.3 .1 Introduction
A vibrational mode of a resonator is defined by the frequency of resonance
and the displacement pattern a t resonance. Each mode has its own
frequency and displacement pattern . For the accelerometer and indeed
fo r most Silicon resonator sensors, the modes may be divided into
two categories. These are, those modes associated with the resonances
of the stress sensitive element (in our case the DETF) and those modes
associated with the whole device (in our case the in e rtia l mass, the
two supporting beams and the surrounding fram e). The modes of the
whole device may or may not be affected by the method of mounting
the whole device and the resonances of the mount. I f the frequency
of resonance of the DETF coincides with any resonances in its surroundings
then energy w ill be lost from the resonator resulting in a drop in
vibrational amplitude and qu ality fa c to r. The coupling w ill also
s h if t the resonant frequency from its uncoupled value. I t is therefore
of importance to know not only the modes of the DETF but also those
of the surrounding structure. A dditionally an accelerometer would
id e a lly have a f l a t response to acceleration as a function of frequency.
One would therefore wish fo r no whole structure or DETF resonances
w ithin the frequency range of the accelerations to be measured.
In addition to th is the s h ift of resonant frequency with temperature
and with the measurand may be related to the mode of the stress sensitive
element. The resonator Q w ill also be a function of the mode since
the shape indicates the coupling of energy from a particu lar mode
to its surroundings.
F in a lly the optimum positions for the excitation and detection of
the vibrations of a resonator w ill be determined by its mode shape
- 8 -

since, fo r example, a detection technique may require maximum stress.
A modes shape and frequency are thus of great importance as a determinant
of the operation of a resonator sensor. This section therefore gives
experimental results fo r the whole structure and DETF modes fo r both
batches of the accelerometer. The importance of each mode of resonance
is considered as a possible sensing mode. F irs tly however the theory
of coupled resonators is presented which gives a q u a lita tiv e description
of the modes of a DETF.
Analysis of the DETF
Figure 2.5 shows a model of the two DETF shapes used fo r the accelerometers.
Thus the DETF may be modelled as two beams with an e la s tic coupling
region represented by the spring of stiffness <. k w ill be d iffe re n t
fo r flexural vibrations in the Z direction (hereafter called out of
plane) compared with flexura l vibrations in the Y d irection (hereafter
called in plane), k w ill also be d iffe re n t fo r each of the two DETF
shapes. <
For two e la s tic a lly coupled beams the d iffe re n tia l equations are:
( 2 . 1)
Eld^Wz + p+ pd2w2 <(w2 - vi1) ( 2 . 2 )
where
_pE is Youngs modulus for the beams (Nm )
I = area moment of in e rtia depending on the plane of v ibration (m^) -3o is density (kg m )
w = displacement of the beam (m)
x = distance along length of the beam (m)
1,2 subscripts represent beams 1 and 2

With appropriate k these equations apply fo r e ither of the DETF with
vibration in e ith er plane. As has been shown (7) th is provides two
related series of resonant frequencies. These are given by:
f = C2. (El )* (2 .3 )n - H (— )
2 tt ( p L q)
fo r the modes in when the beams are vibrating in phase
and
f = C2 (El ) * + '(2 .0 * (2 .4 )" - ! ( — ) (“ )
2 tt ( p L 1* ) ( p)
fo r the modes in which the beams are in antiphase. The valuesof the C are determined by the end conditions of the beam and arengiven by:
End Condition ^3 S
Hinged Hinged 3.14 6.28 9.42 nir (n > 1)Fixed Fixed 4.73 7.85 10.99 (4n + 1 )^ 2 (n>3)
Hinged Fixed 3.92 7.06 10.21 (4n + (n>3)
In an experimental s ituation the end conditions may not be completely
fixed or completely hinged and therefore would produce frequencies
somewhere between those predicted by these boundary conditions.
I f , as may be the case fo r the batch 1 accelerometer samples, I is
d iffe ren t for each beam then i t may be shown that I in equation 2.3
and 2.4 is given by /T jT , where 1 refers to one beam and the other,
The value of the area moment of in e rtia I depends both on the plane
of vibration and the cross sectional shape. Reference 8 gives the
value of I for a number of d iffe re n t cross sections.
- 10 -

2 .3 .3 Analysis of the device resonances
The in e r t ia l mass of the accelerometer is a very thick rectangular
plate of approximately rectangular cross section. Because the in e rt ia l
mass is so thick i t cannot be analysed as a plate without taking
into account the effects of rotary in e rtia and shear deformation.
Rotary in e rtia is the in ertia of the p late as i t flexes and shear
deformation is the deformation due to transverse shearing o f the cross
section under dynamic shear loads. In general these effects w ill tend
to lower the natural frequencies from those given in analytical equations
fo r the resonant frequencies of a plate (8 ) . However these effects
represent corrections of the resonant frequency and therefore should not
a lte r the frequency by orders of magnitude. I t is therefore possible
to obtain a rough estimate of the resonant frequency of the in e rtia l mass from the equation for a p late .
f i j = ^ <2 - 5>2i r a 2 12p O - u 2 >
X-jj 1S determined by the mode of vibrationa is the plate side (m)h is the plate thickness (m)
u is Poisson's ra tio
This equation assumes that the in e rtia l mass vibrates independently
of the supports and surrounding structure. This is not true but the
equation should s t i l l give an estimate of the order of magnitude of the fundamental resonant frequency of the in e r t ia l mass alone.
An estimate of the resonant frequencies of the supports may be obtained
by observing that they are beams of which the end conditions may be
somewhere between fixed and free . Thus th e ir resonant frequencies may
be obtained from equation 2.3.
- 11 -
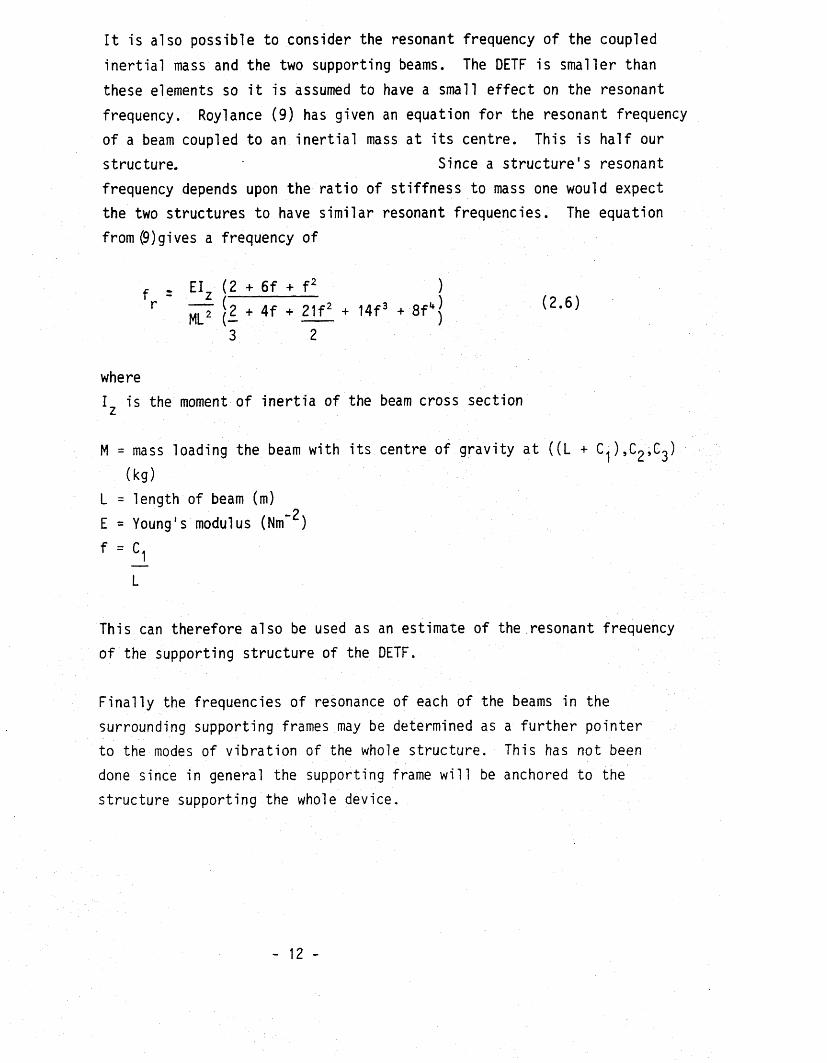
I t is also possible to consider the resonant frequency of the coupled
in e rtia l mass and the two supporting beams. The DETF is smaller than
these elements so i t is assumed to have a small e ffec t on the resonant
frequency. Roylance (9) has given an equation for the resonant frequency
of a beam coupled to an in e r t ia l mass at its centre. This is h a lf our
structure. Since a structure 's resonant
frequency depends upon the ra tio of stiffness to mass one would expect
the two structures to have sim ilar resonant frequencies. The equation
from(9)gives a frequency of
f - EIZ (2 + 6 f + f 2 )
r ML* (- + 4f + llll + 14f3 + Sf1*) (2.6)3 2
whereI is the moment of in e rtia of the beam cross section
M = mass loading the beam with its centre of gravity a t ( ( L +
(kg)L = length of beam (m)
-2E = Young's modulus (Nm )
L
This can therefore also be used as an estimate of the resonant frequency
of the supporting structure of the DETF.
F in a lly the frequencies of resonance of each of the beams in the
surrounding supporting frames may be determined as a fu rth er pointer
to the modes of v ibration of the whole structure. This has not been
done since in general the supporting frame w ill be anchored to the
structure supporting the whole device.
- 12 -
2 .3 .4 DETF Experimental modes of v ibration - Batch 2
The modes of v ibration of 3 samples from batch 2 were studied in deta il
as a function of frequency in the range 1Hz to 1MHz. A ll three samples
showed sim ilar spectra so the results presented here are fo r only
one sample, S17B, but they are indicative of the behaviour o f a ll the devices in batch 2. F irs t ly the frequencies and shapes of vibration
of the DETF are presented fo r both in plane and out of plane vibrations.The shapes agree with those predicted by the analysis of section 2 .3 .2
but the frequencies are d i f f ic u lt to predict because of uncertainty
of the DETF end conditions and the coupling constant between the m o d e s . Each
mode is then considered as a possible stress sensor. F in a lly some
spectra showing the modes of vibration of the whole structure and
th e ir effects are presented.
Figure 2.6 shows the modes of vibration of the DETF and th e ir frequencies
obtained using both the optical detection techniques described la te r
(in terferom etric and non in terferom etric) by scanning the fib res across
the surface and edges of the DETF and measuring the amplitude and
phase of vibration a t each point. The resonances were excited using
a thickness mode p iezoelectric transducer launching acoustic
waves into the accelerometer. This method of excitation tends to
excite a ll vibrational modes of a device rather than ju s t a few as
occurs with other excitation techniques (e .g . e le c tro s ta tic ).
A c lass ifica tio n of each mode is now given. F irs tly predominantly
out of plane vibrations are described as beam lik e and predominantly
in plane vibrations as tuning fork lik e . Next the vibrations are
c lass ified according to whether the beams are vibrating in phase or
180° out of phase. F ina lly the modes are c lass ified according to
the number of zeros they contain i .e . the fundamental contains only
two zeros (one at each end), the f i r s t overtone contains 3 zeros, and the th ird overtone contains 5 zeros, and so on. This c la s s ific a tio n
gives a unique t i t l e fo r each mode and follows from the analysis of coupled beams given in section 2 .3 .2 .
- 13 -
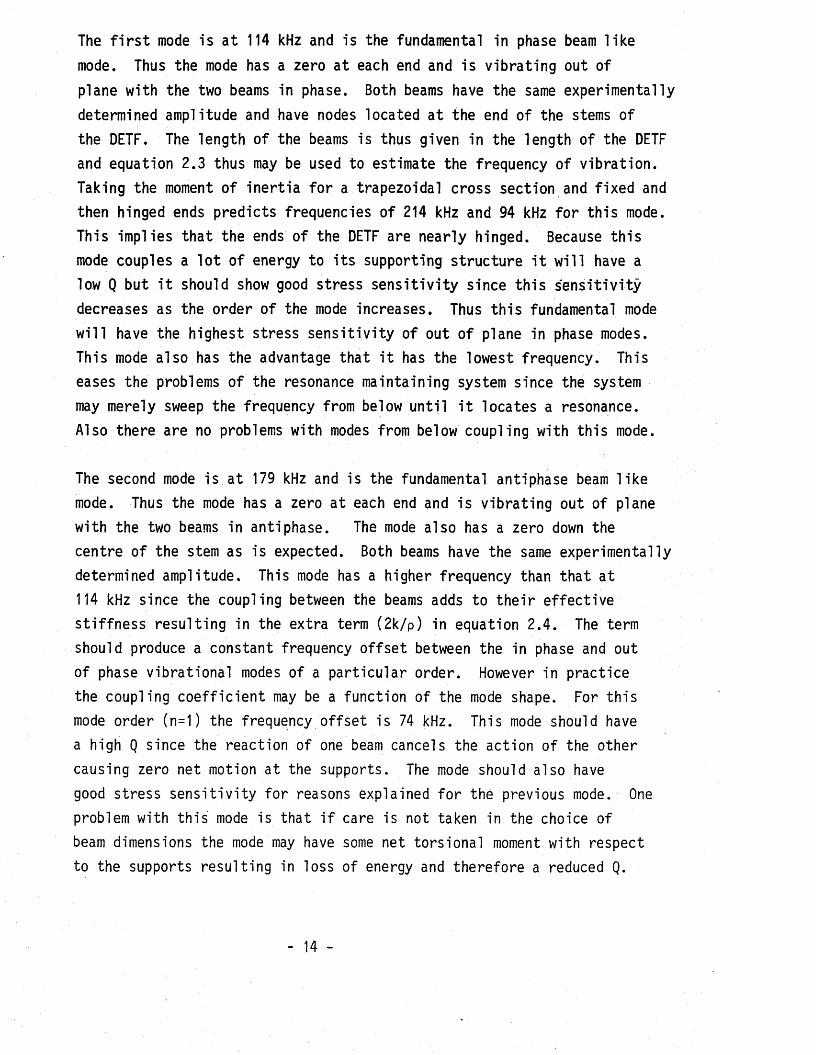
The f i r s t mode is a t 114 kHz and is the fundamental in phase beam lik e
mode. Thus the mode has a zero at each end and is v ibrating out of
plane with the two beams in phase. Both beams have the same experimentally
determined amplitude and have nodes located a t the end of the stems of
the DETF. The length of the beams is thus given in the length of the DETF
and equation 2.3 thus may be used to estimate the frequency of v ibration .
Taking the moment of in e rtia fo r a trapezoidal cross section and fixed and
then hinged ends predicts frequencies of 214 kHz and 94 kHz fo r th is mode. This implies that the ends of the DETF are nearly hinged. Because th is
mode couples a lo t of energy to its supporting structure i t w ill have a
low Q but i t should show good stress s e n s itiv ity since th is sen s itiv ity
decreases as the order of the mode increases. Thus th is fundamental mode
w ill have the highest stress s e n s itiv ity of out of plane in phase modes. This mode also has the advantage that i t has the lowest frequency. This
eases the problems of the resonance maintaining system since the system
may merely sweep the frequency from below u n til i t locates a resonance.
Also there are no problems with modes from below coupling with th is mode.
The second mode is a t 179 kHz and is the fundamental antiphase beam lik e
mode. Thus the mode has a zero at each end and is v ibrating out of plane
with the two beams in antiphase. The mode also has a zero down the
centre of the stem as is expected. Both beams have the same experimentally
determined amplitude. This mode has a higher frequency than that a t 114 kHz since the coupling between the beams adds to th e ir e ffec tive
stiffness resulting in the extra term (2k/p) in equation 2 .4 . The term
should produce a constant frequency o ffset between the in phase and out
of phase vibrational modes of a particu lar order. However in practice
the coupling co e ffic ien t may be a function of the mode shape. For th is
mode order (n=1) the frequency o ffset is 74 kHz. This mode should have
a high Q since the reaction of one beam cancels the action of the other
causing zero net motion at the supports. The mode should also have
good stress s e n s itiv ity fo r reasons explained fo r the previous mode. One
problem with th is mode is that i f care is not taken in the choice of beam dimensions the mode may have some net torsional moment with respect to the supports resulting in loss of energy and therefore a reduced Q.
- 14 -
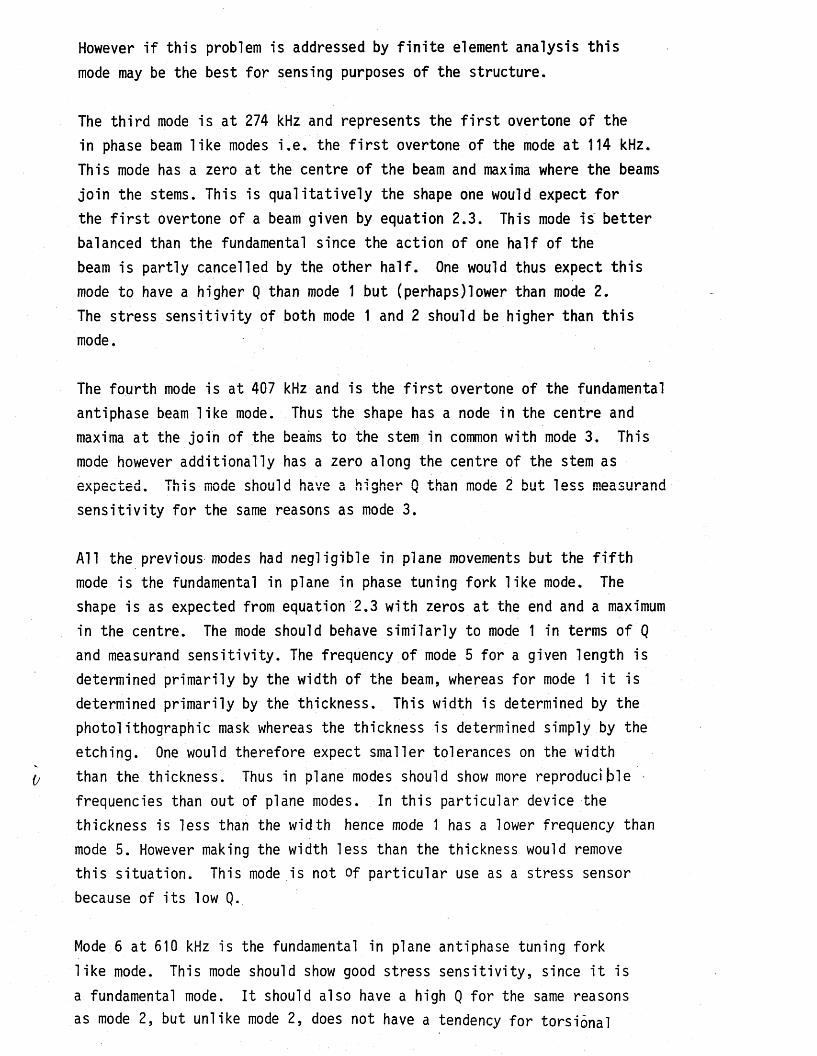
However i f th is problem is addressed by f in i te element analysis th is
mode may be the best fo r sensing purposes of the structure.
The th ird mode is a t 274 kHz and represents the f i r s t overtone of the
in phase beam lik e modes i . e . the f i r s t overtone of the mode a t 114 kHz.
This mode has a zero at the centre of the beam and maxima where the beams
jo in the stems. This is q u a lita tiv e ly the shape one would expect fo r
the f i r s t overtone of a beam given by equation 2 .3 . This mode is b e tte r
balanced than the fundamental since the action of one h a lf of the
beam is partly cancelled by the other h a lf. One would thus expect th is
mode to have a higher Q than mode 1 but (perhaps)lower than mode 2.The stress s en s itiv ity of both mode 1 and 2 should be higher than th is
mode.
The fourth mode is at 407 kHz and is the f i r s t overtone of the fundamental
antiphase beam lik e mode. Thus the shape has a node in the centre and
maxima at the jo in of the beams to the stem in common with mode 3. This
mode however additionally has a zero along the centre of the stem as
expected. This mode should have a higher Q than mode 2 but less measurand
s e n s itiv ity fo r the same reasons as mode 3.
A ll the previous modes had neglig ib le in plane movements but the f i f t h
mode is the fundamental in plane in phase tuning fork lik e mode. The
shape is as expected from equation 2.3 with zeros at the end and a maximum
in the centre. The mode should behave s im ila rly to mode 1 in terms of Q
and measurand s e n s itiv ity . The frequency of mode 5 for a given length is
determined prim arily by the width of the beam, whereas fo r mode 1 i t is
determined prim arily by the thickness. This width is determined by the
photolithographic mask whereas the thickness is determined simply by the
etching. One would therefore expect smaller tolerances on the width
than the thickness. Thus in plane modes should show more reproducible
frequencies than out of plane modes. In th is particu lar device the
thickness is less than the width hence mode 1 has a lower frequency than
mode 5. However making the width less than the thickness would remove
th is s ituation . This mode is not of particu lar use as a stress sensor
because of its low Q.
Mode 6 a t 610 kHz is the fundamental in plane antiphase tuning fork
l ik e mode. This mode should show good stress s e n s itiv ity , since i t is
a fundamental mode. I t should also have a high Q for the same reasons
as mode 2 , but unlike mode 2 , does not have a tendency fo r torsional
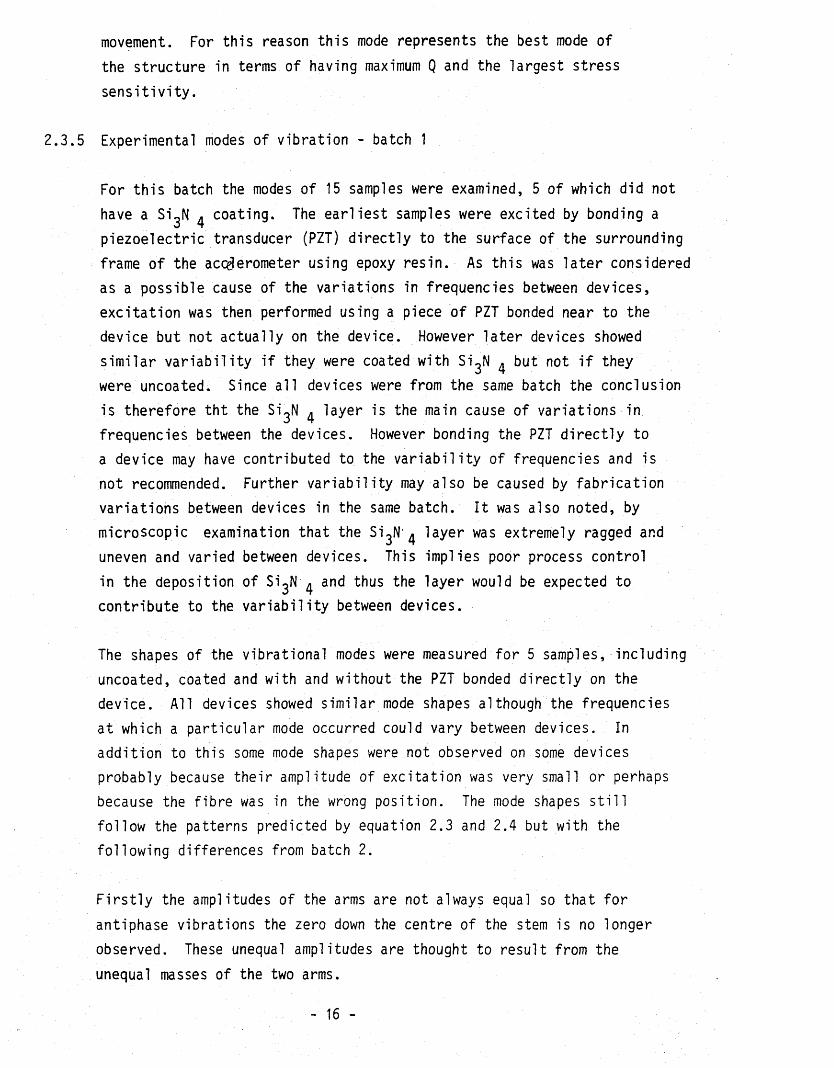
movement. For th is reason th is mode represents the best mode of
the structure in terms of having maximum Q and the largest stress
s e n s itiv ity .
2 .3 .5 Experimental modes of vibration - batch 1
For th is batch the modes of 15 samples were examined, 5 of which did not
have a SigN coating. The e a rlie s t samples were excited by bonding a
piezoelectric transducer (PZT) d irec tly to the surface of the surrounding
frame of the accelerometer using epoxy resin. As this was la te r considered
as a possible cause of the variations in frequencies between devices,
excita tion was then performed using a piece of PZT bonded near to the
device but not actually on the device. However la te r devices showed
sim ilar v a r ia b ility i f they were coated with SigN but not i f they
were uncoated. Since a ll devices were from the same batch the conclusion
is therefore th t the SigN layer is the main cause of variations in
frequencies between the devices. However bonding the PZT d ire c tly to
a device may have contributed to the v a r ia b ility of frequencies and is
not recommended. Further v a r ia b ility may also be caused by fabrication
variations between devices in the same batch. I t was also noted, by
microscopic examination that the S i3N layer was extremely ragged and
uneven and varied between devices. This implies poor process control
in the deposition of SigN and thus the layer would be expected to
contribute to the v a r ia b ility between devices.
The shapes of the vibrational modes were measured fo r 5 samples, including
uncoated, coated and with and without the PZT bonded d ire c tly on the
device. All devices showed sim ilar mode shapes although the frequencies
a t which a particu lar mode occurred could vary between devices. In
addition to this some mode shapes were not observed on some devices
probably because th e ir amplitude of excitation was very small or perhaps
because the fib re was in the wrong position. The mode shapes s t i l l
fo llow the patterns predicted by equation 2.3 and 2.4 but with the
following differences from batch 2 .
F irs t ly the amplitudes of the arms are not always equal so that fo r
antiphase vibrations the zero down the centre of the stem is no longer
observed. These unequal amplitudes are thought to result from the
unequal masses of the two arms.
- 16 -
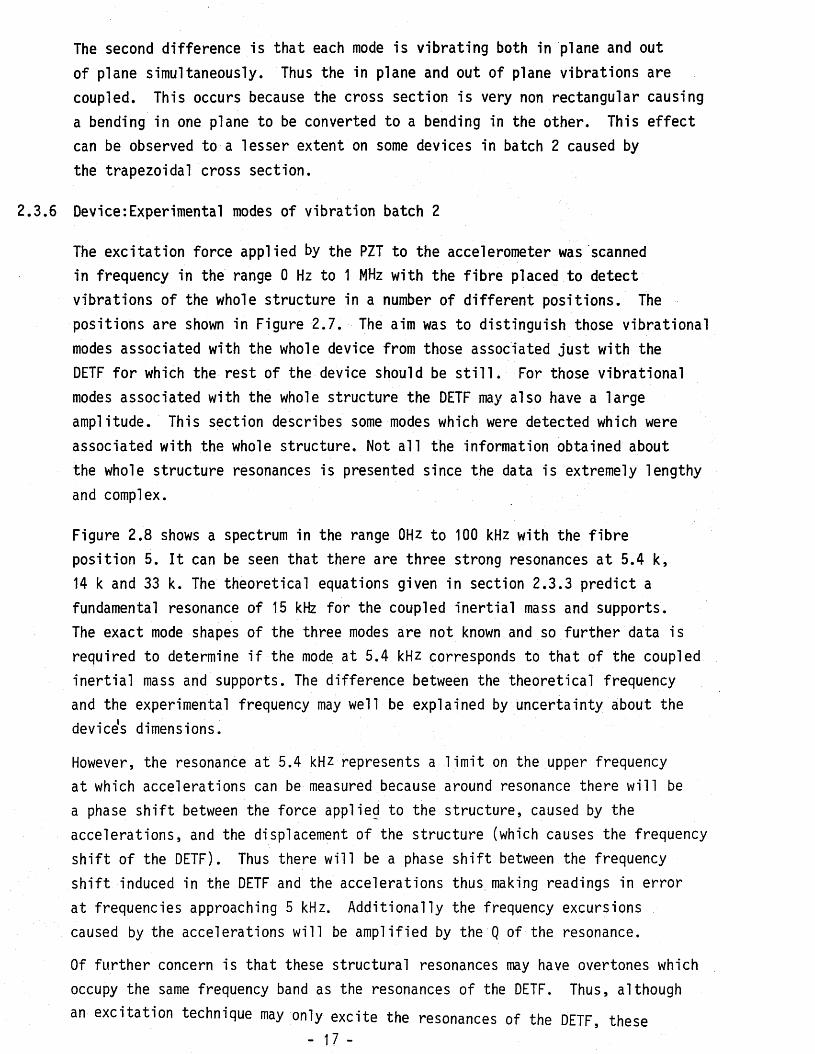
The second difference is that each mode is v ibrating both in plane and out
of plane simultaneously. Thus the in plane and out of plane vibrations are
coupled. This occurs because the cross section is very non rectangular causing
a bending in one plane to be converted to a bending in the other. This e ffe c t
can be observed to a lesser extent on some devices in batch 2 caused by
the trapezoidal cross section.
2 .3 .6 Device:Experimental modes of vibration batch 2
The excitation force applied by the PZT to the accelerometer was scanned
in frequency in the range 0 Hz to 1 MHz with the fib re placed to detect vibrations of the whole structure in a number of d iffe re n t positions. The
positions are shown in Figure 2 .7 . The aim was to distinguish those vibrational
modes associated with the whole device from those associated ju s t with the
DETF fo r which the rest of the device should be s t i l l . For those v ibrational modes associated with the whole structure the DETF may also have a large
amplitude. This section describes some modes which were detected which were
associated with the whole structure. Not a ll the information obtained about the whole structure resonances is presented since the data is extremely lengthy
and complex.
Figure 2.8 shows a spectrum in the range 0Hz to 100 kHz with the fib re
position 5. I t can be seen that there are three strong resonances a t 5.4 k,14 k and 33 k. The theoretical equations given in section 2 .3 .3 predict a
fundamental resonance of 15 kHz fo r the coupled in e rtia l mass and supports.
The exact mode shapes of the three modes are not known and so fu rther data is
required to determine i f the mode at 5.4 kHz corresponds to that of the coupled
in e rtia l mass and supports. The difference between the theoretical frequency
and the experimental frequency may well be explained by uncertainty about the
devices dimensions.
However, the resonance at 5.4 kHz represents a lim it on the upper frequency
at which accelerations can be measured because around resonance there w ill be
a phase s h ift between the force applied to the structure, caused by the
accelerations, and the displacement of the structure (which causes the frequency
s h ift of the DETF). Thus there w ill be a phase s h ift between the frequency
s h ift induced in the DETF and the accelerations thus making readings in error
at frequencies approaching 5 kHz. A dditionally the frequency excursions
caused by the accelerations w ill be amplified by the Q of the resonance.
Of fu rther concern is that these structural resonances may have overtones which
occupy the same frequency band as the resonances of the DETF. Thus, although
an excitation technique may only excite the resonances of the DETF, these- 17 -

resonances may cuupie n u n all uvci w iic UI one UICI n a i ma00/
support resonances causing a decrease in the Q of the DETF.This sort of e ffe c t may be occurring in Fig. 2.9 in the range 500
kH.z to 600 kHz. Throughout the range the mode shape on the DETF remains
the same. A lte rn ative ly the mode of the DETF may be coupling with
resonances of the paddle alone or the supports alone which are inth is frequency range according to the equations given in section 2 .3 .3 .
2 .3 .7 Conclusions
Two modes of the DETF have been id en tifie d as the best fo r sensing
purposes. These modes are the fundamental antiphase beam lik e mode
and the fundamental antiphase tuning fork lik e mode. These modes
promise high Qs and the highest measurand s e n s itiv it ie s . The fundamental
antiphase beam lik e mode has the possible problem of a torsional component
to its motion. F in ite element analysis may minimise th is torsional component and may be used to optimise the geometry fo r maximum Q by
minimising its coupling with the surrounding structure.
Several possible modes of the whole structure have been pointed out.
The modes of the whole structure must be determined experimentally
and th e o re tic a lly , probably by once again using f in ite element analysis.
The simplest method of avoiding coupling of the desired DETF mode
with the whole structure is to arrange fo r the whole structure modes
to occupy a frequency band above that of the desired mode.
2.4 Vibrational Modes of the Pressure Transducer
2.4.1 Introduction
The vibrational modes of the resonant stress sensitive element of
the pressure transducer were o rig in a lly measured by Andres (10 ).However they are included here since they are relevant to both the
temperature dependence of the resonant frequency and the optical powering of the pressure transducer which are described in la te r sections
of th is thesis. The author has confirmed these mode shapes and
frequencies (to within ± 2/3 kHz) fo r a d iffe ren t sample and alsoo
fo r a sample which was coated in a 600 A layer of Chromium.
- 18 -
2 .4 .2 Experimental modes of the pressure transducer's resonator
Figures 2.10 and 2.11 are diagrams of the flexura l modes of the
resonator. The modes have been designated Mnm where the subscriptn indicates the number of nodes across the width o f the resonator
and m the number of nodes along the length of the resonator. I t
can be seen that two series of modes Mn„ and M< have been detectedum imin the frequency range 0Hz to 1MHz. The shapes of the f i r s t three
modes Mgm shown in Figure 2.10 require some explanation. At an applied
pressure of 1 atmosphere the Mqq mode is a t 128 kHz. As the d iffe re n tia l
pressure, applied to the diaphragm is decreased down to zero, thenthe shape of v ibration o f th is mode evolves and eventually two nodal
axes appear a t the ends of the plates moving slowing inwards to th e ir
fin a l position. The fin a l shape at P = 0 and 97 kHz is shown in Figure*
2.10, and referred to as Mg . The modes Mg and Mq2 also shown in
Figure 2.10 cross one another a t low pressure, and th e ir shapes can
hardly be distinguished a t P = 0. Their shapes and frequencies are
therefore given a t P = 1 atm. A ll the other modes which are shown
in Figure 2.11 are taken a t P = 0.
I t should be noted th a t these shapes were obtained by positioning
the optical spot a t a p articu la r point and then, a t each position,
s lig h tly tuning the frequency of excitation to obtain maximum amplitude
of vibration . I f the frequency was tuned to a maximum amplitude of vibration at the end of one p la te , and then the optical spot was
translated to the same place on the other p late , i t was found that th is plate was vibrating with a s ig n ifican tly smaller amplitude.Tuning the frequency s lig h tly produced the same amplitude as the f i r s t
p late . Thus the two plates have s lig h tly d iffe re n t resonant frequencies. The reason fo r th is is thought to be caused by s lig h t differences
in the dimensions of the two plates. I f the coupling between the
two plates was strong, the whole structure would vibrate as one resonator,
however the coupling is weak, being only the thin s trip jo in ing the
two plates, so the two plates vibrate almost independently. At a
p articu lar resonant frequency of one p late , the e ffec t of the small
vibrations of the other plate may tend to cancel out some coupling
of energy to the supports. However i t is thought that a single p late
may show comparable Qs to th is structure.
- 19 -
2.5 Non linear and hysteretic vibrations
2.5.1 Introduction
Theoretical treatments of non lin e a r vibrations in mechanical systems
are well documented (11 ). These treatments generally assume a non
lin ea r restoring force fo r the resonator and show how th is leads to
a frequency of resonance which is dependent on the amplitude of v ib ra tion .
A b r ie f ou tline of the theory is given in the next section. However
there are no examples of this non lin e a r behaviour reported re fer ing
to S ilicon resonator sensors. This section reports on the large
non lin ea r behaviour of the DETF of the accelerometer in batch 1.
Non lin e a r ity is also shown to be present in the accelerometer of
batch 2 , a lb e it to a smaller degree.
This non lin e a r ity which results in a frequency dependence on amplitude
is undesirable fo r a resonator sensor since an amplitude change is
rendered indistinguishable from a measurand change. I t is therefore
desirable to quantify the non lin e a r ity and operate the resonator
a t an amplitude which is fixed to within lim its which cause negligible
resonant frequency variations when compared with those caused by the
smallest measurand change that one wishes to detect. This section
gives a method to quantify the non lin e a r ity fo r a particu lar
mode of resonance.
2 .5 .2 Theory of non lin ear vibrations
In general, i f operated at a large enough amplitude of vibration,
a ll resonators w ill exhibit a non lin ear restoring force which w ill
resu lt in a dependence of the frequency of resonance on amplitude
of v ibration . However in use a resonator w ill usually be operated
within its linear region. For example a pendulum has a constant enough
period of vibration to be the basis fo r a clock but its restoring
force depends upon the sine of its angle of deviation from the vertica l
rather than being d irec tly proportional to the angle. I t thus has
a restoring force which is s lig h tly less than lin ear and is referred
to as a soft non lin e a r ity . An example of a hard non lin e a rity is
a stretched spring of which the tension increases with the amplitude
of v ibra tion . I t is important to rea lise that these examples assume
nothing about the material of the resonator and that the restoring force is merely a property of the geometry of the resonator.
- 20 -
As an aside i t is pointed out that a material may have a non lin ear
e la s t ic ity thus producing its own material caused frequency s h ift
with amplitude. This may be a method of compensating fo r the
geometrical non lin e a r ity although such materials are un like ly to beuseful fo r fabricating resonators.
Reference (12) shows that i f a resonators restoring force varies as
F = - uU + f?e3) ( 2 . 8 )
Where p is the s tiffness of the resonator (Nm)
e is the displacement Cm)-2and 3 is the non lin e a r ity constant (m )
Then its resonant frequency varies as
V V ' f ' + f 6eo > (2 .9 )
Where f r is the resonant frequency at amplitude eQ and f Qr is the
resonant frequency a t very small amplitude.
Thus the resonant frequency w ill have a quadratic dependence on the
amplitude of v ib ration . Whether the frequency decreases or increases
with amplitude w ill depend on the sign of 8 which w ill depend on the
p articu lar geometry of the resonator, a positive 8 is called a hard
non lin e a r ity and a negative 6 is a soft non lin e a r ity .
In general a single resonance of a mechanical structure can be defined
by the equation
20 = °P
I~ [ ' r ] 2 ( 2 . 10)
h
Where is the peak value of eQ which occurs at the resonant
frequency f and h is the damping co effic ien t of the resonance.
Equation 2.9 describes the Lorentzian form of a resonance curve and
- 21 -
th is s t i l l applies i f the deviation of the resonator from lin e a r ity
is small. The non lin e a r ity then manifests i t s e l f as a s lig h t bending
of the top of the resonance curve towards higher or lower frequencies
depending on the sign of $.
I f the non lin e a r ity is large and the frequency of resonance sh ifts
by more than h a lf the bandwidth of the resonance then the resonance
curve develops step discontinuities and hysteresis. Hysteresis is
in the form that the position of the step d iscontinu ities and thus the
shape of the resonance curve depends upon whether the frequency is
being increased or decreased. The form of th is hysteresis is described
in more de ta il in the next section. The minimum of the peak amplitude
required to develop hysteresis is given by
e* v 8h . ... ( 2 . 1 1 )
3 f or |s|
Thus knowing both h (= 2Q/f^)and 3 allows the maximum amplitude of
vibration to be set fo r a resonator.
Accelerometer batch 1, experimental non lin ear vibrations
All the modes of vibration observed fo r this device exhibited a resonant frequency variation with amplitude but i t was not possible to develop
hysteresis in a l l modes. This was a consequence of the effic iency of PZT excitation which lim ited amplitudes of vibrations to a few microns
at best.
All the modes exhibited a soft non lin e a r ity and those with a larger
amplitude of in plane vibrations showed a stronger non lin e a r ity .The physical basis for this soft non lin e a r ity is d i f f ic u lt to find
for th is structure. For a beam one would expect a hard non lin e a r ity
since, i f the ends of the beams are fixed , then the beam's tensionincreases with the square of the amplitude and the restoring force with
the cube. By analogy with a pendulum, a possible source of a soft non
lin e a r ity is the change in the angle, in the case of the pendulum,
between the string and the vertical leading to a restoring force which
varies as Tsinez Te-Te3 For the DETF i f the vibration is such to cause~3~
a large change in angle at the DETF stub th is may produce a soft non l in e a r ity in a sim ilar way.
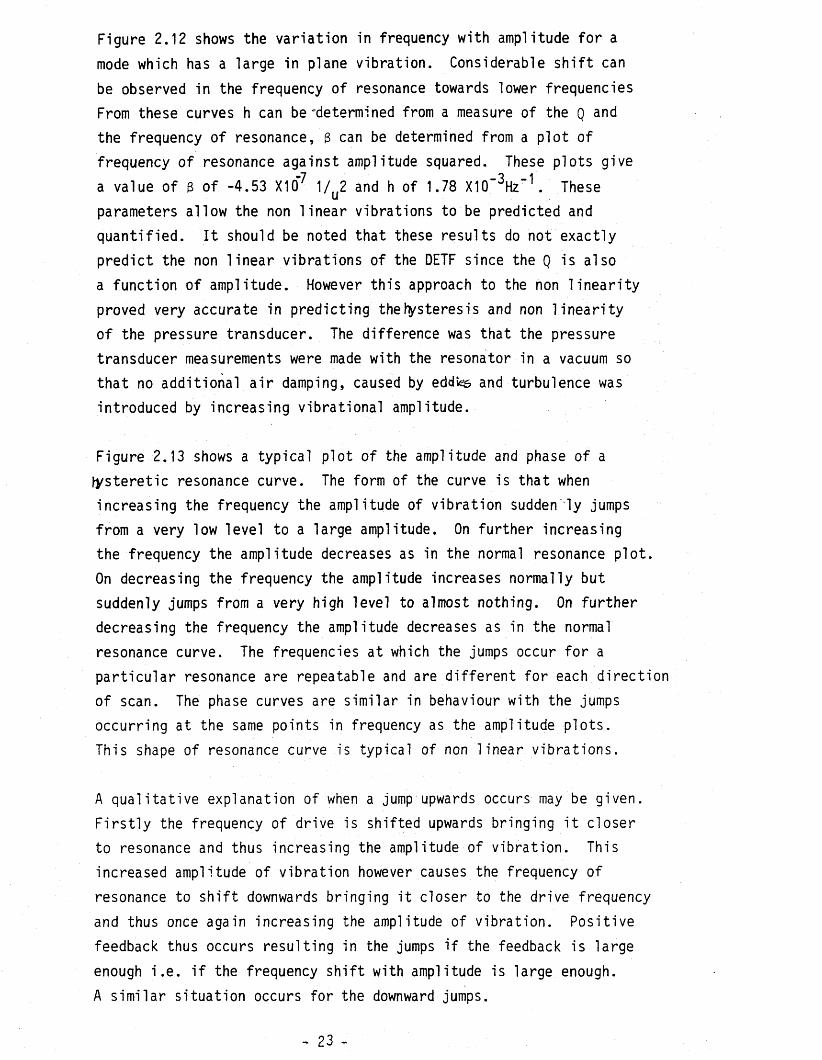
Figure 2.12 shows the variation in frequency with amplitude fo r a
mode which has a large in plane vibration. Considerable s h ift can
be observed in the frequency of resonance towards lower frequencies
From these curves h can be -determined from a measure of the Q and
the frequency of resonance, 3 can be determined from a p lot of
frequency of resonance against amplitude squared. These plots give
a value of 3 of -4 .53 X10 1 /2 and h of 1.78 X10"^Hz~^. These
parameters allow the non lin ea r vibrations to be predicted and
quan tified . I t should be noted that these results do not exactly
predict the non 1 inear vibrations of the DETF since the Q is also
a function of amplitude. However this approach to the non lin e a r ity
proved very accurate in predicting the hysteresis and non lin e a r ity
of the pressure transducer. The difference was that the pressure
transducer measurements were made with the resonator in a vacuum so
that no additional a ir damping, caused by eddfes and turbulence was
introduced by increasing vibrational amplitude.
Figure 2.13 shows a typical plot of the amplitude and phase of a
tysteretic resonance curve. The form of the curve is that when
increasing the frequency the amplitude of vibration sudden ly jumps
from a very low level to a large amplitude. On further increasing
the frequency the amplitude decreases as in the normal resonance p lo t.
On decreasing the frequency the amplitude increases normally but
suddenly jumps from a very high level to almost nothing. On fu rther
decreasing the frequency the amplitude decreases as in the normal
resonance curve. The frequencies at which the jumps occur fo r a
p artic u la r resonance are repeatable and are d iffe re n t fo r each d irection
of scan. The phase curves are sim ilar in behaviour with the jumps
occurring at the same points in frequency as the amplitude p lo ts .
This shape of resonance curve is typical of non 1 inear v ib ra tion s .
A q u a lita tive explanation of when a jump upwards occurs may be given.
F irs t ly the frequency of drive is shifted upwards bringing i t closer
to resonance and thus increasing the amplitude of vibration . This
increased amplitude of vibration however causes the frequency of
resonance to s h ift downwards bringing i t closer to the drive frequency
and thus once again increasing the amplitude of vibration . Positive
feedback thus occurs resulting in the jumps i f the feedback is large
enough i . e . i f the frequency s h ift with amplitude is large enough.
A sim ilar situation occurs for the downward jumps.
- 23 -
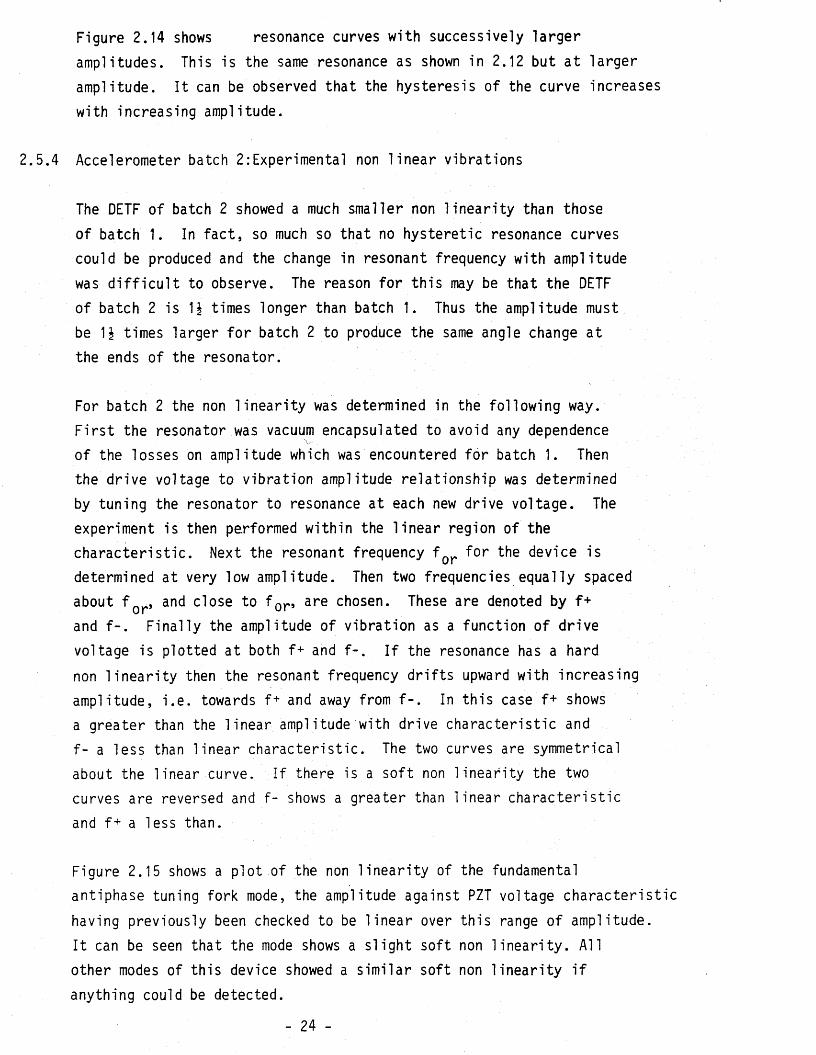
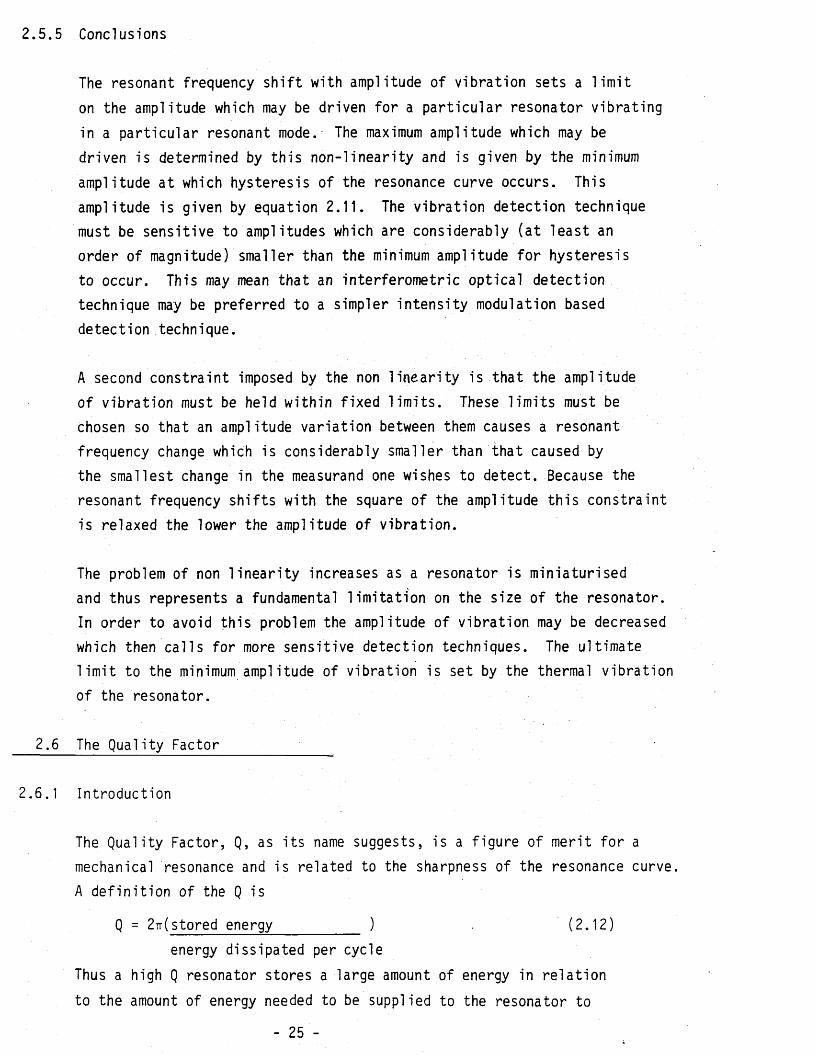
Figure 2.14 shows resonance curves with successively la rger
amplitudes. This is the same resonance as shown in 2.12 but a t larger
amplitude. I t can be observed that the hysteresis of the curve increases
with increasing amplitude.
2 .5 .4 Accelerometer batch 2 :Experimental non lin e a r vibrations
The DETF of batch 2 showed a much smaller non lin e a r ity than those
of batch 1. In fa c t, so much so that no hysteretic resonance curves
could be produced and the change in resonant frequency with amplitude
was d i f f ic u l t to observe. The reason fo r th is may be that the DETF
of batch 2 is U times longer than batch 1. Thus the amplitude must be \ \ times larger fo r batch 2 to produce the same angle change at
the ends of the resonator.
For batch 2 the non lin e a r ity was determined in the following way.
F irs t the resonator was vacuum encapsulated to avoid any dependenceV'
of the losses on amplitude which was encountered fo r batch 1. Then
the drive voltage to vibration amplitude relationship was determined
by tuning the resonator to resonance at each new drive voltage. The
experiment is then performed within the lin ea r region of the
ch arac te ris tic . Next the resonant frequency f Qr fo r the device is
determined at very low amplitude. Then two frequencies equally spaced
about f Qr, and close to f or, are chosen. These are denoted by f+
and f - . F inally the amplitude of vibration as a function of drive
voltage is plotted at both f+ and f - . I f the resonance has a hard
non lin e a r ity then the resonant frequency d r ifts upward with increasing
amplitude, i .e . towards f+ and away from f - . In th is case f+ shows
a greater than the 1 inear amplitude with drive characteristic and
f - a less than lin ear characteris tic . The two curves are symmetrical
about the linear curve. I f there is a soft non lin e a rity the two
curves are reversed and f - shows a greater than linear ch aracteris tic
and f + a less than.
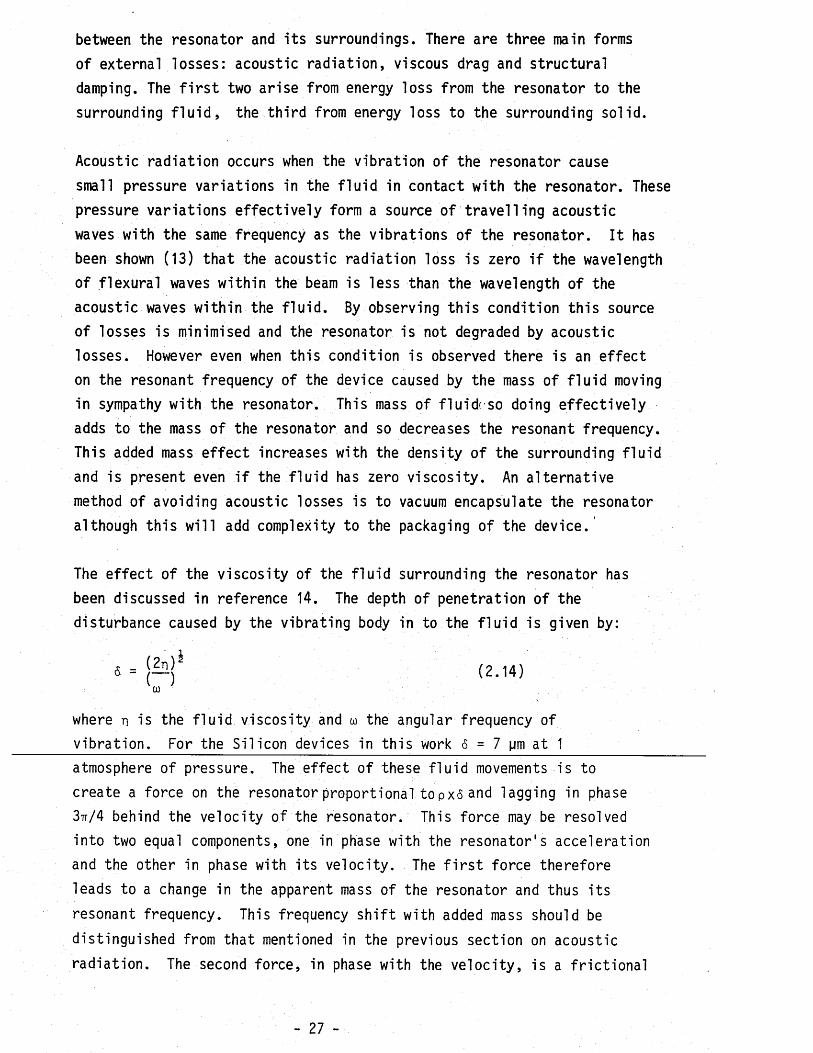
Figure 2.15 shows a plot of the non lin e a r ity of the fundamental
antiphase tuning fork mode, the amplitude against PZT voltage ch arac te ris tic
having previously been checked to be lin ea r over this range of amplitude.
I t can be seen that the mode shows a s lig h t soft non lin e a r ity . A ll
other modes of th is device showed a sim ilar soft non lin e a r ity i f
anything could be detected.
- 24 -
2 .5 .5 Conclusions
The resonant frequency s h ift with amplitude of vibration sets a lim it
on the amplitude which may be driven for a p articu lar resonator vibrating
in a particu lar resonant mode. The maximum amplitude which may be
driven is determined by th is non-linearity and is given by the minimum
amplitude a t which hysteresis of the resonance curve occurs. This
amplitude is given by equation 2.11. The vibration detection technique
must be sensitive to amplitudes which are considerably (a t least an
order of magnitude) smaller than the minimum amplitude fo r hysteresis
to occur. This may mean that an interferom etric optical detection
technique may be preferred to a simpler in ten sity modulation based
detection technique.
A second constraint imposed by the non lin e a r ity is that the amplitude
of vibration must be held within fixed lim its . These lim its must be
chosen so that an amplitude variation between them causes a resonant
frequency change which is considerably smaller than that caused by
the smallest change in the measurand one wishes to detect. Because the
resonant frequency sh ifts with the square of the amplitude th is constraint
is relaxed the lower the amplitude of v ibration .
The problem of non lin e a r ity increases as a resonator is miniaturised
and thus represents a fundamental lim ita tio n on the size of the resonator.
In order to avoid this problem the amplitude of vibration may be decreased
which then calls for more sensitive detection techniques. The ultim ate
l im it to the minimum amplitude of vibration is set by the thermal vibration
of the resonator.
2.6 The Quality Factor
2.6.1 Introduction
The Quality Factor, Q, as its name suggests, is a figure of merit fo r a
mechanical resonance and is related to the sharpness of the resonance curve.
A d e fin itio n of the Q is
Q = 2 t t (stored energy___________ ) (2 .12)
energy dissipated per cycle
Thus a high Q resonator stores a large amount of energy in re la tio n
to the amount of energy needed to be supplied to the resonator to
- 25 -

maintain the vibrations at constant amplitude. Thus fo r Silicon
resonators, which a ll store a s im ilar amount of energy fo r a given
amplitude, the Q is a d irect measure of the power requirement of the
device. Thus high Q resonators are desirable.
The Q may be calculated from
Q = f or (2 .13)
BW
Where-f is the frequency of the resonance and BW is the bandwidth
of the resonance curve and is given by the width of the curve in
frequency at an amplitude of e /^2
where e is the maximum amplitude of the curve, op
Thus, fo r a given frequency, the Q is also a measure of the sharpness
or frequency s e le c tiv ity of the resonance. Thus a higher Q implies a
better defined resonant frequency and thus improves the accuracy, of
the resonant sensor. The greater frequency s e le c tiv ity of a high Q
resonator also implies greater immunity to interference by external
vibrations.
I t is therefore desirable to maximise the Q of the resonator to ensure
a successful sensor. This section deta ils the sources of energy losses
in a mechanical resonator and th e ir significance for Silicon resonator
sensors. Then some experimental results are given for the Q as a
function of the pressure surrounding the resonator. Then the results
of a computer programme to calculate the in trin s ic damping of a
------------S~i~l vccri—res-enrertor arer grveri and compared- w~i~th—the expeirirnefrtd-! resuTts.
2.6 .2 Loss mechanisms in Silicon resonators
For a mechanical resonator the loss mechamisms may conveniently be
divided into two classes: internal and external. Internal are defined
as those losses which are determined prim arily by the material from which
the resonator is made. External losses are determined by the in teraction
- 26 -
between the resonator and its surroundings. There are three main forms
of external losses: acoustic rad iation , viscous drag and structural
damping. The f i r s t two arise from energy loss from the resonator to the
surrounding f lu id , the th ird from energy loss to the surrounding solid.
Acoustic radiation occurs when the vibration of the resonator cause
small pressure variations in the f lu id in contact with the resonator. These
pressure variations e ffec tive ly form a source of tra v e llin g acoustic
waves with the same frequency as the vibrations of the resonator. I t has
been shown (13) that the acoustic radiation loss is zero i f the wavelength
of flexura l waves w ithin the beam is less than the wavelength of the
acoustic waves w ithin the f lu id . By observing th is condition th is source
of losses is minimised and the resonator is not degraded by acoustic
losses. However even when th is condition is observed there is an e ffec t on the resonant frequency of the device caused by the mass of f lu id moving
in sympathy with the resonator. This mass of fluid? so doing e ffe c tiv e ly
adds to the mass of the resonator and so decreases the resonant frequency. This added mass e ffe c t increases with the density of the surrounding f lu id
and is present even i f the f lu id has zero viscosity . An a lte rn ative
method of avoiding acoustic losses is to vacuum encapsulate the resonator although th is w ill add complexity to the packaging of the device.
The e ffec t of the viscosity of the f lu id surrounding the resonator has
been discussed in reference 14. The depth of penetration of the
disturbance caused by the vibrating body in to the f lu id is given by:
S = [— ] (2 .14)0)
where n is the f lu id viscosity and w the angular frequency of vibration . For the Silicon devices in th is work 6 = 7 pm at 1 atmosphere of pressure. The e ffec t of these f lu id movements is to
create a force on the resonator proportional to p x 5 and lagging in phase
3tt/4 behind the velocity of the resonator. This force may be resolved
into two equal components, one in phase with the resonator's acceleration
and the other in phase with its velocity . The f i r s t force therefore
leads to a change in the apparent mass of the resonator and thus its
resonant frequency. This frequency s h ift with added mass should be
distinguished from that mentioned in the previous section on acoustic
rad iation . The second force, in phase with the ve lo c ity , is a fr ic tio n a l
- 27 -
force and thus adds to the losses of the resonator thus decreasing
the Q of the resonator. The resonant frequency of a resonator is known
to be affected to a second order by the losses of a resonator and so
th is force also has an e ffec t on the resonant frequency of the device.
To avoid these problems caused by viscous losses the resonator should
be operated in a vacuum. However fo r a lte rn a tive sensing applications
these effects may be exploited to provide sensors fo r f lu id viscosity
and density. A p a rtic u la rly ingenious form of densimeter avoids the
f i r s t order frequency s h ift caused by viscosity by balancing i t with the
Q s h if t with viscosity by holding the mechanical resonance a t a fixed
phase. For more d e ta ils the reader is referred to reference 15.
From the previous two paragraphs i t can be seen that there are two
approaches to the problems of the interactions of the resonator with
i ts surrounding f lu id . The most obvious is simply to encapsulate the
resonator in a vacuum and this avoids a ll f lu id effects on the resonator's
frequency and losses. I f this is impossible the second approach requires
careful design of the resonator to avoid acoustic loss: and careful
design of the resonator maintaining system to balance the viscous drag
effects on the resonant frequency. However th is approach s t i l l leaves
uncompensated the e ffe c t of the density on the resonant frequency and
the second order e ffe c t of viscosity on the resonant frequency. In
addition to th is the Q is s t i l l decreased by the loss caused by the
viscosity of the surrounding f lu id . Thus, in general, and i f possible,
vacuum encapsulation is preferred.
The th ird form of external damping, that caused by coupling energy
to the surrounding so lid , termed structural damping, can only be
reduced by careful resonator design. The form of th is loss can be
appreciated i f we consider a single beam fixed at both ends and
excited in its fundamental mode. By Newton's th ird law of motion
the action of th is beam as i t is v ibrating must give rise to an equal
and opposite reaction. This reaction can only be provided by the
solid supporting the beam at its ends in the form of movement of that
- 28 -
supporting m ateria l. This energy is e ffe c tiv e ly coupled out of the
ends of the resonator and thus a fixed fixed beam may have a
reduced Q. A p a rtia l solution to th is problem is to resonate the
beam in a higher order mode since in a higher order mode the portions
of a beam e ither side of a node are moving in antiphase and thus
tend to have zero net momentum with respect to the supporting m ateria l.
Thus less energy is coupled out of the beam fo r higher order modes
and they tend to have higher Qs. However fo r reasons of stress s e n s itiv ity
the fundamental mode may be preferred and i f so an a lte rn a tiv e approach
may be to introduce a second identical resonator, coupled to the f i r s t ,
and vibrating in antiphase with the f i r s t . Thus each resonator cancels
the action of the other a t the supporting structure. This approach
is the one adopted fo r the DETF of the accelerometer and the coupled
plates forming the resonator of the pressure transducer. However even
though the two coupled structures may be identical, energy may s t i l l be coupled to the supports, fo r example,it is observed that fo r a
conventional tuning fo rk , the stem a t which the two tines jo in , has
a s ig n ifican t vibrational amplitude in the longditudinal d irection
along the length of the stem. The amplitude of such losses may be
s ig n ific a n tly reduced by analysis of the coupled structure using
f in i t e element analysis programs and trimming the geometry to reduce
the coupling. A recent paper (16) has provided the geometry fo r a
DETF to reduce th is contribution to the losses by a facto r of 6 .A fin a l approach to reduced structural damping is to support the
structure at a natural node of its vibration shape. An example of th is is a free free beam which has a node 0.22 of the length from
each end of the beam. Thus supports here, i f they are small enough,
are not seen by the beam. However such nodally supported structures
have a poor stress sen s itiv ity i f the stress is applied through thesupports. This may be ju s tif ie d by observing that the n o d e s ___________contribute l i t t l e to the stiffness of the resonator and thus increased
stiffness at these points, produced by the stress, has l i t t l e e ffe c t.
The preferred method to reduce structural damping is to use a coupled
structure in conjunction with f in i te element analysis. The increased
Q provided by such structures however must be balanced against th e ir
more complex spectrum of modes. I t should be noted also that
- 29 -

reduced structural damping makes excitation of the resonator more
d i f f ic u lt using those techniques which launch energy from outside
the resonator. An example of such a technique is the piezoelectric
one which was used fo r much of th is work.
The internal damping of a resonator is an a lte rn a tive way of
expressing the attenuation of acoustic waves w ithin a resonator. Thus
the vibrations of a resonator with no external damping w ill eventually
decay because of the attenuation of the m ateria l. The causes of internal damping in a material are numerous and the deta ils widespread
through the lite ra tu re and there appears to be no recent study of in ternal damping mechanisms in S ilicon . The source of most of the
information are references (17) and (18) and the references given
therein .
The major sources of the attenuation of acoustic waves in materials
are motion of dislocations, scattering from im purities, in teraction with
thermal phonons, Akheiser loss and thermoelastic loss.
S ilicon is a very pure material with few dislocations and thus i t is
expected that dislocation based mechanisms w ill produce a small e ffec t
and i t is known that below 400°K the acoustic attenuation in Silicon
is independent of dislocation count. I t is also known that loss
peaks caused by typical impurities in Silicon have l i t t l e e ffe c t on
the attenuation below 500°K. Therefore these two effects are un likely
to cause problems fo r present resonator environments.
At f in i t e temperatures within a solid the thermal motions of the
atoms about th e ir mean positions can be expressed as a large number of mechanical waves. These mechanical waves are termed thermal phonons and they can be attenuated by co llis io n with each other.
The mechanical wave forming the standing wave pattern of the resonance
can also be attenuated in the same way by in teraction with thermal phonons.
- 30 -
The condition fo r acoustic waves to d ire c tly in teract with thermal
phonons isojT > 1 ( 2 . 1 5 )
Where w is the angular frequency of the acoustic waves and T ispY\o\=>r\5
theAthermal relaxation time.
In Silicon the frequency required fo r th is form of damping to occur
is very much greater than those used a t present fo r resonators.
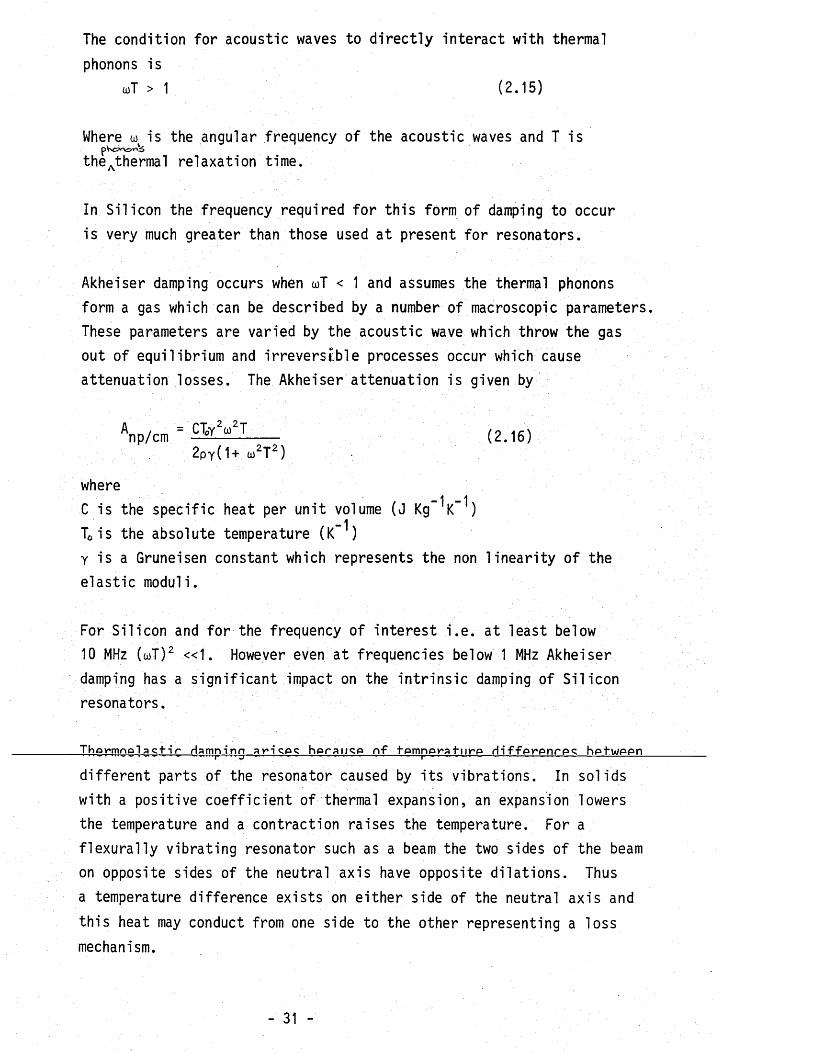
Akheiser damping occurs when wT'< 1 and assumes the thermal phonons
form a gas which can be described by a number of macroscopic parameters. These parameters are varied by the acoustic wave which throw the gas
out of equilibrium and irreve rs ib le processes occur which cause
attenuation losses. The Akheiser attenuation is given by
Anp/cm = ----- (2.16)2py( 1+ o)2T 2 )
where- 1 - 1C is the specific heat per unit volume (J Kg K )
-1T0 is the absolute temperature (K )y is a Gruneisen constant which represents the non lin e a r ity of the
e las tic moduli.
For Silicon and fo r the frequency of in teres t i .e . at least below
10 MHz (ooT) 2 « 1 . However even at frequencies below 1 MHz Akheiser
damping has a s ign ifican t impact on the in tr in s ic damping of S ilicon
resonators.
Thovmnolacfi'r Hpmninn aricpc; hpran<:p nf tpmnpratiirp Hiffprpnrp<; hpfwppn------— -■— - - - r - :w —- - —- —i- - ----------- - '■ -— -----------------
d iffe re n t parts of the resonator caused by its vibrations. In solids
with a positive co effic ien t of thermal expansion, an expansion lowers
the temperature and a contraction raises the temperature. For a
fle x u ra lly vibrating resonator such as a beam the two sides of the beam
on opposite sides of the neutral axis have opposite d ila tio n s . Thus
a temperature difference exists on e ither side of the neutral axis and
th is heat may conduct from one side to the other representing a loss
mechanism.
- 31 -

The frequency of v ibration a t which th is loss mechanism is greatest
is given fo r a rectangular section by
f = (2 .17)0 2 d2
— 1where D is the thermal d iffusion constant (m2s )
d is the beam thickness in the plane of vibration (m)
For usual dimensions of S ilicon resonators th is frequency can be
of the same order as the resonant frequency. The value of the thermo
e la s tic damping is given by
1 = - ET> \ (2 .18)
Q E ( f 2 + f 2 )S ( ° )
Where f is the frequency of vibration (Hz)- 2E is the adiabatic Youngs Modulus (N m )—2Ey is the isothermal Youngs Modulus (Nm )
Adiabatic Youngs Modulus is normally measured by the propagation of acoustic waves a t a frequency at which there is no time fo r heat to
flow . This frequency is given by
V V2 (2.19)f = aC. V2
2ttkwherea = Poissons ra tio
- 1 - 1k = thermal conductivity (Wm K )
- 1V = acoustic velocity (m s )-1 -1Cy = specific heat a t constant volume (J , Kg K )
_______ Tl 0 isothermal Young*s Modulus car, be meas1—'red by static rne^hods.______
2 .6 .3 Accelerometer experimental losses batches 1 and 2
In order to quantify exactly the various contributions to the losses
in S ilicon resonators i t would be necessary to design resonators at
frequencies and of shapes best suited to study each p a rticu la r mechanism.
- 32 -

For the present work th is was not possible and so measurements were
made fo r each mode of vibration fo r both batches.
The losses caused by the surrounding f lu id were quantified by measuring
the Q of the resonator as a function of the pressure of the surrounding
a ir . When the resonator was in vacuum the losses are caused by the sum
of the in tr in s ic damping and loss caused by coupling to the surrounding
m ateria l.
Figure 2.16 shows a typical p lot of the Q of the resonator as a
function of the a ir pressure in th is case fo r the second batch fundamental antiphase beam lik e mode. I t can be seen that below a pressure of around 100 Pa the Q is constant and has reached its in tr in s ic value of
nearly 8000. This was the highest Q mode fo r th is batch. In a ir the
Q dropped by a facto r of two indicating that the additional damping
caused by the a ir was not substantial. To determine whether acoustic
radiation or viscous losses are prim arily responsible fo r the decrease
in Q is not easy. Calculations based on the papers of Newell (19) fo r
the viscous loss and Wallace (20) fo r the acoustic loss both predict
Q values which are lower than those obtained even i f only one form of damping were present. This may p a r t ia lly be explained in the case of the
acoustic radiation calculation since th is refers to a hinged beam
rather than a tuning fork which may have a d iffe re n t radiation e ffic ien c y .
Newell's paper fo r the viscous damping contribution predicts a lin ea r
decrease of Q with pressure whereas most modes showed an experimental Q
decrease with pressure which varies nearly with the square root of the
pressure. In addition to this Newell predicts a constant Q governed
by the viscosity of the a ir above about 400 Pa fo r these device
dimensions. This was not observed in any mode of any device. The
conclusion is that the viscous losses in Silicon resonators are not as
simple as those described in reference (19) and further work is needed
to a n a ly tica lly determine the acoustic losses and viscous loss
contributions.
Table 2.1 is a summary of typical Q values obtained in a ir and in
vacuum for both batches. For batch 2 i t can be seen that there are
some modes which show l i t t l e improvement when vacuum encapsulated.
- 33 -
This is expected fo r those modes in which the two beams are vibrating
in phase since they should have a re la tiv e ly high value of structural
damping. For these antiphase modes which show th is e ffec t i t is believed
that the mode of vibration is coupling with the whole structure resonances.
The modes of the whole structures are expected to have high losses and
these w ill add to the losses of the DETF causing a low Q. Indeed fo r the
mode a t 450 kHz resonant peaks cannot be distinguished and the whole
structure is in continuous v ibra tion . Of p articu lar concern fo r th is
device is the low Q of the fundamental antiphase tuning fork mode.
For batch 1 the mode most s im ilar to th is showed the highest Q nearly
9000 in vacuum. In general th is batch showed higher Q in vacuum and
bette r improvement on vacuum encapsulation. Possible reasons fo r th is
are given in the next section.
2 .6 .4 Theoretical internal damping
A computer program has been w ritten to calculate the contribution to
the internal damping made by the Akheiser and thermoelastic mechanisms.The program thus predicts the Q factor in vacuum as i f the device had
zero structural damping. I t should thus only apply to balanced modes fo r
which th is contribution should be small. The program allows e ith e r the
length or thickness of a Silicon beam to be defined, by the user and
then plots out the Q as a function of frequency.
Results are now presented fo r thicknesses of 40 pm (accelerometer batch 2)
25 pm (accelerometer batch 1) and 8 pm (pressure transducer). Figure
2.17 shows a log. log. plot of Q against frequency in the range 10 Hz
to 10 MHz fo r a beam at 25 pm thickness. The Q given at 10 Hz is greater
than TO7 but in practice i t would be lim ited by other mechanisms. Aboveill Hz the Q fa lls with the ro llo tt being essentia lly governed by the
Akheiser damping u n til a frequency of 100 kHz. Just above 100 kHz
a t around 200 kHz, a minimum of Q is observed and th is is caused by a
maximum in the thermoelastic damping. For higher frequencies the
thermoelastic damping decreases faster than the Akheiser damping increases
and thus the Q b r ie fly rises. Above about 2MHz the Akheiser damping
dominates once again and the Q begins to f a l l . I t is p a rtic u la rly
noticeable that the minimum of Q fa lls within the range of 105Hz to
- 34 -
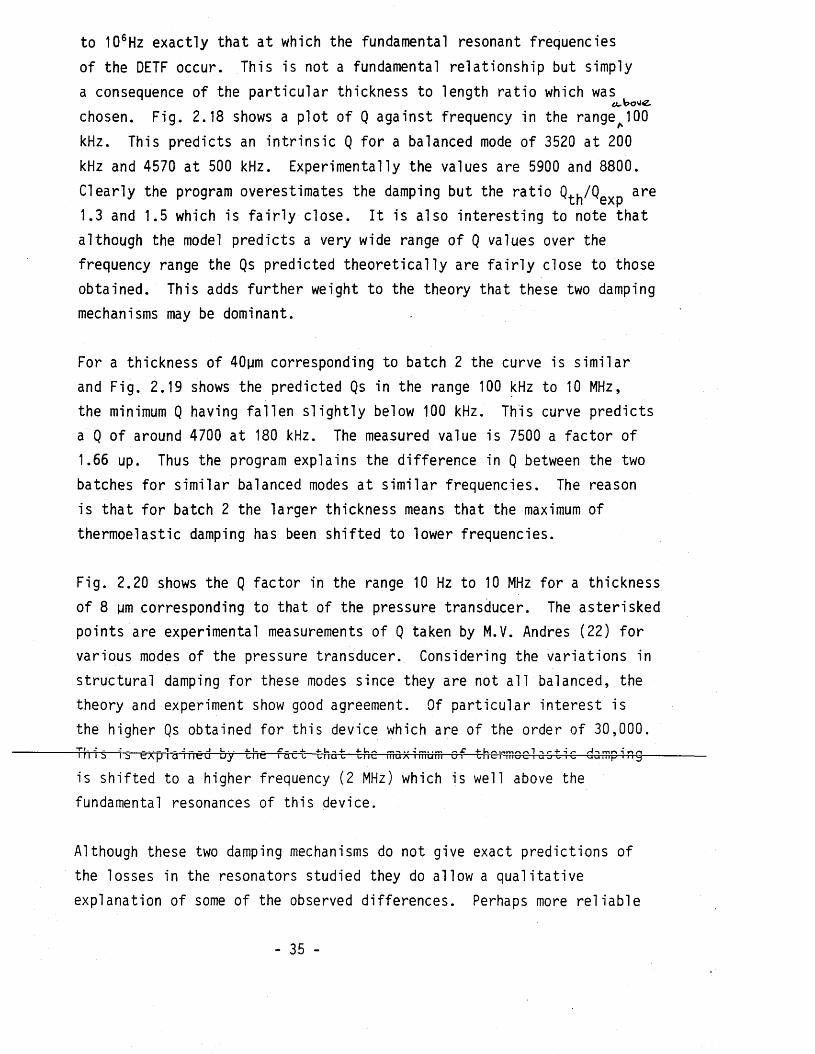
to 106Hz exactly that a t which the fundamental resonant frequencies
of the DETF occur. This is not a fundamental relationship but simply
a consequence of the p articu la r thickness to length ra tio which was
chosen. Fig. 2.18 shows a plot of Q against frequency in the range^lOO
kHz. This predicts an in trin s ic Q fo r a balanced mode of 3520 at 200
kHz and 4570 at 500 kHz. Experimentally the values are 5900 and 8800.
Clearly the program overestimates the damping but the ra tio Qt ^/Qexp are
1.3 and 1.5 which is fa ir ly close. I t is also in teresting to note that although the model predicts a very wide range of Q values over the
frequency range the Qs predicted th eo re tica lly are fa ir ly close to those
obtained. This adds fu rther weight to the theory that these two damping
mechanisms may be dominant.
For a thickness of 40 pm corresponding to batch 2 the curve is s im ilar
and Fig. 2.19 shows the predicted Qs in the range 100 kHz to 10 MHz,
the minimum Q having fa lle n s lig h tly below 100 kHz. This curve predicts
a Q of around 4700 at 180 kHz. The measured value is 7500 a facto r of
1.66 up. Thus the program explains the difference in Q between the two
batches fo r s im ilar balanced modes a t s im ilar frequencies. The reason
is that fo r batch 2 the larger thickness means that the maximum of
thermoelastic damping has been shifted to lower frequencies.
Fig. 2.20 shows the Q factor in the range 10 Hz to 10 MHz for a thickness
of 8 urn corresponding to that of the pressure transducer. The asterisked
points are experimental measurements of Q taken by M.V. Andres (22) fo r
various modes of the pressure transducer. Considering the variations in
structural damping fo r these modes since they are not a ll balanced, the
theory and experiment show good agreement. Of p articu lar in terest is
the higher Qs obtained fo r this device which are of the order of 30,000.
m"T"5 r5 c a p ia 11 icu l ly cttc i av. u cttotc cttc m uxim um o f t h c r m o c l u 5 1"ic—d am p -1 ng—
is shifted to a higher frequency (2 MHz) which is well above the
fundamental resonances of this device.
Although these two damping mechanisms do not give exact predictions of the losses in the resonators studied they do allow a q u a lita tiv e
explanation of some of the observed differences. Perhaps more re lia b le
- 35 -
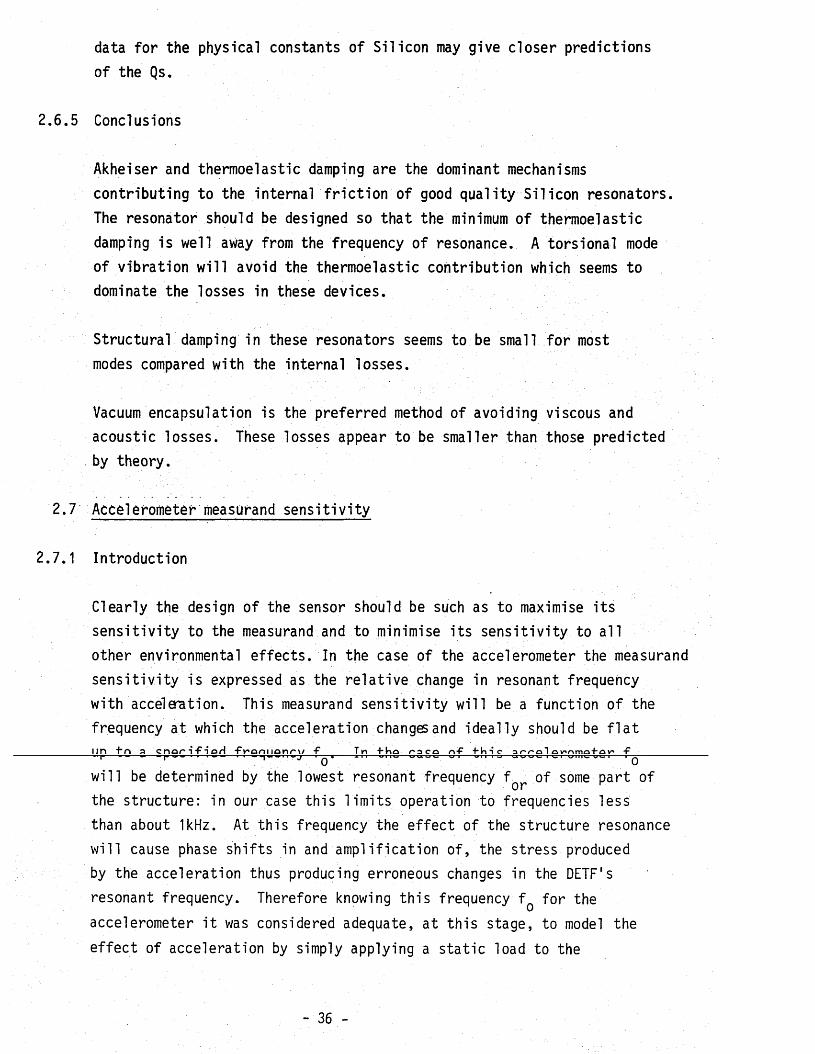
data fo r the physical constants of S ilicon may give closer predictions
of the Qs.
2 .6 .5 Conclusions
Akheiser and thermoelastic damping are the dominant mechanisms
contributing to the internal f r ic t io n of good quality S ilicon resonators.
The resonator should be designed so that the minimum of thermoelastic
damping is well away from the frequency of resonance. A torsional mode
of vibration w ill avoid the thermoelastic contribution which seems to
dominate the losses in these devices.
Structural damping in these resonators seems to be small fo r most
modes compared with the internal losses.
Vacuum encapsulation is the preferred method of avoiding viscous and
acoustic losses. These losses appear to be smaller than those predicted
by theory.
2.7 Accelerometer measurand se n s itiv ity
2.7.1 Introduction
Clearly the design of the sensor should be such as to maximise its
se n s itiv ity to the measurand and to minimise its s e n s itiv ity to a l l other environmental e ffects . In the case of the accelerometer the measurand
s e n s itiv ity is expressed as the re la tiv e change in resonant frequency
with acceleration. This measurand s e n s itiv ity w ill be a function o f the
frequency a t which the acceleration changes and id ea lly should be f la tlin "bn a cnor i f ioH ■fv'om lonrw -F Tn ■bho /~ a c a n-F ■bbiie a r ro l ov'nmatflv' -F
--------------------------------- - T ------------- “ r ■ 1 r — t ------------* - n ----------------------------------------------------- V T I- I - . - - .----- u w w ' - t v . i w i l i v . w w i ---------r - ^ -----------------------------
w ill be determined by the lowest resonant frequency f Qr of some part of the structure: in our case th is lim its operation to frequencies less
than about 1kHz. At this frequency the e ffec t of the structure resonance
w ill cause phase sh ifts in and am plification o f, the stress produced
by the acceleration thus producing erroneous changes in the DETF's
resonant frequency. Therefore knowing th is frequency-f for the
accelerometer i t was considered adequate, a t th is stage, to model the
e ffec t of acceleration by simply applying a s ta tic load to the
-■36 -
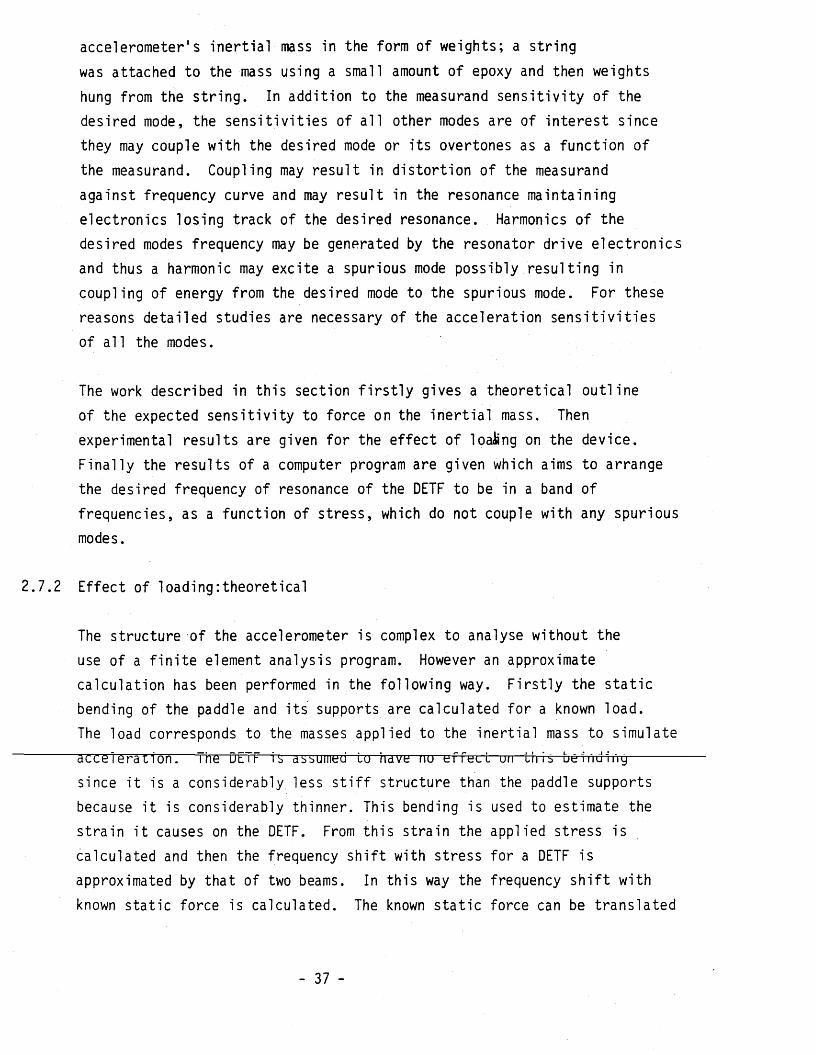
accelerometer's in e rtia l mass in the form of weights; a string
was attached to the mass using a small amount of epoxy and then weights
hung from the s trin g . In addition to the measurand s e n s itiv ity of the
desired mode, the s e n s itiv itie s of a ll other modes are of in teres t since
they may couple with the desired mode or its overtones as a function of
the measurand. Coupling may resu lt in d istortion of the measurand
against frequency curve and may resu lt in the resonance maintaining
electronics losing track of the desired resonance. Harmonics of the
desired modes frequency may be generated by the resonator drive e lectron ics
and thus a harmonic may excite a spurious mode possibly resu lting in
coupling of energy from the desired mode to the spurious mode. For these
reasons detailed studies are necessary of the acceleration s e n s it iv it ie s
of a ll the modes.
The work described in this section f i r s t ly gives a theoretical ou tline
of the expected s e n s itiv ity to force on the in e r t ia l mass. Then
experimental results are given fo r the e ffec t of loaiing on the device.
F in a lly the results of a computer program are given which aims to arrange
the desired frequency of resonance of the DETF to be in a band of
frequencies, as a function of stress, which do not couple with any spurious
modes.
2 .7 .2 Effect of loading:theoretical
The structure of the accelerometer is complex to analyse without the
use of a f in i te element analysis program. However an approximate
calculation has been performed in the following way. F irs tly the s ta tic
bending of the paddle and its supports are calculated fo r a known load.
The load corresponds to the masses applied to the in e rtia l mass to simulate
acceieracion. The DETF is assumed Lo iiave- riu- erreLl~uM"~lii is beinuing------------
since i t is a considerably less s t i f f structure than the paddle supports
because i t is considerably thinner. This bending is used to estimate the
stra in i t causes on the DETF. From this stra in the applied stress is
calculated and then the frequency s h ift with stress for a DETF is
approximated by that of two beams. In th is way the frequency s h if t with
known s ta tic force is calculated. The known s ta tic force can be translated
- 37 -
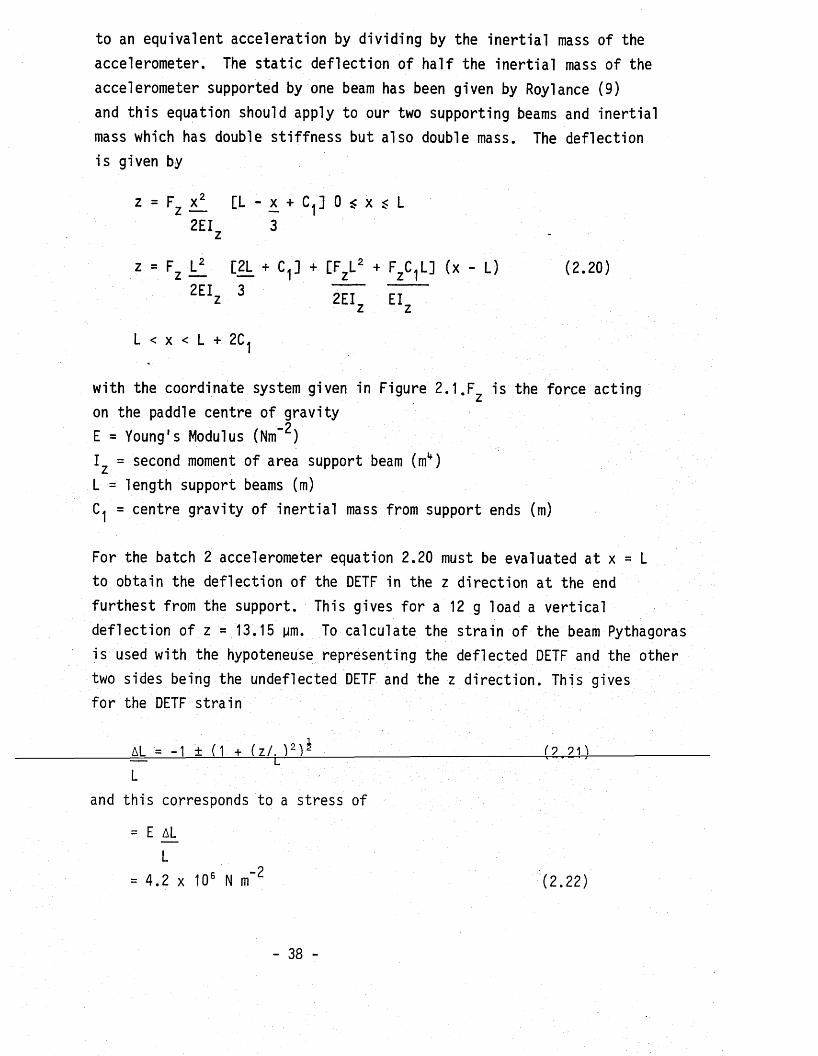
to an equivalent acceleration by dividing by the in e rtia l mass of the
accelerometer. The s ta tic deflection of h a lf the in e rtia l mass of the
accelerometer supported by one beam has been given by Roylance (9)
and th is equation should apply to our two supporting beams and in e rtia l mass which has double s tiffness but also double mass. The deflection
is given by
z = Fz x2 [L - x + C j] 0 s x $ L
2EIz 3
z = Fz Lf_. [2L + C ,] + [FZL2 + F ^ L ] (x - L) (2.20)
2EIz 3 2EI Elz z
L < x < L + 2C
with the coordinate system given in Figure 2 .1 .F is the force acting
on the paddle centre of gravity
E = Young's Modulus (Nm“2)
I = second moment of area support beam (m1*)L = length support beams (m)
= centre gravity of in e rtia l mass from support ends (m)
For the batch 2 accelerometer equation 2.20 must be evaluated at x = L
to obtain the deflection of the DETF in the z direction a t the end
furthest from the support. This gives fo r a 12 g load a vertica l
deflection of z = 13 .15 pm. To calculate the strain of the beam Pythagoras
is used with the hypoteneuse representing the deflected DETF and the other
two sides being the undeflected DETF and the z d irection . This gives
fo r the DETF strain
AL = -1 ± (1 + (z /. ) 2) J---------= ------------------ L :L
and th is corresponds to a stress of
= E aL
L= 4.2 x 10⁶ N m'Z
(? 91 'iV — ■ “ 7"
(2 . 2 2 )
- 38 -
This can then be used to calculate the frequency s h ift of the DETF
with applied stress which is approximated by two coupled beams and is
given by
f iPliO = (1 + 1 P X2) J i = 1 ,2 ,3 . . . .N (2 .23 )or ( — _Li
f |P = 0 ( 2 pb x?)( )
where and x . are determined by the mode of vibration i = 1
corresponding to the fundamental and P is the axial stress required
to buckle the beam. All of x . , x and P depend on the end conditions
of the beam and are given in reference ( 8 ) . For hinged hinged and
clamped clamped these values are
Clamped Clamped Hinged Hinged
p l ! l i (2 .24)B L2A L2A
X, 4.73 , 7 .85, 10.99, 14.14 ru
Thus i t can be seen from equation 2.23 that the response is lin e a r fo r
P < < P and that the fundamental mode has the highest stress s e n s itiv ity
with higher order modes showing a stress s e n s itiv ity decreasing with
th e ir frequencies. Additionally from (2 .24) i t can be seen that a clamped
clamped beam is four times less sensitive than a hinged hinged beam but
can withstand four times more compressive stress before buckling.
_oFor the DETF assuming clamped clamped conditions Pg = 2.57 x 10⁸ Nm .
Applying equation 2.23 for the fundamental antiphase beam lik e mode
givesf |P*0 = 1.0041 orf ;P=0 ~or
This agrees fa ir ly well with the experimentally observed value of 1.0068
p a rtic u la rly in the lig h t of dimensional tolerances and uncerta in ties .
A dditionally the point of attachment of the load in practice may not
exactly be the centre of gravity of the in e r t ia l mass.
- 39 -
2 .7 .3 Effect of loading:Experimental
Figure 2.21 shows the results of a loading experiment on an accelerometer
in batch 2. I t is observed that the response is lin e a r in the range 0 to
12 g. Above 12 g the DETF broke. From equation 2.23 th is corresponds_ p
to a stress level of 4 x 10⁶ N m" in the DETF. The stress produced by
the vibrations a t maximum amplitude is less than 106 Nm . Hence theo
to ta l stress of the beam should be a t maximum less than 107Nm . The
fracture stress of S ilicon microelements in the <110> direction should9 - 2
be greater than 4.9 x 10 Nm (2 3 ). C learly the measured breaking stress
is considerably below th is , however, with a sample of only one device
one cannot say i f th is problem is a product of the fabrication
technique.
I t has been shown (22) that the minimum change of the measurand that
a resonator sensor can detect is given by
6min = 3____ 1_ (de ) (2 25)
2 / 2 QS ( e ) m, „- min
whereS is the re la tiv e frequency change with the measurand and
(de)j is the minimum re la tiv e change of amplitude that the interrogation
syst<?ilin can detect. For figure 2.21 S = 518 ppmg” ,Q= 7500 and assuming
( d e / e ) min = 1 /2 0 given 5 . = 13 mg. Thus the minimum detectable forcemin 3is 103 times smaller than the range of the device. The s e n s itiv ity could
be increased by thinning the supports of the in e rtia l mass or by increasing
the in e rtia l mass a t the expense of a smaller range.
2 .7 .4 Clean mode c rite ria iT h eo re tica l
As each mode of a DETF has a d iffe re n t stress s en s itiv ity i t is clear
th a t, as the stress applied to a DETF changes, the frequencies of resonance may become closer or fu rther apart. Whether the modes
actually couple w ill depend upon th e ir frequency separations a t zero
applied stress and the magnitude of the maximum applied stress. The
maximum value of the applied stress is u ltim ately governed by
- 4 0 -
the fracture stress of the material but a general rule of thumb is fu l l
scale applied stress should produce about a 10% change in resonant
frequency. Thus, having set the stress range, coupling of the desired
mode with a ll other spurious modes of vibration may be avoided by
judicious choice of the dimensions of the resonator.
A recent patent (24) has performed th is calculation fo r some known modes
of the DETF the desired mode being the fundamental antiphase in plane
v ib ra tio n . In particu la r the modes considered are(a) flexure of the bars in phase in a d irection normal to the plane
of the DETF and(b) d itto but with the bars 180° out of phase. The calculation only
includes overtones of modes of type (a ) . No consideration is given to
overtones of mode of type (b ), nor of modes of the type:
(c) flexure of the bars in phase in a direction in the plane of the DETF
and overtones(d) the overtones of the desired mode i .e . flexure of the bars in 180°
out of phase in the plane of the DETF.In addition to th is , a recent paper (16) has shown that the DETF geometry
can produce double frequency components at its ends. These components
may also couple to and excite a spurious mode.
A computer program has been w ritten to include the effects of the
additional modes and frequencies and determine those dimensions which
produce a range of frequencies fo r the desired mode asthe measurand varies
which is free o f spurious modes. Figure 2.23 shows the results of theprogram with the c lear area representing those dimensions which providefrequencies which are free of spurious mode. The condition fo r re jection
of dimensions are a spurious modes frequency coming within 10% of the
desired mode.
Comparisons with the results of reference 24 show that the additional
modes do impose further constraints on the allowed dimensions.
- 41 -
2 .7 .5 Conclusions
Further work is necessary to predict the response of the accelerometer
to applied loads possibly using a f in i te element analysis program.
This structure shows a good dynamic range to s e n s itiv ity ra tio .
Additional modes of v ibration must be considered to ensure th a t the
desired mode remains clear of spurious modes within its frequency
band of in te res t.
2 .8 Temperature dependence of the resonant frequency
2.8 .1 Introduction
Most sensors suffer from cross s e n s itiv ity to temperature and Silicon
resonators are no exception. Indeed, a t present, the resonant frequency
s h ift with temperature represents a major problem and is certa in ly a
disadvantage with respect to Quartz resonators which can be temperature
independent a l lb e it over a lim ited range and at extra cost.
This section presents experimental results fo r the temperature dependence
of the resonant frequency of the accelerometer and the pressure transducer. Several methods are then suggested to compensate fo r the temperature
s e n s itiv ity . F irs t ly however, the main factors which influence the
temperature dependence of the resonant frequency are given.
2 .8 .2 Factors influencing the temperature sen s itiv ity
The temperature dependence of the resonant frequency of a s ilicon
resonator depends on four major influences:
1) Type of v ibration: i .e . whether longditudinal, shear, flexura l or
torsional. This arises since, fo r each type of v ib ra tion , the
resonant frequency w ill depend upon d iffe ren t combinations of moduli of e la s t ic ity , density, Poission's ra tio and dimensions each of which
w ill have a d iffe re n t temperature co effic ien t.
2) Coating on surface of resonator: s ilicon n itr id e layers may be
included on the surface of s ilicon resonators fo r passivation (5 ) .
- 42 -
M eta llic layers can be deposited to increase the effic iency of
optical excitation of v ibrations. However the layer's thermal
expansion c o e ffic ien t w ill generally d if fe r from that of the s ilicon
resonator causing e ith er a positive or a negative stress to be generated
in the resonator as temperature changes. The sign w ill depend upon the
difference in thermal expansion coeffic ien ts of the layer and
s ilic o n . This stress w ill modify the temperature dependence and may be
used fo r temperature compensation. I t has also been suggested that
coating s ilicon resonators with a m aterial which has a positive
temperature c o e ffic ien t of Young's Modulus can also be used to compensate
fo r the temperature dependence of s ilico n resonators (25 ).
3) Temperature dependence of mounting: unless the resonator is in an
a ll s ilicon holder there w ill be a d iffe re n tia l thermal expansion between
the s ilicon and the mount. The resonator may be subject to a temperature
dependent stress, depending on geometry.
4) Orientation: i t is well know that in quartz resonators the temperature
dependence is a sensitive function of orientation of the resonator with
respect to the c rys ta llin e axes. There is a sim ilar e ffec t in s ilicon
and the temperature dependence of Young's Modulus varies by about 25%
along d iffe re n t directions in the ( 100) plane.
In our experiment the batch 2 device was mounted so as to elim inate the
e ffe c t of contribution 3 and there was no coating so contribution 2
can be neglected. The resonator length pointed along the crystal!ographic J
(110) d irection . The mode of vibration was the fundamental antiphase
beam mode. The vibrations were excited and detected o p tic a lly . Figure
2.23 shows the change in resonant frequency with temperature in the
range 293-463 K giving an experimental re la tiv e frequency change of
-29ppm/K. In order to calculate the order of magnitude of the temperature
dependence the vibration of the DETF may be considered as those of two
coupled beams and hence, provided the coupling is temperature independent
the temperature dependence should be the same as that of a beam in
iso la tio n . For a beam in flexural v ibration:
where is the resonant frequency, is a constant depending on
the order of the mode and the end conditions, E is the Young's
Modulus, p is the density, d is the thickness and L is the length.
Each of E, p, d and L is temperature dependent. D iffe re n tia tin g
equation 2.26 with respect to temperature and dividing by equation
2 .2 6 gives
= 1 - - _ L - a ( 2 . 2 7 )f N dT 2E dT 2p dT
where a = 3 x 10”^/K, the thermal expansion co effic ien t of s ilico nand ( i /p ) (dp/dT) = 13x10"*Vk. ( 1/E)(dE/dT) is not well established and
-6 ~6 values between -55x10" /K and.-113x10" /K have been given in e a r l ie rpublications (26 ,27). This gives an in trin s ic temperature dependence
- f i - f iin the range -27x10" /K to -56x10" /K which includes the measured
value.
For the pressure transducer the temperature s e n s itiv ity has been
measured in the range room temperature to 70°C for a ll its modes. Table2 .2 gives the values of the re la tiv e frequency change with temperaturefo r each mode; also included are the modes pressure s e n s it iv it ie s . Because the pressure transducer's modes are flexural modes one would
expect them to have s im ilar temperature s en s itiv ity i .e . -29 ppm/K. However during the experiment the transducer was mounted on Brass which
has a higher thermal expansion co e ffic ien t than S ilicon. Thus a
temperature dependent stress may be applied to the resonator. This is
fu rther supported by the fac t that a mode seems more temperature
dependent the greater its pressure s e n s itiv ity .
Thus great care should be taken in the design of a suitable mount for
th is pressure transducer to ensure any thermally produced stresses
caused by the mount are not transmitted via the diaphragm to the
resonator thus increasing the temperature coeffic ien t of the device.
- 44 -
2 .8 .3 Temperature compensation methods
Temperature compensation methods may be divided into those that
produce a p ara lle l measurement of the temperature and those that
inherently compensate fo r the device's temperature s e n s itiv ity ,
making i t temperature insensitive.
C learly the la t te r approach is more desirable and temperature
in se n s itiv ity can be achieved in resonators fabricated from Quartz and
Ni-Span-C a Ni-Fe-Cr a llo y . For Quartz resonators the orientation of the resonator w ithin the crystal is chosen so that the resonator's
dimensional changes balance its e la s t ic ity changes. For Ni-Span-C
resonators careful material control and blending produces temperature
in s e n s itiv ity . For S ilico n , in i t ia l investigation of the variation of temperature co e ffic ien t with crystallographic angle suggest temperature
compensation cannot be produced in th is way.
A possible method of temperature compensation is to deposit a layer on
one surface of the resonator such that the layer increases the thickness
of the resonator. The layer may be a metal or perhaps Silicon Dioxide
or S ilicon N itr id e . The e ffec t of the layer may be twofold. F irs t
i t w ill cause a frequency o ffset caused by its in b u ilt stress and its
e ffe c t on the stiffness and thickness of the resonator. Second i t w ill
cause a temperature dependent stress to be applied to the resonator which,
depending on the thickness and properties of the layer, may be used to
compensate for the inherent temperature s e n s itiv ity of the resonator.This method is not the preferred method since i t is f e l t that the frequency
o ffse t caused by the layer may a lte r with time as stresses are re lieved; th is w ill resu lt in a high aging rate fo r the resonator.
A better a lternative is to use a layer on two surfaces of a resonator
so we have a three layer laminated beam with the S ilicon in the centre
and the layer on e ither side. In th is case the in b u ilt stress and
temperature dependent stress of one layer is cancelled by the other. Now
the only compensation method is changes in the stiffness of the layer.
For such a three layer beam the resonant frequency may be calculated from
the normal equation fo r a beam but with the stiffness and mass being
given by (8 )
El = 2 bE1 ( t A) 3 + 2bE2 ( ( t 1 + t 2 ) 3 - ( t ^ 3) (2>28)
3 2 3 ( 2 2 )
- 45 -
t h - 2where is the Young's Modulus k layer (Nm )
is the density of k ^ layer (kg m
b is the width (m)th
t^ is the thickness k layer (m) k = 1 is the inner layer of Silicon
k = 2 is the deposited layer
To compensate fo r the frequency s h ift with temperature inherent to
Silicon one needs a layer with a positive temperature c o e ffic ie n t of
Young's Modulus. An ideal material appears to be Silicon Dioxide
which has J_dE = 150x10~6 / ° C
E dTc o
a = 0.4 x10” and p = 2500 kg m . Using these data the temperature
c o e ffic ie n t of a 40 pm thick beam of length 1mm and arb itrary width
has been calculated fo r various layer thicknesses. F i g u r e s h o w s
the temperature co effic ien t of frequency fo r the composite beam as a
function of layer thickness. I t can be seen that zero temperature
c o e ffic ie n t occurs a t a layer thickness of 9.67 pm - about 0.24 of the
beams thickness. This ra tio remained the same fo r other beam thicknesses,
lengths and widths; i t is purely a function of the physical properties
of the layer. For a layer thickness of 0 the frequency of resonance
is 340 kHz, fo r 9.67 pm i t is 360 kHz, fo r 25 pm i t is 416 kHz. I t can
be seen that the layer increases the resonant frequency of the device
i . e . the added stiffness more than compensates fo r the added mass.
Thus the three layer laminate beam is a method of temperature
compensating Silicon resonators but i t w ill only be e ffective over a
lim ited temperature range depending on the second order temperature
co effic ien t of the resonant frequency.
In the p ara lle l measurement category the simplest method is to
introduce a second resonator not coupled to the measurand, fo r example,
a can tilever. The frequency of th is resonator gives a simple
measurement of the temperature fo r compensation purposes. This method
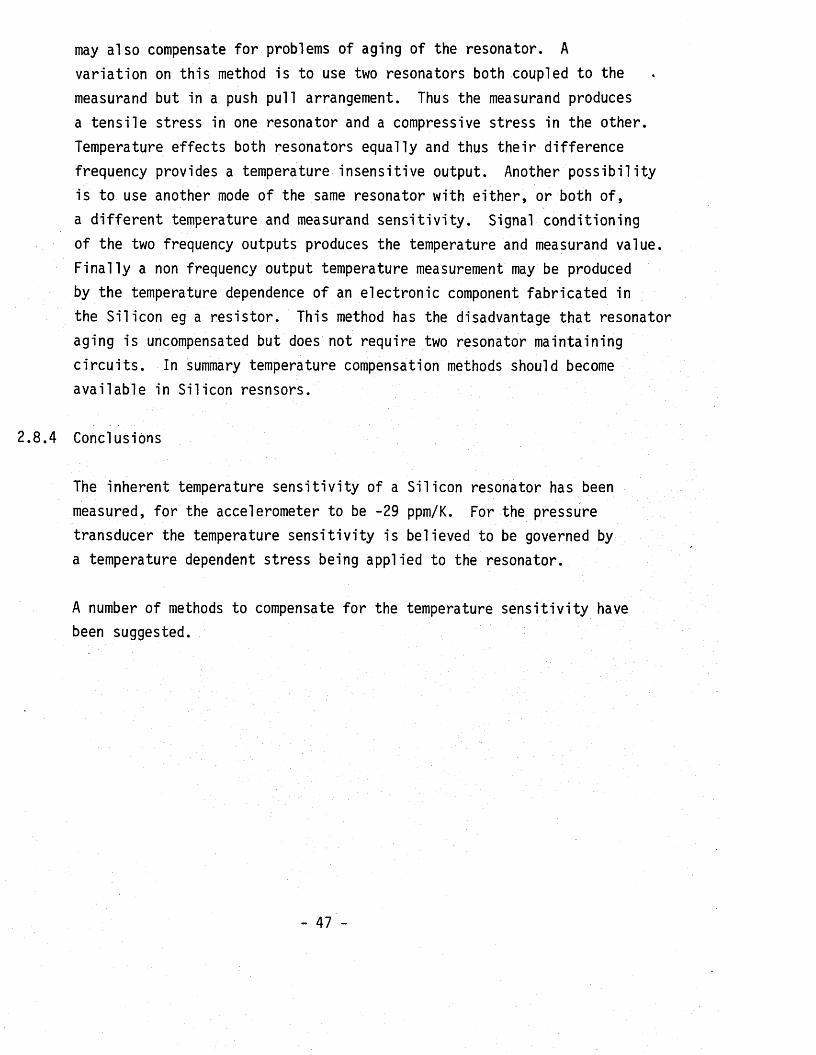
may also compensate fo r problems of aging of the resonator. A
variation on this method is to use two resonators both coupled to the
measurand but in a push pull arrangement. Thus the measurand produces
a ten s ile stress in one resonator and a compressive stress in the other. Temperature effects both resonators equally and thus th e ir difference
frequency provides a temperature insensitive output. Another p o ss ib ility
is to use another mode of the same resonator with e ith e r, or both o f, a d iffe re n t temperature and measurand s e n s itiv ity . Signal conditioning
of the two frequency outputs produces the temperature and measurand value.
F in a lly a non frequency output temperature measurement may be produced
by the temperature dependence of an electronic component fabricated in
the S ilicon eg a res is to r. This method has the disadvantage that resonator
aging is uncompensated but does not require two resonator maintaining
c irc u its . In summary temperature compensation methods should become
availab le in Silicon resnsors.
2 .8 .4 Conclusions
The inherent temperature se n s itiv ity of a Silicon resonator has been
measured, fo r the accelerometer to be -29 ppm/K. For the pressure
transducer the temperature sen s itiv ity is believed to be governed by
a temperature dependent stress being applied to the resonator.
A number of methods to compensate fo r the temperature s e n s itiv ity have
been suggested.
- 47 -
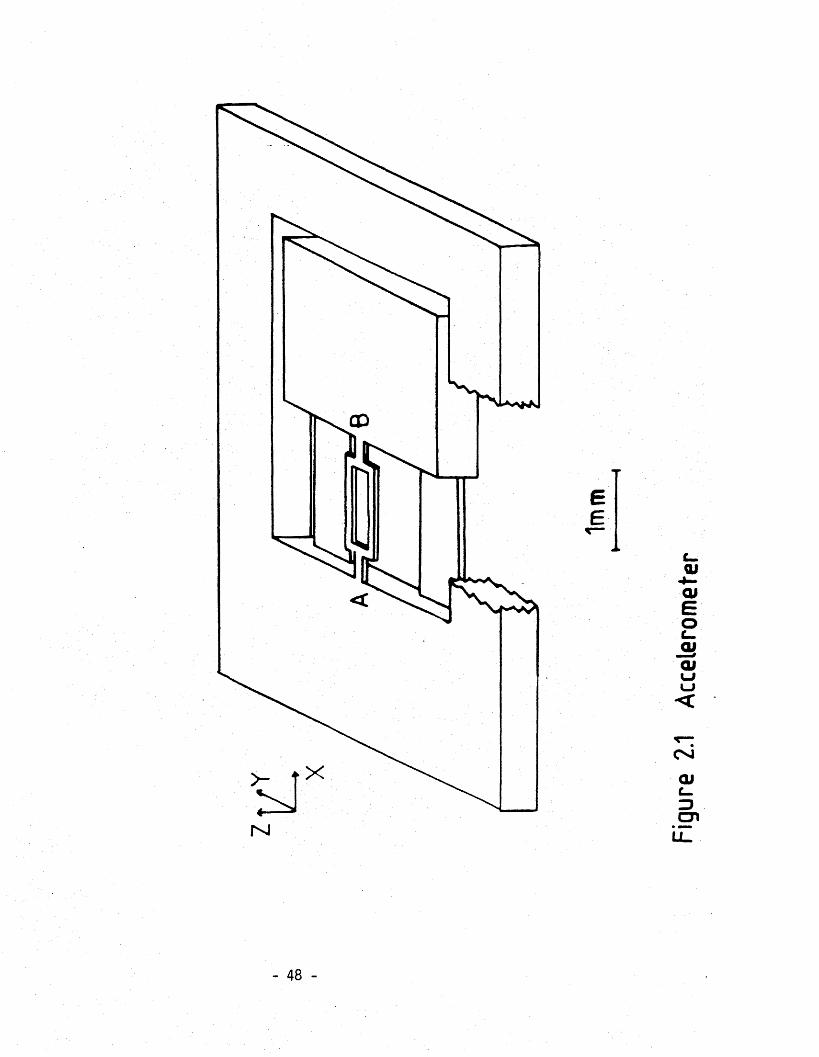
M
- 48 -
Figu
re
2.1 Ac
cele
rom
eter
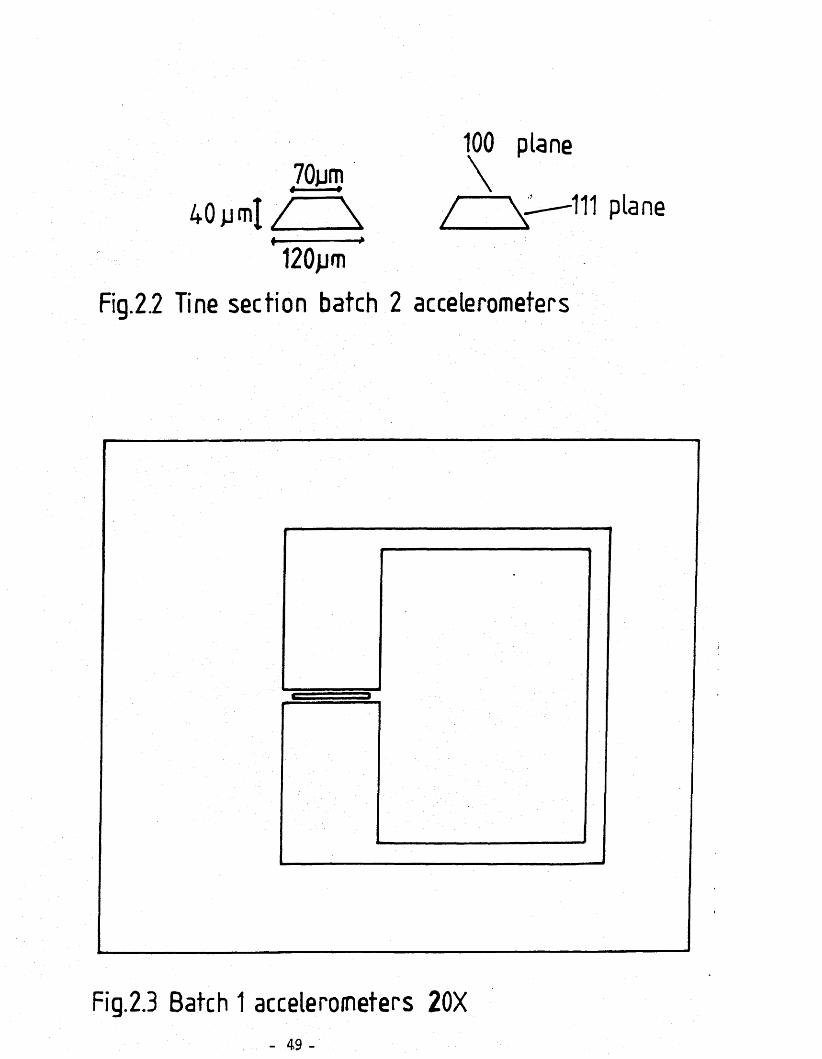
70jjm4 - »
100 plane
40uml / \ / V —111 plane
120pm
Fig.2.2 Tine section batch 2 accelerometers
Fig.2.3 Batch 1 accelerometers 20X- 49 -
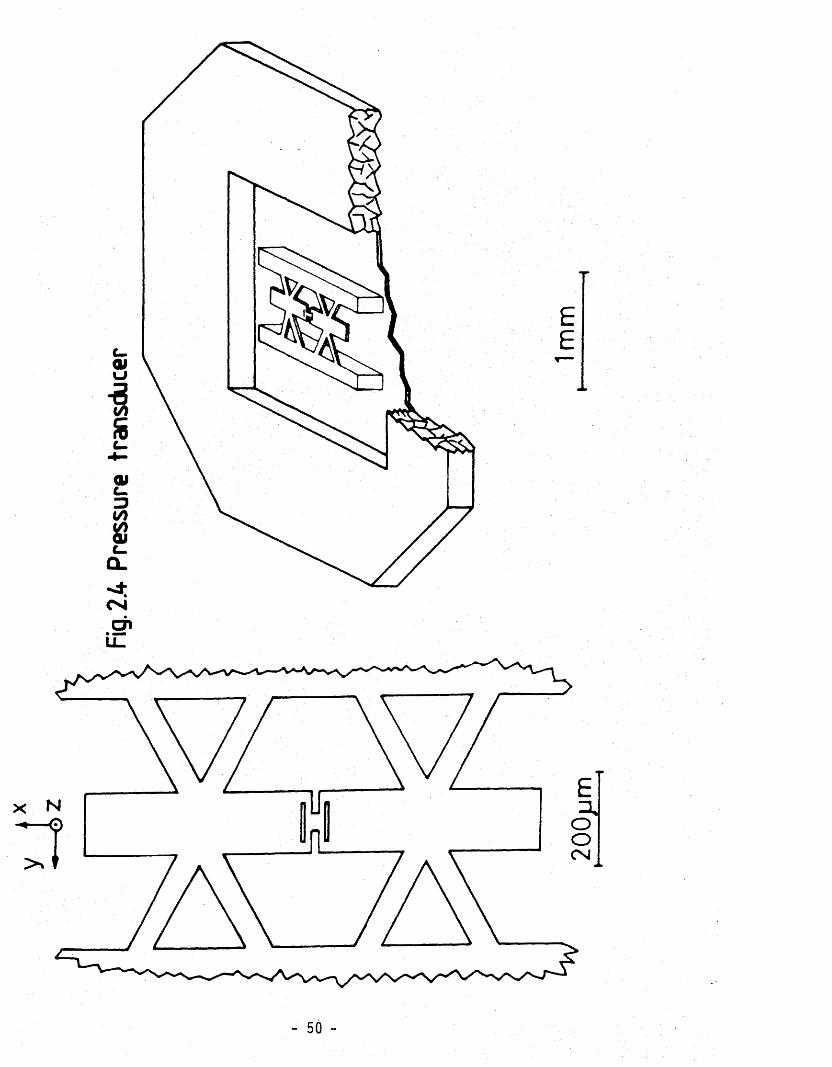
Fig. 2
.4 Pr
essu
re
trans
duce
r
EE
ooCN
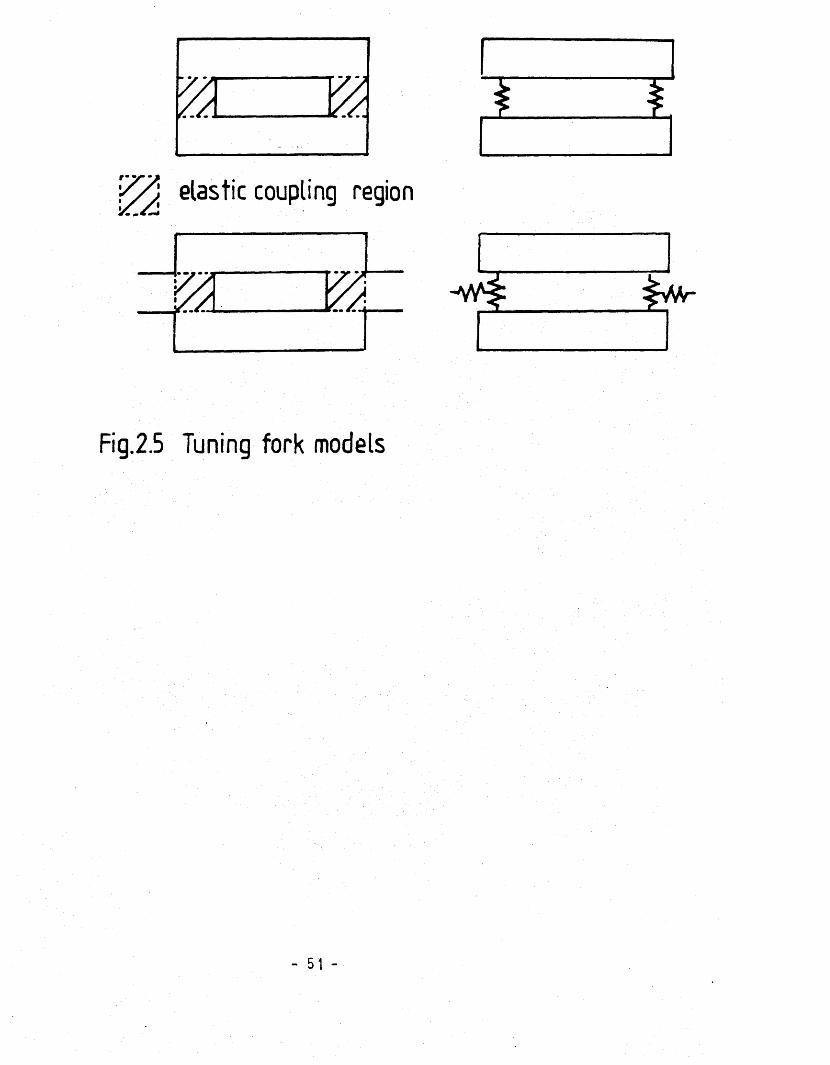
£ y %
'ZAi elastic coupling region
Fig.2.5 Tuning fork models
- 51 -

Freq
uenc
y
- 52 -e4C 4
Fig.2.
6 Mo
de
shap
es
of the
DE
TF

X
o
vO
i— LUQ
<D
NX
OOLD
00QJ0 .fD
' ■ J C
00
QJTJO
Cou
VOo-ich
LL_
- 5 3 -

Fig.2.
7 De
tecti
on p
oints
on de
vice
m
M
- 54 -

t/>01u$co8c .
oE'Dc_
&IS)dDcsid *
- 55 -
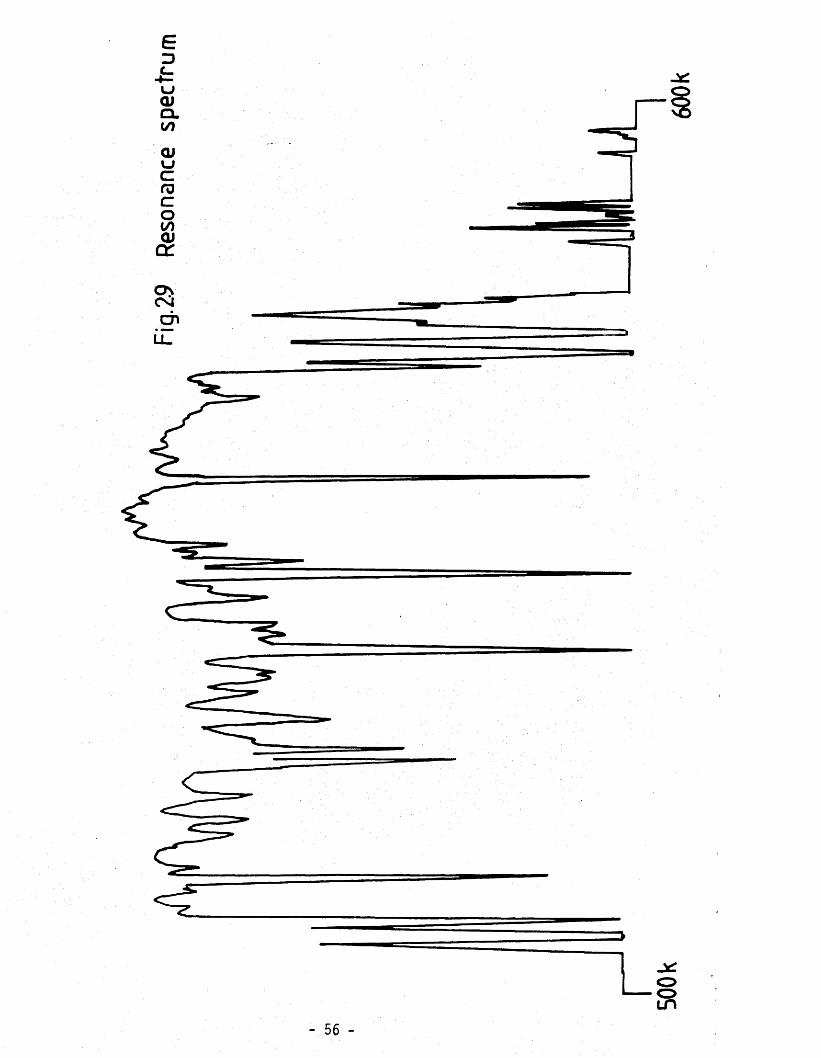
Fig.2-
9 Re
sona
nce
spe
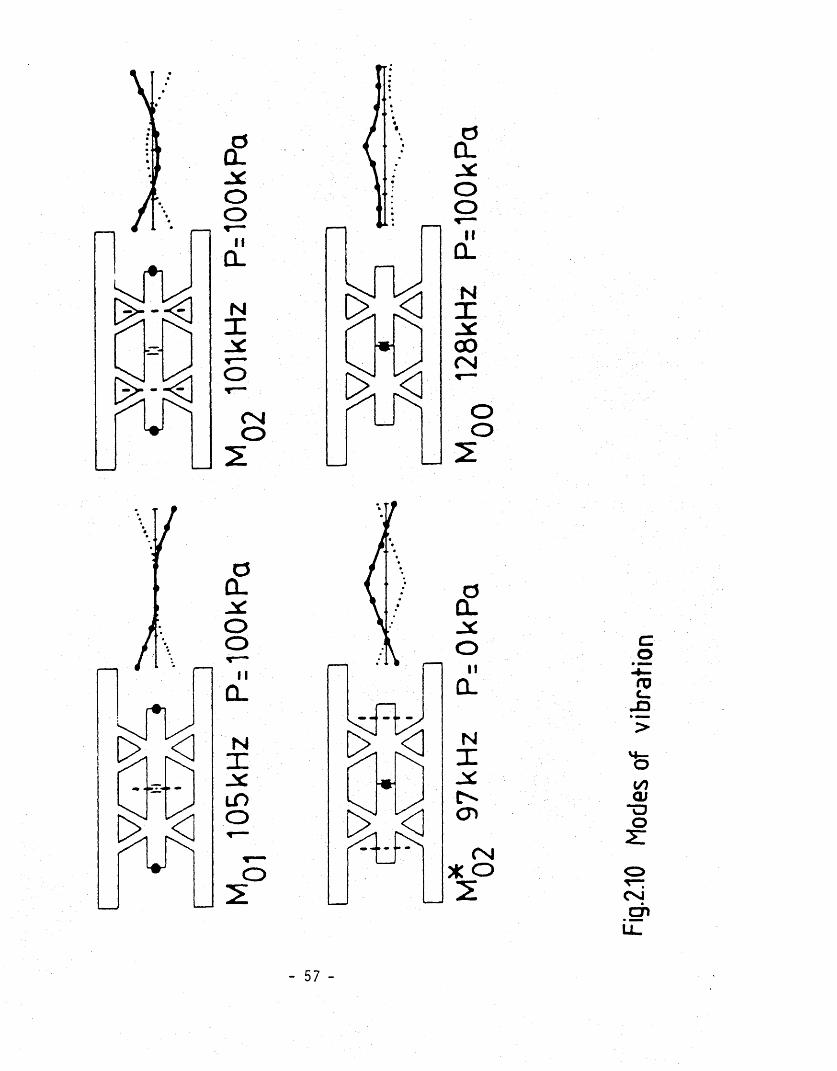
CJa.JSCo o
I ICLNX
.2Co oCN
OO
aCljscOo
nX
NXJSC
LOo
oCM
* O
coojc_
_D>
00a i
“ao
z :
CVjdn
- 57 -
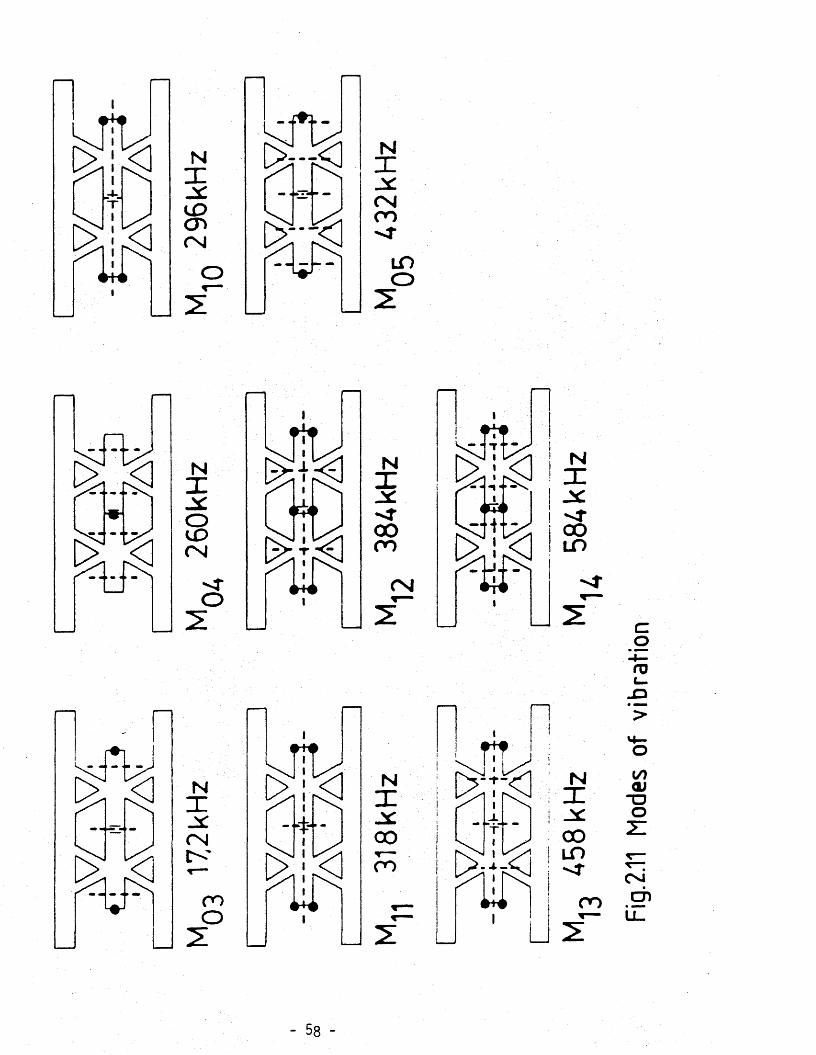
[ > ; - - - £ ]NX
CMCO-4*
LOO
is + s i NX00CO
CM
n
- 58 -
Fig.2.
11
Mode
s of
vibr
atio
n
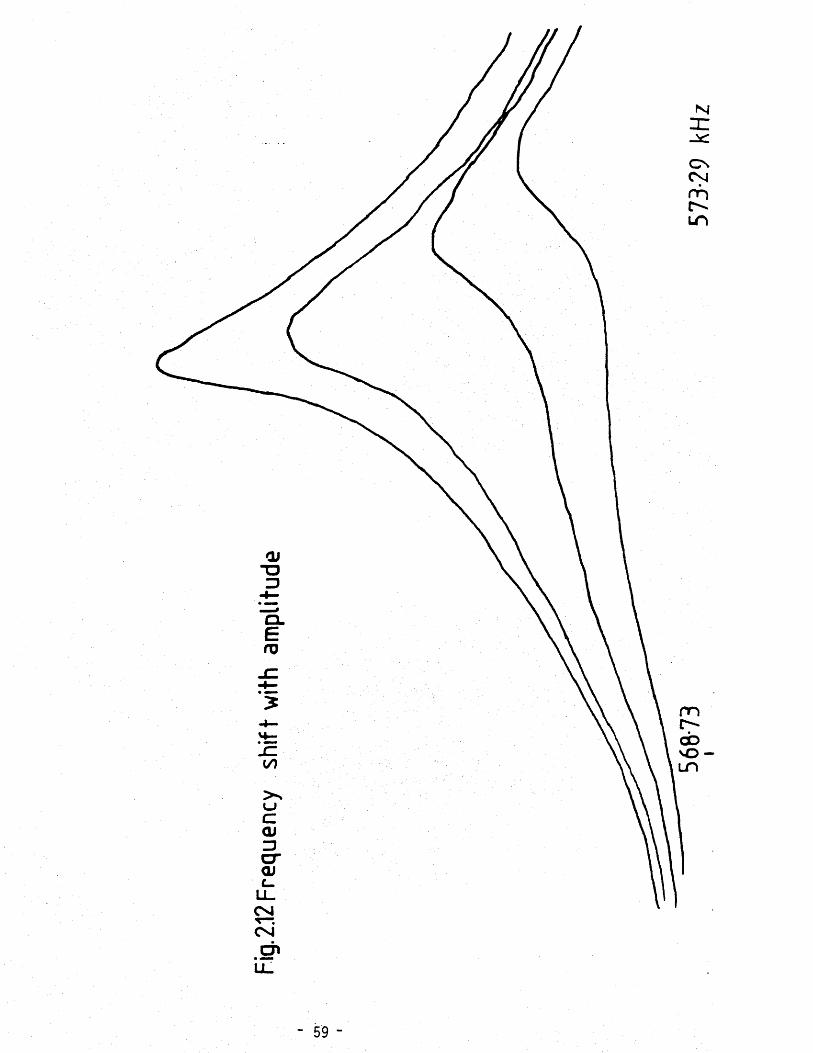
CNCMrn
TD
CL
m
c oVOLH
LJ
- 59 -
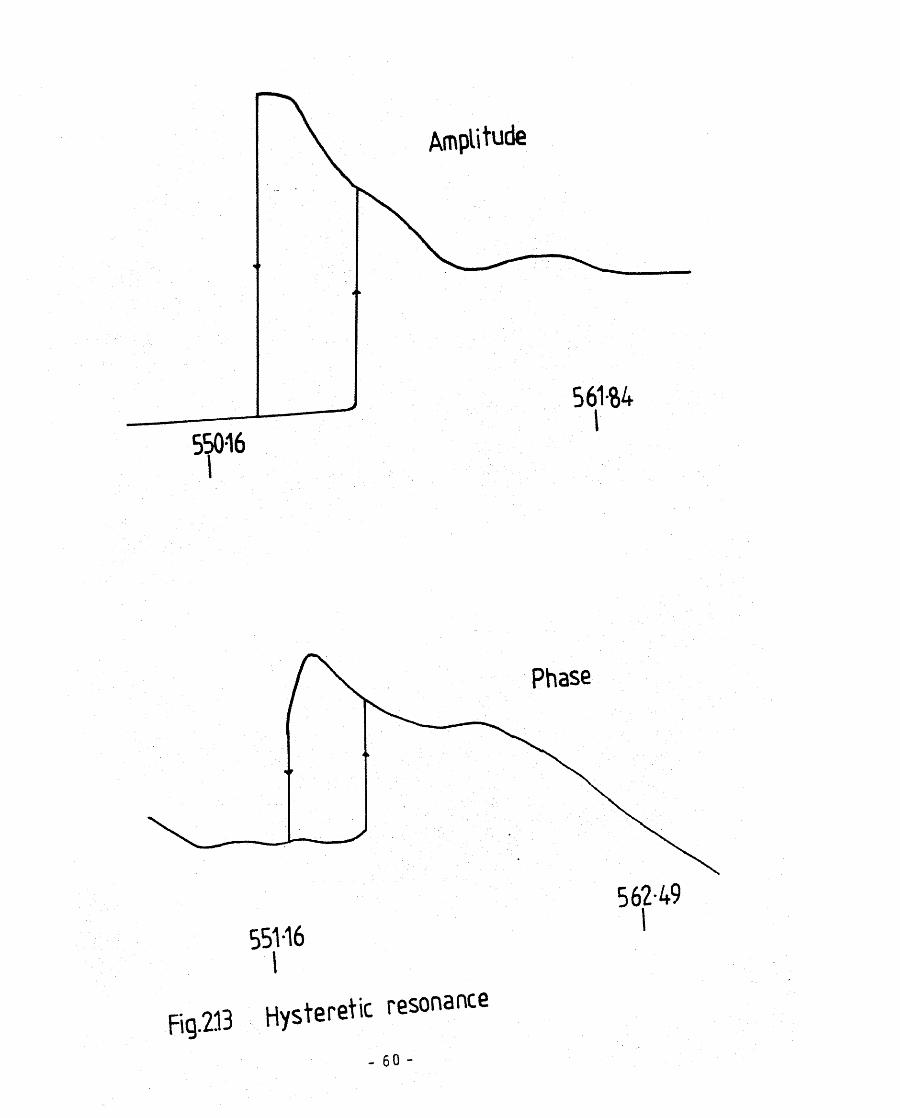
Amplitude
550-16
Phase
562-49
55116I
Fig.213 Hystereticic resonance
- 60 -

- 61 -

16014012010080604020
0
mV
16014012010080604020
0
Fit
M N IJJU IU U C Y O . U l I T C ' U I i v w w i i w i •'
i 1 2 3 V
Amplitude vs. drive: at f+ and f_
• 4
i 1 2 3 4 5 V
?15Non linearity determination- 62- -
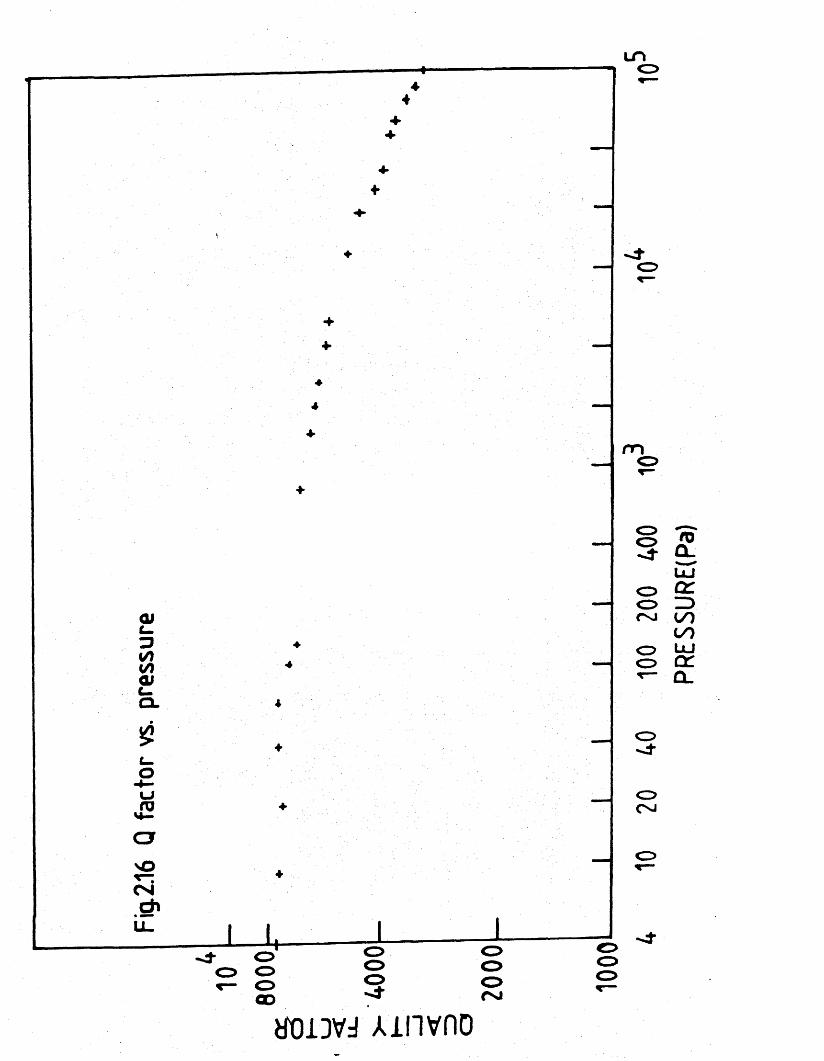
Fig.2.
16
Q fa
ctor
vs
. pr
essu
re
HoiDVd Ainvno
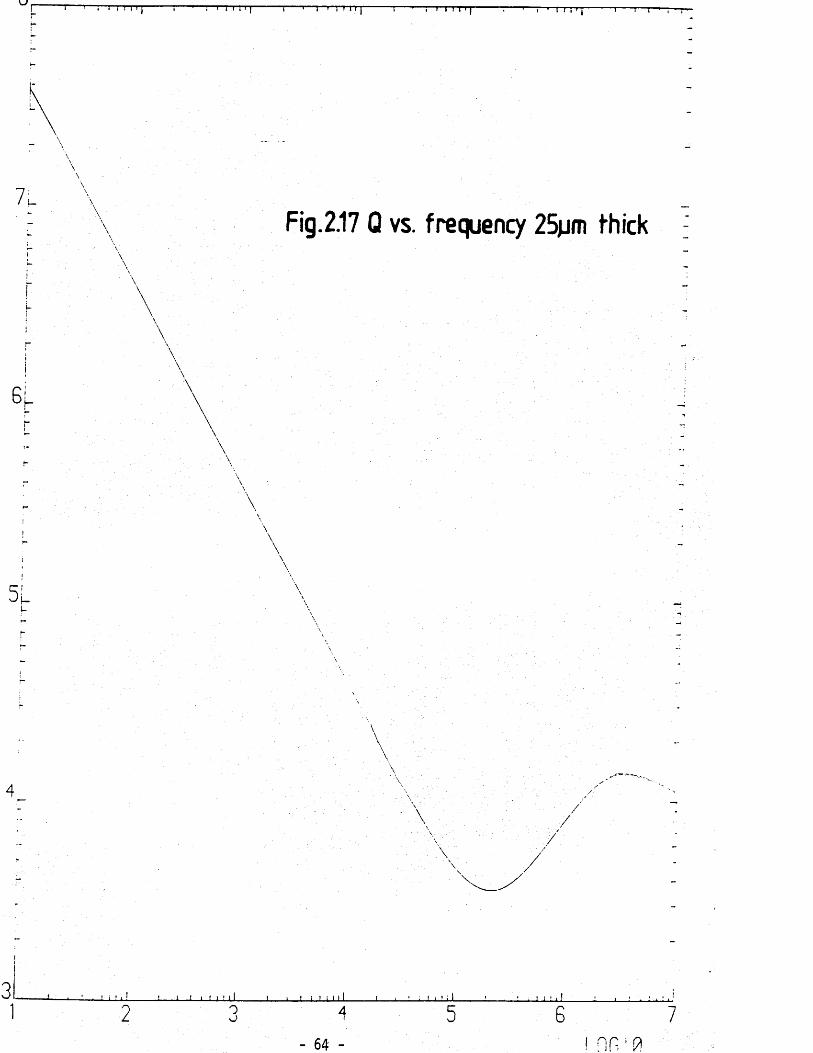
Fig.2.17 Q vs. frequency 25ym thick
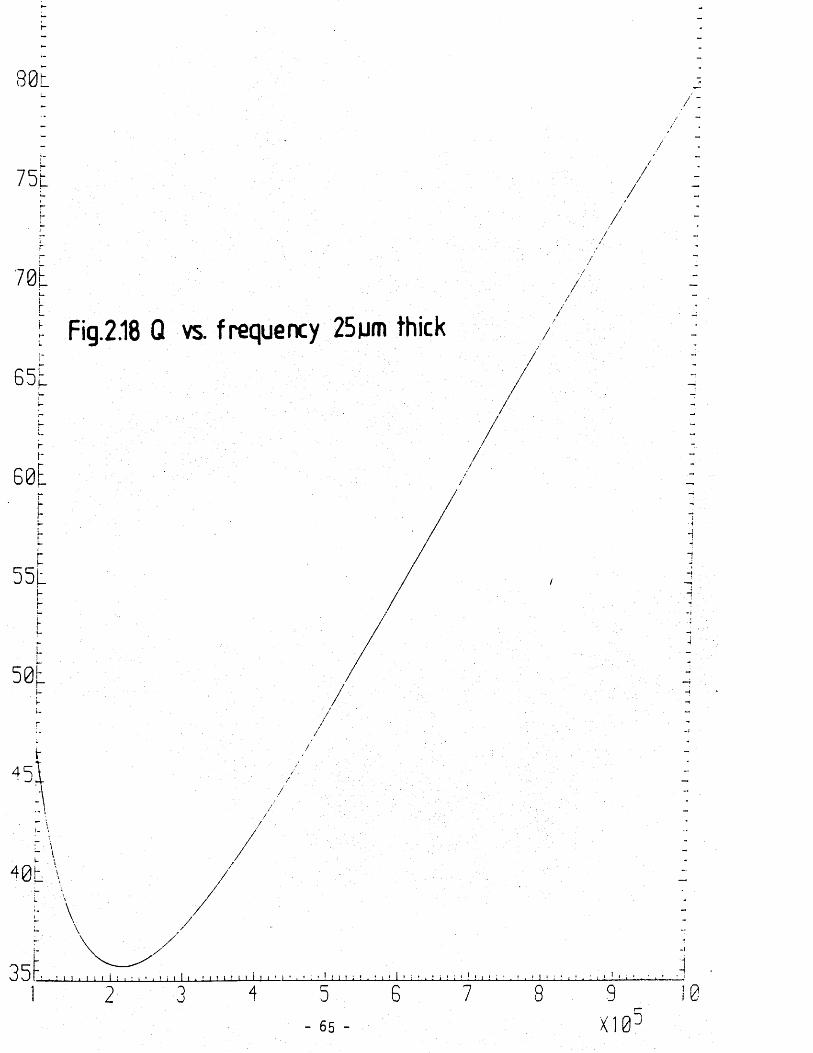
vs. frequency 25um thick
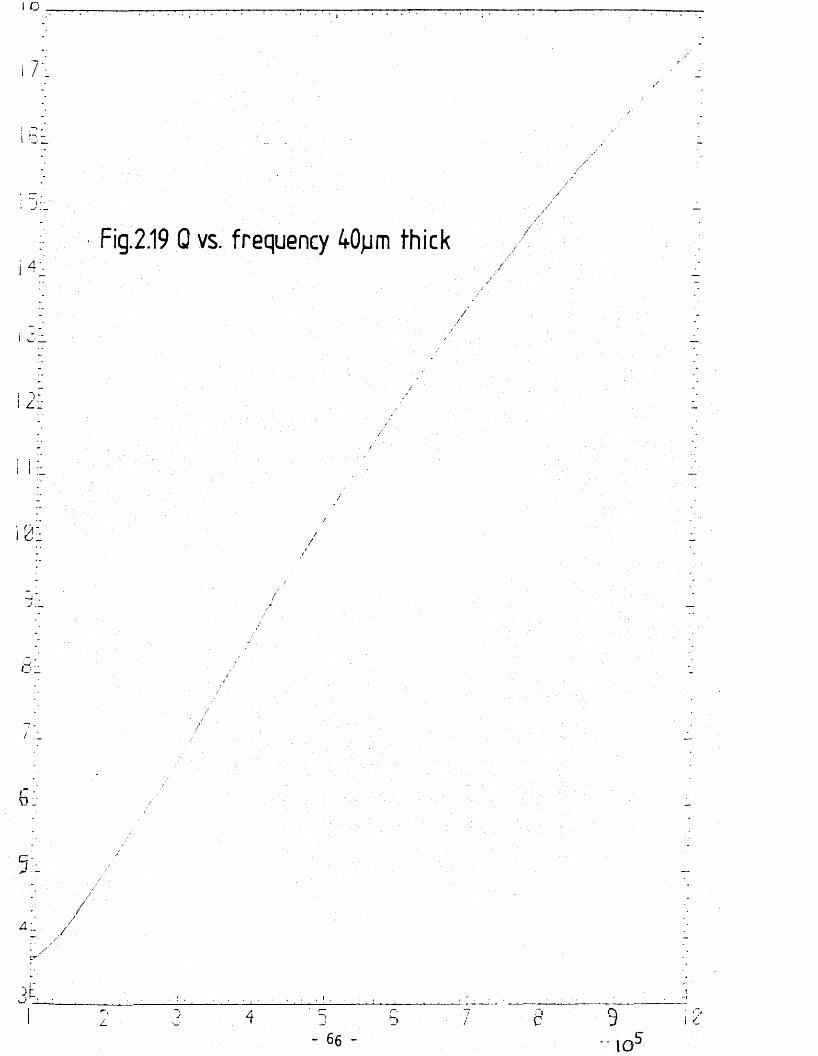
i r .
i 0
Fig.2.19 0 vs. frequency 40jjm thicki 4 '-

Q vs. frequency 8ym thick
LOG 1067
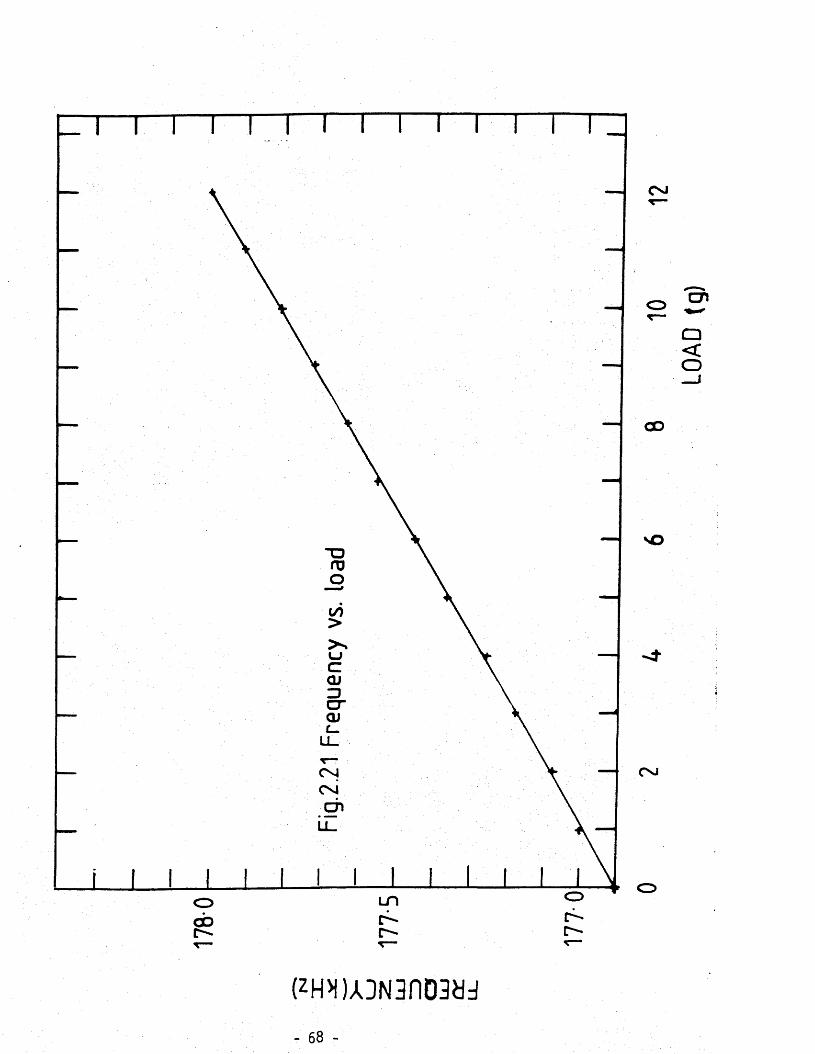
zn—i—i—i—i i i i i i i i i n
(zH'l)A3N3nD3yd- 68 -
LOAD
tg
)
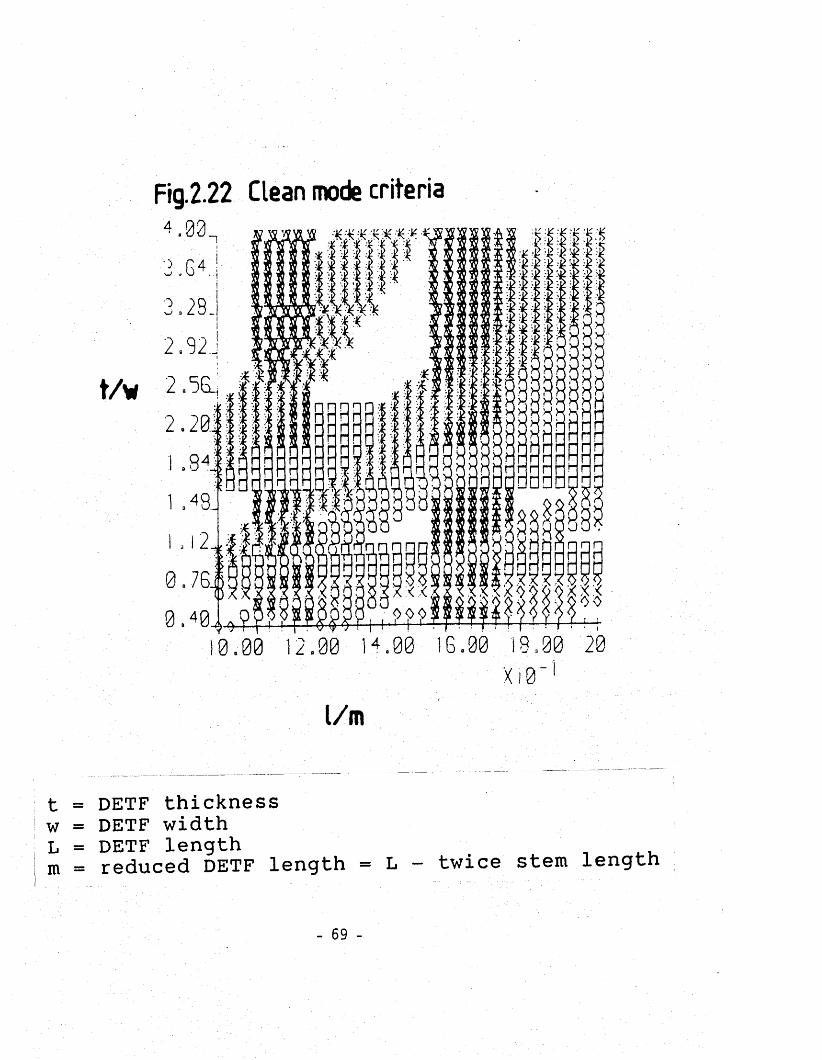
t /v
Ffg.2.22 Clean mode criteria
2 , 3 z .
OX.XX
10.00 12.00 H . 00 I B . 00 19.00 20X i 0 ~ r
l/m
t = D E T F t h i c k n e s s w = D E T F w i d t h L = D E T F l e n g t h m = r e d u c e d D E T F l e n g t h = L - t w i c e s t e m l e n g t h
- 69 -
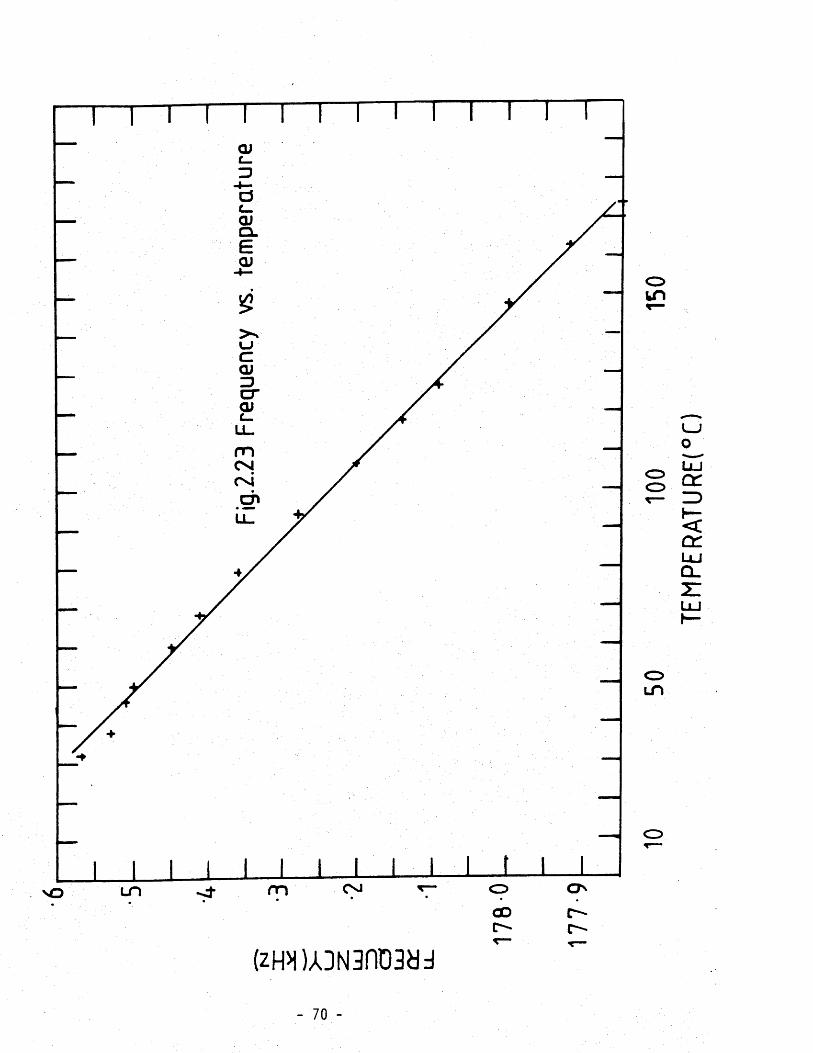
CL
c r
mCMCMch
mco
oin
<z><z>
oin
(zM)A3N3nt)3U3
- 70 -
TEM
PERA
TURE
(°C)
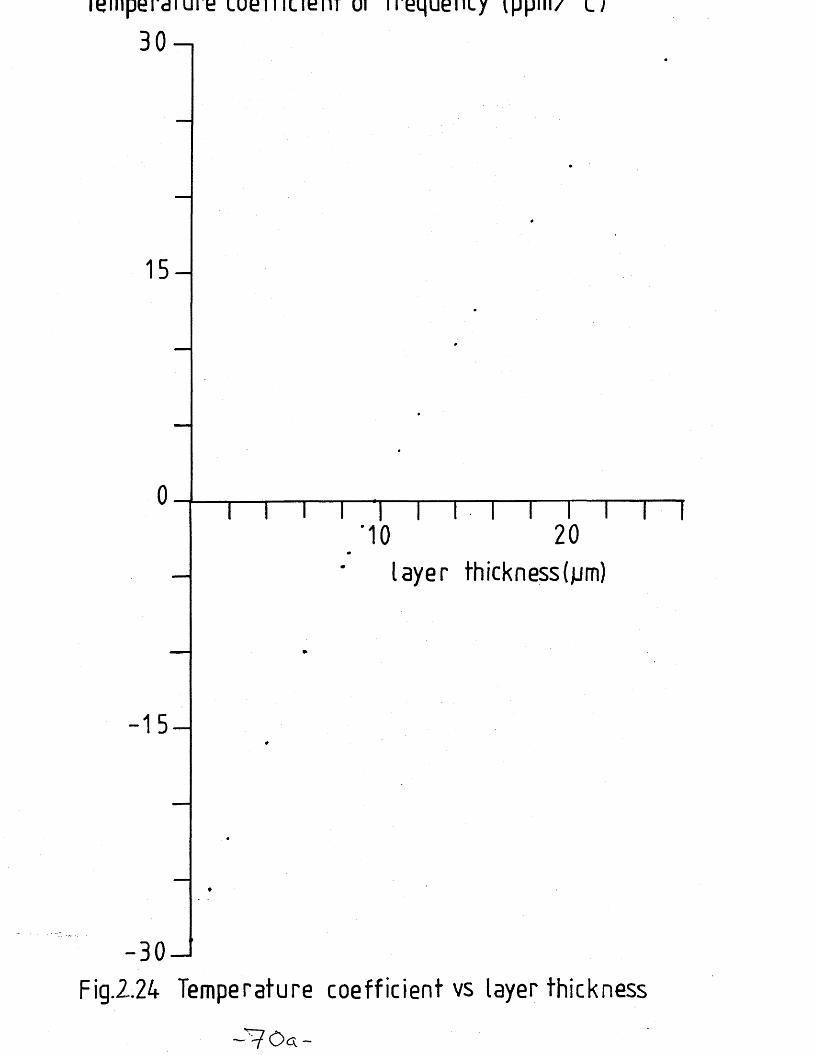
lemperaiure cueTriuem ot i requeue/ l ;
B 0- ,
1 5 -
0
-1 5 -
'101— I— I— I [
20layer thickness (jum)
-30-Fig.2.24 Temperature coefficient vs layer thickness
~ V 0 < x -

Batch 1
Frequency (kHz) Q (1 atm) Q (vacuum)
196 870 3173262 800 5900
408 930
502 3600 8800606 1000
Batch 2
114 400 470178 3100 7550273 250 250408 190 210
450 Continuous vibration610 390 420
Mode iden tif ica tion batch 2 Frequency (kHz)
114 FUNDAMENTAL IN PHASE BEAM
178 FUNDAMENTAL ANTIPHASE BEAM
273 FIRST OVERTONE IN PHASE BEAM
408 FIRST OVERTONE ANTIPHASE BEAM
450 FUNDAMENTAL IN PHASE TUNING FORK
610 FUNDAMENTAL ANTIPHASE TUNING FORK
Table 2.1 Mode Quality Factors at atmospheric pressure
and in vacuum
- 71 -

Mode Frequency (kHz) Mp x 10"6/Pa Mt x 10"6/°C
M01 85 3.55 47
M02 86 3.21 -84
MQ2 -M00 97 4.07 -42
M03 172 : 2.65 -29
M04 260 1.03 -32
M05 432 0.45 -20
M06 587 0.32 -16
M07 758 0.83 - 9
M08 958 1.29 -8 .5
M10 296 3.60 - 9
M11 318 3.22 -33
M12 384 0.77 -15
M13 458 1.37 -
m14 584 0.80 -17
M15 691 0.61 -13
M16 823 1.12 -11
Table 2.2 Pressure Transducer:Pressure and
temperature s en s it iv it ies
- 72 -
CHAPTER 3
DETECTION TECHNIQUES FOR SILICON RESONATOR VIBRATIONS
3.1 Introduction
This chapter describes the optical techniques which have been used,
during the course of this work, to detect the vibrations of the Silicon
resonators. I n i t i a l l y however, the background to this work is given
in the form of existing e lectrica l detection techniques and the optical
detection techniques which have been used by other workers in the f ie ld .
Then section 3.4 describes a detection technique based on an a l l f ib re
Fabry Perot interferometer and section 3.5 describes the logical
extension of this technique using a single mode 2 x 2 coupler. A version
of this system, implemented in multimode f ib re is then described and
i ts differences, advantages and disadvantages pointed out. In section
3.7 a detection scheme based on intensity modulation of the incident
l ig h t is described. F inally possible sensor multiplexing schemes are
discussed.
3.2 E lec tr ica lly based detection
3.2.1 Introduction
This section gives a b r ie f description of the e lec trica l techniques which
have been used to date to detect the vibrations of Silicon resonators.
These are capacitative, piezoresistive, magnetic/optical and piezoelectric . All of these can also be used as methods of exciting vibrations as
described in section 4 .2 .
3 .2 .2 Capacitative detection
The capacitance of a parallel plate capacitor is given by
C = eA (3 .1)d
where e = permittivityFm
A = area of plate m2
d = separation m
- 73 -

Thus a variation in any of e, A and d w il l produce a capacitance
change. For resonator vibrations the variation in d has been used
by Greenwood (6 ) to produce a capacitance change. One plate of the
capacitor is formed by the resonator and the other by an external
electrode aligned paralle l to the surface of the resonator. For the
pressure transducer described in this report this gives a capacitance
of 1 pF for a 10pm plate spacing. A vibration of amplitude 1pm would
cause a capacitance change of 0. 1 pF neglecting edge and angle e ffec ts .Such small changes can be measured using a capacitance bridge in conjunction
with a high common mode rejection ra tio am plifier. The sens it iv ity of
the change in capacitance with d is given by
S = 3C = eA (3.2)
3d d2
and thus the sens it iv ity increases as the plates become closer.However manufacturing tolerances and e lectrosta tic attenuation between
the plates, l im i t how small d can be.
3 .2 .3 Piezoresistive detection
This re lies on the change with stress of the value of a resistor
fabricated by standard integrated c irc u it processes in Silicon. When
a resistor formed in Silicon is stressed along its length, not only does
the length and cross sectional area change (because of the Poissons
ra tio e ffec t) but also the re s is t iv ity changes. The re s is t iv ity change
has i ts origin in changes in the c a rr ie r mobility with stress. The
ra tio of the percentage change in resistance to percentage change in
length is known as the gauge factor k and is given by
k = AR/R = ± 1 + 2p + 8p/p (3.3)
AL/L 3L /L
where
u = Poissons ra tio
p = re s is t iv ity ftm
In Silicon gauges of p type material increase the ir resistance with
increasing s tra in , whereas n type gauges decrease th e ir resistance.
Silicon has a very high gauge factor of around 100, but k is a function
of s tra in . Piezoresistive strain gauges are normally used in Wheatstone
bridge configuration. I f a ll the resistors are in i t i a l l y balanced and
- 74 -
of value R, then, as one varies by AR with strain the output voltage
of the bridge is given by
Vo - Vs AR (3.4)4R + aR
and i f aR is small
Vo : Vs — (3 .5)
jneiThe main problem withApiezoresistors is that above 150°C they can no
longer be distinguished from the resistance of the background m aterial.
Thus th e ir high temperature operation is lim ited.
3 .2 .4 Magnetic/optical detection
This technique (2) is rather complex and is shown in Figure 3 .1 . The
principle of operation is as follows: l ig h t from an optical f ib re is
collimated by a gradient index lens and reflected by an external paddle
of Silicon onto a photodiode. The current from the photodiode, which has
no e le c tr ic a l power supply, is su ffic ien t to power a small coil wrapped
around a softiron core. Behind the Silicon paddle a small permanent magnet is attached. The mirror is deflected by the induced magnetic
f ie ld and the reflected l ig h t misses the photocell and the coil is no
longer activated. The paddle is therefore forced into continuous osc il la tion
and the photodetector current can be sampled to provide the output signal. This scheme is a ttrac tive since i t requires neither previous knowledge of
the devices resonant frequency, nor a search routine b u il t into the
electronics to find the resonance. However, as mentioned e a r l ie r , the
system is complex, and requires a magnet to be bonded to the resonator. I t
is not known whether the magnet, the adhesive or the bonding process w ill a ffec t the lifetim e or s ta b i l i ty of the devices. Additionally photodiodes
cannot be operated above 150°C so i f the environment has a high temperature
requirement then this system must be modified. Also this system is for
torsional vibration and most Silicon resonators to date have used flexural vibrators. However i t may be possible to adapt the system fo r flexural
vibrations.
- 75 -
5 P iezoelectric detection
Layers of ZnO or CdS may be sputtered onto the surface of a Silicon
resonator. Both these materials are piezoelectric and thus a stress
produced by the resonator vibrations w ill produce an e lectrica l output
across the sputtered layer. A major problem with layers deposited
direc tly on the resonator is that they may be of s ignificant dimensions
with respect to the Silicon resonator i t s e l f . Thus the piezoelectric
layer may have a s ign ificant e ffect on the s ta b i l i ty , Quality factor
and li fe t im e of the resonator as a whole.
A more a ttrac tive scheme may be to bond the piezoelectric layer outside
the resonator i t s e l f and detect vibrations coupled out of the resonator. This avoids the effects on the resonator i t s e l f of the piezoelectric
layer but suffers from a small sensitiv ity to resonator vibrations
particu larly for balanced structures such as a tuning fork. In this
method bulk ceramics such as PZT may be used as the piezoelectric material.
6 Conclusions
The above systems a l l require some e lectrica l components and are thus
not in tr in s ic a l ly immune to radio or electromagnetic interference and
they are not in tr in s ic a l ly safe. Only the magnetic/optical detection
scheme may be capable of remote operation since i t is compatible with
optical f ib re technology. Above temperature of 150°C only capacitative
or piezoelectric detection may be used with the la t te r being not well
established. Thus in applications where these factors are of paramount importance optical detection, at present, seems the only a lte rna tive .
3 Optically based detection
1 Introduction
The perceived advantages and attractions of optical fibres are well
documented (1) and much discussed. These are in tr ins ic safety, in tr ins ic
immunity to electromagnetic interference, corrosion resistance,
lightness, cheapness and the fact that the sensor may be remotely
interrogated with an optical f ib re . This section provides a background
to the a ll optical detection work in this thesis as i t describes the
a l l optical detection techniques used by other researchers in the f ie ld- 76 -
to interrogate the vibrations of Silicon resonators. The section
is not intended to be a discussion of optical vibration sensing
systems, this has been provided in detail in reference 28. The aim
of this section is to describe these systems sp ec if ica lly developed
fo r Silicon sensors. These systems have the special constraints that
they should be compatible with small resonators, should enable simple
multiplexing of sensors and should be capable of deployment in a
practical sensing environment.
These a l l optical systems d i f fe r from the magnetic/optical system
described in section 3 .2 .4 since they avoid the use of e lec tr ica l components at the sensor head. All e lectrical components are or can
be situated remotely at the source end of the system.
3 .3 .2 Optically based detectionrother schemes
Figure 3.2 shows an optical system f i r s t described by Venkatesh & Culshaw (29)
In this system the l ig h t is s p l i t by a 50/50 beam s p l i t te r and ha lf isfrequency shifted, by 80 MHz, by a bulk optic Bragg c e l l . The other
ha lf is directed onto the resonator and is Doppler frequency shifted by
the vibrations of the resonator. Detection of the resonator vibrationsis accomplished by in terfering the two frequency shifted beams on asquare law photodetector and analysing its output for frequency
components. The signal is in the form of a central mixing peak at80 MHz with sidebands at frequencies shifted by the frequency of v ibration.The system represents a useful and sensitive (< 1 nm) bulk optic technique
fo r sensing Silicon resonator vibrations but i t is a d i f f i c u l t system to
implement in optical f ib re . This is because, at present, there is no
a l l f ib re frequency sh ifte r available commercially.However should a
frequency sh ifte r become available the system is s t i l l complex. A useful interim system could use a Bragg cell with pigtailed f ib re input and
output.
A second system; recently described by Venkatesh & Novak (30); which they
have interpreted as based on intensity modulation of a laser beam
caused by motion of the resonator along the fib re axis. The mechanism
of the intensity modulation is changes in the f ib re to resonator
longditudinal separation and t i l t , both cause changes in the in tensity
- IT -
of the l ig h t reflected back into the f ib re . As is shown la te r in
Section 3 .5 .2 a larger in tensity variation is caused by changes in the
t i l t than by changes in longditudinal separation. Thus this system
seems more suitable for torsional rather than flexural vibrations.
Intensity based detection systems are in tr in s ic a l ly less sensitive than
phase based systems so this system w ill require larger vibrational
displacements. However a recent paper (31) has suggested that this
system may detect displacements as small as 1 nm which w ill be
adequate for a practical sensor system.
3.4 All f ib re Fabry Perot based detection of vibrations
3.4.1 Introduction
Resonator vibrations were i n i t i a l l y detected using a system based on a
single mode optical fibre Fabry Perot (FP) interferometer (32). This
section summarises the key theory for a FP interferometer, then
describes an experimental f ib re FP interferometer and the theory and
application of the system to sense the vibrations of a Silicon resonator.
The methods used by other workers to compensate for environmentally
induced fluctuations in the interferometer’ s optical length are
summarised and two suggestions are made to avoid this s en s it iv ity in the
vibration sensing system.
3 .4 .2 Theory of the Fabry Perot interferometer
The key results for a Fabry Perot may be obtained by analysis of an
optical plane wave incident on a lossless d ie lec tr ic of re fractive
index n as shown in Figure 3.3 A- is defined as the input il lum ination ,
A the output reflection and Ay the output transmission. The components
of A^are R1, R2, R3, ___ RN, representing a wave reflected N+1 times;the components of A^are T1, T2, T3, TN representing a wave reflected
N times. A11 components are transmitted twice, in i t i a l l y to couple into
the cavity and f in a l ly to couple out. At each interface assume r . and
r^ represent the internal and external reflection coefficients and t..
and t the internal and external IVanswKsie coeffic ients. HencesR1 = r A, T1 = t . t , A , e ' j 6 / 2e i e i i
er i t i Ai e ° TZ = t erV t i Ai e ° ^ (3.6)
er i 2ti Ai e‘ ljS T3 = t er 1" t .A .e '5 jS /2
- 78 -
with 5 representing the phase delay caused by trav e ll in g a distance
21. I t is evident that the RN and TN terms form an in f in i te geometrical
progression and thus may be summed to find and Ay.
Assuming r = ~re , t j = i - t cand substituting for the r e f le c t iv i t y R = r
and the tran sm ittiv ity T = t . 2 gives for the sum
— = AR AR = Fsin26 / 2
I.j A A 1 + Fsin26 / 22
and
JT = a t AT< (3 .7 )
I n- A Ai 1 + Fsin 6 / 2
with the cavity finesse F = 4R/(1-R ) 2
The sharpness of the transmission peaks is given by the fringe
finesse which may be calculated from
f ' = tt/F (3 .8 )
2For a cavity defined by a d ie le c tr ic medium sandwiched between two
others the r e f le c t iv i ty is low producing fringes with poor sharpness.
The re f le c t iv i ty is generally improved by depositing mirrors made of highly reflecting metal or by using mirrors of highly re fle c t in g
multilayer films. In the case of deposited metal mirrors equations
3.7 s t i l l apply but 6 must include the phase s h if t produced on
reflection from metal s.and the loss in the metal must be taken into
account.
3 .4 .3 Fibre Fabry Perot interferometer (FFPI)
A single mode FFPI which behaves e ffec tive ly as the d ie le c tr ic slab
analysed in section 3.4.1 has been realised, based upon the work reported
in reference 32, and is shown in figure 3 .4 . The collimated l ig h t
from a 2mW HeNe laser (Scientifica Cook ISL2) was passed through a
cube beam s p l i t te r (Melles Griot 03BC027); half the l ig h t being
immediately lost. The remaining ha lf was focussed using a s ing let lens
- 79 -
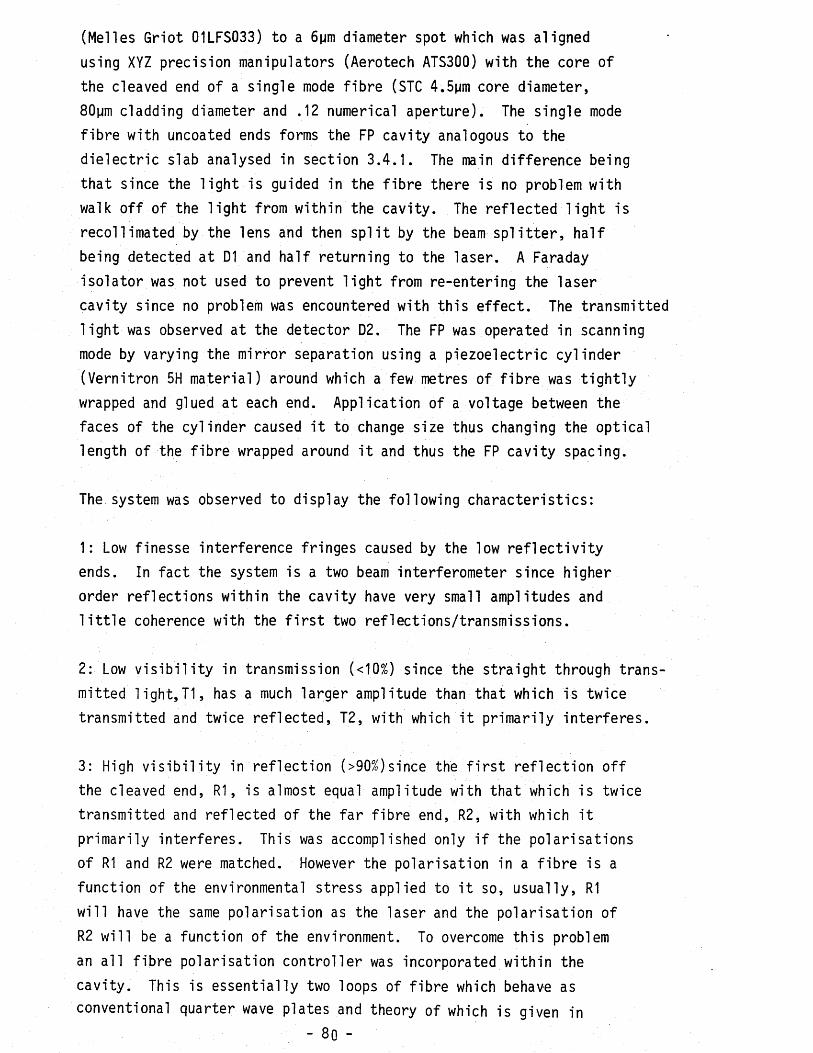
(Melles Griot 01LFS033) to a 6pm diameter spot which was aligned
using XYZ precision manipulators (Aerotech ATS300) with the core of
the cleaved end of a single mode f ib re (STC 4 . 5pm core diameter,
80pm cladding diameter and .12 numerical aperture). The single mode
f ib re with uncoated ends forms the FP cavity analogous to the
d ie lec tr ic slab analysed in section 3 .4 .1 . The main difference being
that since the l ig h t is guided in the f ib re there is no problem with
walk o ff of the l ig h t from within the cavity. The reflected l ig h t is
recollimated by the lens and then s p l i t by the beam s p l i t t e r , ha lf
being detected at D1 and half returning to the laser. A Faraday
isolator was not used to prevent l ig h t from re-entering the laser
cavity since no problem was encountered with this e ffe c t . The transmitted
l ig h t was observed at the detector D2. The FP was operated in scanning
mode by varying the mirror separation using a piezoelectric cylinder
(Vernitron 5H material) around which a few metres of f ib re was t ig h t ly
wrapped and glued at each end. Application of a voltage between the
faces of the cylinder caused i t to change size thus changing the optical length of the fib re wrapped around i t and thus the FP cavity spacing.
The system was observed to display the following characteristics:
1: Low finesse interference fringes caused by the low r e f le c t iv i ty
ends. In fact the system is a two beam interferometer since higher
order reflections within the cavity have very small amplitudes and
l i t t l e coherence with the f i r s t two reflections/transmissions.
2: Low v is ib i l i t y in transmission (<10%) since the straight through transmitted l ig h t ,T 1 , has a much larger amplitude than that which is twice
transmitted and twice reflected, T2, with which i t primarily in terferes .
3: High v is ib i l i t y in reflection (>90%)since the f i r s t re flection o ff
the cleaved end, R1, is almost equal amplitude with that which is twice
transmitted and reflected of the fa r fib re end, R2, with which i t
primarily interferes. This was accomplished only i f the polarisations
of R1 and R2 were matched. However the polarisation in a f ib re is a
function of the environmental stress applied to i t so, usually, R1
w ill have the same polarisation as the laser and the polarisation of
R2 w il l be a function of the environment. To overcome this problem
an a l l f ib re polarisation controller was incorporated within the
cavity . This is essentially two loops of f ib re which behave as
conventional quarter wave plates and theory of which is given in- 8o -
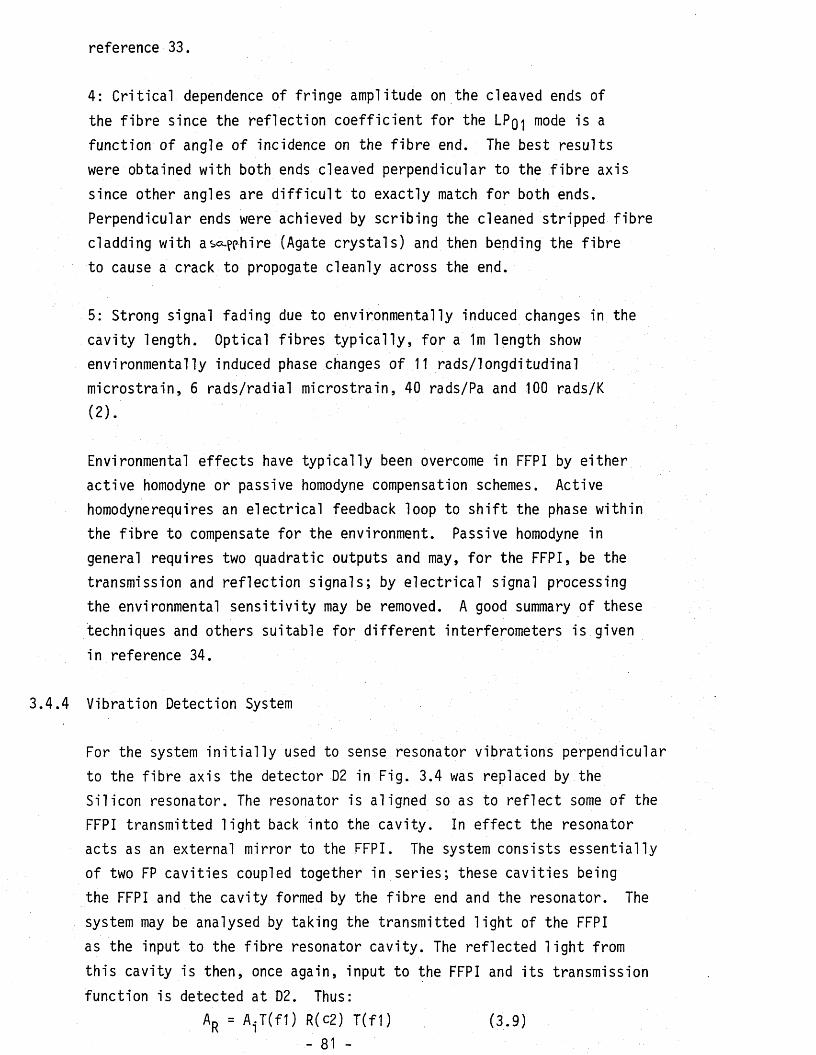
reference 33.
4: C rit ica l dependence of fringe amplitude on the cleaved ends of
the f ib re since the reflection coeffic ien t for the LPq mode is a
function of angle of incidence on the f ib re end. The best results
were obtained with both ends cleaved perpendicular to the f ib re axis
since other angles are d i f f ic u l t to exactly match for both ends.
Perpendicular ends were achieved by scribing the cleaned stripped fib re
cladding with aso-pphire (Agate crystals) and then bending the f ib re
to cause a crack to propogate cleanly across the end.
5: Strong signal fading due to environmentally induced changes in the
cavity length. Optical fibres ty p ic a lly , fo r a 1m length show
environmentally induced phase changes of 11 rads/longditudinal microstrain, 6 rads/radial microstrain, 40 rads/Pa and 100 rads/K
( 2 ) .
Environmental effects have typ ica lly been overcome in FFPI by e ither
active homodyne or passive homodyne compensation schemes. Active
homodynerequires an e lectrical feedback loop to s h if t the phase within
the fib re to compensate for the environment. Passive homodyne in
general requires two quadratic outputs and may, fo r the FFPI, be the
transmission and reflection signals; by e lec trica l signal processing
the environmental sens itiv ity may be removed. A good summary of these
techniques and others suitable for d if fe ren t interferometers is given
in reference 34.
3 .4 .4 Vibration Detection System
For the system i n i t i a l l y used to sense resonator vibrations perpendicular
to the f ib re axis the detector D2 in Fig. 3.4 was replaced by the
Silicon resonator. The resonator is aligned so as to re f le c t some of the
FFPI transmitted l ig h t back into the cavity. In e ffec t the resonator
acts as an external mirror to the FFPI. The system consists essentially
of two FP cavities coupled together in series; these cavities being
the FFPI and the cavity formed by the f ib re end and the resonator. The
system may be analysed by taking the transmitted l ig h t of the FFPI
as the input to the fib re resonator cavity. The reflected l ig h t from
this cavity is then, once again, input to the FFPI and its transmission
function is detected at D2. Thus:Ar = Ai T(f1) R(c2) T ( f 1) (3.9)
- 81 -
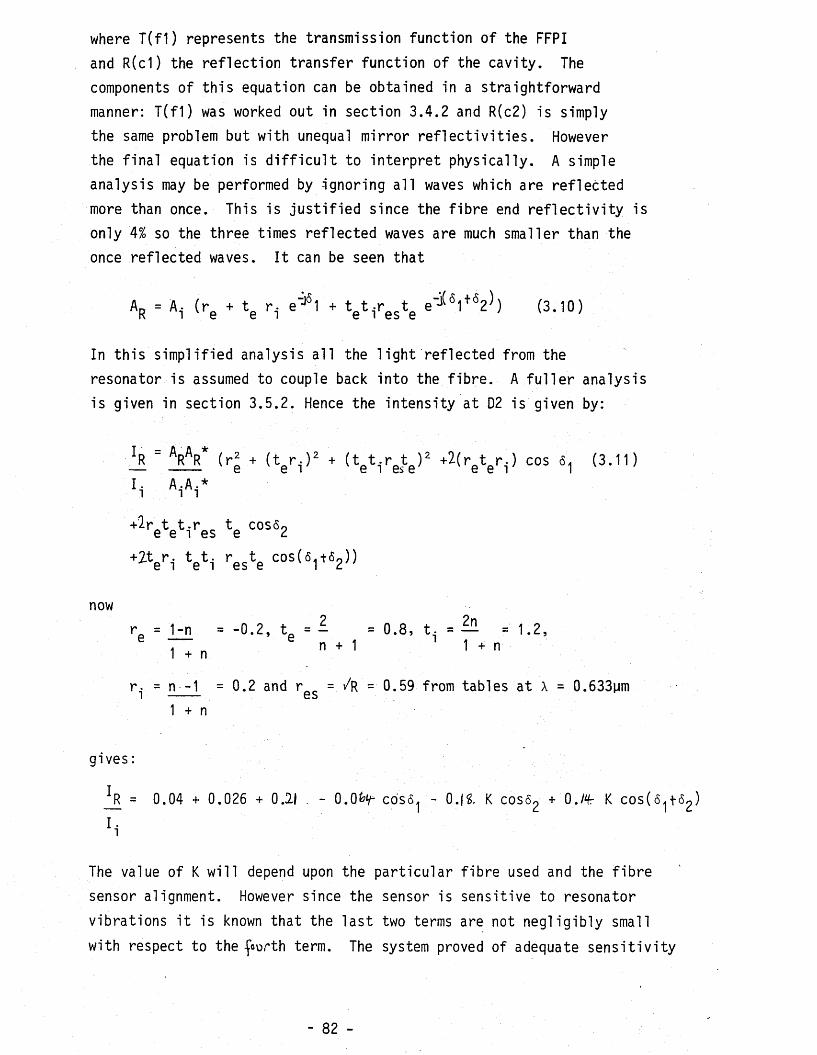
where T(f1) represents the transmission function of the FFPI
and R(c1) the reflection transfer function of the cavity. The
components of this equation can be obtained in a straightforward
manner: T(f1) was worked out in section 3 .4 .2 and R(c2) is simply
the same problem but with unequal mirror r e f le c t iv i t ie s . However the f in a l equation is d i f f i c u l t to in terpret physically. A simple
analysis may be performed by ignoring a l l waves which are reflected
more than once. This is ju s t i f ie d since the fib re end r e f le c t iv i ty is
only 4% so the three times reflected waves are much smaller than the
once reflected waves. I t can be seen that
AR = Ai ( r e + r i e ’j51 + t et i r est e (3 - 10>
In this simplified analysis a l l the l ig h t reflected from the
resonator is assumed to couple back into the f ib re . A f u l le r analysis
is given in section 3 .5 .2 . Hence the intensity at D2 is given by:
^R ARAR* ( r 2 + (tgi^ . ) 2 + ( t g V g t g ) 2 +2(ret er i ) cos 61 (3.11)I A A *
■ i ■ i Mi
■ ^ J ^ t . r C0S59e e i es e 2
+2V i V i
nowr = 1-n = - 0 . 2 , t = - = 0 .8 , t , = — = 1 . 2 ,
~ n 1 1 + n
r i = n = 0*2 and r gs = /R - 0.59 from tables at A = 0.633pm
1 + n
gives:
*R = 0.04 + 0.026 + 0.2.1 . - O.O^f cos6 - 0.(1 K cosS + 0 JHr K cos(6^t62)
! i
The value of K w il l depend upon the particular f ib re used and the f ib re
sensor alignment. However since the sensor is sensitive to resonator
vibrations i t is known that the las t two terms are not negligibly small
with respect to the {oorth term. The system proved of adequate s e n s it iv ity
- 82 -
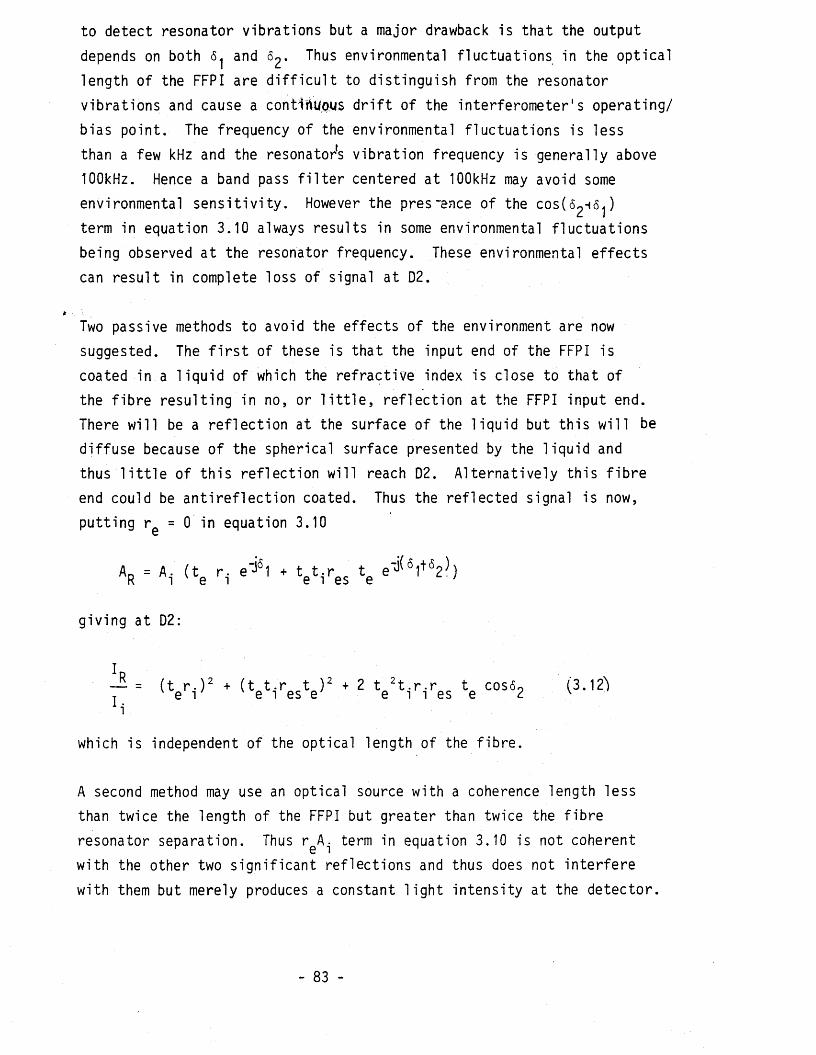
to detect resonator vibrations but a major drawback is that the output
depends on both 5 and ^hus environmental fluctuations in the optical
length of the FFPI are d i f f ic u l t to distinguish from the resonator
vibrations and cause a contiftUQUS d r i f t of the interferometer' s operating/
bias point. The frequency of the environmental fluctuations is less
than a few kHz and the resonator's vibration frequency is generally above
100kHz. Hence a band pass f i l t e r centered at 100kHz may avoid some
environmental s e n s it iv ity . However the pres ~ence of the c o s ^ - * ^ )
term in equation 3.10 always results in some environmental fluctuations
being observed at the resonator frequency. These environmental effects
can result in complete loss of signal at D2.
Two passive methods to avoid the effects of the environment are now
suggested. The f i r s t of these is that the input end of the FFPI is
coated in a l iqu id of which the refractive index is close to that of
the f ib re resulting in no, or l i t t l e , re flection at the FFPI input end.
There w ill be a re flection at the surface of the liqu id but this w il l be
diffuse because of the spherical surface presented by the liqu id and
thus l i t t l e of this reflection w ill reach D2. A lternatively this f ib re
end could be a n tire flec tio n coated. Thus the reflected signal is now,
putting r e = 0 in equation 3.10
AR = Ai ( t e r i e'j6' + t et 1res *e
giving at D2:
I,_R ( t r . ) 2 + ( t t - r t ) 2 + 2 t 2t . r . r t cos60 (3.12^ v e i e i es e e i i es e 2 v
which is independent of the optical length of the f ib re .
A second method may use an optical source with a coherence length less
than twice the length of the FFPI but greater than twice the fib re
resonator separation. Thus r A.j term in equation 3.10 is not coherent
with the other two significant reflections and thus does not in terfere
with them but merely produces a constant l ig h t intensity at the detector,
- 83 -
In both of these methods the input end of the f ib re would be polished
or cleaved at an angle to the fib re axis so that back reflected l ig h t
would emerge at an angle to the f ib re axis and thus would not re-enter
the source cavity and thus could be detected. A lternatively a glass
slide could perform the beam sp lit t in g function. However this would
result in less effic iency of source coupling into the FFPI i n i t i a l l y .
An a lternative to these two schemes was adopted which involves the replacement
of the FFPI by a single mode 2x2 coupler as described in the next section.
3 .4 .5 Conclusions
A length of single mode optical fib re forming a Fabry Perot interferometer
between a Silicon resonator and the aligned f ib re 's perpendicularly
cleaved end is suitable as a sensor for the resonator vibrations.
However care must be taken to avoid the second end of the f ib re also
producing interferences and thus making the system sensitive to
environmental effects on the f ib re . This problem may be solved by using
a source coherence « f ib re length or an index matching f lu id on the
second end.
The use of a bulk optics beam s p li t te r l im its the practical use of this
interferometer although the beam sp lit t in g function may possibly be
performed by an angled cleaved fib re end.
3.5 Single mode 2 x 2 coupler based detection
3.5.1 Introduction
Figure 3.5 shows the 2 x 2 coupler based detection system. The type
of f ib re , the laser, the lens and the resonator are the same as those
described in section 3 .4 .3 , but the FFPI has been replaced by a 2 x 2
coupler. Light is coupled in at port 1, T1, and is s p li t equally, by
power, between arms T2 and T4. The l ig h t reaching T4 is a l l transmitted
since the fib re end is placed in glycerol which has approximately the
same re flec tive index as optical f ib re . Hence T4 has zero r e f le c t iv i ty .
The l ig h t reaching T2 illuminates a Fabry Perot cavity formed by the
cleaved fib re end and the resonator. The reflected signal from this
- 84 -

cavity then travels back down arm 2 and is then equally s p l i t between
arms 1 and 3. The l ig h t in arm 1 returns to the laser cavity and is
lo s t . The l ig h t reaching the detector varies in intensity depending
on the separation of the FP cavity. Thus these intensity variations,
provide a detection method for the resonator vibrations. I t should be
noted that the interferometer output is independent of the f ib re 's
optical length since none of the in terfering l ig h t has any optical path imbalance within the optical f ib re . This is a great a ttraction
of th is system for a practical sensing system.
3 .5 .2 Theory
The in terfering signals are set up at terminal T2, these are, the
wave d irec tly reflected from the end of the fib re and the wave coupled
back into the fib re from the multiple reflections within the cavity formed
by the fib re end and the reflecting surface. By a similar analysis to
that of section 3.4 .2 i t can be shown that the interferometer signal S, the intensity corresponding to which is detected is given by
S = r . + z t . | r | t ( |r |r )m~^|C |e~J m (3.13)i . i 1 s 1 e 1 s 1 e 1 m1 m=1
where r • , r »t and t are the reflection and transmission coeffic ientsof the f ib re a ir interface corresponding to internal and external
incidence, r $ is the reflection coeffic ient of the Silicon resonator andCm is the coupling coeffic ient between the reflection of order m and
the LPQ1 mode. 4>m is the phase delay associated with the path lengthof the multiply reflected wave and m the number of reflections from
the Silicon surface. To obtain a simple and accurate expression
fo r C , the LPg mode can be approximated by a Gaussian beam (35).The situation is similar to calculating the coupling between twomisaligned fibres as a function of th e ir axial separation L, angularmisalignment ip and transverse offset F. The two fibres are formedby the source f ib re and its v irtual image produced behind the Silicon
resonator as i f the resonator were a mirror. In this case however,L, ip and F are determined by the position and t i l t of the source f ib re
with respect to the resonator. From Figure 3.5 i t can be seen, bygeometry, that, for a reflection of order m, L = 2md; ip = 2me andm mFm = 2m2de neglecting second order terms. Hence using the equation for
the splice losses between two misaligned fibres (35) gives
- 85 -
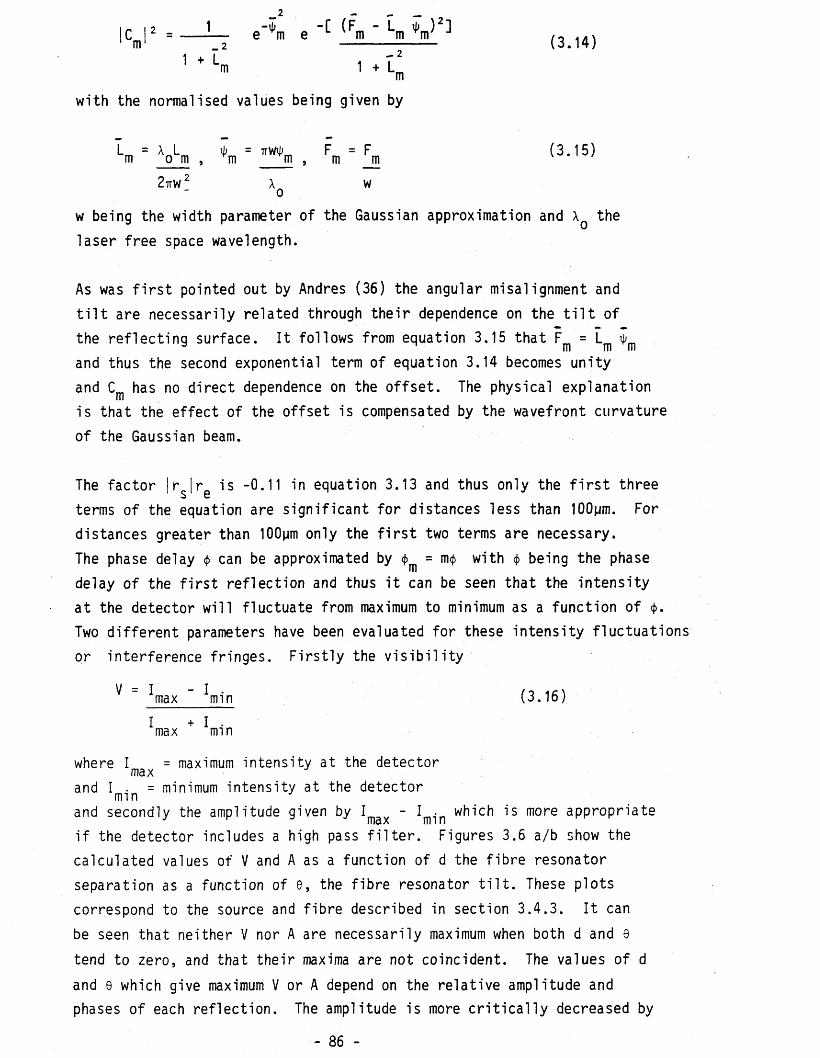
with the normalised values being given by
w
L = X L \ p = i r W t p m F = F (3.15)m o m , ym _m , m _m v
2ttW2 x wobeing the width parameter of the Gaussian approximation and XQ the
laser free space wavelength.
As was f i r s t pointed out by Andres (36) the angular misalignment and
t i l t are necessarily related through th e ir dependence on the t i l t of
the re flecting surface. I t follows from equation 3.15 that = Lm
and thus the second exponential term of equation 3.14 becomes unity
and Cm has no direct dependence on the o ffs e t. The physical explanation
is that the effect of the offset is compensated by the wavefront curvature
of the Gaussian beam.
The factor | r $ | r 0 is -0.11 in equation 3.13 and thus only the f i r s t three
terms of the equation are s ignificant for distances less than 100pm. For
distances greater than 100pm only the f i r s t two terms are necessary.
The phase delay <j> can be approximated by <f>m = m<}> with <j> being the phase
delay of the f i r s t reflection and thus i t can be seen that the in tensity
a t the detector w ill fluctuate from maximum to minimum as a function of <J>.
Two d if fe ren t parameters have been evaluated for these in tensity fluctuations
or interference fringes. F irs t ly the v is ib i l i t y
~ *max ~ *min (3.16)I + I .max mm
where I = maximum intensity at the detector maxand I . = minimum intensity at the detectormmand secondly the amplitude given by I max - I -n which is more appropriate
i f the detector includes a high pass f i l t e r . Figures 3.6 a/b show the
calculated values of V and A as a function of d the fib re resonator
separation as a function of e, the fib re resonator t i l t . These plotscorrespond to the source and f ib re described in section 3 .4 .3 . I t can
be seen that neither V nor A are necessarily maximum when both d and 9
tend to zero, and that the ir maxima are not coincident. The values of d
and e which give maximum V or A depend on the re la tive amplitude and
phases of each re flection. The amplitude is more c r i t ic a l ly decreased by
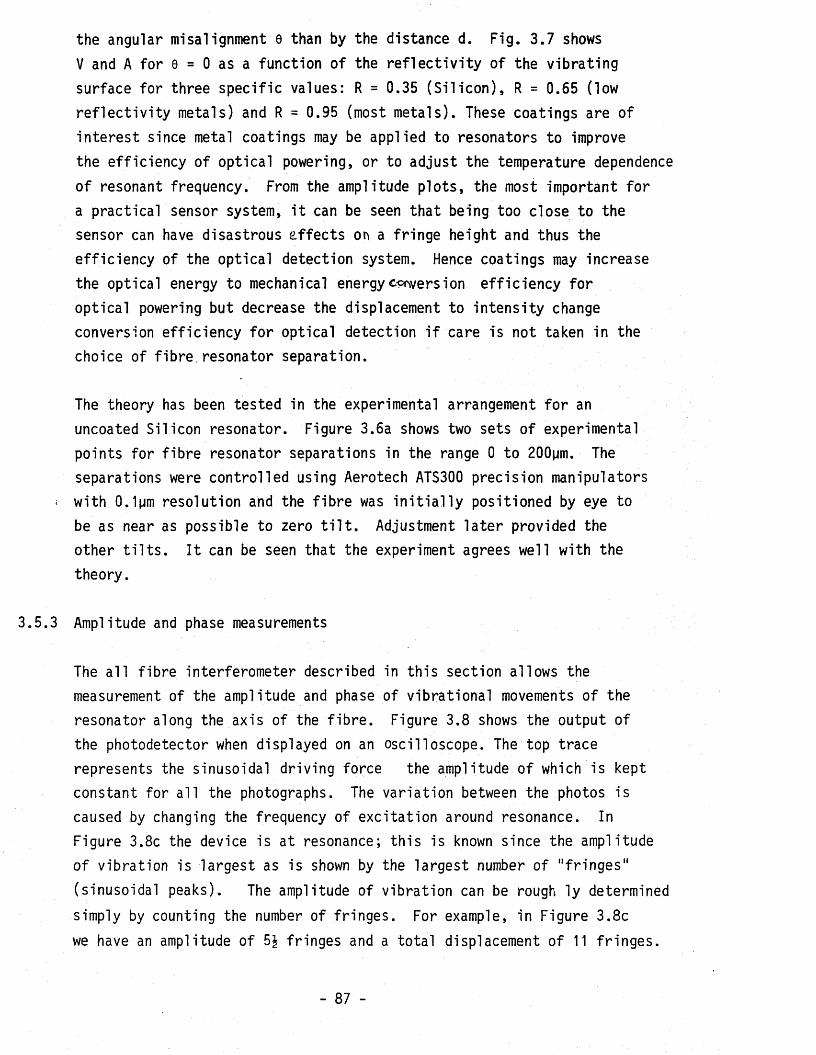
the angular misalignment 0 than by the distance d. Fig. 3.7 shows
V and A for 0 = 0 as a function of the re f le c t iv i ty of the vibrating
surface for three specific values: R = 0.35 (S il ic o n ) , R = 0.65 (low
re f le c t iv i ty metals) and R = 0.95 (most metals). These coatings are of
in terest since metal coatings may be applied to resonators to improve
the efficiency of optical powering, or to adjust the temperature dependence
of resonant frequency. From the amplitude plots, the most important for
a practical sensor system, i t can be seen that being too close to the
sensor can have disastrous effects on a fringe height and thus the
effic iency of the optical detection system. Hence coatings may increase
the optical energy to mechanical energy em ersion e ffic iency for
optical powering but decrease the displacement to in tensity change
conversion effic iency for optical detection i f care is not taken in the
choice of f ib re resonator separation.
The theory has been tested in the experimental arrangement fo r an
uncoated Silicon resonator. Figure 3.6a shows two sets of experimental points for f ib re resonator separations in the range 0 to 200pm. The
separations were controlled using Aerotech ATS300 precision manipulators
* with 0 . 1pm resolution and the f ib re was i n i t i a l l y positioned by eye to
be as near as possible to zero t i l t . Adjustment la te r provided the
other t i l t s . I t can be seen that the experiment agrees well with the
theory.
3 .5 .3 Amplitude and phase measurements
The a l l f ib re interferometer described in this section allows the
measurement of the amplitude and phase of vibrational movements of the
resonator along the axis of the f ib re . Figure 3.8 shows the output of
the photodetector when displayed on an oscilloscope. The top trace
represents the sinusoidal driving force the amplitude of which is kept constant for a l l the photographs. The variation between the photos is
caused by changing the frequency of excitation around resonance. In
Figure 3.8c the device is at resonance; this is known since the amplitude
of vibration is largest as is shown by the largest number of “fringes"
(sinusoidal peaks). The amplitude of vibration can be rough ly determined
simply by counting the number of fringes. For example, in Figure 3.8c
we have an amplitude of 5| fringes and a total displacement of 11 fringes.
- 87 -
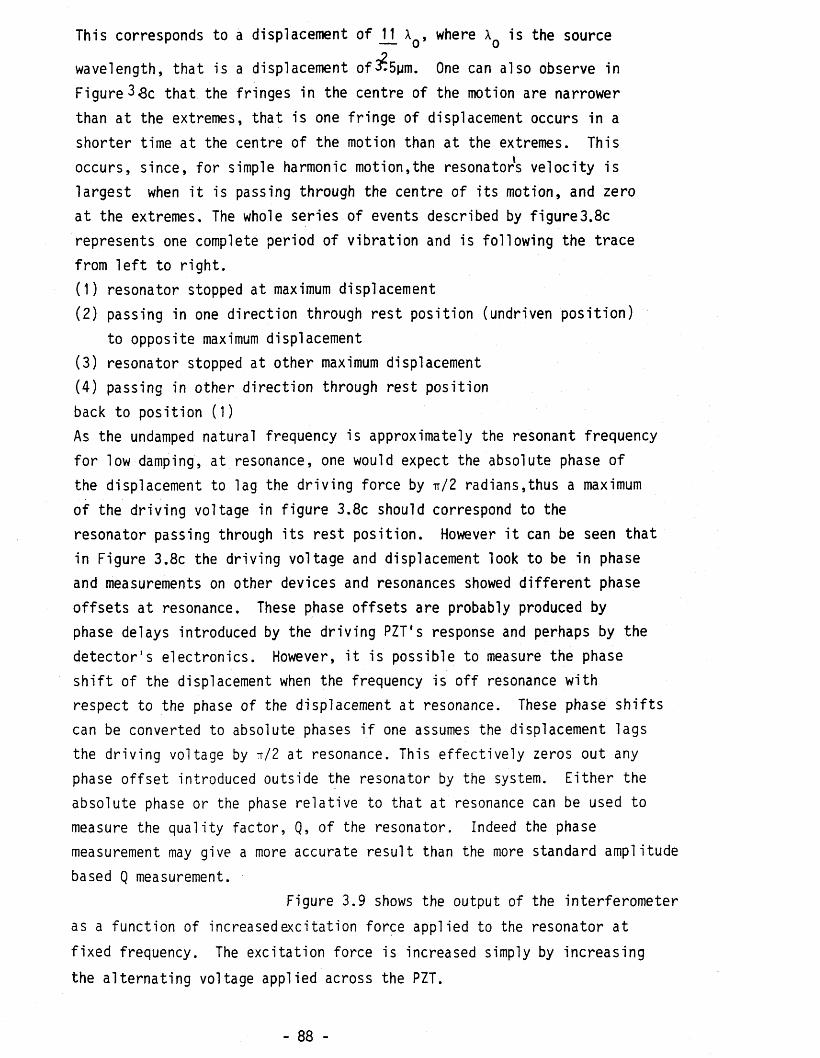
This corresponds to a displacement of _1j_ * 0 > where XQ is the source
wavelength, that is a displacement of3?5pm. One can also observe in
F i g u r e t h a t the fringes in the centre of the motion are narrower
than at the extremes, that is one fringe of displacement occurs in a
shorter time a t the centre of the motion than at the extremes. This
occurs, since, for simple harmonic motion,the resonators velocity is
largest when i t is passing through the centre of its motion, and zero
a t the extremes. The whole series of events described by figure3.8c
represents one complete period of vibration and is following the trace
from l e f t to r igh t.( 1 ) resonator stopped at maximum displacement
( 2 ) passing in one direction through rest position (undriven position)
to opposite maximum displacement(3) resonator stopped at other maximum displacement(4) passing in other direction through rest position
back to position ( 1)As the undamped natural frequency is approximately the resonant frequency
for low damping, at resonance, one would expect the absolute phase of
the displacement to lag the driving force by t t / 2 radians,thus a maximum
of the driving voltage in figure 3.8c should correspond to the
resonator passing through its rest position. However i t can be seen that
in Figure 3.8c the driving voltage and displacement look to be in phase
and measurements on other devices and resonances showed d iffe re n t phase
offsets at resonance. These phase offsets are probably produced by
phase delays introduced by the driving PZT's response and perhaps by the
detector's electronics. However, i t is possible to measure the phase
s h if t of the displacement when the frequency is o ff resonance with
respect to the phase of the displacement at resonance. These phase sh ifts
can be converted to absolute phases i f one assumes the displacement lags
the driving voltage by t t / 2 at resonance. This effective ly zeros out any
phase offset introduced outside the resonator by the system. Either the
absolute phase or the phase re la tive to that at resonance can be used to
measure the quality factor, Q, of the resonator. Indeed the phase
measurement may give a more accurate result than the more standard amplitude
based Q measurement.
Figure 3.9 shows the output of the interferometer
as a function of increasedexcitation force applied to the resonator at
fixed frequency. The excitation force is increased simply by increasing
the alternating voltage applied across the PZT.
- 88 -

As was mentioned e a r l ie r , fo r large displacements, such as those in
Figure 3.9c, the amplitude can be determined by counting the number
of fringes. For smaller displacements i t is f a i r ly straightforward to
make an accurate measurement of the vibration amplitude. F irs t ly the
e q u il ib r iu m distance between the f ib re and the resonator is chosen
so that the interferometer is a t a point of maximum slope Then, as
is shown in Figure 3.10, the amplitude may be obtained from
v =xosin"1- (3,17)4ir A
taking into account only the f i r s t two interferometric re flections .
Thus knowing, A, the fringe height and b, the signal height, bymeasurement one can deduce e- I f b is less than 0.47A one can
oapproximate (3.17) by
=■ v b4tt
V - V - (3.18)A
Thus the wavelength of l ig h t is the reference for amplitudemeasurements and this provides a sensitive technique. Using suitable
amplifying electronics a fr ing e , corresponding to 158nm of displacement,produces a detector output of 2V. Thus 1nm displacement produces asignal of at least 40mV which is quite simply detected. Interferometers
based on lock in amplifiers can typ ica lly detect 1prad of phase changeat these frequencies indicating that the ultimate sens it iv ity of this
-14system may be as low as 5 x 10 m. However lock in techniques would
s ign if ican tly increase the cost and complexity of a practical system
and idea lly suffic ient amplitude of vibration should be excited to avoid
th e ir use.
3 .5 .4 Detector bandwidth requirements
The bandwidth of the detector used for the interferometer to monitor
the resonators vibrations is important. Obviously the bandwidth must be wide enough to follow vibrations at the frequency of resonance. This
is wide enough for vibrations occurring within the linear portion of the
interferometer response curve, that is , when the interferometer is at
quadrature and the amplitude is less than 0.47 A (section 3 .5 .3 ) where
A is the height of a fringe. However at larger amplitudes than th is or
when the interferometer is not at quadrature, the interferometer has
a non linear transfer function and harmonics of the resonant frequency
- 89 -
are introduced into the signal. Figure 3.11 shows the frequency
content of a signal which appeared roughly sinusoidal when viewed
on an oscilloscope. The signal corresponded to less than 1 fringe andthere are frequency components not only at 114 kHz, the frequency
of resonance, but also at 228 kHz and 342 kHz although the harmonics
amplitudes are much smaller than the fundamental. Thus the bandwidth
of the detector must extend to about 350 kHz even though the resonant
frequency is only a t 114 kHz. Figure 3.12shows the same resonant
frequency but this time driving two fringes of amplitude. I t can be
seen that the non linear transfer function of the interferometer
has introduced harmonics up to at least 1 MHz.
Figure 3.13 shows the e ffec t on the fringe pattern of inadequate
detector bandwidth. The fringes produced at the extremes of the
motion are larger than those a t the centre indicating higher detector
gain at the extremes than at the centre of motion. Looking at the
problem in the time domain i t can be seen that, since the resonator is
moving more slowly a t its extremes of motion than when i t passes
through its centre point the response time needs to be faster at the
centre of the motion than the extremes to produce the same output. However, fo r a practical sensor system the amplitude of vibration is
irre levant and this information is not required. So a detector
comprising an am plifier with f l a t gain up to the fundamental frequency, coupled with a band pass f i l t e r centred on the fundamental frequency
would be adequate.
3 .5 .5 Optical source requirements and effects
Because the detection technique is based on interferometry a
coherent optical source is essential. However, the path imbalance
in the interferometer which is the ultimate determinant of the
minimum source coherence length is very small. This path imbalance is
twice the separation of the f ib re terminal T2 and the resonator
(Figure 3 .5 ) . This distance is a maximum of a few hundred microns i f
no lens is included between the fib re terminal T2 and the resonator.
Ideally in a practical set up the source coherence should be s u ff ic ie n tly
^longer than this path imbalance to ensure adequate fringe amplitude.
Longer coherence lengths are not desirable since reflections from
- 90 -
connectors, which w i l l probably be required in a practical system, may
in terfe re with the signal reflections or with reflections from other
connectors. This may have the e ffec t of making a section of fib re
sensitive to the environment thus producing extra noise at the detector.
Additionally the interferometer does not require a polarized source and
has been operated with no change in performance using a randomly polarizedlaser. This may be explained since randomly polarized l ig h t may beconsidered to consist simultaneously of many components of polarized l ig h t
the amplitudes and phases of which are varying sequentially with time.However at the f ib re end near the vibrating element each particular
polarization component w ill produce a transmitted and reflected waveindependently of the others. Since the path difference is independent ofpolarization a l l polarization components w i l l produce the same interferencepattern. This assumes that a particu lar polarization state exists fo r a
time of at least 2d/C where d is the f ib re resonator, separation and C-12is the speed of l ig h t . This is of the order of 10 seconds and proved
no problem in practice. Indeed a randomly polarized laser or a l in e a rly
polarized laser with a Lyot depolariser may avoid problems caused by l ig h t ,
re-entering the laser cavity. These problems occur when the fib re is
brought within a few microns of the vibrating element. Thereafter the
fringe height becomes sensitive to the phase of the l ig h t in coupler arms
T1 and T2 (Figure 3 .5 ) . By putting a heat source near e ither arm i t was
possible to modulate the fringe height in a periodic fashion. This e ffec t
can be explained by considering the l ig h t reflected back into the laser
cavity to produce stimulated emission. This stimulated l ig h t can in te r fe re
destructively or constructively with the laser output depending on th e ir
re la t iv e phases. The phase of the stimulated l ig h t is a function of the
phase of the l ig h t re-entering the cavity which is in turn a function of the mechanical state of the fib re when the fib re is further from the
device there is no such environmental sens it iv ity implying a threshold
of recoupled power necessary to a ffec t the laser output. This seems
reasonable considering the threshold operation of lasing.
The problems of laser intensity noise may be a particular problem i f the
interferometer is illuminated using a poor quality laser diode. These
problems may be avoided using the following technique. The fourth part of
the coupler is s t i l l placed in glycerol but a detector is used to
monitor the transmitted l ig h t in tensity. The
- 91 -

detector output would provide a suitable correction signal for the
laser diodes current.
Source phase noise, which is converted by interferometry to intensity
noise, is not a major problem in this configuration. Generally phase
noise causes greater problems as the path imbalance of an interferometer
increases, so this interferometer, having small path imbalances, is
f a i r l y immune. I t should be noted that this interferometer may be
operated using a very low coherence l ig h t source such as an LED or a
laser diode operated below threshold. These sources ty p ica lly have
coherence lengths of a few tens of microns which would be adequate for
th is interferometer. Additionally they are cheap and generally operate
with lower noise levels than sources using lasing action. But, at present, non laser sources have low irradiance and th is produces lower
power levels in single mode fib res .
3 .5 .6 Requirements for the 2 x 2 coupler
The system described in this thesis was based around a commercially
available fused 2 x 2 coupler. Ideally the coupler should have small loss, be polarization insensitive and have a s p li t t in g ra tio independent
of temperature. All these properties are satisfied by a commercial coupler. Additionally, commercial couplers are available with various
s p li t t in g ratios such as 90:10, 70:30, 50:50 or even active of which
the coupling ratio may be e le c tr ic a l ly altered. The optimum coupling
ra tio for maximum power at the detector is now derived.
Consider Figure 3 .5 , i f P, is the power coupled into an m:1-m coupler
then mP arrives at the resonator. I f KmP is reflected back into the
f ib re then kmP^(1-m) is received at the detector. This can be shown
to be a maximum for m = 0.5 so a 50:50 coupler is the best ra tio for
th is configuration using a passive coupler.
3 .5 .7 Intensity modulation of the interference pattern
In addition to the phase modulation of the coherent l ig h t emitted
from T2 (Figure 3.5) movement of the resonator can also modulate the
in tensity of the l ig h t reflected back into T2. This in tensity modulation
- 92 -
is inherently less sensitive to resonator vibrations than phase
modulation and may be produced by the resonator vibration along or
transverse to the f ib re axis or by torsional v ibration. The intensity
changes are produced by changes in f ib re resonator t i l t , Ion ditudinal
separation or o ffse t. The long itudinal separation w il l change for
vibrations along the f ib re axis, the offset for vibrations transverse
to the axis and the t i l t for torsional vibrations.
For vibrations along the f ib re axis the configuration of Figure 3.5
requires an incoherent source to avoid the small intensity modulation
signal being lost in the large phase modulation signal. This detection
technique has not been investigated.
For vibrations transverse to the axis a large intensity modulation
may be obtained by aligning T2 with the edge of the resonator. Figures
3.14 and 3.15 show the e ffec t of th is type of intensity modulation on
the fringe height. In this case the resonator is vibrating in a mode
in which i t is simultaneously vibrating along and transversely to the
f ib re axis. The theory of this effect is f a i r ly easily produced: consider the interference at T2 which is being produced by the wave
reflected o ff the end of the f ib re a ^ e ^ l* and the wave reflected
o ff the resonator and recoupled into the f ib re . This wave w ill be
delayed by a phase <f> and intensity modulated by the edge of the
resonator. Thus the f ie ld at T2
Ep2 = a ^ e ^ l* (1 + sina^t e ^ ) (3.19)
where032 = frequency of perpendicular vibrations and the both reflected
waves are assumed to have equal powers which gives an in tensity at
the detector of
I = a . 2 (— + 2sinoo9t cos <j> - - cos2w_t) (3.20)1 2 2 2
Thus the amplitude of a fringe (given by the cos<f> term) is modulated
by 2sina>2t term. I t can also be seen from figure 3.15 that the
vibrations in the two orthogonal planes are in phase.
- 93 -
3 .5 .8 Effect of including a glass slide
In certain applications i t may be necessary to seal the resonator
o ff from the surrounding environment such as when vacuum encapsulation
is required or to avoid the ingress of d i r t into the resonator cavity.
This may be accomplished by including a glass slide to seal one side
of an otherwise closed container within which the resonator is held.
This is shown in Figure 3.16. The inclusion of the slide a lte rs the
optical properties of the system to one of those shown in Figures 3.17 -
3.19. Figure 3.17 includes two a i r gaps and, to a f i r s t approximation, there are four reflections returned to T2. Reflections 1, 2 and 3
essentia lly form the reference and reflection 4 the signal. This system
consists of three Fabry Perot cavities in series these being: the
f ib re end to slide face 1 cavity, to two slide faces cavity and
the second slide face to resonator cavity. The problem with th is is
that reflections 1, 2 and 3 are not fixed with respect to each othersince for example re flection 1 may move with respect to 2 and 3 by
vibration and reflection 2 may move with respect to 3 by thermal
expansion. The f i r s t two reflections may be elminated by adopting
the system of Figure 3.19 where some index matching f lu id has been
inserted between the f ib re end and face 1 of the s lide. This systemhowever, has the problem that the f lu id evaporates although i t may be
possible to use epoxy resin for index matching. Also fo r our experiments
the liqu id made movement of the f ib re to a d ifferent part of the
resonator inconvenient. Instead the configuration of Figure 3.18 was
used. Here, the fib re has been pushed down onto the glass slide
thus eliminating reflections 1 and 2 since the fib re and slide have
approximately equal re fractive indexes. This system shows very good
external vibration immunity since the f ib re , glass slide and resonator
essentia lly a ll form one structure which vibrates together. The f ib re
can also be easily moved i f required. An additional advantage of
this structure is that when a perpeniicularly cleaved f ib re end is
pushed onto the glass slide this tends to straighten any angular
misalignment between the slide and the f ib re , so that the f ib re is
perpendicular to the surface of the s lide . Thus the alignment of the
f ib re to the resonator in terms of t i l t is governed by the machining
of the container and so with care angular misalignment can be avoided.
This system shows the best s ta b i l i ty and fringe amplitude of any
interferometric configuration used in this work.
- 94 -

3 .5 .9 Effect of including a lens in system
I t is by no means certain that the diverging beam from T2 once reflected
o ff the resonator couples back into the f ib re with optimum effic iency .
The inclusion of a lens between T2 and the resonator may increase this
effic iency and, with this aim in mind, the effects of two types of lens
were investigated in the interferometer: a gradient index lens (Melles
Griot 06LGE214) and a f ib re coupling sphere (Melles Griot 06LMS005). These
lenses were chosen fo r two reasons: f i r s t l y cheapness since by including
the lens one does not s ig n if ican tly wish to increase the system cost and
secondly smallness since one does not s ign ificantly wish to increase the
bulk of the sensor (the gradient index lens is 1.8 mm in diameter and
5.5 mm long, the sphere is 5 mm in diameter).
When the gradient index lens was included between T2 and the resonator
there was a 7 dB improvement in the fringe amplitude. This was achieved
by translating both the f ib re and the lens, using precision manipulators,
in a-direction normal to the resonator surface. I t was also possible
to translate the f ib re end with respect to the lens. The best position
gave 7 dB gain. The lens chosen translates an incident diverging beam
to a converging beam. The improvement in fringe amplitude w il l be due
to improved recoupling effic iency of back reflected l ig h t into T2. The
exact mechanism is uncertain. A simple geometric calculation shows that
fo r d > 3r/2NA where d is the f ib re resonator separation without lens, r is the fib re core radius and NA its numerical aperture the area of l ig h t
produced on the image f ib re is smaller when the lens is included tha ftwithout i t . However d is l ik e ly to be less than 25pm when the lens is not
included to produce optimum fringe amplitude (see Figure 3.6b). An
alternative possib ility is that the larger numerical aperture of the lens
with respect to the f ib re catches more back reflected l ig h t than the fib re
would and that the angle of this l ig h t fa l ls within the acceptance angle
of the fib re a fte r translation through the lens. An a lternative to
using a bulk optic gradient index lens would be to use a section of gradient index multimode fib re of appropriate length spliced to end of the
single mode f ib re . A recent investigation of these "fibre lenses" (37)
have shown them to be suitable replacements for bulk optic gradient
index lenses.
- 95 -

The action of the f ib re coupling sphere is to produce a roughly collimated
beam from the output of the single mode f ib re . The f ib re was adjusted to
be approximately 1/4 mm from the lens according to i ts specification. The
output of the sphere was observed to be about 1 mm in diameter and slowly
diverging. I t was therefore not surprising that this system produced a
20 dB degradation in fringe amplitude primarily because the beam size was
much larger than the resonator.
3.5.10 Resonance locking system
In the majority of experiments the resonator has been operated open loop
that is without feedback between the output signal and the drive signal
to the resonator. However in a practical system the resonator would be
kept at resonance using a closed loop system. Such a system has been set up based around a Brookdeal phase sensitive detector (psd) and is shown in
Figure 3.20. The reset on the psd applies a ramp voltage to the frequency
sweep of the signal generator. This sweeps the output frequency of the
signal generator until a resonance is found when some signal is applied, via the phase s h if te r , to the psd. The psd continues to sweep the frequency
until this signal is a maximum. The phase sh if te r was included to ensure
resonance was found since there w ill be some phase s h if t between the drive
voltage and the detector output at resonance.
The system worked well and was capable of keeping the device a t resonance
even when using a poor s ta b il i ty signal generator. However other resonances
in the device were comparable in size with the observed one and so the
system sometimes locked on to these. Also over a long period of time the
f ib re tended to d r i f t o f f the device and the interferometer tended to go
out of alignment at the source end. These proved to be the main
d if f ic u l t ie s in keeping the system at resonance.
3.5.11 Conclusions
A single mode f ib re two by two coupler-based vibration detection system
based on phase modulation is a sensitive detector for resonator vibrations.
The sens it iv ity is a function of the f ib re to resonator t i l t , long- itudinal
separation and la tera l offset with t i l t being most c r i t ic a l .
- 96 -
The detection system is immune to environmental effects on the f ib re
and requires only a low coherence source. The use of a low coherence
source also avoids problems which may be caused by interference with
additional reflections which may be present in the system.
Inclusion of a gradient index f ib re lens in the system produces an
improvement in fringe amplitude but th is w il l complicate packaging and
thus w i l l not be used in a practical system. A glass slide included
between the f ib re and resonator enables vacuum encapsulation and may be
used to s tab ilise the system, for laboratory use, by pushing the f ib re
.7 onto the s lide . A practical system may use bonding of the f ib re to s lide .
3.6 Multimode and two mode f ib re 2 x 2 coupler based detection
3.6.1 Introduction
Multimode f ib re systems s t i l l have some economic advantages over single
mode systems particu larly with respect to connectors. Indeed, in some
applications, for example those which require connectors which can be
used underwater, only multimode connectors are available.
This section therefore investigates the properties of a multimode
f ib re based interferometer of the same configuration as the single mode
system. In i t i a l l y however, a system using f ib re supporting two modes
is reported.
3 .6 .2 Two mode coupler based detection
The system layout was the same as the one described in section 3.5 but
the f ib re supported two modes rather than ju st one. These were the
LPq mode and the LP^ mode. I t was found that this system worked
sim ilarly to the one based on single mode fib re but had the following
differences.
1) By adjusting the launch conditions one could arrange to launch
power primarily in either the LPq or the LP^ mode or some
combination.
I f the LPq mode was mainly launched the fringe amplitude was
similar to the single mode system fo r the same launched power. This
is not surprising since the mode supported by any single mode f ib re
- 97 -
is the LPq i *I f the LP^ mode was primarily launched a s ig n if ican tly smaller
fringe amplitude was produced for the same launched power. This
may be explained by considering the intensity p ro fi le of the LP^
mode. This mode has zero intensity for l ig h t which emerges along
the f ib re axis. This is in contrast to the LPq mode which has a
maximum l ig h t along the f ib re axis. For zero t i l t between the f ib re
and the resonator i t is this l ig h t which emerges along the f ib re
axis, which w il l be reflected straight back into the f ib re to
produce the fringes. The interferometer is set up to have zero t i l t
between the f ib re and resonator so one would thus expect larger
fringe amplitude for the LPq mode than the LP^ mode even though the
launched powers are comparable.
2) When both modes are simultaneously launched, perturbing the f ib re
by squeezing causes a variation in the height of a fr ing e . This is
produced by the phenomenon of modal noise (38) which occurs in a l l fibres which are propagating more than one mode but is most serious
fo r a two mode system. A further explanation of modal noise and its
effec t on the fringe amplitude is given la te r in section 3 .6 .3 .
3 .6 .3 Multimode 2 x 2 coupler based detection
The system shown in Figure 3.5 was set up but this time based around
a 50/125 multimode coupler and including a connector in the input arm.
The system s t i l l generates an interferogram but has the following
differences in its operating characteristics when compared with the
single mode system described e a r l ie r (section 3 .5 ) .
Hundreds of modes now travel along the fib re and are incident upon the
end of the f ib re at T2. For sim plicity consider just one mode, the mode p
with complex amplitude Sp at T2. This sets up an in i t ia l reflected
wave rpSp at the fib re a ir interface, rp being the appropriate re flection
coeffic ient for the mode p. The transmitted l ig h t of the mode p is
launched into the optical cavity formed by the f ib re end and the resonator,
and this creates the multi reflected wave. The wave coupled back into the
f ib re has not only a component in the mode p, CppSp5 but also components
in other modes which can now propagate. Thus the total reflected wave
in mode P, consists of the in i t ia l reflected wave r S at the interface
- 98 -

plus the contributions to mode p from a l l the other modes that is ,
r S = r S + C S + z C S (3 .*1 )p p p p p p p p q qq P
For convenience consider just three modes p, q and r . Over a short
enough interval of time the power flow in mode p is given by
Wp = i | r ns„ + CnnS„ + CnnSn + C S I 2 (3.22)2 P P PP P PP P p r
and the tota l power received at the detector is the sum of the powers
in each of the modes.
The signal coherence plays a v ita l role in the consequences of
equation 3.22. I t w i l l be assumed that the coherence length of thesource is always appreciably greater than the separation between the end
of the fib re at T2 and the Silicon resonator. For small separation4. the cross coupling terms become insignificant and the system produceswell defined fringes of interference even with a large number of modes,because the phase differences between r n and C r and Cn etc. are
. P PP q ‘Tqapproximately the same. I f the cross coupling terms are s ign ificant
and signals Sp# and Sr are coherent, then changing the phase
relationships of these signals, by squeezing the f ib re , has a c r i t ic a le ffec t on Wp and is associated with the phenomenon of modal noise (38).Modal noise is caused by the interference between l ig h t rays trave ll in g
d iffe ren t paths, ie d ifferent modes, within a multimode f ib re . Eachmode propagates at a d ifferent velocity within the f ib re and thus, as
the modes travel along the f ib re , they become separated in time. Thuslig h t at a particu lar fib re plane, cut perpendicularly to the f ib re axis,
w il l be a combination of waves which d i f fe r from each other in phase.At any point on the f ib re end these waves may add or cancel dependingon th e ir re la tive phases and amplitudes. This interference causes the speckle
pattern which is seen at the end of a multimode f ib re when i t is illuminatedby a coherent l ig h t source. The f ib re output is said to be speckled
because i t consists of a number of discrete l ig h t and dark spots. Each
speckle is not a mode but is caused by the interference of at least two
modes. By changing the phases between modes, by squeezing the f ib re , one
changes the interference pattern produced and thus the spatial
distribution of speckles across the fib re core. Speckles can lead to
- 99 -

uncertainty in the value of a region of loss such as a misaligned
connector. This may be explained by considering, for example an a x ia l ly
misaligned jo in t between two fibres the loss at such a jo in t w ill largely
be determined by the amount of o ffset but i t w il l also depend on the
fraction of the speckles that f a l l within the core of the second f ib re .
Thus the loss w ill vary with the precise position of the speckles within
the speckle pattern. In the interferometer, points of speckle selective
loss are the f ib re to resonator in terface, the connector and the f ib re to
detector interface. The effects of the environment on the f ib re which
cause variations in the speckle pattern were so great in the interferometer
that the system was useless for re liab le measurements when a high coherence
source such as a HeNe laser was used.
However, i f the coherence of the source is such that S . S and S 'P q r
(equation 3.21) are not coherent then interference only occurs between
the Sp termsyin Wp, the terms in W e tc . , the other terms merely
contribute to the average in tensity. This occurs when the signals have
trave lled along the fib re a distance greater than Lc/An where Lc is the
coherence length of the source and An the difference in re frac tive index
of the core and cladding. Then the fringe amplitude is re la t iv e ly
unaffected by environmental fluctuations or by squeezing the f ib re .
Figure 3.21 shows the variation of the fringe amplitude with d normalised
to the value at d = 0 , when the illumination was a multimode semiconductor
laser with a coherence length of roughly 200um. For the f ib re aligned
perpendicularly to the resonator surface, the fringe amplitude decreases
smoothly primarily because of the beam spreading e ffec t, with an indication
of period ic ity caused by the phase angles of Cpp, etc. changing at
s lig h t ly d iffe ren t rates with d. When the f ib re angle is misaligned these
differences are enhanced giving rise to a more complicated variation. This
also contributes to the reduced fringe amplitude found experimentally but not revealed in the normalised plot of Figure 3.21.
The effects of the connector are twofold. F irs t ly the connector has some
in tr in s ic misalignment which means i t represents a region of speckle
selective loss. Thus by manipulating the fib re one can minimise the
connectors loss when the system is illuminated with a high coherence source.
Secondly the connector operates by mechanically aligning the two fibres
and leaving an a ir gap.
- 100 -

The fibres are not butted and there is no index matching f lu id
between the two ends. This a i r gap has two e ffects . F irs t ly there
are two more reflections in the system, secondly the two aligned end
faces of the fibres e ffe c t iv e ly form a Fabry Perot cavity. I f the
system were in single mode f ib re the additional two reflections would
in terfere with those reflected from T2 and the resonator, provided the
coherence length of the source were long enough. This does not occur fo r the multimode system because the phase and amplitude of each mode
contributing to the additional two reflections, are d if fe ren t and
changing with environmental perturbations compared with the reflections
from T2 and the resonator. Hence the interference between the
reflections from the connector and those from T2 average to a constant power at the detector. The term interference implies coherence between
the reflections from T2 and those from the connector. I f those
reflections are not coherent the powers of the reflections add a t the
detector producing the same outcome. The e ffec t of the Fabry Perot cavity produced between the aligned fib re end faces is more serious.
I f the source coherence is greater than twice the fib re face's separation
then the transmission of the jo in t w ill depend'upon th e ir separation
in the same way as a bulk Fabry Perot cavity. Environmental e ffec ts , particu larly thermal w i l l vary this separation, thus varying the transmitted
intensity and thus the fringe amplitude. Additionally the interference
within the cavity w ill convert laser phase noise to intensity noise
and i t has recently been shown (39) that phase noise produced intensity
noise can be over four orders of magnitude higher than the in tr in s ic
laser intensity noise. In our operational system these sources of noise proved s ign ificant and resulted in a very unstable fringe pattern
and was manifest as a constant j i t t e r in the height of a fr ing e . The
in s ta b i l i ty was avoided by . in c lu d e an index matching liqu id between
the two fib re faces within the connector.
A Fabry Perot cavity can also be formed at the detector between the
f ib re end and the detector cover slide. This was sa tis fac to r ily
avoided by angling the f ib re with respect to the detector and this
represents good practice in a l l optical systems.
- 101 -
However i f some of the l ig h t emitted from T3 misses the detector
then the T3 to detector interface becomes a speckle selective loss and
the fringe amplitude becomes sensitive to squeezing arm 3. Catching a l l
of the l ig h t by using a large area photodiode e ffec tive ly avoids this problem.
Additionally , for the multimode system, T4 does not need to be index
matched since the reflection from T4 behaves in exactly the same way as
the two from the connector with respect to the reflections in arm 2. I t
was observed experimentally thatputting T4 in index matching fluid; had
no e ffe c t on the fringes at the detector but s lig h t ly decreased the power received as expected. The coherence of the source would be adequate to
produce interferences between reflections from T2 and T4. The fact that
T4 can be l e f t unmatched is a very desirable situation for multiplexing.
The system was implemented using a 50/125 coupler. The length of each
arm of the coupler and the f ib re in the coupler arm leading to the sensor was about 10m long. The laser diode had a p ig ta il of about 50cm with
a connector termination. These distances were larger than used with the
single mode system (coupler had 50cm arms) but produced no additional problems. The same system was also implemented in 100/40 f ib re but
without the connector or additional f ib re . The additional feature of the
100/140 system was that i f l ig h t was launched in a small area of the f ib re
core, say 6pm diameter, the l ig h t emerged at the output of the coupler
from approximately the same size spot. This situation occurred using the
50/125 fib re i f no connector was included. The advantage of this is that less l ig h t is lost by missing the resonator and additionally one could
scan across the resonator by simply varying the position of the spot at the input port to the coupler.
3 .6 .4 Inclusion of lenses in the multimode fib re system
The e ffec t of lenses on the multimode interferometer were investigated
for the same reasons as the single mode system mentioned in section 3 .5 .9 .The multimode system using 100/140 f ib re , without connectors and illuminated
using a HeNe laser was adapted by placing a 0.29 pitch gradient index
lens (Melles Griot 06LGE214) between T2 and the resonator.
- 102 -
The lens was the same as used in the single mode experiments. However
in contrast to the single mode system discussed e a r l ie r this produced
a s ligh t decrease in the fringe amplitude. This is thought to be
because the numerical aperture of the lens (0.46) is comparable to that
of the fib re (0.45) so there is no gain to be made in catching more of
the reflected l ig h t . In addition to this misalignment between the f ib re , lens and resonator and the reflections o ff the surfaces of the lens
( in a l l four reflections to a f i r s t approximation) w ill increase the
losses of the system with respect to a simple f ib re system.
The magnification of the lens (1 .5 ) is not thought to be a problem since
the output spot diameter is comparable to the input spot diameter (about
6pm) in this system.
The inclusion of the microspheric lens (Melles Griot 06LMS005)
produced a very large signal degradation probably fo r the same reasons
discussed in section 3 .5 .9 .
Inclusion of e ither of these lens therefore seem to o ffer no technical
advantages where multimode f ib re is used for the interferometer.
3 .6 .5 Conclusions
A multimode 2 x 2 coupler phase modulation based system is a sensitive
detector for resonator vibrations. System in s ta b il i ty is mainly a resu lt
of modal noise and the lowest possible source coherence minimises th is
e ffec t by making each f ib re mode mutually incoherent. The use of connectors within the system produces Fabry Perot cavities at each
connector which causes system in s ta b i l i ty , index matching f lu id within
the connector avoids this problem.
3.7 Detection of vibrations based on intensity modulation
/3.7.1 Introduction
In some circumstances intensity modulation may prove a more suitable
method of vibration detection than phase modulation even though i t is
- 103 -

inherently less sensitive. For example in plane vibrations of a
resonator do not produce phase modulation of a beam perpendicularly
incident on the resonator but they do produce in tensity modulation i f
the beam is positioned over the edge of the resonator. ( I t should be
noted that the configuration of Figure 3.22 can convert in plane
vibrations to out of plane phase modulation but that i t is not suitable
for the present device and may require a specially designed device to be
p ra c tica l) . In addition to this the periodic nature of the interference
patterns means that a t certain in i t ia l f ib re resonator separations the
interferometer would show zero vibration se n s it iv ity . The in tensity
modulation function is not inherently periodic and thus would not show
this zero s e n s it iv ity . Additionally intensity modulation systems
typ ica lly use incoherent sources such as LEDS which have lower noise
levels and are considerably cheaper than coherent laser sources.
F inally the use of connectors is considerably less complicated in an
intensity modulation system than in an interferometric system in which
they introduce noise and additional reflections which may interefere with
the signal.
For these reasons i t is of interest to investigate the detection of
vibrations using in tensity modulation techniques.
3. 7. 2 2 x 2 multimode f ib re coupler with an LED source
Figure 3.23 shows the system which was set up to detect the in plane
vibrations of a commercial quartz crysta l. The system was based around
a 100/140 multimode coupler illuminated by a "sweet spot" LED operating
at a wavelength of 850nm. The "sweet spot"emitter was butt coupled to
the f ib re and produced reasonable coupling efficiency ( i 20%). The
detector was based around a "sweet spot" detector and an am plif ie r.
By e le c tr ic a l ly setting the quartz in oscilla tion using an o s c il la to r
c irc u it and positioning the f ib re over the edge of one of the electrodes
on the surface of the resonator i t was possible to detect the in plane
vibrations of the resonator as intensity modulation of the signal at
the detector. This required only an e lectrical power of Ipw dissipated
- 104 -
in the resonator and this was la te r provided by an intensity modulated
l ig h t source incident on a photodiode which was applied across the
crys ta l. By including a 0.29 pitch gradient index lens between the
resonator and the fib re end a considerable improvement, greater than
ten times, in the signal at the detector occurred. The explanation
is that the resonator is set back behind a glass slide within i t^
packaging and there is thus considerable separation between the f ib re
end and the tines. Because the divergence of this f ib re is large (26°
ha lf angle) this produces a very large spot on the resonator. By
including the lens this e ffec tive ly avoids the divergence of the f ib re
at the expense of the magnification of the lens. This magnification
is approximately 1.5 and appears to a ffec t the signal less than that of the beam divergence.
3 .7 .3 Single mode f ib re system with a HeNe source
The single mode system shown in Figure 3.24 was attempted as a method
of producing intensity modulation since a HeNe source is e f f ic ie n t in
launching l ig h t into a single mode f ib re . The modulation would be
caused by the in plane vibrations of a Silicon double ended tuning fork . Light from a HeNe laser was coupled into a single mode f ib re which was
brought near to the resonator. The detector positioned some distance
behind the resonator picked up the signal. The signal was in the form
of a very stable interference pattern and Figure 3.24 shows two possible
paths of rays to produce such an interference pattern. By moving the
position of the detector both by bringing i t close to the resonator and
translating i t in the plane of vibration i t was possible to obtain an
in tensity modulation signal with interference fringes superimposed.
However at no position was i t possible to obtain only intensity
modulation so this system was replaced by that of Figure 3.25 which
was also based on single mode f ib re . The detector was replaced by a
second single mode fib re with a detector at i ts end.
This system was capable of producing sinusoidal intensity modulation
at the detector when the f i r s t single mode f ib re was positioned at the
edge of the tuning fork and the fork was vibrating transversely. The
in tensity modulation at the detector was purely sinusoidal and
contained no interference terms. This occurred since the f i r s t single
mode f ib re ■was positioned close enough to one tine to ensure that there
was no interaction with the other t in e . A further check that the signal
- 105 -

was an in tensity modulation and not an inteference signal of less
than one fringe was performed, By moving the f i r s t single mode f ib re
along its axis away from the resonator. For an interference pattern
th is should change the operating point of the interferom eter causing
the signal amplitude to rapidly decrease or increase and to cycle
through 180° phase changes; fo r in tensity modulation the amplitude
of the signal should merely decrease s lig h tly . I t was confirmed that
the signal merely decreased s lig h tly .
The height of the signal a t the detector was greatly increased by
replacing the second single mode f ib re (core 4ym, NA 0.12) with a multi -
mode fib re (core 400ym, NA 0 .5 ) . Thus a ll the lig h t emitted by the
single mode fib re was caught by the multimode fib re . The multimode
f ib re core was larger than the two tin e widths plus th e ir separation. This enabled the single mode f ib re to be scanned across each tin e edge
in turn, producing in tensity modulation at the detector without moving
the multimode fib re .
There was 180° phase s h ift between the in tensity modulation signals
caused by opposite edges of a tin e as expected. The phase s h ift
also allowed determination of the mode of vibration of the tuning fo rk .
3 .7 .4 Conclusion
Two intensity modulation based systems (F ig . 3.23 and 3.25) have been
investigated and shown to be capable of detecting in plane vibrations
of Silicon resonators. One system produces a signal in re fle c tio n , the other in transmission and the basic operating princip le of the
two systems is the same.
3.8 Multiplexing
3.8 .1 Introduction
Multiplexing may be defined as the a b il ity to poll a large number of
passive optical sensors from a single optical source and detector.
- 106 -
For our purposes a passive optical sensor may be regarded as a
Silicon frequency output resonator sensor. M ultiplexing is desirable
when a single variable is to be measured a t a number of discrete
points using a number of sensors. An additional complexity may be
that measurement of more than one variable may be required a t each
discrete measurement point. In th is case one must f i r s t ly decide
which sensor is being addressed and then which variab le is being
measured. This section gives some indication of how multiplexing
may be accomplished when the sensor is a S ilicon resonator sensor which is o p tica lly interrogated. No consideration is given as to
how optical excitation would be incorporated into such systems and
th is may considerably complicate matters.
3 .8 .2 Series or para lle l interrogation with a single variab le at each point
Series interrogation is illu s tra te d in Figure 3.26 fo r e ith er transmissive
of re fle c tiv e sensors. The lig h t from the optical source is coupled
into a f ib re and guided to sensor 1 , a t sensor 1 the lig h t is
modulated and transmitted (transmissive sensor) or a portion is
transmitted and a portion reflected (re fle c tiv e sensor). This is
repeated a t a ll sensors and the insertion loss of each sensor is the
ultimate determinant of the maximum number of sensors addressable fo r
a given detector. At the detector the signal is in the form of an
in tensity variation a t the frequency of each sensor irrespective of
whether the optical detection is phase or in tensity based.
The simplest approach to the determination of sensor location is to
arrange that each sensor occupies a separate frequency band as a
function of the measurand. Then using a detector with appropriate band
pass f i l t e r s would determine the measurand a t each location. The
problem with th is system is that each sensor would need d iffe re n t
dimensions to allow them to occupy d iffe re n t frequency bands. F irs tly
th is presents the problem of fabrication of large numbers of s lig h tly
d iffe re n t sensors. Secondly the operation of the sensor in terms of
its specification is not necessarily independent of i t ' s frequency of
vibration . For example, unwanted resonances produced in the packaging
may couple with the desired resonance at certain frequencies. A
common base frequency is desirable for each sensor i f these problems
are to be avoided.
- 107 -
Distinguishing the locations has been addressed by M a lli lie u (40)
using a system based on a radar technique. Their system requires a
re fle c tiv e detection system and in ten sity based detection of resonance.
The technique works by in tensity modulating an incoherent lig h t source
using a swept radio frequency c a rr ie r . The source is launched into the
re fle c tiv e network and the returned signals are detected and e le c tr ic a lly
mixed with a portion of the modulating signal applied to the optical
source. For a lin ea r sweep in frequency of the r f c a rr ie r , time delays
between the optical paths to individual sensors and the reference path
w ill resu lt in sum and difference frequencies when mixed. These beat frequencies are straddled by the appropriate vibration sidebands and
the beat frquency is associated with each sensors location. For typical losses in such a system up to 34 sensors may be addressed in such a way.The disadvantage of this system is that i t only allows fo r incoherent
detection.
An a lte rn a tive is to use time division m ultiplexing. Here an interrogation
pulse is injected and the sensors being separated sp a tia lly produce
re flected pulses separated in time. Once a ll pulses are returned from
a ll sensors, a fu rther pulse may be in jected. The problem with th is
system is the low duty cycles may be necessary when large numbers of sensors are addressed.
For p ara lle l detection a system based on a wavelength division m ultiplexor
may be used. For example a broadband optical source may be launched into
a wavelength division multiplexor thus separating the lig h t into separate
wavelengths along separate output fib res each of which may be used to
interrogate a separate sensor. The returned signals travel back down
the fib res are recombined and the s p lit between separate detectors by a
second wavelength division m ultiplexor. The problems are that the
system is expensive and that many port wavelength division multiplexors
are not commercially availab le.
3 .8 .3 Series or paralle l interrogation with many variables at each point
To rea lise a m ultiple parameter Silicon frequency output sensor i t is
probably easiest to have a number of v ibrating elements each of which
responds, by a change in frequency to d iffe re n t measurands. A geometry
- 108-

has already been suggested (41) fo r a combined pressure and temperature
sensor using one beam coupled to a diaphragnand the other decoupled.
Resonator sensors have also been proposed fo r acceleration, liq u id le v e l,
density, flow and viscosity (4 ) . By using suitable geometries
multimeasurand sensors may be achieved to measure combinations of these
parameters.
Although i t may be possible to have a d iffe re n t frequency band fo r each
resonator a choice must be made of which form the modulation of the lig h t
may take.
I f phase modulation is produced by each resonator operating a t d iffe re n t
frequencies then care must be taken to avoid the many re flectio n s in terfe rin g
with each other. I f in tensity modulation occurs sub c a rr ie r "interference"
of the modulated carriers may occur.
A lte rn ative ly each resonator may have sim ilar frequencies and modulate
d iffe re n t lig h t parameters. The parameters of the lig h t are po la riza tio n ,
phase, in tensity and wavelength. Clearly phase and in ten s ity , may be
independently modulated by independent resonators but at present no
Silicon resonators have been interrogated by polarization or wavelength
modulation.
3 .8 .4 Conclusion
Although much of the above is speculation i t may be seen that S ilicon
resonators may lend themselves to simultaneous measurement of many
measurands using a single sensor. Additionally interrogation may be
performed of a number of sensor locations using a single optical source
and detector and the technology of such techniques is advancing rapid ly
(see re f. 42 fo r a recent review). I t may also be of in te res t to combine
e le c tric a l and optical detection techniques i f the environment is
suitable .
- 109 -

•Fibre
Lens-i n f V?
« ?
\
Detector
—Electromagnet
ResonatorFig. 3.1 Magnetic/Optical detection
Analyser
laser
Braggcell
S
Detector
Fig 3.2 Vibration detection system
- 1 1 0 -
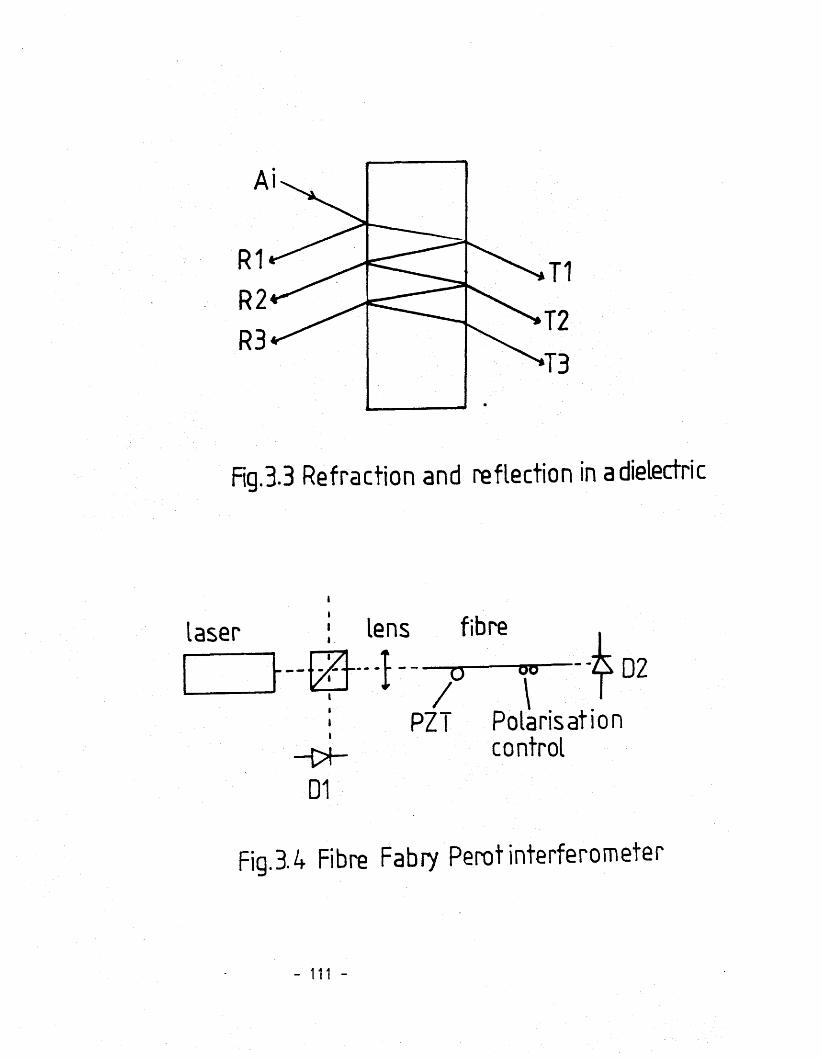
Fig.3.3 Refraction and reflection in a dielectric
laser lens fibre~ —p W
PZ/ \
D2
—
D1
Polarisationcontrol
Fig.3.4 Fibre Fabry Perot interferometer
- 111 -
oroc .
GJCsl c_
CJL
v_j
m t OJOJOl
ID
cu{/)ru
coLJOJcu
TD
“OQJ00ru
JD
cu%
l hmd i
- 112 -
ooLD
LJ
oo
CD
LL.
oo
ooCMCD0 0O
A A l I l i a i S I A
- 113 -
o Eo Olcnn
L iJC JZ A
o <o 1—C s l if)
5
C D v f
( 0 = P ' o0 a A i ^ B T a n )B anilldH V 3AUV13d
- 114 -

uOJ
in l t i mo n n o np • •o o o
a :
cz>om
o - o
o
V I S I B I L I T Y
- 115 -
Fig.3.
7a
Fring
e vi
sibi
lity
vs.
dist
ance
m -p
>
QJ
(Ut o t O s D
oc>
m
0 4o
o o
3 5 , d = 0 )relative( Relative
O*atoi / i
‘* 5
01- or )
O -e<
mS 'X
- 116 -
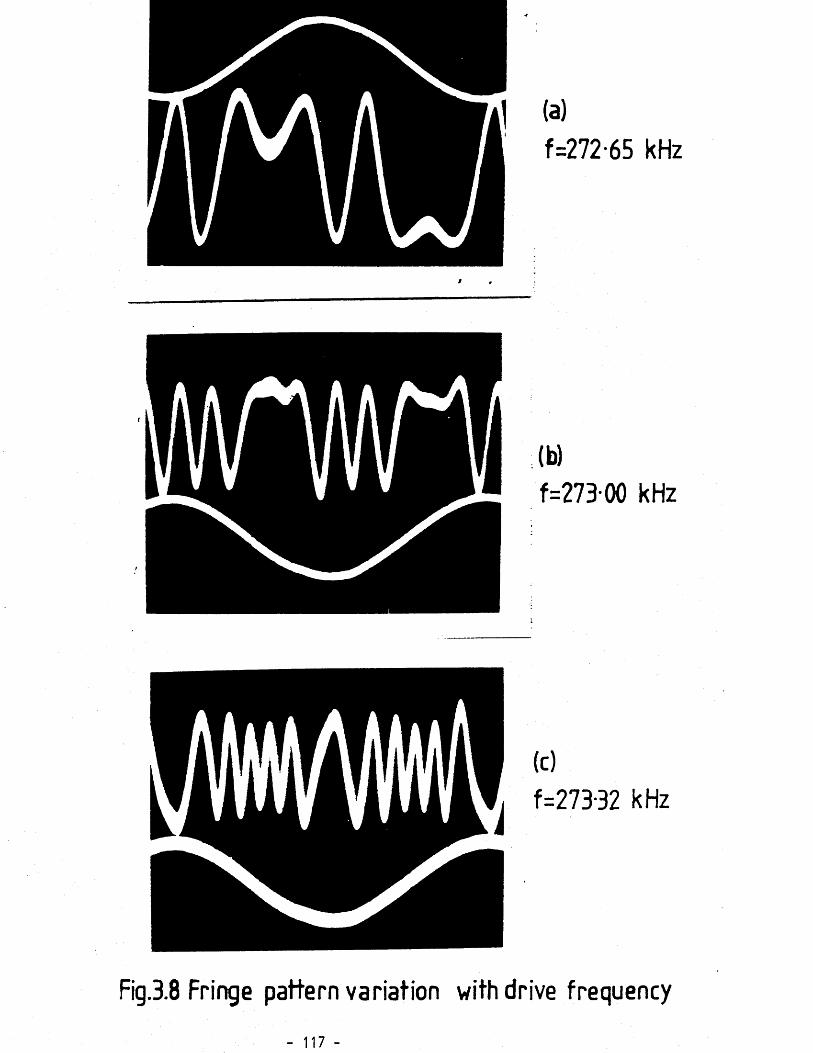
(a)f =272 65 kHz
(b)f=27B 00 kHz
(c)f=273B2 kHz
Fig.3.8 Fringe pattern variation with drive frequency
- 117 -
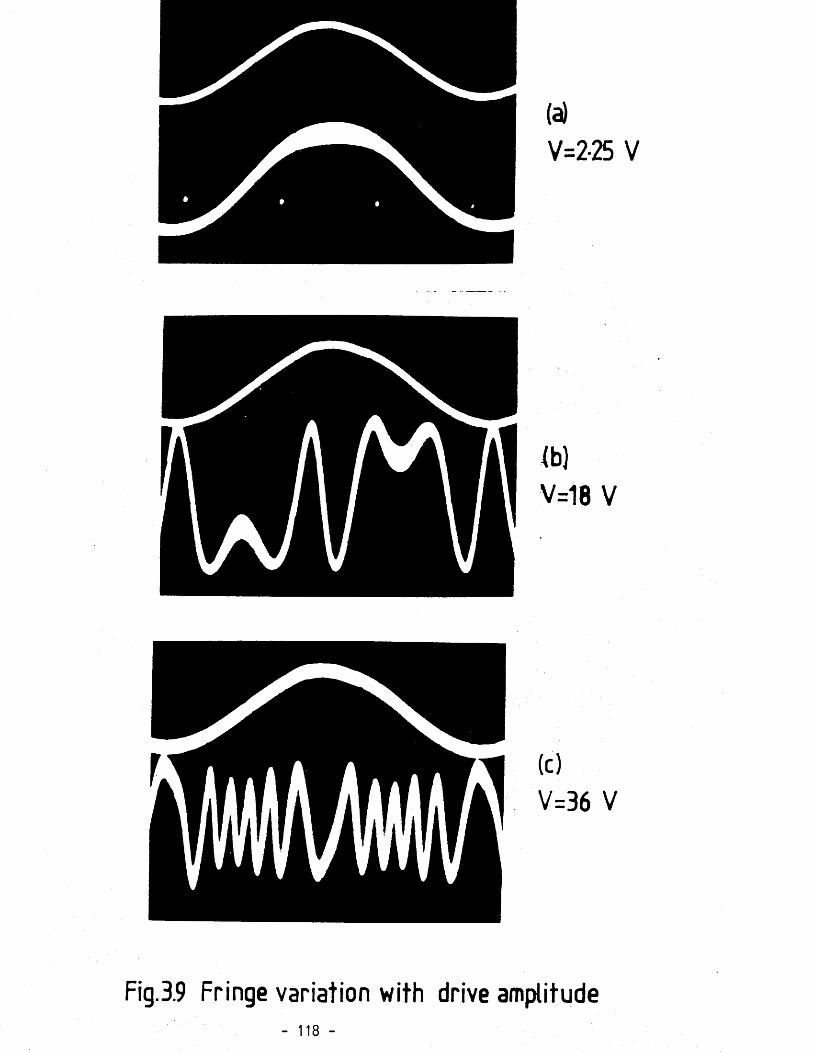
(c)V=36 V
Fig.3.9 Fringe variation with drive amplitude
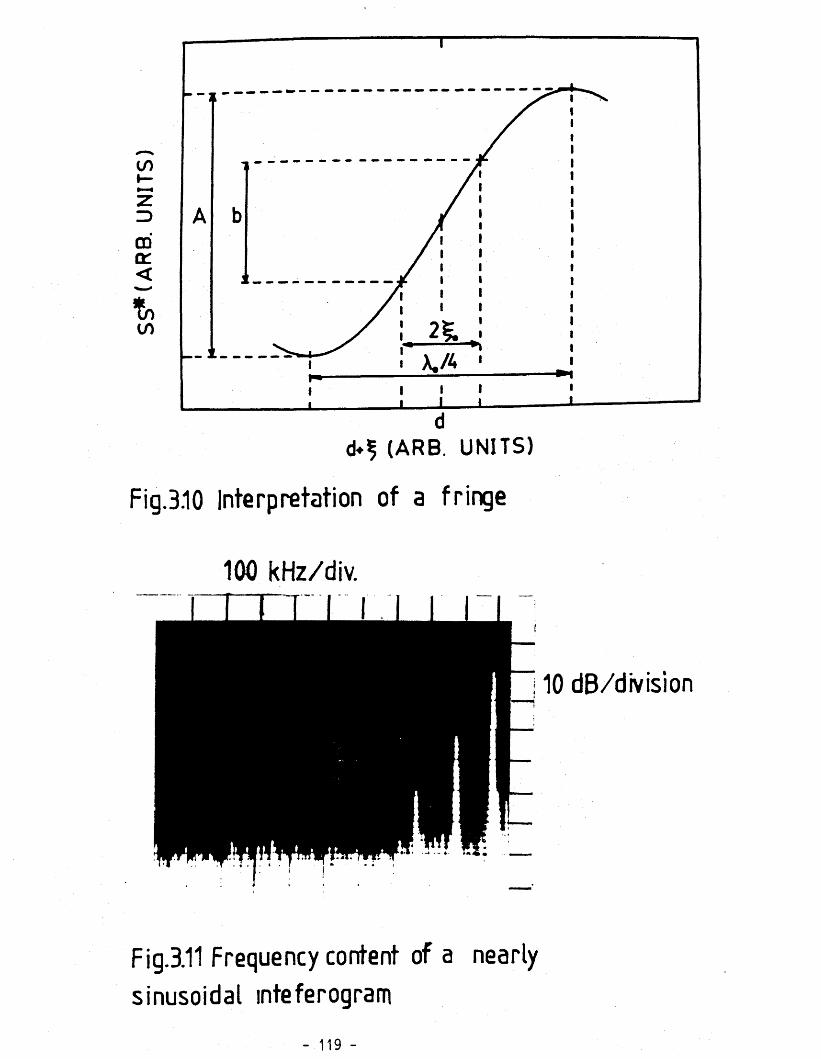
T
ZZ>
CDa :<%V)
d*? (ARB. UNITS)Fig.3.10 Interpretation of a fringe
100 kHz/div.
10 dB/division
Fig.3.11 Frequency content of a nearly sinusoidal inteferogram
- 1 1 9 -
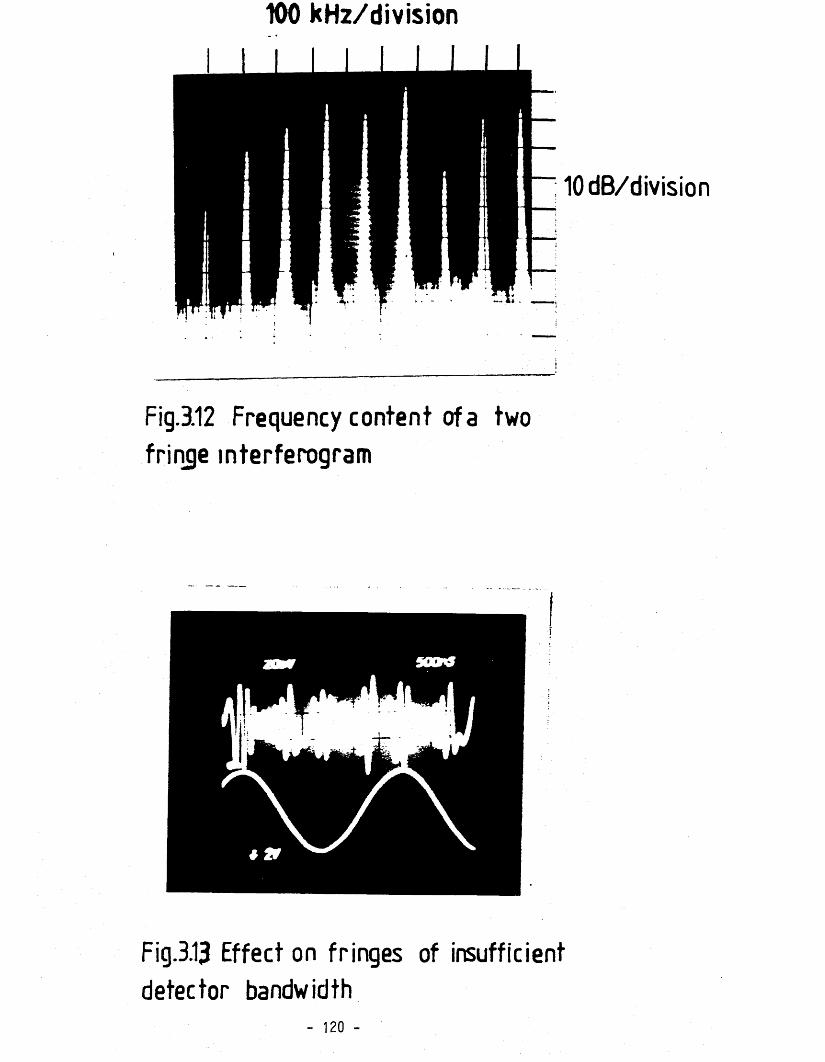
100 kHz/division
10 dB/division
Fig.3.12 Frequency content of a two fringe interferogram
Fig.3.13 Effect on fringes of insufficient detector bandwidth
- 120 -

Fig. 3.14 Intensity modulation of the
interferogram
4 2¥
Fig.3.15 Intensity modulation of the interferogram
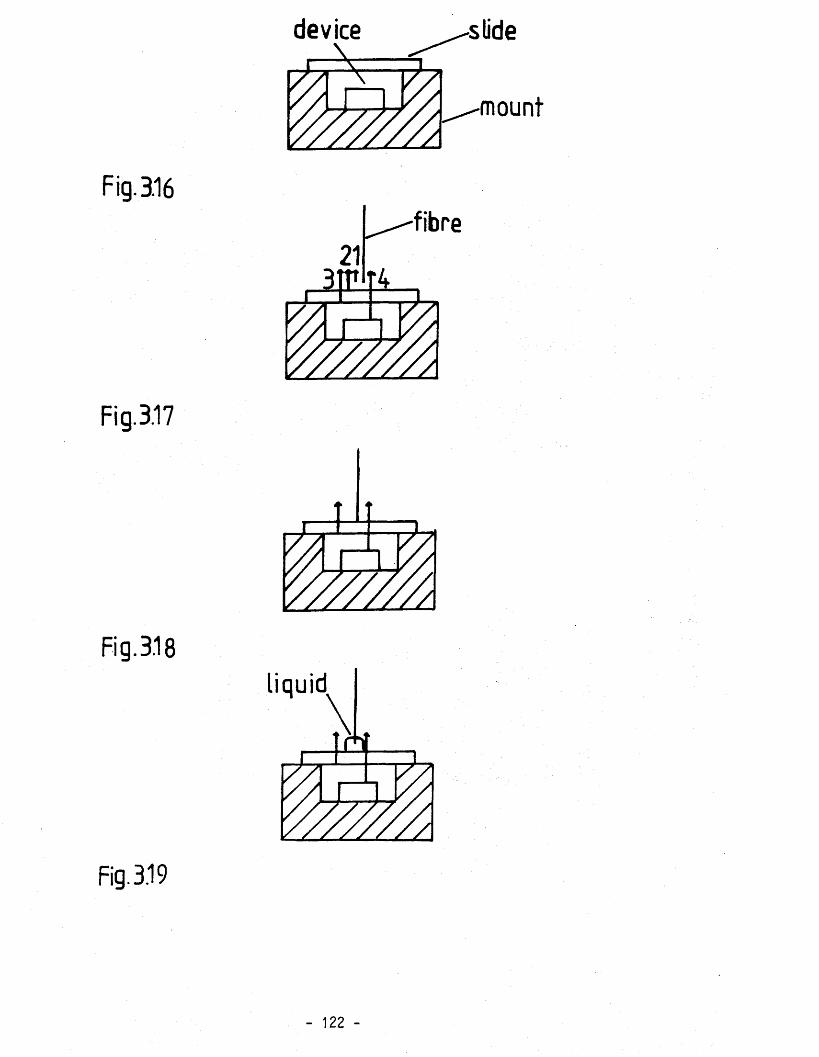
Fig. 3.16fibre
Fig.3.17
Fig. 3.18liquid
Fig. 3.19
- 122 -

System
Fig.3.20Resonance maintaining system
- 123 -

oUJ
a z2 s2 : — !LD <
00
Oo
cz>LTI
oLH
e
<CC
§ ^ ^ UJ
0 0
oro
o0 0UJcrCJ
LHo
3anilldWV 3DN!dd Q3SllVNdON
- 124 -
Fig.3.
21
Fring
e am
plitu
de
vs di
stan
ce
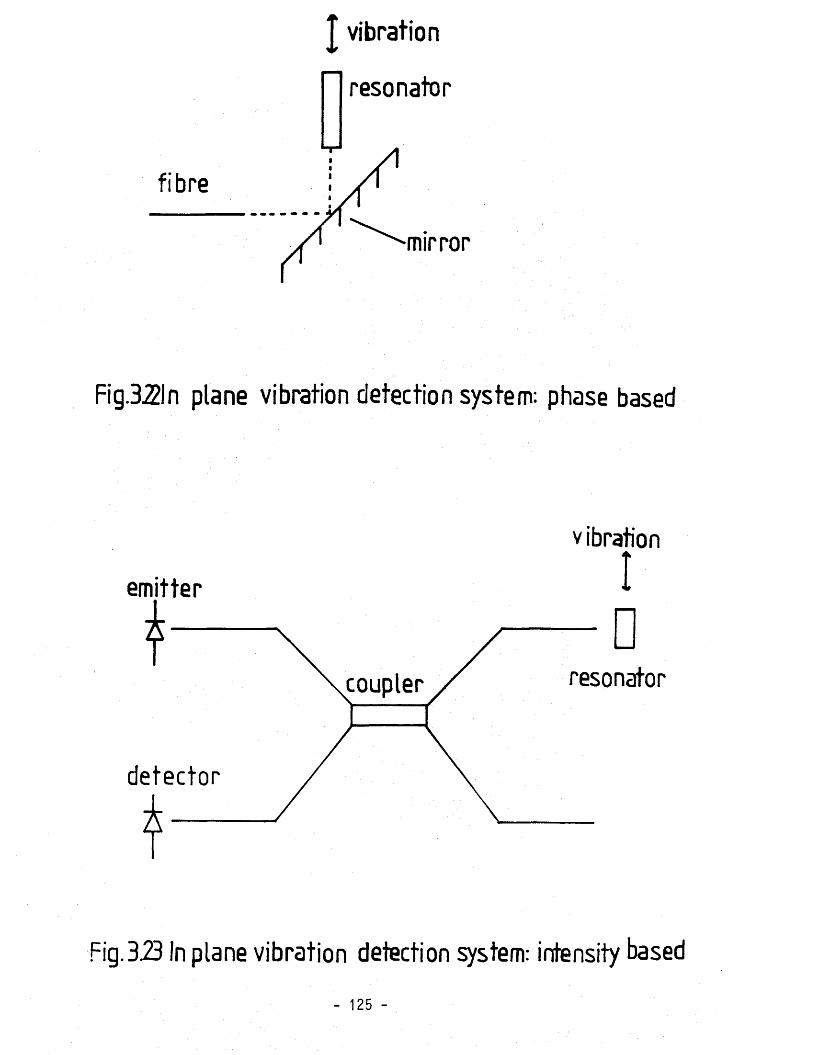
T vibration
Fig.3.2ln plane vibration detection system: phase based
v ibration
emitter
resonatorcoupler
detector
Fig.3.23 In plane vibration detection system: intensity based
- 125 -
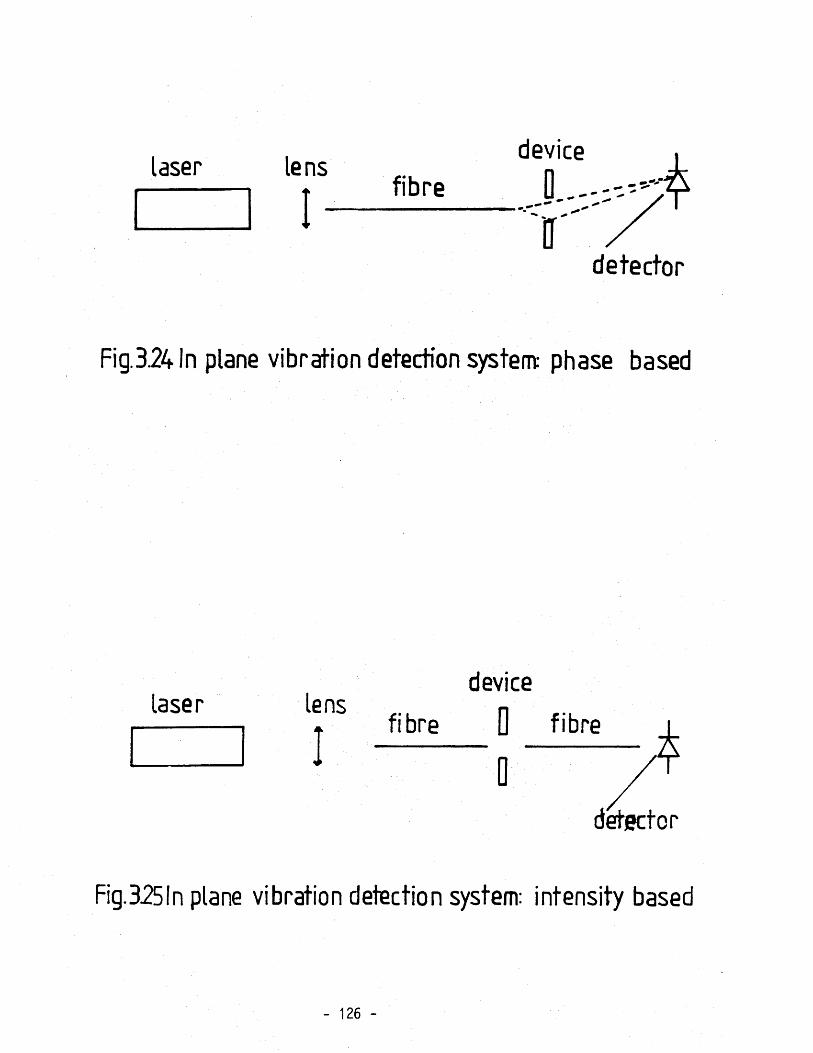
laser lens♦ fibre
device
Bdetector
Fig.324 In plane vibration detection system: phase based
laser lens
1
fibre
device
D fibre
_ Q " _
detector
Fig.325ln plane vibration detection system: intensity based
- 126 -

£— □— □— □— □— iI l l detector
emitter sensors
V D -------P — -D----- □
i-Nletector
Fig.B.26 Series interogation
- 127 -

CHAPTER 4
EXCITATION TECHNIQUES
4.1 Introduction
This chapter is concerned with the physical mechanisms which have been
used to excite the vibrations of a Silicon resonator a t resonance.
The emphasis of the work described in th is thesis is to accomplish an
a ll optical S ilicon resonator sensor and with th is end in mind most of
the work in th is chapter concerns optical excitation of vibrations in
the form of the d irec t interaction of the optical wave tra in with the
resonator.
For completeness, and to allow some comparison, other excitation
techniques are described in the next section. These methods a ll require
some e le c tric a l components at the sensor head and thus, even i f optical detection of vibrations is performed, do not benefit from the perceived
advantages of an a ll optical sensor. I t is believed that commercially
available S ilicon resonator sensors w ill evolve from an e le c tric a l sensor,
perhaps to an e le c tric a l optical hybrid and then to an a ll optical sensor, f in a l ly multiplexed and perhaps multimeasurand a ll optical sensors may
emerge.
The optical excitation work described in this chapter fa l ls into two
categories: pulsed excitation and se lf excita tion , the la t te r being seen
as almost essential fo r a multiplexed system. F irs t pulsed excitation
is discussed fo r both a pure Silicon resonator and a Silicon/Chrome
composite resonator; experimental results are given fo r both the
accelerometer and the pressure transducer. F ina lly the princip le of se lf-exc ita tio n is described and some examples are given of how i t may
be achieved; experimentally se lf excitation could not be achieved.
4 .2 E le c tr ic a lly based excitation
4.2 .1 Introduction
This section gives a b r ie f description of the e le c tric a l techniques
which have been used to date to excite the vibrations of S ilicon resonators.
- 128 -
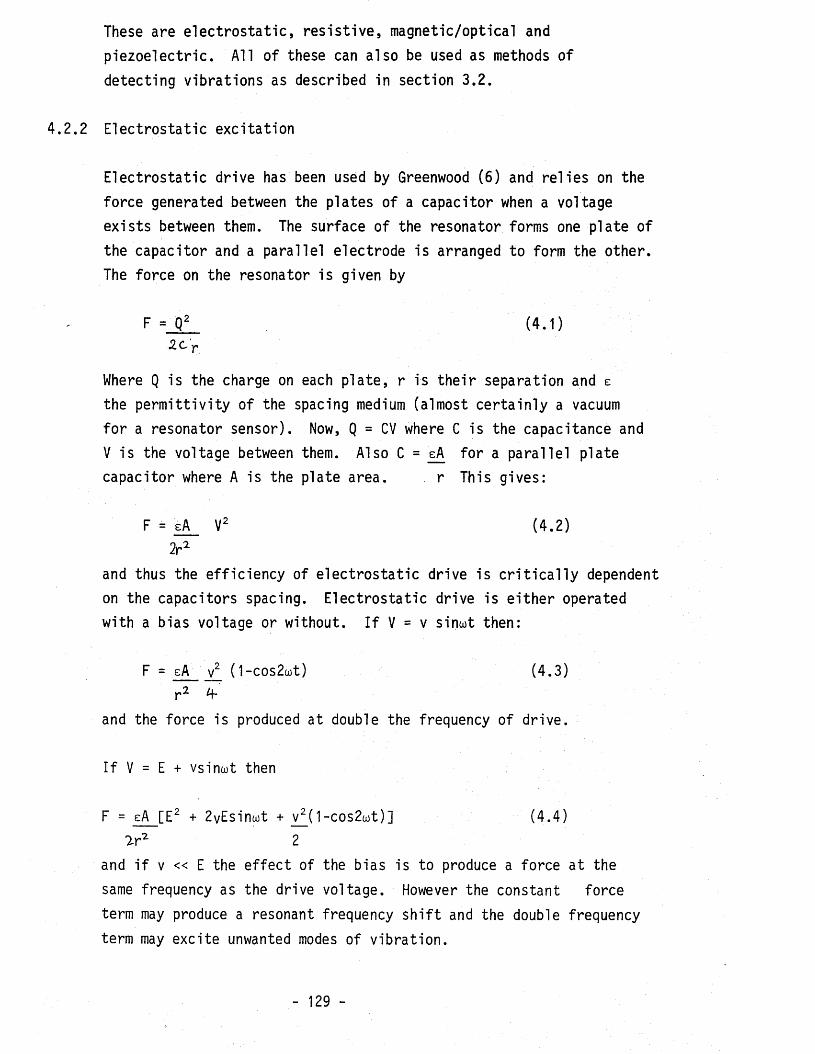
These are e le c tro s ta tic , re s is tiv e , magnetic/optical and
p iezo electric . A ll of these can also be used as methods of
detecting vibrations as described in section 3 .2 .
4 .2 .2 E lectrostatic excitation
E lectrostatic drive has been used by Greenwood (6 ) and re lies on the
force generated between the plates of a capacitor when a voltage
exists between them. The surface of the resonator forms one plate of
the capacitor and a para lle l electrode is arranged to form the other. The force on the resonator is given by
F = Q2 (4 .1 )2 C
Where Q is the charge on each p la te , r is th e ir separation and e the p e rm ittiv ity of the spacing medium (almost certa in ly a vacuum
fo r a resonator sensor). Now, Q = CV where C is the capacitance and
V is the voltage between them. Also C = eA for a p ara lle l plate
capacitor where A is the plate area. r This gives:
F = eA_ V2 (4 .2 )2r 2
and thus the effic iency of e lec tro s ta tic drive is c r i t ic a l ly dependent on the capacitors spacing. E lectrostatic drive is e ith er operated
with a bias voltage or without. I f V = v sinwt then:
F = eA_V ( 1-cos2a)t) (4 .3 )r 2
and the force is produced at double the frequency of drive.
I f V = E + vsinwt then
F = eA [E2 + 2vEsinwt + v^( 1-cos2a)t)] (4 .4 )2 r2 2
and i f v « E the e ffec t of the bias is to produce a force a t the
same frequency as the drive voltage. However the constant force
term may produce a resonant frequency s h ift and the double frequency
term may excite unwanted modes of v ibration .
- 129 -
4 .2 .3 Resistive excitation
The mechanism behind res istive drive is that the heating of a
re s is to r, caused by a current, produces a temperature change which
in turn causes a thermal expansion. I f the resistor is situated in
a suitable place on the resonator th is thermal expansion takes the
form of flexural vibrations.
The heating depends on i 2R i being the current and R the resistance.
Thus res is tive drive can be operated in a s im ilar manner to e lec tro sta tic
drive: e ith e r with or without a bias current on which the ac drive
is imposed.
Resistive drive has a s lig h t advantage over e lec tro sta tic drive in
that i t does not impose the geometrical constraint on the device of the second plate of the capacitor being in close proximity to the
resonator. Resi'stor formation is also a more usual process in integrated
c irc u it design than capacitor formation.
4 .2 .4 Magnetic/Optical excitation
This technique is the one described in section 3 .2 .4 fo r detection
and also provides excitation of the resonator.
C learly magnetic excitation may be performed by sputtering the device
with a magnetic material but, to date, no work has been performed in
th is area.
4 .2 .5 P iezoelectric excitation
This form of excitation has been accomplished by bonding a p iezoelectric
transducer (in a ll our experiments a PZT was used) on or near the
sensor. The PZT was usually bonded using epoxy resin and was mounted
in a trough, machined in metal into which the PZT was inserted and
packed round so lid ly with epoxy. The sensor was then mounted on the
metal. By applying an a lternating voltage to the PZT acoustic waves
were launched into the epoxy and subsequently the metal and f in a l ly the
Silicon sensor. This method proved adequate to excite amplitudes of
vibrations in the resonator of the order of microns. The a ttractio n
- 130 -

of the excitation method is mainly as a diagnostic tool since
i t usually excites a ll the modes of vibration of a device whether they
are associated with the resonator or some part of its supporting structure.
This can prove invaluable in ensuring that spurious modes of the structure
do not couple with the desired mode.
An a lternative form of p iezoelectric excitation is that described in
section 3 .2 .5 fo r p iezoelectric detection using sputtered layers of ZnO
or CdS since c le a rly the piezoelectric e ffec t can be used fo r excita tion .
Once again the problems mentioned in section 3 .2 .5 apply.
4 .2 .6 Conclusion
The above systems may a ll be capable of remote operation by using the
pulsed output of an optical f ib re incident on a photodiode to produce
an e lec trica l signal to provide the power. However th is technique is
not in tr in s ic a lly safe or immune to radio or e le c tric a l in terference. Additionally a photodiode w ill not operate a t temperatures above 150°C
and so this lim its the high temperature operation. This approach w ill also prove expensive i f multiplexing of many sensors is required since
a photodiode is required a t each sensor.
In systems where the above requirements are paramount d irec t optical
excitation of vibrations is required.
4.3 Optical pulsed excitation
4 .3 .1 Introduction
This section describes the basic mechanisms behind the d irec t in teraction
of the optical wave tra in with the Silicon resonator. F irs t ly , fo r an
uncoated resonator, the optical energy to mechanical energy conversion
effic iency is considered from the viewpoint of the absorbtion of the laser
beam, production of electrons and holes and the subsequent production of
acoustic and thermal waves. The main sources of in effic iency in the
process are pointed out and experimental results are given fo r both the
accelerometer and the pressure transducer. Then the conditions fo r a
- 131 -
coating on the surface of the resonator to improve excitation effic iency
are pointed out and the experimental results fo r a Chrome coated pressure
transducer given.
4 .3 .2 Physical mechanisms:uncoated Silicon resonator
The princip le of the optical excitation of vibrations in a mechanical
resonator is that d irec t interaction of an electromagnetic wave (ty p ic a lly
a laser beam) with the solid produces acoustic waves when absorbed.S ig ris t (43) has id en tifie d fiv e in teraction mechanisms which can produce
acoustic waves in such circumstances. These are: d ie le c tr ic breakdown, vaporization or material ab lation, thermoelastic process, e le c tro s tric tio n
and radiation pressure. In a semiconductor such as Silicon a sixth important mechanism exists: electronic stra in produced by the production of electrons
and holes (44 ).
Both d ie le c tr ic breakdown and vaporization occur only a t very high power
densities and resu lt in damage to the sample: they are therefore of no
in te res t fo r S ilicon resonator ac tivation . At wavelengths below 1.1 pm, the cu to ff wavelength fo r S ilicon , the photon energy exceeds the semi
conductor band gap energy and the absorption of lig h t generates electron
and hole pairs: electrons being excited to the conduction band and holes
being le f t in the valence band. Two processes are responsible fo r the
generation of stress: photostriction and therm oelasticity. Photostriction
refers to the fac t that in diamond type crystals a hole in the valence band
decreases the energy of covalent bonds and an electron in the conduction
band introduces an added component to the bonding or antibonding energy(4 5 ). This change in the bonding energy thus causes a change in the la t t ic e
spacing and hence a strain in the c rys ta l. For Germanium the stra in is a
positive d ila ta tio n , fo r Silicon i t is negative. The thermoelastic e ffe c t
refers to res istive losses of the conduction currents which are caused by
the presence of the electromagnetic e le c tric and magnetic f ie ld s . These
res is tiv e losses e ffec tive ly transfer the optical energy to heat, causing
a temperature rise and then a s tra in . The thermoelastic source is thus
in i t ia l l y a thermal source which leads to the production of acoustic waves.
The photostrictive source is in i t ia l l y an acoustic source which leads to
the production of thermal waves. In Silicon the two effects are in
opposition with the photostrictive e ffec t being the larger (44).
- 132 -

At longer wavelengths than 1.1 pm, electron hole pairs are no longer
generated and neither photostrictive nor thermoelastic effects occur.
In th is case the e le c tro s tr ic tiv e e ffe c t may be dominant. This
mechanism occurs due to the e le c tric p o la riz a b ility of molecules (43)
which causes them to move into or out of regions of higher lig h t
in tensity depending on the sign of the p o la r iz a b ility . These motions
e ffe c tiv e ly represent a sound wave. This mechanism is very weak and
th is w ill produce very small amplitudes of vibrations; no attempt was
therefore made to excite vibrations with lig h t of energy below that of the band gap of S ilicon .
F in a lly the radiation pressure of the lig h t i t s e lf is considered. This
is given by the sum of the energy density of the incident wave plusthat of the reflected wave (45) i .e :
P = (1 + R) E (4 .5 )AcAt
where R is the surface re f le c t iv ity
E is the lig h t energy in pulse form
C is the velocity of lig h t
A is the absorbing area (spot size on sample)At is the pulse tine
This is considerably smaller than the thermoelastic /p h o to stric tive
effects (45) and thus is not considered further.
Since fo r uncoated Silicon excited with lig h t of energy above the energy
gap the thermoelastic process and photostrictive process are the most important for activation of S ilicon resonator we now describe the
processes in more d e ta il. The processes are considered important since
they do not damage the sample and are the most e ff ic ie n t acoustic wave
generators of the remaining mechanisms. For our experiments excitation
was performed using a 2ps length laser pulse of which the rep e titio n
frequency could be accurately tuned to match the resonant frequency of the device. At the Silicon surface 32% of the lig h t is immediately
reflected due to the d iffe rin g re frac tive index of Silicon from a ir . The
remainder of the pulse is slowly absorbed in the Silicon within a
- 133 -
distance determined by the wavelength of the incident rad iation . This
distance may be taken as the optical absorption length, L , which is the“ 1 /propagation distance required for the lig h t in tensity to drop to 'e
( : 37%) times its in i t ia l value. For our experiments which were performed
at a wavelength of 850 nm, La = 12pm fo r Boron doped Silicon (such as
the pressure transducer) and 15.8pm fo r undoped Silicon (such as the
accelerometer). By comparison with the thickness of the pressure transducer, 8 pm, and the accelerometer, 25pm or 40pm, i t can be seen that only a
d iffe re n tia l absorption occurs across the thickness of the resonator.Indeed fo r the pressure transducer, the electromagnetic wave is re flected
o ff its back face and travels in opposition to the incident wave.Since flexura l vibrations produce a positive stress on the top face
of the resonator and an equal and opposite stress on the back face of the resonator i t can be seen that th is slow d iffe re n tia l absorption
tends to reduce the effic iency of the optical powering. A dditionally
the slow absorption increases the volume of heated Silicon thus reducing
the temperature increase which is produced fo r a given amount of absorbed
energy. Since th is temperature increase produces the vibrational s tra in
th is also reduces e ffic ie n cy . Thus the absorbed electromagnetic wave at
850nm essentia lly acts as a distributed source in S ilicon . The volume
of the distributed source is governed by the optical absorption length
and the optical spot size on the resonator. The former may be decreased
by decreasing the source wavelength but th is is ruled out since the trend
in fib re technology is towards longer wavelengths. The optical spot size is set by the fib re guiding the lig h t to the resonator so w ill be
about 50pm diameter or about 7pm diameter. The la t te r seems preferable
although the gains made w ill be o ffset by the reduced coupling e ffic iency
to such a f ib re . In our case the nature of th is distributed source is
a combination of the thermoelastic source and the photostrictive source.
As was mentioned e a r lie r the thermeelastic source produces thermal waves
as well as e las tic (acoustic) waves. The periodic heating produced by
the absorbed laser is a source o f thermal waves which then propagate
away from the laser source - essentia lly heat diffuses into the resonator.
This diffusion of heat reduces the e ffic iency of optical exc ita tio n .
This conclusion results from the observation th a t, fo r a flexura l mode
of v ibra tion , the strain is maximum at the resonator's top and bottom
- 134 -
surface and goes through zero in the neutral plane. Thus to
produce such an ideal strain distribution one would wish the top
surface to be at a positive temperature and the bottom surface to be
at an equal negative temperature. The thermal wavelength is given by
(46)
XTH = 2it(2k (4 .6)
( p e w )
where:_3
p = density kg m- 1 - 1c = specific heat capacity Wm k
-1a) = repetition frequency of pulse rad s2 -1k = thermal conductivity m s
The attenuation of these thermal waves is high and they travel only a
wavelength before they become negligibly small. However in Silicon at 100 KHz the thermal wavelength is around lOOpm so this is considerably
longer than the thickness of the resonators and so only a d i f fe re n t ia l
temperature e ffec t is produced between the two opposite faces of the
Silicon resonator. This produces lower effic iency since i t is the
temperature difference across the resonator which is important.
The temperature difference is also reduced because o f the diffusion
of the thermal wave in the length and width directions in the resonator
during the course of the optical pulse. This once again increases the
heated volume. In addition to the e ffec t on optical to mechanical
conversion efficiency of the thermal waves and the rate of electromagnetic
absorption one must also consider the acoustic waves produced by the
thermoelastic source.
F irs t ly the frequency of these acoustic waves must match that of the
resonance of in terest. In our case for pulsed excitation the pulse
w ill be made up of a number of frequencies and thus acoustic waves w ill be generated at each of these frequencies. For a pulse of length t with
repetition frequency f , the frequency components are at f , 2 f } 3f etc.
with re la t iv e intensities given by ( sin (mrfT) ) 2. For our experimental( mrfT )
conditions the f i r s t four re la tive in tensities are given by 1, 0.65, 0.28,
0.06. Acoustic waves at frequencies other than those of the desired
resonance represent lost energy and thus effic iency: thus sinusoidal
- 135 -
modulation of the laser is preferred. The effic iency of the optical
excitation w ill also depend upon the type of acoustic waves generated
by the pulses of l ig h t , and the coupling between these and the standing
wave pattern associated with the mechanical resonance. Flexural modes
of vibration are known to be made up of a superposition of a shear
wave and a compressional wave (47) and each mode w ill exhibit a particu lar
standing pattern of volume d ila ta tion associated with the compressional wave and another standing pattern associated with the shear wave. The
source of acoustic waves produced by the l ig h t is primarily a pure
expansion and thus is a source of compressional waves. How closely the
volume dilatation associated with the flexural mode of vibration is matched
by the volume d ila tation generated by the l ig h t pulse is a further
determinant of the effic iency of optical excitation. S im ilarly the shear
wave pattern associated with the mechanical resonance is another determinant since the thermoelectric source ind irectly generates shear waves. Consider
the thermoelastic source situated in the bulk of a solid: i t radiates
compressional waves equally in a l l directions and thus i ts d ire c t iv i ty
pattern for longditudinal waves is a sphere (45). However as the compression
wave reaches the resonator’s boundary, mode convers ion occurs since
boundary conditions require the normal component of stress to be zero: this leads to the production of a shear wave from the incident longditudinal
wave. The match between these shear waves and the shear waves in the
standing wave pattern of the mechanical resonance is a further determinant
of the efficiency of optical excitation.
In summary the thermoelastic source d irectly produces compressional
waves and indirectly shear waves by mode conversion at the surface.
The d irec tiv ity patterns for the shear and compressional sources w i l l depend upon the proximity of the thermoelastic source to the surface of the resonator (that is the rate of 1 ight absorption) and the acoustic
impedance of the medium surrounding the resonator since this w ill determine
the reflection coeffic ient at the interface. How closely these d i re c t iv i ty
patterns match the angles of the waves required to make up the resonance
is a prime determinant of the effic iency of optical energy to mechanical
energy conversion.
Thus in the thermoelastic process several causes of ineffic iency have
been pointed out:
- 136 -

( 1) mismatch between the e lastic wave generated and those required
by the resonance. This w ill vary with position on a particular
resonance and between resonances.
( 2 ) thermal diffusion from the top surface of the resonator to the
bottom. This reduces the temperature difference produced between the
two surfaces. Additionally diffusion la te r a l ly w i l l increase the
heated volume and reduce the temperature r ise .
(3) the in i t ia l slow absorption of the l ig h t increases the volume heated
and also produces only a reduced d if fe re n t ia l e ffec t between the two*
surfaces.
In addition to these problems the photostrictive e ffec t acts in opposition
to the thermoelastic e ffec t. The source of the electronic strain is
once again the absorption of the laser and thus w ill be diffused throughout
the thickness of the resonator. The photocarriers w il l also have a
diffusion length and this is given by
Me1 = ( 2 D ) i ( 4 . 7 )(a) )
where D is the ambipolar d if fu s iv ity of S ilicon. In our experiments
at 100kHz ue1= 56pm and thus w ill produce only a d if fe re n t ia l e ffec t
in the same way as the thermal e ffec t. No information is known on the
d ire c t iv i ty of the photostrictive source.
The results of the experiments on uncoated Silicon resonators are now
discussed.
4 .3 .3 Experimental optical powering: uncoated devices
In a l l , three systems were used in experiments to evaluate optical powering of the pressure transducer. System 1 is shown in Figure 4.1
Detection of the vibrations was performed using the standard interferometric
set up which was described in Chapter 3. Excitation was performed using
a CW laser diode (LC30 series, 850pm) with a multimode f ib re ta i l ending
- 137 -
in a connector. Due to the size of the connector i t could not be
placed close to the resonator and so its output was allowed to
propagate in free space and then focused onto the resonator using a lens.
The laser diode was driven to produce pulses of 2.25 mW and 2pS
duration, a t a repetition frequency which can be tuned accurately
to the appropriate resonant frequency. The video camera provides a
magnified picture of the device and two optical spots can be observed.
The spot generated by the interrogating fib re is a few microns in
diameter and the spot of the powering l ig h t is aboutbopm diameter. The
position of each spot can be controlled independently.
In system 2 the lens was replaced by a multimode fib re which has a
stratos connector at one end and bare fib re at the other. The two
connectors were joined and the bare fib re end was brought close to the
resonator so as to position its output spot on the resonator and allow
i t to be scanned around the resonator. This set up produced a sim ilar
spot size.
In system 3 the 850 nm laser in system 2 was replaced by a 1300 nm
ELED which also had a multimode f ib re p igta il and stratos connector.
System 2 proved more e f f ic ie n t in launching l ig h t onto the resonator
than system 1 and fo r the same experimental conditions produced about
4/5 times the amplitude of vibration. This allowed more modes of
vibration to be excited and the results presented now are for this
system. Since the characteristic shape of each resonance was alreadyknown (section 2.4) the point on the resonator for each particu lar mode
at which the amplitude is a maximum is also known (Figure 2.10 and 2 .11).
These points were chosen for the position of the interrogating f ib re .Then the distance between this fib re end and the resonator was adjusted
to obtain the maximum detection sens it iv ity , corresponding to the
quadra(£ive condition.
Once the interrogating f ib re is placed on an optimum position for the
particu lar mode of in terest, the resonator is scanned by the powering
spot of l ig h t . A map of the efficiency of the excitation can be deduced
and Figure 4.2 summarises the results showing the excitation regions
for maximum effic iency.
- 138 -

The frequencies are given fo r zero applied pressure and ten out of
the f i r s t eleven modes can be excited in this way; the best displacement
being 20 nm fo r mode 2. Keeping the excitation f ib re fixed and scanning
the detection f ib re over the resonance i t was observed that the mode
shape is identical to those observed for piezoelectric excita tion , the
frequencies are also the same. The regions of maximum excitation
effic iency on this device have been observed by comparison with the
mode shapes, shown in Figures 2.10 and 2.11 to occur in that part of the
mode which exhibits maximum curvature. These regions of maximum curvature
correspond to maximum volume d ila tation in the flexural mode and i t
appears that the thermoelastic/electronic source is best able to couple
with the resonance at those points. From these experiments i t is not known i f e ither the photostrictive or the thermoelastic e ffec t is
dominant.
I t was also noticed during the experiments that the phase of the
vibrations at any chosen point on the resonator changed by it , re la t iv e
to the optical driving pulse, i f the excitation pulse was moved from
one region of the resonator to a similar one of opposite curvature.
I t is seen from Figure 4.2 that the general trend is that the excited
amplitude tends to decrease as the frequency of resonance increases.One reason for this is that as the frequency increases and the pulse
length remains constant the heat per period decreases. A second reason
is that as frequency increases the size of the optical spot more and
more approaches an acoustic wavelength. Thus the spot w il l eventually
cover two regions of opposite curvature on the resonance which w il l result in no movement. Decreasing the spot size should thus increase the
highest frequency of operation; i t w ill also increase the excitation
effic iency since this w il l decrease the heated volume thus increasing the
temperature difference. Thus single mode f ib re is preferred fo r excitation. Looking again at Figure 4.2 i t is seen that most modes require detection
and excitation at d iffe rent points thus requiring two fibres which is a
disadvantage and may be impossible in a packaged sensor. Hence the
design of an optically detected resonator should aim to produce
maximum curvature at maximum amplitude of vibration.
- 139 -
For this reason the Mq2 mode at 97 kHz seems a t tra c t iv e . I f this
mode is excited and detected by a single f ib re at i ts centre an additional
advantage becomes apparent: the modes which have zero (or low) displacement
or zero (or low= curvature at the centre w ill e ither not be detected
or not excited. This decreases the danger of the electronic resonance
maintaining system becoming confused by another mode which is especially
l ik e ly i f pulsed excitation is used.
In conclusion the observed displacement of 20 nm for the best mode
is barely adequate for the interferometric detection system which has
a s en s it iv ity l im i t of around 1nm with the present detector. Improvement
in the effic iency is essential i f multiplexing of many sensors from asingle optical source is required or i f non interferometric detection isdesired. Since this resonator is Boron doped i t s t i l l absorbs
appreciable power at 1300nm as is shown in Figure 4.3 and so some
optical excitation experiments were attempted at this wavelength using
system 3. The ELED used was operated in the same pulsed fashion but
produced less power. Figure 4.4 shows the points of optimum excitation
effic iency and the displacements obtained. These displacements suggest
that excitation at this wavelength may be more e f f ic ie n t even though
l ig h t a t 1300 nm is absorbed more slowly than at 850nm. However
quantative measurements on the powering source's re la t ive power could not be made so i t is d i f f i c u l t to reach a defin ite conclusion.
For the accelerometer displacements of <1nm were obtained fo r the
fundamental mode of vibration for the batch 1 devices using system 2 .
For batch 2 nothing could be excited in vacuum but in air. the f i r s t
three modes were excited with the displacements given in Figure 4 .5 .
This is somewhat surprising since the Q of the resonator is lower in a i r
and hence i t requires more power to produce the same amplitude of v ibration .
However more power is provided since, when the resonator is in a i r , the vacuum retaining glass cover can be removed thus avoiding its
reflections and absorption. Additionally the excitation f ib re can be
pushed more closer to the resonator when the cover is,removed decreasing
the spot size and avoiding spillover losses which occur because of the
small size of the accelerometer. The thickness of the accelerometer
- 140 -
is 40pm compared to the pressure transducers 8pm hence one would
expect the optical powering effic iency to be better since the thickness
is greater than the thermal and electronic diffusion lengths. However the device’s Q is only 4000 compared with about 20,000 for the pressure
transducer and this w il l increase the devices power requirement to
produce the same amplitude. I t can be seen from Figure 4.5 that the
positions of optimum excitation effic iency are once again the points of maximum curvature. However fo r mode 1 a large displacement is also
obtained at the point where the DETF joins the support.
4 .3 .4 Physical Mechanisms:Coated Resonator
In order to increase the effic iency of the optical excitation covering
the resonator in an absorbing layer is the most obvious solution. M etallic
layers were in i t i a l l y considered since they can be evaporated in controlled
thicknesses onto the surface of a resonator.
The conditions for such a layer are
1) i t should absorb enough l ig h t for optical powering but s t i l l re f le c t
enough l ig h t for detection. Clearly the re f le c t iv i ty of Si is
suitable but the reflectivities of metals are high. At 850nm Gold has
a re f le c t iv i ty of 97%, S ilver 98%, Nickel 66% and Chrome 69%.
2 ) Mechanically the layer should be thin with respect to the
resonator so that its properties do not s ign ificantly a ffec t the
performance of the resonator. This criterion is particu la r ly directed
at the long term s ta b i l i ty of the resonant frequency and the
temperature dependence of resonant frequency. Additionally the
acoustic attenuation of the layer should be as low as possible to
avoid a decrease in the Q. Optically , the layer must be thick enough
to absorb a ll the l ig h t at the wavelength of in terest. This ensures
that there is no photostrictive e ffec t since no l ig h t is absorbed
in the Silicon. I t also ensures that the thermoelastic source is
confined to the surface of the resonator and not distributed across
the thickness. Both these effects should increase the e ffic iency of
optical excitation. This condition is easily satisfied by metals:
th e ir absorption lengths are of the order of 20nm.
- 141 -

3) The thermal wavelength should be large in the layer so that the
temperature drop across the layer is neglig ib le . This condition
is satis fied for a l l thin metal layers which have thermal wavelengths
of about 100 microns.
4) The layer should have as small in tr in s ic stress as possible since
a large in b u ilt stress may e ffec t the performance of the sensor.
Only Titanium satis fies this condition and then only a t a thickness
of 0.1pm (48). However i t is hoped that i f the layer is thin enough
with respect to the resonator this e ffec t w ill be neglig ib le .
5) The layer should have no in tr in s ic sen s it iv ity to any potential
measurand unless that measurand is of in terest. For example Nickel
is magnetostrictive so this would produce unwanted magnetic f ie ld
sen s it iv ity in the sensor; conversely this may be a useful e ffec t
fo r a magnetic f ie ld sensor.
In summary the metal should be mechanically th in , op tica lly thick and of
as low re f le c t iv i ty as possible. For these reasons Chromium was chosen
as best meeting these requirements.
4 .3 .5 Experimental results: Chromium coated pressure transducer
For the Chromium coated device the evaporated layer was about 60nm
thick (about 1% of the device thickness) which is about 5 times the
absorption length of Chromium at this wavelength and the thermal
diffusion length is about 100pm at the frequency of 100kHz. The Chrome
coated device showed no decrease in quality factor, no change in
frequency against pressure characteristic , negligible shifts in the
resonant frequencies and no change in the mode shapes.
The Chromium coated devices was operated for optical powering at 850nm
in system 1 and so in this configuration less power was launched on
the device. This meant that only the f i r s t four resonances could be
excited a lb e it with greater effic iency; the points of optimum excitation
effic iency are shown in Figure 4.6 with the displacements obtained.
By comparison with the uncoated positions and displacements shown in
Figure 4.2 i t is seen that the improvement in the displacement varies
with the mode. For the mode 1 the change is 3.5 times, for mode 2 0.4 times
- 142 -
fo r mode 3 9 times and mode 4 1.5 times. Since the improvement in
the temperature difference across the device is the same fo r a l l four
modes the effect must be caused by changes in the e ffic iency of optical
to mechanical conversion. Thus the d ire c t iv ity of the thermoelastic
sources of shear and compressional waves is altered in the Chrome coated
device; for some modes this new d ire c t iv ity pattern couples better with
th e ir standing wave pattern, for others i t does not. Moreover the
general trend for Chrome coating is to improve the opto/mechanical
conversion effic iency because of the faster absorption giving improved
temperature difference across the device. Additionally the avoidance
of the photostrictive e ffec t which acts in opposition to the thermoelastic
e ffec t (which cannot be avoided) improves effic iency. For mode 3 at
97 kHz the improvement in optical to mechanical e ffic iency is 18 times
per unit of absorbed optical power since the Chrome re flec ts about
twice as much l ig h t as S ilicon. This is a further advantage of
Chrome coating because the higher re f le c t iv i ty w ill also improve the
effic iency of the detection system.
4 .3 .6 Conclusion
In i t i a l analysis suggests that Chrome is the best metal fo r coating
Silicon resonators to improve the efficiency of optical activation. Experimental results have produced a best improvement of 18 per unit
of absorbed power of Chrome coated over uncoated devices. This
improvement is attributed to faster absorption of the optical power and
avoidance of the photostrictive e ffec t which opposes the thermoelastic
e ffe c t . There appeared to be no degradation of, or change in , the
Chrome coated resonators mechanical characteristics although no
measurements were made on the devices long term s ta b i l i ty which is
most l ik e ly to be affected. This is believed to be because the layer
was kept thin with respect to the resonator (<1%).
For an absorbed power of about 400pW the Chrome coated device had a
total displacement of 1SOnm. This is c learly adequate fo r an in te r
ferometric detection system and may be enough for a carefu lly
optimised intensity modulation system. However for a multiplexed
system i t seems unlikely that more than one device can be operated
from a single standard laser diode. Further work is s t i l l required on
the use of coating to improve optical excitation e ffic iency .
- 143 -

4.4 Self excited resonators
4.4 .1 Introduction
A complication of using l ig h t pulsed at the frequency of the resonance,
as described in the previous section, is that a feedback system is
required between the detection electronics and the drive electronics
in order to maintain the device at resonance. This feedback must ensure
that the pulse repetition frequency varies as the device resonant
frequency varies. A further problem of the requirement fo r such a
feedback system occurs when a multiplexed system is considered: f i r s t
i t is d i f f i c u l t to multiplex sensors using such a system, second the
system would become extremely complicated.
In order to address these problems solutions have been sought in
in i t ia t in g and maintaining oscilla tions a t the resonant frequency
using unmodulated l ig h t , termed se lf-exc ita tion or se lf o sc il la t io n .The principle is simple: when the l ig h t is in i t i a l l y turned on i t is
absorbed by the resonator and the resulting temperature change causes the
device to move such that i t absorbs less l ig h t , i t then cools and moves
back to its original position. This movement also causes modulation
of the reflected and transmitted l ig h t which provides detection and
positive feedback. This section describes some of the possible approaches
to se lf-exc ita tion of Silicon resonators.
4 .4 .2 Impulse Response
This, s t r ic t ly speaking, does not obey the defin ition of s e lf -e xc ita t io n
given in the previous section but i t does avoid the requirement of an
electronic feedback system.
The approach is based upon the fac t that a delta function pulse of
l ig h t in the time domain contains a l l frequencies in the frequency domain. Thus i f the excitation l ig h t pulse is close to a delta function then
in the frequency domain there should be some power at the devices resonant
frequency whatever i ts value may be. Thus vibrations should be excited.
A major problem with this method is that i t makes in e f f ic ie n t use of the
available l ig h t and so, with present optical to mechanical energy
conversion e ff ic ienc ies , i t is not expected to be e f f ic ie n t enough.
- 144 -
4 .4 .3 Fabry Perot
This approach has been described by Langdon and Dowe (50) and
uses the properties of the Fabry Perot cavity created between an
optical f ib re and a Silicon resonator. In order to improve the finesse
of the system both the end of the f ib re and the resonator may be coated
with a high r e f le c t iv i ty material although this may not be essential.
The transmission of this cavity varies with the beam displacement and
the separation of the cavity is arranged to produce a positive feedback
to generate beam osc illa t ion s , i . e . in i t ia l movement of the beam causes
i t to absorb less l ig h t . Detection is afforded by the reflection of the
cavity. At present the system has only been demonstrated on non-Silicon
resonators (50, 51) but there is no reason to suspect that i t w il l not
work with them. A major problem however is that the f ib re to resonator
spacing is c r i t ic a l ( i t must be held to less than ha lf a wavelength) and this may present problems in applications calling fo r wide temperature
and measurand variations. A possible solution to this problem is shown
in Figure 4 .7 . In this case the cavity is formed by the mechanical resonator geometry which is a DETF thus, due to the accuracy of the
photolithographic process, the cavity spacing can be well controlled.The resonator must be undoped and illuminated at 1300 nm or 1500 nm
at which wavelength Silicon is transparent and so w ill not a ffec t the
cavity properties. The second detector f ib re is optional since detection
may be performed either in transmission or re flection . However the
transmitted l ig h t may be used to illuminate another resonator. A
possible problem with this system is the cavity formed between the end
of the fib re and the f i r s t unsilvered face.
4 .4 .4 Selective masking
This was also proposed in reference (50) and a similar approach has
independently been suggested by the author. The system is suggested
in (50) is shown in Figure 4 .8 . As the beam vibrates, the laser spot intercepts a greater or lesser proportion of the absorbing area, causing
a modulated thermoelastic drive to the surface. By arranging the position
of the absorbing area correctly re la tive to the l ig h t spot, positive
feedback can be achieved between drive and displacement causing
osc illa t ion .
- 145 -

Figure 4.9 shows a variation on this based on the DETF. The desired
mode of vibration is the high Q mode with beams vibrating in antiphase
in the plane of the resonator. In order to select this mode rather
than the in phase mode i t may be necessary to have illumination on each
arm and with the targets oppositely blackened and silvered; however
the higher Q of the antiphase mode may be enough to ensure that only i t
is selected with only one spot. The principle of the method is that more
l ig h t is absorbed in the blackened area than the silvered area causing
the beam to bend and move out of the l ig h t . I t then cools and moves
back in . The reflected beam is modulated providing detection.
Similar techniques are shown in Figure 4.10 and require alignment of
the f ib re with the device edge. The transmitted l ig h t affords certain
detection but perhaps the reflected l ig h t may be used.
4 .4 .5 Conclusions
Self resonant optically driven Silicon sensors should be a powerful
sensing technology and thus ju s t i fy the considerable technical problems
which they e n ta il . The previous sections have outlined some possible
approaches to the problem. These approaches require more analysis, both theoretical and experimental.
- 146 -
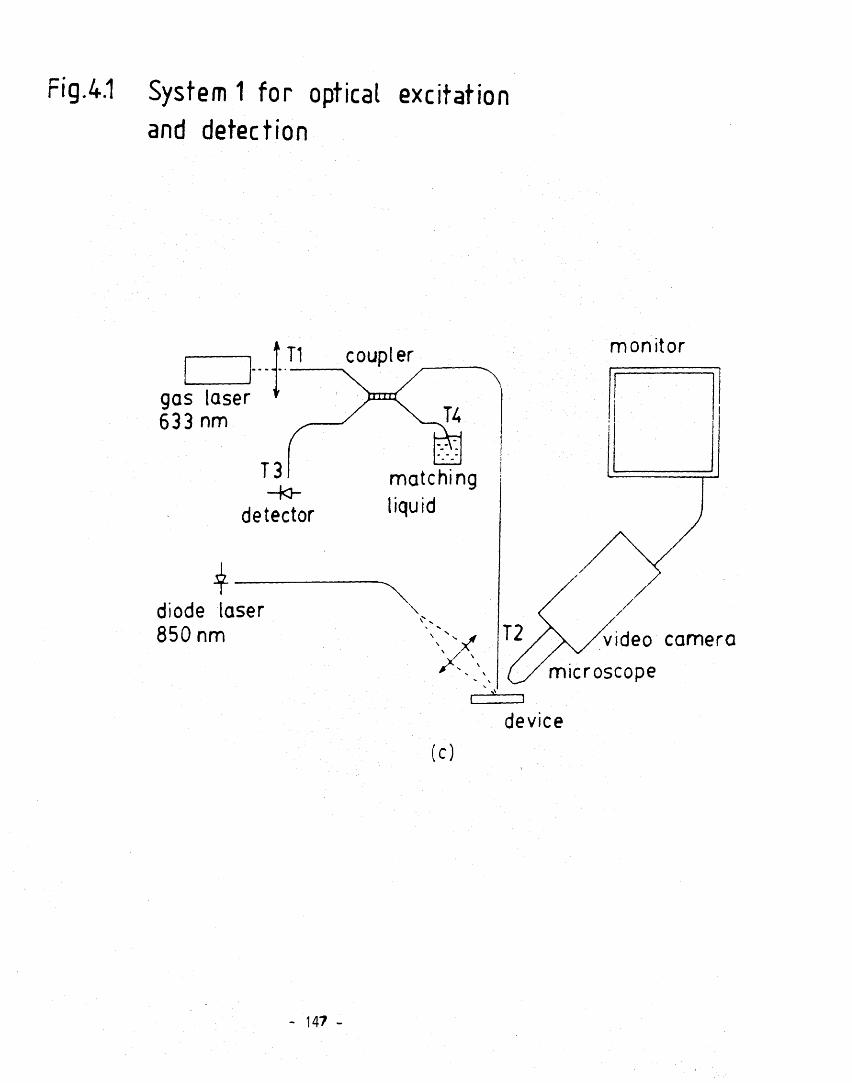
Fig.4.1 System 1 for optical excitation and detection
coupler
gas laser 633 nm
matchingliquid
- k hdetector
diode laser 850 nm video camera
microscope
(c)
- 147 -
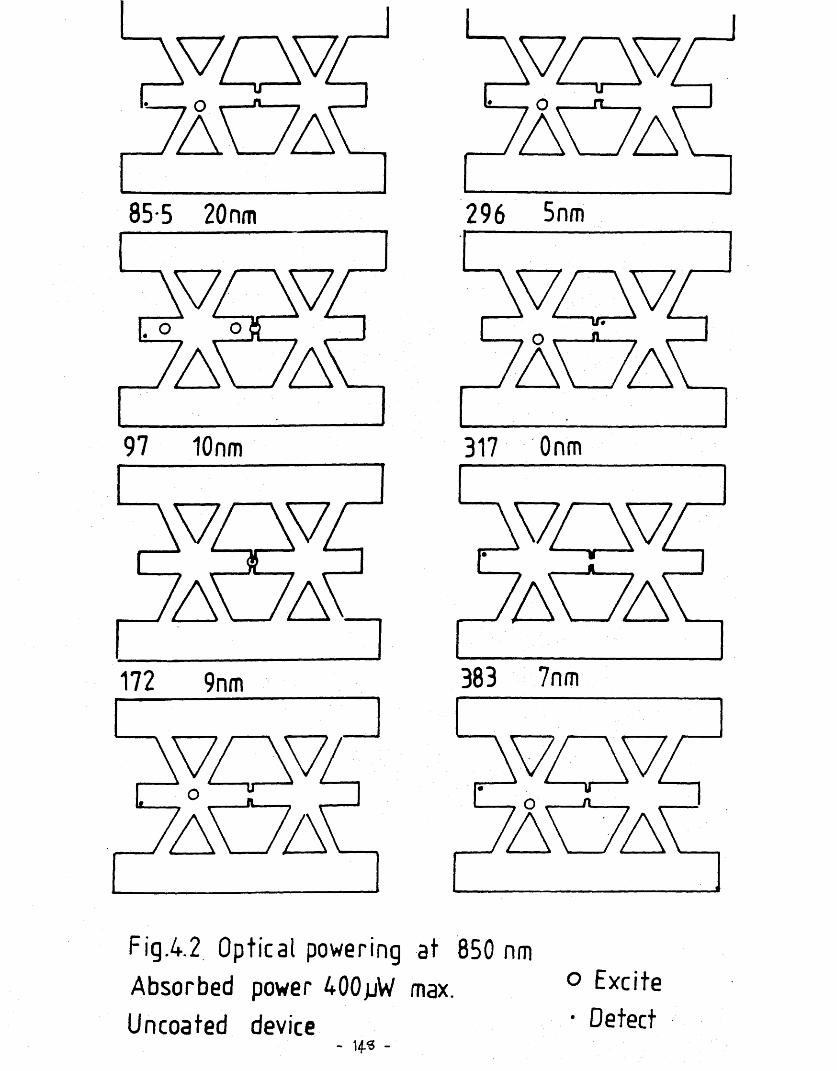
\V/
97 10nm
172 9nm
A A A_7a \ _ 7a v_
296 5nm
A
Fig.4.2 Optical powering at 850 nmAbsorbed power 4 0 0 jjW max. ° ExciteUncoated device -Detect
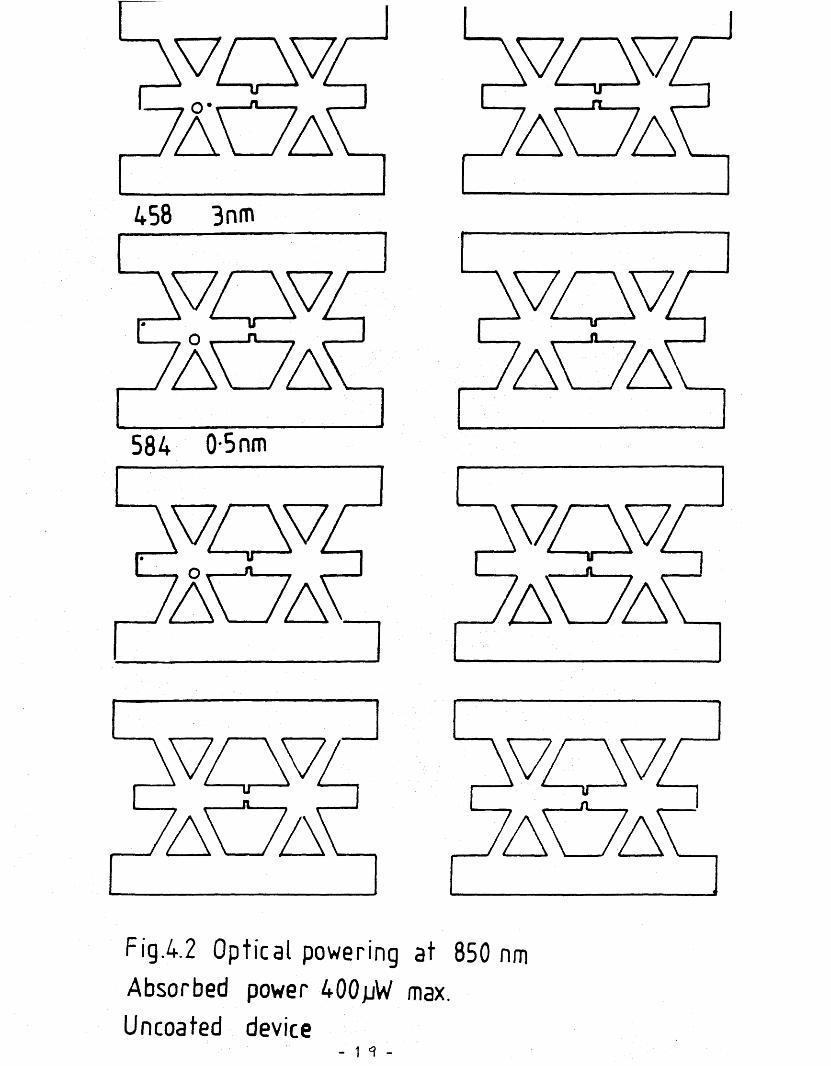
o *
458 3nm
584 0-5nm
Fig.4.2 Optical powering at 850 nmAbsorbed power 400jjW max.Uncoated device
- 1 <? - '

Fig.4.3 Silicon optical absorptioncoefficient vs. wavelength
log.(«*)/cm
4 -
A ( j j m )
o Intrinsic Silicon + Boron doped Silicon
- 150 -
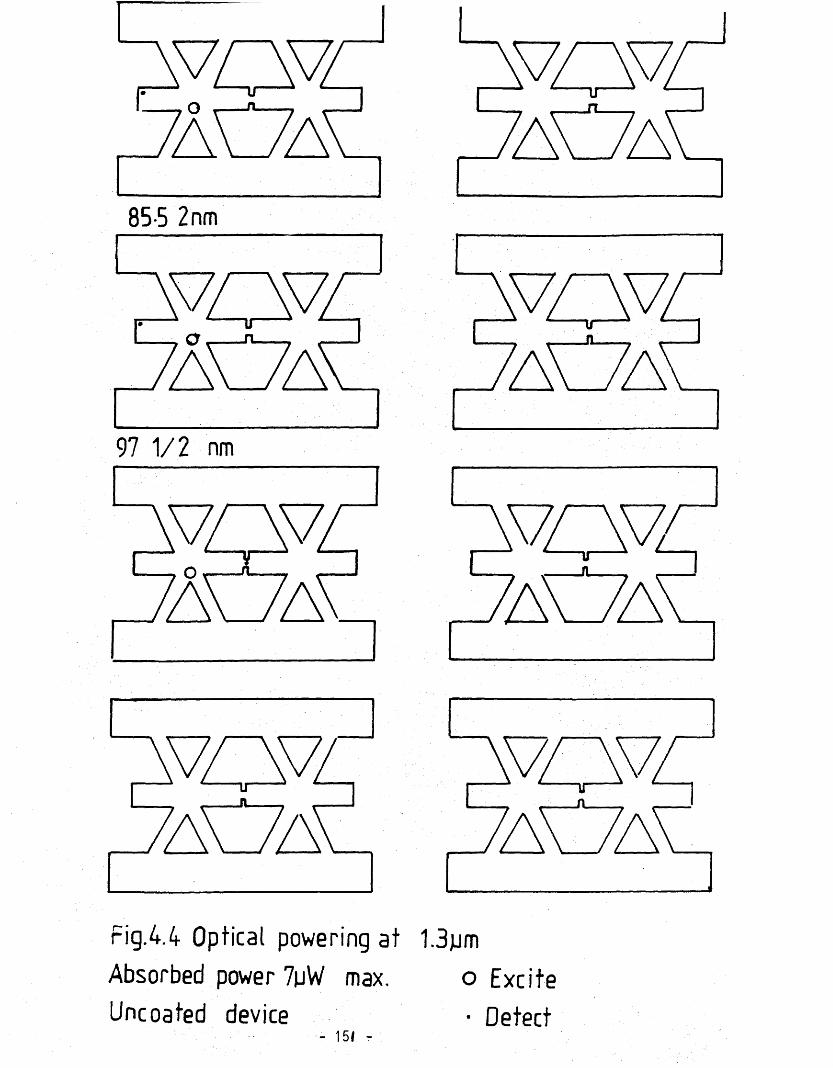
85-5 2nm
97 1/2 nm
rig.4.4 Optical powering at 1.3pmAbsorbed power 7pW max. o ExciteUncoated device • Detect

114
kHz
179
kHz
u rcs
m
NX
r ^rsi
§ £ a;
& - i§ 5O -
- a *> a; ^
jd r : c_ „
s 1x> E ro
^ -oQJ
> a;-a
OJa i
- o ^a} T 3
fOoOJc
EcoLHGO
ro
CPc
cl;00ro
i/)OJ
roOJ“Oc
+ !
c- CQJ O
o 0 - 00 o
CLrou C
‘-4 - Oc l r :
O OJ OJ
- j - - a c h •
- 1 5 1 -
indica
te
excit
ed
disp
lace
men
t.

84-1 2 nm
3nm
Fig.4.6 Optical powering at 850nmAbsorbed power 55pW max o ExciteChrome coated device • Detect

Ivibrationillumination at 1-3/jm
fibre
cavity
fibre (optional)
Fig.4.7 Fabry Perot cavity formed within the resonator
incident light
absorbing layer
earnI vibration
Fig.4.8 Selective masking self resonant system
- 15 f -
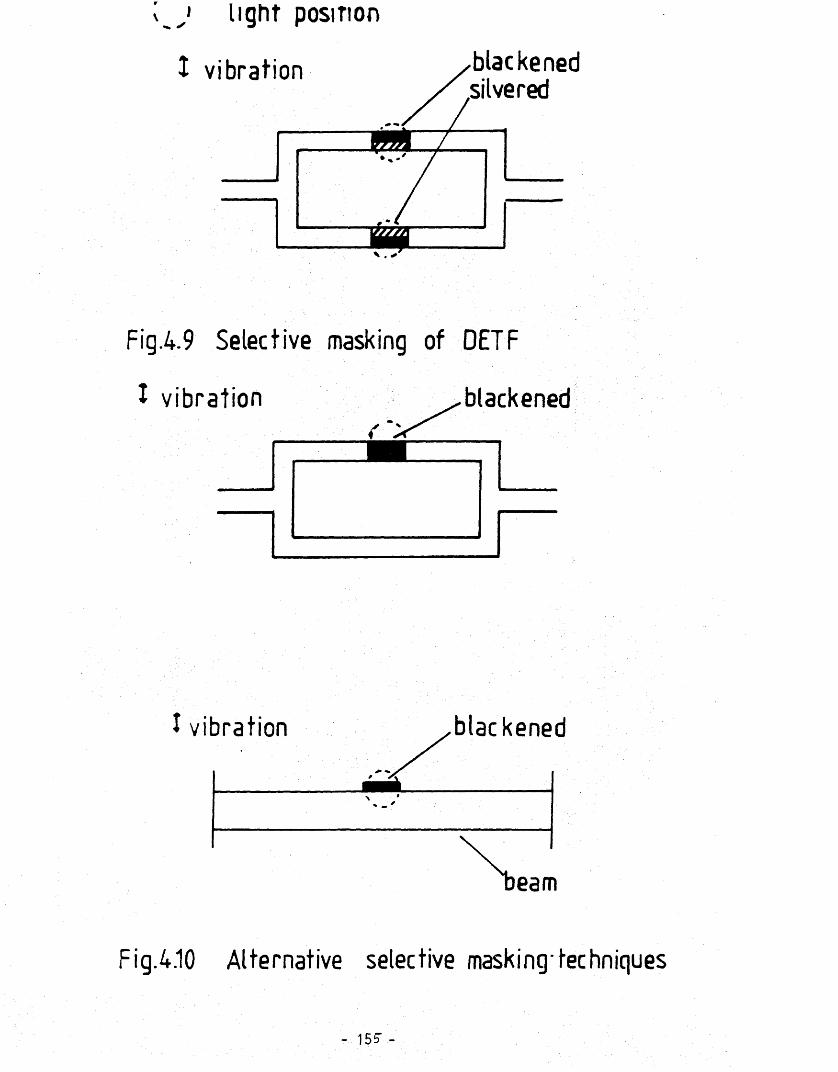
light position
■blackenedsilvered
I vibration
Fig.4.9 Selective masking of DETF
I vibration ^blackened
I vibration blackened
earn
Fig.4.10 Alternative selective masking-techniques
- 155-
CHAPTER 5
CONCLUSIONS
5.1 Conclusions
Optical detection and excitation of flexural vibrations in Silicon
resonator sensors may be performed. Two Silicon resonator sensors
have been demonstrated: one for pressure and one fo r acceleration.
The optical detection of the sensor's vibrations may be based on
modulation of phase or in tensity. The phase modulation system is best
suited for vibrations along the fib re axis and may be implemented in
either single mode or multimode f ib re . Operation with single mode
f ib re renders the system independent of the f ib r e ’ s optical length and
so insensitive to the environment. When operating the system with
multimode fib re environmental sensitiv ity is minimised by using the
minimum necessary source coherence. Both systems are capable of
detecting vibrational amplitudes of less than 1nm. The intensity
modulation system is inherently less sensitive to vibrations than
phase modulation but is better suited to the detection of vibrations
perpendicular to the fib re axis than phase modulation.
The resonator vibrations have been excited o p tica lly or p iezoe lectr ica lly .
Piezoelectric excitation is a useful diagnostic tool since i t excites
a l l flexural modes of the device with amplitudes as large as 1 jjm. Optical
excitation of the uncoated pressure transducer produced a maximum
amplitude of 20nm fo r about 0.5mW of incident power at 850nm. The main
causes of ineffic iency are: slow absorption of the incident l ig h t;
opposition of the photostrictive and photothermal effects and the long
electronic and thermal diffusion lengths with respect to the device
thickness. Coating a device with a metal layer decreases the absorption
length and avoids the photostrictive e ffec t. Chromium coating was chosen
since i t has the lowest re f le c t iv i ty of easily evaporated metals and this
produced an improvement in excited amplitude by a fac to r-o f 9.
Both sensors exhibited resonant frequency shifts with temperature. For
the accelerometer the temperature dependence of resonant frequency was
measured at -29ppm/°C and this agrees with theory. To compensate fo r this
temperature dependence a layer of Silicon Dioxide of thickness of about
- 1SX- -
1/4 of the resonator thickness may be used. For the pressure
transducer the temperature dependence of the resonant frequency is
dominated by stresses imposed on the device by the mounting method;
th is is a c r i t ic a l point for the packaging of the device.
The resonant frequency also varied with the square of vibrational
amplitude as a result of the inherent nonlinearity of the resonator.
To minimise this e ffec t as a cause of inaccuracy the amplitude should
be kept as small as possible.
Resonator sensors in general exhibit a number of unwanted spurious
modes in addition to the desired mode. The desired mode generally
has a higher Quality factor and measurand s en s it iv ity . Care should be
taken to avoid coupling between the desired mode and spurious modes
as a function of temperature and pressure as this w il l s h if t the
frequency of the desired modes. Coupling may be avoided by careful
choice of the device dimensions and measurand s e n s it iv ity .
The devices investigated showed a re la t iv e ly high Q in vacuum, the
maximum Q fo r the accelerometer being about 10000. For these devices
the Q is dominated by the internal loss of the m aterial, in particu lar
the thermoelastic damping.
In conclusion commercial optically interrogated, op tica lly excited
Silicon resonator sensors remain probable; a number of problems have
been highlighted but none appears insurmountable. Further work is
needed in the areas of optical pulsed and se lf excitation, aging
and packaging of Silicon resonator sensors.

REFERENCES
1: T .G .G iallorenzi, J.A.Bucaro, A.Dandridge, G.H.Sigel, J.H.Cole,S.C.Rashleigh, R.G.Priest: "Optical Fibre Sensor Technology",IEEE J. G. E lec., Vol. GE-18(4), pp. 626-665, 1982
2: G .D .P itt , P.Extance, R.C.Neat, D.N.Batchelder, R.E.Jones,J.A.Barnett, R.H.Pratt: "Optical Fibre Sensors", IEE. Proc. Pt. J.No. 4, pp. 214-248, 1985
3: M .Collier, S.M.Mcglade, P.E.Stephens, UK Patent App. No. 2 146120A, 1983, Pub. 11/3/85
4: R.M.Langdon: "Resonator Sensors - a review", J. Phys. E: Sci.Instrum., Vol. 18, pp. 103-113
5: K.E.Peterson: "Silicon as a Mechanical Material", Proc. IEEE,70(5), pp. 420-457, 1982
6 : J.C.Greenwood: "Etched Silicon Vibrating Sensor", J. Phys. E:Sci. Instrum., 17, pp. 650-652, 1984J.C.Greenwood: STC Technology L td . , London Road, Harlow, Essex
7: J.M.Seelig, W.M.Hoppmann I I : "Normal Mode Vibrations of Systems ofE lastica lly Connected Parallel Bars", J. Acous. Soc. Am., 36(1),pp. 93-99, 1964
8 : R.D.Blevins: "Formulas for the Natural Frequency and Mode Shape",Pub. Van Nostrand Rheinhold, 1979
9: L.M.Roylance, J.M.Angell: "A Batch Fabricated Silicon Accelerometer",IEEE Trans., Vol. ED-26(12), pp. 1911-1917
10: M.V.Andres, K.W.H.Foulds, M.J.Tudor: "Sensitivity and Mode Spectrumof a Frequency-Out Pressure Sensor", to be published in Sensors and Actuators
11: F.Dinca, C.Teodsui: "Non Linear and Random Vibrations", Pub. NewYork Academic Press, 1973
12: A.B.Pippard:"The Physics of Vibration Vol. 1", Pub. CambridgeUniversity Press, 1978
13: R.A.Johnson, A.D.S.Barr: "Acoustic and Internal Damping inUniform Beams", J. Mech. Eng. S c i. , 11(2), pp. 117-127, 1969
14: L.D.Landau, E .M .Liftshitz: "Fluid Mechanics", Pergammon Press, 1959
15: A.P.Wegener: "Vibrating Fluid Densimeters: A Solution to theViscosity Problem", IEEE Trans., Vol. I ECI-27(3), pp. 247-253, 1980
16: L.D.Clayton, S.R.Swanson, E.P.Eernisse, "Modifications of the DoubleEnded Tuning Fork Geometry for Reduced Coupling to its Surroundings", IEEE Trans., Vol. UFFC-34(2), pp. 243-252, 1987
17: W.P.Mason: "Physical Acoustics", Vol. 3B, Academic Press, 1965
18: A.B.Bhatia: "Ultrasonic Absorption"
- 158 -
19: W.E.Newell: "Miniaturisation of Tuning Forks", Science, 161,pp. 1320-1326, 1968
20: C.E.Wallace: "Radiation Resistance of a Baffled Beam", J .S .V ib .,Vol. 51(3), Pt. 2, pp. 936-945, 1972
21: R.F.Vogel: "Dual Crystal Gas Density Sensor", Sensors andActuators, 5, pp. 21-28, 1984
22: M.V.Andres, K.W.H.Foulds, M.J.Tudor: "Sensitiv ity of a FrequencyOut Pressure Sensor", Third Eurosensors Conf. on Sensors and th e ir Applications, Cavendish Labs., Cambridge, 1987
23: S.Johansson, J.A.Sweitz, L.Ternerz, T.Tven: "Fracture Testing ofSilicon Microelements in situ in an SEM", Uppsalla University School of Engineering Technical Report
24: E.P.Eernisse, J.M.Paros: "Resonator Force Transducer", US PatentNo. 4 372 173, 1983
25: M.B.Othman, A.A.Brunnschweiler: "Electrothermally Excited SiliconBeam Mechanical Resonators", Electron. L e t t . , 23(14), pp. 728-730, 1987
26: H.J.Mcskimin: "Measurement of the Elastic Constants a t low Temperatures -Data for Silicon and Germanium Single Crystals and fo r Fused S il ic a " ,J. Appl. Phys., 24(4), pp. 988-997, 1953
27: B.L.Weiss, J.L.Sears: "Publish and Retrieve Materials Data withEMIS", IEE Proc. Vol. 128, P t.1 , pp. 189-191, 1981
28: J.P.Monchalin: "Optical Detection of Ultrasound", IEEE Trans.,UFFC-32, No. 5, pp. 485-499, 1986
29: S. Venkatesh, B.Culshaw: "Optically Activated Vibrations in aMicromachined S il ica Structure", Electron. L e t t . , 21 (8), pp. 315-317, 1985
30: S.Venkatesh, S.Novak: "Mechanical Resonators in Fibre Optic Systems",Optics L e t t . , 12(2), pp. 129-131, 1987
31: G.Economou, D.E.N.Davies: "Studies of an Optical Fibre DisplacementSensor", JERE, 57(2), pp. 63-66, 1987
32: A.D.Kersey, D.A.Jackson, M.Corke: "A Simple Fibre Fabry PerotSensor", Opt. Comm., 45(2), 1983
33: H.C.Lefevre: "Single Mode Fractional Wave Devices and PolarizationControllers", Electron. L e t t . , 15, p. 778, 1980
34: D.A.Jackson: "Monomode Optical Fibre Interferometers forPrecision Measurement", J. Phys. E: Sci. Instrum., 18, pp. 981-1001
35: D.Marcuse: "Loss Analysis of Single Mode Fibre Splices", BellSyst.Tech. Journal, 56, pp. 703-718, 1977
36: M.V.Andres, M.J.Tudor, K.W.H.Foulds: "Analysis of an OpticalFibre Detection Technique Applied to Silicon Vibrating Sensors"Electron. L e t t . , 23(15), pp. 774-775, 1987
- 159 -
37: W.L.Emkey, C.A.Jack: "Analysis and Evaluation of Graded IndexFibre Lenses, J.Light. Tech., LT-5(9), pp. 1156-1164, 1987
38: R.E.Epworth: "The Phenomenon of Modal Noise in Analogue andDig ital Optical Fibre Systems", Proc. 4th European Conf. on Optical Fibre Communications" Genoa, pp. 492-501, 1978
39: M.M.Choy, J.L.Gimlet, R.Weller, L.G.Kazovsky, N.K.Cheung:"Interferonmetric Conversion of Laser Phase Noise to Intensity Noise by Single Mode Fibre Optic Components", Electron. L e t t . ,23(21), pp. 1151-1152, 1987
40: K .I .M a l la l ie u , .Younquist, D.E.N.Davies, "FMCW of optical sourceenvelope modulation for passive multiplexing of frequency based f ib re optic sensors", Electronics L e t t . , 22(15), pp. 809-810, 1986
41: B.Culshaw: "Electronics and Power", 1986, p. 538
42: J.P.Dakin: "Multiplexed and Distributed Optical Fibre SensorSystems", J. Phys. E: Sci. Instrum., 20, pp.954-967, 1987
43: M.W.Sigrist: "Laser Generation of Acoustic Waves in Liquids andSolids", J. Appl. Phys., 6 0 (7 ), pp. R83-R121, 1986
44: R.G.Stearns, G.S.Kino: Effect of Electronic Strain on PhotoacousticGeneration in Silicon", Appl. Phys. L e t t . , 47(10), pp. 1048-1050, 1985
45: C.B.Scruby, R.J.Dewhurst, D.A.Hutchins, S.B.Palmer:"Principles of Sound Operation by Laser", AERE Harwell Report No. 10099, Dept, of Applied Phys., Univ. of Hull, 1981
46: A.Rosencraig: "Thermal Wave Imaging", Science, 218(4569),pp. 218-223, 1982
47: B.A.Auld: "Acoustic Waves and Fields in Solids", Vols. 1 and 2,Pub. Wiley, 1973
48: E.Klockholm, B.S.Berry: " In tr ins ic stress in evaporated metal film s".J. Electrochem. Soc., Solid State Science, pp. 823-826, 1968
49: T .F ig ie ls k i: "Photostriction Effect in Germanium", Phys. StatusS olid i. 1, pp. 306-316, 1961
50: R.M.Langdon, D.L.Dowe: "Photoacoustic Oscilla tor Sensors",Fibre Optic Sensors I I Conf., The Hague, 30th March - 3rd April 1987
51: N.Stokes, R.M.A.Fatah, S.Venkatesh: "Self excited vibrations ofoptical microresonators", Electronics L e t t . , 24(13), pp. 777-778, 1988
- 160 -