Surrey County Council BSIP - Bus Service Improvement Plan ...
Upload
khangminh22Category
view
0download
0
CORPORATE REPORT
NO: R127 COUNCIL DATE: June 24, 2019
REGULAR COUNCIL
TO: Mayor & Council DATE: June 19, 2019
FROM: General Manager, Finance FILE: 1880-20
SUBJECT: 2018 Statement of Financial Information
RECOMMENDATION
The Finance Department recommends that Council:
1. Receive this report for information; and
2. Approve the 2018 Statement of Financial Information that is attached to this report asAppendix “I”.
INTENT
The purpose of this report is to fulfil the annual Financial Information Act (the “Act”) requirement to report publicly, the Statement of Financial Information.
BACKGROUND
The Financial Information Act was enacted in the fall of 1993 and requires all municipalities to provide the Province of British Columbia with a Statement of Financial Information on an annual basis. The Statement of Financial Information is to include, for the year being reported, the City’s audited financial statements along with information regarding the remuneration paid to the Mayor and each Councillor, the name of and the remuneration paid to each employee who received more than $75,000 from the City, the name of and the amount paid to each supplier of goods and/or services to whom the City paid more than $25,000, and grants paid by the City for more than $25,000.
The Act requires that Council approve the Statement of Financial Information prior to its submission to the Province of British Columbia. The Act also requires that the Statement of Financial Information be made available to the public before June 30th of the year following the year to which the information in the Statement of Financial Information applies.
DISCUSSION The 2018 Statement of Financial Information has been prepared in accordance with the Act and is attached as Appendix “I” to this report. The Statement of Financial Information includes the 2018 audited financial statements, which were adopted by Council on April 15, 2019. The remuneration and expenses paid to City staff are reported in the Statement of Financial Information under three categories as follows:
• Base Salary: This is the salary that the employee earned in 2018;
• Taxable Benefit and Other: This includes any payout of earned time related to vacations, gratuity payments, pay for performance, lump sum payments, banked overtime, retirement and/or vehicle allowances; and
• Expenses: This includes amounts paid by the City to or for the employee in performing their job function, including annual professional association and membership fees, conferences, training, seminars and travel related to City business.
As part of our ongoing efforts to be an open, transparent and accessible government, staff will post this report to the Financial Documents section of the City’s website. SUSTAINABILITY CONSIDERATIONS The 2018 Statement of Financial Information is required as part of the Financial Information Act. This reporting supports the objectives of the City’s Sustainability Charter 2.0. In particular, this reporting supports the following Corporate Sustainability Objective “SO”:
• Corporate SO8: Work towards corporate financial sustainability, including financial reporting.
CONCLUSION The Act requires that municipalities provide to the Province of British Columbia, a Statement of Financial Information for each calendar year. This Statement of Financial Information is to be approved by Council before it is forwarded to the Province. The Act stipulates that the Statement of Financial Information is to be made available to the public before June 30th of the year following the year to which the information in the Statement applies. Based on the above discussion, it is recommended that Council approve the 2018 Statement of Financial Information that is attached as Appendix “I” to this report and which has been prepared in accordance with the requirements of the Act. Kam Grewal, CPA, CMA General Manager, Finance Appendix “I”: 2018 Statement of Financial Information for the City of Surrey l:\fia\2018\2. city\submission\corporate report\cr sofi 2018 report 2019 06 19 final.docx BD 6/19/19 2:54 PM
CITY OF SURREY
STATEMENT OF FINANCIAL INFORMATION
Year Ended December 31, 2018
(In compliance with the Financial Information Act of British Columbia, Chapter 140)
Appendix "I"
City of Surrey Statement of Financial Information Approval Section 1
2018 Statement of Financial Information
Section Section Number
Statement of Financial Information Approval 1 Management Report 2 Financial Statements 3 Schedule of Debts 4 Schedule of Guarantee and Indemnity Agreements 5 Schedule of Remuneration and Expenses 6 Statement of Severance Agreements 7 Schedule of Suppliers of Goods or Services 8 Schedule of Grants 9
Page 2 of 113

City of Surrey Statement of Financial Information Approval Section 1
2018 Statement of Financial Information
The undersigned, as authorized by the Financial Information Regulation, Schedule 1, subsection 9(2), approves all the statements and schedules included in this Statement of Financial Information, produced under the Financial Information Act.
___________________________________ ___________________________________ Doug McCallum Kam Grewal, CPA, CMA Mayor, City of Surrey General Manager,
Finance
June __, 2019
Page 3 of 113

City of Surrey Statement of Financial Information (SOFI) Management Report Section 2
2018 Statement of Financial Information
The Financial Statements contained in this Statement of Financial Information have been prepared by management in accordance with Canadian generally accepted accounting principles as prescribed by the Public Sector Accounting Board (“PSAB”) of the Canadian Institute of Chartered Accountants. The integrity and objectivity of these statements are management’s responsibility. Management is also responsible for all statements and schedules and for ensuring that this information is consistent with the information contained in the audited financial statements. Management is also responsible for implementing and maintaining a system of internal controls to provide reasonable assurance that reliable financial information is produced. The Audit Committee is responsible for ensuring that management fulfils its responsibilities for financial reporting and internal controls. The Audit Committee meets with management, the internal auditor and the external auditors as required. The external auditors, BDO, conduct an independent examination, in accordance with generally accepted auditing standards, and express their opinion on the financial statements. Their examination does not relate to the other schedules and statements required by the Financial Information Act. Their examination includes a review and evaluation of the City’s system of internal controls and appropriate tests and procedures to provide reasonable assurance that the financial statements are presented fairly. The external auditors have full and fair access to the Audit Committee. On behalf of The City of Surrey Kam Grewal, CPA, CMA General Manager, Finance June __, 2019
Page 4 of 113

City of Surrey Statement of Financial Information (SOFI) Financial Statements Section 3
2018 Statement of Financial Information
Page 5 of 113

38
FINANCIAL STATEMENTS FOR THE YEAR ENDED DECEMBER 31, 2018
Page 6 of 113
39
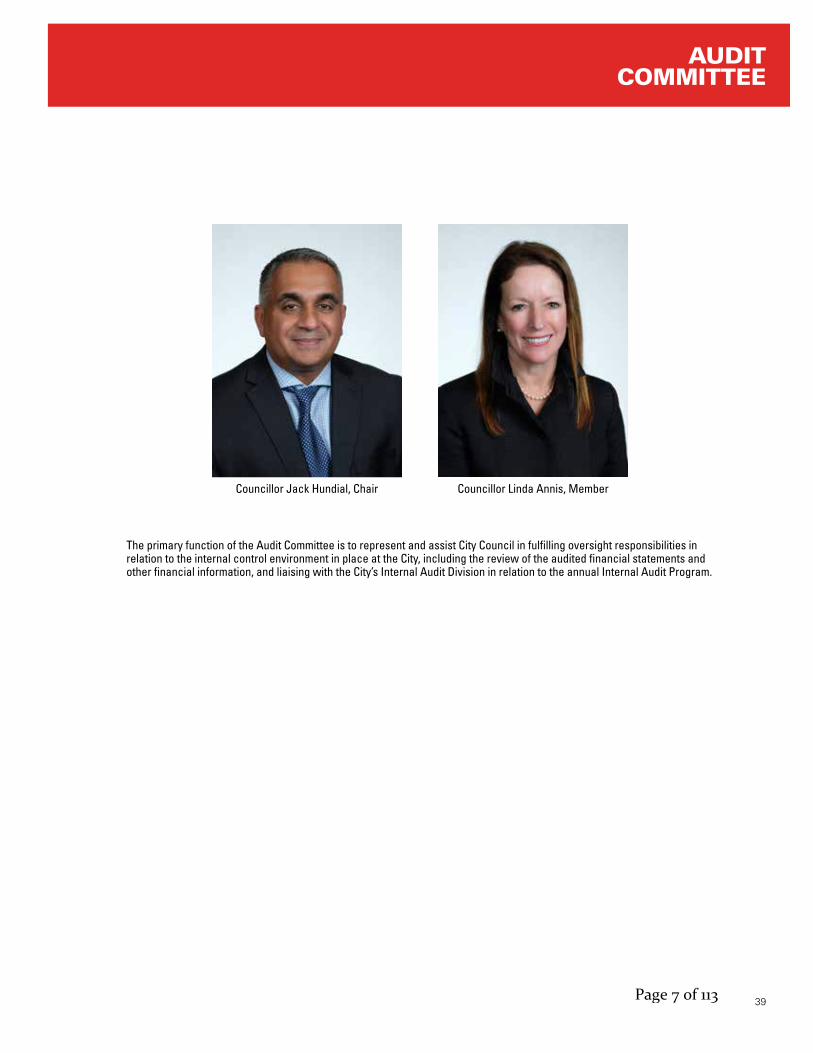
Councillor Jack Hundial, Chair
The primary function of the Audit Committee is to represent and assist City Council in fulfilling oversight responsibilities in relation to the internal control environment in place at the City, including the review of the audited financial statements and other financial information, and liaising with the City’s Internal Audit Division in relation to the annual Internal Audit Program.
Councillor Linda Annis, Member
AUDIT COMMITTEE
Page 7 of 113
40
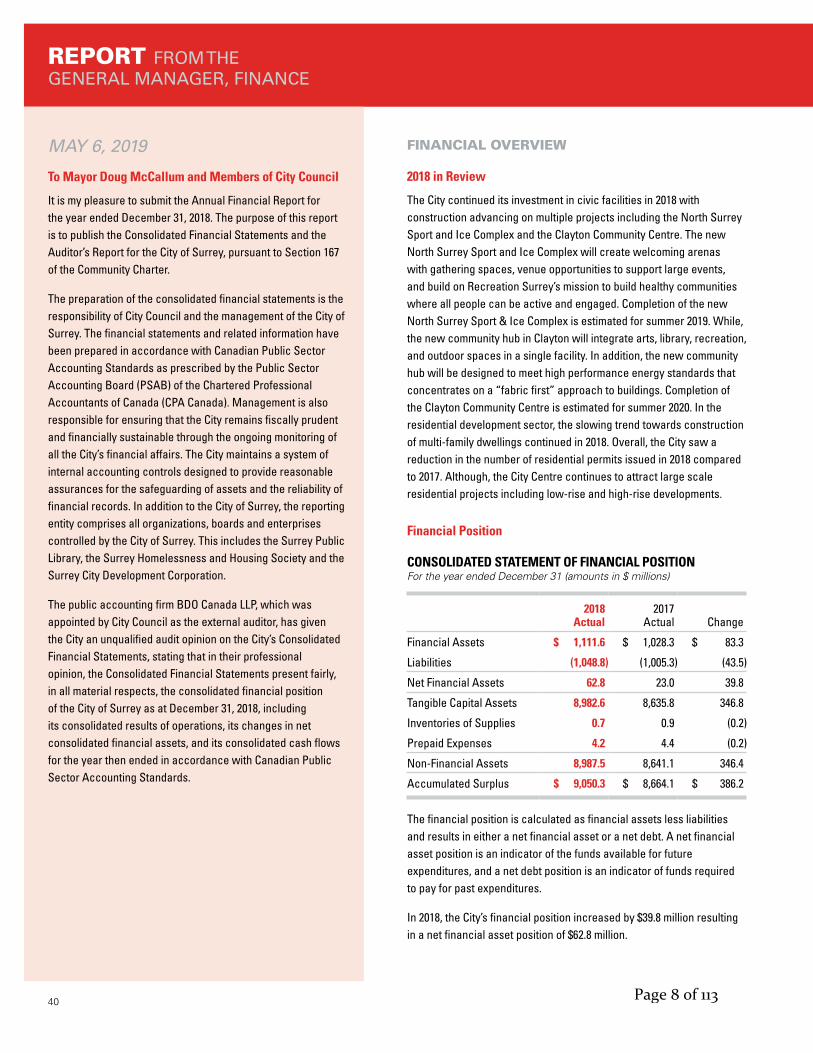
REPORT FROM THE GENERAL MANAGER, FINANCE
MAY 6, 2019
To Mayor Doug McCallum and Members of City Council
It is my pleasure to submit the Annual Financial Report for the year ended December 31, 2018. The purpose of this report is to publish the Consolidated Financial Statements and the Auditor’s Report for the City of Surrey, pursuant to Section 167 of the Community Charter.
The preparation of the consolidated financial statements is the responsibility of City Council and the management of the City of Surrey. The financial statements and related information have been prepared in accordance with Canadian Public Sector Accounting Standards as prescribed by the Public Sector Accounting Board (PSAB) of the Chartered Professional Accountants of Canada (CPA Canada). Management is also responsible for ensuring that the City remains fiscally prudent and financially sustainable through the ongoing monitoring of all the City’s financial affairs. The City maintains a system of internal accounting controls designed to provide reasonable assurances for the safeguarding of assets and the reliability of financial records. In addition to the City of Surrey, the reporting entity comprises all organizations, boards and enterprises controlled by the City of Surrey. This includes the Surrey Public Library, the Surrey Homelessness and Housing Society and the Surrey City Development Corporation.
The public accounting firm BDO Canada LLP, which was appointed by City Council as the external auditor, has given the City an unqualified audit opinion on the City’s Consolidated Financial Statements, stating that in their professional opinion, the Consolidated Financial Statements present fairly, in all material respects, the consolidated financial position of the City of Surrey as at December 31, 2018, including its consolidated results of operations, its changes in net consolidated financial assets, and its consolidated cash flows for the year then ended in accordance with Canadian Public Sector Accounting Standards.
FINANCIAL OVERVIEW
2018 in Review
The City continued its investment in civic facilities in 2018 with construction advancing on multiple projects including the North Surrey Sport and Ice Complex and the Clayton Community Centre. The new North Surrey Sport and Ice Complex will create welcoming arenas with gathering spaces, venue opportunities to support large events, and build on Recreation Surrey’s mission to build healthy communities where all people can be active and engaged. Completion of the new North Surrey Sport & Ice Complex is estimated for summer 2019. While, the new community hub in Clayton will integrate arts, library, recreation, and outdoor spaces in a single facility. In addition, the new community hub will be designed to meet high performance energy standards that concentrates on a “fabric first” approach to buildings. Completion of the Clayton Community Centre is estimated for summer 2020. In the residential development sector, the slowing trend towards construction of multi-family dwellings continued in 2018. Overall, the City saw a reduction in the number of residential permits issued in 2018 compared to 2017. Although, the City Centre continues to attract large scale residential projects including low-rise and high-rise developments.
Financial Position
CONSOLIDATED STATEMENT OF FINANCIAL POSITION For the year ended December 31 (amounts in $ millions)
2018 Actual
2017 Actual Change
Financial Assets $ 1,111.6 $ 1,028.3 $ 83.3
Liabilities (1,048.8) (1,005.3) (43.5)
Net Financial Assets 62.8 23.0 39.8
Tangible Capital Assets 8,982.6 8,635.8 346.8
Inventories of Supplies 0.7 0.9 (0.2)
Prepaid Expenses 4.2 4.4 (0.2)
Non-Financial Assets 8,987.5 8,641.1 346.4
Accumulated Surplus $ 9,050.3 $ 8,664.1 $ 386.2
The financial position is calculated as financial assets less liabilities and results in either a net financial asset or a net debt. A net financial asset position is an indicator of the funds available for future expenditures, and a net debt position is an indicator of funds required to pay for past expenditures.
In 2018, the City’s financial position increased by $39.8 million resulting in a net financial asset position of $62.8 million.
Page 8 of 113

41
The City’s non-financial assets increased in 2018 by $346.4 million, bringing the total to just under $9.0 billion. The increase is the net result of capital additions of physical assets in the year, offset by disposals and amortization expense.
The result of these increases in financial position and non-financial assets was accumulated surplus increasing in 2018 to $9.1 billion (2017 - $8.7 billion). Overall, the City continues to maintain a strong financial position.
CONSOLIDATED STATEMENT OF OPERATIONS For the year ended December 31 (amounts in $ millions)
2018 Actual
2017 Actual Change
Revenues $ 1,159.2 $ 1,024.3 $ 134.9
Expenses (773.0) (737.2) (35.8)
Annual Surplus $ 386.2 $ 287.1 $ 99.1
The City’s revenues in 2018 totaled $1,159.2 million, which is an increase in comparison to revenues of $1,024.3 million collected in 2017. The increase was primarily attributable to additional property taxes, utility fees, licenses, permits, development cost charges and developer contributions. The additional revenue generated from increased property related fees and taxes was required to support a $10.4 million budgeted increase in public safety along with a $16.5 million budgeted increase in support for necessary labour and inflationary cost increases and other various corporate funding requirements.
The City’s expenses totaled $773.0 million in 2018, which was an increase in comparison to expenses of $737.2 million in 2017. This year-over-year change was primarily attributable to increases noted in Police and Fire services, Parks, Recreation and Culture programming, Engineering services, Planning and Development, and in the cost of Water, Sewer, Drainage and Solid Waste.
Investments
City staff continue to administer our investment portfolio, generating a very significant revenue stream to support City services. The administration of the portfolio adheres to the City’s investment policy, which complies with Community Charter requirements. The policy outlines how City funds are to be invested in a manner which will allow for reasonable returns and security while meeting the City’s cash flow requirements. The average portfolio balance related to the City’s investments during 2018 was $816.8 million ($821.6 million in 2017), which earned $22.0 million in interest in 2018 ($17.5 million in 2017). The average rate of return during 2018 on the City’s investment portfolio was 2.34% (1.95% in 2017).
Reserve Funds
The City’s statutory reserve funds, net of internal borrowings to fund capital programs, amount to $86.2 million at the end of 2018 compared to a balance of $103.5 million at the end of 2017. This decrease is mainly due to increases to the use of internal borrowings to fund capital programs during 2018. The deferred development cost charge balance at the end of 2018 was $277.7 million, which is an increase over the balance of $254.3 million at the end of 2017. This is a reflection of the City’s steady development activity. These funds will be used to fund capital projects that are listed in the City’s Five-Year (2019-2023) Financial Plan.
THE FUTURE
2018 was another year of significant growth and development throughout the City, with more residents than ever making our City their home. As we look to future years, we can expect the trend of strong growth to continue, and with this growth will come further demand for services and infrastructure. Two significant initiatives that have been made strategic priorities by Mayor and Council, the creation of our own City Police force and Skytrain, will serve to enhance public safety and transportation respectively for our residents for years to come. The Skytrain extension is part of Translink’s South of Fraser Area Transit Plan that will help shape and impact our City like no other capital project before it, laying the foundation for Surrey’s transportation needs for years to come. In addition to these, the City, with support and direction from Mayor and Council, has continued several key capital investments that will support our residents’ needs. These projects include the completion of a new recreation and cultural facility in Clayton, a partnership with the YMCA to deliver recreation services in the City Centre, a third field hockey turf field and covered bleachers at Tamanawis Park, a new Kabaddi Facility, a new stadium at Bear Creek Park, and various park additions and expansions.
Working under the direction and guidance of our new City Council, the City of Surrey has been, and continues to be, in a strong financial position to deliver a high quality of service and capital infrastructure to its residents and businesses for years to come.
Respectfully submitted,
Kam Grewal, CPA, CMAGeneral Manager, Finance
Page 9 of 113

43
CITY OF SURREY
Page 10 of 113

44 Page 11 of 113
45Page 12 of 113
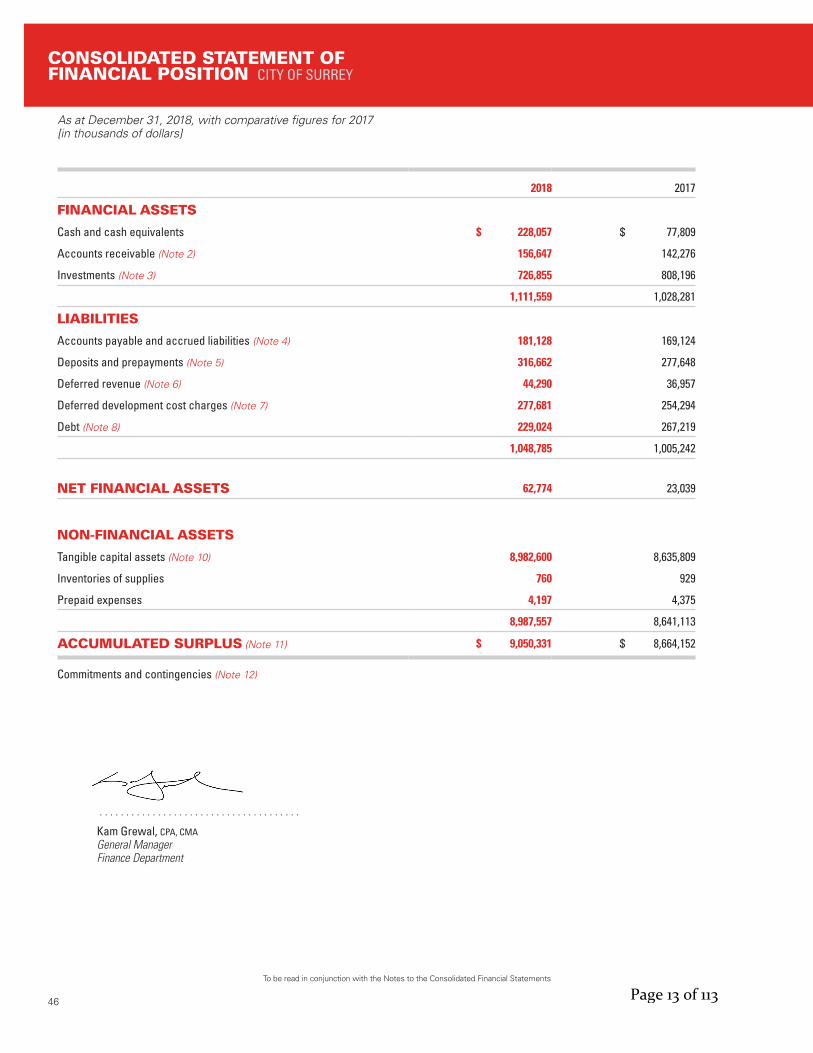
As at December 31, 2018, with comparative figures for 2017[in thousands of dollars]
To be read in conjunction with the Notes to the Consolidated Financial Statements
46
. . . . . . . . . . . . . . . . . . . . . . . . . . . . . . . . . . . . . .
Kam Grewal, CPA, CMA General ManagerFinance Department
CONSOLIDATED STATEMENT OF FINANCIAL POSITION CITY OF SURREY
2018 2017
FINANCIAL ASSETS
Cash and cash equivalents $ 228,057 $ 77,809
Accounts receivable (Note 2) 156,647 142,276
Investments (Note 3) 726,855 808,196
1,111,559 1,028,281
LIABILITIES
Accounts payable and accrued liabilities (Note 4) 181,128 169,124
Deposits and prepayments (Note 5) 316,662 277,648
Deferred revenue (Note 6) 44,290 36,957
Deferred development cost charges (Note 7) 277,681 254,294
Debt (Note 8) 229,024 267,219
1,048,785 1,005,242
NET FINANCIAL ASSETS 62,774 23,039
NON-FINANCIAL ASSETS
Tangible capital assets (Note 10) 8,982,600 8,635,809
Inventories of supplies 760 929
Prepaid expenses 4,197 4,375
8,987,557 8,641,113
ACCUMULATED SURPLUS (Note 11) $ 9,050,331 $ 8,664,152
Commitments and contingencies (Note 12)
Page 13 of 113

To be read in conjunction with the Notes to the Consolidated Financial Statements
For the year ended December 31, 2018, with comparative figures for 2017 [in thousands of dollars]
47
CONSOLIDATED STATEMENT OF CITY OF SURREY OPERATIONS
2018 Budget 2018 2017
(Note 22)
REVENUES
Taxation revenue (Note 15) $ 420,515 $ 420,145 $ 391,695
Sales of goods and services 243,058 250,281 240,037
Development cost charges (Note 7) 161,595 68,353 104,963
Developer contributions 142,629 263,556 183,736
Investment income 20,103 22,633 17,533
Transfers from other governments (Note 21) 36,921 51,722 24,677
Other (Note 16) 73,984 82,541 61,679
TOTAL REVENUES 1,098,805 1,159,231 1,024,320
EXPENSES
Police services 165,698 161,096 152,798
Parks, recreation and culture 117,631 118,159 110,435
General government 88,195 83,649 81,896
Roads and traffic safety 73,326 72,006 75,334
Water 75,631 72,964 67,715
Fire services 65,520 64,669 62,262
Sewer 64,742 63,274 59,971
Solid waste 36,956 35,147 33,117
Drainage 33,587 35,062 32,986
Planning and development 29,969 29,524 27,241
Library services 20,462 20,157 19,051
Engineering 12,354 13,561 11,050
Surrey City Energy 2,115 1,399 1,105
Parking 2,177 2,385 2,244
TOTAL EXPENSES 788,363 773,052 737,205
ANNUAL SURPLUS 310,442 386,179 287,115
Accumulated Surplus, beginning of year 8,664,152 8,664,152 8,377,037
Accumulated Surplus, end of year $ 8,974,594 $ 9,050,331 $ 8,664,152
Page 14 of 113

As at December 31, 2018, with comparative figures for 2017[in thousands of dollars]
To be read in conjunction with the Notes to the Consolidated Financial Statements
48
CONSOLIDATED STATEMENT OF CHANGES INNET FINANCIAL ASSETS (DEBT) CITY OF SURREY
2018 Budget 2018 2017
(Note 22)
ANNUAL SURPLUS $ 310,442 $ 386,179 $ 287,115
Acquisition of tangible capital assets (666,077) (527,460) (489,886)
Amortization of tangible capital assets 128,967 130,649 124,322
Loss (gain) on disposal of tangible capital assets - (11,014) 3,742
Proceeds on disposal of tangible capital assets - 17,242 3,909
(226,668) (4,404) (70,798)
Acquisition of inventories of supplies - (760) (929)
Consumption of inventories of supplies - 929 880
Acquisition of prepaid expenses - (4,197) (4,375)
Use of prepaid expenses - 4,375 4,517
Transfer to properties held-for-sale - 43,792 25,388
Transfer to investment in government business partnership - - 9,679
- 44,139 35,160
CHANGE IN NET FINANCIAL ASSETS (DEBT) (226,668) 39,735 (35,638)
Net financial assets, beginning of year 23,039 23,039 58,677
Net financial assets (debt) , end of year $ (203,629) $ 62,774 $ 23,039
Page 15 of 113

To be read in conjunction with the Notes to the Consolidated Financial Statements
For the year ended December 31, 2018, with comparative figures for 2017 [in thousands of dollars]
49
CONSOLIDATED STATEMENT OF CITY OF SURREY CASH FLOWS
2018 2017
OPERATING TRANSACTIONSAnnual Surplus $ 386,179 $ 287,115
Non-Cash charges to operations:
Amortization of tangible capital assets 130,649 124,322
Loss (gain) on disposal of tangible capital assets (11,014) 3,742
Developer contributions of tangible capital assets (Note 10(b)) (237,028) (151,564)
Change in non-cash operating working capital:
Accounts receivable (14,371) (21,523)
Inventories of supplies 169 (49)
Prepaid expenses 178 142
Accounts payable and accrued liabilities 12,004 15,790
Deposits and prepayments 39,014 36,761
Deferred revenue 7,333 1,643
Deferred development cost charges 23,387 (12,674)
Net change in cash from operating transactions 336,500 283,705
CAPITAL TRANSACTIONSCash used to acquire tangible capital assets (290,091) (288,639)
Acquisition of properties held-for-sale - (2,704)
Transfer of properties held-for-sale 43,792 37,771
Proceeds on disposal of tangible capital assets 17,242 3,909
Cash used by capital transactions (229,057) (249,663)
FINANCING TRANSACTIONSRepayment of MFA debt and loans payable (38,536) (15,686)
Proceeds from issuance of loan payable - 8,660
Cash used by financing transactions (38,536) (7,026)
INVESTING TRANSACTIONSSale of Investments 81,341 17,999
Cash provided by investing transactions 81,341 17,999
INCREASE (DECREASE) IN CASH 150,248 45,015
Cash and cash equivalents, beginning of year 77,809 32,794
Cash and cash equivalents, end of year $ 228,057 $ 77,809
Represented by:
Cash 88,057 27,809
Cash equivalents 140,000 50,000
Cash and cash equivalents, end of year $ 228,057 $ 77,809
NON-CASH TRANSACTIONS:Debt related to Biofuel processing facility (Note 8(ii)) $ 341 $ 49,683
Page 16 of 113

50
For the year ended December 31, 2018 [tabular amounts in thousands of dollars]
NOTES TO THE CONSOLIDATED FINANCIAL STATEMENTS CITY OF SURREY
GENERAL
The City of Surrey (the “City”) is incorporated under the Local Government Act of British Columbia. The City’s principal activities include the provision of local government services to residents of the incorporated area. These include administrative, protective, infrastructure, environmental, recreational, water, sewer, and drainage services.
1. SIGNIFICANT ACCOUNTING POLICIES
a) Basis of accounting These consolidated financial statements have been prepared in accordance with Canadian Public Sector Accounting Standards as prescribed by the Public Sector Accounting Board (“PSAB”) of the Chartered Professional Accountants of Canada.
b) Basis of consolidation The consolidated financial statements are comprised of the City’s funds, Surrey Public Library (the “Library”), Surrey City Development Corporation (“SCDC”), Surrey Homelessness and Housing Society (“SHHS”), and Innovation Boulevard (“IBC”). The Library, SHHS and SCDC are fully consolidated as they are controlled by virtue of their Board being appointed by the City. IBC is consolidated based on the City’s 50% ownership. Inter-fund and inter-corporate transactions and balances have been eliminated. The following is a brief description of the various funds and entities:
i) Operating Funds These funds include the General, Drainage, Parking, Roads & Traffic Safety, Sewer, Solid Waste, Surrey City Energy and Water Operating Funds as well as the Surrey Public Library. They are used to record the operating costs of the services provided by the City.
ii) Capital Funds These funds include the General, Drainage, Parking, Roads & Traffic Safety, Sewer, Solid Waste, Surrey City Energy and Water Capital Funds and Surrey Public Library Capital. They are used to record the acquisition costs of tangible capital assets and any related debt outstanding.
iii) Reserve Funds Under the Community Charter of British Columbia, City Council may, by by-law, establish reserve funds for specified purposes. Money in a reserve fund and interest earned thereon must be expended only for the purpose for which the fund was established. If the amount in a reserve fund is greater than required for the purposes for which it was established, City Council may transfer all or part of the amount to another reserve fund.
iv) Surrey City Development Corporation The consolidated financial statements reflect the assets, liabilities, revenues and expenses of SCDC. SCDC has the following wholly owned subsidiaries and government partnerships, which are accounted for as follows:
i) Surrey City Investment Corporation (“SCIC”) - (100% owned and fully consolidated) Prior to October 9, 2018 SCIC held a 24.4% (2017 – 24.4%) ownership in the following government partnerships (proportionately consolidated), referred to as the “Surrey Centre Limited Partnerships”: • Surrey Centre Office Limited Partnership • Surrey Centre Hotel Limited Partnership • Surrey Centre Residential Limited Partnership
Prior to October 9, 2018 SCIC held a 50% ownership in nine holding companies (proportionately consolidated) referred to as the “Surrey Centre Tower Holdings”.
On October 9, 2018 SCIC disposed of its ownership interest in the Surrey Centre Limited Partnerships and its shares of the Surrey Centre Tower Holdings (Note 19(b)).
.Page 17 of 113
51
For the year ended December 31, 2018 [tabular amounts in thousands of dollars]
NOTES TO THE CONSOLIDATED CITY OF SURREY FINANCIAL STATEMENTS
1. SIGNIFICANT ACCOUNTING POLICIES (CONTINUED)
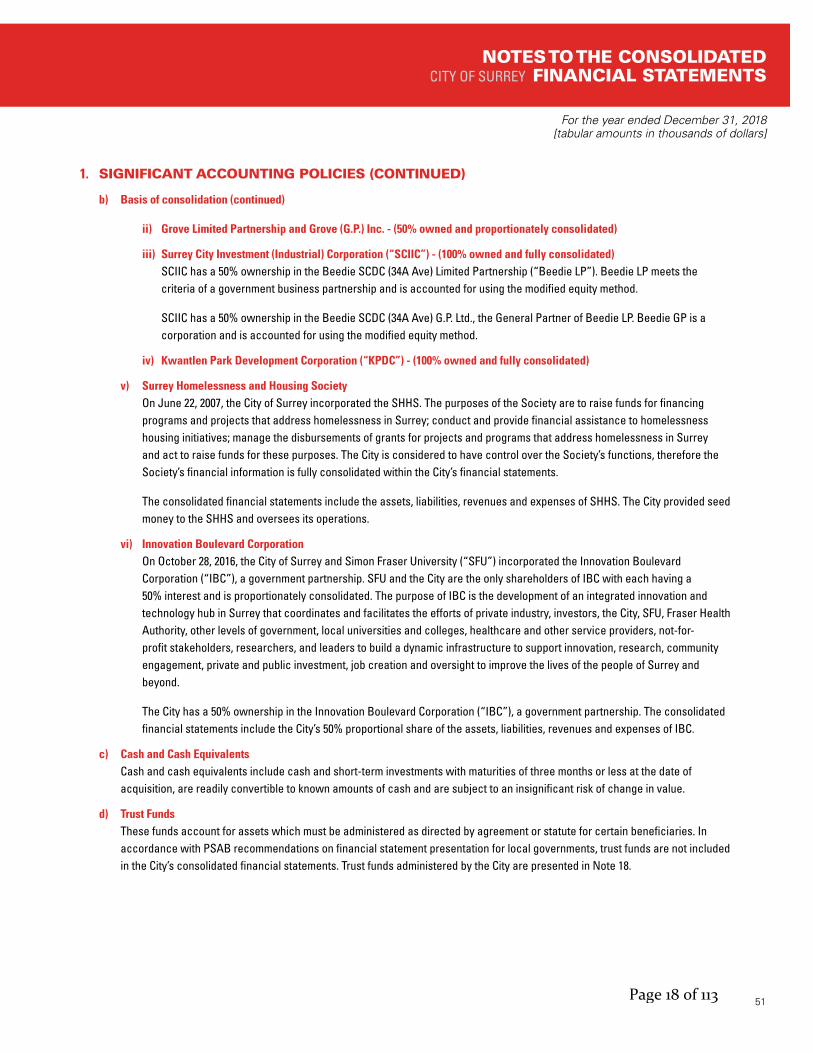
b) Basis of consolidation (continued)
ii) Grove Limited Partnership and Grove (G.P.) Inc. - (50% owned and proportionately consolidated)
iii) Surrey City Investment (Industrial) Corporation (“SCIIC”) - (100% owned and fully consolidated) SCIIC has a 50% ownership in the Beedie SCDC (34A Ave) Limited Partnership (“Beedie LP”). Beedie LP meets the criteria of a government business partnership and is accounted for using the modified equity method.
SCIIC has a 50% ownership in the Beedie SCDC (34A Ave) G.P. Ltd., the General Partner of Beedie LP. Beedie GP is a corporation and is accounted for using the modified equity method.
iv) Kwantlen Park Development Corporation (“KPDC”) - (100% owned and fully consolidated)
v) Surrey Homelessness and Housing Society On June 22, 2007, the City of Surrey incorporated the SHHS. The purposes of the Society are to raise funds for financing programs and projects that address homelessness in Surrey; conduct and provide financial assistance to homelessness housing initiatives; manage the disbursements of grants for projects and programs that address homelessness in Surrey and act to raise funds for these purposes. The City is considered to have control over the Society’s functions, therefore the Society’s financial information is fully consolidated within the City’s financial statements.
The consolidated financial statements include the assets, liabilities, revenues and expenses of SHHS. The City provided seed money to the SHHS and oversees its operations.
vi) Innovation Boulevard Corporation On October 28, 2016, the City of Surrey and Simon Fraser University (“SFU”) incorporated the Innovation Boulevard Corporation (“IBC”), a government partnership. SFU and the City are the only shareholders of IBC with each having a 50% interest and is proportionately consolidated. The purpose of IBC is the development of an integrated innovation and technology hub in Surrey that coordinates and facilitates the efforts of private industry, investors, the City, SFU, Fraser Health Authority, other levels of government, local universities and colleges, healthcare and other service providers, not-for-profit stakeholders, researchers, and leaders to build a dynamic infrastructure to support innovation, research, community engagement, private and public investment, job creation and oversight to improve the lives of the people of Surrey and beyond.
The City has a 50% ownership in the Innovation Boulevard Corporation (“IBC”), a government partnership. The consolidated financial statements include the City’s 50% proportional share of the assets, liabilities, revenues and expenses of IBC.
c) Cash and Cash Equivalents Cash and cash equivalents include cash and short-term investments with maturities of three months or less at the date of acquisition, are readily convertible to known amounts of cash and are subject to an insignificant risk of change in value.
d) Trust Funds These funds account for assets which must be administered as directed by agreement or statute for certain beneficiaries. In accordance with PSAB recommendations on financial statement presentation for local governments, trust funds are not included in the City’s consolidated financial statements. Trust funds administered by the City are presented in Note 18.
Page 18 of 113

52
For the year ended December 31, 2018 [tabular amounts in thousands of dollars]
NOTES TO THE CONSOLIDATED FINANCIAL STATEMENTS CITY OF SURREY
1. SIGNIFICANT ACCOUNTING POLICIES (CONTINUED)
e) Revenue recognition Revenues are recognized in the period in which the transaction or event occurs that give rise to the revenues. All revenues are recorded on an accrual basis, except when the amounts cannot be determined with a reasonable degree of certainty or when their estimation is impractical.
Revenue recognition on sales of properties occurs when the City has transferred the significant risks and rewards of ownership. Property lease revenue includes all amounts earned from tenants, including property tax and operating cost recoveries. Lease revenues are recognized on a straight-line basis over the term of the lease.
f) Taxation Revenue Taxes are recorded at estimated amounts when they meet the definition of an asset, have been authorized and the taxable event occurs. Annual levies for non-optional municipal services and general administrative services are recorded as taxes for municipal services in the year they are levied. Taxes receivable are recognized net of an allowance for anticipated uncollectable amounts. Levies imposed by other taxing authorities are not included as taxes for municipal purposes.
Through the British Columbia Assessments’ appeal process, taxes may be adjusted by way of supplementary roll adjustments. The effects of these adjustments on taxes are recognized at the time they are awarded.
g) Government transfers Restricted transfers from governments are deferred and recognized as revenue in the period the stipulations in the related agreement are met.
Unrestricted transfers are recognized as revenue when received or receivable if the amount to be received can be reasonably estimated and collection is reasonably assured.
h) Collection on behalf of other authorities The City is required to act as the agent for the collection of certain taxes and fees imposed by other authorities. Collections for other authorities are excluded from the City’s taxation revenues.
i) Development cost charges Development cost charges are recorded as a liability at the time they are received. When qualifying expenditures are incurred, they are recognized into revenue. Development cost charges are comprised of the amounts shown in Note 7.
j) Developer contributions Tangible capital assets from developers are a condition of the development approval process. The delivery of the contributed tangible capital assets is dependent upon the developer. Tangible capital assets received as contributions are recorded at their fair value at the date of receipt and are also recorded as revenue. It is not a source of funding available to meet current operating expenditures or obligations.
k) Investment income Investment income is reported as revenue in the period earned.
l) Deferred revenue The City defers the portion of the revenue collected from permits, licenses and other fees relating to services not yet rendered. This revenue is recognized in the year in which related inspections are performed or other related services are provided.
m) Expenses Expenses are recognized as they are incurred and measurable as a result of receipt of goods or services and/or the creation of a legal obligation to pay. Interest expense is accrued as incurred.
Page 19 of 113
53
For the year ended December 31, 2018 [tabular amounts in thousands of dollars]
NOTES TO THE CONSOLIDATED CITY OF SURREY FINANCIAL STATEMENTS
1. SIGNIFICANT ACCOUNTING POLICIES (CONTINUED)
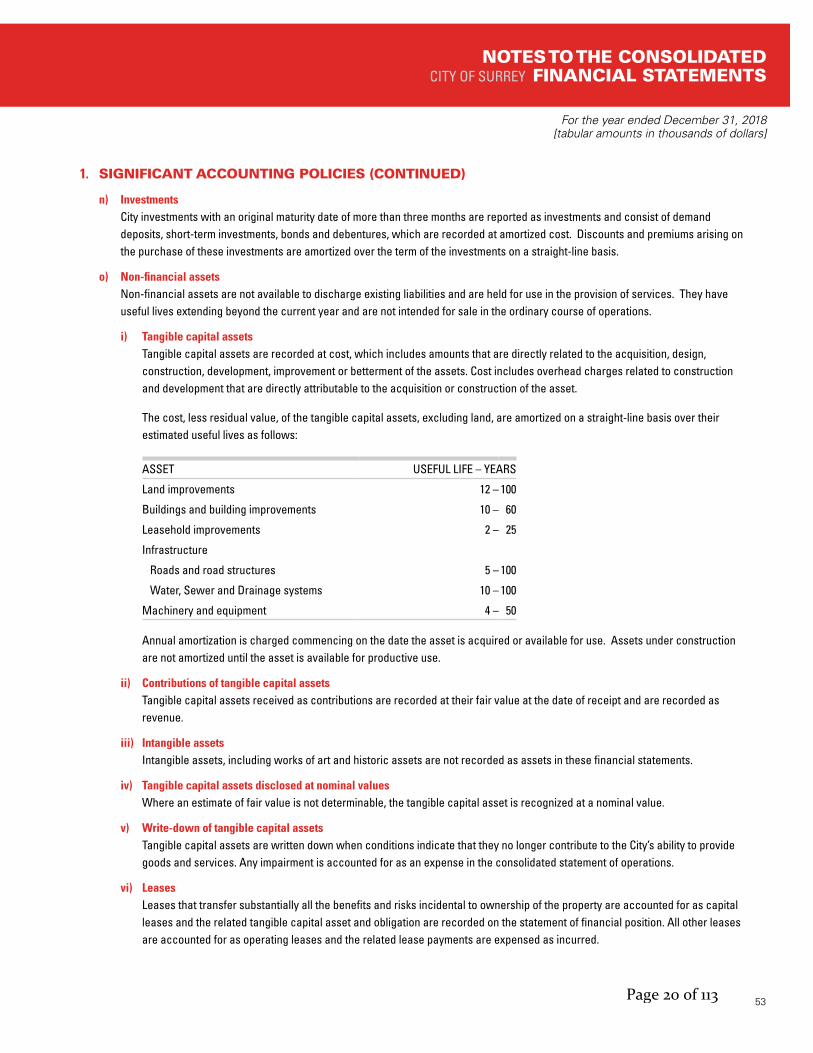
n) Investments City investments with an original maturity date of more than three months are reported as investments and consist of demand deposits, short-term investments, bonds and debentures, which are recorded at amortized cost. Discounts and premiums arising on the purchase of these investments are amortized over the term of the investments on a straight-line basis.
o) Non-financial assets Non-financial assets are not available to discharge existing liabilities and are held for use in the provision of services. They have useful lives extending beyond the current year and are not intended for sale in the ordinary course of operations.
i) Tangible capital assets Tangible capital assets are recorded at cost, which includes amounts that are directly related to the acquisition, design, construction, development, improvement or betterment of the assets. Cost includes overhead charges related to construction and development that are directly attributable to the acquisition or construction of the asset.
The cost, less residual value, of the tangible capital assets, excluding land, are amortized on a straight-line basis over their estimated useful lives as follows:
ASSET USEFUL LIFE – YEARS
Land improvements 12 – 100
Buildings and building improvements 10 – 60
Leasehold improvements 2 – 25
Infrastructure
Roads and road structures 5 – 100
Water, Sewer and Drainage systems 10 – 100
Machinery and equipment 4 – 50
Annual amortization is charged commencing on the date the asset is acquired or available for use. Assets under construction are not amortized until the asset is available for productive use.
ii) Contributions of tangible capital assets Tangible capital assets received as contributions are recorded at their fair value at the date of receipt and are recorded as revenue.
iii) Intangible assets Intangible assets, including works of art and historic assets are not recorded as assets in these financial statements.
iv) Tangible capital assets disclosed at nominal values Where an estimate of fair value is not determinable, the tangible capital asset is recognized at a nominal value.
v) Write-down of tangible capital assets Tangible capital assets are written down when conditions indicate that they no longer contribute to the City’s ability to provide goods and services. Any impairment is accounted for as an expense in the consolidated statement of operations.
vi) Leases Leases that transfer substantially all the benefits and risks incidental to ownership of the property are accounted for as capital leases and the related tangible capital asset and obligation are recorded on the statement of financial position. All other leases are accounted for as operating leases and the related lease payments are expensed as incurred.
Page 20 of 113

54
For the year ended December 31, 2018 [tabular amounts in thousands of dollars]
NOTES TO THE CONSOLIDATED FINANCIAL STATEMENTS CITY OF SURREY
1. SIGNIFICANT ACCOUNTING POLICIES (CONTINUED)
o) Non-financial assets (continued)
vii) Inventories of supplies Inventories of supplies held for consumption are recorded at the lower of cost and replacement cost.
p) Employee future benefits The City and its employees participate in the Municipal Pension Plan. The Municipal Pension Plan is a multi-employer contributory defined benefit pension plan. Payments in the year are expensed.
Sick leave and post-employment benefits also accrue to the City’s employees. The liability relating to these benefits is actuarially determined based on length of service, best estimates of retirement ages and expected future salary and wage increases. The liabilities under these benefit plans are accrued based on projected benefits pro-rated as employees render services necessary to earn the future benefits.
Actuarial gains or losses are amortized over the expected average remaining service life of the related employee group.
The liability for event driven benefits, such as disability benefits, is calculated when the event occurs. The expense is recognized in the year the event occurs.
q) Budget data The budget data presented in these consolidated financial statements was included in the City of Surrey 2018 – 2022 Consolidated Financial Plan and was adopted through By-law #19402 on December 18, 2017.
r) Use of estimates The preparation of financial statements requires management to make estimates and assumptions that affect the reported amounts of assets and liabilities, the disclosure of contingent assets and liabilities at the date of the financial statements, and the reported amounts of revenues and expenses during the period. Significant estimates include assumptions used in estimating contributed tangible capital assets, developer contributions, useful lives for amortization, provisions for accrued liabilities, contingencies and in performing actuarial valuations of employee future benefits. Actual results could differ from these estimates.
s) Segment disclosure A segment is defined as a distinguishable activity or group of activities of a government for which it is appropriate to separately report financial information to achieve the objectives of the standard. The City of Surrey has provided definitions of segments used by the City as well as presented financial information in segmented format (Note 20).
t) Liabilities for contaminated sites Contaminated sites are a result of contamination being introduced into air, soil, water or sediment of a chemical, organic or radioactive material or live organism that exceeds an environmental standard. A liability for remediation of contaminated sites is recognized when a site is not in productive use and all of the following criteria are met:
• An environmental standard exists; • Contamination exceeds an environmental standard; • The City is directly responsible or accepts responsibility; • The City expects that future economic benefits will be given up; and, • A reasonable estimate of the amount can be made.
The liability is measured as management’s estimate of the cost of remediation and post remediation, including operations, maintenance and monitoring, which are an integral part of the remediation strategy for a contaminated site. The liability is recorded net of any expected recoveries.
Page 21 of 113

55
For the year ended December 31, 2018 [tabular amounts in thousands of dollars]
NOTES TO THE CONSOLIDATED CITY OF SURREY FINANCIAL STATEMENTS
1. SIGNIFICANT ACCOUNTING POLICIES (CONTINUED)
u) Accounting policy change The Public Sector Accounting Board issued new standards, PS 3210 Assets, PS 3320 Contingent Assets and PS 3380 Contractual Rights. The new standards apply to the City for the fiscal year beginning January 1, 2018. These standards have been utilized for the preparation of these consolidated financial statements (Note 13).
2. ACCOUNTS RECEIVABLE
2018 2017
General and other accounts receivable $ 56,183 $ 40,624
Development cost charges 56,162 61,492
Property taxes 21,731 18,398
Utility rate charges 16,016 14,473
Due from joint venture partners - 925
Due from other authorities 3,967 3,775
MFA debt reserve fund receivable 2,570 2,516
Tax sale properties 18 73
$ 156,647 $ 142,276
3. INVESTMENTS
2018 2017
Maturing within one year $ 414,649 $ 391,870
Maturing within two years 126,686 153,114
Maturing within ten years 171,720 248,274
City investments (a) 713,055 793,258
SCDC investments (b) 6,455 6,999
SHHS investments (c) 6,517 7,261
Government business partnership (d) 444 374
Government partnership (e) 384 304
$ 726,855 $ 808,196
Page 22 of 113

56
For the year ended December 31, 2018 [tabular amounts in thousands of dollars]
NOTES TO THE CONSOLIDATED FINANCIAL STATEMENTS CITY OF SURREY
3. INVESTMENTS (CONTINUED)
a) City investments had an average portfolio yield of 2.34% (2017 – 1.95%). All City investments can be liquidated on demand but may have associated penalties on liquidation.
b) SCDC investments includes term deposits that had an average portfolio yield of 2.07% (2017 – 1.60%) and can be liquidated on demand without penalty along with GICs with a maturity date of September 17, 2019 and a yield of 1.90% (2017 – 0.0%).
c) SHHS investments includes a diversified portfolio of fixed income and equity securities held by SHHS with an average yield rate of (2.22)% (2017 – 7.66%), for the purpose of supporting programs and projects related to reducing homelessness and increasing access to safe and affordable housing in Surrey.
d) SCDC’s joint-venture partnership in Beedie LP meets the criteria of a government business partnership and therefore the results are accounted for under the modified equity method.
e) During 2013, SCDC invested $700,000 for a 20% ownership of Bosa Properties (Bright A.1) Limited Partnership (“Bosa”). In 2014 SCDC received a $396,502 distribution from Bosa LP, reducing their investment to $303,498. During 2018 the Corporation invested an additional $80,354 in proportion to their ownership interest bringing the SCDC’s investment in the partnership to $383,852. SCDC does not share control of Bosa and accordingly, this has been accounted for as a portfolio investment, carried at cost.
4. ACCOUNTS PAYABLE AND ACCRUED LIABILITIES
2018 2017
Trade accounts payable $ 70,268 $ 63,583
Due to Federal Government 47,991 43,046
Employee future benefits (Note 9) 28,007 27,053
Due to joint venture partners - 3,668
Contractors’ holdbacks 17,068 11,466
Due to Regional Districts 9,373 12,515
Due to Province of British Columbia 4,076 3,840
Due to other government entities 2,336 1,944
Interest payable on debt 2,009 2,009
$ 181,128 $ 169,124
Page 23 of 113
57
For the year ended December 31, 2018 [tabular amounts in thousands of dollars]
NOTES TO THE CONSOLIDATED CITY OF SURREY FINANCIAL STATEMENTS
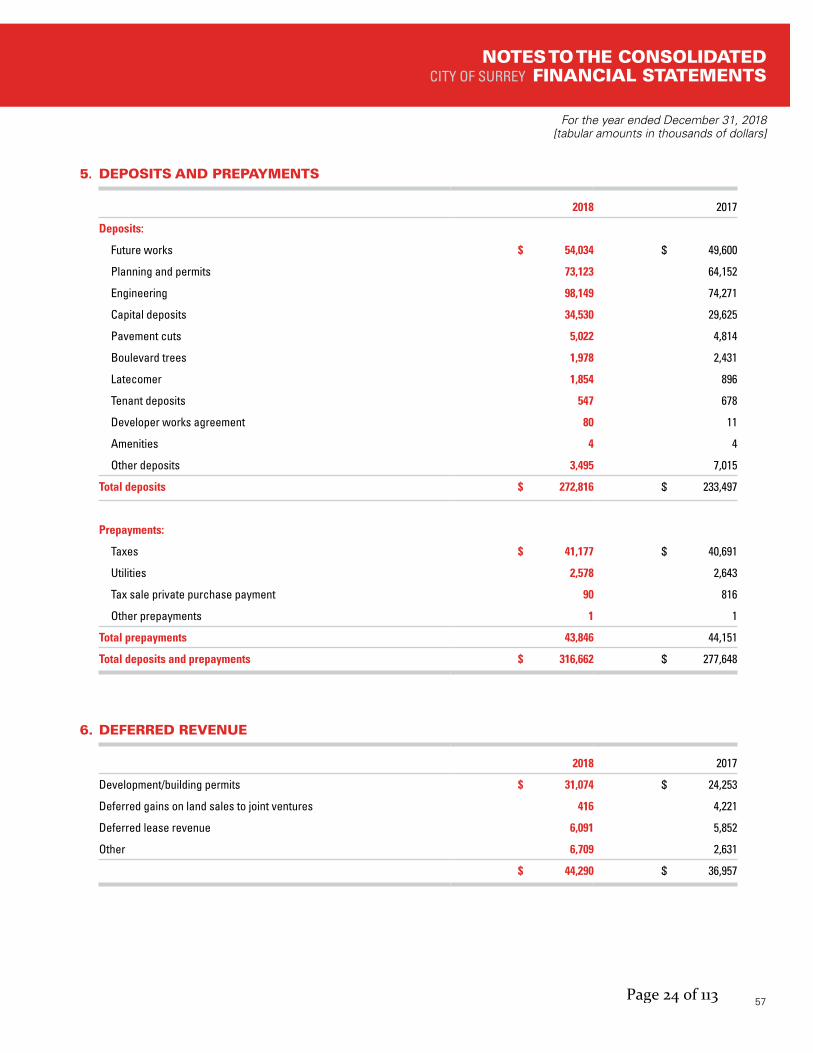
5. DEPOSITS AND PREPAYMENTS
2018 2017
Deposits:
Future works $ 54,034 $ 49,600
Planning and permits 73,123 64,152
Engineering 98,149 74,271
Capital deposits 34,530 29,625
Pavement cuts 5,022 4,814
Boulevard trees 1,978 2,431
Latecomer 1,854 896
Tenant deposits 547 678
Developer works agreement 80 11
Amenities 4 4
Other deposits 3,495 7,015
Total deposits $ 272,816 $ 233,497
Prepayments:
Taxes $ 41,177 $ 40,691
Utilities 2,578 2,643
Tax sale private purchase payment 90 816
Other prepayments 1 1
Total prepayments 43,846 44,151
Total deposits and prepayments $ 316,662 $ 277,648
6. DEFERRED REVENUE
2018 2017
Development/building permits $ 31,074 $ 24,253
Deferred gains on land sales to joint ventures 416 4,221
Deferred lease revenue 6,091 5,852
Other 6,709 2,631
$ 44,290 $ 36,957
Page 24 of 113
58
For the year ended December 31, 2018 [tabular amounts in thousands of dollars]
NOTES TO THE CONSOLIDATED FINANCIAL STATEMENTS CITY OF SURREY
7. DEFERRED DEVELOPMENT COST CHARGES
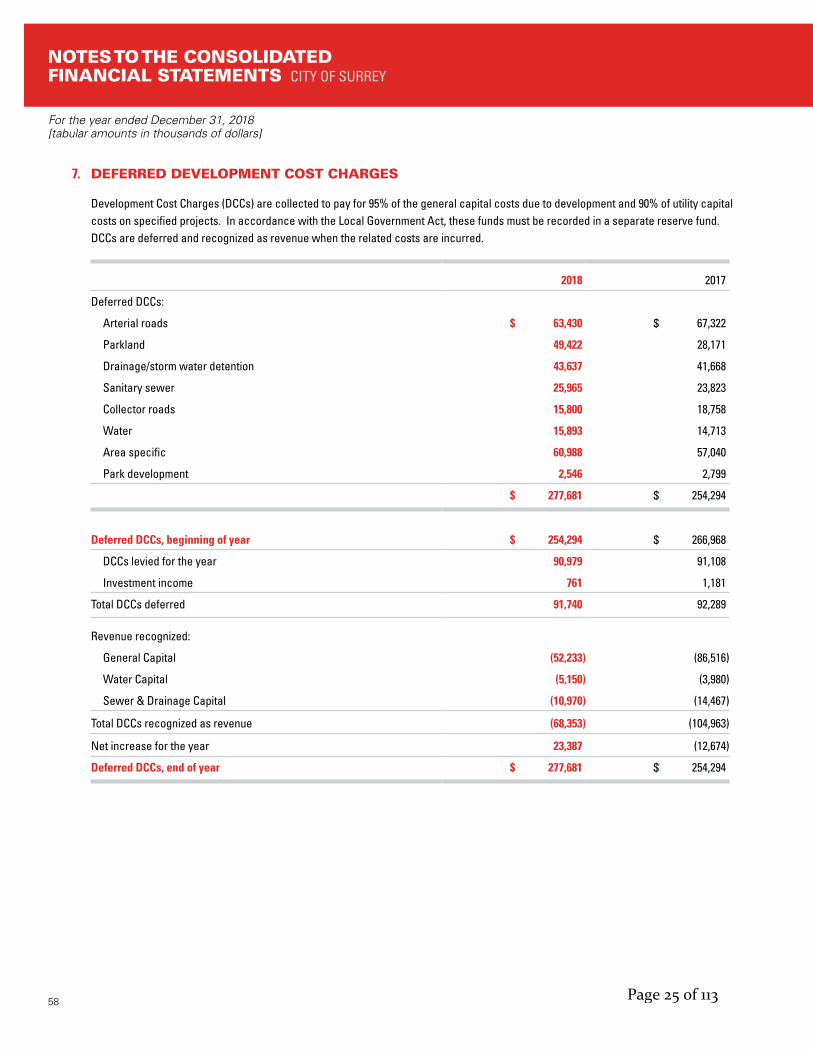
Development Cost Charges (DCCs) are collected to pay for 95% of the general capital costs due to development and 90% of utility capital costs on specified projects. In accordance with the Local Government Act, these funds must be recorded in a separate reserve fund. DCCs are deferred and recognized as revenue when the related costs are incurred.
2018 2017
Deferred DCCs:
Arterial roads $ 63,430 $ 67,322
Parkland 49,422 28,171
Drainage/storm water detention 43,637 41,668
Sanitary sewer 25,965 23,823
Collector roads 15,800 18,758
Water 15,893 14,713
Area specific 60,988 57,040
Park development 2,546 2,799
$ 277,681 $ 254,294
Deferred DCCs, beginning of year $ 254,294 $ 266,968
DCCs levied for the year 90,979 91,108
Investment income 761 1,181
Total DCCs deferred 91,740 92,289
Revenue recognized:
General Capital (52,233) (86,516)
Water Capital (5,150) (3,980)
Sewer & Drainage Capital (10,970) (14,467)
Total DCCs recognized as revenue (68,353) (104,963)
Net increase for the year 23,387 (12,674)
Deferred DCCs, end of year $ 277,681 $ 254,294
Page 25 of 113

59
For the year ended December 31, 2018 [tabular amounts in thousands of dollars]
NOTES TO THE CONSOLIDATED CITY OF SURREY FINANCIAL STATEMENTS
8. DEBT
2018 2017
MFA Debt (i) $ 179,699 $ 185,457
Loans payable (ii) 49,325 81,762
$ 229,024 $ 267,219
i) MFA Debt Pursuant to security issuing by-laws under authority of the Community Charter, the City obtains debt instruments through the Municipal Finance Authority of British Columbia (MFA) to finance certain capital expenditures.
Gross amount of the debt less sinking fund installments and actuarial adjustments to date are as follows:
MFA Issue Gross debt
Sinking fund installments and
actuarial adjustmentsNet debt
2018Net debt
2017
116 $ 100,000 $ 18,966 $ 81,034 $ 84,073
121 45,000 7,167 37,833 39,147
126 67,335 6,503 60,832 62,237
General Capital Fund $ 212,335 $ 32,636 $ 179,699 $ 185,457
Current borrowing includes:
MFA Issue Issue Date Term (yrs.) Maturity Interest Rate * Refinancing Date
116 April 4, 2011 25 April 4, 2036 4.20% April 4, 2021
121 October 4, 2012 25 October 4, 2037 2.90% October 4, 2022
126 September 26, 2013 30 September 26, 2043 3.85% September 26, 2023
*On the Refinancing Date, the City has the option to retire the debt early or refinance the borrowing at a new interest rate.
Page 26 of 113
60
For the year ended December 31, 2018 [tabular amounts in thousands of dollars]
NOTES TO THE CONSOLIDATED FINANCIAL STATEMENTS CITY OF SURREY
8. DEBT (CONTINUED)
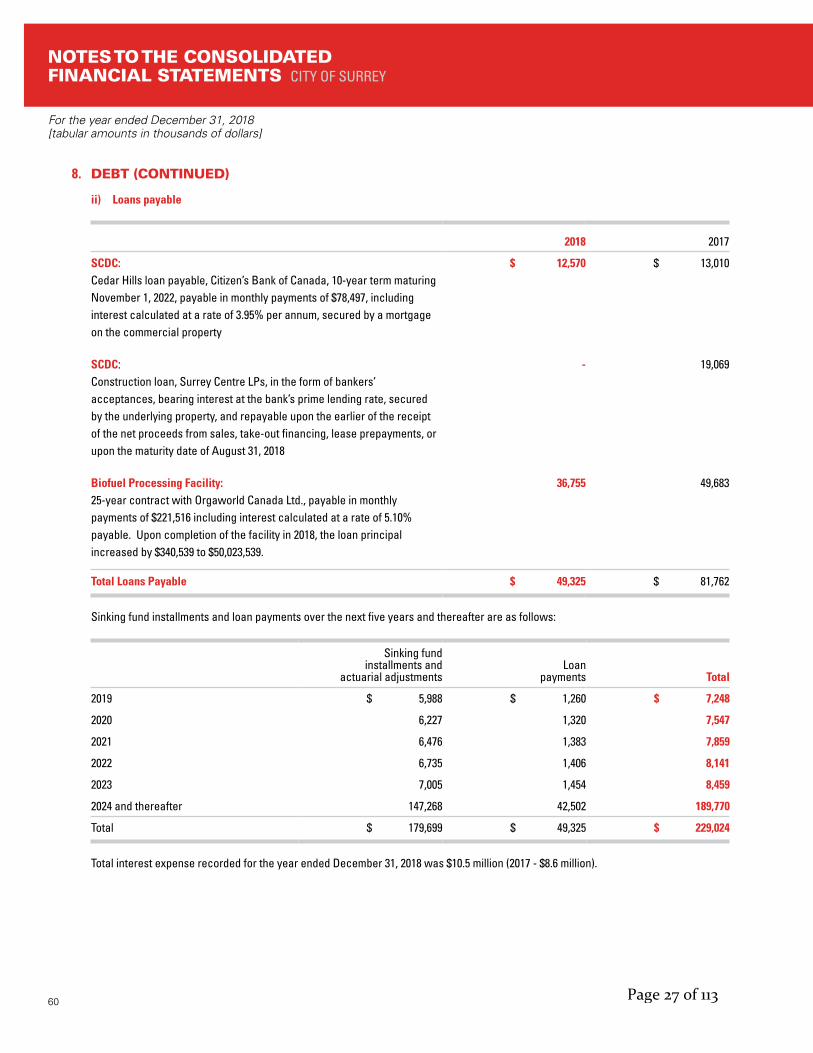
ii) Loans payable
2018 2017
SCDC: Cedar Hills loan payable, Citizen’s Bank of Canada, 10-year term maturing November 1, 2022, payable in monthly payments of $78,497, including interest calculated at a rate of 3.95% per annum, secured by a mortgage on the commercial property
$ 12,570 $ 13,010
SCDC: Construction loan, Surrey Centre LPs, in the form of bankers’ acceptances, bearing interest at the bank’s prime lending rate, secured by the underlying property, and repayable upon the earlier of the receipt of the net proceeds from sales, take-out financing, lease prepayments, or upon the maturity date of August 31, 2018
- 19,069
Biofuel Processing Facility: 25-year contract with Orgaworld Canada Ltd., payable in monthly payments of $221,516 including interest calculated at a rate of 5.10% payable. Upon completion of the facility in 2018, the loan principal increased by $340,539 to $50,023,539.
36,755 49,683
Total Loans Payable $ 49,325 $ 81,762
Sinking fund installments and loan payments over the next five years and thereafter are as follows:
Sinking fund installments and
actuarial adjustments Loan
payments Total
2019 $ 5,988 $ 1,260 $ 7,248
2020 6,227 1,320 7,547
2021 6,476 1,383 7,859
2022 6,735 1,406 8,141
2023 7,005 1,454 8,459
2024 and thereafter 147,268 42,502 189,770
Total $ 179,699 $ 49,325 $ 229,024
Total interest expense recorded for the year ended December 31, 2018 was $10.5 million (2017 - $8.6 million).
Page 27 of 113

61
For the year ended December 31, 2018 [tabular amounts in thousands of dollars]
NOTES TO THE CONSOLIDATED CITY OF SURREY FINANCIAL STATEMENTS
9. EMPLOYEE FUTURE BENEFITS
The City provides certain post-employment and sick leave benefits to its employees. These benefits include accumulated non-vested sick leave, post-employment service pay and post-retirement top-ups for dental, life insurance and accidental death, dismemberment insurance, vacation deferral, supplementary vacation and benefit continuation for disabled employees. The liability associated with these benefits is calculated based on the present value of expected future payments pro-rated for services and is included in accounts payable and accrued liabilities.
Accrued benefit liability: 2018 2017
Balance, beginning of year $ 27,053 $ 26,903
Current service cost 1,820 1,815
Interest cost 768 819
Amortization of net actuarial loss (gain) 72 (244)
Benefits paid (1,706) (2,240)
Accrued benefit liability, end of year $ 28,007 $ 27,053
An actuarial valuation for these benefits was performed to determine the City’s accrued benefit obligation as at December 31, 2018. The difference between the actuarially determined accrued benefit obligation of $24.6 million and the accrued benefit liability of $28.0 million as at December 31, 2018 is an unamortized actuarial gain of $3.4 million. The actuarial gain is amortized over a period equal to the employees’ average remaining service life of 11 years (2017 – 11 years).
Reconciliation of accrued benefit liability to accrued benefit obligation:
2018 2017
Actuarial benefit liability, end of year $ 28,007 $ 27,053
Unamortized actuarial gain (3,356) (2,066)
Accrued benefit obligation, end of year $ 24,651 $ 24,987
Actuarial assumptions used to determine the City’s accrued benefit obligation are as follows:
2018 2017
Discount rate 3.20% 3.00%
Expected future inflation rate 1.80% 1.80%
Expected wage and salary range increases 0.50% 0.50%
Employee average remaining service life (years) 11.00 11.00
Page 28 of 113

62
For the year ended December 31, 2018 [tabular amounts in thousands of dollars]
NOTES TO THE CONSOLIDATED FINANCIAL STATEMENTS CITY OF SURREY
10. TANGIBLE CAPITAL ASSETS
Net Book Value by category 2018 2017
Land and land improvements $ 1,878,923 $ 1,819,749
Land under road 3,079,917 2,922,967
Buildings and building improvements 434,452 391,572
Infrastructure 3,095,717 3,013,032
Machinery and equipment 133,125 133,045
Assets under construction 360,466 355,444
$ 8,982,600 $ 8,635,809
Net Book Value by fund 2018 2017
General capital $ 2,528,916 $ 2,422,481
Transportation capital 4,073,506 3,848,881
Water capital 640,316 623,236
Sewer capital 593,978 576,678
Drainage capital 1,094,243 1,079,156
Library capital 5,388 5,456
Surrey City Development Corp. 46,216 79,924
Other Entities 37 -
$ 8,982,600 $ 8,635,809
For additional detailed information, see the Schedule of Tangible Capital Assets (Schedule 1).
a) Assets Under Construction Assets under construction are comprised of costs related to projects currently under planning, development or construction that will result in a tangible capital asset at a future date. Such costs are capitalized until such time as the property is available for productive use. Assets under construction have not been amortized. Amortization of these assets will commence when each specific asset is put into service.
b) Contributed Tangible Capital Assets Contributed tangible capital assets have been recognized at fair value at the date of contribution. The value of contributed assets received during the year was $237.0 million (2017 - $151.6 million) comprised of roads infrastructure in the amount of $179.2 million (2017 - $125.3 million), water and wastewater infrastructure in the amount of $38.6 million (2017 - $17.3 million) and land in the amount of $19.2 million (2017 - $9.0 million), including improvements.
Page 29 of 113
63
For the year ended December 31, 2018 [tabular amounts in thousands of dollars]
NOTES TO THE CONSOLIDATED CITY OF SURREY FINANCIAL STATEMENTS
10. TANGIBLE CAPITAL ASSETS (CONTINUED)
c) Biofuel Processing Facility The City entered into a 25-year agreement with Orgaworld Surrey Limited Partnership (the “Operator”) to design, build, finance, operate and maintain the Surrey Organics Biofuel Processing facility. The City provided the land upon which the facility was constructed. Under the agreement, the City guaranteed to deliver to the Operator a minimum tonnage of City Organic Waste (as defined in the Agreement) for processing. The City will make payments to the Operator for acceptance of City Organic Waste in accordance with a specified formula. The Operator will also have the right to earn revenue from the delivery/acceptance of organic waste from third parties. In return the City will receive 100% of the biomethane produced at the facility and will share in certain other revenues generated at the facility. Upon expiry of the lease term the facility will become the asset of the City.
The facility was completed and commenced operation in 2018. The City recorded the facility on its financial statements as a tangible capital asset in the amount of its cost of construction being $50.0 million (2017 – $49.7 million). The City also recorded an offsetting liability for an equal amount representing future obligations to the Operator. The liability will be reduced over the term of the agreement as payments are made to the Operator.
d) Works of Art and Historical Cultural Assets The City manages and controls various works of art and non-operational historical cultural assets including buildings, artifacts, paintings and sculptures located at City sites and public display areas. These assets are not recorded as tangible capital assets.
e) Write-down of Tangible Capital Assets No impairments were identified or recorded during the year ended December 31, 2018 or 2017.
Page 30 of 113

64
For the year ended December 31, 2018 [tabular amounts in thousands of dollars]
NOTES TO THE CONSOLIDATED FINANCIAL STATEMENTS CITY OF SURREY
11. ACCUMULATED SURPLUS
Accumulated surplus consists of individual fund surpluses, reserves and equity in tangible capital assets. The City’s Accumulated surplus is as follows:
2018 2017
Accumulated Surplus per Statement of Financial Position $ 9,050,331 $ 8,664,152
Less:
Tangible Capital Assets 8,982,600 8,635,809
Debt funded assets (214,782) (253,184)
Invested in tangible capital assets 8,767,818 8,382,625
Gross Allocations Gross Allocations
Reserves set aside by Council
Capital legacy 47,329 (47,329) - 46,534 (34,608) 11,926
Municipal land 39,002 (39,002) - 22,649 (22,649) -
Equipment and building replacement 32,611 (5,898) 26,713 35,659 (6,767) 28,892
Neighborhood concept plans 22,521 (4,072) 18,449 23,775 (4,511) 19,264
Park land acquisition 22,372 (4,045) 18,327 26,309 (4,992) 21,317
Local improvement financing 17,015 (3,076) 13,939 16,591 (3,148) 13,443
Environmental stewardship 6,749 (1,220) 5,529 6,661 (1,264) 5,397
Parking space 2,629 (475) 2,154 2,618 (497) 2,121
Water claims 1,351 (244) 1,107 1,345 (255) 1,090
Affordable housing 23 (4) 19 23 (4) 19
191,602 86,237 182,164 103,469
Internal borrowing to fund capital program (105,365) (78,695)
Other appropriated funds
Infrastructure replacement (28,318) 28,318 - (45,811) 45,811 -
Revenue stabilization 13,490 (1,908) 11,582 16,593 (3,450) 13,143
Self insurance 11,732 (1,659) 10,073 12,288 (2,555) 9,733
Operating contingency and emergencies 8,276 (1,170) 7,106 8,782 (1,826) 6,956
Environmental emergencies 7,082 (1,002) 6,080 7,420 (1,543) 5,877
Prepaid expenses 4,197 - 4,197 4,375 - 4,375
Inventories of supplies 760 - 760 929 - 929
Committed funds 159,647 (22,579) 137,068 175,223 (36,437) 138,786
176,866 - 176,866 179,799 - 179,799
Other Entities
Surrey City Development Corporation 6,834 (15,910)
Surrey Homelessness and Housing Society 6,019 7,451
Innovation Boulevard 48 209
12,901 (8,250)
Total Appropriated Funds 9,043,822 8,657,643
Unappropriated Surplus $ 6,509 $ 6,509
Page 31 of 113

65
For the year ended December 31, 2018 [tabular amounts in thousands of dollars]
NOTES TO THE CONSOLIDATED CITY OF SURREY FINANCIAL STATEMENTS
12. COMMITMENTS AND CONTINGENCIES
a) The City has significant future contractual commitments for incomplete capital acquisitions and capital construction projects in progress. The City records the capital costs incurred to the end of the year on these projects as work in progress under tangible capital assets. To provide for the completion of the projects, unexpended budget money for incomplete projects is appropriated as Committed Funds (see Note 11). The Financial Plan, updated annually, provides for the financing of these and future obligations within the estimated financial resources of the City.
b) The City has a contingent liability with respect to debentures of the Greater Vancouver Water District, Greater Vancouver Sewerage and Drainage District and Greater Vancouver Regional District, to the extent provided in their respective Enabling Acts, Acts of Incorporation and Amending Acts. Management does not consider payment under this contingency to be likely and therefore no amounts have been accrued.
c) The City is a shareholder of the Emergency Communications for Southwest British Columbia Incorporated (E-Comm) whose services provided include: regional 9-1-1 call centre for the Metro Vancouver Regional District; Wide Area Radio network; dispatch operations; and records management. The City holds 2 Class “A” shares and 1 Class “B” share (of a total of 32 Class “A” and 21 Class “B” shares issued and outstanding as at December 31, 2018). As a Class “A” shareholder, the City shares in both funding the future operations and capital obligations of E-Comm (in accordance with a cost sharing formula), including any lease obligations committed to by E-Comm up to the shareholder’s withdrawal date. As a Class “B” shareholder, the City is obligated to share in funding of the ongoing operating costs. In accordance with the members’ agreement, upon withdrawal from E-Comm, class A shareholders shall be obligated to pay to the withdrawal date as requested by E-Comm their share of the Class A shareholders’ obligation to any long-term capital obligations, including any lease obligations. This includes any lease obligations or repayments thereof committed to by E-Comm up to the withdrawal date.
d) The City is, from time to time, engaged in or party to certain legal actions, assessment appeals and other existing conditions involving uncertainty which may result in material losses. The outcome and amounts that may be payable, if any, under some of these claims, cannot be determined and accordingly only those claims in which a payment is considered likely and the amounts can be reasonably estimated have been recorded in the financial statements as a liability.
e) The City insures itself through a combination of insurance policies and self-insurance. The City has a funded self-insurance appropriation included in accumulated surplus (Note 11). Based on estimates, this appropriation reasonably provides for all outstanding claims where the outcome is not currently determinable.
f) Debt Reserve Fund Demand Note The City has a contingent liability with respect to the Municipal Finance Authority of BC’s (“MFA”) Debt Reserve Fund Demand Notes. This contingent liability is a condition of the borrowings undertaken by the City.
As a condition for each debenture issue, the City is required to execute demand notes in connection with each debenture whereby the City may be required to loan certain amounts to the MFA. The debt agreement with the MFA provides that if at any time the scheduled payments provided for in the agreement are not sufficient to meet the MFA’s obligations in respect to such borrowing, the resulting deficiency becomes the joint and severed liability of the City and all other participants to the agreement through the MFA. The City is similarly liable on a contingent basis for the debt of other municipalities secured through the MFA.
Page 32 of 113

66
For the year ended December 31, 2018 [tabular amounts in thousands of dollars]
NOTES TO THE CONSOLIDATED FINANCIAL STATEMENTS CITY OF SURREY
12. COMMITMENTS AND CONTINGENCIES (CONTINUED)
f) Debt Reserve Fund Demand Note (Continued)
Demand note amounts are as follows:
Issue LA SI Rgn SI Purpose TermDRF
Demand Note
116 17173 R10-2022 1139 Other 25 $ 319
116 17180 R10-2357 1141 Other 25 637
116 17231 R11-124 1142 Other 25 1,035
121 17231 R11-124 1142 Other 25 743
126 17928 R13-1059 1188 Other 30 943
126 17929 R13-1061 1188 Other 30 280
Total $ 3,957
g) Policing services The City entered into a contract with the Provincial Government that provides for the Royal Canadian Mounted Police (“RCMP”) to deliver policing services for the City through to March 31, 2032.
On November 5, 2018, at the first Regular Council Meeting of the October 20, 2018 elected Mayor and Council, Council unanimously approved a motion to direct staff to commence work on creating a Surrey Police Department and serve notice that the City of Surrey will be terminating its contract with the RCMP municipal police service.
13. CONTRACTUAL RIGHTS
Contractual rights are rights to economic resources arising from contracts or agreements that will result in revenues and assets in the future. The significant contractual rights that existed at December 31, 2018 are as follows:
a) Lease revenue The City has entered into a number of fixed term lease agreements for the use of City owned land and/or buildings that are anticipated to provide the City with future revenues. These agreements are for terms that vary from 1 to 25 years. The following table summarizes the contractual rights of the City for future assets:
2019 2020 2021 2022 Thereafter
Lease revenue $ 6,289 $ 5,667 $ 5,185 $ 4,707 $ 27,178
b) Developer contributions The City has entered into a number of public works development agreements which require the developers to contribute various infrastructure assets to the City, including roads and underground utilities. The timing and extent of these future contributions vary depending on development activity and fair value of the assets received at time of contribution, which cannot be determined with certainty at this time.
Page 33 of 113

67
For the year ended December 31, 2018 [tabular amounts in thousands of dollars]
NOTES TO THE CONSOLIDATED CITY OF SURREY FINANCIAL STATEMENTS
14. PENSION PLAN
The City and its employees contribute to the Municipal Pension Plan (the “Plan”), a jointly trusteed pension plan. The Board of Trustees, representing plan members and employers, is responsible for administering the Plan, including investment of the assets and administration of benefits. The Plan is a multi-employer defined benefit pension plan. Basic pension benefits are based on a formula. As at December 31, 2017, the Plan has about 197,000 active members and approximately 95,000 retired members. Active members include approximately 39,000 contributors from local government.
Every three years, an actuarial valuation is performed to assess the financial position of the plan and adequacy of plan funding. The actuary determines an appropriate combined employer and member contribution rate to fund the plan. The actuary’s calculated contribution rate is based on the entry-age normal cost method, which produces the long-term rate of member and employer contributions sufficient to provide benefits for average future entrants to the plan. This rate may be adjusted for the amortization of any actuarial funding surplus and will be adjusted for the amortization of any unfunded actuarial liability.
The most recent valuation for the Plan as at December 31, 2015, indicated a $2,224 million funding surplus for basic pension benefits on a going concern basis. As a result of the 2015 basic account actuarial valuation surplus and pursuant to the joint trustee agreement, $1,927 million was transferred to the rate stabilization account and $297 million of the surplus ensured the required contribution rates remained unchanged.
The City paid $19.6 million (2017 - $18.4 million) for employer contributions while employees contributed $16.4 million (2017 - $15.3 million) to the Plan in 2018.
The next valuation will be as at December 31, 2018, with results available in 2019.
Employers participating in the Plan record their pension expense as the amount of employer contributions made during the fiscal year (defined contribution pension plan accounting). This is because the Plan records accrued liabilities and accrued assets for the Plan in aggregate, resulting in no consistent and reliable basis for allocating the obligation, assets and cost to the individual employers participating in the Plan.
15. TAXATION REVENUE
2018 2017
Tax collected:
Property taxes $ 348,065 $ 320,990
Collections for other authorities 317,471 302,506
Drainage Parcel taxes 55,138 53,629
Grants-in-lieu of taxes 16,626 16,596
Other 316 480
737,616 694,201
Less transfers to other authorities:
Province of BC - School Taxes (241,267) (230,932)
Greater Vancouver Regional District (7,676) (6,541)
BC Assessment Authority (7,766) (7,362)
Greater Vancouver Transportation Authority (46,500) (43,692)
Other (14,262) (13,979)
(317,471) (302,506)
Taxation revenue $ 420,145 $ 391,695
Page 34 of 113

68
For the year ended December 31, 2018 [tabular amounts in thousands of dollars]
NOTES TO THE CONSOLIDATED FINANCIAL STATEMENTS CITY OF SURREY
16. OTHER REVENUE
2018 2017
Licenses and permits $ 33,713 $ 30,040
Leases and rentals 13,286 11,830
Penalties and interest on taxes 5,365 4,812
Miscellaneous 7,130 5,486
Gain on sale of assets 15,709 9,511
Gain on sale of partnership interest (note 19b) 7,338 -
$ 82,541 $ 61,679
17. SIGNIFICANT TAXPAYERS
The City is not reliant upon the revenue from any specific large property taxpayers or businesses. Tax revenues received from the ten largest properties amount to less than four percent of the City’s annual gross taxation revenues.
18. TRUST FUNDS
These funds account for assets, which must be administered as directed by agreement or statute for certain beneficiaries. In accordance with PSAB recommendations on financial statement presentation for local governments, trust funds are not included in the City’s Consolidated Financial Statements. Amounts administered by the City as trust funds are as follows:
2018 2017
Assets
Cash and short-term investments $ 4,239 $ 3,929
Equity Employee
Benefits Fund Cemetery Perpetual
Care Fund 2018 2017
Balance, beginning of year $ 676 $ 3,253 $ 3,929 $ 3,515
Employment insurance rebate 92 - 92 86
Contributions 49 253 302 404
Interest revenue 3 - 3 4
Benefits purchased (17) - (17) (16)
Refunded to employees (70) - (70) (64)
Balance, end of year $ 733 $ 3,506 $ 4,239 $ 3,929
Page 35 of 113
69
For the year ended December 31, 2018 [tabular amounts in thousands of dollars]
NOTES TO THE CONSOLIDATED CITY OF SURREY FINANCIAL STATEMENTS
19. SURREY CITY DEVELOPMENT CORPORATION
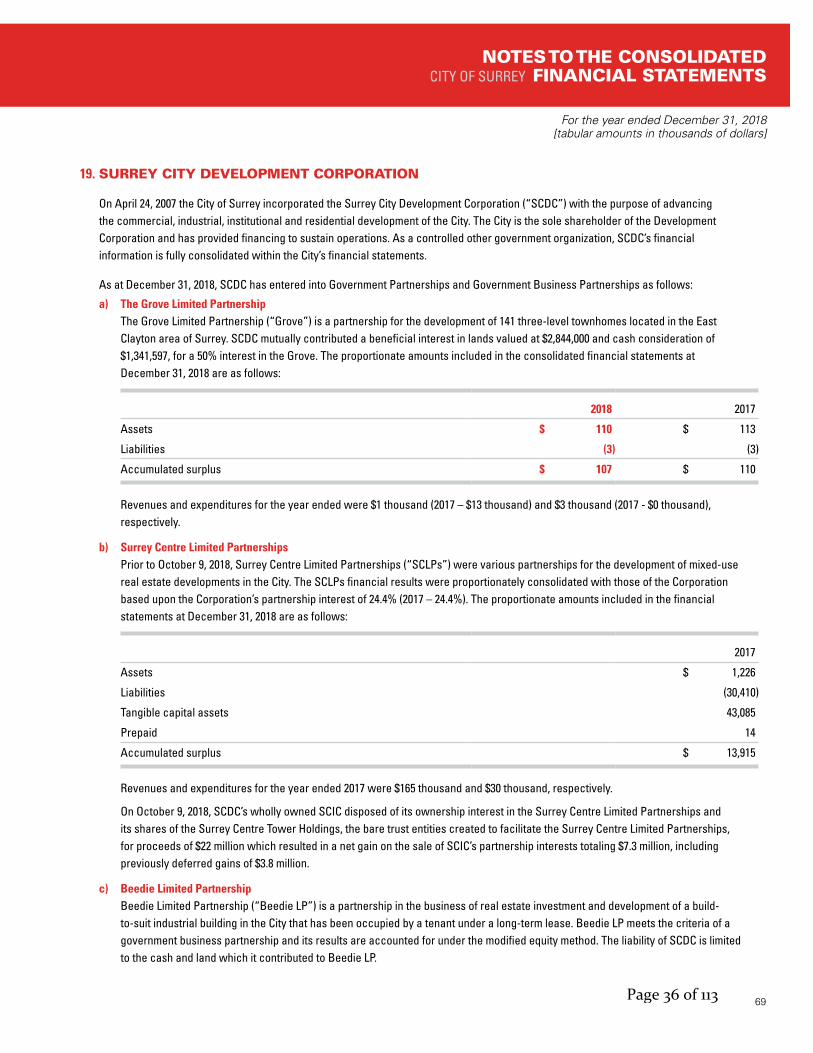
On April 24, 2007 the City of Surrey incorporated the Surrey City Development Corporation (“SCDC”) with the purpose of advancing the commercial, industrial, institutional and residential development of the City. The City is the sole shareholder of the Development Corporation and has provided financing to sustain operations. As a controlled other government organization, SCDC’s financial information is fully consolidated within the City’s financial statements.
As at December 31, 2018, SCDC has entered into Government Partnerships and Government Business Partnerships as follows:
a) The Grove Limited Partnership The Grove Limited Partnership (“Grove”) is a partnership for the development of 141 three-level townhomes located in the East Clayton area of Surrey. SCDC mutually contributed a beneficial interest in lands valued at $2,844,000 and cash consideration of $1,341,597, for a 50% interest in the Grove. The proportionate amounts included in the consolidated financial statements at December 31, 2018 are as follows:
2018 2017
Assets $ 110 $ 113
Liabilities (3) (3)
Accumulated surplus $ 107 $ 110
Revenues and expenditures for the year ended were $1 thousand (2017 – $13 thousand) and $3 thousand (2017 - $0 thousand), respectively.
b) Surrey Centre Limited Partnerships Prior to October 9, 2018, Surrey Centre Limited Partnerships (“SCLPs”) were various partnerships for the development of mixed-use real estate developments in the City. The SCLPs financial results were proportionately consolidated with those of the Corporation based upon the Corporation’s partnership interest of 24.4% (2017 – 24.4%). The proportionate amounts included in the financial statements at December 31, 2018 are as follows:
2017
Assets $ 1,226
Liabilities (30,410)
Tangible capital assets 43,085
Prepaid 14
Accumulated surplus $ 13,915
Revenues and expenditures for the year ended 2017 were $165 thousand and $30 thousand, respectively.
On October 9, 2018, SCDC’s wholly owned SCIC disposed of its ownership interest in the Surrey Centre Limited Partnerships and its shares of the Surrey Centre Tower Holdings, the bare trust entities created to facilitate the Surrey Centre Limited Partnerships, for proceeds of $22 million which resulted in a net gain on the sale of SCIC’s partnership interests totaling $7.3 million, including previously deferred gains of $3.8 million.
c) Beedie Limited Partnership Beedie Limited Partnership (“Beedie LP”) is a partnership in the business of real estate investment and development of a build-to-suit industrial building in the City that has been occupied by a tenant under a long-term lease. Beedie LP meets the criteria of a government business partnership and its results are accounted for under the modified equity method. The liability of SCDC is limited to the cash and land which it contributed to Beedie LP.
Page 36 of 113
70
For the year ended December 31, 2018 [tabular amounts in thousands of dollars]
NOTES TO THE CONSOLIDATED FINANCIAL STATEMENTS CITY OF SURREY
20. SEGMENTED INFORMATION
The City of Surrey is a diversified municipal government institution that provides a wide range of services to the citizens of Surrey, including Police Services; Parks, Recreation and Culture Services; General Government Services; Water Services; Fire Services; Sewer Services; Engineering Services; Drainage Services; Solid Waste Management Services; Roads & Traffic Safety Services; Planning and Development Services; Parking Services; Surrey City Energy Services; and Surrey Public Library Services. For management reporting purposes, the Government’s operations and activities are organized and reported by Service Area. Service Areas were created for the purpose of recording specific activities and related objectives in accordance with legislated requirements.
City Departments and the activities for which they are responsible are reported in these Service Areas. The Departments listed in the segmented information, along with the services that each Department provides are listed below:
Police Services The mandate of the Police Department includes enforcing laws, preventing crime, and maintaining peace, order and security.
Parks, Recreation and Culture Services The Parks, Recreation and Culture Department is responsible for planning, facilitating the development of, operating and maintaining high quality parks, recreation and cultural facilities and services.
General Government Services – Mayor & Councillor’s Department, City Manager’s Department, Finance Department, Corporate Services Department, Surrey City Development Corporation, and Surrey Homelessness and Housing Society General Government Services includes those elements of the organization with responsibility for adopting by-laws, adopting administrative policy, levying taxes, acquiring, disposing and managing City assets, ensuring effective financial management, monitoring performance and ensuring that high quality City service standards are met.
The Surrey City Development Corporation, which engages in the provision of consulting services, land development activities, property acquisition/disposal and asset management and the Surrey Homelessness and Housing Society, which focuses on addressing homelessness in Surrey through raising funds and the provision of grants to worthy projects also form part of General Government Services.
Roads and Traffic Safety Services The Roads & Traffic Safety Utility provides effective managed transportation systems that serves the mobility needs of individuals and businesses and is safe, secure and supports the economic vitality of the City, and protects and enhances the environment.
Water Services The Water Utility operates the water system and its primary responsibility, in partnership with the Operations Division and Metro Vancouver, is to supply clean, safe drinking water to the residences and businesses of Surrey.
Page 37 of 113
71
For the year ended December 31, 2018 [tabular amounts in thousands of dollars]
NOTES TO THE CONSOLIDATED CITY OF SURREY FINANCIAL STATEMENTS
20. SEGMENTED INFORMATION (CONTINUED)
Fire Services The mandate of the Fire Department is to enforce codes and maintain security by protecting life, property and the environment through the provision of emergency response services.
Sewer Services The Sewer Utility operates the network of sewer mains, to collect sewage and convey such sewage to treatment plants. The utility also plans, designs, and constructs sanitary sewer infrastructure; manages inflow and infiltration controls; and undertakes initiatives in support of the region’s Integrated Liquid Waste Resource Management Plan.
Solid Waste Management Services The Solid Waste Utility provides weekly residential curbside organic waste collection with alternating bi-weekly garbage and recycling, and curbside collection services via a fully-automated cart-based collection system.
Drainage Services The Drainage Utility operates the network of storm sewers and pump stations for storm water management. Its primary responsibility is to manage the City’s storm water runoff in partnership with the Operations Division and Metro Vancouver.
Planning and Development Services The Planning and Development Department is responsible for preparing land use plans, by-laws and policies for sustainable development of the City and for reviewing and approving new land and building development.
Surrey Public Library Services The Surrey Public Library provides access to local and global information through its nine Library branches located throughout the City.
Engineering Services The Engineering Department is responsible for providing timely and effective services relating to water, sewer, drainage, garbage collection, transportation systems, and corporate real estate.
Surrey City Energy Surrey City Energy is the municipal energy utility of the Engineering Department. This utility provides the planning and development of community energy systems that will provide thermal energy to new and existing developments throughout the City Centre area.
Parking The Parking Authority Utility is a self-funded program that involves planning, managing and enforcing the City’s on and off street parking assets, employing leading edge technologies, such as license plate recognition and pay stations that provide a user friendly interface, improved theft security and efficient enforcement.
Page 38 of 113

72
NOTES TO THE CONSOLIDATED FINANCIAL STATEMENTS CITY OF SURREY
20. SEGMENTED INFORMATION (CONTINUED)
Police Services
Parks, Recreation and Culture
General Government
Roads & Traffic Safety Water
Fire Services Sewer
Solid Waste Management Drainage
Planning and Development
Library Services Engineering
Surrey City Energy Parking 2018
REVENUESTaxation, grants-in-lieu, assessments $ - $ - $ 669,240 $ 29,682 $ 6 $ - $ 1,275 $ - $ 37,413 $ - $ - $ - $ - $ - $ 737,616
Collections for other authorities - - (317,471) - - - - - - - - - - - (317,471)
Taxation revenue - - 351,769 29,682 6 - 1,275 - 37,413 - - - - - 420,145
Sales of goods and services 1,590 31,018 23,976 274 76,708 2,260 54,494 41,776 - 5,027 285 7,375 1,705 3,793 250,281
Development cost charges - - 68,353 - - - - - - - - - - - 68,353
Developer contributions - 116 41,870 181,956 6,694 - 13,848 - 18,809 - 6 - 257 - 263,556
Investment income - 15 22,000 - 351 - 200 12 55 - - - - - 22,633
Transfers from other governments 6,802 725 20,052 11,873 6,830 - - - 4,458 - 982 - - - 51,722
Other 52 3,248 47,268 116 1,122 21 528 149 127 25,669 426 2,768 19 1,028 82,541
8,444 35,122 575,288 223,901 91,711 2,281 70,345 41,937 60,862 30,696 1,699 10,143 1,981 4,821 1,159,231
EXPENSESSalaries and benefits 26,016 62,696 40,068 6,520 - 58,124 - - - 21,843 14,359 41,610 489 663 272,388
RCMP contracted services 129,972 - - - - - - - - - - - - - 129,972
Consulting and professional services 1,037 5,607 4,405 1,385 760 339 374 635 1,959 1,331 117 826 171 63 19,009
Telephone and communications 420 287 1,017 39 12 166 24 9 20 91 29 245 5 53 2,417
Regional district utility charges - - - - 46,722 - 40,146 - - - - - - - 86,868
Utilities 708 4,222 44 4,318 705 361 2,066 26 7 552 384 1,390 577 3 15,363
Garbage collection and disposal 18 774 16 386 - 24 - 21,707 4 12 11 145 - - 23,097
Maintenance and small equipment 80 7,733 5,759 221 449 1,117 125 18 20 3,256 261 982 24 100 20,145
Insurance and claims - - 2,998 - - - 2 260 - - - 47 - - 3,307
Leases and rentals 825 1,402 504 1,667 465 - 814 552 1,329 22 46 2,060 - 82 9,768
Supplies and materials 369 9,332 3,302 3,554 1,459 2,549 1,405 1,744 933 1,793 541 5,777 3 43 32,804
Advertising and media 2 490 295 17 - 12 - 29 2 26 1,235 15 - - 2,123
Grants and sponsorships - 748 3,605 - - - - - - 10 - - - - 4,363
Contract payments 2 3,646 1,119 8,291 2,728 141 894 1,510 2,025 47 5 1,425 34 614 22,481
Other 1,058 2,846 2,863 1,599 503 1,485 1,047 75 1,431 898 799 966 11 12 15,593
Cost recoveries, net (828) 57 (5,470) 1,961 9,726 (1,454) 4,284 3,821 7,067 (475) 348 (48,231) (183) (442) (29,819)
Interest on debt - - 7,835 - - - - 2,658 - - - - - - 10,493
Other interests and fiscal services 23 405 1,292 - (2) - (2) - - 83 6 1 93 132 2,031
Amortization expense 1,394 17,914 13,997 42,048 9,437 1,805 12,095 2,103 20,265 35 2,016 6,303 175 1,062 130,649
161,096 118,159 83,649 72,006 72,964 64,669 63,274 35,147 35,062 29,524 20,157 13,561 1,399 2,385 773,052
Excess (deficiency) of revenues over expenses (152,652) (83,037) 491,639 151,895 18,747 (62,388) 7,071 6,790 25,800 1,172 (18,458) (3,418) 582 2,436 386,179
Transfer from (to) operating funds - - (97,608) 56,962 3,793 - 11,495 (4,850) (512) - 18,232 - 13,990 (1,502) -
Transfer from (to) reserve funds - 747 (60,693) 47,239 5,422 (1,297) 7,413 (504) 6,019 (198) 100 (2,999) (1,249) - -
Transfer from (to) capital funds - (2,041) 46,071 (45,996) (10,056) - (7,916) 49,749 (15,850) 83 88 45 (14,000) (177) -
Annual surplus (deficit) $ (152,652) $ (84,331) $ 379,409 $ 210,100 $ 17,906 $ (63,685) $ 18,063 $ 51,185 $ 15,457 $ 1,057 $ (38) $ (6,372) $ (677) $ 757 $ 386,179
For the year ended December 31, 2018 [in thousands of dollars]
Page 39 of 113

73
NOTES TO THE CONSOLIDATED CITY OF SURREY FINANCIAL STATEMENTS
Police Services
Parks, Recreation and Culture
General Government
Roads & Traffic Safety Water
Fire Services Sewer
Solid Waste Management Drainage
Planning and Development
Library Services Engineering
Surrey City Energy Parking 2018
REVENUESTaxation, grants-in-lieu, assessments $ - $ - $ 669,240 $ 29,682 $ 6 $ - $ 1,275 $ - $ 37,413 $ - $ - $ - $ - $ - $ 737,616
Collections for other authorities - - (317,471) - - - - - - - - - - - (317,471)
Taxation revenue - - 351,769 29,682 6 - 1,275 - 37,413 - - - - - 420,145
Sales of goods and services 1,590 31,018 23,976 274 76,708 2,260 54,494 41,776 - 5,027 285 7,375 1,705 3,793 250,281
Development cost charges - - 68,353 - - - - - - - - - - - 68,353
Developer contributions - 116 41,870 181,956 6,694 - 13,848 - 18,809 - 6 - 257 - 263,556
Investment income - 15 22,000 - 351 - 200 12 55 - - - - - 22,633
Transfers from other governments 6,802 725 20,052 11,873 6,830 - - - 4,458 - 982 - - - 51,722
Other 52 3,248 47,268 116 1,122 21 528 149 127 25,669 426 2,768 19 1,028 82,541
8,444 35,122 575,288 223,901 91,711 2,281 70,345 41,937 60,862 30,696 1,699 10,143 1,981 4,821 1,159,231
EXPENSESSalaries and benefits 26,016 62,696 40,068 6,520 - 58,124 - - - 21,843 14,359 41,610 489 663 272,388
RCMP contracted services 129,972 - - - - - - - - - - - - - 129,972
Consulting and professional services 1,037 5,607 4,405 1,385 760 339 374 635 1,959 1,331 117 826 171 63 19,009
Telephone and communications 420 287 1,017 39 12 166 24 9 20 91 29 245 5 53 2,417
Regional district utility charges - - - - 46,722 - 40,146 - - - - - - - 86,868
Utilities 708 4,222 44 4,318 705 361 2,066 26 7 552 384 1,390 577 3 15,363
Garbage collection and disposal 18 774 16 386 - 24 - 21,707 4 12 11 145 - - 23,097
Maintenance and small equipment 80 7,733 5,759 221 449 1,117 125 18 20 3,256 261 982 24 100 20,145
Insurance and claims - - 2,998 - - - 2 260 - - - 47 - - 3,307
Leases and rentals 825 1,402 504 1,667 465 - 814 552 1,329 22 46 2,060 - 82 9,768
Supplies and materials 369 9,332 3,302 3,554 1,459 2,549 1,405 1,744 933 1,793 541 5,777 3 43 32,804
Advertising and media 2 490 295 17 - 12 - 29 2 26 1,235 15 - - 2,123
Grants and sponsorships - 748 3,605 - - - - - - 10 - - - - 4,363
Contract payments 2 3,646 1,119 8,291 2,728 141 894 1,510 2,025 47 5 1,425 34 614 22,481
Other 1,058 2,846 2,863 1,599 503 1,485 1,047 75 1,431 898 799 966 11 12 15,593
Cost recoveries, net (828) 57 (5,470) 1,961 9,726 (1,454) 4,284 3,821 7,067 (475) 348 (48,231) (183) (442) (29,819)
Interest on debt - - 7,835 - - - - 2,658 - - - - - - 10,493
Other interests and fiscal services 23 405 1,292 - (2) - (2) - - 83 6 1 93 132 2,031
Amortization expense 1,394 17,914 13,997 42,048 9,437 1,805 12,095 2,103 20,265 35 2,016 6,303 175 1,062 130,649
161,096 118,159 83,649 72,006 72,964 64,669 63,274 35,147 35,062 29,524 20,157 13,561 1,399 2,385 773,052
Excess (deficiency) of revenues over expenses (152,652) (83,037) 491,639 151,895 18,747 (62,388) 7,071 6,790 25,800 1,172 (18,458) (3,418) 582 2,436 386,179
Transfer from (to) operating funds - - (97,608) 56,962 3,793 - 11,495 (4,850) (512) - 18,232 - 13,990 (1,502) -
Transfer from (to) reserve funds - 747 (60,693) 47,239 5,422 (1,297) 7,413 (504) 6,019 (198) 100 (2,999) (1,249) - -
Transfer from (to) capital funds - (2,041) 46,071 (45,996) (10,056) - (7,916) 49,749 (15,850) 83 88 45 (14,000) (177) -
Annual surplus (deficit) $ (152,652) $ (84,331) $ 379,409 $ 210,100 $ 17,906 $ (63,685) $ 18,063 $ 51,185 $ 15,457 $ 1,057 $ (38) $ (6,372) $ (677) $ 757 $ 386,179
For the year ended December 31, 2018 [in thousands of dollars]
Page 40 of 113
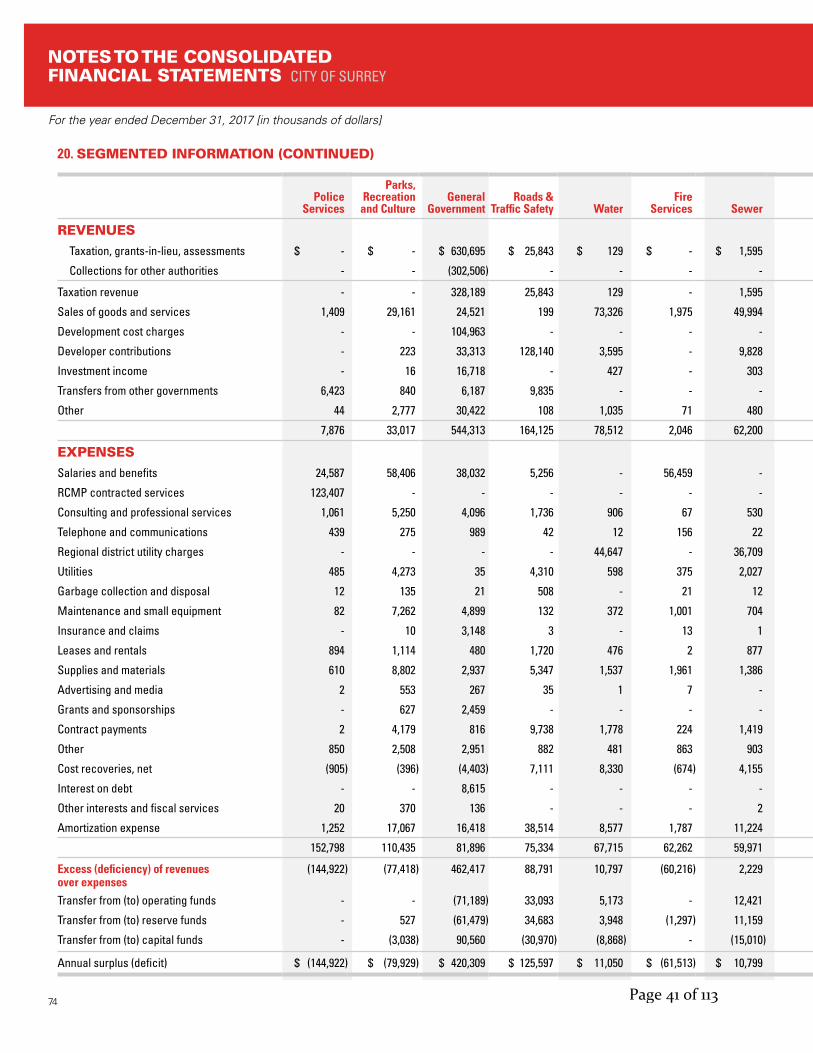
74
NOTES TO THE CONSOLIDATED FINANCIAL STATEMENTS CITY OF SURREY
For the year ended December 31, 2017 [in thousands of dollars]
Police Services
Parks, Recreation and Culture
General Government
Roads & Traffic Safety Water
Fire Services Sewer
Solid Waste Management Drainage
Planning and Development
Library Services Engineering
Surrey City Energy Parking 2017
REVENUESTaxation, grants-in-lieu, assessments $ - $ - $ 630,695 $ 25,843 $ 129 $ - $ 1,595 $ - $ 35,939 $ - $ - $ - $ - $ - $ 694,201
Collections for other authorities - - (302,506) - - - - - - - - - - - (302,506)
Taxation revenue - - 328,189 25,843 129 - 1,595 - 35,939 - - - - - 391,695
Sales of goods and services 1,409 29,161 24,521 199 73,326 1,975 49,994 41,531 - 3,767 274 6,799 1,144 5,937 240,037
Development cost charges - - 104,963 - - - - - - - - - - - 104,963
Developer contributions - 223 33,313 128,140 3,595 - 9,828 - 8,566 - 22 5 44 - 183,736
Investment income - 16 16,718 - 427 - 303 - 69 - - - - - 17,533
Transfers from other governments 6,423 840 6,187 9,835 - - - - 387 - 1,005 - - - 24,677
Other 44 2,777 30,422 108 1,035 71 480 139 111 22,858 419 2,342 9 864 61,679
7,876 33,017 544,313 164,125 78,512 2,046 62,200 41,670 45,072 26,625 1,720 9,146 1,197 6,801 1,024,320
EXPENSESSalaries and benefits 24,587 58,406 38,032 5,256 - 56,459 - - - 20,956 13,533 39,526 436 629 257,820
RCMP contracted services 123,407 - - - - - - - - - - - - - 123,407
Consulting and professional services 1,061 5,250 4,096 1,736 906 67 530 902 2,159 1,052 70 831 172 25 18,857
Telephone and communications 439 275 989 42 12 156 22 9 12 68 39 143 2 51 2,259
Regional district utility charges - - - - 44,647 - 36,709 - - - - - - - 81,356
Utilities 485 4,273 35 4,310 598 375 2,027 7 8 613 400 874 371 7 14,383
Garbage collection and disposal 12 135 21 508 - 21 12 22,198 1 10 11 104 - - 23,033
Maintenance and small equipment 82 7,262 4,899 132 372 1,001 704 15 35 2,559 238 1,154 24 59 18,536
Insurance and claims - 10 3,148 3 - 13 1 170 - - - 65 - - 3,410
Leases and rentals 894 1,114 480 1,720 476 2 877 375 1,671 19 53 1,618 - 5 9,304
Supplies and materials 610 8,802 2,937 5,347 1,537 1,961 1,386 2,846 1,102 2,046 525 5,805 4 23 34,931
Advertising and media 2 553 267 35 1 7 - 90 3 9 1,186 19 - - 2,172
Grants and sponsorships - 627 2,459 - - - - - - - - - - - 3,086
Contract payments 2 4,179 816 9,738 1,778 224 1,419 1,141 1,283 4 31 2,218 294 443 23,570
Other 850 2,508 2,951 882 481 863 903 32 471 868 679 776 6 10 12,280
Cost recoveries, net (905) (396) (4,403) 7,111 8,330 (674) 4,155 3,799 6,471 (1,057) 320 (47,139) (263) (283) (24,934)
Interest on debt - - 8,615 - - - - - - - - - - - 8,615
Other interests and fiscal services 20 370 136 - - - 2 15 - 59 5 1 59 131 798
Amortization expense 1,252 17,067 16,418 38,514 8,577 1,787 11,224 1,518 19,770 35 1,961 4,951 104 1,144 124,322
152,798 110,435 81,896 75,334 67,715 62,262 59,971 33,117 32,986 27,241 19,051 10,946 1,209 2,244 737,205
Excess (deficiency) of revenues over expenses
(144,922) (77,418) 462,417 88,791 10,797 (60,216) 2,229 8,553 12,086 (616) (17,331) (1,800) (12) 4,557 287,115
Transfer from (to) operating funds - - (71,189) 33,093 5,173 - 12,421 (4,742) (1,810) - 17,352 10,290 204 (792) -
Transfer from (to) reserve funds - 527 (61,479) 34,683 3,948 (1,297) 11,159 11,827 4,566 (204) 191 (3,058) - (863) -
Transfer from (to) capital funds - (3,038) 90,560 (30,970) (8,868) - (15,010) (11,815) (10,432) 67 (7) 8 (10,235) (260) -
Annual surplus (deficit) $ (144,922) $ (79,929) $ 420,309 $ 125,597 $ 11,050 $ (61,513) $ 10,799 $ 3,823 $ 4,410 $ (753) $ 205 $ 5,440 $ (10,043) $ 2,642 $ 287,115
20. SEGMENTED INFORMATION (CONTINUED)
Page 41 of 113
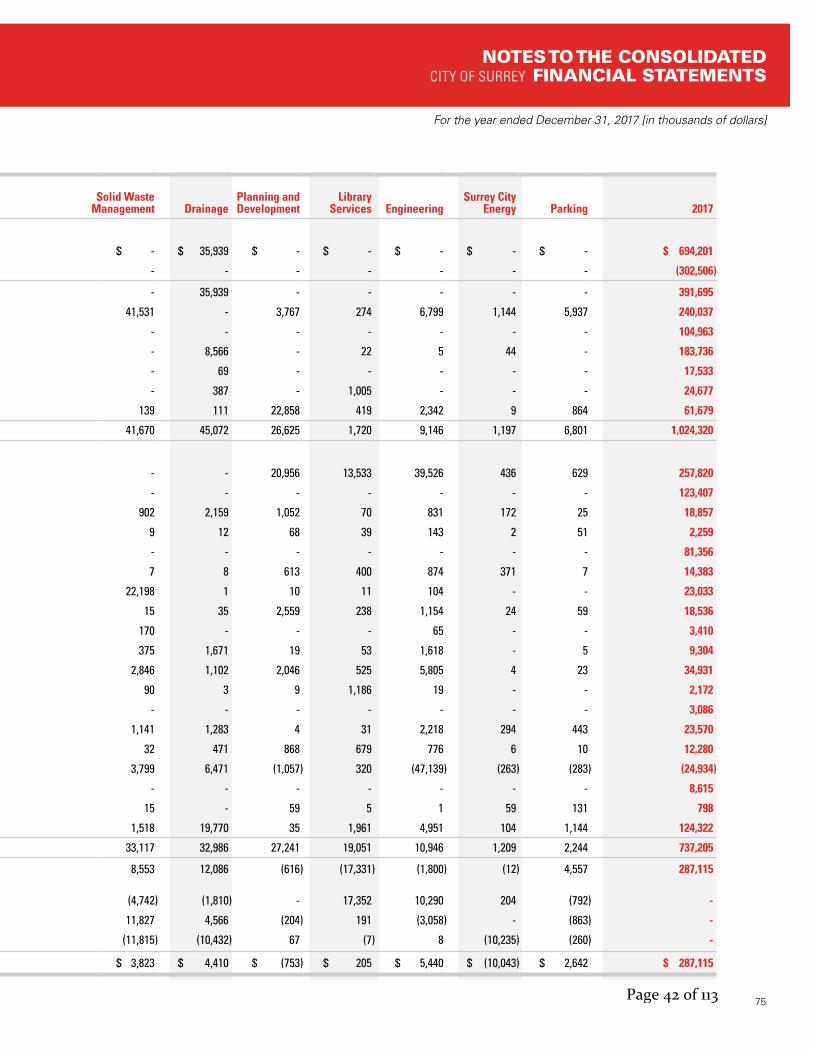
75
NOTES TO THE CONSOLIDATED CITY OF SURREY FINANCIAL STATEMENTS
For the year ended December 31, 2017 [in thousands of dollars]
Police Services
Parks, Recreation and Culture
General Government
Roads & Traffic Safety Water
Fire Services Sewer
Solid Waste Management Drainage
Planning and Development
Library Services Engineering
Surrey City Energy Parking 2017
REVENUESTaxation, grants-in-lieu, assessments $ - $ - $ 630,695 $ 25,843 $ 129 $ - $ 1,595 $ - $ 35,939 $ - $ - $ - $ - $ - $ 694,201
Collections for other authorities - - (302,506) - - - - - - - - - - - (302,506)
Taxation revenue - - 328,189 25,843 129 - 1,595 - 35,939 - - - - - 391,695
Sales of goods and services 1,409 29,161 24,521 199 73,326 1,975 49,994 41,531 - 3,767 274 6,799 1,144 5,937 240,037
Development cost charges - - 104,963 - - - - - - - - - - - 104,963
Developer contributions - 223 33,313 128,140 3,595 - 9,828 - 8,566 - 22 5 44 - 183,736
Investment income - 16 16,718 - 427 - 303 - 69 - - - - - 17,533
Transfers from other governments 6,423 840 6,187 9,835 - - - - 387 - 1,005 - - - 24,677
Other 44 2,777 30,422 108 1,035 71 480 139 111 22,858 419 2,342 9 864 61,679
7,876 33,017 544,313 164,125 78,512 2,046 62,200 41,670 45,072 26,625 1,720 9,146 1,197 6,801 1,024,320
EXPENSESSalaries and benefits 24,587 58,406 38,032 5,256 - 56,459 - - - 20,956 13,533 39,526 436 629 257,820
RCMP contracted services 123,407 - - - - - - - - - - - - - 123,407
Consulting and professional services 1,061 5,250 4,096 1,736 906 67 530 902 2,159 1,052 70 831 172 25 18,857
Telephone and communications 439 275 989 42 12 156 22 9 12 68 39 143 2 51 2,259
Regional district utility charges - - - - 44,647 - 36,709 - - - - - - - 81,356
Utilities 485 4,273 35 4,310 598 375 2,027 7 8 613 400 874 371 7 14,383
Garbage collection and disposal 12 135 21 508 - 21 12 22,198 1 10 11 104 - - 23,033
Maintenance and small equipment 82 7,262 4,899 132 372 1,001 704 15 35 2,559 238 1,154 24 59 18,536
Insurance and claims - 10 3,148 3 - 13 1 170 - - - 65 - - 3,410
Leases and rentals 894 1,114 480 1,720 476 2 877 375 1,671 19 53 1,618 - 5 9,304
Supplies and materials 610 8,802 2,937 5,347 1,537 1,961 1,386 2,846 1,102 2,046 525 5,805 4 23 34,931
Advertising and media 2 553 267 35 1 7 - 90 3 9 1,186 19 - - 2,172
Grants and sponsorships - 627 2,459 - - - - - - - - - - - 3,086
Contract payments 2 4,179 816 9,738 1,778 224 1,419 1,141 1,283 4 31 2,218 294 443 23,570
Other 850 2,508 2,951 882 481 863 903 32 471 868 679 776 6 10 12,280
Cost recoveries, net (905) (396) (4,403) 7,111 8,330 (674) 4,155 3,799 6,471 (1,057) 320 (47,139) (263) (283) (24,934)
Interest on debt - - 8,615 - - - - - - - - - - - 8,615
Other interests and fiscal services 20 370 136 - - - 2 15 - 59 5 1 59 131 798
Amortization expense 1,252 17,067 16,418 38,514 8,577 1,787 11,224 1,518 19,770 35 1,961 4,951 104 1,144 124,322
152,798 110,435 81,896 75,334 67,715 62,262 59,971 33,117 32,986 27,241 19,051 10,946 1,209 2,244 737,205
Excess (deficiency) of revenues over expenses
(144,922) (77,418) 462,417 88,791 10,797 (60,216) 2,229 8,553 12,086 (616) (17,331) (1,800) (12) 4,557 287,115
Transfer from (to) operating funds - - (71,189) 33,093 5,173 - 12,421 (4,742) (1,810) - 17,352 10,290 204 (792) -
Transfer from (to) reserve funds - 527 (61,479) 34,683 3,948 (1,297) 11,159 11,827 4,566 (204) 191 (3,058) - (863) -
Transfer from (to) capital funds - (3,038) 90,560 (30,970) (8,868) - (15,010) (11,815) (10,432) 67 (7) 8 (10,235) (260) -
Annual surplus (deficit) $ (144,922) $ (79,929) $ 420,309 $ 125,597 $ 11,050 $ (61,513) $ 10,799 $ 3,823 $ 4,410 $ (753) $ 205 $ 5,440 $ (10,043) $ 2,642 $ 287,115
Page 42 of 113

76
For the year ended December 31, 2018 [tabular amounts in thousands of dollars]
NOTES TO THE CONSOLIDATED FINANCIAL STATEMENTS CITY OF SURREY
21. TRANSFERS FROM OTHER GOVERNMENTS
The Government transfers reported on the Consolidated Statement of Operations are comprised of the following:
2018 2017
Revenue
BC Provincial government grants:
Roads $ 371 $ 141
Traffic fines revenue sharing 6,419 6,052
Casino revenue sharing 4,301 4,075
Library operating 960 973
Climate Action Revenue Incentive Program 753 638
Sewer replacement 1,770 333
Child care and seniors 405 243
Victim services 200 169
Arts 77 175
BC One Card 22 32
Subtotal BC Provincial government grants 15,278 12,831
Federal government grants:
Infrastructure Canada 13,473 -
Roads 378 2,900
Parks development 175 348
Keep of prisoners 183 203
Summer students 11 17
Child care 57 57
Subtotal Federal government grants 14,277 3,525
TransLink:
Arterial widening and intersection improvements 734 1,431
Arterial paving 1,793 -
Arterial bridges 15,084 2,175
Traffic signals, signs and markings - 1,002
Bicycle street network and other transit projects 3,030 2,239
Subtotal TransLink grants 20,641 6,847
UBCM Community Works Fund: 1,526 1,474
Total transfers from other government revenues $ 51,722 $ 24,677
Page 43 of 113
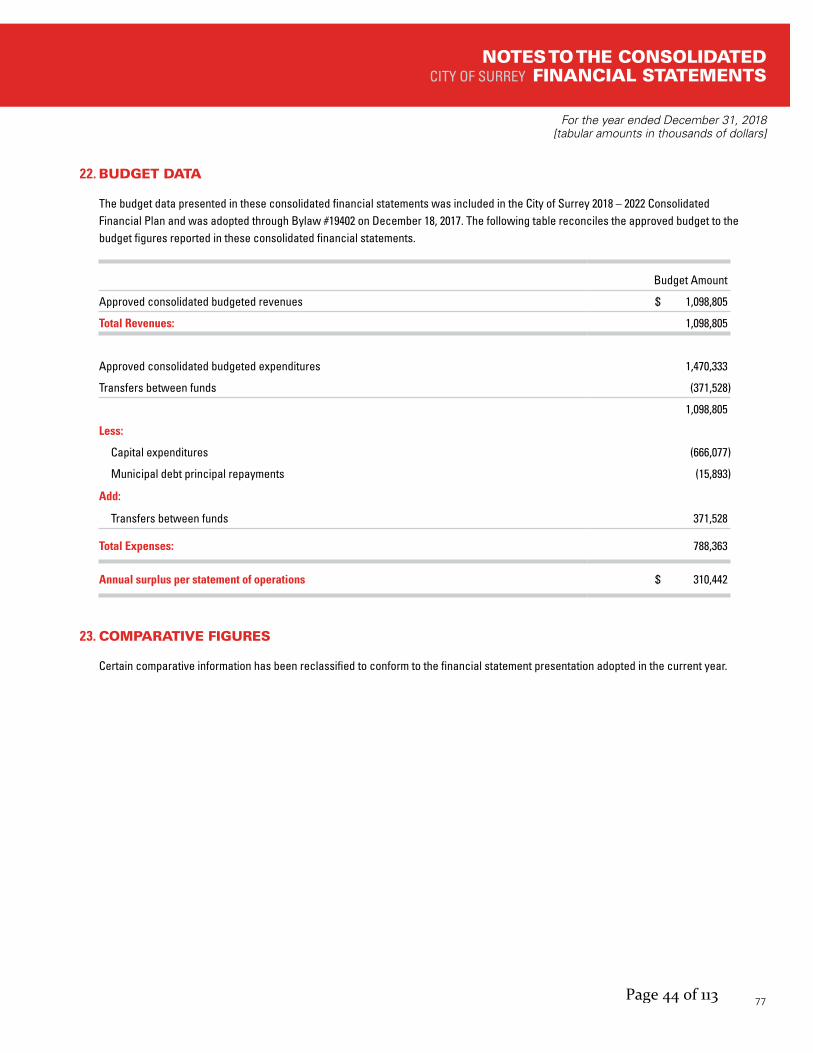
77
For the year ended December 31, 2018 [tabular amounts in thousands of dollars]
NOTES TO THE CONSOLIDATED CITY OF SURREY FINANCIAL STATEMENTS
22. BUDGET DATA
The budget data presented in these consolidated financial statements was included in the City of Surrey 2018 – 2022 Consolidated Financial Plan and was adopted through Bylaw #19402 on December 18, 2017. The following table reconciles the approved budget to the budget figures reported in these consolidated financial statements.
Budget Amount
Approved consolidated budgeted revenues $ 1,098,805
Total Revenues: 1,098,805
Approved consolidated budgeted expenditures 1,470,333
Transfers between funds (371,528)
1,098,805
Less:
Capital expenditures (666,077)
Municipal debt principal repayments (15,893)
Add:
Transfers between funds 371,528
Total Expenses: 788,363
Annual surplus per statement of operations $ 310,442
23. COMPARATIVE FIGURES
Certain comparative information has been reclassified to conform to the financial statement presentation adopted in the current year.
Page 44 of 113
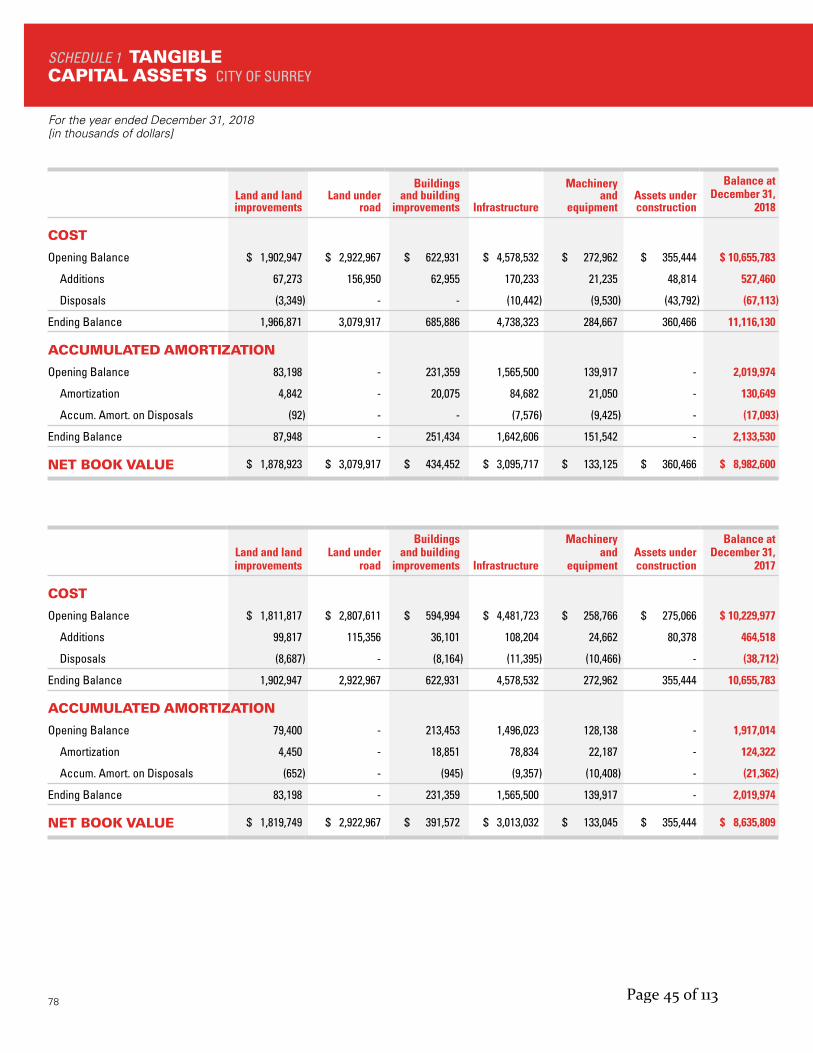
78
For the year ended December 31, 2018 [in thousands of dollars]
SCHEDULE 1 TANGIBLE CAPITAL ASSETS CITY OF SURREY
Land and land improvements
Land under road
Buildings and building
improvements Infrastructure
Machinery and
equipmentAssets under construction
Balance at December 31,
2018
COST
Opening Balance $ 1,902,947 $ 2,922,967 $ 622,931 $ 4,578,532 $ 272,962 $ 355,444 $ 10,655,783
Additions 67,273 156,950 62,955 170,233 21,235 48,814 527,460
Disposals (3,349) - - (10,442) (9,530) (43,792) (67,113)
Ending Balance 1,966,871 3,079,917 685,886 4,738,323 284,667 360,466 11,116,130
ACCUMULATED AMORTIZATION
Opening Balance 83,198 - 231,359 1,565,500 139,917 - 2,019,974
Amortization 4,842 - 20,075 84,682 21,050 - 130,649
Accum. Amort. on Disposals (92) - - (7,576) (9,425) - (17,093)
Ending Balance 87,948 - 251,434 1,642,606 151,542 - 2,133,530
NET BOOK VALUE $ 1,878,923 $ 3,079,917 $ 434,452 $ 3,095,717 $ 133,125 $ 360,466 $ 8,982,600
Land and land improvements
Land under road
Buildings and building
improvements Infrastructure
Machinery and
equipmentAssets under construction
Balance at December 31,
2017
COST
Opening Balance $ 1,811,817 $ 2,807,611 $ 594,994 $ 4,481,723 $ 258,766 $ 275,066 $ 10,229,977
Additions 99,817 115,356 36,101 108,204 24,662 80,378 464,518
Disposals (8,687) - (8,164) (11,395) (10,466) - (38,712)
Ending Balance 1,902,947 2,922,967 622,931 4,578,532 272,962 355,444 10,655,783
ACCUMULATED AMORTIZATION
Opening Balance 79,400 - 213,453 1,496,023 128,138 - 1,917,014
Amortization 4,450 - 18,851 78,834 22,187 - 124,322
Accum. Amort. on Disposals (652) - (945) (9,357) (10,408) - (21,362)
Ending Balance 83,198 - 231,359 1,565,500 139,917 - 2,019,974
NET BOOK VALUE $ 1,819,749 $ 2,922,967 $ 391,572 $ 3,013,032 $ 133,045 $ 355,444 $ 8,635,809
Page 45 of 113
CITY OF SURREYSUPPLEMENTARY
FINANCIAL INFORMATION
Page 46 of 113
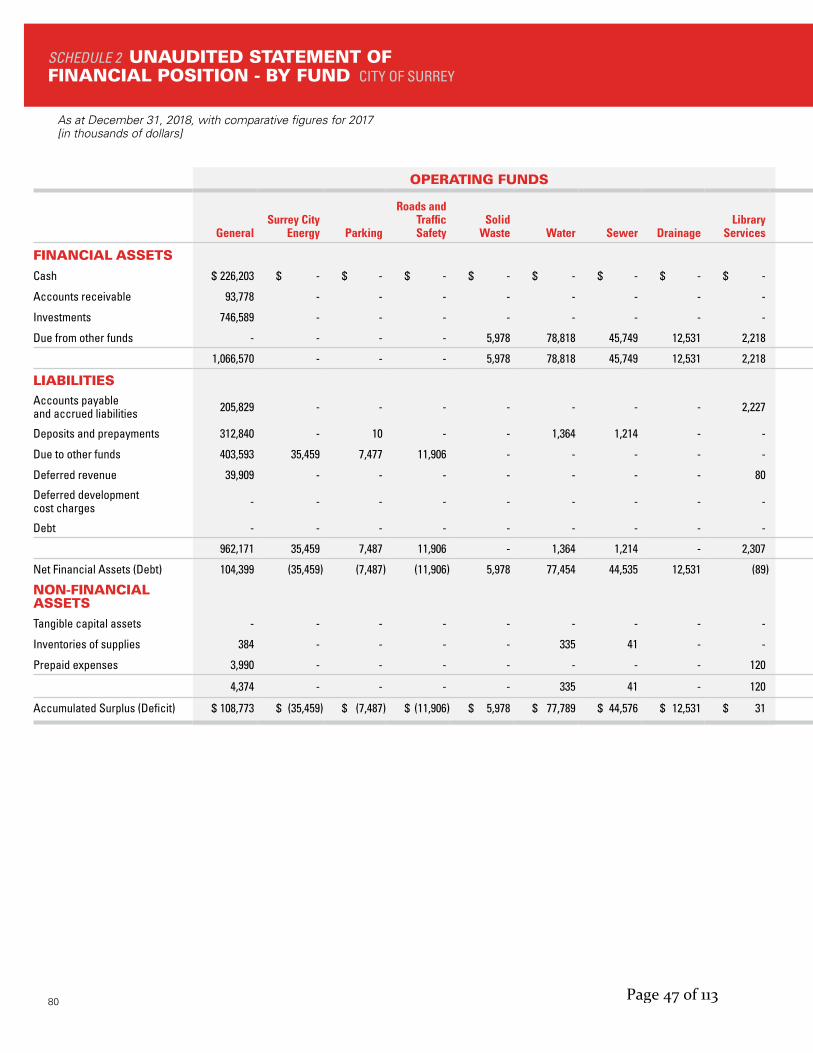
As at December 31, 2018, with comparative figures for 2017[in thousands of dollars]
80
SCHEDULE 2 UNAUDITED STATEMENT OF FINANCIAL POSITION - BY FUND CITY OF SURREY
OPERATING FUNDS CAPITAL FUNDS OTHER ENTITIES CONSOLIDATED
GeneralSurrey City
Energy Parking
Roads and Traffic Safety
Solid Waste Water Sewer Drainage
Library Services
General and Utilities
Library Services SCDC
Other Entities
Reserve Funds Adjustments 2018 2017
FINANCIAL ASSETSCash $ 226,203 $ - $ - $ - $ - $ - $ - $ - $ - $ - $ - $ 1,606 $ 263 $ - $ (15) $ 228,057 $ 77,809
Accounts receivable 93,778 - - - - - - - - 701 - 4,167 328 69,235 (11,562) 156,647 142,276
Investments 746,589 - - - - - - - - - - 7,283 6,517 - (33,534) 726,855 808,196
Due from other funds - - - - 5,978 78,818 45,749 12,531 2,218 13,541 - - - 314,400 (473,235) - -
1,066,570 - - - 5,978 78,818 45,749 12,531 2,218 14,242 - 13,056 7,108 383,635 (518,346) 1,111,559 1,028,281
LIABILITIESAccounts payable and accrued liabilities 205,829 - - - - - - - 2,227 - - 12,922 975 - (40,825) 181,128 169,124
Deposits and prepayments 312,840 - 10 - - 1,364 1,214 - - - - 547 18 683 (14) 316,662 277,648
Due to other funds 403,593 35,459 7,477 11,906 - - - - - - - - - 19,034 (477,469) - -
Deferred revenue 39,909 - - - - - - - 80 - - 4,301 - - - 44,290 36,957
Deferred development cost charges - - - - - - - - - - - - - 277,681 - 277,681 254,294
Debt - - - - - - - - - 216,455 - 12,569 - - - 229,024 267,219
962,171 35,459 7,487 11,906 - 1,364 1,214 - 2,307 216,455 - 30,339 993 297,398 (518,308) 1,048,785 1,005,242
Net Financial Assets (Debt) 104,399 (35,459) (7,487) (11,906) 5,978 77,454 44,535 12,531 (89) (202,213) - (17,283) 6,115 86,237 (38) 62,774 23,039
NON-FINANCIAL ASSETSTangible capital assets - - - - - - - - - 8,945,360 5,388 80,345 40 - (48,533) 8,982,600 8,635,809
Inventories of supplies 384 - - - - 335 41 - - - - - - - - 760 929
Prepaid expenses 3,990 - - - - - - - 120 - - 80 24 - (17) 4,197 4,375
4,374 - - - - 335 41 - 120 8,945,360 5,388 80,425 64 - (48,550) 8,987,557 8,641,113
Accumulated Surplus (Deficit) $ 108,773 $ (35,459) $ (7,487) $ (11,906) $ 5,978 $ 77,789 $ 44,576 $ 12,531 $ 31 $ 8,743,147 $ 5,388 $ 63,142 $ 6,179 $ 86,237 $ (48,588) $ 9,050,331 $ 8,664,152
Page 47 of 113
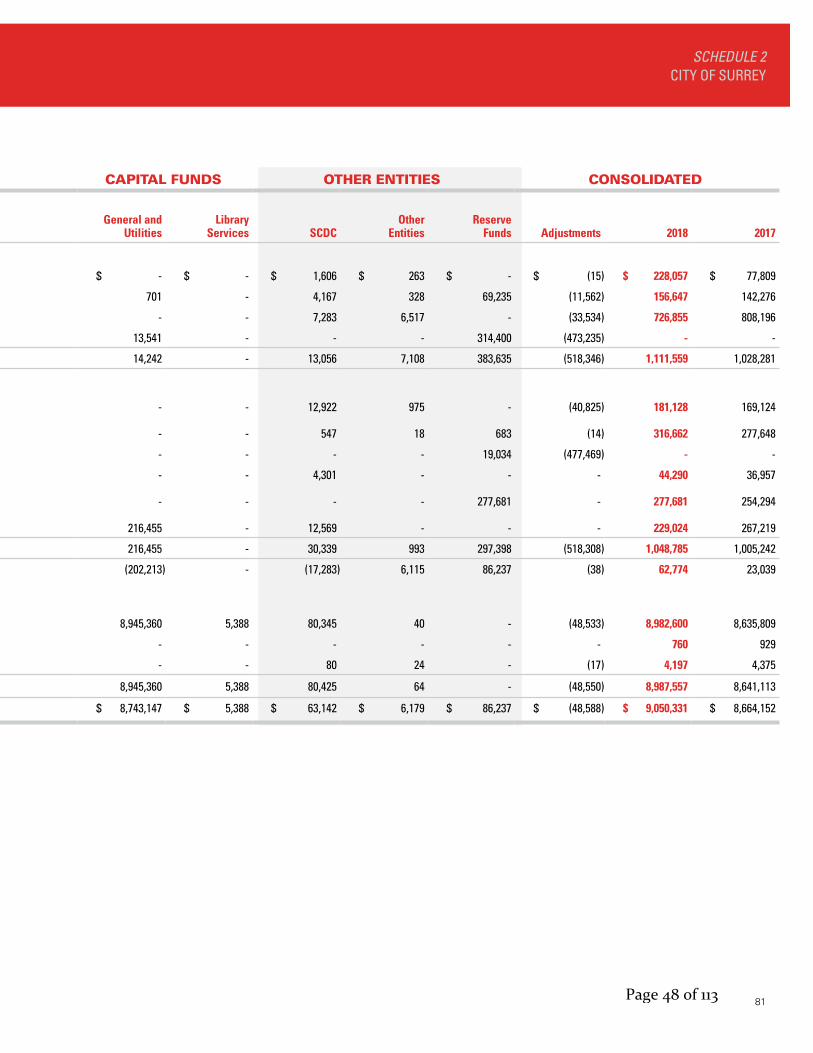
81
SCHEDULE 2 CITY OF SURREY
OPERATING FUNDS CAPITAL FUNDS OTHER ENTITIES CONSOLIDATED
GeneralSurrey City
Energy Parking
Roads and Traffic Safety
Solid Waste Water Sewer Drainage
Library Services
General and Utilities
Library Services SCDC
Other Entities
Reserve Funds Adjustments 2018 2017
FINANCIAL ASSETSCash $ 226,203 $ - $ - $ - $ - $ - $ - $ - $ - $ - $ - $ 1,606 $ 263 $ - $ (15) $ 228,057 $ 77,809
Accounts receivable 93,778 - - - - - - - - 701 - 4,167 328 69,235 (11,562) 156,647 142,276
Investments 746,589 - - - - - - - - - - 7,283 6,517 - (33,534) 726,855 808,196
Due from other funds - - - - 5,978 78,818 45,749 12,531 2,218 13,541 - - - 314,400 (473,235) - -
1,066,570 - - - 5,978 78,818 45,749 12,531 2,218 14,242 - 13,056 7,108 383,635 (518,346) 1,111,559 1,028,281
LIABILITIESAccounts payable and accrued liabilities 205,829 - - - - - - - 2,227 - - 12,922 975 - (40,825) 181,128 169,124
Deposits and prepayments 312,840 - 10 - - 1,364 1,214 - - - - 547 18 683 (14) 316,662 277,648
Due to other funds 403,593 35,459 7,477 11,906 - - - - - - - - - 19,034 (477,469) - -
Deferred revenue 39,909 - - - - - - - 80 - - 4,301 - - - 44,290 36,957
Deferred development cost charges - - - - - - - - - - - - - 277,681 - 277,681 254,294
Debt - - - - - - - - - 216,455 - 12,569 - - - 229,024 267,219
962,171 35,459 7,487 11,906 - 1,364 1,214 - 2,307 216,455 - 30,339 993 297,398 (518,308) 1,048,785 1,005,242
Net Financial Assets (Debt) 104,399 (35,459) (7,487) (11,906) 5,978 77,454 44,535 12,531 (89) (202,213) - (17,283) 6,115 86,237 (38) 62,774 23,039
NON-FINANCIAL ASSETSTangible capital assets - - - - - - - - - 8,945,360 5,388 80,345 40 - (48,533) 8,982,600 8,635,809
Inventories of supplies 384 - - - - 335 41 - - - - - - - - 760 929
Prepaid expenses 3,990 - - - - - - - 120 - - 80 24 - (17) 4,197 4,375
4,374 - - - - 335 41 - 120 8,945,360 5,388 80,425 64 - (48,550) 8,987,557 8,641,113
Accumulated Surplus (Deficit) $ 108,773 $ (35,459) $ (7,487) $ (11,906) $ 5,978 $ 77,789 $ 44,576 $ 12,531 $ 31 $ 8,743,147 $ 5,388 $ 63,142 $ 6,179 $ 86,237 $ (48,588) $ 9,050,331 $ 8,664,152
Page 48 of 113

82
For the year ended December 31, 2018, with comparative figures for 2017[in thousands of dollars]
SCHEDULE 3 UNAUDITED STATEMENT OF OPERATIONS - BY FUND CITY OF SURREY
OPERATING FUNDS CAPITAL FUNDS OTHER ENTITIES CONSOLIDATED
GeneralSurrey City
Energy Parking
Roads and Traffic Safety
Solid Waste Water Sewer Drainage
Library Services
General and Utilities
Library Services SCDC
Other Entities
Reserve Funds Adjustments 2018 2017
REVENUESTaxation revenue $ 351,769 $ - $ - $ 29,682 $ - $ 6 $ 1,275 $ 37,413 $ - $ - $ - $ - $ - $ - $ - $ 420,145 $ 391,695
Sales of goods and services 71,882 1,705 3,793 274 41,776 76,708 54,494 - 285 - - 46 6 61 (749) 250,281 240,037
Development cost charges - - - - - - - - - - - - - 46,915 21,438 68,353 104,963
Developer contributions 124 175 - 787 - 1 - 293 - 245,427 6 - - 16,743 - 263,556 183,736
Investment income 24,562 - - - 12 351 200 55 - 1,193 - 148 283 523 (4,694) 22,633 17,533
Transfers from other governments 27,579 - - 193 - - - - 982 22,968 - - - - - 51,722 24,677
Other 53,217 19 1,027 116 149 1,122 528 127 426 89 - 9,831 830 21,929 (6,869) 82,541 61,679
529,133 1,899 4,820 31,052 41,937 78,188 56,497 37,888 1,693 269,677 6 10,025 1,119 86,171 9,126 1,159,231 1,024,320
EXPENSESPolice services 159,702 - - - - - - - - 1,394 - - - - - 161,096 152,798
Parks, recreation and culture 100,192 - - - - - - - - 18,995 - - - - (1,028) 118,159 110,435
General government 82,297 - - - - - - - - (4,252) - 13,738 2,624 - (10,758) 83,649 81,896
Roads and traffic safety - - - 28,810 - - - - - 43,196 - - - - - 72,006 75,334
Water - - - - - 63,136 - - - 9,828 - - - - 72,964 67,715
Fire services 62,864 - - - - - - - - 1,805 - - - - - 64,669 62,262
Sewer - - - - - - 51,001 - - 12,273 - - - - - 63,274 59,971
Solid waste - - - - 33,044 - - - - 2,103 - - - - - 35,147 33,117
Drainage - - - - - - - 13,649 - 21,413 - - - - - 35,062 32,986
Planning and development 29,489 - - - - - - - - 35 - - - - - 29,524 27,241
Library services - - - - - - - - 18,142 - 2,015 - - - - 20,157 19,051
Engineering 7,259 - - - - - - - - 5,742 - - - - 560 13,561 11,050
Surrey city energy - 1,224 - - - - - - - 175 - - - - - 1,399 1,105
Parking - 1,323 - - - - - - 1,062 - - - - - 2,385 2,244
441,803 1,224 1,323 28,810 33,044 63,136 51,001 13,649 18,142 113,769 2,015 13,738 2,624 - (11,226) 773,052 737,205
Excess (Deficiency) of Revenues over Exp. 87,330 675 3,497 2,242 8,893 15,052 5,496 24,239 (16,449) 155,908 (2,009) (3,713) (1,505) 86,171 20,352 386,179 287,115
Transfer from (to) operating funds (14,297) (145) (1,672) 18,675 (4,849) (5,140) 3,288 (12,340) 16,480 82,526 1,756 - - 31,384 6,700 122,366 94,044
Transfer from (to) reserve funds (29,162) (1,249) - (800) (504) (152) 187 297 - 156,124 100 - - - - 124,841 131,024
Transfer from (to) capital funds (13,067) (14,000) (171) (34,586) (181) (8,933) (8,208) (11,827) - (97) 88 6,700 - (156,225) (6,700) (247,207) (225,068)
ANNUAL SURPLUS (DEFICIT)
30,804 (14,719) 1,654 (14,469) 3,359 827 763 369 31 394,461 (65) 2,987 (1,505) (38,670) 20,352 386,179 287,115
Accumulated Surplus (Deficit), beginning of year
77,969 (20,740) (9,141) 2,563 2,619 76,962 43,813 12,162 - 8,348,686 5,453 60,155 7,684 124,907 (68,940) 8,664,152 8,377,037
Accumulated Surplus (Deficit), end of year
$ 108,773 $ (35,459) $ (7,487) $ (11,906) $ 5,978 $ 77,789 $ 44,576 $ 12,531 $ 31 $ 8,743,147 $ 5,388 $ 63,142 $ 6,179 $ 86,237 $ (48,588) $ 9,050,331 $ 8,664,152
Page 49 of 113
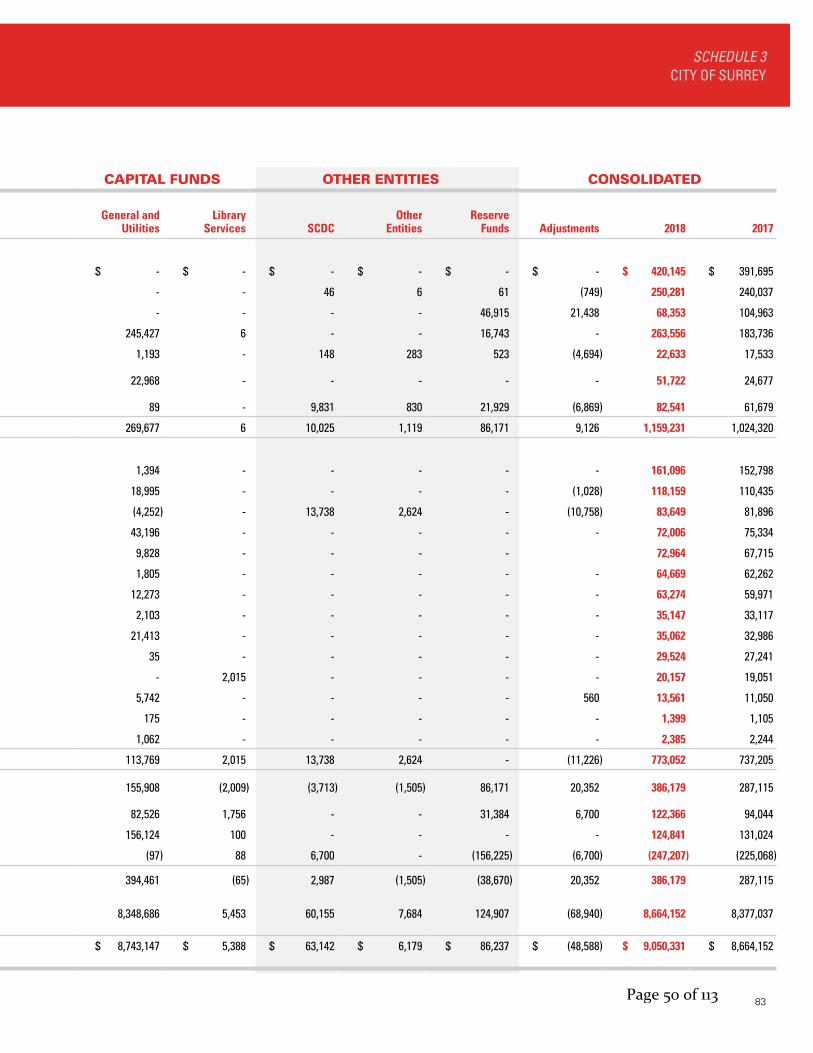
83
SCHEDULE 3 CITY OF SURREY
OPERATING FUNDS CAPITAL FUNDS OTHER ENTITIES CONSOLIDATED
GeneralSurrey City
Energy Parking
Roads and Traffic Safety
Solid Waste Water Sewer Drainage
Library Services
General and Utilities
Library Services SCDC
Other Entities
Reserve Funds Adjustments 2018 2017
REVENUESTaxation revenue $ 351,769 $ - $ - $ 29,682 $ - $ 6 $ 1,275 $ 37,413 $ - $ - $ - $ - $ - $ - $ - $ 420,145 $ 391,695
Sales of goods and services 71,882 1,705 3,793 274 41,776 76,708 54,494 - 285 - - 46 6 61 (749) 250,281 240,037
Development cost charges - - - - - - - - - - - - - 46,915 21,438 68,353 104,963
Developer contributions 124 175 - 787 - 1 - 293 - 245,427 6 - - 16,743 - 263,556 183,736
Investment income 24,562 - - - 12 351 200 55 - 1,193 - 148 283 523 (4,694) 22,633 17,533
Transfers from other governments 27,579 - - 193 - - - - 982 22,968 - - - - - 51,722 24,677
Other 53,217 19 1,027 116 149 1,122 528 127 426 89 - 9,831 830 21,929 (6,869) 82,541 61,679
529,133 1,899 4,820 31,052 41,937 78,188 56,497 37,888 1,693 269,677 6 10,025 1,119 86,171 9,126 1,159,231 1,024,320
EXPENSESPolice services 159,702 - - - - - - - - 1,394 - - - - - 161,096 152,798
Parks, recreation and culture 100,192 - - - - - - - - 18,995 - - - - (1,028) 118,159 110,435
General government 82,297 - - - - - - - - (4,252) - 13,738 2,624 - (10,758) 83,649 81,896
Roads and traffic safety - - - 28,810 - - - - - 43,196 - - - - - 72,006 75,334
Water - - - - - 63,136 - - - 9,828 - - - - 72,964 67,715
Fire services 62,864 - - - - - - - - 1,805 - - - - - 64,669 62,262
Sewer - - - - - - 51,001 - - 12,273 - - - - - 63,274 59,971
Solid waste - - - - 33,044 - - - - 2,103 - - - - - 35,147 33,117
Drainage - - - - - - - 13,649 - 21,413 - - - - - 35,062 32,986
Planning and development 29,489 - - - - - - - - 35 - - - - - 29,524 27,241
Library services - - - - - - - - 18,142 - 2,015 - - - - 20,157 19,051
Engineering 7,259 - - - - - - - - 5,742 - - - - 560 13,561 11,050
Surrey city energy - 1,224 - - - - - - - 175 - - - - - 1,399 1,105
Parking - 1,323 - - - - - - 1,062 - - - - - 2,385 2,244
441,803 1,224 1,323 28,810 33,044 63,136 51,001 13,649 18,142 113,769 2,015 13,738 2,624 - (11,226) 773,052 737,205
Excess (Deficiency) of Revenues over Exp. 87,330 675 3,497 2,242 8,893 15,052 5,496 24,239 (16,449) 155,908 (2,009) (3,713) (1,505) 86,171 20,352 386,179 287,115
Transfer from (to) operating funds (14,297) (145) (1,672) 18,675 (4,849) (5,140) 3,288 (12,340) 16,480 82,526 1,756 - - 31,384 6,700 122,366 94,044
Transfer from (to) reserve funds (29,162) (1,249) - (800) (504) (152) 187 297 - 156,124 100 - - - - 124,841 131,024
Transfer from (to) capital funds (13,067) (14,000) (171) (34,586) (181) (8,933) (8,208) (11,827) - (97) 88 6,700 - (156,225) (6,700) (247,207) (225,068)
ANNUAL SURPLUS (DEFICIT)
30,804 (14,719) 1,654 (14,469) 3,359 827 763 369 31 394,461 (65) 2,987 (1,505) (38,670) 20,352 386,179 287,115
Accumulated Surplus (Deficit), beginning of year
77,969 (20,740) (9,141) 2,563 2,619 76,962 43,813 12,162 - 8,348,686 5,453 60,155 7,684 124,907 (68,940) 8,664,152 8,377,037
Accumulated Surplus (Deficit), end of year
$ 108,773 $ (35,459) $ (7,487) $ (11,906) $ 5,978 $ 77,789 $ 44,576 $ 12,531 $ 31 $ 8,743,147 $ 5,388 $ 63,142 $ 6,179 $ 86,237 $ (48,588) $ 9,050,331 $ 8,664,152
Page 50 of 113
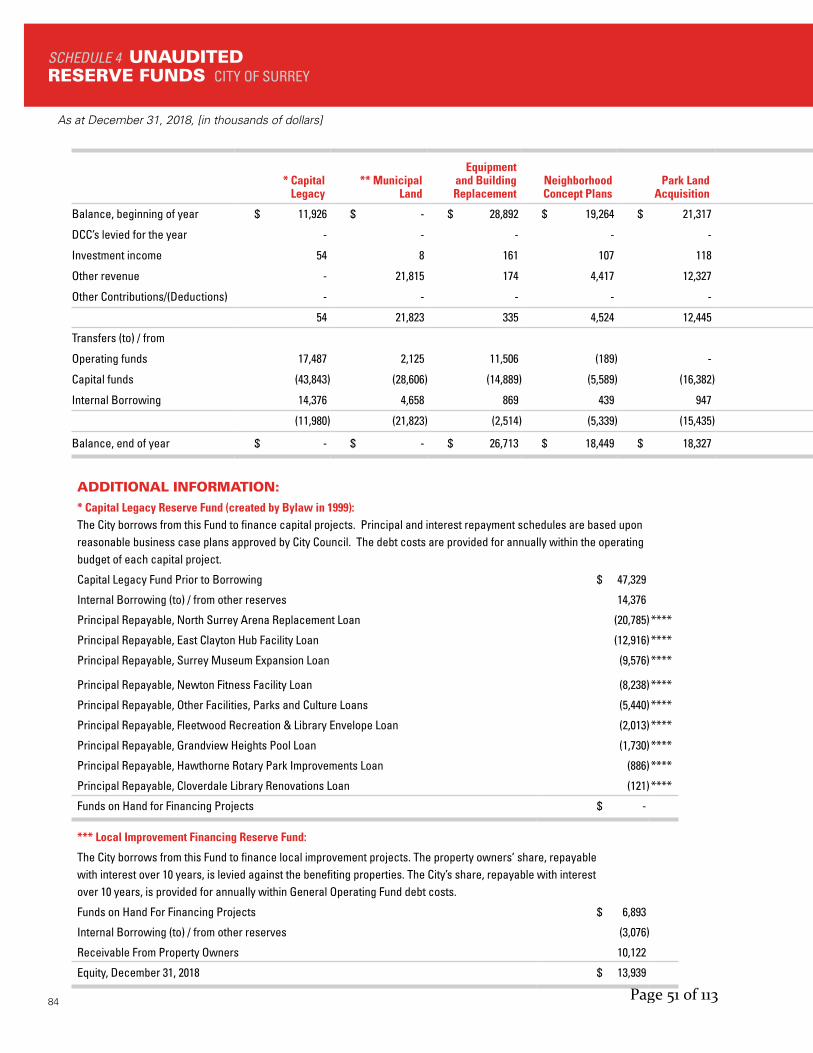
84
SCHEDULE 4 UNAUDITED RESERVE FUNDS CITY OF SURREY
As at December 31, 2018, [in thousands of dollars]
* Capital Legacy
** Municipal Land
Equipment and Building Replacement
Neighborhood Concept Plans
Park Land Acquisition
*** Local Improvement
FinancingEnvironmental
StewardshipParking
SpaceWater
ClaimsAffordable
HousingReserves Subtotal
Deferred Development
Charges
Balance, beginning of year $ 11,926 $ - $ 28,892 $ 19,264 $ 21,317 $ 13,443 $ 5,397 $ 2,121 $ 1,090 $ 19 $ 103,469 $ 254,294
DCC’s levied for the year - - - - - - - - - - - 90,979
Investment income 54 8 161 107 118 27 30 12 6 - 523 761
Other revenue - 21,815 174 4,417 12,327 - - - - - 38,733 -
Other Contributions/(Deductions) - - - - - - - - - - - -
54 21,823 335 4,524 12,445 27 30 12 6 - 39,256 91,740
Transfers (to) / from
Operating funds 17,487 2,125 11,506 (189) - 397 58 - - - 31,384 -
Capital funds (43,843) (28,606) (14,889) (5,589) (16,382) - - (1) - - (109,310) (68,353)
Internal Borrowing 14,376 4,658 869 439 947 72 44 22 11 - 21,438 -
(11,980) (21,823) (2,514) (5,339) (15,435) 469 102 21 11 - (56,488) (68,353)
Balance, end of year $ - $ - $ 26,713 $ 18,449 $ 18,327 $ 13,939 $ 5,529 $ 2,154 $ 1,107 $ 19 $ 86,237 $ 277,681
ADDITIONAL INFORMATION:* Capital Legacy Reserve Fund (created by Bylaw in 1999): The City borrows from this Fund to finance capital projects. Principal and interest repayment schedules are based upon reasonable business case plans approved by City Council. The debt costs are provided for annually within the operating budget of each capital project.
Capital Legacy Fund Prior to Borrowing $ 47,329
Internal Borrowing (to) / from other reserves 14,376
Principal Repayable, North Surrey Arena Replacement Loan (20,785)****
Principal Repayable, East Clayton Hub Facility Loan (12,916)****
Principal Repayable, Surrey Museum Expansion Loan (9,576)****
Principal Repayable, Newton Fitness Facility Loan (8,238)****
Principal Repayable, Other Facilities, Parks and Culture Loans (5,440)****
Principal Repayable, Fleetwood Recreation & Library Envelope Loan (2,013)****
Principal Repayable, Grandview Heights Pool Loan (1,730)****
Principal Repayable, Hawthorne Rotary Park Improvements Loan (886)****
Principal Repayable, Cloverdale Library Renovations Loan (121)****
Funds on Hand for Financing Projects $ -
*** Local Improvement Financing Reserve Fund:
The City borrows from this Fund to finance local improvement projects. The property owners’ share, repayable with interest over 10 years, is levied against the benefiting properties. The City’s share, repayable with interest over 10 years, is provided for annually within General Operating Fund debt costs.
Funds on Hand For Financing Projects $ 6,893
Internal Borrowing (to) / from other reserves (3,076)
Receivable From Property Owners 10,122
Equity, December 31, 2018 $ 13,939
Page 51 of 113
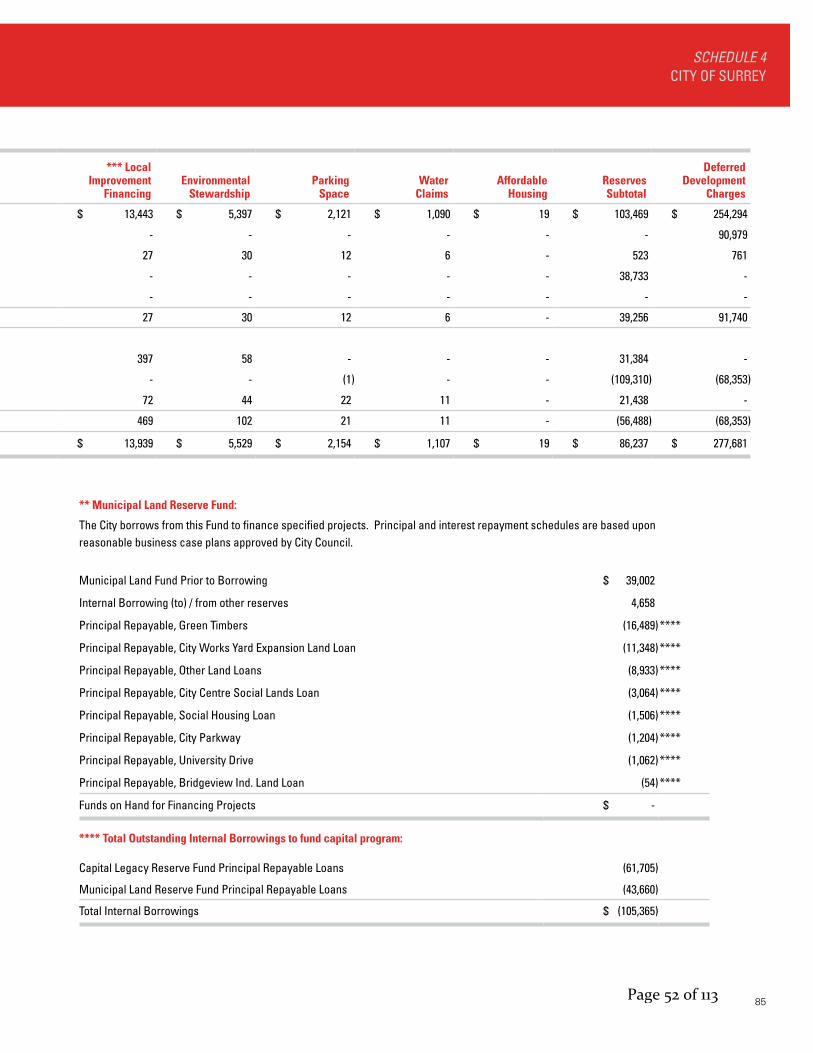
85
SCHEDULE 4 CITY OF SURREY
* Capital Legacy
** Municipal Land
Equipment and Building Replacement
Neighborhood Concept Plans
Park Land Acquisition
*** Local Improvement
FinancingEnvironmental
StewardshipParking
SpaceWater
ClaimsAffordable
HousingReserves Subtotal
Deferred Development
Charges
Balance, beginning of year $ 11,926 $ - $ 28,892 $ 19,264 $ 21,317 $ 13,443 $ 5,397 $ 2,121 $ 1,090 $ 19 $ 103,469 $ 254,294
DCC’s levied for the year - - - - - - - - - - - 90,979
Investment income 54 8 161 107 118 27 30 12 6 - 523 761
Other revenue - 21,815 174 4,417 12,327 - - - - - 38,733 -
Other Contributions/(Deductions) - - - - - - - - - - - -
54 21,823 335 4,524 12,445 27 30 12 6 - 39,256 91,740
Transfers (to) / from
Operating funds 17,487 2,125 11,506 (189) - 397 58 - - - 31,384 -
Capital funds (43,843) (28,606) (14,889) (5,589) (16,382) - - (1) - - (109,310) (68,353)
Internal Borrowing 14,376 4,658 869 439 947 72 44 22 11 - 21,438 -
(11,980) (21,823) (2,514) (5,339) (15,435) 469 102 21 11 - (56,488) (68,353)
Balance, end of year $ - $ - $ 26,713 $ 18,449 $ 18,327 $ 13,939 $ 5,529 $ 2,154 $ 1,107 $ 19 $ 86,237 $ 277,681
** Municipal Land Reserve Fund:
The City borrows from this Fund to finance specified projects. Principal and interest repayment schedules are based upon reasonable business case plans approved by City Council.
Municipal Land Fund Prior to Borrowing $ 39,002
Internal Borrowing (to) / from other reserves 4,658
Principal Repayable, Green Timbers (16,489)****
Principal Repayable, City Works Yard Expansion Land Loan (11,348)****
Principal Repayable, Other Land Loans (8,933)****
Principal Repayable, City Centre Social Lands Loan (3,064)****
Principal Repayable, Social Housing Loan (1,506)****
Principal Repayable, City Parkway (1,204)****
Principal Repayable, University Drive (1,062)****
Principal Repayable, Bridgeview Ind. Land Loan (54)****
Funds on Hand for Financing Projects $ -
**** Total Outstanding Internal Borrowings to fund capital program:
Capital Legacy Reserve Fund Principal Repayable Loans (61,705)
Municipal Land Reserve Fund Principal Repayable Loans (43,660)
Total Internal Borrowings $ (105,365)
Page 52 of 113

121Page 53 of 113
City of Surrey Statement of Financial Information (SOFI) Schedule of Debts Section 4
2018 Statement of Financial Information
Information on the City of Surrey’s outstanding debt is included in Note 8 of the 2018 Notes to the Consolidated Financial Statements. Prepared under the Financial Information Regulation, Schedule 1, section 4
Page 54 of 113
City of Surrey Statement of Financial Information (SOFI) Schedule of Guarantee and Indemnity Agreements Section 5
2018 Statement of Financial Information
Information on all guarantees and indemnities for the City of Surrey is included in Note 12 of the 2018 Notes to the Consolidated Financial Statements. Prepared under the Financial Information Regulation, Schedule 1, section 5
Page 55 of 113

City of Surrey Statement of Financial Information (SOFI) Schedule of Remuneration and Expenses Section 6
2018 Statement of Financial Information
Regulations require the City of Surrey to report the total amount of remuneration for each employee that exceeds $75,000 in the year reported. However, certain exceptions have been noted below:
1. Certain employees were hired part way through the year and theirremuneration does not reflect a full year’s cost.
2. Some employees terminated their employment part way through the year andtheir remuneration does not reflect a full year’s cost.
Prepared under the Financial Information Regulation, Schedule 1, subsection 6(2)
Page 56 of 113

ELECTED OFFICIALS
BASE SALARY
REMUNERATION
TAXABLE BENEFIT
& OTHER
TOTAL
EXPENSES TOTAL
Hepner McMillan,Linda M. 122,257.25 11,628.21 30,378.80 * 164,264.26
McCallum,Doug W. 20,908.95 3,442.50 583.39 24,934.84
Annis,Linda 10,663.64 1,089.84 469.86 12,223.34
Elford,Doug 10,663.64 1,089.84 385.68 12,139.16
Gill,Tarinder 62,566.14 6,415.47 10,050.52 * 79,032.13
Guerra,Laurie 10,663.64 1,089.84 435.68 12,189.16
Hayne,Bruce J 61,741.14 13,682.07 14,714.06 * 90,137.27
Hundial,Jack 10,663.63 1,089.84 385.68 12,139.15
LeFranc,Vera 62,566.14 9,689.07 17,808.76 * 90,063.97
Locke,Brenda 12,142.04 2,568.24 411.68 15,121.96
Martin,Mary E 62,566.14 12,645.87 11,604.57 * 86,816.58
Nagra,Mandeep 10,663.64 1,089.84 385.68 12,139.16
Patton,Allison 10,663.64 1,089.84 460.89 12,214.37
Pettigrew,Steven 10,663.64 1,089.84 385.68 12,139.16
Starchuk,Michael A. 34,763.42 40,677.79 15,386.46 * 90,827.67
Steele,Helen B. 60,707.02 11,754.85 13,490.22 * 85,952.09
Villeneuve,Judy A 62,086.76 6,909.42 15,728.80 * 84,724.98
Woods,David C 62,566.14 12,857.07 18,305.78 * 93,728.99
TOTAL AMOUNT 699,516.61 139,899.44 151,372.19 990,788.24
*Includes separation allowances
CITY OF SURREYSTATEMENT OF FINANCIAL INFORMATION (SOFI)
FOR THE YEAR ENDED DECEMBER 31, 2018
SCHEDULE OF REMUNERATION AND EXPENSES
ELECTED OFFICIALS
Page 57 of 113

EMPLOYEE
NAME
BASE SALARY
REMUNERATION
TAXABLE BENEFIT
& OTHER *
TOTAL
EXPENSES
Aasebo,Brian J 88,435.38 4,460.79 187.75
Afzal,Shabnem 115,384.59 903.10 4,214.08
Ahmed,Haider 77,143.72 3,908.34 377.00
Al Issa,Ammar 89,963.95 1,482.67 1,037.12
Albisser,Benjamin C. 97,150.53 6,580.10 0.00
Aldcorn,Robert 106,481.47 4,468.50 120.00
Aldus,Chris 93,831.80 13,421.47 280.00
Alexander,Craig 77,186.32 4,296.70 1,502.09
Alexis,Joseph J 98,009.91 11,959.82 0.00
Ali,Kylie M 74,344.84 1,524.57 1,271.16
Alizadeh Eghyanous,Farhad 142,447.77 24,851.39 3,020.02
Aller Fernandez,Carlos Guillermo 88,021.62 8,633.56 554.95
Amos,Daniel C. 100,468.72 7,343.51 150.25
Amundson,Erin J 96,703.92 3,429.18 0.00
Andersen,Kirsten 99,288.10 5,879.65 40.62
Andersen,Randy B. 77,391.17 2,539.36 87.32
Andre,Victor M 76,486.40 3,054.49 1,078.11
Androsoff,Natalie B. 69,479.55 17,129.81 304.38
Aney,Kevin G. 82,507.16 2,070.40 7,970.47
Arar,Aiman A. 123,597.73 13,472.96 1,118.70
Arason,Jeff R. 188,967.21 22,039.24 3,430.56
Arbo,Erik D. 105,227.72 3,190.39 431.99
Arlt,Raeanne J. 85,077.84 3,682.98 0.00
Arlt,Tim J. 142,549.22 14,091.11 4,171.15
Arnett,John K 82,631.12 5,532.72 0.00
Asadian,Yalda 99,180.02 1,431.52 1,465.98
Askarian,Mohammad 75,486.29 8,413.11 6,258.09
Athwal,Parwinder S. 89,194.50 13,026.48 633.56
Atkins,Christopher T 87,274.77 8,755.13 526.86
Atkinson,S Melanie 82,744.78 6,562.81 1,063.98
Attwal,Sarbjit S. 88,535.87 4,879.54 618.26
Aujla,Wassan Singh 89,068.90 3,615.34 6,410.78
Aulakh,Lakhveer 79,437.62 7,121.84 577.80
Aven,Neal W. 147,492.27 26,759.22 1,950.42
Ayach,Liana L. 73,662.15 4,263.54 2,166.77
Ayotte,Todd R. 73,919.58 1,671.35 6,120.77
Badial,Harinder S 82,590.53 4,150.37 2,179.38
Bahia,Sukhjit S. 83,948.04 1,528.14 256.34
Bains,Harvinder S. 90,098.25 3,111.23 795.00
Baird,David C. 122,880.98 4,658.60 60.00
Baldwin,Ryan W. 100,501.99 11,825.21 0.00
Balmer,Kevin AJ 97,057.95 2,800.68 0.00
CITY EMPLOYEES
CITY OF SURREYSTATEMENT OF FINANCIAL INFORMATION (SOFI)
FOR THE YEAR ENDED DECEMBER 31, 2018
SCHEDULE OF REMUNERATION AND EXPENSES
Page 58 of 113

EMPLOYEE
NAME
BASE SALARY
REMUNERATION
TAXABLE BENEFIT
& OTHER *
TOTAL
EXPENSES
CITY EMPLOYEES
CITY OF SURREYSTATEMENT OF FINANCIAL INFORMATION (SOFI)
FOR THE YEAR ENDED DECEMBER 31, 2018
SCHEDULE OF REMUNERATION AND EXPENSES
Banford,Matthew J 76,486.40 2,368.01 1,380.65
Banziger,David 83,238.40 5,068.41 7,405.27
BaObaid,Wajeih 97,932.80 3,283.02 84.09
Baragan,Roxana 82,950.47 2,557.41 1,376.44
Barber,Duncan 101,949.31 5,964.60 0.00
Baron,Carolyn A. 139,859.72 10,820.95 1,321.29
Bartholomew,Claude C. 102,693.93 14,154.66 0.00
Bartlett,Jeremy 83,678.90 11,120.51 73.79
Bartlett,Scott M. 107,017.23 17,363.02 1,333.93
Bartnik,Thomas 129,034.65 7,206.37 18.34
Basnayake,Koshala 97,178.90 3,159.68 0.00
Bates,Laurie A. 75,408.98 5,860.82 0.00
Baugh,Nathan Edward Thomas 71,472.10 5,858.18 2,837.02
Baysan,Gem 119,539.77 10,704.13 0.00
Beamer,Adam C 70,254.30 5,118.43 1,391.12
Beattie,Joshua Raymond 97,845.15 4,745.90 10.00
Becker,Edward W. 100,514.20 9,894.56 180.00
Beenham,Kevin R. 110,968.48 21,443.17 90.00
Begin,Gabriel 97,712.67 9,183.15 0.00
Bellefontaine,Philip J. 143,278.86 19,794.96 5,964.33
Bennest,Aaron L 82,296.13 2,296.87 7,548.63
Bennett,Cameron L 75,546.88 989.66 51.26
Bentley,Darin R. 105,447.90 19,467.96 545.20
Berar,Baldev S. 83,576.07 15,434.05 22.17
Berdusco,Kevin A 102,997.69 6,107.74 90.00
Berg,Douglas E. 123,165.16 9,001.78 0.00
Bergen,Brian D. 122,932.41 4,649.93 421.14
Berg‐Iverson,Keith W. 120,572.78 16,183.47 10.00
Bernat,Siegfried 102,164.61 10,525.72 733.53
Berry,David 76,199.06 719.79 7,104.16
Bertoia,Daniel R 117,747.55 4,920.78 0.00
Bertoia,Farah 78,809.90 2,315.94 28.00
Bertoia,Mark A 100,630.66 2,677.14 360.00
Best,Jeffrey W. 35,846.16 43,682.01 63.59
Best,Rob M. 118,450.93 6,679.71 185.00
Betts,Mark E. 107,687.84 18,378.06 918.93
Bhullar,Parissa 79,872.38 872.66 990.62
Bhullar‐Gill,Sally S 131,013.66 17,052.55 2,617.86
Billings,Garrett L 75,832.70 9,497.98 0.00
Binnie,Evan Wesley James 76,192.00 4,058.34 1,152.90
Bird,Josh 89,922.14 6,304.75 73.79
Page 59 of 113
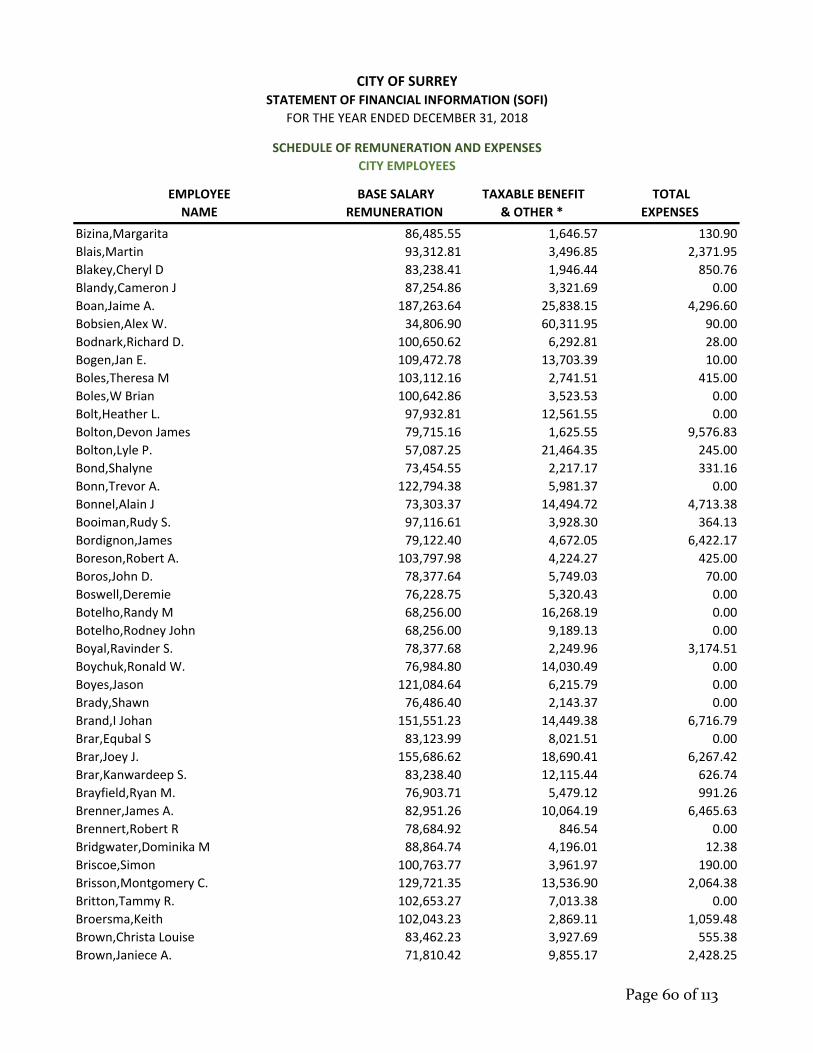
EMPLOYEE
NAME
BASE SALARY
REMUNERATION
TAXABLE BENEFIT
& OTHER *
TOTAL
EXPENSES
CITY EMPLOYEES
CITY OF SURREYSTATEMENT OF FINANCIAL INFORMATION (SOFI)
FOR THE YEAR ENDED DECEMBER 31, 2018
SCHEDULE OF REMUNERATION AND EXPENSES
Bizina,Margarita 86,485.55 1,646.57 130.90
Blais,Martin 93,312.81 3,496.85 2,371.95
Blakey,Cheryl D 83,238.41 1,946.44 850.76
Blandy,Cameron J 87,254.86 3,321.69 0.00
Boan,Jaime A. 187,263.64 25,838.15 4,296.60
Bobsien,Alex W. 34,806.90 60,311.95 90.00
Bodnark,Richard D. 100,650.62 6,292.81 28.00
Bogen,Jan E. 109,472.78 13,703.39 10.00
Boles,Theresa M 103,112.16 2,741.51 415.00
Boles,W Brian 100,642.86 3,523.53 0.00
Bolt,Heather L. 97,932.81 12,561.55 0.00
Bolton,Devon James 79,715.16 1,625.55 9,576.83
Bolton,Lyle P. 57,087.25 21,464.35 245.00
Bond,Shalyne 73,454.55 2,217.17 331.16
Bonn,Trevor A. 122,794.38 5,981.37 0.00
Bonnel,Alain J 73,303.37 14,494.72 4,713.38
Booiman,Rudy S. 97,116.61 3,928.30 364.13
Bordignon,James 79,122.40 4,672.05 6,422.17
Boreson,Robert A. 103,797.98 4,224.27 425.00
Boros,John D. 78,377.64 5,749.03 70.00
Boswell,Deremie 76,228.75 5,320.43 0.00
Botelho,Randy M 68,256.00 16,268.19 0.00
Botelho,Rodney John 68,256.00 9,189.13 0.00
Boyal,Ravinder S. 78,377.68 2,249.96 3,174.51
Boychuk,Ronald W. 76,984.80 14,030.49 0.00
Boyes,Jason 121,084.64 6,215.79 0.00
Brady,Shawn 76,486.40 2,143.37 0.00
Brand,I Johan 151,551.23 14,449.38 6,716.79
Brar,Equbal S 83,123.99 8,021.51 0.00
Brar,Joey J. 155,686.62 18,690.41 6,267.42
Brar,Kanwardeep S. 83,238.40 12,115.44 626.74
Brayfield,Ryan M. 76,903.71 5,479.12 991.26
Brenner,James A. 82,951.26 10,064.19 6,465.63
Brennert,Robert R 78,684.92 846.54 0.00
Bridgwater,Dominika M 88,864.74 4,196.01 12.38
Briscoe,Simon 100,763.77 3,961.97 190.00
Brisson,Montgomery C. 129,721.35 13,536.90 2,064.38
Britton,Tammy R. 102,653.27 7,013.38 0.00
Broersma,Keith 102,043.23 2,869.11 1,059.48
Brown,Christa Louise 83,462.23 3,927.69 555.38
Brown,Janiece A. 71,810.42 9,855.17 2,428.25
Page 60 of 113

EMPLOYEE
NAME
BASE SALARY
REMUNERATION
TAXABLE BENEFIT
& OTHER *
TOTAL
EXPENSES
CITY EMPLOYEES
CITY OF SURREYSTATEMENT OF FINANCIAL INFORMATION (SOFI)
FOR THE YEAR ENDED DECEMBER 31, 2018
SCHEDULE OF REMUNERATION AND EXPENSES
Brown,Kimberley Dianne 71,895.57 3,411.47 261.57
Brown,Matthew K 108,066.37 28,572.22 3,654.77
Browne,Natalie 89,152.42 1,206.18 2,879.27
Bruinink,Karen V 76,563.99 2,133.61 0.00
Buchanan,Donald F 97,580.36 3,353.29 1,672.15
Buchmann,Thomas 127,634.51 7,558.27 1,632.96
Bukowski,John T. 108,960.77 11,716.77 0.00
Buljevic,Ivan 80,767.98 5,980.69 6,850.15
Bulka,Michael J. 122,572.47 12,082.87 0.00
Bull,Dennis R. 123,207.50 3,367.27 125.00
Bunsko,Mark W. 122,898.83 13,724.12 185.00
Burger,Jason A. 134,480.48 8,851.01 78.18
Burkholder,Ross V 90,295.10 13,633.89 304.38
Burns,Ara Kei 91,010.01 7,698.31 63.79
Burns,David R 127,714.72 13,046.02 23.35
Burns,Peter R. 108,762.57 5,895.26 415.00
Bushnell,Jason 76,563.90 9,874.74 4,588.06
Butchart,Brandon 103,959.21 12,654.26 0.00
Butula,Christine M. 106,953.01 6,012.77 415.00
Caines,Andrew M 76,412.80 3,255.83 0.00
Cairney,Jason W. 142,503.54 31,574.26 8,779.19
Callard,Jeff 98,230.62 26,724.00 140.00
Callewaert,James R 82,160.03 3,324.27 140.99
Calvert,Kyle F 97,587.72 14,785.08 10.00
Campbell,Fraser John 75,436.48 401.59 1,016.40
Campbell,Gordon W. 78,377.67 7,906.11 753.24
Campbell,Hugh Macmillan 121,114.80 6,784.35 3,274.52
Canton,Stephen James 78,460.81 4,173.45 710.68
Capuccinello Iraci,Anthony 151,279.55 26,397.69 3,006.81
Carmichael,Brian K. 140,218.04 4,597.06 90.00
Carnegie,Ralston L. 122,548.11 8,660.86 0.00
Carroll,Todd P 78,893.71 3,079.76 3,714.15
Carson,Elizabeth S 88,627.00 3,696.55 1,726.45
Castiglia,Danny V 111,009.90 2,964.53 0.00
Catlin,Michael D 106,318.73 21,391.96 46.20
Cavan,Laurie A. 245,669.04 35,808.06 11,882.68
Cavezza,Vince 75,603.20 1,352.72 28.49
Caviglia,Christina 91,328.35 6,482.91 0.00
Cella,Stefano 82,169.84 5,093.84 770.00
Cerezo,Ernesto 97,932.80 11,107.57 3,069.88
Cesario,Lisa J. 75,227.61 4,419.43 236.25
Page 61 of 113
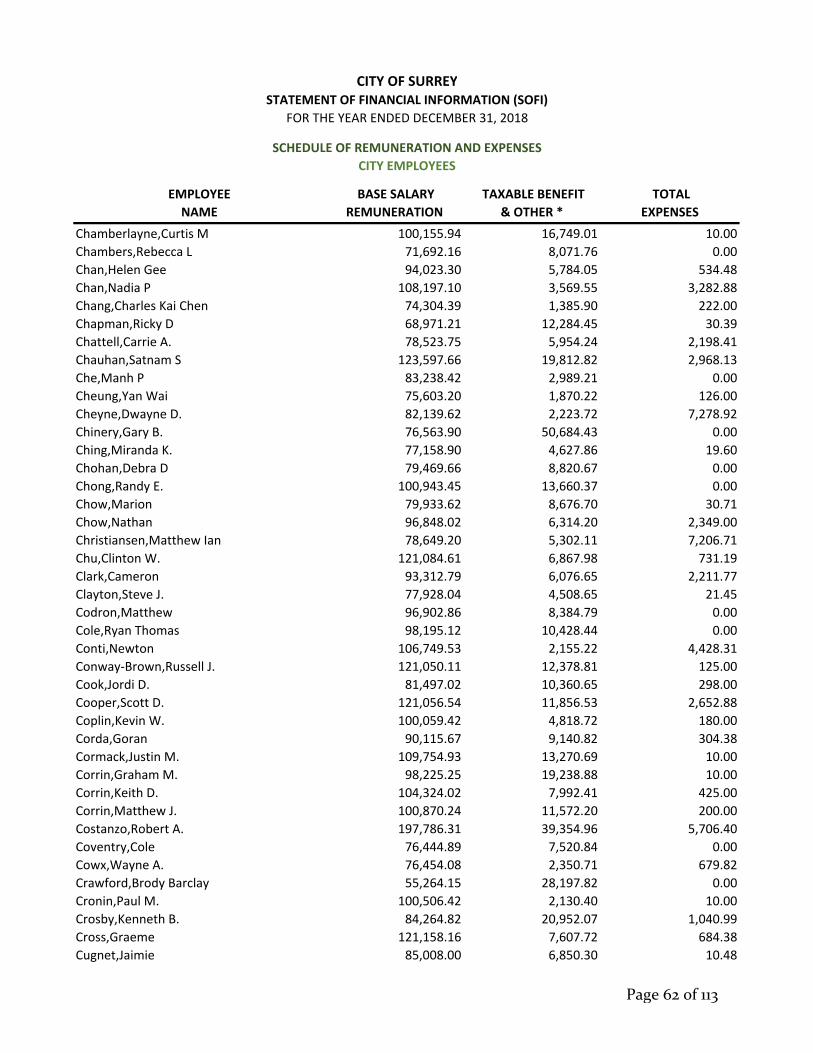
EMPLOYEE
NAME
BASE SALARY
REMUNERATION
TAXABLE BENEFIT
& OTHER *
TOTAL
EXPENSES
CITY EMPLOYEES
CITY OF SURREYSTATEMENT OF FINANCIAL INFORMATION (SOFI)
FOR THE YEAR ENDED DECEMBER 31, 2018
SCHEDULE OF REMUNERATION AND EXPENSES
Chamberlayne,Curtis M 100,155.94 16,749.01 10.00
Chambers,Rebecca L 71,692.16 8,071.76 0.00
Chan,Helen Gee 94,023.30 5,784.05 534.48
Chan,Nadia P 108,197.10 3,569.55 3,282.88
Chang,Charles Kai Chen 74,304.39 1,385.90 222.00
Chapman,Ricky D 68,971.21 12,284.45 30.39
Chattell,Carrie A. 78,523.75 5,954.24 2,198.41
Chauhan,Satnam S 123,597.66 19,812.82 2,968.13
Che,Manh P 83,238.42 2,989.21 0.00
Cheung,Yan Wai 75,603.20 1,870.22 126.00
Cheyne,Dwayne D. 82,139.62 2,223.72 7,278.92
Chinery,Gary B. 76,563.90 50,684.43 0.00
Ching,Miranda K. 77,158.90 4,627.86 19.60
Chohan,Debra D 79,469.66 8,820.67 0.00
Chong,Randy E. 100,943.45 13,660.37 0.00
Chow,Marion 79,933.62 8,676.70 30.71
Chow,Nathan 96,848.02 6,314.20 2,349.00
Christiansen,Matthew Ian 78,649.20 5,302.11 7,206.71
Chu,Clinton W. 121,084.61 6,867.98 731.19
Clark,Cameron 93,312.79 6,076.65 2,211.77
Clayton,Steve J. 77,928.04 4,508.65 21.45
Codron,Matthew 96,902.86 8,384.79 0.00
Cole,Ryan Thomas 98,195.12 10,428.44 0.00
Conti,Newton 106,749.53 2,155.22 4,428.31
Conway‐Brown,Russell J. 121,050.11 12,378.81 125.00
Cook,Jordi D. 81,497.02 10,360.65 298.00
Cooper,Scott D. 121,056.54 11,856.53 2,652.88
Coplin,Kevin W. 100,059.42 4,818.72 180.00
Corda,Goran 90,115.67 9,140.82 304.38
Cormack,Justin M. 109,754.93 13,270.69 10.00
Corrin,Graham M. 98,225.25 19,238.88 10.00
Corrin,Keith D. 104,324.02 7,992.41 425.00
Corrin,Matthew J. 100,870.24 11,572.20 200.00
Costanzo,Robert A. 197,786.31 39,354.96 5,706.40
Coventry,Cole 76,444.89 7,520.84 0.00
Cowx,Wayne A. 76,454.08 2,350.71 679.82
Crawford,Brody Barclay 55,264.15 28,197.82 0.00
Cronin,Paul M. 100,506.42 2,130.40 10.00
Crosby,Kenneth B. 84,264.82 20,952.07 1,040.99
Cross,Graeme 121,158.16 7,607.72 684.38
Cugnet,Jaimie 85,008.00 6,850.30 10.48
Page 62 of 113

EMPLOYEE
NAME
BASE SALARY
REMUNERATION
TAXABLE BENEFIT
& OTHER *
TOTAL
EXPENSES
CITY EMPLOYEES
CITY OF SURREYSTATEMENT OF FINANCIAL INFORMATION (SOFI)
FOR THE YEAR ENDED DECEMBER 31, 2018
SCHEDULE OF REMUNERATION AND EXPENSES
Cumiford,Alan 90,098.72 17,669.50 63.79
Curley,Chris G. 76,095.84 3,623.38 0.00
Currie,Amber 71,332.01 20,220.75 1,653.72
Cuthbert,Andrew 76,486.40 2,223.06 0.00
Cyr,Aaron W 100,676.14 10,987.85 180.00
Cyr,Brian 107,722.13 6,691.47 854.90
Dallas,Ken W 86,249.90 7,101.13 2,038.95
Dance,Ryan G. 100,721.62 14,614.47 10.00
Daniwall,Harnaik S 99,288.11 4,967.60 304.38
Davidson,Louis R. 97,932.83 15,122.14 82.07
Davies,Calvin J. 122,322.12 8,712.60 0.00
Davis,Jeff Barrett 95,506.81 9,531.42 3,569.99
Davison,Liane J. 109,651.81 10,256.20 3,245.96
Dayal,Amit 81,007.22 12,546.53 5,058.72
de Goede,Matthys MH 83,624.94 8,734.92 2,076.80
De Romeri,Enrico A. 67,736.46 9,247.61 0.00
De Vera,Albert John 90,533.16 8,065.49 0.00
Deacon,Jeremy S 97,720.19 12,848.31 0.00
Deane,Gllena 75,068.48 1,714.16 126.00
Deery,Nicole 68,651.27 12,768.22 0.00
Delosada,John K. 122,618.47 4,982.72 10.00
Desai,Inamul H 106,334.93 42,618.05 508.78
Desautels,Erin A. 75,056.75 2,430.03 1,413.73
Dhak,Jaspal 67,090.28 8,376.21 0.00
Dhaliwal,Balwinder K. 76,598.40 11,979.79 0.00
Dhanda,Kamaljit K. 68,924.25 8,415.48 500.00
Dhanjal,Baldev S 75,603.20 1,464.61 0.00
Dhanju,Roohbir S 97,563.28 3,293.83 751.18
Dhanoa,Ameet 74,550.34 6,411.49 996.69
Dhillon,Rashpal S. 122,499.38 11,156.63 10.00
Didmon,Randy M 72,184.70 8,145.52 1,006.19
Dietelbach,Mark D. 107,132.06 2,213.72 683.52
Dietrich,Rick L. 121,579.20 6,730.36 320.00
Dighton,Graham T. 105,240.69 10,182.32 415.00
Ding,Liwen 112,115.38 1,881.62 304.51
Dinwoodie,Byron R. 104,524.35 13,048.75 415.00
Dionne,Danny L 98,227.41 10,236.07 0.00
Dirksen,Benjamin G. 142,503.57 22,856.16 7,255.93
Doad,Jaime D 99,288.09 4,793.72 0.00
Dolphin,Morris H. 78,793.61 7,101.28 190.49
Dong,Andrew G. 87,227.60 5,501.27 0.00
Page 63 of 113
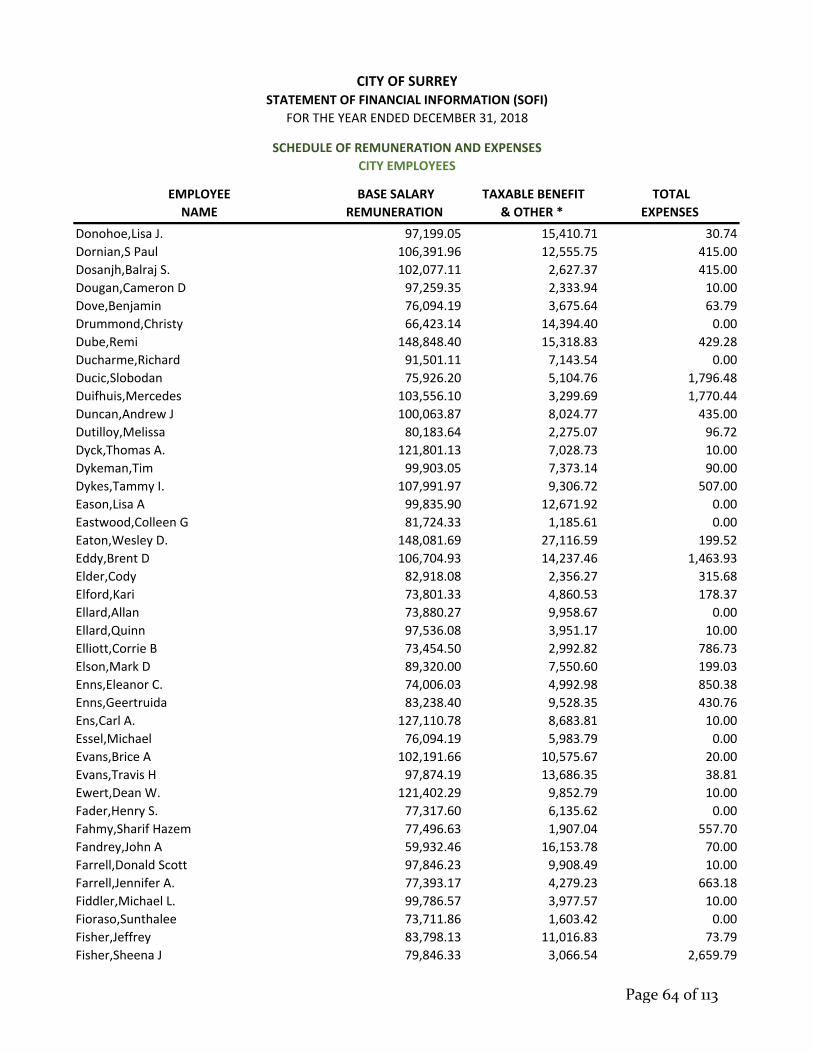
EMPLOYEE
NAME
BASE SALARY
REMUNERATION
TAXABLE BENEFIT
& OTHER *
TOTAL
EXPENSES
CITY EMPLOYEES
CITY OF SURREYSTATEMENT OF FINANCIAL INFORMATION (SOFI)
FOR THE YEAR ENDED DECEMBER 31, 2018
SCHEDULE OF REMUNERATION AND EXPENSES
Donohoe,Lisa J. 97,199.05 15,410.71 30.74
Dornian,S Paul 106,391.96 12,555.75 415.00
Dosanjh,Balraj S. 102,077.11 2,627.37 415.00
Dougan,Cameron D 97,259.35 2,333.94 10.00
Dove,Benjamin 76,094.19 3,675.64 63.79
Drummond,Christy 66,423.14 14,394.40 0.00
Dube,Remi 148,848.40 15,318.83 429.28
Ducharme,Richard 91,501.11 7,143.54 0.00
Ducic,Slobodan 75,926.20 5,104.76 1,796.48
Duifhuis,Mercedes 103,556.10 3,299.69 1,770.44
Duncan,Andrew J 100,063.87 8,024.77 435.00
Dutilloy,Melissa 80,183.64 2,275.07 96.72
Dyck,Thomas A. 121,801.13 7,028.73 10.00
Dykeman,Tim 99,903.05 7,373.14 90.00
Dykes,Tammy I. 107,991.97 9,306.72 507.00
Eason,Lisa A 99,835.90 12,671.92 0.00
Eastwood,Colleen G 81,724.33 1,185.61 0.00
Eaton,Wesley D. 148,081.69 27,116.59 199.52
Eddy,Brent D 106,704.93 14,237.46 1,463.93
Elder,Cody 82,918.08 2,356.27 315.68
Elford,Kari 73,801.33 4,860.53 178.37
Ellard,Allan 73,880.27 9,958.67 0.00
Ellard,Quinn 97,536.08 3,951.17 10.00
Elliott,Corrie B 73,454.50 2,992.82 786.73
Elson,Mark D 89,320.00 7,550.60 199.03
Enns,Eleanor C. 74,006.03 4,992.98 850.38
Enns,Geertruida 83,238.40 9,528.35 430.76
Ens,Carl A. 127,110.78 8,683.81 10.00
Essel,Michael 76,094.19 5,983.79 0.00
Evans,Brice A 102,191.66 10,575.67 20.00
Evans,Travis H 97,874.19 13,686.35 38.81
Ewert,Dean W. 121,402.29 9,852.79 10.00
Fader,Henry S. 77,317.60 6,135.62 0.00
Fahmy,Sharif Hazem 77,496.63 1,907.04 557.70
Fandrey,John A 59,932.46 16,153.78 70.00
Farrell,Donald Scott 97,846.23 9,908.49 10.00
Farrell,Jennifer A. 77,393.17 4,279.23 663.18
Fiddler,Michael L. 99,786.57 3,977.57 10.00
Fioraso,Sunthalee 73,711.86 1,603.42 0.00
Fisher,Jeffrey 83,798.13 11,016.83 73.79
Fisher,Sheena J 79,846.33 3,066.54 2,659.79
Page 64 of 113
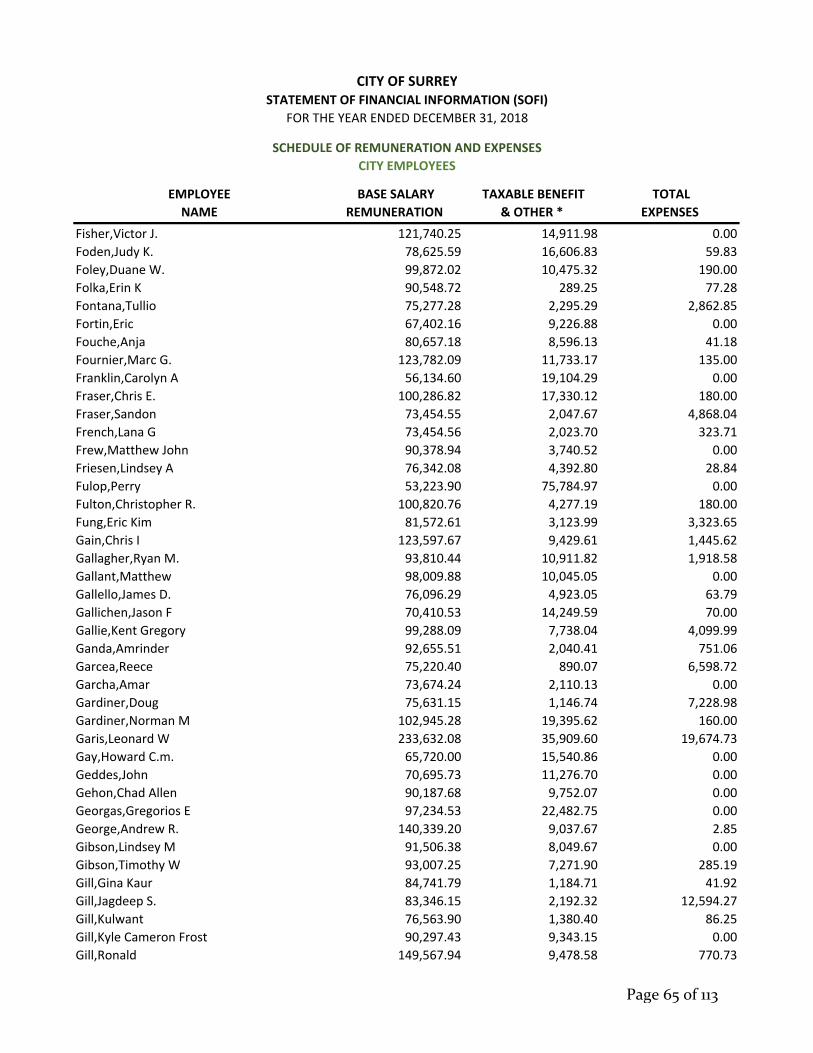
EMPLOYEE
NAME
BASE SALARY
REMUNERATION
TAXABLE BENEFIT
& OTHER *
TOTAL
EXPENSES
CITY EMPLOYEES
CITY OF SURREYSTATEMENT OF FINANCIAL INFORMATION (SOFI)
FOR THE YEAR ENDED DECEMBER 31, 2018
SCHEDULE OF REMUNERATION AND EXPENSES
Fisher,Victor J. 121,740.25 14,911.98 0.00
Foden,Judy K. 78,625.59 16,606.83 59.83
Foley,Duane W. 99,872.02 10,475.32 190.00
Folka,Erin K 90,548.72 289.25 77.28
Fontana,Tullio 75,277.28 2,295.29 2,862.85
Fortin,Eric 67,402.16 9,226.88 0.00
Fouche,Anja 80,657.18 8,596.13 41.18
Fournier,Marc G. 123,782.09 11,733.17 135.00
Franklin,Carolyn A 56,134.60 19,104.29 0.00
Fraser,Chris E. 100,286.82 17,330.12 180.00
Fraser,Sandon 73,454.55 2,047.67 4,868.04
French,Lana G 73,454.56 2,023.70 323.71
Frew,Matthew John 90,378.94 3,740.52 0.00
Friesen,Lindsey A 76,342.08 4,392.80 28.84
Fulop,Perry 53,223.90 75,784.97 0.00
Fulton,Christopher R. 100,820.76 4,277.19 180.00
Fung,Eric Kim 81,572.61 3,123.99 3,323.65
Gain,Chris I 123,597.67 9,429.61 1,445.62
Gallagher,Ryan M. 93,810.44 10,911.82 1,918.58
Gallant,Matthew 98,009.88 10,045.05 0.00
Gallello,James D. 76,096.29 4,923.05 63.79
Gallichen,Jason F 70,410.53 14,249.59 70.00
Gallie,Kent Gregory 99,288.09 7,738.04 4,099.99
Ganda,Amrinder 92,655.51 2,040.41 751.06
Garcea,Reece 75,220.40 890.07 6,598.72
Garcha,Amar 73,674.24 2,110.13 0.00
Gardiner,Doug 75,631.15 1,146.74 7,228.98
Gardiner,Norman M 102,945.28 19,395.62 160.00
Garis,Leonard W 233,632.08 35,909.60 19,674.73
Gay,Howard C.m. 65,720.00 15,540.86 0.00
Geddes,John 70,695.73 11,276.70 0.00
Gehon,Chad Allen 90,187.68 9,752.07 0.00
Georgas,Gregorios E 97,234.53 22,482.75 0.00
George,Andrew R. 140,339.20 9,037.67 2.85
Gibson,Lindsey M 91,506.38 8,049.67 0.00
Gibson,Timothy W 93,007.25 7,271.90 285.19
Gill,Gina Kaur 84,741.79 1,184.71 41.92
Gill,Jagdeep S. 83,346.15 2,192.32 12,594.27
Gill,Kulwant 76,563.90 1,380.40 86.25
Gill,Kyle Cameron Frost 90,297.43 9,343.15 0.00
Gill,Ronald 149,567.94 9,478.58 770.73
Page 65 of 113
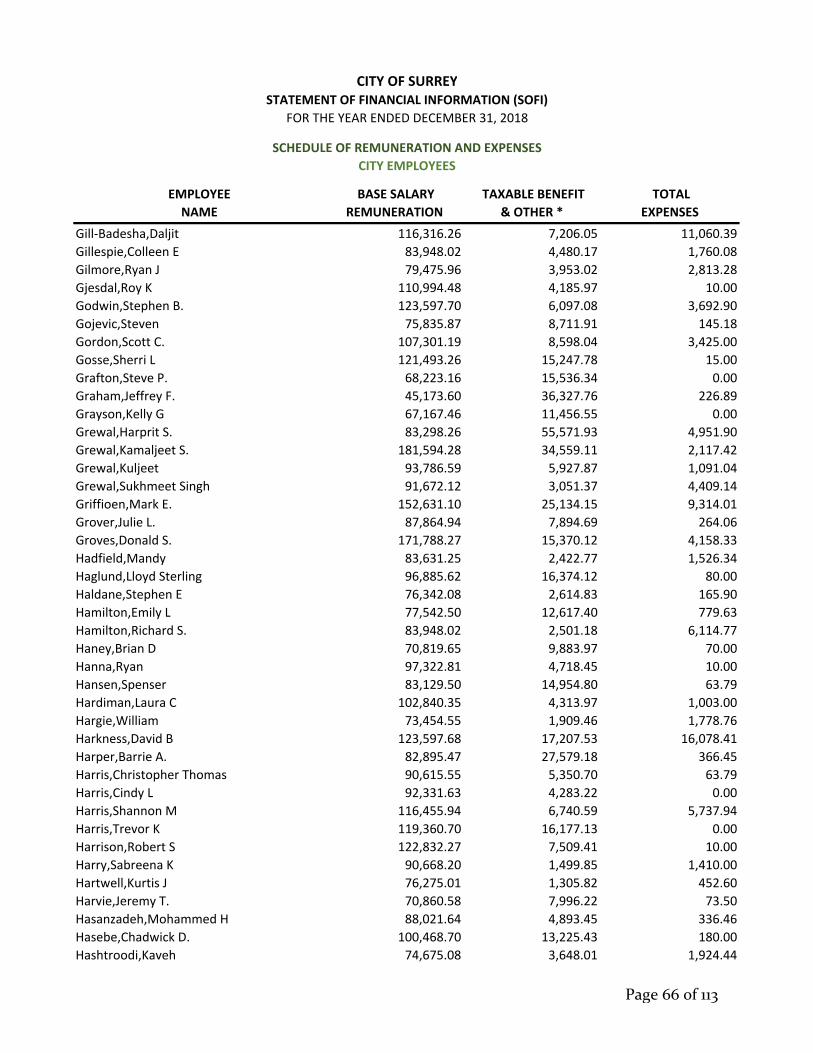
EMPLOYEE
NAME
BASE SALARY
REMUNERATION
TAXABLE BENEFIT
& OTHER *
TOTAL
EXPENSES
CITY EMPLOYEES
CITY OF SURREYSTATEMENT OF FINANCIAL INFORMATION (SOFI)
FOR THE YEAR ENDED DECEMBER 31, 2018
SCHEDULE OF REMUNERATION AND EXPENSES
Gill‐Badesha,Daljit 116,316.26 7,206.05 11,060.39
Gillespie,Colleen E 83,948.02 4,480.17 1,760.08
Gilmore,Ryan J 79,475.96 3,953.02 2,813.28
Gjesdal,Roy K 110,994.48 4,185.97 10.00
Godwin,Stephen B. 123,597.70 6,097.08 3,692.90
Gojevic,Steven 75,835.87 8,711.91 145.18
Gordon,Scott C. 107,301.19 8,598.04 3,425.00
Gosse,Sherri L 121,493.26 15,247.78 15.00
Grafton,Steve P. 68,223.16 15,536.34 0.00
Graham,Jeffrey F. 45,173.60 36,327.76 226.89
Grayson,Kelly G 67,167.46 11,456.55 0.00
Grewal,Harprit S. 83,298.26 55,571.93 4,951.90
Grewal,Kamaljeet S. 181,594.28 34,559.11 2,117.42
Grewal,Kuljeet 93,786.59 5,927.87 1,091.04
Grewal,Sukhmeet Singh 91,672.12 3,051.37 4,409.14
Griffioen,Mark E. 152,631.10 25,134.15 9,314.01
Grover,Julie L. 87,864.94 7,894.69 264.06
Groves,Donald S. 171,788.27 15,370.12 4,158.33
Hadfield,Mandy 83,631.25 2,422.77 1,526.34
Haglund,Lloyd Sterling 96,885.62 16,374.12 80.00
Haldane,Stephen E 76,342.08 2,614.83 165.90
Hamilton,Emily L 77,542.50 12,617.40 779.63
Hamilton,Richard S. 83,948.02 2,501.18 6,114.77
Haney,Brian D 70,819.65 9,883.97 70.00
Hanna,Ryan 97,322.81 4,718.45 10.00
Hansen,Spenser 83,129.50 14,954.80 63.79
Hardiman,Laura C 102,840.35 4,313.97 1,003.00
Hargie,William 73,454.55 1,909.46 1,778.76
Harkness,David B 123,597.68 17,207.53 16,078.41
Harper,Barrie A. 82,895.47 27,579.18 366.45
Harris,Christopher Thomas 90,615.55 5,350.70 63.79
Harris,Cindy L 92,331.63 4,283.22 0.00
Harris,Shannon M 116,455.94 6,740.59 5,737.94
Harris,Trevor K 119,360.70 16,177.13 0.00
Harrison,Robert S 122,832.27 7,509.41 10.00
Harry,Sabreena K 90,668.20 1,499.85 1,410.00
Hartwell,Kurtis J 76,275.01 1,305.82 452.60
Harvie,Jeremy T. 70,860.58 7,996.22 73.50
Hasanzadeh,Mohammed H 88,021.64 4,893.45 336.46
Hasebe,Chadwick D. 100,468.70 13,225.43 180.00
Hashtroodi,Kaveh 74,675.08 3,648.01 1,924.44
Page 66 of 113

EMPLOYEE
NAME
BASE SALARY
REMUNERATION
TAXABLE BENEFIT
& OTHER *
TOTAL
EXPENSES
CITY EMPLOYEES
CITY OF SURREYSTATEMENT OF FINANCIAL INFORMATION (SOFI)
FOR THE YEAR ENDED DECEMBER 31, 2018
SCHEDULE OF REMUNERATION AND EXPENSES
Hatfield,Trent R 76,563.90 5,963.10 4,610.54
Hawley,Shaun 97,844.21 8,727.71 200.00
Haye,Andrew 73,454.51 28,131.25 3,719.13
Hayes,Niles L. 100,048.34 18,119.05 0.00
Healey,Jason D 76,539.76 2,541.88 1,079.83
Hebden,Paul A. 100,255.38 14,381.77 0.00
Heer,Arvinder Singh 76,563.90 5,038.58 804.46
Heer,Preet 146,236.95 6,428.66 16.42
Henderson,W David 104,610.29 4,817.95 10.00
Hensbee,Chad 98,183.23 9,576.72 0.00
Heska,Grant M. 104,354.95 9,951.19 35.00
Higgs,Margaret N 83,241.21 1,703.42 0.00
Hillier,Sheldon D. 122,554.83 5,681.92 25.61
Hindle,Brad 86,526.40 513.28 990.62
Hintsche,Ronald R. 178,667.28 10,267.11 770.73
Ho,Cheuk Ting 82,823.26 1,618.65 332.19
Ho,James C. 83,238.41 5,447.42 0.00
Ho,Susan E. 86,749.92 9,311.73 681.79
Hoath,William D. 98,009.86 6,633.09 211.00
Hobson,Joshua S 104,349.70 4,567.07 425.00
Hodson,Jeffrey Alan 76,268.29 8,411.30 10.00
Hohmann,Peter K. 73,454.54 1,917.75 0.00
Holland,Jeffrey B. 104,868.35 14,323.57 1,233.21
Holovach,Kelvin M. 90,295.11 34,227.27 0.00
Hooker,Verdun 94,459.75 5,755.71 2,409.02
Horita,Steven D 79,945.39 2,263.98 0.00
Horn,Randy H 100,650.63 10,357.35 376.00
Howlett,Lawrence S. 122,665.83 6,890.90 10.00
Howling,Gordon S. 99,275.66 5,483.92 1,300.57
Hryb,Nicholas O. 100,721.60 11,831.89 0.00
Hua,Ning Ning 73,454.52 6,039.58 0.00
Hughan,Sarah 98,403.30 9,346.53 1,728.50
Hughes,Joshua P. 98,651.70 7,392.24 4,065.98
Hungar,Schaelen M. 105,726.73 9,826.37 425.00
Hunt,Terence J. 55,693.47 69,543.31 199.00
Hunter,Brad J. 117,395.41 10,267.37 50.00
Hutfelter,Chase K 91,010.00 4,851.31 109.99
Huynh,Philip 166,542.56 8,321.38 3,339.60
Ibbott,Brad 115,961.50 1,810.10 486.51
Icasiano,Ryan 87,019.60 3,635.07 1,515.22
Innes,Nancy E. 122,572.47 4,540.43 10.00
Page 67 of 113

EMPLOYEE
NAME
BASE SALARY
REMUNERATION
TAXABLE BENEFIT
& OTHER *
TOTAL
EXPENSES
CITY EMPLOYEES
CITY OF SURREYSTATEMENT OF FINANCIAL INFORMATION (SOFI)
FOR THE YEAR ENDED DECEMBER 31, 2018
SCHEDULE OF REMUNERATION AND EXPENSES
Ireland,Jerome K. 91,869.16 746.80 3,518.72
Ivanov,Viatcheslav 94,374.09 5,731.88 587.34
Iverson,Eileen M 90,435.87 15,427.64 0.00
Iverson,Kalum A. 97,712.67 9,183.16 0.00
Izzard,David 121,084.62 5,099.59 2,412.04
Jackson,Kim Michelle 70,680.33 8,516.65 6.14
Jackson,Tyler R 90,449.60 11,158.66 0.00
Jagielski,Arkadiusz R. 83,238.45 8,904.37 30.83
Jain,Parul 87,140.11 1,175.33 12.32
Jamieson,Aaron G 118,678.51 12,328.32 0.00
Jamin,Francois 83,238.45 2,860.37 4,591.56
Janda,Harjinder S 122,064.24 26,033.26 2,347.20
Janzen,Erwin P. 86,676.22 20,568.78 0.00
Jaswal,Gopal 98,186.48 12,243.40 50.00
Jeklin,Troy W 76,480.88 9,733.61 366.45
Jensen,G Hiroshi 82,291.59 1,724.32 543.64
Jerome,Reo R. 141,579.90 28,388.32 0.00
Jerome,Reo Rylee 75,216.38 10,494.17 0.00
Jhingan,Waqt 106,167.21 6,512.31 347.52
Jiang,Tao 88,661.83 2,733.74 1,203.54
Joaquin,Shelley 74,287.61 4,102.69 468.10
Johal,Snover 67,383.74 34,518.73 0.00
Johnson,Duane A 82,659.90 6,107.18 878.00
Johnson,Melissa C 87,069.07 4,256.21 799.05
Johnson,Scott A. 100,721.61 8,134.16 184.00
Johnston,Matthew D 97,985.10 10,122.35 241.20
Jones,Amanda L 90,510.22 4,224.57 498.31
Jones,David J 78,503.57 2,496.42 0.00
Jones,Donna L. 204,775.77 42,330.95 25,764.50
Jones,Ian G 97,700.80 6,268.84 10.00
Jones,Jack D. 76,486.40 1,459.34 189.00
Jones,Natalie 73,788.67 3,384.19 590.51
Jones,Nathan M 101,506.89 9,347.76 10.00
Jones,Stuart D. 110,364.39 4,106.60 526.86
Jonski,Stan 100,875.79 4,406.39 2,792.76
Jow,Jordan 90,688.01 9,217.09 91.79
Jow,Scott D 97,536.07 13,673.36 10.00
Joyce,Nina A. 79,344.12 10,818.07 20.72
Joyce,Peter L 127,782.52 17,363.40 76.45
Jung,Derek S 97,123.61 13,458.88 10.00
Juulsen,Neil B 110,254.30 8,948.24 0.00
Page 68 of 113
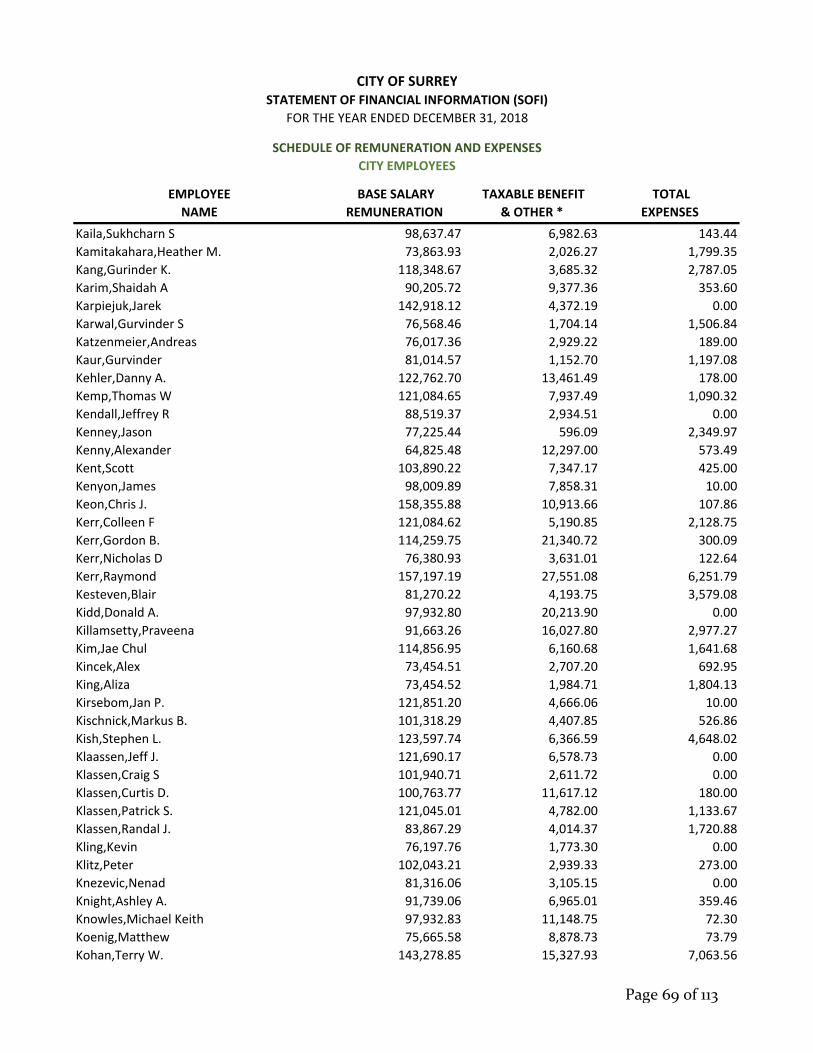
EMPLOYEE
NAME
BASE SALARY
REMUNERATION
TAXABLE BENEFIT
& OTHER *
TOTAL
EXPENSES
CITY EMPLOYEES
CITY OF SURREYSTATEMENT OF FINANCIAL INFORMATION (SOFI)
FOR THE YEAR ENDED DECEMBER 31, 2018
SCHEDULE OF REMUNERATION AND EXPENSES
Kaila,Sukhcharn S 98,637.47 6,982.63 143.44
Kamitakahara,Heather M. 73,863.93 2,026.27 1,799.35
Kang,Gurinder K. 118,348.67 3,685.32 2,787.05
Karim,Shaidah A 90,205.72 9,377.36 353.60
Karpiejuk,Jarek 142,918.12 4,372.19 0.00
Karwal,Gurvinder S 76,568.46 1,704.14 1,506.84
Katzenmeier,Andreas 76,017.36 2,929.22 189.00
Kaur,Gurvinder 81,014.57 1,152.70 1,197.08
Kehler,Danny A. 122,762.70 13,461.49 178.00
Kemp,Thomas W 121,084.65 7,937.49 1,090.32
Kendall,Jeffrey R 88,519.37 2,934.51 0.00
Kenney,Jason 77,225.44 596.09 2,349.97
Kenny,Alexander 64,825.48 12,297.00 573.49
Kent,Scott 103,890.22 7,347.17 425.00
Kenyon,James 98,009.89 7,858.31 10.00
Keon,Chris J. 158,355.88 10,913.66 107.86
Kerr,Colleen F 121,084.62 5,190.85 2,128.75
Kerr,Gordon B. 114,259.75 21,340.72 300.09
Kerr,Nicholas D 76,380.93 3,631.01 122.64
Kerr,Raymond 157,197.19 27,551.08 6,251.79
Kesteven,Blair 81,270.22 4,193.75 3,579.08
Kidd,Donald A. 97,932.80 20,213.90 0.00
Killamsetty,Praveena 91,663.26 16,027.80 2,977.27
Kim,Jae Chul 114,856.95 6,160.68 1,641.68
Kincek,Alex 73,454.51 2,707.20 692.95
King,Aliza 73,454.52 1,984.71 1,804.13
Kirsebom,Jan P. 121,851.20 4,666.06 10.00
Kischnick,Markus B. 101,318.29 4,407.85 526.86
Kish,Stephen L. 123,597.74 6,366.59 4,648.02
Klaassen,Jeff J. 121,690.17 6,578.73 0.00
Klassen,Craig S 101,940.71 2,611.72 0.00
Klassen,Curtis D. 100,763.77 11,617.12 180.00
Klassen,Patrick S. 121,045.01 4,782.00 1,133.67
Klassen,Randal J. 83,867.29 4,014.37 1,720.88
Kling,Kevin 76,197.76 1,773.30 0.00
Klitz,Peter 102,043.21 2,939.33 273.00
Knezevic,Nenad 81,316.06 3,105.15 0.00
Knight,Ashley A. 91,739.06 6,965.01 359.46
Knowles,Michael Keith 97,932.83 11,148.75 72.30
Koenig,Matthew 75,665.58 8,878.73 73.79
Kohan,Terry W. 143,278.85 15,327.93 7,063.56
Page 69 of 113

EMPLOYEE
NAME
BASE SALARY
REMUNERATION
TAXABLE BENEFIT
& OTHER *
TOTAL
EXPENSES
CITY EMPLOYEES
CITY OF SURREYSTATEMENT OF FINANCIAL INFORMATION (SOFI)
FOR THE YEAR ENDED DECEMBER 31, 2018
SCHEDULE OF REMUNERATION AND EXPENSES
Komzak,Robert L. 116,318.33 8,960.37 205.00
Koo,Ching Fu 75,323.46 8,809.87 973.21
Kooner,Gurpreet 84,637.13 1,597.43 4,316.11
Kooner,Harminder S 77,886.60 7,288.83 0.00
Kooner,Kiranjyot K 62,203.22 13,569.41 1,385.33
Kosa,Ileana 91,088.71 3,607.71 795.00
Kozevnikov,Ingrid 66,018.70 33,316.29 0.00
Krgovich,Michael John 97,359.47 9,911.54 0.00
Kubanski,Jacob David 90,890.80 11,302.29 10.00
Kucharczyk,Paula 75,561.25 1,362.60 3,166.29
Kumar,Suneel 76,563.90 2,428.46 57.71
Kwan,Gertrude S.y. 110,364.39 5,355.09 364.22
Kwan,Tammi 97,145.00 2,681.26 1,882.08
Kwok,Emily 81,760.28 2,620.31 1,573.27
Labelle,Jeremy A 75,691.41 7,731.51 0.00
Labrecque,Benoit 83,798.12 4,165.56 63.79
Lachica,Mercedita S 83,238.43 1,337.39 0.00
Lai,Tai Hung 106,334.90 30,632.79 458.40
Lalli,Sarabjit S 113,945.45 19,876.46 0.00
Lalonde,Vincent A. 348,632.97 45,171.58 7,905.97
Lamarre,Laurie S 97,555.87 2,506.72 0.00
Lamontagne,Jean L. 248,706.71 21,820.25 704.93
Landucci,Robin M 72,569.18 10,362.79 4,455.65
Langman,Ronald F. 121,354.02 16,321.01 1,823.27
Lapczak,Ivan P 77,590.27 2,714.65 2,802.67
Larocque,Gilbert 132,761.42 14,207.59 1,647.25
Lattanzio,Saverio E. 108,205.27 9,135.28 415.00
Lau,Samuel S. 182,095.64 16,361.70 1,224.91
Lazenby,Colin Grady 72,327.08 7,932.40 4,778.16
Lee,Benjie 133,461.37 4,765.77 4,498.02
Lee,Jung Min 85,050.91 4,420.62 4,906.60
Lee,Ken S 90,295.14 1,970.83 464.19
Lee,Kyung Mee 99,262.36 4,962.14 3,117.55
Lee,Paul C 151,021.46 18,712.95 5,121.19
Lee,Robert T 139,902.33 11,789.68 1,756.07
Legroulx,Denis R. 83,948.04 4,545.67 2,350.59
Lehal,Mandeep S 82,918.02 3,837.16 167.29
Lehmann,John F. 152,631.14 30,530.19 5,156.87
LeMond,Dan D. 122,665.83 6,647.24 0.00
Lepik,Mark R 77,060.80 3,493.28 220.21
Lewis,Howard 83,322.37 7,727.79 0.00
Page 70 of 113
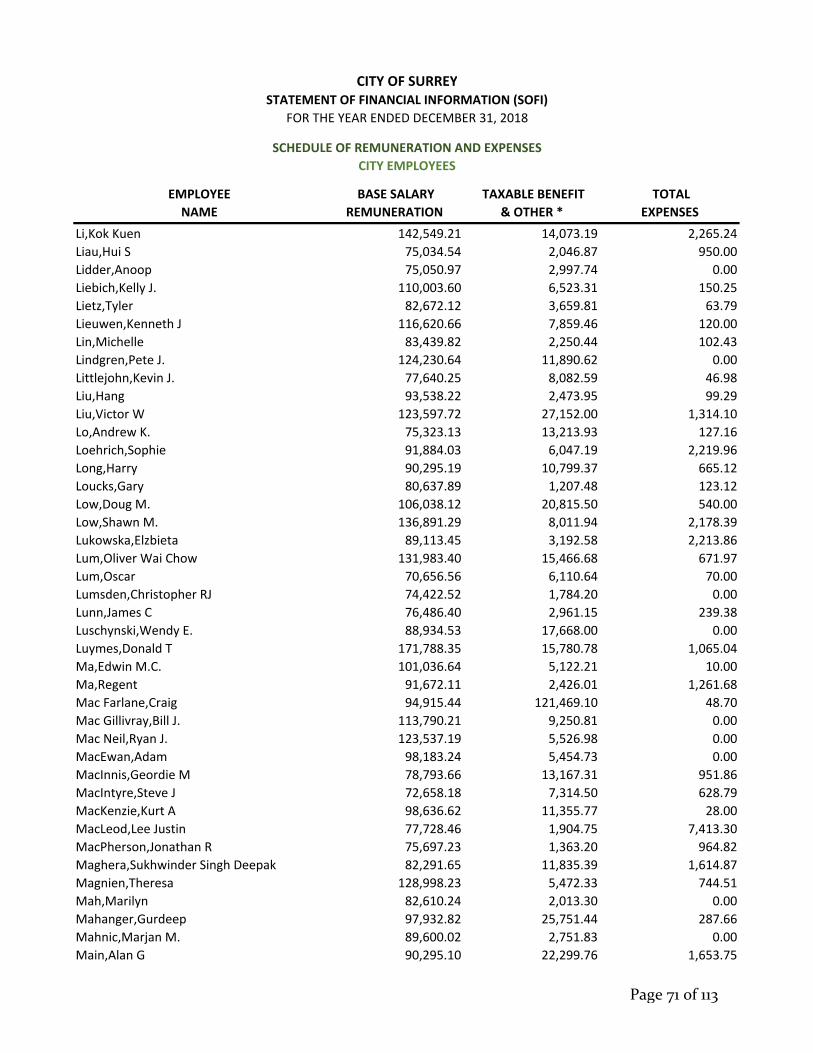
EMPLOYEE
NAME
BASE SALARY
REMUNERATION
TAXABLE BENEFIT
& OTHER *
TOTAL
EXPENSES
CITY EMPLOYEES
CITY OF SURREYSTATEMENT OF FINANCIAL INFORMATION (SOFI)
FOR THE YEAR ENDED DECEMBER 31, 2018
SCHEDULE OF REMUNERATION AND EXPENSES
Li,Kok Kuen 142,549.21 14,073.19 2,265.24
Liau,Hui S 75,034.54 2,046.87 950.00
Lidder,Anoop 75,050.97 2,997.74 0.00
Liebich,Kelly J. 110,003.60 6,523.31 150.25
Lietz,Tyler 82,672.12 3,659.81 63.79
Lieuwen,Kenneth J 116,620.66 7,859.46 120.00
Lin,Michelle 83,439.82 2,250.44 102.43
Lindgren,Pete J. 124,230.64 11,890.62 0.00
Littlejohn,Kevin J. 77,640.25 8,082.59 46.98
Liu,Hang 93,538.22 2,473.95 99.29
Liu,Victor W 123,597.72 27,152.00 1,314.10
Lo,Andrew K. 75,323.13 13,213.93 127.16
Loehrich,Sophie 91,884.03 6,047.19 2,219.96
Long,Harry 90,295.19 10,799.37 665.12
Loucks,Gary 80,637.89 1,207.48 123.12
Low,Doug M. 106,038.12 20,815.50 540.00
Low,Shawn M. 136,891.29 8,011.94 2,178.39
Lukowska,Elzbieta 89,113.45 3,192.58 2,213.86
Lum,Oliver Wai Chow 131,983.40 15,466.68 671.97
Lum,Oscar 70,656.56 6,110.64 70.00
Lumsden,Christopher RJ 74,422.52 1,784.20 0.00
Lunn,James C 76,486.40 2,961.15 239.38
Luschynski,Wendy E. 88,934.53 17,668.00 0.00
Luymes,Donald T 171,788.35 15,780.78 1,065.04
Ma,Edwin M.C. 101,036.64 5,122.21 10.00
Ma,Regent 91,672.11 2,426.01 1,261.68
Mac Farlane,Craig 94,915.44 121,469.10 48.70
Mac Gillivray,Bill J. 113,790.21 9,250.81 0.00
Mac Neil,Ryan J. 123,537.19 5,526.98 0.00
MacEwan,Adam 98,183.24 5,454.73 0.00
MacInnis,Geordie M 78,793.66 13,167.31 951.86
MacIntyre,Steve J 72,658.18 7,314.50 628.79
MacKenzie,Kurt A 98,636.62 11,355.77 28.00
MacLeod,Lee Justin 77,728.46 1,904.75 7,413.30
MacPherson,Jonathan R 75,697.23 1,363.20 964.82
Maghera,Sukhwinder Singh Deepak 82,291.65 11,835.39 1,614.87
Magnien,Theresa 128,998.23 5,472.33 744.51
Mah,Marilyn 82,610.24 2,013.30 0.00
Mahanger,Gurdeep 97,932.82 25,751.44 287.66
Mahnic,Marjan M. 89,600.02 2,751.83 0.00
Main,Alan G 90,295.10 22,299.76 1,653.75
Page 71 of 113

EMPLOYEE
NAME
BASE SALARY
REMUNERATION
TAXABLE BENEFIT
& OTHER *
TOTAL
EXPENSES
CITY EMPLOYEES
CITY OF SURREYSTATEMENT OF FINANCIAL INFORMATION (SOFI)
FOR THE YEAR ENDED DECEMBER 31, 2018
SCHEDULE OF REMUNERATION AND EXPENSES
Majhen,Mark Z. 118,842.49 13,851.47 197.00
Major,Darren 114,179.57 7,517.20 5,123.35
Malcolm,Iain A. 125,023.35 6,945.46 0.00
Mani,Jocelyn Anne 117,152.43 4,612.20 1,033.56
Mann,Gurchan 76,040.93 2,554.35 1,148.62
Mann,Gurdeep 74,813.13 2,241.44 0.00
Mann,Harbinder K. 84,609.41 7,739.39 40.32
Mann,Jagjit K 72,536.53 26,429.46 5,204.27
Maradi,Sandor Janos 79,538.46 2,153.60 4,558.06
March,Lauralee 92,019.37 4,382.66 9,546.75
Marcuk,Devon J 110,496.19 15,519.55 10.00
Marczak,Magdalena 73,746.18 7,407.63 312.61
Margarit,Kristin Lynn 87,129.23 4,259.78 10.00
Marian,Iosif E. 73,454.51 6,673.24 0.00
Marosevich,Kim B 109,057.69 6,225.79 5,395.13
Marriott,Brent W. 122,396.54 15,350.28 10.00
Martens,Allan D. 122,618.48 7,631.76 10.00
Martin,Leita S 73,072.56 2,330.49 2,213.06
Martin,Robert J 97,932.80 24,644.63 16.24
Matharu,Paul 97,480.08 13,900.07 10.00
Matheson,Timothy S 100,510.30 10,388.85 0.00
Mathewson,Anna 105,948.95 5,793.01 14,123.89
Matterson,Scott A 73,454.53 2,520.20 482.95
Matthews,Catherine G. 115,414.00 4,511.88 467.63
Matthews,Ingrid 86,176.38 1,525.05 0.00
Mattoo,Anil 76,563.90 1,449.37 511.57
Mauro,Carli M. 83,901.35 4,916.77 2,705.70
Mauro,Joseph M 97,800.97 7,925.51 130.00
May,Glenn Kyle 81,775.05 1,609.63 7,339.90
Mayer,Irene G 72,747.05 2,533.69 480.88
Mc Beth,Steve D. 75,807.22 19,197.36 366.45
Mc Carron,Darryl L 135,951.64 16,457.65 6,467.05
Mc Donald,Glenn E. 76,486.40 4,320.41 1,401.54
Mc Donald,Victor A 110,362.03 20,298.85 10.00
Mc Guinness,Sean 75,603.20 881.28 366.45
Mc Intosh,Dan J. 125,343.16 4,827.66 99.99
Mc Intyre,Geoff R. 104,564.29 10,926.18 415.00
Mc Intyre,Ryan L 103,586.30 11,894.76 75.00
Mc Kinlay,Scott A. 106,251.58 53,735.56 10.00
Mc Lachlan,Craig D. 103,626.03 19,125.96 2,152.50
Mc Laren,Todd D. 120,790.24 4,973.11 1,297.44
Page 72 of 113

EMPLOYEE
NAME
BASE SALARY
REMUNERATION
TAXABLE BENEFIT
& OTHER *
TOTAL
EXPENSES
CITY EMPLOYEES
CITY OF SURREYSTATEMENT OF FINANCIAL INFORMATION (SOFI)
FOR THE YEAR ENDED DECEMBER 31, 2018
SCHEDULE OF REMUNERATION AND EXPENSES
Mc Lean,Ian 110,557.63 17,883.29 0.00
Mc Nabb,Barry W. 121,058.03 16,248.78 2,238.27
Mc Namara,Michael W. 121,722.61 9,905.06 495.23
Mc Rae,Mark B. 106,108.69 7,370.30 1,392.81
Mc Robbie,Greg E 103,930.97 5,386.98 150.00
McArthur,Brandon 76,135.83 7,229.43 0.00
McDougall,Thomas Allan Angus 97,744.96 12,475.30 30.25
McDowell,Carleen 83,297.39 8,138.38 3,187.05
McIntosh,Richard 90,308.01 2,689.87 0.00
McKay,William David 131,085.46 15,807.16 142.51
McKinnon,Keith 74,088.93 993.77 4,547.98
McLean,Ann 79,230.47 1,822.72 989.00
McLean,Jennifer L. 83,117.94 2,491.93 534.48
McLeod,Doug J 128,411.55 15,488.10 1,979.38
McQueen,Michael 72,558.12 5,773.87 542.50
Medeiros,Victor 91,326.40 22,228.62 0.00
Meers,Scott W 66,235.36 8,886.77 0.00
Melquist,Lisa 75,771.75 1,411.29 0.00
Meng,Qi 121,084.62 7,007.66 1,270.62
Merry,Douglas J 100,018.38 5,581.30 1,466.37
Michielin,Dino F. 122,572.47 16,425.65 184.00
Miklossy,Scott 123,597.72 5,467.00 0.00
Miller,Cynthia M 104,407.91 6,531.20 56.04
Miller,Evan J. 120,923.38 8,567.82 2,094.76
Miller,Owen 97,573.75 10,811.37 90.00
Milling,Tyler W 76,197.76 2,361.64 0.00
Milloy,Jonathan D 89,004.97 3,732.71 7,193.51
Minaker,Gordon R. 100,393.44 5,116.23 45.00
Mohammad,Monica 76,021.70 2,482.80 7,412.32
Mohamoud,Ahmed 96,741.05 12,362.89 0.00
Monk,James R 85,429.84 9,773.23 1,814.12
Moon,Robyn E 56,769.27 32,229.46 0.00
Moore,Derrick 88,930.80 4,606.91 2,354.90
Moore,Raymond 95,175.15 5,445.28 4,366.91
Moquin,Jeffrey A. 76,074.36 8,962.54 540.05
Morgan,Aaron 98,009.88 13,942.30 10.00
Morris,Shelley C 142,503.56 17,219.35 5,521.03
Morrison,Angus E 97,499.41 16,481.84 10.00
Morrison,Gwen A. 83,238.41 563.47 0.00
Mossey,Douglas V 123,597.72 9,705.97 3,204.20
Moyen,Curtis L 103,661.91 13,991.08 415.00
Page 73 of 113

EMPLOYEE
NAME
BASE SALARY
REMUNERATION
TAXABLE BENEFIT
& OTHER *
TOTAL
EXPENSES
CITY EMPLOYEES
CITY OF SURREYSTATEMENT OF FINANCIAL INFORMATION (SOFI)
FOR THE YEAR ENDED DECEMBER 31, 2018
SCHEDULE OF REMUNERATION AND EXPENSES
Muller,Keith J. 97,565.13 34,833.28 0.00
Mumm,David 71,187.88 8,040.15 979.65
Murphy,Aileen M. 110,364.38 7,885.11 1,454.77
Murphy,John D. 110,073.15 19,683.06 10.00
Murphy,Robert D. 121,912.09 15,664.55 480.13
Murphy,Rory K. 65,371.52 22,322.49 60.00
Murray,A Relaine 74,195.70 6,455.72 0.00
Muzzin,Stephen P 97,932.80 1,970.54 3,064.68
Myette,Ken H 90,295.11 2,401.51 612.38
Myette,Robert P 76,486.40 920.18 0.00
Myring,Nicholas M. 97,845.15 5,938.00 10.00
Naceur McLean,Janice Louise 74,608.59 4,351.25 452.68
Nagpal,Vinay 83,238.40 2,254.32 1,940.88
Nam,Hyung Joo 76,659.10 4,973.66 1,869.38
Narayan,Leslie A. 84,377.47 9,973.79 918.93
Narayan,Shiri 130,827.09 11,891.60 1,287.12
Nasato,Linda 95,498.98 2,402.28 0.00
Nazeman,Mehran R. 96,139.21 32,789.59 1,123.15
Neal,Marion H 69,420.11 9,356.93 324.32
Neilson,Layna 88,341.73 2,710.11 1,475.56
Nelson Smith,Matthew B 80,697.95 5,856.17 750.00
Nesci,Cory 80,401.95 1,783.18 155.70
Netherton,Scott E. 118,082.81 4,237.68 2,029.38
Neufeld,Adrian 96,881.33 17,817.43 0.00
Neufeld,Joel Eric 83,425.98 4,974.71 63.79
Neufeld,Tim C 134,494.19 24,913.10 1,933.41
Neuman,Scott 184,672.62 23,738.81 9,125.37
Neustaedter,Charles H 123,597.72 16,479.00 2,175.47
Ng,Jeffrey C. 97,932.80 9,677.97 7,227.14
Nielsen,Dan K. 123,597.69 27,053.82 1,782.78
Nielsen,Mark F. 122,784.91 14,440.28 126.00
Nijjar,Juskar 68,571.21 6,569.61 2,238.89
Nijjar,Reminder S 70,026.32 14,791.55 2,920.00
Nip,Donald Dat Ming 98,573.49 1,912.47 2,753.27
Nolan,Andrew 77,460.30 10,807.03 1,343.32
Noort,Jillian 59,397.90 15,686.36 0.00
Norris,Hugh F. 123,597.68 25,414.05 1,041.66
Nylander,James 106,334.91 2,430.22 0.00
O Hanley,Alanna 78,682.10 1,108.40 0.00
Oakley,Tina Louise 78,771.86 886.89 0.00
O'Brien,Keldon S. 120,081.22 7,663.84 10.00
Page 74 of 113

EMPLOYEE
NAME
BASE SALARY
REMUNERATION
TAXABLE BENEFIT
& OTHER *
TOTAL
EXPENSES
CITY EMPLOYEES
CITY OF SURREYSTATEMENT OF FINANCIAL INFORMATION (SOFI)
FOR THE YEAR ENDED DECEMBER 31, 2018
SCHEDULE OF REMUNERATION AND EXPENSES
O'Byrne,David J 68,256.00 7,607.76 0.00
Okabe,Douglas J 73,454.51 2,065.36 462.61
Oliver,Jeff A. 105,195.31 3,484.71 535.00
Oliver‐Trygg,Steve W. 122,799.79 9,081.36 0.00
Olivier,Nathan 100,490.92 5,712.58 0.00
Olsen,Richard D. 122,659.06 3,722.92 10.00
Olson,Benn 73,597.68 8,513.16 63.79
Olson,George A. 122,832.27 6,696.57 0.00
ONeill,Eoin 83,238.44 877.78 1,877.22
Onusko,Nicholas A. 78,471.28 4,621.90 0.00
Oppelt,Richard D. 123,597.71 13,831.29 671.47
Orcutt,Brenda L. 89,606.82 14,962.19 1,791.78
Ordeman,Arjen A 132,284.57 7,374.65 2,435.17
Orsetti,David F. 76,563.90 26,685.85 926.98
Osler,Matthew F 117,468.34 8,396.17 1,935.44
Ouellette,Jourdain 69,433.54 6,117.27 1,065.70
Overland,Graham A 97,845.11 11,117.38 0.00
Owen,Jason 123,350.29 8,698.54 2,399.93
Padilla,Sarah 82,246.65 4,016.36 138.23
Paduraru,Eliza 61,104.34 16,798.88 0.00
Pajaro,Therese Valerie 87,012.87 2,637.68 1,783.00
Palombi,Lisa A 72,230.95 3,498.54 0.00
Pandher,Karandeep S. 109,889.18 5,739.10 2,016.37
Pang,Jeffrey 96,563.75 6,990.88 251.24
Pape,Matthew N 88,235.03 11,679.25 32.62
Pargee,Robert 100,500.34 5,336.97 279.99
Parkinson,Sarah F 64,145.57 17,087.69 0.00
Parry,Ryan W 122,355.93 16,467.27 0.00
Parsons,Adrienne A. 76,464.99 13,253.48 1,051.47
Parsons,Kelsey 89,288.10 5,830.45 0.00
Pasqua,Richard M. 122,270.70 12,570.33 126.00
Patrick,David 97,789.10 4,136.09 125.00
Patten,Kristin 84,805.80 1,791.60 2,283.67
Patterson,Arielle T 87,599.03 9,124.03 454.48
Paulrajan,Stanley P. 133,315.45 5,890.15 52.50
Peake,Scott S. 123,835.05 11,151.88 10.00
Pearson,Ryan M. 76,516.00 2,191.59 755.91
Pederson,Clifford M. 45,328.80 34,529.10 0.00
Pederson,Denis Erlo 81,905.69 6,556.65 73.79
Pegios,Spiro 127,958.60 11,250.32 10.00
Pencer,Glenn C. 122,073.14 9,144.75 0.00
Page 75 of 113

EMPLOYEE
NAME
BASE SALARY
REMUNERATION
TAXABLE BENEFIT
& OTHER *
TOTAL
EXPENSES
CITY EMPLOYEES
CITY OF SURREYSTATEMENT OF FINANCIAL INFORMATION (SOFI)
FOR THE YEAR ENDED DECEMBER 31, 2018
SCHEDULE OF REMUNERATION AND EXPENSES
Percival,Peter H 98,404.05 11,765.77 10.00
Pereira,Les P 102,352.48 8,783.30 590.00
Perka,Daniel 100,045.80 15,095.09 190.00
Perkins,Tyler Shane 90,610.80 14,030.31 300.88
Pervan,Ward A 109,032.48 18,130.99 525.00
Peters,David 83,238.40 3,702.64 9,478.09
Peters,Raelyn S. 139,603.52 3,815.04 2,033.50
Peters,Shawna 110,767.14 4,290.02 657.60
Petersen,Lauren 76,124.76 2,816.81 2,310.86
Peterson,Cory W. 81,334.96 1,022.11 6,030.33
Petretta,May 121,084.61 5,139.18 875.83
Philp,Colin 72,805.43 7,281.07 0.00
Picard,Chi Ying 82,950.40 6,357.08 272.88
Pinchin,Jay D. 122,174.61 3,468.22 10.00
Pitcairn,Lee‐Anne 110,068.77 5,739.23 0.00
Pitz,Lisa 73,449.04 2,221.23 2,519.39
Placek,Andrew F 75,952.90 4,447.24 63.79
Pladson,Gord C 84,350.84 3,466.76 2,441.87
Poettcker,Alan M. 100,535.24 14,341.63 10.00
Pokorny,Harold J 83,120.67 12,574.05 0.00
Pollock,Eric 97,720.18 13,156.39 0.00
Pollock,Michael E. 121,611.68 7,621.62 10.00
Poon,Eric 92,218.00 1,902.82 1,666.25
Poon,Kenneth M 96,822.60 4,110.67 3,961.79
Popiez,Jacob 75,952.90 9,242.36 63.79
Possey,Chad 82,841.87 4,049.07 10.00
Possey,Josh 75,308.80 702.70 103.58
Powell,Ryan J 74,281.20 1,058.08 5,338.75
Prasad,Jai N. 74,509.02 3,178.21 0.00
Prasad,Jitendra 80,770.39 7,190.38 0.00
Pray,Clinton 76,486.40 3,686.74 441.83
Price,Aaron 76,563.90 3,244.91 950.00
Price,Christopher C. 103,889.50 10,756.02 425.00
Price,Ivan C 106,334.92 6,516.27 28.00
Pruden,Nicole Ashleigh 98,315.71 18,070.19 0.00
Prystay,Deborah 78,438.85 1,208.77 0.00
Pyne,Matthew A. 76,486.40 3,618.52 112.96
Radovich,Joseph I. 122,983.05 15,477.08 10.00
Rai,Ranjeev Randy 83,238.42 3,444.87 4,329.62
Ramsay,David D. 105,593.43 6,239.36 548.05
Randhawa,Amandeep S 76,563.94 2,288.61 511.57
Page 76 of 113

EMPLOYEE
NAME
BASE SALARY
REMUNERATION
TAXABLE BENEFIT
& OTHER *
TOTAL
EXPENSES
CITY EMPLOYEES
CITY OF SURREYSTATEMENT OF FINANCIAL INFORMATION (SOFI)
FOR THE YEAR ENDED DECEMBER 31, 2018
SCHEDULE OF REMUNERATION AND EXPENSES
Rankin,Donald I 112,196.97 8,005.29 1,680.80
Rawcliffe,Nicholas N. 171,788.30 16,692.55 1,434.90
Rayter,Kelly E. 166,918.45 9,847.16 3,410.62
Reddy,Rajesh K. 83,238.41 11,051.07 1,457.10
Redmond,John J. 107,086.03 12,800.87 1,333.93
Rehal,Jaspreet 143,278.87 11,115.19 7,023.79
Reimer,Brian 98,009.87 6,534.19 0.00
Relitz,Trevor K. 76,247.20 1,714.74 205.90
Rennie,Stacey A. 129,306.46 14,645.80 6,148.18
Rennie,Traci C. 73,454.51 2,157.23 160.60
Reny,Robert D 85,358.56 3,503.65 3,641.56
Restrepo,Juan J. 76,563.90 3,672.82 25.00
Resurreccion,Ryan R 96,020.70 6,774.34 0.00
Revell,Samantha 66,390.60 16,409.91 0.00
Reynolds,Guy Q.j. 54,069.52 34,613.78 0.00
Rezazadeh,Forouzan 112,506.72 4,978.68 1,928.70
Rhee,Jung Hun 81,089.96 2,310.19 304.38
Richards,Brad William 90,633.01 12,158.36 196.00
Riley,Chris G. 78,377.64 3,121.98 392.86
Rimek,Brad W. 120,249.33 20,332.51 0.00
Rines,William A. 121,468.24 4,694.80 10.00
Ristau,Kevin W. 122,905.34 7,821.91 10.00
Ritchie,Ronald M. 125,517.93 6,723.66 0.00
Robertson,Judith I. 6,482.58 100,613.19 0.00
Robertson,Ken 103,200.73 2,899.42 425.00
Robinson,Lorne F. 90,929.99 6,998.24 657.98
Robinson,Pierre B. 111,429.27 5,686.96 1,786.33
Robu,Constanta 96,968.84 3,777.93 727.29
Roeck,Aaron Matthew 97,724.47 9,076.74 0.00
Roman,Amanda M 89,907.89 5,546.45 0.00
Rosti,Akhshid Alix 103,051.72 4,908.13 3,338.34
Rothwell,Michael L. 123,597.74 12,847.14 0.00
Roya,Nasrin 68,817.23 7,882.50 0.00
Rubuliak,Nathaniel 76,228.74 6,724.53 0.00
Rudzki,Remi 98,009.85 5,592.70 0.00
Ruediger,Isabel 124,180.01 6,798.92 3,973.76
Ruitenbeck,Gregory 99,288.13 5,327.06 2,522.62
Rukavina,Mary 123,597.68 7,811.73 3,415.29
Ryan,Richard M. 120,308.17 20,891.66 63.41
Rychly,Carey 77,781.15 2,429.86 0.00
Sabarre,Jessica 95,936.65 8,565.49 1,928.29
Page 77 of 113

EMPLOYEE
NAME
BASE SALARY
REMUNERATION
TAXABLE BENEFIT
& OTHER *
TOTAL
EXPENSES
CITY EMPLOYEES
CITY OF SURREYSTATEMENT OF FINANCIAL INFORMATION (SOFI)
FOR THE YEAR ENDED DECEMBER 31, 2018
SCHEDULE OF REMUNERATION AND EXPENSES
Sachdeva,Vipin 132,763.45 8,020.68 1,280.19
Sadafi,Asma 121,084.60 11,775.82 1,069.95
Sadler,David R 78,162.01 2,323.17 3.00
Sadowski,Jordan Tyler 97,720.19 9,593.68 0.00
Saffery,Lynn A. 102,317.89 10,685.85 3,463.82
Sagastizado,Juan F 76,095.84 1,721.89 0.00
Sahota,Parwinder K. 79,042.60 2,677.78 950.00
Saini,Deepika 71,076.66 5,467.78 68.07
Salampassis,Argiro 63,023.90 15,245.41 0.00
Salisbury,Derek M. 105,980.32 6,667.42 415.00
Sampietro,Terry P. 105,245.42 11,109.55 1,705.62
Samson,Geoff P. 155,602.02 12,169.52 1,566.51
Sander,Tim W 83,262.34 7,280.22 7,359.73
Sanderson,Phillipa 123,201.99 9,100.17 2,043.91
Sandu,Rabinder S. 128,177.56 8,527.26 464.59
Sangha,Amrjit S. 101,097.62 36,232.96 0.00
Sangha,Charanpreet 74,627.58 1,140.34 462.00
Sanghera,Harinder K 107,061.31 8,699.64 2,509.12
Santrau,Mandie L. 73,454.53 2,924.18 873.62
Sarai,Scott 97,845.12 14,468.01 150.00
Savage,Reginald H. 99,897.53 10,747.44 180.00
Sawatzky,Ryan 76,135.84 4,473.82 123.79
Saxton,Lauralene 75,476.17 15,607.95 423.99
Sayson,Justin R 97,962.51 7,183.57 0.00
Schaafsma,Jeffrey L. 115,649.22 9,612.04 2,359.04
Schenk,Amanda 80,736.26 2,371.68 10,830.91
Schierling,Todd D. 121,802.58 6,049.19 0.00
Schmidt,Michael K. 103,434.52 5,085.04 415.00
Schmitz,William F. 100,423.25 13,932.20 10.00
Schmor,Carl V. 121,056.51 8,667.73 239.84
Schnare,Philippe A. 123,109.68 11,291.40 0.00
Scholes,Samuel Douglas Delaney 90,211.18 4,279.22 63.79
Schulze,Kevin M. 122,821.44 7,583.69 80.00
Schwartz,Andy A 108,464.40 2,833.78 10.00
Scott,Guthrie Blair 90,386.06 15,659.22 63.79
Scott,Lindsay D 105,999.10 1,965.78 959.18
Scott,Neil 73,454.53 2,322.66 149.24
Scott,Shaun 76,563.90 2,399.10 85.50
Scovill,Dean M 78,615.65 2,973.85 1,625.69
Searle,Jami 69,978.74 6,425.07 19.46
Seehra,Gurbaksh K. 83,238.41 1,608.84 2,254.39
Page 78 of 113
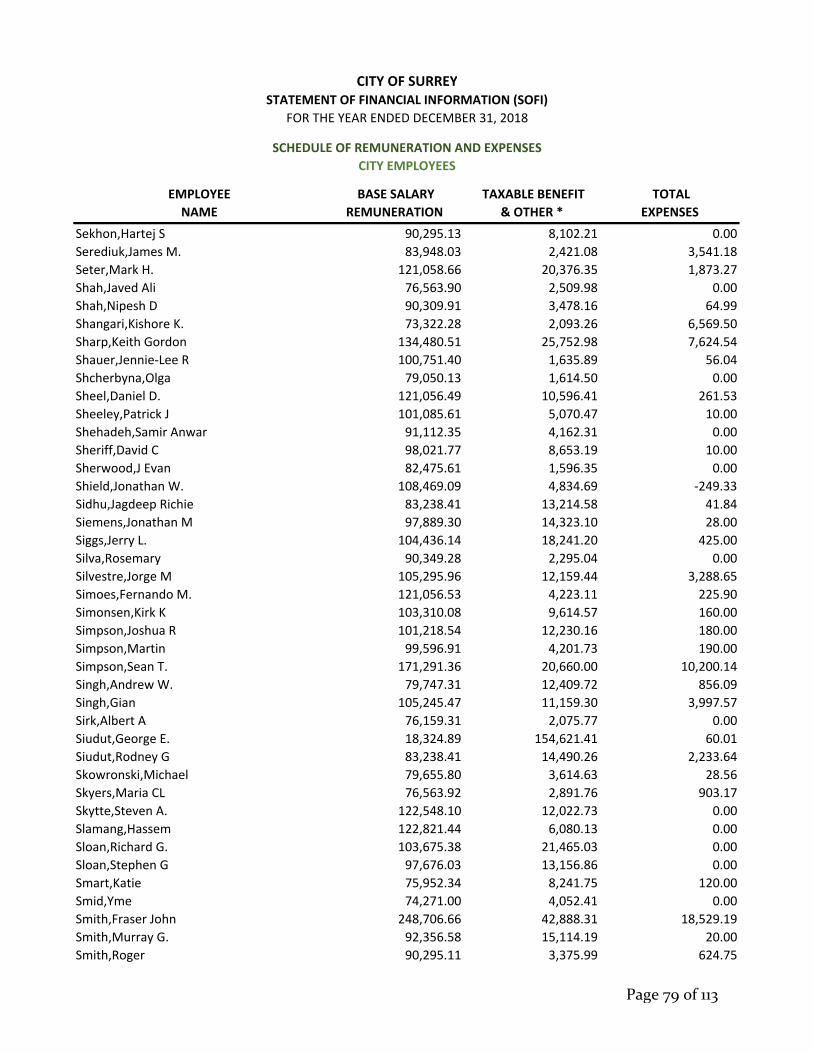
EMPLOYEE
NAME
BASE SALARY
REMUNERATION
TAXABLE BENEFIT
& OTHER *
TOTAL
EXPENSES
CITY EMPLOYEES
CITY OF SURREYSTATEMENT OF FINANCIAL INFORMATION (SOFI)
FOR THE YEAR ENDED DECEMBER 31, 2018
SCHEDULE OF REMUNERATION AND EXPENSES
Sekhon,Hartej S 90,295.13 8,102.21 0.00
Serediuk,James M. 83,948.03 2,421.08 3,541.18
Seter,Mark H. 121,058.66 20,376.35 1,873.27
Shah,Javed Ali 76,563.90 2,509.98 0.00
Shah,Nipesh D 90,309.91 3,478.16 64.99
Shangari,Kishore K. 73,322.28 2,093.26 6,569.50
Sharp,Keith Gordon 134,480.51 25,752.98 7,624.54
Shauer,Jennie‐Lee R 100,751.40 1,635.89 56.04
Shcherbyna,Olga 79,050.13 1,614.50 0.00
Sheel,Daniel D. 121,056.49 10,596.41 261.53
Sheeley,Patrick J 101,085.61 5,070.47 10.00
Shehadeh,Samir Anwar 91,112.35 4,162.31 0.00
Sheriff,David C 98,021.77 8,653.19 10.00
Sherwood,J Evan 82,475.61 1,596.35 0.00
Shield,Jonathan W. 108,469.09 4,834.69 ‐249.33
Sidhu,Jagdeep Richie 83,238.41 13,214.58 41.84
Siemens,Jonathan M 97,889.30 14,323.10 28.00
Siggs,Jerry L. 104,436.14 18,241.20 425.00
Silva,Rosemary 90,349.28 2,295.04 0.00
Silvestre,Jorge M 105,295.96 12,159.44 3,288.65
Simoes,Fernando M. 121,056.53 4,223.11 225.90
Simonsen,Kirk K 103,310.08 9,614.57 160.00
Simpson,Joshua R 101,218.54 12,230.16 180.00
Simpson,Martin 99,596.91 4,201.73 190.00
Simpson,Sean T. 171,291.36 20,660.00 10,200.14
Singh,Andrew W. 79,747.31 12,409.72 856.09
Singh,Gian 105,245.47 11,159.30 3,997.57
Sirk,Albert A 76,159.31 2,075.77 0.00
Siudut,George E. 18,324.89 154,621.41 60.01
Siudut,Rodney G 83,238.41 14,490.26 2,233.64
Skowronski,Michael 79,655.80 3,614.63 28.56
Skyers,Maria CL 76,563.92 2,891.76 903.17
Skytte,Steven A. 122,548.10 12,022.73 0.00
Slamang,Hassem 122,821.44 6,080.13 0.00
Sloan,Richard G. 103,675.38 21,465.03 0.00
Sloan,Stephen G 97,676.03 13,156.86 0.00
Smart,Katie 75,952.34 8,241.75 120.00
Smid,Yme 74,271.00 4,052.41 0.00
Smith,Fraser John 248,706.66 42,888.31 18,529.19
Smith,Murray G. 92,356.58 15,114.19 20.00
Smith,Roger 90,295.11 3,375.99 624.75
Page 79 of 113
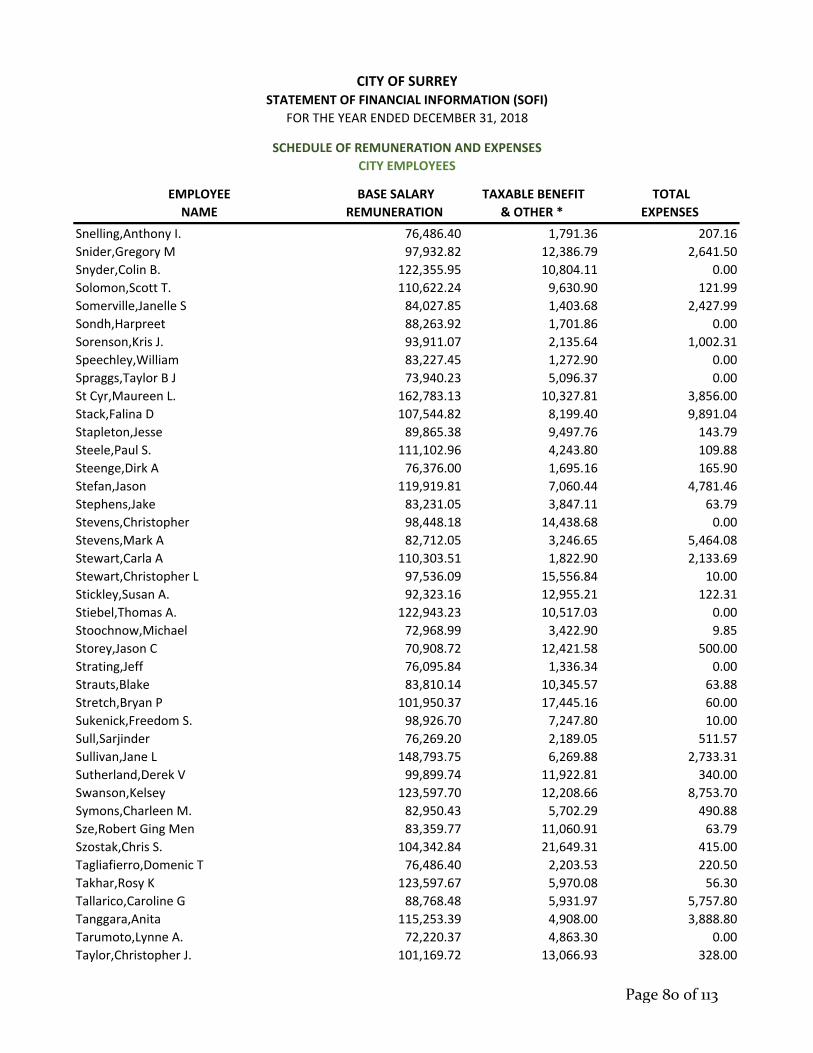
EMPLOYEE
NAME
BASE SALARY
REMUNERATION
TAXABLE BENEFIT
& OTHER *
TOTAL
EXPENSES
CITY EMPLOYEES
CITY OF SURREYSTATEMENT OF FINANCIAL INFORMATION (SOFI)
FOR THE YEAR ENDED DECEMBER 31, 2018
SCHEDULE OF REMUNERATION AND EXPENSES
Snelling,Anthony I. 76,486.40 1,791.36 207.16
Snider,Gregory M 97,932.82 12,386.79 2,641.50
Snyder,Colin B. 122,355.95 10,804.11 0.00
Solomon,Scott T. 110,622.24 9,630.90 121.99
Somerville,Janelle S 84,027.85 1,403.68 2,427.99
Sondh,Harpreet 88,263.92 1,701.86 0.00
Sorenson,Kris J. 93,911.07 2,135.64 1,002.31
Speechley,William 83,227.45 1,272.90 0.00
Spraggs,Taylor B J 73,940.23 5,096.37 0.00
St Cyr,Maureen L. 162,783.13 10,327.81 3,856.00
Stack,Falina D 107,544.82 8,199.40 9,891.04
Stapleton,Jesse 89,865.38 9,497.76 143.79
Steele,Paul S. 111,102.96 4,243.80 109.88
Steenge,Dirk A 76,376.00 1,695.16 165.90
Stefan,Jason 119,919.81 7,060.44 4,781.46
Stephens,Jake 83,231.05 3,847.11 63.79
Stevens,Christopher 98,448.18 14,438.68 0.00
Stevens,Mark A 82,712.05 3,246.65 5,464.08
Stewart,Carla A 110,303.51 1,822.90 2,133.69
Stewart,Christopher L 97,536.09 15,556.84 10.00
Stickley,Susan A. 92,323.16 12,955.21 122.31
Stiebel,Thomas A. 122,943.23 10,517.03 0.00
Stoochnow,Michael 72,968.99 3,422.90 9.85
Storey,Jason C 70,908.72 12,421.58 500.00
Strating,Jeff 76,095.84 1,336.34 0.00
Strauts,Blake 83,810.14 10,345.57 63.88
Stretch,Bryan P 101,950.37 17,445.16 60.00
Sukenick,Freedom S. 98,926.70 7,247.80 10.00
Sull,Sarjinder 76,269.20 2,189.05 511.57
Sullivan,Jane L 148,793.75 6,269.88 2,733.31
Sutherland,Derek V 99,899.74 11,922.81 340.00
Swanson,Kelsey 123,597.70 12,208.66 8,753.70
Symons,Charleen M. 82,950.43 5,702.29 490.88
Sze,Robert Ging Men 83,359.77 11,060.91 63.79
Szostak,Chris S. 104,342.84 21,649.31 415.00
Tagliafierro,Domenic T 76,486.40 2,203.53 220.50
Takhar,Rosy K 123,597.67 5,970.08 56.30
Tallarico,Caroline G 88,768.48 5,931.97 5,757.80
Tanggara,Anita 115,253.39 4,908.00 3,888.80
Tarumoto,Lynne A. 72,220.37 4,863.30 0.00
Taylor,Christopher J. 101,169.72 13,066.93 328.00
Page 80 of 113

EMPLOYEE
NAME
BASE SALARY
REMUNERATION
TAXABLE BENEFIT
& OTHER *
TOTAL
EXPENSES
CITY EMPLOYEES
CITY OF SURREYSTATEMENT OF FINANCIAL INFORMATION (SOFI)
FOR THE YEAR ENDED DECEMBER 31, 2018
SCHEDULE OF REMUNERATION AND EXPENSES
Taylor,Jonathan 75,868.05 3,250.60 91.79
Teeple,Michael N. 51,953.91 26,553.34 0.00
Terzariol,Lory 100,369.08 2,432.34 144.79
Tetrault,Bruce E. 123,355.89 7,525.40 162.38
Tewson,Robert E. 123,802.08 17,181.84 0.00
Thibaudeau,Jerome P 105,250.23 13,913.91 27.50
Thiessen,Scott J 97,322.82 14,322.24 10.00
Thind,Bobby S 83,238.41 622.51 0.00
Thody,Derek R 86,027.91 2,217.89 0.00
Thomas,Larry S. 174,307.64 26,916.77 5,319.20
Thompson,Lance 74,813.13 2,495.88 352.02
Tiede,Kristen L 115,197.52 9,133.64 719.38
Todd,Darren 131,326.38 1,823.08 2,688.80
Tomio,Susanne M 75,192.75 6,015.87 551.10
Torrence,Lindsey M 69,216.40 12,004.51 0.00
Tosdevine‐Tataryn,Sahra‐Lea 83,484.15 2,905.60 1,962.79
Townsend,Charles A. 123,098.83 11,481.17 0.00
Toxopeus,Brian 98,094.97 13,808.28 0.00
Traa,John J 102,410.70 5,401.26 0.00
Trainor,Michael 77,027.80 12,827.32 0.00
Trotman,Robert S. 82,388.25 8,402.86 7,469.30
Tse,Yat Ching 88,195.04 4,170.56 653.00
Tulud,Nele B 76,486.40 2,546.11 20.25
Tung,Inderjit 82,593.07 2,703.79 2,586.92
Turner,Donald F. 50,234.40 28,162.27 0.00
Tyler,James F. 133,426.38 16,268.30 3,200.89
Ungless,Neil 76,096.28 8,236.02 150.00
Unsworth,James D 114,601.32 11,078.12 140.00
Uppal,Raveen 81,925.69 3,964.06 16.18
Vadik,David J. 107,384.87 12,677.85 1,028.86
Valdes,Ryan 75,981.47 8,153.34 0.00
Van Dijk,Victor H 101,457.40 2,494.13 0.00
Van Eaton,Kerri N 88,011.02 1,673.96 2,548.23
Van Rooyen,Dylan 97,715.85 10,609.28 51.81
Varaitch,Terri K. 77,217.98 10,155.30 0.00
Varner,James W. 76,265.60 1,438.95 574.49
Velin,Chris E 98,837.69 4,430.42 3,057.79
Veras Pena,Ramon Alfredo 76,275.01 1,697.22 0.00
Vincent,Michael J 97,700.81 8,146.51 0.00
Virk,Arminder Singh 96,792.99 9,227.04 0.00
Wadhwa,Harsukhdip S. 75,989.60 2,889.17 0.00
Page 81 of 113

EMPLOYEE
NAME
BASE SALARY
REMUNERATION
TAXABLE BENEFIT
& OTHER *
TOTAL
EXPENSES
CITY EMPLOYEES
CITY OF SURREYSTATEMENT OF FINANCIAL INFORMATION (SOFI)
FOR THE YEAR ENDED DECEMBER 31, 2018
SCHEDULE OF REMUNERATION AND EXPENSES
Wainman,Jenny S 73,454.51 5,382.98 634.54
Walker,Benjamin 97,580.23 12,319.92 0.00
Walker,Tracy 75,096.21 2,130.95 1,366.61
Wall,Jordan 83,208.96 3,333.82 63.79
Wallace,Greg 74,698.40 1,145.60 46.77
Wallace,Michael B. 122,134.03 8,203.02 0.00
Wallace,Twyla 82,025.76 1,102.54 160.00
Walters,Corey D 122,406.01 10,475.32 10.00
Walters,Troy 100,948.99 5,187.75 10.00
Wang,Bo Chun 77,402.22 1,715.51 587.44
Wang,Timothy X. 121,084.63 13,567.06 751.31
Ward,Samantha 120,033.13 3,058.07 1,975.57
Warren,Kenneth C 79,070.48 3,068.77 112.35
Warren,Tracy 110,453.80 6,843.00 10.00
Waskito,Joseph 76,563.90 1,737.13 0.00
Waterhouse,Terry 183,812.00 26,220.18 16,526.28
Watson,Natalie E 82,601.92 9,736.39 0.00
Watt,Jason Allan 143,285.87 6,128.55 1,643.46
Watts,Nicholas J. 122,760.47 14,241.97 40.00
Watts,Trevor M. 122,876.94 10,524.75 0.00
Wegleitner,Michael G. 122,277.46 10,748.21 0.00
Welch,Clayton J 82,918.02 1,432.40 4,007.34
Westman,Alison 105,339.38 7,956.66 56.04
Westman,Warren G 113,039.13 18,719.40 0.00
White,Lisa A. 171,788.36 23,869.18 3,074.75
White,Ryan 74,853.55 3,544.73 7,485.88
Whitters,Cameron 83,314.83 12,911.25 63.79
Widera,Waldemar 100,468.72 8,611.51 59.99
Wiederick,Gordon C. 76,280.61 10,111.40 0.00
Wielgasz,Bryan James 97,700.82 4,873.40 0.00
Wiens,Christopher J 73,849.52 4,515.52 110.00
Wiggins,Cory M. 100,948.98 10,629.78 199.00
Wiggins,Ian 90,555.55 10,992.47 0.00
Wilcott,Christopher Ian 85,178.19 1,772.47 534.48
Williamson,Aaron M. 83,080.35 2,274.10 3,201.47
Wilson,Andrew T 97,932.80 3,236.75 10.25
Wilson,Benjamin 119,986.36 9,012.88 336.35
Wilson,Michael J. 101,264.01 14,908.13 180.00
Witt,Matthew 100,536.40 12,350.11 10.00
Wolfe,Tamara M. 101,036.63 3,290.19 180.00
Wong Moon,Roger L 106,334.90 2,287.88 29.00
Page 82 of 113

EMPLOYEE
NAME
BASE SALARY
REMUNERATION
TAXABLE BENEFIT
& OTHER *
TOTAL
EXPENSES
CITY EMPLOYEES
CITY OF SURREYSTATEMENT OF FINANCIAL INFORMATION (SOFI)
FOR THE YEAR ENDED DECEMBER 31, 2018
SCHEDULE OF REMUNERATION AND EXPENSES
Wong,Anders K 83,238.43 3,547.12 1,944.94
Wong,Eldwin 81,567.69 1,326.34 0.00
Wong,Fay K 77,504.00 8,029.70 2,707.75
Wong,Jeremy Jie Min 95,483.16 2,198.65 1,033.56
Wong,Kerry D. 97,932.84 10,181.96 916.76
Wong,Nga Chung 97,932.81 2,390.20 28.93
Woodward,Ken S. 131,013.63 8,665.39 1,788.22
Wooldridge,Collin E 83,238.42 9,657.07 144.14
Woronuik,Brian D 111,221.08 4,090.05 130.00
Woronuik,Jacob Riley 83,798.08 11,689.32 96.31
Worsley,Robert W. 76,095.84 18,267.46 100.99
Wright,Avril E 90,295.13 1,683.03 2,601.29
Wright,Donald G. 110,309.39 13,895.11 3,444.81
Wu,Stephen 121,479.78 15,959.38 7,328.97
Wuensche,Melissa J 88,111.04 3,128.28 0.00
Wyatt,David S 124,761.54 5,736.11 10.00
Xu,Chao 97,932.80 3,055.36 0.00
Xu,Shenglin 86,277.73 1,553.09 431.30
Yadav,Amritprit K. 85,493.00 4,492.71 7,636.75
Yakemchuk,Tasha K 83,948.04 2,075.32 2,989.52
Yakimovitch,Karmelle 77,496.76 930.93 805.36
Yasinski,Steve 76,537.83 2,053.00 0.00
Yee,David L 106,334.90 3,145.07 133.95
Yeung,Alice W 81,014.59 8,838.32 1,475.27
Yih,Elizabeth 75,101.92 7,658.99 937.49
Yohannes,Yonatan 134,987.94 19,993.42 3,327.68
Young,Oliver J. 77,252.80 2,639.08 22.40
Zacharias,Daniel 97,668.52 13,457.06 0.00
Zanon,Egberto 89,747.69 2,305.57 0.00
Zaragoza,Felipe 75,734.21 4,660.15 0.00
Zhang,Huanming 76,486.40 5,297.96 588.00
Zhang,Jing 97,932.80 17,837.53 4,581.85
Zhang,Mei 83,238.42 2,275.32 519.26
Zia,Leah D. 83,165.21 1,758.48 1,532.53
Zinger,Kevin J. 123,434.39 11,334.69 10.00
Zopf,Jason Curtis 96,593.88 4,379.91 1,853.28
Consolidated Total of Employees
with Remuneration exceeding $75,000 103,057,532.42$ 9,907,805.23$ 1,298,926.48$
Consolidated Total of Employees
with Remuneration of $75,000 or less 92,920,377.62$ 5,994,952.08$ 461,593.79$
Page 83 of 113

EMPLOYEE
NAME
BASE SALARY
REMUNERATION
TAXABLE BENEFIT
& OTHER *
TOTAL
EXPENSES
CITY EMPLOYEES
CITY OF SURREYSTATEMENT OF FINANCIAL INFORMATION (SOFI)
FOR THE YEAR ENDED DECEMBER 31, 2018
SCHEDULE OF REMUNERATION AND EXPENSES
Consolidated Total 195,977,910.04$ 15,902,757.31$ 1,760,520.27$
* Taxable Benefit & Other" includes payout of earned time for vacation, gratuity payments, pay for performance,
banked time, and/or vehicle allowances.
The variance between the Schedule of Remuneration and Expenses and the Salaries and benefits expenses
reported on the consolidated financial statements of the City are due to various factors including:
The Remuneration and Expenses schedule is based on actual cash payments made during the fiscal
year (including payouts of vacation, gratuity, and overtime banks) whereas the consolidated financial
statement figure is determined on an accrual basis;
The Remuneration and Expenses schedule excludes the Surrey Public Library and Surrey City
Development Corporation; and,
The Salaries and benefits includes benefits that are recorded at full cost (including overhead
allocations) on the consolidated financial statements and includes items such as employer portions of
federal deductions, retirement benefits and medical benefits.
Page 84 of 113

City of Surrey Statement of Financial Information (SOFI) Statement of Severance Agreements Section 7
2018 Statement of Financial Information
During the fiscal year ending December 31, 2018, the City of Surrey entered into 6 severance agreements ranging from 0.5 months to 9 months in duration. Prepared under the Financial Information Regulation, Schedule 1, subsection 6(7)
Page 85 of 113

City of Surrey Statement of Financial Information (SOFI) Schedule of Suppliers of Goods or Services Section 8
2018 Statement of Financial Information
Regulations require the City of Surrey to report the total amount paid to each supplier for goods and services that exceeds $25,000 in the year reported.
Prepared under the Financial Information Regulation, Schedule 1, subsection 7(1)
Page 86 of 113

SUPPLIER NAME AMOUNT ($)
0890551 BC LTD. DBA ALPINE LANDSCAPING 292,170.89
0946235 B.C. LTD. 89,155.50
0952123 BC LTD 71,940.06
1011534 BC LTD. 105,196.34
1011911 BC LTD. 25,034.10
1014925 BC LTD. 106,029.00
1030603 BC LTD 377,328.56
1050127 BC LTD. 136,402.24
1066182 BC LTD. 55,283.76
1098828 B.C. LTD. 30,126.85
360 SURVEILLANCE INC. 76,276.96
3M CANADA COMPANY COMPAGNIE 3M CANADA 277,392.11
3R DEMOLITION CORP 160,471.50
3SI RISK STRATEGIES INC. 27,447.66
4TH UTILITY INCORPORATED 273,281.06
624270 BC LTD. 67,580.28
635913 BC LTD DBA MUSTANG CONTRACTING 146,632.09
638471 BC LTD 129,478.11
6505589 CANADA INC. DBA WINMAR VANCOUVER 258,076.99
6S MARKETING INC. 35,250.00
7218 KG FINANCIAL INC. C/O VALUE PROPERTY CENTRE INC 593,829.82
A&G SUPPLY LTD. 577,999.70
A.R.M. CONTRACTING 77,266.35
ABBOTSFORD COMMUNITY SERVICES 65,070.70
ABC PIPE CLEANING SERVICES LTD. 63,841.61
ABC TRANSMISSIONS LTD. 29,033.92
ABD TRUCK CRANE SERVICE 49,237.85
ABLE AUCTION 26,385.08
ACCESS GAS SERVICE INC. 1,066,786.68
ACE LOCK & KEY 81,501.98
ACKLANDS‐GRAINGER INC. 25,193.15
ACME VISIBLE FILING SYSTEMS LTD. 26,469.71
ACOM BUILDING MAINTENANCE LTD. 1,098,942.11
ACRODEX INC. dba PCM CANADA 260,191.80
ACTION HOLDINGS LTD. O/A CUSTOM BLACKTOP CO. 893,888.50
ACTION STAINLESS LTD. 29,949.92
ADCENTIVES 486,134.61
AECOM CANADA LTD. 67,471.18
AES ENGINEERING LTD. 25,381.92
CITY OF SURREYSTATEMENT OF FINANCIAL INFORMATION (SOFI)
FOR THE YEAR ENDED DECEMBER 31, 2018
SCHEDULE OF PAYMENTS FOR PROVISION OF GOODS & SERVICES
Page 87 of 113
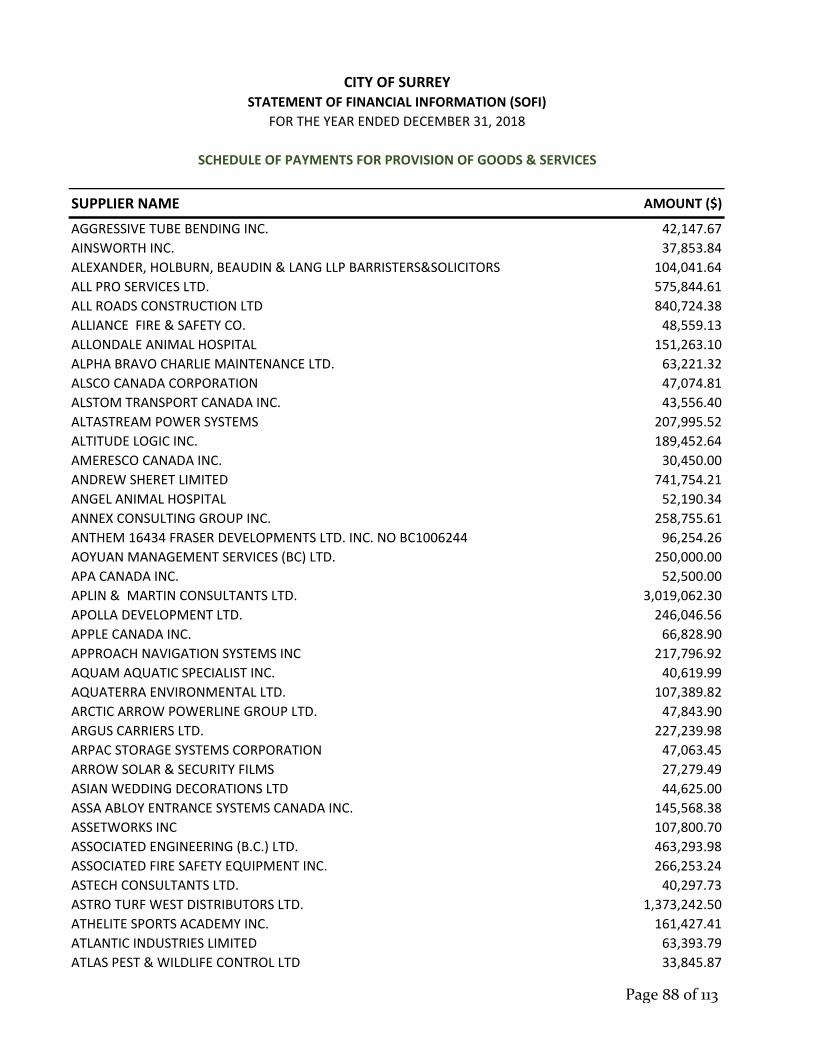
SUPPLIER NAME AMOUNT ($)
CITY OF SURREYSTATEMENT OF FINANCIAL INFORMATION (SOFI)
FOR THE YEAR ENDED DECEMBER 31, 2018
SCHEDULE OF PAYMENTS FOR PROVISION OF GOODS & SERVICES
AGGRESSIVE TUBE BENDING INC. 42,147.67
AINSWORTH INC. 37,853.84
ALEXANDER, HOLBURN, BEAUDIN & LANG LLP BARRISTERS&SOLICITORS 104,041.64
ALL PRO SERVICES LTD. 575,844.61
ALL ROADS CONSTRUCTION LTD 840,724.38
ALLIANCE FIRE & SAFETY CO. 48,559.13
ALLONDALE ANIMAL HOSPITAL 151,263.10
ALPHA BRAVO CHARLIE MAINTENANCE LTD. 63,221.32
ALSCO CANADA CORPORATION 47,074.81
ALSTOM TRANSPORT CANADA INC. 43,556.40
ALTASTREAM POWER SYSTEMS 207,995.52
ALTITUDE LOGIC INC. 189,452.64
AMERESCO CANADA INC. 30,450.00
ANDREW SHERET LIMITED 741,754.21
ANGEL ANIMAL HOSPITAL 52,190.34
ANNEX CONSULTING GROUP INC. 258,755.61
ANTHEM 16434 FRASER DEVELOPMENTS LTD. INC. NO BC1006244 96,254.26
AOYUAN MANAGEMENT SERVICES (BC) LTD. 250,000.00
APA CANADA INC. 52,500.00
APLIN & MARTIN CONSULTANTS LTD. 3,019,062.30
APOLLA DEVELOPMENT LTD. 246,046.56
APPLE CANADA INC. 66,828.90
APPROACH NAVIGATION SYSTEMS INC 217,796.92
AQUAM AQUATIC SPECIALIST INC. 40,619.99
AQUATERRA ENVIRONMENTAL LTD. 107,389.82
ARCTIC ARROW POWERLINE GROUP LTD. 47,843.90
ARGUS CARRIERS LTD. 227,239.98
ARPAC STORAGE SYSTEMS CORPORATION 47,063.45
ARROW SOLAR & SECURITY FILMS 27,279.49
ASIAN WEDDING DECORATIONS LTD 44,625.00
ASSA ABLOY ENTRANCE SYSTEMS CANADA INC. 145,568.38
ASSETWORKS INC 107,800.70
ASSOCIATED ENGINEERING (B.C.) LTD. 463,293.98
ASSOCIATED FIRE SAFETY EQUIPMENT INC. 266,253.24
ASTECH CONSULTANTS LTD. 40,297.73
ASTRO TURF WEST DISTRIBUTORS LTD. 1,373,242.50
ATHELITE SPORTS ACADEMY INC. 161,427.41
ATLANTIC INDUSTRIES LIMITED 63,393.79
ATLAS PEST & WILDLIFE CONTROL LTD 33,845.87
Page 88 of 113
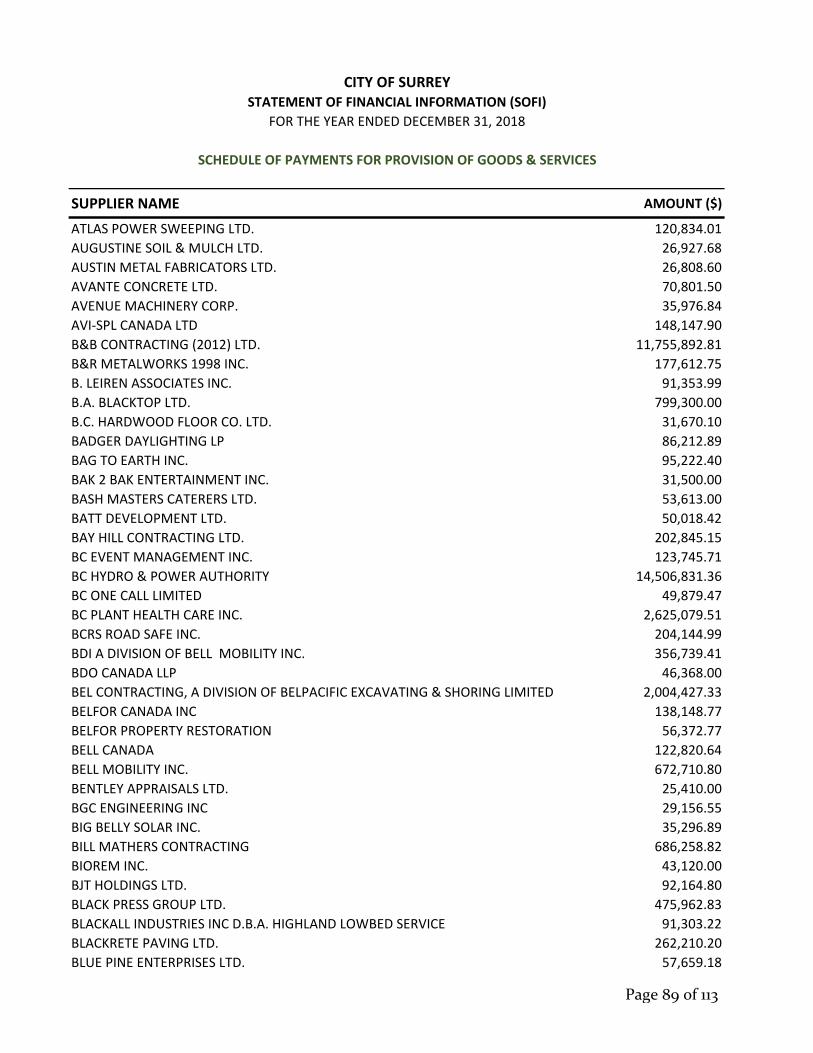
SUPPLIER NAME AMOUNT ($)
CITY OF SURREYSTATEMENT OF FINANCIAL INFORMATION (SOFI)
FOR THE YEAR ENDED DECEMBER 31, 2018
SCHEDULE OF PAYMENTS FOR PROVISION OF GOODS & SERVICES
ATLAS POWER SWEEPING LTD. 120,834.01
AUGUSTINE SOIL & MULCH LTD. 26,927.68
AUSTIN METAL FABRICATORS LTD. 26,808.60
AVANTE CONCRETE LTD. 70,801.50
AVENUE MACHINERY CORP. 35,976.84
AVI‐SPL CANADA LTD 148,147.90
B&B CONTRACTING (2012) LTD. 11,755,892.81
B&R METALWORKS 1998 INC. 177,612.75
B. LEIREN ASSOCIATES INC. 91,353.99
B.A. BLACKTOP LTD. 799,300.00
B.C. HARDWOOD FLOOR CO. LTD. 31,670.10
BADGER DAYLIGHTING LP 86,212.89
BAG TO EARTH INC. 95,222.40
BAK 2 BAK ENTERTAINMENT INC. 31,500.00
BASH MASTERS CATERERS LTD. 53,613.00
BATT DEVELOPMENT LTD. 50,018.42
BAY HILL CONTRACTING LTD. 202,845.15
BC EVENT MANAGEMENT INC. 123,745.71
BC HYDRO & POWER AUTHORITY 14,506,831.36
BC ONE CALL LIMITED 49,879.47
BC PLANT HEALTH CARE INC. 2,625,079.51
BCRS ROAD SAFE INC. 204,144.99
BDI A DIVISION OF BELL MOBILITY INC. 356,739.41
BDO CANADA LLP 46,368.00
BEL CONTRACTING, A DIVISION OF BELPACIFIC EXCAVATING & SHORING LIMITED 2,004,427.33
BELFOR CANADA INC 138,148.77
BELFOR PROPERTY RESTORATION 56,372.77
BELL CANADA 122,820.64
BELL MOBILITY INC. 672,710.80
BENTLEY APPRAISALS LTD. 25,410.00
BGC ENGINEERING INC 29,156.55
BIG BELLY SOLAR INC. 35,296.89
BILL MATHERS CONTRACTING 686,258.82
BIOREM INC. 43,120.00
BJT HOLDINGS LTD. 92,164.80
BLACK PRESS GROUP LTD. 475,962.83
BLACKALL INDUSTRIES INC D.B.A. HIGHLAND LOWBED SERVICE 91,303.22
BLACKRETE PAVING LTD. 262,210.20
BLUE PINE ENTERPRISES LTD. 57,659.18
Page 89 of 113
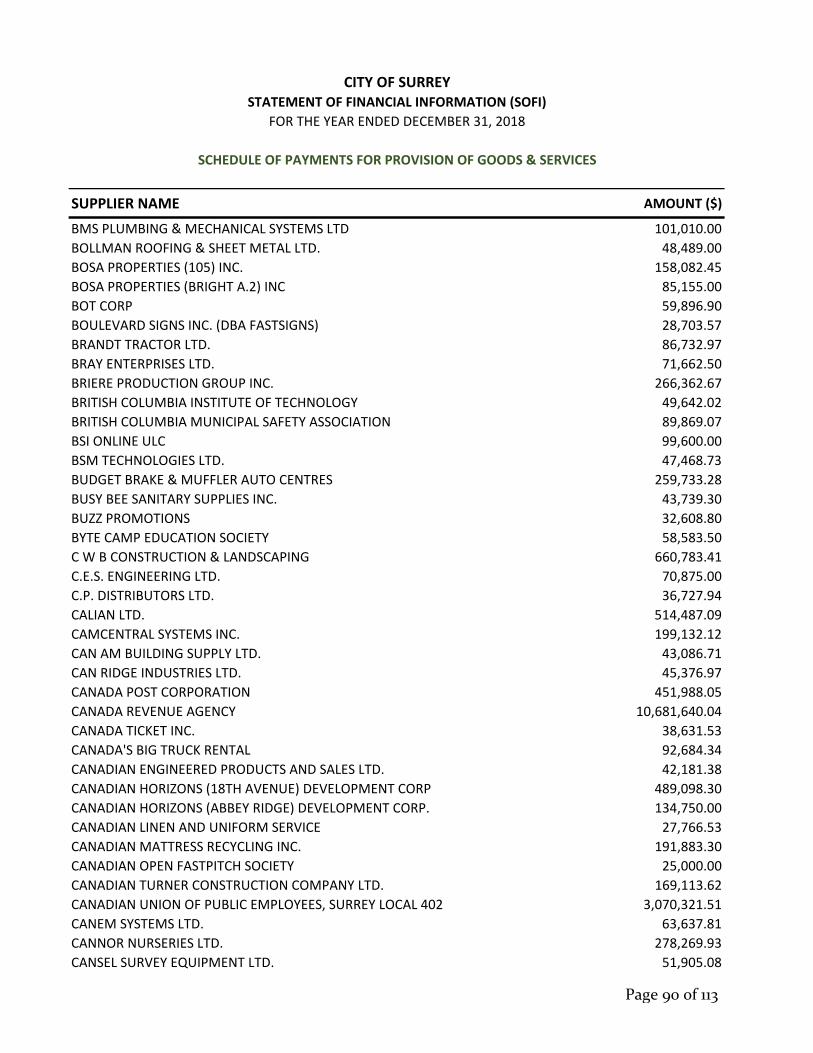
SUPPLIER NAME AMOUNT ($)
CITY OF SURREYSTATEMENT OF FINANCIAL INFORMATION (SOFI)
FOR THE YEAR ENDED DECEMBER 31, 2018
SCHEDULE OF PAYMENTS FOR PROVISION OF GOODS & SERVICES
BMS PLUMBING & MECHANICAL SYSTEMS LTD 101,010.00
BOLLMAN ROOFING & SHEET METAL LTD. 48,489.00
BOSA PROPERTIES (105) INC. 158,082.45
BOSA PROPERTIES (BRIGHT A.2) INC 85,155.00
BOT CORP 59,896.90
BOULEVARD SIGNS INC. (DBA FASTSIGNS) 28,703.57
BRANDT TRACTOR LTD. 86,732.97
BRAY ENTERPRISES LTD. 71,662.50
BRIERE PRODUCTION GROUP INC. 266,362.67
BRITISH COLUMBIA INSTITUTE OF TECHNOLOGY 49,642.02
BRITISH COLUMBIA MUNICIPAL SAFETY ASSOCIATION 89,869.07
BSI ONLINE ULC 99,600.00
BSM TECHNOLOGIES LTD. 47,468.73
BUDGET BRAKE & MUFFLER AUTO CENTRES 259,733.28
BUSY BEE SANITARY SUPPLIES INC. 43,739.30
BUZZ PROMOTIONS 32,608.80
BYTE CAMP EDUCATION SOCIETY 58,583.50
C W B CONSTRUCTION & LANDSCAPING 660,783.41
C.E.S. ENGINEERING LTD. 70,875.00
C.P. DISTRIBUTORS LTD. 36,727.94
CALIAN LTD. 514,487.09
CAMCENTRAL SYSTEMS INC. 199,132.12
CAN AM BUILDING SUPPLY LTD. 43,086.71
CAN RIDGE INDUSTRIES LTD. 45,376.97
CANADA POST CORPORATION 451,988.05
CANADA REVENUE AGENCY 10,681,640.04
CANADA TICKET INC. 38,631.53
CANADA'S BIG TRUCK RENTAL 92,684.34
CANADIAN ENGINEERED PRODUCTS AND SALES LTD. 42,181.38
CANADIAN HORIZONS (18TH AVENUE) DEVELOPMENT CORP 489,098.30
CANADIAN HORIZONS (ABBEY RIDGE) DEVELOPMENT CORP. 134,750.00
CANADIAN LINEN AND UNIFORM SERVICE 27,766.53
CANADIAN MATTRESS RECYCLING INC. 191,883.30
CANADIAN OPEN FASTPITCH SOCIETY 25,000.00
CANADIAN TURNER CONSTRUCTION COMPANY LTD. 169,113.62
CANADIAN UNION OF PUBLIC EMPLOYEES, SURREY LOCAL 402 3,070,321.51
CANEM SYSTEMS LTD. 63,637.81
CANNOR NURSERIES LTD. 278,269.93
CANSEL SURVEY EQUIPMENT LTD. 51,905.08
Page 90 of 113
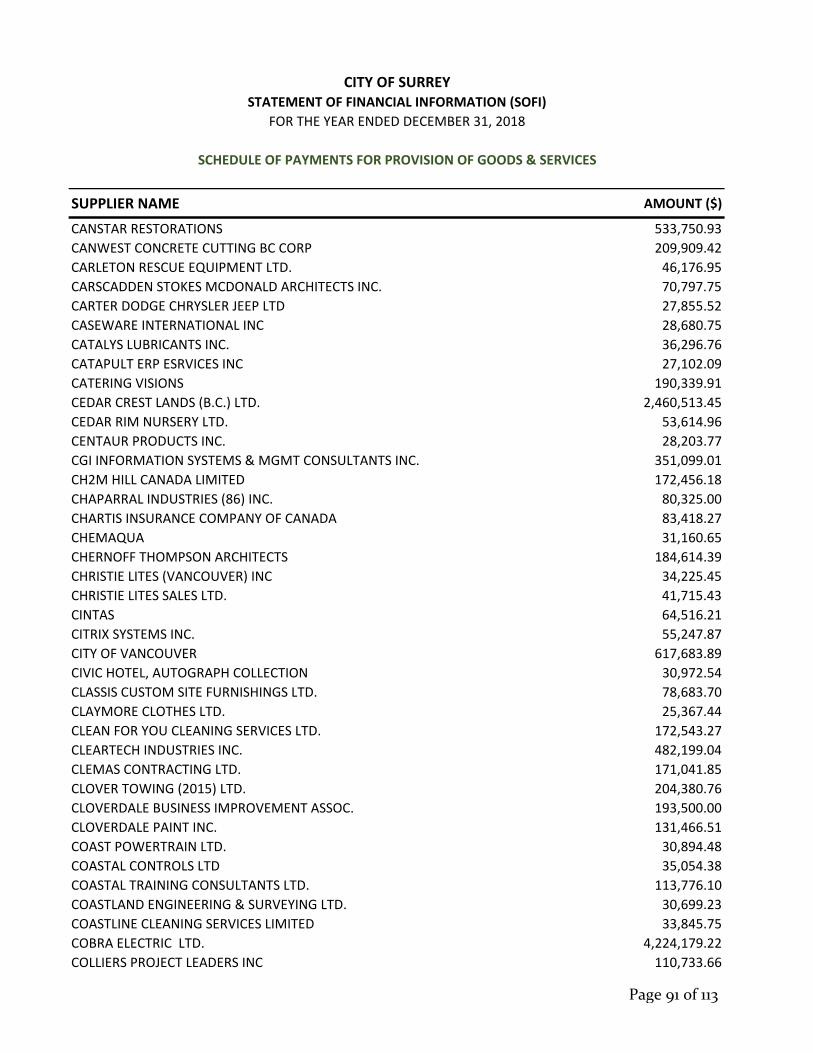
SUPPLIER NAME AMOUNT ($)
CITY OF SURREYSTATEMENT OF FINANCIAL INFORMATION (SOFI)
FOR THE YEAR ENDED DECEMBER 31, 2018
SCHEDULE OF PAYMENTS FOR PROVISION OF GOODS & SERVICES
CANSTAR RESTORATIONS 533,750.93
CANWEST CONCRETE CUTTING BC CORP 209,909.42
CARLETON RESCUE EQUIPMENT LTD. 46,176.95
CARSCADDEN STOKES MCDONALD ARCHITECTS INC. 70,797.75
CARTER DODGE CHRYSLER JEEP LTD 27,855.52
CASEWARE INTERNATIONAL INC 28,680.75
CATALYS LUBRICANTS INC. 36,296.76
CATAPULT ERP ESRVICES INC 27,102.09
CATERING VISIONS 190,339.91
CEDAR CREST LANDS (B.C.) LTD. 2,460,513.45
CEDAR RIM NURSERY LTD. 53,614.96
CENTAUR PRODUCTS INC. 28,203.77
CGI INFORMATION SYSTEMS & MGMT CONSULTANTS INC. 351,099.01
CH2M HILL CANADA LIMITED 172,456.18
CHAPARRAL INDUSTRIES (86) INC. 80,325.00
CHARTIS INSURANCE COMPANY OF CANADA 83,418.27
CHEMAQUA 31,160.65
CHERNOFF THOMPSON ARCHITECTS 184,614.39
CHRISTIE LITES (VANCOUVER) INC 34,225.45
CHRISTIE LITES SALES LTD. 41,715.43
CINTAS 64,516.21
CITRIX SYSTEMS INC. 55,247.87
CITY OF VANCOUVER 617,683.89
CIVIC HOTEL, AUTOGRAPH COLLECTION 30,972.54
CLASSIS CUSTOM SITE FURNISHINGS LTD. 78,683.70
CLAYMORE CLOTHES LTD. 25,367.44
CLEAN FOR YOU CLEANING SERVICES LTD. 172,543.27
CLEARTECH INDUSTRIES INC. 482,199.04
CLEMAS CONTRACTING LTD. 171,041.85
CLOVER TOWING (2015) LTD. 204,380.76
CLOVERDALE BUSINESS IMPROVEMENT ASSOC. 193,500.00
CLOVERDALE PAINT INC. 131,466.51
COAST POWERTRAIN LTD. 30,894.48
COASTAL CONTROLS LTD 35,054.38
COASTAL TRAINING CONSULTANTS LTD. 113,776.10
COASTLAND ENGINEERING & SURVEYING LTD. 30,699.23
COASTLINE CLEANING SERVICES LIMITED 33,845.75
COBRA ELECTRIC LTD. 4,224,179.22
COLLIERS PROJECT LEADERS INC 110,733.66
Page 91 of 113

SUPPLIER NAME AMOUNT ($)
CITY OF SURREYSTATEMENT OF FINANCIAL INFORMATION (SOFI)
FOR THE YEAR ENDED DECEMBER 31, 2018
SCHEDULE OF PAYMENTS FOR PROVISION OF GOODS & SERVICES
COLLINGWOOD APPRAISALS LTD. 40,969.45
COMBINED PAINTING 248,791.58
COMMERCIAL LIGHTING PRODUCTS LTD. 102,870.32
COMMERCIAL TRUCK EQUIPMENT CORP. 95,977.08
COMMON THEORY CREATIVE INC. 46,200.00
COMPASS GROUP CANADA LTD 49,930.35
COMPLETE POWER SYSTEMS LTD. 118,894.25
COMPUTERSHARE TRUST COMPANY OF CANADA 351,597.71
COMPUTRONIX (CANADA) LTD. 61,595.00
CONCORD PAINTING & WALLCOVERING LTD. 53,235.00
CONCORD PARKING LTD 1,161,994.83
CONWEST CONTRACTING LTD. 39,977.92
COREPM SERVICES Ltd. dba CORE PROJECT MANAGEMENT 196,399.68
CORIX UTILITIES INC. 905,791.83
CORIX WATER PRODUCTS LP 1,713,660.50
CORNERSTONE ADJUSTERS INC. 40,082.40
COSSETTE COMMUNICATION INC. 52,172.81
CRAFTSMAN MECHANICAL SYSTEMS INC. 52,683.75
CRATEX CONTAINER SALES (DIV. OF DELTA CONTAINER INC. 79,917.60
CREATIVE CHILDREN FURNITURE AND ART SUPPLIES LTD. 26,337.42
CREATIVE TRANSPORTATION SOLUTIONS LTD. 36,214.50
CRESCENT BEACH LIFE GUARDING CORPORATION 101,430.00
CROCKER EQUIPMENT CO. LTD. 29,650.74
CROSSON VALUATION INC. 25,565.87
CROWN CONTRACTING LIMITED 2,908,733.31
CSDC SYSTEMS INC. 175,879.38
CULINARY CAPERS CATERING INC. 195,349.40
CULLEN WESTERN STAR TRUCKS LTD. 36,065.98
CUMMINGS TRAILER SALES & RENTALS 33,006.42
CUMMINS CANADA ULC DBA CUMMINS WESTERN CANADA 78,484.14
CWPC PROPERTY CONSULTANTS LTD. 57,667.05
CY GROWER SUPPLIES 28,427.21
CYBERNETIC CONTROL SYSTEMS INC. 31,555.83
DAFCO FILTRATION GROUP CORPORATION 46,024.38
DALIBAR SANDHU & NARINDER SIDHU 92,905.29
DAMS FORD LINCOLN SALES LTD. 1,029,715.43
DARNU MANAGEMENT LTD. 320,306.20
DATAFIX A DIVISION OF COMPRINT SYSTEMS 119,892.50
DB PERKS & ASSOCIATES LTD. 158,509.55
Page 92 of 113

SUPPLIER NAME AMOUNT ($)
CITY OF SURREYSTATEMENT OF FINANCIAL INFORMATION (SOFI)
FOR THE YEAR ENDED DECEMBER 31, 2018
SCHEDULE OF PAYMENTS FOR PROVISION OF GOODS & SERVICES
DCH EXCAVATING LTD. 99,974.70
DECCAN INTERNATIONAL 31,175.30
DEKRA‐LITE 61,115.79
DELANEY DISTRIBUTING INC. 32,621.45
DELL CANADA INC. 1,543,145.13
DELOITTE LLP 91,848.97
DENBOW TRANSPORT LTD. 169,061.33
DENTONS CANADA LLP 131,297.69
DETAIL PRESSURE WASHING LTD. 33,932.85
DIALOG BC ARCHITECTURE ENGINEERING INTERIOR DESIGN 96,184.72
DIALOGUE CONSULTING INC. 41,580.00
DIAMOND HEAD CONSULTING LTD. 540,965.02
DILIGENT CORPORATION 37,115.66
DILLON CONSULTING LIMITED 1,134,455.00
DINESEN NURSERIES LTD. 546,167.72
DINKOING TECH INC. 37,110.83
DIRECT EQUIPMENT WEST LTD. 82,433.59
DIVERSIFIED MANAGEMENT INC 28,131.21
DL SAFETY CONSULTING LTD. 2,338,124.91
DL WATTS FLOORINGS (1994) LTD. 82,578.20
DMD & ASSOCIATES LTD. 38,247.45
DOCU‐LINK INTERNATIONAL INC dba GILMORE DOCULINK 52,102.39
DOMAIN7 SOLUTIONS INC. 128,551.50
DOMINION SELF‐PARK SYSTEMS LTD. 33,596.21
DOUBLE DOT INVESTMENT GROUP LTD. 563,038.02
DOUBLE R RENTALS 1987 LIMITED 65,372.94
DOWNTOWN SURREY BUSINESS IMPROVEMENT ASSOCIATION 1,074,400.00
DRAKE MEDOX HEALTH SOLUTIONS 36,078.00
DUECK ISUZU TRUCKS LIMITED 187,888.57
DYE & DURHAM CORPORATION 221,274.85
DYNAMIC SPECIALTY VEHICLES LTD. 297,238.61
E.B. HORSMAN & SON 65,082.71
EAST RICHMOND NURSERIES INC. 106,187.20
E‐CARD ID PRODUCTS LTD. 29,418.20
E‐COMM,EMERGENCY COMMUNICATION FOR BRITISH COLUMBIA INC. 1,754,037.18
ECONOLITE CANADA, INC. 240,152.64
ECOSAFE ZERO WASTE INC. 39,124.17
ECOSCAPE ENVIRONMENTAL CONSULTANTS LTD 89,843.47
ECOWORKS LANDSCAPE SERVICES 731,887.89
Page 93 of 113
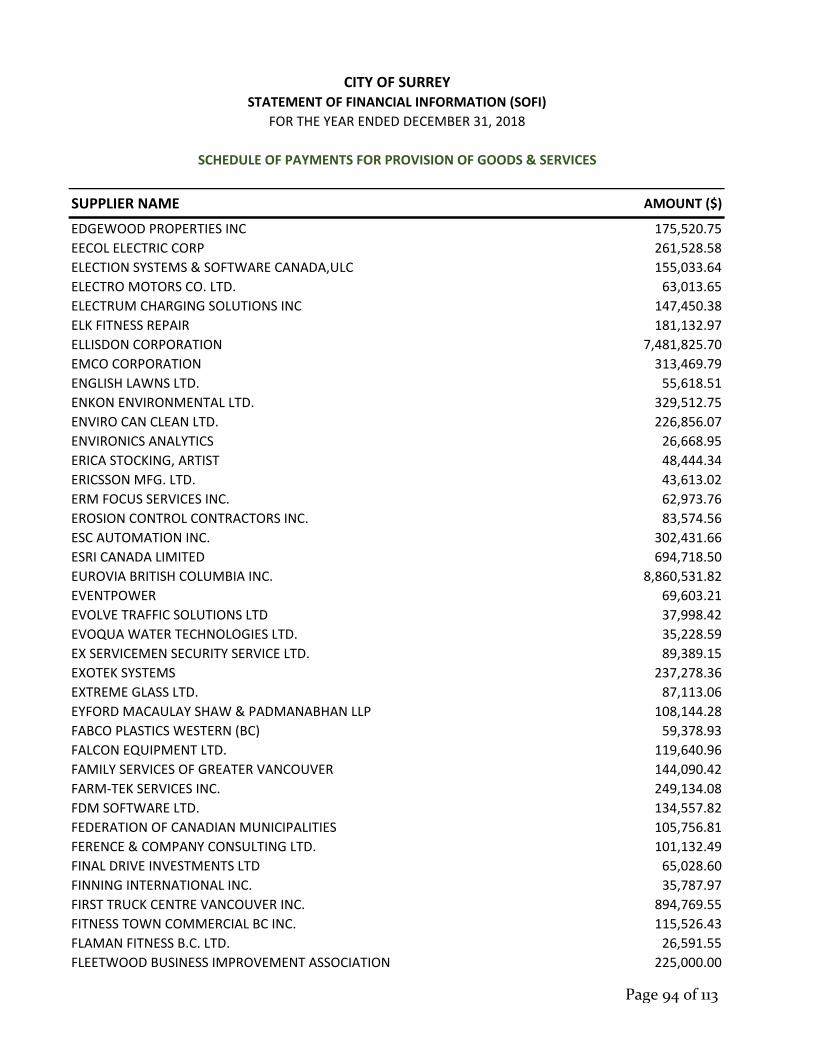
SUPPLIER NAME AMOUNT ($)
CITY OF SURREYSTATEMENT OF FINANCIAL INFORMATION (SOFI)
FOR THE YEAR ENDED DECEMBER 31, 2018
SCHEDULE OF PAYMENTS FOR PROVISION OF GOODS & SERVICES
EDGEWOOD PROPERTIES INC 175,520.75
EECOL ELECTRIC CORP 261,528.58
ELECTION SYSTEMS & SOFTWARE CANADA,ULC 155,033.64
ELECTRO MOTORS CO. LTD. 63,013.65
ELECTRUM CHARGING SOLUTIONS INC 147,450.38
ELK FITNESS REPAIR 181,132.97
ELLISDON CORPORATION 7,481,825.70
EMCO CORPORATION 313,469.79
ENGLISH LAWNS LTD. 55,618.51
ENKON ENVIRONMENTAL LTD. 329,512.75
ENVIRO CAN CLEAN LTD. 226,856.07
ENVIRONICS ANALYTICS 26,668.95
ERICA STOCKING, ARTIST 48,444.34
ERICSSON MFG. LTD. 43,613.02
ERM FOCUS SERVICES INC. 62,973.76
EROSION CONTROL CONTRACTORS INC. 83,574.56
ESC AUTOMATION INC. 302,431.66
ESRI CANADA LIMITED 694,718.50
EUROVIA BRITISH COLUMBIA INC. 8,860,531.82
EVENTPOWER 69,603.21
EVOLVE TRAFFIC SOLUTIONS LTD 37,998.42
EVOQUA WATER TECHNOLOGIES LTD. 35,228.59
EX SERVICEMEN SECURITY SERVICE LTD. 89,389.15
EXOTEK SYSTEMS 237,278.36
EXTREME GLASS LTD. 87,113.06
EYFORD MACAULAY SHAW & PADMANABHAN LLP 108,144.28
FABCO PLASTICS WESTERN (BC) 59,378.93
FALCON EQUIPMENT LTD. 119,640.96
FAMILY SERVICES OF GREATER VANCOUVER 144,090.42
FARM‐TEK SERVICES INC. 249,134.08
FDM SOFTWARE LTD. 134,557.82
FEDERATION OF CANADIAN MUNICIPALITIES 105,756.81
FERENCE & COMPANY CONSULTING LTD. 101,132.49
FINAL DRIVE INVESTMENTS LTD 65,028.60
FINNING INTERNATIONAL INC. 35,787.97
FIRST TRUCK CENTRE VANCOUVER INC. 894,769.55
FITNESS TOWN COMMERCIAL BC INC. 115,526.43
FLAMAN FITNESS B.C. LTD. 26,591.55
FLEETWOOD BUSINESS IMPROVEMENT ASSOCIATION 225,000.00
Page 94 of 113
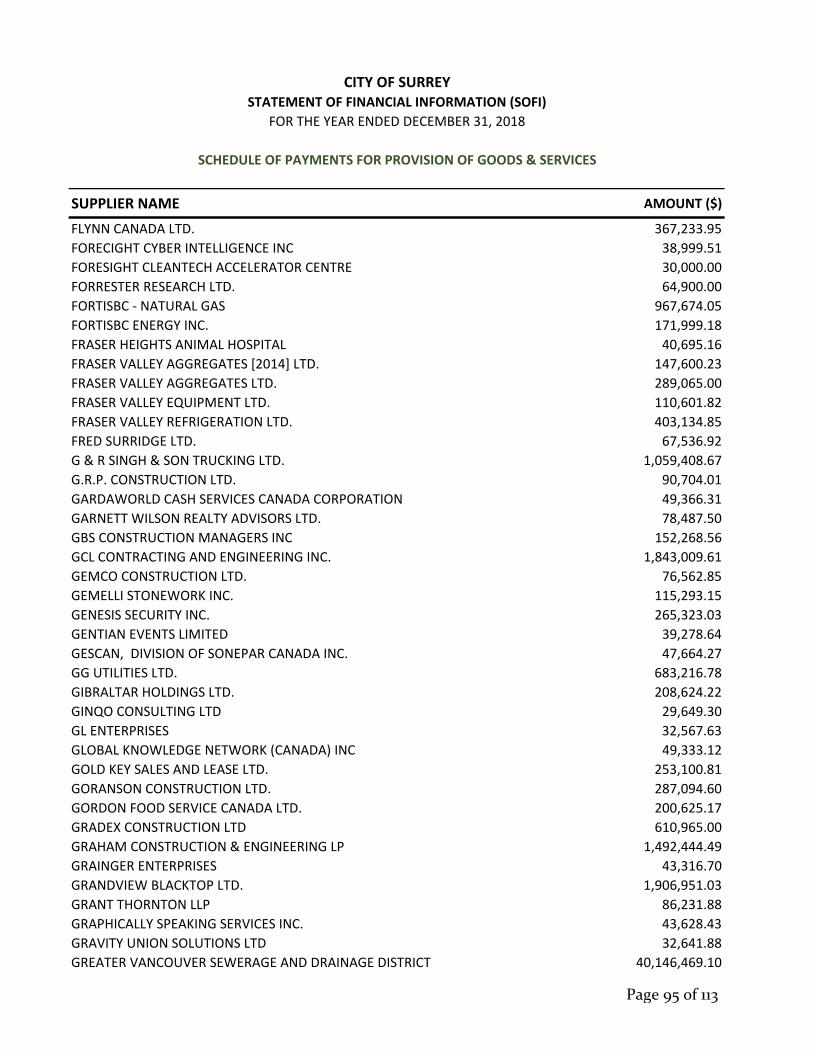
SUPPLIER NAME AMOUNT ($)
CITY OF SURREYSTATEMENT OF FINANCIAL INFORMATION (SOFI)
FOR THE YEAR ENDED DECEMBER 31, 2018
SCHEDULE OF PAYMENTS FOR PROVISION OF GOODS & SERVICES
FLYNN CANADA LTD. 367,233.95
FORECIGHT CYBER INTELLIGENCE INC 38,999.51
FORESIGHT CLEANTECH ACCELERATOR CENTRE 30,000.00
FORRESTER RESEARCH LTD. 64,900.00
FORTISBC ‐ NATURAL GAS 967,674.05
FORTISBC ENERGY INC. 171,999.18
FRASER HEIGHTS ANIMAL HOSPITAL 40,695.16
FRASER VALLEY AGGREGATES [2014] LTD. 147,600.23
FRASER VALLEY AGGREGATES LTD. 289,065.00
FRASER VALLEY EQUIPMENT LTD. 110,601.82
FRASER VALLEY REFRIGERATION LTD. 403,134.85
FRED SURRIDGE LTD. 67,536.92
G & R SINGH & SON TRUCKING LTD. 1,059,408.67
G.R.P. CONSTRUCTION LTD. 90,704.01
GARDAWORLD CASH SERVICES CANADA CORPORATION 49,366.31
GARNETT WILSON REALTY ADVISORS LTD. 78,487.50
GBS CONSTRUCTION MANAGERS INC 152,268.56
GCL CONTRACTING AND ENGINEERING INC. 1,843,009.61
GEMCO CONSTRUCTION LTD. 76,562.85
GEMELLI STONEWORK INC. 115,293.15
GENESIS SECURITY INC. 265,323.03
GENTIAN EVENTS LIMITED 39,278.64
GESCAN, DIVISION OF SONEPAR CANADA INC. 47,664.27
GG UTILITIES LTD. 683,216.78
GIBRALTAR HOLDINGS LTD. 208,624.22
GINQO CONSULTING LTD 29,649.30
GL ENTERPRISES 32,567.63
GLOBAL KNOWLEDGE NETWORK (CANADA) INC 49,333.12
GOLD KEY SALES AND LEASE LTD. 253,100.81
GORANSON CONSTRUCTION LTD. 287,094.60
GORDON FOOD SERVICE CANADA LTD. 200,625.17
GRADEX CONSTRUCTION LTD 610,965.00
GRAHAM CONSTRUCTION & ENGINEERING LP 1,492,444.49
GRAINGER ENTERPRISES 43,316.70
GRANDVIEW BLACKTOP LTD. 1,906,951.03
GRANT THORNTON LLP 86,231.88
GRAPHICALLY SPEAKING SERVICES INC. 43,628.43
GRAVITY UNION SOLUTIONS LTD 32,641.88
GREATER VANCOUVER SEWERAGE AND DRAINAGE DISTRICT 40,146,469.10
Page 95 of 113

SUPPLIER NAME AMOUNT ($)
CITY OF SURREYSTATEMENT OF FINANCIAL INFORMATION (SOFI)
FOR THE YEAR ENDED DECEMBER 31, 2018
SCHEDULE OF PAYMENTS FOR PROVISION OF GOODS & SERVICES
GREATER VANCOUVER WATER DISTRICT 49,143,989.41
GREEN CHAIR RECYCLING 70,942.50
GREEN FOR LIFE ENVIRONMENTAL INC. 129,471.20
GREEN OVER GREY LIVING WALLS AND DESIGN INC. 31,668.13
GREEN TIMBERS HERITAGE SOCIETY 165,000.00
GREENBARN POTTERS SUPPLY LTD. 43,363.95
GREGG DISTRIBUTORS (B.C.) LTD. 73,914.25
GRIFF BUILDING SUPPLIES LTD. 102,240.84
GTECHNA, A DIVISION OF ACCEO SOLUTIONS INC. 52,696.82
GUILLEVIN INTERNATIONAL CIE/CO. 82,425.44
GURU NANAK SIKH GURDWARA SOCIETY 282,949.50
H & T INVESTMENTS, DBA CAFE CENTRAL 27,798.48
H.Y. ENGINEERING LTD. 184,834.92
HABITAT SYSTEMS INC. 310,053.86
HALEY DODGE 55,655.68
HALLWOOD MILHAM TECHNOLOGIES INC. 41,176.82
HANLEY AGENCIES LTD. 357,413.55
HARBOUR WEST CONSULTING INC. 82,601.10
HARMONY EXPRESSIVE ARTS 28,884.45
HARVEST FRASER RICHMOND ORGANICS LTD 441,172.39
HAYER BUILDERS GROUP INC. 40,414.29
HAZMASTERS INC. 88,719.04
HCMA ARCHITECTURE + DESIGN 2,041,841.10
HEAD TO TOE SAFETY LTD 36,836.58
HEATHERBRAE BUILDERS CO. LTD. 9,883,902.57
HERITAGE OFFICE FURNISHINGS LTD. 255,275.75
HI‐LITE TRUCK ACCESSORIES LTD. 101,893.22
HITEX NORTH AMERICA LTD. 117,070.24
HOLIDAYLIGHTS.COM INC. DBA STAR ILLUMINATIONS 27,671.42
HOLMAN EXHIBITS LIMITED 562,591.33
HOPEWELL DEVELOPMENT CORPORATION 396,441.97
HORIZON LANDSCAPE CONTRACTORS INC. 2,130,344.82
HOULE ELECTRIC LIMITED 103,703.82
HUB CYCLING 69,520.00
HUGH & MCKINNON REALTY LTD. 73,196.26
HYLAND EXCAVATING LTD. 2,311,960.18
HYTEK MECHANICAL INC. 60,716.78
IBM CANADA LTD. 206,931.10
IC WALL AND FLOOR SOLUTIONS LTD. 35,715.64
Page 96 of 113
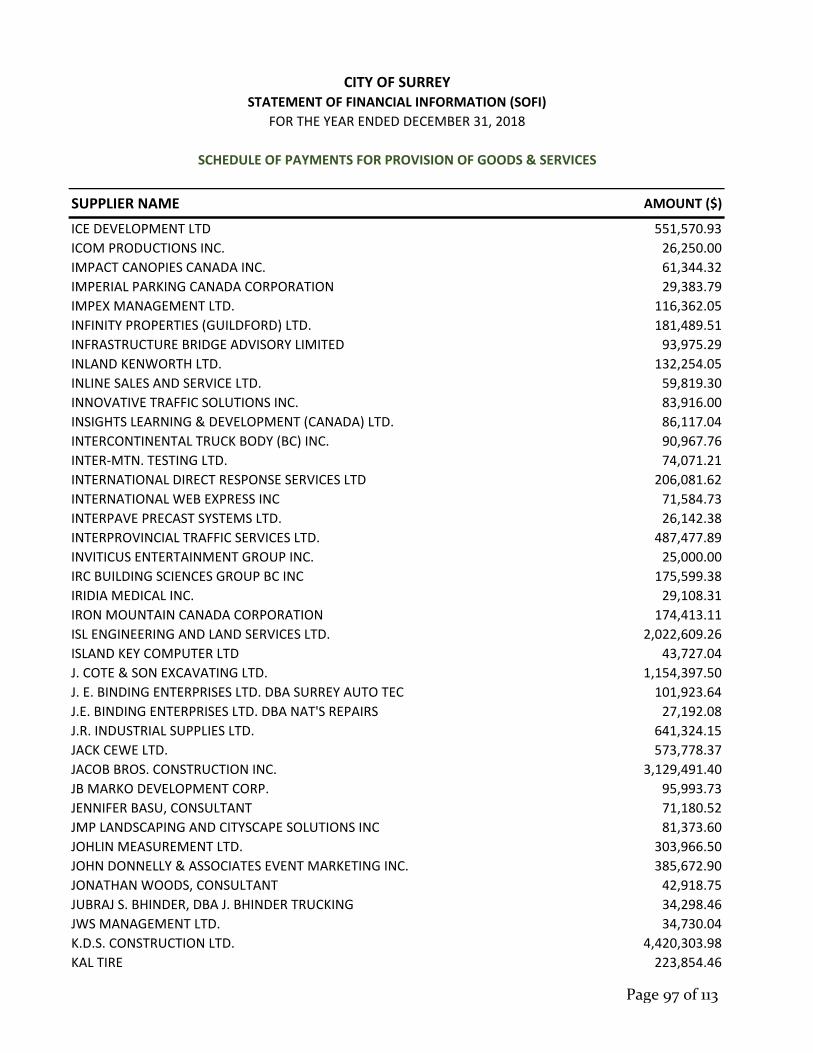
SUPPLIER NAME AMOUNT ($)
CITY OF SURREYSTATEMENT OF FINANCIAL INFORMATION (SOFI)
FOR THE YEAR ENDED DECEMBER 31, 2018
SCHEDULE OF PAYMENTS FOR PROVISION OF GOODS & SERVICES
ICE DEVELOPMENT LTD 551,570.93
ICOM PRODUCTIONS INC. 26,250.00
IMPACT CANOPIES CANADA INC. 61,344.32
IMPERIAL PARKING CANADA CORPORATION 29,383.79
IMPEX MANAGEMENT LTD. 116,362.05
INFINITY PROPERTIES (GUILDFORD) LTD. 181,489.51
INFRASTRUCTURE BRIDGE ADVISORY LIMITED 93,975.29
INLAND KENWORTH LTD. 132,254.05
INLINE SALES AND SERVICE LTD. 59,819.30
INNOVATIVE TRAFFIC SOLUTIONS INC. 83,916.00
INSIGHTS LEARNING & DEVELOPMENT (CANADA) LTD. 86,117.04
INTERCONTINENTAL TRUCK BODY (BC) INC. 90,967.76
INTER‐MTN. TESTING LTD. 74,071.21
INTERNATIONAL DIRECT RESPONSE SERVICES LTD 206,081.62
INTERNATIONAL WEB EXPRESS INC 71,584.73
INTERPAVE PRECAST SYSTEMS LTD. 26,142.38
INTERPROVINCIAL TRAFFIC SERVICES LTD. 487,477.89
INVITICUS ENTERTAINMENT GROUP INC. 25,000.00
IRC BUILDING SCIENCES GROUP BC INC 175,599.38
IRIDIA MEDICAL INC. 29,108.31
IRON MOUNTAIN CANADA CORPORATION 174,413.11
ISL ENGINEERING AND LAND SERVICES LTD. 2,022,609.26
ISLAND KEY COMPUTER LTD 43,727.04
J. COTE & SON EXCAVATING LTD. 1,154,397.50
J. E. BINDING ENTERPRISES LTD. DBA SURREY AUTO TEC 101,923.64
J.E. BINDING ENTERPRISES LTD. DBA NAT'S REPAIRS 27,192.08
J.R. INDUSTRIAL SUPPLIES LTD. 641,324.15
JACK CEWE LTD. 573,778.37
JACOB BROS. CONSTRUCTION INC. 3,129,491.40
JB MARKO DEVELOPMENT CORP. 95,993.73
JENNIFER BASU, CONSULTANT 71,180.52
JMP LANDSCAPING AND CITYSCAPE SOLUTIONS INC 81,373.60
JOHLIN MEASUREMENT LTD. 303,966.50
JOHN DONNELLY & ASSOCIATES EVENT MARKETING INC. 385,672.90
JONATHAN WOODS, CONSULTANT 42,918.75
JUBRAJ S. BHINDER, DBA J. BHINDER TRUCKING 34,298.46
JWS MANAGEMENT LTD. 34,730.04
K.D.S. CONSTRUCTION LTD. 4,420,303.98
KAL TIRE 223,854.46
Page 97 of 113
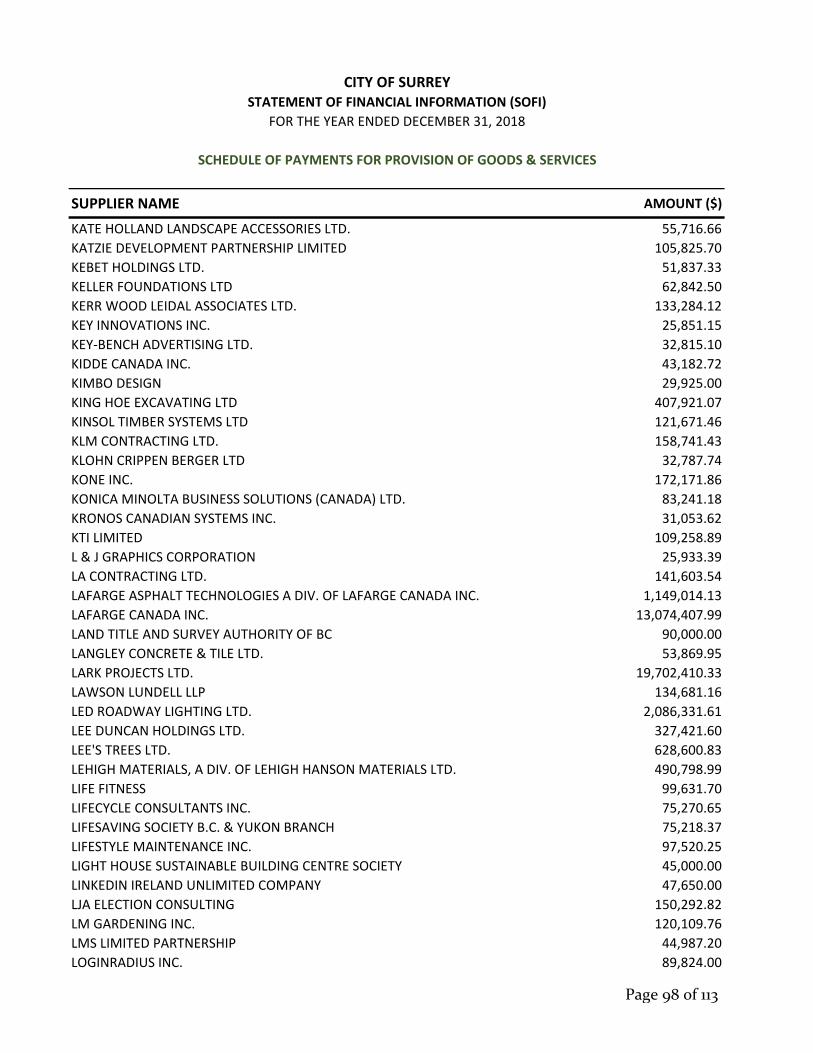
SUPPLIER NAME AMOUNT ($)
CITY OF SURREYSTATEMENT OF FINANCIAL INFORMATION (SOFI)
FOR THE YEAR ENDED DECEMBER 31, 2018
SCHEDULE OF PAYMENTS FOR PROVISION OF GOODS & SERVICES
KATE HOLLAND LANDSCAPE ACCESSORIES LTD. 55,716.66
KATZIE DEVELOPMENT PARTNERSHIP LIMITED 105,825.70
KEBET HOLDINGS LTD. 51,837.33
KELLER FOUNDATIONS LTD 62,842.50
KERR WOOD LEIDAL ASSOCIATES LTD. 133,284.12
KEY INNOVATIONS INC. 25,851.15
KEY‐BENCH ADVERTISING LTD. 32,815.10
KIDDE CANADA INC. 43,182.72
KIMBO DESIGN 29,925.00
KING HOE EXCAVATING LTD 407,921.07
KINSOL TIMBER SYSTEMS LTD 121,671.46
KLM CONTRACTING LTD. 158,741.43
KLOHN CRIPPEN BERGER LTD 32,787.74
KONE INC. 172,171.86
KONICA MINOLTA BUSINESS SOLUTIONS (CANADA) LTD. 83,241.18
KRONOS CANADIAN SYSTEMS INC. 31,053.62
KTI LIMITED 109,258.89
L & J GRAPHICS CORPORATION 25,933.39
LA CONTRACTING LTD. 141,603.54
LAFARGE ASPHALT TECHNOLOGIES A DIV. OF LAFARGE CANADA INC. 1,149,014.13
LAFARGE CANADA INC. 13,074,407.99
LAND TITLE AND SURVEY AUTHORITY OF BC 90,000.00
LANGLEY CONCRETE & TILE LTD. 53,869.95
LARK PROJECTS LTD. 19,702,410.33
LAWSON LUNDELL LLP 134,681.16
LED ROADWAY LIGHTING LTD. 2,086,331.61
LEE DUNCAN HOLDINGS LTD. 327,421.60
LEE'S TREES LTD. 628,600.83
LEHIGH MATERIALS, A DIV. OF LEHIGH HANSON MATERIALS LTD. 490,798.99
LIFE FITNESS 99,631.70
LIFECYCLE CONSULTANTS INC. 75,270.65
LIFESAVING SOCIETY B.C. & YUKON BRANCH 75,218.37
LIFESTYLE MAINTENANCE INC. 97,520.25
LIGHT HOUSE SUSTAINABLE BUILDING CENTRE SOCIETY 45,000.00
LINKEDIN IRELAND UNLIMITED COMPANY 47,650.00
LJA ELECTION CONSULTING 150,292.82
LM GARDENING INC. 120,109.76
LMS LIMITED PARTNERSHIP 44,987.20
LOGINRADIUS INC. 89,824.00
Page 98 of 113
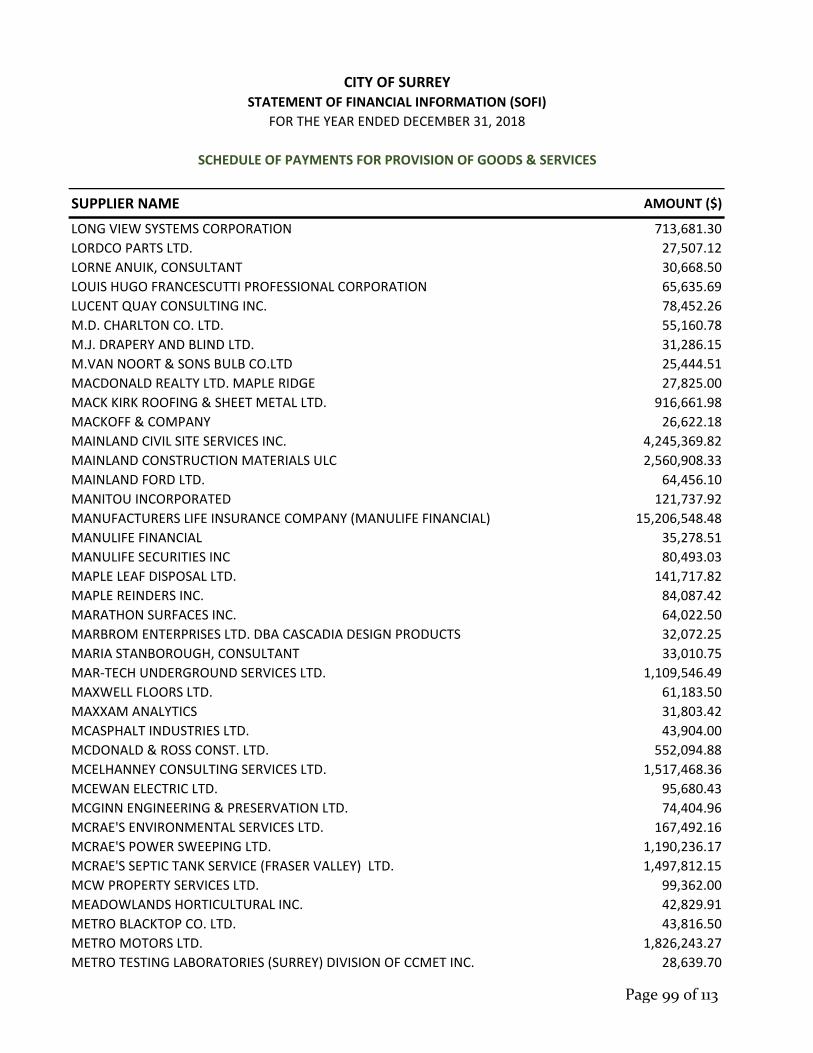
SUPPLIER NAME AMOUNT ($)
CITY OF SURREYSTATEMENT OF FINANCIAL INFORMATION (SOFI)
FOR THE YEAR ENDED DECEMBER 31, 2018
SCHEDULE OF PAYMENTS FOR PROVISION OF GOODS & SERVICES
LONG VIEW SYSTEMS CORPORATION 713,681.30
LORDCO PARTS LTD. 27,507.12
LORNE ANUIK, CONSULTANT 30,668.50
LOUIS HUGO FRANCESCUTTI PROFESSIONAL CORPORATION 65,635.69
LUCENT QUAY CONSULTING INC. 78,452.26
M.D. CHARLTON CO. LTD. 55,160.78
M.J. DRAPERY AND BLIND LTD. 31,286.15
M.VAN NOORT & SONS BULB CO.LTD 25,444.51
MACDONALD REALTY LTD. MAPLE RIDGE 27,825.00
MACK KIRK ROOFING & SHEET METAL LTD. 916,661.98
MACKOFF & COMPANY 26,622.18
MAINLAND CIVIL SITE SERVICES INC. 4,245,369.82
MAINLAND CONSTRUCTION MATERIALS ULC 2,560,908.33
MAINLAND FORD LTD. 64,456.10
MANITOU INCORPORATED 121,737.92
MANUFACTURERS LIFE INSURANCE COMPANY (MANULIFE FINANCIAL) 15,206,548.48
MANULIFE FINANCIAL 35,278.51
MANULIFE SECURITIES INC 80,493.03
MAPLE LEAF DISPOSAL LTD. 141,717.82
MAPLE REINDERS INC. 84,087.42
MARATHON SURFACES INC. 64,022.50
MARBROM ENTERPRISES LTD. DBA CASCADIA DESIGN PRODUCTS 32,072.25
MARIA STANBOROUGH, CONSULTANT 33,010.75
MAR‐TECH UNDERGROUND SERVICES LTD. 1,109,546.49
MAXWELL FLOORS LTD. 61,183.50
MAXXAM ANALYTICS 31,803.42
MCASPHALT INDUSTRIES LTD. 43,904.00
MCDONALD & ROSS CONST. LTD. 552,094.88
MCELHANNEY CONSULTING SERVICES LTD. 1,517,468.36
MCEWAN ELECTRIC LTD. 95,680.43
MCGINN ENGINEERING & PRESERVATION LTD. 74,404.96
MCRAE'S ENVIRONMENTAL SERVICES LTD. 167,492.16
MCRAE'S POWER SWEEPING LTD. 1,190,236.17
MCRAE'S SEPTIC TANK SERVICE (FRASER VALLEY) LTD. 1,497,812.15
MCW PROPERTY SERVICES LTD. 99,362.00
MEADOWLANDS HORTICULTURAL INC. 42,829.91
METRO BLACKTOP CO. LTD. 43,816.50
METRO MOTORS LTD. 1,826,243.27
METRO TESTING LABORATORIES (SURREY) DIVISION OF CCMET INC. 28,639.70
Page 99 of 113

SUPPLIER NAME AMOUNT ($)
CITY OF SURREYSTATEMENT OF FINANCIAL INFORMATION (SOFI)
FOR THE YEAR ENDED DECEMBER 31, 2018
SCHEDULE OF PAYMENTS FOR PROVISION OF GOODS & SERVICES
METRO VANCOUVER REGIONAL DISTRICT 587,099.00
MICHELIN NORTH AMERICA (CANADA) INC. 53,172.57
MICRO COM SYSTEMS LTD. 313,454.49
MICROSOFT CANADA INC. 183,704.38
MICROSOFT CORPORATION 1,702,066.97
MICROSOFT STORE 25,055.40
MINDY SMITH, CONSULTANT 57,896.95
MINISTER OF FINANCE 188,516.77
MINISTER OF FINANCE AND CORPORATE RELATIONS 1,619,482.90
MISSION CONTRACTORS LTD. 247,637.53
MIZA ARCHITECTS INC. 64,410.31
MK ILLUMINATION CANADA WEST INC 64,737.60
MODERN GROUNDS MAINTENANCE LTD. 788,201.20
MODO CO‐OPERATIVE 42,601.36
MODU‐LOC FENCE RENTALS LP 155,242.13
MODUS PLANNING, DESIGN & ENGAGEMENT INC. 44,292.41
MONGODB, INC 284,554.52
MORGAN VIEW ESTATES LTD. & PLATINUM ENTERPRISES LTD. 427,697.85
MORRISON HERSHFIELD LIMITED 38,306.10
MPS SOLUTIONS LTD. 42,631.37
MSC INDUSTRIAL SUPPLY ULC 119,018.27
MUD BAY DYKING DISTRICT 37,284.00
MUNICIPAL PENSION PLAN 19,606,242.50
MURRAY & ASSOCIATES 27,796.23
MURRAY LATTA PROGRESSIVE MACHINE INC. 25,813.76
MURRY HEARL, CONSULTANT 67,980.00
MWL DEMOLITION LTD. 257,023.36
N.A.T.S. NURSERY LTD. 206,152.46
NAPA SURREY ‐ MAG AUTO & INDUSTRIAL SUPPLIES 37,459.61
NATATORIUM CONSULTING SERVICES 117,951.26
NATHANSON, SCHACHTER & THOMPSON LLP 39,023.26
NEDERMAN CANADA LTD. 52,607.15
NET ZERO WASTE ABBOTSFORD INC. 45,641.49
NEVER IDLE HOLDINGS INC. 32,936.00
NEW LINE PRODUCTS LTD. 57,080.45
NEW PLANET COLLISION LTD. 34,597.31
NEWTON BUSINESS IMPROVEMENT ASSOCIATION 400,000.00
NGU CONSULTANTS INC 39,375.00
NILEX INC. 263,412.92
Page 100 of 113

SUPPLIER NAME AMOUNT ($)
CITY OF SURREYSTATEMENT OF FINANCIAL INFORMATION (SOFI)
FOR THE YEAR ENDED DECEMBER 31, 2018
SCHEDULE OF PAYMENTS FOR PROVISION OF GOODS & SERVICES
NORELCO INDUSTRIES LTD 29,738.81
NORSTONE EXCAVATING 30,108.75
NORTHCOAST BUILDING PRODUCTS LTD. 80,761.29
NORTHERN BUILDING SUPPLY LTD. 26,246.38
NORTHWEST GARDENING SERVICES LTD. 117,264.56
NORTHWEST HYDRAULIC CONSULTANTS LTD. 301,934.15
NOVA POLE INTERNATIONAL INC. 79,847.04
NOVACOM BUILDING PARTNERS LTD. 881,628.94
NUCOR ENVIRONMENTAL SOLUTIONS LTD 159,908.89
NUTECH FACILITY SERVICES LTD 239,837.36
NUTRIEN AG SOLUTIONS (CANADA) 42,478.53
OCEAN CONCRETE a division of LEHIGH HANSON MATERIALS LIMITED 31,987.20
OMNI ENGINEERING INC. 275,028.67
ON THE SPOT SERVICES INC. 77,130.92
OPEN TEXT CORPORATION 285,372.73
OPUS INTERNATIONAL CONSULTANTS (CANADA) LTD. 84,330.07
ORACLE CANADA ULC 469,329.79
ORGAWORLD SURREY LP 19,461,099.36
ORION FIRE DISTRIBUTION LTD. 85,032.67
PACE CHEMICALS LTD. 54,527.92
PACE GROUP COMMUNICATIONS INC. 137,304.74
PACHENA PROPERTIES LTD. 107,100.00
PACIFIC ACE SPORTS SURFACES & EQUIPMENT LTD. 53,219.25
PACIFIC COAST HEAVY TRUCK GROUP 160,428.88
PACIFIC FLOW CONTROL LTD. 206,386.81
PACIFIC LAND RESOURCE GROUP INC. 44,973.04
PACIFIC SURREY CONSTRUCTION LTD. 481,955.77
PALADIN SECURITY GROUP LTD. 1,513,458.66
PALADIN TECHNOLOGIES 219,376.65
PANORAMA MEWS DEVELOPMENTS LTD. 194,040.00
PAQUIN ENTERTAINMENT GROUP INC. 41,350.00
PARA SPACE LANDSCAPING INC. 77,378.71
PARK RIDGE HOMES (PANORAMA 3) LTD. 34,042.85
PARKLAND REFINING (B.C.) LTD. 151,731.11
PARSONS INC. 244,192.19
PATRICIA HUNTSMAN CULTURE + COMMUNICATION 28,641.00
PBX ENGINEERING LTD. 60,487.89
PCM PROPERTY SERVICES INC. 89,321.64
PEDRE CONTRACTORS LTD. 8,966,732.91
Page 101 of 113

SUPPLIER NAME AMOUNT ($)
CITY OF SURREYSTATEMENT OF FINANCIAL INFORMATION (SOFI)
FOR THE YEAR ENDED DECEMBER 31, 2018
SCHEDULE OF PAYMENTS FOR PROVISION OF GOODS & SERVICES
PEEL'S NURSERIES LTD. 51,099.86
PEN‐WEST DEVELOPMENTS INC. 135,966.03
PERFECTMIND INC. 248,631.04
PERFORMANCE ELECTRIC LTD. 126,076.94
PETER CLAIR, INSTRUCTOR 35,237.16
PFS STUDIO 76,941.66
PH5 ARCHITECTURE INC 67,780.97
PHOENIX ENTERPRISES LTD 788,856.68
PHOENIX TENT AND EVENT RENTALS 126,266.48
PIC CONTRACTING INC 80,211.31
PICKERING SAFETY 51,633.32
PICTOMETRY CANADA CORP. 86,147.85
PINNA SUSTAINABILITY INC 31,615.50
PIONEER PAVING LTD. 191,545.20
PIT STOP PORTABLE TOILET SERVICES LTD. BC 79,011.08
PITNEY BOWES 59,316.10
PITNEYWORKS 460,000.04
PJS SYSTEMS INC. 47,051.89
PML PROFESSIONAL MECHANICAL LTD. 113,400.11
POLO SECURITY SERVICES LTD. 26,088.30
POLYCRETE RESTORATIONS LTD. 26,628.84
POPULAR LANDSCAPING & GARDENING LTD. 31,084.17
POSSIBIL.COM CONSULTING INC. 29,974.50
POWER FLAGGING & TRAFFIC CONTROL 120,362.24
POWERLAND COMPUTERS LTD. 69,973.03
PRECISION SERVICE & PUMPS INC. 92,381.48
PREMIER PACIFIC SEEDS LTD. 64,583.60
PREMIUM SOILS LTD. 41,596.28
PRINTHINK SOLUTIONS INC 325,723.56
PRO QUALITY LOCKSMITH CO. 39,730.86
PROACTIVE CONSTRUCTION LTD. 77,429.81
PROFIRE EMERGENCY EQUIPMENT INC. 144,061.13
PRO‐LINE FENCE LTD 81,196.68
PROPER LANDSCAPING INC. 404,482.45
PROSHOW AUDIOVISUAL BROADCAST 41,032.41
PROSTAR PAINTING AND RESTORATION LTD 28,688.94
PROTEC PRODUCTION GROUP INC. 37,438.54
PTV AMERICA, INC. 53,486.46
PW TRENCHLESS CONSTRUCTION INC. 173,206.66
Page 102 of 113
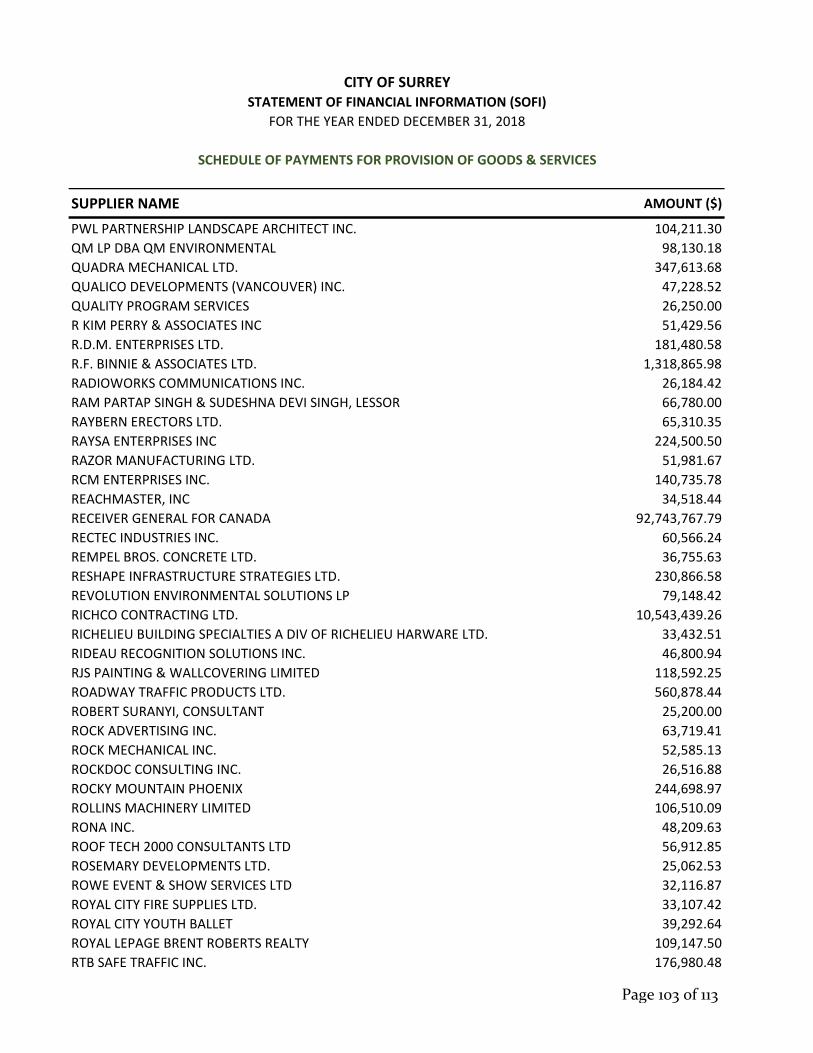
SUPPLIER NAME AMOUNT ($)
CITY OF SURREYSTATEMENT OF FINANCIAL INFORMATION (SOFI)
FOR THE YEAR ENDED DECEMBER 31, 2018
SCHEDULE OF PAYMENTS FOR PROVISION OF GOODS & SERVICES
PWL PARTNERSHIP LANDSCAPE ARCHITECT INC. 104,211.30
QM LP DBA QM ENVIRONMENTAL 98,130.18
QUADRA MECHANICAL LTD. 347,613.68
QUALICO DEVELOPMENTS (VANCOUVER) INC. 47,228.52
QUALITY PROGRAM SERVICES 26,250.00
R KIM PERRY & ASSOCIATES INC 51,429.56
R.D.M. ENTERPRISES LTD. 181,480.58
R.F. BINNIE & ASSOCIATES LTD. 1,318,865.98
RADIOWORKS COMMUNICATIONS INC. 26,184.42
RAM PARTAP SINGH & SUDESHNA DEVI SINGH, LESSOR 66,780.00
RAYBERN ERECTORS LTD. 65,310.35
RAYSA ENTERPRISES INC 224,500.50
RAZOR MANUFACTURING LTD. 51,981.67
RCM ENTERPRISES INC. 140,735.78
REACHMASTER, INC 34,518.44
RECEIVER GENERAL FOR CANADA 92,743,767.79
RECTEC INDUSTRIES INC. 60,566.24
REMPEL BROS. CONCRETE LTD. 36,755.63
RESHAPE INFRASTRUCTURE STRATEGIES LTD. 230,866.58
REVOLUTION ENVIRONMENTAL SOLUTIONS LP 79,148.42
RICHCO CONTRACTING LTD. 10,543,439.26
RICHELIEU BUILDING SPECIALTIES A DIV OF RICHELIEU HARWARE LTD. 33,432.51
RIDEAU RECOGNITION SOLUTIONS INC. 46,800.94
RJS PAINTING & WALLCOVERING LIMITED 118,592.25
ROADWAY TRAFFIC PRODUCTS LTD. 560,878.44
ROBERT SURANYI, CONSULTANT 25,200.00
ROCK ADVERTISING INC. 63,719.41
ROCK MECHANICAL INC. 52,585.13
ROCKDOC CONSULTING INC. 26,516.88
ROCKY MOUNTAIN PHOENIX 244,698.97
ROLLINS MACHINERY LIMITED 106,510.09
RONA INC. 48,209.63
ROOF TECH 2000 CONSULTANTS LTD 56,912.85
ROSEMARY DEVELOPMENTS LTD. 25,062.53
ROWE EVENT & SHOW SERVICES LTD 32,116.87
ROYAL CITY FIRE SUPPLIES LTD. 33,107.42
ROYAL CITY YOUTH BALLET 39,292.64
ROYAL LEPAGE BRENT ROBERTS REALTY 109,147.50
RTB SAFE TRAFFIC INC. 176,980.48
Page 103 of 113

SUPPLIER NAME AMOUNT ($)
CITY OF SURREYSTATEMENT OF FINANCIAL INFORMATION (SOFI)
FOR THE YEAR ENDED DECEMBER 31, 2018
SCHEDULE OF PAYMENTS FOR PROVISION OF GOODS & SERVICES
SAFE GUARD FENCE LTD. 107,190.30
SAFELIGHT COMMUNICATIONS LTD. 86,884.03
SALMON'S RENTALS LTD. DBA APEX EVENT RENTALS INC. 49,809.64
SANDERSON CONCRETE INC. 111,184.64
SANDPIPER CONTRACTING LLP 4,049,649.53
SATISTAR CORPORATION 96,022.50
SBC INSURANCE AGENCIES LTD. 56,023.70
SCALAR DECISIONS INC. 1,030,445.67
SCHOOL DISTRICT (NO. 36) 175,097.32
SCOTT CONSTRUCTION MANAGEMENT LTD. 12,110,296.58
SCOTT VEGETATION MANAGEMENT 44,406.00
SEA TO SKY CONTRACTING DBA SEA TO SKY TRANSFER 307,098.11
SEA TO SKY SOILS AND COMPOSTING INC 562,296.07
SEATTLE BUSINESS SOFTWARE INC. DBA ORBUS SOFTWARE 33,521.65
SECURIGUARD SERVICES LIMITED 266,842.44
SELECT PROJECT MANAGEMENT LTD. 57,246.00
SEMIAHMOO ARTS, COMMUNITY ARTS 177,686.32
SEMIAHMOO BULLDOZING & TRUCKING LTD. 80,810.11
SEMIAHMOO FIRST NATION 47,609.25
SEMIAHMOO STABLES 40,719.42
SENTINEL SECURITY SOLUTIONS INC. 114,661.80
SERENADER SOURCE INC. 38,500.00
SERVANTAGE SERVICES CORP. 384,121.26
SERVICEMASTER FOR BURNABY S FRASER 36,463.88
SERVICENOW, INC. 184,411.14
SEYEM' QWANTLEN RESOURCES LTD 29,888.10
SHANAHAN'S BUILDING PRODUCTS DIV OF SHANAHANS LTD PARTNERSH 41,097.18
SHAW BUSINESS, A DIVISION OF SHAW TELECOM G.P 168,206.68
SHELDON TETREAULT CONSULTING INC. 56,274.70
SHERINE INDUSTRIES LTD. 115,331.75
SHERWIN‐WILLIAMS 26,141.93
SHOW TECH AVL 58,988.65
SHOWMAX EVENT PRODUCTION SERVICES 40,132.75
SIGMA SAFETY 112,173.40
SIMON FRASER UNIVERSITY 30,125.00
SINGH TRUCKING LTD. 151,663.37
SIRSIDYNIX (CANADA) INC. 88,790.66
SKYE CONSULTING (B.C.) LTD. 207,970.56
SLOANE STREET COMMUNICATIONS 25,200.00
Page 104 of 113

SUPPLIER NAME AMOUNT ($)
CITY OF SURREYSTATEMENT OF FINANCIAL INFORMATION (SOFI)
FOR THE YEAR ENDED DECEMBER 31, 2018
SCHEDULE OF PAYMENTS FOR PROVISION OF GOODS & SERVICES
SMARTSHARE SOLUTIONS INC. 25,088.00
SMITH‐CAMERON PUMP SOLUTIONS 173,045.43
SMITHRITE DISPOSAL LTD. 279,918.42
SMS EQUIPMENT INC. 101,837.10
SOCIETY OF COMPOSERS, AUTHORS AND MUSIC PUBLISHERS OF CANADA 27,084.01
SOFTCHOICE CORPORATION 148,745.21
SOLARWINDS, INC. 83,738.42
SOUND SOLUTIONS (2002) INC. 62,883.25
SOUNDBAR AUDIO VISUAL 38,966.70
SOURCE OFFICE FURNISHINGS & SYSTEMS LTD. 48,982.85
SOUTH FRASER BROADCASTING INC. 26,313.00
SOUTHERN RAILWAY OF BC LTD. 416,138.68
SOUTHWEST CONTRACTING LTD. 27,090.00
SPEARHEAD EXECUTIVE COACHING 39,305.42
SPECIALTY COATINGS CO. DIV. OF L&M PAINTING & DEC. 29,715.00
SPECIMEN TREES WHOLESALE NURSERIES LTD. 296,899.69
SPECTRATEC SERVICES GROUP (2002) INC. 41,454.00
SPECTRUM PIPE GROUP INC 45,343.35
SPICERS CANADA ULC 162,655.17
SPORT MEDICINE COUNCIL OF B.C. 29,431.00
SQUARE ONE PAVING LTD. 28,106.40
STACEY HOLLOWAY & ASSOCIATES LTD. 32,859.15
STANTEC CONSULTING LTD. 446,054.81
STAPLES ADVANTAGE 271,637.28
STAR RENTALS LTD. 40,937.64
STEFAN, FRASER & ASSOCIATES INC. 64,480.50
STELLA‐JONES INC. 31,899.32
STERLING FENCE CO. LTD. 36,818.53
STERLING FLEET OUTFITTERS 112,873.87
STERLING WHALLEY TOWERS LTD. 92,905.29
STEVE MURRAY TRUCKING 123,382.35
STILLWOOD CAMP & CONFERENCE CENTRE 29,671.00
STONEWATER VENTURES (NO 182) LTD 66,410.66
STUDIO MORISON LIMITED 66,516.71
SULLY'S LAWN CARE & LANDSCAPING LTD 506,105.47
SUNBELT RENTALS OF CANADA INC. 33,331.65
SUNCORP VALUATIONS LTD. 48,300.00
SUPER SAVE FENCE RENTALS INC. 32,166.64
SUPER SAVE HYDRO VAC INC. 259,323.83
Page 105 of 113

SUPPLIER NAME AMOUNT ($)
CITY OF SURREYSTATEMENT OF FINANCIAL INFORMATION (SOFI)
FOR THE YEAR ENDED DECEMBER 31, 2018
SCHEDULE OF PAYMENTS FOR PROVISION OF GOODS & SERVICES
SURE PROPERTY CONDITION ASSESSMENTS DBA SURE HAZMAT AND TESTING 45,417.97
SURESPAN CONSTRUCTION LTD. 350,759.72
SURREY ASSOCIATION FOR COMMUNITY LIVING 56,415.34
SURREY BOARD OF TRADE 54,548.32
SURREY CITY DEVELOPMENT CORPORATION 443,360.01
SURREY CRIME PREVENTION SOCIETY 30,100.00
SURREY FOOD BANK SOCIETY 26,070.00
SURREY RADIATOR & AIR CONDITIONING 42,258.88
SURREY TOURISM AND CONVENTION ASSOCIATION 30,000.00
SURREY TOWER DEVELOPMENT MANAGEMENT CORPORATION 79,337.66
SUTTON ROAD MARKING LTD. 1,239,740.73
SWAN COMMUNITY SERVICES LTD. 35,126.40
SWR DRAIN SERVICE LTD 42,944.68
T 'N' T ENERGY SYSTEMS SERVICES INC. 46,495.30
TAG CONSTRUCTION LTD. 1,031,491.25
TALBOT MARKETING 90,834.71
TAYLOR KURTZ ARCHITECTURE & DESIGN INC. 1,066,328.25
TEAM AQUATIC SUPPLIES LTD, A DIV OF DB PERKS & ASSOCIATES 65,351.75
TECHNICAL SAFETY BC 71,270.89
TELUS COMMUNICATIONS INC. 832,944.17
TELUS SERVICES INC. PAYMENT PROCESSING 191,368.15
TERRA EQUIPMENT LTD. 95,980.24
TERRALINK HORTICULTURE INC. 57,101.39
TETRA TECH CANADA INC. 146,908.24
TEXTILE IMAGE INC. 33,422.60
THE AME CONSULTING GROUP LTD. 43,319.91
THE CANADIAN RED CROSS SOCIETY 125,107.34
THE CENTRE FOR CHILD DEVELOPMENT OF THE L.MAINLAND 87,210.00
THE CORPORATION OF THE CITY OF WHITE ROCK 34,391.51
THE DRIVING FORCE INC. 210,304.74
THE DUTCHMAN'S CATERERS LTD. 30,182.88
THE FINDOLOGIST 74,154.71
THE GOURMET LUNCH LADIES 34,394.61
THE HERJAVEC GROUP INC. 117,761.91
THE HOCKEY SHOP 30,816.33
THE LOGIC GROUP 95,902.80
THE PEPSI BOTTLING GROUP (CANADA) ULC 27,432.77
THE SENALOSA GROUP, INC. 199,617.48
THE W GROUP 353,724.84
Page 106 of 113
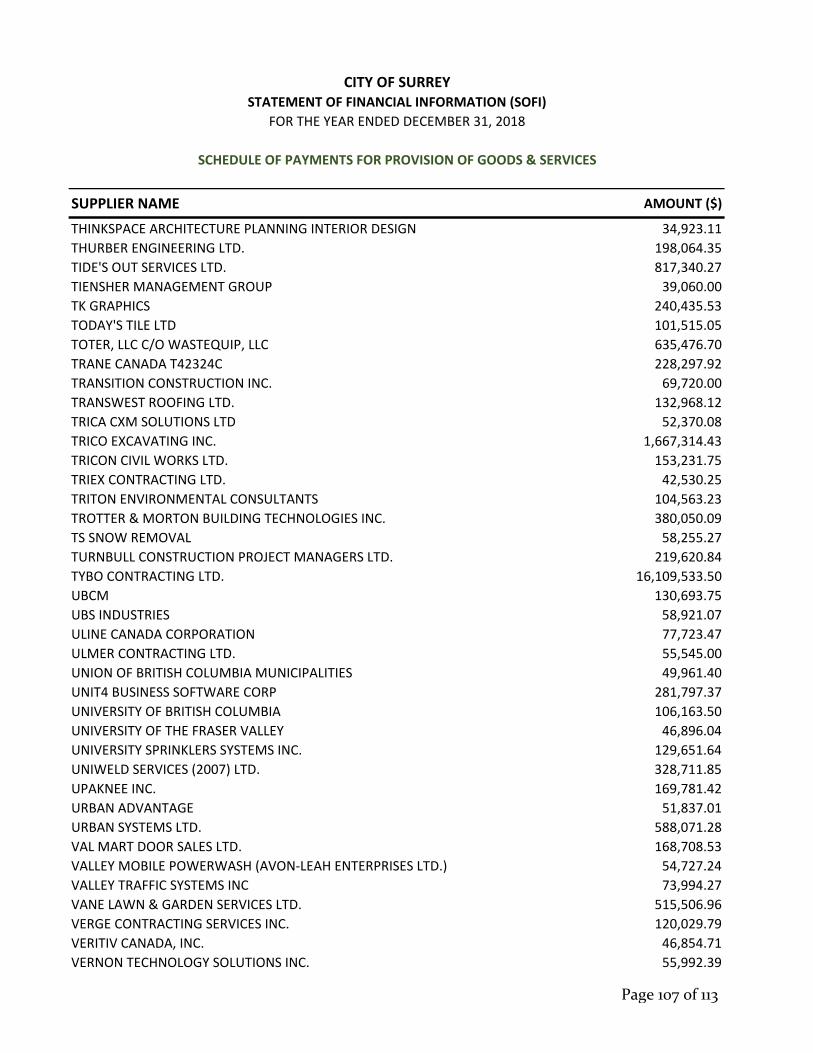
SUPPLIER NAME AMOUNT ($)
CITY OF SURREYSTATEMENT OF FINANCIAL INFORMATION (SOFI)
FOR THE YEAR ENDED DECEMBER 31, 2018
SCHEDULE OF PAYMENTS FOR PROVISION OF GOODS & SERVICES
THINKSPACE ARCHITECTURE PLANNING INTERIOR DESIGN 34,923.11
THURBER ENGINEERING LTD. 198,064.35
TIDE'S OUT SERVICES LTD. 817,340.27
TIENSHER MANAGEMENT GROUP 39,060.00
TK GRAPHICS 240,435.53
TODAY'S TILE LTD 101,515.05
TOTER, LLC C/O WASTEQUIP, LLC 635,476.70
TRANE CANADA T42324C 228,297.92
TRANSITION CONSTRUCTION INC. 69,720.00
TRANSWEST ROOFING LTD. 132,968.12
TRICA CXM SOLUTIONS LTD 52,370.08
TRICO EXCAVATING INC. 1,667,314.43
TRICON CIVIL WORKS LTD. 153,231.75
TRIEX CONTRACTING LTD. 42,530.25
TRITON ENVIRONMENTAL CONSULTANTS 104,563.23
TROTTER & MORTON BUILDING TECHNOLOGIES INC. 380,050.09
TS SNOW REMOVAL 58,255.27
TURNBULL CONSTRUCTION PROJECT MANAGERS LTD. 219,620.84
TYBO CONTRACTING LTD. 16,109,533.50
UBCM 130,693.75
UBS INDUSTRIES 58,921.07
ULINE CANADA CORPORATION 77,723.47
ULMER CONTRACTING LTD. 55,545.00
UNION OF BRITISH COLUMBIA MUNICIPALITIES 49,961.40
UNIT4 BUSINESS SOFTWARE CORP 281,797.37
UNIVERSITY OF BRITISH COLUMBIA 106,163.50
UNIVERSITY OF THE FRASER VALLEY 46,896.04
UNIVERSITY SPRINKLERS SYSTEMS INC. 129,651.64
UNIWELD SERVICES (2007) LTD. 328,711.85
UPAKNEE INC. 169,781.42
URBAN ADVANTAGE 51,837.01
URBAN SYSTEMS LTD. 588,071.28
VAL MART DOOR SALES LTD. 168,708.53
VALLEY MOBILE POWERWASH (AVON‐LEAH ENTERPRISES LTD.) 54,727.24
VALLEY TRAFFIC SYSTEMS INC 73,994.27
VANE LAWN & GARDEN SERVICES LTD. 515,506.96
VERGE CONTRACTING SERVICES INC. 120,029.79
VERITIV CANADA, INC. 46,854.71
VERNON TECHNOLOGY SOLUTIONS INC. 55,992.39
Page 107 of 113

SUPPLIER NAME AMOUNT ($)
CITY OF SURREYSTATEMENT OF FINANCIAL INFORMATION (SOFI)
FOR THE YEAR ENDED DECEMBER 31, 2018
SCHEDULE OF PAYMENTS FOR PROVISION OF GOODS & SERVICES
VERTIV CANADA ULC 27,532.72
VIMAR EQUIPMENT LTD. 207,193.87
VISION CRITICAL COMMUNICATIONS INC. 27,466.35
VITALSMARTS LC 45,692.30
VIVO VENTURES 113,420.86
VP DEVELOPMENTS INC. 141,870.75
W. MADER EXCAVATING & TRUCKING LTD. 55,935.70
WALK OFF THE EARTH ENTERTAINMENT INC. 46,500.00
WASTE CONNECTIONS OF CANADA 14,281,452.22
WASTE MANAGEMENT OF CANADA CORPORATION 77,033.08
WATER MATRIX INC 72,800.00
WATER STREET ENGINEERING LTD. 171,236.90
WEB ENGINEERING LTD. 1,097,607.74
WEDLER ENGINEERING LLP 36,045.65
WESCO DISTRIBUTION CANADA LP 108,176.74
WEST COAST BARK PRODUCTS INC 34,804.89
WEST COAST NISSAN LTD. 39,423.68
WEST PACIFIC CONSULTING GROUP MANAGED SERVICES INC. dba ITIQ TECH RECR 302,704.55
WESTERN GEOTECHNICAL CONSULTANTS LTD 56,595.00
WESTERN SAFETY PRODUCTS LTD. 31,306.66
WESTERN WATERSHED DESIGNS INC. 1,738,888.70
WESTERRA EQUIPMENT LP 28,627.45
WESTKEY GRAPHICS LTD. 26,457.07
WESTPORT CONSTRUCTION GROUP INC. 300,099.56
WESTPRO A DIVISION OF POMERLEAU INC 3,571,870.35
WESTVIEW SALES LTD. 61,004.10
WF ARCHITECTURE INC. & AEPLI ARCHITECTURE INC. DBA FRANCL ARCHITECTURE 415,291.51
WHISTLER CENTRE FOR SUSTAINABILITY 49,225.53
WHITESTAR PROPERTY SERVICES LTD 581,198.49
WICKENHEISER INTERNATIONAL WOMEN'S HOCKEY FESTIVAL LTD. 100,000.00
WILD WEST GARDENS LTD. 148,601.59
WILLE NORTH AMERICA INC. 198,322.22
WILLIS CANADA INC. 1,842,769.10
WINVAN PAVING LTD. 1,443,110.61
WIREFIRE CREATIVE INC. 29,636.25
WISHBONE INDUSTRIES LTD. 44,676.80
WME ENTERTAINMENT 62,708.46
WMW PUBLIC: ARCHITECTURE + COMMUNICATION INC. 193,959.64
WOLSELEY CANADA INC. 451,755.98
Page 108 of 113

SUPPLIER NAME AMOUNT ($)
CITY OF SURREYSTATEMENT OF FINANCIAL INFORMATION (SOFI)
FOR THE YEAR ENDED DECEMBER 31, 2018
SCHEDULE OF PAYMENTS FOR PROVISION OF GOODS & SERVICES
WOOD ENVIRONMENT & INFRASTRUCTURE SOLUTIONS 64,757.18
WOOD PROJECTS LTD 467,012.16
WORK AUTHORITY, A DIVISION OF KODIAK GROUP HOLDINGS CO. 33,494.22
WORK TRUCK WEST A DIV OF WEST COAST MACHINERY 276,928.87
WORKSAFE BC WORKERS COMPENSATION BOARD/BC 2,985,815.99
WSP CANADA GROUP LIMITED 449,381.39
WSP CANADA INC. 218,667.05
WYNKER ELECTRIC & CONTROLS LTD 73,573.82
XEROX CANADA LTD. 664,400.90
XYLEM CANADA COMPANY 179,962.70
YARD‐AT‐A‐TIME CONCRETE (1988) LTD. 450,635.60
YELLOW PENCIL INC. 305,506.95
YOUNG, ANDERSON BARRISTERS & SOLICITORS 59,199.42
ZAPPONE TRUCKING LTD. 103,275.90
ZEEMAC VEHICLE LEASE LTD. 416,076.92
ZENTERRA DEVELOPMENTS LTD. 108,672.28
ZIBIT DESIGN & DISPLAY 50,978.42
Consolidated Total Paid to Suppliers Who Received Aggregate Payment
Exceeding $25,000 614,799,061.00$
Consolidated Total Paid to Suppliers Who Received Aggregate Payment of
$25,000 or less 14,581,933.69$
Total Amount Paid to Suppliers $ 629,380,994.69
Page 109 of 113

SUPPLIER NAME AMOUNT ($)
CITY OF SURREYSTATEMENT OF FINANCIAL INFORMATION (SOFI)
FOR THE YEAR ENDED DECEMBER 31, 2018
SCHEDULE OF PAYMENTS FOR PROVISION OF GOODS & SERVICES
There are payments that are not considered expenditures including payments for assets,
other taxing authorities, and debt principal repayments;
There are expenditures which do not involve an actual cash disbursement (in addition to
accruals), for example some grants and lease‐in‐kind as these are offset by related revenues;
The Schedule of Suppliers of Goods or Services excludes the Surrey Public Library, Surrey
City Development Corporation, Surrey Homelessness & Housing Society and employee expenses
included in the Schedule of Remuneration and Expenses; and
There are expenditures which are externally recovered, these recoveries are recorded
against expenditures on the consolidated financial statements.
The City prepares the Schedule of Suppliers of Goods or Services based on actual disbursements
processed through its Financial System. This provides assurance on completeness as the reported
amounts are reconciled to the financial system payment register and electronic funds transfer
records. The Schedule of Suppliers of Goods or Services is prepared on a "cash basis". This total
figure will vary significantly from the expenditures shown on the consolidated financial statements
that are prepared on a consolidated basis using the accrual method of accounting due to various
factors including:
Timing differences between the cash basis and accrual method;
Page 110 of 113
City of Surrey Statement of Financial Information (SOFI) Schedule of Grants Section 9
2018 Statement of Financial Information
Regulations require the City of Surrey to report the total amount paid for grants and contributions that exceeds $25,000 in the year reported. Prepared under the Financial Information Regulation, Schedule 1, subsection 7(2)(b)
Page 111 of 113
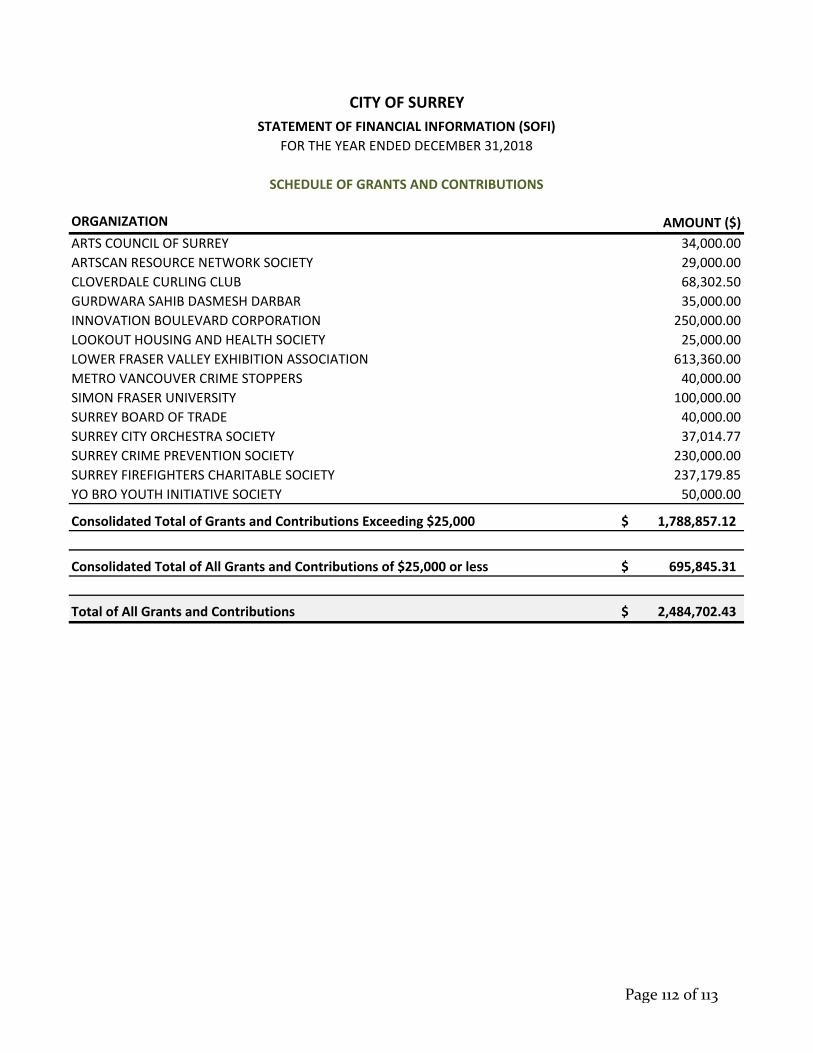
ORGANIZATION AMOUNT ($)
ARTS COUNCIL OF SURREY 34,000.00
ARTSCAN RESOURCE NETWORK SOCIETY 29,000.00
CLOVERDALE CURLING CLUB 68,302.50
GURDWARA SAHIB DASMESH DARBAR 35,000.00
INNOVATION BOULEVARD CORPORATION 250,000.00
LOOKOUT HOUSING AND HEALTH SOCIETY 25,000.00
LOWER FRASER VALLEY EXHIBITION ASSOCIATION 613,360.00
METRO VANCOUVER CRIME STOPPERS 40,000.00
SIMON FRASER UNIVERSITY 100,000.00
SURREY BOARD OF TRADE 40,000.00
SURREY CITY ORCHESTRA SOCIETY 37,014.77
SURREY CRIME PREVENTION SOCIETY 230,000.00
SURREY FIREFIGHTERS CHARITABLE SOCIETY 237,179.85
YO BRO YOUTH INITIATIVE SOCIETY 50,000.00
Consolidated Total of Grants and Contributions Exceeding $25,000 1,788,857.12$
Consolidated Total of All Grants and Contributions of $25,000 or less 695,845.31$
Total of All Grants and Contributions 2,484,702.43$
CITY OF SURREY
SCHEDULE OF GRANTS AND CONTRIBUTIONS
FOR THE YEAR ENDED DECEMBER 31,2018
STATEMENT OF FINANCIAL INFORMATION (SOFI)
Page 112 of 113

ORGANIZATION AMOUNT ($)
Fraser Valley Heritage Railway Society 112,000.00
Surrey Heritage Society 57,000.00
Sunnyside Saddle Club 38,400.00
Consolidated Total of Lease‐In‐Kind exceeding $25,000 207,400.00$
Surrey Sailing Club 24,000.00
Panorama Ridge Riding Club 22,500.00
Lower Mainland German Shepherd Dog Club 6,000.00
Action BMX Association 12,000.00
Crescent Beach Swim Club 625.00
Consolidated Total of Lease‐In‐Kind of $25,000 or Less 65,125.00$
Total Lease‐In‐Kind 272,525.00$
CITY OF SURREY
SCHEDULE OF LEASE‐IN‐KIND
FOR THE YEAR ENDED DECEMBER 31,2018
STATEMENT OF FINANCIAL INFORMATION (SOFI)
Page 113 of 113
Copyright © 2022 FDOKUMEN