The Use of Dielectrophoresis in Oral Cancer - University of Surrey
Upload
khangminh22Category
view
0download
0
1327678 (5922767)
111111111111 111111111
- . .. .. . . . . . . . . ····-··-- .... - --··-------·-----·--·__.../
ProQuest Number:
All rights reserved
INFORMATION TO ALL USERSThe quality of this reproduction is dependent upon the quality of the copy submitted.
In the unlikely event that the author did not send a complete manuscriptand there are missing pages, these will be noted. Also, if material had to be removed,
a note will indicate the deletion.
ProQuest
Published by ProQuest LLC ( ). Copyright of the Dissertation is held by the Author.
All rights reserved.This work is protected against unauthorized copying under Title 17, United States Code
Microform Edition © ProQuest LLC.
ProQuest LLC.789 East Eisenhower Parkway
P.O. Box 1346Ann Arbor, MI 48106 - 1346
10147778
10147778
2017

ZスZセ@.....
_, .
( '.
AUTOMATIC RECOGNITION OF PRINTED MUSIC IN THE CONTEXT OF ELECTRONIC PUBLISHING
BY
NICHOLAS PAUL CARTER, G.R.S.M. (Hons.), L.R.A.M.
A Thesis submitted to the Faculties of Science and Human Studies
at the University of Surrey in partial fulfilment of the
requirements for the degree of. Doctor of Philosophy.
Depts. of Physics and Music
University of Surrey
February 1989

Abstract
Computers are used to manipulate music in various forms, for
example digital sound recordings, digitized images of printed
scores and music representational language (M.R.L.) encodings.
This work is concerned with producing M.R.L. data automatically
from existing printed music scores.
A review of work undertaken in the field of manipulating
printed music by computer is provided. This shows that software
which permits production of high-quality scores is commercially
available, but the necessary data has to be entered using some
form of keyboard, possibly in conjunction with a pointing device.
It is desirable, for reasons detailed in this work, to be able to
convert the musical information contained in the enormous quantity
of existing music into computer-readable form. The only practical
method for achieving this is via an automatic system. Such an
automatic system must cope with the variations in format, content
and print-quality of existing scores.
Background material relating to previous work on pattern
recognition of various types of binary image is included, with a
section covering the subject of automatic recognition of printed
music. An original system for automatic recognition of printed
music developed by the author is described. This is designed to be
widely applicable and hence is, in effect, omnifont and
size-independent, with significant tolerance of noise, limited
rotation, broken print and distortion. Numerous illustrations
ii
l J

showing the application of the system are included, together with
proposals for future areas of development.
iii
Contents
Acknowledgements vii
Chapter 1 INTRODUCTION 1
Chapter 2 THE ACQUISITION, REPRESENTATION AND
RECONSTRUCTION OF PRINTED MUSIC BY COMPUTER
A REVIEW 5
2.1 INTRODUCTION 5
2.2 ACQUISITION 6
2.2.1 Automatic pattern recognition of printed music 7
2.2.2 Operator input 8
2.2.2.1 Directly-connected instrument 8
2.2.2.2 Soundtrack analysis 9
2.2.2.3 The compromise solution to the input problem 10
2.2.2.4 Practical assessment of input methods 11
2.3 REPRESENTATION 15
2.3.1 Existing M.R.L. 's 18
2.3.1.1 DARMS: Digital Alternate Representation
of Musical Scores 19
2.3.1.2 MUSTRAN: Music Translater 20
2.3.1.3 ALMA: Alphanumeric Language
for Music Analysis 21
2.3.2 M.R.L. structure 22
2.3.3 The Editor 22
2.3.4 Problems concerning score representation
in the context of printing
2.4 RECONSTRUCTION
iv
24
26

2.5 APPENDIX (Table of music printing systems) 31
Chapter 3 PATTERN RECOGNITION OF BINARY IMAGES 50
3.1 BACKGROUND 50
3.2 PATTERN RECOGNITION OF BINARY IMAGES 51
3.3 PREVIOUS WORK ON PATTERN RECOGNITION
OF PRINTED MUSIC 61
3.3.1 Background 62
3.3.2 Aims 63
3.3.3 Acquisition 64
3.3.4 Staveline finding and segmentation 68
3.3.5 Grammar and syntax 73
3.3.6 Object (symbol) formation and recognition 75
3.3. 7 Interaction and output 83
3.3.8 Error-checking/correction and future aims 86
Chapter 4 A SYSTEM FOR THE AUTOMATIC RECOGNITION OF
PRINTED MUSIC : TECHNIQUES 89
4.1 ACQUISITION OF THE BINARY IMAGE 89
4.2 EXPERIMENTAL SEGMENTATION 90
4.3 SEGMENTATION 93
4.4 NOISE REMOVAL 98
4.5 FILAMENTS AND STAVELINE FINDING 99
4.6 FILAMENT STRINGS AND STAVE FINDING 101
4. 7 SIMPLIFICATION OF THE TRANSFORMED LAG 103
4.8 OBJECT FORMATION 107
4. 9 SYMBOL ORDERING 107
4.10 RECOGNITION 108
4.11 ANALYSIS OF BEAMED NOTE GROUPS 112
v
4.12 SYSTEM PARAMETERS 120
Chapter 5 A SYSTEM FOR THE AUTOMATIC RECOGNITION OF
PRINTED MUSIC : WORKED EXAMPLES 122
5.1 INTRODUCTION 122
5.2 WORKED EXAMPLES 123
Chapter 6 CONCLUSIONS 148
Postscript 152
Bibliography 153
vi

Acknowledgements
Grateful thanks are extended to my supervisors, Dr. Dick
Bacon and Dr. Tom Messenger, and also to Mr. Andrew Potter (Head
of Music, Oxford University Press) and Mr. David Munro, for their
continual support and encouragement.
Thanks are also due to the following :-
Racal Information Technology Developments Ltd., for the
use of their modified Canon 9030 laser copier, which now forms the
basis of their REOS document storage system.
Oxford University Press, the Performing Right Society
and the Leverhulme Trust, whose sponsorship made this research
possible.
Peters Edition Ltd., Schott & Co. Ltd., Fentone Music
Ltd. (agents for Friedrich Hofmeister Musikverlag) and Boosey &
Hawkes Music Publishers Ltd., who kindly gave permission for
reproduction and manipulation of their copyright material.
I would also like to thank my colleagues in the Physics and
Music Departments for their contributions throughout the duration
of this research.
This work is dedicated to my father and mother.
vii

1. Introduction
Computers are used to manipulate music in various forms, for
example digital sound recordings, digitized images of printed
scores or music representational language (M.R.L.) encodings. This
work is concerned with producing M.R.L. data automatically from
existing printed music scores.
Computers are commonly used in the manipulation of text and
graphics, whether it be creating original work or editing and
analysing existing material. The distinction must be made between
an image of the material and a representation of the information
contained within that image. For instance, a facsimile machine
transmits a bit-map image of a page without having any 'knowledge'
of the meaning of the symbols or graphics on that page. In
contrast, a text document produced by a word-processor is stored
as an encoding of the characters used. This enables manipulation
of the letters and words involved, for example by globally
searching for and replacing one term with another.
Similarly, printed music can be manipulated by the computer
in two forms, i.e. a bit-map ('electronic photograph') or an
encoding using a music representational language. The former can
be used to simply store and retrieve a digitized version of the
original printed page, whilst also enabling the use of digital
image processing techniques, perhaps to enhance or scale the
image. An encoded version of the music printed on the original
page can, however, be manipulated in various ways. Thus,
- 1-
MセMM - ,.._· _ --- セ@ . _ .. , .• _ .. ... t __ - • : _t" '>< •• • - - ... :. ....... -- .... .
operations such as editing or automatic production of parts from a
score are made possible, given the appropriate software. Further
possibilities include the production of braille scores or new
editions in conventional notation, musicological analysis and
electronic publishing.
The above operations are, in fact, equivalent to those now
performed on text. The transformation of a small proportion of the
enormous amount of existing music into music representational
language data by any means other than an automatic system would,
however, be an impractical task. The possibility of using a
computer to encode the music automatically makes the process
possible, although admittedly still a large undertaking.
The text of this thesis is arranged as follows:-
Chapter 2 presents an overview of work undertaken in the
field of manipulating printed music by computer. This includes an
examination of the various methods available for entering into the
computer the information contained in existing scores and a study
of the techniques involved in storing the data. A summary of
hardware available for the printing of music and a table of
significant software packages for printing music are also
included. The chapter is a revised and updated version of a
previously published paper [Carter 1988]. The discussion of
printing hardware has been revised to take account of recent
developments in xerographic printers and the increase in
significance of the Postscript page description language (P .D.L.).
Also, the table of music printing systems has been modified to
-2-

include some new entries and increase the information pertaining
to systems which have increased in importance.
Chapter 3 provides background information on the subject of
pattern recognition, concentrating specifically on the processing
of binary images such as engineering drawings, circuit diagrams
and flowcharts. A review of past work on pattern recognition of
printed music scores is included, which examines the specific
problems involved in dealing with this particular class of binary
image. The background is thus provided for an in-depth examination
of the author1s system for automatic production of M.R.L. data
from existing printed music scores.
Chapter 4 contains such an analysis. The process from
digitized image to M.R.L. data is broken down into its constituent
parts, including filtering, staveline-finding, object (symbol)
formation and recognition. Illustrations of the various stages are
provided.
Chapter 5 contains worked examples of a more substantial
nature showing the application of the above system, again, with
appropriate illustrations. These examples form the basis of a
discussion which covers various aspects of the music recognition
problem in detail, including the location of the stavelines when
these are substantially obscured, processing handwritten material
and dealing with a multi- stave system. Suggestions for solutions
to the problems which have arisen are given.
Chapter 6 summarises the qualities of the system described in
- 3-
chapters 4 and 5 and describes the equipment used for the
development work. Some of the possibilities for the future of the
system are outlined.
-4-
2. The Acquisition, Representation and Reconstruction of Printed Music by Computer: A Review.
2.1 INTRODUCTION
The varied applications of computers to music include sound
synthesis, computer-assisted composition, computer-aided
instruction, music analysis and music printing. In each
application there exists a dividing line between music as sound
and as print. This boundary delineates the present study, which
deals only with the graphical record, from aspects of sound
synthesis and computer-assisted composition. For the latter, the
reader is directed to frequent articles in the Computer Music
Journal and the recent review by Yavelow [Yavelow 1987], which
also includes a useful glossary of terms used in applications of
computers to music. Within the subject of printed music, this
review and the subsequent chapters concentrate, except where
specified, on conventional Western music.
The three sections of the chapter heading - acquisition,
representation and reconstruction of printed music - might well be
supplemented by computerized music-setting, i.e., the design of
software to implement the processes which normally fall to the
music engraver. However, two major works of the literature
[Gomberg 1975] [Byrd 1984] have specifically covered the topic of
computerized music-setting in great detail, including fairly
recent developments. This chapter therefore touches on matters
connected with music-setting only where these are inextricably
linked to other subjects within the province of this review.
-5-
セ@ ....: ·- _._ - - -. セ@ ._ i ;{_-

Section 2.5 alphabetically lists a wide selection of past and
present computer systems for printing music.
The large number of periodicals surveyed is due to the
interdisciplinary nature of the subject. Computers and the
Humanities and Computer Music Journal are the main sources, with a
few references to each of numerous other periodicals, including
Journal of Music Theory, Perspectives of New Music and Fontc.s
Artis Musicae. Conference proceedings, other review articles and
dissertations have also been consulted. A small number of books
covering the subjects of music engraving, music notation and
manuscript layout, which have been widely referenced elsewhere,
are included in the bibliography, as they form a useful foundation
for any work on computerized music printing [Donato 1963, Ross
1970, Gamble 1971, Read 1974, Read 1978, Stone 1980, Rastall
1983].
2.2 ACQUISITION
Acquisition covers the process of transferring music into the
computer's music representational language. Several different
methods of achieving this have been tried, and although it is
difficult . to divide them into rigid categories, distinctions can
be made.
Automatic pattern recognition by optical scanner can be taken
as a distinct category. The other methods can be separated into
those accessible to anybody with a general knowledge of music
notation and those usable only by a musician. For example, use of
-6-

an organ keyboard would suggest the latter category.
This paradigm can be illustrated diagrammatically
Operator
1) Organ keyboard or other directly-
connected instrument.
2) Soundtrack analysis l
I
1) QWERTY keyboard
2) Menu selection (e.g., graphics tablet, mouse, light-pen)
Dedicated, purpose-built hardware
Whatever method is used, the aim is assumed to be an encoding
which uses an internal music representational language (MRL). In
real music acquisition systems various overlaps occur, such as
when an organ keyboard is used in conjunction with a graphics
tablet [Wittlich 1978a]. This overlap suggests an alternative
categorization which involves dividing up the information encoded
in a page of printed music into three basic types and セウウッ」ゥ。エゥョァ@
each with an input device. Thus, pitch may be entered using an
organ keyboard, rhythm could be determined by selecting from an
on-screen menu of durations using a mouse, and miscellaneous
symbols, like slurs, dynamics or text, could be entered using a
purpose-built keyboard.
2.2.1 Automatic pattern recognition of printed music
Past and present work on pattern recognition of printed music
-7-
.__ ____________ ....;..;__;__ __ ⦅⦅[⦅NNNNZNNZNN⦅NZNNNNN[LZ⦅[⦅BBGMGMGMMGMMMMMセMMM ⦅NZ⦅⦅セセセM -- ᄋ セM __ . __ .

is described in detail in chapters 3, 4 and 5. Chapter 3 also
provides a discussion of work in the general field of pattern
recognition of binary images.
2.2.2 Operator input
There are two musician-only methods which attempt to capture
all possible information represented in a score. One uses a
directly-connected musical instrument (usually an organ keyboard)
while the other involves analysing a soundtrack recording of a
performance of the score.
2.2.2.1 Directly-connected instrument
It is impractical to encode all the information represented
in a score by sole use of an organ or electronic piano-type
keyboard (hereafter organ keyboard), and it would also appear
impossible to convert into 100% accurate notation all the
information present in an organ keyboard performance [Knowlton
1971, 1972]. A major problem discussed by Raskin [1980a, 1980b]
and Clements [1980a] is rhythm-fitting, since no performance
contains, throughout, durations which are fully consistent with
the notation. Voice assignment has been found to be an intractable
problem [Maxwell 1983, 1984] [Byrd 1984]. For example_, if two
voices out of three in a three-voiced composition are sounding in
unison, it is impossible for the system to know whether two or
three voices are actually sounding.
Enharmonic notation is another problem of some magnitude. In
-8-·

tonal music, guidelines might be formulated to assist the machine
in determining which particular notation is meant, but for atonal
music the problem appears insurmountable [Byrd 1984] [Gomberg
1975, 1977].
Thus, provided the user circumvents the limitations of using
an organ keyboard as an input device, it can still form part of a
practical system.
2.2.2.2 Soundtrack analysis
Early work in this field by Moorer [1975, 1977] limited input
to no more than two voices with further restrictions on the
harmonic relationship between simultaneously sounding notes. He
stated that 'In general, the system works tolerably well on the
restricted class of musical sound1• More recently, Piszczalski and
Galler [Piszczalski 1977, 1979, 1981] have, according to Moorer
[Byrd 1984, p. 78], 'refined monophonic music transcription to a
fine art1•
Further work by Chafe [1982], Foster [1982] and others, used
artificial intelligence techniques to automatically determine
clef, key and time signatures, and enharmonic notation. However,
Piszczalski and Galler [Piszczalski 1979, p.203] have asserted
that 'the state of the art is nowhere near approaching the
successful automatic transcription of polyphonic music recorded on
a single track.'
Hence, it can be concluded that recognizing music from a
-9-
..._ - - Mセ MMᄋ⦅@ .. _ -- -- -. ᄋ ⦅[ NA⦅ セ@
soundtrack combines all the problems associated with using a
directly-connected instrument for input with those involving
spectral analysis and psychoacoustics.
2.2.2.3 The compromise solution to the input problem
From the previous discussion it will be realized that, except
in very restricted circumstances, methods which appear ideal do
have flaws which prohibit their use as sole input devices. Hence,
whether a musician or non-musician is entering the music data, the
problem becomes one of optimizing the man-machine interface, with
any musical ability on the part of the operator serving to speed
this interaction. The main types of peripheral device available to
any user for entering music data are:- QWERTY keyboard, digitizer
(graphics tablet), and pointer (light-pen/mouse/joystick/
tracker-ball).
As has been previously stated, the three basic types of
information present on a page of printed music (pitch, rhythm and
other symbols) tend to associate themselves with particular
peripherals, depending to a great extent on the type of music
being encoded.
The QWERTY keyboard is always available, which is its main
advantage. With suitably defined function keys and/or an overlay
together with carefully dE)signed software, the ordinary keyboard
can be quite successful, although it is still physically limited
by the number of keys. Some systems still rely on the QWERTY
keyboard for direct input of alphanumeric music-representational
-10-

data, although more use is being made of menu-driven systems with
on-screen icons [Hewlett 1988].
The graphics tablet has been separated here from other
'pointing' systems because, where pitch is concerned, if has a
unique advantage, i.e., the actual printed score (assuming one
exists) can be placed on the tablet (a page at a time) and the
noteheads picked out with the pen or stylus, a method successfully
used by Wittlich et al. [1977, 1978a]. Hence, this is the only
'pointing' system which uses the score directly. This speeds up
entry considerably because it eliminates the repeated movement of
the eyes from score to screen. Alternatively, the tablet can be
divided up (using an appropriate overlay) into regions, each
representing a particular symbol, pitch, etc., so that all aspects
of the music may be entered in this way.
The different types of pointer - light-pen, mouse, joystick,
tracker-ball - work in a similar way, in that they select symbols
from a menu, but vary in their ergonomic convenience. Use of these
devices facilitates screen feedback, hence the adoption of
abbreviations (e.g., for repeated pattern entry) or short-cutting
techniques, such as having various permutations of chord ー。エエ・イセウ@
or arpeggio figures available in the menu.
2.2.2.4 Practical assessment of input methods
The following list gives a general view of which peripheral
-11-
. .
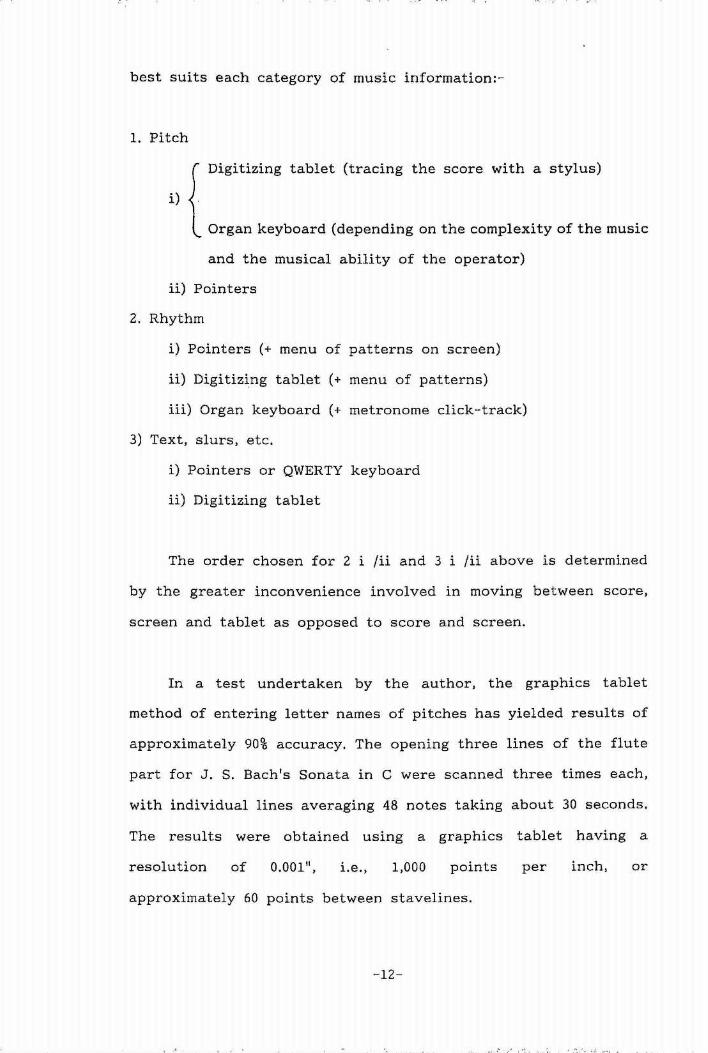
best suits each category of music information:-
1. Pitch
{
Digitizing tablet (tracing the score with a stylus)
i)
Organ keyboard (depending on the complexity of the music
and the musical ability of the opera tor)
ii) Pointers
2. Rhythm
i) Pointers ( + menu of patterns on screen)
ii) Digitizing tablet ( + menu of patterns)
iii) Organ keyboard ( + metronome click-track)
3) Text, slurs, etc.
i) Pointers or QWERTY keyboard
ii) Digitizing tablet
The order chosen for 2 i /ii and 3 i /ii above is determined
by the greater inconvenience involved in moving between score,
screen and tablet as opposed to score and screen.
In a test undertaken by the author, the graphics tablet
method of entering letter names of pitches has yielded results of
approximately 90% accuracy. The opening three lines of the flute
part for J. S. Bach's Sonata in C were scanned three times each,
with individual lines averaging 48 notes taking about 30 seconds.
The results were obtained using a graphics tablet having a
resolution of 0.00111, i.e., 1,000 points per inch, or
approximately 60 points between stavelines.
-12-
MMMMMMMMMMMGMMMMMMGMMMMGMMGMMMMGMMMMGMMMMMGMMMMNZNNNN⦅⦅MセMGMMM MMMMMMMMMMM -- ----- MM セNFZ NNZGZNN Z M ᄋ セ@ ._·· • . ..... , . セ N@ " .... . • " .! ...

Taking into account the improvements that could be made to
the system used, the results were quite promising. Modifications
might include using a cursor with a lens and cross-hair instead of
the pen utilized in the test system, plus some form of guidance as
to the proximity of the pointer to one of the horizontal pitch
lines (i.e., stavelines and centre-lines of spaces) in order to
permit re-entry of wayward values. It has to be accepted that in
general the stave will not be horizontal and any calculations
involving vertical measurements must take this deviation into
consideration. Although the bowing of stavelines (mentioned as a
problem by Wittlich et al. [1978a]) was not encountered, it must
be planned for when indicating the position of the stave (i.e.,
not only indicating end- points). For a non-musician, a
100-notes-per-minute, 90% accurate system for entering pitch
values (letter names only) might form a valuable part of a
practical set-up. Wittlich et al. [1978a] cited user-friendliness
and speed as the most favourable features of this sort of system.
A deciding factor that emerges here is the type of music
involved. For example, the above test was carried out on a sample
of Bach, which consisted of more-or-less continuous semiquavers,
making entry of the rhythm values particularly easy for a 'mouse
and icons' or similar system, with good repeat facilities. In
certain cases, however, the pitches also form patterns and this
may be an example where a mouse could be used to achieve results
faster, picking from a limited set of previously defined patterns,
rather than entering all pitches via the graphics tablet or organ
keyboard. On the other hand, types of twentieth century music
which dispense with the key signature and employ numerous
-13-
./1,,-. ,-;.•· -. . . .... • セN@ • "' i : - - .:.t •• '!.' -· :.... - •

accidentals could not beneficially be entered using a system where
one method is used for entering the letter names of pitches (i.e.,
organ keyboard or tracing the score on a graphics tablet) and
another is used for specifying the desired accidentals. Thus, the
choice of method can be seen to be related to both the type of
information being encoded (pitch, rhythm or other symbols) and the
style of the music.
During the design of Music Representational Languages, much
effort has been expended to support abbreviations, for instance to
avoid repeated encoding of constant rhythm values or to provide a
means of tagging certain patterns (of rhythms or pitches) so that
t .hese can easily be recalled. However, this feature must surely be
most easily implemented by the software controlling a 'pointer and
icons' system rather than the syntax of the M.R.L. (Music
Representational Language). The only possible exception to this
might be where the QWERTY keyboard is used to enter raw data,
where minimizing the number of keystrokes involved in encoding is
paramount. In this case, a cursor-key-controlled 'pointer and
icons' system may still be faster and will certainly be easier to
learn and use [Carter 1984]. As the abbreviated M.R.L. data would
almost certainly have to be expanded to the 'long-hand' version at
some stage (as in user-DARMS to canonical-DARMS discussed in
section 2.3.1.1), program simplification would be achieved by
having the user-interface software output standard M.R.L. · data.
Abbreviations in M.R.L.'s are covered in Section 2.3
REPRESENTATION. Optimization of the man-machine interface is
discussed, for example, by Card, Moran and Newell [Card 1983] in
the context of a formal research project, and by Freeman [ 1986] in
-14-
I.
a personal assessment of one particular application
(word-processing).
At this point, mention should be made of Armando Dal Molin
and his purpose-built music-entry terminals. Dal Molin's
significant contribution to" computerized music-setting and
printing is covered in numerous publications [Dal Molin 1973,
1975, 1976, 1978] [Sargeant 1971]. His Musicomp (PCS 500) terminal
[Dal Molin 1978] utilizes a combination of pitch keyboard (i.e.
four stacked octaves of white keys) and music-orientated QWERTY
keyboard built side-by-side into the console. This permits use of
the left hand for Pitch and right hand for Character (symbol) and
Spacing, hence the acronym PCS. Good on-screen feedback and
editing facilities are significant features of the system, which
produces near engraving-quality output on a phototypesetter.
2.3 REPRESENTATION
In addition to an input method, a means of internally
representing the score is required, as all or part of the
information present in the score must be stored electronically. A
score can be stored as a graphic image, i.e., as an 'electronic
photograph', so that the holding computer has no knowledge of the
meaning of the symbols in the image, but this method is of limited
practical use. Alternatively, the information contained in the
score can be stored using a Music Representational Language
(M.R.L.), enabling reconstruction of the score using appropriate
software, albeit with inevitable slight differences in layout. \
-15-
MN」⦅⦅MMMMMMMMMGMMMMMBMMMMMMMMMGMMMMNNN[NNNN⦅MMMNNN[N⦅⦅NNN[NNNN⦅NZNNNNNNNNN[セZ⦅⦅⦅⦅NZ@ __ MMMMGMMMMGMMMセ ᄋ BM G@ -'---"-'-----'"---'-'.T .. "::I; .; --- • • • ..... -. • ' •.· . .. ·""• セ@

A Music Representational Language is a symbol system,
normally using ASCII characters (but sometimes binary or decimal
numbers) to represent musical pitches, rhythms or other
miscellaneous notational symbols. For example, the letters A to G
might represent the pitches of the same names, and the numbers 2,
4 and 8, the durations of a half, quarter and eighth note (minim,
crotchet and quaver). Hence,
M.R.L., the following
G8 G8 A4 B4 C8 D8 GZ.
using this simple and restricted
extract would be written
Obviously, for a useful M.R.L., more symbols would be
required to represent octaves, clefs, barlines, rests, dotted
notes, slurs, etc. Another factor emerges here, that is, the
amount of decision-making which should be built into the
'score-reconstruction' software, instead of being included in the
M.R.L .. For example, in the music extract above, the pairs of
quavers are beamed, but this is not indicated in the l\LR.L. data;
a score reconstruction might appear with separate quavers. Thus,
either another symbol could be included, indicating beamed notes,
or an automatic beaming facility could be included in the score-
reconstruction software. The latter might cause problems, however;
for instance, where it could not be determined automatically how,
or even if, a number of notes should be beamed.
-16-

Once the score has been converted to M.R.L. data, it can be
analysed by software, edited, performed electronically or
reconstructed for printing. The hardcopy can be in the form of
proofs or finished artwork, consisting of score, separate parts,
or piano reduction. Thus, assuming that an M.R.L. data version of
a score is desirable, the researcher has the choice of either
using an existing M.R.L. or creating his own.
Unfortunately, in the past, music researchers have chosen,
for several reasons, to invent their own M.R.L.'s, and continue to
do so (see [Gourlay 1986]). In most cases, the M.R.L. was tailored
to the particular requirements of an individual research project,
and as the nature and scope of projects differed, so did the
requirements of an M.R.L .. This variety created the problem which
still exists today, i.e., the lack of a standard encoding scheme
for representing music scores. The recently established Musical
Instrument Digital Interface (M.I.D.I.) standard provides the
equivalent for musical sound. The pressing need for a standard has
frequently been stressed by authors writing on the subject of
computers and music (e.g., [Lincoln 1970b] [Morehen 1979]), but
researchers who have encoded large quantities of data using their
own particular M.R.L. are understandably averse to re-encoding the
information. This has meant that a barrier exists between workers
in the field which obstructs the transportation of data and
software for analysis, printing etc. Recently, a task group (the
Music Information Processing Standards Committee) formed under the
auspices of the American National Standards Institute has been
asked to propose a standard for the interchange of musical
-17-
- -- MMMMMMMMセセ セMMMBMMMMMMGM セMMMMGMBMMMMGMMセセセMMGMBMセMMGMMMGMMMセMMセMMMGMMMMG G ZNN⦅ ᄋ MMBM NG M GMMGM ᄋ N ⦅@ .• --'------·-" _ ·_. ·_....:.....: . : . ZN ⦅ N⦅ セ@ -·= -_:_ ... : --··- ..
·.i
information. It is intended to use only printable characters as an
extension of SGML (Standardized General Markup Language), the code
which covers production aspects of text publication. The principal
document produced by the committee includes an outline for the
standard [MIPS 1988]. Also, a working group of the Music Library
Association is currently examining the possibility of using
encodings of music in library cataloguing [Hewlett 1986b].
Irrespective of whether the researcher is choosing an
existing one or creating his own, various attributes of an M.R.L.
have to be assessed; in particular the scope (i.e., completeness),
structure, (hierarchical or sequential), and efficiency (i.e.,
compactness). Also to be considered are the use of mnemonics,
number of passes, availability of software for syntax/semantic
checking or translating, existence of a shorthand version, and
compatibility with existing facilities.
2.3.1 Existing M.R.L. 's
Much of the literature on computers applied to music relates
to the subject of particular M.R.L.'s [Heckmann 1967] [Brook
1970a] [Lincoln 1970a]. However, as few as six have been used in
significant research, or have been specified thoroughly enough for
practical use. A comprehensive survey of M.R.L.'s has been
produced by Boody [1975], together with a more detailed analysis
of six of these which met his list of criteria deemed necessary -
but not sufficient - for a useful language. From consideration of
. these evaluations, three M.R.L.'s emerge as the most suitable for
general use, with a definite ranking of DARMS, MUSTRAN, ALMA.
-18-

2.3.1.1 DARMS: Digital Alternate Representation of Musical Scores
A large proportion of the literature on computers applied to
music mentions DARMS at some point. Originating in the 1960's, the
DARMS Project has involved work by Stefan Bauer-Mengelberg (the
M.R.L. itself), Raymond Erickson (Syntax-checker), Anthony Wolff
and Bruce McLean (user-DARMS to Canonical-DARMS translater,
[McLean 1980]), David Gomberg (score-layout programs) and Melvin
Ferentz (production of printed score). There are three main papers
[Bauer-Mengelberg 1970] [Erickson 1975, 1983] which discuss DARMS
in detail as well as three publications [Gomberg 1975, 1977]
[Wolff 1977] covering aspects of representation and music-setting
which form part of the DARMS project, with its aim of producing
publication-quality music from DARMS data (See also [Gomberg 1972]
[Wolff 1972] [Feldman 1973] [Bauer-Mengelberg 1972, 1974a, 1974b]
[Erickson 1977] ). A user manual has also been produced [Erickson
1976].
DARMS was specifically designed [Erickson 1983 p.l76] 'to
capture accurately all the information provided by the composer,
but not those details of layout within the province of the
engraver or autographer.' DARMS has become the most widely used
M.R.L. because it can be used to encode most music published since
c.l600 which uses Common Musical Notation (C.M.N.).
The encoder can make use of extensive abbreviations which are
permitted in ·•user-DARMS' but these are expanded by the
'Canonizer' software into their complete version, known as
-19-

'Canonical-DARMS'. Hence, there may be several versions of a score
in user-DARMS, but there will be only one Canonical-DARMS
representation. Briefly, the representation uses numbers for
pitches (21 to 29 cover lines and spaces on the stave), letters
for rhythm-values (Q,- E, S, etc = Quarter, Eighth and Sixteenth
notes respectively, i.e. crotchet, quaver and semiquaver) and
other ASCII characters for miscellaneous symbols, e.g.:(# ,- , *)
= HCLセセセI@ respectively. Chords and polyphonic music are catered
for, the latter by a method called Linear Decomposition Mode,
i.e., encoding one voice per pass over the score.
2.3.1.2 MUSTRAN: Music Translater
MUSTRAN [Wenker 1969, 1970, 1972a] was developed by Jerome
Wenker, originally for ethnomusicological purposes, but the
revised version, MUSTRAN II [Wenker 1972b, 1974, 1977] includes
more 'art-music' notation, representing C.M.N. almost as
comprehensively as DARMS.
MUSTRAN (II) uses more mnemonic symbols than DARMS and has
better software support (translator and utilities). The Indiana
University Computer Music System [Wittlich 1978b], which
incorporates Donald Byrd's SMUT (System for Music Transcription)
software [Byrd 1984] uses MUSTRAN as its Representational
Language. It was chosen because of its mnemonic code, relative
completeness and existing translator and syntax analyser. Both the
original MUSTRAN and MUSTRAN II have been described in detail by
Wenker [see Wenker 1969 to 1977] while details of the numerous
MUSTRAN utility programs now available at Indiana University can
-20-

be found in [Hewlett 1985].
2.3.1.3 ALMA: Alphanumeric Language for Music Analysis
ALMA [Gould 1970], which can cope with most C.M.N. (including
polyphony), evolved from the 'Plaine and Easie Code' [Brook 1964,
1965, 1970b] invented by Barry S. Brook and Murray Gould, which
while sometimes used (see [Rosing 1985]), is limited to monophonic
music representation. ALMA supports abbreviations, optional
multi-pass encoding, user-determined order of encoding and
user-defined representational symbols. ALMA also supports a novel
feature which helps with encoding repetitions, i.e., cyclic
duration definition. This means that a recurring rhythmic pattern
can be encoded once only and it will automatically be cyclically
applied to following groups of the same number of notes.
A common problem with both MUSTRAN and ALMA is the use of
letters to represent pitches, for although this seems appropriate
at first (being suitably mnemonic), it means that a separate
octave indicator has to be used. For example, in ALMA, the
apostrophe (') is used once for each octave above middle C and
commas (,) correspondingly indicate octaves below middle C. Thus,
a passage of music which alternates across the boundary between
two octaves will, when encoded, consist of numerous commas or
apostrophes compared to the number of actual pitch symbols. This
inefficiency is overcome in ALMA by an abbreviation facility which
allows the encoder to indicate only a change of octave relative to
the present one (+ or - a fourth relative to the present note).
Obviously, this problem does not occur in DARMS, with its numeric
-21-
Mセ Mセ⦅Z⦅⦅@ __ _:___ __ __:__:__ __ ⦅⦅⦅Z⦅Z⦅MMMGMMBMMGMMGMGMMMMGMMセ M]M ᄋ M]MM ᄋ@ ___ ...:. .. _ . • _: __

セ@ .. . :' : ... セ@ :- .. - ... --
pitch-representation system.
2.3.2 M.R.L. structure
The structure of the M.R.L. is for the most part determined
by the method of encoding polyphonic music. Various ways of
referencing the notes in multi-part music have been adopted or
proposed (e.g., [Clements 1980a, 198Gb] [Maxwell 1983, 1984]).
One method is to encode voices separately with a tag of some
sort to indicate which is which, but this can be wasteful if a
composition consists almost entirely of one voice with just a few
chords, since the subsidiary voices will have to be encoded
throughout. Alternatively, encoding can be orientated around
vertical 'time slots', so that all notes occurring simultaneously
may be referenced together. Different voices then 'switch in and
out' as and when they are required. Both Clements and Maxwell have
favoured the latter approach, defining everything in the time
domain, because the system thereby avoids any constrictions which
would arise through the use of a musical hierarchy. Clements
[1980a] also describes a 'neutral' M.R.L. implemented at the
University of Western Ontario, which contains enough information
in its data to facilitate ready conversion to either a 'sound
output file' (for performance) or DARMS format (for printing).
2.3.3 The Editor
The minimum features of an editor have been formalized by
Clements [1980a], as have the varieties of operational scope
-22-

セ@ .. ャ セ@
セᄋ@ '.='.
. . " Nセ@
needed [Buxton 1980, 1981]. Basically, the editor requires a data
pointer, together with the following functions, the operation of
which should be self-evident: delete, insert, change, transfer,
search, substitute and transpose. The five categories of scope
defined are: simple, block of time, local attributes, contextual
attributes and named structural entities. In order, these refer to
single note or entire score, notes within a certain time interval,
notes encompassed within limits of pitch and duration, a note or
notes within a certain musical context, and notes of a defined
motif or theme.
Various arguments have been put forward supporting different
structures for M.R.L. 's; when consideration is given to the
incorporation of an editor into the system, however, opinions
[Maxwell 1984] [Clements 1980a] come down in favour of a
sequential, time-ordered structure. This facilitates access to the
data by the editor because information which is close together in
the notated score will also be close in the Music Representational
Language form.
It should be stressed that when entering information, the
user can be buffered from the raw M.R.L. data by the use of
certain types of user-interface, as described in sections 2.2.2.3
and 2.2.2.4. Hence, different assessment criteria must be applied
to M.R.L. 's when data is input via a QWERTY keyboard, compared to,
say, a mouse and icons system. When using the former, as has been
stated previously, minimizing the number of keystrokes is of
paramount importance, so abbreviations (shorthand) and mnemonics
(for ease of use) would be prime factors for consideration.
-23-

If another means of input is being employed, however, e.g., organ
keyboard or graphics tablet, then comprehensiveness and efficiency
are perhaps the most relevant features to be considered.
The issue of translation seems to be gaining in importance at
present, as researchers accept the fact that there is no standard
method of representing printed music, and opt for encoding data in
as crude a form as possible so that it can then be tran.3lated into
whichever M.R.L. is later required. If only pitches and rhythms
are required initially (perhaps so that some form of analysis can
be undertaken), and then later printed scores are required and
only DARMS-compatible printing software is available, then it
should be reasonably easy to convert the encoded data into the
DARMS format and at the same time add previously omitted
information. However, despite solving the problem of researchers'
tenacious defence of their own M.R.L.'s (i.e., this approach
allows them to retain their own data format), the result is a
proliferation of translation software.
2.3.4 Problems concerning score representation in the context of
printing
One example of this has already been mentioned, i.e., whether
to indicate beaming in the M.R.L. or to try to formalize the rules
for beaming of notes and to incorporate this knowledge in the
score-reconstruction software. To take another example, the slur
-24-
• ' . ' . .•. Mᄋセ ᄋ@ , • • セ@ --· _ .. _ M セ Z@ _ ... _:.._ ᄋ M]Mᄋセ ᄋ@ "' - .. セ@ ' .. ·' - . セ@ . .

shown below
is 'attached' to the two notes when included in the M.R.L. data,
but its exact position and curvature will probably be determined
by the music-setting software. Some M.R.L.'s do, however, make
provision for stem direction (for example) to be enco'ded (e.g., U
and D for up and down stem respectively) if desired.
A detailed discussion of some of the problems involved in
representing all the complexities of music notation can be found
in Wolff [1977]. For example, sometimes too many notes are present
in a bar, either because the notes are an appoggiatura written in
small notation or because a triplet sign has been omitted. These
features have to be indicated in some way to prevent
syntax-checking software producing an error. Another problem
relates to horizontal positioning, where notes to be sounded
simultaneously are of a similar pitch and must be separated out
horizontally; this separation can also lead to 'too many notes in
a bar' as well as variations in layout.
In coping with the above cases there is a trade-off between
the interpretative ability of the encoder, the knowledge-based
rules programmed into the score-reconstruction software and the
graphical information included in the セiNrNl@ .. Donald Byrd [Byrd
1984] asserts that fully-automatic reconstruction of high-quality
music notation is not possible without artificially intelligent
-25-
.. . - ,:,. セ@ .-·- ' _ , __ .. ---

software for this purpose. As this is not available at present, a
compromise has to be reached; hence the trade- off mentioned
above.
Most of the problems concerned with score-representation seem
to be caused by the transfer from two dimensions (pitch and time)
to the single-dimensional string of ASCII characters. These
difficulties are compounded by the fact that there is not always a
one-to-one correspondence between music-notational symbol and
ASCII character(s). This is due to the graphical variations which
can occur in some musical symbols (e.g., slurs).
2.4 RECONSTRUCTION
It is the actual hardware used which has the most influence
on reconstruction. Once the master copy of the printed page has
been produced, it can be mass produced by traditional means, such
as offset lithography. The software of a music printing system can
be designed to be device-independent, at least within certain
categories of printer. It is easier, however, to convert from a
vector-image (or random-scan) construction scheme to a raster-scan
format than vice versa. Vector-drawing image construction means
building up the image by drawing line segments (vectors);
raster-scan implies plotting a large number of points while making
horizontal sweeps over the imaging area. In the former case, small
segments may not be drawn accurately and producing dots can prove
to be a problem, whereas with the latter it is the number of
points per unit area (i.e., the resolution) which is crucial to
producing a good image (which appears not to be made up of
-26-
. セ G@ ' . · -- _:..::__ _,::_

individual dots).
Numerous types of printer are available for producing
hardcopy computer output. Music printing systems have tended in
the past to use three main varieties, the dot-matrix printer,
plotter and phototypesetter. The primary features which determine
these choices are price, resolution and speed. The printers' best
attributes are shown by category in the following table. The
phototypesetter, for example, provides the best resolution and
speed at the worst ( = highest) price.
dot-matrix
plotter
phototypesetter
price
1
2
3
resolution
3
2
1
speed
2
3
1
The dot-matrix printer is widely available and very popular
because of its price and versatility. It can produce scores at a
resolution of up to approximately 360 dots per inch (d.p.i.) which
is adequate, although beams which slope only slightly will appear
as a 'staircase' and slurs will not be smooth. These disadvantages
can be minimized by producing oversized originals and then using
photoreduction at the production stage. More often, though, the
intention is to use the dot-matrix printer for producing draft
copies for proof-reading or one-off prints for use in an
educational situation or by a composer. Often the dots which
constitute the image are large compared to the 'grid' on which
they can be positioned, so that adjacent dots overlap and, for
-27-
•• ᄋ セ ᄋN@ _'! _

example, a line two dots wide would be less than twice as wide as
a line of single dot thickness.
In the past, the plotter has been by far the most widely used
output device for computer printing of music within the context of
research projects (see section 2.5). Its two main forms are the
X-Y flat-bed pen plotter and the drum plotter. In the former, the
pen travels over both axes, whereas with the latter the pen moves
over one axis only and the paper moves over the other. Although
the plotter is relatively slow, it can resolve up to a thousandth
of an inch, but then suffers from a problem similar to the
dot-matrix printer in that the ultimate resolution is decided by
the pen being used, and not by the 'grid' upon which it is
positioned. Again, photoreduction can be used to improve the
perceived resolution and assist in eliminating 'staircase'
effects.
The phototypesetter also exists in two forms: mechanical and
digital [Seybold 1983], but the latter is rapidly taking over from
the former. Both types produce output on film but the mechanical
typesetter uses templates and an optical system to produce very
high quality images with an accuracy in the region of +/- one
thousandth of an inch. The use of templates dictates that the
character-set is built into the hardware. This restricts the
number of symbols to less than that needed to cover all
orientations of beams and slurs, and is less flexible than the
digital approach. In a digital typesetter, the number of
characters/symbols available is limited solely by the on-line
storage capacity. So, although the digital typesetter is the more
-28-
expensive variety (tens of thousands of pounds), it has enormous
flexibility and is able to produce images of very high quality
(approx. 2500 d.p.i.) making it the ideal music printing device.
More recently, other designs of printer have been developed
and refined and hence have become available for music printing
[Weber 1986a, 1986b]. Specifically, these are varieties of
non-impact machines, such as thermal transfer, electro-erosion,
electrostatic and xerographic printers.
Thermal transfer printers are capable of approximately 300
d.p.i., an example being the IBM Quietwriter 7 typewriter/printer,
but the short life-span of the ribbons used leads to high running
costs.
Electro-erosion printers (such as the IBM 4250) produce up to
600 d.p.i. (low typeset quality) by using a high-density printhead
to burn away the metallic surface covering a black backing paper,
which is then used to produce final output on film.
Electrostatic printers produce a resolution of up to 400
d.p.i. Their print quality and contrast, however, are not as good
as the xerographic printers described below. A disadvantage of
electrostatic printers is their requirement of special paper.
Of all xerographic (or electrographic) printers, the laser
printer is, at present, the most popular form. It is being used
widely for music printing (see section 2.5) where it is seen to
benefit from some of the advantages of the phototypesetter (high
-29-

speed and resolution) but with none of the disadvantages of the
plotter and dot-matrix printer. Other varieties of xerographic
printer use a different light source such as light-emitting
diodes, or a liquid crystal shutter to control the light. Working
on principles similar to those of a photocopier, the modulated
light source directed onto a rotating drum produces an image on
the charged drum surface. This is then used to transfer toner onto
the paper, where it is heat-fused. A diode or liquid crystal
shutter as the light source or controller, respectively, gives the
printer greater reliability because it cuts down on moving parts.
Speeds for laser printers vary between six and 200+ A4-size pages
per minute, prices are from £1,000 upwards, and maximum resolution
is about 600 d.p.i.. Duplex printing (i.e. on both sides of the
page) and A3 paper- handling - both important features for music
printing - are now becoming available in cheaper machines.
Normally, assuming a laser
facility to address all points
printer (or similar) has the
over its imaging area, the
information actually transmitted over the interface between host
computer and printer is a coded description of the original image.
This produces significant data compression compared to
transmitting a complete bit-map representation. A raster image
processor (R.I.P.), normally contained in the printer, converts
the transmitted code into a raster image and controls the marking
engine itself. It is the R.I.P.'s own command language which
determines the text/graphic printing capabilities of any
particular printer. There is a similarity between the laser
printer and phototypesetter in that, in both cases, the host
computer has merely to transmit information regarding which symbol
-30-
(character) is to be printed, where on the page, and perhaps in
what orientation. The printer can then construct the bit-map form
of the image and thus offload a large amount of work from the main
computer. Currently, the effective standard for this type of coded
data transfer between computers and printers is Adobe Systems'
'Postscript', although other page description languages (PDL's)
are in use, for example Xerox's Interpress. In practice, this
means that the same data can be sent to an appropriate laser
printer or phototypesetter, and the only difference in the output
image will be the change in resolution. Also, 'Display Postscript'
is now becoming available, providing even more
device-independence, by enabling a Postscript encoded image to be
displayed on-screen.
2.5 APPENDIX
The following table can be viewed as an enlarged version of
the survey given in Donald Byrd's thesis 'Music Notation by
Computer' [Byrd 1984]. References have been added pertaining to
systems which Byrd mentions. Information on systems which were
recent at the time of his writing, has been expanded upon, and
details of some new systems have been added. Also, the information
is presented in a clear tabular form. Ideally, the same features
of each system would have been examined to facilitate direct
comparison; the systems vary so much, however, that this is not
possible, especially considering the varying amount and age of
information which is available. Examples of output from
significant systems are to be found in [Clements 1980a] and
[Hewlett 1985, 1986b, 1987, 1988]. Where the information provided
-31-
..:... · __ ,; _._. _ ._
' - . : . . ' .- . セ@ . . .
is based on [Byrd 1984], the subjective descriptions of output
(e.g., 'high-quality' scores) have been retained and where the
current author's opinion is being expressed, a similar scale has
been adopted, i.e., low or poor, adequate, reasonable, high, very
high or very good, excellent or engraving-quality.
As the price of technology falls, significant developments
are occurring at a rapid pace. For example, the hardware used in
the Mockingbird system developed at Xerox's Palo Alto Research
Center, deemed 'prohibitively expensive' in 1984, may in the
not-so-distant future come within reach of most music publishers'
budgets, if not those of music copyists. More music printing
software is becoming available for popular microcomputers, which
is having a significant impact, especially where the Postscript
page description language is used, with its aforementioned
flexibility. The possibility of proofing output on a laser printer
and then using a bureau service to produce final typeset material
from the same data is proving attractive in music production (as
well as general graphics applications) because, while giving
access to top-quality output, it removes the need to invest
heavily in typesetting equipment.
TABLE OF MUSIC PRINTING SYSTEMS
Name of system Instigator(s) References
AMADEUS Kurt Maas [Maas ·1985]
Amadeus uses polyphonic real-time input by organ keyboard
-32-
' • • ' セ@ • • • • .. ' • •,:- .# e
and/or QWERTY keyboard. Facilities for playback and transposition
are available, and editing is very versatile giving varied
layouts, including text. The system is MIDI-compatible, and,
connected to a laser phototypesetter, gives excellent quality. The
notational vocabulary is comprehensive and layout facilities cover
several parts to a stave and parts crossing from one stave to
another. The system is used by its origin a tors to provide a
music-setting service (used, for example, by Schotts).
C.C.A.R.H. System Walter B. Hewlett [Hewlett 1985,
1986a, 1986b, 1987, 1988]
[Selfridge-Field 1986b]
The system of the Center for Computer-Assisted Research in
the Humanities runs on the Hewlett Packard 1000 computer using the
IBYCUS operating system. Input is by organ keyboard (each voice
separately) with a playback facility (via any MIDI-compatible
synthesizer) available. Draft-quality output is by dot-matrix
printer, although a limited Hewlett Packard Laser Jet printing
option is available. The system is aimed at the creation of a
music database (initially the works of Bach and experimentally
those of Carelli, Legrenzi and Handel) for musicological and
educational purposes.
COMPOSER'S
ASSISTANT
Syntauri Corporation [Aikin 1983]
Composer's Assistant uses real-time input via a synthesizer
to an Apple II computer, with output by dot-matrix printer.
-33-

Facilities available are very limited, especially editing.
FINALE Coda Software [Hewlett 1988]
[Finale 1988]
Finale is a software package for the Macintosh with
multi-channel real-time MIDI input using 'Hyperscribe' which has a
unique facility for coping with tempo changes. Other input options
include QWERTY keyboard, mouse and non-real-time MIDI. A wide
variety of symbols and score formats are available, as are
user-definable symbols and text underlay. Part extraction and
playback via MIDI are also possible. Output is to any Postscript
device and a version of the program for the IBM PC is under
development.
H B MUSIC ENGRAVER H B Imaging Inc. [HBEngraver 1988a,
1988b]
H B Engraver is a software package for the Macintosh which
automatically positions musical symbols and text according to a
user-definable spacing 'ruler'. Alternatively, symbols can be
ーッウゥエゥッョセ、@ manually. It is available in a version for
composers/arrangers and also in a special publishers' edition.
Input is achieved by use of the mouse
Postscript device using the 'Sonata'
and output
font (the
is via any
proprietary
'Interlude' font is also available). Multiple voices per stave,
chords, various markings and a range of formats are available.
-34-
., . セNNNNNZMZZN@ __ ·._:..... . -- ·-

INTERACTIVE MUSIC
SYSTEM
Lippold and
Dorothea Haken
( C.E.R.L.-Illinois)
[Schmid 1984]
[Scaletti 1985]
[Hewlett 1985, 1986,
1987]
Based on the PLATO computer system (using the 'C' programming
language), the Interactive Music System is part of the
computer-based music education system at the University of
Illinois. Input is via an organ keyboard with alphanumeric and
graphic editing and playback facilities available. Up to 60-part
scores can be produced, with a wide range of notational symbols
(including n-tuplets) available. Draft-quality output is provided
by a dot-matrix printer and laser printer output is available via
an Apple Laserwri ter.
LA MA DE GUIDO Llorenc; Balsach [Balsach 1986]
[Guido 1988]
La Ma De Guido, a software package for the IBM PC, is used by
its originators to provide a music-setting service. Input is by
QWERTY keyboard or MIDI synthesizer and output is via a plotter.
Flexible editing and user-defined symbols are available, as is
transposition and the facility to produce parts from a score. A
limited version restricted to four voices and two staves per
system is also available, as are test programs for either package.
A separate score performance module permits playback of up to
eight voices via a MIDI synthesizer, with control over tempo and
other parameters.
-35-

LUDWIG William Reeves
and William
Buxton (et al.)
·,.,, '1.· ,.; ,
[Reeves 1978]
[Buxton 1978a,
1978b, 1979]
Ludwig is a score-editing system developed as part of the
University of Toronto's Structured Sound Synthesis Project (SSSP).
MANUSCRIPT Rebecca Mercuri [Mercuri 1981]
Manuscript is a music notation system for the Apple II using
menu-input and editing.
McLEYVIER David McLey
(SYNTRONICS)
[McLeyvier 1982]
[Gilbert 1982]
[Spiegel 1983]
[Hewlett 1987]
The McLeyvier uses input via organ keyboard (either real or
non-real time) or M.R.L., with other features similar to the
Synclavier. The system is now owned by Syntronics of Toronto.
MOCKINGBIRD John Turner Maxwell
III & Severo M.
Ornstein (Xerox PARC)
[Roads '81]
[Maxwell 1982,
1983, 1984]
[Ellis 1984]
[Hewlett 1986 b]
Mockingbird uses real-time input via Yamaha CP30 keyboard
(piano music only) with powerful editing facilities to convert
-36-
___ i: MMセNNZNᄋ@ __ : _ ... ' • :."' ':: G セセ ᄋi@ •· '•. " t :.
piano-roll notation to C.M.N. using menus and a mouse. Mockingbird
runs on the Xerox Dorado (Xerox 1132) in Mesa and produces very
good quality output via a laser printer. A playback facility is
incorporated.
MP-1 MINIPRINTER Yamaha Inc. [Yamaha 1983]
The MP-1 is a synthesizer with built-in pen plotter (using
2 1/2" wide paper) which prints melody lines only (i.e.
monophonic).
MPL- NOTATE Gary Nelson [Nelson 1973a, 1977]
MPL - NOTATE is part of an integrated suite of music programs
(MPL = Music Program Library) written in APL on a Xerox Sigma 9.
Input is by QWERTY keyboard with plotter output of fairly high
quality scores, but with only one voice per stave.
M S / SCORE Leland Smith [Smith 1973,1979]
Passport Designs Inc. [Bowles 1974]
[Hewlett 1985, 1986 b]
[SCORE 1988]
M S I SCORE is a well-known system using the researcher's .own·
encoding language to produce multiple voices per stave. Feedback
and interaction are essential features, permitting the system to
cope with music of unlimited complexity. The use of vector
graphics permits output via nine or 24-pin dot-matrix printers or
any Postscript device, including the Apple Laserwriter and
-37-

appropriate phototypesetters. A wide variety of symbols, good
automatic beaming, automatic page layout and production of parts
from a score are all available. Unusual kinds of notation such as
neumes, mensural notation and lute-tablature can also be produced,
as can user-designed symbols. SCORE, the commercially-available
version of the software, runs on IBM PCs.
MUPLOT A. James Gabura [Gabura 1967a, 1967b]
MUPLOT uses alphanumeric input on the IBM scientific
computer, producing single-voice-per-stave scores of high-quality
on a plotter, but with severe limitations.
MUSCOR II Charles Render [Render 1981]
MUSCOR II uses the researcher's own encoding language but
details as to the extent of the implementation of the system are
unclear.
MUSECOM II Jim Troxel [Musecom 1977]
[Price 1977]
[Wittlich 1978b]
Musecom II consists of a single console which contains an
organ keyboard for input (in real-time), a plotter for output
(using pre-drawn manuscript paper) and a monitor screen. The
latter permits editing of up to 20 lines of music. A playback
facility is available.
-38-
. . セ ᄋ@ : .. : Mセ@ . '

MUSIC EDITOR/
LAFFANGRAF
John Laffan [Hewlett 1985]
[Laffangraf 1985]
Music Editor runs on the IBM PC with up to six staves
on-screen (in three possible sizes) but more staves are possible
in total. Cursor keys are used to input pitch, with a QWERTY
keyboard (and M.R.L.) used for all other information, but there is
an organ keyboard option. Chords are possible and beaming is
automatic, but the variety of symbols is limited. Output is by
dot-matrix printer, giving quality which is adequate, but better
on large music notation (e.g., piano scores) rather than
orchestral scores. Limitations include problems with spacing and
beams. Facilities available include good editing, transposition
and parts from scores.
MUSIC PROCESSOR Etienne Darbellay [Hewlett 1985]
The Music Processor is a system orientated towards musicology
which runs on the Texas Instruments Professional Computer and IBM
PCs. Defined function
staves on-screen and
notations (including
editing facilities and
MUSIC PUBLISHER
keys are used for
automatic spacing
mens ural notation)
dot-matrix printing.
Graphic Notes
Trevor Richards
input with up to nine
as a default. Special
are available, as are
[Hewlett 1988]
[Music Publisher 1988]
Music Publisher is a software package for the Macintosh,
based on the work of Trevor Richards. It uses a separate 'PRESTO
-39-

pad', in addition to mouse and QWERTY keyboard, for input. Output
is via any Postscript device or the Apple Imagewriter. A MIDI
playback facility is available and an option for MIDI input is
under development. A wide range of symbols and score formats are
available together with the proprietary 'Repertoire' font. A
dictionary of musical expressions is included for spell-checking.
MUSICOMP (PCS 500) Armando Dal Molin [Dal Molin
1973, 1975, 1976, 1978]
[Sargeant 1971]
[Selfridge-Field 1986a]
[Hewlett 1988]
The Musicomp uses custom-built hardware, including four
stacked octaves of 'pitch keys' and a music-orientated
alphanumeric keyboard, for input. It forms a commercial system
with good feedback and editing facilities producing near-engraving
quality output on a phototypesetter (as of 1982, hand-finished).
Publishers Belwyn Mills currently use four Musicomp terminals. A
version for the IBM PC using an auxiliary keypad for pitch input
is under development.
MUSICSYS/3600 Bernard S Greenberg
and Douglas Dodds
(Symbolics Inc.)
[Hewlett 1985]
Musicsys is a system running on a Symbolics 3600 computer
using QWERTY keyboard for input of researchers' own M.R.L ..
Playback of up to six voices is available internally and
-40-

interfacing to a MIDI synthesizer is also possible. A mouse
editing facility was under development as of 1985 and a laser
printing facility is already available.
MUSIGRAPH William A. Watkins [Watkins 1984]
[Selfridge-Field 1986b]
[Hewlett 1987]
Musigraph is a commercial system which runs on TRS-80
computers, interactively handling complex material. It produces
excellent quality output on a phototypesetter, together with some
manual additions. In 1984 it was being used to provide a
music-setting service to major music and book publishers in North
America, but this operation has since been dissolved and the
system taken over by Grawemeyer Industries of Kentucky.
NED IT Dean Walraff [Walraff 1978]
NEDIT is a system developed at M.I.T. which uses organ
keyboard input in non-real time.
OXFORD MUSIC
PROCESSOR
Richard Vendome [Vendome 1986]
O.M.P., a software package for the IBM PC, which was
undergoing beta-testing durjng 1988, uses QWERTY keyboard input of
M.R.L. data and plotter output (alternatively a dot-matrix printer
can be used for proofing). A utility to convert Hewlett Packard
Graphics Language (HPGL) data into Postscript is provided to
-41-

enable printing via a suitable laser printer or phototypesetter.
Multiple voices per stave are
symbols are available. The
possible and a limited range of
quality of output is, after
photoreduction, equal to engraving.
PERSONAL COMPOSER Jim Miller [Miller 1985]
[Freff 1983]
[Hewlett 1987]
Personal Composer is a software package running on the IBM
PC, using a MIDI -compatible synthesizer for real-time input and a
dot-matrix printer or laser printer with the 'Sonata' font for
output. It is a highly interactive system using a mouse and menus
or, alternatively, QWERTY keyboard editing. Part extraction,
transposition and MIDI playback are available, and text can be
included in scores. Rhythm verification is undertaken
automatically.
PROFESSIONAL
COMPOSER
Mark of the Unicorn Inc. [Moody 198 5]
[Yavelow 1985]
[Hewlett 1986b]
Professional Composer is a software package for the Apple
Macintosh, permitting up to 40-stave scores, with a large variety
of symbols available. Pitch entry is by on-screen cursor, while
other symbols are selected from on-screen menus. Editing is by
cut-and-paste, so that text and metronome markings, etc., can be
freely added. A transposition facility is available. Chords can be
used, but different durations are not permitted simultaneously on
-42-
·-. ' . セ@ - ' ... . . .. . ' - ' . . . セ@ ..

one stave. Main beats are automatically aligned, but barlines must
be entered by hand. Beams are available (including n-tuplets) but
these are always horizontal, presumably because of the dot-matrix
printer originally intended as the output device (although the
Apple Laserwriter can also be used). A preview facility gives a
reduced view of the page as it will appear on the printer. The
program is currently being used by Garland Press in the production
of editions of 16th-Century music.
SCAN-NOTE Mogens Kjaer
(Dataland Co.)
[Dataland 1979]
[Orsted 1976]
(Superseded by 'Tappan Scan-Note' - see entry below)
Scan-note used three keyboards for input (organ in non-real
time, QWERTY, and dedicated symbol keyboard). Output was via a
plotter (double size), with hand additions, covering moderately
complex material. The quality was nearly up to engraving standard.
A transposition facility was available. Originally, this was a
commercial system.
SCOREWRITER Con Brio Digital Synthesizer [Con Brio 1982]
[Ellis 1984]
Scorewriter uses a synthesizer as input device in conjunction
with 'Music Programmer' software which permits editing of a
keyboard performance by interacting with a conventional music
score displayed on a built-in monitor screen. Printout is via a
dot-matrix printer.
-43-

SMUT ( + MUSTRAN) Donald Byrd [Byrd 1970, 1971 1972,
1974, 1976, 1977, 1980, 1984]
[Hewlett 1986b, 1987, 1988]
Input to SMUT is via M.R.L. (MUSTRAN) or organ keyboard (in
conjunction with a translation program). High-quality output is
produced on a plotter, although the software is designed to be
independent of output device. Important features of the system
include portability and routines for rhythm clarification and
automatic beaming. SMUT allows one or two voices per stave and
multiple staves. The software is currently being adapted to run on
the Macintosh using Adobe Systems' 'Sonata' music font (a library
of approximately 200 symbols) under the product name Nightingale.
SOUND CHASER
NOTEWRITER/
POLYWRITER
Passport Designs Inc [Soundchaser
1982, 1984]
[Ellis 1984]
Polywriter uses real-time organ keyboard (MIDI-compatible)
input, played along with a click-track, giving resolution to
triplet semiquavers. Eight score formats are available (from
single stave to 40-part orchestral scores) with a 2700
notes-per-page capacity. Fully polyphonic notation is allowed,
including ties, beams, split stems, double-sharps and flats and
8va, plus 40 automatic instrument transpositions. Up to 28
individual polyphonic parts can be recorded, with fairly
comprehensive editing facilities, including adding text. The
software runs on Apple computers with the Soundchaser keyboard (or
similar MIDI-compatible) and produces adequate output on a
- 44-

dot-matrix printer. Notewriter was a monophonic predecessor.
STAVEWRITER Fairlight Corp. [Ellis 1984]
Stavewriter is a software package for the Fairlight Computer
Music Instrument which allows high-quality printing of music from
either real-time performance or a dedicated M.R.L .. As of 1984,
only monophonic C.M.N. was possible (later four parts were to be
available), or all eight parts of real-time input could be printed
in 'simplified notation'. Options available include adjustable
stave proportions and positioning, proportional spacing,
transposition and automatic calculation of irregular rhythmic
groups. The system is tailored to a specific plotter (the H.P.
7475A), which produces very good output, although the proportions
of some symbols are not quite correct and spacing is abnormal in
some cases.
SYNCLAVIER
MUSIC PRINTING
OPTION
New England Digital
Corp.
[Synclavier 1983]
[Ellis 1984]
[Talbot 1988]
The Music Printing Option for the Synclavier uses either
synthesizer or dedicated M.R.L. ('SCRIPT') input, with output of
high quality by laser printer or phototypesetter (optionally by
dot-matrix printer). One or two voices per stave (including
chords) are available, as is feedback, but editing possibilities
are limited. Notational vocabulary includes n-tuplets, dynamics,
articulation marks, instrument names, text and page or bar
numbers. The system is currently undergoing substantial revision
-45-
• • .P •. • セ[N[@ • .....

and enhancement.
THEME-
THE MUSIC EDITOR
Mark Lambert [Lambert 1983]
[Hewlett 1987, 1988]
THEME is a system for use in musicological applications as
well as printing/ editing, etc. It handles up to 16 polyphonic
voices and eight notes per stem, using QWERTY keyboard
cursor-control input.
automatically and a
Beams and stem-direction are produced
wide variety of notation is available.
Ornamental passages can be freely inserted while maintaining
vertical alignment in the printed score. The software runs on the
Apple II, TRS-80, or IBM PC producing adequate quality output from
a plotter, dot-matrix or laser printer. As of 1983, the facility
to produce parts from a score was mentioned as being under
development. Sound playback is possible via a MIDI synthesizer.
TOPPAN SCAN-NOTE Tappan Printing Co. [Tappan 1984, 1988]
[Hewlett 1986b]
The Scan-Note system described above was taken over by the
Japanese printing company Tappan Ltd. and became the Tappan
Scan-note system. Input as above. Output is via dot-matrix printer
for proof-reading (enabling error-correction and adding of
instrument names, dynamics etc., using a graphics terminal), and
laser-typesetter for engraving-quality final copy. Facilities
available include parts from a score, transposition, alterable
layout and format. Available examples are conservative, so it is
-46-

difficult to assess the versatility of the system as regards
quintuplets, septuplets, appoggiaturas, etc. Although multiple
staves (single line per stave plus chords) are possible, there is
no evidence of multiple voices on one stave. The system is in use
commercially (for example, by Barenreiter Verlag), but is
also available running on the Apple Macintosh II.
Norbert Boker-Heil [Boker-Heil 1972]
A system which uses ALMA input· and plotter output in
producing single-voice-per-stave scores of good quality.
Donald Cantor [Cantor 1971]
This is early work, based on that of W.B. Barker, limited to
two voices on two staves using menu-entry and running on a PDP-11
computer and four cathode ray tubes. The system has a playback
facility.
A-R Editions Inc. [A-R Editions 1985]
[Hewlett 1986b]
A-R Editions' system is part of a commercial operation,
producing engraving-quality output from a phototypesetter, using
QWERTY keyboard input of a dedicated M.R.L. (a hybrid of FASTCODE
- developed by Thomas Hall at Princeton University - and DARMS).
The software checks syntax and does automatic formatting,
positioning of stems, beams, slurs, etc. Automatic extraction of
parts from a score is possible. It is hoped that a large databank
-4 7···
. <. .1: ' セL@ • • セ@ • h.. ᄋセ@ • · ·... c • Zᄋ セ@ ..

of encoded music can be created. The only examples available show
no evidence of a multiple-voices-per-stave capability. The system
is used both for A-R Editions' own publications and by other music
publishers.
Lejaren Hiller [Hiller 1965]
This is early work on the setting of music using an ILLIAC I
computer and Musicwriter typewriter for input and output,
producing high-quality, single-voice-per-stave scores, but limited
in many ways.
Prentiss Knowlton [Knowlton 1971, 1972]
This system uses both types of keyboard for input of pitch
and rhythm (real-time), i.e., an electronic organ linked to PDP-8
computer, producing limited output of poor quality.
(for M.I.T.
LISP machine)
William Kornfeld [Kornfeld 1980]
This system uses M.R.L. input or real/non-real time input by
organ keyboard with good editing made possible using a mouse but
on a bit-map representation (i.e., in image space).
Harry Lincoln [Lincoln 1970a]
This system uses DARMS input and produces low-quality
output consisting of limited complexity music on a line printer
-48-
.. セ@ . ..::. .

with a music character print chain.
Gary Wittlich (et al.) [Wittlich 1973a,
1973b, 1977, 1978a, 1978b]
This system uses real-time organ keyboard and graphics tablet
for input but the only output samples available are of poor
quality.
-49-
3. Pattern Recognition Of Binary Images
3.1 BACKGROUND
Given the large amount of work that has been undertaken with
regard to manipulating printed music using the computer, as
surveyed in chapter 2, it is apparent that there is a significant
need for an automatic acquisition system. The large number of
applications which this would make possible include automatic
production of individual players' parts from an existing printed
score, editing of existing printed material and production of
braille music scores. The possibilities will be detailed and
discussed in section 3.3.
It has been seen in chapter 2 that
usefully be achieved either by using
music data entry can
an automatic pattern
recognition system or by optimizing the man-machine interface of
an operator-driven system. For purely economic reasons the former
is preferable, especially when considering large scale conversion
of existing printed material into computer-manipulable form. It is
interesting to compare a parallel project in the field of text.
The production of the Thesaurus Linguae Graecae (a database of
classical Greek literature containing 62 million words) was
achieved using manual entry in South Korea and the Philippines
[Helgerson 1988], similarly, the electronic form of the New Oxford
English Dictionary (N.O.E.D.) was produced manually [Weiner 1987].
It must be borne in mind, however, that the availability ·of people
skilled in fast entry of text using a standard QWERTY keyboard is
-50-

far greater than those skilled in entry of musical information, by
whatever means. Automatic text reading machines were investigated
as an option for the N.O.E.D. project, but rejected on the grounds
that the wide range of fonts and poor quality of the images
involved were beyond the scope of what was then available [Weiner
1987], and, indeed, would still present a formidable challenge
today. Also to be considered, following the recent growth in use
of desktop publishing, is the availability of desktop scanning
equipment and in conjunction with this, OCR (Optical Character
Recognition) software capable of reading commonly used fonts and
in some cases 'learning' new fonts. Now that automatic text input
(at least of 'standard office fonts') is so widespread, there will
be more demand for acquisition, using the same equipment, of
information contained in various other forms of binary image -
circuit diagrams, for example, as well as music. Currently, these
can be acquired in bit-map form, but the recognition of the
constituent symbols is the subject of on-going research. The
following sections provide background information regarding
pattern recognition of binary images of various types, concluding
with a review of previous work on automatic reading of music
scores.
3.2 PATTERN RECOGNITION OF BINARY IMAGES
The largest area of research within the field of pattern
recognition of binary images is Optical Character Recognition,
i.e. automatic reading of text. Software is now commercially
available, either incorporated into a scanning device or as a
separate product, which will read high-quality material containing
-51-
text in a limited range of fonts and point sizes (e.g. ReadRight
[1988]). Additional limitations include restrictions on skewing of
the original and the type of printing device used in producing the
original. Normally, the technique behind software in the lower end
of the market is template matching, where the character under test
is compared exhaustively with a set of bit-map images of
characters in the system's library. The character with the highest
correspondence measure is output. Contrary to this, most research
papers deal with structural or feature-based methods; however,
recently released OCR systems, particularly the more expensive
ones, are implementations of such techniques [Discover 1988].
Pixel-based thinning is a commonly-used method for initial
data reduction and, possibly, feature extraction, producing a
'skeleton' of the original image by stripping off boundary pixels.
This is a time-consuming process (attempts have been made to
improve performance, for example by implementation in hardware or
parallelising) which may remove structurally significant portions
of the image such as short protrusions, or introduce extraneous
limbs or 'hairs'. These faults have to be considered when
designing the later stages of a recognition system, leading
perhaps to the inclusion of a post-processing stage to remove
hairs [Harris et al. 1982]. Once the skeletonising operation is
complete, the original image will have been converted into a
connected list of nodes (or 'branching points') and segments (or
'strokes') which will then be passed on to the recognition stage
for identification of 'features' arcs, lines, holes, etc
[Pavlidis 1983].
-52-
.... ·:

Alternative methods for thinning or vectorisation have been
suggested, including using the polygonal approximation to the
contours of an image [Meynieux et al. 1986] or using the
line-adjacency graph (LAG) of an image [Pavlidis 1982]. Those
methods aimed at processing just line-work can be separated from
those intended to produce, in addition, a structural description
of regions and miscellaneous filled shapes. Work directed towards
reading general office documents needs to take this capability one
stage further. This would entail the distinction of grey-level or
colour regions from binary graphics and then further division of
the latter into text - to be forwarded to an OCR module - and
graphics - to be vectorised or processed by a recognition module
appropriate to the type of image involved [Maynieux et al. 1986,
OmniPage 1988].
Obviously a recognition system for printed music must be able
to describe blobs (e.g. filled noteheads) as well as line-work
(barlines, stavelines, etc.). After approximating the contours of
an image with polygons, Maynieux et al. [1986] matched pairs of
segments from this outline which were below a threshold for
spacing (i.e. the maximum line thickness), and roughly parallel,
in order to find lines. Segments which could not be paired in this
way had, therefore, to delimit non-linear regions. Much use has
been made of the LAG (and transformed LAG) as a basis for thinning
or feature extraction. Applications include reading English text
[Grimsdale et al. 1959, Hattich et al. 1978, Duerr et al. 1980,
Pavlidis 1986, Kahan 1987] and Chinese characters [Eadie 1985],
analysing electrical circuit diagrams [Bley 1984] and counting
asbestos fibres [Pavlidis 1978]. This is also the basis of the
-53-

music recognition system described in chapter 4. The LAG is
derived from a run-length encoded version of the image. Nodes of
the graph are formed by continuous runs of black pixels and
branches link nodes which are in adjacent columns and which
overlap. The graph can then be used directly in a similar way to a
skeleton, or various rules can be applied to the nodes and
branches, agglomerating or removing these to produce a transformed
LAG. More details of the latter technique are given in chapter 4.
The use of context is another variable in the text
recognition process. Walberg [1986], for example, did not make use
of context, so that a 'superior' system could be produced when
contextual information was supplied. On the other hand, Hull and
Srihari [1986] used context at the word level in a procedure
termed 'hypothesis generation'. For each word a set of extracted
features were used to select a subset of words from a given
vocabulary. This subset should have contained a correct match for
the original word. A 'hypothesis testing' stage - implemented as a
tree search - discriminated between the words in the subset using
'inner features' i.e. features located (spatially) between those
used in the hypothesis generation stage.
In general, pattern classification is achieved using either a
statistical or structural approach [Baird 1986]. In an effort to
benefit from the advantages of both these methods whilst avoiding
their disadvantages, some researchers have made use of composite
approaches. Duerr et al. [1980, Hattich et al. 1978] used a
hierarchical approach consisting of four stages, the first
statistical, followed by two structural (the first of these making
-54-

use of a transformed LAG, as mentioned previously) and the 'mixed'
last stage made the final classification in conjunction with
results from the earlier stages. The reasoning here was that
patterns exhibit both 'characteristic structures' and
'probabilistic deformations'. Pavlidis [1983] used a different
form of combined approach. A structural technique was used for
character decomposition in order to cope with wide variations in
the input, but the results of this were not passed to a
syntactical analyser as might be have been expected; instead a
binary feature vector-based statistical class'ifier was used. This
was because the large number of classes involved in an OCR system
designed to cope with a variety of fonts and sizes (in addition to
Greek characters, mathematical and technical symbols, and
'possibly hand printing') rendered the former approach
impractical.
The recognition of Chinese and/or Japanese characters is a
different form of text recognition, with its own variety of
approaches. As referenced previously, Eadie and Shimura [1985]
used a transformed line adjacency graph, in their case to extract
line segments from handprinted Chinese characters. They cited the
problems with hairs and various distortions of conventional
pixel-based thinning as their reason for using a LAG-based
approach, and relied on a set of heuristics to perform the final
classification of line segments. In the work of Tsukumo and Asai
[1986], which dealt with machine-printed Chinese and Japanese
characters, numerous horizontal and vertical scanning lines were
used and features built up from the number of strokes .crossed by
these lines. In contrast to these stroke-orientated approaches,
-55-
, ,'' ' ' I -:-..,. , ,, .:. .. ... · •. , • : . '• •'·.
Feng and Pavlidis [1975] decomposed the polygonal approximation to
the boundary of each character into simpler shapes - convex
polygons, 't' shapes and spirals. They proposed that recognition
could then be achieved either by producing feature vectors derived
from the characteristics (or simply presence or absence) of
certain shapes or by using a graph structure processing scheme.
Interestingly, results were also given for processing chromosomes,
in addition to Chinese characters, showing the method to be
equally applicable.
The recognition of mathematical formulae is another form 'of
text recognition. In addition to the standard alphabetic
characters, symbols such as '+', '-' '*', 'I' and parentheses are
used, as are various point sizes (for example integral or
summation signs in appropriate circumstances). Recognition of
mathematical formulae is a 2-D problem, a characteristic it shares
with automatic reading of music scores, unlike ordinary OCR of
text strings which is commonly 1-D (see Byrd 1984, section 2.4,
for a comparison between the complexity of mathematical formulae,
Chinese documents and music notation). In the work of Belaid and
Haton [1984] a syntactic approach to this problem was used,
whereby a high priority operator in the formula under examination
was chosen as a starting point, and its operands were then broken
down iteratively until terminal symbols were reached. A list of
rules defining the grammar of a subset of possible formulae was
used in this analysis. Although this work used input from a
graphics tablet, the above approach could equally be applied to an
image-based system.
-56-

Engineering drawings of both mechanical and electrical
varieties have been the subject of a significant amount of pattern
recognition research [Pferd 1978, Clement 1981, Bunke 1982, Bley
1984, Okazaki 1988]. Clement [1981] used a low resolution scan to
find line-work, rather than using the full resolution of the
scanner over the entire image area, given that a large proportion
of this would commonly be background. It was then proposed that
remaining portions of the drawing would be scanned at full
resolution in order to achieve raster-to-vector conversion of more
complex structures and, where appropriate, character recognition.
Pferd and Ramachandran [ 1978] reviewed scanning and vectorisa tion
techniques and described their LAG-based algorithm for converting
run-length encoded images of engineering drawings into vectors.
They saw the conversion of the vector representation into a CAD
database as 'desirable' but not 'essential' given that significant
data compression had been achieved and editing (of the vector
list) enabled.
Bley [1984] used a transformed LAG in order to segment
circuit diagrams. The resulting graph was split into 'large' and
'small' components, the former consisting of line-work and large
symbols, and the latter the legends, i.e. text contained in the
diagram. Small components were clustered, forming associated
characters into words ready for passing on to an OCR stage. After
'dominant line elements' had been extracted, the remaining large
components were processed using 53 'production rules' which
analysed and modified the transformed LAG in order to produce the
final vectorisation. Bunke [1982] introduced the attributed,
programmed graph grammar as a means of interpreting previously
-57-
vectorised circuit diagrams and also flowcharts. A graph
representing the input diagram was processed using a set of
'productions'. These transformed the graph, either performing
error correction of the input, for example, removing extraneous
short line segments, bridging gaps in lines, etc., or producing
the output representation for a particular symbol. These
transformations made use of attributes of the nodes and edges in
the original graph (spatial relationships, line lengths, etc.)
together with 'applicability predicates', which specified
constraints on the attributes, and were in turn 'programmed' by a
'control diagram' which determined the order of application of the
productions.
In a recent paper, Okazaki et al. [1988] used a
loop-structure-based recognition process in reading circuit
diagrams. Nearly all logic circuit symbols contain at least one
loop, i.e. a region of background completely surrounded by
line-work. A few do not: resistors and earth for example, and
these were dealt with separately. Loops were detected in the
original diagram and, for each loop, an appropriate bounding
window (termed a 'minimum region for analysis' or MRA) was
determined within which testing could take place in order to
achieve recognition. A hybrid method was used for this, combining
template matching of primitives,D and o for example, and feature
extraction, using the number of connecting lines, the number and
size of holes, etc. Production rules were used to mediate between
the sets of results derived from the two approaches. These divided
into inference rules, where a candidate result was obtained
despite the above processes producing different results, and test
-58-

rules, where a recognition result was checked for various
parameters before being output. Symbols which did not contain
loops were recognised by line tracing from end and corner points,
and matching structural features (branch, corner and end points)
using a graph structure representation. In addition to reading
symbols with and without loops, line-work and rectangles (macro
gates), the system read text which was defined as consisting of
freehand characters in the OCR font.
Recognition of hand-drawn diagrams has also been widely
researched. Sato and Tojo [1982] used line-tracking as the basis
for a system which interpreted freely- drawn circuit diagrams and
flowcharts. Initially, by using a coarse scan, the average line
width and minimum line spacing were determined. Then, using these
measurements, a tracking window was set up, which was used in the
line-following process. If black pixels were found at the edge of
the window during line-following, the region in question was
termed 'complex' and was saved on a stack for later, detailed,
analysis. Complex regions included bends, branches, crossings,
arrow marks (in flowcharts) and dots. After line-following was
complete, arcs and straight line segments were distinguished.
Relations between detected primitives (lines, arcs, circles and
dots) could then be analysed and symbols recognised according to a
priori knowledge of the structure of permitted symbols.
Suen and Radhakrishnan [1976] concentrated on reading
hand-drawn flowcharts consisting of boxes constructed from
straight lines, interconnecting line-work and associated arrows.
Following initial thinning, a run- length encoding-based method was
-59-
. · .. , .. - < •• , ·

used, in this case for horizontal line detection. Line tracking
was then undertaken from the ends of each horizontal line, and the
direction of these new lines was quantized into one of six
possible directions. This was sufficient to distinguish all but
two categories of symbol (which required one extra test) while the
diamond-shaped symbol was treated separately as it does not
contain a horizontal line. The interconnecting lines could then be
traced and associated directions determined using a priori
knowledge of the number of permitted connections to a particular
type of symbol and recognition of the requisite arrows. This
information was then output in tabular form and it was proposed
that, with the addition of a character recognition capability, a
flowchart alone could be used for program input.
Furuta et al. [1984] also made use of run-length encoding,
but in processing hand-drawn piping and instrument diagrams. Once
a portion of line-work was detected (a group of runs which were
below the threshold for maximum line thickness and which did not
form an arc or bending point), line tracking commenced. When
either the line thickness increased suddenly or exceeded the line
thickness threshold, a bending point was encountered, or no
continuation of the line could be found after traversing a break,
a symbol was deemed to exist. Geometrical feature points were used
in order to achieve symbol recognition. These included end, corner
and branch points, filled regions and isolated points. Noise
removal and line extraction were also performed and then feature
vectors built up, using the number of occurrences of each type of
geometrical feature point, the number of lines, etc. A measure of
similarity between the vector under test and that of each
-60-

'standard symbol' was calculated and used in conjunction with a
threshold in order to complete the recognition process.
3.3 PREVIOUS WORK ON PATTERN RECOGNITION OF PRINTED MUSIC
In the field of pattern recognition of printed music, the
earliest recorded work is that of Pruslin [1967] at M.I.T .. This
work was followed up by, and to a limited extent continued by,
Prerau in the late 1960s and early 1970s [Prerau 1970, 1971,
1975]. A third worker at M.I.T., Mahoney [1982], pursued work in
the same area more recently, as part of an undergraduate project.
Further research on this subject has been undertaken by
Japanese workers. Matsushima et al. [1985a, 1985b, 1985c] produced
the vision system for the WABOT-2 keyboard-playing robot and have
subsequently integrated a braille score production facility into
their system [Hewlett 1987, 1988]. Nakamura et al. [1979]
developed a score-reading facility as a means of acquiring data
which could then be used in forming a database for use in work
aimed at analysing Japanese folk-songs. Aoyama and Tojo [1982,
Tojo and Aoyama 1982] also developed a score-reading system as a
means of entering information contained in existing sheet music
into a database.
Other research work in this area, although apparently of a
short term nature, has also been reported by Wittlich et al.
[1974], Andronico and Ciampa [1982], Tonnesland [1986], Martin
[1987] and Roach and Tatem [1988].
-61-

Work along similar lines by Gary Nelson and Terry Penney
[Nelson 1973b], i.e., 'translating films of printed or handwritten
music into numeric data suitable for analysis by computer,' has
not been reported in detail.
Two publications by Michael Kassler [1970a, 1972] concerned
automatic recognition of printed music. The first of these, 'An
Essay Toward the Specification of a Music Reading Machine', went
some way towards laying out what the machine should be able to
recognize and included an original representational language. The
second, 'Optical Character-recognition of Printed music: a Review
of Two Dissertations', discussed the work of Pruslin and Prerau. A
summary and discussion of Pruslin's work appeared in 'Recognizing
Patterns' [Edeh 1968] which put the music recognition problem in
the context of other pattern recognition work.
The following paragraphs discuss the above work in more
detail.
3.3.1 Background
The aims of researchers mentioned above ranged from forming a
database (Aoyama and Tojo, Nakamura et al.) to providing a robot
vision system (Matsushima et al ). The work of Pruslin and Prerau
was intended to achieve limited symbol recognition in order to
enable general applications. In contrast, Mahoney and Roach and
Tatem concentrated on the problem at a lower level, recognising
symbol components. A significant proportion of the effort of
Pruslin and Prerau was targeted, however, on the specific aspects
-62-

of note-cluster detection and staveline extraction respectively.
All three M.I.T. authors mentioned the distinction between
musical symbols which can be treated as characters (because they
are the same on each appearance) and those which have varying
graphical parameters, such as slurs. Pruslin treated notehead
clusters as characters, but beaming complexes as varying
combinations of parallelograms. Prerau gave special attention to
the problems of recognising non-character symbols whilst Mahoney's
approach of detecting primitives, rather than complete symbols,
partially solved this problem.
A question of terminology arises when comparing the
aforementioned works. Prerau coined the term 'sofon' (Sharp Or
Flat Or Natural) to describe the sharp, flat or natural sign in
any context, as opposed to using the term 'accidental' which,
strictly, implies an alteration of the pitch of a note, compared
to either its previous occurrence or the current key signature. In
this thesis the term accidental will be used セョ@ the strict sense
of the word, to refer to one of :- sharp, double sharp, flat,
double flat or natural.
3.3.2 Aims
The aims of the aforementioned researchers varied widely.
Prerau aimed to produce a program which could be expanded easily
given that his work could not be comprehensive, while Mahoney
emphasised design, thus presenting the basis for a 'real' system.
He advocated retaining as much textual information as possible so
-63-
as not to favour a particular representation scheme, and measured
the usefulness of a music recognition system by its flexibility
(ability to cope with variations in style and print quality). An
important point which Mahoney mentioned in outlining his research
philosophy, which will recur in chapter 4, is the trade-off which
exists between robustness and simplicity of the recognition task.
Nakamura et al. aimed to produce a database of Japanese
folksongs in order to study and manipulate these, as sound and
printed score, using a computer. Aoyama and Tojo also aimed to
produce a database, but of more general material, and as part of
an interactive music editing and arranging system. In contrast,
Roach and Tatem's work was prompted by the economics of music
publishing, where a large amount of money is spent on converting
composers' manuscripts into engraved notation.
3.3.3 Acquisition (scope of input material, scanning and
thresholding)
The scope of the input material also varied, Pruslin asserted
that complete recognition was achieved when the type, order,
volume, tempo and interpretation of notes were specified, but his
work only attempted to recognise solid noteheads and beaming
complexes, as well as determining note order, in single bars of
piano music.
Prerau used a flying-spot scanner to digitise samples
consisting of two or three bars of a duet for wind instruments
taken from Mozart K.487. The scope of his work was defined as an
-64-
engraved sample of standard notation, where this was taken as
'most instrumental and vocal music between the end of the 17th
century and the beginning of the 20th century'. Recognition was
limited to that notation which needed to be recognised in order to
enable a performance of a minimal version of the score. That was,
notes of all types, rests, clefs, time signatures, key signatures
accidentals, and dots, but not dynamics, tempo markings,
ornaments, etc. The source material was chosen to contain all
basic notational symbols while being relatively simple. Duets were
chosen because they provided structural features of larger
ensembles whilst using single-note-per-voice notation. The latter
requirement was stipulated, ostensibly, to lessen the overlap with
Pruslin. The point was emphasised that the source music (K. 487)
was from an ordinary book, i.e. not specially prepared for
computer input. The samples used were 1 1/2" x 1 1/211, i.e. two to
three bars of the duet music digitised at a resolution of 512 x
512 pixels over the total image area of 2 1/411 x 2 1/411, giving
approximately 225 d.p.i.. These were grey-scale images and the
threshold was chosen 'by eye' to give staveline thickness of
approximately three pixels, given that 'any thinner line would run
the risk of having breaks in stavelines. Since staff-line
continuity is an important property used in the isolation section,
staff-line breaks are to be avoided.' Unfortunately, staveline
continuity cannot be relied upon, as will be seen in chapters 4
and 5.
Andronico and Ciampa also used a flying-spot scanner, with
negatives of 24mm x 36mm at 512 x 512 resolution with 64 grey
levels. Binarisation was achieved using a manually selected
-65-
.:. .. . ... . • .

threshold, although the use of automatic thresholding was a future
aim.
Mahoney mentioned that the highest possible resolution,
although desirable, was likely to produce prohibitively large
images. Also, he used no preprocessing in order to reduce the
effects of noise, because the greatest difficulties were 'usually
inherent in the printed text itself'. The worst case of this is
perhaps provided by the breaking up of a symbol which needs to be
connected for recognition purposes. This subject is discussed
further in chapter 5. Mahoney hoped that enough leeway was
inherent in his method to 'absorb flaws', although he added that
touching-up by hand was a possible solution. He provided a
detailed analysis of the processing of an extract of two bars of
guitar music. Resolution of 100 microns (254 d.p.i.) was used to
produce a 256-level grey-scale image. This was then thresholded by
setting all pixels with value greater than zero equal to one.
The WABOT-2 vision system (the work of Matsushima et al.)
required real-time recognition using images from a video camera,
sometimes derived from distorted music sheets. Single A4 pages of
electronic organ score containing relatively simple notation using
three stave systems provided the source material. The method of
image acquisition led to variations in the image due to position
and characteristics of the light source, camera tilt and
resolution, in addition to distortions of the sheet of music and
inconsistencies in the notation itself. The CCD camera produced
images of 2,000 x 3,000 pixels with 256 grey . levels in
approximately two seconds, with the score situated about one metre
-66-

from the camera. The image was subdivided and each region
separately thresholded to allow for uneven illumination. The image
was then rotated as required and normalised to compensate for
distortions introduced at the scanning stage.
The scope of Aoyama and Tojo' s system covered single melody
lines and more complex scores incorporating multiple voices. The
size of the music was free within certain limits and, to some
extent, distortion, blurring and breaks in stavelines were
permitted. A drum scanner with the same specification as that of
Mahoney (i.e. 254 d.p.i. resolution and 256 grey levels) was used,
enabling entry of a complete page, whilst avoiding the problems
encountered by Matsushima et al. in using a video camera. Two
scans were used; the first provided several blocks of widely
spaced scan lines which were used in determining the binarisation
threshold and staveline location, while the second was the
complete high resolution scan. The page was, however, broken up
into windows for processing. This is contrary to the structure of
a large amount of music and is a major limitation when processing
multi-stave systems and symbols which straddle two staves or fall
on a window boundary. Each of the windows contained a single stave
and was stored in run length encoded form - an approach used by
Wittlich et al.
Nakamura et al. dealt with monophonic music in the form of
Japanese folk-songs. The vocabulary of symbols covered included
notes, rests and accidentals. A CCD-array-based scanner was used
for image acquisition and some smoothing of the image was·
attempted as part of the binarisation procedure.
-67-
. , . .

Roach and Tatem worked with a full page greyscale image at
1200 x 800 pixels (equivalent to 100 d.p.i.), and some smaller
images containing a limited range of symbols, and aimed to extract
pitch and duration information.
Wittlich et al. also used a flying-spot scanner, in their
case to produce a single image (1200 vertical x 1000 horizontal
pixels) of a page of Debussy piano music.
3.3.4 Staveline location and segmentation
Finding the stavelines in an image is a prerequisite of
recognition of conventional music notation. It is also a
non-trivial task, a point emphasised by several workers. Prerau
pointed out that segmentation of individual symbols was more
complicated for music than for character recognition. Only
occasionally do letters have to be separated in OCR, when the text
in an image is of poor quality. In his work, 'about as much effort
went into isolating the symbols as went into recognising the
isolated symbols.' Also, on the same subject, he drew attention to
the important fact that 'the original five stavelines are
generally not exactly parallel, horizontal, equidistant, of
constant thickness, or even straight.' Pruslin simply removed thin
horizontal lines by thresholding the length of continuous vertical
runs of pixels, assuming that a figure for 'line thickness' was
known. This approach prevented Prerau from achieving his intended
aim of expanding Pruslin's work, because it distorted symbols and
prevented their recognition. Both Pruslin and Prerau used contour
-68-

tracing, the latter in his own method for separating symbols from
the stavelines, termed 'fragmentation and assemblage'. This
involved a contour trace proceeding along each edge of each
staveline in turn and when the gradient exceeded 1:10, a
'deviation point' - the start of a fragment - was deemed to exist.
A 'staff-line border' was then set up. This was a horizontal line,
starting from the deviation point, which formed the edge of the
fragment where, originally, it touched the staveline. The contour
of the complete fragment could then be found. Fragments were given
type numbers according to the number and position of the
stavelines (if any) to which they were connected. Fragments which
did not touch a staveline had to be found using a separate,
somewhat laborious process involving finely-spaced search lines
which spanned the page. The fragments were then ass em bled using a
criterion which assumed horizontal overlap, so as to reconstitute
the symbols but without the stavelines present in the original.
Unfortunately, this criterion is not always satisfied, for
example, where a symbol such as a shallow slur or bass clef
coincides with a staveline, it may be fragmented.
Instead of using the approach taken by Prerau, i.e. removing
the stavelines and then restoring those parts which coincided with
symbols, Andronico and Ciampa devised a technique which aimed to
remove just the exposed stavelines. No details of the staveline
recognition method were given, although it was mentioned that
'successive trials' were used in searching for the stavelines and
that the number of iterations required was proportional to the
amount of background noise.
-69-
.·:._ ... '..i. · ......... _

The isolation of symbols from stavelines was an important
objective of Mahoney's work. He singled out lines, both straight
and curved, as predominating in common music notation. Also, he
stated that lines could be described by their run-length encoding
in conjunction with collinearity and proximity constraints for
dealing with gaps. Line extraction was described as 'easy' given
the above line encoding, but details of the process used were not
given. Regions which were not lines were found as 4-connected
components by flood-filling [Duda 1973]. With regard to staveline
processing, Mahoney mentioned permissible gaps in lines, where
symbols were superimposed, and suggested interpolation between
end-points. Similarly, close ledger-lines from adjacent notes may
have. been treated as a single line by his method, but apparently
harmlessly. Other problematic configurations which Mahoney
mentioned included two open noteheads either side of a staveline,
the F-clef and time signatures, all of which are examples of
situations where portions of symbols coincide completely with
stavelines. The minims (or semibreves) could be detected, he
asserted, by locating the internal white dots, but this
presupposes that the black boundary is closed. Replacing short
lines after staveline removal was a suggested partial solution for
the other two cases, involving the F-clef and time signatures. If
a stave or ledger-line passed through a hollow notehead, the above
technique could still have been used, once the portion of line
within the notehead had been removed. Another situation which was
mentioned concerned a note stem in a crotchet chord which would
have been treated as ending where it met a close cluster of
noteheads. The association of all the noteheads with the stem
would have to be achieved nonetheless. Similarly, where the tail
-70-
ᄋ セ@
I I

of an individual quaver touched its notehead, the separate
components (notehead, stem and tail) would still have to be
isolated. Passing reference was made to the difficulties which
arise when beams and stavelines are coincident for any significant
distance, thereby disrupting association of staveline segments. A
general rider was provided to the effect that 'these situations
are not generally handled by the system presented in this thesis.'
The stavelines in the scores processed by the system of
Matsushima et al. were detected by a short bar-like filter which
operated down equi-spaced columns in the image, simultaneously
with the scanning process. Pulsed output from the filter indicated
the presence of stavelines. (Similarly, Wittlich et al. used a
bar-like filter which was available as a function of their
scanner.) The points where the presence of stavelines was
indicated were joined to form straight lines, and where five
equi -spaced lines were found, a stave was deemed to exist.
Staveline inclination and curvature, and failed detection all
forced a need for flexibility, and similarly, long slurs parallel
to the stavelines had to be eliminated by checking vertical
spacing.
As already mentioned, Aoyama and Tojo used two scans. The
stavelines were found by forming the horizontal histogram of black
pixels within each block of low resolution scan lines, and using a
threshold to find sets of five peaks. The staveline fragments were
then pieced together, line spacings established and line spacings
calculated. Coarse segmentation was then undertaken, removing,
obvious, exposed sections of (stave-)line-work by examining the
-71-
....

vertical run-lengths involved, but leaving short portions of
staveline where these existed in the proximity of a symbol. This
was intended to help avoid breaking up minims and the like where
they coincided with the stavelines, as the fine segmentation
process could examine each symbol or connected symbols more
carefully. Both black and white noteheads were detected as part of
fine segmentation - by searching for sequences of overlapping
vertical runs of pixels - in order to assist in correctly removing
remaining staveline fragments.
Roach and Tatem described staveline finding as 'a
particularly difficult problem'. They implemented an existing
line-tracking algorithm which calculated line direction and
thickness at each pixel in a grey-scale image by passing a window
of appropriate proportions over the image. They ·pointed out that,
where a symbol coincided with a staveline, the pixels involved
'belonged' to both, and so stavelines needed to be 'intelligently
removed'. The least-squares fit through lines was found and
stavelines were identified as horizontal lines stretching across
almost the width of the page. Vertical lines were found in a
similar way to horizontal lines and then a circularity measure was
applied where a 'wide' portion existed at the end of one of these.
This was classified as a notehead if its circularity exceeded a
threshold. Thinning was used on isolated components to produce
chain codes. These were segmented at junction points and arcs with ·
high curvature were subdivided ready for use by the recognition
routines. Flood-filling the background (i.e. white pixels) was
used to locate 'holes' (small white areas contained within
symbols).
-72-

Nakamura et al used manual entry of the starting co-ordinates
for a line-tracker which constructed least-squares fit lines· for
each of the stavelines. Then, as with Wittlich et al and Pruslin,
a threshold for line thickness was used to erase the stavelines
and achieve segmentation.
The use of a bar-like filter (Wittlich/Matsushima et al) is
not only vulnerable to staveline inclination and curvature, but
also to the effects of multiple beams or other linear elements
which can be present in a score. Also, short staves containing
realised ornaments, for example, would not be detected. The same
applies to the use of a horizontal histogram of black pixels, even
locally (Aoyama and Tojo). All these aspects are covered in
chapters 4 and 5.
3.3.5 Grammar and syntax
Prerau provided syntactic rules for a limited subset of music
notation as well as mentioning the higher-level grammars which are
present in music notation but which were not covered by his
thesis. He made use of syntax and redundancies, for example flats
could only appear in one of two positions (this excluded those
special cases not · within the scope of Prerau's work) - in a key
signature to the right of a clef or barline, or as an accidental.
Also, the clef was the only symbol which could be first in a line
of music. Redundancy in music notation was exemplified by the
first flat of a key signature having to be on the middle line
(assuming treble clef), or conversely, if the first symbol of a
-73-
•. : . l . '·.'. セ@ .• セ@
key signature was on the middle line it had to be a flat.
Similarly, Prerau asserted, if the first symbol of a key signature
was a flat, then the second symbol in the key signature (if any)
had to be on the top space and a flat. Prerau also limited rests
to certain vertical positions and supplied constraints for other
symbols. Time signatures had to be to the right of a clef, barline
or key signature, the triplet indicating numeral '3' had to be
overlapped by a beamed group of three notes and dots had to be
positioned appropriately for duration augmentation or as part of a
repeat sign or F-clef (staccato and other dots were not
permitted).
Andronico and Ciampa formulated two generative grammars. The
higher order structures of music down to the individual symbols
were represented by one grammar and the components of the symbols
by the other. Examples of components are vertical lines of various
lengths, white and black dots, etc. Similarly, Matsushima et al
made use of a simple hierarchical structure for music notation in
directing the correlation techniques used for detecting symbols
and symbol components. Stavelines, noteheads and barlines, which
could occur anywhere over a large area were searched for using
hardware-implemented correlation, while other symbols (clefs,
rests etc.) were found using software-implemented localised search
techniques. The use of a mask to detect crotchet noteheads led to
numerous spurious matches which had to be filtered out at a later
stage. This problem would inevitably worsen in the case of more
complex notation and this shows the weakness of the approach,
given t}Jat the speed factor is overcome by implementation in
hardware. Only treble and bass clefs were permitted in their work,
-74-
... .. . -.. -. . . ... , , . セ M .. セ@ .. ' 'i

and these only at the beginning of a line. Musical syntax rules
used in error-detection and correction included the following :-
the playing times for each part had to be equal, a clef and a key
signature had to begin the opening bar of a part, and, similarly,
a time signature had to exist in the first bar of a score.
Aoyama and Tojo used the following syntax rules :- a key
signature was only permitted on the right hand side of a clef, the
first sharp in a key signature had to be on the fifth line (treble
clef), and accidentals had to be on the lefthand side of a note-
head. They also compared the sum of the rhythm values of the notes \
in each bar with the time signature and any discrepancies were
used in the error correction procedure. This ignores the problems
of n-tuplets where, upon multiple repetition, the associated
numeral is omitted, and also mathematically-incorrect beamed
groups in cadenza passages. Nakamura et al drew attention to the
lack of rigid rules for writing music notation and said that rules
used in practice are often based on 'customary usage'. As a result
of this, they concluded that it was impossible to check
recognition results by using musical grammar and instead relied on
man-machine interaction (using the sound and print production
facilities of their system) for error-correction.
3.3.6 Object (symbol) formation and recognition
Contour tracing after horizontal and vertical line removal
provided the components and their parameters (relative and
absolute size and position) for processing in Pruslin's work. As
mentioned previously, note cluster detection required a large
-75-
. . - ... """ • - ' : .. • .. セ@ セ@ ;. <? •
·} · -
proportion of Pruslin's effort. Twenty-three possible arrangements
of notehead clusters made up from less than five noteheads were
tabulated and used as the basis for the processing of crotchet
chords. This attempt to treat chords as 'character' symbols is
severely restricting in view of the prohibitive number of 'models'
which would be required for a practical system. The identification
process categorised the permutations of noteheads using height and
width information. Those clusters with width greater than a single
notehead had their contour trace examined in specific columns and
the number of black/white transitions determined. The number and
position of these crossing points was used in order to achieve
classification.
Beaming complexes were characterised as combinations of
parallelograms with appropriate restrictions on spacing and extent
of subsidiary beams. It was explained that, due to intersecting
notestems or stavelines, scanner resolution and/or poor print
quality, the constituent parallelograms of a beaming complex may
or may not have formed a single contour trace. The principal beam,
or 'timing bar base' (in this case the beam on the opposite side
of the beaming complex to the notestems) was treated separately,
and subsidiary beams were related to it, and the positions of the
characteristic transitions in thickness extracted. These 'jumps'
were detected by setting a threshold for change in thickness at
just less than half the staveline spacing and using this in
conjunction with a parameter for permitted horizontal deviation
within the thickness transition. Parallelograms (subsidiary beams)
which became separated from the main beam as a result of
pre-processing were subsequently detected and merged using a
-76-

threshold for permitted vertical spacing. The beaming complex was
classified according to whether subsidiary beams were present, and
if so, on which side of the principal beam. Finally the slope of
the principal beam was calculated.
Operations were subsequently performed with the aim of
ordering notes and determining their rhythm values. Ambiguities
regarding regions which could still be either note clusters or
beaming components were resolved using the fact that the latter
had to have related note clusters at both ends. Information
regarding the permitted stem direction for each form of note
cluster was also used. Pruslin also made use of short horizontal
scans on the original image in order to determine whether stems
associated with a quaver (i.e. single) beam were above or below,
as beam and noteheads alike were 'floating' in free space
following the pre-processing. Where note clusters could be
attached to either an ascending or descending stem, similar
searches were made. The problem of ordering the detected notes was
discussed and the unsuitability of simple left to right ordering
was analysed. The vertical alignment across staves of note
clusters was examined, and the corresponding sequence (timing)
information was extracted.
Prerau used the normalised bounding rectangle (normalised
relative to the stave space height) to produce lists of
possibilities for each symbol, after making the assumption that,
unlike alphabetic characters, each musical symbol differed in size
from most others. The tests he used which were based on syntax,
position and redundancy have been mentioned in section 3.3.5 .. When
-77-

these tests failed to remove ambiguities, another type of test was
used which involved measuring features. Feature tests were used to
distinguish between sharp, flat and natural signs and between the
different types of non-beamed notes. An example of such a test
involved measuring the width of a symbol at its vertical
mid-point, thereby distinguishing a stem-up quaver from a
crotchet. Sharp, flat and natural signs were distinguished by
finding the horizontal position of the top and bottom-most points
of the symbol relative to its bounding rectangle. The procedure
for determining the pitch of a note on the stave was not
described. Noteheads in a beamed group were found as
single-connected fragments, whilst corners of beams that also
formed single-connected fragments were detected and removed.
Barlines and double barlines were differentiated as follows :- if
a barline had at least one hole it was considered double and the
stave space where this occurred was tested to ascertain the
appropriate combination of thick and thin lines. Hollow and solid
noteheads were distinguished by a contour trace which detected the
presenqe of an inner boundary in the former. The pitch of notes on
ledger lines was determined by counting the short protrusions on
the opposite side of the note stem to the notehead. This is
particularly unreliable in practice, as these may not exist (see,
for example, figure 5. 7). In the case of the note stem being
downwards, if the distance from the topmost protrusion to the top
of the notehead was greater than 3/4 of the stave space height,
the notehead was above the ledger line, otherwise it was on the
line. An equivalent procedure was adopted in the case of an
up-stem.
-78-

·; ,' >' ', · r • ''',.. • · ᄋ セ@ . '
A specific test found the beams of each beamed group. The
thickness of the beam component was found at points spaced at
intervals of l/5 of the distance between note stems. These
thicknesses were used as follows :- the larger of the first two
gave the thickness for the left- hand note and similarly for the
second pair and the right-hand note. A thickness up to the stave
space height corresponded to. a single beam, one to two times this
measure equalled two beams, and so on. Unfortunately, where
localised measurements such as these are used, noise can severely
distort the results.
Andronico and Ciampa's program recognised clefs (of five
types), key signatures (using flats or sharps), accidentals and a
subset of notes and rests. The brief description of the symbol
processing implied that specific points were examined. These were
located on the stave/ledger lines and on the mid-points between
these lines, in each column of the image. The length of any
vertical line segment present at a point was measured and a crude
deduction drawn, for example a 'long' line indicated a note with a
lefthand stem. The horizontal and vertical position of each symbol
was recorded in addition to symbol type and rhythm vahJe, as
appropriate. The authors mentioned lack of good results in
processing notation half the size of that used for the examples in
their paper, but proposed, as a solution, scaling by
software-control of the camera which was to be used in future
work.
In contrast to the above, the objective of Mahoney's work was
to cope with symbol primitives, thus providing the basis for
-79-

recognising composite music symbols in terms of these primitives.
For complex symbols (sharp/flat/natural signs, clefs, etc.), which
could not be broken down naturally into the above primitives,
correct isolation was the sole aim. The work concentrated on
extracting the primitives, not on combining them into complete
musical symbols. The 2-D relationships between symbols were
expressed using proximity and relative position predicates, the
former used normalised distance while the latter used left, right,
above and below. The measurements used for normalisation were the
thickness of the stavelines and the stave space height.
Histogramming the lengths of both black and white vertical lines
was used to find the normalisation measure; thus, the most common
black line length gave the staveline thickness and the most common
white line length gave the stave space height. No mention is made
however, of different size staves occurring simultaneously in one
image. Areas were apparently normalised using the area of the
interior of a semibreve, an unreliable measurement given the
variability found in this feature in practice.
The parameter list for lines and symbols which Mahoney
proposed provides several points of interest and illustrates some
drastic limitations of the system. For example, the upper limit
for the length of a beam was set at 20 x the stave space height,
while the length of a bar line was limited to 7 x the stave space
height and the permitted angle of rotation for horizontal and
vertical lines was +/- 10°. Beams could be within +/- 45° of the
horizontal, but with no extra allowance for rotation of the ゥュ。ァ・セ@
Also, notestems were distinguished from barlines by using length,
so that a vertical line up to 4.5 x the stave space height was a
-80-

notestem, and above that it was categorised as a barline. A
barline was, however, permitted a thickness up to 50% greater than
a notestem. After removal of all lines, both vertical and
horizontal, individual solid noteheads were detected as isolated
regions of the appropriate size. Vertical clusters (chords) of
solid noteheads were dealt with by separating out the individual
dots by erasing the 'ideal' stave (which consisted of continuous
stavelines formed by interpolating between the broken lines
extracted from the image) and ledger lines. The individual
noteheads could then be recognised, although, as is mentioned, a
lower area threshold would be required. A tail and a sharp were
also extracted from the test image, as these were the only other
types of symbols dealt with by the work.
The correlation techniques used in conjunction with threshold
measurements by Matsushima et al. for detecting noteheads, bar lines
etc., were described in section 3.3.5 .. Clefs (treble and bass)
were discriminated by the crude technique of measuring in from the
start of the stave in two of the stave spaces and comparing these
distances. Similarly, time signatures were distinguished by
localised measurements effected along the centre-lines of spaces.
As mentioned previously, such localised measurements are highly
vulnerable to the effects of noise. Accidentals were located by
searching to the left of noteheads for vertical lines, and the
relative lengths of these lines were used in determining which
symbol (sharp, flat or natural) was present. The region
surrounding each notehead was checked for the presence of tails,
rhythmic dots, and tenuto and staccato marks. Beams were treated
by counting the number of vertical black runs in a pair of columns
-81-
-<fll-.-

equi-spaced either side of the note stem under test.
Aoyama and Tojo achieved recognition using two stages termed
coarse and fine segmentation. Initially, the symbols were divided
into 10 groups using a normalised feature space (normalised
relative to the stave space height) similar to that used by
Prerau. Separate treatment was then applied to each category in
order to achieve recognition. For example, the symbols with the
largest bounding rectangles - slurs and beamed groups in this case
- were separated by searching for the presence of a vertical
component of suitable length (a note stem). The positional
relations between noteheads and stems were classified into 10
types, along the lines of Pruslin's technique for dealing with
chords mentioned at the beginning of this section, although
encompassing polyphonic music where the noteheads of separate
parts touched. The latter were separated and then treated
individually. As a further example of fine classification, the
crotchet rest, quaver rest and sharp, flat and natural signs were
divided by a dedicated algorithm. This made use of the effects of
erasing portions of these symbols using four preset threshold
parameters relating to the width and height of constituent runs of
black pixels. The authors drew attention to compound symbols -
i.e. those made up of several separate components, the F-clef for
example. By examining their relative positions, the different dots
involved in the F-clef, the fermata sign, the repeat barline,
duration augmentation and staccato could, the authors asserted, be
distinguished.
Nakamura et al. reasoned that although musical notes are
-82-
simpler patterns than alphabetic characters, related positional
information is more important. Their recognition technique
involved extracting characteristics and position information from
X and Y projection profiles of the symbols after staveline
erasure. Projection parameters used included the number and
position of peaks, the width of the upper and lower halves of the
symbol and the number of 'protrusions' (the 'limbs' extending from
the main stem of quaver - and shorter duration - rests and also
the tails on single quavers and shorter rhythm values). The
position of any notehead present was also extracted.
Roach and Tatem listed some of the problems regarding
recognition, particularly of handwritten scores (none of the other
authors attempted automatic recognition of handwritten music).
Examples were noteheads not closed, stems not attached to
noteheads, beams which resembled slurs and ended well away from
their associated stems and symbols such as crotchet rests
appearing in multiple guises. They argued that even people had
difficulty reading some handwritten scores, especially if they did
not have the musical knowledge necessary to discern the relevant
symbols.
Wittlich et al. achieved recognition of solid notes, beams,
slurs and bar lines by examining objects' dimensions, but no
details were given.
3.3. 7 Interaction and output
Pruslin's output took the form of text descriptions of note
-83-

clusters, including their sequence numbers and rhythm values. 153
clusters were tested and with the template matching threshold set
at 70%, only one error occurred. 22 beaming complexes were
examined, and all were correctly classified. In contrast, the
output of Prerau's system took the form of DARMS (then called
Ford-Columbia) data, with the intention that this should act as
input to software for analysis, performance, display, printing
etc. In the tests performed, output was 100% accurate, i.e. all
symbols in the subset considered were recognised, and symbols -
e.g. text characters - outside the scope of the program were
identified as such. Andronico and Ciampa also produced music
representational language encodings, but using TAU2-TAUMUS. They
gave output for a single bar which was correctly recognised and
also an example of partial recognition due to either incorrect
binarisation threshold, poor print quality or presence of symbols
which were outside the scope of the work.
Mahoney made use of interaction in developing and refining
parametric descriptions of musical symbol primitives and
characters (complex symbols) and in determining normalisation
factors (this process was termed pre-calibration) which were then
applied automatically. A detailed example of the analysis of an
image was provided - the output simply taking the form of separate
images containing particular categories of primitive or symbol.
The vision system for the WABOT-2 robot had to be completely
automatic, hence interaction was not an option open to Matsushima
et al. For single pages of electronic organ score, complete
processing times were given as 'roughly 15 seconds' and accuracy
described as 'approximately 100%'. Output used a dedicated M.R.L.
-84-
. - Mセセ@ :·· _:

.,
compatible with the robot's limb control system. Various
processing operations were undertaken in order to guarantee that
the information passed to the robot control system was permissible
and would not cause problems when driving the limbs of the robot
(forcing it into attempting to cross hands for example).
Aoyama and Tojo gave an example of output after coarse
classification for a single line of two-voiced music (the contents
of one of their 'unit windows'), and two small detailed examples
of complete analysis. The latter showed the correct separation of
notes belonging to separate voices where the noteheads touched,
and the distinction between the true tail and a spurious fragment
in a stand-alone quaver after removal of thin
vertically-orientated lines. In both cases the number and location
of heads and beams was provided. An example of data in the format
used by the folk-music database of Nakamura et al. was given by
them as the result of recognising a few bars of monophonic
notation, together with a screen display of the original and its
reconstruction in conventional notation, derived from the above
data. Pitch (octave number and semitone offset) and rhythm value
only were stored.
Roach and Tatem provided a general discussion of the result
of processing their six small test images, as no music
representational language data was produced. All stave and ledger
lines were correctly classified as horizontal lines, as were the
centre portion of some long slurs and fragments of noise. Holes
were categorised as large or small using the number of constituent
pixels and a threshold. Some of the holes were not, as hoped,
-85-

hollow noteheads or part of a sharp, flat or natural sign, but
were formed between a quaver tail and its stem. A significant
proportion of the number of noteheads found by the blob detector
(applying the circularity measure mentioned previously) had the
notehead detected at a lower position than its true one, which
meant the wrong pitch would have been assigned. Curves were
detected, but only by selecting a threshold for curvature which
worked for the test images, but, the authors stated, would not
necessarily have been appropriate in the general case. When the
writing in the original was poor, problems were encountered with
loss of information as a result of segmentation, for example
partial beams not distinguished from stavelines. Interestingly,
back-tracking was available in some situations, so that the system
could try alternatives once its original result had proved
incorrect in the light of further data.
3.3.8 Error-checking/correction and future aims
Pruslin made the suggestion that error-correction could be
introduced into his software, for example by testing for beaming
complex thickness transitions from right to left as well as vice
versa, and comparing results. Alternatively, he proposed,
increased use could be made of context. He also stated the
possibility of expanding the vocabulary of the program as a future
aim. This was also Prerau's main concern for the future of h.ls
work. In order to extend the vocabulary of his program, a region
would have to be added in the normalised feature space for each
new symbol, a syntax test devised, and addition made to the output
routine of the appropriate DARMS character. Prerau also stated
-86-
that it would be desirable to add the ability to recognise chords
- perhaps based on Pruslin 1 s algorithms - and to cope with larger
format scores, trios, quartets, and so on. Prerau recognised that
piano/organ music presented a more complicated situation
(requiring 1 a significant effort1 in order to extend the software
to cope with this sort of score) with symbols crossing from one
stave to another, etc. He also proposed that the fragmentation and
assemblage method of dealing with 1 q uali ta ti vely defined
interference1 (the stavelines) might possibly be useful in other
applications.
Andronico and Ciampa also looked to extend the capabilities
of their program - to include reading different types of score
containing a larger range of symbols, by extending the two
grammars used. Mahoney said that expansion of his system to
include new descriptions for symbols and formats was possible, and
further testing was needed to enable evolution of the system. For
instance, musical symbol descriptions needed to be derived from
the primitives and the relationships between them. Also, more
testing was required in order to define the limits for input
quality and recognition accuracy. A convenient image input system
was required too, with the inherent trade-off between image size
and resolution. Program optimisation, the need for pre-processing
and finding a method for dealing with 1complex characters1 (clefs,
sharp/flat/natural signs, etc) were other proposed topics for
future work.
Matsushima et al. did not speculate on future aims, although
their work has since involved incorporating a braille score
-87-
production facility into the system [Hewlett 1987, 1988], and a
third WABOT is under development [Matsushima 1987]. Text
recognition of Italian terms was Aoyama and Tojo's next priority.
They proposed the use of the number and size of the constituent
letters as a possible method for realising this aim. Nakamura et
al, besides expanding the capabilities of their system, aimed to
further classify and compare the folk-music contained in the
resulting database.
Wittlich et al. originally aimed to expand the vocabulary of
their system, but the project was ended due to the large amount of
time spent in producing the processing programs, anticipated
problems in generalizing recognition routines, and difficulties
experienced in obtaining high-quality microfilm [Byrd 1984]. Roach
and Tatem did not outline future work, but simply stressed that
their results were improved as a result of using domain knowledge
in low-level processing - as opposed to the more common practice
of applying this knowledge at high level.
-88-

4. A System of
for the Automatic Recognition Printed Music : Techniques
4.1 ACQUISITION OF THE BINARY IMAGE
In the course of this work, sample images have been acquired
using a modified Canon 9030 laser copier, a flat-bed, CCD-based
device with a maximum image size of A3 (420 x 297 mm), automatic
thresholding and operator-selectable resolution (up to 400
d.p.i.). More recently, a Hewlett Packard Scanjet (also a
flat-bed, CCD-based scanner) has been used, although this was
limited to 300 d.p.i., A4 (297 x 210 mm) sized images.
Thresholding was again done automatically, although a contrast
control was available via the Scanjet driver software (which was
normally set to 'darken'). The first images, scanned at full 400
d.p.i. resolution, included a variety of score formats (layouts
and font sizes) from a solo instrument part through solo
instrument with piano accompaniment to full orchestral score.
Monophonic and polyphonic forms of music were thus included. The
images also included examples of poor-quality print and symbols
such as very long, almost horizontal slurs and
similarly-dimensioned multiple beams, chosen to thoroughly test
the recognition routines. The resulting 400 d.p.i. binary images
each consisted of 4680 rows of 3344 pixels, requiring nearly
2 Mbytes of storage per A4 page using bit-per-pixel
representation. The highest possible resolution was used initially
despite the greater processing time involved in manipulating
larger amounts of information. This was to some extent alleviated
-89-

by the fact that only small portions of a complete page were used
while developing routines - a situation suited to the limited size
of display devices available (maximum 1024 by 768 pixels).
Experience showed that in general 300 d.p.i. (the resolution used
most extensively) was perfectly adequate, but that 400 d.p.i. or
higher was desirable when dealing with small notation (cues, for
example) or exceptionally poor quality print, or indeed a
combination of the two. It had to be borne in mind that a
reduction in resolution from 400 to 300 d.p.i. (or even 300 to 200
d.p.i.) almost halved the amount of data involved. A reduction of
resolution to 200 d.p.i. did however result in significant loss of
detail and was not used in this work.
The first operation used (optionally) on an image was one of
pre-processing using a horizontally-orientated low-pass filter.
This filled gaps of up to </> pixels between set (black) pixels
within individual horizontal lines and had the effect of removing
short breaks in both stavelines and symbols. The maximum value of
</> used was four. This filter will be mentioned again later when
discussing structural segmentation techniques and line-following
algorithms.
4.2 EXPERIMENTAL SEGMENTATION
As mentioned in section 3.3.4, the first step in segmenting
any image of printed music involves locating the stavelines which
are a mandatory component of all scores using conventional music
notation. As a preliminary experiment, a test image was chosen so
that any stavelines present in the image were horizontal, although
-90-

for several reasons this is often not the case. It did, however,
enable the simple technique of forming the histogram of the
horizontal sums of black pixels to be used as the basis of an
elementary stave-finding routine. Once the histogram had been
obtained, groups of five peaks were easily detected, indicating
the presence of staves. Allocation of pixels to stavelines could
then be achieved by obtaining another histogram, in this case of
the height of the vertical runs of black pixels which crossed a
row indicated by the staveline-finding procedure. By tracking
across the image in the appropriate rows and marking all vertical
runs of black pixels whose height was below a threshold derived
from the second histogram, the staveline pixels could be found.
This method had several major weaknesses, but its
implementation provided some important indications of the problems
involved in segmenting an image of printed music, some of which
appeared to be unique to the subject. Firstly, it could not be
assumed that stavelines were horizontal across the whole page -
nor indeed that they continued across the whole page - which in
itself invalidated use of the horizontal-sum histogram. Secondly,
the setting of a fixed threshold for the thickness of a staveline
(i.e. the vertical run of pixels which were to be marked as
staveline pixels) would take no account of local thickness maxima.
Consequently, a single run of pixels which exceeded a given
thickness threshold would be treated as symbol rather than
staveline, despite the possibility that in context this could be
obviously incorrect. Thirdly, although the stavelines may have
been horizontal on the original printed page, there was no
guarantee that the page was exactly level when scanned.
-91-

Consequently, the image may have been slightly skew - and a
rotation of less than 30' could cause the peaks of the
horizontal-sum histogram to merge, rendering the technique
useless. Other problems arose, such as determining the extent to
which a symbol coincided with a staveline. For example, where a
notehead was situated in a stave space, i.e. overlapping two
stavelines, the shape of the isolated notehead would vary
depending on the amount of overlap assumed by the staveline
extraction process. This would, in turn, have a bearing on the
recognition routines, which would need to be immune to such
variations. Similarly, but more significantly with regard to
recognition, where part of a symbol coincided completely with a
staveline and was below the threshold value for maximum staveline
thickness, this part would be categorised as staveline rather than
symbol. The highest part of the main section of a bass clef is a
common example of this situation, as is the portion of the treble
clef which normally coincides with the lowest of the five
stavelines.
It was thus deemed necessary to develop a means of segmenting
an image which would enable location of the stavelines regardless
of a reasonable amount of rotation of the image (say +/- 10 o)
whilst also coping with slight bowing of stavelines and local
thickness maxima. Ideally, 'regional information' would also be
produced which could be used in determining whether a symbol had
merged with a staveline.
-92-
. • r _... ·-
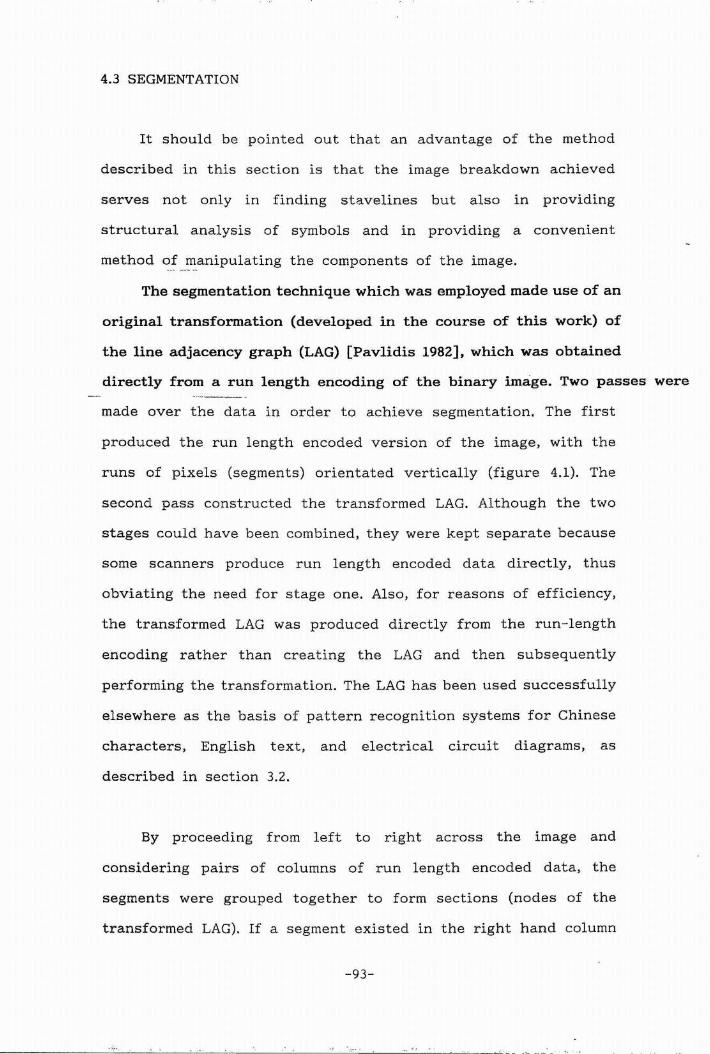
II
4.3 SEGMENTATION
It should be pointed out that an advantage of the method
described in this section is that the image breakdown achieved
serves not only in finding stavelines but also in providing
structural analysis of symbols and in providing a convenient
method of manipulating the components of the image.
The segmentation technique which was employed made use of an
original transformation (developed in the course of this work) of
the line adjacency graph (LAG) [Pavlidis 1982], which was obtained
directly from a run length encoding of the binary image. Two passes were
made over the data in order to achieve segmentation. The first
produced the run length encoded version of the image, with the
runs of pixels (segments) orientated vertically (figure 4.1). The
second pass constructed the transformed LAG. Although the two
stages could have been combined, they were kept separate because
some scanners produce run length encoded data directly, thus
obviating the need for stage one. Also, for reasons of efficiency,
the transformed LAG was produced directly from the run- length
encoding rather than creating the LAG and then subsequently
performing the transformation. The LAG has been used successfully
elsewhere as the basis of pattern recognition systems for Chinese
characters, English text, and electrical circuit diagrams, as
described in section 3.2.
By proceeding from left to right across the image and
considering pairs of columns of run length encoded data, the
segments were grouped together to form sections (nodes of the
transformed LAG). If a segment existed in the right hand column
-93-

t!TIIfllmn111111111111111111IIIlmnm1-llllllllllllllllllllllllllllllllllllllllllllllllllllliiiiiiiiiiiiiiiiiiiiiiiiiiiiiiiiiiiiiiiiiiiiiiiiUllllliiiJ
Figure 4.1 A fragment of an image showing the boundaries of
the segments formed by vertical run-length encoding.
Figure 4.2 The image fragment of figure 4.1 showing the
boundaries of the sections (the nodes of the transformed LAG).
-94-
. . ..::.___-- --- --.!-·- _. - -- - -
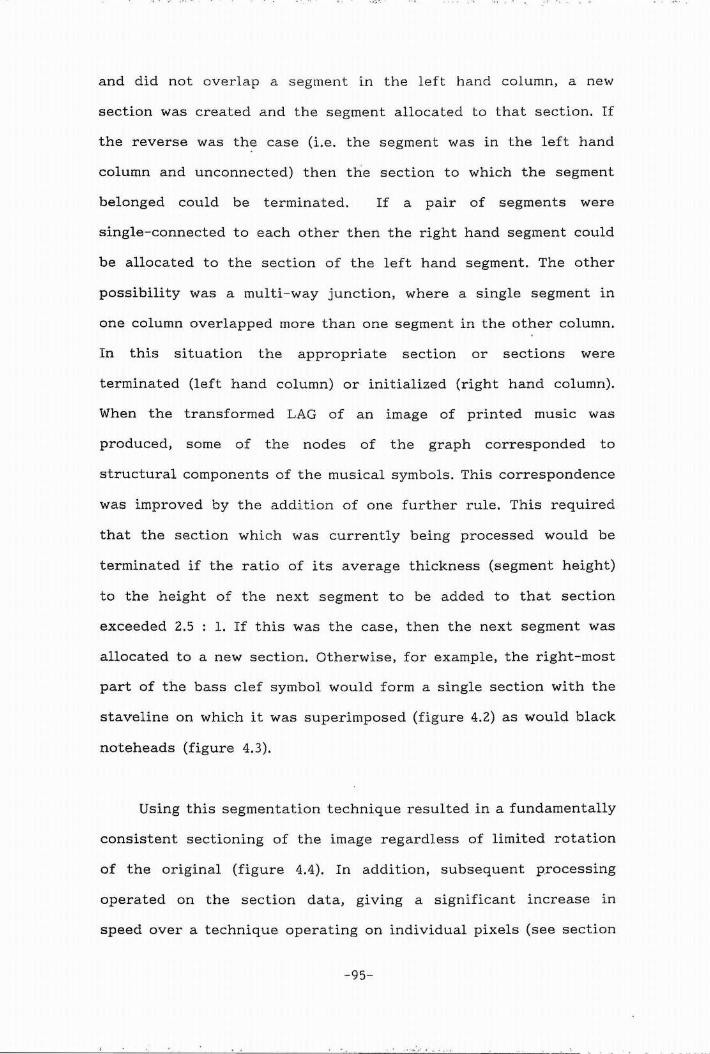
and did not overlap a segment in the left hand column, a new
section was created and the segment allocated to that section. If
the reverse was the case (i.e. the segment was in the left hand
column and unconnected) then the section to which the segment
belonged could be terminated. If a pair of segments were
single-connected to each other then the right hand segment could
be allocated to the section of the left hand segment. The other
possibility was a multi-way junction, where a single segment in
one column overlapped more than one segment in the other column.
In this situation the appropriate section or sections were
terminated (left hand column) or initialized (right hand column).
When the transformed LAG of an image of printed music was
produced, some of the nodes of the graph corresponded to
structural components of the musical symbols. This correspondence
was improved by the addition of one further rule. This required
that the section which was currently being processed would be
terminated if the ratio of its average thickness (segment height)
to the height of the next segment to be added to that section
exceeded 2.5 : 1. If this was the case, then the next segment was
allocated to a new section. Otherwise, for example, the right-most
part of the bass clef symbol would form a single section with the
staveline on which it was superimposed (figure 4.2) as would black
noteheads (figure 4.3).
Using this segmentation technique resulted in a fundamentally
consistent sectioning of the image regardless of limited rotation
of the original (figure 4.4). In addition, subsequent processing
operated on the section data, giving a significant increase in
speed over a technique operating on individual pixels (see section
-95-

I "" "' I
Fig
ure
4.3
A
la
rge
r im
ag
e f
rag
me
nt w
ith
se
cti
on
s in
dic
ate
d.
-----
.... セM
セM-
----
--

Figure 4.4 The boundaries of the sections for a rotated
version of the image fragment shown in figure 4.1.
Figure 4.5
removal.
a) b)
The process of merging sections after noise
-97-

3.3.4 regarding Roach and Tatem's work). Various attributes of the
section were stored together as an entry in a data structure.
These included, for example, x-minimum, x-maximum, y - minimum,
y-maximum, a pointer to a segment list (containing the y-ordinates
of the start and end of each run of pixels), area (number of set
pixels), pointers to lists of forward and backward connections to
other sections, and various summations which were used in
calculating a least squares fit straight line through the
mid-points of the segments.
4.4 NOISE REMOVAL
All sections with a small area (i\ pixels or less, where i\ was
commonly five for a 300 or 400 d.p.i. image) which had no
connections or one connection - either forwards or backwards -
were removed as noise. As a result of removing a single-connected
noise section, the section to which it was connected may itself
have become single-connected. In this case, the sections involved
were merged if a multi-way junction in the original image had now
disappeared, provided that the thickness ratio test originally
applied when producing the transformed LAG was satisfied. For
example, in figure 4.5a, there is a noise section attached to a
vertical stroke. After removal of the noise section, the two
remaining sections would be single-connected. These would then be
merged into a single section as shown in figure 4.5b. To
reiterate, merging did not take place if a multi-way junction
still remained despite the removal of the noise section, or if the -
thickness ratio between the two sections was greater than 2.5 : 1.
-98-
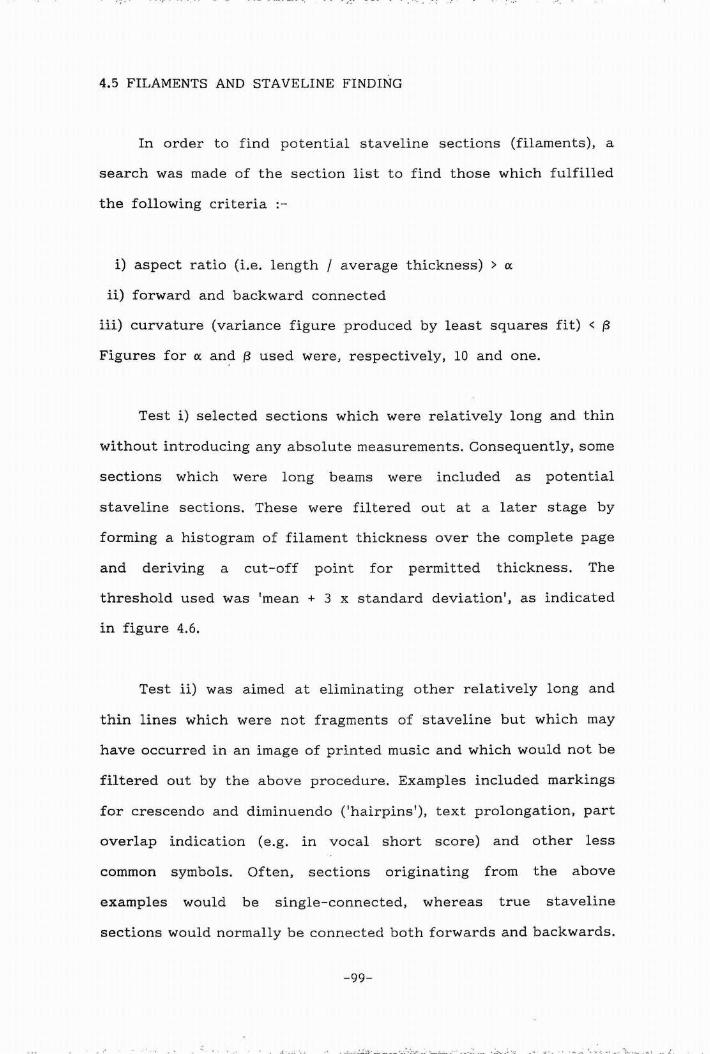
:'; 0 • • - ., • • T • • • •
4.5 FILAMENTS AND STAVELINE FINDING
In order to find potential staveline sections (filaments), a
search was made of the section list to find those which fulfilled
the following criteria :-
i) aspect ratio (i.e. length / average thickness) > ex
ii) forward and backward connected
iii) curvature (variance figure produced by least squares fit) < /3
Figures for ex and /3 used were, respectively, 10 and one.
Test i) selected sections which were relatively long and thin
without introducing any absolute measurements. Consequently, some
sections which were long beams were included as potential
staveline sections. These were filtered out at a later stage by
forming a histogram of filament thickness over the complete page
and deriving a cut- off point for permitted thickness. The
threshold used was 'mean + 3 x standard deviation', as indicated
in figure 4.6.
Test ii) was aimed at eliminating other relatively long and
thin lines which were not fragments of staveline but which may
have occurred in an image of printed music and which would not be
filtered out by the above procedure. Examples included markings
for crescendo and diminuendo ('hairpins'), text prolongation, part
overlap indication (e.g. in vocal short score) and other less
common symbols. Often, sections originating from the above
examples would be single- connected, whereas true staveline
sections would normally be connected both forwards and backwards.
-99-

N 200 -
u m b 175
Figure 4.6 A graph showing the thickness
of filaments indicating the cut-off point
e for permitted filament thickness in order to r 150 -
isolate long beams etc. (relating to the 0 f 12'5 - lower half of figure 5.5).
Thickness (in pixels)
N u m b e 300
r
0 250 f
f 200 i 1 a 150 m e n 100 t s
'5e
-40 -30 -20 10 20 30 40
Angle with the horizon tal · (in degrees)
Figure 4.7 A graph showing the angle formed between the
centre-line of filaments and the horizontal (relating to the
lowest system of figure 5.5). -100-

Unfortunately, due to poor print quality, breaks in stavelines
occurred quite frequently. This produced single-connected
staveline sections, hence the pre-processing stage described
previously. This alleviated the problem to a large extent because
breaks were often very short. It did become apparent, however,
that it was more appropriate in the general case to alter test ii)
to 'single-connected', thus eliminating some non-staveline
filaments which were zero-connected but permitting true staveline
filaments which had an adjoining break. This meant erring on the
side of including some incorrect (i.e. non-staveline) filaments
rather than excluding correct filaments. A significant number of
non-staveline filaments may also be eliminated by using a
histogram of the angles formed by filament centre-lines and the
horizontal, for the whole page (figure 4. 7 shows this for part of
the image in figure 5.5). Even if the page was rotated (within the
permitted tolerance) a main peak would show the large number of
staveline filaments at one angle, whilst hairpins etc., could
normally be excluded.
Test iii) removed slurs which were both long and thin and
also cut through other symbols (making them connected), because
they had a high curvature value - obtained as part of the least
squares fit procedure. The curvature threshold had, however, to be
high enough to include bowed stavelines, and the value of {3 given
above was found to satisfy this aim when using the test images.
4.6 FILAMENT STRINGS AND STAVE FINDING
In order to establish the presence of a stave, five
-101-

• • •• セ@ "!:, • >
horizontally overlapping and roughly equi -spaced filaments had to
be found. The obvious way of achieving this involved stepping
through the filament list and comparing the filament under test
with as many of the other filaments as was necessary to determine
whether or not it formed part of a stave. In the system under
discussion, this process was simplified and hastened by
concatenating the filaments into filament-strings, which then
underwent the requisite tests.
The centre-line of each filament was projected to the right
by a distance of 0.25 x the length of the filament and tests made
to detect the presence of another filament within +/- twice the
mean filament thickness on either side of the projected
centre-line. If such a filament was present, then it was combined
with the current filament to form a filament string. All filaments
which were included in a filament string were flagged to eliminate
them from further testing. When the list of all the filament
strings in the image was complete, each was tested to establish
the number of concurrent (i.e. horizontally overlapping) filament
strings. These, assuming they existed, were then measured for
vertical spacing from the filament string under test and a list of
spacings established. A best fit was obtained for the spacings
between the filament string under test and, if possible, four of
the others in the list, with a threshold for the maximum spacing.
A threshold had to be set for the maximum possible spacing
otherwise matches could have been made between stavelines from
different staves and possibly also with hairpins. It would have
been inappropriate, in order to prevent this, to invalidate a
match because an extraneous filament existed within the potential
-102-
セ@ .• ..: , ; .. · - .. . - • .L.J. ' .. ·- :;. _ ,._ .l _: _____ - _, •_ .: ... _ ;.. _ . - - - - ヲエセ@ - · - • .!· ..

,' .•' I
stave, as this could be a valid situation. For example, a hairpin
might be superimposed on a true stave.
Once a stave had been found, each staveline was tracked
across the page in both directions and all sections which fell
within the projected path of the staveline and were below the
threshold for permitted filament thickness were flagged as
staveline sections (figure 4.8). The tracking was achieved by
using the section connections obtained from the transformed LAG in
conjunction with local centre-line projections. This structural
method could also traverse breaks in stavelines which remained
despite the pre-processing.
After all the staves present in the image had been found, and
all stavelines tracked to their full extent across the page, a
restructuring of the transformed LAG was performed. This involved
stepping through the section list and categorizing sections'
forward and backward connections into staveline and non-staveline
sections. Consequently, the sections' data records also contained
pointers to lists of forward and backward connections to staveline
sections. Merging was again undertaken, as described in section
4.4, in this instance where non-staveline sections had now become
single-connected - ignoring connections to staveline sections -.
and the thickness ratio test was passed. Musical symbols were now,
in effect, isolated from the stavelines (figure 4. 9).
4.7 SIMPLIFICATION OF THE TRANSFORMED LAG
Even after noise removal, the transformed LAG contained
-103-

I !:. I"'. i_ .,.
I セ@ 0 セ@ I
Fig
ure
4.8
T
he
im
ag
e o
f fi
gu
re 4
.3 w
ith
th
e s
tave
lin
e s
ecti
on
s in
dic
ate
d
an
d s
ho
win
g w
he
re th
e r
em
ain
ing
se
cti
on
s h
ave
be
en
me
rge
d a
s a
pp
rop
ria
te.

\0
0
Figure 4.9 A sectioned image fragment with the staveline
sections removed.
-105-

numerous non-staveline sections which did not represent
structurally significant parts of the image. Mostly, these had a
high vertical aspect ratio and were either the result of parts of
the image forming a small angle with the vertical (and hence with
the run length encoding) or short breaks in vertical runs of
pixels (see, for example, figures 4.8 and 4. 9). This led to the
development of two approaches to further processing. The first is
outlined below, while the second is detailed in section 4.11
(ANALYSIS OF BEAMED NOTE GROUPS). As part of further development
work, the two techniques will be integrated within the system to
give complimentary tools for use in processing symbols.
As a result of the nature of the structurally insignificant
sections, any section which fulfilled the following criteria was
removed from the transformed LAG:-
i) Vertical aspect ratio >= o
ii) Single connected to a section which either :-
a) has a bounding rectangle larger than or equal to that of
the section under test
or
b) has a vertical aspect ratio >= o and its area is greater
than that of the section under test
(if the section was single connected in both directions then the
section was removed if either connection satisfied test ii)).
The value of o used was five.
When a section was removed as part of the above process, the
appropriate inter-section connections were maintained. The
-106-
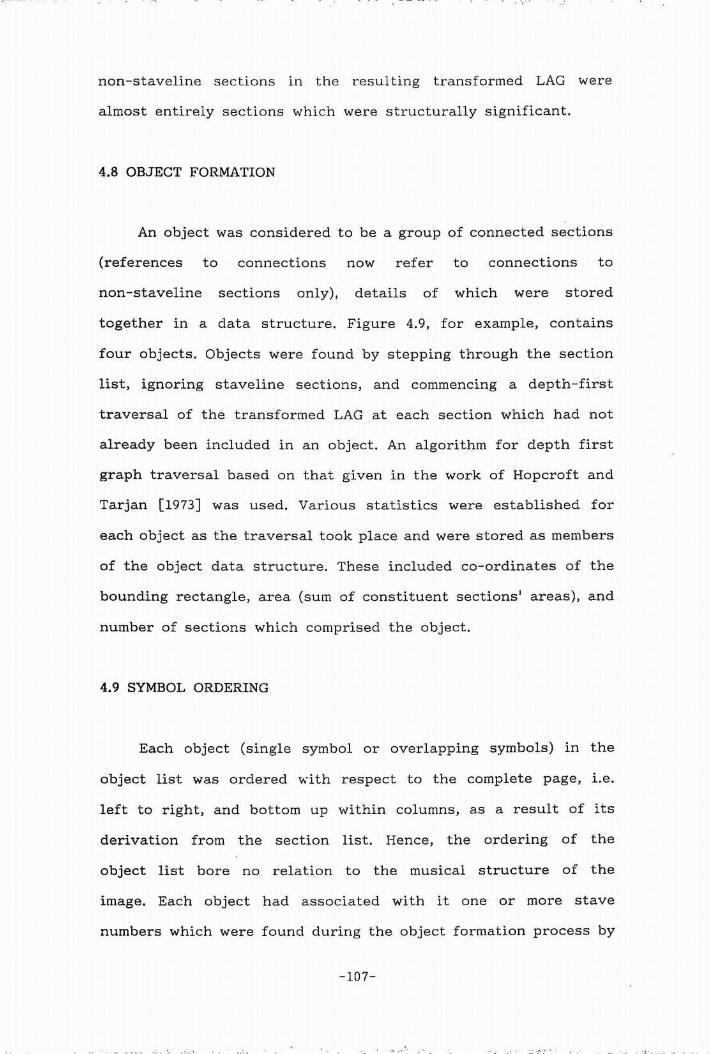
non-staveline sections in the resulting transformed LAG were
almost entirely sections which were structurally significant.
4.8 OBJECT FORMATION
An object was considered to be a group of connected sections
(references to connections now refer to connections to
non-staveline sections only), details of which were stored
together in a data structure. Figure 4.9, for example, contains
four objects. Objects were found by stepping through the section
list, ignoring staveline sections, and commencing a depth-first
traversal of the transformed LAG at each section which had not
already been included in an object. An algorithm for depth first
graph traversal based on that given in the work of Hopcroft and
Tarjan [1973] was used. Various statistics were established for
each object as the traversal took place and were stored as members
of the object data structure. These included co-ordinates of the
bounding rectangle, area (sum of constituent sections' areas), and
number of sections which comprised the object.
4.9 SYMBOL ORDERING
Each object (single symbol or overlapping symbols) in the
object list was ordered with respect to the complete page, i.e.
left to right, and bottom up within columns, as a result of its
derivation from the section list. Hence, the ordering of the
object list bore no relation to the musical structure of the
image. Each object had associated with it one or more stave
numbers which were found during the object formation process by
-107-
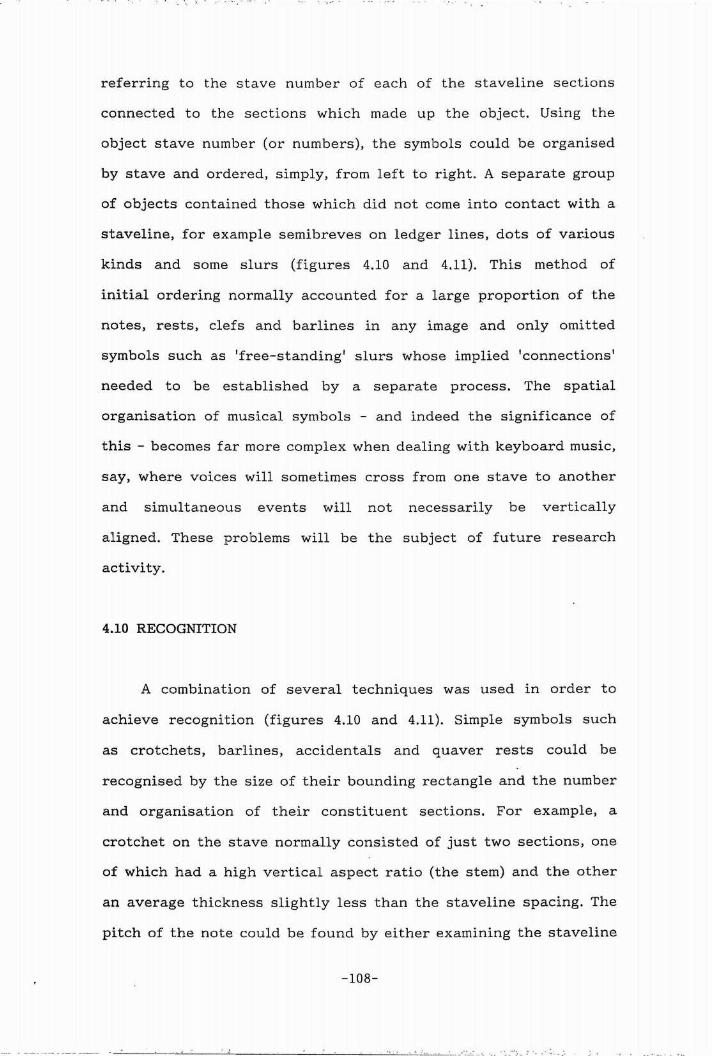
referring to the stave number of each of the staveline sections
connected to the sections which made up the object. Using the
object stave number (or numbers), the symbols could be organised
by stave and ordered, simply, from left to right. A separate group
of objects contained those which did not come into contact with a
staveline, for example semibreves on ledger lines, dots of var.ious
kinds and some slurs (figures 4.10 and 4.11). This method of
initial ordering normally accounted for a large proportion of the
notes, rests, clefs and barlines in any image and only omitted
symbols such as 'free-standing' slurs whose implied 'connections'
needed to be established by a separate process. The spatial
organisation of musical symbols - and indeed the significance of
this - becomes far more complex when dealing with keyboard music,
say, where voices will sometimes cross from one stave to another
and simul tan eo us events will not necessarily be vertically
aligned. These problems will be the subject of future research
activity.
4.10 RECOGNITION
A combination of several techniques was used in order to
achieve recognition (figures 4.10 and 4.11). Simple symbols such
as crotchets, barlines, accidentals and quaver rests could be
recognised by the size of their bounding rectangle and the number
and organisation of their constituent sections. For example, a
crotchet on the stave normally consisted of just two sections, one
of which had a high vertical aspect ratio (the stem) and the other
an average thickness slightly less than the staveline spacing. The
pitch of the note could be found by either examining the staveline
-108-
MM セセ セGMMMMMMBMMMセMMセMMGMMMMセセ ᄋ GMGM B GM G@ _.!.•...:....:.' .. __ • ____ .. :_,_: __ ._ --- -- " - .
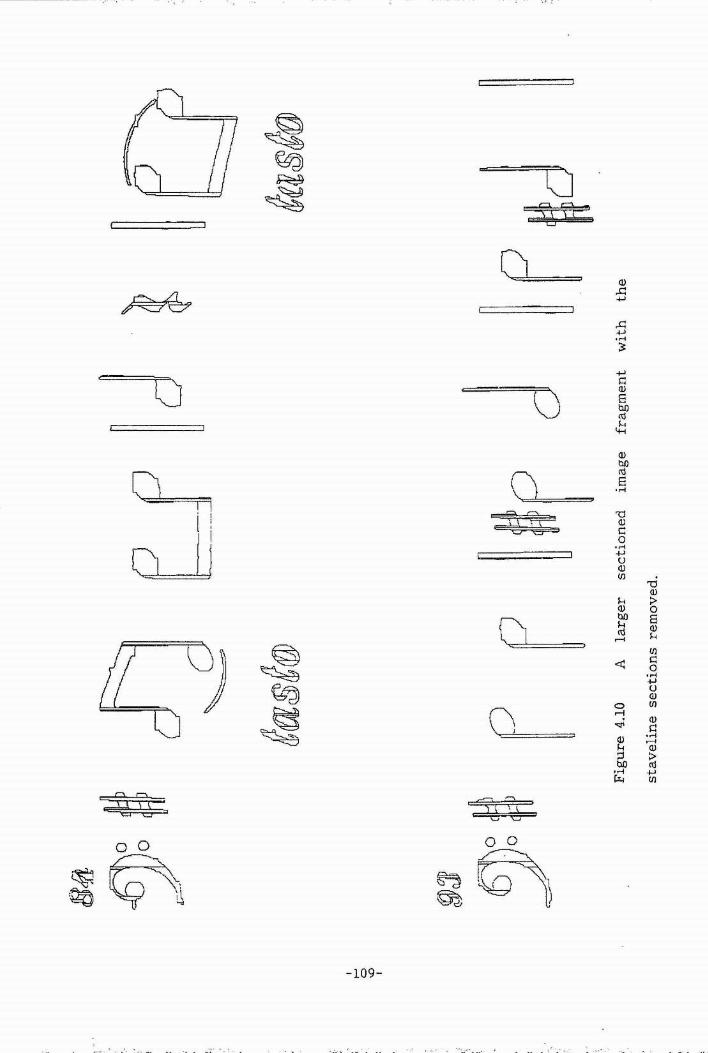
' ..
I I-
' 0 \(
) I
Xセ@ セセセ@ セS@ 6l')o
JJ
Jo
tf
b ____ f
セセ@
Mセ@
tasff@
セセセウエッ@
#f
fセ@F
igu
re 4
.10
A
la
rge
r se
cti
on
ed
im
ag
e
fra
gm
en
t w
ith
th
e
sta
ve
lin
e s
ecti
on
s re
mo
ve
d.
--
--·
·-..
-·
··-·
·.
MᄋM
MᄋMMMセMMMMMMMMMMMMMMMMMMMMMMMMMMMMMMMMMMMMMMMMMMMMMMMMMMMMMMMMM
...
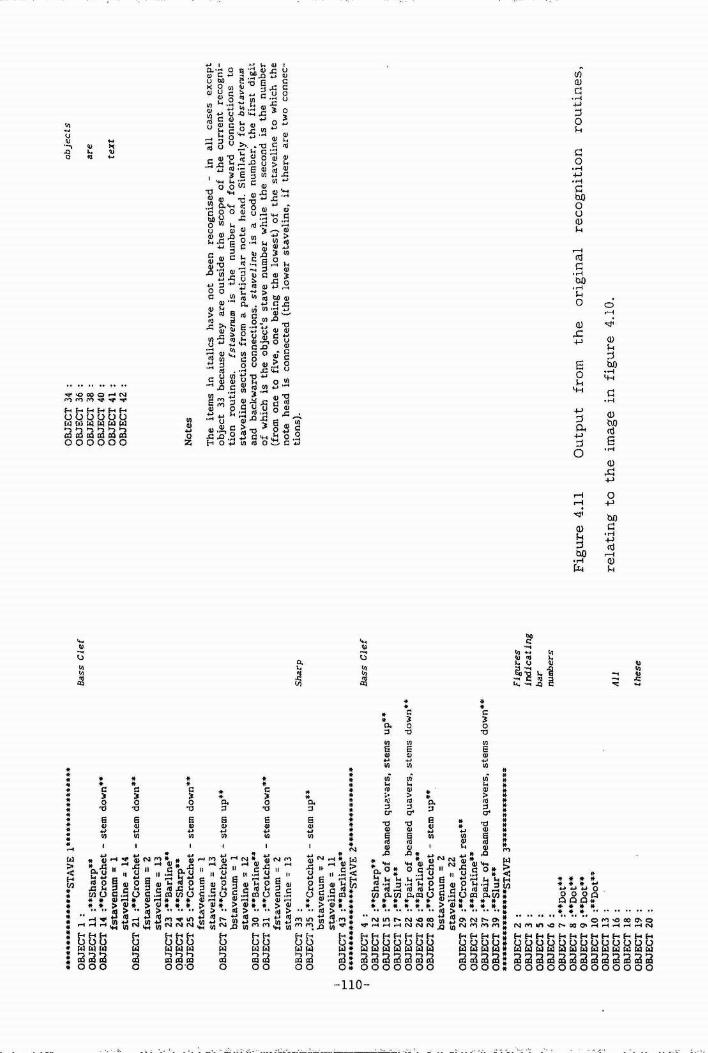
I 1-'
1
-'
0 I
****
****
****
***"
ST
AV
E
!***
"***
***•
***"
* O
BJE
CT
1 :
O
BJE
CT
11
:**
Sh
arp
**
OB
JEC
T 1
4 :*
*Cro
tch
et
-ste
m d
ow
n**
fs
tave
nu
m = 1
sta
ve
lin
e =
14
OB
JEC
T 2
1 :*
*Cro
tch
et
-ste
m d
ow
n**
fs
tave
nu
m = 2
sta
ve
lin
e =
13
OB
JEC
T 2
3 :
**B
arl
ine
**
OB
JEC
T 2
4 :*
*Sh
arp
**
OB
JEC
T 2
5 :*
*Cro
tch
et
-ste
m d
ow
n**
fs
tave
nu
m =
1
sta
ve
lin
e =
13
O
BJE
CT
27
:**C
rotc
he
t -
ste
m u
p**
b
sta
ve
nu
m = 1
sta
ve
lin
e =
12
OB
JEC
T 3
0 :*
*Ba
rlin
e**
O
BJE
CT
31
:**
Cro
tch
et
-ste
m d
ow
n**
fs
tave
nu
m =
2 sta
ve
lin
e =
13
OB
JEC
T 3
3 :
OB
JEC
T ,3
5 :
**C
rotc
he
t -
ste
m u
p**
b
sta
ve
nu
m :;:
2 sta
ve
lin
e =
11
OB
JEC
T 43
:**
Ba
rlin
e**
**
****
****
****
**S
TA
VE
2*
****
****
****
***
OB
JEC
T 4
:
OB
JEC
T 1
2 :*
*Sh
arp
**
OB
JEC
T 1
5 :
**p
air
of
be
am
ed
c;u
ave
:rs,
ste
ms u
p**
O
BJE
CT
17
:**
Slu
r**
OB
JEC
T 2
2 :*
*pa
ir o
f b
ea
me
d q
ua
ve
rs, s
tem
s d
ow
n**
O
BJE
CT
26
:**
Ba
rlin
e**
O
BJE
CT
28
:**
Cro
tch
et
-ste
m u
p**
b
sta
ve
nu
m = 2
·
sta
ve
lin
e =
22
OB
JEC
T 2
9 :
**C
rotc
he
t re
st*
* O
BJE
CT
32
:**
Ba
rlin
e**
O
BJE
CT
37
:**
pa
ir o
f b
ea
me
d q
ua
ve
rs, s
tem
s d
ow
n**
O
BJE
CT
39
:**
Slu
r**
****
****
****
****
ST
AV
E
3***
****
****
****
* O
BJE
CT
2
OB
JEC
T 3
O
BJE
CT
5
OB
JEC
T 6
O
BJE
CT
1 :
**D
ot*
* O
BJE
CT
8 :
**D
ot*
* O
BJE
CT
9 :
**D
ot*
* O
BJE
CT
10
:**D
ot*
* O
BJE
CT
13
O
BJE
CT
16
O
BJE
CT
18
OB
JEC
T 1
9
OB
JEC
T 2
0
Ba
ss C
lef
Sh
arp
Ba
ss C
lef
Fig
ure
s
ind
ica
tin
g
ba
r num
bers
All
the
se
Fig
ure
4.1
1
OB
JEC
T 3
4 O
BJE
CT
36
OB
JEC
T 3
8 O
BJE
CT
40
O
BJE
CT
41
: O
BJE
CT
42
:
No
tes
ob
jects
are
text
Th
e i
tem
s i
n
ita
lics h
ave
no
t b
ee
n r
eco
gn
ise
d -
in
all
ca
se
s e
xce
pt
ob
ject
33
b
eca
use
the
y a
re o
uts
ide
th
e s
co
pe
of
the
cu
rre
nt
reco
gn
i-ti
on
ro
uti
ne
s.
fsta
ven
um
is
the
n
um
be
r o
f fo
rwa
rd
co
nn
ecti
on
s to
sta
ve
lin
e s
ecti
on
s fr
om
a p
art
icu
lar n
ote
he
ad
. Sim
ila
rly f
or
bsta
ve
mm
a
nd
ba
ckw
ard
co
nn
ecti
on
s. s
tave
lin
e is
a
co
de
ョオュ「・イセ@th
e f
irst
dig
it
of
wh
ich
is t
he
ob
ject'
s s
tave
nu
mb
er
wh
ile
th
e s
eco
nd
is t
he
nu
mb
er
(fro
m o
ne
to
fiv
e,
on
e b
ein
g t
he
lo
we
st)
of
the
sta
ve
lin
e to
w
hic
h t
he
n
ote
he
ad
is c
on
ne
cte
d (t
he
lo
we
r sta
ve
lin
e, i
f th
ere
are
tw
o co
nn
ec-
tio
ns).
Ou
tpu
t fr
om
th
e
ori
gin
al
reco
gn
itio
n
rou
tin
es,
rela
tin
g to
th
e i
ma
ge
in
fig
ure
4.1
0.
number of the staveline section(s) connected to the · notehead
section, or - considering the possibility of breaks between
notehead and staveline - the vertical position of the centre of
gravity of the notehead section with respect to local staveline
sections. The sharp sign which has not been recognised in' figure
4.11 has had one of its structurally significant sections removed
by the staveline-finding routine. Only models of ideal forms of
symbols were used at this stage, to show how successful the
application of these could be given the structural breakdown
provided by the transformed LAG.
These models were used in conjunction with rules which
specified relevant dimensions or spatial organisation for the
constituent sections. Each model consisted of the number of
sections which constituted the ideal form of the appropriate
symbol, together with the number of forward and backward
connections for each section. This form of model only guaranteed a
one-to-one correspondence between model and symbol type for the
sub-set of notation being processed, i.e. it was possible . that a
match existed between a model and a symbol outside this sub-set.
Models were included for the following single section objects:-
slur, barline and dot. A high (> 5) horizontal aspect ratio was
used to indicate a slur, a high vertical aspect ratio indicated a
barline and a single-section object which satisfied neither of
these conditions and was enclosed within a bounding rectangle with
side length less than the stave space height, was classified as a
dot.
An object consisting of two sections was classified as a
-111-
J
1 1

'·· .. j
:.·.·,'. crotchet. If the first (i.e. leftmost) section had a high vertical
aspect ratio, it was deemed to be the stem, and the crotchet
:·. · described as 'stem down', otherwise the stem direction was taken
to be up. A further test checked the average thickness of the
other (notehead) section, confirming that this was less than or
equal to the stave space height.
Three types of eight-section object were included; a sharp
,•'j sign, a group of three beamed quavers and a crotchet rest. The
number of forward and backward connections of each constituent
section were used to make the distinction between the first two
symbols, while the presence of a high vertical aspect ratio
section as the first (leftmost) section as part of the beamed
:· ·, . group indicated 'stems down'. If neither set of connections was
appropriate and the width of the bounding rectangle was equal to
the stave space height +/- 20%, whilst the height was between
three and four times the stave space height, the object was
classified as a crotchet rest.
A four-section object was deemed to be a flat or natural,
provided its vertical dimension was between two and three times
' , \.
the stave space height. The ratio of the average height of the
_.'-l' first (leftmost) and last (rightmost) sections was used to
distinguish the two ウケセ「ッャウ[@ 1 : 0.8 or greater indicating a flat.
. N セᄋ@ ' : I -<'
Five-section objects which were modelled included a quaver
rest and a pair of beamed quavers. The list containing the numbers
of forward and backward connections for each constituent section
· .. ·. were used to distinguish between the symbols. The same test as
that used _on the group of three beamed quavers was used to detect
. セ@ : ·· .·: '· :i. , _1
---------------------------------------- - - ------- -

' :: : .. stem direction within the beamed group and an optional check for
セ@ ·... ' .; セセ O@
the presence of noteheads, using the average thickness measure,
could have been added. A model for the main portion of the bass
clef was later added to this category.
To summarise, the above implementation enabled recognition of
the following types of symbol:- slurs, barlines, dots, crotchets,
sharp, flat and natural signs, quaver and crotchet rests, bass
clefs and beamed groups of two or three quavers. Figures 4.10 and
4.11 provide an illustrated example of recognition results
achieved using this representative selection of symbols. All the
above relied upon the isolated object having the correct topology,
and, as shown in figure 4.11, this was not necessarily the case.
More complicated symbols such as beamed note groups needed
more effort in order to achieve correct classification. A separate
algorithm was developed which examined all beamed note groups,
counting ledger lines and beams as it proceeded. This was achieved
regardless of beam fragments occasionally running together due to
the printing process, which removed the correspondence between
single beam sections in the transformed LAG and beam fragments in
the image which ran from note stem to note stem. This approach
was, however, found to be too vulnerable to rotation of either the
individual object or the entire image, so an alternative method
was devised, as described in the following section.
Output was originally in the form of a text description of
the recognised symbols. The categorisation of symbols by stave
(outlined in section 4.9 above) can be seen in figure 4.11 - the
third group of symbols are those which were unconnected,
-111b-
physically, with a stave. This form of output was convenient for
providing feedback during the debugging process but needed to be
-111c-

replaced by M.R.L. data for practical use, i.e. interfacing with
other software. No M.R.L. was used until the last possible
opportunity, to avoid tying the system to a particular
representation scheme and to keep the M.R.L. data production stage
as a self-contained module which could be replaced as required. A
detailed discussion of the SCORE desktop music publishing package
and examples of uses of its M.R.L. in conjunction with the
author's system are included in chapter 5. SCORE was chosen as
the most comprehensive music printing software package available
and also because the M.R.L. used within the package was fully
documented.
Overlapping or superimposed symbols will have to be separated
out by a specific algorithm. Proposals for this are given in
chapter 5. This is similar to the not insignificant problem of
character separation [Kahan 1987] but far more complex due to the
2-D organisation of music notation (see section 3.2 for further
comparisons regarding dimensionality).
4.11 ANALYSIS OF BEAMED NOTE GROUPS
Initially the method for simplifying the transformed LAG
outlined above was applied to beamed note groups. It was found
that this approach was not robust enough to cope with the general
case because it relied upon the notestems involved being very
nearly vertical (sections with high vertical aspect ratio were
identified as note stems and analysis proceeded on that basis).
This approach had to be considered inadequate because the
assumption was often not true, especially in the case of long
-112-

notestems and also when considering the original aim of making the
system immune to rotation of +/- 10 o. With this in mind, and also
in an attempt to benefit from the success achieved in segmenting
stavelines irrespective of imperfections including rotation, a new
approach was devised. This was based on the same transformed LAG
as had been used previously, but with the segments (the continu9us
runs of pixels in the run-length encoding) orientated
horizontally. An investigation into the feasibility of deriving
the new transformed LAG from the original section data for the
object showed this to be inefficient and, in any event,
unnecessary. Instead, the operation was implemented simply by
reconstructing the object in a separate image (figure 4.12), and
applying a new routine for run-length encoding together with the
original sectioning routine. The horizontally-orientated
run-length encoding of the object in figure 4.12 is shown in
figure 4.13 and the new sections derived from this data are shown
in figure 4.14. The new transformed LAG could then be searched for
sections with high aspect ratio - a feature taken to indicate a
vertical line, in this case a notestem.
Those sections with an aspect ratio greater than or equal to
'0 (where 0 was equal to five) were selected as vertical lines and
have been removed in figure 4.15. This then left the noteheaqs and
the beaming complex (a single beam or a combination of multiple or
partial beams treated as a single unit). These components were,
however, to be represented using section data based on the
original orientation of run-length encoding, as this would more
closely resemble the underlying structure. Again, a feasibili'ty
study was undertaken, and the possibility of deriving the required
-113-
MMMGMMMMM MMMM]MBGM MMGMMBMMMGMMBMMMMMGMMMMMMGMG⦅⦅⦅⦅L⦅⦅[⦅ZセBGMGMMMGMMM⦅[⦅⦅Z[Z⦅M⦅⦅⦅⦅Z⦅Z⦅ ⦅⦅L⦅⦅⦅Z⦅⦅NNZN⦅⦅⦅L⦅@ . .:...!.· ᄋ Mセ@ ---- - - --. .., ._ .. J: • ,. ' ...........
/

Figure 4.12
removed).
=
Figure 4.13
A sectioned beamed note group (with noise sections
-
The object from figure 4.12 run-length encoded
with the segments orientated horizontally.
-114-
(

(
Figure 4.14 The sections derived from the run-length encoding
of figure 4.13.
0 0
0
Figure 4.15 The high aspect ratio sections removed from those
shown in figure 4.14.
-115-

section data by operating on the original section list for the
object was examined. This would have entailed removing from the
corresponding sections those complete or partial (vertical)
segments which lay within the region of the object designated as
'notestem' and merging, removing or creating sections as
necessary. The number of possible permutations of these last three
operations made this a complex option to implement. In contrast,
the chosen method simply involved erasing the notestem sections in
the image containing the reconstructed object (as in figure 4.15)
and then re-sectioning the remaining parts of that image using
vertically-orientated run-length encoding (figure 4.16). The
direction of the notestems was then found by searching to the left
of the first (i.e. leftmost) notestem for a notehead. The search
region was defined as having its right hand side formed by a line
parallel to the centre-line of the leftmost notestem and its upper
side a horizontal line extending from the lowest extremity of the
notestem section. The other two sides of the region were formed by
the edges of the image. If a section with an area greater than
(.5 x the average staveline spacing)2 was found, then this was
taken to be a notehead and the notestem direction taken to be up,
otherwise it was assumed to be down and a check was made for a
notehead at the top and to the right of the stem.
The next stage involved forming the beaming complex into a
single object by traversing the constituent sections using the
same algorithm for object formation as had been used previously
(section 4.8). The starting section for this was found by
searching the section list for one which contained a pixel from
the row adjacent to the appropriate end of the notestem region.
-116-
..• . ·p:·· :.· ··- l. · ....
1 I

0 0
0
Figure 4.16 The image of figure 4.15 sectioned using
vertically-orientated run-length encoding.
T h
l6
i c 14
k n f2 e s s HJ
i a n
p G
i X -i e 1 s 2
ae 20 40 60 80 1 00 l 20 I 40 I 60
Distance along beam (in pixels)
Figure 4.17 A graph of overall beam thickness for the beaming
complex shown in figure 4.16. (The average staveline spacing
relating to this object was equal to 21). -117-

Once the beaming complex had been formed into an object, a list of
values for thickness could be ascertained by establishing the
lowest and highest parts of the object for each column over its
entire length. The distance between each pair of points gave the
thickness for that particular column (figure 4.17). By using this
approach, it became irrelevant whether the notestems continued
through a set of multiple beams or ended as they contacted the
first of the beams, as is the case in some styles of engraving.
Also, a break in one or more of a set of beams would not be of
consequence provided that at least enough connections existed in
order to preserve the connectivity of the constituent sections of
the beaming complex. The rhythm values for the individual notes
were determined by calculating the average overall thickness of
the beaming complex in one or two regions, as appropriate, to the
side of each note stem. The width of these regions was set equal
to the average stave space height. If two measurements were taken
(for an inner note of a beamed group of three or more notes) the
larger of these was used in the following calculations. If the
thickness was below p x the average stave space height, the note
was taken to be a quaver, if more than this but less than (1 + p)
x the average stave space height then a semiquaver, and above
this, a demisemiquaver. The value of p commonly used was one. I
These thresholds could be extrapolated to include shorter rhythm
values.
This technique has proved reliable for the general treatment
of standard notation but it seems that further analysis would have
to take place if cue-sized notation was also to be processed.
Investigation of the holes present in the beaming complex would
-118-
NZNセ Z N ⦅ZNN ᄋ セᄋセM MM ^NZNᄋ ⦅ ᄋ N⦅⦅ MスL@ -··

seem to be necessitated, a procedure which could also prove useful
as a second source of information when dealing with standard-sized
notation. The noteheads were found by searching either above and
to the right of, or below and to the left of, each notestem, as
appropriate, and applying the area criterion used in finding the
initial notehead. Pitch was determined by examining the staveline
section connections from the equivalent region in the original
object. Again, this involved matching regions between different
representations, in this case between the - now partially -
reconstructed object and its original section list. Once the
corresponding notehead section or sections had been found, the
position on the stave could be determined from the stave number,
or numbers, of the staveline section connection or connections.
Alternatively, as mentioned previously, the relative positions of
the centre of gravity of the notehead and the nearest staveline
sections could be used.
This technique proved successful in that it was suitably
robust given rotation of the object or image, or varying line
thickness, length or straightness. As a consequence of this, the
technique could also be usefully applied to other symbols
containing vertically-orientated linear components. These include
all individual notes with stems, barlines, quaver (and shorter
duration) rests, sharp, natural, flat and double flat signs, boxes
(surrounding bar numbers or text - see figure 5.1) and brackets.
As mentioned in section 4. 7, the complete integration of the
above approach with that of simplifying the original transformed
LAG is a future aim. The overall robustness of the recognition
-119-

system should be significantly enhanced by this combined approach,
because linear components will be appropriately sectioned whatever
their orientation (given that the angle made with one version of
the run-length encoding will have to be between 45 ° and 90 ° ).
Non-linear components have been seen to be appropriately sectioned
by the original transformed LAG, thus giving a unified approach to
object decomposition. Further discussion and examples of initial
applications of this reasoning can be found in chapter 5.
4.12 SYSTEM PARAMETERS
The parameters of the system, which have previously been
referred to using Greek letters, are listed together in this
section for reference. The number in brackets following the
description of each parameter is its most commonly used value.
ex. = minimum aspect ratio (i.e. length I average thickness) of
a filament. (10)
[3 = maximum curvature (variance figure of least squares fit)
of a filament. (1)
A. = maximum area of a noise section (in pixels). (5)
o = minimum vertical aspect ratio (average thickness I
length) for a section to be removed under the process of section
4.7 - simplification of the transformed LAG. (5)
</> = maximum number of continuous background (white) pixels
(bordered by black pixels) in a horizontal row to be filled by the
pre-processing low-pass filter. ( 4)
p = proportion of the average staveline spacing to be used as
the threshold in differentiating different rhythm values when
-120-

analysing beamed note groups. (1)
0 = minimum aspect ratio for a section to be considered as a
vertical line by the beamed note group analysis routine. (5)
The values for the above parameters were not rigid but those
given in brackets above were found to be widely applicable. The
avoidance, as far as possible, of the use of absolute measurements
led to the adoption of aspect ratios (a, o and 0 ) which preserved
the size-independence of the system. Where pre-processing was
used, the value of ¢ could be reduced with the advantage of
diminishing processing time, while not having a very adverse
effect on later operations. The value of .A could also be reduced,
with similar effects.
-121-

5. A System for the Automatic Recognition of Printed Music Worked Examples
5.1 INTRODUCTION
This chapter contains detailed examples showing the
application of the system described in chapter 4. The examples
illustrate various aspects of the music recognition problem,
including staveline-finding, segmentation, the processing of some
handwritten fragments, dealing with a multi-stave system and the
production of output in the form of M.R.L. data. Initially,
printed (i.e. engraved) music extracts were used as source
material, but the occasional use of handwritten material served to
illustrate, and help enhance, the robust nature of the system.
Also it was found to be convenient to write tailored extracts
including the appropriate features required for testing the system
at a particular stage of development. Such· artificial material was
to some extent constrained, however, so that the development of
the system was not diverted into solving problems which normally
only occur in handwritten music. The variations which commonly
occur in engraved music due to poor print quality do to some
extent correspond to those inherent in handwritten music. For
example, variations in thickness and straightness of lines
(stavelines, notestems, etc.), different shapes of solid noteheads
and multiple beams which run together. The illustrations of
original engraved and handwritten material are reproduced
life-size, except where indicated, while the examples of
run-length encoding and sectioning are suitably enlarged. All
-122-
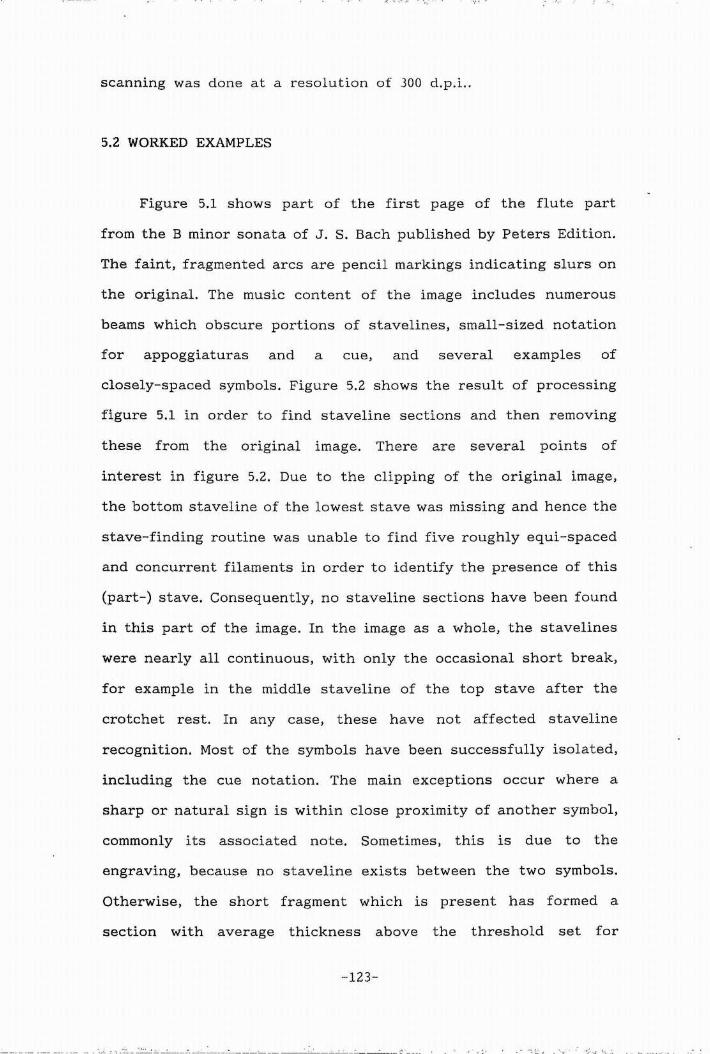
scanning was done at a resolution of 300 d.p.i ..
5.2 WORKED EXAMPLES
Figure 5.1 shows part of the first page of the flute part
from the B minor sonata of J. S. Bach published by Peters Edition.
The faint, fragmented arcs are pencil markings indicating slurs on
the original. The music content of the image includes numerous
beams which obscure portions of stavelines, small-sized notation
for appoggiaturas and a cue, and several examples of
closely-spaced symbols. Figure 5.2 shows the result of processing
figure 5.1 in order to find staveline sections and then removing
these from the original image. There are several points of
interest in figure 5.2. Due to the clipping of the original image,
the bottom staveline of the lowest stave was missing and hence the
stave-finding routine was unable to find five roughly equi-spaced
and concurrent filaments in order to identify the presence of this
(part-) stave. Consequently, no staveline sections have been found
in this part of the image. In the image as a whole, the stavelines
were nearly all continuous, with only the occasional short break,
for example in the middle staveline of the top stave after the
crotchet rest. In any case, these have not affected staveline
recognition. Most of the symbols have been successfully isolated,
including the cue notation. The main exceptions occur where a
sharp or natural sign is within close proximity of another symbol,
commonly its associated note. Sometimes, this is due to the
engraving, because no staveline exists between the two symbols.
Otherwise, the short fragment which is present has formed a
section with average thickness above the threshold set for
-123-
··--------- -------- --- -_...:...: :. __ . ___ • ..:__· ___ . __ セ@ _ __,____-_ __ セMMMM ᄋᄋ M ᄋ@ --· __ ..:._ __ ᄋ M M M Mセ@ -- -- • .,.; • • ..,J .....

Flote [Violine]
Edition Peters Nr. 4461 a
SONATE I
@Copyrinht 1939 by C. F. Peters tl816
Figure 5.1 The opening page of the B minor flute sonata of
J. S. Bach - reproduced with permission of Peters Edition. (80%
life-size).
-124-
-- ------ ---- --------- -- ___ __ !.,. __________________ _: _ ___ ______ __ _ . . ' . . ..
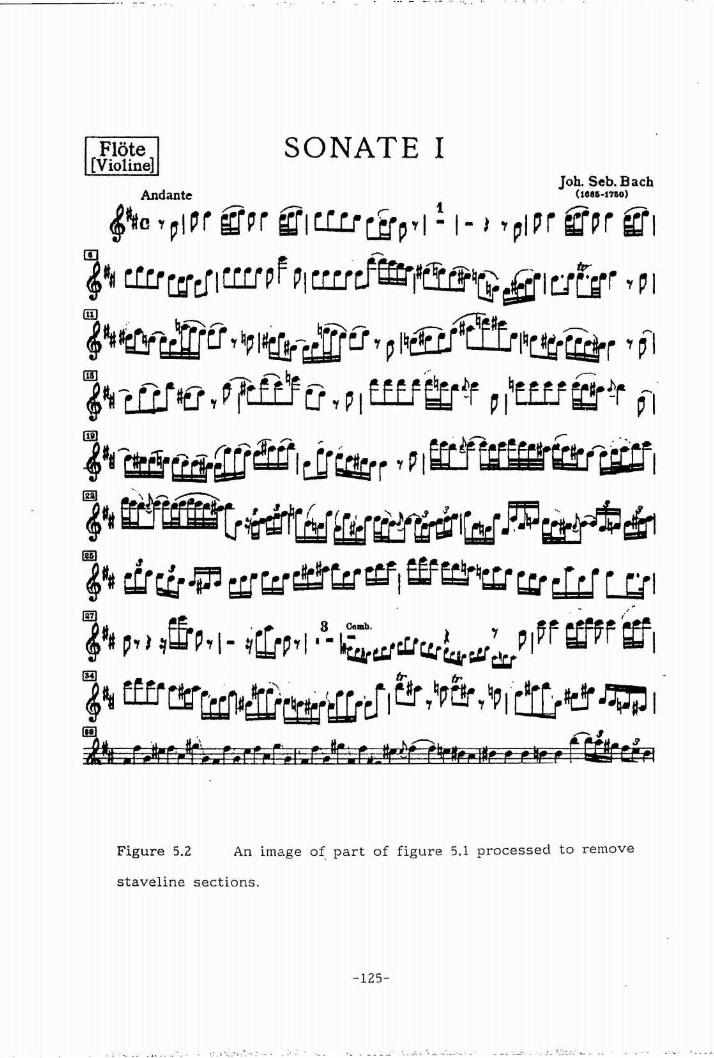
.------ ·-·· :: - ·• , • , .... ,...,. -· .. - " ··-... . ' ·' - ,, ' .
Flote SONATE I [Violine]
job. Seb. Bach Andante (tes5-t'1&o)
セセ」@ 'piPi セh@ ヲイゥlAャNイ」ゥイセGャA@ 1- セ@ 'piH ;Efpr Ea1 00 . -
4•d L!Uca61LWPF pQイキ」NヲセL」イ。イセセセセ。エオイ@ ,p,
QN⦅セQイvヲエQGL@ セp@ セセ@ &u, p iセljゥイヲセLNセセセセイ@ 'fl
ャセセエゥ}jャAuL@ P7r.ffi fJ, pI ゥャャヲセセf@ p Q セeNヲNefヲイセイ@ fl
ャᄋセ]セセ。オセjイセイ@ Lーセセセセセ@
l·· ュキエイセlFイセセセセ@ pZpセセ@l•• 」ゥjセセ「uwセcァイZAiwセセwG「u」ャjAljZエャ@(!!) . . - ,. .. セ@
セᄋᄋ@ P') セヲFーL@ 1- セ「ヲイーLャᄋX
M セ」uセBイ「N[Zイセpivヲ@ セf@ セi@[H) . . tr tr . -4 セ@ ャャゥAセセセwゥャ」{イj@ I L!r GセセlAイG@ セpi N@ d.Ct#& JW I セ@ . セT@ttu .j ... drj ·e1r\ •• イ[イイLNイᄋLNLN⦅ェ⦅オイeイN[NエエイセヲャャャイャイイャMイLN@ ,. -r r r Wrcr,.,
Figure 5.2 An image of. part of figure 5.1 processed to remove
staveline sections.
-125-
, Nセ Z@ ....... 1' .. J. :;, I> ... •' 0 セ Z M セ ᄋ セ セ セᄋANZ セ セ@ ........... セᄋM•• - f --- - ---- -- -- --- -- -----··--

. ' :•'
staveline thickness, often because it has run into one of the
cross-strokes of a sharp sign. The line-tracking has been misled
by the slightly-sloping beam in the last bar of the lowest
complete stave where it has followed the beam rather than the true
staveline - this would in turn have affected the beamed group
recognition routines. The distortion of isolated symbols as a
result of staveline section removal can be seen to be minimal, not
beyond the possible effects of noise in an original image. Through
the use of a line-tracking rather than a global approach to
staveline processing, symbols outsi de the bounds of the stave have
been left untouched.
Figure 5.3 shows a page from the 'cello part for the
'Hamburg' flute sonata of C.P .E. Bach. This is the page from which
the illustrations for chapter 4 were taken (although in that case
scanning was done at 400 d.p.i.). Figure 5.4 shows the image with
the staveline sections removed. This shows that clear symbol
isolation has been achieved in the main but also illustrates
typical cases of part of a particular symbol coinciding with a
staveline, i.e. the top of the bass clef symbol. In several
occurrences of this situation the section formed where the bass
clef symbol merges with the top staveline has a sufficiently high
average thickness to ・ク」・・セ@ the threshold for maximum staveline
thickness, resulting in preservation of the connectivity of the
symbol. In other cases this is not so and the bass clef symbol is
fragmented. This is not too much of a problem for the recognition
stage as models for both versions of this particular symbol can be
stored and applied, in conjunction with a procedure for detecting
and associating the requisite pair of dots.
-126-
G セ@ _, .t.. - · . ' ... . .: .. Gセ@ ·-- . - • . • - .:.. ..

Iaslo Iaslo
10:! .
va r t=tF ·s [J tJDtH j I J t I J l I J J I@ rn Iaslo
120 アセ@ .,......__ VII J F IE r-tr rttr rl t U I (f· I U t IJ セ@ I J l
f . p r r PJ.l taslo ·
it J £ IJ セᆴ@ E irn:J 1J tl BS
Mャエ⦅Lセャヲ@ t IJ t I Iasio
UO 1
:rtJ t IF t If J IF t IE F lr t - IJ セ@1 -
¥kgzrrr EELV ____ r lj± I J r I J J I # t I ;.r¥1 ·p r f p u
Figure 5.3 A page from the 'cello part to the 'Hamburg' flute
sonata of C. P. E. Bach. (80% life-size).
-127-
• • "' - • o. • • セ@ - • .. ' ' '" a • ., J' - • : • • • .<&.J. • • セ@ • · • ,,,';., • ' : - ·- • . ... .. • • • • セ@ • • • ' セ@ • • .' .. -:., • . r ; ' .... • . .:. : . . • . _, , .( " セ@ ᄋMセ@ セ@ :..: .• •
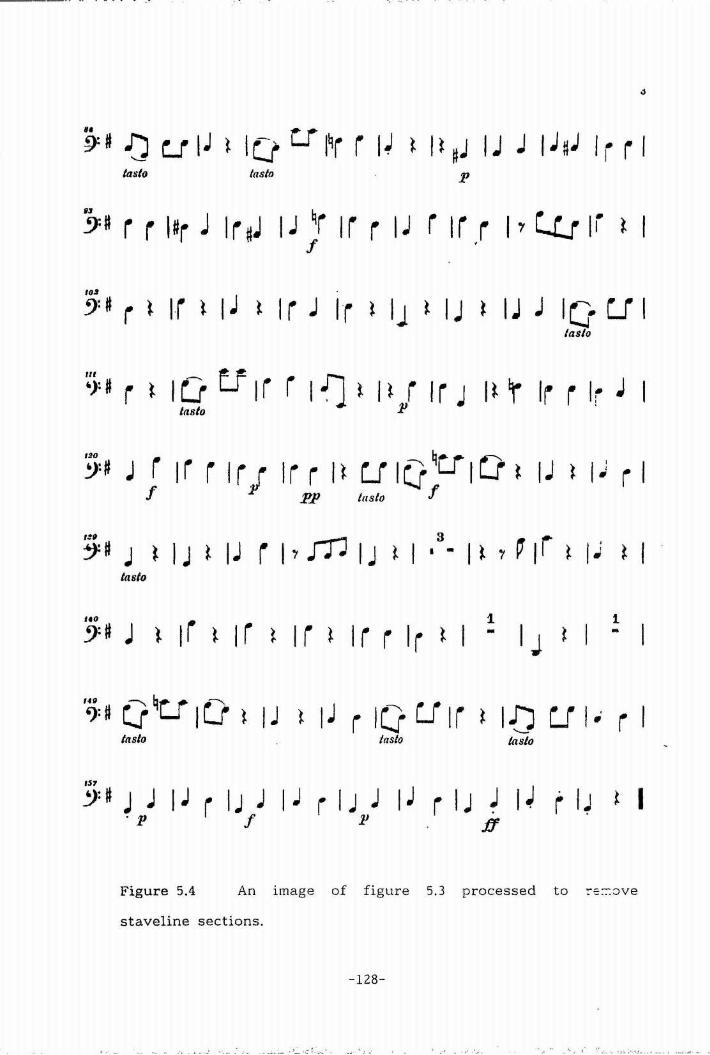
Iasio taslo p
QPセ@ .
9: n i セ@ li t I J t I i J I r t I J t I J s I J J I G· U I taslo
Iasio
ItO 1 1
?# J セ@ I i セ@ I i セ@ I i セ@ I i r I i セ@ I - I J セ@ I - I
ᄋセZC@ cヲセu@ 10 l IJ t IJ r IQ U li セ@ 1.[) U I• r I セセ@ セセ@ セᄋ@
U7
_9:# J J I J i IJ J I J r I J J I J r U セ@ I J f iセ@ セ@ I ·p f p ff
Figure 5.4 An image of figure 5.3 processed to !"s::-:0ve
staveline sections.
-128-
セ@ .. . ' . . : . . . : ,. . セ@ ... セ@ .·. セ@ . ! ::.: • - • - - · - . ••. ·_._ -" - - ' • . - •r .. .. • " .! ,. •• ' セ M • ·•- .... セ@ .. . . •, • -

Figure 5.5 shows an extreme case of stavelines being obscured
by beamed note groups, in this case demisemiquavers. It can be
seen in figure 5.6 that the line-tracking procedure has succeeded
in following the stavelines correctly even in the situation where
a beam coincided over its entire length with a staveline. While
previous examples have shown the staveline-finding strategy to be
a successful one, this example is stretching the line-following
approach to its limits. An alternative approach might use a filter
(i.e. a global operation) for removal of short vertical runs of
pixels, given that the threshold for this has already been set by
the filaments found. This would have to be localised in some way,
to avoid affecting slurs and other thin symbols, possibly by
making use of the positional information available regarding
filaments. Perhaps a combination of line-following and then a
back-up check using a filter of the above type might be useful.
Another possible technique (the one favoured for future inclusion
in the system) would involve a 'clustering' approach, which,
intuition suggests, resembles the technique used by the human
vision system. Here, links would be made between filaments, and a
clustering technique applied to group together filaments from a
common stave, in the process isolating · hairpins and other
extraneous filaments. This would also provide a 'structure' which
would assist the interpolation process in finding staveline
sections which were not categorised as filaments. Alternatively,
the sections with average thickness below the established
threshold for staveline thickness could be included in the
clustering process together with some form of weighting which, in
their case, would be lower than that of filaments (the discussion
of annealing in Byrd's thesis [Byrd 1984] is relevant here).
-129-

21
poco animato
1\ Pice. I b. --- -- .,._f' . . アセᄋM b_,. • b. • h. 11'-b11'"(;,._ .. b .... - ..... b .... LN⦅セ@. Mセᄋ@ · ····U
=lm-- ·-v
p· c 11 p cresc. fl. tC. - - - - .. GQᄏMNセ[MM
tJ
セ@pcrf!sc.
NィN「セ「ᄋ「ᄋMセMセ「セ「セ「セセNセNセセセセ「セM11 Fl. I セN@ - • -t) pcresc. fl Fl.ll --- • - . ..,.. .. - ---tJ p cresc.
8 ................................. セ@ ....................... セ]]ᄋᄋᄋ ᄋᄋZ@
"b"... - b. - h. ... b ... ーZー⦅セセ@
tJ 8 ..................................................... セZZZU@ .. セ@- 'lr .. セ@
11 - • • bfl. ,. IL * セーZセ@ "'-
fff-= if 8 ...................... . . bQ:- )..:
セ@ .Iff-=:::: セイエ@8'""'"''"'"'"'"'"'"''"'"'""""""""''""'''''""'''''''''''"''''""''' .... セ@
" セMM - *" - ..... - ,. b,-. "1,-t.- セ]MセMMセ@.fff-=:::. if セM[[ᄋᄋᄋᄋᄋᄋMMᄋ@ .. セZ@
--"iT fff-==::. sf
8'"'"'''"'"""'''"'"''"''"''""""""''"'"'"'" . . .. M セ@ .. ............. :
-----------l.l-1r""'= fl -- .. .,_ i>p:; セ@
-s. ----- --t--- .. --
fff-==.: if
Figure 5.5 A page of orchestral extracts from the symphonies
of Shostakovitch - reproduced with the permission of Fentone
Music. (80% life-size).
-130-
-. ' MMセ ᄋ セNMM .. ᄋ セNlセ ᄋ ᄋ ⦅L⦅L⦅ᄋ@

poco エャエョGュ。ャッセMMMMM[MMMZMMMMMMMMZMMMLMMMMM[MMMM]MMセ@, セ@ pt-• セイW@ r .,. r r r セ@ セエ@ r セLN@ " ,. -,. エセエセゥ@ イセイ@ ,. t -t i ijr----- . _.._ __ -==-=:..:..::.. =::::::::: =-::===.== == ------ -------
Picc.Il, cnsc. MMMMMMMMMMMMMMMMMMMZMセMZZMNNNNMMZZM
' セ@ . ,..---;;r. r i r i r r ,. r r i r i r b r r r r r ( r ----------- -------- ------ - ---- --------- ---I'CN4C.
' Bセ@ • セセZ@ , r , r 1tr "r -r "r r r r r -r セゥ@ セヲ@ ,.. f':. ,.. , ,.. セ@ Mセ@ f!: fiCI"eiC.
- -------------- - - ---------- --- ----- ------ --- ----·- ------
\' ";·u ,r-r-i _r_r_r_r _r_,._r_r_r ⦅イ⦅イ⦅イセイ⦅イ⦅イ⦅イ@ _r_r_r_r fl Ct"eiC.
-- ------- - --- - --- ---- -- - - -- --- --- -------------- -
Figure 5.6 An image of the upper-most four-stave system
from figure 5.5 processed to remove staveline sections.
-131-
. .. · .. -· ........ . .. I • " • .... · - - -• ' セ@ • - ' 0 I

After the symbols had been isolated by the staveline-finding
procedure, recognition had to be achieved. Initially, as outlined
in section 4.10 (RECOGNITION), a set of models using graph
structures and dimensional parameters was constructed. An object
in the image being processed could then be compared with the
relevant models and, in a large percentage of cases, a match
found.
The development of the technique for analysing beamed note
groups described in section 4.11 (ANALYSIS OF BEAMED NOTE GROUPS)
led to the modification of the above approach. Although the use of
graph structure-based models and associated dimensional parameters
was to be retained, the availability of a robust method for
detecting approximately vertical lines gave this form of symbol
component added importance. The following figures provide detailed
illustrations of the application of the ideas of section 4.11.
Figure 5. 7 shows a complex beamed note group which formed an
individual object after isolation from the stavelines. The
horizontally-orientated run-length encoding of the object was
produced, and the resulting data supplied to the original routine
for the production of the transformed LAG (as explained in section
4.11). The resulting sections for the object are shown in figure
5.8. The high aspect ratio sections have been removed, as
notestems, to produce figure 5.9. This illustrates the need for
several further operations in order to analyse a wide range of
beamed note groups. It can be seen that the rightmost notestem has
not been identified, due to the value of the aspect ratio
-132-
. . . : セセ@ ᄋ セ@

セN@ i': :- '-' セ@: : ·. I: i\ i. '; i: I. I I I
I セ@ w
w
I
Fig
ure
5.7
T
he
co
nsti
tue
nt s
ecti
on
s of
a co
mp
lex b
ea
me
d gro
up
ob
ject is
ola
ted
fro
m t
he
im
ag
e s
ho
wn
in
fig
ure
5.2
.
--
-. --
----
---·--
-------
-------------------------

·:·
I ........
w
セ@
I
Iセ@I
Fig
ure
5.8
T
he
ob
ject
fro
m
fig
ure
5.
7
re-s
ecti
on
ed
ba
se
d o
n
ho
rizo
nta
lly-o
rie
nta
ted
run
-le
ng
th e
nco
din
g.
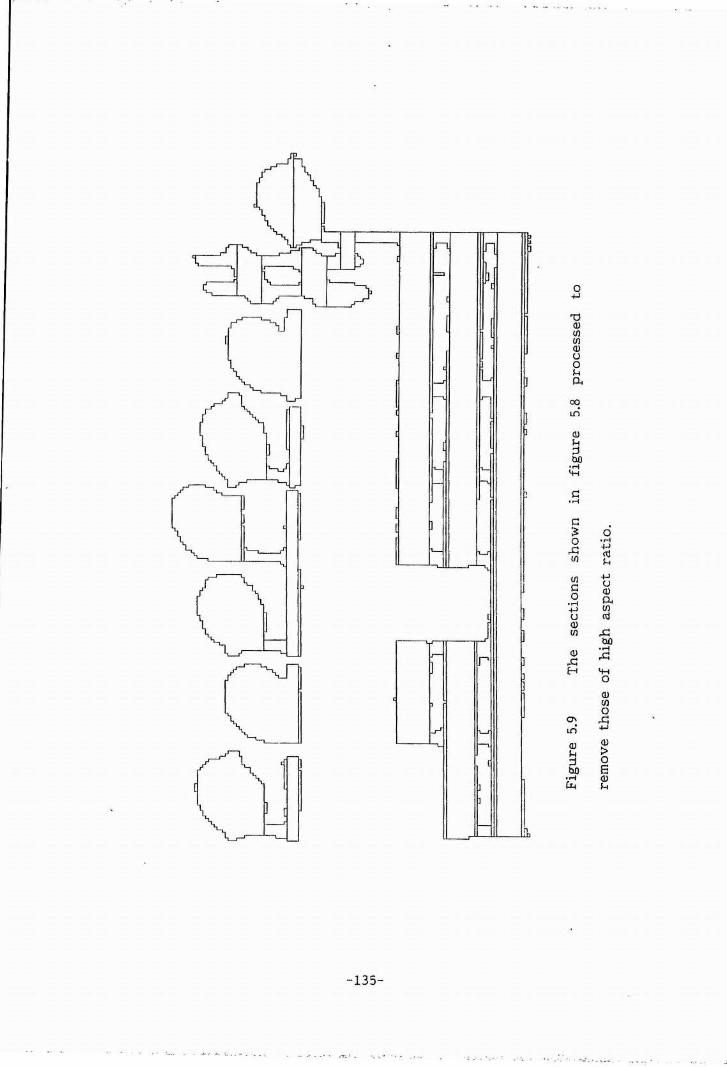
セセN@
I セ@ w
U
1
I
0 ( '
セ@セ@, 1r-s __._-:..., -L
...,;;;;
;===, GMMMMMMMMMMセ@
Fig
ure
5.9
T
he
se
cti
on
s s
ho
wn
in
fi
gu
re
5.8
pro
ce
sse
d to
rem
ove
th
ose
of
hig
h a
sp
ect r
ati
o.
·---
----
·-セ@--
---·-
----
----
----

threshold. In this example the effect is due to the attached sharp
sign, but it may also be encountered where a short notestem occurs
due to a particular combination of pitches or multiple beams. If
the threshold was lowered, notestem fragments located either
between a pair of ledger lines or between a ledger line and a
notehead would also be extracted. This would necessitate the use
of a collinearity test, in order to enable association of multiple
notestem fragments with the appropriate note. It is proposed that
this approach will be used in the future as part of beamed group
analysis. The process required for counting ledger lines by
examining a vertical strip extending downwards from the notehead
has also been formalised but remains to be implemented and tested.
This method for pitch determination will be robust despite the
possible absence of various ledger line fragments (see, for
example, the second, third and fourth notes in figure 5. 9).
The principal problem which has emerged in applying the above
method has involved breaks which occur in notestems. These cause
noteheads to become separated and hence formed into separate
objects rather than integrated with their associated beamed
groups, as expected by the above procedure. This can be
circumvented to a large extent by applying a vertically-orientated
version of the low-pass filter described at the end of section
4.1. The existence of the problem depends on several factors,
including the age of the printing plate, the thickness of the
notestems in the original engraving and the print-quality of the
sample being scanned. Usually notestems are thicker than
stavelines and so the former are less likely to break up in the
printing process. The example given in figure 5.10 illustrates the
-136-
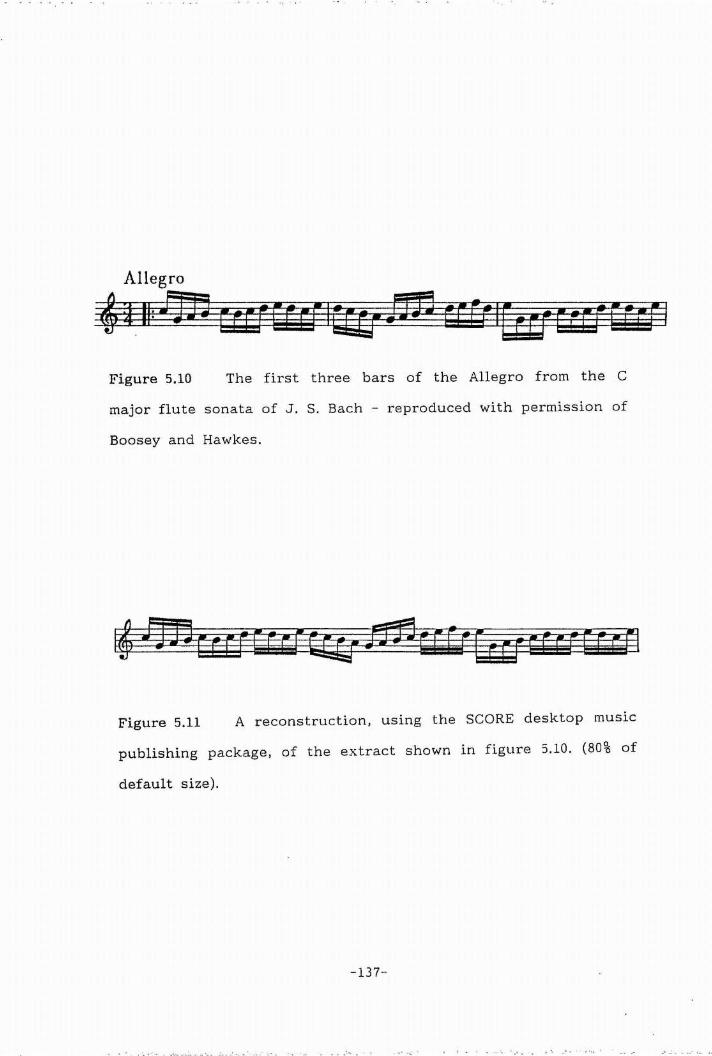
Allegro
Tセ@ ll=lJ:S CtUEErPIWftm rFFrl[rcFUEftfl
Figure 5.10 The first three bars of the Allegro from the C
major flute sonata of J. S. Bach - reproduced with permission of
Boosey and Hawkes.
t@ iJ J J r r F F t E Iff@ JS? E rfr EfB r e E F S E c Fl
Figure 5.11 A reconstruction, using the SCORE desktop music
publishing package, of the extract shown in figure 5.10. (80% of
default size).
-137-
' • " . • セ \N@ ... セ@ .. :... • • ,_ ·-- .: . - . ' ·- .... ·• セ@ ( セ@ セ@ - . . ·. . .. \ -

treatment of beamed groups using the above techniques whilst
incorporating the problem of fragmented stems. Before it is
discussed, the SCORE desktop music publishing package will be
introduced, as it is used in figure 5.11, and the following
figures, for reconstruction of the musical material.
A brief overview of the SCORE desktop music publishing
package appeared in the Appendix to chapter 2. To amplify, it is a
package for the IBM PC based on the work of Professor Leland Smith
at Stanford University. It uses QWERTY keyboard, mouse or
non-real-time MIDI keyboard for input, its own unique internal
representational system and produces output on dot-matrix or
Postscript printers including compatible phototypesetters. An
important facility allows a file containing M.R.L. data to be
prepared externally, using a wordprocessor or, in this case, by
the recognition software, and then imported into SCORE. The M.R.L.
uses a letter and octave number to represent pitch and either
numbers (4 = crotchet, 8 = quaver, etc.) or, in some cases,
letters to represent rhythm. Beaming information, slur positions
and miscellaneous markings (including text underlay) are all
entered separately. The vocabulary of symbols is extensive and, in
addition, there is a facility which enables the integration of
user-defined symbols.
To return to figure 5.10, this shows an extract from the
Allegro from J.S.Bach1s C major flute sonata. The reconstruction
of the musical material achieved using the SCORE package and
printed using a 300 d.p.i. Postscript laser printer is shown in
figure 5.11. Initially, 10 of the noteheads were separated from
-138-
-- _- ._. - セ@ :. . . . ..... : .· .. ; ··.

their respective beamed note groups due to breaks in the notestems
(although this may not be the case in the illustration seen here,
due to the reproduction process). The vertically-orientated
low-pass filtering operation described above removed all but one
of these breaks; the one remaining break caused the misrecogni tion
of the second note in the eighth group. Only beamed groups were
processed at this stage in order to thoroughly test the new method
for their analysis the other symbols present in the
reconstruction were added by default.
In order to encompass fragmented stems with breaks larger
than those filled by filtering, the beamed group recognition
software would have to include a procedure for associating
objects. Where a fragment of notestem existed which was large
enough to be identified as such by the vertical line-finding
procedure of the beamed group analysis routine, the original image
could be searched in the relevant region for the notehead. In the
much rarer case, where the stem is broken into several fragments,
a more complicated procedure for assemblage would have to be
undertaken. This processing option would have to be generally
available eventually so that other grossly fragmented symbols
could be recombined into meaningful structures. A clustering
technique along the lines of the one suggested as a possible
approach to staveline fragment association may be suitable. Coping
with an image of the poor quality now being discussed would be a
tremendous challenge, especially considering that text of such
quality would almost certainly defeat existing OCR systems.
Another factor, briefly touched on in section 4.10 is the
- 139-

セt@ ' •,
relatively common occurrence of overlapping or superimposed
symbols. These need to be separated out by a specific algorithm
and it is proposed to start by extractirilg lines, in any
orientation, from such a compound symbol. This would remove
barlines, slurs and hairpins - the most commonly intersecting
symbols. Similarly, in situations where one symbol becomes
inadvertently attached to another (e.g. the sharp signs attached
to noteheads in figure 5.2), an approach based on iterative
removal of elementary symbols and symbol components is advocated.
Thus, by first identifying and removing the notestem and notehead
of an individual note, the appended sharp (or similar) sign could
then be recognised in isolation.
Figures 5.12 to 5.16 show the stages involved in processing a
short handwritten extract. The original image is shown in figure
5.12, while the same image with its staveline sections removed is
shown in figure 5.13. A fragment of the original image with
sections illustrated is shown in figure 5.14. The SCORE M.R.L.
data file produced as a result of processing the extract is shown
in figure 5.15. The sectioning illustrates the earlier comment
that the characteristics of the handwritten extracts used were
intended to test the recognition system but not to force extension
of its scope to include all handwritten notation. For instance,
the variable thickness and straightness of the notestems was a
reasonable test which was satisfactorily negotiated by the
techniques outlined above, while the shapes of the noteheads were
kept reasonably close to those found in engraved notation,
something which does not apply widely to handwritten manuscripts.
The reconstruction of the extract, obtained using the data file of
-140-

Figure 5.12 A short handwritten extract.
Figure 5.13 The image of figure 5.12 processed to remove
staveline sections.
-141-
L •:' __ ,. L M ᄋセ@ ' i:: '.j. • : •.: .... :: .. セ N@ ' - - -- _.,_. _·, _: · · ____ .•. , __ ]
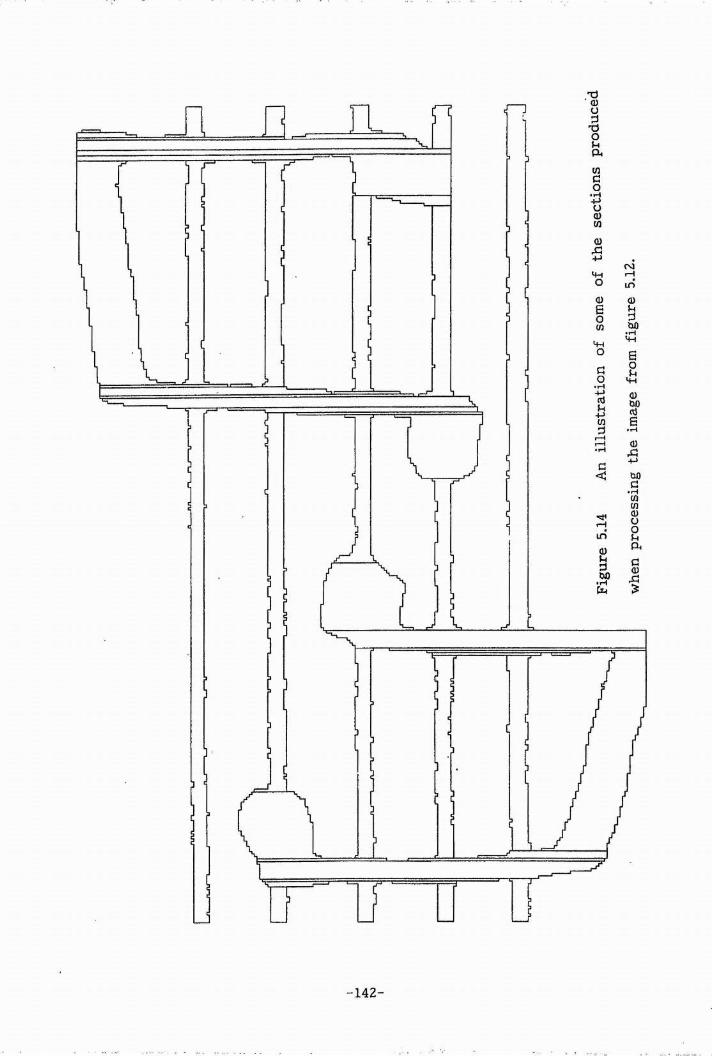
I ...... セ@ N
I
Fig
ure
5.1
4 A
n illu
str
ati
on
of
so
me
of
the
se
cti
on
s p
rod
uce
d
wh
en
pro
ce
ssin
g th
e i
ma
ge
fro
m f
igu
re 5
.12.

Figure 5.15
, ••• I o ^セNG@ -::'
INl 0 BA/E3/F3/D3/B2/G3/B2/C3/D3/G3/E3/F3/E3/D3/B2/M; 8/8/8/8/8/8/16/16/16/16/32/32/16/8;
2B;
The SCORE M.R.L. data file resulting from
processing the image of figure 5.12. (The codes not mentioned in
the text include BA for bass clef, M for measure (bar-) line and
2B meaning beam notes of duration less than a crotchet together in
multiples of two quavers duration.)
r F J Qj o r r t Figure 5.16 The SCOR:!: reconstruction of figure 5.12 using the
data shown in figure 5.15. (80% of default size).
-143-

figure 5.15, is shown in figure 5.16. This was printed in the same
way as figure 5.11.
Figure 5.17 shows a more complex handwritten extract
containing a three-stave system. This was used in testing both the
beamed group analysis routine and also the ability of the system
to cope with objects (the barlines) which were -associated with
multiple staves. The ordering of the staves, as well as symbols
within individual staves, in order to produce the correct SCORE
M.R.L. data file, had also to be achieved. The processed version
of figure 5.17, with staveline sections removed, is shown in
figure 5.18. The problem regarding a part of a symbol coinciding
completely with a staveline is illustrated here in each of the
three clefs. As stated earlier in this chapter, the bass clef
could be recognised regardless of fragmentation, by making
available alternative models, while in the cases of the other
clefs the bounding rectangle was not affected and this was used in
conjunction with positional information to achieve recognition. A
rudimentary object association routine (see above regarding
assembling fragmented symbols) was used to 'connect' the bass clef
components, including the pair of dots. All the other objects were
analysed using the techniques described in section 4.11. The
barlines were recognised as objects which contained a single
vertical line which constituted over 90% of the total area of the
object - this allowed for any remaining extraneous noise sections.
A list of associated staves was established for each object,
containing three entries in the case of each barline and one for
each of the other objects. The stave numbers of the staveline
sections had previously been sorted so that the staves were
-144.:..

·,r
Figure 5.17 A short, handwritten trio extract (three-stave
system).
セ@ セ@ u r:J lr K tJ,L:J u uru ')= f1 n セ@ J1
Figure 5.18 The image of figure 3.17 processed to remove
staveline sections.
-145-
, ....... ,. GᄋMMᄋセM .... ..

numbered in ascending order from one, which was the lowest on the
page. This corresponded to the organisation used by SCORE. The
SCORE M.R.L. data file resulting from processing figure 5.17 is
shown in figure 5.19. The three blocks of data corresponding to
the three staves can be seen, while the code 'M3' indicates a
barline stretching over three staves. The reconstruction of the
extract, produced using the data of figure 5.19 appear·s in figure
5.20.
-146-

Figure 5.19
IN 1 0 M3/BA/G2/D3/G2/B2/M3/G2/G3/G2/F3/M3; 8/8/8/8/8/8/8/8; J
1 2/3 4/5 6/7 8; J
IN 2 SP 1 AL/D4/E4/F4/G4/G4/G4/C4/C4/E4/D4/D4; 16/16/16/16/8/8/8/16/16/8/8; , 1 4/5 6/7 9/10 11;
' IN 3 SP 1 TR/D5/C5/B4/A4/B4/D5/E5/G5/F5/B4; 16/16/16/16/8/8/8/8/8/8; J
1 4/5 6/7 8/9 10;
The SCORE data file resulting from processing the
image of figure 5.17.
/1 • -:::;;- - - ,_ --, セL⦅@ -- - -:;;;: ,_ I -セLLNLNNNM ,_ .... ,_
セ@ I セ@ -セ@ - ----.r
- - -MMセ@ - - ,. ,.. セセNセ@ - ,.. --:;;;: - -,.. - -iiセ@ ;;;;;;;;,r -. セLNN@
セ@MNセ@ I ..
___....., - セ@ セ@l:""i• - - - - .-I ----.. --7 - I ....
セ@セ@_. - .... -
Figure 5.20 The SCORE reconstruction of figure 5.17 using the
data shown in figure 5.19. (80% of default size).
-147-
. Mセ@ ..: .: -- -:.. - M セ NNNNZN⦅Z@ . . . ....:. ____ _ ' ·- .... .. . - - - _. ____________ ...:
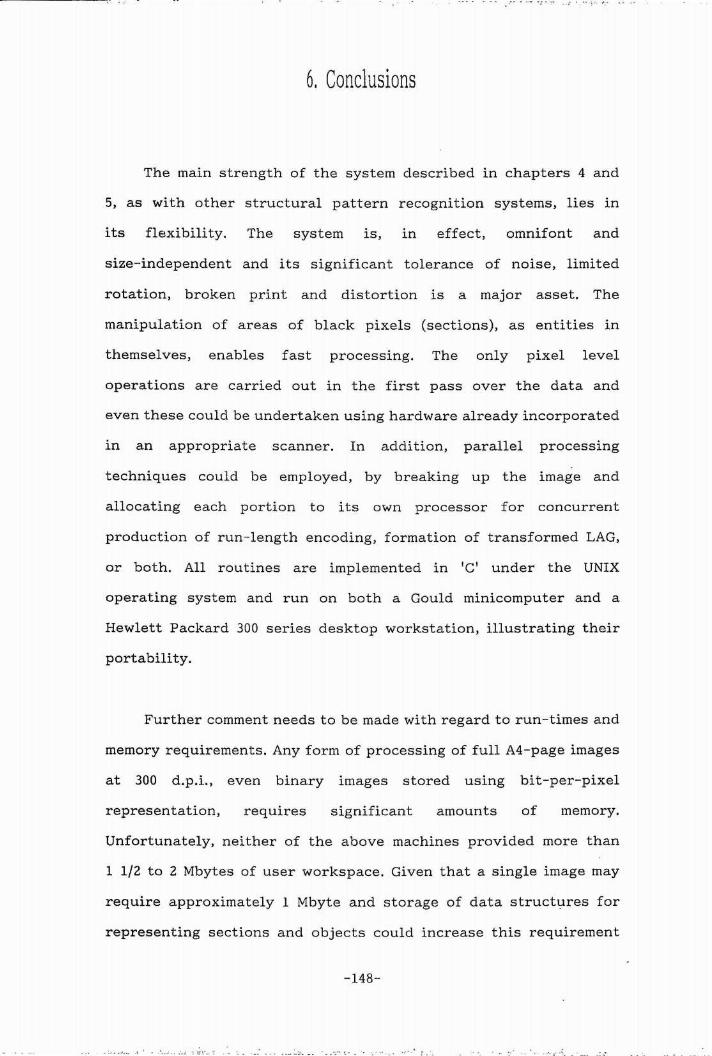
L\エ ー Z セ B@ MセセGN B BᄋセGᄋ G@ ... " セセ@ セᄋ@
6. Conclusions
The main strength of the system described in chapters 4 and
5, as with other structural pattern recognition systems, lies in
its flexibility. The system is, in effect, omnifont and
size-independent and its significant tolerance of noise, limited
rotation, broken print and distortion is a major asset. The
manipulation of areas of black pixels (sections), as entities in
themselves, enables fast processing. The only pixel level
operations are carried out in the first pass over the data and
even these could be undertaken using hardware already incorporated
in an appropriate scanner. In addition, parallel processing
techniques could be employed, by breaking up the image and
allocating each portion to its own processor for concurrent
production of run-length encoding, formation of transformed LAG,
or both. All routines are implemented in 'C' under the UNIX
operating system and run on both a Gould minicomputer and a
Hewlett Packard 300 series desktop workstation, illustrating their
portability.
Further comment needs to be made with regard to run-times and
memory requirements. Any form of processing of full A4-page images
at 300 d.p.i., even binary images stored using bit-per-pixel
representation, requires significant amounts of memory.
Unfortunately, neither of the above machines provided more than
1 1/2 to 2 Mbytes of user workspace. Given that a single image may
require approximately 1 Mbyte and storage of data structl;lres for
representing sections and objects could increase this requirement
-148-
' .. : · . • • ' ᄋセ@ l ' ..

to between six and 10 Mbytes, it can be appreciated that problems
were encountered due to page faults when processing large images.
In the case of the extract shown in figure 4.10, however, total
processing time was approximately 30s, from reading the image from
disk to producing the text interpretation file.
The processing of the image of figure 5.17 through to
producing the SCORE M.R.L. data file shown in figure 5.19 took
approximately 45s. The increase in processing time is roughly in
proportion to the area of the score image involved, given the
limitations of the development environment mentioned above for
testing this. The production of run-length encoding and section
data requires a significant proportion of the total processing
time, but obviously the run-time of procedures such as stave
finding depend on the musical content of the particular image
involved.
The structural approach, by its nature, allows for both
'character' and 'varying graphical parameter' types of sym bal. As
with Prerau's efforts, an easily expandable program was the aim
and has in the most part been achieved. The overall structure of
the software was kept modular so that separate routines could be
modified, replaced, optimized or expanded. The system is a real
one in Mahoney's terms, in that it tackles 'real world' problems
but still needs expanding to cope with a wider range of symbols
and score., formats. As mentioned in section 3.3.2, a trade-off
exists between robustness and simplicity of the recognition task.
Processing stavelines is a prime example. If assumptions are made
that the lines are horizontal or perhaps, as Roach and Tatem
-149-
' .. .'·· _, ᄋセ@

specified, exist across a large proportion of the width of the
page, then their detection becomes far easier. In 'real world'
situations, however, as Prerau noted, the lines cannot be assumed
to be exactly parallel, horizontal, equidistant, of constant
thickness or straight. Also, stavelines may be obscured to a
significant extent by multiple beams, particularly where these are
horizontal. All the above factors combine, in the general case, to
invalidate the use of standard image processing techniques for
locating stavelines, a fact corroborated by Roach and Tatem. The
system was developed with these facts in mind.
As outlined in sections 4.10 and 4.11, the current methods
could be extended to include all symbols which contain
vertically-orientated linear components·, i.e. individual notes
with stems, all beamed groups, barlines, quaver (and shorter
duration) rests, sharp, natural, flat and double flat signs, boxes
(surrounding bar numbers or text) and brackets. Also included
would be those symbols which can be modelled using a graph
structure-based representation of the simplified original
transformed LAG, in conjunction with the appropriate parameters
for describing the dimensions and spatial organisation of the
constituent sections. These two techniques operating in
conjunction should cover the majority of conventional music
symbols. It is anticipated that difficulties will· be encountered
where, for example, grace notes or other small symbols cannot be
consistently analysed by structural breakdown due to the limits on
print quality and scanning resolution.
Some areas have been identified which may prove problematical
-150-
'l ., · セN@ セ ZA N@ ' I ' ./) G セ@ . . Gᄋ ᄋ セ@ '
< ---••

in the context of future work, and possible solutions or
approaches have been suggested. The difficulties resulting from
fragmentation of symbols due to poor print quality have been
circumvented to a significant extent by the techniques presented
in chapters four and five. Severe break-up of symbols will,
however, continue to be a problem for a topology-based approach
and will probably necessitate the use of artificial
intelligence-based techniques in order to take advantage of higher
level musical information. Similarly, suggestions have been made
regarding the processing of overlapping symbols, but with the
large number of possible combinations of symbols which are
permitted to intersect, it would be unrealistic to expect any
single method to cope with all situations. A method based on
isolating characteristic sections within a composite object, and
using these as the basis of an iterative process for separating
out the merged symbols, has been proposed as a limited solution.
The main areas of concern pertaining to more widespread use
of existing techniques have been mentioned in chapter five. These
are :- symbols which remain attached after staveline removal,
removal of symbol components by the staveline identification
process and residual staveline fragments. The first of these can,
perhaps, be categorised with the question of overlapping symbols
as it may be a product of the original engraving rather than the
result of the staveline identification technique. Otherwise, the
problems all seem related to the initial symbol isolation, for if
this is not perfect, there will always be a need for compromise
methods which compensate for the weaknesses of the
staveline-finding technique. As discussed in chapter five, the
present approach to staveline-finding may, in the future, be
--i!>Oa..-
....: ·- セ M . -·

supplemented by a clustering-based technique. This should give
better symbol isolation and hence further simplify the recognition
task.
From the start of the research, it was acknowledged that the
text present in music images would be treated separately. After
isolation, recognition of the text could be achieved either using
existing techniques, possibly modified to use a dictionary (in
processing Italian terms and the like), or by making use of a new
method aimed at identifying not just the text but also its font.
It was hoped that the segmentation techniques developed for
processing the music symbols could be applied to some degree when
dealing with text and this may prove possible in the case of the
orthogonal LAGs.
The intention was to place no restriction on the symbols
which could eventually be included. Similarly, due to the way
processing was carried out, no limit was placed on the formats
which could be read. Chords and multiple voices on a single stave
have not been excluded by the approach which has been taken and it
is hoped that more complex music including these features will be
fully encompassed as part of future research. Originally, a target
-150b-

- - • • 4 '": • - - セ M[@ セ@ . Mセ@ ... セ@ ... - . . .. , ......... • • セ@ I
processing time of five to 10 minutes was set for a complete A4
page of music of 'average' complexity and the results so far
achieved indicate that this will be met. The use of run length
encoding as the basis of the segmentation process also satisfies a
desire for data compression and consequently opens up the
possibility of using a scanner with this facility built in to its
hardware (usually this is in connection with Group III/IV
facsimile transmission), as mentioned in section 4.3.
The fixing of the line thickness threshold used in
staveline-pixel allocation before commencement of processing is a
weakness of several of the systems described in section 3.3. The
author's system avoids this by setting up the line thickness
threshold based on the thickness of all the filaments found in the
image. Importantly, the threshold is applied to complete sections
as an average thickness measure. Filaments themselves are located
using a purely relative measure, namely aspect ratio.
-151-
l . セ@ - n' ' ·.,

Postscript
Bearing in mind the subject field, the reader may be
interested to have details regarding the production of this
thesis. The text was prepared using 'Chiwriter' a 'scientific'
word-processing package running on an IBM PC-compatible running
Sun Microsystems PC-NFS (Network File System) over an Ethernet
network in conjunction with the Physics department Gould
minicomputer. Some use was also made of the vi text editor running
on the latter machine, under BSD 4.2 Unix - this was the main
development environment for the automatic recognition system, as
mentioned in chapter 6. The SCORE desktop music publishing package
was used to produce the music examples in chapter 2 and, where
stated, in chapter 5. Text output and illustrations other than
SCORE output (and reproductions of published music) were produced
on an Epson GQ-3500, 300 d.p.i. laser printer, whilst the SCORE
examples were printed on a QMS PS-810 Postscript laser printer.
-152-

• "!· · •.•
Bibliography
A-R Editions. 1985. A-R Editions (publicity material).
Aikin, J. June 1983. Keyboard Report: The Alpha Syntauri.
Keyboard, 9 (6), 78-90.
Andronico, A. and Ciampa, A. 1982. On Automatic Pattern
Recognition and Acquisition of Printed Music. Proceedings of the
International Computer Music Conference, Venice, Italy, 245-270.
Aoyama, H. and Tojo, A. 1982. Automatic Recognition of Printed
Music. I ECE (Japan) Technical Report, PRL 82-85, 33-40.
(Translated from the original Japanese)
Badie, K. and Shimura, M. 1985. A Structural Approach to
Extraction of Segments in Binary Images. Proceedings of the
Fourth Scandinavian Image Analysis Conference, Trondheim,
Norway, June 18- 20, val. 2, 655-662.
Baird, H. S. 1986. Feature Identification for Hybrid
Structural/Statistical Pattern Classification. Proceedings of
the IEEE Conference on Computer Vision and Pattern Recognition,
Miami Beach, Florida, 150-155.
Balsach, L. 1986. La Ma de Guido (publicity material).
Bauer-Mengelberg, S. 1970. The Ford-Columbia Input Language, in:
Brook 1970a, 48-52.
Bauer-Mengelberg, S. 1972. Music: The Photon Printer and DARMS.
Letter to the Editor, Computers and the Humanities, 6, 110.
Bauer-Mengelberg, S. 1974a. Digital Alternate Representation of
Musical Scores (DARMS) - Project No. M92. Computers and the
Humanities, 8, 255.
-153-
.: ..... _ .. · ...... '• .

Bauer-Mengelberg, S. and Ferentz, M. 1974b. Utilization of
High-Speed Digital Computers in the Preparation of Master Plates
for Music Printing Project No. M91. Computers and the
Humanities, 8, 255.
Belaid, A. and Haton, J-P. 1984. A Syntactic Approach for
Handwritten Mathematical Formula Recognition. IEEE Transactions
on Pattern Analysis and Machine Intelligence, Vol. PAMI-6, No.
1, 105-111.
Bley, H. 1984. Segmentation and Preprocessing of Electrical
Schematics using Picture Graphs. Computer Vis ion, Graphics, and
Image Processing, 28, 271-288.
Boker-Heil, N. 1972. Plotting Conventional Music Notation. Journal
of Music Theory, 16 (1 and 2), 72-101.
Boody, C. G. 1975. Non-Compositional Applications of the Computer
to Music: An Evaluative Study of Materials Published in America
Through June 1973. PhD dissertation, University of Minnesota.
Bowles, G. H. 1974. The Computer-Produced Thematic Catalog: An
Index to the 'Pieces de Violes' of Marin Marais. PhD
dissertation, Stanford University.
Brook, B. S. and Gould, M. 1964. Notating Music with Ordinary
Typewriter Characters: (A Plaine and Easie Code System for
Musicke). Fontes Artis Musicae, 11 (3), 142-155.
Brook, B. S. 1965. The Simplified 'Plaine and Easie Code System'
for Notating Music: A Proposal for International Adoption.
Fontes Artis Musicae, 12 (2-3), 156-160.
Brook, B. S. (Ed.) 1970a. Musicology and the Computer. American
Musicological Society - Greater New York Chapter - Symposia
Proceedings, 1965-66. City University of New York Press.
-154-
Brook, B. S. 1970b. The Plaine and Easie Code, in: Brook 1970a,
53-56.
Bunke, H. November 1982. Attributed Programmed Graph Grammars and
their Application to Schematic Diagram Interpretation. IEEE
Transactions on Pattern Analysis and Machine Intelligence, Vol.
PAMI-4, No. 6, 574-582.
Buxton, W. 1978a. Design Issues in the Foundation of a
Computer-Based Tool for Music Composition. Technical Report
CSRG-97 Toronto: University of Toronto.
Buxton, W. et al. December 1978b. The Use of Hierarchy and
Instance in a Data Structure for Computer Music. Computer Music
Journal, 2 (4), 10-20.
Buxton, W. et al. December 1979. The Evolution of the SSSP Score
Editing Tools. Computer Music Journal, 3 (4), 14-25, 60.
Buxton, W. et al. 1980. On the Specification of Scope in
Interactive Score Editors, in: Howe 1980, 86-95.
Buxton, W. et al. 1981. Scope in Interactive Score Editors.
Computer Music Journal, 5 (3), 50-56.
Byrd, D. 1970. Transcription by Plotter. Random Bits (Indiana
University), 5 (9), lff.
Byrd, D. January 1971. Creative Work in Humanities Programming.
Random Bits (Indiana University), 6 (1), 8-12.
Byrd, D. November 1972. Musical Graphics - Project No. M79.
Computers and the Humanities, 7 (2), 126-127.
Byrd, D. May 1974. A System for Music Printing by Computer.
Computers and the Humanities, 8 (3), 161-172.
Byrd, D. 1976. Music Notation by Computer - Project No. M60.
Computers and the Humanities, 10, 51-52.
-155-
-:_,_ ,.,] _ .. . . N セ@ •. I"' . .. • NN⦅ L セ@ ... • - ' - セ@ ᄋセZN@ .•• • ·!I' - ( • .J ·:. セN@ •
Byrd, D. April 1977. An Integrated Computer Music Software System.
Computer Music Journal, 1 (2), 55-60.
Byrd, D. 1980. Human Engineering in a Machine Independent Music
Notation System, in: Howe 1980, 306-323.
Byrd, D. 1984. Music Notation by Computer. Doctoral dissertation,
Indiana University.
Cantor, D. November 1971. A Computer Program that Accepts Common
Musical Notation. Computers and the Humanities, 4 (2), 103-110.
Card, S. K., Moran, T. P. and Newell, A. 1983. The Psychology of
Human-Computer Interact ion. Lawrence Erlbaum Associates,
Hillsdale, New Jersey.
Carter, N. P. January 1984. Music Maker. Your Computer, 4 (1),
189, 193.
Carter, N. P., Bacon, R. A. and Messenger, T. 1988. Acquisition,
Representation and Reconstruction of Printed Music by Computer:
A Review. Computers and the Humanities, 22 (2), 27-46.
Chafe, C., Mont-Reynaud, B. and Rush, L. Spring 1982. Toward an
Intelligent Editor of Digital Audio: Recognition of Musical
Constructs. Computer Music Journal, 6 (1), 30-41.
Clement, T. P. 1981. The Extraction of Line-structured Data from
Engineering Drawings. Pat tern Recognition, 14, 43-52.
Clements, P. J. 1980a. Computers and Musical Notation. Studies in
Music - Canada, 145-172.
Clements, P. J. 1980b. Musical Data Structures in a Multi-Use
Environment, in: Howe 1980, 231-244.
Con Brio. Summer 1982. Products of Interest. Computer Music
Journal, 6 (2).
Dal Molin, A. October 1973. The Music Reprographics System.
Computational Musicology Newsletter, 1 (1), 8.
- 156-
. .:..· . セ@ _·:!
Dal Molin, A. 1975. The X-Y Typewriters and Their Application as
Music Input Terminals for the Computer. Proceedings of the
Second Annual Music Computation Conference (University of
Illinois), part 4, (Eds. Beauchampe and Melby), 28-53.
Dal Molin, A. October 1976. Second Generation Music Input
Terminals: The PCS-300 Music CRT. Paper presented at the First
International Conference on Computer Music, Massachusetts
Institute of Technology.
Dal Molin, A. 1978. A Terminal for Music Manuscript Input.
Computers and the Humanities, 12 (3), 287-289.
Dataland Co. March 1979. Music Printing: Dataland's Scan-note
System. Computer Music Journal, 3 (1), 60-61.
Discover. November 1988. Kurzweil Discover 7320 (publicity
material).
Donato, A. 1963. Preparing Music Manuscript. Prentice-Hall,
Englewood Cliffs, New Jersey.
Duda, R. 0. and Hart, P. E. 1973. Pattern Classification and Scene
Analysis. John Wiley and Sons, New York.
Duerr, B., Hattich, W., Tropf H., and Winkler G. 1980. A
Combination of Statistical and Syntactical Pattern Recognition
Applied to Classification of Unconstrained Handwritten Numerals.
Pattern Recognition, 12, 189-199.
Eden, M. 1968. Other Pattern Recognition Problems and Some
Generalizations (Chapter 8), in: Recognizing Patterns (Eds.
Eden, M. and Kolers, P.), 196-225. The MIT Press, Cambridge
Massachusetts.
Ellis, D. June 1984. The Gentle Art of Transcription (Part 2).
Electronics & Music Maker.
-157-

i· I
Erickson, R. F. November 1975. The DARMS Project: A Status Report.
Computers and the Humanities, 9 (6), 291-298.
Erickson, R. F. June 1976. DARMS Language Reference Manual.
Erickson, R. F. Spring 1977. MUSICOMP 76 and the State of DARMS.
College Music Symposium, 17 (1), 90-101.
Erickson, R. F. and Wolff, A. 1983. The DARMS Project:
Implementation of an Artificial Language for the Representation
of Music. Trends in Linguistics (Studies and Monographs, 19),
171-219. Mouton Publishers, Berlin and New York.
Feldman, M. A. May 1973. Printing Music on a Plotter from DARMS
Input - Project No. M81. Computers and the Humanities, 7 (5),
314.
Feng, H-Y. F., and Pavlidis, T. 1975. Decomposition of Polygons
into Simpler Components: Feature Generation for Syntactic
Pattern Recognition. IEEE Transact ions on Computers, Vol. C-24,
No.6, 636- 650.
Finale. 1988. Finale (publicity material).
Foster, S. Schloss, W. A. and Rockmore, A. J. Spring 1982. Toward
an Intelligent Editor of Digital Audio: Signal Processing
Methods. Computer Music Journal, 6 (1), 42-51.
Freeman, D. March 1986. Man or Mouse? Personal Computer World,
152-155.
Freff. December 1983. Making Music with the Well-Synthesized PC.
(Personal Composer - Jim Miller). PC Magazine.
Furuta, M., Kase, N., and Emori, S. 1984. Segmentation and
Recognition of Symbols for Handwritten Piping and Instrument
Diagram. Proceedings of the Seventh International Conference on
Pat tern Recognition, 626-629.
-158-
.. ' ... - セ MMM MM • __ .- ----- _:..:.":...:=-'-' N MBMMGMGMMGMMM セNNZNNNNNNNNNZNN ᄋ GM G@ .:::..._·· =··- ··=···'--'<· • c....__c_-'.' "-""" ᄋ ᄋ GMMMGNNNNセ セNNNNNNZNNNNNNNNZ」NN ᄋ ᄋ@ .>....'.• • ___ ᄋᄋMMMᄋセ⦅Zᄋ⦅L⦅⦅NL@ ··-· · ·-
Gabura, A. J. May/June 1967a. Musical Plotter Knows the Score at
University of Toronto. CalComp Newsletter.
Gabura, A. J. and Gotlieb, C. C. Winter 1967/68b. A System for
Keypunching Music. Bullet in of the Computer Society of Canada, 8
(1), 14-22.
Gamble, W. 1971. Music Engraving and Printing: Historical and
Technical Treatise. DaCapo Press, New York.
Gilbert, J. V. June/July 1982. The Well-Tempered McLeyvier: Music
Marries the New Technology. Symphony Magazine.
Gomberg, D. A. May 1972. Automatic Music Printing - Project No.
M73. Computers and the Humanities, 6 (5), 316.
Gomberg, D. A. 1975. A Computer-Oriented System for Music
Printing. DSc dissertation, Sever Institute of Technology of
Washington University.
Gomberg, D. A. 1977. A Computer-Oriented System for Music
Printing. Computers and the Humanities, 11 (2), 63-80.
Gould, M. and Logemann, G. 1970. ALMA: Alphameric Language for
Music Analysis, in: Brook 1970a, 57-90.
Gourlay, J. S. May 1986. A Language for Music Printing.
Communications of the Association for Computing Machinery, 29
(5), 388-401.
Grimsdale, R. L., Sumner, F. H., Tunis, C. J. and Kilburn, T.
1959. A System for the Automatic Recognition of Patterns,
Proceedings of the I EE, B106, No. 26, 210-221.
Guido. 1988. La Ma de Guido. Products of Interest. Computer Music
Journal, 12 (1), 84.
-159-

Harris, J. F., Kittler, J., Llewellyn, B. and Preston, G. 1982. A
Modular System for Interpreting Binary Pixel Representations of
Line-structured Data, in Pat tern Recognition Theory and
Applications, Proceedings of the NATO Advanced Study Institute,
Oxford, March-April, 1981, (Eds. Kittler, J., Fu, K. S., and
Pau, L. F.), 311-351. Reidel, Dordrecht.
Hattich, M., Tropf, H. and Winkler, G. 1978. Combination of
Statistical and Syntactical Pattern Recognition - Applied to
Classification of Unconstrained Handwritten Numerals.
Proceedings of the Fourth International Conference on Pattern
Recognition, Kyoto, Japan, November 7-10, 786-788.
HBEngraver. 1988a. HB Music Engraver. Products of Interest.
Computer Music Journal, 12 (1), 81.
HBEngraver. 1988b. HB Music Engraver (publicity material).
Heckmann, H. (Ed.) 1967. Elektronische Datenverarbei tung in der
Musikwissenschaft. Gustav Bosse Verlag, Regensburg.
Helgerson, L. W. 1988. CD-ROM and Scholarly Research in the
Humanities. Computers and the Humanities, 22, 111-116.
Hewlett, W. B. and Selfridge-Field, E. June 1985, Directory of
Computer Assisted Research in Musicology. Center for cッューオエ・セ@
Assisted Research in the Humanities, Menlo Park, California.
Hewlett, W. B. April/May 1986a. Personal communication.
·Hewlett, W. B. and Selfridge-Field, E. June 1986b. Directory of
Computer Assisted Research in Musicology. Center for Computer
Assisted Research in the Humanities, Menlo Park, California.
Hewlett, W. B. and Selfridge-Field, E. July 1987. Directory of
Computer Assisted Research in Musicology. Center for Computer
Assisted Research in the Humanities, Menlo Park, California.
-160-
• セ セN N@ • • • : ... >
- - - --·- --- -- セ ]\ G ッ^MBBGMZN」N」G ᄋ ZZNN[⦅ᄋ@ -'---'-...:..L.:....-'-' .:..:..:·· ᄋ セMMM MGMGMMMセセ⦅⦅⦅⦅⦅A@

Hewlett, W. B. and Selfridge- Field, E. August 1988. Directory of
Computer Assisted Research in Nusicology. Center for Computer
Assisted Research in the Humanities, Menlo Park, California.
Hiller, L. A. and Baker, R. A. Spring 1965. Automated Music
Printing. Journal of Nus ic Theory, 9 (1), 129-152.
Hopcroft, J., and Tarjan, R. 1973. Efficient Algorithms for Graph
Manipulation. Communications of the Association for Computing
Machinery, 16, 372-378.
Howe, H. S. (Jr.). 1980. Proceedings of the 1980 International
Computer Husic Conference, Queens College of the City University
of New York, November 13-15.
Hull, J. J., and Srihari, S. N. 1986. A Computational Approach to
Visual Word Recognition: Hypothesis Generation and Testing.
Proceedings of the IEEE Conference on Computer Vision and
Pat tern Recognition, Miami Beach, Florida, 156-161.
Kahan, S., Pavlidis, T. and Baird, H. S. March 1987. On the
Recognition of Printed Characters of any Font and Size. IEEE
Transactions on Pattern Analysis and Machine Intelligence, Vol.
PAMI-9, No. 2, 274-288.
Kassler, M. 1970a. An Essay Toward the Specification of a
Music-reading Machine, in: Brook 1970a, 151-175.
Kassler, M. 1972. Optical Character- recognition of Printed Music:
a Review of Two Dissertations. Perspectives of New Husic, 11
(2), 250-254.
Knowlton, P. H. 1971. Interactive Communication and Display of
Keyboard Music. PhD thesis, University of Utah.
Knowlton, P. H. May 1972. Capture and Display of Keyboard Music.
Datamation.
-161-
:"_ ..... -- ...... __ · .. - :."".· ····-. . . セ@ .. _ .....

Kornfeld, W. 1980. MIT , LISP Machine Music Editor (MUZACS),
illustrations. Computer Music Journal, 4 (2) and 4 (3).
Laffangraf. 1985. Laffangraf - Music Editor (publicity material).
Lambert, M. 1983. THEME (publicity material).
Lincoln, H. B. (Ed.) 1970a. The Computer and Music. Cornell
University Press, Ithaca.
Lincoln, H. B. 1970b. The Current State of Music Research and the
Computer. Computers and the Humanities, 5 (1), 29-36.
Maas, K. 1985. Amadeus (publicity material).
Mahoney, J. V. May 1982. Automatic Analysis of Music Score Images.
B.Sc. dissertation, Massachusetts Institute of Technology.
Martin, N. G. 1987. Towards Computer Recognition of the Printed
Musical Score. BSc dissertation, Thames Polytechnic, London.
Matsushima, T. et al. 1985a. Automated Recognition System for
Musical Score. Bulletin of Science and Engineering Research
Laboratory Waseda University, No. 112, 25-52.
Matsushima, T. et al. 1985b. Automated High Speed Recognition of
Printed Music (WABOT 2 Vision System). Proceedings of the
International Conference on Advanced Robotics, September 9-10,
Tokyo, Japan, 4 77-482.
Matsushima, T., Ohteru, S. and Kanamori, K. June 1985c. Automatic
Recognition of Printed Music. Journal of the Acoust leal Society
of Japan, 41 (6), 412-415. (In Japanese)
Matsushima, T. 1987. Personal communication.
Maxwell, J. T., III, 1982. Mockingbird Manual. Xerox Palo Alto
Research Center.
Maxwell, J. T., III, and Ornstein, S. M. 1983. Mockingbird: A
Composer's Amanuensis. Xerox Palo Alto Research Center.
-162-
- · · セ@ • • NZ N セイ@ • • BGセᄋ ⦅ NLNZ ⦅ ᄋ@ .......,· ... セ@ セN[N@ セ LN@ ... •

Maxwell, J. T., III, and Ornstein, S. M. January 1984.
Mockingbird: A Composer's Amanuensis. BYTE, 9 (1), 384-401.
McLean, B. 1980. Design of a Portable DARMS Translator, in: Howe
1980, 246-264.
McLeyvier. Summer 1982. Produr:ts of Interest. Computer Music
Journal, 6 (2).
Mercuri, R. 1981. MANUSCRIPT: Music Notation for the Apple II.
Proceedings of the 1981 Symposium on Small Computers in the
Arts, 8-10.
Meynieux, E., Postl, W., Seisen, S. and Tombre, K. October 1986.
Office Document Analysis. I. F. I. P. Conference on Office Systems,
Pisa, Italy.
Miller, J. 1985. Personal Composer. Computer Music Journal, 9 (4),
27-37.
MIPS. 1988. Music Information Processing Standards · Committee,
Standard Music Description Language - Journal of Development.
The Computer Music Association, California.
Mitchell, J. L. (Ed.) 1974. Computers in the Humanities.
University of Minnesota Press, Minneapolis.
Moody, G. August 1985. Professional Composer. Practical Computing,
8 (8), 70-72.
Moorer, J. A. 1975. On the Segmentation and Analysis of Continuous
Musical Sound by Digital Computer. PhD dissertation, Stanford
University.
Moorer, J. A. 1977. On the Transcription of Musical Sound by
Computer. Computer Music Journal, 1 (4).
Morehen, J. and Bent, I. 1979. Computer Applications in
Musicology. The Musical Times, 120 (7), 563-566.
-163-
... ;,.

Musecom. 1977. Input-Output, Troxel's Musecom II. High Fidelity,
27 (8), 106-107.
Music Publisher. 1988. Music Publisher (publicity material).
Nakamura, Y., Shindo, M., and Inokuchi, S. 1979. Input Method of
Musical Note and Realization of Folk-music Database. I ECE
(Japan) Technical Report, PRL 78-73, 41-50. (Translated from
the original Japanese)
Nelson, G. 1973a. Computerized Music Printing - Project No. M87.
Computers and the Humanities, 8, 50.
Nelson, G. and Penney, T. R. 1973b. Pattern Recognition in Musical
Score - Project No. M88. Computers and the Humanities, 8, 50-51.
Nelson, G. March/ April 1977. MPL: A Program Library for Musical
Data Processing. Great ive Computing, 3 (2), 76-81.
Okazaki, A., et al. May 1988. An Automatic Circuit Diagram Reader
with Loop-structure- based Symbol Recognition. IEEE Transact ions
on Pattern Analysis and Machine Intelligence, Vol. PAMI- 10, No.
3, 331-341.
OmniPage. October 1988. Page Recognition Software. Personal
Computer World, Vol. 11, No. 10, 110.
Orsted, K. March 20, 1976. New Danish Computer Prints Music
Scores. Billboard 88 (3), 57.
Pavlidis, T. and Steiglitz, K. 1978. The Automatic Counting of
Asbestos Fibers in Air Samples. IEEE Transactions on Computers,
C-27, No. 3, 258-261.
Pavlidis, T. 1982. Algorithms for Graphics and Image Processing.
Computer Science Press, Rockville, Maryland.
Pavlidis, T. 1983. Effects of Distortions on the Recognition Rate
of a Structural OCR System. Proceedings of the IEEE Conference
on Computer Vision and Pattern Recognition, Washington, 303- 309.
-164-

Pavlidis, T. 1986. A Vectorizer and Feature Extractor for Document
Recognition. Computer Vision, Graphics, and Image Processing,
35, 111-127.
Pferd, W. and Ramachandran, K. 1978. Computer Aided Automatic
Digitizing of Engineering Drawings. Proceedings of the IEEE
COMSAC, 630-635.
Piszczalski, M. and Galler, B. A. 1977. Automatic Music
Transcription. Computer Music Journal, 1 (4).
Piszczalski, M. and Galler, B. A. July-September 1979. Computer
Analysis and Transcription of Performed Music: A Project Report.
Computers and the Humanities, 13 (3), 195-206.
Piszczalski, M. and Galler, B. A. January-February 1981;. Performed
Music: Analysis, Synthesis and Display by Computer. Journal of
the Audio Engineering Society, 29 (1-2), 38-46.
Prerau, D. S. 1970. Computer
Engraved Music Notation.
Institute of Technology.
Pattern Recognition of Standard
PhD dissertation, Massachusetts
Prerau, D. S. November 1971. Computer Pattern Recognition of
Printed Music. Proceedings of the Fall Joint Computer
Conference, American Federation for Information Processing
Societies, Conference Proceedings, 39, 153-162.
Prerau, D. S. January 1975. DO-RE-M!: A Program that Recognizes
Music Notation. Computers and the Humanities, 9 (1), 25-29.
Price, J. X. March 26, 1977. $18,000 Musecom II: A Magical
Computer Aids Music Publishing, Billboard 89 (also in: Educator
9 ( 4), 32-33).
Pruslin, D. H. January 1967. Automatic Recognition of Sheet Music.
SeD dissertation, Massachusetts Institute of Technology.
-165-
Raskin, J. April 1980a. Using the Computer as a Musician's
Amanuensis. Part 1: Fundamental Problems. BYTE, 5 (4), 18-28.
Raskin, J. May 1980b. Using the Computer as a Musician's
Amanuensis. Part 2: Going from Keyboard to Printed Score. BYTE,
5 (5), 120-128.
Rastall, R. 1983. The Notation of Western Music. Dent, London.
Read, G. 1974. Music Notation: A Manual of Modern Practice.
Gollancz, London.
Read, G. 1978. Modern Rhythmic Notation. Gollancz, London.
ReadRight. 1988. ReadRight Optical Character Recognition Software
(publicity material).
Reeves, W. et al. 1978. Ludwig: an Example of Interactive Computer
Graphics in a Score Editor, in: Roads 1979, 2, 392-409.
Render, C. 1981. The Development of a Computer Program to Arrange
and Print Traditional Music Notation. EdD dissertation,
University of Illinois.
Roach, J. W. and Tatem, J. E. 1988. Using Domain Knowledge in
Low-level Visual Processing to Interpret Handwritten Music: An
Experiment. Pat tern Recognition, 21, 33-44.
Roads, C. (Ed./comp.) 1979. Proceedings of the 1978 International
Computer Music Conference. Northwestern University Press,
Evanston, Illinois.
Roads, C. 1981. A Note on Music Printing by Computer. Computer
Music Journal, 5 (3), 57-59.
Rosing, H. and Schlichte, J. April/June 1985. Addition to Die
Serie A/11 des Internationalen Quellenlexikons der Musik. Fontes
Artis Musicae, 32 (2), 117-118.
Ross, T. 1970. The Art of Music Engraving and Processing. Hansen
Books, Miami.
-166-

Sargeant, W. 18 December 1971. Music Notes (re: Dal Molin). New
Yorker.
Sato, T., and Tojo, A. 1982. Recognition and Understanding of
Hand-drawn Diagrams. Proceedings of the IEEE International
Conference on Pat tern Recognition, val. 2, 674-677.
Scaletti, C. Spring 1985. The CERL Music Project at the University
of Illinois. Computer Music Journal, 9 (1), 45-58.
Schmid, V. and Haken, L. December 1984. The Interactive Music
System User, s Manual. University of Illinois Computer-based
Education Research Laboratory: Urbana.
SCORE. 1988. SCORE (publicity material).
Selfridge-Field, E. October 1986a. Printing Music by Computer:
Additions and Corrections (Supplement to Hewlett 1986b).
Selfridge-Field, E. November 1986b. Personal communication.
Seybold, J. et al. 17 January 1983. Digital Typesetter
Comparisons. The Seybold Report on Publishing Systems, 12 (9).
Smith, L. 1973. Editing and Printing Music by Computer. Journal of
Music Theory, 17 (2), 292-309.
Smith, L. 1979. Handbook of Harmonic Analysis. San Andreas Press,
Palo Alto.
Soundchaser. Summer 1982. Products of Interest. Computer Music
Journal, 6 (2).
· Soundchaser. 1984. Soundchaser Polywriter (publicity material).
Spiegel, L. Summer 1983. Letter to the Editor. Computer Music
Journal, 7 (2).
Stone, K. 1980. Music Notation in the Twentieth Century. Norton,
London.
-167-
- - -- ! .:. -- .:.. 1_,_._--'..._ _ ___,_::..:__--'---'--'-'--" _,__. =-- ____,_.____:· ''--'-' ___,_·.------'---. MMMMMMMG MMMMMMGMM M セMMMMMMGMセM

,-. ------
Suen, C. Y. and Radhakrishnan, T. 1976. Recognition of H?-nd-drawn
Flowcharts. Proceedings of the Third International Joint
Conference on Pattern Recognition, 424-428.
Synclavier. 1983. Synclavier (publicity material).
Talbot, A. 1988. Personal communication.
Tojo, A. and Aoyama, H. 1982. Automatic Recognition of Music
Score. Proceedings of the Sixth International Conference on
Pattern Recognition, 1223.
Tonnesland, S., 1986. SYMFONI: System for Notekoding. PhD Thesis,
Institute of Informatics, Oslo, Norway. (In Norwegian)
Tappan. 1984. Tappan Scan-Note (publicity material).
Tappan. 1988. Tappan Scan-Note (publicity material).
Tsukomo, J., and Asai, K. 1986. Machine Printed Chinese and
Japanese Character Recognition Method and Experiments for
Reading Japanese Pocket Books. Proceedings of the IEEE
Conference on Computer Vision and Pattern Recognition, Miami
Beach, Florida, 162-167.
Vendome, R. April/May 1986. Personal communication.
Walraff, D. 1978. Nedit - A Graphical Editor for Musical Scores,
in: Roads, 1979, 2, 410-450.
Watkins, W. 1984. MUSIGRAPH (publicity material).
Weber, M. February 1986a. The Future for Non-impact Printers.
Computer Systems, 33-35.
Weber, M. March 1986b. Choosing a Non-impact Printer. Computer
Systems, 55-57.
Weiner, E. 1987. Editor, New Oxford English Dictionary - personal
communication.
Wenker, J. November 1969. MUSTRAN - Project No. M45. Computers and
the Humanities, 4 (2), 138.
-168-
Wenker, J. 1970. A Computer Oriented Music Notation Including
Ethnomusicological Symbols, in: Brook, 1970a, 91-129.
Wenker, J. November 1972a. A Music Compiler for Musicologists and
Ethnomusicologists Project No. M32. Computers and the
Humanities, 7 (2), 124.
Wenker, J. November 1972b. MUSTRAN II - An Extended MUSic
TRANslator - Project No. M76. Computers and the Hu.mani ties, 7
(2), 125.
Wenker, J. 1974. MUSTRAN II: A Foundation for Computational
Musicology, in: Mitchell, 1974, 267-280.
Wenker, J. 1977. An Analytical Study of Anglo-Canadian Folksong.
PhD dissertation, Indiana University.
Wittlich, G. E., Martin, H. J. and Ellis, C. R. May 1973a. Project·
SCORE - Project No. M82. Computers and the Humanities, 7 (5),
314.
Wittlich, G. E. October 1973b. Project SCORE. Computational
Musicology Newsletter, 1 (1), 6.
Wittlich, G. E. 1974. Non-Physics Measurements on the PEPR System:
Seismograms and Music Scores. Report to the Oxford Conference on
Computer Scanning: Oxford Nuclear Physics Laboratory. 487-489.
Wittlich, G. E. 1977. Direct Encoding of Music Scores by Organ
Keyboard and Sonic Pen - Project No. M100. Computers and the
Humanities, 11, 41.
Wittlich, G. E., Byrd, D. and Nerheim, R. 1978a. A System for
Interactive Encoding of Music Scores Under Computer Control.
Computers and the Humanities, 12 (4), 309-319.
Wittlich, G. E. Winter 1978b. New Computer Tools for Music
Research. Indiana Theory Review, 1 (2), 8-27.
-169-

"
''· t
Walberg, G. 1986. A Syntactic Omni-font Character Recognition
System. Proceedings of the IEEE Conference on Computer Vision
and Pat tern Recognition, Miami Beach, Florida, 168-173.
Wolff, A. B. and Bauer-Mengelberg, S. May 1972. Development of a
DARMS-to-Canonical DARMS Translator-Project No. M74. Computers
and the Humanities, 6 (5), 316.
Wolff, A. B. 1977. Problems of Representation in Musical
Computing. Computers and エィセ@ Humanities, 11, 3-12.
Yamaha. January 1983. Yamaha-MP1 Miniprinter. New Products.
Computers and Electronics, 11.
Yavelow, C. Autumn 1985. Music Software for the Apple Macintosh.
Computer Music Journal, 9 (3), 52-67.
Yavelow, C. March 1987. Personal Computers and Music. Journal of
the Audio Engineering Society, 35 (3), 160-193.
-170-
セ@ .. · .. Z セ@ .. ..
Copyright © 2022 FDOKUMEN