The Use of Dielectrophoresis in Oral Cancer - University of Surrey
234
University of Surrey Faculty of Engineering and Physical Sciences The Use of Dielectrophoresis in Oral Cancer By Hayley J. Mulhall A thesis submitted to the University of Surrey in candidature for the degree of Doctor of Philosophy. December 2010 © Hayley J. Mulhall 2010
-
Upload
khangminh22 -
Category
Documents
-
view
1 -
download
0
Transcript of The Use of Dielectrophoresis in Oral Cancer - University of Surrey
University of Surrey
Faculty of Engineering and Physical Sciences
The Use of Dielectrophoresis
in Oral Cancer
By
Hayley J. Mulhall
A thesis submitted to the University of Surrey in candidature for the degree of Doctor of
Philosophy.
December 2010
© Hayley J. Mulhall 2010

ProQuest Number: 27694018
All rights reserved
INFORMATION TO ALL USERS The quality of this reproduction is dependent upon the quality of the copy submitted.
In the unlikely event that the author did not send a com p le te manuscript and there are missing pages, these will be noted. Also, if material had to be removed,
a note will indicate the deletion.
uestProQuest 27694018
Published by ProQuest LLO (2019). Copyright of the Dissertation is held by the Author.
All rights reserved.This work is protected against unauthorized copying under Title 17, United States C ode
Microform Edition © ProQuest LLO.
ProQuest LLO.789 East Eisenhower Parkway
P.Q. Box 1346 Ann Arbor, Ml 48106- 1346

Declaration o f Originality
This thesis and the work to which it refers are the results o f my own efforts. Any ideas, data,
images or text resulting from the work of others (whether published or unpublished) are fully
identified as such within the work and attributed to their originator in the text, bibliography or
in footnotes. This thesis has not been submitted in whole or in part for any other academic
degree or professional qualification. I agree that the University has the right to submit my
work to the plagiarism detection service TumitinUK for originality checks. Whether or not
drafts have been so-assessed, the University reserves the right to require an electronic version
o f the final document (as submitted) for assessment as above.
31® December 2010
Hayley Mulhall
ABSTRACT
Most oral cancers are oral squamous cell carcinomas (OSCC) that arise from the epithelial
lining of the oral mucosa. Given that the oral cavity is easily accessible, the disease lends
itself to early detection; however most oral cancers are diagnosed at a late stage and
approximately half of oral cancer sufferers do not survive beyond 5 years, post-diagnosis.
The low survival rate has been attributed to late detection but there is no accepted, reliable
and convenient method for the detection of oral cancer and oral pre-cancer.
Dielectrophoresis (DEP) is a label-free technique which can be used to obtain multi-
parametric measurements of cell dielectric properties. Parameters, such as cytoplasmic
conductivity and effective membrane capacitance ( C eff) , can be non-invasively determined
by the technique. This thesis presents a study of the application of DEP in the detection of
oral cancer. A novel DEP-microwell electrode system, developed at the University of Surrey,
has been used to investigate the dielectric properties of normal, pre-malignant and malignant
oral epithelial cells.
In this study, significant differences in the dielectric properties of normal, pre-malignant and
malignant oral cells grown in standard 2-dimensional monolayer and reconstituted 3-
dimensional organotypical cultures were observed. In addition, variations in the dielectric
properties of oral cells were observed between culture conditions. To determine the
sensitivity of DEP to detect a subpopulation of cancer cells in a host population of normal
cells, the dielectric properties of host normal oral epithelial cells spiked with subpopulations
of malignant oral epithelial cells, grown in reconstituted organotypical models, have been
studied.
In addition, the dielectric properties of exfoliated oral cells harvested by non-invasive brush
biopsy from healthy subjects, clinically healthy tissue in patients with pre-malignant or
malignant oral epithelial disease, pre-malignant oral patient tissue and malignant oral patient
tissue were characterised. The results show that the dielectric properties of exfoliated oral
cells from malignant oral tissue are different to the dielectric properties of cells harvested
from healthy oral tissue.
Page Ii
ACKNOWLEDGEMENTS
I would like to thank the Engineering and Physical Sciences Research Council for funding
this project. I am also most grateful to all of the patients who, despite their ill-health, were
kind enough to take part in this study.
I would like to express my gratitude to my supervisors. Dr. Fatima Labeed, Prof. Mark Lewis
and Prof. Mike Hughes, who have offered patience, guidance and support throughout my
PhD. I am extremely grateful to Dr. Labeed for working through the beginning of her
Christmas break to proof read this thesis. I would also like to thank Dr. Kai Hoettges for use
of the DEP-microwell system and all associated software and for help with trouble-shooting
all associated problems. Thank you to Dr. Stefano Fedele and Prof. Stephen Porter at the
UCL Eastman Dental Institute for providing the clinical samples and for their perpetual
enthusiasm for this project. In addition, I would like to thank Dr. Rita Jabr for her kind
assistance with preparation for presenting work.
There are many people who I have enjoyed working with over the past four years and who
have made my PhD an enjoyable experience. I would like to thank all my friends in the
Centre for Biomedical Engineering at the University of Surrey for providing light relief when
breaks were needed. I also wish to thank Dr. Karin Carlqvist at for making those long days
spent in the lab with no windows a little more bearable. I am also extremely gratefiil to Dr.
Ivan Wall for always going out of his way to help me. I am most grateful for the time and
effort that he took to proof read this thesis and for the thoughts and suggestions that he
offered.
Four years ago Dr. Henry Fatoyinbo introduced me to scientific research. Since then, has he
been a mentor and a source of inspiration, continually providing support and encouragement.
Thank you!
I would like to thank Chris for his unwavering support and patience through those seemingly
endless nights and weekends of lab work and writing. Finally, I am eternally grateful to
Robert, Carol, Rachel and Kate for always being on the end of the phone and making me put
things into perspective when it was panic stations. Their support has been immeasurable and
without it I would have never reached the end.
Page I ii

LIST OF ABBREVIATIONS
NOF Normal Human Oral Fibroblasts
HOK Normal Human Oral Kératinocytes
ECM Extracellular Matrix
FGM Fibroblast Growth Medium
KGM Keratinocyte Growth Medium
PFA Paraformaldehyde
GFP Green Fluorescent Protein
PAG Puromycin Resistance Gene
FACS Fluorescent Activated Cell Sorting
FBS Foetal Bovine Serum
DMEM Dulbecco’s Modified Eagles Medium
EDTA Ethylenediaminetetraacetic acid
PPV Positive Predictive Value
NPV Negative Predictive Value
LFDD Low Frequency Dielectric Dispersion
HFDD High Frequency Dielectric Dispersion
Fxi LFDD Crossover Frequency
Fx2 HFDD Crossover Frequency
C eff Effective Membrane Capacitance
PBS Phosphate Buffered Saline
Page I iii
CONTENTS
1 INTRODUCTION................................................................................................................................................ 1
1.1 Or a l Ca n c e r ............................................................................................................................................. 1
1.2 A C Ele c t r o k in e t ic s ...................................................................................................................................................................2
1.3 T hesis A i m s ...................................................................................................................................................................................... 3
1.4 T hesis St r u c tu r e a n d O u t l in e ............................................................................................................................................4
2 BACKGROUND.................................................................................................................................. 6
2.1 T he O r a l M u c o s a ............................................................................................................................................................. 6
2.1.1 The Oral Epithelium ........................................................................................................................................ 6
2.2 O r a l S q u a m o u s C e l l C a r c in o m a (O SC C ) ......................................................................... 12
2.3 Pr e m a lig n a n t D iso rd er s of th e Or a l Epit h e l iu m ................................................................................................16
2.4 B en ig n D iso rders o f the O r a l Ep it h e l iu m ...............................................................................................................18
2.4.1 Potentially Malignant Disorders o f the Oral Epithelium ........................................................................18
2.5 Cu r r e n t O SCC D etection a n d D iag no stic M e t h o d s .......................................................................................... 20
2.5.1 Conventional Oral Examination ..................................................................................................................20
2.5.2 Adjunctive Techniques.................................................................................................................................. 23
2.6 AC E lec t r o k in e t ic s ............................................................................... 33
2.6.1 Dielectrics and Polarisation ........................................................................................................................ 34
2.6.2 Dielectrophoresis......................................................................... 35
2.6.3 DEP and Biological Cells.............................................................................................................................41
2.6.4 DEP-m icro welI System ................................................................................................................................. 45
2 .7 Ea r l y A C E lectrokinetic St u d ie s ..................................................................................................................................50
2.8 B iom ed ica l A pplic a tio ns o f A C Electrokinetic T e c h n iq u e s ........................................................................ 51
2.8.1 Detection and Diagnostics ............................................................... 51
2.8.2 Cell Sorting and Sample Preparation.........................................................................................................54
2.8.3 Prognostics............................. 58
2.8.4 Drug Screening ................................................................................................................. 59
2.9 Su m m a r y AND Co n c l u s io n s ...................................................................................................... 61
2 .10 A ims a n d O bjec tiv es .........................................................................................................................................................64
3 DIELECTRIC PROPERTIES OF NORMAL, DYSPLASTIC AND MALIGNANT ORAL
KERATINOCYTES.............................. 65
3.1 In t r o d u c t io n ............................. 65
3.1.1 Review o f the Dielectric Properties o f Normal and Cancer C ells........................................................65
3.1.2 Aims and O utline........................................................................................................................................... 68
3.2 M a teria ls a n d M e t h o d s ................................................... ;............................................ 68
3.2.1 Cell Culture.....................................................................................................................................................68
3.2.2 Osmolality Measurements.............................................................................................................................69
3.2.3 DEP Sample Preparation .............................................................................................................................69
Page I iv
3.2.4 DEP-microwell Experiments........................................................................... ..........................................69
3.2.5 Cell Radius M easurements...................................................................... ..................................................70
3.2.6 Optimisation o f Experimental Conditions..................................................................................................70
3.2.7 Statistical Analysis and Data Presentation......................................................... 70
3.3 Re su lts ......................................................................................................................... 71
3.3.1 Optimisation ................................................................................................................................................... 77
5.3.2 Dielectric Properties o f Kératinocytes................................................................... 77
3.4 D isc u ss io n ......................................... ......................................................................:......................... 86
3.4.1 Dielectric Phenotypes o f Normal, Dysplastic and OSCC Oral Kératinocytes..................................87
3.4.2 Comparison to Previous Studies on the Dielectric Properties o f Kératinocytes...............................91
3.4.3 Optimisation o f DEP-microwell Experimental Conditions.................................................................... 92
3.5 C o n c lu s io n s ...................................................................................................... 94
4 DIELECTRIC PROPERTIES OF NORMAL, DYSPLASTIC AND MALIGNANT ORAL
KERATINOCYTES DERIVED FROM RECONSTITUTED ORGANOTYPICAL CULTURES.............96
4.1 Introduction .................................................................................. 96
4.1.1 Reconstituted 3-D Organotypical Cultures o f the Oral Mucosa ...........................................................97
4.1.2 Aims and Structure....................................................................................................................................... 98
4.2 Materials and Meth o d s .................................................................................................................................... 98
4.2.1 Culture o f Cells in M onolayer...................... 98
4.2.2 Transfection o f Kératinocytes with Green Fluorescent Protein (GFP).............................................. 99
4.2.3 Construction o f Reconstituted Oral Organotypical Cultures..............................................................100
4.2.4 Enrichment o f Kératinocytes from Organotypical Constructs............................................. 104
4.2.5 DEP Sample Preparation .......................................................................................................................... 105
4.2.6 DEP-microwell Experiments........................................................................................... 105
4.2.7 Cell Area Measurements..................................... 105
4.2.8 Statistical Analysis and Data Presentation ...................................................................................106
4.2.9 Histological Tissue Processing o f Reconstituted Organotypical Cultures................................ 106
4.2.10 Cell Light Absorbance......................................................................................................................... 107
4.2.11 Cell Fixation and Flow Cytometry.............. 107
4.3 Re su l t s ...................................................................................................................................................................107
4.3.1 Transfection o f Kératinocytes with G F P ................................................................................................107
4.3.2 Histological Data .........................................................................................................................................109
4.3.3 Enrichment o fKératinocytes from Organotypical Cultures ........................................................I l l
4.3.4 Cell Light Absorbance................................................................................................................................ 114
4.3.5 Dielectric Phenotype o f Normal, Dysplastic and Cancerous Oral Kératinocytes Derived from 3-
D Organotypical Cultures....................................................................................................................................... 715
4.3.6 Dielectric Properties o f Mixed Normal and Malignant Oral Kératinocytes Grown in
Reconstituted Organotypical Cultures....................................................................................................................122
4.3.7 Dielectric Properties o f Normal Oral Fibroblasts.................................................................................128
4.4 D isc u ss io n ........................................................................................................................ 130
Page I V
4.4.1 The Dielectric Properties o f Oral Kératinocytes Cultured in Reconstituted Organotypical
Cultures 130
4.4.2 Comparison o f the Dielectric Properties o f Oral Kératinocytes Cultured in Standard 2-D
Monolayer and Reconstituted 3-D Organotypical Cultures................................................................. 133
4.4.3 The Dielectric Properties o f Mixed Populations o f Normal and Malignant Cells Grown in
Reconstituted Organotypical Cultures................................................................................................................... 136
4.4.4 Preparation o f Reconstituted Oral Organotypical Cultures.................................................................137
4.4.5 Isolation o f Oral Kératinocytes from Reconstituted Organotypical Cultures................................... 138
4.5 Co n c l u s io n s ................................................................................................................................... 140
5 DIELECTRIC PHENOTYPE OF EXFOLIATED CELLS FROM HEALTHY, DYSPLASTIC AND
MALIGNANT ORAL TISSUE..............................................................................................................................141
5.1.1 Exfoliation...................................................................................................................................................... 141
5.1.2 Aims and Structure ...................................................................................................................................... 142
5.2 M a t e r ia l s a n d M e t h o d s ................................................................................................................................................. 142
5.2.1 Oral Cell Specimen Collection .................................................................................................................. 142
5.2.2 Evaluation o f Exfoliation Tool....................................................................... 145
5.2.3 Keratinocyte Enrichment.......................... 145
5.2.4 Filtration.......................................................................................................................... 146
5.2.5 DEP Sample Preparation ...........................................................................................................................146
5.2.6 DEP Well Experiments............................................................................................................... 146
5.3 Re s u l t s ...................................................................................................................................................................................... 147
5.3.1 Evaluation o f Exfoliation Tool...................................................................... 147
5.3.2 Features o f Exfoliated Oral Cell Specimens.................................................... 148
5.3.3 Filtration o f Exfoliated Oral Cell Specimens.......................................................................................... 156
5.3.4 Keratinocyte Enrichment................................................... 158
5.3.5 Dielectric Phenotype o f Exfoliated Oral Cells........................................................................................158
5.3.6 Effect o f Cell Size on Dielectric Spectra ..................................................................................................167
5.3.7 Effect o f Contaminating Erythrocytes.. ................................. 168
5.4 D is c u s s io n .................................................................................................................................................................................170
5.4.1 Detection o f Dysplastic and Malignant Cells in Exfoliated Specimens.............................................171
5.4.2 Size o f Exfoliated Oral Cells...................................................................................................................... 172
5.4.3 Clinically Healthy Patient Tissue..............................................................................................................173
5.4.4 Composition o f Exfoliated Oral Cell Specimens.....................................................................................175
5.4.5 Inadequate Exfoliated Oral Cell Specimens.......................................................................................... 178
5.4.6 DEP-microwell System ............................................................................................................................... 179
5.4.7 Study Limitations......................................................................................................................................... 180
5.5 Co n c l u s io n s ........................................................................................................................................................................... 180
6 GENERAL DISCUSSION AND CONCLUSIONS....................................................................................182
6.1 K e y F in d in g s ........................................................................................................................................................................... 182
Page I vi
6.1.1 The Dielectric Phenotypes o f Normal and Malignant Oral Cells are D istinct................................182
6.1.2 The DEP-microwell has the Potential to be Used in a Clinical Setting as an OSCC Detection
Device 185
6.1.3 In vitro Growth Conditions Influence the Dielectric Phenotypes o f Oral C ells ............................ 186
6.1.4 Kératinocytes and Fibroblasts have Distinct Dielectric Properties.................................................186
6.2 FUTURE W O R K ..................................................................................................................................................187
7 REFERENCES................................................................................................................................................190
8 APPENDIX A .................................................................................................................................................. 212
9 APPENDIX B .................................................................................................................................................. 213
Page I vii

TABLE OF FIGURESFigure 2-1 : D ifferentiation in Or a l Epith eliu m ...................................................................................................................11
Figure 2-2: Cr iteria u s e d fo r D iag no sin g Epithelial D y s p l a s ia ................................................................................. 17
Figure 2-3: O r a l Le s io n s . .. .. ............................................................ 22
Figure 2-4: A D ielectric Pa rticle Su sp e n d e d in a U n ifo r m Electric F i e l d ..........................................................36
Figure 2-5: A Sc hem atic D ia g r a m o f U n ifo r m a n d N o n -u n ifo r m Electric F ield s ....................... 38
Figure 2-6: A S c hem atic D iag ra m o f Positive a n d N eg a tive D E P ............................................................. 39
F igure 2-7: D ielectric Spec tr um of a Ho m o g en o u s D ielectric Pa r t ic l e ...............................................................41
Figure 2-8: T he ‘S ing le-S h ell ’ M o d e l .......................................................................................................................................... 42
Figure 2-9: A T y pic a l D ielectrophoretic Spectrum of B iological Cells Su sp e n d e d in a Co n d u c tiv e
M e d iu m ....................... 44
Figure 2-10: D E P-w ell El e c tr o d e .......................... 46
Figure 2-11 : N eg a tive a n d Positive DEP in the D E P-W ell Sy s t e m .............................................................................47
F igure 2-12: A er ia l Photo o f D E P-w ell w iih B a n d in g .......................................................................................................48
Figure 2-13: Co n t o u r Plot In d ic a tin g a Ch a n g e in L ight In t e n sif y in the D EP-m ic r o w e l l ......................49
Figure 2-14: A n Ex a m ple of DEP Sp e c t r a .................................... 50
Figure 3-1: S t a n d a r d C u r v e of Su c r o se Co n c entr a tio n in DEP Ex per im en ta l M ed iu m a n d
O s m o l a l h y ....................................................................................................................................................................................... 73
Figure 3-2: Effect o f DEP Ex per im enta l M ed iu m o n Cell V ia b il h y ......................................................................... 74
Figure 3-3 : Ch a n g e in L ight In t e n sify a s a Fu n c tio n o f T im e in a D E P -w e l l ....................................................... 76
Figure 3-4: A n Ex a m ple o f a D ielectric Spec tr um of O r a l Ce l l s .............................................................................. 77
Figure 3-5: A v er a g e D ielectric Spec tr a of HOK, DO K , H 157 a n d H 357 Ce l l s ....................................................80
Figure 3-6: D ielectric Properties o f O r a l Kér a tin o c y tes ..............................................................................................82
Figure 3-7: S im u la tio n of Effect o f Cell S ize o n D ielectric S pec tr a ......................................................................84
Figure 3-8: DEP Scatter Plot fo r D O K , HOK, H 157 a n d H 357 Or a l Ké r a t in o c y t e s .......................................85
Figure 3-9: Ch a n g e in DEP Re spo n se a s a Fu n c tio n of T im e .............................................................................................86
Figure 3-10: Effect o f a r ed u c tio n in c yto pla sm ic c o n d u c t iv h y a n d a n in c r ea se in m e m br a n e
CONDUCTIVITY ON DEP RESPONSE..............................................................................................................................................94
F igure 4-1 : Co n str u c tio n o f r e c o n st it u t e d O rg a n o ty pic a l Cu l t u r e s .....................:.........................................102
F igure 4-2: Schem atic D ia g r a m of a Rec o n stitu ted Or g a n o ty pic a l Cu l t u r e Ra ise d to the A ir-L iquid
In t e r f a c e ...................................................................... 103
Figure 4-3 : Effect o f Pu r o m y c in o n Cell V ia b il it y .......................... 108
F igure 4-4: D en sity Plots o f H 157 Cells B efore a n d A fter Tr a n sfec tio n w ith th e g en e for G F P ... 109
F igure 4-5: H a em a to x y lin a n d Eo sin Sta in ed O rg a no typic Co -Cu l t u r e s .......................................................... 110
F igure 4-6: Im a g es o f Cells Re lea sed from D igestion o f Or g a n o ty pic a l Cu l t u r e s ................................... 113
F igure 4 -7 : Pe r cen ta g e o f H 15 7°^ ^ Cells H ar v ested from O r g a n o ty pic a l Co n s t r u c t s .........................114
Figure 4-8: Ex a m ple o f a D ielectric Spectrum o f Cells D er iv ed fr o m Re c o n stitu ted 3-D
O r g a n o ty pic a l C o n str u c ts Com prising of Pu r e Popula tio n s o f K é r a t in o c y t e s ............................116
F igure 4-9: d ielec tr ic Properties o f O ra l Kér atin o c ytes Gr o w n in 3-D O r g a n o ty pic a l Cu ltu r es 118
Page I viii
Figure 4-10: Co m pa r iso n o f D ielectric Properties of O r a l Kér a tin o c y tes G r o w n in St a n d a r d
M o n o l a y e r a n d Rec o n stitu ted O rg a n o ty pic a l Cu l t u r e s ............................................................................. 121
Figure 4-11 : D e n sit y Plot o f Cells Ex pr essin g GFP in Or g a n o ty pic a l Cu l t u r e s .................. !........... 124
Figure 4-12: A D ielectric S pectrum of Or a l Kér a tin o c ytes Iso la ted fr o m Recon stitu ted
Or g a n o ty pic a l Cu lt u r e s Co m pr ising M d œ d Po pula tio n s o f N o r m a l a n d M a l ig n a n t Or al
KERATINOCYTES................................................................................................................... 125
Figure 4-13: D ielectric Properties o f Or a l Kér a tin o c ytes D er iv ed from Rec o n stitu ted 3-D
O r g a n o ty pic a l Co n str u c ts Co m pr ising M ixed Po pula tio n s o f N o r m a l a n d C anc er o u s
KERATINOCYTES...............................................................................................................................................................................127
Figure 4-14: D ielectric Spec tr a of N O F c e l l s ...................................................................................................................... 129
Figure 5-1: Ex fo lia ted O r a l Cell Specim en Su m m a r y ............................ 144
Figure 5-2: Im a g es o f O r a l Ké r a t in o c y t e s .............................................................................................................................149
Figure 5-3: Im a g es o f C ells Ha r v e st e d from O r a l Pa tien t T issu e b y Ex fo lia tio n ....................................... 150
Figure 5-4: Re la tio nsh ip betw een Ker atin o c yte Co n c en tr a tio n a n d Co r r ela tio n Co efficien t ........ 154
Figure 5-5: A Su m m a r y o f the M e a n Ker a tin o c yte Co n c en tr a tio n in DEP A n a l y s e d Ex foliated
O r a l Cell Sp e c im e n s .................................................. 155
Figure 5-6: Co m pa r iso n o f Cell S ize betw een Gr o u p s ......................................................................................................156
Figure 5-7: Filtration o f E x fo lia ted O r a l Cell S pe c im e n ............................................................................................157
Figure 5-8: Ex am ples o f D ielectric Spectra o f Ex fo lia ted Or a l Ce l l s ...................................... 159
Figure 5-9: A v er a g e DEP S pec tr a o f Or a l C ells Ha r v ested b y E xfo lia tio n fr o m H ea lth y Subjects
AND H ea lth y T issu e in Pa t ie n t s .................................................... 160
Figure 5-10: A v er a g e DEP Spec tr a o f Cells H a r v ested b y Exfo lia tio n from H e a lth y a n d OSCC
T is s u e .................................................................................................................................................................................................. 161
Figure 5-11: A v e r a g e DEP Spec tr a of C ells Ha r v e st e d b y Ex fo lia tio n fr o m H ea lth y a n d
D y spla stic T iss u e .........................................................................................................................................................................162
Figure 5-12: D ielectric Spec tr a of Ex fo lia ted O r a l C ell Specim ens from Pa tien t M a tc h ed N or m a l
AND O SCC T is s u e ......................................................................................................... 163
Figure 5-13: D ielectric S pec tr a o f Ex fo lia ted Or a l Cells H a r v e st e d fr o m Pa tien t M a tch ed
N o r m a l a n d D y spla stic T is s u e .......................................................................................................... 164
Figure 5-14: Sc atter g r a m o f Cr o sso v e r Frequencies (Fx O of Ex fo lia ted Or a l Ce l l s ..............................165
Figure 5-15: S im u latio n o f Effect o f Cell S ize o n D ielectric Sp e c t r a ............................................................... 167
Figure 5-16: A v er a g e D ielectric Spec tr um a n d D ielectric Properties o f Er y t h r o c y t e s ....................... 168
Figure 5-17: D ielectric S pec tr a o f Exfo lia ted O r a l Cells a n d H u m a n E r y t h r o c y t e s .............................169
Figure 5-18: A v er a g e D ielectric Spec tr a of Or a l Ex fo lia ted Specim ens fr o m H ea lth y T issu e with
OR WITHOUT B LOOD................................................................................................. ............................................... ..................... 170
Page I ix
TABLE OF TABLEST a ble 2-1 : T N M St a g in g o f O r a l Ca n c e r ................................................................................................................................... 14
T a ble 2-2: N u m b e r Sta g ing o f O r a l Ca n c e r .......................................................................... 15
Ta ble 2-3: H isto lo g ic a l G r a d in g o f O r al Ca n c e r ........................................ 15
Ta ble 2-4: N u m b e r Sta g e a n d T w o-Y ea r Cr u d e Su r v iv a l of O r a l Ca n c e r , 1 9 9 6 -2000 ..................................16
T a ble 2-5 A d ju n c tiv e D etection a n d D iag no stic Com m er cia l In s t r u m e n t s ......................................................23
Ta ble 2-6: Stu d ies o n the O r a lC D x ® Sy s t e m ...................................................... 29
Ta ble 3-1: A Su m m a r y o f the Effective M e m b r a n e Ca pa c ita n c e o f Cells w ith H ea lth y a n d
C a n c er o u s Ph e n o t y pe s ........................................................................ 67
Ta ble 3-2: O sm o la lity o f KGM a n d DEP Ex per im enta l M e d iu m .................................................................................72
Ta ble 3-3: A Co m pa r iso n o f the D ielectric Properties o f UP a n d H 357 C e l l s ................................................... 78
Ta ble 3-4: T a b l e o f D ielectric Properties of N o r m a l , D y splastic an d M a l ig n a n t Or a l
KERATINOCYTES.............................................................................................................. 81
Ta ble 4-1 : L ight A b s o r b a n c e o f HOK a n d H 157 Ce l l s .....................................................................................................115
Ta ble 4-2: D ielectric Properties o f N o r m a l , D y spla stic a n d M a l ig n a n t O r a l K ér a tin o c y tes G row n
IN Re c o n stitu ted Or g a n o ty pic a l Cu l t u r e s ............................................................................................................. 117
Ta ble 4-3: T a ble o f D ielectric Properties o f Cells D er iv ed from Rec o n stitu ted 3 -D O r g a n o ty pic a l
Co n str u c ts o f N o r m a l , D y spla stic a n d Ca n c er o u s Or a l M u c o s a ............................................................120
T a ble 4-4: D ielectric Properties o f M ixed Po pula tio n s o f N o r m a l a n d M a l ig n a n t Or a l
KERATINOCYTES GROWN IN RECONSTITUTED ORGANOTYPICAL CULTURES.......................................................... 126
Ta ble 5-1: A Su m m a r y of Pr o blem s Ex perienced w ith Ex fo lia ted O r a l Spec im en s ..................................... 151
T a ble 5-2: Su m m a r y o f the N u m b e r o f Specim ens th a t h a v e DEP Spe c t r a ......................... 152
Ta ble 5-3: A Su m m a r y o f the M e a n Co n c entr a tio n of Kér atin o c y tes a n d Er yth ro cy tes in
Ex fo lia ted Or a l Specim ens th a t h a v e D ielectric Sp e c t r a ............................................................................ 153
T a ble 5-4: M e a n Fxi fo r Ex fo lia ted O r a l Cell Sp e c im e n s ............................................................................................166
Page I X
1 INTRODUCTION
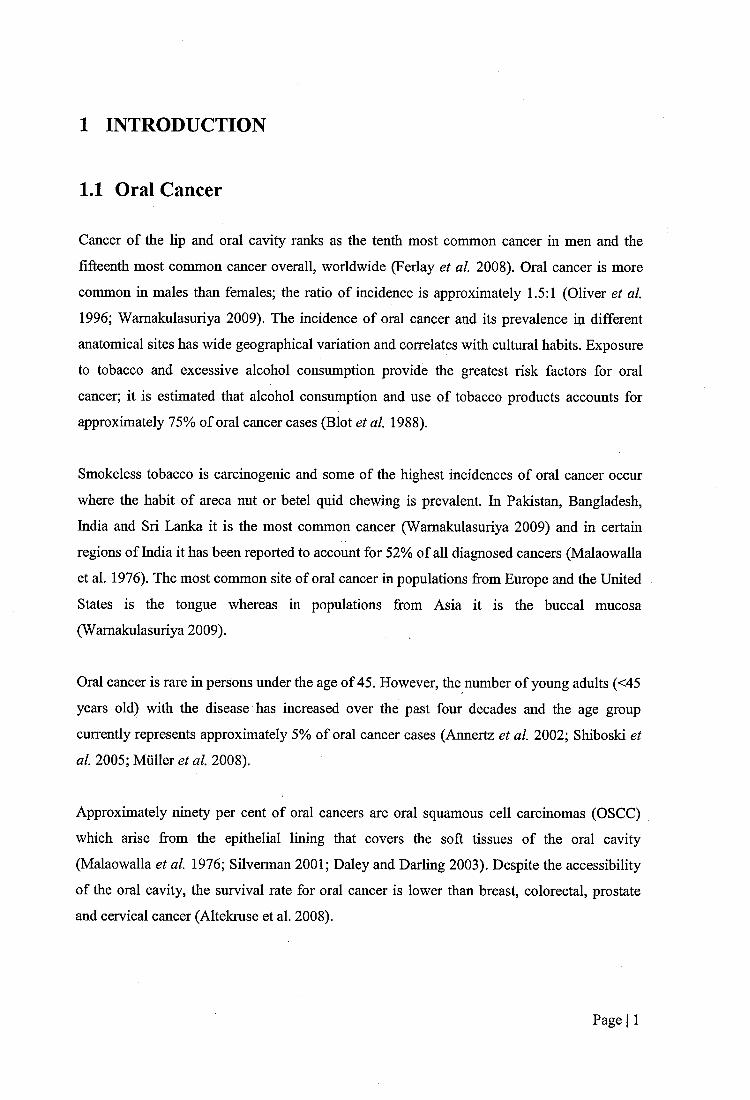
1.1 Oral Cancer
Cancer of the lip and oral cavity ranks as the tenth most common cancer in men and the
fifteenth most common cancer overall, worldwide (Ferlay et a l 2008). Oral cancer is more
common in males than females; the ratio of incidence is approximately 1.5:1 (Oliver et al
1996; Wamakulasuriya 2009). The incidence of oral cancer and its prevalence fti different
anatomical sites has wide geographical variation and correlates with cultural habits. Exposure
to tobacco and excessive alcohol consumption provide the greatest risk factors for oral
cancer; it is estimated that alcohol consumption and use of tobacco products accounts for
approximately 75% of oral cancer cases (Blot et a l 1988).
Smokeless tobacco is carcinogenic and some of the highest incidences of oral cancer occur
where the habit of areca nut or betel quid chewing is prevalent. In Pakistan, Bangladesh,
India and Sri Lanka it is the most common cancer (Wamakulasuriya 2009) and in certain
regions of India it has been reported to account for 52% of all diagnosed cancers (Malaowalla
et al. 1976). The most common site of oral cancer in populations from Europe and the United
States is the tongue whereas in populations from Asia it is the buccal mucosa
(Wamakulasuriya 2009).
Oral cancer is rare in persons under the age of 45. However, the number of young adults (<45
years old) with the disease has increased over the past four decades and the age group
currently represents approximately 5% of oral cancer cases (Annertz et a l 2002; Shiboski et
al 2005; Müller et a l 2008).
Approximately ninety per cent of oral cancers are oral squamous cell carcinomas (OSCC)
which arise from the epithelial lining that covers the soft tissues of the oral cavity
(Malaowalla et a l 1976; Silverman 2001; Daley and Darling 2003). Despite the accessibility
of the oral cavity, the survival rate for oral cancer is lower than breast, colorectal, prostate
and cervical cancer (Altekmse et al. 2008).
Page I 1
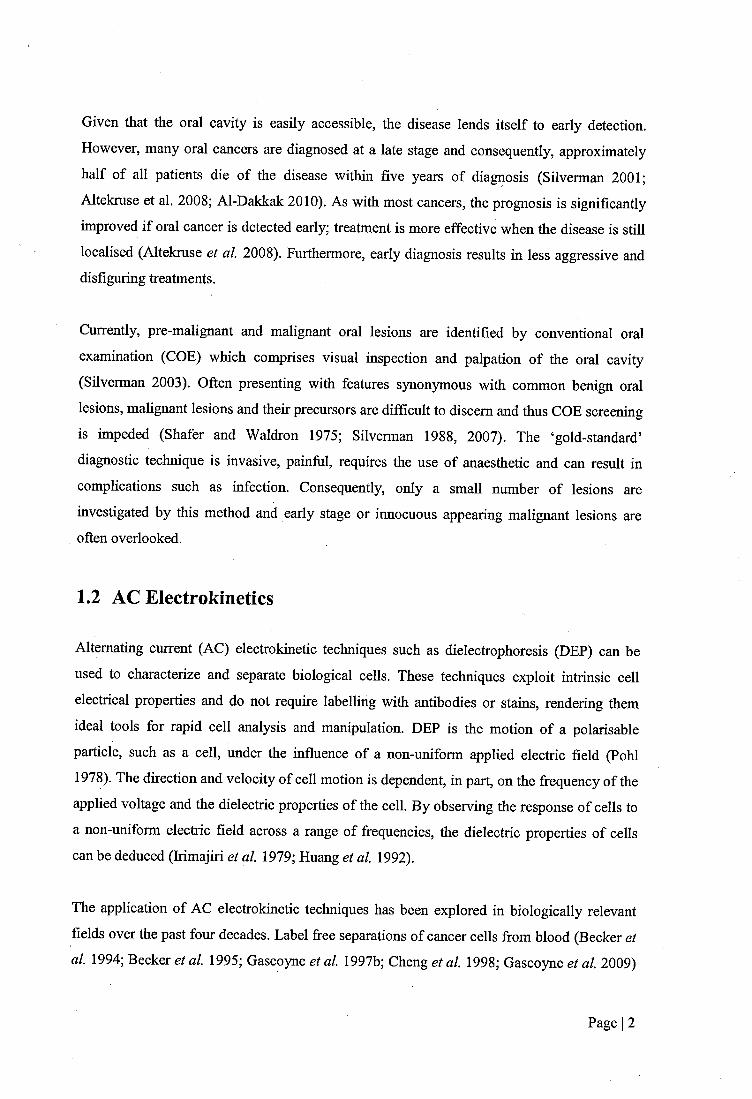
Given that the oral cavity is easily accessible, the disease lends itself to early detection.
However, many oral cancers are diagnosed at a late stage and consequently, approximately
half of all patients die of the disease within five years of diagnosis (Silverman 2001;
Altekmse et al. 2008; Al-Dakkak 2010). As with most cancers, the prognosis is significantly
improved if oral cancer is detected early; treatment is more effective when the disease is still
localised (Altekmse et al. 2008). Furthermore, early diagnosis results in less aggressive and disfiguring treatments.
Currently, pre-malignant and malignant oral lesions are identified by conventional oral
examination (COE) which comprises visual inspection and palpation of the oral cavity
(Silverman 2003). Often presenting with features synonymous with common benign oral
lesions, malignant lesions and their precursors are difficult to discern and thus COE screening
is impeded (Shafer and Waldron 1975; Silverman 1988, 2007). The ‘gold-standard’
diagnostic technique is invasive, painful, requires the use of anaesthetic and can result in
complications such as infection. Consequently, only a small number of lesions are
investigated by this method and early stage or innocuous appearing malignant lesions are often overlooked.
1.2 AC Electrokinetics
Alternating current (AC) electrokinetic techniques such as dielectrophoresis (DEP) can be
used to characterize and separate biological cells. These techniques exploit intrinsic cell
electrical properties and do not require labelling with antibodies or stains, rendering them
ideal tools for rapid cell analysis and manipulation. DEP is the motion of a polarisable
particle, such as a cell, under the influence of a non-uniform applied electric field (Pohl
1978). The direction and velocity of cell motion is dependent, in part, on the frequency of the
applied voltage and the dielectric properties of the cell. By observing the response of cells to
a non-uniform electric field across a range of frequencies, the dielectric properties of cells
can be deduced (Irimajiri et a l 1979; Huang et al 1992).
The application of AC electrokinetic techniques has been explored in biologically relevant
fields over the past four decades. Label free separations of cancer cells from blood (Becker et
al 1994; Becker et a l 1995; Gascoyne et al 1997b; Cheng et a l 1998; Gascoyne et a l 2009)
Page I 2
and isolation and enrichment of rare cells for diagnostic assays (Chan et a l 2000) have been
achieved. The dielectric characteristics of heterogeneous stem cell populations (Flanagan et
al 2008), apoptotic cells (Labeed et al 2006), multi-drug resistant cells (Coley et al 2007)
and cells in different phases of the cell cycle (Huang et a l 1999) have been determined. The
use of dielectric properties as prognostic markers for cancer has also been probed
(Cristofanilli et a l 2002; Labeed et al 2003; Coley et al 2007).
The transition of cells from a healthy to a pathological state is associated with subsequent
variation in the dielectric properties (Gascoyne et al 1994; Huang et a l 1996; Gascoyne et
al 1997a); thus, characterisation of dielectric properties could prove valuable in disease
detection. Recently, it has been demonstrated that the dielectric properties of malignant breast
epithelial cells are different to normal breast cells (An et a l 2009) and malignant oral
epithelial cells are different to quasi-normal dermal epithelial cells (Broche et a l 2007)
suggesting a role for AC electrokinetics in the detection and diagnosis of carcinomas.
1.3 Thesis Aims
With a view to improving the early detection rate of oral cancer, this thesis aims to determine
if pre-malignant (dysplastic) and malignant oral epithelial cells (kératinocytes) can be
distinguished from normal oral epithelial cells on the basis of their dielectric properties. In
addition, this thesis investigates the potential of a novel DEP device (termed the DEP-
microwell and developed at the University of Surrey) to be used as an oral cancer detection
technique in a clinical setting.
To meet the aims of this thesis, the DEP-microwell has been used to obtain dielectric spectra
of normal, dysplastic and malignant oral kératinocytes. The dielectric properties of oral
kératinocytes have been derived from dielectric spectra using a “single-shell” model. The
dielectric properties of in vitro cultured oral kératinocytes and ex vivo exfoliated oral cell
specimens have been determined. The uses and limitations of an oral cancer detection
technique based on DEP have been analysed.
Page I 3
1.4 Thesis Structure and Outline
This thesis begins with a literature review (Chapter 2), the first part of which focuses on oral
cancer. The oral epithelium in normal, pre-malignant and malignant states is examined and
current OSCC detection and diagnostic techniques are reviewed. The second part of the
literature review examines AC electrokinetic techniques. The text outlines the theoretical
background of DEP and the applications of AC electrokinetic techniques in the biomedical
industry are discussed with a focus on their use in oncology.
In the first research chapter (Chapter 3), the dielectric properties of primary normal oral
kératinocytes, and dysplastic and malignant oral keratinocyte cell lines, grown in standard
two-dimensional (2-D) monolayer cultures are described. In addition, the dielectric properties
of a quasi-normal dermal keratinocyte cell line and a malignant oral keratinocyte cell line are
defined and compared to published values.
The second research chapter (Chapter 4) contains a description of the dielectric properties of
primary normal oral kératinocytes, and dysplastic and malignant oral keratinocyte cell lines,
grown in reconstituted three-dimensional (3-D) organotypical cultures. The results are
compared to the dielectric properties of oral kératinocytes grown in standard monolayer
cultures. In order to assess the capacity of the DEP-microwell to detect a small subpopulation
of malignant oral kératinocytes, the dielectric properties of host primary normal oral
kératinocytes containing subpopulations of malignant oral kératinocytes, grown in
reconstituted organotypical cultures, are described.
In the final research chapter (Chapter 5), dielectric spectra of ex vivo exfoliated oral cell
specimens harvested by brush biopsy from healthy subjects, clinically healthy tissue ini
patients with oral epithelial dysplasia or malignancy, dysplastic oral epithelial tissue and
malignant oral epithelial tissue are defined and compared. The potential for the DEP-
microwell to be employed in the detection of oral cancer is assessed and the limitations of the
DEP-microwell in a clinical setting are identified.
Page I 4
In Chapter 6 the results found in this work are discussed and conclusions are drawn. Further
work required is outlined and potential solutions to overcome the limitations of the use of the
DEP-microwell as an oral cancer detection technique are proposed.
Page I 5

2 BACKGROUND
2.1 The Oral Mucosa
The mucous membrane is a moist lining that covers the digestive tract and other cavities that
communicate with the external environment. In the oral cavity, the mucous membrane is
called the oral mucosa. At the pharynx the oral mucosa is continuous with the mucosa of the
remainder of the digestive tract and at the lips it is continuous with the skin (Chisholm et al.
1978). The oral mucosa has several functions; to protect the underlying tissues from
mechanical stress and infection; to sense the contents of the oral cavity; and to secrete saliva
to maintain a moist surface and chemically digest foodstuff (Nanci and Ten Cate 2008). The
oral mucosa shows considerable variation in its structure. Regions subject to mechanical
forces associated with mastication are distinct to regions which require flexibility for
chewing, speech and swallowing and regions which are optimised to collect sensory
information (Squier and Kremer 2001).
The mucous membrane is composed of two components; an underlying supportive,
cormective tissue {stromal, mesenchymal) layer and an overlying epithelial layer (Nanci and
Ten Cate 2008).
The connective tissue of the oral mucosa is termed the lamina propria (Squier and Kremer
2001). The lamina propria is an extracellular matrix (ECM) consisting of collagen and elastin
fibres and fibronectm embedded in a ground substance made of serum-derived proteins and
glycosaminoglycans (Silverman 2003). The lamina propria is populated predominately by
fibroblast cells and penetrated by blood vessels and neural elements (Chisholm et a l 1978).
A basement membrane {lamina densa, basal lamina) separates the lamina propria from the
overlying epithelium (Prunieras 1983).
2.1.1 The Oral Epithelium
Epithélia are a group of tissues found throughout the body which have a diverse range of
fonctions including protection, absorption, secretion and diffusion. The functionality of
epithelia correlates with morphology and therefore epithelia are categorised by the number of
Page I 6

cell layers, the shape of cells and the presence of surface specialisations such as cilia or
keratin.
Epithelial tissue can be simple or stratified; simple epithelium consists of one layer of cells,
all of which are in contact with the basement membrane, whereas stratified epithelium
consists of two or more distinct cell layers or strata. Pseudostratified epithelium is a simple
epithelium which appears stratified as the cell nuclei are not in line and appear at various
levels (Lommel 2002). In general, simple epithelium functions to absorb, secrete, filter and
selectively diffuse substances whereas stratified epithelium typically functions in physical
protection.
The cells of epithelial tissue can have a cuboidal, columnar (elongated) or squamous
(flattened) morphology (Lommel 2002). Simple cuboidal and simple colunmar epithelia are
found in renal tubules and in gland secretary ducts. Simple columnar epithelia are also found
in the gastrointestinal tract. Simple squamous epithelia are found in blood vessels, alveoli o f
the lung and kidney glomerulus. Pseudostratified epithelia are most prevalent in the nasal
cavity, windpipe and bronchi. Stratified cuboidal and columnar epithelia are found in
secretary ducts of glands. Stratified squamous epithelia are found in the skin, the oral cavity,
oesophagus, the cervix and the rectum. Transitional epithelia, found in the bladder and the
urinary tract, are stratified epithelia which can expand or contract in response to changes in
water pressure.
The oral epithelium is a stratified squamous epithelium (Freshney and Freshney 2002). Oral
epithelial cells consist of two discrete populations; a mitotically active (proliferating)
population and a maturing (differentiating) population (Adams 1976). The epithelium is in a
state of perpetual renewal; differentiated cells shed fi*om the surface are continually replaced
by proliferative cells in the deepest cell layers in order to maintain structural integrity and
tissue homeostasis. Epithelial cells are termed kératinocytes because they contain keratin
filaments (Alberts et a l 2007). Keratin filaments or tonofilaments belong to a class of
filaments called intermediate filaments and are composed of heterodimers of acidic and basic
keratin proteins (Presland and Dale 2000).
It is estimated that up to 10% of the oral epithelium is made up of non-keratinocyte cells
(Nanci and Ten Cate 2008) including Langerhans’ cells (Barrett et a l 1996), melanocytes
Page I 7
(Schenk 1975), Merkel cells (Hashimoto 1972) and inflammatory cells (Montgomery 1951;
Squier and Kremer 2001 ; Walker 2004).
2.1.1.1 Proliferating Cells
Mitotically active cells are termed ‘basal’ cells or keratinoblasts and constitute the basal cell
layer {stratum basale, germai cell layer, stratum germinatium); a layer of cuboidal or
colunmar cells adjacent to the basal lamina (Alberts et al. 2007). The basal cell compartment
is one cell thick in thin epithelia such as the floor of the mouth, and 2-3 cells thick in thick
epithelia such as the buccal mucosa (Squier and Kremer 2001). Basal cells can be divided
into two functionally discrete subpopulations; stem cells and amplifying cells (Bickenbach
1981; Hume and Potten 1983). Stem cells are slow-cycling cells which retain a perpetual
capacity to proliferate, constituting between 1-10% of the basal cell layer (Li et al. 1998).
The fimction of stem cells is to produce basal cells, maintaining the proliferative capacity of
the epithelium (Nanci and Ten Cate 2008). Amplifying cells are committed to terminal
differentiation and show increased mitotic activity but unlike stem cells their proliferative
capacity is restricted to a limited number of divisions. The function of amplifying cells is to
produce cells for maturation to populate the supra-basal epithelial cell layers (Nanci and Ten
Cate 2008).
2.1.1.2 Differentiating Cells
Differentiation is the process whereby a cell loses its stem cell phenotype and becomes
specialized to perform a particular fimction (Freshney and Freshney 2002). When a basal cell
leaves the basal cell compartment it withdraws from the cell cycle and exists in a postmitotic
state. The process of differentiation begins as the cell migrates through the epithelium toward
the external stratum.
A number of biochemical and morphological changes occur during differentiation and cells
express the mature phenotype in the exterior strata where they are finally shed from the
epithelium (desquamation). As cells leave the basal cell layer and differentiate they become
larger and flatter and accumulate aggregated keratin tonofilaments (keratinization) (Presland
and Dale 2000).
Different degrees of keratinization occur in different regions of the oral cavity; the oral
epithelium can be nonkeratinized, parakeratinized (partial) or orthokeratinized (complete).
Page I 8
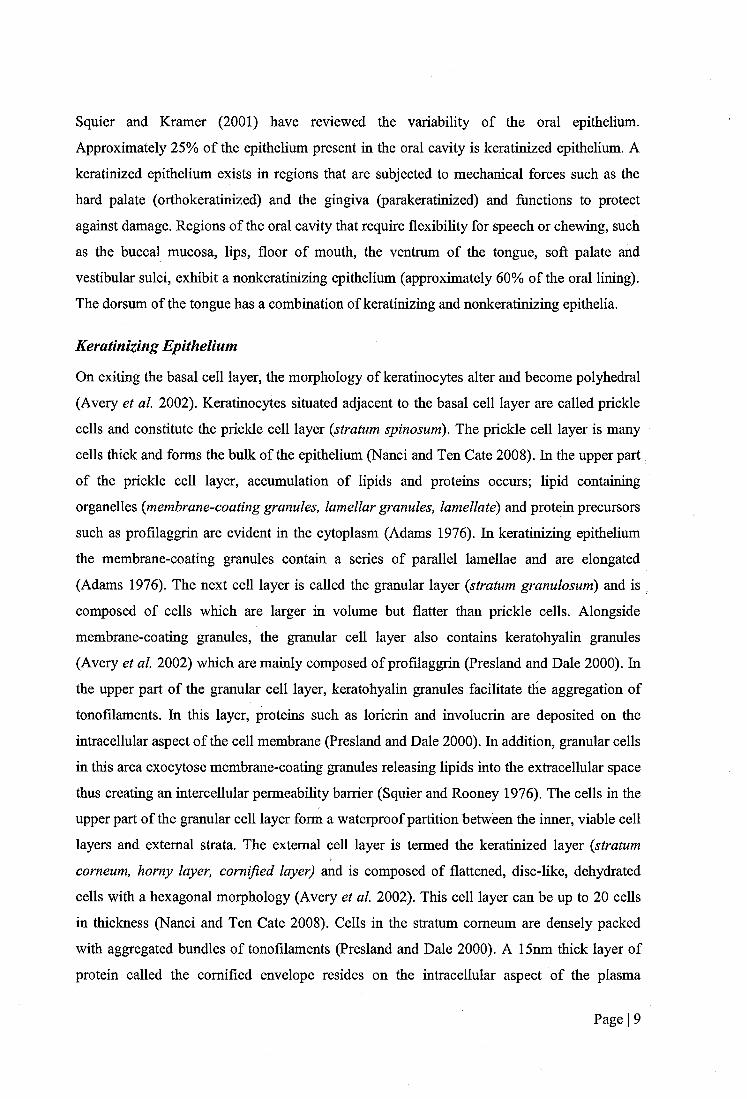
Squier and Kramer (2001) have reviewed the variability of the oral epithelium.
Approximately 25% of the epithelium present in the oral cavity is keratinized epithelium. A
keratinized epithelium exists in regions that are subjected to mechanical forces such as the
hard palate (orthokeratinized) and the gingiva (parakeratinized) and functions to protect
against damage. Regions of the oral cavity that require flexibility for speech or chewing, such
as the buccal mucosa, lips, floor of mouth, the ventrum of the tongue, soft palate and
vestibular sulci, exhibit a nonkeratinizing epithelium (approximately 60% of the oral lining).
The dorsum of the tongue has a combination of keratinizing and nonkeratinizing epithelia.
Keratinizing Epithelium
On exiting the basal cell layer, the morphology of kératinocytes alter and become polyhedral
(Avery et al. 2002). Kératinocytes situated adjacent to the basal cell layer are called prickle
cells and constitute the prickle cell layer {stratum spinosum). The prickle cell layer is many
cells thick and forms the bulk of the epithelium (Nanci and Ten Cate 2008). In the upper part
of the prickle cell layer, accumulation of lipids and proteins occurs; lipid containing
organelles {membrane-coating granules, lamellar granules, lamellate) and protein precursors
such as profilaggrin are evident in the cytoplasm (Adams 1976). In keratinizing epithelium
the membrane-coating granules contain a series of parallel lamellae and are elongated
(Adams 1976). The next cell layer is called the granular layer {stratum granulosum) and is
composed of cells which are larger in volume but flatter than prickle cells. Alongside
membrane-coating granules, the granular cell layer also contains keratohyalin granules
(Avery et al. 2002) which are mainly composed of profilaggrin (Presland and Dale 2000). In
the upper part of the granular cell layer, keratohyalin granules facilitate the aggregation of
tonofilaments. In this layer, proteins such as loricrin and involucrin are deposited on the
intracellular aspect of the cell membrane (Presland and Dale 2000). In addition, granular cells
in this area exocytose membrane-coating granules releasing lipids into the extracellular space
thus creating an intercellular permeability barrier (Squier and Rooney 1976). The cells in the
upper part of the granular cell layer form a waterproof partition between the irmer, viable cell
layers and external strata. The external cell layer is termed the keratinized layer {stratum
comeum, horny layer, cornified layer) and is composed of flattened, disc-like, dehydrated
cells with a hexagonal morphology (Avery et al. 2002). This cell layer can be up to 20 cells
in thickness (Nanci and Ten Cate 2008). Cells in the stratum comeum are densely packed
with aggregated bundles of tonofilaments (Presland and Dale 2000). A 15nm thick layer of
protein called the cornified envelope resides on the intracellular aspect of the plasma
Page I 9

membrane causing membrane thickening (Presland and Dale 2000). The keratinized cell layer
can be orthokeratinized or parakeratinized (Squier and Kremer 2001). In orthokeratinized
epithelium, cells in the keratinized cell layer are devoid of nuclei and organelles, but in
parakeratinized epithelium pyknotic (shrunken) cell nuclei are still present. Fewer
keratohyalin granules are present in the granular cell layer of parakeratinized epithelium
(Nanci and Ten Cate 2008).
Non-keratinizing Epithelium
In non-keratinizing epithelium, the prickle cell layer is similar to that found in keratinizing
epithelium. However, the membrane-coating granules apparent in the upper part of the
prickle cell layer in non-keratinizing epithelium are spherical with a dense amorphous core
(Nanci and Ten Cate 2008).
There is no granular cell layer in non-keratinizing epithelium; the outer layers are divided
into two zones but there is no definitive boundary between them (Squier and Kremer 2001).
The intermediate layer {stratum intermedium) is composed of slightly flattened cells which
have a greater volume than cells in the prickle cell layer (Nanci and Ten Cate 2008).
Synonymous with cells in the granular cell layer of keratinizing epithelium, membrane-
coating granules are exocytosed in the intermediate layer producing a permeability barrier
(Avery et al. 2002). However, the lipid composition of membrane-coating granules in non
keratinizing epithelium is different to keratinizing epithelium. Proteins are also deposited on
the surface of intermediate cells but to a lesser extent than in the granular cell layer of
keratinizing epithelium (Squier and Kremer 2001).
In non-keratinizing epithelium, the external cell layer is called the superficial layer {stratum
superficiale). Accumulation of tonofilaments is less marked than in the stratum comeum of
keratinized epithelium and they do not aggregate (Nanci and Ten Cate 2008). Superficial
cells retain plump nuclei and organelles.
The features of keratinocyte differentiation in keratinizing and non-keratinizing oral
epithelium are shown in Figure 2-1.
Page I 10

Keratinized Layer
Granular Layer
Oranu^s
Prickle-celKj ^Layer -
i
M«mbrar»â-t;t»Ürt3
Superficial Layer
Intermediate Layer
Prick le-ce Layer
Figure 2-1: Differentiation in Oral EpitheliumThe features o f differentiation are shown in (a) keratinized and (b) non-keratinized oral
epithelium. Adapted from Squier and Kremer (2001).
Page I 11
2.2 Oral Squamous Cell Carcinoma (OSCC)
Approximately 90% of all human cancers arise from epithelial tissue and are termed
carcinomas (Cooper 2000). Oral squamous cell carcinoma (OSCC) is a cancer which arises
from the epithelial layer of the oral mucosa (Silverman 2007).
A mass of abnormally proliferating cells is called a tumour (Alberts et al. 2002). A benign
tumour, such as a wart, is confined to its tissue of origin. Conversely, a malignant tumour
(cancer) invades surrounding normal tissues and is capable of spreading through the
circulatory or lymphatic tissue to other parts of the body (metastasis). As discussed in 2.1.1.1,
proliferative kératinocytes in normal oral epithelial tissue are confined to the basal cell
compartment, adjacent to the basal lamina. OSCC is characterised by the expansion of
proliferating kératinocytes within the epithelium and their invasion through the basal lamina
into the underlying lamina propria (Wamakulasuriya et al. 2008).
Many tumours are clones of one altered cell; at each cell division the genetic alteration is
passed onto each daughter cell (Cooper 2000). Progressive conversion of a normal cell into a
cancer cell is the result of a multi-step process. Cancer results from an accumulation of
successive genetic alterations, over successive generations of daughter cells, with each
genetic alteration conferring a growth advantage (Nowell 1976). Increased genetic instability
gives rise to an increased probability of genetic mutation and therefore an enhanced mutation
rate (Alberts et al. 2002).
Hanahan and Weinberg (2000) suggested that there are six hallmark adaptations in cell
physiology that lead to cancer. These adaptations are self-sufficiency in growth signals,
insensitivity to growth inhibitory signals, evasion of apoptosis (programmed cell death),
limitless replication potential, sustained angiogenesis, and tissue invasion and metastasis. The
sequence of acquisition of each adaption varies widely in cancers of the same type and
between different cancers. A specific genetic alteration may contribute only partially to each
adaption.
Cancers of the oral cavity comprise malignancies of the tongue, lip, gingivae, floor of mouth,
palate, buccal mucosa and salivary glands (Silverman 2001). Tobacco use and alcohol
consumption are the two greatest independent risk factors for oral cancer, accounting for an
Page I 12

estimated 75% of all oral cancers (Blot et al. 1988). These products also act synergistically; if
they are both used the risk of oral cancer is a multiplication of the independent risks (Blot et
al. 1988). Other risk factors include low intake of fruit and vegetables (Freedman et al.
2008), infection with the human papilloma virus (HPV) (Luo et al. 2007), immunodeficiency
and poor oral hygiene (Hooper et al. 2009). Ultraviolet light is a risk factor for cancer of the
lip (Visscher and Waal 1998)
Multiple primary tumours of the oral cavity are common and there is an increased risk in
developing a second primary tumour of the oral cavity and pharynx in patients with primary
OSCC (Jovanoic et al. 1994). Slaughter and colleagues (1953) proposed that carcinogenic
exposure preconditions the whole of the oral mucosa to cancer resulting in the presence of
multiple foci of cancer. In a study by Thomson (2002) clinically appearing normal oral
mucosa in sites contra-lateral to existing dysplastic or OSCC lesions were found to be
dysplastic or malignant in 88.5% of patients.
Metastatic (secondary) tumours to the oral region, including both hard and soft tissues,
account for 3% of all oral malignancies (Soderholm 2002). Cancers in the breast, lung,
kidney, adrenal and bone are the most common primary sources of metastatic tumours to the
oral region (Hirshberg et al. 2007). The breast is the most common primary site for cancers
that metastasize to the jawbones, whereas the lung is the most common source for tumours
that metastasize to the oral soft tissues. In the oral soft tissue, the gingiva and the tongue are
reported to be the most common affected sites with 54% and 22.5% of all metastatic cancers
to the oral region.
The treatment and prognosis of OSCC is determined by the extent of the disease at diagnosis.
The extent of the disease is determined by the size of the tumour, the involvement of regional
lymph nodes and the presence of distant métastasés. The TNM and numbering systems are
the two main ways to stage oral cancer (Massano et al. 2006; Altekruse et al. 2008). The
TNM system takes into account the size of the primary tumour (T), involvement of regional
lymph nodes (N) and the presence or absence of distant métastasés (M), as shown in Table
2- 1.
Page I 13

Table 2-1: TNM Staging of Oral Cancer
Stage Description
T1 The tumour is no larger than 2cm and is contained within the tissue of the mouth or oropharynx.
T2 The tumour is larger than 2cm, but smaller than 4cm.
T T3 The tumour is larger than 4cmT4a The tumour has spread into nearby tissues such as bone, tongue, sinuses or skin.
T4bThe tumour has spread into nearby areas such as the space around and behind the jaws, the back of the upper jaw where the large jaw muscles attach, the base of the skull or the area of the neck that surrounds the carotid artery.
NO There is no lymph node involvement.
N1 There is cancer in 1 lymph node on the same side of the neck as the cancer, but the node is less than 3cm across
NN2a There is cancer in 1 lymph node on the same side of the neck, and the node is
more than 3cm across but less than 6cm across
N2b There is cancer in more than 1 lymph node, but none of these nodes are more than 6cm across. All the affected nodes are on the same side of the neck as the cancer
N2c There is cancer in nodes on the other side of the neck, or in nodes on both sides, but none of these nodes are more than 6cm across
N3 At least 1 node containing cancer is more than 6cm across
M MO There are no distant métastasés.Ml There are distant métastasés.
The numbering system allocates a stage of I, II, III and IV to the cancer, I being early and IV
being advanced, as shown in Table 2-2.
Page I 14
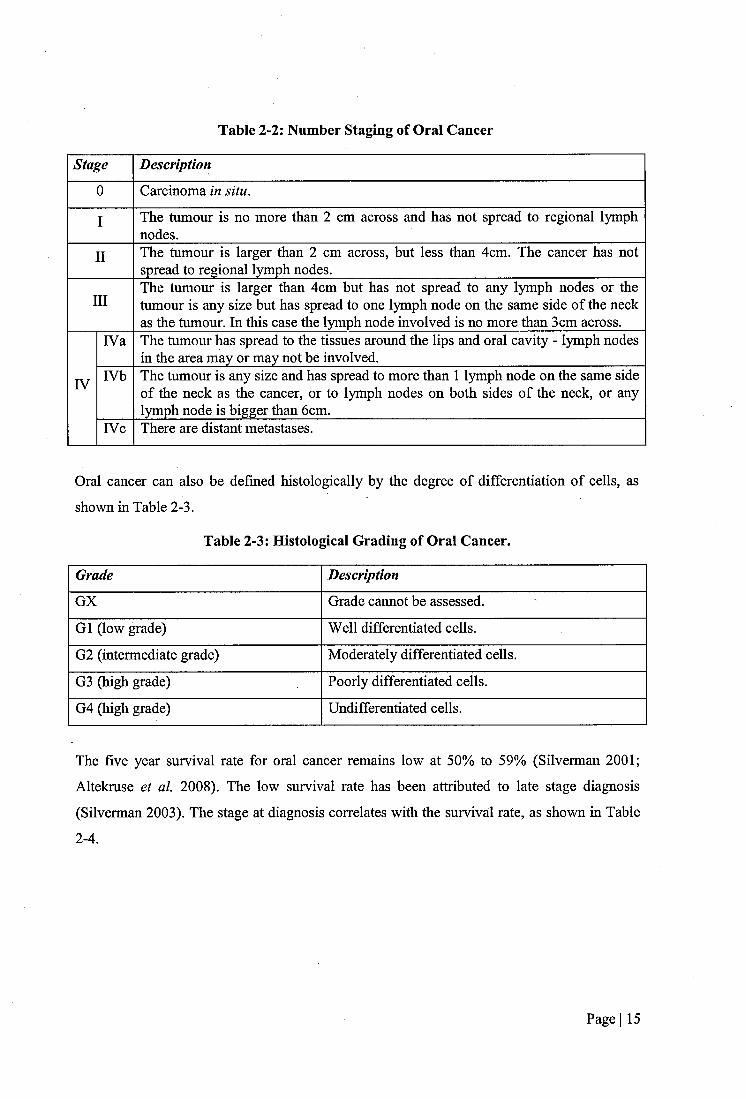
Table 2-2: Number Staging of Oral Cancer
Stage Description
0 Carcinoma in situ.
I The tumour is no more than 2 cm across and has not spread to regional lymph nodes.
II The tumour is larger than 2 cm across, but less than 4cm. The cancer has not spread to regional lymph nodes.
IIIThe tumour is larger than 4cm but has not spread to any lymph nodes or the tumour is any size but has spread to one lymph node on the same side of the neck as the tumour. In this case the lymph node involved is no more than 3cm across.
IVa The tumour has spread to the tissues around the lips and oral cavity - lymph nodes in the area may or may not be involved.
IV IVb The tumour is any size and has spread to more than 1 lymph node on the same side of the neck as the cancer, or to lymph nodes on both sides of the neck, or any lymph node is bigger than 6cm.
rvc There are distant métastasés.
Oral cancer can also be defined histologically by the degree of differentiation of cells, as
shown in Table 2-3.
Table 2-3: Histological Grading of Oral Cancer.
Grade Description
GX Grade cannot be assessed.
G1 (low grade) Well differentiated cells.
G2 (intermediate grade) Moderately differentiated cells.
G3 (high grade) Poorly differentiated cells.
G4 (high grade) Undifferentiated cells.
The five year survival rate for oral cancer remains low at 50% to 59% (Silverman 2001;
Altekruse et a l 2008). The low survival rate has been attributed to late stage diagnosis
(Silverman 2003). The stage at diagnosis correlates with the survival rate, as shown in Table
2-4.
Page I 15
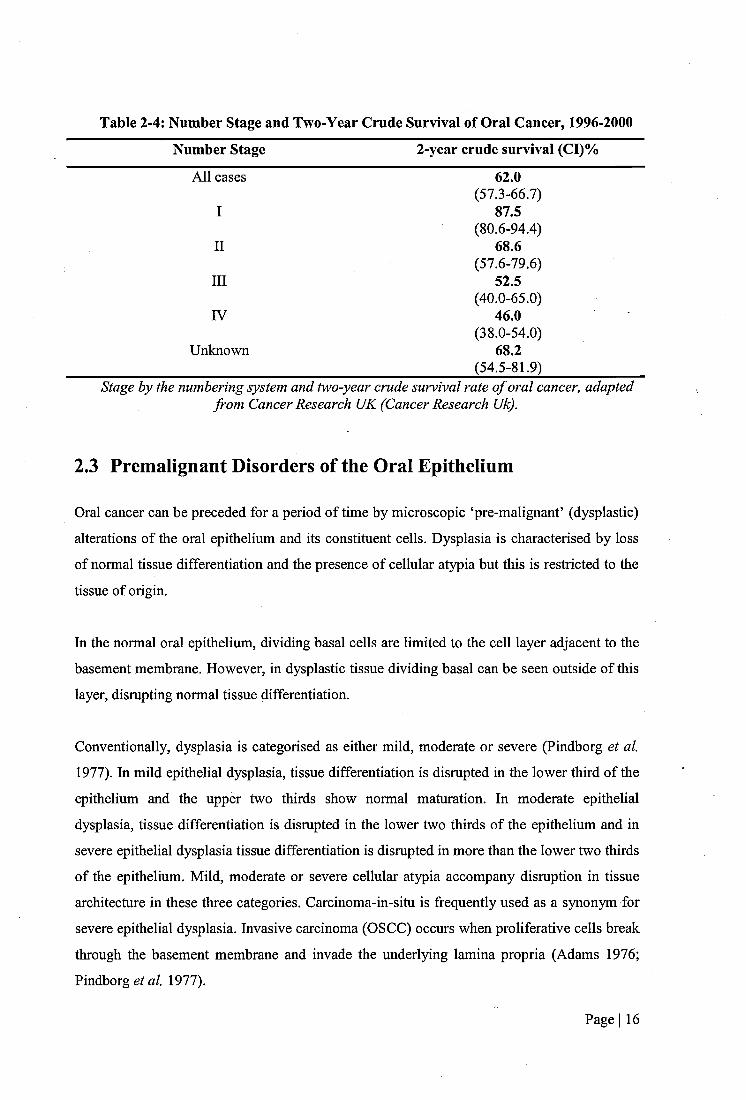
Table 2-4: Number Stage and Two-Year Crude Survival of Oral Cancer, 1996-2000
Number Stage 2-year crude survival (CI)%
All cases 62.0(57.3-66.7)
I 87.5(80.6-94.4)
II 68.6(57.6-79.6)
III 52.5(40.0-65.0)
IV 46.0(38.0-54.0)
Unknown 68.2(54.5-81.9)
Stage by the numbering system and two-year crude survival rate o f oral cancer, adapted from Cancer Research UK (Cancer Research Uk).
2,3 Premalignant Disorders of the Oral Epithelium
Oral cancer can be preceded for a period of time by microscopic ‘pre-malignant’ (dysplastic)
alterations of the oral epithelium and its constituent cells. Dysplasia is characterised by loss
of normal tissue differentiation and the presence of cellular atypia but this is restricted to the
tissue of origin.
In the normal oral epithelium, dividing basal cells are limited to the cell layer adjacent to the
basement membrane. However, in dysplastic tissue dividing basal can be seen outside of this
layer, disrupting normal tissue differentiation.
Conventionally, dysplasia is categorised as either mild, moderate or severe (Pindborg et al
1977). In mild epithelial dysplasia, tissue differentiation is disrupted in the lower third of the
epithelium and the upper two thirds show normal maturation. In moderate epithelial
dysplasia, tissue differentiation is disrupted in the lower two thirds of the epithelium and in
severe epithelial dysplasia tissue differentiation is disrupted in more than the lower two thirds
of the epithelium. Mild, moderate or severe cellular atypia accompany disruption in tissue
architecture in these three categories. Carcinoma-in-situ is frequently used as a synonym for
severe epithelial dysplasia. Invasive carcinoma (OSCC) occurs when proliferative cells break
through the basement membrane and invade the underlying lamina propria (Adams 1976;
Pindborg e /«/. 1977).
Page I 16
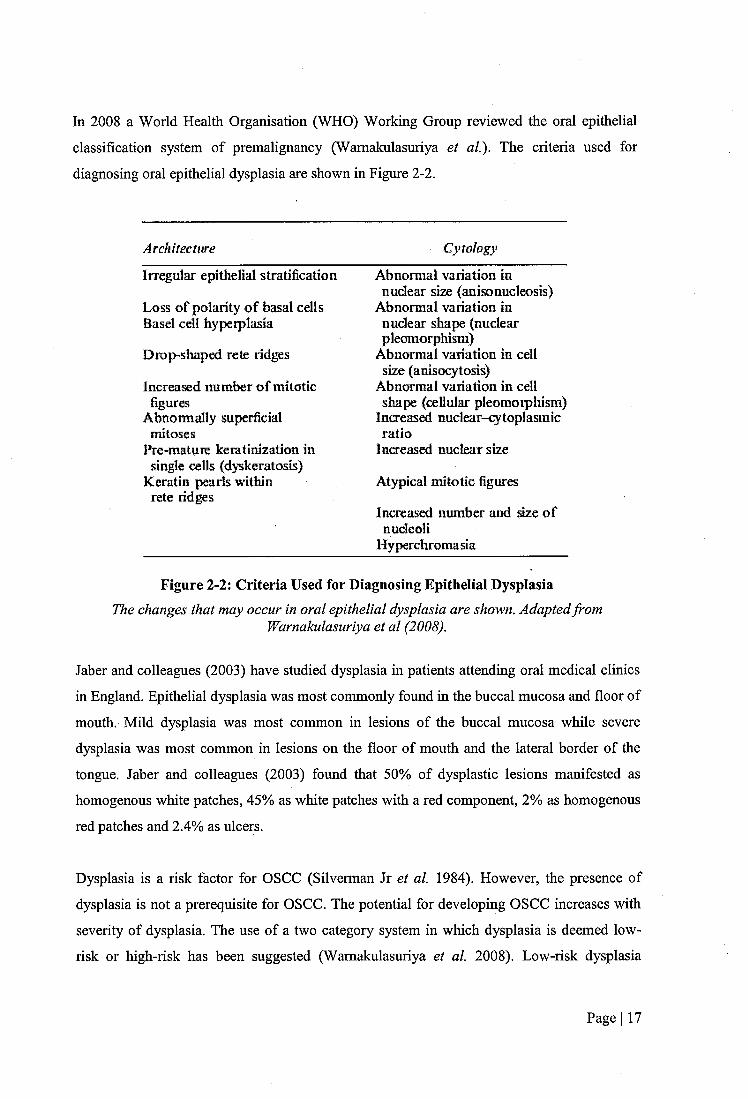
In 2008 a World Health Organisation (WHO) Working Group reviewed the oral epithelial
classification system of premalignaney (Wamakulasuriya et al). The criteria used for
diagnosing oral epithelial dysplasia are shown in Figure 2-2.
Architectitre Cytology
irregular epithelial stratification
Loss of polarity o f b^al cells Basel ceil hypeiplasia
Drop-shaped rete ridges
increa sed number o f mitotic
Abnormally superficial mitoses
Pre-matuie keratinization in single cells (dyskeratosis)
Keratin pearls within rete ridges
Abnormal variation in nuclear size (anisonucleosis)
Abnormal variation in nuclear shape (nuclear pleoraorphism)
Abnormal variation in cell size (aniscxytosis)
Abnormal variation in cell shape (cellular pleomorphism)
Increasoi nuclear-cytoplasmic ratio
increased nuclear size
Atypical mitotic figure
Increased number and size o f nucleoli
Hyj^rcliromasia
Figure 2-2: Criteria Used for Diagnosing Epithelial DysplasiaThe changes that may occur in oral epithelial dysplasia are shown. Adapted from
Wamakulasuriya et al (2008).
Jaber and colleagues (2003) have studied dysplasia in patients attending oral medical clinics
in England. Epithelial dysplasia was most commonly found in the buccal mucosa and floor of
mouth. Mild dysplasia was most common in lesions of the buccal mucosa while severe
dysplasia was most common in lesions on the floor of mouth and the lateral border of the
tongue. Jaber and colleagues (2003) found that 50% of dysplastic lesions manifested as
homogenous white patches, 45% as white patches with a red component, 2% as homogenous
red patches and 2.4% as ulcers.
Dysplasia is a risk factor for OSCC (Silverman Jr et a l 1984). However, the presence of
dysplasia is not a prerequisite for OSCC. The potential for developing OSCC increases with
severity of dysplasia. The use of a two category system in which dysplasia is deemed low-
risk or high-risk has been suggested (Wamakulasuriya et a l 2008). Low-risk dysplasia
Page I 17

comprises questionable or mild dysplasias whereas high-risk dysplasia comprises moderate or
severe dysplasias which have a high transformation rate.
2.4 Benign Disorders of the Oral Epithelium
There are numerous benign disorders of the oral mucosa which show epithelial involvement,
therefore only the most common conditions will be covered in this text. Common benign
disorders involving the oral epithelium include, but are not limited to, viral infections such as
recurrent herpes simplex virus (secondary herpes, herpes labialis, cold sores), fimgal
infections such as candidiasis (thrush), bacterial infections such as syphilis, granulomatous
diseases, frictional lesions, white sponge naevus (Canon’s disease) (Presland and Dale 2000),
aphthous stomatitis (Sutton’s disease, canker sores), leukoplakia (idiopathic white lesions),
erythroplakia (idiopathic red lesions), lichen planus (an inflammatory disease) and benign
tumours such as squamous cell papilloma.
2.4.1 Potentially Malignant Disorders of the Oral Epithelium
Areas of oral epithelial abnormality are referred to as oral lesions. Oral epithelial lesions can
be malignant, pre-malignant or benign. Oral lesions are common, occurring in an estimated 5
to 15% of the general population (Sandler 1962; Malaowalla et al. 1976; Bouquot 1986;
Burzynski et al. 1997; Christian 2002). The macroscopic features of oral lesions are defined
clinically by location, colour, size, outline and texture (Young and Heddie 1981). Oral lesions
can be grouped into five categories; inflammation, infection, inherent, iatrogenic and
idiopathic (Williams et al. 2008).
Oral cancer can be preceded for a period of time by macroscopic morphological alterations of
the oral epithelial surface. In 2007, the term ‘potentially malignant disorders’ (PMDs) was
coined to describe these alterations (Wamakulasuriya et al. 2007). By definition, not all
PMDs will transform into cancer but these conditions are associated with an increased risk of
the disease. PMDs are not site-specific predictors of cancer but indicate an increased risk of
cancer in the whole of the oral mucosa. The most common PMDs are leukoplakia and
erythroplakia. Less predominant PMDs include oral lichen planus (OLP), palatal lesions in
reverse smokers, oral submucous fibrosis, actinic keratosis, discoid lupus erythematosus
(DLE), dyskeratosis congenital (DC) and epidermolysis bullosa.
Page I 18
Leukoplakia and erythroplakia are idiopathic PMDs (Wamakulasuriya et al. 2007).
Leukoplakia and erythroplakia are clinical terms and not specific disease entities and
therefore no histological definitions are ascribed to them (Neville 2002). They are diagnosed
by a process of elimination; all other pathologies must be excluded.
Leukoplakia is an area of hyperkeratinisation in the oral mucosa that cannot be mbbed off. It
is reported to be the most common oral lesion (Bouquot 1986). The prevalence of leukoplakia
is higher in males than females and it is more common on the buccal mucosa, alveolar
mucosa and lower lip. In a study by Waldron and Shafer (1975a), which reviewed 3256
histopathological specimens with a clinical diagnosis of leukoplakia, it was found that 1 2 .2 %
had mild to moderate epithelial dysplasia, 4.5% had severe dysplasia or carcinoma in situ and
3.1% had OSCC. Lesions of the floor of mouth were found most likely to show dysplastic or
malignant alteration (42.9%), followed by the tongue (24.2%) and lower lip (24.0%). The rate
of transformation of leukoplakia to squamous cell carcinoma has been reported to be between
0.13% and 17.5% (Kramer 1969; Malaowalla et al. 1976; S. Silverman et al. 1984). The
study by Silverman and colleagues (1984) found that malignant transformation of leukoplakia
occurred in an average of 8.1 years. Leukoplakia can be grouped into two clinically distinct
types; homogenous and non-homogenous. A leukoplakia interspersed with red patches (non-
homogenous leukoplakia) is termed erythroleukoplakia or speckled leukoplakia. The colour
uniformity is prognostieally significant; lesions containing a red component are statistically
more likely to undergo malignant transformation than homogenous white lesions (Shafer and
Waldron 1975b; Silverman Jr c/cr/. 1984).
Erythroplakia, characterised by a homogenous red lesion, is less common than leukoplakia
(Waldron and Shafer 1975a; Shafer and Waldron 1975b). The red appearance of
erythroplakia is due to a reduced number of epithelial cells and an absence of keratin
production. Erythroplakia is most prevalent in the sixth and seventh decade and there is no
difference in the occurrence of the disease between males and females. Shafer and Waldron
(1975b) found that 9% of homogenous erythroplakias were mild to moderate dysplasia, 40%
were severe dysplasia or carcinoma in situ and 51% were invasive carcinoma.
Oral lichen planus (OLP) is a chronic cell mediated inflammatory disease (Silverman Jr
2000). Accumulation of T-lymphocytes beneath the epithelium causes an increased rate of
differentiation and consequently, hyperkeratosis. Hypereamia and ulceration are also
Page I 19
characteristic of the disease, although not all lesions become ulcerated. In 1985, Krutchkoff
and Eisenberg coined the term ‘lichenoid displasia’ (LD) to describe a lichenoid lesion
showing epithelial displasia. It has been hypothesised that the repetitive process of basal cell
destruction and proliferation causes genetic instability leading to malignant transformation
(Jin et al. 2001). However, the classification of oral lichen planus as a PMD is controversial;
it has been hypothesised that leukoplakia may be misdiagnosed as OLP due to similarities in
the clinical appearance of the two diseases (David et al. 1978). It has also been hypothesized
that a dysplastic lesion itself may cause a cell mediated inflammatory response (OLP) (Lovas
et al. 1989). Malignant transformation of OLP has been seen at rates of 1.2-2.9% (Silverman
et al. 1985; Silverman et al. 1991; Gandolfo et al. 2004).
2.5 Current OSCC Detection and Diagnostic Methods
Diagnosis of oral cancer and subsequent cancer staging is obtained by histopathological
evaluation of haematoxylin and eosin stained excised tissue. This ‘gold-standard’ diagnostic
method is an invasive procedure carried out under local anaesthetic; a piece of tissue
representing the fiill thickness of the epithelium is removed from the lesion using a scalpel or
punch biopsy instrument (Scully et al. 2008). Histological evaluation of the biopsy material is
performed by a pathologist to diagnose dysplasia or malignancy and assess cancer staging.
There are a number of methods currently used in the detection of OSCC. The gold-standard
method is the conventional oral examination (COE). A number of techniques are also used as
adjuncts to the COE.
2.5.1 Conventional Oral Examination
The COE is a clinical examination of the oral cavity to detect pre-malignant and malignant
lesions under incandescent light (Silverman 2003). It involves visual inspection and palpation
of the oral cavity and is reliant upon the macroscopic manifestation of oral abnormalities. The
efficacy of the COE is highly dependent on the aptitude and experience of the examiner,
firstly to perform the examination and secondly to differentiate lesions which require further
investigation.
OSCC can manifest with a variety of clinical features. In reviewing 208 patients with oral
cancer, Sandler (1962) reported OSCC lesions that were ulcerated, rough, smooth, elevated.
Page I 20
indurated, firm, rubbery, soft, granular, popular, furrowed, cracked, glossy and normal.
OSCC lesions ranged from a few millimetres to more than 6 centimetres in size.
Early stage OSCC can present as a homogenous white patch, red patch, a mixed white and
red patch (Waldron and Shafer 1975a; Shafer and Waldron 1975b), a fissure, a nodule or an
ulcer (Chisholm et a l 1978). The majority of OSCCs at an early stage of development are not
painful (Neville and Day 2002) and are usually small.
Advanced stage OSCC often presents with persistent ulceration, induration (firmness),
inflammation, bleeding and fixation to underlying structures (Shafer and Waldron 1975b;
Pindborg et a l 1977; Chisholm et a l 1978; Silverman Jr et al 1984; Silverman 2007; Scully
et al 2008; Williams et al 2008). Late stage OSCCs may be painful (Chisholm et al 1978;
Neville and Day 2002) and large. Owing to spread of the disease to local structures, tongue
immobility, disturbances of sensory of motor fimction and mobility of the teeth can also
occur (Neville and Day 2002).
The clinical manifestations of OSCC are synonymous with those of numerous benign oral
diseases (Pindborg et a l 1977; Silverman 2007; Wamakulasuriya et a l 2007; Gonsalves et
al 2007a, 2007b). Conditions frequently considered for differential diagnoses of OSCC
include, but are not limited to, leukoplakia, granulomatous diseases, traumatic ulceration and
lichen planus (Sandler 1962; Young and Heddie 1981). Examples of the clinical
manifestations of OSCC and differential diagnoses are shown in Figure 2-3.
Page I 21

n
m
Figure 2-3: Oral LesionsImages o f (a) lichen planus, (b) leukoplakia, (c) herpes simplex virus, (d) an aphthous ulcer in
an immunocompromised patient, (e) pyogenic granuloma, and (f, g and h) squamous cell carcinoma, are shown. Images (a), (c-f) and (h) were sourcedfrom Silverman (2007) and images
(b) and (e) was sourcedfrom Gonsalves et al. (2007b).
Page I 22

The prevalence of oral lesions has been reported to be between 5 and 15% (Sandler 1962;
Malaowalla et al. 1976; Bouquot 1986; Burzynski et al. 1997). With approximately 13% of oral
lesions representing OSCC (Sandler 1962), the majority of oral lesions are benign (Sandler 1962;
Sciubba and Collaborative Oral 1999; Christian 2002). Therefore, it is unfeasible and
inappropriate to investigate every oral lesion with a histological evaluation of excised tissue.
Several studies have investigated the reliability of the COE. Sandler (1962) reviewed 208
patients with oral cancer and found that 24% of cases had a preliminary clinical diagnosis of a
disorder other than OSCC. Epstein at al. (2008) reported a false positive rate of 79% with the COE.
2.5.2 Adjunctive Techniques
Adjunctive oral cancer detection and diagnostic techniques are employed to increase the efficacy
of the COE. They are used in three different ways; to identify oral abnormalities not visible by
COE; to define lesion boundaries; or to differentiate between benign and pre-malignant or
malignant lesions. The available techmques can be categorized into three broad groups; vital
dyes, fluorescent and chemiluminescent methods and cytological techniques, see Table 2-5.
Table 2-5 Adjunctive Detection and Diagnostic Commercial Instruments
Technique Category Commercial InstrumentVital Dyes Toludine Blue
Fluorescent Techniques VELscope®Chemiluminescent Techniques ViziLite®, MicroLux™
Cytological Techniques OralCDx®
Commercially available adjunctive OSCC detection techniques are listed.
Adjunctive techniques are not an alternate to inscisional tissue biopsy and histopathological
diagnosis but are used to enhance the efficacy of the COE (Silverman 2003).
Page I 23
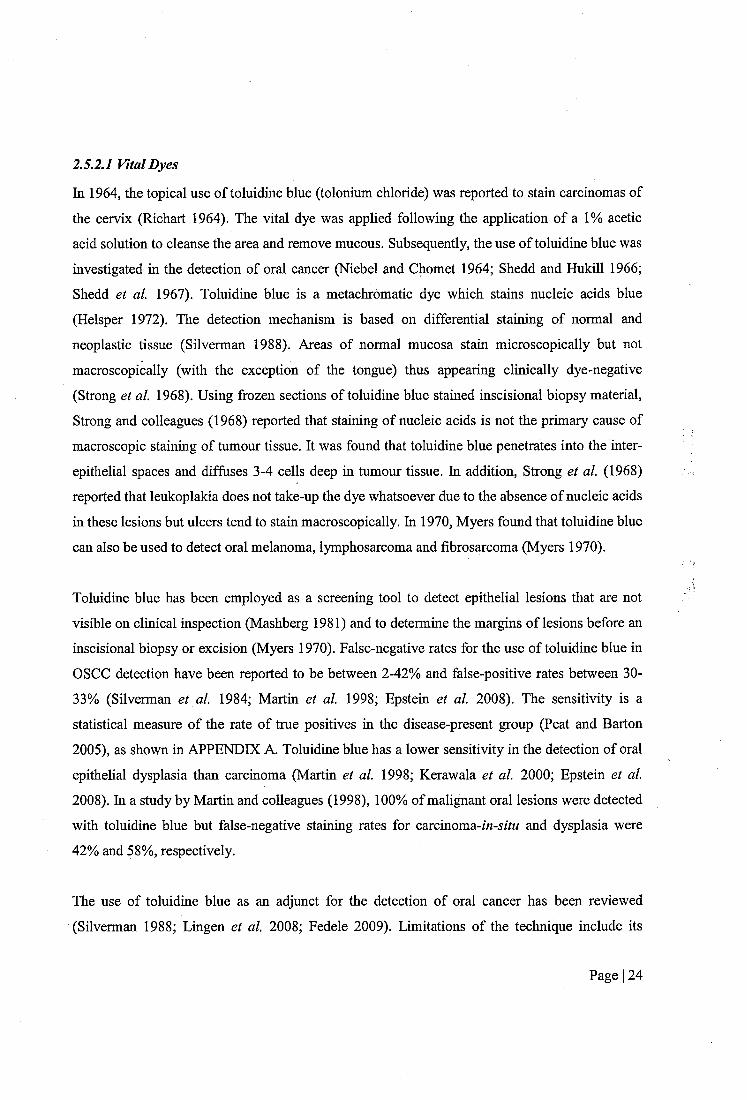
2.5.2.1 Vital Dyes
In 1964, the topical use of toluidine blue (tolonium chloride) was reported to stain carcinomas of
the cervix (Richart 1964). The vital dye was applied following the application of a 1% acetic
acid solution to cleanse the area and remove mucous. Subsequently, the use of toluidine blue was
investigated in the detection of oral cancer (Niebel and Chomet 1964; Shedd and Hukill 1966;
Shedd et al 1967). Toluidine blue is a metachromatic dye which stains nucleic acids blue
(Helsper 1972). The detection mechanism is based on differential staining of normal and
neoplastic tissue (Silverman 1988). Areas of normal mucosa stain microscopically but not
macroscopically (with the exception of the tongue) thus appearing clinically dye-negative
(Strong et al 1968). Using frozen sections of toluidine blue stained inscisional biopsy material.
Strong and colleagues (1968) reported that staining of nucleic acids is not the primary cause of
macroscopic staining of tumour tissue. It was found that toluidine blue penetrates into the inter-
epithelial spaces and diffuses 3-4 cells deep in tumour tissue. In addition. Strong et a l (1968)
reported that leukoplakia does not take-up the dye whatsoever due to the absence of nucleic acids
in these lesions but ulcers tend to stain macroscopically. In 1970, Myers found that toluidine blue
can also be used to detect oral melanoma, lymphosarcoma and fibrosarcoma (Myers 1970).
Toluidine blue has been employed as a screening tool to detect epithelial lesions that are not
visible on clinical inspection (Mashberg 1981) and to determine the margins of lesions before an
inscisional biopsy or excision (Myers 1970). False-negative rates for the use of toluidine blue in
OSCC detection have been reported to be between 2-42% and false-positive rates between 30-
33% (Silverman et al 1984; Martin et al 1998; Epstein et al 2008). The sensitivity is a
statistical measure of the rate of true positives in the disease-present group (Peat and Barton
2005), as shown in APPENDIX A. Toluidine blue has a lower sensitivity in the detection of oral
epithelial dysplasia than carcinoma (Martin et al 1998; Kerawala et al 2000; Epstein et al
2008). In a study by Martin and colleagues (1998), 100% of malignant oral lesions were detected
with toluidine blue but false-negative staining rates for carcinoma-m-5 /Yw and dysplasia were
42% and 58%, respectively.
The use of toluidine blue as an adjunct for the detection of oral cancer has been reviewed
(Silverman 1988; Lingen et al 2008; Fedele 2009). Limitations of the technique include its
Page 124
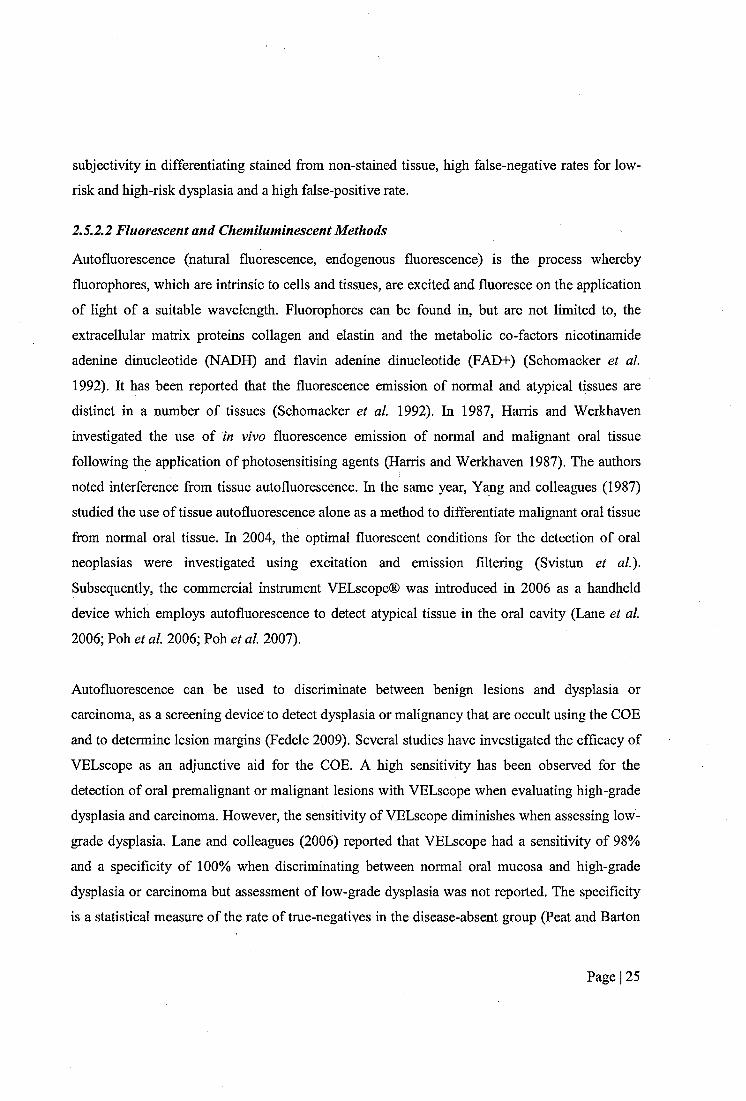
subjectivity in differentiating stained from non-stained tissue, high false-negative rates for low-
risk and high-risk dysplasia and a high false-positive rate.
2.5.2.2 Fluorescent and Chemiluminescent Methods
Autofluorescence (natural fluorescence, endogenous fluorescence) is the process whereby
fluorophores, which are intrinsic to cells and tissues, are excited and fluoresce on the application
of light of a suitable wavelength. Fluorophores can be found in, but are not limited to, the
extracellular matrix proteins collagen and elastin and the metabolic co-factors nicotinamide
adenine dinucleotide (NADH) and flavin adenine dinucleotide (FAD+) (Schomacker et al.
1992). It has been reported that the fluorescence emission of normal and atypical tissues are
distinct in a number of tissues (Schomacker et al. 1992). In 1987, Harris and Werkhaven
investigated the use o ï in vivo fluorescence emission of normal and malignant oral tissue
following the application of photosensitising agents (Harris and Werkhaven 1987). The authors
noted interference from tissue aiitofluorescence. In the same year, Yang and colleagues (1987)
studied the use of tissue autofluorescence alone as a method to differentiate malignant oral tissue
from normal oral tissue. In 2004, the optimal fluorescent conditions for the detection of oral
neoplasias were investigated using excitation and emission filtering (Svistun et al).
Subsequently, the commercial instrument VELscope® was introduced in 2006 as a handheld
device which employs autofluorescence to detect atypical tissue in the oral cavity (Lane et al.
2006; Poh et al. 2006; Poh et al. 2007).
Autofluorescence can be used to discriminate between benign lesions and dysplasia or
carcinoma, as a screening device to detect dysplasia or malignancy that are occult using the COE
and to determine lesion margins (Fedele 2009). Several studies have investigated the efficacy of
VELscope as an adjunctive aid for the COE. A high sensitivity has been observed for the
detection of oral premalignant or malignant lesions with VELscope when evaluating high-grade
dysplasia and carcinoma. However, the sensitivity of VELscope diminishes when assessing low-
grade dysplasia. Lane and colleagues (2006) reported that VELscope had a sensitivity of 98%
and a specificity of 1 0 0 % when discriminating between normal oral mucosa and high-grade
dysplasia or carcinoma but assessment of low-grade dysplasia was not reported. The specificity
is a statistical measure of the rate of true-negatives in the disease-absent group (Peat and Barton
Page I 25
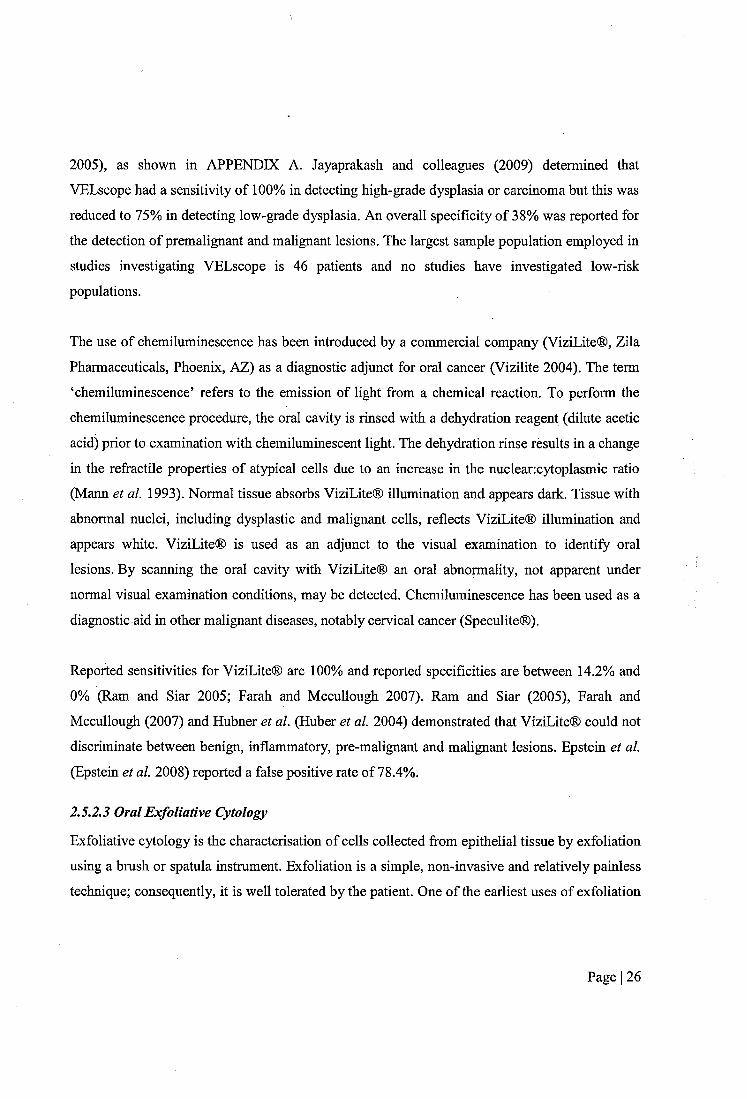
2005), as shown in APPENDIX A. Jayaprakash and colleagues (2009) determined that
VELscope had a sensitivity of 100% in detecting high-grade dysplasia or carcinoma but this was
reduced to 75% in detecting low-grade dysplasia. An overall specificity of 38% was reported for
the detection of premalignant and malignant lesions. The largest sample population employed in
studies investigating VELscope is 46 patients and no studies have investigated low-risk
populations.
The use of chemiluminescence has been introduced by a commercial company (ViziLite®, Zila
Pharmaceuticals, Phoenix, AZ) as a diagnostic adjunct for oral cancer (Vizilite 2004). The term
‘chemiluminescence’ refers to the emission of light from a chemical reaction. To perform the
chemiluminescence procedure, the oral cavity is rinsed with a dehydration reagent (dilute acetic
acid) prior to examination with chemiluminescent light. The dehydration rinse results in a change
in the refractile properties of atypical cells due to an increase in the nuclearicytoplasmic ratio
(Mann et al. 1993). Normal tissue absorbs ViziLite® illumination and appears dark. Tissue with
abnormal nuclei, including dysplastic and malignant cells, reflects ViziLite® illumination and
appears white. ViziLite® is used as an adjunct to the visual examination to identify oral
lesions. By scanning the oral cavity with ViziLite® an oral abnormality, not apparent under
normal visual examination conditions, may be detected. Chemiluminescence has been used as a
diagnostic aid in other malignant diseases, notably cervical cancer (Speculite®).
Reported sensitivities for ViziLite® are 100% and reported specificities are between 14.2% and
0% (Ram and Siar 2005; Farah and Mecullough 2007). Ram and Siar (2005), Farah and
Mccullough (2007) and Hubner et al. (Huber et al. 2004) demonstrated that ViziLite® could not
discriminate between benign, inflammatory, pre-malignant and malignant lesions. Epstein et al.
(Epstein et al. 2008) reported a false positive rate of 78.4%.
2,5.2.3 Oral Exfoliative Cytology
Exfoliative cytology is the characterisation of cells eollected from epithelial tissue by exfoliation
using a brush or spatula instrument. Exfoliation is a simple, non-invasive and relatively painless
technique; consequently, it is well tolerated by the patient. One of the earliest uses of exfoliation
Page I 26
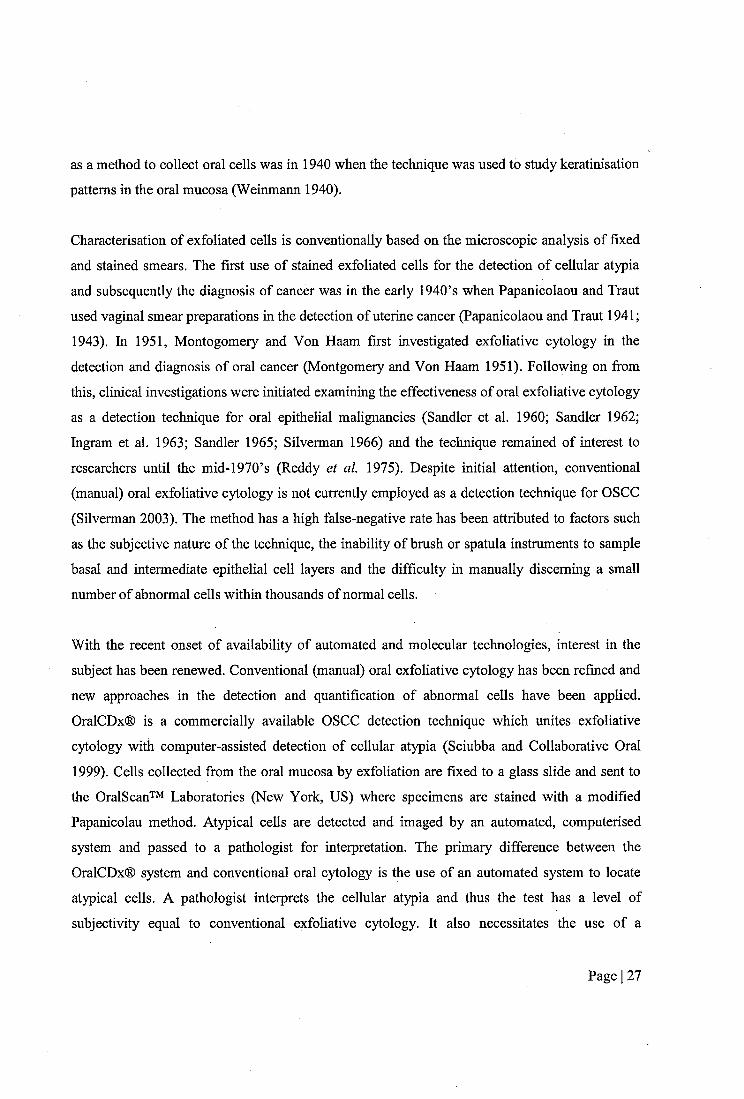
as a method to eollect oral cells was in 1940 when the technique was used to study kératinisation
patterns in the oral mucosa (Weinmann 1940).
Characterisation of exfoliated cells is conventionally based on the microscopic analysis of fixed
and stained smears. The first use of stained exfoliated cells for the detection of cellular atypia
and subsequently the diagnosis of cancer was in the early 1940’s when Papanicolaou and Traut
used vaginal smear preparations in the detection of uterine cancer (Papanicolaou and Traut 1941;
1943). In 1951, Montogomery and Von Haam first investigated exfoliative cytology in the
detection and diagnosis of oral cancer (Montgomery and Von Haam 1951). Following on from
this, clinical investigations were initiated examining the effectiveness of oral exfoliative cytology
as a detection technique for oral epithelial malignancies (Sandler et al. 1960; Sandler 1962;
Ingram et al. 1963; Sandler 1965; Silverman 1966) and the technique remained of interest to
researchers until the mid-1970’s (Reddy et al. 1975). Despite initial attention, conventional
(manual) oral exfoliative cytology is not currently employed as a detection technique for OSCC
(Silverman 2003). The method has a high false-negative rate has been attributed to factors such
as the subjective nature of the technique, the inability of brush or spatula instruments to sample
basal and intermediate epithelial cell layers and the difficulty in manually discerning a small
number of abnormal cells within thousands of normal cells.
With the recent onset of availability of automated and molecular technologies, interest in the
subject has been renewed. Conventional (manual) oral exfoliative eytology has been refined and
new approaches in the detection and quantification of abnormal cells have been applied.
OralCDx® is a commercially available OSCC detection technique which unites exfoliative
cytology with computer-assisted detection of cellular atypia (Sciubba and Collaborative Oral
1999). Cells collected from the oral mucosa by exfoliation are fixed to a glass slide and sent to
the OralScan™ Laboratories (New York, US) where specimens are stained with a modified
Papanicolau method. Atypical cells are detected and imaged by an automated, computerised
system and passed to a pathologist for interpretation. The primary difference between the
OralCDx® system and conventional oral cytology is the use of an automated system to locate
atypical cells. A pathologist interprets the cellular atypia and thus the test has a level of
subjectivity equal to conventional exfoliative cytology. It also necessitates the use of a
Page 1 27

pathologist specializing in OralCDx® specimens. Thus, the test cannot be carried out in real-time
in the clinic and therefore there is a time delay between an OralCDx® test and results.
OralCDx® specimens are categorised as “positive”, “atypical”, “negative” or “inadequate”. A
positive result is defined as having definitive cellular evidence of epithelial dysplasia or
carcinoma; an atypical result is defined as having abnormal epithelial changes of uncertain
diagnostic significance; a negative result is defined as having no epithelial abnormalities and an
inadequate result is defined as not containing an adequate representation of cells fi*om all three
epithelial layers of the oral mucosa. Lesions that have a ‘positive’ or ‘atypical’ OralCDx® result
require further investigation by inscisional biopsy for a definitive diagnosis. Therefore, as the
action is the same for both outcomes, for the purpose of this review, ‘positive’ and ‘atypical’
OralCDx® results will be referred to as ‘abnormal’ results.
A number of studies have investigated the performance of the OralCDx® system (Sciubba and
Collaborative Oral 1999; Christian 2002; Svirsky et al 2002; Poate et al 2004; Scheifele et al
2004; Bhoopathi et a l 2009; Hohlweg-Majert et al 2009). The sensitivity, specificity, positive
predictive value (PPV) and negative predictive value (NPV) have been reported. Calculations of
sensitivity, specificity, PPV and NPV are shown in APPENDDC A. Reported sensitivity values
vary from 52% to 100% and reported specificity values vary from 29% to 100%. The PPV
ranged from 7.9% to 90.3% and one negative predictive value (NPV) was reported at 60%, as
shown in Table 2-6.
Page I 28
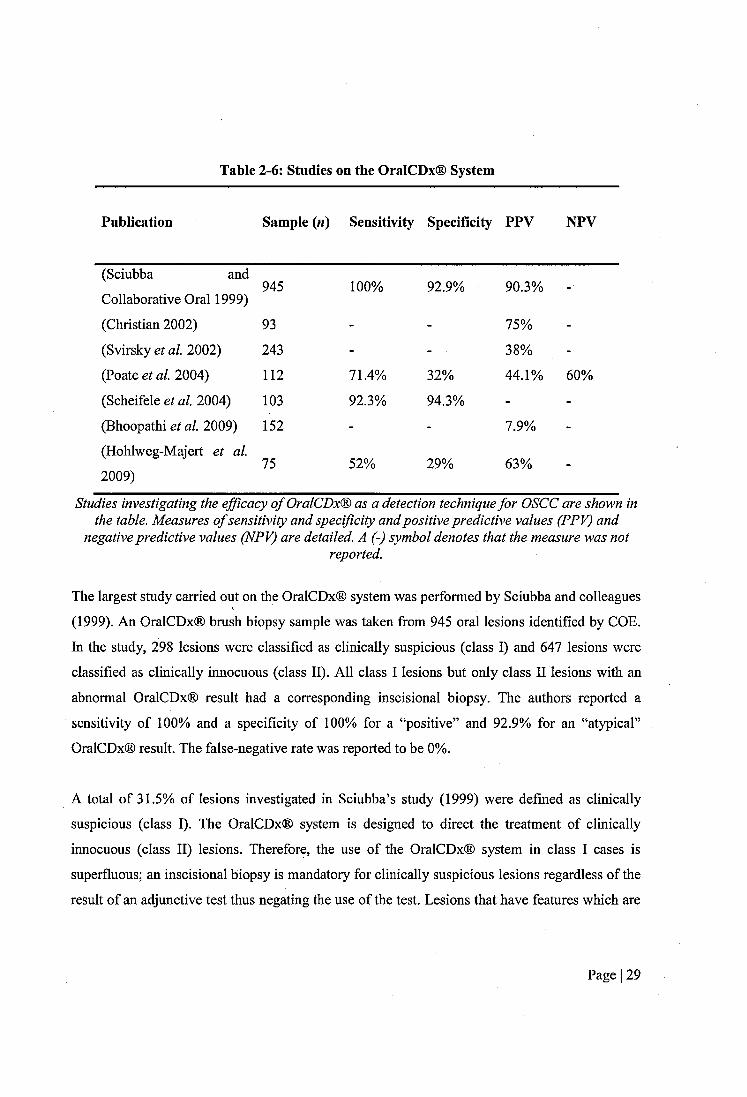
Table 2-6: Studies on the OralCDx® System
Publication Sample («) Sensitivity Specificity PPV NPV
(Sciubba and
Collaborative Oral 1999)945 1 0 0 % 92.9% 90.3% -
(Christian 2002) 93 - - 75% -
(Svirsky et al. 2002) 243 - - 38% -(Poate et al. 2004) 1 1 2 71.4% 32% 44.1% 60%
(Scheifele et al. 2004) 103 92.3% 94.3% - -
(Bhoopathi et al. 2009) 152 - - 7.9% -
(Hohlweg-Majert et al.
2009)75 52% 29% 63% -
Studies investigating the efficacy o f OralCDx® as a detection technique for OSCC are shown in the table. Measures o f sensitivity and specificity and positive predictive values (PPV) and
negative predictive values (NPV) are detailed. A (-) symbol denotes that the measure was notreported.
The largest study carried out on the OralCDx® system was performed by Sciubba and colleagues
(1999). An OralCDx® brush biopsy sample was taken from 945 oral lesions identified by COE.
In the study, 298 lesions were classified as clinically suspicious (class I) and 647 lesions were
classified as clinically innocuous (class II). All class I lesions but only class II lesions with an
abnormal OralCDx® result had a corresponding inscisional biopsy. The authors reported a
sensitivity of 100% and a specificity of 100% for a “positive” and 92.9% for an “atypical”
OralCDx® result. The false-negative rate was reported to be 0%.
A total of 31.5% of lesions investigated in Sciubba’s study (1999) were defined as clinically
suspicious (class I). The OralCDx® system is designed to direct the treatment of clinically
innocuous (class II) lesions. Therefore, the use of the OralCDx® system in class I cases is
superfluous; an inscisional biopsy is mandatory for clinically suspicious lesions regardless of the
result of an adjunctive test thus negating the use of the test. Lesions that have features which are
Page I 29
clinically suspicions are frequently at an advanced stage of malignancy (Bagan et al 2010).
Inclusion of class I lesions in the study will bias the results.
The measures of sensitivity and specificity reported in the study by Sciubba et a l (1999) are
based on lesions that had both an OralCDx® and a gold-standard inscisional biopsy result. The
significance of the Sciubba study (1999) is limited by the lack of confirmatory inscisional
biopsies performed on class II lesions. One hundred and thirty class II lesions had abnormal
OralCDx® results but only 29 of these had a confirmatory inscisional biopsy. Therefore the
investigators elected not to look for false-positive results in 78% (101 cases) of cases with
abnormal OralCDx® results in the OralCDx® target group. In these cases the investigators chose
to disregard the OralCDx® result in favour of their clinical judgment thus negating the use of the
test. If the preliminary clinieal diagnoses of the investigators were correct and lesions with
abnormal OralCDx® results not investigated further with the gold-standard method were actually
benign, the false-positive rate will be higher and therefore the specificity of the OralCDx®
system will be lower than reported. Sciubba et al (1999) did not report the positive predictive
value (PPV). However, from the data reported the PPV can be calculated. If the calculation is
based on lesions which have both OralCDx® and inscisional biopsy results, the PPV of an
abnormal OralCDx® result will be 90.3%. If the lesions which had a positive OralCDx® result
but were not investigated further with an inscisional biopsy are included and the elinical
diagnoses is assumed to be correct (i.e. the lesions were actually benign) the PPV of an abnormal
OralCDx® test will be 56.6%.
In Sciubba and colleagues’ study (1999) it was disclosed that inflammatory lesions such as oral
lichen planus can generate an abnormal OralCDx® result. Lesions with abnormal OralCDx®
results that had clinical diagnoses of inflammatory conditions were excluded from the measures
of sensitivity and specificity. Therefore, the specificity of the OralCDx® system is dependent on
the ability of the investigator to identify inflammatory lesions. The Sciubba study (1999) was a
multicentre investigation carried out at 35 academic dental sites. However, all clinical
investigators had advanced training in oral maxillofacial pathology, oral medicine or oral
surgery. This level of expertise is not an accurate representation of the ability of the general
population of dental practitioners who use the OralCDx® system.
Page I 30
Bhoopathi et al. (2009) conducted a retrospective study on the efficacy of the OralCDx® system
in a ‘real world’ setting. Scalpel biopsy results of 152 lesions that had abnormal OralCDx®
results were assessed. It was found that 92.1% of lesions were neither malignant or dysplastic.
The positive predictive value (PPV) of the OralCDx® system was found to be 7.9% for an
abnormal OralCDx® result. Of the lesions that had an abnormal OralCDx® result and were
found to be benign by inscisional biopsy, 80.3% were reactive or inflammatory. This
demonstrates that the OralCDx® system cannot discriminate between dysplastic and malignant
oral lesions and inflammatory oral lesions. Furthermore, investigators tested inflammatory
lesions with an OralCDx brush biopsy and inscisional biopsy indicating that the clinical
investigators were unable to diseriminate between these two types of lesions.
Another retrospective study evaluating the efficacy of the OralCDx® system was carried out by
Poate et al. (2004). The group reviewed the results of OralCDx® brush biopsies taken from 112
patients. It was found that the OralCDx® system had a sensitivity of 71.4% and a specificity of
32%. The positive predictive value (PPV) of the system was reported as 44.1% and the negative
predictive value (NPV) was 60%, for abnormal results. Poate et al. (2004) also noted that
inflammatory conditions frequently gave rise to an ‘atypical’ OralCDx® result. The study by
Poate et al. (2004) was carried out at a specialist oral medical unit indicating that specialist
clinicians are also unable to differentiate between inflammatory conditions and dysplasia and
malignancy.
Previous studies have shown that OSCC can be misdiagnosed as inflammation by clinical
examination evidencing the inability to differentiate between the two conditions by COE
(Sandler 1962).
In the study by Poate et al. (2004) only lesions which had both OralCDx® and inscisional biopsy
results were included in the analysis of sensitivity and specificity. A number of patients (3/37)
with abnormal (‘positive’ or ‘atypical’) results did not have an inscisional biopsy. Twenty per
cent of cases (15/75 lesions) with negative OralCDx® results were followed up with inscisional
biopsies. These cases were considered to be clinically suspicious. One was found to be OSCC
Page I 31
and five were dysplastic. In the report by Poate and colleagues (2004) it was stated that “«o
patients with clinically obvious carcinomas were included".
Christian et al. (2002) screened dentists and dental hygienists for oral cancer using the
OralCDx® system at the American Dental Association annual sessions (Christian 2002). Thirty-
one volunteer dentists identified 93 oral epithelial lesions in subjects by COE. The lesions were
subsequently tested with the OralCDx® system. Six of the lesions had ‘atypical’ results and one
had a ‘positive’ result. However, 3 of the lesions with ‘atypical’ results did not undergo a
subsequent inscisional biopsy. Of the lesions that had scalpel biopsies, one of the lesions with an
‘atypical’ result was found to be benign and the other 3 lesions were dysplastic. Synonymous
with the study by Scuibba and colleagues (1999), the investigation is limited by the absence of
conformational inscisional biopsies for all lesions that had abnormal OralCDx® results.
Scheifele and colleagues (2004) carried out a hospital based study and reviewed the results of
103 OralCDx® biopsies and compared them to concomitant gold-standard inscisional biopsies
The sensitivity of the OralCDx® system was found to be 92.3% and the specificity was 94.3%.
Scheifele et al. (2004) also reported likelihood ratios. The positive likelihood ratio (LR+) is
defined as the ratio of the true-positive rate to the false-positive rate (Peat and Barton 2005). The
negative likelihood ratio (LR-) is defined as the ratio of the true-negative to the false-negative
rate. The LR+ was 16.2. and the LR- was 0.08. Lesions which were ‘‘obvious oral squamous cell
carcinoma" were included in this study. In a number of cases, inscisional biopsies were
performed prior to the OralCDx® biopsy. If the OralCDx® biopsy is preceded by the inscisional
biopsy then the OralCDx® biopsy cannot be taken from the same tissue as the inscisional biopsy
as this tissue has been removed. Therefore, differences in the tissue state, and thus diagnosis, of
the two specimens may occur. Thus the inscisional biopsy may not be representative of tissue
that is analysed by OralCDx®.
In all studies (Sciubba and Collaborative Oral 1999; Poate et al. 2004; Scheifele et al. 2004;
Hohlweg-Majert et al. 2009), the sensitivity and specificity were calculated from lesions which
had both an OralCDx® result and a concomitant gold-standard inscisional biopsy result.
Therefore, the false-negative and true-negative rates used to calculate sensitivity and specificity
Page I 32
values were based on lesions which had negative OralCDx® results but which the investigator
considered to be clinically suspicious. In retrospective studies, only lesions with a negative
OralCDx® that were judged by the clinician to be clinically suspicious were followed up with an
inscisional biopsy. In prospective studies, the use of inscisional biopsies for confirmatory gold-
standard diagnosis in people who have screened negative for OSCC and there is no clinical
suspicion of disease, is unethical (Downer et al. 2004). In the study by Sciubba et al. (1999),
only 26% of lesions with a negative OralCDx® result had a concomitant inscisional biopsy. In
the study by Poate et al. (2004), only 20% of lesions that had a negative OralCDx® result were
followed up with an inseisional biopsy. In the study by Hohlweg-Majert et al. (2009), 55% of
lesions with a negative OralCDx® result also had an inscisional biopsy. As all negative
OralCDx® results were not verified by the gold-standard inscisional biopsy, the measures of
sensitivity and specificity given in all studies must be interpreted with caution.
The OralCDx® system employs image analysis software to detect atypical cells in a sample
containing normal cells. Sciubba et al (1999) elaim that the system can detect abnormal cells
when they are present as only 0.1% of the cell population. The rate of inadequate OralCDx®
results is reportedly between 1.3-8.3% (Sciubba and Collaborative Oral 1999; Poate et al. 2004;
Scheifele et al. 2004; Hohlweg-Majert et al. 2009).
2.6 AC Electrokinetics
AC electrokinetic techniques include, but are not limited to, dielectrophoresis (DEP), travelling
wave DEP (twDEP) and electrorotation (ROT) (Hughes 2000). AC electrokinetic techniques
have been used to characterise and separate a range of biological particles including yeast
(Huang et al. 1992), bacteria (Markx et al. 1996), algae (Hubner et al. 2003), blood cells (Chan
et al. 2000), cancerous eells (Gascoyne et al. 1997b), stem cells (Flanagan et al. 2008), DNA
(Nedelcu and Watson 2004), RNA, viruses (Hughes et al. 1998), mitochondria, chloroplasts
(Ting et al. 1971) and proteins.
The term ‘dielectrophoresis’ was coined in 1951 by Pohl (Pohl 1951). DEP is defined as the
motion of a polarisable particle suspended in a conduetive medium under the influence of a non
Page I 33

uniform applied electric field (Pohl 1978). twDEP is the linear motion of a polarisable particle
suspended in a conductive medium along an electrode array in response to an electric field phase
gradient (Hughes 2000; Zhang et al. 2010). The electric field phase gradient is produced by
arrays of electrodes excited with phase-shifted signals. The use of twDEP to induce translational
motion in bioparticles was first demonstrated by Masuda et al. (1987; 1988). ROT is a related
phenomenon to twDEP whereby a particle is suspended in the centre of a circular electrode
configuration and induced to rotate about its axis in response to a rotating electric field (Pethig et
al. 2005). Arnold and Zimmermann (1982) first described ROT using bioparticles.
2.6.1 Dielectrics and Polarisation
A dielectric is a material which has the capacity to polarise when subject to an applied electric
field (Morgan and Green 2002). Polarisation is the redistribution of charges bound within a
material under the influence of an applied electric field whereby charges of the same magnitude
and opposite polarity are displaced to different locations within the material. On removal of the
applied electric field, the material returns to its original state. Polarisation is not instantaneous;
charges take a finite amount of time to accumulate. Following removal of the applied electric
field, a finite amount of time is taken for charge equilibrium to be re-established. This is termed
relaxation time (t).
In systems where an alternating current (AC) is used to produee an electric field, polarisation is
frequency dependent. At low frequencies, polarisation realizes its maximum potential before the
direction of the electric field changes. Redistribution of free charge (conductivity) is the
dominating mechanism governing polarisation at low frequencies. At high frequencies,
polarisation does not have time to realize its maximum potential before the direction of the field
changes. Perturbation of bound charges (permittivity) dominates polarisation at high frequencies.
The difference between the two states is called a dielectric dispersion.
The dielectric constant (or relative permittivity) is a measure of the polarisability of a material.
The dielectric constant {K) of a dielectric is the ratio of its permittivity {e) to the permittivity of
free space {eq), given by Equation 1 :
Page I 34
£'K = —
Sq
Equation 1
As no polarisation occurs in a vacuum, all dielectrics will have a dielectric constant greater than
1.
2.6.2 Dielectrophoresis
When a dielectric particle is suspended in a medium of low conductivity and an electric field is
applied, the particle will become polarised. When the particle is more polarisable than the
suspending medium, the charge density at the internal aspect of the interface between the particle
and the suspending medium is greater than the charge density at the external aspect of the
interface. Thus, the net induced dipole is aligned with the electric field and the electric field lines
will bend towards the particle meeting its surface at right angles, as shown in Figure 2-4.
Page I 35
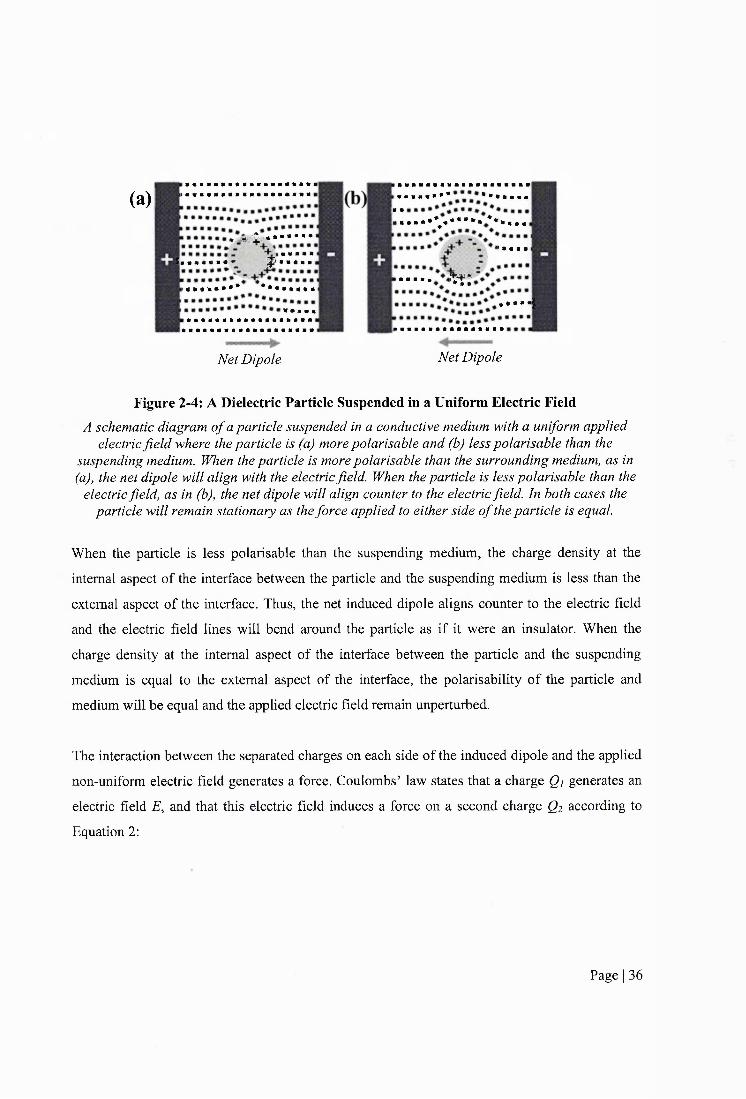
(a)! : # « # # * # # # # * # » # « * » # #
* , « i É s * • • • • ■ •
tt « » * •# « # « # # « # » ^ « » # # »
(««»»•••* ••••<•«#« mmmmm
!;• m
Net Dipole
#####«#* ••••■«■
^ m m m m * \ m * * * * m * * m m m r n
> • a ■ ■
t t :*#«*«|
Net Dipole
Figure 2-4: A Dielectric Particle Suspended in a Uniform Electric FieldA schematic diagram o f a particle suspended in a conductive medium with a uniform applied
electric field where the particle is (a) more polarisable and (b) less polarisable than the suspending medium. When the particle is more polarisable than the surrounding medium, as in (a), the net dipole will align with the electric field. When the particle is less polarisable than the
electric field, as in (b), the net dipole will align counter to the electric field. In both cases the particle will remain stationary as the force applied to either side o f the particle is equal.
When the particle is less polarisable than the suspending medium, the charge density at the
internal aspect of the interface between the particle and the suspending medium is less than the
external aspect of the interface. Thus, the net induced dipole aligns counter to the electric field
and the electric field lines will bend around the particle as if it were an insulator. When the
charge density at the internal aspect of the interface between the particle and the suspending
medium is equal to the external aspect of the interface, the polarisability of the particle and
medium will be equal and the applied electric field remain unperturbed.
The interaction between the separated charges on each side of the induced dipole and the applied
non-uniform electric field generates a force. Coulombs’ law states that a charge Qi generates an
electric field E, and that this electric field induces a force on a second charge Q2 according to
Equation 2:
Page I 36

%
f =
Equation 2
Where e is the permittivity of the material surrounding Q2 , d is the distance between the charges
and r is the unit vector directed from Qi to Q2 .
When a dielectric particle is suspended in a conductive medium and a spatially uniform electric
field is applied, the magnitude of the Coulomb force imparted on the two poles of the induced
dipole is equal and opposite. Thus, the net force acting on the particle is zero and the particle
remains stationary.
When the applied electric field is spatially non-uniform, a gradient of electric field strength
exists. The strength of the electric field is proportional to the number of electric field lines per
unit area. Thus, the electric field strength is stronger where the field lines eonverge and weaker
where they diverge, as shown in Figure 2-5.
Page I 37
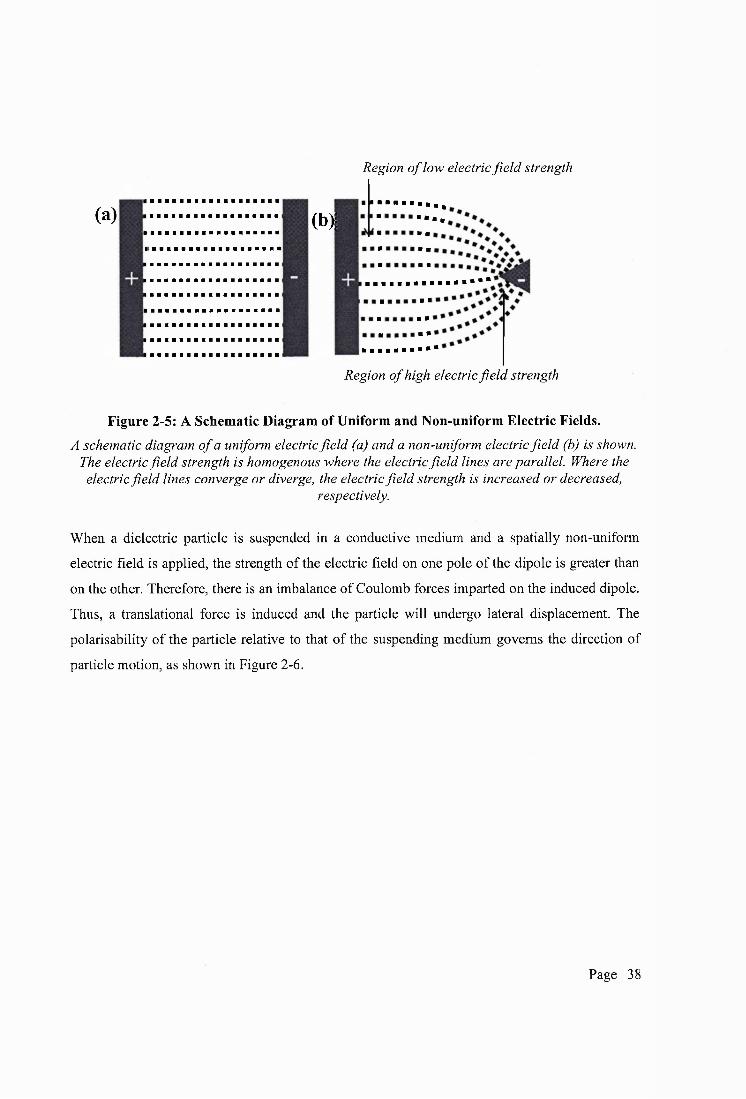
Region o f low electric fie ld strength
(a) m • •
Region o f high electric field strength
Figure 2-5: A Schematic Diagram of Uniform and Non-uniform Electric Fields.A schematic diagram of a uniform electric field (a) and a non-uniform electric field (b) is shown.
The electric field strength is homogenous where the electric field lines are parallel. Where the electric field lines converge or diverge, the electric field strength is increased or decreased,
respectively.
When a dielectric particle is suspended in a conductive medium and a spatially non-uniform
electric field is applied, the strength of the electric field on one pole of the dipole is greater than
on the other. Therefore, there is an imbalance of Coulomb forces imparted on the induced dipole.
Thus, a translational force is induced and the particle will undergo lateral displacement. The
polarisability of the particle relative to that of the suspending medium governs the direction of
particle motion, as shown in Figure 2-6.
Page I 38

(a)
Net Dipole
\ m m t t m m m m m m m
> « • « a « N
!######**5 IP
(b)
Net Dipole
i N « a a a a a a « *a a a a a a a * * ’
POSITIVE DEP DEP NEGATIVE DEP
Figure 2-6: A Schematic Diagram of Positive and Negative DEP.A schematic diagram o f a particle suspended in a conductive medium where the particle is (a) more polarisable and (b) less polarisable than the suspending medium. I f the particle is more polarisable than the suspending medium, the particle will be attracted to high-field strength regions. This is termed positive DEP. I f the particle is less polarisable than the suspending medium, the particle will be repelled from the high-field strength regions. This is termed
negative DEP. The arrows denote the direction o f particle motion. In positive DEP the particle will move toward regions o f high electric field strength. In negative DEP the particle will move
toward region o f low electric field strength.
If the particle is more polarisable than the suspending medium, the particle will move in the
direction of high field strength regions. This is termed positive DEP (+DEP, p-DEP). If the
particle is less polarisable than the suspending medium the particle will be repelled from high
field strength regions. This is termed negative DEP (-DEP, n-DEP). If the polarisability of the
particle is equal to that of the medium, the particle will remain stationary; the frequency at which
this occurs is termed the crossover frequency (Fcross, Fc, F% or Fxo)-
The magnitude of particle displacement is proportional to the force exerted on the particle. The
DEP force is given by Equation 3:
Page I 39

= 2 iït^ fîe [if (&))] VE^
Equation 3
Where r is the radius of the particle, Sm is the medium permittivity, V is the Del operator
(gradient) on the applied electric field E and Re [K(co)] is the real part of the Clausius-Mossotti
factor. The Clausius-Mossotti factor is given by Equation 4:
s* — E*
Equation 4
Where Sp* and Sm* are the complex permittivities of the particle and medium, respectively. The
complex permittivity is given by Equation 5:
CÛ
Equation 5
Where e is the permittivity, co is the angular frequency, j is the square root of -1 and c is the
conductivity. Thus, the permittivity and conductivity of the particle can be derived from
measurements of cell motion as a frmction of frequency.
Dielectric spectra of homogenous dielectric particles have the form of that shown in Figure 2-7.
Page I 40
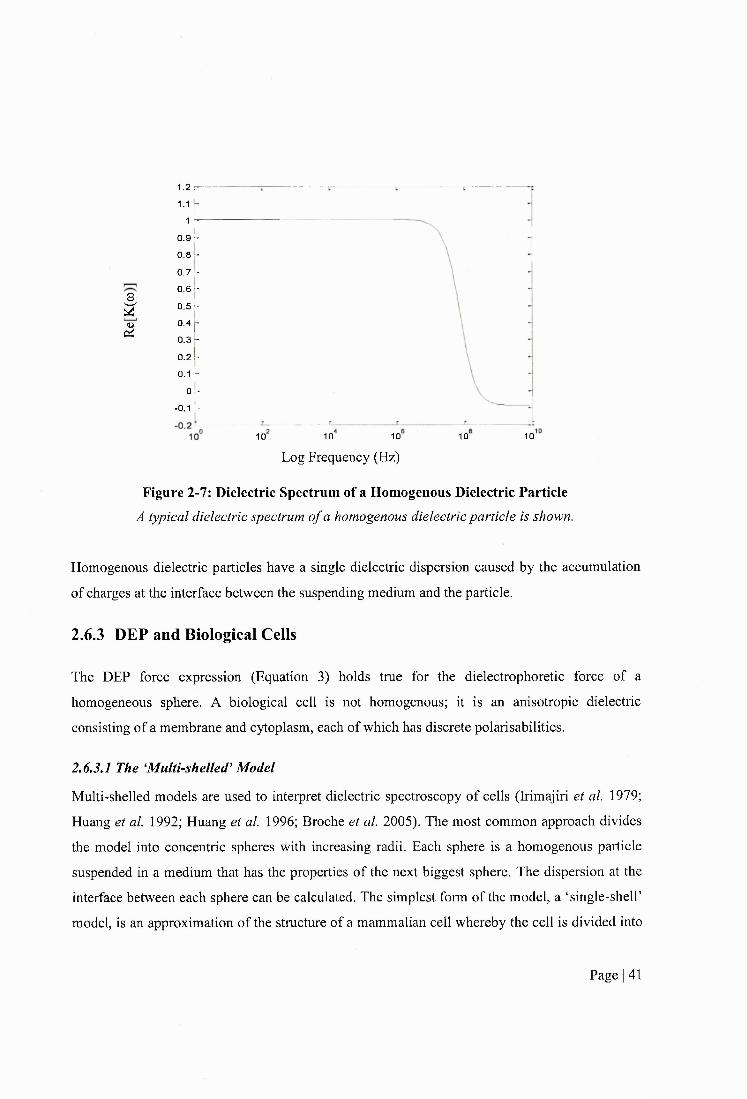
I(2
’■Y1.1 r
40.9 h
0 8 -
0.7 r
0.6 -
o.sk0.4 p
0.3 -
0.2 k
0-1 h Y
-0 .1 Y
10 10 10 10 10
Log Frequency (Hz)
Figure 2-7: Dielectric Spectrum of a Homogenous Dielectric ParticleA typical dielectric spectrum of a homogenous dielectric particle is shown.
Homogenous dielectric particles have a single dielectric dispersion caused by the accumulation
of charges at the interface between the suspending medium and the particle.
2.6.3 DEP and Biological Cells
The DEP force expression (Equation 3) holds true for the dielectrophoretic force of a
homogeneous sphere. A biological cell is not homogenous; it is an anisotropic dielectric
consisting of a membrane and cytoplasm, each of which has discrete polarisabilities.
2.6.3.1 The ‘Multi-shelled Model
Multi-shelled models are used to interpret dielectric spectroscopy of cells (Irimajiri et al. 1979;
Huang et al. 1992; Huang et al. 1996; Broche et al. 2005). The most common approach divides
the model into concentric spheres with increasing radii. Each sphere is a homogenous particle
suspended in a medium that has the properties of the next biggest sphere. The dispersion at the
interface between each sphere can be calculated. The simplest form of the model, a ‘single-shelF
model, is an approximation of the structure of a mammalian cell whereby the cell is divided into
Page I 41
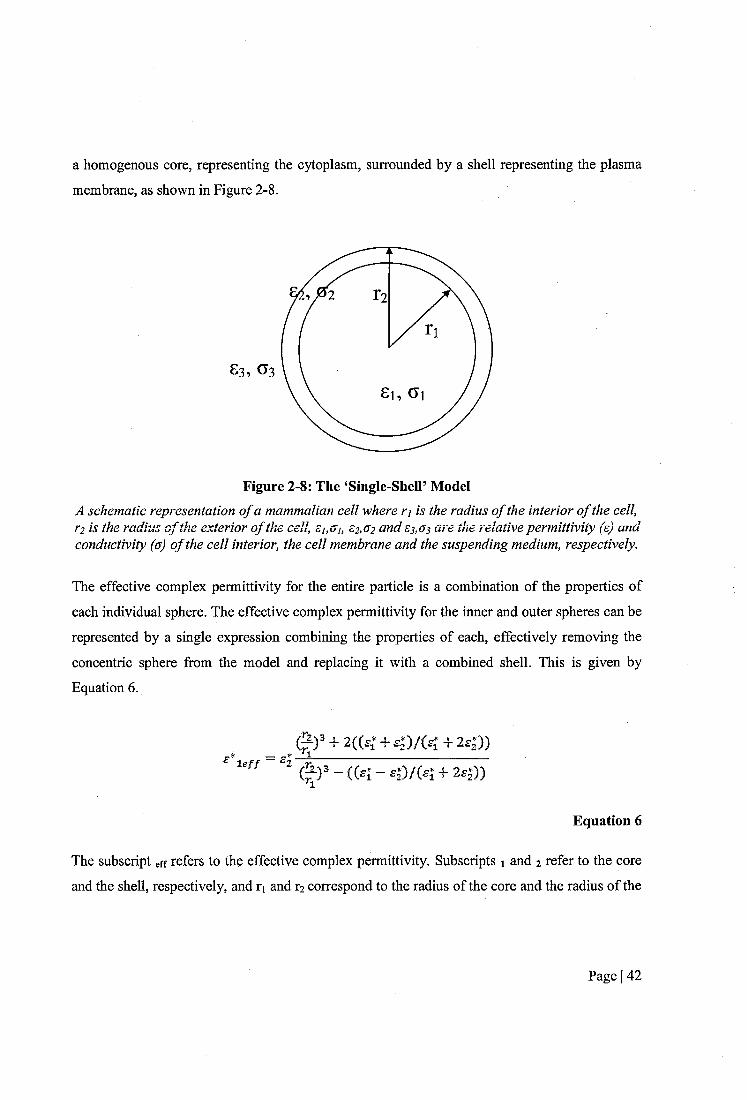
a homogenous core, representing the cytoplasm, surrounded by a shell representing the plasma
membrane, as shown in Figure 2-8.
Figure 2-8: The ‘Single-ShelF ModelA schematic representation o f a mammalian cell where ri is the radius o f the interior o f the cell, r2 is the radius o f the exterior o f the cell, ei,oi, C2,u2 and £3 ,0 3 are the relative permittivity (s) arid conductivity (a) o f the cell interior, the cell membrane and the suspending medium, respectively.
The effective complex permittivity for the entire particle is a combination of the properties of
each individual sphere. The effective complex permittivity for the inner and outer spheres can be
represented by a single expression combining the properties of each, effectively removing the
concentric sphere from the model and replacing it with a combined shell. This is given by
Equation 6 .
le // = £.
# ) = + 2 (C£f + £ j ) / ( £ Î + 2 s |) ) _11__________________________
- (( 1 - 4 )/(4 + 2 4 ))
Equation 6
The subscript eff refers to the effective complex permittivity. Subscripts 1 and 2 refer to the core
and the shell, respectively, and r% and r] correspond to the radius of the core and the radius of the
Page I 42

centre of the sphere to outside of the shell. Thus the Clausius-Mossotti factor is given by
Equation 7.
_ "ig//H sff 2 ^ 3
Equation 7
The subscript 3 corresponds to the suspending medium. Thus, the conductivity and permittivity
values for the membrane and cytoplasm can be determined by curve fitting the model to the data.
The effective membrane capacitance ( C e f f ) is given by Equation 8 .
- _ (^2%)
Equation 8
The C e f f is a function of the permittivity and thickness of the cell membrane. It has been
estimated that a completely smooth cell membrane has a value of approximately 6 mF m'^ (Pethig
and Kell 1987). The C e f f assumes a sphere with a smooth membrane so an increase in surface
area by means of membrane folding would result in an increase in the C e f f value. Therefore, it
follows that the C e f f is also a fonction of surface morphology. High values of C e f f correlate with
a high number of blebs, folds, ruffles and microvilli in the cell membrane (Wang et al 1994;
Ratanachoo et a l 2002; Labeed et a l 2006). In this thesis, C e f f will be presented with the unit
mF m' in line with previous works in DEP. However, it should be noted that the unit pF cm'^ is
routinely used in other disciplines to describe cell capacitance. The conversion factor is shown in
Equation 9.
1 mF m~^ — 0 .1 pF cm"^
Equation 9
Page I 43

Mammalian cells have two dielectric dispersions; one caused by the accumulation of charges at
the interfaee between the suspending medium and the membrane and the other eaused by the
accumulation of charges at the interfaee between the suspending medium and the cytoplasm.
These will be referred to as the low frequency dielectric dispersion (LFDD) and the high
frequency dielectric dispersion (HFDD). A typieal dielectrie spectrum of a suspension of eells is
shown in Figure 2-9.
0.90.80.70.6
U, 0.4
- 0.1 -
-0 .2 L-0.3 k - 0 .4 -
Log Frequeney (Hz)
Figure 2-9: A Typical Dielectrophoretic Spectrum of Biological Cells Suspended in aConductive Medium.
The real part o f the Clausius-Mossotti factor (Re [K(o})]) is plotted as a function offrequency.
The frequeney at whieh is equal to zero is the crossover frequency. There are two
crossover frequeneies for mammalian cells; the LFDD crossover frequeney, termed Fxi, and the
HFDD crossover frequency, termed Fx2 -
Determination of the upper erossover frequeney has proven diffieult due to limitations with
signal generator equipment. However, Broche et al. (2005) devised a method for estimating the
upper crossover frequency of a cell population without observing it direetly, see
Page I 44

APPENDIX B. The ratio of the radius of the cell to the thickness of the membrane is given by
Equation 10.
3a
Equation 10
If the approximation a = 1 is made then the high frequeney crossover is given by Equation 11.
Equation 11
The method holds true when a < 1.15. It relies on knowing the first 10% of the HFDD and the
colleetion of cells at a frequency 3.16 times higher. The method does not work when there is no
upper crossover frequency, that is, when the permittivity of the medium is higher than the
permittivity of the cytoplasm or when the conduetivity of the medium is higher than the
conductivity of the cytoplasm. The method developed by Broehe et al. (2005) treats the eell
interior as a homogenous dieleetrie whereas in reality it is made up of cytoplasm, organelles and
maeromolecules that all have discrete dielectric properties. Thus, the cytoplasmic dielectric
properties that are derived using this method serve as an approximation of the dielectric
properties of the cell interior.
2.6.4 DEP-microwell System
A 3-D electrode design termed the ‘DEP-microwell’ was developed at the University of Surrey
(Hubner et al. 2005; Hoettges et al. 2008; Hoettges 2009) and has been employed in this study to
analyse the dielectrophoretic motion of cells in suspension. The DEP microwell strueture is
composed of alternating layers of electrodes and insulators with a hole drilled through the
structure with a transparent base glued under the hole to create a self-contained sample chamber,
as shown in Figure 2-10.
Page I 45

(a)
Electrode bands inside a well -OO
Figure 2-10: DEP-well Electrode
A photograph o f the well showing the electrode bands inside the well (a) and a schematic diagram o f a DEP-well electrode system (b). The alternating electrodes are manufactured using
8 layers o f 70jum thick copper separated by insulating material providing a spacing o f 150pm between electrodes. The well has a diameter o f 750pm. Adapted from Hubner et al (2005) and
Hoettges et al (2009).
A beam of light is passed through the well and a camera situated above the device captures an
aerial image periodically. Cell displacement is monitored by observing the changes in light
intensity in the micro well during the application of an AC electric field, as shown in Figure 2-11.
Page I 46

(a)Before(Osec)
(b)Negative
DEP
r. t
3
(c) Positive . DEP .
i i i î
Transparent base
^ Camera ^
r0 Sec. 1 120 SecJ 0 Sec
Figure 2-11: Negative and Positive DEP in the DEP-Well SystemA cross-sectional schematic diagram o f the well electrode system containing a cell suspension (a) before DEP, (b) during negative DEP and (c) during positive DEP is shown. A birds-eye view o f a DEP-well (d) with negative DEP and (e) with positive DEP is shown. Adapted from
Hoettges et al. (2009).
A banding system of concentric circles is used to divide the aerial image of the well into a
number of regions from band 10 on the outskirt of the well to band 1 in the centre, as shown in
Figure 2-12.
Page I 47
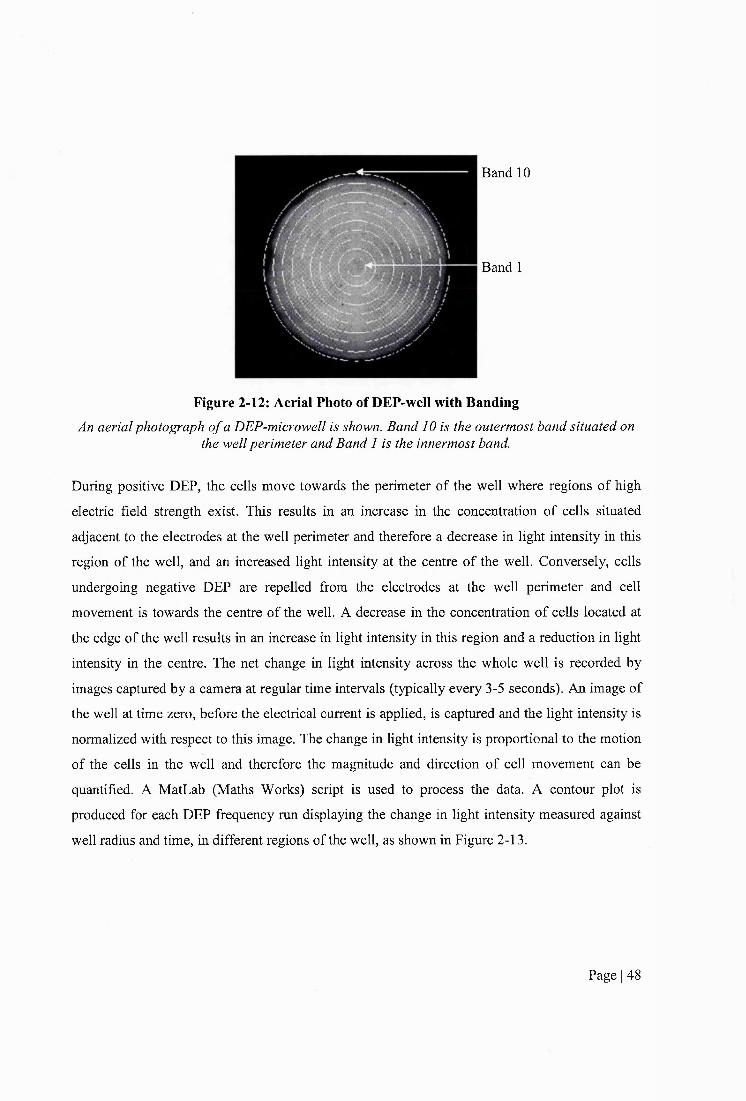
Band 10
Band 1
Figure 2-12; Aerial Photo of DEP-well with BandingAn aerial photograph o f a DEP-microwell is shown. Band 10 is the outermost band situated on
the well perimeter and Band 1 is the innermost band.
During positive DEP, the cells move towards the perimeter of the well where regions of high
electric field strength exist. This results in an increase in the concentration of cells situated
adjacent to the electrodes at the well perimeter and therefore a decrease in light intensity in this
region of the well, and an increased light intensity at the centre of the well. Conversely, cells
undergoing negative DEP are repelled from the electrodes at the well perimeter and cell
movement is towards the centre of the well. A decrease in the concentration of cells located at
the edge of the well results in an increase in light intensity in this region and a reduction in light
intensity in the centre. The net change in light intensity across the whole well is recorded by
images captured by a camera at regular time intervals (typically every 3-5 seconds). An image of
the well at time zero, before the electrical current is applied, is captured and the light intensity is
normalized with respect to this image. The change in light intensity is proportional to the motion
of the cells in the well and therefore the magnitude and direction of cell movement can be
quantified. A MatLab (Maths Works) script is used to process the data. A contour plot is
produced for each DEP frequency run displaying the change in light intensity measured against
well radius and time, in different regions of the well, as shown in Figure 2-13.
Page I 48

36 P
30 O
w 30
Bands
Figure 2-13: Contour Plot Indicating a Change in Light Intensity in the DEP-microwellAn example o f a contour plot showing the change in light intensity within different regions
(bands) o f the DEP-microwell when a suspension o f cells is undergoing positive DEP. The x-axis indicates the radius o f the well, where 1 is the band around the centre o f the well and 10 is the
perimeter o f the well. The y-axis represents the period o f time the electrodes are energised for, in seconds. Red indicates an increase in light intensity whilst dark blue indicates a decrease in light
intensity.
A spectrum of the mean change in light intensity can be plotted as a function of frequency, as
shown in Figure 2-14.
Page I 49
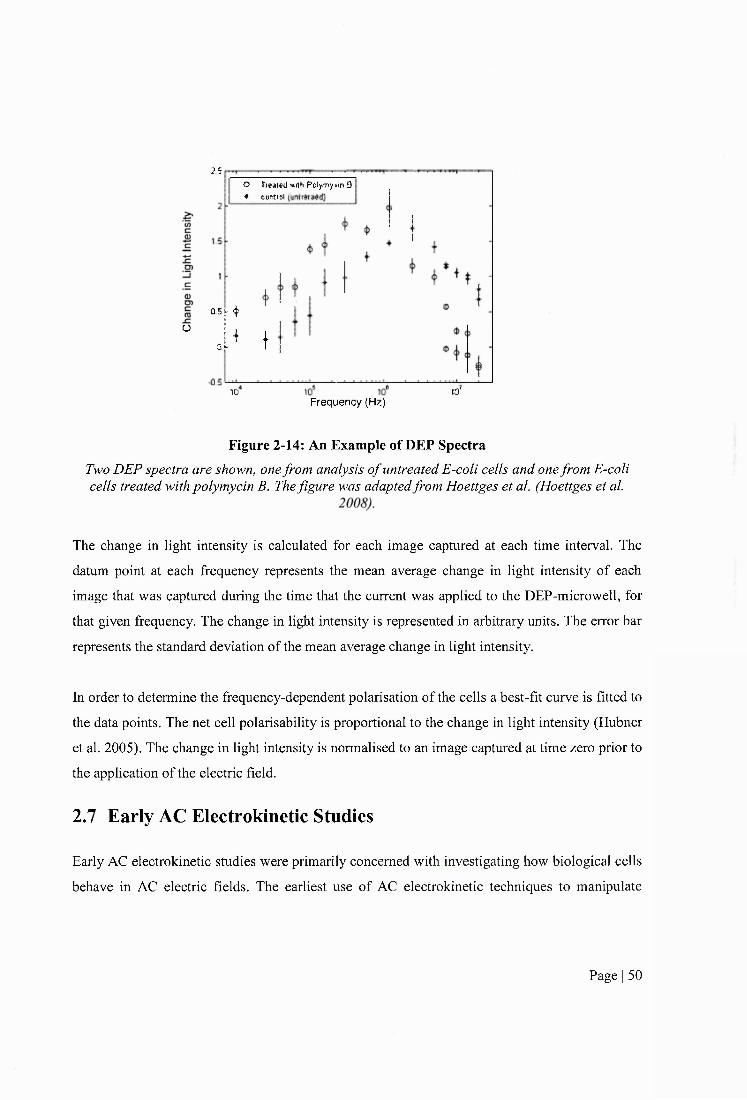
o
2SO Ireated willi Pelymy m 8 ♦ ceati l
10
Û5&$
oi !
Frequency (Hz)10'
Figure 2-14: An Example of DEP SpectraTwo DEP spectra are shown, one from analysis o f untreated E-coli cells and one from E-coli cells treated with polymycin B. The figure was adapted from Hoettges et al. (Hoettges et al.
The change in light intensity is calculated for each image captured at each time interval. The
datum point at each frequency represents the mean average change in light intensity of each
image that was captured during the time that the current was applied to the DEP-microwell, for
that given frequency. The change in light intensity is represented in arbitrary units. The error bar
represents the standard deviation of the mean average change in light intensity.
In order to determine the frequency-dependent polarisation of the cells a best-fit curve is fitted to
the data points. The net cell polarisability is proportional to the change in light intensity (Hubner
et al. 2005). The change in light intensity is normalised to an image captured at time zero prior to
the application of the electric field.
2.7 Early AC Electrokinetic Studies
Early AC electrokinetic studies were primarily concerned with investigating how biological cells
behave in AC electric fields. The earliest use of AC electrokinetic techniques to manipulate
Page I 50
biological cells was in 1966 when Pohl used the phenomenon of DEP to separate live and dead
cells (Pohl and Hawk 1966).
Cancer cells have been used extensively in studies employing AC electrokinetic techniques. In
part, this is due to the availability and ease of growth of cancer cell lines in comparison to
healthy primary cells. Healthy primary cells typically have limited longevity, senescing at a low
population doubling number and necessitate complex growth conditions. One of the earliest DEP
investigations carried out using cancer cells was with melanoma cell lines (Mischel et al. 1983).
Positive DEP and formation of peal chains (attachment of cells to one another) were observed on
the application of a non-uniform electric field. Following chemically induced cell death,
melanoma cells ceased to respond to the applied electric field, whereas untreated and drug-
resistant melanoma cells continued.
2.8 Biomedical Applications of AC Electrokinetic Techniques
The theoretical and technological aspects of DEP have reached maturity in recent years,
evidenced by a reduction in publication output (Pethig 2010). In contrast, interest in the
application of DEP has expanded and it is currently the main focus of research in this area.
Researchers have attempted to address a variety of biomedical challenges with AC electrokinetic
techniques and much effort has been concentrated on improving current methods to tackle
diseases which effect large numbers of people. Cancer is the second biggest killer after
cardiovascular disease; in the United States the disease is the cause if 1 in 4 deaths (Altekruse et
al 2008). Consequently, the subject has received extensive attention from researchers across a
broad spectrum of disciplines and considerable effort has been made towards the use of AC
electrokinetic techniques in oncology. This review will focus on biomedical applications of AC
electrokinetic techniques paying particular attention to applications in oncology.
2.8.1 Detection and Diagnostics
AC electrokinetic techniques have been used to characterise the dielectric properties of a range
of biological particles. To employ AC electrokinetic techniques in the detection and diagnosis of
disease, the transition of biological cells from a healthy to pathological state must be associated
Page I 51
with subsequent variation in cell dielectric properties. Consequently, numerous researchers have
analysed the dielectric properties of cells in both healthy and pathological states.
In 1997, changes in the dielectric properties of erythrocytes following infection with the parasite
P. falciparum, which causes the disease malaria, was investigated (Gascoyne et al. 1997a).
Initially, ROT was used to measure the effective membrane capacitance, the effective membrane
conductance and the cytoplasmic conductance of erythrocytes before and after infection. It was
found that infected cells had dynamic ROT spectra, that is, the ROT spectra shifted with time. In
order to derive meaningful dielectric data, the DEP frequency cross over method was used as less
time was required to obtain data. This method involved applying a frequency in which cells
exhibited positive or negative DEP and increasing or decreasing the frequency until the DEP
force was zero. To characterise the cell properties, this was done over a range of medium
conductivities. Whilst normal erythrocytes showed a linear response of cross over frequency as a
function of experimental medium conductivity, the response of infected cells was non-linear. In
addition, the radii of both normal and infected cells were found to increase with increasing
experimental medium conductivity. This was not deemed to be an osmotic reaction as this would
be expected to result in a decrease in cell size.
In an effort to understand the dielectric properties of cells when they undergo malignant
transformation, Burt and colleagues (1990) used AC electrokinetic techniques to examine cancer
cells before and after chemically induced differentiation. A light absorbance method was
employed to detect cell motion in response to AC electric fields. A change in the dielectric
response of a murine erythroleukemia cell line (DS-19) was evident when the cells were
chemically induced to terminally differentiate by hexamethylenebisacetamide (HMBA)
treatment. There was no change in the DEP response when a cell line cloned from DS-19 cells
with no ability to terminally differentiate (Rl) was treated with HMBA, suggesting the change
was associated with differentiation and not an artefact of treatment. In 1994 the same group
reported that, following treatment with HMBA, the effective membrane capacitance of DS-19
cells decreased from 17.4 to 15.3mF m' (a 12% decrease) using DEP (Gascoyne et al. 1994) and
from 12.6 to 8.8mF m'^ (a 30% decrease) using ROT (Wang et al. 1994), indicating that
withdrawal from the cell cycle and subsequent terminal differentiation is coupled to a decrease in
Page I 52
effective membrane capacitance. Again, the Rl (unresponsive) cell line showed relatively no
change in effective membrane capacitance following treatment. Although the trend was
conserved, there were differences in values and percentage decreases obtained from the two
electrokinetic methods. Gascoyne and colleagues reported similar responses when using the
chemical differentiating agent dimethyl sulfoxide (DMSO). The changes in dielectric phenotype
with malignant transformation was investigated further by Huang and colleagues (1996) when
the group characterised the dielectric properties of a temperature sensitive rat kidney cell line
6m2 which possesses a normal phenotype at 39°C and a transformed phenotype at 33°C. It was
shown that cells in a transformed state had a higher effective membrane capacitance than those
in a normal state. The amount of microvilli detected in scaiming electron micrographs correlated
with the effective membrane capacitance values; transformed cells had increased microvilli
compared normal cells.
Neoplasms of epithelial origin (carcinomas) are the most prevalent type of cancer in humans
(Cooper 2000). Diagnosis of carcinomas and subsequent cancer staging requires information at
both the cellular and tissue level. AC electrokinetic techniques cannot provide tissue specific
information and thus the use of AC electrokinetics in cancer diagnostics is restricted. However,
cancer detection is an area in which AC electrokinetic techniques can offer distinct advantages
over conventional methods. The detection of carcinomas usiug AC electrokinetic techniques has
been explored by various research groups.
An and colleagues (2009) demonstrated differences in the cytoplasmic dielectric properties
between the cell line MCF lOA (quasi-normal breast cells) and the cell line MCF 7 (cancerous
breast cells). Using a pin-pin electrode system, Broche and colleagues (2007) characterised the
dielectric properties of an OSCC cell line (H357) and an immortalised epidermal cell line (UP).
The group reported differences in both the cytoplasmic and membrane dielectric properties,
indicating potential applications of AC electrokinetics in the detection of OSCC. However, the
cell line used as a model for normal oral epithelial cells, UP, was of dermal origin; thus,
differences found in the dielectric phenotypes between the UP and H357 cell lines could be due
to differences in the tissue of origin.
Page I 53
2.8.2 Cell Sorting and Sample Preparation
The isolation of cells of interest from crude biological samples or the separation of different cell
types from heterogeneous populations is fundamental for many analytical and therapeutic
biomedical applications. Conventional techniques often require labelling of cells with
monoclonal antibodies and rely on the expression of specific cell surface antigens. Therefore,
alternative methods, which do not depend on antigens and have the capability of sorting cells
with high purity, recovery and throughput, are desirable. AC electrokinetic techniques exploit
iimate cellular properties and do not require labelling. Consequently, researchers have sought to
develop novel methods of cell separation harnessing AC electrokinetic phenomena for
applications in diagnostics, therapeutics and research.
The use of AC electrokinetic techniques as separation methods in a cancer setting was first
explored by Gascoyne and colleagues (1992). The group demonstrated that DEP could be used to
separate mixtures of murine erythrocytes and erythroleukemia cells. Dielectrophoretic collection
spectra of each cell line were obtained independently and it was found that, over a certain
frequency range, erythrocytes underwent positive DEP and collected at the electrode edges
whilst erythroleukemia cells underwent negative DEP and were repelled from the electrode
edges. Normal erythrocytes are much smaller than erythroleukemia cells. Using size to optically
discriminate between the two cell types, mixed samples were fractionated and redistributed to
different locations within the electrode array on the application of AC electric fields. An and
colleagues (2009) demonstrated the separation of normal and cancerous cells which had similar
size distributions using DEP. A malignant breast epithelial cell line (MCF 7) was separated from
a quasi-normal breast cell line (MCF 10A) on the basis of differential membrane dielectric
properties. By flowing a mixed cell solution across an electrode and applying a frequency in
which the DEP force was negative for MCF 7 cells and zero for MCF lOA cells, malignant
breast cells were diffracted and separated from the more normal breast cells with maximum
efficiencies of 86.67% and 98.73%, respectively.
A recurring theme in AC electrokinetic application studies is the isolation of cells from blood.
Isolation of CD34+ stem cells from peripheral blood and removal of contaminating tumour cells
Page I 54
is required for autologous bone marrow reconstruction in patients with leukaemia. In 1996,
Stephens et al. used an interdigitated microelectrode set-up to isolate CD34+ stem cell
populations from peripheral blood using DEP (Stephens et al. 1996). Stephens and colleagues
(1996) achieved label free isolations of stem cells with an average five-fold enrichment. In 1999,
Huang et al. used a combination of DEP, sedimentation and hydrodynamic drag forces to
separate CD34+ cells from a breast cancer cell line (MDA-435) (Huang et al. 1999). In the
device, an aqueous solution with parabolic distribution was flowed through the channel across an
interdigitated microelectrode array. Negative DEP forces were used to levitate cells to different
heights within the solution. Cells at different heights moved at different velocities resulting in the
fractionation of cells across the channel. The technique is known as DEP field flow fractionation
(depFFF). Huang and colleagues (1999) achieved isolations of over 99% pure fractions of
CD34+ cells.
In addition to therapeutic uses, the isolation of cells from blood is also required for analytical
assays. With a view to isolating trophoblast cells from the maternal circulation for prenatal
detection of genetic abnormalities, the dielectric properties of peripheral blood mononuclear
(PBMN) cells and trophoblast cells were characterised (Chan et al. 2000). Using ROT and DEP,
it was demonstrated that the membrane dielectric properties of PBMN cells were different to
trophoblast cells sequestered from whole placenta or the amniochorion or circulating trophoblast
cells from retroplacental blood.
Gascoyne and colleagues (2002) demonstrated the isolation of malarial infected erythrocytes
from blood. The membrane conductivity of unparasitised erythrocytes was higher than
parasitized erythrocytes, an effect attributed to the loss of ions caused by alterations in
erythrocyte membrane fluidity and pore concentration following malarial infection. Parasitised
erythrocytes were enriched by up to 1000 times from concentrations as low as 1 in 10
parasitised cells per unparasitised cells. Two electrode systems were investigated; interdigitated
and spiral. The interdigitated electrode system achieved lower enrichments than the spiral
electrode system but had the advantage of being scalable to handle large volumes of blood.
Page I 55
Ng et al. (2010) used negative DEP to position cells onto anti-CD34+ antibody coated platforms
for the detection of CD34+ cells in peripheral blood. The impedance of the antibody coated
platform was then measured and used to quantify the number of CD34+ cells in the sample.
Negative, not positive, DEP was chosen to trap cells as positive DEP necessitates the use of
media with a low conductivity. As physiological solutions contain many ions and are highly
conductive the use of positive DEP would require an additional wash step resulting in lower cell
yields.
The isolation of cancer cell from blood using AC electrokinetic techniques has also been
explored. In 1994, Becker and colleagues characterised the dielectric properties of the
promyelocytic leukemic cell line HL-60, normal T-lymphocytes and erythrocytes using ROT
(Becker et al. 1994). Exploiting differences in the membrane dielectric properties of the cell
types, the group used a prototype dielectric affinity column containing an interdigitated
microelectrode array to separate HL-60 cells from erythrocytes. Following on from this, Becker
et al. (1995) obtained DEP and ROT spectra of erythrocytes, T-lymphocytes and a breast cancer
cell line (MDA-231) and demonstrated that each cell type had different membrane dielectric
properties. The group used the same dielectric affinity column as reported by Becker et al.
(1994) to separate mixed populations of erythrocytes and MDA-231 cells. In 1997, Gascoyne et
al. used a dielectric affinity column with similar characteristics to the column used by Becker et
al. (1994; 1995) to separate three different breast cancer cell lines from erythrocytes (Gascoyne
et al. 1997b). To deduce the dielectric properties of cells before cell separations, ROT spectra of
the breast cancer cell lines MDA-231, MDA-435 and MDA-468 and erythrocytes were obtained.
In earlier studies by the group (Becker et al. 1994; 1995), different cell types had been identified
by size but in Gascoyne and colleagues’ study (1997b) breast cancer cells were pre-labelled with
a fluoresceine probe prior to the separations to identify them and quantify viability and yield.
Depending on the starting ratio of tumour cells to erythrocytes, Gascoyne et al. (1997b) were
able to achieve up to 100% pure fractions of breast cancer cells. In 2009, the group described a
depFFF device, similar to the device described by the same group in earlier reports (Huang et al.
1999), to separate breast cancer cells from PBMN cells (Gascoyne et al. 2009). Differential
membrane dielectric properties of PBMN cells and breast cancer cell lines MDA-MB-435,
MDA-MB-231 and MDA-MB-468 were exploited for the fractionation of mixed samples of
Page I 56
PBMN cells and tumour cells. The electrode system comprised of a microelectrode array that
was larger and allowed more clinically relevant cell numbers to be separated than in previous
works by the group (Becker et al. 1994; Becker et al. 1995; Gascoyne et al. 1997b). Gascoyne et
al. (2009) achieved up to 92% pure fractions of tumour cell populations and manipulated cell
samples containing up to 2.25x10^ cells; a higher number of cells than in studies by Becker et al.
(1994; 1995) and Gascoyne et al. (1997b) where samples containing approximately 1x10 cells
were manipulated. In a separate laboratory, with a view to isolating cells for DNA hybridisation
studies, Cheng and colleagues (1998) demonstrated separations of a cervical cancer cell line
(HeLa) from peripheral blood cells by DEP using a checkerboard electrode array.
In addition to the separation of cancer cells from blood, isolation of cancer cells from other crude
biological samples has been investigated. Cristofanilli and colleagues (2008) used depFFF to
separate tumour cells from fine needle aspirates from xenografts. Cells were flowed along a
poly-l-lysine coated slide patterned with microelectrodes and energised with increasing
frequencies from the inlet to the outlet. Thus, cells experienced decreasing levitation forces as
they moved towards the outlet. Depending on the dielectric properties of the cell, cells touched
down and adhered to the slide in spatially distinct regions enabling analysis of different cell
populations within the sample. Yang and colleagues (2010) described a microfluidic cell sorter
based on DEP which achieved isolations of a colorectal cancer cell line (HOT 116) from an
embryonic kidney cell line (HEK293) and the bacteria Escherichia coli {E. coli).
To employ AC electrokinetic techniques in the isolation of cells, it is imperative that cells remain
in their in situ state following manipulation with AC electrokinetic fields. A number of
researchers have investigated the potential negative effects of AC electric fields on cells (Gimsa
et al. 1991; Becker et al. 1995; Stephens et al. 1996; Gascoyne et al. 1997a; Wang et al. 1999;
Gascoyne et al. 2009). Stephens and colleagues (1996) demonstrated that CD34+ cells isolated
by DEP remained viable and could be cultured post isolation by DEP in the frequency range 5 to
500kHz. However, when culturing murine erythroleukemia DS-19 cells after exposure to AC
fields, Wang and colleagues (1999) found that the lag growth period was increased. Wang et al.
(1999) concluded that this was due to the production of hydrogen peroxide in the sugar
containing experimental medium and demonstrated that this could be prevented by the addition
Page I 57

of catalase to the medium. When isolating breast cancer cells from blood cells, Gascoyne et al.
(2009) found that cells that had been suspended in the sugar containing experimental medium for
more than 30 minutes showed a reduced response to the electric field. Simulations suggested that
this may be due to movement of ions from the internal cellular cytoplasm down a concentration
gradient to the external environment resulting in a reduced cytoplasmic conductivity and
increased membrane conductivity. However, the cells remained viable following fractionation
and were shown to retain growth ability. Ion leakage from cells suspended in DEP sugar
containing experimental medium had been noted in previous reports (Gimsa et al. 1991).
2.8.3 Prognostics
Disease prognosis is conventionally based on statistical correlation of disease characteristics with
outcome. In cancer, tissue histopathology, lymph node involvement and the presence of
metastatic disease are taken into account when assessing prognosis and treatment regimes.
However, there is wide variation in treatment response and disease outcome within these groups
and researchers have looked for other indicators to aid in prognosis and determining treatment
regimes.
In 2002, the dieleetrie properties of a range of breast eaneer sublines expressing different levels
of HER2/neu gene, a membrane receptor which is amplified or over expressed in some breast
cancers, were investigated (Cristofanilli et al. 2002). Using ROT, it was shown that the mean
effective membrane capacitances of MCF7-HER2/neo, MCF7-HER2-11 and MCF7-HER2-18
were 20.9, 17.0 and 25.6mF m'^, respectively. MCF7-HER2-11 and MCF7-HER2-18 express the
HER2/neu gene at 20 and 45 times greater than the MCF7 -HER2/neo subline which is
transfected with a neomycin phosphotransferase gene and has normal levels of HER2/neu gene
expression. Variation in mean effective membrane capacitance values associated with gene
expression highlighted the potential for the dielectric phenotype to be used as a prognostic
marker for breast cancer. However, no correlation was found between the magnitude of receptor
expression and membrane dielectric values suggesting a complex relationship between the two.
Multi-drug resistance (MDR) is the pan-resistance of cells to drugs which have a wide variety of
structures and functions (Gottesman et al. 2002). It is the mechanism by which cancer cells
Page I 58

develop resistance to different chemotherapeutic agents that have no common structure. Mischel
and colleagues (1983) were the first group to study the effects of AC electrokinetic fields on
cancer cells and their drug resistant counterparts. In 2003, Labeed and colleagues employed DEP
to investigate the dielectric properties of the K562 cell line and its multi-drug resistant (MDR)
counterpart K562AR (Labeed et al. 2003). It was found that K562 cells had a lower cytoplasmic
conductivity than their MDR equivalent K562AR. Treatment with a MDR modulator had no
effect on the dielectric properties of either cell line.
Broadening their research in MDR, the same group investigated the dielectric properties of a
breast cancer cell line (MCF-7) and its MDR counterparts (MCF-7TaxR, MCF-7DoxR and
MCF-7MDR1) (Coley et al. 2007). Variations in the cytoplasmic conductivity were seen
between the parent cell line and the MDR derivatives. The MDR cell lines which showed
resistance to natural product anti-cancer drugs had the highest cytoplasmic conductivities of the
panel. The effective membrane capacitance value had previously been attributed to both
membrane composition and topology i.e. microvilli, ruffles and blebs (Burt et al. 1990; Wang et
al. 1994). In this study, two out of three of the MDR cell lines expressed P-glycoprotein (P-gp), a
membrane located protein overexpressed in some MDR tumour cells, but only one MDR cell
line showed a difference in the effective membrane capacitance with respect to the parent cell
line. Therefore, the high effective membrane capacitance in this cell line was attributed to
increased membrane ruffles viewed by light microscope and it was not considered a marker of P-
gp expression.
2.8.4 Drug Screening
Apoptosis (programmed cell death) is a physiological process that occurs in cells and is a feature
of normal tissue homeostasis. Defective regulation of apoptosis contributes to the development
of pathological states; aberrant control of apoptosis is a characteristic feature of the cancer cell
phenotype. When cells undergo malignant transformation they evade normal cell senescence and
continue to grow and divide indefinitely. There are two aspects of apoptosis in which AC
electrokinetic techniques have potential applications; detection of apoptosis and elucidation of
the apoptotic process. Conventional apoptosis detection tools include, but are not limited to,
confocal microscopy, flow cytometry (Jin et al. 2010), microtitre plate readers (Yang et al.
Page I 59

2010), immunoassays (Bravo-Cuellar et al. 2010) and electrophoresis (Won et al. 2010). In the
most part, these techniques necessitate the use of labelling with antibodies or dyes rendering
them expensive and labour intensive and they can be slow to detect apoptosis. Therefore, novel
techniques that can detect apoptosis earlier than conventional methods and which do not require
labelling are beneficial and particularly sought after for high-throughput screening of
chemotherapeutic agents.
Mischel and colleagues (1983) were the first group to study the response of cancer cells to AC
electrokinetic fields before and after drug-induced cell death. Following on fi*om this, it was not
until 2002 that the use of AC electrokinetic techniques to detect apoptosis was explored (Wang
et al. 2002). Wang and colleagues used the cross-over frequency method to investigate the
effects of chemically induced apoptosis on effective membrane capacitance and conductance.
Initial experiments showed that the effective membrane capacitance decreased from 17.5 to
9.1mF m'^ during 4 hours of treatment with Genistein. These changes were seen one hour post
treatment initiation whereas the conventional techniques used to measure apoptosis, namely
phosphatidylserine (PS) extemalization and DNA content, did not detect any changes until 2
hours post treatment initiation. Furthermore, the use of caspase inhibitors did not affect the
changes in effective membrane capacitance seen at one hour post treatment, suggesting that early
membrane dielectric alterations were caspase independent. Ratanachoo et al. (2002) expanded
this work by assessing the effects of a panel of toxicants, with varying mechanisms of action, on
cell dielectric properties. HL-60 cells were exposed to paraquat, styrene oxide, N-nitroso-N-
methyurea and puromycin for 0.25 to 2.5 hours. All toxicants elicited a dose and time dependent
decrease in effective membrane capacitance. Parallel assays were carried out to assess the
usefulness of the technique and DEP detection threshold exposure limits were found to be lower
than conventional toxicological assays. The group noted that DEP was more sensitive to agents
that acted directly on the cell membrane.
Thus far, work on apoptosis had largely concentrated on the dielectric properties of the
membrane. In 2006, Labeed and colleagues investigated apoptosis with a focus on the dielectric
properties of the cytoplasm (Labeed et al. 2006). In Labeed’s study (2006), a human
myelogenous leukaemia cell line (K562) was treated with the anti-cancer agent, staurosporine.
Page I 60
and analysed by Annexin V-FITC and propidiumidodide (PI) assays and DEP. Cells were
analysed following 0 to 48 hours of drug exposure. An initial increase in cytoplasmic
conductivity from 0.28 to 0.45S m' was seen at 4 hours and then values remained relatively
constant at 0.45 and 0.42S m' for 8 and 12 hours, respectively. At 24 and 48 hours the
cytoplasmic conductivity peaked at 0.5S m '\ Three populations of cells with different
cytoplasmic conductivities were observed in the DEP spectra of treated cells, a technique
previously reported by Broche and colleagues (2005). The effective membrane capacitance
increased from 9.7 to 19.9mF m'^ throughout the course of the treatment. The study was repeated
by the same group but with a focus on early apoptotic events and K562 cells were analysed by
the same methods after 30 and 60 minutes of Staurosporine treatment (Chin et al. 2006). It was
shown that DEP was able to detect alterations in the dielectric properties of the treated cells 30
minutes post treatment whereas Armexin V-FITC and PI assays did not detect any changes in the
first 60 minutes. The effective membrane capacitance increased from 9.7 to 12.4mFm'^ after 1
hour of treatment. Interestingly, the earlier report by the same group found that the effective
membrane capacitance of K562 cells was lO.OmF m'^ after 4 hours treatment with staurosporine,
lower than the reported values using the same toxicant and cell concentration after one hour of
treatment in this study. Again, multiple populations of cells with different cytoplasmic
conductivities were observed in the DEP spectra of treated cells.
Contrary to the findings by Labeed (2006) and Chin (2006) but analogous to reports by Wang
(2002) and Ratanachoo (2002), Pethig and Talary (2007) reported a decrease in the effective
membrane capacitance of Jurkat T-lymphoblast cells during apoptosis following treatment with
etoposide. Possible causes of this include differences in the cell line tested or in the mechanisms
of action of toxicants. Interestingly, six out of seven toxicants tested all produce similar dielectric
responses in apoptotic cells.
2.9 Summary and Conclusions
Currently, pre-malignant and malignant oral lesions are identified by the visual inspection and
palpation of the oral cavity. Often manifesting with features synonymous with common benign
oral lesions, they are difficult to discern impeding COE screening (Kujan et al. 2006)(Bagan et
Page I 61
al 2010), Oral lesions are common (Sandler 1962; Malaowalla et al 1976; Bouquot 1986;
Burzynski et al 1997) and most are benign (Sciubba and Collaborative Oral 1999; Christian
2002). The gold-standard diagnostic technique is invasive, painful, requires the use of
anaesthetic and can result in complications such as infection. Consequently, only a small number
of lesions are investigated by the gold-standard method and early stage or innocuous appearing
malignant lesions are often overlooked.
In recent years there has been an advent of adjunctive techniques available to aid in the detection
of oral cancer (Silverman 1988; Fedele 2009). However, there is considerable variation in the
outcome of studies evaluating the efficacy of these available techniques. This can be attributed to
differences in study populations, methodologies and the subjectivity of the techniques. Currently
available adjunctive techniques are subjective and show improved efficacy when employed by
highly skilled and experienced clinicians. However, these techniques are of most use in primary
health care settings where handlers will have less expertise. A number of studies evaluating the
efficacy of the OralCDx® test, which was designed to direct the treatment of oral lesions that are
clinically innocuous, have investigated its use in populations which present with clinically
suspicious lesions (termed class I lesions in some studies) for which the gold-standard
histopathological analysis of excised tissue is mandatory. Adjunctive techniques are superfluous
in these circumstances; they would not be employed in this context in a ‘real-life’ situation.
Furthermore, some studies did not have concomitant inscisional biopsies for lesions with a
‘positive’ or ‘atypical’ OralCDx® result. Thus, the false-positive rate was not adequately probed
resulting in artificially high specificities. There is little data on the use of these techniques in low
risk populations by clinicians with less experience. Furthermore, the OralCDx® technique has
waiting periods for results.
Despite uptake and use of adjunctive techniques, the five-year survival rate for oral cancer has
not significantly improved (Neville 2002). Numerous studies have investigated the value of these
techniques in the detection of oral cancer (Martin et al 1998; Svirsky et al 2002; Epstein et al
2008; Bhoopathi et a l 2009; Hohlweg-Majert et al 2009) however no robust evidence exists to
support their efficacy (Kujan et al 2006; Fedele 2009).
Page I 62

There remains a need for a technique which can aid in the detection of pre-malignant and
malignant oral lesions. An OSCC detection method which meets the following criteria would be
of great benefit:
• non-invasive,
• does not require highly experienced or specialist clinicians for the test to be effective,
• objective,
• cost-effective,
• automated,
• does not necessitate laboratory analysis; it can be carried out in a primary health care
setting and provide real-time results.
DEP is the induced motion of a polarisable particle under the influence of an applied electric
field (Pohl 1978). Using a single-shell model, the dielectric properties of polarisable particles,
such as cells, can be determined from dielectric spectra (Irimajiri et al. 1979; Huang et al. 1992).
DEP has been used to analyse and separate cells for a variety of biomedical applications,
including detection and diagnostics (Broche et al. 2007), cell sorting (Gascoyne et al. 1997b)
and sample preparation (Chan et al. 2000), prognostics (Coley et al. 2007) and drug screening
(Pethig and Talary 2007). These techniques have been applied in a cancer setting. The variation
in the dielectric properties of normal and malignant epithelial cells has been explored. An et al.
(2009) compared the dielectric properties of normal and malignant breast cells and Broche et al.
(2007) compared the dielectric properties of normal dermal epithelial cells and malignant oral
epithelial cells. In the studies by An et al. (2009) and Broche et al. (2007), immortalised cell
lines (MCE lOA and UP) were used as models for normal epithelial cells. The MCE lOA cell line
was spontaneously immortalised in vitro and the UP cell line was immortalised by transfection
with the Human Papilloma Virus (HPV) (Pei et al. 1991). To date, the dielectric properties of
primary normal human epithelial cells or clinically relevant epithelial samples such as exfoliated
cells, from any tissue of origin, have not been investigated.
Page I 63
2.10Aims and Objectives
The aim of this work is to determine if DEP can be used as a non-invasive method to detect oral
pre-cancer and eaneer. In addition, this thesis aims to investigate the potential of a novel DEP
device (termed the DEP-microwell and developed at the University of Surrey) to be used as an
oral eaneer detection technique in a clinical setting.
To achieve the aims of this thesis, the first objective is to determine the dielectrie properties of
normal, pre-malignant (dysplastic) and malignant oral kératinocytes grown in standard
monolayer culture conditions using the DEP-microwell. The second objective is to determine the
dielectric properties of normal, pre-malignant (dysplastic) and malignant oral kératinocytes
grown in 3-dimensional organotypical culture conditions using the DEP-microwell. The third
objective is to determine the dielectrie properties of normal, pre-malignant (dysplastic) and
malignant oral kératinocytes harvested by exfoliative eytology from healthy subjeets and patients
with oral pre-cancer and eaneer using the DEP-microwell.
Page I 64
3 DIELECTRIC PROPERTIES OF NORMAL, DYSPLASTIC
AND MALIGNANT ORAL KERATINOCYTES
3.1 Introduction
Over the past two decades, the dielectric properties of a range of cell types with healthy and
cancerous phenotypes have been determined, using AC electrokinetic techniques. In 3.1.1,
the dielectric properties of normal and cancer cells are reviewed and emerging trends are
highlighted.
3.1.1 Review of the Dielectric Properties of Normal and Cancer Cells
In 1994, Gascoyne et ah determined the effective membrane capacitances of murine
erythroleukemia cells and counterpart cells that had undergone chemically induced
differentiation (Gascoyne et a l 1994). The group found that murine erythroleukemia cells
had a higher effective membrane capacitance (12.6 mF m^) than counterpart differentiated
cells (8.8mF m^). Becker and colleagues (1994) investigated the effective membrane
capacitances of a promyelocytic leukemic cell line (HL-60), T-lymphocytes and erythrocytes.
The group found that the effective membrane capacitance of HL-60 eells (15mF m" ) was
higher than T-lymphocytes (1 ImF m'^) and erythrocytes (9mF m'^). While the leukocyte cell
types differed in progenitor lineage and differentiation stage, the group demonstrated that
malignant leukocyte progenitor cells (HL-60) have a higher effective membrane capacitance
than healthy leukocytes (T-lymphocytes). In 1995, the group used ROT to investigate the
dielectric properties of a breast cancer cell line (MDA231) and demonstrated that MDA231
cells have a higher effective membrane capacitance (26mF m^) than normal T lymphocytes
and erythrocytes (Becker et a l 1995). Huang and co-workers (1996) used DEP and ROT to
study the dielectric properties of the temperature sensitive rat kidney cell line 6m2. The 6m2
cell line possesses a normal phenotype at 39°C and a malignant phenotype at 33°C. Using
DEP, Huang et a l (1996) showed that 6m2 cells in a malignant state had a higher effective
membrane capacitance (42.3mF m’ ) than those in a normal state (30.3mF m'^). Using ROT,
Huang et a l (1996) found slightly different effective membrane capacitances for 6m2 cells
(37.2mFm'^ and 27.4mF m'^ for 6m2 cells in a malignant and healthy state, respectively) but
the trend was consistent. The amount of microvilli shown in scanning electron micrographs
Page I 65
correlated with the effective membrane capacitance values; transformed cells had increased
microvilli compared normal cells. An et «/.(An et al. 2009) found that normal breast cells
(MCF 10A) had a higher cytoplasmic conductivity (0.3S m'^) than their malignant
counterparts (MCF 7) (0.23S m'^). A preliminary study carried out by Broche and colleagues
(2007) found that the quasi-normal dermal cell line, UP, had a lower effective membrane
capacitance (11.3mF m'^) than the oral cancer cell line, H357 (17.7mF m‘ ).. In addition.
Broche et al. (2007) found that the cytoplasmic conductivity of UP cells (0.45S m" ) was
higher than H3 57 cells (0.3 S m' ).
While not all of the cells reviewed are directly comparable, an emerging trend has been
observed; cells with a more malignant phenotype have a higher effective membrane
capacitance than cells with a more normal phenotype. There is less data available on the
cytoplasmic conductivity of cells but currently available reports show a trend of lower
cytoplasmic conductivities of cancerous cells compared to normal cells. A summary of the
effective membrane capacitances of cells with a healthy and cancerous phenotype is provided
in Table 3-1.
Page I 66

ëI£%
Ii
w
'Q
§
fs
I i•3 Ca f: c@ Cu
<uuc
<u
'5' 1?'a 1
ONa 1
ON "a o ' "aa py p_i
NO C/5 C/5 hJ a<N a a «n a NO(N
I
I
I
È oQ
om
a
>0<N
ICN
s sI
<ua %
m<Nr- s
diuC4M0dJus
■IS 'ydJ1
IIgM
ctsss
m
S ' 1?1 1On ONGO ocQ Q1 1
^ac3
1"a% Î
100
1arn i
â v4 3
ao \
I’§
t 1e
I<Us
0
1 uia1I " a 'a
m6 <N r-’cn
0Û A1
1fC
aON I
f
NO
i•T)
;Q
g
CN0
4:
8
o4:
8
1Uc/5O
g s
sH ON
s:O n i 'O
ONON
S:ON §
< s
V
I
I I tCQ i%)f
a
V
I so ^
ONÜ
:I
2tt

3.1.2 Aims and Outline
The chapter aims to expand the work by Broche et a l (2007) and to determine if the
dielectric properties of dysplastic and malignant oral kératinocytes are different to normal
oral kératinocytes, in vitro. In addition, this chapter aims to compare the dielectric properties
of kératinocytes obtained using the DEP-microwell with the results obtained by Broche and
colleagues (2007) using an alternative electrode configuration.
In order to meet the aims of this chapter, the DEP-microwell was used to obtain dielectric
spectra of primary normal oral kératinocytes and dysplastic and malignant oral keratinocyte
cell lines. In addition, the DEP-microwell was used to obtain dielectric spectra of a quasi
normal dermal keratinocyte cell line. A single-shell model was used to determine the
dielectric properties of kératinocytes from dielectric spectra. Optimisation of DEP sample
preparation and DEP-microwell experimental conditions were performed.
3.2 Materials and Methods
3.2.1 Cell Culture
The malignant oral keratinocyte cell lines H357, H I57 and the quasi-normal dermal
keratinocyte cell line UP were cultured in keratinocyte growth medium (KGM) which
consisted of 3 volumes of low glucose (Ig L'^) DMEM and 1 volume of F12 Hams. The basal
medium was supplemented with 10% foetal bovine serum (FBS), lO'^^M cholera toxin, 0.5pg
ml" hydrocortisone, lOng ml" epidermal growth factor (EGF), 5pg ml" insulin, 2.5pg ml"
amphotericin B, 1.8xlO"'^M adenine, lOOU ml" penicillin and lOOpg ml'^ streptomycin.
Primary normal oral kératinocytes (HOK) were purchased from TSG Cellworks Ltd.
(Buckingham, U.K.) and grown in Oral Keratinocyte Medium (OKM). The dysplastic oral
keratinocyte cell line DDK was a kind gift from Dr. Daniella Costea (University of Bergen,
Norway). DOK cells were grown in DMEM supplemented with 10% FBS, 5pg mf^
hydrocortisone, lOOU mf^ penicillin and lOOpg ml’* streptomycin. FBS and DMEM were
purchased from PAA (Somerset, UK). F 12 Hams and RPMI 1640 were purchased from
Invitrogen (Paisley, UK). EGF was purchased from ProSpec-Tany Technogene Ltd.
(Rehovot, Isreal) OKM was purchased from TSC Cellworks Ltd. (Buckingham, U.K.). All
Page I 68
other products were purchased from Sigma Aldrich (Poole, UK). All cells were cultured in a
humidified incubator at 3 7°C with 5% CO2 .
3.2.2 Osmolality Measurements
DEP experimental medium was prepared consisting of 17mM glucose and 219, 234, 248,
263, 278 or 292mM sucrose in de-ionised water. The conductivity was adjusted to 5mS m"
by addition of PBS (PAA, Somerset, UK) and verified with a Jenway 470 conductivity meter
(VWR Jencons, Leicestershire, UK). An Osmomat 030 (Ganotec) osmometer (Wolf
Laboratories Limited, York, UK) was used to measure the osmolality of KGM and DEP
experimental media.
3.2.3 DEP Sample Preparation
DEP experimental medium was prepared containing 17mM glucose and 263mM sucrose in
de-ionized water (Gascoyne et al. 1993; Pethig et al. 2005). DEP experimental medium was
adjusted to a conductivity of 5mS m' as described in 3.2.2. Cells were harvested from eulture
vessels by a brief incubation with trypsin-EDTA solution (Sigma Aldrich, Poole, UK) at
37°C. Following detachment, KGM was added to neutralise the trypsin-EDTA solution and
cells were centrifuged at 150xg for 5 minutes. Cells were washed twice by centrifugation at
50xg for 5 minutes in DEP experimental medium then resuspended in DEP experimental
medium at a cell concentration of 2x10^ cells m l'\
3.2.4 DEP-microwell Experimeuts
Approximately Ipl of cell solution was injected into a well in the DEP well chip. The sample
was viewed under a Nikon Eclipse 50i microscope with a 4x magnification. A camera
connected to a PC captured images of the well using Photolite software. The DEP well chip
was energised by a sinusoidal signal produced by a Thurlby/Thandar signal generator. The
signal was monitored by an ISO-Tech IDS710 digital oscilloscope. Images were captured at
time 0 and every 3 seconds thereafter, for a period of 60 seconds at each frequency. Five
frequencies per decade were investigated between 4kHz and 20MHz. A MatLab (The
Mathworks Inc, Nantick USA) script was employed to assess the change in light intensity
over the duration of time that the electrodes were energised. The change in light intensity was
normalised to the image captured at time 0. Following each fi*equency run, the sample was
Page I 69
extracted from the DEP well by absorption. The well was then cleaned with DEP
experimental medium and a new sample of cell solution was injected into the well to prevent
any possible harmful effects the electric current may have on the cells. Each experiment was
repeated at least five times.
3.2.5 Cell Radius Measurements
An aliquot of each cell sample, prepared as in 3.2.3, was transferred onto a haemocytometer.
Image J software (National Institute of Health, Maryland, U.S.) was used to capture images
of cells dispersed over the grid region of the hemocytometer. The number of pixels per pm
was determined by measuring the number of pixels across a line of the grid which had a
known length. The cell diameter was then measured by placing a line across the centre of
each cell. The cell radius was determined by dividing the diameter by 2. Fifty cells were
measured for each sample.
3.2.6 Optimisation of Experimental Conditions
For all optimisation experiments, H I57 cells were prepared as described in 3.2.3.
To determine the effect of DEP experimental medium on cell viability, the viability was
measured after cells were maintained in DEP experimental medium at room temperature for
two hours.
To determine the optimal time that the electric field should be applied for at each frequency,
H I57 cells were probed for a period of 5 minutes per frequency.
To determine the repeatability of the DEP response during the time course of a DEP
experiment, H157 eells were probed repeatedly at 630kHz for 80 minutes.
3.2.7 Statistical Analysis and Data Presentation
At least five dielectric spectra were obtained for each cell type. The cytoplasmic conductivity
and effective membrane capacitance for each dielectric spectrum were determined by curve-
fitting a single shell model to each spectrum, as carried out in previous studies (Labeed et al
2003; Labeed et a l 2006; Hubner et a l 2007). The mean cell radius, cytoplasmic
Page I 70

conductivity and effective membrane capacitanee for each cell type was calculated by
averaging the values obtained for each spectrum.
Statistical analysis was carried out using SPSS version 16.0 (SPSS Inc. Chicago, IL). Cell
dielectric and radius measurements were analysed graphically using a histogram to determine
whether the distribution conformed to a normal curve. If the distribution was normal, the
parametric two independent sample student’s t-test was used. If normality could not be
confirmed, the non-parametric, two independent sample Mann Whitney-U test was
performed. Analysis was two-way and P values displayed are of the exact variant. P values of
<0.05 were considered statistically significant.
3.3 Results
3.3.1 Optimisation
3.3.1.1 Effect o f DEP Experimental Medium Osmolality
A loss in cell viability of up to approximately 50% was noted during the sample preparation
for a DEP experiment using H157 and H357 cells. The osmolality of conventional DEP
Experimental medium and KGM was measured, as shown in Table 3-2.
Page I 71
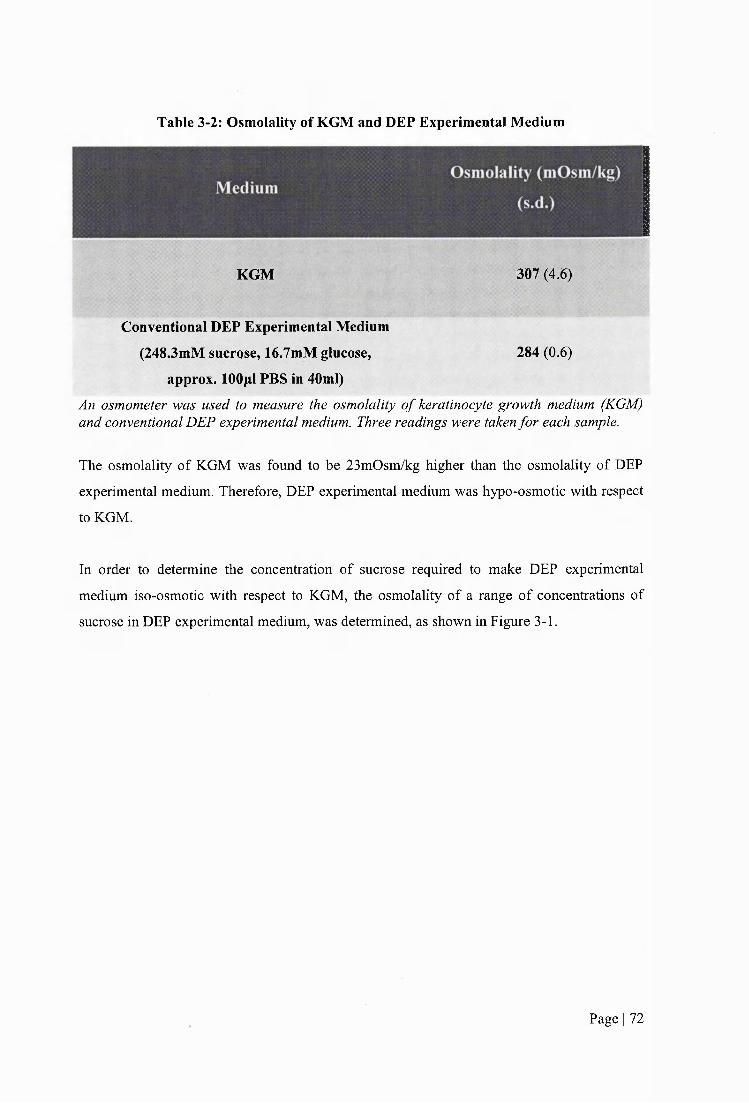
Table 3-2: Osmolality of KGM and DEP Experimental Medium
KGM 307 (4.6)
Conventional DEP Experimental Medium
(248.3mM sucrose, 16.7mM glucose, 284(0.6)
approx. lOOpl PBS in 40ml)
An osmometer was used to measure the osmolality o f keratinocyte growth medium (KGM) and conventional DEP experimental medium. Three readings were taken for each sample.
The osmolality of KGM was found to be 23mOsm/kg higher than the osmolality of DEP
experimental medium. Therefore, DEP experimental medium was hypo-osmotic with respect
to KGM.
In order to determine the concentration of sucrose required to make DEP experimental
medium iso-osmotic with respect to KGM, the osmolality of a range of concentrations of
sucrose in DEP experimental medium, was determined, as shown in Figure 3-1.
Page I 72
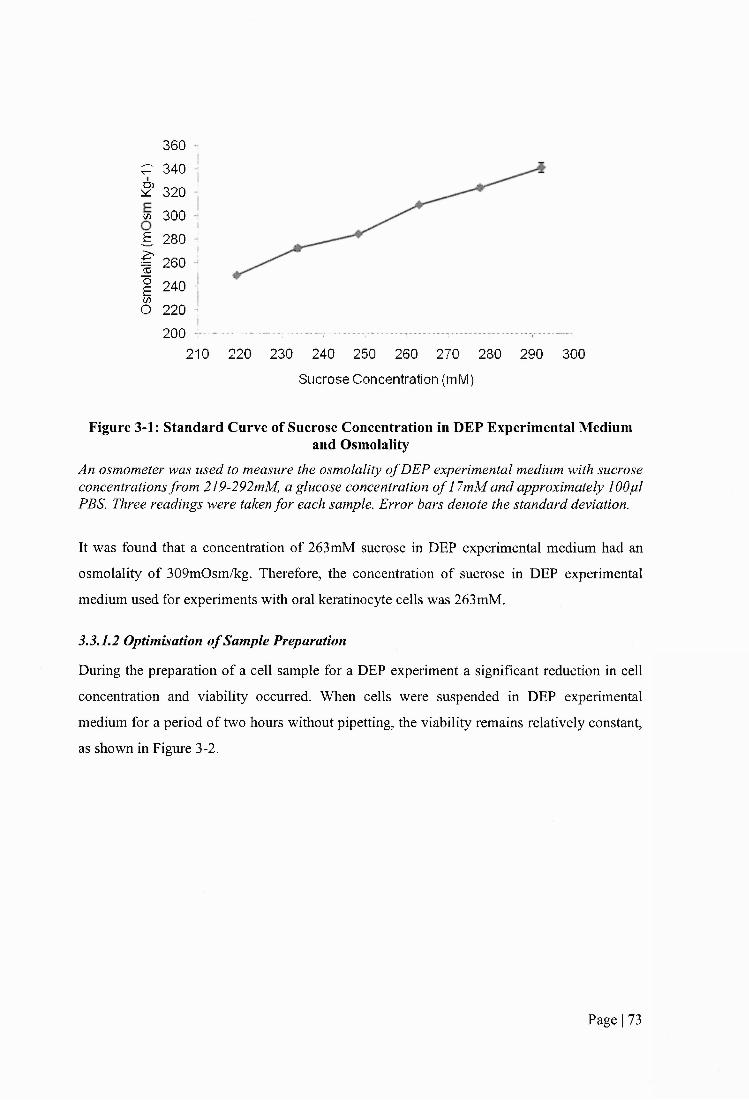
360 1P 340 i S 320 i m 300 ;g 280 i
I 260 jI 240 !(/>O 220 j
200 J —.... :.......... ...- ...--T....-..... -......210 220 230 240 250 260 270 280 290 300
Sucrose Concentration (mM)
Figure 3-1: Standard Curve of Sucrose Concentration in DEP Experimental Mediumand Osmolality
An osmometer was used to measure the osmolality o f DEP experimental medium with sucrose concentrations from 219-292mM, a glucose concentration o f 17mM and approximately 100pi PBS. Three readings were taken for each sample. Error bars denote the standard deviation.
It was found that a concentration of 263mM sucrose in DEP experimental medium had an
osmolality of 309mOsm/kg. Therefore, the concentration of sucrose in DEP experimental
medium used for experiments with oral keratinocyte cells was 263mM.
3.3.1.2 Optimisation of Sample Preparation
During the preparation of a cell sample for a DEP experiment a significant reduction in cell
concentration and viability occurred. When cells were suspended in DEP experimental
medium for a period of two hours without pipetting, the viability remains relatively constant,
as shown in Figure 3-2.
Page I 73

1 0 0 %
90%
& 80%
. è ' 70%
05 60%>
50%O 40%
30%0 Hours
» Complete Growth Medium
2 Hours
DEP Experimental Medium
Figure 3-2: Effect of DEP Experimental Medium on Cell Viability
H357 cells were pooled, counted and aliquoted into centrifuge tubes. Each aliquot was centrifuged, washed twice in 5ml DEP experimental medium or complete growth medium and
resuspended in the same medium. Cells were counted using a haemocytometer. The cell solutions were maintained at room temperature for two hours and then counted again.
3.3.1.3 Optimisation of Experimental Conditions
The following experimental conditions were found to be optimal in the manual operation of
the DEP-microwell. The cell viability over the course of an experiment was reduced if a
syringe was used to add sample to the DEP-microwell. A lOpl Gilson pipette was found to be
the most usefiil; the size of the pipette enabled a sample to be injected into the well and cell
viability remained high over the course of a DEP experiment. It was found that bending the
end of the pipette tip aided in injecting the sample into the DEP-microwell and resulted in
fewer bubbles. The use of a larger pipette, such as a 0.2 or 1.0ml Gilson pipette, to gently mix
the sample prior to removing each aliquot to inject into the DEP-microwell, created a
homogenous distribution of cells. If this was not done, the sample concentration for each
frequency measurement became inconsistent. This was evidenced by differences in light
intensity in the DEP-microwell when each sample aliquot was added.
To maintain a consistent sample volume in the DEP-microwell and therefore a consistent
light path length, the DEP-microwell was cleaned prior to the addition of each aliquot of
sample. DEP experimental medium (without cells) was added to the DEP-microwell using a
syringe after each frequency run. The DEP-microwell was then dried by absorption before a
Page I 74
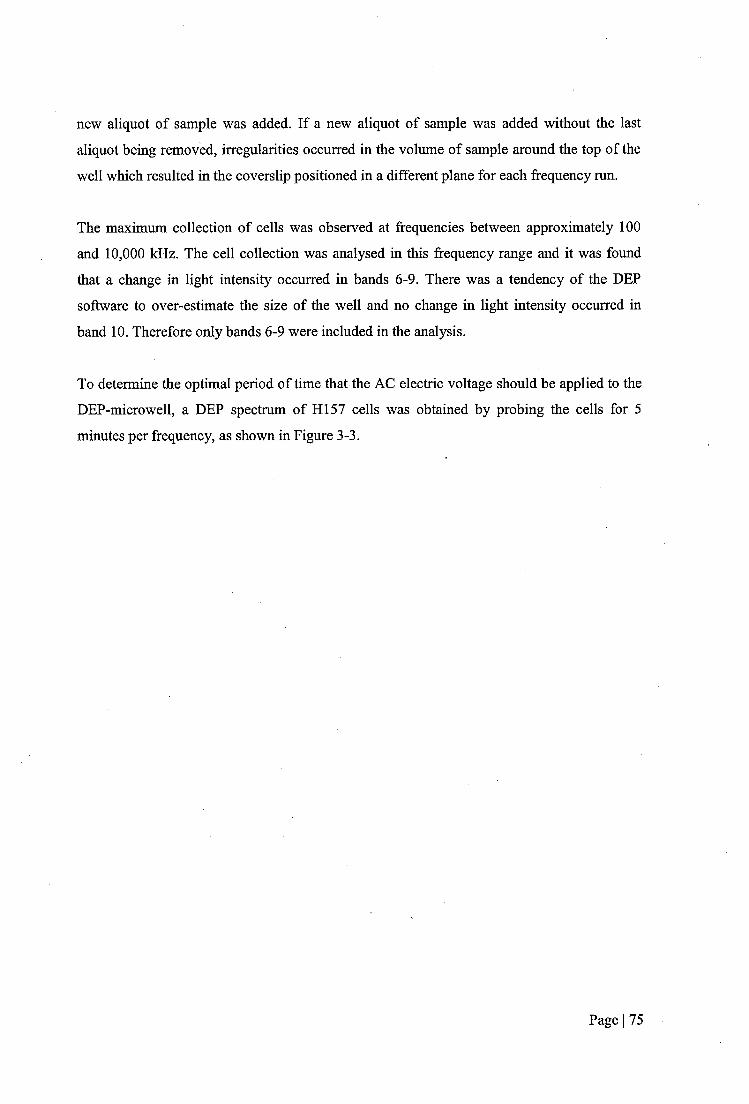
new aliquot of sample was added. If a new aliquot of sample was added without the last
aliquot being removed, irregularities occurred in the volume of sample around the top of the
well which resulted in the coverslip positioned in a different plane for each frequency run.
The maximum collection of cells was observed at frequencies between approximately 100
and 10,000 kHz. The cell collection was analysed in this frequency range and it was found
that a change in light intensity occurred in bands 6-9. There was a tendency of the DEP
software to over-estimate the size of the well and no change in light intensity occurred in
band 10. Therefore only bands 6-9 were included in the analysis.
To determine the optimal period of time that the AC electric voltage should be applied to the
DEP-microwell, a DEP spectrum of H I57 cells was obtained by probing the cells for 5
minutes per frequency, as shown in Figure 3-3.
Page I 75

NXOO
I— 1 —
'
j1
ii ■ —
1
ul \
k
oo
NX_k:o
IM0
.5
10a1I
.5&
U
o>k3DA
§(Z)
I8
'S'
IQ
II•o5
aBueqo À;isu9tu| jL|6n Ai!SU01U| jqBn
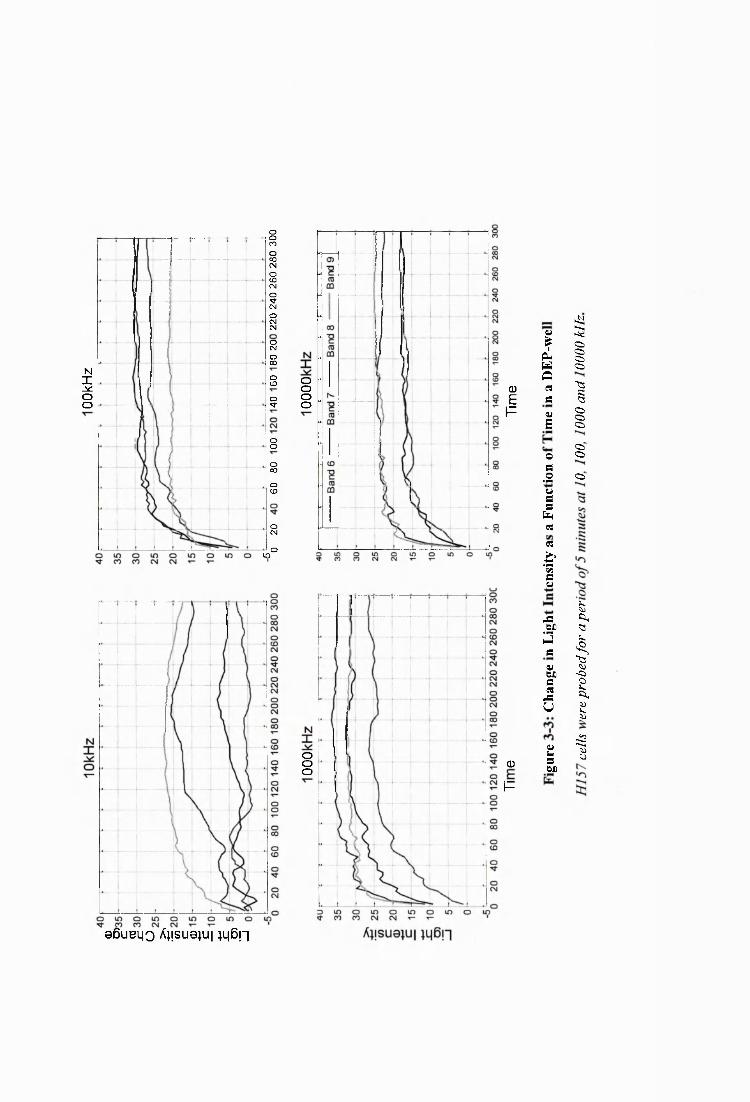
ooCO
o00CM
§CMOSO:
R§
N$OOOCÛ oOO
ooM" 4---
oo
o00
oCD
OCM
Oin
OOo
06ubm o Ai!su01u| iL)6n
0EP
0P
IQCla
IOs•2uS
Siet«
îfw
a&:JSU
%sbX)
I(Z,(Z>CiCi
ICic>Ci
«c.Ci
Ci
Kc
î~cI:I

The majority of the change in light intensity occurred within the first 60 seconds of the
applied field. Following the first 60 seconds, the change in light intensity plateaued.
Therefore, for all DEP experiments in this work, an electric voltage was applied to the
DEP-microwell for a period of 60 seconds at each frequency.
3.3.2 Dielectric Properties of Kératinocytes
Dielectric spectra of primary normal oral kératinocytes (HOK), dysplastic oral
kératinocytes (DOK), two OSCC cell lines (HI57 and H357) and a quasi-normal dermal
cell line (UP) were obtained in this study. An example of a dielectric spectrum of
kératinocytes is shown in Figure 3-4.
ModelO Spectrum
c 0-5
10 10 Frequency [Hz]
Figure 3-4: An Example of a Dielectric Spectrum of Oral CellsAn example o f a dielectric spectrum ofH357 cells is shown. Cells were washed twice and resuspended in DEP experimental medium at a concentration o f 2 x 10^ cells m t\
Cell motion as a function offrequency was analysed using the DEP-microwell. Five frequencies per decade from 4kHz to 20MHz were measured. Each datum point
represents the mean average change in light intensity o f each image captured during the time that the current was applied to the DEP-microwell. The error bar represents the standard deviation o f the mean average change in light intensity. A line o f best fit
(Model) was added to the DEP spectra. The correlation co-efficient o f the line was 0.9or above.
Page I 77
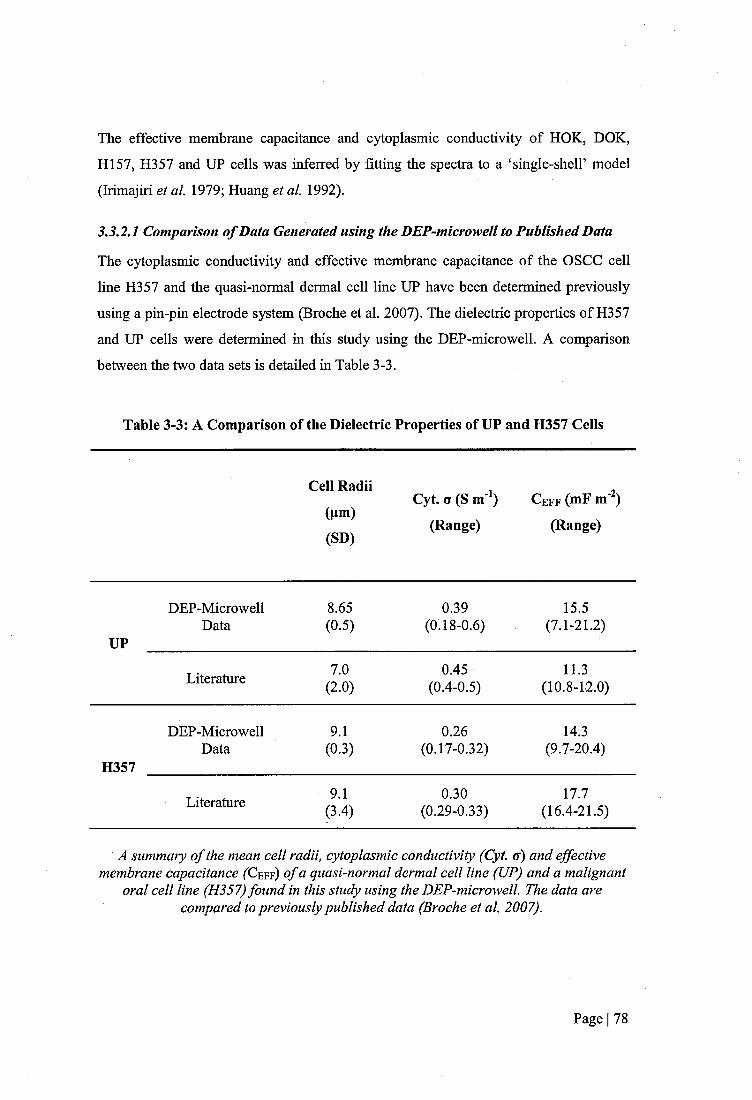
The effective membrane capacitance and cytoplasmic conductivity of HOK, DOK,
H157, H357 and UP cells was inferred by fitting the spectra to a ‘single-shelP model
(Irimajiri et a l 1979; Huang et al 1992),
3.3.2.1 Comparison o f Data Generated using the DEP-microwell to Published Data
The cytoplasmic conductivity and effective membrane capacitance of the OSCC cell
line H357 and the quasi-normal dermal cell line UP have been determined previously
using a pin-pin electrode system (Broche et al. 2007). The dielectric properties of H357
and UP cells were determined in this study using the DEP-microwell. A comparison
between the two data sets is detailed in Table 3-3.
Table 3-3: A Comparison of the Dielectric Properties of UP and H357 Cells
Cell Radii
(pm)
(SD)
Cyt. o (S m'^) C eff (mF m )
(Range) (Range)
UP
DEP-MicrowellData
8.65(0.5)
0.39(0.18-0.6)
15.5(7.1-21.2)
Literature 7.0(2.0)
0.45(0.4-0.5)
11.3(10.8-12.0)
H357
DEP-MicrowellData
9.1(0.3)
0.26(0.17-0.32)
14.3(9.7-20.4)
Literature 9.1(3.4)
0.30(0.29-0.33)
17.7(16.4-21.5)
A summary o f the mean cell radii, cytoplasmic conductivity (Cyt. a) and effective membrane capacitance ( C e f f) o f a quasi-normal dermal cell line (UP) and a malignant
oral cell line (H357) found in this study using the DEP-microwell The data are compared to previously published data (Broche et a l 2007).
Page I 78
The values of cytoplasmic conductivity obtained for UP and H357 cells in this study
using the DEP-microwell were both exactly 13.3% lower than the values obtained
previously by Broche and co-workers (2007) using a pin-pin electrode system.
In this study the cytoplasmic conductivity of H357 cells was 33.3% lower than the
cytoplasmic conductivity of UP cells. In the study by Broche et al. (2007) the
cytoplasmic conductivity of H357 cells was also 33.3% lower than the cytoplasmic
conductivity of UP cells.
In this study, the effective membrane capacitance of H357 cells was 19.2% lower than
the value reported by Broche et al. (2007). In contrast, the effective membrane
capacitance of UP cells was 37.2% higher than the value reported by Broche et al.
(2007).
The effective membrane capacitance of H357 cells was found to be 7.7% lower than the
effective membrane capacitance of UP cells and the difference was not statistically
significant. In contrast, Broche et al. (2007) found that the effective membrane
capacitance of H357 cells was 53.6% higher than UP cells.
The mean H357 cell radius was found to be the same in both studies. However, the
mean cell radius of UP cells was found to 23.6% higher than the value reported by
Broche and co-workers (2007).
Broche and colleagues (2007) did not report standard deviations in their results, only
ranges. Therefore, analysis of the statistical significance of differences between the
study by Broche et al. (2007) and this study could not be carried out.
3.3.2.2 Dielectric Properties of Oral Kératinocytes
To average dielectric spectra, the change in light intensity at each frequency for each
repeat experiment was averaged. A line of best fit was then fitted to the averaged
spectra. Averaged dielectric spectra of HOK, DOK, H357 and H I57 cells were
determined. The low and high fi*equency dispersions in the average dielectric spectra of
each cell type are shown in Figure 3-5 (a) and Figure 3-5 (b), respectively.
Page I 79
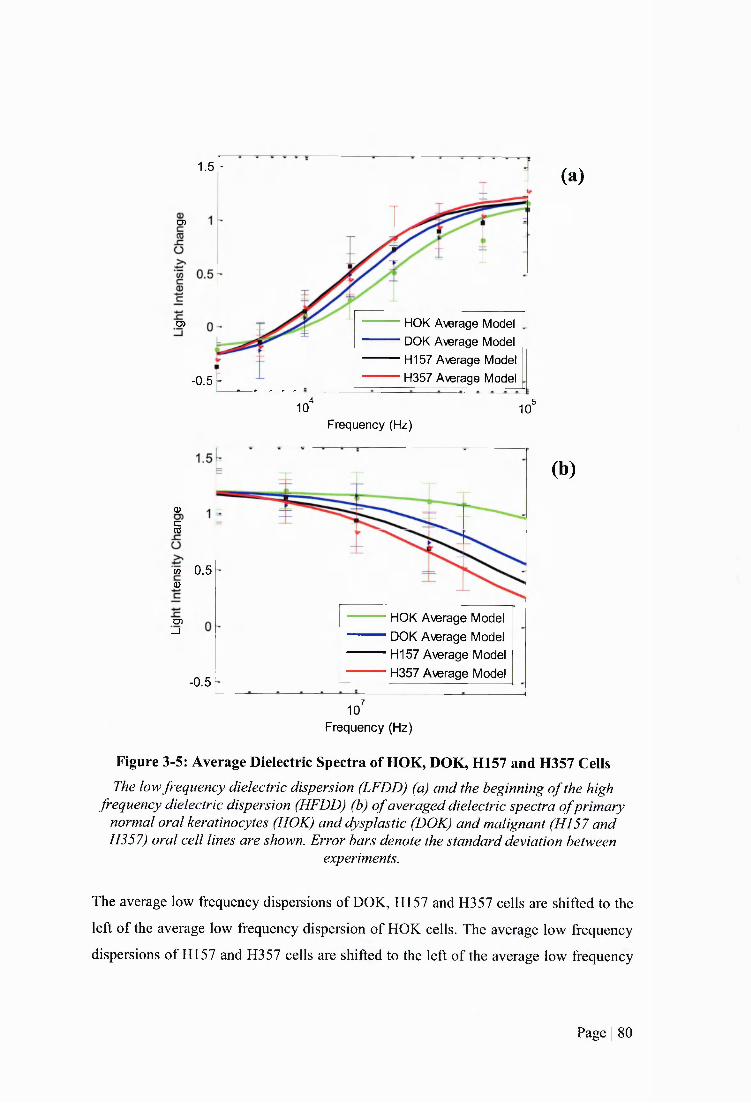
i . sT
O)
HOK Average Model DOK Average Model H157 Average Model H357 Average Model
0 5
-0.5 “4 ,510 10'
(a)
Frequency (Hz)
05
£sv
w 0.5CD
HOK Average Model DOK Average Model H I57 Average Model H357 Average Model
O)_i
-0.5710
(b)
Frequency (Hz)
Figure 3-5: Average Dielectric Spectra of HOK, DOK, H157 and H357 CeilsThe low frequency dielectric dispersion (LFDD) (a) and the beginning o f the high
frequency dielectric dispersion (HFDD) (b) o f averaged dielectric spectra ofprimary normal oral kératinocytes (HOK) and dysplastic (DOK) and malignant (HI57 and H357) oral cell lines are shown. Error bars denote the standard deviation between
experiments.
The average low frequeney dispersions of DOK, HI 57 and H357 cells are shifted to the
left of the average low frequency dispersion of HOK cells. The average low frequency
dispersions of H157 and H357 cells are shifted to the left of the average low frequency
Page I 80

dispersion of DOK cells. The average high frequency dispersions of DOK, H I57 and
H357 cells are shifted to the left of the average high frequency dispersion of HOK cells.
The average high frequency dispersions of HI 57 and H357 cells are shifted to the left of
the average high frequency dispersion of DOK cells.
Each spectrum was also modelled individually and the dielectric properties were
determined. The effective membrane capacitances and cytoplasmic conductivities of
HOK, DOK, H357 and H I57 are shown in Table 3-4 and Figure 3-6.
Table 3-4: Table of Dielectric Properties of Normal, Dysplastic and Malignant
Oral Kératinocytes
Cell Type Cell Radi (pm) Cyt. G (S m'^) C e f f (mF m )
(n) (SD) (SD) (SD)
HOK 12.31 0.71 6.85(5 ) (0.87) (0.08) (0.62)
DOK 9.87 0.42 10.87(5 ) (0.59) (0.26) (1.96)
H157 8.26 0.25 15.05(5 ) (1.29) (0.05) (2.58)
H357 9.13 0.26 14.34(5) (0.29) (0.06) (4.49)
A summary o f the mean cytoplasmic conductivity (Cyt. a) and effective membrane capacitance (Ceff) o f primary normal oral kératinocytes (HOK) and dysplastic (DOK) and malignant (HI57 and H357) oral keratinocyte cell lines, is shown. The dielectric
properties were determined by fitting a line o f best fit to the dielectric spectra and using a ‘Single-ShelT model (Irimajiri et al. 1979; Huang et al. 1992). Five repeat
experiments (n) were carried out for each cell type.
Page I 81
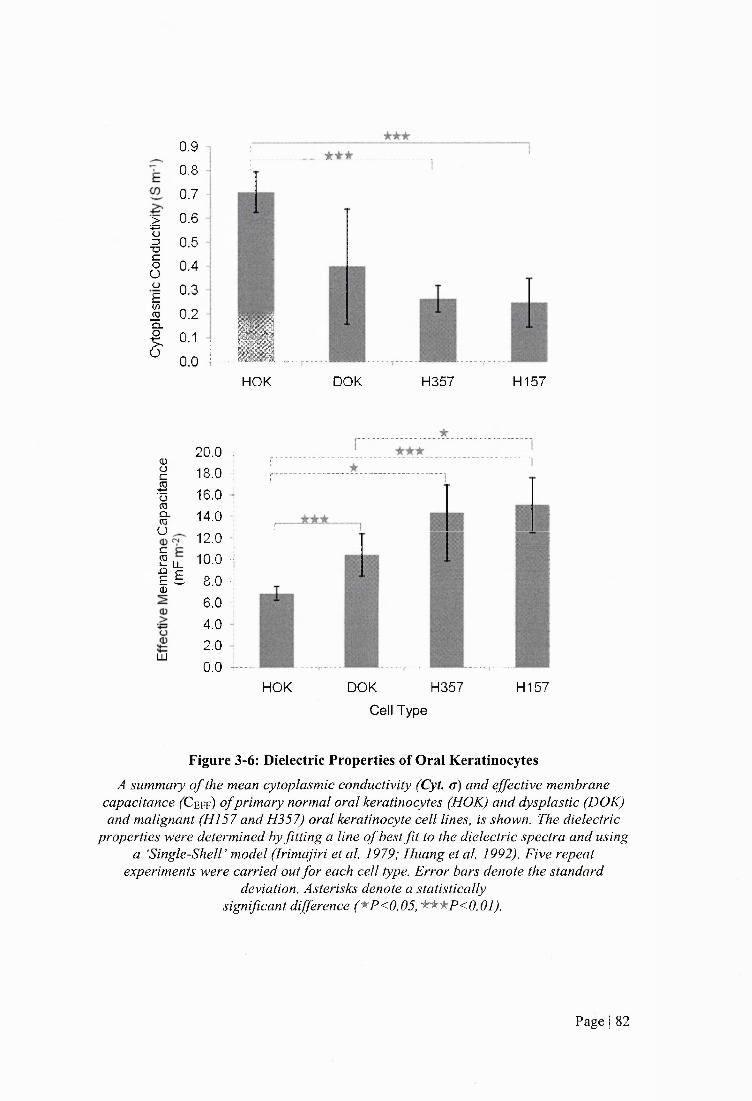
>■•S3X3COuü£(/>jO
ï
0.90.8
0.70.60.50.40.3
0.20.1
0.0 : ■HOK DOK H357 H157
0)ücëo(OCL<nO
i l0)
LU
20.018.016.014.012.0 10.08.06.04.02.0 0.0
HOK DOK H357Cell Type
H157
Figure 3-6: Dielectric Properties of Oral KératinocytesA summary o f the mean cytoplasmic conductivity (Cyt. g) and effective membrane
capacitance ( C e f f ) o f primary normal oral kératinocytes (HOK) and dysplastic (DOK) and malignant (HI57 and H357) oral keratinocyte cell lines, is shown. The dielectric
properties were determined by fitting a line o f best fit to the dielectric spectra and using a ‘Single-Sheir model (Irimajiri et al. 1979; Huang et al. 1992). Five repeat
experiments were carried out for each cell type. Error bars denote the standard deviation. Asterisks denote a statistically
significant difference ('^P<0.05, 'k'^^P<0.01).
Page I 82

A histogram of the distribution of cell radii, cytoplasmic conductivity and effective
membrane capacitance values was produced. The histogram did not conform to a
normal distribution curve therefore the non-parametric Mann Whitney U statistical test
was used to analyse differences in these values.
DOK, H357 and H I57 all had higher mean effective membrane capacitances than HOK
cells (P=0.008, P=0.008 and P=0.008, respectively). H357 and H I57 cells had higher
mean effective membrane capacitances than DOK cells, although this was not
statistically significant for H357 cells (P=0.333 and P=0.048, respectively).
Inversely, DOK, H357 and H I57 cells all displayed lower mean cytoplasmic
conductivities than HOK cells, although this was not statistically significant for DOK
cells (P=0.135, P=0.008 and P=0.008, respectively). H357 and H157 cells had lower
mean cytoplasmic conductivities than DOK cells, although this was not statistically
significant (P=0.548 and P=0.222, respectively).
The cell radii of DOK, H I57 and H357 cells are significantly smaller than the cell
radius of HOK cells (P<0.05). The cell radii of H I57 and H357 cells are significantly
smaller than the cell radius of DOK cells (P<0.05). There is no significant difference in
the cell radii of HI 57 and H357 cells (P>0.05).
The effective membrane capacitance is cell influences by cell radius. To deduce
whether the differences in effective membrane capacitance values seen between HOK,
DOK, H357 and H I57 cells was an artefact of differences in cell radius, a simulation
was produced in which models of cells with different radii were plotted, as shown in
Figure 3-7.
Page I 83
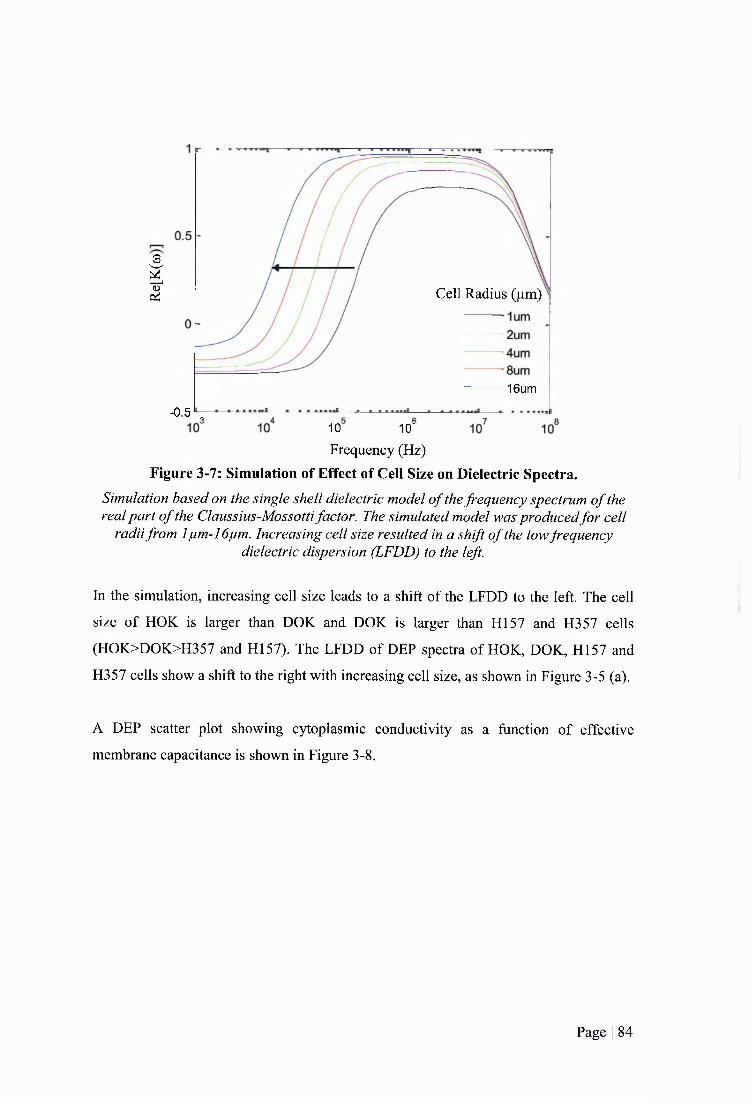
3
gfS Cell Radius (um)
16um
-0 5 ,
10 10“
Frequency (Hz)Figure 3-7: Simulation of Effect of Cell Size on Dielectric Spectra.
Simulation based on the single shell dielectric model o f the frequency spectrum o f the real part o f the Claussius-Mossotti factor. The simulated model was produced for cell
radii from 1pm-16pm. Increasing cell size resulted in a shift o f the low frequency dielectric dispersion (LFDD) to the left.
In the simulation, increasing cell size leads to a shift of the LFDD to the left. The cell
size of HOK is larger than DOK and DOK is larger than HI 57 and H357 eells
(HOK>DOK>H357 and H157). The LFDD of DEP spectra of HOK, DOK, H157 and
H357 cells show a shift to the right with increasing cell size, as shown in Figure 3-5 (a).
A DEP scatter plot showing cytoplasmic conductivity as a function of effective
membrane capacitance is shown in Figure 3-8.
Page I 84
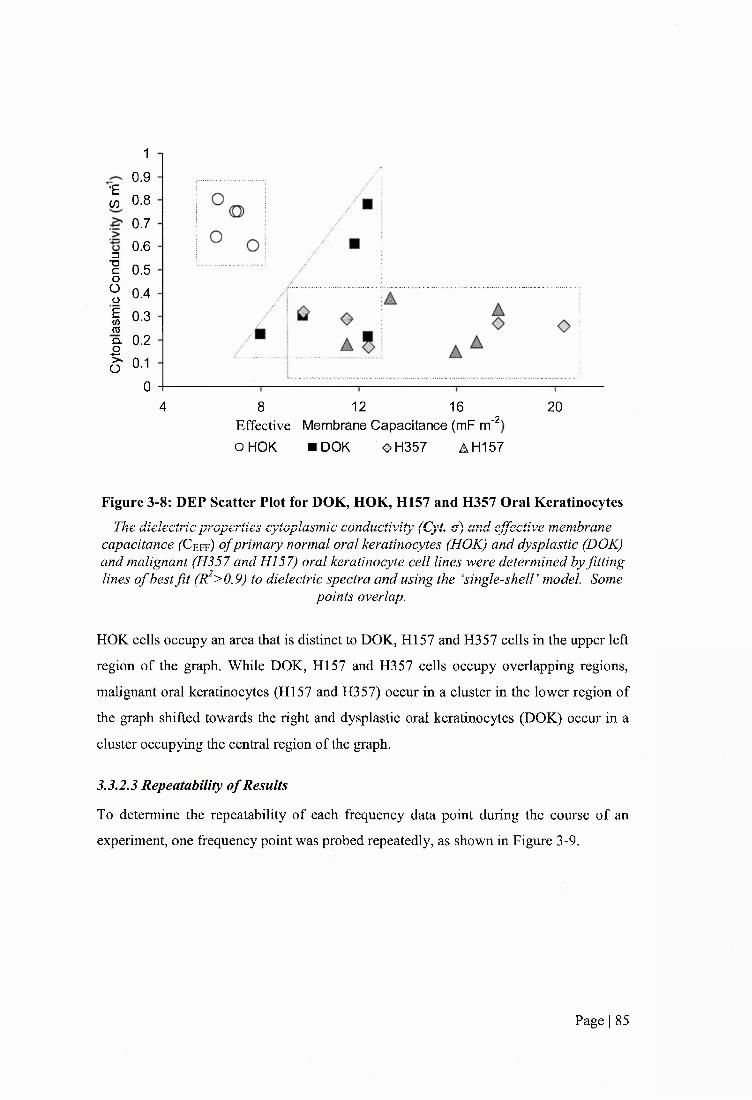
•£03
=3T3COoü£wmQ.
£O
10.90.80.70.60.50.40.30.20.1
0124 8 16 20
-2Effective Membrane Capacitance (mF m OHOK «DOK #H357 AH157
Figure 3-8: DEP Scatter Plot for DOK, HOK, K l57 and H357 Oral KératinocytesThe dielectric properties cytoplasmic conductivity (Cyt a) and effective membrane
capacitance (X! eff) o f primary normal oral kératinocytes (HOK) and dysplastic (DOK) and malignant (H357 and HI 57) oral keratinocyte cell lines were determined by fitting lines o f best fit (R^>0.9) to dielectric spectra and using the ‘single-shelT model. Some
points overlap.
HOK cells occupy an area that is distinct to DOK, H I57 and H357 cells in the upper left
region of the graph. While DOK, H I57 and H357 eells occupy overlapping regions,
malignant oral kératinocytes (HI57 and H357) occur in a cluster in the lower region of
the graph shifted towards the right and dysplastic oral kératinocytes (DOK) occur in a
cluster occupying the central region of the graph.
3.3.2.3 Repeatability of Results
To determine the repeatability of each frequency data point during the course of an
experiment, one frequency point was probed repeatedly, as shown in Figure 3-9.
Page I 85
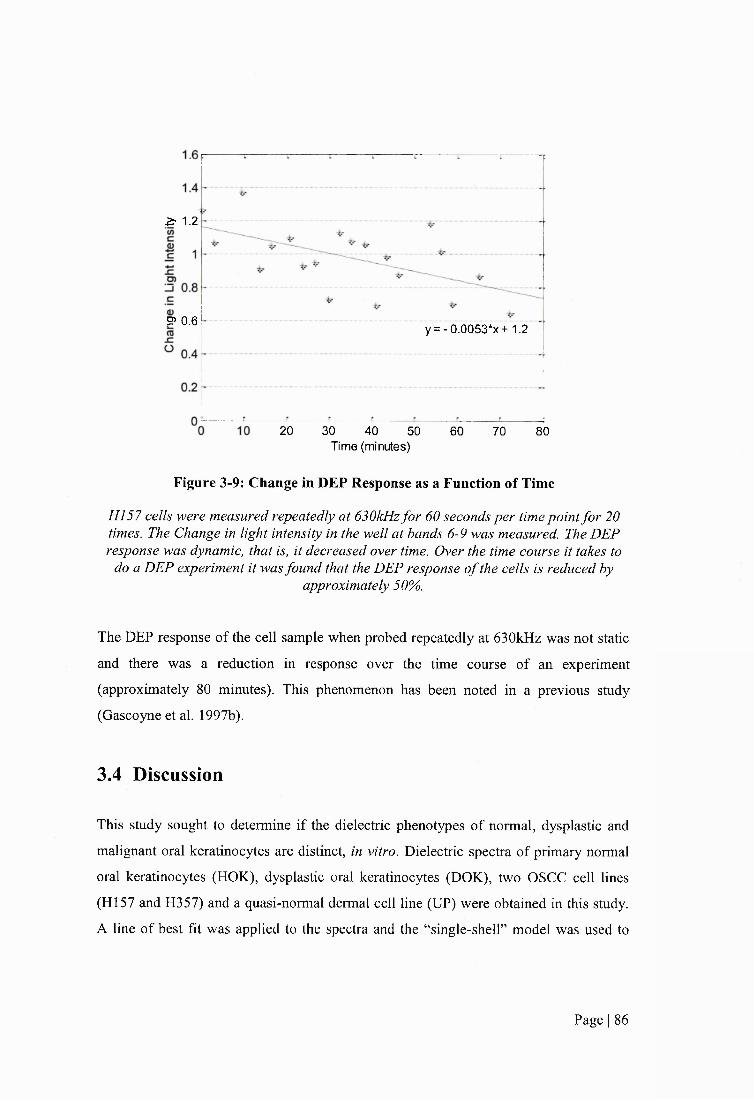
Z ' 1.2
? 0.6y = -0 .0053*x+ 1.2
20 30 40 50 60 70 80Time (minutes)
Figure 3-9: Change in DEP Response as a Function of Time
HI 57 cells were measured repeatedly at 630kHz for 60 seconds per time point for 20 times. The Change in light intensity in the well at bands 6-9 was measured. The DEF response was dynamic, that is, it decreased over time. Over the time course it takes to
do a DEP experiment it was found that the DEP response o f the cells is reduced byapproximately 50%.
The DEP response of the cell sample when probed repeatedly at 630kHz was not static
and there was a reduction in response over the time course of an experiment
(approximately 80 minutes). This phenomenon has been noted in a previous study
(Gascoyne et al. 1997b).
3.4 Discussion
This study sought to determine if the dielectrie phenotypes of normal, dysplastic and
malignant oral kératinocytes are distinct, in vitro. Dielectric spectra of primary normal
oral kératinocytes (HOK), dysplastic oral kératinocytes (DOK), two OSCC cell lines
(HI57 and H357) and a quasi-normal dermal cell line (UP) were obtained in this study.
A line of best fit was applied to the spectra and the “single-shell” model was used to
Page I 86
infer the effective membrane capacitance (C eff) and cytoplasmic conductivity of each
cell line.
3.4.1 Dielectric Phenotypes of Normal, Dysplastic and OSCC Oral
Kératinocytes
Primary normal oral kératinocytes (HOK) and dysplastic (DOK) and OSCC (H357 and
H I57) oral kératinocyte cell lines were compared in this study. The mean effective C eff
values of DOK, H357 and H I57 were higher than HOK cells (P=0.008, P=0.008 and
P=0.008, respectively). The mean effective C eff of H357 and H I57 cells was higher
than DOK cells (P=0.333 and P=0.048, respectively), although this was only
statistically significant for H157 cells. The OSCC cell lines, H357 and H157, showed
similar mean values for effective C eff (15.05 and 14.34S m'% respectively).
The effective C eff is a function of the permittivity and thickness of the cell membrane.
It has been estimated that the a completely smooth cell membrane has a C eff of
approximately 6mF m'^ (Pethig and Kell 1987). The effective C eff assumes a sphere
with a smooth membrane so an increase in surface area by means of membrane folding
would result in an increase in the C eff value. Therefore, the effective C eff is an
indicator of surface morphology. High values of effective C eff correlate with a high
quantity of membrane in a defined area (Wang et al. 1994; Ratanachoo et al. 2002;
Labeed et al. 2006). There are a number of phenomena that could lead to a higher
amount of plasma membrane within a defined area than a completely smooth cell.
Membrane blebs are spherical protrusions of the plasma membrane, which appear for
approximately 1 minute, m which the membrane detaches from the cytoskeleton
(Fackler and Grosse 2008). Membrane blebs are normally associated with apoptosis but
have recently been linked to cell motility (Fackler and Grosse 2008). In contrast to other
means of cell motility, such as lamellipodia and filopodia, which occur by localised
actin polimerisation at the leading edge (Pollard and Borisy 2003), blebbing is a
pressure driven phenomenon (Tinevez et al. 2009). Caveolae are lipid rich, invaginated
microdomains in the plasma membrane and are characterised by the membrane protein
caveolin (Thomsen et al. 2002). Caveolae are found in many cell types and have been
shown to have a role in cell processes including cholesteral transport (Fielding 2004).
Page I 87

Microvilli are flngerlike protrusions present on a variety of cell types. Their functions
include enlargement of the absorptive surface area, calcium signalling, volume
regulation and regulation of substrate transport (Lange 2011). Thus, an increase in any
of these phenomena could result in an increase in the effective C e f f value.
Dysplastic oral cells have a 1.59-fold (58.7%) higher mean effective C e f f than normal
oral cells. Cancerous oral cells have approximately a 1.35-fold (38.4% and 34.4%)
higher mean effective C e f f than dysplastic oral cells and approximately a 2.14-fold
(109.3% and 119.6%) higher mean effective C e f f than normal oral cells. The increase in
mean effective C e f f between normal, dysplastic and malignant cells indicates that the
plasma membrane becomes increasingly dense with disease progression. This is
consistent with observations that increased membrane microvilli is a component of the
cancer cell phenotype and correlates with metastatic potential and invasiveness (Partin
et a/. 1988; Ren et a l 1990; Nicolas et a l 1992; Jiang 1995).
The mean cytoplasmic conductivity values of DOK, H357 and H I57 cells were lower
than HOK cells (P=0.135, P=0.008 and P=0.008, respectively), although this was not
statistically significant for DOK cells. The mean cytoplasmic conductivities of H357
and H I57 cells were lower than DOK cells, although this was not statistically
significant (P=0.548 and P=0.222, respectively). The OSCC cell lines, H357 and H157,
showed similar mean values for cytoplasmic conductivity (0.26 and 0.25S m'%
respectively). DOK, H357 and H157 cells have a 40.8%, 63.3%, 64.7% lower mean
cytoplasmic conductivity than HOK cells, respectively. H357 and H I57 cells have a
38.1% and 40.5% lower mean cytoplasmic conductivity than DOK cells, respectively.
Differences in cytoplasmic conductivity could arise from (1) a difference in the
concentration of intracellular or (2) a difference in the mobility of intracellular mobile
ion species.
The concentration of intracellular mobile ion species is dependent, in part, on the
overall intracellular solute composition. Ions, small organic molecules such as sugars,
amino acids and nucleotides, and macromolecules such as proteins, are collectively
Page I 88

termed osmolytes and contribute to the internal osmotic pressure of the cell (Alberts et
al 2007). Cells regulate transient changes in osmotic pressure by adjusting the
intracellular water and ion content to re-establish physiological (approximately
SOOmOsm kg’ ) osmotic pressure. Therefore, the concentration of mobile ion species in
the cytoplasm, and consequently the cytoplasmic conductivity, is dependent, in part, on
the intracellular composition of ionic and non-ionic osmolytes. Thus, it follows that the
membrane permeability to different osmolytes will also affect the cytoplasmic
conductivity. For instance, when glucose moves down its concentration gradient across
the plasma membrane into the cell, changes in intracellular water and ion content will
occur to re-establish physiological osmolarity. If different cells have different
permeability’s to glucose and other osmolytes, differences will arise in the intracellular
content of water and ionic species.
The cytoplasmic pH in healthy cells is approximately 7.2 (Casey et a l 2010). However,
a more acidic cytoplasm has been found in cancer cells (Simon et a l 1994). The
cytoplasmic pH could affect the intracellular concentration of mobile ion species by
altering the ionic interactions between mobile ion species and intracellular proteins.
Acidic and basic functional groups on proteins are dependent on the pH of the
surrounding solution, that is, the pH of the cytoplasm. Mobile ion species are attracted
to functional groups with counter charges on intracellular proteins. Permeable ions of
opposite charge, which are not attracted to proteins, are able to pass through the plasma
membrane to the extracellular space resulting in an uneven distribution of charge across
the membrane (termed the Donnan effect). Thus, changes in the Dorman equilibrium
could result in changes in the intracellular concentrations of permeable mobile ion
species.
The mobility of intracellular mobile ion species is dependant, in part, on the
composition of intracellular mobile ion species. Ion species with more charge will carry
more current than ion species with less charge, thus the conductivity of a cytoplasm
containing mostly divalent ions will be higher than a cytoplasm containing mostly
monovalent ions. In addition, the dissociation constant of ionic molecules will also
affect the cytoplasmic conductivity. Only charged molecules or dissociated ions will
Page I 89
contribute to the conductivity of a solution. Therefore, if ions are in their molecular,
electroneutral form, they will not contribute to the conductivity of the cytoplasm.
The radii of DOK, H357 and H157 cells were 19.8%, 25.8% and 32.9% smaller than
HOK cells, respectively. This equates to a lower volume of approximately 63%, 57%
and 70% for DOK, H357 and H I57. The reduction in cytoplasmic conductivity is 41%,
63% and 65% for DOK, H357 and H I57, respectively. The cell volume correlates
positively with the cytoplasmic conductivity values.
The average lower frequency dielectric dispersion (LFDD) for each cell line shows a
shift to the right with increasing cell size. This is counter to the shift expected from
simulations of different cell sizes. An increase in cell size would result in the LFDD of
dielectric spectra shifting to the left.
In reviewing the current literature and the results from this study, an emerging trend has
been observed; cells with a more malignant phenotype have a higher effective C eff and
a lower cytoplasmic conductivity than cells with a more normal phenotype. In a study
by Gascoyne and colleagues (1994) murine erythroleukemia cells showed a higher
effective C eff (12.6 mF m^) than their counterpart cells which had undergone
chemically induced differentiation (8.8mF m^). Becker and colleagues (1994; 1995)
demonstrated that the cancerous leukocyte progenitor cell line HL-60 and the breast
cancer cell line MDA231 have higher effective C eff values (15 mF m^ and 26 mF m ,
respectively) than normal T lymphocytes (11 mF m^) and erythrocytes (9 mF m^).
Investigations on the temperature sensitive rat kidney cell line 6m2 which possesses a
normal phenotype at 39°C and a transformed phenotype at 33°C showed that cells in a
transformed state had a higher effective C eff than those in a normal state (Huang et al.
1996). The amount of microvilli shown in scanning electron micrographs correlated
with the effective C eff values; transformed cells had increased microvilli compared
normal cells. A study on breast epithelial cells revealed that normal breast cells (MCF
10A) had a higher cytoplasmic conductivity (0.3S m'^) than their malignant counterparts
(MCF 7) (0.23S m'^) (An et al. 2009). In the study by Broche et al. (2007) investigating
the dielectric properties of keratinocyte cells it was found that the quasi-normal dermal
Page I 90

cell line (UP) had a lower effective C e f f than the OSCC cell line, H357. Furthermore, it
was shown that UP cells had a higher cytoplasmic conductivity than H357 cells.
3.4.2 Comparison to Previous Studies on the Dielectric Properties of
Kératinocytes
This investigation expands the work carried out by Broche and colleagues (2007).
Broche et al (2007) analysed the dielectric properties of one OSCC cell line (H357) and
a quasi-normal cell line (UP). The UP cell line, which was used as a model for normal
oral kératinocytes, is a HPV-16 immortalized dermal keratinocyte cell line (Pei et al.
1991). The UP cell line is non-tumourogenic but has a reduced capacity to terminally
differentiate. Thus, it is a weak model for normal oral kératinocytes. This study
analysed primary normal human oral kératinocytes which are more representative of the
cells of interest. In addition, the dielectric properties of one dysplastic and two SCC oral
keratinocyte cell lines are reported here.
The dielectric properties of the OSCC cell line, H357, and the quasi-normal dermal cell
line, UP, were determined in this study and compared to existing published data
(Broche et al. 2007). The values of cytoplasmic conductivity obtained for H357 and UP
cells using a DEP-microwell were lower than the values obtained previously using a
pin-pin electrode sggem. However, the trend remained consistent; the cytoplasmic
conductivity of H357 cells was 33.3% lower than UP cells in both studies. The effective
C e f f of H357 cells was not significantly different to UP cells in this study whereas
Broche and colleagues (2007) reported that the effective C e f f of H357 cells was higher
than UP cells.
Although both groups of data were obtained by dielectrophoretic spectroscopy and
analysed using the ‘single-shell’ model, Broche and colleagues (2007) used a pin-pin
electrode system which differs to the methods used in this study. The pin-pin electrode
employs two needle shaped electrodes pointed towards each other to create an electric
field gradient. Cell collection is measured by manually counting cells as they attach to
the electrode edges. This system analyses a small number of cells compared to the DEP-
microwell system. In the study conducted by Broche et al. (2007), a mean of up to 30
Page I 91
cells were counted at any given frequency. If approximately 0.8pi is added to the DEP-
microwell and approximately 40% of the radius is analysed, the volume of cell solution
analysed will be approximately 0.5pi (volume of whole well minus volume of central
non-analysed area of well). Therefore, if the concentration of cells in the DEP-
microwell is 2x10^ cells ml" then the DEP force acting on approximately 1000 cells will
be measured at any given frequency. Greater than 3 3-fold more cells are measured using
the DEP-microwell at any given frequency which makes the data derived from the DEP-
microwell more statistically relevant than that from the pin-pin system. In addition, the
DEP-microwell can measure positive and negative DEP whereas the pin-pin system can
only measure positive DEP as only cell collection can be quantified. The pin-pin
electrode system is also open to systematic error as only the cells in a small area of the
field of view can be counted at any one time resulting in differences in the area size and
position for each experiment. However, the experiments carried out by Broche et al
(2007) provided more consistent results than the experiments in this study, as evidenced
by the narrower range of values reported for each experimental condition.
In this study, the osmolality of DEP experimental medium was adjusted so that it was
iso-osmotic with respect to KGM. This was not the case in the study by Broche et al
(2007) where a sucrose concentration of 248mM was used.
3.4.3 Optimisation of DEP-microwell Experimental Conditions
The DEP-microwell has been used previously to obtain dielectric properties of human
erythrocytes and bacteria in response to chemical agents (Hubner et al. 2005; Hoettges
et al. 2008). The methods used in this study were derived from these previous reports. A
number of modifications were made to the sample preparation and experimental
conditions in order to optimise the experiment for the cells studied in this investigation.
In order to optimise DEP experimental conditions, a series of experiments were carried
out. The osmolality of complete growth media formulations used in this study were
found to be higher than the osmolality of conventional DEP experimental medium
(284mOsm Kg"'). When cells grown in these growth media were suspended and
centrifuged in DEP experimental medium with physiological osmolality, cell viability
Page I 92

and concentration was reduced and a number of cells with a ‘ghost-like’ appearance
were observed. The ghost cells were amorphic and extremely pale blue in colour when
assayed with trypan blue. They were difficult to discern under the light microscope and
therefore it is probable that trypan blue assay significantly underestimated the non-
viable cell fraction. Conventional DEP experimental medium is hypo-osmotic with
respect to these growth media preparations. If cells are placed into a hypo-osmotic
environment water will move into the cell and its volume with increase. It is postulated
that an increase in cell volume causes the cell membrane to be more fragile and
susceptible to shearing forces. It is possible that ghost cells are burst cells, where
membrane integrity has been compromised to such an extent that they cannot retain
trypan blue dye. Thus, centrifugation of cells in this solution resulted in cell death. In
this study, the osmolality of DEP experimental media comprising a range of sucrose
concentrations was determined. The sucrose concentration of the DEP experimental
medium that had an osmolality nearest to the osmolality of KGM was used for DEP
experimentation. When the DEP experimental medium containing 263mM sucrose was
used for sample preparation and DEP experimentation, ghost cells were not observed
and cell viability remained at around 95%.
A cell concentration of 2x10^ cells ml' was used in these experiments. At high cell
concentrations the average distance between cells is reduced and cell-cell interactions
occur resulting in the formation of pearl chains. In a study using the DEP-microwell
Hoettges et al. (2008) used a cell concentration of 5x10^ cells m l'\ A lower
concentration was used in this study due to the limited number of cells produced by the
HOK cell culture. HOK cells are a primary cells and senesce after a short growth
period. The cell cultures used in this study contained mitotically active cells thus they
are more representative of basal kératinocytes than differentiated kératinocytes.
A reduction in positive DEP response over the time course of an experiment
(approximately 80 minutes) was observed when the cell sample was probed repeatedly
at 630kHz. This phenomenon has been noted previously (Gimsa et al. 1991; Gascoyne
et al. 1997a; Gascoyne et al. 1997b; Gascoyne et al. 2009). A reduction in positive
Page I 93
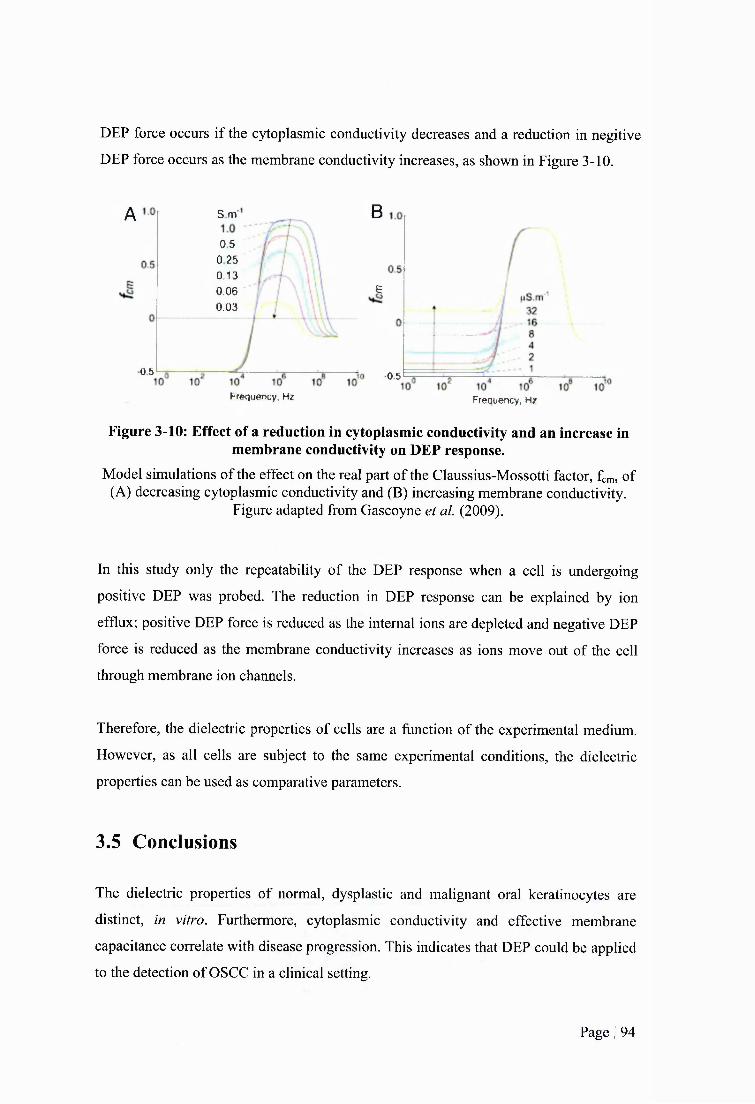
DEP force occurs if the cytoplasmic conductivity decreases and a reduction in negitive
DEP force occurs as the membrane conductivity increases, as shown in Figure 3-10.
A S m
0.5 0 25 0.13 0.06 0.03
0 5
Frequency, Hz
B
e
•0.5
Frequency, Hz
Figure 3-10: Effect of a reduction in cytoplasmic conductivity and an increase in membrane conductivity on DEP response.
Model simulations of the effect on the real part of the Claussius-Mossotti factor, fcm, of (A) decreasing cytoplasmic conductivity and (B) increasing membrane conductivity.
Figure adapted from Gascoyne et al. (2009).
In this study only the repeatability of the DEP response when a cell is undergoing
positive DEP was probed. The reduction in DEP response can be explained by ion
efflux; positive DEP force is reduced as the internal ions are depleted and negative DEP
force is reduced as the membrane conductivity increases as ions move out of the cell
through membrane ion channels.
Therefore, the dielectric properties of cells are a function of the experimental medium.
However, as all cells are subject to the same experimental conditions, the dielectric
properties can be used as comparative parameters.
3.5 Conclusions
The dielectric properties of normal, dysplastic and malignant oral kératinocytes are
distinct, in vitro. Furthermore, cytoplasmic conductivity and effective membrane
capacitance correlate with disease progression. This indicates that DEP could be applied
to the detection of OSCC in a clinical setting.
Page I 94

The osmolality of growth media formulations vary and are not always consistent with
physiological osmolality. The osmolality of DEP experimental medium should be
prepared so it is identical to cell growth media, not physiological, osmolality. If the
osmolality of DEP experimental medium is lower than cell growth medium cell death
occurs during the DEP wash procedure.
Page I 95
4 DIELECTRIC PROPERTIES OF NORMAL, DYSPLASTIC
AND MALIGNANT ORAL KERATINOCYTES DERIVED
FROM RECONSTITUTED ORGANOTYPICAL
CULTURES
4.1 Introduction
Native epithelial tissue is a heterogeneous composition of epithelial cells at different stages of
differentiation. The epithelium shows basal to apical polarity; cells in the basal layer have an
undifferentiated stem cell-like phenotype whereas cells in the external layer are folly
differentiated keratinized squames, as discussed in 2.1.1. The apical surface of the epithelium
is exposed to the external environment while the basal surface is connected to the underlying
mesenchymal layer, which provides nourishment by diffosion and contains mesenchymal
(fibroblast) cells. In 2-dimensional (2-D) standard monolayer culture conditions kératinocytes
are grown submerged in medium and devoid of influences from an extracellular matrix
(ECM) or mesenchymal cells. In this environment, kératinocytes do not realise their capacity
to folly differentiate and reorganise into structured epithelia (epithelialisation) (Freshney and
Freshney 2002). Thus, epithelial cells are not well modelled by standard monolayer culture
conditions as these fail to reproduce in vivo like patterns of normal epithelial growth.
The first attempt to enhance epithelialisation of keratinocyte cells in vitro was in 1975 when
Swiss mouse 3T3 fibroblasts, irradiated with y-rays to render them permanently post-mitotic,
were co-cultured with epithelial cells (Rheinwald and Green 1975). These were termed
“feeder layers”. However, in these 2-D co-cultures only partial epithelialisation occurred and
organised, stratified, polarised epithelium did not folly develop.
Epithelial reconstituted 3-dimentional (3-D) organotypical cultures, prepared by plating
epidermal cells on a collagen matrix populated with fibroblasts, were devised by Bell and
colleagues, who sought to create in vivo skin grafts (Bell et al. 1979; Bell et al. 1981; Bell et
al. 1983). These models incorporated both an ECM and mesenchymal cells resulting in the
production of epithelium representative of native tissue. Asselineau and Prunieras (1984)
further refined this model and developed the raft method which incorporates a period of
Page I 96

growth in which the culture is maintained at the air-liquid interface. The raft method involves
the use of a stainless steel platform to elevate the culture so that the surface of the epithelium
is exposed to air and the collagen matrix is in contact with the growth medium resulting in
the epithelium being nourished by diffusion fi-om below (Freshney and Freshney 2002).
4.1.1 Reconstituted 3-D Organotypical Cultures of the Oral Mucosa
In 1996, the first reconstituted oral organotypical culture was developed (Masuda 1996).
Thereafter, reconstituted organotypical culture models have been used to study normal, pre-
malignant and malignant oral kératinocytes.
Reconstituted organotypical culture models of the normal oral mucosa comprising normal
oral kératinocytes plated on fibroblast-populated collagen matrices have been used as models
of the normal oral mucosa. Costea and co-workers (2005) used organotypical cultures to
study the effects of oral fibroblasts and their soluble product, keratinocyte growth factor
(KGF), on oral epithelial morphogenesis. Garlick et a l (1996) studied re-epithelisation after
wounding in oral organotypical cultures. Royack et al (2000) studied the effects of oxygen
firee radicals and vitamin E on normal oral kératinocytes in organotypical cultures.
Fibroblast-populated collagen matrices plated with normal, dysplastic and malignant oral
kératinocytes have been used as models for normal, premalignant and malignant oral mucosa,
respectively. Hansson (2001) used organotypical culture models to investigate keratin
expression in normal, immortalised and malignant oral kératinocytes. Costea et a l (2005)
used organotypical culture models to study the influence of fibroblasts during epithelial
neoplastic progression. Brusevold and colleagues (2010) used organotypical culture models
to investigate prognostic markers for OSCC.
Host populations of normal oral kératinocytes containing subpopulations of malignant oral
kératinocytes plated on fibroblasts-populated collagen matrices have also been used as
models for malignant oral epithelium. Mackenzie (2004) used reconstituted organotypical
cultures of normal oral epithelium spiked with malignant oral kératinocytes to study the
interaction between normal and malignant oral kératinocytes during tumourigenesis of the
oral epithelium.
Page I 97

4.1.2 Aims and Structure
This chapter fiirther investigates the dielectric properties of normal, dysplastic and malignant
oral kératinocytes in vitro. The aims of this chapter are twofold. Firstly, to determine if the
dielectric properties of oral kératinocytes grown in standard monolayer cultures are
conserved when cells are propagated in an in vitro environment more representative of native
tissue. Secondly, this chapter aims to determine the ability of DEP to detect a subpopulation
of malignant oral kératinocytes within a host population of normal oral kératinocytes.
To meet the aims of this chapter, normal, dysplastic and malignant oral kératinocytes and
mixed populations of normal and malignant oral kératinocytes, have been grown in
reconstituted 3-D organotypical cultures. Following a defined growth period, kératinocytes
were isolated from these cultures and dielectric spectra were obtained.
The dielectric properties of pure populations of normal, dysplastic and malignant oral
kératinocytes grown in reconstituted 3-D organotypical cultures have been determined and
compared with the dielectric properties of counterpart cells grown in standard 2-D monolayer
culture conditions.
The dielectric properties of normal oral kératinocytes spiked with varying ratios of malignant
oral kératinocytes grown in reconstituted 3-D organotypical cultures were determined. Prior
to seeding cells in reconstituted organotypical cultures, malignant oral kératinocytes were
transfected with the gene for green fluorescent protein (GFP) so that they can be identified
and when mixed with normal oral kératinocytes. The ratio of malignant to normal oral
kératinocytes was quantified with flow cytometry following the organotypical propagation
period.
4.2 Materials and Methods
4.2.1 Culture of Cells in Monolayer
Normal oral fibroblast (NOF) cells were a kind gift from Prof. Mark Lewis at the University
College London Eastman Dental Institute. NOF cells were cultured in fibroblast growth
medium (FGM), which comprised of high glucose (4.5g L'^) DMEM (PAA, Somerset, UK)
Page I 98
supplemented with 10% FBS, lOOU ml' penicillin and lOOpg ml’* streptomycin. Primary
normal oral kératinocytes (HOK) and dysplastic (DOK) and malignant (HI57) oral
keratinocyte cell lines were cultured as described in 3.2.1.
4.2.2 Transfection of Kératinocytes with Green Fluorescent Protein (GFP)
In order to identify and quantify the fraction of malignant oral kératinocytes (HI 57 cells) in
cell mixtures with normal oral kératinocytes (HOK cells), H I57 cells were transfected with
the gene for green fluorescent protein (GFP). The gene for puromycin resistance (PAC) was
co-transfected to enable selection of GFP-expressing HI 57 cells (HI 57^^^ cells).
4.2.2.1 Lentiviral Transfection
H I57 cells were incubated for a period of 18 hours with a lentiviral construct containing the
GFP and PAC genes (Biogenova™, Maryland, US) (as recommended by manufacturer). The
transfection medium comprised of DMEM (low glucose) supplemented with 10% FBS, lOOU
ml'^ penicillin, lOOpg mf^ streptomycin and 8pg/ml polybrene (Sigma Aldrich, Poole, U.K.)
(as recommended by manufacturer). A multiplicity of infection (MOl) of 10 was used (as
recommended by manufacturer). The transfection solution was then replaced with KGM for a
period of 48 hours.
4.2.2.2 Concentration of Puromycin in Selection Medium
Following transfection, H I57 cells were incubated in medium containing puromycin to select
for cells expressing the GFP and PAC genes and to kill cells not expressing the GFP and
PAC genes. To deduce the concentration of puromycin required to kill cells not expressing
the GFP and PAC genes, a concentration-effect experiment was carried out. Non-transfected
H I57 cells were incubated with selection media composed of KGM supplemented with
puromycin (Sigma Aldrich, Poole, U.K.) at concentrations of 0-1 Opg ml"% for a period of 4
days (as recommended by supplier). The viability of cells was measured every 24 hours using
trypan blue assay.
4.2.2.3 HIS Cell Selection
To select for H I57^^^ cells, KGM was aspirated from transfected cells and replaced with
selection medium containing puromycin at the lowest concentration found to kill 100% of
cells within 4 days in the coneentration-effect experiments carried out in 4.2.2.2. The
selection medium was renewed every 2-3 days for a period of 10 days until the cell
Page I 99
population contained H I57^^^ only cells (determined by the death of non-transfected
H I57°^^' control cells). The transfection efficiency was analysed by flow cytometry using
non-transfected cells as negative controls.
4.2.2.4 H I57^^^^ Cell Enrichment: Fluorescent Activated Cell Sorting
To enrich the H I57^^^ cell population following transfection and selection, H I57 cells were
sorted using a fluorescent activated cell sorter (FACS). Transfected and selected H I57 cells
were detached from the culture plate using trypsin-EDTA, centrifuged and resuspended in
FACS medium which consisted of 3 parts DMEM (PAA, Somerset, UK) and one part F I2
Hams (Invitrogen, Paisley, UK) supplemented with 1% FBS (PAA, Somerset, UK), 25mM
HEPES (Invitrogen, Paisley, UK) and 5mM EDTA (Sigma-Aldrich, Poole, UK). The FACS
medium was filtered with a 0.2pm sterile filter. The cell suspension was passed through a
30pm MACS® Pre-separation Filter (Miltenyi Biotec Ltd, Surrey, UK) to remove cell
aggregates and held on ice before the sort. The cells were sorted using a Becton Dickinson
FACS Aria flow cytometer cell sorter. Non-transfected H I57°^^' cells were used as a
negative control.
4.2.3 Construction of Reconstituted Oral Organotypical Cultures
Reconstituted oral organotypical cultures consisted of oral kératinocytes (the epithelium
equivalent) plated on top of a collagen matrix populated with NOF cells (the mesenchymal
equivalent). After two days submerged in growth medium, the cultures were raised to the air-
liquid interface and fed from below.
To make NOF-populated collagen matrices, 8 volumes of Rat Tail Collagen Type 1 (First
Link UK, Birmingham, UK) were mixed with 1 volume of lOx DMEM (Sigma Aldrich,
Poole, UK) (Igarashi et al. 2003). The collagen solution was neutralized with sodium
hydroxide (indicated by a colour change) and kept on ice (as recommended by manufacturer).
NOF cells were harvested by trypsinization and suspended in 1 volume FGM. The NOF-
FGM solution was then added to the collagen solution to achieve a final concentration of 2 x
10 fibroblasts per ml collagen (Igarashi et al. 2003). Aliquots of 700pl of collagen-fibroblast
mix were transferred into each well of a 24 well plate and allowed to polymerize for 1 hour in
a humidified incubator at 37°C with 5% CO2. FGM was added on top of each collagen matrix
and the matrices were left to equilibrate in a humidified incubator at 37°C with 5% CO2 for
24 hours (Freshney and Freshney 2002; Costea et al. 2003; Igarashi et al. 2003).
Page I 100
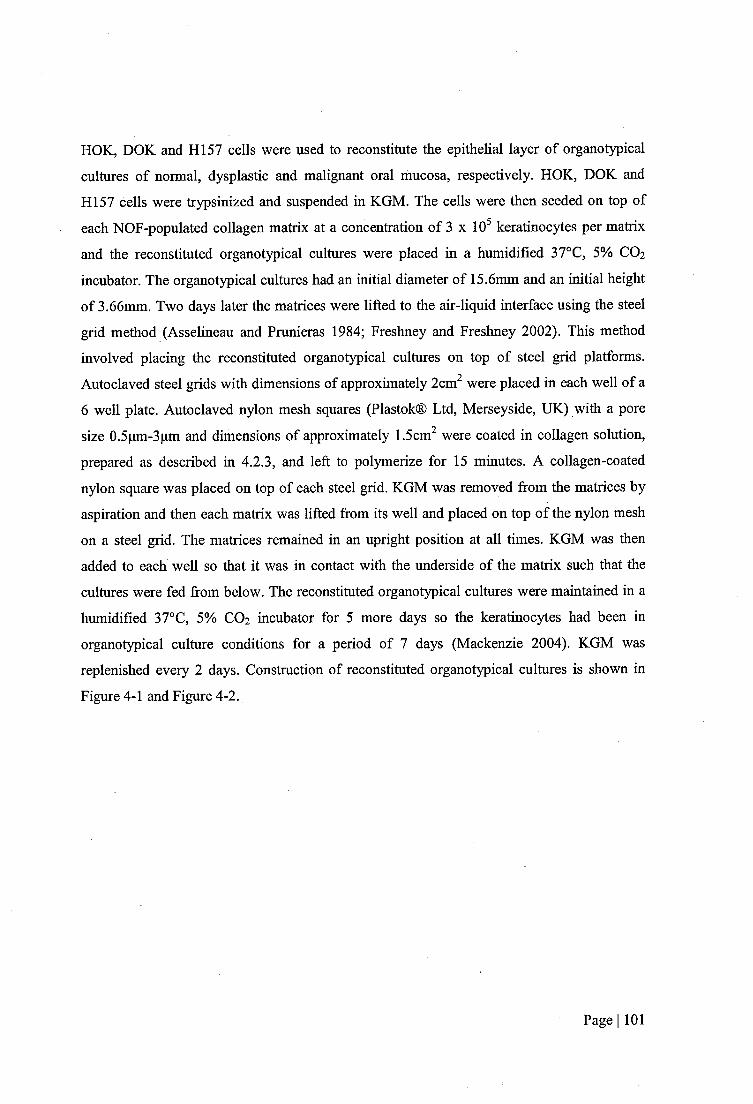
HOK, DOK and H I57 cells were used to reconstitute the epithelial layer of organotypical
cultures of normal, dysplastic and malignant oral mucosa, respectively. HOK, DOK and
H I57 cells were trypsinized and suspended in KGM. The cells were then seeded on top of
each NOF-populated collagen matrix at a concentration of 3 x 10 kératinocytes per matrix
and the reconstituted organotypical cultures were placed in a humidified 37°C, 5% CO2
incubator. The organotypical cultures had an initial diameter of 15.6mm and an initial height
of 3.66mm. Two days later the matriees were lifted to the air-liquid interface using the steel
grid method (Asselineau and Prunieras 1984; Freshney and Freshney 2002). This method
involved placing the reconstituted organotypical cultures on top of steel grid platforms.
Autoclaved steel grids with dimensions of approximately 2cm^ were placed in each well of a
6 well plate. Autoclaved nylon mesh squares (Plastok® Ltd, Merseyside, UK) with a pore
size 0.5pm-3pm and dimensions of approximately 1.5cm^ were coated in collagen solution,
prepared as described in 4.2.3, and left to polymerize for 15 minutes. A collagen-coated
nylon square was placed on top of each steel grid. KGM was removed from the matrices by
aspiration and then each matrix was lifted from its well and placed on top of the nylon mesh
on a steel grid. The matrices remained in an upright position at all times. KGM was then
added to each well so that it was in contact with the underside of the matrix such that the
cultures were fed fi-om below. The reconstituted organotypical cultures were maintained in a
humidified 37°C, 5% CO2 incubator for 5 more days so the kératinocytes had been in
organotypical culture conditions for a period of 7 days (Mackenzie 2004). KGM was
replenished every 2 days. Construction of reconstituted organotypical cultures is shown in
Figure 4-1 and Figure 4-2.
Page I 101
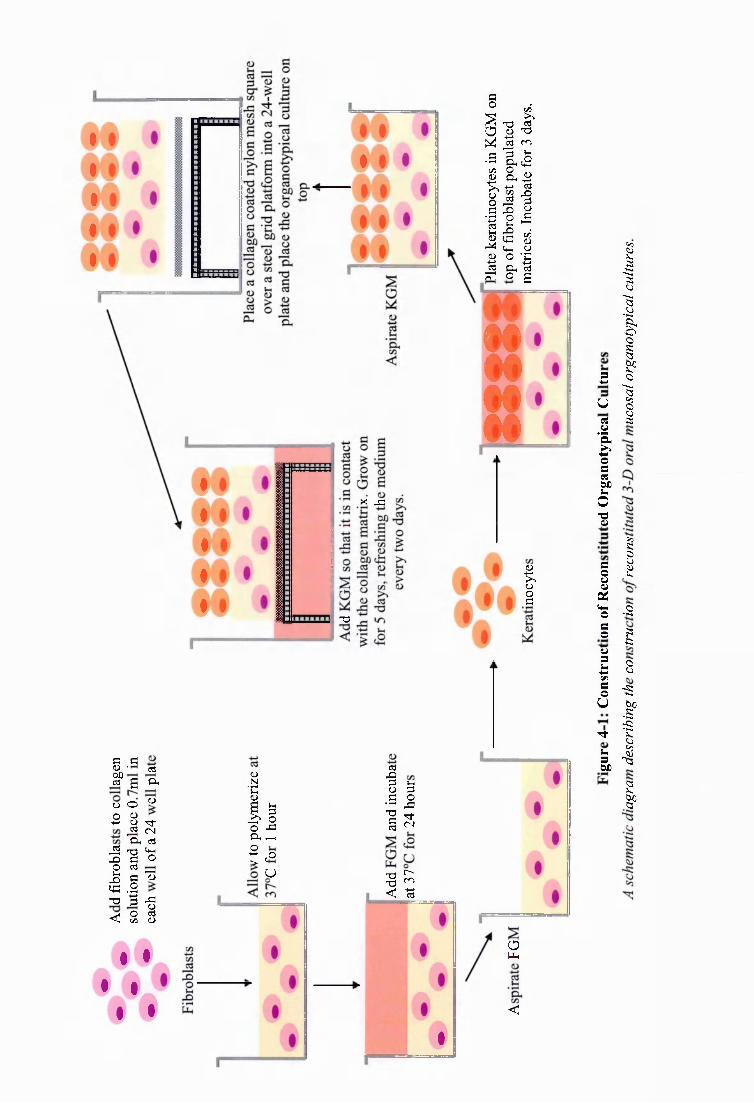
fi _fiu CTjbûcü B a
o o (D
O u4-* u T )-oS
' a<NC(J
S n3 q-ir f i f i OO cj
1 11 3
T3 ' 3 -fio< oun 2
IlCl, ^ !,=
aI•S
IIT)-(N
u
I #$ #
$ •
1 5
#
% rS=i
"O
I ilis
I Q I
88
I§
_ L j
Op-i
<
5u2
Iofi2dkO'2
fi
I(4-1Ofi0U1fiou
tT
I
iIë0113
i•S
g8
":StIII

Oral Kératinocytes
Polymerized . collagen populated
withNOFs.Collagen Coated
Nylon Mesh
WellSteel Grid
Platform KGM
Figure 4-2: Schematic Diagram of a Reconstituted Organotypical Culture Raised to theAir-Liquid Interface
Schematic diagram o f a reconstituted organotypical culture maintained at the air-liquid interface for a period o f 5 days using the steel grid method. Oral epithelium was
reconstituted with HOK, DOK or H I57 cells on a NOF-populated collagen gel. The culture was fedfrom the underside with keratinocyte growth medium (KGM) which was replenished
every 2 days.
To determine the ability of DEP to detect a subpopulation of malignant oral kératinocytes
within a host population of normal oral kératinocytes, mixed populations of HOK and H I57
cells were grown in reconstituted organotypical cultures. Reconstituted organotypical
cultures, comprising host populations of HOK cells spiked with subpopulations of H I57 cells
at 1% and 10% of the total keratinocyte population, were prepared. In addition, reconstituted
organotypical cultures comprising of pure populations of HOK and H I57 cells seeded on
NOF-populated collagen matrices, were prepared. For a number of the reconstituted
organotypical cultures, H I57 cells were substituted for H I57°^^^ cells to allow for
quantification of H I57 and HOK cells following the growth period of the reconstituted
organotypical cultures.
Each DEP experiment required 2x10^ cells m f \ To achieve this number of cells, 5
reconstituted organotypical cultures were prepared for each DEP experiment. For each cell
type, at least 4 DEP experiments were conducted. In addition, 6 organotypical models were
prepared for histological analysis for each cell type. Therefore, at least 26 organotypical
cultures were prepared for each cell type or cell mixture.
Page I 103
4.2.4 Enrichment of Kératinocytes from Organotypical Constructs
To isolate epithelial cells from the underlying NOF-populated collagen matrix (mesenchymal
equivalent), two approaches were explored; dissociation of the intact epithelial layer from the
intact mesenchymal equivalent layer (Mackenzie 2004) and selective digestion of the
mesenchymal equivalent layer leaving an intact epithelial layer (Freshney and Freshney
2002).
4.2.4.1 Dissociation of the Epithelial Layer from the Mesenchymal Equivalent Layer
Reconstituted organotypical cultures, consisting of an underlying NOF-populated collagen
matrix and an overlying layer of HOK, DOK or H I57 cells were constructed, as described in
4.2.3. Following the growth period, reconstituted organotypical cultures were washed twice
in PBS (calcium and magnesium negative) and submerged in 20mM EDTA (Invitrogen,
Paisley, UK) until the epithelial layer could be separated from the mesenchymal equivalent
with forceps (Mackenzie 2004).
4.2.4.2 Selective Digestion of the Mesenchymal Equivalent Layer
Reconstituted NOF-populated collagen matrices with no overlying epithelial layer (epithelial-
negative matrices) and reconstituted organotypical cultures comprising of an underlying
NOF-populated collagen matrix and an overlying layer of HOK, DOK or H I57 cells, were
constructed as described in 4.2.3. Epithelial-negative matrices were submerged in PBS
containing 0.5mg ml"* type lA collagenase (Sigma Aldrich, Poole, UK) supplemented with
5mM calcium chloride (as suggested by the supplier) and incubated at 37°C. The collagenase
treated matrices were agitated approximately every 10 minutes until the matrices had been
fully digested and a single cell suspension of NOF cells remained. The collagenase exposure
time required to digest the collagen matrices and release NOF cells was recorded. The
procedure was repeated with organotypical cultures with an epithelial layer comprising HOK,
DOK or H I57 cells for the same incubation time recorded previously for epithelial-negative
matrices.
4.2.4.3 Digestion of the Epithelial Layer into a Single Cell Suspension
Isolated epithelial sheets were washed twice in PBS and submerged in trypsin-EDTA solution
until the sheets were digested into a single cell suspension (between 10 and 20 minutes). Cell
Page 1 104
membrane integrity, and thus an estimate of the viable cell fraction, was determined by
trypan blue assay.
4.2.5 DEP Sample Preparation
Seven days after plating kératinocytes on NOF-populated collagen matrices, reconstituted
organotypical cultures were digested and keratinocyte cells were isolated.
The selective digestion method detailed in 4.2.4.2 was used to isolate kératinocytes from
reconstituted organotypical cultures for DEP analysis. Type 1A collagenase (Sigma Aldrich,
Poole, UK) was dissolved in PBS at a concentration of 0.5mg ml'* collagenase and
supplemented with calcium chloride to a final concentration of 5mM (as suggested by
manufacturer). Reconstituted organotypical cultures were submerged in collagenase solution,
incubated at 37°C and agitated every 10 minutes for a period of 35 minutes (time determined
in 4.2.4.2). The resulting epithelial sheet was washed twice in PBS, submerged in trypsin-
EDTA solution and incubated until the sheet was digested into a single cell solution (between
10 and 20 minutes). FGM was added to neutralize the trypsin-EDTA solution and the cell
solution was centrifiiged at 150xg for 5 minutes. DEP experimental medium was prepared
containing 17mM glucose and 263mM sucrose in de-ionized water. The solution was
adjusted to a conductivity of 5mS m * by addition of PBS (PAA, Somerset, UK) and verified
with a Jenway 470 conductivity meter (VWR Jencons, Leicestershire, UK). The cells were
washed twice by centrifugation in DEP experimental medium at 50xg for 5 minutes and
resuspended in DEP experimental medium at a cell concentration of 2x10^ cells ml *.
4.2.6 DEP-microwell Experiments
The DEP-microwell experiments were carried out as described in 3.2.4, Each experiment was
repeated at least four times for analysis of pure populations of kératinocytes and three times
for analysis of mixed populations of kératinocytes.
4.2.7 Cell Area Measurements
An aliquot of each cell sample, prepared as in 4.2.6, was transferred onto a haemocytometer.
Image J software (National Institute of Health, Maryland, U.S.) was used to capture images
of cells dispersed over the grid region of the hemocytometer. The number of pixels per pm
Page I 105
was determined by measuring the number of pixels across a line of the grid which had a
known length. The cell area was then measured by tracing a line around the perimeter of each
cell and using the calculate area command in Image J.
4.2.8 Statistical Analysis and Data Presentation
The cytoplasmic conductivity and effective membrane capacitance for each dielectric
spectrum were determined by curve-fitting a single shell model to each spectrum, as carried
out in previous studies (Labeed et al. 2003; Labeed et al. 2006; Hubner et al. 2007). The
mean cell radius, cytoplasmic conductivity and effective membrane capacitance for each cell
type was calculated by averaging the values obtained for each spectrum.
Statistical analysis was carried out using SPSS version 16.0 (SPSS Inc. Chicago, IL). Cell
dielectric and radius measurements were analysed graphically using a histogram to determine
whether the distribution conformed to a normal curve. If the distribution was normal, the
parametric two independent sample student’s t-test was used. If normality could not be
confirmed, the non-parametric, two independent sample Mann Whitney-U test was
performed. Analysis was two-way and P values displayed are of the exact variant. P values of
<0.05 were considered statistically significant.
4.2.9 Histological Tissue Processing of Reconstituted Organotypical
Cultures
Reconstituted organotypical cultures were fixed in 10% formal saline solution at room
temperature for three days. The samples were dehydrated by incubating in a series of graded
alcohol at room temperature for 20 minutes and subsequently embedded in paraffin wax.
Three micrometre sections were cut using the Leitz Wetzlar 1401 microtome and mounted
upon glass slides. The slides were deparaffinised in xylene, dehydrated in graded ethanol and
stained with Haematoxylin and Eosin. Slides were then washed in graded alcohol followed by
graded xylene before being mounted with DPX mounting medium. All materials were
purchased from Sigma Aldrich (Poole, U.K.).
Page I 106
4.2.10 Cell Light Absorbance
The DEP-microwell uses light absorbance to detect cell motion. If different cell types have
different light absorbance profiles, when mixed together the signal produced from one cell
type may be greater than the signal produced from the other. The light absorbance of HOK
and H157 cells were measured using a Jenway Genova spectrophotometer (VWR-Jencons,
Leicestershire, U.K.). HOK and H I57 cells were washed twice and resuspended in DEP
experimental medium at a concentration of 2x10^ cells ml *. A blank comprising DEP
experimental medium was used to calibrate the spectrophotometer. Cell suspensions were
measured in triplicate.
4.2.11 Cell Fixation and Flow Cytometry
For some experiments, mixed populations of HOK and H I57 cells were seeded on NOF-
populated collagen matrices and grown in reconstituted organotypical cultures. To quantify
the fraction of H I57 cells in mixed populations of H I57 and HOK cells, H I57 cells were
replaced with H I57**** cells in a number of organotypical cultures. For analysis of GFP
expression with flow cytometry, keratinocyte cells were isolated from reconstituted
organotypical cultures as detailed in 4.2.5. Isolated keratinocyte cells were washed twice in
PBS and resuspended at a concentration of 1 x 10 cells ml * in PBS solution containing 4%
paraformaldehyde (PFA) and incubated for 30 minutes at room temperature. Cells were then
centrifuged and washed again in PBS. At each wash step, cells were incubated for 10 minutes
in PBS before centrifiiging. Samples were kept between 2-8°C for no longer than one week.
The fraction of fluorescent (GFP+) cells was quantified using a Benton Dickinson Flow
Analyser and 10,000 events were recorded for each sample.
4.3 Results
4.3.1 Transfection of Kératinocytes witb GFP
In order to identify and quantify the fraction of H I57 cells in cell mixtures with HOK cells,
H I57 cells were co-transfected with the genes for green fluorescent protein (GFP) and
puromycin resistance (PAC). Following transfection, H I57 cells were incubated in selection
Page I 107
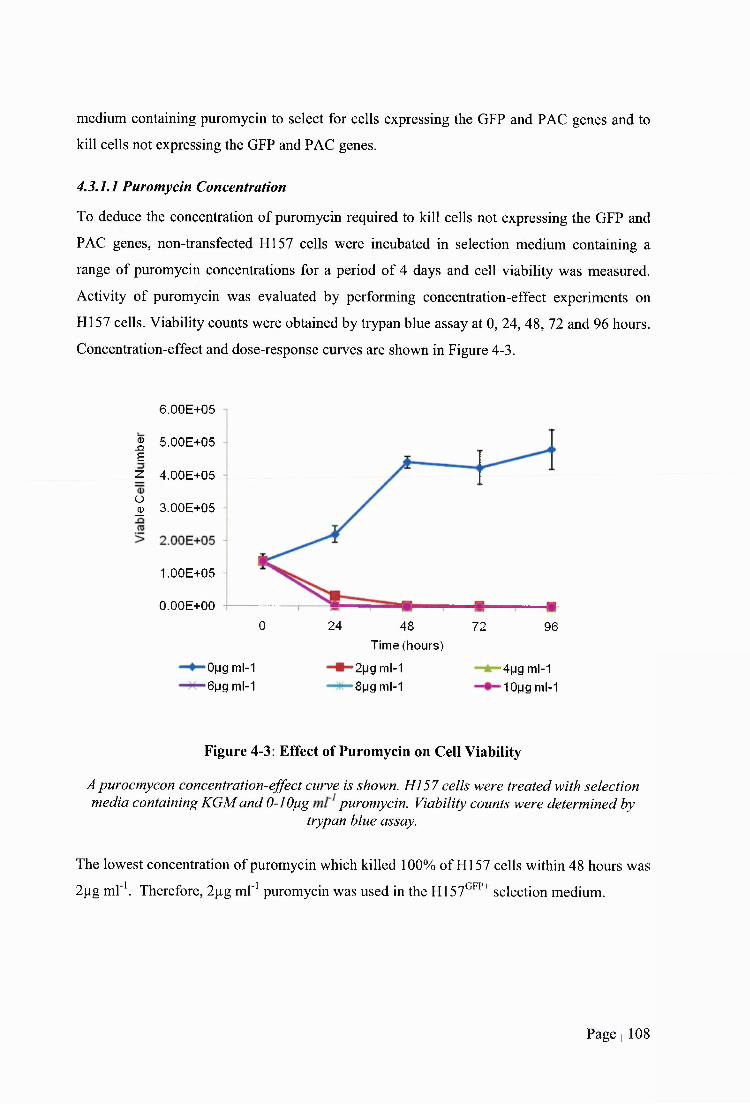
medium containing puromycin to select for cells expressing the GFP and PAC genes and to
kill cells not expressing the GFP and PAC genes.
4.3.1.1 Puromycin Concentration
To deduce the concentration of puromycin required to kill cells not expressing the GFP and
PAC genes, non-transfeeted H I57 cells were incubated in selection medium containing a
range of puromycin concentrations for a period of 4 days and cell viability was measured.
Activity of puromycin was evaluated by performing concentration-effect experiments on
H I57 cells. Viability counts were obtained by trypan blue assay at 0, 24, 48, 72 and 96 hours.
Coneentration-effeet and dose-response curves are shown in Figure 4-3.
6.00E + 05
^ 5 .00E + 05 E
z 4 .00E + 05
% 3 .00E + 05
1.00E +05
O.OOE+00
>0(jg ml-1 >6|jg ml-1
Time (hours)
*2|jg ml-1 '8 |jg ml-1
0 24 48 72 96
'4pg ml-1
■lOijg ml-1
Figure 4-3: Effect of Puromycin on Cell Viability
A purocmycon concentration-effect curve is shown. H I57 cells were treated with selection media containing KGM and 0-1 Opg puromycin. Viability counts were determined by
trypan blue assay.
The lowest concentration of puromycin which killed 100% of HI 57 cells within 48 hours was
2pg m l'\ Therefore, 2pg ml"' puromycin was used in the H I57^^^^ selection medium.
Page I 108
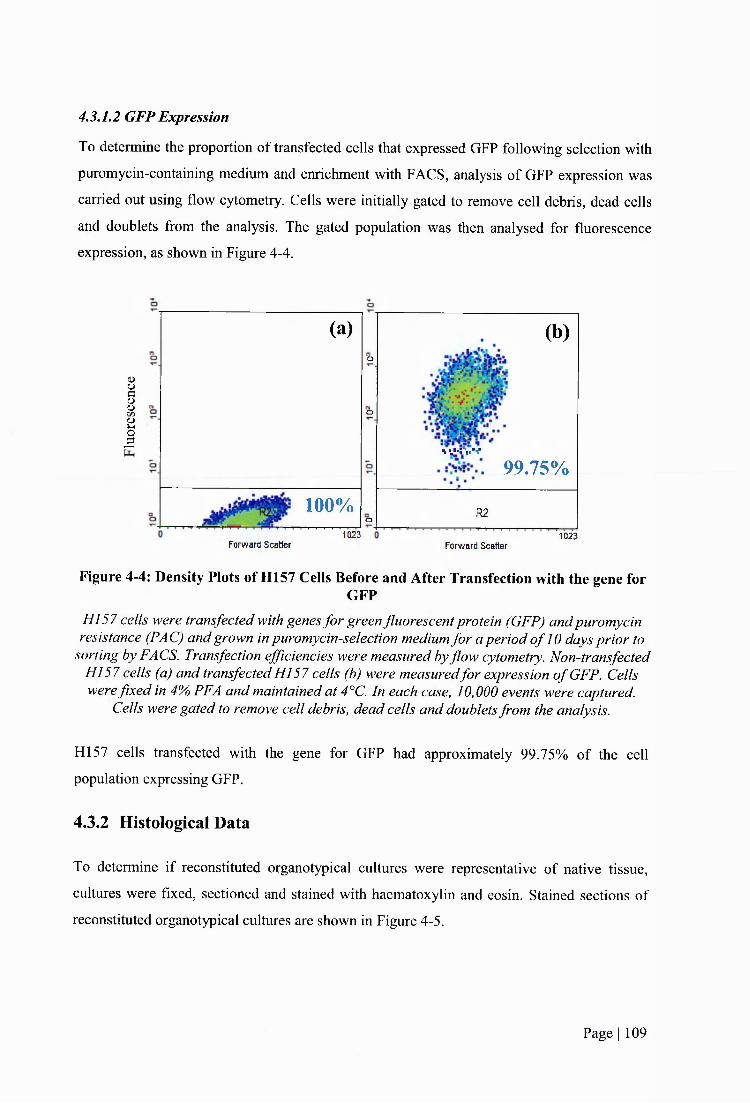
4.3,1.2 GFP Expression
To determine the proportion of transfected cells that expressed GFP following selection with
puromycin-containing medium and enrichment with FACS, analysis of GFP expression was
carried out using flow cytometry. Cells were initially gated to remove cell debris, dead cells
and doublets from the analysis. The gated population was then analysed for fluorescence
expression, as shown in Figure 4-4.
(UIoJ
(a) (b)o
o
. . . K V v
99.75%
100%o R2
1023Forward Scatter Forv/ard Scatter
1023
Figure 4-4: Density Plots of H157 Cells Before and After Transfection with the gene forGFP
HI 57 cells were transfected with genes for green fluorescent protein (GFP) and puromycin resistance (PAG) and grown in puromycin-selection medium for a period o f 10 days prior to
sorting by FACS. Transfection efficiencies were measured by flow cytometry. Non-transfected HI 57 cells (a) and transfected HI 57 cells (b) were measured for expression o f GFP. Cells were fixed in 4% PFA and maintained at 4°C. In each case, 10,000 events were captured.
Cells were gated to remove cell debris, dead cells and doublets from the analysis.
H I57 cells transfected with the gene for GFP had approximately 99.75% of the cell
population expressing GFP.
4.3.2 Histological Data
To determine if reconstituted organotypical cultures were representative of native tissue,
cultures were fixed, sectioned and stained with haematoxylin and eosin. Stained sections of
reconstituted organotypical cultures are shown in Figure 4-5.
Page I 109
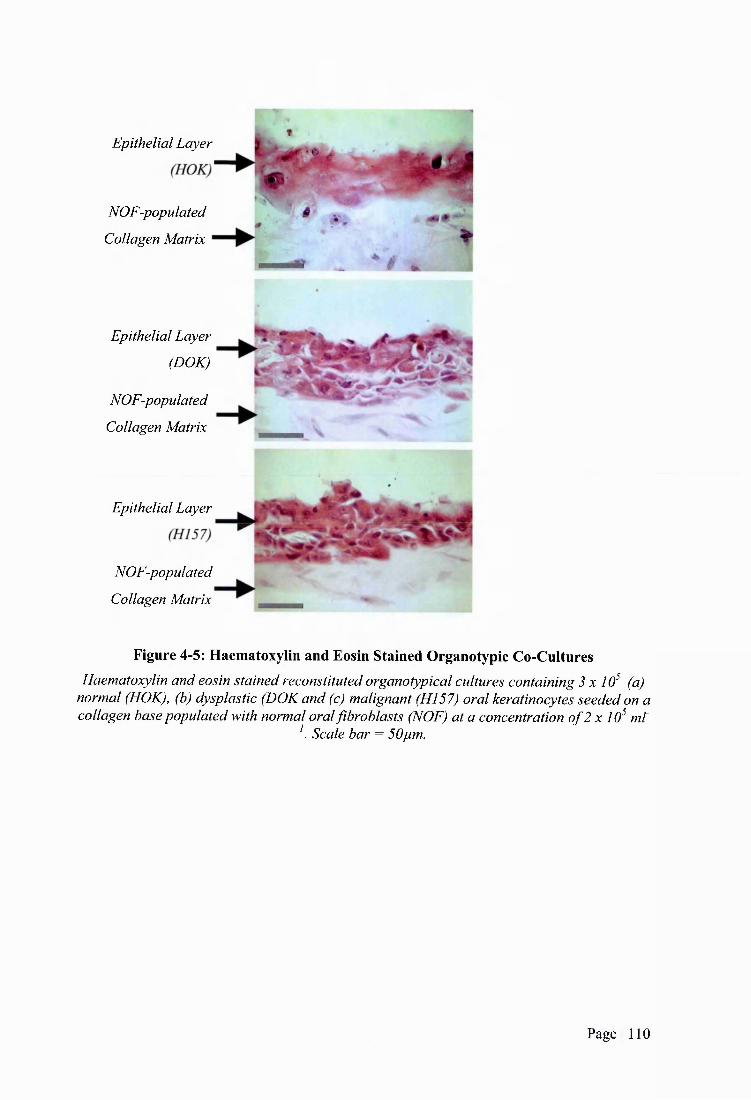
Epithelial Layer
NOF-populated
Collagen Matrix
Epithelial Layer
(DOA;;
NOF-populated
Collagen Matrix
Epithelial Layer
NOF-populated
Collagen Matrix
Figure 4-5: Haematoxylin and Eosin Stained Organotypic Co-CulturesHaematoxylin and eosin stained reconstituted organotypical cultures containing 3 x 10^ (a)
normal (HOK), (b) dysplastic (DOK and (c) malignant (HI57) oral kératinocytes seeded on a collagen base populated with normal oral fibroblasts (NOF) at a concentration o f 2 x 10^ ml'
. Scale bar = 50pm.
Page I 110
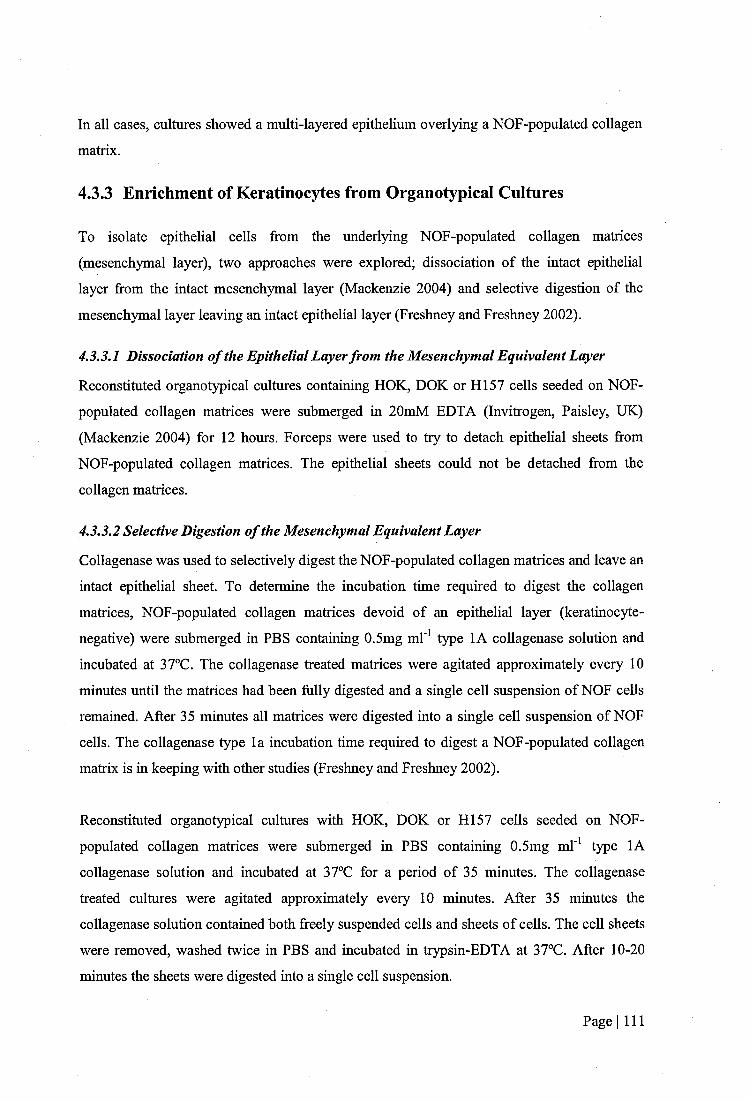
In all cases, cultures showed a multi-layered epithelium overlying a NOF-populated collagen
matrix.
4.3.3 Enrichment of Kératinocytes from Organotypical Cultures
To isolate epithelial cells from the underlying NOF-populated collagen matrices
(mesenchymal layer), two approaches were explored; dissociation of the intact epithelial
layer from the intact mesenchymal layer (Mackenzie 2004) and selective digestion of the
mesenchymal layer leaving an intact epithelial layer (Freshney and Freshney 2002).
4.3.3.1 Dissociation of the Epithelial Layer from the Mesenchymal Equivalent Layer
Reconstituted organotypical cultures containing HOK, DOK or H I57 cells seeded on NOF-
populated collagen matrices were submerged in 20mM EDTA (Invitrogen, Paisley, UK)
(Mackenzie 2004) for 12 hours. Forceps were used to try to detach epithelial sheets from
NOF-populated collagen matrices. The epithelial sheets could not be detached from the
collagen matrices.
4.3.3.2 Selective Digestion of the Mesenchymal Equivalent Layer
Collagenase was used to selectively digest the NOF-populated collagen matrices and leave an
intact epithelial sheet. To determine the incubation time required to digest the collagen
matrices, NOF-populated collagen matrices devoid of an epithelial layer (keratinocyte-
negative) were submerged in PBS containing 0.5mg ml" type lA collagenase solution and
incubated at 37°C. The collagenase treated matriees were agitated approximately every 10
minutes until the matriees had been fully digested and a single cell suspension of NOF cells
remained. After 35 minutes all matriees were digested into a single cell suspension of NOF
cells. The collagenase type la incubation time required to digest a NOF-populated collagen
matrix is in keeping with other studies (Freshney and Freshney 2002).
Reconstituted organotypical cultures with HOK, DOK or H I57 cells seeded on NOF-
populated collagen matrices were submerged in PBS containing 0.5mg ml'^ type lA
collagenase solution and incubated at 37°C for a period of 35 minutes. The collagenase
treated cultures were agitated approximately every 10 minutes. After 35 minutes the
collagenase solution contained both freely suspended cells and sheets of cells. The cell sheets
were removed, washed twice in PBS and incubated in trypsin-EDTA at 37°C. After 10-20
minutes the sheets were digested into a single cell suspension.
Page I 111
Morphology
Keratinocyte-negative NOF-populated collagen matrices were fiilly digested after 35 minutes
of incubation in collagenase. Reconstituted organotypical cultures incubated in collagenase
released cells into the solution but a sheet of cells remained after 35 minutes incubation. The
morphology of cells released during collagenase digestion of reconstituted organotypical
cultures was similar to that of the cells released into solution during collagenase digestion of
keratinocyte-negative NOF-populated collagen matrices. These cells had a fusiform or
stellate morphology with long processes consistent with the morphology of fibroblast cells
(Nanci and Ten Cate 2008). The remaining cell sheets were incubated in trypsin-EDTA until
they had been digested into a single cell solution. The cells released during trypsin-EDTA
treatment had a morphology resembling that of kératinocytes. The viability of cells released
during incubation with collagenase and trypsin-EDTA was greater than 95% in all cases. The
morphology of cells released at each stage of the sample preparation is shown in Figure 4-6.
Page I 112
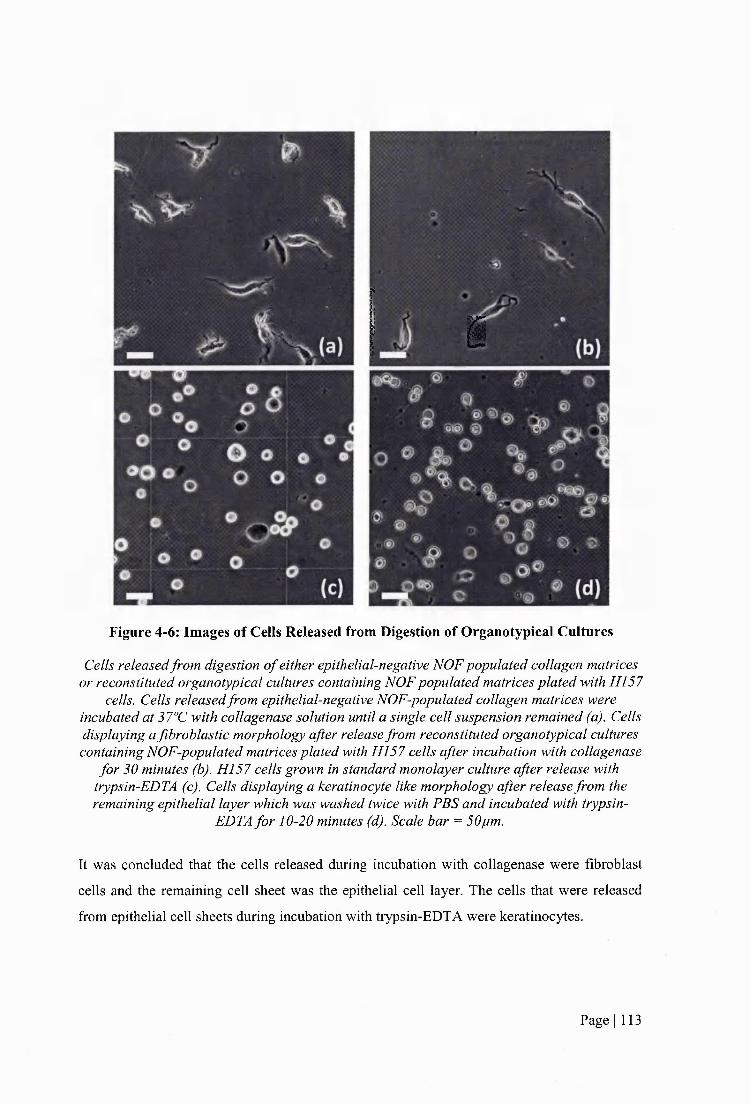
c
Figure 4-6: Images of Cells Released from Digestion of Organotypical Cultures
Cells released from digestion o f either epithelial-negative NOF populated collagen matrices or reconstituted organotypical cultures containing NOF populated matrices plated with HI 57
cells. Cells released from epithelial-negative NOF-populated collagen matrices were incubated at 37°C with collagenase solution until a single cell suspension remained (a). Cells displaying a fibroblastic morphology after release from reconstituted organotypical cultures containing NOF-populated matrices plated with H I57 cells after incubation with collagenase
for 30 minutes (b). H I57 cells grown in standard monolayer culture after release with trypsin-EDTA (c). Cells displaying a keratinocyte like morphology after release from the remaining epithelial layer which was washed twice with PBS and incubated with trypsin-
EDTA for 10-20 minutes (d). Scale bar = 50pm.
It was concluded that the cells released during incubation with collagenase were fibroblast
cells and the remaining cell sheet was the epithelial cell layer. The cells that were released
from epithelial cell sheets during incubation with trypsin-EDTA were kératinocytes.
Page I 113
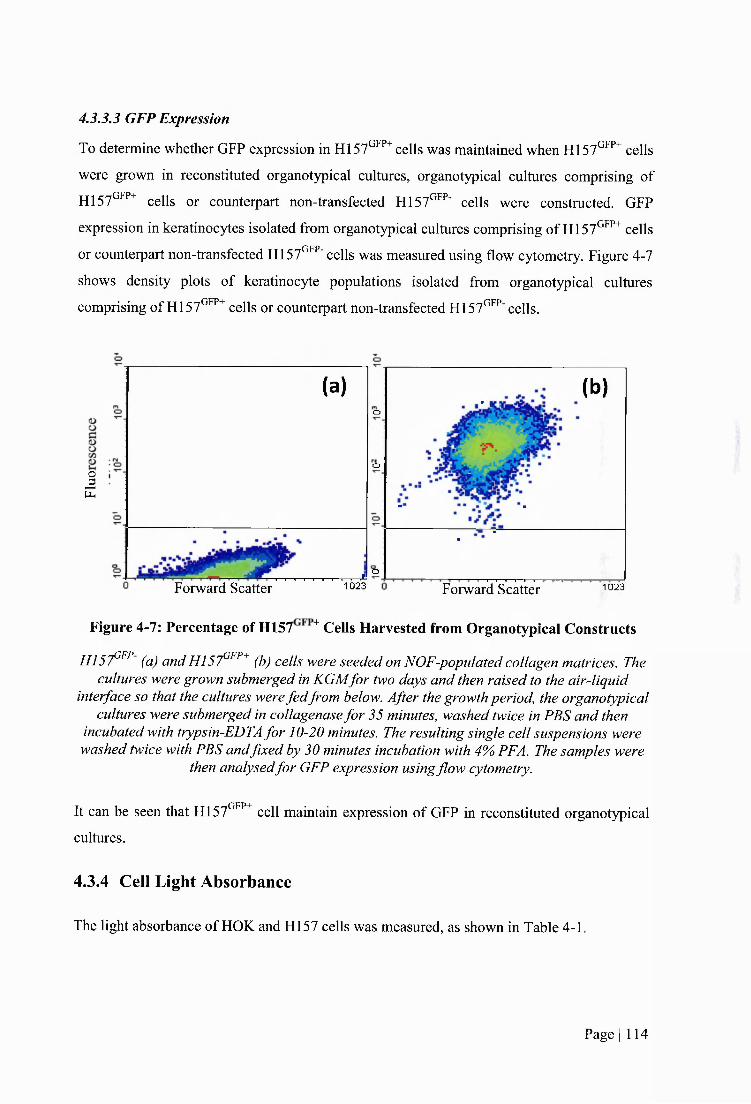
4.3.3.3 GFP Expression
To determine whether GFP expression in H I57^^^^cells was maintained when H I57^^^^ cells
were grown in reconstituted organotypical cultures, organotypical cultures comprising of
H I57^^^^ cells or counterpart non-transfected H I57°^^' cells were constructed. GFP
expression in kératinocytes isolated from organotypical cultures comprising of HI 57^^^^ cells
or counterpart non-transfected H I57^^' cells was measured using flow cytometry. Figure 4-7
shows density plots of keratinocyte populations isolated from organotypical cultures
comprising of HI 57^^^ cells or counterpart non-transfected HI 57^^^'cells.
IP-(
(a)O
. (b)
O
■ ■
--- —1— ,—1—1—1—1—1—1—,—,—X O
. ■
Forward Scatter 10 2 3 Forward Scatter 10 2 3
Figure 4-7: Percentage of H157 Cells Harvested from Organotypical Constructs
H I57^^^ (a) and H I57^^^^ (b) cells were seeded on NOF-populated collagen matrices. The cultures were grown submerged in KGMfor two days and then raised to the air-liquid
interface so that the cultures were fedfrom below. After the growth period, the organotypical cultures were submerged in collagenase fo r 35 minutes, washed twice in PBS and then
incubated with trypsin-EDTA for 10-20 minutes. The resulting single cell suspensions were washed twice with PBS andfixed by 30 minutes incubation with 4% PFA. The samples were
then analysedfor GFP expression using flow cytometry.
It can be seen that H I57^^^^ cell maintain expression of GFP in reconstituted organotypical
cultures.
4.3.4 Cell Light Absorbance
The light absorbance of HOK and H I57 cells was measured, as shown in Table 4-1,
Page I 114
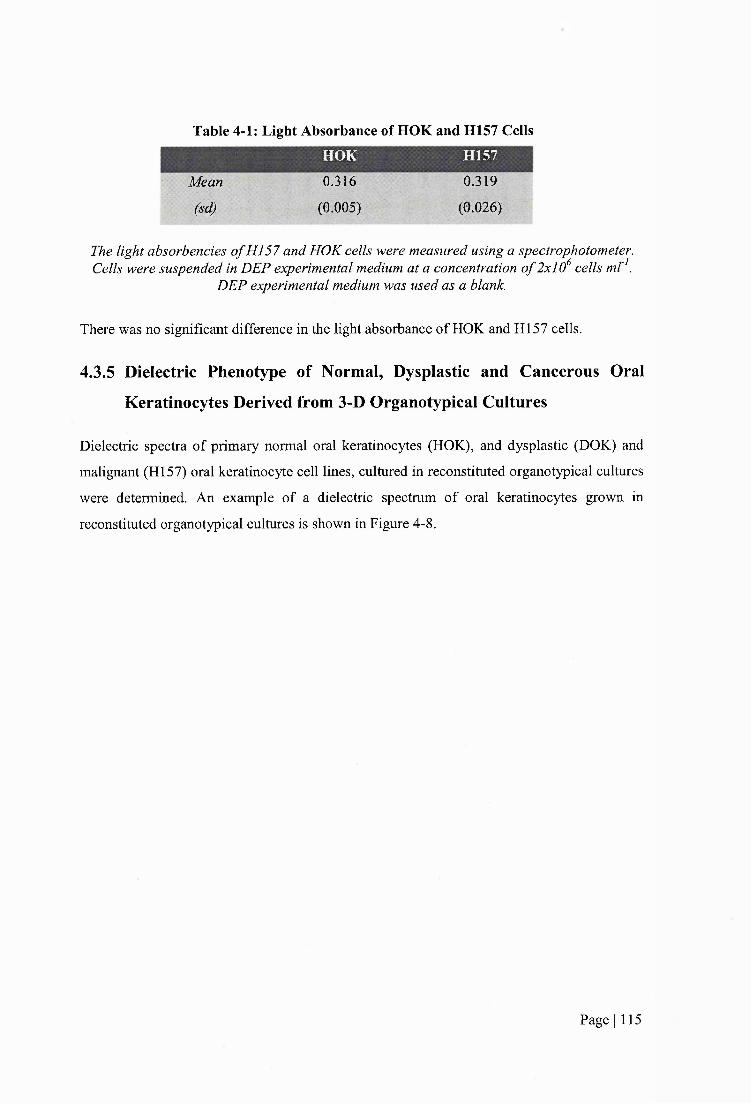
Table 4-1: Light Absorbance of HOK and H157 Cells
HOK H157
Mean 0.316 0.319
M (0005) (0.026)
The light absorbencies o f HI 57 and HOK cells were measured using a spectrophotometer. Cells were suspended in DEP experimental medium at a concentration o f 2x10^ cells m l’.
DEP experimental medium was used as a blank.
There was no significant difference in the light absorbance of HOK and HI 57 cells.
4.3.5 Dielectric Phenotype of Normal, Dysplastic and Cancerous Oral
Kératinocytes Derived from 3-D Organotypical Cultures
Dielectric spectra of primary normal oral kératinocytes (HOK), and dysplastic (DOK) and
malignant (HI57) oral keratinocyte cell lines, cultured in reconstituted organotypical cultures
were determined. An example of a dielectric spectrum of oral kératinocytes grown in
reconstituted organotypical cultures is shown in Figure 4-8.
Page I 115
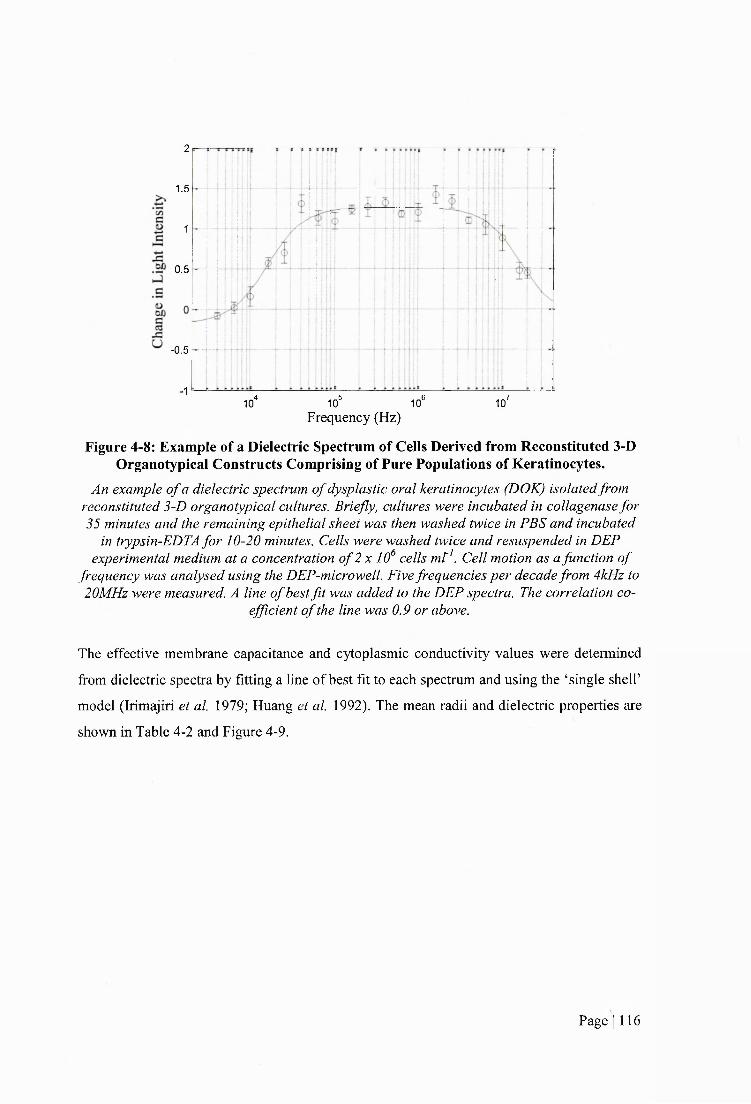
2
1.5
1
0.5
-0.5
■1,5 10® ,74 1010 10'
Frequency (Hz)
Figure 4-8: Example of a Dielectric Spectrum of Cells Derived from Reconstituted 3-D Organotypical Constructs Comprising of Pure Populations of Kératinocytes.
An example o f a dielectric spectrum o f dysplastic oral kératinocytes (DOK) isolated from reconstituted 3-D organotypical cultures. Briefly, cultures were incubated in collagenase for 35 minutes and the remaining epithelial sheet was then washed twice in PBS and incubated
in trypsin-EDTA for 10-20 minutes. Cells were washed twice and resuspended in DEP experimental medium at a concentration o f 2 x 10^ cells mt^. Cell motion as a function o f
frequency was analysed using the DEP-microwell. Five frequencies per decade from 4kHz to 20MHz were measured. A line o f best fit was added to the DEP spectra. The correlation co
efficient o f the line was 0.9 or above.
The effective membrane capacitance and cytoplasmic conductivity values were determined
from dielectric spectra by fitting a line of best fit to each spectrum and using the ‘single shelf
model (Irimajiri et al. 1979; Huang et al. 1992). The mean radii and dielectric properties are
shown in Table 4-2 and Figure 4-9.
Page I 116
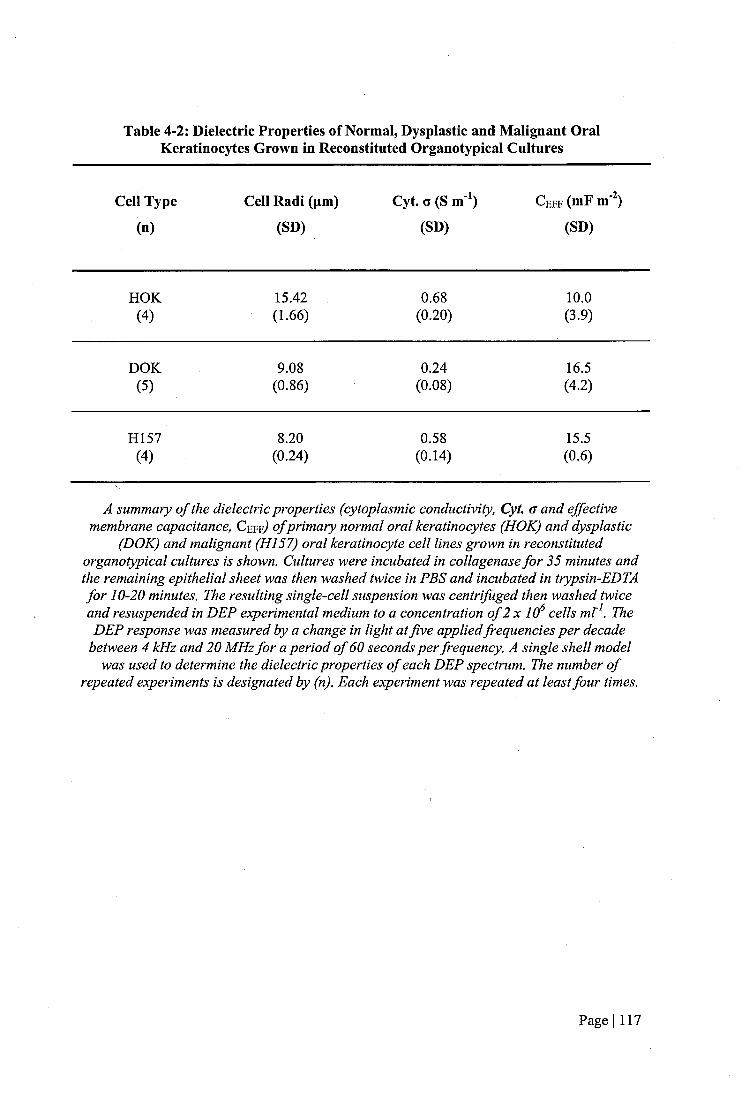
Table 4-2: Dielectric Properties of Normal, Dysplastic and Malignant Oral Kératinocytes Grown in Reconstituted Organotypical Cultures
Cell Type Cell Radi (pm) Cyt. G (S m^) C e f f (mF m )
(n) (SD) (SD) (SD)
HOK 15.42 0.68 10.0(4) (1.66) (0.20) (3.9)
DOK 9.08 0.24 16.5(5) (0.86) (0.08) (4.2)
H157 8.20 0.58 15.5(4) (0.24) (0.14) (0.6)
A summary o f the dielectric properties (cytoplasmic conductivity, Cyt. <r and effective membrane capacitance, Cefr) o f primary normal oral kératinocytes (HOK) and dysplastic
(DOK) and malignant (HI57) oral keratinocyte cell lines grown in reconstituted organotypical cultures is shown. Cultures were incubated in collagenase for 35 minutes and the remaining epithelial sheet was then washed twice in PBS and incubated in trypsin-EDTA for 10-20 minutes. The resulting single-cell suspension was centrifuged then washed twice and resuspended in DEP experimental medium to a concentration o f 2 x 10^ cells mb\ The DEP response was measured by a changé in light at five applied frequencies per decade
between 4 kHz and 20 MHz for a period o f 60 seconds per frequency. A single shell model was used to determine the dielectric properties o f each DEP spectrum. The number o f
repeated experiments is designated by (n). Each experiment was repeated at least four times.
Page I 117

0>ocëocoC lCO
11E &m
LU
2220181614121086420
(a)
HOK DOK
Cell Line
H157
>
1.00.90.80.70.6
o3 ■O Co0 ^g w 0.5(/)_çoQ.
10.40.30.20.10.0
(b)
HOK DOK
Gel! Type
H157
Figure 4-9: Dielectric Properties of Oral Kératinocytes Grown in 3-D OrganotypicalCultures
A summary o f the dielectric properties (cytoplasmic conductivity, Cyt. a and effective membrane capacitance, Ceff) Of primary normal oral kératinocytes (HOK) and dysplastic
(DOK) and malignant (HI57) oral keratinocyte cell lines grown in reconstituted organotypical cultures is shown. Cultures were incubated in collagenase for 35 minutes and the remaining epithelial sheet was then washed twice in PBS and incubated in trypsin-EDTA for 10-20 minutes. The resulting single-cell suspension was centrifuged then washed twice and resuspended in DEP experimental medium to a concentration o f 2 x 10^ cells ml^. The DEP response was measured by a change in light at five applied frequencies per decade
between 4 kHz and 20 MHz for a period o f 60 seconds per frequency. A single-shell model was used to determine the dielectric properties o f each DEP spectrum. Each experiment was
repeated at least four times. Error bars denote the standard deviation. Asterisk denote a statistically significant different ( '^P<0.05).
Page I 118
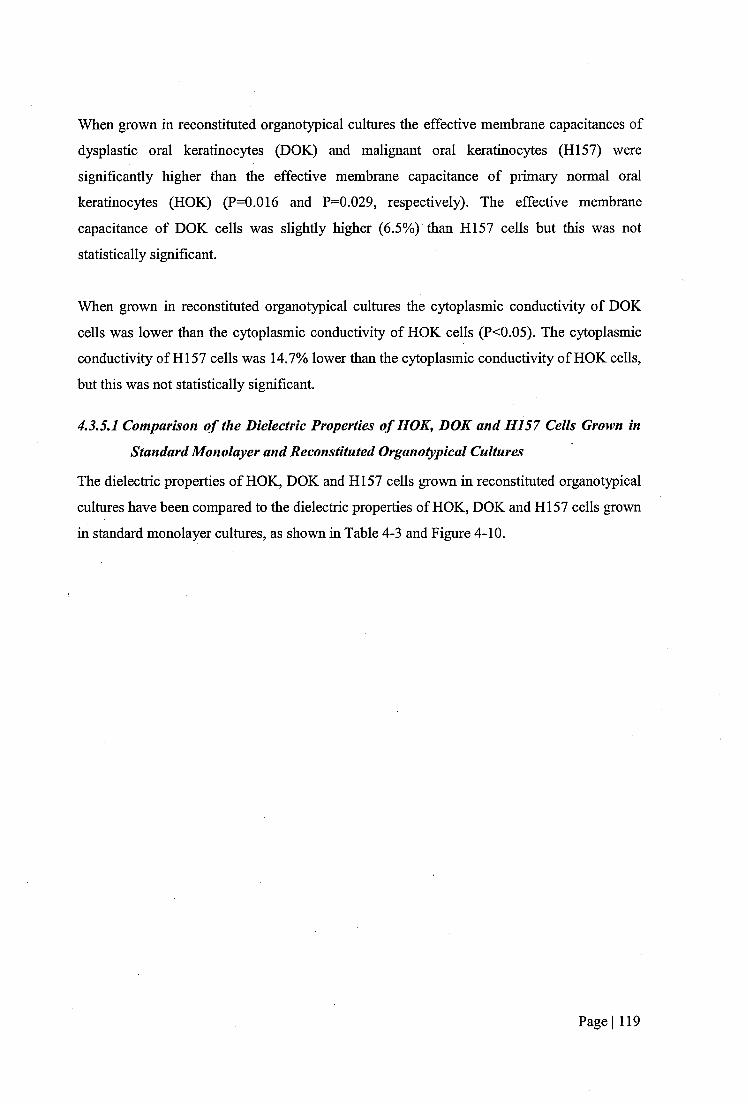
When grown in reconstituted organotypical cultures the effective membrane capacitances of
dysplastic oral kératinocytes (DOK) and malignant oral kératinocytes (HI57) were
significantly higher than the effective membrane capacitance of primary normal oral
kératinocytes (HOK) (P=0.016 and P=0.029, respectively). The effective membrane
capacitance of DOK cells was slightly higher (6.5%) than H I57 cells but this was not
statistically significant.
When grown in reconstituted organotypical cultures the cytoplasmic conductivity of DOK
cells was lower than the cytoplasmic conductivity of HOK cells (P<0.05). The cytoplasmic
conductivity of HI 57 cells was 14.7% lower than the cytoplasmic conductivity of HOK cells,
but this was not statistically significant.
4.3,5.1 Comparison of the Dielectric Properties of HOK, DOK and H157 Cells Grown in
Standard Monolayer and Reconstituted Organotypical Cultures
The dielectric properties of HOK, DOK and HI 57 cells grown in reconstituted organotypical
cultures have been compared to the dielectric properties of HOK, DOK and HI 57 cells grown
in standard monolayer cultures, as shown in Table 4-3 and Figure 4-10.
Page I 119
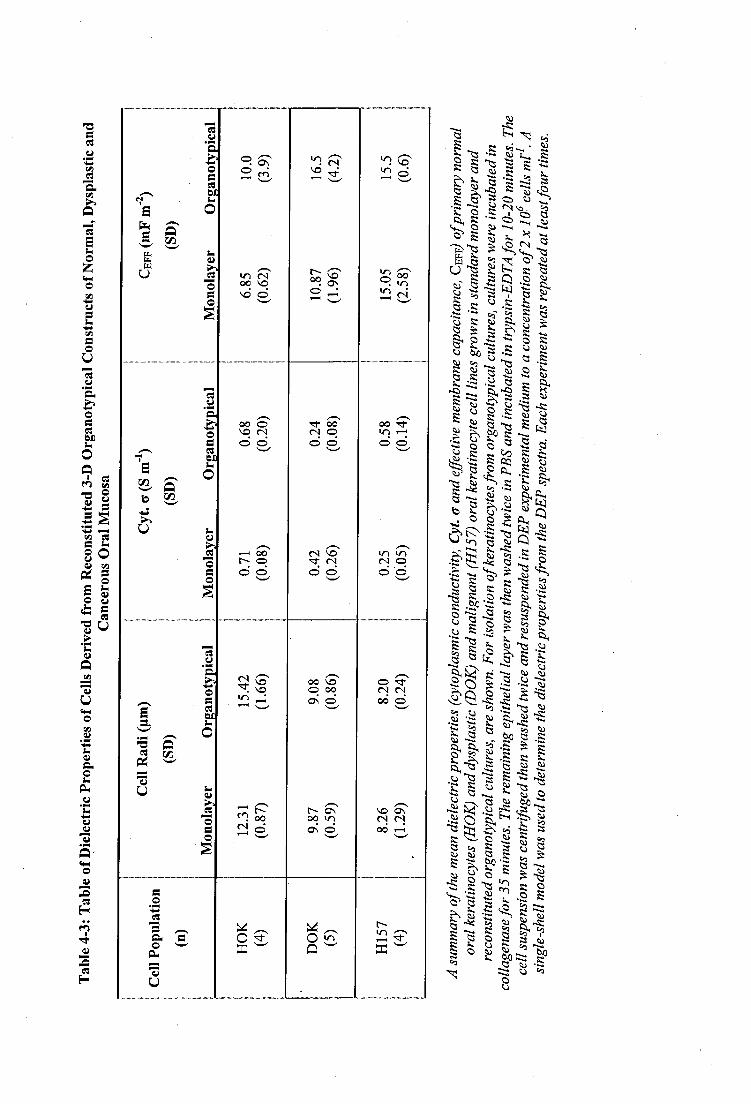
(o
oo CN o
rô S
en RS|oU en
iloo
o 'êtes <N od o
00 vo o 00 On o
mO
luQI o
CM
S%
J |
iilîè s ll
III
■îii:D (ü
.S
Q
QO
K
^ g
l i i.§%
1 - S :"g8I.
telîiï,K
I | fII"j t i1 1 -I
.S!llll
I
|1| 11C ÜS
>•4=O3■OO —
ïlV )
CL.
f .o
1.00.90.80.70.60.50.40.30.20.10.0
(a)
. I
HOK DOK H157
(b)
iHOK DOK H157
Cell Type» Monolayer Organotypic
Figure 4-10: Comparison of Dielectric Properties of Oral Kératinocytes Grown in Standard Monolayer and Reconstituted Organotypical Cultures
The effective membrane capacitance (mF m'^) (a) and cytoplasmic conductivity (S m'^) (b) o f primary normal oral kératinocytes (HOK) and dysplastic (DOK) and malignant
(H157) oral keratinocyte cell lines grown in standard 2-D monolayer and reconstituted 3-D organotypical cultures are shown. A single-shell model was used to determine the
dielectric properties from DEP spectra. Each experiment was repeated at least four times. Values that show statistically significant differences are marked with an asterisk
<0.07/
Page I 121
There was an increase of 46.0% in the effective membrane capacitance of HOK cells
when grown in reconstituted organotypical cultures compared to counterpart cells
grown in standard monolayer cultures. However, this was not statistically significant.
The effective membrane capacitance of DOK cells grown in organotypical cultures was
51.8% higher than effective membrane capacitance of DOK cells grown in standard
monolayer cultures (P=0.008). There was no significant difference in the mean effective
membrane capacitance of H I57 cells grown in standard monolayer cultures and
reconstituted organotypical cultures.
There was no significant difference in the cytoplasmic conductivity of HOK cells grown
in reconstituted organotypical cultures and counterpart cells grown in standard
monolayer cultures. The cytoplasmic conductivity of DOK cells grown in reconstituted
organotypical cultures was lower (42.9%) than the cytoplasmic conductivity of
counterpart cells grown in standard monolayer cultures. However, this was not
statistically significant. The cytoplasmic conductivity of H I57 cells grown in
organotypical cultures was 132% higher than H I57 cells grown in standard monolayer
cultures (P=0.016).
The cell radius of HOK cells grown in reconstituted organotypical cultures was 25.3%
larger than the cell radius of HOK cells grown in standard monolayer cultures. In
contrast, the cell radius of DOK cells grown in reconstituted organotypical cultures was
8.0% smaller than the cell radius of DOK cells grown in standard monolayer cultures.
There was no significant difference in the cell radius of H I57 cells grown in standard
monolayer and reconstituted organotypical cultures. The differences in cell radii
between oral kératinocytes grown in standard monolayer and reconstituted
organotypical cultures were not statistically significant.
4.3.6 Dielectric Properties of Mixed Normal and Malignant Oral
Kératinocytes Grown in Reconstituted Organotypical Cultures
To determine the ability of DEP to detect a subpopulation of malignant oral
kératinocytes within a host population of normal oral kératinocytes, mixed populations
Page I 122

of HOK and H I57 cells were grown in reconstituted organotypical cultures.
Reconstituted organotypical cultures comprising host populations of HOK cells spiked
with 1% and 10% H I57 cells seeded on NOF-populated collagen matrices, were
prepared. In addition, reconstituted organotypical cultures comprising of pure
populations of HOK and H I57 cells seeded on NOF-populated collagen matrices, were
prepared. After a growth period, kératinocytes were isolated from the cultures and DEP
analysis was carried out.
4.3.6.1 Ratio of H157 Cells to HOK Cells in Reconstituted Organotypical Cultures
Following the Growth Period
For a number of reconstituted organotypical cultures, H I57 cells were substituted for
HI 57^^^ cells to allow for quantification of HI 57 and HOK cells following the growth
period of the reconstituted organotypical cultures. When HI 57^^^ cells were seeded at
1% and 10% of the epithelial layer, H I57 and HOK cells remain at approximately the
seeding density after the growth period, as shown in Figure 4-11.
Page I 123

' M g r - '
• (b ) .
■■ ; w . , ■■ ■
1023 G 1023
10.52%. (c)' ' “j - ■
■ ■
0.43% (d)
Forward Scatter1023 0
Forward Scatter 1023
Figure 4-11: Density Plot of Cells Expressing GFP in Organotypical CulturesDensity plots o f keratinocyte cells derivedfrom reconstituted organotypical cultures plated with (a) 100% HOK cells, (b) 100% H157°'’’‘* cells, (c) 90%, HOK and 10%
H I57^^’’*cells and (d) 99% HOK and 1%, H l S f " * cells. After seeding oral kératinocytes on to NOF-populated collagen matrices, the cultures were grown
submerged in KGMfor two days and then raised to the air-liquid interface andfedfrom below. After five days, the organotypical cultures were submerged in collagenase fo r 35 minutes, washed twice in PBS and then incubated with trypsin-EDTA for 10-20 minutes.
The resulting single cell suspensions were washed twice with PBS and fixed by 30 minutes incubation with 4% PFA. The samples were then analysedfor GFP expression
using a Becton Dickinson flow cytometer.
After the growth period, reconstituted organotypical cultures comprising of host
populations of HOK cells with subpopulations of HI 57 cells seeded at 1% and 10% of
the total keratinocyte population, contained 0.43% and 10.52% H I57^''^^ cells,
respectively.
Page I 124
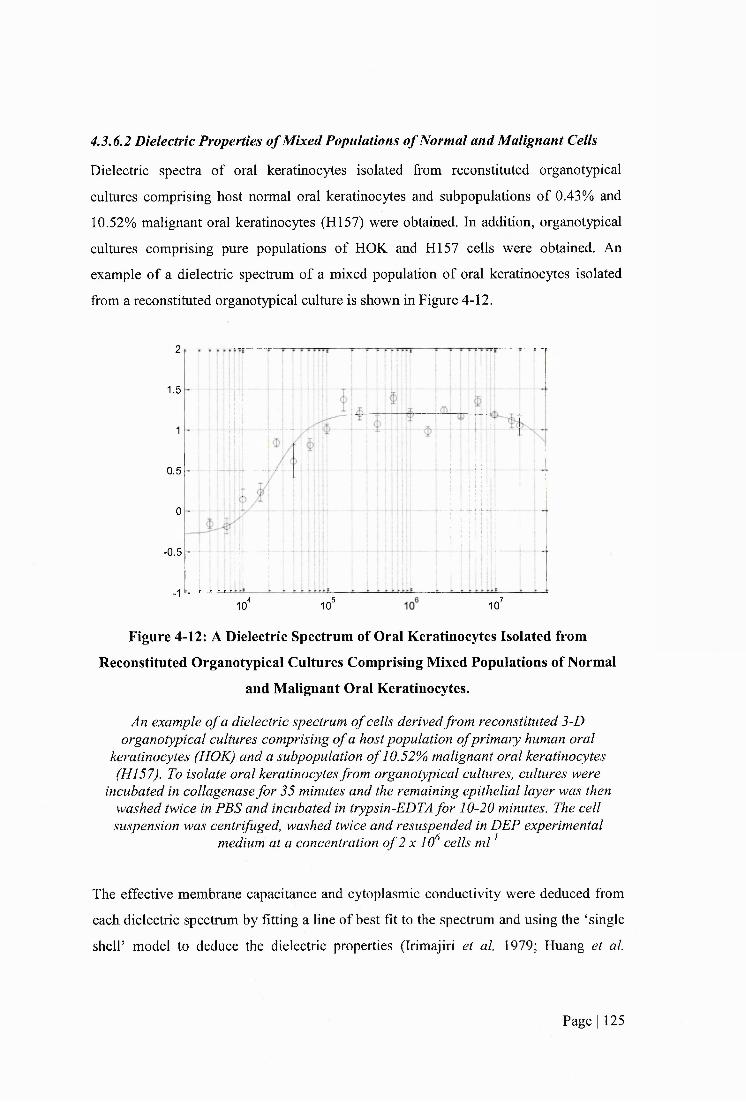
4.3.6.2 Dielectric Properties of Mixed Populations of Normal and Malignant Cells
Dielectric spectra of oral kcratinocytcs isolated from reconstituted organotypical
cultures comprising host normal oral kcratinocytcs and subpopulations of 0.43% and
10.52% malignant oral kcratinocytcs (HI57) were obtained. In addition, organotypical
cultures comprising pure populations of HOK and H I57 cells were obtained. An
example of a dielectric spectrum of a mixed population of oral kcratinocytcs isolated
from a reconstituted organotypical culture is shown in Figure 4-12.
2
1.5
1
0.5
0
-0.5
■1 ,5 74 1010'10
Figure 4-12: A Dielectric Spectrum of Oral Kératinocytes Isolated from
Reconstituted Organotypical Cultures Comprising Mixed Populations of Normal
and Malignant Oral Kcratinocytcs.
An example o f a dielectric spectrum o f cells derived from reconstituted 3-D organotypical cultures comprising o f a host population ofprimary human oral
kératinocytes (HOK) and a subpopulation o f 10.52% malignant oral kératinocytes (H157). To isolate oral kératinocytes from organotypical cultures, cultures were
incubated in collagenase for 35 minutes and the remaining epithelial layer was then washed twice in PBS and incubated in trypsin-EDTA for 10-20 minutes. The cell suspension was centrifuged, washed twice and resuspended in DEP experimental
medium at a concentration o f 2 x 10^ cells ml'^
The effective membrane capacitance and cytoplasmic conductivity were deduced from
each dielectric spectrum by fitting a line of best fit to the spectrum and using the ‘single
shell’ model to deduce the dielectric properties (Irimajiri et al. 1979; Huang et al.
Page I 125
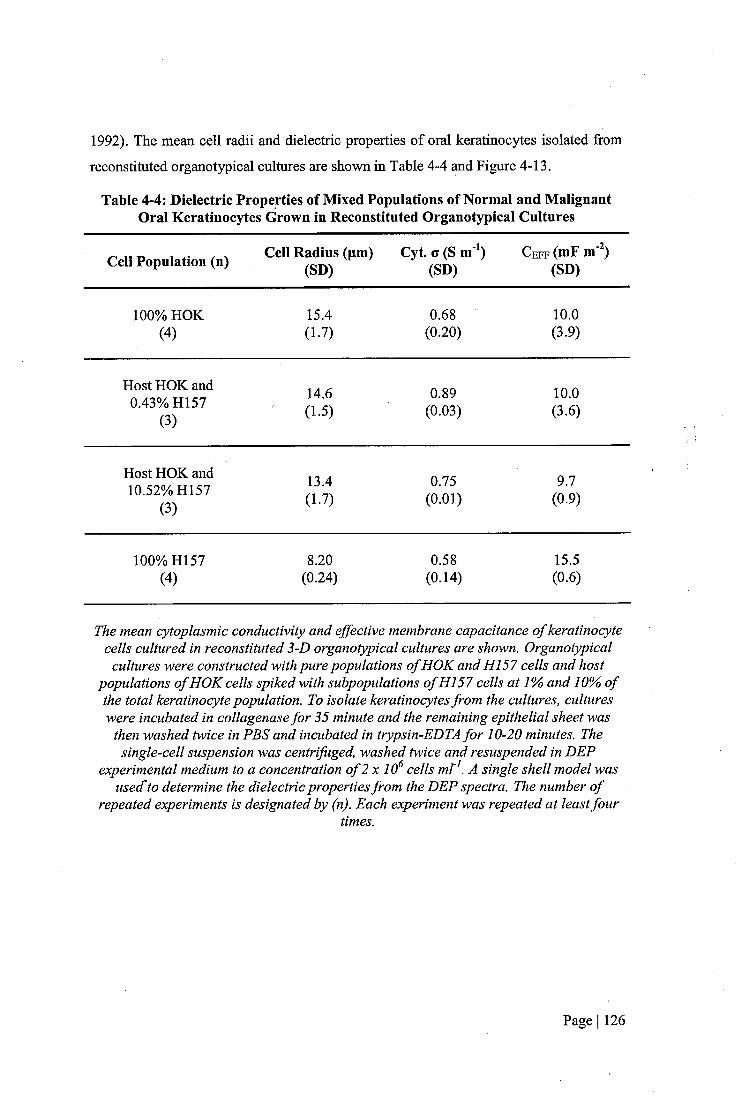
1992). The mean cell radii and dielectric properties of oral kcratinocytcs isolated from
reconstituted organotypical cultures arc shown in Table 4-4 and Figure 4-13.
Table 4-4: Dielectric Properties of Mixed Populations of Normal and Malignant Oral Kcratinocytcs Grown in Reconstituted Organotypical Cultures
Cell Population (n) Cell Radius (pm) (SD)
Cyt. G (S m'*) (SD)
C e f f (mF m ) (SD)
100% HOK 15.4 0.68 10.0(4 ) (1.7) (0.20) (3.9)
Host HOK and 14.6 0.89 10.00.43% H157 (3 )
(1.5) (0.03) (3.6)
Host HOK and 13.4 0.75 9.710.52% H157(3 )
(1.7) (0.01) (0.9)
100% H157 8.20 0.58 15.5(4 ) (0.24) (0.14) (0.6)
The mean cytoplasmic conductivity and effective membrane capacitance o f keratinocyte cells cultured in reconstituted 3-D organotypical cultures are shown. Organotypical
cultures were constructed with pure populations o f HOK and HI 57 cells and host populations o f HOK cells spiked with subpopulations o f HI 57 cells at 1% and 10% o f the total keratinocyte population. To isolate kératinocytes from the cultures, cultures were incubated in collagenase for 35 minute and the remaining epithelial sheet was
then washed twice in PBS and incubated in trypsin-EDTA for 10-20 minutes. The single-cell suspension was centrifuged, washed twice and resuspended in DEP
experimental medium to a concentration o f 2 x 10^ cells mV . A single shell model was used'to determine the dielectric properties from the DEP spectra. The number o f
repeated experiments is designated by (n). Each experiment was repeated at least fourtimes.
Page I 126

20 1ocro 18 iÜ 16 i(0Cl. 14 1<0
Ü ^ 12 1mm E 10 1
^ 8 jE g 6 -0)
4 10)> 2 4o(D 0 -1...SzLU 0% 0.43% 10.52% 100%
>
3 XJ C .o <Üo1 'i f )_caQ .
f .O
1.00.90.80.70.60.50.40.30.20.10.0
I
0% 0.43% 10.52% 100%
Subpopulation of H I57 Cells (%) In Host Population of HOK Cells
Figure 4-13: Dielectric Properties of Oral Kcratinocytcs Derived from Reconstituted 3-D Organotypical Constructs Comprising Mixed Populations of
Normal and Cancerous Kcratinocytcs.The effective membrane capacitance (mF m'^) (a) and cytoplasmic conductivity
(S m'^) (b) o f primary normal oral keratinocyte (HOK) and malignant oral kératinocytes (HI57) grown in monolayer and 3-D organotypical cultures are shown.
A single shell model was used to determine the dielectric properties from DEP spectra. Each experiment was repeated at least four times. Values o f that are statistically different are marked by an asterisk (~^P<0.05). Error bars denote the standard
deviation.
There was no significant difference in the effective membrane capacitance of host
populations of HOK cells containing subpopulations of H I57 cells at 0.43% and
Page I 127
10.52% of the keratinocyte population compared to pure populations of HOK cells,
when grown in reconstituted organotypical cultures. The effective membrane
capacitance of pure populations of H157 cells was 55% higher than the effective
membrane capacitance of pure populations of HOK cells, when cultured in
organotypical models (P<0.05).
When grown in reconstituted organotypical cultures the cytoplasmic conductivity of
keratinocyte samples comprising host populations of HOK cells spiked with
subpopulations of HI 57 cells at 0.43% and 10.52% of the total keratinocyte population
was 30.9% and 10.3% higher, respectively, than the cytoplasmic conductivity of pure
populations of HOK cells. However, these differences were not statistically significant.
The cytoplasmic conductivity of pure populations of HI 57 cells was 14.7% smaller than
the cytoplasmic conductivity of pure populations of HOK cells, but this was not
statistically significant.
When grown in reconstituted organotypical cultures the cell radius of keratinocyte
samples comprising host populations of HOK cells spiked with subpopulations of HI 57
cells at 0.43% and 10.52% of the total keratinocyte population had 5.2% and 13.0%
smaller cell radii, respectively, than keratinocyte samples comprising pure populations
of HOK cells. However, these differences were not statistically significant. The cell
radius of keratinocyte samples comprising pure populations of H I57 cells was 46.8%
smaller than the cell radius of pure populations of HOK cells (P<0.05).
4.3.7 Dielectric Properties of Normal Oral Fibroblasts
Dielectric spectra of NOF cells have been obtained and the mean effective membrane
capacitance and cytoplasmic conductivity have been deduced, as shown in Figure 4-14.
Page I 128

2
1.5
-t—i-4-!"1
0.5
0 î t r n —
-0 .5
■14 5 ,6 7
10 10 ' 10 10
(a)
Frequency [Hz]
(b)
Cell Population (n)Cell Radi (pm) Cyt. o (S m^) Ceff (mF m )
(SD) (SD) (SD)
NOF 12.9 0.39 21.6(5) (1.1) (0.10) (8.7)
Figure 4-14: Dielectric Spectra of NOF cellsThe dielectric properties o f normal oral fibroblasts (NOF) grown in standard
monolayer culture conditions were determined. An example o f a dielectric spectrum o f NOF cells (a) and a table o f the mean dielectric properties o f NOF cells (b), are shown.
The effective membrane capacitance of NOF cells is higher than the effective
membrane capacitance of HOK, DOK and H I57 cells, as shown in Table 4-4 and
Figure 4-2. The cytoplasmic conductivity of NOF cells is lower than the cytoplasmic
conductivity of HOK and H I57 cells but higher than the cytoplasmic conductivity of
DOK cells, as shown in Table 4-2 and Figure 4-9. NOF cells exhibit positive DEP at
lower frequencies than HOK cells and there is a frequency range in which NOF cells
collect at the electrode edges and HOK cells are repelled.
Page I 129
4.4 Discussion
This investigation sought to determine if culture conditions had an effect on the
dielectric properties of oral kératinocytes grown in vitro. Reconstituted 3-D
organotypical cultures are more representative of native tissue than standard 2-D
monolayer cultures. In this study, primary normal oral kératinocytes (HOK) and
dysplastic (DOK) and malignant (HI57) oral keratinocyte cell lines were grown in
reconstituted organotypical cultures. Oral kératinocytes were isolated from cultures and
dielectric spectra were obtained. The dielectric properties were determined using a
single-shell model. The dielectric properties of HOK, DOK and H I57 cells grown in
reconstituted organotypical cultures were compared to the dielectric properties of
counterpart cells grown in standard monolayer cultures.
In addition, this work has also investigated the capacity of DEP to detect a
subpopulation of malignant oral kcratinocytcs in a host population of normal oral
kcratinocytcs. Dielectric spectra of host populations of HOK cells containing
subpopulations H I57 cells and pure populations of HOK and H I57 cells, grown in
reconstituted organotypical cultures, were obtained. The dielectric properties of cells
were determined from dielectric spectra using a single-shell model.
4.4.1 The Dielectric Properties of Oral Kcratinocytcs Cultured iu
Reconstituted Organotypical Cultures
The effective effective membrane capacitance ( C e f f) and cytoplasmic conductivity of
HOK, DOK and H I57 cells, grown in reconstituted organotypical cultures, have been
determined. The effective C e f f values of DOK and H I57 cells were 65% and 55%
higher, respectively, than HOK cells (P=0.016 and P=0.029, respectively). The mean
effective C e f f of DOK cells was slightly higher (9.6%) than HI 57 cells, but this was not
statistically significant.
When oral kératinocytes were grown in standard monolayer cultures, effective C e f f
correlated with cancer progression; HOK, DOK and H I57 cells had effective C e f f
values of 6.85, 10.87 and 15.G5mF m'^, respectively. In standard monolayer cultures the
Page I 130
effective C eff values of DOK and H157 cells were approximately 59% and 120%
higher, respectively, than HOK cells. H157 cells had a 38.5% higher effective C eff than
DOK cells. This correlation was not present when oral kératinocytes were grown in
reconstituted organotypical cultures. The effective C eff values of HOK, DOK and HI 57
cells grown in reconstituted organotypical cultures were 10.0, 16.5 and 15.5mF m'^,
respectively. There was no statistically significant difference between the effective C eff
values of DOK and H I57 cells. Therefore, when cells were grown in reconstituted
organotypical cultures, it was possible to distinguish DOK and H I57 cells from HOK
cells, on the basis of their effective C eff values. However, DOK cells could not be
distinguished from HI 57 cells, on the basis of their effective C eff values.
As discussed in 3.4.1., an effective C eff larger than 6mF m'^, the estimated effective
C eff of a completely smooth cell (Pethig and Kell 1987), could be due to an increase in
membrane surface area density. High values of effective C eff correlate with a high
quantity of membrane in a defined area (Wang et a l 1994; Ratanachoo et a l 2002;
Labeed et a l 2006). An increase in membrane blebbing, caveolae or microvilli could
result in an increase in effective C eff- Synonymous with cells grown in standard
monolayer cultures, DOK and H I57 cells have a higher effective C eff value than HOK
cells. This indicates that DOK and H I57 cells have a higher membrane density and thus
an increase in the amount of membrane blebbing, caveolae or microvilli compared to
HOK cells when grown in organotypical cultures.
When grown in reconstituted organotypical cultures, the cytoplasmic conductivity of
DOK cells was 65% lower than the cytoplasmic conductivity of HOK (P<0.05). The
cytoplasmic conductivity of H I57 cells was 15% lower than the cytoplasmic
conductivity of HOK cells, but this was not statistically significant.
When oral kératinocytes were grown in standard monolayer cultures, cytoplasmic
conductivity correlated with cancer progression; HOK, DOK and H I57 cells had
cytoplasmic conductivities of 0.71, 0.42 and 0.25S m'% respectively. In standard
monolayer cultures the cytoplasmic conductivities of DOK and H I57 cells were
approximately 41% and 65% lower, respectively, than HOK cells. H157 cells had a
Page I 131

lower cytoplasmic conductivity than DOK cells. This correlation was not present when
oral kératinocytes were grown in reconstituted organotypical cultures. The cytoplasmic
conductivities of HOK, DOK and H I57 cells grown in reconstituted organotypical
cultures were 0.68, 0.24 and 0.58S m'% respectively. There was no statistically
significant difference between the cytoplasmic conductivities of HOK and H I57 cells.
The cytoplasmic conductivity of DOK cells was significantly lower than HOK and
H157 cells (P<0.05 in both cases).
The difference in the cytoplasmic conductivity of DOK and HOK cells grown in
organotypical cultures (65%) was greater than the difference observed when DOK and
HOK cells were grown in monolayer cultures (41%). Conversely, the difference in the
cytoplasmic conductivity of H I57 and HOK cells grown in organotypical cultures
(15%) was smaller than the difference observed when H I57 and HOK cells were grown
in monolayer cultures (65%). Therefore, the cytoplasmic conductivity of DOK cells was
more different to HOK cells when cells were grown in reconstituted organotypical
cultures compared to when cells were grown in standard monolayer cultures. The
cytoplasmic conductivity of HI 57 cells was less different to HOK cells when cells were
grown in reconstituted organotypical cultures than when cells were grown in monolayer
cultures.
In this study, growing malignant oral kératinocytes in reconstituted organotypical
cultures resulted in a normalising effect on the cytoplasmic conductivity; there was less
difference in the cytoplasmic conductivity of malignant and normal oral kératinocytes
than when grown in standard monolayer cultures. In contrast, growing dysplastic oral
kératinocytes in reconstituted organotypical cultures resulted in a greater difference in
the cytoplasmic conductivity of dysplastic and normal oral kératinocytes than when they
were grown in standard monolayer culture.
There was no significant difference in the cytoplasmic conductivity of normal and
malignant oral kératinocytes when grown in reconstituted organotypical cultures
whereas the cytoplasmic conductivity of dysplastic oral kératinocytes was significantly
different to normal and malignant oral kératinocytes. Other studies have noted that
Page I 132
normal and malignant oral kératinocytes can behave similarly in reconstituted
organotypical cultures whereas dysplastic oral kératinocytes behave differently to
normal and malignant oral kératinocytes. Hansson et al. (2001) observed that expression
of differentiation keratin proteins in normal and malignant oral kératinocytes grown in
reconstituted organotypical cultures were relatively similar. In contrast, the group found
that expression of differentiation keratin proteins in dysplastic oral kératinocytes was
distinct to normal and malignant oral kératinocytes.
As discussed in 3.4.1., differences in cytoplasmic conductivity found between normal,
dysplastic and malignant oral kératinocytes could be a result of differences in the
concentration of mobile ion species m the cytoplasm or differences in the mobility of
mobile ion species in the cytoplasm. The concentration of intracellular mobile ion
species is dependent on the intracellular composition of ionic and non-ionic osmolytes
and therefore the membrane permeability to different osmolytes. In addition, the
cytoplasmic pH could affect the intracellular concentration of mobile ion species as
differences in pH lead to difference in the ionic interactions between mobile ion species
and intracellular proteins and therefore differences in the Donnan equilibrium.
Differences in the Donnan equilibrium would lead to changes in the intracellular
concentrations of permeable mobile ion species and therefore the cytoplasmic
conductivity. The cytoplasmic conductivity may also depend on the proportion of
intracellular monovalent and divalent mobile ion species.
4.4.2 Comparison of the Dielectric Properties of Oral Kcratinocytcs
Cultured in Standard 2-D Monolayer and Reconstituted 3-D
Organotypical Cultures
There was a 46% increase in the mean effective C e f f of HOK cells grown in
reconstituted organotypical cultures compared to HOK cells grown in standard
monolayer cultures. However, this was not statistically significant. There was a 52%
increase in the effective C e f f of DOK cells grown in reconstituted organotypical
cultures compared to DOK cells grown in standard monolayer cultures (P<0.05). There
Page I 133
was no significant difference in the effective C e f f of H I57 cells grown in standard
monolayer cultures and reconstituted organotypical cultures.
The results suggest that the membrane of HOK and DOK cells are smoother when
grown in standard monolayer cultures and an increase in membrane blebbing, caveolae
or microvilli occurs when HOK and DOK cells are grown in reconstituted organotypical
cultures. Membrane smoothness of H157 cells is similar when grown in standard
monolayer or reconstituted organotypical cultures.
The cell radius of HOK cells grown in reconstituted organotypical cultures was
approximately 25% larger than the cell radius of HOK cells grown in standard
monolayer cultures. As keratinocyte cells differentiate they become larger. Therefore,
an increase in the mean cell size of kératinocytes when grown in organotypical cultures
may be due to cell differentiation which does not occur in standard monolayer cultures.
In contrast, the cell radius of DOK cells grown in reconstituted organotypical cultures
was 8% smaller than the cell radius of DOK cells grown in standard monolayer cultures.
There was no difference in the cell radius of H I57 cells grown in standard monolayer
and reconstituted organotypical cultures. Dysplastic and cancerous kératinocytes show
less differentiation than normal cells in native tissue. Therefore no change in cell size
would be expected when they are grown in organotypical cultures compared to when
they are grown m standard monolayer cultures. However, the differences in cell radii
between oral keratmocytes grown in standard monolayer and reconstituted
organotypical cultures were not statistically significant.
The mean cytoplasmic conductivity of HOK cells grown in reconstituted organotypical
cultures was approximately 4% lower than the cytoplasmic conductivity of HOK cells
grown in standard monolayer cultures, but this was not statistically significant. The
mean cytoplasmic conductivity of DOK cells grown in reconstituted organotypical
cultures was approximately 43% lower than the cytoplasmic conductivity of DOK cells
grown in standard monolayer cultures, but again this was not statistically significant.
The mean cytoplasmic conductivity of H I57 cells grown in reconstituted organotypical
Page I 134
cultures was 132% higher than the mean cytoplasmic conductivity of HOK cells grown
in standard monolayer cultures (P<0.05).
The cytoplasmic conductivity of H I57 cells more than doubled when grown in
organotypical cultures compared to standard monolayer cultures. One explanation for
this could be that the intracellular mobile ion species became more concentrated due to
water efflux from the cell. Net water movement out of the cell would result in a volume
decrease and concentration of the intracellular environment, leading to an increase in
the mobile ion concentration and consequently the cytoplasmic conductivity. However,
cells regulate transient changes in osmotic pressure by adjusting the intracellular water
and ion content to re-establish physiological (approximately 300m0sm kg'^) osmotic
pressure. Therefore, the concentration of osmolytes in the cytoplasm should remain
constant. In addition, there was no significant difference in cell size when H I57 cells
were grown in standard monolayer or organotypical cultures, suggesting that there was
no water efflux from the cells.
A difference in the composition of intracellular non-ionic and ionic osmolytes, a
difference in the Donnan equilibrium or a difference in the composition of intracellular
mobile ion species when H I57 cells were grown in organotypical cultures compared to
standard monolayer cultures, could result in a difference in the cytoplasmic
conductivity. There was no significant difference iu the cytoplasmic conductivity of
HOK cells when grown in standard monolayer or organotypical cultures, indicating that
the cytoplasmic conductivity of cancer cells is more sensitive to growth conditions than
healthy cells.
Consistent with studies on HOK, DOK and H I57 cells grown in standard monolayer
cultures, DOK and H I57 cells had lower cytoplasmic conductivities than HOK cells
when grown in reconstituted organotypical cultures, although this was only statistically
significant for DOK cells (P<0.05). In contrast, DOK cells had a lower cytoplasmic
conductivity than H I57 cells (P<0.05) when grown in reconstituted organotypical
cultures.
Page I 135
4.4.3 The Dielectric Properties of Mixed Populations of Normal and
Malignant Cells Grown in Reconstituted Organotypical Cultures
Host HOK cell populations were spiked with subpopulations of HI 57 cells at 1%, and
10% of the total keratinocyte population and seeded on NOF-populated collagen
matrices to produce reconstituted organotypical cultures. Pure populations of HOK and
H I57 cells were also seeded on NOF-populated collagen matrices to produce
organotypical cultures.
There was no significant difference in the effective membrane capacitances of oral
keratinocyte samples comprising 1% and 10% H157 in host HOK cell populations
compared to pure populations of HOK cells, when grown in reconstituted organotypical
cultures.
There was no significant difference in the cytoplasmic conductivities of oral
keratinocyte samples comprising 1% and 10% H157 in host HOK cell populations
compared to pure populations of HOK cells, when grown in reconstituted organotypical
cultures.
OSCC models comprising reconstituted normal oral organotypical constructs dosed
with malignant oral cells have been studies previously (Mackenzie 2004). Mackenzie
(2004) used organotypical cultures plated with malignant cell subpopulations at
concentrations of 0.1-5%. The study found that the malignant subpopulations had
expanded to replace the whole of the epithelium 2-3 weeks after plating. Variability in
the growth of different malignant cell lines when added to host organotypical constructs
was observed. The malignant cell line used in this study, H I57, was not included in the
investigation by Mackenzie (2004). Thus, estimation of the growth rate of HI 57 cells in
an organotypical environment and therefore the OSCC cell seeding density required to
achieve the desired OSCC cell concentration after the growth period was problematic.
Therefore, subpopulations of 1% and 10% were used with the aim of achieving a
subpopulation of approximately 50% after the growth period. However, the proportion
Page I 136
of the subpopulation following the growth period remained approximately the same as
the seeding concentration.
The OralCDx® system employs image analysis software to detect atypical cells in a
sample containing normal cells. Sciubba et al. (1999) claim that the system can detect
abnormal cells when they are present as only 0.1% of the cell population.
4.4.4 Preparation of Reconstituted Oral Organotypical Cultures
Reconstituted organotypical cultures have been employed in the study of epithelial
tissue for the past three decades (Bell et al. 1983; Jakiæ-Razumoviæ et al. 1998;
Mackenzie 2004). Many different methods have been used to construct organotypical
cultures and numerous protocols, employing different concentrations of cells and
lengths of growth phases, exist. The rationale for the protocol used in this study is
detailed below.
In the absence of fibroblasts, oral kératinocytes plated on collagen matrices and raised
to the air-liquid interface are able to proliferate and stratify but produce only thin,
disorganised epithelia (Costea et al. 2003; Costea et al. 2005). Epithelial thickness is
directly related to fibroblast concentration; increasing fibroblast concentration positively
correlates with increasing epithelial thickness (Freshney and Freshney 2002). The
concentration of fibroblasts used to populate collagen matrices in reconstructed
organotypical cultures is limited due to a phenomenon called collagen matrix
contraction. When a collagen matrix is populated with fibroblasts it undergoes a phase
of contraction resulting in a shrinkage and dissolution of the matrix (Igarashi et al.
2003). The extent of contraction is directly related to fibroblast concentration; a high
number of fibroblasts results in increased matrix contraction (Freshney and Freshney
2002). Plating epithelial cells on a contracted collagen matrices leads to the generation
of non-uniform epithelia (Igarashi et al. 2003). Igarashi and colleagues (2003)
investigated different organotypical culture conditions with the aim of optimising the
method for producing consistent reconstituted oral and dermal epithelia in vitro. The
study found that a fibroblast concentration at or below 2 x 10 cells ml'^ collagen
resulted in delaying collagen contraction for 2-3 days after construction. Plating
Page I 137
kératinocytes on collagen matrices 24 hours after construction further delayed
contraction for another 2-3 days and if the cultures were placed on collagen coated
nylon meshes, the mechanical restriction resulted in the cultures maintaining near to
their full surface area. Thus, 2x10^ fibroblasts per ml of collagen was the concentration
used to produce reconstituted oral epithelium in this study. Reconstituted organotypical
cultures were propagated for a period of seven days. It has been shown that a stratified
epithelial structure forms during this period (Mackenzie 2004).
4.4.5 Isolation of Oral Kératinocytes from Reconstituted
Organotypical Cultures
EDTA has previously been used to isolate epithelial layers from reconstituted oral
organotypical cultures (Mackenzie 2004). Mackenzie (2004) achieved this with
reconstituted organotypical cultures 7 days after plating kératinocytes on NOF-
populated collagen matrices. However, in the present study, the author was unsuccessful
in using this method to isolate epithelial sheets from organotypical cultures. The
presence of an epithelial sheet was observed, but whilst attempting to remove the sheets
firom the collagen matrices, the sheets ruptured easily and tore the collagen matrices.
Therefore, an alternative method was developed to isolate kératinocytes firom
organotypical cultures. NOF-populated collagen matrices were incubated in collagenase
to digest the collagen and remove NOF cells, thereby isolating the epithelial sheet.
Enzymatic digestion of the epithelial sheet was then carried out to yield a single
suspension of cells with greater than 95% viability.
The dielectric spectra of NOF cells grown in keratinocyte-negative organotypical
cultures could not be obtained as NOF cells could not be isolated firom digested
collagen particles. Therefore, the dielectric properties of NOF cells were derived fi*om
dielectric spectra of NOF cells grown in standard monolayer cultures. When
trypsinized, NOF cells round up but retain projections. The single-shell model was used
to analyse the dielectric properties of NOF cells to deduce whether kératinocytes
isolated firom organotypical cultures were contaminated with NOF cells.
Page I 138
There is an increase in the effective membrane capacitance of HOK, DOK and H I57
cells grown in organotypical cultures compared to HOK, DOK and H I57 cells grown in
standard monolayer culture conditions. However, the increase is only statistically
significant for DOK cells (P<0.05). The effective membrane capacitance of normal oral
fibroblast (NOF) cells is higher than the effective membrane capacitance of HOK, DOK
and H I57 cells grown in standard monolayer cultures. This suggests that contaminating
NOF cells are present to some degree in oral keratinocyte cell samples isolated from
reconstituted organotypical cultures, resulting in an increase in effective membrane
capacitance of keratinocyte cell samples.
The cytoplasmic conductivity of NOF cells was found to be 0.39S m'% lower than HOK
(0.71 S m'^) and DOK (0.42S m"*) cells but higher than H157 (0.25S m'^) cells grown in
standard monolayer cultures. A decrease in the cytoplasmic conductivity of HOK and
DOK cells and an increase in the cytoplasmic conductivity of HI 57 cells occurred when
oral kératinocytes were grown in reconstituted organotypical cultures compared to
standard monolayer cultures. However, this was only statistically significant for H I57
cells. The decrease observed in the cytoplasmic conductivity of DOK cells (from 0.42 to
0.24S m'^) when grown in organotypical cultures compared to standard monolayer
cultures is greater than the decrease one would expect to see (from 0.42 to 0.39S m'^) if
the change was purely due to contamination of oral keratinocyte samples with NOF
cells. The increase observed in the cytoplasmic conductivity of HI 57 cells (from 0.25 to
0.58S m'^) when grown in organotypical cultures compared to standard monolayer
cultures is greater than the increase one would expect to see (from 0.25 to 0.39S m'^) if
the change was purely due to contamination of oral keratinocyte samples with NOF
cells. In addition, the mean cell radius of NOF cells was 12.9. The mean cell radius of
HOK cells increased from 12.31 in monolayer cultures to 15.42 in organotypical
cultures, which is much higher than the mean cell radius of NOF cells. There was no
significant difference in the mean cell radii of DOK and HI 57 cells when grown in
standard monolayer or reconstituted organotypical cultures. Therefore it can be deduced
that NOF cells are not responsible for the whole difference observed between the
dielectric properties of oral kératinocytes grown in standard monolayer and
reconstituted organotypical cultures.
Page I 139
It should be noted that only dielectric spectra of NOF cells grown in standard
monolayer culture conditions were obtained. NOF cells could not be isolated from
collagen particles following digestion of the collagen matrix. Therefore, the dielectric
properties of NOF cells grown in reconstituted organotypical culture conditions were
not deduced. Thus, it is possible that the dielectric properties of NOF cells may alter
when grown in reconstituted organotypical cultures compared to standard monolayer
cultures.
4.5 Conclusions
The effective membrane capacitances of dysplastic and malignant oral kératinocytes
were significantly higher than the effective membrane capacitance of normal oral
kératinocytes when grown in both standard 2-D monolayer and reconstituted 3-D
organotypical cultures. In contrast, the cytoplasmic conductivity of malignant oral
kératinocytes was normalised and there was no significant difference between the
cytoplasmic conductivities of normal and malignant oral kératinocytes when grown in
reconstituted organotypical cultures. This suggests that the membrane, but not the
cytoplasmic, dielectric properties can be used for the detection of oral epithelial
dysplasia and malignancy.
The effective membrane capacitances of normal, dysplastic and malignant oral
kératinocytes grown in reconstituted organotypical cultures were higher than the
effective membrane capacitances of counterpart cells grown in standard monolayer
cultures. This indicates that oral keratinocyte membranes have more blebs, caveolae and
microvilli when cells are grown in reconstituted organotypical cultures compared to
standard monolayer cultures. However, this difference was only statistically significant
for dysplastic oral kératinocytes.
A subpopulation of 10% or less malignant oral kératinocytes within a host population of
normal oral kératinocytes cannot be detected using the DEP-microwell, in .vitro.
Page I 140

5 DIELECTRIC PHENOTYPE OF EXFOLIATED CELLS
FROM HEALTHY, DYSPLASTIC AND MALIGNANT
ORAL TISSUEOral epithelial dysplasia and OSCC often appear as macroscopic lesions on the surface of the
oral epithelium. Dysplasia and OSCC can be ulcerated, rough, smooth, elevated, indurated,
firm, rubbery, soft, granular, popular, furrowed, cracked, glossy or normal (Sandler 1962;
Bagan et al. 2010). Dysplastic and OSCC lesions also vary widely in size; they can be only a
few millimetres or several inches (Silverman 2003).
The gold-standard diagnostic test for OSCC is histopathological evaluation of tissue
harvested from the oral mucosa by inscisional biopsy. An inscisional biopsy is a procedure
carried out under local anaesthetic in which a piece of tissue representing the ftill thickness of
the epithelium is removed from a lesion using a scalpel or punch biopsy instrument (Scully et
al. 2008). The use of anaesthetic and stiches are required, therefore, the inscisional biopsy is
considered an invasive procedure (Silverman 2003). In contrast, exfoliation of the oral
mucosa, whereby cells are ‘rubbed’ off the mucosal surface, is considered a non-invasive
method of harvesting cells for investigative purposes (Poate et al. 2004). Consequently, it is
well tolerated by the patient.
5.1.1 Exfoliation
Epithelial cells can be collected from the oral mucosa by exfoliation. There are a variety of
instruments which can be used to collect cells by exfoliation but by far the most widely used
is a brush type instrument (Ingram et al. 1963; Reddy et al. 1975; Sciubba and Collaborative
Oral 1999). An incisional biopsy harvests cellular material in the form of tissue (Scully et al.
2008). In contrast, exfoliation collects cellular material in the form of individual or small
aggregates of cells (Weinmann 1940).
Exfoliation is predominantly used to harvest cervical epithelial cells for cervical cytological
smears (Boon and Suurmeijer 1996). However, it has also been harnessed as a cell collection
method for oral cytological smears (Montgomery and Von Haam 1951; Silverman 1988;
Sciubba and Collaborative Oral 1999). Exfoliation has been used as a method to harvest oral
epithelial cells since the 1940s (Weinmann 1940).
Page I 141

5.1.2 Aims and Structure
This chapter aims to determine if dielectric spectra of exfoliated oral cells from dysplastic
and OSCC tissue are different to dielectric spectra of cells from healthy tissue. In addition,
this chapter aims to evaluate the potential of the DEP-microwell to be used as an OSCC
detection tool.
The work presented here describes the use of the DEP-microwell system to determine
dielectric spectra of exfoliated oral cells isolated from healthy subjects, clinically healthy
tissue in patients with dysplasia and OSCC and dysplastic and OSCC tissue in patients. In
addition, the evaluation of different sample preparation techniques to prepare crude exfoliated
oral cell specimens for DEP analysis is described.
5.2 Materials and Methods
5.2.1 Oral Cell Specimen Collection
Oral cell specimens were collected from patients referred to the UCL Eastman Dental
Institute, University College London. Favourable ethical opinion was given for this study
from the Centre of Research Ethical Campaign (COREC) and internal ethical committees at
University College London and the University of Surrey. Three subject groups participated in
this study; subjects without dysplasia or OSCC, patients with suspected or confirmed
dysplasia and patients with suspected or confirmed OSCC. One specimen was collected from
oral tissue from each subject without dysplasia or OSCC. Two specimens were collected
from each patient with dysplasia or OSCC; one from dysplastic or OSCC tissue and one from
clinically appearing normal tissue on the side contra-lateral to the dysplastic or OSCC tissue.
Oral cell specimens were collected by a dental clinician by using a Rovers® Orcellex® Soft
Brush, see Figure 5-1. The brush based cell collection tool was rotated around over the point
of interest for at least ten rotations in order to collect cells, as advised by the manufacturer.
The brush heads were then suspended in sample collection media containing high glucose
(4.5mg/ml) DMEM (PAA, Somerset, UK) supplemented with lOOU mf* penicillin and
lOOpg mf* streptomycin (Sigma Aldrich, Poole, UK). Vials containing specimens were
received marked with a numerical code. The study was carried out as a blind survey. A total
of 45 specimens were collected. Cell specimens were assigned to four groups; exfoliated cell
Page I 142
specimens from healthy subjects (Group I), exfoliated cell specimens from healthy tissue in
patients with dysplasia or OSCC (Groups II), exfoliated cell specimens from dysplastic tissue
in patients (Group III) and exfoliated cell specimens from OSCC tissue in patients (Group
IV). Figure 5-1 shows the oral brush biopsy tool and the number of specimens from each
group.
Page I 143
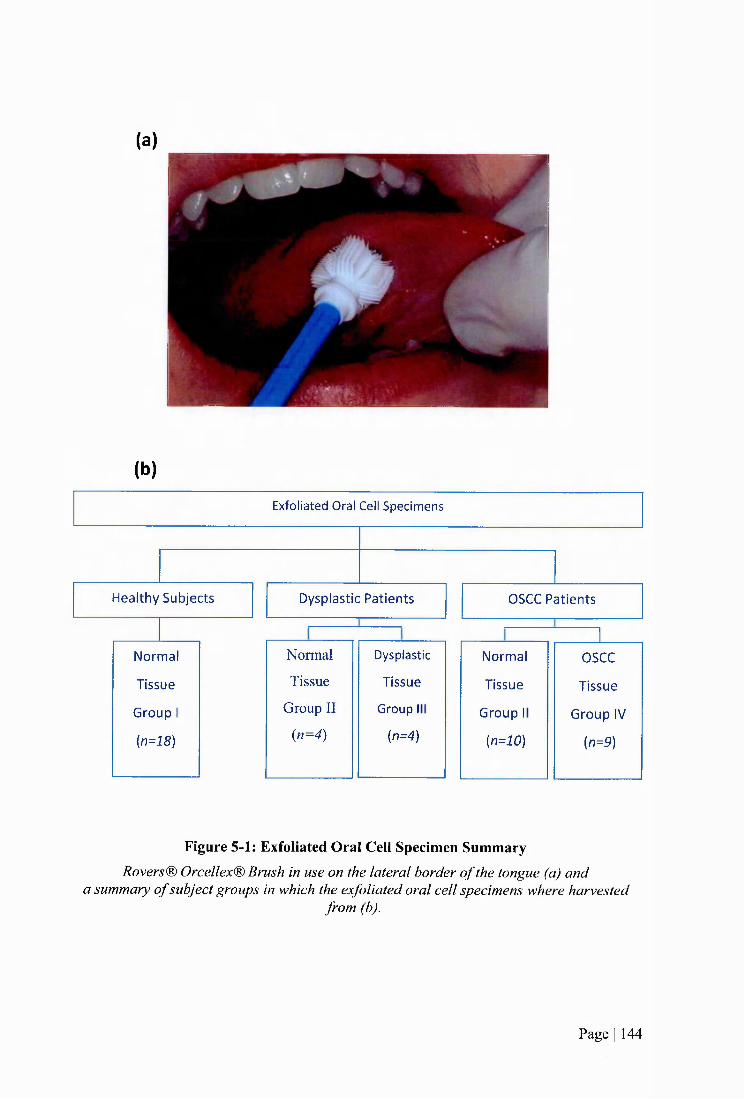
(a)
(b)
H ealthy S u b jects OSCC P a tien tsD ysplastic P a tien ts
G roup I
{n=18)
N orm al
T issue
Normal
Tissue
Group II
(n=4)
Dysplastic
T issue
Group I
{n=4)G roup IV
{n=9)
T issu e
OSCC
G roup I
{n=10)
N orm al
T issue
Exfoliated Oral Cell Specim ens
Figure 5-1: Exfoliated Oral Cell Specimen SummaryRovers® Orcellex® Brush in use on the lateral border o f the tongue (a) and
a summary o f subject groups in which the exfoliated oral cell specimens where harvestedfrom (b).
Page I 144
5.2.2 Evaluation of Exfoliation Tool
Cytotak™ Transwab Brushes (Medical Wire and Equipment, Wiltshire, U.K.), Rovers®
Orcellex® Stiff and Rovers® Orcellex® Soft Brushes (Rovers Medical devices B.V., Oss,
Netherlands) were evaluated as cytological collection methods. Factors considered included
the number of cells collected, the layers of the epithelium that were sampled and the form of
the sample material such as a single cell suspension or tissue fi*agments. Cell specimens used
for brush evaluation were collected from healthy subjects.
5.2.3 Keratinocyte Enrichment
To remove non-keratinocyte cells and cell debris and enrich for the number of oral
kératinocytes within exfoliated oral cell specimens, density gradient centrifugation and red
blood cell lysis were tested.
5.2.3.1 Density Gradient Centrifugation
Exfoliated oral cell specimens harvested from healthy subjects were pooled and centrifuged
at 200xg for 5 minutes. The pooled specimen was aliquoted into five vials and 7x10^
erythrocytes (Type A2) (Lome Laboratories, Reading, UK) were added to each vial. Cells
were then centrifuged at 200xg for 5 minutes and resuspended in PBS. For each vial, a 3ml
solution of Percoll (Sigma, Poole, UK) was prepared at a density of 1.077mg/ml by the
addition of 0.3ml PBS (PAA, Somerset, U.K.) and 1.06ml distilled water to 1.64ml Percoll.
The PBS-cell solution was layered on top of the Percoll solution using a pipette. The vial was
centrifuged at 400xg for 20 minutes using a swing bucket rotor. The supernatant was
decanted into a vial and 15ml or 30ml of PBS was added. The supematant-PBS solution was
centrifuged at 200xg for 10 or 20 minutes.
5.2.3.2 Erythrocyte Lysis
Exfoliated oral cell specimens harvested from healthy subjects were pooled and centrifuged.
The pooled specimen was aliquoted into three vials and 7x10^ erythrocytes (Type A2) (Lome
Laboratories, Reading, UK) were added to each vial. The cell mixtures were centrifuged and
resuspended in 1ml erythrocyte lysis solution (Sigma Aldrich, Poole, UK). The cells were
gently mixed for 1 minute and then the lysis solution was diluted with 15-20 ml of PBS. The
Page I 145
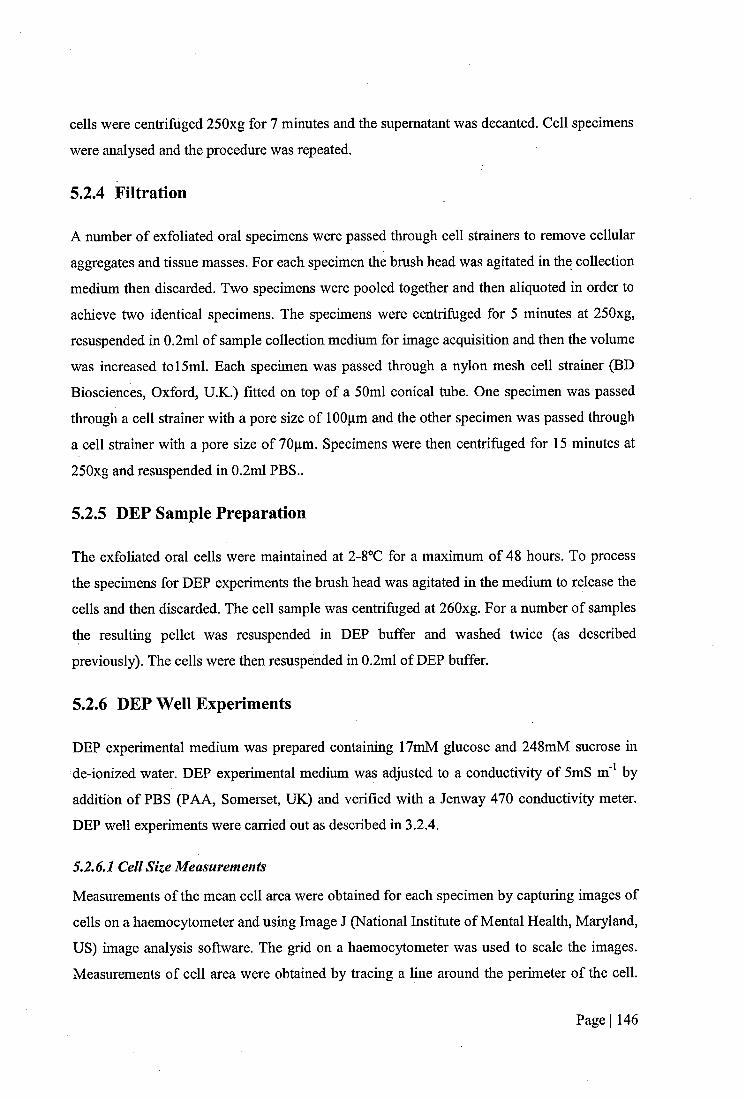
cells were centrifuged 250xg for 7 minutes and the supernatant was decanted. Cell specimens
were analysed and the procedure was repeated.
5.2.4 Filtration
A number of exfoliated oral specimens were passed through cell strainers to remove cellular
aggregates and tissue masses. For each specimen the brush head was agitated in the collection
medium then discarded. Two specimens were pooled together and then aliquoted in order to
achieve two identical specimens. The specimens were centrifuged for 5 minutes at 250xg,
resuspended in 0.2ml of sample collection medium for image acquisition and then the volume
was increased to 15ml. Each specimen was passed through a nylon mesh cell strainer (BD
Biosciences, Oxford, U.K.) fitted on top of a 50ml conical tube. One specimen was passed
through a cell strainer with a pore size of 100pm and the other specimen was passed through
a cell strainer with a pore size of 70pm. Specimens were then centrifuged for 15 minutes at
250xg and resuspended in 0.2ml PBS..
5.2.5 DEP Sample Preparation
The exfoliated oral cells were maintained at 2-8°C for a maximum of 48 hours. To process
the specimens for DEP experiments the brush head was agitated in the medium to release the
cells and then discarded. The cell sample was centrifuged at 260xg. For a number of samples
the resulting pellet was resuspended in DEP buffer and washed twice (as described
previously). The cells were then resuspended in 0.2ml of DEP buffer.
5.2.6 DEP Well Experiments
DEP experimental medium was prepared containing 17mM glucose and 248mM sucrose in
de-ionized water. DEP experimental medium was adjusted to a conductivity of 5mS m' by
addition of PBS (PAA, Somerset, UK) and verified with a Jenway 470 conductivity meter.
DEP well experiments were carried out as described in 3.2.4.
5.2.6.1 Cell Size Measurements
Measurements of the mean cell area were obtained for each specimen by capturing images of
cells on a haemocytometer and using Image J (National Institute of Mental Health, Maryland,
US) image analysis software. The grid on a haemocytometer was used to scale the images.
Measurements of cell area were obtained by tracing a line around the perimeter of the cell.
Page I 146
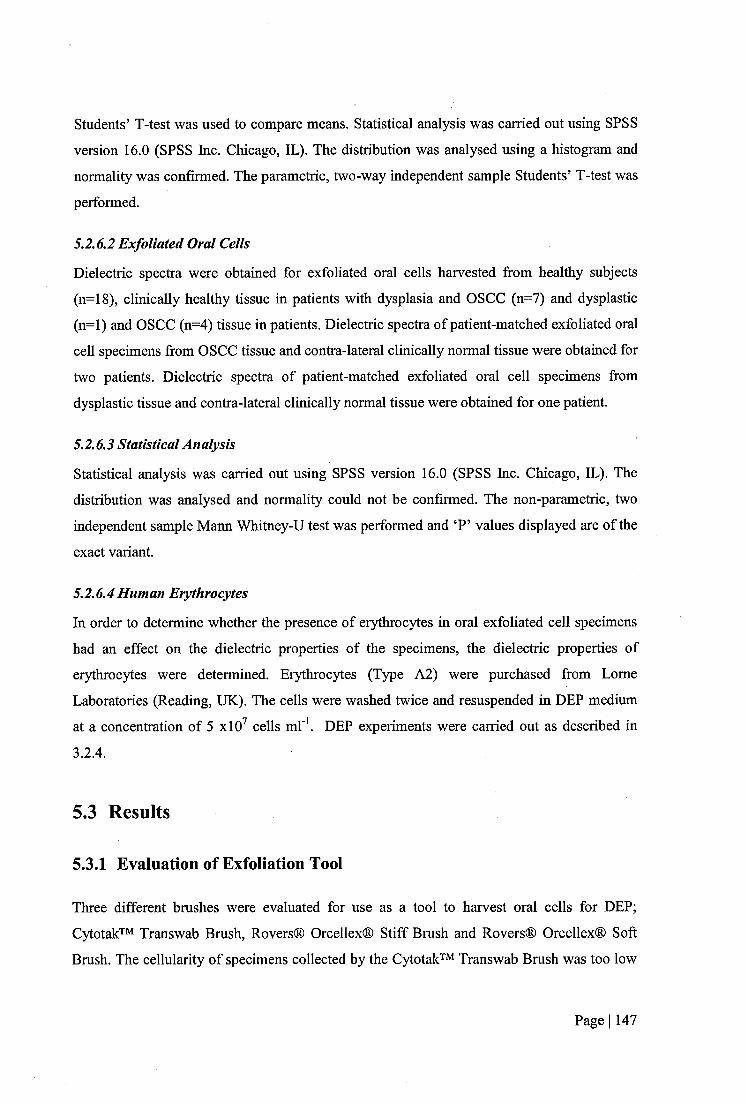
Students’ T-test was used to compare means. Statistical analysis was carried out using SPSS
version 16.0 (SPSS Inc. Chicago, IL). The distribution was analysed using a histogram and
normality was confirmed. The parametric, two-way independent sample Students’ T-test was
performed.
5.2.6.2 Exfoliated Oral Cells
Dielectric spectra were obtained for exfoliated oral cells harvested from healthy subjects
(n=18), clinically healthy tissue in patients with dysplasia and OSCC (n=7) and dysplastic
(n=l) and OSCC (n=4) tissue in patients. Dielectric spectra of patient-matched exfoliated oral
cell specimens from OSCC tissue and contra-lateral clinically normal tissue were obtained for
two patients. Dielectric spectra of patient-matched exfoliated oral cell specimens from
dysplastic tissue and contra-lateral clinically normal tissue were obtained for one patient.
5.2.6.3 Statistical Analysis
Statistical analysis was carried out using SPSS version 16.0 (SPSS Inc. Chicago, IL). The
distribution was analysed and normality could not be confirmed. The non-parametric, two
independent sample Mann Whitney-U test was performed and ‘P’ values displayed are of the
exact variant.
5.2.6.4Human Erythrocytes
In order to determine whether the presence of erythrocytes in oral exfoliated cell specimens
had an effect on the dielectric properties of the specimens, the dielectric properties of
erythrocytes were determined. Erythrocytes (Type A2) were purchased from Lome
Laboratories (Reading, UK). The cells were washed twice and resuspended in DEP medium
at a concentration of 5 xlO^ cells m l'\ DEP experiments were carried out as described in
3.2.4.
5.3 Results
5.3.1 Evaluation of Exfoliation Tool
Three different bmshes were evaluated for use as a tool to harvest oral cells for DEP;
Cytotak™ Transwab Brush, Rovers® Orcellex® Stiff Brush and Rovers® Orcellex® Soft
Brush. The cellularity of specimens collected by the Cytotak™ Transwab Brush was too low
Page I 147

to gain adequate dielectric data. Both the Rovers® Orcellex® Stiff and Soft brushes collected
specimens with adequate cellularity for DEP experimentation. The Rovers® Orcellex® Stiff
Brush contained more tissue clumps than the soft brush. Specimens collected using the
Rovers® Orcellex® Soft Brush contained less tissue clumps and more cells in a single cell
suspension. Therefore, the Rovers® Orcellex® Soft Brush was chosen to harvest specimens
for DEP analysis.
5.3.2 Features of Exfoliated Oral Cell Specimens
5.3.2.1 Morphology of Exfoliated Oral Cells
The morphology of exfoliated oral cells is different to the morphology of cultured
kératinocytes, as shown in Figure 5-2.
Page I 148
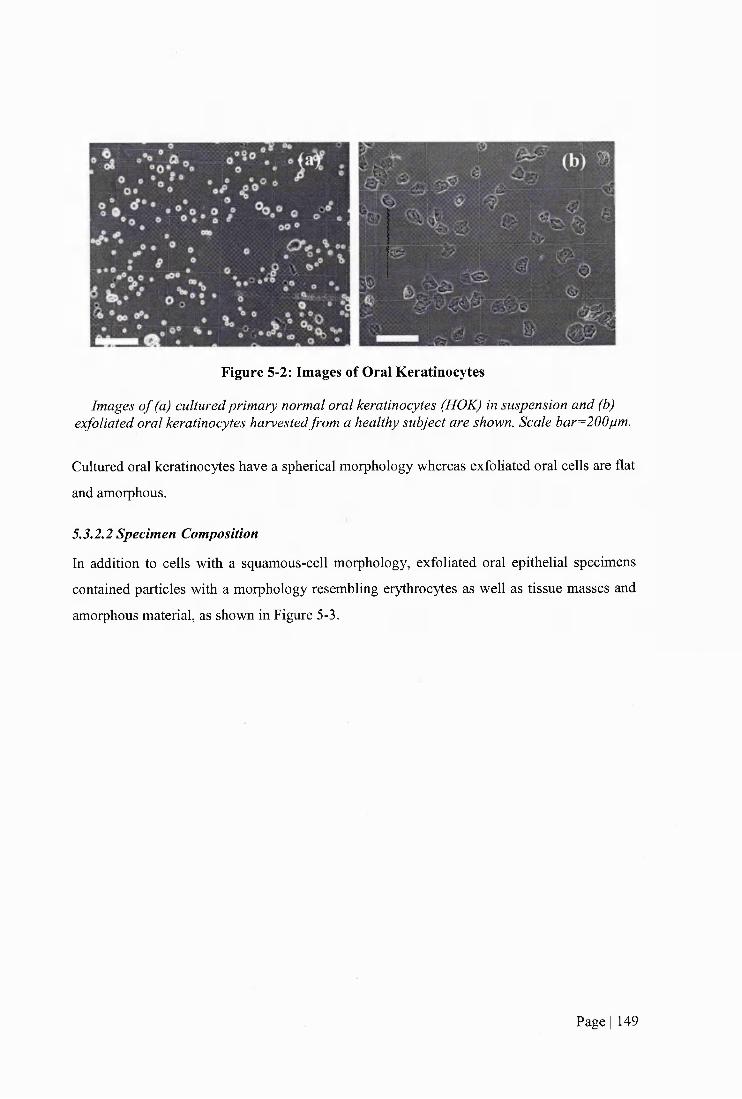
Figure 5-2: Images of Oral Keratinoeytes
Images o f (a) cultured primary normal oral keratinoeytes (HOK) in suspension and (b) exfoliated oral keratinoeytes harvested from a healthy subject are shown. Scale bar=200jum.
Cultured oral keratinoeytes have a spherical morphology whereas exfoliated oral cells are flat
and amorphous.
53.2.2 Specimen Composition
In addition to cells with a squamous-cell morphology, exfoliated oral epithelial specimens
contained particles with a morphology resembling erythrocytes as well as tissue masses and
amorphous material, as shown in Figure 5-3.
Page I 149
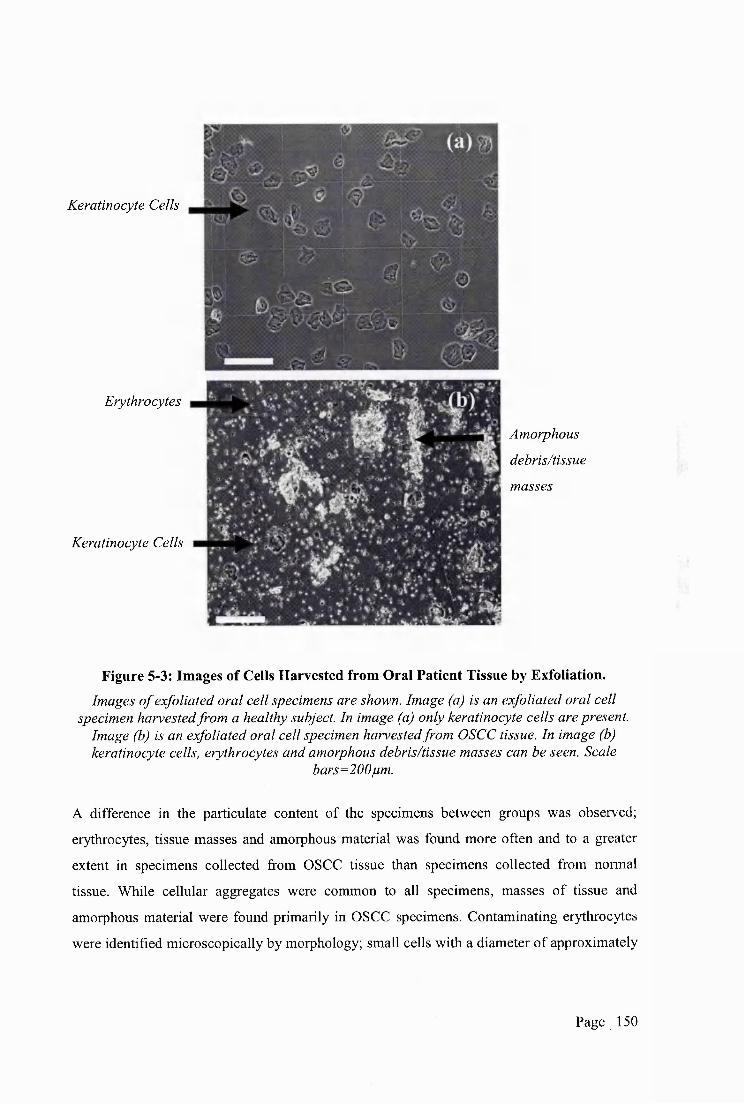
Keratinocyte Cells
Erythrocytes
Keratinocyte Cells
Amorphous
debris/tissue
masses
Figure 5-3: Images of Cells Harvested from Oral Patient Tissue by Exfoliation.Images o f exfoliated oral cell specimens are shown. Image (a) is an exfoliated oral cell
specimen harvested from a healthy subject. In image (a) only keratinocyte cells are present. Image (b) is an exfoliated oral cell specimen harvested from OSCC tissue. In image (b) keratinocyte cells, erythrocytes and amorphous debris/tissue masses can be seen. Scale
bars=200pm.
A difference in the particulate content of the specimens between groups was observed;
erythrocytes, tissue masses and amorphous material was found more often and to a greater
extent in specimens collected from OSCC tissue than specimens collected from normal
tissue. While cellular aggregates were common to all specimens, masses of tissue and
amorphous material were found primarily in OSCC specimens. Contaminating erythrocytes
were identified microscopically by morphology; small cells with a diameter of approximately
Page 1 150
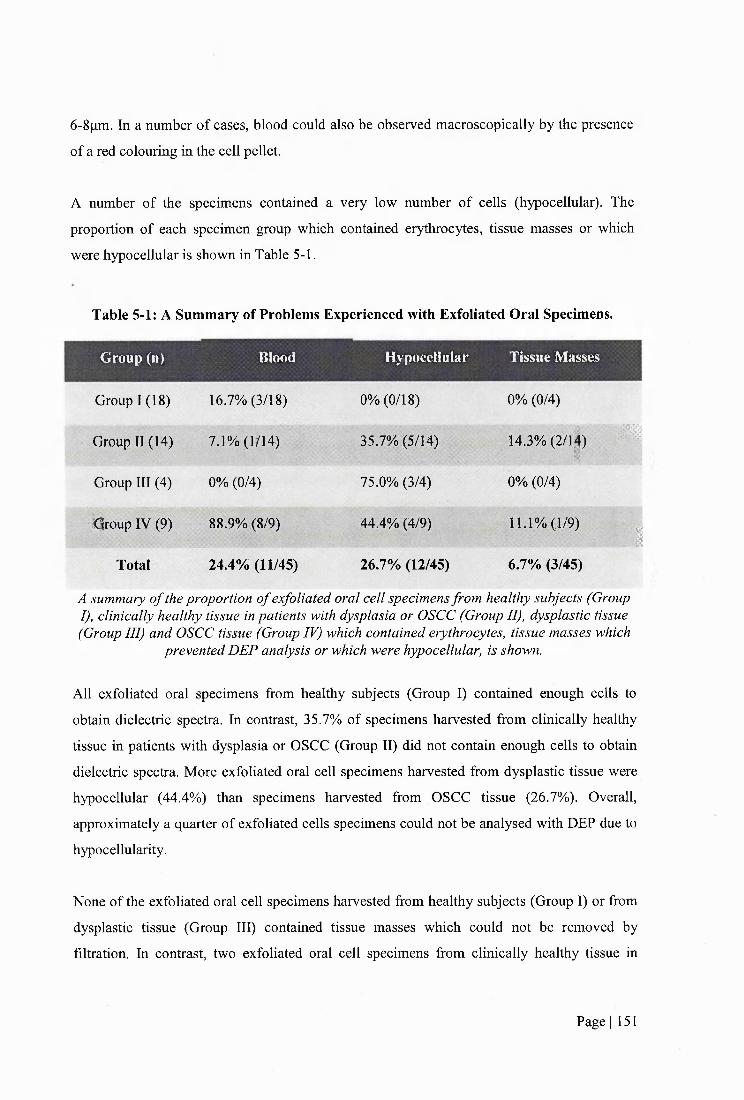
6-8fim. In a number of cases, blood could also be observed macroscopically by the presence
of a red colouring in the cell pellet.
A number of the specimens contained a very low number of cells (hypocellular). The
proportion of each specimen group which contained erythrocytes, tissue masses or which
were hypocellular is shown in Table 5-1.
Table 5-1: A Summary of Problems Experienced with Exfoliated Oral Specimens.
Group (n) Blood Hypocellular Tissue Masses
Group 1 (18)
; Group II (14)
Group III (4)
■Iqroup IV (9)
Total
16.7% (3/18)
7.1% (lh 4)
0% (0/4)
88.9% (8/9)
24.4% (11/45)
0% (0/18)
35.7% (5/14)
75.0%(3/4)
44.4% (4/9)
26.7% (12/45)
0% (0/4)
14.3% (2/1^)
0% (0/4)
11.1% (1/9)
6.7% (3/45)
*
I
A summary o f the proportion o f exfoliated oral cell specimens from healthy subjects (GroupI), clinically healthy tissue in patients with dysplasia or OSCC (Group II), dysplastic tissue (Group III) and OSCC tissue (Group IV) which contained erythrocytes, tissue masses which
prevented DEP analysis or which were hypocellular, is shown.
All exfoliated oral specimens from healthy subjects (Group 1) contained enough cells to
obtain dielectric spectra. In contrast, 35.7% of specimens harvested from clinically healthy
tissue in patients with dysplasia or OSCC (Group II) did not contain enough cells to obtain
dielectric spectra. More exfoliated oral cell specimens harvested from dysplastic tissue were
hypocellular (44.4%) than specimens harvested from OSCC tissue (26.7%). Overall,
approximately a quarter of exfoliated cells specimens could not be analysed with DEP due to
hypocellularity.
None of the exfoliated oral cell specimens harvested from healthy subjects (Group 1) or from
dysplastic tissue (Group 111) contained tissue masses which could not be removed by
filtration. In contrast, two exfoliated oral cell specimens from clinically healthy tissue in
Page I 151
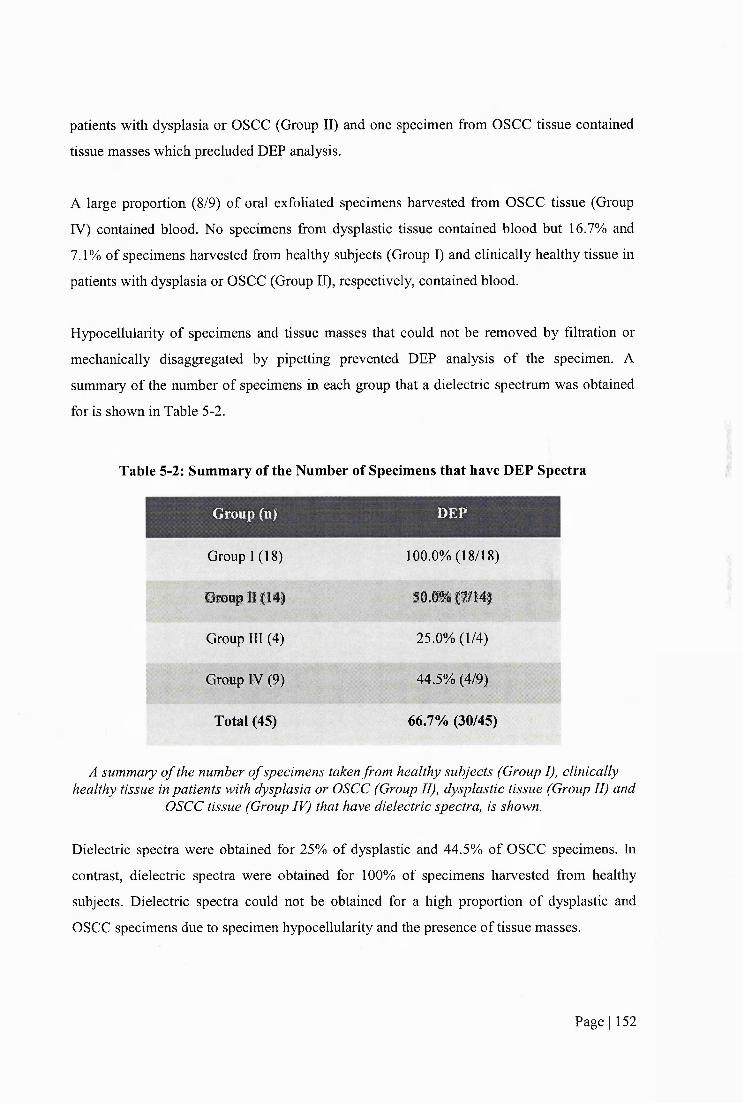
patients with dysplasia or OSCC (Group 11) and one specimen from OSCC tissue contained
tissue masses which precluded DEP analysis.
A large proportion (8/9) of oral exfoliated specimens harvested from OSCC tissue (Group
IV) contained blood. No specimens from dysplastic tissue contained blood but 16.7% and
7.1% of specimens harvested from healthy subjects (Group 1) and clinically healthy tissue in
patients with dysplasia or OSCC (Group 11), respectively, contained blood.
Hypocellularity of specimens and tissue masses that could not be removed by filtration or
mechanically disaggregated by pipetting prevented DEP analysis of the specimen. A
summary of the number of specimens in each group that a dielectric spectrum was obtained
for is shown in Table 5-2.
Table 5-2: Summary of the Number of Specimens that have DEP Spectra
Group (n)
Group 1 (18)
Group II (14)
Group 111 (4)
Group IV (9)
Total (45)
DEP
100.0% (18/18)
50.0% (7/14)
25.0% (1/4)
44.5% (4/9)
66.7% (30/45)
A summary o f the number o f specimens taken from healthy subjects (Group I), clinically healthy tissue in patients with dysplasia or OSCC (Group II), dysplastic tissue (Group II) and
OSCC tissue (Group IV) that have dielectric spectra, is shown.
Dielectric spectra were obtained for 25% of dysplastic and 44.5% of OSCC specimens. In
contrast, dielectric spectra were obtained for 100% of specimens harvested from healthy
subjects. Dielectric spectra could not be obtained for a high proportion of dysplastic and
OSCC specimens due to specimen hypocellularity and the presence of tissue masses.
Page I 152

Estimates of the concentration of keratinoeytes and erythrocytes were made for each
specimen analysed with DEP that contained blood are shown in Table 5-3.
Table 5-3: A Summary of the Mean Concentration of Keratinoeytes and Erythrocytes in
Exfoliated Oral Specimens that have Dielectric Spectra.
Mean Erythrocyte
Concentration (x 10 )
(cells mr‘) (s.d.) (cells ml *) (s.d.)
Group 1 (n=18)
Group 11 (n=7)
Group 111 (n=l)
Group IV (n=4)
62.6 (35.6)
n/a
n/a
36.8 (14.3)
81.0(29.1)
0.0
283.0(291.9)
A summary o f the mean concentration o f keratinoeytes and erythrocyte in exfoliated oral cell specimens containing blood is shown. Cell concentration was measured using a
haemocytometer when cells were suspended in DEP experimental medium following the DEP sample preparation. Keratinoeytes and erythrocytes were distinguished by morphology.
The mean concentration of erythrocytes was higher in exfoliated oral cell specimens from
OSCC tissue (Group IV) than from healthy tissue (Groups 1 and 11),
Each exfoliated cell specimen was suspended in 0.2ml of DEP experimental medium for DEP
experimentation. The cell concentration was not adjusted to a consistent concentration due to
the low number of cells present in the specimens. There was a weak positive correlation
between cell concentration of exfoliated oral specimens and the level of scatter in the data, as
shown in Figure 5-4.
Page I 153
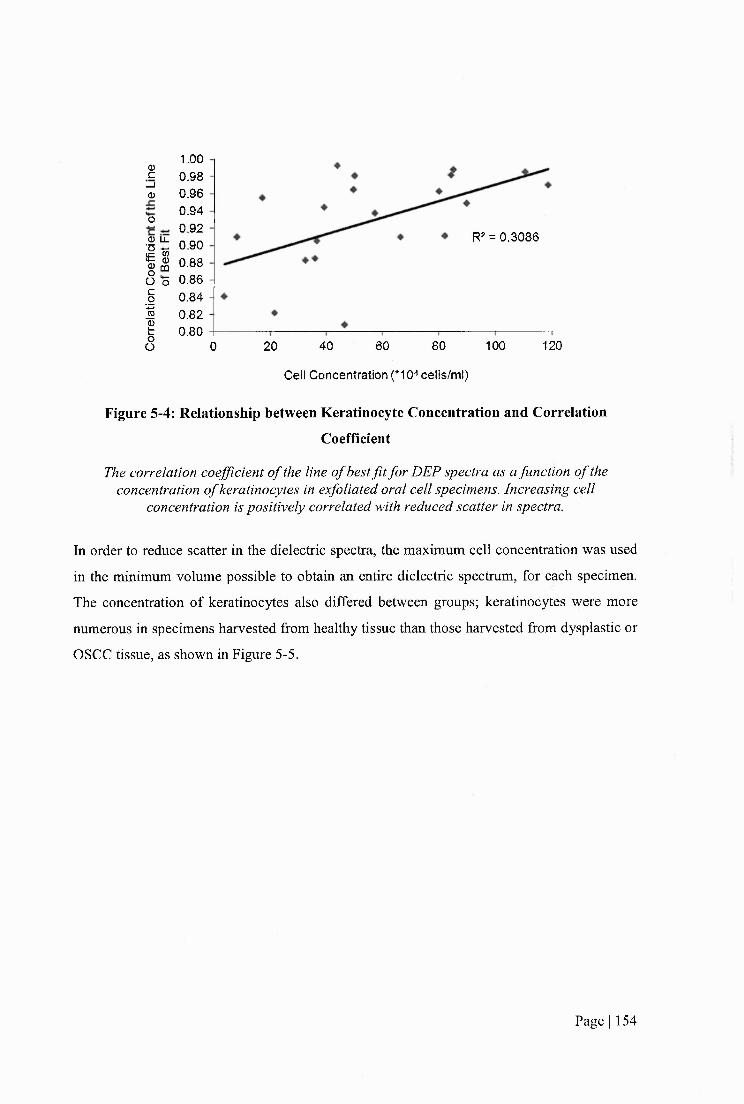
1.000.980.960.940.920.900.880.860.840.820.80
0)c
_ l0)0<33 LJL
iic
1I
R2 = 0 .3086
oO 12060 80 10040200
Cell Concentration (*10^ cells/m l)
Figure 5-4: Relationship between Keratinocyte Concentration and Correlation
Coefficient
The correlation coefficient o f the line o f best fit for DEP spectra as a function o f the concentration o f keratinoeytes in exfoliated oral cell specimens. Increasing cell
concentration is positively correlated with reduced scatter in spectra.
In order to reduce scatter in the dielectric spectra, the maximum cell concentration was used
in the minimum volume possible to obtain an entire dielectric spectrum, for each specimen.
The concentration of keratinoeytes also differed between groups; keratinoeytes were more
numerous in specimens harvested from healthy tissue than those harvested from dysplastic or
OSCC tissue, as shown in Figure 5-5.
Page I 154
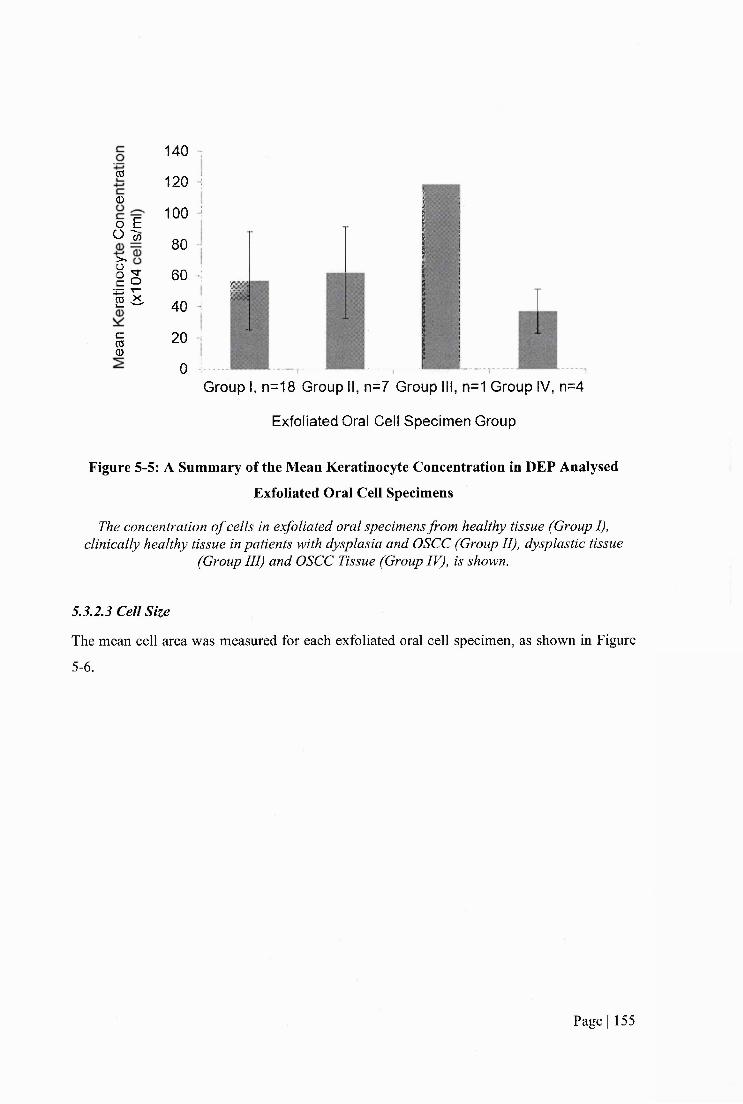
CO
0
o E0 In
I sI E
1
140 1
120 !
100 1
80 ;
60 j0
40 1
20 !,
0 !.Group I, n=18 Group II, n=7 Group III, n=1 Group IV, n=4
Exfoliated Oral Cell Specimen Group
Figure 5-5: A Summary of the Mean Keratinocyte Concentration in DEP Analysed
Exfoliated Oral Cell Specimens
The concentration o f cells in exfoliated oral specimens from healthy tissue (Group I), clinically healthy tissue in patients with dysplasia and OSCC (Group II), dysplastic tissue
(Group III) and OSCC Tissue (Group IV), is shown.
5.3.23 Cell Size
The mean eell area was measured for each exfoliated oral cell specimen, as shown in Figure
5-6.
Page 1 155
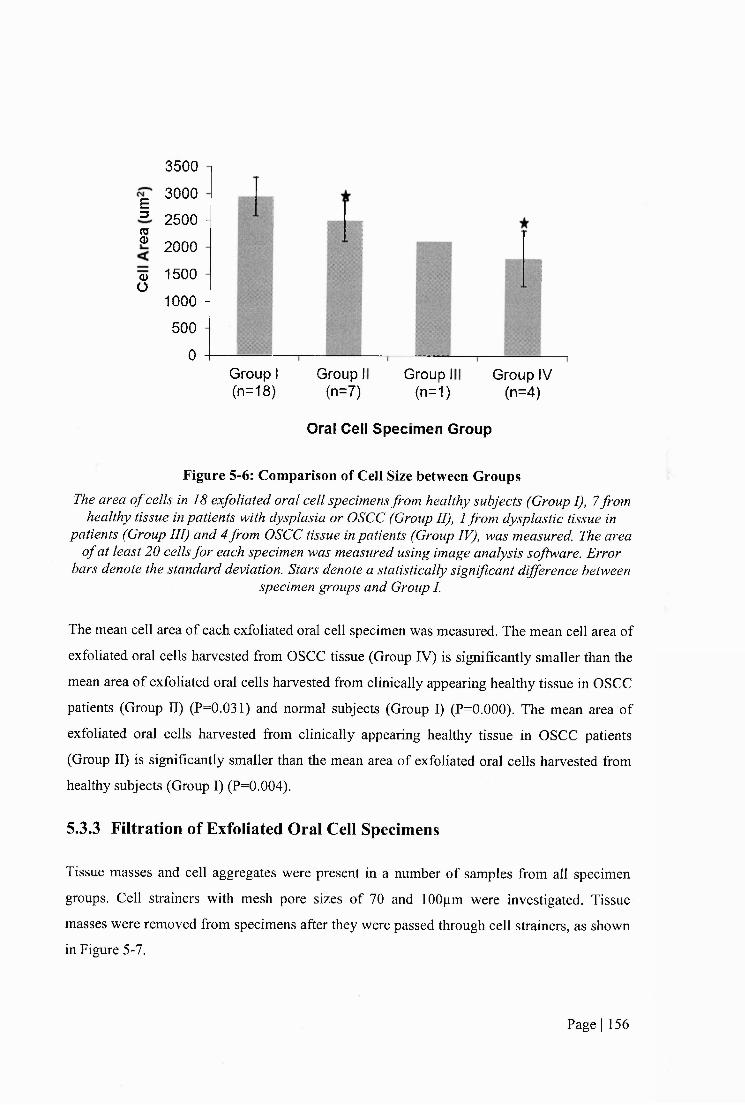
E3
S
Q>O
3500
3000
2500 H
2000
1500
1000 H 500
0Group I (n=18)
Group I (n=7)
Group 1 (n=1)
Group IV (n=4)
Oral Cell Specim en Group
Figure 5-6: Comparison of Cell Size between GroupsThe area o f cells in 18 exfoliated oral cell specimens from healthy subjects (Group I), 7 from
healthy tissue in patients with dysplasia or OSCC (Group II), 1 from dysplastic tissue in patients (Group III) and 4 from OSCC tissue in patients (Group IV), was measured. The area
o f at least 20 cells for each specimen was measured using image analysis software. Error bars denote the standard deviation. Stars denote a statistically significant difference between
specimen groups and Group I.
The mean cell area of each exfoliated oral cell specimen was measured. The mean cell area of
exfoliated oral cells harvested from OSCC tissue (Group IV) is significantly smaller than the
mean area of exfoliated oral cells harvested from clinically appearing healthy tissue in OSCC
patients (Group II) (P=0.031) and normal subjects (Group I) (P=0.000). The mean area of
exfoliated oral cells harvested from clinically appearing healthy tissue in OSCC patients
(Group II) is significantly smaller than the mean area of exfoliated oral cells harvested from
healthy subjects (Group I) (P=0.004).
5.3.3 Filtration of Exfoliated Oral Cell Specimens
Tissue masses and cell aggregates were present in a number of samples from all specimen
groups. Cell strainers with mesh pore sizes of 70 and 100pm were investigated. Tissue
masses were removed from specimens after they were passed through cell strainers, as shown
in Figure 5-7.
Page I 156

%
Figure 5-7: Filtration of Exfoliated Oral Cell Specimen
Images o f an exfoliated oral cell specimen harvested from the buccal mucosa o f a healthy subject. Cellular aggregates are present in exfoliated oral cell specimens before
filtration, as shown in images (a) and (b). Cellular aggregates are removed after filtration through a 70pm cell strainer, as shown in image (c) and (d). Scale bar =
250pm.
Tissue masses and eell aggregates were removed from exfoliated oral cell specimens by
both 70pm and 100pm cell strainers. However, it was apparent that there was a
reduction in the number of single cells in the specimens following filtration. This could
not be quantified due to the difficulties in counting cells prior to filtration when tissue
masses were present and obscured the view of single cells. A number of specimens
could not be analysed with DEP following filtration due to the low number of cells
remaining in the specimens.
Page I 157
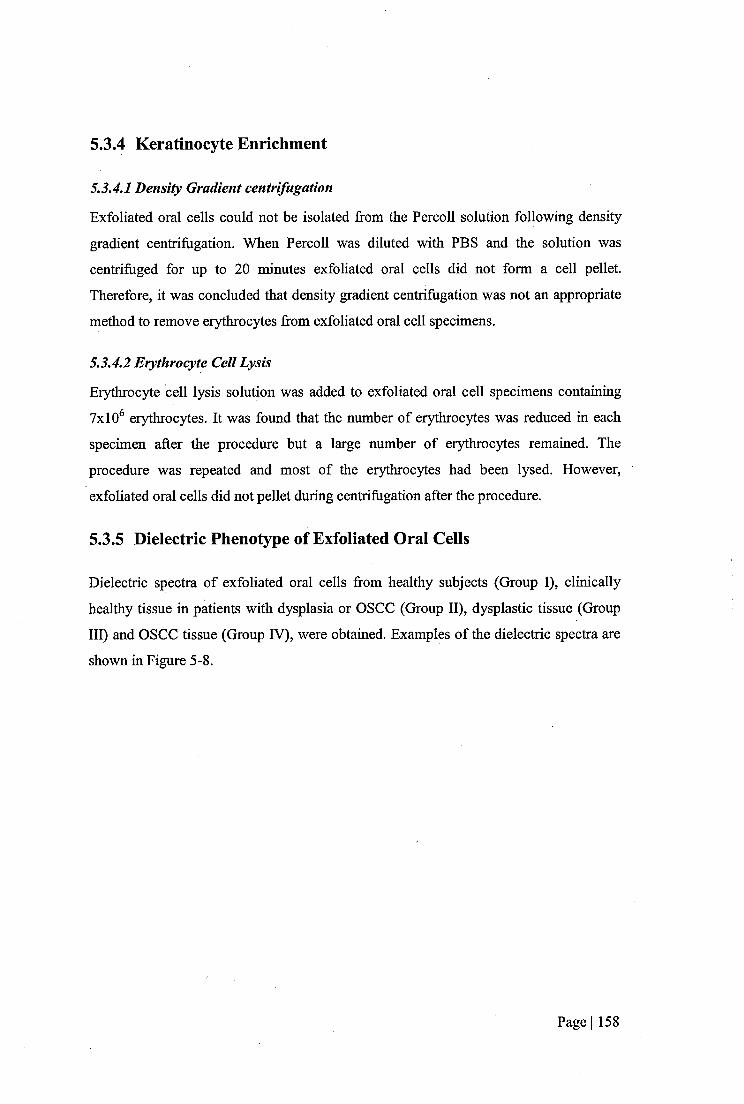
5.3.4 Keratinocyte Enrichment
5.3.4.1 Density Gradient centrifugation
Exfoliated oral cells could not be isolated from the Percoll solution following density
gradient centrifugation. When Percoll was diluted with PBS and the solution was
centrifuged for up to 20 minutes exfoliated oral cells did not form a cell pellet.
Therefore, it was concluded that density gradient centrifugation was not an appropriate
method to remove erythrocytes from exfoliated oral cell specimens.
5.3.4.2 Erythrocyte Cell Lysis
Erythrocyte cell lysis solution was added to exfoliated oral cell specimens containing
7x10^ erythrocytes. It was found that the number of erythrocytes was reduced in each
specimen after the procedure but a large number of erythrocytes remained. The
procedure was repeated and most of the erythrocytes had been lysed. However,
exfoliated oral cells did not pellet during centrifugation after the procedure.
5.3.5 Dielectric Phenotype of Exfoliated Oral Cells
Dielectric spectra of exfoliated oral cells from healthy subjects (Group 1), clinically
healthy tissue in patients with dysplasia or OSCC (Group 11), dysplastic tissue (Group
111) and OSCC tissue (Group IV), were obtained. Examples of the dielectric spectra are
shown in Figure 5-8.
Page I 158
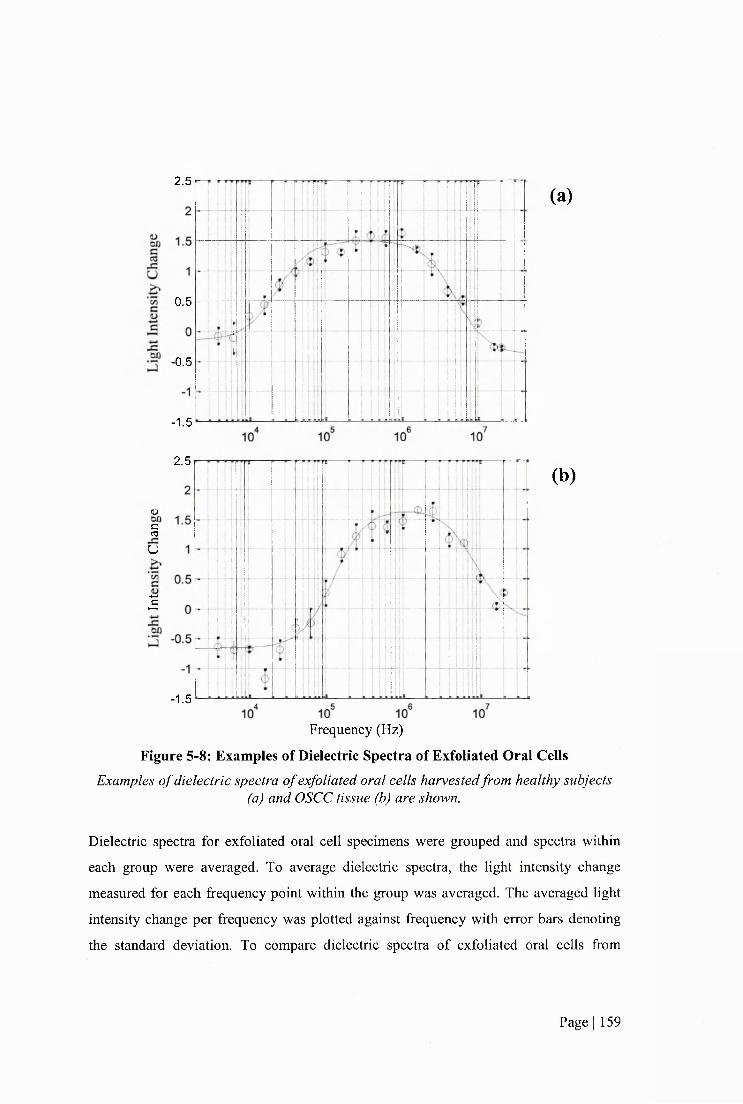
2.5
0.5
-0.5
-1.5
(a)
2.5
u§u
g
-1.5
Frequency (Hz)
(b)
Figure 5-8: Examples of Dielectric Spectra of Exfoliated Oral CellsExamples o f dielectric spectra o f exfoliated oral cells harvested from healthy subjects
(a) and OSCC tissue (b) are shown.
Dielectric spectra for exfoliated oral cell specimens were grouped and spectra within
each group were averaged. To average dielectric spectra, the light intensity change
measured for each frequency point within the group was averaged. The averaged light
intensity change per frequency was plotted against frequency with error bars denoting
the standard deviation. To compare dielectric spectra of exfoliated oral cells from
Page I 159
healthy subjects (Group I) and clinically healthy tissue from patients with dysplasia and
OSCC (Group II), the averaged spectra of these groups were plotted, as shown in Figure
5-9.
2.5
O)
0.5
O)
-0.5Healthy Subjects Average (n=18)
Healthy Patient Tissue Average (n=7)
-1.5
Frequency (Hz)
Figure 5-9: Average DEP Spectra of Oral Ceils Harvested by Exfoliation from
Healthy Subjects and Healthy Tissue in Patients
Average dielectric spectra and line o f best f i t o f exfoliated oral cells harvestedfrom healthy subjects (Group I, n=18) and clinically appearing healthy tissue in patients with dysplasia or OSCC (Group II, n=7).The correlation co-efficient is 0.9 or above fo r all
models. Error bars denote the standard deviation.
There is very little difference in the average dielectric spectra of exfoliated oral cells
harvested from healthy subjects (Group I) and from clinically healthy tissue in patients
with dysplasia or OSCC (Group II).
To compare the dielectric spectra of exfoliated cells harvested from healthy subjects
(Group I) and from clinically healthy tissue in patients with dysplasia or OSCC (Group
II), and cells harvested from OSCC tissue (Group IV), the averaged dielectric spectra of
these groups were plotted and are shown in Figure 5-10.
Page I 160

(D
P0 0.5
w1 0
05Healthy Subjects Average (18)
-0.5
Healthy Patient Tissue Average (7)
OSCC Average (4)
-1.5
Frequency (Hz)
Figure 5-10: Average DEP Spectra of Cells Harvested by Exfoliation from Healthyand OSCC Tissue
Average dielectric spectra and line o f best f i t o f oral cells harvested by exfoliation from healthy subjects (Group I, n=18), healthy tissue in patients with dysplasia and OSCC
(Group II, n=7) and OSCC tissue (Group IV, n=4). The correlation co-efficient is 0.9 or above for all models. Error bars denote the standard deviation.
The low frequency dieleetrie dispersion (LFDD) of the average dielectric spectra of
exfoliated oral cells harvested from OSCC tissue (Group IV) is shifted to the right with
respect to the LFDD of the average dielectric spectra of exfoliated oral cells harvested
from healthy tissue (Groups I and II). The average Fxi is approximately IxlO'^Hz for
oral cells harvested from healthy tissue (Group I and II) and approximately 6x10% z for
oral cells harvested from OSCC tissue (Group IV).
To compare the dielectric spectra of exfoliated cells harvested from healthy tissue
(Group I and II) and cells harvested from dysplastic tissue (Group III), the averaged
dielectric spectra of these groups were plotted and are shown in Figure 5-11
Page I 161
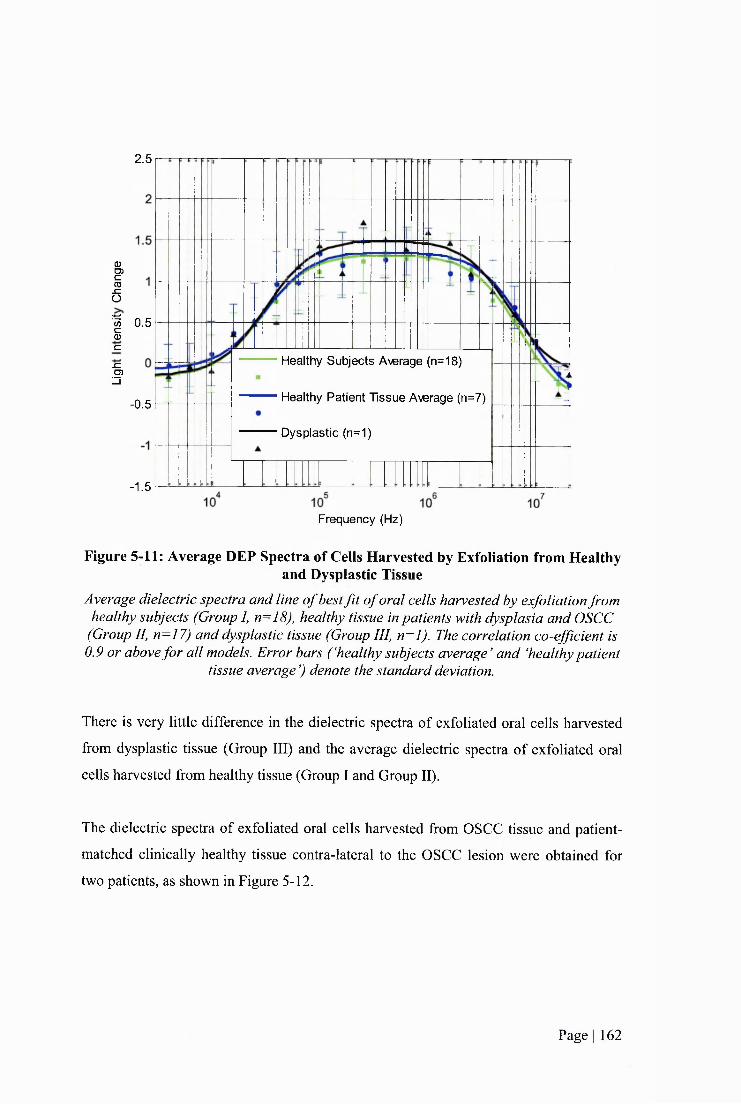
2.5
Q>O)cCO
6I 0.5CD
C
Healthy Subjects A\^rage (n=18)JCO)3Healthy Patient Tissue Average (n=7)-0.5
Dysplastic (n=1)
-1.5
Frequency (Hz)
Figure 5-11: Average DEP Spectra of Cells Harvested by Exfoliation from Healthyand Dysplastic Tissue
Average dielectric spectra and line o f best f i t o f oral cells harvested by exfoliation from healthy subjects (Group I, n=18), healthy tissue in patients with dysplasia and OSCC
(Group II, n=I7) and dysplastic tissue (Group III, n=l). The correlation co-efficient is 0.9 or above for all models. Error bars ( ‘healthy subjects average ’ and ‘healthy patient
tissue average j denote the standard deviation.
There is very little differenee in the dieleetric spectra of exfoliated oral cells harvested
from dysplastic tissue (Group III) and the average dieleetric spectra of exfoliated oral
cells harvested from healthy tissue (Group I and Group II).
The dielectric spectra of exfoliated oral cells harvested from OSCC tissue and patient-
matched clinically healthy tissue contra-lateral to the OSCC lesion were obtained for
two patients, as shown in Figure 5-12.
Page I 162
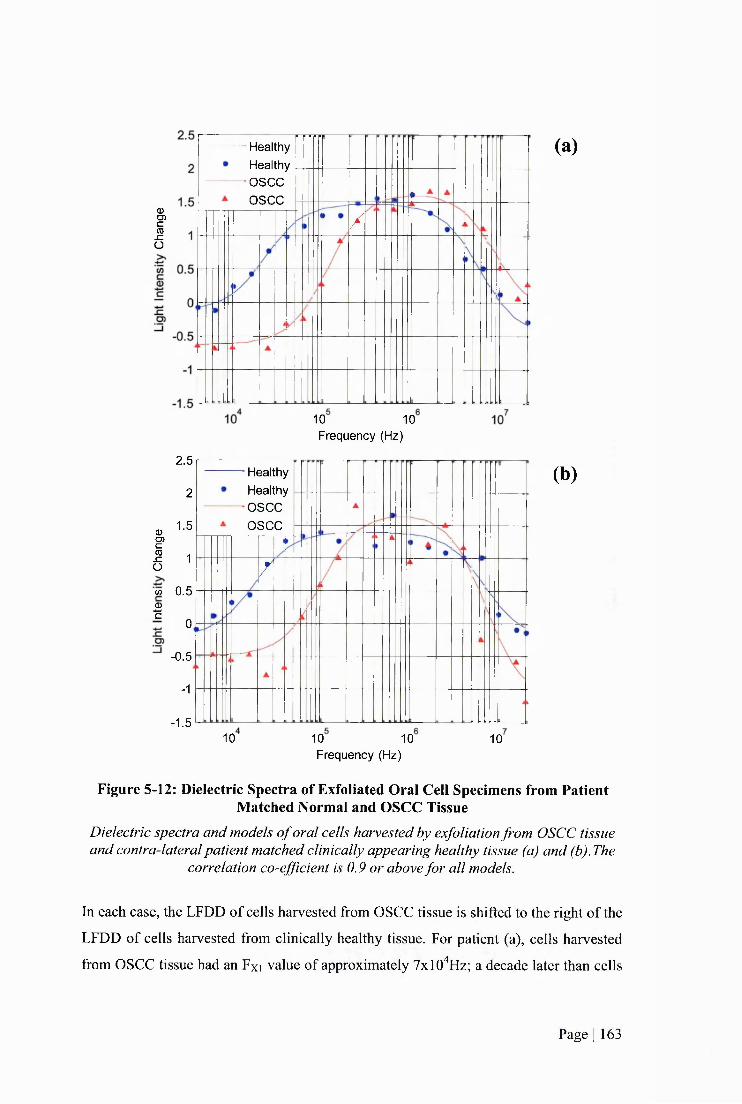
ICDSZO
HealthyHealthy
■OSCCOSCC
/
10 10 Frequency (Hz)
2.5
2
^ 1-5D)
I 1w 0.5 0 -2
0
-0.5
-1
-1.5
HealthyHealthyOSCCOSCC
/ I
10 10 10 Frequency (Hz)
10
(a)
(b)
Figure 5-12: Dielectric Spectra of Exfoliated Oral Cell Specimens from Patient Matched Normal and OSCC Tissue
Dielectric spectra and models o f oral cells harvested by exfoliation from OSCC tissue and contra-lateral patient matched clinically appearing healthy tissue (a) and (b).The
correlation co-efficient is 0.9 or above for all models.
In each case, the LFDD of cells harvested from OSCC tissue is shifted to the right of the
LFDD of cells harvested from clinically healthy tissue. For patient (a), cells harvested
from OSCC tissue had an Fxi value of approximately 7x10%z; a decade later than cells
Page I 163

harvested from healthy tissue contra-lateral to the OSCC lesion which had an Fxi value
of approximately 7xlO^Hz. For patient (b), cells harvested from OSCC tissue had an Fxi
value of approximately SxlO'^Hz, whereas cells harvested from healthy tissue contra
lateral to the OSCC lesion had an Fxi value of approximately 7xlO^Hz.
The dielectric spectra of exfoliated oral cells from dysplastic tissue and patient-matched
clinically appearing healthy tissue contra-lateral to the dysplastic lesion were obtained
for one patient, as shown in Figure 5-13.
2.5HealthyHealthyDysplasticDysplastic
O)
0.5
O)
Frequency (Hz)
Figure 5-13; Dielectric Spectra of Exfoliated Oral Cells Harvested from Patient Matched Normal and Dysplastic Tissue
Dielectric spectra and models o f oral cells harvested by exfoliation from dysplastic tissue and contra-lateral patient matched clinically appearing healthy tissue. The
correlation co-efficient is 0.9 or above for all models.
The LFDD of cells harvested from dysplastic tissue is shifted to the left of the LFDD of
cells harvested from clinically appearing healthy tissue. Cells harvested from dysplastic
tissue have an Fxi value of approximately IxlO'^Hz, whereas cells harvested from
healthy tissue contra-lateral to the dysplastic lesion have an Fxi value of approximately
4xlO^Hz.
Page I 164
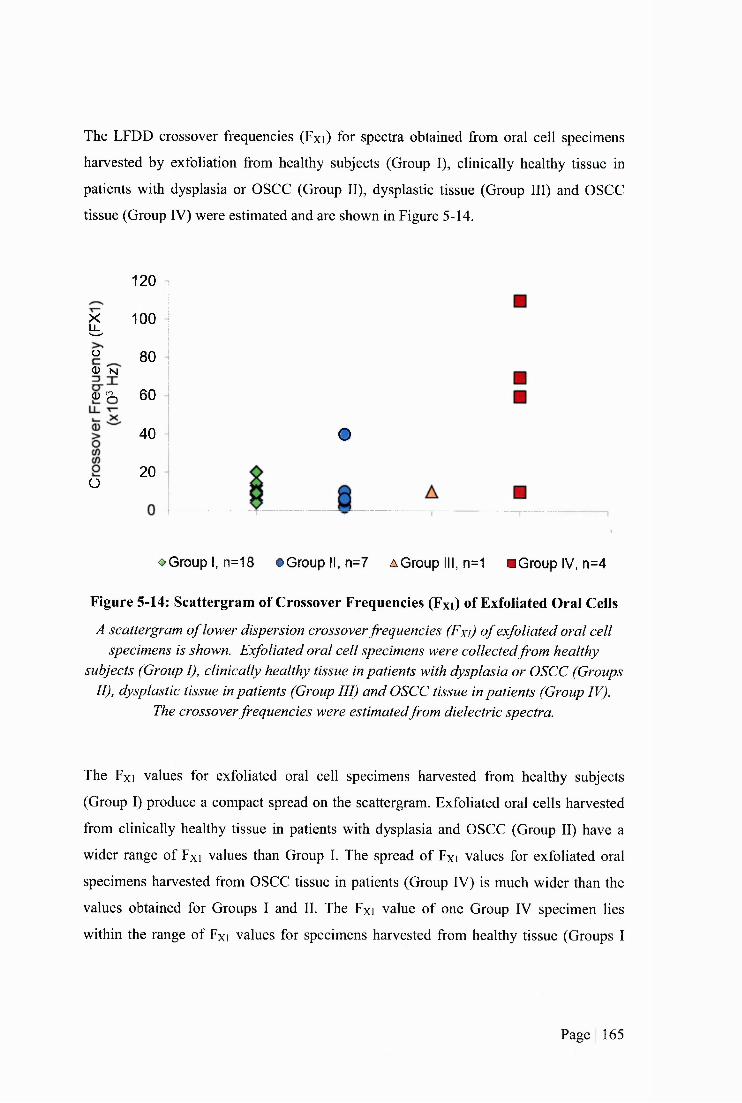
The LFDD crossover frequencies (Fxi) for spectra obtained from oral cell specimens
harvested by exfoliation from healthy subjects (Group I), clinically healthy tissue in
patients with dysplasia or OSCC (Group II), dysplastic tissue (Group III) and OSCC
tissue (Group IV) were estimated and are shown in Figure 5-14.
£Ü0 -N
Q) ^
O
120
100
8 0
6 0
4 0
20
o
o Group I, n=18 • G r o u p II, n=7 A Group III, n=1 m Group IV, n=4
Figure 5-14: Scattergram of Crossover Frequencies (Fxi) of Exfoliated Oral Ceils
A scattergram o f lower dispersion crossover frequencies (Fxi) o f exfoliated oral cell specimens is shown. Exfoliated oral cell specimens were collected from healthy
subjects (Group I), clinically healthy tissue in patients with dysplasia or OSCC (Groups II), dysplastic tissue in patients (Group III) and OSCC tissue in patients (Group IV).
The crossover frequencies were estimatedfrom dielectric spectra.
The Fxi values for exfoliated oral cell specimens harvested from healthy subjects
(Group I) produce a compact spread on the scattergram. Exfoliated oral cells harvested
from clinically healthy tissue in patients with dysplasia and OSCC (Group II) have a
wider range of Fxi values than Group I. The spread of Fxi values for exfoliated oral
specimens harvested from OSCC tissue in patients (Group IV) is much wider than the
values obtained for Groups I and II. The Fxi value of one Group IV specimen lies
within the range of Fxi values for specimens harvested from healthy tissue (Groups I
Page I 165
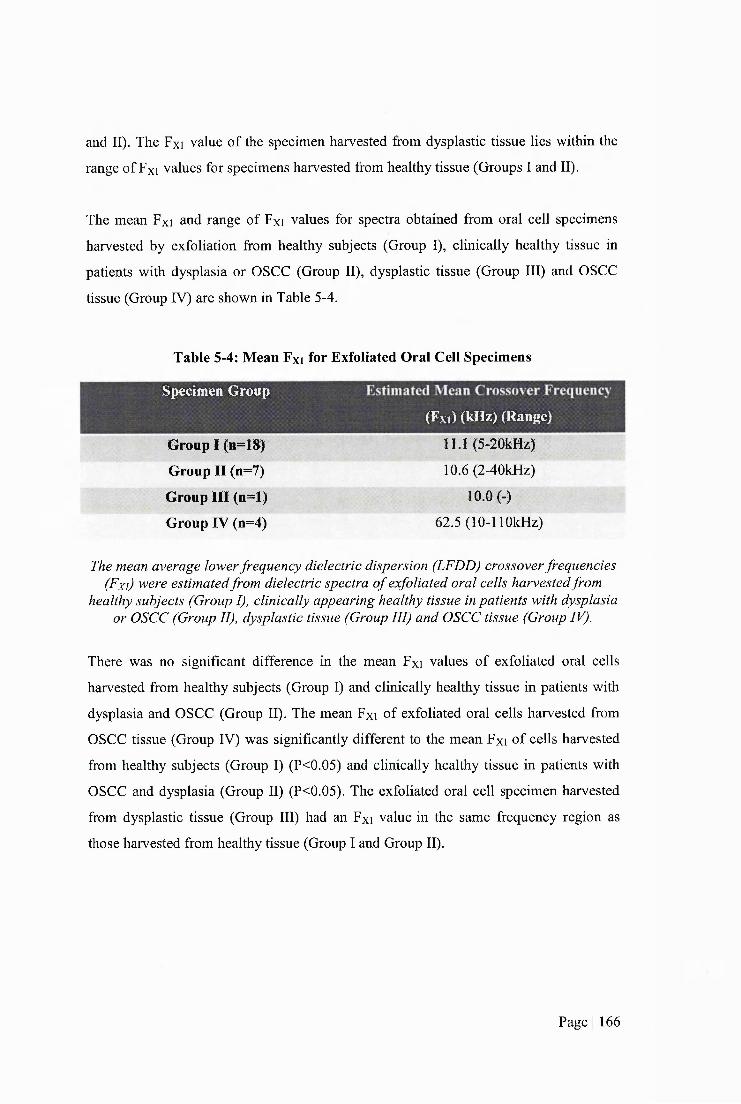
and II). The Fxi value of the specimen harvested from dysplastic tissue lies within the
range of Fxi values for specimens harvested from healthy tissue (Groups I and II).
The mean Fxi and range of Fxi values for spectra obtained from oral cell specimens
harvested by exfoliation from healthy subjects (Group I), clinically healthy tissue in
patients with dysplasia or OSCC (Group II), dysplastic tissue (Group III) and OSCC
tissue (Group IV) are shown in Table 5-4.
Table 5-4: Mean Fxi for Exfoliated Oral Cell Specimens
Specimen Group
Group I (n=18)
Group II (n=7)
Group III (n=l)
Group IV (n=4)
(Fxi) (kHz) (Range)
11.1 (5-20kHz)
10.6 (2-40kHz)
10.0 (-)
62.5 (lO-llOkHz)
The mean average lower frequency dielectric dispersion (LFDD) crossover frequencies (Fxi) were estimated from dielectric spectra o f exfoliated oral cells harvested from
healthy subjects (Group I), clinically appearing healthy tissue in patients with dysplasia or OSCC (Group II), dysplastic tissue (Group III) and OSCC tissue (Group IV).
There was no significant difference in the mean Fxi values of exfoliated oral cells
harvested from healthy subjects (Group I) and clinically healthy tissue in patients with
dysplasia and OSCC (Group II). The mean Fxi of exfoliated oral cells harvested from
OSCC tissue (Group IV) was significantly different to the mean Fxi of cells harvested
from healthy subjects (Group I) (P<0.05) and clinically healthy tissue in patients with
OSCC and dysplasia (Group II) (P<0.05). The exfoliated oral cell specimen harvested
from dysplastic tissue (Group III) had an Fxi value in the same frequency region as
those harvested from healthy tissue (Group I and Group II).
Page I 166
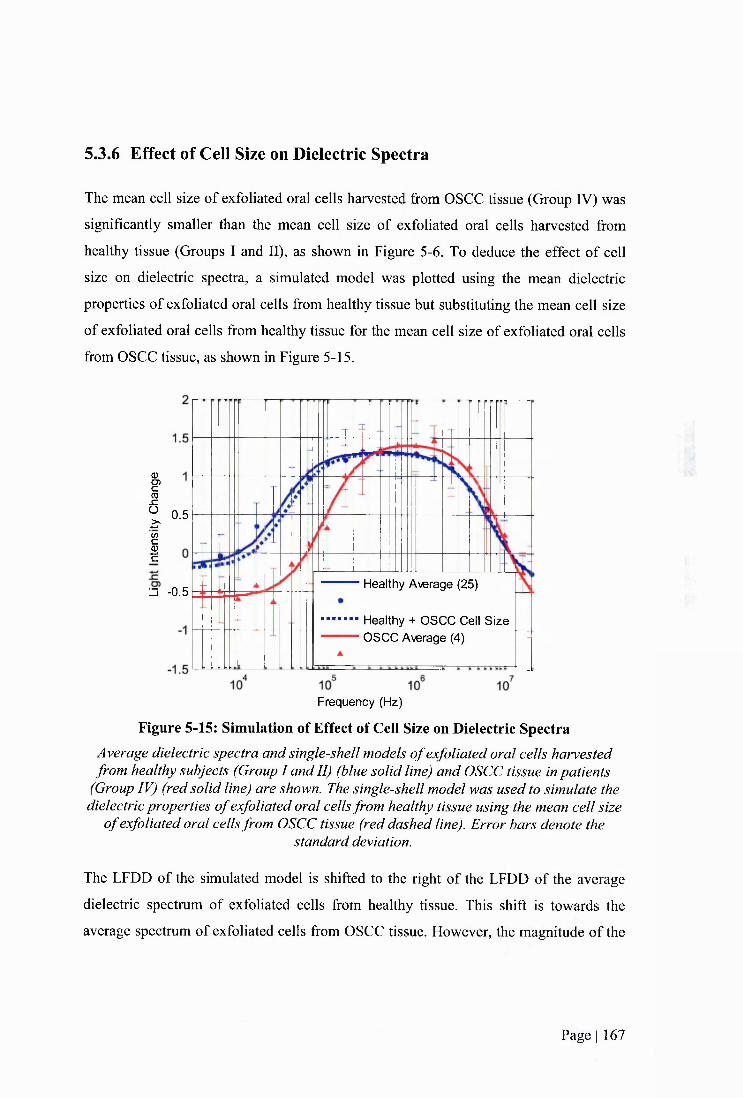
5.3.6 Effect of Cell Size on Dielectric Spectra
The mean cell size of exfoliated oral cells harvested from OSCC tissue (Group IV) was
significantly smaller than the mean cell size of exfoliated oral cells harvested from
healthy tissue (Groups I and II), as shown in Figure 5-6. To deduce the effect of cell
size on dielectric spectra, a simulated model was plotted using the mean dielectric
properties of exfoliated oral cells from healthy tissue but substituting the mean cell size
of exfoliated oral cells from healthy tissue for the mean cell size of exfoliated oral cells
from OSCC tissue, as shown in Figure 5-15.
0PCO
6Z' 0.5
IHealthy Average (25)
□ -0.5
Healthy + OSCC Cell S ize OSCC Average (4)
Frequency (Hz)
Figure 5-15: Simulation of Effect of Cell Size on Dielectric SpectraAverage dielectric spectra and single-shell models o f exfoliated oral cells harvested from healthy subjects (Group I and II) (blue solid line) and OSCC tissue in patients
(Group IV) (red solid line) are shown. The single-shell model was used to simulate the dielectric properties o f exfoliated oral cells from healthy tissue using the mean cell size
o f exfoliated oral cells from OSCC tissue (red dashed line). Error bars denote thestandard deviation.
The LFDD of the simulated model is shifted to the right of the LFDD of the average
dieleetric spectrum of exfoliated cells from healthy tissue. This shift is towards the
average spectrum of exfoliated cells from OSCC tissue. However, the magnitude of the
Page I 167
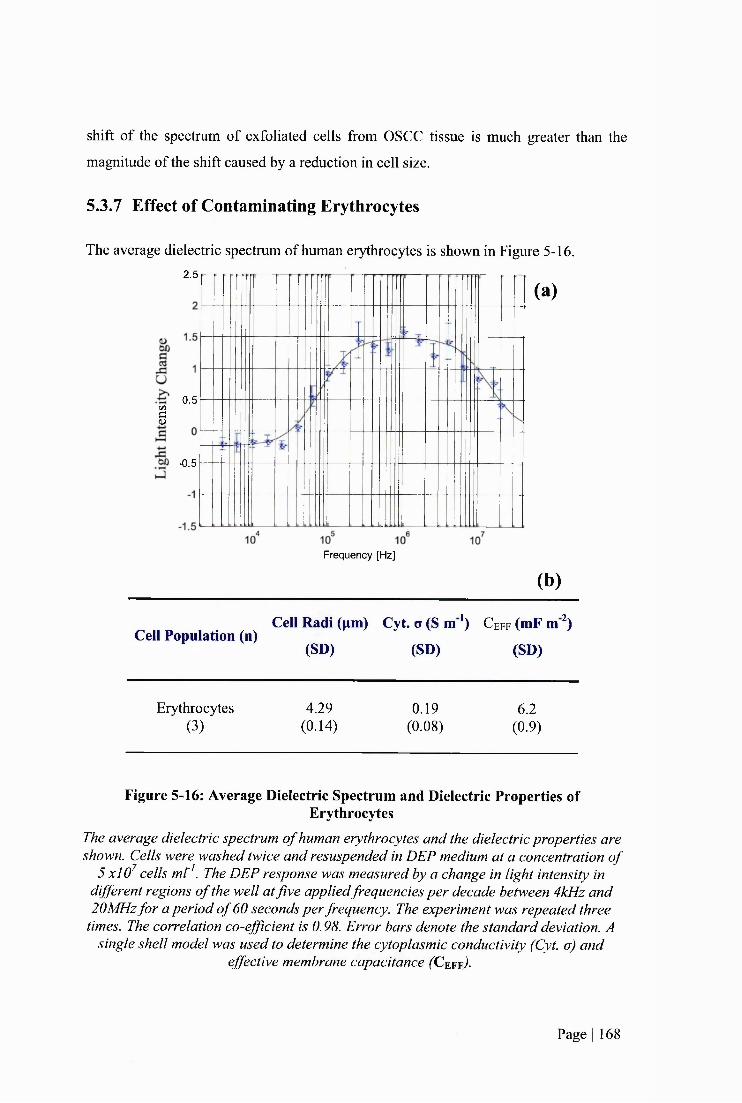
shift of the spectrum of exfoliated cells from OSCC tissue is much greater than the
magnitude of the shift caused by a reduction in cell size.
5.3.7 Effect of Contaminating Erythrocytes
The average dielectric spectrum of human erythrocytes is shown in Figure 5-16.
(a)2.5
0.5C/3
§
-0.5
Frequency [Hz]
(b)
Cell Population (n)Cell Radi (pm) Cyt. o (S m *) C e f f (mF m )
(SD) (SD) (SD)
Erythrocytes 4.29 0.19 6.2(3 ) (0.14) (0.08) (0.9)
Figure 5-16: Average Dielectric Spectrum and Dielectric Properties ofErythrocytes
The average dielectric spectrum o f human erythrocytes and the dielectric properties are shown. Cells were washed twice and resuspended in DEP medium at a concentration o f
5 xlO^ cells mt^. The DEP response was measured by a change in light intensity in different regions o f the well at five appliedfrequencies per decade between 4kHz and 20MHz fo r a period o f 60 seconds per frequency. The experiment was repeated three
times. The correlation co-efficient is 0.98. Error bars denote the standard deviation. A single shell model was used to determine the cytoplasmic conductivity (Cyt. o) and
effective membrane capacitance (Ceff)-
Page I 168
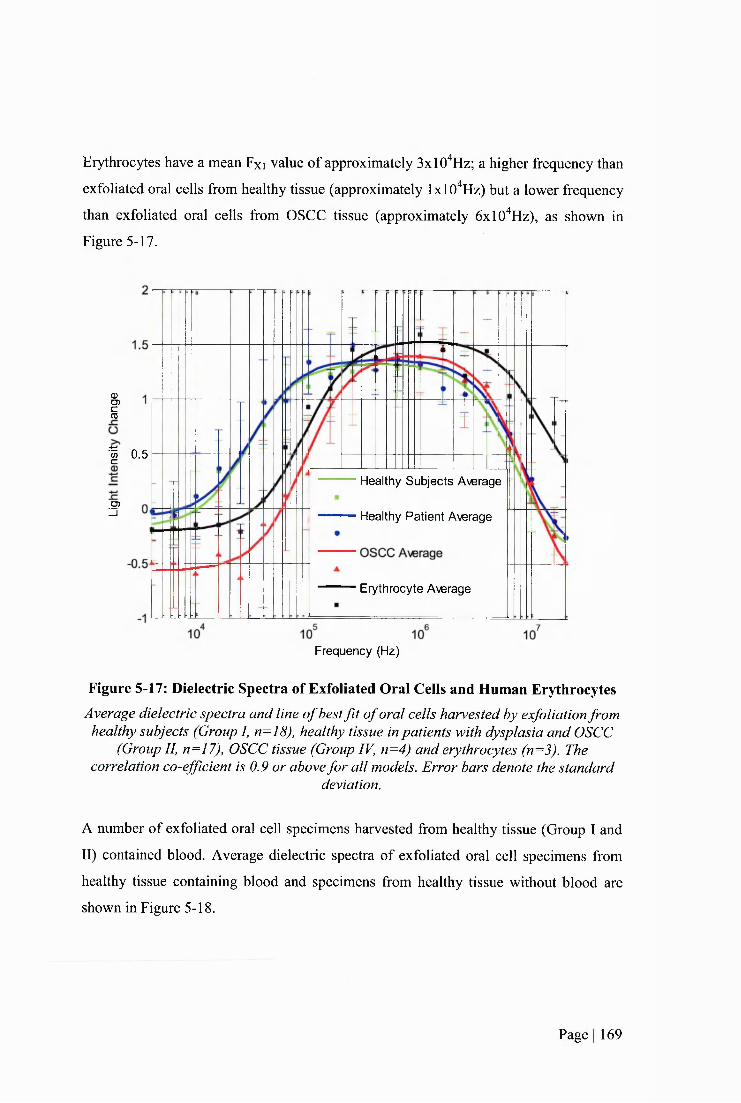
Erythrocytes have a mean Fxi value of approximately 3xlO"^Hz; a higher frequency than
exfoliated oral cells from healthy tissue (approximately IxlO'^Hz) but a lower frequency
than exfoliated oral cells from OSCC tissue (approximately ôxlO'^Hz), as shown in
Figure 5-17.
ICD
•| 0.5
Healthy Subjects Average
O)Zi Healthy Patient Average
Erythrocyte Average
Frequency (Hz)
Figure 5-17: Dielectric Spectra of Exfoliated Oral Cells and Human ErythrocytesAverage dielectric spectra and line o f best f i t o f oral cells harvested by exfoliation from
healthy subjects (Group I, n=18), healthy tissue in patients with dysplasia and OSCC (Group II, n=17), OSCC tissue (Group IV, n=4) and erythrocytes (n=3). The
correlation co-efficient is 0.9 or above for all models. Error bars denote the standarddeviation.
A number of exfoliated oral cell specimens harvested from healthy tissue (Group I and
II) contained blood. Average dielectric spectra of exfoliated oral cell specimens from
healthy tissue containing blood and specimens from healthy tissue without blood are
shown in Figure 5-18.
Page I 169
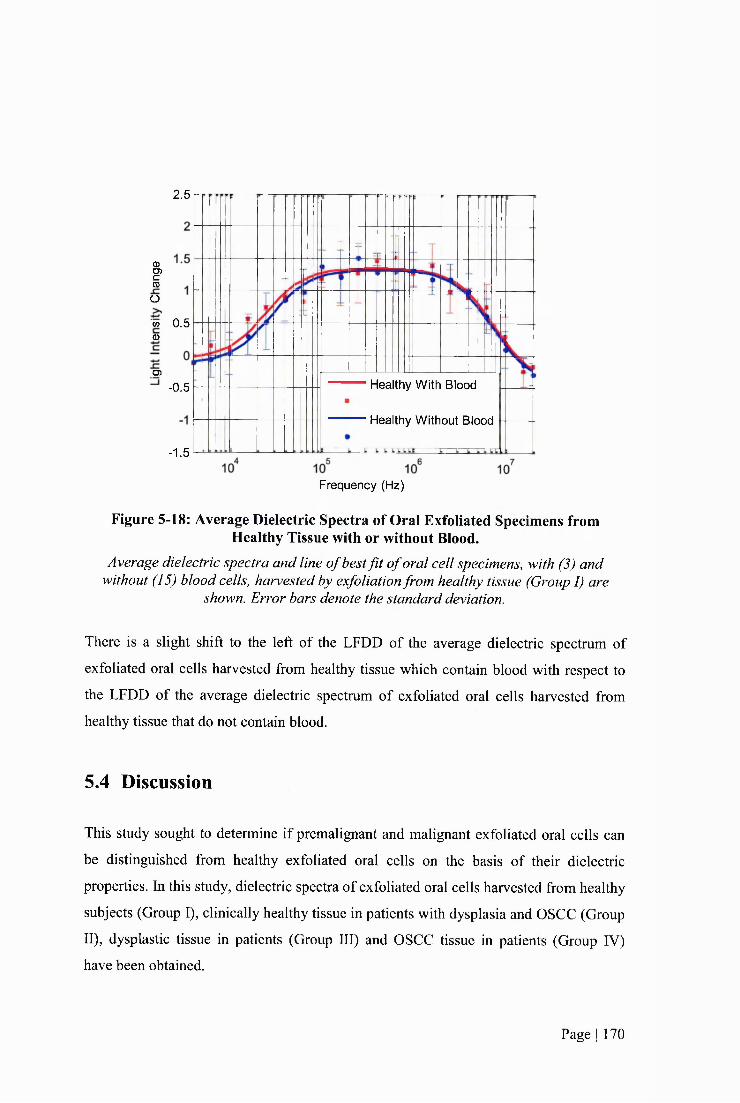
2.5
mO)c(0
o'w 0.5 0)
D)
-0.5 Healthy With Blood
Healthy Without Blood
-1.5
Frequency (Hz)
Figure 5-18: Average Dielectric Spectra of Oral Exfoliated Specimens from Healthy Tissue with or without Blood.
Average dielectric spectra and line o f best f i t o f oral cell specimens, with (3) and without (15) blood cells, harvested by exfoliation from healthy tissue (Group I) are
shown. Error bars denote the standard deviation.
There is a slight shift to the left of the LFDD of the average dielectric spectrum of
exfoliated oral cells harvested from healthy tissue which contain blood with respect to
the LFDD of the average dielectric spectrum of exfoliated oral cells harvested from
healthy tissue that do not contain blood.
5.4 Discussion
This study sought to determine if premalignant and malignant exfoliated oral cells can
be distinguished from healthy exfoliated oral cells on the basis of their dielectric
properties. In this study, dieleetric spectra of exfoliated oral cells harvested from healthy
subjects (Group I), clinically healthy tissue in patients with dysplasia and OSCC (Group
II), dysplastic tissue in patients (Group III) and OSCC tissue in patients (Group IV)
have been obtained.
Page I 170
5.4.1 Detection of Dysplastic and Malignant Cells in Exfoliated
Specimens
The low frequency dielectric dispersion (LFDD) crossover frequency (Fxi), the
frequency at which the polarisability of the cell is equal to the suspending medium in
the low frequency range, was determined for exfoliated oral cell specimens. Exfoliated
oral cells harvested from healthy subjects had Fxi values between 5-20 kHz (a range of
15 kHz). Exfoliated cells from clinically healthy tissue in patients with dysplasia or
OSCC (Group 11) had Fxi values between 2-40 kHz (a range of 38 kHz). Interestingly,
the range of Fxi values for Group 11 specimens was wider than the range of values for
Group 1 specimens and extended toward the range of values for Group IV specimens.
Exfoliated oral cells harvested from OSCC tissue in patients (Group IV) had Fxi values
between 10-110 kHz (a range of 100 kHz). Group IV specimens had the largest spread
of values. Exfoliated oral cells harvested from dysplastic tissue had an Fxi value of 10
kHz, which lay within the range of values found for healthy tissue.
Dielectric spectra of exfoliated oral cells were averaged for each specimen group. The
LFDD of the average dielectric spectrum of exfoliated oral cells harvested from OSCC
tissue (Group FV) is shifted to the right of the LFDD of the average dielectric spectra of
cells harvested from clinically healthy tissue in patients (Group 11) and healthy subjects
(Group 1). There was nearly no difference in the high frequency dielectric dispersion
(HFDD) (s) of the average dielectric spectra of cells from OSCC and healthy tissue.
There was no difference in the average dielectric spectra of exfoliated oral cells
harvested from healthy volunteers (Group 1) and exfoliated cells from clinically healthy
oral tissue in patients with dysplasia or OSCC (Group 11). Dielectric spectra of patient-
matched exfoliated oral cells from OSCC tissue and contra-lateral clinically healthy
tissue were obtained for two patients. In both instances, the LFDDs of OSCC cells were
shifted to the right of the LFDDs of clinically normal cells. Dielectric spectra of patient-
matched exfoliated oral cell specimens from dysplastic tissue and contra-lateral
clinically normal tissue were obtained for one patient. The LFDD of dysplastic tissue
was shifted to the left of the LFDD of normal tissue. This is in the opposite direction to
the shift that was observed in the two OSCC patient-matched cases.
Page I 171

The LFDD is dependent on the dielectric properties of the cell membrane. The results
indicate that the dielectric phenotype of the cell membrane of malignant oral exfoliated
cells is distinct to that of exfoliated oral cells from healthy subjects and clinically
healthy tissue in patients with dysplasia or OSCC.
The “single-shell” model, which was used to determine dielectric properties of cell
suspensions from dielectric spectra in Chapters 3 and 4 has not been employed to
determine the dielectric properties of exfoliated oral cells. The morphology of
kératinocytes is dependent on their maturation state; basal cells are spherical, prickle
cells are cuboidal, granular cells are polyhedral and comifred cells are amorphic (Nanci
and Ten Cate 2008). Thus exfoliated oral cell specimens are morphologically
heterogeneous. The majority of exfoliated oral cells are harvested from the external
strata and are flat and amorphic and, depending on the site of harvest within the oral
cavity, they may be parakeratinized or orthokeratinized (Squier and Kremer 2001).
Furthermore, keratinized cells in keratinized epithelium have a proteinacious layer
deposited on the internal and external aspects of the cell membrane (Presland and Dale
2000). The single-shell model assumes a spherical morphology with a lipid bilayer
surrounding the cell interior (Irimajiri et al. 1979; Huang et al. 1992). As these
assumptions were not met, the model was not used.
5.4.2 Size of Exfoliated Oral Ceils
The size of exfoliated oral cells differed depending on the type of tissue cells were
harvested from; cells from OSCC tissue (Group IV) were the smallest followed by cells
from dysplastic tissue (Group 111), followed by cells from clinically appearing normal
tissue from patients (Group 11) and cells from healthy subjects (Group 1) were the
largest. These observations are in agreement with previous studies (Khandelwal and
Solomon 2010; Weigum et al. 2010). Synonymous with the results from this study,
Khandelwal and Solomon and Weigum et al. found that the mean area of exfoliated
cells harvested from clinically appearing healthy tissue in OSCC patients was smaller
than the mean area of cells harvested from healthy subjects. This suggests that clinically
appearing healthy tissue in patients is not normal. The investigations by Khandelwal
Page I 172
and Solomon and Weigum et al. also found that the nuclear region and the nuclear to
cytoplasmic ratio were larger in cells harvested from OSCC tissue.
Cell size influences the LFDD of dielectric spectra. To determine the effect of cell size
on dielectric spectra of exfoliated oral cells, a simulated model was used. The mean size
of exfoliated oral cells from healthy tissue was replaced with the mean size of exfoliated
oral cells from OSCC tissue in the average dielectric model of exfoliated oral cells from
healthy tissue, as shown in Figure 5-15. While the simulated model shifted to the right
of the spectrum of exfoliated oral cells from healthy tissue, the magnitude of the shift
was not as great as the shift of the spectrum of exfoliated oral cells from OSCC tissue.
Therefore, it can be concluded that the difference in cell size between exfoliated oral
cells from healthy and OSCC tissue is not the source of the entire shift.
The difference in cell size could be due to a difference in the proportion of cells
harvested from each epithelial layer in different groups as opposed to a difference
similar cell types. Cell specimens harvested from healthy subjects may contain a large
proportion of cells from the superficial or comified cell layer whereas cell specimens
harvested from OSCC tissue may contain a large proportion of basal cells. The
proportion of cells from each layer could be determined by analysing keratin expression
but this was not done in this study.
5.4.3 Clinically Healthy Patient Tissue
In this study, dysplastic (Group III) and OSCC (Group IV) lesions underwent
concomitant DEP analysis of exfoliated cells and histopathological assessment of
excised tissue. Exfoliated oral cells harvested from healthy subjects (Group I) and
clinically healthy tissue in patients with dysplasia and OSCC (Group II) underwent
exfoliation for DEP analysis but tissue was not excised for confirmatory
histopathological analysis. Due to the invasive nature of the inscisional biopsy, its use
on tissue that is clinically healthy is inappropriate (Downer et al. 2004). Thus, clinically
assessed normal oral mucosa did not undergo a concomitant inscisional biopsy in this
study. Expert clinical diagnosis was assigned to normal oral mucosal tissue by a
specialist in oral medicine. Due to the ethical limitations, similar studies investigating
Page I 173
oral cancer detection techniques also did not confirm the healthy status of clinically
healthy patient tissue by histopathological analysis of inscisional biopsy (Sciubba and
Collaborative Oral 1999; Christian 2002; Poate et al. 2004; Scheifele et al. 2004).
Conflicting evidence relating to the status of clinically healthy tissue in patients with
dysplasia or OSCC was found in this study. Differences in morphology and Fxi
distribution between exfoliated oral cells harvested fi*om healthy subjects and cells
harvested from clinically healthy tissue in patients with dysplasia and OSCC indicate
that clinically healthy oral tissue in patients with premalignant or malignant oral disease
is different to the oral tissue in healthy subjects. Exfoliated oral cells harvested from
healthy subjects (Group I) were significantly larger than exfoliated oral cells harvested
from clinically healthy tissue in patients with dysplasia and OSCC (Group II)
(P=.0.004). In addition, the range of Fxi values for Group II specimens was wider than
the range of values for Group I specimens and extended in the direction of the range of
values for Group IV specimens.
Multiple primary tumours of the oral cavity are common in patients with primary OSCC
(Wamakulasuriya et al. 2003). The risk of developing a second primary tumour of the
oral cavity and pharynx in patients which have a primary OSCC tumour is higher than
the risk observed for the general population (Jovanoic et al. 1994). The ‘field
cancérisation’ hypothesis, proposed by Slaughter (1953), postulates that cancer does not
arise from one altered stem cell alone but the whole of the oral mucosa is
preconditioned to cancer by carcinogenic exposure. This results in the presence of
multiple foci of cancer; development of multiple primary tumours at varying time points
is dependent on the time and degree of carcinogenic exposure. Thomson (2002) studied
clinically normal epithelial tissue in patients with OSCC. Inscisional biopsies were
taken from clinically appearing normal tissue contra-lateral to the OSCC lesion and it
was found that 27% of patients had dysplasia and 8% had OSCC in clinically appearing
normal tissue.
Tobacco use and alcohol consumption are the two greatest independent risk factors for
oral cancer, accounting for an estimated 75% of all oral cancers (Blot et al. 1988).
Page 1 174

Ogden et a l (1999a; 1999b) investigated the effect of alcohol consumption on the
morphology of exfoliated oral cells. The group found a significant reduction in mean
cytoplasmic and nuclear areas of exfoliated cells harvested fi*om excessive alcohol
consumers compared to controls with regular consumption rates (Ogden et a l 1999a).
In addition, Ogden et a l (1999b) reported a reduction in total cell area in samples from
subjects who were excessive alcohol consumers.
Therefore, clinically healthy oral tissue in patients with dysplasia or OSCC may not be
normal. However, this study found that there was no significant difference in the mean
crossover frequencies and average dielectric spectra of exfoliated oral cells harvested
from healthy subjects (Group I) and cells harvested from clinically healthy tissue in
patients with dysplasia and OSCC (Group II).
5.4.4 Composition of Exfoliated Oral Cell Specimens
In addition to oral kératinocytes, exfoliated oral cell specimens contained non-
keratinocyte cells.
5.4.4.1 Erythrocytes
Erythrocytes were detected in a number of specimens of exfoliated oral cells from all
specimen groups. Erythrocytes were identified by morphological analysis and
concentrations were estimated by counting cells on a haemocytometer. Dielectric
spectra of human erythrocytes were obtained under the same experimental conditions
that were used for the DEP analysis of exfoliated oral cell specimens, as shown in
Figure 5-16 and Figure 5-17. The value for the effective Ceff obtained for erythrocytes
in this study is near to values obtained by different methods (Takashima et a l 1988),
The average dielectric spectrum of erythrocytes is shifted to the right of the average
dielectric spectrum of exfoliated oral cells from healthy tissue. The spectrum is shifted
in the same direction as exfoliated oral cells from OSCC tissue but the shift is not of the
same magnitude. This indicates that that the presence of erythrocytes is not the cause of
the whole difference observed between exfoliated cells from healthy tissue and those
from OSCC tissue. As shown in Figure 5-17, the mean Fxi is lower for human
Page I 175
erythrocytes than exfoliated oral cells from OSCC tissue. This suggests that the
difference in the dielectric spectra of oral cells exfoliated from normal tissue and cells
exfoliated from OSCC tissue is not exclusively due to the presence of an increased
number of erythrocytes in OSCC specimens.
The average dielectric spectra of exfoliated oral cell specimens from healthy tissue
which do not contain identified erythrocytes and specimens from normal tissue that did
contain erythrocytes are shown in Figure 5-18. The LFDD of the average spectrum of
cells exfoliated from normal tissue which contains erythrocytes shows a slight shift to
the left. This is counter to the shift of the LFDD of the spectra of the cells from
exfoliated OSCC tissue which showed a shift to the right of much greater magnitude, as
shown in Figure 5-10. It is possible that the left shift of erythrocyte containing
specimens from healthy tissue is from the same population as non-erythrocyte
containing specimens from normal tissue but the low sample number has not identified
this. While erythrocytes have been observed in some specimens harvested from healthy
tissue, the concentration of erythrocytes is lower in these specimens than in exfoliated
oral cell specimens from dysplastic or OSCC tissue. It is possible that there is a
threshold concentration that below which the erythrocytes cannot be detected by the
DEP-micro well system.
Both physical and chemical methods have been investigated in an effort to eliminate
erythrocytes from exfoliated oral specimens. Two methods for this purpose have been
explored in this study; density gradient centrifugation (DGC) and chemically induced
erythrocyte cell lysis. DGC harnesses cell density as a means of separating cells.
Erythrocytes have a density of approximately 1.09g ml'^ (Handin et al. 2003).
Therefore, when centrifuged in Percoll at a density of 1.07g mT or below, erythrocytes
will pellet at the bottom of the tube. Chemieally induced erythrocyte lysis selectively
lyses erythrocytes and leaves other cells intact. Centrifugation results in intact cells
collecting in a pellet at the bottom of a tube and erythrocyte debris remaining in the
supernatant.
Page I 176
Exfoliated oral cells could not be separated and collected from the suspending medium
after DGC and chemically induced erythrocyte lysis. Following centriftigation, cells
remained dispersed throughout the media.
The density of epithelial cells has been determined previously by density gradient
centrifugation experiments. The density of kératinocytes has been reported to be 1.046 g
ml"^from the colorectal passage of patients with ulcerative colitis (Keller et al. 1999),
between 1.025-1.l lg ml'^ from the epidermis of guinea pigs (Goldenhersh et al. 1982)
and between 1.023-1.09g ml"' from the epidermis of rats (Brysk et al. 1981). Epithelial
cell density inversely correlates with cell maturity; basal cells are the most dense and
squamous cells are the least (Brysk et al. 1981; Goldenhersh et al. 1982; Lichti and
Yuspa 1988). Therefore, it is possible that the density of oral squames harvested by
exfoliation from the oral mucosa is too low to allow isolation from DGC and
erythrocyte cell lysis solution.
Erythrocyte filtration has the potential to separate kératinocytes from erythrocytes.
Erythrocytes have a diameter of 6-8pm which is much smaller than the diameter of
kératinocytes which ranges between approximately 16pm for basal cells to 50pm for
superficial squames. Passing exfoliated oral cell specimens through a filter with a pore
size of approximately 10pm will result in the removal of erythrocytes in the filtrate and
retention of kératinocytes on the surface of the filter. Cells larger than 10 pm, namely
kératinocytes, could be recovered by back-flushing the filter. Previous studies have
shown the separation of epithelial cells from non-epithelial cells using filtration (Daniel
and Jacalyn 1998; Lila et al. 2003). Polycarbonate track-etched membrane filters have
proven to be optimal for keratinocyte retention and collection as cells do not become
trapped on the membrane surface which is a problem with filter paper (Daniel and
Jacalyn 1998; Weigum et al. 2010).
S.4.4.2 Non-Erythrocyte Contamination
It is estimated that up to 10% of the oral epithelium is made up of non-keratinocyte cells
(Nanci and Ten Cate 2008) including Langerhans’ cells (Barrett et al 1996),
melanocytes (Schenk 1975), Merkel cells (Hashimoto 1972) and inflammatory cells
(Montgomery 1951; Squier and Kremer 2001; Walker 2004). Therefore, it is possible
Page I 177
that a proportion of exfoliated oral cell specimens are non-keratinocyte cells.
Furthermore, the presence of blood in exfoliated specimens indicates that the underlying
lamina propria has been sampled to some degree. Thus, cells present in the lamina
propria of the oral mucosa such as fibroblasts and immune cells may also be present in
the exfoliated cell specimens.
5.4.4.3 Tissue Masses and Cell Aggregates
Tissue masses and cell aggregates were present in a number of samples fi*om all
specimen groups. Filtration was explored as a means of removing these and providing a
single cell suspension. Cell strainers with mesh pore sizes of 70 and 100pm were
investigated. Tissue masses were removed from specimens after they were passed
through 70 and 100pm cell strainers. Due to the presence of large tissue masses in crude
specimens, it was difficult to accurately count the cell number prior to filtering. Thus,
the number of single cells which became trapped in the strainer and were lost during
this process could not be quantified.
5.4.4.4 Proportion of Proliferative and Differentiated Cells
The differences found in the dielectric spectra of exfoliated oral cells harvested from
healthy and cancerous tissue could be due to the differing proportions of proliferating
and differentiating cells in each sample group. The difference in cell size between
groups is supportive of this conclusion. The composition of proliferating and
differentiating cells in exfoliated specimens was not investigated in this study.
5.4.5 Inadequate Exfoliated Oral Cell Specimens
A number of exfoliated oral cell specimens (12/45) in this study did not have adequate
cellularity to obtain dielectric spectra using the DEP-microwell. All exfoliated oral cell
specimens harvested from healthy subjects (Group I) contained an adequate number of
cells for analysis with the DEP-microwell. However, a number of exfoliated oral cell
specimens harvested from clinically healthy tissue in patients with dysplasia and OSCC
(Group II), dysplastic tissue (Group III) and OSCC tissue (Group IV) did not contain an
adequate number of cells for analysis with the DEP-microwell. A higher number of
specimens harvested from dysplastic (Group III) and OSCC (Group IV) tissue were
Page I 178
hypocellular than from clinically healthy tissue in patients with dysplasia or OSCC
(Groups I and II).
Low specimen cellularity could be a function of the physicians’ exfoliation technique or
the lack of readily released cells could be an intrinsic property of OSCC lesions. The
brush biopsy is a non-invasive technique to harvest cells from the oral epithelium.
However, during the study it became apparent that patients with OSCC often find the
procedure very painful. This prevents the physician from applying pressure with the
brush to the lesion for the necessary period of time to harvest the required number of
cells.
In addition to hypocellularity, a number of specimens (3/45) contained tissue masses
that could not be eliminated by filtration. Dielectric spectra could not be obtained for
these specimens.
The inadequate specimen rate for the DEP-microwell was 33.3% (15/45). As discussed
in 2.5.2.3, OralCDx® is a commercially available OSCC detection technique which
unites exfoliative cytology with computer-assisted detection of cellular atypia (Sciubba
and Collaborative Oral 1999). The rate of inadequate OralCDx® results has been
reported to be between 1.3% and 8.3% (Sciubba and Collaborative Oral 1999; Poate et
al. 2004; Scheifele et al. 2004; Hohlweg-Majert et al. 2009). Therefore, the rate of
specimens that eould not be processed using the DEP-microwell was between 4 and 25
times higher than the rate of the OralCDx® test.
5.4.6 DEP-microwell System
An inherent limitation in the DEP-microwell electrode system is the concentration of
exfoliated oral cells required to produce a signal. As shown in Table 5-1, 26.7% of
samples did not contain enough cells to produce a signal. The current technique requires
at least 200pl to obtain a full DEP spectrum; approximately Ipl is required for each
frequency run but volume losses that occur during sample handling dictates that, using
the protocol presented in this work, no less than 200pl is required to obtain a full
spectrum. Suspension of exfoliated oral cells into this volume resulted in insufficient
Page I 179
cellularity for DEP analysis in 26.7% of exfoliated oral cells specimens. A possible
solution to this is to reduce the number of frequencies analysed, either by reducing the
number of frequencies per decade or by focusing on a reduced frequency range. The
former would reduce the confidence of the line of best fit and thus the confidence in the
result. The latter is viable if there is an appreciable difference between the curve of
normal, dysplastic and malignant cells in one fi-equency range in the spectra. From the
results shown in Figure 5-10 it can be seen that the average LFDD of exfoliated oral
cells from OSCC tissue is different to the average LFDD of exfoliated oral cells fi-om
healthy tissue. Thus, analysis in the fi-equency decade IxlO" to 1x10^, where the LFDDs
occur, would be sufficient to deduce if the cell specimen contained normal or OSCC
cells.
5.4.7 Study Limitations
This study serves as a preliminary investigation into the potential of premalignant and
malignant cells in the oral mucosa to be detected on the basis of their dielectric
properties. The sample number for each group, in particular dysplastic (Group II) and
OSCC (Group IV), is low and should be increased to derive any definitive conclusions.
In this study, dysplastic and OSCC tissue underwent concomitant exfoliative cytology
for DEP analysis and inscisional biopsy for histopathological examination. This
investigation is limited by the absence of conformational gold-standard inscisional
biopsy information for clinically appearing normal tissue. However, expert clinical
diagnosis was assigned to normal oral mucosal tissue by a specialist in oral medicine.
The dielectric properties of exfoliated oral cells harvested fi-om benign oral lesions were
not analysed in this study.
5.5 Conclusions
Exfoliated oral cell specimens from OSCC tissue have dielectric spectra distinct to the
dielectric spectra of exfoliated oral cells from healthy subjects and clinically healthy
tissue in patients with dysplasia and OSCC. The dielectric spectrum of exfoliated oral
Page I 180
cells obtained from dysplastic tissue is not distinct to the average dielectric spectra
obtained from healthy tissue. However, only one specimen was obtained from
dysplastic tissue and to derive any conclusions more specimens from dysplastic tissue
must be tested. No discrimination can be made between the dielectric spectra of
exfoliated cells from healthy subjects and exfoliated cells from healthy tissue in patients
with dysplasia and OSCC.
This study serves as a preliminary investigation into the potential to detect premalignant
and malignant lesions on the basis of their dielectric properties. The sample number for
each group, in particular dysplastic (Group II) and OSCC (Group IV), should be
increased to derive any definitive conclusions.
This study has investigated the potential of the DEP-microwell to be used for the
analysis of ex vivo clinical exfoliated cell specimens. The limitations of the DEP-
microwell for use in this setting have been determined. These include, the presence of
other cells types which mask the signal of kératinocytes, the presence of tissue masses
and cell aggregates can preclude DEP analysis and the low number of cells harvested by
exfoliation can result in little or no signal from the DEP-microwell. However, frirther
optimisation of specimen collection methods, specimen preparation methods and the
DEP-microwell system could overcome these drawbacks.
Page I 181
6 GENERAL DISCUSSION AND CONCLUSIONSWith a view to using DEP as an OSCC detection assay, this work sought to investigate
the dielectric properties of normal oral kératinocytes and their pre-malignant and
malignant counterparts. In addition, this work aimed to assess the potential of the DEP-
microwell, a novel DEP electrode device developed at the University of Surrey, to be
employed in the detection of OSCC.
6.1 Key Findings
6.1.1 The Dielectric Phenotypes of Normal and Malignant Oral Cells
are Distinct
The average dielectric spectrum and mean Fxi of exfoliated oral cells harvested from
OSCC tissue were distinct to the average dielectric spectrum and mean Fxi of exfoliated
oral cells harvested from healthy tissue. The differences observed in average dielectric
spectra obtained from exfoliated oral cell specimens are in the low frequency dielectric
dispersion (LFDD) of dielectric spectra.
This finding is consistent with results obtained in this study from investigations on oral
kératinocytes cultured in vitro. The effective membrane capacitance, which is deduced
from the LFDD, of normal oral kératinocytes was distinct to the effective membrane
capacitance of malignant oral kératinocytes when grown in standard monolayer and
reconstituted organotypical cultures. Differences in the LFDD between malignant and
healthy oral cells were consistently present, irrespective of culture conditions or cell
source. In addition, the effective membrane capacitance of dysplastic oral kératinocytes
was distinet to normal oral kératinocytes when grown in standard monolayer and
reconstituted organotypical cultures.
There was no difference in the high frequency dielectric dispersion (HFDD) of average
dielectric spectra obtained from exfoliated oral cell specimens harvested from OSCC
tissue and healthy tissue. This finding is consistent with results obtained in this study
from investigations on oral kératinocytes grown in reconstituted organotypical cultures
Page I 182
in vitro. There was no significant difference in the cytoplasmic conductivity, which is
deduced from the HFDD, of normal oral kératinocytes and malignant oral kératinocytes
when grown in reconstituted organotypical cultures. In contrast, the cytoplasmic
conductivity of malignant oral kératinocytes was significantly different to the
cytoplasmic conductivity of normal oral kératinocytes when cells were grown in
standard monolayer cultures.
This indicates that the cytoplasmic dielectric properties of oral kératinocytes grown in
reconstituted organotypical cultures are more representative of the cytoplasmic
dielectric properties of ex vivo oral kératinocytes from native oral epithelium than cells
grown in standard monolayer cultures.
The average LFDD of malignant oral kératinocytes is shifted to the left of the average
LFDD of normal oral kératinocytes, in vitro. This is not consistent with the direction of
the shift observed in ex vivo exfoliated oral cell specimens; the average LFDD of
exfoliated oral cells harvested from OSCC tissue is shifted to the right of the average
LFDD of exfoliated oral cells harvested from healthy tissue. The differences in
morphology between in vitro cultured oral cells and exfoliated oral cells could account
for the differences observed in the shifts between normal and malignant oral
kératinocytes.
The difference in dielectric spectra and size of cells harvested by exfoliation from
healthy and OSCC tissue could be due to a difference in the proportion of cells
harvested from each epithelial layer, as opposed to a real difference in cells from the
same differentiation stage. Cell specimens harvested from healthy subjects may contain
a large proportion of cells from the superficial or comified cell layer whereas cell
specimens harvested from OSCC tissue may contain a large proportion of basal cells.
However, proliferative normal and OSCC oral kératinocytes grown in standard
monolayer culture conditions have different dielectric properties. Thus, it follows that
there is a real difference in the dielectric properties of cells at a similar differentiation
stage in vitro, which indicates that it is feasible that there is a real difference between
cells of similar maturity harvested by bmsh biopsy from healthy and OSCC tissue.
Page I 183
Diagnosis of oral epithelial malignancy and subsequent cancer staging requires
information at both the cellular and tissue level. DEP cannot provide tissue effective
information and thus it is limited in its usefiilness as an OSCC diagnostic device.
However, DEP can offer distinct advantages over currently available OSCC detection
methods; DEP has the potential to be used in a primary health care setting and can
provide rapid results. DEP is non-subjective; an attribute not possessed by any other
OSCC detection technique or commercially instrument. Most importantly, DEP can also
be used non-invasively.
DEP was able to detect 3 OSCC lesions but it was not able to detect one dysplastic
lesion and one OSCC lesions. Consequently, if dysplastic and OSCC lesions are
grouped together as abnormal lesions, DEP could detect 3 out of 5 abnormal lesions.
From the preliminary results found in this study, the sensitivity of DEP to detect
abnormal lesions is 60%. Confirmatory inscisional biopsies were not taken for tissue
that had a clinical diagnosis of healthy tissue. Normal (negative) tissue was not
confirmed normal with a gold-standard test. Therefore, false positive and true negative
values found in this study were not confirmed with the gold-standard test. However, if
one assumes that the clinical diagnoses of normal tissue were correct, the specificity,
PPV and NPV can be calculated. The specificity of DEP to detect abnormal lesions is
100%. The PPV of DEP for detecting OSCC was 100% (the PPV was only calculated
for OSCC as there was only one dysplastic lesion which had a negative result). The
NPV of DEP for detecting abnormal lesions was 92.6%.
The sensitivity of OralCDx® in detecting abnormal lesions has been reported to be
between 52% and 100% and the specificity has been reported to be between 29% and
94.3% (Sciubba and Collaborative Oral 1999; Poate et al. 2004; Scheifele et al. 2004;
Hohlweg-Majert et al. 2009). The PPV has been reported to be between 7.9% and
90.3% (Sciubba and Collaborative Oral 1999; Christian 2002; Svirsky et al. 2002; Poate
et al. 2004; Bhoopathi et al. 2009; Hohlweg-Majert et al. 2009). One NPV has been
reported and that was 60% (Poate et al. 2004).
Page I 184
The largest study evaluating the efficacy of the OralCDx® test was carried out by
Sciubba et al. (1999). Sciubba et al. (1999) only included lesions which had both an
OralCDx® and inscisional biopsy result. The group reported a sensitivity of 100%,
specificity of 92.9%, a PPV of 90.3% and a NPV of 100% of OralCDx® to detect
abnormal lesions. However, if all lesions with a positive OralCDx® result are included
in the calculations and the clinical diagnoses of lesions without an inscisional biopsy
result are assumed to be correct, the sensitivity and NPV will remain the same but the
specificity will be 61.3% and the PPV will be 53.3%.
Therefore, if the DEP results are compared to the OralCDx® results reported by
Sciubba et al. (1999) it can be seen that the PPV of DEP (100%) is higher than the PPV
of the OralCDx® system (53.3%) to detect abnormal lesions.
6.1.2 The DEP-microwell has the Potential to be Used in a Clinical
Setting as an OSCC Detection Device
In this study, the DEP-microwell was used to obtain dielectric spectra of cell specimens
harvested by exfoliation from oral tissue in healthy subjects and patients with pre
malignant and malignant oral epithelial disease. The limitations of the DEP-microwell
for use as an OSCC detection technique have been identified in this study. These
include the relatively high number of cells required for a signal, the inability to
distinguish between the signal from kératinocytes and other specimen components such
as erythrocytes and amorphous debris and the necessity of a single cell suspension.
However, all of these factors can be overcome. Different brush instruments and other
non-invasive methods of cell harvesting can be investigated in order to increase cell
yield. Improvement in operator technique when harvesting cells could also lead to
improved cell yields. Sample preparation techniques, such as filtration and sonication
may be able to isolate cells of interest and remove cell aggregates and tissue masses.
Page I 185
6.1.3 In vitro Growth Conditions Influence the Dielectric Phenotypes
of Oral Cells
There was no difference in the mean effective membrane capacitance of H I57 cells
grown in standard monolayer cultures and reconstituted organotypical cultures.
Although not statistically significant, there was an increase in the effective membrane
capacitance of HOK cells when grown in reconstituted organotypical cultures compared
to HOK cells grown in standard monolayer cultures. However, the trend observed in the
effective membrane capacitance of HOK and H I57 cells grown in standard monolayer
cultures remained consistent; HOK cells had a lower effective membrane capacitance
than H I57 cells.
DOK cells grown in reconstituted organotypical cultures had a higher mean effective
membrane capacitance than DOK cells grown in standard monolayer cultures. Again,
the trend observed in the effective membrane capacitance of HOK and DOK cells
grown in standard monolayer cultures remained consistent; DOK cells had a higher
effective membrane capacitance than HOK cells.
6.1.4 Kératinocytes and Fibroblasts have Distinct Dielectric Properties
Dielectric spectra of primary normal oral kératinocytes (HOK) and primary normal oral
fibroblasts (NOT) have been determined and the dielectric properties deduced. The
dielectric phenotypes of primary normal oral fibroblasts are distinct to primary normal
oral kératinocytes, in vitro. NOF cells exhibit positive DEP at lower frequencies than
HOK cells and there is a frequency range in which NOF cells collect at the electrode
edges and HOK cells are repelled. Thus, fibroblast and keratinocyte cells could
potentially be separated into two discrete populations using DEP. Conventional
techniques used to isolate kératinocytes and fibroblasts from native tissue include
selective media, magnetic activated cell sorting (MACS) and fluorescence activated cell
sorting (FACS). It is difficult to isolate a pure population of kératinocytes;
contaminating fibroblasts frequently outgrow and repopulate the keratinocyte
population (Freshney and Freshney 2002). The different membrane dielectric properties
of the two cell types suggest that it will be possible to separate them using DEP. DEP
Page I 186
has the advantage of being label free and does not require selective media thus
eliminating negative effects of these two conventional methods. It is also possible that
DEP could yield a more pure population of cells.
6.2 FUTURE WORK
The number of specimens of exfoliated oral cells harvested from dysplastic and OSCC
lesions analysed by DEP in this study is low. To conclusively determine if there is a
difference in the dielectric properties of exfoliated cells from normal and dysplastic and
OSCC oral lesions, the number of specimens analysed should be increased.
Preliminary data produced in this study suggests that the dielectric properties of
exfoliated oral cells from OSCC tissue differ from exfoliated oral cells from healthy
tissue. However, the technique will be most useful as clinical aid to determine whether
an oral lesion detected by visual inspection and palpation of the oral cavity requires
fiirther analysis, as discussed in 2.9. The efficacy of DEP as a detection technique is
determined by the ability for dysplastic and OSCC cells to be distinguishable from both
exfoliated cells from normal tissue and from benign oral lesions. Clinical investigations
should be expanded to include exfoliated specimens from patients who present with
benign oral lesions. In addition, it has been demonstrated that inflammatory benign oral
lesions lead to an abnormal OralCDx® result. Over 80% of benign oral lesions are
inflammatory. Thus, if inflammatory benign oral lesions could be distinguished from
dysplastic and malignant oral lesions, DEP could offer a distinct advantage over the
OralCDx® test.
The composition of exfoliated oral cell specimens harvested from normal and malignant
tissue was different. Specimens harvested from dysplastic and OSCC tissue contained a
higher fraction of erythrocytes, tissue masses and amorphous material and a lower
number of cells, than those harvested from healthy tissue.
DEP analysis of a number of exfoliated oral cell specimens was impeded by the low
cellularity of the specimens. In order to resolve the problem of specimen
Page I 187
hypocellularity, it must be determined whether low specimen cellularity is a function of
the physicians’ technique or whether the lack of readily released cells is an intrinsic
property of OSCC lesions.
Tissue masses were removed by filtration thus providing a single cell suspension of
cells. However, following the filtration procedure some specimens could not be
analysed due to the low cell yield. Investigations using enzymatic methods of tissue
degradation should be carried out in an attempt to digest tissue clumps into a single cell
suspension to yield more cells.
It has been found that brush instruments for harvesting exfoliated oral cells can dislodge
tissue masses in a tooth-pick-like fashion from dysplastic and carcinoma tissue (Boon
and Suurmeijer 1996). Three bushes were evaluated in this study as tools to harvest
cells from the oral epithelium. Due to the availability of patients, the brushes were only
tested on healthy subjects. Cell harvest methods should be evaluated using normal,
dysplastic and OSCC tissue to ensure a single cell suspension is consistently obtained
from in all specimen groups. More brushes should be assessed in order to find a tool
that can harvest more single cells and less tissue masses from the oral epithelium.
All of the exfoliated oral specimens from OSCC lesions contained blood and
erythrocytes were present in a higher concentration than in specimens from normal
tissue. Dielectric spectra of erythrocytes were deduced in this study and it was
concluded that erythrocytes were not responsible in full for the difference in the spectra
of exfoliated cells from normal and OSCC oral tissue. However, the average LFDD of
erythrocytes was shifted in the same direction but to a lesser extent as the LFDD of
exfoliated cells from OSCC tissue was shifted, with respect to the LFDD of exfoliated
cells from healthy tissue. The removal of erythrocytes from the specimens would
conclusively determine their contribution to the DEP spectra of exfoliated oral
specimens.
Currently, oral cells are collected by exfoliation of an oral lesion using a brush
instrument. This precludes the use of the technique as a screening method as it is reliant
Page I 188
upon the macroscopic manifestation of oral abnormalities. Collection of oral cells using
a mouthwash would enable sampling of the entire oral cavity in asymptomatic
individuals and thus could be used to screen for OSCC. However, a mouth wash may
not yield cells from all layers of the epithelium like the brush instrument which may
reduce the sensitivity of the test compared to collecting using the brush instrument.
This study has found that the dielectric properties of normal oral keratinocyte cells
differ to normal oral fibroblast cells. Thus, DEP could be harnessed as a method to
separate kératinocytes and fibroblasts following dissociation of oral tissue. To
conclusively determine if DEP could be used for this purpose, the dielectric properties
of patient-matched fibroblast and keratinocyte cells should be determined.
Page I 189

7 REFERENCES
Adams, D. (1976). "Keratinization in the Oral Epithelium." Annals of The Royal
College of Surgeons of England 58(51: 351-358.
Adams, D. (1976). "Keratinization of the Oral Epithelium." Armais of The Royal
College of Surgeons of England 58(5): 351-358.
Al-Dakkak, I. (2010). "Diagnostic Delay Broadly Associated with More Advanced
Stage Oral Cancer." Evidence-Based Dentistry 11(1): 24-24.
Alberts, B., Johnson, A., Lewis, J., Raff, M., Roberts, K. and Walter, P. (2002).
Molecular Biology of the Cell. Garland Science.
Alberts, B., Johnson, A., Lewis, J., Raff, M., Roberts, K. and Walter, P. (2007).
Molecular Biology of the Cell.
Altekruse, S., Kosary, C., Krapcho, M., Neyman, N., Aminou, R., Waldron, W., Ruhl,
J., Howlader, N., Tatalovich, Z., Cho, H., Mariotto, A., Eisner, M., Lewis, D.,
Cronin, K., Chen, H., Feuer, E. and Stinchcomb, D. (2008). Seer Cancer
Statistics Review, 1975-2007, National Cancer Institute. . based on November
2009 SEER data submission, posted to the SEER web site. 2010. B. Edwards,
National Cancer Institute, Bethesda, MD.
An, J., Lee, J., Lee, S., Park, J. and Kim, B. (2009). "Separation of Malignant Human
Breast Cancer Epithelial Cells from Healthy Epithelial Cells Using an Advanced
Dielectrophoresis-Activated Cell Sorter (Dacs)." Analytical and Bioanalvtical
Chemistry 394(3): 801-809.
Annertz, K., Anderson, H., Biorklund, A., Moller, T., Kantola, S., Mork, J., Olsen, J. H.
and Wennerberg, J. (2002). "Incidence and Survival of Squamous Cell
Carcinoma of the Tongue in Scandinavia, with Special Reference to Young
Adults." International Journal of Cancer 101(1): 95-99.
Arnold, W. M. and Zimmermann, U. (1982). "Rotation of an Isolated Cell in a Rotating
Electric Field." Naturwissenschaften 69(6): 297-298.
Asselineau, D. and Prunieras, M. (1984). "Reconstruction o f ‘Simplified’ Skin: Control
of Fabrication." British Journal of Dermatology 111: 219-222.
Avery, J. K., Steele, P. F. and Avery, N. (2002). Oral Development and Histology
Thieme.
Page I 190
Bagan, J., Sarrion, G. and Jimenez, Y. (2010). "Oral Cancer: Clinical Features." Oral
Oncology 46(6): 414-417.
Barrett, A. W., Cmchley, A. T. and Williams, D. M. (1996). "Oral Mucosal Langerhans'
Cells." Critical Reviews in Oral Biology Medicine 7(1): 36-58.
Becker, F. F., Wang, X., Huang, Y., Pethig, R., Vykoukal, J. and Gascoyne, P. R. C.
(1995). Separation of Human Breast Cancer Cells from Blood by Differential
Dielectric Affinity. 92: 860-864.
Becker, F. F., Wang, X. B., Huang, Y., Pethig, R., Vykoukal, J. and Gascoyne, P. R. C.
(1994). "The Removal of Human Leukaemia Cells from Blood Using
Interdigitated Microelectrodes." Journal of Physics D: Applied Physics 27(12):
2659-2662.
Bell, E., Ehrlich, H. P., Buttle, D. J. and Nakatsuji, T. (1981). "Living Tissue Formed in
Vitro and Accepted as Skin-Equivalent Tissue of Full Thickness." Science
211(4486): 1052-1054.
Bell, E., Ivarsson, B. and Merrill, C. (1979). "Production of a Tissue-Like Structure by
Contraction of Collagen Lattices by Human Fibroblasts of Different
Proliferative Potential in Vitro." Proceedings of the National Academy of
Sciences of the United States of America 76(31: 1274-1278.
Bell, E., Sher, S., Hull, B., Merrill, C., Rosen, S., Chamson, A., Asselineau, D.,
Dubertret, L., Coulomb, B., Lapiere, C., Nusgens, B. and Neveux, Y. (1983).
"The Reconstitution of Living Skin." J Investig Dermatol 81(sl): 2s-10s.
Bhoopathi, V., Kabani, S. and Mascarenhas, A. K. (2009). "Low Positive Predictive
Value of the Oral Brush Biopsy in Detecting Dysplastic Oral Lesions." Cancer
115(5): 1036-1040.
Bickenbach, J. (1981). "Identification and Behavior of Label-Retaining Cells in Oral
Mucosa and Skin." journal of Dental Research 60: 1611-1620.
Blot, W. J., Mclaughlin, J. K., Winn, D. M., Austin, D. F., Greenberg, R. S., Preston-
Martin, S., Bernstein, L., Schoenberg, J. B., Stemhagen, A. and Fraumeni, J. F.
(1988). "Smoking and Drinking in Relation to Oral and Pharyngeal Cancer."
Cancer Research 48(11): 3282-3287.
Boon, M. E. and Suurmeijer, A. J. H. (1996). The Pan Smear Harwood Academic
Publishers.
Page I 191
Bouquot, J. E. (1986). "Common Oral Lesions Found During a Mass Screening
Examination." The Journal of the American Dental Association 112(1): 50-57.
Bravo-Cuellar, A., Ortiz-Lazareno, P. C., Lerma-Diaz, J. M., Dominguez-Rodriguez, J.
R., Jave-Suarez, L. F., Aguilar-Lemarroy, A., Del Toro-Arreola, S., De Celis-
Carrillo, R., Sahagun-Flores, J. E., De Alba-Garcia, J. E. G. and Hemandez-
Flores, G. (2010). "Sensitization of Cervix Cancer Cells to Adriamycin by
Pentoxifylline Induces an Increase in Apoptosis and Decrease Senescence."
Molecular Cancer 9.
Broche, L. M., Bhadal, N., Lewis, M. P., Porter, S., Hughes, M. P. and Labeed, F. H.
(2007). "Early Detection of Oral Cancer - Is Dielectrophoresis the Answer?"
Oral Oncology 43(2): 199-203.
Broche, L. M., Labeed, F. H. and Hughes, M. P. (2005). "Extraction of Dielectric
Properties of Multiple Populations from Dielectrophoretic Collection Spectrum
Data." Physics in Medicine and Biology 50(101: 2267-2274.
Brusevold, I. J., Soland, T. M., Khun, C., Christoffersen, T. and Bryne, M. (2010).
"Nuclear and Cytoplasmic Expression of Met in Oral Squamous Cell Carcinoma
and in an Organotypic Oral Cancer Model." European Journal of Oral Sciences
118(4): 342-349.
Brysk, M. M., Snider, J. M. and Smith, E. B. (1981). "Separation of Newborn Rat
Epidermal Cells on Discontinuous Isokinetic Gradients of Percoll." J Investig
Dermatol 77(2): 205-209.
Burt, J. P. H., Pethig, R., Gascoyne, P. R. C. and Becker, F. F. (1990).
"Dielectrophoretic Characterisation of Friend Murine Erythroleukaemic Cells as
a Measure of Induced Differentiation." Biochimica et Biophvsica Acta fBBAI -
General Subjects 1034(1): 93-101.
Burzynski, N., Firriolo, F., Butters, J. and Sorrell, C. (1997). "Evaluation of Oral Cancer
Screening.
." Journal of Cancer Education 12(2): 95-99.
Cancer Research Uk. from
http://info.cancerresearchuk.org/cancerstats/tvpes/oral/incidence/.
Casey, J. R., Grinstein, S. and Orlowski, J. (2010). "Sensors and Regulators of
Intracellular Ph." Nat Rev Mol Cell Biol 11(1): 50-61.
Page I 192
Chan, K. L., Morgan, H., Morgan, E., Cameron, I. T. and Thomas, M. R. (2000).
"Measurements of the Dielectric Properties of Peripheral Blood Mononuclear
Cells and Trophoblast Cells Using Ac Electrokinetic Techniques." Biochimica et
Biophvsica Acta fBBAl - Molecular Basis of Disease 1500(3): 313-322.
Cheng, J., Sheldon, E. L., Wu, L., Heller, M. J. and O'connell, J. P. (1998). "Isolation of
Cultured Cervical Carcinoma Cells Mixed with Peripheral Blood Cells on a
Bio electronic Chip." Analytical Chemistry 70(11): 2321-2326.
Chin, S., Hughes, M. P., Coley, H. M. and Labeed, F. H. (2006). "Rapid Assessment of
Early Biophysical Changes in K562 Cells During Apoptosis Determined Using
Dielectrophoresis." International Journal of Nanomedicine 1(3): 333-337.
Chisholm, D., Ferguson, M., Jones, H. and Mason, D. (1978). Introduction to Oral
Medicine. W.B. Saunders Company Ltd.
Christian, D. C. (2002). "Computer-Assisted Analysis of Oral Brush Biopsies at an Oral
Cancer Screening Program." The Journal of the American Dental Association
133(3): 357-362.
Coley, H. M., Labeed, F. H., Thomas, H. and Hughes, M. P. (2007). "Biophysical
Characterization of Mdr Breast Cancer Cell Lines Reveals the Cytoplasm Is
Critical in Determining Drug Sensitivity." Biochimica et Biophvsica Acta
fBBAI - General Subjects 1770(4): 601-608.
Cooper, G. M. (2000). The Cell, a Molecular Approach. Sinauer Associates.
Costea, D., Johannessen, A. and Vintermyr, O. (2005). "Fibroblast Control on Epithelial
Differentiation Is Gradually Lost During in Vitro Tumor Progression."
Differentiation 73(4): 134-141.
Costea, D. E., Johannessen, A. C. and Vintermyr, O. K. (2005). "Fibroblast Control on
Epithelial Differentiation Is Gradually Lost During in Vitro Tumor Progression."
Differentiation 73(4): 134-141.
Costea, D. E., Loro, L. L., Dimba, E. A. O., Vintermyr, O. K. and Johannessen, A. C.
(2003). "Crucial Effects of Fibroblasts and Keratinocyte Growth Factor on
Morphogenesis of Reconstituted Human Oral Epithelium." Journal of
Investigative Dermatology 121(6): 1479-1486.
Cristofanilli, M., De Gasperis, G., Zhang, L., Hung, M.-C., Gascoyne, P. R. C. and
Hortobagyi, G. N. (2002). "Automated Electrorotation to Reveal Dielectric
Page I 193
Variations Related to Her-2/Neu Overexpression in Mcf-7 Sublines." Clinical
Cancer Research 8(2): 615-619.
Cristofanilli, M., Krishnamurthy, S., Das, C. M., Reuben, J. M., Spohn, W., Noshari, J.,
Becker, F. and Gascoyne, P. R. (2008). "Dielectric Cell Separation of Fine
Needle Aspirates from Tumor Xenografts." Journal of Separation Science
31(21): 3732-3739.
Daley, T. and Darling, M. (2003). "Nonsquamous Cell Malignant Tumours of the Oral
Cavity: An Overview." J Can Dent Assoc 69(9): 577-82.
Daniel, C. L. and Jacalyn, P. (1998). Performance Optimization of the Thinprep®
Processor: Effect of Microscope Slides. 19: 388-391.
David, J. K., Leslie, C. and Stella, L. (1978). "Oral Lichen Planus." Journal of Oral
Pathology & Medicine 1(V): 1-7.
Downer, M. C., Moles, D. R., Palmer, S. and Speight, P. M. (2004). "A Systematic
Review of Test Performance in Screening for Oral Cancer and Precancer." Oral
Oncology 40(3): 264-273.
Epstein, J. B., Silverman Jr, S., Epstein, J. D., Lonky, S. A. and Bride, M. A. (2008).
"Analysis of Oral Lesion Biopsies Identified and Evaluated by Visual
Examination, Chemiluminescence and Toluidine Blue." Oral Oncology 44(6):
538-544.
Fackler, O. T. and Grosse, R. (2008). Cell Motility through Plasma Membrane
Blebbing. 181: 879-884.
Farah, C. S. and Mccullough, M. J. (2007). "A Pilot Case Control Study on the Efficacy
of Acetic Acid Wash and Chemiluminescent Illumination (Vizilite(Tm)) in the
Visualisation of Oral Mucosal White Lesions." Oral Oncology 43(8): 820-824.
Fedele, S. (2009). "Diagnostic Aids in the Screening of Oral Cancer." Head Neck Oncol
1(1): 5.
Ferlay, J., Shin, H., Bray, F., Forman, D., Mathers, C. and Parkin, D. (2008, 2011).
"Globocan 2008, Cancer Incidence and Mortality Worldwide: larc Cancer Base
No. 10 [Internet]." from http://globocan.iarc.fr
Fielding, C. J. (2004). "Caveolin and Cholesterol in Lipid Transport and Signaling."
International Congress Series 1262: 396-399.
Page I 194
Flanagan, L. A., Lu, J., Wang, L., Marchenko, S. A., Jeon, N. L., Lee, A, P. and
Monuki, E. S. (2008). "Unique Dielectric Properties Distinguish Stem Cells and
Their Differentiated Progeny." Stem Cells 26(3): 656-665.
Freedman, N. D., Park, Y., Subar, A. F., Hollenbeck, A. R., Leitzmann, M. F.,
Schatzkin, A. and Abnet, C. C. (2008). "Fruit and Vegetable Intake and Head
and Neck Cancer Risk in a Large United States Prospective Cohort Study."
International Journal of Cancer 122(10): 2330-2336.
Freshney, R. and Freshney, M. (2002). Culture of Epithelial Cells. Wiley-Liss, Inc.
Freshney, R. I. and Freshney, M. G. (2002). Culture of Epithelial Cells. Wiley-Liss.
Freshney, R. I. and Freshney, M. G. (2002). Culture of Epithelial Cells, Wiley-Liss:
195.
Gandolfo, S., Richiardi, L., Carrozzo, M., Broccoletti, R., Carbone, M., Pagano, M.,
Vestita, C., Rosso, S. and Merletti, F. (2004). "Risk of Oral Squamous Cell
Carcinoma in 402 Patients with Oral Lichen Planus: A Follow-up Study in an
Italian Population." Oral Oncology 40(1): 77-83.
Garlick, J. A., Parks, W. C., Welgus, H. G. and Taichman, L. B. (1996). "Re-
Epithelialization of Human Oral Kératinocytes in Vitro." Journal of Dental
Research 75(3): 912-918.
Gascoyne, P., Mahidol, C., Ruchirawat, M., Satayavivad, J., Watcharasit, P. and
Becker, F. F. (2002). "Microsample Preparation by Dielectrophoresis : Isolation
of Malaria." Lab on a Chip 2(2): 70-75.
Gascoyne, P., Pethig, R., Satayavivad, J., Becker, F. F. and Ruchirawat, M. (1997a).
"Dielectrophoretic Detection of Changes in Erythrocyte Membranes Following
Malarial Infection." Biochimica et Biophvsica Acta [BBAl - Biomembranes
1323(2): 240-252.
Gascoyne, P. R. C., Huang, Y., Pethig, P., Vykoukal, J. and Becker, F. (1992).
"Dielectrophoretic Separation of Manunalian Cells Studied by Computerized
Image Analysis " Measurement Science and Technology 3(5).
Gascoyne, P. R. C., Noshari, J., Anderson, T. J. and Becker, F. F. (2009). "Isolation of
Rare Cells from Cell Mixtures by Dielectrophoresis." Electrophoresis 30(8):
1388-1398.
Page I 195
Gascoyne, p. R. C., Noshari, J., Becker, F. F. and Pethig, R. (1994). "Use of
Dielectrophoretic Collection Spectra for Characterizing Differences between
Normal and Cancerous Cells." Industry Applications. IEEE Transactions on
30(4): 829-834.
Gascoyne, P. R. C., Pethig, R., Burt, J. P. H. and Becker, F. F. (1993). "Membrane
Changes Accompanying the Induced Differentiation of Friend Murine
Erythroleukemia Cells Studied by Dielectrophoresis." Biochimica et Biophvsica
Acta fBBAI - Biomembranes 1149(1): 119-126.
Gascoyne, P. R. C., Wang, X. B., Huang, Y. and Becker, F. F. (1997b).
"Dielectrophoretic Separation of Cancer Cells from Blood." leee Transactions
on Industry Applications 33(3): 670-678.
Gimsa, J., Marszalek, P., Loewe, U. and Tsong, T. Y. (1991). Dielectrophoresis and
Electrorotation of Neurospora Slime and Murine Myeloma Cells. 60: 749-760.
Goldenhersh, M. A., Good, R. A., Sarkar, N. H. and Safai, B. (1982). "Separation of
Epidermal Cells by Density Gradient Centrifugation on a Continuous Colloidal
Silica (Percoll) Gradient." Analytical Biochemistry 119(2): 246-252.
Gonsalves, W., Chi, A. and Neville, B. (2007a). "Common Oral Lesions: Part I.
Superficial Mucosal Lesions." American Family Physician 75(4): 501-7.
Gonsalves, W., Chi, A. and Neville, B. (2007b). "Common Oral Lesions: Part li.
Masses and Neoplasia." American Family Physician 75(4): 509-12.
Gottesman, M. M., Fojo, T. and Bates, S. E. (2002). "Multidrug Resistance in Cancer:
Role of Aft)-Dependent Transporters." Nat Rev Cancer 2(1): 48-58.
Hanahan, D. and Weinberg, R. A. (2000). "The Hallmarks of Cancer." Cell 100(1): 57-
70.
Handin, R. I., Lux, S. E. and Stossel, T. P. (2003). Blood: Principles and Practice of
Hematology. Volume 1. Lippincott Williams and Wilkins.
Hansson, A., Bloor, B. K., Haig, Y., Morgan, P. R., Ekstrand, J. and Grafstrom, R. C.
(2001). "Expression of Keratins in Normal, Immortalized and Malignant Oral
Epithélia in Organotypic Culture." Oral Oncology 37(5): 419-430.
Harris, D. M. and Werkhaven, J. (1987). "Endogenous Porphyrin Fluorescence in
Tumors." Lasers in Surgery and Medicine 7(6): 467-472.
Page I 196

Hashimoto, K. (1972). "Fine Structure of Merkel Cell in Human Oral Mucosa." J
Investis Dermatol 58(6): 381-387.
Helsper, J. T. (1972). "Staining Techniques: Screening Tests for Oral Cancer." CA: A
Cancer Journal for Clinicians 22: 172-175.
Hirshberg, A., Shnaiderman-Shapiro, A., Kaplan, I. and Berger, R. (2007). "Metastatic
Tumours to the Oral Cavity - Pathogenesis and Analysis of 673 Cases." Oral
Oncology 44(8).
Hoettges, K. F. (2009). Dielectrophoresis as a Cell Characterisation Tool.
Microengineering in Biotechnology. M. P. Hughes and K. F. Hoettges, Humana
Press. 583: 183-198.
Hoettges, K. F., Hubner, Y., Broche, L. M., Ogin, S. L., Kass, G. E. N. and Hughes, M.
P. (2008). "Dielectrophoresis-Activated Multiwell Plate for Label-Free High-
Throughput Drug Assessment." American Chemical Society 80(6): 2063-2068.
Hohlweg-Majert, B., Deppe, H., Metzger, M. C., Schumm, S., Hoefler, H., Kesting, M.
R., Holzle, F. and Wolff, K. D. (2009). "Sensitivity and Specificity of Oral
Brush Biopsy." Cancer Investigation 27(3): 293-297.
Hooper, S. J., Wilson, M. J. and Crean, S. J. (2009). "Exploring the Link between
Microorganisms and Oral Cancer: A Systematic Review of the Literature." Head
& Neck 31(9): 1228-1239.
Huang, Y., Holzel, R., Pethig, R. and Wang, X.-B. (1992). "Differences in the Ac
Electrodynamics of Viable and Non-Viable Yeast Cells Determined through
Combined Dielectrophoresis and Electrorotation Studies." Physics in Medicine
and Biology 37(7): 1499-1517.
Huang, Y., Wang, X.-B., Becker, F. F. and Gascoyne, P. R. C. (1996). "Membrane
Changes Associated with the Temperature-Sensitive P85gag-Mos-Dependent
Transformation of Rat Kidney Cells as Determined by Dielectrophoresis and
Electrorotation." Biochimica et Biophvsica Acta (BBA) - Biomembranes
1282(1): 76-84.
Huang, Y., Wang, X.-B., Gascoyne, P. R. C. and Becker, F. F. (1999). "Membrane
Dielectric Responses of Human T-Lymphocytes Following Mitogenic
Stimulation." Biochimica et Biophvsica Acta (BBA) - Biomembranes 1417(1):
51-62.
Page I 197

Huang, Y., Yang, J., Wang, X., Becker, F. and Gascoyne, P. (1999). "The Removal of
Human Breast Cancer Cells from Hematopoietic Cd34+ Stem Cells by
Dielectrophoretic Field-Flow-Fractionation." Journal of Hematotheranv and
Stem Cell Research 8(5): 481-490.
Huber, M. A., Bsoul, S. A. and Terezhalmy, G. T. (2004). "Acetic Acid Wash and
Chemiluminescent Illumination as an Adjunct to Conventional Oral Soft Tissue
Examination for the Detection of Dysplasia: A Pilot Study." Quintessence
International 35(5): 378-384.
Hubner, Y., Hoettges, K. F. and Hughes, M. P. (2003). "Water Quality Test Based on
Dielectrophoretic Measurements of Fresh Water Algae Selenastrum
Capricomutum." Journal of Environmental Monitoring 5(6): 861-864.
Hubner, Y., Hoettges, K. F., Kass, G. E. N., Ogin, S. L. and Hughes, M. P. (2005).
"Parallel Measurements of Drug Actions on Erythrocytes by Dielectrophoresis,
Using a Three-Dimensional Electrode Design." Nanobiotechnologv. lEE
Proceedings- 152(4): 150-154.
Hubner, Y., Mulhall, H., Hoettges, K. F., Kass, G. E. N., Ogin, S. L. and Hughes, M. P.
(2007). "Dielectrophoresis: A New in Vitro Approach to Measure Drug-Induced
Cvtotoxicitv." Toxicology 240(3): 183-184.
Hughes, M. . P. (2000). "Ac Electrokinetics: Applications for Nanotechnology."
Nanotechnology 11(2): 124-132.
Hughes, M, P., Morgan, H., Rixon, F. J., Burt, J. P. H. and Pethig, R. (1998).
"Manipulation of Herpes Simplex Virus Type 1 by Dielectrophoresis."
Biochimica et Biophvsica Acta (BBA) - General Subjects 1425(1): 119-126.
Hume, W. J. and Potten, C. S. (1983). "Proliferative Units in Stratified Squamous
Epithelium." Clinical and Experimental Dermatology 8(1): 95-106.
Igarashi, M., Irwin, C. R., Locke, M. and Mackenzie, I. C. (2003). "Construction of
Large Area Organotypical Cultures of Oral Mucosa and Skin." Journal of Oral
Pathology & Medicine 32(7): 422-430.
Ingram, R. C., Mendeloff, J., Krantz, S. and Leslie, H. (1963). "Exfoliative Cytology
and Early Diagnosis of Oral Cancer." Cancer 16(2): 160-&.
Page I 198
Irimajiri, A., Hanai, T. and Inouye, A. (1979). "Dielectric Theory of Multi-Stratified
Shell-Model with Its Application to a Lymphoma Cell." Journal of Theoretical
Biology 78(2): 251-269.
Jaber, M. A., Porter, S. R., Speight, P., Eveson, J. W. and Scully, C. (2003). "Oral
Epithelial Dysplasia: Clinical Characteristics of Western European Residents."
Oral Oncology 39(6): 589-596.
Jakiæ-Razumoviæ, J., Zekusiæ, M., Vladoviæ-Relja, T. and Boraniæ, M. (1998).
"Organotypic Skin Cultures: A Human Model for Basic Studies." Croatian
Medical Journal 9(4).
Jayaprakash, V., Sullivan, M., Merzianu, M., Rigual, N. R., Loree, T. R., Popat, S. R.,
Moysich, K. B., Ramananda, S., Johnson, T., Marshall, J. R., Hutson, A. D.,
Mang, T. S., Wilson, B. C., Gill, S. R., Frustino, J., Bogaards, A. and Reid, M.
E. (2009). "Autofluorescence-Guided Surveillance for Oral Cancer." Cancer
Prevention Research 2(11): 966-974.
Jiang, W. G. (1995). "Focus on Science-Membrane Ruffling of Cancer Cells: A
Parameter of Tumour Cell Motility and Invasion." European Journal of Surgical
Oncology 21(3): 307-309.
Jin, K., Jong in, Y., Eun Ha, L., Mi Heon, R., Jung Hoon, Y., Jun Chul, H., Dong Ju, K.
and Hyun Sil, K. (2001). "Evaluation of Premalignant Potential in Oral Lichen
Planus Using Interphase Cytogenetics." Journal of Oral Pathology & Medicine
30(2): 65-72.
Jin, L., Tabe, Y., Kojima, K., Zhou, Y., Pittaluga, S., Konopleva, M., Miida, T. and
Raffeld, M. (2010). "Mdm2 Antagonist Nutlin-3 Enhances Bortezomib-
Mediated Mitochondrial Apoptosis in Tp53-Mutated Mantle Cell Lymphoma."
Cancer Letters 299(2): 161-170.
Jovanoic, A., Toi, I. G. H. V. D., Schulten, E., Kostense, P., Vries, N. D., Snow, G. and
Waal, I. V. D. (1994). Risk of Multiple Primary Tumors Following Oral
Squamous-Cell Carcinoma. 56: 320-323.
Keller, R., Brandt, B., Terpe, H.-J., Winde, G., Foerster, E. C. and Domschke, W.
(1999). "Density Gradient Centrifugation of Colonic Fluid after Segmental
Lavage: A Method of Purification of Exfoliative Epithelial Colonic Cells for
Page I 199
Cytological Interpretation and Image Cytometry in Patients with Long-Standing
Ulcerative Colitis." Am J Gastroenterol 94(2): 404-409.
Kerawala, C. J., Beale, V., Reed, M. and Martin, I. C. (2000). "The Role of Vital Tissue
Staining in the Marginal Control of Oral Squamous Cell Carcinoma."
International Journal of Oral and Maxillofacial Surgerv 29(1): 32-35.
Khandelwal, S. and Solomon, M. C. (2010). "Cytomorphological Analysis of
Kératinocytes in Oral Smears from Tobacco Users and Oral Squamous Cell
Carcinoma Lesions — a Histochemical Approach." International Journal of Oral
Science 2(1): 45-52.
Kramer, I. R. (1969). "Precancerous Conditions of the Oral Mucosa. A Computer-Aided
Study." Annals of Roval College of Surgeons of England 45(6): 340-356.
Kujan, O., Glenny, A., Duxbury, A., Thakker, N. and Sloan, P. (2006). "Screening
Programmes for the Early Detection and Prevention of Oral Cancer." Cochrane
Database of Systematic Reviews 5(2): 40-1.
Labeed, F. H., Coley, H. M, and Hughes, M. P. (2006). "Differences in the Biophysical
Properties of Membrane and Cytoplasm of Apoptotic Cells Revealed Using
Dielectrophoresis." Biochimica et Biophvsica Acta (BBA) - General Subjects
1760(6): 922-929.
Labeed, F. H., Coley, H. M., Thomas, H. and Hughes, M. P. (2003). "Assessment of
Multidrug Resistance Reversal Using Dielectrophoresis and Flow Cytometry."
Biophysical Journal 85(3): 2028-2034.
Lane, P. M., Gilhuly, T., Whitehead, P., Zeng, H. S., Poh, C. F., Ng, S., Williams, P.
M., Zhang, L. W., Rosin, M. P. and Macaulay, C. E. (2006). "Simple Device for
the Direct Visualization of Oral-Cavity Tissue Fluorescence." Journal of
Biomedical Optics 11(2).
Lange, K. (2011). "Fundamental Role of Microvilli in the Main Functions of
Differentiated Cells: Outline of an Universal Regulating and Signaling System
at the Cell Periphery." Journal of Cellular Physiology 226(4): 896-927.
Li, A., Simmons, P. J. and Kaur, P. (1998). "Identification and Isolation of Candidate
Human Keratinocyte Stem Cells Based on Cell Surface Phenotype." Proceedings
of the National Academy of Sciences 95(7): 3902-3907.
Page I 200
Lichti, U. and Yuspa, S. H. (1988). "Modulation of Tissue and Epidermal
Transglutaminases in Mouse Epidermal Cells after Treatment with 12-0-
Tetradecanoylphorbol-13-Acetate and/or Retinoic Acid in Vivo and in Culture."
Cancer Research 48(1): 74-81.
Lila, Z., Michael, G. O., Marina, P., Alistair, R., Ian, E. S. and Mitch, D. (2003). Cell
Filtration-Laser Scanning Cytometry for the Characterisation of Circulating
Breast Cancer Cells. 55A: 102-108.
Lingen, M. W., Kalmar, J. R., Karrison, T. and Speight, P. M. (2008). "Critical
Evaluation of Diagnostic Aids for the Detection of Oral Cancer." Oral Oncology
44(1): 10-22.
Lommel, A. T. L. V. (2002). From Cells to Organs: A Histology Textbook and Atlas
Springer.
Lovas, J. G. L., Harsanyi, B. B. and Elgeneidy, A. K. (1989). "Oral Lichenoid
Dysplasia: A Clinicopathologic Analysis." Oral Surgerv. Oral Medicine. Oral
Pathology 68(1): 57-63.
Luo, C. W., Roan, C. H. and Liu, C. J. (2007). "Human Papillomaviruses in Oral
Squamous Cell Carcinoma and Pre-Cancerous Lesions Detected by Pcr-Based
Gene-Chip Array." International Journal of Oral and Maxillofacial Surgerv
36(2): 153-158.
Mackenzie, I. (2004). "Growth of Malignant Oral Epithelial Stem Cells after Seeding
into Organotypical Cultures of Normal Mucosa." Journal of Oral Pathology &
Medicine 33(2): 71-78.
Mackenzie, I. C. (2004). "Growth of Malignant Oral Epithelial Stem Cells after Seeding
into Organotypical Cultures of Normal Mucosa." Journal of Oral Pathology &
Medicine 33(2): 71-78.
Malaowalla, A. M., Silverman, S., Mani, N. J., Bilimoria, K. F. and Smith, L. W.
(1976). "Oral Cancer in 57,518 Industrial Workers of Gujarat, India. A
Prevalence and Foliowup Study." Cancer 37(4): 1882-1886.
Mann, W., Lonky, N., Massad, S., Scotti, R., Blanco, J. and Vasilev, S. (1993).
"Papanicolaou Smear Screening Augmented by a Magnified Chemiluminescent
Exam." International Journal of Gynecology & Obstetrics 43(3): 289-296.
Page I 201
Markx, G. H., Dyda, P. A. and Pethig, R. (1996). "Dielectrophoretic Separation of
Bacteria Using a Conductivity Gradient." Journal of Biotechnologv 51(2): 175-
180.
Martin, I. C., Kerawala, C. J. and Reed, M. (1998). "The Application of Toluidine Blue
as a Diagnostic Adjunct in the Detection of Epithelial Dysplasia." Oral Surgerv,
Oral Medicine. Oral Pathology. Oral Radiology, and Endodontologv 85(4): 444-
446.
Mashberg, A. (1981). "Tolonium (Toluidine Blue) Rinse—a Screening Method for
Recognition of Squamous Carcinoma. Continuing Study of Oral Cancer Iv."
JAMA: The Journal of the American Medical Association 245(23): 2408-2410.
Massano, J., Regateiro, F. S., Januario, G. and Ferreira, A. (2006). "Oral Squamous Cell
Carcinoma: Review of Prognostic and Predictive Factors." Oral Surgerv. Oral
Medicine. Oral Pathology. Oral Radiology, and Endodontologv 102(1): 67-76.
Masuda, I. (1996). "An in Vitro Oral Mucosal Model Reconstructed from Human
Normal Gingival Cells
" Kokubvo Gakkai Zasshi. 63(2): 334-353.
Masuda, S., Washizu, M. and Iwadare, M. (1987). "Separation of Small Particles
Suspended in Liquid by Nonuniform Traveling Field." Industry Applications.
IEEE Transactions on IA-23(3): 474-480.
Masuda, S., Washizu, M. and Kawabata, I. (1988). "Movement of Blood Cells in Liquid
by Nonuniform Traveling Field." Industry Applications. IEEE Transactions on
24(2): 217-222.
Mischel, M., Rouge, F., Lamprecht, I., Aubert, C. and Prota, G. (1983).
"Dielectrophoresis . of Malignant Human Melanocytes." Archives of
Dermatological Research 275(3): 141-143.
Montgomery, P. W. (1951). "A Study of Exfoliative Cytology of Normal Human Oral
Mucosa." Journal of Dental Research 30(1): 12-18.
Montgomery, P. W. and Von Haam, E. (1951). "A Study of the Exfoliative Cytology in
Patients with Carcinoma of the Oral Mucosa." Journal of Dental Research 30(3):
308-313.
Morgan, H. and Green, N. G. (2002). Ac Electrokinetics: Colloids and Nanonarticles.
Research Studies Press Ltd.
Page I 202

Müller, S., Pan, Y., Li, R. and Chi, A. (2008). "Changing Trends in Oral Squamous Cell
Carcinoma with Particular Reference to Young Patients; 1971-2006. The Emory
University Experience." Head and Neck Pathology 2(2): 60-66.
Myers, E. N. (1970). "The Toluidine Blue Test in Lesions of the Oral Cavity." CA: A
Cancer Journal for Clinicians 20(3): 134-139.
Nanci, A. and Ten Cate, A. R. (2008). Oral Mucosa. Ten Cate's Oral Histology:
Development. Structure, and Function J. J. Dolan and J. Pendill.
Nedelcu, S. and Watson, J. H. P. (2004). "Size Separation of DNA Molecules by Pulsed
Electric Field Dielectrophoresis." Journal of Physics D-Applied Physics 37(15):
2197-2204.
Neville, B. (2002). "Oral Cancer and Precancerous Lesions." CA A Cancer Journal for
Clinicians 52(4): 195-215.
Neville, B. W. and Day, T. A. (2002). "Oral Cancer and Precancerous Lesions." CA: A
Cancer Journal for Clinicians 52(4): 195-215.
Ng, S. Y., Reboud, J., Wang, K. Y. P., Tang, K. C., Zhang, L., Wong, P., Moe, K. T.,
Shim, W. and Chen, Y. (2010). "Label-Free Impedance Detection of Low Levels
of Circulating Endothelial Progenitor Cells for Point-of-Care Diagnosis."
Biosensors and Bioelectronics 25(5): 1095-1101.
Nicolas, A. F. V. L., Marc, E. B. and Marc, M. M. (1992). "Invasive Epithelial Cells
Show More Fast Plasma Membrane Movements Than Related or Parental Non-
Invasive Cells." Cvtometrv 13(1): 9-14.
Niebel, H. and Chomet, B. (1964). "In Vivo Staining Test for Delineation of Oral
Intraepithélial Neoplastic Change: Preliminary Report." Journal of the American
Dental Association 6 8 : 801-806.
Nowell, P. C. (1976). "The Clonal Evolution of Tumor Cell Populations." Science
194(4260): 23-28.
Ogden, G. R., Wight, A. and Cowpe, J. (1999b). "Quantitative Oral Exfoliative
Cytology. Effect of Alcohol on Normal Buccal Mucosa." Analytical and
quantitative cytology and histology 21(2): 126-30.
Ogden, G. R., Wight, A. J. and Rice, P. (1999a). "Effect of Alcohol on the Oral Mucosa
Assessed by Quantitative Cytomorphometry." Journal of Oral Pathology &
Medicine 28(5): 216-220.
Page I 203
Oliver, A. J., Helfrick, J. F. and Gard, D. (1996). "Primary Oral Squamous Cell
Carcinoma: A Review of 92 Cases." Journal of Oral and Maxillofacial Surgerv
54(8): 949-954.
Papanicolaou, G. N. and Traut, H. F. (1941). "The Diagnostic Value of Vaginal Smears
in Carcinoma of the Uterus." The American Journal of Obstetrics and
Gvnecologv 42(2): 193-206.
Papanicolaou, G. N. and Trout, H. F. (1943). Diagnosis of Uterine Cancer bv the
Vaginal Smear, New York: Commonwealth Fund.
Partin, A. W., Isaacs, J. T., Treiger, B. and Coffey, D. S. (1988). "Early Cell Motility
Changes Associated with an Increase in Metastatic Ability in Rat Prostatic
Cancer Cells Transfected with the V-Harvey-Ras Oncogene." Cancer Research
48(21): 6050-6053.
Peat, J. and Barton, B. (2005). Medical Statistics: A Guide to Data Analysis and Critical
Appraisal Blackwell Publishing.
Pei, X. F., Gorman, P. A. and Watt, F. (1991). "Two Strains of Human Kératinocytes
Transfected with Hpvl6 DNA: Comparison with the Normal Parental Cells."
Carcinogenesis 12(2): 277-284.
Pethig, R. (2010). "Review Article-Dielectrophoresis: Status of the Theory,
Technology, and Applications." Biomicrofluidics 4(2).
Pethig, R., Jakubek, L. M., Sanger, R. H., Heart, E., Corson, E. D. and Smith, P. J. S.
(2005). "Electrokinetic Measurements of Membrane Capacitance and
Conductance for Pancreatic Beta-Cells." lEE Proceedings Nanobio technology
152(6): 189-193.
Pethig, R. and Kell, D. B. (1987). "The Passive Electrical Properties of Biological
Systems - Their Significance in Physiology, Biophysics and Biotechnology."
Physics in Medicine and Biology 32(8): 933-970.
Pethig, R. and Talary, M. S. (2007). "Dielectrophoretic Detection of Membrane
Morphology Changes in Jurkat T-Cells Undergoing Etoposide-Induced
Apoptosis." let Nanobiotechnology 1(1): 2-9.
Pindborg, J. J., Reichart, P. A., Smith, C. J. and Van Der Waal, I. (1977). Histological
Typing of Cancer and Precancer of the Oral Mucosa Springer.
Page I 204
Poate, T. W. J., Buchanan, J. A. G., Hodgson, T. A., Speight, P. M., Barrett, A. W.,
Moles, D. R., Scully, C. and Porter, S. R. (2004). "An Audit of the Efficacy of
the Oral Brush Biopsy Technique in a Specialist Oral Medicine Unit." Oral
Oncology 40(8): 829-834.
Poh, C. F., Ng, S. P., Williams, P. M., Zhang, L., Laronde, D. M., Lane, P., Macaulay,
C. and Rosin, M. P. (2007). "Direct Fluorescence Visualization of Clinically
Occult High-Risk Oral Premalignant Disease Using a Simple Hand-Held
Device." Head & Neck 29(1): 71-76.
Poh, C. F., Zhang, L., Anderson, D. W., Durham, J. S., Williams, P. M., Priddy, R. W.,
Berean, K. W., Ng, S., Tseng, O. L., Macaulay, C. and Rosin, M. P. (2006).
"Fluorescence Visualization Detection of Field Alterations in Tumor Margins of
Oral Cancer Patients." Clinical Cancer Research 12(22): 6716-6722.
Pohl, H. A. (1951). "The Motion and Precipitation of Suspensoids in Divergent Electric
Fields." Journal of Applied Physics 22(7): 869-871.
Pohl, H. A. (1978). Dielectrophoresis the Behavior of Neutral Matter in Nonuniform
Electric Fields. Cambridge University Press.
Pohl, H. A. and Hawk, I. (1966). "Separation of Living and Dead Cells by
Dielectrophoresis." Science 152(3722): 647-&.
Pollard, T. D. and Borisy, G. G. (2003). "Cellular Motility Driven by Assembly and
Disassembly of Actin Filaments." Cell 112(4): 453-465.
Presland, R. B. and Dale, B. A. (2000). "Epithelial Structural Proteins of the Skin and
Oral Cavity: Function in Health and Disease." Critical Reviews in Oral Biology
& Medicine 11(4): 383-408.
Prunieras, M., Regnier, M., Fougere, S. and Woodley, D. (1983). "Kératinocytes
Synthesize Basal-Lamina Proteins in Culture." J Investig Dermatol 81(sl): 74s-
81s.
Ram, S. and Siar, C. H. (2005). "Chemiluminescence as a Diagnostic Aid in the
Detection of Oral Cancer and Potentially Malignant Epithelial Lesions."
International Journal of Oral and Maxillofacial Surgerv 34(5): 521-527.
Ratanachoo, K., Gascoyne, P. R. C. and Ruchirawat, M. (2002). "Detection of Cellular
Responses to Toxicants by Dielectrophoresis." Biochimica et Biophvsica Acta
(BBA) - Biomembranes 1564(2): 449-458.
Page I 205

Reddy, C., Kameswari, V. R., Prahlad, D., Ramulu, C. and Reddy, P. G. (1975).
"Correlative Study of Exfoliative Cytology and Histopathology of Oral
Carcinomas." Journal of Oral Surgerv 33(6): 435-438.
Ren, J., Hamada, J.-L, Okada, F., Takeichi, N., Morikawa, K., Flosokawa, M. and
Kobayashi, H. (1990). "Correlation between the Presence of Microvilli and the
Growth or Metastatic Potential of Tumor Cells." Cancer Science 81(9): 920-926.
Rheinwald, J. G. and Green, H. (1975). "Formation of a Keratinizing Epithelium in
Culture by a Cloned Cell Line Derived from a Teratoma." Cell 6(3): 317-330.
Richart, R. M. (1964). "A Clinical Staining Test for the in Vivo Delineation of
Dysplasia and Carcinoma in Situ." Obstetrical & Gynecological Survey 19(1).
Royack, G. A., Nguyen, M. P., Tong, D. C., Poot, M. and Oda, D. (2000). "Response of
Human Oral Epithelial Cells to Oxidative Damage and the Effect of Vitamin E."
Oral Oncology 36(1): 37-41.
S. Silverman, J., Gorsky, M. and Lozada, F. (1984). "Oral Leukoplakia and Malignant
Transformation. A Follow-up Study of 257 Patients." Cancer 53(3): 563-568.
Sandler, H. C. (1962). "Cytological Screening for Early Mouth Cancer. Interim Report
of the Veterans Administration Co-Operative Study of Oral Exfoliative
Cytology." Cancer 15(6): 1119-1124.
Scheifele, C., Schmidt-Westhausen, A.-M., Dietrich, T. and Reichart, P. A. (2004).
"The Sensitivity and Specificity of the Oralcdx Technique: Evaluation of 103
Cases." Oral Oncology 40(8): 824-828.
Schenk, P. (1975). "Melanocytes, Langerhans' Cells and Merkel Cells in Oral
Epithelium " Acta Oto-Larvngologica 80(3-4): 301-311.
Schomacker, K. T., Frisoli, J. K., Compton, C. C., Flotte, T. J., Richter, J. M., Nishioka,
N. S. and Deutsch, T. F. (1992). "Ultraviolet Laser-Induced Fluorescence of
Colonic Tissue: Basic Biology and Diagnostic Potential." Lasers in Surgerv and
Medicine 12(1): 63-78.
Sciubba, J. J. and Collaborative Oral, C. S. G. (1999). "Improving Detection of
Precancerous and Cancerous Oral Lesions - Computer-Assisted Analysis of the
Oral Brush Biopsy." Journal of the American Dental Association 130(10): 1445-
1457.
Page I 206
Scully, C., Bagan, J. V., Hopper, C. and Epstein, J. B. (2008). "Oral Cancer: Current
and Future Diagnostic Techniques." American Journal of Dentistry 21(4): 199-
209.
Shafer, W. G. and Waldron, C. A. (1975). Erythroplakia of the Oral Cavity. 36: 1021-
1028.
Shafer, W. G. and Waldron, C. A. (1975b). Erythroplakia of the Oral Cavity. 36: 1021-
1028.
Shedd, D. P. and Hukill, P. B. (1966). "In Vivo Staining Properties of Oral Cancer."
Plastic and Reconstructive Surgerv 37(6).
Shedd, P. D., Hukill, B. P., Bah, N. S., Ferraro, H. R. and Klingbeil, J. R. (1967).
"Further Appraisal of in Vivo Staining Properties of Oral Cancer." Plastic and
Reconstructive Surgerv 40(5).
Shiboski, C. H., Schmidt, B. L. and Jordan, R. C. K. (2005). "Tongue and Tonsil
Carcinoma." Cancer 103(9): 1843-1849.
Silverman Jr, S. (2000). "Oral Lichen Planus: A Potentially Premalignant Lesion."
Journal of Oral and Maxillofacial Surgerv 58(11): 1286-1288.
Silverman Jr, S., Gorsky, M. and Lozada, F. (1984). "Oral Leukoplakia and Malignant
Transformation. A Follow-up Study of 257 Patients." Cancer 53(3): 563-568.
Silverman, J. S., Gorsky, M. and Lozada-Nur, F. (1985). "A Prospective Follow-up
Study of 570 Patients with Oral Lichen Planus: Persistence, Remission, and
Malignant Association." Oral Surgerv. Oral Medicine. Oral Pathology 60(1): 30-
34.
Silverman, S. (1988). "Early Diagnosis of Oral Cancer." Cancer 62(S1): 1796-1799.
Silverman, S. (2003). Oral Cancer. B.C. Becker Inc.
Silverman, S., Gorsky, M., Lozada-Nur, F. and Giannotti, K. (1991). "A Prospective
Study of Findings and Management in 214 Patients with Oral Lichen Planus."
Oral Surgerv. Oral Medicine. Oral Pathology 72(6): 665-670.
Silverman, S., Jr. (2007). "Mucosal Lesions in Older Adults." The Journal of the
American Dental Association 138(suppl_l): 41S-46.
Silverman, S., Migliorati, C. and Barbosa, J. (1984). "Toluidine Blue Staining in the
Detection of Oral Precancerous and Malignant Lesions." Oral Surgerv. Oral
Medicine. Oral Pathology 57(4): 379-382.
Page I 207
Silverman, S. J. (2001). "Demographics and Occurrence of Oral and Pharyngeal
Cancers: The Outcomes, the Trends, the Challenge." The Journal of the
American Dental Association 132(suppl_l): 7S-11.
Simon, S., Roy, D. and Schindler, M. (1994). "Intracellular Ph and the Control of
Multidrug Resistance." Proceedings of the National Academv of Sciences 91(3):
1128-1132.
Slaughter, D. P., Southwick, H. W. and Smejkal, W. (1953). "Field Cancerization" In
Oral Stratified Squamous Epithelium. Clinical Implications of Multicentric
Origin. 6 ; 963-968.
Soderholm, A.-L. (2002). Oral Malignancies: Etiology. Distribution, and Basic
Treatment Considerations Springer New York.
Squier, C. A. and Kremer, M. J. (2001). Biology of Oral Mucosa and Esophagus. 2001:
7-15.
Squier, C. A. and Rooney, L. (1976). "The Permeability of Keratinized and
Nonkeratinized Oral Epithelium to Lanthanum in Vivo." Journal of
Ultrastructure Research 54(2): 286-295.
Stephens, M., Talary, M. S., Pethig, R., Burnett, A. K. and Mills, K. I. (1996). "The
Dielectrophoresis Enrichment of Cd34(+) Cells from Peripheral Blood Stem
Cell Harvests." Bone Marrow Transplantation 18(4): 777-782.
Strong, M. S., Vaughan, C. W. and Incze, J. S. (1968). "Toluidine Blue in the
Management of Carcinoma of the Oral Cavity." Archives of Otolarvngology-
Head & Neck Surgerv 87(5): 527-531.
Svirsky, J., Bums, J., Carpenter, W., Cohen, D., Bhattacharyya, I., Fantasia, J.,
Lederman, D., Lynch, D., Sciubba, J. and Zunt, S. (2002). "Comparison of
Computer-Assisted Bmsh Biopsy Results with Follow up Scalpel Biopsy and
Histology." General Dentistry 50(6): 500-3.
Svistun, E., Alizadeh-Naderi, R., El-Naggar, A., Jacob, R., Gillenwater, A. and
Richards-Kortum, R. (2004). "Vision Enhancement System for Detection of
Oral Cavity Neoplasia Based on Auto fluorescence." Head & Neck 26(3): 205-
215.
Page I 208
Takashima, S., Asami, K. and Takahashi, Y. (1988). "Frequency Domain Studies of
Impedance Characteristics of Biological Cells Using Micropipet Technique. I.
Erythrocyte." Biophysical Journal 54(6): 995-1000.
Thomsen, P., Roepstorff, K., Stahlhut, M. and Van Deurs, B. (2002). "Caveolae Are
Highly Immobile Plasma Membrane Microdomains, Which Are Not Involved in
Constitutive Endocytic Trafficking." Molecular Biology of the Cell 13(1): 238-
250.
Thomson, P. J. (2002). "Field Change and Oral Cancer: New Evidence for Widespread
Carcinogenesis?" International Journal of Oral and Maxillofacial Surgerv 31(3):
262-266.
Tinevez, J.-Y., Schulze, U., Salbreux, G., Roensch, J., Joanny, J.-F. O. and Paluch, E.
(2009). "Role of Cortical Tension in Bleb Growth." Proceedings of the National
Academv of Sciences of the United States of America 106(44): 18581-18586.
Ting, I. P., Jolley, K., Beasley, C. A. and Pohl, H. A. (1971). "Dielectrophoresis of
Chloroplasts." Biochimica et Biophvsica Acta (BBA) - Bio energetics 234(3):
324-329.
Visscher, J. G. A. M. D. and Waal, I. V. D. (1998). "Etiology of Cancer of the Lip: A
Review." International Journal of Oral and Maxillofacial Surgerv 27(3): 199-
203.
Vizilite. (2004). "Vizilite Product Information." fi*om http://www.vizilite.com.
Waldron, C. and Shafer, W. (1975a). "Leukoplakia Revisited. A Clinicopathologic
Study 3256 Oral Leukoplakias." Cancer 36(4): 1386-92.
Walker, D. M. (2004). "Oral Mucosal Immunology: An Overview." Annals of the
Academv of Medicine. Singapore 33(4): 27-30.
Wang, X.-B., Huang, Y., Gascoyne, P. R. C., Becker, F. F., Holzel, R. and Pethig, R.
(1994). "Changes in Friend Murine Erythroleukaemia Cell Membranes During
Induced Differentiation Determined by Electrorotation." Biochimica et
Biophvsica Acta (BBA) - Biomembranes 1193(2): 330-344.
Wang, X., Becker, F. F. and Gascoyne, P. R. C. (2002). "Membrane Dielectric Changes
Indicate Induced Apoptosis in Hl-60 Cells More Sensitively Than Surface
Phosphatidylserine Expression or DNA Fragmentation." Biochimica et
Biophvsica Acta (BBA) - Biomembranes 1564(2): 412-420.
Page I 209
Wang, X., Yang, J. and Gascoyne, P. R. C. (1999). "Role of Peroxide in Ac Electrical
Field Exposure Effects on Friend Murine Erythroleukemia Cells During
Dielectrophoretic Manipulations." Biochimica et Biophvsica Acta (BBA) -
General Subjects 1426(1): 53-68.
Wamakulasuriya, K. A. A. S., Robinson, D. and Evans, H. (2003). "Multiple Primary
Tumours Following Head and Neck Cancer in Southern England During 1961-
98." Journal of Oral Pathology & Medicine 32(8): 443-449.
Wamakulasuriya, S. (2009). "Global Epidemiology of Oral and Oropharyngeal Cancer."
Oral Oncology 45(4-5): 309-316.
Wamakulasuriya, S., Johnson, N. W. and Van Der Waal, I. (2007). Nomenclature and
Classification of Potentially Malignant Disorders of the Oral Mucosa. 36: 575-
580.
Wamakulasuriya, S., Reibel, J., Bouquot, J. and Dabelsteen, E. (2008). "Oral Epithelial
Dysplasia Classification Systems: Predictive Value, Utility, Weaknesses and
Scope for Improvement." Joumal of Oral Pathology & Medicine 37(3): 127-133.
Weigum, S. E., Floriano, P. N., Redding, S. W., Yeh, C. K., Westbrook, S. D., Mcguff,
H. S., Lin, A., Miller, F. R., Villarreal, F., Rowan, S. D., Vigneswaran, N.,
Williams, M. D. and Mcdevitt, J. T. (2010). "Nano-Bio-Chip Sensor Platform
for Examination of Oral Exfoliative Cytology." Cancer Prevention Research
3(4): 518-528.
Weinmann, J. (1940). "The Keratinization of the Human Oral Mucosa." Joumal of
Dental Research 19(1): 57-71.
Williams, P., Poh, C. F., Hovan, A. J., Ng, S. and Rosin, M. P. (2008). "Evaluation of a
Suspicious Oral Mucosal Lesion." Joumal of Canadian Dental Association
74(3): 275-280.
Williams, P. M., Poh, C. F., Hovan, A. J., Ng, S. and Rosin, M. P. (2008). "Evaluation
of a Suspicious Oral Mucosal Lesion." Joumal of the Canadian Dental
Association 74(3): 275-280.
Won, K.-J., Chung, K.-S., Lee, Y. S., Alia, M. S., Pervez, M. K., Fatima, S., Choi, J.-H.
and Lee, K.-T. (2010). "Haplophytin-a Induces Caspase-8 -Mediated Apoptosis
Via the Formation of Death-Inducing Signaling Complex in Human
Page I 210

Promyelocytic Leukemia Hl-60 Cells." Chemico-Biological Interactions 188(3):
505-511.
Yang, P., Yang, X. M., Jiang, H., Wood, P., Hrushesky, W. and Wang, G. R. (2010).
Dielectrophoresis Separation of Colon Cancer Cell. Mnhmt2009. Vol 1. New
York, Amer Soc Mechanical Engineers: 351-356.
Yang, Y., Xing, D., Zhou, F. F. and Chen, Q. (2010). "Mitochondrial Autophagy
Protects against Heat Shock-Induced Apoptosis through Reducing Cytosolic
Cytochrome C Release and Downstream Caspase-3 Activation." Biochemical
and Biophysical Research Communications 395(2): 190-195.
Yang, Y. L., Ye, Y. M., Li, F. M., Li, Y. F. and Ma, P. (1987). "Characteristic
Auto fluorescence for Cancer Diagnosis and Its Origin." Lasers in Surgerv and
Medicine 7(6): 528-523.
Young, W. and Heddie, H. (1981). Atlas of Oral Pathology. University of Minnesota
Press.
Zhang, C., Khoshmanesh, K., Mitchell, A. and Kalantar-Zadeh, K. (2010).
"Dielectrophoresis for Manipulation of Micro/Nano Particles in Micro fluidic
Systems." Analytical and Bioanalvtical Chemistry 396(1): 401-420.
Page I 211

8 APPENDIX A
True PositiveTrue Positive + False N egative
Specificity =True Negative
True N egative + False Positive
Equation 12
PPV =True Positive
True Positive + False Positive
Equation 13
NPVTrue Negative
True Negative + False N egative
Equation 14
LR+=Sensitivity
Equation 15
L R -=1 — Sensitivity
Specif i d
Equation 16
Equation 17
Where PPV is the positive predictive value, NPV is the negative predictive value, LR+ is the
positive likelihood ratio, LR- is the negative likelihood ratio.
Page I 212
9 APPENDIX B
bm rruTE o f I’m'sics PuBUSinxo P h ysics in M kdicike a n d B io lo g y
Phyg.Mcd. Biol.a)(2005)22(i?-2274 dm:10.1088/0031-9155/50/IO/[K)6
Extraction of dielectric properties of multiple populations from dielectrophoretic collection spectrum data
Lionel M Itroche, ratlma U Labeed and Michael F HughesCentre for Biomédical Engineering. School of Engineering, University of Surrey, GiiildfOrd, SuneyGl%TKH,UK
E-mail: m.hiighc!# mrrey.ae.u&
Received 11 December 2004, in final form 18 March 2005 Published 27 April 2005Online at stacks,iop.org/PMB/50/2267
AbstractIn this paper we show how simplifying assumptions can be used to extract useful data from the dielectrophoretic collection spectrum, in particular for the cytoplasm, and hence delemiine the properties of multiple populations of cells within a sample. Specifically, the observation of the frequencies of onset of dielectric dispersion allows the identification and enumeration of populations of cells according to cytoplasmic conductivity, with particular relevance to the detenninatlon of the action of drugs for high-throughput screening applications.
Introduction
Dielectrophoresis (DEP) is the induced motion of particles in non-unifonn electric fields. This phenomenon has been widely applied to the manipulation, separation and analysis of cellular and viral particles (Zimmermann and Neil 1996, Hughes 2002). Particles experiencing such forces can be made to exhibit a variety of motions including attrac tion to, and repulsion from, regions of high electric field (termed positive and negative DEP, respectively) by changing the frequency of the applied electric field. Since bioparticles such as bacteria, cells or viruses have characteristic dielectric properties, dielectrophoresis can be used to distinguish between different types of bacteria, to detect changes in cell cytoplasmic properties and to detect whether cells are viable or non-viable. The main factors Influencing the dielectric properties of a bioparticle are the surface charge, the membrane capacitance and the conductivity of the membrane and cytoplasm. If drugs such as antibiotics change any of these, factors, the dielectric properties of the cell change and can be detected. This change can be used to distinguish between cells that are resistant or sensitive to a drug, for example.
By exploiting the fact that different particles may experience forces acting in different directions when all other factors are the same, researchers have been able to use DEP to analyse
Page I 213
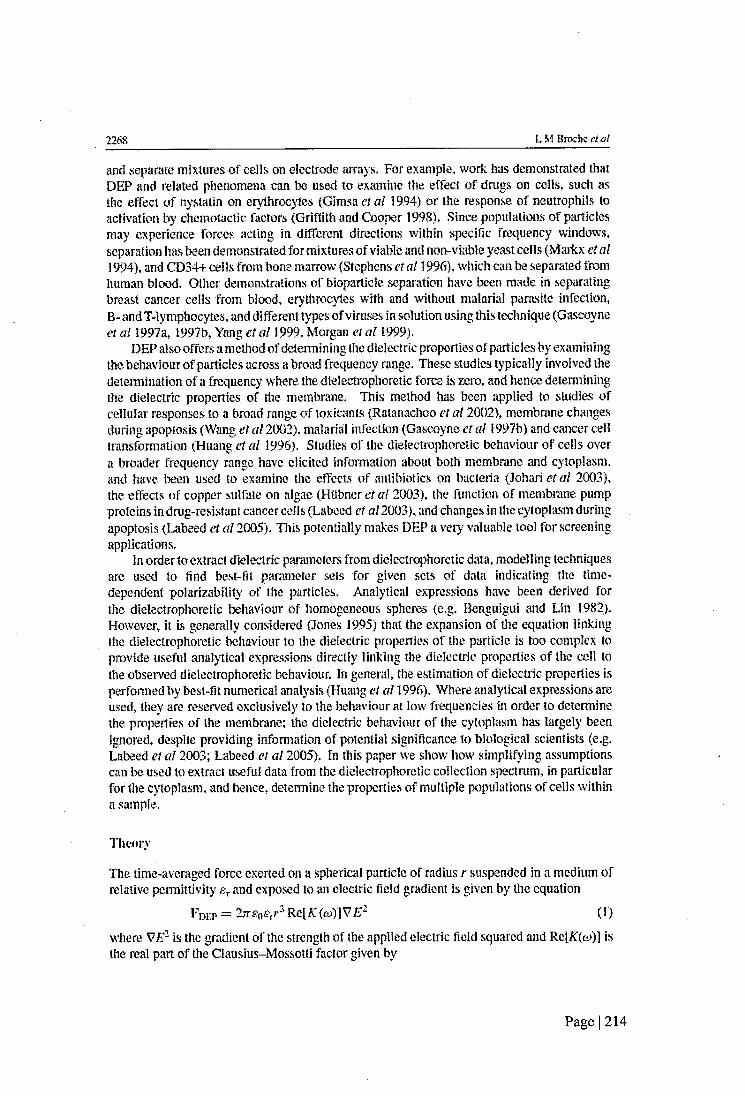
226S L M Brtxrhe e t a l
and separate mixtures of cells on electrode arrays. For ex^ple, work has demonstrated that DEP and related phenomena can. be used to examine the effect of drugs on cells, such as the effect of nystatin on eiythrocytes (Gimsa et a! 1994) or the response of neutrophils to activation by chemotactic factors (Griffith and Cooper 1998). Since populations of particles may experience forces acting in different directions witliin specific frequency windows.
1994), and CD34+ ceils from bone marrow (Stephens e ta /1996), which can be separated fiorn human blood. Other demonstrations of bioparticle separation have been made in separating breast cancer cells from blood, erythrocytes with and without malarial parasite infection, B- and T-lymphocytes, and different types of viruses in solution using this technique (Gascoyne et rtf 1997a, 1997b, Yang ef af 1999, Morgan et of 1999).
DEP also offers a method of determining the dielectric properties of particles by examining the behaviour of particles across a broad frequency range. These studies typically Involved the determination of a frequency where the dielectrophoretic force is zero, and hence determining the dielectric properties of the membrane. This method has been applied to studies of cellular responses to a broad range of toxicants (Ratanachoo et al 2002), membrane changes during apoplosis (Wang et al 2002), malarial infection (Gascoyne et al î 997b) and cancer cell transformation (Huang et at 1996). Studies of the dielectrophoretic behaviour of cells over a broader frequency range have elicited information about both membrane and cytoplasm, and have been used to examine the effects of antibiotics on bacteria (Johari et al 2003), the effects of copper sulfate on algae (Htlbner et al 2003), the function of membrane pump proteins in drug-resistant cancer cells (Labeed et al 2003). and changes in the cytoplasm during apoplosis (Labeed et al 2005). This potentially makes DEP a very valuable tool for screening applications.
In order to extract dielectric parameters from dielectrophoretic data, modelling techniques are used to find best-fit parameter sets for given sets of data indicating the time- dependent poWzability of the particles. Analytical expressions have been derived for the dielectrophoretic behaviour of homogeneous spheres (e.g. Benguigui and Lin 1982). However, it is generally considered (Jones 1995) that the expansion of the equation linking the dielectrophoretic behaviour to the dielectric properties of the particle is too complex to provide useful analytical expressions directly linking the dielectric properties of the cell to the observed dielectrophoretic behaviour. In general, the estimation of dielectric properties is perfoimed by best-fit numerical analysis (Huang et al 1996). Where analytical expressions are used, they are reserved exclusively to the behaviour at low frequencies in order to determine the properties of the membrane; the dielectric behaviour of the cytoplasm has largely been Ignored, despite providing information of potential significance to biological scientists (e.g. Labeed eta! 2003; Labeed et al 2005). In this paper we show how simplifying assumptions can be used to extract useful data from the dielectrophoretic collection spectrum, in particular for the cytoplasm, and hence, determine the properties of multiple populations of cells within a sample.
Theory
The time-averaged force exerted on a spherical particle of radius r suspended in a medium of relative permittivity and exposed to an electric field gradient is given by the equation
Foup = RelTC (m)] VE" ( I )where VE“ is the gradient of the strength of the applied electric field squared and Re[/f(rt>)J is the real part of the Clausiiis-Mossotti factor given by
Page I 214
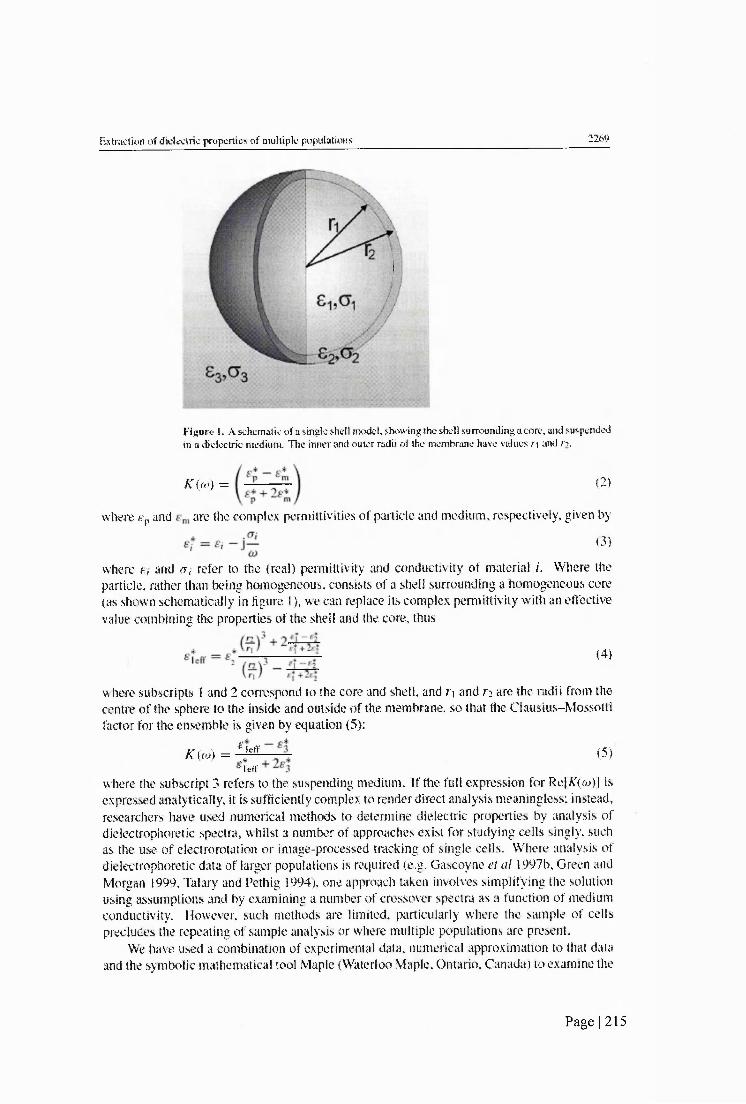
EsîKtcîÏOT of dieleciric properties of multiple populations 2269
Figure 1. A schematic of a single shell model showing the shell surrounding a core, and suspended in a dielectric medium. The inner and outer radii of the membrane have values r\ and n .
K (ft?) = (2)
where gp and are (he complex permittivities of particle and medium, mspectively, given by
(3)
where e, and a, refer to the (real) permittivity and conductivity of material i. Where the particle, rather than being homogeneous, consists of a shell surrounding a homogeneous core (as shown schematically in figure 1), we can replace its complex permittivity with an effective value combining the properties of the shell and the core, thus
(4)
where subscripts I and 2 correspond to the core and shell, and f] and ri are the radii from the centre of (he sphere to the inside and outside of the membrane, so that the Clausius-Mossotti factor for (he ensemble is given by quation (5):
K M = Im
Tctr(5)
where the subscript 3 refers to the suspending medium. If the fell expression for Re[X(w)| is expressed analytically, it is sufhciently complex to render direct analysis meaningless; instead, researchers have used numerical methods to determine dielectric properties by tmalysis ofdielectrophoretic spectra, whilst a number of approaches exist for studying cells singly, such as the use of electrorotation or image-processed tracking of single cells. Where analysis of dielectrophoretic data of larger populations is required (e.g. Gascoyne e! a! 1997b, Green and Morgan 1999, Talary and Pethig 1994). one approach taken involves simplifying the solution using assumptions and by examining a number of crossover spectra as a function of medium conductivity. However, such methods are limited, particularly where the sample of cells precludes the repeating of sample analysis or where multiple populations are present.
We have used a combination of experimental data, numerical approximation to that data and the symbolic mathematical tool Maple (Waterloo Maple, Ontario. Canada) to examine the
Page I 215

2270 L M Bmchc es a i
05
G-
■0 ,
Frequency (Hz)
Fîgurt; 2. A ty pical spcctntm showing the relative polart/aWlily (Re{AT(w)]) of a single-sbeUed particle as a function of frequency. Noie the three plateaux at low frequency (negative DEP), intermediate frequencies (positive DEP) and high frequency (negative DEP). The transit between these plateaux takes approximately one decade; the lower and upper CTOSsover frequencies, where Re|Â'(&d| — 0, are indicated by F,xl and F ,;, respectively.
key features of dielectrophoretic collection data, and demonstrate here that It can be used to identify a number of cell populations in a single sample by identillcation of key features ofthe polarizabllfty spectrum.
Analysis of key spectrum events
For a given shelled sphere, where the shell is of relatively low conductivity compared to the inner compartment and outer medium, we anticipate a polarizability spectrum of the type shown in figure 2. This displays two characteristic dispersions, one rising at lower (Ÿcquency and one falling at higher frequency. The frequency where the polarizability crosses from tKgative to positive for a homogenoiB sphere allows the direct determination of the properties of the sphere from equation (2 ) by equating it to zero; however, for a shelled sphere the expression is much more complicated to determine such factors. Some work has been performed in deriving expressions for the lower crossover frequency, but the upper frequency has largely been ignored because of limitations with signal generation equipment.
Benguigui and Lin (1982) demonstrated that it is po!%ible to determine an expression for the low-frequency crossover of a homogeneous sphere of conductivity and permittivity and (Tp, respectively: this was extended by Huang etal (1992,1996) to consider the low-frequency crossover of a shelled sphere by considering it to be equivalent to a homogeneous sphere of effective conductivity and permittivity of
(6)
Using this approximation, Huang and co-workers produced an expression for the low- fr^uency crossover
1 12rr| — A(T2<73 — .4 -ay2jr y A h 2 — — 2^3
(7)
Page I 216
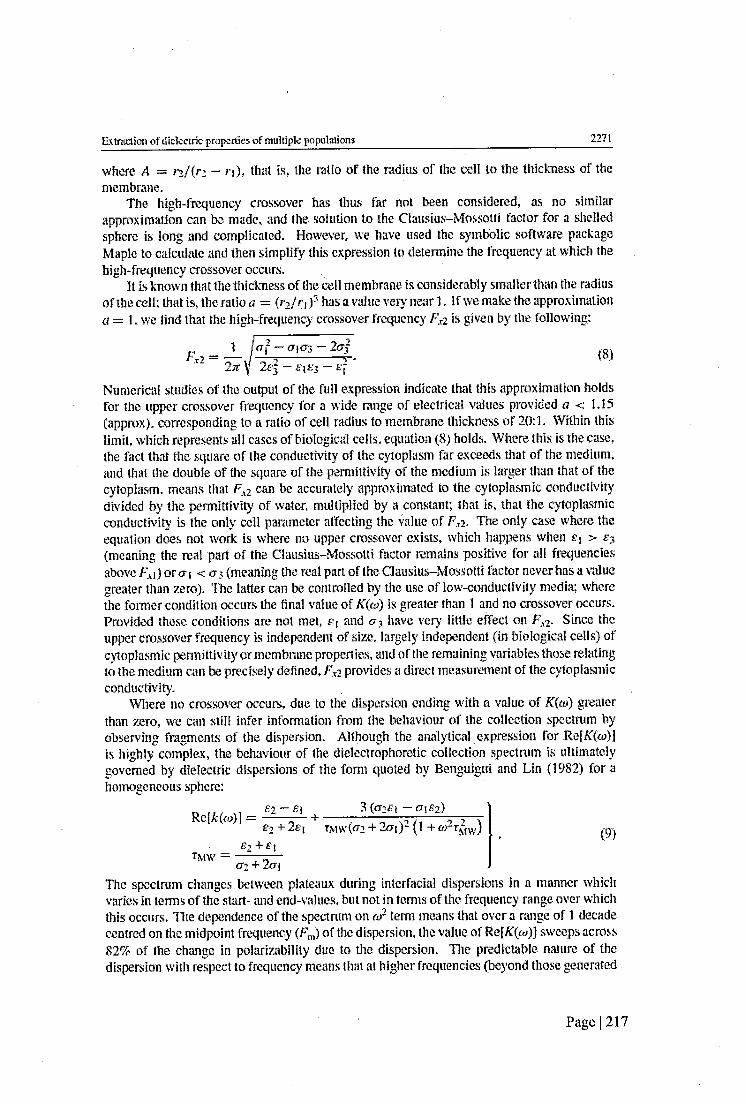
Extracdon o f dielectric properties o f multiple populations____________________________________ 2271
where zi = rs/(r2 - ri), that is, the ratio of the radius of the ceil to the thickness of the membrane.
The high-frequency crossover has thus far not been considered, as no similar appmximadon can be made, and the solution to the Clausius-Mossotti factor for a shelled sphem is long and complicated. However, we have used the symbolic software packageMaple to calculate and then simplify this expression to determine the frequency at which the high-frequency crossover occurs.
It is known that the thickness of the cell membrane is considerably smaller than Ae radius of Ae cell; Aat is, the ratio a = (n /ri has a value very near 1. If we make the approximation a = 1, we find that the high-frequency crossover frequency Fxi is given by the following:
<Ji — (Troj ~ 2a |2E j — £■!% — ■S’l'
Numerical studies of the output of the full expression indicate that this approximation holds for the upper crossover frequency for a wide range of electrical values provided û < 1.15 (approx), corresponding to a ratio of cell radius to membrane thickness of 20:1. Within this limit, which represents all cases of biological cells, equation (S) holds. Where this is the case, the fact that the square of the conductivity of the cytoplasm far exceeds that of the medium, and that the double of the square of the permittivity of the medium is larger than that of the cytoplasm, means that can be accurately approximated to the cytoplasmic conductivity divided by the permittivity of water, multiplied by a constant; that is, that the cytoplasmic conductivity is the only cell parameter affecting the value of The only case where the equation does not work Is where no upper crossover exists, which happens when e* > % (meaning Ae real part of the Clausius-Mossotti factor remains positive for all frequencies above &i) or <r i < a 3 (meaning Ae real part of the Clausius-Mossotti factor never has a value greater than zero). The latter can be controlled by the use of low-conductivity media; where Ae fonner condition occurs Ae hnal value of &*) Is greater Aan 1 and no crossover occurs. Provided these conditions are not met, f ; and 0 3 have very little effect on Since the upper crossover foequency is mdependent of size, largely independent (in biological cells) of cytoplasmic permittivity or membrane properties, and of the remaining variables Aose relating to the medium can be precisely defined, provides a direct measurement of the cytoplasmic conductivity.
Where no crossover occurs, due to the dispersion ending with a value of K(w) greater than zero, we can still infer information from the behaviour of Ae collection spectrum by observmg fragments of the dispersion. AlAough Ae analytical expression for Re[^(a))] is highly complex, the behaviour of the dielectrophoretic collection spectrum is ultimately governed by dielectric dispersions of the form quoted by Benguigui and Lin (1982) for a homogeneous sphere;
^ 3 i — (T;&2)
(9)
02 + 2mThe spectrum changes between plateaux during interfacial dispersions In a manner which varies in terms of the start- and end-values, but not in terms of the frequency range over which this occurs. The dependence of the spectrum on €o~ term means that over a range of 1 decade centred on the midpoint frequency (F„J of the dispersion, the value ofRe[AT(a))] sweeps across 82% of the change in polarizability due to the dispersion. The predictable nature of the dispersion with respect to frequency means that at higher frequencies (beyond those generated
Page 1 217
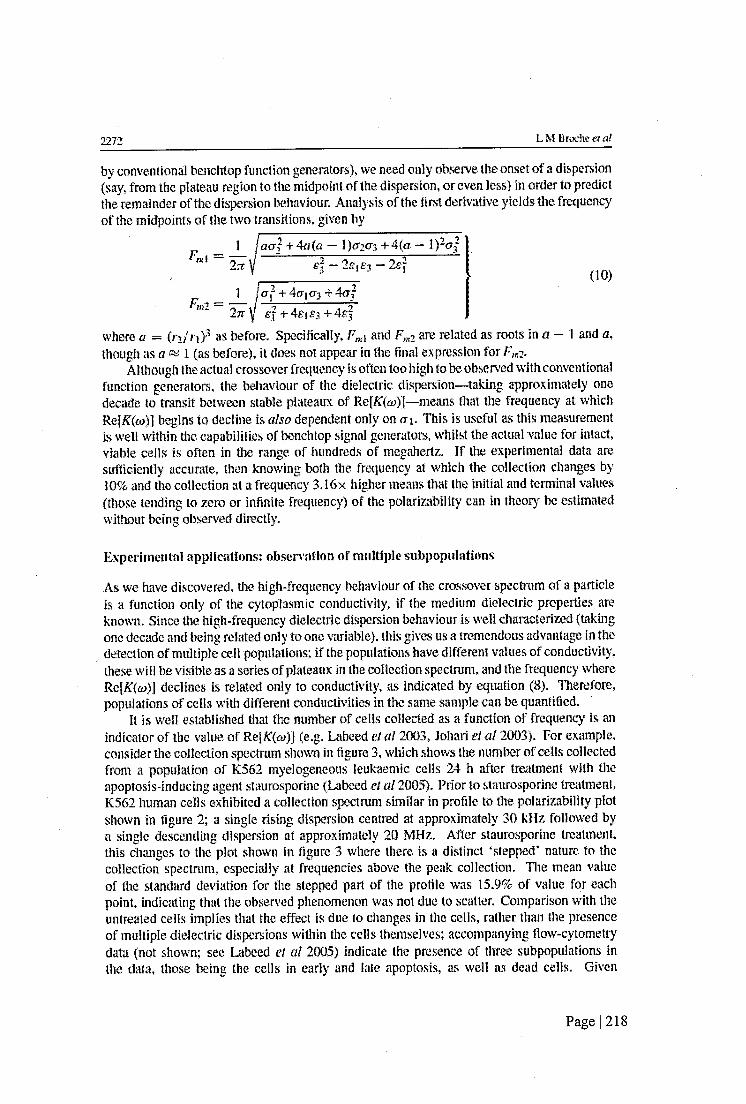
2272 L M Broche ei al
by conventional benchtop fonction generators), we n^d only observe the onset of a dispersion (say, from Ae plateau region to Ae midpoint of the di^rsion, or even less) in orda to predict Ae remafoder of the dispersion behavioun Analysis of the hrst derivative yields Ae frequency of the midpoints of the two transitions, given by
lacrl + 4o(n — 1)(T2<j% -t-4(o — l) Og
___ _ / g f + 40103-1-401
where o = (rz/f*)^ as before. Specibcally, ^nd are related as roots in a - 1 and a, Aough as a % 1 (as before), it does not appear m Ae bnal expression for Fmz.
Although the actual crossover frequency is often too high to be observed with conventional function generators, Ae behaviour of Ae dielectric dispersion—4aking approximately one decade to transit between stable plateaux of Re[#r(a))]-^eans Aat Ae frequenry at which Re[f (a*)] begins to decline is aka dependent only on a ,. This is useful as Ais measurement is well within the capabilities of benchtop signal generators, whilst the actual value for intact, viable cells is often in Ae range of hundreds of megahertz. If the experlmenAl daA are sufficiently accurate, then knowing both the frequency at which the collection changes by 10% and Ae collection at a frequency 3.16x higher means that Ae Initial and terminal values (those Anding to zero or infinite foequency) of Ae polarizability can in Aeory be estimated without being observed directly.
Experimental applications; observation of multiple subpopulations
As we have discovered, the high-frequency behaviour of Ae crossover spectrum of a particle is a function only of Ae cytoplasmic conductivity, if Ae medmm dielectric properties are known. Since Ae high-foequency dielectric dispersion behaviour is well characterized (Aking one decade and being related only to one variable), this gives us a tremendous advantage in the detection of multiple cell populations; if the populations have different values of conducdvity, these will be visible as a series of plaAaux m the collection spectrum, and Ae foequency where Re[AT(m)] declines Is related only to conductivity, as mAcated by equation (8 ). Therefore, populations of cells wlA different conductivities in Ae same sample (an be quantihed.
It is well esAbllshed Aat the number of cells collected as a function of frequency Is an indicator of Ae value of Re|F(m)) (e.g. Labeed etai 2003, Johari ei al 2003). For example, consider the collection spectrum shown In figure 3, which shows the number of cells collected from a population of K562 myelogeneous leukaemlc cells 24 b after treatment wiA the apoptosis-inducmg agent staurosporine (Labeed el a! 2005). Prior to slaurosporme treatment, K562 human cells exhibited a collection spectrum similar in profile to the polarizability plot shown in figure 2; a single rising dispersion centred at approximately 30 kHz followed by a single descending dispersion at approximately 20 MHz. After staurosporine treatment, this changes to the plot shown in figure 3 where there is a distinct ‘stepped’ nature to the collection spectrum, especially at frequencies above the peak collection. The mean value of the standard deviation for the stepped part of the profile was 15.9% of value for each point, indicating that the observed phenomenon was not due to scatter. Comparison with the untreated cells implies that the effect is due to changes in the cells, rather than the presence of multiple dielectric dispersions within the cells themselves; accompanying flow-cytometry data (not shown; see Labeed el al 2005} indicate the presence of three subpopulations in the data, those being the cells in early and late apoplosis, as well as dead cells. Given
Page 1218

Exlraclioû of dielectric properties of multiple populations 2273
Frequency (Hz)
Figure 3. A collection prolik- for staurosporine-treated K562 cells, showing the cells collected after i min of exposure to DE P (circles s, and the best-lit line to the data Isolid line) as delerniined by combining the predicted collection spectra for three populations (broken lines). Note the presence of three distinct c o lle c t if plateaux. The spectrum for untreated cells can be seen for comparison in Labeed eta! (2Ü03).
the mathematical analysis in the above section, we suggest that the data do indeed show that there are three cell populations present; the diflerence in collection levels between the plateaux allows the determination of the ratios of cell populations. In the case of the two populations exhibiting the lowest-frequency dispersions, the crossover frequency is evident al the point where the downward movement of the curve meets the next plateau, indicative that the population has undergone crossover and is therefore no longer collecting. This allows the determination of the parameters using equation (8 ). Although the crossover frequency cannot be observed for the third population the knowledge of the dispersion behaviour means that the cytoplasmic conductivity can still be determined by matching the comer frequency where the dispersion starts, and hence determining the location of the midpoint frequency described in equation (1 0 ).
By treating the net collection spectrum as being a sum of three crossover spectra and then modelling these three populations, a best-lit curve such as the one shown in figure 3 can be produced. Extracting these data, we find that the populations have cytoplasmic conductivities of approximately 500 mS m L 30 mS m-^ and 3 mS m-^ corresponding well to expectations for cells in early and late stage apoptosis, and cell necrosis respectively. Furthermore, the cell proportions tally with observations of apoptotic progression measured using Annexin-V. Further details of this work are to be published elsewhere (Labeed et al 2005).
Conclusion
It has been shown that an analytical treatment of the time-variant polarizability of cells can provide new methods of dielectrophoretic cell analysis. Specitically, the observation of the onset of the high-frequency dielectric dispersion allows the identillcation and enumeration of populations of cells according to cytoplasmic conductivity, with particular relevance to the determination of the action of drugs for high-throughput screening applications.
Page I 219

2274 L M Broche e /a/
Dielectrophoredc collection methods allow the determination of large numbers of cells simultaneously, and the cytoplasmic conductivity is a significant marker of cell state, particularly with respect to membrane hyperpolarization, or depolarization after necrosis. We suggest that the use of automated cuiwe-fnting software based on the principles outlined hem would significantly enhance the Identification of multiple cell populations.
References
Iknguigui L and Lin IJ 1982 More abont the dielecirophotetic force J. AppL Phys. 53 1141-3 C iistofiiilli M ei of 2002 Automated ekctrorotation to reveal dielectric variations related to HER-2/ncu
overexpression in MCF-7 subiines CMn. Cancer Res.^ 615—9 Ga&coyoe PRC, Backer F F and Wang X-B 1995 Nnmencal analysis of the mdtœncc of cspenmcntal conditions
on the accuracy o f dielectric parameters derived from electrorotation measurements Biaekctrachem. Biaenerg. 36115-25
Gascoyne P RC ff of 1997a Dielectrophoretic scparaüon of cancer odls Bmn blood fEEE Tmw. W . Appf. 33 670-8 Gascoyne P eta! 1997b Dielectrophorotic detection of changes in eiythrocyte membranes following malarial Infection
BiocMnh Biaphys. Acta. 1323 240-52 Glmsa J, SchneHe % Zechel G and Glaser R 1994 Diekctric-spectroscopy of human erythrocytes—im stigalions
under the inlluence oim ^ M m B m pbys.J . 66 1244-53 Omen H G and Morgan H 1999 Dielectrophoresis o f subniicrometer latex spheres. L Experimental results/. Phys.
CAemr. 8:0341-50Griffith A W and Cooper J M 1998 Single-œil measurements o f human neutrophil activation using eicclrorotation
Anof. CAem. 70 2607—12Huang Y, Holza R, Pethig R and %ng X B 1992 DilTcrences in the ac electrodynamics of viable and nonviable
yeast-cells determined through combined dielcctrophoresis and electrorotation studies Phys. Med. Bioi. 37 1499-517
Huiuig Y, Wang X-B, Becker F F and Gascoyne PRC 1996 Membrane changes associated with the temperature- sensitivB W5^™-dependent transformation of rat kidney cells as detaroiiMd by dielectrophoreris and electroroiatton Bi&chim. Biophys. Acta. 1282 76-84
Htlbner Y, Hoettges K F and Hughes M P 2003 Rapid assessment of toxic effects in algae by dieleetmphoresis / . Emirafh Manit. 5 861-4
Hughes M P aXXZ AFaMoekctromeckamcx m f a n d Biofogy (Boca Raton. FL: CRC Press)Hughes M P, Hoettges K F, Ogin S L and Whattingham R 2003 Device for dielectrophoretic manipulation of particles
' ArfenrGB/0304720.6 "johari J, HatxierY, Hull J, Dde j W and Hughes M P2003 Dielectrophoretic assay ofbacterial resistance toanffbir ics
PAys. AW. BW. 48X193-6 Jones T B 1995 Ekrtrr mictVwmics qf AMHar (CamWdge: Cambridge Universily Press)Labeed F H, Coley H M Thomas H and Hughes M P 2003 Assessment o f multidnig resistance reversal using
dieleetmphoresis and flow cytometry Brnphy.';. J. 85 2028-34 Labixd F H, Coley H M, Thomas H and Hu]^es M P2005 Changes in the cytoplasm of apoptotic cells am okenned
by dklectrophorcsis Biopbys, J. submitted Maritx G H, Talmy M S and Pethig R 1994 Separation of viable and rmnviable yeast using diclectTt#on%is
J, Bloteehno!. 32 29-37Morgan H, Hughes M P and Green N G 1999 Separation of sub-micron pmtides by dielectrophoresis Biaphys.J. 77
516-25 ^RatanKhoo K, Gascoyne P R C and Ruchirawat M 2002 Detection of cellular responses to toxicants by
diekctrophorcsis Biochim. Biophys. Acta 1564 449-58 Stephens M et a! 1996 The dielectrophoretic enrichment of CD34(-f) cells from peripheral blood stem cell harvests
Bone .Marrow Tran.^p!. 18 777-82 Talary M S and Pethig R 1994 Optical technique for measuring the positive and negative dielectrophoretic behavior
o f cells and colloidal suspcnsians !EE Prac. Sci. Mea. . Tech. 141 395-9 Wang X, Becker F F and Gascoyne P R C 2002 Membrane dielectric changes indicate induced apoplosis in HL-60
cells more sensitively than surface phosphatidylscrine expression or DMA fragmentation Biochim. Blophys. Acta 1564412-20
Yang J et a l 1999 Dielectric properties o f human leukocyte subpopulations detennined by electrorotation as a cell separation criterion Biophys. J. 76 3307-14
Zimmermann Ü and Neil G A 1996 Eketratiianipukitio/i of Cells (Boca Raton, FL: CRC Press)
Page 1 220