
Middlesex University Research Repository
228
Middlesex University Research Repository An open access repository of Middlesex University research Raheem, Rand (2016) Interference management and system optimisation for Femtocells technology in LTE and future 4G/5G networks. PhD thesis, Middlesex University. [Thesis] Final accepted version (with author’s formatting) This version is available at: Copyright: Middlesex University Research Repository makes the University’s research available electronically. Copyright and moral rights to this work are retained by the author and/or other copyright owners unless otherwise stated. The work is supplied on the understanding that any use for commercial gain is strictly forbidden. A copy may be downloaded for personal, non-commercial, research or study without prior permission and without charge. Works, including theses and research projects, may not be reproduced in any format or medium, or extensive quotations taken from them, or their content changed in any way, without first obtaining permission in writing from the copyright holder(s). They may not be sold or exploited commercially in any format or medium without the prior written permission of the copyright holder(s). Full bibliographic details must be given when referring to, or quoting from full items including the author’s name, the title of the work, publication details where relevant (place, publisher, date), pag- ination, and for theses or dissertations the awarding institution, the degree type awarded, and the date of the award. If you believe that any material held in the repository infringes copyright law, please contact the Repository Team at Middlesex University via the following email address: [email protected] The item will be removed from the repository while any claim is being investigated. See also repository copyright: re-use policy:
-
Upload
khangminh22 -
Category
Documents
-
view
0 -
download
0
Transcript of Middlesex University Research Repository

Middlesex University Research RepositoryAn open access repository of
Middlesex University research
http://eprints.mdx.ac.uk
Raheem, Rand (2016) Interference management and system optimisation for Femtocellstechnology in LTE and future 4G/5G networks. PhD thesis, Middlesex University. [Thesis]
Final accepted version (with author’s formatting)
This version is available at: https://eprints.mdx.ac.uk/21255/
Copyright:
Middlesex University Research Repository makes the University’s research available electronically.
Copyright and moral rights to this work are retained by the author and/or other copyright ownersunless otherwise stated. The work is supplied on the understanding that any use for commercial gainis strictly forbidden. A copy may be downloaded for personal, non-commercial, research or studywithout prior permission and without charge.
Works, including theses and research projects, may not be reproduced in any format or medium, orextensive quotations taken from them, or their content changed in any way, without first obtainingpermission in writing from the copyright holder(s). They may not be sold or exploited commercially inany format or medium without the prior written permission of the copyright holder(s).
Full bibliographic details must be given when referring to, or quoting from full items including theauthor’s name, the title of the work, publication details where relevant (place, publisher, date), pag-ination, and for theses or dissertations the awarding institution, the degree type awarded, and thedate of the award.
If you believe that any material held in the repository infringes copyright law, please contact theRepository Team at Middlesex University via the following email address:
The item will be removed from the repository while any claim is being investigated.
See also repository copyright: re-use policy: http://eprints.mdx.ac.uk/policies.html#copy

I
A thesis submitted in partial fulfilment of the requirements for the degree of Doctor of Philosophy (PhD)
School of Science and Technology
Middlesex University
United Kingdom
By
Rand Hussein Raheem
Supervised by
Prof. Aboubaker Lasebae
Dr. Mahdi Aiash
Prof. Jonathan Loo
March 2016
Interference Management and System
Optimisation for Femtocells Technology in LTE
and Future 4G/5G Networks

II
Abstract
Femtocells are seen to be the future of Long Term Evaluation (LTE) networks to
improve the performance of indoor, outdoor and cell edge User Equipments (UEs). These
small cells work efficiently in areas that suffer from high penetration loss and path-loss to
improve the coverage area. It is said that 30% of total served UEs in LTE networks are
vehicular, which poses challenges in LTE networks due to their high mobility, high vehicular
penetration loss (VPL), high path loss and high interference. Therefore, self-optimising and
dynamic solutions are required to incorporate more intelligence into the current standard of
LTE system. This makes the network more adaptive, able to handle peak data demands and
cope with the increasing capacity for vehicular UEs.
This research has drawn a performance comparison between vehicular UEs who are served
by Mobile-Femto, Fixed-Femto and eNB under different VPL scales that range between
highs and lows e.g. 0dB, 25dB and 40dB. Deploying Mobile-Femto under high VPLs has
improved the vehicular UE Ergodic capacity by 1% and 5% under 25dB and 40dB VPL
respectively as compared to other eNB technologies. A noticeable improvement is also seen
in signal strength, throughput and spectral efficiency.
Furthermore, this research discusses the co-channel interference between the eNB and the
Mobile-Femto as both share the same resources and bandwidth. This has created an
interference issue from the downlink signals of each other to their UEs. There were no
previous solutions that worked efficiently in cases where UEs and base stations are mobile.
Therefore, this research has adapted an efficient frequency reuse scheme that worked
dynamically over distance and achieved improved results in the signal strength and
throughput of Macro and Mobile-Femto UE as compared to previous interference
management schemes e.g. Fractional Frequency Reuse factor1 (NoFFR-3) and Fractional
Frequency Reuse factor3 (FFR-3).
Also, the achieved results show that implementing the proposed handover scheme together
with the Mobile-Femto deployment has reduced the dropped calls probability by 7% and the
blocked calls probability by 14% compared to the direct transmission from the eNB.
Furthermore, the outage signal probabilities under different VPLs have been reduced by 1.8%
and 2% when the VPLs are 25dB and 40dB respectively compared to other eNB
technologies.

III
To my parents, for all their love, kindness and sacrifice,

IV
Acknowledgements
The quest for a PhD has indeed been a long one! I thank Allah first for His abundant
blessings, and for blessing me in particular with the opportunity to pursue a doctorate. I
thank Him for supporting me in the face of challenges with His Mercy and Guidance, and for
facilitating the completion of this thesis.
First of all, I would like to thank my Director of Studies Prof. Aboubaker Lasebae and
supervisors Dr. Mahdi Aiash and Prof. Jonathan Loo for their invaluable guidance,
encouragement, cooperation and support over the years. I thank Middlesex University for
giving me the opportunity to do PhD and be one of its students.
Among family and friends, I would like to thank my parents (Prof. Hussein Mustafa and Prof.
Ibtisam Al-Dourie) for their love and for being so patient and supportive in every way
possible. I would like to thank them in particular for ensuring that I keep smiling even during
the tough times I had. Their faith in my ability and their constant encouragement to explore
new horizons helped bring out the best in me and I remain indebted to them for this.

V
Table of Contents
Abstract………………………………………………………………………………...
Acknowledgments……………………………………………………………………...
Table of Contents………………………………………………………………………
List of Figures………………………………………………………………………….
List of Tables…………………………………………………………………………...
List of Abbreviations …………………………………………………………………..
List of Publications ……………………………………………………………………
II
IV
V
VIII
XI
XII
XVI
1. Introduction……………………………………………………………………
1.1 Motivation towards small cells…………………………………………….
1.2 Challenges………………………………………………………………….
1.3 Aims of research……………………………………………………………
1.4 Contributions……………………………………………………………….
1.5 Thesis Outline………………………………………………………………
1
1
6
8
11
13
2. General Overview about Small Cells in Next Generation Networks…………
2.1 Introduction to LTE architecture………………………...…………………
2.2 Macrocell technologies…………………………………………………….
2.3 Femtocell Technologies……………………………………………………
2.3.1 Access Mechanisms…………………………………………………..
2.3.1.1 Close Access…………………………………………………
2.3.1.2 Open Access………………………………………………….
2.3.1.3 Hybrid Access………………………………………………..
2.4 Technical challenges…………………………………………………….....
2.4.1 Penetration Loss, LTE Fading and Path-Loss..………………………
2.4.2 Interference…………………………………………………………...
2.4.3 Mobility…………………………………………………………........
2.5 Summary.……………………………………………………………………
16
16
19
19
21
21
22
22
23
24
27
28
29
3. Research Methodology………………………………………………………...
3.1 Simulator Structure…………………………………………………………
31
32
VI
3.2 Simulator Development…………………………………………………….
3.3 Simulator Description………………………………………………………
3.4 Summary……………………………………………………………………
35
36
38
4. Fixed & Mobile Femtocells’ Performance Evaluation……………………….
4.1 Introduction to Mobile-Femtocell networks…………………….…………
4.2 Related work………………………………………………………………
4.2.1 LTE Vehicular UEs Penetration Loss………………………………..
4.2.2 Vehicular UEs Performance………………………………………….
4.2.3 Interference………………………………………………………….
4.2.4 Mobility………………………………………………………………
4.3 Vehicular UEs performance analysis in LTE network………………….....
4.3.1 System Model……………………………………………………….
4.3.2 Fixed & Mobile Femtocells scenarios in LTE Macrocell……….......
4.3.2.1 Macrocell (eNB)-Vehicular UEs scenario……………………..
4.3.2.2 Fixed Femtos-Vehicular UEs scenario…………………………
4.3.2.3 Mobile-Femto-Vehicular UEs scenario………………………...
4.3.3 Results and discussion……………………………………………….
4.4 Summary …………………………………………………………………...
40
40
43
44
45
49
54
58
59
73
74
74
75
76
83
5. Interference Management for Co-Channel Femtocells Technology………….
5.1 Introduction to LTE-Femto Interference …………………………………..
5.2 Interference management…………………………………………………..
5.3 Coverage Optimisation……………………………………………………..
5.4 Transmission Power control………………………………….…………….
5.5 Proposed scheme…………………………………….……………………..
5.6 The proposed scheme (System Performance analysis)…………………….
5.7 Results and discussion……………………………………………………..
5.7.1 Simulated Results……………………………………………….....
5.7.1.1 Scenario 1: Fixed-Femtos with vehicular UEs………………...
5.7.1.2 Scenario 2: Mobile-Femtos with vehicular UEs……………….
5.7.1.3 The Simulated results of the proposed interference scheme…...
5.8 Summary …………………………………………………………………..
84
84
86
88
91
93
100
105
106
107
111
115
120

VII
6. Mobility Management in LTE/Mobile-Femto Networks……………………..
6.1 Introduction to LTE Mobility……………………………………………..
6.2 The Proposed HO procedure……………………………………………..
6.3 Outage probability………………………………………………………..
6.4 Results and Discussion……………………………………………………
6.5 Summary …………………………………………………………………
121
121
124
134
141
154
7. Conclusion and Future work ...…………………………………………..…...
7.1 Conclusions…………………………………………………………………
7.1.1 Performance Evaluation...……………………………………………
7.1.2 Interference Management Schemes Evaluation...……………………
7.1.3 Mobility Management Evaluation…………………………………...
7.2 Future work…………………………………………………………………
7.2.1 Downlink Interference………………………………………………..
7.2.2 Uplink Interference..……………………………………………........
155
155
156
157
159
162
165
165
8. References…………………………………………………………………….. 166
Appendices……………………………………………………………………….
Appendix A: Mobile-Femto implementation…………………………………….
Appendix B: Mobile-Femto configuration………………………………………
Appendix C: Mobile-Femtos scheduling process……………………………….
Appendix E: Microcell NLOS path-loss, which is based on the COST 231
Walfish-Ikegami NLOS model…………………………………………………..
Appendix F: MobileFemto Handover Process…………………………………..
Appendix G: Mobile-Femto.m file plus the Handover process………………….
183
183
184
185
187
190
192

VIII
List of Figures
Page
Fig 1.1 Key challenges to the evolution of LTE 1
Fig 1.2 LTE small base stations 3
Fig 1.3 Spectrum Allocation between Macrocell and Femtocell 4
Fig 1.4 LTE architecture after deploying the Femtocells 6
Fig 1.5 LTE Data Explosion challenges 7
Fig 1.6 LTE stack protocol
11
Fig 2.1 Outdoor and Indoor Femtocells 20
Fig 2.2 Different access control mechanisms in Femtocell network 21
Fig 2.3 Vehicular UEs fading issue 25
Fig 2.4 Large and small-scale fading 26
Fig 2.5 Non-faded vs. faded signal 26
Fig 2.6 Fading influence on the signal quality 26
Fig 2.7 Fading Components 27
Fig 2.8 Co-channels interference scenarios
28
Fig 3.1 Schematic block diagram of LTE System Level Simulator 34
Fig 3.2 Mobile-Femto implementation
36
Fig 4.1 Fixed and Mobile Femtocell Technologies 41
Fig 4.2 Mobile Femtocell architecture with its layering system 42
Fig 4.3 eNB, Fixed-Femto and Mobile-Femto system model architecture 60
Fig 4.4 Time sharing strategy for Fixed and Mobile Femtos in LTE system 60
Fig 4.5 Proportional fair scheduler for UEs in LTE network 62
Fig 4.6 Vehicular and mobile UEs served by the Macrocell 74
Fig 4.7 Vehicular and Mobile UEs served by the Fixed-Femtos 75
Fig 4.8 Vehicular UEs served by Mobile-Femtos 75
Fig 4.9 The Ergodic Capacity when the VPL = 0 dB 77
Fig 4.10 The Ergodic Capacity when the VPL = 25 dB 77
Fig 4.11 The Ergodic Capacity when the VPL = 40 dB 78
Fig 4.12 Average spectral efficiency of vehicular UEs at VPL=25dB 80
IX
Fig 4.13 Average vehicular UEs throughput at VPL=25dB 81
Fig 4.14 Antenna gains of the eNB and the Femtocell 82
Fig 4.15 SINR of vehicular UEs at VPL=25dB
83
Fig 5.1 Different interference scenarios 87
Fig 5.2 Summarisation of three interference scenarios 94
Fig 5.3 The proposed interference management scheme based on the FFR 96
Fig 5.4 Inner Cell radius 98
Fig 5.5 NoFFR-3(left) and FFR-3(right) 104
Fig 5.6 Microcell path-loss 106
Fig 5.7 Fixed-Femtos coverage distribution when the transmission power is
24dBm and VPL is 25dB
107
Fig 5.8 Fixed-Femtos Sector SINR, calculated with distance dependent
Microcell path-loss (left) while (right) represents the distributed space
correlation with shadow fading
108
Fig 5.9 Fixed-Femtos Sector Spectral efficiency with distance dependent
Microcell path-loss (left) while (right) represents the distributed spectral
efficiency correlation with shadow fading
109
Fig 5.10 Microcell path-loss of eNBs and Fixed-Femtos 110
Fig 5.11 Mobile-Femtos coverage distribution 112
Fig 5.12 Mobile-Femtos Sector SINR, calculated with distance dependent
Microcell path-loss (left) while (right) represents the distributed space
correlation with shadow fading
113
Fig 5.13 Mobile-Femtos Sector Spectral efficiency with distance dependent
Microcell path-loss (left) while (right) represents the distributed spectral
efficiency correlation with shadow fading
113
Fig 5.14 Microcell path-loss of eNBs and Mobile-Femtos 114
Fig 5.15 Average Throughput of Macro UEs located in centre and edge zones as
the number of Mobile-Femto varies
116
Fig 5.16 Total Throughput of Macro and Mobile-Femto UEs located only in the
edge zone as the number of Mobile-Femto varies
117
Fig 5.17 Total throughput of Macrocell and Mobile-Femto UEs in the entire
Macrocell as the number of Mobile-Femto varies
118

X
Fig 5.18 Outage Probability of Macro and Mobile-Femto UEs based on the
SINR threshold that varies when 30 Mobile-Femtos are deployed in the
Macrocell
119
Fig 6.1 Heterogeneous networks 122
Fig 6.2 Handing over Mobile-Femtos between Macrocells 124
Fig 6.3 Group HO of Mobile-Femto UEs 125
Fig 6.4 Mobile-Femtos HO from serving eNB to target eNB 128
Fig 6.5 Connection establishment in the worst-case traffic 130
Fig 6.6 Connection establishment for new vehicular UEs 131
Fig 6.7 Vehicular UEs HO process from eNB to Mobile-Femto 132
Fig 6.8 Vehicular UE connection probabilities 135
Fig 6.9 Important Mobility Terms in Mobile Communication Environment 140
Fig 6.10 SINR received from eNB, Fixed-Femto and Mobile-Femto 142
Fig 6.11 Uplink throughput of vehicular UE before and after deploying
Femtocells
143
Fig 6.12 Outage Probability when the VPL= 0 dB 145
Fig 6.13 Outage Probability when the VPL= 25 dB 146
Fig 6.14 Outage Probability when the VPL= 40 dB 147
Fig 6.15 Drop Calls Probability vs. Distance from the BS 150
Fig 6.16 Dropping Calls probability vs. Call Duration 151
Fig 6.17 Block Calls Probability vs. No. of channels 152
Fig 6.18 Block Call Probability vs. Traffic Load
158
Fig 7.1 An example of a coordinated Mobile-Femtos system 163
Fig 7.2 DL Interference 165
Fig 7.3 UL Interference scenarios
165

XI
List of Tables
Page
Table 3.1 Simulation parameters
38
Table 5.1 Comparison between the proposed and previous schemes 104
Table 5.2 Fixed-Femto simulated parameters 110
Table 5.3 Mobile-Femto simulated parameters
114
Table 6.1 Detailed simulated parameters of Outage Probability scenarios 144

XII
List of Abbreviations
3GPP 3rd
Generation Partnership Project
AAA/HSS Authentication, Authorisation & Accounting/ HSS
ANL Access Network Layer
AP Access Point
AuC Authentication Centre
BCP Block Calls Probability
BER Bit Error Rate
BLER Block Error Rate
BNL Bus network Layer
BS Base Station
BW Bandwidth
CA Carrier Aggregation
CAC Call Admission Control
CCEs Control Channel Elements
CCI Co-Channel Interference
CDMA Code Division Multiple Access
C/I Carrier-to-Interference Ratio
CL Convergence Layer
CN Core Network
CoMP Coordinated Multipoint
CP Cyclic Prefix
CQI Channel Quality Indicator
CSI Channel State Information
CSMA Carrier Sense Multiple Access
DF Decode and Forward
DL Downlink
DCP Drop Calls Probability
DSL Digital Subscriber Line
ECDF Empirical Cumulative Distribution Function
eNB Evolved Node B
EPS Evolved Packet System

XIII
E-RAB E-UTRAN Radio Access Bearer
E-UTRAN Evolved Universal Terrestrial Radio Access Network
FFR Fractional Frequency Reuse
FRN Fixed Relay Node
GERAN GSM/EDGE Radio Access Network
GPRS General Packet Radio Service
GSM Global System for Mobile communications
HLR Home Location Register
HO Handover
HSPA High-Speed Packet Access
HSS Home Subscriber Server
HST High Speed Train
HTTP Hyper Text Transfer Protocol
ICI Inter-Carrier Interference
ICIC Inter-Cell Interference Coordination
IFR Integer Frequency Reuse
IMS IP Multimedia Subsystem
IP Internet Protocol
LOS Line Of Sight
LTE Long Term Evolution
MAC Media Access Control
MCS Modulation & Coding Scheme
MIMO Multi-antenna Multiple-Input Multiple-Output
MME Mobility Management Entity
MNO Mobile Network Operator
MRN Mobile Relay Node
NAS Non Access Stratum
NBS Nash Bargaining Solution
NLOS None-Line Of Sight
OAM Operations, Administration and Maintenance
OFDM Orthogonal Frequency Division Multiplexing
OFDMA Orthogonal Frequency Division Multiplexing Access
OOP Object-Oriented Programming

XIV
PDCP Packet Data Convergence Control
PDN-GW Packet Data Network-Gateway
PMI Pre-coding Matrix Indicator
PRB Physical resource Block
PF Proportional Fair
QAM Quadrature Amplitude Modulation
QoS Quality of Service
QPSK Quadrature Phase Shift Keying
RACH Random Access Channel
RAN Radio Access Network
RF Radio Frequency
RI Rand Indicator
RLC Radio Link Control
RNL Radio Network Layer
ROI Region Of Interest
RRC Radio Resource Control
RRM Radio Resource Management
RSS Received Signal Strength
SC-FDMA Single Carrier-Frequency Division Multiplexing Access
SCM Spatial Channel Model
SDU Service Data Unit
SFR Soft Frequency Reuse
SGW Serving Gateway
SGSN Serving GPRS Support Node
SINR Signal to Interference plus Noise Ratio
SIR Signal to Interference Ratio
SMS Short Message Service
SNR Signal to Noise Ratio
TB Transport Block
TDMA Time Division Multiple Access
TLPC Two Level Power Control
TNL Transport Network Layer
TTI Transmission Time Interval

XV
TTT Time To Trigger
TVWS TV White Space
UE User Equipment
UL Uplink
UMTS Universal Mobile Telecommunications System
UTRAN Universal Terrestrial Radio Access Network
VPL Vehicular Penetration Loss
WCDMA Wideband Code Division Multiple Access
WiMAX Worldwide Interoperability for Microwave Access
WLAN Wireless Local Area Network

XVI
List of Publications
[1] R. Raheem, A. Lasebae, M. Aiash and J. Loo, “Mobile Femtocell Technology in LTE
Networks”, in proc. of School of Science and Technology -Summer Conference, Middlesex
University, London, United Kingdom, 2013.
[2] R. Raheem, A. Lasebae, M. Aiash and J. Loo, “From Fixed to Mobile Femtocells in LTE
systems: Issues & Challenges”, in proc. of the IEEE 2nd
International Conference on Future
Generation Communication Technologies (FGCT-2013), London, United Kingdom, 2013.
[3] R. Raheem, A. Lasebae and J. Loo, “Performance Evaluation of LTE network via using
Fixed/Mobile Femtocells”, in proc. of the IEEE 28th
International Conference on Advanced
Information Networking and Applications (AINA-2014), Victoria, Canada, 2014.
[4] R. Raheem, A. Lasebae and J. Loo, “Mobility Management in LTE/Mobile Femtocell
Networks: Outage Probability and Drop/Block Calls probability”, in proc. of the IEEE 3rd
International Conference on Emerging Research Paradigms in Business and Social Sciences
(ERPBSS-2015), Dubai, United Arab Emirates, 2015.
[5] R. Raheem, A. Lasebae and J. Loo, “Interference Management for Co-Channel Mobile
Femtocells Technology in LTE Network”, in proc. of the IEEE 12th
International Conference
on Intelligent Environments (IE’16), London, United Kingdom, 2016.
[6] R. Raheem, A. Lasebae, M. Aiash and J. Loo, “Performance Evaluation of Mobile Users
Served by Fixed and Mobile Femtocells in LTE Networks”, in proc. of the International
Journal of Network Technology, 2016. (Invited Journal)
[7] R. Raheem, A. Lasebae, M. Aiash and J. Loo, “Mobility Management for Vehicular User
Equipment in LTE/Mobile Femtocell Networks”, in proc. of the International Journal of
Information Systems in the Service Sector (IJISSS), 2016. (Invited Journal)
[8] R. Raheem, A. Lasebae, M. Aiash and J. Loo, “Mobile Femtocells utilisation in LTE
vehicular Environment: Penetration Loss and Path Loss Elimination”, in proc. of ELSEVIER
Journal on Vehicular Communications, 2016.

1
Chapter 1: Introduction
1.1 Motivation towards small cells
With the increasing number of users and applications, changes are required in any
technology to cope with the users’ needs. In the past, mobile communication networks were
dominated by phone calls and data transfer requirements with limited number of users, while
a few years ago, emails, web pages, data files and applications dominated these networks as
well as the increased number of users who require to be connected to the Internet everywhere
and at any time. This has led to a huge growth in the amount of data and pressure on the
network operators that are trying to transfer data across mobile communication networks. In
response to this problem, network operators have greatly increased the capacity of the mobile
communication networks. One way of achieving this is by improving the used technology so
that information between mobile phones and the Base Stations (BSs) can be transmitted and
received faster than ever before. Therefore, Long Term Evolution (LTE) technology was
associated to releases 8 and 9, and now LTE- Advanced supports wider Bandwidths (BWs)
with low latencies to maximise the data rate and provide better Quality of Service (QoS) to
end User Equipments (UEs). In addition, advance modulations techniques are used, such as
64 QAM, to support high data rates with multiple services that will open the door towards 5G
Networks and onwards. However, these high data rates may cause high traffic load and
burden on the serving evolved Node B (eNB) that may take the whole network down as
Figure 1.1 shows.
Fig 1.1 Key challenges to the evolution of LTE

2
Therefore, it was required to come up with small BSs to improve the network capacity and to
offload the load from the eNB to these small BSs.
Besides, LTE high penetration loss has created an obstacle for those indoor UEs to be
connected to the outdoor BSs. Hence, Femtocells have been deployed as a solution to
mitigate the LTE high penetration loss in an indoor environment like houses, offices, small
organisations to meet the users’ needs. The main concern here is the cell-edge vehicular UEs
who suffer from high penetration loss, high path-loss and high interference. Due to high
mobility of vehicular UEs, deploying fixed Femtocells may not be a reasonable solution for
vehicular environments as the excessive penetration loss and the unnecessary number of HOs
play an important role. The European 5G project (METIS) predicts that by 2020, a large
number of mobile UEs will be vehicular. The number of those vehicular UEs will be 50
active vehicular UE devices per bus while up to 300 active vehicular UE devices per train
[5GNow, 2015]. This has created a significant motivation towards improving the
performance of cell-edge vehicular UEs inside public transportations like buses & trains,
reducing dropped/blocked calls and outage probabilities and mitigating the interference in
LTE and 5G Networks. Thus, an efficient technology for LTE cell-edge vehicular users is
required as the performance of those UEs in LTE network has been always a motivation for
many researches to improve their connection and data rates [Fujitsu, 2011], [Kokkoniemi et
al, 2013] and [Anjum et al., 2014]. The previous motivations were the enlightenments for
many technologies to be developed like; Relay nodes, Femtocells, Pico-cells and Microcells
to improve the end UE connection for indoor environments. While a few studies have
considered the vehicular environment as a challenge to improve the end vehicular UEs’
connection and performance as Figure 1.2 shows [Sui et al., 2013].

3
Fig 1.2 LTE small base stations
Moreover, the growth in traffic requires an improvement in the spectrum and its efficiency in
order to cope with the increased number of small mobile cells. The latter will help in
increasing the network density and decreasing the load burden on the Macrocell (eNB) as
stated before. This provides a strong motivation for developing Femtocells and provides
short-range coverage. Needless to say that, the most typical deployment of Femtocells is the
co-channel deployment where the same carriers are shared between the Femtocell and the
Macrocell as Figure 1.3 shows. Consideration must be taken into account here to overcome
the interference issue in co-channel deployment, which cannot be mitigated efficiently by
traditional network planning techniques [An et al., 2012]. Several studies have proved that
vehicular UEs are more affected by interference, dropped calls and unnecessary number of
Handovers (HOs) [Sui et al., 2015]. Therefore, managing interference in a shared spectrum
makes mobile broadband sustainable and ensures that data throughput is improved with low
signals leakage so that each UE gets the most BW without the need for manual intervention
[Saunder, 2012]. For that reason, two motivations toward interference scenarios can be seen
here; firstly interference between eNB and Femtocell and secondly interference between
Femtocell and another nearby Femtocell. Solving the interference problem in these two
scenarios has the positive impact on the spectral efficiency and the throughput improvement.

4
Fig 1.3 Spectrum Allocation between Macrocell and Femtocell
However, since the aim of heterogeneous networks is to improve the spectral efficiency per
unit area by deploying Microcells, Pico-cells, Femtocells and Relay nodes in one mixture
[Rohde et al., 2013], the users’ mobility is considered as a challenge among all the previous
technologies. This is because those UEs are more affected by the high number of unnecessary
HOs as well as link variation and failures. Therefore, the goal is to introduce an efficient
mobility management scheme to improve and support seamless mobility between the
Macrocell and the other small cells. In this framework, new rules are necessary to support the
processes of HO and link adaption that requires the measurement of the signal’s strength and
quality during the UE mobility as well as the presented BS mobility. One of these rules is
group HO procedure for all those UEs inside the vehicle when handing over the mobile BS
from one Macrocell to another. Several challenges will be considered here like the HO
process, resource allocation, dropping calls probability, outage probability and other UEs
performance requirements.
While the following represents why the motivation of this research is toward Femtocell and
not towards any other small cells technologies e.g. Pico-cells, Microcells, Wi-Fi, Relay
nodes, mobile router among many others. The common factor in all these approaches to small
cells is that they are centrally managed by Mobile Network Operators (MNOs). These small
cells provide a small radio footprint, which can range from 10 meters within urban and in-
building locations to 2 km for a rural location [Jighi, 2015]. Pico-cells and Microcells can
also have a range of a few hundred meters to a few kilometres; however, their drawback is
that they do not always have self-organising and self-management capabilities like
Femtocells [Qualcomm, 2015]. While Wi-Fi is a small cell but does not operate in a licensed
spectrum; therefore, cannot be managed as effectively as the Femtocells that are utilising

5
licensed spectrum. Where the Relay node has limited capability to cope with the increasing
number of UEs, limited battery life that would serve few numbers of UEs and its architecture
is complex to be incorporated with the LTE and 5G Networks architecture. In addition, it has
limited coverage area that could be a solution for the interference, but it raises other issues
e.g. the unnecessary HOs issue and the HO time delay [Radio-Electronics.com, 2015].
However, the drawbacks in the case of the mobile router are: it drains the battery life of the
UEs’ devices, it often has strict data limit as well as it is an expensive choice to be deployed
[4G.co.uk, 2015]. While the Femtocell saves the battery life of the mobile device as it has
higher data capacity than any other technology. Moreover, the Femtocells coordinate their
communication in a cooperative manner with other Femtocells whereas Wi-Fi Access Points
(APs) have to compete with other radios operating in un-licensed band. Furthermore,
Femtocells operate in the licensed spectrum band for cellular service providers that cause less
interference for other BSs [Chowdhury et al., 2011]. It can provide high Quality of Service
(QoS) and it does not require the use of dual-mode terminal, whereas Wireless Local Area
Network (WLAN) requires dual mode terminal. Besides that, Wi-Fi LAN does not provide a
good QoS for voice communication because of the CSMA MAC (Carrier Sense Multiple
Access/ Media Access Control) [Suryana, 2012]. All these drawbacks created a strong
motivation towards using mobile Femotcell technology to improve the performance of
vehicular UEs since the architecture of this technology is compatible with the architecture of
LTE network where UEs require no new equipments [Germano et al., 2010].
Thus, after discussing the advantages that Femtocells have brought to the Macrocell coverage
over other technologies, it is important now to highlight the incorporation of Femtocells with
the LTE architecture as Figure 1.4 shows. The figure illustrates that Femtocells can be
connected to the Mobility Management Entity/Serving Gateway (MME/S-GW) either by
having its own gateway or by sharing the same gateway with the eNB [Femtoforum, 2015].
An indoor UE can make a voice call after being connected wirelessly to any nearby
Femtocell. Then the Femtocell will automatically route the voice transmission through the
Femtocell rather than the nearest eNB. Afterwards, it will send the voice data through the
home cable or Digital Subscriber Line (DSL) modem to its destination, which enables the UE
to send voice data over Internet Protocol (IP) with less cost. However, it is important to state
that the eNBs are interconnected with each other by means of the X2 interface while they are
connected by the S1 interface to the EPC (Evolved Packet Core). The eNB connects to the
MME by means of the S1-MME interface and to the S-GW by means of the S1-U interface.

6
The S1 interface supports a many-to-many relation between MMEs/S-GW and eNBs. It is
also used to connect the Femtocells to the EPC.
Fig 1.4 LTE architecture after deploying the Femtocells [Femtoforum, 2015]
However, in any technology there are couple of challenges to be considered by researchers in
order to meet the UEs’ needs and improve the system capacity. Therefore, the next section
demonstrates some of these challenges.
1.2 Challenges
With the evolution of communication services and wireless diversity, mobile networks
require to support the increasing demands in order to provide UEs with better QoS. The LTE
ecosystem for the next decade is expected to meet the market demands with a wide range of
services with multiple devices, higher capacity and coverage areas [Nokia Siemens Networks
Corporation, 2010] and [Brydon, 2014].
The evolution of LTE networks created many obstacles that are required to be considered
continuously such as LTE high penetration losses and traffic loads. The high traffic loads
occur because of the many applications with high data throughput that are required to be
handled in a much more efficient way as Figure 1.5 shows [Huawei, 2012]. This may not be a
big issue in the case of the fixed and slow mobility UEs while it may be a concern in the case
of the vehicular UEs since the later is more affected by the high penetration loss, path-loss,

7
interference and mobility. However, addressing these issues will be the evolution towards
developing 5G Networks.
Fig 1.5 LTE Data Explosion challenges
Having fixed Femtocells have helped the network in expanding the coverage areas of indoors
environment and overcoming the issue of high penetration loss. This also has helped in
improving the performance of those indoor users in LTE and future networks. While the
challenge here is still the quality of connection and performance of vehicular UEs in outdoor
environment such as public transportations like buses. This meant that the ability of having
outdoor Femtocells to serve vehicular UEs in buses has become a concern in every research.
Therefore, this research reviews the impact of having fixed Femtocells to serve outdoor
vehicular UEs. It also examines the need of having an efficient technology that serves the
vehicular UEs from inside the vehicle and aims to improve the throughput and Signal to
Interference plus Noise Ratio (SINR) while ultimately reducing dropping and blocking calls
probabilities and outage probability. The technology needs to satisfy the users’ needs and
reduce the traffic load on the eNB. With the increased number of UEs and signalling, the
serving cell assigns the UEs to the ‘always online’ state which means a longer connection
time and hence dynamic scheduling, dynamic resource allocation and mobile BSs are
becoming necessity to improve the quality of connection of those vehicular UEs [Martin et
al., 2012].
Moreover, there are various forms of interference that are a matter of major concern as they
make the LTE and 5G systems vulnerable, which in turn may cause communication failures
or could take down the whole network [Rohde et al., 2014]. One of these interference forms

8
is the co-channel interference originating from the presented Femtocell (Mobile-Femto) with
the nearby eNB and the second interference form is the co-tier interference between the
Mobile-Femto and nearby Mobile-Femto. To mitigate this issue, the impact of transmission
power and network deployment has been tackled in this research to evaluate the need of
having an efficient frequency reuse scheme. This dynamic technique dose not waste
frequency since the same frequency can be reused several times over distance to mitigate the
generated interference.
Furthermore, the drawback in introducing the Femtocell as a solution to improve the
performance of vehicular UEs is that with the large number of deployed Femtocells in the
Macrocell, the number of unnecessary HOs would increase especially when the vehicular
UEs move away from the coverage area of one Femtocell to the other. Besides that, the
system’s improved performance must be guaranteed under different mobility conditions and
the HO process is then a very important factor to maintain the connection between the UE
and the BS in LTE and future networks. For that reason and in order to improve the network
performance it is very important to avoid any extra activity that may put the network under
unnecessary operations like performing unnecessary HOs in a very short time by transmitting
the signalling data over a short period of time within a short distance [Sui et al., 2013]. If the
UE is in a high mobility state (Vehicular UE) the impact of signalling caused by high
mobility may cause radio link failure and affect other service characteristics. Therefore, to
overcome this issue mobile Femtocell technology has been presented to maintain the
connection of those vehicular UEs in an efficient way.
Addressing these challenges was therefore the main drive of this research as Femtocell
technology and methods are required to improve the existing networks and smart phones’
performance to meet the growing demands for data and subscribers.
1.3 Aims of research
The aim of this research is to study the LTE standard and provide comprehensive
solutions to mitigate outlined challenges that can be overcome in 5G and future networks. In
an LTE system and due to technology evolution, it is required to introduce self-optimising
and dynamic solutions to endow the current standard with more intelligence. This will make
the network more adaptive and able to handle peak data demands and cope with the
increasing capacity requirements especially in the case of the vehicular UEs who are

9
considered as a significant percentage in LTE networks. Additionally, by 2020 it is predicted
that this percentage will be increased especially with the evolution of 5G Networks [5GNow,
2015]. Thus, the following are the three addressed objectives:
The first part of this research investigates the performance of LTE vehicular UEs
before and after deploying the Femtocells technology into the Macrocells in an open
access environment when the penetration loss ranges between lows and highs. Since
vehicular UEs are considered as a significant percentage in LTE and future networks,
their QoS and quality of connection has been studied and investigated to improve
their performance. A comparison has been drawn in term of vehicular UEs before and
after deploying the Fixed-Femtos and Mobile-Femtos under the coverage area of the
Macrocell under the impact of the vehicular environment penetration loss. Several
mathematical equations have been formulated in term of users’ SINR, throughput,
spectral efficiency and links Ergodic capacity to generate the simulated environment.
The second part of this research discusses the co-channel interference issue, which
occurs between the eNB and Femtocell because of the shared resources and BW
between the two. Thus due to the generated co-channel interference between the
Mobile-Femto with the nearby eNB and between the Mobile-Femto with each others,
several solutions have been discussed to mitigate this issue as follows:
1. Control the used transmission power of the deployed base stations.
2. An optimised network-planning scheme based on the Microcell path-loss model.
3. An efficient frequency reuse scheme that works dynamically over distance to avoid
frequency wastage. The scheme allows the same frequency be reused several times
over distance which can efficiently mitigate the generated interference between the
Mobile-Femtos themselves and between the Mobile-Femtos and the eNBs.
This frequency reuse scheme has been evaluated through a comparison between the
proposed scheme with the previous schemes like NoFFR-3 (reuse factor 1) and FFR-3
(reuse factor 3) in term of signal outage probability and UEs throughput where FFR is
stand for Fractional Frequency Reuse scheme.

10
The third part of this research reviews the importance of HO process especially in
cases where the environments are vehicular. This HO process was considered from
different aspects as the following;
1. The HO when the UE moves from the connection of the eNB to the Mobile-
Femto.
2. The HO when the Mobile-Femto moves out of the coverage area of one Macrocell
to another.
The second HO scenario is considered as a research challenge because handing over
the Mobile-Femto itself from one eNB to another is dependent upon Mobile-Femto’s
direction, speed, channels availability, BW availability and Physical Resource Blocks
(PRBs) availability in the next cell. Whereas, UEs group HO procedure has taken a
place in this HO process as handing over the Mobile-Femto to the Target eNB
requires UEs group HO for all Mobile-Femto UEs to the Target eNB. This group HO
process is required to save the network resources and time. Thus, this research has
considered the impact of UEs mobility on dropping/blocking calls probability and on
the outage probability in LTE and future networks. This is because vehicular UEs are
more exposed to potential radio link failures as they are severely affected by the high
penetration loss as well as the path-loss.
Research questions
1. What are the degradations that vehicular UEs inside public transportations suffer
from? Is the presented Femtocell technology able to mitigate the VPL and improve
the vehicular UEs’ performance?
2. How the Co-Channel interference issue between the vehicular Femtocells and the
eNB is mitigated? Is the presented frequency reuse mechanism able to improve the
vehicular UEs throughput and mitigate the outage probability?
3. What is the impact of UEs mobility on the potential radio link failures, calls dropping,
calls blocking and signal outage probabilities? And, how does the HO process occur
when the vehicular Femtocell itself leaves the coverage area of one Macrocell to
another?

11
1.4 Contributions
The presented technology and algorithms are incorporated in the LTE stack protocol over
different layers as Figure 1.6 shows.
Fig 1.6 LTE stack protocol
As a result, three main contributions can be seen in the following research and as listed
below:
The first contribution, proposes the mobile Femtocell technology as a vehicular small
cell to improve the vehicular UEs performance and signal quality in LTE and 5G
Networks. This contribution will take a place in the Physical and MAC Layers. Here
the Physical Layer is responsible on carrying all the information from the MAC
transport channels over the air interface. It also takes care of link adaptation,
measurements and configuration between eNBs, Mobile/Fixed Femtos and UEs. At
this stage, the link adaption process is important as it identifies the ability to adapt the
modulation scheme and the coding rate of the error correction according to the quality
of the radio link. If the conditions of the radio link are good, a high-level efficient
modulation scheme and a small amount of error correction is used and vice versa. Not
only identifying the link quality is done at the Physical Layer but also the cell search
for UEs and Mobile-Femto for initial synchronisation and handover process that will

12
be further considered in chapter 6. This is without neglecting the existing of the
OFDM in order to arrange the access mechanism between DL and UL for
Mobile/Fixed Femtos and UEs. While the MAC Layer handles the priority and
dynamicity of scheduling the Fixed/Mobile Femtos and UEs information in the
Macrocell. However, several factors may influence the occurrence of this scheduling
process. These factors can be summarised by the existence of the penetration loss,
path-loss and signal fading as UEs can loss the signal connection easily with the
serving BS. Therefore, vehicular BSs have been proposed in order to mitigate these
factors as much as possible and improve the scheduling process in the Marcocell. As a
result, a comparison has been drawn in term of vehicular UEs’ performance before
and after deploying the Fixed-Femtos and Mobile-Femtos into the Macrocell in order
to evaluate their link quality connection. The comparison has been done when the
penetration loss is quite high (e.g. 25dB and 40dB) in the vehicular environment.
Several mathematical equations have been integrated with each other in term of UEs’
SINR, throughput, spectral efficiency and system capacity to create the simulation
environment.
The second contribution presents a solution to the co-channel interference issue,
caused by the shared resources and bandwidth between the eNB and the mobile
Femtocells. In the LTE protocol stack, the Physical layer is responsible on controlling
the transmission power of BSs which may have the biggest impact on the generated
interference between UEs and BSs. It is also responsible on observing the available
spectrum frequencies that will be later allocated by the MAC Layer to Macrocells and
small cells. However, after allocating the spectrum frequencies, the MAC Layer will
take the responsibility in scheduling the UEs and the small cells in the Macrocell in
order to minimise the generate interference. Since the MAC Layer is responsible on
the small cells and UEs scheduling process, it also has the capability in controlling the
in/out traffic, allocating the channels for transmission and allocating UEs and small
cells resources. Subsequently, some interference avoidance mechanisms are needed in
this case in order to minimise the generate interference issue as much as possible
between cells that share the same spectrum. One of these mechanisms is the
frequency reuse scheme, which has been proposed to overcome the interference issue
and avoid the frequency wastage. The impact of the proposed scheme in term of
vehicular UEs has been compared with previous schemes like NoFFR-3 and FFR-3 in

13
order to create a systematic study to reduce the signal outage probability and improve
the vehicular UEs throughput.
The third contribution presents an efficient HO process for the vehicular environment.
Two HO processes have been considered; firstly, the HO when the UE moves from
the connection of the eNB to the Mobile-Femto. Secondly, the HO when the Mobile-
Femto itself moves out of the coverage area of one Macrocell to another. The second
HO scenario is considered as a challenge in this research as the HO process will not
be done for a normal UE but it is handing over a mobile BS from one Macrocell to
another. This HO process requires certain conditions such as Mobile-Femto direction,
speed, channel availability, BW availability and PRBs availability in the next cell.
This HO process is accompanied with group UEs’ HO process in order to reduce the
HO time delay, reduce the load on the eNB and save the eNB resources. However, in
this contribution the Network Layer plays a significant role in the mobility process,
security control and authentication process. This is because the Network Layer
consists of many required protocols like the Non Access Stratum (NAS) Protocol, the
Radio Resource Control (RRC) protocol and the Internet Protocol (IP). All of these
protocols are needed in order to accomplish successful HO process, in the right timing
and direction. This will be more needed in the case of vehicular UEs HO process
when they are served by vehicular and fixed BSs. The NAS protocol here supports the
mobility of the UE and the Mobile Femto together with maintaining the IP
connectivity with the Core Network Gateways. As a result, in order to evaluate the
impact of UEs mobility on the dropped/blocked calls probability and the outage
probability, a comparison has been drawn between the Mobile-Femto/Fixed-Femto
and Macrocell transmissions in LTE and 5G Networks.
1.5 Thesis Outline
This thesis has seven chapters, beginning with an introductory chapter that outlines the
work in LTE and Femtocells technologies. It spotlights the thesis contributions, aims,
objectives and motivations. Each chapter opens with an introduction and issues discussion
related to the studied research area, it goes further to evaluate the achieved performance after
proposing suitable solutions to the raised issues. A summary is provided at the end of the
chapter.

14
Chapter two provides an overview of LTE and Femtocells technologies that is considered
the base of this research. In addition, it discusses in details the challenges that face the LTE
network especially in the case of vehicular UEs from the points of view of previous works.
Chapter three gives detailed analysis to the followed research methodology. Moreover, it
demonstrates the used simulator and parameters in details in order to generate the required
environment and scenarios.
Chapter four introduces the Mobile-Femto technology and its architecture in LTE networks.
Furthermore, it provides a comprehensive literature review in term of the vehicular UEs
performance, the impact of penetration loss, interference and mobility. Subsequently, a
design of the vehicular BS has been proposed in LTE networks with the support of all the
required mathematical equations to create the simulation environment. A presentation of
variety of results of the simulated scenarios has been provided in this chapter.
Chapter five starts with a review of the impact of interference issue on the network
performance. It also discusses the previous interference mitigation schemes in the case of
vehicular UEs in LTE networks. Moreover, it tackles the impact of transmission power and
coverage-planning schemes on the generated interference. Similarly, an interference
mitigation scheme based on the frequency reuse concept has been proposed with all the
required mathematical formulas. It also provides a comparison between the achieved results
of the proposed scheme with the previous interference mitigation schemes in LTE network.
Chapter six discusses the mobility impact on LTE network performance in details in term of
the presented technology. It also outlines the effects of mobility on the HO process and the
link adaptation especially in the case of vehicular UEs. In addition, it presents the concept of
handing over the Mobile-Femtos from one eNB to another as well as the concept of UEs’
group HO. The achieved results present a comparison between the vehicular UEs outage
probability, dropping calls probability and blocking calls probability before and after
implementing the presented Femtocell in the Macrocell.

15
Chapter seven summarises the research findings and concludes this work by providing a
conclusion and an insight into the future work in the area of LTE vehicular environments.

16
Chapter 2: General Overview about Small Cells in Next
Generation Networks
This chapter introduces the main purpose behind developing LTE cellular systems and
shows the development process of phone generations through years. It also represents the
technical background of this thesis as it provides the baseline of the research. Moreover,
small base stations like Femtocells have been introduced in order to overcome the LTE high
penetration loss issue. However, several challenging issues in LTE system are presented so
that later chapters can advise ways to fix these issues, ensuring that the effects of the
addressed challenges and technical problems are minimised. This will help future networks
like 5G Networks to overcome these challenges and offer the best service ever.
2.1 Introduction to LTE architecture
In the past, mobile communication networks were dominated by phone calls and data
transfer requirements while a few years ago, emails, web pages, data files and applications
dominated these networks. Furthermore, outdoor and mobile UEs are considered as a
significant proportion of users that required to be attached to the internet everywhere at any
time. This has led to huge growth in the amount of data while network operators are trying to
transfer this data across mobile communication networks and meet all the users’ needs.
Therefore, network operators had to increase the mobile communication networks capacity by
improving the used technology, so information between mobile phones and BSs can be
transmitted and received faster than ever before. This means that the main drive behind the
introduction of LTE is a change in mobile communication technology, so that it runs faster
and reaches UEs faster to achieve higher data transfer rates and higher capacity.
Through years, mobile phones have gone through several generations like; 1G, 2G, 3G, 4G
and now under research is the 5G networks [Gawas, 2015]. The first generation of mobile
phones were the large analogue mobile phones from 1980s while the mobile phones became
more popular with the second generation in the 1990s. This brought with it the introduction of
Global System for Mobile communications (GSM), which was the first mobile
communication device even though it could only handle phone calls and text messages. The
General Packet Radio Service (GPRS) (2.5G) enhanced the 2G phones by adding data to the
previous voice and Short Message Service (SMS). The design of GSM however, did not

17
permit the required high communication data rate. Universal Mobile Telecommunications
System (UMTS) was then introduced as the first 3G technology, known as Wideband Code
Division Multiple Access (WCDMA), which is the name of the radio communication in most
3G systems. In 3G networks, the architecture of the network has been kept more or less intact,
but the nature of radio communication has completely changed in order to make it work faster.
This is because, WCDMA is characterised by the use of a wider band than the Code Division
Multiple Access (CDMA). This has given the WCDMA the advantages of having high
transfer rate, high system capacity and communication quality. It also utilises efficiently the
radio spectrum to provide a maximum data rate of 2 Mbps. Then the 4G mobile
communication systems came about to solve remain issues of 3G systems and provide wide
variety of new services from high voice and video qualities as well as high data rate.
Therefore, the main three approaches in developing the future 4G networks are firstly,
increasing the cell capacity using new technologies such as LTE, which replaces the
Worldwide Interoperability for Microwave Access (WiMAX) backbone stations. Secondly,
improving the spectral efficiencies via using reconfigurable technologies such as the Cognitive
Radio and advanced antenna systems. Thirdly, developing new architectures for mobile
networks that help to achieve an autonomous communications as well as develop new small
cells. The 4G systems are intended to provide high-speed data rate, low cost per bit and IP
based services. The previous approaches were the motivation behind developing the 4G
systems over the 3G systems. It is to be mentioned that in the 3G systems, the system occupies
a fixed BW of 5MHz. The use of a fixed BW means that the use of the spectrum is inflexible,
while LTE works in a variety of different BWs range from 1.4MHz to 20MHz that allow
higher data and spectrum flexibility.
Obviously, 3GPP had standardised the LTE to improve the spectral efficiency and the
speed of data rate of a cellular network. It also, introduced an intelligent BS, which is the eNB,
and that was an important complement to simplify the system architecture and minimise the
control plane and UE plane latency. As mentioned earlier, LTE offers significant
improvements over previous technologies such as UMTS and High-Speed Packet Access
(HSPA) by introducing a novel physical layer and reforming the core network. The main
reasons for these changes in the Radio Access Network (RAN) system design are the need to
provide higher spectral efficiency, lower delay, and more multi-user flexibility than the
currently deployed networks. Besides that, 3GPP has extended the original proposed LTE to
LTE-Advance that aims to data rates up to 3Gbps and 1.5Gbps in Downlink (DL) and Uplink

18
(UL) respectively by employing advanced Multi-antenna Multiple-Input, Multiple-Output
(MIMO) techniques, Carrier Aggregation (CA), Relay stations, Heterogeneous Network or
HetNet and many other schemes [Sadekar, 2015]. Here, it is worth noting that while LTE-A
standard creates a bridge between 4G and 5G worlds, in many ways, the notion of HetNet is
serving as glue between LTE-A and 5G worlds. That’s why many wireless industry observers
call 5G wireless an enhanced form of LTE-A. In LTE-A, HetNet is a gradual evolution of the
cellular architecture, is a vastly more complex network as small cells add hundreds or even
thousands of entry points into the cellular system. The Self-Organizing Network (SON)
concept is one of the key enabling technologies that are considered in LTE-A applications in
order to organise the communication between these small cells. That makes sense because the
main concept behind developing 5G systems is to expand the idea of small cell network to a
completely new level and create a super dense network that will put tiny cells in every room
and vehicle. This leads to a conclusion that LTE-A is the foundation of 5G Radio Access
Network (RAN). However, 5G Network raises the bar to higher frequency usage from 6 GHz
to 100 GHz and Massive MIMO technology. The Massive MIMO technology acts as a large
array of radiating elements that extends the antenna matrix to a new level from 16×16 to
256×256 MIMO and this is considered as a leap in the wireless network speed and coverage
[Ahmad, 2016]. Therefore, it is expected that by 2020 the 5G systems will be available for
users in order to enhance the performance of current technologies [Mundy, 2016].
Thus, in order to overcome the limitations in 5G Networks, it is important first to understand
and overcome the limitations in 4G Networks (e.g. LTE and LTE-A Networks). LTE network
is similar to other networks that can be affected easily by fading, path-loss and penetration loss
issues. The LTE high penetration loss is considered as one of the factors that cause high loss in
the signal power. As well as it distorts the transmitted and received signal. It indicates the
fading of radio signals from an indoor terminal to a BS due to the obstruction by buildings or
walls. This means that indoor UEs’ signal will be very poor when trying to communicate with
the outdoor eNB and vice versa. In this respect, the deployment of LTE was a revolution for
outdoor mobile UEs when the penetration loss is zero while it is being considered as a
challenge for indoor UEs who suffer from high penetration loss. This in turn has led to the
development of small cells that work as an indoor coverage to improve the UEs signal quality.
These small coverage cells are known as Femtocells that have been mainly developed to
mitigate the impact of LTE high penetration loss in indoor environments. However, it is
important first to give an overview about the Macrocell technology, which is the mother BS
that accommodates all the deployed Femtocells.

19
2.2 Macrocell Technologies
A Macrocell or evolved Node B (eNB) is a cell in a mobile phone network that provides
radio coverage served by a high power cellular BS (tower). Generally, Macrocells provide
coverage larger than any other technology e.g. Microcells, Femtocells, Relay nodes, Picocells.
This is because, the Macrocells’ antennas are mounted on ground-based masts, rooftops and
other existing structures, at a height that provides a clear view over the surrounding buildings
and terrain. It also has a power output of typically tens of watts and its performance can be
increased by increasing the efficiency of the transceiver [OFcom, 2016].
The locations of the Macrocell BSs are carefully chosen through network planning, and the
BSs settings are properly configured to maximise the coverage and control the interference
between them. As the traffic demand grows and the Radio Frequency (RF) environment
changes, the network relies on cell splitting or additional carriers to overcome capacity and
transmission link limitations while maintaining UEs QoS. However, this deployment process
is complex and inefficient. Furthermore, site acquisition for Macro BSs with towers becomes
more difficult in dense urban areas. Another severe issue for Macrocells in LTE networks is
the LTE high penetration loss in indoor environment, which has in itself a negative impact on
the transmitted and received signals. Therefore, Femtocells technology has incorporated into
the LTE network in order to improve UEs broadband experience in a ubiquitous and cost-
effective way [Qualcomm, 2011]. These small cells are seen as the future of next generation
networks as they are more reachable and cost- effective than any other technology as shown in
this research.
2.3 Femtocell Technologies
Femtocell is an economical solution to provide reliable high-speed indoor communications
via using the existing broadband Internet connection instead of the conventional Macro-
cellular networks. It is also known as home BS or home evolved NodeB (Home eNB) which is
operating in the licensed spectrum that can integrate mobile and Internet technologies within
the home using optical fibre connection or DSL. From the economics point of view,
Femtocells are a low cost solution compared to installing higher power Macrocells to provide
the same quality of service for indoor coverage [Germano et al., 2010].

20
Based on this, the use of Femtocells can benefit both the mobile operator and the UE. For a
mobile operator, the deployment of Femtocells can improve the coverage, especially indoors,
capacity and reduce the consumption power. Coverage is improved because Femtocells can
fill in the gaps and eliminate loss of signal through buildings (e.g. penetration loss) [Akinladi
et al., 2015]. Capacity on the other hand, is improved by reducing the number of UEs
attempting to use the main network cells (eNBs) and by off-loading the traffic through the
UE's network (via the internet) to the operator's infrastructure [Das et al., 2011]. Offloading
the traffic from the eNB to the Femtocell especially for indoor UEs who require higher
transmission power and resources, saves the eNB resources and consumption power. This will
increase the network capacity, as the Macrocell will be able to serve more outdoor UEs while
the Femtocells take care of the indoor UEs. Where, indoor UEs can benefit from the improved
indoor coverage by having indoor BSs e.g. in offices and homes to mitigate the negative
impact of the high penetration loss on their performance. As a result, the UE achieves the
same or higher data rates using less power as the transmission range between the Femtocell
and its UEs is short and the battery life is long. Moreover, the authors in [Akinlabi et al., 2015]
show that the UE can achieve better voice quality and signal strength via using the indoor
Femtocell for transmission rather than being connected directly to the outdoor eNB.
However, there are two types of Femtocells; indoor Femtocells and outdoor Femtocells.
The indoor Femtocells can be installed at home or campus to get better indoor coverage and
improve the service quality for those indoor UEs. While the outdoor Femtocells are placed in
public areas like train stations and stadiums to improve the cell-edge users’ performance in the
cellular system as Figure 2.1 shows.
Fig 2.1 Outdoor and Indoor Femtocells

21
Thus, Femtocells are expected to be deployed based on several access mechanisms to have
more control towards the traffic flow. This will help in mitigating the interference issue and
the network traffic loads by controlling the UEs accessibility into the network.
2.3.1 Access Mechanisms
As mentioned earlier, Femtocells have been seen as a solution that helped to reduce the
capital and the operational expenditure of a mobile network while enhancing the system
coverage and capacity. However, the avoidance of interference has always been an issue that
needs to be addressed to deploy successfully Femtocells along with the existing Macrocell
networks. Therefore, interference is strongly dependent on the type of access control, which
decides if a given user can or cannot connect to the available Femtocell technology. Figure
2.2 illustrates the different types deployed access methods: close, open and hybrid accesses
[Roche et al., 2010].
Fig 2.2 Different access control mechanisms in Femtocell network
2.3.1.1 Close Access
A Femtocell can be positioned in close access network areas e.g. homes or offices, which
means that the Femtocell provides services to fewer UEs, and only registered UEs have
access to such a Femtocell while the Macro UEs have no access to the Femtocell. From the
description of close access, only UEs who are listed in the allowed access list of the
Femtocell are granted access to this particular Femtocell. The main reason for this type of

22
deployment is to guarantee UEs knowledge when they are within the coverage of the
Femtocell. However, one critical issue arises with the deployment of this method when an
unsigned UE enters the Femtocell coverage and that UE is not on the allowed access list.
Generally, the visiting Macro UE to the Femtocell coverage area will still attempt to access
with the Femtocell due to the fact that close Femtocell pilot power signal is usually higher
than the Macrocell BS pilot signal within the Femtocell coverage. Nevertheless, this effort
will fail because the visiting Macro UEs are not listed in the allowed access list of the
Femtocell. This method has the advantage of decreasing the number of HOs in this particular
network. Each UE can get a high data rate for being close to the Femtocell station because of
the limited number of UEs.
2.3.1.2 Open Access
When Femtocells are deployed in open areas like airports or hospitals, any UE has the
right to access these Femtocells without the need for a registration procedure in this case.
Complete open access occurs when any UE within the coverage area of the Femtocell has the
ability to be connected to this Femtocell as long as there is enough resource capacity to serve
the coming UEs. Apparently, open access is beneficial to network operators, by providing an
inexpensive way to expand their network capacities by leveraging third-party backhaul for
free. However, unwanted HOs may be increased for many users entering and leaving such
Femtocells, causing a noticeable decline in the QoS [Xia et al., 2010].
2.3.1.3 Hybrid Access
The approach of open and close access methods for Femtocells applications are likely to
occur in some cases. In such a model, the unregistered subscribers are allowed to access the
Femtocell, but only for limited usage of resources. A limited amount of Femtocell resources is
available to all UEs, while the rest are operated in a closed subscriber’s group manner. The
deployment of closed subscriber’s group in Femtocells makes the interference problem
mitigation even more complex. However, hybrid access methods reach a compromise between
the impact on the performance of subscribers and the level of access granted to
nonsubscribers. Therefore, the sharing of Femtocell resources between subscribers and
nonsubscribers needs to be finely tuned. Otherwise, subscribers might feel that they are paying
for a service that is to be exploited by others. In this case, the Orthogonal Frequency Division

23
Multiplexing Access (OFDMA) scheme can be used in Femtocell networks to manage the
shared resources over frequency and time between subscribers and nonsubscribers as well as
to define the available resources for each [Al-Rubaye et al., 2011].
Although the Femtocell has great advantages in improving coverage for outdoor/indoor
UEs, still the interference and mobility management problems are critical issues in the
operation of Femtocell networks. In the applied deployment of Femtocell systems, the
location of Femtocells in a random and uncoordinated fashion is unavoidable and may
generate high interference scenarios and dead spots particularly in wireless environment
[Sung et al., 2010]. The impact of interference on Macro/Femto cells’ UEs depends on the
transmitted power, BW utilization, Femtocell density, as well as the access control methods
of co-channel Femtocells.
In addition, the deployment of Femtocells are physically fixed which makes it impossible to
cover all the remote areas that are hard for the eNB to reach due to the high path-loss and
penetration loss especially in the case of vehicular UEs. This will increase the number of
deployed Femtocells in the Macrocell which will increase the deployment cost since there is a
need for more Femtocells to be deployed. Added to this, the increased number of deployed
Femtocells in the Macrocell will bring another issue which is the increased number of
unnecessary HOs to maintain the UE’s service quality connection. And as the Femtocell is
physically fixed, a higher transmission power is required in order to reach the far distance
areas which can create an interference issue as shown in chapter 5. Hence, the following
section discusses the main technical challenges that face the LTE/Femtocell technologies that
can be mitigated in future networks.
2.4 Technical challenges
LTE and future networks require flexible frequency bands and reasonable mobility
management scheme that works effectively with future networks architecture. Listed below
are some of the technical challenges that are continuously considered in all LTE 3GPP
releases and specifications:

24
2.4.1 Penetration Loss, LTE Fading and Path-Loss
Penetration loss in LTE and LTE-A networks is one of the main drawbacks of this
technology as it is not possible to provide good indoor coverage area without the support of an
indoor Femtocell. This is because, the penetration loss in LTE indicates the fading of radio
signals from an indoor terminal to an outdoor BS due to obstruction by buildings or walls.
However, the challenge here is not serving regular indoor UEs; it is serving vehicular UEs
who always suffer from performance degradation due to the high mobility as well as the high
penetration loss. All the previous researches have shown that LTE network works efficiently
with Femtocells to improve the indoor coverage while few studies have considered the
vehicular coverage to improve the vehicular UEs performance. According to [Kostanic, 2015]
the vehicular penetration loss depends on the vehicle type (e.g. car, bus or train), vehicle
orientation (e.g. random direction or uniform direction) and environment (e.g. urban, suburban
or rural). All the previous factors make the Vehicular Penetration Loss (VPL) a real challenge
as it limits the vehicular UEs’ throughput, SINR, spectral efficiency and system capacity. It is
important to state that the VPL occurs because of the obstruction by the vehicle chassis that
works as a barrier between in and out signals.
Furthermore, fading is considered as another challenge in the case of vehicular UEs. It
occurs when signals travel on different ray paths from the transmitter to the receiver due to the
UE’s mobility or position. One of the effects of this multi path is that when the receiver is
picking up different signals from the transmitter, those signals can either be added together
and reinforce each other, or they cancel each other out, and this is known as fading as Figure
2.3 shows. According to [Mir et al., 2014], Fading is considered as a serious issue in the case
of vehicular UEs as shown below.

25
Fig 2.3 Vehicular UEs fading issue [ShareTechnote, 2015]
Figure 2.3 represents the communication between the eNB and the vehicular UE, which is
mostly Non-Line of Sight (NLOS) because the LOS path between the transmitter and the
receiver is affected by the environment and obstructed by buildings and other objects.
Moreover, the UEs mobility, directions and speeds play important roles in distorting the signal
as the RF signal from the transmitter is scattered by reflection and diffraction and reaches the
receiver through many Non-LOS paths. This NLOS path causes long-term and short-term
fluctuations, which degrade the performance of the RF channel [Radio-Electronics.com,
2015]. The two types of fading are shown in Figure 2.4 and can be summarised as:
Large-scale fading (Slow fading), which is mainly caused by the path-loss of signal as
a function of distance and shadowing by large objects such as buildings and hills. This
occurs as the vehicular UE moves away from the eNB to the cell-edges as well as in
the high penetration loss areas.
Small-scale fading (Fast fading), which is mainly caused by the constructive and
destructive interference of multiple signal paths between the transmitter and receiver.
This occurs at the spatial scale of the carrier wavelength order as it is greatly affected
by Doppler Effect. As the speed of vehicle increases, the frequency is changing more
rapidly over a short period of time or travel distance.

26
Fig 2.4 Large and small-scale fading [Teletopix, 2015]
Thus, in order to see the difference between the faded signal and the non-faded signal over the
received power, Figure 2.5 shows a comparison between the two signals through using a
spectrum analyzer [Sharetechnote, 2015]. It is noticeable that in the faded signal there is high
fluctuating amplitude across the channel bandwidth.
Fig 2.5 Non-faded vs. faded signal [Sharetechnote, 2015]
While Figure 2.6 shows how the fading influences the signal quality decoded by the receiver.
Fig 2.6 Fading influence on the signal quality [Sharetechnote, 2015]
While, path-loss in the case of vehicular UEs is one of the many factors that generate fading
and its impact on signal distortion is no less effect than the Doppler Shift, the signal
reflection and diffraction from various objects and the fluctuation of the received signal

27
power that is created by multi-path transmission [Shabbir et al., 2011]. Figure 2.7 represents
the decreased signal power correlation over distance due to the increased path-loss. It also
shows the impact of shadowing and multipath on the transmitted signal, which can be seen as
a signal power fluctuation. However, when observing a real received signal, it will not be
easy to see these factors in a separate form as the left side of the figure shows, and what can
be really seen is the result of summation of all the factors and this is like what the right side
of the figure shows.
Fig 2.7 Fading Components
2.4.2 Interference
Interference in cellular systems is one of the most common issues that affect the system
performance. Although each transmission service is assigned a portion of frequency, operators
aim to increase the throughput by sharing the spectrum between BSs. The LTE system is
designed so that each eNB uses the whole BW with a frequency reuse of 1. Deploying
Femtocells improve the spectrum efficiency; however, these new introduced components in
the LTE network architecture may create an interference problem. Therefore, the key
challenge is to improve the spectrum utilisation, while mitigating the co-channel interference
of Macro-UEs and Femto-UEs [NSN, 2014]. It is to be mentioned that, there are many co-
channel interference scenarios that limit the operation and deployment of Femtocells as Figure
2.5 shows.

28
1. Macrocell UE Femtocell BS
Cross- Tier 2. Macrocell BS Femtocell UE
3. Femtocell UE Macrocell BS
4. Femtocell BS Macrocell UE
5. Femtocell ‘A’ UE Femtocell ‘B’ BS
Co-Tier 6. Femtocell ‘A’ BS Femtocell ‘B’ UE
Fig 2.8 Co-channels interference scenarios
However, the above challenge may be elevated to another level in the case of vehicular
environment as interference may be considered an issue in the case of fixed and slow
mobility UEs while it is considered a severe challenge in the case of vehicular UEs. This is
because vehicular UEs are more affected by path-loss, penetration loss, radio link failure and
signal variation issues. Moreover, developing vehicular coverage area to serve the vehicular
UEs may increase the co-channel interference issue among the Macro-UEs and the vehicular
UEs who are being served by those vehicular BSs. The above issues need to be considered in
the vehicular environment to mitigate the interference issue and improve both the vehicular
UEs spectral efficiency and throughput.
2.4.3 Mobility
UEs high mobility aspect affects the HO procedure and wastes resources in the case of
multiple radio link failures. LTE aims to optimise performance for different mobile speeds,

29
with particular consideration given to speeds in the range of 3 km/h to 160km/h as well as
measurement reporting, configuration for mobility and scheduling [ETSI TS 136 133, 2013].
However, due to LTE high penetration loss, path-loss and radio link failures of vehicular UEs,
mobility has always been a challenge for the 3GPP in LTE networks and next generation
networks. Introducing the small cells as a solution to overcome the previous issue has brought
more issues like increasing the number of HOs and wasting the network resources. Several
practical issues may prevent the mobility procedure from functioning in a proper way,
especially the heterogeneous deployment (e.g. small BSs deployment). The expansion of
heterogeneous networks presents challenges due to the increase in the node numbers, which in
turn creates confusion between cells of different sizes [4G Americas, 2013]. It has been
mentioned in [NSN, 2014] that the link adaptation for LTE is not yet standardised, and that is
why the focus has been on the LTE interfaces by 3GPP. This creates differences in the
network performance in heterogeneous networks and makes it necessary to optimise the
underlying link adaptation functionality in this field so that the scheduler’s decision values are
improved. In addition, a radical solution to improve the vehicular UEs performance is needed
to be proposed. Although, developing vehicular BSs may solve the issue of unnecessary HOs
and radio link failures of vehicular UEs, it creates another challenge especially when these
vehicular BSs move out of the coverage area of one Macrocell to another.
2.5 Summary
LTE- Advanced has the potential to enhance the current deployments of 3GPP networks
and to enable considerable new service opportunities. Therefore, this chapter has introduced
the development process of phone generations through years that led to the evolution of LTE,
LTE-A and 5G Networks. It also, considered the drawbacks that LTE networks have like
fading, path-loss and penetration loss issues. Therefore, this chapter has shown that Femtocell
technology has been introduced for indoor UEs to overcome those issues as well as to show
the benefits that these small cells have brought into the developed LTE technology and future
networks. Besides that, it has introduced the technical background of Femtocells technology
and the impact of these small cells on the UE and network performance.
Afterwards, several technical challenges have been considered in LTE and Femtocell
technologies that are required to be addressed by the server provider. LTE vehicular

30
penetration loss, Path-loss, interference management and seamless mobility are the main
challenges that face the LTE network in the vehicular environments. As this chapter has
summarised the main technical challenges in the area of this research, the following chapters
will present a detailed analysis of the current challenges, and subsequently propose radical
solutions that can meet these challenges.

31
Chapter 3: Research Methodology
The methodology of this research was proposed after detailed analysis of the current
challenges with enough consideration given to multiple parameters in each studied area. The
literature review has discussed many previous related works to the present study in order to
evaluate the existing limitations and present suitable solutions to minimise these limitations,
thus, improve the system performance.
As a result, several mathematical equations have been integrated with each other to create the
simulation environment of the designed scenarios. This makes these scenarios closer to real
life environments and helps to find suitable solutions to the raised issues. Then, System Level
Simulator in MATLAB has been used for the simulation purpose. This simulator enables the
user to run several scenarios and simulates different parameters where the processes of
interests such as HO, random access, timing and speed intersect together. This produces wide
range of results regarding parameters of interest such as SINR, Signal to Noise Ratio (SNR),
throughput, Spectral efficiency, signal strength and distributions. While the network
deployment and distribution had been chosen wisely after considering several parameters
like; LTE penetration loss, path-loss model, distance between BSs and UEs, Mobile-
Femto/UEs’ path, direction and speed.
It is to be mentioned that the used System Level Simulator has been modified to contain three
types of serving cells. The first serving cell is the Macrocell (eNB) which has the major role
in the present study. The eNB monitors the signalling in the cell and adapts the dynamic
parameters in response to load changes. The Fixed-Femto is the second considered serving
cell, which has the signal capabilities of adapting its signalling procedures in response to the
detected Macrocell signal to mitigate interference. For mobility, Mobile-Femto technology
has been introduced as a third serving cell in this work. The network should be able to adapt
its configuration in response to the UEs and Mobile-Femtos’ mobility level. Many important
parameters are considered in this case such as the UE and Mobile-Femto speed level,
direction, distribution and HOs.
Consequently, the network topology consists mainly of the serving cells with the associated
UEs. The serving cells might be an eNB, Fixed-Femto or a Mobile-Femto as mentioned
earlier. All the simulated scenarios are set up according to the 3rd
Generation Partnership

32
Project (3GPP) standards in terms of geographical areas and node parameter configurations.
Various applications are deployed such as Hyper-Text Transfer Protocol (HTTP), video and
voice to maintain data traffic and resource utilisation during simulations. The achieved results
through MATLAB System Level Simulator have been evaluated with a comparison between
three technologies; the eNB, the Fixed-Femto and the Mobile-Femto. Added to this, different
scenarios and configurations had been explored to evaluate the results of the proposed
schemes with the goal of introducing a technology to the current addressed objectives in
wireless networks for 4th
Generation (4G) systems and onwards.
For further details about the used simulator, the following sections give detailed
explanation about the simulator structure, simulator development, simulator description and
the simulation environment of System Level Simulator.
3.1 Simulator Structure
The LTE system-level simulator offers a high degree of flexibility. For the
implementation, extensive use of the Object-Oriented Programming (OOP) capabilities of
MATLAB, introduced with the 2008a Release have been made. Having a modular code with a
clear structure based in objects results in a much more organised, understandable and
maintainable simulator structure in which new functionalities and algorithms can be easily
added and tested. The simulator is divided into two different models. The first model is used
for measuring the link quality and the second model is used for analysing the performance of
the link quality. The link quality is measured for every UE/Femtocell and it is extracted from
the Channel Quality Indicator (CQI) reports that are sent by each UE/Femtocell, where CQI is
an indicator carrying the information on how good/bad the communication channel quality is.
The CQI value ranges from 0 to 30. Where 30 indicates the best channel quality and 0, 1
indicates the poorest channel quality. Depending which value UE reports, network transmits
data with different transport block size, which in turn can be directly converted into
throughput. If network gets high CQI value from UE, it transmits the data with larger transport
block size and vice versa.
Subsequently, the model performs the link adaptation operation followed by resource
allocation based on the sent reports. The measurement that is done by this model is per
subcarrier. The values of the Precoding Matrix Indicator (PMI), Rank Indicator (RI) and CQI
reports act as feedback that are calculated by UEs/Femtocells from their respective SINR

33
values. These feedback values are then utilised for calculating the link adaptation, while the
function of the other model is to find out the Block Error Rate (BLER) values from the SINR,
which has already been calculated by the measurement model.
However, in the development and standardisation of LTE, as well as the implementation
process of equipment manufacturers, simulations are necessary to test and optimise algorithms
and procedures. This has to be performed on both, the physical layer (link-level) and in the
network (system-level) context.
While link level simulator allows for the investigation of issues such as Multiple-Input
Multiple Output (MIMO) gains, Adaptive Modulation and Coding (AMC) feedback,
modelling of channel encoding and decoding or physical layer modelling for system level.
System Level Simulator focuses more in network related issues such as scheduling, mobility
handling or interference management. Hence, Figure 3.1 shows the schematic diagram of LTE
System Level Simulator as explained in [Ikuno et al., 2010]. The figure shows that the core
parts are link measurement model and link performance model. The link measurement model
abstracts the measured link quality used for link adaptation and resource allocation. On the
other hand, the link performance model determines the link BLER at reduced complexity. As
an output, the simulator calculates the throughput and the BLER in order to check the
performance of the link. The simulation is performed by defining a Region of Interest (ROI) in
which the eNBs, Femtocells and UEs are positioned in Transmission Time Intervals (TTIs).

34
Fig 3.1 Schematic block diagram of LTE System Level Simulator [Ikuno et al., 2010]
Based on the feedback obtained from the UE/Femtocell and the used scheduling algorithm,
the scheduler does its job of resource assignment as well as the selection of an appropriate
Modulation and Coding Scheme (MCS) for every UE. Using the link measurement model,
the UE can calculate the SINR value. This value depends on the strength of the signal from
the serving eNB/Femtocell, the interference level due to signals from adjacent cells as well as
the level of noise power. These parameters are themselves dependent on the path-loss, the
penetration loss and the two types of fading, shadowing and time-invariant. The same process
occurs when the Mobile-Femto SINR with the serving eNB gets weak and a handover
process needs to take a place here to maintain the Mobile-Femto signal. This will be further
demonstrated in chapter 6.
However, in the implementation wise, the simulator flow executes as the following pseudo-
code with slight modifications will be done later to suit the vehicular environment. The
simulator is performed by defining a ROI in which the eNB, Femtocell and UEs are positioned
where the simulation length is in TTI. That means whenever UEs are moved outside the ROI,
they will be re-allocated randomly in the ROI. Thus, for scheduling the UEs, the simulator
does the following [Ikuno et al., 2014]:

35
for each simulated TTI do
move UEs
if UE outside ROI then
reallocate UE randomly in ROI
for each eNodeB do
receive UE feedback after a given feedback delay
schedule users
for each UE do
1- channel state → link quality model → SINR
2- SINR, MCS → link performance model → BLER
3- send UE feedback
where "→" represents the data flow of the simulator.
It is important to mention that the Shadow fading that is caused by obstacles in the
propagation path between the UE and the eNodeB or between the UE and the Femtocell, can
be interpreted as the irregularities of the geographical characteristics of the terrain introduced
with respect to the average pathloss obtained from the microcell pathloss model. It is typically
approximated by a log-normal distribution of mean 0 dB and standard deviation 8 dB. While
for simulating small scale fading a one-dimensional random function of time may suffice, as
the waveform changes significantly even for small amounts of movement.
3.2 Simulator Development
In order to simulate the vehicular environment, Mobile-Femtos have been implemented by
considering several criteria e.g. speed, direction and distance from the eNB as Figure 3.2
shows. The Mobile-Femto speed has been set to be the same speed of the UEs inside the bus
as they are moving as one unit at the same speed and direction. Moreover, the VPL has been
added to all signals traversing the chassis of the vehicle from the eNBs and the Fixed-Femtos.
Furthermore, the Microcell NLOS path-loss model has been used between the eNB’s
transceiver and UEs or between the Femtocells and UEs to model the propagation path-loss
via using the distance and the antenna gain. This path-loss model has been further explained in
chapter 5. However, all the required simulated parameters for the Femtocells and the

36
implemented environment are shown later in this chapter. While for further details on the
implementation code, please refer tothe appendices section
Fig 3.2 Mobile-Femto implementation
3.3 Simulator Description
The performance of vehicular UEs in LTE network has been evaluated via using the
dynamic System Level Simulator, which considers the LTE specification [Ikuno et al., 2014].
The dynamic System Level Simulator is an open source code that is offered for free under an
academic, non commercial use license which has been developed in 2010 by a group of
researchers in the Institute of Telecommunication in Vienna University of Technology. The
main purpose behind developing this simulator is to evaluate the performance of the new
mobile technologies and the impact of deploying small cells in next generation networks.
However, the word dynamic is used to express the time varying behaviour of a system and
the adaptability of that system to cope with different scenarios. Additionally, the distance
plays another important role in the dynamicity of the system and this is way it is important to
identify the dimensions of the ROI. For example, when the users move out of the identified
ROI they will be reallocated dynamically again in the ROI as illustrated earlier. This
dynamicity cannot be generated by itself and it requires a mathematical model for this
purpose. This mathematical model has already been inserted in the designed code, which
gives the simulator the ability to generate different scenarios dynamically. Furthermore, this
simulator is capable of evaluating the performance of UEs, BSs, and the use of different
antenna modes (e.g. MIMO or SISO) and transmission modes (e.g. Open Loop Spatial
Multiplexing and Close Loop Spatial Multiplexing) ...etc. Additionally, the simulator
considers the SINR threshold as an important parameter to provide calculations for fading,
when the Handover is needed and when the interference is generated. Thus, having this

37
flexibility was the main motivation behind choosing this simulator to implement the vehicular
small BSs for next generation networks.
This simulator has been modified to use the Microcell NLOS path-loss model, which is based
on the COST 231 Walfish-Ikegami NLOS model with urban environment as shown in
chapter 5. This model is more appropriate when the distance between two BSs is less than
1Km [3GPP Specification, 2011]. The vehicular UEs who have been served by the eNB,
Fixed-Femtos and Mobile-Femtos were distributed randomly in the Macrocell, while the
Femtocells’ coverage has been distributed based on the Microcell NLOS path-loss model.
The fast fading model [Ikuno et al., 2014] is generated according to the speed of the
UEs/Mobile-Femtos and the used transmission mode. The environment uses the Proportional
Fair scheduler, as it is more efficient in the case of vehicular environment in order to avoid
interference and improve throughput. The directional TS36.942 antenna specification is used
for the simulated eNBs with a gain of 15dBi while omnidirectional antenna is used for the
Fixed-Femtos and Mobile-Femtos with a gain of 0dBi. Other options are also available,
depending upon the environment and frequencies. The MIMO is used as a transmission mode
in order to have a better throughput and serve more UEs. All the mathematical equations and
algorithms have been integrated along the simulations in order to create the required
environment.
For further description, a single base station with three sites (3 eNBs) has been considered
where three Fixed-Femtos or two Mobile-Femtos have been distributed in each 1Km2. The
eNB and Fixed-Femto/Mobile-Femto UEs were assumed to be 40 and 10 respectively in each
Macrocell. The LTE frame structure has been considered, which consists of blocks of 12
contiguous subcarriers in the frequency domain and 7 Orthogonal Frequency Division
Multiplexing (OFDM) symbols in the time domain. The scheduling period is 1 ms per each
sub-frame. The carrier BW is fixed at 10 MHz with 50 PRBs. A full eNB buffer is considered
where there are always buffered data ready for transmission for each node. The transmission
power of the eNB and Fixed-Femtos/Mobile-Femtos were assumed to be 46dBm and 24dBm
respectivly. Furthermore, the speed of the Mobile-Femto and the vehicular UEs in the bus
were assumed to range from 3km/h to 160km/h where VPL scales have been considered in
the simulated environment. Table 3.1 represents additional used parameters in this research
that helped to design the required simulation environment.

38
Table 3.1 Simulation parameters
Parameter Value
Carrier frequency 1.9 GHz
System bandwidth 10 MHz
Number of PRBs 50
Number of macrocells 3
Inter-site distance (ISD) 500 m
UE position random distribution
Traffic model Full buffer
UE scheduler Proportional fair
Penetration loss 0, 25, 40 dB
Shadowing standard deviation eNB-UE 8 dB
eNB antenna height 12.5 m
Femtocell antenna height 2 m
eNB & Mobile Femto Antenna gains 15 dBi and 0 dBi respectively
Scheduler window (∆T) 25
Minimum coupling loss between eNB vs. UE
or UE vs. UE
70 dB
Path-loss model Urban NLOS Microcell model
UE receiver noise figure 9 dB
UE thermal noise density -174 dBm/Hz
PRB bandwidth 180 MHz
nTx X nRx antennas 2 X 2
Tx mode Close Loop Spatial Multiplexing
(CLSM)
Simulation time 10 TTI
eNB and Femtocells antenna types Directional & Omnidirectional antennas
respectively
Mobile-Femto & Fixed-Femto access model Open access model
However, one of the important parameters that has been used in most of the simulated
equations is the channel gain (G). This parameter represents the quality of transmission
channel that could be either good or bad. The value of this gain ranges between 0 and 1, where
0 represents the worst channel condition and 1 represents the best channel condition. This
value has the most significant influence on the achieved UEs throughput, SINR and
performance in general.
3.4 Summary
This chapter has introduced the methodology of the present research following a detailed
analysis of the current challenges as shown in the previous chapters. This methodology started
with an intensive research in the current related literature. It is followed by an assessment of
the existing limitations in the present work in order to suggest suitable solutions to minimise

39
these limitations and improve the system performance. Afterwards, several mathematical
equations have been integrated with each other to create the simulation environment of the
designed scenarios. Finally, System Level Simulator in MATLAB has been used to simulate
these equations together with the designed scenarios in order to evaluate the impact of the
proposed technology and schemes.
The chapter has also shown the simulator structure, simulator development, simulator
description and the simulation environment of the System Level Simulator. It has also given
detailed demonstration to the used parameters of this research that will be used later in the
following chapters. All the used parameters, mathematical equations and the designed
scenarios have helped to evaluate the UEs performance of three technologies: eNB, Fixed-
Femto and Mobile-Femto as will be shown in the following chapters.

40
Chapter 4: Fixed & Mobile Femtocells’ Performance
Evaluation
This chapter introduces the presented Femtocell technology as well as its architecture in
order to have a clear comparison between the proposed technology and previous technologies.
Afterwards, a critical evaluation of previous works has been done in term of the vehicular UEs
penetration loss, throughput, spectral efficiency, SINR and capacity. The chapter proceeds to
provide all the needed mathematical equations that helped with evaluating the vehicular UEs
performance through the simulated environment. It goes further to show the UEs scheduling
process and resource allocation for each eNB, Fixed-Femtos and Mobile-Femtos UEs. The
achieved performance has been evaluated through a comparison between direct transmission
from the eNB, Fixed-Femtos assisted-transmission and finally Mobile-Femtos assisted-
transmission. The achieved results showed the importance of deploying a technology inside
public transportations like buses to overcome the high penetration loss and high path-loss
issues.
4.1 Introduction to Mobile-Femtocell networks
In mobile and ubiquitous networks, it is desirable that UEs do not experience fluctuations
in the services quality when they are moving from one place to another, i.e., they should not
be aware of mobility. Nowadays, vehicular UEs demand for the quality in their own network
rather than in mobile devices. In this sense, efficient mobility management systems are
needed to prevent the UEs from detecting changes in the QoS when they are continuously
moving. Mobile-Femto architecture has been designed to improve the 3G and 4G
connectivity inside buses environment to support mobility between the bus passengers and
the core network in LTE network.
It is to be mentioned here that the concept of Mobile-Femto has been derived from combining
the concept of two technologies; the Fixed-Femto technology and the Mobile Relay Node
(MRN) technology. The main advantage of implementing the Mobile-Femto technology is
the ability of this small cell to move around and dynamically change its connection with the
operator’s core network. This Mobile-Femto concept can be seen as a practical
implementation of the moving networks that can be deployed in public transportations like
buses to overcome the high penetration loss and path-loss issues. Therefore, Mobile-Femto is

41
seen as the new paradigm of the Femto-cellular network technology that reduces the impact
of vehicular environment on the UEs SNIR, throughput, spectral efficiency and capacity as
will be shown in this chapter. However, the approach of network configuration should be
different for different vehicular environments due to vehicles speed variation, availability of
wireless backhaul networks and Doppler Shift in the case of high-speed trains.
UEs inside public transportations may execute multiple HOs at the same time that may cause
a significant increase in the signalling load and drop in the network connections. This has led
to look at the Mobile-Femtos as a solution to minimise the signalling load, the number of
dropped packets and the number of HOs. Hence, Figure 4.1 represents the fixed and mobile
Femtocells that could be either inside buildings, on streets or public transportations like trams
and buses.
Fig 4.1 Fixed and Mobile Femtocell Technologies
As mentioned earlier, Mobile-Femto is a moving hotspot with multiple UEs who are
requesting diverse data services, e.g. web browsing, Voice over IP (VoIP), e-mailing and
video streaming. It adapts the LTE’s standard radio interface to communicate with the
serving eNB and the group of UEs who are within the coverage area of that particular
Mobile-Femto. Mobile-Femto architecture in LTE system needs to be demonstrated to enable
the cellular connectivity in bus environment. Figure 4.2 shows that, there are three types of
links that have been utilised to differentiate between the eNB & Mobile-Femto, Mobile-
Femto & UE and eNB and UE links which are the backhaul link, the access link and the
direct link respectively. Moreover, the vehicular UEs who are inside the bus will consider the
Mobile-Femto that exists in the same bus as a fixed Femtocell. This is because those UEs are

42
moving at the same speed and direction of the serving Mobile-Femto as they are considered
as one unit while it will be considered as a mobile Femtocell for those UEs who are outside
the bus.
Fig 4.2 Mobile Femtocell architecture with its layering system
Hence, the Mobile-Femto architecture relies on three different designed layers as shown in
Figure 4.2.
1. The Bus Network Layer (BNL) consists of the Mobile-Femto along the bus and all the
vehicular UEs (passengers) attached to this Femtocell.
2. Convergence Layer (CL) aggregates the traffic sent by the Mobile-Femtos in the
BNLs via the backhaul links and forwards it to the Internet. The eNBs or the mother
BSs enable connectivity for the Mobile-Femto technology that is installed in the bus
with the outside environment.
3. The Access Network Layer (ANL) is composed by the outdoor wireless technology
that is available along the bus paths, e.g. LTE technology. Thus, the ANL is the LTE
core network and it is the decision maker ahead of the eNB in the LTE systems.
Hence, the above designed BS has three potential advantages:

43
1. It avoids the multiple HOs procedures since a single HO is required between the
vehicular UE and the serving Femtocell in the bus instead of performing many HO
procedures for each UE. And since only the Mobile-Femto handles the quality service
connection and the HO procedures, end UEs do not have to care about the mobility
aspect which will be further discussed in chapter 6.
2. It improves the mobile devices battery life due to the short distance between those
mobile devices and the serving Femtocell that is installed in public transportations.
3. It makes a better use of the coverage area because of the use of the omnidirectional
antenna that gives equal signal quality distribution. This makes those vehicular UEs
enjoy a better signal quality as well as it mitigates the high LTE penetration loss inside
the bus. The result is a longer use of the wireless link and therefore the number of
needed HOs can be reduced as well as the signal outage probability, which will be
shown later in this research.
Hence, it is important to discuss the previous works that have considered the vehicular UEs
performance as a significant degradation in LTE cellular system in order to propose suitable
solutions that work for 5G and future networks. LTE VPL is considered as one of the main
factors that have negative impact on the UEs performance, thus, enhancing the vehicular UEs
performance can be achieved by mitigating the impact of LTE penetration loss, which can
efficiently improve the vehicular UEs SINR, throughput, spectral efficiency and system
capacity. Added to this, the literature has included two more sections. One of them discusses
the impact of interference issue on the vehicular UEs throughput and SINR, while the second
discusses the impact of vehicular UEs mobility on the quality of connection and
dropping/blocking calls probability. Discussing the previous works has helped in proposing
effective solutions that suit the vehicular environment as the following chapters show.
4.2 Related work
Mobile computing is fast becoming a vital part of everyday life in which UEs demand
being reachable anywhere and anytime as they spend much time traveling from one place to
another, often by trains or buses. The ultimate purpose of passengers is the ability to be
connected to the Internet while they are moving from one place to another with their mobile

44
devices. Providing indoor coverage on trains and buses directly with the outdoor BSs may not
be a good solution due to the high penetration losses in the LTE and LTE-A networks,
especially for high speed trains caused by the Faraday cage characteristics of the railcars
[Vivas et al., 2012]. This fact leads to a poor signal quality inside the train and offering
broadband services is not always possible. Although, the broadband access on buses and
trains could be achieved by installing BSs close to the railways, however, this solution is not
quite convenient to trains and buses’ operators due to the high investment needed to deploy
such BSs. In additions, this will increase the number of unnecessary HOs. This issue has
focused the research community effort on offering solutions that take advantages of the
existing wireless infrastructure in order to propose efficient methods to manage the mobility
in seamless way for the end-UEs. Therefore, this literature reviews the related work in term
of the vehicular UEs performance and the suggested solutions to improve their performance
in LTE networks.
4.2.1 LTE Vehicular UEs Penetration Loss
The indoor coverage can badly be degraded by the penetration losses through the walls of
buildings. If the BS is outdoors but the mobile is indoors, then the penetrations losses
typically reduce the received signal power by 10 to 20 decibels (dB) - a factor of 10 to 100 -
which can greatly reduce the indoor coverage. This is one of the motivations behind the
progressive introduction of Femtocells [Vilicom, 2015]. It is worth noting that the previous
fact applies to vehicular UEs as well, as those UEs experience high penetration loss since there
is a barrier, the vehicle's chassis between those UEs and the outdoor BSs that affects the
quality of the transmitted and received signals.
In order to solve the previous issue of the high LTE VPL, the authors in [Papadogiannis et
al., 2012] present three categories of Relays that pertinent to type-1 Relays, type-2 Relays and
Moving Relays. The Moving Relays have been presented as a solution to the ever-growing
demand for wireless broadband by UEs within public transportations. Although, this study
showed that Moving Relays can overcome the VPL issue; however, as mentioned earlier, the
drawback of this study is the limited capability of these relay nodes as well as the limited
coverage areas.

45
While in [Kostanic et al., 1998], the authors present a series of VPL measurements performed
in 800MHz-frequency band. These measurements were conducted for three different vehicle
types, mini-van, full size car and sports car with different types of environments e.g. urban or
suburban. The statistical properties of the VPL have been examined in order to determine the
benchmark parameters to be used in the design of wireless communication systems. While the
achieved results have shown that the vehicle’s chassis, speed and distance from the serving BS
play very effective roles in term of the quality of the transmitted signal. Hence, this study has
made it clear why the vehicular UEs in trains suffer from the worst link connection with the
outdoor BS. According to [Ai et al., 2012], the high-speed trains can be a fruitful environment
for mobile services as users are concentrated in relatively small areas. In the train
environments, the trains’ paths are always known and the railway environment itself has large
tunnels, wide cuttings and curves. However, several issues arise in such an environment like
fading, Doppler, transients, and penetration loss into carriages, as well as special situations
such as cuttings and tunnels. This creates a problem with the operation of the physical layer as
this may affect the link between the UE and the outdoor serving BS that causes performance
degradation at the highest train speeds.
Obviously, this has shown that vehicular UEs are most affected by the high penetration loss
due to the signal strength fluctuation and radio link failures between the vehicular UEs and the
outdoor BSs as the mobility aspect plays a negative role in this case. Therefore, the coming
section discusses the vehicular UEs signal quality (SINR), spectral efficiency and throughput
degradations besides analysing the previous implemented solutions and technologies to
improve the vehicular UEs performance.
4.2.2 Vehicular UEs Performance
The signal quality inside vehicular environment is very poor due to the high penetration
loss, path-loss and fading. However, poor signal means poor SINR as in wireless
communication the SINR is being used to measure the signal quality of wireless connections.
Therefore in order to improve the SINR inside vehicular environments, indoor coverage needs
to be deployed as study [Chowdhury et al., 2011] shows. In this study, the authors discuss the
ability of improving the QoS of vehicular UEs and solving the issues behind the low SINR by
deploying mobile Femtocells in the Macrocell. The proposed study has stated that the short
distance between the UE and the Femtocell provides better signal quality. The inside
Femtocells have been connected to the core network or the Macrocell through the satellite

46
networks. One stronger transceiver is installed outside the roof of the vehicle. This transceiver
is connected to the Femtocells using wired connection and to the Macrocell and the satellite
access networks using wireless link. However, this study has proposed an expensive solution
due to the use of the satellite networks and the large transceiver, which reduces the system
flexibility and reliability. Another study however has discussed the cell-edge vehicular UEs
who suffer from low SINR and performance degradation in general [Beniero et al., 2009]. The
authors have considered the feasibility of Decode and Forward (DF) Relay nodes from the
3GPP LTE-Advanced perspective as an attractive solution to solve the SINR reduction. The
proposed solution is based on finding the relation between the relay node transmission power,
ratio between number of BSs and Relay nodes and the performance of the system. The
achieved results have shown a good performance in term of the signal strength after the
deployment of the Relay nodes. However, the proposed solution was not practical from the
network operator point of view as the interference issue might occur in the case of increased
traffic. This is because with the high traffic load, increasing the transmission power to cover
wider range can increase the interference, while reducing the transmission power to eliminate
the interference can increase the number of HOs especially in the case of vehicular UEs. This
has its negative impact on the spectrum efficiency (BW utilisation) of served UEs and it
wastes the network resource.
The spectrum/spectral efficiency or the BW efficiency is the rate of information that can be
transmitted over a given BW in a specific communication system. It is a measurement of how
efficiently a limited frequency spectrum is utilised by the physical layer protocol, and
sometimes by the MAC layer. It is more affected by the UE’s mobility and speed, which has
the biggest impact on the quality of the spectrum efficiency utilisation. The authors in [Haider
et al., 2011] discuss the ability of improving the spectrum efficiency via using the mobile
Femtocell technology. This study has stated that the spectral efficiency of mobile Femtocell’s
UE can be improved with the use of two resource partitioning schemes, orthogonal and non-
orthogonal. However, this study has neglected the generated interference between the mobile
Femtocells themselves and it assumed that the chosen environment is an ideal environment
where there is no noise and interference, which may affect the accuracy and reliability of the
achieved results since it does not match the real life scenarios. While [Jangsher et al., 2013],
has discussed the problem of resource allocation in a cellular network with mobile Femtocells.
This study has shown that the speed and path information of the mobile Femtocells have been

47
used to determine the interference correlations between different Femtocells at different time
instants and represent them as a time interval dependent interference graph.
Other studies like [Nguyen et al., 2013] have considered the cognitive radio as a core
technology for future wireless communications in which the wireless spectrum can be
dynamically shared between the eNB and the Femtocell. This study has shown that sharing the
resources between the eNB and the Femtocells can achieve higher BW utilisation as well as
spectral efficiency. However, interference problem is always been such a critical issue in such
deployments.
On the other hand, [Kulkarni et al., 2010] and [Andrews et al., 2010] show that the Radio
Resource Management (RRM) model that used in LTE system is responsible for the spectrum
resource, channel allocation, transmission power and modulation schemes. These studies have
proposed different resource allocation schemes to allocate resources between the Macrocell
and the Femtocell over the shared spectrum. In these studies, the Femtocells try to learn the
resource usage pattern of Macrocells based on their synchronisation and adjust the resource
block pattern based on the interference. Whenever, the Femtocell finds a free slot from
Macrocell, it allocates the free resource block to Femtocell’s UEs. This is applicable only
when there is less traffic, which may generate high interference in the case of high traffic
loads. While the authors in [Shbat et al., 2011] have proposed the approaches of cognitive
radio resource and dynamic fractional reuse scheme to solve the previous interference issue
between the eNB’s via X2 interface and subcarrier allocation. However, the previous two
proposed schemes might be a reasonable solution to solve the issue of spectrum efficiency
reduction and high interference in the case of fixed BSs and fixed UEs while it is considered
as a challenge in the case of mobile BSs and mobile UEs.
More studies have been done by [Sethom et al., 2012], [Yoon et al., 2012] and [Tang et al.,
2012] on the resource management of Femtocell by introducing several mechanisms and
techniques to share resources between the Macrocells and Femtocells. Whilst sharing the
spectrum efficiently among the Macrocell and Femtocell’s UEs with less interference has been
discussed in [Bai et al., 2009], [Al-Rubaye, 2012] and [Yang et al., 2011]. Other studies
concentrated more on investigating the OFDMA technique based on LTE network like [Al-
Rubaye, 2012] and [Hatoum et al., 2011]. These studies have shown the correlation between

48
the OFDMA and Physical Resource Blocks (PRBs) as well as the impact of this access
scheme on sharing the resources between Macrocell and Femtocell UEs. While other studies
have observed the impact of PRBs distribution on the achieved cell capacity in LTE networks
like [Ali et al., 2013] and [Karvounas et al., 2012]. Distributing the PRBs and dynamically
allocating the resources among UEs can greatly improve the achieved capacity as well as the
spectrum efficiency. Hence, all the previous studies have shown that the distribution of the
PRBs depends on the UE’s traffic that the cell is experiencing which might be a burden on the
network without an efficiently resource allocation scheme. However, most of the previous
studies were limited to the fact that they have considered the case of fixed BSs with mobile
UEs but not the mobile BSs with mobile UEs as it is considered a challenge in this case.
Nevertheless, the authors in [Mimura et al., 2012] have proposed a method for the mobile
environment, which is the multi-operator mobile Relay node for cellular networks on buses
and trains. This study has enabled an improvement in the spectral efficiency because an
antenna with higher gain than that of UE has been installed in the Relay node. However,
installing different Relay nodes for different operators is not a practical solution because of the
large amount of space that needs multiple Relay nodes to be installed in buses in order to
cover wider areas. Therefore, the previous problem has been solved by sharing the Relay
nodes among multiple operators as well as using dynamic spectrum allocation among the
operators for Relay node-UEs communication based on Nash Bargaining Solution (NBS). In
other words, the effective use of radio resources among Relay nodes can be achieved by
allocating the BW to operators depending on the link quality. This has improved the achieved
throughput by approximately 20% in comparison with situations where multiple operators
install different Relay nodes individually. However, the previous proposed solution has
created confusion from the end UEs side since indoor vehicular UEs may experience multi-
signal interference due to the multi-network operators that share the same coverage area
surrounding those vehicular UEs.
As a result, the network throughput is more affected by the UE’s mobility and speed as the
last has the biggest impact on the UE’s quality of connection and throughput. Accordingly,
many researchers have considered this issue as an area of interest. In [Scott et al., 2013], the
authors have presented a system level simulation results for a cooperative moving Relay node
system deployed on a High-Speed Train (HST) to provide enhanced cellular coverage to UEs

49
in public transportations, particularly HSTs, of which the modern construction materials and
techniques cause high VPL when signals propagate into the train. This study has shown that
the mobile relay nodes utilising antenna arrays on the exterior and interior of the train are a
promising solution to overcoming this VPL in order to provide onboard UEs with improved
services. The achieved results showed a slight improvement to in the achieved throughput of
onboard UEs when compared to direct transmission of those vehicular UEs. Another study has
considered the mobile Relays as a solution to improve the vehicular UEs throughput as in [Sui
et al., 2013]. Here, the authors have considered the mobile Relay node to be deployed on
public transportation to serve vehicular UEs in order to reduce the impact of the penetration
loss and improve the UEs throughput. However, both of the previous studies were limited to
the fact of the limited number of served UEs i.e. max five UEs, and coverage areas while
another issue added to the second study, which is the random movement of the mobile Relay
that agitates the interference problems.
Hence, all the previous works like [Scott et al., 2013] and [Mimura et al., 2012] have
shown that the increased demand for using the new multimedia services and features of
today’s Smart-Phones in vehicular environment have been considered as a drawback in
nowadays networks. This is because vehicular UEs may not be able to connect to the network
directly without the use of an efficient technology to cover the network holes and improve the
vehicular UEs performance. However, several challenges can face the deployment of Mobile-
Femto technology that are needed to be considered from different aspects such as; the resource
distribution between the Macrocell and the Mobile-Femto, the UEs scheduling process, the
vehicular UEs spectral efficiency, throughput, SINR, and link capacity to accommodate the
increased amount of transmitted data rate. Additional to that, the main concern will be
reducing the effect of path-loss, penetration loss, interference and mobility in vehicular
environments and improve the performance of vehicular UEs.
4.2.3 Interference
The deployment of low power nodes in heterogeneous networks has a beneficial impact on
enhancing the system’s capacity by bringing the transmitter and the receiver closer to each
other. However, the dense deployment of these Femtocells has created a serious interference
issue. Thus, in order to reduce and mitigate the interference between those small BSs and
between the Macrocell, many studies have been carried out based on the power control for

50
Uplink (UL) and Downlink (DL) signals, radio resource scheduling, Femto/Macro local
information, UE measurement, cooperative approach, time/frequency allocation, QoS
requirements, frequency division, frequency reuse and network planning approaches. While
other studies have discussed the impact of interference issue on the network performance in
LTE and LTE-Advanced networks as in [Bennis et al., 2011], [Dalal et al., 2011] and [Zheng
et al., 2010]. The previous studies have shown that, the position of Femtocells needs to be
chosen wisely in order to have the smallest possible number of Femtocells but with the
largest possible coverage area. Using this technique reduces the implementation cost and
interference as it is necessary to specify the cell threshold areas and place the Femtocells near
to those areas.
Other studies have considered the transmission power as a way of controlling the interference
like in [Claussen, 2007]. In this study, the author has proposed a method for power control of
randomly deployed Femtocells. The system model is based on the idea of a constant
Femtocell coverage area by enabling the control of pilot power and data on the DL
transmission. In the UL, the transmission power of the UE is limited to a predefined value in
order to guarantee that interference is at its minimum level for the existing Macro-UEs.
While in [Shin et al., 2013], a dynamic power control algorithm is proposed in order to
reduce the interference level while maximising the indoor coverage. The aim of this scheme
is considering the load balance of the Femtocells so that loaded Femtocell reduces its
coverage area by adjusting the transmission power and vice versa, which helps to reduce the
interference issue.
In contrast, in [Stefania et al., 2001] the authors have described a communication mechanism
over the X2 interface between the Macrocell and Femtocells for Inter-Cell Interference
Coordination (ICIC). One example is that when a certain cell needs to transmit, it has to
inform its neighbours about its transmission power level on the DL. Another approach utilises
the UL by exchanging the measurements about interference levels among different cells.
While in [Chu et al., 2010], the authors have proposed a decentralised resource allocation
scheme for hybrid networks. In this scheme, the available radio resources are divided into time
and frequency domains. The Macrocell can select and use all the resources, while the
Femtocell has to select only a subset from the available OFDMA frequency resources when it
wants to transmit in a random manner. The aim is to minimise the probability of interference
occurring for every resource block. While in [Sundaresan et al., 2009], a Femtocell

51
management model was proposed, where resources are allocated to Femtocells and Macrocells
orthogonally in time and frequency domains. However, this approach requires a high level of
synchronisation between different cells in addition to the overhead caused by the large amount
of signalling. In [Zhang et al., 2010], the cognitive approach has been proposed for Femtocells
in LTE systems. The Femtocells share information among themselves about path-loss, then
the interference is estimated, and the Femtocell selects a component carrier according to
mutual interference levels.
In [Lopez-Perez et al., 2010], a dynamic technique for interference avoidance between the
Macrocell and Femtocells was put forward. The proposed scheme is a combination of power
control and HO process. When the Macro-UE is discovered to be under interference from a
Femtocell, the Macrocell will perform intra HO so that the UE is assigned to a different
channel with lower interference. This also applies to Femtocells for changing their allocated
channels. While, in [Li et al., 2011], the authors have presented a method for interference
control based on clustering, BW division and power control. In this approach, the Femtocells
are allocated different frequencies in a frequency-reuse manner, according to the cluster
position interference level.
It is worth mentioning here that the RRM model used in LTE system is responsible for the
spectrum resources, channel allocations, transmission powers and modulation schemes.
Several studies have proposed different resource allocation schemes to allocate resources
between the Macrocells and the Femtocells like [Zhang et al., 2013], [Chu et al., 2010] and
[Ahmed et al., 2014]. The Femtocells try to learn the resource usage pattern of Macrocells
based on their synchronisation and adjust the resource block pattern based on the interference
level. The Femtocell finds a free slot from Macrocell and allocates the free resource block to
Femtocell’s UE; this is applicable only when there is less traffic. While [Hussain, 2009] has
proposed the approaches like cognitive radio resource and dynamic Fractional Frequency
Reuse (FFR) scheme to reduce the interference between eNB’s via X2 interface and sub-
carrier allocation. The FFR and Soft Frequency Reuse (SFR) are existing solutions for
frequency reuse in LTE Femtocell based systems [Ghaffar et al., 2010]. The FFR splits the
given BW into an inner and an outer part. It allocates the inner part to the near users (located
close to the BS in terms of path-loss) with reduced power applying a frequency reuse factor
of one. For users closer to the cell edge (far users), a fraction of the outer part of BW is
dedicated with the frequency reuse factor greater than one. In contrast, with the SFR, the

52
overall BW is shared by all BSs (i.e. a reuse factor of one is applied), but for the transmission
on each subcarrier, the BSs are restricted to a certain power bound. Another drawback in the
SFR is that, if the user density is not high in a particular region, the spectrum band used in
that region will be wasted.
In order to mitigate the interference between the Femtocell and the Macrocell, [Airvana, 2013]
has introduced a frequency planning technique to avoid this interference issue. This study has
shown that the mobile operator has three basic options (scenarios) for allocating available
frequencies in Femtocell deployments. The first scenario represents a dedicated radio channel
for Femtocell deployment that provides separate Macrocell and Femtocell radio channels. This
has the advantage of minimising the interference between the two networks and simplifying
initial deployment of Femtocells. This Scenario is typically more suitable in rural areas where
the mobile operators may have unused radio channels. The second scenario shares all available
radio channels between the Macrocell and Femtocell networks. This has the advantage of
providing more degrees of freedom to manage interference between Femtocells, especially in
dense urban deployments, but also requires the greatest degree of interference management to
ensure minimal impact on the Macrocell network from the co-channel Femtocells. While the
third scenario represents a compromise between the first and the second scenarios in which
some radio channels are shared between the Macrocell and Femtocell networks and other
radio channels are reserved for the Macrocell network only. In this scenario, the Macrocell
can redirect the mobile devices that are serving over the shared radio channel to a dedicated
Macrocell radio channel when they approach a Femtocell. This approach may not work
perfectly in the case of vehicular environment since the Mobile-Femtos and UEs keep
changing their locations from one place to another.
Further studies have introduced the cross-tier (co-channel) interference as a significant issue in
LTE network. In [Peng et al., 2011], the authors have stated that the traditional Femtocell
shares the same licensed frequency band with Macrocell, which causes the cross-tier
interference. Therefore, a resource allocation scheme of using TV White Space (TVWS) for
LTE Femtocell Network was introduced, showing the potential to solve the cross-tier
interference in traditional Femtocell deployment. While in [Hosseinzadeh-Salati et al., 2014],
the authors deal with the problem of aggregate interference modelling and static resource
allocation in OFDMA-based two-tier Femtocell networks for both close and open access
Femtocells. It has been assumed that for Macrocell UEs, the spectrum allocation is

53
accomplished through FFR scheme. The authors’ objective is to maximise the Femtocell UEs’
throughput while maintaining as low as it is possible the impact of interference on the
Macrocell UEs’ performance. Their proposed algorithm is decentralised, and based on some
measurements that need to be performed only when Femtocell access point is plugged in.
While more studies like [Mahmud et al., 2014] have shown that Femtocells are capable of
achieving higher capacity and improving indoor coverage due to the short distance between
the transmitter and receiver, where FFR has been proposed to improve spectral efficiency in
emerging OFDMA networks.
There are many other related studies on frequency reuse techniques for interference
mitigation in LTE-A deployments. The evaluation of various frequency reuse schemes
including Integer Frequency Reuse (IFR), FFR and Two Level Power Control (TLPC) have
been presented in the work of [Godlewski et al., 2008]. A brief comparison of these schemes
has been provided and concluded that FFR and TLPC with appropriate settings of inner region
radius and power ratio provide the best performance together with applying fair-share
scheduler. While [5GNow, 2015] has proposed a scheme that adjusts its radio frequency
parameters taking into account all the network conditions and show that co-channel
assignment of the spectrum can lead to higher cell throughputs. However, [Lee et al., 2010]
has proposed a frequency planning mechanism, in which Femtocells choose the frequency
sub-bands that will not be used in the sub-region of a Macrocell using FFR in an integrated
Macrocell/Femtocell network. In [Han et al., 2008], the authors have proposed a novel
frequency partitioning method, in which both sub-channels for inner cell region and sub-
channels for outer region are allowed to be used in the inner region of cells while sub-channels
for outer region are defined differently from cell to cell to reduce Co-Channel Interference
(CCI). Furthermore, FFR scheme is introduced by [Giuliano et al., 2008], which has stated
that the inner and the outer regions can be served in a different way, not only in terms of
frequency sub-bands but also in terms of time slots. This scheme has been extended further by
[Hamoudal et al., 2009] that employs the concept of making cell sectors while an optimisation
mechanism for FFR configuration is presented by [Bilios et al., 2012] to achieve better system
performance based on dynamic cluster sizing and frequency allocation.

54
However, Chapter 5 has discussed the possible interference scenarios in term of vehicular
environments and proposed effective solutions to minimise the interference impact on the
achieved UEs performance.
4.2.4 Mobility
In the LTE system, the mobility management procedures such as HO and cell reselection
are becoming more complex due to the dense deployment of different type of cells. Many
studies have examined the mobility robustness and HO issues in heterogeneous networks.
Researchers have focused on different topics such as signal strength during HO, interference,
SINR, cells’ properties, UEs positioning, outage probability, drop and block calls
probabilities. Therefore, the following discusses some of the previous works in term of the
mobility management of mobile and vehicular UEs in LTE network.
The authors in [Guohua et al., 2013] have proposed mobility robustness optimisation scheme
based on exploiting the measurement reports. The aim of this study is to find the best target
cell by updating the HO trigger mechanism after considering the SINR parameter. The later is
introduced in order to consider the interference variation and interference distribution within
the HO region. The HO preparation and triggering is controlled depending on a defined SINR
threshold. While in [Peng et al., 2012], the authors have proposed two schemes to improve the
HO performance during the process of Pico-cells leaving and attaching. The idea is to perform
the HO from a small to a large cell and vice versa, in addition to control the attaching/leaving
process to/from Pico-cells to avoid the unnecessary number of HOs. However, the previous
two studies were limited to the fact of the limited adaptation with the increased UEs’ speed.
This is because with the increased UEs’ speed the number of unnecessary HOs increases as
those UEs are in continuous movement, while the limited coverage BSs are fixed positioned.
This may have negative impact on the vehicular UEs’ performance in the serving network as
well as this may increase the number of dropped calls too.
On the other hand, in [Guidolin et al., 2014] based on the Markov mathematical model, the
researchers have modelled the UE state during the HO process to find optimal HO criterion
with consideration given to path-loss, channel outage and fading propagation. The HO
performance model was controlled by a timer countdown, depending on the SINR threshold.
This timer is the Time-to-Trigger (TTT) where the countdown is aborted and the process is

55
stopped if the SINR changes along the UE’s trajectory. Thus, if the SINR decreases below the
threshold and continues to do so, the UE switches off its cell and connects to a new one and so
on. While in [Lopze-perez et al., 2012], the researchers have proposed a technique based on
the ICIC with a metric to detect the HO failure and evaluate the ping-pong state. In this
technique, the co-channel scenario is assumed between Pico-cells and the Macrocell. Mobility
is evaluated depending on the HO counts and the cell reselection threshold during a time
window. Pico-cells employ some of their resources so the Macrocell exploits these blank
resources to schedule UEs with high mobility and protect them from Pico-cells’ interference.
In contrast, Pico-cells schedule low mobility UEs during the blank sub-frames of the
Macrocell. However, this technique may not work efficiently in high penetration loss and
path-loss areas, e.g. LTE cell-edge vehicular UEs. This is because assigning the cell-edge
vehicular UEs to be served by the Macrocell, due to their high speed and according to the
previous study, can increase the outage probability and dropping calls probability because of
the high penetration loss of direct signals as well as the extra burden on the eNB to maintain
their connection.
In addition, the effects of cell range expansion combined with ICIC on HO performance have
been evaluated in [Kitagawa et al., 2012]. This study has shown that cell range expansion has
a positive correlation with the number of connected UEs to the Pico-cells since the last will
have more capability to offload the traffic from the eNB. This study has linked the cell range
expansion technique to the HO performance, and ascertained the application range that could
keep the HO failure under a certain percent. While in [Ma et al., 2012], the HO decision
scheme has been investigated in a three-tier network (Macrocell, Relay node and Femtocell) to
reduce the frequent and unnecessary HOs. This study is based on HO priority and Dwell
probability as in some scenarios where higher priorities are given to the HO process to the
Femtocell or Relay node in order to reduce the unwanted HOs. When assigning these
priorities, the information gives pre-knowledge about whether or not the UE is camping on the
coverage of the Femtocell or Relay node, and this is very important for the HO decision. In the
case where there is no pre-knowledge, prediction based on a history record was used instead.
However, in this study the speed issue raises again as with high-speeds the number of
unnecessary HOs increases which affects the UE/network performance.

56
More studies have considered the HO between the Fixed-Femto and the eNB in LTE network.
In [Xu et al., 2010] the authors have investigated the HO between the Macrocell and the
Fixed-Femto layers based on the UE’s state and the SINR, taking into account the power
difference between the two layers. Instead of relying on the Received Signal Strength (RSS) as
in a conventional HO, the UE hands off to the cell of higher SINR. While in [Moon et al.,
2010], a novel decision algorithm has been proposed to manage the mobility of the UE
towards the Fixed-Femto. In this algorithm, the values of the RRS of the source and target
cells are combined to generate an adaptive offset. In this offset, the Femtocell’s RRS should
be greater than the set threshold in order to guarantee a good combination and a better
connection according to that threshold’s value. Other studies, such as [Becvar et al., 2010],
have considered the location of the UE to adapt the HO parameters, while [Moon et al., 2009]
is based on the large asymmetry in the cell’s transmitted power.
On the other hand, the authors in [Saied et al., 2012] have proposed an analytical model for
mobile UE connection probability in Femto-Macro cellular networks. The aim of this study is
to improve the performance of the connectivity probability in term of the communication
range when Macro UEs at the boundary of the Macrocell and at the same time at the boundary
of the Fixed-Femto. The achieved results have shown an improvement in the performance of
the connectivity probability after increasing the communication range by increasing the
number of deployed Fixed-Femtos in the Macrocell. However, this study raises the cost issue
and the deployment of unnecessary number of Fixed-Femtos in the Macrocell. Increasing the
number of Fixed-Femtos will bring more issues regarding the interference and the unnecessary
number of HOs with the highly UEs speed.
While in the case of Mobile BSs, the authors in [Chae et al., 2013] have presented a novel HO
scheme that is utilising the coordinated multipoint transmission (CoMP) in high-speed moving
vehicular Femtocell networks. This study has discussed the deployment of Femtocell networks
inside high-speed moving vehicles such as trains to provide the highly speed passengers with
the internet. The proposed scheme was aspiring for a seamless, deployable and efficient HO
procedure for group of Mobile-Femtos that are installed in trains especially when the train
moves out of the coverage area of one eNB to another. However, this study is limited due to
the limited number of available PRBs in the target Macrocells. In that case, most of the
Mobile-Femtos connections will be dropped and in turn, the Mobile-Femtos UEs connections

57
will be dropped too. This occurs when the target eNB has a full use of the PRBs to the extent
that it cannot accommodate the coming Mobile-Femtos especially when those Mobile-Femtos
are moving in a high speed towards a specific direction. This may affect the UEs and network
performance. Besides that, using a high transmission power for the Mobile-Femtos and not
leaving enough distance between them may cause a high interference issue that will affect the
LTE network performance again especially when those Mobile-Femtos share the same
spectrum with the eNB.
After discussing the related work in term of mobile/vehicular UEs’ HOs, it is important
now to discuss the related work of the impact of HO procedure on the outage probability and
the connection quality between the vehicular UEs and the serving BS. To begin with, having a
high outage probability can drop the network performance and affect the UE’s quality of
service. Therefore, several studies have considered the vehicular UEs outage probability as an
issue to be solved in LTE networks. In [Sui et al., 2012], the authors have investigated the
power outage probability of vehicular UEs who are served by half-duplex decode-and-forward
Relay Nodes (RN) under co-channel interference. The aim of the proposed framework is to
optimise the HO parameters, as well as numerically optimise the fixed RN position, which
minimises the average power outage probability at the vehicular UEs end. Fixed RN shows its
advantage in serving its nearby vehicular UEs while the moving RN has shown a better quality
of connection in term of those vehicular UEs. On the other hand, in [Pan et al., 2015], the
authors have proposed an efficient HO scheme, which contains two procedures in order to
mitigate the signal outage probability of vehicular UEs and improve their performance. The
first procedure is an enhanced measurement procedure, which can accelerate the measurement
procedure when the mobile Relay knows that the train is moving toward some neighbouring
DeNBs. The second procedure is a group in-network HO procedure, which can occur similarly
to network HO procedures in the core network. However, the limitation in the previous two
studies is the occurrence of the interference among RN UEs and Macro UEs as RNs use the
unlicensed spectrum unlike the Femtocells in LTE networks.
While in [Elkourdi et al., 2011], the authors have evaluated the performance advantage of
using Femtocells as mobile Relays by communicating with the Macro BSs to improve and
extend coverage for mobile UEs. The proposed approach enables cooperative strategies
between Home BSs and Macrocell BSs in order to mitigate the signal outage probability of

58
vehicular UEs. While in [Haider et al., 2011], the authors have investigated the effects of
using mobile Femtocells in vehicles, specifically on the amount of signalling overhead
between mobile Femtocells and Macrocells. The results show that there is a large saving in the
volume of control signalling after using mobile Femtocells to communicate with the eNB on
behalf of the onboard mobile UEs. This has its own positive impact on improving the signals
inside vehicles. Whereas, other studies concentrated on improving the signal quality inside
vehicles like [Chowdhury et al., 2011]. This study has proposed the deployment of Femtocells
in vehicles to improve the uplink throughput for mobile UE. The mobile BS is connected to
the operator’s Core Network (CN) through the Macrocell BS or a satellite where the results
have shown that mobile Femtocells can improve service quality and maintain an acceptable
level of SINR.
It is quite noticeable that most of the HO work tackled the HO from Pico-cells, Fixed-Femtos
and mobile Relays to eNBs and vice versa. Very few studies have considered the Mobile-
Femto HO as a research of interest unlike the HO process between the Fixed-Femto and the
Macrocell which has been discussed in many studies like [Zaman et al., 2013], [Badri et al.,
2013] and [Xenakis et al., 2012]. However, the proposed HO schemes of those studies were
limited to the fact that they are dealing with mobile UEs but fixed BSs which do not work with
the highly UEs speed. Additionally, the previous works have shown a limitation in term of the
Mobile-Femto HO procedure and the possibility of handing over these small BSs from one
Macrocell to another. As a result, handing over the Mobile-Femto from one Macrocell to
another is considered a challenge due to many factors that need to take a place here, like the
adaptability of the backhaul link between the Mobile-Femto and the target eNB, the
availability of the PRBs in the target eNB and the speed/direction of the Mobile-Femto.
Therefore, chapter 6 proposes the Mobile-Femto HO procedure and the group vehicular UEs
HO process. The impact of the proposed HO scheme on the reduction of the outage
probability, dropping calls and blocking calls probabilities will be also tackled together with
the increased traffic, number of channels and calls duration in comparison with the direct
transmission from the eNB and the Fixed-Femto.
4.3 Vehicular UEs performance analysis in LTE network
The main aim of this section is to look into the Fixed-Femto and Mobile-Femto
technologies and their impact on the vehicular UEs’ performance in LTE and next generation

59
networks. Therefore, being able to improve the performance of those cell-edges vehicular UEs
who are suffering from high penetration loss, high path-loss, weak signal strength and low
throughput is the main concern of this section. However, it is to be noticed here that the
backhaul link between the eNB and the Mobile-Femto experiences fast fading with a NLOS
channel while the access link between the Mobile-Femto and the UE is assumed to be LOS
with slow fading channel. Also it is worth mentioning that the wireless backhaul link
transmission does not interfere with the Small/ Macro-cells arrangement. This is because it
uses a frequency band that has not been used before. This is required in order to avoid the
interference between different wireless backhaul links as well as with different direct and
access links.
The used path-loss model will be flexible to be used on the direct, the backhaul and the
access links in urban and suburban areas where the buildings are of nearly uniform height and
the distance between two BSs is less than 1Km. It is important to clarify the communication
process between the eNB and the Femtocell and between the Femtocell and the UE in LTE
system. The eNB gathers the Channel State Information (CSI) from all UEs and Fixed-
Femtos/Mobile-Femtos in the Macrocell. Likewise, the UEs within the Fixed-Femto/Mobile-
Femto coverage will feedback this information only to the Fixed-Femto/Mobile-Femto. In the
transmission process, the eNB transmits the data to the selected Fixed-Femto/Mobile-Femto
via the backhaul link and then the Fixed-Femto/Mobile-Femto will fully decode the data,
buffer it and retransmit it to its UE via the access link.
Hence, this research shows the potential of deploying the Mobile-Femtos in the Macrocell
as they have been assumed to be installed across the roof of public transportations e.g. buses
to improve the capacity, reliability and coverage for vehicular UEs in 5G and future wireless
networks. To this end, the following section will draw a mathematical comparison between
the vehicular UEs performance before and after deploying the Fixed-Femto and Mobile-
Femto in LTE Macrocell.
4.3.1 System Model
As depicted in Figure 4.3, the considered eNB has a fixed coverage of D meters depends
on the chosen transmission power, while one vehicle (bus) is moving along the highway with
a number of UEs inside it. It has been assumed that both the Fixed-Femto and the Mobile-
Femto consider the dual-hop transmission where the eNB transmits to a vehicular UE via the
Fixed-Femto/Mobile-Femto and vice versa as mentioned earlier. Additionally, d meter is the

60
distance between the eNB and the Fixed-Femto while x is the distance between the eNB and
the vehicular UE.
Fig 4.3 eNB, Fixed-Femto and Mobile-Femto system model architecture
In order to generate the simulation environment, several mathematical equations will be
integrated with each other and developed to suit the designed scenarios. MATLAB simulator
has been used for the simulation purposes to evaluate the achieved results between three
technologies: eNB, Fixed-Femto and Mobile-Femto .
However, before clarifying the communication links between the eNBs, Fixed-Femtos and
Mobile-Femtos, it is significant first to discuss the UEs scheduling process and resource
allocation scheme in these BSs. A multiuser scheduling scheme is assumed where the
Macrocell UEs, the Mobile-Femtos and the Fixed-Femtos are served over k PRBs, indexed by
k=1,…….,K. The Fixed and Mobile Femtos are scheduled over a dedicated time-frequency
zone in such a set of Fixed-Femtos and Mobile-Femtos that are selected according to
scheduling criterion e.g. serving priority or channel condition. Figure 4.4 shows the scheduling
mechanism in term of eNB, Mobile-Femtos and Fixed-Femtos UEs.
Fig 4.4Time sharing strategy for Fixed and Mobile Femtos in LTE system

61
As mentioned earlier, the eNB is responsible for scheduling all the links of the network,
Femtocells’ links and UEs’ links. The Femtocell nodes only forward the received data and
signalling from/to the eNB without any scheduling. The scheduler in the eNB should take into
account the limitation of the Control Channel Elements (CCEs) when allocating the PRBs to
the UEs in both directions UL and DL. Therefore, the UEs scheduling has two successive
scheduling decisions; the candidates selection followed by frequency domain resources
allocation to assign the PRBs among the selected UEs. It is to be mentioned that, the
candidates’ selection can be either UEs or Femtocells who need to be scheduled in the
Macrocell. The eNB will schedule the Mobile-Femtos like any other UEs but of course, more
PRBs will be allocated to those access points than normal UEs need. Hence, the scheduling
process can be summarised as the following;
1. The time domain scheduler will prioritise the UEs based on a given priority criterion
e.g. Proportional Fair (PF) Scheduler.
2. It selects only Marco UEs or Mobile-Femtos/Fixed-Femtos with highest scheduling
priority taking into account the total Control Channel Elements (CCEs) constraints as
well as the number of available PRBs. This can be defined as (N UEs n Nmax), (J
Mobile-Femtos j ≤ Jmax) or (I Fixed-Femtos i ≤ Imax), where n ∈ N = {1,..., N}
denotes the set of UEs who communicate directly with the eNB (Macrocell UEs).
While Nj refers to a group of UEs within a Mobile-Femto j and Ni denotes the group
of UEs within a Fixed-Femto i, where Mobile-Femto j ∈ J = {1,....J} and Fixed-Femto
i ∈ I = {1,....I}.
This research considers the PF scheduling policies. This type of scheduling refers to the
amount of resources allocated within a given time window to UEs with better channel quality
in order to offer high cell throughput as well as fairness satisfactory. The PF scheduling
mechanism has been presented by Figure 4.5 [Habaebi et al., 2013].

62
Fig 4.5 Proportional fair scheduler for UEs in LTE network
As the above figure shows, the scheduling technique works as the following; firstly, the
scheduler sorts the UEs in descending order according to the proportional fair metric (Liu et
al., 2008) and then it picks up only some of the UEs depending on the availability of the CCE,
the PRBs and UE’s CQI. Secondly, the scheduler allocates the PRB k to UE n, Mobile-Femto j
or Fixed-Femto i according to the following criterion:
∈
Where the denotes the average data rate of UE n before the current scheduling
subframe t. Thus, ∈ and is the
instantaneous achievable rate on PRB k for a user n, which can be calculated according to
Shannon formula:
(4.1)
(4.2)

63
Hence, the average data rate of UE n can be calculated using an exponential average filtering,
which will be unpdated using the following formula:
Where T is the average window length, which is considered as an important element in the PF
scheduler and is a binary indicator that is set to 1 if the user n is scheduled on PRB k
at time 1 and to 0 otherwise.
Since the main concern of this research is the vehicular environment, vehicular UEs and
Femtocells scheduling process may occur differently from the traditional one. This is because
the scheduling process here is not only for vehicular UEs but it is for Femtocells as well.
Therefore, the availability of BW resulted in resource blocks plays important role in the
scheduling process of both UEs and Femtocells. However, it should be noticed that, there is a
positive correlation between the used BW and the transmitted data rate (Rn). In other words,
whenever the used BW is large, the ability of allocating more PRBs to UEs and Femtocells
increases. This has its positive influence on the transmitted bit rate and achieved throughput.
Accordingly, the following algorithm represents the UEs and Femtocells PF scheduling
scheme in the Macrocell under different traffic loads (low, medium and heavy) traffics:
(4.3)

64
Algorithm 4.1: Scheduling UEs and Femtocells
1:
/* Bandwidth Scheduling to Macro UEs, Mobile-Femtos & Fixed-Femtos
2: for N = {1,..., N}, J = {1,....J}, I = {1,....I}
3: compute CCE
4: compute CQI
5: compute max_RBs
6: if (Sch_ ) then
7: (
) %thus, do the
following
8: sch_N
9: sch_J
10: sch_I
11: accept_Transmission then
12: for n=1 % for all UEs do the following calculations
13: ergodiccapacity = calculate_ ergodiccapacity(n)
14: spectraleffeciency = calculate_ spectraleffeciency(n)
15: throughput = calculate_ throughput(n)
16: sinr = calculate_sinr(n)
17: end for
18: end if
19: else if ) then
20:
)
21: rej_sch
22: rej_Transmission
23: end
24: end for
Hence, the SNR in (dB) can be defined as the power ratio between the signal and the noise,
and it can be given as the following equation [Audio precision, 2013]
(4.4)

65
Thus, based on the above equation the received signal-to-noise ratio (SNR) at the receiver
(Rx) side can be given by
Where G represents the channel gain and has been used to model the Path-Loss when the
receiver Rx is at distance L away from the transmitter Tx,. The Px is the average transmission
power at the transmitter Tx while is the VPL and Pnoise represents the noise power.
As shown earlier in Figure 4.3, the vehicular UEs is at distance x away from the eNB. Thus,
according to Shannon equation the capacities of the backhaul and access links in bits/s/Hz
can be given as and
respectively [Cover et al., 2006], where
Hence, for the Fixed-Femto assisted-transmission the equation is given as
On the other hand, the distance between the transmitter Tx of the vehicular UE and the
Femtocell that is allocated in the same bus (Mobile-Femto), is shorter than 5 meters at most.
As a result, a LOS access link and a constant power loss Closs = -84.55dB have been assumed
[Masui et al., 2002]. The SNR of the Mobile-Femto assisted-transmission can be given by
(4.5)
(4.6)
(4.7)
(4.8)

66
Here, the
denote the average transmission power of the eNB,
Fixed-Femto and Mobile-Femto while G1 denotes the channel gain of the backhaul link and
G2 denotes the channel gain of the access link in the Fixed-Femto assisted transmission.
Whereas the channel gain of the Mobile-Femto assisted-transmission has been assumed to be
1 (means unity) due to the short distance between the UE and the Femtocell as well as the
LOS access link. After presenting the SNR of the eNB, Fixed-Femto and Mobile-Femto
assisted transmissions, now it becomes necessary to state the Ergodic capacity of the direct,
backhaul and access links, which are generally can be given by
The backhaul links between the eNB-Fixed Femtos and the eNB-Mobile Femtos are assumed
to be NLOS outdoor links. As a result, the backhaul link capacity in (bits/s/Hz) between the
eNB and the Fixed-Femto at distance d can be given by
While the the backhaul link capacity between the eNB and the Mobile-Femto at distance x can
be given by
Here the BWeNB-FixedFemto and BWeNB-MobileFemto represent the bandwidth of backhaul links
between eNB-FixedFemto, eNB-MobileFemto while BWFixedFemto-UE and BWMobileFemto-UE
represent the bandwidth of access links between FixedFemto-UE and MobileFemto-UE
respectively.
It should be noticed that, in the backhaul link capacity between the eNB and the Mobile-Femto
there is a small channel gain like the Fixed-Femto due to the distance gap between the Mobile-
Femto and the eNB as well as the NLOS backhaul link. While, the Cdirect(eNB-UE) can be given
as the same as the C backhaul(eNB-Mobile-Femto) in equation (4.11), since the direct link between the
(4.9)
(4.10)
(4.11)

67
eNB and the vehicular UEs is a NLOS link and the distance between the eNB and the UE is
the same as the distance between the eNB and the Mobile-Femto.
Hence, based on the above equations, the access link capacity between the Fixed-Femto and
the vehicular UE at distance x-d can be derived and given as
While the access link capacity between the Mobile-Femto and the vehicular UE is a special
case scenario as the penetration loss does not exist in this case. This is because there are no
boundaries between the UEs and the serving small BS so nothing resists the signal from
reaching the UEs without losses. Therefore, the link capacity can be given by
Hence, it is important to state that the backhaul link between the eNB and the Mobile-Femto
is the capacity bottleneck of the Mobile-Femto technology and many challenges can be faced
with deploying this technology. One of these challenges is observed when the UE and Mobile-
Femto speed goes up, the rapid variations of mobile channels combined with feedback delays
reduce the accuracy of the CSI at the eNB side. The CSI feedback inaccuracy at the eNB
limits the use of advanced MIMO transmission schemes that are needed in LTE and 5G
systems to further increase the throughput of the backhaul link. To control the previous issues,
the speed of the designed scenarios has been controlled. Nevertheless, new challenges
regarding the interference management arise due to the use of Mobile-Femtos. This is because
the backhaul link becomes complicated as the interference is expected between different
Fixed-Femtos and Mobile-Femtos backhaul links. The previous issue can be mitigated with an
efficient coverage planning scheme as well as specifying the buses paths (buses zones) within
the Macrocell to avoid the overlapping areas. However, there is always a worst-case scenario
in term of the interference problem, which will be further investigated in chapter 5.
After discussing the scheduling process, PRBs distribution among Macro UEs and
Femtocells in the Macrocell and clarifying the communication links between the eNBs, Fixed-
(4.12)
(4.13)
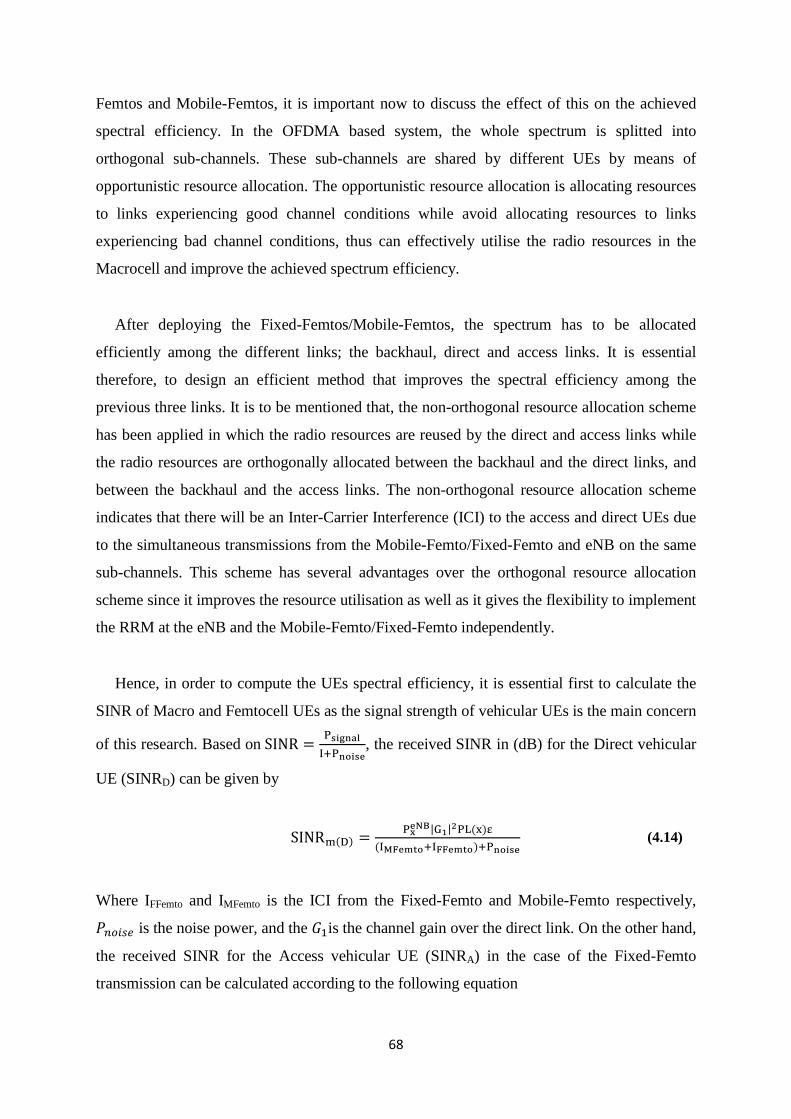
68
Femtos and Mobile-Femtos, it is important now to discuss the effect of this on the achieved
spectral efficiency. In the OFDMA based system, the whole spectrum is splitted into
orthogonal sub-channels. These sub-channels are shared by different UEs by means of
opportunistic resource allocation. The opportunistic resource allocation is allocating resources
to links experiencing good channel conditions while avoid allocating resources to links
experiencing bad channel conditions, thus can effectively utilise the radio resources in the
Macrocell and improve the achieved spectrum efficiency.
After deploying the Fixed-Femtos/Mobile-Femtos, the spectrum has to be allocated
efficiently among the different links; the backhaul, direct and access links. It is essential
therefore, to design an efficient method that improves the spectral efficiency among the
previous three links. It is to be mentioned that, the non-orthogonal resource allocation scheme
has been applied in which the radio resources are reused by the direct and access links while
the radio resources are orthogonally allocated between the backhaul and the direct links, and
between the backhaul and the access links. The non-orthogonal resource allocation scheme
indicates that there will be an Inter-Carrier Interference (ICI) to the access and direct UEs due
to the simultaneous transmissions from the Mobile-Femto/Fixed-Femto and eNB on the same
sub-channels. This scheme has several advantages over the orthogonal resource allocation
scheme since it improves the resource utilisation as well as it gives the flexibility to implement
the RRM at the eNB and the Mobile-Femto/Fixed-Femto independently.
Hence, in order to compute the UEs spectral efficiency, it is essential first to calculate the
SINR of Macro and Femtocell UEs as the signal strength of vehicular UEs is the main concern
of this research. Based on
, the received SINR in (dB) for the Direct vehicular
UE (SINRD) can be given by
Where IFFemto and IMFemto is the ICI from the Fixed-Femto and Mobile-Femto respectively,
is the noise power, and the is the channel gain over the direct link. On the other hand,
the received SINR for the Access vehicular UE (SINRA) in the case of the Fixed-Femto
transmission can be calculated according to the following equation
(4.14)

69
Where is the ICI from the eNB and is the channel gain over the access link between
the Fixed-Femto and the vehicular UE. Whilst, the received SINR for the Access vehicular
UE (SINRA) in the case of the Mobile-Femto can be calculated according to the following
formula
As mentioned earlier, the channel gain over the Mobile-Femto access link is unity (equal to 1)
because of the LOS link and the short distance between the Mobile-Femto and the UE while
there is a constant loss Closs between the two parties. However, the UEs might experience
some interference from the eNB and the nearby Fixed-Femtos as it may affect the SINR value.
This will be further investigated in the next chapter.
Therefore, if the power of noise has been ignored and assumed to be zero, then the SINR
reduces to the Signal to Interference Ratio (SIR). This will update the SINR equations of the
direct and access UEs to the following formulas, as the SIR of direct vehicular UEs can be
given by
Where the considered ICI in the case of direct UEs is the interference from the Mobile-Femto
and the Fixed-Femto. While, the following formula represents the SIR of the access vehicular
UEs over the Fixed-Femto transmission as the considered ICI is from the eNB and the Mobile-
Femto
Hence, the SIR of the Mobile-Femto access UEs is given by the following equation after
considering the interference from the eNB and the Fixed-Femto
(4.17)
(4.16)
(4.15)
(4.18)

70
On the other hand, if the interference from the eNB, Fixed-Femto and Mobile-Femto has
been ignored (equal zero) then, the SINR will be reduced to the SNR as shown earlier. This
can be achieved by either controlling the transmission power of the Fixed-Femto/Mobile-
Femto, implementing an optimised coverage planning mechanism or by introducing an
efficient interference mitigation scheme as will be shown in chapter 5.
All the previous formulas have created the base to generate more equations that helped in
calculating the spectral efficiency and throughput in order to evaluate the vehicular UEs
performance. As explained, the spectral efficiency is the optimum spectrum that used to
provide a large amount of data at a specific BW. In other words, it is defined for each location,
as the ratio of throughput to the available BW for a UE under the assumption of one single
subscriber in the cell as the following represents [Patankar, 2013].
Moving on from the previous concept of the spectral efficiency to Shannon capacity formula
(
), this will create the base to calculate the maximum (total) spectral
efficiency [Tombaz et al., 2011]. Hence, the spectral efficiency of eNBUE, Fixed-FemtoUE and
Mobile-FemtoUE can be derived as following
Where c is the achieved capacity that can be given by bits/sec/Hz. Hence, base on (4.20) and
(4.21) the spectral efficiency in (bits/cu) can be given by
(4.20)
(4.21)
(4.22)
(4.19)

71
Equations 4.20, 4.21 and 4.22 have made it clear that the main difference between the
previous capacity equations and the following spectral efficiency equations is the existence of
the bandwidth parameter. It is obvious for the reader that in the capacity equations the
bandwidth has been multiplied by one of the equation ends to get the link capacity. While in
the spectral efficiency equations, the capacity has been divided by the bandwidth itself in
order to calculate the achieved spectral efficiency. Another difference in the spectral efficiency
equations is the presence of the variable E, which represents the minimum expected value of
the spectral efficiency over time.
Thus, the spectral efficiency of vehicular UE can be calculated based on the previous SNR
formulas for direct and access UEs, i.e. formulas (4.6), (4.7) and (4.8). The direct vehicular
UEs spectral efficiency is given by
Where, E represents the minimum expected value of the Spectral Efficiency over time
While the spectral efficiency of the Fixed-Femto vehicular UE at distance x-d can be
calculated by the following equation
On the other hand, the spectral efficiency of the Mobile-Femto UE can be given by the
following formula
In this case, there is no penetration loss due to the absence of walls between the vehicular UE
and the Mobile-Femto that both share the same bus. That means there is no resistance against
the signal, which can be transmitted smoothly without substantial power degradation.
After computing the spectral efficiency of the direct and access UEs, it becomes clear that in
order to find the total spectral efficiency of the Macrocell, those spectral efficiencies can be
(4.24)
(4.23)
(4.25)

72
added up. This will help in understanding the impact of deploying the Fixed-Femto/Mobile-
Femto into the LTE Macrocell to serve the vehicular UEs.
Hence,
Since this study considers the spectral efficiency of vehicular UEs, it is important to
consider the throughput of those UEs as well. This is because of the positive correlation
between the vehicular UEs spectral efficiency and the achieved throughput by those UEs as
the following formula shows
Based on shannon equation, the throughput in (bits/s) of direct vehicular UEs at distance x
from the eNB can be given by
Whereas, the following represents the throughput of Fixed-Femto vehicular UEs at distance
x-d where the penetration loss plays an important role in this case as below shows
Likewise the following equation represents the throughput of Mobile-Femto UEs with the
absence of the penetration as explained earlier.
(4.26)
(4.27)
(4.29)
(4.30)
(4.28)

73
where the BWeNB, BWFFemto and BWMFemto is the avaliable bandwidth at the eNB, Fixed-
Femto and Mobile-Femto respectvily to serve the vehicular UEs. In order to evalute the
impact of deploying Fixed-Femto and Mobile-Femto in the Macrocell to serve the vehicular
UEs, the overall vehicular UEs throughput can be calculated before and after deploying the
Femtocells into the Macrocell to see the obvious difference as the following formula shows:
which can be clearly given by
In conclusion, this section has introduced all the needed mathematical equations in term
of vehicular UEs SINR, spectral efficiency, throughput, as well as capacity of wireless links
between the vehicular UEs and BSs. Furthermore, enhancing the performance of vehicular
UEs by mitigating the impact of mobility, path-loss and penetration loss have been the main
concern of this research. All the presented mathematical equations help create the desired
environment, which will in turn be simulated to draw a clear comparison in term of vehicular
UEs’ performance before and after deploying the Fixed and Mobile Femtocells into the
Macrocell.
4.3.2 Fixed & Mobile Femtocells scenarios in LTE Macrocell
The following subsection presents the designed scenarios that have been simulated in
MATLAB along with the previous presented mathematical equations in order to create the
required environment. Three scenarios have been designed in order to draw a clear
(4.31)
(4.32)
(4.33)

74
comparison between vehicular UEs’ performance before and after deploying the Fixed-
Femtos and Mobile-Femtos into the LTE Macrocell. The designed scenarios have been
classified as the following:
4.3.2.1 Macrocell (eNB) – Vehicular UEs scenario
The first scenario represents the case when the eNB serves the vehicular UEs where
LTE penetration loss is quite high. This scenario works efficiently when the penetration loss
and the path-loss are low, but this is not always the case especially when here the talk is about
the vehicular UEs who are always suffering from high penetration loss, high path-loss and
high interference. It is obvious here that this scenario demonstrates the case of Macrocell
before deploying the Femtocells, and when all the links between the UEs and the eNB are
Direct links as the following Figure 4.6 shows.
Fig 4.6 Vehicular and mobile UEs served by the Macrocell
4.3.2.2 Fixed Femtos - Vehicular UEs scenario
The second scenario shown in Figure 4.7 represents the case when the Fixed-Femtos are
installed in bus stations and railways stations or even outdoor nearer to the threshold of the
cell to improve the vehicular UEs performance. In other words, this scenario demonstrates the
possibility of serving those vehicular UEs even for a short period of time and study the impact
of implementing Fixed-Femtos to serve vehicular UEs when the penetration loss is quite high.
Deploying these Fixed-Femtos at fixed positions may generate several issues in term of

75
vehicular UEs; unnecessary number of HOs, high dropped calls probability and high outage
probability, which will be demonstrated later in this research.
Fig 4.7 Vehicular and Mobile UEs served by the Fixed-Femtos
4.3.2.3 Mobile-Femtos - Vehicular UEs scenario
The third scenario represents the case when the Mobile-Femtos are deployed to serve
the vehicular UEs and improve their performance as Figure 4.8 shows. These Femtocells can
be possibly installed in buses to serve the bus passengers where several criteria are needed to
be considered e.g. UEs/Mobile-Femto speed, direction and distance. Those Mobile-Femtos
will be considered as fixed Femtocells for those UEs who are inside the same bus as they are
moving together as one unit while they will be considered as mobile BSs for those UEs who
are outside the bus.
Fig 4.8 Vehicular UEs served by Mobile-Femtos

76
The above three scenarios have been simulated individually to have a clear evaluation of
the vehicular UEs performance in each scenario without the impact of other scenarios. This
will give accurate results as SINR, spectral utilisation (spectral efficiency), throughput and
links’ capacity can be evaluated efficiently without the influence of other factors.
4.3.3 Results and discussion
The following section represents the achieved results in term of vehicular UEs Ergodic
capacity, spectral efficiency, throughput and SINR for direct transmission, with Fixed-Femto
and with Mobile-Femto assisted transmissions. It is to be mentioned that the simulated
scenarios of this research are based on the parameters in chapter 3.
The Ergodic capacity of vehicular UEs’ links plays an important role in evaluating their
performance as it is significantly affected by both the penetration loss and the path-loss. The
Ergodic capacity (channel capacity) is the maximum rate that reliable communication can be
achieved via assuming that the communication duration is long enough to experience all
channel states. This has helped in evaluating the direct and the access links capacity of
vehicular UEs over distance. Therefore, Figures 4.9, 4.10 and 4.11 present the simulated
Ergodic capacity under different VPL scales.
Figure 4.9 shows that when there is no VPL, the direct transmission always achieves the
highest Ergodic capacity. Low penetration loss means low resistance against the transmitted
signal and the signal can pass through easily without facing a dramatic reduction in the
signal’s power. Even though the Mobile-Femto is seen as a better option rather than using the
Fixed-Femto for vehicular UEs, however, at 500m to 1000m distance from the serving eNB,
the Fixed-Femto shows a flat capacity improvement. This is because the x-axis of this diagram
indicates the distance gap between the vehicular UEs and the serving eNB. Therefore, as long
those vehicular UEs are moving away from the serving eNB toward the cell-edges, they can be
served by any nearby Fixed-Femto with the absence of the VPL, which will improve their
Ergodic capacity. In other words, when the penetration loss is equal to 0dB, being served by
Fixed-Femtos at high distances from the eNB, sounds a better option than using the Mobile-
Femto. That is due to the backhaul link variation between the eNB and Mobile-Femto in high
path-loss areas, which in turn limits the communication between the two and becomes more
obvious in the absence of the VPL. Subsequently, this limits the achieved Ergodic capacity of
Mobile-Femto UEs’ access links.

77
Fig 4.9 The Ergodic Capacity when the VPL = 0dB
On the other hand, as the VPL increases, both the Mobile-Femto and Fixed-Femto assisted-
transmission schemes achieve higher capacities especially when the vehicular UE moves away
from the eNB as shown in Figures 4.10 and 4.11.
Figure 4.10 shows the Ergodic capacity when the penetration loss is equal to 25dB. At 500m
distance from the eNB, the Mobile-Femto starts to achieve higher capacity in the case of
vehicular UEs who are facing the high penetration loss and signal variation. This is because
with the increased penetration loss and path-loss due to the distance from the eNB, the
Mobile-Femto in the bus is seeing as a better option for the vehicular UEs to be connected to,
and improve their throughput, subsequently their performance.
Fig 4.10 The Ergodic Capacity when the VPL = 25dB

78
While in Figure 4.11, it is important to notice that at a certain stage both of the direct and
the Fixed-Femto transmission Ergodic Capacity will be poor as the penetration loss and the
path-loss increase due to the distance gap between the vehicular UE and the eNB. At this
stage, deploying Mobile-Femtos inside buses will be a promising solution to overcome the
signal reduction with the increased in both distance and penetration loss for vehicular UEs.
Moreover, at almost 440m distance apart from the eNB, the Fixed-Femto starts to achieve
higher capacity than the eNB as those vehicular UEs experience very high penetration loss,
distance gap and weak signal from the eNB. Therefore, the best option for those vehicular UEs
is to connect to any nearby Fixed-Femto even for few moments just to maintain the signal
connection.
Fig 4.11 The Ergodic Capacity when the VPL = 40dB
After discussing the results of the vehicular UEs links Ergodic capacity, it is important now
to consider the other performance evaluation elements like the spectral efficiency, throughput
and SINR.
Since the previous sections computed the theoretical part of the spectral efficiency, now it is
highly required to discuss the simulated spectral efficiency results together with the factors
that have the biggest impact on the achieved spectral efficiency of this work. These factors
are the following:
The transmission power of Fixed-Femtos and Mobile-Femtos might affect the spectral
efficiency. Therefore, an appropriate transmission power has been chosen for each
BS. This is caused by the fact that when the transmission power is too high, it may

79
cause high interference to the neighbouring Macrocell, Fixed-Femtos or Mobile-
Femtos, which may cause low SINR. On the other hand, if the transmission power is
too low, this may limit the coverage area of the Fixed-Femtos and Mobile-Femtos and
that will limit the achieved results and increase the number of unnecessary HOs.
The distance plays an important role in the spectral efficiency. For example, if there is
no enough distance between the eNB, Fixed-Femtos and Mobile-Femtos, the
interference issue will generate again, which might affect the spectral efficiency.
Therefore, the Mobile-Femtos have the flexibility to be moved around in known paths
and in this case, it is easier to control the interference issue between them. Moreover,
a wise coverage planning distribution model has been implemented in this research,
which has the biggest impact in avoiding the generated interference between the BSs
and UEs, which will be further discussed in chapter 5.
The speed of the developed Mobile-Femto plays an important role in the network
performance. It has the biggest impact on the HO failures, HO delay or unnecessary
number of HOs especially when Mobile-Femtos move out of the coverage area of one
Macrocell to another, which will be further discussed in chapter 6. This may affect the
spectral and performance efficiency. In order to overcome the previous issues, the
speed of the Mobile-Femto has been controlled to avoid the frequent link changes that
might affect the spectral efficiency.
Figure 4.12 represents a comparison between the spectral efficiency in respect to the
Empirical Cumulative Distribution Function (ECDF) of vehicular UE in the case of direct
transmission from the eNB and in the case of implementing the Fixed-Femto and Mobile-
Femto in the Macrocell. There was an obvious improvement in the average spectral
efficiency of the vehicular UE after implementing the Mobile-Femto rather than the Fixed-
Femto. This is because: Firstly, the UEs are vehicular and moving from one place to another
in public transportations like buses, which makes it hard for them to establish a long
connection with the nearby Fixed-Femto unless those vehicular UEs have stopped for few
minutes close to a Fixed-Femto that has been deployed in a nearby bus station. This is why
the figure shows a slight improvement in the case of vehicular UEs spectral efficiency who
have been attached to the Fixed-Femto over the direct transmission UEs. As the distance

80
between the vehicular UEs and the eNB increases, the Fixed-Femto starts to look as a better
option than relying on the eNB to provide the connection for them. Secondly, the high
penetration loss that is 25dB in the case of vehicular UEs plays an important role in the poor
spectral efficiency of direct transmission as well as the Fixed-Femto UEs transmission.
Therefore, 90% of the vehicular UEs have enjoyed a spectral efficiency around 3.7bit/cu
when they are connected to the Mobile-Femto, while 2.5bit/cu in the case of direct and Fixed-
Femto transmissions.
Fig 4.12 Average spectral efficiency of vehicular UEs at VPL=25dB
Thus, since the spectral efficiency has a positive correlation with the throughput, the achieved
throughput of vehicular UEs needs to be demonstrated before and after deploying Femtocells
into the Macrocell. It is obvious that whenever there is a Mobile-Femto, the number of
scheduled vehicular UEs increases which means that the throughput of those vehicular UEs
improves. Mobile-Femto can reach areas the Fixed-Femto cannot reach and this is an
advantage for the Mobile-Femto over the Fixed-Femto. Additionally, the penetration loss
inside vehicles plays an important role in the throughput degradation as eNB and Fixed-Femto
signals poorly penetrate the chassis of the vehicles to reach the vehicular UEs.
On this basis, Figure 4.13 represents the vehicular UEs and Mobile-Femto average throughput
in respect to the ECDF. The results show a comparison between the vehicular UE throughput
before and after implementing the Femtocells into the Macrocell. As it is shown in the figure
below, implementing the Fixed-Femto into the Macrocell did not improve the vehicular UEs
throughput due to the previous factors that has been mentioned earlier in the spectral

81
efficiency. However, at a certain distance, the Fixed-Femto vehicular UEs start to achieve a
slight higher throughput than the eNB vehicular UEs. This is because the vehicular UEs are
moving close and far from a nearby Fixed-Femto especially when the distance gap increases
between the vehicular UEs and the eNB, but then the throughput drops again as the
penetration loss and distance gap (path-loss) increase between the Fixed-Femto and vehicular
UE. Therefore, deploying the Mobile-Femto in the Macrocell shows an improvement in the
vehicular UEs average throughput as 80% of the vehicular UEs throughput increased by
300Kbps. Furthermore, the Mobile-Femtos themselves have a higher throughput around
500Kbps due to the additional gain in the received SINR on the backhaul link which has
improved the transmitted signal between the eNB and the Mobile-Femto, thus the achieved
throughput [Bulakci, 2010]. This gain can be achieved by using a highly directional antenna
pattern in the eNB and directing it towards the positioned Mobile-Femto antenna.
Fig 4.13 Average vehicular UEs throughput at VPL=25dB
However, it is to be mentioned that, the gain of the directional and omnidirectional
transmission antennas is 15dBi and 0dBi for the eNB and the Mobile-Femto respectively as
mentioned earlier. These two antenna gains have the great influence on the UEs throughput as
the high-gain in the eNB directional antenna is focused with a narrow radio wave beam-width.
This narrow beam width allows more precise targeting of the radio signals, which may work
perfectly in open areas when the penetration loss is equal to zero. On the other hand, the low-
gain in the Femtocell omnidirectional antenna with a broad radio wave beam-width, allows the
signal to propagate reasonably well even in public transportations and it is thus more reliable
500 Kbps

82
regardless of the network environment. The low gain antennas are often used in wide spaces as
a backup to the high-gain antenna like the case of the Mobile-Femto especially with the high
penetration and path losses inside public transportations like buses. The use of the two
previous antennas to complement each other has helped in achieving higher throughput.
Figure 4.14 shows a comparison between the directional and omnidirectional antenna gains as
it has been set to 15dBi and 0dBi respectively.
Fig 4.14 Antenna gains of the eNB and the Femtocell
Added to the spectral efficiency and the throughput, the SINR of vehicular UEs plays an
important role in measuring the UEs performance. The SINR is indicating the signal strength
especially for those UEs who are suffering from high penetration loss and path-loss.
Therefore, mitigating the penetration loss and improving the signal strength especially for
vehicular UEs inside public transportations is one of the main goals of this research.
Figure 4.15 presents the vehicular UEs SINR before and after implementing Femtocells into
the Macrocell. The results show that 80% of the vehicular UEs have increased their SINR with
4dB and that means implementing the Mobile-Femto into the Macrocell has been a reasonable
solution to overcome the signal degradation. While, the vehicular UEs SINR who have been
served by the Fixed-Femtos showed slight improvement as the distance between the vehicular
UEs and the eNB is more than 500m. Therefore, those vehicular UEs will try to establish a
connection to maintain their signal with any nearby Fixed-Femto even for a short period of
time. As a result, deploying Mobile-Femtos as well as Fixed-Femtos in the Macrocell can be
seen as the future of next generation networks to provide internet along the buses and buses’
routes when the penetration and path losses are very high. However, issues may arise here like
the interference issue and the HOs procedure which might become complex, therefore, both of
these issues will be further investigated and solved in the next two chapters.
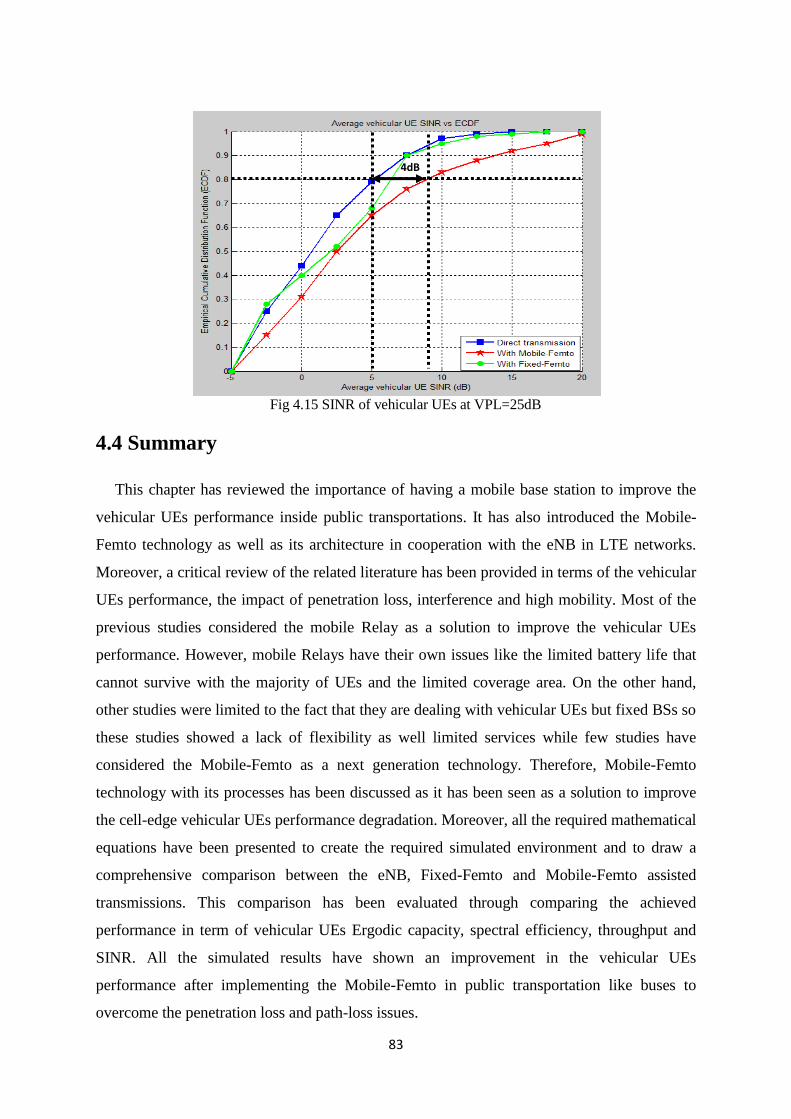
83
Fig 4.15 SINR of vehicular UEs at VPL=25dB
4.4 Summary
This chapter has reviewed the importance of having a mobile base station to improve the
vehicular UEs performance inside public transportations. It has also introduced the Mobile-
Femto technology as well as its architecture in cooperation with the eNB in LTE networks.
Moreover, a critical review of the related literature has been provided in terms of the vehicular
UEs performance, the impact of penetration loss, interference and high mobility. Most of the
previous studies considered the mobile Relay as a solution to improve the vehicular UEs
performance. However, mobile Relays have their own issues like the limited battery life that
cannot survive with the majority of UEs and the limited coverage area. On the other hand,
other studies were limited to the fact that they are dealing with vehicular UEs but fixed BSs so
these studies showed a lack of flexibility as well limited services while few studies have
considered the Mobile-Femto as a next generation technology. Therefore, Mobile-Femto
technology with its processes has been discussed as it has been seen as a solution to improve
the cell-edge vehicular UEs performance degradation. Moreover, all the required mathematical
equations have been presented to create the required simulated environment and to draw a
comprehensive comparison between the eNB, Fixed-Femto and Mobile-Femto assisted
transmissions. This comparison has been evaluated through comparing the achieved
performance in term of vehicular UEs Ergodic capacity, spectral efficiency, throughput and
SINR. All the simulated results have shown an improvement in the vehicular UEs
performance after implementing the Mobile-Femto in public transportation like buses to
overcome the penetration loss and path-loss issues.
4dB

84
Chapter 5: Interference Management for Co-Channel
Femtocells Technology
The dense deployment of Fixed-Femtos and Mobile-Femtos within the Macrocell’s
coverage is expected to dominate the future of LTE networks. Mobile-Femtos could be the
solution for vehicular networks when there is a need to improve the vehicular UEs’
performance by mitigating the impact of penetration loss and path-loss issues. Many studies
have focused on the Femtocell planning and management scheme when thousands of these
small cells are deployed in the LTE networks. The deployed Femtocells have operated in a
co-channel deployment due to the scarcity of spectrums. This issue causes interference
between Femtocells and Macrocells as well it causes extra overhead on the LTE networks
because of the co-tire interference between adjacent Femtocells. Issues such as co-tire
interference and co-channel interference between Femtocells and Macrocells have been under
research in order to avoid and eliminate the generated interference. In this chapter two
interference scenarios will be considered, the interference between Mobile-Femto and
Macrocell, and the interference between the Mobile Femtos themselves. Therefore, to avoid
the generated interference between Femtocells, the controlled transmission powers as well as
the coverage planning techniques have been discussed. While in the worst-case scenario, a
frequency reuse scheme has been proposed to avoid the generated interference effectively and
dynamically between the Mobile-Femtos as well as their UEs and between the Macrocell
UEs.
5.1 Introduction to LTE-Femto Interference
The mobile phone industry has undergone remarkable evolution and has introduced
innovative services, leading to a competitive market. Therefore, operators are looking for
new technologies that can help to serve this increasing growth in the number of UEs and
devices. One of the current methods is to use broadband internet to increase radio coverage
and network capacity by deploying Femtocells technologies. As mentioned earlier,
Femtocells are low power BSs, designed for indoor coverage. They use licensed spectrum
and are able to improve wireless services and provide short distance radio access to mobile
UEs. Regardless to say, previous studies have shown that the largest number of phone calls
are still made from indoors environment e.g. houses and offices [Wang et al., 2014] and from
vehicular environment e.g. buses and trains [5GNow, 2015]. Thus, Femtocell is a technology

85
that can potentially bring large benefits to indoor, outdoor and vehicular wireless
communications as well as to network operators and UEs alike. It is also useful to be able to
offload traffic from Macrocells down to smaller BSs such as Femtocells, as this improves the
system’s capacity and coverage [Saquib et al., 2012]. This might be needed more in the case
of cell-edge vehicular UEs, as those UEs add extra burden on the Macrocell, which in turn
wastes the Macrocell resources when trying to serve those UEs with extra transmission power
and allocating more resources for their poor connections. Hence, Femtocells are utilised by
service providers as a way of maintaining the quality of service and improving the UE’s
reception in situations where a high data rate is required e.g. in the case of vehicular UEs.
Vehicular UEs experience always high penetration loss and path-loss; therefore, deploying
Mobile-Femtos are seen as the future of vehicular environment to improve vehicular UEs’
performance. Added to this, the battery life of the mobile device can be prolonged, as it only
needs to connect over short distance when connecting to a Mobile-Femto in the same bus,
rather than connecting directly to the Macrocell [Haider et al., 2011]. However, due to the
Femtocells low power transmission, Femtocells reduce the amount of interference with other
electrical devices, while this is not always the case especially when two Mobile-Femtos pass
closely to each other or closely to a Macrocell. This is because Femtocells might share the
same spectrum with the Macrocell or utilise a specific spectrum, and this can be known as a
non-orthogonal or an orthogonal mode respectively [Al-Rubaye, 2012]. The difference
between the two modes is that in the orthogonal mode, the Femtocell utilises a separate
spectrum band that has not been used by the eNB and this can be the solution to avoid the
previous interference issue between Femtocell and Macrocell. While in the non-orthogonal
mode, the Femtocell shares the same spectrum with the Macrocell and that may create
interference issues.
In addition, spectrum holes and scarcity are two of the main obstacles that affect network
productivity in vehicular environment; as a result, Femtocells are needed to support and
increase network coverage and capacity. Therefore, the motivation of deploying Mobile-
Femtos came about to be implemented inside public transportation to improve the vehicular
UEs performance. Furthermore, network availability, voice quality and data services will be
improved when deploying these cost-effective and small BSs inside public transportations
like buses. Hence, the deployment of Mobile-Femtos in multi-tier networks requires a high
level of interference management scheme because the unplanned dense deployment of Fixed
and Mobile Femtos may have a major impact on their characterisation in addition to their

86
identification within the network. Therefore, in this research the developed Mobile-Femtos
were assumed to be inside buses where the buses’ paths are already identified in this work.
In this chapter, the deployment of dense Femtocells (Fixed and Mobile Femtos) in an LTE
network has been presented. The neighbouring Fixed-Femtos/Mobile-Femtos may suffer
from their frequencies being overlapped, which may cause the Femto-UEs to interfere with
each other; this is known as co-tier interference. Cross-tire or Co-Channel interference could
also occur, when there is an overlap between the Macrocell and the Femtocell signals on the
DL within the Macrocell coverage area [Zahir et al., 2013]. Therefore, this chapter discusses
the impact of Femtocell power control and coverage planning mechanisms on the generated
interference. Also, an efficient interference mitigation scheme will be proposed in order to
guarantee the QoS in OFDM Femto-cellular networks and improve the spectrum utilisation in
an LTE environment by enhancing the vehicular UEs throughput.
5.2 Interference management
The interference management particularly when Mobile-Femtos are densely deployed in
LTE networks is a challenge issue. The densely deployment of those low power vehicular
nodes is one of the main features of the future of 4G networks. It is therefore, vital to the
efficiency of the system that the performance of those vehicular nodes does not undermine
the activity level of the primary UEs of the system, the Macro UEs and the secondary UEs of
the system, the Femto UEs. In general, a feature of Femtocells is that they are deployed
without planning; therefore, a Macro-UE operating close to a Femtocell may experience
severe interference, as well as the other neighbouring Femto-UEs [Doppler et al., 2011].
Subsequently, the interference management is essential in Fixed and Mobile Femtocells
dense deployment schemes, as they have to operate in a coordinated way in order to avoid the
generated interference. This is because, the fierce competition for available radio resources
among Femtocells is unacceptable as; firstly, it may waste resources, and secondly it does not
guarantee the required QoS level.
The interference management is even more important when there is a Macro BS that may
share all or part of the BW with the deployed Femtocells. As in this case the already existing
Macrocells and UEs may experience interference from the deployed Fixed-Femtos/Mobile-
Femtos as well as the Fixed-Femtos/Mobile-Femtos may experience interference from each
other. However, the presence of small BSs within the coverage of larger ones changes the

87
architecture of the cellular system. As the Fixed and Mobile Femtocells are deployed within
the coverage of the Macrocell, this can cause interference within the same tier or on different
tiers as Figure 5.1 shows. However, it is to be mentioned that, the presented Femtocells in the
figure could be either fixed or mobile as they may experience and cause the same type of
interferences.
Fig 5.1 Different interference scenarios [Chaudhary et al., 2013]
The above figure shows the cross-tier interference where the Femtocell causes interference on
the DL signal of the Macrocell to the Macro UE, and also the Macro UE causes interference
on the UL signal to the Femtocell. Furthermore, the figure shows the co-tier interference
when the Femtocell causes interference on the DL signal to another Femtocell UE, and also
when the Femtocell UE causes interference on the UL signal to another nearby Femtocell.
Consequently, the following two scenarios are considered as the worst-case scenarios in the
case of the Mobile-Femto deployment. This is because in the OFDM system, the interference
level varies depending on the subcarriers’ allocation as shown in [Adhikary et al., 2011] and
[Gur et al., 2010]. In the first scenario, the interference occurs when a cell-edge Macro UE
inside the bus has to transmit with high power due to its far position from the Macrocell to
overcome the path-loss issue and vice versa. Thus, if the Mobile-Femto installed in the same
bus, it will receive a massive amount of interference from the Macro UE. While in the second

88
scenario, the interference occurs when two buses are close to each other and a UE attached to
Mobile-FemtoB is being interfered by a DL signal from Mobile-FemtoA and vice versa.
Hence, to overcome the generated interference issues in LTE and 5G networks with the
highly deployed dense of Femtocells, optimising the coverage planning scheme based on the
used path-loss model and controlling the transmission power of these small BSs have been
discussed. While an efficient frequency reuse scheme has been proposed for the worst-case
interference scenarios.
5.3 Coverage Optimisation
An important challenge for Femtocells is optimising their radio coverage area
dynamically. The goal is to achieve a desired level of performance for mobile transmission,
avoid the undesired interference and reduce power consumption. Providing optimal
Femtocell signal coverage is important to improve UEs’ mobile usage experience as well as
reducing service cost expenditure [Ma et al., 2015]. In outdoor enterprise environment, a
number of Femtocells may be deployed together to achieve joint coverage. This is also done
to cover a large area while balancing the UEs load, minimising coverage gaps and overlaps
between multiple Femtocells. Hence, researchers have begun to consider the problem of
coverage optimisation of Femtocells in LTE networks as an important aspect that influences
the amount of generated interference on UEs performance [Lu et al., 2012]. However, most
of the previous works focused on the coverage optimisation of Fixed-Femtos rather than on
the coverage optimisation of Mobile-Femtos as the mobility of Mobile-Femtos is considered
a challenge in this research area.
Hence, the purpose of this section is to find an efficient Femtocells coverage planning
solution that involves identifying locations for installing Femtocells that are either Fixed or
Mobile in LTE and 5G Networks. Femtocells locations play a vital role in achieving a good
trade-off between coverage and interference. Poor choices of Fixed or Mobile Femtocells
locations may result in coverage holes. Coverage hole occurs when Femtocells are either
placed or moving distant apart from each other, while the maximum transmission power-level
is not sufficient to cover certain regions in the outdoor environment. Moreover, incorrect
locations such as placing or moving Femtocells too close to each other may result in
excessive interference to Mobile or Fixed Femtocells’ UEs and Macro UEs. Therefore, in the
case of Mobile-Femto, identifying the bus path that the Mobile-Femto will be installed in will

89
be a reasonable solution to avoid the interference issue between any nearby Mobile-Femtos.
However, there is always a worst-case scenario and this will be discussed later.
Thus, the goal of the coverage planning process is to have good radio conditions everywhere
within the outdoor area (especially the cell-edges) or in the vehicular environment so UEs can
acquire, initiate and sustain voice calls, as well as overcome the penetration loss and path-loss
issues. Good coverage performance is addressed by limiting the maximum path-loss, which
can be mitigated by deploying Fixed-Femtos and Mobile-Femtos in the right positions inside
the Macrocell and added to this a proper Fixed-Femtos and Mobile-Femtos power calibration
is needed.
Therefore, it is important to state that the used path-loss model in this research is the
Microcell NLOS path-loss, which is based on the COST 231 Walfish-Ikegami NLOS model.
The COST 231 Walfish-Ikegami model is an evolution of the Ikegami model [Alqudah,
2013]. It is developed for urban areas and it takes into consideration obstructing building
height and street width, as well as other factors related to the urban environment. Therefore,
in order to calculate the Microcell NLOS path-loss, the following parameters are needed: BS
antenna height 12.5m, building height 12m, building to building distance 50m, street width
25m, Mobile Station (MS) antenna height 1.5m, orientation 30deg for all paths, and selection
of metropolitan center. And the distance between two BSs is less than 1Km [Naguib, 2007].
Hence, based on the previous parameters, the NLOS path-loss equation simplifies to:
This is resulting that the path-loss at 1900 MHz is given by:
Thus, it is equal to
(5.1)
(5.3)
(5.2)

90
Where L is the distance in meters and it is at least 20m.
On the other hand, the Microcell LOS path-loss is based on the COST 231 Walfish-Ikegami
street canyon model with the same parameters as in the NLOS case [Naguib, 2007]. The LOS
path-loss is given by
This is resulting that the path-loss at 1900 MHz is equal to:
Thus, it is equal to
Hence, it becomes easier to classify the achieved path-loss equations among the direct and
access links of eNB and Femtocells in LTE network. The used path-loss on the direct
transmission between the eNB and the vehicular UEs is the 3GPP Spatial Channel Model
(SCM) urban NLOS Microcells model as shown in equation (5.3). The same NLOS model
has been used for the Fixed-Femto for both; the backhaul link between the eNB and the
Fixed-Femto and the access links between the Fixed-Femtos and vehicular UEs. Therefore,
based on equation (4.5) the received SNR at the NLOS receiver Rx can be modified to
. It is to be mentioned that the path-loss model has been
included in all the developed equations because of its negative impact on the signal quality
together with the penetration loss and the noise power issues in the SNR case. Based on
Figure 4.3, the L distance here is changeable according to the distance between the
transmitter and the receiver, which could be either x in the case of the direct transmission
from the eNB or x-d in the case of the Fixed-Femto transmission.
On the other hand, in the case of the Mobile-Femto, the backhaul link between the Mobile-
Femto and the eNB has used the same previous NLOS model. Whereas, for the LOS access
link between the Mobile-Femto and the vehicular UEs in the same bus a Constant Path-Loss
(5.4)
(5.6)
(5.5)

91
has used, which is a free space loss when there is no obstacle against the transmitted and
received signals. The free space loss can be very small or sometimes unity when the distance
between the receiver and the transmitter is very small and does not exceed few meters.
However, there is always a constant power loss of -84.55 [Masui et al., 2002] and based on
equation (4.8), the received SNR at the LOS receiver Rx is given by
.
Thus, identifying the used path-loss model between the links of two BSs or between the links
of BSs and vehicular UEs has helped in reducing the interference issue by allowing the
operator to know where the Fixed and Mobile Femtocells are needed to be placed or moving
based on the used path-loss model. In the case of the Mobile-Femto, identifying the path-loss
is an important factor for the network operator because it helps the operator to indicate the
Mobile-Femto paths, which are the bus paths. This is due to the fact that, as much as it is
important to reduce the path and penetration losses between the vehicular UEs and the
serving Femtocell, it is more important to maintain the backhaul path-loss between the eNB
and Mobile-Femto, so it can serve those vehicular UEs without losing the connection with the
mother BS (eNB). Having strong connection between the Mobile-Femto and the eNB as well
as between the Mobile-Femto and the vehicular UEs in the same bus has helped in mitigating
the generated interference. This strong connection can be achieved by having an efficient
coverage planning technique together with choosing the right path-loss model.
Hence, after discussing the chosen path-loss model in the case of vehicular environment and
its impact on mitigating the interference, it is important now to discuss the effect of the
chosen transmission power on the generated interference as the following section shows.
5.4 Transmission Power control
Controlling the BS transmission power is a very important factor in 4G and next
generation systems since it indicates the transmission range of BSs e.g. eNBs and Femtocells.
However, the power may leak between neighbouring Femtocells due to the dense
deployment, and this creates dead zones, which means areas without coverage (holes). While,
high transmission power with high Femtocells dense deployment creates excessive
interference issue. The organised installation of Fixed-Femto makes it easier to manage the
Femtocells planning and the distribution dense. In contrast, the environment and location
changes of the Mobile-Femto without any prior knowledge available of other Mobile-Femtos

92
within the network, makes it very important to equip the Femtocell with some kind of
interference management schemes.
Hence, controlling the transmission power of the Femtocells has been discussed in many
researches as a method for interference avoidance. Normally, the distance between the Femto
UEs and the serving Femtocell does not require high transmission power as they can
communicate with less power. However, in 4G and next generation systems, power control is
essential to avoid dead zones and power leakage between adjacent carriers when there is
spectrum splitting. Controlling the transmission power in an optimised way helps to protect
the Macro UEs as well as Femto UEs and improves the indoor cellular coverage. It is to be
remembered that, the transmission power should not be very low, as it will not reach the UE’s
receiver as well as it will limit the coverage area. On the other hand, it should not be very
high, as it will cause interference to other UEs who are being served by other BSs.
In the Femtocell scenario, as a result of the close distance between the transmitter and the
receiver, the channel between the Femtocell and its UEs is considered in a good state which
may be less affected by the interfered signals from the eNB. Besides that, the high
penetration loss in the case of vehicular UEs due to the vehicle chassis can be counted as an
advantage as it prevents the outside signals from passing through to the vehicular UEs. This
means that the bus chassis can isolate the vehicular UEs from the outside signals as they can
be served only by the installed Femtocell (Mobile-Femto) in the same bus, which can help to
mitigate the interference.
Thus, indicating the Mobile-Femtos paths as well as the Fixed-Femtos positions based on the
path-loss model has helped in mitigating the interference and expanding the coverage area.
Additionally, the transmission power of Fixed-Femtos and Mobile-Femtos plays an important
role in mitigating the interference as well as in filling the coverage holes. Therefore, the
chosen transmission power in the case of Fixed-Femtos and Mobile-Femtos has been
assumed to be 24dBm while 46dBm in the case of eNB transmission. The previous
transmission power values have been chosen after running the simulation several times with
different transmission powers and taking into consideration the impact of that on the achieved
throughput and SINR. This has led to the following conclusion, choosing lower transmission
powers has its negative impact on the achieved throughput and number of scheduled UEs
even when the interference is mitigated. This is because limiting the transmission power is

93
not only about the interference but it is also about the network performance and UEs
throughput in general.
However, there is always a worst-case scenario especially in the Mobile-Femto case, as the
mobility aspect plays an important role in increasing the interference percentage. This is
because with the vehicular environment, unexpected scenarios can occur at anytime. This
means a bus might change its path and pass nearby another Mobile-Femto in another bus or a
Mobile-Femto is interfering with the eNB signal; therefore, an efficient interference
management scheme is required. In fact, the Fixed-Femtos interference is easier to be
mitigated with a good coverage planning and good transmission power control as mentioned
earlier, while the Mobile-Femto technology requires an efficient interference management
scheme due to its high mobility and movement from one place to another.
5.5 Proposed scheme
Regarding 4G Femtocells, the mobility of Mobile-Femto positioning in public
transportations like buses makes it difficult for the cellular operator to control the interference
of these new small BSs especially when they change their routes. Therefore, this section
presents an efficient interference mitigation scheme that has been proposed for the Mobile-
Femto in order to have an interference management and performance improvement. The aim
here is to enable the system to avoid the generated interference between the eNB/Mobile-
Femtos and between the Mobile-Femtos themselves. However, controlling the transmission
power and using the spectrum splitting method in the case of Mobile-Femto may result in
SINR degradation and wasting the system resources. Therefore, it was an urgent need to
develop an efficient interference management scheme that does not rely on power reduction
techniques and spectrum splitting methods.
Hence, it is important to explain how the Mobile-Femto technology will react to the possible
interference scenarios that might occur at anytime within the Macrocell coverage as Figure
5.2 shows. The figure represents three possible interference scenarios that might occur in the
DL signal of each the eNB and the Mobile-Femto. The first interference scenario occurs
when a vehicular UE inside BusA who is being served by the Femtocell that is installed in the
same bus interferes with the DL signal of the eNB. This scenario occurs when BusA gets
close to the eNB (distance less than 500m) which makes the eNB DL signal strength equal to

94
the DL signal strength of the Mobile-Femto in BusA. On the other hand, the second
interference scenario may occur when two nearby Mobile-Femtos interfere with one another
e.g. a UE in BusB can be interfered by the DL signal of Mobile-Femto in BusA especially
when the used transmission power of the Mobile-Femtos is quite high and vice versa. While
the third interference scenario occurs when a Macro UE (primary UE) is close to BusA and
interferes by the DL signal of the Femtocell in BusA.
Fig 5.2 Summarisation of three interference scenarios
To overcome the previous interference issues as well as to improve the vehicular UEs
throughput and save the used frequency, the FFR scheme has been presented to meet the
requirements of the proposed interference management scheme in the Mobile-Femtos
deployment.
The FFR is one of the solutions to reduce the ICI in the Macrocell system, especially for the
cell-edge UEs. In addition, it is helpful to achieve the reuse factor of one for the centre zone of
the Macrocell. Under this condition, the interference from the Femtocell deployment should be
minimised for the Macro UEs as well as for Femto UEs. Therefore, the focus here is to
mitigate the interference between the Macrocell and the Mobile-Femtos as well as between the
Mobile-Femtos themselves via using the FFR scheme.
The FFR has been discussed in the OFDMA based network, such as the LTE, to overcome
the CCI problems [Hosseinzadeh-Salati et al., 2014]. In the FFR, the whole frequency band is

95
divided into several sub-bands, and each sub-band is differently assigned to centre zones and
edge zones. The reuse factor of one is used for the centre zone while the edge zone adopts
bigger reuse factor. Subsequently, the ICI is substantially reduced and the system throughput
is improved. On this basis, this research proposes an efficient interference management
scheme in the LTE Mobile-Femto systems via using the FFR management scheme. When the
Macrocell allocates frequency band using the FFR, the Mobile-Femto chooses sub-bands
which have not been used by the Macrocell sub-area and other Mobile-Femtos to avoid the
generated interference.
Thus, in order to understand the proposed scheme, Figure 5.3 represents the allocated
frequency sub-bands to the Macrocells and Femtocells in details. The Macrocell coverage is
divided into centre zone and edge zone including the frequency sub-band F0 for the Macrocell
centre zone while the edge zone has three frequency sub-bands denoted by, F1, F2 and F3. The
reuse factor of one is applied in the centre zone, while the edge zone adopts the reuse factor
of three. The sub-band F0 is used in the centre zone of Macrocell1, Macrocell2 and
Macrocell3, and sub-band F1, F2 and F3 is applied in the edges of Macrocell1, Macrocell2 and
Macrocell3 respectively. Under this circumstance, the Mobile-Femto chooses sub-bands
which have not been used by the Macrocell sub-area and other Mobile-Femtos as mentioned
earlier. However, as mentioned earlier the used frequency for the backhaul link transmission
between the eNB and the Mobile-Femto is different from the below frequency set. This is
because it uses a frequency band which has not been used before. This is required in order to
avoid the interference between different backhaul links as well as with different direct and
access links.

96
Fig 5.3 The proposed interference management scheme based on the FFR

97
For instance, when a Mobile-Femto is moving in the cell-edge of Macrocell2, it can reuse the
centre zone’s frequency sub-band F0 or F1+F3 to serve the Femto UEs, while the Macrocell
uses sub-band F0 for its centre zone. On the other hand, if a Mobile-Femto is moving in the
central zone of Macrocell2 (eNB2), sub-band F1+F3 is applied. The Mobile-Femto cannot
reuse sub-band F0 which is already been used by the Macrocell in the central zone. Besides
that, it cannot reuse sub-band F2 which is used by the Macrocell to serve the cell-edge Macro
UEs of the Macrocell2. This is because the transmission power of the eNB in each case is
different. The centre UEs who are close to the eNB require low transmission power whereas,
the eNB should transmit in maximum power in order to satisfy the cell-edge UEs. Following
the previous approach has helped in avoiding the interference between the transmitted
signals. In this study, more subcarriers are allocated to the Mobile-Femto that is located in the
cell-edge rather than the centre zone in order to improve the performance of the vehicular
cell-edge UEs. While in order to mitigate the interference between two nearby Mobile-
Femtos that belong to the same Macrocell, the proposed scheme has used the same frequency
reuse approach. For example, when a Mobile-Femto is moving in the cell-edge of Macrocell2,
it uses sub-band F0 or F1+F3 as mentioned earlier, while the other Mobile-Femto that is
moving in the centre zone of Macrocell2 (eNB2), will be using sub-band F1+F3 to avoid the
signals conflict between the two Mobile-Femtos. In this manner, each of the Mobile-Femtos
will not be using the frequency sub-band that has already been used by the other Mobile-
Femtos that belong to the same Macrocell.
It is quite important then to state how this interference management scheme works in real
life scenarios. The proposed scheme receives as an input the Macrocell environment
dimensioning, the number of Mobile-Femtos and their positions as well as other
characteristics of the network such as the Macrocell and Mobile-Femtos transmission powers.
Then, it calculates the received power from the serving cells as well as from the interfering
cells. Based on the pervious values and by taking into account the white Gaussian noise, the
scheme is able to make estimation for the SINR and throughput at any given position of the
examined LTE network. Thus, the proposed scheme follows the approach presented below:
Calculate the inner cell radius
Based on the Macrocells’ characteristics and the used transmission power, the inner
cell radius can be calculated which will help later to indicate the centre zone and cell-
edge zone as Figure 5.4 shows. Indicating the best dimensions of the inner cell
optimises the UEs’ throughput, thus achieves better performance.

98
Fig 5.4 Inner Cell radius
Find the optimum frequency band division
The aim of this step is to calculate the UEs throughput as well as the UEs SINR for
every possible combination of the spectrum division. As mentioned earlier, the radio
spectrum is divided into frequency sub-bands reserved for a single use or a range of
compatible uses. Within each band, individual transmitters often use separate
frequencies or channels, so they do not interfere with each other. Hence, the available
spectrum will be allocated to UEs according to the combination that maximises their
throughput. Thus, there are two disjoint sets of subcarriers: the subcarriers in the
centre zone and the subcarriers in the cell-edge zone. Every time the frequency band
that is allocated to the cell-edge zone is equally divided between F1, F2 and F3 as
mentioned earlier. Initially, let it be assumed that the set of the centre zone is an
empty set and all the subcarriers are contained in the set of cell-edge zone, that means
all the subcarriers that are allocated to the cell-edge zone, and each one of F1, F2 and
F3 equals to Totalsubcarriers/3. Each time one subcarrier is removed from the set of cell-
edge zone and added to the set of centre zone. Finally, the set of the centre zone will
consist of Totalsubcarriers and the set of the cell-edge zone will be an empty set.
Allocate frequency band to the Mobile-Femtos
In this step, the frequency is allocated to the Mobile-Femtos with the process
presented in Figure 5.3.

99
The proposed scheme can be summarised in the following algorithm, which represents briefly
the general idea of how this scheme works.
Algorithm 4.1: Frequency Reuse Scheme for Interference Avoidance for
Macrocell/Mobile-Femtos
1:
create_Networktopolgy(); /*defines Macrocells, Mobile-Femtos and UEs
2: for r = 0: R /*inner cell radius
3: for f = 0: Total-subcarriers /*frequency band division
4: allocate frequency band for macrocells;
5:
if r > = distance_mfemto /*Mobile-Femto belongs to Macro centre
zone
6: allocate frequency band for mfemto;
7: else if r < distance_mfemto /*Mobile-Femto belongs to Macro cell-edge
zone
8: allocate frequency band for mfemto;
9: End
10: End
11: for u = 1 : U /*For all UEs calculate
12: sinr = calculate_sinr(u)
13: capacity = calculate_capacity(u)
14: throughput = calculate_ throughput(u)
15: outageprobability = calculate _Outageprobability(u)
16: End
17: End
18: End
19: define_FFR(max_ user_throughput)
However, the following section presents the required mathematical equations that will be
simulated later through MATLAB simulator to calculate the UEs SINR and throughput.
These equations will create the base to evaluate the performance of users after deploying the
proposed frequency resuse scheme in comparsion with previous schemes such as NoFFR-3
and FFR-3 schemes.

100
5.6 The proposed scheme (System Performance analysis)
This section presents all the needed mathematical formulas that will be simulated later in
MATLAB in order to evaluate the impact of the proposed scheme on the system
performance. It is important to formulate the DL SINR, throughput and capacity to have clear
comparison between the UEs performance before and after implementing the proposed
scheme. Needless to say that, the overall network is composed of three Macrocells with two
Mobile-Femtos distributed in every 1Km2 based on the used path-loss model that has been
discussed earlier. Additionally, the only considered interference scenarios in this section are
the interference between Mobile-Femtos and Macrocells or interference among Mobile-
Femtos themselves. The Macro UE can be interfered by the DL signal of any adjacent
Mobile-Femto and the same may happen for the Mobile-Femto UE with the Macrocell or any
adjacent Mobile-Femto. Thus, based on equation (4.14), the received SINR for an outdoor
direct Macro UE (m) on subcarrier n can be expressed as
Where, and
are the transmission power of the serving Macrocell (eNB) and the
neighbouring Macrocell (eNB’) on subcarrier n respectively. is the channel gain
between the Macro UE m and serving Macrocell (eNB) on subcarrier n. Channel gain from
neighbouring Macrocells is denoted by . Similarly, is the transmission
power of neighbouring Mobile-Femto (MFemto) on sub-carrier n. is the channel
gain between the Macro UE m and neighbouring Mobile-Femto (MFemto) on sub-carrier n.
Whilst, has been modelled to express the Path-Loss model and x is the distance between
the Macro UE and the serving eNB. is the VPL and Pnoise is the white noise power. Hence,
equation 5.7 has made it clear that outdoor Macro UEs can be interfered by two interference
sources, one is the interference from neibouring Macrocells signals which has been given
by
and the second is the interference from Mobile-Femtos in the
same Macrocell which has been given by
. Therefore, both
of the interference sources have been considered together with the noise power in this
(5.7)

101
equation in order to evaluate the impact of them on the received SINR for an outdoor Macro
UE.
In contrast, the Macrocell or any adjacent Mobile-Femto can cause interference to a Mobile-
Femto’s UE based on formula (4.16), thus, the received SINR of a Mobile-Femto UE (mf) on
subcarrier n can be formulated as
There is a system constant loss but no channel gain over the Mobile-Femto LOS access link
between the UE and the serving Mobile-Femto. The only existing channel gain ( )
is the channel gain between the Mobile-Femto UE with other adjacent Mobile-Femtos that
may cause interference to the considered UE.
Hence, the Macro-UE capacity on a specific subcarrier n can be estimated via the SINR from
the following equation [Lee et al., 2010]
Where BW is the available bandwidth for subcarrier n divided by the number of UEs that
share the specific subcarrier and is the coding margin and in this equation it is a constant
for target Bit Error Rate (BER) that defined by = -1.5/ln(5BER) [Nungu et al., 2014]. Here,
the BER has been set to 10-6
. So the overall throughput of the serving Macrocell M can be
expressed as
Where, m,n here notifies the subcarrier assignment for Macro UEs. When m(D),n = 1, the
subcarrier n is assigned to Macro UE m and otherwise m(D),n = 0. From the characteristics of
(5.8)
(5.9)
(5.10)

102
the OFDMA system, each subcarrier is allocated to only one Macro UE in a Macrocell in
every time slot. This implies that = 1 for k, where Nm is the number of Macro
UEs in a Macrocell and k is the available PRBs. While similar expression for Mobile-Femto
UEs related to the practical capacity and the overall throughput is possible except
= 3 for k ∈ FMobile-Femto. Nmf is the number of Mobile-Femto UEs in a
Macrocell and FMobile-Femto is the available sub-bands allocated to Mobile-Femtos in
Macrocells. This implies that the proposed scheme reuses the full frequency band three times
in the considered Macrocells.
Thus, the Mobile-Femto UE capacity on a specific subcarrier n can be estimated via the SINR
as the following equation shows
Where the overall throughput of the serving Mobile-Femto (MFemto) can be expressed as
After discussing the SINR, throughput and capacity, here it is important to state that the
outage probability plays an essential role in the proposed scheme as it affects the network
performance by affecting the data rate and throughput of UEs. If the outage probability is
small, the throughput increases, and then when the throughput increases the data rate
increases, thus, the performance improves and the interference decreases. However, the
outage probability affects the performance of cell-edge UEs more than the Macro UEs due to
their high path-loss. To find out the outage probability it is required first to identify the SINR
threshold value in the range of 0dB to 30dB. Thus, the outage probability (Pout) is determined
when the SINR level of a subcarrier is below the designated threshold and it can be given by
(5.11)
(5.12)

103
Where, indicates the failed subcarrier of UE u on subcarrier n. This can occur when the
penetration loss and path-loss issues are severe especially in the vehicular environment,
which may affect the received SINR at the receiver side. Thus, if =1, the SINR of that
subcarrier is under the SINR threshold (SINRu,n < SINRthreshold). As a result of that, the ratio
between the number of subcarriers under the SINR threshold and the number of the total
subcarriers is the outage probability.
The subsequent results will show that the proposed scheme is greatly capable of preventing
the interference among the Macro UEs as well as the interference among the Mobile-Femto
UEs. The Mobile-Femto UEs effect on Macro UEs and vice versa is less in the proposed
scheme in comparison with the previous schemes. For example, the FFR-3 (frequency factor
reuse 3) and NoFFR (frequency factor reuse 1) techniques assign random subcarriers to the
Femto UEs, regardless of the subcarriers that have been used by the Macro UE. Therefore,
the Macro UEs and the Femto UEs may use subcarriers very nearer to one another that cause
interference. Due to this fact, the interference between the Macro UEs and the Femto UEs is
higher than the proposed scheme. Nevertheless, the proposed scheme avoids this interference
at minimal degradation and the total amount of available subcarriers for Mobile-Femto UEs
is three times of the full band in this scheme. The above comparison has been summarised in
Table 5.1. Also, the table shows the fact that Macro UEs have the option to choose one
frequency band at a time in each Macrocell and their choice is limited on whether those UEs
are in the centre zone or edge zone. In contrast, the Mobile-Femto UEs have the choice to
choose between three different frequency bands at a time and their choice is again based on
UEs locations and whether they are in the centre zone or edge zone. (Refer to Figure 5.3)
(5.13)

104
Table 5.1 Comparison between the proposed and previous interference management schemes
Schemes Macro-user Femto-user
Frequency Amount Frequency Amount
Proposed for the
Mobile-Femto/
Macrocell
FFR 1
Centre zone: F0
Edge zone: F1, F2
or F3 depends on
the Macro UE
position in each
Macrocell
Divide centre and
edge zones
3
Centre zone has 2
options
Edge zone has 4
potions: F0, F1, F2
or F3 depends on
the Mobile-Femto
UE position in
each Macrocell
FFR-3 (reuse 3) FFR
1
Random
1 NoFFR-3 (reuse 1) Random Random
Note: Amount column implies value of and
for Macro and Mobile-Femto
UEs respectively.
Obviously, all the previous mathematical analysis has built the main base for implementing
the proposed interference management scheme. Accordingly, the achieved results will be
discussed in the following section as these results have created a comparison between the
proposed scheme, and the FFR-3 (frequency reuse factor 3) and NoFFR-3 (frequency reuse
factor 1) schemes as shown in Figure 5.5.
Fig 5.5 NoFFR-3 (left) and FFR-3(right)
105
However, it is important to mention here the difference between the frequency reuse factor 1
and the frequency reuse factor 3. In the frequency reuse factor 1, the same frequency band in
a cell is reused in each of the adjacent cells. As a result of using the same frequency, high
interference occurs in this system making it impractical. On the other hand, in the frequency
reuse factor 3, the allocated frequency band is divided into 3 sub-bands (possibly with equal
BW) and the three sub‐bands are reused in an alternating fashion. No neighbouring cells have
the same frequency in this configuration resulting in more practical frequency reuse. Thus,
reusing frequencies by dividing the allocated band by a specific integer number of cells and
assigning each cell one division and then repeating the assignment repeatedly produces a
trade-off between network capacity and reception quality as follows:
The higher the number of divisions of the spectrum over cells (higher cell‐reuse
factor), the lower the capacity of the network but the further away cells with similar
frequency allocations is located resulting in lower interference.
The lower the number of divisions of the spectrum over cells (Lower cell‐reuse
factor), the higher the capacity of the network but the closer cells with similar
frequency allocations is located resulting in higher interference.
5.7 Results and discussion
The following section represents the simulated results of the interference avoidance
mechanisms, e.g. the coverage planning technique based on the path-loss model and the
transmission power controlling technique. As mentioned earlier, those mechanisms can work
efficiently in the case of fixed BSs in close areas. While in the case of mobile BSs the path of
the Mobile-Femto (bus) has been specified based on the chosen path-loss model, however the
street traffic is unpredictable and Mobile-Femtos can change their directions, which might
create interference problems in some scenarios. These interference scenarios can occur when;
Macro UE interferes with a DL signal from the nearby Mobile-Femto, a Mobile-Femto UE
interferes with a DL signal from the eNB and finally a Mobile-Femto UE interferes by a DL
signal of neighbouring Mobile-Femto. Hence, the proposed scheme has been compared with
previous reuse frequency interference mitigation schemes like FFR-3 scheme (frequency
reuse factor 3) and NoFFR-3 scheme (frequency reuse factor 1) in order to have a
comprehensive comparison between the three schemes.

106
5.7.1 Simulated Results
It is obvious that there is a positive correlation between the distance and the path-loss,
which means that whenever the distance between the transmitter and the receiver increases
the path-loss increases. In other words, the path-loss reaches its max at the edges of the
Macrocell as well as whenever there are high buildings that block the signal. More
specifically, the signal loses its strength along the distance, which affects the UEs ability of
being attached to the Macrocell. The previous issue is worst in the case of cell-edge vehicular
UEs because beside the high path-loss, they are more affected by the mobility and the VPL,
which decreases the signals strength inside vehicles from/to the Macrocell dramatically.
Figure 5.6 shows that at 500m, the path-loss is almost 116dB and it continues to increase as
the distance gap increases between the transmitter and the receiver, between the eNB and the
vehicular UEs. However, the used path-loss model in this research is the NLOS Microcell
Path-loss, which is based on the COST 231 Walfich-Ikegami NLOS model and it is more
suitable in areas where the distance between two BSs is less than 1km.
Fig 5.6 Microcell path-loss
For this reason, implementing Femtocells in Macrocells is one of the solutions to improve the
UEs performance. Since the talk in this research is about vehicular UEs who are suffering
from high path-loss, high penetration loss and shadow fading, implementing Femtocells
(Fixed and Mobile) can be a reasonable solution to overcome the previous issues. However,
due to vehicular UEs mobility, the coverage distribution and signal transmission power of
each Fixed-Femto and Mobile-Femto play important roles in improving the UEs performance

107
as well as reducing the interference issue as much as possible. Therefore, the following two
scenarios represent the coverage distribution based on the used path-loss model as well as the
assumed transmission power of Fixed-Femtos and Mobile-Femtos. These two scenarios were
simulated separately in order to see clearly the impact of Fixed-Femtos and Mobile-Femtos
coverage distribution and transmission power on the generated interference and coverage
overlapping.
5.7.1.1 Scenario 1: Fixed-Femtos with vehicular UEs
The first simulated scenario represents the Fixed-Femtos deployment to serve vehicular
UEs. The Fixed-Femtos have been distributed in the Macrocell based on the used path-loss
model as shown in Figure 5.7. Added to this, the use of high transmission power, which is
24dBm, was required to reach the vehicular UEs and overcome the high VPL. However, this
has created overlapping areas in the three considered Macrocells coverages since those
Femtocells are in fixed positions when trying to serve vehicular UEs. The occurred
interference is between the Femtocells themselves and the Femtocells and the eNB as the
figure shows.
Fig 5.7 Fixed-Femtos coverage distribution when the transmission power is 24dBm and VPL is 25dB

108
The previous interference issue can be mitigated by reducing the used transmission power,
although, this will have negative impact on the achieved throughput as using lower
transmission power makes the signal too weak to penetrate the chassis of the vehicle and
makes it unable to reach the distant vehicular UEs.
While Figure 5.8 represents the Fixed-Femtos distribution in the ROI in term of path-loss
with and without the shadow fading. In this figure, the dark red areas represent the coverage
area with good signal strength as the path-loss is at its lowest value. In this case, the highest
SINR value that represents the signal strength is 20dB. In contrast, the dark blue areas
represent the areas with low signal strength as the path-loss is at its highest value. In this
case, the SINR reaches its lowest at -5dB. It is noticeable that in this figure there are many
overlapped areas and the highlighted area represents the worst overlapped area due to the
high transmission power of those Fixed-Femtos in the coverage area of the Macrocell as
shown in Figure 5.8. However, it is to be mentioned that these plots have been generated
through MATLAB System Level Simulator as demonstrated earlier in chapter 3. Microcell
path-loss model together with 25dB VPL and shadow fading played important roles in the
simulated plots. These three parameters were the base behind designing the required
environment. They helped also in illustrating the impact of interference between BSs and
UEs on the achieved SINR and spectral efficiency.
Fig 5.8 Fixed-Femtos Sector SINR, calculated with distance dependent Microcell path-loss (left) while
(right) represents the distributed space correlation with shadow fading
The overlapped areas shown in the previous figure do not only have a negative impact on the
SINR but also have a negative impact on the spectral efficiency as Figure 5.9 shows. The

109
figure shows that in the highlighted areas, the spectral efficiency is low as the yellow colour
represents the low spectral efficiency of 3 bits/cu. While other Fixed-Femtos have more of
the red and dark red areas that represent the areas with less interference as the spectral
efficiency is high. Whereas the right side of the figure represents the spectral efficiency with
the effect of the shadow fading. It is obvious that the signal strength of the interfered
highlighted areas fades faster than other Fixed-Femtos because of the interference effect on
the signal strength as well as the achieved spectral efficiency.
Fig 5.9 Fixed-Femtos Sector Spectral efficiency with distance dependent Microcell path-loss (left) while
(right) represents the distributed spectral efficiency correlation with shadow fading
While Figure 5.10 represents the impact of path-loss on the signal’s strength degradation as
the path-loss gets higher over distance. The figure shows the Microscopic path-loss of 3 eNBs
and 9 Fixed-Femtos which have been distributed based on the used path-loss model between
the BS and vehicular UEs in LTE network. Definitely, the coverage area of the eNB is wider
than the Fixed-Femto coverage but whenever the signal gets weaker, a Fixed-Femto is
implemented in the high path-loss areas. Added to this, the figure shows that the path-loss can
reach its highest at 160dB in the case of the eNBs while it can reach its highest at 120dB in the
case of Fixed-Femtos. This is because the eNB transmission power is higher than the Fixed-
Femto transmission power, which gives the eNB the capability to cover wider areas. In
addition, the use of the directional antenna in the case of the eNB rather than the
omidirectional antenna in the case of the Fixed-Femto gives it more concentration towards the
covered areas that has more resistance against losing the signal power over distance, which
means that the signal loses its power gradually. Besides, using the Fixed-Femto to serve the
vehicular UEs in order to overcome the path-loss and VPL might not be the best option due to

110
its fixed position that does not give the Femtocell the flexibility to serve those vehicular UEs
at a certain distance. Hence, the highlighted area represents an example of how the path-loss
increases over distance and reaches its max to 120dB. At this high path-loss value, the
vehicular UEs start to loss their connections with the serving Fixed-Femtos.
Fig 5.10 Microcell path-loss of eNBs and Fixed-Femtos
Hence, Table (5.2) represents the used parameters in the simulated scenario as any changes in
these parameters can change the output results and may have negative or positive impacts on
the achieved SINR and spectral efficiency.
Table 5.2 Fixed-Femto simulated parameters
Parameters Value
Type of Femtocell Fixed
Number of Fixed-Femtos 3 Fixed-Femto per each 1 Km2
Number of Fixed-Femto’s server UEs 10 UEs
Fixed-Femto transmission power 24dBm
Fixed-Femto antenna type Omnidirectional antenna
Vehicular UEs speed 3-160km/h
Antenna gain Fixed-Femto 0
Shadowing standard deviation eNB-Fixed-Femto 8
Path-loss model SCM urban NLOS Microcell model for both
backhaul and access links

111
In order to mitigate the interference issue between the Macro and Fixed-Femto UEs, the
transmission power of these Fixed-Femtos can be reduced to avoid the overlapped areas.
Reducing the transmission power can limit the coverage area of the Fixed-Femto, which may
increase the cost since more Fixed-Femtos are required to be deployed to cover all the high
path-loss areas. Moreover, reducing the transmission power can increase the number of
unnecessary HOs especially in the case of vehicular UEs who are in continuous movement
and keep changing their locations and connections with the serving BS. To sum up, all the
previous results had shown that having Fixed-Femtos to serve vehicular UEs even in bus
stops or along the bus paths is not always the best solution, and hereby the next scenario
comes.
5.7.1.2 Scenario 2: Mobile-Femtos with vehicular UEs
The second scenario represents the case when there is Mobile-Femto installed in a bus
while the UEs are inside the bus. The aim of this scenario is to improve the signal connection
of those vehicular UEs with the serving network. Those UEs are suffering from high
penetration loss and high path-loss as they are at the edges of the Macrocell besides of the
vehicle chassis that works as a signal barrier against in and out signals.
The distribution of the Mobile-Femtos is based on the used path-loss model that helps in
creating the bus paths of the Mobile-Femtos. Installing the Mobile-Femtos efficiently in
public transportations like buses has helped in mitigating the penetration loss, path-loss and
cost to serve vehicular UEs. A constant loss has been assumed between the Mobile-Femtos
and the vehicular UEs due to the LOS access link as well as the short distance between the
two, which is less than 5m. In addition, the used transmission power in the Mobile-Femto is
24dBm while the path of the Mobile-Femto -which is the bus path- has been specified as
mentioned earlier, and two Mobile-Femtos have been assumed to be deployed in every 1Km2.
Using this technique has its advantages in mitigating the interference and the path-loss. This
has given the Mobile-Femto the ability to cover wider areas and reach the remote areas that
are hard for the eNB to reach due to the high path-loss and penetration loss. Hence, Figure
5.11 shows the movement of the Mobile-Femto, which is a uniform movement in the areas
that suffer from high path-loss as the arrows show.

112
Fig 5.11 Mobile-Femtos coverage distribution
The max SINR of the ROI has been improved after deploying the Mobile-Femtos to serve
vehicular UEs. This is because Mobile-Femtos are able to overcome the high penetration
loss, path-loss and interference issues that vehicular UEs are suffering from by improving
their connection with the serving network compared to the Fixed-Femto deployment as
Figure 5.12 shows. This figure represents the Mobile-Femtos distribution in the ROI in term
of the path-loss with and without the shadow fading. As mentioned earlier, the dark red areas
represent the coverage area with good signal strength as the path-loss is at its lowest value.
The dark blue areas, however, represent areas with low signal strength as the path-loss is at
its highest value. It has become quite obvious to the reader that the Mobile-Femtos have
achieved better coverage area as the paths of these Mobile-Femtos were specified based on
the path-loss model so it is rare that the Mobile-Femtos coverage is overlapped with each
other. In addition, the figure shows that each Mobile-Femto has strong signal strength at the
centre then the signal fades gradually as the highlighted area shows in both cases with and
without the shadow fading.

113
Fig 5.12 Mobile-Femtos Sector SINR, calculated with distance dependent Microcell path-loss (left)
while (right) represents the distributed space correlation with shadow fading
The SINR improvement is accompanied with an improvement in the achieved spectral
efficiency as Figure 5.13 shows. The figure shows that in the highlighted area the spectral
efficiency of the Mobile-Femto is high as the dark red colour in the centre represents a
spectral efficiency of higher than 4.5 bits/cu. This high spectral efficiency reflects that the
Mobile-Femto coverage is less susceptible to interference compared to the Fixed-Femto. This
is due to the organised distribution and the specified paths in the case of the Mobile-Femto,
which makes it less exposed to the interference issue. Thus, the Mobile-Femto signal fades
gradually since the interference is low as the right side of the figure shows.
Fig 5.13 Mobile-Femtos Sector Spectral efficiency with distance dependent Microcell path-loss (left)
while (right) represents the distributed spectral efficiency correlation with shadow fading
While Figure 5.14 represents the impact of path-loss on the signal’s strength degradation as
the path-loss gets higher over distance. This figure shows the Microscopic path-loss of 3 eNBs

114
and 6 Mobile-Femtos which have been distributed based on the used path-loss model between
the BSs and vehicular UEs in LTE network. As mentioned earlier, installing the Mobile-Femto
in buses to serve the vehicular UEs is a reasonable solution to overcome the path-loss and
VPL. This is due to the Mobile-Femto moving aspect that moves with UEs as if they are one
unit. In addition, the path-loss of the Mobile-Femto is low as the interference is very low in
this case.
Fig 5.14 Microcell path-loss of eNBs and Mobile-Femtos
The following table represents the used parameters in the Mobile-Femto simulated scenario in
order to create the required environment.
Table 5.3 Mobile-Femto simulated parameters
Parameters Value
Type of femtocell Mobile
Number of Mobile-Femtos 2 MFemto per each 1 Km2
Number of Mobile-Femto’s server UEs 10 UEs
Mobile- Femto transmission power 24dBm
MFemto antenna type Omnidirectional antenna
Speed of Mobile-Femto and passengers in the bus 3-160km/h
Antenna gain Mobile-Femto 0
Shadowing standard deviation eNB-Mobile-
Femto
8
Path-loss model 3GPP SCM urban NLOS Microcells model
for backhaul link while constant path-loss for
the LOS access links
The dark blue area represents the low
path-loss area while the dark red area
represents the high path-loss area.
That means the signal strength can be
read from down to up

115
Hence, it can be concluded that the Mobile-Femto shows a better coverage distribution over
the Fixed-Femto as the SINR and spectral efficiency have been improved in the case of
vehicular UEs. Additionally, less interference occurred in the case of the Mobile-Femto and
this is because of the uniform movement of these mobile BSs that improved the vehicular
UEs signal strength and mitigated the penetration loss and path-loss. Thus, deploying the
Mobile-Femtos is seen as a promising solution for the next generation technology as it is able
to improve the vehicular UEs performance by mitigating the penetration loss, path-loss and
interference. However, it is to be emphasised that there is always worst-case interference
scenarios especially when the Mobile-Femto changes its path e.g. facing traffic congestion
and being close to other BSs, which may cause three interference scenarios. First, the Mobile-
Femto’s UE can be interfered by the Macrocell DL signal, which can affect the UE
throughput. Second, the Mobile-Femto UE can be interfered by another Mobile-Femto DL
signal. Third, a Macro UE can be interfered by the Mobile-Femto DL signal, which has
negative impact on the UE’s SINR and throughput. Therefore, it was needed to come up with
the proposed scheme and discuss the achieved results that showed a better interference
management and performance improvement compared to the previous schemes as the
following section shows.
5.7.1.3 The simulated results of the proposed interference scheme
The overall network is composed of 3 Macrocells and 2 Mobile-Femtos in every 1Km2
that have been distributed in the Macrocell based on the used path-loss model. All the BSs are
operated by the OFDMA technology as mentioned earlier. The number of UEs has been
assumed to be 40 and 10 per each eNB and Mobile-Femto respectively. The proposed scheme
has been implemented in order to create a comprehensive comparison between the proposed
and previous frequency reuse schemes. This has helped in evaluating the throughput
differences of cell-edge UEs before and after implementing the proposed scheme. Besides
that, the UEs connection with the serving BS has been evaluated through analysing the signal
outage probability before and after implementing the interference proposed scheme.
Hence, Figure 5.15 represents the throughput of Macro UEs located in the Macrocell coverage
as the number of Mobile-Femtos varies. In the proposed frequency reuse scheme, the Mobile-
Femto UEs can allocate the subcarriers, which are not used by the Macro UEs at each location.
Thus, the interference between the Macro UEs and Mobile-Femtos is greatly avoided. The

116
Mobile-Femtos effect to Macro UEs who are located in the same zone is less in the proposed
scheme compared to the previous schemes. This is because in FFR-3 and NoFFR-3 schemes,
the subcarriers are randomly assigned to the Mobile-Femto UEs regardless of the subcarriers
used by the Macro UEs. This means that the same subcarriers are used by the Macro UEs and
the Mobile-Femto UEs who are very close to each other, which can create severe interference
for the two. This figure reflects the impact of interference on each of the two previous
schemes compared to the proposed scheme in term of the achieved throughput. The
throughput gap between the proposed and previous schemes is bigger when more Mobile-
Femtos are deployed in the Macrocell. This is because with highly deployed number of
Mobile-Femtos, the chance of Macro UE to be interfered with the increased number of
deployed Femtocells is greater. Hence, the proposed scheme has achieved an acceptable,
almost stable, throughput around 8Mbps in the range between 8 to 20 deployed numbers of
Mobile-Femtos in the Macrocell, while for the same numbers of Mobile-Femtos, the FFR-3
and NoFFR-3 schemes have achieved lower throughput that starts with 6Mbps and then
decreases to 4Mbps. This is due to the increased unavoidable interference between those
Mobile-Femtos and Macro UEs with the increase number of Mobile-Femtos in the Macrocell.
Fig 5.15 Average Throughput of Macro UEs located in centre and edge zones as the number of
Mobile-Femto varies
On the other hand, Figure 5.16 illustrates the throughput of Macro and Mobile-Femto UEs
located at the edge zone only. In the OFDMA cellular network, the performance of the edge
zone is always poor due to the ICI that increases with the increased path-loss. However, in the
proposed scheme, allocating more subcarriers to cell-edge Mobile-Femtos can greatly improve
1
2

117
the throughput of cell-edge vehicular UEs. While, the compared schemes assign the
subcarriers irrespective of the UEs location, centre zone or edge zones and this is why those
schemes achieved less throughput compared to the proposed interference scheme. However, it
is to be mentioned that the FFR-3 scheme shows higher throughput than the NoFFR-3 scheme
and this is because the FFR-3 scheme reduces interference by applying FFR to the Macro UEs
but still the interference from other Mobile-Femtos is unavoidable. Since cell-edge vehicular
UEs with the proposed interference scheme has enjoyed higher throughput than the FFR-3 and
NoFFR-3 interference mitigations schemes; that means the proposed scheme is able to
mitigate the UEs’ interference not only between the Mobile-Femtos and the Macro UEs but
also between the Mobile-Femtos UEs themselves. The figure shows that with 30 deployed
number of Mobile-Femtos in the Macrocell, the cell-edge UEs have achieved a max
throughput of almost 29Mbps while 20Mbps for the FFR-3 scheme and 14Mbps for the
NoFFR-3 scheme. This is due to the increased interference with the increased number of
deployed Mobile-Femtos in the Macrocell and the adaptability of each scheme with the
generated interference issue.
Fig 5.16 Total Throughput of Macro and Mobile-Femto UEs located only in the edge zone as the
number of Mobile-Femto varies
While Figure 5.17 represents the total throughput of centre and cell-edge zones after deploying
the Mobile-Femto in the Macrocell. The achieved simulated results show that the throughput
increases with the increased number of deployed Mobile-Femtos in the Macrocell. This is due
to the ability of this Mobile BS to reach vehicular UEs and improve their performance fast and
efficiently compared to other technologies. However, deploying many Mobile-Femtos to

118
improve the vehicular UEs performance by reducing the vehicular penetration loss in LTE
network can increase the interference issue between Macro and Mobile-Femto UEs.
Therefore, implementing the proposed interference mitigation scheme has shown better
throughput compared to the FFR-3 and No-FFR schemes as the max-achieved throughput is
almost 58Mbps in the proposed scheme while it is 40Mbps in the FFR-3 and No-FFR
schemes. Implementing the proposed scheme has shown an improvement of 18Mbps over the
previous schemes. Actually, with the increased number of deployed Mobile-Femtos in the
Macrocell and exactly 30 Mobile-Femtos, the FFR-3 and the NoFFR-3 achieved the same
throughput as the generated interference between the Macro and Mobile-Femto UEs is
unavoidable in this case. In other words, at a certain number of deployed Femtocells in the
Macrocell, the FFR-3 scheme will allocate the same subcarriers to the Macro UEs and the
Mobile-Femto UEs who are very close to each other. This can occur mostly with the increased
number of Mobile-Femto UEs in the Macrocell.
Fig 5.17 Total throughput of Macrocell and Mobile-Femto UEs in the entire Macrocell as the number
of Mobile-Femto varies
Now, after discussing the impact of the proposed scheme on the achieved throughput of Macro
and Mobile-Femto UEs, it is necessary to consider the impact of this scheme on the achieved
signal outage probability with the increased number of Mobile-Femtos in the Macrocell. It is
to be mentioned that with the increased number of deployed small BSs in the Macrocell, the
generated interference issue increases, thus the signal outage increases as well. However, this
does not mean that less number of Mobile-Femtos should be deployed in the Macrocell to
mitigate the generated interference and signal outage. The signal outage can be reduced with

119
the proposed scheme as Figure 5.18 shows. The figure depicts the outage probability of UEs
according to the SINR threshold, when 30 Mobile-Femtos are deployed in the Macrocell. In a
given SINR threshold, the proposed scheme indicates lower outage probability than the FFR-3
and NoFFR-3 schemes. Added to this, it decreases the outage probability more at low SINR
threshold while it reaches its max at 0.96 with high SINR threshold. This implies that the
proposed scheme effectively supports more UEs, even though the interference is excessive.
While in the case of the NoFFR-3, UEs have achieved the highest outage probability, which
has started with 0.4 under low SINR threshold and continuously increased with the increased
SINR threshold. However, at 15dB SINR the outage probability of the proposed scheme has
been reduced by 0.07 compared to the FFR-3 scheme while reduced by 0.14 compared to the
NoFFR-3 scheme.
Fig 5.18 Signal Outage Probability of Macro and Mobile-Femto UEs based on the SINR threshold that
varies when 30 Mobile-Femtos are deployed in the Macrocell
Thus, it is obvious that using the proposed frequency reuse scheme in the presented Femtocell
technology has improved the UEs throughput in the cell centre and edge zones for both the
Macro and Mobile-Femto UEs. Improving the UEs throughput and reducing the signal outage
are very important factors to improve the vehicular UEs performance in LTE and 5G
Networks. Paying more attention towards the vehicular cell-edge UEs is one of the key factors
to improve the network performance in general as those UEs are more affected by the path-
loss, penetration loss, interference due to their weak connection with the serving BS and
shadowing. This is why the current research has paid more attention towards the performance

120
of vehicular cell-edge UEs. Hence, after studying the impact of Mobile-Femto and the
proposed interference avoidance scheme, it is important now to further investigate the impact
of mobility on the performance of vehicular UEs and propose the suitable mobility
management scheme that copes with the presented technology as shown in chapter 6.
5.8 Summary
This chapter has introduced the interference issues that small BSs might cause in LTE and
5G Networks and the impact of increasing the transmission power and the chosen cell
planning mechanism of these BSs on the Macro and Femto UEs. This chapter has shown that
those small BSs have created an interference issue for vehicular UEs and Macro UEs. This
interference is worst in the case of cell-edge vehicular UEs due to the high vehicular
penetration loss, path-loss and shadowing. Therefore, the chapter has considered the generated
interference for both the Macro and Mobile-Femto UEs. Three important interference
scenarios based on the DL signal of each the eNB and the Mobile-Femto have been evaluated
in this chapter. The first interference scenario occurs when a Mobile-Femto UE interferes with
the DL signal of the eNB. While the second interference scenario occurs when two nearby
Mobile-Femtos interfere each other UEs. The third interference scenario occurs when a
Macro-UE (primary UE) is close to the Mobile-Femto and interferes by the DL signal of this
Mobile-Femto. As a result, controlling the transmission power as well as optimising the BS
distribution in the network can cause positive or negative impact on the generated interference
in LTE and 5G Networks. However, there are always worst-case scenarios that require special
mechanisms to mitigate the generated interference between Macro and Mobile-Femto UEs.
Accordingly, the proposed interference mitigation scheme based on the frequency reuse
scheme has achieved an obvious throughput gain in term of Macro and Mobile-Femto UEs in
the cell centre and cell-edge zones. The achieved results of the proposed scheme have been
compared with the previous frequency reuse schemes, the FFR-3 and No FFR-3 interference
management schemes. This has helped in evaluating the performance of the proposed scheme
compared to the previous schemes.

121
Chapter 6: Mobility Management in LTE/Mobile-Femto
Networks
In this chapter, the vehicular UEs performance during mobility has been analysed, and the
focus here is on two issues: the first one is related to signalling and the second is related to
transmission, namely Handover (HO) and link adaptation. The HO is a process where UEs
move between cells in order to connect to the strongest available cell, and link adaptation is a
process introduced to improve data transmission between UEs and serving cells. This chapter
has shown that both processes experience degradation during mobility and this is worst in the
case of the cell-edge vehicular UEs. Added to this, the literature review discussed earlier in
chapter 4 evinced that the vehicular UEs are the most who drop calls and lose connections
with the serving BSs. Moreover, it showed that the number of HOs increases with the
increased UEs speed and with the increased number of unnecessary deployed small base
stations in the Macrocell. Hence, this chapter has presented an efficient HO procedure that
works when the Mobile-Femto itself leaves the coverage area of one Macrocell to another
with the consideration of group UEs HO procedure. The vehicular UEs outage probability has
been calculated as well as the dropping and blocking calls probabilities that helped in creating
the simulated results. Mitigating the previous three factors is considered as the main goal of
this chapter in term of maintaining the vehicular UEs connection regardless of their mobility
and location. The outcome results have shown that the vehicular UEs who are attached to the
Mobile-Femto have achieved better signalling as the outage probability has been reduced
after implementing the proposed HO procedure.
6.1 Introduction to LTE Mobility
In LTE and 5G heterogeneous networks, there is a large number of small cells such as
Microcells, Pico-cells or Femtocells camped on the coverage of larger cells like Macrocell as
Figure 6.1 shows. The evaluation in network topology improves the radio link performance
and the spectrum efficiency [Damnjanovic et al., 2011]. The spectrum configurations could be
different among cells, or could be in co-channel deployment as mentioned in the previous
chapters. One of the main incentives of heterogeneous networks is the increase in the capacity
and the improvement of the coverage area of LTE and next generation systems. However, at
the cell-edge, the Macrocell coverage may not be as strong as expected due to many factors on
top of them path-loss, penetration loss and different type of fading. Therefore, the small cells

122
are deployed at the cell-edges to improve the Macrocells coverage, and they are also deployed
inside the Macrocells in hotspots to increase the possibility of traffic offloading from larger
cells to small cells [Bhat et al., 2012].
Fig 6.1 Heterogeneous networks [Heath, 2015]
Recently, the mobility enhancement is under consideration for LTE-Advanced networks [TR
Zhang et al., 2015]. In the new cell topology of the LTE system, mobility is challenging due to
the changes in the cell size and radio channel conditions each time the UE connects to a new
cell. The UE may pass through the deployed cells with different speeds and this affects the
robustness of the HO process in some situations where there is low SINR and high
interference between the small cells. The generated interference may affect the efficiency of
HO process as well as the performance of high-speed UEs.
The UEs’ main concern is to receive the desired signal in terms of strength and quality. Those
UEs have the option to connect to any cell – large or small – when the signal of this cell meets
the selection criteria of the eNB. Another important consideration is the UE’s speed when
passing cross or close to small cells. Sometimes the variation of the UEs’ speed makes the
load variation rapid between cells, due to the limited capacity of these small cells that can
serve only limited number of UEs [Lorca et al., 2013]. Furthermore, the high UEs speed
makes it impossible for those vehicular UEs to have long connection with the serving small
cells outside the vehicle as this may increase the number of unnecessary HOs because the
number of HOs is inversely proportional to the cell size. High number of HOs implies that

123
there is an increase in the signalling load, and this has a negative impact on the achieved
throughput, as there is no data transmission during the HO period.
Mobility also has a major impact on the channel conditions measurement and the utilisation of
the data channel. High mobility makes the channel fast varying and frequency-selective [Plass
et al., 2009]. This impact the channel feedback process, which is reported by the UEs to the
serving eNB upon the UL and introduces delays to the feedback procedure. The reported CQI
value on the UL - and its corresponding MCS - for one location may not be suitable at another
location and may also differ among small and large cells’ coverage. Channel estimation and
reporting is delay sensitive and the reported SINR values may be different from the actual
values that occurred prior to the UL transmission. This means that the high UEs speed plays
an important role in performance degradation in LTE system without having a good mobility
management scheme, which will be more needed in the deployment of 5G Networks.
Definitely, mobility management is an essential component of mobile cellular communication
systems because it offers clear benefits to the end UE i.e. low delay services such as voice or
real time video connections can be maintained while moving even in high-speed trains. One of
the main goals of the LTE and 5G radio networks is to provide fast and seamless HO from
one cell to another while simultaneously keeping the network management simple. However
and in the case of vehicular UEs, the HO will be more frequent and fast which may affect the
UEs connection performance. Therefore, improving the vehicular UEs HO is one of the key
procedures for ensuring that those UEs can move freely through the network while still being
connected and bestowed quality services. Hence, Mobile-Femtos have been proposed to serve
those vehicular UEs and improve the HO procedure by reducing the unnecessary number of
HOs. Besides the high mobility aspect, the challenge here is handing over the Mobile-Femto
itself when it leaves the Macrocell coverage to another Macrocell. This in itself is a challenge
since the HO process here is not for regular UEs, it is for handing over a BS with group of
UEs e.g. bus passengers. Thus, several criteria need to be considered in this case like the
bus/(Mobile-Femto) direction, backhaul link adaption between Macrocell and Mobile-Femto,
channel availability, BW availability and PRBs availability in the target Macrocell. In the light
of this, the present chapter has proposed an optimised HO algorithm to achieve the required
network performance by mitigating the vehicular UEs outage probability and the probability
of dropped/blocked calls in LTE and 5G vehicular networks.

124
6.2 The Proposed HO procedure
A major consequence of the objective of offering seamless HOs in LTE and LTE-
Advanced systems is the data forwarded from the source eNB (SeNB) to the target eNB
(TeNB). This forwarding of data typically takes place over the (wired) X2 interface between
the eNBs. In the presence of Mobile-Femto deployments, this chapter discusses a challenging
HO scenario which is handing-over the Mobile-Femto itself from one eNB to another
neighbouring eNB and forwarding the Mobile-Femto packets from the serving eNB to the
target eNB. This HO scenario occurs when the Mobile-Femto moves away from one
Macrocell towards another Macrocell based on the bus path as Figure 6.2 shows.
Fig 6.2 Handing over Mobile-Femtos between Macrocells
In the above scenario, whenever the signal strength (SINR) between the Mobile-Femto and the
source eNB goes down, the Mobile-Femto initiates a HO procedure in order to be handed-over
to the neighbouring eNBs based on the Mobile-Femto direction (bus path). But, if the
available PRBs in the target Macrocell are not enough to accommodate the coming Mobile-
Femto, the Call Admission Control (CAC) allows the release of some BW from the existing
direct links of Macro UEs by degrading their QoS level. The CAC policy will permit the
reduction of the required BW for the Mobile-Femto request, which means that the system
allows a maximum (BWeNB - BWmin-required) amount of BW reduction for an existing Mobile-
Femto or requested HO call. Hence, handing-over the Mobile-Femto to the target Macrocell
after finding the required PRBs will be accompanied by a group UEs HO procedure for all
those UEs inside the bus who are being served by the Mobile-Femto that is installed in the

125
same bus as Figure 6.3 shows. It is to be emphasised that the CAC is such a provisioning
strategy to limit the number of call connections into the network in order to reduce the
network congestion and call dropping [Wang et al., 2013]. It can also be used to ensure or
maintain a certain level of audio quality in voice communications networks, or a certain level
of performance in Internet nodes and servers where the VoIP traffic exists [Rouse, 2013].
Therefore, the system increases the number of connected Mobile-Femtos and served UEs as
well as reduces the HO dropping call probability. On the other hand, if the BWmin-required is not
available in the target eNB after releasing some of the BW from the existing direct links of
Macro UEs, the Mobile-Femto will not be connected to the target eNB and the UEs calls will
be dropped. This is due to the lack of a sufficient number of PRBs to accommodate the
coming Mobile-Femto and its UEs.
Fig 6.3 Group HO of Mobile-Femto UEs
The following represents the HO process of handing-over the Mobile-Femto from the serving
eNB to the target eNB when the required BW is available in the target eNB to accommodate
the coming Mobile-Femto and its UEs.
During the Mobile-Femto HO process, several procedures are needed to be done sequentially
in order to maximise the HO success probability in LTE and 5G vehicular networks. These
procedures have been classified into five phases as Figure 6.4 shows. However, before moving
into the first phase of the Mobile-Femto HO process, it is important to point out that, the
serving DeNB (S-DeNB) configures and triggers the Mobile-Femto measurement procedure
and then the Mobile-Femto sends a measurement report to the S-DeNB, includes the eNB ID

126
of the Target DeNB (T-DeNB). Afterwards, the following phases take a place in this HO
process:
1) HO decision phase: In this phase, the S-DeNB makes HO decisions based on the
measurement reports of the Mobile-Femto. If the S-DeNB decides that the Mobile-
Femto has to perform HO, the S-DeNB sends a HO request command to the T-DeNB
including the necessary information to prepare the Mobile-Femto HO at the T-DeNB.
This information may include S1/X2 signalling references and E-UTRAN Radio
Access Bearer (E-RAB) attributes for Mobile-Femto. Necessary Radio Network Layer
(RNL) and Transport Network Layer (TNL) information to the Mobile-Femto should
also be passed to T-DeNB to ensure connectivity. The T-DeNB then performs the
admission control dependent on the transmitted E-RAB attributes of the Mobile-Femto
to decide whether to accept the Mobile-Femto or not. If yes, the T-DeNB replies a HO
request Acknowledgment (ACK) to the S-DeNB after configuring/reserving the
necessary resources for the Mobile-Femto operation. This ACK message includes
RNL/TNL information for data forwarding of the Mobile-Femto and necessary
security information of T-DeNB to the considered Mobile-Femto. Then, the S-DeNB
informs the Mobile-Femto to handover by a Radio Resource Control (RRC)
connection reconfiguration command.
2) Synchronization phase: After receiving the RRC connection reconfiguration
command, the Mobile-Femto applies those configurations carried in the command.
These RRC commands contain the necessary information for backhaul reconfiguration
of Mobile-Femto towards the T-DeNB. Notice that the necessary RRC information
used in this phase is new and specific to the Un-interface (i.e. different from the RRC
configuration messages exchanged during the HO of a regular UE, as the considered
HO here is handing-over a BS). Then, the Mobile-Femto will try to synchronise with
the T-DeNB by sending a preamble message. In the meantime, the S-DeNB sends a
status transfer command to the T-DeNB to convey the Packet Data Convergence
Control (PDCP) SNR receiver status for UL and DL of the Mobile-Femto in order to
ensure the sequence of data forwarding of the Mobile-Femto Service Data Units
(SDUs) from the S-DeNB to the T-DeNB. Additionally, in this phase the Mobile-
Femto performs backhaul reconfiguration to the T-DeNB and access to the resources

127
signalled previously in the RRC message. When compared to a regular UE HO, no
Random Access Channel (RACH) procedure is needed in this case. On the UL the data
of the UEs is buffered in the Mobile-Femto, while on the DL the incoming data for
Mobile-Femto is forwarded by the S-DeNB to the T-DeNB and buffered in the T-
DeNB. When the Mobile-Femto successfully connects to the target DeNB, the Mobile-
Femto sends RRC message to the T-DeNB to confirm HO and T-DeNB begins to send
DL data to Mobile-Femto.
3) Tracking area update phase: If successfully synchronised with the T-DeNB, the
Mobile-Femto sends a tracking area update command to its MME. After receiving the
command, the MME updates the Mobile-Femto’s location. Then, the MME replies a
tracking area update accept command to the Mobile-Femto to finish this phase.
4) Path switch phase: In this phase, the T-DeNB switches the routing path to the
Mobile-Femto by sending a path switch request command to the MME. Then, the
MME of the Mobile-Femto issues a UE plane update request command to the S-GW of
the Mobile-Femto to switch the routing path. After finishing path switch, the S-GW
replies a UE plane update response command to the MME, and then, the MME of the
Mobile-Femto sends a path switch request ACK to the T-DeNB.
5) S1/X2 and OAM phase: In this phase, the Mobile-Femto updates its registration
information by the configurations from the Operations, Administration and
Maintenance (OAM) server. The Mobile-Femto also requests the T-DeNB to
reconfigure S1/X2 connections toward the S-GW and MME. After the given
procedures, the T-DeNB and S-GW can forward data along the new routing path to the
Mobile-Femto, and the in-network HO procedure ends.
In this HO process, the UE plane for UEs connected to the Mobile-Femto and the
corresponding path switch are naturally grouped in the S/P-GW of the Mobile-Femto. This
allows a group HO procedure of UEs plane during the Mobile-Femto mobility. However,
if the T-DeNB does not have enough resources to accommodate the coming Mobile-
Femto, it can reject all UEs attached to this Mobile-Femto thus drops their calls.

128
Fig 6.4 Mobile-Femtos HO from serving eNB to target eNB

129
On the other hand, there is always a possibility of PRBs shortage when trying to
handover a Mobile-Femto to the neighbouring Macrocell. This shortage can occur when there
are overlapped Mobile-Femtos at the same T-DeNB or when the T-DeNB is under heavy
traffic load. This is because the traffic movement in streets is unpredictable especially for
buses and cars and this may affect the HO procedure of Mobile-Femtos from one Macrocell to
another. Consequently, the following scenario is considered as the worst-case scenario as the
high volume of traffic is the main issue here. For example, when there is a Mobile-Femto
moving out of the coverage area of the S-DeNB towards the coverage area of the T-DeNB
while the required number of PRBs is inadequate to accommodate the coming Mobile-Femto
with its UEs, the connection will be dropped, only when the number of required PRBs is
available, then a connection will be established.
To maintain the vehicular UEs connection inside buses, those UEs can be served by the T-
DeNB, by any nearby Fixed-Femtos that might be positioned in bus stops or along the bus
path or even by any nearby Mobile-Femtos on another bus as Figure 6.5 shows. However, this
connection might not last long enough to continue serving those vehicular UEs. It might not
even last more than few moments depending on those vehicular UEs speed and direction – the
bus speed and direction.
In other words, as long as those vehicular UEs, who are being served by the nearby eNB,
Fixed-Femto or another Mobile-Femto, leave the serving coverage area, their connections will
breakdown and their calls will be dropped unless another HO process is being established here
to maintain those UEs connections. It is to be mentioned that the path-loss and penetration loss
play important roles in the quality of connection between those vehicular UEs and the serving
BSs. High path-loss and penetration loss cause degradation in the network performance while
mitigating the previous two factors can improve the vehicular UEs performance, thus the
network performance.

130
Fig 6.5 Connection establishment in the worst-case traffic
When the Mobile-Femto connection drops down after leaving the coverage of the serving
Macrocell to a new one, those vehicular UEs inside the bus will be considered as new UEs and
they can establish a connection with any close by BS. Hence, the CAC initially checks
whether the Mobile-Femto coverage in the same bus is still available or not. If the Mobile-
Femto coverage is available, then the Mobile-Femto is the first choice to connect the UE to;
otherwise, other options are needed to be looked for. The Mobile-Femto accepts the UE
connection if the received SINR level is satisfied and the PRBs in the Mobile-Femto are
available to accommodate this UE.
However, if the above conditions are not satisfied, then the UE tries to connect with the T-
DeNB. The T-DeNB does not allow the QoS degradation policy to accept any new UE and
this UE will be rejected if the requested BW is not available in the T-DeNB. Afterwards, if
both the Mobile-Femto and the eNB coverage are not available, then the UE will try to look
for another option, which is connecting to a nearby Fixed-Femto. Hence, coverage and BW
checks will be done and if any is not available then a worst-case solution comes here which is
trying to connect to any nearby Mobile-Femto. However, if the last is not available too then
the call will be blocked and no connection will be established unless the requested BW is
available as Figure 6.6 shows.
When the bus passengers establish
a connection with the closest
Mobile-Femto, their connection
might not last long enough as long
as the distance between the two
buses increases which depends on
the two buses direction and speed.

131
Fig 6.6 Connection establishment for new vehicular UEs

132
After discussing the worst-case scenario, here it is important to discuss the Macro UE HO
procedure when this UE is already been connected to the eNB and needs a connection
enhancement to overcome the high path and penetration losses inside vehicles. In this case,
whenever this UE enters the bus, it can sense the Mobile-Femto SINR due to the short distance
between this UE and the Mobile-Femto. The CAC policy checks the received SINR level of
the target Mobile-Femto (SINRTMF) compared to the eNB received SINR (SINReNB). Thus, the
Macro-UE will be handed-over to the target Mobile-Femto when the current received SINReNB
level is less than or equal to the received SINRTMF. If any of the above conditions is satisfied,
then the CAC policy checks the availability of the requested PRBs in the target Mobile-Femto.
If the requested PRBs available then this vehicular UE will be handed-over to the target
Mobile-Femto; otherwise it will remain connected to the eNB. Figure 6.7 illustrates what has
been explained earlier;
Fig 6.7 Vehicular UEs HO process from eNB to Mobile-Femto

133
Hence, the following algorithm represents the HO procedure between the Macrocell and the
Mobile-Femto to improve the vehicular UEs performance and overcome the high path-loss and
penetration loss issues. While the Fixed-Femto is always seen as an option when the Mobile-
Femto coverage is not available to improve the Macro UE’s signal quality.
Algorithm 6.1: Macro UE HO procedure
1: detects Mobile-Femto SINR /* if available so do the following
2: initiate HO_ DReq /* send HO request to the Mobile-Femto
3: receive DReq from Macrocell of UEu
4: if *Nj Njmax & BWMFemto-total + BWrequired BWMFemto-max then
5: accept UEu
6: Nj = Nj + 1
7: BWMFemto-total = BWMFemto-total + BWrequierd
8: else if Nj Njmax & BWMFemto-total + BWrequired BWMFemto-max then
9: reject UEu
10: end
11: end
12: else Detects Fixed-Femto SINR /* if available so do the following
13 initiate HO_ DReq /* send HO request to the Fixed-Femto
14: receive DReq from Macrocell of UEu
15: if *Ni < Nimax & BWFFemto-total + BWrequired < BWFFemto-max then
16: accept UEu
17: Ni = Ni + 1
18: BWFFemto-total = BWFFemto-total + BWrequierd
19: else if Ni Nimax & BWFFemto-total + BWrequired BWFFemto-max then
20: reject UEu
21: end
22: end
23: if performance_degradates then
24: drop_call
25: end
*Nj and Ni represent the number of vehicular UEs in Mobile-Femto and Fixed-Femto respectively

134
Thus, after discussing the importance of the HO procedure in Mobile-Femto technology, now
it is essential to evaluate the impact of handing-over the vehicular UE (bus passenger) to be
attached and served by the installed Mobile-Femto in the same bus. The performance has been
evaluated based on the signal outage probability, dropping calls probability and blocking calls
probability in LTE and 5G vehicular networks. In order to have a clear comparison between
the achieved results, the analysed mathematical equations have been presented in respect to
direct transmission from the eNB, Fixed-Femto transmission and finally Mobile-Femto
transmission as the following subsection illustrates.
6.3 Outage probability
In the presence of fading, penetration loss and path-loss, there is always a probability
that the received SINR at the receiver is below a given threshold to support a required
transmission rate of R bits/sec. This is because all types of services have some minimum bit-
error-rate requirements. These requirements can be translated to the minimum required
average of the received SINR at the receiver. Based on what has been illustrated earlier, the
probability that the received SINR falls below a given SINR threshold is referred to an outage
probability. Nowadays, systems try always to keep this probability as low as possible to
improve their network performance by especially improving their vehicular UEs connections.
Therefore, the outage probability has been analysed in term of the Fixed-Femto and Mobile-
Femto deployments in the LTE Macrocell. This analysis has been done according to three
transmission schemes; direct transmission from the eNB, Fixed-Femto assisted-transmission
and Mobile-Femto assisted-transmission. Thus, it is essential to illustrate the considered
scenario, which is based on the scenario in Figure 4.3 that has been discussed earlier in
chapter 4. However, it is worth mentioning that all the presented scenarios in this research are
linked together to build a comprehensive study in term of the deployment of Mobile-Femtos
in public transportations (buses).

135
Fig 6.8 Vehicular UE connection probabilities
Where Figure 6.8 represents the HO possibilities that a vehicular UE can process to send and
receive data or calls efficiently. Obviously, the highlighted vehicular UE has three BS options
to be attached to as all the three BSs are in short range. Nevertheless, in this case the
penetration loss plays a significant role in choosing the right BS. Besides that, the outage
probability in this case is considered as an important factor that can easily affect the vehicular
UEs signals, connections and performance. It is required here to calculate the outage
probability of the vehicular UE in three cases; when this UE is connected directly with either
the eNB, the Fixed-Femto or the Mobile-Femto. Having high outage probability means that
the vehicular UE has made the wrong choice of connection with one of surrounding BSs.
Hence, the outage probability of a single-hop system, when there is a direct transmission from
the eNB to the vehicular UE, can be given by
Where the SINRRx represents the instantaneous received SINR at the receiver Rx and Pr is the
received power at the Rx [Goldsmith, 2005]. The SINRth_D is the required SINR threshold at
the receiver Rx to support a given target rate over the direct link between the eNB and the
vehicular UE. While the threshold here is a system designated parameter and depends on
(6.1)

136
several factors such as the achievable target rate of an LTE system. It is worth noting that the
signal will be outage when the received SINR at the receiver side is below the given SINR
threshold. This has its negative impact on the achieved system performance especially when
the UEs feel that they are not getting the best services they are paying for.
Thus, the SINR threshold in the case of direct transmission when a rate of R bits/sec is
required at the vehicular UE’s end, is given by
Femtocells are using the full duplex transmission mode like the eNB and this is why in
Femtocell-assisted system, both the backhaul and the access links are supporting a given end-
to-end rate of R bits/sec at the receiver Rx like the direct transmission of the eNB, thus the
same SINR threshold will be used.
However, if the transmitter Tx has an average transmission power of Px and the receiver Rx is
at distance y from the transmitter Tx, the received power (Pr) at Rx can be given by
Where L(y) models the path-loss when the receiver Rx is at distance y from the transmitter Tx.
The denotes the power loss caused by shadowing and represents the channel gain. Here
the threshold SINRth_D or SINRth_femto varies according to different QoS requirements like the
achievable rate in bits/sec of an LTE system as mentioned earlier, which is in turn based on
Shannon capacity can be given by the following
where BWeff adjusts for the bandwidth efficiency and the SINR has been considered here
instead of the SNR because of the existence of the interference issue in this case [Raymaps,
2016]. This is due to the multiple access method, since several transmitters can send
information simultaneously over a single communication channel. This allows several UEs to
(6.2)
(6.3)
(6.4)

137
share a band of frequencies, which may cause interference between UEs as illustrated earlier
in chapter 5.
Hence, the SINRth_D and SINRth_femto can be obtained from equation (6.2) with a required end-
to-end rate of R bits/sec for direct, backhaul and access links transmission as the following
formula shows
Thus, after calculating all the required parameters, it becomes now easier to find out the
outage probability of Mobile-Femto and Fixed-Femto assisted transmissions. In Mobile-
Femto assisted system, the access link is not corrupted or affected by the multipath fading due
to the LOS link and the the short distance between the UE and the serving Mobile-Femto. In
this case, the outage probability can be obtained similarly to the single-hop system of direct
transmission with the use of which is the same of the as both are using
the full duplex mode. While, the Pr value will be different from the direct transmission Pr as a
result of the removed channel gain in the case of Mobile-Femto transmission. This is due to
the LOS access link, the short distance between the receiver and the transmitter and the
absence of the penetration loss between the two parties. Hence, the Mobile-Femto assisted-
transmission Pr can be obtained by
Where here the is equal to the constant loss (C) of the free space path-loss model as
previously explained in chapter 4.
On the other hand, the outage may occur if either the backhaul or the access link is outage in
the case of the Fixed-Femto assisted system. Thus, the outage probability for Fixed-Femto
assisted system can be given by
(6.6)
(6.7)
(6.5)

138
Hence, if the value of the achieved outage probability is high, so the number of dropped calls
is high too. That takes the reader to the second part of these calculations, which is the impact
of vehicular UEs mobility and outage probability on the dropped and blocked calls
probabilities. The dropped calls probability is one of the key performance indicators, which is
used by various mobile phone service operators for measuring the system QoS. It generally
refers to the phenomenon of calls/packets dropping in both voice and data networks. Here,
call dropping indicates the termination of calls in progress before either any involved party
intentionally ends the call.
The connection request to an eNB may be one of the following; it may be from a vehicular
UE in the current Macrocell cell who wants to improve his/her connection, or it may be from
a vehicular UE who is currently connected to a neighbouring Macrocell and has just got into
the area of the current eNB. These two connections might be either a HO call or a new call as
been discussed earlier. That is why call dropping and call blocking are the two most
important parameters of the QoS of mobile systems. The call blocking occurs in cellular
system when a cell receives a request for a new connection, and does not accept it due to non-
availability of the needed channels when the cell suffers from high traffic load. On the other
hand, if an existing connection is dropped due the incapability of the cell to provide sufficient
BW to continue the connection, then call dropping occurs.
Therefore, several elements play an important role in dropping calls probability and the
strength of received power over distance such as the path-loss, penetration loss and
shadowing. The path-loss is caused by dissipation of power radiated by the transmitter as well
as effects of the propagation channel. While shadowing is caused by obstacles between the
transmitter and receiver that absorb power, which is known also as the penetration loss.
However, when the obstacle absorbs all the power, the signal is blocked and this is what
happens for vehicular UEs in public transportations. The variation due to the path-loss occurs
over very large distances, whereas variation due to shadowing occurs over distances
proportional to the length of the obstructing objects, which might be buildings or even the
chassis of vehicles. As previous chapters illustrated, the used path-loss model (in dB) in this
scenario is the Microcell NLOS path-loss model, which is based on the COST 231 Walfish-
Ikegami NLOS model and can be given by the following

139
where L is the distance from the transmitter to the receiver.
However, in wireless systems there is typically a target minimum received power level Pmin
below which performance becomes unacceptable. As a result, the Dropping Call Probability
DCP(Pmin, L) under path-loss and shadowing is the probability that the received power at a
given distance L, Pr(L), falls below Pmin which can be given by
While the blocking calls probability occurs when there is a shortage with the availability of
the required number of channels to accommodate the new coming UE into the Macrocell and
this happens in high-traffic areas. This is because; there is indirect correlation between the
number of available channels and the number of available resource blocks. In this research,
the used channel bandwidth is 10MHz, which provides 50 resource blocks in each channel.
That means with the increased number of available channels to serve vehicular UEs more
resource blocks are available to serve those UEs. In contrast, with the increased traffic load,
less channels and resource blocks are available to serve vehicular UEs, thus, increase the
number of blocked calls. Therefore, the Blocking Call Probability (BCP) can be calculated by
Where A is the successive call time arrivals and N is the number of channels in the system.
Here A is also known as the traffic stated in Erlang and can be given by the
In which represents the call arrival rate per second and th is the call holding time of UEs per
second.
(6.8)
(6.9)
(6.10)
(6.11)

140
It has become obvious now that there are many factors influencing dropped and blocked calls
probabilities like the signal received power and the channel availability to accommodate the
coming calls. Other indirect factors have huge impact on increasing any of the previous
probabilities like the path-loss, penetration loss, shadowing and the heavy load traffic.
Therefore, it was needed to deploy the Mobile-Femtos in public transportation to improve the
vehicular UEs performance and reduce the dropped calls probability by reducing the path-loss
and penetration loss impacts, thus increasing the received power strength at the UEs ends.
However, it is to be mentioned that UEs mobility in 5G Networks is not only affect the
probability of signal outage or dropped/blocked calls, but it also affects the recieved
throughput, the number of recieved packets or even the HO time delay. Added to this, the DL
interference is another term in the mobile communication environment that limits the success
of the HO process. Because in this case, the UE who needs to be handed over to the target cell
can be interfered by the DL signal of other neighbouring cells. More issues here are a matter
of concern like the slow and fast fading issues, Doppler Shift and channel availability in the
target cell. All these factors together can have a negative impact on the success of the HO
process, this is without neglacting the fact of the importance of having an efficient scheduling
and resource management mechanisms. Hence, maintaining the UE connection can improve
the achieved backhaul capacity, thus the network capacity. All these important terms of
comunication environment have been illustrated in Figure 6.9.
Fig 6.9 Important Mobilty Terms in Mobile Communication Environment

141
Consequently, it can be concluded that vehicular UEs are most likely to be exposed to drop
and block calls as they are in continuous movement under different speeds. Besides that, their
unpredictable movement creates a performance fluctuation whenever they are close or far
from any BS. Therefore, this research is more concerned on the vehicular UEs signal outage,
dropped and blocked calls together with channel availability to accommodate the handed over
or new UEs. This research has created a comparison between the vehicular UEs dropped and
blocked calls probabilities in the case of direct transmission, with Fixed-Femto assisted-
transmission and finally with Mobile-Femto assisted-transmission. The achieved results in the
following section will show the impact of deploying each of the previous technologies on the
achieved probabilities.
6.4 Results and Discussion
This section discusses the achieved results in term of the vehicular UEs outage
probability, dropped calls probability and blocked calls probability. These achieved results
create a comprehensive comparison between the signal quality of the direct transmission from
the eNB, the transmission from the Fixed-Femto and finally the transmission from the Mobile-
Femto. In these results, three parameters play an important role in the achieved performance,
which are the path-loss, the penetration loss and finally the signal shadowing.
Hence, evaluating the signal outage probability especially for vehicular UEs is an important
element in the LTE performance system in order to have a proper and seamless connection
between the vehicular UE and the serving BS. Figure 6.10 represents the comparison between
the SINR levels from the eNB, the Fixed-Femto and the Mobile-Femto for vehicular UEs
inside public transportations. The signal level becomes very poor with the increased distance
between the eNB and the vehicular UEs. Another factor plays significant role in the SINR
reduction, which is the LTE high VPL that has been set to 25dB.
On the other hand, the SINR from the Fixed-Femto starts below the SINR from the eNB and
this is due to the limited coverage area of the Femtocell. However, between 400m to 600m,
the signal strength increases due to the close distance between the vehicular UE and the
nearby serving Fixed-Femto. At this distance, the Fixed-Femto transmission achieves higher
SINR than the eNB transmission because of the path-loss issue in the case of the eNB

142
transmission. While the SINR of the Fixed-Femto drops again when the distance increases
between the vehicular UE (inside the bus) and the serving Fixed-Femto.
The figure clearly shows the advantage of having the Mobile-Femto in LTE vehicular
networks especially when the distance between the eNB and the vehicular UE is
comparatively high. The signal level at the UE from the Mobile-Femto is almost the same
because the distance between the UE and the Mobile-Femto is constant since this UE is
located in the Bus that the Mobile-Femto installed in, where there are no barriers between the
two. In this case, the SINR is at its highest, which is 52dB while in the case of eNB
transmission the SINR starts with 41dB and drops with the increased distance –increased
path-loss. Whilst in the case of the Fixed-Femto transmission, the SINR starts with 33dB,
which drops, increases, and then drops again with the increased path-loss too.
Fig 6.10 SINR received from eNB, Fixed-Femto and Mobile-Femto
While Figure 6.11 illustrates the uplink throughput comparison of vehicular UEs in LTE
Macro-cellular network. The poor received signal from the eNB causes very small Uplink
throughput compared to the Uplink throughput of UEs who are being served by the Mobile-
Femto. This is due to the short distance between the vehicular UE and the installed Mobile-
Femto in the same bus.
Also, in the case of the Mobile-Femto transmission, the received signal level at the receiver
outside the vehicle, e.g. the bus, is comparatively acceptable for those UEs who are close to

143
the bus. However, the connection with those outside the bus UEs might not last more than
few moments depending on the bus’s direction and speed. This represents the case when there
are UEs on another bus close to a Mobile-Femto and they can get the advantage of this
Mobile- Femto signal when they could not find enough channels and PRBs in their own
Mobile-Femto. Those UEs connection might not last more than few moments and their calls
will be dropped as long as the distance between the two parties increases.
Whilst, here again because of the distance fluctuation between the vehicular UE and the
Fixed-Femto, an improvement in the uplink throughput is noticeable between the 300m and
600m. This throughput improvement will not last long enough because of the high impact of
both path-loss and penetration loss, which drops the uplink throughput again.
Fig 6.11 Uplink throughput of vehicular UE before and after deploying Femtocells
After discussing the signal quality inside public transportation, it is important now to discuss
the signal outage probability of those UEs inside these vehicles.
Table 6.1 gives detailed parameters of the simulated scenarios in order to create a
comprehensive comparison between the outage probability of vehicular UEs who are served
by the eNB, Fixed-Femto and Mobile-Femto in LTE networks. In addition, this comparison

144
considered the outage probability under different penetration loss scales in order to
understand the impact of different penetration losses on the achieved outage probability.
Table 6.1 Detailed simulated parameters of the Outage Probability scenarios
Parameters Values
Schemes Duplex Mode Path-loss
Model
UE Position
Distribution
VPL (dB) Transmission
Power
Direct
Transmission
Full Duplex 3GPP SCM
Urban NLOS
Microcell
model
Uniform
distribution
0, 25, 40
Fixed-Femto
assisted
Transmission
Full Duplex Urban SCM
NLOS
Microcell
model for both
backhaul and
access links
Uniform
distribution
0, 25, 40
and
Mobile-Femto
assisted
Transmission
Full Duplex Backhaul link:
SCM urban
NLOS
Microcell
model. Access
link: Constant
path-loss
Uniform
distribution
0
and
Path-loss Model in dB
Cell Radius D 1000 m
Receiver noise figure for both Femtocell and UE 9 dB
Minimum required rate R at the UE 2 bits/sec
Fading Small-scale fading
In the outage probability scenarios, the Mobile-Femto is assumed to be installed in public
transportations like buses, and it is assumed to fully circumvent the VPL while the Fixed-
Femtos are assumed to be positioned in bus stations (bus stops) or at the side of the bus paths.
Figure 6.12, Figure 6.13 and Figure 6.14 demonstrate the outage probability under different
VPL scales. The results show that, when the VPL is equal to 0dB, the direct transmission
from the eNB always achieves the lowest outage probability since there is no resistance
against the transmitted signal. While at 400m distance from the BS, the vehicular UEs who
are being served by the Fixed-Femto achieve lower outage probability than the Mobile-Femto
UEs. This is because when there is no penetration loss, the Fixed-Femto signal can travel

145
smoothly without massive reduction in the received power (Pr) at the vehicular UE’s end.
Besides that, the mobility aspect of the Mobile-Femto creates link variation in the backhaul
link between the eNB and the serving Mobile-Femto, which becomes obvious compared to
the other BSs transmissions with the absence of the VPL.
Fig 6.12 Outage Probability when the VPL= 0dB
While Figure 6.13 and Figure 6.14 show a more interesting trend when both, the penetration
loss and the eNB-vehicular UE distance are increased.
In Figure 6.13, the outage probability of the Mobile-Femto assisted-transmission at a VPL of
25dB is always lower than the outage probability of the direct transmission form the eNB to
the vehicular UE. In addition, it is also lower than the outage probability of the Fixed-Femto
assisted-transmission. This indicates that the Mobile-Femto assisted system is better at
maintaining a given rate of R bits/sec for a vehicular UE, which can be translated to a good
QoS compared to the other two transmissions.
However, with the increased distance -over 300m- the Fixed-Femto assisted-transmission
starts to achieve lower outage probability than the direct transmission from the eNB and this
is because of the high path-loss of the eNB signal over distance when it tries to reach the
vehicular UEs inside vehicles. Here it raises the case of being able to be attached to any
nearby Fixed-Femto when the Mobile-Femto channels and PRBs are fully occupied by other
UEs. This might be a temporary solution to improve the vehicular UEs signal quality unless

146
the required PRBs are available in the Mobile-Femto to accommodate those UEs. Otherwise,
the connection will be dropped as soon the distance increases between the vehicular UE and
the serving Fixed-Femto.
Fig 6.13 Outage Probability when the VPL= 25dB
As the VPL value goes up to 40dB, the Mobile-Femto assisted-transmission outperforms the
direct transmission when the vehicular UE is fairly near the eNB (around 50m). The 40dB
vehicular penetration loss is presented as an extreme case, which can rarely be observed in
the current wireless systems. However, higher vehicular penetration losses are foreseeable if
higher frequency bands are used [Stavrou et al., 2003], e.g., the 3.6 GHz band is allocated to
next generation mobile communication systems.
Hence, Figure 6.14 represents the outage probability of vehicular UEs when the penetration
loss is equal to 40dB. From the figure below, it is obvious that vehicular UEs are enjoying
better quality of connection and signal strength when they are served by the Mobile-Femto
rather being served directly by the eNB or the Fixed-Femto.
However, in term of Fixed-Femtos at 500m the results again show less outage probability
compared to the eNB transmission, although the outage probability increases again as the
vehicular UEs move away from the serving Fixed-Femto.

147
Fig 6.14 Outage Probability when the VPL= 40dB
Thus, it can be concluded that under high VPLs, the vehicular UEs have enjoyed better
connection and less outage probability when they are connected directly to the Mobile-Femto.
On the other hand, the Fixed-Femto outage probability was changing between lows and highs
as the path-loss and penetration loss increase between the eNB and the vehicular UEs.
However, high outage probability means high number of dropped and blocked calls.
Therefore, the following part discusses the achieved results in term of dropped and blocked
calls probabilities of vehicular UEs and the impact of path-loss and penetration loss on the
achieved results.
Call dropping and call blocking mostly occurs when the UEs are vehicular and
continuously changing their connection with the serving BS more likely than fixed UEs and
pedestrians. This is because those vehicular UEs are requiring more HO procedures to
maintain their connection and services. Hence, there is a positive correlation between the HO
time delay and the number of dropped calls. The HO procedure can be delayed for several
reasons and one of these reasons is channel availability, which is the same reason that a call
might be blocked.
In other words, no channel availability means NO PRBs to accommodate the coming
vehicular UEs so the HO procedure cannot be completed and then calls will be dropped or

148
blocked depending on the nature of these calls (HO calls or new calls). Therefore, the
following section represents the impact of distance gap between the BS and the UE, calls
duration, number of available channels and traffic intensity on the dropping and blocking
calls probabilities. Where few points have been considered in the dropped and blocked calls
scenarios as below:
Traffic type: The considered traffic is a delay sensitive traffic (e.g. voice, video
conferences etc). These calls are dropped if not picked up within a very small waiting
time.
Drop and block calls: In any cell, a new call is picked up immediately if the number of
active calls in that cell, at the time of its arrival is less than K parallel calls. If all the K
servers are busy, the call is dropped. This will have a negative impact on the arrival rate
(lambda) of the system since the number of the dropped and blocked calls is high due to
the non-channel availability.
Scheduling with priority: Means that the attached eNB UEs, Fixed-Femto UEs and
Mobile-Femto UEs have the priority to be served first by their own serving BSs before
any handed over UEs or any new coming UEs to the cell. The calls of those handed
over UEs and new UEs will be dropped or blocked if the required number of channels
is not available in the target BS.
Speed and location: The considered environment in this research is the vehicular
environment where the Mobile-Femtos and UEs are moving together as one unit.
Where Poisson process has been considered here that counts the number of events in a
given time interval. The time between each pair of consecutive has an exponential
distribution with parameter ( ) and each of these inter-arrival times is assumed to be
independent of other inter-arrival times. The previous process can work efficiently at
places like call-centres when many calls (events) occur at random times. Moreover, a
uniform velocity that ranges between 3km/h to 120km/h has been assumed while each
of the Fixed-Femto and the Mobile-Femto locations have been chosen based on the

149
Microcell NLOS path-loss model. Furthermore, the chosen VPL is 25dBm as this value
is playing a significant role in increasing the dropped and blocked calls probabilities.
Hence, Figure 6.15 represents the correlation between dropping calls probability and the
distance gap between the vehicular UE and the eNB BS. A comparison between the
transmissions of three technologies has been drawn to evaluate the probability of dropping
calls when the transmission is from the eNB, Fixed-Femto and Mobile-Femto. The achieved
results reflect the fact that dropped calls probability has reduced when those UEs are being
served by the Mobile-Femto rather than by the eNB or Fixed-Femto. This is because many
factors play significant role in the case of dropping calls in LTE vehicular environment e.g. the
VPL of UEs’ signals inside public transportations, which makes it challengeable to maintain
those UEs’ connections.
Furthermore, the path-loss affects the signal power over distance d since the last makes the
received signal at Rx much weaker than the minimum threshold Pmin as in .
However, the distance between the vehicular UE and the Mobile-Femto is very short -less than
5m. This means the , which reduces the number of dropped calls. The Mobile-
Femto achieved less dropping calls probability when the distance between the UE and the eNB
BS is less than 500 while it increases slowly until it reaches its max of 0.05 at 1000m. This is
due to the backhaul link variation occurring when the Mobile-Femto moves away from the
eNB and gets close to the edges of the Macrocell. A HO procedure is needed to be established
with a neighbouring Macrocell to maintain the connection of this Mobile-Femto.
On the other hand, the eNB and the Fixed-Femto dropped calls probability starts to increase
after 400m due to the high penetration and path losses. Fixed-Femto achieves higher dropped
calls probability than eNB, which is 0.16 and 0.12 for the Fixed-Femto and eNB respectively.
This is due to the limited coverage area of Fixed-Femtos and the continuous movement of the
vehicular UEs who require many HOs to maintain their connections and obviously many calls
dropping occur.

150
Fig 6.15 Drop Calls Probability vs. Distance from the BS
On the other hand, Figure 6.16 illustrates the correlation between dropping calls probability
and call duration. It shows that the call duration is another parameter that can affect the QoS in
a cellular network, and this is why it is considered when planning any network. The call
duration or mean call holding time is the time a mobile station takes to complete a call
connection, which has been given by
where A is the traffic intensity and is the call
arrival rate. The call arrival rate varies with call duration the same way it varies with dropping
calls probability. Hence, dropped calls probability decreases with the increase in call duration.
In real life scenarios, it is noticeable that calls may last longer with the good quality
connection, as the strong signal is available. Deploying Femtocells in public transportations
like buses has improved the ability of UEs to make phone calls and being connected to the
Internet while the bus is moving. Besides that, deploying Mobile-Femtos has helped to
overcome the general issues like penetration loss, path-loss, interference and weak signal.
In this way, the figure divides the UE’s call durations into four sections as the highlighted areas
show. The degradation of dropping calls probability over time starts sharply in the first
highlighted section then slowly for the second section while the dropping is dramatically
decreased at section three as the call duration is between 280 and 290 sec. On the other hand,
from 290 to 300 sec the dropping calls probability is steady for the Fixed-Femto transmission
at 0.059, eNB transmission at 0.03 while the Mobile-Femto transmission at 0.018. These
changes in the call time durations depends on the quality of connections of vehicular UEs that

151
improve with the mitigation of penetration loss, path-loss and interference in public
transportations
Fig 6.16 Dropping Calls probability vs. Call Duration
As path-loss and call duration play important roles in the degradation of the dropping calls
probability, the channels availability has a significant role too. Channels availability does not
affect only the probability of dropping calls but also the probability of blocking calls. This is
because when new calls (new UEs) try to establish a connection with the target BS, the calls of
those UEs can be blocked due to the non-availability of the required number of channels and
PRBs to accommodated the new UEs.
Hence, Figure 6.17 represents the correlation between the blocked calls probability and the
number of available channels in the case of three transmissions, eNB transmission, Fixed-
Femto transmission and Mobile-Femto transmission. It is noticeable that with the increased
number of channels, vehicular UEs experience less blocked calls probability in the case of the
Mobile-Femto implementation. This is because vehicular UEs who always suffer from high
penetration loss, do not need to establish a connection with far BSs when they can be
connected to the Femtocell that is installed in the same bus. This reduces the blocking calls
probability as it is easier for those UEs to accommodate the available channels in the serving
Mobile-Femto rather than looking for far BSs. The channel here is used to express an
information signal, e.g. a digital bit stream, from one or several transmitters to one or several
receivers. It has a certain capacity for transmitting information, often measured by its
1
2
3
4

152
bandwidth in Hz or its data rate in bits per second. The channel bandwidth of this research is
10MHz, which provides 50 resource blocks in each channel. That means with the increased
number of available channels to serve vehicular UEs more resource blocks are available to
serve those UEs, thus, less number of blocked calls.
Moreover, the number of HOs can be reduced too as those UEs can have long connections with
the installed Femtocell regardless of their continuous movement from a place to another. It
should be noticed that at 4 available channels the blocked calls probability is 0.4 for the Fixed-
Femto transmission, 0.35 for the eNB transmission and 0.22 for the Mobile-Femto
transmission while it continues decreasing with the increased number of available channels
until it achieves its lowest at 0.04 in the case of Mobile-Femto transmission. This is because
Mobile-Femtos can effectively mitigate the penetration and path losses inside public
transportations.
Fig 6.17 Block Calls Probability vs. No. of channels
As mentioned earlier, the new calls will be blocked when the required number of channels is
not available to accommodate these calls. NO channels availability means the number of
resource blocks is not available to accommodate the upcoming new UEs to the cell. This is
because with the increased number of active UEs, more resources are required in order to
accommodate the upcoming traffic. This issue increases in the case of vehicular UEs as they
are more exposed to interference, high path-loss and high penetration loss, which can
increase the burden on the eNB. Thus, implementing Mobile-Femtos can effectively

153
improve those new vehicular UEs services by giving them the ability to establish a
connection with the installed Femtocell in the same bus. Implementing Mobile-Femto can
reduce the number of blocked calls as Mobile-Femtos can be reached easily by those
vehicular UEs where they can enjoy better connection and services.
Figure 6.18 shows that Fixed-Femto vehicular UEs experience the highest blocking calls
probability at max 0.33 due to the vehicular UEs continuous movement that makes it hard
for the new UEs to establish new connections without losing them after moments as the
vehicle speed goes up and move away from the Fixed-Femto.
On the other hand, the eNB transmission has achieved lower blocked calls probability at
0.25 due to the wide coverage area that is less affected by UEs mobility while Mobile-
Femto assisted-transmission has achieved the lowest blocking calls probability at 0.2 due to
the high SINR inside the vehicle. This means that Mobile-Femto is more effective in
mitigating the blocked calls probability by providing high SINR inside public
transportations. Added to this, the LOS Access link and the short distance between the
transmitter and the receiver, which is less than 5m played an important role in reducing the
VPL issue.
Fig 6.18 Block Call Probability vs. Traffic Load

154
6.5 Summary
This chapter has discussed the Mobile-Femto HO procedure especially the process of
handing over the Mobile-Femto itself from the coverage area of one Macrocell to another.
Additionally, the grouped UEs HO process has been included in the proposed HO scheme
for those vehicular UEs who are inside the bus when the Mobile-Femto moves away from
one Macrocell to another. Furthermore, this chapter has discussed the mobility aspect and
the impact of the UEs mobility on increasing signal outage probability, dropped calls
probability and blocked calls probability. This chapter has shown that vehicular UEs are
the most who drop calls and lose connection with the serving BSs. Therefore, coming up
with an efficient technology to solve this issue was the main motivation behind
introducing the Mobile-Femto. Previous works have shown that the number of HOs
increases with the increased value of UEs speed as well as the number of unnecessary
deployed small BSs. For those reasons, the outage probability and the UE’s distance
correlation has been evaluated under different VPL scales to understand the impact of the
last on the UEs’ connection and signal quality.
However, having Mobile-Femtos inside buses have helped in mitigating the outage
probability compared to the transmission from the eNB and the Fixed-Femto as Mobile-
Femto technology was able to eliminate the VPL issue that ranged between 25dB to 40dB
under the worst-case scenarios. This chapter has also evaluated the impact of path-loss and
call duration on the achieved dropped calls probability. While blocking calls probability
has been evaluated in term of channel availability as well as traffic intensity. The achieved
results have shown that the number of dropped and blocked calls has reduced after
implementing the Mobile-Femtos in the Macrocell compared to the direct transmission
from the eNB and the Fixed-Femtos. This is because Mobile-Femto is closer to the end
UEs, can reach those UEs without barriers and can reduce the impact of the VPL, path-loss
and interference.

155
Chapter 7: Conclusions and Further work
The on-going increasing demand for wireless based services nowadays makes it necessary
to be available everywhere and at any time by introducing new technologies, standards and
polices. This can be implemented in a way that makes the wireless environment match with
this high evolution in wireless devices and technology. Hence, the overall goal of this thesis is
to design and implement a technology that solves the drawbacks of vehicular users’
performance for the future of wireless technologies e.g. 5G Networks. The Mobile-Femto
technology allows higher throughput, signal strength and capacity for the served vehicular
users by the 4G networks. Upon proposing the Mobile-Femto with the required methods to
avoid interference and to improve users’ mobility along with the performance evaluations of
those approaches, it is strongly felt that there is scope for further potential developments
related to the work done especially in the interference management area.
The difference between this thesis proposal and other literature is that most of the other
researches lay on fixed base stations to serve vehicular UEs while this thesis focuses on
vehicular base stations to serve vehicular UEs. In addition, this thesis proposes an optimised
system that involves a cooperative scheme between PHY, MAC, and NET layers. As a result,
incorporating mobility and Femtocell systems has fulfilled the research aims. Apart from this
proposed work done in this thesis, there are some other research issues and related avenues that
need to be explored based on the current research. Therefore, this chapter consists of two parts;
a summary of research done in each chapter and the possible future work related to the
contributions of each chapter in order to make further extensions and potential approaches for
further improvements especially in the mobility and interference areas.
7.1 Conclusion In conclusion, this thesis has provided a comprehensive study about the LTE vehicular
environment, which will be the enlightenment towards developing the 5G Networks. The
literature has shown that LTE vehicular UEs are mostly exposed to performance degradation.
This is because, vehicular UEs are more affected by VPL, path-loss and interference due to
their high mobility and unexpected scenarios. Therefore, an efficient mobile Femtocell
technology has been proposed in order to improve the vehicular UEs performance and mitigate
the impact of VPL. Hence, the following points conclude the main findings of the thesis.

156
7.1.1 Performance Evaluation
A performance evaluation in term of vehicular UEs throughput, spectral efficiency, SINR
and capacity has been provided. The evaluation has been done for three technologies in order
to generate a comprehensive comparison between the vehicular UEs who have been served by
the eNB direct transmission, Fixed-Femto assisted-transmission and finally the Mobile-Femto
assisted-transmission. The achieved results through MATLAB simulator showed that Mobile-
Femto UEs have achieved higher throughput and performance in comparison with other
transmissions and this is because Mobile-Femto is more effective in mitigating the penetration
loss inside public transportations. This has been noticed through the significant improvement in
the SINR (signal strength). Moreover, the Ergodic capacity in term of vehicular UEs’ links has
improved under high penetration losses due to the implementation of Mobile-Femto inside
public transportations. The previous experiment has been done under different VPL scales that
range between 0dB, 25dB and finally 40dB.The latter is considered as the worst-case scenario
of high penetration losses inside public transportations. From the achieved results, it was
obvious that with the increased penetration loss, deploying Mobile-Femto is seen as a better
option for those UEs to be connected to and improve the links Ergodic capacity. However, and
in the case of 40dB and at almost 440m distance apart from the eNB, the Fixed-Femto has
achieved higher capacity than the eNB as those vehicular UEs experience very high penetration
loss, distance gap and weak signal from the eNB. Therefore, the option for those vehicular UEs
is to connect to any close by Fixed-Femto even for few moments just to maintain the signal
connection.
In addition, Mobile-Femto UEs have achieved the highest spectral efficiency in comparison
with the spectral efficiency of eNB and Fixed-Femto UEs. This is because; firstly, the UEs are
vehicular, which makes it hard for them to establish long connection with the close by Fixed-
Femto unless those vehicular UEs have stopped for few minutes close to a Fixed-Femto that
has been deployed in a nearby bus station. This is why there was a slight improvement in the
case of vehicular UEs spectral efficiency who were connected to the Fixed-Femto over the
direct transmission UEs. As the distance between the vehicular UEs and the eNB increases, the
Fixed-Femto starts to look as a better option than relying merely on the eNB to provide the
connection for those UEs. Secondly, the high penetration loss that is 25dB in the case of
vehicular UEs plays a significant role in the poor spectral efficiency of direct and Fixed-Femto

157
UEs transmissions. Therefore, 90% of the vehicular UEs have enjoyed better spectral
efficiency up to 3.7 bit/cu when they were connected to the Mobile-Femto, while 2.5 bit/cu in
the case of direct and Fixed-Femto transmissions.
7.1.2 Interference Management Schemes Evaluation
Deploying Fixed-Femtos and Mobile-Femtos in Macrocells has created an excessive
interference issue between the served vehicular UEs and the deployed BSs. Therefore, several
interference scenarios have been discussed and technical solutions have been introduced to
mitigate the generated interference. The coverage planning solution based on the path-loss
model has been examined together with controlling the transmission power. However, the
achieved results showed that the previous solutions can be regarded as reasonable solutions to
solve the interference issue in the Fixed-Femtos scenario while it is challengeable in the
vehicular environment scenario especially when here the BSs are vehicular. Also, controlling
the transmission power and the coverage distribution to mitigate interference are not always
efficient solutions as these techniques can affect the coverage areas by creating coverage holes
and high path-loss areas.
Therefore, an efficient frequency reuse scheme has been proposed to mitigate the interference
between the Mobile-Femto UEs, Macro UEs and BSs. In this scheme, each cell has been
divided into two zones; the centre zone and the edge zone. The Mobile-Femtos in the cell centre
zone will be using the frequencies allocated for the edge zones and likewise for the cell-edge
zone where the Mobile-Femtos will be using the frequencies that have been allocated for the
centre zones. The achieved results via MATLAB simulator showed a noticeable improvement in
the achieved throughput after implementing the proposed scheme compared to previous
frequency reuse schemes. This has been noticed in the case of Macro UEs, as the throughput
gap between the proposed and the previous schemes was bigger when more Mobile-Femtos
were deployed in the Macrocell. This is because with highly deployed number of Mobile-
Femtos, the chance of Macro UE to be interfered with the increased number of deployed
Femtocells is greater. Hence, the proposed scheme has achieved an acceptable -almost stable-
throughput around 8Mbps in the range between 8 to 20 deployed numbers of Mobile-Femtos in
the Macrocell, while for the same numbers of Mobile-Femtos, the FFR-3 (reuse factor 3) and
NoFFR-3 (reuse factor 1) schemes have achieved lower throughput that starts with 6Mbps and

158
then decreased to 4Mbps. This was due to the increased unavoidable interference between those
Mobile-Femtos and Macro UEs with the increased number of Mobile-Femtos in the Macrocell.
Whilst, the throughput of Macro and Mobile-Femto UEs located at the edge zone only showed a
noticeable improvement after deploying the Mobile-Femto with the use of the proposed scheme.
This is because the proposed scheme allocates more subcarriers to cell-edge Mobile-Femtos,
which has greatly improved the throughput of cell-edge vehicular UEs. While, the compared
schemes assign the subcarriers irrespective of the UEs location, centre zones or edge zones and
this is why those schemes have achieved less throughput compared to the proposed interference
scheme. Additionally, the achieved results showed that the proposed scheme is able to mitigate
the UEs’ interference not only between the Mobile-Femtos and the Macro UEs but also between
the Mobile-Femtos UEs themselves. This has been noticed as the number of deployed Mobile-
Femtos increased in the Macrocell up to 30 where the cell-edge UEs have achieved a max
throughput of almost 29Mbps while 20Mbps for the FFR-3 scheme and 14Mbps for the NoFFR-
3 scheme. However, with the 30 deployed Mobile-Femtos in the Macrocell, the FFR-3 and the
NoFFR-3 achieved the same total throughput for centre and edge UEs as the generated
interference between the Macro and Mobile-Femto UEs was unavoidable in this case. In other
words, at a certain number of deployed Femtocells in the Macrocell, the FFR-3 scheme will
allocate the same subcarriers to the Macro and Mobile-Femto UEs who are very close to one
another which can occur mostly with the increased number of Mobile-Femto UEs in the
Macrocell. While the proposed interference mitigation scheme was able to improve the achieved
total throughput for centre and edge UEs regardless of the number of deployed Femtocells in the
Macrocell as different frequencies have been assigned to different zones.
Added to this, implementing the proposed interference mitigation scheme has improved the
achieved SINR as the outage probability has reduced because of the interference reduction. The
achieved results showed that at a given SINR threshold, the proposed scheme indicated lower
outage probability than the FFR-3 and NoFFR-3 schemes. The previous has been indicated as
the outage probability decreased at low SINR threshold while it reached its max at 0.96 with
high SINR threshold. This implies that the proposed scheme effectively supports more UEs,
even though the interference was severe. While in the case of the NoFFR-3, UEs have achieved
the highest outage probability, which has started with 0.4 under low SINR threshold and
continuously increased with the increased SINR threshold. However, the achieved results

159
showed that at 15dB SINR the outage probability of the proposed scheme has been reduced by
7% compared to the FFR-3 scheme while reduced by 14% compared to the NoFFR-3 scheme.
7.1.3 Mobility Management Evaluation
The HO process occupied a significant chapter in this research as handing over the Mobile-
Femto from one Macrocell to another has been considered a challenge in this study. Thus, a
proposed HO scheme was presented in this work in order to tackle the issue of Mobile-Femtos
mobility through multi-Macrocells. The UEs group HO procedure has been integrated with the
proposed HO scheme taking into account the availability of the PRBs in the target Macrocells.
Then, the impact of the proposed scheme has been evaluated in term of the outage probability,
dropped calls probability and blocked call probability. The simulated results of the outage
probability under different VPLs showed that UEs who have been served by the Mobile-Femto
assisted-transmission achieved the lowest signal outage with the increased penetration losses.
This can be summarised as follows: When the vehicular penetration loss is equal to 0dB, the
direct transmission from the eNB always achieves the lowest Outage Probability since there is
no resistance against the transmitted signal. Whiles, at 400m distance from the BS, the vehicular
UEs who have been served by the Fixed-Femto achieve lower outage probability than the
Mobile-Femto UEs. This is because when there is no penetration loss, the Fixed-Femto signal
can travel smoothly without massive reduction in the received power (Pr) at the vehicular UE’s
end. Besides that, the mobility aspect of the Mobile-Femto creates link variation in the backhaul
link between the eNB and the serving Mobile-Femto, which becomes obvious compared to
other BSs transmissions with the absence of the VPL.
While, when the VPL is equal to 25dB, the Mobile-Femto assisted-transmission always
achieves lower outage probability than the eNB direct transmission. It is also lower than the
outage probability of the Fixed-Femto assisted-transmission. This indicates that the Mobile-
Femto assisted system is better at maintaining a given rate of R bits/sec for vehicular UE, which
can be translated to a better QoS in comparison with the other two transmissions. However, it is
to be mentioned that with the increased distance, the Fixed-Femto assisted-transmission starts to
achieve lower outage probability than the eNB direct transmission and this is because of the
high path-loss of the eNB signal over distance when it is trying to reach far vehicular UEs who
are inside vehicles.

160
On the other hand, as the VPL value goes up to 40dB, the Mobile-Femto assisted-transmission
outperforms the direct transmission when the vehicular UE is fairly near the eNB (around 50m).
From the achieved results, it was obvious that vehicular UEs enjoy better quality of connection
and signal strength when they are served by the Mobile-Femto rather than being served directly
by the eNB or the Fixed-Femto. Although, in term of Fixed-Femtos at 500m the results showed
less outage probability compared to the eNB transmission, however the outage probability
increased again as the vehicular UEs moved away from the serving Fixed-Femto.
Dropped calls probability, has been evaluated in term of the received power over distance –
increased path-loss- and call duration. The results showed again the advantage of deploying
Mobile-Femto over the eNB direct transmission and the Fixed-Femto assisted-transmission. The
achieved results reflected the fact that the number of dropped calls has reduced when the
vehicular UEs have been served by the Mobile-Femto rather than being served by the eNB or
Fixed-Femto. This is because many factors play significant role in this case e.g. the VPL of UEs
signal inside public transportations, which makes it challengeable to maintain those UEs’
connections. In addition, the path-loss affects the signal power over distance d as the last makes
the received signal at the Rx much weaker than the minimum threshold Pmin as shown in
. Thus, as the distance between the vehicular UE and the Mobile-Femto is very
short -less than 5m- so the and that reduces the number of dropped calls. The
Mobile-Femto UEs achieved less dropped calls probability when the distance between the UE
and the eNB BS is less than 500 while it increased slowly till it reaches its max of 0.05 at
1000m. This is due to the backhaul link variation. When the Mobile-Femto moves away from
the eNB and being close to the edges of the Macrocell, a HO procedure is needed to be
established with a neighbouring Macrocell to maintain the connection of this Mobile-Femto. On
the other hand, the eNB and the Fixed-Femto dropped calls probability started to increase after
400m due to the high penetration and path losses. The Fixed-Femto achieved higher dropped
calls probability than eNB, this was due to the limited coverage area of Fixed-Femtos and the
continuous movement of the vehicular UEs who require many HOs to maintain their
connections, and obviously many calls dropping occur.
On the other hand, the achieved results showed outcomes that are more interesting in term of
call duration, which is another parameter that affects the QoS in a cellular network. The call

161
arrival rate varies with call duration the same way it varies with dropped calls probability i.e.,
dropping calls probability decreases when the call duration increases. Therefore, deploying
Femtocells in public transportations like buses has improved the ability of UEs to make phone
calls and being connected to the Internet while the bus is moving. Moreover, deploying
Mobile-Femtos has helped to overcome the general issues like VPL, path-loss, interference and
weak signal. Noticeably, any changes in the call time durations depend on the quality of
connections of vehicular UEs that improve with the mitigation of the previous factors;
penetration loss, path-loss and interference in public transportations.
The simulated results of blocked calls probability when new calls are arriving to the network
have illustrated the impact of channel availability and traffic intensity on the probability of
blocked calls. Thus, it has proven that with the increased number of channels, less number of
blocked calls can be achieved and more calls can be served. This is because channels
availability does not affect only the probability of dropped calls but also the probability of
blocked calls. This is because when new calls (new UEs) try to establish a connection with the
target BS, the calls of those UEs can be blocked due to the non-availability of the required
number of channels, thus PRBs to accommodated the new UEs. It was quite noticeable that with
the increased number of channels, vehicular UEs were experiencing less blocked calls
probability in the case of the Mobile-Femto implementation. As those vehicular UEs who
always suffer from the high penetration loss, do not need to establish a connection with far BSs
when they can be connected to the Femtocell that is installed in the same bus. This reduces the
blocked calls probability as it is easier for those UEs to accommodate the available channels in
the serving Mobile-Femto rather than looking for far BSs. In addition, the number of HOs can
be reduced too as those UEs can have long connection to the installed Femtocell regardless of
their continuous movement from a place to another.
As mentioned earlier, the new calls will be blocked when the required number of channels is
not available to accommodate these calls. NO channels availability means that the number of
PRBs is not available to accommodate the upcoming new UEs to the cell. This is because with
the increased number of active UEs, more resources are required in order to accommodate the
upcoming traffic. This issue increases in the case of vehicular UEs as they are more exposed to
interference, high path-loss and high penetration loss that can increase the burden on the eNB.

162
Thus, implementing Mobile-Femtos has effectively improved those new vehicular UEs
services by giving them the ability to establish a connection with the installed Femtocell in the
same bus. This means that with the increased burden on the eNB, vehicular UEs can establish
their connections with Mobile-Femtos to enjoy better connection and services. On the other
hand, the achieved results showed that Fixed-Femto vehicular UEs experienced the highest
blocking call probability at max 0.33 due to the continuous movement of vehicular UEs that
makes it hard for the new UEs to establish a new connection without losing it after moments as
the vehicle speed goes up and move away from the Fixed-Femto. While, the eNB transmission
has achieved lower blocking calls probability at 0.25 due to the wider coverage area, which
makes it less affected by UEs mobility. Whereas Mobile-Femto transmission has achieved the
lowest blocking call probability at 0.2 due to the high SINR inside the vehicle and short
distance between UEs and Femtocells.
For all the above discussed reasons, Mobile-Femto is seen as the future of next network
generation, which can effectively improve the vehicular UEs performance in public
transportations like buses. All the achieved results showed an improvement in the vehicular UEs
performance after deploying the Mobile-Femtos in the LTE Macrocell. Added to this, all the
proposed algorithms and schemes in term of the interference mitigation and mobility
management have supported the presented technology to provide the vehicular UEs with the
best services they can have.
However, deploying Mobile-Femtos in high-speed trains to improve the train passengers’
performance and provide them with the internet is seen as the future work of this research as
many challenges are raised here that will be discussed briefly in the future work section.
7.2 Future Work
The aim of the mobile communications Enablers for Twenty-twenty (2020) Information
Society (METIS), which is an EU co-funded research project, is to lay the foundation for the
next generation of the mobile and wireless communications system. The project is examining
the possibility of improving the cellular network by supplementing the infrastructure with
simple, low power small BSs. It also has introduced the proposal of placing mobile BSs in

163
vehicles, such as cars, trucks, buses and trains to improve the vehicular UEs performance. That
is why, considering the train Mobile-Femtos technology as the future work of this research is
seen as a complement of what has been proposed earlier in regard to the deployment of
Mobile-Femto technologies in public transportations (i.e. buses).
The cooperative and coordinated Mobile-Femto systems in train carriages need to be further
investigated as it consists of a set of interconnected and coordinated Mobile-Femtos as shown
in Figure 7.1. The coordinated Mobile-Femtos would be implemented on trains or on other
vehicles with large spatial dimensions where those coordinated Mobile-Femtos are connected
to one another through the CrX2 coordination interface. This allows several optimisation
methods for group HO and backhaul link optimisation.
Fig 7.1 An example of a coordinated Mobile-Femtos system
Actually, there are four challenging reasons that affect communication services on high-speed
trains. These challenges are listed as the following:
Large penetration loss via the shield of the train, which is expected to be 40dB.
Large number of HOs in very a short time. This is due to the hundreds or thousands of
UEs who need HO procedures from one site to another concurrently/sequentially.
This phenomenon affects system stability and eats-up capacity.

164
High power consumption for UEs transmission and this is because UEs on the train
need higher transmission power to overcome the large penetration loss in uplink as
well.
High-speeds of trains are considered one of the challenges as some trains speeds range
between 300km/h to 350km/h, which makes the impact of Doppler Shift is very
severe in this case.
However, the high-speed trains are considered nowadays as one of the most important
transportation services as they save time and effort. For example, the TGV Eurostar in Europe
is 393m long, moves at speed reaching 300km/h. The Shinkansen in Japan has similar
characteristics with 480m long and 300km/h of commercial speed. The high-speed train
in China is also a 432m long and moving at speed reaching 350km/h. Hence, due to the fast
moving and well shield carriages; the network in high-speed train scenario faces severe
Doppler frequency shift and high penetration loss, low HO success rate, high power
consumption of UEs as well as UL and DL interference issues that will be illustrated later in
this this section.
Thus, a common adopted solution for high-speed trains is to condense the network along the
railway to combat the large penetration loss. However, this will make the second issue more
severe, as the number of HO procedures is increased due to smaller site- to-site distance.
Another way is to increase the transmission power of the BSs, which helps to solve the issue of
the large penetration loss as well. However, this can create excessive ICI for the DL and UL
signals. Besides that, neither of these solutions is cost-effective. Therefore, thinking about an
effective solution to solve the above challenges was the motive behind proposing the
coordinated Mobile-Femtos system in trains as the future work of this research. The interference
between the coordinated Mobile-Femtos and eNB’s and interference between Backhaul links
need to be considered as well in the future work of this research. Therefore, the following
discusses the expected DL and UL interference scenarios of the coordinated Mobile-Femtos in
trains.
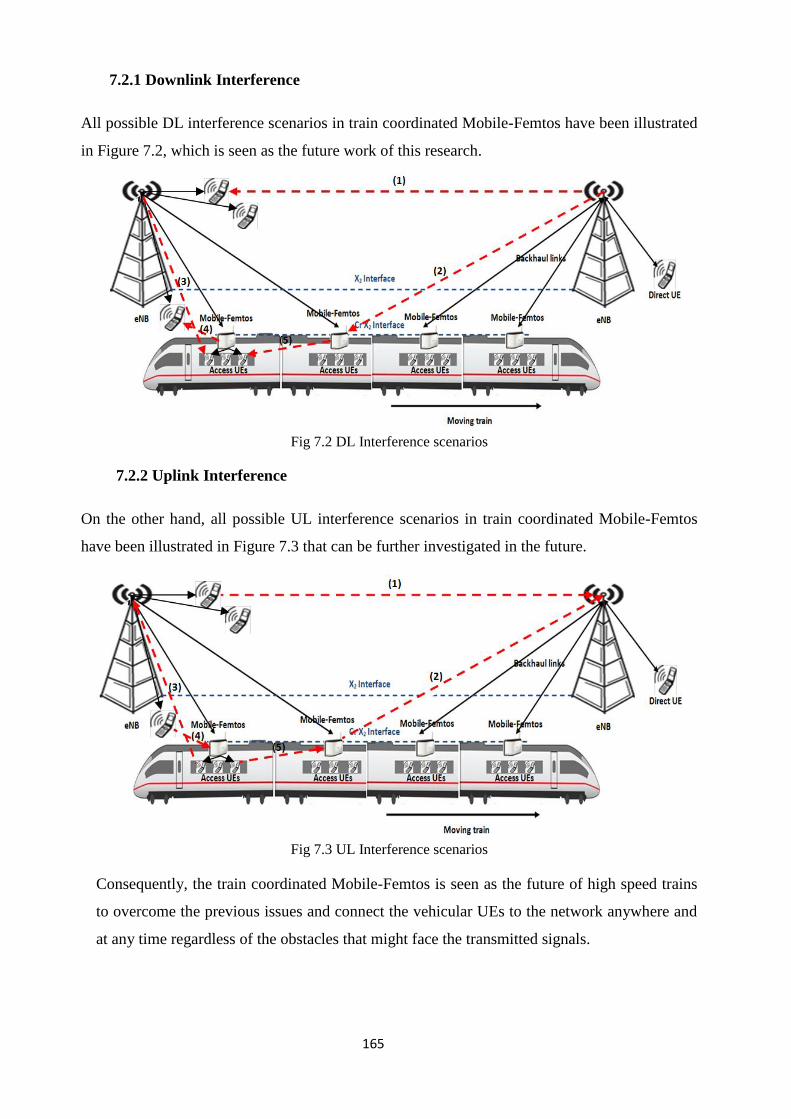
165
7.2.1 Downlink Interference
All possible DL interference scenarios in train coordinated Mobile-Femtos have been illustrated
in Figure 7.2, which is seen as the future work of this research.
Fig 7.2 DL Interference scenarios
7.2.2 Uplink Interference
On the other hand, all possible UL interference scenarios in train coordinated Mobile-Femtos
have been illustrated in Figure 7.3 that can be further investigated in the future.
Fig 7.3 UL Interference scenarios
Consequently, the train coordinated Mobile-Femtos is seen as the future of high speed trains
to overcome the previous issues and connect the vehicular UEs to the network anywhere and
at any time regardless of the obstacles that might face the transmitted signals.

166
8. References
3GPP Specification, “Physical layer aspects for E-UTRA”, Technical Report. Accessed on:
12/11/2011, accessed at: http://www.3gpp.org/ftp/Specs/html-info/25814.htm.
4G Americas, “Self-Optmizing Networks in 3GPP Release 11: the Benefits of SON in LTE”,
White Paper, 2013.
4G.co.uk, “4G Mobile Broadband: Everything you need to know”, accessed on 12/06/2015,
available at: http://www.4g.co.uk.
5GNow, 5th
Generation Non-Orthogonal Waveforms for Asynchronous Signalling, accessed
on: 15/05/2015, available at: http://www.5gnow.eu.
Adhikary A., Ntranos V. and Caire G., “ Cognative femtocells: breaking the spatial reuse
barrier of cellular systems”, in information Theory and Applications Workshop (ITA), 2011,
pp.1-10.
Afridi A., “Macro and Femto Network Aspects for Realistic LTE Usage Scenarios”, White
Paper, 2011.
Ahmed A.U., Islam M.T., Ismail A. and Ghanbarisabagh M., “Dynamic resource Allocation in
Hybrid Access Femtocell Network”, the scientific world journal, 2014.
Ahmad M., “4G and 5G wireless: How they are alike and how they differ”, Available at:
http://www.androidauthority.com, Accessed on: 18/08/2016.
Ai B., He R., Zhong Z., Guan K., Chen B., Liu P. and Li Y., “Radio Wave Propagation Scence
Partitioning for High-Speed Rails”, Hindawi, International Journal of Antennas and
Propagation, 2012.

167
Airvana, “LTE Femtocells”, accessed at http://www.airvana.com/LTE-femtocells, accessed
date: 20/09/2013.
Akinladi O. A., Paul B. S., Joseph M.K. and Ferreira H.C, “Indoor Communication: Femtocell
Behavior in an Indoor Environment”, in proc. of the International MultiConference of
Engineers and Computer Scientists (IMECS) conference, Hong Kong, 2015.
Ali S., Zeeshan M. and Naveed A., “A capacity minimum quarantee-based service class-
oriented scheduler for LTE networks”, EURASIP Journal on Wireless Communication and
Networking, 2013.
Alqudah Y. A., “On the performance of Cost 231 Walfish Ikegami model in deployed 3.5 GHz
network”, in proc. of technological Advances in Electrical, Electronics and Computer
Engineering (TAEECE) International Conference, Konya, 2013.
Al-Rubaye S., Al-Dulaimi A. and Cosmas J., “Cognitive Femtocells: Future Wireless
Networks for Indoor Applications,” IEEE Vehicular Technology Magazine, vol.6, no.1, pp.44 -
51, 2011.
Al-Rubaye S., “Radio Network management in Cognitive LTE/Femtocell Systems”, Ph.D
thesis, Electronic and Computer Engineering, School of Engineering and Design, Brunel
University, Sep 2012.
An X. and Pianese F., “Understanding co-channel interference in LTE-based multi-tier cellular
networks”, in Proceeding of the 9th
ACM Symposium on Performance Evaluation of Wireless
Ad Hoc, Sensor, and Ubiquitous Networks, 2012, pp.107-112.
Andrews M., Veronigue and Feki A., “Autonomous Spectrum Sharing For mixed LTE Femto
and Macro Cells Deployments”, in proc.of IEEE INFOCOM 2010.

168
Anjum O., Wijting C., Uusitalo M. A. and Valkealahti K. “On the performance of
decentralized cell edge coordinated scheduling in small cell clusters with difference densities”,
in proc. of the European Conference of Networks and Communications (EuCNC), 2014.
Audio precision, “Signal-to-Noise Ratio”, Introduction to the Basic Six Audio Testes, accessed
on 13/07/2013, available at: http://www.ap.com
Badri T., Rachid S., Wahbi M. and Samir M., “Handover Management Schemes in LTE
Femtocell Networks”, Electrical Engineering department, University Kenitra Moroco,
International Journal of Computer Sciences & Information technology (IJCSIT), 2013.
Bai Y., Zhou J., and Chen L., “Hybrid spectrum usage for over laying LTE macrocell and
Femtocell,” inProc. IEEE GLOBECOM09, pp. 1–6, Dec. 2009.
Bai Y., Zhou J., and Chen L., “Hybrid spectrum arrangement and interference mitigation for
coexistence between LTE macro-cellular and femtocell networks,” EURASIP Journal on
Wireless Communication and Networking, 2013.
Becvar Z. and Mach P., “Adaptive hysteresis margin for handover in femtocell networks”, in
Wireless and Mobile Communications (ICWMC), 2010 6th
International Conference, 2010,
pp.256-261.
Beniero T., Redana S., Hamalainen J. and Raaf B., “Effect of Relaying on Coverage in 3GPP
LTE-Advanced”, IEEE Vehicular Technology Conference (VTC), 2009.
Bennis M., Giupponi L., Diaz E.M and Lalam M. M., “Interference management in self-
organized femtocell networks: The BeFEMTO approach”, Wireless Communication, Vehicular
Technology, Information Theory and Aerospace & Electronics Systems Technology (Wireless
VITAE), 2011 2nd
International Conference, 2011.

169
Bhat P., Nagata S., Campoy L., Berberana I., Derham T., Liu G., Shen X., Zong P. and Yang
J., “LTE-Advanced: an operator prespective”, Communications Magazine, IEEE, vol. 50,
pp.104-114, 2012.
Bilios D., Bouras C., Kokkinos V., Papazois A., and Tseliou G., “Optimization of fractional
frequency reuse in long term evolution networks”, IEEE Wireless Communications and
Networking Conference (WCNC 2012), Shanghai, Republic of China (pp. 1853-1857).
doi:10.1109/WCNC.2012.6214087.
Brydon A. “5G mobile network features”, UNWIRED INSIGHT, 2014.
Bulakci O., “On Bakhuling of Relay Enhanced Networks in LTE-Advanced”, Department of
Communication and Networking, Alto University, Finland, 2010.
Chae S., Nguyen T. and Jang M. Y., “A Novel Handover Scheme in Moving Vehicular
Femtocell Networks”, Department of Electronics Engineering, Kookmin University, Seoul
136-702, Korea, 2013.
Chambers D., “Which handover modes do femtocells need first”, ThinkSmallCell, CISCO,
accessed on: 01/05/2013, accessed at: http://www.thinksmallcell.com/System/which-handover-
modes-do-femtocells-need-first.html.
Chaudhary K. R., Rawat D. and Madwal E., “Interference Aware & SINR Estimation in
Femtocell Networks”, In proc. Of IOSR Journal of Computer Engineering (IOSR-JCE), 2013,
PP 64-69.
Chowdhury M., Lee S., Ru B., Park N and Jang W., “Service Quality Improvement of Mobile
Users in Vehicular Environment by Mobile Femtocell Network Deployment,” in Proc. Int.
Conf. on ICT Convergence (ICTC), Sept. 2011, pp. 194–198.
Chu X., Wu Y. and Benmesbah L., “Resource Allocation in Hybrid Macro/Femto Networks”,
in IEEE Wireless Communications and Networking Conference Workshops (WCNCW), 2010.

170
Claussen H., “Performance of macro and co-channel femtocells in a hierarchical cell
structure”, in personal, Indoor and Mobile Radio Communications, 2007. PIMRC 2007. IEEE
18th
international Symposium, 2007, pp.1-5.
Cover T. M. and Thomas J. A., "Elements of Information Theory," Sep. 2006.
Dalal A., Hailong L. and Agrawal D.P, “Fractional Frequency Reuse to Mitigate Interference
in Self- Configuration LTE-Femtocell Network”, Mobile Adhoc and Sensor Systems (MASS),
2011 IEEE 8th
International Conference, 2011.
Damnjanovic A., Montojo J., Wei Y., Ji T., Luo T., Vajapeyam M., Yoo T., Song O. and
Malladi D., “A survey on 3GPP heterogeneous networks”, Wireless Communications, IEEE,
vol. 18, pp.10-21, 2011.
Das S., Chandhar P., Mitra S. and Ghosh P., “Issues in Femtocell Deployment in Broadband
OFDMA Networks: 3GPP–LTE a case study,” In proc. of the 74th IEEE VTC Fal), San
Francisco, United States, 2011, pp. 1 - 5.
Doppler K., Moisio M. and Valkealahti K., “On interference management for uncoordinated
LTE-femto cell deployments”, in Wireless Conference 2011- Sustainable Wireless
technologies (European Wireless), 11th
European, 2011, pp. 1-6.
Elkourdi T. and Simeone O., “Femtocell as a Relay: An Outage Analysis” IEEE Transactions
on Wireless Communications, 2011.
ETSI TS 136 133, “LTE, Evolved Universal radio Access (E-UTRA), Requirements for
support of radio resources management”, 3GPP, 2013.
Femtoforum, “HeNB (LTE Femto) Network Architecture”, accessed on 25/06/2015, available
at http://www.slideshare.net.
Firmin F., “The Evolved Packet Core”, 3GPP, 2013.

171
Fraser S., “Channel State Information (CSI)”, Wireless Communications Agilent Technologies,
2012.
Fujitsu Network Communications Inc, “Enhancing LTE Cell-Edge Performance via PDCCH
ICIC”, White Paper, 2011.
Gawas A. U., “An Overview of Evolution of Wireless Communication Networks: 1G-6G”,
International Journal on Recent and Innovation Trends in Computing and Communication
(IJRITCC), Volume: 3 issue: 5, 2015.
Germano A. and Chairman V., Femto Forum, “The Impact of Femtocells on Next Generation
LTE Mobile Networks”, 3GPP, 2010.
Ghaffar R. and Knopp R., “Fractional frequency resure and interference suppression for
OFDMA networks”, Modeling and Optmization in Mobile, Ad Hoc and Wireless Networks
(WiOpt), 2010 Proceeding of the 8th
International Symposium, 2010.
Giuliano R., Monti C., and Loreti P., “WiMAX fractional frequency reuse for rural
environments”, IEEE Wireless Communications, 15(3), 60–65.
doi:10.1109/MWC.2008.4547524.
Godlewski P., Maqbool M., Coupechoux M., and Kelif J.-M., “Analytical evaluation of various
frequency reuse schemes in cellular OFDMA networks”, 3rd International Conference on
Performance Evaluation Methodologies and Tools (ValueTools 2008. ICST), Brussels,
Belgium (pp. 32:1-32:10). doi:10.4108/ ICST.VALUETOOLS2008.4372.
Goldsmith A., Wireless Communications, Cambridge University Press, 2005.
Guidolin F., pappalardo I., Zanella A. and Zorzi M., “A markov-based framework for handover
optimization in HetNets”, in Ad Hoc Networking Workshop (MED-HOC-NET), 2014, 13th
Annual Mediterranean, 2014, pp.134-139.

172
Guohua Z., legg P. and Hui G., “A network controlled handover mechanism and its
optimization in LTE heterogeneous networks”, in Wireless Communications and Networking
Conference (WCNC), 2013 IEEE, 2013, pp.1915-1919.
Gur G., Bayhan S. and Alagoz F., “Cognitive femtocell networks: an overlay architecture for
localized dynamic spectrum access [dynamic spectrum management]”, Wireless
Communications, IEEE, vol.17, pp. 62-70, 2010.
Habaebi M. H., Chebil J., Sakkaf A. G. and Dahawi T. H, “Comparison between scheduling
techniques in Long Term Evolution”, IIUM Engineering Journal, Vol. 14, No. 1, 2013.
Haider F., Dianati M., and Tafazolli R., “A simulation based study of mobile femtocell assisted
LTE networks,” in Proc. International Wireless Communication and Mobile Computing
Conference (IWCMC), UK, July 2011, pp. 2198– 2203.
Hamoudal S., Yeh C., Kim J., Wooram S., and Kwon D.S., “Dynamic hard fractional
frequency reuse for mobile WiMAX”, IEEE international conference on pervasive computing
and communications (PerCom 2009), Galveston, TX (pp. 1-6).
Han S. S., Park J., Lee T.-J., Ahn H. G., and Jang K., “A new frequency partitioning and
allocation of subcarriers for fractional frequency reuse in mobile communication systems”,
IEICE Transactions on Communications, E91- B(8), 2748–2751. doi:10.1093/ietcom/ e91-
b.8.2748, 2008.
Haring G., Marie R., Puigjaner R. and Trivedi K., “Loss formulas and their Application to
Optimization for Cellular Networks”, IEEE Transactions on Vehicular Technology, Vol. 50,
No.3, May, 2001.
Harrison K. and Ranade G., “Dynamic Fractional Reuse in OFDMA systems”, EE 2244B Final
Project, 2010.
Hatoum A., Aitsaadi N., Langar R. and Boutaba R., “FCRA: Femtocell Cluster-Based resource
Allocation Scheme for OFDMA Networks”, IEEE Communication (ICC), 2011.

173
Heath JR. R. W., Heterogeneous Networks, accessed on: 08/08/2015, accessed at:
http://www.profheath.org.
Hosseinzadeh-Salati A.S. and Nasiri-Kenari M., “Aggregate interference modelling and static
resource allocation in closed and open access femtocells”, published in Communications,
IET (Institution of Engineering and Technology), 2014.
Huawei, “Smartphone solutions”, White Paper, 2012.
Hussain S., “Dynamic Radio resource Management in 3GPP LTE”, Master thesis, Blekinge
Institute of Technology, 2009.
Ikuno J. C. and Wrulich M., Dimensioning Vienna LTE Simulators System Level Simulator
Documentation, v1.8r1375, Instit. of Comm. and Radio-Frequency Engg., Vienna Univ of
Tech, Austria Gusshausstrasse 25/389, A-1040 Vienna, Austria, 2014.
Ikuno J. C., Wrulich M. and Rupp M., “System level simulation of LTE networks”, IEEE 71st
Vehicular Technology Conference (VTC), 2010.
Jangsher S. and Li V. O. K., “Resource Allocation in Cellular Networks Employing Mobile
Femtocells with Deterministic Mobility”, IEEE Wireless Communications and Networking
Conference (WCNC), 2013.
Jighi Education Publication “Small Cells: What are They”, Technical Reference, White Paper,
2015.
Karvounas D., Georgakopoulos A., Stavroulaki V., Koutsouris N., Tsagkaris K. and
Demestichas P., “Resource allocation to femtocells for coordinated capacity expansion of
wireless access infrastructures”, EURASIP Journal on Wireless Communication and
Networking 2012.

174
Kitagawa K., komine T., Yamamoto T. and Konishi S., “Performance evaluation of handover
in LTE-advanced systems with pico cell range expansion”, in personal Indoor and Mobile
Kokkoniemi J., Ylitalo J., Luoto P., Scott S., LeinonenJ. and Latva-aho M. “Performance
Evaluation of Vehicular LTE Mobile Relay Nodes”, in proc. of IEEE 24th
International
Symposium on Personal, Indoor and Mobile Radio Communications: mobile Wireless
Networks (PIMRC) Conference, 2013.
Radio Communications (PIMRC) 2012, IEEE 23th International Symposium, 2012, pp. 1071-
1076.
Kostanic I., “Link budgets and nominal cell planning”, accessed on: 20/0/2015, available at
http://slideplayer.com.
Kostanic I., Hall C. and McCarthy J., “Measurements of the Vehicle Penetration Loss
Characteristics at 800MHz”, TEC CELLULAR, Inc., 7619 Emerald Drive, West Melbourne,
FL 32904, 1998.
Kulkarni P., Chin W. H. and Farnham T., “Radio Resource Consideration for LTE”, ACM
SIGCOMM Computer Communication Review, vol. 40, no. 1, January 2010.
Lauro, “Downlink Throughput Troubleshooting”, accessed on: 28/06/2015, available at:
http://lteuniversity.com.
Lee P., Lee T., Jeong J., and Shin J., “Interference management in LTE femtocell systems
using fractional frequency reuse”, International Conference on Advanced Communication
Technology (ICACT 2010), Phoenix Park, Korea (pp. 1047-1051).
Li H., Xu X., Hu D., Tao X., Zhang P., Ci S. and Tang H., “Clustering strategy based on graph
method and power control for frequency resource management in femtocell and macrocell
overlaid system”, Communications and Networks, Journal Of, vol. 13, pp.664-677, 2011.

175
Liu E. and Leung K. K., “propotional Fair Scheduling: Analytical Insight under Rayleing
Fading Environment”, Proc. IEEE WCNC, pp. 1883-1888, 2008.
Lopze-perez D., Guvenc I. and Chu X., “Mobility enhancements for heterogeneous networks
through interference coordination”, in Wireless Communications and Networking Conference
Workshops (WCNCW), 2012 IEEE, pp.69-74.
Lopez-Perez D., Ladanyi A., Juttner A. and Zhang J., “OFDMA femtocells: Intracell handover
for interference and handover mitigation in two-tier networks”, in Wireless Communication
and Networking Conference (WCNC), 2010 IEEE, 2010, pp.1-6.
Lorca J. and Sierra A., “A simple speed estmation algorithm for mobility aware SON RRM
strategies in LTE”, in Wireless Days (WD), 2013 IFIP, 2013, pp.1-3.
Lu Z., Bansal T., Sinha P., “Achieving User-Level Fairness in Open-Access Femtocell based
Architecture”, Mobile Computing, IEEE transactions, pp.1943-1954, 2012.
Ma C., Yu G. and Zhang J., “Inter-tier handover in macrocell/femtocell heterogeneous
networks”, in Vehicular Technology Conference (VTC spring), 2012 IEEE 75th
, 2012, pp.1-5.
Ma T. and Pietzuch P., “Femtocell Coverage Optimisation Using Statistical Verification”
accessed on: 06/06/2015, available at: http://lsds.doc.ic.ac.uk.
Mahmud A. and Hamdi K.A., “On the Co-channel Femtocells Exclusion Region in Fractional
Frequency Reuse Macrocells”, Wireless Communications and Networking Conference
(WCNC), 2014 IEEE, Istanbul, 2014.
Marwat S. N, “LTE Channel Modelling for System Level Simulation”, White Paper, 2011.
Martin B. A., Callender C. P., Geary S. I., Charles A. G., Franklin S. and Howard J., “Fast
Reselection Between Different Radio Access Technology Networks”, White Paper, 2012.
Masui H., Kobayashi T., and Akaike M., “Microwave path-loss modelling in urban line-of-
sight environments,” IEEE J. Sel. Areas Commun., vol. 20, pp. 1151–1155, Aug 2002.

176
Mimura T., Yamamoto K., Iwata A., Nishio A. and Morikura M., “Multi-operator mobile-
relaying: Effect of shared spectrum allocation”, IEEE 23th international conference on
Personal Indoor and Mobile Radio Communications (PIMRC), 2012.
Mir Z. H. and Filali F., “LTE and IEEE 802.11p for vehicular networking: a performance
evaluation”, EURASIP Journal on Wireless Communications and Networking, 2014.
Moon J. and Cho D., “Efficient handoff algorithm for inbound mobility in hierarchical
macro/femto cell networks”, Communications Letters, IEEE, vol.13, pp.755-757, 2009.
Moon J. and Cho D., “Novel handoff decision algorithm in hierarchical macro/femto-cell
networks”, in Wireless Communications and Networking Conference (WCNC), 2010 IEEE,
2010, pp. 1-6.
Mundy J., “What is 5G? 5G vs 4G and the future of mobile networks”, Accessed at:
http://www.trustedreviews.com, Accessed on: 18/08/2016.
Naguib A., “Channel Models for IEEE 802.20 MBWA System Simulations – Rev 08r1”, IEEE
802.20 Working Group on Mobile Broadband Wireless Access, 2007.
Nguyen K. D., Nguyen H. N. and Morino H., “Performance Study of Channel Allocation
Schemes for beyond 4G Cognitive Femtocell- Cellular Mobile Networks”, Autonomous
Decentralized Systems (ISADS), IEEE Eleventh International Symposium, Mexico City,
Mexico, 2013.
Nokia Siemens Networks LTE 1800 MHz, “Introducing LTE with maximum reuse of GSM
assets”, White Paper, 2012.
Nokia Siemens Networks Corporation, “Long Term Evolution (LTE) will meet the promise of
global mobile broadband”, White Paper, 2010.

177
Nungu A., Pehrson B. and Sansa-Otim J., “e-Infrastructure and e-Services for Developing
Countries”, Springer publisher, the 6th
International Conference, AFRICOMM, Kampala,
Uganda, 2014.
NSN, “Nokia Solutions and Networks Smart Scheduler”, White Paper, 2014.
OFcome, “Mobile Phones: Jardon Explained”, accessed at:
http://stakeholders.ofcom.org.uk/sitefinder/glossary/jargon/ , accessed on: 30/05/2016.
Papadogiannisi A., Farber M., Saadani A., Danish M., Weitkempers P., Suit Y., Svenssoni T.,
Ktenas D., Cassiau N. and Martins T. “Advanced Relaying Concepts for Future Wireless
Networks”, Future Network & Mobile Summit Conference, ISBN: 978-1-905824-30-4, 2012.
Pan M. S., Lin M. and Chen W. T. “An Enhanced Handover Scheme for Mobile Relays in
LTE-A High-Speed Rail Networks”, IEEE Transactions on Vehicular Technology, Vol. 64,
No. 2, Feb 2015.
Patankar A., “What is Spectral Efficiency?”, accessed on 13/08/2013, avaliable at:
http://wirelesscafe.wordpress.com
Peng F., Gao Y., Chen Y., Chai K.K., Cuthbert L., “Using TV White Space for Interference
Mitigation in LTE Femtocell Networks”, Communication Technology and Application
(ICCTA 2011), IET International Conference, Beijing, 2011.
Peng Y., Yang W., Zhang Y. and Zhu Y., “Mobility performance enhancement for LTE-
advanced heterogeneous networks”, in personal Indoor and Mobile Radio Communications
(PIMRC), 2012 IEEE 23rd
International Symposium, 2012, pp.413-418.
Plass S., Dammann A., Kaiser S. and Fazel K., Multi-Carrier Systems and Solutions, Springer,
2009
Qualcomm, “Small Cells are a product of Qualcomm Technologies Inc”, 2015.

178
Qualcomm, “LTE Advanced: Heterogenous Networks”, 2011.
Radio-Electronics.com, “4G LTE Advanced Relay, how relaying works and details about relay
nodes, RNs”, 2015.
Raymaps, “Shannon Capacity CDMA vs OFDMA”, accessed at
http://www.raymaps.com/index.php/tag/shannon-capacity/. Accessed on 24/06/2016.
Roche G., Valcarce A., Lopez-Perez D. and Zhang J. “Access control mechanisms for
femtocells”, IEEE Communication Magazine, PP: 33-39, 2010.
Rohde and Schwarz, “LTE-Advanced (3GPP Rel.11) Technology Introduction”, White Paper
1MA232_1E, 2013.
Rohde and Schwarz, “Vulnerabilities of LTE and LTE-Advanced Communications”, White
Paper, 2014.
Rouse M., “Call Admission Control”, accessed on 01/07/ 2013, accessed at:
http://searchunifiedcommunications.techtarget.com/definition/call admission-control,
Sadekar A. M., “LTE-A enhanced Inter-Cell Interference Coordination (eICIC with Pico Cell
Adaptive Antenna)” in Proc. of Submitted Master thesis in Electrical and Computer
Engineering, Carleton University, Ottawa, Ontario, 2015.
Saied M., El-atty A. and Gharsseldien Z. M., “Analytical Model for Mobile User Connectivity
in Coexisting Femtocell/Macrocell Networks”, International Journal of Wireless & Mobile
Networks (IJWMN) Vol. 4, No.6, Dec 2012.
Saquib N., Hossain E., Le L. B. and Kim D. I., “Interference management in OFDMA
femtocell networks: Issues and approaches”, Wireless Communication, IEEE, vol.19, pp. 86-
95, 2012.

179
Saunder S., Small Cell Forum (Alcatel-lucent), “Management interference can improve
everyone’s mobile broadband experience”, White Paper, 2012.
Scott S., Leinonen J., Pirinen P., Vihriala J., Phan V. V. and Latva-aho M., “A Cooperative
Moving Relay Node System Deployment In A High Speed Train”, Centre for Wireless
Commun., Univ. of Oulu, Oulu, Finland, 2013.
Sethom K., Salem A. B., Mhiri F. and Bouallegue R., “Resource Management Mechanism For
Femtocell Enterprise Networks”, University of Carthage, Tunisia, 2012.
Shabbir N., Sadiq M. T., Kashif H. and Ullah R., “Comparison of Radio Propagation Models
for Long Term Evolution (LTE) Network”, International Journal of Next-Generation Networks
(IJNGN) Vol.3, No.3, 2011.
ShareTechnote, “LTE Fading”, accessed on 18/08/2015, available at:
http://www.sharetechnote.com/html/Handbook_LTE_Fading.html
Shbat M. S. and Tuzlukov V., “Combined Radio Resource Management for 3Gpp LTE
Networks”, Advances in mathematical and Computational Method, vol. 1, no. 1, September
2011.
Shin D. and Choi S., “Dynamic power control for balanced data traffic with coverage in
femtocell networks”, in Wireless Communications and Mobile Computing Conference
(IWCMC) 8th
international, 2013, pp. 648-653.
Stavrou S. and Saunder S., “Factors influencing outdoor to indoor radio wave propagation,” in
Proc. 12th ICAP 2003.
Stefania S., Issam T. and Matthew B., “Utility-based power control in cellular wireless
systems”, in INFOCOM 2001, 20th
Annual Joint Conference of the IEEE Computer and
Communication Societies, Proceedings. IEEE, 2001, pp. 412-421.

180
Sui Y., Guvenc I. and Svensson T., “Interference Management for Moving Networks in Ultra
Urban Scenarios”, EURASIP Journal on Wireless Communication Networking, 2015.
Sui Y., Papadogiannis A., Yang W., and Svensson T., “Performance Comparison of Fixed and
Moving Relays under Co-channel Interference”, GC'12 Workshop: The 4th IEEE International
Workshop on Heterogeneous and Small Cell Networks (HetSNets), 2012.
Sui Y., Ren Z., Sun W., Svensson T. and Fertl P., “Performance Study of Fixed and Moving
relays for Vehicular users with Multi-cell Handover Co-channel Interference”, Connected
Vehicles and Expo (ICCVE), 2013 International Conference.
Sui Y., Vihriala J., Papadogiannis A. and Sternad M., “Moving Cells: A promising Solution to
Boost Performance for Vehicular Users”, Chalmers University of Technology, 2013.
Sundaresan K. and Rangarajan S., “Efficient resource management in OFDMA femto cells”, in
Proceeding of the 10th
ACM International Symposium on Mobile Ad Hoc Networking and
Computing, 2009, pp.33-42.
Sung K. W., Haas H. and Mclaughli S., “A Semi analytical PDF of Downlink SINR for
Femtocell Networks”, Journal on Wireless Communications and Networking Volume, Article
ID 256370, 9 pages doi:10.1155/2010/256370, 2010.
Suryana I. R. J, “Mobile Data Offloading: Femtocells vs. WiFi”, 4G-Portal.com, 2012.
Tang H., Hong P., Xue K. and Peng J., “Cluster-Based Resource Allocation for Interference
Mitigation in LTE Heterogeneous Networks”, IEEE Vehicular Technology Conference (VTC
Fall), 2012.
Teletopix. ORG, “How MAC protocol Work in LTE”, accessed on 15/07/2015, available at:
http://www.teletopix.org.
181
Teletopix. ORG, “What is Fading, Its type and Effect in RF Design”, accessed on 20/07/2015,
available at: http://www.teletopix.org/gsm/what-is-fading-its-type-and-effect-in-rf-design/.
Tombaz S., Usman M., and Zander J., “Energy Efficiency Improvements through
heterogeneous Networks in Diverse Traffic Distribution Scenarios,” In Proc. of the 6th IEEE
International Conference on Communications and Networking in China (CHINACOM),
Harbin, China, 2011.
Vilicom, “Signalling the Future”, White Paper, accessed on 28/06/2015, available at:
http://people.ucsc.edu.
Vivas P. N., Campo C., Rubio C. G. and Carrion A. R., “Communication Technology for
Vehicles”, 4th International Workshop, Nets4Cars/Nets4Trains, Vilnius, pp 174-185, 2012.
Wang J. and Qiu Y., “A New Call Admission Control for LTE Femtocell Networks”, 2nd
International Conference on Advances in Computer Science and Engineering (CSE 2013).
Wang W. and Zhang Q., “Local cooperation architecture for self-healing femtocell networks”,
Wireless communications, IEEE, vol.21,pp.42-49,2014.
Xenakis D., Passas N. and Verikoukis C., “An energy- centric handover decision algorithm for
the integrated LTE macrocell-femtocell network”, Special issue: Wireless Green
Communication and Networking, ELSEVIER, 2012.
Xia P., Chandrasekhar V., and Andrews J., “Open vs. Closed Access Femtocells in the
Uplink”, IEEE Transactions on Wireless Communications, vol. 9, no. 12, pp.3798 - 3809,
2010.
Xing S., Ghosal P., Barua S., Subramanian R. and Sandrasegaran K., “System Level Simulation
For Two Tier Macro-Femto Cellular Networks”, International Journal of Wireless & Mobile
Networks (IJWMN) Vol. 6, No. 6, December 2014.

182
Yang L., Zhange L., Yang T. and Fang W., “Location-Based Hybrid Spectrum Allocation and
Reuse for Tiered LTE-A Networks”, IEEE Vehicular Technology Conference (VTC Spring),
2011.
Yassin M., Lahoud S., Ibrahim M., Khawam K., Mezher D. and Cousin B., “Non-Cooperative
Inter-Cell Interfernce Coordination Technique for Increasing Throughput Fairness in LTE
Networks”, Vehicular Technology Conference (VTC Spring), 2015 IEEE 81st, 2015, pp. 1-5.
Yoon J., Arslan M. Y., Sundaresan K., Srikanth V. and Banerjee S., “A Distributed Resource
Management Framework for Interference Mitigation in OFDMA femtocell Networks”,
University of Wisconsin, USA, 2012.
Zahir T., Arshad K., nakata A. and Moessner K., “Interference management in femtocells”,
Communications Surveys & Tutorials, IEEE, vol. 15, pp. 293-311, 2013.
Zhang H., Chu X. and Wen X., “4G Femtocells: resource Allocation and Interference
Managment”, 2013, Published book pp. 4-5.
Zhang J., Feng J., Liu C., Hong X., Zhange X. And Wang W., “Mobility enhancement and
performance evaluation for 5G Ultra dense Networks”, in IEEE Wireless Communications and
Networking Conference (WCNC), New Orleans, LA, 2015.
Zhang L., Yang L. and Yang T., “Cognitive interference management for LTE-a femtocells
with distributed carrier selection”, in Vehicular Technology Conference Fall (VTC 2010-Fall),
2010 IEEE 72nd, 2010, pp.1-5.
Zheng K., Fanglong H., Lei L. and Wenbo W., “Interference coordination between femtocells
in LTE-advanced networks with carrier aggregation”, Communication and Networking in
China (CHINACOM), 2010 5th
International ICST Conference, 2010.
Zyren J., “Overview of the 3GPP Long Term Evolution Physical Layer”, 3GPP, White Paper,
2007.

183
Appendices
The following Appendices represent some of the codes that have been added to implement the
Mobile-Femto in LTE Macrocell system via using MATLAB System Level Simulator.
Appendix A: Mobile-Femto implementation - part of the code
function [eNodeBs_ eNodeBs_sectors_ ] =
LTE_init_add_MobileFemtos(LTE_config,sites,eNodeBs,networkPathlossMap ) % Add MobileFemtos to the actual path-loss map % For now just do this mode: a fixed nubmer of average Mobile-Femtos
will be put per km2 switch LTE_config.MobileFemtos_config.spatial_distribution case 'homogenous density' spatial_distribution_model =
spatial_distributions.homogeneousEnodebSpatialDistribution(networkPathl
ossMap,sites,eNodeBs,LTE_config.MobileFemtos_config.MobileFemtos_per_km
2); otherwise error('Spatial distribution "%s" not
supported',LTE_config.MobileFemtos_config.spatial_distribution); end MobileFemto_pos = spatial_distribution_model.generate_positions;
for mf_=1:size(MobileFemto_pos,1) % Create the Mobile-Femto sites MobileFemto_sites(mf_) = network_elements.eNodeB; MobileFemto_sites(mf_).id = length(sites)+mf_; MobileFemto_sites(mf_).pos = MobileFemto_pos(mf_,:);
MobileFemto_sites(mf_).speed = UE_speed;
MobileFemto_sites(mf_).site_type = 'MobileFemto';
% Create the Mobile-Femtos in eNodeBs cell and indicate which % Mobile-Femto belong to which eNodeB sector MobileFemto_sites(mf_).sectors =
network_elements.eNodeB_sector; MobileFemto_sites(mf_).sectors.parent_eNodeB =
MobileFemto_sites(mf_); MobileFemto_sites(mf_).sectors.id = 1; MobileFemto_sites(mf_).sectors.azimuth = 0; % Omnidirectional
antenna MobileFemto_sites(mf_).sectors.max_power =
LTE_config.MobileFemtos_config.tx_power_W; MobileFemto_sites(mf_).sectors.antenna_type = 'omnidirectional'; MobileFemto_sites(mf_).sectors.nTX = LTE_config.nTX; MobileFemto_sites(mf_).sectors.eNodeB_id = length(eNodeBs) +
mf_; MobileFemto_sites(mf_).sectors.antenna =
antennas.omnidirectionalAntenna;
MobileFemto_sectors(mf_) = MobileFemto_sites(mf_).sectors;
% Create the Microcell pahloss model that will be used.

184
if LTE_config.debug_level>=1 fprintf('MobileFemto Site %d: ',mf_); end
MobileFemto_sectors(mf_).microcell_pathloss_model =
microcell_pathloss_models.generalPathlossModel.generateMicrocellPathlos
sModel(... LTE_config,... LTE_config.MobileFemtos_config.microcell_pathloss_model,... LTE_config.frequency,...
LTE_config.MobileFemtos_config.microcell_pathloss_model_settings); end
if size(MobileFemto_pos,1)>0 % There are Mobile-Femtos eNodeBs_ = [ sites MobileFemto_sites ]; eNodeBs_sectors_ = [ eNodeBs MobileFemto_sectors ]; else % No Mobile-Femtos. Return the same values eNodeBs_ = sites; eNodeBs_sectors_ = eNodeBs; return end
Appendix B: Mobile-Femto configuration - part of the code
simulation_type = 'tri_sector_plus_MobileFemtos';
LTE_config = LTE_load_params(simulation_type);
LTE_config.frequency = 1.9e9; % Frequency in Hz LTE_config.bandwidth = 10e6; %or 20e6;
LTE_config.show_network = 2; LTE_config.nTX = 2; LTE_config.nRX = 2; LTE_config.tx_mode = 4; LTE_config.nr_eNodeB_rings = 0; % Number of eNodeB rings (0, 1 or
2) LTE_config.UE_per_eNodeB = [40 10]; % First number refers to
'Macro', second to 'Mobile-Femto' ,i.e. [Nr_of_UEs_per_Macro
Nr_of_UEs_per_Femto]
LTE_config.scheduler = 'prop fair'; % or round robin LTE_config.simulation_time_tti = 10; LTE_config.map_resolution = 5; LTE_config.compute_only_center_users = true; % Inclusion radius set in
LTE_init_determine_eNodeBs_to_compute.m
LTE_config.inter_eNodeB_distance = 500; % In meters. When the network
is generated, this determines the distance between the eNodeBs.
LTE_config.compact_results_file = true;

185
LTE_config.keep_UEs_still = true; LTE_config.FFR_active = true; % Activate or
deactivate the propsed frequency reuse scheme % Mobile-Femto specifications LTE_config.MobileFemtos_config.MobileFemtos_ per_km2 = 2;
% LTE_config.FixedFemtos_config.FixedFemtos_per_km2 = 3;
LTE_config.MobileFemtos_config.tx_power_W = 10^2.4/1000; % 24 dBm
or 10^0.5/1000 % 5 dBm
LTE_config.FixedFemtos_config.tx_power_W = 10^2.4/1000; % 24 dBm
or 10^0.5/1000 % 5 dBm
LTE_config.MobileFemto_config.microcell_pathloss_model_settings.environment
= 'urban';
LTE_config.MobileFemtos_config.mode = 'OSG';
LTE_config.add_MobileFemto_speed = 160/3.6; % changable LTE_config.MobileFemtos_config. microcell_pathloss_model_settings.wall_loss
= 25; % or 0 or 40 LTE_config.MobileFemtos_config.microcell_pathloss_model_settings.penetration
_loss =
LTE_config.MobileFemtos_config.microcell_pathloss_model_settings.wall_loss;
% Desired signal experiences penetration loss
Appendix C: Mobile-Femtos scheduling process - part of the code as this scheduling process
should include the Fixed-Femtos and UEs
classdef propFairScheduler < schedulers.lteScheduler % A proportional fair LTE scheduler
properties av_throughput % exponentially weighted throughputs end methods % Class constructor. Just specify where to attach the scheduler function obj =
propFairScheduler(scheduler_params,attached_eNodeB_sector) % Fill in basic parameters (handled by the superclass
constructor) obj =
[email protected](scheduler_params,attached_eNodeB_sector); obj.name = 'Proportional fair scheduler'; end
% Add Mobile-Femto (no memory, so empty) function add_MobileFemto(obj,MobileFemto_id) end % Delete Mobile-Femto (no memory, so empty) function remove_MobileFemto(obj,MobileFemto_id) end
% Schedule the Mobile-Femto in the given RB grid function
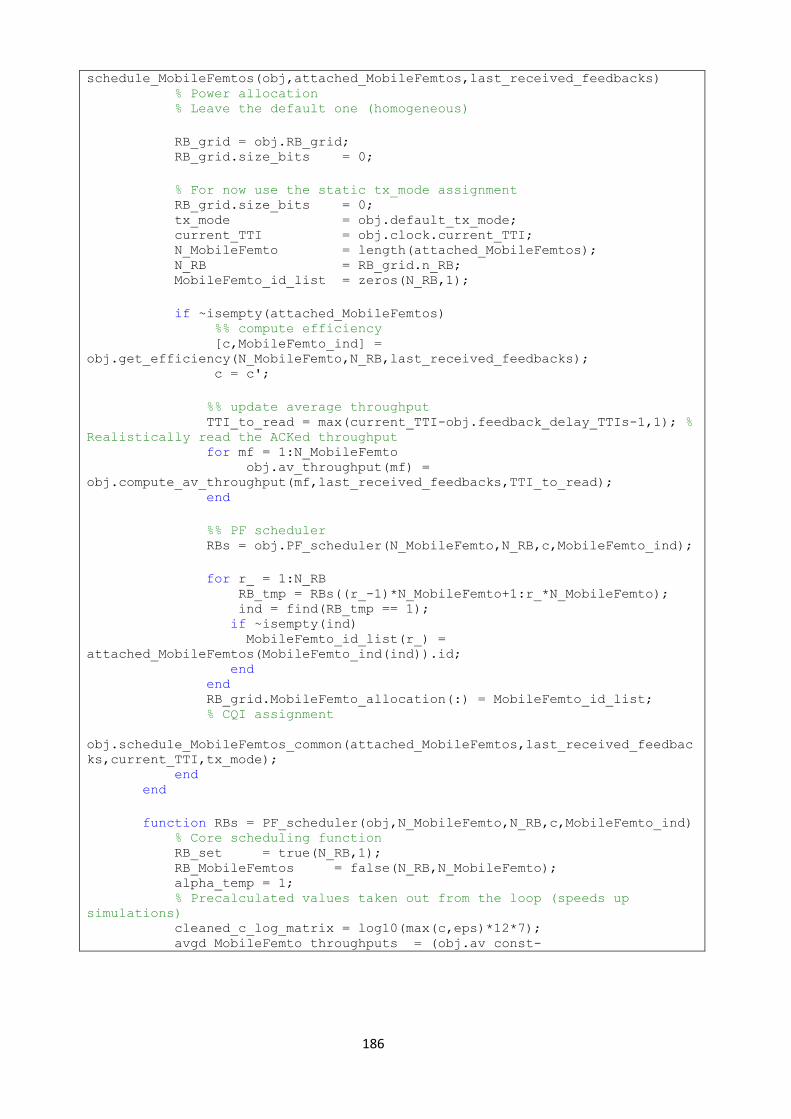
186
schedule_MobileFemtos(obj,attached_MobileFemtos,last_received_feedbacks) % Power allocation % Leave the default one (homogeneous)
RB_grid = obj.RB_grid; RB_grid.size_bits = 0;
% For now use the static tx_mode assignment RB_grid.size_bits = 0; tx_mode = obj.default_tx_mode; current_TTI = obj.clock.current_TTI; N_MobileFemto = length(attached_MobileFemtos); N_RB = RB_grid.n_RB; MobileFemto_id_list = zeros(N_RB,1);
if ~isempty(attached_MobileFemtos) %% compute efficiency [c,MobileFemto_ind] =
obj.get_efficiency(N_MobileFemto,N_RB,last_received_feedbacks); c = c';
%% update average throughput TTI_to_read = max(current_TTI-obj.feedback_delay_TTIs-1,1); %
Realistically read the ACKed throughput for mf = 1:N_MobileFemto obj.av_throughput(mf) =
obj.compute_av_throughput(mf,last_received_feedbacks,TTI_to_read); end
%% PF scheduler RBs = obj.PF_scheduler(N_MobileFemto,N_RB,c,MobileFemto_ind);
for r_ = 1:N_RB RB_tmp = RBs((r_-1)*N_MobileFemto+1:r_*N_MobileFemto); ind = find(RB_tmp == 1); if ~isempty(ind) MobileFemto_id_list(r_) =
attached_MobileFemtos(MobileFemto_ind(ind)).id; end end RB_grid.MobileFemto_allocation(:) = MobileFemto_id_list; % CQI assignment
obj.schedule_MobileFemtos_common(attached_MobileFemtos,last_received_feedbac
ks,current_TTI,tx_mode); end end
function RBs = PF_scheduler(obj,N_MobileFemto,N_RB,c,MobileFemto_ind) % Core scheduling function RB_set = true(N_RB,1); RB_MobileFemtos = false(N_RB,N_MobileFemto); alpha_temp = 1; % Precalculated values taken out from the loop (speeds up
simulations) cleaned_c_log_matrix = log10(max(c,eps)*12*7); avgd_MobileFemto_throughputs = (obj.av_const-

187
1)*obj.av_throughput(MobileFemto_ind);
% Calculate metric for each RB and attached Mobile-Femto for rr = 1:N_RB res = find(RB_set); metric = -Inf(N_RB,N_MobileFemto); MobileFemto_avgd_pre_metric = -
alpha_temp*log10(max(avgd_MobileFemto_throughputs+sum(RB_MobileFemtos.*c,1)*
12*7,eps)); MobileFemto_avgd_pre_metric_mat =
MobileFemto_avgd_pre_metric(ones(1,N_RB),:);
metric(res(1:sum(RB_set)),:) =
cleaned_c_log_matrix(res(1:sum(RB_set)),:)+MobileFemto_avgd_pre_metric_mat(r
es(1:sum(RB_set)),:);
maxi = max(metric(:)); [RB_idx MobileFemto_idx] = find(metric == maxi); ind = randi(length(RB_idx));
RB_set(RB_idx(ind)) = false; RB_MobileFemtos(RB_idx(ind),MobileFemto_idx(ind)) = true; end RB_MobileFemtos = RB_MobileFemtos'; RBs = RB_MobileFemtos(:); end end end
Appendix E: Microcell NLOS path-loss, which is based on the COST 231 Walfish-Ikegami
NLOS model - Other models are included in this code as well
classdef cost231PathlossModel <
macroscopic_pathloss_models.generalPathlossModel % COST231 Walfish-Ikegami pathloss model properties frequency % Frequency in HERTZs (for consistency, although this % model makes calculations with frequencies set in MHz environment % Environment that this instance represents
Cm % correction factor for dense buildings (dB),
urban_macro and suburban_macro only h_antenna % height of base station antenna (m) h_mobile % height of the mobile (m) d_min % minimum base station distance in m
h_roof % height of buildings (m), urban_micro only w % width of the roads (m), urban_micro only b % building separation (m), urban_micro only phi % road orientation with respect to the direct radio
path (°), urban_micro only

188
minimum_pathloss
% This function is to call the right environment (urban micro,
macro, suburban...). pathloss_function_handle urban_micro = 1; % urban_macro = 2; % suburban_macro = 3;
end
methods % Class constructor function obj = cost231PathlossModel(frequency,environment) obj.frequency = frequency; obj.environment = environment; obj.name = 'COST231'; switch environment case 'urban_micro' obj.name = [obj.name ' urban micro']; obj.pathloss_function_handle = 1; % values according to TR25.996 obj.h_antenna = 12.5; obj.h_mobile = 1.5; obj.d_min = 20; obj.h_roof = 12; obj.w = 25; obj.b = 50; obj.phi = 30; case 'urban_macro' obj.name = [obj.name ' urban macro']; obj.pathloss_function_handle = 2; % values according to TR25.996 obj.Cm = 3; obj.h_antenna = 32; obj.h_mobile = 1.5; obj.d_min = 35; case 'suburban_macro' obj.name = [obj.name ' suburban macro']; obj.pathloss_function_handle = 3; % values according to TR25.996 obj.Cm = 0; obj.h_antenna = 32; obj.h_mobile = 1.5; obj.d_min = 35; otherwise error(['"' environment '"" environment not valid']); end
switch obj.pathloss_function_handle case 1 obj.minimum_pathloss =
obj.pathloss_urbanmicro(obj.d_min); case 2 obj.minimum_pathloss =
obj.pathloss_urbanmacro(obj.d_min);
189
case 3 obj.minimum_pathloss =
obj.pathloss_suburbanmacro(obj.d_min); end end
% Returns the NLOS pathloss in dB. Note: distance in METERS function pathloss_in_db_NLOS = pathloss(obj,distance) % Restrict that pathloss must be bigger than the loss with the
minimum distance switch obj.pathloss_function_handle case 1 pathloss_in_db_NLOS = obj.pathloss_urbanmicro(distance); case 2 pathloss_in_db_NLOS = obj.pathloss_urbanmacro(distance); case 3 pathloss_in_db_NLOS =
obj.pathloss_suburbanmacro(distance); end pathloss_in_db_NLOS =
max(pathloss_in_db_NLOS,obj.minimum_pathloss); end
% COST 231 urban micro pathloss function pl_NLOS = pathloss_urbanmicro(obj,distance) % function to evaluate the microcell LOS and NLOS pathloss based
on the COST231 % Walfish-Ikegami model, see TR25.996 and COST 231 book pl_NLOS = LTE_aux_COST231_urban_micro_pathloss(... distance,... obj.frequency,... obj.h_roof,... obj.h_antenna,... obj.h_mobile,... obj.phi,... obj.w,... obj.b); %NLOS pathloss
% distance ... actual distance in m % output: pl_NLOS ... NLOS pathloss in dB
distance = distance/1000; % Calculations are done in
Km frequency = obj.frequency/1000000; % Calculations are done in
freq in MHz
pl_NLOS = -55.9 + 38*log10(d_min) + (24.5+ obj.h_mobile
*(frequency/925)) * log10(frequency);
end
% COST 231 urban macro pathloss function pl_NLOS = pathloss_urbanmacro(obj,distance)
% function to evaluate the urban macrocell pathloss based on the COST 231 % distance ... actual distance in m % output: pl_NLOS ... NLOS pathloss in dB

190
distance = distance/1000; % Calculations are done in Km frequency = obj.frequency/1000000; % Calculations are done in
freq in MHz
a = (1.1*log10(frequency) - 0.7)*obj.h_mobile - ... (1.56*log10(frequency)-0.8);
pl_NLOS = 46.3 + 33.9*log10(frequency) -
13.82*log10(obj.h_antenna) - a + (44.9 -
6.55*log10(obj.h_antenna))*log10(distance) + obj.Cm; end
% COST 231 suburban macro pathloss function pl_NLOS = pathloss_suburbanmacro(obj,distance) % function to evaluate the suburban macrocell pathloss based on
the COST 231
% distance ... actual distance in m % output: pl_NLOS ... NLOS pathloss in dB
distance = distance/1000; % Calculations are done in Km frequency = obj.frequency/1000000; % Calculations are done in
freq in MHz
a = (1.1*log10(frequency) - 0.7)*obj.h_mobile - ... (1.56*log10(frequency)-0.8);
pl_NLOS = 46.3 + 33.9*log10(frequency) -
13.82*log10(obj.h_antenna) - a + (44.9 -
6.55*log10(obj.h_antenna))*log10(distance) + obj.Cm; end end end
Appendix F: MobileFemto Handover Process - part of the code
function
move_all_MobileFemtos(LTE_config,MobileFemtos,networkPathlossMap,eNodeBs_sec
tors) % This function moves each MobileFemto and for such cases in which a given
MobileFemto is moved % outside of the ROI, it places it back in the ROI. some_MobileFemto_out_of_ROI_this_TTI = false; for mf_ = 1:length(MobileFemtos) MobileFemtos(mf_).move; [ x_range y_range ] = networkPathlossMap.valid_range;
% Now this is an implementation of the MobileFemto handover procedure
ROI_teleport = ~MobileFemtos(mf_).is_in_roi(x_range,y_range);

191
handover_requested = MobileFemtos(mf_).cell_change.requested;
if ROI_teleport || handover_requested old_eNodeB_id = MobileFemtos(mf_).attached_eNodeB.eNodeB_id; if ROI_teleport new_MobileFemto_position = networkPathlossMap.random_position;
% Actually it should not be done like this. Measure all the
neighboring cells' SINR and then decide which one is better [new_site_id new_sector_id new_eNodeB_id] =
networkPathlossMap.cell_assignment(new_MobileFemto_position);
% Teleport MobileFemto MobileFemtos(mf_).pos = new_MobileFemto_position; elseif handover_requested new_eNodeB_id =
MobileFemtos(mf_).cell_change.target_eNodeB; MobileFemtos(mf_).cell_change.requested = false; % reset the
handover request field MobileFemtos(mf_).cell_change.target_eNodeB = []; end
% Deattach MobileFemto from old eNodeB and reattach to new one MobileFemtos(mf_).start_handover(eNodeBs_sectors(new_eNodeB_id));
% Accordingly activate or deactivate MobileFemto % Check whether this MobileFemto should be deativated to speed-up % simulation. Allows for run-time changes. if ~isempty(LTE_config.compute_only_MobileFemtos_from_this_eNodeBs) if
isempty(find(MobileFemtos(mf_).attached_eNodeB.eNodeB_id==LTE_config.compute
_only_MobileFemtos_from_this_eNodeBs,1)) % Deactivate MobileFemto MobileFemtos(mf_).deactivate_MobileFemto = true; else % Activate MobileFemto (already activated by default, but
just in case) MobileFemtos(mf_).deactivate_MobileFemto = false; end end
% Print some debug if ~some_MobileFemto_out_of_ROI_this_TTI if LTE_config.debug_level>=1 fprintf(1,'\n'); end some_MobileFemto_out_of_ROI_this_TTI = true; end if LTE_config.debug_level>=1 if ROI_teleport fprintf('MobileFemto %g going out of ROI, teleporting to %g
%g. eNodeB %g -> eNodeB
%g\n',MobileFemtos(mf_).id,new_MobileFemto_position(1),new_MobileFemto_posit
ion(2),old_eNodeB_id,new_eNodeB_id); elseif handover_requested fprintf('MobileFemto %g handover request. eNodeB %g ->
eNodeB %g\n',MobileFemtos(mf_).id,old_eNodeB_id,new_eNodeB_id);

192
end end end end if some_MobileFemto_out_of_ROI_this_TTI if LTE_config.debug_level>=1 fprintf(' '); end end
Appendix G: Mobile-Femto.m file plus the Handover process - This code has been added to
the Mobile-Femto.m file to identify and continue the MobileFemto Handover Process
classdef MobileFemto < handle % Class that represents an LTE MobileFemto
properties
id % Unique Mobile-Femto id pos % pos in meters (x,y) attached_site % Site to where this Mobile-Femto is attached attached_sector_idx % sector index to which the Mobile-Femto is
attached attached_eNodeB % eNodeB to which the Mobile-Femto is attached
to
vehicular_model % Vehicular model for this Mobile-Femto downlink_channel % Downlink channel model for this Mobile-Femto RB_grid % This links to obj.downlink_channel.RB_grid
Stored again here for efficiency reasons
uplink_channel % Uplink channel model for this Mobile-Femto receiver_noise_figure % Noise figure for this specific Mobile-Femto
(dB) thermal_noise_W_RB % Calculated based on the thermal noise
density and the receiver noise figure in Watts/RB penetration_loss % Penetration loss in dB for the vehicular
environment nRX % Number of receive antennas antenna_gain % Antenna gain of the Mobile-Femto
trace % Trace that stores info about what happened clock % Network clock. Tells the Mobile-Femto in
what TTI it is CQI_mapper % Performs the mapping between SINR and CQI
% Output of the link quality (measurement) model. link_quality_model_output
% Data to be fedbacked to the eNodeB. It is used to pass the

193
feedback data to the send_feedback() function feedback
% Whether the CQI feedback should be unquantized. Having this set % to true is equivalent to directly sending the post-equalization % SINR for each codeword (note that there is still a layer mapping) unquantized_CQI_feedback
% Will decide whether a give TB made it or not BLER_curves
% Gives the means to average the several Transport Block (TB) SINRs SINR_averager
% Contains the LTE precoding codebook codebook
% Signaling from the eNodeB to this Mobile-Femto. This is a direct
channel % between the eNodeB and this Mobile-Femto, where it gets signaled % MobileFemto-specific signaling information. The signaled
information and % where it is located is as follows: % Mobile-Femto signaling: % - TB_CQI % CQI used for the transmission of each
codeword % - TB_size % size of the current TB, in bits % - tx_mode % transmission mode used (MIMO, tx
diversity, spatial multiplexing) % - rv_idx % redundancy version index for each
codeword % downlink_channel.RB_grid % - MobileFemto_allocation % what Mobile-Femto every RB belongs
to % - power_allocation % how much power to allocate to each RB, % - n_RB % RB grid size (frequency) % - sym_per_RB % number of symbols per RB (12 subcarriers,
0.5ms) % - size_bits % total size of the RB grid in bits % - numStreams % maximum number of allowed streams.
Resource allocation is described for all of them eNodeB_signaling
% Extra tracing options (default options) trace_SINR
% average preequalization SNR at current position (averaged over
microscopic fading and noise) SNR_avg_preequal
% This is an "overall SINR", calculated by summing up all of the % signal power and dividing it by the sum of all interfering and % noise power. wideband_SINR
% However if it is needed to shorten the simulation time some

194
Mobile-Femtos can be "deactivated". Note that the feedback will also be
deactivated. deactivate_MobileFemto
% This variable is used for the default feedback calculation sent in % case the Mobile-Femto was not scheduled. For the old (v1) trace
format, this % sets the actual transmit mode. default_tx_mode
traffic_model lambda = 0;
adaptive_RI
% The following are some of the needed variables for the the Mobile-
Femto handover management process. cell_change
end
methods % Constructor with the default Mobile-Femto parameter values function obj = MobileFemto obj.unquantized_CQI_feedback = false; obj.trace_SINR = false; obj.deactivate_MobileFemto = false; obj.cell_change.requested = false; obj.cell_change.target_eNodeB = []; end
function print(obj) if isempty(obj.attached_site) fprintf('MobileFemto %d, (%d,%d), not attached to an
eNodeB\n',obj.id,obj.pos(1),obj.pos(2)); else fprintf('MobileFemto %d, (%d,%d), Site %d, sector %d (eNodeB
%d)\n',obj.id,obj.pos(1),obj.pos(2),obj.attached_site.id,obj.attached_sector
_idx,obj.attached_eNodeB); end obj.vehicular_model.print; end
% Clear variables function clear(obj) obj.attached_site = []; obj.attached_eNodeB = []; obj.vehicular_model = []; obj.downlink_channel = []; obj.RB_grid = []; obj.uplink_channel = []; obj.trace = []; obj.clock = []; obj.CQI_mapper = []; obj.link_quality_model_output = []; obj.feedback = []; obj.BLER_curves = [];

195
obj.SINR_averager = []; obj.eNodeB_signaling = []; obj.traffic_model = []; obj.codebook = []; end
% Move this MobileFemto according to its settings function move(obj) new_pos = obj.vehicular_model.move(obj.pos); obj.pos = new_pos; end % Move this MobileFemto to where it was the last TTI before
according to its settings function move_back(obj) old_pos = obj.vehicular_model.move(obj.pos); obj.pos = old_pos; end function MobileFemto_in_roi =
is_in_roi(a_UE,roi_x_range,roi_y_range) % Tells you whether a Mobile-Femto is in the Region of Interest
(ROI) or not % input: a_MobileFemto ... the MobileFemto in
question % roi_x_range ... roi x range. minimum and maximum x
coordinates % which are valid % roi_y_range ... roi y range. minimum and maximum y
coordinates % which are valid % output: MobileFemto_in_roi ... true or false, whether the
MobileFemto is inside or not
MobileFemto_pos_x = a_MobileFemto.pos(1); MobileFemto_pos_y = a_MobileFemto.pos(2);
if MobileFemto_pos_x<roi_x_range(1) ||
MobileFemto_pos_x>roi_x_range(2) MobileFemto_in_roi = false; return; end
if MobileFemto_pos_y<roi_y_range(1) ||
MobileFemto_pos_y>roi_y_range(2) MobileFemto_in_roi = false; return; end MobileFemto_in_roi = true; end % Starts handover procedures from the currently attached eNodeB to % the specified target_eNodeB % for now... immediate handover. A proper implementation remains % pending. function start_handover(obj,new_eNodeB) % Remove the Mobile-Femto from the eNodeB and its scheduler obj.attached_eNodeB.deattachMobileFemto(obj);
% Add the Mobile-Femto to the eNodeB and its scheduler

196
new_eNodeB.attachMobileFemto(obj); end
% Measure whatever needs to be measured and send a feedback to the
attached eNodeB function send_feedback(obj) obj.uplink_channel.send_feedback(obj.feedback); end
% Calculates the receiver SINR, which is the metric used to measure % link quality ( This process is necessary to make sure wether the
MobileFemto will be handed over with the target eNodeB or to stay with the
serving eNodeB) function link_quality_model(obj,config)
% Get current time t = obj.clock.time;
% Get map-dependant parameters for the current Mobile-Femto interfering_eNodeBs =
obj.attached_eNodeB.neighbors_eNodeB; MobileFemto_microcell_pathloss =
obj.downlink_channel.microcell_pathloss + obj.penetration_loss -
obj.antenna_gain; % Already includes the TX and RX antenna gain (dB) MobileFemto_microcell_pathloss_linear =
10^(0.1*MobileFemto_microcell_pathloss); MobileFemto_shadow_fading_loss =
obj.downlink_channel.shadow_fading_pathloss; % Shadow fading loss (dB) MobileFemto_shadow_fading_loss_linear =
10^(0.1*MobileFemto_shadow_fading_loss); there_are_interferers =
~isempty(interfering_eNodeBs);
% Number of codewords, layers, power etc. assigned to this
Mobile-Femto DL_signaling = obj.eNodeB_signaling; tx_mode = obj.default_tx_mode; % Fixed tx mode
according to LTE_config the_RB_grid = obj.downlink_channel.RB_grid; nRB = the_RB_grid.n_RB; nSC = nRB*2;
% Get the RX power (power allocation) from the target eNodeB TX_power_data = the_RB_grid.power_allocation'; TX_power_signaling = the_RB_grid.power_allocation_signaling'; RX_total =
(TX_power_data+TX_power_signaling)./MobileFemto_microcell_pathloss_linear./M
obileFemto_shadow_fading_loss_linear; RX_total = reshape([RX_total; RX_total],1,[])/(2);
% Get fast fading trace for this subframe MobileFemto_microscale_fading_params =
obj.downlink_channel.fast_fading_pathloss(t,tx_mode); MobileFemto_microscale_fading_mode_params =
MobileFemto_microscale_fading_params(tx_mode);
%% The SINR calculation is done under the following

197
circumstances: % Power allocation is done on a per-subframe (1 ms) and RB basis % The fast fading trace is given for every 6 subcarriers (every % 90 KHz), so as to provide enough samples related to a % worst-case-scenario channel length
% TX_power_signaling_half_RB = TODO: add signaling interference
in better-modeled way S_dims = size(MobileFemto_microscale_fading_mode_params.zeta); S_dims(2) = 1; % All MATLAB variables have at least 2
dimensions.
% RX power switch tx_mode case 4 % MIMO RX_power =
RX_total.*MobileFemto_microscale_fading_mode_params.zeta.'; otherwise % TxD, OLSM or CLSM RX_power_half_RB_repmat = repmat(RX_total,S_dims); RX_power =
RX_power_half_RB_repmat.*MobileFemto_microscale_fading_mode_params.zeta; end
% Get interfering eNodeBs if there_are_interferers % no interfering eNodeBs present
(single eNodeB simulation) parent_sites =
[interfering_eNodeBs.parent_eNodeB]; parent_sites_id = [parent_sites.id]; interfering_eNodeB_ids =
[interfering_eNodeBs.eNodeB_id]; interfering_RB_grids =
[interfering_eNodeBs.RB_grid]; interfering_power_allocations_data =
[interfering_RB_grids.power_allocation]; interfering_power_allocations_signaling =
[interfering_RB_grids.power_allocation_signaling];
% Get microcell pathloss and shadow fading values interfering_microcell_pathloss_eNodeB =
obj.downlink_channel.interfering_microcell_pathloss(interfering_eNodeB_ids)
+ obj.penetration_loss - obj.antenna_gain; interfering_shadow_fading_loss =
obj.downlink_channel.interfering_shadow_fading_pathloss(parent_sites_id); interfering_microcell_pathloss_eNodeB_linear =
10.^(0.1*interfering_microcell_pathloss_eNodeB); interfering_shadow_fading_loss_linear =
10.^(0.1*interfering_shadow_fading_loss);
% Total power allocations interfering_power_allocations =
interfering_power_allocations_data +
interfering_power_allocations_signaling;
% Get interfering channel fading parameters (the trace
returns it for all eNodeBs switch tx_mode

198
case 4 % MIMO microscale_interfering_thetas =
MobileFemto_microscale_fading_mode_params.theta(:,interfering_eNodeB_ids).'; otherwise % TxD, OLSM or CLSM microscale_interfering_thetas =
MobileFemto_microscale_fading_mode_params.theta(:,:,interfering_eNodeB_ids,:
); end SINR_interf_dims = size(microscale_interfering_thetas);
% Get assigned interfering power on a per-half-RB-basis if config.feedback_channel_delay~=0 interf_power_all_RB =
kron(interfering_power_allocations,[1;1])/2'; % Take scheduled power else interf_power_all_RB =
repmat([interfering_eNodeBs.max_power]/SINR_interf_dims(2),[SINR_interf_dims
(2) 1]); % Turn on all interferers end
temp_micro_mat =
interfering_microcell_pathloss_eNodeB_linear'; temp_micro_mat =
temp_mairo_mat(ones(SINR_interf_dims(2),1),:); temp_shadow_mat =
interfering_shadow_fading_loss_linear'; temp_shadow_mat =
temp_shadow_mat(ones(SINR_interf_dims(2),1),:); interf_power_all_RB =
interf_power_all_RB./temp_macro_mat./temp_shadow_mat; % Add micro and shadow
fading
max_Layers = SINR_interf_dims(1); if length(SINR_interf_dims) > 3 N_RI = SINR_interf_dims(4); else N_RI = 1; end
switch tx_mode case 4 interf_power_all_RB_repmat = interf_power_all_RB.'; otherwise interf_power_all_RB_repmat =
zeros(SINR_interf_dims); for nLayers = 1:max_Layers for RI = 1:N_RI interf_power_all_RB_repmat(nLayers,:,:,RI) =
interf_power_all_RB; end end
end else
end

199
% Calculate thermal noise thermal_noise_watts_per_half_RB = obj.thermal_noise_W_RB/2;
% Calculate average preequalization SNR % This is a total SNR, (the channel is normalized to nTX, so
this is also necessary here!) obj.SNR_avg_preequal =
10*log10(RX_total(1)./thermal_noise_watts_per_half_RB);%*config.nTX));
switch tx_mode case 1 % SINR calculation (MIMO) noise_plus_inter_layer_power =
MobileFemto_microscale_fading_mode_params.psi.*thermal_noise_watts_per_half_
RB;
if there_are_interferers % Also works for more than one rank (i.e. extra
dimension) interfering_rx_power =
squeeze(sum(interf_power_all_RB_repmat.*microscale_interfering_thetas,1)); Interference_plus_noise_power =
noise_plus_inter_layer_power + interfering_rx_power.'; else Interference_plus_noise_power =
noise_plus_inter_layer_power; end SINR_linear = RX_power ./
Interference_plus_noise_power.'; % Divide thermal noise by 2: Half-RB
frequency bins
% Calculate SIR % if there_are_interferers % SIR_linear = RX_power ./ interfering_rx_power.'; % else % SIR_linear = Inf(size(SINR_linear)); % end otherwise % SINR calculation (TxD, OLSM, CLSM) noise_plus_inter_layer_power =
MobileFemto_microscale_fading_mode_params.chi.*RX_power +
MobileFemto_microscale_fading_mode_params.psi.*thermal_noise_watts_per_half_
RB; % Divide thermal noise by 2: Half-RB frequency bins if there_are_interferers % Also works for more than one rank (i.e. extra
dimension) interfering_rx_power =
squeeze(sum(interf_power_all_RB_repmat.*microscale_interfering_thetas,3)); Interference_plus_noise_power =
noise_plus_inter_layer_power + interfering_rx_power; else Interference_plus_noise_power =
noise_plus_inter_layer_power; end SINR_linear = RX_power ./ Interference_plus_noise_power;
% Calculate SIR

200
% if there_are_interferers % SIR_linear = RX_power ./ interfering_rx_power; % else % SIR_linear = Inf(size(SINR_linear)); % end end
% Calculation of the wideband SINR if there_are_interferers obj.wideband_SINR =
10*log10(sum(RX_total(:))/(sum(interf_power_all_RB(:))+thermal_noise_watts_p
er_half_RB*nSC)); else obj.wideband_SINR =
10*log10(sum(RX_total(:))/(thermal_noise_watts_per_half_RB*nSC)); end
% Calculation of the post-equalization symbols SINR SINR_dB = 10*log10(SINR_linear); % SIR_dB = 10*log10(SIR_linear);
% Calculate and save feedback, as well as the measured SINRs
obj.calculate_feedback(config,tx_mode,SINR_linear,SINR_dB,nRB,[],DL_signalin
g); end
% Nex version of the Link Quality model, implemented with run-time
precoding function link_quality_model_v2(obj,config)
% Get current time t = obj.clock.time;
% Get map-dependant parameters for the current Mobile-Femto interfering_eNodeBs =
obj.attached_eNodeB.neighbors_eNodeB; MobileFemto_microcell_pathloss_dB =
obj.downlink_channel.microcell_pathloss + obj.penetration_loss -
obj.antenna_gain; % Already includes the TX and RX antenna gain (dB) MobileFemto_microcell_pathloss_linear =
10^(0.1*MobileFemto_microcell_pathloss_dB); MobileFemto_shadow_fading_loss =
obj.downlink_channel.shadow_fading_pathloss; % Shadow fading loss (dB) MobileFemto_shadow_fading_loss_linear =
10^(0.1*MobileFemto_shadow_fading_loss); there_are_interferers =
~isempty(interfering_eNodeBs); N_interferers = length(interfering_eNodeBs); interfering_eNodeBs_idxs =
[interfering_eNodeBs.eNodeB_id];
% Number of codewords, layers, power etc. assigned to this
Mobile-Femto DL_signaling = obj.eNodeB_signaling; tx_mode = DL_signaling.tx_mode;

201
% For the case the Mobile-Femto is not scheduled if DL_signaling.num_assigned_RBs==0 tx_mode = obj.default_tx_mode; end
the_RB_grid = obj.downlink_channel.RB_grid;
% Get fast fading trace for this subframe [H_0 H_i PMI_precalc] =
obj.downlink_channel.fast_fading_pathloss_v2(t,interfering_eNodeBs_idxs); PMI_precalc_sc = kron(PMI_precalc,[1;1]); [nRX nTX nSC] = size(H_0); nRB = the_RB_grid.n_RB; max_layer = min(nRX,nTX);
% The SINR calculation is done under the following
circumstances: % Power allocation is done on a per-subframe (1 ms) and RB
basis. The fast fading trace is given for every 6 subcarriers (every 90 KHz)
% TX power for each layer TX_power_half_RB_data =
reshape([the_RB_grid.power_allocation';
the_RB_grid.power_allocation'],1,[])/(2); % Divided by two: half-RB
granularity TX_power_half_RB_signaling =
reshape([the_RB_grid.power_allocation_signaling';
the_RB_grid.power_allocation_signaling'],1,[])/(2);
TX_power_half_RB = TX_power_half_RB_data +
TX_power_half_RB_signaling; RX_power_half_RB = TX_power_half_RB /
MobileFemto_microcell_pathloss_linear /
MobileFemto_shadow_fading_loss_linear; % TX_power_signaling_half_RB = TODO: add signaling interference
in better-modeled way
% Interfering eNodeBs' power allocation if there_are_interferers % no interfering eNodeBs present
(single eNodeB simulation) parent_sites_interf =
[interfering_eNodeBs.parent_eNodeB]; parent_sites_interf_id =
[parent_sites_interf.id]; interfering_eNodeB_ids =
[interfering_eNodeBs.eNodeB_id]; interfering_RB_grids =
[interfering_eNodeBs.RB_grid]; interfering_power_allocations_data =
[interfering_RB_grids.power_allocation]'; interfering_power_allocations_signaling =
[interfering_RB_grids.power_allocation_signaling]';
% Get microcell pathloss and shadow fading values interfering_microcell_pathloss_eNodeB_dB =
obj.downlink_channel.interfering_microcell_pathloss(interfering_eNodeB_ids)
+ obj.penetration_loss - obj.antenna_gain;

202
interfering_shadow_fading_loss =
obj.downlink_channel.interfering_shadow_fading_pathloss(parent_sites_interf_
id); interfering_microcell_pathloss_eNodeB_linear =
10.^(0.1*interfering_microcell_pathloss_eNodeB_dB); interfering_shadow_fading_loss_linear =
10.^(0.1*interfering_shadow_fading_loss);
% Total power allocations power_allocations_interf =
interfering_power_allocations_data +
interfering_power_allocations_signaling; power_allocations_interf_sc =
reshape([power_allocations_interf(:)';power_allocations_interf(:)'],nSC,[])'
/2; % Power allocation per half-RB
% Total received interfering power RX_power_half_RB_interf = power_allocations_interf_sc ./
kron(interfering_microcell_pathloss_eNodeB_linear,ones(1,nSC))./kron(interfe
ring_shadow_fading_loss_linear,ones(1,nSC)); end
thermal_noise_watts_per_half_RB = obj.thermal_noise_W_RB/2;
% Get the correct precodig matrices switch tx_mode case 4 % CLSM precoding = [obj.codebook{:,nTX,tx_mode}]; case 3 % OLSM error('Not yet supported (3)'); precoding = [obj.codebook{:,nRX,tx_mode}]; case 2 % TxD: none error('Not yet supported (2)'); case 1 % Single TX antenna: none error('Not yet supported (1)'); otherwise error('Not yet supported (other)'); end
% SINR calculation for each layer possibility SINR_linear = nan(max_layer,nSC,max_layer); for l_=1:max_layer H0_H0_l = zeros(l_,nSC); H_0_eff_inv_l_ = zeros(l_,nTX,nSC); precoders_l = precoding(l_).W; % All the possible
precoders for this layer number choice % Obtain the effective channel matrix for sc_=1:nSC precoder = precoders_l(:,:,PMI_precalc_sc(sc_,l_)); H0_pinv = pinv(H_0(:,:,sc_)*precoder); H_0_eff_inv_l_(:,:,sc_) = H0_pinv; H0_H0_l(:,sc_) = diag(H0_pinv*H0_pinv'); end

203
MSE_signal_part = thermal_noise_watts_per_half_RB*H0_H0_l; %
ToDo: Add Channel Estimation error MSE_interf_part = zeros(l_,nSC,N_interferers); if there_are_interferers for int_=1:N_interferers interferer_precoding = precoders_l(:,:,1); %
Arbitrary and fixed precoder for the interferers. Could be changed, though for sc_=1:nSC H_i_W_i =
H_i(:,:,sc_,int_)*interferer_precoding; H_i_W_i_2 = H_i_W_i*H_i_W_i'; H_0_eff_inv = H_0_eff_inv_l_(:,:,sc_); MSE_interf_part(:,sc_,int_) =
diag(RX_power_half_RB_interf(int_,sc_) * H_0_eff_inv * H_i_W_i_2 *
H_0_eff_inv'); end end end MSE = real(MSE_signal_part +
sum(MSE_interf_part,3)); % The remaining imaginary part is just due to type
rounding. There is no imaginary part, actually. SINR_linear(1:l_,:,l_) = kron(RX_power_half_RB,ones(l_,1))
./ MSE; end SINR_dB = 10*log10(SINR_linear);
% Calculate average preequalization SNR: This is a total SNR obj.SNR_avg_preequal =
10*log10(RX_power_half_RB(1)/thermal_noise_watts_per_half_RB);
% Calculation of the wideband SINR if there_are_interferers obj.wideband_SINR = 10*log10(sum(RX_power_half_RB) /
(sum(RX_power_half_RB_interf(:))+thermal_noise_watts_per_half_RB*nSC)); else obj.wideband_SINR = 10*log10(sum(RX_power_half_RB) /
(thermal_noise_watts_per_half_RB*nSC)); end
% Calculate and save feedback, as well as the measured SINRs
obj.calculate_feedback(config,tx_mode,SINR_linear,SINR_dB,nRB,PMI_precalc,DL
_signaling); end
% Calculate the feedback values based on the input. This function % is called from the link quality model and is separated for % convenience and readability. The results of the feedback % calculation are stored in the following variables: % - obj.feedback.CQI: CQI feedback % - obj.feedback.RI: Rank Indicator feedback (when
applicable) % - obj.link_quality_model_output: SINR values % % As input parameters you have one SINR per RB % (SINRs_to_map_to_CQI) or all of the SINRs the SL simulator % traces, which are currently two per RB (SINR_dB)

204
function
calculate_feedback(obj,config,tx_mode,SINR_linear,SINR_dB,nRB,PMI_suggestion
,DL_signaling) % Take a subset of the SINRs for feedback calculation % For SM we send 2 CQIs, one for each of the codewords (which in
the 2x2 % case are also the layers). For TxD, both layers have the same
SINR % The CQI is calculated as a linear averaging of the SINRs in % dB. This is done because like this the Tx has an "overall % idea" of the state of the RB, not just a sample of it. switch tx_mode case 1 % SISO SINRs_to_map_to_CQI =
(SINR_dB(1:2:end)+SINR_dB(2:2:end))/2; obj.link_quality_model_output.SINR_dB = SINR_dB; obj.link_quality_model_output.SINR_linear = SINR_linear; case 2 % TxD % Both layers have the same SINR SINRs_to_map_to_CQI =
(SINR_dB(1,1:2:end)+SINR_dB(1,2:2:end))/2; obj.link_quality_model_output.SINR_dB =
SINR_dB(1,:); obj.link_quality_model_output.SINR_linear =
SINR_linear(1,:); case {3,4} % OLSM, CLSM SINRs_to_map_to_CQI =
(SINR_dB(:,1:2:end,:)+SINR_dB(:,2:2:end,:))/2; obj.link_quality_model_output.SINR_dB = SINR_dB; obj.link_quality_model_output.SINR_linear = SINR_linear; otherwise error('TX mode not yet supported'); end
max_rank = size(SINRs_to_map_to_CQI,3);
if (tx_mode==3) || (tx_mode==4) % Rank decision for SM MCSs_all = 1:15; Is_MCSs =
obj.SINR_averager.SINR_to_I(SINRs_to_map_to_CQI,MCSs_all);
% Compute the per-layer mutual-information sum Is_dims = size(Is_MCSs); Is_MCSs_no_nans = zeros(size(Is_MCSs)); Is_finite_idxs = isfinite(Is_MCSs); Is_MCSs_no_nans(Is_finite_idxs) = Is_MCSs(Is_finite_idxs); Is_sum_MCSs_per_layer =
reshape(sum(Is_MCSs_no_nans,1),Is_dims(2:end));
% Optional: take only the N best values, as measured by the
last MCS (if not one would need to calcualte it for every rank-MCS pair,
making it too computationally costly!) Is_mean_MCSs_per_rank = zeros(length(MCSs_all),max_rank); last_MCS_Is_sum =
Is_sum_MCSs_per_layer(:,:,MCSs_all(end)); sort_idxs = zeros(size(last_MCS_Is_sum)); multiplier_matrix =

205
kron(1:max_rank,ones(length(MCSs_all),1));
% Calculate the average I of the RBs that were scheduled
(for the appropriate rank) if DL_signaling.num_assigned_RBs > 0 RBs_reference =
last_MCS_Is_sum(DL_signaling.assigned_RB_map,DL_signaling.nLayers); else RBs_reference = []; end
%% Calculate mean MI value for each rank and MCS pair based
on the best N MI values for each rank for r_=1:max_rank if obj.adaptive_RI==1 &&
~isempty(DL_signaling.adaptive_RI) &&
~isempty(DL_signaling.adaptive_RI.avg_MI) &&
~isempty(DL_signaling.adaptive_RI.min_MI) % Take only the RBs with similar spectral efficiency
as previously scheduled (measured in BICM capacity) spectral_eff_threshold =
DL_signaling.adaptive_RI.min_MI;
number_of_RBs_to_take =
DL_signaling.num_assigned_RBs; if number_of_RBs_to_take==0 number_of_RBs_to_take = nRB; end [sort_values,sort_idxs] =
sort(last_MCS_Is_sum(:,r_)); bigger_than_threshold =
sort_values>=spectral_eff_threshold; bigger_than_threshold_idxs =
sort_idxs(bigger_than_threshold); begin_idx =
max(length(bigger_than_threshold_idxs)-number_of_RBs_to_take+1,1); end_idx =
length(bigger_than_threshold_idxs); RBs_to_average_idx_rank =
bigger_than_threshold_idxs(begin_idx:end_idx);
RBs_to_average =
Is_sum_MCSs_per_layer(RBs_to_average_idx_rank,r_,:);
if isempty(RBs_to_average) RBs_to_average = Is_sum_MCSs_per_layer(:,r_,:);
% All values end elseif obj.adaptive_RI==2 &&
~isempty(DL_signaling.adaptive_RI) &&
~isempty(DL_signaling.adaptive_RI.RBs_for_feedback) RBs_to_average =
Is_sum_MCSs_per_layer(DL_signaling.adaptive_RI.RBs_for_feedback,r_,:); % The
indicated values else RBs_to_average = Is_sum_MCSs_per_layer(:,r_,:); end

206
Is_mean_MCSs_per_rank(:,r_) =
reshape(mean(RBs_to_average,1),[Is_dims(end) 1]) ./ multiplier_matrix(:,r_); end
%% Rank Indicator: Decide based on the number of transmitted
data bits for a rank value SINR_av_dB_for_RI =
obj.SINR_averager.average_for_RI(Is_mean_MCSs_per_rank,1:15); CQI_temp_all =
floor(obj.CQI_mapper.SINR_to_CQI(SINR_av_dB_for_RI)); all_CQIs = reshape(1:15,[],1); all_CQIs = all_CQIs(:,ones(1,max_rank)); temp_var = CQI_temp_all-all_CQIs; temp_var(temp_var<0) = Inf; [C CQI_layer_all] = min(temp_var); out_of_range = CQI_layer_all<1; CQI_layer_all(out_of_range) = 1; bits_layer_config =
(1:max_rank).*(8*round(1/8*[config.CQI_params(CQI_layer_all).modulation_orde
r] .* [config.CQI_params(CQI_layer_all).coding_rate_x_1024]/1024 *
config.sym_per_RB_nosync * config.N_RB*2)-24); bits_layer_config(out_of_range) = 0; [C,optimium_rank] = max(bits_layer_config); % Choose the RI
for which the number of bits is maximized
%% Calculate CQI feedback on a per-codeword basis
% CQI reporting Layer mappings according to TS 36.211 switch optimium_rank case 1 SINRs_to_CQI_CWs = SINRs_to_map_to_CQI(1,:,1); case 2 SINRs_to_CQI_CWs = SINRs_to_map_to_CQI(1:2,:,2); case 3 % Manually set to two Codewords. Layer-to-codeword
mapping according to TS 36.211 and done with the last CQI codeword2_SINRs_dB_avg =
obj.SINR_averager.average_codeword(Is_MCSs(2:3,:,optimium_rank,MCSs_all(end)
),MCSs_all(end)); SINRs_to_CQI_CWs =
[SINRs_to_map_to_CQI(1,:,3); codeword2_SINRs_dB_avg]; case 4 % Manually set to two Codewords. Layer-to-codeword
mapping according to TS 36.211 codeword1_SINRs_dB_avg =
obj.SINR_averager.average_codeword(Is_MCSs(1:2,:,optimium_rank,MCSs_all(end)
),MCSs_all(end)); codeword2_SINRs_dB_avg =
obj.SINR_averager.average_codeword(Is_MCSs(3:4,:,optimium_rank,MCSs_all(end)
),MCSs_all(end)); SINRs_to_CQI_CWs = [codeword1_SINRs_dB_avg;
codeword2_SINRs_dB_avg]; end
obj.feedback.RI = optimium_rank; else

207
obj.feedback.RI = 1; SINRs_to_CQI_CWs = SINRs_to_map_to_CQI; % I have to cehck
whether this also holds for TxD because of the matrix dimensions end
if tx_mode==4 && ~isempty(PMI_suggestion) obj.feedback.PMI = PMI_suggestion(:,optimium_rank); else obj.feedback.PMI = nan(nRB,1); end
% Send as feedback the CQI for each RB. % Flooring the CQI provides much better results than % rounding it, as by rounding it to a higher CQI you will % very easily jump the BLER to 1. The other way around it % will jump to 0. if obj.unquantized_CQI_feedback CQIs = obj.CQI_mapper.SINR_to_CQI(SINRs_to_CQI_CWs); else CQIs = floor(obj.CQI_mapper.SINR_to_CQI(SINRs_to_CQI_CWs)); end
obj.feedback.CQI = CQIs; obj.feedback.tx_mode = tx_mode; end
% Evaluate whether this TB arrived correctly by using the data from % the link quality model and feeding it to the link performance % model (BLER curves) function link_performance_model(obj)
% Get RB grid % the_RB_grid = obj.RB_grid;
% Get SINRs from the link quality model. Only the dB (not % linear) are needed. SINR_dB = obj.link_quality_model_output.SINR_dB;
% Calculate TB SINR DL_signaling = obj.eNodeB_signaling; TB_CQI = DL_signaling.TB_CQI; user_RBs = DL_signaling.assigned_RB_map; assigned_RBs = DL_signaling.num_assigned_RBs; assigned_power = DL_signaling.assigned_power; tx_mode = DL_signaling.tx_mode; nLayers = DL_signaling.nLayers; nCodewords = DL_signaling.nCodewords; rv_idxs = DL_signaling.rv_idx; TB_size = DL_signaling.TB_size;
% Preallocate variables to store in trace TB_SINR_dB = zeros(1,nCodewords); BLER = zeros(1,nCodewords);
% Needed for non-full-buffer simulations N_used_bits = DL_signaling.N_used_bits;

208
packet_parts = DL_signaling.packet_parts;
% NOTE: This needs to be changed into a per-layer SINR. A layer-
to-stream translation will be needed MobileFemto_TB_SINR_idxs = logical(kron(MobileFemto_RBs',[1
1])); % Setting this Kronecker product to [1 0] would mean that you
only take one SC per RB and repeat it. i.e. not use all of % your SCs in the trace.
% Set feedback for all streams if assigned_RBs~=0 % Not all of the dimensions are needed switch tx_mode case {1,2} % SIXO, TxD case {3,4} % OLSM, CLSM
% Take only the SINRs of the layers that are needed SINR_dB = SINR_dB(1:nLayers,:,nLayers);
% Layer mapping % NOTHING (for now) -> 2 TX antennas does not yet
need a proper mapping % Convert the shape of the SINR_dB vector, as well % as the mapping otherwise error('Mode not supported'); end
% Layer mapping according to TS 36.212 for cw_=1:nCodewords switch cw_ case 1 switch nLayers case 4 layers_cw = [1 2]; otherwise layers_cw = 1; end case 2 switch nLayers case 1 error('2 codewords and 1 layers not
allowed'); case 2 layers_cw = 2; case 3 layers_cw = [2 3]; case 4 layers_cw = [3 4]; end end layer_SINRs = SINR_dB(layers_cw,:); MobileFemto_TB_SINR_idxs_layers =
MobileFemto_TB_SINR_idxs(ones(length(layers_cw),1),:);

209
MobileFemto_TB_SINRs_layer =
layer_SINRs(MobileFemto_TB_SINR_idxs_layers); [TB_SINR_dB(cw_)] =
obj.SINR_averager.average(MobileFemto_TB_SINRs_layer,TB_CQI(cw_),true); BLER(cw_) =
obj.BLER_curves.get_BLER(TB_CQI(cw_),TB_SINR_dB(cw_)); end
% Receive ACK = BLER<rand(1,nCodewords); else % Dummy results TB_SINR_dB = []; ACK = false(1,nCodewords); end
% Needed for non-full-buffer simulations if ~obj.traffic_model.is_fullbuffer obj.process_packet_parts(packet_parts,nCodewords); end
% Add BLER/ACK feedback to the CQI and RI feedback if assigned_RBs~=0 obj.feedback.MobileFemto_scheduled = true; obj.feedback.nCodewords = nCodewords; obj.feedback.TB_size = TB_size; obj.feedback.BLER = BLER; obj.feedback.ACK = ACK; else obj.feedback.MobileFemto_scheduled = false; obj.feedback.nCodewords = 0; obj.feedback.TB_size = 0; obj.feedback.BLER = NaN; obj.feedback.ACK = false; end
% Optional traces if obj.trace_SINR extra_traces{1} = obj.link_quality_model_output.SINR_dB; extra_traces{2} = obj.SNR_avg_preequal; else extra_traces{1} = []; extra_traces{2} = []; end
% Store trace of the relevant information tti_idx = obj.clock.current_TTI;
% Store trace obj.trace.store(... obj.feedback,... obj.attached_eNodeB,... obj.pos,... tti_idx,... assigned_RBs,... assigned_power,... TB_CQI,...

210
TB_size,... BLER,... TB_SINR_dB,... N_used_bits,... obj.wideband_SINR,... obj.deactivate_MobileFemto,... extra_traces); end
function distance_to_site = distance_to_attached_site(obj) % Return the distance to the attached site (function added for
convenience) distance_to_site = sqrt(sum((obj.attached_site.pos -
obj.pos).^2)); end
% Clear all non-basic info and leaves just basic information
describing the UE function clear_non_basic_info(obj) obj.attached_site = []; obj.attached_sector_idx = []; obj.attached_eNodeB = []; obj.vehicular_model = []; obj.downlink_channel = []; obj.RB_grid = []; obj.uplink_channel = []; obj.trace = []; obj.clock = []; obj.CQI_mapper = []; obj.link_quality_model_output = []; obj.feedback = []; obj.unquantized_CQI_feedback = []; obj.BLER_curves = []; obj.SINR_averager = []; obj.codebook = []; obj.eNodeB_signaling = []; obj.trace_SINR = []; obj.SNR_avg_preequal = []; obj.wideband_SINR = []; obj.deactivate_MobileFemto = []; obj.default_tx_mode = []; obj.traffic_model = []; obj.lambda = []; end
% Returns a struct containing the basic information (not deleted
with the previous function) from the MobileFemto function struct_out = basic_information_in_struct(obj) struct_out.id = obj.id; struct_out.pos = obj.pos; struct_out.receiver_noise_figure = obj.receiver_noise_figure; struct_out.thermal_noise_W_RB = obj.thermal_noise_W_RB; struct_out.penetration_loss = obj.penetration_loss; struct_out.nRX = obj.nRX; struct_out.antenna_gain = obj.antenna_gain; end

211
% Processes tha packet parts function process_packet_parts(obj,packet_parts,nCodewords) for cw_ = 1:nCodewords if ACK(cw_) if strcmp(obj.traffic_model.type,'voip') ||
strcmp(obj.traffic_model.type,'video') ||
strcmp(obj.traffic_model.type,'gaming') for pp = 1:length(packet_parts{cw_}) % acknowledge
all packet parts and remove them from the buffer if packet_parts{cw_}(pp).data_packet_id packet_ind =
obj.traffic_model.get_packet_ids == packet_parts{cw_}(pp).data_packet_id; if sum(packet_ind) [packet_done,packet_id] =
obj.traffic_model.packet_buffer(packet_ind).acknowledge_packet_part(packet_p
arts{cw_}(pp).id,true); if packet_done && packet_id
obj.traffic_model.remove_packet(packet_id,true); end end end end end else
end end end end end