
1931S.pdf - Pakistan Research Repository
380
-
Upload
khangminh22 -
Category
Documents
-
view
1 -
download
0
Transcript of 1931S.pdf - Pakistan Research Repository


II
Electrochemical Study of Metal Complexes ofActive Ingredient of Nigella sativa (Black seed)
A thesis submitted in fulfillment of the requirement for the Degree ofDoctor of Philosophy in Chemistry
By
Farah Kishwar
Federal Urdu University of Arts, Science and TechnologyGulshan-e-Iqbal CampusUniversity Road, Karachi
2013

III
CERTIFICATE
Certified that Farah Kishwar has carried out her research and experimental work on thetopic entitled “Electrochemical Study of Metal Complexes of Active Ingredient of Nigellasativa (Black seed)” under our guidance and supervision. Her research work is original and herdissertation is worthy of presentation to the Federal Urdu University of Arts, Science andTechnology for award of Doctor of Philosophy in Chemistry.
Supervisor: -------------------------------------------------Prof. Dr. Qamar- ul – Haque,Department of Chemistry,Federal Urdu University of Arts, Science andTechnology, Gulshan-e-Iqbal Campus,Karachi.
Co-supervisor: ---------------------------------------------------Prof. Dr. Khalid M. Khan,H.E.J Research Institute of Karachi,University of Karachi,Karachi.
External examiner: ---------------------------------------------------
Chairperson: ---------------------------------------------------Prof. Rehana Iqbal,Department of Chemistry,Federal Urdu University of Arts, Science andTechnology, Gulshan-e-Iqbal Campus,Karachi.

IV
DEDICATED
TO
MY MOTHER

V
ACKNOWLEDGEMENT
First of all I am highly grateful to the most merciful, Omnipresent and Omniscient Almighty
Allah. His help and blessing made me able to achieve my goal.
Secondly, I feel great honor to express my sincere gratitude to my research supervisor Prof. Dr.
Qamar-ul-Haq who encouraged me at every step, hence it became possible for me to accomplish
this assignment.
I am very grateful to Prof. Dr. Khalid M. Khan for his cooperation and generous gesture. He
made available all necessary facilities regarding isolation in the present work which was carried
out at the H.E.J. Research Institute of Chemistry, University of Karachi.
I would especially like to thank Prof. Rehana Iqbal, Chairperson Department of the Chemistry,
Federal Urdu University of Arts, Science and Technology for her generous cooperation and kind
behavior.
I would like to pay my heartiest thanks to Dr. Zahida T. Maqsood, Dr. Mahboob Mohammad,
Dr. Arif Kazmi, Dr. Talat Mahmood, Dr. Humera Anwer, Dr. Kausar Yasmeen, Dr. Sobia
Perwaiz, Dr. Iftekhar Ahmed Tahiri, Dr. Iffat Mahmood and Dr. Junaid Hashmi for their support
and help. Their kind attitude, valuable guidance and suggestions helped me very much to solve
the difficulties during the research.
I would also like to express my sincere appreciation and thanks to my colleagues Prof.
Samiuddin Qadri, Mrs. Anila Anwar, Mrs. Rubina Perveen, Dr. Syed Tahir Ali and Dr. Sajid
Jahangir for their moral support and encouragement.
This acknowledgement will remain incomplete without acknowledging my beloved children
whose patience, sacrifice and prayers provided me mental peace and the opportunity to
concentrate on my work.
My special thanks are due to all technical, non-technical staff and lab staff of Chemistry
department of Federal Urdu University for their sincere help during my experimental work.
Farah Kishwar
VI
ABSTRACT
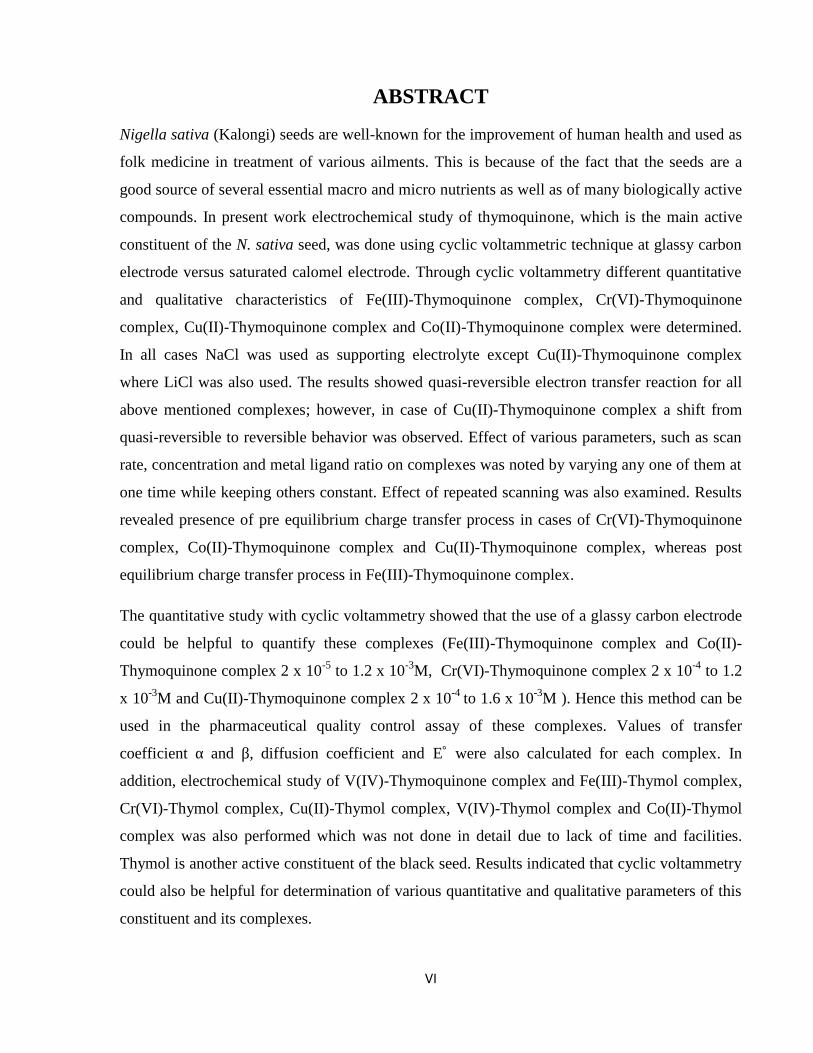
Nigella sativa (Kalongi) seeds are well-known for the improvement of human health and used as
folk medicine in treatment of various ailments. This is because of the fact that the seeds are a
good source of several essential macro and micro nutrients as well as of many biologically active
compounds. In present work electrochemical study of thymoquinone, which is the main active
constituent of the N. sativa seed, was done using cyclic voltammetric technique at glassy carbon
electrode versus saturated calomel electrode. Through cyclic voltammetry different quantitative
and qualitative characteristics of Fe(III)-Thymoquinone complex, Cr(VI)-Thymoquinone
complex, Cu(II)-Thymoquinone complex and Co(II)-Thymoquinone complex were determined.
In all cases NaCl was used as supporting electrolyte except Cu(II)-Thymoquinone complex
where LiCl was also used. The results showed quasi-reversible electron transfer reaction for all
above mentioned complexes; however, in case of Cu(II)-Thymoquinone complex a shift from
quasi-reversible to reversible behavior was observed. Effect of various parameters, such as scan
rate, concentration and metal ligand ratio on complexes was noted by varying any one of them at
one time while keeping others constant. Effect of repeated scanning was also examined. Results
revealed presence of pre equilibrium charge transfer process in cases of Cr(VI)-Thymoquinone
complex, Co(II)-Thymoquinone complex and Cu(II)-Thymoquinone complex, whereas post
equilibrium charge transfer process in Fe(III)-Thymoquinone complex.
The quantitative study with cyclic voltammetry showed that the use of a glassy carbon electrode
could be helpful to quantify these complexes (Fe(III)-Thymoquinone complex and Co(II)-
Thymoquinone complex 2 x 10⁻⁵ to 1.2 x 10⁻³M, Cr(VI)-Thymoquinone complex 2 x 10⁻⁴ to 1.2
x 10-3M and Cu(II)-Thymoquinone complex 2 x 10⁻⁴ to 1.6 x 10⁻³M ). Hence this method can be
used in the pharmaceutical quality control assay of these complexes. Values of transfer
coefficient α and β, diffusion coefficient and E˚ were also calculated for each complex. In
addition, electrochemical study of V(IV)-Thymoquinone complex and Fe(III)-Thymol complex,
Cr(VI)-Thymol complex, Cu(II)-Thymol complex, V(IV)-Thymol complex and Co(II)-Thymol
complex was also performed which was not done in detail due to lack of time and facilities.
Thymol is another active constituent of the black seed. Results indicated that cyclic voltammetry
could also be helpful for determination of various quantitative and qualitative parameters of this
constituent and its complexes.
VII
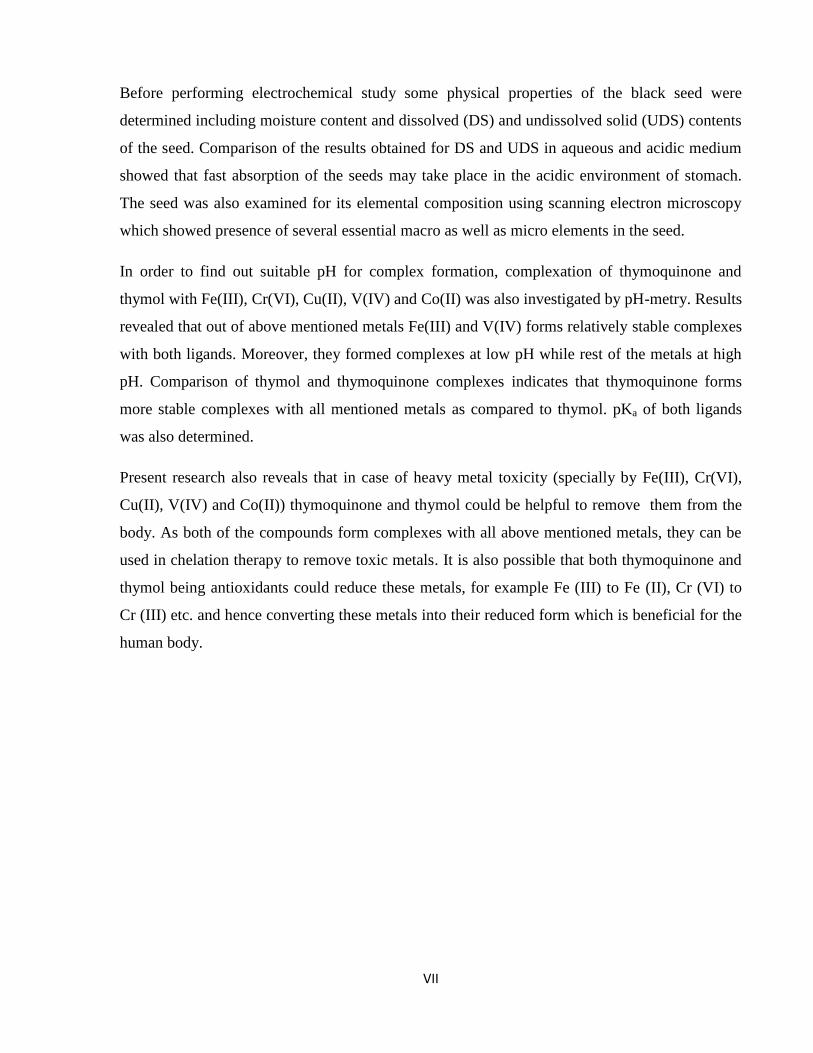
Before performing electrochemical study some physical properties of the black seed were
determined including moisture content and dissolved (DS) and undissolved solid (UDS) contents
of the seed. Comparison of the results obtained for DS and UDS in aqueous and acidic medium
showed that fast absorption of the seeds may take place in the acidic environment of stomach.
The seed was also examined for its elemental composition using scanning electron microscopy
which showed presence of several essential macro as well as micro elements in the seed.
In order to find out suitable pH for complex formation, complexation of thymoquinone and
thymol with Fe(III), Cr(VI), Cu(II), V(IV) and Co(II) was also investigated by pH-metry. Results
revealed that out of above mentioned metals Fe(III) and V(IV) forms relatively stable complexes
with both ligands. Moreover, they formed complexes at low pH while rest of the metals at high
pH. Comparison of thymol and thymoquinone complexes indicates that thymoquinone forms
more stable complexes with all mentioned metals as compared to thymol. pKa of both ligands
was also determined.
Present research also reveals that in case of heavy metal toxicity (specially by Fe(III), Cr(VI),
Cu(II), V(IV) and Co(II)) thymoquinone and thymol could be helpful to remove them from the
body. As both of the compounds form complexes with all above mentioned metals, they can be
used in chelation therapy to remove toxic metals. It is also possible that both thymoquinone and
thymol being antioxidants could reduce these metals, for example Fe (III) to Fe (II), Cr (VI) to
Cr (III) etc. and hence converting these metals into their reduced form which is beneficial for the
human body.

VIII
خالصہ
مختلفاورہیںمشہورلئےکےکرنےپیدابہتریمیںصحتانسانیبیجکےکلونجیاسکیدرحقیقت-ہیںجاتےکئےاستعمالپرطورکےدواعاممیںعالجکےبیماریوں
پائےعناصرمائیکرواورمیکروضروریکئمیںبیجوںکےکلونجیکہہےیہوجہزیر-ہیںذریعہبہترینکامرکباتعاملسےبہتپرطورحیاتیاتیبیجیہنیزہیںجاتےجزفعالاوربنیادیایککابیجکےکلونجیجوتھائیموکیونون،میںمقٌٌالےتحقیقینظرکیوولٹامیٹریسائیکلکلئےکےمقصداس-گیاکیامطالعہکیمیائیبرقیکاہے،
شدہسیرجبکہٹیسٹبطورکوبرقیرےکاربنگالسیمیںجس-گئکیاستعمالتکنیک-)III(آئرنوولٹامیٹریسائکلکبزریعہ-گیاکیااستعمالبرقیرہریفرنسبطورکوکیلومل
پیچیدہتھائیموکیونون-)II(کاپرپیچیدہ،تھائیموکیونون-)IV(کرومیمپیچیدہ،تھائیموکیونونکیمعلومخصوصیاتکٌمیاورکیفیمختلفکیپیچیدہتھائیموکیونون-)II(کوبالٹاور
پرطورکےپاشیدہبرقمعاونبطورNaClمیںمطالعےکےپیچیداتتمامان-گئیںLiClلئےکےمقصداسجہاںکےپیچیدہتھائیموکیونون-)II(کاپرسوائےگیاکیااستعمال
تمامباالمندرجہکہہےہوتامعلومیہسےنتائجکےمطالعےتحقیقی-گیاکیااستعمالبھی-)II(کاپرالبتہہیں،کرتےاظہارکاتبادلےالیکٹراندوطرفہ-قواسیپیچیدات
دوطرفہسےتبادلےالیکٹراندوطرفہ-قواسیمیںبرتاؤکےپیچیدہتھائیموکیونونمختلفپرپیچیداتتمامانمیںتحقیقموجودہ-گئکینوٹمنتقلیمیںتبادلےالیکٹران
نوٹ کئےبھیاثراتکےتناسبلیجنڈ-دھاتاورارتکازریٹ،اسکانمثًالپیرامیٹرزباقیجبکہگیاکیاتبدیلکوایککسیمیںوقتایکسےمیںانلئےکےجسگئے
-گیاکیامشاہدہبھیکااثراتکےاسکاننگمٌکررپرپیچیدات-گیارکھامستقلکوتمامپیچیدہ،تھائیموکیونون-)VI(کرومیمکہہےہوتیظاہرباتیہسےنتائجتحقیقیتوازنازقبلمیںپیچیدہتھائیموکیونون-)II(کاپراورپیچیدہتھائیموکیونون-)II(کوبالٹچارجتوازنازبعدمیںپیچیدہتھائیموکیونون-)III(آئرنجبکہطریقہٹرانسفرچارج
-ہےجاتاپایاطریقہٹرانسفر
معلومذریعےکےلعےمطاکٌمیوالےجانےکئےذریعےکےوولٹامیٹریسائیکلککوبالٹاورپیچیدہتھائیموکیونون-)III(آئرن(پیچیداتانبرقیرہکاربنگالسیکہہےہوتا
)II(-پیچیدہتھائیموکیونونM5-10x2تاM3-10x1.2،کرومیم)VI(-تھائیموکیونون پیچیدہM4-10x2تاM3-10x1.2کاپراور)II(-پیچیدہتھائیموکیونونM4-10x2تا

IX
M3-10x1.6(انکوکارطریقہاسلہذاہےہواثابتمددگارمیںکرنےتعٌینکامقدارکیباالمندرجہ-ہےسکتاجاکیااستعمالمیںجانچکوالٹی کنٹرولفارماسیوٹیکلکیپیچیدات
HalfاورDiffusion coefficient،tTransfer coefficienلئےکےپیچیدہہرwave potentialگئیںکیمعلومبھیقیمتیںکی-
پیچیدہ،تھائیمول-)III(آئرنپیچیدہ،تھائیموکیونون-)IV(وینیڈیمعالوہکےاساورپیچیدہتھائیمول-)IV(وینیڈیمپیچیدہ،تھائیمول-)II(کاپرپیچیدہ،تھائیمول-)VI(کرومیمسہولیاتاوروقتگیا جوکیامطالعہکیمیائیبرقیبھیکاپیچیدہتھائیمول-)II(کوبالٹ
فعالاورایککابیجکےکلونجیتھائیمول-گیاکیانہیںسےتفصیلباعثکےکمیکیپیچیداتکےاساورجزاسوولٹامیٹریسائیکلککہہےہوتامعلومسےتحقیق-ہےجزہوسکتیثابتمددگارلئےکےکرنےمعلومخصوصیاتکٌمیاورکیفیمختلفبھیکیہےکیمعلومخصوصیاتطبعیکچھکیبیجوںکےکلونجیقبلسےمطالعےکیمیائیقیبر
مقدارکیٹھوسپذیرحلغیراورپذیرحلاورکی مقدارنمیمجودمیںبیجمیںجنگئیںکیٹھوسپذیرحلغیراورپذیرحلشدہحاصلمیںواسطوںتیزابیاورآبی-ہیںشامل
کےتیزیکابیجوںانمیںماحولتیزابیکےمعدےجائزہتقابلیکانتائجکےمقداروںکیبیجذریعےکےمائیکرواسکوپیالیکٹراناسکاننگ-ہےکرتاظاہرانجذابساتھ
کئمیںبیجوںکےکلونجیکہہوامعلومسےجسگیاکیامشاہدہبھیکاترکیبعنصری-ہیںجاتےپائےعناصرمائیکرواورمیکروضروری
تھائیموکیونونلئےکےکرنےمعلومpHمناسبدرکارلئےکےبننےکےپیچیداتپیچیدات)II(کوبالٹاور) IV(وینیڈیم،)II(کاپر،)VI(کرومیم،)III(تھائیمول کے آئرناورباالمندرجہکہہیںکرتےظاہرنتائج-گیاکیامطالعہبھیکے ذریعےمیٹریایچ-پیکا
پذیرقیاممقابلًتاساتھکےلیجنڈزدونوں) IV(وینیڈیماور) III(آئرنسےمیںدھاتوںکمنسبًتاپچیدہمیںمقابلےکےدھاتوںدوسریدھاتیں،دونوںنیزیہ-ہیںپیچیدات بناتے
pHکہظاہرکرتاہےجائزہتقابلیکاکے پیچیداتاورتھائیموکیونونتھائیمول-ہیںپربناتیقیام زیادہساتھکےدھاتوںکردہبیانتمامتھائیموکیونونمیںمقابلےکےتھائیمول
بھیقیمتکیpKaلئےکےلیجنڈزدونوںمیںتحقیقموجودہ-بناتاھےپزیرپیچیدات-گئکیمعلوم
،)III(آئرنبالخصوص(دھاتوںبھاریکہہےہوتااخذبھینتیجہیہسےتحقیقنظرزیرکرنےدورکواثراتزہریلےکے)) II(کوبالٹاور) IV(وینیڈیم،)II(کاپر،)VI(کرومیم

X
سےتحقیقاسکہجیسا-ہیںہوسکتےثابتمددگارتھائیمولاورتھائیموکیونونلئےکےلہذاہیںبناتےپیچیدہساتھکےدھاتوںتمامکردہبیانمرکٌباتدونوںیہکہہےہوتاظاہر
سےجسمکےدھاتوںزہریلیچیلیٹربطورمیںChelation therapyکومرکٌباتانAntiدونوںتھائیمولاورتھائیموکیونونکیونکہ-ہےجاسکتاکیااستعماللئےکےاخراج
oxidantمثًال-کردیںتخفیفکیدھاتوںانمرکٌباتیہکہہےممکنبھییہلہذاہیںاپنیدھاتیںیہاسطرحاورمیں) III(کرومیمکو) VI(کرومیممیں،) II(آئرنکو) III(آئرن
کےہونےضرربےلئےکےجسمانسانیجوہیںہوسکتیتبدیلمیںحالتشدہتخفیف-ہیںبھیمندفائدہساتھ

XI
LIST OF CONTENTSChapter Topics Page No.
Dedication IV
Acknowledgements V
Abstract VI
1 Introduction 1
1.1 General Introduction 1
1.2 Plant Introduction of Nigella sativa (Black Seed) 2
1.2.1 History of Black Seed 3
1.2.2 Origin 3
1.2.3 Morphology 3
1.2.4 Common Use 4
1.2.5 Cultivation and Collection of Black Seed 4
1.3 Chemical Constituents of Nigella sativa Seed 5
1.3.1 Essential Oil / Volatile Oil 5
1.3.2 Lipids 7
1.3.3 Fatty Acids 9
1.3.4 Steroids 9
1.3.5 Flavonoids 10
1.3.6 Saponins 10
1.3.7 Alkaloids 11
1.3.8 Amino Acids 12
1.3.9 Vitamins 12
1.3.10 Elements 12
1.3.11 Active Constituents of Nigella sativa 13

XII
1.4 Physical Constants of Nigella sativa Seed Oil 14
1.5 Nutritional Value of Nigella sativa Seed 15
1.6 Medicinal Properties of Nigella sativa 16
1.7 Biological Activities of Nigella sativa Seed 17
1.7.1 Antimicrobial Activity 18
1.7.2 Antioxidant Activity 20
1.7.3 Anticancer/ Antitumor/ Cytotoxic Activity 22
1.7.4 Apoptosis Induction Activity 23
1.7.5 Anti-inflammatory Activity 24
1.7.6 Antidiabetic/ Hypoglycemic Activity 25
1.7.7 Antihypertensive, Cardio-protective and Cholesterol Lowering Activity 27
1.7.8 Antihistaminic, Antagonistic, Antispasmodic Activity 29
1.7.9 Neuroprotective Effect and Effect in Neuropathy and Nephropathy 30
1.7.10 Immunomodulatory Activity 31
1.7.11 Analgesic Activity 31
1.7.12 Insecticidal and Anticestodal Activity 32
1.7.13 Effect on Fertility 32
1.7.14 Miscellaneous Activities 33
1.8 Toxicity 34
1.9 Minerals/Elements 35
1.9.1 Micro-nutrients (Trace Elements) 36
1.9.1.1 Iron 37
1.9.1.1.1 Role of iron in the body 37
1.9.1.1.2 Iron deficiency 38
1.9.1.1.3 Iron toxicity 38

XIII
1.9.1.1.4 Iron (III) complexes 39
1.9.1.1.5 Redox properties of iron 40
1.9.1.2 Chromium 41
1.9.1.2.1 Role of chromium in the body 41
1.9.1.2.2 Chromium deficiency 41
1.9.1.2.3 Chromium toxicity 42
1.9.1.2.4 Chromium (VI) complexes 42
1.9.1.2.5 Redox properties of chromium 43
1.9.1.3 Copper 43
1.9.1.3.1 Role of copper in the body 43
1.9.1.3.2 Copper deficiency 44
1.9.1.3.3 Copper toxicity 45
1.9.1.3.4 Cu (II) complexes 45
1.9.1.3.5 Redox properties of copper 46
1.9.1.4 Vanadium 47
1.9.1.4.1 Role of vanadium in the body 47
1.9.1.4.2 Vanadium deficiency 48
1.9.1.4.3 Vanadium toxicity 48
1.9.1.4.4 Vanadium (IV) complexes 48
1.9.1.4.5 Redox properties of vanadium 49
1.9.1.5 Cobalt 50
1.9.1.5.1 Role of cobalt in the body 50
1.9.1.5.2 Cobalt deficiency 50
1.9.1.5.3 Cobalt toxicity 50
1.9.1.5.4 Cobalt (II) complexes 51

XIV
1.9.1.5.5 Redox properties of cobalt 51
1.9.1.6 Manganese 52
1.9.1.6.1 Role of manganese in the body 52
1.9.1.6.2 Manganese deficiency 52
1.9.1.6.3 Manganese toxicity 52
1.9.1.7 Silicon 53
1.9.2 Toxic Elements 53
1.9.2.1 Cadmium 53
1.9.2.1.1 Role of cadmium 53
1.9.2.1.2 Cadmium toxicity 53
1.9.2.2 Aluminium 54
1.9.2.2.1 Role of aluminium 54
1.9.2.2.2 Aluminium deficiency 54
1.9.2.2.3 Aluminium toxicity 54
1.9.2.3 Arsenic 55
1.9.2.3.1 Role of arsenic 55
1.9.2.3.2 Arsenic deficiency 55
1.9.2.3.3 Arsenic toxicity 55
1.9.2.4 Lead 56
1.9.3 Macro-nutrients 56
1.9.3.1 Sodium 56
1.9.3.1.1 Role of sodium in the body 56
1.9.3.1.2 Sodium deficiency 57
1.9.3.1.3 Sodium toxicity 57
1.9.3.2 Potassium 57

XV
1.9.3.2.1 Role of potassium in the body 57
1.9.3.2.2 Potassium deficiency 58
1.9.3.2.3 Potassium toxicity 58
1.9.3.3 Calcium 58
1.9.3.3.1 Role of calcium in the body 58
1.9.3.3.2 Calcium deficiency 59
1.9.3.3.3 Calcium toxicity 59
2 Theoretical background 66
2.1 Chromatography 67
2.1.1 Liquid-solid Chromatography (LSC) 68
2.1.1.1 LSC Stationary Phase 68
2.1.1.2 LSC Mobile Phase 68
2.1.2 Thin-layer Chromatography (TLC) 69
2.2 Mass Spectrometry 70
2.2.1 Mass Spectrum 70
2.2.2 Application of Mass Spectrometry 71
2.3 Nuclear Magnetic Resonance Spectroscopy (NMR) 71
2.3.1 1H NMR 72
2.3.1.1 Chemical Shift 72
2.3.1.2 Peak Area/ Integration of Signal Area 72
2.3.1.3 Coupling/ Signal Splitting 73
2.3.2 Carbon-13 NMR 73
2.4 Infrared Spectroscopy 73
2.5 UV-Visible Spectroscopy 75
2.5.1 UV-Visible Spectrum 75

XVI
2.5.2 Principles of Absorption Spectroscopy 76
2.6 Scanning Electron Microscopy 77
2.6.1 Principles of Scanning Electron Microscopy 77
2.6.2 Scanning Process 78
2.6.3 Applications 78
2.6.3.1 Morphological Investigation 78
2.6.3.2 Compositional Contrast by Imaging with BS Electrons 78
2.6.3.3 Electron Backscattering Diffraction 78
2.6.3.4 Energy Dispersive X-Ray Spectroscopy 78
2.6.3.5 Wavelength Dispersive X-Ray Spectroscopy 78
2.6.3.6 X-Ray Diffractometry 79
2.7 pH-Metric Studies 79
2.7.1 pH-Meter 79
2.7.1.1 Standard Electrode 80
2.7.1.2 Indicator/ Special Electrode (The Probe) 80
2.7.1.3 Working of pH-Meter 81
2.7.2 pH-Metric Titrations 82
2.7.3 Stability of Constant Complexes 82
2.8 Electrochemical Studies 83
2.8.1 Voltammetry 83
2.8.2 Types of Voltammetry 84
2.8.3 Cyclic Voltammetry 84
2.8.3.1 Basic Principle of Cyclic Voltammetry 85
2.8.3.2 Cyclic Voltammogram 86
2.8.3.3 Supporting Electrolyte and Base Line 86

XVII
2.8.3.4 Types of Redox Reactions 87
2.8.3.4.1 Reversible process 90
2.8.3.4.2 Quasi-reversible process 90
2.8.3.4.3 Irreversible process 90
2.8.3.5 Applications of Cyclic Voltammetry 91
2.8.3.6 Limitations of Cyclic Voltammetry 91
3 Experimental work 95
3.1 Materials and Methods 95
3.1.1 Materials 95
3.1.2 Apparatus and Equipments 95
3.1.3 Collection and Pretreatment of Sample 96
3.1.4 Preparation of Samples and Solutions 96
3.1.4.1 Moisture Analysis 96
3.1.4.2 Dissolved and Undissolved Solid Determination 96
3.1.4.3 Scanning Electron Microscopy 96
3.1.4.4 Isolation 96
3.1.4.5 pH-Metric Studies 96
3.1.4.5.1 Calibration buffers 96
3.1.4.5.2 Sodium hydroxide solution 96
3.1.4.5.3 Thymol solution 97
3.1.4.5.4 Thymoquinone solution 97
3.1.4.5.5 Ferric chloride solution 97
3.1.4.5.6 Potassium dichromate solution 97
3.1.4.5.7 Copper sulphate solution 97
XVIII
3.1.4.5.8 Vanadyle sulphate solution 97
3.1.4.5.9 Cobolt acetate solutuin 97
3.1.4.6 Cyclic Voltammetric Study 97
3.1.4.6.1 Supporting electrolytes 97
3.1.4.6.2 Analyte solutions 98
3.2 Experimental Methods 98
3.2.1 General Treatment of Nigella sativa Seed 98
3.2.1.1 Moisture Content 98
3.2.1.2 Dissolved and Undissolved Solid (DS and UDS) 99
3.2.1.3 Scanning Electron Microscopy (SEM) 99
3.2.2 Extraction and Isolation of Nigella sativa Seed 99
3.2.3 pH-Metric Studies 101
3.2.3.1 pH-Metric Titrations of Ligands 101
3.2.3.1.1 pH-Metric titration of thymol (THY) 101
3.2.3.1.2 pH-Metric titration of thymoquinone (TQ) 102
3.2.3.2 pH-Metric Titrations of Thymol Complexes 102
3.2.3.2.1 Fe(III)-thymol complex 102
3.2.3.2.2 Cr(VI)-thymol complex 102
3.2.3.2.3 Cu(II)-thymol complex 102
3.2.3.2.4 V(IV)-thymol complex 103
3.2.3.2.5 Co(II)-thymol complex 103
3.2.3.3 pH-Metric Titrations of Thymoquinone Complexes 103
3.2.3.3.1 Fe(III)-thymoquinone complex 103
3.2.3.3.2 Cr(VI)-thymoquinone complex 104
3.2.3.3.3 Cu(II)-thymoquinone complex 104

XIX
3.2.3.3.4 V(IV)-thymoquinone complex 104
3.2.3.3.5 Co(II)-thymoquinone complex 104
3.2.4 Cyclic Voltammetric Studies 105
3.2.4.1 Cyclic Voltammeter 105
3.2.4.2 Description of CH-700 Cyclic Voltammeter 105
3.2.4.3 Caliberation of the Instrument 106
3.2.4.4 Repolishing of Working Electrode 107
3.2.4.5 Procedure to take Cyclic Voltammogram at CHI 760 System 107
3.2.4.6 Determination of Base Line 108
3.2.4.7 Cyclic Voltammograms of Analyte Solutions 109
3.2.4.7.1 Fe(III)-thymoquinone complex 109
3.2.4.7.2 Cr(VI)-thymoquinone complex 110
3.2.4.7.3 Co(II)-thymoquinone complex 111
3.2.4.7.4 Cu(II)-thymoquinone complex 112
3.2.4.7.5 V(IV)-thymoquinone complex 114
3.2.4.7.6 Cyclic voltammetric studies of thymol and its complexes 114
4 Results and discussion 119
4.1 General Treatment of Nigella sativa Seed 119
4.1.1 Moisture Content 119
4.1.2 Dissolved and Undissolved Solid 119
4.1.3 Scanning Electron Microscopy (SEM) 120
4.1.3.1 Macro-nutrients 120
4.1.3.1.1 Carbon 121
4.1.3.1.2 Oxygen 121
4.1.3.1.3 Sodium 121
XX
4.1.3.1.4 Potassium 121
4.1.3.1.5 Calcium 121
4.1.3.2 Trace Elements 122
4.1.3.2.1 Iron 122
4.1.3.2.2 Manganese 122
4.1.3.2.3 Cobalt 122
4.1.3.2.4 Chromium 122
4.1.3.2.5 Silicon 122
4.1.3.2.6 Cadmium 123
4.1.3.2.7 Arsenic 123
4.1.3.2.8 Aluminium 123
4.1.3.2.9 Lead 123
4.1.3.3 Surface Morphology 123
4.2 Extraction and Isolation of Nigella sativa Seed 124
4.3 pH Metric Studies 125
4.3.1 pH-Metric Titrations of Ligands 125
4.3.2 pH-Metric Titrations of Thymol Complexes 125
4.3.2.1 Fe(III)-Thymol Complex 126
4.3.2.2 Cr(VI)-Thymol Complex 126
4.3.2.3 Cu(II)-Thymol Complex 127
4.3.2.4 V(IV)-Thymol Complex 127
4.3.2.5 Co(II)-Thymol Complex 128
4.3.2.6 Fe(III)-Thymoquinone Complex 128

XXI
4.3.2.7 Cr(VI)-Thymoquinone Complex 129
4.3.2.8 Cu(II)-Thymoquinone Complex 129
4.3.2.9 V(IV)-Thymoquinone Complex 129
4.3.2.10 Co(II)-Thymoquinone Complex 130
4.4 Cyclic Voltammetric Studies 130
4.4.1 Fe(III) – Thymoquinone Complex 131
4.4.1.1 Effect of Scan Rate 132
4.4.1.2 Effect of Concentration 134
4.4.1.3 Effect of Metal-ligand Ratio 136
4.4.1.4 Effect of Repeated Scans 136
4.4.1.5 Analysis of E˚ 137
4.4.1.6 Analysis of Diffusion Coefficient 137
4.4.2 Cr(VI) – Thymoquinone Complex 137
4.4.2.1 Effect of Scan Rate 138
4.4.2.2 Effect of Concentration 139
4.4.2.3 Effect of Metal-ligand Ratio 140
4.4.2.4 Analysis of E˚ 141
4.4.2.5 Analysis of Diffusion Coefficient 141
4.4.3 Co(II) – Thymoquinone Complex 142
4.4.3.1 Effect of Scan Rate 143
4.4.3.2 Effect of Concentration 144
4.4.3.3 Effect of Metal-ligand Ratio 145

XXII
4.4.3.4 Effect of Repeated Scan 146
4.4.3.5 Analysis of E˚ 146
4.4.3.6 Analysis of Diffusion Coefficient 146
4.4.4 Cu(II) – Thymoquinone Complex 147
4.4.4.1 Effect of Scan Rate 148
4.4.4.2 Effect of Concentration 149
4.4.4.3 Effect of Metal-ligand Ratio 150
4.4.4.4 Effect of Repeated Scan 150
4.4.4.5 Analysis of E˚ 150
4.4.4.6 Analysis of Diffusion Coefficient 151
4.4.4.7 Effect of Supporting Electrolyte 151
4.4.5 Cyclic Voltammetric Studies of V (IV) – Thymoquinone Complex, 152Thymol and its Complexes
4.5 Recommendation for Future Work 153
5 CONCLUSION 306
6 APPENDICES 311
7 REFERENCES 314

XXIII
LIST OF TNBLES
Chapter NO: 1 INTRODUCTION Page No.
1.1 Recommanded Dietry Allowances (RDA) and Adequate Intakes (AI) 60
1.2 Tollerable Upper Intakes Levels (UL) 61
Chapter NO: 4 results and discussion
4.1 General Description of Nigella sativa 155
4.2 Percentage of Moisture in Nigella sativa Seed 156
4.3 Percentage of Dissolved and Undissolved Solid in Water Extract of Nigella sativa 157
4.4 Percentage of Dissolved and Undissolved Solid in Acid Extract of Nigella sativa 158
4.5 Determination of Elements in Nigella sativa by Scanning Electron Microscopy 159at 500 Magnification
4.6 Determination of Elements in Nigella sativa by Scanning Electron Microscopy 160at 4,500 Magnification
4.7 Determination of Elements in Nigella sativa by Scanning Electron Microscopy 161at 11,000 Magnification
4.8 Determination of Elements in Nigella sativa by Scanning Electron Microscopy 162at 35,000 Magnification
4.9 pH-metric Titration of Thymol 163
4.10 pH-metric Titration of Thymoquinone 164
4.11 pH-metric Titration of Fe(III)-Thymol Complex 165
4.12 pH-metric Titration of Cr(VI)-Thymol Complex 166
4.13 pH-metric Titration of Cu(II)-Thymol Complex 167
4.14 pH-metric Titration of V(IV)-Thymol Complex 168
4.15 pH-metric Titration of Co(II)-Thymol Complex 169
4.16 pH-metric Titration of Fe(III)-Thymoquinone Complex 170

XXIV
4.17 pH-metric Titration of Cr(VI)-Thymoquinone Complex 171
4.18 pH-metric Titration of Cu(II)-Thymoquinone Complex 172
4.19 pH-metric Titration of V(IV)-Thymoquinone Complex 173
4.20 pH-metric Titration of Co(II)-Thymoquinone Complex 174
4.21 Electrochemical Parameters of Cyclic- Voltammograms of Thymoquinone, Fe(III), 175and Fe(III)-Thymoquinone Complex
4.22 The Values of Ep, Ep/2, Ep-Ep/2, Epa-Epc and Ip from Voltammograms of Fe(III)- 176Thymoquinone Complex with Different Scan Rates
4.23 The Values of Ep, Ep/2, Ep-Ep/2, Epa-Epc ,Ipa, αna and βnb from Cyclic- 177Voltammograms of Fe(III)-Thymoquinone Complex with Different Concentrations
4.24 The Values of Ep, Ep/2, Epa-Epc, Ip and αna and βnb from Cyclic- Voltammograms of 178Fe(III)-Thymoquinone Complex with Different Metal-ligand Ratios
4.25 The Values of Half Wave Potential (E˚= E1/2) from Cyclic- Voltammograms of 179Fe(III)-Thymoquinone Complex at Different Scan Rates, with DifferentConcentrations and Metal-Ligand Ratios
4.26 Comprison of the Diffusion Coefficients of Thymoquinone, Fe(III), and Fe(III)- 180Thymoquinone Complex
4.27 Diffusion Coefficients of Fe(III)-Thymoquinone Complex at Different Scan Rates 181
4.28 Diffusion Coefficients of Fe(III)-Thymoquinone Complex at Different 182Concentrations
4.29 Diffusion Coefficients of Fe(III)-Thymoquinone Complex at Different 183Metal-ligand Ratios
4.30 Electrochemical Parameters of Cyclic Voltammograms of Thymoquinone, Cr(VI), 184and Cr(VI)-Thymoquinone Complex
4.31 The Values of Ep, Ep/2, Ep-Ep/2, Epa-Epc and Ip from Voltammograms of Cr(VI)- 185Thymoquinone Complex with Different Scan Rates
4.32 The Values of Ep, Ep/2, Ep-Ep/2, Epa-Epc ,Ipa, αna and βnb from Cyclic- 186Voltammograms of Cr(VI)-Thymoquinone Complex with Different Concentrations

XXV
4.33 The Values of Ep, Ep/2, Epa-Epc, Ip, αna and βnb from Cyclic- Voltammograms of 187Cr(VI)-Thymoquinone Complex with Different Metal-ligand Ratios
4.34 The Values of Half Wave Potential (E˚= E1/2) from Cyclic- Voltammograms of 188Cr(VI)-Thymoquinone Complex at Different Scan Rates, with DifferentConcentrations and Metal-Ligand Ratios
4.35 Comprison of the Diffusion Coefficients of Thymoquinone, Cr(VI), and Cr(VI)- 189Thymoquinone Complex
4.36 Diffusion Coefficients of Cr(VI)-Thymoquinone Complex at Different Scan Rates 190
4.37 Diffusion coefficients of Cr(VI)-Thymoquinone Complex at Different Concentrations 191
4.38 Diffusion coefficients of Cr(VI)-Thymoquinone Complex at Different 192Metal-ligand Ratios
4.39 Electrochemical Parameters of Cyclic Voltammograms of Thymoquinone, Co(II), 193and Co(II)-Thymoquinone Complex
4.40 The Values of Ep, Ep/2, Ep-Ep/2, Epa-Epc and Ip from Voltammograms of Co(II)- 194Thymoquinone Complex with Different Scan Rates
4.41 Values of the Ep, Ep/2, Ep-Ep/2, Epa-Epc ,Ipa, αna and βnb from Cyclic Voltammograms 195of Co(II)- Thymoquinone Complex with Different Concentrations
4.42 The Values of Ep, Ep/2, Epa-Epc, Ip, αna and βnb from Cyclic- Voltammograms 196of Co(II)-Thymoquinone Complex with Different Metal-ligand Ratios
4.43 The Values of Half Wave Potential (E˚= E1/2) from Cyclic- Voltammograms 197of Co(II)-Thymoquinone Complex at Different Scan Rates, with Different
Concentrations and Metal-Ligand Ratios
4.44 Comprison of the Diffusion Coefficients of Thymoquinone, Co(II), and Co(II)- 198Thymoquinone Complex
4.45 Diffusion Coefficients of Co(II)-Thymoquinone Complex at Different Scan Rates 199
4.46 Diffusion coefficients of Co(II)-Thymoquinone Complex at Different Concentrations 200
4.47 Diffusion coefficients of Co(II)-Thymoquinone Complex at Different 201Metal-ligand Ratios

XXVI
4.48 Electrochemical Parameters of Cyclic- Voltammograms of Thymoquinone, Cu(II), 202and Cu(II)-Thymoquinone Complex in NaCl
4.49 The Values of Ep, Ep/2, Ep-Ep/2, Epa-Epc and Ip from Voltammograms of Cu(II)- 203Thymoquinone Complex in NaCl at Different Scan Rates
4.50 The Values of Ep, Ep/2, Ep-Ep/2, Epa-Epc ,Ipa, αna and βnb from Cyclic- 204Voltammograms of Cu(II)-Thymoquinone Complex in NaCl with DifferentConcentrations
4.51 The Values of Ep, Ep/2, Epa-Epc, Ip, αna and βnb from Cyclic- Voltammograms of 205Cu(II)-Thymoquinone Complex in NaCl with Different Metal-ligand Ratios
4.52 The Values of Half Wave Potential (E˚= E1/2) from Cyclic- Voltammograms of 206Cu(II)-Thymoquinone Complex at Different Scan Rates, with DifferentConcentrations and Metal-Ligand Ratios
4.53 Comprison of the Diffusion Coefficients of Thymoquinone, Cu(II), and Cu(II)- 207Thymoquinone Complex in NaCl
4.54 Diffusion Coefficients of Cu(II)-Thymoquinone Complex in NaCl at Different 208Scan Rates
4.55 Diffusion Coefficients of Cu(II)-Thymoquinone Complex in NaCl at Different 209Concentrations in NaCl
4.56 Diffusion Coefficients of Cu(II)-Thymoquinone Complex in NaCl at Different 210Metal-ligand Ratios in NaCl
4.57 Electrochemical Parameters of Cyclic- Voltammograms of Thymoquinone, Cu(II), 211and Cu(II)-Thymoquinone Complex in LiCl
4.58 The Values of Ep, Ep/2, Ep-Ep/2, Epa-Epc and Ip from Voltammograms of Cu(II)- 212Thymoquinone Complex in LiCl at Different Scan Rates
4.59 The Values of Ep, Ep/2, Ep-Ep/2, Epa-Epc ,Ipa, αna and βnb from Cyclic 213Voltammograms of Cu(II)-Thymoquinone Complex in LiCl with DifferentConcentrations
4.60 The Values of Ep, Ep/2, Epa-Epc, Ip, αna and βnb from Cyclic- Voltammograms of 214Cu(II)-Thymoquinone Complex in LiCl with Different Metal-ligand Ratios

XXVII
4.61 The Values of Half Wave Potential (E˚= E1/2) from Cyclic- Voltammograms of 215Cu(II)- Thymoquinone Complex at Different Scan Rates, with Different
Concentrations and Metal-Ligand Ratios
4.62 Comprison of the Diffusion Coefficients of Thymoquinone, Cu(II), and Cu(II)- 216Thymoquinone Complex
4.63 Diffusion Coefficients of Cu(II)-Thymoquinone Complex in LiCl at Different 217Scan Rates
4.64 Diffusion coefficients of Cu(II)-Thymoquinone Complex at Different 218Concentrations in LiCl
4.65 Diffusion coefficients of Cu(II)-Thymoquinone Complex at Different 219Metal-ligand Ratios in LiCl

XXVIII
LIST OF SCHEMES
Chapter NO: 3 experimental work
I Extraction and Isolation Scheme 115
II Ethyl Acetate Residue Scheme 116

XXIX
LIST OF FIGURES
Chapter NO: 1 INTRODUCTION Page No.
1.1 Nigella sativa Plant 62
1.2 A Flower of Nigella sativa 63
1.3 (a) Nigella sativa Seeds 64(b) Close view of Nigella sativa Seed
1.4 Some Active Constituents of Nigella sativa Seed 65
Chapter NO: 2 Theoretical background
2.1 Scanning Process by SEM 92
2.2 A typical Cyclic Voltammogram 93
2.3 Cyclic Voltammograms for Reversible, Quasi reversible and Irreversible Reactions 94
Chapter NO: 3 experimental work
3.1 Cell for pH-metric Measurements 117
3.2 CHI-760 D Electrochemical Work Station Cyclic Voltammeter 118
Chapter NO: 4 results and discussion
4.1 Moisture Content of Nigella sativa 220
4.2 Percentage of DS and UDS in Water extract of Nigella sativa 221
4.3 Percentage of DS and UDS Acid extract of Nigella sativa 222
4.4 Comparison of Percentages of DS in Water and Acid Extracts of Nigella sativa 223
4.5 Comparison of Percentages of UDS in Water and Acid Extracts of Nigella sativa 224
4.6 Comparison of Total Solid Material (TS) in Water and Acid Extracts of 225Nigella sativa
4.7 Scanning Electron Micrograph of Nigella sativa at 35,000 Magnification 226
4.8 Scanning Electron Micrograph of Nigella sativa at 11,000 Magnification 227

XXX
4.9 Scanning Electron Micrograph of Nigella sativa at 4,500 Magnification 228
4.10 Scanning Electron Micrograph of Nigella sativa at 500 Magnification 229
4.11 pH-Metric Titration of Thymol 230
4.12 pH-Metric Titration of Thymoquinone 231
4.13 pH-Metric Titration of Thymol and Fe(III)-Thymol Complex 232
4.14 Species Distribution Curves for Fe(III)-Thymol Complex 233
4.15 pH-Metric Titration of Thymol and Cr(VI)-Thymol Complex 234
4.16 Species Distribution Curves for Cr(VI)-Thymol Complex 235
4.17 pH-Metric Titration of Thymol and Cu(II)-Thymol Complex 236
4.18 Species Distribution Curves for Cu(II)-Thymol Complex 237
4.19 pH-Metric Titration of Thymol and V(IV)-Thymol Complex 238
4.20 Species Distribution Curves for V(IV)-Thymol Complex 239
4.21 pH-Metric Titration of Thymol and Co(II)-Thymol Complex 240
4.22 Species Distribution Curves for Co(II)-Thymol Complex 241
4.23 pH-Metric Titration of Thymoquinone and Fe(III)-Thymoquinone Complex 242
4.24 Species Distribution Curves for Fe(III)-Thymoquinone Complex 243
4.25 pH-Metric Titration of Thymoquinone and Cr(VI)-Thymoquinone Complex 244
4.26 Species Distribution Curves for Cr(VI)-Thymoquinone Complex 245
4.27 pH-Metric Titration of Thymoquinone and Cu(II)-Thymoquinone Complex 246
4.28 Species Distribution Curves for Cu(II)-Thymoquinone Complex 247
4.29 pH-Metric Titration of Thymoquinone and V(IV)-Thymoquinone Complex 248
4.30 Species Distribution Curves for V(IV)-Thymoquinone Complex 249
4.31 pH-Metric Titration of Thymoquinone and Co(II)-Thymoquinone Complex 250
4.32 Species Distribution Curves for Co(II)-Thymoquinone Complex 251

XXXI
4.33 Cyclic- Voltammograms of NaCl, Thymoquinone, Fe(III) and Fe(III)-Thymoquinone 252Complex at 0.1V/sec
4.34 Cyclic Voltammogram of Fe(III)-Thymoquinone Complex at Different Scan Rates 253
4.35 Variation of Anodic and Cathodic Peak Current with Square root of Sweep Scan- 254Rate from the Cyclic voltammograms of Fe(III)-Thymoquinone Complex
4.36 Variation of Anodic and Cathodic Peak Potential with Sweep Rate from Cyclic- 255Voltammograms of Fe(III)-Thymoquinone Complex
4.37 Cyclic- Voltammograms of Fe(III)-Thymoquinone Complex Showing Effect of 256Concentration
4.38 Plot of Anodic and Cathodic Peak Current against Concentration of Fe(III)- 257Thymoquinone Complex
4.39 Variation of Anodic and Cathodic Peak Potential with log of Concentration on 258Cyclic- Voltammogram of Fe(III)-Thymoquinone Complex
4.40 Cyclic- Voltammogram of Fe(III)-Thymoquinone Complex Showing Effect of 259Metal – Ligand Ratio
4.41 Variation of Anodic and Cathodic Peak Potentials with Change of Metal - Ligand 260Ratio in Cyclic- Voltammogram of Fe(III)-Thymoquinone Complex
4.42 Variation of Anodic and Cathodic Peak Currents with Change of Metal - Ligand 261Ratio in Cyclic- Voltammogram of Fe(III)-Thymoquinone Complex
4.43 Repeated Scan Cyclic- Voltammogram of Fe(III)-Thymoquinone Complex 262
4.44 Cyclic- Voltammograms of Thymoquinone, Cr(VI) and Cr(VI)-Thymoquinone 263Complex in NaCl at 0.1V/sec
4.45 Cyclic- Voltammogram of Cr(VI)-Thymoquinone Complex at Different Scan Rates 264
4.46 Variation of Anodic and Cathodic Peak Current with Square root of Sweep Scan- 265Rate from the Cyclic- Voltammograms of Cr(VI)-Thymoquinone Complex
4.47 Variation of Anodic and Cathodic Peak Potential with Sweep Rate from Cyclic- 266
Voltammograms of Cr(VI)-Thymoquinone Complex

XXXII
4.48 Cyclic- Voltammograms of Cr(VI)-Thymoquinone Complex Showing Effect of 267Concentration
4.49 Plot of Anodic and Cathodic Peak Current against Concentration of Cr(VI)- 268Thymoquinone Complex
4.50 Variation of Anodic and Cathodic Peak Potential with log of Concentration on 269Cyclic-Voltammogram of Cr(VI)-Thymoquinone Complex
4.51 Cyclic- Voltammogram of Cr(VI)-Thymoquinone Complex Showing Effect of 270Metal – Ligand Ratio
4.52 Variation of Anodic and Cathodic Peak Potentials with Change of Metal - Ligand 271Ratio in Cyclic voltammogram of Cr(VI)-Thymoquinone Complex
4.53 Variation of Anodic and Cathodic Peak Currents with Change of Metal - Ligand 272Ratio in Cyclic voltammogram of Cr(VI)-Thymoquinone Complex
4.54 Cyclic- Voltammograms of Thymoquinone, Co(II) and Co(II)-Thymoquinone 273Complex in NaCl at 0.1V/sec
4.55 Cyclic- Voltammogram of Co(II)-Thymoquinone Complex at Different Scan Rates 274
4.56 Variation of Anodic and Cathodic Peak Current with Square root of Sweep Scan- 275Rate from the Cyclic- Voltammograms of Co(II)-Thymoquinone Complex
4.57 Variation of Anodic and Cathodic Peak Potential with Sweep Rate from Cyclic- 276Voltammograms of Co(II)-Thymoquinone Complex
4.58 Cyclic- Voltammograms of Co(II)-Thymoquinone Complex Showing Effect of 277Concentration
4.59 Plot of Anodic and Cathodic Peak Current against Concentration of Co(II)- 278Thymoquinone Complex
4.60 Variation of Anodic and Cathodic Peak Potential with log of Concentration on 279Cyclic-Voltammogram of Co(II)-Thymoquinone Complex
4.61 Cyclic- Voltammogram of Co(II)-Thymoquinone Complex Showing Effect of 280Metal – Ligand Ratio
4.62 Variation of Anodic and Cathodic Peak Potentials with Change of Metal - Ligand 281Ratio in Cyclic- Voltammogram of Co(II)-Thymoquinone Complex
4.63 Variation of Anodic and Cathodic Peak Currents with Change of Metal - Ligand 282Ratio in Cyclic- Voltammogram of Co(II)-Thymoquinone Complex

XXXIII
4.64 Repeated Scan Cyclic- Voltammogram of Co(II)-Thymoquinone Complex 283
4.65 Cyclic- Voltammograms of Thymoquinone, Cu(II) and Cu(II)-Thymoquinone 284Complex in NaCl at 0.1V/sec
4.66 Variation of Anodic and Cathodic Peak Current with Square root of Sweep Scan- 285Rate from the Cyclic- Voltammograms of Cu(II)-Thymoquinone Complex in NaCl
4.67 Variation of Anodic and Cathodic Peak Potential with Sweep Rate from Cyclic- 286Voltammograms of Cu(II)-Thymoquinone Complex in NaCl
4.68 Cyclic- Voltammograms of Cu(II)-Thymoquinone Complex Showing Effect of 287Concentration in NaCl
4.69 Plot of Anodic and Cathodic Peak Current against Concentration of Cu(II)- 288Thymoquinone Complex
4.70 Variation of Anodic and Cathodic Peak Potential with log of Concentration on 289Cyclic- Voltammogram of Cu(II)-Thymoquinone
4.71 Cyclic- Voltammogram of Cu(II)-Thymoquinone Complex Showing Effect of 290Metal – Ligand Ratio in NaCl
4.72 Variation of Anodic and Cathodic Peak Potentials with Change of Metal - Ligand 291Ratio in Cyclic- Voltammogram of Cu(II)-Thymoquinone Complex in NaCl
4.73 Variation of Anodic and Cathodic Peak Currents with Change of Metal - Ligand 292Ratio in Cyclic- Voltammogram of Cu(II)-Thymoquinone Complex in NaCl
4.74 Repeated Scan Cyclic- Voltammogram of Cu(II)-Thymoquinone Complex in NaCl 293
4.75 Cyclic- Voltammograms of Thymoquinone, Cu(II) and Cu(II)-Thymoquinone 294Complex in LiCl at 0.1V/sec
4.76 Cyclic- Voltammogram of Cu(II)-Thymoquinone Complex at Different Scan Rates 295in LiCl
4.77 Variation of Anodic and Cathodic Peak Current with Square root of Sweep Scan 296Rate from the Cyclic- Voltammograms of Cu(II)-Thymoquinone Complex in LiCl
4.78 Variation of Anodic and Cathodic Peak Potential with Sweep Rate from Cyclic- 297Voltammograms of Cu(II)-Thymoquinone Complex in LiCl
4.79 Cyclic- Voltammograms of Cu(II)-Thymoquinone Complex Showing Effect of 298Concentration in LiCl

XXXIV
4.80 Plot of Anodic and Cathodic Peak Current against Concentration of Cu(II)- 299Thymoquinone Complex in LiCl
4.81 Variation of Anodic and Cathodic Peak Potential with log of Concentration on 300Cyclic- Voltammogram of Cu(II)-Thymoquinone Complex
4.82 Cyclic- Voltammogram of Cu(II)-Thymoquinone Complex Showing Effect of 301Metal – Ligand Ratio in LiCl
4.83 Variation of Anodic and Cathodic Peak Potentials with Change of Metal – Ligand 302Ratio in Cyclic- Voltammogram of Cu(II)-Thymoquinone Complex
4.84 Variation of Anodic and Cathodic Peak Currents with Change of Metal – Ligand 303Ratio in Cyclic- Voltammogram of Cu(II)-Thymoquinone Complex in LiCl
4.85 Repeated Scan Cyclic- Voltammogram of Cu(II)-Thymoquinone Complex in LiCl 304
4.86 Cyclic- Voltammogram of Cu(II)-Thymoquinone Complex in NaCl and LiCl 305at 0.1 V

CHAPTER NO 1
INTRODUCTION
1.1 General Introduction
Plants and man are inseparable [1]. The use of plants for healing purposes is as old as the history
of human beings [2]. They started using plants from ancient time and realized that most of the
plants can be used as food; beside this some of them possess medicinal properties.
Medicinal plants are the backbone of traditional medicines [3]. In 1806 AD morphine was
isolated and then researchers found a new way for the search of beneficial drugs from plants. The
researchers concentrated more on medicinal plants after the isolation of quinine, nicotine,
cocaine and papaverine [4, 5]. Actually medicinal plants contain biologically active chemical
substances which are helpful to cure diseases. In addition, plants contain other chemical
compound medicines including herbal medicines and teas in which active compounds of the
plants are directly used. On the one hand these plants are an important source of medicines on
the other hand they provide active substances with potential properties effects. They possess
untapped potential.
As the research towards active constituents of the medicinal plants further proceeded it resulted
in preparation of several synthetic drugs. According to World Health Organization (WHO) 80%
of the world population uses plants extracts to cure different diseases because of their
effectiveness with no harmful side effects, low cost, easy access, ancestral experience and high
cost of other forms of treatments [6-20].
Major problem in the treatment of many infectious diseases through antibiotics is the developed
resistance of microorganisms against that drug. Moreover, most of the antibiotics have adverse
effects [21].
Several substances extracted from plants are also used as pesticides and preferred on synthetic
pesticides due to hazardous effects of the later on living beings and environment [22-24].

2
The great importance and the considerable use of Indian medicinal plants in many developing
countries attracted the interest of WHO which intensified efforts on the documentation of
ethnomedical data of medicinal plants [25-27]. It has been estimated that in developing countries
70-80% of the population often relies on herbal remedies [28]. Every country in the world has list
of herbal remedies for the treatment of disease and different other pathological conditions [29].
Research on medicinal plants is increasing day by day. This is because of the fact that other
methods of the treatment of diseases are also effective but most of them cause severe side effects
and complications. With the advent of biotechnology and various tools and techniques available,
researchers have been able to elucidate the molecular mechanism of plant products interaction
with human body. Not surprisingly the results have led to the identification and elucidation of a
number of potential molecules that have widespread implications in a number of chronic diseases
[30].
1.2 Plant Introduction of Nigella sativa (Black Seed)
Black seed is the medicinal plant which is the main concern of this research study. There are
different names used for the herb of black seed. For example, it is named as “Panacea” in old
Latin which means “cure all”, whereas in Arabic it is known by two names “Habbah Sawda” and
“Habbatal Baraka”, means “Seeds of blessing”. It has given this name due to its strong healing
qualities for different diseases [28, 31]. In English in addition to black seed it is also called as
Black Cumin and sometimes as Small Fennel [32-36] or Nutmeg Flower [35] in Urdu as Kalongi,
in Persian as Shonaiz [36] and as Siyah daneh, in Unani as Kalongi and Kamaazaruus [33], in
Hindi as Kala jira and Kulangi, in French as Cumin noir [32], black caraway, in Roman
coriander or carvi, in German as schwarzkummel, in Russian as chernushka, in Turkish as corek-
out, whereas in China it is known as Hak Jung Chou [31]. Its trade name is Kalwanjee [37],
whereas it is commonly known as Kalongi [37-39].
The plant belongs to the Ranunculancae family [32-37]. Its genus is Nigella which includes
important species such as N. arvensis, N. bucharica, N. ciliaris, N. damascene, N. hispanica, N.
integrifolia, N. nigellastrum, N. orientalis and N. sativa. Among all of these, the most
exhaustively studied specie is N. sativa due to the fact that it possesses innumerable therapeutic
properties [31].

3
1.2.1 History of Black Seed
Black seed has been discovered in the tomb of Tutankhamen. Its earliest written reference is
found in the book of Isaiah in the Old Testament (Isaiah 28:25, 27 N KJV). A Greek physician
named Dioscorides in 1st Century reported that black seed has been used to treat headaches,
toothache, congestion, and intestinal worms in addition; it was also used as diuretic. The seeds
were known to promote menstruation and increase secretion of milk. Al-Biruni (973-1048)
described the black seed as a kind of grain termed as alwanak in the Sigzi dialect. Afterwards
this was confirmed by Suhar Bakhat who reported it as habb-i-Sajzi (viz. Sigzi grains). The word
“grain” for the black seed refers its use for nutritive purpose during the 10th and 11th centuries.
The Unani system of medicine, which was founded in Greece, described black seed to be
effective in hepatic and digestive disorders.
According to Ibn Sina the black seed helps the body to recover from fatigue and it also
stimulates body’s energy. Al-Tibb al-Nabawi also include black seeds under the list of natural
drugs, it has been referred as “Hold onto the use of black seed, it has a remedy for every illness
except death” [36, 40- 42].
1.2.2 Origion
Black seed is thought to be indigenous to the Mediterranean region, but it has been cultivated in
many other parts of the world also. It is widely cultivated throughout Arabian Peninsula,
Northern Africa, South Europe, Syria, Egypt, Saudi Arabia, Turkey, Iran, Pakistan, India and
Afghanistan and is now well known in USA [36, 43, 44]. In Pakistan and India it is cultivated as
an annual herb [45-48].
1.2.3 Morphology
It is a pretty small annual herb (Fig. 1.1), 30-60 cm in height, slender or stout. It has an erect and
round stem which is 2-5 mm in diameter. The plant has finely divided grayish-green alternate
leaves. The lower leaves are usually small and petioled, whereas upper leaves are sessile. The
leaf segments are narrowly linear to thread like. The herb contains beautiful greenish-white or
bluish-white flowers (Fig. 1.2) which are star shaped having small petals. The fruit capsule has
5-12 more or less united follicles, each containing many black trigonal, rugulose-tubercular
seeds. The flowers produce abundant pollen and are attractive to bees [34, 35, 37, 43, 49- 59].

4
The ripe seed (Fig. 1.3(a) and (b)) is black, flat and oblong angular. It is slightly aromatic and
has camphor like scent. It has bitter, sharp taste. The seed has a length of about 0.2 cm and width
of about 0.1 cm. The transverse section of the black seed reveals that it consists of single layer of
epidermis, 2-4 layers of parenchymatous cells and a pigmented layer. The cells of all the types of
layers are thick-walled. The cells of the first layer are elliptical in shape, whereas of the second
one are tangentially elongated and the third layer has rectangular elongated cells. Inner to these
layers another layer having rectangular and elongated cells is present while endosperm is
composed of thin-walled cells which are polygonal in shape and are usually filled with globules
of oil [35, 36, 52].
1.2.4 Common Use
Black seeds are commonly used in recipes in Asian countries since 2000 years [53]. Locally
seeds are often used as condiment in curries, pickles. It is used to flavor bread, candies, and
bakery and confectionary items. It is also a common practice to spread the seeds between folds
of woolen clothing to prevent worm damage. The oil is used in perfumery and for flavoring
soups, cheese and soap industry [32, 36, 44, 54-63].
1.2.5 Cultivation and Collection of Black Seed
For cultivation of black cumin, dried seeds are first sown by broadcasting method in rows. Dry
atmosphere is very important for good growth. While cultivating, care should be taken that the
temperature range should be between 13-12 °C. It is very necessary to cultivate black cumin in
humus soil which has pH of 5.6 to 8.2 for its luxuriant growth. When the plants are grown up to
a meter, in the winter season, they are transplanted in the field where further growth takes place.
During blossoming, in the spring the plant bears flowers. After pollination takes place, the petals
of the flower wither off and development of fruit starts. This is ultimately nothing but a seed. So
when the fruit is dried the seed is formed [64].
To collect the seeds, fruits are not allowed to ripe on the plants. Hence the entire plant is
uprooted and dried in sun. Next, they are beaten and thrashed with stick in order to separate the
seeds from the stalks. Finally, the unwanted plant parts are removed and seeds are collected in
dry bags.

5
1.3 Chemical Constituents of Nigella sativa Seed
The chemical composition of N. sativa seed is very rich. These little seeds have over one
hundred different chemical constituents. Black Seed contains moisture 7.43%, ash 3.7-4.14%,
fixed 36-38%, volatile oil 1.64%, protein 21%, fats 5.5%, essential oil 0.4-2.5%. It was also
reported to contain cellulose 8.32%, albumin 8.2%, organic acid 38%, mucilage 1.9%, melanthin
1.4%, metabin 1.36% and sugar 2.75% [32, 46, 60, 65-68].
In a research [69] Nigella seeds crude fat content was found up to 38.7% and seeds were also
found to be a good source of protein, being about 21%. The seeds possessed a high concentration
of crude fiber; while starch, sugars, ash and non-protein nitrogen were quite low.
In another research [70] oil seed residue of N. sativa was found to contain protein 34.03%, fiber
7.16%, moisture 6.04% and ash 4.4%. The seeds have also been reported as a good source of
several essential minerals such as sodium, potassium, calcium, iron, copper, zinc, magnesium
and selenium [71].
As major constituents of seeds of N. sativa, presence of alkaloids [47, 72-76], saponins [48, 76-
79], sterols [80-81], fatty acids [82-84], amino acids [85] and essential oil [84-86] have been
frequently reported [87, 88]. A bitter principle Nigellin, tannins, resins, reducing sugar,
glucosidal saponin, melanthin and also 1.0% melantigenin are the minor constituents [88-90].
1.3.1 Essential Oil / Volatile Oil
N. sativa seeds contain a volatile oil 1.5%, which is the active constituent. It consists of three
components; an unsaturated ketone called as carvone (45-60%), a terpene known as carvene and
cymene [32].
Jukneviciene et al. have reported that N. sativa seed contained 0.45% essential oil [91]. In
addition, the volatile contains thymoquinone (thymoil), thymol and −limonene. Citronellyl
acetate and (+) citronellol also detected by GLC. It contains esters of unsaturated fatty acids,
dehydro stearic acid, linoleic acid, sesquiterpenoid and higher terpenoids.It also contains
aliphatic alcohols and β unsaturated hydroxyketones [92, 93].
It has also been reported that as a result of an analysis of the oil from N. sativa seeds by capillary
gas chromatography coupled to a mass spectrometer 67 compounds were obtained. The oil

6
contained 46% monoterpenes the main components of which were p-cymene (31.7%) and α-
pinene (9.3%). The oil also contained 25 carbonyl compounds mainly thymoquinone (24.5%)
whereas phenols, alcohols and esters were also present [44].
In a research, in 2000, the essential oil of the seeds was investigated the by coupled GC-MS and
identified 18 volatile compounds. The most abundant compounds were p-cymene, g-terpinene, a-
campholenal and a- thujene respectively [94]. In a research, in 2003, the volatile oil composition
of N. sativa seeds was found to contain trans-anethole, p-cymene, limonene and carvone as
major components [95].
El-Ghorab and Ahmed, in the same year, isolated the volatile oil of N. sativa by supercritical
fluid extraction (SFE) and analysed the oils by GC-MS. The main components found were
thymoquinone (41.05%), β-cymene (10.64%) and caryophyllene (1.89%) [96]. In a research, in
2004, a comparative study of the volatile components in chloroform extracts and essential oils
from seeds of N. sativa was carried out by GC and GC/MS. The seeds contained volatile
compounds monoterpenes, including p-cymene (49.0% ext.,47.4% oil) and thymoquinone
(20.6% ext., 20.8% oil) [97].
Powel and Dorota, in 2004, studied the effect of pressure; process temperature and moisture
content of extracted raw material on the quality and percentage of components of essential oil
from N. sativa. They found that it appeared possible to affect the product composition by
selecting the extraction parameters [98].
A research study conducted in 2005 on essential oil of N. sativa by GC and GC-MS identified 38
components. Out of which p-cymene (36.2%) and thymoquinone (11.27%) were reported as
major components while α-thujene, longifolene, β-pinene, α-pinene and carvacrol were also
detected in considerable quantities [99].
In the same year another research was conducted in which N. sativa essential oil was extracted
by two different procedures hydrodistillation and microwave assisted process. The last
mentioned method gave the best yield with reduction of the extraction time and high amount of
the volatile fraction. The analysis of the oil was performed by hydrodistillation and by
microwave process. 108 & 48 components were identified in the seed oil respectively obtained
by above mentioned techniques. The main constituent were p-cymene (26.7%, 36.5%), α-thujene

7
(15.35%, 16.5%), sabinene (13.0%,7.5%), thymoquinone (5.9%,14.7%), carbacrol (4.6%,1.9%),
trans-sabinene hydrate (2.8%,2.2%), γ-terpinene (2.8%, 1,9%), longifolene (1.3%, 3.1% ) and α-
longipinene (1.6%, 1.1% ) [100].
In 2006, the GC and GC/MS analysis of the oils carried out and showed that oils were rich in
volatile compounds, such as p-cymene and thymoquinone which have medicinal properties.
Monoterpenes and ketones constitute the principal classes of oils [36, 101]
Farid and Aoumeur, in 2007, collected N. sativa seeds from two different locations in Sahara
desert and conducted extraction of essential oil by hydrodistillation and microwave distillation
process [102].
A research, conducted in 2008, identified 48 compounds in the essential oil, out of which 14
were new. Two monoterpenoids and cis and trans-4- methoxythujane were also isolated from N.
sativa seeds [103].
In a study, in the same year, N. sativa seed essential oil was obtained by different techniques
including hydro distillation, dry steam distillation and steam distillation of crude oil. The results
showed that the essential oils tested differed markedly in their chemical compositions. The oils
obtained by first two techniques were dominated by p-cymene [104]. Recently, in 2010, the
volatile oil from seeds of N. sativa was extracted by steam distillation. Its analysis by GC-MS
yielded nine volatile oils [105].
In another research, in the same year, the chemical composition of the volatiles obtained from
the fixed oils of N. sativa seeds was investigated. It gave thymoquinone and thymohydroquinone
as predominant antioxidant compounds, while monoterpene hydrocarbons constitute relatively
the lower fraction [106].
1.3.2 Lipids
In a research in 1993, it was found that Nigella seed lipids consisted of 8 fractions of glyceride
and non-glyceride compounds with triglycerides being the major fraction [69]. In a research total
tocopherols of the oil were determined [107], whereas in another study, in the same year
presence of α-, β-, γ- and - tocopherols in crude oil was determined. Phospholipid composition

8
include phosphatidylethanolamine (94.3%), phosphatidyl choline (5.4%) and
phosphatidylinositol (0.3%) [108].
In a research study, the total lipid contents of N. sativa seeds were found 31.8%. Neutral lipids
were predominant while the glycolipids and phospholipids were present in lower quantities.
Glycolipids consisted of monogalactosyldiglyceride, digalactosyldiglyceride, acylated
sterylgalactoside and sterylgalactoside. The phospholipids consisted of
phosphatidylethanolamine, phosphatidylinositol, phosphatidylcholine, cardiolipin and
phosphatidylglycerol. Lysophosphatidylethanolamine and lysophosphatidylcholine were present
in small amounts [44, 109].
In a study, the GC-MS analysis of N. sativa seeds fatty oil revealed the presence of 26
compounds which were identified as Me hept 6-enoate, 1- phenylhepta-2, 4-dione, pentadecane ,
hexadec- 1-ene, 1-phenyldecan-2-one, octadec-1-ene, octadecane, Me-pentadecanoate, bis (3-
chlorophenyl) ketone, di-Et phthalate, Et octadeo-7-enoate, Me octadecanoate, tricos -9-ene,
octadeca -9,12-dienoic acid, hexadecanoic acid, Me hexadecanoate, Me octadec-15-enoate,
henicoran-10-one, 2-Me octadecanoic acid, docos-1-ene, Et octadecanoate, Me octadecanoate,
pentacos -5- ene, 12-methyl tricosane, di-Bu phthalate and 2-methyl tetracosane [110].
Deineka and co-workers, in 2004, carried out quantitative determination of triglycerides from
plant oils using reversed-phase HPLC. The chromatogram of seed oil showed triglycerides from
cis-11, cis-14- eicosadienoic acid [111]. In a research two aliphatic esters, pentyl undecanoate
and methyl octadeca-14, 16- dienoate were isolated [112].
In another study, in 2006, N. sativa seed oil was classified by thin layer chromatography into
neutral lipids (94.7%) and polar lipids (5.3%). The natural lipids identified were sterol esters
(2.8%), triacylglycerols (67.1%), free fatty acids (3.2%), 1, 3-diacylglycerols (5.7%), 1, 2-
diacylglycerols (4.3%), sterols (1.2%), 2-monoacylglycerols (5.9%) and 1-monoacylglycerols
(4.5%). The polar lipids were phosphatidylethanolamines (1.7%), phosphatidylcholines (1.5%),
lysophosphatidylethanolamines (1.2%) and phosphatidylinositols (0.9%) [113].
In a research, in 2008, novel lipids were isolated from the unsaponified matter extracted from
seed of N. sativa by using n-hexane. The new dieonate was Me nonadeca-15, 17 dienoate and

9
two monoesters were pentyl hexade-12-enoate, and pentyl pentadec -11- enoate, which were the
new lipids. These were identified by spectral and chemical analysis [114].
1.3.3 Fatty Acids
In different research studies the fatty acid content of N. sativa seed oil was found to be consisting
of linoleic acid (56%) as major constituent followed by oleic acid (24.6%) and palmitic acid
(12%). Stearic acid (3%), eicosadienoic acid (2.5%), linolenic acid (0.7%) and myristic acid
(0.16%) were detected in relatively low quantities [66, 95, 108, 113].
In a research, in 2007, fatty acid composition in seven commercially available and three freshly
extracted samples were determined by gas liquid chromatography. The total amount of saturated
fatty acids, palmitic and stearic acid was found to be 17.77% i.e, 14.82% palmitic acid, and
2.95% stearic acid. Monounsaturated fatty acids oleic acid was 24.17%, whereas polyunsaturated
fatty acid (ω6) was identified as the major component, being 53.64%. An unusual fatty acid,
eicosadienoic acid (2.3%) was also found. This acid was first reported by Houghton [115]. In
other studies myristic, palmitoleic, myristoleic and some other fatty acids were also detected in
minor quantities [70, 116, 117].
The seed oils from six plant species were analyzed for their fatty acid composition in a research
in 2010. Out of these, black seed oil was found to contain maximum quantity of unsaturated fatty
acids having 73.79% [118].
1.3.4 Steroids
In a research, in 1963, β-sitosterol was separated from unsaponified matter of N. sativa seed oil
and confirmed by acetate and benzoate derivatives [84]. Salam in 1973 reported that N. sativa
seed oil contained cholesterol, compesterol, stigmasterol, β-sitosterol and α-spinasterol [81]. In
two different researches composition of sterols for N. sativa seed was studied. The sterols were
β-sitosterol, compesterol and stigmasterol [107, 108]. Polyphenol content was also studied [107].
In another research, in 2006, one steroid was isolated from the seeds of N. sativa. It was
recognized as ergosta-5, 24 (28)-dien-2, 3-cis-diol [112]. In 2009, polyphenolic composition of
N. sativa seed methnol extract was determined and vanillic acid was found predominant [119]. In
2011, total phenolic amounts of plant extracts obtained from some common Mediterranean plant

10
species including N. sativa. The phenolic constituents of these extracts also determined using
HPLC. The content was found a good source of antioxidants for application in food [120].
1.3.5 Flavonoids
Merfort and co-workers, 1997, isolated three new flavonoid glycosides from black seeds and
identified them as:
(i) quercetin 3-O- β-gluco-pyronosyl (1→2)-O-β-galactopyranosyl (1→2)-O-β-
glucopyranoside,
(ii) kaempferol 3-O- β-gluco-pyranosyl (1→2)-O-β-galactopyranosyl (1→2)-O-β-
glucopyranoside,
(iii) quercetin 3-O- (6-feruloyl-β-glucopyranosyl) (1→2)-O-β-galactopyranosyl (1→2-O-
β -gluco-pyranoside
In addition to this, they isolated three known flavonoids also [121].
In another research, in 1999, a flavonol triglycoside was found from N. sativa seeds, and
identified as kaempferol 3-O-[ β-D-glucosyl-(1→2)-O-β-D-glucosyl-(1→2)] glucoside [122].
Chemical study of n-butanol fraction of N. sativa seeds, in 2005, resulted in the isolation and
identification of kaempferol, astragallin and α- hederin in addition to some known compounds
[123].
In another research, in the same year, chemical study of n-butanol fraction of seeds marc leads to
isolation and identification of kaempferol, astragallin, α - hederin, 3-O-[ β-D-
xylopyranosyl(1→3) - α -L-rhamnopyranosyl(1→2) - α -L-arabinosyl ] 27 hederagenin, 3-O-[ β-
D-xylopyranosyl - (1→3) - α -L-rhamnopyranosyl - (1→2) – α -L-arabinosyl ]-28-O- [ α-L
rhamnopyranosyl (1→4) β- D- glucopyranosyl- (1→6)-β-D- glucopyranosyl] hederagenin and
kaempferol -3-O- β-D-gluco- pyranosyol (1→2) )-β-D- glucopyranosyl (1→2) -β- D-
glucopyranoside [124].
1.3.6 Saponins
Tiwari, in 1946, has reported that N. sativa seeds previously extracted with benzene to remove
fats, contained tannin, reducing sugars and some glucoside or polysaccharides. An amorphous
compound C20 H32 O7, having melting point 310 ˚C, giving reactions of a saponin was isolated.

11
Its hydrolysis gave a yellow phenol C14 H22 O2 and a carbohydrate [77]. Bose and co-workers
has reported presence of higher terpenoids, as well as aliphatic alcohols in N. sativa seeds [82].
In a research, in 1988, a saponin was isolated from black seeds and identified as 3-O-[β-D-
xylopyranosyl - (1-3) - α -L-rhamnopyranosyl - (1→2) - α -L-arabinopyranosyl]-28-O- [ α -L-
rhamnopyranosyl- (1-4) -β- D- glucopyranosyl- (1-6)-β-D- glucopyranosyl] –hederagenin. The
saponin was isolated by chromatography and was analysed by spectroscopy [48].
In another research, two triterpene saponins were isolated from seeds of N. sativa. They were
identified as 3-O-[β-D-xylopyranosyl - (1→3) - α-L-rhamnopyranosyl - (1→2) - α -L-
arabinopyranosyl]-28-O- [α -L- rhamnopyranosyl- (1→4) -β- D- glucopyranosyl]- hederagenin
and 3-O-[β-D-xylopyranosyl - (1→3) - α -L-rhamnopyranosyl - (1→2) - α -L-
arabinopyranosyl]- hedergenin [122].
Mehta and co-workers, in 2008, isolated two new triterpenoid from the n-hexane extract of the
seeds and identified it as cycloart-23-methyl-7, 20, 22-triene-3β, 30-diot and cycloart-3-one-7,
22- diene-24-ol. Two aliphatic compounds and two known sugars were also isolated from
alcoholic extract [125].
In 2009, a new glycosylated triterpene was isolated and identified as 3-O-[β-D-xylopyranosyl -
(1→3) - α -D-rhamnopyranosyl (1→4) -β- D- glucopyranosyl] -11- methoxy -16- hydroxyl-17-
acetoxy hederagenin [126].
1.3.7 Alkaloids
Keller has isolated an alkaloid named damascenine from the seeds of N. sativa [48, 79]. In a
study, related to chemical constituents of the seeds, a pyridine alkaloid was found to a small
extent [82]. According to some other researches the seeds were also reported to contain
connigelline and negelline [35].
Atta-ur-Rehman and co-workers, in 1985 isolated a new minor isoquinoline alkaloid, nigellimine
N-oxide from seeds of N. sativa [72]. In the same year another alkaloid nigellicine was isolated
and determined by x-ray diffraction and spectroscopic techniques [47]. In 1995 an alkaloid
nigellidine was isolated from the black seeds, which contained an indazole nucleus [127].

12
In 2004 four new alkaloids, namely nigellamines A1, A2, B1 and B2, were isolated and their
several activities were determined. These compounds were diterpene of the dolabellane type
[128].
In the same year, same researchers continued this research and isolated some more new alkaloids
of the same type. They were named as nigellamines A3, A4, A5 and C. Biological activities of
these isolated compounds were also examined [129].
1.3.8 Amino Acids
For the first time in 1953 presence of free amino acids was determined using paper
chromatography technique in the dormant seeds of N. sativa and N. damascene. The study
proved the presence of cystine, lysine, alanine, aspartic and glutamic acids, tryptophan, valine
and leucine in large quantities [85].
In 1992, a research related to the analysis of seeds of N. sativa revealed presence of glutamic
acid, arginine and aspartic acid as major amino acids, whereas cystine and methionine were
reported as minor ones. Alanine, tryptophan and leucine were also present [114].
In 2009, a protein (Ns – LTP1) was isolated from seeds of the N. sativa. The molecular mass, N-
terminal amino acid sequence, and amino acid composition were determined. The protein was
found capable to suppress the development of some phytopathogenic fungi and oomycetes [130].
1.3.9 Vitamins
Different studies on chemical composition of N. sativa seed revealed that it is a good source of
vitamins e.g.; vitamin A, B, B2, niacin and vitamin C. In a research, in 1993, Nergiz and Otles
carried out analysis of water-soluble vitamins in the seeds of N. sativa [107].
1.3.10 Elements
The role of elements in health and disease is now an established fact [131,132]. Trace elements
are virtually crucial to all biochemical and physiological process in plants, animals and human
beings [107]. Among these, iron, zinc, cobalt, manganese, nickel, copper, chromium and
molybdenum are now thought to be essential for animal’s life [133]. Herbs are also the source of
these minerals [134,135].

13
The N. sativa seed is an excellent source of several minerals including calcium, potassium, iron,
copper, zinc, magnesium, selenium and sodium [71]. Siong and co-workers, in 1989, determined
Ca in 132 foods belonging to 8 food groups by atomic absorption spectrophotometry and KMnO4
titration and results were compared. N. sativa was one of these food samples. Ash solution for
each food sample was prepared and aliquots were used in the study [136]. In the same year, same
researchers conducted a comparative study of the determination of iron in a wide variety of food
including N. sativa by atomic absorption spectrophotometric and phenanthroline colorimetric
methods [137].
Al- Jassir and co-workers in 1992 reported presence of potassium, phosphorus, sodium and iron
as predominant elements in the black cumin seeds [68]. In a research, in 1993, chemical
composition of N. sativa seed was determined and analysis of minerals was carried out [107]. In
the identical year during the analysis of N. sativa seed mineral composition was also determined
and it was suggested that Nigella seeds are good source of P, Ca, K, Mg, and Na [69]. Al-Bataina
and co-workers, in 2003, analyzed N. sativa seed for its element composition using X-ray
fluorescence and they found the seeds to contain K, Ca, P, Ca, Fe, Cu, Zn, Mg, and Na [138].
In another research, in the same year, concentrations of some essential elements were determined
in some commonly used spices. Black cumin seed was found to contain highest concentration of
Fe, Zn, Cu, and Ni [139]. In 2006 level of Selenium was determined in N. sativa seeds using
inductively coupled plasma spectrometry. The concentration of Selenium was 0.17 ± 0.10 mg/kg
fresh wt. [140].
In another study monovalent copper was determined in different herbs including N. sativa by
differential pulse polarography and standard addition method was also employed. [71]. In a
recent research, in 2011, zinc was determined in trace quantities in different herbs including N.
sativa, using flame atomic absorption spectrometry [141].
1.3.11 Active Constituents of Nigella sativa Seed
Mahfouz and Dakhakhny, in 1960, reported that the essential oil separated by steam distillation
from the crude oil of N. sativa contained nigellone, which was constituent of carbonyl fraction.
Its formula was given as C18 H22 O4 [142].

14
Dakhakhny in 1963 isolated a new compound thymoquinone (TQ) (Fig. 1.4(a)) from the
essential oil of black seeds. Its content was 24% in the crude oil [84]. TQ is related to 2, 5-di-
substituted benzoquinone which has a methyl group at C-2 and an isopropyl group at C-5
positions [143]. In addition to TQ, the main active constituent, seed also contain thymol,
thymohydroquinone, dithymoquinone (Fig. 1.4 b - 1.4 d) and polythymoquinone [115, 144-147].
Ghosheh and co-workers in 1998 found that concentration of these isolated active constituents in
the oil depends upon the storage conditions [148]. In another research presence of high contents
of thymohydroquinone were detected by analysing black seeds using electron spin resonance
technique [149].
In a research polarographic behaviour of TQ was studied. It was observed that TQ gives a single
and reversible peak at -0.095 V. It was suggested that this method could be used to estimate TQ
in different oil samples of black seed [150]. According to a research study, carried out in 2004,
TQ belongs to triclinic system. It was concluded that in solid state weak Vander Walls forces are
found between the molecules [151]. Michelitsch and colleagues in 2004 estimated the
concentrations of thymol and carvacrol in black seed oil. They found that both compounds gave
reproducible peaks at Ep + 0.49 V [152].
The levels of thymoquinone, thymol, tocopherols and trans-retinol were examined in N. sativa
seeds by Al-Saleh and co-workers in 2006. First two compounds were found in considerable
higher quantities [140]. In 2011 a high performance thin-layer chromatographic method was
developed for estimation of thymoquinone in various extracts of N. sativa and different other
marketed and domestic formulations. The researchers reported this method as a simple but
accurate and time saving method for the analysis of thymoquinone [153].
1.4 Physical Constants of Nigella sativa Seed Oil
In 1928 it was reported that the oil extracted with ether from the seeds of N. sativa in 30% had
constants as follows: d = 0.8930, acid number = 14.68, saponification number = 210.60, Iodine
number 110.9, Reichert-Meissel number = 3.378, Polenske number = 0.532, Herner number =
89.22 [154].
In another publication, in 1931, same workers again reported the yield and physical constants of
oil at room temperature with ether. The yield and physical constants were 33.4%, density =

15
15.8960, acid number = 29.42, saponification number = 201.98, Iodine number 107.40, Reichert-
Meissel number = 3.379, Polenske number = 0.535, Herner number = 89.25, acetyl number =
23.89, glycerol 9.06% [155].
Singh and Tiwari in 1942 obtained dark red brown semi-drying oil (I) and pure fatty oil (II) by
different techniques. The physico-chemical constants of I and II were specific gravity at 35 ˚C =
0.9164. 0.91521, 21 Л D = 1.4660, 1.4662, acid value = 40.64, 42.83, saponification value =
196.9, 199.6; Iodine value = 116.9, 117.6, unsaponified matter = 0.04, 0.03; Herner value = 89.2,
89.6; Reichert-Meissel value = 4.1, 3.9 [156].
In a research in 1963 the seeds were extracted with pet. Ether and then steam distillation was
carried out, which removed essential oil, the residue being the fatty oil has the following physical
constants: d20 = 0.9, acid value = 30.3, saponification value = 196.3, Iodine value = 114.5,
Polenske number = 0.534 [84].
In a research two samples of N. sativa seeds obtained from two different sources were analysed
and characterized. Physical properties were also determined. The seeds were very small having a
bulk d. value of 0.562 ± 0.01 g/ml. The oil exhibited high saponofication value and medium
iodine value. It had relatively high value of acidity and peroxide [69].
In another research in 2007 the physical and chemical characteristics of seven N. sativa
commercial oils were determined. The average values and ranges obtained were as follows:
specific gravity = 0.9166 (at 20˚C); refractive index = 1.473 (at 20˚C); iodine value (Wij’s) =
119.98; saponification value = 201.80; and unsaponifiable matter = 0.61% [70].
1.5 Nutritional Value of Nigella sativa Seed
As far as nutritional value of N. sativa seed is concerned it contains valuable nutrients such as
proteins, fats, minerals, essential amino acids, which indicate high nutritional potential of it [68].
A research in 1997 showed that N. sativa oil contained more than 50% glycerides of linolic acid.
Because of its high content of unsaturated linolic acid, the oil is proposed as edible oil, whereas
seeds as seasoning for bread and other food [60].

16
In a research on nutritional value of different samples of N. sativa seed, it was suggested that the
seed possesses good nutritional status. It was found a good source of protein, fats, minerals and
vitamins [157].
In many researches, nutritional status of N. sativa was examined. Fixed oil of the seeds yields
triglycerides of fatty acid which help to determine the biological properties of the body cells.
Much recent researches have confirmed that a dietary source containing Omega (ω)-6, and ω-3
fatty acids is essential for optimum tissue functions in humanbeings. Since human body can’t
synthesize them they must be taken through essential fatty acid containing food supplements in
order to sustain health. N. sativa seed oil is an excellent source of linoleic fatty acid (ω6) which
has the ability to boost human immune system. In addition, it is very useful to cure various
diseases and is equally beneficial for all ages and genders [70,158-161].
1.6 Medicinal Properties of Nigella sativa
N. sativa seeds are well-known for the improvement of health and used as folk medicine. In
Hikmat (an indigenous system of medicine) the N. sativa seeds are reputed to possess warm and
dry properties and are known to remain potent for seven years. The seeds are usually regarded as
carminative, stimulant, diaphoretic, emmenagogue (stimulate uterine contractions), excellent
diuretic especially in scanty urination, stomachic, galactogogue, enodyne, appetizing,
anthelmintic, constipating, sudorific, febrifuge, expectorant, decongestant, local anaesthetic,
antipyretic- analgesic agent, antiflatulant, antiemetic, restores sense of smell, increases the
menstrual flow and the secretion of milk [32-34, 36, 37, 44, 54, 162, 163-165].
The seeds are used for the treatment of various ailments, for example cold, cough, fever
including tertiary fever and puerperal fever, various kinds of pains including toothache,
headache, nausea, vomiting, urinary tract infections, kidney or urinary bladder stones, intestinal
worms, nerve defects, asthma, rheumatism, influenza, paralysis, diabetes mellitus, tongue
inflammation and induce sweating. They are also employed in treatment of hydrophobia. They
are also beneficial in the treatment of skin diseases, cephalagia, haemorrhoids, jaundice,
halitosis, ophthalmia, anorexia, dyspepsia, dysentry, diarrhoea, amenorrhoea, dysmenorrhoea,
helminthiasis, strangury and agalactia [11, 32-34, 36, 37, 44, 48, 74, 163, 166-173].

17
The powdered seeds mixed with gingelly oil and sometimes with sesame oil are applied on
eruptions of the skin. It is also useful in various bodyache and in catarrh. The fixed oil from
seeds is used topically for treatment of eczema, arthritis, back pain and psoriasis. The paste of
powdered seed of N. sativa and Psoralea corylifolia with coconut oil is useful in eczema,
scorpion sting, spider sting, snack/ cat or dog bite and other skin diseases [11, 55, 65, 70, 174 -
177].
Lots of hair problems are common nowadays e.g., dandruff, hair splits, hair falling and graying
in the early span of life. In a research, in 2004, an herbal formulation containing N. sativa,
Lawsonia inermis and Olea europea was prepared and applied on patients having hair problems
such as dandruff, scales and oozing from scalp. The herbal formulation gave good response in
clearing the scalp from dandruff and found to strengthen the hairs [178].
1.7 Biological Activities of Nigella sativa Seed
Plant flora has been a great source of therapeutic agents [179, 180]. Research is going on to
explore the importance of medicinal plants [181-187]. Various research studies have been carried
out to discover different components of black seed [56, 188-191]. Out of them many chemical
constituents were found to be pharmacologically active [84, 142, 166, 188, 192] and proved to be
beneficial. These pharmacological properties were found to be due to crude or purified
component. The seed has several biological activities such as antihistaminic [145],
hypoglycemic [169], antihypertensive [193], antifungal [194], anti-inflammatory [195],
insecticidal [196], analgesic [197], antioxidant [198], along with significant anti-neoplastic [199]
activities. The toxicity level of black seed extract, oils and active constituents is very low which
is found to contribute to its safe application at therapeutic dose levels [200, 201].
In different research studies, the aqueous and oil extracts of the black seeds have been found to
exhibit antioxidant, anti-inflammatory, anticancer, analgesic hypolipemic, immune- regulatory,
anti-platelet and antimicrobial activities. Most of these properties have been attributed to
thymoquinone which is the active constituents of the seed [87, 202, 203].
The seed has potential role in case of many diseases such as for the amelioration of oxidative
stress due to its free radical scavenging ability. The seed possesses apoptosis induction activity
and can reduce blood glucose. Its immunopotentiating and immuno- modulating property keeps

18
the immune system of the body in balanced condition. In a recent research in 2010, N. sativa
seeds found to be effective in hematotoxicity, hepatotoxicity, cardiotoxicity and nephrotoxicity.
It was also suggested that the seed might be effective in case of toxicity caused by chemical
pollutants and environmental contaminants or other pathogenic factors. In short, daily use of N.
sativa seed and/or its bioactive components in diet is beneficial for health in many respects [204-
206].
1.7.1 Antimicrobial Activity
Essential oil of N. sativa obtained by steam distillation of petroleum extract was found to inhibit
growth of most of the gram positive and gram negative bacteria [166]. The phenolic fraction of
essential oil also showed the maximum activity. Alcoholic extract of the seeds inhibited the
action of S.aureus and E.coli [25].
Rakesh Agarwal in, 1979, reported the presence of pronounced antibacterial activity even in high
dilutions with organic solvent against gram positive and gram negative bacteria [207]. Its strong
positive antimicrobial activity against Salmonella typhii, Pseudomonas aeruginosa, Rhizoctonia
solani and Collectorium capsici was also reported which might be due to the presence of carvone
[208]. Petroleum extract of seeds also showed antimicrobial activity against E. coli, Bacillus
subtilis and Streptococcus faecalis [209]. In many other researches its antibacterial activity,
against several bacteria has been investigated [210-213].
In a research study antimicrobial activity of volatile oil of the N. sativa seed was examined and
compared with ampicillin. It showed good activity particularly against gram positive bacteria
[91]. In another research, in 1999, antimicrobial test of the extract of crude seed was carried out
against ten species of microorganisms. The extract was found active against many species
including Bacillus subtilis, Klebsiella pneumonia, Micobacterium phlei [149].
In another study in the same year antibacterial activity of the ethanolic and diethyl ether extracts
of N. sativa was determined by agar well diffusion method. Both extracts showed antibacterial
activity against Escherichia coli, which were statistically highly significant. Compared with the
standard Neomycin sulphate solution, the percent of inhibition were 64.83% and 65.04%
respectively [214]. Salem and colleagues investigated the anti-viral effect of black seed oil
19
against murine cytomegalovirus infection. According to the results the oil exhibited an excellent
effect [215].
In a research, in 2000, the active components from the crude oil of the N. sativa seed were
extracted by methanol and then purified using TLC followed by a column of silica gel. The
obtained TLC separated spots were studied for their antimicrobial activity using Streptococcus
faecalis, E.Coli and Candida albicans as test strains. Results declared the various degrees of
inhibition. The obtained ingredients were subjected to a spectroscopic analysis, which revealed
that separated compounds were thymol, thymoquinone, α- pinene and β-situsterol [216].
Gurdip Singh and colleagues, in 2005, investigated the antifungal and antibacterial potential of
essential oil and acetone extract of the seed by inverted petriplate method and by agar well
diffusion method. The first one exhibited stronger effect in both cases against different
organisms [99].
In a research in 2006 an ester, pentyl undecanoate was isolated from the seeds of N. sativa. The
isolated compound exhibited significant activity against Staphylococcus aureus and Shigella spp.
[112]. Similarly in 2009, a protein was isolated from the seeds and was found capable of
suppressing the development of some phyto pathogenic fungi and oomycetes [130]. In a research
study in the same year activity of thymoquinone against Mycobacterium tuberculosis was
investigated and thymoquinone was found to possess anti-tuberculosis activity [217].
In another research the seed volatile oil was tested against 19 microbes, and showed that Gram
negative bacteria Haemophilus influenza, Klebsiella pneumoniae and Proteus vulgaris were
highly sensitive against volatile oil [218].
Besides being good antimicrobial agent [219] thymoquinone and thymohydroquinone also bear
antifungal effect. Taha and colleagues, in 2010, investigated the antifungul effect of thymol,
thymoquinone and thymohydroquinone against thirty human pathogens including eleven
dematophyte, eight yeast and eleven molds. All of the three compounds showed 100% inhibition
for the thirty pathogens at concentration of 1 mg/ml [220]. Another research in the same year
showed that many biological properties of N. sativa seeds including antibacterial activity are
mainly due to the action of thymoquinone [221].

20
In a research, in 2011, researchers studied the antimicrobial activity of N. sativa seeds extracts
against multiple antibiotic resistant bacteria isolated from clinical specimens. They prepared
three types of extracts, methanolic extract, ether extract and aqueous extract. They found highest
antimicrobial activity in methanolic extract, which may be due to the thymoquinone in the
methanol soluble portion of N. sativa [222]. Thymohydroquinone [149] and thymol [223, 224]
have also shown good antimicrobial activity in different researches. Methanolic extract of N.
sativa was found effective against many bacteria which were multi-drug resistant or sensitive. It
was concluded that in susceptible cases, it can be used therapeutically, at least topically [53].
1.7. 2 Antioxidant Activity
Plants produce a lot of compounds to resist the adverse effects of sunrays and oxygen. These
compounds represent a source of new agents with antioxidant activities. Certain free radicals and
reactive oxygen species, if present in the body, may cause damage to cells. The substances which
protect the body from these harmful species are called anti-oxidants. These agents are very
important as they perform significant roles in prevention from certain diseases [30, 225].
Production of reactive oxygen species in the body results in oxidative stress which has been
found to be responsible for a number of diseases in human beings, for example, inflammation,
cancer, diabetes mellitus, hypertension, atherosclerosis and AIDS [226-229].
In a research study in 1995, it was found that the fixed oil of black seed and thymoquinone,
possess the ability of inhibition of non-enzymatic lipid peroxidation in liposomes [115]. In
another research the four main constituents i.e. thymoquinone, carvacrol, t-anethole and 4-
terpineol and the essential oil of the black seeds showed variable antioxidant activity [147].
In a research in 1997, the protective effects of thymoquinone (TQ) from N. sativa seeds on
carbon tetra chloride induced hepato-toxicity were investigated and the results of the study
suggested that it has an excellent cytoprotective activity. Its action might be mediated through
inhibition of lipid peroxidation [230].
Daba and colleagues, in 1998, tested TQ, as a hepatoprotective agent and compared its protecting
activity against silybin, which was used as a known hepato-protective agent. Results showed that
TQ has a comparatively less ability to protect the liver enzymes leakage [231].

21
In a research the effect of N. sativa seeds extracts on autoxidation of corn oil was studied. Both
water and ethanolic extracts displayed an antioxidant activity when β-carotene emulsion was
used as substrate [232].
In a research, in 2000, it was observed that TQ can cause significant decrease in hepatic
antioxidant enzymes and can inhibit microsomal lipid peroxidation [233]. Another research study
found that thymoquinone and dihydrothymoquinone (a reduced form of TQ) both have good free
radical scavenging ability. It was suggested that protective effect of TQ is due to combined
antioxidant effects of the both compounds [234].
Badary and co-workers studied the antioxidant effect of TQ together with its pro-oxidant effect
and found that TQ has powerful antioxidant properties because of its free radicals scavenging
ability [235]. According to another research, in 2003, the volatile oil of the seeds revealed
antioxidant and radical scavenging activities, which might be due to considerable concentration
of phenolic contents [96]. In the same year it was found that TQ can decrease oxidative stress by
inducing glutathione [236].
In addition to above mentioned studies there are several other research studies which show that
the antioxidant properties of N .sativa seed are due to its phenolic content and active components
mainly thymoquinone [237-245]. Moreover, there are many research studies which point out
towards an excellent antioxidant action of seed’s extracts. In a research in 2007 antiradical
activity and lipid peroxidation inhibition ability of extract of black cumin seed, under and after
stimulated digestion, was observed. It was noted that the activity increased after digestion [242].
Barron and colleagues found that the use of TQ together with Selenium is comparatively more
effective in treatment of human osteosarcoma cells [225].
A research on methanol extract and essential oil of N. sativa showed both of them as strong
radical scavengers; however, the oil exhibited the highest activity. Antimutagenic activity was
also determined. The essential oil and methanol extract both showed similar antimutagenic
effects [119].
Nadia and Razia, in 2009, found that, N. sativa oil and its main constituent TQ are capable of
providing some protection against diabetes induced alterations in the heart and brain because of
their antioxidant properties [246]. Lutterodt and co-workers, in 2010, investigated the oxidative

22
stability and antioxidant properties of cold-pressed black seed oil. The results revealed that it can
be used as an excellent dietary source of natural antioxidants [247].
Research to explore antioxidant properties of black seed, its various extracts and active
constituents is continued in different directions and about different aspects all over the world.
These research studies have given very hopeful and valuable discoveries [248- 250].
Tesarova and colleagues in 2011 compared the antioxidant capacities of main quinone
constituents of N. sativa seeds, namely dithymoquinone (i), thymohydroquinone (ii) and
thymoquinone (iii), using DPPH and oxygen radical absorbance capacity (ORAC) methods. The
best scavenging activity was produced by ii. Contrastingly, iii possessed only weak DPPH
scavenging efficacy but significant anti-oxidative action. It concludes that quinone constituents
of N. sativa possess antioxidant properties [251].
1.7.3 Anticancer/ Antitumor/ Cytotoxic Activity
Zawahry in 1963 reported that ethanolic extract of N. sativa seeds indicates 100% cytotoxicity at
a concentration of 25mg equivalent to original powder. The active cytotoxic ingredient was
soluble in alcohol and was found to be lipid in nature [192], whereas the aqueous extract of the
seeds together with Smilax China and Hemidesmus indicus (1:3:2) was reported to be beneficial
to cure the oral cancer [252].
In many researches seed’s extract was reported to be effective against skin carcinogenesis and
tumor development with insignificant side-effects. It was thought that the seed contains some
fatty acids which possess antitumor activity [253, 254].
Worthen and colleagues, during their investigation, found that most of the cytotoxic action of the
black seed is due to thymoquinone and dithymoquinone. Both of these compounds were found
effective in case of all tested human tumor cell lines [199]. Another research investigation was
under taken to discover whether the supplementation of N. sativa seed powder in food of rats
treated with carcinogenic substances dibutylnitrosamine (DBNA) and diethylnitrosamine
(DENA) prevents rat liver toxicity or not. Results showed that supplementation with N. sativa
seed powder prevents or decreases the toxic effects [255].

23
In a research in 2001, an antitumor principal α- Hederin was isolated from ethanolic extract of
N. sativa and its antitumor activity was investigated. Results indicated that it produced
significant tumor inhibition [256]. In a research it has been
shown that TQ inhibits formation of certain products which are essential for the growth and
development of colon cancer cells [257].
Variety of research studies have been conducted and showed that antioxidant property of the
black seed is mainly due to TQ, although its effect may be enhanced due to the presence of other
antioxidant components of the plant. Some studies explained the mechanism of antioxidant
action of TQ [258, 259]. In a research its antioxidant/anticancer property was compared with the
chemotherapeutic drug, 5- fluorouracil. It was found that the TQ produces the similar effects as
the drug [260].
Al-Johar and co-workers, in 2008, found that the action of N. sativa seed to inhibit
carcinogenesis may be due to combined effect of antioxidant constituents of the seed [261]. In a
research in 2009 TQ was reported to produce anti-proliferative activity in addition to cytotoxic
activity towards human cervical carcinoma cells [262]. Raval and colleagues investigated the
anticancer activity of the methanolic extract of the seeds on different cancer and normal cell
lines. Results indicated that extract showed potent inhibition of cancerous cell growth [263].
In 2011, anticancer effects of TQ on cancer cells of breast were examined and it was observed
that it produces powerful effect on them. It was also studied that TQ’s effect could be enhanced
by combining it with doxorubicin and 5-fluorouracil [264].
1.7.4 Apoptosis Induction Activity
Several research studies have revealed that inhibitory action of TQ towards various types of
cancer cells is accompanied by its apoptosis induction activity and cell cycle arrest [265-270].
This apoptosis induction is dose and time-dependent [271]. It has been proved that TQ can kill
different types of cancer cells including human breast, colon and prostate cancer cells [272-274].
Kaseb and co-workers in 2007 observed that TQ destroys only the cancer cells, whereas non
cancerous cells remain unaffected [275]. In many recent researches TQ has shown an excellent
inhibitory action on cancer cells of various types with a fairly good degree of selectivity [275-

24
276]. Cecarini and co-workers in 2010 investigated apoptosis induction activity of TQ and found
that only damaged, oxidized and misfolded proteins were removed as a result of its action [277].
In some studies TQ’s activity was compared with some standards. In a research in 2011, the
apoptosis induction activity of TQ was compared with cisplatin. Results conclude that TQ was
more effective [278]. Recently Arafa and colleagues studied the action of TQ in resistant cancer
cells. They reported that TQ has good inhibitory action on doxorubicin-resistant human breast
cancer cell proliferation [279].
1.7.5 Anti-inflammatory Activity
Inflammation is a severe condition which can produce diverse reactive oxygen species and
reactive nitrogen species. These can give rise to various patho-physiological disorders, for
example, ulcerative colitis [280-284], gastric helicobactor pylori infection [285] and colorectal
adenocarcinoma [281, 286].
Fixed and volatile oil of N. sativa seed and its active component TQ have been reported to inhibit
edema, as well as all inflammatory processes, which are dose dependent. This action was
supposed to be due to the inhibition of eicosanoids generation and lipid peroxidation [115, 287].
In a study of anti-inflammatory effects of the black seed powder, petroleum and alcoholic
extracts were examined. The results revealed a remarked anti-inflammatory activity of the tested
natural agents. Concerning liver and kidney function tests, the three tested natural agents showed
complete safety [158].
In an investigation on the analgesic and anti-inflammatory activities of water extract of N. sativa,
the extract showed better inhibition in case of curative effect than preventive effect. In gastric
irritation study animals treated by N. sativa Linn did not show any gastric irritation which is a
common side-effect for conventional anti-inflammatory drugs. Results concluded that N. sativa
Linn can be used as analgesic and anti-inflammatory agent for pain and acute inflammation
[165].
Many research studies have been carried out which revealed that various extracts of N. sativa
seed, its oils and its different active constituents, possess significant anti-inflammatory effects.
This effect was observed to be dose and time dependent [195, 257, 288- 290]. In a research anti-

25
inflammatory effect of the seed oil and its two constituents nigellone (polythymoquinone) and
thymoquinone was investigated. It was suggested that anti-inflammatory action of these
constituents is because of their antioxidant property [257]. In a research TQ was reported as a
powerful inhibitor of leukotrienes formation in blood cells of human beings. This property of TQ
helps in suppressing inflammation [288].
During a research TQ was found to exhibit strong anti-inflammatory action in case of lungs
allergy [291]. Briefly, a lot of research studies have been carried out which confirm anti-
inflammatory role of N. sativa seed and its active constituents [243, 292-294].
N. sativa oil and TQ are also found to cause good improvement on neuro-degeneration [295]. In
a recent research terpene content of N. sativa seed (including thymoquinone) has been reported
to exhibit high anti-inflammatory activity [221]. In another current research TQ was found to
improve liver dysfunction in case of hepato-toxicity. It was concluded that the protective effect
of TQ was due to its anti-inflammatory activity in addition to its antioxidant and antiapoptic
activities [296].
1.7.6 Anti-diabetic / Hypoglycemic Activity
Diabetes mellitus leads to many complications e.g.; hyperglycemia, which is the most serious
factor in acute and chronic metabolic complications of diabetes [297]. Another complication of
diabetes is neuropathy [298]. Reactive oxygen species are the cause of severity in the vascular
[299] and neuronal cell [297] complications in diabetes mellitus.
Volatile oil of N. sativa has been reported to produce significant and time-dependent
hypoglycemic effects [300, 301]. Bamosa in 1997 reported that intake of 1g N. sativa seeds
orally, twice a day for two weeks decreased human blood glucose level [302]. In different
research studies hypoglycemic effect of various extracts of N. sativa seed, its oil and its
constituents nigellone and thymoquinone was studied. It was observed that their anti-diabetic
effect is probably via stimulation of insulin released by them [303, 304, 305].
Black seed was also found to play a therapeutic protective role in diabetes. On the one hand it is
due to the ability of the seed to decrease oxidative stress, on the other hand because of the ability
to preserve pancreatic beta-cell integrity [306]. In some studies hypoglycemic effect of the seed
was observed to be due to a decline in hepatic gluconeogenesis [307, 308].

26
Kaleem and co-workers investigated that the intake of ethanol extract of black seeds causes a
significant decrease in high levels of blood glucose, lipids and plasma insulin. In addition, an
improvement in products of lipid peroxidation and antioxidant enzymes was also observed. So it
was concluded that the seed bears good anti-diabetic activity and its use could be beneficial in
preventing diabetic complications because its antioxidant effects [309].
In a research the anti-hyperglycemia effects of the crude MeOH extract and the commercial oil
of black seed were studied. Effect of these two substances on other diabetes-linked factors such
as the reducing power of the plasma and the osmotic fragility of erythrocytes was also studied.
Daily oral administration of the crude MeOH extract and its oil for 25 days was observed to
lower glycemia significantly. Results suggested that the action of both substances was a result of
the inhibition of enzymes involved in the neoglucogenesis pathway in the liver [310].
Another research showed that the use of N. sativa oil in diabetic patients reduces fasting blood
glucose significantly, whereas causes an increase in insulin level. It was concluded that the oil
plays the above mentioned role with reasonable renal and hepatic safety [311].
In a research the therapeutic action of N. sativa oil in diabetes and hepatic toxicity was evaluated.
Results showed that treatment of diabetic rats with the oil ameliorate hyperglycemia induced
stress oxidative and hepatic dysfunction in diabetic rats. Administration of N. sativa oil to
diabetic rats caused anti-diabetic and anti-oxidant activities by decreasing plasmatic glucose
level and increasing hepatic superoxide dismutase, glutathione peroxidase and catalase activities.
The glutathione and glycogen contents were also reduced [312].
Later some other researchers have also confirmed these facts. Diabetes increases tissue
malondialdehyde and serum glucose levels and decreases insulin and super oxide dismutase
levels. N. sativa seed works against diabetes by causing decrease in oxidative stress and it
prevents pancreatic β-cell integrity, as a result an improvement in β-cell structure occurs and an
increase in insulin level is observed, both of these are the causes of hypoglycemic effect of the
seed. Moreover, due to these properties the black seed and its constituents are able to offer some
protection against diabetes induced alterations in the heart and brain also [246, 313].

27
1.7.7 Antihypertensive, Cardio-protective and Cholesterol Lowering Activity
In some experiments on animal model, it was found that the essential oil and the saponifiable
matters [314], alcoholic extract of the marc [192], 50% ethanolic extract [25], aqueous extract
[315], methanolic extract [316], and the volatile oil and its constituent thymoquinone [146] of the
black seeds showed significant antihypertensive property.
Several research studies proved that N. sativa seed also possess cardio-protective activity. In a
research it was observed that administration of volatile oil of the seed and its constituent TQ
causes a decrease in arterial blood pressure as well as in the heart rate. The oil produced this
effect in a dose-dependent manner. Results concluded that the oil produces these effects probably
due to TQ and were probably mediated centrally within the medulla oblongata via activation of
5-hydroxytryptaminergic and muscarinic mechanisms [317].
Study of some bio-chemicals effects of whole powdered seeds of N. sativa, as well as its
petroleum and alcoholic extracts showed that the alcoholic extract produced a remarkable
decrease in plasma cholesterol and body weight while the petroleum ether extracts reduced
plasma cholesterol and postprandial blood sugar significantly [158].
In another research feeding of N. sativa seed fixed oil (1ml/kg) to rats for 12 weeks caused
significant lowering of serum cholesterol, triglycerides and glucose levels as compared to
controls [200].
In another study the influence of dethymoquinonated volatile oil of N. sativa and its two major
components α-pinene and p-cymene on the cardiovascular systems of urethane-anesthetized rats
was examined. Administration of the oil, α- pinene or p-cymene decreased both the arterial blood
pressure and the heart rate. It was concluded that deprivation of the whole volatile oil of its
constituents TQ which is known for its broncho-constricting and gastric ulcerogenic actions did
not abolish the cardiovascular depressant actions of the oil [318].
In another research the N. sativa oil was observed to increase respiration in addition to a decrease
in blood pressure. It was reported that administration of the oil causes certain changes such as an
increase in packed cell volume and Hb together with a decreased plasma concentrations level of
cholesterol, triglycerides and glucose [198].
28
Many research studies showed that the black seed possessed hypolipidemic activity also [305].
Cheikh-Rouhou and colleagues extracted the oil from N. sativa seeds and analysed for sterol
composition. β-sitosterol was major sterol. It was suggested that it may cause lowering of blood
cholesterol, hence could play a powerful role in the prevention of coronary heart disease [319].
In another research the black seed oil was reported to possess cardioprotective effect which may
be due to its antioxidant activities [320].
Bhatti and co-workers evaluated the N. sativa seeds for their effects on lipid profile in human
beings. The powder of N. sativa seeds was orally administered to hypercholesterolemic patients.
Results showed a reduction in total cholesterol and triglycerides levels to a highly significant
extent. The study demonstrated that the seeds of N. sativa favorably modify the plasma lipid
profile in hypercholesterolemic patients [321].
In another research, cholesterol lowering ability of finely powdered seeds of N. sativa was
examined in comparison to atorvastatin, the most frequently used lipid lowering agent. The
results indicate that both atorvastatin and N. sativa have a definite role in retarding the rate of
weight gain as a consequence to high cholesterol diet in rabbits. Also there was fewer rises in all
the lipid parameters in treatment groups when compared to the control group. Though
atorvastatin was definitely more effective in reducing the lipid parameters, it also significantly
lowered HDL, whereas N. sativa showed promising results when compared to placebo and also
had a favorable effect on HDL. Results suggested that N. sativa could be used in the prevention
of hyper-cholesterolemia and atherosclerosis in patients with coronary artery disease. Moreover,
it was found that the seed could be used for a long period without any side effects [322].
Ismail and Al-Naqeeb in 2010, invented a rich antioxidant nutraceuticals prepared from N. sativa
seeds for the treatment and prevention of hyper-cholesterolemia. These nutraceuticals had shown
successfully to have hypocholesterolmic, anti-atherogenic and anti-oxidant activities using in
vitro and in vivo study [323].
A recent research showed that oleic and linoleic acids play important role in the decrease of high
blood pressure [324]. Another recent research revealed that N. sativa is effective to change the
lipid profile significantly in a way which is beneficial to heart as compared to other standard
drugs [325].

29
1.7.8 Antihistaminic, Antagonistic, Antispasmodic Activity
Mahfouz and Dakhakhany, in 1960, have reported that essential separated by steam distillation
from the crude oil of the black seed was active in protecting guinea pig against histamine
induced bronchosparm [142]. In a study the chemical and pharmacological properties of the marc
of seeds from N. sativa were described. Alcoholic extract showed lowering of blood pressure of
the dog and inhibition of contraction of rabbit intestine [192]. In a research an alkaloid and
glycoside from the alcoholic extract of the flowering top, leaf and seed of N. sativa were
isolated. The glycoside had hypotensive and antispasmodic action [73].
El-Dakhakhny in 1965, reported that all three compounds thymoquinone, thymohydroquinone
and polythymoquinone (which are the main constituents of N. sativa seeds), showed uricosuric
activity in rats and choleretic activity in dogs and protected guinea pigs from the bronchospasm
induced by exposure to a mist of histamine. Poly thymoquinone was reported to be least active,
yet because of its lower toxicity it may be therapeutically useful in patients with hepatic
insufficiency, gout, arthritis and some cases of bronchial asthma [188]. In another study
antispasmodic and diuretic actions of the seed have been reported [326].
Several research studies have been carried out to show the mechanism that how the antagonistic
effect of the seed works. The seed was found to inhibit the contractions of tracheal smooth
muscle [327], vascular smooth muscle [328], jejunum [329] and spontaneous movement uterine
smooth muscle [330]. These inhibitions were dose dependent and reversible. In another study
nigellone, which is one of the active constituent of the seed, was found to inhibit histamine
release very effectively even in very low concentrations [145].
A research observed that N. sativa caused relaxation on the isolated tracheal chain preparation. It
inhibited the contractile action of histamine on isolated tracheal chains. The effects of aqueous
extract of seeds were dose dependent. It was concluded from results that the aqueous extract
could be used in diseases due to broncho-constrictions (e.g. bronchial asthma) and in cases of
various types of allergies due to the release of histamine [331].
In a research TQ, another constituent of the seed, was also found effective in inhibition of
smooth muscle contractions. It produces non selective and dose dependent inhibition [332].

30
Parvadeh and Hosseinzadeh investigated the hypnotic and muscle relaxant effects of TQ using
pentobarbital-induced hypnosis and the traction test respectively. Also they evaluated the effects
of TQ on locomotor activity and motor coordination using the open field activity and the rotarod
tests respectively. The results showed that TQ did not show any hypnotic effect but exerted
muscle relaxation in 30% of mice treated. In rotarod test, TQ produced motor in-coordination
dose dependently. The results showed that TQ has not any hypnotic effect, but produces muscle
relaxation as well as motor in-coordination and reduces the locomotor activity [333].
A research was carried out to observe the effect of TQ on spontaneous contractions and on
contractions induced by agonists. TQ reduced spontaneous contractions in a concentration
dependent action. The results suggested that TQ induced inhibition of urterotonic potential of
various oxytocic agents may be due to Ca2+ channels blocking action [334].
In an investigation the anti-spasmodic effects of nigellone and TQ on trachea and on respiratory
clearance was examined. Both the constituents had inhibitory effect on trachea which was
concentration dependent [335]. In a recent research TQ was reported to decrease in the tension of
the pulmonary arterial rings [336].
1.7.9 Neuroprotective Effect and Effect in Neuropathy and Nephropathy
It has been proved that N. sativa seed possesses neuro-protective effect and is also useful in
nephropathy and neuropathy.
In a research it was concluded that TQ could be used as protective agent in case of pathogenesis
associated with nephropathy, protein-urea, albumin-urea and hyperlipidemia accompanied by
nephritic syndrome [337].
Al-Majid and co-workers evaluated the neuro-protective effect of TQ and found it very
beneficial. This striking ability makes TQ an excellent protective agent in pathological
conditions implicating neuro-degeneratio [338].
Several research studies have been carried out to examine neuroprotective effect of the black
seed extract, its oil and TQ. In all these cases toxicity was induced by either disease or
chemicals. Every research showed that the black seed and its constituents exhibit significant

31
improvement. In most of the cases it was observed that protective ability of the seed is due to its
antioxidant action [198, 295, 339-341].
Etheve and co-workers, in 2011, studied the use of Nigella species extracts and their volatile
componants for the treatment of symptoms connected to impaired neurotransmission in animals
including humans, as well as to dietry supplements, food and feed or nutraceutical composition
containing such extracts or their volatile components. Thus serotonin uptake via the transporter
was inhibited by a lipophilic N. sativa seed extract obtained using organic solvents. Soft gelatin
capsules containing N. sativa extract 200mg, evening primrose oil 300mg and vitamin B6 may
be used for alleviation of premenstrual syndrome or other symptoms e.g., increased tension and
irritability associated with the menstrual cycle [342].
1.7.10 Immunomodulatory Activity
The use of plants as a source of immunomodulators is still in its infancy in modern medicine.
Some herbs have been shown to play an important role to maintain immune system. They
perform this action by stimulation of immune system and hence improve defence system of the
body. They are also helpful in the case of immune disorders. Their administration in the body
results in the maintenance of the body resistance and improvement of positive health. Some
herbs and traditional foods including N. sativa have been investigated from immunological and
health benefit point of view [30, 343]. A research study found that the black seed oil causes
stimulation of macrophage phagocytic activity which is the reason of its immunopotentiating
effect [307].
Different research studies have proved the immunomodulatory and immunotherapeutic effects of
black seed and its constituents. In a research its use was observed to increase the total white
blood cells count with an increase in the bone marrow cellularity also. It was concluded that the
seed possesses these activities due to its antioxidant property [344- 346]. The results of these
studies suggest that black seed can be used in treatment of different types of infections.
1.7.11 Analgesic Activity
In a research analgesic action of Nigella sativa seed oil and its effect on CNS were investigated.
The oil was found to possess CNS depressant and powerful analgesic effect. It was suggested

32
that the mentioned action of the oil is due to the presence of an opioid principle [56]. Many other
researches also showed N. sativa seeds extract to possess analgesic activity [165, 195].
1.7.12 Insecticidal and Anticestodal Activity
N. sativa seeds were also reported to have insecticidal activity. Deshpande and co-workers in
1974 have reported that the oleic acid and linoleic acid isolated from the seeds showed
insecticidal activity against stored grain insects, Sitophilus oryuzae, Stegobium paniceum,
Tribolium castaneum and Bruchus chinensis [347].
In another research anticestodal activity of N. sativa was studied. For which efficacy of the total
glycosides, saponins and anthraquinones was observed in goats. These goats were infected due to
gastro-intestinal nematodes. The glycosides were administered orally to a group of sheep, while
Nilzan was similarly administered to the controlled sheep. On treatment N. sativa glycosides
were found as effective as Nilzan against goat cestodes. The data suggested that the total
glycosides of N. sativa seeds possess considerable activity against cestodes. It was also
suggested in this study that glycosides of the seeds may be responsible for the anticestodal
efficacy of the powdered seeds already reported to be effective against tape worms of sheep
[348].
Kumar and Tiwari in 2011, studied fumigant toxicity of some plants oil including N. sativa seed
oil against S. oryzae, R. dominica and T. castaneum in stored wheat. The N. sativa seed oil was
found highly effective [349].
1.7.13 Effect on Fertility
Different research studies have been carried out to observe effect of black seed on fertility. In a
research it was noted that ethanolic extract of N. sativa seeds inhibits ovulation in rabbits to
some extent which was induced by copper acetate [350]. In another study, Seshadri and co-
workers investigated that oral administration of recipe containing N. sativa seeds along with five
other Ayurvedic drugs Foeniculum vulgare, Curcuma zedoaria, Mesua ferrea, Terminalia
chebula and Terminalia arjuna in equal quantities given from 1st to 5th days of pregnancy
exhibited anti-implantation activity with 61.1% foetal loss [351].
Bashandy, in 2007, studied the effect of black seed oil on male fertility. The effect was observed
in normal and hyperlipidemic rats. Plasma lipid profile including cholesterol, triglycerides, Low

33
D. Lipoprotein (LDL) and High D. Lipoprotein (HDL) was evaluated. Fertility index as
determined by sex organ weights, plasma testosterone level and sperms evaluation (sperm
motility, sperm abnormalities and sperm count) was investigated. The results showed that oral
administration of seed oil to either normal or hyper-lipidemic rats improved the fertility index as
manifested by increase in seminal vesicle weight, testosterone level, sperm motility and sperm
count and a decrease in sperm abnormalities. It was concluded that administration of N. sativa oil
to hyper-lipidemic rats made their reproductive efficacy better. Moreover, the oil caused
protection against hyper-lipidemia induced reduction in-fertility [352].
In another study the effect of thymoquinone on embryonic development in case of diabetic mice
was investigated. The data of the study demonstrated that TQ causes a decrease in the rate of
embryo malformations during pregnancy. It also causes an increase in the size of embryos and
speed up their maturation. On the basis of the results it was suggested that the use of
thymoquinone is useful in pregnancy of diabetic females [353]. In a current study role of
alcoholic extract of black seed on fertility potential was investigated. The extract was found to
possess a positive effect on some fertility parameters and pituitary-testicular hormone axis [354].
1.7.14 Miscellaneous Activities
Ethanolic extract of the black seeds has been reported to possess weak spasmolytic activity [25].
N. sativa seeds containing diet was reported to have powerful galactagogue action in addition to
proliferative action on the breast tissue in lactating rats [355]. The seeds were also found to
increase the secretion of milk in all clinical cases of agalactia in goats [356]. The aqueous extract
of the seeds was observed to exert a nicotinic effect [315]. The seeds were also reported to have
anthelmintic [207], and antihelmentic [357] activities.
Namba and co-workers, in 1985, carried out a study on the dental caries prevention by traditional
medicines. Various crude drugs were screened for anti-plaque action against Streptococcus
mutans. Both the methanolic and 50% methanolic extracts of N. sativa seeds potently inhibited
adherence of viable cells of S. mutans to smooth surface [358].
In a research black seeds extract was investigated for its HIV protease-inhibiting activities. In
vitro tests indicated that extract showed some extent of inhibitory effects [359]. The radio
protective effect of seed oil was examined on the liver of swiss albino mice. It was observed that

34
administration of N. sativa oil prior to irradiation causes improvement in DNA, RNA,
glutathione and superoxide dismutase [360]. In a research the antinociceptive effect of black seed
oil and TQ was observed [361].
Abou-Hozaifa studied effect of the seed and TQ on platelet aggregation. The results suggested
that regular consumption of N. sativa would not influence platelet aggregation in human,
whereas the TQ induces an inhibitory effect only when large doses were administered [362].
In a study antitussive activity of thymoquinone was evaluated. TQ and codein, a prototype
antitussive agent, reduced the number of cough in animals. The results suggested that TQ has
antitussive activity probably through opioid receptors [343].
Yaman and co-workers compared the effects of black seed and silver sulfadiazine (SSD) cream
on healing of burn wounds in rats. Rats were divided into three groups of equal members. The
burned areas in the first, second and third groups were covered with daily cold cream
(controlled), SSD cream and N. sativa cream (50% N. sativa oil +50% cold cream), respectively.
Histopathological evaluations showed burn healing to be better in the N. sativa and SSD groups
with respect to the controlled group. It was concluded that application of N. sativa and SSD
cream are effective to heal burn related skin injuries in the rat model [363].
In a research anti-malarial activity of N. sativa extract was investigated. The extract was found to
be very effective and caused almost complete inhibition of the parasite growth [364]. Nutten and
co-workers studied that an opioid receptor-stimulating compound, like TQ or plant extract from
N. sativa can be used for the treatment or prevention of food allergy [365].
1.8 Toxicity
Various pharmacological properties of black seed and its oil with low toxicity are the major
reasons for its traditional use for treatment of various diseases. The seeds have been reported to
cause no adverse effects when used orally and in moderate amount [366]. When used in large
quantities it may stimulate uterine contractions resulting in abortion in case of pregnancy [330].
In different research the acute and chronic toxicities of black seed, its extract and oil were
examined. During the use of seed and its oil key hepatic enzymes remained stable and no
reasonable side effects were observed on kidney, liver or any other organ. Results of these

35
studies suggested that the seed could be used at therapeutic doses with safety [198, 200].
However, high level of TQ may cause some adverse effects including damage to DNA in
hepatocytes [367].
Hina and co-workers have reported the influence of intake of N. sativa oil in rats. It was
observed that animals fed with the oil were healthy. No unusual change in behavior or in
locomotors activity, no ataxia and no sign of intoxication were observed. No differences in
growth and food consumption of controlled and experimental groups were observed. The results
suggested that the feed intake and utilization of protein and other nutrients were not affected by
the intake of N. sativa oil [65].
1.9 Minerals/ Elements
Minerals are actually inorganic elements. These elements always retain their chemical identity.
Due to the same reason when they enter into our body, they remain there in their original form
until excreted. Out of these several minerals have important biochemical and nutritional function
in all living things, including human beings. For this purpose they should be in proper balance
with respect to one another. These minerals are called essential minerals and they are further
classified into two classes i.e., macro-nutrients and micro-nutrients, depending upon their
requirement to maintain metabolic balance in the body. Macro-nutrients include sodium,
potassium, calcium, phosphorus and magnesium, whereas micro-nutrients include iron,
chromium, copper, vanadium, cobalt, manganese, zinc, nickel, tin, selenium and molybdenum
[368, 369]. They are also called trace elements because they are required in low quantities [370,
371].
Different metals have different mechanisms for their biochemical and nutritional functions in the
body. Some minerals, such as potassium are readily absorbed into the blood. They are
transported freely and excreted by the kidneys easily. On the other hand, there are some minerals
such as calcium, which need carriers to be absorbed or transported. Their bioavailability varies.
Some food contains binders, such as phytates, which prevent mineral absorption. Nutrient
interaction can also vary bioavailability of minerals. For instance, high intake of sodium may
cause interaction of sodium with calcium resulting in excretion of both elements from the body
[372]. Some minerals absorb in the body only when they are in ionic state (e.g, Cr, Cu, Fe, Mg,

36
Zn, Mo, Mn, and Se). These minerals, when come into contact with hydrochloric acid in
stomach, become ionic. Gastric atrophy, achlorhydria or hypochlorhydria can inhibit the
absorption of these minerals in the body [373].
Various drugs, which are used to treat different diseases, are another source of metals [374]. The
recommended dietary allowances and adequate intakes have been set for the minerals (Table –
1.1). If the concentration of a metal exceeds the required level in the body, it may be toxic.
Therefore, we should know the normal concentrations of these metals in human body. Free
radical formation could result in damage of cells, impair the immune system and this may even
lead to cancer. Antioxidants protect the cells from free radicals by donating one of their own
electrons. This results in neutralization of free radicals [260]. Hence antioxidants also strengthen
the immune system of the body. These antioxidants are supplied by food to the body. Some
minerals help them to do their role and without these minerals, antioxidants are unable to fight
against free radicals. Herbs are also an important source of antioxidants.
Furthermore, if metals exceed toxic level, they may alter the cell membrane charge by binding to
it and ultimately change the membrane permeability. This could even cause cell death. These
metals could also bind to mitochondria and result in impairing of cellular respiration [375].
1.9.1 Micro-nutrients (Trace Elements)
Trace elements are of great importance and they are required by the body in an amount of 100mg
or less per day or may be present in the body in an amount of 0.01% or less of body weight.
They provide a variety of essential structural and regulatory roles. Some of their functions are
unique, e.g. iodine is needed to make thyroid hormones, iron is needed to carry oxygen to body
cells, and fluoride is needed for strong teeth. Others are similar and complementary; selenium,
copper, zinc, iron, and manganese each function as cofactors for antioxidant enzyme systems.
Bioavailability is an important concern with trace elements because our diet contains a small of
these elements. Phytates, tannins, oxalate, and fiber can bind minerals, reducing their absorption.
The interactions among the minerals that can affect their absorption and utilization also have a
greater impact on trace element status [376]. Some of the trace elements, their importance,
deficiencies and toxicities are as under:

37
1.9.1.1 Iron
Iron is the second most abundant metal of the world. The earth’s core is thought to be made up of
iron and nickel, mainly [377]. Iron has a key role in our life due to the fact that it is an essential
component of many proteins and enzymes in the body [378].
1.9.1.1.1 Role of iron in the body
In eighteenth century this fact became evident that iron is the major constituent of the blood
[376]. Iron can serve different functions because of its ability to exist in ferrous and ferric iron.
For example, it can play an important role as a cofactor to enzymes which are involved in
oxidation-reduction reactions. Most of the iron is present in hemoglobin and myoglobin. In both
cases iron helps to accept and carry oxygen; and finally its release also takes place with the help
of iron. Iron is also needed by enzymes which are involved in the production of amino acids,
hormones, collagen and neurotransmitters [378].
Absorption of iron in the body depends on its source. Our food contains two different forms of
iron. The first one is known as heme iron, whereas the second one is called non-heme iron. In
first form iron is present as a part of a chemical complex found in proteins. Examples of the food
which provide heme-iron are meat, poultry and fish. Non-heme iron is derived from plants e.g.
leafy green vegetable, legumes and grains etc. Another source of non-heme iron is iron cooking
utensils.
Iron from the diet is absorbed into intestinal mucosal cells. The amount of iron absorbed depends
on whether the iron is heme or non-heme iron. It also depends on the factors that could enhance
or inhibit iron absorption for example, MFP factor and ascorbic acid which enhance iron’s
absorption. On the other hand phytates, oxalates and fibers inhibit its absorption. Heme iron
absorbs more easily and efficiently than non-heme iron [376, 378, 379].
The iron in diet is mostly present in ferric state (i.e. either as Fe (OH)3 or as ferric organic
compound) [380]. In the stomach these iron compounds are broken down and converted into free
ferric iron or loosely bound organic iron because of acidic medium of stomach. Then Fe3+ iron is
converted to Fe2+iron because of presence of reducing substances in the food. In reduced form
iron is more soluble and easily absorbed in the body. Its absorption occurs largely in small
intestine. The body stores surplus iron in the liver, bone marrow and spleen [378]. Iron can be
38
metabolized from body stores as needed, and deficiency signs appear only after stores are
depleted [376].
1.9.1.1.2 Iron deficiency
Iron deficiency is the most common among all nutrient deficiencies throughout the world. In
developing countries one-third of the children and women of reproductive age were observed to
have iron-deficiency anemia [381]. When iron is deficient, hemoglobin cannot be produced, as a
result small and pale red blood cells are formed which are unable to perform their function
efficiently. Anemia is the last stage of iron deficiency. Earlier two stages have no symptoms. In
the first stage iron diminishes from the storage organs while in the second stage a decline in
transport iron occurs, as a result serum iron falls. Fatigue, weakness, headache, an inability to
maintain body temperature in a cold environment, decline in resistance to infection, rapid heart
rate, palpitation, adverse pregnancy out comes and improper development in infants are the
symptoms of anemia. A curious behavior seen in some iron-deficient people is pica. This is a
compulsion to eat non-food items such as clay, ice, paste, laundry starch, paint chips and ashes.
These substances contain no iron and may contain toxic minerals, such as lead based paints, and
can introduce substances into diet that inhibit mineral absorption e.g. clay inhibit iron absorption
[376, 378]. In case of severe deficiency nails may become brittle and spoon-shaped. Sores at the
corners of the mouth and a sore tongue may also be the result of anemia [382]. Supplementation
with vitamin A has been found to improve iron level in children and pregnant women [383].
A deficiency of copper can decrease available iron by reducing the amount of iron that can bind
to plasma iron transport proteins. In case of copper deficiency iron accumulates in liver [376,
384]. High levels of calcium [385], and phosphate [386] causes a decrease in absorption of iron.
Fiber rich food [387] and polyphenol [388] also inhibit iron absorption resulting in its deficiency.
1.9.1.1.3 Iron toxicity
Iron is essential for cellular metabolism, but too much can be toxic (Table – 1.2). Iron in excess
could promote free radical formation, hence causing cell death due to excess oxidation of cellular
components.

39
Even a single large dose results in acute iron toxicity and it could be life threatening. Iron
poisoning can damage the intestinal lining (which can cause internal bleeding) and may cause
abnormalities in body pH, shock and liver failure [376, 378, 389].
Iron toxicity due to accumulation of iron in storage organs is referred to as iron overload. In this
case iron accumulates in tissues such as the heart and liver. Iron overload can occur in people
with conditions that cause abnormal red blood cells synthesis and in those with disease requiring
frequent blood transfusion. But the most common cause of iron overload is hemochromatosis
[390-319].
Symptoms of iron overload are weight loss, fatigue, weakness and abdominal pain. If allowed to
progress it causes tissue damage particularly in heart and liver. Iron is hypothesized to promote
heart disease by increasing formation of oxidized LDL cholesterol [392], which then leads to
atherosclerosis. High iron deposits in the body may increase the risk of diabetes, as iron
promotes the formation of free radicals, which contribute to insulin resistance and eventually
decreased insulin secretion [376]. The increase in free radical formation as a result of iron over
load may also increase cancer risk, since free radicals could damage DNA. Iron deposits also
darken the skin [378]. The dietary intake values for iron are shown in table- 1.1 [393].
1.9.1.1.4 Iron (III) complexes
In aqueous solution hydrolysis of the Iron (III) takes place or it may form complexes, for
example [Fe (H2O)6]3+. The hydrolysis of this complex in non-complexing media is complicated
and condition dependent [394].
In presence of complexing anions such as Cl-, the Fe3+ hydrolysis becomes more complicated. It
results in formation of chloro, aqua and hydroxy species. In solutions containing high
concentrations of chloride ion it forms the yellow tetrahedral anion [FeCl4]- . Iron (III) chloride
also forms adducts with donors e.g. FeCl3 (THF)3 [377].
As far as fluoride complexes of Fe (III) are concerned, they are much stronger than Fe (II) and
hence reduce the oxidizing power of Fe (III). Many other anions (such as phosphate) have
similar effect. [FeF6]3- ion is one of the examples of an octahedral high spin d5 complex [395].

40
The affinity of Fe (III) for amines is very low, however it readily forms complexes with chlating
amines such as ethylenediaminetetraacetate (EDTA), 2,2' – bipyridyl and 1,10- phenanthroline.
Example of such complexes are: [Fe (EDTA) H2O]- and [Fe (phen)3]3+.
Oxygen ligands have high affinity for Fe (III), it also forms complexes with oxalate and
phosphate ion, glycerol and sugars etc. A characteristic feature is formation of oxo and / or
hydroxo bridges. Binuclear systems may be (a) doubly bridged and (b) singly bridged with a
linear or bent FeOFe. The bent ones are known with four-, five -, and six-coordinate iron (III).
Like OH, OR can also bridge. Oxo bridges can also be formed from OH group on multidentate
ligands. Iron (III) also forms extensive series of basic carboxylates.
Both Fe (II) and Fe (III) forms complexes with cyanide ion, but [Fe(CN)6]3- is a bit more reactive
than the [Fe (CN)6]4-. For kinetic reasons the [Fe(CN)6]
3- dissociates and react rapidly (it is for
example, poisonous), whereas [Fe(CN)6]4- is not labile. Iron (III) also forms various substituted
ions of the type [Fe(CN)5 X] where X = H2O,NO2,etc. Thiocyanate also forms complex with Fe
(III) [377, 395].
1.9.1.1.5 Redox properties of iron
Regarding stability Fe(II) and Fe(III) lie much closer together as compared to (II) and (III)
oxidation states of other transition elements, and this is the reason that ferrous (Fe2+) and ferric
(Fe3+) solutions are readily inter-convertible by the use of mild oxidizing or reducing agents. The
standard electrode potential shows that Fe (II) is a good reducing agent.
Fe3+ + e- ⇌ Fe2+ E˚= 0.77 V
All Fe(II) compounds should thermodynamically, be oxidized in air at [H+] = 1
2Fe2+ +1/2 O2 + H+ → 2Fe3+ + H2O
Fe(III) forms more stable complexes as compared to Fe(II). For the same reason most of the
Fe(II) complexes readily oxidize to Fe(III) complexes [395].

41
1.9.1.2 Chromium
Chromium is widely distributed in our entire environment including air, water, soil, plants and in
animals. Chromium is an essential mineral as it plays important role in metabolism of
carbohydrate and lipid. Cr3+ and Cr6+ are the most common form of chromium, out of these first
one is effective. Dietary sources of chromium include: liver, nuts, cheeses and whole grains;
while milk, vegetables and fruits are poor sources. Refined carbohydrates (e.g. breads, pasta and
white rice) are also poor sources. Herbs are also a source of chromium [376, 378].
1.9.1.2.1 Role of chromium in the body
Based on the amount of chromium in a balanced diet, an adequate intake (AI) has been set
(Table- 1.1) [376]. Average dietary absorption ranges from 0.4 % to 3 % [396].
The body utilizes chromium probably in its trivalent state. After absorption, chromium is
transported in the blood by its binding to transferrin. When carbohydrate is consumed insulin is
released and binds to receptors in cell membranes. This binding triggers the uptake of glucose by
cells, an increase in protein and lipid synthesis and other effects [397]. Chromium is thought to
behave as part of a small peptide which through binding to insulin receptor increases insulin’s
effect [398].
Supplementations of chromium are marketed to reduce body fat and increase lean body tissue.
Because chromium is necessary for insulin action and insulin is required for protein synthesis, it
is likely that adequate chromium is necessary to increase lean body mass.
1.9.1.2.2 Chromium deficiency
Deficiency is more common in malnourished children. It may cause elevated glucose levels of
the blood and increased insulin levels, hence may result in development of type 2 diabetes [378].
Chromium competes iron for one of the bonding sites on transferrin; hence iron overload may
interfere with chromium transport in case of hereditary hemochromatosis. Consequently, people
suffering from hemochromatosis may be at the risk of diabetes also [393]. Chromium deficiency
may also cause elevated blood cholesterol and triglyceride levels, but the role of chromium in
lipid metabolism is not fully understood [376].

42
1.9.1.2.3 Chromium toxicity
Chromium toxicity from diet is rare, although few cases of renal failure have been reported in
individuals who were taking high doses of chromium supplements [376].
High levels of chromium, in all of its forms, may cause toxic effects, but chromium (VI) has
been reported more toxic. It produces several hazardous effects on health. It is a strong irritant;
as a result it may cause different types of allergic reactions, such as skin rashes. Inhalation of
high levels of Cr (VI) can cause irritation and damage to nose, lungs, stomach and intestines.
Ingestion of very large amounts of it could result in stomach upsets and ulcers, convulsions,
damage to kidney and liver and even death. In case of Chronic toxicity chromium might cause
pulmonary fibrosis and lung cancer. People working in textile and steel industry and those who
smoke tobacco are greatly exposed to chromium (VI). However, reducing substances in the food
reduces chromium (VI) to chromium (III) if it is ingested at low levels. The acidic medium of
stomach also helps in this reduction [393, 399-402].
1.9.1.2.4 Chromium (VI) complexes
Chromium is one of the more familiar transition metal owing to the uses of chromium (VI) oxide
and dichromate as oxidizing agents. For chromium the highest oxidation state is Cr (VI) which is
strongly oxidizing. In addition (III) and (II) are other chief oxidation states of chromium. Cr (VI)
salts are usually in the form of chromates and di-chromates. Their reactions are pH-dependent.
With sulphuric acid HCrO4- forms a sulphato complex.
Cr (VI) form oxohalides e.g. CrOF4, CrO2Cl2, CrO2F2 and CrO2Br2. Cr (VI) forms peroxo
complexes also. They are more or less unstable and in the solid state some of them are
dangerously explosive or flammable in the air. In aqueous solution chromates rapidly
decomposes forming Cr(III) and oxygen
By the action of hydrogen peroxide on neutral or slightly acidic solutions of di-chromates,
diamagnetic violet salts are obtained which are believed to contain the [CrO(O2)2OH]- ion. The
action of H2O2 on aqueous solutions of CrO3 containing ethylenediamine or other amine gives
chromium (IV) complexes [377, 395].

43
1.9.1.2.5 Redox properties of chromium
Chromium (VI) in acidic solution is a powerful oxidant.
Cr2O72- + H+ + 6e- 2Cr3+ + 7H2O E˚=1.33V
It is however, often a slow one because of the mechanistic complexities involved in the overall
tree-electron change. In alkaline media it is much less powerfully oxidizing and under these
conditions chromium (III) is fairly easily oxidized to chromium (VI).
CrO42- + 4H2O + 3e- Cr(OH)3 + 5OH- E˚= -0.13V
For example, when CrO4- is heated with hydrogen peroxide, in an acid containing solution the
overall action of acidic hydrogen peroxide on chromium (VI) is to reduce it to chromium (III),
on the other hand in alkaline solution reverse is the case [377, 395].
1.9.1.3 Copper
Copper compounds commonly occur as copper (II) salts. Minerals containing Cu(II) have a wide
use as pigments due to its colour.
It also serves as an essential trace element in higher plants and animals’ life. Liver and kidneys
are its richest sources. Other sources include seafood, whole grain breads, nuts, seeds, cereals,
chocolate, green leafy vegetables and dried legumes [376].
1.9.1.3.1 Role of copper in the body
Since copper can easily accept and donate electron, it plays a vital role in oxidation reduction
reactions of the body as well as in scavenging of free radicals [403].
About 30 – 40 % of the copper from our food is absorbed. The Zn content of the diet can have a
major impact on copper absorption. When Zn intake is high, it stimulates the synthesis of the
protein metallothionein in the mucosal cells. Although metallothionein binds zinc, it binds to
copper more tightly. Therefore, metallothionein binds with copper, prevent it from being moved
out of mucosal cells into the blood. The antagonism between copper and zinc is so great that
phytates, which inhibit zinc absorption, actually increase the absorption and utilization of copper
[376].

44
Copper serves as a constituent of several proteins and enzymes [404] which are required in the
metabolism of iron and lipid, synthesis of connective tissue and in maintenance of heart muscle.
They are also needed for proper functioning of immune system as well as central nervous
systems [393]. Two enzymes, copper / zinc superoxide dismutase (SOD) and extracellular SOD,
serve as antioxidants by catalyzing free radicals to hydrogen peroxide. It is finally converted to
water [405].
Copper is required by many metabolic reactions which are related to the release of energy e.g.
copper containing enzyme cytochrome C oxidase participates in the electron transport chain and
catalyzes the reduction of oxygen to water. The energy released is used by mitochondria to
produce ATP [404]. Another copper enzyme lysyl oxidase helps to manufacture collagen and
heal wounds. Copper is also required in bone formation and in cholesterol and glucose
metabolism. It may also be involved in the synthesis of myelin, which is necessary for
transmission of nerve signals [376].
The recommended copper intake (RDA) for adult is 900 µg / day. During pregnancy and
lactation RDA is increased (Table- 1.1). Over half of the copper from food is absorbed, whereas
rest of it is eliminated through bile [403].
1.9.1.3.2 Copper deficiency
Human body doesn’t need much copper. Hence copper deficiency is rare, but it occurs most
often in preterm infants and malnourished children [406]. Copper absorption may hindered by
several dietary factors which can cause its deficiency e.g. high intake of iron, manganese and
molybdenum reduce copper absorption. One more factor is vitamin C, which reduces copper
absorption. Large doses of antacids also inhibit copper absorption and. Zinc supplementation for
a long period may also cause copper deficiency [376, 405, 407].
Anemia is the most common problem resulting from copper deficiency. This is due to the fact
that copper-containing proteins are needed for iron transport [405]. In the case of copper
deficiency even if iron is sufficient in the diet, it cannot be transported out of the intestinal
mucosa. Copper deficiency causes osteoporosis and other skeletal abnormalities similar to those
seen in vitamin C deficiency (scurvy). This is because the enzyme needed for cross-linking of
connective tissue requires copper.

45
Copper deficiency in animals raises blood cholesterol and damages blood vessels, which may
become cause of cardiovascular disease in humans. Copper deficiency may also cause
aneutrophils, in which number of white blood cells rapidly decreases. Deficiency may also cause
decrease in the immune response and results in high incidence of infections.
Copper deficiency has been reported to cause impaired growth, degeneration of heart muscles
and nervous system, loss of pigment from the skin, thyroid problems and changes in hair color
and structure [376, 404, 405]. Menkes disease is a genetic disorder which could result in life
threatening deficiency [378].
1.9.1.3.3 Copper toxicity
Copper toxicity has been reported in case of drinking water from contaminated resources or due
to consumption of beverages and foods stored in copper containers [408]. Symptoms of the
toxicity include headache, dizziness, nausea, abdominal pain, vomiting and diarrhea. Acute
copper toxicity is rare but can cause heart problems, liver damage, jaundice, kidney failure, coma
and even death. Wilson’s disease is another life- threatening toxicity in which accumulation of
copper in brain, liver, kidneys and eyes takes place. People suffering from Wilson’s disease and
with other hereditary conditions such as idiopathic copper toxicosis and childhood cirrhosis
should not take copper supplements [409].
1.9.1.3.4 Cu (II) complexes
Copper is tough, soft, and ductile reddish metal with high thermal and electrical conductivities.
Both Cu(I) and Cu(II) form a wide variety of compounds. Most of the Cu(I) compounds are
easily oxidized to give Cu(II) compounds.
Most Cu (II) salts readily dissolve to form aqua ion [Cu(H2O)6]2+. When a ligand is added to
such solutions it results in the formation of complexes by successive displacement of water
molecules, for example complexes with ammonia and ethylenediamine [410]. Several Cu (II)
complexes can be obtained by treating aqueous solutions with different ligands. If the formed
complexes are neutral and water-insoluble they may be e.g. bis(acetylacetonato)–copper (II)
complex. When CN- is added to Cu(II) in presence of nitrogen donors like 1,10- phenanthroline,
five – coordinate complexes like [Cu(phen)2(CN)]+ and [Cu(phen)2(CN)2] are formed.

46
Cu(II) form complexes of considerable complexity with multidentate ligands specially which
coordinate through their oxygen or nitrogen atom. One well-known example is Fehling’s
solution [377].
Cu (II) forms several halide complexes also. The main characteristic of which is the large
number of salts of differing stoichiometries and cation-dependent structures that may be
crystallized from solutions e.g. chloro complexes [411] or may be isolated e.g. salts [412].
Some distorted Cu(II) is found in some Schiff base complexes with bulky substituents on N and
in some dipyrromethane species. With these few exceptions neutral four-coordinate Cu(II)
complexes with chelate ligands have planer coordination [377].
Cu(II) forms cage polynuclear complexes also. For example, oxidation of (CuClPEt3)4 and
similar complexes by oxygen leads to Cu(II) complexes of the type Cu4OX6L4, L=OPEt3, py,
NH3 or [Cu4OCl10]4- in chloride media [413]. The structure has a µ4-oxygen atom at the center
of a Cu4 tetrahedron; each Cu is bound to a ligand L, and three Cl atoms act as bridges. Another
compound Cu4Cl4(OR)4 is also known for Cu(II), where the alkoxide is 2
diethylaminoethanolate, has a cuban type structure with a Cu4O4 cube and tetrahedral Cu(II).
Dimeric or polymeric compounds are also known for alkoxides or aryl oxides, for example,
[Cu(OPh)2en]2.2PhOH, which has distorted sp copper [414]. Cu(II) Carboxylates are readily
made by interaction of the acid with CuCO3. They are binuclear with four carboxylate bridges
and may have end groups [415]. A number of mixed valence complexes, containing both Cu(I)
and Cu(II), are well established. The sulfides, for example, K3Cu8S6 made by heating K2CO3, Cu
and S, may have metal-like electrical conductivities and magnetic properties [416].
1.9.1.3.5 Redox properties of copper
There is not-much difference in stability between Cu(I) and Cu(II). Copper is the only member
of the first transition series which shows stable +1 oxidation state. In aqueous media both
oxidation states of copper shows stability with a very small difference and following equilibrium
can readily be shifted in either direction.
Cu2+ + e- Cu+ E˚ = 0.15 V

47
However, here the relative stabilities of Cu(I) and of Cu(I) and Cu(II) are strongly affected by
the nature of ligands or other anions present. Another factor is the solvent. In aqueous solution
Cu(I) can exist only in very low equilibrium concentrations [377, 395].
1.9.1.4 Vanadium
Vanadium is another trace element which is essential and is involved in several biological
systems [376]. The main food sources of vanadium are sea-foods, corn, olives, black pepper,
radishes, vegetable oil and whole grains [417].
1.9.1.4.1 Role of vanadium in human body
Vanadium is necessary for growth, bones development, and healthy teeth and also for
reproduction. It is also needed for the proper growth of red blood cells and performs important
role in iron metabolism. It reduces the risk of heart attacks by inhibiting the cholesterol
formation. Vanadium has been shown to have insulin-like action and to stimulate cell
proliferation and differentiation. Due to its assistance with many chemical reactions and
processes it helps in good health of human body [376, 378, 417].
Absorption of vanadium is only 0.1-1.5 % of its intake. The reason for such small amount of
vanadium absorption is probably the presence of vanadium in the form of complexes in most of
the foods. Vanadium in the form of vanadyl ion binds ferritin and transported into the blood.
Different research studies revealed that the vanadium is absorbed either in V(V) or V(IV) states
in the body. It is mainly distributed to bones, kidneys liver and spleen. It is also found in testes.
Vanadium is excreted via urine [418, 419]. The absorbed vanadium can accumulate in the body
particularly in the bones. As compared to inorganic form of vanadium, organic forms of
vanadium are reported to be more absorbable and have a therapeutic effect up to 50% more than
inorganic salts of vanadium. Organic forms are safer also and showed better biological effects
[420, 421].
The ability of vanadium to exist as V(IV) and V(V) makes it very important in several enzymatic
reactions. For example vanadium is needed for halogenations of several organic substrates,
which are carried out by haloperoxidases. Vanadium as oxovanadium ion facilitates the
substitution of other metal ions (divalent) in the enzyme active centers, whereas as vanadate it
serves phosphate antagonist. The main pharmaceutical application of vanadium is because of its

48
insulin-like action and is in treatment of diabetes (type I and II). Vanadium compounds possess
anti-tumor and anti-inflammatory activities also [422-425].
Vanadium in the form of VO2+ plays an important role in cellular system by binding with ATP.
As this binding lowers the rate of oxidation of Vanadyl ion to vanadates, which otherwise can
cause hydrolysis of the nucleotide [426]. In addition to this, vanadates have been reported to
produce several unwanted results e.g, elevated blood pressure and stimulation of monoamine
oxidase inhibitors. Vanadate is also known to obstruct with cellular energy production [427].
1.9.1.4.2 Vanadium deficiency
Vanadium deficiency is rare. Since vanadium compounds have potential therapeutic effects, its
deficiency is thought to be related with certain diseases for example diabetes, high cholesterol,
obesity, hypoglycemia, infertility, cardiovascular diseases, hyperinsulemia as well as slow
growth in children [417, 418].
1.9.1.4.3 Vanadium toxicity
There is not sufficient evidence on vanadium’s toxicity through diet and if vanadium is inhaled,
then it is subsequently excreted by urine.
V(V) compounds are more toxic than V(IV). Toxicity systems may include stunted growth,
diarrhea, loss of appetite and stomach cramping. At high doses even death can occur [417].
Exposure to vanadium dust may cause irritation of the eyes as well as upper respiratory tract
which may be accompanied with rhinitis, nose bleeds, conjunctivitis, pain in chest, sore throat
and cough. V(IV) and V(V) compounds have also been reported to decrease fertility and to
cause complications in pregnancy such as feto-toxicity and embryo lethality. Major cause of
vanadium toxicity is related to its wide industrial use, where high air concentrations of vanadium
occur [427, 428].
1.9.1.4.4 Vanadium (IV) complexes
Vanadium has abundance in nature of ~ 0.02%. Vanadium metal is steel-grey in color, and pure
vanadium is rare because it is quite reactive. Vanadium exists in several oxidation states e.g., -1,
0, +2, +3, +4, and +5, but normal oxidation states are +2, +3, +4 and +5. The highest oxidation
states are most familiar [377, 395, 429].

49
Vanadium (IV) forms complexes with several ligands, such as with halides, it forms vanadium
halides e.g. VCl4 [V (NR2)4], [V(OR)4]x and [V(S2CNR2)4] are compounds derived from
vanadium halides, but the chemistry of vanadium (IV) is dominated by oxygen compounds or
oxo-vanadium (IV) ion (VO2+).
The interaction of V2O5 with ethanolic HCl gives a solution containing [VOCl5]3-, that can
conveniently be used as a source of V(IV) oxo complexes. These complexes mostly have five-
or six- coordinate geometry. Discrete complexes of VO2+ are legion. For the most part they have
square pyramidal structures. In few cases, for example, in certain Schiff base complexes the
structure is distorted trigonal bipyramidal. In majority of these cases the ligands are bi-or
polydentate [430] but simple [VOX4]2- and [VOX5]
3- species (X = F, Cl, CN, SCN etc.) have
been well characterized [431, 432]. There are also bridged binuclear species known for V(IV)
complexes [433, 434]. Many other VO (porph) complexes can be made and have the expected
square pyramidal structures [435].
Several complexes of V(IV) have been reported which do not contain VO2+ ion, for example
[V(cat)3]2-, and a series of cis-and trans VX2(LL)2 (X= Cl and Br), in which LL- is a bidentate
ligand employing (O,O), (N,O) or (N, N) donors. These are also adducts of the halides VX4 such
as VCl4 (PMe3)2 [377]. Beside these, VO2+ has also been reported to form complexes, which
have blood- glucose lowering and insulin enhancing effects, e.g. VO (metf)2 [436].
1.9.1.4.5 Redox properties of vanadium
There are four well defined cationic species regarding different oxidation states of vanadium,
[V(H2O)6]2+, [V(H2O)6]
3+, VO2+(aq) and VO2+(aq), and none of these dis-proportionates because
the ions become better oxidants as the oxidation state increases; both V(II) and V(III) ions are
oxidized by air, whereas vanadium metal is a powerful reductant. The potential diagram for
vanadium at [H+] = 1 is as follows:
VO2+ .⎯ VO2+ .⎯ V3+ .⎯ V2+ .⎯ V
V(II) in the form of [V(H2O)6]2+ ion is strongly reducing and is rapidly oxidizes on exposure to
air. V(III) forms blue aqua ion which can be obtained by electrolysis or by chemical reduction of
V(IV) or V(V), and like V(II) aqua ion it also oxidizes in air.
50
V(V) is strong oxidant and can easily be reduced to V(IV). Vanadium has a unique property of
converting into different oxidation states either by gaining or losing one electron. Due to this
property vanadium could be widely used in synthesis of several compounds including
compounds having pharmacological and therpeutic activities [377, 395].
1.9.1.5 Cobalt
1.9.1.5.1 Role of cobalt in the body
Cobalt is the key mineral in large molecule of vitamin B12 [378]. Therefore, cobalt helps in red
blood cells formation and nerve tissue maintenance. Its normal concentration is 80 – 300 µg/ml
in the blood. The main food sources are all green leafy vegetables, organ and muscle meats,
dairy products, and sea foods. Fruits and herbs are also sources of cobalt [437]. The cobalt level
in plants is dependent on the concentration of cobalt in the soil.
Since body does not absorb cobalt directly, vitamin B12 is the only main source of it. Moreover,
vitamin B12 is also needed for proper functioning of iron, calcium and vitamin B6. Vitamin B12 is
the part of several enzymes and is also involved in maintenance of body cells. It helps in
metabolism of carbohydrates, protein and fats, and is also essential for metabolism of folic acid
[437, 438].
1.9.1.5.2 Cobalt deficiency
Deficiency of cobalt can result in anemia, abnormalities in cell formation, nervous disorders,
nerves deprived of energy, palpitation of heart, unsteady gait, fatigue, diarrhea, finger and toe
numbness, paralysis and even death. Cobalt deficiency may also cause scaly skin and atrophy
[437, 439- 441]. Depression and Alzheimer’s disease have also been reported in vitamin B12
deficient people [442, 443]. Use of alcohol and sleeping pills may produce cobalt deficiency.
Sunlight and estrogen may also cause depletion of cobalt.
1.9.1.5.3 Cobalt toxicity
From dietary source cobalt toxicity is rare but large doses of inorganic cobalt may produce toxic
effects including thyroid stimulation resulting in enlarged thyroid glands. Toxicity may also
disturb bone marrow function causing excess production of red blood cells (polycythemia) [437,
439].

51
1.9.1.5.4 Cobalt (II) complexes
Cobalt is a hard and bluish-white metal. Co (II) is its most stable oxidation state and it forms
numerous complexes. Most of the complexes are octahedral or tetrahedral. In addition, it also
forms five-coordinate and square species. The stability difference between octahedral and
tetrahedral Co(II) complexes is very small, hence(consequently) the two forms are
interconvertable e.g. thiocyanate in methanol [444]. In aqueous solution it forms [Co(H2O)6]2+
and [Co(H2O)4]2+ . Both forms are usually in equilibrium with each other.
Co(II) generally forms tetrahedral complexes with mono and some bidentate dentate ligands but
with chelating bidentate ligands complexes having higher coordination number are formed. As
far as stability is concerned, [Co(H2O)6]2+ and [CoCl4]
2- are both very stable with respect to
oxidation; this is also true for blue thiocyanato complex [Co(NCS)4]2-. On the other hand, the
[Co(NH3)6]2+ ion is very easily oxidised, and the same is true for amine complexes [395].
Planer complexes are formed with several bidentate monoanions such as dimethylglyoximate, O-
aminophenoxide, dithioacetylacetonate and dithiolate-type ligands. Several neutral bidentate
ligands also give planer complexes, but coordinated anions in some cases make them distorted
octahedral e.g. [Co(en)2] (AgI2)2 [377]. Another example of Co(II) complex is vitamin B12,
which prevents pernicious anemia[395].
1.9.1.5.5 Redox properties of cobalt
Cobalt metal is somewhat less reactive than iron. E˚ for the Co2+/Co system is -0.28 V. It
dissolves slowly in dilute mineral acids, but concentrated nitric acid makes it passive; alkalis
have no action.
In aqueous solutions containing no complexing agents, oxidation of [Co(H2O)6]2+ to Co(III) is
very unfavorable:
[Co(H2O)6]3+ + e- [Co(H2O)6]
2+ E˚ = 1.84 V.
The aquo ion of Co(III) is a powerful reductant. Water rapidly reduces un-complexed Co(III) at
room temperature and this relative instability is evidences by the rarity of simple salts and binary
compounds, whereas Co(II) forms such compounds in abundance and many Co(II) complexes
both octahedral and tetrahedral, are also known [377, 395].

52
1.9.1.6 Manganese
Manganese is also an essential trace element. The grains, nuts, fruits, vegetables, meat, dairy
products are its different sources.
1.9.1.6.1 Role of manganese in the body
It plays very important roles in several physiological processes. It is needed as a part of some
enzymes but it also works as an activator of some others [445]. Manganese requiring enzymes
are involved in amino acid, carbohydrate and cholesterol metabolism; urea synthesis and
antioxidant protection [376]. Like copper it is needed for the activity of a form of superoxide
dismutase [446]. Manganese is a cofactor of an enzyme glycosyl transferase which is involved in
formation of cartilage and bones [447].
Absorption of manganese depends on its intake. It increases in case of low intake but decreases
when intake is high. Manganese is eliminated by secretion into the intestinal tract in bile [393].
The AI (adequate intake) for manganese is given in table-1.1.
1.9.1.6.2 Manganese deficiency
Manganese requirements are low so deficiencies are quite uncommon [448]. Some dietary
factors such as phytates inhibit manganese absorption causing its deficiency [449]. In addition,
high intake of iron reduces manganese absorption. A decrease in blood manganese levels has
been observed with iron supplementation [450]. Several research studies have reported that
manganese bioavailability is decreased by supplemental calcium [451]. Manganese deficiency
results in growth retardation, reproductive problems, congenital malformations in the off spring
and abnormalities in brain function, bone formation, glucose regulation and lipid metabolism.
Severe manganese deficiency may cause osteoporosis, diabetes and epilepsy [376, 447].
1.9.1.6.3 Manganese toxicity
In human, toxicity has been reported in mine workers exposed to high concentrations of inhaled
manganese dust [446]. Toxicity may result in damage to nervous system and brain diseases.
Severe manganese toxicity may cause abnormalities in appearance and behavior such as
irritability and aggressiveness. The UL is 11 mg / day from all sources [376, 378].

53
1.9.1.7 Silicon
Silicon is known as primary constituent of sand, but it is also needed for human beings as a
mineral. Silicon helps in the growth and development of healthy bones and is involved in
calcification of bones. It also plays important roles in the formation of connective tissues and
hair, skin and nails. It has been reported to prevent hardening of arteries and veins. Moreover,
silicon has been suggested useful in joints pains, bones weakness and aging of skin. Furthermore,
this element has been known to reduce the activities of aluminium in the body. Rich sources of
silicon include whole grains cereals, peas, beans, beets, alfalfa and bell peppers [452].
1.9.2 Toxic Elements
Many other trace elements are found in minute amounts in the human body. Their essentiality is
uncertain, hence they are considered toxic.
1.9.2.1 Cadmium
Cadmium is a unique mineral, on which mixed opinions have been reported. It has been
suggested that it plays some important roles in the human body.
1.9.2.1.1 Role of cadmium
Human adult renal metallothionein has a natural content of cadmium which induces resynthesis
of this protein upon its catabolism. Cadmium has been reported to be beneficial in thyroid
disease [453].
1.9.2.1.2 Cadmium toxicity
Cadmium is believed to be extremely toxic for human being, as well as it is an environmental
hazard. Water, air and soil are the main sources of cadmium. Foods that contain high cadmium
content are kidney (right), mushrooms, cocoa powder, shell fish and dried seaweeds. Vegetables
grown in a soil containing high cadmium level may another source or the meat of the animals
that have ingested those plants [454].
Its toxicity may result in severe irritation of stomach, resulting in vomiting and diarrhea.
Breathing high levels of cadmium may result in metal fume fever which may further cause
severe lung damage followed by pneumonitis, pulmonary edema and death [455].

54
Cadmium mainly accumulates in kidneys and liver. The high chronic toxicity of cadmium may
cause bone diseases, serious kidney failure, nephro-toxicity, renal stone formation, glucose-urea
and protein urea [453, 456].
Acute cadmium exposure also has many dangerous effects including liver injury, and renal
failure. High calcium, protein and iron, whereas low fat intake help to reduce cadmium toxicity
[455].
1.9.2.2 Aluminium
1.9.2.2.1 Role of aluminium
Aluminium has now been suggested to be essential to some extent. It helps some enzymes, e.g.
d-aminolevulinate dehydrase and succinic dehydrogenase to play their roles more effectively.
Sources of aluminium may be food and drinking water. Other sources may be food additives,
indigestion pills, some antacids and de-odorants [452].
1.9.2.2.2 Aluminium deficiency
Alumium deficiency has not been reported. Its amount needed by the body is greatly exceeded
by different incidental sources [452].
1.9.2.2.3 Aluminium toxicity
Toxic effects of aluminium are mainly due to its interference with binding of other metals in
different enzymes and proteins. It competes the metal such as magnesium, calcium or iron by
binding itself to the site, resulting in impaired function of protein [457]. Aluminium has been
reported toxic both in plants as well as in animals. Acid soils generally contain high contents of
aluminium. Acid rain increases the bioavailability and solubility of aluminium in such soil.
Aluminium gets into the plants growing in this soil and alters their growth [458]. Aluminium has
reported to be more toxic in acid water fishes, resulting in their death [459]. In human,
aluminium toxicity may cause damage to nervous system resulting in different severe problems
such as Alzheimers disease [452].

55
1.9.2.3 Arsenic
1.9.2.3.1 Role of arsenic
Although this element is well known as a poison yet it has been reported as an essential element
in tiny quantities. Several researches on animals have shown its essentiality for proper growth,
reproduction and nervous system in order to perform their function properly. [452].
Elemental and Organic forms of arsenic are usually present in food. These forms of arsenic are
readily eliminated by the kidneys and do not create problem [460]. An arsenic compound,
arsenic trioxide, has been reported useful in treatment of a dangerous form of leukemia called
acute promyelocytic leukemia [452].
1.9.2.3.2 Arsenic deficiency
Arsenic deficiency has never been observed in human beings. However, in studies on animals
symptoms of low level arsenic observed were retardation in growth and development [452].
Arsenic deficiency has been correlated with nervous system disorders, blood vessel diseases and
cancer [376].
1.9.2.3.3 Arsenic toxicity
The inorganic arsenates or trivalent forms of arsenic are toxic to human beings e.g., arsenic
trioxide, which is used industrially and found as food contaminant. Most reported arsenic
poisonings are caused by this compound, which is found in drinking water. Occupational
exposure, burning of fuel oils and coal are some other sources of poisoning. Rice grown along
the bank of a water reservoir which contains high level of arsenic is another source of arsenic
poisoning [460, 461].
Initial symptoms of poisoning are headache, severe diarrhea and drowsiness. Acute toxicity
symptoms may include blood in urine, cramping muscles, hair loss, stomach pain and severe
convulsions. Finally, it may cause coma and eventually death.
Arsenic has been found to be associated with heart diseases, respiratory diseases, hypertension,
stroke, cancer, and diabetes. Arsenic toxicity causes these severe results by interfering with
various cellular metabolic processes and biochemistry of the body. These interferences results in
multi system organ failure and then leads to death [461].

56
1.9.2.4 Lead
Lead is one of the contaminant minerals that enter the food supply by way of soil, water and air
pollution. It disrupts body processes and impairs nutrition status.
It usually gets into the drinking water, which may contain either dissolved or particulate form of
lead. Lead containing paint particles can contaminate its neighborhood. Lead coming from
industrial sources and transport is the major source of environmental pollution. Lead absorption
is efficient at low pH. Luckily a large amount of lead passes through the body unabsorbed and
eliminated. Absorbed lead goes to liver, where it accumulates and produces severe harmful
effects when reaches to toxic levels.
Due to its similarity to some other essential minerals, it can displace them from their metabolic
sites; hence these essential minerals become unable to perform their role in the body. For
instance, lead can compete with iron in heme, hence inhibiting the oxygen carrying ability. In the
same way by competing in the brain it can disturb the function of the nerve cells by blocking
their signal messages. Lead binds to antibodies, thereby impairing the body’s immunity.
Lead at toxic levels may damage nervous system, kidneys and bone marrow. It interferes several
normal body activities, for example it impairs growth by interfering with hormone activity. It
may create reproductive complications in both men and women. Lead toxicity is known to
associate with increased rate of infertility, miscarriages and still birth. In children, toxicity
symptoms include learning disabilities such as, reduced memory and impaired concentration
also. It causes dental caries also. Thus, lead’s interactions in the body have profound adverse
effects and the greater the exposure, the more damaging the effects [378, 462].
1.9.3 Macro– nutrients
1.9.3.1 Sodium
1.9.3.1.1 Role of sodium in the body
Sodium plays a critical role to maintain the fluid balance of the body. It is present in extra
cellular fluid whereas potassium is present inside the cell. Sodium along with potassium
maintains a cell’s membrane potential which is produced by the concentration difference of
sodium and potassium ions. This control of cell membrane potential is extremely essential for

57
many life-sustaining processes. Sodium absorption helps in absorption of water, glucose and
chloride [463].
A main source of sodium is table salt, seafood, cheese, eggs, beef, yogurt and vegetables. The
minimum requirement of sodium for adults is set at 500 mg / day [378].
1.9.3.1.2 Sodium deficiency
Deficiency of sodium from diet is uncommon. But some conditions could cause its deficiency,
for example diarrhea, vomiting and heavy sweating. Use of some diuretics may also cause
sodium deficiency. Sodium deficiency may cause headache, nausea and vomiting. Some more
symptoms are fatigue, disorientation and fainting. Severe sodium deficiency may result in
cerebral edema, seizures and brain damage. It could even cause coma and death [464].
1.9.3.1.3 Sodium toxicity
People suffering from renal disease, diabetes, aged or overweight people are at the high risk of
sodium toxicity. Symptoms include edema and hypertension which may further result in heart
disease and even death [378].
A high sodium level has also been reported to cause excretion of calcium through urine. This, if
continued for a long period, may develop calcium stones [465].
1.9.3.2 Potassium
1.9.3.2.1 Role of potassium in the body
Potassium is an essential mineral and like sodium, it is another positively charge ion present in
the body working as an electrolyte. In contrast to sodium, it is present inside the cell. As many of
our body functions depend upon potassium so its concentration is strictly regulated inside and
outside of body cell.
Actually the concentration difference of potassium and sodium across the cell membrane creates
a membrane potential, which is maintained by Na, K- ATPase pumps. A strict control of this
membrane potential is essential, as it is involved in muscle contractions, nerve impulse
transmission and regulation of heart beat. Some enzymes, such as pyruvate kinase need
potassium for their function. This enzyme is involved in carbohydrate metabolism [466].

58
Potassium is abundant in fresh foods of all kinds e.g.; spinach, potato, sweet potato, carrots,
mango, grapes, banana, dates, water melon, French beans, and pumpkin etc. Estimated minimum
requirement of potassium for adults is set at 2000 mg/ day [378].
1.9.3.2.2 Potassium deficiency
It is usually caused by losses of potassium in high amount. Diabetic acidosis, prolonged
vomiting/diarrhea, dehydration are the causes of potassium deficiency. Use of some drugs
containing diuretics, steroids and strong laxatives can also create low potassium level in plasma
and may cause hypokalemia. Alcoholism and magnesium depletion may also increase the risk of
hypokalemia [378, 467].
Deficiency may result in high blood pressure. Intake of potassium in adequate amounts can
decrease the risk of stroke and kidney stones. Potassium deficiency accompanies dehydration
[378, 468].
1.9.3.2.3 Potassium toxicity
Potassium toxicity does not result from over eating food high in potassium. It can result from
over consumption of potassium salts or supplements and from certain diseases and treatments
[469]. Symptoms of potassium toxicity (hyperkalemia) may be muscular weakness and tingling
of hands and feet. A high potassium intake may cause nausea, vomiting, diarrhea and ulcers in
gastrointestinal tract. Hyperkalemia may cause temporary paralysis [378].
1.9.3.3 Calcium
1.9.3.3.1 Role of calcium in the body
Our bones and teeth contain 99 % of the total calcium of the body. It performs two important
functions in bones. On the one hand being a part of bone structure it forms a rigid frame that
helps the body to remain in an upright position and give the body an appropriate shape together
with the muscles. On the other hand it serves as acalcium storage. Calcium is readily provided to
the body whenever its level in the blood drops.

59
Calcium is needed throughout the life for the formation of new bone cells called osteoblasts
which synthesize new bones in order to replace the bone that was dissolved. Similar process
takes place in teeth formation [378, 470].
Calcium also plays important roles in muscle contractions, contraction and relaxation of blood
vessels, clotting of blood, transmission of nerve impulses, secretion of hormones, such as insulin,
diabetes hypertension, colon cancer and activation of some enzyme reactions [378, 471].
Vitamin D is needed to make calcium’s absorption effective. Its deficiency results in high or low
blood calcium levels. Absorption also depends on needs. Many factors impair calcium absorption
such as insufficient vitamin D and fiber or binders (e.g.; phytate and oxalate) in the food. Richest
source of calcium is milk and its products [378, 472].
1.9.3.3.2 Calcium deficiency
In children low calcium intake results in stunted growth. Calcium loss takes place throughout the
life in the form of bone loss. Moreover, a chronic dietary deficiency of calcium or a chronic
deficiency due to poor absorption depletes the stored deposits of calcium in the bones. This
results in demineralization of bones to maintain normal blood calcium levels [470]. This bone
loss can result in osteoporosis. High calcium intake in such conditions may prevent further
deterioration. Calcium deficiency may also result in tooth decay.
Calcium deficiency may occur due to increased sodium or protein intake, as their high intake
increases the urinary excretion of calcium [471].
1.9.3.3.3 Calcium toxicity
The UL for calcium is set at 2500 mg / day. Calcium toxicity or elevated blood calcium level is
known as hypercalcemia. It has never been reported to occur from food. The cause of calcium
toxicity is mostly as a result of high intake of its supplements.
Toxicity symptoms include constipation, abnormal heart beat, abnormal blood clothing, and
interference with absorption of other minerals. It may also increase the risk of urinary stone
formation and kidney dysfunction. Elevated excretion of calcium by kidneys is normally related
to formation of kidney stones. Low sodium intake, whereas, high phosphorus intake can decrease
the urinary excretion of calcium [378, 471].

60
TABLE- 1.1
Recommended Dietary Allowances (RDA) and Adequate Intakes (AI)
Age (yr)CaAI
(mg/day)
PRDA
(mg/day)
MgRDA
(mg/day)
FeRDA
(mg/day)
ZnRDA
(mg/day)
SeRDA
(µg/day)
CuRDA
(µg/day)
MnAl
(mg/day
CrAI
(µg/day)
Infants
0-0.5 210 100 30 0.27 2 15 200 0.003 0.2
0.5-1 270 275 75 11 3 20 220 0.6 5.5Children
1-3 500 460 80 7 3 20 340 1.2 11
4-8 800 500 130 10 5 30 440 1.5 15Males
9-13 1300 1250 240 8 8 40 700 1.9 25
14-18 1300 1250 410 11 11 55 890 2.2 35
19-30 1000 700 400 8 11 55 900 2.3 35
31-50 1000 700 420 8 11 55 900 2.3 35
51-70 1200 700 420 8 11 55 900 2.3 30
>70 1200 700 420 8 11 55 900 2.3 30Females
9-13 1300 1250 240 8 8 40 700 1.6 21
14-18 1300 1250 360 15 9 55 890 1.6 24
19-30 1000 700 310 18 8 55 900 1.8 25
31-50 1000 700 320 18 8 55 900 1.8 25
51-70 1200 700 320 8 8 55 900 1.8 20
>70 1200 700 320 8 8 55 900 1.8 20Pregnancy
≤ 18 1300 1250 400 27 13 60 1000 2 29
19-30 1000 700 350 27 11 60 1000 2 30
31-50 1000 700 360 27 11 60 1000 2 30
Lactation
≤ 18 1300 1250 360 10 14 70 1300 2.6 44
19-30 1000 700 310 9 12 70 1300 2.6 45
31-50 1000 700 320 9 12 70 1300 2.6 45

61
TABLE- 1.2
Tolerable Upper Intakes Levels (UL)
Age(yr)
Ca(mg/day)
P(mg/day)
Mg(mg/day)
Fe(mg/day)
Zn(mg/day)
Se(µg/day)
Cu(µg/day)
Mn(mg/day)
Ni(mg/day)
V(mg/day)
Infants
0-0.5 - - - 40 4 45 - - - -
0.5-1 - - - 40 5 60 - - - -
Children
1-3 2500 3000 65 40 7 90 1000 2 0.2 -
4-8 2500 3000 110 40 12 150 3000 3 0.3 -
9-13 2500 4000 350 40 23 280 5000 6 0.6 -
Adolescents
14-18 2500 4000 350 45 34 400 8000 9 1 -
Adults
19-70 2500 4000 350 45 40 400 10,000 11 1 1.8
> 70 2500 3000 350 45 40 400 10,000 11 1 1.8
Pregnancy
≤ 18 2500 3500 350 45 34 400 8000 9 1 -
19-50 2500 3500 350 45 40 400 10,000 11 1 -
Lactation
≤ 18 2500 4000 350 45 34 400 8000 9 1 -
19-50 2500 4000 350 45 40 400 10,000 11 1 -
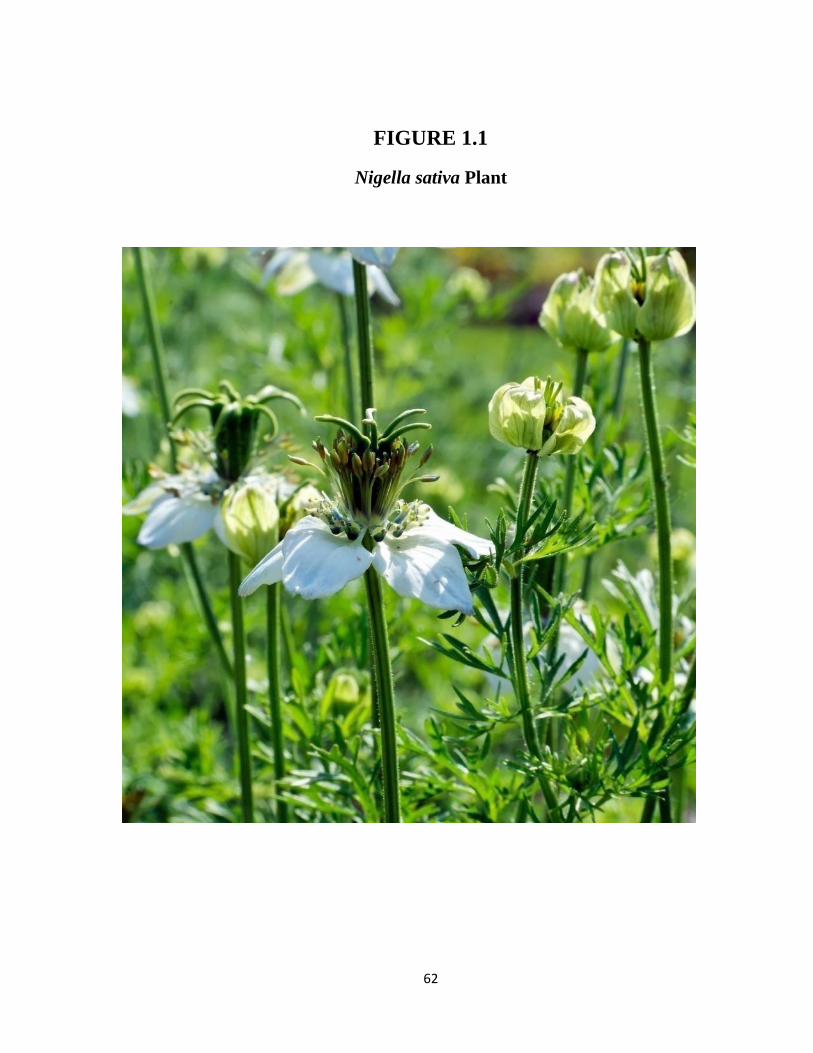
62
FIGURE 1.1
Nigella sativa Plant

63
FIGURE 1.2
A Flower of Nigella sativa
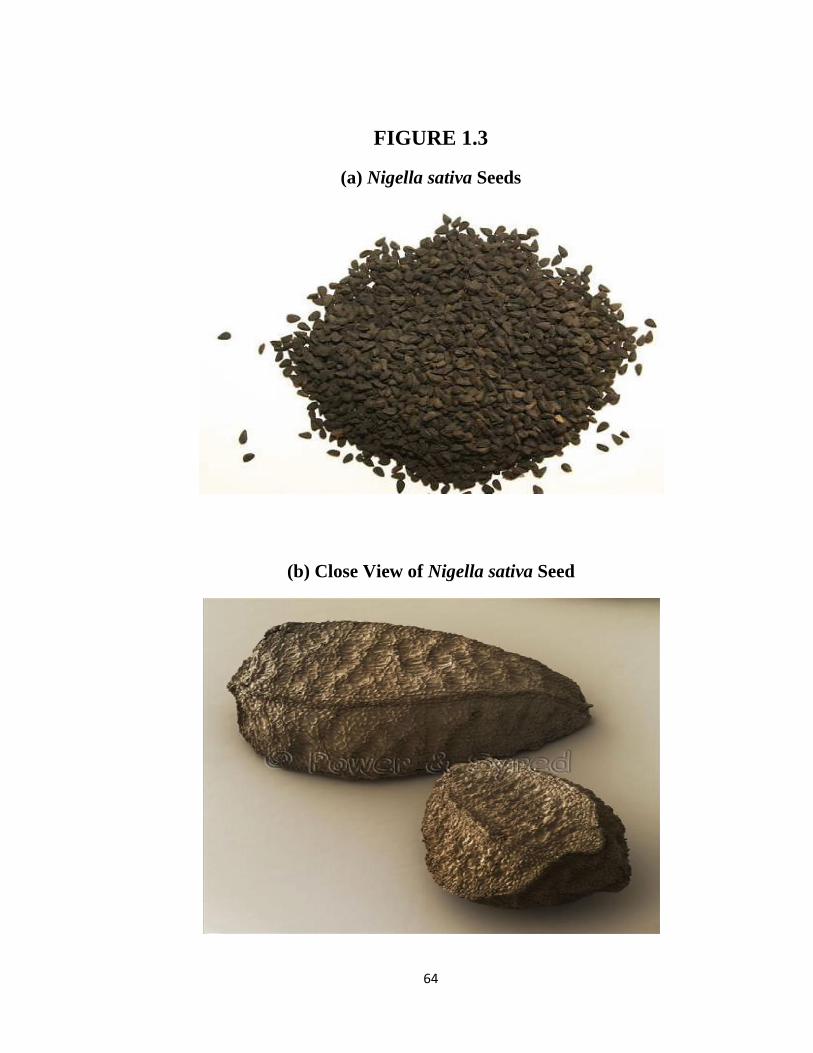
64
FIGURE 1.3
(a) Nigella sativa Seeds
(b) Close View of Nigella sativa Seed

65
FIGURE 1.4
Some Active Constituents of Nigella sativa Seed
(a) Thymoquinone (b) Thymol
CH3
O
O
CH3H3C CH3
OH
H3C CH3
(c) Thymohydroquinone (d) Dithymoquinone
CH3H3C
HO
CH3
OH
O
O
CH
Me
Me Me
Me
O
OHC Me
Me

66
CHAPTER NO 2
THEORITICAL BACKGROUND
Most of the modern researches involve use of instrumental methods. Instrumental methods are
classified into optical methods, separation methods and electro-analytical methods.
Various types of separation methods are used, out of which most common is chromatography. In
electro-analytical method an electrical measurement is used to perform the qualitative or
quantitative analysis, for example potentiometry and voltammetry. The main advantage of
optical and electro-analytical methods is their ability to determine extremely small amount of
any substance in the analyte [473].
Following techniques were used in the present work:
Chromatography
Mass spectrometry
NMR spectroscopy
IR spectroscopy
UV-Visible spectroscopy
Scanning Electron Microscopy
pH-metry
Cyclic Voltammetry
These techniques were used for isolation and identification of different constituents of the
N. sativa seeds, elemental determination of the seed and determination of stoichiometry, stability
constant and electro-chemical study of complexes of active ingredients of seed with some
essential trace elements.

67
2.1 Chromatography
In this technique closely related components of a complex mixture are separated into individual
components. This separation depends on their relative attraction for a stationary and a mobile
phase. The mixture is partitioned between the two phases and moves along with mobile phases at
a rate which depends upon the relative attraction of each component for the two phases [473].
The relative amount of a particular species in the stationary phase as compared with the amount
in the mobile phase is known as the distribution coefficient [474].
K = CS /CM
The amount of time required to elute a sample component from the stationary phase is known as
retention time. It is related to the volume of mobile phase needed to elute the substance from the
stationary phase, the retention volume, by:
V = Ft
Another important parameter is relative retention which is given by:
α = t - tm /tref-tm = V – Vm /Vref -Vm
Where,
‘tm’ and’ Vm ‘ are corrected retention time or volume of a reference compound.
Efficiency of a column directly depends upon number of theoretical plates and the height
equivalent of a theoretical plate (H). It is the length of column corresponding to a single
theoretical plate [473].
H = L/n
In present research elution analysis, which is the most popular chromatographic technique, was
used to separate different components of the seed. First, crude components of the seeds were
separated using partitioning. This technique uses immiscible liquids. Here separation of
components depends upon ability of the mixture components to partition themselves between
two liquid phases. Further separation and purification of seed components was performed by
liquid-solid chromatography (LSC).

68
2.1.1 Liquid – Solid Chromatography (LSC)
It is also known as adsorption chromatography. The column used for this technique is usually a
glass tube with a valve at the bottom. Either a plug or glass wool or a porous glass plate is placed
above the valve in the column to hold the stationary packing material in. While the valve is
closed, mobile phase is poured into the column and slurry of stationary phase is added. The walls
of the column are tapped to ensure uniform packing and to avoid air pockets. A thin plug of glass
wool is added to the top of the packing material to hold the stationary phase in place. The
column must always be covered with mobile phase. Otherwise, air pockets can develop within
the column and impede mobile phase flow. Sample solution is then added to the packed column
and drained onto the stationary phase by opening the valve. After this process mobile phase is
added. As a molecule of sample component enters an LSC column, it can either be adsorbed on
the stationary phase or remain dissolved in the mobile phase [474, 475].
2.1.1.1 LSC Stationary Phase
The solid stationary phase is usually composed of fine granular particles of nearly equal size. It
must be insoluble in the mobile phase and chemically inert with respect to the mobile phase and
the sample components. Further, it must have particle dimensions which permit separation in a
reasonable time. Most commonly used adsorbents are alumina and silica gel [473].
2.1.1.2 LSC Mobile phases
There is a competition between the mobile phase and the sample components for adsorption sites
on the stationary phase. For this purpose different solvents can be used depending upon the
required polarity. Use of a mobile phase, which has high polarity, results in a decrease in the
retention times of the sample components.
In present research sample components were separated by gradient-elution analysis. In this
analysis two mobile phases of compatible polarities are used to elute the sample through the
column. In the beginning less polar solvent is used and then the relative quantity of the more
polar solvent in the mobile phase is increased while the amount of the less polar solvent is
decreased. The two solvents must be completely soluble in each other. The analyst can exert
some control over the degree of separation by choosing the solvent or mixture of solvents to be

69
used as the mobile phase [473, 474]. The order of polarity of solvents used in present research is
as follows:
n-Hexane < ethyl-acetate < dichloroethane < methanol
Fractions of the eluate are collected and analysed by thin layer chromatography.
2.1.2 Thin – layer Chromatography (TLC)
TLC is a form of plane chromatographic technique. In this technique the stationary phase is a
thin and adherent layer of a finely divided solid on a glass, plastic or aluminium plate. A slurry
of stationary phase is prepared and loaded into a spreader, which applies the slurry to the plate in
a uniform thin layer. After drying the plate is ready to use. Some stationary phases are activated
by heating them prior to use.
Solid adsorbents such as silica gel and alumina are most commonly used as TLC stationary
phases. In addition a binder, fluorescent indicator or other substances are added to the plate.
Plaster of Paris is a common binder, since it forms gypsum upon addition to water. The
stationary phase particle size used in TLC separation has an effect upon the efficiency of a TLC
plate and a decrease in particle size increases efficiency of separation.
The sample is spotted or streaked on the TLC plate. Mostly manual application of samples is
performed by touching a capillary tube containing the sample to the plate. After placing the
sample on the TLC plate, its position is marked. Then, the plate is placed in an air tight glass
chamber saturated with vapors of developing solvent. One or more solvents are used for this
purpose. The developing solvent travels up the plate, being drawn by the capillary action
between the fine particles. As the developing solvent travels past the point of sample application,
it dissolves the sample and carries it up the plate, with the sample distributing itself between the
moving solvent and the stationary phase. If an adsorbent is used as the stationary phase, less
polar compounds migrate more rapidly along the plate and yield larger retardation factors (Rf)
[474, 476].
If the sample component absorbs UV radiations or fluoresces, the developed spot can be located
by holding the TLC plate under a UV lamp. Some spots can be made visible, absorbing, or

70
fluorescent by spraying them with various chemical reagents, e.g. iodine solution, sulphuric acid,
ninhydrin or fluorescamine [473].
2.2 Mass Spectrometry
Mass spectrometry (MS) involves formation of ions in a mass spectrometer followed by
separation and detection of the ions according to mass and charge [477]. In this technique an
organic compound, in a high vacuum is bombarded with electrons and is converted into positive
ions by loss of an electron.
M + e- → M+ + 2 e-
The positive ion, M+ is known as the molecular ion or parent ion and is formed when the energy
of the electrons is equal to that of the ionization potential. In practice, the energy of the electrons
is 50 – 70 eV, and under these conditions the molecular ion is formed with an excess of energy,
large enough for it to break down into a mixture of neutral and positively charged fragments.
Most ions carry a unit positive charge but some may carry a double or greater positive charge.
The ions are sorted out with respect to their mass / charge (m/e) ratios, and so the masses of the
ions can be determined. Since most ions have a unit positive charge, m/e is equivalent to m [478].
2.2.1 Mass Spectrum
It is a plot m/e ratio against abundance of each detected ion. Mass spectrum is a characteristic of
any pure compound and a pure compound is characterized by its cracking pattern, that is the
fragmentation pattern and the relative abundance of the peaks are fixed.
The largest peak in a mass spectrum corresponds to the base peak and has a numerical value 100.
The intensities of all other peaks are described with respect to the height of the base peak. M+ in
the spectrum indicates the molecular ion peak. It may or may not be the peak of highest intensity.
The molecular ion is the most important ion, since its mass is the mass of the parent molecule
[477, 479].This series of calculated values is the cracking pattern and it may be described in the
form of a line diagram, or may be reported in tabular form in which mass number and relative
abundance are listed.

71
The interpretation of a mass spectrum is difficult, complications arises from various sources. The
main source of difficulty is that the molecular ion may undergo rearrangement to give
fragmentation patterns not anticipated from the structure of the compound. Molecular ions
formed by EIMS are high energetic species. They can break apart in a variety of ways; the
fragments that are produced can undergo further fragmentation, and so on. One important type of
fragmentation is the simple cleavage of a single bond. With a radical cation this cleavage can
take place in at least two ways: each way produces a cation and a radical [478].
Isotopic peaks give one method for determining molecular formulas. Most of the common
elements found in organic compounds have naturally occurring heavier isotopes, for example
carbon, hydrogen and nitrogen. The principle heavier isotope is one mass unit greater than the
most common isotope. The presence of these elements in a compound gives rise to a small
isotopic peak with mass one unit greater than the molecular ion. This helps to calculate
molecular weight, but as the number of atoms in a molecule increases, molecular weight
calculations become more complex.
2.2.2 Applications of Mass Spectrometry
Mass spectrometry may be used with gases, liquids and solids. The main advantage of this
technique is that only very small amounts of material are necessary (a few µg). It has been
proved extremely valuable for determination of accurate molecular weights, obtaining molecular
formulae, elucidation of structure, quantitative analysis of mixtures, ionization potentials, and
bond strengths [478].
The fragmentation processes of organic molecules follow certain patterns in that the fragments
broken off are related to bond strengths and the stability of the species formed. Since certain
structural features in molecule produce definite characteristic fragmentation patterns, the
identification of these fragments and their relative intensities in a mass spectrum can be
beneficial for the structural determination of organic compounds [479].
2.3 Nuclear Magnetic Resonance Spectroscopy (NMR)
The nuclei of certain elements including 1H and 13C nuclei, behaves as though they were magnets
spinning about an axis. When a compound containing protons or carbon-13 nuclei is kept in a
very strong magnetic field its irradiation with electromagnetic energy results in absorption of the

72
energy. The absorption of energy produces a characteristic spectrum which is particular for that
compound and is known as NMR spectrum. It gives very useful information about molecular
structure [477].
For both proton and carbon -13 NMR, tetra methyl silence (TMS) is used as frequency standard;
it is chosen for several reasons. It contains twelve equivalent protons and four equivalent
carbons, it give rise to sharp NMR signals, it is chemically inert, soluble in most organic
compounds and sufficiently volatile to be easily removed from the sample after the spectrum has
been recorded [480].
2.3.1 1H NMR
It is the most common type of NMR.
2.3.1.1 Chemical Shift
The position of a signal along the x-axis of an NMR spectrum is called its chemical shift. It
depends on the local magnetic environment of a nucleus which is influenced by electron density
and other factors. The physical meaning of chemical shift values relates to the actual frequency
of the NMR signals produced by the nuclei. The chemical shift gives important clues about
molecular structure. Each NMR signal indicates the presence of nuclei in a different magnetic
environment. Chemical shift are measured along the spectrum axis using a delta ( ) scale, in
units of parts per million (ppm). When comparing one signal with another, a signal that occurs at
a higher value is said to occur downfield, whereas the signal that occur at a lower value is
said to occur upfield. The terms upfield and downfield relate to the strength of the magnetic field
that is required to bring the nuclei into resonance [477].
2.3.1.2 Peak Area / Integration of Signal Area
The area under each signal in a 1H NMR spectrum depends directly on the number of hydrogen
atoms producing the signal. These areas can be electronically integrated by a NMR spectrometer.
Comparison of the areas provides the ratio among the various kinds of protons in the molecules
[479].

73
2.3.1.3 Coupling / Signal Splitting
Coupling or signal splitting or signal multiplicity gives important information regarding the
structure of a compound. The effect of the nearby hydrogen is to split or couple with the energy
levels of the hydrogens whose signal is being observed, and the result is a signal with multiple
peaks. The importance of coupling is that it is predictable, and it gives us specific information
about the constitution of the molecule under study.
The typical coupling is from non-equivalent, vicinal hydrogens. The number of peaks in a 1H
NMR, in this case, is equal to n+1, where n is the number of vicinal hydrogen atoms that are
non-equivalent to those producing the signal. Coupling can also occur between non-equivalent
geminal hydrogens [477- 479].
2.3.2 Carbon – 13 NMR
13C NMR is very important for the analysis of organic compounds. 13C spectra are usually less
complex and easier to interpret than 1H NMR spectra. The reason for this simplicity of
interpretation process is that each unique carbon atom in an ordinary organic molecule produces
only one 13C NMR peak. There is no carbon- carbon coupling that causes splitting of signals into
multiple peaks. Since 13C is only 1.1 % of natural carbon, the probability of there being two 13C
atoms adjacent to each other in a molecule is only about 1 in 10,000. Carbon-13 NMR spectra
can be obtained only on pulse FTNMR spectrometers where signal averaging is possible.
Carbon atoms that are attached only to other carbon and hydrogen atoms are relatively shielded
from the magnetic field by the density of electrons around them. On the other hand
electronegative groups deshield the carbons to which they are attached, causing their 13C NMR
peaks to occur further downfield than those of un-substituted carbon atoms.
NMR spectrometers can differentiate among carbon atoms on the basis of the number of
hydrogen atom that are attached to each carbon. This also helps to interpret the NMR spectra
[477, 478].
2.4 Infrared Spectroscopy
This is a simple technique which gives information about the presence of different functional
groups present in a compound. Infrared spectroscopy depends on the interaction of molecules or

74
atoms with electromagnetic radiations. Absorption in infrared region is due to changes in
vibrational energy. This region ranges from 5000 – 667 cm-1. The area from 5000 – 1300 cm-1, is
called the functional group region. The bands in this region are particularly useful in determining
the type of functional group present in the molecule, whereas the area from 1300 – 667 cm-1 is
called the finger print region. A peak by peak match of an unknown spectrum with the spectrum
of the suspected compound in this region can be used to confirm its identity [477, 479].
When a molecule contains n atoms, there are 3n – 6, for a non linear, and 3n-5 for a linear
molecule, fundamental vibrational frequencies. The actual number of fundamental frequencies
depends largely on the symmetry of the molecule. Overtones of fundamental absorption bands
may also be seen in IR spectra. They occur with reduced intensity. Combination bands and
difference bands may also appear in IR spectra; as a result spectrum becomes complicated.
The stretching regions have higher frequencies than the deformation regions and the intensities
of the former are much greater than those of the latter. Several factors influence the frequency of
absorption, major of which is masses of bonded atoms. Other factors include the nature of
neighboring atoms, steric effects, etc. Thus a particular group does not have a fixed maximum
absorption wavelength, but have a region of absorption. The spectrum also depends on the
physical state of the compound [477, 478].
Infrared spectroscopy is a very useful technique for identification of unknown compounds. An
IR spectrum is known as the finger print of a molecule. This technique is non-destructive. Apart
from structural elucidation, the study of infrared spectra leads to many other information, for
example;
Infrared spectroscopy has been used to distinguish between geometrical isomers.
Infrared spectroscopy has also been a very valuable method in conformational
studies.
The three isomeric disubstituted benzenes have characteristic absorption bands,
and this offers a means of determining their orientation.
Infrared spectroscopy is also helpful in solving the problem of free rotation
about a single bond.
In many cases the existence of tautomerism can be ascertained by infrared
spectroscopy.

75
Infrared spectroscopy appears to be the best means of ascertaining the presence
of hydrogen bonding.
It is possible to evaluate dipole moments from infrared spectra.
From the large amount of data collected in infrared work, it is possible to predict
group frequencies in various compounds.
2.5 UV – Visible Spectroscopy
In UV visible spectroscopy, the 200 – 750 nm region of the ultraviolet spectrum is used. This
includes both the visible region (400 – 750 nm) and near ultraviolet region (200 – 400 nm). If
electromagnetic radiation in these regions passes through a compound having non bonding
electrons or electrons involved in a π – bond, some part of these radiations may be absorbed by
the compound. Radiation of these wave lengths is sufficiently energetic. This absorption is the
result of the transfer of energy from the radiation to electrons, which are in the orbital of lower
energy. This results in excitation of them to orbital of higher energy. For absorption in this
particular region of ultraviolet spectrum, the molecule must contain conjugated double bonds. If
conjugation is extensive the molecule will absorb in the visible region [479].
2.5.1 UV – Visible Spectrum
It is a plot of the wave length against light at that wave length. The ultraviolet-visible spectrum
is composed of only a few broad bands of absorption. The wave length of maximum absorbance
is referred to as λmax.
In case of UV visible spectroscopy the range of wavelength for absorption is very wide. The
energy levels for different excited states, vibrational and rotational excitations, are quite closely
spaced; corresponding to energy differences considerably smaller as compared to those of
electronic levels. A molecule may, therefore, undergo electronic and vibrational – rotational
excitation simultaneously giving a broad band of absorption centered near the wave length of the
major transition [479, 481].
Mostly non conjugated alkenes show an intense absorption below 200nm and are, therefore,
inaccessible. Whereas non conjugated carbonyl compounds have a very weak absorption band in
the 200 – 300 nm region. Conjugation of a carbon-carbon double bond and a carbonyl group

76
shifts the λmax of both groups to longer wave lengths. As the number of double bonds in
conjugation increases, λmax also increases [479].
2.5.2 Principles of Absorption Spectroscopy
When radiations having intensity Io passes through a cell which has an absorbing species, some
portion of those radiations is absorbed. As a result of this the intensity I of the radiation which
comes out of the cell is lesser than Io. The ratio of the two intensities of radiation is called
transmittance.
T = I / Io
But log of the Io / I is known as absorbance, hence:
A = - log T
Absorbance could also be expressed as:
A = abC
Or A = bC
or molar absorptivity is a property of the molecule undergoing an electronic transition. Itindicates strength or intensity of absorption.
UV-Visible spectroscopy is a widely used technique. It is equally beneficial for qualitative and
quantitative analysis. It can be used for identification of unknown inorganic and organic
compounds as well as to monitor the progress of chemical reactions and equilibrium position.
Spectroscopic methods are of great importance for identification of unknown compounds. Other
tests for identification require large quantity of the compound, but spectroscopic methods require
very small amount of compound. Furthermore, most of the spectroscopic techniques are non-
destructive. These techniques give very valuable and reliable information. These features make
them ideal for identification of unknown compounds.
For the same reason various spectroscopic techniques such as, mass spectrometry, NMR
spectroscopy, IR and UV - visible spectroscopy, were used in present research work to identify
the isolated compounds [473, 481].

77
2.6 Scanning Electron Microscopy
Scanning electron microscopy is an advanced and sophisticated technique which is equally
useful in numerous fields of researches including botany, chemistry and geology. In present
research this technique was used mainly to detect the elemental composition of N. sativa seed.
In this technique the sample surface is targeted by high energy electrons. As a result different
signals are obtained which provide information regarding the sample’s morphology, chemical
composition, crystalline orientation and structure. In this way it helps in qualitative or semi-
quantitative determination of sample [482].
2.6.1 Principles of Scanning Electron Microscopy
The signals obtained by SEM consist of secondary electrons, backscattered electrons (BSE),
diffracted backscattered electrons (EBSD), photons (characteristic X-rays), visible light
(cathodoluminescence-CL) and heat. Secondary electrons are of great value to show morphology
and topography on samples. They possess low energy [483].
BSE are quite important to show contrast in composition in multiphase samples. They help to
find out elemental composition of the specimen. BSE contain high energy electrons. EBDS is
beneficial to find out the crystal structure of the sample. CL is the emission of light which results
when excited atoms returns to their ground state. This excitation is caused by high energy
electrons [483].
When primary electron interacts with the sample, emission of certain electromagnetic radiations
takes place. These radiations are known as Characteristic X-rays, as they possess high energy
and short wave length. This type of radiation is helpful for identification of the composition and
to find out the abundance of different elements in the sample. The signals are exhibited due to
interactions between atoms of the sample and the beam of electrons. These atoms are present at
or near the samples’ surface. As electron beam of SEM micrographs is very narrow so it
possesses a great depth of field resulting in a characteristic three dimensional appearance which
provides knowledge about structure of the surface of a sample. For this purpose a wide range of
magnification can be used, from about 10 times to more than 500,000 times.

78
2.6.2 Scanning Process
An electron gun which is fitted with a tungsten filament cathode is used to emit electron beam
(Fig. 2.1). The beam is focused by one / two condenser lenses. First, a primary electron beam
comes in contact with the specimen. As a result, energy exchange between the electron beam and
the specimen takes place which results in emission of secondary electrons electromagnetic
radiation [484].
2.6.3 Applications
2.6.3.1 Morphological Investigation
In this field SEM gives information about the structure of a specimen in the micrometer and the
sub micrometer range. Imaging with secondary electrons enables a resolution down to the
nanometer range.
2.6.3.2 Compositional Contrast by Imaging with Backscattered Electrons
Differences in the local chemical composition of a material lead to a contrast mechanism called
compositional contrast. Typically backscattered electrons are used to get images, where different
gray levels in the image can be attributed to different chemical phases of a specimen.
2.6.3.3 Electron Backscattering Diffraction
It enables both orientation imaging microscopy (OIM) and phase analysis. It can be used to
allocate different crystallographic orientations.
2.6.3.4 Energy Dispersive X-Ray Spectroscopy (EDS)
It gives knowledge regarding the chemical composition of the sample.
2.6.3.5 Wavelength Dispersive X-Ray Spectroscopy (WDS)
It provides information about the chemical composition of the material. An additional advantage
of this method is the better energy resolution which helps to discern chemical elements which
cannot be identified with EDS.

79
2.6.3.6 X-Ray Diffractometry
X-ray diffraction gives information regarding chemical composition and crystalline structure.
It is a non-destructive technique and is equally beneficial for all types of natural and synthetic
materials [485].
There are many advantages of the SEMs. They are easy to operate and time saving techniques.
They require very small quantity of the sample and give reliable results. [486].
2.7 pH – Metric Studies
Titrimetric analysis is used for a wide range of chemical reactions, for example acid – base,
complex formation, precipitation and oxidation reduction reactions. In present research study pH
– metric titrations are used to determine stability and stoichiometry of the complexes of thymol
and thymoquinone with different metals.
pH – metry is the most popular, easiest, low cost and convenient way for qualitative as well as
quantitative analysis. It gives reliable and useful information. The knowledge of the
concentration of hydrogen ions is of the greatest importance in chemistry. These hydrogen ion
concentrations of a solution are typically quite small numbers and are reported in terms of pH
[479]. It is related to the degree of acidity or alkalinity. Mathematically it is represented as:
pH = -log [H+]
2.7.1 pH Meter
pH of a solution can be determined by the use of either pH papers or indicators or a pH meter.
Results obtained from pH papers and indicators are not usually accurate. They are difficult to
interpret correctly in case of colored solutions. On the contrary, pH meter gives greater accuracy.
A high impedance pH meter is an amplifier which determines the pH accurately by a strict
measurement of minute electrode voltage produced. It shows the results in pH units on either an
analogue or digital display.
A pH meter consists of a voltmeter connected to two electrodes, a reference/ standard electrode
and a pH measuring/ indicator electrode.

80
2.7.1.1 Standard Electrode
It is also known as reference electrode. This electrode is of known potential [479]. Hydrogen
electrode can be used as a reference electrode, but for this purpose hydrogen pressure and the H+
activity should held constant [473]. Although the hydrogen electrode is the primary reference
electrode it has many disadvantages. Problems in preparation and difficulties in operating
satisfactorily are two of them. The platinum black coating of the electrode is susceptible to
poisoning by a variety of substances. Furthermore the electrode cannot be used in the presence of
oxidizing or reducing agents. Therefore several subsidiary electrodes are used, for example the
calomel and silver – chloride electrodes. Out of these the first one is most widely used because it
is easy to prepare and has constant potential. The half cell notation for a saturated calomel
electrode could be written as:
Hg (l) | Hg2Cl2 (satd.). KCl (aq) ||
The potential of the saturated calomel electrode varies rapidly with alteration in temperature
owing to changes in the solubility of potassium chloride, whereas the potentials of the decimolar
and molar electrodes are less affected by change in temperature. The silver-silver chloride
electrode has a silver wire / a silver-plated platinum wire which is coated with a thin layer of
AgCl. For this purpose the electrode is dipped into a potassium chloride solution of known
concentration which is saturated with silver chloride [487].
2.7.1.2 Indicator/ Special Electrode (The Probe)
The glass electrode is mostly used as special / indicator electrode. Use of this electrode depends
upon the fact that when a glass membrane is dipped in a solution, a potential is developed which
is directly influenced by the hydrogen ion concentration of that solution. This electrode is
enclosed in a glass membrane that allows migration of H+ ions. The glass case contains a
reference solution of dilute HCl [487]. Change in the composition of the glass enables electrode
to be selective for different ions. The glasses used in glass membranes are composed of mixtures
of oxides of elements which have an oxidation number of at least 3 and elements with an
oxidation number of 1 or 2. These glass membranes are selective for monovalent cations. The
selectivity of the glass electrodes is related both to the ability of various monovalent cations to
penetrate into the glass membrane and to the degree of attraction of the cations to the negative

81
sites within the glass [473]. Lithium-based glasses are mostly used for hydrogen ion responsive
electrodes; since they can work better even at high pH than sodium based electrodes [487].
2.7.1.3 Working of pH – Meter
The reference and the indicator both electrodes are dipped in the solution to be tested. If this
solution has a different pH from the solution in the probe, this produces an electrical potential.
The potential between the standard and the glass electrode changes with the pH of the solution
under test. This potential is recorded by an inbuilt potentiometer of the pH meter. The
potentiometer reading is automatically converted electrically to a direct reading of the pH of the
unknown solution. Knowing the pH of the solution its hydrogen ion concentration can be
calculated [479].
The modern pH meter is an electronic digital voltmeter, scaled to read pH directly, and may
range from a comparatively simple hand-held instrument to more elaborate bench models, often
provided with a scale-expansion facility, with a resolution of 0.001 pH unit and an accuracy of ±
0.001 units. Calibration of the pH meter should always be performed before start of the work. It
is due to the fact that a glass electrode has an asymmetry potential which makes it impossible to
relate a measured electrode potential directly to the pH of the solution and makes it necessary to
calibrate the electrode [487]. For calibration buffer solutions having pH 4, 7 and 10 are normally
used. Buffer solutions are prepared with great care. These solutions should be stored in air tight
containers, as exposure to air can contaminate them. Used solutions should be discarded and
fresh solution should be prepared every time prior to calibration. It is necessary to rinse the probe
with distilled or deionized water after every reading. After that it should be blotted with as
scientific wipe. The dried probe is then quickly immersed in another solution, whose pH is to be
measured.
As dehydration of the glass probe may leads to dysfunction of the electrode, hence it is essential
to keep its tip wet all the time. For this purpose an acidic solution (pH= 3.0) is used to store a
glass electrode, whereas combined electrodes are usually stored in the bridge electrolyte. A 3M
solution of KCl is used for this purpose.
HCl (0.1 M) is generally used as pH – electrode cleaning solution to clean the probe. In case of
membrane poisoning of the glass electrode diluted hydrofluoric acid can be used [488].

82
2.7.2 pH – Metric Titrations
The quantitative measurements of pH involve pH titrations of the free H+ ions with a standard
base using a pH meter. In present research work metal ligand complex solution were prepared
and then titrated with standard sodium hydroxide. pH changes were plotted against incremental
addition of NaOH; and from these pH curves several useful information regarding stoichiometry
of complexes, stability constants and pKa valves were obtained.
2.7.3 Stability Constant of Complexes
Metal-ligand complex formation could be explained on the basis of Lewis acid-base theory. This
concept classifies metal ions as acids. As metals are electron deficient, they can react with
several electron pair donor species, whose member is equal to the coordination number of the
metal ion. Whereas ligands share electron pairs with metals; thus ligands are Lewis bases.
Ligands may be monodentate or they may be polydentate. The equilibrium constant of complex
forming reaction is called stability constant [489].
Metal complexes are usually formed by stepwise reactions, for example in an octahedral
complex metals react with up to six ligands and equilibrium constants can be written for each
step [490]. In this case equilibrium constants are called step-wise stability constants (K). A
second type of equilibrium constant is called over-all stability constant (β), which is used to
express equilibrium expression of overall reaction. Both stepwise and over-all stability constants
describe identical chemical system and are related to each other by the following expression:
βn = K1. K2. K3.........Kn
Stability constants usually help to describe the equilibrium behavior of metal complexes. Their
numerical value describes the relative concentrations of species at equilibrium. It is considered
that a complex will be stable if has a large equilibrium constant [489].
In present research complex formations of thymol and thymoquinone, with different metals, have
been studied. Complexes formed were of different stabilities. pKa values of ligands were
determined. pKa values are extremely helpful in pharmacological, structural, physiological, and
analytical studies. These values are related to the physical and chemical behavior of the species

83
and are also useful for industrial purposes [491]. Henderson equation was used for the
calculation of pKa which is as follows:
pH = pKa + log [Salt] / [Acid]
If concentration of salt and acid are equal then above equation will be:
pH = pKa
The point at which concentration of salt and acid are equal to each other can be obtained by the
plot of pH change against volume of standard base. pH becomes equal to pKa at half
neutralization point in the curve [492].
2.8 Electrochemical Studies
Electrochemical studies have been divided into two categories, potentiometric and non
potentiometric. In potentiometry the amount of a substance in solution is determined either
directly or indirectly from measurement of electromotive force / potential between two
electrodes dipped into the solution, whereas in non-potentiometric techniques the measurement
involves current [493, 494].
In case of non-potentiometric techniques an electro chemical reaction is drived by an external
source of energy. This source of energy may be in the form of potential or current. When
potential is applied as external source of energy, then resultant current is the analytical signal and
in case of application of current the analytical signal is the resultant potential. Out of these, the
techniques in which potential is applied as external source of energy are known as voltammetric
methods [493].
2.8.1 Voltammetry
It consists of a group of electro-analytical methods in which potential is applied and current is
measured as a function of it. In this way information regarding the analyte is obtained. In
voltammetry an electrochemical cell with a three electrode system along with a potentiostat is
used [494]. These electrodes include working / indicator, reference and auxiliary electrodes.
[487]. The indicator electrode is usually constructed from platinum, gold or some forms of
carbon, either graphite or glassy carbon. The potential of the indicator electrode varies according

84
to the reference electrode. Among reference electrodes, calomel electrodes are most common. A
calomel half cell consists of mercury and a calomel (Hg2Cl2) covered with potassium chloride
solution. The concentration of KCl may be 0.1 M, 1M or saturated. Out of various calomel
electrodes saturated calomel electrode is most widely used. The potential of the calomel
electrode depends upon the activity of the chloride ion in the half cell. The overall half reaction
that takes place at a calomel electrode is:
Hg2Cl2 (satd.) + 2e- = 2Hg (liq.) + 2Cl-
The third electrode, which is known as an auxiliary or counter electrode, is made from an inert
conductor with a relatively large surface area. A platinum foil or gauze is usually used for this
purpose [473].
In voltammetry, the excitation signal gives a current response which is characteristic and the
whole procedure is based on it. The classical voltammetric excitation signal is the linear scan.
The current which is produced in the electro chemical cell is recorded as a function of time and
hence it is also related to the applied potential. [474].
2.8.2 Type of Voltammetry
There are several types of voltammetric techniques which are different to each other. In some
cases a potential sweep is used on the working electrode, whereas in other techniques a sudden
potential is applied. In some cases the solution moves with respect to the surface of the working
electrode, whereas in others it does not move.
Examples of some voltammetric techniques are Cyclic voltammetry, Staircase voltammetry,
A.C. voltammetry and Hydrodynamic modulation voltammetry.
2.8.3 Cyclic Voltammetry
It is a potentiodynamic electrochemical measurement. There is a great similarity between Linear
sweep voltammetry and Cyclic voltammetry [495]. Early work on Cyclic voltammetry has been
done by Kolthoff and Tomsicek [496], and Tandles [497].

85
2.8.3.1 Basic Principle of Cyclic Voltammatry
In Cyclic voltammetry, a triangular potential wave form causes the excitation of the current
response of an electrode in a solution. The potential is scanned at a fixed rate from the initial
potential to a maximum or minimum potential and it is then returned at the same scan rate to the
initial potential. The initial direction of potential scan can be either negative or positive. This
excitation cycle is generally repeated numerous times. The potential at which the process is
reversed is known as switching potentials.
The electrodes used for Cyclic voltammetry remain stationary and there is no stirring. Since
neither the solution nor the electrode is in motion, the rate of transfer of electro-active species is
controlled by diffusion. As the potential at which the electro-active species starts to react is
reached, a current begins to flow through the cell. Increased potential leads to an increased
current. Eventually the electro-active species is reacted as rapidly as it comes to the electrode
surface and the current flowing through the cell becomes diffusion-controlled. With a further
increase in the applied potential, that is as the time increases the depleted layer of electro-active
species around the electrode grows. As a result the electro-active species must diffuse through a
larger average distance to reach the electrode and therefore a decrease in current is observed,
which results in a peaked voltammogram. Eventually, the current becomes nearly constant
because a relatively constant thickness diffusion layer is achieved.
In the voltage ramp (Fig. 2.2(a)) when the potential reaches the top of triangle, the direction of
the scan reverses and the potential returns back to its initial value. During the first half of the
voltage ramp, the electroactive species reacts at the surface of the electrode. The reaction product
is a reduced species if the initial potential scan is towards more negative potentials.
OX + ne- → Red
But if the initial potential scan is towards more positive potentials, the reaction product is an
oxidized species.
Red → Ox + ne–
If the reaction product is also electro-active, it can react during the reverse scan to yield the
original electro-active species. It results in a current flow through the cell in the direction

86
opposite to that of the current flow which yielded the original peak in the voltammogram [473,
474].
2.8.3.2 Cyclic Voltammogram
In Cyclic voltammetry the change in potential has a linear dependence on time. This rate of
potential change with respect to time is called scan rate (ν) [494]. In this technique the potential
is applied between the reference and the indicator electrode and the current is measured between
the indicator and the auxiliary electrode. The data obtained is plotted as current versus potential
and is known as cyclic voltammogram [498, 499].
Before the beginning of the experiment the solution has only the reduced form of electro-active
species. So at the potentials lower than the initial potential, there is no net conversion of reduced
species (R) into oxidised species (O) (Fig: 2.2(a).Point A). As redox potential is approached, the
anodic current increases exponentially with potential. Then R is oxidized to O and after that
concentration gradients are set for both R and O. Next diffusion takes place, which is down these
concentration gradients. Point B, in the Fig. 2.2(a), shows anodic peak. At this point any R which
is present at the surface of the electrode is instantaneously oxidized to O because of sufficient
positive redox potential. Then the current begins to fall off as a result of the depletion of the
analyte’s concentration close to the surface of the electrode which leads the reversal of the scan
(Point C).There is continuous decrease of current until it reaches the redox potential. Here O is
converted to R producing a cathodic current, which gives a second peak (Point D) [494, 500].
The voltammogram gives information about some important parameters, for example anodic
peak current (Ipa), cathodic peak current (Ipc), anodic peak potential (Epa) and cathodic peak
potential (Epc) (Fig: 2.2(a)). From these parameters some other parameters can be obtained such
as Ep/2 of Epa and Epc and E1/2, which is E85% for both Epa and Epc (Fig: 2.2(b)). These parameters
help to calculate some other experimental quantities [499, 500].
2.8.3.3 Supporting Electrolyte and Base Line
An electrolyte is a substance which ionizes into free ions, when it is dissolved in water or on
melting, to form an electrically conducting solution. An electrolyte is used in electrochemical
processes to produce electrical conductivity between the electrodes, for example between anode

87
and cathode. The ions which can be used in electrolytic solutions include sodium, potassium,
magnesium, calcium, chloride, carbonate and phosphate.
In cyclic voltammetry a solution of an electro-chemically inert salt; such as sodium chloride,
potassium chloride, potassium nitrate, lithium chloride or tetrabutyl-ammonium perchlorate is
dissolved either in water or any other highly polar solvent to make a solution. This solution is
known as supporting electrolyte. The function of the supporting electrolyte is to facilitate the
normal flow of current. Normally supporting electrolyte having 0.1 M concentration is used to
prepare solution of electro-active species, which are present at low concentration.
Before running cyclic voltammogram of analyte, a cyclic voltammogram of the supporting
electrolyte is runned in order to check the purity of electrolytic solution. It is known as base-line
and is extremely important for accurate analysis. Any electro active impurities from reagent,
solvent or glass ware could give rise to unexpected peaks in the cyclic voltammogram of
supporting electrolyte. For base-line potential range and all other condition kept same as that of
analyte. Repolishing and resurfacing of the electrode’s surface is very important, otherwise the
electrode may cause an increase in background current [501, 502].
In present work NaCl and LiCl were used as supporting electrolytes. First their base-lines were
drawn and then electrochemical behaviour of complexes of thymoquinone and thymol with iron
(III), chromium (VI), copper (II), vanadium (IV) and cobalt (II) were observed.
2.8.3.4 Types of Redox Reactions
There are three types of redox reactions given by electro-active species; reversible, irreversible
and quasi-reversible.
In case of a reversible reaction, the Ipa and Ipc are approximately equal but opposite in direction.
The oxidation peak in this case, usually has similar shape and same size to the reduction peak
(Fig: 2.3(a)). Here the difference in peak potentials is 0.0592 / n. The peak potential of an
electro-active species depends upon the chemical identity of the species and on the scan rate
which is used during the study. For qualitative analysis half wave potential is more useful than
peak potential. The peak current is directly proportional to the concentration of the electro-active
species at a fixed scan rate. In most of the cases it increases with the increase in scan rate. A
reversible electrochemical reaction exhibits a direct relationship between the Ip and the square

88
root of the ν. Ip values for the forward scan of a triangular wave voltammogram can be used for
quantitative analysis if the scan rate is held constant. Scan rates used for this purpose are usually
in the range of 0.02 to10 V/s, but while for qualitative analysis scan rates between 0.05 and 0.2
V/s are generally preferred [473, 474].
In a reversible process, the surface concentrations of the oxidized species and reduced species
are maintained at the same values, which are required by the Nernst equation. The reversibility
depends upon the relative values of the standard heterogeneous electron transfer rate constant
(ks) and scan rate (ν).
In quasi-reversible process the ratio of ks /ν is sufficiently small and hence the surface
concentrations required by the Nernst equation are not maintained [503, 504]. If an
electrochemical process is not reversible then the two peaks (oxidation and reduction) are
separated by a greater potential difference than 0.0592 / n. If the reverse reaction does not occur
at all, that is in case of irreversible reactions, then the second peak corresponding to the reverse
reaction is not observed in the voltammogram (Fig: 2.3(c)). There is a third possibility of
formation of a reaction product, which is electro-active but does not react to form the initial
electro-active species. In this case a second peak is observed which is not at the expected
potential for the reverse reaction [473]. This is known as quasi reversible reaction (Fig: 2.3(b)).
In a solution the oxidized species can be converted to reduce species and vice versa, which could
be represented by the following electro-chemical reaction.
O + ne- ⇌ R
If CO and CR represent the concentrations of oxidized and reduced species, whereas CO* and CR*
are their bulk concentrations and DO and DR are their diffusion coefficients, then diffusion
equation according to Fick’s second law for a reversible reaction could be expressed as follows
[505]:
E = E˚̕ + (RT / nF) ln (CO / CR)
Here n is the number of electron, E is the electrode potential, E˚̕ is the formal electrode potential.
E˚̕ for a reversible reaction could be written as follows [487, 499]:

89
E˚̕ = (Epa + Epc) / 2
At 25˚C the number of electron transferred for a reversible reaction can be calculated from
following relation [487]:
Ep = Epa - Epc = 0.0592 V / n
It is clear from above equation that the difference between the oxidation and reduction peaks is
0.0592 V for a reversible reaction. Practically this difference ranges from 0.07 – 0.1 V. In a quasi
reversible process this difference is normally greater than 0.0592 V [498, 500, 504]. A plot of
potential (Ep) versus scan rate (ν) should have a slope equal to zero, whereas a plot of Ip against
Co* should be a straight line having an intercept equal to zero. Deviations from zero could be
due to adsorption. A plot of Ip versus ν1/2 should also be a straight line. Diffusion coefficient can
be calculated by the slope of this plot [505, 506].
For an electrochemically reversible reaction, the peak height (Ip) is linearly depends on the
concentration of analyte (C). Following is the Randles Sevcik equation which describes this
relationship:
IP = 0.4463 nFA Co* (nFνDo / RT)1/2
For a system at 25oC / 298.15 K, the above equation could be written as [499]:
Ip = (2.687 x 10⁵) n3/2 ν1/2 Do1/2A Co*
Where:
2.687x10⁵ is a constant having unit C mol-1 V-1/2
Ip is peak current in A,
n is the number of electron transferred,
D is the diffusion coefficient in cm2/s,
Co* is the concentration in mol / cm3,
ν is potential scan rate in V/s and

90
A is area of electrode in cm2,
Some parameters which are used to differentiate cyclic voltammograms of reversible, quasi-
reversible and irreversible processes at 25oC are as follows [503- 505, 507]:
2.8.3.4.1 Reversible process
At all scan rates the difference between the peak potentials is as follows
(Epa – Epc) = 0.0592 V / n
At all values of ν
= 1 (Jp / ν1/2) does not depend on ν. Here Jp is the peak current density in A / cm2.
The peak current can be calculated by,
Ip = 2.69 x 10⁵ n3/2 A C D1/2 ν1/2
2.8.3.4.2 Quasi-reversible process
Although |Jp | is not proportional to ν1/2, but it increases with the increase of
ν1/2.
If αc = αa = 0.5,
then |Jpa / Jpc | = 1
Δ Ep > 0.0592 V/n
Δ Ep increases with the increase of ν
As ν increases, Epc shifts negatively.
2.8.3.4.3 Irreversible process
There is no reverse peak.
Jpc α ν1/2
For each decade increase in ν, Epc shifts -30 / αc nα m V
| Ep – Ep/2 | = 48 / αc nα m V

91
2.8.3.5 Applications of Cyclic Voltammetry
The primary function of this technique is to give qualitative information regarding various
electrochemical processes. Although cyclic voltammetry is useful for quantitative analysis, it is
even more useful technique for determining electrochemical reaction mechanisms and reaction
kinetics. It helps to find out rates of oxidation /reduction processes, stability of different
oxidation states etc. Furthermore, often cyclic voltammograms are helpful to give information
about the presence of intermediates in various redox reactions.
2.8.3.6 Limitations of Cyclic Voltammetry
In case of presence of heterogeneous electron transfer with chemical reactions, simulation is the
only way to calculate the rate constants.
Another drawback is owing to the presence of capacitance of the interface which is at the
working electrode (Cdl). It is because of a background charging current of magnitude ν Cdl.
Inspite of these facts cyclic voltammetry is one of the most widely used, reliable and standard
technique.

92
FIGURE – 2.1
Scanning Process by SEM
92
FIGURE – 2.1
Scanning Process by SEM
92
FIGURE – 2.1
Scanning Process by SEM

93
FIGURE – 2.2 (a)
A Typical Cyclic Voltammogram
FIGURE – 2.2 (b)

94
FIGURE – 2.3
Cyclic Voltammograms for Reversible, Quasi reversible and IrreversibleReactions
(a) Reversible
(b) Quasi-reversible
(c) Irreversible

95
CHAPTER 3
EXPERIMENTAL WORK
3.1 Materials and Methods
3.1.1 Materials
In present research work, all the reagents used were of analytical grade purchased from different
sources like Merck, Bio Basic Inc., and MP Biochemical LLC and were employed without
further purification (Appendix I).
Distilled water was redistilled and then passed through a column of cation exchanger (Amberlite
resin IRA-401 from BDH) in order to make it free from cations. This distilled deionized water
was used in the preparation of all stock/standard solutions, as well as in dilutions and rinsing the
glass ware.
For column chromatography distilled solvent were used, then they were dehydrated using
anhydrous sodium sulphate. For pH titration, CO2 free water was prepared by boiling distilled
deionized water for 10 minutes and then it was cooled in an air tight flask [487].
3.1.2 Apparatus and Equipments
All the glass apparatus; including columns, beakers, funnels, volumetric flasks, round bottomed
flasks, conical flasks, burettes, pipettes, CV-cell, measuring cylinders etc. were of standard
quality. The glassware was washed with special care before usage. First, they were washed with
detergent solution followed by tap water and then soaked in dilute nitric acid prior to several
time rinsing with distilled deionized water. Finally, apparatus was oven dried.
The equipments used for research were: Electrical balance, Electrical Oven, furnace, UV-visible
spectrophotometer, IR-spectrophotometer, Mass spectrometer, NMR spectrophotometer, pH
meter, Thermostat and Cyclic voltammeter. The specification of instruments is given in
Appendix II.

96
3.1.3 Collection and Pretreatment of Sample
Collection and pretreatment are the most important steps of any chemical analysis. Black seeds
were collected from a market of Karachi. The seeds were cleaned properly to remove dirt and
stored in air tight jars.
3.1.4 Preparation of Samples and Solutions
3.1.4.1 Moisture Analysis
For moisture analysis sample was used in the form of whole seeds.
3.1.4.2 Dissolved and Undissolved Solid Determination
The sample was used in the form of seeds to soak in distilled deionized water and in 0.1 M HCl.
0.1 M HCl was prepared by taking 8.3mL of 12 M HCl in 1000mL volumetric flask. It was
diluted with distilled deionized water.
3.1.4.3 Scanning Electron Microscopy
Sample was used in the form of dry whole seeds.
3.1.4.4 Isolation
N. sativa seed was cleaned and ground and then soaked in methanol to get extract. Seeds were
repeatedly extracted with methanol at room temperature.
3.1.4.5 pH- Metric Studies
For each set of experiment fresh solutions were prepared. pH meter was calibrated every time
before use with freshly prepared buffer solutions.
3.1.4.5.1 Calibration buffers
Calibration buffers of pH 4.00 and 7.00 were prepared using Buffer tablets.
3.1.4.5.2 Sodium hydroxide solution
0.1M NaOH solution was prepared by dissolving 1g of NaOH in distilled deionized water, in a
250mL volumetric flask. The solution was standardized using oxalic acid as standard solution.

97
3.1.4.5.3 Thymol solution
0.005M solution of thymol (THY) was prepared by dissolving 0.0751g of THY in distilled
deionized water, in a 100mL volumetric flask. A colourless solution was obtained.
3.1.4.5.4 Thymoquinone solution
0.005M solution of thymoquinone (TQ) was prepared by dissolving 0.0821g of TQ in distilled
deionized water, in a 100mL volumetric flask. A light yellow coloured solution was formed.
3.1.4.5.5 Ferric chloride solution
0.005M solution of FeCl3. 6H2O was prepared by dissolving 0.1350g of ferric chloride in
distilled deionized water, in a100mL volumetric flask. A light brown solution was prepared.
3.1.4.5.6 Potassium dichromate solution
0.005M solution of K2Cr2O7 was prepared by dissolving 0.1480g of potassium dichromate in
distilled deionized water, in a 100mL volumetric flask. A yellow coloured solution was obtained.
3.1.4.5.7 Copper sulphate solution
0.005M solution of CuSO4.5H2O was prepared by dissolving 0.1250g of copper sulphate in
distilled deionized water, in a 100mL volumetric flask. A light blue solution was formed.
3.1.4.5.8 Vanadyle sulphate solution
0.005 M solution of VOSO4.5H2O was prepared by dissolving 0.1265g of vanadyl sulphate in
distilled deionized water, in a 100mL volumetric flask. A light blue solution was prepared.
3.1.4.5.9 Cobolt acetate solutuin
0.005M solution of Co(CH3COO)2. 4H2O was prepared by dissolving 0.1245g of cobalt acetate
in distilled deionized water, in a 100mL volumetric flask. A very light pink solution was
obtained.
3.1.4.6 Cyclic Voltammetric Study
For cyclic voltammetric study following solutions of supporting electrolytes and analytes were
prepared.
3.1.4.6.1 Supporting electrolytes
Reagents used as supporting electrolytes for electro chemical studies are as under:
98
Sodium Chloride Solution: 0.1M solution of NaCl was prepared by taking 2.9220g of NaCl in a
500mL volumetric flask and then dissolving it in distilled deinoized water. Finally, the volume
was made up till mark on the flask.
Lithium Chloride Solution: 2.1195g of LiCl was weighed and transferred to a 500mL
volumetric flask. After dissolving it the solution was made up to the mark with distilled
deionized water. The resulting solution was about 0.1M LiCl.
3.1.4.6.2 Analyte solutions
0.005M solutions of THY, TQ, ferric chloride, potassium dichromate, copper sulphate, vanadyl
sulphate and cobalt acetate were prepared as analyte using sodium chloride as electrolytic
solution. For preparing solutions of THY and TQ, they were first dissolved in few mL of
methanol and then remaining volume was made up by NaCl. Methanol was 10% of the total
volume. In order to maintain same conditions methanol was also added to the metal’s solutions
in the same quantity.
Lithium chloride was also used as electrolyte solution for preparation of 0.005M TQ and copper
sulphate solutions.
3.2 Experimental Methods
All experimental work was done at room temperature. Experimental work includes:
General treatment of N. sativa (black seed)
Isolation of some ingredients of N. sativa
pH metric studies of complexes of active ingredients of N. sativa
Electro chemical studies of above mentioned complexes
3.2.1 General Treatment of N. sativa Seed
3.2.1.1 Moisture Content
For this purpose approximately 5g of cleaned sample was weighed and then kept in electrical
oven at 105 ± 1˚C for 1 hour, it was further kept in desiccators to cool and then weighed.
Experiment was repeated until constant weight was obtained. The accurate weight of dried
sample was noted for calculations of moisture.

99
3.2.1.2 Dissolved and Undissolved Solid (DS and UDS)
To check DS and UDS, approximately 1gm of cleaned and dried N. sativa seeds were weighed
and then soaked in distilled deionized water for different time intervals i.e. 0.5, 1,2,3,4 and 5
hours. These samples then filtered and dissolved and undissolved materials were dried
separately. Filtrate (DS) was evaporated to dryness on a preheated water bath and then it was
kept in oven at 105 ± 1˚C up to dryness, whereas residue (UDS) was also kept in oven at above
mentioned temperature till complete dryness. Same procedure was repeated with 0.1M HCl
extract.
3.2.1.3 Scanning Electron Microscopy (SEM)
For SEM sample must be moisture free, so dried seeds of N. sativa were used. The analysis was
carried out on the instrument, Jeol Japan, Model JSM 6380 A. The sample was coated with Auto
coater from Jeol Japan with gold, and targeted up to 300˚A. 10.00 kV accelerated voltage was
used with probe current 1.00000nA. Results were taken at different magnification i.e. 500, 4500,
11000, 35000.
3.2.2 Extraction and Isolation of N. sativa Seeds
N. sativa seeds (10 kg) were collected from a local market of Karachi. The seeds, after proper
cleaning, were ground to small particles and then soaked in methanol for one week at room
temperature. After that seed’s methanolic extract was collected. The seeds were repeatedly
extracted. The combined methanolic extract was evaporated in vacuo to thick syrup which was
partitioned between hexane and water. Hexane layer was separated, washed and concentrated
under vacuo. The aqueous layer was further extracted with ethyl acetate. After separation of
ethyl acetate layer, the aqueous layer was further extracted with dichloromethane (Scheme-I)
The ethylacetate phase was dried over anhydrous Na2SO4, concentrated and evaporated under
vacuo to a gummy residue (44.1 g), which was then subjected to gravity column chromatography
after loading it in a silica gel column. Then it was fractionally eluted with different solvents in
order of increasing polarity (hexane, hexane: ethyl acetate, ethyl acetate) and finally with pure
methanol. In this way a number of fractions (200 ml each) were collected which were evaporated
under vacuo and then combined on the basis of thin layer chromatography (TLC) to obtain 39
fractions (1 to 39) (Scheme-II).

100
The fraction number 8, obtained from the above combined fractions was washed with hexane
several times and then re-crystallized to obtain pure white crystals. These crystals were analysed
by different spectroscopic techniques. Fraction number 4 (1.00 g) was also subjected to gravity
column chromatography. For this purpose slurry of it was loaded in a silica gel column and then
fractionally eluted with different solvents in order of increasing polarity (hexane, hexane: ethyl
acetate, ethyl acetate). In this way 250 fractions were collected which were combined on the
basis of TLC to get six combined fractions (A-1 to A-6). Out of these fractions, A-2 seems pure.
Gravity column chromatography of Fraction 5 of the combined ethyl acetate fractions was also
carried out. For which 3.00 g of the fraction 5 was loaded in a silica gel column in the form of
slurry. 400 fractions were obtained in the same way as earlier and then these were combined to
obtain 8 combined fractions (B-1 to B-8). Out of these B-5 was seems pure and subjected to
different spectroscopic techniques for its identification.
Fraction B-2 (1.00 g) of above combined fractions was also subjected to column chromatography
in the same manner as above. It was fractionally eluted with different solvents of increasing
polarity (hexane, hexane: ethyl acetate, ethyl acetate) and 200 fractions were collected which
were combined on the basis of TLC to get 5 combined fractions (B-2a to B-2e). Out of these
fractions B-2c was found to be pure (Scheme-II).
The isolated compounds (Fraction number 8, A-2, B-5 and B-2c) were subjected to ultraviolet,
infra-red and nuclear magnetic spectroscopy for their identification and confirmation. Ultraviolet
spectra were recorded in methanol on Thermo Scientific Evolution 300 spectrophotometer.
Infrared spectra of Fraction number 8 was measured in CDCl3 but of A-2, B-5 and B-2c were
recorded in KBr on Bruker Vector 22 FTIR. High resolution mass measurements were carried
out by peak matching using PKF as internal standard. Nuclear magnetic spectra were recorded in
CDCl3 on BRUKER AM 300 and BRUKER AM 600 NMR spectrometers operating at 300 and
600 MHz. The chemical shifts were recorded in ppm ( ) whereas coupling constant (J) is
expressed in Hz.
Column chromatography was carried out using silica gel 60 (Merck kieselgel 60, 70-230 mesh
size). TLC was performed on Silica gel 60 F254 (Merck).
101
3.2.3 pH – Metric Studies
All pH metric titrations were done at 25˚C. Each time fresh buffer solutions were prepared and
pH meter was calibrated prior to the start of work. Sodium hydroxide and sample solutions were
also freshly prepared each time. Sodium hydroxide solution was standardized using standard
oxalic acid every time before titration of sample solutions. All pH metric titrations were carried
out in a double walled glass cell (Fig. 3.1). The temperature was controlled by circulating water
through a thermostat. The capacity of this cell is 100mL. The rubber stopper of the cell contains
four holes, one for micro-burette to add standard base, second for purging inert gas (Nitrigen-
99.99% purity), third for the removal of oxygen and forth for the glass electrode. The solution
completely deareated by passing N2 gas for 30 minutes in a sealed flask and was protected with
atmosphere. The pH was measured with a combination of glass electrode attached to a Jenway,
Model 3510 pH meter.
In present research pH-metric titrations of ligands (thymol and thymoquinone) and their
complexes were performed.
3.2.3.1 pH-Metric Titrations of Ligands
At first ligands were titrated with standard base. The pH curves obtained were compared against
the changes in the curves of their complexes.
3.2.3.1.1 pH-Metric titration of thymol (THY)
Titration was done at 25˚C. 40ml of THY solution (0.005M) and 10mL of distilled deionized
water was taken in the pH metric cell containing magnetic bead. Purified nitrogen gas was
purged through the solution for half an hour. The temperature was controlled by circulating
water (using a thermostat). Then the THY solution was titrated against 0.1M standard sodium
hydroxide solution. NaOH solution was standardized against 0.05M Oxalic acid solution prior to
the pH metric titration of THY.
During titration regular stirring was maintained by means of magnetic stirrer. Standard NaOH
was added in sufficiently small increments of 0.05mL with the help of micro burette and after
each increment, pH of the reaction mixture was recorded till pH was not affected by further
addition of standard NaOH. pH values were plotted against volume of standard NaOH added.

102
3.2.3.1.2 pH-Metric titration of thymoquinone (TQ)
Similar to the above, titration of TQ solution (0.005M) was carried out. 40mL of TQ solution
and 10mL of distilled deionized water was taken in the pH metric cell containing magnetic bead
and titration was performed in exactly the same manner. Standard sodium hydroxide solution
was added in small increments of 0.05mL. pH of solution was noted after each addition of
standard NaOH solution and pH valued were plotted against volume of standard NaOH added.
3.2.3.2 pH-Metric Titrations of Thymol Complexes
3.2.3.2.1 Fe(III)-Thymol complex
For pH metric titration of above mentioned complex 40mL of THY solution (0.005M) and 10mL
of Fe (III) solution (0.005M) were mixed to give 1:4 metal-ligand solution. The resulting
reaction mixture was titrated against standard sodium hydroxide solution (0.1M) under the same
conditions and in the same manner as previous two titrations.
All conditions were kept constant to compare pH metric titration of THY and Fe (III)-Thymol
complex. pH was recorded after each addition of NaOH and pH values were plotted against
volume of standard NaOH added which showed the volume of the base required to neutralize the
H+ ions produced as a result of complex formation. With the help of pH-metric data species
distribution curve was also plotted to find out best pH values for M (free metal), ML (1:1
complex) and ML2(1:2 complex) species.
3.2.3.2.2 Cr(VI)-Thymol complex
pH metric titration of Cr(IV)-thymol complex was performed under same conditions. For this
purpose 40mL THY solution (0.005M) and 10mL of Cr(VI) solution (0.005M) were mixed to
give 1:4 metal-ligand solution. Standard NaOH (0.1M) added in small increments and pH was
noted. pH values were plotted against the volume of NaOH added and with the help of pH metric
data species distribution curve was also plotted.
3.2.3.2.3 Cu(II)-Thymol complex
The pH metric titration of Cu (II)-Thymol complex was also performed in the same manner. pH
of the reaction mixture was noted after each addition of standard NaOH, and pH values were

103
plotted against volume of NaOH. In addition to this plot, species distribution curve was also
plotted.
3.2.3.2.4 Vanadium (IV) thymol complex
This titration was also performed in the same manner and under the same conditions. Standard
NaOH was added in small increments of 0.05mL and pH of the solution was noted. pH values
were plotted against volume of NaOH added which provide valuable information. The data was
also helpful to plot species distribution curve.
3.2.3.2.5 Co(II)-Thymol complex
Similar to above mentioned titrations, pH-metric titration of Co(II)-Thymol Complex was done.
pH was noted after each addition of NaOH and pH values were plotted against volume of NaOH
added. Using pH metric data species distribution curve was also plotted to find the best pH
values for M, ML, and ML2 species.
3.2.3.3 pH-Metric Titrations of Thymoquinone Complexes
All pH metric titrations of TQ with different metals were also performed in the manner in which
THY titration was done.
3.2.3.3.1 Fe(III)-Thymoquinone complex
40ml of TQ solution (0.005M) were mixed with 10ml of Fe(III)solution (0.005M) to give 1:4
metal-ligand solution. The resulting reaction mixture was titrated against standard sodium
hydroxide solution (0.1M). All the conditions of titration of TQ and complexes of TQ with
metals were kept constant in order to compare the pH metric titrations of ligand with its
complexes. Standard sodium hydroxide was added in small increments and pH of reaction
mixture was noted after each addition.
pH values were plotted against volume of standard NaOH added. These pH metric data provided
valuable information and with the help of it species distribution curve was also plotted to find
best pH values for M, ML and ML2 species.

104
3.2.3.3.2 Cr (VI)-Thymoquinone complex
For this purpose 40mL of TQ solution (0.005M) and 10mL of Cr(VI) solution (0.005M)were
mixed in the pH metric cell containing magnetic bead. All the conditions in this titration were
kept same as that of the titration of TQ to compare pH metric change in two cases. Standard
sodium hydroxide solution was added in small increments of 0.05mL and pH was noted after
each addition.
pH values were plotted against volume of standard NaOH added to obtain pH plot and species
distribution curve.
3.2.3.3.3 Cu(II)-Thymoquinone complex
This titration was also performed in the manner of previous two titrations of TQ complexes.
10mL of Cu (II) solution (0.005M) and 40mL of TQ solution (0.005M) were mixed in a pH
metric cell and standard NaOH was added. pH of the resulting reaction mixture was noted after
each addition. pH values were plotted against volume of standard NaOH added. With the help of
pH metric data species distribution curve was also plotted.
3.2.3.3.4 V(IV)- Thymoquinone complex
pH metric titration of V(IV)-Thymoquinone complex was also done in the same manner. pH of
the reaction mixture was noted after each addition of standard NaOH, and pH values were
plotted against volume of NaOH. Species distribution curve was also plotted using pH metric
data.
3.2.3.3.5 Co (II)- Thymoquinone complex
This titration was also performed in the same manner and under the same conditions. 40mL of
TQ solution (0.005M) and 10mL of Co(II)solution (0.005M) were mixed in a pH metric cell.
Standard NaOH was added and pH was recorded after each addition, unless the pH of the
reaction mixture was not affected by further addition of NaOH.
pH values were plotted against volume of NaOH added. With the help of pH metric data species
distribution curve was also plotted which gave best pH values for M, ML and ML2 species.

105
3.2.4 Cyclic Voltammetric Studies
3.2.4.1 Cyclic Voltammeter
CHI – 760 D Electrochemical work station, cyclic voltammeter was used for cyclic voltammetric
studies of the complexes (Fig. 3.2). The apparatus include a PC under Windows environment, a
potentiostat and a cell assembly. The cell assembly consists of a cell stand and a cyclic
voltammetric (CV) glass cell.
3.2.4.2 Description of CH – 700 Cyclic Voltammeter
The instrument is a computerized general purpose potentiostat. A typical application involves a
rotating ring disk electrode but this system can also be used for other applications where dual
channel measurements are essential such as dual channel electro chemical detection. The system
contains a fast digital function generator, a high speed data acquisition circuitry and a
potentiostat. The potential control range of instrument is ± 10V where as current range is ±250
mA. The instrument can measure current down to pico amperes. It can also measure steady state
current of 10 µm disk electrode.
The instrument provides very wide range in experimental time scales. For example, the scan rate
can be up to 1000 V/s with a 0.1 mV potential increment or 5000V/s with a 1mV potential
increment. The potentiostat uses 4- electrode configuration. Multiplex data acquisition system
allows an external input signal. The instrument will also automatically re-zero both potential and
current, so that periodic re-calibration of the instrument can be avoided.
The instrument is controlled by an external PC under Windows environment. The commands,
parameters and options are in terminology with which most of the chemists are familiar. The
instrument provides many valuable functions, such as file handling, experimental control,
graphics, data analyses and digital simulation. Some more feature are macro command, working
electrode conditioning, color, legend, and font selection, data interpolation, visual baseline
correction, data point removing, visual data point modification, signal averaging, Fourier
spectrum and equations relating to electro chemical techniques.
The file menu of the instrument have different commands like open, save as, delete, retrieve,
update instrument software, list data file, convert to text, text file format, import text file, print
and exit commands. Similarly set up menu also contains numerous commands such as

106
parameters command. Control menu has run, pause / resume, stop run, reverse scan, run status,
repetitive runs, multiplexer, macro, open circuit potential, iR compensation, filter setting cell,
step functions, preconditioning and rotating disk electrode commands. Whereas graphic menu
contains present data plot, overlay plots, add data to overlay, parallel plots, add data to parallel
plots, zoom in , manual result, peak definition, XY plot, peak parameter plot, graph options,
color and legend, font and copy to clipboard commands. Data processing menu has smoothing,
derivatives, integration, interpolation, baseline fitting and subtraction, linear base line correction,
data point removing, data point modifying, Background subtraction signal averaging,
mathematical operation and Fourier spectrum commands. Analysis menu also contains various
useful commands such as calibration curve, standard addition, data file report and time
dependence commands etc.
Simulation menu contains a mechanism command, which has a digital cyclic voltammetry
simulator. This command is used to set the reaction mechanism. The options required for this
purpose are the concentration of each involved species, the kinetic parameters, the experimental
parameters and some other variables. This command can also be helpful for finding equilibrium
concentrations.
The electrode’s leads are connected to the rear panel of the instrument. These three electrodes
are a glassy carbon electrode as working electrode, a saturated calomel electrode as reference
electrode and a platinum wire electrode as an auxiliary or counter electrode. There are three clips
to connect them to the instrument. The clip with green cover is for working electrode, the white
one is for the reference electrode and the red one is for the counter electrode. The voltammetric
cell vial is a glass vial, which has a control on the rear panel of the instrument. This cell control
can be used to control purge of inert gas and stirring etc.
3.2.4.3 Calibration of the Instrument
The calibration of the instrument was carried out as described in the User’s Manual [508].A
dummy cell was connected between reference/ counter electrode clip and working electrode clip.
Potential range and current sensitivity were selected according to the manual and experiment was
run through Run command. Same results were obtained as given in the manual which showed
satisfactory performance of the instrument.

107
3.2.4.4 Repolishing of Working Electrode
Repolishing and resurfacing of working electrode is very necessary. It requires a very fine
abrasive material, for example alumina. The glassy carbon electrode was used as working
electrode. It comes with a polishing kit. The kit consists of soft polishing pads and a small vial of
Alumina polishing compound. For polishing few drops of alumina compound were placed on
pad and then few drops of distilled water were added to alumina. Then the electrode was placed
face down on the wetted pad and gently rubbed for 1-2 minutes. The rubbing was performed in
circular motion applying very light pressure. Then the electrode was thoroughly washed with
distilled water in order to remove alumina compound from its surface. Finally, the electrode was
dried by gently wiping it with a tissue paper.
3.2.4.5 Procedure to Take Cyclic Voltammogram at CHI 760 System
The surface of the working electrode was resurfaced every time prior to start the work. After that
cell was cleaned and washed, then rinsed with distilled water and finally rinsed thrice with the
solution to be analysed.
The CV- cell was filled with 10 cm3 solution (supporting electrolyte or analyte) and then fitted to
its cell top. All three electrodes were inserted in their holes in the cell top after rinsing them with
distill water and then with supporting electrolyte / analyte solution. Presence of air bubbles may
result in large potentials. So the surface of working electrode was examined every time before
start of scan in order to avoid the presence of air bubbles. In case of the presence of air bubble
they were removed by repeated insertion of electrode in the solution. After that leads were
connected to their respective electrodes, that is, the lead with green cover was connected to
working electrode, the white one was connected to the reference electrode, whereas the red one
to auxiliary electrode. The instrument was turned on before to start of all this work. All the
parameters regarding initial potential, final potential limit (high limit of potential scan / low limit
of potential scan), initial scan direction, potential scan rate, sweep segments and current
sensitivity were set. Then experiment was run using run command under the control menu.
Voltammogram of the analyte solution was displayed on the monitor. After that, under the
graphic menu, header was turned on. The header is a caption shown on the top of the
voltammogram and header text can be typed in the Header text area. So the name of analyte with

108
its concentration and other necessary information was typed in header text area. Then save as
command was used to save the voltammogram.
At the end of experiment all electrodes were disconnected from the electrode assembly, washed
thoroughly with distilled water, dried carefully with very fine tissue paper and kept in their
respective cases supplied by the manufacturer. The CV cell was also washed thoroughly with
distilled water and then dried. Finally, the instrument was turned off.
3.2.4.6 Determination of Base Line
Base lines of supporting electrolytes were recorded before recording the cyclic voltammograms
of sample solution. This is necessary to estimate the residual or background currents in order to
minimize the effect of non-faradic contribution in the total current.
For this purpose freshly prepared solution of supporting electrolyte (NaCl / LiCl) was taken in
the CV- cell and then the cell top was fitted on the cell. The three electrodes were immersed in
their respective holes in the cell top. The CV-cell, its top and three electrodes were rinsed several
times with supporting electrolyte solution prior to this work. After this, surface of the working
electrode was examined, if any air bubble was found it was removed by repeated insertion of the
electrode in the supporting electrolyte solution. Next, the three leads were connected to their
respective electrodes. The instrument turned on and all the parameters were set according to the
experiment. Finally, the scan was initiated by clicking the run command under control menu.
The base line plot started plotting in the window and displayed on monitor. When the potential
cycle completed followed by oxidation and reduction range, it stopped automatically. The header
was turned on and the name and concentration supporting electrolyte were typed in the header
text area and the plot was saved. At the end of the experiment, the instrument was turned off. All
the leads were removed from electrodes. The electrodes and CV-cell were washed thoroughly
with distilled water. The glassy carbon electrode was re-surfaced as explained previously. All
electrodes were dried carefully and kept in their cases.
The base lines for supporting electrolytes (NaCl and LiCl) were taken at scan rate 0.1 V/s,
whereas the concentrations of supporting electrolytes were 0.1 M.

109
3.2.4.7 Cyclic Voltammogram of Analyte Solutions
Fresh analyte and supporting electrolyte solutions were prepared each time. The solutions of
supporting electrolyte, metals and the ligands were prepared at the same time and under the same
conditions. All parameters of the CV study kept constant. TQ and THY were used as ligands,
whereas iron, chromium, copper, vanadium and cobalt were used as metals to form complexes
with TQ and THY. Their electrochemical study was performed according to the following
manner:
3.2.4.7.1 Fe(III) – Thymoquinone complex
For this study 0.005M solutions of both iron (III) and TQ were prepared in supporting electrolyte
(NaCl- 0.1 M) and 10% methanol.
After determining the base line of NaCl as described earlier, the cell assembly and the three
electrodes were rinsed thrice with the metal solution. The CV- cell was filled will 10cm3 of
metal’s solution and the cell top was fitted on it. The three electrodes were immersed into the
metal solution. Any air bubble if present, on the surface of the working electrode, was removed.
The leads were connected to their respective electrodes. The instrument was turned on before
start of all this work. All parameters, under the set up menu, were set regarding initial potential,
final potential limit; initial scan direction, potential scan rate, sweep segments and current
sensitivity were set. Potential scan rate was 0.1 V/s, whereas current sensitivity was 1x10⁻⁴ A/V.
The potential range was set from -0.20 V to +0.80 V and then reversed back to -0.20 V. The
instrument was run and voltammogram of the metal was displayed on the window. Then the
header was turned on and the name of metal and supporting electrolyte, with their concentrations
were typed in the header text area and finally saved. After this process the cell assembly was
rinsed thrice with TQ’s solution and the working electrode was re-polished. 10 cm3 solution of
TQ was filled in the CV cell and then whole procedure was repeated as mentioned above to
obtain cyclic voltammogram of TQ. Finally, it was saved.
In order to study complexation, Fe(III)-TQ(1:1) solution was prepared and its voltammogram
was recorded in the same manner as mentioned above. This complexation was studied in the
light of effects of several parameters which are as under:

110
(a) Effect of Metal- Ligand Ratio
For this purpose metal-ligand complex solutions having different metal ligand ratios were
prepared i.e, 1:1-1:5. Cyclic voltammograms of all the solution were recorded in the same
manner as described earlier. The cell assembly was rinsed thrice with the analyte every time and
the working electrode was re-polished time to time throughout the experiment. The
voltammogram were taken at scan rate 0.1 V/s. An overlay was plotted to compare the data of
each plot. For this, data files of complexes with different metal-ligand ratio were selected by
pointing mouse cursor to the file name and a single left click holding the Ctrl key. Then data
was added to overlay command under the graphic menu.
(b) Effect of Concentration
To study effect of concentration, complex solutions having concentrations 0.02x10⁻³ M- 1.2x10⁻³
M were prepared. In all these solutions metal ligand ratio was 1:3. Their voltammograms were
recorded at the same scan rate and current sensitivity. Potential range was also same. CV-cell
and electrodes were rinsed regularly and with great care after changing each solution in order to
observe the correct effect. An overlay was plotted, which showed multiple sets of data at
different concentration in a single plot.
(c) Effect of Scan-rate
For this purpose Fe (III)-TQ complex solution (1:3) was run at different scan rates ranging 0.05-
200 V/s. Voltammograms of the complex at each scan rate were recorded and saved. An overlay
was plotted to compare the effect at each scan rate. Current sensitivity and potential range were
same as above.
(d) Effect of Repeated Scan
Repeated scan of the complex solution (1:3) of Fe(III) and TQ was recorded, for this purpose
numbers of sweep segments used were 14. Scan rate was 0.1 V/s, whereas current sensitivity and
potential range were same as mentioned above.
3.2.4.7.2 Cr (VI) – Thymoquinone complex
To study complexation between Cr (VI) and TQ, 0.005M solutions of both were prepared in 0.1
M NaCl (which was used as supporting electrolyte) and 10% methanol. CV cell and the three
electrodes were rinsed with supporting electrolyte and base-line was determined. After that CV-
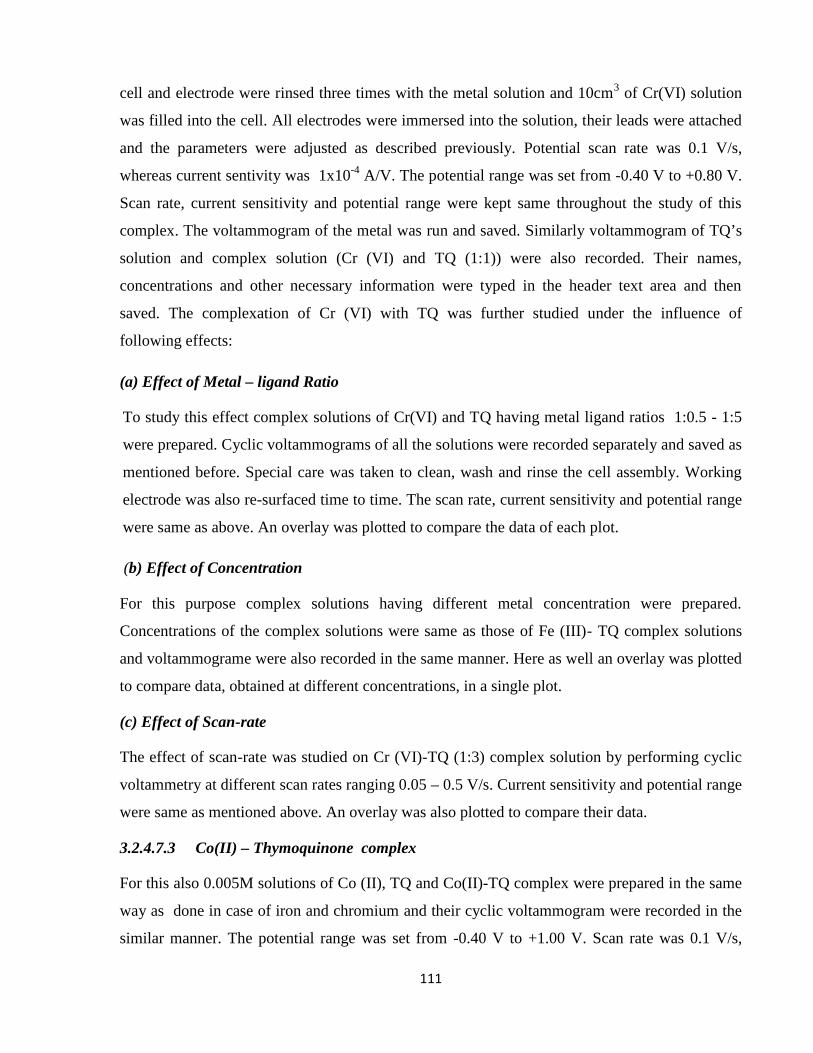
111
cell and electrode were rinsed three times with the metal solution and 10cm3 of Cr(VI) solution
was filled into the cell. All electrodes were immersed into the solution, their leads were attached
and the parameters were adjusted as described previously. Potential scan rate was 0.1 V/s,
whereas current sentivity was 1x10⁻⁴ A/V. The potential range was set from -0.40 V to +0.80 V.
Scan rate, current sensitivity and potential range were kept same throughout the study of this
complex. The voltammogram of the metal was run and saved. Similarly voltammogram of TQ’s
solution and complex solution (Cr (VI) and TQ (1:1)) were also recorded. Their names,
concentrations and other necessary information were typed in the header text area and then
saved. The complexation of Cr (VI) with TQ was further studied under the influence of
following effects:
(a) Effect of Metal – ligand Ratio
To study this effect complex solutions of Cr(VI) and TQ having metal ligand ratios 1:0.5 - 1:5
were prepared. Cyclic voltammograms of all the solutions were recorded separately and saved as
mentioned before. Special care was taken to clean, wash and rinse the cell assembly. Working
electrode was also re-surfaced time to time. The scan rate, current sensitivity and potential range
were same as above. An overlay was plotted to compare the data of each plot.
(b) Effect of Concentration
For this purpose complex solutions having different metal concentration were prepared.
Concentrations of the complex solutions were same as those of Fe (III)- TQ complex solutions
and voltammograme were also recorded in the same manner. Here as well an overlay was plotted
to compare data, obtained at different concentrations, in a single plot.
(c) Effect of Scan-rate
The effect of scan-rate was studied on Cr (VI)-TQ (1:3) complex solution by performing cyclic
voltammetry at different scan rates ranging 0.05 – 0.5 V/s. Current sensitivity and potential range
were same as mentioned above. An overlay was also plotted to compare their data.
3.2.4.7.3 Co(II) – Thymoquinone complex
For this also 0.005M solutions of Co (II), TQ and Co(II)-TQ complex were prepared in the same
way as done in case of iron and chromium and their cyclic voltammogram were recorded in the
similar manner. The potential range was set from -0.40 V to +1.00 V. Scan rate was 0.1 V/s,

112
whereas current sensitivity was 1x10⁻⁴ A/V. Scan rate, current sensitivity and the potential range
were kept constant throughout the study of this complex. Following effects were studied on
cyclic voltammograms of Co (II) – TQ complex.
(a) Effect of Metal – Ligand Ratio
Effect of metal ligand ratio on complexation of Co (II) with TQ was examined by preparing
complex solutions having 1:0.5 - 1:5 ratios. Their cyclic voltammograms were also taken
individually in the same fashion as described earlier. The scan rate, current sensitivity and
potential range were kept same as mentioned above. An overlay was also taken to compare the
data and to observe changes in a single plot.
(b) Effect of Concentration
Complex solutions having different Co(II) concentrations were prepared concentrations of the
complex solutions were same as those of Fe (III)- TQ complex solutions. Cyclic voltammograms
of all solutions were recorded at the same scan rate; current sensitivity and potential range were
also the same as mentioned above. An overlay was also plotted.
(c) Effect of Scan – Rate
The effect of scan rate, on Co(II)-TQ (1:3) complex solution was examined at different scan rates
ranging 0.05 – 0.5 V/s and an overlay was also plotted to compare the data at different scan rates.
(d) Effect of Repeated Scan
Repeated scan of Co (II) –TQ (1:3) complex solution was recorded at scan rate 0.1 V/s. Number
of sweep segments were set at 16.
3.2.4.7.4 Cu (II) – Thymoquinone complex
0.005M solution of Cu (II), TQ and Cu (II) -TQ complex were prepared in 0.1M, NaCl (used as
supporting electrolyte) and 10% methanol of and their cyclic voltammograms were runned in the
same way to check complexation. The potential range was set from -0.20 V to +1.00 V. Scan rate
was 0.1 V/s, whereas current sentivity was 1x10⁻⁴ A/V.
Effects of different parameters were also studied on complexation, such as:

113
(a) Effect of Metal – Ligand Ratio
To check effect of metal- ligand ratio on Cu(II) –TQ complexation different solutions having
metal-ligand ratios 1:1- 1:5, were prepared and their voltammograms were run at the same scan
rate and current sensitivity. Potential range was also the same. An overlay was also plotted to
compare data at different metal-ligand ratios.
(b) Effect of Concentration
Cu (II) – TQ complex solutions having different concentration of metal were prepared. The
concentration of the solutions were 2x10⁻⁵ M - 1.6x10⁻³ M. Cyclic voltammograms of each
solution was recorded at the same scan rate and current sensitivity as in the case of metal-ligand
ratio, potential range was also the same. An overlay was also plotted.
(c) Effect of Scan rate
For studying the effect of scan rate cyclic voltammograms of Cu(II)-TQ (1:2) complex solution
were recorded at scan rates ranging from 0.01-0.5 V/s. Current sensitivity and potential range
were same as in above case. An overlay was also plotted in order to compare the data at different
scan rates.
(d) Effect of Repeated scan
Repeated scan of Cu(II)-TQ (1:2) complex was runned at scan rate 0.1 V/s. Numbers of sweep
segments were set at 24.
(e) Effect of Supporting Electrolyte
To check the effect of supporting electrolyte on complexation of Cu(II) and TQ , LiCl was also
used as supporting electrolyte and complexation was studied considering all parameters which
were examined in case of NaCl inorder to analyze any influence of supporting electrolyte. For
this purpose 0.1 M solution of LiCl was prepared and then 0.005 M Cu(II), TQ and Cu (II)- TQ
complex solutions were prepared in LiCl and 10% methanol.
CV - cell and all the three electrodes were washed with distilled water, and then the working
electrode was re-surfaced. Next, whole cell assembly was rinsed three times with LiCl. Then
10cm3 LiCl was filled in the cell and base-line of LiCl was determined in the same manner as
that of NaCl. The scan rate, current sensitivity and the potential range were set at 0.1 V/s, 1x10⁻⁴

114
A/V and -0.20 V to +0.80 V respectively. The name and concentration of LiCl were typed in the
header text area, and the scan was saved.
Similarly cyclic voltammograms of Cu (II), TQ and Cu (II)-TQ complex were run and their data
was compared and saved. Here also effect of metal –ligand ratio, effect of concentration, effect
of scan rate and effect of repeated scan were studied.
For metal- ligand ratio; sample solutions having 1:1- 1:5 Cu (II) and TQ ratio were prepared
using LiCl as supporting electrolyte, whereas for repeated scan Cu (II) –TQ complex was used in
the ratio of 1:2. Numbers of sweep segments used were 16. For effect of concentration solution
having metal concentration in the range of 2x10⁻⁵ M - 1.6x10⁻³ M were used. Cyclic
voltammogram of all these solutions were recorded at scan rate 0.1 V/s and saved. Current
sensitivity and potential range were same as in case of LiCl. Effect of scan rate was determined
at different scan rates ranging from 0.05 – 0.3 V/s. Overlays were also plotted in all of above
cases to compare the data and examine the change.
3.2.4.7.5 V (IV) – Thymoquinone complex
0.005M solution of V(IV), TQ and V (IV) – TQ complex (1:1) were prepared in 0.1 M NaCl
and 10% methanol. After determining base-line cyclic voltammograms of vanadium, TQ and
complex solution were recorded. Potential scan rate, current sensitivity and potential range were
same as in case of Cr (VI) – Thymoquinone Complex.
3.2.4.7.6 Cyclic voltammetric studies of thymol and its complexes
Cyclic voltammetric study of thymol and its complexes with Fe (III), Cr(VI), Cu(II), V(IV) and
Co(II) was also performed. For this purpose 0.1 M solution of sodium chloride was prepared and
used as supporting electrolyte. 0.005 M solution of each of thymol and metals was prepared in
NaCl and 10% methanol.
Cyclic voltammograms of thymol, Fe (III), Fe (III)- THY complex, Cr (VI), Cr (VI)- THY
complex, Cu (II), Cu (II)- THY complex, V (IV), V (IV)- THY complex, Co (II) and Co (II)-
THY complex were recorded at scan rate 0.1 V/s and current sensitivity was 1x10⁻⁴ A/V.
Potential range was set from -0.40 V to +1.00 V. Metal –ligand ratio in all complex solutions
was 1:1. The information about the name and concentration of metals and ligand were typed in
the header text area and the voltammograms were saved.

115
SCHEME – I
Extraction and Isolation Scheme
Seeds of Nigella sativa (10 kg)
Soaked in
Methanol (x 5)
Solvent removed under vacuo
Concentrated Syrup
+ Hexane + H2O
Hexane Phase Aqueous PhaseWashed, dried,concentrated under vacuo + EtOAc
Oily Syrup
EtOAc Phase Aqueous PhaseWashed, dried,concentrated under vacuo + dichloro-
methane
Gummy Residue (44.1g)
Scheme-IIDichloromethane AqueousPhase

116
SCHEME –IIEthyl acetate Residue (44.1 g)
1 2 3 4 5 6 7 8 9 10 1112 13141516171819 20 21 22 23 24 25 26 27 28 29 30 3132 3334 35 36 37 38 39
Subjected to gravitycolumn chromatography Subjected to gravity washed with(vide experimental) column chromatography hexane
(vide experimental)
Hexane soluble Hexane insoluble
A-1 A-2 A-3 A-4 A-5 A-6
RecrystallizationWashedand
Palmitic acid (i) B-1 B-2 B-3 B-4 B-5 B-6 B-7 B-8 driedSubjected to gravity
Column chromatography Stigmasterol (ii)(vide experimental)
B-2a B-2b B-2c B-2d B-2e
Palmitic acid (i)Palmitic acid (i)

117
FIGURE – 3.1
Cell for pH-Metric Studies

118
FIGURE – 3.2
CHI-760 D Electrochemical Work Station Cyclic Voltammeter

119
CHAPTER 4
RESULTS AND DISCUSSION
4.1 General Treatment of N. sativa Seed
N. sativa seeds (Table - 4.1) were subjected to different physical treatments which are as follows:
4.1.1 Moisture Content
For moisture content determination sample was taken in the form of seeds. Approximately 5g of
seeds were accurately weighed and kept in electrical oven at 105 ± 1˚C until constant weighing.
The accurate weight of dried sample was noted for calculation of percentage of moisture (Table -
4.2). From present research moisture content was found 7.932% (Fig. 4.1), which shows good
agreement with the reported value [65].
4.1.2 Dissolved and Undissolved Solid (DS and UDS)
To check DS and UDS, cleaned and dried sample of black seeds was weighed and then soaked in
distilled deionized water for different time intervals. These samples then filtered and dissolved
and undissolved materials were dried separately. Filterate was evaporated to dryness to give DS,
where as residue after complete drying gave UDS. Their percentages were calculated for each
time interval (Table - 4.3). DS and UDS were also estimated in 0.1M HCl in the same manner as
mentioned above (Table - 4.4).
According to results obtained in case of DS in aqueous extract it seems that 1 hour is sufficient
for its maximum extraction and after 3 hours no increase in DS was observed. The results for
UDS also showed no distinct change after 2 hours. In the beginning their percentage decreased
and then became approximately constant (Fig. 4.2).
In case of acid extract, results showed that, short time is required to extract maximum DS as
compared to water. It seems that half an hour is sufficient for maximum extraction. As quantity
of DS increased with respect time, a decrease in quantity of UDS was observed (Fig. 4.3).
The comparative data of DS in aqueous and acid extract showed higher percentage of dissolved
material in acid than water and less time was required for maximum extraction of DS in case of

120
acid than water (Figure-4.4). On the other hand quantity of UDS was found higher in aqueous
extract than acid extract (Table- 4.3, 4.4; Fig.4.5).This shows that probably seed contains
substances which are less soluble in water and more soluble in acid probably due to chelated
metals which are water insoluble or the seed may contain substances which decompose in acid.
Since pH of acid (0.1HCl) and stomach is same it is also possible that maximum part of the seed
could dissolve in stomach with in a very short period of time. Results also suggest that insoluble
metal chlorides, such as chlorides of silver, lead or mercury, are not present in the seed in
reasonable quantity.
In case of total solid material (TS) a decrease was observed within first two hours of soaking and
after 2 hours its quantity remained approximately the same. This decrease in TS within first two
hours shows that probably seed contains some volatile compounds which on soaking dissolve
into the medium and then escape into atmosphere causing a decrease in the total percentage (Fig.
4.6).
4.1.3 Scanning Electron Microscopy (SEM)
The object of using this sophisticated technique in present research is to determine the elemental
composition of dried seeds of N. sativa. For analysis by SEM sample must be moisture free, so
dried seeds of N. sativa were used. Elemental composition of the seed was determined at
different magnifications ranging from 500-35,000. Presence of several essential macro and micro
nutrients in the seed was detected. Results showed presence of both non-metals as well as metals.
Out of non-metals carbon and oxygen were found in high quantity; whereas silicon was in low
quantity. It has been reported that carbon and oxygen are among those six elements which
comprise 99% of the mass of the human body [509]. Metal content of the seed includes sodium,
potassium, calcium, iron, chromium, cobalt, aluminium, arsenic, cadmium and lead (Tables- 4.5-
4.8).

121
4.1.3.1 Macro-nutrients
Following macro-nutrients were detected in the N. sativa seeds.
4.1.3.1.1 Carbon
Carbon has been detected at all magnifications in highest percentage among all elements. It is
thought to be macro-nutrient and is perhaps the most important element for life. Carbon atom has
tendency to form long chains with itself and with other elements. Due to this ability it is
considered as building block of our body [452].
4.1.3.1.2 Oxygen
It is the second most abundant element found in the N. sativa seed. It is an extremely important
element and without oxygen life can’t exist.
4.1.3.1.3 Sodium
It is an essential element and is important to maintain acid-base balance of the body. It is also
needed to nerve transmission and muscle contractions [378]. Sodium has been reported as major
constituent of N. sativa seeds in the past also [68].
4.1.3.1.4 Potassium
It is another important mineral which is detected in the seeds. N. sativa seeds have been reported
as good source of potassium [68]. It helps to regulate the fluid and electrolyte balance of the
body along with sodium.
4.1.3.1.5 Calcium
From present research calcium was found in the range of 0.1-0.47% in the seeds (Table- 4.5,
4.8). It is main constituent of our bones and teeth. N. sativa seeds have been reported as a good
source of calcium in past also [69].

122
4.1.3.2 Trace Elements
Following trace elements were found in the seeds of N. sativa from present research.
4.1.3.2.1 Iron
Detection of iron is supported by reported results [68]. Importance of iron is now clearly known
to everyone. It is not only essential for human body, but is important for all living organisms. Its
deficiency results in many severe problems such as anemia and vitamin A deficiency [383].
4.1.3.2.2 Manganese
In present research study manganese has been detected in the range of 0.02-0.06% (Tables- 4.6,
4.8). It is also an essential element. On the one hand it is constituent of some enzymes on the
other hand it acts as activator of some other enzymes. These enzymes play vital roles in
metabolism of carbohydrates, amino acids and cholesterol [510].
4.1.3.2.3 Cobalt
Cobalt showed 4.54-5.75% by SEM (Tables- 4.5- 4.8). It is the main constituent of the vitamin
B12 and is required for the synthesis of red blood cells. In addition, it has many important roles in
the human body including metabolism of carbohydrates, proteins, fats and folic acid [437, 440].
N. sativa seeds may be good source of cobalt.
4.1.3.2.4 Chromium
It is also an essential element which is involved in several metabolisms. Its deficiency mainly
results in impaired glucose tolerance [378]. The Adequate Intake for chromium is 35µg/day for
men and 25µg/day for women. From present research chromium is detected at low levels i.e.
0.01- 0.02% (Table- 4.5, 4.8) in the N. sativa seeds, which is not harmful for human health.
4.1.3.2.5 Silicon
It showed 0.1% abundance in the N. sativa seeds (Table- 4.5). Silicon also plays essential roles in
the human body. With calcium it helps to grow and maintain strong bones. It is also needed for
the formation of skin hair and nails [452].

123
4.1.3.2.6 Cadmium
From present research the percentage of cadmium was found to be 0.08% (Table- 4.8). Cadmium
is thought to be important for some metabolic processes and has a leading role to cure thyroid
disease [511].
4.1.3.2.7 Arsenic
From present research arsenic was detected 0.03-0.17% (Table- 4.5- 4.7), whereas its average
intake is estimated at 1mg/day from food. Arsenic is known as a poison but in fact arsenic in
food is in non poisonous form [460]. It is considered essential for the proper growth and
reproduction. It is also important for nervous system and its lack in the body may result in
nervous system disorders [376].
4.1.3.2.8 Aluminium
The reputation of aluminium is also as a toxic element but in fact it is needed by some enzymes.
From present research aluminium is found to be 0.19% (Table- 4.5). Aluminium may be added
from the soil to the plant. Acid rain increases the bioavailability and solubility of aluminium and
it is absorbed in the plants growing in this soil [458].
4.1.3.2.9 Lead
Lead has also been detected in the N. sativa seeds. It is a toxic element and can cause severe
problems regarding human health such as damage to nervous system, kidneys and bone marrow.
It may also be responsible for complications in reproductive system [378, 462]. Lead can be
absorbed by the plant through the soil, water and polluted air.
4.1.3.3 Surface Morphology
Surface morphology of the seed was also examined by SEM at all mentioned magnifications.
Scan at 35,000 magnification up to 1.0 µm showed irregular surface of the seed (Fig. 4.7),
whereas at 11,000 magnification up to 3.0 µm showed layer of the seed composed of elongated
cells (Fig. 4.8). Third scanning electron micrograph at 4,500 magnification up to 10 µm revealed
a layer of rectangular elongated cells (Fig. 4.9), whereas thick polygonal cells were observed at
500 magnification which was up to 100 µm. Globules of oil can be seen between the cells (Fig.
4.10). The morphology of seed shows good agreement with the reported one [36].

124
4.2 Extraction and Isolation of N. sativa Seed
N. sativa seeds are selected for the present research due to the reason that they possess
uncountable medicinal and biological properties. They are used as indigenous resource from
ancient time. The purpose of this research was to isolate active ingredient of N. sativa seed and
then study electrochemical properties of these active constituents and their complexes. For this
purpose the seeds were extracted with methanol. After repeated extraction, the concentrated
extract was subjected to solvent separation and different chromatographic techniques such as
column chromatography and thin layer chromatography as described in the experimental work.
The structure of the isolated constituents was confirmed through different spectral studies
including UV, IR, MS, 1H- and 13C-NMR. The comparison of the spectral data of the isolated
constituents with the reported one revealed that the isolated constituents were known compounds
which have been reported earlier from this source. Spectral information revealed that fraction A-
2 of fraction number 4; B-5 of fraction number 5 and B-2c of the fraction number B-2 were
Palmitic acid (i), whereas fraction 8 was confirmed as Stigmasterol (ii).
The structures of the isolated compounds are as follows:
1. Palmitic acid (i) [75,107,121]
Hexadecanoic acid
Molecular weight = 256.417
Molecular formula = C16H32O2
2. Stigmasterol (ii) [90,120,121]
17-(4-Ethyl-1,5-dimethylhexyl)-10,1-dimethyl-2, 3, 4, 7, 8, 9, 10, 11, 12,
13, 14, 15, 16, 17-tetradecahydro-1H-cyclo penta[a]phenanthren-3-ol
Molecular weight = 412.706
Molecular formula = C29H48O

125
4.3 pH Metric Studies
The pH metric studies include pH-metric titrations of ligands L1 and L2 (thymol and
thymoquinone) and their complexes. These titrations were performed at room temperature
(25±1˚C) using standard sodium hydroxide solution. pH change was plotted for incremental
addition of NaOH. From these plots valuable informations are obtained. The results obtained in
these experiments substantiate the elucidation about different stoichiometry at different pH. With
the help of pH-metric data, species distribution curves were also plotted against pH and percent
distribution of complex species. In each case two curves were obtained for complex, one for ML
(1:1) whereas second for ML2 (1:2) species.
4.3.1 pH-Metric Titrations of Ligands
As a reference, titrations were initially performed with ligands, thymol (Fig. 1.4(b)) and
thymoquinone (Fig. 1.4(a)). In case of thymol only one curve near pH 10.80 was observed (Fig.
4.11). Initial pH of thymol was 6.72. It increased rapidly with the addition of NaOH and then
became constant (Table- 4.9). pKa of the thymol was calculated using the relation pKa= -log Ka.
It was found to be 9.00±1, which is close to the reported value 10.77 [512].
In case of thymoquinone also only one curve near pH 10.50 was observed (Fig. 4.12). Initially its
pH was 5.72 at no addition of NaOH. Since thymoquinone contains no H+ ion hence pH of the
ligand increased drastically by the addition of the NaOH and then became constant (Table- 4.10).
pKa of thymoquinone in aqueous solution has been determined for the first time from present
research. It was found to be 8.5.
To check complexation similar titrations were repeated with complexes of thymol and
thymoquinone with different metals i.e. iron(III), chromium(VI), copper(II), vanadium (IV) and
cobalt(II).
4.3.2 pH-Metric Titrations of Thymol Complexes
All these titrations were also performed at room temperature in thermostatic conditions. For
titration 10mL of metal solution (0.005M) was mixed with 40mL of thymol solution (0.005M)
and titrated with standard sodium hydroxide solution.

126
4.3.2.1 Fe(III)-Thymol Complex
Remarkable difference in titration curves of complex and ligand was observed, which showed
release of H+ ions due to formation of complex between metal and thymol (Table-4.11, Fig.
4.13).
Two prominent curves near pH 3.00 and 10.00 were observed. First curve shows rapid reaction
between metal and ligand, which may be due to formation of ML and ML2 complex species. The
prominent complexation was noted at low pH i.e. at pH 3.00, but as the volume of added NaOH
increased a drastic change in pH was observed and the pH plot goes straight in upward direction
showing unavailability of H+ ion for the neutralization. This shows that all the metal was
consumed to form ML and ML2. After this only excess of ligand was titrated, this gave second
curve.
Species distribution curve shows maximum ML species formation near pH 3.00, whereas
maximum ML2 formation seems to occur near pH 6.50 (Fig. 4.14). The complex seems stable at
low pH. Out of all studied complexes of thymol, Fe(III) formed most stable complex.
4.3.2.2 Cr(VI)-Thymol Complex
Prominent difference in the titration curves of complex and ligand confirms complexation. This
shows release of H+ ions due to formation of complex between metal and the ligand (Table- 4.12,
Fig. 4.15). In case of complex two prominent curves were observed. First curve starts near pH
5.50 and covers a pH range up to 8.00, this curve shows maximum complex formation and here
formation of ML and ML2 species took place. Second curve was near pH 10.00 and it crossed the
ligand’s curve and showed pH higher than the pH of ligand’s curve. It indicates that complex
may have some water molecules in its co-ordination sphere, which were releasing H+ ions after
complex formation and those H+ ions were neutralizing by NaOH.
Species distribution curve for Cr (VI)-Thymol complex revealed that maximum complexation of
ML and ML2 took place at pH 4.50 and 8.50 respectively, whereas between pH range 6.00-6.50
each specie was 50% (Fig. 4.16).

127
4.3.2.3 Cu(II)-Thymol Complex
Very clear difference in the titration curves of complex and ligand was observed, which reveals
the formation of a complex. This difference shows release of H+ ions due to formation of
complex (Table- 4.13, Fig. 4.17). In titration curve of the complex a twist was observed at pH
5.80 and two curves near pH 6.50 and 9.50 were observed. First two changes may be due to
formation of ML and ML2 complex species respectively, whereas the third one may be due to
titration of excess ligand. The reaction mixture showed a pH 5.50 at no addition of the NaOH. As
the base was added the pH increased slowly, then rapid increase was observed after pH 6.00.
White precipitates were appeared in the solution after pH 6.00 which might be due to reaction
between copper and hydroxyl ions.
Specie distribution plot showed a decrease in the concentration of free metal ion with the
addition of NaOH. Maximum ML and ML2 species seems to form at pH 4.00 and 7.00, whereas
between pH 5.00 to 6.00 each species was 50% (Fig. 4.18).
4.3.2.4 V(IV)-Thymol Complex
Significant difference in the titration curves of complex and ligand was observed, which showed
release of H+ ions due to formation of complex between metal and ligand (Table- 4.14, Fig.
4.19). In the plot first curve was observed near pH 4.00 and no significant change in pH was
observed up to the addition of 0.80 mL of NaOH, this indicates that the complex between V(IV)
and thymol is stable at low pH. ML and ML2 complex species seems to form within pH range
4.00-5.00 and after that rapid increase in pH was observed with the addition of the base. Second
curve was seen near pH 9.50. This curve proceed in the same manner as that of the ligand, hence
it seems that this curve is due to the titration of excess ligand. As titration proceeds the colour of
the solution became light yellow and as the titration proceed further it became green and finally
to dark green. As the ligand solution was colourless where as colour of metal solution was light
blue, yellow and green colours shows complexation between metal and ligand.
Species distribution curves showed maximum ML and ML2 formation at pH 3.50 and 6.50
respectively (Fig. 4.20).

128
4.3.2.5 Co(II)-Thymol Complex
Clear difference in titration curves of complex and ligand was observed, which showed
complexation (Table - 4.15, Fig. 4.21).
Two distinct curves were observed. The first one near pH 8.00, whereas second near pH 9.00
which may be due to formation of ML and ML2 species respectively. During experiment as pH
value exceeds from 8.00 the colour of the solution changed from colorless to sky blue, which
may be due to ML. Second change was observed when pH exceeds value 9.50. This change was
in the form of bluish green precipitates. This was the same pH region where second curve was
observed, this change may correspond to the formation of ML2 species.
Species distribution curve showed 50% formation of each of the ML and ML2 near pH 8.00 and
their maximum formation at pH 5.00 and 11.00 respectively (Fig. 4.22).
4.3.2.6 Fe(III)-Thymoquinone Complex
Very clear complex formation between Fe(III) and Thymoquinone can be seen by comparing
their pH curves (Table- 4.16, Fig. 4.23). Two distinct curves were observed, first near pH 3.00,
whereas second near pH 10.50. First curve indicates the fast consumption of metal, which may
be due to formation of ML and ML2 species; whereas the second curve indicates the
neutralization of excess ligand by NaOH. Initial pH of the reaction mixture was 2.90. As NaOH
was added pH started to change very slowly, this indicates stability of the complex at low pH.
The ML specie seems to be stable with in pH range 2.90 – 3.50, during this pH range colour of
the solution changes from yellow to orange. ML2 probably formed within pH range 3.60-7.00.
After this a rapid increase in pH was observed by the addition of NaOH. With the increase of pH
colour of the solution changed to brown and as pH reached to 10.00 precipitates started to
appear.
According to species distribution curve also the reaction between Fe(III) and thymoquinone is
very fast. From the plot maximum ML and ML2 species formation seems to occur near pH 3.00
and 7.00, whereas around pH 4 each species was 50% (Fig. 4.24).

129
4.3.2.7 Cr(VI)-Thymoquinone Complex
The titration curves of complex and ligand were very different which showed complexation
between Cr(VI) and Thymoquinone (Table - 4.17, Fig. 4.25). In the plot of the complex a slight
twist was observed at pH 5.80, which may be due to formation of ML specie. This twist lies
within pH range 5.35-6.00. After that pH change became relatively slow and another curve was
observed near pH 7.50 which may be due to ML2 species. After this pH change became fast and
a third curve appeared near pH 10.00 which shows titration of excess ligand. During titration
colour of the solution changed from yellow to green, which indicates oxidation reduction
reaction between metal and the ligand.
According to species distribution curve maximum percent distribution for ML and ML2 species
was found at pH 4.00 and 9.00 respectively whereas between pH 6.00-7.00 each species seems
50% (Fig. 4.26).
4.3.2.8 Cu(II)-Thymoquinone Complex
Titration curve of complex was very different from that of the ligand showing clear complex
formation (Table- 4.18, Fig. 4.27). In pH plot three prominent curves were observed. First one
near pH 6.00 which may be due to formation of ML specie, second curve near pH 6.50 which
shows formation of ML2 species probably. The last curve near pH 10.00 indicates titration of
excess ligand. The reaction mixture showed a pH reading 5.21 when no base was added. pH
increased as the NaOH was added and first curve appeared in the pH range 5.20-6.10, after that
pH change became relatively slow and colour of the solution started to change to green. As the
pH crossed the value 5.00 it showed a fast increase and this is the region where second curve
appeared. After pH 6.00 green precipitate were formed.
Species distribution plot shows maximum ML and ML2 species formation at pH 4.00 and 8.00
respectively, whereas plot shows that near pH 6.00, each species in the reaction mixture was
probably 50% (Fig. 4.28).
4.3.2.9 V(IV)-Thymoquinone Complex
Remarkable change in the titration curves of complex and ligand was observed, which reveals
complex formation between V(IV) and thymoquinone (Table- 4.19, Fig. 4.29). Two curves were

130
observed, first one near pH 4.50 and second one near pH 10.00. Prior to the titration the pH of
the reaction mixture was 4.15. In the beginning no significant change in pH was observed by the
addition of NaOH which shows stability of complex at low pH. Formation of ML and ML2
complex species occurred within pH range 4.00-7.00. At start colour of the solution changed
from yellow to green, which turned to dark green on further proceeding of titration. This colour
change also signals formation of mentioned complex species. Second curve may be due to
titration of excess ligand.
Species distribution plot shows a fast reaction between vanadium and thymoquinone. Maximum
percent distributions of ML and ML2 were observed at pH 4.00 and 7.00 respectively, whereas it
is evident from the plot that near pH 5.00 the distribution of each species was 50% (Fig. 4.30).
4.3.2.10 Co(II)-Thymoquinone Complex
Titration curve of complex was found totally different from that of ligand, indicating complex
formation between Co(II) and thymoquinone (Table 4.20, Fig. 4.31).
Here also two clear curves could be seen, one near pH 7.90 and second near pH 8.50 indicating
formation of two types of complex species, ML and ML2. During experiment as pH reached
value 8.00 the colour of the solution changed from yellow to green showing complex formation.
As pH exceeds value 10.00 precipitate formation was observed.
According to species distribution plot maximum ML and ML2 formation was took place at pH
6.00 and 11.00 respectively, whereas it seems that each species was 50% between pH 8.00-9.00
(Fig. 4.32).
4.4 Cyclic Voltammetric Studies
It is one of the standard sweep techniques of voltammetry and is most widely used nowadays. In
present research work it is used to confirm complexation of thymoquinone and thymol with
different metals {i.e; Fe(III), Cr(VI), Cu(II), V(IV) and Co(II)} as well as to measure different
electrochemical properties of some of these complexes. In this way cyclic voltammetry is used to
study qualitative and quantitative characteristics of these complexes. All the work was performed
on CHI – 760 D Electrochemical work station at 25 ± 1˚C. The electrodes used were glassy
carbon electrode, saturated calomel electrode and a platinum wire electrode which worked as

131
working, reference and auxiliary electrodes respectively. NaCl was used as supporting
electrolyte in all the cases except for Cu(II)-thymoquinone complex where LiCl was also used.
Complexation of thymoquinone and thymol with all above mentioned metals has been proved
earlier in section 4.3 of this chapter.
For the study fresh analyte and supporting electrolyte solutions were prepared each time.
Electrochemical study of different complexes is as under.
4.4.1 Fe(III) – Thymoquinone Complex
The solutions of NaCl (0.1M), Fe(III) (5x10⁻⁴M), thymoquinone (5x10⁻⁴M) and a mixed solution
of metal and ligand in 1:1 metal-ligand ratio (5x10⁻⁴M) were run at 0.1 V/s and 1x10⁻⁴ Amp/ Volt
(Fig. 4.33(a)-(d)). Volume of the solution in each case was 15mL. The oxidative wave in the
cyclic voltammogram of the complex could be seen going from -0.2 V to +0.8 V and then
reduction of the oxidized species is evident from the reverse scan from +0.8 V to -0.2 V (Fig.
4.33(d)). Same potential range, scan rate and current sensitivity were used throughout the study
of this complex.
The comparison of the cyclic voltammograms of NaCl, Fe(III), thymoquinone and Fe(III)-
Thymoquinone complex gave valuable information. The base line obtained is horizontally
straight which confirms absence of impurity and cleanliness of working electrode (Fig 4.33(a)).
In case of iron only reduction peak was observed within the mentioned potential range at +0.238
V. Thymoquinone and the complex showed anodic peaks at -0.242 V and +0.282 V; and
cathodic peaks at -0.326 V and +0.066 V respectively. These values showed that neither Fe(III)
nor thymoquinone showed peaks in this potential window at mentioned Epa and Epc which
clearly indicates that complex formation has occurred (Table- 4.21). The shape of the cyclic
voltammogram of Fe(III)-Thymoquinone complex indicates coupling of oxidation with
reduction. The cyclic voltammogram shows a well defined anodic peak showing oxidation of
[Fe2+, TQ] to [Fe3+, TQ] and a cathodic peak indicating reduction of electrochemically generated
[Fe3+, TQ] (Fig. 4.33(d)). This reduction occurs at the electrode surface and the oxidized specie is
converted back to the [Fe2+, TQ].
The comparison of the cyclic voltammograms also tells that out of pre and post equilibrium
charge transfer processes which one took place during complexation. In pre-equilibrium charge

132
transfer process electron transfer takes place before formation of metal-ligand bond, as shown in
the following equation. This is indicated by the positive shift of the peak potential of complex
with respect to metal.
Fe2+ ⇌ Fe3+ + 1e-
Fe3+ + TQ ⇌ [Fe3+, TQ]
Whereas in case of post equilibrium charge transfer process, electron transfer takes place after
formation of metal-ligand bond as indicated in the following equation. This is revealed by a
negative shift in the peak potential of complex with respect to metal.
Fe2+ + TQ ⇌ [Fe2+, TQ]
[Fe2+, TQ] [Fe3+, TQ] + 1e-
The comparison of the voltammograms reveals that post equilibrium charge transfer process has
occurred in Fe(III)-Thymoquinone complex because of a negative shift in peak potential of the
complex with respect to metal has been observed. A decrease in values of both Ipa and Ipc was
observed after complexation (Table- 4.21).
The complexation of above mentioned complex was studied in the light of effects of several
parameters in order to determine different quantitative characteristics of the complex. These are
as follows:
4.4.1.1 Effect of Scan Rate
For this purpose cyclic voltammograms of Fe(III)-Thymoquinone complex (5x10⁻⁴M) were
recorded in NaCl (0.1M) which was used as supporting electrolyte. 15 mL of the complex
solution having 1:3 metal-ligand ratio was run at different scan rates i.e. 0.05 V/s - 0.20 V/s. The
data obtained was used to determine different electrochemical parameters (Table- 4.22).
Valuable information is obtained from the overlay (Fig. 4.34). Voltammograms fulfill the criteria
of quasi-reversible behavior. This could be seen from the plot of peak current (Ip) versus square
root of scan rate (ν1/2) (Fig. 4.35). The plot shows that the Ip increases with the increase of ν1/2 but
it is not proportional to ν1/2. Another quasi-reversible behavior found was that the ratio of the
peak currents (Ipa/Ipc) was not equal to 1(Table- 4.22). Furthermore, Epa-Epc was found to be
greater than 59/n mV and an increase in the ∆Ep was noted with the increase in ν. The fourth and

133
last diagnostic criterion for quasi reversible behaviour is that with the increase of scan rate Epc
shifts negatively [500, 505]. In this respect also complex followed the quasi reversible behaviour
and Epc shifted from 0.049V to 0.018V (Fig. 4.34). Different diagnostic tests for reversible,
irreversible and quasi reversible system and their comparison with the results obtained from the
Fe(III)-Thymoquinone complex are given in the following table.
Comparison of diagnostic criteria for reversible, irreversible and quasi-reversible systems
at 25 ± 1˚C and results obtained from Fe(III)-Thymoquinone complex
S.No Criteria for Reversible System*Results Obtained from
Fe(III)-Thymoquinone Complex
1 lIpl α ν1/2 lIpl is not proportional to ν1/2
2 lIpa / Ipcl = 1 lIpa / Ipcl ≠ 1
3 ∆Ep = Epa-Epc = 59/n mV ∆Ep = Epa-Epc ≠ 59/n mV
4 Ep is independent of ν Ep is dependent of ν
5 lEp-Ep/2l = 59/n mV lEp-Ep/2l ≠ 59/n mV
Criteria for Irreversible System*
1 lIpcl α ν1/2 lIpcl α ν1/2
2 No reverse peak Reverse peak is present
3 Epc shifts -30/αcnα mV for each
decade increase in ν
Epc shift ≠ -30/ αcnα mV for each
decade increase in ν
4 lEp-Ep/2l = 48/αcnα mV lEp-Ep/2l ≠ 48/αcnα mV
Criteria for Quasi-reversible
System**
1 lIpl is not proportional to ν1/2, but
increases with increase in ν1/2
lIpl is not proportional to ν1/2 and it
increases with increase in ν1/2
2 lIpa/Ipcl = 1, provided αc = αa = 0.5 lIpa/Ipcl ≠ 1
3 Epa-Epc > 59/n mV and increases
with increase in ν
Epa-Epc > 59/n mV and it increased
with increase in ν
4 Epc shifts negatively as ν increases As ν increases Epc shifts negatively
References*= [505], **= [503-505]
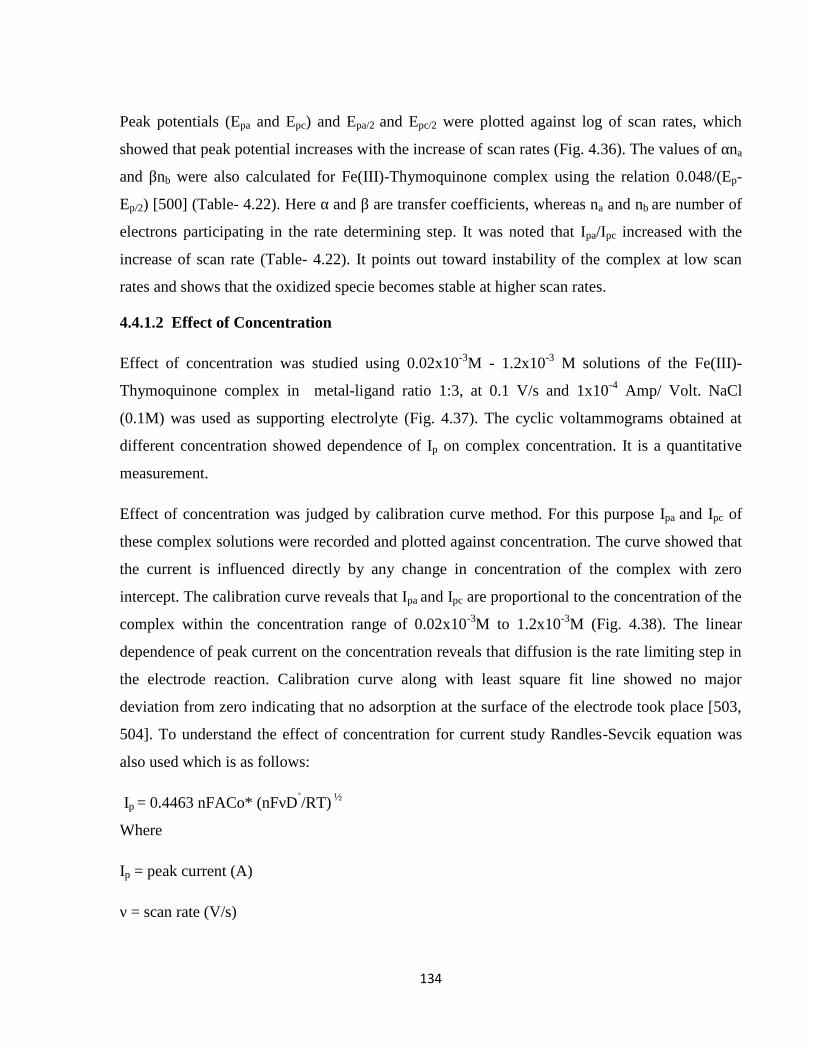
134
Peak potentials (Epa and Epc) and Epa/2 and Epc/2 were plotted against log of scan rates, which
showed that peak potential increases with the increase of scan rates (Fig. 4.36). The values of αna
and βnb were also calculated for Fe(III)-Thymoquinone complex using the relation 0.048/(Ep-
Ep/2) [500] (Table- 4.22). Here α and β are transfer coefficients, whereas na and nb are number of
electrons participating in the rate determining step. It was noted that Ipa/Ipc increased with the
increase of scan rate (Table- 4.22). It points out toward instability of the complex at low scan
rates and shows that the oxidized specie becomes stable at higher scan rates.
4.4.1.2 Effect of Concentration
Effect of concentration was studied using 0.02x10⁻³M - 1.2x10⁻³ M solutions of the Fe(III)-
Thymoquinone complex in metal-ligand ratio 1:3, at 0.1 V/s and 1x10⁻⁴ Amp/ Volt. NaCl
(0.1M) was used as supporting electrolyte (Fig. 4.37). The cyclic voltammograms obtained at
different concentration showed dependence of Ip on complex concentration. It is a quantitative
measurement.
Effect of concentration was judged by calibration curve method. For this purpose Ipa and Ipc of
these complex solutions were recorded and plotted against concentration. The curve showed that
the current is influenced directly by any change in concentration of the complex with zero
intercept. The calibration curve reveals that Ipa and Ipc are proportional to the concentration of the
complex within the concentration range of 0.02x10⁻³M to 1.2x10⁻³M (Fig. 4.38). The linear
dependence of peak current on the concentration reveals that diffusion is the rate limiting step in
the electrode reaction. Calibration curve along with least square fit line showed no major
deviation from zero indicating that no adsorption at the surface of the electrode took place [503,
504]. To understand the effect of concentration for current study Randles-Sevcik equation was
also used which is as follows:
Ip = 0.4463 nFACo* (nFνD˚/RT) ½
Where
Ip = peak current (A)
ν = scan rate (V/s)

135
n = number of transferred electron
F = Faraday’s constant
A = Area of the electrode (cm2)
Co* = Concentration of complex (moles/cm3)
D˚= Diffusion coefficient of complex (cm2 s-1)
T = 25±2˚C
R = Rate constant
More precisely this equation can be written as:
Ip = (2.69x10⁵) D1/2(n)3/2 AC (ν)1/2
As the current was found directly proportional to concentration (0.02x10⁻³M to 1.2x10⁻³ M), the
effect of concentration followed Randles-Sevick equation (Table- 4.23). These results indicate
that calibration curve method can be used for quantification of Fe(III)-Thymoquinone complex
within a wide range i.e. (0.02x10⁻³M to 1.2x10⁻³M).
Next quantitative information was obtained from peak potential (Epa and Epc). To observe
dependence of peak potential on concentration values of Epa and Epc were noted at different
concentrations and then plotted against log of concentration. These plots showed straight lines.
Similarly the plot of Epa/2 and Epc/2 against log of concentration also gave a straight line with good
R2 value (Fig. 4.39).
A decrease in the values of Ipa/Ipc along with noticeable increase in the cathodic current was
observed at higher concentrations which may indicate instability of complex at higher
concentrations (Table- 4.23). The instability may be due to decomposition of the complex or
chemical coupling of the reaction. In addition, there is a possibility of the reaction between
oxidized specie and the solvent. Another possibility is the formation of any extra specie in
addition to the complex. In either case the complex formed with solvent or the extra specie will
also participate in cathodic peak current along with Fe(III)-Thymoquinone complex.

136
4.4.1.3 Effect of Metal-ligand Ratio
It is an important factor which can affect the complexation. Hence to examine this effect on
important electrochemical parameters, metal-ligand complex solutions having metal-ligand ratios
1:1 - 1:5 were studied at the same scan rate and current sensitivity mentioned above in case of
effect of concentration. The potential range was also the same. All these solutions were prepared
in 0.1M NaCl by varying ligand’s concentration and keeping metal’s concentration constant (i.e.
5x10⁻⁴M). An overlay was plotted to compare the data of each plot (Fig. 4.40). Different
electrochemical parameters were determined from theses cyclic voltammograms, from which
several important experimental quantities were calculated (Table- 4.24). Here as well, cyclic
voltammograms followed the criteria for quasi-reversible reactions. This fact is evident from the
Ipa/Ipc, which was not equal to one and ∆Ep, which showed values greater than 59/n mV (Table-
4.24). The values of α and β were found in the range of 0.814 ± 0.01 to 0.923 ± 0.02 and 0.827 ±
0.01 to 0.979 ± 0.01 respectively.
A plot of Epa and Epc against metal-ligand ratio gave a straight line, similarly the plot of Epa/2 and
Epc/2 against metal-ligand ratio also gave a straight line. Both plots gave good R2 value (Fig.
4.41). An increase in the peak current (Ipa and Ipc) was observed with the increase in metal-ligand
ratio but it slowed down at metal-ligand ratio 1:3, showing nearly maximum complexation at this
ratio (Fig. 4.42). It seems from Ipa/Ipc that the metal and the ligand forms most stable complex
with ratio 1:1. When the ratio was increased value of Ipa/Ipc decreased whereas rapid increase in
cathodic current was observed, which shows that high concentration of ligand may be
responsible for making the complex unstable.
4.4.1.4 Effect of Repeated Scans
Another advantage of cyclic voltammetry is to provide information regarding adsorption process.
For this purpose Fe(III)-Thymoquinone complex solution (5x10⁻⁴M) in 1:3 in metal-ligand ratio
was analyzed up to 14 sweep segments (Fig. 4.43). Results revealed that the shape of the cyclic
voltammograms of complex remain unchanged in terms of peak potentials (Epa and Epc) on
repeated scanning but a little bit change in anodic and cathodic peak heights was noticed.
However, only up to 3rd to 4th cycle limiting values were achieved. The shapes of single and
multiple step scan were similar and no appearance of any pre or post-peak was observed which
confirms neither adsorption nor deposition of complex on electrode surface occurred.

137
4.4.1.5 Analysis of E˚
E1/2≅ E˚ or E85.2% i.e. the potential corresponding to 85% of the peak current is a characteristic
property and is constant for a particular system. For Fe(III)-Thymoquinone complex effects of
scan rate, concentration and metal-ligand ratio were observed on E˚ by varying each of them and
E˚ was calculated at different scan rates, concentrations and metal-ligand ratios. Results show
that E˚ is not affected by these variations and remains constant (Table- 4.25)
4.4.1.6 Analysis of Diffusion Coefficient
Cyclic voltammetry is a cheap and easy technique for the determination of diffusion coefficient
of different complexes and compounds [507, 513]. So present study used cyclic voltammetry for
calculation of diffusion coefficient of Fe(III)-Thymoquinone complex. For this purpose Randles-
Sevcik equation was used. Comparison of diffusion coefficient of thymoquinone, Fe(III) and
Fe(III)-Thymoquinone complex confirmed complex formation (Table- 4.26). It was also
calculated at different scan rates, concentrations and metal-ligand ratios (Table- 4.27-4.29). Area
of electrode was 0.0706 cm2, whereas number of electron transfer (n) was 1. The value of the
diffusion coefficient was found to be approximately same and no reasonable effect of varying
scan rates, concentration or metal-ligand ratio was observed. It was observed that diffusion
coefficient for forward scan and for reverse scan is not the same. Diffusion coefficient in case of
cathodic wave showed values in 10-4 which indicates possibility of some sort of coupled
chemical reaction.
4.4.2 Cr(VI) – Thymoquinone Complex
Cyclic voltammetric study of Cr(VI) – Thymoquinone complex was performed in the same way
as that of Fe(III) -Thymoquinone complex. To check complexation solutions of NaCl (0.1M),
Cr(VI) (5x10⁻⁴M), thymoquinone (5x10⁻⁴ M) and a mixed solution of Cr(VI) and thymoquinone
in 1:1 metal-ligand ratio (5x10⁻⁴M) were run to get overlay at 0.1 V/s and 1x10⁻⁴ Amp/ Volt. The
potential range, scan rate and current sensitivity were kept same throughout the study of this
complex (Fig. 4.44).
The overlay of the cyclic voltammograms of NaCl, Cr(VI), thymoquinone and Cr(VI)-
Thymoquinone complex showed a horizontally straight base line. The linearity of the base line

138
reveals that supporting electrolyte was free from impurities. On the other hand, metal also gave a
linear response showing its redox inactivity within applied potential scan range. The overlay
shows significant differences in the cyclic voltammograms of Cr(VI), thymoquinone and Cr(VI)
– Thymoquinone complex which shows complexation between Cr(VI) and thymoquinone. In
case of complex an oxidative wave in the potential range of forward scan could be seen going
from -0.4 V to +0.8 V. Then during the reverse scan the oxidized species is reduced back from
+0.8 V to -0.4 V. Electrochemical parameters obtained from these cyclic voltammograms further
confirm complexation. The anodic peak for the complex was noted at +0.179 V, whereas
cathodic peak was seen at -0.210 V. The comparison shows that there is a great difference
between values of Epa and Epc of thymoquinone and complex, whereas metal gave no peak in the
observed potential window. Hence all these facts points out that complex formation has taken
place between Cr(VI) and thymoquinone (Table- 4.30).
The cyclic voltammogram of Cr(VI)-Thymoquinone complex clearly shows coupling of
oxidation reaction with reduction reaction. A well defined anodic peak could be seen in figure
4.44 indicating to the oxidation of reduced specie (probably [Cr3+, TQ]) to [Cr6+, TQ]. A
cathodic peak was also observed at -0.210 V which shows reduction of electrochemically
generated [Cr6+, TQ]. As a result of this reduction the oxidized specie is converted back to the
reduced specie. Fig.4. 44 shows significant drop in the peak current of the complex as compared
to the ligand, as well as positive shift in the peak potential. These observations suggest presence
of pre equilibrium charge transfer process in Cr(VI)-Thymoquinone complex (Table- 4.30).
Crn+ ⇌ Cr(n+)+1 + 1e-
Cr(n+)+1 + L ⇌ [Cr(n+)+1, L]
The complexation was studied under the influence of several parameters. This study proved to be
helpful to determine several electrochemical quantities of the complex. These are as follows:
4.4.2.1 Effect of Scan Rate
To observe this effect on Cr(VI)-Thymoquinone complex cyclic voltammograms of Cr(VI)-
Thymoquinone complex (5x10⁻⁴M) were run at different scan rates i.e. 0.05 V/s - 0.5 V/s. For
this purpose 15 mL of the complex solution having metal-ligand ratio 1:3 in NaCl was used.

139
The overlay gave quite useful information (Fig. 4.45) which clearly reveals the presence of a
quasi-reversible electron transfer. Usually a quasi-reversible process shows reversible behavior
at low sweep rate and irreversible behaviour at high sweep rate [504]. To check that either the
electrochemical process is diffusion controlled or not, the peak current (Ip) was plotted versus
square root of scan rate (ν1/2). It gave a straight line indicating an increase in the peak current
with the increase in ν1/2 and hence the reaction may be diffusion controlled (Fig. 4.46).
The data obtained from the cyclic voltammograms at different scan rates was used to determine
different electrochemical parameters (Table- 4.31). Here Ipa/Ipc was not equal to 1 but it was
nearly 0.5 at low scan rates (0.05-0.2V), whereas Epa-Epc was found to be greater than 59/n mV
and as the potential scan rate was increased an increase in the ∆Ep was noted. Another
observation was the negative shift of Epc with the increase of scan rate. All these facts favours
the presence of quasi reversible electron transfer process in Cr(VI)-Thymoquinone complex.
Fig. 4.45 shows clear anodic and cathodic peaks, however it was observed that at higher scan
rates anodic peak distorted but an increase in current shows presence of some chemical reaction.
Distortion may be due to the presence of two waves very close to each other, hence their
superimposition broadened the anodic wave. Adsorption of any specie may also be another cause
of distortion.
Peak potentials (Ep and Ep/2) were plotted against log of scan rates. They all gave very good R2
values. The plots showed that peak potential increases with the increase of scan rates (Fig. 4.47).
The values of αna and βnb were also calculated for Cr(VI)-Thymoquinone complex according to
the relation 0.048/(Ep-Ep/2) at different scan rates (Table- 4.31).
4.4.2.2 Effect of Concentration
For this purpose Cr(VI)-Thymoquinone complex solutions having different concentrations
ranging from 0.02x10⁻³M - 1.2x10⁻³ M were prepared using NaCl as supporting electrolyte. In all
these solutions metal-ligand ratio was 1:3 and scans were run at 0.1 V/s and 1x10⁻⁴ Amp/ Volt
(Fig. 4.48).
The cyclic voltammograms obtained at different concentration revealed dependence of Ip on
concentration of the complex. At low concentrations i.e. in case of 0.02x10⁻³M and 0.1x10⁻³ M
no oxidative wave was observed in the potential range of forward scan while the reduction peak

140
could be seen when the oxidized species is reduced during the reverse scan. It is evident from
fig. 4.48 that one small peak is also appearing along with a bigger peak in both forward as well
as in reverse scan. It shows complications in the reaction. It is possible that the metal need low
concentration of the ligand for complex formation and excess ligand may be responsible for
giving bigger peaks, as these peaks appeared within the potential range similar to that of
thymoquinone (Table- 4.30). The Epa and Epc for the smaller peak were observed at +0.188 V
and -0.150 V respectively.
Ipa and Ipc for all complex solutions were plotted against concentration. The plot shows that the
peak currents are proportional to the concentration of the complex within the concentration range
of 0.02x10⁻³M to 1.2x10⁻³ M (Fig. 4.49). Calibration curve along with least square fit line
showed no major deviation from zero indicating that no adsorption at the surface of the electrode
occurred [503, 504]. Randles-Sevcik equation was also used to study the effect of concentration
on Cr(VI)-Thymoquinone complex. Direct increase of current with concentration (0.02x10⁻³M to
1.2x10⁻³M) shows that effect of concentration followed the Randles-Sevick equation (Table-
4.32). Present study reveals that calibration curve method can be helpful in quantification of
Cr(VI)-Thymoquinone complex.
Dependence of peak potential (Epa and Epc) on concentration was also noted at a particular scan
rate. For this purpose peak potentials were plotted against log of concentration (Fig. 4.50). In all
four cases the plots showed straight lines with good R2 values. Values of the peak potentials
were approximately constant at all concentrations showing no considerable shifting of anodic
and cathodic peaks (Fig. 4.48).
4.4.2.3 Effect of Metal-ligand Ratio
For this purpose cyclic voltammograms of complex solutions having metal-ligand ratios 1:0.5,
1:1, 1:2, 1:3, 1:4 and 1:5 were studied. Scan rate, current sensitivity and potential range were
kept same as in case of effect of concentration. All these solutions were prepared in NaCl
(0.1M) by keeping metal’s concentration constant (i.e. 5x10⁻⁴M) and by changing concentration
for ligand. It is evident from the overlay that complete compexation occurred probably at metal
ligand ratio 1:1 because here anodic and cathodic peaks were observed in a potential range
entirely different from that of thymoquinone (Table- 4.33, Fig. 4.51). Even at the ratio 1:0.5
prominent oxidative and reductive waves were noted showing complete consumption of ligand.

141
But as the metal-ligand ratio was increased sudden change in the peak potential was noted, it
seems that thymoquinone suppressed the metal due to its increased concentration and its peak
became prominent. At higher ratios i.e., 1:3-1:5 distortion in the peaks was observed which may
be due to the presence of two peaks very close to each other. These two peaks may be of
complex and thymoquinone. Another reason of broadening of peak may be adsorption of any
specie on electrode.
Various quantitative measurements were made from information obtained from the cyclic
voltammograms. In this case also the cyclic voltammograms seems to fulfill the criteria for
quasi-reversible reactions. As Ipa/Ipc was not equal to one and ∆Ep was found to be greater than
59/n mV, it seems that quasi-reversible behavior is favoured (Table- 4.33). For each case α and β
were also calculated using the relation 0.048/Ep-Ep/2 which were found in the range of 0.716 ±
0.01 to 1.231 ± 0.01 and 0.814 ± 0.01 to 0.906 ± 0.01 respectively.
Values of Epa and Epc were plotted against metal-ligand ratio which gave a straight line. Same
result was obtained in the plot of Epa/2 and Epc/2 against metal-ligand ratio. In both cases very
good results for R2 values were achieved (Fig. 4.52). An increase in Ipa and Ipc was noted with the
increase in metal-ligand ratio but the peak potential became nearly constant at metal-ligand ratio
1:3, showing nearly maximum complexation below this ratio (Fig. 4.53).
4.4.2.4 Analysis of E˚
E1/2≅ E˚ or E85.2% is the potential corresponding to 85% of the peak current. It is a
characteristic property and, therefore, is unaffected by variation of different parameters such as
change in scan rate, concentration or metal-ligand ratio. It remains constant for a particular
system. For Cr(VI)-Thymoquinone complex values of E˚ were determined at different scan rates,
concentrations and metal-ligand ratios. The values of E˚ for forward and reverse scan were found
to be different. This shows some chemical complexation which may be due to some
irreversibility in chemical reaction, or due to superimposition of two waves. This difference in
values was observed in all cases (Table- 4.34).
4.4.2.5 Analysis of Diffusion Coefficient
Diffusion coefficient is an important quantitative measurement and it could easily and accurately
be measured by cyclic voltammetry. In present research it was found that diffusion coefficient of

142
thymoquinone is entirely different as compared to that of complex which confirms complexation
between Cr(VI) and thymoquinone(Table- 4.35). Moreover, diffusion coefficient was also
determined at different scan rates, concentrations and metal-ligand ratios (Table- 4.36-4.38). For
this purpose Randles-Sevcik equation was used. No reasonable effect of varying scan rates,
concentration or metal-ligand ratio on diffusion coefficient was observed and its value remained
nearly the same under all above mentioned conditions.
4.4.3 Co(II) – Thymoquinone Complex
To study complexation between Co(II) and thymoquinone, solutions of supporting electrolyte
(NaCl- 0.1M), metal (Co(II)- 5x10⁻⁴M), ligand (thymoquinone- 5x10⁻⁴M) and a solution having
1:1 Co(II) to thymoquinone ratio (5x10⁻⁴M) were prepared. Their cyclic voltammograms were
run at the same scan rate and current sensitivity as that of the Cr(VI)-Thymoquinone complex.
Potential range was also the same (Fig. 4.54).
The comparison of the cyclic voltammograms of NaCl, Co(II), thymoquinone and Co(II)-
Thymoquinone complex gave valuable information. The base line is horizontally straight which
indicates absence of impurity and cleanliness of working electrode. The metal also gave a linear
response which shows that it is redox inactive within this potential scan range. Thymoquinone
showed very prominent anodic and cathodic peaks respectively, whereas the complex gave only
cathodic peak while no anodic peak was seen (Fig. 4.54). These drastic differences in the cyclic
voltammograms of Co(II), thymoquinone and Co(II) – Thymoquinone complex and significant
drop in the cathodic peak current confirms complex formation between Co(II) and
thymoquinone (Table- 4.39).
The shape of the cyclic voltammogram of Co(II)-Thymoquinone complex indicates coupling of
oxidation with reduction (Fig. 4.54). The cyclic voltammogram shows an oxidative wave in the
cyclic voltammogram of the complex going from -0.4 V to +0.8 V and a then cathodic peak was
noted which is due to reduction of electrochemically generated oxidized species. This reduction
occurs at the electrode surface and the oxidized specie is converted back to the reduced species.
Significant drop in the peak current of the complex, as compared to the ligand, was observed
(Fig.4.54). In addition, positive shift in the peak potential was also noted. These observations
reveal presence of pre equilibrium charge transfer process in Co(II)-Thymoquinone complex.

143
Con+ ⇌ Co(n+)+1 + 1e-
Co(n+)+1 + L ⇌ [Co(n+)+1, L]
The study of Co(II)-Thymoquinone complex was performed under the influence of the
following parameters:
4.4.3.1 Effect of Scan Rate
For this purpose 15 mL of Fe(III)-Thymoquinone complex solution (5x10⁻⁴M) having 1:3 metal-
ligand ratio was run at different scan rates i.e. 0.05 V/s - 0.5 V/s to get an overlay (Fig. 4.55).
Various electrochemical parameters were determined from the data obtained at different scan
rates (Table- 4.40).
Cyclic voltammograms seems to obey the criteria of quasi-reversible behaviour (Fig. 4.55). This
fact is further confirmed by the plot of Ip versus ν1/2 (Fig. 4.56). The plot shows that the Ip
enhances with the increase of ν1/2 but it is not proportional to ν1/2. Secondly, Ipa/Ipc was not found
equal to 1(Table- 4.40). Thirdly, Epa-Epc was observed to be greater than 59/n mV and an
increase in the ∆Ep was observed with the increase in potential scan rate (ν). Furthermore, a
negative shift in Epc was noted (from -0.324V to -0.372 V) with the increase of scan rate which
further favours quasi-reversible mechanism.
The plot of Ipc versus ν1/2 showed good linearity which is evident from excellent R2 value but the
plot of Ipa showed linear relationship only up to 0.25 V. It shows that the reaction is diffusion
controlled between scan rates 0.05 V- 0.25 V but further increase in scan rate results in chemical
complications which rendered the reaction free from diffusion control. This complication may be
in the form of adsorption of any specie or any other chemical reaction. Epa and Epc at different
scan rates were plotted also against log of ν. The plot showed that Epc increases with the increase
of scan rates, whereas Epa remains approximately constant (Fig. 4.57). Similarly, Epa/2 and Epc/2
were also plotted against log of scan rates which showed similar results.
The values of αna and βnb were also calculated at different scan rates for Co(II)-Thymoquinone
complex in the same manner as described in case of previous two complexes. The values of α
were found 0.667 ± 0.01 to 0.873 ± 0.01, whereas values of β were obtained in the range of
0.738 ± 0.01 to 1.091 ± 0.01.

144
4.4.3.2 Effect of Concentration
To examine effect of concentration on Co(II)-Thymoquinone complex, solutions having
concentrations 0.02x10⁻³M - 1.2x10⁻³M were prepared using NaCl as supporting electrolyte. The
metal-ligand ratio was 1:3 and their cyclic voltammograms were run at 0.1 V/s and 1x10⁻⁴ Amp/
Volt (Fig. 4.58).
The cyclic voltammograms obtained at different concentration showed that any variation in the
complex concentration affects peak current. At low concentrations, i.e. in case of 0.02x10⁻³M,
only oxidative wave was observed in the potential range of forward scan and no reduction peak
was seen when the oxidized species is reduced during the reverse scan; whereas in rest of the
cases both peaks could be seen. At high concentrations (0.4 x10⁻³ M to 1.2 x 10⁻³ M) a smaller
peak was also observed in case of forward scan. The peak showed oxidative potential at 0.097 V
in complex solution having concentration 0.4 x10⁻³. Then it shifted positively and finally, in case
of 1.2 x 10⁻³ M complex solution it was noted at 0.138 V. It may be due to reaction of oxidized
specie with the solvent resulting in the formation of another complex which gave the mentioned
oxidation potential. But in this case no reverse peak was seen so the complex formed with
solvent might decompose or unstable.
Effect of concentration was judged by calibration curve method. To achieve this goal Ipa and Ipc
of the complex solutions, having different concentrations, were plotted versus concentration. The
plot shows that both Ipa and Ipc are proportional to the concentration of the complex (within the
concentration range of 0.02x10⁻³M to 1.2x10⁻³ M) (Fig. 4.59). The curve shows an approximate
linear relationship between them with zero intercept which indicates that diffusion is the rate
limiting step in the electrode reaction. It also points out no adsorption of complex at the electrode
surface. As for the Co(II)-Thymoquinone complex current was found directly proportional to
concentration (0.02x10⁻³M to 1.2x10⁻³ M), the effect of concentration obeys the Randles-Sevick
equation (Table- 4.41). These results indicate that calibration curve method can be used for
quantification of Co(II)-Thymoquinone complex within a wide range i.e. (0.02x10⁻³M to 1.2x10-
3 M) successfully.
Another quantitative information was obtained from peak Epa and Epc. To observe dependence of
peak potential on concentration, values of Epa and Epc at different concentrations were plotted
against log of concentration. These plots showed straight lines. In the same way Epa/2 and Epc/2

145
were also plotted versus log of concentration which also gave straight lines (Fig. 4.60). It was
also observed that the values of peak potential remain approximately same at different
concentrations at a particular scan rate (Table- 4.41).
4.4.3.3 Effect of Metal-ligand Ratio
It is an important factor which can affect the complex formation. To examine this effect on
Co(II)-Thymoquinone complex, metal-ligand complex solutions having metal-ligand ratios 1:1 -
1:5 were prepared. The cyclic voltammograms of these solutions were recorded at the same scan
rate, current sensitivity and potential range as mentioned in the case of effect of concentration.
All these solutions were prepared in NaCl (0.1M). In all these complex solutions metal’s
concentration was kept constant (i.e. 5x10⁻⁴M) while ligand’s concentration was varied. The
cyclic voltammogram of 1:1 metal-ligand ratio showed no anodic peak but a prominent cathodic
peak was observed at -0.302 V. Rest of the solutions gave very clear anodic and cathodic peaks
which could be seen in overlay (Fig. 4.61). The oxidative wave showed another small peak at
0.037 V in case of 1:2 metal-ligand complex solution which shifted positively as the metal to
ligand ratio was increased. This shifting of Ep became nearly constant in case of 1:4 metal-ligand
ratio. It is possible that at high concentration of any of the reactant any extra complex specie
formed which was responsible for the resulting oxidation potential. The formation of this
additional complex could be due to reaction of oxidized specie with the solvent or by any other
way. Here no reverse peak was observed indicating instability of the complex.
Different electrochemical parameters were obtained from the cyclic voltammograms. From the
data obtained Ipa/Ipc was calculated which was found less than one. The difference between Epa
and Epc was found greater than 59/n mV. The values of α and β were also determined (Table-
4.42). All these observations reveals that Co(II)-Thymoquinone complex follow quasi-reversible
behaviour.
Dependence of peak potential on metal-ligand ratio was studied by plotting it against M: L ratio.
The plot gave straight lines in all the cases with good R2 value (Fig. 4.62). An increase in the
peak current (Ipa and Ipc) was observed with the increase in metal-ligand ratio showing linear
relationship between current and concentration (Fig. 4.63, Table- 4.42).

146
4.4.3.4 Effect of Repeated Scan
Effect of successive cyclic scans on Co(II)-Thymoquinone complex was examined to get
information about adsorption process. For this 5x10⁻⁴ M Co(II)-Thymoquinone complex was
analyzed up to 16 sweep segments. The scanning process was performed at 0.1V/s and 1x10⁻⁴
Amp/Volt (Fig. 4.64).
From figure it is clear that on repeated scanning the shape of the cyclic voltammograms of
complex remains unchanged in terms of peak potentials (Epa and Epc). However, a little bit
change in anodic and cathodic peak heights was noticed. The shapes of single and multiple step
scan were similar and no appearance of any pre or post-peak was observed. It shows that
neither adsorption nor deposition of complex on electrode surface took place.
4.4.3.5 Analysis of E˚
E1/2≅ E˚ is the potential corresponding to 85% of the peak current. Being a characteristic
property it is unaffected by variation of different parameters such as change in scan rate,
concentration or metal-ligand ratio; and remains constant for a particular system. For Co(II)-
Thymoquinone complex effects of scan rate, concentration and metal-ligand ratio were observed
on E˚ by varying each of them. Results revealed slight difference in the values of E˚ for oxidative
and reductive wave (Table- 4.43). This difference may be due to resistance of solution by the
increase of scan rate. As a result of which peak shifting occurred and resulted in variation of E˚
values. Other causes of different E˚ values may include some irreversibility in chemical reaction
and heterogeneous electron transfer. This difference in values was observed in all cases (Table-
4.43).
4.4.3.6 Analysis of Diffusion Coefficient
As in the case of previous two complexes diffusion coefficient (D) for the Co(II)-Thymoquinone
complex was determined using Randles-Sevcik equation. Significant difference in diffusion
coefficient of thymoquinone and complex was observed (Table- 4.44). In order to examine effect
of various parameters on diffusion coefficient it was studied at different scan rates,
concentrations and metal-ligand ratios. Area of electrode (A) and number of electron transferred
(n) were same as in Fe(III)-Thymoquinone complex. In this case also the values of diffusion
coefficient remained unaffected by varying scan rate, concentration or metal-ligand ratio (Table-

147
4.45 - 4.47). It was noted that in each case, diffusion coefficient for reverse scan was in the range
of 10-4. It points out towards some chemical complication including some sort of coupled
reaction or adsorption of any specie on the electrode.
4.4.4 Cu(II) – Thymoquinone Complex
The complexation of thymoquinone was also checked with Cu(II) in addition to Fe(II), Cr(VI)
and Co(II). For this purpose solutions of NaCl (0.1M), Cu(II) (5x10⁻⁴M), thymoquinone (5x10⁻⁴
M) and a mixed solution of Cu(II) and thymoquinone in 1:1 metal-ligand ratio (5x10⁻⁴M) were
run at 0.1 V/s and 1x10⁻⁴ Amp/ Volt (Fig. 4.65(a)-(d)). The potential range was same as in case
of Co(II)-Thymoquinone complex.
The comparison of the cyclic voltammograms of NaCl, Cu(II), thymoquinone and Cu(II)-
Thymoquinone complex gave many information about complex formation between Cu(II) and
thymoquinone. Fig. 4.65 (a) shows a horizontally straight base line which indicates absence of
impurity and cleanliness of working electrode. Thymoquinone gave anodic and cathodic peaks at
-0.242 V and -0.326 V respectively (as seen in earlier complexes of thymoquinone discussed in
present research work). The metal showed very prominent anodic and cathodic peaks at 0.125 V
and 0.051 V respectively (Fig. 4.65(c)). In case of complex although both peaks were observed
at potentials close to those of the metal, but a clear shifting in both Epa and Epc was observed
(Fig. 4.65(d)). In case of complex Epa was found at 0.128 V, whereas Epc occurred at 0.040 V.
Another thing that confirms complex formation between Cu(II) and thymoquinone is the peak
current. It is clear from cyclic voltammogram of complex that Ipa and Ipc of the complex are less
than those of the metal. Decreased value of peak currents and shifting of peak potentials
confirms complex formation (Table- 4.48). From cyclic voltammogram of Cu(II)-Thymoquinone
complex it is evident that oxidation is coupled with reduction, as a well defined anodic peak
could be seen which shows the oxidation of [Cu1+, TQ] to [Cu2+, TQ]. A cathodic peak was also
observed which was due to reduction of electrochemically generated [Cu2+, TQ]. This reduction
occurs at the electrode surface and as a result the oxidized specie is converted back to the [Cu1+,
TQ].
In addition to other useful information the comparison of the cyclic voltammograms of metal and
complex also suggests that either pre or post-equilibrium charge transfer took place during
complexation. Significant drop in the peak current of the complex, as compared to the metal and

148
positive shift in the peak potential reveal that pre-equilibrium charge transfer may occurred in the
case of Cu(II)-Thymoquinone complex. It is shown in the following equation:
Cu1+ ⇌ Cu2+ + 1e-
Cu2+ + TQ ⇌ [Cu2+, TQ]
The complexation of Cu(II)-Thymoquinone complex was studied in the light of effects of several
parameters in order to determine different quantitative characteristics of the complex. These are
as follows:
4.4.4.1 Effect of Scan Rate
For this purpose cyclic voltammograms of Cu(II)-Thymoquinone complex (5x10⁻⁴M) were
recorded in NaCl (0.1 M). Complex solution having 1:2 metal-ligand ratio was run at different
scan rates i.e. 0.04 V/s- 0.50 V/s. The data obtained was used to determine different
electrochemical parameters (Table- 4.49).
Cyclic voltammograms of the complex at different scan rates showed an increase in the peak
current with the increase of scan rate which can be seen from the plot of Ipc versus ν1/2. This plot
gave good R2 value (Fig. 4.66). Whereas Ipa exhibited linear relationship with ν1/2 within the
range of 0.04V to 0.20 V only. Within this range as the scan rate is increased an increase in Ipa
was noted but after 0.20 V a decrease in peak current was observed. It could be due to any
complication including chemical coupling of the reaction or adsorption of any specie on the
electrode. The plot of peak potential against log of ν at different scan rates showed slight change
in the potential with the increase of scan rates (Fig. 4.67).
From Ipa/Ipc it seems that the reaction is stable within the scan rate range 0.04 V to 0.20 V as
within this range the ratio of the two peak currents is close to 1. But as the scan rate was further
increased it resulted in the decrease of the ratio. ∆Ep was found to be greater than 59/n mV and it
increased with the increase in potential scan rate, furthermore a negative shift in Epc was noted as
the scan rate was enhanced (Table- 4.49). All these facts points out that the reaction followed the
quasi-reversible behaviour. The plot of Ip versus ν1/2 also points out towards the above mentioned
behaviour. The plot shows an increase in the Ip with the increase of ν1/2 but it is not proportional
to ν1/2 (Fig. 4.66).

149
The values of transfer coefficients αna and βnb for Cu(II)-Thymoquinone complex were also
calculated using the relation 0.048/(Ep-Ep/2) [500]. The values of α and β at different scan rates
were found to be 0.696±0.01- 0.828 ±0.01 and 0.727±0.01 – 1.09±0.01 respectively.
4.4.4.2 Effect of Concentration
Effect of concentration was studied using 0.02x10⁻³M - 1.6x10⁻³M solutions of the Cu(II)-
Thymoquinone complex in metal-ligand ratio 1:2 (Fig. 4.68).
It was observed through cyclic voltammograms that peak current clearly influenced by the
concentration of the complex. At low concentrations i.e. in case of 0.02x10⁻³M and 0.1x10⁻³ M
no oxidative as well as reductive peak was observed. But significant anodic and cathodic peaks
were seen in the concentration range of 0.2x10⁻³M to 1.6x10⁻³M.
To study effect of concentration, calibration curve method was used. For this Ipa and Ipc of these
complex solutions were plotted against concentration. The calibration curve reveals that anodic
and cathodic peak currents are proportional to the concentration of the complex within the
concentration range of 0.2x10⁻³M to 1.6x10⁻³M (Fig. 4.69). The linear dependence of peak
current on the concentration reveals that diffusion is the rate limiting step in the electrode
reaction. In the calibration curve along with least square fit line no major deviation from zero
was noted which shows that no adsorption at the surface of the electrode took place [503, 504].
As the current exhibited linear proportionality to the concentration (0.2x10⁻³M to 1.6x10⁻³M), the
effect of concentration followed Randles-Sevick equation. Results revealed that calibration curve
method can be used for quantification of Cu(II)-Thymoquinone complex within a wide range i.e.
(0.2x10⁻³M to 1.6x10⁻³M).
Dependence of peak potential (Epa and Epc) on concentration at a particular scan rate was also
studied. For this purpose peak potentials were plotted against log of concentration (Fig. 4.70). In
all four cases the plots showed straight lines with good R2 values. Values of peak potentials,
especially Epc, and Epc/2 were approximately constant at all concentrations showing no
considerable shifting of peaks (Table- 4.50). From the data obtained the reaction seems to be
diffusion controlled and stable. Different electrochemical quantities showed that the reaction
exhibit reversible behaviour at high concentrations, for example lEp-Ep/2l≅ 60 mV, lEp-E1/2l≅30 mV, lEp/2-E1/2l≅ 30 mV and lIpa/Ipcl 1 (within concentration range 0.6x10⁻³ to 1.6x10⁻³ M).

150
4.4.4.3 Effect of Metal-ligand Ratio
To examine this effect on important electrochemical parameters of Cu(II)-Thymoquinone
complex cyclic voltammograms of complex solutions having metal-ligand ratios 1:1 - 1:5 were
run. Metal’s concentration was kept constant (i.e. 5x10⁻⁴M) while ligand’s concentration was
varied. Scan rate and current sensitivity were same as mentioned above for effect of
concentration. The potential range was also the same. NaCl (0.1M) was used as supporting
electrolyte. An overlay was plotted to compare the data of each plot (Fig. 4.71) from which
different electrochemical parameters were determined. According to the data obtained at
different metal-ligand ratios Ipa/Ipc was found to be in the range of 0.615 ± 0.01 to 0.751 ± 0.01,
whereas ∆Ep values were found greater than 59/n mV. The values of transfer coefficient (α and
β) were also calculated (Table- 4.51).
Peak potentials (Epa and Epc) gave approximately same values showing no shifting of peaks. A
plot of Epa and Epc against metal-ligand ratio gave straight lines, similarly the plot of Epa/2 and
Epc/2 against metal-ligand ratio also gave a straight line. In all cases plots gave good R2 value
(Fig. 4.72). Results showed an increase in the peak current (Ipa and Ipc) but the increase became
slow after metal-ligand ratio 1:2, showing nearly maximum complexation at this ratio (Fig.
4.73).
4.4.4.4 Effect of Repeated Scan
Effect of successive cyclic scans on Cu(II)-Thymoquinone complex was also examined. For this
purpose 5x10⁻⁴ M Cu(II)-Thymoquinone complex was analyzed up to 24 sweep segments at
0.1V/s and 1x10⁻⁴ Amp/Volt (Fig. 4.74). It was observed that on repeated scanning the shape of
the cyclic voltammograms of complex remained unchanged in terms of peak potentials (Epa
and Epc). However, small changes in anodic and cathodic peak heights were observed, but the
shapes of single and multiple step scan were similar and no appearance of any pre- or post-
peak was observed which reveals no adsorption or deposition of complex on electrode surface
has been occurred.
4.4.4.5 Analysis of E˚
Effect of changing various parameters such as scan rate, concentration, metal-ligand ratio and
supporting electrolyte on E˚ of Cu(II)-Thymoquinone complex was examined. Its values for

151
forward and reverse scan were found to be slightly different. One reason may be resistance of the
solution by the increase of scan rate causing peak shifting and hence variation in E˚. Other
reasons might include some irreversibility in chemical reaction or heterogeneous electron
transfer or chemical coupling (Table- 4.52, 4.61). This difference in values was observed in all
cases.
4.4.4.6 Analysis of Diffusion Coefficient
Another most important quantitative measurement is determination of diffusion coefficient.
Hence in present research diffusion coefficient of Cu(II)-Thymoquinone complex was
calculated. For this purpose Randles-Sevcik equation was applied using area of electrode (A)
same as in case of previous three complexes. The number of electron transfer (n) was assumed to
be 1. Value of diffusion coefficient was determined at different scan rates, concentrations and
metal-ligand ratios for both supporting electrolytes (Table- 4.53 - 4.56, 4.62 - 4.65). Difference
in diffusion coefficient of thymoquinone, Cu(II) and complex reveals complexation in case of
both supporting electrolytes (Table- 4.53, 4.62). In both cases effect of various parameters on
diffusion coefficient was studied such as variation in scan rates, concentrations and metal-ligand
ratios. It was concluded that diffusion coefficient for Cu(II)-Thymoquinone complex remains
constant under all above mentioned conditions and any change in scan rate, concentration, metal-
ligand ratio and supporting electrolyte has no effect on it.
4.4.4.7 Effect of Supporting Electrolyte
Effect of change of supporting electrolyte was also observed on Cu(II)-Thymoquinone complex.
For this purpose complexation and all above mentioned factors were studied using LiCl (0.1M)
as supporting electrolyte in addition to NaCl. Li has a higher charge density as compared to Na
due to its smaller size and high electrostatic field. Owing to the same reason Na+ ion polarizes to
a lower extent than Li+ ion. So the current study was carried out to understand the electrostatic
effect of Li on complex formation.
To check complexation, concentrations of metal and the ligand were kept same as in case of
NaCl. Scan rate, current sensitivity and other conditions were also maintained same. The
comparison of the cyclic voltammograms of LiCl, Cu(II), thymoquinone and Cu(II)-
Thymoquinone complex gave similar information about complex formation as in case of NaCl

152
(Fig. 4.75). Here also anodic and cathodic peaks of the complex were observed at potentials
close to the potentials of anodic and cathodic peaks of metal but a shift in peak potential,
especially Epc was noted (Table- 4.57). Peak current also showed the same behaviour.
Complexation was studied by varying scan rate, concentration and metal-ligand ratio. Effect of
repeated scan was also observed. Various electrochemical parameters were determined, from
which different quantitative measurements were obtained. In all these cases Cu(II)-
Thymoquimnone complex gave the same response as in case of NaCl (Table-4.58- 4.60; Fig.
4.76-4.85). No effect of supporting electrolyte on complexation of Cu(II) and thymoquinone is
also evident from figure 4.86.
4.4.5 Cyclic Voltammetric Studies of V(IV) – Thymoquinone Complex,
Thymol and its Complexes
The complexation of thymoquinone was also checked with V(IV) using cyclic voltammetry. For
this study solutions of NaCl (0.1M), V(IV) (5x10⁻⁴M), thymoquinone (5x10⁻⁴ M) and a mixed
solution of V(IV) and thymoquinone in 1:1 metal-ligand ratio (5x10⁻⁴M) were run at the same
scan rate and current sensitivity as used in other complexes of thymoquinone. Potential range
was also the same.
In addition to above mentioned complexes cyclic voltammetric study of thymol and its
complexes with Fe (III), Cr(VI), Cu(II), V(IV) and Co(II) was also performed. Concentrations of
metals, ligand and supporting electrolyte were kept same as in the case of thymoquinone and its
complexes. The cyclic voltammograms of supporting electrolyte, metals, ligand and their
complex solutions were recorded at scan rate 0.1 V/s and current sensitivity was 1x10⁻⁴ A/V in
order to check complexation.
The comparison of the cyclic voltammograms of NaCl, metals, ligands and complexes revealed
that complexation has occurred in all above cases. These complexations have already been
proved in section 4.3 of present research work. Cyclic voltammetric study of V(IV)-
Thymoquinone complex and thymol complexes with the above mentioned metals was not
performed in detail due to the shortage of time.

153
4.5 Recommendations for Future Work
During present research, it was realized that the present research topic is very vast and there are
so many questions whose answer has to be found out. Hence lots of work could be further
performed regarding the present research which was not done due to lack of time and facilities.
Following recommendations are suggested for the future work related to the present study.
(i) As far as electrochemical study of the complexes of thymoquinone is concerned, their
kinetics may be studied. The ratio of complex formation at different temperatures can
be determined for all complexes. Investigation regarding the energy of activation of
these complexes will be useful in determination of mechanism of reaction during
complex formation. Digital simulation may also be performed to verify different
electrochemical properties of the complexes.
(ii) The complexes studied in this research may be synthesized and their studies by
different techniques such as mass spectroscopy, IR spectroscopy, NMR spectroscopy,
crystallography and magnetic susceptibility could be performed. This will give very
important information about the complexes, e.g. about the geometrical structure,
charge of the complex, strong-field / weak-field nature of the complexes etc.
Furthermore, determination of various biological activities such as anti-tumor, anti-
inflammatory, anti-bacterial, anti-fungal and insecticidal activities of these complexes
will be of great value and very beneficial.
(iii) Cyclic voltammetric studies of the presently studied complexes may be performed in
detail in non-aqueous media. Comparison of various redox properties of the
complexes in aqueous and non- aqueous media would be of great importance.
(iv) Whole cyclic voltammetric studies performed in the present work could be repeated
using supporting electrolytes other than NaCl such as LiCl, KCl and KNO3. Non-
aqueous supporting electrolytes can also be used such as methanol, ethanol etc. In this
way effect of different supporting electrolytes on various electrochemical parameters
of the complexes could be observed.
(v) Cyclic voltammetric studies of complexes of present research may also be performed
at different pH in order to observe influence of pH on various electrochemical
parameters. This study will also help to determine suitable pH for complex formation.
154
(vi) Cyclic voltammetric studies of thymol complexes can also be performed in detail just
as it is done in this study for thymoquinone complexes.
(vii) Complexation of thymoquinone and thymol with the metals used in present research
can also be confirmed by spectrophotometry. This technique will also be helpful to
determine several experimental quantities such as λmax and stability constant. Effect
of pH can also be observed on complexes and their spectra by varying pH of the
complex solutions.
(viii) Complexation of redox active metals, other than those used in present research, with
thymoquinone and thymol can also be studied by cyclic voltammetry.
(ix) Complexation of other principal constituents of black seed such as dithymoquinone,
thymohydroquinone and carvacrol with various redox active metals can also be
investigated using cyclic voltammetry.

155
TABLE- 4.1
General Description of Nigella sativa
Botanical name Nigella sativa L.
Common name Kalongi
English name Black seed, Black cumin, Small fennel, Nutmeg flower
Genus Nigella
Family Ranunculaceae
Habit Herb
Part of plant used Seeds
DocumentedMedicinal-properties
Carminative, stimulant, diaphoretic, emmenagogue, excellentdiuretic, stomachic, galactogogue, enodyne, appetizing,anthelmintic, constipating, sudorific, febrifuge, expectorant,decongestant, local anaesthetic, antipyretic-analgesic agent,antidiabetic, anticancer, antimicrobial etc.
DocumentedChemicalConstituents
Alkaloids, saponins, sterols, fatty acids, amino acids, tannins,minerals, proteins, vitamins etc.

156
TABLE - 4.2
Percentage of Moisture in Nigella sativa Seed
n = 4
Weight of sample(g)
Weight loss on drying(g)
Moisture (±SD)(%)
5.005 0.397 7.932 ± 0.055
Reported value = 7.43 % [65]

157
TABLE - 4.3
Percentage of Dissolved(DS) and Undissolved(UDS) Solid in WaterExtract of Nigella sativa
S.No Time DS (±SD) UDS (±SD)Total Solid(DS+UDS)
(hr.) (%) (%) (%)
1 0.5 1.851 ± 0.1948 95.396 ± 1.3789 97.247
2 1 3.582 ± 0.0515 94.601 ± 0.7853 98.182
3 2 3.234 ± 0.1033 91.320 ± 0.4470 94.554
4 3 3.095 ± 0.1402 91.739 ± 0.4644 94.835
5 4 2.716 ± 0.0986 91.310 ± 0.3856 94.026
6 5 2.735 ± 0.0478 90.730 ± 0.1777 93.465

158
TABLE- 4.4
Percentage of Dissolved(DS) and Undissolved Solid(UDS) in AcidExtract of Nigella sativa
S.NoTime(hr.)
DS (±SD) UDS (±SD)Total Solid(DS+UDS)
% % %
1 0.5 7.579 ± 0.2887 87.199 ± 0.2527 94.778
2 1 6.399 ± 0.1916 84.196 ± 0.3737 90.595
3 2 6.208 ± 0.3021 79.122 ± 0.3106 85.330
4 3 5.994 ± 0.2935 76.023 ± 0.2238 82.017
5 4 6.089 ± 0.1242 75.928 ± 0.1722 82.018
6 5 6.083 ± 0.1885 75.550 ± 0.6815 81.633
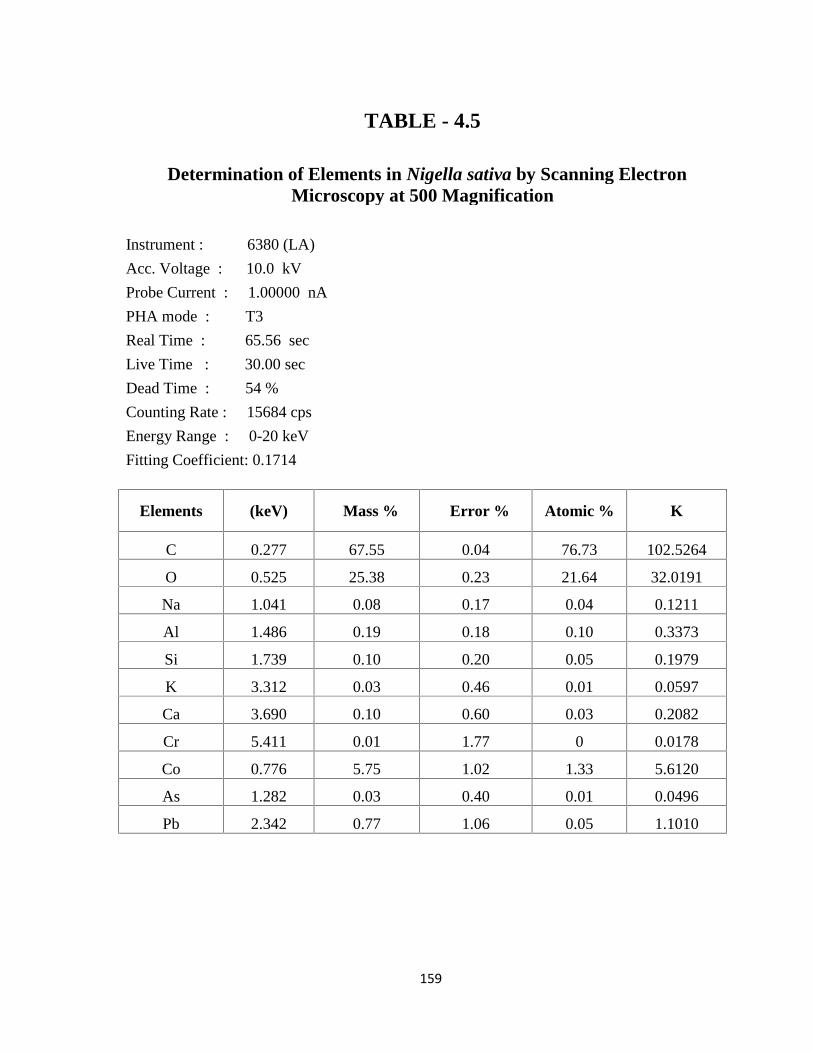
159
TABLE - 4.5
Determination of Elements in Nigella sativa by Scanning ElectronMicroscopy at 500 Magnification
Instrument : 6380 (LA)
Acc. Voltage : 10.0 kV
Probe Current : 1.00000 nA
PHA mode : T3
Real Time : 65.56 sec
Live Time : 30.00 sec
Dead Time : 54 %
Counting Rate : 15684 cps
Energy Range : 0-20 keV
Fitting Coefficient: 0.1714
Elements (keV) Mass % Error % Atomic % K
C 0.277 67.55 0.04 76.73 102.5264
O 0.525 25.38 0.23 21.64 32.0191
Na 1.041 0.08 0.17 0.04 0.1211
Al 1.486 0.19 0.18 0.10 0.3373
Si 1.739 0.10 0.20 0.05 0.1979
K 3.312 0.03 0.46 0.01 0.0597
Ca 3.690 0.10 0.60 0.03 0.2082
Cr 5.411 0.01 1.77 0 0.0178
Co 0.776 5.75 1.02 1.33 5.6120
As 1.282 0.03 0.40 0.01 0.0496
Pb 2.342 0.77 1.06 0.05 1.1010

160
TABLE - 4.6
Determination of Elements in Nigella sativa by Scanning ElectronMicroscopy at 4,500 Magnification
Instrument : 6380 (LA)
Acc. Voltage : 10.0 kV
Probe Current : 1.00000 nA
PHA mode : T3
Real Time : 50.14 sec
Live Time : 30.00 sec
Dead Time : 42 %
Counting Rate : 11678 cps
Energy Range : 0-20 keV
Fitting Coefficient : 0.1843
Elements (keV) Mass % Error % Atomic % K
C 0.277 79.05 0.04 84.32 121.9579
O 0.525 19.39 0.33 15.52 19.3462
Na 1.041 0.08 0.21 0.04 0.1178
Mn 5.894 0.02 3.57 0 0.0279
Fe 6.389 0.02 4.83 0 0.0221
As 1.282 0.17 0.50 0.03 0.2613
Pb 2.342 1.29 1.37 0.08 1.6448

161
TABLE - 4.7
Determination of Elements in Nigella sativa by Scanning ElectronMicroscopy at 11,000 Magnification
Instrument : 6380 (LA)
Acc. Voltage : 10.0 kV
Probe Current : 1.00000 nA
PHA mode : T3
Real Time : 60.03 sec
Live Time : 30.00 sec
Dead Time : 49 %
Counting Rate : 13357 cps
Energy Range : 0-20 keV
Fitting Coefficient : 0.1986
Elements (keV) Mass % Error % Atomic % K
C 0.277 73.38 0.05 81.14 113.0402
O 0.525 21.51 0.33 17.85 24.4477
Na 1.041 0.05 0.23 0.03 0.0828
K 3.312 0.10 0.62 0.03 0.1929
Co 0.776 3.79 1.36 0.85 3.5745
As 1.282 0.17 0.52 0.03 0.2758
Pb 2.342 1.00 1.39 0.06 1.3672

162
TABLE - 4.8
Determination of Elements in Nigella sativa by Scanning ElectronMicroscopy at 35,000 Magnification
Instrument : 6380 (LA)
Acc. Voltage : 10.0 kV
Probe Current : 1.00000 nA
PHA mode : T3
Real Time : 69.76 sec
Live Time : 30.00 sec
Dead Time : 55 %
Counting Rate : 16122 cps
Energy Range : 0-20 keV
Fitting Coefficient : 0.1808
Elements (keV) Mass%
Error%
Atomic % K
C 0.277 68.00 0.04 77.08 104.0523
O 0.525 25.27 0.22 21.51 31.009
Na 1.041 0.03 0.17 0.02 0.0537
K 3.312 0.17 0.47 0.06 0.3355
Ca 3.690 0.47 0.57 0.16 0.964
Mn 5.894 0.06 2.36 0.02 0.1111
Cr 5.411 0.02 1.74 0.01 0.035
Co 0.776 4.54 0.99 1.05 4.3224
Cd 3.132 0.08 1.11 0.01 0.1057
Pb 2.342 1.35 1.00 0.09 1.8991

163
TABLE - 4.9
pH-metric Titration of Thymol
Volume of Thymol Solution = 40.0 mLVolume of Distilled deionized water = 10.0 mLConcentration of Thymol solution = 0.005MConcentration of NaOH solution = 0.1MTemperature = 25̊ C
S.No.Vol. ofNaOH(mL)
pH of Thymol S.No.Vol. ofNaOH(mL)
pH of Thymol S.No.Vol. ofNaOH(mL)
pH of Thymol
1 0.00 6.72 37 1.80 10.70 73 3.70 11.252 0.05 8.01 38 1.85 10.72 74 3.80 11.273 0.10 9.02 39 1.90 10.74 75 3.90 11.294 0.15 9.20 40 1.95 10.76 76 4.00 11.315 0.20 9.41 41 2.00 10.78 77 4.10 11.336 0.25 9.52 42 2.05 10.80 78 4.20 11.347 0.30 9.61 43 2.10 10.82 79 4.30 11.358 0.35 9.71 44 2.15 10.84 80 4.40 11.369 0.40 9.80 45 2.20 10.86 81 4.50 11.37
10 0.45 9.90 46 2.25 10.88 82 4.60 11.3811 0.50 9.95 47 2.30 10.89 83 4.70 11.3912 0.55 10.00 48 2.35 10.90 84 4.80 11.4013 0.60 10.05 49 2.40 10.92 85 4.90 11.4114 0.65 10.10 50 2.45 10.94 86 5.00 11.4215 0.70 10.15 51 2.50 10.96 87 5.20 11.4416 0.75 10.18 52 2.55 10.97 88 5.40 11.4617 0.80 10.22 53 2.60 10.98 89 5.60 11.4818 0.85 10.24 54 2.65 10.99 90 5.90 11.5019 0.90 10.26 55 2.70 11.00 91 6.20 11.5220 0.95 10.28 56 2.75 11.02 92 6.60 11.5521 1.00 10.30 57 2.80 11.04 93 7.00 11.6122 1.05 10.33 58 2.85 11.06 94 7.40 11.6323 1.10 10.36 59 2.90 11.07 95 7.80 11.6624 1.15 10.39 60 2.95 11.08 96 8.20 11.6925 1.20 10.42 61 3.00 11.09 97 8.60 11.7326 1.25 10.45 62 3.05 11.10 98 9.00 11.7527 1.30 10.48 63 3.10 11.12 99 9.40 11.7728 1.35 10.50 64 3.15 11.14 100 10.00 11.8029 1.40 10.52 65 3.20 11.16 101 11.00 11.8530 1.45 10.54 66 3.25 11.17 102 12.00 11.8931 1.50 10.56 67 3.30 11.18 103 12.50 11.9132 1.55 10.58 68 3.35 11.19 104 13.00 11.9233 1.60 10.60 69 3.40 11.20 105 13.50 11.9334 1.65 10.62 70 3.45 11.21 106 14.00 11.9535 1.70 10.64 71 3.50 11.22 107 14.50 11.9636 1.75 10.67 72 3.60 11.23 108 15.80 12.00

164
TABLE - 4.10pH-metric Titration of Thymoquinone
Volume of Thymoquinone Solution = 40.0 mLVolume of Distilled deionized water = 10.0 mLConcentration of Thymoquinone solution = 0.005MConcentration of NaOH solution = 0.1MTemperature = 25̊ C
S.No.Vol. ofNaOH(mL)
pH ofThymoquinone S.No.
Vol. ofNaOH(mL)
pH ofThymoquinone S.No.
Vol. ofNaOH(mL)
pH ofThymoquinone
1 0.00 5.72 37 1.80 11.22 73 4.60 11.582 0.05 6.74 38 1.85 11.23 74 4.75 11.593 0.10 9.80 39 1.90 11.24 75 4.90 11.604 0.15 10.21 40 1.95 11.25 76 5.00 11.615 0.20 10.40 41 2.00 11.26 77 5.10 11.626 0.25 10.45 42 2.05 11.27 78 5.20 11.637 0.30 10.51 43 2.10 11.28 79 5.40 11.648 0.35 10.65 44 2.15 11.29 80 5.50 11.659 0.40 10.71 45 2.20 11.30 81 5.60 11.66
10 0.45 10.74 46 2.25 11.31 82 5.70 11.6711 0.50 10.77 47 2.30 11.32 83 5.90 11.6812 0.55 10.80 48 2.35 11.33 84 6.00 11.6913 0.60 10.82 49 2.40 11.34 85 6.20 11.7014 0.65 10.84 50 2.45 11.35 86 6.40 11.7115 0.70 10.86 51 2.50 11.36 87 6.60 11.7216 0.75 10.88 52 2.55 11.37 88 6.80 11.7317 0.80 10.90 53 2.60 11.38 89 7.00 11.7418 0.85 10.92 54 2.65 11.39 90 7.20 11.7519 0.90 10.94 55 2.70 11.40 91 7.30 11.7620 0.95 10.96 56 2.75 11.41 92 7.50 11.7721 1.00 10.98 57 2.80 11.42 93 7.70 11.7822 1.05 11.00 58 2.90 11.43 94 7.90 11.7923 1.10 11.02 59 3.00 11.44 95 8.10 11.8024 1.15 11.05 60 3.10 11.45 96 8.40 11.8125 1.20 11.08 61 3.20 11.46 97 8.70 11.8226 1.25 11.11 62 3.30 11.47 98 9.00 11.8327 1.30 11.12 63 3.40 11.48 99 9.30 11.8428 1.35 11.13 64 3.50 11.49 100 9.60 11.8529 1.40 11.14 65 3.60 11.50 101 9.90 11.8630 1.45 11.15 66 3.70 11.51 102 10.50 11.8831 1.50 11.16 67 3.80 11.52 103 11.20 11.9032 1.55 11.17 68 3.90 11.53 104 12.00 11.9233 1.60 11.18 69 4.00 11.54 105 12.80 11.9434 1.65 11.19 70 4.15 11.55 106 13.60 11.9635 1.70 11.20 71 4.30 11.56 107 14.40 11.9836 1.75 11.21 72 4.45 11.57 108 15.20 12.00

165
TABLE - 4.11pH-metric Titration of Fe(III)-Thymol Complex
Volume of Thymol solution = 40.0 mLVolume of Fe(III) solution = 10.0 mLConcentration of Thymol solution = 0.005MConcentration of Fe(III) solution = 0.005MConcentration of NaOH solution = 0.1 MTemperature = 25̊ C
S.No.Vol. ofNaOH(mL)
pH ofComplex S.No.
Vol. ofNaOH(mL)
pH ofComplex S.No.
Vol. ofNaOH(mL)
pH ofComplex
1 0.00 2.80 37 1.80 5.72 73 3.60 10.652 0.05 2.81 38 1.85 6.19 74 3.65 10.683 0.10 2.82 39 1.90 7.80 75 3.70 10.714 0.15 2.83 40 1.95 8.62 76 3.75 10.745 0.20 2.84 41 2.00 9.00 77 3.80 10.776 0.25 2.85 42 2.05 9.21 78 3.85 10.797 0.30 2.86 43 2.10 9.40 79 3.90 10.808 0.35 2.87 44 2.15 9.52 80 3.95 10.819 0.40 2.88 45 2.20 9.61 81 4.00 10.83
10 0.45 2.89 46 2.25 9.70 82 4.20 10.9111 0.50 2.90 47 2.30 9.75 83 4.40 10.9812 0.55 2.92 48 2.35 9.80 84 4.60 11.0413 0.60 2.94 49 2.40 9.85 85 4.80 11.0814 0.65 2.96 50 2.45 9.90 86 5.00 11.1415 0.70 2.98 51 2.50 9.95 87 5.20 11.1816 0.75 3.00 52 2.55 10.01 88 5.40 11.2217 0.80 3.02 53 2.60 10.05 89 5.60 11.4818 0.85 3.04 54 2.65 10.10 90 5.80 11.4919 0.90 3.06 55 2.70 10.15 91 6.00 11.5020 0.95 3.08 56 2.75 10.20 92 6.20 11.5221 1.00 3.10 57 2.80 10.24 93 6.40 11.5322 1.05 3.13 58 2.85 10.29 94 6.70 11.5523 1.10 3.16 59 2.90 10.30 95 7.00 11.6124 1.15 3.19 60 2.95 10.32 96 7.30 11.6325 1.20 3.22 61 3.00 10.34 97 7.60 11.6526 1.25 3.26 62 3.05 10.37 98 7.90 11.6727 1.30 3.30 63 3.10 10.40 99 8.20 11.6928 1.35 3.35 64 3.15 10.43 100 8.60 11.7329 1.40 3.40 65 3.20 10.46 101 9.00 11.7530 1.45 3.50 66 3.25 10.49 102 9.50 11.6931 1.50 3.61 67 3.30 10.51 103 10.00 11.7232 1.55 3.72 68 3.35 10.53 104 11.00 11.7733 1.60 3.83 69 3.40 10.56 105 13.00 11.8734 1.65 3.95 70 3.45 10.59 106 15.00 11.9635 1.70 4.46 71 3.50 10.61 107 17.10 11.9836 1.75 5.08 72 3.55 10.63 108 19.20 12.00

166
TABLE - 4.12pH-metric Titration of Cr(VI)-Thymol Complex
Volume of Thymol Solution = 40.0 mLVolume of Cr(VI) solution = 10.0 mLConcentration of Thymol solution = 0.005MConcentration of Cr(VI) solution = 0.005MConcentration of NaOH solution = 0.1MTemperature = 25̊ C
S.No.Vol. ofNaOH(mL)
pH ofComplex S.No.
Vol. ofNaOH(mL)
pH ofComplex S.No.
Vol. ofNaOH(mL)
pH ofComplex
1 0.00 5.52 37 1.80 11.06 73 3.60 11.662 0.05 6.01 38 1.85 11.08 74 3.65 11.673 0.10 6.30 39 1.90 11.10 75 3.70 11.684 0.15 6.61 40 1.95 11.14 76 3.75 11.695 0.20 6.82 41 2.00 11.18 77 3.80 11.706 0.25 7.02 42 2.05 11.22 78 3.90 11.717 0.30 7.31 43 2.10 11.25 79 4.00 11.728 0.35 7.52 44 2.15 11.28 80 4.10 11.739 0.40 7.74 45 2.20 11.31 81 4.20 11.74
10 0.45 8.74 46 2.25 11.34 82 4.30 11.7611 0.50 9.45 47 2.30 11.37 83 4.40 11.7812 0.55 9.55 48 2.35 11.39 84 4.50 11.8013 0.60 9.64 49 2.40 11.41 85 4.60 11.8114 0.65 9.85 50 2.45 11.42 86 4.70 11.8215 0.70 9.95 51 2.50 11.43 87 4.80 11.8316 0.75 10.05 52 2.55 11.44 88 4.90 11.8417 0.80 10.15 53 2.60 11.45 89 5.00 11.8518 0.85 10.25 54 2.65 11.46 90 5.10 11.8619 0.90 10.30 55 2.70 11.47 91 5.20 11.8720 0.95 10.35 56 2.75 11.48 92 5.30 11.8821 1.00 10.40 57 2.80 11.50 93 5.40 11.8922 1.05 10.45 58 2.85 11.51 94 5.50 11.9023 1.10 10.50 59 2.90 11.52 95 5.60 11.9124 1.15 10.55 60 2.95 11.53 96 5.70 11.9225 1.20 10.60 61 3.00 11.54 97 5.80 11.9326 1.25 10.65 62 3.05 11.55 98 5.90 11.9427 1.30 10.70 63 3.10 11.56 99 6.00 11.9528 1.35 10.75 64 3.15 11.57 100 6.10 11.9629 1.40 10.80 65 3.20 11.58 101 6.30 11.9730 1.45 10.85 66 3.25 11.59 102 6.50 11.9831 1.50 10.92 67 3.30 11.60 103 6.70 11.9932 1.55 10.40 68 3.35 11.61 104 6.90 12.0033 1.60 10.80 69 3.40 11.6234 1.65 11.00 70 3.45 11.6335 1.70 11.02 71 3.50 11.6436 1.75 11.04 72 3.55 11.65

167
TABLE - 4.13pH-metric Titration of Cu(II)-Thymol Complex
Volume of Thymol Solution = 40.0 mLVolume of Cu(II) solution = 10.0 mLConcentration of Thymol solution = 0.005MConcentration of Cu(II) solution = 0.005MConcentration of NaOH solution = 0.1 MTemperature = 25̊ C
S.No.Vol. ofNaOH(mL)
pH ofComplex S.No.
Vol. ofNaOH(mL)
pH ofComplex S.No.
Vol. ofNaOH(mL)
pH ofComplex
1 0.00 5.50 37 1.80 10.32 73 4.80 11.362 0.05 5.81 38 1.85 10.35 74 5.00 11.383 0.10 6.01 39 1.90 10.37 75 5.20 11.404 0.15 6.02 40 1.95 10.39 76 5.40 11.435 0.20 6.03 41 2.00 10.41 77 5.60 11.456 0.25 6.04 42 2.05 10.43 78 5.80 11.477 0.30 6.05 43 2.10 10.45 79 6.10 11.508 0.35 6.06 44 2.15 10.48 80 6.40 11.539 0.40 6.07 45 2.20 10.51 81 6.70 11.56
10 0.45 6.08 46 2.25 10.54 82 7.00 11.5811 0.50 6.10 47 2.30 10.57 83 7.30 11.5912 0.55 6.15 48 2.35 10.60 84 7.60 11.6113 0.60 6.20 49 2.40 10.63 85 7.90 11.6314 0.65 6.25 50 2.45 10.66 86 8.20 11.6515 0.70 6.30 51 2.50 10.68 87 8.50 11.6816 0.75 6.41 52 2.55 10.70 88 8.80 11.6917 0.80 6.51 53 2.60 10.72 89 9.10 11.7118 0.85 6.83 54 2.65 10.74 90 9.40 11.7219 0.90 7.94 55 2.70 10.76 91 9.70 11.7420 0.95 9.05 56 2.75 10.78 92 10.00 11.7521 1.00 9.35 57 2.80 10.80 93 10.30 11.7722 1.05 9.55 58 2.90 10.82 94 10.70 11.7823 1.10 9.65 59 3.00 10.86 95 11.10 11.7924 1.15 9.75 60 3.10 10.90 96 11.50 11.8025 1.20 9.80 61 3.20 10.94 97 12.10 11.8226 1.25 9.85 62 3.30 11.00 98 12.70 11.8427 1.30 9.90 63 3.40 11.04 99 13.20 11.8628 1.35 9.95 64 3.50 11.08 100 13.80 11.8829 1.40 10.00 65 3.60 11.10 101 14.50 11.9030 1.45 10.05 66 3.70 11.13 102 14.90 11.9231 1.50 10.10 67 3.80 11.16 103 15.00 11.9332 1.55 10.15 68 3.90 11.18 104 16.00 11.9433 1.60 10.20 69 4.00 11.20 105 17.00 11.9534 1.65 10.23 70 4.20 11.24 106 20.20 12.0035 1.70 10.26 71 4.40 11.2836 1.75 10.29 72 4.60 11.32
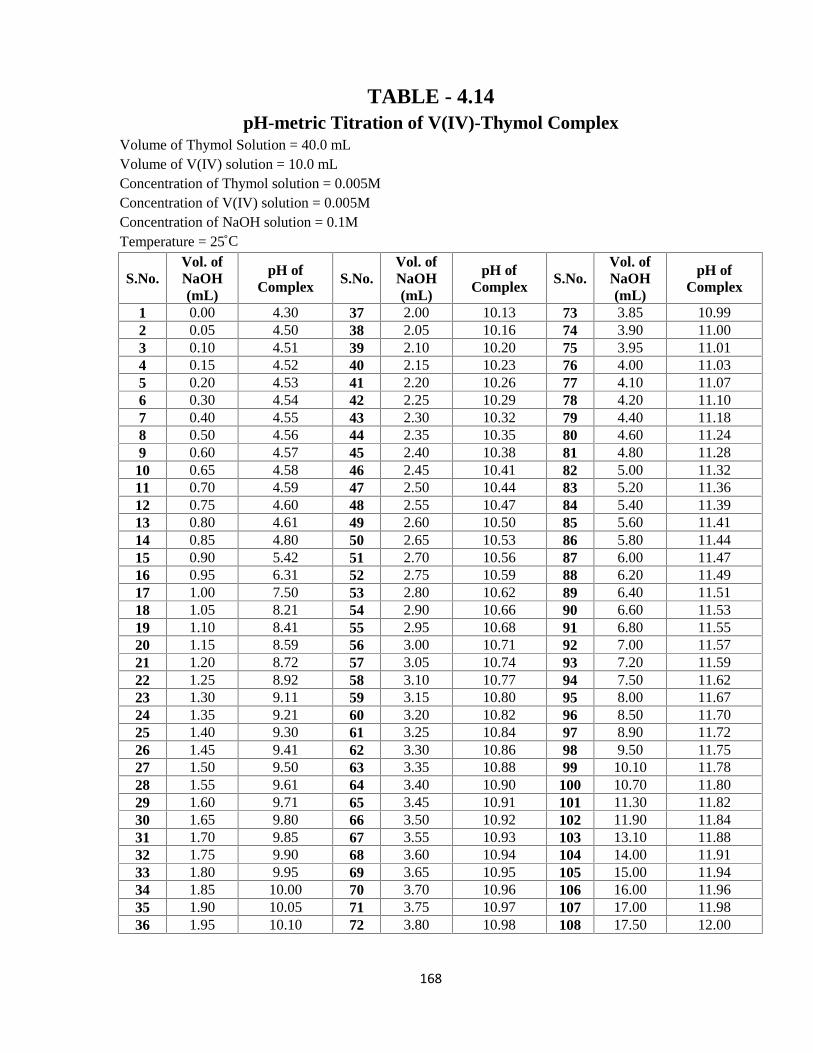
168
TABLE - 4.14pH-metric Titration of V(IV)-Thymol Complex
Volume of Thymol Solution = 40.0 mLVolume of V(IV) solution = 10.0 mLConcentration of Thymol solution = 0.005MConcentration of V(IV) solution = 0.005MConcentration of NaOH solution = 0.1MTemperature = 25̊ C
S.No.Vol. ofNaOH(mL)
pH ofComplex S.No.
Vol. ofNaOH(mL)
pH ofComplex S.No.
Vol. ofNaOH(mL)
pH ofComplex
1 0.00 4.30 37 2.00 10.13 73 3.85 10.992 0.05 4.50 38 2.05 10.16 74 3.90 11.003 0.10 4.51 39 2.10 10.20 75 3.95 11.014 0.15 4.52 40 2.15 10.23 76 4.00 11.035 0.20 4.53 41 2.20 10.26 77 4.10 11.076 0.30 4.54 42 2.25 10.29 78 4.20 11.107 0.40 4.55 43 2.30 10.32 79 4.40 11.188 0.50 4.56 44 2.35 10.35 80 4.60 11.249 0.60 4.57 45 2.40 10.38 81 4.80 11.28
10 0.65 4.58 46 2.45 10.41 82 5.00 11.3211 0.70 4.59 47 2.50 10.44 83 5.20 11.3612 0.75 4.60 48 2.55 10.47 84 5.40 11.3913 0.80 4.61 49 2.60 10.50 85 5.60 11.4114 0.85 4.80 50 2.65 10.53 86 5.80 11.4415 0.90 5.42 51 2.70 10.56 87 6.00 11.4716 0.95 6.31 52 2.75 10.59 88 6.20 11.4917 1.00 7.50 53 2.80 10.62 89 6.40 11.5118 1.05 8.21 54 2.90 10.66 90 6.60 11.5319 1.10 8.41 55 2.95 10.68 91 6.80 11.5520 1.15 8.59 56 3.00 10.71 92 7.00 11.5721 1.20 8.72 57 3.05 10.74 93 7.20 11.5922 1.25 8.92 58 3.10 10.77 94 7.50 11.6223 1.30 9.11 59 3.15 10.80 95 8.00 11.6724 1.35 9.21 60 3.20 10.82 96 8.50 11.7025 1.40 9.30 61 3.25 10.84 97 8.90 11.7226 1.45 9.41 62 3.30 10.86 98 9.50 11.7527 1.50 9.50 63 3.35 10.88 99 10.10 11.7828 1.55 9.61 64 3.40 10.90 100 10.70 11.8029 1.60 9.71 65 3.45 10.91 101 11.30 11.8230 1.65 9.80 66 3.50 10.92 102 11.90 11.8431 1.70 9.85 67 3.55 10.93 103 13.10 11.8832 1.75 9.90 68 3.60 10.94 104 14.00 11.9133 1.80 9.95 69 3.65 10.95 105 15.00 11.9434 1.85 10.00 70 3.70 10.96 106 16.00 11.9635 1.90 10.05 71 3.75 10.97 107 17.00 11.9836 1.95 10.10 72 3.80 10.98 108 17.50 12.00

169
TABLE - 4.15pH-metric Titration of Co(II)-Thymol Complex
Volume of Thymol Solution = 40.0 mLVolume of Co(II) solution = 10.0 mLConcentration of Thymol solution = 0.005MConcentration of Co(II) solution = 0.005MConcentration of NaOH solution = 0.1MTemperature = 25̊ C
S.No.Vol. ofNaOH(mL)
pH ofComplex S.No.
Vol. ofNaOH(mL)
pH ofComplex S.No.
Vol. ofNaOH(mL)
pH ofComplex
1 0.00 6.60 37 1.80 10.10 73 3.65 11.092 0.05 7.52 38 1.85 10.15 74 3.70 11.103 0.10 8.01 39 1.90 10.20 75 3.75 11.114 0.15 8.22 40 1.95 10.25 76 3.80 11.125 0.20 8.31 41 2.00 10.30 77 3.85 11.136 0.25 8.40 42 2.05 10.33 78 3.90 11.147 0.30 8.45 43 2.10 10.36 79 3.95 11.168 0.35 8.50 44 2.15 10.39 80 40.00 11.189 0.40 8.55 45 2.20 10.42 81 4.10 11.20
10 0.45 8.60 46 2.25 10.45 82 4.20 11.2211 0.50 8.63 47 2.30 10.48 83 4.30 11.2412 0.55 8.66 48 2.35 10.51 84 4.40 11.2613 0.60 8.69 49 2.40 10.54 85 4.50 11.2814 0.65 8.72 50 2.45 10.57 86 4.60 11.3015 0.70 8.74 51 2.50 10.60 87 4.80 11.3416 0.75 8.76 52 2.55 10.63 88 5.00 11.3817 0.80 8.78 53 2.60 10.66 89 5.20 11.4118 0.85 8.79 54 2.65 10.69 90 5.50 11.4619 0.90 8.80 55 2.70 10.72 91 5.90 11.5020 0.95 8.85 56 2.75 10.74 92 6.30 11.5521 1.00 8.90 57 2.80 10.75 93 6.70 11.6022 1.05 8.95 58 2.90 10.77 94 7.00 11.6323 1.10 9.02 59 2.95 10.79 95 7.50 11.6724 1.15 9.12 60 3.00 10.81 96 8.10 11.7025 1.20 9.21 61 3.05 10.84 97 8.50 11.7226 1.25 9.32 62 3.10 10.87 98 9.00 11.7527 1.30 9.43 63 3.15 10.90 99 9.50 11.8028 1.35 9.62 64 3.20 10.92 100 10.00 11.8329 1.40 9.71 65 3.25 10.94 101 10.50 11.8630 1.45 9.81 66 3.30 10.96 102 11.00 11.8731 1.50 9.84 67 3.35 10.98 103 11.60 11.8932 1.55 9.87 68 3.40 11.00 104 12.10 11.9133 1.60 9.90 69 3.45 11.02 105 13.00 11.9434 1.65 9.95 70 3.50 11.04 106 14.00 11.9735 1.70 10.01 71 3.55 11.06 107 15.70 12.0036 1.75 10.05 72 3.60 11.08

170
TABLE - 4.16pH-metric Titration of Fe(III)-Thymoquinone Complex
Volume of Thymoquinone solution = 40.0 mLVolume of Fe(III) solution = 10.0 mLConcentration of Thymoquinone solution = 0.005MConcentration of Fe(III) solution = 0.005MConcentration of NaOH solution = 0.1MTemperature = 25̊ C
S.No.Vol. ofNaOH(mL)
pH ofComplex S.No.
Vol. ofNaOH(mL)
pH ofComplex S.No.
Vol. ofNaOH(mL)
pH ofComplex
1 0.00 2.92 37 2.80 3.35 73 6.40 11.452 0.10 2.93 38 2.85 3.40 74 6.60 11.483 0.20 2.94 39 2.90 3.45 75 6.80 11.514 0.30 2.95 40 2.95 3.50 76 7.00 11.545 0.40 2.96 41 3.00 3.55 77 7.20 11.566 0.50 2.97 42 3.05 3.60 78 7.40 11.587 0.60 2.98 43 3.10 3.71 79 7.60 11.608 0.70 2.99 44 3.15 3.81 80 7.80 11.629 0.80 3.00 45 3.20 4.10 81 8.00 11.64
10 0.90 3.01 46 3.25 4.45 82 8.20 11.6611 1.00 3.02 47 3.30 5.10 83 8.40 11.6712 1.10 3.03 48 3.35 5.41 84 8.60 11.6813 1.20 3.04 49 3.40 5.83 85 8.80 11.6914 1.30 3.05 50 3.45 6.62 86 9.00 11.7015 1.40 3.06 51 3.50 8.70 87 9.20 11.7116 1.50 3.07 52 3.55 9.71 88 9.40 11.7217 1.60 3.08 53 3.60 10.05 89 9.60 11.7418 1.70 3.09 54 3.65 10.22 90 9.80 11.7519 1.80 3.10 55 3.70 10.33 91 10.00 11.7620 1.90 3.11 56 3.75 10.44 92 10.20 11.7821 2.00 3.12 57 3.80 10.50 93 10.40 11.7922 2.05 3.13 58 3.85 10.55 94 10.60 11.8023 2.10 3.14 59 3.90 10.60 95 10.80 11.8124 2.15 3.15 60 4.00 10.70 96 11.00 11.8225 2.20 3.16 61 4.10 10.80 97 11.50 11.8426 2.25 3.17 62 4.20 10.90 98 12.00 11.8627 2.30 3.18 63 4.40 10.98 99 12.50 11.8728 2.35 3.19 64 4.60 11.06 100 13.00 11.8929 2.40 3.20 65 4.80 11.14 101 13.50 11.9030 2.45 3.21 66 5.00 11.20 102 14.00 11.9231 2.50 3.22 67 5.20 11.24 103 14.50 11.9432 2.55 3.24 68 5.40 11.28 104 15.00 11.9533 2.60 3.26 69 5.60 11.32 105 15.50 11.9634 2.65 3.28 70 5.80 11.36 106 16.10 11.9835 2.70 3.30 71 6.00 11.39 107 16.50 11.9936 2.75 3.33 72 6.20 11.42 108 16.90 12.00

171
TABLE - 4.17pH-metric Titration of Cr(VI)-Thymoquinone Complex
Volume of Thymoquinone solution = 40.0 mLVolume of Cr(VI) solution = 10.0 mLConcentration of Thymoquinone solution = 0.005MConcentration of Cr(VI) solution = 0.005MConcentration of NaOH solution = 0.1MTemperature = 25̊ C
S.No.Vol. ofNaOH(mL)
pH ofComplex S.No.
Vol. ofNaOH(mL)
pH ofComplex S.No.
Vol. ofNaOH(mL)
pH ofComplex
1 0.00 5.35 37 1.80 11.08 73 3.85 11.532 0.05 5.87 38 1.85 11.10 74 3.95 11.543 0.10 6.05 39 1.90 11.12 75 4.05 11.554 0.15 6.21 40 1.95 11.14 76 4.15 11.565 0.20 6.33 41 2.00 11.16 77 4.25 11.576 0.25 6.52 42 2.05 11.18 78 4.35 11.587 0.30 6.61 43 2.10 11.19 79 4.45 11.598 0.35 6.70 44 2.15 11.22 80 4.60 11.619 0.40 6.82 45 2.20 11.24 81 4.70 11.62
10 0.45 6.91 46 2.25 11.26 82 4.80 11.6311 0.50 7.03 47 2.30 11.27 83 4.90 11.6412 0.55 7.12 48 2.35 11.28 84 5.00 11.6513 0.60 7.21 49 2.40 11.29 85 5.10 11.6614 0.65 7.30 50 2.45 11.30 86 5.25 11.6715 0.70 7.40 51 2.50 11.31 87 5.40 11.6816 0.75 7.52 52 2.55 11.32 88 5.55 11.6917 0.80 7.84 53 2.60 11.33 89 5.70 11.7018 0.85 8.73 54 2.65 11.34 90 5.80 11.7119 0.90 9.72 55 2.70 11.35 91 5.90 11.7220 0.95 10.11 56 2.75 11.36 92 6.00 11.7321 1.00 10.20 57 2.80 11.37 93 6.10 11.7422 1.05 10.32 58 2.85 11.38 94 6.20 11.7523 1.10 10.43 59 2.90 11.39 95 6.40 11.7624 1.15 10.54 60 2.95 11.40 96 6.80 11.7825 1.20 10.63 61 3.00 11.41 97 7.20 11.8026 1.25 10.70 62 3.05 11.42 98 7.60 11.8227 1.30 10.75 63 3.10 11.43 99 8.00 11.8428 1.35 10.80 64 3.15 11.44 100 8.40 11.8629 1.40 10.85 65 3.20 11.45 101 8.80 11.8830 1.45 10.91 66 3.25 11.46 102 9.20 11.9031 1.50 10.94 67 3.30 11.47 103 9.80 11.9232 1.55 10.97 68 3.35 11.48 104 10.40 11.9433 1.60 11.00 69 3.45 11.49 105 11.00 11.9634 1.65 11.02 70 3.55 11.50 106 11.60 11.9835 1.70 11.04 71 3.65 11.51 107 12.00 11.9936 1.75 11.06 72 3.75 11.52 108 12.40 12.00

172
TABLE - 4.18pH-metric Titration of Cu(II)-Thymoquinone Complex
Volume of Thymoquinone solution = 40.0 mLVolume of Cu(II) solution = 10.0 mLConcentration of Thymoquinone solution = 0.005MConcentration of Cu(II) solution = 0.005MConcentration of NaOH solution = 0.1MTemperature = 25̊ C
S.No.Vol. ofNaOH(mL)
pH ofComplex S.No.
Vol. ofNaOH(mL)
pH ofComplex S.No.
Vol. ofNaOH(mL)
pH ofComplex
1 0.00 5.21 37 1.80 11.04 73 3.60 11.532 0.05 5.62 38 1.85 11.06 74 3.65 11.543 0.10 5.93 39 1.90 11.08 75 3.70 11.554 0.15 6.03 40 1.95 11.10 76 3.75 11.565 0.20 6.10 41 2.00 11.15 77 3.80 11.576 0.25 6.11 42 2.05 11.20 78 3.85 11.587 0.30 6.12 43 2.10 11.22 79 3.90 11.598 0.35 6.13 44 2.15 11.24 80 3.95 11.609 0.40 6.14 45 2.20 11.25 81 4.05 11.61
10 0.45 6.15 46 2.25 11.26 82 4.15 11.6211 0.50 6.16 47 2.30 11.27 83 4.25 11.6312 0.55 6.17 48 2.35 11.28 84 4.35 11.6413 0.60 6.18 49 2.40 11.29 85 4.45 11.6514 0.65 6.19 50 2.45 11.30 86 4.55 11.6615 0.70 6.20 51 2.50 11.31 87 4.65 11.6716 0.75 6.31 52 2.55 11.32 88 4.80 11.6817 0.80 6.42 53 2.60 11.33 89 4.90 11.6918 0.85 6.60 54 2.65 11.34 90 5.10 11.7019 0.90 7.02 55 2.70 11.35 91 5.30 11.7220 0.95 9.01 56 2.75 11.36 92 5.40 11.7321 1.00 10.02 57 2.80 11.37 93 5.55 11.7422 1.05 10.31 58 2.85 11.38 94 5.70 11.7523 1.10 10.42 59 2.90 11.39 95 5.85 11.7624 1.15 10.52 60 2.95 11.40 96 6.00 11.7725 1.20 10.62 61 3.00 11.41 97 6.15 11.7826 1.25 10.71 62 3.05 11.42 98 6.40 11.7927 1.30 10.75 63 3.10 11.43 99 6.70 11.8028 1.35 10.80 64 3.15 11.44 100 7.30 11.8229 1.40 10.85 65 3.20 11.45 101 7.90 11.8430 1.45 10.9 66 3.25 11.46 102 8.50 11.8831 1.50 10.92 67 3.30 11.47 103 9.10 11.9032 1.55 10.94 68 3.35 11.48 104 9.70 11.9233 1.60 10.96 69 3.40 11.49 105 10.40 11.9434 1.65 10.98 70 3.45 11.50 106 11.00 11.9635 1.70 11.00 71 3.50 11.51 107 11.80 11.9836 1.75 11.02 72 3.55 11.52 108 12.60 12.00

173
TABLE - 4.19pH-metric Titration of V(IV)-Thymoquinone Complex
Volume of Thymoquinone solution = 40.0 mLVolume of V(IV) solution = 10.0 mLConcentration of Thymoquinone solution = 0.005MConcentration of V(IV) solution = 0.005MConcentration of NaOH solution = 0.1MTemperature = 25̊ C
S.No.Vol. ofNaOH(mL)
pH ofComplex S.No.
Vol. ofNaOH(mL)
pH ofComplex S.No.
Vol. ofNaOH(mL)
pH ofComplex
1 0.00 4.15 37 1.90 10.42 73 3.70 11.382 0.05 4.30 38 1.95 10.51 74 3.75 11.393 0.10 4.30 39 2.00 10.60 75 3.80 11.404 0.15 4.31 40 2.05 10.65 76 3.85 11.415 0.20 4.32 41 2.10 10.70 77 3.90 11.426 0.25 4.33 42 2.15 10.75 78 3.95 11.437 0.35 4.34 43 2.20 10.80 79 4.00 11.448 0.45 4.35 44 2.25 10.85 80 4.05 11.459 0.50 4.36 45 2.30 10.90 81 4.10 11.46
10 0.55 4.37 46 2.35 10.94 82 4.15 11.4711 0.60 4.38 47 2.40 10.98 83 4.20 11.4812 0.65 4.39 48 2.45 11.00 84 4.30 11.4913 0.70 4.40 49 2.50 11.02 85 4.50 11.5114 0.75 4.45 50 2.55 11.04 86 4.70 11.5315 0.80 4.50 51 2.60 11.06 87 4.90 11.5516 0.85 4.54 52 2.65 11.08 88 5.10 11.5717 0.90 4.59 53 2.70 11.10 89 5.30 11.6118 0.95 4.64 54 2.75 11.12 90 5.50 11.6419 1.00 4.70 55 2.80 11.14 91 5.70 11.6620 1.05 4.85 56 2.85 11.16 92 6.10 11.6821 1.10 5.04 57 2.90 11.18 93 6.50 11.7022 1.15 5.62 58 2.95 11.19 94 7.10 11.7423 1.20 6.21 59 3.00 11.2 95 7.50 11.7624 1.25 6.62 60 3.05 11.22 96 7.90 11.7825 1.30 7.03 61 3.10 11.24 97 8.30 11.8026 1.35 8.02 62 3.15 11.26 98 8.70 11.8227 1.40 8.52 63 3.20 11.27 99 9.30 11.8428 1.45 8.81 64 3.25 11.28 100 9.90 11.8629 1.50 9.03 65 3.30 11.29 101 10.50 11.8830 1.55 9.22 66 3.35 11.30 102 11.10 11.9031 1.60 9.41 67 3.40 11.32 103 11.70 11.9232 1.65 9.62 68 3.45 11.33 104 12.30 11.9433 1.70 9.75 69 3.50 11.34 105 12.90 11.9634 1.75 9.90 70 3.55 11.35 106 13.70 11.9835 1.80 10.11 71 3.60 11.36 107 14.50 12.0036 1.85 10.31 72 3.65 11.37

174
TABLE - 4.20pH-metric Titration of Co(II)-Thymoquinone Complex
Volume of Thymoquinone solution = 40.0 mLVolume of Co(II) solution = 10.0 mLConcentration of Thymoquinone solution = 0.005MConcentration of Co(II) solution = 0.005MConcentration of NaOH solution = 0.1MTemperature = 25̊ C
S.No.Vol. ofNaOH(mL)
pH ofComplex S.No.
Vol. ofNaOH(mL)
pH ofComplex S.No.
Vol. ofNaOH(mL)
pH ofComplex
1 0.00 6.61 37 1.80 10.70 73 5.40 11.642 0.05 7.20 38 1.85 10.82 74 5.50 11.653 0.10 7.52 39 1.90 10.84 75 5.60 11.664 0.15 7.72 40 1.95 10.86 76 5.70 11.675 0.20 7.91 41 2.00 10.90 77 5.80 11.686 0.25 7.95 42 2.05 10.93 78 5.90 11.697 0.30 8.01 43 2.10 10.96 79 6.00 11.708 0.35 8.05 44 2.15 10.98 80 6.10 11.719 0.40 8.10 45 2.20 11.01 81 6.20 11.72
10 0.45 8.12 46 2.25 11.03 82 6.40 11.7311 0.50 8.14 47 2.30 11.06 83 6.60 11.7412 0.55 8.15 48 2.35 11.10 84 6.80 11.7513 0.60 8.16 49 2.40 11.12 85 7.00 11.7614 0.65 8.17 50 2.45 11.14 86 7.20 11.7815 0.70 8.18 51 2.50 11.16 87 7.40 11.7916 0.75 8.19 52 2.60 11.20 88 7.60 11.8017 0.80 8.22 53 2.70 11.24 89 7.80 11.8118 0.85 8.24 54 2.80 11.27 90 8.00 11.8219 0.90 8.26 55 2.90 11.30 91 8.20 11.8320 0.95 8.28 56 3.00 11.32 92 8.50 11.8421 1.00 8.30 57 3.10 11.34 93 8.80 11.8522 1.05 8.32 58 3.20 11.36 94 9.10 11.8623 1.10 8.34 59 3.30 11.38 95 9.40 11.8724 1.15 8.37 60 3.40 11.40 96 9.70 11.8825 1.20 8.41 61 3.50 11.42 97 10.00 11.8926 1.25 8.52 62 3.60 11.44 98 10.30 11.9027 1.30 8.62 63 3.70 11.45 99 10.70 11.9128 1.35 8.71 64 3.80 11.46 100 11.10 11.9229 1.40 9.12 65 3.90 11.48 101 11.50 11.9330 1.45 9.52 66 4.10 11.50 102 11.90 11.9431 1.50 9.65 67 4.30 11.52 103 12.30 11.9532 1.55 10.13 68 4.50 11.54 104 12.70 11.9633 1.60 10.31 69 4.70 11.56 105 13.10 11.9734 1.65 10.40 70 4.90 11.58 106 13.50 11.9835 1.70 10.52 71 5.10 11.61 107 13.90 11.9936 1.75 10.61 72 5.30 11.63 108 14.30 12.00

175
TABLE - 4.21
Electrochemical Parameters of Cyclic Voltammograms of Thymoquinone,Fe(III), and Fe(III)-Thymoquinone Complex
Working electrode = Glassy carbon
Reference electrode = Saturated calomel
Auxialary electrode = Platinum
Temperature = 25±1˚C
Current sensitivity = 1x10⁻⁴ A/V
Scan rate = 0.1 V/s
Concentration of Thymoquinone solution = 5x10⁻⁴M
Concentration of Fe(III) solution = 5x10⁻⁴M
Concentration of Fe(III)-Thymoquinone Complex(1:1) = 5x10⁻⁴MSupporting electrolyte = NaCl (0.1 M)
Ipa
(A)Ipc
(A)Epa
(V/s)Epc
(V/s)
Thymoquinone 1.017x10⁻⁵±0.01 2.717x10⁻⁵±0.01 -0.242±0.01 -0.326±0.01
Fe(III) - 2.805x10⁻⁶±0.01 - 0.238±0.01
Fe(III)-Thymoquinone 5.875x10⁻⁶±0.01 1.149x10⁻⁵±0.01 0.282±0.01 0.066±0.01

176
TABLE - 4.22
The Values of Ep, Ep/2, Ep-Ep/2, Epa-Epc and Ip from Voltammogramsof Fe(III)-Thymoquinone Complex with Different Scan Rates
Working electrode = Glassy carbon
Reference electrode = Saturated calomel
Auxialary electrode = Platinum
Temperature = 25±1˚C
Current sensitivity = 1x10⁻⁴ A/V
Concentration of Fe(III)-Thymoquinone Complex(1:3) = 5x10⁻⁴M
Supporting electrolyte = NaCl (0.1M)
Scan rate(V/s)
Epa
(V)Epa/2
(V)Epa-Epa/2
(V)Ipa
x10-5(A)Ipa/Ipc
βnb=0.048/Epa-Epa/2
0.05 0.298±0.01 0.250±0.01 0.048± 0.011 0.798±0.01 0.274 1.000±0.01
0.10 0.309±0.01 0.262±0.01 0.047± 0.011 1.035±0.01 0.253 1.021±0.01
0.15 0.318±0.01 0.266±0.01 0.052± 0.011 1.743±0.01 0.355 0.923±0.01
0.20 0.326±0.01 0.267±0.01 0.059± 0.011 2.541±0.01 0.463 0.814±0.01
Scan rate(V/s)
Epc
(V)Epc/2
(V)Epc-Epc/2
(V)Epa-Epc
(V)Ipc
x10-5(A)αna=0.048/
Epc-Epc/2
0.05 0.049±0.01 0.110± 0.01 -0.061±0.011 0.249±0.01 2.917±0.01 0.787±0.01
0.10 0.034±0.01 0.090± 0.01 -0.056±0.011 0.275±0.01 4.084±0.01 0.857±0.01
0.15 0.024±0.01 0.082±0.01 -0.058±0.011 0.294±0.01 4.912±0.01 0.828±0.01
0.20 0.018±0.01 0.076±0.01 -0.058±0.012 0.308±0.01 5.488±0.01 0.828±0.01

177
TABLE – 4.23
The Values of Ep, Ep/2, Ep-Ep/2, Epa-Epc ,Ipa, αna and βnb fromCyclic Voltammograms of Fe(III)-Thymoquinone Complex
with Different Concentrations
Working electrode = Glassy carbon
Reference electrode = Saturated calomel
Auxialary electrode = Platinum
Temperature = 25±1˚C
Current sensitivity = 1x10⁻⁴ A/V
Scan rate = 0.1 V/sSupporting electrolyte = NaCl (0.1M)
Conc.x10-3 M
Epa
(V)Epa/2
(V)Epa-Epa/2
(V)Ipa
x10-5 (A) Ipa/Ipcβnb=0.048/Epa-Epa/2
0.02 0.163±0.02 0.11 ± 0.02 0.053± 0.012 0.214 ± 0.02 0.489 0.906 ± 0.02
0.1 0.227±0.01 0.162±0.01 0.065± 0.011 0.4839 ± 0.01 0.481 0.738 ± 0.01
0.2 0.263±0.01 0.21 ± 0.01 0.053± 0.011 0.7272 ± 0.01 0.418 0.906 ± 0.01
0.4 0.292±0.01 0.24 ± 0.01 0.052± 0.011 0.9398 ± 0.01 0.364 0.923 ± 0.01
0.6 0.310± 0.01 0.27 ± 0.01 0.040± 0.011 1.188 ± 0.01 0.280 0.979 ± 0.01
0.8 0.341±0.01 0.29 ± 0.01 0.051± 0.011 1.735 ± 0.01 0.296 0.941 ± 0.01
1.0 0.36 ± 0.01 0.305±0.01 0.055± 0.011 2.199 ± 0.01 0.310 0.873 ± 0.01
1.2 0.367±0.02 0.305±0.01 0.062± 0.011 2.788 ± 0.02 0.319 0.774 ± 0.01
Conc.x10-3 M
Epc
(V)Epc/2
(V)Epc-Epc/2
(V)Epa-Epc
(V)Ipc
x10-5 (A)αna=0.048/
Epc-Epc/2
0.02 0.017±0.02 0.072±0.02 -0.055±0.011 0.146 ± 0.01 0.4375±0.02 0.872 ± 0.01
0.1 0.036±0.01 0.09 ± 0.01 -0.054±0.011 0.191 ± 0.01 1.007 ± 0.01 0.889 ± 0.01
0.2 0.036±0.01 0.09 ± 0.01 -0.054±0.011 0.227 ± 0.01 1.738 ± 0.01 0.889 ± 0.01
0.4 0.039±0.01 0.091±0.01 -0.052±0.012 0.253 ± 0.01 2.582 ± 0.01 0.923 ± 0.01
0.6 0.031±0.01 0.091±0.01 -0.060±0.011 0.288 ± 0.01 4.236 ± 0.01 0.800 ± 0.01
0.8 0.020 ± 0.01 0.092±0.01 -0.072±0.011 0.321 ± 0.01 5.870 ± 0.01 0.667 ± 0.01
1.0 0.006±0.02 0.077±0.02 -0.071±0.012 0.354 ± 0.01 7.088 ± 0.02 0.676 ± 0.01
1.2 0.009±0.01 0.078±0.01 -0.069±0.012 0.358 ± 0.01 8.730 ± 0.01 0.696 ± 0.01

178
TABLE – 4.24
The Values of Ep, Ep/2, Epa-Epc, Ip and αna and βnb from Cyclic-Voltammograms of Fe(III)-Thymoquinone Complex with Different
Metal-Ligand Ratios
Working electrode = Glassy carbon
Reference electrode = Saturated calomel
Auxialary electrode = Platinum
Temperature = 25±1˚C
Current sensitivity = 1x10⁻⁴ A/V
Scan rate = 0.1 V/sConcentration of Fe(III)-Thymoquinone Complex = 5x10⁻⁴MSupporting electrolyte = 0.1M
RatioL/M
Epa
(V)Epa/2
(V)Epa-Epa/2
(V)Ipa
x10-5 (A) Ipa/Ipcβnb=0.04/Epa-Epa/2
1 0.282±0.03 0.230±0.03 0.052±0.03 0.588±0.02 0.511 0.923±0.01
2 0.298±0.01 0.241±0.01 0.057±0.01 0.919±0.01 0.343 0.842±0.01
3 0.309±0.01 0.260±0.01 0.049±0.01 1.035±0.01 0.253 0.979±0.01
4 0.321±0.02 0.270±0.02 0.051±0.02 1.187±0.03 0.237 0.941±0.02
5 0.333±0.01 0.275±0.01 0.058±0.01 2.167±.01 0.327 0.827±0.01
RatioL/M
Epc
(V)Epc/2
(V)Epc-Epc/2
(V)Epa-Epc
(V)Ipc
x10-5 (A)αna=0.048/
Epc-Epc/2
1 0.066±0.01 0.120±0.01 -0.054±0.01 0.216±0.01 1.149±0.01 0.889±0.01
2 0.048±0.02 0.100±0.01 -0.052±0.02 0.25±0.02 2.683±0.02 0.923±0.02
3 0.034±0.01 0.090±0.01 -0.056±0.01 0.275±0.01 4.084±0.01 0.857±0.01
4 0.022±0.02 0.080±0.02 -0.058±0.02 0.299±0.02 5.002±0.02 0.827±0.01
5 0.013±0.01 0.072±0.01 -0.059±0.01 0.32 ±0.01 6.626±0.01 0.814±0.01

179
TABLE - 4.25
The Values of Half Wave Potential (E˚= E1/2) from Cyclic-Voltammograms of Fe(III)-Thymoquinone Complex at Different
Scan Rates, with Different Concentrations and Metal-Ligand Ratios
Working electrode = Glassy carbon
Reference electrode = Saturated calomel
Auxialary electrode = Platinum
Temperature = 25±1˚C
Current sensitivity = 1x10⁻⁴ A/V
Supporting electrolyte = NaCl (0.1M)
Scan rate(V/s)
E˚(V)
Conc.x10-3 M
E˚(V)
Ratio L/M E˚(V)
0.05 0.274 ± 0.01 0.2 0.237 ± 0.01 1 0.256 ± 0.01
0.1 0.286 ± 0.01 0.4 0.266 ± 0.01 2 0.270 ± 0.01
0.15 0.292 ± 0.01 0.6 0.295 ± 0.01 3 0.285 ± 0.01
0.2 0.297 ± 0.01 0.8 0.316 ± 0.01 4 0.296 ± 0.02
- - - - 5 0.304 ± 0.01

180
TABLE - 4.26
Comparison of the Diffusion Coefficients of Thymoquinone,Fe(III), and Fe(III)-Thymoquinone Complex
Working electrode = Glassy carbon
Reference electrode = Saturated calomel
Auxialary electrode = Platinum
Temperature = 25±1˚C
Current sensitivity = 1x10⁻⁴ A/VConcentration of Fe(III)-Thymoquinone Complex (1:1) = 5x10⁻⁷ moles/cm3
Scan rate = 0.1 V/s
Supporting electrolyte = NaCl (0.1M)
Number of electron transfer = n = 1
Area of Electrode = A = 0.0706 cm2
D1/2 = Ip / (2.69x10⁵) (n)3/2 AC (ν)1/2
Ipa
(A) D1/2 D(cm2 s-1)
Thymoquinone 1.017x10⁻⁵±0.01 3.39 x 10⁻³ 1.15 x 10⁻⁵
Fe(III) - - -
Fe(III)-Thymoquinone 5.875x10⁻⁶±0.01 1.96 x 10⁻³ 3.84 x 10⁻⁶
Ipc
(A) D1/2 D(cm2 s-1)
Thymoquinone 2.717x10⁻⁵±0.01 9.06 x 10⁻³ 8.20 x 10⁻⁵
Fe(III) 2.805x10⁻⁶±0.01 9.35 x 10⁻⁴ 8.74 x 10⁻⁷
Fe(III)-Thymoquinone 1.149x10⁻⁵±0.01 3.83 x 10⁻³ 1.47 x 10⁻⁵

181
TABLE - 4.27
Diffusion Coefficients of Fe(III)-Thymoquinone Complex atDifferent Scan Rates
Working electrode = Glassy carbon
Reference electrode = Saturated calomel
Auxialary electrode = Platinum
Temperature = 25±1˚C
Current sensitivity = 1x10⁻⁴ A/V
Concentration of Fe(III)-Thymoquinone Complex = 5x10⁻⁷ moles/cm3
Supporting electrolyte = NaCl (0.1M)
Number of electron transfer = n = 1
Area of Electrode = A = 0.0706 cm2
D1/2 = Ip / (2.69x10⁵ ) (n)3/2 AC (ν)1/2
ν(V/s)
ν1/2 Ipa
x10-5(A)D1/2 D
(cm2 s-1)
0.05 0.224 0.798 ± 0.01 3.57 x 10⁻³ 1.41 x 10⁻⁵
0.10 0.316 1.035 ± 0.01 3.45 x 10⁻³ 1.19 x 10⁻⁵
0.15 0.387 1.743 ± 0.01 4.74 x 10⁻³ 2.25 x 10⁻⁵
0.20 0.447 2.541 ± 0.01 5.99 x 10⁻³ 3.58 x 10⁻⁵
Average = 2.11(±0.01) x10-5
ν(V/s)
ν1/2 Ipc
x10-5 (A)D1/2 D
(cm2 s-1)
0.05 0.224 2.917 ± 0.01 1.37 x 10⁻² 1.88 x 10⁻⁴
0.10 0.316 4.084 ± 0.01 1.36 x 10⁻² 1.85 x 10⁻⁴
0.15 0.387 4.912 ± 0.01 1.34 x 10⁻² 1.80 x 10⁻⁴
0.20 0.447 5.488 ± 0.01 1.29 x 10⁻² 1.67 x 10⁻⁴
Average = 1.8(±0.01) x10-4

182
TABLE - 4.28Diffusion coefficients of Fe(III)-Thymoquinone Complex at
Different ConcentrationsWorking electrode = Glassy carbon
Reference electrode = Saturated calomel
Auxialary electrode = Platinum
Temperature = 25±1˚C
Current sensitivity = 1x10⁻⁴ A/V
Scan rate = 0.1 V/s
Supporting electrolyte = NaCl (0.1M)
Number of electron transfer = n = 1
Area of Electrode = A = 0.0706 cm2
D1/2 = Ip / (2.69x10⁵) (n)3/2 AC (ν)1/2
Conc. x10-3 IpaD1/2 D
(moles/cm3) x 10-5 (A) (cm2 s-1)
0.1 0.4839 ± 0.01 8.06 x 10⁻³ 6.50 x 10⁻⁵
0.2 0.7272 ± 0.01 6.06 x 10⁻³ 3.67 x 10⁻⁵
0.4 0.9398 ± 0.01 3.92 x 10⁻³ 1.53 x 10⁻⁵
0.6 1.188 ± 0.01 3.30 x 10⁻³ 1.09 x 10⁻⁵
0.8 1.735 ± 0.01 3.61 x 10⁻³ 1.31 x 10⁻⁵
1.0 2.199 ± 0.01 3.66 x 10⁻³ 1.34 x 10⁻⁵
1.2 2.788 ± 0.02 3.87 x 10⁻³ 1.50 x 10⁻⁵
Average = 2.42(±0.2) x10-5
Conc. x10-3 IpcD1/2 D
(moles/cm3) x10-5 (A) (cm2 s-1)
0.1 1.007 ± 0.01 1.68 x 10⁻² 2.82 x 10⁻⁴
0.2 1.738 ± 0.01 1.45 x 10⁻² 2.10 x 10⁻⁴
0.4 2.582 ± 0.01 1.08 x 10⁻² 1.16 x 10⁻⁴
0.6 4.236 ± 0.01 1.18 x 10⁻² 1.38 x 10⁻⁴
0.8 5.87 ± 0.01 1.22 x 10⁻² 1.50 x 10⁻⁴
1.0 7.088 ± 0.02 1.18 x 10⁻² 1.40 x 10⁻⁴
1.2 8.73 ± 0.01 1.21 x 10⁻² 1.47 x 10⁻⁴
Average = 1.69(±0.05) x10-4
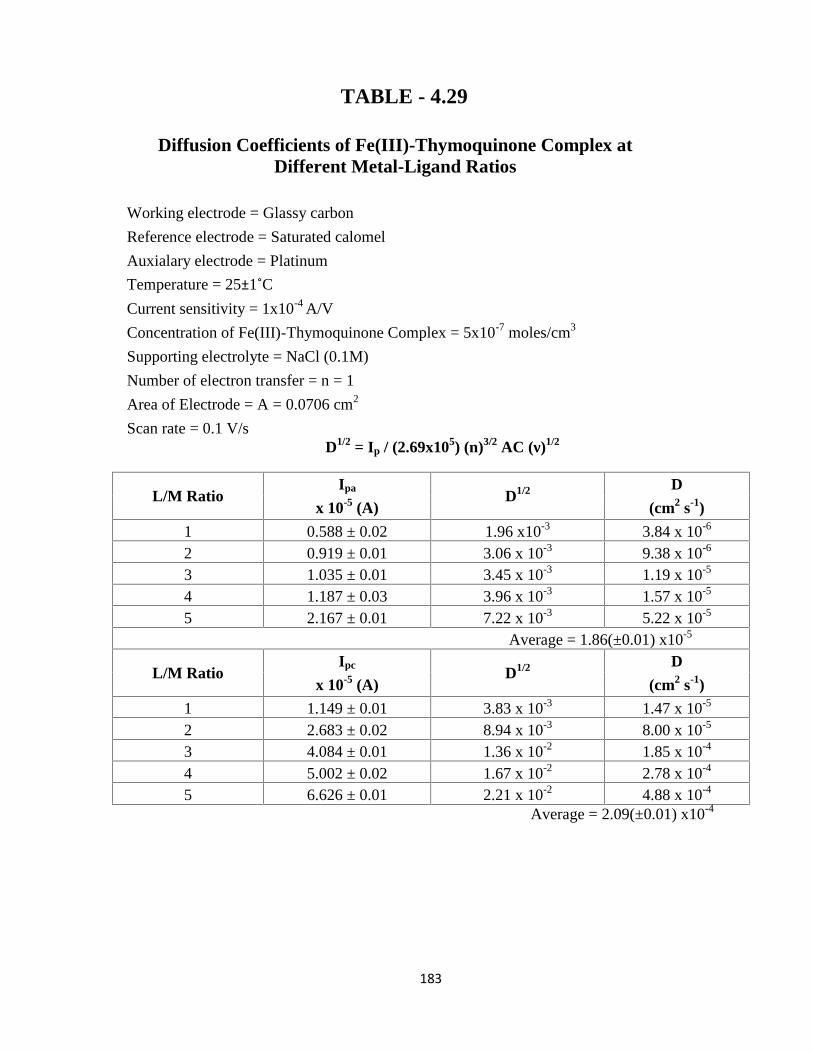
183
TABLE - 4.29
Diffusion Coefficients of Fe(III)-Thymoquinone Complex atDifferent Metal-Ligand Ratios
Working electrode = Glassy carbon
Reference electrode = Saturated calomel
Auxialary electrode = Platinum
Temperature = 25±1˚C
Current sensitivity = 1x10⁻⁴ A/V
Concentration of Fe(III)-Thymoquinone Complex = 5x10⁻⁷ moles/cm3
Supporting electrolyte = NaCl (0.1M)
Number of electron transfer = n = 1
Area of Electrode = A = 0.0706 cm2
Scan rate = 0.1 V/sD1/2 = Ip / (2.69x10⁵) (n)3/2 AC (ν)1/2
L/M RatioIpa
D1/2 D
x 10-5 (A) (cm2 s-1)
1 0.588 ± 0.02 1.96 x10⁻³ 3.84 x 10⁻⁶
2 0.919 ± 0.01 3.06 x 10⁻³ 9.38 x 10⁻⁶
3 1.035 ± 0.01 3.45 x 10⁻³ 1.19 x 10⁻⁵
4 1.187 ± 0.03 3.96 x 10⁻³ 1.57 x 10⁻⁵
5 2.167 ± 0.01 7.22 x 10⁻³ 5.22 x 10⁻⁵
Average = 1.86(±0.01) x10-5
L/M RatioIpc
D1/2 D
x 10-5 (A) (cm2 s-1)
1 1.149 ± 0.01 3.83 x 10⁻³ 1.47 x 10⁻⁵
2 2.683 ± 0.02 8.94 x 10⁻³ 8.00 x 10⁻⁵
3 4.084 ± 0.01 1.36 x 10⁻² 1.85 x 10⁻⁴
4 5.002 ± 0.02 1.67 x 10⁻² 2.78 x 10⁻⁴
5 6.626 ± 0.01 2.21 x 10⁻² 4.88 x 10⁻⁴
Average = 2.09(±0.01) x10-4

184
TABLE - 4.30
Electrochemical Parameters of Cyclic Voltammograms of Thymoquinone,Cr(VI), and Cr(VI)-Thymoquinone Complex
Working electrode = Glassy carbon
Reference electrode = Saturated calomel
Auxialary electrode = Platinum
Temperature = 25±1˚C
Current sensitivity = 1x10⁻⁴ A/V
Scan rate = 0.1 V/s
Concentration of Thymoquinone solution = 5x10⁻⁴M
Concentration of Cr(VI) solution = 5x10⁻⁴M
Concentration of Cr(VI)-Thymoquinone Complex(1:1) = 5x10⁻⁴M
Supporting electrolyte = NaCl (0.1M)
Ipa
(A)Ipc
(A)Epa
(V/s)Epc
(V/s)
Thymoquinone 1.017x10⁻⁵± 0.01 2.717x10⁻⁵± 0.01 -0.242 ± 0.01 -0.326 ± 0.01
Cr(VI) - - - -
Cr(VI)-Thymoquinone 2.463x10⁻⁶± 0.01 1.142x10⁻⁵± 0.01 0.179 ± 0.01 -0.210 ± 0.01

185
TABLE - 4.31
The Values of Ep, Ep/2, Ep-Ep/2, Epa-Epc and Ip from Voltammogramsof Cr(VI)-Thymoquinone Complex with Different Scan Rates
Working electrode = Glassy carbonReference electrode = Saturated calomelAuxialary electrode = PlatinumTemperature = 25±1˚CCurrent sensitivity = 1x10⁻⁴ A/VConcentration of Cr(VI)-Thymoquinone Complex(1:3) = 5x10⁻⁴ MSupporting electrolyte = NaCl (0.1 M)
Scanrate(V/s)
Epa
(V)Epa/2
(V)Epa-Epa/2
(V)Ipa
x10-5 (A)Ipa/Ipc
βnb=0.048/Epa-Epa/2
0.05 -0.238±0.01 -0.279±0.01 0.041±0.01 1.180±0.01 0.459±0.01 1.171± 0.01
0.10 -0.236±0.01 -0.282±0.01 0.046±0.01 1.431±0.01 0.434±0.01 1.043± 0.01
0.15 -0.233±0.02 -0.288±0.01 0.055±0.01 1.709±0.02 0.474±0.02 0.873± 0.01
0.20 -0.229±0.01 -0.290±0.01 0.061±0.01 1.957±0.01 0.503±0.01 0.787± 0.01
0.25 -0.228±0.02 -0.292±0.01 0.064±0.01 1.811±0.02 0.405±0.02 0.750± 0.01
0.35 a - - - - -
0.40 a - - - - -
0.45 a - - - - -
0.50 a - - - - -a = Peak distorted
Scanrate(V/s)
Epc
(V)Epc/2
(V)Epc-Epc/2
(V)Epa-Epc
(V)Ipc
x10-5 (A)αna=0.048/
Epc-Epc/2
0.05 -0.336± 0.01 -0.291±0.01 -0.045± 0.01 0.098±0.01 2.568± 0.01 1.067± 0.010.10 -0.344± 0.01 -0.303±0.01 -0.041± 0.01 0.108±0.01 3.300± 0.01 1.171± 0.010.15 -0.354± 0.01 -0.315±0.01 -0.039±0.01 0.121±0.01 3.604± 0.01 1.231± 0.010.20 -0.370± 0.01 -0.315±0.01 -0.055±0.01 0.141±0.01 3.888± 0.01 0.873± 0.010.25 -0.379± 0.01 -0.315±0.01 -0.064±0.01 0.151±0.01 4.471± 0.01 0.750± 0.010.35 -0.403± 0.02 -0.335±0.02 -0.068±0.02 - 4.915± 0.02 0.706± 0.020.40 -0.410± 0.02 -0.339±0.02 -0.071±0.02 - 5.061± 0.02 0.676± 0.020.45 -0.415± 0.02 -0.339±0.02 -0.076±0.02 - 5.215± 0.02 0.632± 0.020.50 -0.419± 0.02 -0.338±0.02 -0.081±0.02 - 5.417± 0.02 0.593± 0.02

186
TABLE - 4.32
The Values of Ep, Ep/2, Ep-Ep/2, Epa-Epc ,Ipa, αna and βnb fromCyclic Voltammograms of Cr(VI)-Thymoquinone Complex
with Different Concentrations
Working electrode = Glassy carbonReference electrode = Saturated calomelAuxialary electrode = PlatinumTemperature = 25±1˚C
Current sensitivity = 1x10⁻⁴ A/VScan rate = 0.1 V/sSupporting electrolyte = NaCl (0.1M)
Conc.x10-3 M
Epa
(V)Epa/2
(V)Epa-Epa/2
(V)Ipa
x10-5 (A)Ipa/Ipc
βnb=0.048/Epa-Epa/2
0.2 -0.236±0.01 -0.290±0.01 0.054± 0.011 1.431 ± 0.01 1.15 0.889 ± 0.01
0.4 -0.238±0.01 -0.292±0.01 0.054± 0.011 1.507 ± 0.01 0.883 0.889 ± 0.01
0.6 -0.240±0.01 -0.294±0.01 0.054± 0.011 2.143 ± 0.01 0.566 0.889 ± 0.01
0.8 -0.247±0.02 -0.300±0.02 0.053± 0.012 3.419 ± 0.02 0.651 0.906 ± 0.02
1.0 -0.248±0.02 -0.301±0.02 0.053± 0.011 4.099 ± 0.02 0.610 0.906 ± 0.01
1.2 -0.248±0.02 -0.301±0.02 0.053± 0.012 4.252 ± 0.02 0.508 0.906 ± 0.02
Conc.x10-3 M
Epc
(V)Epc/2
(V)Epc-Epc/2
(V)Epa-Epc
(V)Ipc
x10-5 (A)αna=0.048/
Epc-Epc/2
0.2 -0.377± 0.02 -0.333±0.02 -0.041±0.011 0.141 ± 0.01 1.248±0.02 1.20 ± 0.02
0.4 -0.375± 0.01 -0.330±0.01 -0.045±0.012 0.137 ± 0.01 1.706±0.01 1.10 ± 0.01
0.6 -0.353± 0.01 -0.312±0.01 -0.041±0.011 0.113 ± 0.01 3.785±0.01 1.20 ± 0.01
0.8 -0.348± 0.01 -0.295±0.01 -0.053±0.011 0.101 ± 0.01 5.248±0.01 0.906 ± 0.01
1.0 -0.342± 0.02 -0.294±0.02 -0.048±0.012 0.094 ± 0.01 6.716±0.02 1.00 ± 0.01
1.2 -0.350± 0.01 -0.301±0.01 -0.049±0.012 0.102 ± 0.01 8.370±0.01 0.980 ± 0.01

187
TABLE - 4.33
The Values of Ep, Ep/2, Epa-Epc, Ip, αna and βnb from Cyclic-Voltammograms of Cr(VI)-Thymoquinone Complex with Different
Metal-Ligand Ratios
Working electrode = Glassy carbonReference electrode = Saturated calomelAuxialary electrode = PlatinumTemperature = 25±1˚C
Current sensitivity = 1x10⁻⁴ A/VScan rate = 0.1 V/s
Concentration of Cr(VI)-Thymoquinone Complex = 5x10⁻⁴MSupporting electrolyte = NaCl (0.1M)
RatioL/M
Epa
(V)Epa/2
(V)Epa-Epa/2
(V)Ipa
x10-5 (A)Ipa/Ipc
βnb=0.048/Epa-Epa/2
0.5 0.149± 0.01 0.09± 0.01 0.059± 0.01 0.200± 0.01 0.256± 0.01 0.814± 0.01
1 0.179± 0.01 0.12± 0.01 0.059± 0.01 0.246±0.01 0.215± 0.01 0.814± 0.012 -0.232±0.01 -0.290±0.01 0.058±0.01 0.932±0.01 0.460 ± 0.01 0.828 ± 0.013 -0.236±0.02 -0.291±0.01 0.055±0.02 1.431±0.01 0.434± 0.01 0.873± 0.024 -0.239±0.01 -0.292±0.01 0.053±0.01 1.411±0.01 0.352± 0.01 0.906± 0.015 a - - - - -
a = Peak distorted
RatioL/M
Epc
(V)Epc/2
(V)Epc-Epc/2
(V)Epa-Epc
(V)Ipc
x10-5 (A)αna=0.048/
Epc-Epc/2
0.05 -0.170± 0.01 -0.103±0.02 -0.067±0.02 0.021±0.02 0.780± 0.01 0.716±0.021 -0.210± 0.01 -0.150±0.01 -0.060±0.01 0.031±0.02 1.142± 0.01 0.800± 0.012 -0.338±0.01 -0.299±0.01 -0.039±0.01 0.106±0.01 2.028 ±0.01 1.231 ±0.013 -0.346±0.01 -0.302±0.01 -0.044±0.01 0.110±0.01 3.300 ±0.01 1.091 ±0.014 -0.370±0.01 -0.310±0.01 -0.060±0.02 0.131±0.02 4.011 ±0.01 0.800 ±0.015 - - - - - -

188
TABLE - 4.34
The Values of Half Wave Potential (E˚= E1/2) from Cyclic-Voltammograms of Cr(VI)-Thymoquinone Complex at Different
Scan Rates, with Different Concentrations and Metal-Ligand Ratios
Working electrode = Glassy carbon
Reference electrode = Saturated calomel
Auxialary electrode = PlatinumSupporting electrolyte = NaCl (0.1M)
Scan rate(V/s)
(E˚)a(V)
Conc.x10-3 M
(E˚)a(V)
Ratio L/M (E˚)a(V)
0.05 0.259 ± 0.01 0.2 0.264 ± 0.01 0.5 0.120 ± 0.02
0.10 0.259 ± 0.01 0.4 0.265 ± 0.01 1 0.150 ± 0.02
0.15 0.261 ± 0.01 0.6 0.267 ± 0.01 2 0.261 ± 0.02
0.20 0.259 ± 0.01 0.8 0.274 ± 0.02 3 0.264 ± 0.01
0.25 0.260 ± 0.01 1.0 0.275 ± 0.02 4 0.266 ± 0.01
0.35 - 1.2 0.275 ± 0.02 5 -
0.40 - - - - -
0.45 - - - - -
0.50 - - - - -
Scan rate(V/s)
(E˚)c(V)
Conc.x10-3 M
(E˚)c(V)
Ratio L/M (E˚)c(V)
0.05 0.314 ± 0.01 0.2 0.355 ± 0.02 0.5 0.137 ± 0.02
0.10 0.324 ± 0.01 0.4 0.353 ± 0.01 1 0.180 ± 0.01
0.15 0.335 ± 0.01 0.6 0.333 ± 0.01 2 0.319 ± 0.01
0.20 0.343 ± 0.01 0.8 0.322 ± 0.01 3 0.324 ± 0.01
0.25 0.347 ± 0.01 1.0 0.318 ± 0.02 4 0.340 ± 0.02
0.35 0.369 ± 0.03 1.2 0.326 ± 0.01 5 -
0.40 0.375 ± 0.02 - - - -
0.45 0.377 ± 0.02 - - - -
0.50 0.379 ± 0.02 - - - -

189
TABLE - 4.35
Comparison of the Diffusion Coefficients of Thymoquinone,Cr(VI), and Cr(VI)-Thymoquinone Complex
Working electrode = Glassy carbon
Reference electrode = Saturated calomel
Auxialary electrode = Platinum
Temperature = 25±1˚C
Current sensitivity = 1x10⁻⁴ A/VConcentration of Cr(VI)-Thymoquinone Complex (1:1) = 5x10⁻⁷ moles/cm3
Scan rate = 0.1 V/s
Supporting electrolyte = NaCl (0.1M)
Number of electron transfer = n = 3Area of Electrode = A = 0.0706 cm2
D1/2 = Ip / (2.69x10⁵) (n)3/2 AC (ν)1/2
Ipa
(A) D1/2 D(cm2 s-1)
Thymoquinone 1.017x10⁻⁵± 0.01 3.39 x 10⁻³ 1.15 x 10⁻⁵
Cr(VI) - - -
Cr(VI)-Thymoquinone 0.246x10⁻⁵ ± 0.01 5.68 x 10⁻⁴ 3.23 x 10⁻⁷
Ipc
(A) D1/2 D(cm2 s-1)
Thymoquinone 2.717x10⁻⁵±0.01 9.06 x 10⁻³ 8.20 x 10⁻⁵
Cr(VI) - - -
Cr(VI)-Thymoquinone 1.142 x10⁻⁵±0.01 2.64 x 10⁻³ 6.97 x 10⁻⁶
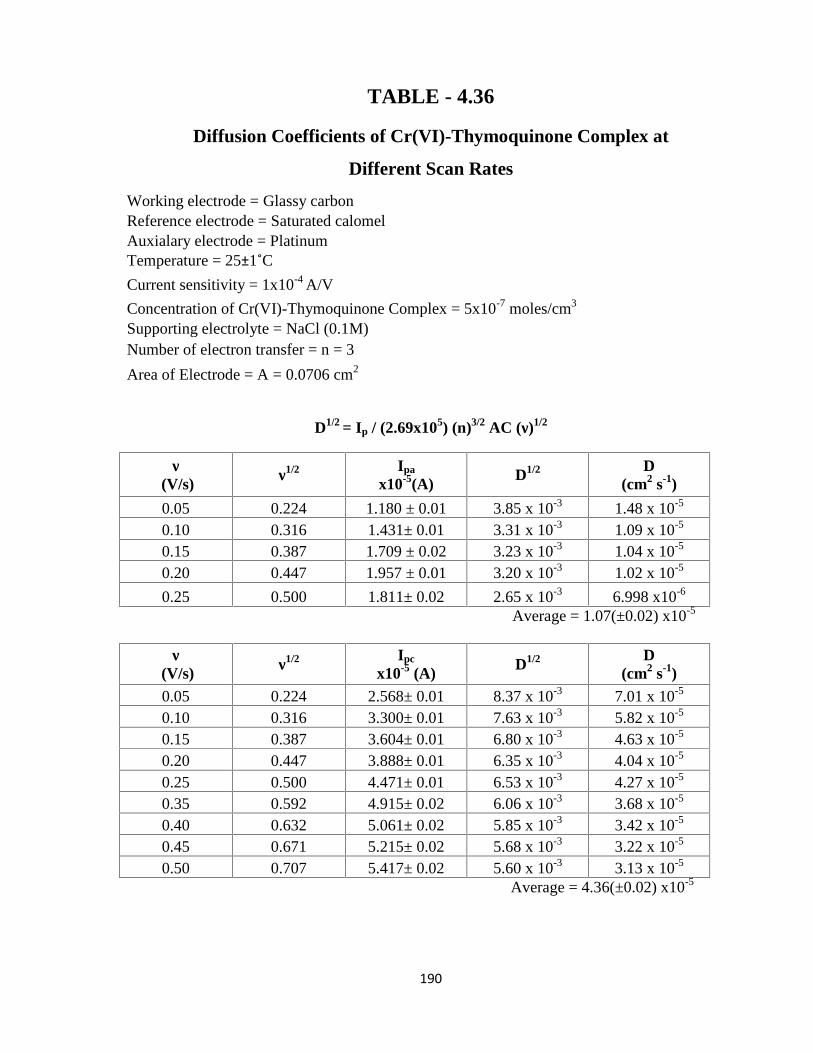
190
TABLE - 4.36
Diffusion Coefficients of Cr(VI)-Thymoquinone Complex at
Different Scan Rates
Working electrode = Glassy carbonReference electrode = Saturated calomelAuxialary electrode = PlatinumTemperature = 25±1˚C
Current sensitivity = 1x10⁻⁴ A/V
Concentration of Cr(VI)-Thymoquinone Complex = 5x10⁻⁷ moles/cm3
Supporting electrolyte = NaCl (0.1M)Number of electron transfer = n = 3
Area of Electrode = A = 0.0706 cm2
D1/2 = Ip / (2.69x10⁵) (n)3/2 AC (ν)1/2
ν(V/s)
ν1/2 Ipa
x10-5(A)D1/2 D
(cm2 s-1)
0.05 0.224 1.180 ± 0.01 3.85 x 10⁻³ 1.48 x 10⁻⁵
0.10 0.316 1.431± 0.01 3.31 x 10⁻³ 1.09 x 10⁻⁵
0.15 0.387 1.709 ± 0.02 3.23 x 10⁻³ 1.04 x 10⁻⁵
0.20 0.447 1.957 ± 0.01 3.20 x 10⁻³ 1.02 x 10⁻⁵
0.25 0.500 1.811± 0.02 2.65 x 10⁻³ 6.998 x10⁻⁶
Average = 1.07(±0.02) x10-5
ν(V/s) ν1/2 Ipc
x10-5 (A) D1/2 D(cm2 s-1)
0.05 0.224 2.568± 0.01 8.37 x 10⁻³ 7.01 x 10⁻⁵
0.10 0.316 3.300± 0.01 7.63 x 10⁻³ 5.82 x 10⁻⁵
0.15 0.387 3.604± 0.01 6.80 x 10⁻³ 4.63 x 10⁻⁵
0.20 0.447 3.888± 0.01 6.35 x 10⁻³ 4.04 x 10⁻⁵
0.25 0.500 4.471± 0.01 6.53 x 10⁻³ 4.27 x 10⁻⁵
0.35 0.592 4.915± 0.02 6.06 x 10⁻³ 3.68 x 10⁻⁵
0.40 0.632 5.061± 0.02 5.85 x 10⁻³ 3.42 x 10⁻⁵
0.45 0.671 5.215± 0.02 5.68 x 10⁻³ 3.22 x 10⁻⁵
0.50 0.707 5.417± 0.02 5.60 x 10⁻³ 3.13 x 10⁻⁵
Average = 4.36(±0.02) x10-5

191
TABLE - 4.37
Diffusion coefficients of Cr(VI)-Thymoquinone Complex at
Different Concentrations
Working electrode = Glassy carbonReference electrode = Saturated calomelAuxialary electrode = PlatinumTemperature = 25±1˚CCurrent sensitivity = 1x10⁻⁴ A/VScan rate = 0.1 V/sSupporting electrolyte = NaCl (0.1M)Number of electron transfer = n = 3
Area of Electrode = A = 0.0706 cm2
D1/2 = Ip / (2.69x10⁵) (n)3/2 AC (ν)1/2
Conc. x10-3 Ipa D1/2 D(moles/cm3) x 10-5 (A) (cm2 s-1)
0.2 1.431 ± 0.01 8.27 x 10⁻³ 6.83 x 10⁻⁵
0.4 1.507 ± 0.01 4.35 x 10⁻³ 1.90 x 10⁻⁵
0.6 2.143 ± 0.01 4.13 x 10⁻³ 1.70 x 10⁻⁵
0.8 3.419 ± 0.02 4.94 x 10⁻³ 2.44 x 10⁻⁵
1.0 4.099 ± 0.02 4.74 x 10⁻³ 2.24 x 10⁻⁵
1.2 4.252 ± 0.02 4.10 x 10⁻³ 1.68 x 10⁻⁵
Average = 2.80(±0.01) x10-5
Conc. x10-3 Ipc D1/2 D(moles/cm3) x10-5 (A) (cm2 s-1)
0.2 3.300 ± 0.01 1.91 x 10⁻² 3.63 x 10⁻⁴
0.4 1.706 ± 0.01 4.93 x 10⁻³ 2.43 x 10⁻⁵
0.6 3.785 ± 0.01 7.29 x 10⁻³ 5.31 x 10⁻⁵
0.8 5.248 ± 0.01 7.58x 10⁻³ 5.75 x 10⁻⁵
1.0 6.716 ± 0.02 7.76 x 10⁻³ 6.02 x 10⁻⁵
1.2 8.370 ± 0.01 8.06 x 10⁻³ 6.50 x 10⁻⁵
Average = 4.40(±0.02) x10-5

192
TABLE - 4.38
Diffusion coefficients of Cr(VI)-Thymoquinone Complex atDifferent Metal-Ligand Ratios
Working electrode = Glassy carbon
Reference electrode = Saturated calomel
Auxialary electrode = Platinum
Temperature = 25±1˚CCurrent sensitivity = 1x10⁻⁴ A/V
Concentration of Cr(VI)-Thymoquinone Complex = 5x10⁻⁷ moles/cm3
Supporting electrolyte = NaCl (0.1M)
Number of electron transfer = n = 3
Area of Electrode = A = 0.0706 cm2
Scan rate = 0.1 V/s
D1/2 = Ip / (2.69x10⁵) (n)3/2 AC (ν)1/2
L/M RatioIpa
D1/2 D
x 10-5 (A) (cm2 s-1)
2 0.932±0.01 2.15 x 10⁻³ 4.64 x 10⁻⁶
3 1.431±0.01 3.31 x 10⁻³ 1.09 x 10⁻⁵
4 1.411±0.01 3.26 x 10⁻³ 1.06 x 10⁻⁵
Average = 0.87(±0.02) x10-5
L/M RatioIpc
D1/2 D
x 10-5 (A) (cm2 s-1)
2 2.028 ±0.01 4.69 x 10⁻³ 2.20 x 10⁻⁵
3 3.300 ±0.01 7.63 x 10⁻³ 5.82 x 10⁻⁵
4 4.011 ±0.01 9.27 x 10⁻³ 8.59 x 10⁻⁵
Average = 5.54(±0.01) x10-5

193
TABLE - 4.39
Electrochemical Parameters of Cyclic Voltammograms of Thymoquinone,Co(II), and Co(II)-Thymoquinone Complex
Working electrode = Glassy carbon
Reference electrode = Saturated calomelAuxialary electrode = PlatinumTemperature = 25±1˚C
Current sensitivity = 1x10⁻⁴ A/VScan rate = 0.1 V/s
Concentration of Thymoquinone solution = 5x10⁻⁴M
Concentration of Co(II) solution = 5x10⁻⁴M
Concentration of Co(II)-Thymoquinone Complex(1:1) = 5x10⁻⁴MSupporting electrolyte = NaCl (0.1M)
Ipa
(A)Ipc
(A)Epa
(V/s)Epc
(V/s)
Thymoquinone 1.017x10⁻⁵±0.01 2.717x10⁻⁵± 0.01 -0.242 ± 0.01 -0.326 ± 0.01
Co(II) - - - -Co(II)-Thymoquinone - 1.743x10⁻⁵± 0.01 - -0.302 ± 0.01

194
TABLE - 4.40
The Values of Ep, Ep/2, Ep-Ep/2, Epa-Epc and Ip from Cyclic-Voltammograms ofCo(II)-Thymoquinone Complex with Different
Scan RatesWorking electrode = Glassy carbonReference electrode = Saturated calomelAuxialary electrode = PlatinumTemperature = 25±1˚C
Current sensitivity = 1x10⁻⁴ A/V
Concentration of Co(II)-Thymoquinone Complex(1:3) = 5x10⁻⁴MSupporting electrolyte = NaCl (0.1M)
Scan rate(V/s)
Epa
(V)Epa/2
(V)Epa-Epa/2
(V)Ipa
x10-5 (A) Ipa/Ipcβnb=0.048/Epa-Epa/2
0.05 -0.251 ± 0.01 -0.312 ±0.01 0.061 ±0.01 1.706 ± 0.01 0.415 ±0.01 0.787 ± 0.01
0.10 -0.245 ±0.01 -0.310 ±0.01 0.065 ±0.01 2.188 ± 0.01 0.430 ±0.01 0.738 ± 0.01
0.15 -0.249 ±0.02 -0.310±0.01 0.061 ±0.02 3.994 ± 0.02 0.574±0.02 0.787 ± 0.02
0.20 -0.247 ±0.01 -0.309 ±0.01 0.062 ±0.01 4.417 ± 0.01 0.532 ±0.01 0.774± 0.01
0.25 -0.246 ±0.02 -0.307 ±0.02 0.061 ±0.02 4.444 ± 0.02 0.464 ±0.02 0.787 ± 0.02
0.30 -0.247 ±0.01 -0.307 ±0.01 0.060 ±0.01 4.460 ± 0.01 0.414 ±0.01 0.800 ± 0.01
0.35 -0.246 ±0.01 -0.300 ±0.01 0.054 ±0.01 4.336 ± 0.01 0.366 ±0.01 0.889 ± 0.01
0.40 -0.244 ±0.01 -0.300 ±0.01 0.056 ±0.01 3.956 ± 0.01 0.308 ±0.01 0.857 ± 0.01
0.45 -0.242 ±0.01 -0.288 ±0.01 0.046 ±0.01 3.660 ± 0.01 0.267 ±0.01 1.043 ± 0.01
0.50 -0.242 ±0.01 -0.286 ±0.01 0.044 ±0.01 3.336 ± 0.01 0.228 ±0.01 1.091 ± 0.01
Scan rate(V/s)
Epc
(V)Epc/2
(V)Epc-Epc/2
(V)Epa-Epc
(V)Ipc
x10-5 (A)αna=0.048/
Epc-Epc/2
0.05 -0.324 ± 0.01 -0.261 ± 0.01 -0.063± 0.01 -0.073±0.01 4.106 ± 0.01 0.761 ± 0.01
0.10 -0.326 ± 0.01 -0.271 ± 0.01 -0.055± 0.01 -0.081±0.01 5.090 ± 0.01 0.873 ± 0.01
0.15 -0.339 ± 0.01 -0.280 ± 0.01 -0.059± 0.01 -0.090±0.01 6.961 ± 0.01 0.814 ± 0.01
0.20 -0.344 ± 0.01 -0.286 ± 0.01 -0.058± 0.01 -0.097±0.01 8.304 ± 0.01 0.828 ± 0.01
0.25 -0.350 ± 0.01 -0.293 ± 0.01 -0.057± 0.01 -0.104 ±0.01 9.577 ± 0.01 0.842 ± 0.01
0.30 -0.355 ± 0.01 -0.295 ± 0.01 -0.060± 0.01 -0.108 ±0.01 10.78± 0.01 0.800 ± 0.01
0.35 -0.359 ± 0.01 -0.297 ± 0.01 -0.062± 0.01 -0.113 ±0.01 11.85± 0.01 0.774 ± 0.01
0.40 -0.365 ± 0.02 -0.300± 0.02 -0.065± 0.02 -0.121 ±0.01 12.84± 0.01 0.738 ± 0.01
0.45 -0.368 ± 0.01 -0.300 ± 0.01 -0.068± 0.01 -0.126 ±0.01 13.73± 0.01 0.706 ± 0.01
0.50 -0.372 ± 0.02 -0.300 ± 0.01 -0.072± 0.02 -0.130 ±0.01 14.62± 0.01 0.667 ± 0.01

195
TABLE - 4.41
Values of the Ep, Ep/2, Ep-Ep/2, Epa-Epc, Ipa, αna and βnb from Cyclic-Voltammograms of Co(II)-Thymoquinone Complex
with Different Concentrations
Working electrode = Glassy carbonReference electrode = Saturated calomelAuxialary electrode = PlatinumTemperature = 25±1˚CCurrent sensitivity = 1x10⁻⁴ A/VScan rate = 0.1 V/s
Conc.x10-3 M
Epa
(V)Epa/2
(V)Epa-Epa/2
(V)Ipa
x10-5 (A) Ipa/Ipcβnb=0.048/Epa-Epa/2
0.02 -0.242 ± 0.01 -0.282 ± 0.01 0.040 ± 0.01 0.252 ± 0.01 - 1.20±0.01
0.1 -0.247 ± 0.01 -0.285 ± 0.02 0.038 ± 0.02 0.785 ± 0.01 0.287 1.20±0.01
0.2 -0.245 ± 0.01 -0.288 ± 0.01 0.043 ± 0.01 1.490 ± 0.01 0.443 1.10± 0.01
0.4 -0.247 ± 0.01 -0.288 ± 0.01 0.041 ± 0.01 1.341 ± 0.01 0.27 1.10±0.01
0.6 -0.251 ± 0.01 -0.289 ± 0.01 0.038 ± 0.01 1.618 ± 0.01 0.244 1.20±0.02
0.8 -0.251 ± 0.02 -0.289 ± 0.02 0.038 ± 0.02 2.460 ± 0.02 0.296 1.20±0.02
1.0 -0.252 ± 0.01 -0.296 ± 0.01 0.044 ± 0.01 3.330 ± 0.01 0.339 1.00±0.01
1.2 -0.253 ± 0.02 -0.299 ± 0.02 0.046 ± 0.02 4.094 ± 0.02 0.371 1.00±0.02
Conc.x10-3 M
Epc
(V)Epc/2
(V)Epc-Epc/2
(V)Epa-Epc
(V)Ipc
x10-5 (A)αna=0.048/
Epc-Epc/2
0.02 - - - - - -
0.1 -0.323 ± 0.02 -0.271 ± 0.02 -0.052±0.011 0.076± 0.01 2.733±0.01 0.923± 0.01
0.2 -0.316 ± 0.01 -0.270 ± 0.01 -0.046±0.011 0.071 ± 0.01 3.365±0.02 1.00 ± 0.02
0.4 -0.330 ± 0.01 -0.273 ± 0.01 -0.057±0.012 0.083 ± 0.01 4.967±0.01 0.842± 0.01
0.6 -0.337 ± 0.01 -0.278 ± 0.01 -0.059±0.011 0.086 ± 0.01 6.637±0.01 0.814± 0.01
0.8 -0.347 ± 0.01 -0.286 ± 0.01 -0.061±0.011 0.096 ± 0.01 8.302±0.01 0.787± 0.01
1.0 -0.355 ± 0.02 -0.286 ± 0.02 -0.069±0.012 0.103 ± 0.02 9.817±0.02 0.696± 0.02
1.2 -0.362 ± 0.01 -0.291 ± 0.01 -0.071±0.012 0.109 ± 0.02 11.03±0.01 0.676± 0.02

196
TABLE - 4.42
The Values of Ep, Ep/2, Epa-Epc, Ip, αna and βnb from Cyclic-Voltammograms of Co(II)-Thymoquinone Complex with Different
Metal- Ligand Ratios
Working electrode = Glassy carbonReference electrode = Saturated calomelAuxialary electrode = PlatinumTemperature = 25±1˚C
Current sensitivity = 1x10⁻⁴ A/VScan rate = 0.1 V/s
Concentration of Co(II)-Thymoquinone Complex = 5x10⁻⁴MSupporting electrolyte = NaCl (0.1M)
Ratio L/M Epa
(V)Epa/2
(V)Epa-Epa/2
(V)Ipa
x10-5 (A)Ipa/Ipc βnb
0.5 - - - - - -1 - - - - - -2 -0.238±0.01 -0.300±0.01 0.062±0.01 1.917±0.01 0.504±0.01 0.758±0.013 -0.245±0.01 -0.301±0.01 0.056±0.02 2.188±0.01 0.430±0.01 0.857±0.024 -0.248±0.01 -0.302±0.02 0.054±0.02 3.550±0.01 0.515±0.01 0.889±0.015 -0.255±0.02 -0.303±0.01 0.053±0.01 3.778±0.02 0.418±0.02 0.887±0.02
Ratio L/M Epc
(V)Epc/2
(V)Epc-Epc/2
(V)Epa-Epc
(V)Ipc
x10-5 (A)αna
0.05 -0.267±0.01 -0.203±0.01 -0.064±0.01 - 1.118±0.01 0.734 ± 0.011 -0.302±0.01 -0.243±0.01 -0.059±0.01 - 1.743±0.01 0.797 ± 0.012 -0.324±0.01 -0.262±0.01 -0.062±0.01 0.086±0.01 3.804±0.01 0.774 ± 0.013 -0.326±0.02 -0.271±0.02 -0.055±0.02 0.081±0.01 5.090±0.01 0.855 ± 0.014 -0.338±0.01 -0.279±0.01 -0.059±0.01 0.090±0.01 6.896±0.01 0.797 ± 0.015 -0.349±0.02 -0.288±0.02 -0.061±0.02 0.094±0.02 9.029±0.02 0.787 ±0.02

197
TABLE - 4.43
The Values of Half Wave Potential (E˚= E1/2) from Cyclic- Voltammograms ofCo(II)-Thymoquinone Complex at Different Scan Rates, with Different
Concentrations and Metal-Ligand Ratios
Working electrode = Glassy carbonReference electrode = Saturated calomelAuxialary electrode = PlatinumTemperature = 25±1˚C
Current sensitivity = 1x10⁻⁴ A/VSupporting electrolyte = NaCl (0.1M)
Scan rate(V/s)
(E˚)a
(V)Conc.
x10-3 M(E˚)a
(V)Ratio L/M (E˚)a
(V)0.05 0.282 ± 0.01 0.02 0.262 ± 0.01 0.5 -0.10 0.278 ± 0.02 0.1 0.266 ± 0.01 1 -
0.15 0.280 ± 0.01 0.2 0.267 ± 0.01 2 0.269 ± 0.01
0.20 0.278 ± 0.01 0.4 0.268 ± 0.01 3 0.273 ± 0.01
0.25 0.277 ± 0.01 0.6 0.270 ± 0.01 4 0.275 ± 0.02
0.30 0.277 ± 0.01 0.8 0.270 ± 0.02 5 0.279 ± 0.02
0.35 0.273 ± 0.01 1.0 0.274 ± 0.01 - -
0.40 0.272 ± 0.01 1.2 0.276 ± 0.02 - -
0.45 0.265 ± 0.01 - - - -
0.50 0.264 ± 0.02 - - - -Scan rate
(V/s)(E˚)c
(V)Conc.
x10-3 M(E˚)c
(V) Ratio L/M(E˚)c
(V)0.05 0.291 ± 0.01 0.02 - 0.5 0.235± 0.01
0.10 0.299 ± 0.01 0.1 0.297 ± 0.02 1 0.273 ± 0.01
0.15 0.310 ± 0.01 0.2 0.293 ± 0.01 2 0.293 ± 0.01
0.20 0.315 ± 0.01 0.4 0.302 ± 0.01 3 0.299 ± 0.02
0.25 0.322 ± 0.01 0.6 0.308 ± 0.01 4 0.309 ± 0.01
0.30 0.325 ± 0.01 0.8 0.317 ± 0.01 5 0.318 ± 0.02
0.35 0.328 ± 0.03 1.0 0.321 ± 0.02 - -
0.40 0.333 ± 0.02 1.2 0.327 ± 0.01 - -
0.45 0.334 ± 0.02 - - - -
0.50 0.336 ± 0.02 - - - -

198
TABLE - 4.44
Comparison of the Diffusion Coefficients of Thymoquinone,Co(II), and Co(II)-Thymoquinone Complex
Working electrode = Glassy carbon
Reference electrode = Saturated calomel
Auxialary electrode = Platinum
Temperature = 25±1˚C
Current sensitivity = 1x10⁻⁴ A/VConcentration of Co(II)-Thymoquinone Complex (1:1) = 5x10⁻⁷ moles/cm3
Scan rate = 0.1 V/s
Supporting electrolyte = NaCl (0.1M)
Number of electron transfer = n = 1Area of Electrode = A = 0.0706 cm2
D1/2 = Ip / (2.69x10⁵) (n)3/2 AC (ν)1/2
Ipa
(A) D1/2 D(cm2 s-1)
Thymoquinone 1.017x10⁻⁵± 0.01 3.39 x 10⁻³ 1.15 x 10⁻⁵
Co(II) - - -
Co(II)-Thymoquinone - - -
Ipc
(A) D1/2 D(cm2 s-1)
Thymoquinone 2.717x10⁻⁵±0.01 9.06 x 10⁻³ 8.20 x 10⁻⁵
Co(II) - - -
Co(II)-Thymoquinone 1.743 x10⁻⁵±0.01 5.81 x 10⁻³ 3.38 x 10⁻⁵

199
TABLE - 4.45
Diffusion Coefficients of Co(II)-Thymoquinone Complex atDifferent Scan Rates
Working electrode = Glassy carbonReference electrode = Saturated calomelAuxialary electrode = PlatinumTemperature = 25±1˚C
Current sensitivity = 1x10⁻⁴ A/V
Concentration of Co(II)-Thymoquinone Complex = 5x10⁻⁷ moles/cm3
Supporting electrolyte = NaCl (0.1M)Number of electron transfer = n = 1
Area of Electrode = A = 0.0706 cm2
D1/2 = Ip / (2.69x10⁵) (n)3/2 AC (ν)1/2
ν(V/s) ν1/2 Ipa
x10-5(A) D1/2 D(cm2 s-1)
0.05 0.224 1.706 ± 0.01 8.02 x 10⁻³ 6.43 x 10⁻⁵
0.10 0.316 2.188 ± 0.01 7.29 x 10⁻³ 5.32 x 10⁻⁵
0.15 0.387 3.994 ± 0.02 1.09 x 10⁻² 1.18 x 10⁻⁴
0.20 0.447 4.417 ± 0.02 1.01 x 10⁻² 1.08 x 10⁻⁴
0.25 0.500 4.444 ± 0.02 9.36 x10⁻³ 8.76 x10⁻⁵
0.30 0.548 4.460 ± 0.01 8.57 x10⁻³ 7.35 x10⁻⁵
0.35 0.592 4.336 ± 0.01 7.71 x10⁻³ 5.95 x10⁻⁵
0.40 0.632 3.956 ± 0.01 6.59 x10⁻³ 4.35 x10⁻⁵
0.45 0.671 3.660 ± 0.01 5.74 x10⁻³ 3.30 x10⁻⁵
0.50 0.707 3.336 ± 0.01 4.97 x10⁻³ 2.47 x10⁻⁵
Average = 6.65(±0.02) x10-5
ν(V/s)
ν1/2 Ipc
x10-5 (A)D1/2 D
(cm2 s-1)0.05 0.224 -4.106 ± 0.01 1.93 x 10⁻² 3.73 x 10⁻⁴
0.10 0.316 -5.090 ± 0.01 1.70 x 10⁻² 2.88 x 10⁻⁴
0.15 0.387 -6.961 ± 0.01 1.90 x 10⁻² 3.59 x 10⁻⁴
0.20 0.447 -8.304 ± 0.01 1.96 x 10⁻² 3.83 x 10⁻⁴
0.25 0.500 -9.577 ± 0.01 2.02 x 10⁻² 4.07 x 10⁻⁴
0.30 0.548 -10.78± 0.01 2.08 x 10⁻² 4.30 x 10⁻⁴
0.35 0.592 -11.85± 0.01 2.11 x 10⁻² 4.45 x 10⁻⁴
0.40 0.632 -12.84± 0.01 2.14 x 10⁻² 4.58 x 10⁻⁴
0.45 0.671 -13.73± 0.01 2.16 x 10⁻² 4.65 x 10⁻⁴
0.50 0.707 -14.62± 0.01 2.18 x 10⁻² 4.75 x 10⁻⁴
Average = 4.08(±0.02) x10-4

200
TABLE - 4.46
Diffusion coefficients of Co(II)-Thymoquinone Complex atDifferent Concentrations
Working electrode = Glassy carbonReference electrode = Saturated calomelAuxialary electrode = PlatinumTemperature = 25±1̊ CCurrent sensitivity = 1x10⁻⁴ A/VScan rate = 0.1 V/sSupporting electrolyte = NaCl (0.1M)Number of electron transfer = n = 1
Area of Electrode = A = 0.0706 cm2
D1/2 = Ip / (2.69x10⁵) (n)3/2 AC (ν)1/2
Conc. x10-3 Ipa D1/2 D(moles/cm3) x 10-5 (A) (cm2 s-1)
0.2 1.490 ± 0.01 1.24 x 10⁻² 1.54 x 10⁻⁴
0.4 1.341 ± 0.01 5.59 x 10⁻³ 3.12 x 10⁻⁵
0.6 1.618 ± 0.01 4.49 x 10⁻³ 2.02 x 10⁻⁵
0.8 2.460 ± 0.02 5.12 x 10⁻³ 2.63 x 10⁻⁵
1.0 3.330 ± 0.01 5.55 x 10⁻³ 3.09 x 10⁻⁵
1.2 4.094 ± 0.02 5.68 x 10⁻³ 3.23 x 10⁻⁵
Average = 4.92(±0.02) x10-5
Conc. x10-3 Ipc D1/2 D(moles/cm3) x10-5 (A) (cm2 s-1)
0.2 3.365 ± 0.01 2.80 x 10⁻² 7.86 x 10⁻⁴
0.4 4.967 ± 0.01 2.07 x 10⁻² 4.28 x 10⁻⁴
0.6 6.637 ± 0.01 1.84 x 10⁻² 3.40 x 10⁻⁴
0.8 8.302 ± 0.01 1.73 x 10⁻² 2.99 x 10⁻⁴
1.0 9.817 ± 0.02 1.64 x 10⁻² 2.68 x 10⁻⁴
1.2 11.03 ± 0.01 1.53 x 10⁻² 2.35 x 10⁻⁴
Average = 3.93(±0.02) x10-4
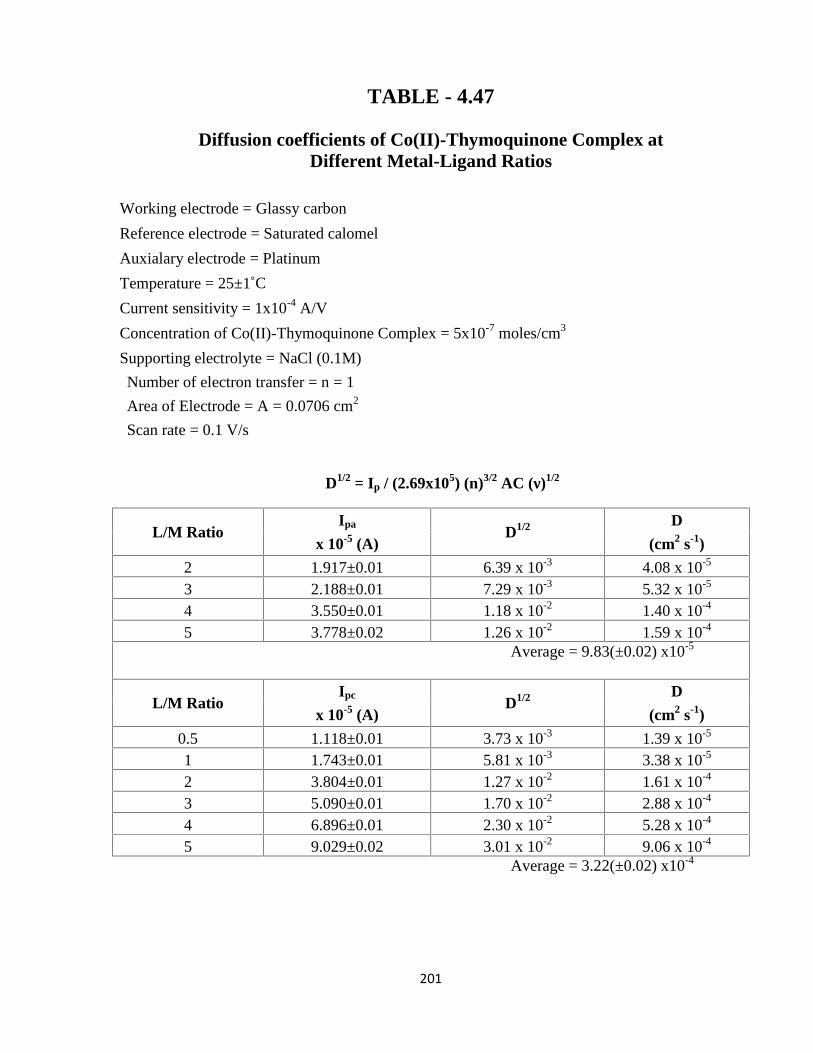
201
TABLE - 4.47
Diffusion coefficients of Co(II)-Thymoquinone Complex atDifferent Metal-Ligand Ratios
Working electrode = Glassy carbon
Reference electrode = Saturated calomel
Auxialary electrode = Platinum
Temperature = 25±1˚CCurrent sensitivity = 1x10⁻⁴ A/V
Concentration of Co(II)-Thymoquinone Complex = 5x10⁻⁷ moles/cm3
Supporting electrolyte = NaCl (0.1M)
Number of electron transfer = n = 1
Area of Electrode = A = 0.0706 cm2
Scan rate = 0.1 V/s
D1/2 = Ip / (2.69x10⁵) (n)3/2 AC (ν)1/2
L/M RatioIpa
D1/2 D
x 10-5 (A) (cm2 s-1)
2 1.917±0.01 6.39 x 10⁻³ 4.08 x 10⁻⁵
3 2.188±0.01 7.29 x 10⁻³ 5.32 x 10⁻⁵
4 3.550±0.01 1.18 x 10⁻² 1.40 x 10⁻⁴
5 3.778±0.02 1.26 x 10⁻² 1.59 x 10⁻⁴
Average = 9.83(±0.02) x10-5
L/M RatioIpc
D1/2 D
x 10-5 (A) (cm2 s-1)
0.5 1.118±0.01 3.73 x 10⁻³ 1.39 x 10⁻⁵
1 1.743±0.01 5.81 x 10⁻³ 3.38 x 10⁻⁵
2 3.804±0.01 1.27 x 10⁻² 1.61 x 10⁻⁴
3 5.090±0.01 1.70 x 10⁻² 2.88 x 10⁻⁴
4 6.896±0.01 2.30 x 10⁻² 5.28 x 10⁻⁴
5 9.029±0.02 3.01 x 10⁻² 9.06 x 10⁻⁴
Average = 3.22(±0.02) x10-4

202
TABLE - 4.48
Electrochemical Parameters of Cyclic Voltammograms of Thymoquinone,Cu(II), and Cu(II)-Thymoquinone Complex in NaCl
Working electrode = Glassy carbonReference electrode = Saturated calomelAuxialary electrode = PlatinumTemperature = 25±1˚C
Current sensitivity = 1x10⁻⁴ A/VScan rate = 0.1 V/s
Concentration of Thymoquinone solution = 5x10⁻⁴M
Concentration of Cu(II) solution = 5x10⁻⁴M
Concentration of Cu(II)-Thymoquinone Complex(1:1) = 5x10⁻⁴MSupporting electrolyte = NaCl (0.1M)
Ipa
(A)Ipc
(A)Epa
(V/s)Epc
(V/s)
Thymoquinone 1.017x10⁻⁵± 0.01 2.717x10⁻⁵± 0.01 -0.242 ± 0.01 -0.326 ± 0.01
Cu(II) 5.916 x10⁻⁶± 0.01 7.061x10⁻⁶± 0.01 0.125 ± 0.01 0.051 ± 0.01
Cu(II)-Thymoquinone 5.581x10⁻⁶± 0.01 7.514x10⁻⁶± 0.01 0.128 ± 0.01 0.040 ± 0.01

203
TABLE - 4.49
The Values of Ep, Ep/2, Ep-Ep/2, Epa-Epc and Ip from Voltammograms ofCu(II)-Thymoquinone Complex in NaCl at Different Scan Rates
Working electrode = Glassy carbonReference electrode = Saturated calomelAuxialary electrode = PlatinumTemperature = 25±1˚C
Current sensitivity = 1x10⁻⁴ A/V
Concentration of Cu(II)-Thymoquinone Complex(1:2) = 5x10⁻⁴MSupporting electrolyte = NaCl (0.1M)
Scan rate(V/s)
Epa
(V)Epa/2
(V)Epa-Epa/2
(V)Ipa
x10-6 (A) Ipa/Ipcβnb=0.048/
Epa-Epa/2
0.04 0.129 ± 0.01 0.064±0.01 0.065±0.01 3.125 ± 0.01 0.691 ±0.01 0.738 ± 0.01
0.10 0.132 ± 0.01 0.067±0.01 0.065±0.01 4.273 ± 0.01 0.632 ±0.01 0.738 ± 0.01
0.14 0.134 ± 0.01 0.068±0.01 0.066±0.01 4.149 ± 0.01 0.562±0.01 0.727 ± 0.01
0.20 0.138 ± 0.01 0.073±0.01 0.065±0.01 3.631 ± 0.01 0.445 ±0.01 0.738± 0.01
0.25 0.137 ± 0.01 0.075±0.01 0.062±0.01 2.554 ± 0.01 0.315 ±0.01 0.774 ± 0.01
0.30 0.138 ± 0.01 0.080±0.01 0.058±0.01 3.695± 0.01 0.399 ±0.01 0.828 ± 0.01
0.35 0.138 ± 0.01 0.085±0.01 0.053±0.01 1.580 ± 0.01 0.098 ±0.01 0.906 ± 0.01
0.42 0.139 ± 0.01 0.089±0.01 0.050±0.01 2.073 ± 0.01 0.200 ±0.01 0.960 ± 0.01
0.46 0.138 ±0.01 0.094±0.01 0.044±0.01 1.241 ± 0.01 0.123 ±0.01 1.09 ± 0.01
0.50 - - - - - -
Scan rate(V/s)
Epc
(V)Epc/2
(V)Epc-Epc/2
(V)Epa-Epc
(V)Ipc
x10-6 (A)αna=0.048/
Epc-Epc/2
0.04 0.045 ± 0.01 0.103 ± 0.01 -0.058±0.01 0.084±0.01 4.523 ± 0.01 0.828 ± 0.01
0.10 0.041 ± 0.01 0.099 ± 0.01 -0.058±0.01 0.091±0.01 6.759 ± 0.01 0.828 ± 0.01
0.14 0.039 ± 0.01 0.097 ± 0.01 -0.058±0.01 0.095±0.01 7.384 ± 0.01 0.828 ± 0.01
0.20 0.035 ± 0.01 0.097 ± 0.01 -0.062±0.01 0.103±0.01 8.164 ± 0.01 0.774 ± 0.01
0.25 0.033 ± 0.01 0.097 ± 0.01 -0.064±0.01 0.104±0.01 8.115 ± 0.01 0.750 ± 0.01
0.30 0.032 ± 0.01 0.096 ± 0.01 -0.064±0.01 0.106±0.01 9.253± 0.01 0.750 ± 0.01
0.35 0.031 ± 0.01 0.096 ± 0.01 -0.065±0.01 0.107±0.01 7.961± 0.01 0.738 ± 0.01
0.42 0.025 ± 0.02 0.094 ± 0.01 -0.069±0.01 0.114±0.01 10.34± 0.01 0.696 ± 0.01
0.46 0.027 ± 0.01 0.093 ± 0.01 -0.066±0.01 0.111±0.01 10.26± 0.01 0.727 ± 0.01
0.50 0.024 ± 0.02 0.092 ± 0.01 -0.068±0.01 - 9.425± 0.01 0.706 ± 0.01

204
TABLE - 4.50
The Values of Ep, Ep/2, Ep-Ep/2, Epa-Epc, Ipa, αna and βnb fromCyclic Voltammograms of Cu(II)-Thymoquinone Complex
in NaCl with Different ConcentrationsWorking electrode = Glassy carbonReference electrode = Saturated calomelAuxialary electrode = PlatinumTemperature = 25±1˚C
Current sensitivity = 1x10⁻⁴ A/VScan rate = 0.1 V/s
Supporting electrolyte = NaCl (0.1M)
Conc.x10-3 M
Epa
(V)Epa/2
(V)Epa-Epa/2
(V)Ipa
x10-5 (A)Ipa/Ipc
βnb=0.048/Epa-Epa/2
0.02 - - - - - -0.1 - - - - - -
0.2 0.121 ± 0.01 0.061 ± 0.01 0.06± 0.01 0.1592 ± 0.01 0.495 0.800±0.01
0.4 0.129 ± 0.01 0.073 ± 0.01 0.056± 0.01 0.2758 ± 0.01 0.472 0.857±0.01
0.6 0.135 ± 0.02 0.078 ± 0.02 0.057± 0.02 0.6941 ± 0.01 0.717 0.842±0.01
0.8 0.138 ± 0.01 0.081 ± 0.01 0.057± 0.01 1.040 ± 0.01 0.834 0.842±0.01
1.0 0.141 ± 0.01 0.084 ± 0.02 0.057± 0.01 1.123 ± 0.01 0.871 0.842±0.01
1.2 0.145 ± 0.01 0.086 ± 0.01 0.059± 0.01 1.365 ± 0.01 0.896 0.813±0.01
1.4 0.149 ± 0.01 0.091 ± 0.01 0.058± 0.01 1.911 ± 0.01 0.993 0.828±0.01
1.6 0.148 ± 0.03 0.095 ± 0.01 0.053± 0.01 2.478 ± 0.02 1.076 0.905±0.01
Conc.x10-3 M
Epc
(V)Epc/2
(V)Epc-Epc/2
(V)Epa-Epc
(V)Ipc
x10-5 (A)αna=0.048/Epc-Epc/2
0.02 - - - - - -0.1 - - - - - -
0.2 0.042 ± 0.01 0.11 ± 0.01 -0.068 ± 0.01 0.079± 0.01 0.3215±0.01 0.706± 0.01
0.4 0.045 ± 0.01 0.112 ± 0.01 -0.067 ± 0.01 0.084± 0.01 0.5841±0.01 0.716± 0.01
0.6 0.048 ± 0.02 0.114 ± 0.02 -0.066 ± 0.02 0.087± 0.02 0.9682±0.01 0.727± 0.01
0.8 0.049 ± 0.01 0.116 ± 0.01 -0.067 ± 0.01 0.089± 0.01 1.247 ± 0.01 0.716± 0.01
1.0 0.049 ± 0.01 0.116 ± 0.01 -0.067 ± 0.01 0.092± 0.01 1.289 ± 0.01 0.716± 0.01
1.2 0.049 ± 0.01 0.116 ± 0.01 -0.067 ± 0.01 0.096± 0.01 1.524 ± 0.01 0.716± 0.01
1.4 0.049 ± 0.02 0.116 ± 0.02 -0.067 ± 0.01 0.100± 0.01 1.924 ± 0.01 0.716± 0.01
1.6 0.048 ± 0.01 0.116 ± 0.01 -0.068 ± 0.01 0.100± 0.01 2.303 ± 0.01 0.706± 0.01

205
TABLE - 4.51
The Values of Ep, Ep/2, Epa-Epc, Ip, αna and βnb from Cyclic-Voltammograms of Cu(II)-Thymoquinone Complex in NaCl with Different
Metal-ligand Ratios
Working electrode = Glassy carbonReference electrode = Saturated calomelAuxialary electrode = PlatinumTemperature = 25±1˚C
Current sensitivity = 1x10⁻⁴ A/VScan rate = 0.1 V/s
Concentration of Cu(II)-Thymoquinone Complex = 5x10⁻⁴ MSupporting electrolyte = NaCl (0.1M)
Ratio L/M Epa
(V)Epa/2
(V)Epa-Epa/2
(V)Ipa
x10-6 (A)Ipa/Ipc
βnb=0.048/Epa-Epa/2
1 0.127±0.01 0.068 ±0.01 0.059 ±0.01 5.083 ±0.01 0.751 ±0.01 0.814 ±0.01
2 0.129±0.02 0.069 ±0.02 0.060 ±0.02 5.581 ±0.02 0.743 ±0.02 0.800 ±0.01
3 0.134±0.02 0.071 ±0.01 0.063 ±0.01 5.880 ±0.01 0.773 ±0.01 0.762 ±0.02
4 0.134±0.01 0.071 ±0.01 0.063 ±0.01 5.169 ±0.01 0.659 ±0.01 0.762 ±0.01
5 0.134±0.01 0.071 ±0.01 0.063 ±0.01 4.391 ±0.01 0.615 ±0.01 0.762 ±0.01
Ratio L/M Epc
(V)Epc/2
(V)Epc-Epc/2
(V)Epa-Epc
(V)Ipc
x10-6 (A)αna=0.048/Epa-Epa/2
1 0.038±0.01 0.103 ±0.01 -0.065 ±0.01 0.089 ±0.01 6.767 ±0.01 0.738 ±0.01
2 0.039±0.03 0.104 ±0.02 -0.065 ±0.01 0.090 ±0.01 7.514 ±0.03 0.738 ±0.01
3 0.045±0.01 0.107 ±0.01 -0.062 ±0.01 0.090 ±0.02 7.607 ±0.01 0.774 ±0.01
4 0.051±0.01 0.112 ±0.01 -0.061 ±0.01 0.083 ±0.01 7.845 ±0.01 0.787 ±0.01
5 0.051±0.02 0.112 ±0.02 -0.061 ±0.02 0.083 ±0.01 7.138 ±0.02 0.787 ±0.01

206
TABLE - 4.52
The Values of Half Wave Potential (E˚= E1/2) from Cyclic- Voltammograms ofCu(II)-Thymoquinone Complex at Different Scan Rates, with Different
Concentrations and Metal-Ligand Ratios
Working electrode = Glassy carbonReference electrode = Saturated calomelAuxialary electrode = PlatinumTemperature = 25±1˚C
Current sensitivity = 1x10⁻⁴ A/VSupporting electrolyte = NaCl (0.1M)
Scan rate(V/s)
(E˚)a(V)
Conc.x10-3 M
(E˚)a(V)
Ratio L/M (E˚)a(V)
0.04 0.097 ± 0.01 0.02 - 1 0.0985 ± 0.01
0.10 0.010 ± 0.02 0.1 - 2 0.0995 ± 0.02
0.14 0.101 ± 0.01 0.2 0.091 ± 0.01 3 0.1030 ± 0.02
0.20 0.106 ± 0.01 0.4 0.101 ± 0.01 4 0.1025 ± 0.01
0.25 0.106 ± 0.01 0.6 0.106 ± 0.01 5 0.1025 ± 0.01
0.30 0.109 ± 0.01 0.8 0.109 ± 0.01 - -
0.35 0.112 ± 0.01 1.0 0.112 ± 0.02 - -
0.42 0.114 ± 0.01 1.2 0.115 ± 0.01 - -
0.46 0.116 ± 0.01 1.4 0.120 ± 0.01 - -
0.50 - 1.6 0.1215 ± 0.02 - -Scan rate
(V/s)(E˚)c
(V)Conc.
x10-3 M(E˚)c(V)
Ratio L/M (E˚)c(V)
0.04 0.074 ± 0.01 0.02 - 1 0.0705 ± 0.01
0.10 0.070 ± 0.01 0.1 - 2 0.0715 ± 0.03
0.14 0.068 ± 0.01 0.2 0.076 ± 0.01 3 0.0760 ± 0.01
0.20 0.066 ± 0.01 0.4 0.0785 ± 0.01 4 0.0815 ± 0.01
0.25 0.065 ± 0.01 0.6 0.082 ± 0.02 5 0.0815 ± 0.02
0.30 0.064 ± 0.01 0.8 0.0825 ± 0.01 - -
0.35 0.064 ± 0.01 1.0 0.0825 ± 0.01 - -
0.42 0.060± 0.02 1.2 0.082 ± 0.01 - -
0.46 0.060± 0.02 1.4 0.0815 ± 0.02 - -
0.50 0.058± 0.02 1.6 0.0805 ± 0.01 - -

207
TABLE - 4.53
Comparison of the Diffusion Coefficients of Thymoquinone,Cu(II), and Cu(II)-Thymoquinone Complex in NaCl
Working electrode = Glassy carbon
Reference electrode = Saturated calomel
Auxialary electrode = Platinum
Temperature = 25±1˚C
Current sensitivity = 1x10⁻⁴ A/VConcentration of Cu(II)-Thymoquinone Complex (1:1) = 5x10⁻⁷ moles/cm3
Scan rate = 0.1 V/s
Supporting electrolyte = NaCl (0.1 M)
Number of electron transfer = n = 1Area of Electrode = A = 0.0706 cm2
D1/2 = Ip/ (2.69x10⁵) (n)3/2 AC (ν)1/2
Ipa
(A)D1/2 D
(cm2 s-1)
Thymoquinone 1.017x10⁻⁵± 0.01 3.39 x 10⁻³ 1.15 x 10⁻⁵
Cu(II) 5.916 x10⁻⁶± 0.01 1.97 x 10⁻³ 3.90 x 10⁻⁶
Cu(II)-Thymoquinone 5.581x10⁻⁶± 0.01 1.86 x 10⁻³ 3.46 x 10⁻⁶
Ipc
(A)D1/2 D
(cm2 s-1)
Thymoquinone 2.717x10⁻⁵±0.01 9.06 x 10⁻³ 8.20 x 10⁻⁵
Cu(II) 7.061x10⁻⁶± 0.01 2.354 x 10⁻³ 5.54 x 10⁻⁶
Cu(II)-Thymoquinone 7.514x10⁻⁶± 0.01 2.505 x 10⁻³ 6.27 x 10⁻⁶

208
TABLE - 4.54
Diffusion Coefficients of Cu(II)-Thymoquinone Complex in NaCl at
Different Scan Rates
Working electrode = Glassy carbon
Reference electrode = Saturated calomel
Auxialary electrode = PlatinumTemperature = 25±1˚C
Current sensitivity = 1x10⁻⁴ A/V
Concentration of Cu(II)-Thymoquinone Complex = 5x10⁻⁷ moles/cm3
Supporting electrolyte = NaCl (0.1M)
Number of electron transfer = n = 1
Area of Electrode = A = 0.0706 cm2
D1/2 = Ip / (2.69x10⁵) (n)3/2 AC (ν)1/2
ν(V/s)
ν1/2 Ipa
x10-6(A)D1/2 D
(cm2 s-1)0.04 0.2 3.125 ± 0.01 1.65 x 10⁻³ 2.71 x 10⁻⁶
0.06 0.245 3.614 ± 0.01 1.54 x 10⁻³ 2.41 x 10⁻⁶
0.09 0.300 4.459 ± 0.01 1.57 x 10⁻³ 2.45 x 10⁻⁶
0.10 0.316 4.273 ± 0.01 1.42 x 10⁻³ 2.03 x 10⁻⁶
0.12 0.346 4.420 ± 0.01 1.35 x 10⁻³ 1.81 x 10⁻⁶
0.14 0.374 4.149± 0.01 1.17 x 10⁻³ 1.37 x 10⁻⁶
0.16 0.400 4.053± 0.01 1.07 x 10⁻³ 1.14 x 10⁻⁶
0.25 0.5 2.554 ± 0.01 5.38 x 10⁻⁴ 2.90 x 10⁻⁷
0.26 0.51 5.808 ± 0.02 1.20 x 10⁻³ 1.44 x 10⁻⁶
0.27 0.52 5.258 ± 0.02 1.07 x 10⁻³ 1.13 x 10⁻⁶
Average = 1.68(±0.03) x10-6
ν(V/s) ν1/2 Ipc
x10-6 (A) D1/2 D(cm2 s-1)
0.04 0.2 4.523 ± 0.01 2.38 x 10⁻³ 5.67 x 10⁻⁶
0.06 0.245 5.411 ± 0.01 2.33 x 10⁻³ 5.41 x 10⁻⁶
0.09 0.300 6.725 ± 0.01 2.36 x 10⁻³ 5.57 x 10⁻⁶
0.10 0.316 6.759 ± 0.01 2.25 x 10⁻³ 5.08 x 10⁻⁶
0.12 0.346 7.200 ± 0.01 2.19 x 10⁻³ 4.80 x 10⁻⁶
0.14 0.374 7.384 ± 0.01 2.08 x 10⁻³ 4.32 x 10⁻⁶
0.16 0.400 7.661 ± 0.01 2.02 x 10⁻³ 4.07 x 10⁻⁶
0.25 0.5 8.115 ± 0.01 1.71 x 10⁻³ 2.92 x 10⁻⁶
0.26 0.51 10.94 ± 0.01 2.26 x 10⁻³ 5.10 x 10⁻⁶
0.27 0.52 10.40 ± 0.01 2.11 x 10⁻³ 4.44 x 10⁻⁶
Average = 4.74(±0.02) x10-6
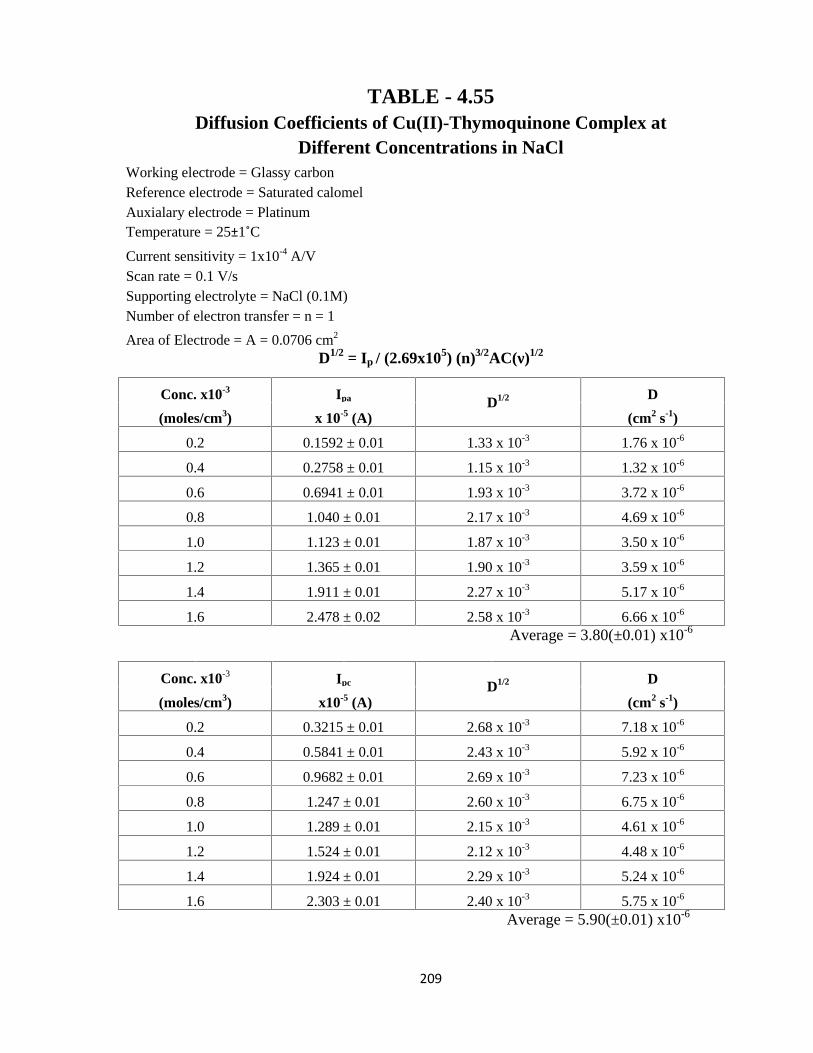
209
TABLE - 4.55Diffusion Coefficients of Cu(II)-Thymoquinone Complex at
Different Concentrations in NaClWorking electrode = Glassy carbonReference electrode = Saturated calomelAuxialary electrode = PlatinumTemperature = 25±1˚C
Current sensitivity = 1x10⁻⁴ A/VScan rate = 0.1 V/sSupporting electrolyte = NaCl (0.1M)Number of electron transfer = n = 1
Area of Electrode = A = 0.0706 cm2
D1/2 = Ip / (2.69x10⁵) (n)3/2AC(ν)1/2
Conc. x10-3 Ipa D1/2 D
(moles/cm3) x 10-5 (A) (cm2 s-1)
0.2 0.1592 ± 0.01 1.33 x 10⁻³ 1.76 x 10⁻⁶
0.4 0.2758 ± 0.01 1.15 x 10⁻³ 1.32 x 10⁻⁶
0.6 0.6941 ± 0.01 1.93 x 10⁻³ 3.72 x 10⁻⁶
0.8 1.040 ± 0.01 2.17 x 10⁻³ 4.69 x 10⁻⁶
1.0 1.123 ± 0.01 1.87 x 10⁻³ 3.50 x 10⁻⁶
1.2 1.365 ± 0.01 1.90 x 10⁻³ 3.59 x 10⁻⁶
1.4 1.911 ± 0.01 2.27 x 10⁻³ 5.17 x 10⁻⁶
1.6 2.478 ± 0.02 2.58 x 10⁻³ 6.66 x 10⁻⁶
Average = 3.80(±0.01) x10-6
Conc. x10-3 Ipc D1/2 D
(moles/cm3) x10-5 (A) (cm2 s-1)
0.2 0.3215 ± 0.01 2.68 x 10⁻³ 7.18 x 10⁻⁶
0.4 0.5841 ± 0.01 2.43 x 10⁻³ 5.92 x 10⁻⁶
0.6 0.9682 ± 0.01 2.69 x 10⁻³ 7.23 x 10⁻⁶
0.8 1.247 ± 0.01 2.60 x 10⁻³ 6.75 x 10⁻⁶
1.0 1.289 ± 0.01 2.15 x 10⁻³ 4.61 x 10⁻⁶
1.2 1.524 ± 0.01 2.12 x 10⁻³ 4.48 x 10⁻⁶
1.4 1.924 ± 0.01 2.29 x 10⁻³ 5.24 x 10⁻⁶
1.6 2.303 ± 0.01 2.40 x 10⁻³ 5.75 x 10⁻⁶
Average = 5.90(±0.01) x10-6

210
TABLE - 4.56
Diffusion Coefficients of Cu(II)-Thymoquinone Complex at
Different Metal-Ligand Ratios in NaCl
Working electrode = Glassy carbon
Reference electrode = Saturated calomel
Auxialary electrode = Platinum
Temperature = 25±1˚CCurrent sensitivity = 1x10⁻⁴ A/V
Concentration of Cu(II)-Thymoquinone Complex = 5x10⁻⁷ moles/cm3
Supporting electrolyte = NaCl (0.1M)
Number of electron transfer = n = 1
Area of Electrode = A = 0.0706 cm2
Scan rate = 0.1 V/s
D1/2 = Ip / (2.69x10⁵) (n)3/2 AC (ν)1/2
L/M RatioIpa D1/2 D
x 10-6 (A) (cm2 s-1)1 5.083 ±0.01 1.69 x 10⁻³ 2.87 x 10⁻⁶
2 5.581 ±0.02 1.86 x 10⁻³ 3.46 x 10⁻⁶
3 5.880 ±0.01 1.96 x 10⁻³ 3.84 x 10⁻⁶
4 5.169 ±0.01 1.72 x 10⁻³ 2.97 x 10⁻⁶
5 4.391 ±0.01 1.46 x 10⁻³ 2.14 x 10⁻⁶
Average = 3.06(±0.01) x10-6
L/M Ratio Ipc
x 10-6D1/2 D
(cm2 s-1)1 6.767 ±0.01 2.26 x 10⁻³ 5.09 x 10⁻⁶
2 7.514 ±0.03 2.51 x 10⁻³ 6.27 x 10⁻⁶
3 7.607 ±0.01 2.54 x 10⁻³ 6.43 x 10⁻⁶
4 7.845 ±0.01 2.62 x 10⁻³ 6.84 x 10⁻⁶
5 7.138 ±0.02 2.38 x 10⁻³ 5.66 x 10⁻⁶
Average = 6.06(±0.01) x10-6

211
TABLE - 4.57
Electrochemical Parameters of Cyclic Voltammograms of Thymoquinone,Cu(II), and Cu(II)-Thymoquinone Complex in LiCl
Working electrode = Glassy carbonReference electrode = Saturated calomelAuxialary electrode = PlatinumTemperature = 25±1˚C
Current sensitivity = 1x10⁻⁴ A/VScan rate = 0.1 V/s
Concentration of Thymoquinone solution = 5x10⁻⁴ M
Concentration of Cu(II) solution = 5x10⁻⁴ M
Concentration of Cu(II)-Thymoquinone Complex(1:1) = 5x10⁻⁴ MSupporting electrolyte = LiCl (0.1M)
Ipa
(A)Ipc
(A)Epa
(V/s)Epc
(V/s)
Thymoquinone 1.969x10⁻⁷± 0.01 - 0.326 ± 0.01 -
Cu(II) 6.499 x10⁻⁶± 0.01 7.964x10⁻⁶± 0.01 0.129 ± 0.01 0.054 ± 0.01
Cu(II)-Thymoquinone 6.221x10⁻⁶± 0.01 7.598x10⁻⁶± 0.01 0.128 ± 0.01 0.050 ± 0.01

212
TABLE - 4.58
The Values of Ep, Ep/2, Ep-Ep/2, Epa-Epc and Ip from Voltammograms of
Cu(II)-Thymoquinone Complex in LiCl at Different Scan Rates
Working electrode = Glassy carbonReference electrode = Saturated calomelAuxialary electrode = PlatinumTemperature = 25±1˚C
Current sensitivity = 1x10⁻⁴ A/V
Concentration of Cu(II)-Thymoquinone Complex(1:2) = 5x10⁻⁴ MSupporting electrolyte = LiCl (0.1M)
Scanrate(V/s)
Epa
(V)Epa/2
(V)Epa-Epa/2
(V)Ipa
x10-6 (A) Ipa/Ipc βnb
0.05 0.129 ± 0.01 0.069 ± 0.01 0.060 ± 0.01 3.444 ± 0.01 0.717 ± 0.01 0.800 ± 0.010.10 0.132 ± 0.01 0.071 ± 0.01 0.061 ± 0.01 5.361 ± 0.01 0.743 ± 0.01 0.787 ± 0.010.15 0.135 ± 0.01 0.074 ± 0.01 0.061 ± 0.01 6.619 ± 0.02 0.745 ± 0.01 0.787 ± 0.010.20 0.136 ± 0.01 0.076 ± 0.01 0.060 ± 0.01 5.031 ± 0.01 0.604 ± 0.01 0.800 ± 0.010.25 0.136 ± 0.01 0.077 ± 0.01 0.059 ± 0.01 5.988 ± 0.01 0.627 ± 0.01 0.814 ± 0.010.30 0.136 ± 0.02 0.077 ± 0.02 0.059 ± 0.02 5.437 ± 0.01 0.570 ± 0.01 0.814 ± 0.02
Scanrate(V/s)
Epc
(V)Epc/2
(V)Epc-Epc/2
(V)Epa-Epc
(V)Ipc
x10-6 (A) αna
0.05 0.047 ± 0.01 0.113 ± 0.01 -0.066±0.01 0.082 ± 0.01 4.801 ± 0.01 0.727 ± 0.010.10 0.048 ± 0.01 0.115 ± 0.01 -0.067±0.01 0.084 ± 0.01 7.213 ± 0.01 0.716 ± 0.010.15 0.049 ± 0.01 0.115 ± 0.01 -0.066±0.01 0.086 ± 0.01 8.885 ± 0.01 0.727 ± 0.010.20 0.051 ± 0.01 0.117 ± 0.01 -0.066±0.01 0.085 ± 0.01 8.329 ± 0.01 0.727 ± 0.010.25 0.052 ± 0.01 0.117 ± 0.01 -0.065±0.01 0.084 ± 0.01 9.556 ± 0.01 0.738 ± 0.010.30 0.053 ± 0.02 0.117 ± 0.02 -0.064±0.02 0.083 ± 0.01 9.536 ± 0.01 0.750 ± 0.02

213
TABLE - 4.59
The Values of Ep, Ep/2, Ep-Ep/2, Epa-Epc, Ipa, αna and βnb from Cyclic-Voltammograms of Cu(II)-Thymoquinone Complex
in LiCl with Different Concentrations
Working electrode = Glassy carbonReference electrode = Saturated calomelAuxialary electrode = PlatinumTemperature = 25±1˚CCurrent sensitivity = 1x10⁻⁴ A/VScan rate = 0.1 V/sSupporting electrolyte = LiCl (0.1M)
Conc.x10-3
M
Epa
(V)Epa/2
(V)Epa-Epa/2
(V)Ipa
x10-6 (A) Ipa/Ipcβnb=0.048/Epa-Epa/2
0.02 0.118 ± 0.01 0.056 ± 0.01 0.062±0.01 0.1923 ± 0.01 0.256 0.774± 0.010.1 0.126 ± 0.01 0.063 ± 0.01 0.063±0.01 0.8150 ± 0.01 0.475 0.762± 0.010.2 0.131 ± 0.01 0.068 ± 0.01 0.063±0.01 1.901 ± 0.01 0.611 0.762± 0.010.4 0.137 ± 0.02 0.073 ± 0.02 0.064±0.01 4.734 ± 0.01 0.776 0.75± 0.010.6 0.139 ± 0.01 0.075 ± 0.01 0.064±0.01 6.978 ± 0.01 0.773 0.75± 0.010.8 0.145 ± 0.01 0.081 ± 0.01 0.064±0.01 7.999 ± 0.01 0.865 0.75± 0.011.0 0.149 ± 0.01 0.083 ± 0.01 0.066±0.01 10.95 ± 0.01 0.918 0.727± 0.011.2 0.152 ± 0.01 0.086 ± 0.01 0.066±0.01 15.54 ± 0.01 0.953 0.727± 0.011.4 0.153 ± 0.02 0.088 ± 0.01 0.065±0.01 18.68 ± 0.01 1.00 0.738± 0.011.6 0.155 ± 0.01 0.090 ± 0.01 0.065±0.01 21.99 ± 0.01 1.04 0.738± 0.01
Conc.x10-3
M
Epc
(V)Epc/2
(V)Epc-Epc/2
(V)Epa-Epc
(V)Ipc
x10-6 (A)αna=0.048/Epc-Epc/2
0.02 0.038 ± 0.01 0.101 ± 0.01 -0.063±0.01 0.08± 0.01 0.7508±0.01 0.762± 0.010.1 0.045 ± 0.01 0.106 ± 0.01 -0.061±0.01 0.081± 0.01 1.716 ± 0.01 0.787± 0.010.2 0.047 ± 0.01 0.109 ± 0.01 -0.062±0.01 0.084± 0.01 3.110 ± 0.01 0.774± 0.01
0.4 0.049 ± 0.01 0.110 ± 0.01 -0.051±0.01 0.088± 0.01 6.103 ± 0.01 0.941± 0.010.6 0.050 ± 0.01 0.111 ± 0.01 -0.061±0.01 0.089± 0.01 9.032 ± 0.01 0.787± 0.01
0.8 0.050 ± 0.02 0.111 ± 0.02 -0.061±0.01 0.095± 0.01 9.243 ± 0.01 0.787± 0.011.0 0.050 ± 0.01 0.111 ± 0.01 -0.061±0.01 0.099± 0.01 11.917±0.01 0.787± 0.01
1.2 0.050 ± 0.01 0.111 ± 0.01 -0.061±0.01 0.102± 0.01 16.31 ± 0.01 0.787± 0.011.4 0.050 ± 0.01 0.111 ± 0.01 -0.061±0.01 0.103± 0.01 18.68 ± 0.01 0.787± 0.01
1.6 0.050 ± 0.01 0.111 ± 0.01 -0.061±0.01 0.105± 0.01 21.03 ± 0.01 0.787± 0.01
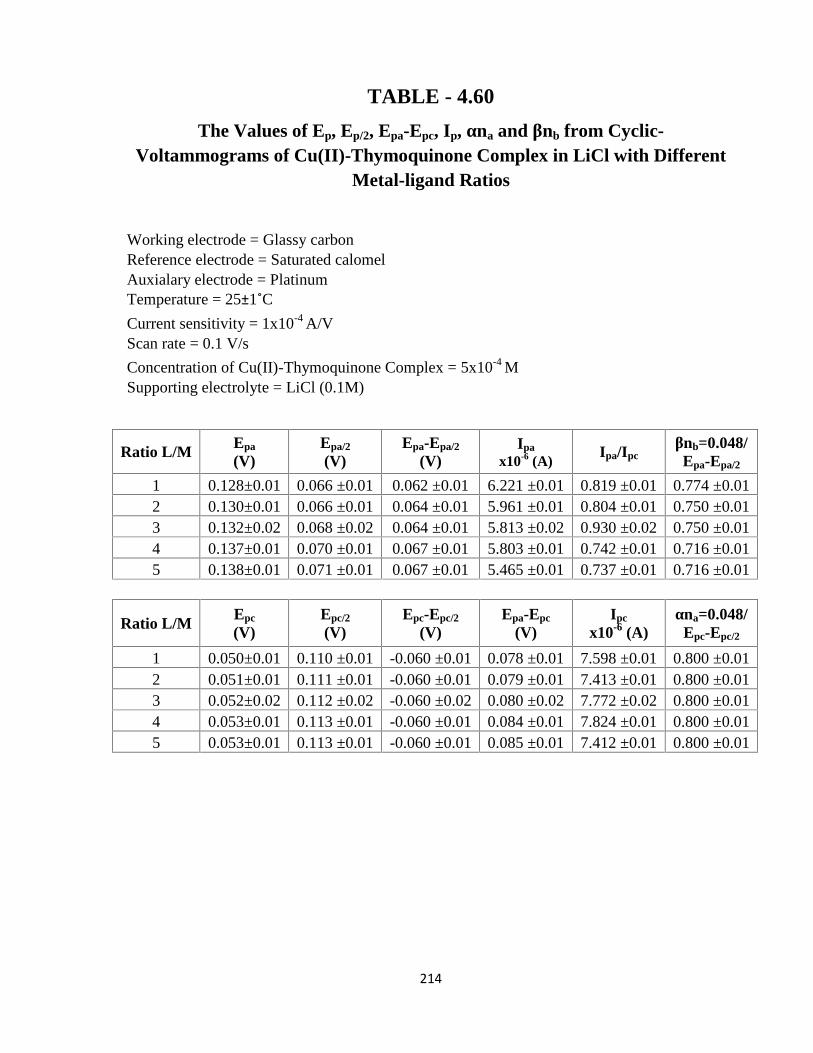
214
TABLE - 4.60
The Values of Ep, Ep/2, Epa-Epc, Ip, αna and βnb from Cyclic-Voltammograms of Cu(II)-Thymoquinone Complex in LiCl with Different
Metal-ligand Ratios
Working electrode = Glassy carbonReference electrode = Saturated calomelAuxialary electrode = PlatinumTemperature = 25±1˚C
Current sensitivity = 1x10⁻⁴ A/VScan rate = 0.1 V/s
Concentration of Cu(II)-Thymoquinone Complex = 5x10⁻⁴ MSupporting electrolyte = LiCl (0.1M)
Ratio L/M Epa
(V)Epa/2
(V)Epa-Epa/2
(V)Ipa
x10-6 (A)Ipa/Ipc
βnb=0.048/Epa-Epa/2
1 0.128±0.01 0.066 ±0.01 0.062 ±0.01 6.221 ±0.01 0.819 ±0.01 0.774 ±0.012 0.130±0.01 0.066 ±0.01 0.064 ±0.01 5.961 ±0.01 0.804 ±0.01 0.750 ±0.013 0.132±0.02 0.068 ±0.02 0.064 ±0.01 5.813 ±0.02 0.930 ±0.02 0.750 ±0.014 0.137±0.01 0.070 ±0.01 0.067 ±0.01 5.803 ±0.01 0.742 ±0.01 0.716 ±0.015 0.138±0.01 0.071 ±0.01 0.067 ±0.01 5.465 ±0.01 0.737 ±0.01 0.716 ±0.01
Ratio L/MEpc
(V)Epc/2
(V)Epc-Epc/2
(V)Epa-Epc
(V)Ipc
x10-6 (A)αna=0.048/
Epc-Epc/2
1 0.050±0.01 0.110 ±0.01 -0.060 ±0.01 0.078 ±0.01 7.598 ±0.01 0.800 ±0.012 0.051±0.01 0.111 ±0.01 -0.060 ±0.01 0.079 ±0.01 7.413 ±0.01 0.800 ±0.013 0.052±0.02 0.112 ±0.02 -0.060 ±0.02 0.080 ±0.02 7.772 ±0.02 0.800 ±0.014 0.053±0.01 0.113 ±0.01 -0.060 ±0.01 0.084 ±0.01 7.824 ±0.01 0.800 ±0.015 0.053±0.01 0.113 ±0.01 -0.060 ±0.01 0.085 ±0.01 7.412 ±0.01 0.800 ±0.01

215
TABLE - 4.61
The Values of Half Wave Potential (E˚= E1/2) from Cyclic- Voltammograms ofCu(II)-Thymoquinone Complex at Different Scan Rates, with Different
Concentrations and Metal-Ligand Ratios
Working electrode = Glassy carbonReference electrode = Saturated calomelAuxialary electrode = PlatinumTemperature = 25±1˚C
Current sensitivity = 1x10⁻⁴ A/VSupporting electrolyte = LiCl (0.1M)
Scan rate(V/s)
(E˚)a
(V)Conc.
x10-3 M(E˚)a
(V) Ratio L/M(E˚)a
(V)0.05 0.099 ± 0.01 0.02 0.087 ± 0.01 1 0.097 ± 0.01
0.10 0.102 ± 0.01 0.1 0.095 ± 0.01 2 0.098 ± 0.01
0.15 0.105 ± 0.01 0.2 0.100 ± 0.01 3 0.100 ± 0.01
0.20 0.106 ± 0.01 0.4 0.105 ± 0.02 4 0.103 ± 0.01
0.25 0.107 ± 0.01 0.6 0.107 ± 0.01 5 0.104 ± 0.01
0.30 0.107 ± 0.02 0.8 0.113 ± 0.01 - -
- - 1.0 0.116 ± 0.01 - -
- - 1.2 0.119 ± 0.01 - -
- - 1.4 0.120 ± 0.01 - -
- - 1.6 0.122 ± 0.01 - -Scan rate
(V/s)(E˚)c
(V)Conc.
x10-3 M(E˚)c
(V) Ratio L/M(E˚)c
(V)0.05 0.080 ± 0.01 0.02 0.070 ± 0.01 1 0.080 ± 0.01
0.10 0.082 ± 0.01 0.1 0.076 ± 0.01 2 0.081 ± 0.01
0.15 0.082 ± 0.01 0.2 0.078 ± 0.01 3 0.082 ± 0.01
0.20 0.084 ± 0.01 0.4 0.080 ± 0.01 4 0.083 ± 0.01
0.25 0.085 ± 0.01 0.6 0.081 ± 0.01 5 0.083 ± 0.01
0.30 0.085 ± 0.02 0.8 0.081 ± 0.02 - -
- - 1.0 0.081 ± 0.01 - -
- - 1.2 0.081 ± 0.01 - -
- - 1.4 0.081 ± 0.01 - -
- - 1.6 0.081 ± 0.01 - -

216
TABLE - 4.62
Comprison of the Diffusion Coefficients of Thymoquinone,Cu(II), and Cu(II)-Thymoquinone Complex
Working electrode = Glassy carbon
Reference electrode = Saturated calomel
Auxialary electrode = Platinum
Temperature = 25±1˚C
Current sensitivity = 1x10⁻⁴ A/VConcentration of Cu(II)-Thymoquinone Complex (1:1) = 5x10⁻⁷ moles/cm3
Scan rate = 0.1 V/s
Supporting electrolyte = LiCl (0.1 M)
Number of electron transfer = n = 1Area of Electrode = A = 0.0706 cm2
D1/2 = Ip / (2.69x10⁵) (n)3/2 AC (ν)1/2
Ipa
(A)D1/2 D
(cm2 s-1)
Thymoquinone 1.969x10⁻⁷± 0.01 6.56 x 10⁻⁵ 4.31 x 10⁻⁹
Cu(II) 6.499 x10⁻⁶± 0.01 2.17 x 10⁻³ 4.69 x 10⁻⁶
Cu(II)-Thymoquinone 6.221x10⁻⁶± 0.01 2.07 x 10⁻³ 4.30 x 10⁻⁶
Ipc
(A)D1/2 D
(cm2 s-1)
Thymoquinone - - -
Cu(II) 7.964x10⁻⁶± 0.01 2.66 x 10⁻³ 7.05 x 10⁻⁶
Cu(II)-Thymoquinone 7.598x10⁻⁶± 0.01 2.53 x 10⁻³ 6.41 x 10⁻⁶

217
TABLE - 4.63
Diffusion Coefficients of Cu(II)-Thymoquinone Complex in LiCl at
Different Scan Rates
Working electrode = Glassy carbon
Reference electrode = Saturated calomel
Auxialary electrode = PlatinumTemperature = 25±1˚C
Current sensitivity = 1x10⁻⁴ A/V
Concentration of Cu(II)-Thymoquinone Complex = 5x10⁻⁷ moles/cm3
Supporting electrolyte = LiCl (0.1 M)
Number of electron transfer = n = 1
Area of Electrode = A = 0.0706 cm2
D1/2 = Ip / (2.69x10⁵) (n)3/2 AC (ν)1/2
ν(V/s)
ν1/2 Ipa
x10-6(A)D1/2 D
(cm2 s-1)
0.05 0.224 3.444 ± 0.01 1.62 x 10⁻³ 2.62 x 10⁻⁶
0.10 0.316 5.361 ± 0.01 1.79 x 10⁻³ 3.19 x 10⁻⁶
0.15 0.387 6.619 ± 0.02 1.80 x 10⁻³ 3.24 x 10⁻⁶
0.20 0.447 5.031 ± 0.01 1.19 x 10⁻³ 1.41 x 10⁻⁶
0.25 0.500 5.988 ± 0.01 1.26 x 10⁻³ 1.59 x 10⁻⁶
0.30 0.548 5.437 ± 0.01 1.05 x 10⁻³ 1.09 x 10⁻⁶
Average = 2.19(±0.01) x10-6
ν(V/s)
ν1/2 Ipc
x10-6 (A)D1/2 D
(cm2 s-1)
0.05 0.224 4.801 ± 0.01 2.26 x 10⁻³ 5.67 x 10⁻⁶
0.10 0.316 7.213 ± 0.01 2.40 x 10⁻³ 5.41 x 10⁻⁶
0.15 0.387 8.885 ± 0.01 2.42 x 10⁻³ 5.12 x 10⁻⁶
0.20 0.447 8.329 ± 0.01 1.96 x 10⁻³ 5.57 x 10⁻⁶
0.25 0.500 9.556 ± 0.01 2.01 x 10⁻³ 5.08 x 10⁻⁶
0.30 0.548 9.536 ± 0.01 1.83 x 10⁻³ 4.96 x 10⁻⁶
Average = 5.30(±0.01) x10-6

218
TABLE - 4.64
Diffusion coefficients of Cu(II)-Thymoquinone Complex atDifferent Concentrations in LiCl
Working electrode = Glassy carbonReference electrode = Saturated calomelAuxialary electrode = PlatinumTemperature = 25±1˚C
Current sensitivity = 1x10⁻⁴ A/VScan rate = 0.1 V/sSupporting electrolyte = LiCl (0.1 M)Number of electron transfer = n = 1
Area of Electrode = A = 0.0706 cm2
D1/2 = Ip / (2.69x10⁵) (n)3/2AC(ν)1/2
Conc. x10-3 Ipa D1/2 D(moles/cm3) x 10-6 (A) (cm2 s-1)
0.02 0.1923 ± 0.01 1.60 x 10⁻³ 2.57 x 10⁻⁶
0.1 0.8150 ± 0.01 1.36 x 10⁻³ 1.84 x 10⁻⁶
0.2 1.901 ± 0.01 1.58 x 10⁻³ 2.51 x 10⁻⁶
0.4 4.734 ± 0.01 1.97 x 10⁻³ 3.89 x 10⁻⁶
0.6 6.978 ± 0.01 1.94 x 10⁻³ 3.76 x 10⁻⁶
0.8 7.999 ± 0.01 1.67 x 10⁻³ 2.78 x 10⁻⁶
1.0 10.95 ± 0.01 1.83 x 10⁻³ 3.33 x 10⁻⁶
1.2 15.54 ± 0.01 2.16 x 10⁻³ 4.66 x 10⁻⁶
1.4 18.68 ± 0.01 2.22 x 10⁻³ 4.94 x 10⁻⁶
1.6 21.99 ± 0.01 2.29 x 10⁻³ 5.25 x 10⁻⁶
Average = 3.55(±0.01) x10-6
Conc. x10-3 Ipc D1/2 D(moles/cm3) x10-6 (A) (cm2 s-1)
0.02 0.7508 ± 0.01 6.26 x 10⁻³ 3.91 x 10⁻⁵
0.1 1.716 ± 0.01 2.86 x 10⁻³ 8.18 x 10⁻⁶
0.2 3.110 ± 0.01 2.59 x 10⁻³ 6.72 x 10⁻⁶
0.4 6.103 ± 0.01 2.54 x 10⁻³ 6.47 x 10⁻⁶
0.6 9.032 ± 0.01 2.51 x 10⁻³ 6.29 x 10⁻⁶
0.8 9.243 ± 0.01 1.93 x 10⁻³ 3.71 x 10⁻⁶
1.0 11.917 ± 0.01 1.99 x 10⁻³ 3.94 x 10⁻⁶
1.2 16.31 ± 0.01 2.27 x 10⁻³ 5.13 x 10⁻⁶
1.4 18.68 ± 0.01 2.22 x 10⁻³ 4.94 x 10⁻⁶
1.6 21.03 ± 0.01 2.19 x 10⁻³ 4.80 x 10⁻⁶
Average = 5.41(±0.01) x10-6

219
TABLE - 4.65
Diffusion coefficients of Cu(II)-Thymoquinone Complex at
Different Metal-Ligand Ratios in LiCl
Working electrode = Glassy carbon
Reference electrode = Saturated calomel
Auxialary electrode = Platinum
Temperature = 25±1˚CCurrent sensitivity = 1x10⁻⁴ A/V
Concentration of Cu(II)-Thymoquinone Complex = 5x10⁻⁷ moles/cm3
Supporting electrolyte = LiCl (0.1M)
Number of electron transfer = n = 1
Area of Electrode = A = 0.0706 cm2
Scan rate = 0.1 V/s
D1/2 = Ip / (2.69x10⁵) (n)3/2 AC (ν)1/2
L/M RatioIpa
D1/2 D
x 10-6 (A) (cm2 s-1)
1 6.221 ±0.01 2.07 x 10⁻³ 4.30 x 10⁻⁶
2 5.961 ±0.01 1.99 x 10⁻³ 3.95 x 10⁻⁶
3 5.813 ±0.02 1.94 x 10⁻³ 3.76 x 10⁻⁶
4 5.803 ±0.01 1.93 x 10⁻³ 3.74 x 10⁻⁶
5 5.465 ±0.01 1.82 x 10⁻³ 3.32 x 10⁻⁶
Average = 3.81(±0.01) x10-6
L/M Ratio Ipc
x 10-6 D1/2 D(cm2 s-1)
1 7.598 ±001 2.53 x 10⁻³ 6.41 x 10⁻⁶
2 7.413 ±0.01 2.47 x 10⁻³ 6.12 x 10⁻⁶
3 7.772 ±0.02 2.59 x 10⁻³ 6.71 x 10⁻⁶
4 7.824 ±0.01 2.69 x 10⁻³ 6.80 x 10⁻⁶
5 7.412 ±0.01 2.47 x 10⁻³ 6.10 x 10⁻⁶
Average = 6.43(±0.01) x10-6
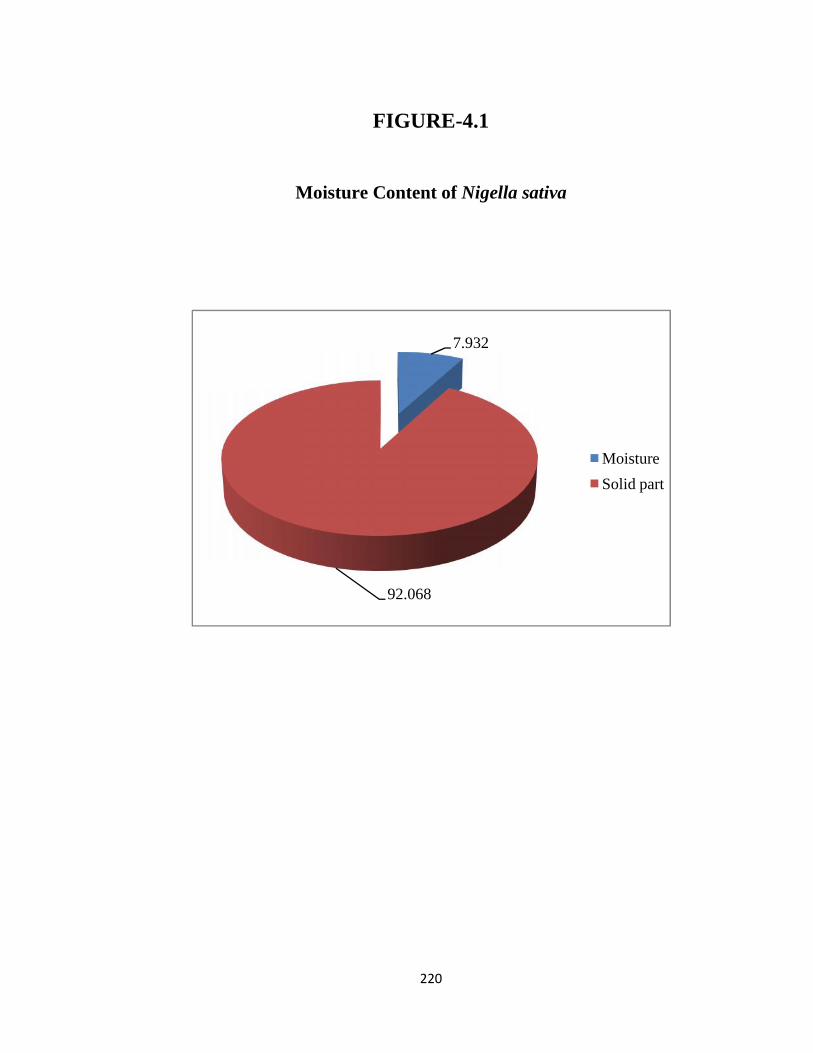
220
FIGURE-4.1
Moisture Content of Nigella sativa
220
FIGURE-4.1
Moisture Content of Nigella sativa
7.932
92.068
Moisture
Solid part
220
FIGURE-4.1
Moisture Content of Nigella sativa
Moisture
Solid part

221
FIGURE-4.2
Percentage of DS and UDS in Water extract of Nigella sativa
0
10
20
30
40
50
60
70
80
90
100
1
% o
f D
S &
UD
S
221
FIGURE-4.2
Percentage of DS and UDS in Water extract of Nigella sativa
2 3 4 5 6
Time (hr.)
221
FIGURE-4.2
Percentage of DS and UDS in Water extract of Nigella sativa
DS
UDS

222
FIGURE-4.3
Percentage of DS and UDS Acid extract of Nigella sativa
0
10
20
30
40
50
60
70
80
90
100
1
% o
f D
S &
UD
S
222
FIGURE-4.3
Percentage of DS and UDS Acid extract of Nigella sativa
1 2 3 4 5 6
Time (hr.)
222
FIGURE-4.3
Percentage of DS and UDS Acid extract of Nigella sativa
DS
UDS

223
FIGURE-4.4
Comparison of Percentages of DS in Water and Acid Extracts of
Nigella sativa
0
1
2
3
4
5
6
7
8
1
% o
f D
S in
Wat
er &
Aci
d E
xtra
ct
223
FIGURE-4.4
Comparison of Percentages of DS in Water and Acid Extracts of
Nigella sativa
2 3 4 5 6
Time (hr.)
DS(W)
DS(A)
223
FIGURE-4.4
Comparison of Percentages of DS in Water and Acid Extracts of
Nigella sativa
DS(W)
DS(A)

224
FIGURE-4.5
Comparison of Percentages of UDS in Water and Acid Extracts of
Nigella sativa
0
10
20
30
40
50
60
70
80
90
100
1% o
f U
DS
in W
ater
& A
cid
Ext
ract
224
FIGURE-4.5
Comparison of Percentages of UDS in Water and Acid Extracts of
Nigella sativa
2 3 4 5 6
Time (hr.)
UDS(W)
UDS(A)
224
FIGURE-4.5
Comparison of Percentages of UDS in Water and Acid Extracts of
Nigella sativa
UDS(W)
UDS(A)

225
FIGURE-4.6
Comparison of Total Solid Material (TS) in Water and Acid Extracts of
Nigella sativa
0
10
20
30
40
50
60
70
80
90
100
1 2
% o
f TS
in W
ater
and
Aci
d E
xtra
cts
225
FIGURE-4.6
Comparison of Total Solid Material (TS) in Water and Acid Extracts of
Nigella sativa
2 3 4 5 6
Time (hr.)
225
FIGURE-4.6
Comparison of Total Solid Material (TS) in Water and Acid Extracts of
Nigella sativa
TS (W)
TS (A)

226
FIGURE-4.7
Scanning Electron Micrograph of Nigella sativa at 35,000 Magnification
scan 2scan 2 1.0 µm1.0 µm1.0 µm1.0 µm1.0 µm
0.00 2.05 4.09 6.14 8.19 10.24 12.28 14.33 16.38 18.42
keV
scan 2
100
101
102
103
104
105
CP
S
CK
aO
Ka
NaK
a
PK
a
KK
aK
Kb
CaK
aC
aKb
CrL
lC
rLa
CrK
aC
rKb
MnL
lM
nLa
MnK
aM
nKb
FeL
lF
eLa
FeK
esc
FeK
aF
eKb
CoL
lC
oLa C
oKa
CoK
b
NiL
l
NiK
a
NiK
b
MoL
lM
oLa
MoK
a
CdL
aC
dLb
CdL
b2
PbM
zP
bMa
PbM
bP
bMr
PbL
a
PbL
b

227
FIGURE-4.8
Scanning Electron Micrograph of Nigella sativa at 11,000 Magnification
scan 1scan 1 3.0 µm3.0 µm3.0 µm3.0 µm3.0 µm
0.00 1.00 2.00 3.00 4.00 5.00 6.00 7.00 8.00 9.00 10.00
keV
scan 1
0
5000
10000
15000
20000
25000
30000
35000
40000
45000
50000
Co
un
ts
CK
aO
Ka
NaK
a
PK
a
KK
aK
Kb
CrL
lC
rLa
CrK
a
CrK
b
Mn
Ll
Mn
La
Mn
Ka
Mn
Kb
Co
Ll
Co
La
Co
Ka
Co
Kb
NiL
a
NiK
a
NiK
b
AsL
lA
sLa
Mo
Ll
Mo
La
Cd
La
Cd
Lb
Cd
Lb
2
Pb
Mz
Pb
Ma
Pb
Mb
Pb
Mr

228
FIGURE-4.9
Scanning Electron Micrograph of Nigella sativa at 4,500 Magnification
scan 4scan 4 10 µm10 µm10 µm10 µm10 µm
0.00 1.00 2.00 3.00 4.00 5.00 6.00 7.00 8.00 9.00 10.00
keV
scan 4
100
101
102
103
104
105
CP
S
CK
aO
Ka
NaK
a
PK
a
KK
aK
Kb
CrL
lC
rLa
CrK
a
CrK
b
MnL
lM
nLa
MnK
a
MnK
b
FeL
lF
eLa
FeK
esc F
eKa
FeK
b
CoL
lC
oLa
CoK
a
CoK
b
NiL
l
NiK
a
NiK
b
AsL
lA
sLa
MoL
lM
oLa
CdL
aC
dLb
CdL
b2
PbM
z
PbM
aP
bMb
PbM
r

229
FIGURE-4.10
Scanning Electron Micrograph of Nigella sativa at 500 Magnification
scan 3scan 3 100 µm100 µm100 µm100 µm100 µm
0.00 1.00 2.00 3.00 4.00 5.00 6.00 7.00 8.00 9.00 10.00
keV
scan 3
100
101
102
103
104
105
CP
S
CK
aO
Ka
NaK
a
AlK
aS
iKa
PK
aS
Ka
SK
b
KK
aK
Kb
CaK
aC
aKb
CrL
lC
rLa
CrK
a
CrK
b
MnL
lM
nLa
MnK
a
MnK
b
CoL
lC
oLa
CoK
a
CoK
b
NiL
lN
iLa N
iKa
NiK
b
AsL
lA
sLa
MoL
lM
oLa
CdL
aC
dLb
CdL
b2
PbM
z
PbM
aP
bMb
PbM
r

230
FIGURE-4.11
pH-Metric Titration of Thymol
Concentration of Thymol = 5x10⁻³M
0
2
4
6
8
10
12
0 2 4 6 8 10 12 14
pH
Volume of NaOH (mL)

231
FIGURE-4.12
pH-Metric Titration of Thymoquinone
Concentration of Thymoquinone = 5x10⁻³M
0
2
4
6
8
10
12
0 5 10 15 20
pH
Volume of NaOH (mL)

232
FIGURE-4.13
pH-Metric Titration of Thymol and Fe(III)-Thymol Complex
L1 = Thymol = 5x10⁻³M
C1 = Fe(III)-Thymol Complex= 5x10⁻³M
0
2
4
6
8
10
12
0 5 10 15
pH
Volume of NaOH (mL)
L1
C1

233
FIGURE-4.14
Species Distribution Curves for Fe(III)-Thymol Complex
M = Fe(III)
ML = Fe(III)-Thymol complex (1:1)
ML2= Fe(III)-Thymol complex (1:2)
0
10
20
30
40
50
60
70
80
90
100
0 2 4 6 8
% S
peci
es
pH
M
ML
ML2

234
FIGURE-4.15
pH-Metric Titration of Thymol and Cr(VI)-Thymol Complex
L1 = Thymol = 5x10⁻³M
C2 = Cr(VI)-Thymol Complex= 5x10⁻³M
0
2
4
6
8
10
12
0 1 2 3 4 5 6
pH
Volume of NaOH (mL)
L1
C2

235
FIGURE-4.16
Species Distribution Curves for Cr(VI)-Thymol Complex
M = Cr(VI)
ML = Cr(VI)-Thymol complex (1:1)
ML2= Cr(VI)-Thymol complex (1:2)
0
10
20
30
40
50
60
70
80
90
100
0 2 4 6 8 10
% S
peci
es
pH
M
ML
ML2

236
FIGURE-4.17
pH-Metric Titration of Thymol and Cu(II)-Thymol Complex
L1 = Thymol = 5x10⁻³M
C3 = Cu(II)-Thymol Complex= 5x10⁻³M
0
2
4
6
8
10
12
0 1 2 3 4 5 6
pH
Volume of NaOH (mL)
L1
C3

237
FIGURE-4.18
Species Distribution Curves for Cu(II)-Thymol Complex
M = Cu(II)
ML = Cu(II)-Thymol complex (1:1)
ML2= Cu(II)-Thymol complex (1:2)
0
10
20
30
40
50
60
70
80
90
100
0 2 4 6 8
% S
peci
es
pH
M
ML
ML2

238
FIGURE-4.19
pH-Metric Titration of Thymol and V(IV)-Thymol Complex
L1 = Thymol = 5x10⁻³M
C4 = V(IV)-Thymol Complex= 5x10⁻³M
0
2
4
6
8
10
12
0 1 2 3 4 5 6
pH
Volume of NaOH (mL)
L1
C4

239
FIGURE-4.20
Species Distribution Curves for V(IV)-Thymol Complex
M = V(IV)
ML = V(IV)-Thymol complex (1:1)
ML2= V(IV)-Thymol complex (1:2)
0
10
20
30
40
50
60
70
80
90
100
0 2 4 6 8
% S
peci
es
pH
M
ML
ML2

240
FIGURE-4.21
pH-Metric Titration of Thymol and Co(II)-Thymol Complex
L1 = Thymol = 5x10⁻³M
C5 = Co(II)-Thymol Complex= 5x10⁻³M
4
5
6
7
8
9
10
11
12
0 1 2 3 4 5 6
pH
Volume of NaOH (mL)
L1
C5

241
FIGURE-4.22
Species Distribution Curves for Co(II)-Thymol Complex
M = Co(II)
ML = Co(II)-Thymol complex (1:1)
ML2= Co(II)-Thymol complex (1:2)
0
10
20
30
40
50
60
70
80
90
100
0 2 4 6 8 10 12
% S
peci
es
pH
M
ML
ML2

242
FIGURE-4.23
pH-Metric Titration of Thymoquinone and Fe(III)-Thymoquinone Complex
L2 = Thymoquinone = 5x10⁻³M
C6 = Fe(III)-Thymoquinone Complex= 5x10⁻³M
0
2
4
6
8
10
12
0 2 4 6 8 10 12 14 16
pH
Volume of NaOH (mL)
L2
C6
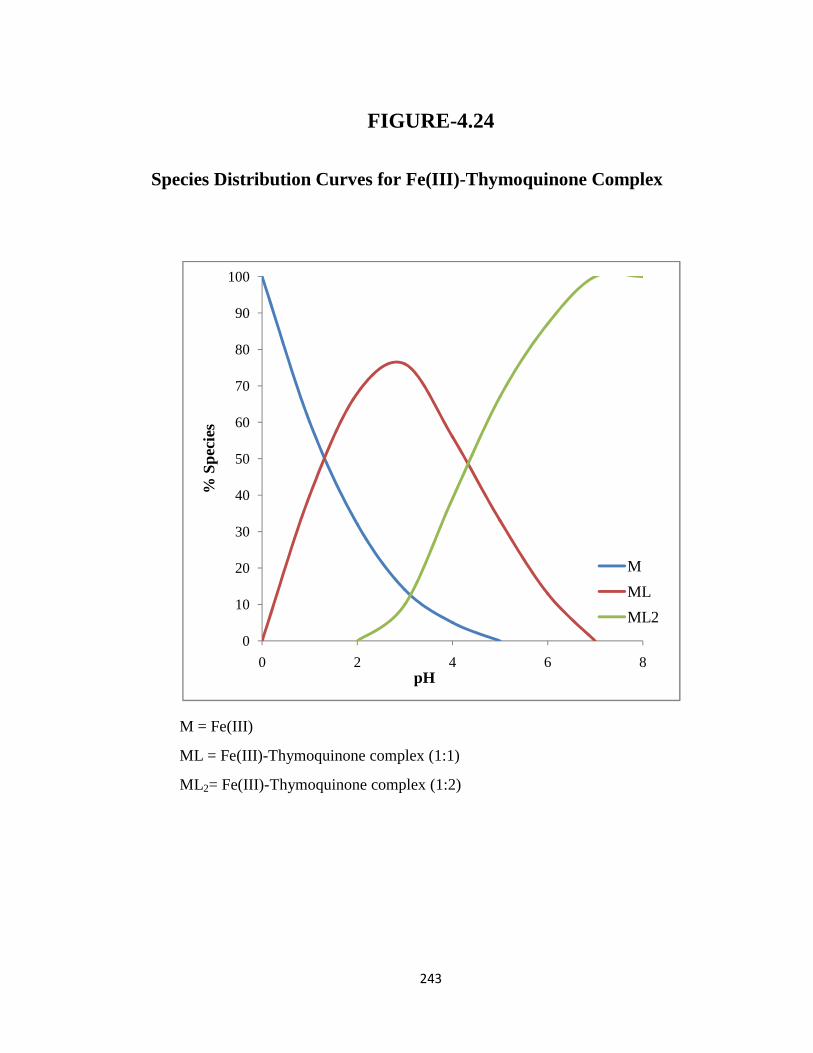
243
FIGURE-4.24
Species Distribution Curves for Fe(III)-Thymoquinone Complex
M = Fe(III)
ML = Fe(III)-Thymoquinone complex (1:1)
ML2= Fe(III)-Thymoquinone complex (1:2)
0
10
20
30
40
50
60
70
80
90
100
0 2 4 6 8
% S
peci
es
pH
M
ML
ML2

244
FIGURE-4.25
pH-Metric Titration of Thymoquinone and Cr(VI)-Thymoquinone Complex
L2 = Thymoquinone = 5x10⁻³M
C7 = Cr(VI)-Thymoquinone Complex= 5x10⁻³M
4
5
6
7
8
9
10
11
12
0 1 2 3 4 5 6
pH
Volume of NaOH (mL)
L2
C7

245
FIGURE-4.26
Species Distribution Curves for Cr(VI)-Thymoquinone Complex
M = Cr(VI)
ML = Cr(VI)-Thymoquinone complex (1:1)
ML2= Cr(VI)-Thymoquinone complex (1:2)
0
10
20
30
40
50
60
70
80
90
100
0 2 4 6 8 10
% S
peci
es
pH
M
ML
ML2

246
FIGURE-4.27
pH-Metric Titration of Thymoquinone and Cu(II)-Thymoquinone Complex
L2 = Thymoquinone = 5x10⁻³M
C8 = Cu(II)-Thymoquinone Complex= 5x10⁻³M
4
5
6
7
8
9
10
11
12
0 1 2 3 4 5 6
pH
Volume of NaOH (mL)
L2
C8
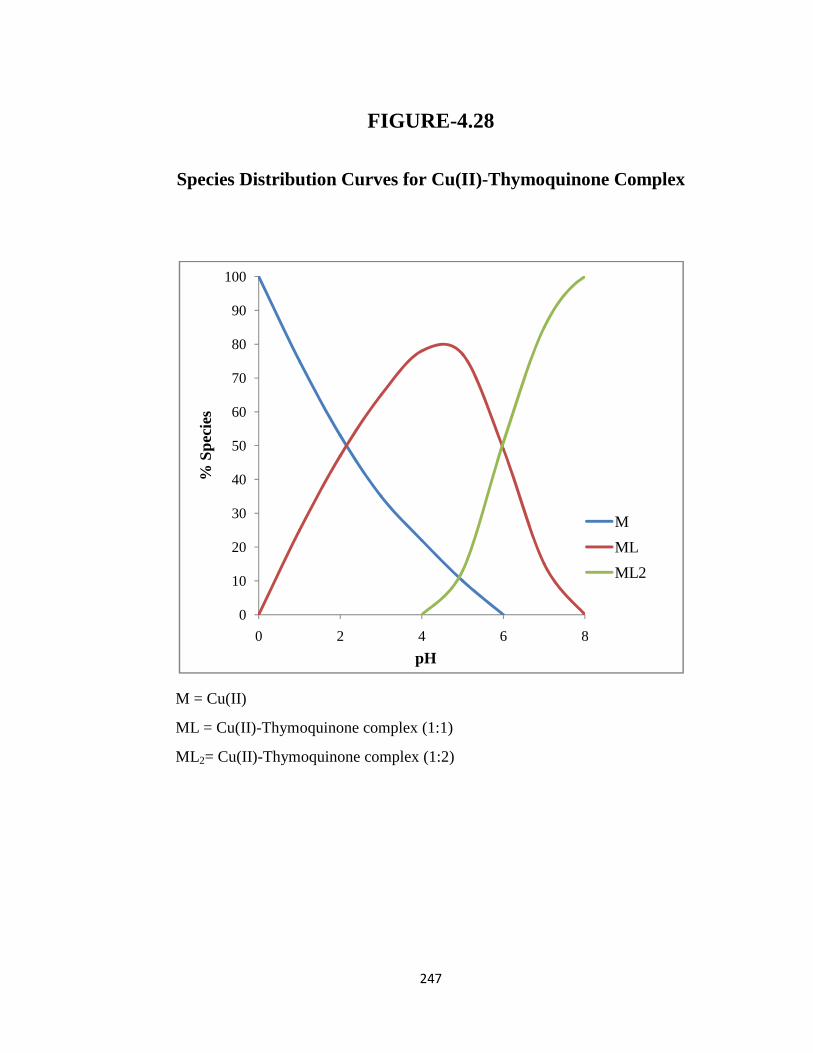
247
FIGURE-4.28
Species Distribution Curves for Cu(II)-Thymoquinone Complex
M = Cu(II)
ML = Cu(II)-Thymoquinone complex (1:1)
ML2= Cu(II)-Thymoquinone complex (1:2)
0
10
20
30
40
50
60
70
80
90
100
0 2 4 6 8
% S
peci
es
pH
M
ML
ML2
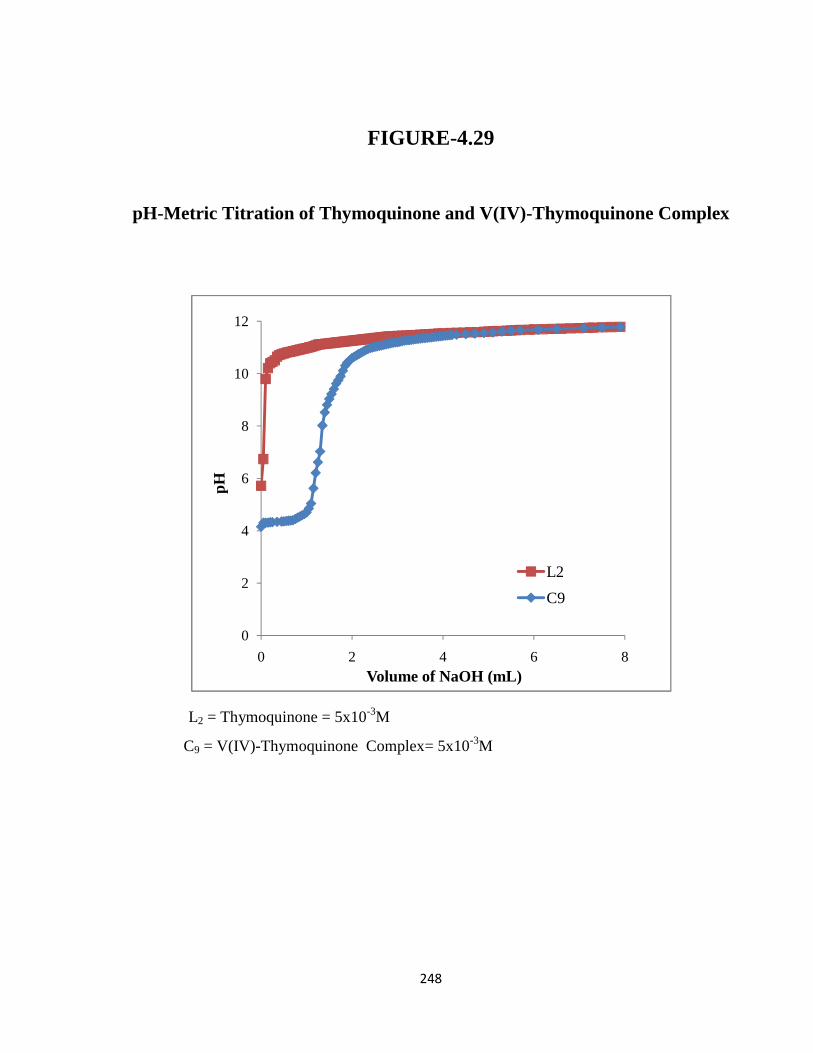
248
FIGURE-4.29
pH-Metric Titration of Thymoquinone and V(IV)-Thymoquinone Complex
L2 = Thymoquinone = 5x10⁻³M
C9 = V(IV)-Thymoquinone Complex= 5x10⁻³M
0
2
4
6
8
10
12
0 2 4 6 8
pH
Volume of NaOH (mL)
L2
C9

249
FIGURE-4.30
Species Distribution Curves for V(IV)-Thymoquinone Complex
M = V(IV)
ML = V(VI)-Thymoquinone complex (1:1)
ML2= V(VI)-Thymoquinone complex (1:2)
0
10
20
30
40
50
60
70
80
90
100
0 2 4 6 8
% S
peci
es
pH
M
ML
ML2

250
FIGURE-4.31
pH-Metric Titration of Thymoquinone and Co(II)-Thymoquinone Complex
L2 = Thymoquinone = 5x10⁻³M
C10 = Co(II)-Thymoquinone Complex= 5x10⁻³M
4
5
6
7
8
9
10
11
12
0 2 4 6 8
pH
Volume of NaOH (mL)
L2
C10

251
FIGURE-4.32
Species Distribution Curves for Co(II)-Thymoquinone Complex
M = Co(II)
ML = Co(II)-Thymoquinone complex (1:1)
ML2= Co(II)-Thymoquinone complex (1:2)
0
10
20
30
40
50
60
70
80
90
100
0 2 4 6 8 10 12
% S
peci
es
pH
M
ML
ML2

252
FIGURE-4.33
Cyclic Voltammograms of NaCl, Thymoquinone, Fe(III) andFe(III)-Thymoquinone Complex at 0.1V/sec
(a) (b)
(c) (d)
252
FIGURE-4.33
Cyclic Voltammograms of NaCl, Thymoquinone, Fe(III) andFe(III)-Thymoquinone Complex at 0.1V/sec
(a) (b)
(c) (d)
252
FIGURE-4.33
Cyclic Voltammograms of NaCl, Thymoquinone, Fe(III) andFe(III)-Thymoquinone Complex at 0.1V/sec
(a) (b)
(c) (d)

253
FIGURE-4.34
Cyclic Voltammogram of Fe(III)-Thymoquinone Complex atDifferent Scan rates
Scan rates = 0.05 V, 0.1 V, 0.15V, 0.2V

254
FIGURE-4.35
Variation of Anodic and Cathodic Peak Current with Square root ofSweep Scan rate from the Cyclic voltammograms of
Fe(III)-Thymoquinone Complex
R² = 0.904
0
0.5
1
1.5
2
2.5
3
0 0.1 0.2 0.3 0.4 0.5
I pa
x 10
-5(A
)
ν1/2
R² = 0.996
0
1
2
3
4
5
6
0 0.1 0.2 0.3 0.4 0.5
I pc
x 10
-5(A
)
ν1/2

255
FIGURE-4.36
Variation of Anodic and Cathodic Peak Potential with Sweep Ratefrom Cyclic- Voltammograms of Fe(III)-Thymoquinone Complex
R² = 0.984
R² = 0.997
0
0.05
0.1
0.15
0.2
0.25
0.3
0.35
0.4
0.45
0.5
-1.4 -1.2 -1 -0.8 -0.6 -0.4 -0.2 0
Epa
(V)
log ν
Epa
Epa/2
R² = 0.999
R² = 0.990
-0.04
-0.02
0
0.02
0.04
0.06
0.08
0.1
0.12
-1.4 -1.2 -1 -0.8 -0.6 -0.4 -0.2 0
Epc
(V)
log ν
Epc
Epc/2

256
FIGURE-4.37
Cyclic- Voltammograms of Fe(III)-Thymoquinone ComplexShowing Effect of Concentration
Concentrations = (0.02x10⁻³, 0.1x10⁻³, 0.2x10⁻³, 0.4x10⁻³, 0.6x10⁻³, 0.8x10⁻³, 1x10⁻³, 1.2x10⁻³)

257
FIGURE-4.38
Plot of Anodic and Cathodic Peak Current against Concentrationof Fe(III)-Thymoquinone Complex
R² = 0.979
0
0.5
1
1.5
2
2.5
3
0 0.2 0.4 0.6 0.8 1 1.2 1.4
I pax
10-5
(A)
Conc.x10-3 M
R² = 0.995
0
2
4
6
8
10
0 0.2 0.4 0.6 0.8 1 1.2 1.4
I pcx
10-5
(A)
Conc.x10-3 M

258
FIGURE-4.39
Variation of Anodic and Cathodic Peak Potential with log ofConcentration on Cyclic- Voltammogram of Fe(III)-Thymoquinone Complex
R² = 0.983
R² = 0.983
0
0.05
0.1
0.15
0.2
0.25
0.3
0.35
0.4
0.45
0.5
-9 -7 -5 -3 -1 1
Epa
(V)
log Conc.x10-4
Epa
Epa/2
R² = 0.887
R² = 0.886
0
0.01
0.02
0.03
0.04
0.05
0.06
0.07
0.08
0.09
0.1
-20 -15 -10 -5 0
Epc
(V)
log Conc.x10-4
Epc
Epc/2

259
FIGURE-4.40
Cyclic- Voltammogram of Fe(III)-Thymoquinone Complex ShowingEffect of Metal - Ligand Ratio
Metal-ligand Ratio = 1:1, 1:2, 1:3, 1:5

260
FIGURE-4.41
Variation of Anodic and Cathodic Peak Potentials with Change ofMetal - Ligand Ratio in Cyclic- Voltammogram of
Fe(III)-Thymoquinone Complex
R² = 0.995
R² = 0.962
0
0.05
0.1
0.15
0.2
0.25
0.3
0.35
0.4
0.45
0.5
0 1 2 3 4 5
Epa
(V)
M:L Ratio
Epa
Epa/2
R² = 0.983
R² = 0.964
0
0.02
0.04
0.06
0.08
0.1
0.12
0.14
0 1 2 3 4 5
Epc
(V)
M:L Ratio
Epc
Epc/2

261
FIGURE-4.42
Variation of Anodic and Cathodic Peak Currents with Change ofMetal - Ligand Ratio in Cyclic- Voltammogram of
Fe(III)-Thymoquinone Complex
0
0.2
0.4
0.6
0.8
1
1.2
1.4
1.6
1.8
0 1 2 3 4 5
I pa
x 10
-5(A
)
M:L Ratio
0
1
2
3
4
5
6
7
8
0 1 2 3 4 5
I pc
x 10
-5(A
)
M:L Ratio

262
FIGURE-4.43
Repeated Scan Cyclic- Voltammogram of Fe(III)-Thymoquinone Complex
Concentration of Fe(III)-TQ Complex = 5x10⁻⁴ M

263
FIGURE-4.44
Cyclic- Voltammograms of Thymoquinone, Cr(VI) andCr(VI)-Thymoquinone Complex in NaCl at 0.1V/sec
Baseline = NaCl (0.1 M), Metal = Cr(VI) (5x10⁻⁴ M), Ligand = TQ (5x10⁻⁴ M),Complex = Cr(VI)-TQ (5x10⁻⁴) M

264
FIGURE-4.45
Cyclic- Voltammogram of Cr(VI)-Thymoquinone Complex atDifferent Scan rates
Scan rates = 0.05 V, 0.1 V, 0.15V, 0.2V, 0.25 V, 0.3 V, 0.35 V, 0.4 V, 0.45 V, 0.5 V

265
FIGURE-4.46
Variation of Anodic and Cathodic Peak Current with Square root ofSweep Scan Rate from the Cyclic- Voltammograms of
Cr(VI)-Thymoquinone Complex
R² = 0.99
0
0.5
1
1.5
2
2.5
0 0.1 0.2 0.3 0.4 0.5
I pax
10-5
(A)
ν1/2
R² = 0.989
0
1
2
3
4
5
6
0 0.2 0.4 0.6 0.8
I pcx
10-5
(A)
ν1/2

266
FIGURE-4.47
Variation of Anodic and Cathodic Peak Potential with Sweep Rate fromCyclic- Voltammograms of Cr(VI)-Thymoquinone Complex
R² = 0.922
R² = 0.957
-0.4
-0.35
-0.3
-0.25
-0.2
-0.15
-0.1
-0.05
0
-1.50 -1.00 -0.50 0.00E
pa(V
)
log ν
Epa
Epa/2
R² = 0.930
R² = 0.939
-0.5
-0.45
-0.4
-0.35
-0.3
-0.25
-0.2
-0.15
-0.1
-0.05
0
-1.5 -1 -0.5 0
Epc
(V)
log ν
Epc
Epc/2

267
FIGURE-4.48
Cyclic- Voltammograms of Cr(VI)-Thymoquinone ComplexShowing Effect of Concentration
Concentrations = 0.02x10⁻³, 0.1x10⁻³, 0.2x10⁻³, 0.4x10⁻³, 0.6x10⁻³, 0.8x10⁻³, 1x10⁻³, 1.2x10⁻³

268
FIGURE-4.49
Plot of Anodic and Cathodic Peak Current against Concentrationof Cr(VI)-Thymoquinone Complex
R² = 0.904
0
0.5
1
1.5
2
2.5
3
3.5
4
4.5
5
0 0.5 1 1.5
I pa
x 10
-5(A
)
Conc. x 10-3 M
R² = 0.971
0
1
2
3
4
5
6
7
8
9
0 0.5 1 1.5
I pcx
10-5
(A)
Conc. x 10-3 M

269
FIGURE-4.50
Variation of Anodic and Cathodic Peak Potential with log ofConcentration on Cyclic- Voltammogram of Cr(VI)-Thymoquinone Complex
R² = 0.872
R² = 0.888
-0.4
-0.35
-0.3
-0.25
-0.2
-0.15
-0.1
-0.05
-9 -7 -5 -3 -1 1E
pa(V
)
log Conc. x 10-4
Epa
Epa/2
R² = 0.819
R² = 0.829
-0.5
-0.45
-0.4
-0.35
-0.3
-0.25
-0.2
-0.15
-0.1
-0.05
0
-9 -7 -5 -3 -1 1
Epc
(V)
log Conc. x 10-4
Epc
Epc/2

270
FIGURE-4.51
Cyclic- Voltammogram of Cr(VI)-Thymoquinone Complex ShowingEffect of Metal - Ligand Ratio
Metal-ligand Ratio = 1:0.5, 1:1, 1:2, 1:3, 1:4, 1:5

271
FIGURE-4.52
Variation of Anodic and Cathodic Peak Potentials with Change ofMetal - Ligand Ratio in Cyclic voltammogram of
Cr(VI)-Thymoquinone Complex
R² = 0.993
R² = 1
-0.4
-0.35
-0.3
-0.25
-0.2
-0.15
-0.1
-0.05
0
0 1 2 3 4
Epa
(V)
M:L Ratio
Epa
Epa/2
R² = 0.923
R² = 0.935
-0.6
-0.5
-0.4
-0.3
-0.2
-0.1
-1E-15
0 1 2 3 4
Epc
(V)
M:L Ratio
Epc
Epc/2

272
FIGURE-4.53
Variation of Anodic and Cathodic Peak Currents with Change ofMetal - Ligand Ratio in Cyclic voltammogram of
Cr(VI)-Thymoquinone Complex
0
0.2
0.4
0.6
0.8
1
1.2
1.4
1.6
0 1 2 3 4 5
I pax
10-5
(A)
M:L Ratio
0
0.5
1
1.5
2
2.5
3
3.5
4
4.5
0 1 2 3 4 5
I pc
x 10
-5(A
)
M:L Ratio

273
FIGURE-4.54
Cyclic- Voltammograms of Thymoquinone, Co(II) andCo(II)-Thymoquinone Complex in NaCl at 0.1V/sec
Baseline = NaCl (0.1 M), Metal = Co(II) (5x10⁻⁴ M), Ligand = TQ (5x10⁻⁴ M),Complex = Co(II)-TQ (5x10⁻⁴) M

274
FIGURE-4.55
Cyclic- Voltammogram of Co(II)-Thymoquinone Complex atDifferent Scan Rates
Scan rates = 0.05 V, 0.1 V, 0.15V, 0.2V, 0.25 V, 0.3 V, 0.35 V, 0.4 V, 0.45 V, 0.5 V

275
FIGURE-4.56
Variation of Anodic and Cathodic Peak Current with Square root ofSweep Scan Rate from the Cyclic- Voltammograms of
Co(II)-Thymoquinone Complex
R² = 0.901
0
1
2
3
4
5
6
0 0.2 0.4 0.6 0.8
Ipa
x 10
-5(A
)
ν1/2
R² = 0.993
0
2
4
6
8
10
12
14
16
0 0.2 0.4 0.6 0.8
I pc
x 10
-5(A
)
ν1/2

276
FIGURE-4.57
Variation of Anodic and Cathodic Peak Potential with Sweep Rate fromCyclic- Voltammograms of Co(II)-Thymoquinone Complex
R² = 0.627
R² = 0.616
-0.4
-0.35
-0.3
-0.25
-0.2
-0.15
-0.1
-0.05
0
-1.4 -1.2 -1 -0.8 -0.6 -0.4 -0.2 0E
pa(V
)
log ν
Epa
Epa/2
R² = 0.943
R² = 0.983
-0.45
-0.4
-0.35
-0.3
-0.25
-0.2
-0.15
-0.1
-0.05
0
-1.4 -1.2 -1 -0.8 -0.6 -0.4 -0.2 0
Epc
(V)
log ν
Epc
Epc/2

277
FIGURE-4.58
Cyclic- Voltammograms of Co(II)-Thymoquinone ComplexShowing Effect of Concentration
Concentrations = 0.02x10⁻³, 0.1x10⁻³, 0.2x10⁻³, 0.4x10⁻³, 0.6x10⁻³, 0.8x10⁻³, 1.0x10⁻³, 1.2x10⁻³

278
FIGURE-4.59
Plot of Anodic and Cathodic Peak Current against Concentrationof Co(II)-Thymoquinone Complex
R² = 0.963
0
0.5
1
1.5
2
2.5
3
3.5
4
4.5
5
0 0.2 0.4 0.6 0.8 1 1.2
I pax
10-5
(A)
Conc. x 10-3 M
R² = 0.880
0
2
4
6
8
10
12
0 0.2 0.4 0.6 0.8 1 1.2
I pc
x10-5
(A)
Conc. x 10-3 M

279
FIGURE-4.60
Variation of Anodic and Cathodic Peak Potential with log ofConcentration on Cyclic- Voltammogram of Co(II)-Thymoquinone Complex
R² = 0.860
R² = 0.851
-0.4
-0.35
-0.3
-0.25
-0.2
-0.15
-0.1
-0.05
-20 -17 -14 -11 -8 -5 -2 1E
pa(V
)
log Conc. x 10-4
Epa
Epa/2
R² = 0.864
R² = 0.850
-0.5
-0.45
-0.4
-0.35
-0.3
-0.25
-0.2
-0.15
-0.1
-0.05
0
-11 -9 -7 -5 -3 -1 1
Epc
(V)
log Conc. x 10-4
Epc
Epc/2

280
FIGURE-4.61
Cyclic- Voltammogram of Co(II)-Thymoquinone Complex ShowingEffect of Metal - Ligand Ratio
Metal-ligand Ratio = 1:1, 1:2, 1:3, 1:4, 1:5

281
FIGURE-4.62
Variation of Anodic and Cathodic Peak Potentials with Change ofMetal - Ligand Ratio in Cyclic- Voltammogram of
Co(II)-Thymoquinone Complex
R² = 0.978
R² = 1
-0.4
-0.35
-0.3
-0.25
-0.2
-0.15
-0.1
-0.05
0
0 1 2 3 4 5E
pa(V
)
M:L Ratio
Epa
Epa/2
R² = 0.89
R² = 0.873
-0.5
-0.45
-0.4
-0.35
-0.3
-0.25
-0.2
-0.15
-0.1
-0.05
0
0 1 2 3 4 5
Epc
(V)
M:L Ratio
Epc
Epc/2

282
FIGURE-4.63
Variation of Anodic and Cathodic Peak Currents with Change ofMetal - Ligand Ratio in Cyclic- Voltammogram of
Co(II)-Thymoquinone Complex
0
1
2
3
4
5
0 1 2 3 4 5 6
I pa
x10-5
(A)
M:L Ratio
0
1
2
3
4
5
6
7
8
9
10
0 1 2 3 4 5 6
Ipcx
10-5
(A)
M:L Ratio

283
FIGURE-4.64
Repeated Scan Cyclic- Voltammogram of Co(II)-Thymoquinone Complex
283
FIGURE-4.64
Repeated Scan Cyclic- Voltammogram of Co(II)-Thymoquinone Complex
283
FIGURE-4.64
Repeated Scan Cyclic- Voltammogram of Co(II)-Thymoquinone Complex

284
FIGURE-4.65
Cyclic- Voltammograms of Thymoquinone, Cu(II) andCu(II)-Thymoquinone Complex in NaCl at 0.1V/sec
(a) (b)
(c) (d)
284
FIGURE-4.65
Cyclic- Voltammograms of Thymoquinone, Cu(II) andCu(II)-Thymoquinone Complex in NaCl at 0.1V/sec
(a) (b)
(c) (d)
284
FIGURE-4.65
Cyclic- Voltammograms of Thymoquinone, Cu(II) andCu(II)-Thymoquinone Complex in NaCl at 0.1V/sec
(a) (b)
(c) (d)

285
FIGURE-4.66
Variation of Anodic and Cathodic Peak Current with Square root ofSweep Scan Rate from the Cyclic- Voltammograms of
Cu(II)-Thymoquinone Complex in NaCl
R² = 0.921
0
1
2
3
4
5
6
0.1 0.2 0.3 0.4 0.5 0.6
I pa
x 10
-6(A
)
ν1/2
R² = 0.948
0
2
4
6
8
10
12
0 0.2 0.4 0.6 0.8
I pcx
10-6
(A)
ν1/2

286
FIGURE-4.67
Variation of Anodic and Cathodic Peak Potential with Sweep Rate fromCyclic- Voltammograms of Cu(II)-Thymoquinone Complex in NaCl
R² = 0.846
R² = 0.827
0
0.02
0.04
0.06
0.08
0.1
0.12
0.14
0.16
-1.5 -1 -0.5 0
Epa
(V)
log ν
Epa
Epa/2
R² = 0.933
R² = 0.904
0
0.02
0.04
0.06
0.08
0.1
0.12
-1.5 -1 -0.5 0
Epc
(V)
log ν
Epc
Epc/2

287
FIGURE-4.68
Cyclic- Voltammograms of Cu(II)-Thymoquinone ComplexShowing Effect of Concentration in NaCl
Concentrations = 0.02x10⁻³, 0.1x10⁻³, 0.2x10⁻³, 0.4x10⁻³, 0.6x10⁻³, 0.8x10⁻³, 1.0x10⁻³ ,
1.2x10⁻³, 1.4X10⁻³, 1.6X10⁻³

288
FIGURE-4.69
Plot of Anodic and Cathodic Peak Current against Concentrationof Cu(II)-Thymoquinone Complex
R² = 0.948
0
0.2
0.4
0.6
0.8
1
1.2
1.4
1.6
1.8
2
0 0.5 1 1.5
I pa
x 10
-5(A
)
Conc. x 10-3 M
R² = 0.974
0
0.5
1
1.5
2
2.5
0 0.5 1 1.5 2
I pcx
10-5
(A)
Conc.x10-3 M
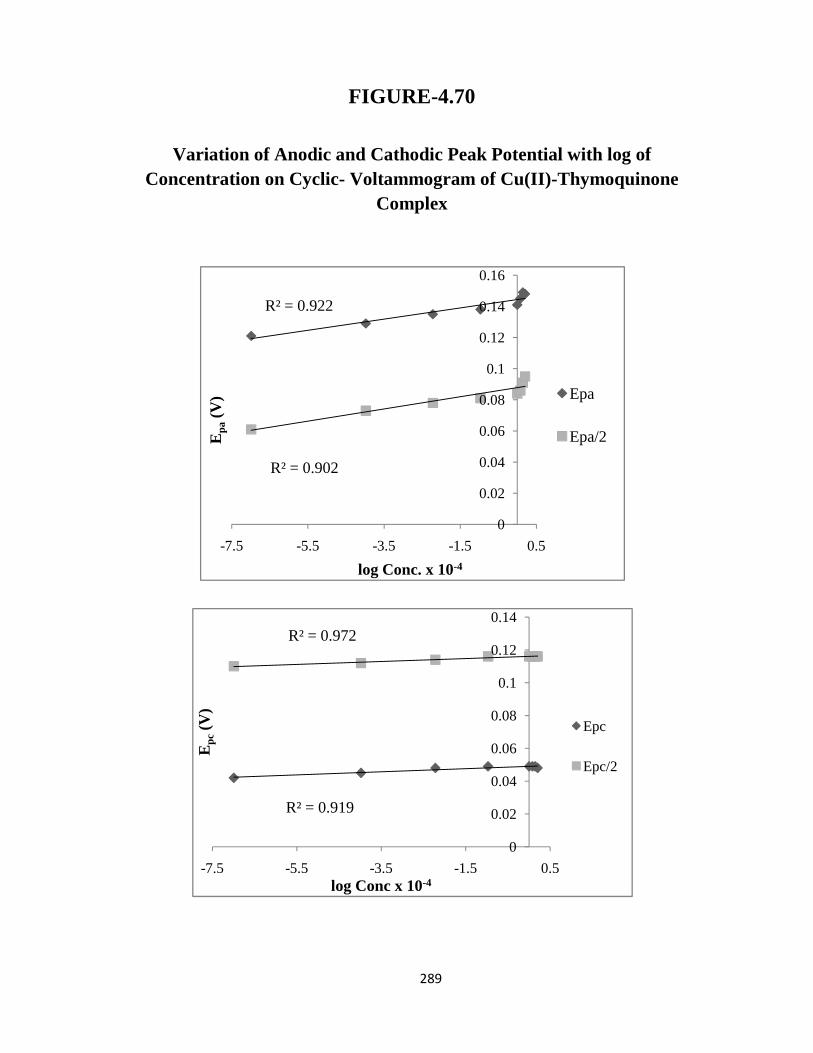
289
FIGURE-4.70
Variation of Anodic and Cathodic Peak Potential with log ofConcentration on Cyclic- Voltammogram of Cu(II)-Thymoquinone
Complex
R² = 0.922
R² = 0.902
0
0.02
0.04
0.06
0.08
0.1
0.12
0.14
0.16
-7.5 -5.5 -3.5 -1.5 0.5
Epa
(V)
log Conc. x 10-4
Epa
Epa/2
R² = 0.919
R² = 0.972
0
0.02
0.04
0.06
0.08
0.1
0.12
0.14
-7.5 -5.5 -3.5 -1.5 0.5
Epc
(V)
log Conc x 10-4
Epc
Epc/2
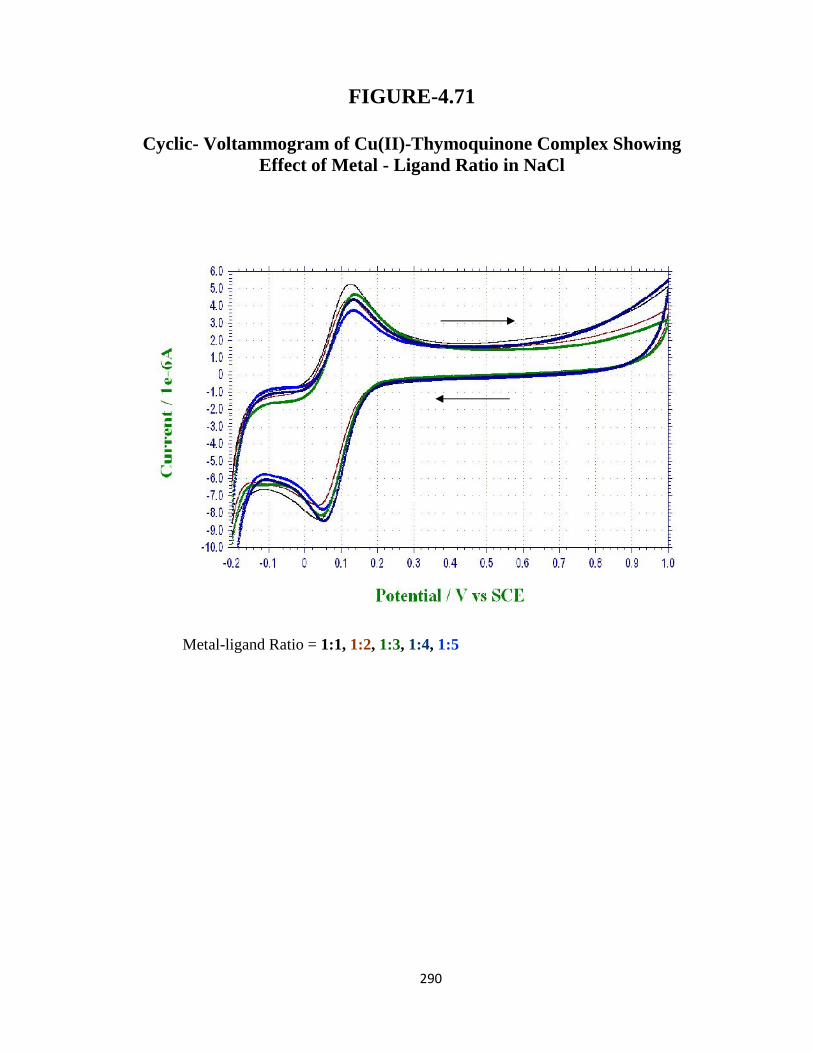
290
FIGURE-4.71
Cyclic- Voltammogram of Cu(II)-Thymoquinone Complex ShowingEffect of Metal - Ligand Ratio in NaCl
Metal-ligand Ratio = 1:1, 1:2, 1:3, 1:4, 1:5

291
FIGURE-4.72
Variation of Anodic and Cathodic Peak Potentials with Change ofMetal - Ligand Ratio In Cyclic- Voltammogram of
Cu(II)-Thymoquinone Complex in NaCl
R² = 0.798
R² = 0.8
0
0.02
0.04
0.06
0.08
0.1
0.12
0.14
0.16
0 2 4 6
Epa
(V)
M:L Ratio
Epa
Epa/2
R² = 0.920
R² = 0.923
0
0.02
0.04
0.06
0.08
0.1
0.12
0 2 4 6
Epc
(V)
M:L Ratio
Epc
Epc/2

292
FIGURE-4.73
Variation of Anodic and Cathodic Peak Currents with Change ofMetal - Ligand Ratio in Cyclic- Voltammogram of
Cu(II)-Thymoquinone Complex in NaCl
0
1
2
3
4
5
6
7
8
0 1 2 3 4 5
I pa
x 10
-6(A
)
M:L Ratio
0
1
2
3
4
5
6
7
8
9
0 1 2 3 4 5
I pc
x 10
-6(A
)
M:L Ratio

293
FIGURE-4.74
Repeated Scan Cyclic- Voltammogram of Cu(II)-ThymoquinoneComplex in NaCl
293
FIGURE-4.74
Repeated Scan Cyclic- Voltammogram of Cu(II)-ThymoquinoneComplex in NaCl
293
FIGURE-4.74
Repeated Scan Cyclic- Voltammogram of Cu(II)-ThymoquinoneComplex in NaCl

294
FIGURE-4.75
Cyclic- Voltammograms of Thymoquinone, Cu(II) andCu(II)-Thymoquinone Complex in LiCl at 0.1V/sec
Baseline = LiCl (0.1 M), Metal = Cu(II) (5x10⁻⁴ M), Ligand = TQ (5x10⁻⁴ M),Complex = Cu(II)-TQ (5x10⁻⁴) M
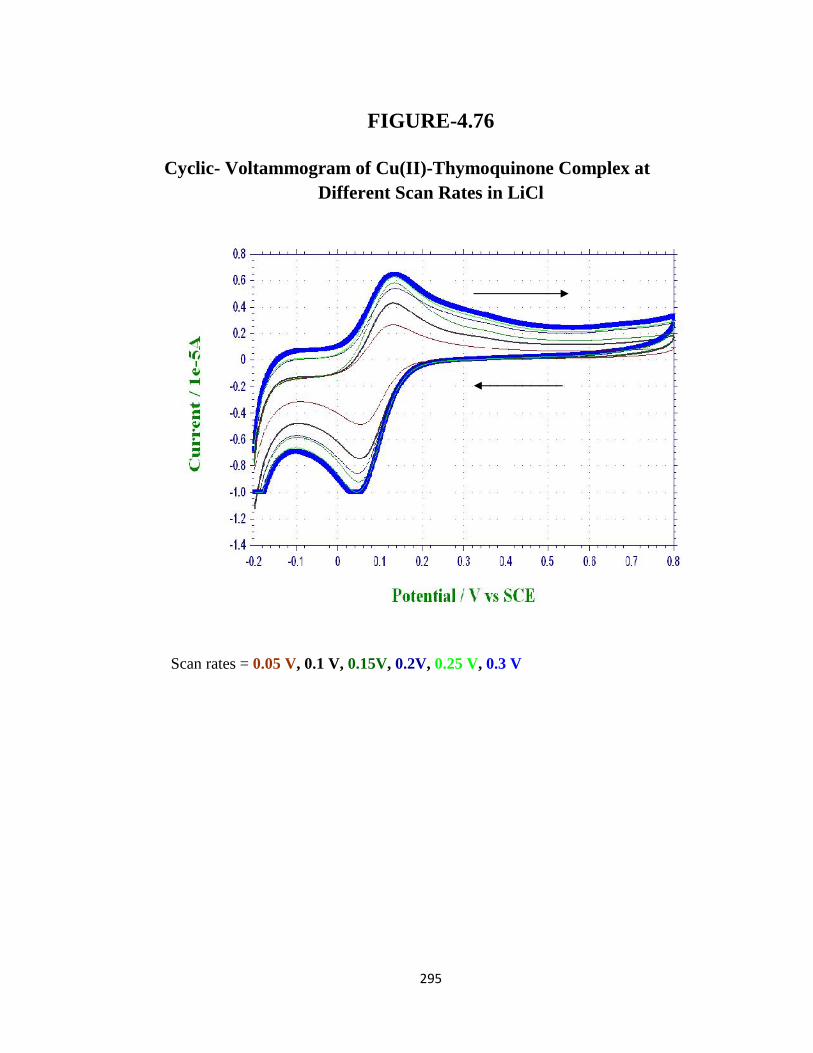
295
FIGURE-4.76
Cyclic- Voltammogram of Cu(II)-Thymoquinone Complex atDifferent Scan Rates in LiCl
Scan rates = 0.05 V, 0.1 V, 0.15V, 0.2V, 0.25 V, 0.3 V

296
FIGURE-4.77
Variation of Anodic and Cathodic Peak Current with Square root ofSweep Scan Rate from the Cyclic- Voltammograms of
Cu(II)-Thymoquinone Complex in LiCl
R² = 0.998
2
3
4
5
6
7
8
0.1 0.2 0.3 0.4 0.5 0.6
I pax
10-6
(A)
ν1/2
R² = 0.999
0
2
4
6
8
10
12
0.1 0.2 0.3 0.4 0.5 0.6
I pc
x 10
-6(A
)
ν1/2

297
FIGURE-4.78
Variation of Anodic and Cathodic Peak Potential with Sweep Rate fromCyclic- Voltammograms of Cu(II)-Thymoquinone Complex in LiCl
R² = 0.935
R² = 0.965
0
0.02
0.04
0.06
0.08
0.1
0.12
0.14
0.16
-1.50 -1.00 -0.50 0.00
Epa
(V)
log ν
Epa
Epa/2
R² = 0.914
R² = 0.919
0
0.02
0.04
0.06
0.08
0.1
0.12
0.14
-1.50 -1.00 -0.50 0.00
Epc
(V)
log ν
Epc
Epc/2
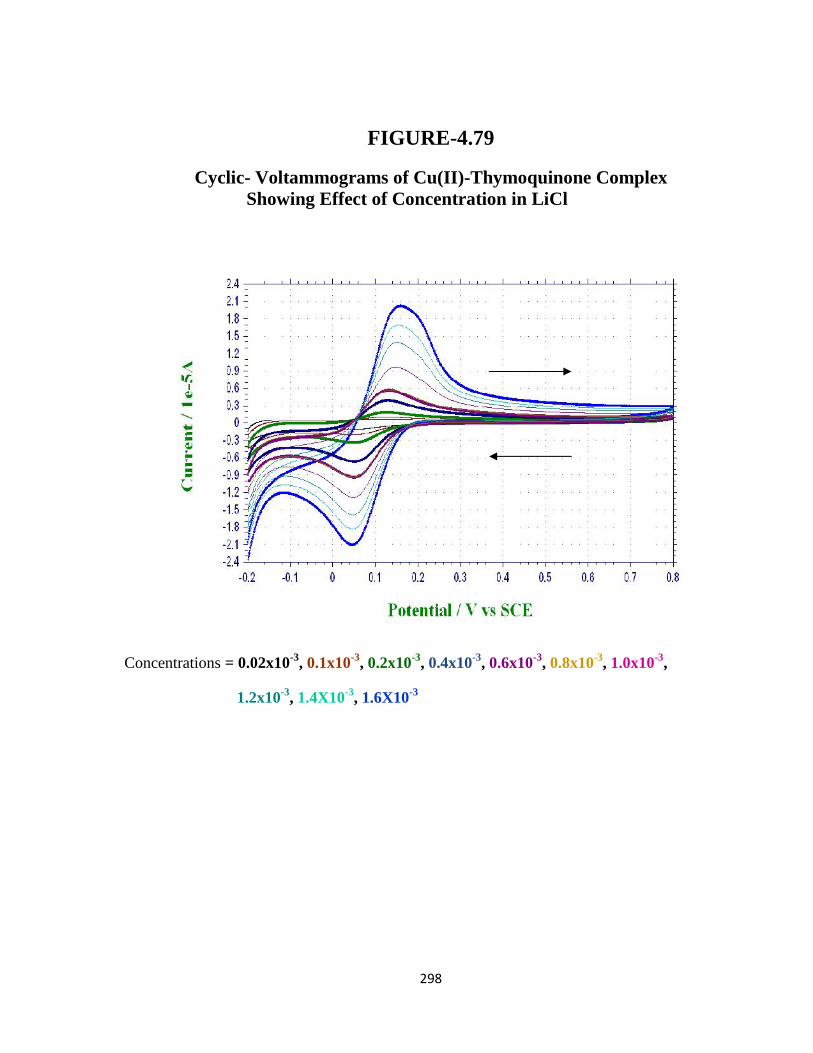
298
FIGURE-4.79
Cyclic- Voltammograms of Cu(II)-Thymoquinone ComplexShowing Effect of Concentration in LiCl
Concentrations = 0.02x10⁻³, 0.1x10⁻³, 0.2x10⁻³, 0.4x10⁻³, 0.6x10⁻³, 0.8x10⁻³, 1.0x10⁻³,
1.2x10⁻³, 1.4X10⁻³, 1.6X10⁻³

299
FIGURE-4.80
Plot of Anodic and Cathodic Peak Current against Concentrationof Cu(II)-Thymoquinone Complex in LiCl
R² = 0.976
0
5
10
15
20
25
0 0.5 1 1.5 2
I pax
10-6
(A)
Conc.x10-3 M
R² = 0.986
0
5
10
15
20
25
0 0.5 1 1.5 2
I pcx
10-6
(A)
Conc.x10-3 M

300
FIGURE-4.81
Variation of Anodic and Cathodic Peak Potential with log ofConcentration on Cyclic- Voltammogram of Cu(II)-Thymoquinone Complex
R² = 0.904
R² = 0.900
0
0.02
0.04
0.06
0.08
0.1
0.12
0.14
0.16
0.18
-20 -15 -10 -5 0
Epa
(V)
log Conc. x 10-4
Epa
Epa/2
R² = 0.944
R² = 0.945
0
0.02
0.04
0.06
0.08
0.1
0.12
-20 -15 -10 -5 0
Epc
(V)
log Conc. x 10-4
Epc
Epc/2

301
FIGURE-4.82
Cyclic- Voltammogram of Cu(II)-Thymoquinone Complex ShowingEffect of Metal - Ligand Ratio in LiCl
Metal-ligand Ratio = 1:1, 1:2, 1:3, 1:4, 1:5

302
FIGURE-4.83
Variation of Anodic and Cathodic Peak Potentials with Change ofMetal - Ligand Ratio in Cyclic- Voltammogram of
Cu(II)-Thymoquinone Complex
R² = 0.959
R² = 0.942
0
0.02
0.04
0.06
0.08
0.1
0.12
0.14
0.16
0 1 2 3 4 5 6
Epa
(V)
M:L Ratio
Epa
Epa/2
R² = 0.941
R² = 0.941
0
0.02
0.04
0.06
0.08
0.1
0.12
0 1 2 3 4 5 6
Epc
(V)
M:L Ratio
Epc
Epc/2

303
FIGURE-4.84
Variation of Anodic and Cathodic Peak Currents with Change ofMetal - Ligand Ratio in Cyclic- Voltammogram of
Cu(II)-Thymoquinone Complex in LiCl
0
1
2
3
4
5
6
7
8
0 1 2 3 4 5
I pax
10-6
(A)
M:L Ratio
0
1
2
3
4
5
6
7
8
9
0 1 2 3 4 5
I pcx
10-6
(A)
M:L Ratio

304
FIGURE-4.85
Repeated Scan Cyclic- Voltammogram of Cu(II)-Thymoquinone Complex inLiCl
304
FIGURE-4.85
Repeated Scan Cyclic- Voltammogram of Cu(II)-Thymoquinone Complex inLiCl
304
FIGURE-4.85
Repeated Scan Cyclic- Voltammogram of Cu(II)-Thymoquinone Complex inLiCl

305
FIGURE-4.86
Cyclic- Voltammogram of Cu(II)-Thymoquinone Complexin NaCl and LiCl at 0.1 V
LiCl = Cu(II)-TQ Complex (5x10⁻⁴ M)
NaCl = Cu(II)-TQ Complex (5x10⁻⁴ M)
305
FIGURE-4.86
Cyclic- Voltammogram of Cu(II)-Thymoquinone Complexin NaCl and LiCl at 0.1 V
LiCl = Cu(II)-TQ Complex (5x10⁻⁴ M)
NaCl = Cu(II)-TQ Complex (5x10⁻⁴ M)
305
FIGURE-4.86
Cyclic- Voltammogram of Cu(II)-Thymoquinone Complexin NaCl and LiCl at 0.1 V
LiCl = Cu(II)-TQ Complex (5x10⁻⁴ M)
NaCl = Cu(II)-TQ Complex (5x10⁻⁴ M)

306
CHAPTER NO 5
CONCLUSION
N. sativa seeds are commonly used in recipes in Asian countries. They are a good source of
several essential macro as well as micro nutrients, for instance sodium, potassium, calcium,
phosphorus, magnesium, iron, copper, chromium, zinc, manganese and selenium. In addition,
they are an excellent source of many biologically active compounds such as thymoquinone,
thymohydroquinone, dithymoquinone, thymol, carvacrol tocopherols and trans-retinol etc.
The metals studied in the present research are all those which are essential to the human beings
in trace quantities. For example iron, is an essential component of several proteins and enzymes.
It is found in hemoglobin and myoglobin where it helps to accept, carry and then release oxygen.
Iron serves as a co-factor to enzymes involved in oxidation reduction reactions. It is involved in
the synthesis of amino acids, collagen, hormones and neurotransmitters. Chromium is needed for
carbohydrate and lipid metabolism. It is necessary for insulin action. Copper, on the one hand
plays vital role in oxidation reduction reactions which take place in the body and on the other
hand in scavenging of free radicals. It is an essential constituent of several proteins and enzymes,
which are involved in iron and lipid metabolism, connective tissue synthesis, maintenance of
heart muscle and functioning of immune and central nervous systems. Vanadium is necessary for
growth, bones development, and healthy teeth and also for normal reproduction. It is also
essential for iron metabolism and growth of red blood cells. It has been proved to have insulin
like action. Cobalt being the key mineral of vitamin B12; aids in the formation of normal red
blood cells, maintenance of nerve tissues, and normal formation of cells. Due to these facts the
deficiency of any of the above mentioned metal in the body gives rise to severe problems. But as
they are needed in very small quantities their excess can be equally deadly. For example, iron
toxicity can damage the intestinal lining and may cause abnormalities in body pH, shock and
liver failure. Iron toxicity may result in heart diseases, diabetes, arthritis and cancer. High levels
of chromium may cause many complications including renal failure. At high levels inhalation of
Cr(VI) may irritate nose lungs, stomach and intestines, whereas its ingestion can cause severe
problems leading to kidney and liver damage and even death. Acute copper toxicity may result in
heart problems, liver damage, jaundice, kidney failure, coma and death. High doses of vanadium

307
may lead severe complications and may even lead to death. Exposure to vanadium dust may
result in rhinitis, nose bleeds and conjunctivitis. Large doses of cobalt might stimulate thyroid
and bone marrow functions.
N. sativa seeds possess various biological activities due to its different active constituents. Out of
several constituents, thymoquinone and thymol are the two main constituents of the seeds. Most
of the pharmacological properties of the seeds such as antioxidant, anti-tumor, anti-
inflammatory, antidiabatic, antitussive and antimicrobial activities are due to these two
components.
In present research, analysis of the dissolved and undissolved solids reveals that fast absorption
of the N. sativa seed may take place in the acidic environment of stomach. Comparatively more
amount of dissolved solid in case of hydrochloric acid extract shows that chlorides of such
metals which are insoluble in HCl such as those of silver, lead, mercury etc., are not present in
the seed in a reasonable quantity.
Elemental analysis shows the presence of several essential macro as well as micro elements,
including sodium, potassium, calcium, iron, manganese, cobalt and chromium, in the seeds
showing its high nutritional status.
Complexation of thymoquinone and thymol with different metals i.e. Fe(III), Cr(VI), Cu(II),
V(IV) and Co(II) were investigated by pH-metry and cyclic voltammetry. Both techniques
revealed that above mentioned compounds successfully formed complexes with all metals. pH-
metric studies revealed that out of above mentioned metals Fe(III) and V(IV) forms relatively
stable complexes with both ligands. Moreover, they formed complexes at low pH while rest of
the metals at high pH. Comparison of thymol and thymoquinone complexes revealed that
thymoquinone forms more stable complexes with all mentioned metals than thymol. pKa of both
ligands was also determined which also showed comparatively more potential of thymoquinone
towards complex formation.
It is a fact that all metals studied in present research are required in trace quantities for the human
body and their excess results in heavy metal toxicity which can cause a wide range of problems.
From present research it is concluded that in case of metal toxicity thymoquinone and thymol
could be helpful in removing heavy metals from the body. They could perform this action by two

308
ways. Firstly, by forming complexes with the metals which exceed the toxic level. These metals
after formation of complexes will be unable to absorb in the body and then excreted from the
body in the complexed form. Secondly, since both thymoquinone and thymol are antioxidants
they can reduce these metals, for example Fe (III) to Fe (II), Cr (VI) to Cr (III) etc. and thus
converting the toxic metals into reduced form in which they play their active roles in the body.
Cyclic voltammetric studies showed that all the metals mentioned above formed complexes with
both thymoquinone and thymol. The results obtained for Fe(III)-Thymoquinone complex
revealed that the complex follow quasi-reversible reaction mechanism. Furthermore, post
equilibrium charge transfer process seems to occur in the complex, as a negative shift in peak
potential of the complex with respect to metal has been observed. The complex showed
relatively more stability at higher scan rates and at lower concentrations. High concentration of
ligand as compared to metal also found to destabilize the complex.
In case of Cr(VI)-Thymoquinone complex significant drop in the peak current of the complex as
compared to the ligand and a positive shift in the peak potential suggested the presence of pre
equilibrium charge transfer process in the complex. The data at different scan rates showed that
the complex exhibited quasi-reversible behaviour. The complex seems to be stable at lower
values of both scan rate and concentrations. It was also noted that here best complex formation
occurred at metal-ligand ratio 1:1. At higher ratios distortion in the anodic peak was observed
which may be due to presence of two peaks very close to each other.
Co(II)-Thymoquinone complex exhibited behaviour similar to Cr(VI)-Thymoquinone complex.
Here also pre equilibrium charge transfer process and quasi-reversible mechanism was suggested
on the basis of results. The reaction seems to be diffusion controlled between scan rates 0.05 V-
0.25 V. Results showed that high concentrations of complex or ligand may destabilize the
complex.
In case of Cu(II)-Thymoquinone complex a drop in the peak current of the complex as compared
to the metal and a positive shift in the peak potential of the complex were observed which
indicates the presence of pre equilibrium charge transfer process in the complex. The complex
seems to be stable at lower scan rates and at higher concentrations. In these cases reaction seems
to shift from quasi-reversible to reversible behaviour which was indicated by several
electrochemical parameters. Best complex formation seems to occur at metal-ligand ratio 1:2.

309
On repeated scanning of above mentioned complexes no change in peak potentials was observed
in any case. Moreover, no pre or post-peak was observed which shows that neither adsorption
nor deposition of complex on electrode surface occurred. Values of E˚ and diffusion coefficient
were also calculated in case of each complex. Comparison of diffusion coefficient of
thymoquinone, metal and metal-thymoquinone complex also confirmed complex formation in
each case. Variation in diffusion coeffient for forward and reverse scan in case of Fe(III)-
Thymoquinone complex indicates involvement of some coupled chemical reaction.
In brief whole research work can be concluded as follows:
N. sativa seeds can be a good source of several essential macro and micro elements as
well as many important biologically active compounds including thymoquinone and
thymol.
From present research it is revealed that since the metals which were investigated in
present research especially vanadium and iron form complexes at low pH, it is possible
that some comparatively more potential ligands, if present in the food, may chelate these
metals. Hence intake of black seed along with the meal may create their deficiency so it
is better to take the seeds on empty stomach.
Since both thymoquinone and thymol formed complexes with the mentioned metals,
intake of the N. sativa seed in case of any of the above mentioned essential metal toxicity
could be very effective. Furthermore, this way of treatment could be much safer than
others, such as chelation therapy which may produce dangerous side effects. It is possible
to use both above mentioned ligands as chelators in chelation therapy instead of drugs
which are used in this technique and are potentially toxic.
Electrochemical studies of the complexes of thymoquinone and thymol with some metals
i.e. Fe(III), Cr(VI), Cu(II), V(IV) and Co(II) was performed which has not been reported
earlier. Out of these, complexes of thymoquinone with Fe(III), Cr(VI), Co(II) and Cu(II)
were studied in detail using cyclic voltammetry.
In case of all the complexes the base lines were found to be horizontally straight. Effects
of various parameters such as scan rate, concentration, metal-ligand ratio, supporting
electrolyte and repeated scanning were observed on complexation. The data obtained
from the study gave several useful information regarding pre / post equilibrium charge

310
transfer, mechanism of reactions, stability of the complex, half-wave potential, transfer
coefficient and diffusion coefficient.
The quantitative studies revealed that cyclic voltammetry at glassy carbon electrode can
be used in the pharmaceutical quality control assays of these complexes.

311
APPENDIX – I
LIST OF CHEMICALS
Name of Chemicals Chemical Formula Secification
Buffer tablets pH 4.0 and 7.0 BDH AnalaR
Cobalt acetatetetrahydrate
Co(CH3COO)2. 4H2OMerckM= 249.08 g/mol
Copper sulphatepentahydrate
CuSO4. 5H2OBio Basic Inc.M= 249.68 g/mol
Dichloromethane CH2Cl2MerckM= 84.93 g/mol, 99%
Ethyl acetate C4H8O2MerckM= 88.11 g/mol , 99.5%
Ferric chloridehexahydrate
FeCl3. 6H2OMerckM = 270.33 g/mol
n-Hexane C6H14MerckM = 86.18 g/mol
Hydrochloric acid HClMerckM = 12.07 g/mol , 37%
Lithium chloride LiCl Bio Basic Inc.M= 42.39 g/mol , 99%
Methanol CH3OHMerckM= 32.04 g/mol , 99.5%
Oxalic acid (COOH)2. H2OBDH
M = 126.064 g/mol
Potassium dichromate K2Cr2O7MerckM = 294.19 g/mol , 99.5%
Silica gel SiO2 Merck kieselgel 60
Sodium chloride NaClMerckM = 58.44 g/mol
Sodium hydroxide NaOH MerckM = 39.90 g/mol
Sodium sulphateanhydrous
Na2SO4MerckM = 142.04 g/mol
Thymol[2-{(CH3)2CH} C6H3-5-(CH3)OH]
Bio Basic Inc.M = 150.22
Thymoquinone C10H12O2MP Biomedicals, LLCM = 164.2
TLC Cards-
MerckTLC Silica gel 60 F254
Vanadyl sulphate hydrate VOSO4. xH2OMP Biomedicals, LLCM = 50.9415

312
APPENDIX - II
LIST OF INSTRUMENTS
Instrument Specification
Cyclic voltammeter CH Instrument, CHI-760 D Electrochemical Workstation
Electrical balance Shimadzu AX 200, Max 200 g, d = 0.1mg
Electrical oven Double-walled laboratory oven, Model J-5015-50
IR spectrometer Bruker Vector 22 FTIR
Magnetic stirrer IKAMAG E.C.T stirrer
Mass spectrometer JEOL MSRoute
NMR spectrometer BRUKER AM 300 and BRUKER AM 400
pH meter Jenway, Model 3510 pH meter
Rotary evaporator BÜCHI Rotavapor & BÜCHI Heating Bath
Scanning electronmicroscope
Make-Jeol Japan, Model JSM 6380 A; Coater- Jeol Japan,Model JFC 1500; EDS detector- Jeol Japan, Model ES 54175JMU
Thermostat HAAKE, Model KT 33, Germany
UV/VisibleSpectrophotometer
Thermo Scientific Evolution 300

313
APPENDIX – III
LIST OF ABBREVIATIONS
Abbreviation Full Name
L1 Thymol
L2 Thymoquinone
C1 Fe (III)-Thymol Complex
C2 Cr (VI)-Thymol Complex
C3 Cu(II)-Thymol Complex
C4 V(IV)-Thymol Complex
C5 Co(II)-Thymol Complex
C6 Fe (III)-Thymoquinone Complex
C7 Cr (VI)-Thymoquinone Complex
C8 Cu(II)-Thymoquinone Complex
C9 V(IV)-Thymoquinone Complex
C10 Co(II)-Thymoquinone Complex
314
REFERENCES
1. Said, H. M., Hamdard Medicus, 1983, XXVI(2), 3.
2. Buchman, D.D, Herbal Medicine, the natural way to get well and stay well,Gramercy Publishing Company, New York, 1980, 8.
3. Farns Worth, N.R., Ethnopharmacology and Drug Development, In: Cibo FoundationSymposium, 185, Wiley, Chichester, 1994, 42.
4. Standen, O.D.; In Schnitzer, R.J., and Hawking, F. (Eds.), Experimental Chemotherapy,Academic Press, New York, London, 1963, Vol. I.
5. Ladmier, D.; Mitscher, L.A., Organic Chemistry of Drug Synthesis, 1984.
6. Dymock, W.; Warden, C.J.H.; Hooper, D., Pharmacographia Indica, The Institute of Healthand Tibbi Research, Republished under the auspices of Hamdard National FoundationPakistan, 1980, Vol. I-III.
7. Dey, K.L.; Mair, W., The Indigenous Drugs of India, 2nd ed. Pama Primlane, ChronicaBotanica, New Delhi (India), 1973.
8. Dustur, J. F., Medicinal Plants of India and Pakistan, D.B. Taraporevala Sons & Co,Bombay (India), 1977.
9. Ayurveda, Pharmacopoeia, Department of Ayurveda, Colombo, Sri Lanka, 1979, Vol. I & II.
10. Dey, A. C., Indian Medicinal Plants used in Ayuredic preparations, Bishen Singh MahendraPal Singh, Dehra Dun (India), 1980.
11. Jayaweera, D.M.A., Medicinal Plants (Indigenous and Exotic) used in Cylon, Part IV, TheNational Science Council of Sri Lanka, Colombo, 1982.
12. Ballardrin, M.F.; Klocke, J.A., Medicinal, aromatic and industrial materials from plants, InBajaj, Y.P.S. (Ed), Biotechnology in Agriculture and Forestry 4, Medicinal and aromaticplants I, Spring-Verlag Co., New York, 1988, 3.

315
13. Chevallier, A., The Encyclopedia of Medicinal Plants, Dorling Kindersley Ltd; London,1996, 336.
14. Small, E. (Ed.), Culinary Herbs, NRC Research Press Ottawa, 1997, 710.
15. Baquar, S.R., Medicinal and Poisonous Plants of Pakistan, Printas, Ist ed., Karachi, Pakistan,1989.
16. Chansouria, J.P.N.; Ray, A.B.; Hemalatha, S., Medicinal Plants, Hypolipidemic,Hypocholesterolemic and anti-atherosclerotic properties, International Book DistributingCo., Ist ed., Printed at Salasar Imaging Systems, Delhi, India, 2006.
17. Sohni, Y.R.; Kamal, P.; Bhatt, R.M., Journal of Ethnopharmacology, 1995, 45, 43.
18. Ahmed, I.; Mehmood, Z.; Mohammad F., Journal of Ethnopharmacology, 1998, 62, 183.
19. Mirza, M.; Ahmad, S.; Qadri, N.M.; Qureshi, S., Hamdard Medicus, 2001, XLIV(4), 57.
20. World Health Organization, Summary of WHO guidelines for assessment of herbalmedicines, Herbal Gram, 1993, 28, 13.
21. Davis, J., Science, 1994, 264, 375.
22. Vietmeyer, N.D.(Ed.), National Research Council, Neem-A Tree for Solving GlobalProblems, National Academy Press, Washington, D.C., USA, 1992.
23. Kraus, W.; In Schmutterer, H. (Ed.), The Neem Tree, New York: VCH Publishers Inc.,Weinhein, Germany, 1995.
24. Kraus, W.; Bokel, M.; Scwinger, M.; Volger, M.; Soellner, R.; Wachendroff, U., In VanBeek, T., and Breteler, H. (Eds.), Phytochemistry and Agriculture, Oxford University Press,1993.
25. Dhar, L.M.; Dhar, M.M.; Dhawan, N.; Mehrotra, B.N.; Ray, C., Indian Journal ofExperimental Biology, 1968, 6, 232.

316
26. Perumalsamy, R.; Patricraja, D., Acta Botanica Indica, 1996, 24, 113.
27. Waller, D.P., Journal of Ethnopharmacology, 1993, 38, 189.
28. Al-Bashan, M.M., Hamdard Medicus, 2006, XLIX(1), 169.
29. Satoskar, R.S.; Bhandarkar, S.D., Pharmacology and Pharmacotherapeutics, Part 1, 8th ed.,Popular Prakashan, Bombay, India, 1983.
30. Khan, K.H.; Jain, S.K., Hamdard Medicus, 2003, XLVI(3), 23.
31. Aggarwal, B.B.; Kunnamakkara, A.B.; Harikumar, K.B.; Tharakan, S.T.; Sung, B.; Anand,P., Planta Med Jul 8, 2008.
32. Dr. Nadkarni, K.M., Indian materia medica, 1954, 1, 854.
33. Khare, C.P. (Ed.), Indian Medicinal Plants, An Illustrated Dictionary, Springer Science +Business Media, LLC., New Delhi, India, 2007, 439.
34. Prajapati, D.N.; Prohit, S.S.; Sharma, A, K.; Kumar, T., A Handbook of Medicinal Plants,Agrobios (India), Jodhpur, India, 2003, 884.
35. Dr. Rizvi, M.A.; Dr. Saeed, A.; Zubairy, H.N., Medicinal Plants, History, Cultivaton anduses, 1st ed.,Hamdard Institute of Advance Studies and Research, Printed at Altitude graphicand Printers, Pakistan, 2007,109.
36. Khan, M.; Siddiqui, A.; Chatap, V.; Tanaji, N., Hamdard Medicus, 2006, XLIX(3), 5.
37. Shinwari, Z.K.; Rehman, M.; Watanabe, T.; Yoshikawa, T., A Pictorial guide to MedicinalPlants of Pakistan, Published by Kohat university of Science & Technology, Peshawar,Pakistan, 2006, 294.
38. Blatter, E.; Caius, J.F.; Mhaskar, K.S., Indian Medicinal Plants, 2nd ed., Allahabad, India,1984, 11.
39. Gupta, A.K., Quality Standards of Indian Medicinal Plants, 1st ed., 2003, 1, 161.
317
40. Muhammad, A.A., (773-835 A.D) Sahih Bukhari, Translated in Urdu by Waheeduzzaman,Taj Company Ltd., Karachi, Chap. 591-592, 1984, VII, 475.
41. Zohary, D.; Hopt, M., Domestication of Plants in the Old World, Oxford University Press,2001.
42. Ghaznavi, K., Tibbe Nabvi aur Jadeed Science, Al-Faisal Publishers, Lahore, Pakistan, 1996,46.
43. Burits, M.; Bucar, F., Phytother Res, 2000, 14(5), 323.
44. Riaz, M.; Syed, M.; Chaudhary, F.M., Hamdard Medicus, 1996, XXXIX(2), 40.
45. Nadkarni, A.K., Indian Materia Medica, Popular Parkashan Pvt. Ltd., Bombay, India, 1976.
46. Randhawa, M.A.; Al-Ghamdi, M.S., Pak. J. Med. Res., 2002, 41, 77.
47. Rehman, A.; Malik, S.; Cunheng, He.; Clardy, J., Tetrahedron Lett., 1985, 26(23), 2759.
48. Ansari, A.A.; Hassan, S.; Kenne, L.; Rehman, A.; Wehler, T., Phytochemistry, 1988, 27(12),3977.
49. Chopra, R.N.; Nayar S.L.; Chopra, I.C., Glossary of Indian Medicinal plants, CSIRPublication, New Delhi, India, 1956.
50. Malik, S., Studies on the chemical constituents of Rhazya stricta and Nigella sativa (A thesissubmitted for Doctor of Philosophy), H.E.J Research Institute of Chemistry, University ofKarachi, 1985, 171.
51. Stodola, J.; Volak, J.; In Bunney, S. (Ed.), The Illustrated Encyclopedia of Herbs, ChancellorPress, Michelin House, London, 1992, 197.
52. Kirtikar, K.R.; Basu, B.D., Indian Medicinal Plants, 2nd ed, 1999, 1, 11.
53. Salman, M.T.; Khan, R.A.; Shukla, I., Hamdard medicus, 2011, 54(1), 48.

318
54. Shabbir, G.; Saghir, M.; Ahmad, I.; Rafi, M., Hamdard Medicus, 2004, XLVII(2), 5.
55. Yousuf, M.; Chowdhury, J.U.; Wahab, M.A.; Begum, J., Medicinal Plants of Bangladesh,BCSIR Laboratories, Chittagong, Bangladesh, 1994, 221.
56. Khanna, T.; Zaidi, F.A.; Dandiya, P.C., Fitoterapia, 1993, 64(5), 407.
57. Aboutabl, E.A.; El-Azzouny, A.A.; Hammerschmidt, F.J., Aroma volatiles of Nigella sativaL. seed, Progress in Essential Oil Research, Walter de Gruyter & Co., Berlin, New York,1986, 49.
58. Bhatia, S.C., A Concise Encyclopedia of Essential Oil & Perfumery Chemicals, ShreePublishing House, New delhi, India, 1983, 34.
59. Eschborn, M.I., Prϋfung von Schwarzkϋmmelöl, Pharmazeut. Ztg., 1997, 142, 46.
60. Lautenbacher, L.M., Dtch. Apoth. Ztg., Deutscher Apotheker Verlag, 1997, 137(50), 4602.
61. Al-Jishi, S.A.A., A study of Nigella sativa on blood homeostatic functions, M.Sc. thesis, KingFaisal University, Dammam, Saudi Arabia, 2000.
62. El-Kadi, A.; Kandil, O., Bull. Islamic Med., 1986, 4, 344.
63. Ray, A.B.; Chansouria, J.P.N.; Hemalatha, S., Hemalatha, S., Medicinal Plants: Antidiabeticand Hypoglycemic Activities, 1st ed., ibdc Publishers, Salasar Imaging System, 2010.
64. Gokhale, S.H.; Kokate, C.K.; Purohit, A.P., Pharmacognosy, 22nd ed., Nirali Prakashan,2003, 310.
65. Imran, H.; Yaqeen, Z.; Sohail, T.; Saleem, R., Hamdard Medicus, 2009, 52(4), 100.
66. Babayan, V.K.; Koottungel, D.; Halaby, G.A., J. Food Sci., 1978, 43(4), 1314.
67. Said, H.M., Pharmacographia Indica(Repr.) Hamdard (special issue), 1972, 15, 28.
68. Al-Jassir, M.S., Food Chem., 1992, 45(4), 239.

319
69. Abdel-Aal, E.S.M.; Attia, R.S., Alexandria Sci. Exch., 1993, 14(4), 467.
70. Saleem, R.; Sultana, R.; Ambrat; Begum, A., Pak. J. Sci. Ind. Res., 2007, 50(5), 308.
71. Anwer, H.; Khan, I.A.T., Int. J. Biol. Biotech., 2007, 4(2-3), 253.
72. Rahman, A.; Malik, S.; Sultan, A.; Rehman, H.; Chaudhary, I., Heterocycles, 1985, 23(4),953.
73. Zawahry, M.R.; Kararra, A., Indian Med. Forum, 1964, 15(9), 289.
74. Zawahry, M.R., Inst. Pharm. Abstr., 1964, 1(1), 416.
75. Lewis, J.R., Nat. Prod. Report, 1986, 3(6), 587.
76. Rehman, A., Pure Appl. Chem., 1989, 61(3), 453.
77. Tewari, R.D., Chem. Sect., Univ. Allahabad studies, 1946, 1, 41.
78. Tewari, R.D., Biol. Abst., 1950, 24(7):21671.
79. Keller, O., Arch. Pharm., 1908, 246, 1.
80. Menounos, P.; Staphylakis, K.; Gegiou, D., Phytochemistry, 1986, 25(3), 761.
81. Salam, R.B., Planta Med., 1973, 24(4), 375.
82. Bose, B.; Ghosh, O.; Singh, R.P., J. Inst. Chem., (India) 1981, 53(6), 273.
83. Ansari, A.A.; Osman, S.M.; Subbaran, M.R., J. Oil Technol. Assoc.,(India) 1975, 7(1), 26.
84. Gad, A.M.; Dakhakhny, M.El.; Hassan, M.M., Planta Med., Arzneipflanzenforshung, 1963,11(2), 134.
320
85. Kudryashova, N.A.; Kolobvkova, E.V., DokladyAkad. Nauk, S.S.S.R., 1953, 91, 1365.
86. http://www.theblessedseed.com/ ? how it works,26
87. Xin, X.; Xue, H.; Ajiaikebaier, A.; Wang, H., Schizhen Guoyi Guoyao, 2008, 19(6), 1514.
88. Al-Yahya, M.A., Fitoterapia, 1986, 57(3), 179.
89. Shabbir, G.; Saghir, M.; Ahmed, I.; Rafi, M., Hamdard Medicus, 2004, XLVII(2), 5.
90. Raza, A.; Asif, A.R.; Yasin, G., Int. J. Agri. Biol., 1999, 1(3), 184.
91. Jukneviciene, G.; Dagyte, S.; Stankeviciene, N., Liet. TSR Mokslu Akad. Darb Sec. C-3,1977, 9.
92. Rao, T.S.S.; Nigam, S.S., Indian Perfum., 1978, 22, 232.
93. Rastogi, R.P.; Mehrotra, B.N., Compendium of Indian Medicinal Plants, Printed at NationalInstitute of Science Communication, CSIR, New Delhi, India, 1980-1984, 3, 452.
94. Hasanzadeh, M.K.; Ramazanie, M.; Golmohammadzadeh, S., Orient. J. Chem., 2000, 16(3)461.
95. Mojab, F.; Nickavar, B.; Javidnia, K.; Roodger Amoli, M.A., Faslnamah-i Giyahan-i Daruyi,2003, 2(6), 21.
96. El-Ghorab, A.H., Journal of Essential Oil Bearing Plants, 2003, 6(2), 67.
97. Rchid, H.; Nmila, R.; Bessiere, J.M.; Sauvaire, Y.; Chokairi, M., Journal of Essential OilResearch, 2004, 16(6), 585.
98. Wawrzyniak, P.; Iwanek, D.; Kalemba, D., Inzynieria i Aparatura Chemiczna, 2004, 43(3),161.
99. Singh, G.; Marimuthu, P.; de Heluani, C.S.; Catalan, C., Journal of Science of Food andAgriculture, 2005, 85(13), 2297.

321
100. Benkaci-Ali, F.; Baaliouamer, A.; Meklati, B.Y., Journal of Nature, 2005, 17(1), 3.
101. Benkaci-Ali, F.; Baaliouamer, A.; Wathelet, J.P.; Marlier, M., Rivista Italiana EPPOS, 2006,41, 23.
102. Benkaci-Ali, F.; Baaliouamer, A.; Meklati, B.Y.; Chemat, F., Flavour and FragranceJournal, 2007, 22(2), 148.
103. Wajs, A.; Bonikowski, R.; Kalemba, D., Flavour and Fragrance Journal, 2008, 23(2), 126.
104. Kokoska, L.; Havlik, J.; Valterova, I.; Sovova, H.; Sajfrtova, M.; Jankovska, I., Journal ofFood Protection, 2008, 71(12), 2475.
105. Adamu, H.M.; Ekanem, E.O.; Bulama, S., Pakistan Journal of Nutrition, 2010, 9(10), 966.
106. Benkaci-Ali, F.; Baaliouamer, A.; Wathelet, J.P.; Marlier, M., Journal of Essential OilResearch, 2010, 22(4), 318.
107. Nergiz, C.; Otles, S., Food Chem., 1993, 48(3), 259.
108. Zeitoun, M.A.M.; Neff, W.E., Ol., Corps Gras, Lipides, 1995, 2(3), 245.
109. Bhakare, H.A.; Kulkarni, A.S.; Khotpal, R.R., J. Food. Sci. Technol., 1993, 30(1), 54.
110. Singh, N.; Pandit, V.; Verma, M.; Mehta, B.K., Grasas y Aceites, 2002, 53(2), 173.
111. Deineka, V.I.; Sirotin, A.A.; Ospishcheva, N.V., Chemistry of Natural Compounds, 2004,40(3), 295.
112. Mehta, B.K.; Gupta, M.; Verma, M., Indian Journal of Chemistry, Section B: OrganicChemistry Including Medicinal Chemistry, 2006, 45B(6), 1567.
113. Mahmud, S.; Khanum, R.; Mazhar, S.; Shahzad, M.I., Pakistan Journal of ScientificResearch, 2006, 58(3-4), 11.
114. Mehta, B.K.; Verma, M.; Gupta, M., Journal of Brazilian Chemical Society, 2008, 19(3),458.
322
115. Houghton, P.J.; Zarka, R.; de las Heras, B.; Hoult, J.R.S., Planta Med., 1995, 61(1), 33.
116. Chiekh-Rouhou, S.; Besbes, S.; Hentati, B.; Blecker, C.; Deroanne, C.; Attia, H., FoodChemistry, 2007, 101(2), 673.
117. Amin, S.; Mir Showkat, R.; Kohli, K.; Ali, B.; Ali, M., Natural Product Research, 2010,24(12), 1151.
118. Chauhan, S.; Parveen, S.; Sharma, S.; Sherwani, M.R.K., Biosciences, BiotechnologyResearch Asia, 2010, 7(2), 1021.
119. Bourgou, S.; Ksouri, R.; Skandrani, I.; Chekir, G.L.; Marzouk, B., Italian Journal of FoodScience, 2008, 20(2), 191.
120. Rababah, T.M.; Ereifej, K.I.; Esoh, R.B.; Al-u’datt, M.H.; Alrababah, M.A.; Yang, W.,Natural Product Research, 2011, 25(6), 596.
121. Merfort, I.; Wray, V.; Barakat, H.H.; Hussein, S.A.M.; Nawwar, M.A.M.; Willuhn, G.,Phytochemistry, 1997, 46(2), 359.
122. Singab, A.B.; Khalifa, T.I.; Okuyama, T.; Fushiya, S., Al-Azhar J. Pharm. Sci., 1999, 24, 1.
123. Kadry, H.A.; El-Dondaity, S.E.; Muhammad, A.I., Egyptian journal of Biotechnology, 2005,21, 169.
124. Kadry, H.A.; El-Dondaity, S.E.; Muhammad, A.I., Egyptian journal of Biotechnology, 2005,21, 241.
125. Mehta, B.K.; Sharma, U.; Agrawal, S.; Pandit, V.; Joshi, N.; Gupta, M., Medicinal ChemistryResearch, 2008, 17(2/7), 462.
126. Mehta, B.K.; Mehta, P.; Gupta, M., Carbohydrate Research, 2009, 344(1), 149.
127. Rahman, A.; Malik, S.; Hasan, S.S.; Choudhary, M.I.; Ni, C.; Clardy, J., Tetrahedron Lett.,1995, 36(12), 1993.

323
128. Morikawa, T.; Xu, F.; Kashima, Y.; Matsuda, H.; Ninomiya, K.; Yoshikawa, M., OrganicLetters, 2004, 6(6), 869.
129. Morikawa, T.; Xu, F.; Ninomiya, K.; Matsuda, H.; Yoshikawa, M., Kyoto PharmaceuticalBulletin, 2004, 52(4), 494.
130. Oshchepkova, Y.I.; Veshkurova,O.N.; Rogozhin, E.A.; Musolyamov, A.K.; Smirnov, A.N.;Odintsova, T.I.; Egorov, T.A.; Grishin, E.V.; Salikhov, S.I., Russian Journal of BioorganicChemistry, 2009, 35(3), 315.
131. Siddiqi, T.O.; Kan, H.A., Acta Manilana, 1990, 38, 19.
132. Hewamanna, R.; Anuraadhai, N.; Fernando, R.K.S., 2004, J. Trop. Med. Plants, 2004, 5,211.
133. Cheblowski, J.I.; Coleman, J.E., Zinc and its role in enzymes, In: Metal ions in biologicalsystems (Seigel, H., Dekker, Ed.), Academic Press, NY, 1976, 198.
134. Shahito, S.R.; Kazi, T.G.; Kazi, G.H.; Jakhrani, M.A., J. Chem. Soc. Pak., 2002, 24, 134.
135. Fatima, N.; Maqsood, Z.T.; Khan, B., Scientia Iranica Study, 2005a, 12(3), 269.
136. Siong, T.E.; Choo, K.S.; Shahid, S.M., Pertanika, 1989, 12(3), 303.
137. Siong, T.E.; Choo, K.S.; Shahid, S.M., Pertanika, 1989, 12(3), 313.
138. Al-Bataina, B.A.; Maslat, A.O.; Al-Kofahi, M.M., Journal of Trace elements in Medicineand Biology, 2003, 17(2), 85.
139. Hassan, A.M.; Mandeel, Q.A.; Nabi, H.A., Arab Gulf Journal of Scientific Research, 2003,21(2), 79.
140. Al-Saleh, I.A.; Billedo, G.; El-Doush,I.I., Journal of Food Composition and Analysis, 2006,19(2-3), 167.
141. Kolachi, N.F.; Kazi, T.G.; Khan, S.; Wadhawa, S.K.; Baig, J.A.; Afridi, H.I.; Shah, A.Q.;Shah, F., Food and Chemical Toxicology, 2011, 49(10), 2548.
142. Mahfouz, M.; El-Dakhakhny, M., J. Pharm. Sci., United Arab Rep., 1960, 1, 9.

324
143. Dockal, E.R.; Cass, Q.B.; Broksom, T.J.; Brocksom, U.; Correa, A.G., Synthetic Comm.,1955, 15, 1033.
144. Aftab, K.; Usmani, S.B.; Ahmad, S.I.; Usmanghani, K., Hamdard Medicus, 1996, 39(1) 44.
145. Chakaravarty, N., Annals. of Allergy, 1993, 70(3), 237.
146. El-Tahir, K.E.; Ashour, M.M.; al Harbi, M.M., Gen. Pharmacol., 1993, 24(5), 1123.
147. Aboul-Enein, H.Y.; Abou-Basha, L.I., J. Liq. Chromatogr., 1995, 18(5), 895.
148. Ghosheh, O.A.; Houdi, A.A.; Crooks, P.A., J Pharm Biomed Anal., 1999, 19(5), 762.
149. Mouhajir, F.; Pedersen, J.A.; Rejdali, M.; Towers, G.H.N., Pharm. Biol., 1999, 37(5), 391.
150. Michelitsch, A.; Rittmannsberger, A., Phytochemical Analysis, 2003, 14(4), 224.
151. Pagola, S.; Benavente, A.; Raschi, A.; Romano, E.; Molina, M.A.; Stephens, P.W., Pharm.Sci. Tech., 2004, 5, e28.
152. Michelitsch, A.; Rittmannsberger, A.; Huefner, A.; Rueckert, U.; Likussar, W.,Phytochemical Analysis, 2004, 15(5), 320.
153. Velho-Pereira, R.M.; Barhate, C.R.; Kulkarni, S.R.; Jagtap, A.G., Phytochemical Analysis,2011, 22(4), 367.
154. Bures, E.; Mladkova, H., Casopis Ceskolov. Lekarnictva, 1928, 8, 186.
155. Bures, E.; Mladkova, H., Casopis Ceskolov. Lekarnictva, 1930, 10, 317.
156. Singh, B.K.; Tiwari, R.D., Proc. Natl. Acad. Sci. India, 1942, 12(2), 141.
157. Takruri, H.R.H.; Dameh, M.A.F., J. Sci. Food Agric., 1998, 76, 404.
158. Al-Okbi, S.Y.; Ammar, N.M.; El-Kader, M.M.Abd., Egypt. J. Pharm. Sci., 1997, 38(4-6),451.
159. Schweig, T., Pharm. Ztg., 1999, 144(33), 2582.
160. Kahkashan,Z.; Rehman, S.Z.; Tajuddin, A.L.; Nasreen, J., Hamdard Medicus, 2008, 51(1),77.
161. http.//www.naijaryders.com/foroms/68564-blachseed-oil html
162. Ali, M.S.; Ahmed, V.; Azhar, I.; Usmanghani, K., Hamdard Medicus, 1998, XLI(2), 96.

325
163. Khan, M.T.H.; Choudhri, M.S.K., Hamdard Medicus, 1998, XLI(1), 44.
164. El-Alfy, T.S.; El-Fatatry, H.M.; Toama, M.A., Pharmazie, 1975, 30, 109.
165. Khan, M.T.H.; Jabbar, S.; Choudhri, M.S.K.; Ghafur, M.A., Hamdard Medicus, 1999,XLII(4), 22.
166. Topozada, H.H.; Masloum, H.; El-Dakhakhany, M.J., Egypt, Med. Assoc., 1965, 48, 187.
167. Akhter, M.S.; Riffat, S., J. Pakistan Med. Assoc., 1991, 41(8), 185.
168. Nair, S.C.; Salomi, M.J.; Panikkar, K.R., J. Ethnopharmacol., 1991, 31(1), 75.
169. Khan, M.T.H.; Jabbar, S.; Choudhri, M.S.K., Hamdard Medicus, 1998, XLI(3), 56.
170. Desta, B., J. Ethnopharmacol., 1993, 39, 129.
171. Zagari, A., Medicinal Plants, 6th ed., Tehran Univ. Publications, Tehran, Iran, 1993, 1, 946.
172. Burkill, I.H., Dictionary of the Economic Products of the Malay Peninsula, Ministry ofAgriculture and Cooperatives, Kuala Lumpur, Malaysia, 1966, Vol. 2.
173. Al-Khalil, S., Int. Pharmaceut., 1995, 33, 317.
174. Said, H.M., Hamdard Medicus, 1980, 23(3), 29.
175. Saxena, A.P.; Vyas, K.M., J. Econ. Tax. Bot., 1986, 8(2), 291.
176. Boulos, L., Medicinal Plants of South Africa, Reference Publications, Algonac, Michigan,1983, 150.
177. Sayed, M.D., J. Ethnopharmacol., 1980, 2, 19.
178. Hafeez, I.; Mannan, H.A.; Latafat, T.; Siddique, M., Hamdard Medicus, 2004, XLVII(4),109.
179. Halith, S.M.; Abirami, A.; Jayaprakash, S.; Karthikeyini, C.; Pillai, K.K.; Firthouse, P.U.M.,Der Pharmacia Lettre, 2009, 1(2),68.
180. Okwu, D.E.; Ohenhen, O.N., Der Pharma Chemica, 2009, 1(2), 32.

326
181. Djipa, C.D.; Delmee, M.; Leclereq, J.Q., J. Ethnopharmacol., 2000, 71, 307.
182. Scartezzini, P.; Speroni, E., J. Ethnopharmacol., 2000, 71, 23.
183. Kapil, A.; Sharma, S., J. Ethnopharmacol., 1997, 58, 89.
184. Gujral, M.L.; Kohli, R.P.; Bhargava, K.P.; Saxena, P.N., Ind. J. Med. Res., 1955, 43, 11.
185. Archana, R.; Namasivayam, A., J. Ethnopharmacol., 1999, 64, 91.
186. Devi, P.U.; Sharada, A.C.; Solomon, F.E., Indian Journal of Experimental Biology, 1993, 31,607.
187. Duley, J.N., J. Ethnopharmacol., 2000, 70, 57.
188. El-Dakhakhny, M., Arzneimittelforschung, 1965, 15(10), 1227.
189. Mehfouz, M.; Abdel-Maquid, R.; El-Dakhakhny, M., Arzneimittelforschung, 1965, 15, 1230.
190. Marozzi, F.j.; Kocialski, A.B.; Malone, M.H., Drug Res., 1970, 20, 1574.
191. Akhtar, A.H.; Ahmed, K.D.; Gilani, S.N.; Nazir, A., Fitoterapia, 1996, 3, 195.
192. Zawahry, M.R., Kongr. Pharm. Wiss., Votr. Originalmitt., 1963, 23, 193.
193. Zaoui, A.; Cherrah, Y.; Lacaille-Dubois, M.A.; Settaf, A.; Amarouch, H.; Hassar, M.,Therapie, 2000, 55, 379.
194. Khan, M.A.; Ashfaq, M.K.; Zuberi, H.S.; Mahmood, M.S.; Gilani, A.H., Phytother Res.,2003,17, 183.
195. Al-Ghamdi, M.S., J. Ethnopharmacol., 2001, 76, 45.
196. Mumtazuddin, S., Asian Journal of Chemistry, 2005, 17(2), 1307.
197. Khan, M.A., Inflammopharmacology, 1999, 7(1), 15.
198. Ali, B.H.; Blunden, G., Phytother Res, 2003, 17(4), 299.

327
199. Worthen, D.R.; Ghosheh, O.A.; Crooks, P.A., Anticancer Res, 1998, 18(3A), 1527.
200. Zaoui, A.; Cherrah, Y.; Mahassini, N.; Alaoui, K.; Amarouch, H.; Hassar, M.,Phytomedicine, 2002, 9(1), 69.
201. Ilaiyaraja, N.; Khanum, F., Journal of Herbal Medicine and Toxicology, 2010,4(2), 1.
202. Mehta, B.K.; Pandit, V.; Gupta, M., Natural Product Research, Part A, 2009, 23(2), 138.
203. Gali-Muhtasib, H.; El-Najjar, N.; Schneider-Stock, R., Advances in Phytomedicine, 2006, 2,133.
204. Butt, M.S.; Sultan, M.T., Critical Reviews in Food Sciences and Nutrition, 2010, 50(7), 654.
205. Babish, J.G.; Pacioretty, L.M.; Debenedetto, J., U.S. Pat. Appl. Publ., 2011, 32.
206. Al-Attar, A.M.; Al-Taisan, W.A., Australian Journal of Basic and Applied Sciences, 2010,4(5), 957.
207. Agarwal, R.; Kharya, M.D.; Shrivastava, R., Ind. J. Exp. Biol., 1979, 17(11), 1264.
208. Rathi, P.S.; Mishra, S.H.; Kaushal, R., Ind. J. Pharm. Sci., 1982, 44(1), 8.
209. Naqvi, S.H.H.; Khan, M.S.Y.; Vohra, S.B., Fitoterapia, 1991, LXII(3), 221.
210. Akgul, A.; Kivane, M., Doga: Turk Tarim Ormancilik. Derg, 1989, 13(1), 1.
211. Bourrel, C.; Vilarem, G.; Perineau, F., Riv. Ital. EPPOS, 1993, 4(10), 21.
212. Alkofahi, A.; Masaadeh, H.; Al-Khalil, S., Alexandria J. Pharm. Sci., 1996, 10(2), 123.
213. El-Kamali, H.H.; Ahmed, A.H.; Mohammad, A.S.; Yahia, A.A.M.; El-Tayeb, I.H.; Ali, A.A.,Fitoterapia, 1998, 69(1), 77.
214. Khan, M.T.H.; Jabbar, S., Hamdard Medicus, 1999, XLII(2), 16.
215. Salem, M.L.; Hossain, M.S., Int. J. Immunopharmacol., 2000, 22(9), 729.

328
216. Sidkey, N.M.; Desoukey, E.M.; Ammar, M.S.; Hussein, W.M., Al-Azhar J. Pharm. Sci.,2000, 26, 40.
217. Randhawa, M.A., Congress of the European Association for Clinical Pharmacology andTherapeutics, Proceedings, 9th, Edinburgh, United Kingdom, 2009, 169.
218. Gerige, S.J.; Gerige, M.K.Y.; Rao, M.; Ramanjaneyulu, Brazilian Archives of Biology andTechnology, 2009, 52(5), 1189.
219. Halawani, E., Advances in Biological Research, 2009, 3(5-6), 148.
220. Taha, M.; Abdel Aziz, A.Z., Saudi W. Egyptian Journal of Biochemistry & MolecularBiology, 2010, 28(2), 109.
221. Bourgou, S.; Pichette, A.; Marzouk, B.; Legault, J., South African Journal of Botany, 2010,76(2), 210.
222. Basha, A.L.I.; Rashed, M.S.; Aboul, E.H.Y., Journal of Liquid Chromatography, 1995,18(1), 105.
223. Salman, M.T.; Khan, R.A.; Shukla, I., Natural Product Radiance, 2008, 7(1), 10.
224. Karapinar, M.; Aktug, S.E., Int. J. Food Microbiol., 1987, 4(2), 161.
225. Barron, J.; Benghuzzi, H.; Tucci, M., Biomedical Sciences Instrumentation, 2008, 44, 434.
226. Gutteridge, J.M.C.; Halliwell, B., Oxidative stress. In, Antioxidants in Nutrition, Health andDisease, Oxford University Press, Oxford, 1994, 90.
227. Maxwell, S.R.J., Drugs, 1995, 49, 345.
228. Sies, H., Oxidative stress, Academic Press, London, 1991.
229. Halliwell, B.; Gutteridge, J.M.C., Free Radicals in Biology and Medicine, 2nd ed., ClarendonPress, Oxford, 1989, 416.
230. Al-Gharably, N.M.; Osama, A.; Nagi, M.N.; Al-Shabanah, O.A.; Al-Sawaf, H.A.; Al-Rikabi,A.C.; Al-Bekairi, A.M., Res. Commun. Pharmacol. Toxicol., 1997, 2(1&2), 41.
231. Daba, M.H.; Abdel-Rahman, M.S., Toxicol. Lett., 1998, 95(1), 23.

329
232. Atta, M.B.; Imaizumi, K., Nihon Yukagakkaishi, 1998, 47(5), 475.
233. Badary, O.A.; Abdel- Naim A.B.; Abdel-Wahab, M.H.; Hamada, F.M., Toxicology, 2000,143, 219.
234. Mansour, M.A.; Nagi, M.N.; El-Khatib, A.S.; Al-Bekairi A.M., Cell Biochem Func., 2002,20, 143.
235. Badary, O.A.; Taha, R.A.; Gamal El-Din, A.M.; Abdel-Wahab, M.H., Egyptian Journal ofBiochemistry & Molecular Biology, 2002, 20(1), 17.
236. Mohamed, A.; Shoker, A.; Bendjelloul, F.; Mare, A.; Alzrigh, M.; Benghuzzi, H.; Desin, T.,Bimed Sci Instrum., 2003, 39, 440.
237. El-Abhar, H.S.; Abdullah, D.M.; Saleh, S., J. Ethnopharmacol, 2003, 84, 251.
238. El-Saleh, S.C.; Al-Sagair, O.A.; Al-Khlaf, M.I., Int. J. Cardiol., 2004, 93, 19.
239. Parvardeh, S.; Nassiri, A.M.; Hosseinzadeh, H., Majallah-i-Ulum-i-Payah-i Pizishki-i Iran,2004, 7(2), 65.
240. Thippeswamy, N.B.; Naidu, K.A., European Food Research and Technology, 2005,220(5-6), 472.
241. Kanter, M., Demir, H.; Karakaya, C.; Ozbek, H., World J. Gastroenterol., 2005, 11, 6662.
242. Gawlik-Dziki, U.; Swieca, M., Herba Polonica, 2007, 53(3), 279.
243. Khalife, K.H.; Lupidi, G., Free Radic Res., 2007, 41, 153.
244. Syed-Ahmed, M.M.; Nagi, M.N., Clin. Exp. Pharmacol. Physiol., 2007, 34, 399.
245. Khattab, M.M.; Nagi, M.N., Phytother Res., 2007, 21, 410.
246. Nadia, M.H.; Ragia, A.T., Pharmacology, 2009, 84, 127.
247. Lutterodt, H.; Luther, M.; Slavin, M.; Yin, J.; Parry, J.; Gao, J.; Yu, L., Food Science andTechnology, 2010, 43(9), 1409.

330
248. Ismail, M.; Al-Naqeep, G.; Chan, K.W., Free Radical Biology and Medicine, 2010, 48(5),664.
249. Awad, A.S.; Kamel, R.; Sherief, M.E., Journal of Pharmacy and Pharmacology, 2011, 63(8),1037.
250. Ashraf, S.S.; Rao, M.V.; Kaneez, F.S.; Qadri, S.; Al-Marzouqi, A.H.; Chandranath, I.S.;Adem, A., Journal of Chromatographic Science, 2011, 49(4), 321.
251. Tesarova, H.; Svobodova, B.; Kokoska, L.; Marsik, P.; Pribylova, M.; Landa, P.; Vadlejch,J.,Natural Product Communication, 2011, 6(2),213.
252. Salomi, M.J.; Panikkar, K.R.; Kesavan, M.; Donata, S.R.; Rajagopalan, K., Ancient Sci. Life,1989, 8(384), 262.
253. Salomi, M.J.; Nair, S.C.; Panikkar, K.R., Nutr. Cancer, 1991, 16(1), 67.
254. Abdel-Salam, I.M.; Abdel- Wahab, S.; El-Aaser, A.A.; El-Merzabani, M.M., Egypt. J.Biochem., 1992, 10(2), 348.
255. Yousuf, W.B.; Akel, S.; El-Humeed, F., Bull. Fac. Sci., Univ. Alexandria, 1999, 39 (1, 2), 1.
256. Kumara, S.S.M.; Huat, B.T.K., Planta Med., 2001, 67(1), 29.
257. El-Dakhakhny, M.; Madi, N.J.; Lembert, N.; Ammon, H.P., J. Ethnopharmacol., 2002, 81,161.
258. Gali-Muhtasib, H.; ab-Assaf, M.; Boltze, C.; Al-Hmaira, J.; Hartig, R.; Roessner, A.;Schneider-Stock, R., Int. J. Oncol., 2004a, 25, 857.
259. Gali-Muhtasib, H.U.; bou-Kheir, W.G.; Kheir, L.A.; Darwiche, N.; Crooks, P.A., AnticancerDrugs, 2004b, 15, 389.
260. Norwood, A.A.; Tan, M.; May, M.; Tucci, M.; Beng-huzzi, H., Biomedical SciencesInstrumentation, 2006, 42, 350.
261. Al-Johar, D.; Shinwari, N.; Arif, J.; Al-Sanea, N.; Abdul-Jabbar, A.; El-Syed, R.; Mashhour,A.; Billedo, G.; El-Doush, I.; Al-Saleh, I., Phytotherapy Research, 2008, 22(10), 1311.
262. Yazan, L.S.; Ng.Wei,K.; Al-Naqeeb, G.; Ismail, M., Journal of Pharmacy Research, 2009,2(4), 585.

331
263. Raval, B.P.; Shah, T.G.; Patel, J.D.; Patel, B.A.; Patel,R.K.; Suthar, M.P., Archives ofApplied Science Research, 2010, 2(1), 52.
264. Woo, C.C.; Loo, S.Y.; Gee, V.; Yap, C.W.; Sethi, G.; Kumar, A.P.; Tan, K.H.B.,Biochemical Pharmacology, 2011, 82(50), 464.
265. Yonish-Rouach, E.; Resnitzky, D.; Lotem, J.; Sachs, L.; Kimchi, A.; Oren, M., Nature, 1991,352, 345.
266. Shaw, P.; Bovey, R.; Tardy, S.; Sahli, R.; Sordat, B.; Costa, J., Proc. Natl. Acad. Sci. U.S.A.,1992, 89, 4495.
267. Hermeking, H.; Lengauer, C.; Polyak, K.; He, T.C.; Zhang, L.; Thiagalingam, S.; Kinzler,K.W.; Vogelstein, B., Mol. Cell., 1997, 1,3.
268. Bunz, F.; Dutriaux, A.; Lemgauer, C.; Waldman, T.; Zhou, S.; Brown, J.P.; Sedivy, J.M.;Kinzler, K.W.; Vogelstein, B., Science, 1998, 282, 1497.
269. Padhye, S.; Banerjee, S.; Ahmad, A.; Mohammad, R.; Sarkar, F.H., Cancer Therapy, 2008,6, 495.
270. Shoib, A.M.; Elgayyar, M.; Dudrick, P.S.; Bell, J.L.; Tithof, P.K., International Journal ofOncology, 2003, 22(1), 107.
271. Yamasaki, L., Cancer Treat Res., 2003, 115, 209.
272. Bawadi, H.A.; Bansode, R.R.; Losso, J.N., Thymoquinone in the control of hypoxia-inducedangiogenic disease biomarkers: Insight into the mechanism of action in vitro, IFT AnnualMeeting, Las Vegas, NV, USA, 7-12-2004.
273. El-Mahdy, M.A.; Zhu, Q.; Wang, Q.E.; Wani, G.; Wani, A.A., Int. J. Cancer, 2005,117,409.
274. Roepke, M.; Diestel, A.; Bajbouy, K.; Walluscheck, D.; Schonfeld, P.; Roessner, A.;Schneider-Stock, R.; Gali-Muhtasib, H., Cancer Biology and Therapy, 2007, 6(2), 160.
275. Kaseb,A.O.; Chinnakannu, K.; Chen, D.; Sivanandam, A.; Tejwani, S.; Menon, M.; Dou,Q.P.; Reddy, G.P., Cancer Research, 2007, 67(16), 7782.
276. Reindl, W.; Yuan, J.; Kramer, A.; Strebhardt, K.; Berg, T., Chem Biol, 2008, 15, 459.

332
277. Cecarini, V.; Quassinti, L.; Di Blasio, A.; Bonfili, L.; Bramucci, M.; Lupidi, G.; Cuccioloni,M.; Mozzicafreddo, M.; Angeletti, M.; Eleuteri, A.M., FEBS Journal, 2010, 277(9), 2128.
278. Ng, W.K.; Yazan, L.S.; Ismail, M., Toxicology In Vitro, 2011, 25(7), 1392.
279. Arafa, E.A.; Zhu, Q.; Shah, Z.I.; Wani, G.; Barakat, B.M.; Racoma, I.; El-Mahdy, M.A.;Wani, A.A., Mutation Research, Fundamental and Molecular Mechanisms of Mutagenesis,2011, 706(1-2), 28.
280. Greenstein, A.J.; Sachar, D.B.; Smith, H.; Pucillo, A.; Papatestas, A.E.; Kreel, I.; Galler,S.A.; Janowitz, H.D.; Aufses, A.H., Jr Gastroenterology, 1979, 77, 290.
281. Ekbom, A.; Helmick, C.; Zack, M.; Adami, H.O., N Engl J Med, 1990, 323, 1228.
282. D̕ Haens, G.R.; Lashner, B.A.; Hanauer, S.B., Am J Gastroenterol, 1993, 88, 1174.
283. Brentnall, T.A.; Haggitt, R.C.; Rabinovitch, P.S.; Kimmey, M.B.; Bronner, M.P.; Levine,D.S.; Kowdley, K.V.; Stevens, A.C.; Crispin, D.A.; Emond, M.; Rubin, C.E.,Gastroenterology, 1996, 110, 331.
284. Krok, K.L.; Lichtenstein, G.R., Curr Opin Gastroenterol, 2004, 20, 43.
285. Crowe, S.E., Curr Opin Gastroenterol, 2005, 21, 32.
286. Neilson, C.K.; Campbell, J.I.; Ohd, J.F.; Morgelin, M.; Riebeck, K.; Landberg, G.; Sjolander,A., Cancer Res, 2005, 65, 732.
287. Mutabagani, A.; El-Mahdy, Samiha, A.M., Saudi Pharm J., 1997, 5(2-3), 110.
288. Mansour, M.; Tornhamre, S., J Enzyme Inhib Med Chem., 2004, 19, 431.
289. Hajhashmi, V.; Ghannadi, A.; Jafarabadi, H., Phytother Res, 2004, 18, 195.
290. Marsik, P.; Kokoska, L.; Landa, P.; Nepovim, A.; Soudek, P.; Vanek, T., Planta Medica,2005, 71(8), 739.
291. El-Gazzar, M.; El-Mezayen, R.; Marecki, J.C.; Nicolis, M.R.; Canastar, A.; Dreskin, S.C.,International Immunopharmacology, 2006, 6(7), 1135.
292. Teuscher, E., Medicinal Spices, A Hand Book of Culinary Herbs, Spices, Spice Mixtures andtheir Essential Oils, Med pharm Scientific Publisher, Stuttgart, Germany, 2006, 83.

333
293. Ahmed, M.; Mahmud, H., Science International, 2006, 18(2), 179.
294. Tekeoglu, I.; Dogan, A.; Ediz, L.; Budancamanak, M.; Demirel, A., Phytother Res, 2007,21(9), 895.
295. Kanter, M., Neurochemical Research, 2008b, 33(11), 2241.
296. Helal, G., Pakistan Journal of Pharmaceutical Sciences, 2010, 23(2), 131.
297. Ates, O.; Cayli, S.R.; Yucel, N, et al., J Clin Neurosci., 2007, 14, 256.
298. Ramakrishnana, R.; Sheeladevib, R.; Suthanthirarajanc, N.; Namasivayam, A., Brain ResBull., 2005, 67, 46.
299. Ma, L.; Yao, S.; Li, K., J Biol Chem., 2004, 279, 42351.
300. Al-Hader, A.; Aqel, M.; Hasan, Z., Int J Pharmacogn., 1993, 31(2), 96.
301. Al-Zuhair, H.H.; El-Syed, M.I.; Sadek, M.A., Bull Fac Pharm (Cairo Univ), 1996, 34(2),101.
302. Bamosa, A.O.; Ali,B.A.; Sowayan, S.A., Saudi Pharm J., 1997, 5, 126.
303. El-Dakhakhany, M.; Mady, N.; Lambert, N.; Ammon, H.P.T., Planta Med., 2002, 68(5), 465.
304. Rchid, H.; Chevassus, H.; Nmila, R.; Guiral, C.; Petit, P.; chokairi, M.; Sauvaire, Y., FundamClin Pharmacol., 2004, 18(5), 525.
305. Le, P.M.; Benhaddou, A.A.; Elimadi, A.; Settaf, A.; Cherrah, Y.; Haddad, P.S., JEthnopharmacol., 2004, 94(2-3), 251.
306. Kanter, M.; Coskien, O.; Korkmaz, A.; Oter, S., Anat Rec A Discov Mol Cell Evol Biol.,2004, 279(1), 685.
307. Fararh, K.M.; Atoji, Y.; Shimizu, Y.; Shiina, T.; Nikami, H.; Takewaki, T., Res Vet Sci.,2004, 77(2), 123.
308. Fararh, K.M.; Shimizu, Y.; Shiina, T.; Nikami, H.; Ghanem, H.; Takewaki, T., Research inVeterinary Science, 2005, 79(3), 219.

334
309. Kaleem, M.; Kirmani, D.; Asif, M.; Ahmed, Q.; Bano, B., Indian J Exp Biol., 2006, 44(9),745.
310. Houcher, Z.; Boudiaf, K.; Benboubetra, M.; Houcher, B., Pteridines, 2007, 18(1), 8.
311. Bilal, A.; Masud, T.; Uppal, A.M.; Naveed, A., Asian Journal of Chemistry, 2009, 21(7),5373.
312. Hamden, K.; Carreau, S.; Jamoussi, K.; Ayadi, F.; Garmazi, F.; Elfeki, A., Food Science andBiotechnology, 2009, 18(3), 739.
313. Abdelmeguid, N.E.; Fakhoury, R.; Kamal, S.M.; Al-Wafai, R.J., Journal of Diabetes, 2010,2(4), 256.
314. Agarwal, R., Indian J. Pharmaceut. Sci., 1979, 41, 248.
315. Dei, S., Indian J. Pharmacol., 1976, 8, 90.
316. Dehkordi, F.R.; Kamkhah, A.F., Fundam Clin Pharmacol., 2008, 22(4), 447.
317. El-Tahir, K.E.H.; Aqeel, A.M., Saudi Pharm. J., 1994, 2(4), 163.
318. El-Tahir, K.; Al-Ajmi, M.F.; Al-Bekairi, A.M., Saudi Pharmaceutical Journal, 2003, 11(3),104.
319. Chiekh, R.S.; Besbes, S.; Lognay, G.; Blecker, C.; Deroanne, C.; Attia, H., Journal of FoodComposition and analysis, 2008, 21(2), 162.
320. Ebru, U.; Burak, U.; Yusuf, S.; Reyhan, B.; Arif, K.; Faruk, T.H.; Emin, M.; Aydm, K.;Atilla, I.I.; Semsettin, S.; Kemal, E., Basic & Clinical Pharmacology & Toxicology, 2008,103(6), 574.
321. Bhatti, I.; Ur-Rehman, F.; Khan, M.A.; Marwat, S.K., World Applied Sciences Journal, 2009,6(8), 1053.
322. Paul, S.; Paul, K.K.; Palodhi, S.; Dutla, S., Phamacologyonline, 2010, (2), 842.
323. Ismail, M.; Al-Naqeeb, G., PCT Int. Appl., 2010, 32.
335
324. Mahmmoud, Y.A.; Christensen, S.B., Biochimica et Biophysica Acta, Biomembranes, 2011,1808(10), 2413.
325. Tasawar, Z.; Siraj, Z.; Ahmed, N.; Lashari, M.H., Pakistan Journal of Nutrition, 2011, 10(2),162.
326. Vohra, S.B.; Khan, M.S.Y., Ind. Drug Pharm Ind., 1981, 16(1), 39.
327. Aqel, M.B., Dirasat-Univ. Jordan, Ser. B., 1992, 19 B(1), 119.
328. Aqel, M.B., Dirasat-Univ. Jordan, Ser. B., 1992, 19 B(2), 91.
329. Aqel, M.B., Int. J. Pharmacog., 1993, 31(1), 55.
330. Aqel, M.; Shaheen, R., J. Ethnopharmacol., 1996, 52(1), 23.
331. Khan, M.T.H.; Jabbar, S.; Choudhuri, M.S.K.; Ghafur, M.A., Hamdard Medicus, 2000,XLIII(4), 30.
332. Parvardeh, S.; Fatehi, M., Pharmaceutical Biology, 2003, 41(8), 616.
333. Parvardeh, S.; Hosseinzadeh, H., Faslnamah-i Giyahan-i Daruyi, 2003, 2(8), 17.
334. Taha, R.A.M., Egyptian Journal of Biomedical Sciences, 2004, 16, 152.
335. Wienkoetter, N.; Hoepner, D.; Schuette, U.; Bauer, K.; Begrow, F.; El-Dakhakhny, M.;Verspohl, E.J., Planta Medica, 2008, 74(2), 105.
336. Suddek, G.; M., Journal of Ethpharmacology, 2010, 127(2), 210.
337. Al-Shabanah, O.A.; Badary, O.A.; Nagi, M.N.; Al-Gharably, N.M.; Al-Rikabi, A.C.; Al-Bekairi, A.M., J Exp Clin Cancer Res, 1998, 17, 193.
338. Al-Majed, A.A.; Al-Omar, F.A.; Nagi, M.N., Eur J Pharmacol., 2006, 543, 40.
339. Kanter, M., Neurochemical Research, 2008a, 33(1), 87.
340. Ismail, N.; Ismail, M.; Latiff, L.A.; Mazlan, M.; Mariod, A.A., Journal of Food Lipids, 2008,15(4), 519.

336
341. Mohamadin, A.M.; Sheikh, B.; Abd El-Aal, A.A.; Elberry, A.A.; Al-Abbasi, F.A., PesticideBiochemistry and Physiology, 2010, 98(1), 128.
342. Etheve, S.; Fowler, A.; Goralczyk, R.; Kilpert, C.; Mohajeri, H.; Schweikert, L., PCT Int.Appl., 2011, 31.
343. Naik, S.R.; Thakare, V.N.; Joshi, F.P., Journal of Complementary and Integrative Medicine,2010, 7(1), 1.
344. Salem, M.L., Int Immunopharmacol., 2005, 5, 1749.
345. Mahamed, A.; Waris, H.M.; Ramadan, H.; Qureshi, M.; Kaira, J., Biomedical SciencesInstrumentation, 2009, 45, 274.
346. Ghonime, M.; Eldomany, R.; Abdelaziz, A.; Soliman, H., Immunopharmacology andImmunotoxicology, 2011, 33(1), 141.
347. Deshpande, R.S.; Adhikary, P.R.; Tipnis, H.P., Bull Grain Technol., 1974, 12(3), 232.
348. Akhtar, M.S.; Aslam, M., Pak J. Pharmacol., 1997, 14(2), 7.
349. Kumar, R.; Tiwari, S.N., Pestology, 2011, 35(2) 43.
350. Vohra, S.B.; Khan, M.S.Y.; Afaq, S.H., Ind. J. Pharm., 1973, 35(3), 100.
351. Seshadri, C.; Pillai, S.R.; Venkataraghvan, J. Sci. Res. Plants Med., Nos.1&2, 1981,1.
352. Bashandy, A.E.S., International Journal of Pharmacology, 2007, 3(1), 27.
353. Al-Enazi, M.M., Pakistan Journal of Biological Sciences, 2007, 10(18), 3115.
354. Rehmatollah, P.; Yousofvand, N.; Ghorbani, R., Iran J Reprod Med., 2012, 10(4), 355.
355. Agarwal, I.P.; Achar, M.V.S.; Boradkar, R.V.; Roy, N., Ind. J. Med. Res., 1968, 56(6), 841.
356. Vihan, V.S.; Panwar, H.S., Ind. Vet. J., 1987, 64(4), 347.
357. Salomi, M.J.; Nair, S.C.; Jayawardhanan, K.K.; Vargheses, C.D.; Panikkar, K.R., CancerLett., (Shannon Irel), 1992, 63(1), 41.

337
358. Namba, T.; Tsunezuka, M.; Dissanayake, DMRB.; Pilaapitiya, U.; Saito K.; Kakiuchi, N.;Hattori, M., Shoyakugaku Zashi, 1985, 39(2), 146.
359. Ma, C.; Nakabayashi, T.; Miyashiro, H.; Hattori, M.; El-Meckkawy, S.; Namba, T.;Shimotohno, K., Wakan Iyakugaku Zasshi, 1994, 11(4), 416.
360. Abdel-Salam, I.M.; Raafat, A.; Abdel- Moniem, H., Egypt. J. Biochem., 1998, 16(1), 167.
361. Abdel-Fattah, A.F.M.; Matsumoto, K.; Watanabe, H., Eur. J. Pharmacol., 2000, 400(1), 89.
362. Abou-Hozaifa, B.M., Saudi Pharmaceutical Journal, 2002, 10(4), 167.
363. Yaman, I.; Durmus, A.S.; Ceribasi, S.; Yaman, M., Veterinarni Medicina, 2010, 55(12), 619.
364. Ahmed, E.M.; Nour, B.Y.M.; Mohammad, Y.G.; Khalid, H.S., Environmental HealthInsights, 2010, 4, 1.
365. Nutten, S.; Philippe, D.; Mercenier, A.; Duncker, S., PCT Int. Appl., 2010, 25.
366. Der, M.A.; Lawrence, L.; Beutler, J.; Grauds, C.; Tatro, D.S.; Cirigliano, D.D., The Reviewof Natural Products, Facts and Comparisons, 4th ed., Lipincott William & Wilkins, 2005.
367. Khader, M.; Bresgen, N.; Eckl, P.M., Food and Chemical Toxicology, 2009, 47(1), 129.
368. Atkins, P.W.; Holker, J.S.E.; Holiday, A.K., Metals and Metabolism, Oxford Univ. Press,1978.
369. DAS, A.K., A Text Book on Medicinal Aspects of Bio-Inorganic Chemistry, CBS Publishers,Delhi, 1990.
370. Sackheim, G.I.; Lehman, D.D., Chemistry for the Health Sciences, 7th ed., MacMillan, 1994.
371. Hay, R.W., Bioinorganic Chemistry, 2nd ed., John Willy, 1987.
372. Khan, S.Y., Ph.D Thesis, Departmant of Chemistry, University of Karachi, Pakistan, 2000.
373. Ruth, L.P.; Myrtle, L.B., Nutrition, An Integrated Approach, John Wiley & Sons, 1984, 1,283.

338
374. Lippard, S.J.; Berg, J.M., Principles of Bioinorganic Chemistry, University Science Books,Mill Valley, CA, 1994.
375. Weinberg, J.M.; Harding, P.G.; Humes, H.D., J. Biol. Chem., 1982, 257, 68.
376. Lori, A.S.; Mary, B.G., Nutrition: Science and Applications, John Wiley & Sons, Inc. Printedin USA, 2007.
377. Cotton, F.A.; Wilkinson, G., Advanced Inorganic Chemistry, 5th ed., John Wiley & Sons,1988.
378. Eleanor, N.W.; Sharon, R.R., Understanding Nutrition, 9th ed., Wadsworth, USA, 2002.
379. Reddy, M.B.; Hurrel, R.F.; Cook, J.D., Am. J. Clin. Nutr., 2000, 71, 937.
380. Marilyn, S.W.; William, M.A.Jr., In Thomas, M.D. (Ed.), Text Book of Biochemistry withClinical Correlations, 2nd ed., John Wiley & Sons, 1986.
381. West, C.E., Am. J. Clin. Nutr., 1996, 64, 789.
382. Lee, G.R. In, Lee, G.R.; Foerster, J.; Paraskevas, F.; Greer, J.P.; Rogers, G.M. (Eds.),Wintrobe’s Clinical Hematology, 10th ed., Baltimore, William & Wilkins, 1999, 979.
383. Lynch, S.R., Nutr. Rev., 1997, 55(4), 102.
384. Vulpe, C.D.; Kuo, Y.M.; Murphy, T.L., Nat. Genet., 1999, 21(2), 195.
385. Solomons, N.W., In Bodwell, C.E.; Erdman, J.W.,Jr.(Eds.), Nutrient Interactions, MarcelDekker, Inc., New York, 1988.
386. Forth, W.; Rummel, W., Physiol. Rev., 1973, 53, 724.
387. Reinhold, J.G., In Kies, C. (Ed.), Nutritional Bioavailability of Iron, American ChemicalSociety (Symp. Ser. 203), Washington DC, 1982, 143.
388. Brown, R.; Klein, A.; Hurrel, R.F., In Johnson, I.T.; Fenwick, G.R. (Eds.), NutrientAvailability: Chemical and Biological Aspects, Southgate, D.T.A., Royal Society ofChemistry, 1989, 147.

339
389. Bartfay, W.J. and coauthors, Journal of Trace Elements in Medicine and Biology, 2000, 14,14.
390. Nowicki, M.J.; Bacon, B.R., Pediatrics, 2000, 105, 426.
391. Ahmed, M. (Ed.), Essentials of Medicinal Biochemistry, 1982, 3, 394.
392. Grobusch, K.K. and coauthors, American Journal of Epidemiology, 1999, 149, 421.
393. Food and Nutrition Board, Institute of Medicine, Dietry Reference Intakes: Vitamin A,Vitamin K, Arsenic, Boron, Chromium, Copper, Iodine Iron, Manganese, Molybdenum,Nickel, Silicon, Vanadium and Zinc, Washington, DC, National Academy Press, 2001.
394. Khoe, G.H. et al., J. Chem. Soc. Dalton Trans., 1986, 1901.
395. Sharpe, A.G., Inorganic Chemistry, 3rd ed., Longman Singapore Publishers Pte Ltd., 1996.
396. Groff, J.L.; Gropper, S.S., Advanced Nutrition and Human Metabolism, 3rd ed., Wadsworth,USA, 1999.
397. Hellerstein, M.K., Nutr. Rev., 1998, 56(10), 302.
398. Mertz, W., Nutr. Rev., 1998, 56, 174.
399. Stoecker, B.J., Chromium, In Shills M.; Olson, J.A.; Shike, M.; Ross, A.C. (Eds.), Nutritionin Health and Disease, 9th ed., Baltimore, William & Wilkins, 1999, 277.
400. Lukaski, H.V.; Annu. Rev. Nutr., 1999, 19, 279.
401. tuberose.com/Heavy-Metal-Toxicity.html.
402. http://www.online.vitamins-guide.com/minerals/chromium.htm
403. Linder, M.C.; Hazegh-Azam, M., Am. J. Clin. Nutr., 1996, 63(5), 797S.
404. Uauy, R.; Olivers, M.; Gonzalez, M., Am. J. Clin. Nutr., 1998, 67, 952S.
405. Turnlund, J.R. Copper. In Shills, M.; Olson, J.A.; Shike, M.; Ross, A.C. (Eds.), Nutrition inHealth and Disease, 9th ed., Baltimore, William & Wilkins, 1999, 241.

340
406. Cordano, A., Am. J. Clin. Nutr., 1998, 67, 1012S.
407. Wapnir, R.A., Am. J. Clin. Nutr., 1998, 67, 1054S.
408. Bremner, I., Am. J. Clin. Nutr., 1998, 67(5), 1069.
409. www.umm.edu/altmed/articles/ copper-000296.htm
410. Sano, M. et al., Inorg. Chem., 1984, 23, 4466.
411. Ramette, R.W., Inorg. Chem., 1986, 108, 1173.
412. Willett, R.D. et al., J. Am. Chem. Soc., 1986, 108, 1173.
413. Davies, G. et al., Inorg. Chem., 1986, 24, 4479.
414. Calderazzo, F. et al., J. Chem. Soc. Dalton Trans., 1980, 1419.
415. Battaglia, L.P. et al., J. Chem. Soc. Dalton Trans., 1986, 1653.
416. Kwaiatkowski, E. et al., J. Chem. Soc. Dalton Trans., 1985, 2319.
417. http://www.online-family-doctor.com/minerals/vanadium.html
418. Talvite, N.A.; Wagner, W.D., Arch. Ind. Hyg. Occup. Med., 1954, 9, 414.
419. Hamel, F.G.; Solomon, S.S.; Jespersen, A.S.; Blotcky, A.; Rack, E.; Duckworth, W.S.,Metabolism, 1993, 42(12), 1503.
420. McNeil, J.H.; Yuen, V.G.; Dai, S.; Orvig, C., Mol. Cell Biochem., 1995, 153(1-2), 175.
421. Badmaev, V.; Prakash, S.; Majeed, M., J. Altern. Complement Med., 1999, 5(3), 273.
422. Baron, E.J., J. Inorg. Biochem., 2000, 80, 1.
423. Meisch, H.U.; Bielg, H.J., Basic Res. Cardiol., 1980, 75(3), 413.

341
424. Shinde, U.A.; Mehta, A.A.; Goyal, R.K., J. Ind. Exp. Biol., 2001, 39(9), 864.
425. Thompson, K.H.; Orvig, C., Coord. Chem. Rev., 2001, 219, 1033.
426. Shah, D.I.; Singh, M., Vascul. Pharmacol., 2006, 44(3), 177.
427. Murray, M., Encyclopedia of Nutritional Supplements, Rocklin, C.A.; Prima Publisher, 1996.
428. Barceloux, D.G., J. Toxicol. Clin. Toxicol., 1999, 37(2), 265.
429. Macara, I.G., Trends Biochem. Sci., 1980, 5, 92.
430. Ortega, R.B. et al., Acta Crystallogr., 1980, B 36, 1786.
431. Bukovec, P.; Golic, L., Acta Crystallogr., 1980, B 36, 1925.
432. Garner, C.D. et al., J. Chem. Soc. Dalton Trans., 1980, 667.
433. Bukovec, P. et al., J. Chem. Soc. Dalton Trans., 1981, 1802.
434. Cotton, F.A. et al., Inorg. Chem., 1986, 25, 3505.
435. Drew, M.G.B. et al., Inorg. Chim. Acta, 1984, 82, 63.
436. Woo, L.C.Y.; Yuen, V.G.; Katherine, H.; Thompson, K.H.; McNeil, J.H.; Orvig, C., J. Inorg.Biochem, 1999, 76(3-4), 251.
437. http:www.best-home-remedies.com/minerals/cobalt.htm
438. Shane, B., In Stipanuk M., Folic Acid, Vitamin B-12, and Vitamin B-6, In Stipanuk M. (Ed.),Biochemical and Physiological Aspects of Human Nutrition, ed., Philadelphia, W.B.Saunders Co., 2000, 483.
439. Food and Nutrition Board, Institute of Medicine, Vitamin B-12, Dietry Reference Intakes:Thiamin, Riboflavin, Niacin, Vitamin B-6, Vitamin B-12, Pantothenic Acid, Biotin andCholine. Washington DC., National Academy Press, 1998, 306.
440. Baik, H.W.; Russell, R.M., Annu. Rev. Nutr., 1999, 19, 357.

342
441. Null, G., The Complete Encyclopedia of Natural Healing, New York, Kensington PublishingCorp., 1998.
442. Nourhashemi, F.; Gillette-guyonnet, S.; Andrieu, S., Am. J. Clin. Nutr., 2000, 71(2), 643S.
443. Hutto, B.R., Compr. Psychiatry, 1997, 38(6), 305.
444. Silver, H.B.; Murgia, M.A., Inorg. Chem., 1985, 24, 3794.
445. Neilson, F.H., Ultratrace minerals, In Shills, M.; Olson, J.A.; Shike, M.; Ross, A.C. (Eds.),Nutrition in Health and Disease, 9th ed., Baltimore, William & Wilkins, 1999, 283.
446. Leach, R.M.; Harris, E.D., Manganese, In O̕Dell BL, Sunde, R.A. (Eds.), Handbook ofnutritionally essential minerals, New York, Marcel Dekker, Inc., 1997, 335.
447. Keen, C.L.; Zidenberg-Cherr, S., Manganese, In Ziegler, E.E.; Filer, L.J. (Eds.), PresentKnowledge in Nutrition, 7th ed., Washington DC, ILSI Press, 1996, 334.
448. Fair-weather-Tait, S.; Hurrel, R.F., Nutrition Research Reviews, 1996, 9, 295.
449. Davidson, L. and coauthors, Am. J. Clin. Nutr., 1995, 62, 984.
450. Davis, C.D.; Greger, J.L., Am. J. Clin. Nutr., 1992, 55(3), 747.
451. Johnson, P.E.; Lykken, G.I., J. Trace Elem. Exp. Med., 1991, 4, 19.
452. http://www.mii.org/periodic/lifeelement.html
453. http://www.ncbi.nim.nih.gov/pubmed/2959560
454. http://www.cadmium.org/pg-n.php?id menu=5
455. http://corrosion-doctors.org/Elements-Toxic/Cadmium.htm
456. http://en.wikipedia.org/wiki/Cadmium
457. Birchall, J.D., Aluminium in Chemistry, Biology and Medicine, Wiley, New York, 1992.
458. Kinraide, T.B.; Parker, D.R., Phys. Plant., 1990, 79, 283.

343
459. Exley, C.; Chapell, J.S.; Birchall, J., J. Theor. Biol., 1991, 151, 417.
460. http/www.healthy.net/scr/article.aspx?ID=2004
461. http;//en.wikipedia.org/wiki/Arsenic-poisoning
462. Magos, L., Human and Experimental Toxicology, 1994, 13, 735.
463. Harper, M.E.; Willis, J.S.; Patrick, J., Potassium, In O̕Dell, B.L.; Sunde, R.A. (Eds.),Handbook of nutritionally essential minerals, New York, Marcel Dekker, 1997, 93.
464. Adrogue, H.J.; Madias, N.E., N. Engl. J. Med., 2000, 342(21), 1581.
465. Heller, H.J., J. Am. Coll. Nutr., 1999, 18(5), 373S.
466. Sheng, H.W., In Stipanuk, M., Sodium, Chloride and Potassium,In Stipanuk, M., (Ed.),Biochemical Physiological Aspects of Human Nutrition, ed., Philadelphia, W.B. SaundersCompany, 2000, 686.
467. Gennari, F.J., N. Engl. J. Med., 1998, 339(7), 451.
468. Hajjar, I.M.; Grim, C.E.; George, V.; Kotchen, T.A., Arch. Intern. Med., 2001, 161(4), 589.
469. Kathleen, K.; Hyperkalemia, American Journal of Nursing, 2000, 100, 55.
470. Weaver, C.M.; Heaney, R.P., Calcium, In Shills, M.; Olson, J.A.; Shike, M.; Ross, A.C.(Eds.), Nutrition in Health and Disease, 9th ed., Baltimore, William & Wilkins, 1999, 141.
471. Food and Nutrition Board, Institute of Medicine, Calcium, Washington, DC, NationalAcademy Press, 1997, 71.
472. Brien, K.O.O̕. and coauthors, Am. J. Clin. Nutr., 1996, 63, 579.
473. Braun, R.D., Introduction to Chemical Analysis, International Student Edition, McGraw- HillBook Co., Singapore, 1983.
474. Skoog, D.A.; Holler, F.J.; Nieman, T.A., Principles of Instrumental Analysis, 5th ed.,Saunders College Publishing, Harcourt Brace College Publishers, Printed in USA, 1998.

344
475. Snyder, L.R.; Kirkland, J.J., Introduction to Modern Liquid Chromatography, 2nd ed., Wiley,New York, 1979, 365.
476. Hamilton, R.; Hamilton, S., Thin Layer Chromatography, Wiley, New York, 1987.
477. Solomon, T.W.G.; Fryhle, C.B., Organic Chemistry, 9th ed., John Wiley & Sons (Asia) Pte.Ltd., Delhi, India, 2010.
478. Finar, I.L., Organic Chemistry, Stereochemistry and Chemistry of Natural Products, 5th ed.,published by Pearson Education Pte. Ltd., Delhi, India, 2005, 2.
479. Bahl, A.; Bahl, B.S.; Tuli, G.D., Essentials of Physical Chemistry, Multicolour Edition,Rajendra Ravindra Printers (Pvt.), S. Chand & Company Ltd., Ram Nagar, New Delhi,2009.
480. Kemp, W., NMR in Chemistry, A Multinuclear Introduction, The Mac millan Press Ltd.,Printed in Hong Kong, 1986.
481. Pavia, D.L.; Lampman, G.M.; Kriz, G.S., Introduction to Spectroscopy, 3rd ed., HarcourtCollege Publishers, Printed at Chennai Micro Print Pvt. Ltd., Chennai, India, 2001.
482. http://serc.carleton.edu/research_education/geochemsheets/techniques/SEM.htm
483. http://en. wikipedia.org/wiki/Scanning_electron_microscope
484. http://www.purdue.edu/rem/rs/sem.htm
485. http://www.panalytical.com/index.cfm?pid=152&WT.srch=1&gclid=CKOZiKjMlrMCFXHLtAodDxoAyA
486. http://www.microscopemaster.com/scanning_electron_microscope.html
487. Jeffery, G.H.; Bassett, J.; Mendham, J.; Denny, R.C., Vogel’s Text Book of QuantitativeChemical Analysis, 5th ed., ELBS Longman Group UK Ltd., Bath Press Ltd., Great Britain,1991, 550.
488. http://en. wikipedia.org/wiki/PH_meter
489. Basolo, F.; Johnson, R., Coordination Chemistry, The Chemistry of Metal Complexes,Benjamin, W.A. Inc., 1988.

345
490. Frieser, H.; Fernando, Q.; Krieger, R.E., Ionic Equilibria in Analytical Chemistry, Robert, E.Krieger Publication Company Huntington, New York, 1979, 35.
491. Cookson, R.F., Chem. Rev., 1974, 74, 5.
492. Hill, J.W.; Petrucci, R.H., General Chemistry, Prentice-Hall, Inc., New Jersey, USA, 1996.
493. Braun, R.D.; Walters, F.H., Application of Chemical Analysis, McGraw Hill, 1976.
494. Sawyer, D.T.; Heineman, W.R.; Beebe, J.M., Chemistry Experiments for InstrumentalMethods, 1st ed., John Wiley & Sons, New York, 1984.
495. Ali, S.A.; Maqsood, Z.T.; Fahimuddin; Qureshi, S., J. Nat. Sci. Math., 1988, 28(1), 187.
496. Kolthof, I.M.; Tomsicek, W.J., J. Phys. Chem., 1935, 39, 945.
497. Randles, J.E.B., Trans. Faraday Soc., 1952, 48, 828.
498. Sawyer, D.T.; Sobkowiak, A.; Roberts, J.L. Jr., Electrochemistry for Chemists, IntersciencePublishes, 2nd ed., 1995.
499. Petrovic, S., Chem Edu., 1993, 60(4), 290.
500. Mohammad, M.; Amjad, M., Principles of Electrode Kinetics, 2nd ed., Rooha printers,Lahore, Pakistan, 2001, 23, 137.
501. Adams, R.N., Electrochemistry at Solid Electrodes, Marcel Dekker, New York, 1969.
502. Van Benschoten, J.J.; Lewis, J.Y.; Heineman, W.R.; Roston, D.A.; Kissinger, P.T., J. Chem.Edu., 1983, 60(90), 772.
503. Nicholson, R.S., Anal. Chem., 1965, 37(11)1351.
504. Bard, A.J.; Faulkner L.R., Electrochemical Methods: Fundamentals and Applications, 2nd
ed., John Wiley & Sons, New York, 2001.
505. Greaf, R.; Peat, R.; Reter, L.M. Pletcher, D.; Robinson, J., Instrumental Methods inElectrochemistry, 1st ed., John Wiley & Sons, New York, 1985.
506. Asakawa, T.; Sunagawa, H.; Miyagishi, S., Am. Chem. Soc., 1998, 14(25), 7091.

346
507. Ali, S.A., Electrochemical Studies of Some Biologically Active Compounds using GraphitePaste Electrode, Ph.D. Thesis, University of Karachi, Karachi, Pakistan, 1995.
508. “User’s Manual- CH Instruments” CH Instruments, Inc. 3700 Tennison Hill Drive, Austin,TX 78738, USA.
509. http://chemistry.about.com/od/periodictableelements/ig/Elements-in-the-Human-Body/.
510. Nielsen F.H., Ultratrace minerals, In, Shils M., Olson J.A., Shike, M., Ross, A.C. eds.Nutrition in Health and Disease. 9th ed. Baltimore, Willams and Wilkins, 1999, 283-303.
511. www.hc-sc.gc.ca/ewh-semt/pubs/water.../cadmium/index-eng.php
512. http://sitem.herts.ac.uk/aeru/footprint/en/Reports/1889.htm
513. Anwer, H. Complexation of Vanadyl Compounds with Maltol, Ph.D. Dissertation,University of Karachi, Karachi, (2006).