Adnan PhD Thesis.pdf - Pakistan Research Repository
264
STUDIES ON IMPREGNATED CATALYSTS FOR CONVERSION OF WASTE EXPANDED POLYSTYRENE INTO VALUE ADDED HYDROCARBONS Ph.D Thesis By ADNAN INSTITUTE OF CHEMICAL SCIENCES UNIVERSITY OF PESHAWAR PAKISTAN MAY 2014
-
Upload
khangminh22 -
Category
Documents
-
view
2 -
download
0
Transcript of Adnan PhD Thesis.pdf - Pakistan Research Repository

STUDIES ON IMPREGNATED CATALYSTS FOR
CONVERSION OF WASTE EXPANDED
POLYSTYRENE INTO VALUE ADDED
HYDROCARBONS
Ph.D Thesis
By
ADNAN
INSTITUTE OF CHEMICAL SCIENCES
UNIVERSITY OF PESHAWAR
PAKISTAN
MAY 2014

STUDIES ON IMPREGNATED CATALYSTS FOR
CONVERSION OF WASTE EXPANDED
POLYSTYRENE INTO VALUE ADDED
HYDROCARBONS
By
ADNAN
DISSERTATION
SUBMITTED TO THE UNIVERSITY OF PESHAWAR IN
PARTIAL FULFILLMENT OF THE REQUIREMENTS FOR
THE DEGREE OF DOCTOR OF PHILOSOPHY
IN CHEMISTRY
INSTITUTE OF CHEMICAL SCIENCES
UNIVERSITY OF PESHAWAR
PAKISTAN
MAY 2014

INSTITUTE OF CHEMICAL SCIENCES
UNIVERSITY OF PESHAWAR
PAKISTAN
Certified that MR ADNAN S/O ABDUL RAUF has carried out his research and
experimental work on the topic entitled as “Studies on Impregnated Catalysts for
Conversion of Waste Expanded Polystyrene into Value Added Hydrocarbons” under
our guidance and supervision. His research work is original and his dissertation is worthy
of presentation to the University of Peshawar for the award of degree of Doctor of
Philosophy in Chemistry.
______________________ _______________________
SUPERVISOR CO-SUPERVISOR
Meritorious Prof. Dr. Jasmin Shah Prof. Emeritus Dr. Muhammad Rasul Jan
Institute of Chemical Sciences Institute of Chemical Sciences,
University of Peshawar, Pakistan, University of Peshawar, Pakistan
Khyber Pakhtunkhwa, Pakistan Vice Chancellor,
University of Peshawar, Peshawar,
Khyber Pakhtunkhwa, Pakistan
_____________________
EXTERNAL EXAMINER

In the name of ALLAH, the most Beneficent, the most Merciful.

Parents With Prayers and Love
To My

ACKNOWLEDGEMENTS
In the name of ALLAH, the most Gracious, the most Compassionate, Who is the Creator of
the heavens and the earth and He, Who guides us in oceans of darkness and difficulties. I
would like to express my gratitude to Allah for providing me the blessings to accomplish this
work. May Allah accept this work as Sadqa-e-Jaria for helping the environment and His
creation, and reward us the highest level in Jannah. During my PhD a number of people
contributed, to whom my words are insufficient to acknowledge.
First, I submit my highest appreciation to my primary supervisor, meritorious professor Dr.
Jasmin Shah, whose institution elevated me to the stature I am today, who have been my
parent, my mentor, my confidant, my colleague, and a never-ending fount of moral support.
Whose guidance, stimulation, valuable suggestions, constant encouragement and
affectionate behavior helped me to complete this work. She encouraged me to not only
grow as a researcher and as a chemist, but also as an instructor and an independent thinker.
She is an excellent example of a good and successful women chemist.
I am also obliged to my co-supervisor professor emeritus Dr. Muhammad Rasul Jan, whose
thought provoking attitude, skilled discussions, highly specialized guidance, constant
support and continuous feedback enabled me to complete this thesis. I am thankful to him
and acknowledge his devotion and precious time.
In fact, I am truly thankful to both of them and find myself lucky to have such teachers, who
cared so much about me and my work. I pray, may Allah shower His endless blessing upon
them and reward them according to His Generosity.
I would also like to mention my foreign advisor Ah-Hyung Alissa Park, Associate Professor,
Department of Earth and Environmental Engineering, Columbia University, New York, USA.
I am thankful to her for providing me the opportunity to work as a visiting researcher in her
lab. I learned much more from her company. I am also thankful to Greeshma Gadikota, post
doctorate researcher at Prof. Park Group for her help and guidance in writing skills.
I acknowledge the funding of Higher Education Commission of Pakistan under 5000 PhD
Indigenous Scholarship Program, Pin No. 106-1039-Ps6-033 and under International

Research Support Initiative Program (IRSIP), Pin No. IRSIP 24 PS 13. I am also thankful to the
Director and all the faculty of Institute of Chemical Sciences, University of Peshawar for
providing me help, facilities and encouragement in perusing my higher education in
chemistry.
After my teachers I would mention two of my friends because of whom inspiration I believe
I am here, Mr. Arif Khalil and Mr. Abdus Salam. Their constant support, unique guidance
towards getting knowledge heighted me in the skies.
Words cannot express the role of my uncle Dr. Abdul Ahad, who was a role example for me
and he was the one whose teachings led me here.
I am thankful to the teaching faculty of our section Assistant Prof. Dr. Kashif Gul, Dr.
Sajjadullah and Mrs. Saima Sohni.
I am obliged to Mr. Iftikhar Ahmad, Mr. Zia ur Rehman, Mr. Hamid Ali, Mr. Asmat Ali, Mr.
Zaheer ud Din, Mr. Muhammad Ali, other clerical and para teaching staff.
In my PhD lab. work, my lab. colleagues have a major role and they have to be mentioned
individually. I am thankful to Dr. Hussain Gulab for his true heartier suggestions, Dr. Atta ul
Haq for extreme sincerity, Dr. Mian Muhammad for his constant encouragement and boost
up, Dr. Behisht Ara for kind guide and gentle handling, Dr. Maria Sadia for creation of trust
and self-confidence, Dr. Inayatullah for his soft accent with kind heart, and a man of
principles, Dr. Sultan Shah for his wise talks, advises and sea of knowledge, Dr. Muhammad
Naeem for his friendly brother hood, moral support and working efficiency, Mr, Mansoor
Khan for his joyful discussions, enhancing personality and constant partnership, Ms. Salma
Amir for her companionship and enhancing quench of knowledge, Ms. Tasmia for her
believes and approach toward gaining knowledge, Mr. Aamir Iqbal for his good attitude
toward research and social work, Mr. Ibadat ur Rehman for his learning techniques Mr.
Muhammad Zada as co-worker. I would like to mention my other colleagues also Dr. Farhat
un Nissa, Dr. Sadaf Durani, Dr. Ubaid Khan, Mr. Aamir Javed, Mr. Sajjad Khan, Mr. Zeeshan
Khan, Ms. Mutaqia, Ms. Faiza Bakhtiar.

I have to mention the companionship and support of my roommates. Mr. Masaud Shah, Mr.
Gul Mar Jan, Mr. Rashid Khan, Mr. Naqeeb Ahmad Jan, Mr. Yahya Jamal, Mr. Ayaz Khan and
finally my US roommates Mr. Samiullah Khan and Mr.Muzafar Shah, who waited for me till
late nights and cared about me.
There are many people behind the screen, who encourage and support me during my PhD
studies. I would like to thank and acknowledge my friends of: PhD A1 Group; Dr. Faridoon,
Dr. Nasirullah, Dr. Muhammad Ikram, Dr. Waqas Ahmad, and Dr. Ihsan Ali. Swat A1 Group;
Mr. Zahid Ali, Mr. Mehboob Alam, Mr. Murad Alam, Mr. Iftikhar, Mr. Qayum, Mr. Kher
Muhamamd and Dr. Faiz Muhammad.
I cannot not forget the favors of my friends Mr. Shakil Khan, and my uncle Mr. Mehboob Ali,
Mr. Umer Farooq Khalil, Mr. Ikramullah, Mr. Nabiullah, Mr. Iqbal Yousaf, Mr. Shafiq Ahmad,
Mr. Afzal Khan, Mr. Hussain Ahmad, Mr. Salman Khan, Mr. Munir Khan, Mr. Shujaat Ali Khan,
Dr. Pervaiz Khan, Dr. Barkatullah and Mr. Arshad Khan. I would like to extend my words and
express my deepest gratitude and thanks to Mr. Umer Farooq Khalil.
I must acknowledge the help and support of Prof. Robert J. Farrauto (Bob Farrauto), Asst.
Prof. Junfeng Wang, Mr. Xiazhou (Hellius) Zhou, Ms. Sarah Frances Teevan, Mr. Kyle Fricker,
Shanxue Jiang and Dr. Ioannis Valsamakis, who all helped me in Lab. work during my stay at
Columbia University-in the City of New York, USA.
At the end, I have to mention my family; my father, my mother, my brothers, my sisters, my
late grandmother (May Allah keep her soul in rest and peace) and other relatives, whose
prayers and continuous moral support enabled me to achieve this hard task done.
ADNAN
University of Peshawar
May 2014

i
TABLE OF CONTENTS
S. No. Title Page No.
LIST OF FIGURES vi
LIST OF TABLES xiv
ABBREVIATIONS xix
SUMMARY xxxi
CHAPTER 1. INTRODUCTION
1.1 Catalysts and Catalysis 1
1.2 Classification of catalysts 1
1.2.1 Homogenous catalysts 1
1.2.2 Heterogeneous catalysts 2
1.3 Preparation of supported catalysts 5
1.3.1 Introduction of active phase 5
1.3.2 Drying and calcination 7
1.3.3 Reduction or activation 7
1.4 Catalyst performance parameters 7
1.4.1 Activity 7
1.4.2 Selectivity 7
1.4.3 Stability and regenerability 8
1.5 Plastics and its types 8

ii
1.6 Polystyrene and its applications 9
1.7 Environmental impact of polystyrene 9
1.8 Plastic waste management 10
1.9 Chemical recycling or tertiary recycling 11
1.9.1 Depolymerization 11
1.9.2 Partial oxidation 11
1.9.3 Degradation or cracking or pyrolysis 11
1.10 Polystyrene degradation mechanism 13
1.10.1 Thermal degradation (radical mechanism) 14
1.10.2 Catalytic degradation (ionic mechanism) 19
1.11 Aim of the present work 22
References 23
CHAPTER 2. LITERATURE REVIEW
2 Literature Review 32
References 42
CHAPTER 3. EXPERIMENTAL
3.1 Catalysts preparation 46
3.2 Characterization of catalysts 47
3.2.1 Surface area, pore volume and pore size analysis 47
3.2.2 SEM analysis 47

iii
3.2.3 XRD analysis 48
3.3 Thermogravimetric analysis (TGA) 48
3.3.1 TGA of waste expanded polystyrene (WEPS) 48
3.3.2 TGA of polystyrene (PS) and polyethylene terephthalate (PET) 48
3.4 Thermal and catalytic degradation of polymer samples 49
3.4.1 Thermal and catalytic degradation of WEPS 50
3.4.1.1 Reactor assembly 50
3.4.1.2 WEPS sample preparation 51
3.4.1.3 WEPS degradation 51
3.4.1.4 Liquid products collection in bulk 52
3.4.1.5 Fractional distillation 53
3.4.2 Thermal and catalytic degradation of polystyrene (PS) and
polyethylene terephthalate (PET)
54
3.4.1.1 Reactor assembly 54
3.4.1.2 PS and PET samples preparation 55
3.4.1.3 PS and PET degradation 56
3.5 Isolated liquid products characterization 56
3.5.1 Physiochemical properties 56
3.5.1.1 Determination of density (d) 56
3.5.1.2 Measurement of refractive index (η) 57

iv
3.5.2 Gas chromatography – mass spectrometry (GC-MS) analysis 58
CHAPTER 4. RESULTS AND DISCUSSIONS
Section 1: Characterization of impregnated catalysts 59
4.1 Metals impregnated catalysts over alumina (Al₂O₃) 59
4.2 Metals impregnated catalysts over montmorillonite (Mmn) 64
4.3 Metals impregnated catalysts over activated charcoal (AC) 69
Section 2: Catalytic activity, selectivity and recovery studies for the
degradation of waste expanded polystyrene (WEPS)
74
4.4 Thermogravimetric analysis (TGA) 74
4.4.1 TGA of WEPS 74
4.4.2 TGA of polystyrene (PS) and polyethylene terephthalate (PET) 75
4.5 Thermal degradation of WEPS 77
4.6 Catalytic degradation of WEPS using alumina (Al₂O₃),
montmorillonite (Mmn) and activated charcoal (AC) as catalysts
83
4.7 Catalytic degradation of WEPS using Mg, MgO and MgCO₃
catalysts
92
4.8 Catalytic degradation of WEPS using Mg impregnated catalysts 101
4.9 Catalytic degradation of WEPS using Zn, ZnO and ZnCl₂ catalysts 109
4.10 Catalytic degradation of WEPS using Zn impregnated catalysts 121
4.11 Catalytic degradation of WEPS using Al, Al₂O₃ and AlCl₃
catalysts
128

v
4.12 Catalytic degradation of WEPS using Al impregnated catalysts 139
4.13 Catalytic degradation of WEPS using Cu, CuO and CuCl₂
catalysts
146
4.14 Catalytic degradation of WEPS using Cu impregnated catalysts 156
4.15 Catalytic degradation of WEPS using Fe, Fe₂O₃ and FeCl₃
catalysts
163
4.16 Catalytic degradation of WEPS using Fe impregnated catalysts 174
4.17 Effect of polyethylene terephthalate (PET) on the catalytic
degradation of polystyrene (PS)
180
References 195
Conclusions 203
List of publications 209

vi
LIST OF FIGURES
Fig. No. Caption Page No.
1.1 Diagrammatic representation of the steps involves in
heterogeneous catalysis
3
3.1 Process Flow for the degradation of waste expanded polystyrene 49
3.2 Schematic flow sheet diagram of the reaction assembly used for
WEPS degradation
50
3.3 Schematic flow sheet diagram of fractional distillation assembly 54
3.4 Schematic flow sheet diagram of the reaction assembly used for
PS and PET degradation
55
4.1.1 SEM micrograph of (a) Al₂O₃ support, (b) 15% Mg-Al₂O₃, (c)
20% Zn-Al₂O₃, (d) 20% Al-Al₂O₃, (e) 20% Cu-Al₂O₃ and (f)
5% Fe-Al₂O₃
61
4.1.2 XRD diffractogram of (a) Al₂O₃ support, (b) 20% Mg-Al₂O₃, (c)
20% Zn-Al₂O₃, (d) 20% Al-Al₂O₃, (e) 20% Cu-Al₂O₃ and (f)
05% Fe-Al₂O₃
63
4.2.1 SEM micrograph of (a) Mmn support, (b) 20% Mg-Mmn, (c)
20% Zn-Mmn, (d) 05% Al-Mmn, (e) 15% Cu-Mmn and (f) 20%
Fe-Mmn
66
4.2.2 XRD diffractogram of (a) Mmn support, (b) 20% Mg-Mmn, (c)
20% Zn-Mmn, (d) 5% Al-Mmn, (e) 15% Cu-Mmn and (f) 20%
Fe-Mmn
68
4.3.1 SEM micrographs of (a) AC support, (b) 15% Mg-AC, (c) 20%
Zn-AC, (d) 20% Al-AC, (e) 20% Cu-AC and (f) 20% Fe-AC
71

vii
4.3.2 XRD diffractogram of (a) AC support, (b) 20% Mg-AC, (c) 20%
Zn-AC, (d) 20% Al-AC, (e) 20% Cu-AC and (f) 20% Fe-AC
73
4.4.1 TGA curves of WEPS in O2 and N₂ environment 75
4.4.2 TGA curves of PS and PET in N₂ environment 76
4.5.1 Effect of degradation temperature for thermal degradation of
WEPS
77
4.5.2 Effect of reaction time for thermal degradation of WEPS 78
4.5.3 Chromatogram of catalytically derived liquid products obtained
with thermal degradation at optimized conditions
80
4.6.1 Effect of degradation temperature and comparison of
catalytically derived liquid products obtained with Al₂O₃, Mmn
and AC as catalysts
84
4.6.2 Effect of reaction time and comparison of catalytically derived
liquid products obtained with Al₂O₃, Mmn and AC as catalysts
at optimum conditions
85
4.6.3 Effect of polymer to catalyst ratio and comparison of
catalytically derived liquid products obtained with Al₂O₃, Mmn
and AC as catalysts at optimum conditions
87
4.6.4 Chromatogram of catalytically derived liquid products obtained
with Al₂O₃ catalyst at optimized conditions
90
4.6.5 Chromatogram of catalytically derived liquid products obtained
with Mmn as catalyst at optimized conditions
90
4.6.6 Chromatogram of catalytically derived liquid products obtained
with AC as catalyst at optimized conditions
91

viii
4.7.1 Effect of degradation temperature and comparison of
catalytically derived liquid products obtained with Mg, MgO and
MgCO₃ catalysts
92
4.7.2 Effect of reaction time and comparison of catalytically derived
liquid obtained with Mg, MgO and MgCO₃ catalysts at optimum
conditions
93
4.7.3 Effect of polymer to catalyst ratio and comparison of
catalytically derived liquid products obtained with thermal
degradation, Mg, MgO and MgCO₃ catalysts at optimum
conditions
95
4.7.4 Chromatogram of catalytically derived liquid products obtained
with Mg as catalyst at optimized conditions
97
4.7.5 Chromatogram of catalytically derived liquid products obtained
with MgO as catalyst at optimized conditions
97
4.7.6 Chromatogram of catalytically derived liquid products obtained
with MgCO₃ as catalyst at optimized conditions
98
4.8.1 Effect of percentage of impregnated precursor metal (Mg) over
Al₂O₃, Mmn and AC supports for maximum liquid products
102
4.8.2 Chromatogram of catalytically derived liquid products obtained
with 15% Mg-Al₂O₃ catalyst at optimized conditions
106
4.8.3 Chromatogram of catalytically derived liquid products obtained
with 20% Mg-Mmn catalyst at optimized conditions
106
4.8.4 Chromatogram of catalytically derived liquid products obtained
with 20% Mg-AC catalyst at optimized conditions
107

ix
4.9.1 Effect of temperature and comparison of catalytically derived
liquid products obtained with Zn, ZnO and ZnCl₂ catalysts at
optimum conditions
110
4.9.2 Effect of reaction time and comparison of catalytically derived
liquid products obtained with Zn, ZnO and ZnCl₂ catalysts at
optimized conditions
111
4.9.3 Effect of polymer to catalyst ratio and comparison of
catalytically derived liquid products obtained with thermal
degradation, Zn, ZnO and ZnCl₂ catalysts at optimized
conditions
114
4.9.4 Chromatogram of catalytically derived liquid products obtained
with Zn catalyst at optimized conditions
116
4.9.5 Chromatogram of catalytically derived liquid products obtained
with ZnO catalyst at optimized conditions
117
4.9.6 Chromatogram of catalytically derived liquid products obtained
with ZnCl₂ catalyst at optimized conditions
117
4.10.1 Effect of percentage of impregnated precursor metal (Zn) over
Al₂O₃, Mmn and AC supports for maximum liquid products
123
4.10.2 Chromatogram of catalytically derived liquid products obtained
with 20% Zn-Al₂O₃ catalyst at optimized conditions
126
4.10.3 Chromatogram of catalytically derived liquid products obtained
with 20% Zn-Mmn catalyst at optimized conditions
126
4.10.4 Chromatogram of catalytically derived liquid products obtained
with Zn-AC catalyst at optimized conditions
127

x
4.11.1 Effect of temperature and comparison of catalytically derived
liquid products obtained with Al, Al₂O₃ and AlCl₃ catalysts
129
4.11.2 Effect of reaction time and comparison of catalytically derived
liquid products obtained with Al, Al₂O₃ and AlCl₃ catalysts at
optimized conditions
130
4.11.3 Effect of polymer to catalyst ratio and comparison of
catalytically derived liquid products obtained with thermal
degradation, Al, Al₂O₃ and AlCl₃ catalysts at optimized
conditions
132
4.11.4 Chromatogram of catalytically derived liquid products obtained
with Al catalyst at optimized conditions
135
4.11.5 Chromatogram of catalytically derived liquid products obtained
with Al₂O₃ catalyst at optimized conditions
135
4.11.6 Chromatogram of catalytically derived liquid products obtained
with AlCl₃ catalyst at optimized conditions
136
4.12.1 Effect of percentage of impregnated precursor metal (Al) over
Al₂O₃, Mmn and AC supports for maximum liquid products
140
4.12.2 Chromatogram of catalytically derived liquid products obtained
with 20% Al-Al₂O₃ catalyst at optimized conditions
144
4.12.3 Chromatogram of catalytically derived liquid products obtained
with 5% Al-Mmn catalyst at optimized conditions
144
4.12.4 Chromatogram of catalytically derived liquid products obtained
with 20% Al-AC catalyst at optimized conditions
145

xi
4.13.1 Effect of degradation temperature and comparison of
catalytically derived liquid products obtained with Cu, CuO and
CuCl₂ catalysts
147
4.13.2 Effect of reaction time and comparison of catalytically derived
liquid products obtained with Cu, CuO and CuCl₂ catalysts at
optimized conditions
148
4.13.3 Effect of polymer to catalyst ratio and comparison of
catalytically derived liquid products obtained with thermal
degradation, Cu, CuO and CuCl₂ catalysts at optimized
conditions
149
4.13.4 Chromatogram of catalytically derived liquid products obtained
with Cu catalyst at optimized conditions
152
4.13.5 Chromatogram of catalytically derived liquid products obtained
with CuO catalyst at optimized conditions
152
4.13.6 Chromatogram of catalytically derived liquid products obtained
with CuCl₂ catalyst at optimized conditions
153
4.14.1 Effect of percentage of impregnated precursor metal (Cu) over
Al₂O₃, Mmn and AC supports for maximum liquid products
157
4.14.2 Chromatogram of catalytically derived liquid products obtained
with 20% Cu-Al₂O₃ catalyst at optimized conditions
161
4.14.3 Chromatogram of catalytically derived liquid products obtained
with 20% Al-Mmn catalyst at optimized conditions
161
4.14.4 Chromatogram of catalytically derived liquid products obtained
with 20% Al-AC catalyst at optimized conditions
162

xii
4.15.1 Effect of degradation temperature and comparison of
catalytically derived liquid products obtained with Fe, Fe₂O₃ and
FeCl₃ catalyst
164
4.15.2 Effect of reaction time and comparison of catalytically derived
liquid products obtained with Fe, Fe₂O₃ and FeCl₃ catalysts at
optimized conditions
165
4.15.3 Effect of polymer to catalyst ratio and comparison of
catalytically derived liquid products obtained with thermal
degradation, Fe, Fe₂O₃ and FeCl₃ catalysts at optimized
conditions
166
4.15.4 Chromatogram of catalytically derived liquid products obtained
with Fe as catalyst at optimized conditions
170
4.15.5 Chromatogram of catalytically derived liquid products obtained
with Fe₂O₃ catalyst at optimized conditions
170
4.15.6 Chromatogram of catalytically derived liquid products obtained
with FeCl₃ catalyst at optimized conditions
171
4.16.1 Effect of percentage of impregnated precursor metal (Fe) over
Al₂O₃, Mmn and AC supports for maximum liquid products
175
4.16.2 Chromatogram of catalytically derived liquid products using 5%
Fe-Al₂O₃ catalyst at optimized conditions
178
4.16.3 Chromatogram of catalytically derived liquid products using
20% Fe-Mmn catalyst at optimized conditions
178
4.16.4 Chromatogram of catalytically derived liquid products using
20% Fe-AC catalyst at optimized conditions
179

xiii
4.17.1 Effect of degradation temperature on the yield of catalytically
derived products (liquids and gases) for the degradation of PS,
10PET+PS, 20PET+PS and 30PET+PS
182
4.17.2 Effect of reaction time on the yield of catalytically derived
products (liquid and gases) for the degradation of PS,
10PET+PS, 20PET+PS and 30PET+PS at optimized conditions
184
4.17.3 Effect of polymer to catalyst ratio of the yield of catalytically
derived products (liquid and gases) for the degradation of PS,
10PET+PS, 20PET+PS and 30PET+PS at optimized conditions
187

xiv
LIST OF TABLES
Table No. Caption Page No.
3.1 Percentage (%) of active metal and their calculated weight
impregnated over 5 g of each support i.e. Al2O3, Mmn and
AC.
47
4.1 Surface area, pore size and pore volume analysis of
impregnated catalysts over Al₂O₃ support
59
4.2 Surface area, pore size and pore volume analysis of
impregnated catalysts over Mmn support
64
4.3 Surface area, pore size and pore volume analysis of
impregnated catalysts over AC support
69
4.5.1 Products formed by thermal degradation of WEPS at
optimized conditions
79
4.5.2 Physiochemical parameters of the fractions obtained using
fractional distillation of the liquid derived from the thermal
degradation of WEPS
81
4.5.3 Physiochemical parameters of standards compounds. 82
4.6.1 Optimum reaction conditions and contents of products using
Al₂O₃, Mmn and AC as catalysts
86
4.6.2 Products formed by the catalytic degradation of WEPS
using Al₂O₃, Mmn and AC as catalysts at optimized
conditions.
89
4.7.1 Optimum reaction conditions and contents of products using
Mg, MgO and MgCO₃ catalysts
94

xv
4.7.2 Products formed by the catalytic degradation of WEPS
using Mg, MgO and MgCO₃ catalysts at optimized
conditions
96
4.7.3 Physical parameters of the fractions obtained using
fractional distillation of the liquid derived from the
degradation of WEPS using Mg, MgO and MgCO₃ catalysts
100
4.8.1 Optimum reaction conditions and contents of product using
15% Mg-Al₂O₃, 20% Mg-Mmn and 20% Mg-AC catalysts
102
4.8.2 Products formed by the catalytic degradation of WEPS
using 15% Mg-Al₂O₃, 20% Mg-Mmn and 20% Mg-AC
catalysts at optimized conditions
105
4.8.3 Comparison of liquid products and their contents with
literature reported methods along with their reaction
conditions
108
4.9.1 Optimum reaction conditions and contents of product using
Zn, ZnO and ZnCl₂ catalysts
113
4.9.2 Products formed by the catalytic degradation of WEPS
using Zn, ZnO and ZnCl₂ catalysts at optimized condition
116
4.9.3 Physiochemical parameters of the fractions obtained using
fractional distillation of the liquid derived from the
degradation of WEPS using Zn, ZnO and ZnCl₂ catalysts
120
4.10.1 Optimum reaction conditions and contents of product 20%
Zn-Al₂O₃, 20% Zn-Mmn and 20% Zn-AC catalysts
122

xvi
4.10.2 Products formed by the catalytic degradation of WEPS
using 20% Zn-Al₂O₃, 20% Zn-Mmn and 20% Zn-AC
catalysts
125
4.11.1 Optimum reaction conditions and contents of products using
Al, Al₂O₃ and AlCl₃ catalysts
131
4.11.2 Products formed by the catalytic degradation of WEPS
using Al, Al₂O₃ and AlCl₃ catalysts at optimized conditions
134
4.11.3 Physiochemical parameters of the fractions obtained using
fractional distillation of the liquid derived from the
degradation of WEPS using Al, Al₂O₃ and AlCl₃ catalysts
138
4.12.1 Optimum reaction conditions and contents of product using
20% Al-Al₂O₃, 5% Al-Mmn and 20% Al-AC catalysts
140
4.12.2 Products formed by WEPS degradation using Al
impregnated catalysts at optimized conditions
143
4.13.1 Optimum reaction conditions and contents of the products
obtained with Cu, CuO and CuCl₂ catalysts
150
4.13.2 Products formed by the catalytic degradation of WEPS
using Cu, CuO and CuCl₂ catalysts at optimized conditions
151
4.13.3 Physical parameters of the fractions obtained using
fractional distillation of the liquid derived from the
degradation of WEPS using Cu, CuO and CuCl₂ catalysts
155
4.14.1 Comparison of reaction conditions and contents of products
using 20% Cu-Al₂O₃, 15% Cu-Mmn and 20% Cu-AC
catalysts
157

xvii
4.14.2 Products formed by WEPS degradation using 20% Cu-
Al₂O₃, 15% Cu-Mmn and 20% Cu-AC catalysts at
optimized conditions
160
4.15.1 Optimum reaction conditions and contents of the product
using Fe, Fe₂O₃ and FeCl₃ catalysts
167
4.15.2 Products formed by the catalytic degradation of WEPS
using thermal degradation, Fe, Fe₂O₃ and FeCl₃ catalysts at
optimized conditions
169
4.15.3 Physiochemical parameters of the fractions obtained using
fractional distillation of the liquid derived from the
degradation of WEPS using Fe, Fe₂O₃ and FeCl₃ catalysts
173
4.16.1 Comparison of reaction conditions and products
components using 5% Fe-Al₂O₃, 20% Fe-Mmn and 20%
Fe-AC catalysts
175
4.16.2 Products formed by WEPS degradation using Fe and its
impregnated catalysts at optimized conditions
177
4.17.1 Optimum reaction conditions and the yield of catalytically
derived products for the degradation of PS, 10PET+PS,
20PET+PS and 30PET+PS
186
4.17.2 Fractions of interest identified by GC-MS in the
catalytically derived liquid products obtained from the
degradation of PS, 10PET+PS, 20PET+PS and 30PET+PS
at optimized conditions
189
4.17.3 Depolymerization products identified by GC-MS in the
catalytically derived liquid products obtained from the
190

xviii
degradation of PS, 10PET+PS, 20PET+PS and 30PET+PS
at optimized conditions
4.17.4 Products obtained from the degradation of PS, 10PET+PS,
20PET+PS and 30PET+PS at optimized conditions
193

xix
ABBREVIATIONS
Abbreviation Full name
% Percent
AC Activated charcoal
(CaO2(Al,Mg)Si4O10(OH)2) montmorillonite-15A
(Mg,Fe)Al2SiO5(OH)2 Chloritoid
°C/min Degree Celsius per min
µL Micro liter
µm Micrometer
⁰ Degree
10PET+PS 10% PET mixture with 90% PS
15% Cu-Mmn 15 percent copper over montmorillonite
15% Mg-Al₂O₃ 15 percent magnesium over alumina
20% Al-AC 20 percent aluminium over activated charcoal
20% Al-Al₂O₃ 20 percent aluminium over alumina
20% Cu-AC 20 percent copper over activate charcoal
20% Cu-Al₂O₃ 20 percent copper over alumina
20% Fe-AC 20 percent iron over activated charcoal
20% Fe-Mmn 20 percent iron over montmorillonite
20% Mg-AC 20 percent magnesium over activated charcoal

xx
20% Mg-Mmn 20 percent magnesium over montmorillonite
20% Zn-AC 20 percent zinc over activated charcoal
20% Zn-Al₂O₃ 20 percent zinc over alumina
20% Zn-Mmn 20 percent zinc over montmorillonite
20PET+PS 20% PET mixture with 80% PS
30PET+PS 30% PET mixture with 70% PS
5% Al-Mmn 5 percent aluminium over montmorillonite
5% Fe-Al₂O₃ 5 percent iron over alumina
Å Angstrom
Al Aluminium
Al10Cl3(OH)27. 13H2O Aluminum chloride hydroxide hydrate
Al2.892Cu6.1808 Aluminium copper alloy
Al2CuMg Aluminium copper magnesium alloy
Al₂O₃-KOH-K Alumina-potassium hydroxide-potassium
Al3+ Aluminium (III) ion
AlCl₃ Aluminium Chloride
AlCl₃. 6H2O Aluminium chloride hexa hydrated or
Chloraluminite
BaO Barium oxide
BET Brunauer, Emmett and Teller method

xxi
BF3 Boron triflouride
BJH Barrett, Joyner and Halenda method
C10-C18 Hydrocarbons range having 10 carbons to 18
carbons
C19-C24 Hydrocarbons range having 19 carbons to 24
carbons
C6-C24 Hydrocarbons range having 6 carbons to 24
carbons
C6-C9 Hydrocarbons range having 6 carbons to 9 carbons
Ca14Mg2(SiO4)8 Bredigite
Ca2.8(Na,K)0.9Al6.5Si11.5O36.5H2O Sodium or potassium form calcium alumino
silicate hydrate
Ca2Al2O5 Dicalcium aluminate
Ca2CuO2Cl2 Oxychloride cuprate
Ca4Al8Si8O32.8H2O Calcium aluminum silicate hydrate
CaO Calcium oxide
C-C Carbon-carbon bond
C-C bond Carbon-carbon bond
cc/g Cubic centimeter per gram (unit of pore volume)
Cl Chlorine atom
Cm Centi meter (unit of length)

xxii
Co Cobalt
C-O Carbon oxygen bond
COx Carbon oxide - represent CO and CO₂
CrO3 Chromium trioxide or Chromium(VI) oxide
CsNaY Cesium and sodium zeolite Y
Cu Copper metal
Cu(ClO4)2 Copper(II) perchlorate
Cu2O Copper(I) oxide
CuAl2O4 Copper aluminate
CuCl₂ Copper chloride
CuCl3 Copper(III) chloride
CuO Copper oxide
Cu-Zn oxide/Al₂O₃ Copper and zinc oxide over alumina
Cx Carbon number, where x stands for 1,2,3,4…
d25 Density at 25 ºC
DTA Differential thermal analysis
EPS Expanded polystyrene
EPSW Expanded polystyrene wastes
eV Electron volt
FCC Spent FCC

xxiii
Fe Iron metal
Fe2O3 Ferric oxide or Iron(III) oxide
FeCl3 Ferric chloride or Iron (III) chloride
Fe-K/Al₂O₃ Iron potassium over alumina
Fig. Figure
FTIR Fourier Transform Infrared spectroscopy
g Gram (unit of mass)
g/ml Gram per micro liter (unit of density)
g/mol Gram per mole (unit of molar mass)
GC-MS Gas chromatography-mass spectrometry
GPPS General purpose polystyrene
H Hydrogen
h Height
h Hour
H‾ Hydride ion
H+ Hydrogen ion
H2SO4 Sulfuric acid
HDPE High density polyethylene
He Helium
HFC's Hydrofluorocarbons

xxiv
HIPS High impact polystyrene
HMCM-41 Hydrogen form of Mobil Composition of Matter-
41
HMOR Hydrogen form of mordenite zeolite
HMS Hexagonal mesoporous silica
HNZ Natural clinoptilolite zeolite
HUSY Hydrogen form of ultra-stable zeolite Y
HY Hydrogen form of zeolites Y
HY-700 Hydrogen form of zeolites Y No.700
HZSM-5 Hydrogen form of zeolite socony mobil-5
I.D Internal diameter
ICDD International committee for diffraction data
IEPC Isoelectric point charge
JCPDS Joint committee on powder diffraction standards
K Kelvin
K2O Potassium oxide
K2O/Si-MCM-41 Potassium oxide over silica modified MCM-41
KCaAl2F9 Elpasolite mineral
KCaCl3 Chlorocalcite
Kcal/mol Kilo calorie per mole (unit of energy per number
of molecules, atoms, or other similar particles)

xxv
KCrF4 A magnetic mineral of potassium chromium and
fluoride
Kg/h Kilo gram per hour (unit of mass flow rate)
KJ/mol Kilo joule per mol (Unit of energy per amount of
material)
KNO₃ Potassium nitrate
KV Kilo volt (major unit of electric potential)
LDPE Low density polyethylene
m/s meter per second (unit of velocity)
m2/g Meter square per gram (unit of surface area)
mA Milli ampere (sub unit of electric current)
MCM-41 Mobile composition of matter no.41
MCM-41 Mobile composition of matter-41
Mg Magnesium metal
Mg(OH)2 Magnesium hydroxide
Mg3Al2(SiO4)3 Magnesium aluminium silicate
MgAl₂O₃ Magnesium aluminium oxide
MgAl2O4 Magnesium aluminium oxide or spinel mineral
MgCl2. 6H2O Magnesium chloride hexa hydrate
MgCO3 Magnesium carbonate
MgO Magnesium oxide

xxvi
MgO-Al₂O₃ Magnesium oxide over alumina
min Minute
MIP Molecular impregnated polymers
ml Milli Liter (sub unit of volume commonly used for
liquids measurement)
mm Millimeter (sub unit of length measurement)
Mmn Montmorillonite
Mo2N Molybdenum nitride
MOF5 Metal organic framework 5
mol Mole (unit for the expression of amounts of a
chemical substance)
Mw Molecular weight
MWD Molecular weight distribution
N₂ Nitrogen
Na1.15Al1.15Si0.85O4 Sodium aluminum silicate - a type of mineral
Na10Zn4O9 Sodium zinc oxide (Oxozincate) - a type of
mineral
Na2Al2Si2.5O9.6.2H2O Sodium aluminum silicate hydrate - a type of
mineral
Na2Ca4Mg2Si4O15 Sodium magnesium silicate - a type of mineral
Na2Mg3Zn2Si12O30 Sodium magnesium zinc silicate - a type of
mineral

xxvii
Na2MgSiO4 Sodium magnesium silicate - a type of mineral
Na2ZnSiO4 Sodium zinc silicate
Na3Mg3Ca5Al19Si117O272 Gottardiite mineral
Na4(Si8Al4)O24·11H2O Gmelinite-Na
Na96Al96Si96O384.216H2O Sodium alumino silicate (zeolite A)
NaOH Sodium hydroxide
Ni/Al₂O₃ Nickel over alumina
NiO Nickel oxide
NiO2 Nickel oxide
nm Nano meter (sub unit of length)
NOx Nitrogen oxide - representation NO, NO2 and N2O
O(Et)2 Diethyl ether
O₂ Oxygen
ºC Degree Celsius
PE Polyethylene
PET Polyethylene terephthalate
pH Negative log of hydrogen concentration
PONA Paraffins (P), olefins (O), naphthenes (N) and
aromatics content
PP Polypropylene

xxviii
PS Polystyrene
Pt Platinum
Pt/γ-Al₂O₃ Platinum over gamma alumina
Pt-Cl/γ-Al₂O₃ Platinum and chlorine over gamma alumina
Pt-Rh Platinum-rhodium alloy
PVC Polyvinylchloride
PZC Zero point of charge
R1 Radical 1
R2 Radical 2
SA Silica-alumina
SAA Surface area analysis
SD Standard deviation
SEM Scanning electron microscopy
Si/Al Ratio determination for SiO₂ and Al₂O₃
Si/Al Silicalite - a type of mineral
Si34O68 Silicon oxide
SiO₂-Al₂O₃ Silica-alumina
SnCl4 Tin(VI) chloride
SOx Sulfur oxide - represent SO, SO2, SO3, S7O2, S6O2,
S2O2

xxix
Tab. Table
TEM Transmission Electron Microscopy
TG Thermogravimetry
TiO2 Titinia
USA United States of America
V Volume
V2O3 Vanadium(III) oxide
WC Tungsten carbide
WEPS Waste expanded polystyrene
WEPS Waste expanded polystyrene
wt.% Weight percent
xPET+PS x amount of PET mixture with x amount of PS
XRD X-ray diffraction
Zn Zinc
Zn3Al94O144 Zinc aluminum oxide
Zn4O6+ Zinc oxide cluster
ZnCl2 Zinc chloride
ZnO Zinc oxide
ZrO₂-KOH Zirconia-potassium hydroxide
ZSM-5 Zeolite Socony Mobile-5

xxx
α Alpha
β Beta
γ Specific refraction
γ-Al₂O₃ Gamma alumina
γM Molar refraction
θ Theta
λ Lambda
π Pie
σ Sigma
Refractive index
Refractive index at 20 ºC using sodium lamp
Density

Summary
xxxi
SUMMARY
The ongoing growth of population and rapid industrialization causes daily refusal of huge
quantities of solid waste especially of plastics. Polystyrene (PS) being an important
commodity is present in large quantities among the discarded plastic wastes in the form of
waste expanded polystyrene (WEPS) and represents a valuable source of chemical products
like styrene monomer and other valuable aromatic hydrocarbons. Waste management of
polymer via conversion into valuable hydrocarbons is a best solution for the problem. The
aim of the current study was the development of novel high activity impregnated catalysts
for the low cost thermo-catalytic degradation of WEPS into selective valuable products
and their separation via fractional distillation followed by physiochemical and GC-MS
characterization.
The first chapter of this dissertation based on brief introduction to catalysts, catalysis,
classification of catalysts, preparation of catalysts (impregnated catalysts) and catalyst
performance parameters. Along with catalysis it included introduction to plastics, types of
plastics with special context of polystyrene (PS), applications of PS and its impact on the
environment when discarded. Waste management and various ways to recycling of plastic
wastes including thermal and catalytic degradation methods which are the main focus of
this thesis are described. Mechanism involved in the processes using either thermal process
or various kinds of catalysts are also included in first chapter.
The second chapter covers a thorough review of relevant literature reported for the thermal
and thermo-catalytic degradation of PS. The literature included catalytic conversion of PS
and some other plastics to their monomer like styrene and other value added hydrocarbons
using various types of bulk and supported catalysts. The literature highlighted different
types of catalysts, reactor types, additives, solvents, effective parameters and impact of
other plastics on the yield of liquid products.
Third chapter comprise of preparation of supported catalysts, catalyst characterization
procedures and different instruments used during preparation and characterization of
catalysts. It include experimental methods applied for thermal and catalytic degradation of
WEPS. This chapter also include discussion of pyrolysis reactors used in the study and

Summary
xxxii
different equipments used in characterization and analysis of liquid products. It also include
the fractionation procedure of parent liquid products, their identification and analysis using
physiochemical parameters and GC-MS analysis.
In the fourth and last chapter results of the experimental findings were discussed. The
Section 1 of the thesis have characterization of the impregnated catalysts using N₂
adsorption and desorption, SEM and XRD analysis in comparison with their supporting
materials. The Section 2 based on characterization of WEPS using TGA, and thermal &
thermo-catalytic degradation of WEPS using several bulk and impregnated catalysts. The
bulk catalysts consist of Mg, MgO, MgCO₃, Zn, ZnO, ZnCl₂, Al, Al₂O₃, AlCl₃, Cu, CuO,
CuCl₂, Fe, Fe₂O₃, FeCl₃, montmorillonite (Mmn) and activated charcoal (AC). Whereas,
impregnated catalysts like Mg-Al₂O₃, Zn-Al₂O₃, Al-Al₂O₃, Cu-Al₂O₃, Fe-Al₂O₃, Mg-
Mmn, Zn-Mmn, Al-Mmn, Cu-Mmn, Fe-Mmn, Mg-AC, Zn-AC, Al-AC, Cu-AC and Fe-
AC. For maximum yield of liquid products different parameters and operation conditions
were optimized. The WEPS was degraded with and without catalysts using different
temperature like 250 ºC, 300 ºC, 350 ºC, 400 ºC, 450 ºC and 500 ºC, different reaction time
like 30 min, 60 min, 90 min, 120 min and 150 min, and different polymer to catalysts ratio
like 1:0.05, 1:0.1, 1:0.2, 1:0.3, 1:0.4 and 1:0.5. The degradation of WEPS were explored
with the effect of polyethylenterephthalat (PET) addition on the yield of component
products of liquid.
Part 1 of the section 2 describes the characterization of WEPS using thermogravimetric
analysis (TGA) in O₂ and N₂ environments. The onset and endset temperature in case of
N₂ environment was 300.98 °C and 409.85 °C, respectively. While the onset and endset
temperature in the case of O₂ environment was 292.50 °C and 407.79 °C, respectively. In
the case of O₂ environment, about 100 wt.% changes were observed and further
degradations of WEPS were carried out at ambient conditions.
In part 2 of the section, thermal degradation of WEPS without the use of any catalysts was
discussed. The maximum yield of liquid products was (78.07 ± 0.64 wt.%) achieved with
500 ºC degradation temperature and 150 min reaction time. Products analysis shows non-
significant yield of value added hydrocarbons and high concentration of high molecular

Summary
xxxiii
weight aromatic hydrocarbons. The yield of different components like toluene,
ethylbenzene, styrene monomer α-methylstyrene, benzene, 3-butynyl and 1,2-propanediol,
3-benzyloxy-1,2-diacetyl was 2.06 wt.%, 0.85 wt.%, 39.31 wt.%, 1.33 wt.%, 17.56 wt.%
and 10.10 wt.%, respectively. The recovery of component products were different than the
composition shown by GC-MS analysis that is attributed to the further degradation of the
products. Benzene, ethylbenzene and 1,2-propanediol, 3-benzyloxy-1,2-diacetyl were
recovered in small quantities. Where the abundant products recovered during the fractional
distillation were toluene (51.0 wt.%), styrene monomer (35.0 wt.%), and about 6.0 wt.%
phenanthrene.
Part 3 of the section describes the comparative degradation of WEPS using different
supporting as catalysts i.e., Al₂O₃, Mmn and AC. Degradation temperature, reaction time
and polymer to catalyst ratio were optimized for maximum liquid products. Mmn catalyst
was found with good catalytic activity having a maximum liquid product yield of 92.40 ±
0.87 wt.%. A significant amount of valuable products were produced with all the three
materials. AC catalysts was found to possess highly active sites that caused to yield mostly
low molecular weight aromatic hydrocarbons abundant with toluene (6.96 wt.%) and
ethylbenzene (6.55 wt.%). However, the yield of styrene monomer was 45.65 wt.% and
45.42 wt.% maximum with Al₂O₃ and AC catalyst.
Investigation on catalytic degradation of WEPS using Mg bulk catalysts were included in
Part 4 of the section 2. The current method i.e. using Mg bulk catalysts, gave more selective
products with significant yield. The yield of low molecular weight aromatic compounds
were in high quantities with selective production of aromatic hydrocarbons. Maximum
recovery of styrene (43.0 wt.%) was achieved with Mg metal catalyst. MgO catalyst
yielded 23.8 wt.% styrene and 35.0 wt.% ethylbenzene while MgCO₃ catalysts yielded
51.87 wt.% styrene and 15.81 wt.% toluene.
In Part 5 of this section thermo-catalytic degradation of WEPS using Mg impregnated
catalysts over Al₂O₃, Mmn and AC supports were explained. The catalytic degradation of
WEPS in the presence of 15% Mg-Al₂O₃ led to narrow range of hydrocarbons with higher
concentration as compared to Mg metal, 20% Mg-Mmn and 20% Mg-AC catalysts. The

Summary
xxxiv
yield of low molecular weight aromatic hydrocarbons like benzene, toluene, ethylbenzene,
styrene, α-methylstyrene and many other valuable hydrocarbons was maximum with 20%
Al-Al₂O₃ catalyst. The catalytic activity and yield of component products were compared
to literature reported methods and current method was found significant for low cost
conversion into valuable products.
Zn-bulk catalysts for thermo-catalytic degradation of WEPS were also described in Part 6
of this section. The catalytic activity and selectivity revealed that zinc bulk catalysts
enhanced the yield of liquid products and affected the formation of component products as
compared to thermal pyrolysis, particularly with Zn metal as catalysts. The catalysts
decreased pyrolysis temperature and heating time as compared to thermal degradation
while on the other hand it increased the yield of liquid products from 78.07 ± 0.64 wt.% to
96.73 ± 0.12 wt.%. The catalysts not only enhances the yield of liquid products, but also
increased value added compounds including toluene, ethylbenzene and styrene. Overall,
the zinc bulk catalysts enhanced both the activity and selectivity of products. During
fraction distillation in addition to thermal pyrolysis, cyclization and recombination
reactions were also observed.
Part 7 of the section describes zinc supported catalysts i.e. Zn-Al₂O₃, Zn-Mmn and Zn-AC
for thermo-catalytic degradation of WEPS. It was found that with zinc impregnated
catalysts the activity and selectivity were better than Zn bulk catalysts. Among the Zn
supported catalysts 20% Zn-Al₂O₃ was found with better catalytic performance, which
yielded 90.20 ± 0.35 wt.% liquid products that were less than the Zn metal catalyst (96.07
± 0.31), but the selectivity of products was good in case of 20% Zn-Al₂O₃ as maximum
valuable aromatic hydrocarbons were formed. The composition of styrene, toluene,
ethylbenzene and α-methylstyrene with 20% Zn-Al₂O₃ were 62.08%, 11.79%, 7.35% and
4.58%, respectively.
Part 8 of section 2 include discussion on the investigation of aluminium bulk catalysts i.e.
(Al metal, Al₂O₃ and AlCl₃) for the degradation of WEPS. Al bulk catalysts were found
with high activity comparable with thermal degradation. The catalyst yielded selective and
desirable hydrocarbons which more specifically in the case of Lewis acid catalysts i.e.

Summary
xxxv
AlCl₃. The yield of styrene monomer in case of AlCl₃ catalyst was 46 wt.%. The separation
of liquid products for the recovery of value added products were also studied in Part 8.
AlCl₃ catalyst was found with maximum recovery of toluene and ethylbenzene. Maximum
recovery of styrene was 50 wt.% and 51 wt.% and α-methylstyrene recovery was 13 wt.%
and 9 wt.% with Al and Al₂O₃ catalysts, respectively.
Part 9 (section 2) of chapter 4 describes aluminium impregnated catalysts over Al2O3, Mmn
and AC supports for thermo-catalytic degradation of WEPS. The results of liquid product
yield and GC-MS characterization revealed that the catalytic activity of 20% Al-Al2O3
catalyst was good producing 91.20 ± 0.35 wt.% liquid products with selective
hydrocarbons. The amount of light weight aromatics were higher in the case of 20% Al-
Al₂O₃ as compared to other catalysts used, which consist major fraction of styrene
monomer i.e. 56.52%.
Comparative degradation of WEPS using Cu, CuO and CuCl₂ bulk catalysts for the
recovery of valuable hydrocarbon have been described in Part 10 of Section 2. Copper bulk
catalysts were found more effective for catalytic activity and selectivity. The majority of
low molecular weight aromatic hydrocarbons were formed with a very small amount of
residue, gases and unwanted high molecular weight aromatic hydrocarbons. Cu metal was
found the best catalyst among the used catalysts with a liquid product yield of 93.93 wt.%
having styrene selectivity of 55.14 wt.% and styrene monomer recovery of 60 wt.%.
In Part 11 of the section discussed, the catalytic activity and selectivity of Cu impregnated
catalysts over Al2O3, Mmn and AC for the degradation of WEPS. It was found that the
yield of liquid products with Cu impregnated catalysts was moderate, but with high
selectivity toward low molecular weight aromatic hydrocarbons. Among the impregnated
catalysts, 20% Cu-Al₂O₃, 15% Cu-Mmn and 20% Cu-AC showed high activities, however,
the selectivity was good only with the 20% Cu-Al₂O₃ catalyst for styrene monomers. For
the selectivity of toluene and ethylbenzene, 15% Cu-Mmn and 20% Cu-AC were found
selective catalysts.

Summary
xxxvi
Part 12 of the section explains the catalytic degradation of WEPS using Fe, Fe₂O₃ and
FeCl₃ bulk catalysts. Fe bulk catalysts were found to increase the yield of liquid product
and selectivity as compared to thermal degradation. Fe and Fe₂O₃ were having more
selectivity for low molecular weight aromatic hydrocarbons. Where the recovery of styrene
monomer was high with Fe metal as catalyst. After Fe metal, FeCl₃ (Lewis acid) was found
with good recovery of toluene, ethylbenzene and styrene monomer.
Investigation and discussion on Fe impregnated catalysts for the degradation of WEPS was
described in Part 13 of this chapter. The catalysts were investigated for the activities of
liquid product and selectivity of component products. 5% Fe-Al₂O₃ and 20% Fe-Mmn was
found with good catalytic activity and selectivity of products. The yield of liquid products
with 5% Fe-Al₂O₃ and 20% Fe-Mmn was 89.27 ± 0.31 wt.% and 88.87 ± 0.42 wt.%,
respectively. The yield of component products like toluene, ethylene and styrene monomer
was almost the same with 5% Fe-Al₂O₃ and 20% Fe-Mmn catalysts. Overall, the yield of
liquid products was less than Fe metal catalysts, but the selectivity of products enhanced
with Fe impregnated catalysts.
The effect of PET on the degradation of PS was discussed in Part 14 of the section 2 in
chapter 4. In the presence of 20% Al-Al₂O₃ catalyst, the degradation of PS, 10PET+PS,
20PET+PS and 30PET+PS started at a lower temperature than the TG pyrolysis of PS and
PET. Degradation temperature, reaction time and feed to catalyst ratio affected the yield of
liquid products and gases. The yield of liquid products was maximum at 500 ºC, 60 min
reaction time and 1:0.2 polymer to catalyst ratio in the cases of PS and 10PET+PS, it was
maximum at 450 ºC, 60 min reaction time and 1:0.2 polymer to catalyst ratio in the case of
20PET+PS whereas it was maximum at 450 ºC, 90 min reaction time and 1:0.2 polymer to
catalyst ratio in the case of 30PET+PS. Generally, the yield of liquid products decreased
and gases increased with the increase of PET percentage. GC-MS analysis showed the
formation of single ring aromatic hydrocarbons (C6-C9 fraction) in bulk. Styrene monomer
was found dominant in the pyrolysis of all materials. The formation of many new and
oxygenated hydrocarbons is attributed to the addition of PET which increased with the
increase of PET percentage. The yield of styrene dimers, styrene oligomers and oxygen

Summary
xxxvii
containing compounds increased with the increase of PET percentage. 10% PET was found
to have good interaction with PS with the yield of maximum liquid and component
products after PS.

INTRODUCTION

Introduction
1
Chapter 1
INTRODUCTION
1.1. Catalysts and catalysis
The catalyst is a substance that increases the rate of a chemical reaction without being
consumed itself or changed chemically and recovered (recycled) at the end of a chemical
reaction for further use in next reaction. The phenomenon of a catalyst to accelerate a
chemical reaction is called catalysis. Catalyst work by binding itself with reactant species
and lower its activation block (rate-limiting free energy of activation or simply activation
energy) for the rapid transformation into products, by providing a new reaction mechanism.
The catalyst may increase the rate of a reaction, decrease the required temperature and may
enhance selectivity [1, 2].
1.2. Classification of catalysts
Catalysts vary from atoms and molecules to large structure like enzymes and zeolites.
Catalysts can be classified using criteria’s like structure, composition, area of application,
catalyst properties, or state of aggregation. Commonly they are classified as acid catalysts
and base catalysts. Here they are classified on the basis of state of aggregation according
to which catalyst has two large divisions i.e. homogeneous catalysts and heterogeneous
catalysts [3].
1.2.1. Homogenous catalysts
A homogenous catalyst is a substance that is in the same phase as the reactants.
Homogenous catalysts are typically dissolved in a solvent with the substrate. The reaction
of chlorine atoms to decompose ozone in the atmosphere is the example of homogenous
catalyst in this reaction. Ozone decomposes spontaneously and also with lightening, but
chlorine (Cl) atoms accelerate the reaction to form oxygen (O2) tremendously [1].

Introduction
2
or overall reaction is
Similarly, another example of homogeneous catalysts is the effect of H+ on carboxylic acid
esterification like the reaction of acetic acid and methanol to form methyl acetate [4].
1.2.2. Heterogeneous catalysts
A heterogeneous catalyst is a substance that is in a different phase from the reactant phase.
Most of heterogeneous catalysts are in solid form which act on the substrate in liquid or
gaseous reaction mixture. For example, Fe in the Haber process for the production of
ammonia [5].
And Co catalysed Fischer–Tropsch synthesis [6].
The heterogeneous catalysis involve three steps as shown in Fig. 1.1, i.e. adsorption,
reaction and desorption. In adsorption step reactants are bonded to catalyst active centers
on its surface, either by Langmuir-Hinshelwood, Eley-Rideal or Mars-van Krevelen
adsorption mechanisms and or their reverse or combination [7] while in second step when
the molecules get oriented, reaction takes place. In the last step the products are released
from catalyst surface and make it available for the next reaction [8].

Introduction
3
Figure 1.1 Diagrammatic representation of the steps involves in heterogeneous catalysis.
Heterogeneous catalysts have specific features that depend upon the morphology of
catalysts. They are preferred over homogenous catalysts because they are cheap, easily
regenerated and stable within a wide range of temperature and pressure. They can be stored
for a long time and could be easily handled. Due to non-toxic nature their disposal is easy
and safe. They present multiple active centres and avoid the formation of inorganic salts
[3]. The most important aspect of a catalyst is its total surface area, the smaller the particle
size of a catalyst will have the larger the surface area, facilitating the adsorption of reactant
molecules [9]. Thus the activity of a catalyst is the function of chemisorption, unsaturation
(uneven geometry of the surface of catalyst), acidity and electronic properties [10].
Heterogeneous catalysts have been classified on the basis of various properties. On the
basis of application, catalysts have been categorized as hydrogenation catalysts, oxidation
catalysts, dehydration catalysts, cracking catalysts and so on [11]. Other classification is
given below:
i. Solid acid and base catalysts
Solid acid catalysts exhibit acidity at elevated temperatures while solid base catalysts show
basic characters in their reactions. They are characterized by their Brønsted and/or Lewis
acidity and by the number and strength of their sites. Examples of solid acid catalysts are
MCM-41, mesoporous molecular sieves (HMS), AlCl3, FeCl3, montmorillonite (Mmn),

Introduction
4
sulfated zirconia and other ion exchange resins. Examples of solid base catalysts are oxides
(MgO, CaO, NiO, ZnO), modified oxides (Al2O3-KOH-K, ZrO2-KOH, MgO-Al2O3,
hydrotalcites) and zeolites (CsNaY, microporous titanosilicates) [12-15].
ii. Conductor, semiconductor and insulator catalysts
On the basis of electronic mobilities catalysts have been classified into conductors,
semiconductors and insulators. The majority of the conductor catalyst are metals like iron,
vanadium, silver and platinum. These catalysts have chemisorption by electron transfer
mechanism. Semiconductors are oxides, like NiO, ZnO and Cu2O. When sufficient energy
is provided in a compound they interchange electrons from the filled valence band. Where
insulators catalysts are a wide range of substances, like silica gel, alumina and activated
charcoal. These catalysts have no electronic movements and are often strong acids. Their
activity mechanism is known to be due to the carbonium ion generation at the acid site on
the surface of catalyst [10, 11, 16].
iii. Unsupported (bulk) and supported catalysts
a. Unsupported or bulk catalysts
Simple, solid heterogeneous catalysts are known as unsupported or bulk catalysts and they
have only active species. For example, metals and metals alloys (Fe, Pt, Mg, Cu, Pt-Rh,
etc.), metal oxides (TiO2, ZnO, NiO2 etc.), simple binary oxides (Al2O3, V2O3, CrO3 etc.),
complex multi component oxides (SiO2-Al2O3, zeolites, hydrotalcites, montmorillonite
etc.), carbides and nitrides (WC, Mo2N etc.), carbons (activated carbons, carbon nanotubes
and graphene etc.), ion-exchange resins and ionomers (polymers matrix, Nafion etc.),
molecularly imprinted catalysts (MIP of Al3+ doped silica gel and cross-link polymers etc.),
metal-organic frameworks (MOF-5 consist of Zn4O6+) and metal salts (ZnCl2, CuCl3,
FeCl3) [3, 17]. Most of the oxides of bulk catalysts can also be used as supports like Al2O3,
activated charcoal (AC), silica (SiO2), zirconia (ZrO2) and titania (TiO2) [18-23] etc.
b. Supported catalysts
When catalytically active components are dispersed on a porous support with large specific
surface area for the effectiveness or minimized cost, they are known as supported catalysts.
Introduction
5
In supported catalyst the active phase is in small quantity and in a sufficiently dispersed
form over a support to achieve large specific surface area and maximum specific activity.
Supported catalysts are prepared with the aim to achieve maximum activity, selectivity and
stability. In order to achieve the said objective the active metal phase is deposited over a
support – usually highly thermostable and porous material having a large surface area and
suitable mechanical strength to longer catalyst life [24, 25].
1.3. Preparation of supported catalysts
The preparation of supported catalyst involves three steps i.e. the introduction of active
phase or component, drying & calcination and reduction or activation, details are followed
below;
1.3.1. Introduction of active phase
The active metal precursor is introduced over porous support by four principle techniques.
i. Ion-exchange
Aqueous solution of suspended supports like Al2O3, TiO2, SiO2, MgO etc. tend to
polarize and surface changed, controlled by the pH of the solution according to the
following schematic equations:
1.1
1.2
In acidic media Eq. 1.1, the surface sites are positively charged and will be covered by
anions while in basic media Eq. 1.2, the acidic surface sites are negatively charged and
covered by cations. For these supports, the pH at which the surface become neutral called
isoelectric point charge (IEPC) or zero point of charge (PZC). For instance, γ-Al2O3 (PZC
8) will attract cations in a solution of pH above its PZC and will attract cations below its
PZC e.g. Pt/γ-Al2O3 is obtained in a solution with a pH above it PZC value and or Pt-Cl/γ-
Al2O3 by reverse pH. Instead of proton the surface could have ionic species to exchange
[24].

Introduction
6
ii. Precipitation or co-precipitation
This technique involves the precipitation or co-precipitation of the metal salt and support
(salt of a compound) under stirring with a base in the form of hydroxides and or carbonates
which after washing is transformed into refractory oxides support. The active metal is
dispersed by calcination e.g. Ni/Al2O3 and Cu-Zn oxide/Al2O3 prepared by co-precipitation
method [24, 26, 27].
iii. Deposition
This technique is identical to the co-precipitations and involve the precipitation of a metal
sol (containing active metal precursor in the form of hydroxide or carbonate) onto a
suspended support. For example phosphine stabilized gold cluster deposition onto TiO2
[24, 28].
iv. Impregnation
It is the most common method to prepare supported or impregnated catalysts. In
impregnation method the support is kept in contact with the solution of precursor metal salt
to achieve pore filling or saturation of pores of support followed by drying and calcination.
On the basis of amount of solution used there are two types of impregnation i.e. (a) dry
impregnation and (b) wet impregnation.
a. Dry impregnation
Its other names are incipient wetness or dry or capillary impregnation. In dry impregnation
the support is sprayed with impregnation or active component solution without the use of
excess solution.
b. Wet impregnation
Wet impregnation is also known as soaking or dipping impregnation. By this method the
catalyst is prepared by adding excess amount of the solution with respect to the pore
volume of the support, kept for a period of time under continuing stirring, filtered and dried.

Introduction
7
1.3.2. Drying and calcination
In order to evaporate the used solvent the material is heated at a temperature of 80-200 ºC,
under a specific atmosphere for a certain period of time depending on the nature of solvent
and materials used. After drying the material is usually heated at high or a little higher than
drying temperature in the presence of atmospheric oxygen or oxygenated environment. In
calcination the metal precursor is decomposed by the formation of oxide (sintering step) as
well as the removal of gases like water, carbon dioxide, the cations, the anions or other
residues [24, 29].
1.3.3. Reduction or activation
Reduction is the process in which the oxides or precursor metal compounds are converted
into metal by thermal treatment in the presence of hydrogen or solution of hydrazine or
formaldehyde [24].
1.4. Catalyst performance parameters
1.4.1. Activity
The action of a catalyst in terms of increasing the reaction rate is known as catalytic
activity. Activity is an important performance parameter for the evaluation of a catalyst.
Activity is increased by maximizing both the availability and dispersion of active phase
and it is expressed in terms of reaction rates normalized for the active phase surface area.
The catalytic activity is measured in terms of turnover frequency or measured readily by
space-time yield expressed in units of the amount of products formed in the reactor per unit
reactor volume and per unit time [7, 30].
1.4.2. Selectivity
The ability of a catalyst to convert reactants into desirable products per amount of
consumed reactants is selectivity. The selectivity of the products could be altered with
physical or chemical properties of catalysts, including diffusivity, pore-size distributions
and location of active ingredients as well as mass transport through the pore structure. For
selectivity the most important property is nature of the active phase of a catalyst [7, 30].

Introduction
8
1.4.3. Stability and regenerability
Stability means the loss of activity of a catalyst with the passage of time either out of the
reaction mixture (Environment) or in the reaction mixture. This might be caused by
polluting the catalyst surface, by sintering of the active phase, poising of active surface
with feed impurities or due to the clogging of pores in catalyst support. Regenerability
mean the regeneration of catalyst either by only washing, calcination in oxidative
environment or often accompanied by the re-dispersion of the active phase onto the surface
of the catalyst [30].
1.5. Plastics and its types
Plastics are man-made polymers or synthetic polymers that are moldable into any shape.
The examples of plastics are polyethylene (PE), polystyrene (PS) and polyvinylchloride
(PVC) etc. Plastics are made of petrochemicals like crude oil, coal or gas under the
application of pressure and heat. They can be classified on the basis of chemical structure
of their polymer backbone as well as side chains, they can also be classified by their
synthetic chemical process like condensation, polyaddition and cross-linking. On the basis
of processibility plastics have two main types i.e. one which gets soft with heating and hard
with cooling are thermoplastics, and those which get hard by heating and soft by cooling
are thermosetting [31].
The production of man-made polymers (plastics) has accelerated human society towards
success. Plastics have been produced in various forms because of their unique properties;
they tolerate a wide temperature range, resist chemicals and light, having good mechanical
strength and are easily moldable at high temperature. Human has started working with
plastics since 1600 BC while the plastic production on an industrial scale has started around
the 1940s and 1950s, since then its production and demand is increasing day by day.
Worldwide production of plastics in 2011 was 280 million tons with annual increases of
4% since 2010 and this is expected to grow till 2016 with a rate of about 5% per year.
Plastics have thousands of types, but low cost commodity plastics that are used on a large
scale are polyethylene terephthalate (PET), high-density polyethylene (HDPE),
polyvinylchloride (PVC), low-density polyethylene (LDPE), polypropylene (PP) and

Introduction
9
polystyrene (PS). According to a survey the global demand of categories of plastics i.e.
PET, PVC, PS, (expanded polystyrene) EPS and polyolefins is more than 90%. Among the
total plastics, the demand of PE, PP, PVC, PS and PET is 37%, 19%, 19%, 6% and 6%,
respectively [32-34]. These plastics have thousands of indoor and outdoor applications and
had made our society resourceful regarding human health and environment. Plastics have
dominated our lives, life without plastics is hard to consider, we use plastics extensively,
they are everywhere, from a writing pen to large bodies, including packing material, water
supplies, water storages, insulating materials, body organs, solar panels and in light aircraft
bodies [34].
1.6. Polystyrene and its applications
Polystyrene (PS) is a petroleum derived aromatic polymer of styrene monomer. PS was
discovered by Eduard Simon in 1839 while its commercial production started in 1930s.
Polystyrene is available in three forms: general purpose polystyrene (GPPS), high impact
polystyrene (HIPS) and expanded polystyrene (EPS) [34]. PS is a widely used commodity
thermoplastic, in 2004 the total world production of EPS was 5 million tons, the average
annual growth is expected to be 2.5% per annum through 2010 and according to an
expectation its total amount will be double, within 25 years.
EPS rank fourth in the world consumption of polymers due to its unique physical and
chemical properties like rigidity, light weight, resistant to chemicals and moisture, hygienic
character, thermal insulation, shock proof nature, cost effective production and durability.
EPS has a wide range of uses, it is used in packaging of breakable supplies or expensive
goods, as insulation material in buildings and in air-conditioning while for domestic
purpose EPS is commonly used in drinking cups, trays, hairdryers and kitchen appliances.
It is also used for making toys and molded parts inside of cars [35-40].
1.7. Environmental impact of polystyrene
The increasing demands of plastics and its growing industry is facilitating human beings
while on the other hand its increasing demands also leads its disposal into the environment
causing serious pollution [37, 41]. Most of the plastics are disposed in open space after its
use where PS comprise 9% of the total municipal solid waste. Statistical calculations per

Introduction
10
2010 reports the annual growth of EPS is 2.5 % per year that is expected to be doubled by
the year 2025 [38, 42]. Disposing plastics are unwise because they are produced from
limited petrochemical resources. The use of PS in furniture and upholstery is reported
highly flammable causing fire in commercial and domestic buildings. They are
environmentally stable and are non-biodegradable materials remaining unchanged for
hundreds of years, limiting landfill space while roads and buildings build over land filled
with EPS could crack and be crashed. EPS because of its light weight and moisture resistant
nature can easily float in the air and water bodies creating an unpleasant look affecting the
beauty of nature. According to an approximation, about 46,000 pieces of plastics are
floating in each square mile of the oceans and its wastes has killed millions seabirds, more
than hundred thousand mammals and countless fish each year [43]. EPS production is
energy demanding process producing greenhouse gases during its production. In spite the
claims of industries, EPS is produced with the use of hydrofluorocarbons (HFC’s) that are
3-5 time more dangerous than the original for the depletion of ozone layer [44]. Moreover,
incineration of EPS is also dangerous for health, it produces toxic gases like light
hydrocarbons, nitrous oxides and sulfur oxides, dioxins and other toxins and cause
associated diseases. Styrene has been reported to leach into food and into human tissues
from polystyrene food wares and has reported in occupational exposure with lung tumor,
leukemia, lymphoma and high rate of neurotoxicological effects (balance effect, spatial
orientation, hearing problems, decreased color judgment and concentration problems etc.)
and carcinogenic effects (Urinary bladder cancer, prostate cancer, colorectal cancer and
pancreatic cancer) [38, 45].
1.8. Plastic waste management
The excellent desirable properties of plastics and its numerous applications in diverse fields
is increasing its demand day by day. The increase in production and use of plastics with
special concern of PS throughout the world increasing its wastes too and it often disposed
directly to the open space or water flowing bodies. Plastics are recovered and managed
using five different ways i.e. disposing by landfill, mechanical recycling, biological
recycling, thermal incineration and chemical recycling. EPS disposal has become a threat
to the environment and its disposal by landfill is prohibited while due to the production of

Introduction
11
toxic and carcinogenic gases its incineration practice has also stopped. Mechanical
recycling is expensive and often full of impurities while biological recycling is much slow
process and it is only practiced for degradable plastics. All the above mentioned methods
are not suitable for waste management. The only way is chemical recycling or tertiary
recycling to get maximum benefit of the plastics waste and convert it into valuable
hydrocarbons [46].
1.9. Chemical recycling or tertiary recycling
Chemical recycling is also known as tertiary recycling, which refers to the recovery of
hydrocarbons or value added compounds. Polymers are considered to be the richest sources
of valuable hydrocarbons. Synthetic polymers, i.e. plastics are produced from
petrochemicals and waste plastics can be converted back into liquid fuels or other important
and useful compounds including its monomer [47]. Chemical recycling is achieved by three
different means:
1.9.1. Depolymerization
Depolymerization refers to reverse synthesis of condensation polymers like polyamides
and nylon to initial diacids and diamines etc. Hydrolysis, alcoholysis and glycolysis are the
typical examples of depolymerization. This method cannot be applied to more than 70% of
municipal solid wastes [47].
1.9.2. Partial oxidation
Partial oxidation (use of steam and/or oxygen) is the direct combustion of polymer waste
with high calorific value for energy recovery. Partial oxidation also produces NOx, SOx and
COx including some light hydrocarbons and thus is not an environmental friendly process.
This method has reported with 60% to 70% hydrogen production [47].
1.9.3. Degradation or cracking or pyrolysis
Degradation is the process of chemical conversion of polymers into its monomer or other
compounds due to secondary reactions taking place. It’s the breakdown of polymer chain

Introduction
12
into useful low molecular weight hydrocarbons in liquid forms that can be utilized as
chemicals or fuels for combustion. It has further subdivided into the following types:
i. Thermal degradation
Thermal degradation is a type of tertiary recycling, which is achieved with
elevated temperature (i.e., from 250 °C to 1200 °C or may vary with polymer
nature) in the absence of any other compounds like catalyst, solvent and oxygen.
Thermal degradation often requires high temperature and produce more gaseous
products. The liquid products produced are often in a broad range with no
selectivity and in much longer time [37, 47, 48].
ii. Catalytic degradation
In catalytic degradation the plastic wastes are broken down into chemical products in the
presence of a suitable cracking catalyst. The liquid products produced during the
degradation process can be used as a fuel or raw material like styrene, toluene and
ethylbenzene to produce either new polymers or other substances in case of PS degradation
[49-53]. Catalyst increases the rate of reaction by decreasing activation energy with
ultimate decrease of final degradation temperature and reaction time with selective and
desirable products yield in narrow ranges. This method is the best way to waste plastic
recycling that is cost effective and largely practiced throughout the world [47].
The catalytic or thermal degradation can also be carried out using special conditions like
in the presence of hydrogen (hydrocracking), oxygen and inert gas like nitrogen. Many
researchers have carried out the degradation of plastics in different solvents or other
compounds. The degradation of plastics may also be affected by different parameters like
degradation temperature, reaction time and polymer to catalyst ratio. Proper selection of
catalyst and reactor design can also decrease temperature for catalytic degradation as well
as an increase in selectivity of products [54-56].
iii. Photodegradation
The process of breakdown of large molecules of a polymer into small molecules by
irradiation with ultraviolet (UV) or visible light.

Introduction
13
iv. Biodegradation
The breakdown of polymer molecules into small fragment by the help of micro-organism
such as bacteria, which divide the polymer into fragments by the release of enzymes and
eat.
There are some other types of degradation but they have no importance to the context of
this study, therefore, not included. However, our field of interest is thermal and catalytic
degradation, therefor, they are given in details.
1.10. Polystyrene degradation mechanism
The degradation of polymers is a complex phenomenon to understand because thousands
of species are generating and interacting with each other at a single time, therefore, it is
hard to divine a specific mechanism but there are a few agreements using different natures
of catalysts. Generally the depolymerization and or degradation of polymers occur in three
stages:
i. Initiation
ii. Propagation
iii. Termination
The scission or degradation of PS polymer backbone is proposed by Cullis and Hirchler
[57] with four common proposed mechanisms i.e. (i) end-chain scission or unzipping –
where degradation is targeted at the chain ends and successively production of monomer
resulting decrease in the length of polymer, (ii) random-chain scission – in random
fragmentation of polymer result the formation of both monomers and oligomers, (iii) chain-
stripping - side chain reactions involving substituents on the polymer chain, (iv) cross-
linking reactions - two adjacent polymer chains can form a bond resulting in a higher
molecular weight species or even within the same polymer some cross-linking reactions
take place. There are various types of degradation with different mechanisms. It has been
proved that the degradation of PS is accompanied by thermal transformations along with
catalytic transformation in thermal assisted pyrolysis. Therefore, it is often termed as

Introduction
14
thermo-catalytic degradation [58] and the subject of our concern therefore, for ease of
understanding they are described separately.
1.10.1. Thermal degradation (radical mechanism)
The degradation of PS into its monomer, dimer, oligomers or associated degraded
compounds is caused by chemical bond scission reaction of the polymer backbone of
macromolecules [48]. Thermal or heat assisted degradation of PS follow chain mechanism
and initiate with the formation of polymer radicals, followed by propagation, transfer and
termination steps [59-68]. PS initiate thermal degradation via C-C bond rupture of the
polymer chain to form two radicals: a primary radical (R1) and a secondary radical (R₂).
The formation of radicals are followed by propagation step by continuous
depolymerization (β-scission) to form a series of R1 and R2 radicals with the formation of
styrene monomer. Some primary and secondary radicals also transformed to tertiary
radicals by the intramolecular H-abstraction, which lead the formation of α-methylstyrene
and dimers shown in Scheme 1.

Introduction
15
Some of the radicals along with α-methylstyrene and dimers undergo transfer or
recombination reaction of low activation energy [66, 67] shown in scheme 2. The formation
of head to head structure and some R1 and R2 root products were formed. The
recombination reactions followed by intermolecular H-abstraction and or
disproportionation reaction then lead to the formation of wide range of products. Extensive
random chain scission cause to form composite radicals of R1 and R2 in combination with
C-C bond linkage of phenyl rings in order to form phenyl radicals and these radicals are
then transformed into head-to-head structure by the abstraction of intermolecular hydrogen
(H) or disproportionation reactions. Scheme 2 represent the routes to many products
formed by this mechanism, which include toluene; ethylbenzene; Benzene, (1-

Introduction
16
methylethyl); diphenylmethane; benzene, 1,1'-ethylidenebis; ethylene, 1,1-diphenyl;
benzene, 1,1'-(1,2-ethanediyl)bis; 1,2-diphenylethylene; benzene, 1,1'-(1-methyl-1,2-
ethanediyl)bis; benzene, 1,1'-(1-butene-1,4-diyl)bis; benzene, 1,1'-(1,3-propanediyl)bis;
benzene, 1,1'-(3-methyl-1-propene-1,3-diyl)bis; benzene, 1,1'-(1-methyl-1,3-
propanediyl)bis; benzene, 1,1'-(1-butenylidene)bis; benzene, 1,1'-(1,5-hexadiene-1,6-
diyl)bis; benzene, 1,1'-(1,4-butanediyl)bis; benzene, 1,1'-(3-methyl-1-propene-1,3-
diyl)bis; 1,4-diphenyl-1,3-butadiene; benzene, 1,1'-(2-methyl-1-propenylidene)bis; 2,5-
diphenyl-1,5-hexadiene; 1-pentene, 1,5-diphenyl; 1-(4-methylphenyl)-4-phenylbuta-1,3-
diene; 1,5-diphenyl-1,5-hexadiene; benzene, 1,1'-(2-pentene-1,5-diyl)bis etc.
Scheme 3 & 4 shows that some of the radical composites also go through the random chains
scission and forming condensed aromatic compounds by intramolecular cyclization and
dehydrogenation of the alkyl moiety that lead to the formation of condensed products such
as 2-phenylnaphthalene; indene; 1,2-diphenylcyclopropane; 2-phenyl-1H-indene; 3-
phenyl-1Hindene; 1,2-dihydro-1-phenylnaphthalene; naphthalene, 1,2-dihydro-4-phenyl;
naphthalene, 1-phenyl and benzene, 1,3,5-triphenyl [68]. Apart from these they may also
form 1H-indene, 2-methyl-3-phenyl; p-terphenyl; m-terphenyl and similar products.
The formation of some condensed products like naphthalene; naphthalene, 1-methyl; and
naphthalene, 1-benzyl with their possible routes [69] have been presented in Scheme 5.
Where the formation mechanism of arenes from toluene with the production of anthracene
; anthracene, 9,10-dihydro and 9,10-dimethylanthracene [69] have given in Scheme 6.
These are mechanism for common products, there may occur hundreds of other reactions
producing numerous compounds depending upon the product of initiation and its
interacting species.

Introduction
17

Introduction
18

Introduction
19
1.10.2. Catalytic degradation (ionic mechanism)
1.10.2.1. Acidic catalysts (cationic mechanism)
Acidic catalysts initiate the degradation of PS with the attack of a proton associated with a
Brönsted acid site to the phenyl ring of the PS polymer backbone. The resulting carbocation
(carbenium) undergo β-scission followed by a hydrogen transfer.
The mechanism to the production of major and important compounds is described by
Audisio et al. [70]. The hydrogen of acidic catalysts attack the branched aromatic ring
giving rise to primary cation Type I of π-complex, which upon β-scission convert to σ-
complex (secondary cation) and release benzene, shown in scheme 1.
The secondary cation produce during the β-scission of type I primary cation undergo
catalytic cyclization and produce indane and or its derivatives [70, 71], the mechanism is
shown in scheme 2.
The same way the hydrogen of acidic catalysts attack the branched phenyl group of PS and
produce primary cation Type II, which upon β-scission give rise to a polymer ion (A)
having positive charge on the last carbon atom of the chain and also produce a cyclodiene
substituted polymer chain (B) as shown in scheme 3. The ion A further undergo β-scission
and yield styrene monomer and secondary ions of A. Therefore, high amount of styrene is
produced. The primary or secondary ion A also undergo hydride ion rearrangement
followed by β-scission to produce α-methylstyrene [70, 71].

Introduction
20
Scheme 4 shows the cyclodiene substituted polymer chain (B) rearrangement, which is
attacked by a proton and forms another cation. The cation then undergo β-scission
producing a toluene and a secondary ions.
Some intermolecular hydrogen transfer also takes place, which results in the formation of
ethylbenzene and benzene, (1-methylethyl). The mechanism is given in scheme 5.

Introduction
21
Lewis acids catalyze degradation of PS initiate with an elimination of hydrogen atom from
the benzyl carbon of the aliphatic chain in polymer backbone (dealkylation reaction)
forming a polycation [72, 73] shown in scheme 6. The polycation produced by the
elimination of hydride then undergo cationic transformations as shown in scheme 1-5.
Benzene, toluene and ethylbenzene can also be formed by further degradation and
hydrogenation of styrene [55, 74]. Whereas, the dispersion of Lewis acid over acidic
support results in the formation of both Brönsted and Lewis acidic sites for the degradation
of PS [75]. Beside these, some interaction between the pre-formed molecules also take
place and some cross-linking reactions among the adjacent polymeric chains or even inside
the same polymer take place [76]. The formation of residue is due to the secondary cross-
linking reactions [71, 77].
1.10.2.2. Basic catalysts (anionic mechanism)
The catalytic degradation of PS with basic catalyst initiate through deprotonation and
formation of carboanion. The resulting carboanion undergo β-scission of the C-C bond on
the aliphatic chain [71]. The formation route of styrene, dimers and many other compounds
with anionic mechanism is identical with thermal degradation.

Introduction
22
The later compounds upon isomerization and decomposition form other cracking products
such benzene; toluene; ethylbenzene; styrene; α-methylstyrene; benzene, (1-methylethyl);
indane; indene; naphthalene and others [58].
1.11. Aim of the Present Work
The aim of present work is the exploration of new bulk catalysts and preparation of novel
impregnated catalysts followed by characterization using N2 adsorption/desorption, SEM
and XRD techniques for the degradation of WEPS with high activity and selectivity of the
yielded products for desirable and valuable compounds obtained from degradation
reaction. After degradation of WEPS with high activity and selectivity bulk liquid products
will be collected and then its separation by fractional distillation followed by the
characterization of parent liquid products and fractionates by physiochemical techniques
and GC-MS studies.

Introduction
23
References
[1] I. Chorkendorff, J. W. Niemantsverdriet, "Concepts of Modern Catalysis and
Kinetics", Wiley-VCH Verlag GmbH & Co. KGaA, Weinheim, Germany, pp. 457
(2007).
[2] A. J. B. Robertson, "Catalysis of Gas Reactions by Metals", Logos Press Ltd.,
London, UK (1970).
[3] J. Hagen, "Introduction" in Industrial Catalysis: A practical approach, Wiley-VCH
Verlag GmbH & Co. KGaA, Weinheim, Germany, pp. 1-14 (2006).
[4] A. Behr, "Organometallic Compounds and Homogeneous Catalysis" in Ullmann's
Encyclopedia of Industrial Chemistry, Wiley-VCH Verlag GmbH & Co. KGaA,
Weinheim, Germany, (2000).
[5] M. D. Fryzuk, Inorganic chemistry: Ammonia transformed, Nature 427 (6974) 498-
499 (2004).
[6] K. Pansanga, N. Lohitharn, A. C. Y. Chien, E. Lotero, J. Panpranot, P. Praserthdam,
J. G. Goodwin Jr, Copper-modified alumina as a support for iron Fischer–Tropsch
synthesis catalysts, Applied Catalysis A: General 332 (1) 130-137 (2007).
[7] H. Knözinger, K. Kochloefl, "Heterogeneous Catalysis and Solid Catalysts" in
Ullmann's Encyclopedia of Industrial Chemistry, Wiley-VCH Verlag GmbH & Co.
KGaA, Weinheim, Germany, (2000).
[8] J. M. Thomas, W. J. Thomas, "Principles and Practice of Heterogeneous
Catalysis", VCH, Weinheim Germany, pp. 464 (1997).
[9] Y. Zhang, Y. Yoneyama, K. Fujimoto, N. Tsubaki, A new preparation method of
bimodal catalyst support and its application in Fischer–Tropsch Synthesis, Topics
in Catalysis 26 (1-4) 129-137 (2003).
[10] J. M. Smith, "Chemical engineering kinetics", McGraw-Hill Kogakusha Ltd.,
Tokoyo, Japan, pp. 612 (1970).

Introduction
24
[11] M. V. C. Sastri, V. Srinivasan, B. Viswanathan, "Electrical Properties of Solid
Catalysts" in Modern Aspects of Solid State Chemistry, C. N. R. Rao (Ed.), Springer
US, pp. 425-445 (1988).
[12] K. Wilson, J. H. Clark, Solid acids and their use as environmentally friendly
catalysts in organic synthesis, Pure and Applied Chemistry 72 (7) 1313-1319
(2000).
[13] M. A. Harmer, Q. Sun, Solid acid catalysis using ion-exchange resins, Applied
Catalysis A: General 221 (1–2) 45-62 (2001).
[14] M. H. Valkenberg, C. deCastro, W. F. Hölderich, Friedel-Crafts acylation of
aromatics catalysed by supported ionic liquids, Applied Catalysis A: General 215
(1–2) 185-190 (2001).
[15] K. Tanabe, W. F. Hölderich, Industrial application of solid acid–base catalysts,
Applied Catalysis A: General 181 (2) 399-434 (1999).
[16] A. Ozaki, K. Kimura, The effective site on acid catalysts revealed in n-butene
isomerization, Journal of Catalysis 3 (5) 395-405 (1964).
[17] O. Deutschmann, H. Knözinger, K. Kochloefl, T. Turek, "Heterogeneous Catalysis
and Solid Catalysts" in Ullmann's Encyclopedia of Industrial Chemistry, Wiley-
VCH Verlag GmbH & Co. KGaA, (2000).
[18] P. Gayán, M. A. Pans, M. Ortiz, A. Abad, L. F. de Diego, F. García-Labiano, J.
Adánez, Testing of a highly reactive impregnated Fe2O3/Al2O3 oxygen carrier for
a SR–CLC system in a continuous CLC unit, Fuel Processing Technology 96 (0)
37-47 (2012).
[19] Y. Lu, S. Li, L. Guo, Hydrogen production by supercritical water gasification of
glucose with Ni/CeO2/Al2O3: Effect of Ce loading, Fuel 103 (0) 193-199 (2013).
[20] A. Romero-Pérez, A. Infantes-Molina, A. Jiménez-López, E. R. Jalil, K. Sapag, E.
Rodríguez-Castellón, Al-pillared montmorillonite as a support for catalysts based
on ruthenium sulfide in HDS reactions, Catalysis Today 187 (1) 88-96 (2012).

Introduction
25
[21] J. Taghavimoghaddam, G. P. Knowles, A. L. Chaffee, Preparation and
characterization of mesoporous silica supported cobalt oxide as a catalyst for the
oxidation of cyclohexanol, Journal of Molecular Catalysis A: Chemical 358 (0) 79-
88 (2012).
[22] A. Machocki, A. Denis, W. Grzegorczyk, W. Gac, Nano- and micro-powder of
zirconia and ceria-supported cobalt catalysts for the steam reforming of bio-
ethanol, Applied Surface Science 256 (17) 5551-5558 (2010).
[23] J. Ludvíková, K. Jirátová, J. Klempa, V. Boehmová, L. Obalová, Titania supported
Co–Mn–Al oxide catalysts in total oxidation of ethanol, Catalysis Today 179 (1)
164-169 (2012).
[24] F. Pinna, Supported metal catalysts preparation, Catalysis Today 41 (1–3) 129-137
(1998).
[25] A. A. Adesina, Hydrocarbon synthesis via Fischer-Tropsch reaction: travails and
triumphs, Applied Catalysis A: General 138 (2) 345-367 (1996).
[26] G. Li, L. Hu, J. M. Hill, Comparison of reducibility and stability of alumina-
supported Ni catalysts prepared by impregnation and co-precipitation, Applied
Catalysis A: General 301 (1) 16-24 (2006).
[27] S. Wang, H. Liu, Selective hydrogenolysis of glycerol to propylene glycol on Cu–
ZnO catalysts, Catalysis Letters 117 (1-2) 62-67 (2007).
[28] C. C. Chusuei, X. Lai, K. A. Davis, E. K. Bowers, J. P. Fackler, D. W. Goodman,
A nanoscale model catalyst preparation: Solution deposition of phosphine-
stabilized gold clusters onto a planar TiO2 (110) support, Langmuir 17 (13) 4113-
4117 (2001).
[29] M. A. Vicente, C. Belver, R. Trujillano, M. A. Bañares-Muñoz, V. Rives, S. A.
Korili, A. Gil, L. M. Gandı́a, J. F. Lambert, Preparation and characterisation of
vanadium catalysts supported over alumina-pillared clays, Catalysis Today 78 (1–
4) 181-190 (2003).

Introduction
26
[30] G. J. K. Acres, A. J. Bird, J. W. Jenkins, F. King, "The design and preparation of
supported catalysts" in Catalysis, C. Kemball, D. A. Dowden (Eds.), The Royal
Society of Chemistry, pp. 1-30 (1981).
[31] L. Li, N. Zhao, W. Wei, Y. Sun, A review of research progress on CO2 capture,
storage, and utilization in Chinese Academy of Sciences, Fuel 108 (0) 112-130
(2013).
[32] A. Brems, J. Baeyens, J. Beerlandt, R. Dewil, Thermogravimetric pyrolysis of
waste polyethylene-terephthalate and polystyrene: A critical assessment of kinetics
modelling, Resources, Conservation and Recycling 55 (8) 772-781 (2011).
[33] B. Dutcher, M. Fan, S. Cui, X.-D. Shen, Y. Kong, A. G. Russell, P. McCurdy, M.
Giotto, Characterization and stability of a new, high-capacity amine-functionalized
CO2 sorbent, International Journal of Greenhouse Gas Control 18 (0) 51-56
(2013).
[34] A. L. Andrady, M. A. Neal, Applications and societal benefits of plastics,
Philosophical Transactions of the Royal Society B: Biological Sciences 364 (1526)
1977-1984 (2009).
[35] Z. Ahmad, F. Al-Sagheer, N. A. Al-Awadi, Pyro-GC/MS and thermal degradation
studies in polystyrene-poly(vinyl chloride) blends, Journal of Analytical and
Applied Pyrolysis 87 (1) 99-107 (2010).
[36] J. M. Arandes, J. Ereña, M. J. Azkoiti, M. Olazar, J. Bilbao, Thermal recycling of
polystyrene and polystyrene-butadiene dissolved in a light cycle oil, Journal of
Analytical and Applied Pyrolysis 70 (2) 747-760 (2003).
[37] Z. Hussain, K. M. Khan, K. Hussain, Microwave-metal interaction pyrolysis of
polystyrene, Journal of Analytical and Applied Pyrolysis 89 (1) 39-43 (2010).
[38] R. S. Chauhan, S. Gopinath, P. Razdan, C. Delattre, G. S. Nirmala, R. Natarajan,
Thermal decomposition of expanded polystyrene in a pebble bed reactor to get

Introduction
27
higher liquid fraction yield at low temperatures, Waste Management 28 (11) 2140-
2145 (2008).
[39] V. R. Chumbhale, J. S. Kim, S. B. Lee, M. J. Choi, Catalytic degradation of
expandable polystyrene waste (EPSW) over mordenite and modified mordenites,
Journal of Molecular Catalysis A: Chemical 222 (1–2) 133-141 (2004).
[40] H.-Y. Shin, S.-Y. Bae, Thermal decomposition of polystyrene in supercritical
methanol, Journal of Applied Polymer Science 108 (6) 3467-3472 (2008).
[41] M. R. Islam, M. Parveen, H. Haniu, M. R. Islam, Innovation in pyrolysis technology
for management of scrap tire: a Solution of energy and environment, International
Journal of Environmental Science and Development 1 (1) 89-96 (2010).
[42] S. E. Levine, L. J. Broadbelt, Reaction pathways to dimer in polystyrene pyrolysis:
A mechanistic modeling study, Polymer Degradation and Stability 93 (5) 941-951
(2008).
[43] Marine Litter: A Global Challenge, Available from:
http://www.unep.org/publications/search/pub_details_s.asp?ID=4021 (Accessed:
12th July, 2013)
[44] Polystyrene Foam Report, Available from:
http://www.earthresource.org/campaigns/capp/capp-styrofoam.html (Accessed: 12
July, 2013)
[45] Eliminate the Use of Polystyrene, Available from:
http://www.ejnet.org/plastics/polystyrene/nader.html (Accessed: 12th July, 2013)
[46] N. Miskolczi, L. Bartha, A. Angyal, High Energy Containing Fractions from Plastic
Wastes by Their Chemical Recycling, Macromolecular Symposia 245-246 (1) 599-
606 (2006).
[47] A. K. Panda, R. K. Singh, D. K. Mishra, Thermolysis of waste plastics to liquid
fuel: A suitable method for plastic waste management and manufacture of value

Introduction
28
added products-A world prospective, Renewable and Sustainable Energy Reviews
14 (1) 233-248 (2010).
[48] C. L. Beyler, M. M. Hirschler, "ASTM E 176, "Standard Terminology of Fire
Standards"" in Annual Book of ASTM Standards, American Society for Testing and
Materials, West Conshohocken, PA, USA,
[49] M. Blazsó, Recent trends in analytical and applied pyrolysis of polymers, Journal
of Analytical and Applied Pyrolysis 39 (1) 1-25 (1997).
[50] K. Huang, L. H. Tang, Z. B. Zhu, W. Y. Ying, Continuous distribution kinetics for
degradation of polystyrene in sub and supercritical toluene, Journal of Analytical
and Applied Pyrolysis 76 (1–2) 186-190 (2006).
[51] N. Kiran, E. Ekinci, C. E. Snape, Recyling of plastic wastes via pyrolysis,
Resources, Conservation and Recycling 29 (4) 273-283 (2000).
[52] P. Layman, Germany's big chemical firms cut dividends, Chemical and
Engineering News, 1993, pp. 4–5
[53] Z. Zhibo, S. Nishio, Y. Morioka, A. Ueno, H. Ohkita, Y. Tochihara, T. Mizushima,
N. Kakuta, Thermal and chemical recycle of waste polymers, Catalysis Today 29
(1-4) 303-308 (1996).
[54] K. H. Lee, Composition of aromatic products in the catalytic degradation of the
mixture of waste polystyrene and high-density polyethylene using spent FCC
catalyst, Polymer Degradation and Stability 93 (7) 1284-1289 (2008).
[55] S.-Y. Lee, J.-H. Yoon, J.-R. Kim, D.-W. Park, Degradation of polystyrene using
clinoptilolite catalysts, Journal of Analytical and Applied Pyrolysis 64 (1) 71-83
(2002).
[56] A. Marcilla, J. C. García-Quesada, S. Sánchez, R. Ruiz, Study of the catalytic
pyrolysis behaviour of polyethylene-polypropylene mixtures, Journal of Analytical
and Applied Pyrolysis 74 (1-2) 387-392 (2005).

Introduction
29
[57] C. F. Cullis, M. M. Hirschler, "The combustion of organic polymers", Clarendon
Press ; Oxford University Press, Oxford, New York (1981).
[58] M. Marczewski, E. Kamińska, H. Marczewska, M. Godek, G. Rokicki, J.
Sokołowski, Catalytic decomposition of polystyrene. The role of acid and basic
active centers, Applied Catalysis B: Environmental 129 (0) 236-246 (2013).
[59] H. H. G. Jellinek, Thermal degradation of polystyrene and polyethylene. Part III,
Journal of Polymer Science 4 (1) 13-36 (1949).
[60] S. L. Madorsky, S. Straus, D. Thompson, L. Williamson, Pyrolysis of
polyisobutene (vistanex), polyisoprene, polybutadiene, GR-S, and polyethylene in
a high vacuum, Journal of Polymer Science 4 (5) 639-664 (1949).
[61] T. Faravelli, M. Pinciroli, F. Pisano, G. Bozzano, M. Dente, E. Ranzi, Thermal
degradation of polystyrene, Journal of Analytical and Applied Pyrolysis 60 (1) 103-
121 (2001).
[62] J.-S. Kim, W.-Y. Lee, S.-B. Lee, S.-B. Kim, M.-J. Choi, Degradation of polystyrene
waste over base promoted Fe catalysts, Catalysis Today 87 (1–4) 59-68 (2003).
[63] Y. Hu, S. Li, The effects of magnesium hydroxide on flash pyrolysis of polystyrene,
Journal of Analytical and Applied Pyrolysis 78 (1) 32-39 (2007).
[64] T. M. Kruse, O. S. Woo, H.-W. Wong, S. S. Khan, L. J. Broadbelt, Mechanistic
modeling of polymer degradation: A comprehensive study of polystyrene,
Macromolecules 35 (20) 7830-7844 (2002).
[65] B. N. Jang, C. A. Wilkie, The thermal degradation of polystyrene nanocomposite,
Polymer 46 (9) 2933-2942 (2005).
[66] T. M. Kruse, S. E. Levine, H.-W. Wong, E. Duoss, A. H. Lebovitz, J. M. Torkelson,
L. J. Broadbelt, Binary mixture pyrolysis of polypropylene and polystyrene: A
modeling and experimental study, Journal of Analytical and Applied Pyrolysis 73
(2) 342-354 (2005).

Introduction
30
[67] T. M. Kruse, O. Sang Woo, L. J. Broadbelt, Detailed mechanistic modeling of
polymer degradation: application to polystyrene, Chemical Engineering Science 56
(3) 971-979 (2001).
[68] I. C. McNeill, M. Zulfiqar, T. Kousar, A detailed investigation of the products of
the thermal degradation of polystyrene, Polymer Degradation and Stability 28 (2)
131-151 (1990).
[69] C. D. Hurd, A. R. Macon, J. I. Simon, R. V. Levetan, Pyrolytic formation of arenes.
I. Survey of general principles and findings, Journal of the American Chemical
Society 84 (23) 4509-4515 (1962).
[70] G. Audisio, F. Bertini, P. L. Beltrame, P. Carniti, Catalytic degradation of
polymers: Part III—Degradation of polystyrene, Polymer Degradation and
Stability 29 (2) 191-200 (1990).
[71] H. Ukei, T. Hirose, S. Horikawa, Y. Takai, M. Taka, N. Azuma, A. Ueno, Catalytic
degradation of polystyrene into styrene and a design of recyclable polystyrene with
dispersed catalysts, Catalysis Today 62 (1) 67-75 (2000).
[72] V. Karmore, G. Madras, Thermal degradation of polystyrene by Lewis acids in
solution, Industrial & Engineering Chemistry Research 41 (4) 657-660 (2002).
[73] R. Lin, R. L. White, Acid-catalyzed cracking of polystyrene, Journal of Applied
Polymer Science 63 (10) 1287-1298 (1997).
[74] S. Y. Lee, J. H. Yoon, J. R. Kim, D. W. Park, Catalytic degradation of polystyrene
over natural clinoptilolite zeolite, Polymer Degradation and Stability 74 (2) 297-
305 (2001).
[75] X. S. Zhao, M. G. Q. Lu, C. Song, Immobilization of aluminum chloride on MCM-
41 as a new catalyst system for liquid-phase isopropylation of naphthalene, Journal
of Molecular Catalysis A: Chemical 191 (1) 67-74 (2003).

Introduction
31
[76] H. Nanbu, Y. Sakuma, Y. Ishihara, T. Takesue, T. Ikemura, Catalytic degradation
of polystyrene in the presence of aluminum chloride catalyst, Polymer Degradation
and Stability 19 (1) 61-76 (1987).
[77] C. Xie, F. Liu, S. Yu, F. Xie, L. Li, S. Zhang, J. Yang, Study on catalytic pyrolysis
of polystyrene over base modified silicon mesoporous molecular sieve, Catalysis
Communications 9 (6) 1132-1136 (2008).

LITERATURE REVIEW

Literature Review
32
Serrano et al., [1] reported the degradation of PS at 375 ºC using amorphous SiO2-Al2O3,
HMCM-41 and HZSM-5 zeolite as catalyst. Amorphous SiO2-Al2O3 and HZSM-5 catalyst
was reported with similar or lower conversion into products in comparison with thermal
degradation while HMCM-41 showed increased catalytic activity. This behavior of the
catalyst was explained by cross-linking competitive reaction supported by the strength and
Brönsted nature of the zeolite acid sites. Styrene was obtained as a major product
approximately 50 wt.% with thermal degradation and catalytic degradation using HZSM-
5 as a catalyst while using HMCM-41 and SiO2-Al2O3 as catalysts; benzene, ethylbenzene
and cumene were the major products but with less than 20 wt.%. The catalytic behavior of
HZSM-5 zeolite regarding its results was credited to of its microporous structure and acidic
character. The catalytic degradation of PS was explained that practically external acid sites
are active for degradation reactions, but the polymer is bulky to enter the micropores.
HMCM-41 was marked the best catalyst for the degradation of PS because of its moderate
acidic strength and mesoporous structure.
Ukei et al., [2] investigated a number of solid acid and solid base catalysts for the catalytic
cracking of PS into styrene monomer and dimer. Solid base catalysts were found with good
catalytic activity as compared to solid acid catalyst on the bases of the degradation
mechanism. BaO was as having better with best catalytic activity among solid bases. When
PS was thermally degraded in a mixture with BaO powder at 350 ºC, 90 wt.% styrene
produced. A model recyclable plastic was prepared with the help of a twin - roller at 120
ºC by dispersing 1 wt.% BaO powder in PS to produce PS films. The films were also
expanded into styrofoam along with dispersed BaO powder by using a gas absorption and
evolution method. More than 85 wt.% of the BaO dispersed PS films were converted into
the styrene at 350 ºC without the use of any other catalyst.
Lee et al., [3] reported the degradation of PS with natural clinoptilolite zeolite (HNZ) at
400 ºC. The pyrolysis studied were conducted to compare the catalytic performance of
HNZ catalyst with thermal degradation, HZSM-5 and silica-alumina catalysts and found
HNZ was as effective as HZSM-5 for liquid product yield with carbon numbers C5-C12
range. Styrene was the major product over both non-catalytic and catalytic degradation of
PS. Silica-alumina because of their mesoporous structure produced maximum

Literature Review
33
ethylbenzene with the concomitant decrease of styrene monomer. Using HNZ the
selectivity of ethylbenzene and propylbenzene was increased with increase in degradation
temperature while the selectivity for styrene monomer decreased styrene dimers. Kinetic
studies were also carried out by thermogravimetric analysis using a dynamic model which
showed reliable kinetic parameters for the degradation of PS using HNZ as catalyst.
Activation energy, calculated was 360 KJ/mol with first order kinetics.
Lee et al., [4] studied a number of solid acid i.e. silica-alumina, HY, HZSM-5, clinoptilolite
(both natural and synthetic) and mordenite for the degradation PS. They reported
clinoptilolites with good catalytic activity and yielded highly selective aromatic products
for the degradation of PS. The degradation behavior of the distribution of aromatic products
was discussed with the effect of catalyst acidity, degradation temperature and reaction time.
They found ethylbenzene was increased with the increase of reaction time and surface
acidity of the catalyst where styrene monomer was increased with increase of degradation
temperature.
Lee et al., [5] reported catalytic cracking of PS in fluidized bed reactor. Two types of PS;
general purpose polystyrene (GPPS) and expanded polystyrene wastes (EPSW) was used
while N2 was used as fluidized gas and silica sand was used as bed material. The study was
conducted with BaO, powder Fe2O3 and HZSM-5 (Si/Al=30) catalysts. The pyrolysis of
polymer was carried out uisng temperature ranging from 400 ºC to 550 ºC, gas velocity
from 0.3 m/s to 0.6 m/s and amount of catalyst (Fe2O3) for maximum yield of liquid
products and styrene monomer in comparison with thermal degradation. It was found that
catalysts yielded maximum liquids and styrene monomer as compared to thermal
degradation using the fluidized bed catalytic reactor. The catalytic activity of Fe₂O₃ was
found to be higher than BaO and HZSM-5 with the following descending order Fe2O3 >
BaO > HZSM-5. The amount of Fe2O3 was optimized with 5 wt.%. The amount of catalyst
using degradation temperature 450 ºC and gas velocity of 0.5 m/s.
Karmore and Madras [6] investigated Lewis acids such as AlCl3, FeCl3, BF3. O(Et)2 and
SnCl4 in the temperature ranging from 75 ºC to 125 ºC for the degradation of PS.
Continuous distribution kinetics and stoichiometry kernel for random chain scission was
used to model the evolution of molecular weight distribution (MWD). It was found that the

Literature Review
34
degradation rate was high with AlCl3 catalyst. The studies were also conducted with
varying amount of AlCl3 catalyst revealing that the rate of degradation was proportional to
the fourth power of the Lewis acid concentration. In the presence of AlCl3 catalyst, the
activation energy for the degradation of PS was found to be 7.7 Kcal/mol calculated from
the temperature dependence of the degradation rate coefficient.
Lee et al., [7] studied the degradation of waste PS for the recovery of styrene monomer and
value added products using swirling fluidized bed reactor with 5.8 cm I.D and 150 cm H
to control the residence time of feeds with the enhancement of temperature distribution
uniformity within the reactor. BaO, Fe2O3 and HZSM-5 (Si/Al=30) was used as catalysts
for maximum selective degradation of PS into styrene monomer. PS degradation was
investigated with respect to degradation temperature, reacting time, volume flow rate of
gas and the ratio of swirling gas to the amount of primary fluidizing gas. The effect of
operating variables on distribution of temperature and their variation in radial and axial
directions for the degradation of PS waste in swirling fluidized bed reactor was also
studied. It was found that with the addition of a catalyst. The reaction time and degradation
temperature decreased intensely. The cause of periodic and persistent temperature variation
was described by the mode of swirling fluidization which increased temperature
distribution uniformity by reducing the temperature gradient in the reactor. It was also
found that with the increase of swirling gas (V2/V1) the yield of liquid as well as styrene
monomer have increased, but their maximum values were achieved by increasing the
volume flow rate of gas.
Hu and Li [8] reported the pyrolysis of pure and flame-retarded PS composite with
Mg(OH)2 in off-line furnace for 10 min at 700 ºC degradation temperature. Cambridge pad
was used for collection of liquid and tar products and were analyzed both qualitatively and
quantitatively by GC-MS with significant results on flash pyrolysis of PS degradation with
Mg(OH)2. It was found that composite of PS and Mg(OH)2 does not produce new
compounds, but the quantity of resulting products was different from the that of pure PS
degradation. It was revealed that some head to head structures and condensed products
increased with the associated and prominent decrease of styrene monomer.

Literature Review
35
Rahul Kumar Balakrishnan and Chandan Guria [9] reported the pyrolysis of PS using
Fe2O3 catalyst, benzene solvent and hydrogen gas at low degradation temperature of 170
ºC to 240 ºC. The various factors affecting the degradation of PS like temperature, the
amount of catalyst and polymer in hydrogen atmosphere were investigated. The
degradation studies were also concluded at differing initial hydrogen partial pressure where
the time dependent molecular weight was calculated with viscosity average technique and
found that degradation was enhanced in the presence of hydrogen gas which followed
random chain scission degradation mechanism. Kelen- random degradation kinetic model
was used for the estimation of degradation rate constant and proposed empirical
correlations for the effect of amount of catalyst and initial hydrogen partial pressure in the
pyrolysis reaction. These proposed models were used to calculate true thermal degradation
rate constants at a given amount of catalyst and initial hydrogen partial pressure at changing
temperature. Arrhenius equation was used for the calculation of activation energy and
frequency factor considering the true thermal degradation rate constant.
Chauhan et al., [10] investigated the degradation of expanded PS into a maximum yield of
into liquid styrene monomer in a designed bench scale reactor for the recycling of styrene
and other value added hydrocarbons under oxidative (O2) environment and vacuum from
300 ºC to 500 ºC. Vacuum condition was found the best for degradation reaction with
heating temperature of 500 ºC, at these conditions 91.7 wt.% liquid products were obtained
with 85.5% of styrene. The products were characterized using distillation and IR
spectroscopy and the remaining products of degradation reactions were found to be
benzene, ethylbenzene, styrene monomer and styrene dimers.
Hussain et al., [11] developed a novel method for the degradation of PS waste using
microwave metal interaction at high temperature. The degradation may be catalyzed by the
interaction of metal and altering components of products was explained. A batch reactor
having a cylindrical mesh of iron was used in the study and it was observed that PS
degraded rapidly by heating in microwave. The temperature produced by iron mesh was
measured 1100 ºC to 1200 ºC producing 80% liquid and 15% gaseous products with small
amount of char residue (5%). The products were condensed by cooling and analyzed by
GC-MS. The results showed that the products contain styrene monomer and other aromatic

Literature Review
36
hydrocarbons i.e. polycyclic condensed ring aromatic and polycyclic aromatic as the
product of degradation. The formation of different products have also been explained.
Jin et al., [12] prepared mesoporous MCM-41 sepiolite percolation and sequent
hydrothermal preparation in NaOH solution in combination with
hexedecyltrimethylammonium bromide as template. The resulting products were
characterized by SEM, TEM and BET surface area. It was found to increase with increase
in crystallization time, ratios of surfactant to silica and decreases the Mg content increased
the pore size and crystallinity of MCM-41. The degradation of PS revealed MCM-41 with
MgO from natural sepiolite had high catalytic with good selectivity for the production of
styrene monomer using polymer to catalyst ratio 200. The side reactions of PS degradation
yield ethylbenzene, isopropylbenzene, isopropenylbenzene where side, cross linking
reactions were controlled by the basic character of the MgO in MCM-41 catalyst.
Lin and Sharratt [13] investigated catalytic degradation of pure plastics (high density
polyethylene, polypropylene, polystyrene and polyvinyl chloride) and waste plastics with
the aim to reduce net disposal cost. Acidic zeolitic catalysts (HMOR, HUSY and HZM-5),
non-zeolitic catalyst (SiO2-Al2O3) and silicalite (Si/Al) were used for the degradation
reactions in a designed fluidized bed reactor. It was observed that using catalysts in the
reactor reduce degradation temperature, enhanced aromatic products and product
distribution selectivity was also enhanced. To predict the production rates and selectivity a
kinetic/mechanistic model was presented. Product distributions have been discussed in
terms of catalyst structures, feedstock and preliminary process model.
Kim et al., [14] reported catalytic pyrolysis of mixture polypropylene (PP) and PS using
semi-batch reactor. The effect of degradation temperature and nature of catalyst was
investigated on the products. It was observed that liquid products were maximum products
of the degradation reactions mainly in the gasoline range. SiO2-Al2O3 (SA) and natural
clinoptilolite (HNZ) was found with similar catalytic activity for the degradation of plastic
mixture where HZSM-5 was marked to produce highest amount of gases. It was observed
that the amount of ethylbenzene and propylbenzene decreased by increasing pyrolysis
temperature with parallel increase of styrene monomer. Thermogravimetric analysis
revealed an interaction between PP and PS in the thermocatalytic pyrolysis.

Literature Review
37
Lee et al., [15] investigated the pyrolysis of mixture of high-density polyethylene (HDPE)
and PS with different proportions using spent FCC as catalyst in a stirred semi-batch
reactor at 400 ºC. The role of time or mixing proportion of mixing reactants were taken
into account for the determination of the rate of degradation into liquid products, aggregate
amount, distribution, the carbon number distribution, and the paraffin, naphthene, olefin
and aromatic (PONA) distribution of the resulting liquid products. The aggregated amount
distributed was found to depend on the mixing ratio of HDPE and PS, and the initial
degradation rate was ramped exponentially with PS contents while for the final degradation
rate ramped with HDPE contents. Increase in the gasoline fraction 85 wt.% to 100 wt.%
was observed with the increase of PS contents from 0 wt.% to 100 wt.%, respectively.
Liquid PONA product distribution was reported with the interaction of degraded
components of HDPE and PS. It was also observed that increasing PS components more
than 60 wt.% increased the production of aromatic components (mono-cycling) and the
selectivity toward aromatic products like ethylbenzene and styrene.
Ciliz et al., [16] investigated slow degradation of pure polypropylene (PP) and in mixture
with polyethylene (PE) and PS under identical conditions. The impact of waste on products
composition as well as different mixing ratios were investigated. They also conducted
thermogravimetric analysis of the plastics and because of impurities found differences from
the weight loss curves for the derivatives of pure PP and waste PP were observed. The
distribution of liquid yield regarding aliphatic, mono-aromatic and poly-aromatic
compounds varied with an increase in the ratio of PP in mixture. The variation of
alkene/alkane ratio of gas products with a mixing ratio of waste was also explained.
Miskolczi et al., [17] reported thermocatalytic degradation technique of plastics into liquid
hydrocarbon. Degradation of waste plastic mixture of polyethylene (PE) and PS was
carried out in batch reactor over equilibrium FCC, ZSM-5 and natural clinoptilolite zeolite
(HNZ) catalysts. The mixture of PE and PS was degraded from 410 ºC to 450 ºC
temperatures. The effect of catalyst and their average particle size have been investigated
on the yield of major degradation products i.e. gasoline, diesel oil and gases. Equilibrium
FCC and HNZ catalysts were founded with good catalytic activity to produce low
molecular weight hydrocarbons and ZSM-5 was found to yield the highest amount of

Literature Review
38
gaseous products. Gas chromatography was used for the characterization of resulting liquid
and gas products. The hydrocarbon distribution was broad from C5 to C28 carbon number
range depending upon degradation parameters. The degradation of polyethylene yielded
linear, non-branched compounds and the degradation of PS yielded benzene, toluene,
ethylbenzene and styrene like aromatic products. It was observed that with the increase in
pyrolysis temperature the concentration of volatile products increased, whereas the yield
of unsaturated component decreased. Infrared technique was used for the measurement of
olefin contents which was reported from 50% to 60%. On the basis of volatile products
composition, activation energies were calculated to be decreased. Carbon-chain and double
bond isomerization were reported due to catalyst.
Lee [18] used spent FCC catalyst because of its environmental favored and economical
aspect for thermocatalytic degradation of HDPE and PS mixture. The effect of reaction
time and the ratio of HDPE and PS mixture was investigated for liquid products and their
aromatic product distribution in comparative studies. It was found that light hydrocarbons
in the gasoline range were the major products in initial reaction time where the yield of
aromatics like ethylbenzene and styrene monomer were dependent on reaction time and
the ratio of HDPE and PS in mixture. The results revealed C9 to C12 alkylaromatic product
distribution as by-products where methylstyrene (C1-styrene) and isopropylbenzene (C3-
benzene) were the major products formed by β-scission mechanism and hydrogen transfer
mechanism. Other alkylaromatics were found in the range of 1% or less.
Murata et al., [19] degraded polyethylene (PE), polypropylene (PP) and PS in a mixture
with 1-2 wt.% polyvinylchloride (PVC) in a continuous flow reactor using a feed rate of
0-1.5 Kg/h under atmospheric pressure. The degradation was carried out in a temperature
range of 360 ºC to 440 ºC depending on the nature of feed material. The degradation
behavior and the resulting product and its properties were studied and explained as a
function of amount of PVC, degradation temperature and SiO2-Al2O3 catalyst. The study
was conducted for binary mixtures of PE/PVC, PP/PVC and PS/PVC as well as a complex
mixture of PE/PP/PS/PV and an interaction was found between PVC and each polyolefin.
It was observed that SiO2-Al2O3 catalyst decreased the concentration of Chloride contents

Literature Review
39
in liquid products but produces high amounts of organo-chlorine compounds in gaseous
products.
Huang et al., [20] reported the pyrolysis of polymer waste (LDPE/HDPE/PP/PS) of
hospital i.e. low-density polyethylene (LDPE), high-density polyethylene (HDPE),
polypropylene (PP) and PS. The degradation was carried out in isothermal fluidized-bed
reactor at ambient pressure over a different catalyst both zeolitic and non-zeolitic catalysts.
It was observed that zeolitic catalysts yielded a higher amount of volatile hydrocarbons
than non-zeolitic catalysts. The order of zeolitic catalysts in term of activity is ZSM-5 >
MOR > USY and non-zeolitic catalysts MCM-41 > ASA. A wide carbon number
distribution olefinic product mixture was yielded with MCM-41 because of large
mesopores. Catalyst ASA has weaker acidic sites on the other hand lead to the formation
of larger amount of saturated product mixture with wide carbon number distribution while
coke was produced using USY catalyst. The result of the study indicated the uses of catalyst
lead to better activity and increasing product selectivity. Based on kinetic and mechanistic
consideration a novel model was developed to investigate chemical reactions and
deactivation of catalysts for the degradation of mixture of polymer waste. The model
represented benefits of product selectivity like alkane, alkenes, aromatics and coke in
relation with nature and particle size of the catalyst.
Hussain et al., [21] reported co-degradation of PS and coal using microwave copper
interaction producing high temperature where copper antenna acts as catalyst too. It was
found that the degradation was occurring with the combine action of microwave
interaction, high temperature and the active species produced during degradation reactions.
The microwave metal interaction rapidly degraded the mixture giving 66%, 6% and 18%
liquids, gases and residue, respectively. It was observed that 10% of the liquids was
composed of sulfides where the GC-MS analysis of products reveal that it contain major
aromatic products in narrow ranges.
Kim et al., [22] investigated the degradation of waste expanded PS (WEPS) with low
temperature over modified Fe-base catalyst. It was found that the increase of degradation
temperature and Fe-based catalysts increased the yield of liquids and styrene monomer.
The selectivity toward styrene monomer was credited to carboanions. The degradation of

Literature Review
40
WEPS lead to the formation of 92.2 wt.% liquid products and 65.8 wt.% styrene monomer
at 400 ºC using Fe-K/Al2O3 catalyst. The activation energies calculated for thermal and
catalytic degradation are 194 KJ/mol and 138 KJ/mol, respectively.
Chumbhale et al., [23] reported the degradation of expanded PS waste (EPSW) over
modified mordenite zeolites. EPSW were degraded in a temperature range of 360 to 400
ºC using batch reactor. The study was aimed to understand the role of H-mordenite catalyst
followed by the effect of its modification weather through metal impregnation or
dealumination. It was found that dealuminated mordenite with silica-alumina ratio of 86
increased the styrene to styrene dimer molar ratios at 360 ºC and styrene to ethylbenzene
molar ratio at 400 ºC because of acidic strength generation. The metal impregnation of H-
mordenite with phosphorous loadings alter the acidic and catalytic properties of EPSW
degradation and improved the yield of styrene monomer with higher selectivity than
thermal degradation.
Tae et al., [24] reported the catalytic cracking of PS over acid-treated halloysite catalysts
using a semi-batch reactor. The cracking reactions of PS were carried out in the temperature
range of 400 to 450 ºC. Experiments were conducted to find out the effect of acidity of
catalyst, degradation temperature and reaction time on the yield of aromatic products. It
was found that acid-treated halloysite catalysts have higher catalytic activity and good
selectivity towards aromatic compounds. Increase in contact time and surface acidity
increased the production of ethylbenzene where increasing temperature enhanced the yield
of styrene.
Chumbhale et al., [25] investigated the degradation of expanded polystyrene waste (EPSW)
over HY and modified HY zeolites. HY zeolites were dealuminated by controlled steaming
with the application of heat. The study compared and discussed the yield of liquids, gases
and residues as well as boiling point distribution of liquid products with thermal
degradation without the use of any catalyst. It was found that the presence of HY catalyst
enhanced liquid product and decreased gases and residue while HY-700 catalyst showed
an enhancement in styrene monomer/styrene dimer as compared to the thermal
degradation. A correlation was also established between Al (nf/f), acidity (B/L) and styrene
monomer/styrene dimer (mole ratio).

Literature Review
41
Xie et al., [26] studied the degradation of polystyrene (PS) using impregnated catalyst.
Molecular sieve impregnated catalyst K2O/Si-MCM-41 was prepared by saturating Si-
MCM-41 with KNO3 and was characterized by N2 adsorption/desorption, FTIR, XRD and
TEM. It was observed from the results that K2O/Si-MCM-41 was mesoporous where K2O
decreased the long range order of the catalyst while KNO3 decomposed completely to K2O
at 600 ºC. Effect of K2O percentage, degradation temperature, catalyst to polymer ratio and
reaction time were investigated. The activity of the catalyst was determined for the
degradation of PS in comparison with CaO, Si-MCM-41 and Al-MCM-41 catalysts. The
results show that 9% K2O, 400 ºC temperature, 0.02 catalyst to polymer ratio and 30 min
heating time yielded 85.67% liquids with 69.02% styrene monomer.
Marczewski et al., [27]investigated acidic and basic catalysts for the degradation of PS, for
conversion into selective products. Treated SiO2-Al2O3 (45%) with 1-20 wt.% NaOH and
treated γ-Al2O3 with 1-8 wt.% NaOH or H2SO4 were initially tested for cumene and
diacetone degradation and then for PS degradation. It was found that thermal
transformation consists of gradual depolymerization to styrene monomer and further
cracking lead to the formation of dimers, trimmers or other oligomers where catalytic
transformation includes the conversion of oligomers. Toluene, ethylbenzene, styrene, α-
methylstyrene was formed also by the cracking linear styrene dimers activated by Brønsted
acid sites with simultaneous production of hydrogen (H+ and H‾) and coke where the
hydrogenation of styrene produced ethylbenzene. Acidic catalysts were found isomerize
linear dimers into cyclic products, followed by dealkylation leads to benzene and
methylindane, the later produces methylindene and naphthalene by isomerization and
hydrogen transfer reactions.

Literature Review
42
References
[1] D. P. Serrano, J. Aguado, J. M. Escola, Catalytic conversion of polystyrene over
HMCM-41, HZSM-5 and amorphous SiO2–Al2O3: comparison with thermal
cracking, Applied Catalysis B: Environmental 25 (2–3) 181-189 (2000).
[2] H. Ukei, T. Hirose, S. Horikawa, Y. Takai, M. Taka, N. Azuma, A. Ueno, Catalytic
degradation of polystyrene into styrene and a design of recyclable polystyrene with
dispersed catalysts, Catalysis Today 62 (1) 67-75 (2000).
[3] S. Y. Lee, J. H. Yoon, J. R. Kim, D. W. Park, Catalytic degradation of polystyrene
over natural clinoptilolite zeolite, Polymer Degradation and Stability 74 (2) 297-
305 (2001).
[4] S.-Y. Lee, J.-H. Yoon, J.-R. Kim, D.-W. Park, Degradation of polystyrene using
clinoptilolite catalysts, Journal of Analytical and Applied Pyrolysis 64 (1) 71-83
(2002).
[5] C. G. Lee, J. S. Kim, P. S. Song, Y. J. Cho, Y. Kang, M. J. Choi, Effects of catalyst
on the pyrolysis of polystyrene wastes in a fluidized bed catalytic reactor, Hwahak
Konghak 40 (4) 445-449 (2002).
[6] V. Karmore, G. Madras, Thermal degradation of polystyrene by Lewis acids in
solution, Industrial & Engineering Chemistry Research 41 (4) 657-660 (2002).
[7] C.-G. Lee, Y.-J. Cho, P.-S. Song, Y. Kang, J.-S. Kim, M.-J. Choi, Effects of
temperature distribution on the catalytic pyrolysis of polystyrene waste in a swirling
fluidized-bed reactor, Catalysis Today 79–80 (0) 453-464 (2003).
[8] Y. Hu, S. Li, The effects of magnesium hydroxide on flash pyrolysis of polystyrene,
Journal of Analytical and Applied Pyrolysis 78 (1) 32-39 (2007).
[9] R. K. Balakrishnan, C. Guria, Thermal degradation of polystyrene in the presence
of hydrogen by catalyst in solution, Polymer Degradation and Stability 92 (8) 1583-
1591 (2007).

Literature Review
43
[10] R. S. Chauhan, S. Gopinath, P. Razdan, C. Delattre, G. S. Nirmala, R. Natarajan,
Thermal decomposition of expanded polystyrene in a pebble bed reactor to get
higher liquid fraction yield at low temperatures, Waste Management 28 (11) 2140-
2145 (2008).
[11] Z. Hussain, K. M. Khan, K. Hussain, Microwave-metal interaction pyrolysis of
polystyrene, Journal of Analytical and Applied Pyrolysis 89 (1) 39-43 (2010).
[12] S. Jin, K. Cui, H. Guan, M. Yang, L. Liu, C. Lan, Preparation of mesoporous MCM-
41 from natural sepiolite and its catalytic activity of cracking waste polystyrene
plastics, Applied Clay Science 56 (0) 1-6 (2012).
[13] Y.-H. Lin, P. N. Sharratt, Conversion of waste plastics to hydrocarbons by catalytic
zeolited pyrolysis, Journal of the Chinese Institute of Environmental Engineering
10 (4) 271-277 (2000).
[14] J.-R. Kim, J.-H. Yoon, D.-W. Park, Catalytic recycling of the mixture of
polypropylene and polystyrene, Polymer Degradation and Stability 76 (1) 61-67
(2002).
[15] K.-H. Lee, D.-H. Shin, Y.-H. Seo, Liquid-phase catalytic degradation of mixtures
of waste high-density polyethylene and polystyrene over spent FCC catalyst. Effect
of mixing proportions of reactants, Polymer Degradation and Stability 84 (1) 123-
127 (2004).
[16] N. Kiran Ciliz, E. Ekinci, C. E. Snape, Pyrolysis of virgin and waste polypropylene
and its mixtures with waste polyethylene and polystyrene, Waste Management 24
(2) 173-181 (2004).
[17] N. Miskolczi, L. Bartha, G. Deák, Thermal degradation of polyethylene and
polystyrene from the packaging industry over different catalysts into fuel-like feed
stocks, Polymer Degradation and Stability 91 (3) 517-526 (2006).

Literature Review
44
[18] K. H. Lee, Composition of aromatic products in the catalytic degradation of the
mixture of waste polystyrene and high-density polyethylene using spent FCC
catalyst, Polymer Degradation and Stability 93 (7) 1284-1289 (2008).
[19] K. Murata, M. Brebu, Y. Sakata, The effect of PVC on thermal and catalytic
degradation of polyethylene, polypropylene and polystyrene by a continuous flow
reactor, Journal of Analytical and Applied Pyrolysis 86 (1) 33-38 (2009).
[20] W.-C. Huang, M.-S. Huang, C.-F. Huang, C.-C. Chen, K.-L. Ou, Thermochemical
conversion of polymer wastes into hydrocarbon fuels over various fluidizing
cracking catalysts, Fuel 89 (9) 2305-2316 (2010).
[21] Z. Hussain, K. M. Khan, N. Basheer, K. Hussain, Co-liquefaction of Makarwal coal
and waste polystyrene by microwave–metal interaction pyrolysis in copper coil
reactor, Journal of Analytical and Applied Pyrolysis 90 (1) 53-55 (2011).
[22] J.-S. Kim, W.-Y. Lee, S.-B. Lee, S.-B. Kim, M.-J. Choi, Degradation of polystyrene
waste over base promoted Fe catalysts, Catalysis Today 87 (1–4) 59-68 (2003).
[23] V. R. Chumbhale, J. S. Kim, S. B. Lee, M. J. Choi, Catalytic degradation of
expandable polystyrene waste (EPSW) over mordenite and modified mordenites,
Journal of Molecular Catalysis A: Chemical 222 (1–2) 133-141 (2004).
[24] J.-W. Tae, B.-S. Jang, J.-R. Kim, I. Kim, D.-W. Park, Catalytic degradation of
polystyrene using acid-treated halloysite clays, Solid State Ionics 172 (1–4) 129-
133 (2004).
[25] V. R. Chumbhale, J. S. Kim, W. Y. Lee, S. H. Song, S. B. Lee, M. J. Choi, Catalytic
degradation of expandable polystyrene waste (EPSW) over HY and modified HY
zeolites, Journal of Industrial and Engineering Chemistry 11 (2) 253-260 (2005).
[26] C. Xie, F. Liu, S. Yu, F. Xie, L. Li, S. Zhang, J. Yang, Study on catalytic pyrolysis
of polystyrene over base modified silicon mesoporous molecular sieve, Catalysis
Communications 9 (6) 1132-1136 (2008).

Literature Review
45
[27] M. Marczewski, E. Kamińska, H. Marczewska, M. Godek, G. Rokicki, J.
Sokołowski, Catalytic decomposition of polystyrene. The role of acid and basic
active centers, Applied Catalysis B: Environmental 129 (0) 236-246 (2013).

EXPERIMENTAL

Experimental
46
3.1. Catalyst Preparation
i. Materials
Powder of Mg, MgCl2. 6H2O, ZnO, ZnCl2, Al, Al2O3, AlCl3. 6H2O, CuCl₂.
2H2O, MgO, MgCO₃, CuO, Fe₂O₃ and FeCl₃. 6H2O, granular Zn and metal
turnings of Cu and Fe were used.
ii. Catalyst preparation
The catalytic degradation of polystyrene (PS) was followed by two types of
catalysts i.e. bulk catalysts and impregnated catalysts. The bulk catalysts like
Mg, MgO, MgCO₃, Zn, ZnO, ZnCl₂, Al, Al₂O₃, AlCl₃ 6H2O, Cu, CuO, CuCl₂
2H2O, Fe, Fe₂O₃ and FeCl₃. 6H2O were grounded with the help of pestle and
mortar and screened to uniform size followed by drying in an oven at 120 ºC for
3 h.
A series of impregnated catalyst were prepared using the wet impregnation
method. Five different active central metals i.e. Mg, Zn, Al, Cu and Fe in the
form of their chloride salts were impregnated over three different supporting
materials i.e. alumina (Al₂O₃), montmorillonite clay (Mmn) and activated
charcoal (AC). The salts of Mg, Zn, Al, Cu and Fe was calculated 5%, 10%,
15%, 20% and 25% on the basis of metal weight for a known weight of support
i.e. for 5 g of each support the weight of Mg, Zn, Al, Cu and Fe are given in
table 1. The precursor metal salts were dissolved in appropriate amount of water
and were added to the slurry of supporting material. The mixture was stirred at
60 ºC for 1 h followed by drying in oven at 110 ºC for 6 h. The sample was
calcined at 300 ºC for 4 h and then brought to mesh size <445 µm.

Experimental
47
Table 3.1 Percentage (%) of active metal and their calculated weight
impregnated over 5 g of each support (Al2O3, Mmn and AC).
Percentage
(%)
Weight of metal loading (g)
Mg Zn Al Cu Fe
05 2.092 0.525 2.235 0.671 1.210
10 4.185 1.050 4.470 1.342 2.421
15 6.280 1.575 6.705 2.013 3.631
20 8.370 2.100 8.940 2.684 4.841
25 10.463 2.625 11.175 3.355 6.100
3.2. Characterization of catalysts
The prepared impregnated catalysts were characterized using N2 adsorption/desorption,
scanning electron microscopy (SEM) and X-ray diffraction (XRD).
3.2.1 Surface area, pore volume and pore size analysis
The surface area, pore volume and pore size of impregnated catalysts and supports was
determined using a Surface Area Analyzer “NOVA2200e Quantachrome, USA” using
nitrogen adsorption/desorption at 77.4 K. The surface area was determined using Brunauer-
Emmett-Teller (BET) method and Barrett-Joyner-Halenda (BJH) method, while the pore
volume and pore size were also measured by the BJH method. Prior to analysis the samples
were outgassed for 2 h at 100 ºC in vacuum to remove all adsorbed moisture from the
catalyst surface and pores and subjected to analysis.
3.2.2. SEM analysis
The surface morphology and particle size of the supports i.e. Al2O3, Mmn and AC before
and after impregnation were evaluated by 30 KV Scanning Electron Microscope (SEM)
(JSM5910, JEOL, Japan). The samples were prepared using conventional methods, the
powdered samples were mounted on standard specimen stubs with double adhesive carbon
tape.
Experimental
48
3.2.3. XRD analysis
X-ray diffraction (XRD) patterns were taken using a JDX-3532 JEOL (Japan) diffractmeter
with monochromatic Cu-Kα radiation (λ=1.5418Å) at 40 KV and 30 mA in the 2θ range
of 10-80⁰ with 1.03⁰ per minute.
3.3. Thermogravimetric analysis (TGA)
3.3.1. TGA of waste expanded polystyrene (WEPS)
i. Instrument
Perkin – Elmer TG/DTA Diamond series (USA)
ii. Material
Waste expanded polystyrene samples
iii. Procedure
Perkin-Elmer TG/DTA Diamond Series (USA) instrument was used for thermogravimetric
analysis of the WEPS sample, pieces of WEPS sample (7 Mg) was heated with the increase
of temperature from 40 °C to a final temperature 1000 °C at a rate of 10 °C/min. The
temperature of the sample was measured with a thermocouple attached directly at the
crucible very close to the sample. The weight loss verses temperature curve for thermal
decomposition of WEPS under a linear heating rate of oxidative (O2) and inert (N2)
atmosphere was recorded.
3.3.2. TGA of polystyrene (PS) and polyethylene terephthalate (PET)
iv. Instrument
Rigaku TAS 100 Data Station
v. Material
Virgin polystyrene (PS) and polyethylene terephthalate

Experimental
49
vi. Procedure
PS and PET samples were monitored by Thermogravimetric Analyzer (TGA) using Rigaku
TAS 100 Data Station. Approximately, 10 mg samples were heated. The temperature was
maintained for 10 min at ambient temperature (30 ºC) and then linearly increased from 30
ºC to 1000 ºC at the rate of 10 ºC/min in a nitrogen (N₂) flow rate of 20 ml/min.
3.4. Thermal and catalytic degradation of polymer samples
The flow process thermal and catalytic degradation of WEPS is given in Fig. 3.1.
Figure 3.1 Process flow for the degradation of waste expanded polystyrene.

Experimental
50
3.4.1. Thermal and catalytic degradation of WEPS
4.4.1.1. Reactor assembly
WEPS degradation studies were carried out using self-designed Pyrex glass reactor with
internal diameter 7 cm, height 22 cm and wall thickness 2.4 mm having a quick fit led,
inserted in an indigenously designed vertical heating furnace fitted with digital temperature
controller and attached thermocouple located in the center of furnace that can operate up
to 1000 ºC. The basic component of the reactor was fitted in steel assembly with power
on/off button. The outlet of the Pyrex glass reactor was connected with condenser and a
supply line of cold water. Cold traps was connected to the assembly for liquid product
collection as well as a sidewise outlet for gas collection. Schematic flow sheet diagram of
the assembly is given in Fig. 3.2.
1
49
7
6
8
1. Reactor2. Air tight lid3. Feed material + catalyst4. Electric furnace5. Temperature controller6. Water condenser7. Liquid products receiver8. Gas collection cylinder9. Ice cold trap
3
2
0450 ºC
ON
OFF
5
Figure 3.2 Schematic flow sheet diagram of the reaction assembly used for WEPS
degradation

Experimental
51
3.4.1.2. WEPS sample preparation
i. Instrument
Oven
ii. Materials
WEPS samples
iii. Procedure
WEPS samples were collected from refrigeration industry used for packing of
refrigerators and freezers; WEPS beads are manufactured with an average
molecular weight between (Mw) 160,000 and 260,000 g/mol. WEPS slabs and
large pieces were chopped into small granules and heated at 150 ºC for 20 min
to reduce its volume 20 times.
3.4.1.3. WEPS degradation
WEPS samples were degraded using thermal and thermocatalytic degradation.
Thermocatalytic degradation was carried out using two types of catalyst i.e.
simple and impregnated catalysts. The WEPS were degraded with metals and
their salts as a catalyst in a first step and then were degraded with impregnated
catalysts. Weighted sample of WEPS was taken in the center of the Pyrex glass
reactor without the use of any catalyst while in thermocatalytic degradation
WEPS in a mixture with corresponding amount of catalyst was loaded into the
reactor, a solid-solid blend without the use of any solvent and other chemicals.
For optimum reaction conditions of WEPS 5 g sample (each) was taken. The
effect of degradation temperature (250 ºC to 500 ºC) for constant reaction time
and polymer to catalyst ratio was investigated. For the effect of reaction time the
WEPS samples were degraded from 30 min to 150 min reaction time keeping
constant optimum temperature and polymer to catalyst ratio. In the last step for
the effect of polymer to catalyst ratio (only in thermocatalytic degradation)
WEPS sample in a mixture with corresponding catalyst from 1:0.1 to 1:0.5

Experimental
52
polymer to catalyst keeping optimum degradation temperature and optimum
reaction time was investigated. In impregnated catalysts, the percentage of
precursor active metal center with respect to its supporting material were
optimized from 5% to 25% using optimized condition for respective simple
metal catalyst. The reaction products were cooled by the condenser and liquid
product were collected in attached bottle. All experiments were carried out using
triplicate analysis, the results of the experiments are consistent and within the
statistical acceptable range. The degradation of WEPS products obtained were
liquids, gases and residues (the carbonaceous compounds stuck to the reactor
wall). The yield of liquids, gases and residue were reported in weight percent
(wt.%) of WEPS sample employed.
For wt.% and material balance calculations the following formula were used
given in Eqs. 3.1-3.3:
𝐿𝑖𝑞𝑢𝑖𝑑 𝑦𝑖𝑒𝑙𝑑 (𝑤𝑡. %) = 𝑊𝑡. 𝑜𝑓 𝐿𝑖𝑞𝑢𝑖𝑑 𝑜𝑏𝑡𝑎𝑖𝑛𝑒𝑑
𝑊𝑡. 𝑜𝑓 𝐹𝑒𝑒𝑑 × 100 3.1
𝐺𝑎𝑠 𝑦𝑖𝑒𝑙𝑑(𝑤𝑡. %) = 𝑊𝑡. 𝑜𝑓 𝐹𝑒𝑒𝑑−(𝑊𝑡. 𝑜𝑓 𝐿𝑖𝑞𝑢𝑖𝑑 + 𝑊𝑡. 𝑜𝑓 𝑅𝑒𝑠𝑖𝑑𝑢𝑒)
𝑊𝑡. 𝑜𝑓 𝐹𝑒𝑒𝑑 × 100 3.2
𝑇𝑜𝑡𝑎𝑙 𝑐𝑜𝑛𝑣𝑒𝑟𝑠𝑖𝑜𝑛 (𝑤𝑡. %) = (𝑊𝑡.𝑜𝑓 𝐹𝑒𝑒𝑑−𝑊𝑡.𝑜𝑓 𝑅𝑒𝑠𝑖𝑑𝑢𝑒)
𝑊𝑡.𝑜𝑓 𝐹𝑒𝑒𝑑 × 100 3.3
3.4.1.4. Liquid products collection in bulk
Liquid product was collected in bulk from the degradation of thermal and thermocatalytic
degradation experiments. WEPS sample (100 g) was degraded in each experiment in a
mixture using optimized parameters, and the liquid products were collected in a 500 mL
capacity flask.

Experimental
53
3.4.1.5. Fractional distillation
i. Instrument
The liquid product derived in bulk both of thermal and thermocatalytic degradation
reactions were subjected for fractional distillation. The same heating assembly was used in
fractional distillation as for degradation experiments. For fractional distillation, a Pyrex
glass tube was designed having internal diameter 7 cm, height 22 cm and wall thickness
2.4 mm with an outlet with thermometer as shown in Fig. 3.2. The fractionating outlet was
attached to condenser for collection of separated products.
ii. Procedure
The liquid products obtained with both thermal and thermocatalytic degradation (simple
and impregnated catalyst) were subjected to fractional distillation for the separation of
compounds. Liquid product (300 mL) was taken in the Pyrex glass tube and inserted in the
vertical furnace of the heating assembly, quick fitted with fractionating column, equipped
with a thermometer and condenser as shown in Fig. 3.3. The assembly was heated with a
rate of 10 ºC/min, the liquid components were vaporized according to their boiling point,
and the fractionating column separated liquids accordingly. The temperature of the
attached thermometer was observed continuously for the collection of different fractions
reaching at different temperatures. The liquid products collected were in the range of 80
ºC to 300 ºC.

Experimental
54
1
3
9
8
7
10
1. Reactor2. Feed material + catalyst3. Electric furnace4. Temperature controller5. Fractionating column6. Thermometer7. Water condenser8. Liquid products receiver9. Gas collection cylinder10. Ice cold trap
20450 ºC
ON
OFF
4
5
6
Figure 3.3 Schematic flow sheet diagram of fractional distillation assembly
3.4.2. Thermal and catalytic degradation of polystyrene (PS) and polyethylene
terephthalate (PET)
4.4.2.1. Reactor assembly
The degradation experiments were carried out in a quartz tube reactor having height 30 cm
and internal diameter 2.5 cm with steel fittings led with immersed thermocouple. The tube
reactor was set in a furnace operated at ambient conditions and temperature was controlled
by a digital temperature controller. The outlet of the quartz reactor was connected with
Schlenk-type Liebig condenser and a supply line of cold water, the condenser was
connected with round bottom flask receiver with the help of an adapter which also have
outlet for gas collection. The schematic of the experimental setup is shown in Fig. 3.4.

Experimental
55
1
48
6
5
7
1. Reactor2. Air tight lid3. Feed material + catalyst4. Electric furnace5. Water condenser6. Liquid products receiver7. Gas collection cylinder8. Ice cold trap
3
2
Figure 3.4 Schematic flow sheet diagram of the reaction assembly used for PS and PET
degradation
3.4.2.2. PS and PET sample preparation
i. Materials
Virgin polystyrene (PS) and polyethylene terephthalate samples
ii. Procedure
Virgin polystyrene (PS) were purchased from Sigma-Aldrich and Polyethylene
terephthalate (PET) was supplied by DuPont Teijin film with average molecular
weights (MW) ~192,000 and ~24,900, respectively. The compositions of PET
and PS were used in the mixture as feed material were denoted as xPET+PS,
where x represents the wt.% of PET with respect to PS. Three different varieties
of PET and PS were prepared and studied are: 10PET+PS, 20PET+PS and
30PET+PS.

Experimental
56
3.4.2.3. PS and PET degradation
The PS and PET samples were also degraded using thermal and thermocatalytic
degradation like the degradation of WEPS. For thermocatalytic degradation of PS and PET
mixture only 20% Al-Al₂O₃ catalysts was used. Known amount of sample (5 g) was loaded
into the reactor with a specified amount of catalyst in mixture with the feed material. The
reactor was heated to a desired temperature at 25 ºC/min rate for the rest of analysis and
the final temperature was held constant for specified durations of time. Like the
degradation of WEPS, the mixture of PS and PET was also optimized with the effect of
degradation temperature (250-500 ºC), reaction time (20-90 min) and polymer to catalysts
ratio (1:0.05-1:0.3). For the collection of products the same procedure was used as used for
WEPS and the yield was calculated according to equation 1-3 of section 3.4.1.3.
3.5. Isolated liquid products characterization
The WEPS degraded parent liquid product and fractionated products obtained both from
thermal and thermocatalytic degradation (i.e. with simple catalysts and impregnated
catalysts) were characterized using physiochemical tests and GC-MS analysis.
3.5.1. Physiochemical properties
3.5.1.1. Determination of density (d)
i. Instrument
Specific gravity bottle
ii. Materials
The parent liquid product obtained with thermal and thermocatalytic degradation and their
fractions obtained at a different temperature from the fractional distillation.
iii. Procedure
Density of both parent liquid products and fractionates was measured by standard method
using a pycnometer. For this first empty pycnometer was weighted followed by filling a
pycnometer with liquid products at 20 ºC. The following relation of Eq. 3.4 was used to
calculate the density of the liquid products.

Experimental
57
Density (d) =mass
volume 3.4
3.5.1.2. Measurement of Refractive index (η)
i. Instrument
Abbe’s Refractometer (ATAGO DTM-1 Japan)
ii. Procedure
The refractive index of the liquid product samples was measured at 20 ºC. For this purpose,
the sample holder or prism of the Refractometer was cleaned with acetone damped cotton
piece before measurement. After drying the instrument was calibrated with distilled water
by putting 2-3 drops of distilled water on the prism box and fixed the above prism on lower
prism in such a way that no air bubbles were left. Mirror position was adjusted for
maximum illumination and fine adjustment knob was used to focus the field front in such
a way that dark and bright half circles were touching each other in the center clearly. Using
other eye piece the reading was taken up to four decimal points. The refractive index (𝛈𝑫𝟐𝟎)
for water is 1.3330. The same procedure was repeated for parent liquid products and
fractions obtained by fractional distillation. Using refractive index (𝛈𝑫𝟐𝟎), density (d) and
molecular weight of the component compound, the specific refraction (r) and molar
refraction of the liquid products were calculated using the following Eqs. 3.5 and 3.6:
Specific Refraction (γ):
γ =(η2−1)
(η2+2)⋅
1
d 3.5
Molar Refraction (γM)
γM =(η2−1)
(η2+2)⋅
M
d 3.6

Experimental
58
3.5.1.3. GC-MS analysis
i. Instrument
GC-MS Shimadzu QP2010 Plus was used for both thermal and thermo-catalytically
derived liquid products, and their fractions obtained by fractional distillation. The
instrument has a stationary phase of 95% dimethylpolysiloxane with 5% polyphenyl fitted
with a DB-5MS (J&W Scientific) fused silica capillary column (30 m × 0.25 mm ID, 0.25
μm film thickness). 99.99% helium (He) was used as a carrier gas.
ii. Materials
Acetone, thermally and catalytically derived liquid products, and their fractions obtained
by fractional distillation at different temperatures.
iii. Procedure
A known amount (0.2 µL) of both parent liquid products and fractions obtained at different
temperatures were dissolved in 5 mL of acetone. The samples were taken in sample vials
and were placed in automatic sample analyzer of GC-MS. The volume of injection was 1
µL with injector temperature maintained at 300 ºC. The injector port was provided with
split mode 1:50. He flow rate was 1.5 mL/min. The oven temperature programing was as
follows; the oven was held at 35 ºC for 5 min, then increased to 100 ºC at the rate of 5
ºC/min, held for 1 min at 100 ºC then the temperature was increased to 150 ºC at the rate
of 10 ºC/min, held for 10 min at 150 ºC and then the temperature was increased to 290 ºC
at 2.5 ºC/min which was held for 10 min at 290 ºC. The mass ionization energy was 35 eV.
The ion source temperatures were 280 ºC and the interface temperature was 290 ºC. The
GC-MS chromatograms were obtained for all the samples, each peak in the chromatogram
was searched in digital updated library only those peaks were attributed name which have
matching more than 90% and the whole peaks were interpreted for a given sample. The
quantitative analysis of each identified component was done by the peak area normalization
method (calculation based on the peak area) and were expressed in terms of wt.% of WEPS
sample degraded. All the samples were analyzed by this procedure.

RESULTS & DISCUSSION

Results and Discussion
59
Section 1
Characterization of impregnated catalysts
4.1. Metals impregnated catalysts over alumina (Al₂O₃)
i. Surface area, pore size and pore volume analysis
BET and BJH surface area, BJH pore size and pore volume of the Al₂O₃ support and its
impregnated catalysts were determined, and the results are presented in Table 4.1. The
surface area of the impregnated catalysts as compared to Al₂O₃ support had increased. The
order of BET surface area for impregnated catalysts was 05% Fe-Al₂O₃ > 20% Zn-Al₂O₃
> 20% Cu-Al₂O₃ > 15% Mg-Al₂O₃ > 20% Al-Al₂O₃ > Al₂O₃.
Table 4.1 Surface area, pore size and pore volume analysis of impregnated catalysts
over Al₂O₃ support
Catalysts Al₂O₃ 15% Mg-
Al₂O₃
20% Zn-
Al₂O₃
20% Al-
Al₂O₃
20% Cu-
Al₂O₃
05% Fe-
Al₂O₃
BET surface area
( m2/g) 68.31 72.62 77.38 70.16 73.99 109.12
BJH surface area
( m2/g) 137.14 162.75 120.56 67.68 153.02 400.53
Pore volume (cc/g) 0.38 0.33 0.20 0.10 0.51 1.22
Pore size (Å) 119.91 100.45 103.12 79.30 133.78 121.38

Results and Discussion
60
ii. SEM analysis
SEM analysis was performed in order to study the morphology of the impregnated catalysts
prepared with maximum catalytic activity and its comparison to Al₂O₃ support. Fig.
4.1.1(a) shows the morphology of Al₂O₃ support, the micrograph of the sample depicts
oval discs particles, the particles are with smooth evident edges looks like flattened beans
having a relative particle size of 2-3 µm. Fig. 4.1.1(b) represent the morphology of 15%
Mg-Al₂O₃ catalyst. The SEM photograph of 15% Mg-Al₂O₃ clearly shows changes in the
morphology of support, the catalyst has a large particle size with rough surface, large
cracks and pores opening paths to the active metal centers (i.e., Mg) through micropores.
Where in the case of 20% Zn-Al₂O₃ shown in Fig. 4.1.1(c), the micrograph shows slabs of
the catalyst with varying shape and size ranging from 1 µm to 6 µm. Fig. 4.1.1(d) depicts
20% Al-Al₂O₃ which exhibiting rough surface with evident macro and micro cracks, the
micro cracks are formed due to accumulation of nano-crystalline structures with crystal
size 300-500 nm. In contrast, the Fig. 4.1.1(e) of 20% Cu-Al₂O₃ shows irregular shape and
rough surface. The particles are bright, clear with white shape, confirming the presence of
Cu loadings. The catalyst has particle size 2-5 µm in separated aggregation throughout the
micrograph with adequate dispersion of Cu on Al₂O₃ aggregation providing more reaction
site for the degradation reaction. The last micrograph in Fig. 4.1.1(f) represents 5% Fe-
Al₂O₃ catalyst with large particles, each particle is 5-13 µm in size with dense black
structure and evident emerging bodies.

Results and Discussion
61
Figure 4.1.1 SEM micrograph of (a) Al₂O₃ support, (b) 15% Mg-Al₂O₃, (c) 20% Zn-
Al₂O₃, (d) 20% Al-Al₂O₃, (e) 20% Cu-Al₂O₃ and (f) 5% Fe-Al₂O₃

Results and Discussion
62
iii. XRD analysis
The XRD diffraction patterns of both supports and impregnated catalysts were taken. It can
be seen from Fig. 4.1.2 that the composition of Al₂O₃ has changed after impregnation of
precursor active metals.
The diffraction patterns in Fig. 4.1.2(a) indicate that all the major peaks of Al₂O₃ at 25.5⁰,
35.2⁰, 37.8⁰, 43.5⁰, 52.2⁰, 61.4⁰, 66.7⁰, 76.9⁰ and 77.2⁰ of 2θ (ICDD Card No. 46212 and
520803). The XRD patterns for 15% Mg-Al₂O₃ catalyst are shown in Fig. 4. 1.2(b), the
major diffraction peaks at 31.3⁰ and 68.7⁰ of 2θ shows MgAl2O4, spinel mineral with major
peaks which indicates the solid-solid interaction between MgCl2 and Al₂O₃ (ICDD Card
No. 211152) in addition to residue peaks of Gmelinite-Na, KCrF4, KCaCl₃ (Chlorocalcite)
and KCaAl2F9 (elpasolite) according to ICDD Card No. 380435, 401001, 211170 and
441359, respectively. According to JCPDS card No. 21-1152, the spinel has cubic
structure.
In Fig. 4.1.2(c), the XRD patterns of 20% Zn-Al₂O₃ shows major peaks for Al₂O₃ at
25.48⁰, 35.08⁰, 37.72⁰, 43.27⁰, 52.51⁰, 57.46⁰, 61.00⁰, 66.43⁰, 68.11⁰ and 77.08⁰ (ICDD
Card No. 461212) and zinc aluminum oxide (Zn3Al94O144) at 30.31⁰, 35.08⁰, 37.72⁰,
43.27⁰, 57.46⁰, 61.00⁰, 66.43⁰ and 68.11⁰ (ICDD Card No. 231490) along with secondary
phases ZnCl2 and AlCl₃ (ICDD Card No. 160851 and 220010). The patterns show Al₂O₃
with rhombohedral geometry (JCPDS Card No. 46-1212) and Zn3Al94O144 with monoclinic
geometry (JCPDS Card No.23-1490).
The XRD patterns of 20% Al-Al₂O₃ catalyst are shown in Fig. 4.1.2(d). The patterns show
major peaks of chloraluminite (AlCl₃. 6H2O) according to ICDD Card No. 441473 at
15.07⁰, 27.19⁰, 27.52⁰, 35.05⁰, 39.01⁰, 41.38⁰, 43.33⁰, 51.94⁰ and 68.35⁰ with
rhombohedral geometry (JCPDS Card No. 44-1473) along with the peaks of aluminum
chloride hydroxide hydrate (Al10Cl3(OH)27. 13H2O) at 27.19, 39.01, 52.63 and 57.67
(ICDD Card No. 270009) having a monoclinic system according to JCPDS Card No. 27-
0009.

Results and Discussion
63
Where Fig. 4.1.2(e) corresponds to 20% Cu-Al₂O₃, according to ICDD Card No. 330448,
it shows CuAl2O4 at peaks 44.80⁰ and 77.23⁰ with cubic structure and according to ICDD
Card No. 110661, 11243, and 160394 it shows Al₂O₃ at 16.24⁰, 22.00⁰, 25.63⁰, 32.80⁰,
35.20⁰, 37.87⁰, 43.42⁰, 52.60⁰, 57.46⁰, 66.52⁰ and 68.29⁰ with Cu(ClO4)2 and
Al2.892Cu6.1808 according to ICDD Cards No. 320448 and 190010, respectively.
The Fig. 4.1.2(f) represent 05% Fe-Al₂O₃, there is no pattern for this catalyst suggesting
that the catalyst is amorphous.
Figure 4.1.2 XRD diffractogram of (a) Al₂O₃ support, (b) 20% Mg-Al₂O₃, (c) 20% Zn-
Al₂O₃, (d) 20% Al-Al₂O₃, (e) 20% Cu-Al₂O₃ and (f) 05% Fe-Al₂O₃

Results and Discussion
64
4.2. Metals impregnated catalysts over montmorillonite (Mmn)
i. Surface area, pore size and pore volume analysis
Mmn support with 116.21 m2/g BET surface area was impregnated with 20% Mg, 20% Zn,
5% Al, 15% Cu and 20% Fe in the form of their respective salts. BET and BJH surface
area, BJH pore size and pore volume of the Mmn support and its impregnated catalysts are
given in Table 4.2. The surface area of the impregnated catalysts over Mmn support
decreased as compared to Mmn support. The order of BET surface area for impregnated
catalysts was Mmn>5% Al-Mmn>20% Mg-Mmn>20% Zn-Mmn>20% Fe-Mmn>15% Cu-
Mmn.
Table 4.2 Surface area, pore size and pore volume analysis of impregnated catalysts
over Mmn support
Catalysts Mmn 20% Mg-
Mmn
20% Zn-
Mmn
5% Al-
Mmn
15% Cu-
Mmn
20% Fe-
Mmn
BET surface area
( m2/g) 116.21 96.14 78.25 102.2 49.86 69.53
BJH surface area
( m2/g) 489.23 412.08 297.60 264.56 54.60 77.53
Pore volume (cc/g) 1.25 1.26 0.68 1.23 0.09 0.13
Pore size (Å) 115.39 121.84 102.38 118.96 78.73 77.72
ii. SEM analysis
The SEM image of Mmn is depicted in Fig. 4.2.1(a) showing a highly porous structure
with uniform particle size of 10-30 µm. Fig. 4.2.1(b) presents the morphology of 20% Mg-
Mmn, the high magnification of the image reveal a huge condense structure presenting
valley model, the surface seems to have brailed bodies and pores throughout the whole

Results and Discussion
65
structure. The surface structure of 20% Zn-Mmn is shown in Fig. 4.2.1(c), the Zn-Mmn
particles are 2-3 µm in size having smooth surface area. The image shows clear
impregnation of Zn salt on Mmn support, the bright edges confirm successful impregnation
of zinc. Fig. 4.2.1(d) indicates 5% Al-Mmn catalyst with irregular shape particles having
size 1-4 µm, the bright metallic view of the particles indicate successful impregnation of
the precursor component. Fig. 4.2.1 (e) presents the morphology of 15% Cu-Mmn catalyst
which indicate agglomerated particles with smaller size than Mmn support. The picture
shows 0.6 µm (600 nm) to 5 µm particles with good dispersion of Cu active center. Fig.
4.2.1(f) corresponds to 20% Fe-Mmn, the surface of the catalysts also presents the
agglomerates in stack forms with irregular particles having porous channels throughout the
surface of the catalyst.
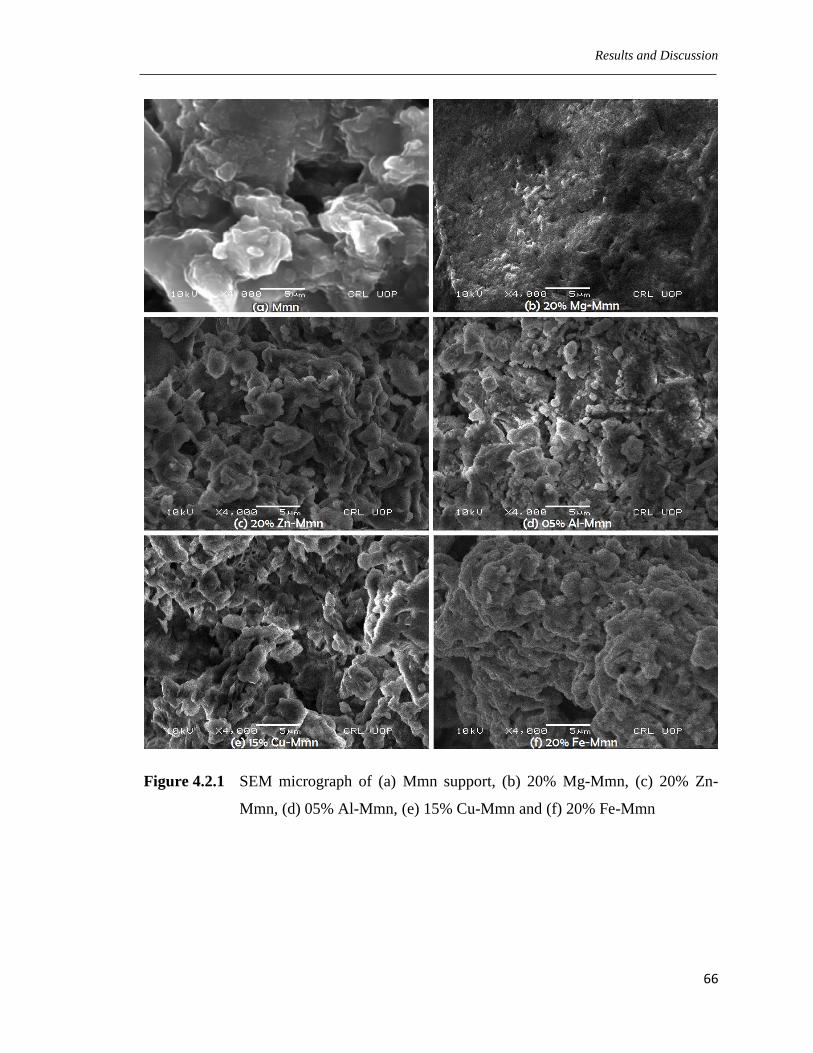
Results and Discussion
66
Figure 4.2.1 SEM micrograph of (a) Mmn support, (b) 20% Mg-Mmn, (c) 20% Zn-
Mmn, (d) 05% Al-Mmn, (e) 15% Cu-Mmn and (f) 20% Fe-Mmn

Results and Discussion
67
XRD analysis
Impregnated catalysts using XRD spectrum for montmorillonite support are shown in Fig.
4.2.2(a), the diffractogram for Mmn at 19.51⁰, 25.24⁰, 26.29⁰, 29.41⁰, 47.38⁰ and 57.07⁰
indicates bredigite (Ca14Mg2(SiO4)8 according to ICDD Card No. 360399, the patterns at
20.62⁰, 25.24⁰ and 57.07⁰ also shows sodium magnesium silicate (Na2MgSiO4) (ICDD
Card No. 471499). The structures of both minerals are orthorhombic according to JCPDS
Card No. 36-0399 and 47-1499, respectively, along with peaks at 19.51⁰, 23.77⁰ and 29.41⁰
shows montmorillonite-15A (CaO2(Al,Mg)Si4O10(OH)2) (ICDD Card No. 130135) having
hexagonal geometry (JCPDS Card No. 13-0135).
The XRD diffraction patterns for 20% Mg-Mmn are shown in Fig. 4.2.2(b). The major
diffraction peaks at 21.58⁰, 29.63⁰ and 31.87⁰ indicate Na3Mg3Ca5Al19Si117O272 according
to ICDD Card No. 491831 having orthorhombic geometry (JCPDS Card No.49-1831) and,
at 20.95⁰, 22.48⁰, 31.03⁰, 42.19⁰ and 49.42⁰ shows Na2Al2Si2.5O9.6.2H2O (ICDD Card No.
380237) with cubic system (JCPDS Card No. 38-237), it also indicates some relevant
materials i.e., (Mg,Fe)Al2SiO5(OH)2, Na2Ca4Mg2Si4O15, Na2Ca4Mg2Si4O15,
Na96Al96Si96O384.216H2O, Ca2.8(Na,K)0.9Al6.5Si11.5O36. 5H2O and Ca4Al8Si8O32.8H2O
according to ICDD Card Nos. 441427, 421484, 400064, 390222, 461263 and 460341,
respectively.
Fig. 4.2.2(c) shows XRD patterns for 20% Zn-Mmn, it indicates sodium zinc oxide
(Na10Zn4O9) at 22.03⁰, 32.38⁰ and 34.93⁰ according to ICDD Card No. 520058 with
rhombohedral system (JCPDS Card No. 52-0058), the pattern also shows sodium zinc
silicate (Na2ZnSiO4) at 19.87⁰ and 26.71⁰ (ICDD Card No. 370407) with orthorhombic
system according to JCPDS Card No. 37-0407. The XRD diffractogram also indicates
sodium magnesium zinc silicate (Na2Mg3Zn2Si12O30) at 29.50⁰, 32.38⁰ and 63.46⁰
according to ICDD Card No. 480418 having hexagonal geometry (JCPDS Card No. 48-
0418).
The XRD patterns for 5% Al-Mmn catalyst is shown in Fig. 4.2.2(d), it shows the major
peaks for silicon oxide (Si34O68) at 26.65⁰, 27.64⁰, 35.17⁰ and 45.40⁰ (ICDD Card No.
520144) that is in the hexagonal system according to JCPDS Card No. 52-0144. The

Results and Discussion
68
patterns also shows at 31.75⁰ and 62.02⁰ sodium aluminum silicate (Na1.15Al1.15Si0.85O4
and Na1.75Al1.75Si0.25O4) according to ICDD Card Nos. 490007 and 490004, respectively,
both with orthorhombic geometry. The catalyst also contain a small amount of magnesium
aluminum oxide (MgAl₂O₃) and magnesium aluminum silicate (Mg3Al2(SiO4)3 according
to ICDD Card No. 211152 and 150742. The presence of these substances indicates
interaction of Al with Mmn support.
Fig. 4.2.2(e) corresponds to 15% Cu-Mmn and its pattern shows Ca2CuO2Cl2 according to
ICDD Card No. 480319 at peaks 29.02⁰, 32.62⁰ and 61.63⁰, the patterns shows Al2CuMg
at 45.34⁰, 54.76⁰ and 61.63⁰ according to ICDD Card No. 280014, it shows Ca2Al2O5
according to ICDD Card No. 521722 at peaks 26.62⁰, 34.09⁰, 61.63⁰, it also shows
monoclinic CaCu at peaks 16.24⁰, 32.62⁰, 34.09⁰, 45.34⁰ and 57.55⁰ with ICDD Card No.
411276 and monoclinic CuCl₂ with ICDD Card No. 10185.
The XRD pattern indicates that 20% Fe-Mmn is amorphous as shown in Fig. 4.2.2(f)
Figure 4.2.2 XRD diffractogram of (a) Mmn support, (b) 20% Mg-Mmn, (c) 20% Zn-
Mmn, (d) 5% Al-Mmn, (e) 15% Cu-Mmn and (f) 20% Fe-Mmn

Results and Discussion
69
4.3. Metals impregnated catalysts over activated charcoal (AC)
i. Surface area, pore size and pore volume analysis
The BET and BJH surface area, BJH pore size and pore volume for AC support and its
impregnated catalysts are given in Table 4.3. The surface area decreased remarkably after
impregnation with selected catalysts. The order of BET surface area for impregnated
catalysts was AC > 20% Zn-AC > 20% Cu-AC > 20% Mg-AC > 20% Fe-AC > 20% Al-
AC.
Table 4.3 Surface area, pore size and pore volume analysis of impregnated catalysts
over AC support
Catalysts AC 20% Mg-
AC
20% Zn-
AC
20% Al-
AC
20% Cu-
AC
20% Fe-
AC
BET surface area
( m2/g) 335.24 116.50 141.60 66.31 120.44 71.00
BJH surface area
( m2/g) 106.15 241.75 69.04 47.66 47.40 64.77
Pore volume (cc/g) 0.11 1.00 0.10 0.06 0.04 0.09
Pore size (Å) 23.17 165.60 35.31 34.45 23.37 34.55
ii. SEM analysis
SEM was used to investigate the morphology of selected impregnated catalysts over AC in
comparison with AC support. Fig. 4.3.1(a) depicts the morphology of AC support, the
structure exhibits dense, smooth surface having pores and few particles emerging the
structural body. Like AC surface 20% Mg-AC catalysts (Fig. 4.3.1(b)) also exhibits dense
but highly rough structure having brailed slabs with ups and down having cracks with
evident shapes and the catalyst shows well-developed macropores system throughout the

Results and Discussion
70
body. Fig. 4.3.1(c) represent the morphology of 20% Zn-AC, which as compared to its
support shows great morphological changes, the catalyst structure consists of solid particles
with irregular and variable particle having 0.5-10 µm particle size. The SEM image of 20%
Al-AC catalyst is shown in Fig. 4.3.1(d), confirming the successful impregnation of
precursor forming large blocks like particles with smooth surfaces having a particle size
from 0.5-30 µm. Modified 20% Cu-AC catalysts (Fig. 4.3.1(e)) exhibits different
morphology in comparison with its AC support, but having a similar morphology with that
of 20% Zn-AC catalyst. It also shows agglomerates of varying size that range from 0.2 µm
(200 nm) to 5 µm particle size. Fig. 4.3.1(f) represents 20% Fe-AC impregnated catalyst
with very fine rice like uniform particles having particle size 1-3 µm with porous surfaces.

Results and Discussion
71
Figure 4.3.1 SEM micrographs of (a) AC support, (b) 15% Mg-AC, (c) 20% Zn-AC, (d)
20% Al-AC, (e) 20% Cu-AC and (f) 20% Fe-AC

Results and Discussion
72
iii. XRD analysis
The XRD diffraction patterns for activated charcoal (AC) is shown in Fig. 4.3.2(a), it
clearly indicates charcoal at 26.59⁰ (ICDD Card No. 261076) with hexagonal geometry
(JCPDS Card No. 26-1076). Where the XRD patterns of 20% Mg-AC and 20% Zn-AC are
shown in Fig. 4.3.2(b) and Fig. 4.3.2(c), respectively. It depicts that the precursor active
center is fully dispersed in the pores of AC with the amorphous nature of catalysts.
The Fig. 4.3.2(d) shows diffractogram aluminum chloride (AlCl₃) with maximum major
peaks at 17.26⁰, 26.62⁰, 30.31⁰, 36.55⁰, 62.59⁰, 66.34⁰, 73.57⁰ having monoclinic structure
(JCPDS Card No. 22-0010) and carbon (charcoal) with major peaks at 44.17⁰, 46.69⁰ and
70.96⁰ according to ICDD Card Nos. 220010 and 501086, respectively having
rhombohedral structure (JCPDS Card No. 50-1086).
Figs. 4.3.2(e) and 4.3.2(f) also shows that for 20% Cu-AC and 20% Fe-AC catalysts no
patter were observed and it was revealed that the catalysts are amorphous in nature.

Results and Discussion
73
Figure 4.3.2 XRD diffractogram of (a) AC support, (b) 20% Mg-AC, (c) 20% Zn-Ac,
(d) 20% Al-AC, (e) 20% Cu-AC and (f) 20% Fe-AC

Results and Discussion
74
Section 2
Catalytic activity, selectivity and recovery studies for the degradation of
waste expanded polystyrene (WEPS)
4.4. Thermogravimetric analysis (TGA)
4.4.1. TGA of WEPS
The weight loss verses temperature curves for thermal decomposition of WEPS
under a linear heating rate in the inert (N2) and oxidative (O2) environment was
carried out and the results are shown in Fig. 4.4.1. It can be seen from the figure
that the decomposition is a single step process with the onset and end temperature
of 300.98 °C and 409.85 °C, respectively in the case of N2 environment and 292.50
°C and 407.79 °C, respectively for oxidative environment. The curve shows that
maximum weight loss related to volatilization of hydrocarbons occurred at 369.28
°C in inert atmosphere and 364.68 °C in the case of oxidative atmosphere. In inert
atmosphere 99.57% change occurred from 300.98 °C to 409.85 °C. In the case of
oxidative environment 100% weight changes occurred from 292.50 °C to 407.79
°C. At these temperatures with the volatilization process, other reactions like
cracking of side chain from aromatic rings, isomerization and poly condensation
also takes place. Therefore, one might think that all the volatile matter of WEPS
has been decomposed to volatile hydrocarbons.

Results and Discussion
75
Figure 4.4.1 TGA curves of WEPS in O2 and N₂ environment
4.4.2. TGA of polystyrene (PS) and polyethylene terephthalate (PET)
The TGA results of virgin PS and PET are shown in Fig. 4.4.2. The initial thermal
decomposition of both PS and PET was endothermic due to C-C and C-O (for PET
only) bond rupture. The weight loss versus temperature curves of both, PS and
PET shows single step pyrolysis in a N₂ [1]. It shows the onset temperature of
290.2 ºC, 378.0 ºC, and end set temperature of 431.3 ºC and 479.8 ºC for PS and
PET, respectively. The curve shows 100 wt.% loss in the case of PS and 83.7 wt.%
loss in the case of PET at their respective end set temperatures. PET in the process
of thermal pyrolysis left carbonaceous material as a solid residue that did not
decompose at 1000 ºC. This phenomenon is supported by several studies of PET
pyrolysis in the N₂ environment at high temperature. The residue left even at a
high temperature in the case of PET is attributed to the interlinking reaction
between the decomposed products of PET forming stabilized products [2]. The TG

Results and Discussion
76
curves show almost complete conversion of PS where PET shows incomplete
conversion which was also reported in other studies [3].
Figure 4.4.2. TGA curves of PS and PET in N₂ environment

Results and Discussion
77
4.5. Thermal degradation of WEPS
i. Effect of temperature
The effect of temperature on the thermal degradation of WEPS was studied in the range of
250 ºC to 500 ºC, the results are shown in Fig. 4.5.1. Most of the previous studies have
reported the degradation of WEPS with fixed temperature [4, 5] or with the lower limit of
the reactor temperature, for example, most of autoclaves can be operated up to a certain
temperature like 250 °C and 427 °C [6, 7]. In the current method, thermal degradation was
carried out in 120 min reaction time. The amount of liquid products increased with increase
of temperature and maximum yield of liquid products were obtained at 500 ºC. The
maximum amount of liquid was 74.13 ± 4.05 wt.% with 95.87% total conversion. Further
increase in temperature did not show any significant increase in the yield of liquid products.
Figure 4.5.1 Effect of degradation temperature for thermal degradation of WEPS

Results and Discussion
78
ii. Effect of time
The Effect of reaction time on the thermal degradation of WEPS was studied from 30 min
to 150 min at optimum temperature i.e., 500 ºC, the results of the study are shown in Fig.
4.5.2. The effect of time has not been studied in most of the studies and the degradation of
WEPS has been carried out for a fixed reaction time [5, 7]. The effect of reaction time has
a profound effect on the degradation of WEPS and the reaction products or liquid products.
In the current study, the effect of time was checked for the degradation of WEPS at a fix
optimized temperature.
It was observed that the liquid product yield increased with the increase of time from 30
min to 150 min. The yield of liquid products was maximum with a 150 min reaction time.
This time was considered sufficient and beyond this time the degradation of WEPS will be
considered not economical. The maximum liquid products obtained at optimized
conditions was 78.07 ± 0.64 wt.% with 98.47% total percent conversion.
Figure 4.5.2 Effect of reaction time for thermal degradation of WEPS

Results and Discussion
79
iii. Composition of derived liquid products
The liquid products obtained were analyzed for their chemical composition using GC-MS.
The results of the analysis are given in Table 4.5.1 in terms of wt.% of WEPS degraded
and GC-MS spectra for thermal degradation is shown in Fig. 4.5.3. It was observed that
the liquid products consisted of eight major components, mostly of aromatic hydrocarbons.
These hydrocarbons included major products toluene, styrene, α-methylstyrene and
benzene, 3-butynyl etc. The percent composition of liquid showed that styrene monomer
is the predominant compound in the liquid products obtained with thermal degradation.
The yield of toluene; ethylbenzene; styrene; α-methylstyrene; benzene, 3-butynyl; 1,2-
propanediol, 3-benzyloxy-1,2-diacetyl was 2.06 wt.%, 0.85 wt.%, 39.31 wt.%, 1.33 wt.%,
17.56 wt.% and 10.10 wt.%, respectively. Thermal degradation of WEPS start with a
random initiation mechanism that ultimately form free radicals, which undergo β-scission
producing styrene monomer while during the depolymerization reaction the secondary
radicals, or tertiary radicals (formed by H-abstraction) produce α-methylstyrene and/or
dimers [8, 9]. The presence of oxygenated derivatives of aromatic hydrocarbons is believed
to be due to reaction between atmospheric oxygen and degraded products [10]. Toluene
and ethylbenzene are formed by further degradation of styrene monomer [11].
Table 4.5.1 Products formed by thermal degradation of WEPS at optimized conditions.
S.No. Products Composition (wt.%)
1 Toluene 2.06
2 Ethylbenzene 0.85
3 Styrene 39.31
4 α-Methylstyrene 1.33
5 Benzene, 1,1'-(1,3-propanediyl)bis 1.97
6 Benzene, 3-butynyl 17.56
7 Benzene, (1-methyl-3-butenyl) 1.16
8 1,2-propanediol, 3-benzyloxy-1,2-diacetyl 10.10
Other hydrocarbons 3.72
Gases (wt.%) 20.40
Residue (wt.%) 1.53

Results and Discussion
80
Figure 4.5.3 Chromatogram of catalytically derived liquid products obtained with
thermal degradation at optimized conditions
iii. Separation of the products using fractional distillation
After GC-MS characterization of the parent liquid products, the liquid was separated into
different fractions using fractional distillation to recover the hydrocarbons selectively.
Fractions obtained by the fractional distillation of parent liquids derived from the
degradation of WEPS, were characterized for different parameters like density (d25),
refractive index (𝜂𝐷25), and molar refraction (γM). The results of the study are given in
Table 4.5.3. As can be seen from the table that during fractional distillation the residence
time of liquid increased and further degradation occurs in the liquid with the decrease in
percentage of styrene from 39.31 wt.% to 35.0 wt.%, α-methylstyrene; benzene, 1,1'-(1,3-
propanediyl)bis; benzene, 3-butynyl and benzene, (1-methyl-3-butenyl) were totally
disappeared by further degradation where conversion to benzene took place and the yield
of toluene increased markedly from 2.06 wt.% to 51 wt.%. Phenanthrene was also formed
during the fractional distillation process and was isolated, which may have formed by the
intramolecular cyclization/dehydrogenation process [12, 13]. Beside these some other
hydrocarbons were also detected by GC-MS analysis in negligible quantity where open

Results and Discussion
81
chain hydrocarbons or gaseous products were also formed during the fractional distillation
process.
Refractive index and density of each fraction from fractional distillation was measured for
calculation of molar refraction (Table 4.5.2). The molar refraction values of standard
compounds used for comparison are given in Table 4.5.3. The molar refraction values of
aromatic compounds from different catalytic degradation of WEPS are in close agreement
with the standard compounds which confirm these compounds.
Table 4.5.2 Physiochemical parameters of the fractions obtained using fractional
distillation of the liquid derived from the thermal degradation of WEPS
Compounds
Thermal
%age d25 (g/ml) 𝜼𝑫𝟐𝟓 γM
Benzene 1.0 0.8770 1.5223 27.18
Toluene 51.0 0.9293 1.5363 30.93
Ethylbenzene 2.0 0.8731 1.5051 36.07
Styrene 35.0 0.9115 1.5510 36.45
Phenanthrene 6.0 0.9910 1.5999 61.52
1,2-propanediol, 3-benzyloxy-1,2-diacetyl 3.0 0.9320 1.5273 87.88
Where %age (Percentage of the Fraction), d25 (g/ml) (density), 𝜂𝐷25 (Refractive
Index using Na lamp at 25 ºC), and γM (Molar Refraction)

Results and Discussion
82
Table 4.5.3 Physiochemical parameters of standards compounds
Compound Density (d)
g/ml
Refractive
Index (η)
Molar
Refraction
(γM)
Benzene 0.873 1.5010 26.253
Toluene 0.872 1.4967 31.078
2-Phenone, 4-hydroxy-4-methyl 0.868 1.4970 35.802
Ethylbenzene 0.868 1.4970 35.802
Styrene 0.903 1.5460 37.177
Benzene, (1-methylethyl) or Cumene 0.862 1.4910 40.438
Benzaldehyde 1.050 1.5450 33.006
α-Methylstyrene 0.872 1.5450 42.002
Benzene, 1,1'-(1,3-propanediyl)bis 0.984 1.5600 64.922
Phenanthrene 1.130 1.7150 61.938
Benzene, 3-butynyl 0.936 1.5290 42.896
2-Phenylnaphthalene 1.082 1.6480 68.687
Benzene, (1-methyl-3-butynyl) 0.872 1.5020 49.429
1,2-propanediol, 3-benzyloxy-1,2-diacetyl 1.225 1.5420 68.393
1,1':3,1"-Terphenyl, 5'-phenyl 1.074 1.6190 100.290

Results and Discussion
83
4.6. Catalytic degradation of WEPS using alumina (Al₂O₃),
montmorillonite (Mmn) and activated charcoal (AC) as catalysts
i. Effect of temperature
The effect of temperature on the catalytic degradation of WEPS was monitored in the range
of 250 ºC to 500 ºC keeping optimum reaction time (30 min) and polymer to catalysts ratio
(1:0.2) using Al₂O₃, Mmn and AC as catalyst. The results are shown in Fig. 4.6.1. The
yield of liquid products increased with increase of temperature in the case of all catalysts
i.e., Al₂O₃, Mmn and AC. The degradation at 250 ºC yielded only gaseous products in the
case of Al₂O₃ and Mmn catalysts, while in case of AC a small liquid products was also
observed. At 450 ºC maximum liquid products that is 80.20 ± 1.91 wt.% and 89.93 ± 0.31
wt.% were observed in the case of Al₂O₃ and Mmn catalysts, respectively, with 100% total
conversion. The maximum yield of liquid products in case of AC was 83.80 ± 0.20 wt.%
at 500 ºC with 100% total conversion. The yield of liquid products was not affected with
further increase of temperature above optimized degradation temperature.

Results and Discussion
84
Figure 4.6.1 Effect of degradation temperature and comparison of catalytically derived
liquid products obtained with Al₂O₃, Mmn and AC as catalysts
ii. Effect of time
The effect of reaction time was followed in the range of 30 to 150 min for obtaining
maximum liquid products for the degradation of WESP at an optimized degradation
temperature (450 ºC for Al₂O₃ and Mmn, and 500 ºC for AC) and 1:0.2 polymer to catalyst
ratio (Fig. 4.6.2). Maximum liquid products was obtained at 60 min reaction time. There
was not much effect of reaction time on the liquid product. A slight decrease in reaction
products was observed with increase of reaction time that is due to high residence time of
the product in degradation reactor causing further cracking of the products to low molecular
weight hydrocarbons. The yield of liquid was 87.00 ± 0.80 wt.% and 91.33 ± 0.31 wt.%
with 100% total conversion using Al₂O₃ and Mmn catalysts, respectively. The yield of

Results and Discussion
85
liquid products was 83.80 ± 0.20 wt.% maximum with 30 min reaction time and 100% total
conversion using AC as catalyst.
Figure 4.6.2 Effect of reaction time and comparison of catalytically derived liquid
products obtained with Al₂O₃, Mmn and AC as catalysts at optimized
conditions
iii. Effect of polymer to catalyst ratio
WEPS degradation was also optimized for the effect of polymer to catalyst ratio using
Al₂O₃, Mmn and AC catalysts (Fig. 4.6.3), using 450 ºC degradation temperature with 60
min reaction time for Al₂O₃ and Mmn and 30 min reaction time for AC catalyst at 500 ºC.
The polymer to catalyst ratio was varied form 1:0.1 to 1:0.5. In the case of Al₂O₃ and Mmn
catalysts, the yield of liquid products was small with 1:0.1 polymer to catalyst ratio as
compared to the yield of 1:0.2 polymer to catalyst ratio. The yield of liquid products
decreased with the increase of catalyst. The increase of catalyst provided more surface area

Results and Discussion
86
in turn providing more reaction sites for degradation reaction ultimately leading to side
chain reactions, forming more gaseous products leading to decrease in the yield of liquid
products. The maximum liquid products obtained were 87.00 ± 0.80 wt.% and 92.40 ± 0.87
wt.% with 1:0.2 polymer to catalyst ratio with 100% total conversion for both Al₂O₃ and
Mmn catalysts. In the case of AC maximum yield was 84.47 ± 0.12 wt.% (100% total
conversion) with 1:0.1 polymer to catalyst ratio. The results are given in Table 4.6.1.
Table 4.6.1 Optimum reaction conditions and contents of products using Al₂O₃, Mmn
and AC catalysts
Al₂O₃ Mmn AC
Reaction conditions
Temperature (°C) 450 450 500
Time (min) 60 60 30
Polymer to catalyst ratio 1:0.2 1:0.2 1:0.1
Content of products (wt.%)
Liquids 87.00 ± 0.80 92.40 ± 0.87 84.47 ± 0.12
Gases 13.00 ± 0.80 7.60 ± 0.87 15.53 ± 0.12
Residue 0.00 ± 0.00 0.00 ± 0.00 0.00 ± 0.00
Total percent conversion 100.00 100.00 100.00

Results and Discussion
87
Figure 4.6.3 Effect of polymer to catalyst ratio and comparison of catalytically derived
liquid products obtained with Al₂O₃, Mmn and AC as catalysts at optimized
conditions
i. Composition of derived liquid products and selectivity of its components
The parent liquid products obtained from the catalytic degradation of WEPS using Al₂O₃,
Mmn and AC catalyst were analyzed by GC-MS for its chemical composition. The results
of the analysis are given in Table 4.6.2 expressed in terms of weight percent of the WEPS
sample degraded and GC-MS chromatograms are shown in Figs. 4.6.4-4.6.6 for Al₂O₃,
Mmn and AC catalysts, respectively.
The percentage composition of the analysis was correlated in 100%, according to the
following formula (Eq. 4.6.1) for all three catalysts i.e., Al₂O₃, Mmn and AC.
𝐶𝑜𝑟𝑟𝑒𝑙𝑎𝑡𝑖𝑜𝑛 %𝑎𝑔𝑒 = 𝑀𝑎𝑥𝑖𝑚𝑢𝑚 𝑙𝑖𝑞𝑢𝑖𝑑
100 × %𝑎𝑔𝑒 𝑜𝑓 𝑐𝑜𝑚𝑝𝑜𝑛𝑒𝑛𝑡 𝑝𝑟𝑜𝑑𝑢𝑐𝑡 4.6.1

Results and Discussion
88
Sixteen major chemical products were detected where styrene monomer was the dominant
product in the catalytic degradation similar to the data reported in the literature [10, 14].
The other important hydrocarbons included toluene, ethylbenzene, α-methylstyrene and
benzene, 1,1'-(1,3-propanediyl)bis. The selectivity of products formed, highly depend on
surface area, nature and active sites of the catalysts used. The nature of Al₂O₃, Mmn and
AC catalysts have been reported as heterogeneous solid acids, with a demerit of soon
deactivation than transition metal oxides and also impregnated catalysts [15, 16], however,
mechanism for the degradation described using acidic catalysts have been described in
many papers to be of carbonium nature followed by β-scission of C-C bond [17, 18].
GC-MS analysis revealed that AC catalyst formed the maximum number of products which
were mostly desirable and low molecular weight aromatic hydrocarbons while on the other
hand Mmn catalyst yielded a minimum number of products but with a high amount of
undesirable and high molecular weight aromatic hydrocarbons. The yield of styrene
monomer was approximately the same i.e., 45.65 wt.%, 45.42 wt.% and 43.61 wt.% with
Al₂O₃, Mmn and AC catalysts, respectively. Therefore, yield of toluene (6.96 wt.%),
ethylbenzene (6.55 wt.%) and α-methylstyrene (2.262 wt.%) were maximum with the AC
catalyst. AC catalyst has a porous internal microstructure with high surface area (335.24
m2/g) and the active sites present over charcoal showing high activity [19] which causes
further cracking of high molecular weight aromatic hydrocarbons to produce toluene and
ethylbenzene and/or α-methylstyrene like compounds by the acidic sites (of AC catalyst),
reported by Audisio et al. [17, 18]. Another dominant product after styrene monomer was
benzene, 3-butynyl with all the catalysts where 1,2-propanediol, 3-benzyloxy-1,2-diacetyl
was also dominant in the case of Al₂O₃ and Mmn catalysts. The presence of 1,2-
propanediol, 3-benzyloxy-1,2-diacetyl like oxygenated compounds have its origin with the
reaction with atmospheric oxygen or other possible residue present in the WEPS samples.

Results and Discussion
89
Table 4.6.2 Products formed by the catalytic degradation of WEPS using Al₂O₃, Mmn
and AC as catalysts at optimized conditions.
S.No. Products Composition (wt.%)
Al₂O₃ Mmn AC
1 Toluene 2.58 1.59 6.96
2 Ethylbenzene 1.40 0.49 6.55
3 Styrene 45.65 45.42 43.61
4 α-Methylstyrene 1.11 0.70 2.62
5 Benzene, 1,1'-(1,2-ethanediyl)bis 0.94 0.75 4.29
6 Benzene, 1,1'-(1-methyl-1,2-ethanediyl)bis 0.47 0.31 1.89
7 Benzene, 1,1'-(1-butene-1,4-diyl)bis-, (Z) 0.05 0.06 0.67
8 Benzene, 1,1'-(1,3-propanediyl)bis 0.98 0.81 0.00
9 Phenanthrene 0.09 0.07 0.53
10 Benzene, 3-butynyl 14.29 18.35 6.87
11 Benzene, (1-methyl-3-butenyl) 0.72 0.72 0.64
12 Benzene, (1-ethyl-2-propenyl) 0.39 0.51 0.11
13 2-Phenylnaphthalene 0.45 0.10 1.57
14 2-pentenal, 5-phenyl 0.11 0.13 0.52
15 1,2-propanediol, 3-benzyloxy-1,2-diacetyl 13.75 19.00 0.00
16 1,1':3,1''-Terphenyl, 5'-phenyl 0.36 0.30 0.67
17 Other hydrocarbons 3.67 3.09 6.98
Gases (Wt.%) 13.00 7.60 15.53
Residue (Wt.%) 0.00 0.00 0.00

Results and Discussion
90
Figure 4.6.4 Chromatogram of catalytically derived liquid products obtained with Al₂O₃
catalyst at optimized conditions
Figure 4.6.5 Chromatogram of catalytically derived liquid products obtained with Mmn
as catalyst at optimized conditions

Results and Discussion
91
Figure 4.6.6 Chromatogram of catalytically derived liquid products obtained with AC as
catalyst at optimized conditions

Results and Discussion
92
4.7. Catalytic degradation of WEPS using Mg, MgO and MgCO₃ catalysts
ii. Effect of temperature
The effect of temperature on thermal and catalytic degradation of WEPS using Mg, MgO
and MgCO₃ as a catalysts was studied in the range of 250 ºC to 500 ºC, keeping reaction
time (60 min) and polymer to catalyst ratio (1:0.3), the results are shown in Fig. 4.7.1. The
amount of liquid increased with increase of degradation temperature and maximum yield
of liquid products 76.87 ± 1.50 wt.% were obtained at 450 ºC with Mg as catalyst with
99.40% total conversion. The maximum amount of liquid 57.80 ± 0.53 wt.% and 43.27 ±
0.42 wt.% was obtained at 400 ºC with 79.27% and 60.47% total conversion in the case of
MgO and MgCO₃ catalysts, respectively. Further increase in temperature did not show any
increase in the yield of liquid, but the amount of residue was decreased with the increase
of gases in the case of Mg and MgO catalysts.
Figure 4.7.1 Effect of degradation temperature and comparison of catalytically derived
liquid products obtained with Mg, MgO and MgCO₃ catalysts

Results and Discussion
93
iii. Effect of time
The effect of reaction time on thermal and catalytic degradation of WEPS was studied from
30 min to 150 min at optimum temperature (Fig. 4.7.2) keeping polymer to catalyst ratio
1:0.3. Only in the case of Mg as a catalyst the yield of liquid was 82.20 ± 3.80 wt.% with
30 min reaction time, while with MgO and MgCO₃ catalysts maximum liquid obtained was
91.60 ± 0.20 wt.% and 81.80 ± 0.53 wt.% for 120 min reaction time. Negligible amount of
residue 0.60 ± 0.40 wt.% was obtained using Mg catalyst with 99.40 wt.% total conversion.
The yield of liquid products were high with minimum reaction time with all catalysts as
compared to previous studies. H. Ukei et al. [11] reported catalytic degradation of WEPS
with maximum liquid yield 93.4 wt.% producing 76.4 wt.% styrene at 450 °C for 180 min
and Lee et al. [20] found SiO2/Al₂O₃ catalyst with maximum 83.5 wt.% of liquid products
at 400 °C for 120 min.
Figure 4.7.2 Effect of reaction time and comparison of catalytically derived liquid
obtained with Mg, MgO and MgCO₃ catalysts at optimized conditions

Results and Discussion
94
iv. Effect of polymer to catalyst ratio
Polymer to catalyst ratio was optimized from 1:0.1 to 1:0.5 using Mg, MgO and MgCO₃
as catalyst keeping optimum temperature and reaction time. The results are shown in Fig.
4.7.3. It is evident from the previous studies that catalyst selection has a profound role in
the degradation of polymer and as well as the selectivity of products. Many researchers
have reported the impact of polymer to catalyst ratio on the degradation of WEPS [6, 21].
In our study the effect of polymer to catalyst ratio was evaluated for the degradation of
WEPS. For all catalysts the liquid yield was increased with increase in feed ratio from 1:0.1
to 1:0.3 and a small decrease was observed with further increase. Therefore, a polymer to
catalyst ratio of 1:0.3 was taken as optimum and was used in the further degradation
process. At optimum conditions maximum liquid yield and gas was obtained with
minimum residue using all the three catalysts. The total percent conversion at optimum
conditions was 99.40 wt.%, 98.60 wt.% and 94.87 wt.% with Mg, MgO and MgCO₃
catalysts, respectively. Among the used catalysts Mg was found with high activity. The
comparative reaction conditions and contents of products are given in Table 4.7.1.
Table 4.7.1 Optimum reaction conditions and contents of products using Mg, MgO and
MgCO₃ catalysts
Mg MgO MgCO₃
Reaction conditions
Temperature (ºC) 450 400 400
Time (min) 30 120 120
Polymer to catalyst ratio 1:0.3 1:0.3 1:0.3
Contents of product (wt.%)
Liquids 82.20 ± 3.80 91.60 ± 0.20 81.80 ± 0.53
Gases 17.20 ± 3.40 7.00 ± 0.20 13.07 ± 0.23
Residue 0.60 ± 0.40 1.40 ± 0.20 5.13 ± 0.31
Total conversion 99.40 98.60 94.97

Results and Discussion
95
Figure 4.7.3 Effect of polymer to catalyst ratio and comparison of catalytically derived
liquid products obtained with thermal degradation, Mg, MgO and MgCO₃
catalysts at optimized conditions
v. Composition of derived liquid products and selectivity of its components
The liquid products obtained from catalytic degradation at optimum conditions were
dissolved in acetone and analyzed for their chemical composition by GC-MS. The results
of the analysis are given in Table 4.7.2 and GC-MS spectra’s are shown in Figs 4.7.4-4.7.6
for Mg, MgO and MgCO₃ catalysts, respectively. The liquid products consisted of ten
major components entirely of aromatic hydrocarbons. These hydrocarbons included
toluene, ethylbenzene, styrene, α-methylstyrene and benzene, 1,1'-(1,3-propanediyl)bis.
Catalysts with basic nature like BaO have been reported having good selectivity for styrene
monomer [11] where metal catalysts have also been reported for the efficient, rapid
degradation of polystyrene [10, 22]. It was observed that Mg catalysts act as synergist as
well as a catalyst with its basic compounds i.e., MgO and MgCO₃ using indigenously

Results and Discussion
96
designed glass reactor and heating assembly in order to compare the composition of liquid
products. Percent composition of liquid products showed that styrene monomer is the
predominant compound in the liquid obtained from catalytic degradation. Maximum
amount of styrene (54.71 wt.%) was obtained with Mg catalytic degradation while the yield
of styrene with MgO and MgCO₃ catalysts were 49.95 wt.% and 45.17 wt.%, respectively.
The presence of high molecular weight aromatic hydrocarbons like benzene, 3-butynyl in
the case of base catalysts indicate that along with depolymerization processes; ring
opening, dehydrogenation, hydrogenation and cyclization processes were also taking place
[11, 23]. The presence of oxygen containing compounds might be due to the reaction of
atmospheric oxygen and any residue present in the WEPS samples [10].
Table 4.7.2 Products formed by the catalytic degradation of WEPS using Mg, MgO and
MgCO₃ catalysts at optimized conditions
S.No. Products Composition (wt.%)
Mg MgO MgCO₃
1 Toluene 2.24 3.71 5.13
2 Ethylbenzene 0.73 2.04 6.20
3 Styrene 54.71 49.95 45.17
4 Benzene, (1-methylethyl) 0.34 0.15 1.28
5 α-Methylstyrene 1.25 3.42 4.67
6 Benzene, 1,1'-(1,3-propanediyl)bis 1.99 4.95 5.15
7 Benzene, 3-butynyl 0.00 15.67 7.03
8 Benzene, (1-methyl-3-butenyl) 1.23 2.01 0.82
9 Benzene, 1,1'-(2-methyl-1-
propenylidene)bis 0.08 0.49 0.58
10 1,2-propanediol, 3-benzyloxy-1,2-diacetyl 15.74 4.61 2.10
Other hydrocarbons 4.23 4.75 4.92
Gases (wt.%) 17.20 7.00 13.07
Residue (wt.%) 0.60 1.40 5.13

Results and Discussion
97
Figure 4.7.4 Chromatogram of catalytically derived liquid products obtained with Mg as
catalyst at optimized conditions
Figure 4.7.5 Chromatogram of catalytically derived liquid products obtained with MgO
as catalyst at optimized conditions

Results and Discussion
98
Figure 4.7.6 Chromatogram of catalytically derived liquid products obtained with
MgCO₃ as catalyst at optimized conditions
vi. Separation of the products using fractional distillation
After the characterization data of GC-MS, the liquid products obtained with Mg, MgO and
MgCO₃ catalytic degradation were separated into different fractions using fractional
distillation to recover the hydrocarbons selectively. Fractions obtained by the fractional
distillation of parent liquids derived from the catalytic degradation of WEPS were
characterized by different physiochemical parameters like density (d25), refractive index
(𝜂𝐷25), and molar refraction (γM) for the identification of different fractions (Table 4.7.3).
The separated component products were also confirmed individually by GC-MS analysis.
As can be seen from the data, during the fractional distillation increase in residence time
of liquid products caused further degradation of liquid products with the decrease of styrene
monomer percentage from 54.71 wt.% to 43.0 wt.% and 49.95 wt.% to 23.0 wt.% in the
case of liquid obtained with Mg and MgO catalysts, respectively, with the concurrent
increase of toluene, α-methylstyrene; benzene, 3-butynyl and 1,2-propanediol, 3-
benzyloxy-1,2-diacetyl in the case of liquid products obtained with Mg as a catalyst, where
with MgO catalyst, low molecular weight aromatic hydrocarbons were formed with high

Results and Discussion
99
amount and high molecular weight hydrocarbons disappeared. The decrease of styrene
monomer in the case of Mg catalyst might be due to the repolymerization of styrene and/or
condensation and degradation of new high molecular weight aromatic hydrocarbons [24]
while the formation of toluene and ethylbenzene in the case of liquids obtained with Mg,
MgO and MgCO₃ catalysts is because of further cracking of styrene or dimers [11, 17].
The yield of styrene increased with more basic catalyst relatively with low yields of toluene
and ethylbenzene with the disappearance of high molecular weight aromatic hydrocarbons.
Catalytic degradation of WEPS using MgCO₃ catalyst could be selectively used for the
recovery of toluene (15.8 wt.%) and styrene monomer (51.9 wt.%) where MgO could be
used for the selective recovery of ethylbenzene (35 wt.%). MgO catalyst could be used for
selective recovery of toluene (11.5 wt.%), ethylbenzene (35.0 wt.%), styrene monomer
(23.8 wt.%) and α.-methylstyrene (11.0 wt.%) while Mg catalyst could be used for the
recovery of toluene (9.0 wt.%), styrene monomer (43.0 wt.%), α-methylstyrene (4.0 wt.%)
and 1,2-propanediol, 3-benzyloxy-1,2-diacetyl (18 wt.%).
Refractive index and density of each fraction from fractional distillation was measured for
calculation of molar refraction (Table 4.7.3). The molar refraction values of standard
compounds used for comparison are given in Table 4.5.3 in section 4.5 (Page 82). The
molar refraction values of aromatic compounds from different catalytic degradation of
WEPS are in close agreement with the standard compounds molar refraction values which
confirm the product component.

Results and Discussion
100
Table 4.7.3 Physiochemical parameters of the fractions obtained using fractional distillation of the liquid derived from the
degradation of WEPS using Mg, MgO and MgCO₃ catalysts
Compound
Mg MgO MgCO₃
%age d25
(g/ml) 𝜼𝑫
𝟐𝟓 γM %age d25
(g/ml) 𝜼𝑫
𝟐𝟓 γM %age d25
(g/ml) 𝜼𝑫
𝟐𝟓 γM
2-Phenone, 4-hydroxy-4-
methyl - - - - - - - - 9.0 1.0033 1.4620 31.83
Toluene 9.0 0.9020 1.5334 31.72 11.5 0.8768 1.5086 31.36 15.8 0.9005 1.5097 30.59
Ethylbenzene 35.0 0.8909 1.5084 35.55 5.9 0.8684 1.5050 36.26
Styrene 43.0 0.9165 1.5421 35.77 23.8 0.9082 1.5470 36.37 51.9 0.9013 1.5463 36.60
Benzene, (1-methylethyl) - - - - 6.0 0.8802 1.5102 40.85 - - - -
Benzaldehyde -- - - - 1.5 0.8802 1.5455 38.15 - - - -
α.-Methylstyrene 4.0 0.9004 1.5496 41.79 11.0 0.9037 1.5329 40.58 3.0 0.9166 1.5347 40.12
Benzene, 1,1'-(1,3-
propanediyl)bis - - - - - - - - 6.0 0.9612 1.5497 65.03
Phenanthrene - - - - - - - - - - -
Benzene, 3-butynyl - - - -- - - - - 5.5 0.9035 1.5174 43.62
Benzene, (1-methyl-3-butynyl) 14.0 0.9022 1.5285 49.95 - - - - - - -
1,2-propanediol, 3-benzyloxy-
1,2-diacetyl 18.0 1.2095 1.5396 69.04 - - - - - - - -
Where %age (Percentage of the Fraction), d25 (g/ml) (density), 𝜂𝐷25 (Refractive Index), and γM (Molar Refraction)

Results and Discussion
101
4.8. Catalytic degradation of WEPS using Mg impregnated catalysts
i. Effect of percentage of precursor active metal center
WEPS samples were degraded with Mg impregnated catalysts (Mg-Al₂O₃, Mg-Mmn and
Mg-AC) and the percentage of impregnated metal (Mg) over different supports was
optimized using optimum conditions of Mg catalyst i.e., 450 ºC degradation temperature,
30 min reaction time and 1:0.3 polymer to catalyst ratio. WEPS was degraded using
impregnated catalysts having 5%, 10%, 15%, 20% and 25% precursor active center over
Al₂O₃, Mmn and AC supports (Fig. 4.8.1). The yield of liquid products was increased with
the increase of percentage of impregnated active center (Mg). The yield of liquid products
was lower in the case of 5% Mg-Al₂O₃ and it increases with the increase of percent Mg
impregnation. The low yield of liquid products in the case of 5% Mg-Al₂O₃ may be
attributed due to its acidic character and high reactivity of Al₂O₃ support for the
degradation of WEPS that transform it into gaseous products [25]. The yield of liquid
products was maximum in the case of 15% Mg-Al₂O₃ catalyst having maximum liquid
products 95.47 ± 0.12 wt.% and a further increase in the percentage of the impregnated
active center did not affect the yield of liquid products. The yield of liquid products was
88.87 ± 0.42 wt.% and 87.47 ± 0.12 wt.%, respectively, maximum with 20% Mg-Mmn and
20% Mg-AC catalysts. The increase of percent Mg impregnation increase the liquid
products are due to the blocking of support active site with the help of precursor active
center molecules, which cause to increase the selectivity of the catalyst. Comparative
reaction conditions and contents of products of 15% Mg-Al₂O₃, 20% Mg-Mmn and 20%
Mg-AC catalysts are given in Table 4.8.1. The order of activity of Mg impregnated
catalysts and Mg catalyst is 20% Mg-Mmn ≥ 15% Mg-Al₂O₃ > 20% Mg-AC > Mg. WEPS
was degraded with impregnated catalysts (Mg-Al₂O₃, Mg-Mmn and Mg-AC) and the
percentage of impregnated metal (Mg) over different supports was optimized using
optimum conditions of Mg catalyst i.e., 450 ºC degradation temperature, 30 min reaction
time and 1:0.3 polymer to catalyst ratio. The degradation data of impregnated catalysts i.e.
15% Mg-Al₂O₃, 20% Mg-Mmn and 20% Mg-AC were compared in terms of activity of
catalysts and selectivity of aromatic products.

Results and Discussion
102
Table 4.8.1 Optimum reaction conditions and contents of product using 15% Mg-
Al₂O₃, 20% Mg-Mmn and 20% Mg-AC catalysts
15% Mg-
Al₂O₃
20% Mg-
Mmn
20% Mg-
AC
Reaction conditions
Temperature (⁰C) 450 450 450
Time (min) 30 30 30
Polymer to catalyst ratio 1:0.3 1:0.3 1:0.3
Contents of product (wt.%)
Liquids 95.47 ± 0.12 88.87 ± 0.42 87.47 ± 0.12
Gases 4.53 ± 0.12 11.20 ± 0.42 12.50 ± 0.12
Residue 0.00 ± 0.00 0.00 ± 0.00 0.00 ± 0.00
Total conversion 100 100 100
Figure 4.8.1 Effect of percentage of impregnated precursor metal (Mg) over Al₂O₃,
Mmn and AC supports for maximum liquid products

Results and Discussion
103
ii. Composition of derived liquid products and selectivity of its components
The liquid obtained with the degradation of WEPS using Mg, 15% Mg-Al₂O₃, 20% Mg-
Mmn and 20% Mg-AC catalyst was analyzed by GC-MS for identification of component
products. The results of GC-MS analysis represented in terms of weight percent of the
WEPS sample degraded and are given in Table 4.8.2. GC-MS chromatograms are shown
in Figs 4.8.2-4.8.4. The analysis showed that the degraded products of WEPS yielded 20
major components comprising toluene, ethyl benzene and styrene monomer in higher
percentages.
Acidic catalysts initiate the degradation of PS with the attack of a proton associated with a
Brönsted acid site to the phenyl ring of the PS polymer backbone. The resulting carbocation
(carbenium) undergo β-scission followed by a hydrogen transfer [18]. The hydrogen of
acidic catalysts attacks the branched aromatic ring giving rise to primary cation Type I of
π-complex, the same way the hydrogen of acidic catalysts attacks the branched phenyl
group of PS and produce primary cation Type II. The Type I cation upon β-scission convert
to σ-complex (secondary cation) and release benzene, shown in scheme 1 of section
1.10.2.1. Where cation Type II upon β-scission give rise to a polymer ion (A) and also
produce a cyclodiene substituted polymer chain (B) as shown in scheme 3 of section
1.10.2.1. The ion A further undergo β-scission and yield styrene monomer and secondary
ions of A. Therefore, styrene monomer was the major component with all the catalysts,
maximum with 15% Mg-Al₂O₃ (56.20 wt.%) and it was 46.62 wt.% and 44.41 wt.% with
20% Mg-Mmn and 20% Mg-AC catalysts, respectively. The primary or secondary ion A
also undergoes hydride ion rearrangement followed by β-scission to produce α-
methylstyrene [11, 18]. However, the formation of benzene and its hydrogenation to form
toluene and ethylbenzene or the formation of other products decreased the yield of styrene
monomer [11, 20]. The hydrogenation of styrene and production of benzene, (1-
methylethyl) by intermolecular H transfer are shown in scheme 5 section 1.10.2.1, where
the formation of toluene is shown in Scheme 4 of section 1.10.2.1. Toluene (13.10 wt.%)
and ethyl benzene (8.93 wt.%) were maximum with 15% Mg-Al₂O₃ catalyst as compared
to 20% Mg-Mmn and 20% Mg-AC catalysts. The production of toluene and the formation
of ethylbenzene from the hydrogenation of styrene is shown in Scheme 4 and Scheme 1,

Results and Discussion
104
respectively. The highly acidic support Al₂O₃ with 15% Mg impregnation was proved to
be the best activity and high selectivity catalysts. The activity of Mg impregnated catalysts
over Al₂O₃ and Mmn supports was almost the same, but selectivity was found to increase
with the increase of acidity of supporting material. The order of selectivity of valuable
hydrocarbons was 15% Mg-Al₂O₃ > 20% Mg-Mmn > 20% Mg-AC.
Catalysts like 15% Mg-Al₂O₃, 20% Mg-Mmn and 20% Mg-AC is having both Lewis acid
sites and Brönsted acid sites, does not seem to promote cross-linking reactions instead
accelerated hydrogenation reactions that’s why the yield of ethylbenzene is greater with
these catalysts. Along with aromatic products some open chain ketones were also formed
using impregnated catalysts. The presence of these ketones and other oxygenated products
might be due to the reaction of atmospheric oxygen [10]. The products obtained with 20%
Mg-AC catalyst including some open chain and other aromatic products were in a broad
range with relatively lower concentration as compared to the other two catalysts. The
catalytic activity as well as the selectivity of styrene and other aromatic hydrocarbons of
15% Mg-Al₂O₃ were better than the 20% Mg-Mmn and 20% Mg-AC catalysts. The high
yield of low molecular weight aromatic hydrocarbons in the presence of acidic catalyst has
already been reported and it was suggested that it is due to the acidic catalyst that led the
reaction through an end-chain scission pathway without promoting thermal cracking [26,
27]. The degradation of WEPS using 15% Mg-Al₂O₃, 20% Mg-Mmn and 20% Mg-AC
catalysts were compared with other literature reported methods, in terms of weight percent
of the WEPS degraded, which is different from their reported method, the comparison are
given in Table 4.8.3. The activity of Mg impregnated catalysts was (95.47 wt.%) better as
compared to the methods reported by Xie et al. [5], Chumbhale et al. [21], Tae et al. [28],
Chumbhale et al. [29], Lee et al. [30]. However, the selectivity of styrene was less than Fe-
K/Al₂O₃ [5] catalyst and 9% K2O/Si-MCM-41 [30] but the current catalysts are more
economic than all the reported catalysts, they are easy to prepare and can be recycled easily.
This method also gives more selective and high amount of low molecular weight aromatic
hydrocarbons in major with environmental friendly method as compared to the degradation
products by other researchers [7, 10, 31].

Results and Discussion
105
Table 4.8.2 Products formed by the catalytic degradation of WEPS using 15% Mg-
Al₂O₃, 20% Mg-Mmn and 20% Mg-AC catalysts at optimized conditions
S. No. Products
Composition (wt.%)
15% Mg-
Al₂O₃
20% Mg-
Mmn
20% Mg-
AC
1 Benzene 1.36 0.36 0.66
2 Toluene 13.10 5.90 6.38
3 3-Hexen-2-one 4.72 0.00 0.00
4 3-Penten-2-one, 4-methyl 0.00 0.00 8.83
5 2-Pentanone, 4-hydroxy-4-methyl- 1.53 3.84 3.82
6 Ethylbenzene 8.93 5.48 7.00
7 5-Hexene-2-one 3.88 0.00 0.00
8 Styrene 56.20 46.62 44.41
9 α-Methylstyrene 3.05 2.22 1.58
10 Azulene 0.71 0.00 0.00
11 Undecane, 3,8-dimethyl 0.00 0.04 1.01
12 3-Ethyl-3-methylheptane 0.00 0.30 1.95
13 Benzene, 1,1'-(1,2-ethanediyl)bis 0.00 1.79 1.31
14 Benzene, 1,1'-(1-methyl-1,2-
ethanediyl)bis
0.00 1.38 0.78
15 Benzene, 1,1'-(1,3-propanediyl)bis 0.00 0.70 0.35
16 Benzene, 3-butynyl 0.00 4.86 2.39
17 Benzene, (1-methyl-3-butenyl) 0.00 0.50 0.23
18 2-Phenylnaphthalene 0.00 1.59 1.13
19 1,2-propanediol, 3-benzyloxy-1,2-
diacetyl
0.00 0.92 0.27
20 1,1':3,1''-Terphenyl, 5'-phenyl 0.00 0.50 0.26
Other hydrocarbons 2.01 5.93 5.12
Gases (wt.%) 4.53 17.04 12.50
Residue (wt.%) 0.00 0.00 0.00

Results and Discussion
106
Figure 4.8.2 Chromatogram of catalytically derived liquid products obtained with 15%
Mg-Al₂O₃ catalyst at optimized conditions
Figure 4.8.3 Chromatogram of catalytically derived liquid products obtained with 20%
Mg-Mmn catalyst at optimized conditions

Results and Discussion
107
Figure 4.8.4 Chromatogram of catalytically derived liquid products obtained with 20%
Mg-AC catalyst at optimized conditions
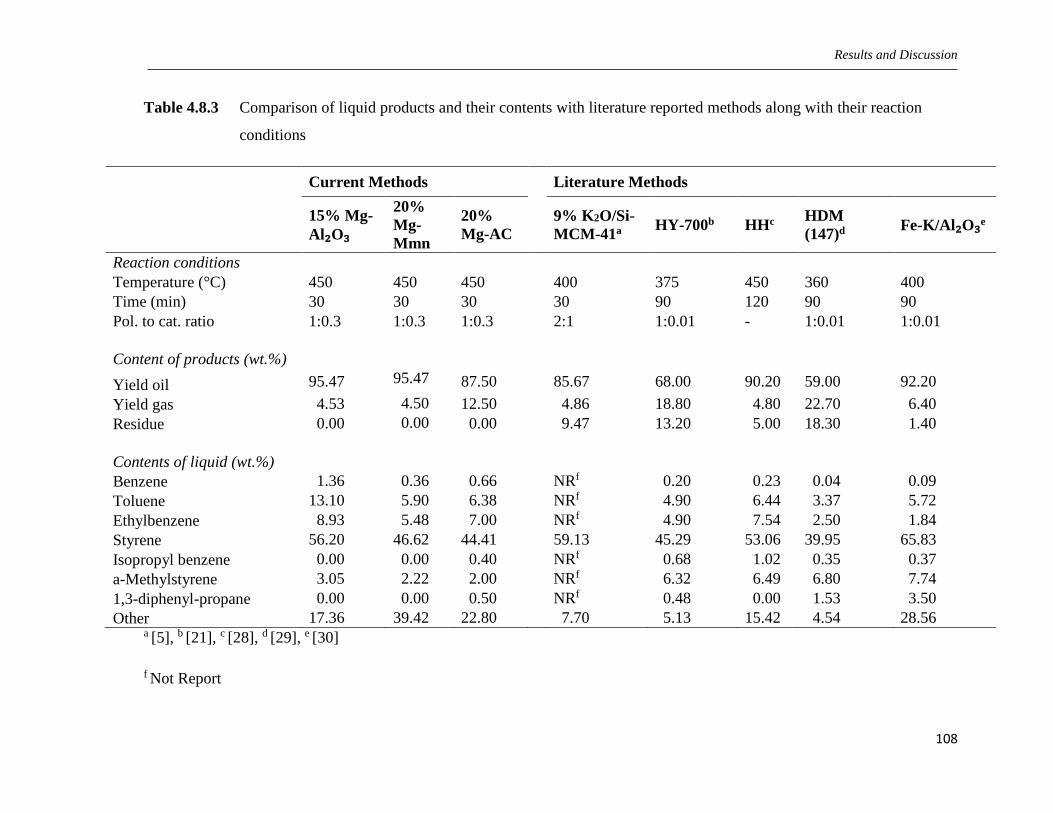
Results and Discussion
108
Table 4.8.3 Comparison of liquid products and their contents with literature reported methods along with their reaction
conditions
Current Methods Literature Methods
15% Mg-
Al₂O₃
20%
Mg-
Mmn
20%
Mg-AC
9% K2O/Si-
MCM-41a HY-700b HHc
HDM
(147)d Fe-K/Al₂O₃e
Reaction conditions
Temperature (°C) 450 450 450 400 375 450 360 400
Time (min) 30 30 30 30 90 120 90 90
Pol. to cat. ratio 1:0.3 1:0.3 1:0.3 2:1 1:0.01 - 1:0.01 1:0.01
Content of products (wt.%)
Yield oil 95.47 95.47 87.50 85.67 68.00 90.20 59.00 92.20
Yield gas 4.53 4.50 12.50 4.86 18.80 4.80 22.70 6.40
Residue 0.00 0.00 0.00 9.47 13.20 5.00 18.30 1.40
Contents of liquid (wt.%)
Benzene 1.36 0.36 0.66 NRf 0.20 0.23 0.04 0.09
Toluene 13.10 5.90 6.38 NRf 4.90 6.44 3.37 5.72
Ethylbenzene 8.93 5.48 7.00 NRf 4.90 7.54 2.50 1.84
Styrene 56.20 46.62 44.41 59.13 45.29 53.06 39.95 65.83
Isopropyl benzene 0.00 0.00 0.40 NRf 0.68 1.02 0.35 0.37
a-Methylstyrene 3.05 2.22 2.00 NRf 6.32 6.49 6.80 7.74
1,3-diphenyl-propane 0.00 0.00 0.50 NRf 0.48 0.00 1.53 3.50
Other 17.36 39.42 22.80 7.70 5.13 15.42 4.54 28.56 a [5], b [21], c [28], d [29], e [30]
f Not Report

Results and Discussion
109
4.9. Catalytic degradation of WEPS using Zn, ZnO and ZnCl₂ catalysts
i. Effect of degradation temperature
The effect of pyrolysis temperature on thermo-catalytic pyrolysis of WEPS was
investigated in the temperature range of 250 ºC to 500 ºC for all the three catalysts at
optimum conditions using 60 min reaction time and 1:0.2 feed to catalyst ratio. The results
for the effect of pyrolysis temperature are shown in Fig. 4.9.1. Most of the reported work
has been carried out at fixed temperature either because of the limitation of reactor
(autoclave etc.) or heating assembly [4-7]. On the other hand 500 ºC is the adequate
maximum temperature for conversion into liquid products, which has been reported by
various researchers [17, 21, 28, 32]. The yield of liquid products at 250 ºC was 0% with
the formation of small amounts of gaseous products. The yield of liquid products started at
350 ºC in the case of Zn and ZnO catalysts where it was 0 wt.% in the case of ZnCl₂
catalysts at this temperature. However, the yield of gaseous product at this temperature was
more than Zn and ZnO catalysts. It is because of the moderate Lewis character of ZnCl₂,
which catalyze the polymer to yield only gaseous products (volatile light hydrocarbons). It
was confirmed by performing some additional experiments with 10 g of feed material (feed
to catalyst ratio of 1:0.05), the amount of gaseous products were almost the same with the
additional collection of 5.87 ± 1.39 wt.% liquid products. It was assumed that only ZnCl₂
surrounded polymer molecules are converted to gaseous products while the remaining are
converting due to thermal effects. The yield of liquid products increased with the increase
of degradation temperature using constant reaction time and feed to catalyst ratio for all
the three catalysts. The liquid product yield reached to a maximum of 82.93 ± 2.00 wt.%
and 84.73 ± 2.31 wt.% at 450 ºC for the Zn and ZnO catalysts, respectively, and no

Results and Discussion
110
significant increase was observed after 450 ºC. The yield of liquid products was 79.40 ±
0.72 wt.% for ZnCl2 catalyst at 500 ºC. For all the three catalysts the total yield was 100%.
Figure 4.9.1 Effect of temperature and comparison of catalytically derived liquid
products obtained with Zn, ZnO and ZnCl₂ catalysts at optimized contions
ii. Effect of reaction time
The effect of reaction time on the degradation of WEPS is shown in Fig. 4.9.2. The
degradation experiment was carried out in 30, 60, 90, 120 and 150 min reaction time at
their respective optimized conditions i.e. 450 ºC pyrolysis temperature and 1:0.2 feed to
catalyst ratio for Zn and ZnO catalysts, and 500 ºC pyrolysis temperature and 1:0.2 feed to
catalyst ratio for ZnCl2 catalyst. The effect of reaction time changes the amount of products
formed as well as alter component products because of changing residence reaction time.
The yield of the liquid products increased with increase of reaction time for all the three
catalysts and then with further increase it either remain constant or start decreasing. The

Results and Discussion
111
decrease of liquid products is due to the increase in residence time in the reactor, which
leads to inter-product's interaction and the formation of gaseous products. The second
cause is the escape of volatile products from the liquid products receiver through the gas
outlet at a much longer time. In the case of Zn catalyst, the yield of liquid products
increased from 30 min to 120 min, where it was maximum i.e., 96.73 ± 0.12 wt.% with
100% total yield. The yield of liquid products was maximum that is 84.73 ± 2.31 wt.% and
79.40 ± 0.72 wt.% with 60 min reaction time in the case of ZnO and ZnCl2 catalysts,
respectively. The total yield in case of Zn and ZnCl2 was 100%.
Figure 4.9.2 Effect of reaction time and comparison of catalytically derived liquid
products obtained with Zn, ZnO and ZnCl₂ catalysts at optimized conditions
iii. Effect of polymer to catalyst ratio
The degradation of WEPS was carried out using polymer to catalyst ratio in the range of
1:0.1 to 1:0.5, while keeping other reaction conditions as follow: for Zn catalyst; 120 min

Results and Discussion
112
reaction time and 450 ºC pyrolysis temperature, for ZnO catalyst; 60 min reaction time and
450 ºC pyrolysis temperature, and for ZnCl2 catalysts; 60 min reaction time and 500 ºC
pyrolysis temperature. The results of the experiments are shown in Fig. 4.9.3. Changing
the polymer to catalyst ratio in the case of Zn catalyst from 1:0.2 to 1:0.1, the yield of
liquids was 96.07 ± 0.31 wt.% - the same as with 1:0.2 feed to catalyst ratio. Further no
significant impact was recorded on the yield of liquid products above 1:0.2 feed to catalyst
ratio. Therefore, 1:0.2 was chosen optimum polymer to catalyst ratio. In the case of ZnO
catalyst, the yield of liquid products was 84.73 ± 2.31 wt.% maximum with 1:0.2 and then
a slight decrease was observed with increase of catalyst amount. In the case of ZnCl2
catalyst, the yield was maximum with 1:0.1 polymer to catalyst ratio (79.60 ± 4.20 wt.%).
The total yield was 100% at optimum conditions for all the three catalysts. The effect of
degradation temperature, reaction time and polymer to catalyst ratio were determined for
all the used catalysts for maximum conversion of WEPS into liquid products. The
maximum yield of liquids was 96.07 ± 0.31 wt.%, 84.73 ± 2.31 wt.% and 79.60 ± 4.20
wt.% using Zn, ZnO and ZnCl2 catalysts, respectively, at their respective optimized
conditions. Among the used catalysts, the yield of liquids was the highest in the case of Zn
as catalyst. A comparative study describing reaction conditions and contents of products
are given in Table 4.9.1 using thermal degradation and zinc bulk catalysts. The degradation
of WEPS using Zn catalyst without the use of any solvent was found better than using
benzene solvent as reported by Guoxi et al., [33]. The yield of liquid products of Zn catalyst
was more than reported by Ukei et al., [11] using BaO catalyst (93.4 wt.%) at 600 ºC for 3
hours and ZnO and ZnCl₂ catalyst were also good from his reported acid and base catalysts
due to low degradation temperature and small reaction time.

Results and Discussion
113
Table 4.9.1 Optimum reaction conditions and contents of product using Zn, ZnO and
ZnCl₂ catalysts
Zn ZnO ZnCl₂
Reaction conditions
Temperature (ºC) 450 450 500
Time (min) 120 60 60
Polymer to catalyst ratio 1:0.2 1:0.2 1:0.1
Contents of product (wt.%)
Liquids 96.73 ± 0.12 84.73 ± 2.31 79.60 ± 4.20
Gases 3.27 ± 0.12 15.27 ± 2.31 20.40 ± 4.20
Residue 0.00 ± 0.00 0.00 ± 0.00 0.00 ± 0.00
Total conversion 100 100 100

Results and Discussion
114
Figure 4.9.3 Effect of polymer to catalyst ratio and comparison of catalytically derived
liquid products obtained with thermal degradation, Zn, ZnO and ZnCl₂
catalysts at optimized conditions
iv. Composition of derived liquid products and selectivity of its components
The degraded liquid products of WEPS were analyzed by GC-MS. The results of the
analysis are given in Table 4.9.2. The analysis revealed that the products obtained with all
the three catalysts yielded nine major aromatic hydrocarbons among which toluene; styrene
monomer; α-methylstyrene; benzene, 3-butynyl: benzene, 1,1'-(1,3-propanediyl) bis and
1,2-propanediol, 3-benzyloxy-1,2-diacetyl were the major components. Like other
literature reported methods, styrene monomer in this study was also the major products
with thermal pyrolysis and as well as with zinc bulk catalysts [11, 16, 20]. The yield of all
the reported products was higher with Zn catalyst, as compared to thermal, ZnO and ZnCl₂
catalysts, except for 1,2-propanediol, 3-benzyloxy-1,2-diacetyl, the composition of which

Results and Discussion
115
was high with ZnO catalyst (13.91 wt.%). The yield of styrene monomer was 39.31 wt.%,
47.96 wt.%, 41.45 wt.% and 40.88 wt.% with thermal, Zn, ZnO and ZnCl₂ catalysts,
respectively. The yield of major products was maximum with Zn catalyst with 2.47 wt.%
toluene, 47.96 wt.% styrene, 1.90 wt.% α-methylstyrene, 2.98 wt.% benzene, 1,1'-(1,3-
propanediyl)bis, 21.53 wt.% benzene, 3-butynyl and 12.29 wt.% 1,2-propanediol, 3-
benzyloxy-1,2-diacetyl. In the current study, Zn as a catalyst was found with high activity
for the production of liquid products yielding minimum gases and residue (Table 4.9.1)
with 100% total yield as well as with high selectivity for aromatic hydrocarbons as
compared to the other catalysts used in this study. Thermo-catalytic degradation of
polymers leads to numerous species involving hundreds of interactions, therefore, it is hard
to devise a specific mechanism but there are a few agreements using different types of
catalysts. A Lewis acid such as ZnCl₂ catalyst detach a hydride anion from the benzylic
position in PS reported by Karmore et al [34] and basic catalysts like ZnO, activates PS
through deprotonating with subsequent β-scission of the polymer backbone [14]. The low
yield of styrene monomer with ZnCl₂ as compared to solid basic catalysts (ZnO and Zn
catalysts) is due to the numerous active Lewis acidic sites causing further cracking of the
styrene monomer and hydrogenation with a competitive crosslinking reaction or side
reaction which ultimately increase the yield of gases with the concomitant decrease of
liquid product yield [5, 11, 20]. As a whole the selectivity of low molecular weight aromatic
hydrocarbons was better with zinc bulk catalyst with small duration of reaction time and
degradation temperature without using any additive and solvent than reported by literature
[20, 35], but the selectivity of styrene was smaller than that of reported by Ukei et al. [11]
and Guoxi et al. [33]. This was because of their wt.% calculation method, high residence
time, degradation temperature and use of additives or solvent, which ultimately cause high
production cost. Zn was found with higher activity and selectivity for the production of
low molecular weight aromatic hydrocarbons, especially for styrene monomer with a cost
effective method.

Results and Discussion
116
Table 4.9.2 Products formed by the catalytic degradation of WEPS using Zn, ZnO and
ZnCl₂ catalysts at optimized condition
S.No. Products Composition (wt.%)
Zn ZnO ZnCl₂
1 Toluene 2.47 1.80 2.11
2 Ethylbenzene 1.16 0.60 1.93
3 Styrene 47.96 41.45 40.88
4 α-Methylstyrene 1.90 1.13 1.26
5 Benzene, 1,1'-(1,3-
propanediyl)bis 2.98 1.70 1.16
6 Benzene, 3-butynyl 21.53 19.57 12.94
7 Benzene, (1-methyl-3-butenyl) 1.57 1.02 0.59
8 1,2-propanediol, 3-benzyloxy-
1,2-diacetyl 12.29 13.91 12.54
9 1,1':3,1''-Terphenyl, 5'-phenyl 0.71 0.34 0.35
10 Other hydrocarbons 4.16 3.19 5.83
Gases (Wt.%) 3.27 15.27 20.40
Residue (Wt.%) 0.00 0.00 0.00
Figure 4.9.4 Chromatogram of catalytically derived liquid products obtained with Zn
catalyst at optimized conditions

Results and Discussion
117
Figure 4.9.5 Chromatogram of catalytically derived liquid products obtained with ZnO
catalyst at optimized conditions
Figure 4.9.6 Chromatogram of catalytically derived liquid products obtained with ZnCl₂
catalyst at optimized conditions

Results and Discussion
118
v. Separation of the products using fractional distillation
Catalytic degradation significantly increased the yield of liquid products as compared to
thermal cracking. Among the catalysts zinc bulk catalyst was found with amazing
selectivity for desirable aromatic hydrocarbons. The effective degradation of WEPS was
followed by the separation of component products of bulk liquids using fractional
distillation assembly. Fractions were collected at various boiling points ranges and were
characterized using physiochemical techniques like density (d20), refractive index (𝜂𝐷20),
molar refraction (γM) and as well as GC-MS analysis in order to identify different fractions
obtained. The results of the analysis are given in Table 4.9.3. It was observed that during
the fractional distillation further cracking of huge molecules took place in addition with
cyclization and recombination reactions [12, 13, 36] in the heating reactor and major
variation in the products were observed.
Each fraction separated was confirmed by the GC-MS analysis. Each fraction was found
with the contamination of other aromatic hydrocarbons in small percentage. The yield of
styrene remained almost constant, where benzene, 1,1’-(1,3-propanediyl)bis decreased
using the liquid products obtained with Zn and ZnO catalysts. For the liquid obtained with
ZnCl₂ catalyst the yield of styrene monomer increased from 40.88 wt.% to 48 wt.% and
the yield of benzene, 1,1’-(1,3-propanediyl)bis increased from 1.16 wt.% to 9.0 wt.%. The
yield of toluene, ethylbenzene and α-methylstyrene increased for all the liquid products.
The increase in the yield of these components may be attributed to further thermal pyrolysis
of higher molecular weight aromatic hydrocarbons. During fractional distillation, The last
products obtained was 1,1':3,1"-terphenyl, 5'-phenyl with apparent increase for all the three
liquids. The increase was from 0.71 wt.% to 10 wt.%, 0.34 wt.% to 6 wt.% and 0.35 wt.%
to 6 wt.% using liquid products obtained with Zn, ZnO and ZnCl₂ catalysts, respectively.
Increase in the yield of this component and the formation of 2-phenylnaphthalene using
liquid products obtained with ZnCl₂ catalysts might be due the dehydrogenation/
cyclization reaction [24]. From the separation studies it is concluded that the Zn containing
catalysts can be selectively used for the recovery of toluene, ethylbenzene, styrene
monomer and α-methylstyrene. Molar refraction of each component was calculated from

Results and Discussion
119
the measured refractive index and density as shown in Table 4.9.3. The data were compared
with the molar refraction of standards (Table 4.5.3 in section 4.5 (Page 82)) and found in
close agreement with that of the standards.

Results and Discussion
120
Table 4.9.3 Physiochemical parameters of the fractions obtained using fractional distillation of the liquid derived from the
degradation of WEPS using Zn, ZnO and ZnCl₂ catalysts
Compound
Zn ZnO ZnCl₂
%age d25
(g/ml) 𝜼𝑫
𝟐𝟓 γM %age d25
(g/ml) 𝜼𝑫
𝟐𝟓 γM %age d25
(g/ml) 𝜼𝑫
𝟐𝟓 γM
Toluene 11.0 0.8740 1.5013 26.3434 7.0 0.8930 1.5109 30.9053 6.0 0.9387 1.5370 30.6545
Ethylbenzene 6.0 0.8710 1.4970 35.6689 9.0 0.8890 1.5069 35.5349 4.0 0.8720 1.4967 35.6097
Styrene 47.0 0.9128 1.5478 36.2280 42.0 0.9144 1.5463 36.0817 48.0 0.9103 1.5439 36.1155
α.-Methylstyrene 12.0 1.0337 1.5523 32.8176 9.0 0.9034 1.5435 41.2620 12.0 0.8974 1.5481 41.8319
Benzene, 1,1'-(1,3-
propanediyl)bis 0.0 - - - 7.0 0.9905 1.5670 64.7377 9.0 0.9835 1.5611 64.6428
Benzene, 3-butynyl 14.0 0.9457 1.5327 42.7045 17.0 0.9792 1.5585 42.8979 10.0 0.9421 1.5309 42.7477
2-Phenylnaphthalene 0.0 - - - 3.0 1.0870 1.6530 68.7928 5.0 1.0790 1.6409 68.2836
1,1':3,1"-Terphenyl, 5'-
phenyl 10.0 1.0730 1.6190 100.1761 6.0 1.0710 1.6150 99.8418 6.0 1.0690 1.6151 100.0417
Where %age (Percentage of the Fraction), d25 (g/ml) (density), 𝜂𝐷25 (Refractive Index), and γM (Molar Refraction)

Results and Discussion
121
4.10. Catalytic degradation of WEPS using Zn impregnated catalysts
i. Effect of percentage of precursor active metal center
The degradation of WEPS was carried out using Zn impregnated catalysts i.e., Zn-Al₂O₃,
Zn-Mmn and Zn-AC. The degradation experiments were conducted with the optimized
parameters for Zn catalyst i.e., 450 ºC degradation temperature, 120 min reaction time and
1:0.3 polymer to catalyst ratio. WEPS were degraded by 5%, 10%, 15%, 20%, and 25% of
Zn impregnation as precursor metal over Al₂O₃, Mmn and AC supports. The results of the
analysis are shown in Fig. 4.10.1. The yield of liquid products increased with the increase
of impregnated metal (Zn) percentage. The high activity of supported catalyst is due to the
availability of more reaction site for the degradation of WEPS into liquid products [16].
The yield of liquid products was maximum with 20% of the impregnated Zn catalysts for
all the three supports. The maximum yield of liquid products was 90.20 ± 0.35 wt.%, 84.53
± 0.12 wt.% and 84.13 ± 0.23 wt.% using Zn-Al₂O₃, Zn-Mmn and Zn-AC catalysts
respectively, with 100% total yield in all cases.
The maximum yield of liquid products at optimized conditions of temperature, time and
feed to catalysts ratio was 96.97 ± 0.42 wt.%, 90.20 ± 0.35 wt.%, 84.53 ± 0.12 wt.% and
84.13 ± 0.23 wt.% with Zn, 20% Zn-Al₂O₃, 20% Zn-Mmn and 20% Zn-AC catalysts,
respectively, with 100% total conversion in all cases. Comparison of optimum reaction
conditions and yield of products is given in Table 4.10.1. The activity of catalysts for
maximum yield of liquid products was in the order, Zn > 20% Zn-Al₂O₃ > 20% Zn-Mmn
> 20% Zn-AC. The activity of Zn catalysts was higher than reported by Ukei et al., [11]
with BaO catalyst and the activity of supported catalysts was also more than of their
reported catalysts, not only on the basis of products yield but also on the basis of
degradation temperature and reaction time. Moreover, the current degradation of WEPS
was carried out without the use of any solvent, which has been used in literature which also
increase the cost of the method [33]. Among the used catalysts, the activity of liquid

Results and Discussion
122
products was higher with Zn catalysts but the aim of the study was not only activity but
also selectivity with ultimate aim of low cost method.
Table 4.10.1 Optimum reaction conditions and contents of product 20% Zn-Al₂O₃, 20%
Zn-Mmn and 20% Zn-AC catalysts
20% Zn-Al₂O₃ 20% Zn-Mmn 20% Zn-AC
Reaction conditions
Temperature (⁰C) 450 450 450
Time (min) 120 120 120
Polymer to catalyst ratio 1:0.3 1:0.3 1:0.3
Contents of product (wt.%)
Liquids 90.20 ± 0.35 84.53 ± 0.12 84.13 ± 0.23
Gases 9.70 ± 0.35 15.40 ± 0.12 15.80 ± 0.23
Residue 0.00 ± 0.00 0.00 ± 0.00 0.00 ± 0.00
Total conversion 100 100 100

Results and Discussion
123
Figure 4.10.1 Effect of percentage of impregnated precursor metal (Zn) over Al₂O₃, Mmn
and AC supports for maximum liquid products
ii. Composition of derived liquid products and selectivity of its components
Highly dispersed Zn supported catalysts showed high activity than simple bulk catalysts
for the pyrolysis of PS. Acidic supports with Lewis acids have been reported with both
Lewis and Brönsted acidic sites active for pyrolysis [37]. ZnCl₂ dispersion over different
supports also results in the formation of acidic catalysts. The cracking of WEPS with acidic
catalysts is of carbonium nature involve with the attack of proton associated with a
Brönsted acid site to rings of PS [17, 18]. The reaction is followed by β-scission and a
hydrogen transfer to form styrene or lower aromatic fragments, the possible reaction
pathways toward most of the component products have been reported in the literature [14].
The GC-MS analysis of liquid products (WEPS degraded products) was carried out to
identify the component compounds. The GC-MS analysis results are given in Table 4.10.2,
while the GC-MS chromatograms are shown in Figs. 4.10.2-4.10.4 for 20% Zn-Al₂O₃,

Results and Discussion
124
20% Zn-Mmn and 20% Zn-AC catalysts, respectively. Styrene, ethylbenzene, toluene,
benzene, 1,1'-(1,3-propanediyl)bis, benzene, 3-butynyl were the major products along with
some other products. The data reveal that styrene monomer was the major component with
all the catalysts i.e. 62.88 wt.%, 46.16 wt.% and 42.72 wt.% with 20% Zn-Al₂O₃, 20% Zn-
Mmn, 20% Zn-AC, respectively. The compositions of benzene, toluene, styrene and α-
methylstyrene were maximum with 20% Zn-Al₂O₃ catalyst i.e. 0.72 wt.%, 11.79 wt.%,
7.35 wt.%, 62.88 wt.% and 4.58 wt.%, respectively, with small range of products. The yield
of these low molecular weight aromatic hydrocarbons using 20% Zn-Al₂O₃ catalyst is due
the successful depolymerization of WEPS into styrene monomer but the high activity of
the catalysts also cause further cracking of styrene monomer leading to production of
benzene & toluene, and upon hydrogenation of leads to the formation of ethylbenzene [11,
17].
Dimeric species like benzene, 1,1'-(1,2-ethanediyl)bis, benzene, 1,1'-(1-methyl-1,2-
ethanediyl)bis were formed with 20% Zn-Mmn, 20 % Zn-AC catalysts maximum with
20% Zn-Mmn catalyst. The formation of dimeric species with supported catalyst may be
attributed to the combination of thermal transformation, which not only produce styrene
monomer but also produce styrene dimers [11] and also other oligomers [23, 38, 39].
Benzene was maximum with 20% Zn-Al₂O₃ catalyst, ethylbenzene was maximum with
20% Zn-AC catalyst where high molecular weight aromatic hydrocarbons like benzene, 3-
butynyl; benzene, (1-methyl-3-butenyl) and 1,2-propanediol, 3-benzyloxy-1,2-diacetyl
were maximum with 20% Zn-Mmn and 20% Zn-AC catalysts. The presence of oxygenated
aromatic products is attributed to the presence of contamination in WEPS sample or might
be produced due to the reaction of products with atmospheric oxygen at elevated
temperature [10]. Among the Zn impregnated catalysts 20% Zn-Al₂O₃ was found with
better selectivity of component products. The selectivity and yield of component products
were compared with literature reported methods. The selectivity of low molecular weight
aromatic hydrocarbons such as benzene, toluene and ethylbenzene increased, especially in
the case of 20% Zn-Al₂O₃ catalysts. The selectivity of styrene monomer was higher than
reported literature methods using cost effective conditions and materials [11, 33].

Results and Discussion
125
Table 4.10.2 Products formed by the catalytic degradation of WEPS using 20% Zn-
Al₂O₃, 20% Zn-Mmn and 20% Zn-AC catalysts
S.No. Products
Composition (wt.%)
20% Zn-
Al₂O₃
20% Zn-
Mmn
20% Zn-
AC
1 Benzene 0.72 0.55 0.54
2 Toluene 11.79 7.16 7.79
3 2-Pentanone, 4-hydroxy-4-methyl- 0.60 0.67 0.00
4 Ethylbenzene 7.35 3.28 11.13
5 Styrene 62.88 46.16 42.72
6 .α.-Methylstyrene 4.58 0.00 3.55
7 Naphthalene 0.82 0.72 0.00
8 Benzene, 1,1'-(1,2-ethanediyl)bis 0.00 4.41 2.22
9 Benzene, 1,1'-(1-methyl-1,2-
ethanediyl)bis 0.00 2.06 1.27
10 Benzene, 1,1'-(1,3-propanediyl)bis 0.00 0.48 1.23
11 Phenanthrene 0.00 0.55 0.00
12 Benzene, 3-butynyl 0.00 7.87 5.00
13 Benzene, (1-methyl-3-butenyl) 0.00 0.72 0.47
14 Anthracene 0.00 0.61 0.60
15 2-Phenylnaphthalene 0.00 1.25 1.93
16 1,2-propanediol, 3-benzyloxy-1,2-
diacetyl 0.00 0.62 0.95
17 1,1':3,1''-Terphenyl, 5'-phenyl 0.00 0.00 1.15
Other hydrocarbons 1.56 4.76 5.42
Gases (Wt.%) 9.70 18.13 14.03
Residue (Wt.%) 0.00 0.00 0.00

Results and Discussion
126
Figure 4.10.2 Chromatogram of catalytically derived liquid products obtained with 20%
Zn-Al₂O₃ catalyst at optimized conditions
Figure 4.10.3 Chromatogram of catalytically derived liquid products obtained with 20%
Zn-Mmn catalyst at optimized conditions

Results and Discussion
127
Figure 4.10.4 Chromatogram of catalytically derived liquid products obtained with Zn-
AC catalyst at optimized conditions

Results and Discussion
128
4.11. Catalytic degradation of WEPS using Al, Al₂O₃ and AlCl₃ catalysts
i. Effect of temperature
WEPS samples were degraded in the temperature range varies from 250 ºC to 500 ºC, and
the results are shown in Fig. 4.11.1. During optimization of temperature other reaction
conditions were as follow: for Al catalyst; reaction time 60 min, polymer to catalyst ratio
1:0.2, for Al₂O₃ and for AlCl₃ catalysts; reaction time 30 min, polymer to catalyst ratio
1:0.2. The results show that as the temperature was increased from 250 ºC to 500 ºC the
yield of liquid products also increased from 0.00 to 91.53 ± 2.27 wt.% in the case of Al
catalyst, from 0.00 to 80.20 ± 1.91 wt.% in the case of Al₂O₃ catalyst and from 0.00 to
93.47 ± 0.50 wt.% in the case of AlCl₃ catalyst with associated decrease of gases. The
maximum yield of liquid products in the case of Al catalyst was 91.53 ± 2.27 wt.% (100%
total conversion) at 500 ºC, while the maximum yield of liquid products in the case of
Al₂O₃ and AlCl₃ was 80.20 ± 1.19 wt.% (100% total conversion) and 93.47 ± 0.50 wt.%
(100% total conversion), respectively at 450 ºC. Among the three catalysts, the yield of
liquid products was high using AlCl₃ with relatively low degradation temperature.

Results and Discussion
129
Figure 4.11.1 Effect of temperature and comparison of catalytically derived liquid
products obtained with Al, Al₂O₃ and AlCl₃ catalysts
ii. Effect of time
WEPS samples were degraded using time intervals of 30 min, 60 min, 90 min, 120 min
and 150 min keeping other parameters constant. For Al catalyst the degradation
temperature was 500 ºC and polymer to catalyst ratio 1:0.2 while for Al₂O₃ and AlCl₃
catalysts; degradation temperature 450 ºC and polymer to catalyst ratio 1:0.2 were used.
The results of these experiments are shown in Fig. 4.11.2. The results shows that increasing
reaction time from 30 min to 60 min, the yield of liquid products increased in the case of
Al catalyst from 85.07 ± 2.58 wt.% to 91.53 ± 2.27 wt.% and in the case of Al₂O₃ from
80.20 ± 1.91 wt.% to 87.00 ± 0.80 wt.% where beyond 60 min no change in liquid products
was observed or a decrease occurred because of large residence time causing further
cracking of the products to gaseous compounds. The maximum yield of liquid products

Results and Discussion
130
was achieved with a 60 min reaction time in the case of Al (91.53 ± 2.27 wt.%) and Al₂O₃
(87.00 ± 0.80 wt.%) catalysts with 100% total conversion. For AlCl₃ catalyst maximum
liquid product was (93.47 ± 0.50 wt.%) achieved in 30 min reaction time with 100% total
conversion. Among the catalysts maximum liquid was achieved with AlCl₃ catalyst.
Figure 4.11.2 Effect of reaction time and comparison of catalytically derived liquid
products obtained with Al, Al₂O₃ and AlCl₃ catalysts at optimized
conditions
iii. Effect of polymer to catalyst ratio
The effect of polymer to catalysts ratio was investigated for the degradation of WEPS. The
catalysts were used in mixture of polymer to catalyst ratio of 1:0.1 to 1:0.5 using optimized
degradation temperature and reaction time for each catalyst. The results are shown in Fig.
4.11.3. It was observed that the change in polymer to catalyst ratio does not increase the
liquid products substantially, however an increase in the yield of liquid products was

Results and Discussion
131
observed up to 1:0.2 for all the catalysts. Decreasing/increasing the polymer to catalyst
ratio from 1:0.2 decreased the product in the case of Al₂O₃ and AlCl₃ catalysts. The yield
of liquid products was 90.13 ± 1.45 wt.%, 87.00 ± 0.80 wt.% and 93.47 ± 0.50 wt.% using
Al, Al₂O₃ and AlCl₃ catalysts, respectively. In the case of Al catalyst, 1:0.1 was taken
optimum viewing the cost of the method where in the case of Al₂O₃ and AlCl₃ 1:0.2
polymer to catalyst ratio was taken optimum. A comparison of reaction conditions and
contents of products using Al, Al₂O₃ and AlCl₃ catalysts are given in Table 4.11.1.
Table 4.11.1 Optimum reaction conditions and contents of products using Al, Al₂O₃ and
AlCl₃ catalysts
Catalysts Al Al₂O₃ AlCl₃
Reaction conditions
Temperature (ºC) 500 450 450
Time (min) 60 60 30
Polymer to catalyst ratio 1:0.2 1:0.2 1:0.2
Contents of products (wt.%)
Liquids 91.53 ± 2.27 87.00 ± 0.80 93.47 ± 0.50
Gases 8.47 ± 22.7 13.00 ± 0.80 6.53 ± 0.50
Residue 0.00 ± 0.00 0.00 ± 0.00 0.00 ± 0.00
Total percent conversion 100 100 100

Results and Discussion
132
Figure 4.11.3 Effect of polymer to catalyst ratio and comparison of catalytically derived
liquid products obtained with thermal degradation, Al, Al₂O₃ and AlCl₃
catalysts at optimized conditions
iv. Composition of derived liquid products and selectivity of its components
GC-MS was used for the identification of component products of the derived liquid
obtained from degradation of WEPS using Al, Al₂O₃ and AlCl₃ catalysts. The analysis in
term of weight percent of the WEPS degraded is given in Table 4.11.2 and GC-MS
chromatograms are shown in Figs. 4.11.4-4.11.6. The data obtained shows 16 different
compounds with toluene; ethylbenzene; styrene; α-methylstyrene; benzene, 3-butynyl and
1,2-propanediol, 3-benzyloxy-1,2-diacetyl as major components along with trace
compounds, which were entirely aromatic hydrocarbons.
Al and AlCl₃ catalysts were found with higher selectivity than Al₂O₃. The use of these
catalysts decreased the yield of gases and high molecular weight aromatic hydrocarbons to

Results and Discussion
133
desirable and low molecular weight aromatic hydrocarbons like benzene, toluene,
ethylbenzene, styrene and α-methylstyrene. Al and AlCl₃ act as heterogeneous acid and
had higher selectivity than acidic Al₂O₃. It was observed that catalyst nature and properties
have an important role in the selectivity of products, where literature has reported the role
of catalyst in the degradation of WEPS and selectivity of products [6, 21].
Heterogeneous acidic catalysts initiate the process of degradation production of carbonium
ion. This resulting ion may further undergo β-scission followed by a hydrogen transfer,
toward different possible products. The reaction mechanism is reported by Audisio et al.
[17, 18] for Lewis acid catalyst like AlCl₃. The degradation of PS starts with the
elimination of the proton, which depend on the strength and electronegativity of the Lewis
acid, followed by β-cleavage of C-C bond [34]. The yield of styrene monomer was 47.89
wt.% with Al catalyst and was 45.65 wt.% and 46.58 wt.% with Al₂O₃ and AlCl₃ catalysts,
the yield of styrene monomer was much higher than thermal degradation. Also other light
weight aromatic hydrocarbons like toluene (4.36 wt.%) and ethylbenzene (7.01 wt.%) were
maximum with AlCl₃. The higher amount of toluene and ethylbenzene are due to the
further degradation of styrene monomer and into other light weight aromatic hydrocarbons.
However, AlCl₃ was found to have high activity for the production of liquid products and
selectivity of desirable product, decreasing the yield of gases to 6.53 wt.%.

Results and Discussion
134
Table 4.11.2 Products formed by the catalytic degradation of WEPS using Al, Al₂O₃ and
AlCl₃ catalysts at optimized conditions
S.No. Products Composition (wt.%)
Al Al₂O₃ AlCl₃
1 Toluene 3.23 2.58 4.36
2 Ethylbenzene 1.47 1.40 7.01
3 Styrene 47.89 45.65 46.58
4 Benzene, (1-methylethyl)- 0.04 0.03 1.07
5 α-Methylstyrene 1.32 1.11 0.64
6 α-Chloro-o-xylene 0.00 0.00 4.70
7 Benzene,1,1'-(1,1,2,2-tetramethyl-
1,2-ethanediyl)bis 0.00 0.00 3.75
8 Benzene, 1,1'-(1,2-ethanediyl)bis 1.44 0.94 0.52
9 Benzene, 1,1'-(1,3-propanediyl)bis 0.70 0.98 1.88
10 Benzene, 3-butynyl 14.64 14.29 3.81
11 Benzene, (1-methyl-3-butenyl) 0.64 0.72 0.60
12 Tetracyclo[4,2,1,0(3,7),0(2,9)]non-4-
ene, 4-phenyl 0.20 0.00 0.76
13 Benzene, 1,1'-(2-methyl-1-
propenylidene)bis 0.11 0.00 1.24
14 2-Phenylnaphthalene 0.50 0.45 0.56
15 1,2-propanediol, 3-benzyloxy-1,2-
diacetyl 14.57 13.75 7.68
16 1-Propene, 3-(2-cyclopentenyl)-2-
methyl-1,1-diphenyl 0.04 0.00 1.61
Other hydrocarbons 4.63 5.12 6.64
Gases (Wt.%) 8.47 13.00 6.53
Residue (Wt.%) 0.00 0.00 0.00

Results and Discussion
135
Figure 4.11.4 Chromatogram of catalytically derived liquid products obtained with Al
catalyst at optimized conditions
Figure 4.11.5 Chromatogram of catalytically derived liquid products obtained with Al₂O₃
catalyst at optimized conditions

Results and Discussion
136
Figure 4.11.6 Chromatogram of catalytically derived liquid products obtained with AlCl₃
catalyst at optimized conditions
v. Separation of the products using fractional distillation
The liquid products obtained under optimized condition were collected in bulk for all
catalysts and were separated on the basis of boiling point using fractional distillation.
Fractional distillation was carried out in the same heating assembly with slight
modification in the reactor with top quick fit beads condenser and fitted thermometer.
Different fractions obtained at different temperature were characterized using
physiochemical parameter like density (d25), refractive index (𝜂𝐷25), and molar refraction
(γM) for the identification of fractions or component products, the result of the analysis are
given in Table 4.11.3. The components of product were identified by GC-MS analysis.
Physiochemical and GC-MS characterization data of component products suggest that
further cracking of high molecular weight aromatic hydrocarbons and/or condensation
followed by conversion to other products. The yield of toluene, ethylbenzene and α-
methylstyrene were observed to increase for all liquid products. The yield of these
components along with benzene that is only formed with the liquid product obtained with

Results and Discussion
137
AlCl₃ catalyst is believed to be due to further cracking of high molecular weight aromatic
hydrocarbons [14]. The yield of styrene increased from 47 wt.% to 50 wt.% and form 45
wt.% to 51 wt.% in the case of liquid product of Al and Al₂O₃ catalysts, respectively, where
the yield of styrene monomer decreased from 46.48 wt.% to 28 wt.% for liquid product
with strong Lewis acid i.e., AlCl₃ catalyst, in the case of this liquid product the yield of
1,1’-(1,3-propanediyl)bis (styrene dimer) increased and it might be because of the
condensation or polymerization followed by degradation into dimer. 2-Phenylnaphthalene
and 1,1':3,1"-Terphenyl, 5'-phenyl were formed and separated with all the liquid products
obtained with all the three catalysts. The yield of these products is believed to be due to the
cyclization/dehydrogenation reaction of the radicals formed, the same is also reported by
McNeil et al. [24, 40]. The formation of these head to head compounds and condense
aromatic hydrocarbons is believed due to their low activation energies [12, 13, 24]. Among
the used catalysts Al powder and Al₂O₃ was found good for the recovery of toluene,
ethylbenzene, styrene and α-methylstyrene like products. Where AlCl₃ catalyst is suitable
for the maximum recovery of benzene, toluene and ethylbenzene only.
Density and refractive index of the fractions obtained from the fractional distillation of
liquid products derived from catalytic degradation of WEPS were measured, their molar
refractions were calculated and the results are given in Table 4.11.3. The data of molar
refraction was compared with that of standard compounds and found in close agreement
(Table 4.5.3 in section 4.5 (Page 82)).

Results and Discussion
138
Table 4.11.3 Physiochemical parameters of the fractions obtained using fractional distillation of the liquid derived from the
degradation of WEPS using Al, Al₂O₃ and AlCl₃ catalysts
Compound
Al Al₂O₃ AlCl₃
%age d25
(g/ml) 𝜼𝑫
𝟐𝟓 γM %age d25
(g/ml) 𝜼𝑫
𝟐𝟓 γM %age d25
(g/ml) 𝜼𝑫
𝟐𝟓 γM
Benzene 0.00 - - - - - - - 6.0 0.9023 1.5158 26.1386
Toluene 14.00 0.875 1.4970 30.8138 13.0 0.9266 1.5299 30.7117 17.0 0.9214 1.5239 30.5920
Ethylbenzene 8.00 0.833 1.4790 36.1427 4.0 0.8730 1.4983 35.6661 26.0 0.9001 1.5299 36.4300
Styrene 50.00 0.90722 1.5452 36.3072 51.0 0.8994 1.5400 36.3323 28.0 0.9032 1.5416 36.2686
α-Methylstyrene 13.00 0.9069 1.5321 40.3865 9.0 0.9307 1.5479 40.3237 - - - -
Benzene, 1,1'-(1,3-
propanediyl)bis 0.00 - - - - - - - 7.0 0.9844 1.5594 64.4190
Benzene, 3-butynyl 0.00 - - - 12.0 0.9354 1.5259 42.7145 - - - -
2-Phenylnaphthalene 7.0 1.0800 1.6389 68.0511 4.0 1.0820 1.6476 68.6583 7.0 1.1008 1.6623 68.6919
1,1':3,1"-Terphenyl, 5'-
phenyl 8.0 1.0740 1.5921 96.5550 7.0 1.0800 1.6201 99.6687 9.0 1.0803 1.5930 96.1105
Where %age (Percentage of the Fraction), d25 (g/ml) (density), 𝜂𝐷25 (Refractive Index), and γM (Molar Refraction)

Results and Discussion
139
4.12. Catalytic degradation of WEPS using Al impregnated catalysts
i. Effect of percent of precursor active metal center
The degradation of WEPS was carried out using Al impregnated catalysts i.e. Al-Al₂O₃,
Al-Mmn and Al-AC catalysts. The degradation experiments of WEPS samples were
carried out using optimized parameters of Al as catalyst (500 ºC degradation temperature,
120 min reaction time and 1:0.2 polymer to catalyst ratio). The effect of the impregnation
percentage of the precursor metal (Al) was optimized over Al₂O₃, Mmn and AC supports.
Al impregnated catalyst (5% to 25%) over Al₂O₃, Mmn and AC were applied for the
degradation of WEPS, the results are shown in Fig. 4.12.1.
In the case of Al-Al₂O₃ and Al-AC catalysts the yield of liquid products increased with the
increase of percentage of precursor metal (Al) and reached to maximum with the use of
20% of Al with further increase no significant changes in liquid product was observed. The
yield of liquid products with 20% Al-Al₂O₃ catalysts was 91.20 ± 0.35 wt.% and with 20%
Al-AC catalysts were 88.87 ± 0.81%. Using Al-Mmn catalyst, the yield of liquid products
was 89.60 ± 0.20 wt.% maximum with 5% Al-Mmn catalysts and does not changed with
the increase of Al percentage over Mmn support. The maximum yield of liquid products
was 91.20 ± 0.35 wt.%, 89.60 ± 0.20 wt.% and 88.87 ± 0.81 wt.% with 100%, 92% and
100% total conversion using 20% Al-Al₂O₃, 5% Al-Mmn and 20% Al-AC catalysts,
respectively. A comparison of optimum reaction conditions and yield of products is given
in Table 4.12.1.

Results and Discussion
140
Table 4.12.1 Optimum reaction conditions and contents of product using 20% Al-Al₂O₃,
5% Al-Mmn and 20% Al-AC catalysts
20% Al-Al₂O₃ 5% Al-Mmn 20% Al-AC
Reaction conditions
Temperature (ºC) 500 500 500
Time (min) 60 60 60
Polymer to catalyst ratio 1:0.2 1:0.2 1:0.2
Contents of product (wt.%)
Liquids 91.20 ± 0.35 89.60 ± 0.20 88.87 ± 0.81
Gases 8.70 ± 0.35 2.40 ± 0.00 10.70 ± 0.81
Residue 0.00 ± 0.00 8.00 ± 0.20 0.00 ± 0.00
Total conversion 100.00 92.00 100.00
Figure 4.12.1 Effect of percentage of impregnated precursor metal (Al) over Al₂O₃, Mmn
and AC supports for maximum liquid products

Results and Discussion
141
ii. Composition of derived liquid products and selectivity of its components
The maximum liquid products obtained with 20% Al-Al₂O₃, 5% Al-Mmn and 20% Al-AC
was subjected to GC-MS analysis. The data obtained from the analysis was compared with
spectral libraries to identify the components of liquid products. The yield of compounds
was expressed in terms of wt.% of WEPS employed instead of wt.% of the oil. For the
calculation of yield in wt.% Eq. 4.6.1 of section 4.6 (Page 87) was used. The results of the
analysis are tabulated in Table 4.12.2 and GC-MS chromatograms for each liquid are given
in Fig. 4.12.2-4.12.4 for 20% Al-Al₂O₃, 5% Al-Mmn and 20% Al-AC catalysts,
respectively. The yield of lower molecular weight aromatic hydrocarbons was maximum
with impregnated catalysts. Toluene, ethylbenzene, styrene, α-methylstyrene, benzene,
1,1’(1,1,2,2-tetramethyl-1,2-ethanediyl)bis, benzene, 3-butynyl and 1,2-propanediol, 3-
benzyloxy-1,2-diacetyl were the major and prominent constituents with almost all the
catalysts used in the experiments. The yield of benzene was very small with Al impregnated
catalysts i.e., 1.13 wt.%, 0.81 wt.% and 1.42 wt.% with 20% Al-Al₂O₃, 5% Al-Mmn and
20% Al-AC catalysts, respectively. The yield of toluene was highest with 20% Al-Al₂O₃
(9.47 wt.%) where ethylbenzene was 8.90 wt.% maximum with 20% Al-AC. Styrene
monomer was the major component of the degradation products as it was 56.52 wt.%,
49.28 wt.% and 47.29 wt.% with 20% Al-Al₂O₃, 5% Al-Mmn and 20% Al-AC catalysts,
respectively. Styrene monomer was maximum (56.52 wt.%) with 20% Al-Al₂O₃. The yield
of benzene, 3-butynyl was 0 wt.%, 5.58 wt.% and 4.94 wt.%, 1,2-propanediol, 3-
benzyloxy-1,2-diacetyl was 0 wt.%, 0 wt.% and 1.55 wt.% with 20% Al-Al₂O₃, 5% Al-
Mmn and 20% Al-AC catalysts, respectively. The percent composition of α-methylstyrene
was 1.72 wt.%, 2.80 wt.% and 1.38 wt.% and the percent composition of benzene,
1,1,’(1,2-ethanediyl)bis was 0 wt.%, 3.56 wt.% and 1.35 wt.% with 20% Al-Al₂O₃, 5%
Al-Mmn and 20% Al-AC catalysts, respectively. Beside these, many other compounds
were formed by the degradation of WEPS using Al impregnated catalysts. Lewis acid
supported catalyst like AlCl₃ act as a heterogeneous solid super acid in reactions [41, 42],
where the acidic supports with Lewis acid have also been reported with both Lewis acid
and Brönsted sites [37]. Highly dispersed Al catalyst over different support actively
degrade PS depending on their acidic strength and nature of the sites. The yield of styrene,

Results and Discussion
142
toluene, ethylbenzene and α-methylstyrene with different routes have been reported by
many researchers [11, 17, 18, 43].
Nano-crystalline 20% Al-Al₂O₃ catalyst have exposed active center for resulting in the
formation of products in low molecular weight aromatic hydrocarbon region with high
contents of styrene, toluene, and ethylbenzene like components. The presence of oxygen
containing compounds may have sources of atmospheric oxygen action with reaction
products or due to any residue present in the PS samples.
The results of degradation of WEPS were compared with that of Table 4.8.3, the data in
the table are converted by the formula given in Eq. 4.6.1 of section 4.6 (Page 87).
According to the findings the yield of benzene and toluene was higher by 20% Al-Al₂O₃
than the reported catalysts, where the yield of styrene monomer was approximately the
same with 9% K2O/Si-MCM-41 [5] it was less than that of Fe-K/Al₂O₃ [16] and so for α-
methylstyrene. The yield of low molecular weight aromatic hydrocarbons was greater
using 20% Al-Al₂O₃ as compared to the reported catalysts by literature [5, 16].

Results and Discussion
143
Table 4.12.2 Products formed by WEPS degradation using Al impregnated catalysts at
optimized conditions
S. No. Products
Composition (wt.%)
20% Al-
Al₂O₃
5% Al-
Mmn
20% Al-
AC
1 Benzene 1.13 0.81 1.42
2 Toluene 9.47 8.49 8.49
3 3-Hexen-2-one 6.10 0.00 0.00
4 2-Pentanone, 4-hydroxy-4-methyl- 0.96 0.88 0.34
5 Ethylbenzene 5.55 5.13 8.90
6 5-Hexene-2-one 5.12 0.00 0.00
7 Styrene 56.32 49.28 47.29
8 Benzene, (1-methylethyl)- 0.24 0.28 0.76
9 .α.-Methylstyrene 1.71 2.80 1.38
10 Indene 0.71 0.00 0.00
11 .α.-Chloro-o-xylene 0.74 0.00 1.86
12 Benzene,1,1'-(1,1,2,2-tetramethyl-
1,2-ethanediyl)bis
1.94 0.20 1.27
13 Naphthalene 0.74 0.62 0.44
14 Benzene, 1,1'-(1,2-ethanediyl)bis 0.00 3.56 1.35
15 Benzene, 1,1'-(1-methyl-1,2-
ethanediyl)bis
0.00 1.69 0.97
16 Benzene, 3-butynyl 0.00 5.58 4.94
17 Benzene, (1-methyl-3-butenyl) 0.00 0.55 0.44
18 Anthracene 0.00 0.60 0.30
19 2-Phenylnaphthalene 0.00 1.84 1.77
20 1,2-propanediol, 3-benzyloxy-1,2-
diacetyl
0.00 0.00 1.55
21 Other hydrocarbons 0.57 7.30 5.81
Gases (Wt.%) 8.70 2.40 10.70
Residue (Wt.%) 0.00 8.00 0.00

Results and Discussion
144
Figure 4.12.2 Chromatogram of catalytically derived liquid products obtained with 20%
Al-Al₂O₃ catalyst at optimized conditions
Figure 4.12.3 Chromatogram of catalytically derived liquid products obtained with 5%
Al-Mmn catalyst at optimized conditions

Results and Discussion
145
Figure 4.12.4 Chromatogram of catalytically derived liquid products obtained with 20%
Al-AC catalyst at optimized conditions

Results and Discussion
146
4.13. Catalytic degradation of WEPS using Cu, CuO and CuCl₂ catalysts
i. Effect of temperature
Many of the previous reported methods have the limitation of fixed temperature [4-7]. The
current study was conducted using Cu, CuO and CuCl₂ as catalysts for the catalytic
degradation of WEPS in the range of 250 ºC to 500 ºC (Fig. 4.13.1) keeping 30 min reaction
time and 1:0.2 polymer to catalyst ratio. The degradation reaction started at 245 ºC with
the production of small amounts of gases, but the collection of liquid products started at
300 ºC in the case of CuO catalyst and started at 350 ºC in the case of Cu & CuCl₂ catalysts.
It was observed that with the increase of degradation temperature up to 450 ºC, the yield
of liquid products increased and beyond this temperature no significant change in the yield
of liquid product was observed. At 450 ºC the yield of liquid products was 91.53 ± 0.83
wt.% (97.53% total conversion), 90.27 ± 0.50 wt.% (98.07% total conversion) and 91.40
± 2.99 wt.% (91.40% total conversion) for Cu, CuO and CuCl₂ catalysts, respectively.

Results and Discussion
147
Figure 4.13.1 Effect of degradation temperature and comparison of catalytically derived
liquid products obtained with Cu, CuO and CuCl₂ catalysts
ii. Effect of time
Time is another parameter which affects the yield of liquid products, where most of the
work related to WEPS degradation has been carried out with fix reaction time while in
some methods time has no effect on the yield of liquid products [5, 7]. The Effect of
reaction time was optimized for the catalytic degradation of WEPS from 30 min to 150 min
at an optimum degradation temperature (450 ºC) using 1:0.2 polymer to catalyst ratio. The
results of the analysis are depicted in Fig. 4.13.2. As can be seen from the result that the
yield of liquid products was not affected with the increase of reaction time from 30 min to
150 min. The yield of liquid products was 91.53 ± 0.83 wt.% (97.53% total conversion),
90.27 ± 0.50 wt.% (98.07% total conversion) and 91.40 ± 2.99 wt.% (100% total
conversion) with Cu, CuO and CuCl₂ catalysts, respectively. As compared to previous

Results and Discussion
148
methods the degradation of WEPS was low cost and the yield of products were high in
relatively small reaction time [11, 20].
Figure 4.13.2 Effect of reaction time and comparison of catalytically derived liquid
products obtained with Cu, CuO and CuCl₂ catalysts at optimized
conditions
iii. Effect of polymer to catalyst ratio
The economical recycling of WEPS is of global interest and for this purpose its degradation
has been carried out with a number of heterogeneous acid and base catalysts. Catalyst
selection play a major role on the activity and selectivity of the products [6, 21]. For
effective conversion catalyst to polymer ratio was varied from 1:0.1 to 1:0.5 using optimum
temperature (450 ºC) & reaction time (30 min) and the results are shown in Fig. 4.13.3. At
optimum degradation temperature and reaction time, the yield of liquid products increased
with the increase of catalyst amount in polymer to catalyst ratio. However, the yield was

Results and Discussion
149
decreased using 1:0.1 polymer to catalyst as compared to 1:0.2 polymer to catalyst ratio.
The yield of liquid products was maximum with 1:0.2 polymer to catalysts ratio and no
further increase was observed when the amount of catalysts was increased in polymer to
catalyst ratio in the case of the CuO and CuCl₂ catalysts. The yield of liquid products was
increased in the case of Cu catalyst with the increase of amount of catalyst in polymer to
catalyst ratio up to 1:0.3. The maximum yield of liquid products was 90.27 ± 0.50 wt.%
(98.07% total conversion) and 91.40 ± 2.99 wt.% (100% total conversion) with 1:0.2
polymer to catalyst ratio using CuO and CuCl₂ catalysts, respectively. The maximum yield
of liquid products was 93.93 ± 2.69 wt.% (100% total conversion) with Cu catalyst beyond
this polymer to catalyst ratio no change in the yield of liquid products was observed.
Comparison reaction conditions and contents of products using Cu, CuO and CuCl₂
catalysts is given in Table 4.13.1.
Figure 4.13.3 Effect of polymer to catalyst ratio and comparison of catalytically derived
liquid products obtained with thermal degradation, Cu, CuO and CuCl₂
catalysts at optimized conditions

Results and Discussion
150
Table 4.13.1 Optimum reaction conditions and contents of the products obtained with
Cu, CuO and CuCl₂ catalysts
Cu CuO CuCl₂
Reaction conditions
Temperature (ºC) 450 450 450
Time (min) 30 30 30
Polymer to catalyst ratio 1:0.3 1:0.2 1:0.2
Contents of product (wt.%)
Liquids 93.93 ± 2.69 90.27 ± 0.50 91.40 ± 2.99
Gases 6.07 ± 2.60 7.80 ± 1.11 8.60 ± 2.99
Residue 0.00 ± 0.00 1.93 ± 0.61 0.00 ± 0.00
Total percent conversion 100 98.07 100
iv. Composition of derived liquid products and selectivity of its components
Parent liquid products obtained from the degradation of WEPS using Cu, CuO and CuCl₂
catalysts was analyzed using GC-MS (Fig. 4.13.4-4.13.6). The results reveal the presence
of 14 major components where styrene monomer was predominant specie along with
benzene, 3-butynyl and 1,2-propanediol, 3-benzyloxy-1,2-diacetyl. The results of the
analysis and its comparison with thermal degradation are shown in Table 4.13.2 in terms
of weight percent of the liquid applied. The yield of styrene was maximum in all the three
catalytically derived liquid as compared to thermal degradation, where the yield of styrene
monomer was 55.14 wt.% and 55.53 wt.% maximum with acidic catalysts i.e., Cu and
CuCl₂, respectively. The yield of styrene monomer was lower with basic catalyst (CuO).
CuCl₂ is a Lewis acid that initiates the degradation of WEPS with elimination of proton
from benzyl position and the reaction further proceed via β-cleavage of the polymer
backbone [14, 34]. Among the used catalysts, high acidic catalyst CuCl₂ was found with
good selectivity toward light weight aromatic hydrocarbons. The yield of toluene (4.87
wt.%), ethylbenzene (6.31 wt.%) was maximum with CuCl₂ catalyst having negligible
amount of other high molecular weight aromatic hydrocarbons. The production of styrene
and its dimer with acidic catalysts is due to the β-scission of C-C bonds or simple

Results and Discussion
151
depolymerization [11]. The high amount of toluene and ethylbenzene is believed to be
formed by further cracking of styrene monomer and hydrogenation [17, 20]. The yield of
oxygenated products may be due to the reaction carried out in atmospheric oxygen [10].
The yield of liquid products was almost the same with a Cu group of catalysts with benefits
of low reaction time and present a cost effective method having better selectivity for styrene
monomer than reported by Ukie et al [11].
Table 4.13.2 Products formed by the catalytic degradation of WEPS using Cu, CuO and
CuCl₂ catalysts at optimized conditions
S.No. Products Composition (wt.%)
Cu CuO CuCl₂
1 Toluene 0.00 1.81 4.87
2 Ethylbenzene 0.49 0.73 6.31
3 Styrene 55.14 52.37 55.53
4 α-Methylstyrene 0.00 1.13 0.99
5 Benzene,1,1'-(1,1,2,2-tetramethyl-
1,2-ethanediyl)bis
0.00 0.00 1.67
6 Benzene, 1,1'-(1,3-propanediyl)bis 1.06 0.65 2.45
7 Benzene, 3-butynyl 17.07 11.54 2.65
8 Benzene, (1-methyl-3-butenyl) 0.79 0.58 0.51
9 Tetracyclo[4,2,1,0(3,7),0(2,9)]non-4-
ene, 4-phenyl
0.19 0.50 1.03
10 2-Phenylnaphthalene 0.00 0.52 1.00
11 1-Propene, 3-(2-cyclopentenyl)-2-
methyl-1,1-diphenyl
0.00 0.00 1.00
12 1,2-propanediol, 3-benzyloxy-1,2-
diacetyl
16.81 15.38 0.03
13 1-Propene, 3-(2-cyclopentenyl)-2-
methyl-1,1-diphenyl
0.03 0.06 2.44
14 1,1':3,1''-Terphenyl, 5'-phenyl 0.30 1.55 0.62
Other hydrocarbons 2.06 3.45 10.30
Gases (wt.%) 6.07 7.80 8.60
Residue (wt.%) 0.00 1.93 0.00

Results and Discussion
152
Figure 4.13.4 Chromatogram of catalytically derived liquid products obtained with Cu
catalyst at optimized conditions
Figure 4.13.5 Chromatogram of catalytically derived liquid products obtained with CuO
catalyst at optimized conditions

Results and Discussion
153
Figure 4.13.6 Chromatogram of catalytically derived liquid products obtained with CuCl₂
catalyst at optimized conditions
v. Separation of the products using fractional distillation
For isolation and identification of components the liquid obtained was fractionated by
fractional distillation. The separated fractions were characterized by different
physiochemical parameters like density (d25), refractive index (𝜂𝐷25), molar refraction (γM)
and GC-MS. Physiochemical characterization of the fractions with wt.% recovery are given
in the Table 4.13.3. The data suggest that during fractional distillation condensation,
polymerization and re-degradation processes has taken place with high variation in the
component products yield and recovery.
Toluene was formed or increased for all liquids obtained by catalytic degradation, where
ethylbenzene was only increased in the liquid obtained with CuCl₂ catalyst and α-
methylstyrene form during fractional distillation in the case of liquid obtained with Cu as
a catalyst. Formation or increase in the yield of these products is due to further dissociation
of high molecular weight aromatic hydrocarbons like styrene [17, 20]. It was observed that
these products were formed or increased with associated decrease of 1,1’-(1,3-

Results and Discussion
154
propanediyl)bis; benzene, 3-butynyl and 1,2-propanediol, 3-benzyloxy-1,2-diacetyl for
liquid products of all catalysts. Styrene monomer increased for liquid product obtained
with Cu catalyst, where it decreased for liquid obtained with CuO and CuCl₂ catalysts.
This was caused by further hydrogenation of styrene into toluene or polymerization
followed by dehydrogenation/cyclization to form head to head products like, 2-
phenylnaphthalene and 1,1':3,1"-Terphenyl, 5'-phenyl [11, 24]. The yield of 2-phenone, 4-
hydroxy-4-methyl may be due to the reaction of low molecular weight open chain
hydrocarbons with atmospheric oxygen [10]. The maximum recovery of toluene was 13
wt.%, 20 wt.% and 12 wt.% with liquid product obtained with Cu, CuO and CuCl₂
catalysts, respectively. Maximum recovery of styrene monomer (60 wt.%) was achieved
from the liquid products obtained with Cu catalyst where the recovery of styrene monomer
with CuO and CuCl₂ catalysts were 47 wt.% and 52 wt.%. The Cu catalyst was found more
selective for the recovery of styrene where CuO was good for the recovery of toluene.
Refractive index and density of each fraction separated was measured for the calculation
of molar refraction and are given in Table 4.13.3. The molar refraction of fractions obtained
was compared with that of the standards compounds molar refractions (Table 4.5.3 in
section 4.5 (Page 82)) and found the results in close agreement with each other.

Results and Discussion
155
Table 4.13.3 Physiochemical parameters of the fractions obtained using fractional distillation of the liquid derived from the
degradation of WEPS using Cu, CuO and CuCl₂ catalysts
Compound
Cu CuO CuCl₂
%age d25
(g/ml) 𝜼𝑫
𝟐𝟓 γM %age d25
(g/ml) 𝜼𝑫
𝟐𝟓 γM %age d25
(g/ml) 𝜼𝑫
𝟐𝟓 γM
2-Phenone, 4-hydroxy-4-
methyl - - - - 8.0 0.9472 1.4280 31.5510 - - - -
Toluene 13.0 0.8910 1.5104 30.9496 20.0 0.8830 1.5083 31.1210 12.0 0.9176 1.5320 31.1156
Ethylbenzene - - - - - - - - 11.0 0.8730 1.4879 35.0293
Styrene 60.0 0.9038 1.5539 36.9258 47.0 0.9112 1.5469 36.2422 52.0 0.9054 1.5443 37.0175
α.-Methylstyrene 4.0 0.8820 1.5140 40.3389 - - - - - - - -
Benzene, 1,1'-(1,3-
propanediyl)bis - - - - - - - - 7.0 0.9860 1.5635 64.7027
Benzene, 3-butynyl 8.0 0.9306 1.5226 42.7089 11.0 0.9779 1.5558 42.7815 - - - -
2-Phenylnaphthalene - - - - - - - - 12.0 1.0810 1.6480 68.7554
1,1':3,1"-Terphenyl, 5'-
phenyl 15.0 1.0750 1.6189 99.9768 14.0 1.0800 1.6220 99.9135 6.0 1.0810 1.6239 100.0653
Where %age (Percentage of the Fraction), d25 (g/ml) (density), 𝜂𝐷25 (Refractive Index), and γM (Molar Refraction)

Results and Discussion
156
4.14. Catalytic degradation of WEPS using Cu impregnated catalysts
i. Effect of percentage of precursor active metal center
WEPS samples were degraded using Cu impregnated catalysts i.e., Cu-Al₂O₃, Cu-Mmn
and Cu-AC at optimum parameters like 450 ºC degradation temperature, 30 min reaction
time and 1:0.2 polymer to catalyst ratio. The catalytic activities of differing percentage of
Cu (5-25%) supported on Al₂O₃, Mmn and AC was optimized for maximum yield of liquid
products, the results of the experiments are shown in Fig. 4.14.1. The yield of liquid
products as compared to pure Cu was drastically decreased in the case of Cu impregnated
catalyst over different supports. However, the yield of liquid products increased with the
increase of impregnated precursor copper on all the three supports. In the case of Cu-Al₂O₃
and Cu-AC the yield of liquid products was maximum with 20% Cu impregnation i.e.,
86.87 ± 0.23 wt.% and 83.47 ± 0.12 wt.%, respectively with 100% total conversion. In the
case of Cu-Mmn, the maximum yield of liquids was obtained with 15% Cu impregnation
having 98.20% total conversion. Up to reaching a maximum the yield of liquid products
decreased with further increase of precursor copper impregnation. The maximum yield of
liquid products was obtained with 20% Cu-Al₂O₃, 15% Cu-Mmn and 20% Al-C catalysts
producing liquid products 86.87 ± 0.23 wt.%, 89.20 ± 0.20 wt.% and 83.47 ± 0.12 wt.%
with 100%, 98.20% and 100% total conversion, respectively.
A comparison of reaction conditions and product components using 20% Cu-Al₂O₃, 15%
Cu-Mmn and 20% Cu-AC catalysts are presented in Table 4.14.1. Thermal degradation of
WEPS was not only time and energy consuming (150 min reaction time) but also yield
small amount of liquid products. The yield of liquid products was high using Al₂O₃ (450
ºC, reaction time 60 min, Polymer to catalyst ratio1: 0.2), Mmn (450 ºC, reaction 60 min,
polymer to catalyst ratio 1:0.2) and AC (500 ºC, 30 min, polymer to catalyst ratio 1:0.1) as
a catalyst but was more expensive for its more time and energy consumption than 20% Cu-
Al₂O₃, as mentioned in section 4.6 (page 94). The yield of liquid product is important, but
the focus of the study is the maximum liquid product with selectivity in products.

Results and Discussion
157
Table 4.14.1 Comparison of reaction conditions and contents of products using 20% Cu-
Al₂O₃, 15% Cu-Mmn and 20% Cu-AC catalysts
20% Cu-Al₂O₃ 15% Cu-Mmn 20% Cu-AC
Reaction conditions
Temperature (ºC) 450 450 450
Time (min) 30 30 30
Polymer to catalyst ratio 1:0.3 1:0.3 1:0.3
Contents of product (wt.%)
Liquids 86.87 ± 0.23 89.20 ± 0.20 83.47 ± 0.12
Gases 13.00 ± 0.23 9.07 ± 0.12 16.50 ± 0.12
Residue 0.00 ± 0.00 1.73 ± 0.12 0.00 ± 0.00
Total conversion 100 98.27 100
Figure 4.14.1 Effect of percentage of impregnated precursor metal (Cu) over Al₂O₃, Mmn
and AC supports for maximum liquid products

Results and Discussion
158
ii. Composition of derived liquid products and selectivity of its components
GC-MS analysis of the liquid products obtained with 20% Cu-Al₂O₃ 15% Cu-Mmn and
20% Cu-AC shows more than 20 major compounds. The yield of compounds is expressed
in terms of wt.% of WEPS. The compounds are listed in Table 4.14.2 and their respective
GC-MS chromatograms are shown in Figs. 4.14.2-4.14.4. The table shows compounds
distribution from low to high molecular weight aromatic hydrocarbons. The selectivity of
20% Cu-Al₂O₃ was better than with 15% Cu-Mmn and 20% Cu-AC. Lewis acidic catalysts
over acidic supports bear Lewis acidic sites and some Brönsted sites too [16]. Cu
impregnated catalysts prepared by wet impregnation of active precursor Cu in the form of
CuCl₂ salt over different supports has been reported with good catalytic activities and
selectivity of products [44, 45]. Lewis acid catalysts like CuCl₂ initiate the degradation of
WEPS with the elimination of a proton from PS ring, where Brönsted acidic catalysts
initiate the degradation of WEPS by the attack of proton to generate a carbenium ion with
subsequent β-scission of C-C bonds [11]. The degradation of WEPS with Cu impregnated
catalysts is of acidic nature. The yield of styrene monomer and associated degraded
compounds like benzene, toluene, ethylbenzene and α-methylstyrene has been discussed
with possible routes and mechanism in literature [11, 17, 20]. Styrene monomer was the
maximum product with all the catalysts investigated, it was 60.48 wt.%, 48.46 wt.% and
39.39 wt.% with 20% Cu-Al₂O₃, 15% Cu-Mmn and 20% Cu-AC. 20% Cu-Al₂O₃ yielded
low molecular weight hydrocarbons and with very low selectivity of compounds with 15%
Cu-Mmn and 20% Cu-AC. Toluene was the second major compound (10.98 wt.%) with
20% Cu-Al₂O₃, while it was 9.76 wt.% and 6.55 wt.% with 15% Cu-Mmn and 20% Cu-
AC catalysts, respectively. The yield of ethylbenzene was maximum (12.92 wt.%) with
20% Cu-Mmn and it was 8.92 wt.% and 6.61 wt.% with 20% Cu-Al₂O₃ and 15% Cu-Mmn
catalysts, respectively. α-Methylstyrene was also the major product (3.66 wt.%) with 20%
Cu-Al₂O₃ and with 15% Cu-Mmn and 20% Cu-AC it was 2.75 wt.% and 2.20 wt.%,
respectively. The source of oxygenated compound is believed to be due to the reaction of
product with atmospheric oxygen or of other possible impurities present in WEPS samples.

Results and Discussion
159
20% Cu-Al₂O₃ produced mostly low molecular weight aromatic hydrocarbons in
maximum quantity with compared to the reported methods in literature (Table 4.8.3).

Results and Discussion
160
Table 4.14.2 Products formed by WEPS degradation using 20% Cu-Al₂O₃, 15% Cu-
Mmn and 20% Cu-AC catalysts at optimized conditions
S.No. Products Composition (wt.%)
20% Cu-Al₂O₃ 15% Cu-Mmn 20% Cu-AC
1 Benzene 0.00 0.82 0.82
2 Toluene 10.98 9.76 6.55
3 2-Pentanone, 4-hydroxy-4-
methyl-
0.66 1.59 0.12
4 Ethylbenzene 8.92 6.61 12.92
5 Styrene 60.48 48.46 39.39
6 Benzene, (1-methylethyl)- 0.23 0.16 0.89
7 α.-Methylstyrene 3.66 2.75 2.20
8 Benzene,1,1'-(1,1,2,2-
tetramethyl-1,2-ethanediyl)bis
0.00 0.10 0.83
9 Octane, 2,3,3-trimethyl 0.00 0.90 0.02
10 Naphthalene 0.75 0.00 0.21
11 3-Ethyl-3-methylheptane 0.00 1.48 0.30
12 Benzene, 1,1'-(1,2-ethanediyl)bis 0.00 2.47 0.83
13 Benzene, 1,1'-(1-methyl-1,2-
ethanediyl)bis
0.00 1.12 0.73
14 Benzene, 1,1'-(1,3-
propanediyl)bis
0.00 0.32 1.23
15 Phenanthrene 0.00 0.56 0.19
16 Benzene, 3-butynyl 0.00 2.68 2.89
17 Anthracene 0.00 0.75 0.14
18 Benzene, 1,1'-(2-methyl-1-
propenylidene)bis
0.00 0.19 1.24
19 2-Phenylnaphthalene 0.00 2.80 2.20
20 p-Terphenyl 0.00 0.51 0.18
21 1,2-propanediol, 3-benzyloxy-
1,2-diacetyl
0.00 0.16 1.50
22 1-Propene, 3-(2-cyclopentenyl)-
2-methyl-1,1-diphenyl
0.00 0.00 0.92
23 1,1':3,1''-Terphenyl, 5'-phenyl 0.00 0.36 0.61
Other hydrocarbons 1.31 4.66 6.61
Gases (wt.%) 13.00 9.07 16.50
Residue (wt.%) 0.00 1.73 0.00

Results and Discussion
161
Figure 4.14.2 Chromatogram of catalytically derived liquid products obtained with 20%
Cu-Al₂O₃ catalyst at optimized conditions
Figure 4.14.3 Chromatogram of catalytically derived liquid products obtained with 20%
Al-Mmn catalyst at optimized conditions

Results and Discussion
162
Figure 4.14.4 Chromatogram of catalytically derived liquid products obtained with 20%
Al-AC catalyst at optimized conditions

Results and Discussion
163
4.15. Catalytic degradation of WEPS using Fe, Fe₂O₃ and FeCl₃
catalysts
i. Effect of temperature
Temperature effect was investigated in the range of 250 ºC to 500 ºC for catalytic
degradation of WEPS using Fe, Fe₂O₃ and FeCl₃ catalysts (Fig. 4.15.1) keeping 30 min
reaction time and 1:0.2 polymer to catalyst ratio. The degradation of WEPS started with Fe
catalysts with the collection of liquid product at 250 ºC where the collection of liquid in
the case of Fe₂O₃ and FeCl₃ started at 350 ºC and 400 ºC, respectively. The yield of liquid
products increased with the increase of temperature and maximum liquid products were
88.07 ± 1.01 wt.% obtained at 450 ºC using Fe as a catalyst. The maximum yield of liquid
products was 86.27 ± 2.20 wt.% at 400 ºC in the case of Fe₂O₃ catalyst and 84.07 ± 0.46
wt.% at 500 ºC in the case of FeCl₃ catalysts. Further increase in temperature beyond
optimum did not affect the yield of liquid products and thus 450 ºC and 400 ºC was taken
optimum for Fe and Fe₂O₃ catalysts, respectively. At optimum temperatures the total
conversion was 93.33%, 96.20% and 100% for Fe, Fe₂O₃ and FeCl₃ catalysts, respectively.

Results and Discussion
164
Figure 4.15.1 Effect of degradation temperature and comparison of catalytically derived
liquid products obtained with Fe, Fe₂O₃ and FeCl₃ catalyst
ii. Effect of time
Reaction time on the degradation of WEPS was optimized in the range of 30 min to 150
min reaction time (Fig. 4.15.2) using 1:0.2 polymer to catalyst ratio and optimum
degradation temperature for each catalyst. Similar studies have been reported on the
degradation and collection of liquid products [5, 7]. The yield of liquid products was
independent of reaction time in the case of Fe and FeCl₃ catalysts and maximum liquid
was achieved at 30 min reaction time i.e., 99.07 ± 1.01 wt.% and 84.07 ± 0.46 wt.%,
respectively. The yield of liquid products increased with reaction time in the case of Fe₂O₃
catalyst and maximum liquid was achieved with 90 min reaction time. Further increase has

Results and Discussion
165
no effect on the quantity of liquid products. At optimized time the total conversion was
93.33%, 100% and 100% in the case of Fe, Fe₂O₃ and FeCl₃ catalysts, respectively.
Figure 4.15.2 Effect of reaction time and comparison of catalytically derived liquid
products obtained with Fe, Fe₂O₃ and FeCl₃ catalysts at optimized
conditions
iii. Effect of polymer to catalyst ratio
WEPS catalytic degradation was also optimized for the polymer to catalyst ratio in the
range of 1:0.1 to 1:0.5 for Fe, Fe₂O₃ and FeCl₃ catalysts using optimum temperature and
time for each catalysts .The results of the experiments are shown in Fig. 4.15.3. The yield
of liquid products decreased when the amount of catalyst was decrease in polymer to
catalyst ratio from 1:0.2 to 1:0.1 in the case of Fe and FeCl₃ catalysts. The yield of liquid
products was maximum with 1:0.1 polymer to catalyst ratio in the case of Fe₂O₃ catalysts.
The maximum yield liquid products were 88.07 ± 1.01 wt.% (97.40% total conversion),

Results and Discussion
166
91.60 ± 1.51 wt.% (100% total conversion) and 84.07 ± 0.46 wt.% (100% total conversion)
with Fe, Fe₂O₃ and FeCl₃ catalysts, respectively. Beyond the optimized value no change
in the yield of liquid products was observed.
A comparison of optimized reaction condition and maximum component products like
liquid and gas as well as residue left and total percent conversion of Fe, Fe₂O₃ and FeCl₃
catalysts are given in Table 4.15.1.
Figure 4.15.3 Effect of polymer to catalyst ratio and comparison of catalytically derived
liquid products obtained with thermal degradation, Fe, Fe₂O₃ and FeCl₃
catalysts at optimized conditions

Results and Discussion
167
Table 4.15.1 Optimum reaction conditions and contents of the product using Fe, Fe₂O₃
and FeCl₃ catalysts
Fe Fe₂O₃ FeCl₃
Reaction conditions
Temperature (⁰C) 450 400 500
Time (min) 30 90 30
Polymer to catalyst ratio 1:0.2 1:0.1 1:0.2
Contents of product (wt.%)
Liquids 88.07 ± 1.01 91.60 ± 1.51 84.07 ± 0.46
Gases 9.33 ± 1.55 8.40 ± 1.51 15.93 ± 0.46
Residue 2.60 ± 0.72 0.00 ± 0.00 0.00 ± 0.00
Total percent conversion 97.40 100 100
iv. Composition of derived liquid products and selectivity of its components
The parent liquid products obtained with Fe, Fe₂O₃ and FeCl₃ catalysts were analyzed for
component products using GC-MS. The result of the study in comparison with each other
are given in Table 4.15.2 in terms of weight percent of the WEPS degraded. The conversion
to weight percent was made using formula given in Eq. 4.6.1 of section 4.6 (Page 87) and
the GC-MS chromatograms are given in Figs. 4.15.4-4.15.6. The analysis revealed that the
yield of liquid products has up to 15 major components with maximum amount of styrene
monomer and other major amongst these 15 components were benzene, 3-butynyl and 1,2-
propanediol, 3-benzyloxy-1,2-diacetyl in all the cases.
The degradation was carried out with Fe and Fe containing catalysts in order to find
similarities of the component products, Fe and FeCl₃ with acidic nature and Fe₂O₃ with
basic nature. Fe₂O₃ with high pH was found the best catalysts for the degradation of WEPS
and production of styrene monomer where FeCl₃ with low pH (high acidity) was found to
yield maximum quantity of low molecular weight aromatic hydrocarbons. The yield of
styrene monomer was maximum 62.76 wt.% with Fe₂O₃ catalyst, where the yield of
styrene monomer was 59.78 wt.% and 49.43 wt.% with Fe and FeCl₃ catalysts,

Results and Discussion
168
respectively. The yield of toluene and ethylbenzene was maximum with FeCl₃ catalysts.
The degradation of WEPS is initiated with elimination of proton followed by subsequent
β-scission of the C-C bond [14, 34]. The low yield of styrene monomer in the case of FeCl₃
catalyst is may be due the further cracking and hydrogenation of styrene monomer into
toluene and ethylbenzene [20]. Moreover, numerous Lewis acidic sites of FeCl₃ undergo
secondary competitive reactions, producing low molecular weight and high amount of
gaseous products, decreasing the ultimate yield of styrene monomer [5, 11, 18]. On the
other hand the catalytic degradation on solid bases is initiated with the formation of
carboanions due to the elimination of a hydrogen atom of WEPS [11]. In comparison with
solid base catalysts solid acid catalysts degrade WEPS on routes identical to thermal
degradation where solid basic catalysts have been found to have greater selectivity toward
styrene monomer than solid acid catalysts [11]. In the case of the basic catalysts the yield
of toluene and ethylbenzene may be due to the carboanions formation followed by β-
scission of C-C bond and due to the formation of resulting radicals and cations [50]. Among
the used catalysts both Fe and Fe₂O₃ were found with high activity and selectivity toward
value added products.

Results and Discussion
169
Table 4.15.2 Products formed by the catalytic degradation of WEPS using thermal
degradation, Fe, Fe₂O₃ and FeCl₃ catalysts at optimized conditions
S.No. Products Composition (wt.%)
Fe Fe₂O₃ FeCl₃
1 Toluene 4.09 3.44 5.24
2 Ethylbenzene 1.68 2.46 7.17
3 Styrene 59.78 62.76 49.43
4 α-Methylstyrene 1.76 2.32 1.57
5 Benzene, 1,1'-(1,2-ethanediyl)bis 2.25 0.76 0.41
6 Benzene, 1,1'-(1-methyl-1,2-
ethanediyl)bis
0.86 0.43 0.28
7 Benzene, 1,1'-(1,3-propanediyl)bis 0.76 1.40 2.16
8 Benzene, 3-butynyl 11.55 11.67 3.31
9 Benzene, (1-methyl-3-butenyl) 0.66 0.89 0.73
10 Tetracyclo[4,2,1,0(3,7),0(2,9)]non-
4-ene, 4-phenyl
0.00 0.57 0.57
11 Benzene, 1,1'-(2-methyl-1-
propenylidene)bis
0.00 0.35 0.77
12 2-Phenylnaphthalene 0.45 0.43 0.70
13 1,2-propanediol, 3-benzyloxy-1,2-
diacetyl
0.00 0.11 5.78
14 1-Propene, 3-(2-cyclopentenyl)-2-
methyl-1,1-diphenyl
0.00 0.29 0.95
15 1,1':3,1''-Terphenyl, 5'-phenyl 0.00 0.58 0.55
Other hydrocarbons 4.24 3.16 4.44
Gases (wt.%) 9.33 8.40 15.93
Residue (wt.%) 2.60 0.00 0.00

Results and Discussion
170
Figure 4.15.4 Chromatogram of catalytically derived liquid products obtained with Fe as
catalyst at optimized conditions
Figure 4.15.5 Chromatogram of catalytically derived liquid products obtained with Fe₂O₃
catalyst at optimized conditions

Results and Discussion
171
Figure 4.15.6 Chromatogram of catalytically derived liquid products obtained with FeCl₃
catalyst at optimized conditions
v. Separation of the products using fractional distillation
Catalytic degradation of WEPS with high selectivity has been reported in literature with
large number of catalysts [5, 10, 11, 16, 31, 46]. The separation or recovery of these
products is a big challenge and no study has been reported for the separation of the
products. After successful characterization the bulk liquid products were separated using
fractional distillation and the fractions were characterized by physiochemical parameter
i.e., density (d25), refractive index (𝜂𝐷25), and molar refraction (γM) with subsequent
identification by GC-MS analysis. The results of the analysis are given in Table 4.15.3
which suggests that further component polymerization, condensation or degradation to new
products lead to change the existing products. The yield of toluene, ethylbenzene, styrene
and α-methylstyrene were increased for liquid products of all catalysts except the yield of
styrene monomer decreased with liquid products of the Fe₂O₃ catalyst with the concurrent
formation of 2-pentanone, 4-hydroxy-4-methyl. It is because due to further degradation of
styrene or other high molecular weight aromatic hydrocarbons and their reaction with

Results and Discussion
172
atmospheric oxygen [10]. The yield of high molecular weight aromatic hydrocarbons
decreased due to further degradation except in the case of liquid products with Fe catalysts.
Maximum recovery of toluene was 12 wt.%, 15 wt.% and 18 wt.% for liquid products with
Fe, Fe₂O₃ and FeCl₃ catalysts, respectively. Maximum recovery for ethylbenzene was 5
wt.%, 6 wt.% and 20 wt.% where the recovery of styrene monomer was 60 wt.%, 36 wt.%
and 53 wt.% for liquid products with Fe, Fe₂O₃ and FeCl₃ catalysts, respectively. Styrene
monomer recovery was maximum (60 wt.%) for Fe catalyst along with toluene,
ethylbenzene and α-methylstyrene.
Density and refractive index measurement were used for the calculation of molar refraction
of each fraction collected, the results are given in Table 4.15.3 and the data was compared
with that of the molar refraction of standard compounds and found in close agreement
(Table 4.5.3 in section 4.5 (Page 82)).

Results and Discussion
173
Table 4.15.3 Physiochemical parameters of the fractions obtained using fractional distillation of the liquid derived from the
degradation of WEPS using Fe, Fe₂O₃ and FeCl₃ catalysts
Compound
Fe Fe₂O₃ FeCl₃
%age d25
(g/ml) 𝜼𝑫
𝟐𝟓 γM %age d25
(g/ml) 𝜼𝑫
𝟐𝟓 γM %age d25
(g/ml) 𝜼𝑫
𝟐𝟓 γM
2-Phenone, 4-hydroxy-4-
methyl - - - - 17.0 0.9502 1.4241 31.2007 - - - -
Toluene 12.0 0.8892 1.4997 30.4613 15.0 0.8901 1.5089 30.9036 18.0 0.8750 1.4997 30.9557
Ethylbenzene 5.0 0.8770 1.4986 35.5215 6.0 0.8390 1.4895 36.5540 20.0 0.9337 1.5380 35.5664
Styrene 60.0 0.9018 1.5484 36.7032 36.0 0.9039 1.5478 36.5847 53.0 0.9088 1.5620 37.1654
α.-Methylstyrene 4.0 0.9279 1.5420 40.0835 9.0 0.9087 1.5370 40.6159 9.0 0.9534 1.5592 40.0339
Benzene, 1,1'-(1,3-
propanediyl)bis 6.0 0.9843 1.5637 64.8334 7.0 0.9675 1.5533 64.9533 - - - -
Benzene, 3-butynyl - - - - 10.0 0.9369 1.5333 43.1472 - - - -
2-Phenylnaphthalene 5.0 1.0840 1.6484 68.5986 - - - - - - - -
1,1':3,1"-Terphenyl, 5'-
phenyl 8.0 1.0600 1.6091 100.0979 - - - - - - - -
Where %age (Percentage of the Fraction), d25 (g/ml) (density), 𝜂𝐷25 (Refractive Index), and γM (Molar Refraction

Results and Discussion
174
4.16. Catalytic degradation of WEPS using Fe impregnated catalysts
i. Effect percentage of precursor active metal center
The degradation of WEPS was carried out with Fe impregnated catalysts i.e. Fe-Al₂O₃, Fe-
Mmn and Fe-AC catalysts. WEPS sample was degraded using Fe impregnated catalyst
using optimum parameter for Fe catalyst i.e., 450 ºC degradation temperature, 30 min
reaction time and 1:0.2 polymer to catalyst ratio. The percentage of impregnated Fe on
different support was varied from 5% to 25% for impregnation of Fe over Al₂O₃, and AC
supports and the result are shown in Fig. 4.16.1. The yield of liquid products was maximum
89.27 ± 0.31 wt.% for 5% Fe-Al₂O₃, the yield of liquids decreased with 10% Fe-Al₂O₃
and then the yield of liquid products remain the same with further increase of Fe
impregnation. In the case of Fe-Mmn and Fe-AC catalysts the yield of liquid products
increased with the increase of iron impregnation over respective supports. The yield of
liquid reached to a maximum of 88.87 ± 0.42 wt.% and 84.47 ± 0.42 wt.% with 20% Fe-
Mmn and 20% Fe-AC catalysts, respectively. With further increase of impregnated Fe
percentage the yield of liquid products decreased in the case of Fe-Mmn catalysts where
the yield of liquids remains constant in the case of Fe-AC catalysts. The maximum yield
of liquids was 89.27 ± 0.31 wt.%, 88.87 ± 0.42 wt.% and 84.47 ± 0.50 wt.% having 94.27%,
100% and 100% total conversion with 5% Fe-Al₂O₃, 20% Fe-Mmn and 20% Fe-C,
respectively. A comparison of reaction conditions and contents of the product are given in
Table 4.16.1.

Results and Discussion
175
Table 4.16.1 Comparison of reaction conditions and products components using 5% Fe-
Al₂O₃, 20% Fe-Mmn and 20% Fe-AC catalysts
5% Fe-Al₂O₃ 20% Fe-Mmn 20% Fe-AC
Reaction conditions
Temperature (ºC) 450 450 450
Time (min) 30 30 30
Polymer to catalyst ratio 1:0.3 1:0.3 1:0.3
Contents of product (wt.%)
Liquids 89.27 ± 0.31 88.87 ± 0.42 84.47 ± 0.50
Gases 5.00 ± 0.53 11.20 ± 0.42 15.30 ± 0.50
Residue 5.73 ± 0.31 0.00 ± 0.00 0.00 ± 0.00
Total conversion 94.27 100 100
Figure 4.16.1 Effect of percentage of impregnated precursor metal (Fe) over Al₂O₃, Mmn
and AC supports for maximum liquid products

Results and Discussion
176
ii. Composition of derived liquid products and selectivity of its components
The composition of liquid products was recorded from GC-MS results for maximum liquid
products obtained with 5% Fe-Al₂O₃, 20% Fe-Mmn and 20% Fe-AC catalysts. The results
of the analysis are given in Table 4.16.2 and are expressed in terms of weight percent of
WEPS samples taken. The GC-MS analysis chromatograms are also shown in Figs. 4.16.2-
4.16.4 for liquid products obtained with 5% Fe-Al₂O₃, 20% Fe-Mmn and 20% Fe-AC
catalysts, respectively. The selectivity of product was founded related with the nature of
catalyst used. The use of FeCl₃ catalysts for different product as Lewis acid has good
activity and selectivity of products [47, 48] on the other hand impregnated catalysts shows
better activity and selectivity than bulk catalysts [49, 50]. The dispersion of Lewis acid
catalysts over acidic support result super heterogeneous solid acid with both Lewis and
Brönsted sites [37, 41, 42]. Acid catalysts have a well-established mechanism and have
routes to different products with the initiation of a carbonium ion generation where Lewis
acidic catalysts start depolymerization with the elimination of hydrogen, in both cases
followed by C-C bond scission [17, 18]. Using Fe impregnated catalysts, the composition
of liquid products were compared for the employed catalysts with the desired selectivity of
styrene monomer and other low molecular weight aromatic hydrocarbons. 20% Fe-Mmn
was the best selective catalyst for the production of low molecular weight aromatic
hydrocarbons. The yield of styrene monomer in comparison with Fe impregnated catalysts
was 51.68 wt.%, 50.93 wt.% and 46.31 wt.% with 5% Fe-Al₂O₃, 20% Fe-Mmn and 20%
Fe-AC catalysts, respectively. The yield of toluene (10.15 wt.%) was the highest with 20%
Fe-Mmn as compared to the other catalysts and the yield of α-methylstyrene was 2.31 wt.%
reasonable with 20% Fe-Mmn. The low yield of styrene with Fe impregnated catalysts was
because of their strong acidic sites responsible for further degradation of high molecular
weight aromatic hydrocarbons, which reduce styrene monomer with the production of
toluene, ethylbenzene and α-methylstyrene [17, 20]. The degradation of WEPS in
comparison with thermal degradation, and the supports used for the loading of Fe i.e.,
Al₂O₃, Mmn and AC were better. The efficient selective degradation was obtained with
20% Fe-Mmn yielding 88.87 wt.% liquid in comparison with literature reported method of
modified or impregnated catalysts [5, 21, 28-30]. It was found that the component products

Results and Discussion
177
of the degradation were having more tendency toward low molecular weight aromatic
hydrocarbons i.e., the yield of benzene, toluene, ethylbenzene and styrene were high.
Table 4.16.2 Products formed by WEPS degradation using Fe and its impregnated
catalysts at optimized conditions
S.No. Products
Composition (wt.%)
5% Fe-
Al₂O₃
20% Fe-
Mmn
20% Fe-
AC
1 Benzene 0.00 0.79 0.64
2 Toluene 7.50 10.15 6.34
3 Ethylbenzene 5.84 6.42 7.93
4 Styrene 51.68 50.93 46.31
5 α.-Methylstyrene 2.71 2.31 1.97
6 Benzene,1,1'-(1,1,2,2-tetramethyl-1,2-
ethanediyl)bis
0.00 0.73 0.54
7 Naphthalene 0.00 0.67 0.00
8 Benzene, 1,1'-(1,2-ethanediyl)bis 3.00 2.36 1.67
9 Benzene, 1,1'-(1-methyl-1,2-
ethanediyl)bis
1.54 1.14 1.11
10 Benzene, 1,1'-(1,3-propanediyl)bis 0.56 0.00 0.88
11 Benzene, 3-butynyl 4.76 2.60 5.95
12 Benzene, (1-methyl-3-butenyl) 0.52 0.00 0.49
13 Anthracene 0.50 0.62 0.00
14 Benzene, 1,1'-(2-methyl-1-
propenylidene)bis
0.00 0.00 0.85
15 2-Phenylnaphthalene 2.07 2.81 1.64
16 p-Terphenyl 0.00 0.63 0.00
17 1,2-propanediol, 3-benzyloxy-1,2-
diacetyl
0.00 0.00 1.77
18 1,1':3,1''-Terphenyl, 5'-phenyl 0.65 0.72 0.46
Other hydrocarbons 7.93 5.94 6.17
Gases (wt.%) 5.00 11.20 15.30
Residue (wt.%) 5.73 0.00 0.00

Results and Discussion
178
Figure 4.16.2 Chromatogram of catalytically derived liquid products using 5% Fe-Al₂O₃
catalyst at optimized conditions
Figure 4.16.3 Chromatogram of catalytically derived liquid products using 20% Fe-Mmn
catalyst at optimized conditions

Results and Discussion
179
Figure 4.16.4 Chromatogram of catalytically derived liquid products using 20% Fe-AC
catalyst at optimized conditions

Results and Discussion
180
4.17. Effect of polyethylene terephthalate (PET) on the catalytic
degradation of polystyrene (PS)
The complete conversion of WEPS into useful products is a challenge and it was decided
to explore the possibility of significant interaction of co-processing it with PET for the said
purpose. Thus, catalytic degradation reaction containing binary combination of PET and
PS were studied. The amount of PET was varied to understand and explore its role and
reactivity on the degradation of PS. The degradation products were liquids, gases, and solid
residue in the case of PS, 10PET+PS, 20PET+PS and 30PET+PS. The effect of
degradation temperature, reaction time and polymer to catalyst ratio on thermo-catalytic
degradation of PS, 10PET+PS, 20PET+PS and 30PET+PS were investigated to determine
the conditions that favor the formation of maximum liquid products and to compare the
products and product compositions formed at the optimized reaction conditions.
i. Effect of degradation temperature
The process of degrading PS or mixture of polystyrene with other plastic has been mostly
investigated at a constant temperature [27, 51] or within a small range such as 430-440 ºC
or 440-450 ºC [3, 52]. In the present work, the effect of degradation temperature over a
wide range of 250 ºC to 500 ºC at a reaction time of 30 min, and polymer to catalyst ratio
of 1:0.05 on the distribution of liquids and gases was studied (Fig. 4.17.1). Among the
impregnated catalysts, supported catalyst over Al₂O₃ support were found to have better
activity and selectivity, where 15% Mg-Al₂O₃ and 20% Al-Al₂O₃ were found to have the
higher activity and selectivity. However, the N₂ adsorption/desorption studies and SEM
images revealed 20% Al-Al₂O₃ to be the best as a future catalyst. Therefore, 20% Al-Al₂O₃
was constantly used throughout the study. This temperature range was selected because the
decomposition of PS and PET occurred after 250 ºC as shown by the TGA (Fig. 4.4.2) and
a temperature range of 400 ºC to 500 ºC was reported to achieve a maximum yield of liquid
products [14, 28, 51-53]. For liquid products, the yield increased linearly with the increase
in temperature reaching its maximum of 82.4 wt.% and 67.3 wt.% at 500 ºC in the case of

Results and Discussion
181
PS and 10PET+PS, respectively. In the case of 20PET+PS and 30PET+PS, the yield
initially increased up to a maximum of 37.3 wt.% and 19.2 at 450 ºC, respectively but
further increase in the degradation temperature slightly reduced the yield. For gases, the
maximum yield was achieved at 250 ºC and it decreased with the rise in temperature in the
degradation of PS and 10PET+PS. In the case of 20PET+PS, however, the yield of gases
increased initially with the rise in temperature reaching its upper limit at 300 ºC and then
decreased with further increase. In the case of 30PET+PS, the yield of gases increased up
to 350 ºC then decreased a little and eventually increased up to its upper limit at 500 ºC.
The maximum total yields in the cases of PS, 10PET+PS, 20PET+PS and 30PET+PS was
98.4 wt.% at 500 ºC, 98.4 wt.% at 450 ºC, 95.9 wt.% at 450 ºC and 96.7 wt.% at 500 ºC,
respectively. In the presence of 20% Al-Al₂O₃ the production of gases at 250 ºC in the case
of all materials indicates that the decomposition process started before 250 ºC instead of
290.2 ºC or 378.0 ºC for PS and PET, respectively as identified by the TGA (Fig. 4.4.2).
Interestingly, the increase of PET percentage dramatically reduced the yield of liquid
products with the concomitant increase of gases. At higher temperature, the decrease in the
liquid products and increase in gases produced might be due to the further cracking of the
preformed products, the same observations were also reported by Vasile et al., [52]. PET
has been reported to produce more gases and residue compared to liquid products and some
studies have reported the formation of negligible amount of liquid products [2]. In some
plastic mixtures, PET was also reported to increase the carbon residue by up to 25 wt.%
[54].

Results and Discussion
182
Figure 4.17.1 Effect of degradation temperature on the yield of catalytically derived
products (liquids and gases) for the degradation of PS, 10PET+PS,
20PET+PS and 30PET+PS
ii. Effect of reaction time
The effect of the reaction time on the degradation of virgin PS and mixed plastics
(xPET+PS) was investigated. Experiments were performed at reaction times varying from
20 to 90 min, at an optimized degradation temperature of 500 ºC for PS and 10PET+PS,
and 450 ºC for 20PET+PS and 30PET+PS, and a polymer to catalyst ratio of 1:0.05 (Fig.
4.17.2). It was observed that the liquid yield increased significantly when the reaction time
was increased from 20 min to 60 min in the cases of PS, 10PET+PS and 20PET+PS. In the
case of 30PET+PS however, a very small increase was observed when the reaction time
was increased to 90 min. The maximum yield was 86.3 wt.%, 70.0 wt.% and 40.6 wt.% in
60 min in the cases of PS, 10PET+PS and 20PET+PS, respectively. In the case of

Results and Discussion
183
30PET+PS, the maximum yield was 21.1 wt.% in 90 min. The maximum total yield in the
cases of PS, 10PET+PS, 20PET+PS and 30PET+PS was 99.3 wt.%, 97.7 wt.%, 95.4 wt.%
and 93.5 wt.%, respectively at optimum reaction conditions (degradation temperature 500
ºC for PS and 10PET+PS, and 450 ºC for 20PET+PS and 30PET+PS; reaction time 60 min
for PS, 10PET+PS and 20PET+PS and 90 min for 30PET+PS).
Beyond the described optimum time, a further increase in reaction time showed no apparent
change in the yield of liquid products. The yield of gases was observed to increase initially
up to 30 min and then decreases, it is suggested to be due the interaction of gaseous
products with other compounds which ultimately form high molecular weight aromatic
hydrocarbons. However, in some cases the yield of gases also increased beyond the
optimized time, which resulted in an increase in the total yield. The increase in the liquid
product in cases of longer reaction times indicates the completion of the degradation
reaction, whereas an increase in the yield of gases with further increase in reaction time
may be due to the further degradation of some pre-formed products or the decomposition
of some part of the residue.

Results and Discussion
184
Figure 4.17.2 Effect of reaction time on the yield of catalytically derived products (liquid
and gases) for the degradation of PS, 10PET+PS, 20PET+PS and
30PET+PS at optimized conditions
iii. Effect of polymer to catalyst ratio
The influence of feed to catalyst ratio was investigated in 1:0 (without catalysts or thermal
degradation only), 1:0.05, 1:0.1, 1:0.2 and 1:0.3 feed to catalyst ratio at optimized
degradation temperature and reaction time, the results are shown in Fig. 4.17.3. A
significant increase was observed in the yield of liquid products when the catalyst was
added using the same reaction conditions as compared to thermal degradation without the
use of catalyst. The liquid products was increases from 78.1 to 86.3 wt.% in the case of PS,
from 56.2 to 70.0 wt.% in the case of 10PET+PS, from 21.6 to 40.60 wt.% in the case of
20PET+PS and from 6.3 to 21.1 wt.% in the case of 30PET+PS. In the presence of 20%
Al-Al₂O₃ catalysts, the yield of liquid products increased significantly when the polymer

Results and Discussion
185
to catalyst ratio was increased and a maximum was achieved with a feed to catalyst ratio
of 1:0.2 in all cases. The yield was increased significantly from 86.3 wt.% to 92.5 wt.% in
the case of PS and from 70.0 wt.% to 76.5 wt.% in the case of 10PET+PS. The conversion
of PS into liquid products was practically the same as those obtained with 20% Al-Al₂O₃
in our previous method [55]. The yield was increased slightly from 40.6 wt.% to 42.7 wt.%
in the case of 20PET+PS and it increased from 21.1 wt.% to 22.7 wt.% in the case of
30PET+PS.
The yield of gases was also affected by the increase in the polymer to catalyst ratio. Unlike
in the case of PS and 10PET+PS degradation when the yield of gases decreased with an
increase in the polymer to catalyst ratio. The yield, first decreased and then increased with
associated increase in liquid products in the cases of 20PET+PS and 30PET+PS. The feed
to catalyst ratio also raised the total yield, which was 100.00 wt.%, 97.7 wt.%, 95.1 wt.%
and 88.9 wt.% maximum with 1:0.2 polymer to catalyst ratio in the cases of PS, 10PET+PS,
20PET+PS and 30PET+PS. A further increase in the polymer to catalyst ratio of 1:0.2
reduced the yield of liquid products. It is suggested that this may be due to the availability
of more reaction sites due to an increase in the amount of acidic catalysts, which impacts
the reaction mechanism leading to the production of more gaseous products [17].
Collectively, the addition of PET resulted in a significant decrease in the yield of liquid
products, and a small decrease in the total percent conversion with concomitant increase in
the yield of gases.
The maximum yield of products and total yield along with the optimized conditions for the
degradation of PS, 10PET+PS, 20PET+PS and 30PET+PS using 20% Al-Al₂O₃ catalyst is
given in Table 4.17.1. The increase in gases with associated decrease in the liquid products
is attributed to the presence of PET and an increase in the amount of high activity catalysts,
which bear a large number of Brönsted acid sites [27]. The degradation of pure PET has
been reported to produce high amount of char and residue [2]. Therefore, the increase in
PET content during the degradation of xPET+PS produced more residue which may cause
deactivation of the catalyst, thus promoting thermal degradation.

Results and Discussion
186
Table 4.17.1 Optimum reaction conditions and the yield of catalytically derived products
for the degradation of PS, 10PET+PS, 20PET+PS and 30PET+PS
PS 10PET+PS 20PET+PS 30PET+PS
Reaction conditions
Degradation temperature
(ºC) 500 500 450 450
Reaction time (min) 60 60 60 90
Feed to catalyst ratio 1:0.2 1:0.2 1:0.2 1:0.2
Contents of products
(wt.%)
Liquid yield 92.69 76.40 44.60 22.50
Gas yield 7.31 21.30 50.51 71.80
Residue left - 2.30 03.89 05.70
Total conversion 100.00 97.70 95.11 88.90

Results and Discussion
187
Figure 4.17.3 Effect of polymer to catalyst ratio of the yield of catalytically derived
products (liquid and gases) for the degradation of PS, 10PET+PS,
20PET+PS and 30PET+PS at optimized conditions
iv. Composition of derived liquid products and selectivity of its components
The products obtained from the degradation of PS and xPET+PS were identified by GC-
MS and classified in three different ways i.e., classification on the basis of (i) carbon
number, (ii) depolymerization, and (iii) identified component products. The distribution of
liquid products obtained from the degradation of PS, 10PET+PS, 20PET+PS and
30PET+PS at optimized conditions are represented in Tables 4.17.2-4.17.4 and expressed
in terms of wt.% of the liquids. The liquid products derived from the degradation of virgin
PS and xPET+PS gave almost exclusively substituted aromatic hydrocarbons. Generally
the degradation of polymers due to their poly-disperse nature and high molecular weight
lead to reactions with thousands of species, which often result in the formation of a wide

Results and Discussion
188
spectrum of compounds. Furthermore, the catalytic degradation of polymers is also
accompanied by thermal processes, which result in more complex mechanisms [14]. As
discussed in the earlier section, increasing the concentration of PET increases the amount
of residue left, which in turn results in the deactivation of catalysts and leads to thermal
transformation.
Table 4.17.2 shows classification on the basis of the carbon number and the distribution of
aromatic and non-aromatic hydrocarbons in the range of C6-C24 which are grouped in three
categories: C6-C9, C10-C18, and C19-C24 fractions. As can be seen in Table 4.17.2, the yield
of C6-C9 non-aromatic fraction was 12.0 wt.%, 0.3 wt.%, 0.5 wt.% and 0.6 wt.%, where
the yield of C6-C9 aromatic fractions was 85.0 wt.%, 56.8 wt.%, 71.9 wt.% and 74.3 wt.%
in the cases of PS, 10PET+PS, 20PET+PS and 30PET+PS, respectively. Consequently, the
yield of C10-C18 fraction was 3.0 wt.%, 40.6 wt.%, 22.4 wt.% and 22.3 wt.% in the cases
of PS, 10PET+PS, 20PET+PS and 30PET+PS, respectively. Concerning the degradation
of PS, C21-C24 fraction did not form at all and it was 2.4 wt. %, 5.2 wt.% and 2.8 wt.% in
the cases of 10PET+PS, 20PET+PS and 30PET+PS, respectively. The C6-C9 fraction was
the main fraction and mostly comprised of aromatic hydrocarbons, more specifically single
ring aromatic hydrocarbons. However, the addition of PET caused an increase in the yield
of C10-C18 and C21-C24 fractions, which comprise double ring, triple ring and quartet ring
products. The yield of non-aromatic hydrocarbons in the C6-C9 fraction has also been
reported by Lopez-Urionabarrenechea et al. [27]. The high yield of low molecular weight
aromatic hydrocarbons in the presence of acidic catalyst has been reported and it was
suggested that it is due to the acidic catalyst that led the reaction through an end-chain
scission pathway without promoting thermal cracking [26, 27]. The results indicate the
formation of higher fraction in the case of PET addition. This is attributed to the
deactivation of the catalyst due to deposition of cracked and melted fragments of polymer
that ultimately promoted thermal degradation that resulted in the formation of a large
number of aromatic hydrocarbons with a random scission mechanism. Similarly, Carniti et
al., [56] suggested that the formation of aromatic hydrocarbons from the degradation of
polyolefins is due to the saturation of aromatic compounds at ethylenic double bonds which
leads to the formation of a large number of aromatic compounds.

Results and Discussion
189
Table 4.17.2 Fractions of interest identified by GC-MS in the catalytically derived liquid
products obtained from the degradation of PS, 10PET+PS, 20PET+PS and
30PET+PS at optimized conditions
Carbon No. Type PS 10PET+PS 20PET+PS 30PET+PS
C6-C9 Non-aromatic 12.00 0.28 0.54 0.61
Aromatic 85.01 56.75 71.93 74.32
C10-C18 Aromatic 2.99 40.59 22.37 22.27
C21-C24 Aromatic 0.00 2.38 5.16 2.80
The classification of component products based on the depolymerization of PS is shown in
Table 4.17.3. The main families identified were single styrene monomeric products,
styrene dimeric products, styrene oligomers, naphthalenes and naphthalene derivatives,
anthracene, and anthracene derivatives. Styrene monomeric products were abundant in all
the degradation liquids. Their compositions were 84.2 wt.%, 65.8 wt.%, 78.1 wt.% and
80.6 wt.% in the cases of PS, 10PET+PS, 20PET+PS and 30PET+PS, respectively. Among
the monomeric products, benzene, toluene, ethylbenzene, styrene, benzaldehyde, α-
methylstyrene, α-ethylstyrene and benzene, 3-butenyl were the dominant compounds. The
depolymerization of PS is of carbonium nature which involves the attack of a proton to the
aromatic rings of PS. The resulting carbenium species undergo continuous decomposition
followed by a hydrogen transfer. Therefore, styrene monomer was abundant in all the liquid
products [17, 18]. The formation of benzene and its hydrogenation to form toluene and
ethylbenzene or the formation of other products decreased the yield of styrene monomer
[11, 20]. The preformed compounds upon isomerization and further decomposition can
form final products such as benzene, toluene, ethylbenzene, α-methylstyrene, benzene, (1-
methylethyl), naphthalene, and others have been discussed in several studies using acidic
catalysts [14, 24]. The higher content of styrene monomeric products in the liquid products
derived from the degradation of xPET+PS as suggested by Serrano et al. [26] is due the

Results and Discussion
190
catalyst has lost its activity. Terepthalic acid is also reported as a rich source of aromatic
hydrocarbons like benzene, toluene, biphenyls, naphthalene and their derivatives [2, 3, 57].
The cracking PET on its ester bond results in the formation of terephthalic acid, which on
decarboxylation produces benzoic acid, and then benzene. These products are the sources
of aromatic hydrocarbons.
Table 4.17.3 Depolymerization products identified by GC-MS in the catalytically
derived liquid products obtained from the degradation of PS, 10PET+PS, 20PET+PS and
30PET+PS at optimized conditions
Products PS 10PET+PS 20PET+PS 30PET+PS
Styrene monomeric products 84.24 65.77 78.06 80.60
Styrene dimeric products 2.94 18.52 12.19 13.07
Styrene oligomers 0.00 5.11 4.51 1.80
Naphthalene and its derivatives 0.82 8.36 0.60 0.95
Anthracene and its derivatives 0.00 2.47 2.76 2.98
Other components 12.00 0.77 1.88 0.60
The highest compositions of styrene dimers, oligomers, naphthalenes, naphthalene
derivatives and some other products were noted in the case of 10PET+PS. These
compositions were lower in the case of 20PET+PS and 30PET+PS. The dominant dimeric
products detected were: benzene,1,1'-(1,1,2,2-tetramethyl-1,2-ethanediyl)bis; benzene,
1,1'-(1-methyl-1,2-ethanediyl)bis; benzene, 1,1'-(1,3-propanediyl)bis; benzene, 1,1'-(3-
methyl-1-propene-1,3-diyl)bis and benzene, 1,1'-(2-methyl-1-propenylidene)bis. The
formation of some styrene oligomers (trimers and tetramers) was also noted. Their
compositions were the highest (5.1 wt.%) in the case of liquid products with the
degradation of 10PET+PS. The highest yield of naphthalene and its derivatives were also
achieved in the case of liquid products obtained from the degradation of 10PET+PS. The
production of a considerable amount of naphthalene and naphthalene derivatives have also

Results and Discussion
191
been reported by Vasile et al. [52] during the degradation of mixed plastics. The formation
of products like benzene, naphthalene, indane and indene, and diphenyl derivatives have
been reported during the degradation of virgin PS over acidic catalysts [14]. The
depolymerization of PS in the presence of PET is again attributed to the loss of activity of
catalyst that resulted in the formation of dimers, trimers and oligomers with prolonged
heating in thermal degradation [58]. The yield of important compounds in the case of
10PET+PS in significant amounts is due to degradation at a sufficiently high temperature
of 500 ºC for a sufficient amount of time reaction time (60 min). The yield of anthracene
and its derivatives slightly increased with the increase in PET percentage. This might be
due to the interaction of styrene oligomers with the reactive groups of PET products or
further competitive interactions between the pyrolyzed products.
The main identified components of the degradation liquids are shown in Table 4.17.4. This
table shows that a small number of hydrocarbons were formed in the case of PS degradation
i.e. only C6-C18 fraction was formed. The addition of PET resulted in the production of
higher fractions i.e., C10-C24. The production of a wide spectrum of hydrocarbons with the
addition of PET on the catalytic degradation of PS resembles the thermal degradation of
PS. The yield of styrene monomer was dominant in all the liquids. These yields were 62.5
wt.%, 47.0 wt.%, 59.86 wt.% and 64.31 wt.% in the cases of PS, 10PET+PS, 20PET+PS
and 30PET+PS, respectively.
Other studies have also reported the formation of styrene as a major product during the
degradation of mixed plastics [27]. The addition of PET reduced the yield of benzene,
toluene and ethylbenzene, which was slightly increased with the further addition of PET
among the liquid products. High concentrations of ethylbenzene in all the liquid products
formed in the presence of acidic catalysts as a result of degradation of styrene oligomers,
which was also reported by Marczewski et al. [14] who studied the degradation of PS. The
insignificant yield of liquid in the addition of PET is due to the formation of large amount
of gaseous (COx and aliphatic) products. On the other hand, the competing reaction
between cross-linking of polymers (PS and PET) and cracking at elevated temperature
might be the cause of residue. The yield of aromatic hydrocarbons particularly benzene,

Results and Discussion
192
toluene, ethylbenzene, styrene, α-methylstyrene, naphthalene and anthracene represent a
potentially significant route from waste plastics as an alternative source of useful
hydrocarbons, which deliver a variety of industrial applications in the production of
dyestuffs, surfactants, pharmaceutical products, pesticides and as solvents [27]. Siddiqui
and Redhwi [3] proposed the same conclusion for the primary production of aromatic
hydrocarbons from the degradation of mixed plastics.
It can be seen that the component products of liquid derived from the degradation of virgin
PS are different from those derived with the addition PET (xPET+PS). The results of Table
4.17.2-4.17.4 indicate significant interactions between PET and PS materials that
contributed to the formation of new and important organic compounds. These compounds
include acetophenone, 2-buten-1-one, 1-phenyl; diphenylmethane; ethylene, 1,1-diphenyl;
biphenyl; 1,2-diphenylethylene; benzene, 1,1'-(1-methyl-1,2-ethanediyl)bis; benzene, 1,1'-
(1,3-propanediyl)bis; phenanthrene; benzene, 3-butynyl; benzene, (1-methyl-3-butenyl);
anthracene; benzene, 1,1'-(3-methyl-1-propene-1,3-diyl)bis; 1-methylanthracene; benzene,
1,1'-(2-methyl-1-propenylidene)bis; 2-phenylnaphthalene; p-terphenyl; di-n-octyl
phthalate; 1,1':2',1'':2''.1'''-quaterphenyl, and 1,1':3,1''-terphenyl, 5'-phenyl. In addition,
oxygen containing compounds were also formed [2]. In most cases, the yield of these
compounds increased with the increase in the composition of PET. Among the detected
compounds, many of them are reported with quite similar results either with the
degradation of PS or PET or PET+PS like acetophenone; diphenylmethane; ethylene, 1,1-
diphenyl; biphenyl; anthracene; terphenyl; di-n-octyl phthalate; 1,1': 2', 1'': 2''. 1'''-
quaterphenyl 7 and 1,1': 3,1''-terphenyl, 5'-phenyl [2, 3, 27, 57]. The formation of new
products suggests that during the degradation experiments, the rearrangement of the
reactant polymer structures via various reaction pathways led to the formation of new
degradation products.

Results and Discussion
193
Table 4.17.4 Products obtained from the degradation of PS, 10PET+PS, 20PET+PS and
30PET+PS at optimized conditions
S. No. Products Composition (wt.%)
PS 10PET+PS 20PET+PS 30PET+PS
1 Benzene 1.26 0.98 1.73 1.07
2 Toluene 10.51 0.06 1.28 1.49
3 3-Hexen-2-one 6.69 0.00 0.00 0.00
4 2-Pentanone, 4-hydroxy-4-methyl- 0.00 0.28 0.54 0.69
5 Ethylbenzene 7.17 1.58 3.01 3.30
6 Styrene 62.54 46.97 59.86 64.31
7 Benzaldehyde 0.00 1.44 1.09 0.29
8 α-Methylstyrene 1.90 3.50 2.48 1.65
9 Methyl-styrene 0.30 0.61 0.41 0.10
10 Indene 0.79 0.54 0.54 0.55
12 α-Ethylstyrene 0.02 0.06 2.97 3.84
13 Benzenemethanol, α, α-dimethyl 0.00 0.00 0.21 0.17
14 Acetophenone 0.00 0.71 0.77 0.87
15 Benzene,1,1'-(1,1,2,2-tetramethyl-
1,2-ethanediyl)bis 2.15 0.65 0.76 0.84
16 Naphthalene 0.82 1.88 0.21 0.16
17 2-Butanone, 4-phenyl 0.00 0.00 0.18 0.23
18 2-Buten-1-one, 1-phenyl 0.00 0.35 0.58 1.08
19 Diphenylmethane 0.00 0.52 3.00 3.89
20 Ethylene, 1,1-diphenyl 0.00 0.39 0.00 1.14
21 Biphenyl 0.00 6.64 0.17 0.00
22 1,2-Diphenylethylene 0.00 0.16 1.75 2.22
23 Benzene, 1,1'-(1-methyl-1,2-
ethanediyl)bis 0.00 3.89 0.59 0.00
24 Benzene, 1,1'-(1,3-propanediyl)bis 0.00 1.11 0.35 0.29
25 1,2-Diphenylcyclopropane 0.00 0.18 0.00 0.00
26 Benzene, 1,1'-(3-methyl-1-
propene-1,3-diyl)bis 0.00 0.49 0.55 0.57
27 Phenanthrene 0.00 1.11 0.42 0.10
29 Benzene, 3-butynyl 0.00 4.39 0.00 0.00
30 Benzene, (1-methyl-3-butenyl) 0.00 1.21 0.32 0.05
31 Anthracene 0.00 0.13 0.96 1.39

Results and Discussion
194
32 Benzene, 1,1'-(3-methyl-1-
propene-1,3-diyl)bis 0.00 0.18 1.07 1.18
33 1-Methylanthracene 0.00 0.02 1.08 1.38
34 Benzene, 1,1'-(2-methyl-1-
propenylidene)bis 0.00 1.87 0.18 0.02
35 Benzene, (1-ethyl-2-propenyl) 0.00 0.46 0.47 0.96
36 Anthracene, 9-ethenyl- 0.00 0.87 0.12 0.09
37 o-Terphenyl 0.00 0.36 0.26 0.15
38 Naphthalene, 1,2-dihydro-4-phenyl 0.00 0.31 0.14 0.07
39 Anthracene, 9-methyl 0.00 0.31 0.13 0.02
40 2-Phenylnaphthalene 0.00 5.68 0.07 0.57
41 1-(4-Methylphenyl)-4-phenylbuta-
1,3-diene 0.00 0.24 0.43 0.74
42 9-Phenyl-5H-benzocycloheptene 0.00 0.60 0.61 0.63
43 p-Terphenyl 0.00 1.35 0.27 0.15
44 m-Terphenyl 0.00 0.65 0.00 0.00
45 1,2-propanediol, 3-benzyloxy-1,2-
diacetyl 0.00 2.31 0.63 0.00
46 Di-n-octyl phthalate 0.00 0.52 0.96 1.08
47 1,1':2',1'':2''.1'''-Quaterphenyl 0.00 0.13 1.48 1.59
48 1,1':3,1''-Terphenyl, 5'-phenyl 0.00 1.33 2.31 0.00
Other aromatic hydrocarbons 5.84 3.00 5.08 1.08

Results and Discussion
195
References
[1] Y. Cai, H. Ke, L. Lin, X. Fei, Q. Wei, L. Song, Y. Hu, H. Fong, Preparation,
morphology and thermal properties of electrospun fatty acid eutectics/polyethylene
terephthalate form-stable phase change ultrafine composite fibers for thermal
energy storage, Energy Conversion and Management 64 (0) 245-255 (2012).
[2] T. Yoshioka, G. Grause, C. Eger, W. Kaminsky, A. Okuwaki, Pyrolysis of
poly(ethylene terephthalate) in a fluidised bed plant, Polymer Degradation and
Stability 86 (3) 499-504 (2004).
[3] M. N. Siddiqui, H. H. Redhwi, Pyrolysis of mixed plastics for the recovery of useful
products, Fuel Processing Technology 90 (4) 545-552 (2009).
[4] J. Kronholm, P. Vastamäki, R. Räsänen, A. Ahonen, K. Hartonen, M.-L. Riekkola,
Thermal field-flow fractionation and gas chromatography−mass spectrometry in
determination of decomposition products of expandable polystyrene after reactions
in pressurized hot water and supercritical water, Industrial & Engineering
Chemistry Research 45 (9) 3029-3035 (2006).
[5] C. Xie, F. Liu, S. Yu, F. Xie, L. Li, S. Zhang, J. Yang, Study on catalytic pyrolysis
of polystyrene over base modified silicon mesoporous molecular sieve, Catalysis
Communications 9 (6) 1132-1136 (2008).
[6] H. Y. Shin, S. Y. Bae, Thermal decomposition of polystyrene in supercritical
methanol, Journal of Applied Polymer Science 108 (6) 3467-3472 (2008).
[7] P. Tiwary, C. Guria, Effect of Metal Oxide Catalysts on Degradation of Waste
Polystyrene in Hydrogen at Elevated Temperature and Pressure in Benzene
Solution, Journal of Polymers and the Environment 18 (3) 298-307 (2010 ).

Results and Discussion
196
[8] K. Murata, M. Brebu, Y. Sakata, The effect of PVC on thermal and catalytic
degradation of polyethylene, polypropylene and polystyrene by a continuous flow
reactor, Journal of Analytical and Applied Pyrolysis 86 (1) 33-38 (2009).
[9] K. Murata, Y. Hirano, Y. Sakata, M. A. Uddin, Basic study on a continuous flow
reactor for thermal degradation of polymers, Journal of Analytical and Applied
Pyrolysis 65 (1) 71-90 (2002).
[10] Z. Hussain, K. M. Khan, K. Hussain, Microwave-metal interaction pyrolysis of
polystyrene, Journal of Analytical and Applied Pyrolysis 89 (1) 39-43 (2010).
[11] H. Ukei, T. Hirose, S. Horikawa, Y. Takai, M. Taka, N. Azuma, A. Ueno, Catalytic
degradation of polystyrene into styrene and a design of recyclable polystyrene with
dispersed catalysts, Catalysis Today 62 (1) 67-75 (2000).
[12] T. M. Kruse, O. S. Woo, H.-W. Wong, S. S. Khan, L. J. Broadbelt, Mechanistic
modeling of polymer degradation: A comprehensive study of polystyrene,
Macromolecules 35 (20) 7830-7844 (2002).
[13] T. M. Kruse, O. S. Woo, L. J. Broadbelt, Detailed mechanistic modeling of polymer
degradation: application to polystyrene, Chemical Engineering Science 56 (3) 971-
979 (2001).
[14] M. Marczewski, E. Kamińska, H. Marczewska, M. Godek, G. Rokicki, J.
Sokołowski, Catalytic decomposition of polystyrene. The role of acid and basic
active centers, Applied Catalysis B: Environmental 129 (0) 236-246 (2013).
[15] Z. Zhang, T. Hirose, S. Nishio, Y. Morioka, N. Azuma, A. Ueno, H. Ohkita, M.
Okada, Chemical recycling of waste polystyrene into styrene over solid acids and
bases, Industrial & Engineering Chemistry Research 34 (12) 4514-4519 (1995).

Results and Discussion
197
[16] J.-S. Kim, W.-Y. Lee, S.-B. Lee, S.-B. Kim, M.-J. Choi, Degradation of polystyrene
waste over base promoted Fe catalysts, Catalysis Today 87 (1–4) 59-68 (2003).
[17] S. Y. Lee, J. H. Yoon, J. R. Kim, D. W. Park, Catalytic degradation of polystyrene
over natural clinoptilolite zeolite, Polymer Degradation and Stability 74 (2) 297-
305 (2001).
[18] G. Audisio, F. Bertini, P. L. Beltrame, P. Carniti, Catalytic degradation of
polymers: Part III—Degradation of polystyrene, Polymer Degradation and
Stability 29 (2) 191-200 (1990).
[19] A. Mukherjee, L. B. Alemany, R. Thaner, W. H. Guo, W. E. Billups, Soluble
activated charcoal, Carbon 47 (14) 3145-3150 (2009).
[20] S.-Y. Lee, J.-H. Yoon, J.-R. Kim, D.-W. Park, Degradation of polystyrene using
clinoptilolite catalysts, Journal of Analytical and Applied Pyrolysis 64 (1) 71-83
(2002).
[21] V. R. Chumbhale, J. S. Kim, W. Y. Lee, S. H. Song, S. B. Lee, M. J. Choi, Catalytic
degradation of expandable polystyrene waste (EPSW) over HY and modified HY
zeolites, Journal of Industrial and Engineering Chemistry 11 (2) 253-260 (2005).
[22] Z. Hussain, K. M. Khan, N. Basheer, K. Hussain, Co-liquefaction of Makarwal coal
and waste polystyrene by microwave–metal interaction pyrolysis in copper coil
reactor, Journal of Analytical and Applied Pyrolysis 90 (1) 53-55 (2011).
[23] O. S. Woo, N. Ayala, L. J. Broadbelt, Mechanistic interpretation of base-catalyzed
depolymerization of polystyrene, Catalysis Today 55 (1-2) 161-171 (2000).
[24] Y. Hu, S. Li, The effects of magnesium hydroxide on flash pyrolysis of polystyrene,
Journal of Analytical and Applied Pyrolysis 78 (1) 32-39 (2007).

Results and Discussion
198
[25] D. P. Serrano, J. Aguado, J. M. Escola, Catalytic conversion of polystyrene over
HMCM-41, HZSM-5 and amorphous SiO2–Al2O3: comparison with thermal
cracking, Applied Catalysis B: Environmental 25 (2–3) 181-189 (2000).
[26] D. P. Serrano, J. Aguado, J. M. Escola, J. M. Rodríguez, Influence of
nanocrystalline HZSM-5 external surface on the catalytic cracking of polyolefins,
Journal of Analytical and Applied Pyrolysis 74 (1–2) 353-360 (2005).
[27] A. Lopez-Urionabarrenechea, I. de Marco, B. M. Caballero, M. F. Laresgoiti, A.
Adrados, Catalytic stepwise pyrolysis of packaging plastic waste, Journal of
Analytical and Applied Pyrolysis 96 (0) 54-62 (2012).
[28] J.-W. Tae, B.-S. Jang, J.-R. Kim, I. Kim, D.-W. Park, Catalytic degradation of
polystyrene using acid-treated halloysite clays, Solid State Ionics 172 (1–4) 129-
133 (2004).
[29] V. R. Chumbhale, J.-S. Kim, S.-B. Lee, M.-J. Choi, Catalytic degradation of
expandable polystyrene waste (EPSW) over mordenite and modified mordenites,
Journal of Molecular Catalysis A: Chemical 222 (1–2) 133-141 (2004).
[30] C.-G. Lee, J.-S. Kim, P.-S. Song, G.-S. Choi, Y. Kang, M.-J. Choi, Decomposition
characteristics of residue from the pyrolysis of polystyrene waste in a fluidized-bed
reactor, Korean Journal of Chemical Engineering 20 (1) 133-137 (2003).
[31] K. H. Lee, Composition of aromatic products in the catalytic degradation of the
mixture of waste polystyrene and high-density polyethylene using spent FCC
catalyst, Polymer Degradation and Stability 93 (7) 1284-1289 (2008).

Results and Discussion
199
[32] A. Karaduman, E. H. Şimşek, B. Çiçek, A. Y. Bilgesü, Flash pyrolysis of
polystyrene wastes in a free-fall reactor under vacuum, Journal of Analytical and
Applied Pyrolysis 60 (2) 179-186 (2001).
[33] X. Guoxi, L. Rui, T. Qinhu, L. Jinghua, Mechanism studies on the catalytic
degradation of waste polystyrene into styrene in the presence of metal powders,
Journal of Applied Polymer Science 73 (7) 1139-1143 (1999).
[34] V. Karmore, G. Madras, Thermal degradation of polystyrene by Lewis acids in
solution, Industrial & Engineering Chemistry Research 41 (4) 657-660 (2002).
[35] G. Audisio, F. Bertini, P. L. Beltrame, P. Carniti, Catalytic degradation of
polymers: Part III--Degradation of polystyrene, Polymer Degradation and Stability
29 (2) 191-200 (1990).
[36] C. D. Hurd, A. R. Macon, J. I. Simon, R. V. Levetan, Pyrolytic formation of arenes.
I. Survey of general principles and findings, Journal of the American Chemical
Society 84 (23) 4509-4515 (1962).
[37] X. S. Zhao, M. G. Q. Lu, C. Song, Immobilization of aluminum chloride on MCM-
41 as a new catalyst system for liquid-phase isopropylation of naphthalene, Journal
of Molecular Catalysis A: Chemical 191 (1) 67-74 (2003).
[38] R. Lin, R. L. White, Acid-catalyzed cracking of polystyrene, Journal of Applied
Polymer Science 63 (10) 1287-1298 (1997).
[39] T. Faravelli, M. Pinciroli, F. Pisano, G. Bozzano, M. Dente, E. Ranzi, Thermal
degradation of polystyrene, Journal of Analytical and Applied Pyrolysis 60 (1) 103-
121 (2001).

Results and Discussion
200
[40] I. C. McNeill, M. Zulfiqar, T. Kousar, A detailed investigation of the products of
the thermal degradation of polystyrene, Polymer Degradation and Stability 28 (2)
131-151 (1990).
[41] T. Xu, N. Kob, R. S. Drago, J. B. Nicholas, J. F. Haw, A solid acid catalyst at the
threshold of superacid strength: NMR, calorimetry, and density functional theory
studies of silica-supported aluminum chloride, Journal of the American Chemical
Society 119 (50) 12231-12239 (1997).
[42] Z. Li, X. Ma, J. Liu, X. Feng, G. Tian, A. Zhu, Silica-supported aluminum chloride:
A recyclable and reusable catalyst for one-pot three-component Mannich-type
reactions, Journal of Molecular Catalysis A: Chemical 272 (1–2) 132-135 (2007).
[43] A. Corma, V. Fornes, M. T. Navarro, J. Perezpariente, Acidity and Stability of
MCM-41 Crystalline Aluminosilicates, Journal of Catalysis 148 (2) 569-574
(1994).
[44] D. Gianolio, N. B. Muddada, U. Olsbye, C. Lamberti, Doped-CuCl2/Al2O3 catalysts
for ethylene oxychlorination: Influence of additives on the nature of active phase
and reducibility, Nuclear Instruments and Methods in Physics Research Section B:
Beam Interactions with Materials and Atoms 284 (0) 53-57 (2012).
[45] K. Tomishige, T. Sakaihori, S.-I. Sakai, K. Fujimoto, Dimethyl carbonate synthesis
by oxidative carbonylation on activated carbon supported CuCl2 catalysts: catalytic
properties and structural change, Applied Catalysis A: General 181 (1) 95-102
(1999).
[46] W.-L. Fanchiang, Y.-C. Lin, Catalytic fast pyrolysis of furfural over H-ZSM-5 and
Zn/H-ZSM-5 catalysts, Applied Catalysis A: General 419–420 (0) 102-110 (2012).

Results and Discussion
201
[47] R. Das, D. Chakraborty, I2-TEMPO as an efficient oxidizing agent for the one-pot
conversion of alcohol to amide using FeCl3 as the catalyst, Catalysis
Communications 26 (0) 48-53 (2012).
[48] Z. X. Li, Z. Duan, Y. J. Wu, FeCl3 catalyzed diarylmethanes formations, Chinese
Chemical Letters 20 (5) 511-513 (2009).
[49] M. Salavati-Niasari, J. Hasanalian, H. Najafian, Alumina-supported FeCl3, MnCl2,
CoCl2, NiCl2, CuCl2, and ZnCl2 as catalysts for the benzylation of benzene by
benzyl chloride, Journal of Molecular Catalysis A: Chemical 209 (1–2) 209-214
(2004).
[50] G.-F. Chen, H.-M. Jia, L.-Y. Zhang, B.-H. Chen, J.-T. Li, An efficient synthesis of
2-substituted benzothiazoles in the presence of FeCl3/Montmorillonite K-10 under
ultrasound irradiation, Ultrasonics Sonochemistry 20 (2) 627-632 (2013).
[51] P. T. Williams, E. Slaney, Analysis of products from the pyrolysis and liquefaction
of single plastics and waste plastic mixtures, Resources, Conservation and
Recycling 51 (4) 754-769 (2007).
[52] C. Vasile, H. Pakdel, B. Mihai, P. Onu, H. Darie, S. Ciocâlteu, Thermal and
catalytic decomposition of mixed plastics, Journal of Analytical and Applied
Pyrolysis 57 (2) 287-303 (2001).
[53] R. S. Chauhan, S. Gopinath, P. Razdan, C. Delattre, G. S. Nirmala, R. Natarajan,
Thermal decomposition of expanded polystyrene in a pebble bed reactor to get
higher liquid fraction yield at low temperatures, Waste Management 28 (11) 2140-
2145 (2008).

Results and Discussion
202
[54] T. Bhaskar, J. Kaneko, A. Muto, Y. Sakata, E. Jakab, T. Matsui, M. A. Uddin,
Pyrolysis studies of PP/PE/PS/PVC/HIPS-Br plastics mixed with PET and
dehalogenation (Br, Cl) of the liquid products, Journal of Analytical and Applied
Pyrolysis 72 (1) 27-33 (2004).
[55] J. Shah, M. R. Jan, Adnan, Catalytic activity of metal impregnated catalysts for
degradation of waste polystyrene, Journal of Industrial and Engineering Chemistry
0) (2014). http://dx.doi.org/10.1016/j.jiec.2013.12.055 (
[56] P. Carniti, P. L. Beltrame, M. Armada, A. Gervasini, G. Audisio, Polystyrene
thermodegradation. 2. Kinetics of formation of volatile products, Industrial &
Engineering Chemistry Research 30 (7) 1624-1629 (1991).
[57] T. Yoshioka, T. Handa, G. Grause, Z. Lei, H. Inomata, T. Mizoguchi, Effects of
metal oxides on the pyrolysis of poly(ethylene terephthalate), Journal of Analytical
and Applied Pyrolysis 73 (1) 139-144 (2005).
[58] G. Xi, M. Lu, C. Sun, Study on depolymerization of waste polyethylene
terephthalate into monomer of bis(2-hydroxyethyl terephthalate), Polymer
Degradation and Stability 87 (1) 117-120 (2005).

Conclusions
203
CONCLUSIONS
The aim of this study was the development of novel high activity impregnated catalysts for
the low cost thermo-catalytic degradation of WEPS into selective valuable products and
their separation via fractional distillation followed by physiochemical and GC-MS
characterization. The degradation of WEPS was carried out using various groups of bulk
catalyst (i.e. metals, metal oxides and metal salts) and the metals were also impregnated in
the form of their salts over Al₂O₃, Mmn and AC supports. The impregnated catalyst 20%
Al-Al₂O₃ was also used for the degradation of PS with the effect of PET and was
investigated for activity and selectivity of products and as well as the novelty of the
products. PEI impregnated zeolite Y was also investigated for the capture of CO₂. The
supporting materials and catalysts were synthesized with wet impregnation and
characterized using N₂ adsorption/desorption, SEM and XRD analysis.
The WEPS was characterized using thermogravimetric analysis (TGA) in both O₂ and N₂
environments. In the case of O₂ environment, 100 wt.% changes were observed. Therefore,
the degradation of WEPS was carried out at ambient conditions.
The WEPS were also degraded using thermal degradation (without catalyst). The
maximum yield of liquid products was achieved with 500 ºC degradation temperature and
150 min reaction time. At optimum condition the yield of liquid products was 78.0.7 ± 0.64
wt.% and the total conversion was 98.47 ± 0.61 wt.%.
The GC-MS analysis of parent liquid products shows non-significant amount of valuable
material and the yield of products was major in high molecular weight aromatic
hydrocarbons. The yield of toluene was 2.06 wt.%, ethylbenzene was 0.85 wt.% and
styrene monomer was 39.31 wt.%, α-methylstyrene was 1.33 wt.%, benzene, 3-butynyl
was 17.56 wt.% and 1,2-propanediol, 3-benzyloxy-1,2-diacetyl was 10.10 wt.%.
However, during recovery the products further degraded into smaller products and the
small amount of benzene, ethylbenzene and 1,2-propanediol, 3-benzyloxy-1,2-diacetyl was
recovered. Toluene was abundant in the recovery with 51.0 wt.% styrene was the second
35.0 wt.% and small amount of phenanthrene (6.0 wt.%) was also found.

Conclusions
204
The comparative degradation of WEPS was carried out using different supporting materials
for the impregnation of metals i.e., Al₂O₃, Mmn and AC. The catalytic degradation was
optimized for degradation temperature, reaction time and polymer to catalyst ratio for
maximum liquid products. Mmn was found with good catalytic activity with a maximum
liquid product yield of 92.40 ± 0.87 wt.%. All the three materials yielded a significant
amount of valuable products. AC was found to possess acidic sites of high activity that
caused to yield mostly low molecular weight aromatic hydrocarbons abundant with toluene
(6.96) and ethylbenzene (6.55). However, the yield of styrene monomer was 45.65 wt.%
and 45.42 wt.% maximum with Al₂O₃ and AC catalyst
The catalytic degradation of WEPS investigated using Mg-bulk catalysts and compared.
The present method gave more selective products with significant yield. The majority of
low molecular weight aromatic compounds were in high quantities indicating the method
is environment friendly. The degradation process resulted in the selective production of
aromatic hydrocarbons. Maximum recovery of styrene (43.0 wt.%) could be achieved with
Mg (metal) catalyst, styrene (23.8 wt.%) and ethylbenzene (35.0 wt.%) with MgO catalyst,
while styrene (51.87 wt.%) and toluene (15.81 wt.%) with MgCO₃ catalyst.
Mg impregnated catalysts over different supports were used for thermo-catalytic
degradation of WEPS. The catalytic degradation of WEPS in the presence of 15% Mg-
Al₂O₃ led to a smaller number of hydrocarbons with higher concentration as compared to
Mg metal, 20% Mg-Mmn and 20% Mg-AC catalysts. The yield of benzene, toluene,
ethylbenzene, styrene, α-methylstyrene and many other valuable compounds was
maximum with 20% Al-Al₂O₃ catalyst. The catalytic activity and yield of component
products were compared to reported methods and current method was found significant for
low cost conversion into valuable products.
The catalytic pyrolysis of WEPS was carried out using zinc bulk catalysts. It was found
from the catalytic activity and selectivity data that zinc bulk catalysts enhanced the yield
of liquid products and affected the formation of component products as compared to
thermal degradation, particularly with Zn metal as a catalyst. In comparison to thermal
degradation, the catalysts decreased degradation temperature and heating time while on the

Conclusions
205
other hand it increased the yield of liquid products from 78.07 ± 0.64 wt.% to 96.73 ± 0.12
wt.%. The catalysts, not only enhanced liquid products, but also increased value added
components of the liquid products including toluene, ethylbenzene and styrene. Overall,
the zinc bulk catalysts enhanced both the activity and selectivity of products. During
fractional distillation variation in products was observed due to cyclization and re-
combination along with thermal degradation. The fractions were analyzed using
physiochemical methods as well as GC-MS characterization.
Zn-Al₂O₃, Zn-Mmn and Zn-AC impregnated catalysts were prepared by impregnating zinc
in the form of its salt over Al₂O₃, Mmn and AC supports. The catalysts were characterized
by SAA, SEM and XRD. The activity and selectivity of liquid products and its components
were better than Zn bulk catalysts. Among the Zn supported catalysts 20% Zn-Al₂O₃ was
having better catalytic performance with 90.20 ± 0.35 wt.% liquid products that are less
than the Zn (96.07 ± 0.31) but the selectivity of the products was good in case of 20% Zn-
Al₂O₃ having maximum valuable aromatic hydrocarbons. The composition of styrene,
toluene, ethylbenzene and α-methylstyrene with 20% Zn-Al₂O₃ were 62.08%, 11.79%,
7.35% and 4.58%, respectively.
Aluminum bulk catalysts i.e. (Al metal, Al₂O₃ and AlCl₃) were found with high activity
for the degradation of WEPS comparable with thermal degradation. The catalytic
degradation was selective with the production of desirable low molecular weight aromatic
hydrocarbons more specifically in the case of Lewis acid catalysts i.e. AlCl₃. The yield of
styrene monomer in case of AlCl₃ catalyst was 46 wt.%. The liquid product was also
separated for the recovery of value added products, AlCl₃ catalyst was found with
maximum recovery of toluene and ethylbenzene. Maximum recovery of styrene was 50
wt.% and 51 wt.% and α-methylstyrene recovery was 13 wt.% and 9 wt.% with Al and
Al₂O₃ catalysts, respectively.
Al and its impregnated catalysts using Al2O3, Mmn and AC as supports were prepared. The
prepared catalysts were characterized using surface area, SEM and XRD. The results of
liquid product yield and GC-MS characterization revealed that 20% Al-Al2O3 with good
catalytic activity producing 91.20 ± 0.35 wt. % liquid products with low molecular weight

Conclusions
206
hydrocarbons. The amount of light weight aromatic was higher as compared to other
catalysts used with a major fraction of styrene monomer i.e. 56.52%.
Cu, CuO and CuCl₂ bulk catalysts were compared for thermo-catalytic degradation of
WEPS for the recovery of valuable products. Cu bulk catalysts were found more effective
for catalytic activity and selectivity. The majority of low molecular weight aromatic
hydrocarbons was formed with a very small amount of residue, gases and unwanted high
molecular weight aromatic hydrocarbons. Cu metal was found the best catalyst among the
used catalysts with a liquid product yield of 93.93 wt.%, styrene selectivity of 55.14 wt.%
and styrene monomer recovery of 60 wt.%.
The catalytic activity and selectivity of Cu impregnated catalysts over Al2O3, Mmn and
AC were investigated for the degradation of WEPS. The BET surface area of 20% Cu-
Al₂O₃ was increased to 73.99m2/g as compared to Al₂O₃ (68.31 m2/g) with particle size 2-
5 μm and adequate dispersion of precursor active centers, which in turn provides more
reaction sites. It was found that the yield of liquid products with Cu impregnated catalysts
was moderate, but with high selectivity toward low molecular weight aromatic
hydrocarbons. Among the impregnated catalysts, 20% Cu-Al₂O₃, 15% Cu-Mmn and 20%
Cu-AC showed high activities, however, the selectivity was good only with the 20% Cu-
Al₂O₃ catalyst for styrene monomers. For the selectivity of toluene and ethylbenzene, 15%
Cu-Mmn and 20% Cu-AC were found good selective catalysts.
Catalytic degradation of WEPS was carried out using Fe, Fe₂O₃ and FeCl₃ bulk catalysts,
and found to increase the yield of liquid products with high selectivity as compared to
thermal degradation. Fe and Fe₂O₃ were having more selectivity for low molecular weight
aromatic hydrocarbons. Where the recovery of styrene monomer was high for liquid
product obtained with Fe metal as catalyst. FeCl₃ (Lewis acid) was found moderate
catalysts with good recovery of toluene, ethylbenzene and styrene monomer.
Fe impregnated catalysts were investigated for the degradation of WEPS. The
activities of liquid product and selectivity of component products were
determined. The BET surface area of 5% Fe-Al₂O₃ was increased to 109.12
m2/g as compared to Al₂O₃ (68.31 m2/g) with high pore volume and sized
Conclusions
207
throughout the catalysts body. 5% Fe-Al₂O₃ and 20% Fe-Mmn was found with
good catalytic activity and selectivity of products. The yield of liquid products
using 5% Fe-Al₂O₃ and 20% Fe-Mmn was 89.27 ± 0.31 wt.% and 88.87 ± 0.42
wt.%, respectively. The yield of component products like toluene, ethylene and
styrene monomer was almost the same with 5% Fe-Al₂O₃ and 20% Fe-Mmn
catalysts. Overall, the yield of liquid products was less than Fe metal, but the
selectivity of products enhanced with Fe impregnated catalysts.
In the presence of catalysts, the pyrolysis of PS, 10PET+PS, 20PET+PS and
30PET+PS started at a lower temperature than the TG pyrolysis. Pyrolysis
temperature, reaction time and feed to catalyst ratio affected the yield of liquid
products and gases. The yield of liquid products was maximum at 500 ºC, 60
min reaction time and 1:0.2 feed to catalyst ratio in the cases of PS and
10PET+PS, it was maximum at 450 ºC, 60 min reaction time and 1:0.2 feed to
catalyst ratio in the case of 20PET+PS while it was maximum at 450 ºC, 90 min
reaction time and 1:0.2 feed to catalyst ratio in the case of 30PET+PS.
Generally, the yield of liquid products decreased and gases increased with the
increase of PET percentage. GC-MS analysis showed the formation of single
ring aromatic hydrocarbons (C6-C9 fraction) in bulk. Styrene monomer was
found dominant in the pyrolysis of all materials. The formation of many new
and oxygenated hydrocarbons is attributed to the addition of PET which
increased with the increase of PET percentage. The yield of styrene dimers,
styrene oligomers and oxygen containing compounds increased with the
increase of PET percentage. 10% PET was found to have good interaction with
PS with the yield of maximum liquid and component products after PS.
Thermo-catalytic degradation of WEPS using bulk and impregnated catalysts significantly
enhanced the yield of liquid products and improved the selectivity of component products.
In most cases along with products enhancement it showed marked reduction in the
degradation temperature and reaction. More basic catalyst (like MgO, MgCO₃ and Fe₂O₃)
yielded maximum liquid products comparatively at low temperature i.e. 400 ⁰C and greater
time. High temperature (500 ⁰C) requires a relatively small amount of catalyst where the

Conclusions
208
yield of desirable products decreases with the increase of degradation temperature. Low
molecular weight aromatic hydrocarbons are favored by moderate temperature (450 ⁰C)
with maximum total percent conversion. In most cases, more reaction time favors the yield
of selective and desirable products with the decrease of non-desirable products.
Impregnated catalysts increased the selectivity of products and decreased the yield of high
molecular weight aromatic hydrocarbons to almost zero in most cases. Impregnation over
Al₂O₃ support gives greater activity and selectivity of products. Metals not only catalyzed
the reaction, but also acted as synergist with low degradation temperature and time. The
low yield of styrene monomer with acidic catalysts is due to the further degradation into
benzene, toluene and ethylbenzene like products. The impact of PET on the yield of liquid
products was observed with significant interactions. The addition of PET caused to yield
gases in the majority. GC-MS analysis of liquid products showed many novel compounds
and mostly oxygenated aromatic hydrocarbons.

List of Publications
209
List of Publications
1. Jasmin Shah, M. Rasul Jan, Adnan, “Catalytic activity of metal impregnated
catalysts for degradation of waste polystyrene”, Journal of Industrial and
Engineering Chemistry 20 (5) 3604-3611 (2014). IF = 2.063
2. Jasmin Shah, M. Rasul Jan, Adnan, “Conversion of waste polystyrene through
catalytic degradation into valuable products”, Korean Journal of Chemical
Engineering 31(8), 1389-1398 (2014). IF = 1.241
3. Adnan, Jasmin Shah, M. Rasul Jan, “Thermo-catalytic pyrolysis of polystyrene in
the presence of zinc bulk catalysts”, Journal of the Taiwan Institute of Chemical
Engineers 45 (2014) 2494–2500. IF = 2.637
4. Jasmin Shah, M. Rasul Jan, Adnan, “Catalytic Activity of Aluminum Impregnated
Catalysts for the Degradation of Waste Polystyrene”, International Journal of
Chemical, Nuclear, Metallurgical and Materials Engineering 8(4) 83-89 (2014).
5. Adnan, Jasmin Shah, M. Rasul Jan, “Polystyrene Degradation Studies using Cu
Supported Catalysts”, Journal Analytical and Applied Pyrolysis 109, 196–204
(2014). IF = 3.070
6. Adnan, Jasmin Shah, M. Rasul Jan, “Effect of polyethylene terephthalate on the
catalytic pyrolysis of polystyrene: Investigation of the liquid products”, Journal of
the Taiwan Institute of Chemical Engineers. (Accepted)
7. Adnan, Jasmin Shah, M. Rasul Jan, “Zinc supported catalysts for tertiary recycling
of polystyrene into desirable hydrocarbons”, Canadian Journal of Chemical
Engineering. (Submitted)
8. Jasmin Shah, M. Rasul Jan, Adnan, “Degradation of Polystyrene over Impregnated
Catalysts using Montmorillonite Clay as Supporting Material”, Applied Clay
Sciences. (Submitted)
9. Jasmin Shah, M. Rasul Jan, Adnan, “Thermo-catalytic degradation of polystyrene
using magnesium Impregnated catalysts”, Journal of Analytical and Applied
Pyrolysis. (Submitted)
10. Jasmin Shah, M. Rasul Jan, Adnan, “Cracking of Waste Expanded Polystyrene
using Supported Fe Catalysts”. (In the process of submission)

List of Publications
210
11. Jasmin Shah, M. Rasul Jan, Adnan, “Chemical Recycling of Waste Expanded
Polystyrene in the Presence of Impregnated Catalysts over Activated Charcoal”. (In
the process of submission)
12. Jasmin Shah, M. Rasul Jan, Adnan, “Thermo-Catalytic Decomposition of Waste
Polystyrene Plastic using Aluminum bulk catalyst”. (In the process of submission)
13. Jasmin Shah, M. Rasul Jan, Adnan, “Catalytic Degradation of Waste Expanded
Polystyrene Using Cu, CuO and CuCl₂ catalysts”. (In the process of submission)
14. Jasmin Shah, M. Rasul Jan, Adnan, “Study of Expanded Polystyrene Pyrolysis
using Iron Bulk Catalysts”. (In the process of submission)

List of Publications
211

List of Publications
212

List of Publications
213

List of Publications
214

List of Publications
215