Muhammad Thesis 19-6-18.pdf - Pakistan Research Repository
203
i AN ANALYSIS OF HOUSEHOLDS’ DEMAND FOR IMPROVED WATER AND SANITATION SERVICES TOWARDS BETTER PLANNING IN PESHAWAR, KHYBER PAKHTUNKHWA Submitted to: Dr. Syed Akhtar Ali Shah Submitted By: MUHAMMAD Ph.D. (Scholar) DEPARTMENT OF URBAN AND REGIONAL PLANNING UNIVERSITY OF PESHAWAR Session: 2011-2012
-
Upload
khangminh22 -
Category
Documents
-
view
0 -
download
0
Transcript of Muhammad Thesis 19-6-18.pdf - Pakistan Research Repository

i
AN ANALYSIS OF HOUSEHOLDS’ DEMAND FOR IMPROVED WATER
AND SANITATION SERVICES TOWARDS BETTER PLANNING IN
PESHAWAR, KHYBER PAKHTUNKHWA
Submitted to: Dr. Syed Akhtar Ali Shah
Submitted By: MUHAMMAD
Ph.D. (Scholar)
DEPARTMENT OF URBAN AND REGIONAL PLANNING
UNIVERSITY OF PESHAWAR
Session: 2011-2012

ii
AN ANALYSIS OF HOUSEHOLDS’ DEMAND FOR IMPROVED WATER
AND SANITATION SERVICES TOWARDS BETTER PLANNING IN
PESHAWAR, KHYBER PAKHTUNKHWA
A dissertation submitted to the Department Urban and Regional Planning,
University of Peshawar in partial fulfillment for Degree of Doctor of
Philosophy (Ph.D.) in Urban and Regional Planning
By
MUHAMMAD
Supervised By
Professor Dr. Syed Ali Shah
DEPARTMENT OF URBAN AND REGIONAL PLANNING
UNIVERSITY OF PESHAWAR
(OCTOBER 2017)

iii
Certificate of Approval
This is to certify that the research work presented in this thesis, entitled “AN
ANALYSIS OF HOUSEHOLDS’ DEMAND FOR IMPROVED WATER AND
SANITATION SERVICES TOWARDS BETTER PLANNING IN PESHAWAR,
KHYBER PAKHTUNKHWA” was conducted by Mr. Muhammad under the
supervision of Dr. Syed Akhtar Ali Shah. No part of this thesis has been submitted
anywhere else for any other degree. This thesis is submitted to the Department of Urban
and Regional Planning in partial fulfilment of the requirements for the degree of Doctor
of Philosophy in Field of Urban Environmental Economic Planning, Department of
Urban and Regional Planning
University of Peshawar.
Student Name: Muhammad Signature: __________
Examination Committee:
a) External Examiner 1:
Prof. Dr. Ghulam Abbas Anjum Signature:___________
Dean Faculty of Architecture and Planning,
UET, Lahore.
b) External Examiner 2: Signature:___________
Dr. Rashid Rehan
Director of NIUIP, UET, Peshawar.
c) Internal Examiner: Signature:___________
Dr. Zulfiqar Ali
Department of Urban and Regional Planning
University of Peshawar
Supervisor:
Dr. Syed Akhtar Ali Shah Signature:____________
Chairman:
Prof. Dr. Fazlur Rahman Signature:_____________

iv
Author’s Declaration
I, Muhammad hereby state that my Ph.D thesis titled: “AN ANALYSIS OF
HOUSEHOLDS’ DEMAND FOR IMPROVED WATER AND SANITATION
SERVICES TOWARDS BETTER PLANNING IN PESHAWAR, KHYBER
PAKHTUNKHWA” is my own work and has not been submitted previously by me for
taking any degree from the University of Peshawar or anywhere else in the
country/world. At any time if my statement is found to be incorrect even after my
graduation the university has the right to withdraw my Ph.D degree.
Muhammad
Date: May 02, 2018

v
Dedicated
To
My Parents and Family Who Devoted Their Life to
My Accomplishments and whose Prayers Have
Always
Been a Constant Source of Motivation and
Encouragement for Me

vi
Table of Contents Acknowledgements ......................................................................................xi ABSTRACT ..................................................................................................xiii CHAPTER 1: INTRODUCTION ...............................................................1 1.1 Background of the Study ....................................................................1 1.2 Area Description .................................................................................3
1.3 Problem Statement ..............................................................................5 1.4 Significance of the Study ....................................................................5 1.5 Aims and Objectives ...........................................................................6 1.6 Research Questions .............................................................................7 1.7 Organization of the Study ...................................................................7
CHAPTER 2: LITERATURE REVIEW ..................................................8 2.1 Introduction .........................................................................................8
2.2 Status of Water, Sanitation and its Related Issues ..............................8 2.3 Importance of Public Participatory Planning Approach .....................10 2.4 Strategies Used for Measurement of Household Demand ..................12 2.5 The Use of Contingent Valuation Survey Method .............................12 2.6 The Use of Willingness to Pay Method for Measuring Demand ........14
2.7 Household Demand Function for Water and Sanitation in Developed
Countries .............................................................................................17 2.8 Domestic Water and Sanitation Demand in Developing Countries ...18
2.8.1 Average Quantity of Water Consumption ...............................20
2.8.2 Quality of Water Services ........................................................22 2.8.3 Socio-Economic Characteristics and Water Demand ..............22
2.9 Determinants of Willingness to Pay for Improved Sanitation in
Developing Countries .........................................................................23
2.10 Household Demand Function Evidence from Pakistan ......................24 2.11 Contribution of the Present Study .......................................................27 2.12 Summary .............................................................................................27
CHAPTER 3: WATER AND SANITATION SERVICES IN PAKISTAN 29 3.1 Situational Analysis of Drinking Water in Pakistan ...........................29
3.2 Inter Provincial Situation of Water and Sanitation .............................32 3.3 Status of Sanitation .............................................................................34 3.4 Waste Water Coverage .......................................................................36 3.5 Toilet Facilities ...................................................................................36
3.6 Municipal Service Facilities ...............................................................38 3.7 Present Institutional Framework of Municipal Services .....................39
3.8 Challenges of Water and Sanitation Services .....................................39 3.8.1 Infrastructure Challenges .........................................................40 3.8.2 Institutional Challenges in Pakistan .........................................41 3.8.3 User Ownership .......................................................................41
3.9 Drinking Water and Sanitation Policies in Pakistan ...........................42
3.10 Decentralization of Municipal Services in Pakistan ...........................43
CHAPTER 4: METHODOLOGY FOR DATA COLLECTION ............45 4.1 Source of Drinking Water ...................................................................45 4.2 Population Forecasting .......................................................................48 4.3 Sampling Design .................................................................................48
4.4 Allocation of Sampling .......................................................................48 4.5 Nature and Sources of Data ................................................................49
4.6 Household Survey Questionnaire .......................................................50

vii
4.7 Key Informant Interviews ...................................................................50 4.8 Survey and Data Collection ................................................................51 4.9 Analytical Tools ..................................................................................52 4.10 Satisfaction Index ...............................................................................54 4.11 Priority Indices ....................................................................................55
4.12 Households’ Demand for Improved Water and Sanitation Services ..55 4.13 Derivation of Household Demand Improved Water Services ............56
4.13.1 Theoretical Model for Household Water Demand ...................56
4.13.2 Model Derivation for Improved Water Services .....................57
4.14 Derivation of Household Willingness to pay for Improved Sanitation
Services ...............................................................................................58
4.14.1 Theoretical Framework for Improved Sanitation Services ......59
4.14.2 Model Derivation for Improved Sanitation Services ...............60
4.15 Performance Indices for Water and Sanitation Services Authority ....61 4.16 Governance Score Card for Water and Sanitation Services ...............62
CHAPTER 5: DATA ANALYSIS OF WATER SERVICES IN URBAN
PESHAWAR ................................................................................................63 5.1 Field Visits and Community Perceptions ...........................................63 5.2 Findings from Key Informant Interviews ...........................................66 5.3 Governance Score Card for Service provider. ....................................69
5.4 Socio-Economic Characteristics of Households .................................71 5.5 State of Existing Water Services in Urban Peshawar .........................73
5.6 Households Perception on Domestic Water .......................................75 5.7 Indicators Analysis of Water Services ................................................76
5.7.1 Water Consumption Per Capita per Day .......................................76 5.7.2 Domestic Water Treatment in Urban Peshawar ............................77 5.7.3 Percentage of Children<36 Months of Age Suffered from Diarrhea 79
5.7.4 Percentage of Households with Access to Improved Water Source 80 5.8 State of Satisfaction for Domestic Water Services .............................81
5.9 Priorities for Improvement of Domestic Water Services ....................83 5.9.1 Water Quantity Problem ................................................................83 5.9.2 Infrastructure Problems .................................................................85 5.9.3 Quality of Water Problems ............................................................89
5.10 Performance Indices for Water and Sanitation Service Authority .....92
5.11 Cost Recovery and Household Willingness to pay for Improved
Water Services ....................................................................................94 5.12 Demand Curve for Improved Water Services .....................................95 5.13 Variables of Model for Improved Water Services ..............................97 5.14 Determinants of Household’s WTP for Improved Water Services ....98 5.15 Correlation Matrixes of Variable in the Model ..................................100
5.15.1 Income of the Household and Willingness to Pay for Improved
Water Services ........................................................................................102 5.15.2 Education of the Respondents and Willingness to Pay for Improved
Waster Services ......................................................................................103 5.15.3 Employment and Household Willingness to Pay for Improved
Waster Services ......................................................................................104
5.15.4 Housing Ownership and Willingness to Pay for Improved Waster
Services...................................................................................................105

viii
5.15.5 Household size and WTP for Improved Waster Services ...........106 5.16 Summary .............................................................................................106
CHAPTER 6: DATA ANALYSIS OF SANITATION SERVICES IN
URBAN PESHAWAR .................................................................................108 6.1 Field Visits and Community Perceptions ................................................108
6.2 Findings from Key Informant Interviews ................................................110 6.3 State of Sanitation in Urban Peshawar.....................................................112 6.4 Perception of Household Regarding Sanitation Services ........................114 6.5 Indicators Analysis for Improved Sanitation Services in Urban Peshawar 116
6.5.1 Households Access to Sanitation Facility .....................................116
6.5.2 Households Access to Hygienic Sanitation Facility in Urban
Peshawar .................................................................................................117
6.6 State of Satisfaction of the Household for Sanitation Services ...............118 6.7 Priorities for Improvement of Sanitation Services ...................................119 6.8 Public Health Problems and Households Priorities for Solution .............123 6.9 Cost Recovery and Household Willingness to Pay for Improved Sanitation
Service ................................................................................................126
6.10 Average Demand Curve for Improved Sanitation Services ...................127 6.11 Variable of Model for Improved Sanitation Services ............................129
6.12 Determinants of Household Willingness to Pay for Improved Sanitation
Services ...............................................................................................129
6.13 Correlation of Variables in the Model ...................................................131 6.13.1 Income and Household Willingness to Pay for Improved Sanitation
Services...................................................................................................132
6.13.2 Education and Households’ Willingness to Pay for Sanitation
Services...................................................................................................133 6.13.3 Employment and Household Willingness to Pay for Improved
Sanitation Services .................................................................................134
6.13.4 Housing Ownership and Household Willingness to Pay for
Improved Sanitation Services .................................................................135
6.13.5 Household Size and Household Willingness to Pay for Improved
Sanitation Services .................................................................................136 6.14 Summary ................................................................................................136
CHAPTER 7: CONCLUSION AND POLICY IMPLICATIONS ..........138 7.1 State of water and sanitation services in Urban Peshawar ..................138
7.2 Problems Faced by Households Regarding Water and Sanitation
Services ..............................................................................................139
7.3 Household Demand for Improved Water Services ..................................139 7.4 Household Demand for Improved Sanitation Services ............................140 7.5 Policy Implications for Better Planning ...................................................140
REFERENCES .............................................................................................144 ANNEXURES ...............................................................................................164 Annexure I: Projected Population of Urban Union Councils Peshawar ........164 Annexure II: Calculation of Water and Sanitation Indicators .......................166 Annexure III: Household Questionnaire ........................................................167 Annexure IV: Focus Group Discussion Questionnaire ..................................178 Annexure V: Average Domestic Water supply in Urban Peshawar ..............180
Annexure VI: Notification of Revised Rates of Water and Sanitation ..........181
Annexure VII: Socio-Economic Characteristics of the Respondents in Urban
Peshawar .............................................................................................185

ix
LIST OF TABLES
Table 5. 1: Community Perceptions to water services in Urban Peshawar ................. 64
Table 5. 2: General Findings from Key Informant Interviews in Urban Peshawar ..... 66
Table 5. 3: Performance Evaluation of the services providers through Governance
Score Card Method ...................................................................................................... 71
Table 5. 4: Socio-Economic Characteristics of the Respondents in Urban Peshawar . 72
Table 5. 5: State of Existing Water services in Urban Peshawar................................. 73
Table 5. 6: Perception of Household Regarding Domestic Water services ................. 75
Table 5. 7: Household Per Capita Water Consumption in Urban Peshawar ............... 77
Table 5. 8: Type of Domestic Water Treatment Methods in Urban Peshawar ............ 79
Table 5. 9: Percentage of Household whose kid suffering from Diarrhea ................... 80
Table 5. 10: Satisfaction Indices for Domestic Water services ................................... 81
Table 5. 11: Problems of Sufficient Quantity and Households Priorities for
Improvement ................................................................................................................ 83
Table 5. 12: Indicators of Infrastructure Problem and Priorities for Solution ............. 86
Table 5. 13: Physical Water Qualities and Problems Priorities for Solution ............... 90
Table 5. 14: Degree of Performance of Municipal Authority in Urban Peshawar ...... 92
Table 5. 15: Various bids of WTP for Improved Water Service in Urban Peshawar .. 95
Table 5. 16: Definition and Summary Statistics of Variables ..................................... 97
Table 5. 17: Result of Logistic Regression Model for Improved Water Services in
Urban Peshawar ........................................................................................................... 99
Table 5. 18: Correlations of Variables in the Model ................................................. 101
Table 6. 1: Summary of Community Perceptions Regarding Sanitation Services 108
Table 6. 2: Summary of General Findings from Key Informant Interviews ............. 110
Table 6. 3: Household Responses Regarding State of Sanitation .............................. 113
Table 6. 4: Household Perception Regarding Existing Sanitation Services .............. 115
Table 6. 5: Satisfaction Indices for Sanitation Services in Urban Peshawar ............. 118
Table 6. 6: Sanitation Problems and Priorities for Solution in Urban Peshawar ....... 119
Table 6. 7: Priority Indices for Public Health Problem in Urban Peshawar .............. 124
Table 6. 8: Various bids for Willingness to Pay for Improved Sanitation Service .... 127
Table 6. 9: Definition and Summary Statistics of Variables in Model ...................... 129
Table 6. 10: Results of Logistic Regression Model for Improved Sanitation Services
in Urban Peshawar ..................................................................................................... 130
Table 6. 11: Correlations of Variables in the Logistic Model ................................... 132

x
LIST OF FIGURES
Figure 1. 1: Impact of Improved Water and Sanitation on Public Health .....2
Figure 1. 2: Urban Union Councils of District Peshawar ..............................4
Figure 2. 1: Classification of Willingness to Pay Methods ...........................15
Figure 2.2: Classification of Methods Used for Estimation of WTP .............16
Figure 2.3: Hierarchy of Water Requirement for Domestic Uses .................21
Figure 3.1: Proportion of Population Access to Improved Water Source in
Pakistan .........................................................................................................30
Figure 3. 2: Trend of Children Under Five (05) Years Who Suffered from
Diarrhea in Pakistan .......................................................................................31
Figure 3. 3: Province wise Diarrhoea Cases in Pakistan ...............................32
Figure 3. 4: Province wise Distribution by Source of Drinking Water in
Pakistan ..........................................................................................................33
Figure 3. 5: The proportion of Population Access to Improved Sanitation in
Pakistan ..........................................................................................................35
Figure 3. 6: Wastewater Sewerage Facilities in Pakistan ..............................36
Figure 3. 7: : Percentage of Population having Toilet Facilities....................37
Figure 3. 8: Province Wise Status of Sanitation in Pakistan..........................38
Figure 3. 9: Municipal Services Facility in Pakistan .....................................39
Figure 3. 10: Hierarchy of the Water and Sanitation Service Utility.............44
Figure 4. 1: Spatial Location of Existing Tube Wells in District Peshawar ..46
Figure 4. 2: Water Table Depth in feet in District Peshawar .........................47
Figure 5. 1: Spatial Location of Water Filtration Plants in the Study Area ...78
Figure 5. 2: Demand curve for Improved Water Service in Urban Peshawar 96
Figure 5. 3: Income and Willingness to pay for Improved Water Services ...102
Figure 5. 4: Education and Willingness to Pay of Household for Improved
Water services ................................................................................................103
Figure 5. 5: Employment and Household Willingness to Pay for Improved
Water Services ...............................................................................................104
Figure 5. 6: Household Tenancy and Willingness to Pay for Improved Water
Services ..........................................................................................................105
Figure 5. 7: Size of Household and Willingness to Pay for Improved Water
Services ..........................................................................................................106
Figure 6. 1: Demand cure for Improved Sanitation service in Urban Peshawar 128
Figure 6. 2: Income and Household and Willingness to Pay for Improved
Sanitation Services .........................................................................................133
Figure 6. 3: Education and Household Willingness to Pay for Improved Sanitation
Services ..........................................................................................................134
Figure 6. 4: Employment of Households' and Willingness to Pay for Improved
Sanitation Services .........................................................................................135
Figure 6. 5: Housing Ownership and Willingness to Pay for Improved Sanitation
Services ..........................................................................................................135
Figure 6. 6: Household Size and Willingness to Pay for Improved Sanitation
service ............................................................................................................136

xi
LIST OF IMAGES
Image 5.1: A view of Key Informant Interview in Union Council Palosai ..66
Image 5.2: A view of Key Informant Interview in Union Council Palosai ..69
Image 5.3: Illegal Connection at Nasir Bagh Road .......................................85
Image 5.4: Rusted and Damaged Pipes in Nasir Bagh Road, Canal Town ...87
Image 5.5: Unplanned Water Supply Distribution in Nasir Bagh Road
Canal Town ...................................................................................................88
Image 5.6: Unplanned Water Supply Distribution System in Jamrud Road
Tehkal ............................................................................................................88
Image 5.7: Retrofitting Pipes along Road in Murad Abad ............................89
Image 5.8: Distribution Pipes Along with Sewerage/Drainage System in
Canal Town ....................................................................................................89
Image 5.9: A view of Water Supply Network parallel to sewage line in Rahat
Abad. ..............................................................................................................91
Image 5.10: Joints near Sewers and Leaking Pipelines in Shaheen Town ....91
Image 5.11: Complaint Redressal Cell of WSSP in Zone D .........................93
Image 5.12: Monitoring Mechanisms of Field Staff .....................................94
Image 6.1: Awareness Walk by Chief Executive Officer of WSSP & other
Volunteers .....................................................................................................116
Image 6.2: The Drain Situation in Canal Town .............................................119
Image 6.3: A Scenario of Old Infrastructure and Blocked Drains in
Kandi Maghalzai ............................................................................................122
Image 6.4: Mismanagement of Solid Waste in Nasir Bagh Drain .................123
Image 6.5: A Pictorial View of Proper SWM Campaign in Peshawar ..........123
Image 6.6: Over flow of water in the street in Nasir Bagh (Zone D) ............126
Image 6.7: Pictorial view of Fumigation Campaign in Tehkal ......................126

xii
ACKNOWLEDGEMENTS
I am very thankful to Almighty Allah who enabled me to complete this research work.
I wish to record my heartfelt gratitude to the following people for their assistance:
encouragement and contributions, which ultimately led to the completion of this thesis.
• Dr. Syed Akhtar Ali Shah, Chairman, Department of Urban and Regional Planning,
University of Peshawar, for his motivation and continuous guidance as my supervisor.
• Dr. Anwar Hussain, Pakistan Institute of Development Economics(PIDE), Quaid-
e-Azam University campus Islamabad as a co-supervisor and Dr. Umar Hyat,
Department of Economics and Development Studies for his time to time professional
and constructive guidance and help in concept generation.
• Dr. Amir Khan, Dr. Zulfiqar Ali and Dr. Niaz Ahmad, Department of Urban and
Regional Planning, the University of Peshawar for their valued assistance during the
entire course of study.
• Mr. Nasir Ghafoor Khan CEO Water and Sanitation Company Mardan and Mr.
Khan Zeb Khan CEO Water and Sanitation Company Peshawar, for their logistic
assistance throughout the duration of my study.
• Mr. Kashif Ahmad Technical Advisor in GIZ and Mr. Sherin Khan SDO Irrigation
for editing and language proficiency services.
• All friends and Colleagues from the Urban Policy and Planning Units, especially
Muhammad Suleman Bacha for their motivation, support and words of encouragement.
• All the respondents to the questionnaire from the urban areas of district Peshawar
for their precious time and willingness to respond.
• My family members for their moral support and words of encouragement especially
my father and late mother, for laying a solid foundation for my success.
Muhammad

xiii
ABSTRACT
This comprehensive study was carried out in the urban area of Peshawar, Pakistan, to
analyze the Households’ (HHs) demand for improved water and sanitation services. As
a capital city, Peshawar has much Push and Pull factors of migration along with all
possible environmental and sociological ramifications. Over the past few decades, the
natural population growth and the influx of Afghan refugees followed by the recent
settlement of IDPs has triggered urban sprawl resulting in an immense pressure on the
municipal services. In the absence of proper urban planning, the poorly functioning
institutional capacity and the land market are promoting irregulated land transfer and
speculation, the households tend to cluster together. This trend has overburdened the
carrying capacity of existing infrastructure and the municipal services can no longer
cope with the needs of the continuously expanding urban population. Water and
sanitation are usually taken into consideration in isolation, however, they are
complementary and mostly jointly demanded. In most cases, they cannot be studied in
isolation. While designing a project for water and sanitation usually the beneficiaries
are ignored altogether, although communities have both the right and obligation to be
involved in the planning and implementation of any project and programmes. Limited
data is available about the socio-economic condition, municipal services, and the
demand-side information of household priorities, preferences and their Willingness to
Pay (WTP) for improved water and sanitation services. The weak political commitment,
inadequate institutional capacity, poor technology, and scanty financing are some of the
major obstacles to acceptable water and sanitation services. In light of the above
mentioned problems the present study is a preliminary work and step towards a
pluralistic approach to incorporate communal values to analyze the household demand
for improved WSS for ensuring better planning in district Peshawar.
The Contingent Valuation (CV) survey method with a sample size of six hundred (600)
was used to investigate HHs demand for improved Water and Sanitation Services
(WSS) through a well-designed questionnaire. Data was collected through the
household survey, field observation, and Key Informant Interview (KII). The
perceptions of the HHs were evaluated through various statistical tools like satisfaction,
priority, and performance indices. The Linear Logistic Model was used to estimate the
impact of various influencing factors on the household demand for improved WSS.

xiv
The findings reveal that majority of HHs (89.8 per cent) are served by Water and
Sanitation services Company in Peshawar (WSSP) and have public water tap facilities
at home. However, most of the respondents (72 per cent) are not satisfied with these
services and have reported poor quality, low pressure, inadequate quantity,
unreliability, and distance from the source as the main problems. The study reveals that
the lack of funds, paucity of modern tools, improper planning and insufficient skilled
staff are the major obstacles in the provision of quality WSS. Majority of the HHs (89
per cent) are willing to pay PKR 328 per month for Improved Water Services (IWS)1 .
Policy variables such as the income of the respondents, education, occupation,
ownership of the house and household size have a significant impact on household
demand for IWS.
Regarding sanitation, the analysis shows that a majority of HHs (97 per cent) have
latrine facility at home but the latrines are not connected to the sewerage line. In the
absence of proper sewerage facilities, 80 per cent respondents report that the existing
environmental condition of the area is pathetic and unhygienic. Chocked drains,
dysfunctional wastewater treatment plant, absence of the sewerage line, lack of public
latrines, inadequate water supply and improper solid waste management are the main
problems of the study area. Majority of households (93 per cent) are not satisfied with
the existing services and demand for Improved Sanitation Services (ISS)2. Policy
variables such as income, education and household employment have a statistically
significant impact on household demand for ISS. The study further revealed that a
majority of households (452) are willing to pay PKR 220 per month for ISS.
This study concludes that a pluralistic approach for incorporation of the communal
values is imperative in the planning process for a city like Peshawar. This approach will
increase the level of satisfaction of a majority of households, create a sense of
ownership among the people, and generate additional revenues for the sustenance of
these services. This study also identifies new avenues for further investigation in water
and sanitation in the region.
1 Improved water services (IWS) mean the supply of sufficient and safe domestic water. 2 Here Improved Sanitation Services(ISS) mean the sewage disposal, solid waste management and
clearance of municipal drains.

xv
LIST OF ACRONYMS
ADP Annual Development Plan
AIDS Acquired Immune Deficiency Syndrome
AMCOW African Minister Council on Water
CBO Community Based Organization
CB Cantonment Board
CCB Citizen Community Board
CEO Chief Executive Officer
CVM Contingent Valuation Method
DCE Discrete Choice Experiment
DFID Department for International Development
DNI Distribution Network Improvement
EPA Environmental Protection Agency
GDP Gross Domestic Product
GOKP Government of Khyber-Pakhtunkhwa
GSC Governance Score Card
HHS Households
HPM Hedonic Price Method
IDPS Internally Displaced Peoples
IEC Information, Education and Communication
ISS Improved Sanitation Services
IWS Improved Water Services
KII Key Informant Interview
KWSB Karachi Water Supply Board
LG Local Government
LPCD Liter Per Capita Per Day
LPM Linear Probability Model
MCP Municipal Corporation Peshawar
MDG Millennium Development Goal
MICS Multiple Indicator Cluster Survy

xvi
MSP Municipal Service Programme
MTDF Medium Term Development Framework
NDWQS National Drinking Water Quality Standard
NRW Non-Revenue Water
NGOS Non-Governmental Organizations
NWFP North West Frontier Province
NWQS National Water Quality Standards
OPP Orangi Pilot Project
ORS Oral Re-Hydration Salts
PCRWR Pakistan Council for Research in Water Resources
PDA Peshawar Development Authority
PEPA Pakistan Environmental Protection Act
PHED Public Health Engineering Department
PLA Participatory Learning Approach
R&D Research and Development
RDD Rural Development Department
RHF Recommended Home Fluid
RPS Revealed Preference Survey
SDG Sustainable Development Goal
SDO Sub Division Officer
SOP Standard Operating procedure
SWM Solid Waste Management
TMA Tehsil Municipal Administration
TCM Travel Cost Method
UC Union Council
UIPT Urban Immoveable Property Tax
UNDP United Nations Development Program
UNICEF United Nations International Children's Emergency Fund
WASA Water and Sanitation Agencies
WHO World Health Organization

xvii
WSSP Water and sanitation Services Company in Peshawar
WTP Willingness to Pay
WWT Waste Water Treatment

1
CHAPTER 1: INTRODUCTION
1.1 Background of the Study
Sufficient and safe water supply, and hygienic sanitation services are the right of every
citizen (Hutton, 2012). Water Supply and Sanitation Services Agencies must ensure
safe, clean water and adequate wastewater treatment services on priority basis to the
inhabitants (Rollins et al., 1997). The 7th of Millennium Development Goal (MDG)
aims to minimize the percentage of people having lack of access to improved drinking
water and sanitation up to 50 per cent by 2015 (United Nations, 2010). In 2015, the
United Nation (UN) approved and replaced MDGs with Sustainable Development
Goals (SDGs) because of its expiry and framed their development plans and policies
for 2015-30. As per 6th SDG, all member countries must ensure access to safe,
affordable drinking water and adequate sanitation for all by 2030 (United Nation,
2016).
Globally, access to tap water is gradually increasing but the reliability of services and
water quality remain an issue (Watkins, 2006). World Health Organization (WHO)
reports that 663 million people are without improved drinking water and 2.4 billion
people have lack of adequate sanitation facilities (WHO, 2015). In developing
countries, urban areas face long-term severe challenges in the provision of sustainable
water supply service (Soto Montes de Oca and Bateman, 2006; Serageldin, 1994).
There is a wide gap between peoples’ demand for sufficient and safe drinking water
services and provision of these facilities at current charges. In many areas, the
household demand often exceeds the existing carrying capacity of infrastructure (Soto
Montes de Oca and Bateman, 2006). However, provision of improved drinking water
and adequate sanitation services are important elements to the human society and have
positive external benefits, such as improvement to public health and economic
prosperity of a society (AMCOW, 2011).
Besides economic prosperity and social well-being, improved Water and Sanitation
Services (WSS) reduce the communication of disease agents as shown in Figure 1.1.
The safe disposal of human feces can reduce the pathogen load in the unhygienic
environment resulting from an overall public health improvement (Esrey et al., 1991,
Huttly et al., 1997).

2
Figure 1. 1: Impact of Improved Water and Sanitation on Public Health
Source: Billig et al., 1999.
In developing countries, large and medium-sized urban centers face several issues for
instance overcrowded and obsolete urban infrastructure, non-revenue water, non-
judicious distribution of municipal services, economic and technical inefficiency and
uncertain cost recovery of these services (Nickson, 1997; Basu and Main, 2001; Zekri
and Dinar 2003; Davis, 2005; Reddy and Dev, 2006 and Gupta et al., 2012). In
developing countries, 1.8 million people die every year because of Cholera and
Diarrhea caused by unsafe drinking water and inadequate and unhygienic sanitation,
out of which 90 per cent are children under 5 years of age (Haq et al., 2007). The
information on the existing WSS services, household preferences and WTP for
potential improvements which impede better planning for controlled and sustainable
land use and well managed spatial development are usually absent (Whittington et al.,
1990; World Bank, 1993).
In Pakistan, about 38.5 million people are without safe drinking water and
approximately 50.8 million people lack access to improved sanitation. With this trend,
it is anticipated that presently around 52 million people are deprived of safe drinking
water and despite some improvement in the recent years almost similar number is
lacking sanitation facilities (Khan and Javed, 2007). Water and sanitation services have
many problems like obsolete infrastructure, poor planning and lack of sufficient finance
in the country (Government of Pakistan, 2015). Inadequate water supply and sanitation
services cause major environmental and health hazards in the country (Ahmad and
Sattar, 2010). It is estimated that PKR 112 billion per year is required for the

3
improvement of water, sanitation and hygiene-related services in Pakistan (Government
of Pakistan, 2009).
In Peshawar, there is a wide gap between people’s desires, needs, expectations, and
policies for the improvement of WSS (Nawab and Nyborg, 2009). Pakistan Social
Living Measure (PSLM) reports, that only 59 per cent people have tap water facilities
and 81 per cent households have in-house flush toilet facilities (Government of
Pakistan, 2014). The WSS has an obsolete infrastructure in the city and is a neglected
sector. The revenues from these services are negligible and mostly not recorded. The
developmental funds for these services are very low as 80 per cent of the municipal
budget is consumed on staff salaries (Mosel and Jackson, 2013). Due to deficiency of
development funds and the absence of proper urban infrastructure, the growing demand
for the municipal services has not been met by relevant planning agencies. Besides, the
planning process still lacks the demand-side information of household priorities,
preferences, and their WTP. This information is essential for planners and policymakers
who frame proper policies for recovering maintenance costs and make the services
sustainable.
Against this background, it is imperative to analyse the existing problems, priorities for
solution, and demand for improved WSS in Urban Peshawar. Where the information of
households’ WTP for Improved Water Services (IWS) and Improved Sanitation
Services (ISS) can provide important inputs to planner and policy makers for better
municipal planning.
1.2 Area Description
Peshawar is a dynamic and eighth most populous city of Pakistan. It is the capital of
Khyber Pakhtunkhwa province, a historic city with a significant military, political and
economic role. It is surrounded by Nowshera on the East, Charsadda district on the
North, the adjoining agencies Mohmand and Khyber are its North West and FR Kohat
to its South. Geographically it is located between 33° 44′ and 34° 15′ East longitudes
and 71° 22′ and 71° 42′ North latitudes and nearly 1173 feet (358 m) above sea level
(Government of Pakistan, 1998). The total area of district Peshawar is 1,257 km2. Out
of this 122 km2 (9.7 per cent) is urban and 1135 Km2 (90.3 per cent) is rural. As per
1998 census, the total population of Peshawar was 2,019,000 persons with annual
growth rate of 3.56 per cent. Out of the total population (982816 persons) 48.69 per

4
cent was urban population and rural population is (1,036,000 persons) 51.3 per cent and
immigrant population was (301,788) 30.7 per cent (Government of Pakistan, 1998).
The average household size was 8.9 and the literacy ratio of the male was 55.96 per
cent, which is higher than females 25.8 per cent (Government of Pakistan, 1998). The
average temperature varies during summer from 40°C to 25°C and winter from 4 °C to
18.35°C respectively3. For more detail and in-depth analysis, the study was limited to
45 urban union councils given in Figure 1.2.
Figure 1. 2: Urban Union Councils of District Peshawar
Source: Modified from (Government of Pakistan, 1998)
3http://peshawarian.blogspot.com/2009/02/peshawar-geography-and-climate.html

5
1.3 Problem Statement
As a capital city, Peshawar has much Push and Pull factors of migration along with all
possible environmental and sociological ramifications. Over the past few decades, the
natural population growth and the influx of Afghan refugees followed by the recent
settlement of IDPs has triggered urban sprawl resulting immense pressure on the
municipal services. In the absence of proper urban planning, the poorly functioning
institutional capacity and the land market are promoting irregulated land transfer and
speculation, the households tend to cluster together. This trend has overburdened the
carrying capacity of existing infrastructure and the municipal services can no longer
cope with the needs of the continuously expanding urban population. The existing
drainage systems are mostly combined thus convey domestic, commercial and
industrial wastewater along with surface runoffs during rain events. The open and
covered drains and, in some areas, the underground sewers are clogged due to garbage
accumulation. In the absence of public sewerage line effluent is being directly
discharged into rivers, irrigation canals, Khawars or agricultural land, and thereby
contributing to severe environmental and public health hazards. Urbanites are also
confronted with the problem of lack of appropriate public toilet facilities. Due to the
absence of proper urban infrastructure, the growing demand for the municipal services
has not been met by the relevant planning agencies. The existing WSS is substandard
and typically falls short of offering the services that are generally acceptable and suit
every segment of the urban dwellers. The planning process lacks the demand-side
information of household priorities, preferences, and their WTP for improved WSS.
Household demand determinants for water supply and sanitation services have not been
carefully investigated and analyzed. The lack of policy guidelines from the government,
in this context, has further increased the miseries of an ordinary citizen causing
environment and health problems.
1.4 Significance of the Study
Public policy decisions and sustainable environmental planning have external benefits
to the society. These effects, however, cannot be measured in monetary terms because
of non-transacted nature in everyday market. Therefore, a hypothetical proxy or
complementary market is created to find out a real price of the environmental
commodities (Dutta and Verma, 2009). The market does not generate an accurate price
of the environmental commodities such as environmental sanitation and better water

6
services. So, the concept of shadow prices can be used to determine indirectly the
economic value of these goods and services. (Misra, 1999). This becomes very hard to
study the effect of service improvement being provided by the public utility company
to the households in diverse socio-economic settings and heterogeneous planning
environments in most developing countries. For sustainable and better water and
sanitation planning, it is a matter of foremost importance that the households’ WTP
must be assessed for service improvement. Because, decisions in isolation without
interaction with the ultimate beneficiaries of the services causes bad repercussion and
ultimately cannot reach the precise balance of cost and benefits allocation (Davis and
Whittington, 1998). A better understanding of households’ WTP information and their
preferences provide a valuable data to determine the restructuring options and the
financial viability of a project (Adamowicz et al., 1994; Ryan and Wordsworth, 2000;
Louviere et al., 2000; Hanley et al., 2001, 2005). This information is required for
making an explicit decision regarding quality services and their prices. The value
estimated from social choice and community preferences can be evaluated in terms of
options and will be incorporated in better policy and planning. The complex and diverse
institutional structure, physical and legal constraints, heavy investment to reach all
classes of the community, diverse cultural values of the people and sustainability of
resources are the issues of concern (Bakker, 2003). Therefore, for better policymaking,
sustainable planning thorough assessment of impacts in monetary terms was required
to facilitate decision makers to design need-based policies for taking appropriate
location-specific actions (McFadden, 2001; Bateman et al., 2002). So, this study has
been conducted in urban Peshawar, Pakistan to investigate the household demand for
improved water and sanitation services to overcome the obstacle for better planning in
the WSS provisions. In this background, the objective of the study is mentioned in
section 1.5.
1.5 Aims and Objectives
The aim of this study is to analyze household demand for improved WSS for ensuring
better planning in district Peshawar. The specific objectives are:
To assess the existing state of WSS in Peshawar and comparing the information
with the national and international standards.
To analyze problems faced by households regarding WSS and prioritizing these
issues.

7
To estimate the households’ demand for improved water and sanitation services.
To assess the determinants of WTP for improved WSS.
To determine the policy gaps and suggesting policy recommendation for
improved WSS.
1.6 Research Questions
The key research questions for this study will be as under:
Is the existing situation of water and sanitation services in line with national and
international standards in Peshawar?
What are the main problems faced by households regarding WSS?
How many households are WTP for improved WSS?
What are the main determinants of WTP for improved WSS?
What are the policy lapses regarding WSS?
1.7 Organization of the Study
The study was organized in the following manner.
Chapter 1 gives a detail description of the background, study area, problem statement,
the significance of the study, aims and objectives of the study and finally research
questions based on the objectives in a sequential manner. Chapter 2 is devoted to
literature review of household water and sanitation demand studies which is based on
empirical data collected from developed and developing countries followed by
Pakistan. Chapter 3 comprises context specific water and sanitation analysis, which is
based on secondary data. Chapter 4 focuses on data and methodology used for
undertaking this dissertation. Survey design, a method of data collection and data
processing methods have been presented in detail. Chapter 5 presents an in-depth
analysis of the socio-economic characteristics of the respondents, existing state of
domestic water, and their characteristics in the form of descriptive statistics, use of
satisfaction, priority and performance indices for different water-related issues. The use
of Logistic Model to bid wise analysis of household WTP and their determinants, and
final conclusion has been discussed in detail.
Chapter 6 highlights improved sanitation status quo in the urban area of Peshawar,
household satisfaction regarding present services, priorities for improvement and WTP
for better environmental services. Chapter 7 concludes the study with a summary and
policy implication, further suggestions are also outlined for future research.

8
CHAPTER 2: LITERATURE REVIEW
2.1 Introduction
A large body of literature and more extensive studies were undertaken on the present-
day dynamics of WSS in the cities of developed, developing countries, and Pakistan.
This chapter is the backbone of the thesis and will explain, how this research is relevant
and differences to prior research undertaken on this topic, issue and justification of the
proposed methodology and preparedness for the completion of this research. So, this
chapter covers current status, issues of water and sanitation, public participatory
planning approach, the concept of Willingness to Pay (WTP), use of CVM, estimation
of the household demand function for water and sanitation in developed countries.
Besides this, general scenario and issue of sanitation in developing countries and
Pakistan are also discussed. Finally, literature regarding household demand function in
Pakistan has also been reviewed, which includes data, modelling, strategies, and
conclusion.
2.2 Status of Water, Sanitation and its Related Issues
Water is a marvelous element for survival and covers 70 per cent of the earth surface
(Wurbs, 2002). Safe drinking water and hygienic sanitation are the least expensive and
most effective method for the improvement of human health. WSS have many issues
and it has been reported that more than 1.1 billion people suffer from lack of access to
improved drinking water services and approximately 2.6 billion individuals live
without improved sanitation. In developing countries, a billion of people live without
safe drinking water and two (02) to three (03) time that number have lack of sanitation
facilities which causes parasitic infection transmitted through contaminated water. The
health impacts of these services are much severe, nearly 60 per cent mortality in
newborn children are linked with these infectious diseases caused by unsafe water,
inadequate sanitation and hygienic environment (Montgomery and Elimelech, 2007).
Other diseases like Diarrhea, the third largest cause of morbidity in newborn children
and sixth largest cause of mortality around the world was also caused by unsafe
drinking water (Pond et al., 2004). So, improved WSS are vital for primary health care
in the newborn children and have an important role in health improvement and poverty
alleviation. The relationship between people’s accessibility to improved water and
increased national Gross Domestic Product (GDP) is always positive and have the

9
multiplier effect on national income of a country. By increasing 0.3 per cent investment
in the provision of safe drinking water can increase one per cent in GDP. It also
mitigates 70 per cent of the mortality and morbidity caused by unsafe drinking water
as an effective health intervention. Besides, it also reduces health cost, increase labour
productivity and school enrollment as well (Haq et al., 2007). Review from various
studies advocate that progresses in health is directly linked with safe drinking water
rather than increase in quantity of drinking water (Esrey et al., 1991; Huttly et al., 1997).
In developing countries, around half (1/2) of the people have improved sanitation and
most of the countries would not achieve the universal access to improved sanitation and
clean water by 2015 (Francis, 2014). The regional disparities, growing water scarcity,
lack of conservation of water resources, and potential use and reuse of these resources
impede the issue further. For achieving the universal access to improved water and
sanitation, there is a need for a courageous political will, allocation of sufficient funds
and the use of advanced technologies (Moe and Rheingans, 2006). Improved Sanitation
play a significant role in the safe dumping of excreta and other wastes. A simple pit
latrine is one of the most basic type use for domestic sanitation and substitute of an
environmentally intensive sewage system. The fundamental sources of pathogens have
not been given due attention as water treatment that causes most water, sanitation, and
hygienic diseases (Cairncross and Feachem, 1993). The lack of proper water and
sanitation management is one of the major sources of environmental pollution and
adversely affect the public health. Wastewater disposal is worse around the globe, and
35 per cent of urban and 15 per cent of the rural population has only wastewater disposal
facilities (UNICEF, 1998; Heller, 1999).
Public health improvement is the collective solution of domestic water and sanitation
problems, but usually, there is mass public unawareness and they do not perceive the
fruits and magnitude of these benefits directly (Esrey et al., 1990 and 1991; Young and
Briscoe, 1987). The services of improved sanitation are like "merit goods,” political
motivation and social marketing are essential to device a socially optimal investment
program. This need planners, health and environmental specialists, and technical
engineers to use their expert opinion and overlook the likely unaware wishes of
households (Mac Rae et al., 1988).

10
Sanitation planners often face problems to increase user fee, because wealthier
households have already invested in improved flush toilet system and septic tanks to
solve their problem on a priority basis. However, a poorer household is unable and
unwilling to pay for sewer connection or wastewater treatment. Thus, it is a great
challenge for the planner that neither poor nor the rich household will agree to
participate actively in consultative agreement to improve the public health condition in
the area (Choe et al., 1996). Quite rationally, poor household unwilling and do not care
about environmental health problems, until they meet their own immediate needs and
private benefits related to improved sanitation such as flush toilet system. Those
households that have sewer connection facilities pay monthly charges.
In Pakistan, most of the households do not have access to safe and improved drinking
water facilities. Recognizing the need and importance, the state must have to ensure its
provision to all cities and to achieving the sustainable development goal of 100 per cent
water and sanitation facilities to the people. As a basic human right of every citizen,
Government must provide sufficient quantity of safe drinking water and basic sanitation
to general masses at an affordable cost and in an equitable, efficient and sustainable
manner. To accomplish this pledge of the state, the Ministry of Environment
consultative with National Environment Policy has framed the National Drinking Water
Policy 2009. The aim of this policy is to increase public awareness about safe drinking
water, adequate and hygienic practices and conservation of water through use and reuse
practices (Government of Pakistan, 2009).
2.3 Importance of Public Participatory Planning Approach
For provision of Sustainable WSS improvements, it is necessary that informed
preferences of the community must be addressed. The use of public participatory
planning followed by public awareness can best identify those services that people want
and for which they are willing to pay.
In developing countries, usually, a supply-driven approach was used and principally
government officials, technical experts, and consultants of external support were
involved for water and sanitation planning (Arbués et al., 2003). For WSS improvement
poor and informal communities were rarely consulted and technical experts and
stakeholders were not involved, which is very important for sustainable planning
(Krauss and Boland, 1997). The public participatory principle for environmental

11
improvement was enunciated at water and environment international conference held
at Dublin in the year 1992. The main principle of concern that public participatory
approach is necessary for any water services improvement and management. This
means that involving beneficiaries, planner and policy maker and other technical
experts at all level with decisions taken at the lowest appropriate level (Gorre-Dale,
1992). This means that for sustainable planning local and regional agencies can consent
and coordinate so that the households will be provided with those goods and services
for which that are willing to pay. Choice and quality of services and charges for the
services must be based on the user pay approach. Besides, it is also important to involve
the technical experts, engineers, planners, hydrologist and economist at all levels of
planning (Whittington et al., 1998). The important aspect of community-based demand-
driven service delivery is that it places the customers in a command position and
empowering them to choose the type of technology used, the quality of services, and
more important the charge of the service. This approach inculcates a sense of
ownership, responsibility and respect for the system and WTP for the services. Also, it
does away with expert oriented, expensive and often unacceptable provision of these
services.
In Pakistan, the community based participatory planning approach was first practised
in the early 1980s, Akhter Hameed Khan, a famous development practitioner and social
scientist for the informal slums settlement of Karachi in the name of Orangi Pilot
Project (OPP. The project was based on what the people want to reduce the cost to an
affordable level. In-house, sanitary latrine, covert sewers in the streets and sewerage
system were offered less than $50 per household. The project was initiated with a small
pilot project due to the high cost of land and sewerage system and created a “snowball”
effect. The initial success of the project compelled the municipality to issue more funds
for construction of trunk sewers in the area. The project has served 600,000 poor people
in Karachi and provides the sewerage system. Following the success story of OPP
several municipalities launched the projects using the method and procedure of OPP.
Arif Hasan stated that the government now practice like non-government organization
by consulting the beneficiaries of the project. The mayor of Karachi also formally
accepts the principle of “internal” development by residents and “external”
development by the municipality (World Bank, 1993).

12
2.4 Strategies Used for Measurement of Household Demand
Various strategies have been used to get the required information to study the behavior
of household and demand for improved drinking water services in developing countries.
First, a well-designed questionnaire will be used to study and collect the existing data
from the public utility. Second, by a suitable technique like revealed preference, stated
preference or experimental methods can be used to investigate the respondents
regarding how they would behave in hypothetical water-use situations (World Bank,
1993; Whittington et al., 1990, 2002). Third, data can be collected from the secondary
markets such as housing, the researcher can draw inferences, and how households value
improved services of water and sanitation (North and Griffin 1993; Daniere 1994;
Komives, 2003). Fourth, the use of experimental methods in which Randomized
Controlled Trials (RCT)4 can be used to examine the households in response to different
water supply and improved sanitation service interventions (Kremer et al., 2007, 2008).
In developing countries for analysis of household demand function for WSS,
information has been collected from cross-sectional household surveys. To avoid the
issues related to cross section household survey, an artificial panel data set have been
developed by merging the stated and revealed preference data (Cheesman et al., 2008).
Using this approach Diakité et al., (2009) used utility data over the year 1998-2002 for
156 small towns in Co ˆte d’Ivoire.
2.5 The Use of Contingent Valuation Survey Method
CVM is non-market valuation method and used to estimate changes of all kinds
environmental commodities from status quo (Bateman and Willis, 2001). This approach
became popular for water supply and sanitation planning and generally accepted in
many developing countries. The main theme of this approach, that household should be
provide those services which they want and willing to pay. It means investment in
services improvement must be “demand driven,” (Whittington et al., 1998). The CVM
is frequently used to measure economic values of both use value5 and non-use value6
and been frequently used by environmental planners and economists to evaluate the
4 A method in which people are allocated at random/chance to receive one of several interventions 5 Value derived from actual use of a good or service. Uses may include indirect uses. For example, enjoying a
television show about whales provides an indirect use value for the whales.
6 Values that are not associated with actual use, or even the option to use a good or service.

13
positive advantage of environmental developments and other public goods (Van Minh
et al., 2013). Under hypothetical market the monetary values were placed on
environmental commodities usually not bought and sold in the market. This is the only
possible method for including passive use considerations in an economic analysis
(Carson, 2000). A comprehensive work like Mitchell and Carson (1989); Whittington
et al., (1998); Louviere et al., (2000); Bradburn et al., (2004) and available guidelines
on the subject such as Wedgwood and Sanson (2003); Grosh and Glewwe (2000) have
highlighted the use and importance CVM for non-market goods and service. While
using this method, beneficiaries were involved and directly asked, how much they
would be WTP for improvement of WSS. As in this method people should state their
WTP for definite hypothetical situation and environmental service improvement so this
is called “contingent” valuation, method. This is also called “stated preference” method
because households directly state their values, rather than inferencing from actual
choices as in the case of revealed preference method. It means that what people say
rather than what people observed and is the greatest strength of CV method.
Designing a questionnaire for CV survey is trickier and not a simple task. Before
designing the questionnaire, care should be taken that, the information provided should
be understandable to the average citizen and consistent with technical, scientific and
expert knowledge of the design survey. It means that the analyst must be trained in
survey design, usually something economists are not trained in. For structuring, more
effective Contingent Valuation questionnaire (Carson, 2000) describe some important
section as follow:
The introduction, purpose and objective of the survey.
The clear description of the good and service to be valued.
The current and base line situation and probable future statuses of goods and
services in the case of no implementation of the proposed policy.
Elicitation of household maximum WTP to obtain the improved services.
The household comprehension of the question and certainty of the answers
provided.
The socio-demographic characteristics of the respondents.
Following the above steps various studies like Whittington et al., (1993a), Kumasi,
Ghana CVM were used for measuring demand for sanitation services. Besides Altaf

14
(1994) also estimated household WTP and used it as a tool for better water and
sanitation planning in Gujranwala, Pakistan.
The importance of CVM in routine planning and demand assessment can provide
useful information for better water and sanitation planning and most expensive failure
can be avoided (Whittington et al., 1993). Similar practice for measuring demand and
WTP for improved sanitation were also used by Arimah (1996) in the City of Lagos by
using a hedonic housing price approach. Whittington et al., (1998) also used Contingent
Valuation Method (CVM) and Participatory Learning Approach (PLA) for gathering
data on WTP and demand of HHs in Lugas, Uganda. HHs water facilities and public
latrine demand were checked by both methods give the same result. This is unique type
research in which PLA and CVM are used as a planning tool for the household demand.
This argument is also supported by DFID (1998a), in which Revealed Preference
Surveys (RPS) and CVM were recommended for water and sanitation planning
programs. The issues, benefits and constraints of CVM and WTP also reviewed by
Goldblatt (1999) and Griffin et al., (1995). The finding confirms the appropriateness of
using CVM is a suitable planning tool and provide solid bases for sustainable WSS
provision. It also concludes that the frequent use of CVM not only improves the
methodology but also lowers the cost of a relatively expensive survey. Rogerson (1996)
review, a detailed review of the literature on estimation of WTP and use of CVM can
provides a great understanding of the issues of WTP and the application of CVM in
water demand planning in developing countries.
2.6 The Use of Willingness to Pay Method for Measuring Demand
The concept of WTP has originated from consumer theory in economics. This concept
is very frequently used to assess social impacts of environmental conservation policies
and planning. Variety of methods are used to measure household WTP for improvement
of environmental and infrastructure quality improvement such as water, sanitation and
public works (Fujita et al., 2005). Figure 2.1 gives a detail classification of the most
common methods used for measuring of WTP in both developed and developing
countries. Both revealed and stated preferences methods are used, depending on the
type of goods or services in question and research resources availability and time.
The development of Stated Preferences can be traced back to Jeremy Bentham (1789),
the philosophy of utilitarianism and the term was more explained in the hedonic term,

15
the pleasure that they produce (Kahneman, 1992). While some others have explained
utility in terms of want ability (Fisher, 1918). However, it is a market research tool and
can be used for utility measurement and demand forecasting. Stated preferences method
is used in such hypnotical situation when the interest of the analyst is not observable or
currently unavailable. So, stated preference (SP) methods are used to exams such
situations, which are hypothetically created by some systematic and planned design
process (Louviere et al., 2000; Wedgwood and Sansom, 2003). Stated preference
methods are further bifurcated into CVM and choice modelling techniques including
Discrete Choice Experiment (DCE).
Figure 2. 1: Classification of Willingness to Pay Methods
Source: (Bateman et al.,2002; Kjaer, 2005)
Various methods like CVM, Alternative Method and Hedonic Price Method (HPM)
and Travel Cost Method (TCM) are commonly practices value non-market goods and
WTP for improvement. Usually, CVM is the most frequently used method in recent
years and covers wide range of themes like project advantage e.g. improvement in
public services and allocating monetary value to public goods and services by directly
asking people's WTP for such services through a properly well-designed questionnaire.

16
The CVM has become popular since 1970 for valuation and powerful tool for
measuring the economic benefits of infrastructure projects in most of the developing
countries for non-market goods and services (Mitchell and Carson, 1989). Globally,
more than 5000 CVM research studies have been conducted in over 100 countries to
examine drinking water, sanitation related problems, and other environmental resource
(Birol et al., 2006). Some popular studies conducted in south Asia like Sri Lanka
(Gunatilake et al., 2007); Calcutta (Guha, 2007) and Khulna (Gunatilake and Tachiiri,
2012) used the CVM survey method for environmental improvement. In Pakistan,
various studies have also been conducted in various cities like Hyderabad (Ahmad and
Sattar, 2007); Abbottabad (Haq et al., 2007); Peshawar (Khan et al., 2010) and one for
Rural Punjab (Altaf et al., 1992).
Several method (as given in Figure 2.2) can be used to estimate household WTP and
every method have its own advantages and drawbacks. All the metods are not so much
simple, however it depends upon the objevtive of the policy makers, planners and
researchers.
Figure 2. 2: Classification of Methods Used for Estimation of WTP
Sources: (Breidert et al.,2006).
Various studies have been conducted e.g. Chowdhury (1999) in Bangladesh; Guha
(2007) in India; Gunatilake and Tachiiri (2012) in Sri Lanka; Haq et al., (2007) and
Parveen (2015) in Pakistan used CVM survey for eliciting WTP for improved WSS.

17
Against this background, for conducting the survey for the present study CVM is most
feasible to elicit household WTP for improved WSS in Urban Peshawar.
2.7 Household Demand Function for Water and Sanitation in Developed
Countries
In developed countries, the pattern of the public utility services is planned and
managed; and every household must by law connect sanitary facilities in their house to
a sewer. However, this regularity approach can only work when the household have
sufficient financial resources to pay for the sewer system and the connection
(Whittington, 1993).
The most recent work like meta-analysis done by Sebri (2014) on residential water
demand and numerous other countries, including Australia (Grafton) 2008; Sweden
(Höglund) 1999; Denmark (Hansen) 1996; Canada (Kulshreshtha) 1996; United States
(Foster and Beattie) 1979; France (Nauges and Thomas) 2000; Spain (Martínez-
Espiñeira) 2002; Arizona (Agthe and Billings) 1980; Illinois (Chicoine) 1986; United
State (Nieswiadomy and Molina) 1989; Texas (Hewitt and Hanemann) 1995);
California (Pint) 1999 and California (Renwick and Green) 2000. Similarly, the work
of Espey et al., (1997); Hanemann (1984); Arbués et al., (2003) and Dalhuisen et al.,
(2003) etc. were the studies performed in developed countries. The review of all these
studies show that water own price, household socio economic condition, housing
condition and climatologic variable etc. were the main determinants of the household
domestic water demand. Double-log functional form was used, to direct estimates of
elasticities. Few debates on the use of functional form like Griffin and Chang (1991)
were in favor of more elastic forms e.g. Cobb-Douglas, while Gaudin et al., (2001)
debate the trade-off between parsimony and simplicity of parameters. This modeling of
single-equation method indirectly assumes that there is no close substitute for drinking
water.
Drinking Water reliability and quality were not included because there is slight
variation in quality along the same distribution system. Focus have been paid to analyze
price elasticity and socio-economic characteristics, mainly income on drinking water
consumption.

18
But methodological issues occur when there is a choice between marginal prices i.e.
the price of extra cubic meter mean price (total bill divide by total household
consumption). Authors who use the average price are of the view that majority
households were not informed about the charge by their local drinking water utility, so
probably they may react in average price instead of marginal price. Studies like Deller
et al., (1986); Agthe et al., (1986); Nieswiadomy and Molina (1989); Hewitt and
Hanemann (1995) and Olmstead et al., (2007) analyzed the nonlinear price of domestic
water demand function. Most of the data for model development are easily available
from secondary sources and come from the water utility records which is not available
in the developing countries. In water utility records the panel data on each household is
easily available with great accuracy. So, the estimation in developed countries are more
precise and accurate to the availability of household demand accurate data. However, a
disadvantage is that, that usually in panel data there is little or no information about the
socio-economic status of the household in the water utility record. There is also slight
difference in possibly important covariates, e.g. water quality and reliability and tariff
structure itself.
Most studies from the developed countries find, that household domestic drinking water
demand is mutually price- and income-inelastic. The average price elasticity of drinking
water demand was –0.51 and income elasticity has frequently occurred in the range
[0.1–0.4] in several studies from developed countries (Arbués et al., 2003). Besides,
household characteristic like household size, garden size of the household, features of
housing i.e. principal versus secondary house; water stock appliances and
meteorological conditions were usually recognized as determinants of domestic water
demand in developed countries.
2.8 Domestic Water and Sanitation Demand in Developing Countries
Every household required for personal or domestic use should not only be sufficient but
also be safe from chemical substances, micro-organisms, and radiological hazards that
cause threat to health. Literature from various countries suggest that the water supply
facility for everyone must be continuous and sufficient for own and domestic uses such
as drinking, washing, food preparation, toilet and household hygiene (Cahill, 2005;
Solón, 2010; Kayser et al., 2013). The availability of sufficient and safe water can
reduce the spread of various contagious diseases (Cairncross and Feachem, 1993;

19
Feachem et al., 1977). Besides, it also reduces the incidence of poverty, and increases
the income of the household (Howard and Bartram, 2005; Van Koppen et al., 2006).
There is substantial WTP for water quantity improvements in most of the developing
countries (Adenike and Titus, 2009; Whittington, 2010). However, in these countries
estimation of household demand for the improved drinking water and adequate
sanitation services is not simple and need expertise. The factors affecting household
WTP are relatively more complex in developing countries. It is not possible to link
household WTP directly to income as common practices in the past. Other influencing
factors like cost or price, water reliability, perceptions of water quality, and quality of
service are also important and affect WTP (Garn, 1998). A holistic approach can be
used to measure household demand for improved drinking WSS because, most
commonly sanitation is water-borne it can be priced based on water as advocated by
many studies (DFID, 1998). Therefore, for better planning water and sanitation should
be considered together to maximize the health benefits. In developing countries, due to
poverty and mass unawareness sanitation demand needs to be created among the
households rather than measured. Therefore, they need a different methodology for
measuring household drinking water demand in these countries (Parry-Jones, 1999).
Numerous studies from developing countries like Kenya (Mu et al.,) 1990; Philippines
(Persson) 2002; Madagascar (Larson et al.,) 2006; Honduras (Nauges and Strand) 2007;
Cambodia (Basani et al.,) 2008; Sri Lanka (Nauges and van den Berg) 2009; Saudi
Arabia (Rizaiza) 1991; Indonesia (Crane) 1994; Philippines (David and Inocencio)
1998; Indonesia (Rietveld et al.,) 2000; Central America (Strand and Walker) 2005;
Vietnam (Cheesman et al.) 2008; Sri Lanka (Nauges and van den Berg) 2009; Ethiopia
(Mezgebo and Ewnetu) 2015 and Pakistan (Parveen) 2015. Apart from Uganda and
Kenya, the remaining were from medium to large cities of developing countries have
the following findings.
The water price has a significant role in water demand and is the main demand
determinants. When the cross-sectional data was obtained from one-time household
survey there were little differences in the policy variables such as levels of services,
connection cost and charges for the services. In Fianarantsoa (Madagascar) Larson et
al., (2006) completely ignore water charges in their analysis since all surveyed
households had the same price calendar.

20
To overcome this issue both stated and revealed preference data can combine and
household were questioned regarding the amount of water against various bids of
hypothetical prices (Acharya and Barbier, 2002; Cheesman et al., 2008). Most of the
household from the study area does not know exactly the daily volume of water
consumption, so the prices for water offered by the researcher are outside their
experience. Usually, the prices of drinking water depend on the sources, for non-piped
sources, the situation varies across sources and places. It may be distributed free without
no charges, or at a fixed price depends upon the volume per litre. From the non-tap
source of drinking water, obvious cross-sectional variation was observed in the data.
The reason behind this variation is self-reported information of the data means that
households were questioned to report the buckets of water used each day. A
considerable error was observed using this method for water consumption
measurement. The case studies concluded that there is a heterogeneous pattern of
drinking water sources in all developing countries.
2.8.1 Average Quantity of Water Consumption
It is difficult to ensure a uniform per capita water availability because of local and
regional difference of water availability, type of water supply and climate of the area.
As per WHO standard, a minimum of 20 L and 100 L optimal water per capita per day
is necessary, so 50 L to 100 L of water are needed per capita per day to ensure basic
needs are met and few health concerns arise (Howard and Bartram, 2003; Gilman et al.,
1993). In line of this Gleick (1998) recommended 50 lpcd. However, the minimum
requirements depend upon the temperature and climate. Under the normal temperature
and climate, the domestic water use detail is given as follow:
Drinking water: The drinking water requirements varies from 2.5 to 5 liters per capita
per day (lpcd). With temperature, climate change and activities these requirement
increases. Gleick, (1998) recommended 5 lpcd and suggested that the lower limit is
subsistence.
Bathing: Like drinking water the bathing water requirement also varies from 5 to 15
lpcd and for showering 15 to 25 lpcd in developing countries. So, the recommended set
standard is 15 lpcd.
Food preparation: In both developed and developing countries the range varies from
10 to 20 lpcd. However, the recommended standard is 10 lpcd.

21
Hygiene and sanitation: Setting one standard for sanitation is too problematic because
of variety of excrete technologies used in disposal. The pour/flush toilet uses from 6-
10 lpcd. However, Gleick recommended 20 lpcd for sanitation including domestic and
personal hygiene.
Figure 2. 3: Hierarchy of Water Requirement for Domestic Uses
Source: Reed, 2005.
The average water consumption of the household with piped connection varies from
place to place. The water consumption of the group of seven provincial towns in
Cambodia was 72 liters per capita per day (Basani et al., 2008). Analysis from
Indonesia City Salatiga, reveals that this figure was 130 lpcd (Rietveld et al., 2000),
while 88 lpcd in Fianarantsoa city of Madagascar (Larson et al., 2006). Similarly, 120
lpcd in Buon Ma Thuot city of Vietnam (Cheesman et al., 2008), and average 135 lpcd
were from medium cities of Sri Lanka namely Gampaha, Kalutara, and Galle (Nauges
and van den Berg, 2009).
However, none of the connected households from the public system have average 25
lpcd water consumption. While those depend on their own private sources like well,
consume about 110 lpcd. Households having their own private source consume more
as compared to those whose point is outside the home (Nauges and Strand, 2007).
The costs of water collection depend upon source distance and collection time are also
important factors of respondents’ choice of water source. Many studies like (Mu et al.,)
1990 from Ukunda a coastal town of Kenya, Persson (2002) from city Cebu, the

22
Philippines, Briand and Laré (2013) from Dakar, Senegal confirm this statement in their
studies.
In Pakistan, 38.5 million people were deprived of safe drinking water accessibility
(Khan and Javed, 2007). In urban areas of the country, only 30 per cent of population
has access to safe drinking water (Rosemann, 2005). The per capita water availability
reduced from 5260 m3 in 1951 to 1050 m3 in 2010 and consumption varies from 30 to
350 liters per capita per day (Bhatti and Nasu, 2010).
2.8.2 Quality of Water Services
Regarding the quality of water service, the consumer choice of the water source
depends on Piped water pressure, taste and reliability of the services (Madanat and
Humplick, 1993). There is direct relation between hours of piped service and number
of household connection to these services (Nauges and van den Berg, 2009). However,
this effect is too small as evident from the study conducted in Sri Lanka districts of
Gampaha, Kalutara, and Galle, where this increase in only 2 per cent on average. So,
the water services quality in household demand function have not significant role in
general. Regarding drinking water services, household may invest in lump sum cost in
alternative supply sources and storage facilities (Pattanayak et al., 2006). If the
household purchase a storage tank it will be mitigating the problem of reliably and low
pressure, that may associate with private housing connection and if the households
depend on private wells, modern pumping equipment may be purchased.
2.8.3 Socio-Economic Characteristics and Water Demand
Household Socioeconomic Characteristics like income and education also have a
positive correlation to demand for improved water services (Madanat and Humplick,
1993; Persson, 2002; Larson et al., 2006; Nauges and Strand, 2007; Basani et al., 2008;
Adenike and Titus, 2009; Nauges and van den Berg, 2009). Using facts from Ukunda
(Kenya) and Dakar (Senegal) respectively, reveals that structure and size of affects
demand for water source. Adenike and Titus (2009), analyzed household WTP for
improved drinking water services in Osogbo Metropolis; Osun State, Nigeria a by using
descriptive statistics and logistic regression. The study concluded that education level
of the respondent, connection charges and income are the main determinants of
household WTP for these services.

23
In Ukanda those household who have large number of women for do not buy water
from vendor but rely on their private source i.e. well or kiosks. However, in Dekkar the
demand piped water increases if the head of the household was widow. In these studies,
income and expenditure elasticities are very low i.e. 0.1 to 0.3 and household size is
more significant. Per capita consumption decreases with the increase of household size.
Taking information from Buon Ma Thuot (Vietnam), Cheesman et al., (2008) reveals
that doubling the number of permanent residents of the household increased household
water consumption piped source by 50 per cent.
2.9 Determinants of Willingness to Pay for Improved Sanitation in Developing
Countries
In developing countries majority of households have lack of improved sanitation and
have many issue (Mara et al., 2010). In these countries, it is not possible for the
governments to afford and provide these services to majority of population on
subsidized rate. Thus, improvements in sanitation services in these countries heavily
depend on the household financial contributions, which in turn depends not only upon
WTP but also the ability to pay for the improved sanitation (Russell et al., 1995). A
series of studied in developing countries have been conducted to estimate household
WTP for improvement of these services e.g. in Pakistan (Altaf) 1994; Nigeria (Arimah)
1996; Ghana (Whittington et al.,) 1993; Vietnam (Van Minh et al.,) 2013; Peru (Morris
and Thi Le) 2012 and Uganda (Francis) 2014. Various methods have been used like
hedonic housing price approach, averting behavior, almost all the studies used
contingent valuation method for data collection and elicit household WTP for improved
and safe sanitation services. In CVM information from the household were randomly
collected simply by asking, whether they were using the new sanitation services if they
were available at certain prices (Cumming et al., 1986a; Mitchell and Carson, 1989).
Variables like socio economic characteristics, satisfaction regarding the current
services, distance from the improved source and the environmental condition of the
study area etc. were the main determinants. Findings reveal that gender of the head of
household, age of the head of household, economic status of household, type of current
toilet, satisfaction with existing toilet, and knowledge of health effects of poor
sanitation were found statistically significant for WTP and statement is also confirmed
by (Van Minh et al., 2013). Findings further reveals that, most of the households of the
developing countries were off the track from the laid down targets of the MDGs and

24
SDGs for improved sanitation (World health organization, 2015). Majority of
households were not satisfied from the existing sanitation services and want
improvement (Montgomery and Elimelech, 2007).
2.10 Household Demand Function Evidence from Pakistan
Access to an improved WSS not only precondition for a healthy life but also a human
right. Unfortunately, these sectors are neglected and have many issues. Majority of the
people do not have access to improved WSS. The poor people, living in rural areas or
urban slums, do not only have low income, but they also have lack of necessities to
meets their own needs such as education, health, safe water supply and environmental
sanitation facilities.
In Pakistan, various studies like Altaf et al., (1992); Ahmed and Sattar (2007); Khan
and Javed (2007); Noor et al., (2010); Khan et al., (2010); Ahmad and Sattar (2010);
Haq et al., (2007); Khan (2014); Parveen (2015) and Rauf et al., (2015) have estimated
household WTP for improvement in the WSS. Methods like CVM and risk averting
behaviour methods were used, however, CVM was used most frequently for household
WTP for WSS improvement. The review some of these studies are as follow:
Altaf et al., (1992) carried out by the in Rural Panjab in three water zones: the sweet
water zone, brackish water zone and the arid zone. The main objective of this study was
to analyze Households willingness, determinants for demand, preference regarding
service delivery for improved water and sanitation and appropriateness of current
government policy for service delivery of water in rural areas. Households WTP was
estimated through “contingent valuation method, by asking several structured questions
to determine HHs maximum amount of money WTP for a good or service. The main
findings of this study were that in Central Punjab (brackish and sweet water zones)
there has been a qualitative change in household demand. In the arid zone, HHs demand
is still largely for personal water use, and majority households are satisfied with a lower
reliability of service, which is still qualitatively superior to the substitutes of public
wells and surface water.
Sattar and Ahmad (2007) used the Averting Behavior Approach for preserving water
contamination by using the Multinomial Logit Model for District Hyderabad. The
findings of the study revealed that the formal education of household heads and their

25
mass media exposure significantly affect WTP of the household for the different water
decontamination strategies. The study also showed that household education and
income of the decision-makers is more significant in determining their WTP as
compared to their income level and poverty are the main determinants of low demand.
Noor et al., (2010) examines the prevailing drinking water quality and asses’
household’s WTP for improvement in water quality services in Lahore. CVM was used
in six town and household perceptions and WTP were checked using Tobit Model. The
main determinants of household WTP are education level of head of the family and
coping costs that respondents pay for ensuring quality water. The recommendation of
this study is that by ensuring the sufficient water supply and quality water service not
only have positive externalities in the form of public health improvement but also
ensure additional revenue by the authority.
Khan et al., (2010) conducted a study in planned town Hayatabad, Peshawar, Khyber
Pakhtunkhwa. The study was based on primary data source from 150 households by
using two-stage stratified sampling technique. The highest level of education of
household head, awareness about the quality of water, water-borne diseases, income
and wealth level of the household, and exposure to media were the main factors
determines household WTP. The Multinomial Logit Model to measure the households’
WTP for quality drinking water services by using the CVM. Income, education and
awareness of the respondent were statistically significant variables for households’
WTP for improved drinking water. The results also show that most household’s WTP
has above the current monthly bills charged by the authorities.
Ahmad and Sattar (2010), carried out a study in District Peshawar. Primary data was
collected from 315 HHs to measure HHs responses about the health risk associated with
contaminated water. It was found that water sources become depleted with the passage
of time due to ill planning and urbanization, and now a days water becomes a scarce
well. Resultantly, the insufficient water, adequate sanitation, and hygiene practices
were causing major environmental degradation and health damages in Pakistan.
Household acceptability about the public or private service provider and their maximum
WTP for an improved water service were checked. Schooling, HHs income, the
occurrence of Diarrheal diseases and exposure to mass media, were used the main
determinants of their responses. Majority of the HHs were in the favour of Govt. water

26
service. The role of respondents’ health awareness besides income is the key
determinant of household demand for safe drinking water, and the majority of
households do not use any purification method.
Haq et al., (2007), estimated household WTP for improved water and sanitation
services by using the CVM in District Abbott bad. The finding of the study shows that
location of the household e.g. whether household belongs to the urban or rural area,
family members’ education and water source has a significant role on the households
WTP for improved water services.
Similarly, Haq et al., (2007) in District Abbottabad conducted a study to determine
household WTP for safe drinking water. CVM and Averting Behavior strategies were
used to estimate households WTP for both service and quality improvement service.
Source of water, education level of the households’ awareness, and quality of drinking
water were taken as the determinants for WTP. Results show that education is the main
determinant and has a significant effect on households WTP for improved water
service. In averting behavior strategies for quality improvement education have also the
important role as well. Besides this, awareness has a positive role in determining the
household towards the opportunity cost of using unsafe water.
Presently Parveen (2015) conducted a study in District Nowshera, Khyber
Pakhtunkhwa, by using CVM for measuring household WTP for improved water
services. Income, education, health expenditure, awareness, and filter cost were the
main determinants of household WTP. The study concluded that awareness has
significant impacts on household WTP for quality water to mitigate the jeopardy of
health and vulnerability to water-borne diseases such as Typhoid, Diarrhea, Dysentery
and Cholera. Both formal and informal education of respondents also has a significant
role in demand for quality water. The study further reveals that respondents having
high-income and education level were more WTP for safe drinking water
Hence, the above detailed literature review suggests that CVM is a feasible method to
quantify Households’ WTP for improved WSS. Income, education, household size,
employment, and satisfaction regarding the existing services were the most frequent
variables that determine household WTP. Thus, the reviewed literature has provided a
sound base for this study to analyze households demand and WTP for improved WSS.

27
A detail consumer survey was conducted in Urban Peshawar to know the present status
of water and sanitation services, household satisfaction and priorities for more
improvement. Thus, household WTP for improved WSS can provide important inputs
to the planners, and policy makers for better municipal planning.
2.11 Contribution of the Present Study
The review of literature from various countries reveals that water and sanitation are
major issues. Usually, there is a lack of public involvement in decision making and
planning stage for services improvement. In urban Peshawar, apart from a few
developed towns; most of the inhabitants face the issues of water and sanitation
services. (Khan et al., 2010). The government and non-government organization
allocates huge funds, implement the projects but still, the ultimate beneficiaries were
not satisfied, and the desired results remain a dream for the policy makers and planners
in the region. The growing demand for municipal services has not been met by relevant
planning agencies. There is a need for a regular supply of clean pipe water and improved
sanitation however, the concerned authorities fail to provide sufficient and safe water.
The planning process still lacks the demand-side information of household priorities
and preferences and their WTP for better service level in the urban area. The lack of
policy guidelines from the government in this context has further increased the miseries
of an ordinary citizen causing health and environment problems. Against this
background, this study was conducted in the urban area of District Peshawar, a capital
city of Khyber-Pakhtunkhwa. For better and sustainable planning of water and
sanitation services improvement, consumer scurvy was conducted, to investigate
household WTP. The important aspect of this study is to understand households WTP
for Improved WSS, which provide important inputs to the planner, policy makers for
better municipal planning e.g. quality of services, charges applied against these
services.
2.12 Summary
A better understanding of household WTP for improvement in WSS is necessary for
managers and planners to manage and expand water and sanitation systems more
effectively. An overview of literature from both developed, developing countries and
Pakistan reveals that in-depth analysis of household demand for quality WSS requires
a detailed study and household survey. However, in developed countries based on

28
aggregate demand usually available from panel data collected from public water
utilities. In these countries, authors commonly assumed that subject to the budget
constraint household water demand function can be derived from household
maximization utility based on the assumption that water is homogeneously Good and
has close substitute or complement. However, the underlying model is different in
developing countries. In developing countries, household demand is mostly determined
by households’ health, education and leisure time, and these are the main variables in
the model (Behrman and Deolalikar, 1988). Travel cost model was also used to estimate
revealed preference of water source and quality in rural Kenya (Kremer et al., 2007).
Other models like Prohibit and Logit Models were used to estimate household demand,
but Logistic Model is best suited to measure household demand (Persson, 2002). For
choice estimation, i.e. to obtain water from the private connection or from non-tap
sources a Two-level Sequential Choice Model were used (Madanat and Humplick,
1993). To make the planning for water and sanitation sustainable, demand-driven
approach is used by the various planners in which the household is directly asked about
their WTP for specific goods and services. The household WTP for improved WSS
were checked based on various determinants depending on their regional scenario
despite the heterogeneity in the places and time periods studied.

29
CHAPTER 3: WATER AND SANITATION SERVICES IN PAKISTAN
Water and Sanitation Services are the most significant municipal services falling in the
domain of Municipal Administration and the citizens reserve the right to quality service
delivery. However, in Pakistan, the inhabitants face major problems in the provision of
quality WSS. The lack of public participation in the planning process and performance
assessment has been central to this deteriorating situation. Besides, factors like poor
documentation, absence of proper mapping and design data, below-par operation and
maintenance of existing infrastructure, inadequate staffing and multi-institutional
arrangements endanger the ability of municipalities to ensure quality service delivery.
The mainstream population has lack of improved WSS facilities, which is pre-requisite
and essential for human dignity and quality of life.
This chapter is based on the secondary data collected through various official
documents and analysed to study more in-depth the existing situation of water and
sanitation in Pakistan. Further the historical perspective of municipal services has also
been reviewed from various literature.
3.1 Situational Analysis of Drinking Water in Pakistan
Pakistan, the 6th populous country in the world rank with approximately 20.78 million
total according to population census 2017. It is anticipated that at the end of 2030,
around 50 per cent of Pakistan’s population, i.e. roughly 137 million people will be
living in urban areas and the number of cities with more than one million inhabitants
will increase from 8 to at least 12 in rank. A combination of natural calamities and
insurgency in some areas has pushed many people and forced urban areas to absorb
these IDPs which ultimately overburdened the carrying capacity of the existing
infrastructure and services (Government of Pakistan, 2011). As a part of the
international agreement of MDGs, Pakistan has committed to minimize the percentage
of population (urban and rural) with sustainable access to safe and secure (improved)
clean drinking water by 2015 and under the SDGs 100 per cent by 2030. That’s why
the Medium-Term Development Framework (MTDF) has tried to increase access to
improved sanitation up to 76 per cent of population (urban and rural) by 2009-10.
Figure 3.1 shows that the MDGs target of 93 per cent was not achieved at the end of
2015. Recently published data shows that Pakistan is stirring back and forth to achieve
the MDGs; the percentage of the population having access to improved water sources

30
in the base year 1990-91 was 53 per cent and reached only to 86 per cent in 2014-15.
While the MDG target for the year was 93 per cent which is far beyond the archived
target as shown in Figure 3.1.
Figure 3. 1: Proportion of Population Access to Improved Water Source in
Pakistan
Source: Extracted from Pakistan Social Living Measurement survey2014-15
The WSS related problems are aggravating day by day in Pakistan to impede the
development of urban centers and deteriorate the quality of life of people. Numerous
diseases like Diarrhea, Cholera, Typhoid and Hepatitis ‘A’ and ‘E’ are the water borne
diseases. Diarrhea is a serious health concern among children under 5 years of age and
contribute to child mortality in the country. The eradication and stoppage of diarrhea is
a key objective of the government through provision of improved WSS. The mortality
risk can be mitigated by domesticated Oral Re-Hydration Salts (ORS) or a
Recommended Home Fluid (RHF). Figure 3.2 shows diarrhea trends in Pakistan from
1990 to 2015.
0
10
20
30
40
50
60
70
80
90
100
53
8791 89 87 89 87 87 86
93
%ag
e of
Popula
tion
Years

31
Figure 3. 2: Trend of Children Under Five (05) Years Who Suffered from
Diarrhea in Pakistan
Source: Author’s own Calculation from PSLM Survey 2014-15
It is clear that in the year 2014-15 the number of children who suffered from Diarrhea
is 9 per cent as compared to 10 per cent in the previous year (2012-13). Province wise,
Balochistan reported highest percentage of Diarrhea cases with 11 per cent in 2014-15
as compared to 14 per cent in 2012-13, and lowest percentage who reported in Sindh
province with 6 per cent in the year 2014-15 as compared to 9 per cent in 2012-13. The
decline incidence percentage of Diarrhea cases was much rapid in Sindh and
Balochistan than in other two provinces between 2014-15 and 2012-13 as shown in
Figure 3.3.
0
5
10
15
20
25
3026
1110 10
11
810
9 9 <10
%a
ge
of
Ch
ild
ren
Years

32
Figure 3. 3: Province wise Diarrhoea Cases in Pakistan
Source: Extracted from PSLM (2013-14)
It is clear from the figure that Pakistan shows better trend in achieving the MDGs target
of <10 per cent for the year 2015. Province wise, Sind shows better performance in
reducing the Diarrheal i.e. Six (06) per cent cases followed by Punjab Nine (09) per
cent, Khyber-Pakhtunkhwa Ten (10) per cent and Balochistan Eleven (11) per cent,
respectively.
To overcome the above mentioned challenges, the country must have to shift from
covert to overt plans and policies for water supply and sanitation, and to restructure the
conventional top-down (supply driven approach) to decentralization of power to local
self-governments (demand driven approach) at the grass root level.
3.2 Inter Provincial Situation of Water and Sanitation
Pakistan shows a positive trend in the accessibility of the population to improved water
sources and has increased from 85 per cent in 1990 to 91 per cent in 2014. Similarly,
0
2
4
6
8
10
12
14
Pakistan Punjab Sind Khyberpakhtunkhawa
Baluchistan
2010-11 11 11 12 10 13
2012-13 10 10 9 11 14
2014-15 9 9 6 10 11
11 11
12
10
13
10 10
9
11
14
9 9
6
10
11
%ag
e o
f D
iarr
ho
ea
Inci
de
nce
(%)

33
accessibility to improved sanitation has also risen from 27 per cent to 48 per cent during
the same period (World Health Organization, 2015).
Figure 3.4 shows disparities among provinces in provision of improved water in
Pakistan. It is evident that, in Punjab about 18 per cent of the population has access to
tap water through pipe networks, 28 per cent by hand pumps, 45 per cent by motor
pumps, 1 per cent by dug well and 9 per cent others like spring, lakes and streams.
Figure 3. 4: Province wise Distribution by Source of Drinking Water in Pakistan
Source: Extracted from PSLM (2014-15)
Figure 3.4 further explains that tap coverage is the lowest in Punjab i.e. 18 per cent, and
highest in Sind i.e. 41 per cent, followed by Khyber-Pakhtunkhwa and Balochistan, 35
per cent and 33 per cent respectively. Increase in tap coverage should be considered an
optimistic improvement only if the water supplied through taps is safe for human
utilization. Beside public tap, 73 per cent people have their own private drinking water
system in the country.
Major portions of the population are facilitated by the provincial governments as well
as the local governments in form of Rural Development Department (RDD), the Public
Health Engineering Department (PHED) and other non-government organizations in
0
5
10
15
20
25
30
35
40
45
27
18
41
3533
2628
34
12
7
33
45
11
26
18
31
48
11119 10
18
30
Per
cen
tag
e
Regions
Tap Water Hand Pump Motor Pump Dug Well Other

34
the sphere of water schemes and drinking water facilities. In own source of drinking
water sources, water motor pumps, hand pumps, dug well and other sources like rivers,
rings etc. are also the major sources of drinking water in Pakistan. It is clear from Figure
3.4 that the percentage of people using motorized pump for water is highest in Punjab
(45 Per cent), followed by Khyber-Pakhtunkhwa (26 per cent), and lowest in Sind (only
11 per cent). At the same time, the percentage of people using a hand pump as a source
of water is highest in Sind (34 per cent) followed by Punjab (28 per cent), and Khyber-
Pakhtunkhwa (12 per cent) respectively, while Balochistan keeps the lowest percentage
(7 per cent). As the water table is going down, it has forced people to use motorized
pumps to obtain water and this trend is there in almost all provinces of Pakistan. The
poor residents in many urban slums and rural areas are forced to depend on ponds and
irrigation-channels for the supply of water for household usage. Similarly, for the
disposal of waste these sources are also brought into use. Different sorts of illnesses
and the un-bearable cost of medical treatment that the poor and low-income strata of
the society face are the major causes that contribute to the present persistence of poverty
in the society. It is note-worthy that water provided through the taps inside or outside
the houses, and water being obtained through hand-pumps was declared as improved
water. Thus, keeping the risks of contamination in such water provisions the term
improved ought not to be considered as a synonym of safe.
3.3 Status of Sanitation
The safe, secure, and hygienic sanitation system is the right of every citizen (Hutton,
2012). Sanitation is the process of maintaining hygienic environment and dealing with
sewage. The term is however, used in a wide scope and covers the proper collection of
solid and liquid waste and environmental disposal, hygiene, and cleanliness. Slangy,
the term is used for waste reduction, recycle and reuses and change in the behavior
towards production and consumption patterns are other essential goals for sustainable
environment. World Health Organization (WHO) defines hygienic sanitation as a group
of procedures used for safe disposal of human excreta as well as communal waste water
in a hygienic way so that human and public health is not altered (Van Minh, et al.,
2013).
Worldwide 2.55 billion people lack improved water and sanitation facilities which
constitute 36 per cent of global population. Out of this 693 million people use
unimproved sanitation, 761 million uses public or shared sanitation facilities and

35
around one billion practice open defecation, while 786 million uses unsafe water for
their drinking purpose (Khalid, 2014). In developing countries, less than half of the
population uses improved sanitation and is off-track to the achievement of universal
access to improved sanitation and clean water by 2015 (Francis, 2014). Each year about
1.8 million people die from Diarrhea and Cholera, of which 90 per cent are children
aged 5 and below (Haq et al., 2007).
In Pakistan, the main goal of National Sanitation Policy 2009 is to ensure countrywide
hygienic public health and quality of life to citizens without discrimination. The country
has committed to reduce the proportion of population having sustainable access to
improved sanitation source up to 90 per cent by the year 2015 to obtain the MDGs as
shown in the Figure 3.5. However, due to unrealistic planning and lack of political will,
the required targets have not been achieved.
Overall, in Pakistan, 73 per cent of households use flush toilet; 13 per cent households
have no toilet facility while 13 per cent are using non-flush (Government of Pakistan,
2015).
Figure 3. 5: The proportion of Population Access to Improved Sanitation in
Pakistan
Source: Extracted from PSLM survey (2013-14)
Figure 3.5 shows the trends of household access to improved sanitation services. The
trend values increased from 30 per cent in 1990-91 to 73 per cent in the year 2014-15.
0
10
20
30
40
50
60
70
80
90
30
5966 63 66
72 71 74 73
90
Pe
rce
nta
ge o
f P
op
ula
tio
n
Years

36
It is evident that Pakistan has shown a positive development in achieving the MDGs
target of 90 per cent and SDGs targets of 100 per cent.
3.4 Waste Water Coverage
Figure 3.6 shows PSLM 2012-13 information on type of sanitation and waste water
sewerage system in Pakistan. It is evident that the waste water system is not satisfactory
and gives a distinct Image between urban and rural areas. The safe underground
sewerage system is mostly found in urban areas while in rural areas a meagre population
has this facility.
Figure 3. 6: Wastewater Sewerage Facilities in Pakistan
Source: Extracted from PSLM survey (2012-13)
Except for a few big cities, sewerage service almost does not exist, or is Kaccha and
unlined, which create serious health problems.
3.5 Toilet Facilities
Toilet is a facility for hygienic urination and defecation, which comprises a bowl which
is filtered with a hinged seat and is connected to a waste pipe and flushing machinery.
As per PSLM 2014-15, in Pakistan, 73 per cent compared to 71 per cent in 2012-13
people had flush sanitation facilities at home. Moreover, we learn that the progress
towards improved sanitation is much slower compared to that in water.
0
10
20
30
40
50
60
Underground
Drains
Covered
Drains
Open Drains No system
Urban 59 3 34 5
Rural 4 3 38 55
Total 24 3 36 37
59
3
34
54 3
38
55
24
3
36 37
Per
cen
tage P
op
ula
tio
n

37
Figure 3. 7: Percentage of Population having Toilet Facilities
Source: Extracted from PSLM survey (2013-14)
The flush toilet facilities show an increase from 66 per cent in 2010-11 to 73 per cent
in 2014-15, and only 13 per cent households in 2014-15 did not have any toilet facility
as compared to 18 per cent in 2010-11. This gap largely varies between urban and rural
areas and a widened gap has been observed as given in Figure 3.7. Punjab shows the
highest flush toilet coverage followed by both Sindh and Khyber-Pakhtunkhwa in
similar position. Balochistan shows high urban rural dualisms and 78 per cent of urban
and 14 per cent of rural population have flush toilet facilities at home. Among
provinces, the percentage of households having toilet facilities is highest in Punjab (79
per cent), followed by Khyber Pakhtunkhwa (76 per cent), while Balochistan having
(31 per cent) is the lowest. Although it has been observed that there is considerable
increase in the coverage sanitary latrines, it is still that most of these latrines are
connected to sanitary sewers, the result is that the excretion and effluence from these
latrines are released into open ravines. In this way very, few number of people mainly
in rural and urban slums are safe from the unhygienic disposal of these excreta and
effluents.
0
10
20
30
40
50
60
70
80
2010-11 2012-13 2014-15
Flush 66 71 73
Non Flush 15 14 13
No Toilet 18 15 13
6671 73
15 14 1318
15 13
Per
cen
tag
e o
f P
op
ula
tio
n

38
Figure 3. 8: Province Wise Status of Sanitation in Pakistan
Source: Extracted from PSLM (2014-15)
Whether they are effluents or children excreta that lay in the open or lay in a compound
well that flows into the open drains or whether that be seepage from septic tanks,
latrines or treatments plants, most people mainly of poor in slums and informal
households are the ones that face life threat from this unsafe kind of excrete or waste
disposal.
3.6 Municipal Service Facilities
Municipal Service is one of the most significant services falling in the domain of
municipal administration and the citizens have the right to quality service delivery.
It is evident from Figure 3.9 that in Pakistan 76 per cent of the households had no proper
garbage collection mechanism during 2013-14 in comparison to 75 per cent during
2011-12. Urban and rural areas show a distinct situation where 95 per cent of rural and
43 per cent of urban population have no proper garbage collection facilities. Province
wise the situation is a bit improved in Punjab. Garbage collected by municipalities and
private sector are 17 and 7 per cent respectively.
Medical waste disposals are posing a great challenge due to its hidden health effects.
Since there exists no effective public service delivery system for safe collection,
0102030405060708090
100
Punjab Sind Khyber
Pakhtunkhawa
Baluchistan
Urban 98 97 97 78
Rural 70 31 71 14
Total 79 67 76 31
98 97 97
7870
31
71
14
79
6776
31
Per
cen
atg
e o
f P
op
ula
tio
n

39
disposal and removal of industrial, agricultural and hospitals wastes, it is dispensed
with improperly leading to negative repercussions for people’s health.
Figure 3. 9: Municipal Services Facility in Pakistan
Sources: Extracted from PSLM (2013-14)
3.7 Present Institutional Framework of Municipal Services
Municipal water and Sanitation Services are the most significant municipal services
falling in the ambit of local government and the citizens reserve the right to quality
service delivery. The 1973 Constitution delegated the policy, planning, and financial
responsibility of WSS to the provinces. There would be three tiers of local government:
Districts, TMAs and Union councils depending on the geography and size of the union
councils. Since these services are local in nature, the operation is at level of
municipalities (Nawab and Nyborg, 2009).
Keeping in view the need and demand of the people, government provides these
services to the public and decides the quality, charges, and nature of the services. The
clause of Pakistan Environmental Protection Act (PEPA) about punitive measurement
for water quality standard and waste water treatment are not properly implemented to
date.
3.8 Challenges of Water and Sanitation Services
Literature suggests several arguments related to WSS failures and hurdle for provision
universal access to all the people. These arguments are based upon various causes, like,
Municipality
17%
Privately
7%
No system
76%
Municipality Privately No system

40
high cost of location-specific infrastructure, institutional weaknesses, bottom-up
community-led effort, shortage of trained and skilled workforce and political interest
as the main causes of sluggish progress in WSS. However, all the failures are often
evaluated based on individual cases, instead of considering the entire globe. Some of
the common dominant issues in obtaining universal access are as follows:
3.8.1 Infrastructure Challenges
The municipal infrastructure scarcity is the most noticeable symbol of urban
deterioration in Pakistan (Cotton and Franceys, 1994; Looney and Frederiksen, 1995;
Sohail et al., 2005). Worldwide, the investment required for infrastructure of water and
wastewater is more than that for transport and energy combined (Emerton and Bos,
2004). Two (02) types investment are needed in infrastructure: funds to be used for
replacing the deteriorated infrastructure and development, and extension of the
infrastructure to accommodate the fast-increasing population. Besides this the policy
and planning also play a very important role in tackling the infrastructure delivery
challenge (Rouse, 2014).
In Pakistan, less than one per cent of waste water is treated and the remaining waste
water can flow into rivers, streams and gorges, thus leading to serious results. Rivers,
streams, ravines and rivulets have taken the shape of sewers. Less than 50 per cent of
the wastes produced in the cities is collected by the city governments, while the rest is
allowed to decompose on the banks of roads and in the streets (Haider and Badami,
2010). Most of the collected waste, however is left in untreated open fields or is got
burnt in some cases, most of it is dumped into gorges, rivers and streams. This dumped
waste can also cause other health issues and severe consequences (Sabiha et al., 2008).
Ground water gets contaminated because of dumping the wastes in the open fields
(Rouse, 2006). Besides this, burnt waste can also cause air pollution which is the most
dangerous pollution. Thus, urban infrastructure fails to cater to the needs of a healthy
life style. The availability of services and infrastructure depend on socio economic
background and social link within the cities (Mosel and Jackson, 2013). Even the
federal capital Islamabad, the residents of the well-off communities and planned city,
face chronic water shortages. Water supply reached to the extent of 62 million gallons
per day in April 2009 alone, which were still deficient from up to 50 per cent from
drinking water demand for portable water in Islamabad, the capital of Pakistan. (Haider
and Badami, 2010).

41
3.8.2 Institutional Challenges in Pakistan
The UN and other international forums have acknowledged safe drinking water and
adequate sanitation as the fundamental human right and indispensable for improvement
of health and eradication of poverty. It was made compulsory for the member states and
government to make realist policies for ensuring the fulfillment of their citizen (United
Nation, 2005). Along with Pakistan, most of the developing countries have focused of
legislation and policy formulation instead of legitimate regulatory instrument and
effective and efficient administration which are necessary for effective Implementation
of policies (Saleth and Dinar, 1997). The local communities usually resist and question
the expert formulated rules and policies, which often does not meet and clashes with
socio cultural norms, values, daily practices and economic consideration (Douglas,
1966; Weber, 1968; Dinar, 1998; Loetscher and Keller, 2002 and Mara, 2003).
To meet the needs of the people the government of Pakistan has shifted from status quo
supply driven (top down) approach to a more appropriate demand driven bottom up
approach of devolution plan, and implicit to explicit oriented policies. For this purpose,
the government has initiated a million-dollar project but still a major chunk is deprived
of safe drinking water and basic sanitation in Pakistan.
3.8.3 User Ownership
The top down and supply/ expert driven approach in water and sanitation planning
failed due to lack of customization to meet local needs. Urban planning studies in
developing countries suggest that water and sanitation services improvement must be
demand driven and community led (Annamalai et al., 2016). Various international
studies have been undertaken and favor the user ownership and involvement during
water and sanitation planning and implementation. The demand driven, and community
led being very important for the success and sustainability of any development project
(McGranahan, 2015). A case study titled, “Implementing a Demand-Driven Approach
to Community Water Supply Planning” were the best example of demand driven
approaches’. The beneficiaries of the project were actively involved regarding the
service choice and tariff charges against each service. (Whittington et al., 1998). For
proper citizen engagement, there is need for cooperation between the technical experts
and the end user of these services so that they can be in an accepting mood for changes
in future demands that rely on socio-economic, public health, environmental and
political factors. Local communities’ access to technical experts can be facilitated by

42
the government through partnerships with local NGO or other organizations that hire
experts for water and sanitation services. Urban places in Asia and Latin America and
Africa highlighted the significance of multi stakeholder co-operation and flexibleness
(Lüthi et al., 2010). For example, the better outcome of citizen engagement in a small
Peruvian community encourage them to consolidate themselves for other
developmental projects apart from Water and Sanitation Services (Hubbard et al.,
2011).
3.9 Drinking Water and Sanitation Policies in Pakistan
Universal access to safe drinking water and adequate sanitation facilities and basic
human needs. National Environmental Policy 2005; National Drinking Water Policy
2009; National Drinking Water Quality Standards 2009 and National Sanitation Policy
2006 were developed to ensure quality water and sanitation services to entire Pakistani
population by 2025 at an affordable cost and achieve MDGs at national and provincial
levels. However, these policies have not endeared a role as drivers for reforms due to
weak regional implementation capacity, lack of resources, and a low institutional
capacity.
After provincial autonomy, each province has developed its own water and sanitation
policies following the National Drinking water and Sanitation policies. Punjab is the
pioneer and has developed its own Urban Water and Sanitation Policy 2007 followed
by Sindh Sanitation Strategy 2008 and Balochistan Sanitation Strategy and Action
2008. Beside this, Balochistan has also developed Sector Strategy for Drinking Water
Supply, Sanitation and Hygiene 2006. To achieve sustainable development goal of
universal drinking water and sanitation coverage in the province the government of
Khyber Pakhtunkhwa developed draft water and sanitation policies 2011 but has not
been approved from the cabinet as legal documents.
Other relevant legal documents for the water supply relevant to the study area include:
Pakistan Environmental Protection Act, 1997.
Local Government Act, GoKP, 2012.
NWFP River Protection Ordinance 2002.
Environmental Protection Agency (EPA) KP Guidelines for small to medium
size water supply schemes 2004.
WHO Water Quality Guidelines.

43
National Water Quality Standards (NWQS)
The key findings of these policy documents are:
i. To enhance the universal coverage to all inhabitants to contribute to the
government commitment of achievement of MDGs targets.
ii. To ensure the provision of moderate amount of drinking water to all urban
population.
iii. To monitor the drinking water quality and promote measure for treatment.
iv. To encourage and promote public participation in planning and development.
v. To promote public awareness program for safe and hygiene practice, water
conservation and solid waste management.
vi. Enhance the capacity of concerned department and guideline for better planning.
vii. Promote research and development for enhancing access, effectiveness and
sustainability of water supply interventions;
viii. To clarify the role and responsibilities of each department and various tiers of
government in drinking water and sanitation sectors.
3.10 Decentralization of Municipal Services in Pakistan
The 18th amendment 2010 shoulders the fiscal, administrative and functional
decentralization to the four provinces and each province should devise its own strategy
for better provision of the services. For small and medium sized towns, the water and
sanitation services operations are managed by Tehsil Municipal Administrations
(TMAs) and large cities by various authorities like Water and Sanitation Agencies
(WASAs) in five large cities in the Punjab and one in Balochistan and Karachi Water
Supply Board (KWSB) in Karachi. However, around the country, PHED have sole
responsibility of WSS in rural areas. Due to conferred interest and power, the PHED
would have continued to keep the status quo and work on the discretion of civil service
rather than to be kept under the control of local politicians. Based on available budget
PHED prepares its own Annual Development Plan (ADP) for each district based on the
needs of people and political interests.
The Government of Khyber Pakhtunkhwa (GoKP) has been deliberating for some time
on improving the institutional arrangements for the provision of municipal services in
Peshawar. For this purpose, the present GoKP has established an independent utility

44
companies in Five (05) major cities, Peshawar, Mardan, Mingora, Abbottabad and
Kohat for unified services delivery.
In Peshawar, consensus has been developed for the establishment of a city-wide
integrated utility for water supply, solid waste and sanitation services, managed by
professionals with corporate governance. In 2012, the Government of Khyber
Pakhtunkhwa has established an independent utility company in the name of WSSP. It
is the first corporate entity in Pakistan for provision of integrate services of water
supply, sanitation and SWM. The logic behind establishing this company is to
amalgamate various departments such as Peshawar Municipal Corporation, Peshawar
Development Authority, Town Municipal Administrations and Town Committees
under one public utility company and provide WSS in Peshawar City. The presence of
the existing organization in delivering municipal services has contributed to
overlapping of responsibilities which has resulted in confusion and inefficiency in the
operation and management of the utility systems. Although the multiple cluster
indicator survey of 2008 jointly done by the GoKP and UNICEF shows that nearly 90
per cent of the population has access to drinking water but the reliability of their
information, particularly regarding urban area of Peshawar (except the Cantonment and
Hayatabad area) remains a challenge for a variety of reasons.
Figure 3. 10: Hierarchy of the Water and Sanitation Service Utility

45
CHAPTER 4: METHODOLOGY FOR DATA COLLECTION
This chapter gives a detailed description of the data source and various tools and
techniques used for achieving the objectives of the study in a logical manner. Moreover,
this chapter will give detailed description of the study area and step by step procedure
for in-depth analysis of the targets objective of the study and details are as follow:
4.1 Source of Drinking Water
The main source of drinking water in Peshawar district is ground water and contributes
to more than 95 per cent of the total water supply by means of tube wells and overhead
reservoir as given in Figure 4.1. The quality of water throughout Peshawar district was
once considered to be exceptionally good in the past. However, in recent times
contamination had been observed in different areas. It is fast deteriorating now. Ground
water analysis shows that in Peshawar, there are two main aquifers, the first extends to
a depth of 60 meters and the second lies at depth of about 180 meters. Peshawar valley
is mostly comprised of alluvial deposits having variable depths eroded from the
surrounding mountainous. The alluvial deposits that fill the valley make up the aquifer
that provides groundwater for Peshawar. There are two main aquifers in the alluvial fill
underlying the Peshawar area. The upper aquifer, a water table aquifer, extends from
ground surface to a depth of 61 meters and the lower alluvial aquifer is semi-confined
and extends from 61 meters to a depth of about 180 meters, which contains water under
artesian conditions. Ground water movement in both the aquifers is northeast towards
the Kabul River. The depth of water table varies from about 2 meters to 45 meters (Inam
Ullah and Alam, 2014).

46
Figure 4. 1: Spatial Location of Existing Tube Wells in District Peshawar
Figure 4.2 shows the water table depth and north east of the city is not fit for building
construction due to high water table. The permeability is ten times lower in the lower
semi-confined aquifer than in the shallower water table aquifer zone.

47
Figure 4. 2: Water Table Depth in feet in District Peshawar
Source: Modified from (Samiullah, 2013)
Recharge to the aquifer is by infiltration from the surrounding mountains and seepage
from the irrigation system passing through the central and southern area of Peshawar
city and its surroundings. Groundwater quality from shallow and deep aquifers
underlying Peshawar area is generally fresh and has remained unchanged over the past
40 years. However, recently, the presence of E-Coli has been reported in certain
minimum number of tube wells, which may be due to wastewater infiltration.

48
4.2 Population Forecasting
In the absence of current census the population was projected using the following
formula:
Pn=P0X (1+r/100)t……………………………………….(Eq. 4.1;GoKP, 2013)
Where:
Pn = Population of desired year
Po = Population of the base census (From which estimated population is calculated).
r = Growth rate and
t = Time Interval (in years) between two census/calculated period.
Population growth rate of the District during the inter-census period 1972-1981 was
3.89 per cent, which declined to 3.56 per cent during the period 1981-1998, implying a
decline of 0.33 per cent over 17 years, or on average 0.10 per cent after every 5 years
(Government of Pakistan,1998).
Using the population growth rate statistics of 1998 census, the current population of the
urban Peshawar for the year 2017 is estimated to be 19, 49,932 (Given in Annexure I).
Furthermore, the households were selected randomly from each union council. Similar
approach was also adopted by Altaf (1994) and GoKP (2013).
4.3 Sampling Design
For selection of suitable sample size from the given population, the following formula
was used:
𝑆𝑆 = Z2 ∗ (p) ∗ (1−p)
C2…………………………………. (Eq. 4.2)
Where:
Z = Z value (e.g. 1.96 for 95 per cent confidence level and 4.0 per cent confidence
level)
p = Percentage picking a choice, expressed as decimal (0.5 used for sample size needed)
c = Confidence interval, expressed as decimal (e.g., 0.04 = ±4)
As the total projected urban population of Peshawar for the year 2013 was 1,694,936,
the minimum sample size calculated is 600 households. Similar approach was adopted
by Altaf (1994) and Vásquez et al., (2009).
4.4 Allocation of Sampling
For choosing sample from each union council of urban Peshawar, proportion allocation
method was used. Details are as under:

49
Let there are N villages/union councils, where data should be collected from the field.
Then
N=N1+N2+N3+N4……………Nh=∑Ni
A total of ‘n’ sample should be studied for analysis. The size of total sample is:
n=n1+n2+n3+…………. nh=∑ni
The sample size of each union council is:
ni =n*Ni/N……………………………………………... (Eq. 4.3; Hansen et al., 1953)
Where
ni=sample selected from each UC.
n=Total sample size
Ni=population of each UC.
N=Total population of all UCs
4.5 Nature and Sources of Data
Mixed method approach i.e. both qualitative and quantitative and information was
collected through semi structured questionnaire, using personal investigation method.
Various literature such as Whittington et al., (1987); Birol et al., (2006); Chowdhury,
(1999); Guha, (2007); Kaliba et al., (2002); Gunatilake and Tachiiri, (2012); Haq et al.,
(2007); Khan et al., (2010); Altaf et al., (1992) used both qualitative and quantitative
data to measure household WTP for services improvement.
Primary data was collected from the head of household regarding household
demographics, existing state of water and sanitation service, issues and problems of
existing services, household perceptions and priorities for improvement. Further data
was also collected to check determinants of household WTP for improved water and
sanitation services.
Apart from this data, Key Informant Interviews (KIIs) was conducted to collect data
from experts, professional, practitioners and other personal, who possesses background
knowledge of water and sanitation in the area. In KII information was collected through
well designed questionnaire (Given in Annexure IV). Secondary data was collected
from Government of Pakistan (GoP) published statistics, reports, magazine,
newspapers and Khyber Pakhtunkhwa Bureau of Statistics.

50
4.6 Household Survey Questionnaire
For conducting households’ survey, a properly well-designed questionnaire (See in
Annexure III) was used consisting of the following parts:
The introduction, purpose and objective of the survey
The socio-demographic characteristics of the respondents
The current and baseline situation of water and sanitation and their
characteristics.
Satisfaction, priorities and performance indices regarding various variable of
the services.
Various bids of household WTP for WSS.
Finally, household recommendations and suggestions in the form of open ended
question.
4.7 Key Informant Interviews
To evaluate the performance of existing service providers and policy gap in the way of
better planning of WSS, data was collected through KIIs. For this purpose, a separate
questionnaire (See Annexure IV) was designed for practitioners and elite members
from each UC. A total of 100 questionnaires were administered and data was collected
from KIIs regarding the existing WSS. The experts and professionals were selected
from various departments like:
Local Government Election and Rural Development Department
(LGE&RDD)
Municipal Corporation
Town Municipal Committee Peshawar
Peshawar Development Authority (PDA)
Cantonment Board Peshawar (CBP)
KP Public Health Engineering Department
Municipal Service Program(MSP)
WSSP
UNICEF
NGOs working on water and sanitation
Impersonal interviews were conducted from elite members of each UC, like elected
representatives (Nazim and councilors), social workers, and members of Community

51
Based Organization (CBO) and philanthropists of the community to know the problems
of WSS in more detail. Information about existing problems of WSS, like demand
supply gap, low quality, low pressure, departmental constraint, government plans and
constrained in the way of not achieving the goals and objectives laid down by
Millennium Development Goals (MDGs), WHO, National water and sanitation polices
were also taken in the interviews sessions.
4.8 Survey and Data Collection
Usually the economic value of traded commodities, such as food items or houses, is
determined by the prices of the goods consumers are willing to pay for them. However,
unlike normal goods and services, these commodities are not traded in the market due
to features of public good, monopoly or market failures. In such situation survey-based
stated preference methods were commonly used to make the policies more effective
and provide input for sustainable planning (Freeman et al., 2014). CVM method was
commonly used to conduct survey and elicit household WTP for improvement in WSS
(Champ et al., 2003).
In urban Peshawar, in the absence of competitive market of WSS, CVM survey was
carried out and data was collected randomly from the head of the household through
well designed questionnaire. The precise nature of the goods offered through
hypothetical market was defined in the questionnaire. Households were offered the
opportunity to 'purchase' the goods through various choices offered in bids, ranges of
offered bids were used to develop a data set from which a statistical estimate of
household’s demand curve was derived. For details see Freeman (1993) and Mitchell
and Carson (1989) provides a good review based on economic theory. Recent
application such as Raje et al., (2002) in mega city of India, Pattanayak et al., (2005)
in Kathmandu (Nepal), Rosado et al., (2006) in urban areas of Espı´rito Santo (Brazil),
Genius and Tsagarakis (2006) in Heraklion (Greece), Soto Montes de Oca and Bateman
(2006) in Mexico City (Mexico) and Tziakis et al., (2009) in the Municipality of
Kissamos (Northwest Crete) provide good examples of the use of CVM studies in
developing countries. All these studies demonstrate the usefulness of CVM for
information collection on households demand for improvement in public goods and
services.

52
4.9 Analytical Tools
For analysis of data, various tools such as Indices, Regression Analysis and Descriptive
statistics mainly averages, percentages, graphs using SPSS and Excel software. The
step wise procedure for each objective are as follows:
To assess the existing state of WSS in Peshawar and to compare the information with
national and international standard, the following five (05) indicators (Given in
Annexure II) were constructed.
Quantity of water used per capita per day
It means all the water collected by or delivered to the consumers and used for their
drinking, bathing and cooking, personal and hygiene and sanitation needs. A day is
considered as 24 hours and the amount collected is the amount used. For calculation of
this indication the following formula is used:
𝑋
=Volume of water(in litres)collected for all domestic use perday by all HHs in the sample
Total numbers of person in the sample HHs............(Eq. 4.4,
Billig et al.,1999)
Where
X=Quantity of water used per capita per day by the household.
Use of Water Purification Methods
The use of adequate Water Purification method means to purify water from
harmful pathogens. For calculation of the indication the following formula is
used.
X =
Numbers of HHs who treat their water using an adequate water purification methods
Total numbers of HHs members surveyed.......(Eq.
4.5, GoKP, 2008)
Where
X= Total numbers of respondents using an adequate water purification method
Per cent of Children<36 Months of Age with Diarrhea in the last Two Weeks
Definition: Diarrhea means more than three loose stools passed in 24 hours’
period. The percentage of children who have Diarrhea at the time of data is
collected or who have it any time in the two forgoing weeks. Age is the

53
completed years at the time of survey is undertaken and data is collected. If
child is 20 days old is considered as zero month of age, and a child of 50 days
is considered as one month of age (Billig et al.,1999).
The calculation procedure for the indicator are as follows:
X =
Numbers of children<36 𝑚𝑜𝑛𝑡ℎ𝑠 𝑜𝑓 𝑎𝑔𝑒 ℎ𝑎𝑣𝑖𝑛𝑔 𝑑𝑖𝑎𝑟𝑟ℎ𝑒𝑎 𝑖𝑛 𝑡ℎ𝑒 𝑙𝑎𝑠𝑡 14 𝑑𝑎𝑦𝑠
Total numbers of children<36 𝑚𝑜𝑛𝑡ℎ𝑠 𝑜𝑓 𝑎𝑔𝑒 𝑖𝑛 𝑡ℎ𝑒 𝑠𝑎𝑚𝑝𝑙𝑒.........................(Eq.
4.6, Billig et al.,1999)
Where
X=Total numbers of Diarrhea cases during the survey period
Percentage of Households with Access to Improved Water Source Year Around
It means either direct connection to home or public facility, piped system or
well or public stand point within 200 meters from the home. And this facility is
available around the year when the water supply is least reliable. This water is
useable for drinking, cooking, bathing and cleaning and no particular water is
implied. Water from unimproved sources such as river, streams and lakes
should not be counted (Billig et al.,1999).
The calculations are as follows:
𝑋 =𝑁𝑜.𝑜𝑓 𝐻𝐻𝑠 𝑎𝑐𝑐𝑒𝑠𝑠 𝑡𝑜 𝑖𝑚𝑝𝑟𝑜𝑣𝑒𝑑 𝑤𝑎𝑡𝑒𝑟 𝑠𝑜𝑢𝑟𝑐𝑒
𝑇𝑜𝑡𝑎𝑙 𝑛𝑜 𝑜𝑓 𝐻𝐻𝑠 𝑖𝑛 𝑡ℎ𝑒 𝑠𝑎𝑚𝑝𝑙𝑒......................................(Eq. 4.7, Billig et
al.,1999)
Where
X= percentage of respondents’ access to improved water sources.
Percentage of Households with access to Sanitation Facility
Definition: Sanitation facility means excreta disposal facility, typically a toilet: and
access to facility means Households has their own private facility or shared facility with
others in the house (Billig et al.,1999). The simple calculation formula is given as
follows:
X =
Numbers of HHs in the sample with access to sanitation facility
Total no of HHs in the sample.................................(Eq.
4.8, Billig et al.,1999)
Where
X= percentage of people access to improved sanitation facilities.

54
Percentage of Households access to Hygienic Sanitation Facility
Definition: Sanitation facility means excreta facility, usually a toilet, and hygienic
means the internal environment is not pathetic i.e. no faeces on the floor or seat and
there are few flies (Billig et al.,1999).
The calculation procedure for this indicator are as follows:
𝑋1 =
𝑁𝑜.𝑜𝑓 𝐻𝐻𝑠 𝑖𝑛 𝑡ℎ𝑒 𝑠𝑎𝑚𝑝𝑙𝑒 𝑢𝑠𝑖𝑛𝑔 ℎ𝑦𝑔𝑒𝑛𝑖𝑐 𝑠𝑎𝑛𝑖𝑡𝑎𝑡𝑖𝑜𝑛 𝑓𝑎𝑐𝑖𝑙𝑖𝑡𝑖𝑒𝑠.
𝑇𝑜𝑡𝑎𝑙 𝑛𝑜 𝑜𝑓 𝐻𝐻𝑠 𝑖𝑛 𝑡ℎ𝑒 𝑠𝑎𝑚𝑝𝑙𝑒.............................(Eq.
4.9, Billig et al.,1999)
Where
X= percentage of people access to hygienic sanitation facilities.
The indicators estimated were also be compared with the national and international
standards.
4.10 Satisfaction Index
For analysis of household responses regarding the existing water and sanitation
services, the satisfaction indices was used. The responses of HHs were recorded about
the existing water quality and quantity, pressure, monthly water bill, distance from
water source, type of toilet, distance from the toilet, number of HHs using the facility
and type of disposal facility.
However, to have better idea about the state of satisfaction, the following scale was
used:
Satisfied Dissatisfied
1 -1
The index was computed by using the following formula.
I= (fs-fd)/N……………………………………………… (Eq. 4.10)
Where
I=satisfaction index such that -1 ≤ I ≤ + 1
fs= frequency of household’s responses indicating satisfaction.
fd= frequency of household’s responses indicating dissatisfaction.
N=Total number of households interviewed=∑fi

55
4.11 Priority Indices
The existing problems faced by households regarding WSS and priority for solution
was analysed in the study area using the procedure as follows:
The problems faced by households about the WSS were listed separately and the
households were asked to prioritize these problems. This information gives a guide line
to policy makers and practitioners to take policy action and solve the more severe
problem on priority basis. For the estimation purpose, each problem was classified on
a various scales priority, as under:
Priority table
1st priority 2nd priority 3rd priority 4th priority No priority
1.00 0.75 0.50 0.25 0.00
The indices value lies between 0,1and was computed by the following formula:
I=∑sifi/N………………………………………. (Eq. 4.11)
Where I=priority index such that 0≤ I ≤ 1
si=Scale value at ith priority.
fi= Frequency of ith priority
N= Total no of observation=∑fi
4.12 Households’ Demand for Improved Water and Sanitation Services
For estimation of household demand for improved WSS, literature suggests various
methods, namely Hedonic Travel Cost Method used by Brown and Mendelsohn (1984)
and Englin and Mendelsohn (1991); Revealed Preference Approach by Richter (1966)
and Samuelson (1948) and CVM by Carson et al., (1993) and Mitchell et al., (2013).
As this research tries to quantify the households WTP for non-market good and
services, so CVM is appropriate survey method to be use. More specifically, the
households were asked about the monetary value which they would be WTP for
improved WSS and they were asked about their maximum WTP by offering various
bids. For analysis of household demand for improved WSS, separate methodology was
used for each service (IWS and ISS) and the details are as follows:

56
4.13 Derivation of Household Demand Improved Water Services
For analysis of household demand for IWS the following procedures were used:
4.13.1 Theoretical Model for Household Water Demand7
Every consumer wants to maximize his utility subject to given income and the prices
of goods and services they want (Deaton and Muellbauer, 1980). In urban Peshawar,
limited information is available regarding the existing state of WSS and the monetary
value people attached for improvement in these services. The demand for IWS can be
regarded as any other commodity and households’ maximize their utility subject to the
household’s total income constraints. So, it can be modeled either within the utility
maximization framework or within the expenditure minimization model.
E (IWS, X)
Where
IWS=W= Improved Water Service
X=composite good and services
Subject to U (W, X)
As every households’ want to spend their income for Improved Water Services (W) and
other combination of composite good (X). This can be kept subject to the utility
constraint, the households will try to minimize the following expenditure function:
E*= (PW, Px, U)
Where
PW= the services charges of water
Px= price of other composite goods and services
However, since improved water service is being offered either take-it or leave-it pro
position, so consumer can think of this as a limited demand problem and consumer
cannot observe PW and choose W, but usually W is presented, and consumer can choose
to pay for it or not. Therefore, the value of PW is replaced with W and the expenditure
function takes the following form:
E*=E (W, Px, U)
7This section is heavily drawn on Arimah (1996), Caseyet al., (2006), Vásquez et al., (2009), Khan et
al., (2010) and Parveen (2015).

57
In this case, the WTP for W is the difference between two expenditure functions with
W1>W0. So, the household compensating surplus welfare estimate can be derived from
this difference of W0 form W1.
CS (W0, W1) =E (PX, W0, U0)-E (PX, W1, U1)
Where
W0= Water services before improvement
W1= Water service after improvement
Estimation of compensating surplus (CS) is the amount that each household is willing
to spend extra and still remain at the earlier utility level. We can think of this WTP for
better service as a function of not only the exact cost of service charged, but also other
household characteristics like socioeconomic, demographic and attitudinal, which can
be represented by d in the expenditure function.
CS (W0, W1) =E (PX, W0, U0; d)- E (Px, W1, U1; d)
4.13.2 Model Derivation for Improved Water Services
Using the Logistic Regression Model, the dependent variable is constructed as WTP
taking value 1 if the household is WTP for IWS and 0 otherwise. As dependent variable
is dichotomous in nature, i.e. WTP for better service level, so probabilistic linear model
was used for estimation. This model helps in estimating the probability of odd of an
event and is given by:
𝑃𝑟𝑜𝑏𝑖𝑏𝑖𝑙𝑖𝑡𝑦 (𝑒𝑣𝑒𝑛𝑡) =1
𝑒−𝑍
Where Z is the combination of variables X1, X2………………. Xn
𝑃𝑟𝑜𝑏𝑖𝑏𝑖𝑙𝑖𝑡𝑦 (𝑒𝑣𝑒𝑛𝑡) =1
𝑒−(𝛽0+𝛽𝑖𝑋𝑖)
The above given probability equation can be transformed to determine the log odds in
favor of the event as:
ln (probability of event/1-probability of event) =Z
In our model
Z= β0 + β1Ih+ β2Edu+ +β3HHs+ β4 HO+ β5HOcp+εi………………………. (Eq. 4.12)
Where

58
β0= the Y-intercept.
βi= The regression coefficient in the model.
Ih = Total Income of Household in PKR/month and it is expected to be positive. This
also confirmed by many studies like Wasike and Hanley (1998) in Keneya; Khan et al.,
(2010) in Peshawar, Pakistan; Adenike and Titus (2009) in Osun State, Nigeria; Calkins
et al., (2002) in Mali; Asante et al., (2002) in the chairman Volta Basin and Briscoe
and de Ferranti (1988) in Zimbabwe.
Edu=Number of years in education of the main earning member of the household. This
is categorical variable and like income the expected sign will be Positive in the lighted
of many studies like Vásquez et al., (2009); Khan et al., (2010); Adenike and Titus
(2009); Wasike and Hanley (1998) and WBWDRT, (1993).
HHs= Household Size in number. The WTP of household does not directly depend
upon household size, so the sign of this variable will be negative and augmented by
Wasike and Hanley, (1998) and Briscoe and de-Ferranti, (1988))
HO=Household occupation. This expected sign of this variable will be positive in line
of many studies like Whittington et al., (1990); Wendimu and Bekele, (2011).
HOwn=Housing ownership reflect a safety feature to WTP. Where the inhabitant
knows that they will be staying in the home for long time the WTP for quality service
increases. So, the proposed sign of this variable is positive and supported by Casey et
al., (2006) and Vásquez et al., (2009).
εi =The residual error, which is an unmeasured variable
In these variable incomes has direct and positive relationship of household WTP.
Beside this education, household size, employment and housing occupancy also have
relevant variables and differently impact household WTP.
4.14 Derivation of Household Willingness to pay for Improved Sanitation
Services
Similarly, for derivation of household demand for improved sanitation is determined
through following procedure:

59
4.14.1 Theoretical Framework8 for Improved Sanitation Services
Demand is the power of a commodity to satisfy a human need. In the perspective of
Deaton and Muellbaure (1980) traditional demand theory, many factors are responsible
for demand determination, like household income, education, demographics, own price,
cross price, taste, preferences, awareness and profession of households.
For analyzing demand for improved service, in this study tentative monetary value is
needed. For this purpose, multi stage budget procedure is used so that household can
use their limited income and decide to spend their limited budget in an effective manner.
It is assumed that household gives priority to more pressing needs like food items,
health services etc. Spending for improved sanitation service comes in later stage.
Usually household with high income and consumption pattern are skew shaped which
means that individuals are willing and spend more income to get hygienic environment
because of high income level (Arimah,1996).
Further Arimah (1996) concluded that, WTP for improved sanitation service is
determined by household income, existing sanitation services, and consumption of
housing attributes and size of household. Household having higher income gives more
priorities towards ISS for safe and hygienic environment condition.
The residents of urban Peshawar typically maximize their utility, subject to budget
constraints. Thus, demand for improved sanitation service can be viewed as any other
commodity and therefore modeled within the utility maximization framework or
alternatively within the expenditure minimization model.
E (S, X)
Subject to U (S, X)
Where
ISS=S= Improved sanitation services
X= Composite goods and services
As household wants to spend their income on Improved Sanitation Services (S) and
composite good (X) subject to the utility constraint, the consumer will try to minimize
the following expenditure function:
8This section is heavily drawn on Arimah (1996), Parveen (2015), Casey et al., (2006), Vásquez et al.,
(2009) and Khan et al., (2010).

60
E*= (PS, Px, U)
Ps= Price of sanitation services
Px= Price of composite goods
However, since improved sanitation service level is being offered in the form of bids
i.e.to take-it or leave-it pro position and have controlled demand problem. Usually in
such situation the consumer does not take into consideration price of the service (Ps),
but rather services (S) offered and should decide to pay for it or not. Therefore, Ps is
exchanged with S and the consumer expenditure function takes the following form:
E*=E (S, Px, U)
In this restricted case, the WTP for ISS is merely the difference between two
expenditure functions with S1>S0 and from the difference between S1 and S0 the
compensating surplus welfare can be derived.
CS (S0, S1) =E (PX, S0, Uo)-E (Px, S1, U1)
This computation of compensating surplus (CS) is a measure of the household WTP for
ISS. It is the exact amount that each household is WTP and remains at the former utility
level without any effect on his budget expenditure. We can think of this WTP for
improved sanitation service as a function of not only the exact cost of service level, but
also socioeconomic characteristic of household, attitude and cultural values, which can
be represented by ‘d’ in the expenditure function.
CS (S0, S1) =E (PX, S0, Uo; d)- E (Px, S1, U1; d)
4.14.2 Model Derivation for Improved Sanitation Services
For estimating household WTP for ISS, bid wise Binary Logit Regression Models were
used. The dependent variable is constructed in dichotomous format, i.e. taking the value
‘1’ if the household is WTP for quality environmental services and ‘0’ otherwise. The
model is set in the line with Whittington et al., (1993); Raje et al., (2002); Van Minh et
al., (2013) has advantage over other discrete choice models (Linear Probability mode,
Tobit Model and Probit model). This model helps in estimating the probability of odd
of an event and is given by:
𝑃𝑟𝑜𝑏𝑖𝑏𝑖𝑙𝑖𝑡𝑦 (𝑒𝑣𝑒𝑛𝑡) =1
𝑒−𝑍
Where Z is the combination of variables X1, X2………………. Xn

61
𝑃𝑟𝑜𝑏𝑖𝑏𝑖𝑙𝑖𝑡𝑦 (𝑒𝑣𝑒𝑛𝑡) =1
𝑒−(𝛽0+𝛽𝑖𝑋𝑖)
The above given probability equation can be transformed to determine the log odds in
favor of the event as:
ln (probability of event/1-probability of event) =Z
In our model
Z= β0 + β1Ih+ β2Edu+β3HHs+ β4 HO+ β5HOcp+εi…………………...(Eq. 4.13)
Where
β0= the Y-intercept.
βi= The regression coefficient in the model.
Ih = Total Income of Household in PKR/month.
Edu=Number of years in education of the main earning member of the household.
HHs= Household Size in number.
HO=Household occupation.
HOcp=Housing occupancy of household
εi=The residual error, which is an unmeasured variable
4.15 Performance Indices for Water and Sanitation Services Authority
To measure the performance of the existing WSS authorities, the performance indexes
was used. Performance scale was constructed, and the greater scale value shows
excellent performance. The scale value lies within range of ‘0’ and ‘4’ i.e. 0≤I≤4and
can be constructed as follows:
0 1 2 3 4
Poor Fair Good Very Excellent
The performance of existing authorities were checked based on complaint redressal of
the customers, planning for the future, monitoring mechanisms, revenue collection and
provision of improved WSS, using the following indices:
0≤ I ≤ 4
The indexes are computed by the following formula:

62
P=∑sifi/N……………………………………. (Eq. 4.14)
Where
P=performance index such that 0≤ I ≤ 4
si=scale value at ith performance
fi= frequency of ith performance.
N= frequency of observation=∑fi
4.16 Governance Score Card for Water and Sanitation Services
To achieve the aims and objectives of ‘performance valuation and accountability of
service providers’, and ‘advocacy for demand-oriented development planning’ the GSC
method was followed in Peshawar City. It is a tool to involve citizens for evaluating the
existing WSS, based on their experiences and satisfaction in relation to specific
qualities of services.
To assess the service providers, data was collected from Hundred (100) KIIs through a
separate questionnaire. Based on given nine (09) principles of good governance i.e.
transparency, equity, rules of law, sustainability, equity, quality of services,
responsiveness, accountability, participation and strategic vision, the performance was
checked using formula given in Eq. 4.14. The three-point scale value indicates the
performance and lies within the range of 0 and 2 i.e.0 ≤ I ≤ 2 and can be constructed as
follows:
0 1 2
Poor Good Excellent

63
CHAPTER 5: DATA ANALYSIS OF WATER SERVICES IN URBAN PESHAWAR
This Chapter is based on field data regarding household demand for Improved Water
Services (IWS) collected through household survey and Key Informant Interviews
(KIIs). Various statistical tools like descriptive statistics, satisfaction indices, priority
indices, performance indices and Linear Logistic Model were used to analyze the data.
First of all, the data and information on existing WSS through KIIs was tabulated and
recorded with extensive detail. Further performance of the existing WSS providers was
evaluated using the Governance Score Card Method.
Moreover, the socio-economic characteristics of the household and assessment of the
current state of water service was also discussed in detail in this chapter. The household
satisfaction regarding the existing water services and priorities for improvement were
also analyzed. Linear Logistic Regression Model was used for measuring household
WTP for IWS and significance of each policy variable was also statistically analysed.
Finally, the service delivery performance of WSSP was evaluated based on some
indicators. The detailed analysis is as follows:
5.1 Field Visits and Community Perceptions
The primary aim of field visit is to understand, in general terms, the community’s
opinions regarding existing drinking water services to gaining insights about fields’
problems and suggestions for better planning and services’ improvement. An overview
of the general community perceptions are given in Table 5.1.

64
Table 5. 1: Community Perceptions to water services in Urban Peshawar
Indicators Community Perspectives
Satisfaction
with
service
In general, drinking water services are reported ineffective in urban
area of Peshawar and the response time for repairs and customers’
services is unsatisfactory, poor, or non-existent in most parts of the
study area.
Domestic
water issues
Domestic water is not sufficient and safe.
Most of the water becomes contaminated before reaching the
ultimate consumers in its distribution lines due to the rusted
and leaking pipe line system.
Dysfunctional filtration plants.
Non-revenue water losses in the distribution system.
Illegal/unauthorized connections and the use of suction pumps
which ultimately affect the customers at the tail end.
The issue of encroachments on the distribution lines.
Suggestion
for
improvement
Rehabilitation of the existing tube wells.
Replacing of all asbestos with pipes High Density
Polyethoylen (HDPE).
Legal restriction on dugging wells and increasing the coverage
of public tap water.
The existing filtration plants should be rehabilitated and
connected directly to the system. Moreover, plants need to be
installed on need basis. The major reason for non-functioning
of plants is the lack of maintenance and non-replacement of
filters. Thus, filters remain clogged. The timely institutional
response to any breakdown of plants is very poor.
Restriction and removal of encroachment on or along the
pipelines.
Laws need to be strictly enforced to ensure proper future
development and sustainability of infrastructure.
A rigorous programme of reducing Non-Revenue Water
(NRW) is suggested after repairing broken and leaky pipelines.

65
Public education and awareness about service providers, in
urban Peshawar. Majority of the residents generally know who
provides municipal service within their area, but they are not
very aware of them. It is suggested that in each urban UC has
at least one Citizen Community Board (CCB), to address civic
concerns, including municipal services.
A mass awareness campaign needs to be launched to motivate
communities to avoid their common undesired practices of
misuse and wastages of drinking water.
Water meters should be introduced, along with other equitable
approaches to collect revenue for services along with subsidies
for the poor and unprivileged communities.
Filtration plants must be installed at UC/Mohallah/Community
level with proper systems and repairing mechanisms.
Establishment of Research and Development (R&D) center, to
undertake detail studies in the area.
During planning and designing any project for WWS
Improvements Public hearing is necessary to address the needs
and demands of the silent masses.

66
Image 5.1: A view of Key Informant Interview in Union Council Palosai
5.2 Findings from Key Informant Interviews
The aim of the KIIs is to determine the policy gaps and suggest policy recommendations
for IWS. A separate meeting was conducted with various experts and professional data
was collected through questionnaire and their findings are summarized as Table 5.2.
Table 5. 2: General Findings from Key Informant Interviews in Urban Peshawar
General
Indicators
Experts and Professional Perspectives
Working
Organization
WSSP, Peshawar Development Authority (PDA), Municipal Services
Program(MSP), Municipal Corporation (MC), UNICEF, Local
Government, Public Health Engineering Department (PHED),
Cantonment Board (CB) and Non-Governmental Organizations (NGOs)
working on water, Academia and other personal working in water related
issues.

67
Function of the
Organization
To provide sufficient and safe water to the inhabitant of urban Peshawar
without discrimination.
Exiting water
issues
Nonexistence of urban land use planning
The existing water facilities are not per human right standards.
Political intervention
Lack of financial resources
Policies lapses After provincial autonomy, still, the Govt. of Khyber-
Pakhtunkhwa water policy is in draft form and in the pipeline for
cabinet’s approval to obtain legal status.
There is no solid waste management policy of GoKP.
Laws need to be strictly enforced to ensure proper future
development and sustainability of infrastructure.
The service providers are not properly empowered in
implementation area so political intervention should be
abandoned.
In the absence of a regulator, water service is not properly
monitored in the study area.
Achievement
of WSSP
Behavioural change in communication system.
Android-based attendance system.
Elimination of contamination through leakage control and
rectification of water supply pipes crossing drains
Reduction in monthly electricity bill through efficient energy
management including billing on actual meter readings
Water quality monitoring
1334 complaint redressal centre
Billing digitalization
40 per cent replacement of the existing pipes.
Operation and maintenance of the existing tube wells.
Suggestion for
improvement
GoKP to establish a “Water Quality Surveillance Authority” to
independently assess the quality of water being supplied by the
service providers and initiation of appropriate planning for

68
promotion where the lapse occurs. Government should allocate
funds to fulfill and ensure:
The vision of draft drinking water and sanitation policies of
GoKP.
Ensure the National Drinking Water Quality Standard (NDWQS),
a set standard in the region.
WHO water quality guidelines
Ensure minimum quantity objectives to all citizen without
discrimination.
To protect and conserve surface and groundwater resources in
line with the provisions of the National Environment Policy and
Pakistan Environmental Protection Act (PEPA),1997
And achieve the Millennium Development Goals (MDGs) now
replaced to Sustainable Development Goals (SDGs) by 2030.
The government required to develop Standard Operating
Procedures (SOPs). This will ensure adherence to the technical
standards and specifications and quality construction and
sustainable service.
Under the devolution plan, GoKP should approve the Drinking
Water Policy and sanitation policy from the cabinet officially and
planning should be made as per the vision and objectives of the
policies to ensure quality services for the public.
The government should promote research by allocating more
funds to replicate successful pilots in other areas of Pakistan and
international best practices and technologies in drinking water
and sanitation sector.
Need by-laws regarding the use of drains.
Need anti-litter by-laws to control the undesirable practices.
The government should establish an independent regulator for the
urban service providers in Peshawar under public utility company
management control to ensure quality and quantity of sufficient
drinking water provision.

69
GoKP need to establish a specialized training academy to
organize for their staff on: Planning, design, implementation,
monitoring and evaluation of domestic water supply programs;
effective and efficient operation and maintenance of domestic
water supply systems; domestic water quality monitoring;
community mobilization; hygiene promotion; financial
management; budgeting; audit and accounting; contract
management; and revenue collection. This will strengthen the
technical, institutional and financial capacity of WSS providers.
Image 5.2: A pictorial image of the Meeting with Zonal and Water Manager of WSSP
5.3 Governance Score Card for Service provider.
The United Nations Development Program (UNDP) had defined good governance in
the policy document 1997, titled “Governance for Sustainable Human Development”.
The definition stated that governance is the practical application of political,
administrative and economic authority to supervise a country’s matters at all levels,
having the following important elements presented by (UNDP, 1997):
Transparency. It means that there will be free flow of information and clarity of
government rules and regulations to public. In municipal services context, it means,
description of services, satisfaction of beneficiaries with provision of services,
existence of documents on types of services, procedures for assessing how relevant
services are, information to employees and citizens about local policies and activities
implemented by the municipalities, etc. All such needs will be accessible to the
concerned beneficiaries directly with understandable and monitorable form.

70
Equity. All men and women, rich and poor alike should be served without
discrimination, having equivalent chance to sustain or improve their welfare. In
Peshawar, the services are more effective and have proper infrastructure. While in
slums and unplanned areas, most of the water is contaminated due to obsolete
infrastructure and substandard quality (Khan et al., 2010). This means the equity
concept in urban Peshawar is vague and has no practical application.
Rule of law. It means the authority should set rules and regulations that are enforced
impartially without any discrimination.
Sustainability. It means to improve the WSS and sustain them with sufficient revenue
so that majority of the people are satisfied and could enjoy long-term welfare of quality
services and best hygiene practices.
Quality of services is the degree to which water and sanitation service providing
authority promotes consumer satisfaction.
Responsiveness means authorities of water and sanitation services procedures should
serve all stakeholders.
Accountability means that the managers of the service providers are answerable and
accountable to general masses and institutions.
Participation means that all men and women, rich and poor should have a voice in the
planning and decision-making that represent their interest.
Strategic Vision, it means that the service providers have long term planning for human
development. A manager who can keep clear vision of the historical, cultural and social
issues of the area with a planning that is grounded for solution, carries strategic vision.
To evaluate the performance of the existing WSS providers, the GSC method was used.
Using the formula given in Eq. 5.14, the citizens’ perception was evaluated on the basis
of Nine (09) principles of good governance. GSC were used as a tool to engage citizens
to evaluate the WSS based on their experience to be captured in terms of their
satisfaction regarding to specific attributes of the services. Table 5.3 gives an
assessment of the bottlenecks in the existing WSS provision with the aim of prompting
discussion for potential solutions of those lapses.

71
Table 5. 3: Performance Evaluation of the services providers through Governance
Score Card Method
Indicators /code f0 f1 f2 N P= ∑sifi/N Performance
Transparency 10 25 65 100 1.55 2
Equity 75 10 15 100 0.4 0
Rules of law 20 45 35 100 1.15 1
Sustainability 85 5 10 100 0.25 0
Quality of services 15 50 35 100 1.2 1
Responsiveness 10 20 70 100 1.6 2
Accountability 20 21 59 100 1.39 1
Participation 80 10 10 100 0.3 0
Strategic vision 10 46 44 100 1.34 1
It is evident from Table 5.3, that WSS is rated highest in ‘Transparency’ and
‘Responsiveness’ while shows lowest rate in ‘Equity’ ‘Sustainability’ and
‘Participation’. The low performance is due to inefficiency in implementation of
envisage plans, lack of policy making of the service provider authorities, weak
administration and lack or no public education. Besides this, institutional structure and
practices, poor documentation and mapping of existing WSS, existing state of
infrastructure, poor maintenance, unskilled and inadequate staffing and water treatment
plants may lead to poor performance in service delivery.
5.4 Socio-Economic Characteristics of Households
Table 5.4 and Annexure VII give the details of socioeconomic characteristics of the
respondents in the study area. The age of the respondents lies within the range of 20 to
91 years, and the average age is 55.5 years. Majority of the respondents are married and
of working age and had no dependency hence, they are more likely to adopt improved
services. The household size also varies from 2 to 30 persons in the study area; large
family size is common in traditional and low-income families. The average household
size is 6.4 person. Table 5.4 also reveals that the education of the respondents varies
from illiterate to higher degree, however, it is clear that most of the respondents are
educated (see Annexure VII) and are aware regarding the bad effects of low-quality
services.

72
Table 5. 4: Socio-Economic Characteristics of the Respondents in Urban
Peshawar
Socio-Economic Characteristics Minimum Maximum Mean Std. Deviation
Age of the Respondents (In Years) 1 6 2.45 1.290
Marital status of the Household 1 2 1.92 .269
Size of the Household (In Numbers) 2 30 6.41 3.699
Education status of the Earning Member 0 6 1.54 1.350
Employment Status of the Respondents 1 4 2.98 .931
Income of Household (In PKR) 1 6 3.38 1.567
Housing occupancy status 0 1 .80 .404
Plot size of the Household (In Marla) 1 6 3.09 1.179
Total no of Respondents(N=600)
The findings further show that more than 1/3 of the population has no formal education
of attending schools. Majority of respondents are matriculates while only a minor level
keeps the highest level of education i.e. graduate and postgraduate (details are given in
Annexure VII). Various studies like Vásquez et al., (2009) and Khan et al., (2010)
reveal that educated respondents demand improved drinking water services and have
more concern about their families’ health and hygiene.
Regarding income of the household, it was experienced during the pilot study that most
of the households do not divulge their real income. For this purpose, the income of the
household is calculated from the expenditure (food and non-food items) and are used
as a proxy for their monthly income. Field data reveals that the income distribution of
the study area varies from low to very high income and dualism is observed in many
families. Economic theory suggests that; demand depends upon the total income of the
households ceteris paribus (Flores and Carson, 1997). Economically well-off people
usually invest more on the improved water services and follow the law of income effect
for normal goods.
Similarly, employment of households also has mix-up position and diverse nature of
jobs. Majority of households have private jobs, 26.2 per cent are involved in public
service, 27 per cent have private jobs while only about 22 per cent are engaged in their

73
own business activities. The remaining one-third of the respondents are heads of the
household but have no job at all.
Regarding the plot size of the houses, it is evident that it varies from narrow to spacious,
depending upon the economic status and size of the households. The majority (1/3) of
the households resides in 6 to 10 Marla’s of houses while a minor portion (3.5 per cent)
resides in spacious homes. Furthermore, majority of people, almost 60 per cent have
their own housing occupancy and the status of most houses are pakka, made from bricks
or cement blocks.
5.5 State of Existing Water Services in Urban Peshawar
Provision of safe water for the public is one of the top priority of all municipalities
around the world including Pakistan. The inhabitants of Peshawar are facing an acute
quality water shortage because of rapid population growth and a persistent drought
causing groundwater levels to drop rapidly (Province, 2010). The city depends upon
the group water for all its supply and the water table is depleting for the last few years
(ibid). The KIIs (Given in Table 5.2) reveals that previously the city had a good quality
of water and used by the households for all domestic purposes. However, the city
groundwater is contaminating, depleting and it is expected that it would not be
sufficient and safe for the future demands.
Table 5.5 shows the existing state of water in Urban Peshawar. It is evident that almost
90 per cent of the household is served by WSSP and have in-house public tap facilities,
while a meagre proportion has their own private sources at home. Besides this, the
services of CB are limited to cantonment area.
Table 5. 5: State of Existing Water services in Urban Peshawar
Source Frequency Percentage
Authority Responsible for Water services
Water and sanitation service company9 539 89.8
Cantonment board 42 7.0
Own/ Private sources 19 3.2
Total 600 100.0
9Presently the municipal services of Hayatabad and University Town Peshawar have been again
delegated to Peshawar Development Authority (PDA).

74
Source of Water services in Urban Area
i. Protected source
Private bore/Hand pump 18 3.0
Public tap 346 57.7
Both Public and private 192 32.0
Total 556 92.7
ii. Unprotected source
Unprotected well 44 7.3
Grand Total 600 100.0
iii. Total Collection Time (In Minutes)
Water at premises 343 57.17
1-10 minutes 214 35.67
11-20 minutes 35 5.83
21-30 minutes 5 0.83
31 and above 3 0.5
Total 600 100.0
The breakdown of domestic water source shows that majority (92.7 per cent) of the
households have water from the protected sources10, while a minor portion depends on
unprotected11 shallow well water. The baseline study shows that, overall household
have improved drinking water sources and are on track to achieve the MDG target of
93 per cent (Given in Figure 3.1) for the year 2014-15. Majority of households have in-
house water facilities at their premises or compound while a minor portion depends on
the source outside their homes. However, evaluation of the community perception
confirm that majority of people are not satisfied from the existing quantity and quality
of domestic water in the area (See Table 5.1). Additionally, KIIs confirmed that the
perceived quality is good at sources level but due to outdated and obsolete infrastructure
most of the water is lost and gets contaminated in the distribution lines (See Table 5.2).
This statement is also in line with Ahmad and Sattar (2010) and Mosel and Jackson
(2013).
10 Protected drinking water means, ground water from deep aquifer like public tap, private bore/hand
pumps. 11 Unprotected means self-made shallow wells, spring, ponds and canal and Khawar water.

75
5.6 Households Perception on Domestic Water
This section discusses households’ perception and attitude on the existing quality and
quantity of domestic water. Table 5.6 reveals that a majority of households shows great
dissatisfaction over the existing quantity, quality, water pressure and want improvement
in these services.
In the meeting with the community members, most of them demanded for water
metering system and judicious distribution of domestic water. In planned towns, the
services are efficient but water distribution system, based on asbestos cement pipes, is
more vulnerable to contamination and is dangerous from public health perspective.
Other than the developed towns, the water distribution system is mostly rusted,
unplanned and encroached by the city dwellers. The poor water services are also
confirmed from Table 5.1 and reveals that large majority of people are not satisfied
from the existing services. In a KIIs they highlighted that the city water quality, once
considered to be exceptionally good, is fast deteriorating.
Table 5. 6: Perception of Household Regarding Domestic Water services
i. Water Quantity
Satisfactory 433 72.2
Dissatisfactory 80 13.3
Total 513 85.5
Water Pressure
Satisfied 232 38.7
Dissatisfied 368 61.3
Total 600
Water Quality
Dissatisfactory 503 83.8
Satisfactory 97 16.2
Total 600 100.0
WTP for Improvement in the Water Service level
No. 68 11.3
Yes 532 88.7

76
According to PCRWR, in Rural Peshawar, 77 per cent of drinking water sources is
contaminated by some heavy metals and unsafe (Khan et al., 2010). However, in Urban
Peshawar, most of the water from dug wells and unprotected sources are unfit for
drinking purposes due to bacteriologic contamination (Soomro et al., 2011).
5.7 Indicators Analysis of Water Services
For an in-depth analysis of water services, this study is based on some indicators like
consumption of water per capita per day, use of adequate treatments methods and
diarrhea cases. The estimated values are compared with the national and international
standards and targets. Detailed calculation of each indicator is as under:
5.7.1 Water Consumption Per Capita per Day
It means the total amount of water collected from various sources and used by the
household for their drinking, cleaning, personal hygiene and sanitation. A day is
considered as 24 hours and the amount collected is the amount used (Billig et al., 1999).
The average daily per capita water consumption forms the basis of domestic water
demand which depends upon a number of factors such as population and its socio-
economic condition, source availability, the size of service area, the extent of
affordability, climate etc.
In Pakistan the per capita water demand varies from 30 to 350 litres per day (Bhatti and
Nasu, 2010). In the study area, information was collected from heads of household on
Self-Reported survey technique regarding average domestic water consumption. The
formula as given in Eq. 4.5 was used to calculate per capita water consumption as
follows:
𝑋 = 185174
3847= 48.14 𝑙𝑖𝑡𝑒𝑟 𝑝𝑒𝑟 𝑐𝑎𝑝𝑖𝑡𝑎 𝑝𝑒𝑟 𝑑𝑎𝑦 (𝑙𝑝𝑐𝑑)
The tube well and their discharge data was collected from WSSP (Given in Annexure
V) and average per capita water supply was calculated from them for various hours of
operation. Results shows that 37.85 lpcd are average household supply @30% NRW
for average 5 hours of operation period. It was pointed out during the KIIs that, the
daily commuters and commercial use of water was also part of domestic water
consumption, so they argue that actual domestic water supply is far less than the
demand.
Further, WHO (2003) recommended four levels of water supply:

77
i) Below 5 lpcd, means no access ii) approximately 20 lpcd means basic access iii) 50
lpcd means intermediate access and iv) in the range of 100-200 lpcd means optimal
access. WHO further suggest a minimum water requirement of 15-20 lpcd in case of
temporary settlement like that for IDPs in case of emergencies and natural disasters.
The existing water supply (48.1 lpcd) in the study area is below 50 lpcd (the
intermediate set standards of WHO).
The detail bifurcation of water usage for various purposes are given in Table 5.7.
Table 5. 7: Household Per Capita Water Consumption in Urban Peshawar
Usage of Water Total (In Litres) Percentage
Volume of Water used for drinking 7.00 14.55
Volume of water used for bathing 15.00 31.16
Volume of water used for cooking 3.00 6.23
Volume of water used for cleaning 9.67 13.86
Volume of water used for toilets 5.00 10.39
Volume of water used for watering animal 1.26 2.62
Volume of water used for garden 6.96 14.46
Volume of water used for other purposes 0.24 0.50
Total 48.14 100
It is clear from the above information that household use great proportion of water for
bathing, drinking, gardening and cleaning consecutively which is necessary for better
hygiene practices.
5.7.2 Domestic Water Treatment in Urban Peshawar
Unsafe drinking water and inadequate water supply causes major health problems.
Therefore, adequate treatment is needed to disinfect water and kill harmful pathogens.
Common methods are boiling, filtering, and straining through the cloth, adding
bleach/chlorine and solar disinfection. In Khyber-Pakhtunkhwa, only 2.3 per cent
people use in-house water treatment to disinfect the water before drinking and the
remaining 93.7 per cent do not use any method (Government of Pakistan, 2008). For

78
measurement the percentage of households using in-house methods for water treatment,
the formulae given in Eq. 4.5 was used and calculated as follows:
𝐻𝑜𝑢𝑠𝑒ℎ𝑜𝑙𝑑 𝑢𝑠𝑒𝑠 𝑑𝑜𝑒𝑚𝑒𝑠𝑡𝑖𝑐 𝑤𝑎𝑡𝑒𝑟 𝑡𝑟𝑒𝑎𝑡𝑚𝑒𝑛𝑡 𝑚𝑒𝑡ℎ𝑜𝑑𝑠 = 38 ∗ 100
600= 6.3%
It is clear that majority of household consume water without any in-house treatment
and considers it the state responsibility to provide safe water for domestic use. During
field visit majority of people suggested that the existing filtration plant could be put
into operation after minor repair. Out of the total 33 existing plants (As given Figure
5.1), 24 are functional and 9 are dysfunctional. Most of the functional plants are located
within the Cantonment area and are properly maintained. The major reason for non-
functioning of plants is the lack of maintenance and non-replacement of the clogged
filters. The timely institutional response to breakdown of plants is very poor.
Figure 5. 1: Spatial Location of Water Filtration Plants in the Study Area

79
Table 5.8 gives a detail bifurcation of in-house water treatment methods in the study
area.
Table 5. 8: Type of Domestic Water Treatment Methods in Urban Peshawar
Method Frequency Percentage
Boil 18 3.0
Use water filter 17 2.8
Use of Bleach 3 0.5
Total 38 6.3
No Treatment 562 93.7
It is evident from the above Table 5.8, that majority of household (93.7 per cent) uses
water directly from the source without any in-house treatment. While a chunk of people
(6.3 per cent) use traditional and low-cost method of boiling and in-house filtration. In
meeting with KIIs, they confirmed that most of filtration plants are not installed on the
main source for direct supply of water to the end users.
5.7.3 Percentage of Children<36 Months of Age Suffered from Diarrhea
Diarrhea means more than three loose stools passed in 24 hours’ period. The percentage
of children in the selected sample who have the symptom of Diarrhea at the time of
survey conducted and data collection or who have it anytime in the two forgoing weeks.
Age is less than 36 months at the time of data collection. If a child is 20 days old, he/she
is considered as zero month of age, and a child of 50 days is considered as one month
of age (Billig et al., 1999).
In Pakistan, the situation is much alarming and every year 0.2 million children die from
Diarrhea (Rosemann, 2005). In the study area, the data was collected on self-reported
information method regarding the cases of Diarrhea prior to the survey in last 30 days.
If the child was suffering from Diarrhea, they were further investigated, and remedial
measures were adopted. Table 5.9 shows the frequency of each response along with
their percentage.

80
Table 5. 9: Percentage of Household whose kid suffering from Diarrhea
Responses Frequency Percentage
No. 546 91
Yes 54 9
Total 600 100
The percentage of children suffering from diarrhea in the study area was calculated
using the formula in Eq. 4.6 as follows:
𝑃𝑒𝑟𝑐𝑒𝑛𝑡𝑎𝑔𝑒 𝑜𝑓 𝑐ℎ𝑖𝑙𝑑𝑟𝑒𝑛 𝑠𝑢𝑓𝑓𝑒𝑟𝑖𝑛𝑔 𝑓𝑟𝑜𝑚 𝐷𝑖𝑎𝑟𝑟ℎ𝑒𝑎 = 82 ∗ 100
631= 13 𝑝𝑒𝑟𝑐𝑒𝑛𝑡
It is evident that 13 per cent of children whose age is less than three years are suffering
from Diarrhea and is off track of the MDGs target of <10 cases (See Figure 3.2) and
the SDGs target of 100 per cent of eradication of Diarrhea cases from Peshawar.
Province wise comparison for the PSLM survey period shows that Balochistan has the
highest percentage while Sind shows the lowest percentage as is given in Figure 3.3.
For sustainable health improvement and mitigation of Diarrheal cases, safe water and
hygienic sanitation are necessary. An assessment of combined water sanitation and
hygiene education shows 25 per cent decrease in Diarrheal morbidity (Aziz et al.,
1990).
5.7.4 Percentage of Households with Access to Improved Water Source12
Access to improved water source means either a direct connection to the home or public
facility, piped system or well or public standpoint within 200 meters from the home.
This facility will be available around the year when the water supply is least reliable
(Billig et al., 1999).
In this survey questions were asked to collect information about the main source of
water like tap water, motorized pumps, hand pumps and other protected sources. It is
evident from Annexure VIII that in the city major source of drinking water is tube well
and water comes through networks of pipes in their houses or compounds. Then the
water is lifted for the various uses of the household to underground reservoir or tanks
built at the roof of the houses and such system is considered as tap water. Motorized
12Improved water source means Tap water, Hand Pump and Motorized pumping as per PSLM survey.

81
pumps are also used to draw water from the borehole through an electric machine, while
hand pumps are operated manually.
For measuring household access to the improved water source in urban Peshawar, the
formula Eq. 4.7 was used and calculated as follows:
𝐻𝑜𝑢𝑠𝑒ℎ𝑜𝑙𝑑𝑠, 𝑎𝑐𝑐𝑒𝑠𝑠 𝑡𝑜 𝑖𝑚𝑝𝑟𝑜𝑣𝑒𝑑 𝑤𝑎𝑡𝑒𝑟 𝑠𝑜𝑢𝑟𝑐𝑒 = 556 ∗ 100
600= 92.7𝑃𝑒𝑟𝑐𝑒𝑛𝑡
Majority of the household have access to improved water sources and are on track in
achieving the MDGs target of 93 per cent (see Figure 3.1) for the year 2015. Still, most
of them are not satisfied with the quality. Table 5.10 shows that majority of the
household is not satisfied with the quality of the domestic water which is also confirmed
from community perceptions given in Table 5.1.
Figure 3.4 reveals that, in Pakistan, 27 per cent of household have tap water at their
premises, 33 per cent have their own motorized pumps, 26 per cent have hand pumps,
3 per cent have dug well and 11 per cent uses other sources like a stream, spring and
canal water for their drinking purposes. Province wise Punjab shows the highest rank
in the provision of drinking from the improved source, while Balochistan shows the
lowest rank.
5.8 State of Satisfaction for Domestic Water Services
In the study area the existing domestic water services were evaluated on the basis of
some indicators given in Table 5.10. To find out the households’ perception of each
indicator the formula in Eq. 4.10 was used.
Results reveal that household shows greater dissatisfaction over the quantity of water
available for their daily usage followed by discrimination in services provision, quality
of water and pressure of water consecutively as given in Table 5.10.
Table 5. 10: Satisfaction Indices for Domestic Water services
Indicator Satisfaction
(fs)
Dissatisfaction
(fd) I=fs-fd/N
Distance from the source 580 20 0.933
Quantity of water available 55 545 -0.817
Pressure of water 232 386 -0.250
Monthly charges applied for the services 376 224 0.253
Discrimination in distribution of the service 111 489 -0.63
Quality of water 97 553 -0.68

82
Regarding water availability for their daily usage, it depends upon the size and density
of population and its composition such as occupation, income level, age, gender and
other parameters of the household. During meetings with people, it was highlighted that
fluctuations in water supply normally produce peaks which may be during early
morning hours, close to noon and in the evening. KIIs suggested introducing water
metering system to monitor the unequal distribution of water supply services. The
volume of water entering the Distribution Network Improvement13 (DNI) zone is
measured and clients with in the DNI should be metered and paid on a volumetric basis.
This strategy not only mitigate the discrimination in services provision but also ensure
more revenue on the equity basis and control water wastages as well. During a
discussion with operators it was also highlighted that, low pressure is due to the
inefficient performance of old pumps, existing leakages as well as indiscriminate lateral
extensions in the distribution systems and inter-connection of the systems of one UC
with the other or within the same UC. They suggested that for proper maintenance and
controlled pressure in the system, pressure management concept can be introduced. The
use of pressure gauges in the water supply network can reduce the leakage and NRW.
When reducing pressure, the minimum required pressure must be ensured at the critical
points in the network. The location of the critical point(s) in the network depends on
topography, pipe diameter and water consumption behaviour within the system.
Regarding quality, the trouble with water pollution is that very little of it is available to
naked eyes. During field visits and by personal monitoring water from different points,
no visible arsenic and pathogenic contamination were observed through naked eyes.
This allows for a situation in which the people continue to consume unhealthy water,
the effects of which are to further cripple the failing health system in the area. The
severity of the problem was also confirmed from various studies in Peshawar like Khan
et al., (2011) and Soomro et al., (2011) and concluded that Peshawar city water is
contaminated by heavy metals. However, experts and practitioners pointed out that
water quality is good and satisfactory at source (Tube wells), but due to leaking and
damage pipes, bacterial contaminations have been found in the distribution networks.
13A Distribution Network Improvement(DNI) zone is a selected area within an existing water distribution
system that can be isolated from the rest of the distribution network to facilitate effective and efficient
water distribution.

83
They further explained that contamination was found in household own private
boreholes due to low depth.
5.9 Priorities for Improvement of Domestic Water Services
In this section, domestic water problems are further bifurcated into quantity, quality
and infrastructure and each are evaluated as follows:
5.9.1 Water Quantity Problem
The availability of sufficient water is important for drinking and food preparation and
necessary for public health improvement (Esrey et al., 1991; Fewtrell et al., 2005).
In urban Peshawar most of the household have problems in provision of adequate
domestic water. This is an uphill task for the service provider authority to provide
adequate water especially to poorest and slum dwellers at the need basis. Keeping in
view the importance of adequate water, information was collected on the enlisted
problems given in Table 5.11 and their solutions were prioritized.
Table 5. 11: Problems of Sufficient Quantity and Households Priorities for
Improvement
Problem of sufficient
water f1 f2 f3 f4 f0 I Ranking
Low pressure 388 55 39 19 99 0.76 1st
Power outage 297 49 102 97 55 0.68 5th
Illegal Connection 286 153 41 42 78 0.72 2nd
Hours of water supply 335 33 77 56 99 0.69 4th
Non-Revenue Water 301 103 34 108 54 0.70 3rd
Total number of observation (N)=600
I=∑sifi/N
For measuring the severity of each problem and ranking for their solution formula given
in Eq. 4.11 was used. It is evident for Table 5.11 that households attach top priority to
the issue of low water pressure followed by the illegal connection and NRW.
Additionally, power outages and hours of water supply are also priorities for the

84
solution. Meeting with the regional water managers, it was ensured that legally the
municipality has designed the system based on 24/7 basis for the provision of sufficient
domestic water to the city dwellers. Tube well operators pointed out that hours of
operation depends upon locality, the condition of tube well and availability of power.
In the study area, the water supply varies from 10 to 4 hours depending upon the
installed capacity of tube wells and power availability. The restricted supply duration
compels the households to collect maximum water during the limited supply hours.
Therefore, the household storage of water is not constant during the peak hours. The
household demand thus, depending upon the maximum quantity of water can be
collected from various sources throughout restricted supply hours. Various sources like
the underground reservoir, tanks and buckets are used by consumers to collect the
maximum amount of water. The inflow into a reservoir of tank depends upon the
household location and the pressure conditions in the network. During field visits, it
was observed that people usually use the suction pump to store maximum water during
limited water supply time, which causes low water pressure in the system and affect
people in the low-lying areas. Majority of the community members suggested the
electricity backup system (generators) to solve the restricted water supply issue in the
area. Beside this, for low pressure and NRW, they suggested use of pressure gauges in
the water supply network. When reducing pressure, the minimum required pressure
must be ensured at the critical points in the network. Further, they suggested punitive
measures for the illegal connector and use of suction machines which is not per by-laws
as sighted in the Image 5.3.

85
Image 5.3: Illegal Connection at Nasir Bagh Road
5.9.2 Infrastructure Problems
In Peshawar, existing water and sanitation networks are in poor condition and in some
cases, infrastructure are totally destroyed. Data and information regarding the local
condition and behavior of the people is necessary for the formulation of coherent
strategies to wisely invest in the institutions and infrastructure to achieve the best
possible value. Unfortunately, very limited information is available to better insight into
the perceptions, behaviors, knowledge, attitudes and practices regarding Peshawar
(province, 2010).
For detail analysis and better insight Table 5.12, summarizes the infrastructure
problems and priority for solutions. It is clear that, obsolete pipes, ill planning, lack of
finance, combined system and low carrying capacity of existing system are the main
issues related to infrastructure in the study area.
During field visits, it was observed that most of the infrastructure has become old,
corroded pipes are mostly above ground sometimes across open drains without
adequate sleeve protection were witnessed in the field as given in Image 5.4. Besides

86
this, lack of planning and improper construction without consideration of the hydraulic
system, leakage, seepages and poor operation and maintenance is affecting the
sustainability of existing services in urban Peshawar. The community members
suggested that, replacing and repairing the broken and leaky pipelines can reduce the
NRW for sustainable planning. Table 5.12 reveals that majority of household are
casting for rusted and damaged pipe lines as the major problem related to infrastructure
in the area.
Table 5. 12: Indicators of Infrastructure Problem and Priorities for Solution
Problem f1 f2 f3 f4 f0 I Ranking
Rusted and damage pipes 454 73 40 19 14 0.89 1st
Unplanned water supply
distribution system. 331 71 102 62 34 0.75 2nd
lack of investments in water supply
infrastructure 294 145 51 76 34 0.76 3rd
Distribution pipes along with
sewerage/drainage system. 312 56 108 81 43 0.71 4th
Network capacity to cope with
growing demand 303 42 80 116 59 0.67 5th
Total number of observation (N)=600
I=∑sifi/N
The unplanned water distribution system is the 2nd severe problem of the area as evident
from the pictorial survey given in Image 5.5 and Image 5.6. The issue is further
amplified by continuous urban sprawl without any by law which leads to unplanned
water distribution system and numerous problems associated with safe domestic water
provision. The experts were of the opinion that; the current distribution system is
designed haphazardly and is laid without any planning. Furthermore, most of the
experts of water and sanitation criticized the partially undersized piped system and
corroded pipelines causing leaking which augmented the problem of water wastages
and NRW.
The lack of investment to replace the existing infrastructure are the 3rd major issue of
the area highlighted by the household. The experts and professionals criticized the
already non-professional designing and lack of consideration of engineering and

87
hydraulic mechanism during designing of these services. In many parts of the study
area, primary systems are augmented to address water shortage issues by adding parallel
pipelines without studying the hydraulic patterns or assessing the transmission or
production capability of the system. By implementing such improvements without
adequate planning or hydraulic considerations, most primary systems resemble a
“spaghetti” type network of intertwined pipes that operate very inefficiently. This is
due to unplanned colonies developed by private builders due to low land prices and
their proximity to neighbourhood attract many people for residential and commercial
activities. It was highlighted in meeting with members of service providers that, in the
absence of urban land use of planning residential area is expanding rapidly so it is not
possible to keep up with the available funds for necessary infrastructure. Usually, one
water connection is being illegally shared by many households in such areas which
affect both quality and quantity of domestic water supply. Besides this, narrow roads
usually encroached over lanes that create severe issues in retrofitting the existing piped
network as sighted in the field Image 5.7. In urban Peshawar, the combined system i.e.
the distribution pipes along with sewerage/drainage system are the 4th major issue
highlighted by the household and Image 5.8. They demanded to separation of both
systems to solve the problem of contamination, while the capacity of the existing
system to cope with growing population demand is also the issue of concern highlighted
by the field data.
Image 5.4: Rusted and Damaged Pipes in Nasir Bagh Road, Canal Town

88
Image 5.5: Unplanned Water Supply Distribution in Nasir Bagh Road Canal Town
Image 5.6: Unplanned Water Supply Distribution System in Jamrud Road Tehkal

89
Image 5.7: Retrofitting Pipes along Road in Murad Abad
Image 5.8: Distribution Pipes Along with Sewerage/Drainage System in Canal Town.
5.9.3 Quality of Water Problems
Pakistan Council of Research in Water Resources conduct study in Rural Peshawar to
analyze the drinking water. Results show that, most of drinking water is unsafe and
contaminated by some heavy metals, 62 per cent of water sources were
bacteriologically contaminated and 38 per cent contained both high iron contents and
E. coli but no evidence of arsenic was recorded so far (Government of Pakistan, 2004).

90
Further, analysis of water samples from wells (open wells, dug wells, pumps etc.) in
urban area of Peshawar shows that the quality is not compatible with WHO potable
water quality standards. Heavy metals like magnesium and calcium were found but
magnesium had more saturation than Calcium. The study concluded that tube wells
were less polluted than open wells and dug wells since most tube wells were at depths
beyond 350 feet and are less vulnerable to pollution (Khan et al., 2005).
On the basis of physical characteristics of water quality, household perceptions were
recorded and evaluated using the formula in Eq. 4.11.
Table 5. 13: Physical Water Qualities and Problems Priorities for Solution
Quality problem f1 f2 f3 f0 N I=∑sifi/N Priority
Water color 95 23 482 95 600 0.18 2nd
Water smell 27 61 512 27 600 0.10 3rd
Tastes is not good. 133 211 256 133 600 0.40 1st
The clear indication in Table 5.13 is that the taste of water is the main problem and give
top priority followed by colour and smell of the water respectively. Meeting with the
experts and practitioners, it was concluded that, groundwater quality from shallow and
deep aquifers underlying Peshawar area is generally fresh and has remained unchanged
over the past 40 years. However recently, the presence of E-Coli has been reported in a
certain minimum number of tube wells, which may be due to wastewater infiltration.
Beside this, the water supply network running parallel to sewage disposal system is
vulnerable to serious contamination as evident from Image 5.9. The obsolete
distribution systems are making the potable water systems lose pressure and are subject
to contamination by diffusion from nearby sources. The community members during
the meeting also pointed out that water is mostly contaminated in unplanned and slum
areas. In these areas, most of the system is combined and joints/valves lie close to
sewers, pipes leaking near sewer lines, uses of boosters by the inhabitants can suck
sewer water and contaminate the whole system as shown in Image 5.10. Many low-
lying areas due to unplanned drainage and sewerage system get flooded during rainy
seasons. Many times, the sewage enter into water pipeline and contaminates the
domestic water. During the visit, it was found that, in slums areas, many settlements
depend on shallow hand pumps’ and use as a source of water, which is usually unfit for

91
drinking and other domestic use due to underground contamination. Further, wastage
and overexploitation of groundwater have also contributed to the depletion of water in
different parts of the city.
Image 5.9: A view of Water Supply Network parallel to sewage line in Rahat Abad
Image 5.10: Joints near Sewers and Leaking Pipelines in Shaheen Town

92
5.10 Performance Indices for Water and Sanitation Service Authority
In the study area, besides the cantonment area, WSSP is shouldering the whole
responsibility of water and sanitation services in Peshawar. Performances indices given
in Eq. 4.14 were used to evaluate the government agencies performance against each
indicator given in Table 5.14.
It is clear from the Table 5.14, that majority of households show high satisfaction over
the complaint redressal services of the authorities.
Table 5. 14: Degree of Performance of Municipal Authority in Urban Peshawar
Indicators Scale values Total P=∑sifi/
N
Rate
0 1 2 3 4
f1 f2 f3 f4 f5 ∑fi=N
Complaint redressal 10 112 52 196 230 600 2.87 V Good
Planning for the future 10 398 52 124 16 600 1.56 Good
Monitoring mechanisms 10 112 338 116 24 600 2.05 Good
Revenue collection 373 112 52 49 14 600 0.70 Fair
Quality WSS 380 120 68 22 10 600 0.60 Fair
During the field visits to each zone, it was observed that the company has maintained a
systematic way of redressal process for the complaints received from the community as
shown in an Image-5.11 from Zone-D. For this purpose, each Zone has its own
complaint cell which receives the complaints from the community, the complaints are
registered and forwarded to the concerned officials for resolving. The complaints
register is checked on daily basis by the concerned department manager. The
complaints received are resolved in 24 hours. In case of delay, the reasons along with
recommendations and the expected date of clearance is submitted to Zonal Manager
and the complainer. For better and quick response routine and surprise visits are
conducted to the Field Manger. Further, the authorities show medium performance in
proper planning and monitoring of the staff as sighted in Image 5.12. During meeting
with zonal managers, it was highlighted that company has plane to improve the
performance especially the problem of old infrastructure and proper monitoring
mechanism.

93
However, the authorities show poor performance in quality WSS and sufficient revenue
collection for sustainability of these services. The poor performance in quality of
service provision are also evident from field data and various newspaper reports.
According to “THE NEWS” report, the company has badly failed and have zero
performance in provision of adequate clean water and conservancy services. The
services of WSSP remained only confined to the GT road and Hayatabad, while the
situation is much pathetic elsewhere. Most of the elected members were unhappy of the
existing WSSP services and alleged it as white elephant. They were of the opinion that
company employee receives huge salaries and lavish perks but have zero performance
in terms of any improvement in the services (Report, 2017).
For sustainability of the services, the Chief Executive Officer (CEO) of WSSP pointed
out that the company has implemented the revisited service charges (See Annexure VI)
and plan to step wise abolish the subsidy till 2019. They further elaborate that political
interference especially the local elected members need to be restricted.
Image 5.11: Complaint Redressal Cell of WSSP in Zone D

94
Image 5.12: Monitoring Mechanisms of Field Staff
5.11 Cost Recovery and Household Willingness to pay for Improved Water
Services
In Peshawar, tariff, Urban Immoveable Property Tax (UIPT), subsidies and efficiency
gains are the main source of revenue of the WSSP. In a meeting with CEO of WSSP, it
was highlighted that the company have PKR 1000 million liabilities in the form of
subsidies and about PKR 475 million electricity bills which is far below the revenue of
the company.
The cost recovery of services stands between 10‐30 per cent. It means that domestic
water remains a highly subsidized service in the metropolitan city (province, 2010). For
sustainable operation of the system with steady growth rate in revenue collection it is
necessary to revise the rules of thumb system for fixing the charges.
For measuring optimal WTP, households’ data was collected through bidding game
method. The analysis shows that most of the households are willing to pay judiciously
which justified the cost of IWS. Table 5.15 gives details of various for IWS and
frequency of responses against each bid in the form of yes and no.

95
Table 5. 15: Various bids of WTP for Improved Water Service in Urban
Peshawar
It is clear from the Table 5.15 that majority of households are odd in favor of bid one
(01) and mean WTP is PKR 328/-. Increasing the bids values from lower to high the
frequency of household WTP decreases and follows the law of demand for normal
goods.
5.12 Demand Curve for Improved Water Services
The demand curve for IWS has been derived from WTP information given in Table
5.12. Frequency of households WTP were plotted on the vertical axis and the bids
values along the horizontal axis (Figure 5.2). To derive the household demand curve
for the proposed services against various bids, it is just the intersection of bids value to
corresponding frequency of household WTP. Every point on the demand curve shows
households that choose and willing to pay for the proposed water service but did not
bid more than the corresponding value on the WTP axis. The demand curve slopes
downwards from left to right and follows the law of demand for normal goods. If
domestic water is considered as a free commodity for the community i.e. tariff is zero,
then the total area under the demand curve would be considered as consumers' surplus.
Bid
No
Various bids
(In PKR)
Frequency of Responses
WTP for the service Per cent Mean WTP
1 300-350 432 81.20 328
2 351-400 53 9.96 391
3 401-450 19 3.57 443
4 451-500 16 3.00 490
5 501-550 12 2.25 537
Total 532 100.00

96
Figure 5. 2: Demand curve for Improved Water Service in Urban Peshawar
However, investigation from the existing service providers shows that presently the
household pays services charges for domestic water and various localities have its own
management. In Hayatabad and university town the water fee is charged on progressive
rate. For three (03) to seven (07) Marla of plots size PKR 200/-, ten (10) Marla PKR
250, Fourteen (14) Marla and One (01) Kanal PKR 440/- while for Two (02) Kanal
PKR 550/month respectively. In University Town in Peshawar, water charges are PKR
350/month on flat rate. Other than Hayatabad and University Town most of the charges
are on flat rate PKR 200/ month (See Annexure VI). Cantonment area in Peshawar have
its own arrangements and collects PKR 230 per connection on quarterly basis.
Analysis of field data shows that household demand and pay more fee for improvement
in municipal water services. But since these fees is usually set by the municipalities to
cover the cost of the services and not determined by competitive markets, so they are
always not indicative of demand (WTP) of the customers. Already households pay
water charges on flat rate in most of the localities i.e. PKR 200/month. It is obvious
from the Figure-5.2 that highest folk are odd in favor of bid (300-350) and mean willing
to pay are PKR 328/month. The current water charges PKR 200/month is lower than
432
53
19 16 12
0
50
100
150
200
250
300
350
400
450
500
Fre
quen
y o
f H
Hs
Mean WTP(In PKR)

97
the optimal rate PKR 328/months and the difference between two values is actually
consumer surplus.
The monetary benefits of the IWS provision are the sum of anticipated extra revenue,
consumer's surplus of the community and the dead weight loss to service provider
authorities14. If the new rate PKR 328/month for the proposed services are properly
implemented, it will not only make the service more sustainable but also decrease the
consumer surplus and mitigate the dead weight loss as well. Further the extra revenue
will make the company self-sufficient in its own resources and could also reduce the
existing subsidies.
5.13 Variables of Model for Improved Water Services
The results of descriptive statistics were presented in Table 5.16
Table 5. 16: Definition and Summary Statistics of Variables
Variable Description of the variables Unit
A priori
Expectation
Ih Income of household.
PKR +
Edu Education of household.
(0= Illiterate, 1=Middle,
2=Secondary, 3=Higher
Secondary, 4=Bachelor, 5=
Master, 6=Higher level)
+
HHs Total members of household.
Number _
HO Household status of
employment
(1= Un Employed, 2= Govt.
Emplyed,3= Private
employed,4=own business)
+
Hocp Household Housing
occupancy status. (1=Own, 0= Otherwise) +
WTP Willingness to Pay for
Improved Water Services (Dichotomous, 1=Yes, 0=No) 0.258
14In study area Water and Sanitation Service Peshawar (WSSP), Peshawar Development Authority
(PDA) and Cantonment Board (CB) provide the water and sanitation services.

98
The detailed description of each variable is given in the table above. Household Income,
Education, Occupation, Housing occupancy and Household size were main dependent
variables for WTP. Moreover, mean WTP of the sampled household was also derived
in the analysis. The income of the household was estimated from the household monthly
expenditure.
5.14 Determinants of Household’s WTP for Improved Water Services
Table 5.17 presents Logistic analysis and factors that determine WTP for IWS given in
Eq. 4.12. The odds ratio values corresponding to each variable, as shown in Table,
indicates the variable’s contribution to the odds in favour of WTP. After analyzing the
Table 5.17 only 3 factors are dominant in determining of households WTP. These
variables have loadings greater than 50% and were selected as defining variables. The
detail description of each variable is given as follows:
Income of household (Ih)
‘Ih’, are statistically significant for both bid one (01) and bid two (02) at P< 0.05 and
P< 0.01. The odd-ratios column shows that 1 unit increase in ‘Ih’ leads to approximately
20 and 72 times increase in the household’s WTP for IWS for bid-1 and bid 2
respectively. This means that changes the ‘Ih’ by one unit have chances of 95% to pay
PKR (300-350) and 99% chances to pay for PKR (351-400) for IWS. The theory also
presents the importance of income as a catalyst for demand shifter and have positively
related to WTP (Horowitz and McConnell, 2003). As the income of household
increases, it positively affects households WTP for public goods improvement. The
positive relationship is also confirmed by many studies like Dey et al., (2018) in Tala
Upazila in a Coastal District of Bangladesh; Chatterjee et al., (2017) in the city of
Jacksonville (Florida); Wasike and Hanley (1998) in Keneya; Khan et al., (2010) in
Peshawar, Pakistan; Adenike and Titus (2009) in Osun State, Nigeria; Calkins et al.,
(2002) in Mali; Asante et al., (2002) in the chairman Volta Basin and Briscoe and de
Ferranti (1988).

99
Table 5. 17: Result of Logistic Regression Model for Improved Water Services in
Urban Peshawar
Independent
variable
Dependent Variable: WTP for IWS at different Bids (Dichotomous)
PKR (300-350) PKR (351-400)
Estimated coefficients
Odds ratio
Probabil
ity
(%)
Estimated coefficients
Odds ratio
Probabili
ty
(%)
Ih 2.979***
(0.387) 19.59
95.1 4.296***
(0.542) 72.77
98.64
Edu 1.409***
(0.1960) 4.09
80.3 0.304*
(0.196) 1.31
56.71
HHs -0.037
(0.620) 0.96
48.9 0.072
(0.102) 0.99
49.75
HO 0.279**
(0.152) 1.32
56.9 -0.027
(0.250) 1.05
51.29
Hocp -0.436
(0.490) .642
39.1 0.103
(0.630) 1.05
51.15
Constant -34.344***
(4.403) .000
-- -55.824***
(6.966)
.000
---
No of observation, N =432
Pseudo R2=0.601
χ2=252.897
No of observation, N=53
Pseudo R2=0.649
χ2=178.734
Standard Error value are given in the parenthesis.
Above standard error value shows coefficient of variables(β)
*** significant at 1per cent
**significant at 5 per cent
* significant at 10 per cent
Education of the Household(Edu)
‘Likewise, ‘Ih’, ‘Edu’ are statistically significant for bid one (01) at P< 0.01 and bid
two (02) at P< 0.01. The odd-ratio value of education for bid one(01) is higher than in
bid two(02) means that the probability of households WTP for bid1 is greater than bid
2.this means that educated respondents demand the IWS at lower bid to optimize his

100
limited resources. The positive relationship is also shown by previous literature e.g.
Vásquez et al., (2009); Khan et al., (2010); Adenike and Titus (2009); Wasike and
Hanley (1998) and WBWDRT (1993).
Household’s Occupation (HO)
Household occupation ‘HO’ have also have a positive and dominant role in household
WTP for IWS. It is clear from Table 5.17 that ‘HO’ value is significant at P<0.05 only
for bid 1 where the odds ratio value greater than ‘1’ means that changes in ‘HO’ by one
rank have the chance of 57% to make changes of households WTP for IWS. The
positive relationships are also confirmed by many studies like Whittington et al.,
(1990); Wendimu and Bekele, (2011); Tussupova et al., (2015); Brouwer et al., (2015);
Tanellari et al., (2015); Dey et al., (2018).
The findings further suggest that the coefficient of ‘Household size’ is a negative sign,
indicating that, besides household size, other factors also determine household WTP
for IWS and were also confirmed by (Adenike and Titus, 2009). Similarly, the
coefficient values of housing ownership show negative impacts on household WTP for
IWS. This means that majority of the rented household also want IWS and this factor
is one of the important determinants of households WTP for improved water service.
As a conclusion for better policy option, policy makers and services provider authority
before implementing and increase any water services tariff must consider income,
education and occupation of the households for more revenue collection and sustainable
services provision.
5.15 Correlation Matrixes of Variable in the Model
The Pearson Correlation statistical tool was used to analyze the correlation among the
variables. Coefficient, r, is a measure of the strength and direction among various
variables in continuous pairs form. The Pearson Correlation is a parametric measure
and was used to find out statistical indication for a linear relationship among the same
pairs of variables in the population, represented by a population correlation coefficient,
ρ. Its value lies from +1.0 to -1.0 ranges and gives us an information of the strength of
relationship. If the value, r > 0 means positive relationship, r < 0 shows negative
relationship while r = 0 designates no relationship. While r = +1.0 and r = -1.0 describes
a perfect positive correlation and perfect negative correlation respectively. Closer the

101
coefficients value to +1.0 and -1.0, greater is the strength of the relationship between
the variables.
Table 5. 18: Correlations of Variables in the Model
WTP for
Water
Job of the
House-
hold
House-
hold size
level of
Educatio
n
Income
of HH
House
hold
Employ
ment
WTP for
Improved
Water
services
Pearson
Correlation 1 0.479** -0.159** 0.360** 0.295** 0.519**
Sig. (2-
tailed) .000 .000 .000 .000 .000
Job of the
Household
Pearson
Correlation 0.479** 1 0.016 0.231** 0.240** 0.256**
Sig. (2-
tailed) .000 .693 .000 .000 .000
Household
size
Pearson
Correlation -0.159** 0.016 1 -0.109** -0.102* -0.013
Sig. (2-
tailed) 0.000 0.693 0.007 0.012 0.747
level of
education
Pearson
Correlation 0.360** 0.231** -0.109** 1 0.365** 0.149**
Sig. (2-
tailed) .000 .000 .007 .000 .000
Income of
HH
Pearson
Correlation 0.295** 0.240** -0.102* 0.365** 1 0.108**
Sig. (2-
tailed) .000 .000 0.012 .000 0.008
House
hold
occupatio
n
Pearson
Correlation 0.519** 0.256** -0.013 0.149** 0.108** 1
Sig. (2-
tailed) .000 .000 0.747 .000 0.008
Total number of observation N=600
** Correlation is significant at the 0.01 level (2-tailed).
* Correlation is significant at the 0.05 level (2-tailed).

102
It is evident from Table 5.18 that household WTP have positive and strong correlation
to income, education, employment and ownership of housing of the household and
negative relation to household size, means as the numbers of household increase they
spend more on other necessities than better service level of domestic water. The
analysis further shows that, among all variables in the model have positive correlation
at P<0.01 and P<0.05, while household size shows negative or no correlation to most
of the variable.
5.15.1 Income of the Household and Willingness to Pay for Improved Water
Services
The positive relation of household income and WTP for IWS is shown in Figure 5.3.
The rich household are more WTP for IWS as compared to their counterparts of the
poor households.
Figure 5. 3: Income and Willingness to pay for Improved Water Services
Further Table 5.17 also endorsed the statement of positive and significant variable in
household WTP for IWS. During meeting with the zonal water managers, it was
highlighted that people of the poor and informal settlement usually draws water from
illegal connections without any services charges. Many studies from developing
0
20
40
60
80
100
120
140
160
5000-50000
51000-100000
100001-150000
151000-200000
200001-250000
251000and above
no 53 15 1 0 0 0
yes 26 126 141 93 51 94
53
15
1 0 0 0
26
126
141
93
51
94
Re
spo
nce
s o
f W
TP

103
countries like Adenike and Titus, 2009; Asante et al., 2002; Briscoe and de Ferranti,
1988 and Calkins et al., 2002 also confirmed the positive relation between household
income and WTP for better water services. Adenike and Titus (2009) conducted a study
in Osun State, Nigeria and found a positive correlation between income of the
respondent and WTP. Asante et al., (2002) also proved in his study from Ghana shows
positive correlation between income and WTP.
5.15.2 Education of the Respondents and Willingness to Pay for Improved
Waster Services
Table 5.17 shows that, education of the respondents’ have significant and positive
impact on the household WTP for the IWS. Figure 5.4 also confirm the positive
correlation between income and WTP and shows highly qualified respondents are more
WTP compared to illiterate households. This is due to the fact that educated people are
more aware regarding health problems caused by unsafe drinking water.
Figure 5. 4: Education and Willingness to Pay of Household for Improved Water
services
This relationship also holds in developing countries, e.g. the findings of WBWDRT
(1993), revealed that educated households are WTP more than their counterpart who
0
20
40
60
80
100
120
140
160
180
200
Illiterate Middle Matric Intermediate
Bachlor Master Higher
no 69 0 0 0 0 0 0
yes 169 105 192 41 14 9 1
69
0 0 0 0 0 0
169
105
192
41
14 91
Res
po
nse
s o
f H
Hs
WT
P

104
are uneducated ones for IWS. Another study, Asthana (1997) and Venkatachalam,
(2006) in India conducted clearly linked WTP and education as both interlinked.
Similarly, Ahmad and Sattar (2010) in Pakistan, Whittington et al., (1990) in southern
Hatai, Afroz et al., (2009) in Bangladesh and in Zimbabwe Briscoe and de-Ferranti
found that the higher the level of education, greater would be demand for clean water.
5.15.3 Employment and Household Willingness to Pay for Improved Waster
Services
Household employment also positively contributes in explanation to variance in the
model as given in Table 5.17. The correlation of household employment status and
WTP are given in Figure 5.5. It is evident that majority of unemployed household are
not willing to pay due to low income and vicious circle of poverty. Besides this, Figure
5.5 also shows that employed respondents are likely to pay more for IWS.
Figure 5. 5: Employment and Household Willingness to Pay for Improved Water
Services
The positive correlation was also shown by Whittington et al., (1990) in a survey of
different parts of the developing world. They concluded that increasing the position of
respondents from lower job to better job increase the probability of WTP for better
0
20
40
60
80
100
120
140
160
180
Un emplyed Govt. emplyee Private
emplyee
Own buisness
no 68 1 0 0
yes 81 156 162 132
68
1 0 0
81
156162
132
Res
pon
ses
of
HH
s W
TP

105
service level. They also concluded that household employment was statistically
significant in the determination of WTP for better service level of drinking water which
is also confirmed by Wendimu and Bekele, (2011).
5.15.4 Housing Ownership and Willingness to Pay for Improved Waster Services
Figure 5.6 shows the correlation between WTP for IWS and housing occupancy of the
households. It is clear that respondents in rented houses are WTP smaller amount than
respondents staying in their own houses. Majority of the respondents i.e. 77.2 per cent
have their own permanent houses and are willing for improved services while a minor
portion i.e. 2.5 per cent were not WTP. The renting households’ due to temporary tenure
feel insecure and were WTP in most cases. While households staying in their own
houses may have already played the entire advance and feel secure to be staying there
for their life time. However, this variable does not significantly affect the WTP for IWS
due to the monthly water charges paid by all – regardless of the nature of tenancy.
Figure 5. 6: Household Tenancy and Willingness to Pay for Improved Water
Services
Literature review from various studies like Casey et al., (2006) and Vásquez et al.,
(2009) and Venkatachalam, (2006) also endorsed the positive correlation. The finding
further shows that the positive correlation is due to security aspect, where the
inhabitants knows that they will be staying in the home for ever.
0
50
100
150
200
250
300
350
400
450
500
Rented Own
no 54 15
yes 68 463
5415
68
463
Re
spo
nce
s o
f H
ou
seh
old
WTP

106
5.15.5 Household size and WTP for Improved Waster Services
The household WTP for IWS are not directly dependent upon household size as shown
in Figure 5.7. As household size increase they spent more on basic necessities like food,
health, education etc. and have negatively correlated with WTP for IWS.
Figure 5. 7: Size of Household and Willingness to Pay for Improved Water
Services
The negative correlation was also shown by Wasike and Hanley (1998) and Briscoe
and de-Ferranti (1988) in their studies. Reasons like availability of more individuals to
collect water from outdoor source or opportunity cost of spending income on IWS, due
to increased demand for food and other necessities in such households, are main causes
of negative relationship.
5.16 Summary
Low quality of drinking water is a long-lasting issue in many developing countries and
Pakistan is no exception to this characterization. Research shows that CV survey has
frequently applied in the water sector and is an effective tool in analyzing problems of
public policy for more improvement in these services (Griffinn et al., 1995, Rollins et
al., 1997). The present chapter shows to analyze the household demand for IWS in
Urban Peshawar, Pakistan. A detailed household survey was conducted to analyze the
existing state of domestic water service, household’s satisfaction over existing services
0
50
100
150
200
250
300
350
1-6 7-12 13-16 17 and above
No 36 23 4 6
Yes 323 182 18 8
3623
4 6
323
182
18 8
Re
spo
nce
s o
f H
ou
seh
old
WTP

107
and priorities for improvement. CVM was used to elicit household willingness for IWS.
The finding reveals that the present domestic water services in Peshawar are grossly
inadequate and 88.5 per cent of households are not satisfied with the existing services.
Old infrastructure, insufficient and low quality of water availability, encroachment and
ill planning are some major problem related to IWS. Majority of households are ready
to pay more than their existing charges for IWS. The bid wise analysis shows that
highest folk are in odd of bid one (01) and mean WTP is PKR 328/month. The findings
further show that income, education and household occupation are the main policy
variable in the model. This chapter recommends that planning strategy should be
changed from centralized, supply-oriented to decentralized, demand-oriented policy to
bridge the gap that usually exists between the customer and service providers. This will
make the services more sustainable by an increase in revenue collection and the
collected information will provide a deep insight to planners, policy makers for better
planning. As a conclusion, this study becomes a springboard for research academia for
future detailed empirical investigations in the region.

108
CHAPTER 6: DATA ANALYSIS OF SANITATION SERVICES IN URBAN
PESHAWAR
This chapter gives an in-depth analysis of Improved Sanitation Service (ISS), including
sewage disposal, solid waste management and clearance of municipal drains in urban
Peshawar. At first, the current state, household perception and perception regarding
existing sanitation services were discussed. The priorities of the households based on
enlisted problems were discussed in the second section. Later on, for assessing WTP,
Contingent Valuation Method (CVM) and bid-wise Binary Logic Model were applied
and WTP for ISS and determinants were analyzed. Detailed description is as follows:
6.1 Field Visits and Community Perceptions
The primary aim of field visit is to understand, in general terms, the community’s
opinions regarding existing sanitation services and to gain insights for better planning
of services improvement. An overview of general community perceptions on the
existing sanitation services are given in Table 6.1.
Table 6. 1: Summary of Community Perceptions Regarding Sanitation Services
Indicators Community Perspectives
Satisfaction
with
service
In general, sanitation services are reported to be ineffective in city
areas and the response time for repairs and customers’ services is
unsatisfactory, poor, or non-existent in most parts of the study area.
Sanitation
issue
The use of traditional method for sweeping and streets
cleaning.
Most of the drains are clogged
Unlined and kaccha drains.
Public sewerage line is absent in most areas.
Lack of sanitary workers
Public toilet facilities needed in public places.
Sanitation have combined system that levy both rain water and
sanitation water.
Sporadic heaps and dumps of solid waste causes air pollution.

109
Stagnant water in the streets and drains which germinates the
flies.
Illegal encroachment on the drains.
Lack of public sewerage line.
Suggestion
for
improvement
All existing drains need to be cleaned to improve their carrying
capacity.
Rehabilitation and repair to existing drains: all damaged
portion of the drains shall be repaired and rehabilitated to
reinstate their efficient performance.
Kacha drains need to be lined in brickwork or RCC/PCC.
Secondary and tertiary drains to be covered on top with inlets
for rain storm.
Provision for construction of new tertiary drains, wherever
needed.
Restriction and removal of encroachment on or along drains.
Laws needed to be strictly enforced to ensure proper future
development and sustainability of infrastructure.
Separate sewer lines are also proposed in some areas which
should be connected to the main channels.
Due to very little space inside houses for construction of septic
tanks and narrow streets, the relevant authorities may
technically evaluate the possibility of converting open drains
into some improvised shape to reduce the risk for public health
and find out suitable places for communal septic tanks.
All existing water treatment plants need to be rehabilitated and
new plants must be proposed to serve the sewage treatment
requirements in their respective regions.
The existing sanitary workers are deficient in numbers and,
lack technical skills as they mostly use traditional and non-
mechanized method of sweeping. It was suggested that more
workers should be recruited with proper training with the
provision of modern machines for sweeping.

110
Public education and awareness about the service providers, in
urban Peshawar majority of the residents generally know who
provides municipal service within their area, but they are not
very aware of them. It is suggested that in each urban UC has
at least one Citizen Community Board (CCB), to address civic
concerns, including municipal services.
A mass awareness campaign needs to be launched to motivate
communities to avoid their common undesired practices of
solid waste disposal into the drains and irrigation canals which
is the biggest source of the blockage in its outlets.
Establishment of Research and Development (R&D) center, to
undertake detailed studies in the area.
During planning and designing any project for sanitation
Improvement Public hearing is necessary to address the needs
and demand of voiceless peoples.
6.2 Findings from Key Informant Interviews
The aim of the KIIs is to determine the policy gaps and suggest policy recommendations
for ISS. A total of 100 personnel was selected from various departments and their
opinions are summarized in Table 6.2.
Table 6. 2: Summary of General Findings from Key Informant Interviews
General
Indicators
Experts and Professional Perspectives
Working
Organization
WSSP, Peshawar Development Authority (PDA), Municipal Services
Program(MSP), Municipal Corporation (MC), UNICEF, Local
Government, Public Health Engineering Department (PHED),
Cantonment Board (CB) and Non-Governmental Organizations (NGOs)
working on water and sanitation, Academia and other personal working
in WSS.
Function of the
Organization
To provide sufficient and safe water and provide secure and hygienic
environment to the inhabitants of urban Peshawar without
discrimination.

111
Exiting sanitation
issues
Nonexistence of urban land use planning
Existing sanitation facilities are not per human right standards.
Services are not according as per SDG goal 6 “Ensure access to
water and sanitation for all”.
Political intervention
Lack of financial resources
Policies lapses After provincial autonomy, still the Govt. of Khyber-
Pakhtunkhwa sanitation policy is in draft form and in pipeline
for cabinet’s approval to obtain legal status.
There is no solid waste management policy of GoKP.
Laws need to be strictly enforced to ensure proper future
development and sustainability of infrastructure.
Service provider authorities are not properly empowered in
implementation so political intervention should be abandoned.
Achievement of
WSSP
Behavioural change communication system.
Android based attendance system.
Elimination of contamination through leakage control and
rectification of water supply pipes crossing drains
Reduction in monthly electricity bill through efficient energy
management including billing on actual meter readings
1334 complaint redressal center
Billing digitalization
40 per cent replacement of the existing pipes.
Operation and maintenance of existing tube wells.
Suggestion for
improvement
GoKP to establish a “Water Quality Surveillance Authority” to
independently assess quality of water being supplied by the
service providers and initiate appropriate planning for promotion
where the lapse occurs.
Government should allocate funds to fulfill and ensure:
The vision of draft sanitation policy of GoKP.
WHO quality guidelines

112
Ensue the minimum quantity objectives to all citizen without
discrimination.
And achieve the Millennium Development Goals (MDGs) now
replaced to Sustainable Development Goals (SDGs) by 2030.
Government required to develop Standard Operating Procedures
(SOPs). This will ensure adherence to the technical standards
and specifications and quality construction and sustainable
service.
Under the devolution plan, GoKP should approve the sanitation
policy from the cabinet to become a legal document and
planning should be made per vision and objectives of the
policies to ensure quality services for public.
Government should promote research by allocating more funds
to replicate successful pilot studies in other areas of Pakistan and
international best practices and technologies in drinking water
and sanitation sector.
Need by-laws regarding the use of drains.
GoKP need to establish a specialized training academy for their
staff on: Planning, design, implementation, mobilization;
hygiene promotion; financial management; budgeting; audit and
accounting; contract management; and revenue collection. This
will strengthen the technical, institutional and financial capacity
of the service providers.
6.3 State of Sanitation in Urban Peshawar
In urban Peshawar, the households are facing major problems like unplanned
urbanization and over-utilization of the municipal sanitation resources. Lack of proper
planning and absence of public participation in planning processes have resulted in a
deteriorating situation. Besides, multi-institutional arrangement leading to duplication
of initiatives and wastage of resources, below-par operation and maintenance of
existing infrastructure, inadequate staffing etc., has crippled the ability of the
municipalities to ensure continuity of the basic service delivery to the citizens. For the
provision of these basic services, the incumbent government of Khyber Pakhtunkhwa
(GoKP) has established an independent utility company by the name of WSSP.

113
Table 6.3 shows that the water and sanitation services to 93 per cent of the urban
population in is provided by the WSSP and the remaining 7.0 per cent receive these
services from the Cantonment Board Peshawar. The WSSP has amalgamated multi
institutional arrangement under one corporate entity and initiated different projects to
improve the overall planning and service delivery in the city by making infrastructure
development, operations and maintenance more efficient and effective.
Table 6. 3: Household Responses Regarding State of Sanitation
Frequency Percentage
Sanitation service providers
WSSP 558 93.0
Cantonment board 42 7.0
Access to Toilet Facility
Yes 582 97.0
No. 18 3.0
Types of Toilet Facility
Flush 415 69.2
VIP latrine/pit latrine with slab 152 25.3
Pit latrine without slab 15 2.5
Public latrine/Hanging latrine 8 1.3
No facility/Bush/field 10 1.7
Toilet Connection to the Sewerage line
Yes 75 12.5
No. 525 87.5
Total no of Respondents (N)=600

114
Analysis shows that majority of households (97.0 per cent) have improved toilet15
facilities while the remaining 3.0 per cent have unimproved16 sanitation. Table 6.3
revealed that, although majority of households have toilet facility at home, but almost
90 per cent of households let their waste water and effluents being directly discharged
into open drains, canals and streams. Flushing to the open drain is a big hazard and an
open threat to community health. It is as bad and, in some cases, riskier than open
defecation.
So, majority of respondents suggested that, since there is no or little space inside houses
for construction of septic tanks, so the authorities may evaluate on technical and
innovative grounds, the possibility of converting open drains into some improvised
shape of septic tanks to mitigate the public health hazards and find suitable places for
communal septic tanks where there is no possibility of having the public sewerage line
infrastructure. Furthermore, it was pointed out in meetings with various community
members that the WSSP may adapt tailor-made waste water management services to
the needs of poor households.
6.4 Perception of Household Regarding Sanitation Services
An ever-increasing urbanization with the additional burden of the Afghan refugees and
the IDPs from FATA in the last decade, has put an enormous pressure on the existing
limited resources and the environmental amenities of the Peshawar city. Resultantly,
quality of life has deteriorated due to degrading civic systems such as water supply,
sanitation, drainage and solid waste management. Different governments over the last
two decades had struggled hard to improve the land-use planning to prevent haphazard
and unplanned urban development. However, success in this area has been limited due
to a number of factors and as a result the city largely remains unorganized and under-
developed.
Table 6.4 shows, concerns regarding the surrounding environmental condition of the
households as 80 per cent of respondents were not satisfied and evaluated it as pathetic
and unhygienic.
15Improved sanitation means the installation of piped sewer system, flush toilet, flush/pour flush to pit
latrine, septic tank, ventilated improved pit latrine, composting toilet, pit latrine with slab(Khalid, 2014) 16 Unimproved sanitation means pit latrine without slab, Bucket, hanging toilet or hanging latrine or
flush/pour flush sometime no facility or bush or field (Khalid, 2014).

115
Table 6. 4: Household Perception Regarding Existing Sanitation Services
Frequency
Total no of Respondents
(N=600)
Percentage
Surrounding Environmental Condition
Pathetic and unhygienic 481 80.2
Fair and satisfactory 105 17.5
Good and hygienic 14 2.3
Satisfaction Regarding the Existing Sanitation Services
No 557 92.8
Yes 43 7.2
WTP for Improved Sanitation Service
No. 43 7.2
Yes 557 92.8
The Table 6.4 further explains that 92.8 per cent were not satisfied from the existing
sanitation services. Key Informant Interviews (KIIs) highlighted the unhygienic
environment especially in slums and demanded for routine sweeping, waste water
management, proper trash collection of solid waste and dumping grounds at every town
to avoid open solid waste disposal and unhygienic dumping sites. Representatives of
the service provider authorities were of the view that, as an old and unplanned city
Peshawar needed a huge amount of funds to replace the old infrastructure and
regenerate the city (See Table 6.2). During the meeting with the people’s
representatives, they argued that a clean and green Peshawar was the top priority of the
present elected government in the province. For this purpose, the government has not
only allocated massive funding for WSSP but also mobilized the citizens through
various awareness campaigns about water, sanitation, health and hygiene with due
support of NGOs and volunteer groups as shown in Image 6.1.

116
Image 6.1: Awareness Walk by Chief Executive Officer of WSSP & other Volunteers
6.5 Indicators Analysis for Improved Sanitation Services in Urban Peshawar
The existing state of sanitation was analyzed based on some indicators like households
access to sanitation and hygienic sanitation facilities and was calculated separately as
follows:
6.5.1 Households Access to Sanitation Facility
Sanitation facility means the excreta disposal facility, typically a toilet: and access to
facility means households has their own private facility or shared facility with others in
the house (Billig et al., 1999).
To measure household access to sanitation facility in the study area, Eq. 4.8 were used
and calculated as followed:
𝐻𝑜𝑢𝑠𝑒ℎ𝑜𝑙𝑑𝑠′ 𝑎𝑐𝑐𝑒𝑠𝑠 𝑡𝑜 𝑠𝑎𝑛𝑖𝑡𝑎𝑡𝑖𝑜𝑛 𝑓𝑎𝑐𝑖𝑙𝑖𝑡𝑦 = 583 ∗ 100
600= 97𝑃𝑒𝑟𝑐𝑒𝑛𝑡
This means that 97 per cent people have sanitation facilities at their doorstep which is
much encouraging and on track towards MDG target value of 91 per cent for the year
2015 (See Figure 3.5). However, still, majority of the household were not satisfied with
the existing facilities as is given in Table 6.4. This is because improved sources are not
always safe and most of the households had directly connected their flush toilets to the

117
open drains, perennial nullas and the nearby freshwater channels due to the absence of
public sewerage lines and septic tanks. This not only made the surrounding environment
more pathetic but also contaminated the underground drinking water aquifers with
additional mortal dangers for the public health. Figure-3.7 shows that in Pakistan the
situation was also satisfactory as the use of the Flush toilet in 2013-14 has increased to
74 per cent from 72 per cent in the year 2011-12. However urban-rural dualism was
observed, and rural areas show slow pace. The interprovincial comparison shows
Punjab have the top ranking of 81 per cent whereas Balochistan 39 per cent and is at
the bottom (Government of Pakistan, 2015).
6.5.2 Households Access to Hygienic Sanitation Facility in Urban Peshawar
Sanitation means the excreta facility, usually a toilet, and hygienic means that the
internal environment is not pathetic i.e. no faeces on the floor or seat and there are few
flies and the effluent have safe and improved disposal.
Hygienic sanitation has positive health implications and can mitigate massive disease
burden through cost effective health interventions, where the benefits could be more
than the cost of these interventions (Bartram and Cairncross, 2010).
In urban Peshawar, flushing to the open drains is a challenge to service providers and
one of the biggest public health issues. It is more risky than open defecation and a severe
threat to the community health. Based on the collected data, the percentage of
household access to this facility were calculated using the formula given in Eq. 4.9.
𝑃𝑒𝑟𝑐𝑒𝑛𝑡 𝑜𝑓 𝐻𝐻 𝑤𝑖𝑡ℎ 𝑎𝑐𝑐𝑒𝑠𝑠 𝑡𝑜 ℎ𝑦𝑔𝑒𝑛𝑖𝑐 𝑠𝑎𝑛𝑖𝑡𝑎𝑡𝑖𝑜𝑛 = 75 ∗ 100
600= 12 𝑃𝑒𝑟𝑐𝑒𝑛𝑡
𝑃𝑒𝑟𝑐𝑒𝑛𝑡 𝑜𝑓 𝐻𝐻𝑠 𝑤𝑖𝑡ℎ 𝑢𝑛ℎ𝑦𝑔𝑒𝑛𝑖𝑐 𝑠𝑎𝑛𝑖𝑡𝑎𝑡𝑖𝑜𝑛 = 525 ∗ 100
600= 87.5 𝑃𝑒𝑟𝑐𝑒𝑛𝑡
It is clear from the calculation that in urban Peshawar majority of the respondent have
unhygienic facilities at their homes and they are not properly connected to the main
sewerage line. In meeting with the community member, the demand for separate sewer
lines which should be connected to the main channels to higenically dispose the human
sludges (See Table 6.1). During KIIs (Given in Table 6.2), it was highlighted that the
existing administrative structures do provide methods and policies, but practice is
contrary. The absence of citizen envelopment in public planning and policy making is
the main reason for decline of service delivery and they ultimately suffer from the

118
syndrome of ‘learned helplessness’. They suggested that structural intervention should
be supported by non-structural intervention. If the service provider has lack of financial
resources, then community should be motivated with social mobilization to raise their
own indigenous resources for construction of the communal septic tanks at the available
suitable places. However, this too will require timely technical input from service
providers.
6.6 State of Satisfaction of the Household for Sanitation Services
The household’s satisfaction was assessed based on indicators of ISS given in Table
6.5. The satisfaction and dissatisfaction level were calculated using formula in Eq. 4.10.
It is evident from the table values that almost all indicators of improved service show
negative sign and majority of the household perceive the existing sanitation services as
dissatisfactory.
Table 6. 5: Satisfaction Indices for Sanitation Services in Urban Peshawar
Services Dissatisfaction
(fd)
Satisfaction
(fs)
Total
(N) I= ∑fs-fd/N
Solid waste management 487 113 600 -0.62
Clearance of municipal drains 470 130 600 -0.57
Conservancy &sweeping of the
streets 489 111 600 -0.63
Proper sewage disposal services 515 85 600 -0.72
Community members showed great dissatisfaction over the existing Solid Waste
Management (SWM) and street sweeping services. They argued that the existing waste
collection bins/points are totally absent or available far away from their homes. They
suggested for readjustment and demand for additional waste bins where the distance of
existing waste bins is more than the threshold. Additionally, the mass awareness
campaigns are also necessary for motivating communities, changing their attitude and
behavior regarding waste disposal (See Table 6.1).
The residents also showed dissatisfaction over the desolation and dislodging over the
existing municipal drains, sweeping of streets and proper sewerage service. In an oral
discussion with various communities and during field observation, it was found that
most of the drains are blocked and had remained totally neglected for years as shown

119
in the Image 6.2 and Table 6.2. The situation is even worse with the encroachments
where the commercial area can create huge drainage challenges. The resident demanded
regular cleaning of these drains and necessary repair work to control further damage
and increase the drainage capacity for efficient flow of wastewater.
Image 6.2: The Drain Situation in Canal Town
6.7 Priorities for Improvement of Sanitation Services
In the study area, the data was collected from households, based on the enlisted
sanitation problems given in Table 6.6. The severity of each problem and rank of
priority for solutions are calculated using formula in Eq. 4.11.
Table 6. 6: Sanitation Problems and Priorities for Solution in Urban Peshawar
Problems f1 f2 f3 f4 f5 f6 f0 I Rank
Chocked drains 218 121 73 34 28 40 86 0.67 1st
Main sewerage line 91 66 134 73 50 95 91 0.51 3rd
Waste water treatment
plant 68 154 61 101 69 58 89 0.53 2nd
Public latrine 57 76 133 70 96 67 101 0.48 4th
Water supply 68 65 72 117 110 81 87 0.46 5th
SWM 34 45 50 108 135 129 99 0.38 6th
Total number of observation (N)=600
I=∑sifi/N

120
It is clear from the above Table 6.6 and field pictorial Image 6.3 that the clogged drains
is the main issue and majority of respondents gave top priority for clearance of these
drains. KIIs highlights, that proper planning for the provision of drains and underground
sewers along the streets and roads to dispose-off sewage away from the urban areas
play important role in creating a clean and healthy environment in the city (See Table
6.2). Unfortunately, most of such sewerage system is currently out of use due to their
continuous neglect and poor maintenance. The local representatives pointed out that the
drains are not routinely cleaned nor maintained by the service provider. Because of this,
sewer backups are common, including overflows onto the streets. They demanded, that
the existing drains need to be rehabilitated in many of their sites and their structural
integrity should be reinforced. Silt clearance, embankment strengthening, and provision
for approach roads are required to ensure the long-term, effective use of these drains
(See Table 6.1).
The service provider representatives argued that Peshawar being an old city have no
sanitation planning from the very beginning and has increased its problems with the
growth of the city. The existing sanitation and water supply systems are mostly
combined that convey domestic, commercial and industrial wastewater along with
surface runoffs during rain events. The sewers flow is mostly conveyed by open or
covered drains except for only a few planned towns where the system is structured
underground. Trunk sewers that are built to convey flows from the secondary and
tertiary system segments are mostly clogged at their manholes, after being used as a
repository for solid waste and are not currently physically visible on the ground.
However, currently, WSSP and PDA have devised a proper mechanism for SWM and
have clear plans for repair and maintenance of drains completely.
Wastewater treatment is the 2nd problem and a priority of the majority households’ for
the solution. In the study area, a majority of the people are letting their wastewater flow
into open drains, irrigation channels, streets and in some time to empty plots. However,
in a case where one’s wastewater flows out to sanitation infrastructure, there is a greater
need for revision and improvement. In a few areas, it has been observed that some
drains have their outlets in canals and there is no alternative way for disposing of their
wastewater. During KIIs it has been highlighted that, in Peshawar, there are three public
wastewater treatment plants (WWTP), within the very limits of the study area. Almost

121
all these plants are dysfunctional, and wastewater is discharged into rivers, irrigation
canals, Khawars or an agricultural land without proper treatments. Resultingly, this
practice is contributing to severe environmental and public health hazards. The natural
streams and irrigation channels currently being used for the disposal of raw sewage
generation pass through the city and suburbs, thereby polluting the city environment.
During field visits, community members suggested making plans on priority basis for
arranging alternate options for the citizens.
Public toilets are also important for the provision of clean and hygienic environment,
free from open defecation. CEO of WSSP and managers of water and sanitation were
of the view that, for best public interest, around 20 public toilets across the city of
Peshawar are already available for public use by the Municipal Corporation and it was
planned to increase the number of such toilets to other public places to facilitate the
people and make the environment pollution-free. Besides this, a few units were also
maintained by Cantonment Board within its jurisdiction, and by the private sector at
bus stands. Effluent from all the toilets is disposed into open/covered drains. The overall
hygiene and structural conditions of these toilets is poor.
Like other environmental issues, improper management and handling of solid waste is
also a burning issue especially in developing countries like Pakistan which not only
affects the environmental health but also a risk to the human health. Therefore, the issue
needs a special focus in terms of planning and management to protect human health
and environment. For this purpose, an integrated solid waste management strategy and
modern technology need to be institutionalized and operationalized. In this regard,
WSSP, a government-owned company has to shoulder the responsibility of water,
wastewater and solid waste management service and is committed to providing high
quality and international level SWM and other services for the people of Peshawar. For
this purpose, at each Zonal level, specialized SWM department has been established
which are solely responsible for providing SWM services through collection and
disposal of solid waste in their area of jurisdiction.
After the inception of the company, the overall planning and service delivery has
improved by making infrastructure development, and operations and maintenance more
efficient and effective. The overall SWM system has been upgraded in terms of human
resources, tools, equipment and vehicles. It is clear from Image-6.4 that mostly due to

122
ill-planning the open drains become the repository for solid waste and are observed in
most of the study area. This along with siltation impedes flow conveyance. Like other
initiatives, creating awareness among the community about the importance of proper
waste management is the key to sustainable SWM. Community participation and their
due participation have a direct bearing on the efficient SWM. Therefore, the community
needs to be properly educated about waste handling and disposing to the designated
sites. For this purpose, service providers have to initiate awareness campaigns with the
cooperation of District Management and relevant stalk holders in the whole city to
highlight the importance and criticality of SMW. The CEO of WSSP argued that we
had already started this practice as is shown in Image-6.5. Thousands of tasks force and
other volunteers participated in awareness campaigns which were divided into different
groups led by the WSSP management. Information, Education and Communication
(IEC) materials was distributed during the campaigns among the local community for
their raising awareness about these sensitive issues.
Image 6.3: A Scenario of Old Infrastructure and Blocked Drains in Kandi Maghalzai

123
Image 6.4: Mismanagement of Solid Waste in Nasir Bagh Drain
Image 6.5: A Pictorial View of Proper SWM Campaign in Peshawar
6.8 Public Health Problems and Households Priorities for Solution
Public health is directly related to environmental sanitation. Poor sanitation, improper
waste and unsafe excreta disposal causes severe public health hazards and causes the
transmission of communicable diseases, including infectious hepatitis, polio,
cryptosporidiosis, cholera, typhoid and ascariasis. WHO reports that, 2.1 million people

124
die annually due to Diarrheal diseases and 40 per cent gets infected with trematodes or
parasitic flatworms and six million are permanently blind due to Trachoma of world
population. In Pakistan, Diarrhea is responsible for the death of over 200,000 children
under five years old every year and mainly Diarrhea here is caused by unhygienic water
and sanitation. (Khalid, 2014). Approximately, PKR 112/-billion expenditures are
associated with water and sanitation borne diseases each year, out of this amount PKR
55 to 80 billion cost is associated with Diarrheal diseases in the country17.
In the study area, based on enlisted heath issues like open defecation, bad smell,
diseases threats, contiguous diseases and flies in the surrounding and household
responses were recorded and responses were recorded against each problem. The
severity of each problem and households’ priority for solution were calculated using
the formula in Eq. 4.11. Table 6.7 gives us the detail of the enlisted issues related to
public health and priorities for their solution.
Table 6. 7: Priority Indices for Public Health Problem in Urban Peshawar
Problems f1 f2 f3 f4 f5 f0 I Rank
Open defecation problem 35 79 101 148 99 138 0.40 4th
Over flow of water in the street 113 136 134 73 29 115 0.56 2nd
Bad smell 129 155 103 75 20 118 0.58 1st
Contagious dieses 131 86 99 110 44 130 0.52 3rd
Flies in the surrounding 91 42 33 45 214 172 0.34 5th
Total number of observation (N)=600
I=∑sifi/N
In urban areas of Peshawar, sizeable and sporadic heaps of solid waste accumulated
were observed instead of proper containers. In the absence of regular collection from
filth deposits to dumping point, it causes environmental pollution and bad smell in the
area. It is evident from the Table 6.7 that, majority of respondent attached 1st priority
to the bad smell and demanded regular trash collection and sweeping of streets. Besides
17Sanitation sector analysis report Pakistan (July 2010). Global sanitation Fund Water Supply and Sanitation Collaborative Council.

125
this, the clogged, unlined and narrow sewer systems which does not cope with growing
population demands also causes bad smell in the area.
The overflow of water is the 2nd severe problem and priority of households for the
solution. Capacity constraints become an issue. Sanitation Manager of WSS was of the
view that, due to ill planning the downstream, where the secondary conveyance
segments receive flows from the tertiary network may not have adequate capacity to
convey the cumulative generation of flow and could not transfer from upstream of its
catchment area. This results in backups into the tertiary lines and causes overflows.
Similarly, capacity is also an issue when these secondary lines convey flows to the
primary conveyance lines.
Beside these, other related issues like open defecation and flies in the streets, causing
various contagious diseases, are due to poor sanitation facilities in the area. Open
defecation was also observed in the study area which cause flies, bad smell and various
contagious diseases.
In a meeting with the KIIs of WSS, it was highlighted that the company is committed
to provide health and clean environment to the people of Peshawar by reducing health
risks to the community through the provision of fumigation services to the community.
Such service is managed not only through the redressal of the community complaints
but also through periodic fumigation plans operations which covers the whole zone as
shown in Image 6.7. During fumigation low lying areas, rivers and drains and stagnant
water is targeted in this campaign to eliminate the chances of spread of mosquitoes
which are considered the sources of spreading malaria and dengue fever. According to
the daily “Dawn” seven people have been killed and 1500 were affected when virus
was diagnosed in Peshawar. Most of the cases were from Tehkal, Warsak road and
Pishtakhara and the citizens also consult the court to take action against the defaulters.
(Akbar, 2017).

126
Image 6.6: Over flow of water in the street in Nasir Bagh (Zone D)
Image 6.7: Pictorial view of Fumigation Campaign in Tehkal
6.9 Cost Recovery and Household Willingness to Pay for Improved Sanitation
Service
For better planning and sustainable sanitation services provision, it is essential for the
service provider to provide the services which people want and then charge judicious
fee for it. However, in Peshawar, usually the beneficiaries consent is not undertaken
and traditionally the charges are set by thumb rules. The household demand
determinants for improved environmental sanitation services and charges applied for

127
these services have not been carefully investigated and analyzed. The lack of policy
guidelines from the government in this context has further increased the miseries of an
ordinary citizen besides causing health and environment problems. Table 6.8 shows
households’ WTP for the environmental sanitation services, including connection to
public sewerage line, solid waste management and clearance of blocked drains.
Table 6. 8: Various bids for Willingness to Pay for Improved Sanitation Service
Household responses were recorded against each bid. It is evident that, most of the
households’ 81.1 Per cent were in favor of bid1and mean WTP was PKR 220/month.
As the bids value increases the percentage frequency of household WTP decreases.
6.10 Average Demand Curve for Improved Sanitation Services
The demand curve for ISS was derived from WTP information given in Table 6.6. Y-
axis shows frequency of households willing to pay while bids values were plotted on
X-axis (Figure 6.1). Every point on the demand curve shows households WTP for the
bid offered and slope downwards as the bid values increases, the households’ WTP
decreases.
Bid No Various bids
(In PKR)
Frequency of Responses
WTP for the service. Per cent
Mean
WTP
1 200-250 452 81.1 220
2 251-300 66 11.8 280
3 301-350 18 3.23 340
4 351-400 11 1.97 370
5 401-451 10 1.79 428
Total 557 100

128
Figure 6. 1.: Demand cure for Improved Sanitation service in Urban Peshawar
It is obvious from the above figure that the highest folks are in odd of bid one (01) and
mean WTP are PKR 220/month for the desired services. Increasing the bids value, the
frequency of WTP for the subsequent decreases as shown in Figure 6.1. However,
information from the service providers reveals that previously beside some developed
area, have no conservancy charges. The existing Water and Sanitation Company have
revised and notified a more elaborate system of sanitation service charges. In
Hayatabad, the conservancy charges vary from PKR (100 to 350) per month while
sewerage charges vary from PKR 50 to 195 per month depending upon the size of the
plots. In University Town Peshawar, the conservancy charges are PKR 170/- and
sewerage charges are PKR 90/- per month on flat rate. The Cantonment Board (CB)
area have its own arrangements. With the exception of the PDA and CB jurisdiction, in
the whole WSSP jurisdiction the conservancy charges are PKR 100/- and sewerage
charges are 50/- per month on flat rate (See Notification in Annexure VI). The existing
service charges were implanted by the company without proper involvement of
households, their desired quality of services and willingness to pay for the services. In
the absence of baseline survey, the existing services are falling short of the demand and
desires of the majority of households and thus charges applied against these services
are just like compulsory tax. It is evident that most of households are not satisfied from
the existing services and demanding improvement in the existing services (See Table
6.5).
452
66
18 11 10
0
50
100
150
200
250
300
350
400
450
500
200 250 300 350 400 450
Fre
quen
cy o
f H
Hs
Mean WTP (In PKR)

129
6.11 Variable of Model for Improved Sanitation Services
The results of descriptive statistics were presented in Table 6.9.
Table 6. 9: Definition and Summary Statistics of Variables in Model
Variable Description of the variable Mean Std.
Deviation
Ih Income of household. 167991.01 164020.649
Edu
Education of household. (0= Illiterate, 1=Middle,
2=Secondary, 3=Higher Secondary, 4=Bachelor,
5= Master, 6=Higher level)
1.1983 3.699
HHs Total members of household. 6.412 3.699
HO
Household status of employment. (1= Un
Employed, 2= Govt. Emplyed,3= Private
employed,4=own business)
2.462 1.089
Hocp Household Housing occupancy status. (1=Own,
0= Otherwise) 0.797 0.403
WTP WTP (Dichotomous, 1=Yes, 0=No) 0.930 0.258
The detailed description of each variable is given in the table above. Household Income,
Education, Occupation, Housing occupancy and Household size were main dependent
variables for WTP. Moreover, mean WTP of the sampled household was also derived
in the analysis. The income of the household was estimated from the household monthly
expenditure.
6.12 Determinants of Household Willingness to Pay for Improved Sanitation
Services
Household WTP for ISS has direct, indirect or associated benefits, such as mitigating
diseases, enhancing social status and improving hygienic condition (Hussen, 2012).
Table 6.10 represented bid-wise logit analysis of the variables that determined
households’ WTP for ISS in urban Peshawar. After analyzing the Table 6.10 only three
(03) factors are dominant in determining of households WTP. These variables have
loadings greater than 50% and were selected as defining variables. The detailed
description of each variable is given as follow:

130
Income of the Households(Ih)
The estimate of the parameter of variable Income of household (Ih) in the model is
significant as well as positive in bid One (01) and bid Two (02) at P<0.01). The odd-
ratios columns show that 1 unit increase in ‘Ih’ leads to approximately 12 and 16 times
increase in the household’s WTP for bid 1 and bid 2 respectively for ISS. This means
that there is 95% chance to pay for PKR (200-250) and 99% chances to pay for PKR
(251-300) for ISS. The theory also presents the importance of income as a catalyst for
demand shifter and have positively related to WTP (Horowitz and McConnell, 2003).
As the income of household increases, it positively affects households WTP for public
goods improvement. The positive relation between income and WTP for ISS were also
reported in studies like Whittington et al., (1993); Fujita et al., (2005).
Table 6. 10: Results of Logistic Regression Model for Improved Sanitation
Services in Urban Peshawar
Independ
ent
variable
Dependent Variable: Willing to Pay for ISS at different Bids (Dichotomous)
PKR (200-250) PKR (251-300)
Estimated
coefficients
Odds
Ratio
Probability
(%)
Estimated
coefficients
Odds
Ratio
Probability
(%)
Ih 2.521***
(0.375) 12.46
93 2.747***
(0.330) 15.59
94
Edu 2.083***
(0.287) 7.92
89 0.351***
(0.148) 1.42
59
HHs -0.100*
(0.054) 0.89
47 0.028
(0.53) 1.03
51
HO .675***
(0.170) 1.96
66 -0.275*
(0.187) 0.76
28
Hocp -0.575
(0.521) 0.55
35 0.079
(0.026) 1.08
52
Constant -29.252***
(4.221)
--- --- -35.615 ***
(4.198)
-- --
Diagnosti
cs
No of observation, N =452
Pseudo R2=0.698
χ2=322.285
No of observation, N =66
Pseudo R2=0.462
χ2=135.799
Standard Error values are given in parenthesis.
*** significant at 1per cent
**significant at 5 per cent
* significant at 10 per cent

131
Education of the Households(Edu)
‘Edu’ of households are also highest loadings variable and significant for both bid1
and bid2 at (P<0.01), which manifest that the WTP for ISS increased with the level of
education. The odd-ratio value shows that an increase of one rank from lower to higher
in the state of education make 8 and 1-time changes respectively in WTP for bid1 and
bid2 for ISS. The probability columns depict that there are 89% and 59% chances that
respondents are willing to pay for bid1 and bid 2 consecutively. The positive role of
education has been stressed in literature like Fujita et al., (2005); Jenkins and Scott,
(2007); Seraj (2008) and Adenike and Titus, 2009). This simply means that educated
respondents are more aware regarding themselves and their family health and want
improvement in their ambient environment.
Households Occupation (HO)
The variable ‘Household’s occupation’ is significant for initial two bids at (P<0.01) and
(P<0.05). This phenomenon implied that WTP for ISS is dependent on employment
hierarchy of the respondents. The odds ratio value shows that a one unit change in the
occupation of the respondents make 2-time changes in the WTP of the respondents for
ISS means that there are 66% chances that households are WTP for PKR (200-250).
The variable ‘HHs’ had a significant and negative effect which indicated that as the
household size increased, WTP for ISS decreased while the variable ‘Hocp’ has are not
significant in the model. To sum up, majority of households in the study area are WTP
for ISS. Further, WTP amount was strongly influenced by the economic status,
education and occupation of the households.
6.13 Correlation of Variables in the Model
Table 6.11 show correlation among variable in the model. It is evident that most of the
model have strong and positive correlation except the household size which have
negative and weak correlation.

132
Table 6. 11: Correlations of Variables in the Logistic Model
WTP for
Improved
sanitation
Income of
Household
Level of
Educatio
n
Household
Occupation
Househol
d size
House
hold
size
WTP for
Improved
sanitation
services
PC 1 .232** .277** .373** -.163** .438**
Sig.
.000 .000 .000 .000 .000
Income of
Household
PC .232** 1 .365** .240** -.102* .108**
Sig. .000 .000 .000 .012 .008
Level of
Education
PC .277** .365** 1 .231** -.109** .149**
Sig. .000 .000 .000 .007 .000
Household
Occupation
PC .373** .240** .231** 1 .016 .256**
Sig. .000 .000 .000 .693 .000
Household
size
PC -.163** -.102* -.109** .016 1 -.013
Sig. .000 .012 .007 .693 .747
Housing
occupancy
PC .438** .108** .149** .256** -.013 1
Sig. .000 .008 .000 .000 .747
PC means Pearson Correlation
Total no of observation(N)=600
**. Correlation is significant at the 0.01 level (2-tailed).
*. Correlation is significant at the 0.05 level (2-tailed).
6.13.1 Income and Household Willingness to Pay for Improved Sanitation Services
The information given in Figure 6.2 illustrate that there is direct and positive
relationship between households’ income and WTP for ISS.

133
Figure 6. 2: Income and Household and Willingness to Pay for Improved
Sanitation Services
Various studies such as Whittington et al., (1993); Flores and Carson (1997); ABIAD
(1999); Altaf (1994); Arimah (1996); Jenkins and Scott (2007)., Sigel et al., (2012) and
Abdulkarim et al., 2017 estimated the positive bond between income and WTP for
quality services in developing countries.
6.13.2 Education and Households’ Willingness to Pay for Sanitation Services
The WTP for quality environmental services is positively correlated with education of
the respondent. The Figure 6.3 depicts this relationship and show educated household
are mostly willing to pay for quality services for ensuring the hygienic environment.
0
20
40
60
80
100
120
140
160
5000-50000 51000-100000
100001-150000
151000-200000
200001-250000
251000 andabove
No. 37 5 1 0 0 0
Yes 42 136 141 93 51 94
37
51 0 0 0
42
136141
93
51
94
Ho
use
ho
ld R
esp
on
ces
of
WTP

134
Figure 6. 3: Education and Household Willingness to Pay for Improved
Sanitation Services
The positive relationship of household education and WTP for quality environmental
services were confirmed by other researchers such as Whittington et al., (1993);
WBWDRT (1993); Arimah (1996) and Abdulkarim et al., 2017.
6.13.3 Employment and Household Willingness to Pay for Improved Sanitation
Services
The positive relationship of households’ employment and WTP for quality
environmental service is obvious from Figure 6.4. Employed respondents are more
willing to pay due to their permanent income hypothesis, as compared to their
counterpart unemployed household who are daily wagers and have no permanent
income as given in the Figure 6.4.
0
20
40
60
80
100
120
140
160
180
200
Illiterate Middle Matric Intermedi
ate
Bachlor Master Higher
No. 43 0 0 0 0 0 0
Yes 195 105 192 41 14 9 1
43
0 0 0 0 0 0
195
105
192
41
14 91R
esp
on
ces
of
Ho
use
ho
ld W
TP

135
Figure 6. 4: Employment of Households' and Willingness to Pay for Improved
Sanitation Services
Analysis shows that out of total 149 unemployed households 43 are not willing to pay.
Due to the vicious circle of poverty they were more concerned about the necessities
rather than the improvement of the environmental services.
6.13.4 Housing Ownership and Household Willingness to Pay for Improved
Sanitation Services
The positive relationship of housing ownership and WTP for ISS is shown in Figure
6.5.
Figure 6. 5: Housing Ownership and Willingness to Pay for Improved Sanitation
Services
0
20
40
60
80
100
120
140
160
180
Un emplyed Govt. emplyee Private emplyee Own buisness
No. 43 0 0 0
Yes 106 157 162 132
43
0 0 0
106
157 162
132
Res
po
nse
s o
f H
ou
seh
old
WT
P
0
100
200
300
400
500
600
rent own Total
No. 36 7 43
Yes 86 471 557
367
4386
471
557
Res
po
nce
s o
f H
ou
seh
old
WT
P

136
The positive relation of permanent housing tenancy and willing to pay was also depicted
from numerous studies conducted in developing countries (Whittington et al., 1990;
Wendimu and Bekele, 2011).
6.13.5 Household Size and Household Willingness to Pay for Improved Sanitation
Services
The Figure 6.6 shows there is inverse relationship of household size and WTP for ISS.
This is because as the size increases household demand for food and other necessities
in such families increases.
Figure 6. 6: Household Size and Willingness to Pay for Improved Sanitation
service
The negative relation of household size and WTP for sanitation services area are also
confirmed by Wasike and Hanley (1998) and Briscoe and de-Ferranti (1988) in his
studies.
6.14 Summary
Generally, Peshawar is confronted with ever-growing environmental issues and
challenges. Most of the households are not satisfied with the environmental sanitation
services, including public sewerage line, desilting of drains and proper trash collection
in the streets. It was found that, in Urban Peshawar, 97 per cent households have
improved sanitation facilities but most of them are without connection to the public
0
50
100
150
200
250
300
350
1-6 7-12 13-16 17 and above
No. 21 15 3 4
Yes 338 190 19 10
21 153 4
338
190
19 10
Res
po
nse
s o
f H
ou
seh
old
WT
P

137
sewerage line and directly flows to open drains or streets. The blocking of drains,
wastewater treatment, the absence of public sewerage line, lack of latrine at public
places and proper trash collection in the streets are the main problems of the area. Most
of the households are not satisfied with the existing sanitation services and evaluated
their surrounding environment as pathetic and unhygienic. It was also ascertained that
majority of the households are willing to pay for ISS and CVM was found as an
effective tool for assessing WTP and subsequently for framing public policy. The use
of Logit Model, with key determinants income, education and household occupation,
housing occupancy and household size. Majority of households were odd in favour of
bid one (01) and mean willingness to pay was PKR 220/month. Income, education and
occupation of the household were statistically significant for initial three bids while the
household size was significant with a negative sign on WTP.
This chapter recommends that practitioners of Public Utility Company can use the
CVM for measuring households WTP to bridge the gap between the customers and
policymakers. Assessing WTP will not only increase the revenue of the public utility
company but also make the services more sustainable. Besides this study will also
become a springboard for future research studies.

138
CHAPTER 7: CONCLUSION AND POLICY IMPLICATIONS
This study was carried out in urban Peshawar with the intention to highlight the
significance of WSS improvement in overall development planning. A sample of six
hundred (600) questionnaires was proportionally allocated to 45 urban union councils.
The data was collected from the field through observation, household survey and KIIs
with experts and professionals through the well-designed questionnaire. Statistical tools
like descriptive statistics, satisfaction, priority, performance indices and logistic
regression models were used to analyze the field data. The objective wise conclusion
of the analyzed data are as follows:
7.1 State of water and sanitation services in Urban Peshawar
Analysis of the existing state of water and sanitation services reveals that majority of
urbanities in Peshawar are served by WSSP and the public tap is a major source of
domestic water. Majority of the households have water facilities at premises and the
average demand is more than the available supply. The existing water infrastructure is
drastically inadequate and obsolete. Some families endorsed indications of waterborne
diseases like Diarrhea especially in children less than 3 years of age during the survey
period. Majority of households are not satisfied with the existing state and want
improvement in the prevailing services.
Similarly, sanitation services also mandate of WSSP in the Urban areas of Peshawar.
Findings reveal that majority of households have access to toilet facilities at home,
however, in the absence of public sewerage line facilities, people discharge sludge
directly to open drains, canals and perennial nullas. Besides this, households are also
not satisfied with the existing sanitation services including sewage disposal, solid waste
management and clearance of municipal drains in the area. The households evaluate
their surrounding environment as pathetic and are not satisfied. The chocking of drains,
wastewater treatment, the absence of public sewerage line, lack of latrine facility at
public places and improper trash collection are the main issues of the area. As a
conclusion household evaluate their ambient indoor and outdoor environment on public
health perspectives.

139
7.2 Problems Faced by Households Regarding Water and Sanitation Services
In urban Peshawar, the inhabitants face various problems regarding water and sanitation
services. Regarding water, it was found that low pressure, wastages of water, fewer
hours of water supply, ill-maintained storage facilities, and longer distance from the
main source are major problems in the area. Besides, water loss and contamination of
water in the distribution lines due to obsoleteness were also reported by the majority of
households. Various diseases like Diarrhea, Cholera, Hepatitis A, B, C are reported by
the households due to the low quality of water.
Regarding sanitation, it was found that most of the people are not happy with the
ambient environment and consider it pathetic. Chocked drains, dysfunctional
wastewater treatment plants, the absence of public sewerage lines, lack of latrine at
public places and proper trash collection in the streets are the main issues of the area.
From the public health perspective, most of the households are odd in favour of bad
smell followed by stagnant water in the street, prevalence of various contagious disease,
open defecation and flies respectively.
The authorities responsible for water and sanitation services have overlapping
responsibilities and have low performance in quality services provision. In the absence
of proper urban planning, the preference, priorities, and WTP of the majority
households remains ambiguous and are not properly investigated to further improve the
services and to make it sustainable.
7.3 Household Demand for Improved Water Services
For analysis of household demand for improved domestic water services, bids game
method was used. Ranges of bids in the form of monetary values and household
responses were recorded against each bid. Separate Logistic Regression Model was
used to analyze each bid and significance of each policy variable. The analysis shows
that in Peshawar, a majority of households are not satisfied and demand improvement
in the existing services. Policy variables income, education and household occupation
are positively linked with households’ WTP for IWS while household size has a
negative impact. The result shows that majority of urbanities want improvement in the
existing services even if they are required to pay up to PKR 350/-. The mean willingness
to pay is PKR 328/month for sufficient and safe domestic water service.

140
7.4 Household Demand for Improved Sanitation Services
For assessing household demand for ISS, CVM and Bid-wise Binary Logic Model were
applied to a sample size of Six Hundred (600). Analysis shows that 92.8 per cent of the
household are not satisfied with existing situation of sanitation and want improvement
in the services. Policy variables: household income, education, occupation, size and
ownership of the respondents, were used as regressands. Among the policy variables,
household income, education and occupation were statistically significant for the first
three bids in the model. This study further elaborated that 452 respondents are in odd
of bid1 and are willing to pay Rupees 220/= per month for ISS.
7.5 Policy Implications for Better Planning
Based on the findings, we can draw the following important policy implications for
better planning for water and sanitation services improvement.
Urban water and sanitation utility company should take into consideration the
provision of sufficient and safe domestic water in designing the water system of the
city since these two characteristics are found to be the sources of greater
dissatisfaction in the study area.
In Peshawar, except few developed neighborhoods, majority of the urban
population lives in dilapidated houses that are not equipped with proper
municipality services. Limited baseline information is available about the quantity
and quality of services and institutional, administrative and social constraints that
affect how best such services can be provided. Given the magnitude of the challenge
and the bad consequences that flow from poor access, it is recommended for better
planning to start a focused assessment for better understanding of the current level
of services, their improvements and best approaches towards their effectiveness.
Such an assessment would include primary research as well as international
experiences to shape an approach that will meet the specific needs of the dwellers.
It is recommended that planning strategy should be changed from centralized,
supply-oriented to decentralized, demand-oriented policy and efforts should be
made to bridge the gap that usually exists between the customer and utility company
by using Contingent Valuation survey to get the required information. This strategy
will increase the revenue collection for the maintenance and improvement of the
water and sanitation services. Otherwise, the delivered services will not be
according to the aspiration of the urbanites. So, the government should formulate

141
policies in line with citizens’ perception and willingness to pay. This approach will
help the planners and policy makers for better planning and will become a
springboard for future detailed empirical investigations in the region.
The government and service providers can use the collected information for better
water and sanitation service planning and policy-making, thus optimizing the
allocation of the resource among different public services. To achieve financial
sustainability there is a need for appropriate tariff determination with proper
justification from both user and supplier perspective.
The service providers and government officials are normally fixing the service
charges by the rule of thumb, estimates of the WTP can be used as approximate
guides on how much to charge for desired water and sanitation services. Since the
mean WTP of the sampled households is far above the current municipal charges
for the proposed services, the service provider can implement the new charges for
the proposed water and sanitation services to satisfy the needs of the community.
This strategy will not only collect more revenue for the service providers but also
to make the municipal services more sustainable.
In urban Peshawar, the lack of wastewater collection and treatment system
adversely affects the quality of domestic water supply. Wastewater treatment is
important to protect the current and future use of low-cost water source. Presently
there are three wastewater treatment plants that face operational difficulties and
rising energy cost. A long-term strategy for wastewater management is needed
across all urban centres that should focus on the use of appropriate and affordable
technologies. The intent of the approach should be to realize the economic
significance of wastewater treatment which will lead to higher intensity for reusing
an important natural resource and mitigating the problem in many resource
constrained areas. The role of private sector is particularly important as it provides
leverage to public sector financing and skills with knowledge of capital and
operational efficiencies.
A robust policy must be opted to improve the quality of service through
demolishing the encroachment from public sewerage line. Main drains should be
provided all along a roadway on one bank while walkway along the other bank with
a stringent measure to restrict subsequent encroachments. A well draft strategy in
consultation with civil society is also needed for controlling the illegal connection

142
through punitive measures, leakage management, and expansion of networks to
low-income areas and increased collection and treatment of wastewater.
In urban Peshawar, water quality at source (tube wells) is satisfactory, but due to
leaking and damage pipes, bacterial contaminations were found in the distribution
networks. So, for better planning, government should replace the existing
infrastructure with a new one.
Households in study areas have installed illegal booster pumps either installed on
their individual underground storage tanks or connected directly with the service
pipeline for pumping extra water during summer season. Residents having no
booster pump facilities face shortage of water. Although rules and regulations are
there to stop this practice but because of gratification or nepotism these are not
evenly implemented. So as a policy measure it is suggested that such rules and
regulations must be forcefully implemented. Further wastages of water should also
be mitigated through media campaigns and other mass education
networks/platforms.
All existing chocked drains need to be cleaned to improve their carrying capacity.
The damaged portion of the drains shall be repaired and rehabilitated to reinstate
their efficient performance. Unlined (Kacha) drains need to be lined with brickwork
or concrete. Secondary and tertiary drains must be covered with proper inlets for
the rainstorm. Covering must have provision for cleaning and maintenance. New
tertiary drains, wherever needed, must be provided.
The government should allocate more budget to increase services coverage and
better quality of service. More revenue can be generated through consumer surplus
for operation, maintenance, and sustainability of the services.
Adopt an engagement policy with the help of private sector to augment private
investment, improve quality of services, revenue collection and enhance access.
Mass public awareness campaigns are needed to motivate the vague communities
to avoid most common undesired practices of waste disposal into the drains and
irrigation canals which is the biggest source of drains blockage.
The WTP information is a useful tool for the planners, policymakers, government
officials, and practitioners working in WSS agencies, as well as for improving water
supply and sanitation services.

143
There is a need to establish an advanced research and advocacy fund for proper
water and sanitation planning and also of inviting research proposals on priority
basis.
For proper operation and maintenance of existing infrastructure and rapid response
to public complaints, improvements in institutional setup shall be made compulsory
which will ensure the sustainability and workability of the existing services more
effectively. Institutional transformative actions are necessary to improve the
municipal services and sustain future investments in the utility infrastructure.
Under the devolution plan, now it is the responsibility of each province to develop
its own Drinking Water Policy. Likewise, Khyber Pakhtunkhwa drinking water
policy, sanitation, and SWM policies must be made to ensure quality services for
public.
For institutional strengthening, the provincial government should set clear goals,
objectives, and strategies for achieving the Sustainable Development Goals 100 per
cent target of water and sanitation coverage.
The government should establish an independent regulator for urban service
providers in the Peshawar to ensure quality and quantity for sufficient domestic
water provision and effective services.

144
REFERENCES
Abdulkarim, B., Yacob, M. R., Abdullah, A. M., &Radam, A. 2017. Households
Preferences and WTP for Watershed Services Attributes in North Selangor Peat
Swamp Forest Malaysia. Asian Journal of Economic Modelling, 5(1), 98-109.
ABIAD, V. 1999. Household demand for improved sanitation services: A case
study of Calamba, the Philippines.
Acharya, G., &Barbier, E. 2002. Using Domestic Water Analysis to Value
Groundwater Recharge in the Hadejia'Jama'are Floodplain, Northern
Nigeria. American Journal of Agricultural Economics, 84(2), 415-426.
Adamowicz, W., Louviere, J., & Williams, M. 1994. Combining revealed and stated
preference methods for valuing environmental amenities. Journal of environmental
economics and management, 26(3), 271-292.
Adenike, A. A., & Titus, O. B. 2009. Determinants of WTP for improved water
supply in Osogbo Metropolis; Osun State, Nigeria. Research Journal of Social
Sciences, 4, 1-6.
Afroz, R., Hanaki, K., & Hasegawa-Kurisu, K. 2009. WTP for waste management
improvement in Dhaka city, Bangladesh. Journal of environmental
management, 90(1), 492-503.
Agthe, D. E., & Billings, R. B. 1980. Dynamic models of residential water
demand. Water Resources Research, 16(3), 476-480.
Agthe, D. E., R. B. Billings, J. L. Dobra, and K. Raffiee. 1986. “A Simultaneous
Equation Demand Model for Block Rates.” Water Resources Research, 22(1):1–4.
Ahmad, I., and Sattar, A. 2010. Factors Determining Public Demand for Safe
Drinking Water (A Case Study of District Peshawar) (2010:58). Pakistan Institute
of Development Economics Islamabad.
Ahmed, E., & Sattar, A. 2007. Awareness and the demand of safe drinking water
practices (No. 2007: 21). Pakistan Institute of Development Economics Islamabad.
Akbar A,2017. Seven dead over 1,500 affected by Dengue in Peshawar, official.
THE DAWN, August 22, 2017. Retrived from https://www.dawn.com/news/
1353212/7-dead-over-1500-affected-by-dengue-in-peshawar-officials.

145
Altaf, A., Jamal, H., Whittington, D., & Mundial, B. 1992. WTP for water in rural
Punjab, Pakistan. In World Bank water and sanitation report (Vol. 4). Banco
Mundial.
Altaf, M. A. 1994. Household demand for improved water and sanitation in a large
secondary city: findings from a study in Gujranwala, Pakistan. Habitat
International, 18(1), 45-55.
AMCOW (African Ministers Council on Water). 2011. AMCOW Country Status
Overviews – Regional Synthesis Report. The World Bank/Water and Sanitation
Program. Washington, DC.
Annamalai, T. R., Devkar, G., Mahalingam, A., Benjamin, S., Rajan, S. C., &
Deep, A. 2016. What is the Evidence on Top-down and Bottom-up Approaches in
Improving Access to Water, Sanitation and Electricity Services in Low-income or
Informal Settlements. EPPI-Centre. Social Science Research Unit, UCL Institute
of Education, University College London: London.
Arbués, F., Garcıa-Valiñas, M.Á. and Martınez-Espiñeira, R. 2003. Estimation of
residential water demand: a state-of-the-art review, Journal of Socio-Economics,
32, pp. 81-102.
Arimah, B. C. 1996. WTP for improved environmental sanitation in a Nigerian
City. Journal of Environmental management, 48(2), 127-138.
Asante, F., Berger, T., Engel, S., & Iskandarani, M. 2002. Water security in the
Ghanaian Volta Basin: Patterns, determinants, and consequences. Quarterly
Journal of International Agriculture, 41(1), 145-167.
Asthana, A. N. 1997. Where the water is free but the buckets are empty: demand
analysis of drinking water in rural India. Open economies review,8(2), 137-149.
Aziz, J. A. 2005. Management of source and drinking-water quality in Pakistan.
Bakker, K. J. 2003. From public to private to… mutual? Restructuring water supply
governance in England and Wales. Geoforum, 34(3), 359-374.
Bartram, J., & Cairncross, S. 2010. Hygiene, sanitation, and water: forgotten
foundations of health. PLoS Med, 7(11), e1000367.
Basani, M., J. Isham, and B. Reilly. 2008. “The Determinants of Water Connection
and Water Consumption: Empirical Evidence from a Cambodian Household
Survey.” World Development, 36(5):953–968.

146
Basu, S. R., & Main, H. A. C. 2001. Calcutta's water supply: demand, governance
and environmental change. Applied Geography, 21(1), 23-44.
Bateman, I. J., & Willis, K. G. 2001. Valuing environmental preferences: theory
and practice of the contingent valuation method in the US, EU, and developing
countries. Oxford University Press on Demand.
Bateman, I. J., Carson, R. T., Day, B., Hanemann, M., Hanley, N., Hett, T., ... &
Pearce, D. W. 2002. Economic valuation with stated preference techniques: a
manual. Economic valuation with stated preference techniques: a manual.
Behrman, J. R., and Deolalikar, A. B. 1988. Health and nutrition. Handbook of
development economics, 1, 631-711.
Bhatti, A. M., & Nasu, S. 2010. Domestic water demand forecasting and
management under changing socio-economic scenario. Journal of Society for
Social Management Systems, Japan, SMS-10-183.
Billig, P., Bendahmane, D., &Swindale, A. 1999. Water and sanitation indicators
measurement guide. Food and Nutrition Technical Assistance Project, Academy
for Educational Development.
Birol, E., Karousakis, K., &Koundouri, P. 2006. Using economic valuation
techniques to inform water resources management: A survey and critical appraisal
of available techniques and an application. Science of the total
environment, 365(1), 105-122.
Boatable, F. 1993. The value of clean water: the public's WTP for boatable,
fishable, and swimmable quality water. Water resources research, 29, 2445-2454.
Bradburn, N. M., Sudman, S., &Wansink, B. 2004. Asking questions: the definitive
guide to questionnaire design--for market research, political polls, and social and
health questionnaires. John Wiley & Sons.
Breidert, C., Hahsler, M., &Reutterer, T. 2006. A review of methods for measuring
willingness-to-pay. Innovative Marketing, 2(4), 8-32.
Briand, A., &Laré, A. L. 2013. Households’ Demand of TAP connection from
Small Scale Private operators: A Study Applied to Maputo’s Peripheral Districts.
Revue économique, 64(4), 685-719.
Briscoe, J. and de Ferranti, D. 1988. Water for rural communities: Helping people
help themselves. Washington, Work Bank.

147
Brouwer, R., Job, F. C., van der Kroon, B., & Johnston, R. 2015. Comparing
willingness to pay for improved drinking-water quality using stated preference
methods in rural and urban Kenya. Applied health economics and health
policy, 13(1), 81-94.
Brown Jr, G., & Mendelsohn, R. 1984. The hedonic travel cost method. The review
of economics and statistics,66(3), 427-433.
Cahill, A. 2005. ‘The human right to water–a right of unique status’: The legal
status and normative content of the right to water. International Journal of Human
Rights, 9(3), 389-410.
Cairncross, S., &Feachem, R. 1993. Environmental health engineering in the
tropics: an introductory text (No. Ed. 2). John Wiley & Sons Ltd.
Calkins, P., Larue, B., &Vézina, M. 2002. WTP for drinking water in the Sahara:
The case of Douentza in Mali. Cahiers d’Econ. Sociol. Rurales, 64, 37-56.
Carson, R. T. 2000. Contingent valuation: a user's guide. Environmental science &
technology, 34(8), 1413-1418.
Carson, R. T., & Mitchell, R. C. 1993. The issue of scope in contingent valuation
studies. American Journal of Agricultural Economics, 75(5), 1263-1267.
Casey, J. F., Kahn, J. R., & Rivas, A. 2006. WTP for improved water service in
Manaus, Amazonas, Brazil. Ecological Economics, 58(2), 365-372.
Champ, P. A., Brown, T.C., & Boyle, K. J. 2003. Primer on Nonmarket Valuation.
The Economics of Nonmarket Goods and Resource, V (3). Academic publisher
Netherland.
Chatterjee, C., Triplett, R., Johnson, C. K., & Ahmed, P. 2017. Willingness to pay
for safe drinking water: A contingent valuation study in Jacksonville, FL. Journal
of environmental management, 203, 413-421
Cheema, G. S. 2005. Building democratic institutions: governance reform in
developing countries. Kumarian Press.
Cheesman, J., Bennett, J., & Son, T. V. H. 2008. Estimating household water
demand using revealed and contingent behaviors: Evidence from Vietnam. Water
resources research, 44(11).
Chicoine, D. L., S. C. Deller, and G. Ramamurthy. 1986. “Water Demand
Estimation under Block Rate Pricing: A Simultaneous Equation Approach.” Water
Resources Research, 22(6):859–863.

148
Choe, KveongAe, Dale Whittington, and Donald r. Lauria. 1996. The economic
benefits of surface water quality improvements in developing countries: A case
study of Davao, Philippines. Land Economics, 72(4):519-537.
Chowdhury, N. T. 1999. WTP for water in Dhaka slums: A Contingent Valuation
Study. Ahmad et al., IUCN-The World Conservation Union, Association of Green
Accounting, Environmental Economics in Bangladesh, 105-116.
Cotton, A. and R. Franceys. 1994. Infrastructure for the urban-poor—policy and
planning issues, Cities, 11: 15–24.
Crane, R. 1994. “Water Markets, Market Reform and the Urban Poor: Results from
Jakarta, Indonesia.” World Development, 22(1):71–83.
Cummings, R. G., Brookshire, D. S., Bishop, R. C., & Arrow, K. J. 1986. Valuing
environmental goods: an assessment of the contingent valuation method. Rowman
& Littlefield Pub Incorporated.
Cummings, R., Schulze, W., Gerking, S., & Brookshire, D. 1986. Measuring the
elasticity of substitution of wages for municipal infrastructure: A comparison of
the survey and wage hedonic approaches. Journal of Environmental Economics
and Management, 13(3), 269-276.
Dalhuisen, J. M., R. Florax, H. De Groot, and P. Nijkamp. 2003. “Price and Income
Elasticities of Residential Water Demand: A Meta-Analysis.” Land Economics,
79(2):292–308.
Daniere, A. G. 1994. Estimating willingness-to-pay for housing attributes an
application to Cairo and Manila. Regional Science and Urban Economics, 24(5),
577-599.
David, C. C., and A. B. Inocencio. 1998. “Understanding Household Demand for
Water: The Metro Manila Case.” Research Report, EEPSEA, Economy and
Environment Program for South East Asia. Available at http://web.idrc.ca/en/ev-
8441-201-1-DO_TOPIC.html.
Davis, J. 2005. Private-sector participation in the water and sanitation sector. Annu.
Rev. Environ. Resour., 30, 145-183.
Davis, J., & Whittington, D. 1998. “Participatory” research for development
projects: A comparison of the community meeting and household survey
techniques. Economic Development and Cultural Change, 47(1), 73-94.

149
Deaton, A., and Muellbauer, J. 1980. Economics and consumer behavior.
Cambridge university press.
Deller, S. C., D. L. Chicoine, and G. Ramamurthy. 1986. “Instrumental Variables
Approach to Rural Water Service Demand.” Southern Economic Journal,
53(2):333–346.
Dey, N. C., Parvez, M., Saha, R., Islam, M. R., Akter, T., Rahman, M., ... & Islam,
A. 2018. Water Quality and Willingness to Pay for Safe Drinking Water in Tala
Upazila in a Coastal District of Bangladesh. Exposure and Health, 1-14.
DFID. 1998a. Guidance manual for water and sanitation programs, WELL
Diakité, D., Semenov, A., & Thomas, A. 2009. A proposal for social pricing of
water supply in Côte d'Ivoire. Journal of Development Economics, 88(2), 258-268.
Dinar, A. 1998. Water policy reforms: information needs and implementation
obstacles. Water Policy, 1(4), 367–382.
Douglas, M. 1966. Purity and Danger: An Analysis of Concept of Pollution and
Taboo. Routledge, New York.
Dungumaro, E. W., &Madulu, N. F. 2003. Public participation in integrated water
resources management: the case of Tanzania. Physics and Chemistry of the Earth,
Parts A/B/C, 28(20), 1009-1014.
Dutta, V., &Verma, N. M. P. 2009. Water pricing, affordability and public choice:
An economic assessment from a large Indian metropolis. International Journal of
Economics and Finance, 1(2), 238.
Emerton, L., & Bos, E. 2004. Value: Counting ecosystems as water infrastructure.
Iucn.
Englin, J., & Mendelsohn, R. 1991. A hedonic travel cost analysis for valuation of
multiple components of site quality: the recreation value of forest management.
Journal of Environmental Economics and Management, 21(3), 275-290.
Espey, M., J. Espey, and W. D. Shaw. 1997. “Price Elasticity of Residential
Demand for Water: a Meta-analysis.” Water Resources Research, 33(6):1369–
1374.
Esrey, S. A., Potash, J. B., Roberts, L., &Shiff, C. 1990. Health benefits from
improvements in water supply and sanitation: survey and analysis of the literature
on selected diseases. WASH Technical Report. United States Agency for
International Development, (66).

150
Esrey, S. A., Potash, J. B., Roberts, L., &Shiff, C. 1991. Effects of improved water
supply and sanitation on ascariasis, diarrhoea, dracunculiasis, hookworm infection,
schistosomiasis, and trachoma. Bulletin of the World Health organization, 69(5),
609.
Feachem, R. G., McGarry, M. G., & Mara, D. D. 1977. Water, wastes and health in
hot climates. John Wiley and Sons Ltd.
Fewtrell, L., Kaufmann, R. B., Kay, D., Enanoria, W., Haller, L., &Colford, J. M.
2005. Water, sanitation, and hygiene interventions to reduce Diarrhea in less
developed countries: a systematic review and meta-analysis. The Lancet infectious
diseases, 5(1), 42-52.
Fisher, I. 1918. Is" Utility" the Most Suitable Term for the Concept It is Used to
Denote? The American Economic Review, 8(2), 335-337.
Flores, N. E., &Carson, R. T. 1997. The relationship between the income elasticities
of demand and willingness to pay. Journal of Environmental Economics and
Management, 33(3), 287-295
Foster, H. S. J., and B. R. Beattie. 1979. “Urban Residential Demand for Water in
the United States. “Land Economics, 55(1):43–58.
Francis, A. 2014. willingness-to-pay for improved sanitation among rural
communities in kabarole district.
Freeman III, A. M., Herriges, J. A., & Kling, C. L. 2014. The measurement of
environmental and resource values: theory and methods. Routledge.
Fujita, Y., Fujii, A., Furukawa, S., & Ogawa, T. 2005. Estimation of willingness-
to-pay (WTP) for water and sanitation services through contingent valuation
method (CVM): A case study in Iquitos City, The Republic of Peru. JBICI review,
11(March), 59-87.
Gadgil, A. 1998. Drinking water in developing countries. Annual review of energy
and the environment, 23(1), 253-286.
Garn, M. 1998. Managing water as an economic good: The transition from supply-
oriented to demand-responsive services. World Bank, Washington, DC.
Gaudin, S., R. C. Griffin, and R. Sickles. 2001. “Demand Specification for
Municipal Water Management: Evaluation of the Stone-Geary Form.” Land
Economics, 77(3):399–422.

151
Gilman, R. H., Marquis, G. S., Ventura, G., Campos, M., Spira, W., & Diaz, F.
1993. Water cost and availability: key determinants of family hygiene in a Peruvian
shantytown. American Journal of Public Health, 83(11), 1554-1558.
Gleick, P. H. 1998. The human right to water. Water policy, 1(5), 487-503.
GoKP (Government of Khyber Pakhtunkhwa, 2013. Development Statistics,
Bureau of statistics, Planning & Development Department. Peshawar, Pakistan.
GoKP. 2008. Multiple Indicator Cluster Survy (MISC), Government of Khyber
Pakhtunkhawa.
Goldblatt, M. 1999. Assessing the effective demand for improved water supplies in
informal settlements: a WTP survey in Vlakfontein and Finetown,
Johannesburg. Geoforum, 30(1), 27-41.
Gorre-Dale, E. 1992. The Dublin Statement on Water and Sustainable
Development. Environmental Conservation, 19(02), 181-181
Government of Khyber Pakhtunkhwa. 2012. Local Government System in Khyber
Pakhtunkhwa A Historical Analysis. Good Governance Programme in Pakistan.
Government of Pakistan, 2004. National water Quality Monitoring Program,
PCRWR.
Government of Pakistan. 1998. District Census Report of Peshawar. Population
Census Organization Statistic Division, Govt. of Pakistan, Islamabad.
Government of Pakistan. 2009. Pakistan National Drinking Water Policy. Ministry
of environment, GoP.
Government of Pakistan. 2011. State Bank of Pakistan Annual Report 2010–2011.
Islamabad. ww.sbp.org.pk/reports/annual/arFY11/Economic_Outlook.pdf.
Government of Pakistan. 2015. Pakistan Social and Living Standards Measurement
Survey (PSLM). Federal Bureau of Statistics Islamabad (FBS).
Grafton. R. Q., and M. Ward. 2008. “Prices versus Rationing: Marshallian Surplus
and Mandatory Water Restrictions.” The Economic Record, 84: 57-65.
Griffin, R. C., and C. Chang. 1991. “Seasonality in Community Water Demand.”
Western Journal of Agricultural Economics, 16(2):207–217.
Griffinn, C., Briscoe, J., Singh, B., Ramasubban, R., Bhatia, R., 1995. Contingent
valuation and actual behaviour: predicting connections to new water systems in the
state of Kerala, India. The World Bank Economic Review, 9 (3), 373-395.

152
Grosh, M., & Glewwe, P. 2000. Designing household survey questionnaires for
developing countries. Washington, DC: World Bank.
Guha, S. 2007. Valuation of clean water supply by WTP method in a developing
nation: A case study in Calcutta, India. Journal of Young Investigators, 17(4).
Gunatilake, H., & Tachiiri, M. 2012. WTP and inclusive tariff designs for improved
water supply services in Khulna, Bangladesh.
Gunatilake, H., Yang, J. C., Pattanayak, S., &Choe, K. A. 2007. Good practices for
estimating reliable willingness-to-pay values in the water supply and sanitation
sector.
Gupta, S., Kumar, S., & Sarangi, G. K. 2012. Measuring the performance of water
service providers in urban India: implications for managing water utilities. Water
Policy, 14(3), 391-408.
Haider, M., &Badami, M. G. 2010. Urbanization and local governance challenges
in Pakistan. Environment and urbanization ASIA, 1(1), 81-96.
Hanemann, W. M. 1984. Welfare evaluations in contingent valuation experiments
with discrete responses. American Journal of Agricultural Economics 66: 332-341.
Hanemann, W. M. 1998. “Determinants of Urban Water Use.” In Urban Water
Demand Management and Planning, edited by Duane Baumann, John Boland, and
Michael Hanemann. 31–75. New York: McGraw Hill.
Hanley, N., Adamowicz, W., & Wright, R. E. 2005. Price vector effects in choice
experiments: an empirical test. Resource and energy economics, 27(3), 227-234.
Hanley, N., Mourato, S., & Wright, R. E. 2001. Choice Modelling Approaches: A
Superior Alternative for Environmental Valuation? Journal of economic
surveys, 15(3), 435-462
Hansen, L. G. 1996. “Water and Energy Price Impacts on Residential Water
Demand in Copenhagen.” Land Economics, 72(1):66–79.
Hansen, M. H., Hurwitz, W. N., & Madow, W. G. 1953. Sample survey methods
and theory (Vol. 1, p. 638). New York: Wiley.
Haq, M., Mustafa, U., & Ahmad, I. 2007. Household's WTP for safe drinking water:
a case study of Abbottabad district. The Pakistan Development Review, 1137-1153.
Heller, L. 1999. Health impact of lack of adequate water supply and sanitation:
status and prospects for future research. Pan Amer. Health Org. NY.

153
Hewitt, J. A., & Hanemann, W. M. 1995. A discrete/continuous choice approach to
residential water demand under block rate pricing. Land Economics, 71: 173-192.
Höglund, L. 1999. “Household Demand for Water in Sweden, with Implications of
a Potential Tax on Water Use.” Water Resources Research, 35(12):3853–3863.
Horowitz, J. K., &McConnell, K. E. 2003. Willingness to accept, willingness to pay
and the income effect. Journal of Economic Behavior & Organization, 51(4), 537-
545
Howard, G., & Bartram, J. 2003. Domestic water quantity, service level, and
health (p. 33). Geneva: World Health Organization.
Howard, G., & Bartram, J. 2005. Effective water supply surveillance in urban areas
of developing countries. Journal of water and health, 3(1), 31-43.
Hubbard, B., Sarisky, J., Gelting, R., Baffigo, V., Seminario, R., & Centurion, C.
2011. A community demand-driven approach toward sustainable water and
sanitation infrastructure development. International journal of hygiene and
environmental health, 214(4), 326-334.
Hussen, A. 2012. Principles of environmental economics and sustainability: An
integrated economic and ecological approach. Routledge.
Huttly, S.., S. Morris, and V. Pisani. 1997. Prevention of diarrhoea in young
children in developing countries. Bulletin of the World Health Organization,
75(2):163-174.
Hutton, G. 2012. Monitoring “Affordability” of water and sanitation services after
2015: Review of global indicator options. A paper submitted to the UN Office of
the High Commissioner for Human Rights.
Inam Ullah, E., & Alam, A. 2014. Assessment of drinking water quality in
Peshawar, Pakistan. Bulg. J. Agric. Sci, 20, 595-600.
Jayasundara, J., Kotagama, H. B., & Weerahewa, J. 1999. WTP for drinking water
quality improvements.
Jenkins, M. W., & Scott, B. 2007. Behavioral indicators of household decision-
making and demand for sanitation and potential gains from social marketing in
Ghana. Social Science & Medicine, 64(12), 2427-2442.
Kahneman, D.; Knetsch, J. L. 1992. Valuing public goods: the purchase of moral
satisfaction. Journal of Environmental Economics and Management, 22: 57-70.

154
Kaliba, A. R., Norman, D. W., & Chang, Y. M. 2003. WTP to improve domestic
water supply in rural areas of Central Tanzania: Implications for policy. The
International Journal of Sustainable Development & World Ecology, 10(2), 119-
132.
Kayser, G. L., Moriarty, P., Fonseca, C., & Bartram, J. 2013. Domestic water
service delivery indicators and frameworks for monitoring, evaluation, policy and
planning: a review. International journal of environmental research and public
health, 10(10), 4812-4835.
Khalid, Tehseen. 2014. "Environmental Sustainability-Access to improved
Drinking Water and Sanitation.” Pakistan Institute e for Parliamentary Services, I
(4), pp 1-11.
Khan, F. J., and Javed, Y. 2007. Delivering access to safe drinking water and
adequate sanitation in Pakistan (2007: 30). Pakistan Institute of Development
Economics, Islamabad.
Khan, H. 2014. Estimating elasticities of demand and WTP for clean drinking
water: empirical evidence from a household level survey in northern
Pakistan. Water and Environment Journal, 28(1), 145-152.
Khan, H., Iqbal, F., Saeed, I., & Khan, I. 2010. Estimating WTP for improvements
in drinking water quality: evidence from Peshawar, Northern
Pakistan. Environmental Economics, 1(2), 38-43.
Kjaer, T. 2005. A review of the discrete choice experiment-with emphasis on its
application in health care (p. 1). Denmark: Syddansk Universitet.
Komives, K. 2003. Infrastructure, property values, and housing choice: an
application of property value models in the developing country
context. Infrastructure, property values, and housing choice: an application of
property value models in the developing country context.
Krauss, G., & Boland, J. J. 1997. Water and sanitation services for
megacities. Water Quality International, 5(1997), 9-12.
Kremer, M., Leino, J., Miguel, E., & Zwane, A. P. 2007. Spring cleaning: a
randomized evaluation of source water quality improvement. Quarterly Journal of
Economics, 4(2), 09-30.
Kremer, M., Null, C., Miguel, E., & Zwane, A. P. 2008. Trickle down: diffusion of
chlorine for drinking water treatment in Kenya. Available from (Accessed:).

155
Kulshreshtha, S. N. 1996. “Residential Water Demand in Saskatchewan
Communities: Role Played by Block Pricing System in Water Conservation.”
Canadian Water Resources Journal, 21(2):139–155.
Larson, B., B. Minten, and R. Razafindralambo. 2006. “Unravelling the Linkages
between the Millennium Development Goals for Poverty, Education, Access to
Water and Household Water Use in Developing Countries: Evidence from
Madagascar.” Journal of Development Studies, 42(1):22–40.
Loetscher, T. & Keller, J. 2002. A decision support system for selecting sanitation
systems in developing countries. Socioeconomic Planning Sciences, 36, 267–290.
Looney, R.E. and P.C. Frederiksen. 1995. Constraints on Pakistan industrial-
development—A test of the infrastructural bottleneck hypothesis, Third World
Planning Review, 17: 87–95.
Louviere, J. J., Hensher, D. A., &Swait, J. D. 2000. Stated choice methods: analysis
and applications. Cambridge University Press.
Lüthi, C., McConville, J., & Kvarnström, E. 2010. Community-based approaches
for addressing the urban sanitation challenges. International Journal of Urban
Sustainable Development, 1(1-2), 49-63.
MacRae, Duncan, Jr. and Dale Whittington. 1988. Assessing preferences in cost-
benefit analysis: Reflections on rural water supply evaluation in Haiti. Journal of
Policy Analysis and Management, 7(2):246-263.
Madanat, S., and F. Humplick. 1993. “A Model of Household Choice of Water
Supply Systems in Developing countries.” Water Resources Research, 29:1353–
8.
Mara, D. D. 2003. Water, sanitation and hygiene for the health of developing
nations. Public Health, 117, 452–456.
Mara, D., Lane, J., Scott, B., &Trouba, D. 2010. Sanitation and health. PLoS
Medicine, 7(11), e1000363.
Martínez-Espiñeira, R. 2002. “Residential Water Demand in the Northwest of
Spain.” Environmental and Resource Economics, 21(2):161–187.
McFadden, D. 2001. Economic choices. The American Economic Review, 91(3),
351-378.

156
McGranahan, G. 2015. Realizing the right to sanitation in deprived urban
communities: meeting the challenges of collective action, coproduction,
affordability, and housing tenure. World Development, 68: 242-253.
Mezgebo, G. K., &Ewnetu, Z. 2015. Households WTP for improved water services
in urban areas: A case study from Nebelet town, Ethiopia. Journal of Development
and Agricultural Economics, 7(1), 12-19.
Misra, S. 1999. Water pollution abatement in small-scale industries: an exploration
of collective action possibilities in Nandesari Industrial Area in Gujarat. A Ph. D
Thesis submitted to the University of Delhi, Delhi.
Mitchell, R. C., & Carson, R. T. 1989. Using surveys to value public goods: the
contingent valuation method. Resources for the Future.
Moe, C. L., &Rheingans, R. D. 2006. Global challenges in water, sanitation and
health. Journal of water and health, 4(S1), 41-57.
Montgomery, M. A., &Elimelech, M. 2007. Water and sanitation in developing
countries: including health in the Equation. Environ. Sci. Technol, 41(1), 17-24.
Morris, E., &Thi Le, T. T.2012. A modified method to determine the value for
sanitation: Case study on the WTP for sanitation in peri-urban households of
Peru. Waterlines, 31(4), 314-325.
Mosel, I., and Jackson, A. 2013. Sanctuary in the City? Urban Displacement and
Vulnerability in Peshawar, Pakistan. Overseas development institute United
Kingdom.
Mu, X., D. Whittington, and J. Briscoe. 1990. “Modeling Village Water Demand
Behavior: A Discrete Choice Approach,” Water Resources Research, 26(4):521–
529.
Nauges, C., and A. Thomas. 2000. “Privately-operated Water Utilities, Municipal
Price Negotiation, and Estimation of Residential Water Demand: The Case of
France.” Land Economics. 76(1):68–85.
Nauges, C., and C. van den Berg. 2009. “Demand for Piped and Non-Piped Water
Supply Services: Evidence from Southwest Sri Lanka.” Environmental and
Resource Economics, 42(4):535-549.
Nauges, C., and J. Strand. 2007. “Estimation of Non-tap Water Demand in Central
American Cities.” Resource and Energy Economics, 29:165–182.

157
Nawab, B., and Nyborg, I. L. 2009. Institutional challenges in water supply and
sanitation in Pakistan: revealing the gap between national policy and local
experience. Water Policy, 2009, international water association, 11(5): 582-597.
Nickson, A. 1997. The public-private mix in urban water supply. America, 4, 649-
83.
Nieswiadomy, M. L., and D. J. Molina. 1989. “Comparing Residential Water
Demand Estimates under Decreasing and Increasing Block Rates Using Household
Data.” Land Economics, 65(3):280–289.
Noor, J., Siddiqi, W., & Muhammad, T. 2010. Estimation of WTP for
Improvements in Drinking Water Quality in Lahore: A Case Study of WASA,
Lahore. Online at http://mpra.ub.uni-muenchen.de/53763/ .
North, J. H., & Griffin, C. C. 1993. Water source as a housing characteristic:
Hedonic property valuation and WTP for water. Water Resources Research, 29(7),
1923-1929.
Olmstead, S. M., W. M. Hanemann, and R. N. Stavins. 2007. “Water Demand
under Alternative Price Structures.” Journal of Environmental and Economics
Management, 54:181–198.
Organization, W. H. 1987. Technology for water supply and sanitation in
developing countries: report of a WHO study group [meeting held in Geneva from
14 to 19 April 1986].
Parry-Jones, S. (1999). Optimising the selection of demand assessment techniques
for water supply and sanitation projects. Project task, (207).
Parveen, S. 2015. Estimating WTP for Drinking Water Quality in Nowshera: A
Domestic Study for Public Health. Journal of Economics, 1(1).
Pattanayak, S. K., Van den Berg, C., Yang, J. C., & Van Houtven, G. 2006. The
use of WTP experiments: estimating demand for piped water connections in Sri
Lanka. World Bank Policy Research Working Paper, (3818).
Pattanayak, S. K., Yang, J. C., Whittington, D., & Bal Kumar, K. C. 2005. Coping
with unreliable public water supplies: averting expenditures by households in
Kathmandu, Nepal. Water Resources Research, 41(2).
Persson, T. H. 2002. Household choice of drinking–water source in the
Philippines. Asian Economic Journal, 16(4), 303-316

158
Pint, E. 1999. “Household Responses to Increased Water Rates during the
California Drought.” Land Economics, 75(2):246–266.
Pond, K.; Rueedi, J.; Pedley, S. Microrisk: 2004. Pathogens in Drinking Water
Sources; Robens Centre for Public and Environmental Health, University of
Surrey, U.K.
Province, K. P. 2010. Pakistan Safe Drinking Water And Hygiene Promotion
Project In Khyber Pakhtunkhwa and Peshawar.
Rauf, S., Bakhsh, K., Hassan, S., Nadeem, A. M., & Kamran, M. A. 2015.
Determinants of a Household’s Choice of Drinking Water Source in Punjab,
Pakistan. Polish Journal of Environmental Studies, 24(6).
Reddy, V. R., & Dev, S. M. 2006. The Canvas: Policies, Institutions, and
Technologies. Managing Water Resources, Policies, Institutions, and
Technologies, by V. Ratna Reddy and S. Mahendra Dev, Oxford University Press,
New Delhi.
Reed, B. J. 2005. "Minimum water quantity needed for domestic uses."
WHO/SEARO Technical Notes for Emergencies Technical Note 9 (2005).
Renwick, M. E., and R. Green. 2000. “Do Residential Water Demand Side
Management Policies Measure Up? An Analysis of Eight California Water
Agencies.” Journal of Environmental Economics and Management, 40(1):37–55.
Report, B. 2017. Elected councillors blast WSSP for ‘zero performance’ THE
NEWS. Retrieved from https://www.thenews.com.pk/print/198687-Elected-
councillors-blast-WSSP-for-zero-performance.
Richter, M. K. 1966. Revealed preference theory. Econometrica: Journal of the
Econometric Society, 34(3): 635-645.
Rietveld, P., J. Rouwendal, and B. Zwart. 2000. “Block Rate Pricing of Water in
Indonesia: An Analysis of Welfare Effects.” Bulletin of Indonesian Economic
Studies, 36(3):73–92.
Rizaiza, O. 1991. “Residential Water Usage: A Case Study of the Major Cities of
the Western Region of Saudi Arabia.” Water Resources Research, 27(5):667–671.
Rogerson, C. 1996. WTP for water: the international debates, Water SA, 22(4),73-
80.

159
Rollins, K., Zachariah, O., Frehs, J., & Tate, D. 1997. Resource Valuation and
Public Policy: Consumers ‘WTP for Improving Water Servicing
Infrastructure. Canadian Water Resources Journal, 22(2), 185-195.
Rosemann, N. 2005. Drinking water crises in Pakistan and the issue of bottled
water: The Case of Nestle’s Pure Life. Actionaid Pakistan.
Rouse, J.R. 2006. Seeking common ground for people: Livelihoods, governance
and waste, Habitat International, 30:741–53.
Rouse, M. 2014. The worldwide urban water and wastewater infrastructure
challenge. International Journal of Water Resources Development, 30(1), 20-27.
doi:10.1080/07900627.2014.882203
Russell, S., FOX-RUSHBY, J. U. L. I. A., & ARHIN, D. 1995. Willingness and
ability to pay for health care: a selection of methods and issues. Health Policy and
Planning, 10(1), 94-101.
Ryan, M., & Wordsworth, S. 2000. Sensitivity of WTP estimates to the level of
attributes in discrete choice experiments. Scottish Journal of Political
Economy, 47(5), 504-524.
Sabiha, J., M. Tufail and S. Khalid. 2008. Heavy metal pollution from medical
waste incineration at Islamabad and Rawalpindi, Pakistan, Microchemical Journal,
90: 77–81.
Saleth, R. M., & Dinar, A. 1997. Satisfying urban thirst: water supply
augmentation and pricing policy in Hyderabad City, India (Vol. 395). World Bank
Publications.
Samiullah, S.2013. Expansion of Built Up Area and Its Impact on Urban
Agriculture: A Case Study of Peshawar Pakistan (Doctoral dissertation, University
of Peshawar, Peshawar).
Samuelson, P. A. 1948. Consumption theory in terms of revealed
preference. Economica, 15(60), 243-253.
Sattar, A., Ahmad, E., & Pant, K. P. 2007. WTP for the Quality of Drinking Water
[with Comments]. The Pakistan Development Review, 767-777.
Sebri, M. 2014. A meta-analysis of residential water demand studies. Environment,
development and sustainability, 16(3), 499-520.
Serageldin, I. 1994. Water supply, sanitation, and environmental sustainability: the
financing challenge. World Bank.

160
Seraj, K. F. B. 2008. WTP for improved sanitation services and its implication on
demand responsive approach of BRAC water, sanitation and hygiene programme.
BRAC.
Sigel, K., Altantuul, K., &Basandorj, D. 2012. Household needs and demand for
improved water supply and sanitation in peri-urban ger areas: the case of Darkhan,
Mongolia. Environmental Earth Sciences, 65(5), 1561-1566.
Sohail, M., Cavill, S., & Cotton, A. P. 2005. Sustainable operation and
maintenance of urban infrastructure: Myth or reality? Journal of urban planning
and development, 131(1), 39-49.
Solón, P. 2010. The Human Right to Water and Sanitation. 64th General Assembly
Plenary, United Nations, New York (28 July 2010).
Soomro, M., Khokhar, M., Hussain, W., & Hussain, M. 2011. Drinking water
Quality challenges in Pakistan. Pakistan Council of Research in Water Resources,
Lahore, 17-28.
Soto Montes de Oca, G., & Bateman, I. J. 2006. Scope sensitivity in households'
WTP for maintained and improved water supplies in a developing world urban
area: Investigating the influence of baseline supply quality and income distribution
upon stated preferences in Mexico City. Water Resources Research, 42(7).
Strand, J., and I. Walker. 2005. “Water Markets and Demand in Central American
Cities.” Environment and Development Economics, 10(3):313–335.
Tanellari, E., Bosch, D., Boyle, K., & Mykerezi, E. (2015). On consumers' attitudes
and willingness to pay for improved drinking water quality and
infrastructure. Water Resources Research, 51(1), 47-57.
The Mashriq, 2017.the spread of dengue virous in Peshawar (The daily Mashriq,
dated 16-08-2017)
Tussupova, K., Berndtsson, R., Bramryd, T., & Beisenova, R. (2015). Investigating
willingness to pay to improve water supply services: application of contingent
valuation method. Water, 7(6), 3024-3039.
Tziakis, I., Pachiadakis, I., Moraitakis, M., Xideas, K., Theologis, G.,
&Tsagarakis, K. P. 2009. Valuing benefits from wastewater treatment and reuse
using contingent valuation methodology. Desalination, 237(1), 117-125.
UNDP. 1997. Governance for Sustainable Human Development. UNDP.

161
UNICEF. 1998. Cost and impact analysis of water supply and environmental
sanitation in Pakistan. Master plan of Operation. Govt. of Pakistan, Islamabad.
United Nation .2005. Health, Dignity, and Development: What Will it Take? UN
Millennium Project task Force on Water and Sanitation, Washington, DC.
United Nations (UN). 2010. The Millennium Development Goals Report,
Published the United Nations Department of Economic and Social Affairs, June,
2010, New York.
United Nations. 2016. The Sustainable Development Goals Report, Published the
United Nations Department of Economic and Social Affairs, June, 2016, New
York.
Van Koppen, B., Moriarty, P., &Boelee, E. 2006. Multiple-use water services to
advance the millennium development goals (Vol. 98). IWMI.
Van Minh, H., Nguyen-Viet, H., Thanh, N. H., & Yang, J. C.2013. Assessing WTP
for improved sanitation in rural Vietnam. Environmental health and preventive
medicine, 18(4), 275-284.
van Ryneveld, M., 1995. Costs and affordability of water supply and sanitation
provision in the urban areas of South Africa. Water SA, 21 (5), 1-14.
Vásquez, W. F., Mozumder, P., Hernández-Arce, J., &Berrens, R. P. 2009. WTP
for safe drinking water: Evidence from Parral, Mexico. Journal of Environmental
Management, 90(11), 3391-3400.
Venkatachalam, L. 2006. Factors influencing household WTP (WTP) for drinking
water in peri-urban areas: a case study in the Indian context. Water Policy, 8(5),
461-473.
Wasike, W. S., & Hanley, N. 1998. The Pricing of Domestic Water Services in
Developing Countries: A Contingent Valuation Application to Kenya.
International Journal of Water Resources Development, 14(1): 41-54.
Watkins, K. 2006. Human Development Report 2006-Beyond scarcity: Power,
poverty and the global water crisis. UNDP Human Development Reports.
WBWDRT. 1993. World Bank Water Demand Research Team. The demand for
water in rural areas: determinants and policy implications. The World Bank
Research Observer, 8(1), 47-70.

162
Weber, M. 1968. Economy and Society: An Interpretive Sociology. Gerth, Hans
H. & Wright Mills, C. (eds). Oxford University Press, New York, (original essays
published in 1906–1924).
Wedgwood, A., & Sansom, K. 2003. Willingness-to-Pay Surveys: A Streamlined
Approach: Guidance Notes for Small Town Water Services. WEDC,
Loughborough University.
Wendimu, S., & Bekele, W. 2011. Determinants of individual WTP for quality
water supply: The case of WonjiShoa Sugar Estate, Ethiopia. Journal of Ecology
and the Natural Environment, 3(15), 474-480.
Whittington, D. 1998. Administering contingent valuation surveys in developing
countries. World development, 26(1), 21-30.
Whittington, D. 2002. Improving the performance of contingent valuation studies
in developing countries. Environmental and resource economics, 22(1-2), 323-
367.
Whittington, D. 2010. What have we learned from 20 years of stated preference
research in less-developed countries? Annu. Rev. Resour. Econ., 2(1), 209-236.
Whittington, D., Briscoe, J., Mu, X., & Barron, W. 1990. Estimating the WTP for
water services in developing countries: a case study of the use of contingent
valuation surveys in Southern Haiti. Economic development and cultural
change, 38(2), 293-311.
Whittington, D., Davis, J., & McClelland, E. 1998. Implementing a demand-driven
approach to community water supply planning: A case study of Lugazi, Uganda.
Water international, 23(3), 134-145.
Whittington, D., Lauria, D. T., & Mu, X. 1991. A study of water vending and WTP
for water in Onitsha, Nigeria. World development, 19(2), 179-198.
Whittington, D., Lauria, D., Okun, D., and Mu,X. 1987, An assessment of water
vending activities in developing countries, Working Papers No 185 Arlington,VA,
Washington.
Whittington, Dale, Donald T. Lauria, Albert M. Wright, Kyeong Ae Choe, Jeffrey
Hughes, and Venkateswarlu Swarna. 1993a. Household demand for improved
sanitation services in Kumasi, Ghana: A contingent valuation study. Water
Resources Research, 29(6): 1539- 1560.
163
Whittington, Dale, Donald T. Lauria, Kyeong AeChoe, Jeffrey Hughes, and
Venkateswarlu Swarna. 1993b. Household sanitation in Kumasi, Ghana: A
description of current practices, attitudes, and perceptions. World Development,
21(5):733-748.
Whittington, G. 1993. Corporate governance and the regulation of financial
reporting. Accounting and Business Research, 23(sup1), 311-319.
WHO. 2015. Progress on sanitation and drinking water: WHO/UNICEF Joint
Monitoring program.
World Bank. 1993. Water Demand Research Team. The demand for water in rural
areas: determinants and policy implications. The World Bank Research
Observer, 8(1), 47-70.
Wurbs, R. A., & James, W. P. 2002. Water resources engineering. Prentice Hall.
Yin, R. (1984). case study research. Beverly Hills.
Young, Beverly, and John Briscoe. 1987. A case-control study of the effect of
environmental sanitation on Diarrhea morbidity in Malawi. Journal of
Epidemiology and Community Health 42(l):82-88.
Zekri, S., & Dinar, A. 2003. Welfare consequences of water supply alternatives in
rural Tunisia. Agricultural Economics, 28(1), 1-12.

164
ANNEXURES
Annexure I: Projected Population of Urban Union Councils Peshawar
Projected population of Urban Union Councils Peshawar and allocation of sample size
through Proportional Allocation Method.
Name of UC Population
1998 1998-2003 2003-2008 2008-2013 2013-2018
Sample
size
Akhunabad 24,100 28706 34028 40337 47815 15
Andhar Sher 17,099 20367 24143 28619 33925 10
Asia 25752 30674 36361 43102 51093 16
Bhanna Mari 17637 21008 24903 29520 34992 11
Cantt Area-I and II 68740 81878 97058 115052 136382 42
Deh Bahdar 23138 27560 32670 38727 45906 14
Dheri Bhagmanan 17351 20667 24499 29041 34425 11
Faqirabad 16351 19476 23087 27367 32441 10
Gunj 18685 22256 26382 31274 37072 11
Gulbahar 18492 22026 26110 30951 36689 11
Hassan Ghari No.1 21613 25744 30517 36174 42881 13
Hassan Ghari No.2 18641 22204 26320 31200 36984 11
Hayatabad No-1 14986 17850 21160 25082 29733 9
Hayatabad No-2 17753 21146 25067 29714 35222 11
Hazar Khawani -1 20720 24680 29256 34680 41109 13
Hazar Khawani -2 25330 30171 35765 42396 50255 15
Jahangir Pura 19105 22757 26976 31977 37905 12
Kakshal-1 19222 22896 27141 32172 38137 12
Kakshal-2 18998 22629 26824 31797 37693 12
Karim Pura 16666 19851 23532 27894 33066 10
Khalisa-1 15861 18893 22395 26547 31469 10
Khalisa-2 22711 27052 32067 38012 45059 14
Lahori 18429 21951 26021 30845 36564 11
Landi Arbab 22032 26243 31108 36876 43712 13
Mahal Terahi -1 23504 27996 33187 39339 46633 14

165
Mahal Terahi -2 32634 38871 46078 54620 64747 20
Malkandhir 20467 24379 28899 34256 40607 12
Nauthia Qadeem 21887 26070 30904 36633 43424 13
Nauthia Jadid 23295 27747 32892 38989 46218 14
Palosi 22528 26834 31809 37706 44696 14
Pawaka 24817 29560 35041 41537 49238 15
Shaheen Muslim
Town 1 19268
22951 27206 32249 38228 12
Shaheen Muslim
Town 2 21495
25603 30350 35977 42647 13
Shaheen Town 25749 30670 36357 43097 51087 16
Shahi Bagh 18147 21615 25623 30373 36004 11
Sheikh Junaidabad 22837 27202 32245 38223 45309 14
Sikandar Town 19687 23450 27797 32951 39060 12
Tehkal Bala 26178 31181 36962 43815 51938 16
Tehkal Payan -1 18550 22096 26192 31048 36804 11
Tehkal Payan -2 15961 19012 22536 26714 31667 10
University Town 18581 22132 26236 31100 36865 11
Wazir Bagh 24768 29502 34971 41455 49140 15
Yakka Toot-i 16719 19915 23607 27983 33171 10
Yakka Toot-ii 26230 31243 37036 43902 52041 16
Yakka Toot-iii 20102 23944 28383 33645 39883 12
subtotal urban 982,816 1170664 1387697 1644967 1949932 600

166
Annexure II: Calculation of Water and Sanitation Indicators
Water and Sanitation Indicators Analyzed in Urban Peshawar
S# Indicators Definition Calculation
Numerator Denominator
1 Quantity of
water used per
day.
All the water collected by or
delivered to the Household
and used for personal purpose.
Volume of water (in
liters) collected for all
domestic use per day by
all HHs in the sample
Total no of
people in the
sample HHs.
2 Use of
adequate
Water
Treatment
method.
Use of adequate Water
Treatment method means to
disinfect water, killing
harmful pathogens.
No of HHs who treat
their water using an
adequate water treatment
method.
Total no of
HHs member
surveyed.
3 Children<36
months with
Diarrhea in the
last two weeks
Diarrhea means more than
three loose stools passed in 24
hrs period
No of children<36
months of age in the
sample with Diarrhea in
the last two weeks
Total no of
children <36
months of age
in the sample.
4 HHs access to
improved
water source.
Access means either direct
connection to home or public
facility within 200 meter from
the home.
No of HHs access in the
sample with access to an
improved water source.
Total no of
HHs in the
sample.
5 HHs access to
sanitation
facility
Sanitation facility means and
excreta disposal facility,
typically a toilet or latrine:
and access means HHs has
private facility or share
facility with others in the
house.
No of HHs in the sample
with access to sanitation
facility
Total no of
HHs in the
sample.
6 HHs access to
hygienic
sanitation
facility
Sanitation facility means and
excreta disposal facility,
typically a toilet or latrine:
and hygienic means there is
no feces on the floor or seat
and there are few flies.
Number of people >36
months of age in HH in
the sample using
hygienic sanitation
facilities
Total no of
people >36
months of age
in the HHs in
the sample
area.

167
Annexure III: Household Questionnaire
An Analysis of Household’s Demand for Improved Water and Sanitation
Services towards better planning in Peshawar
Questionnaire
Aims and Objectives
The aim of this study is to analyze household demands for improved water and
sanitation services for ensuring better planning in Peshawar. The detailed objectives
are:
To assess the existing state of water and sanitation services in Peshawar and to
compare the information with the international standards.
To analyze problems faced by households regarding water and sanitation services
and to prioritize these issues.
To estimate the household’s demand for improved water and sanitation services.
To assess the determinants of WTP for improved water and sanitation services.
To determine the policy gaps and suggesting policy recommendation for improved
water and sanitation services.
Part-I: Demographic
1. Name and Code of Union council.
Name of UC Code of UC
2. How old are you?
........................years
3. Housing occupancy status?
Own Other wise
4. In case of rented - Monthly rent paid for current month?
Rs……………………….
5. Type of Material used in the construction of house?
Kaccha Pakkha Mixed

168
7. Plot size of the household’s?
<3 Marla 3-5 Marla 6-10
Marla
11-15 Marla 16-20 Marla >20
8. Are you employed?
Yes No
9. If yes, what is your occupation?
1
Govt. Employee
2
Private Employee
3
Self Emplyed
4
Other
10. What is your marital status?
Single
Married
11. Total number of persons in the household.
Male Female Total
12. Are you educated? (Yes/ No)
13. State your education.
i. Middle
ii. Matric
iii. Intermediate
iv. Bachelor
v. Master
vi. Higher (M.Phil./Ph.D.)
14. Total No of children, whose age <36 months in this household?
Number…………………...
15. Total No of household’s members whose age is >36 months?
Number………………

169
16. Number of earning members in the family?
Male Female Total
17. Total Household monthly expenditure (In PKR)?
i. Utility expenditure--------------------
ii. Food expenditure--------------------
iii. Education expenditure-------------------
iv. Health expenditure------------------------
v. Miscellaneous ----------------------
18. Total income of the main earner of this household?
Rs. Per month………………………...
Part-II: Water Supply
19. Water source at Household level?
Private bore/ hand pump. Public
tap.
Both public and
private
Unprotected
well
Other
20. If access is public, which authority is responsible for water services in this
locality? Please tick
Water and sanitation service company
Peshawar development authority
Cantonment board
Other? Specify please
21. Volume of water uses for all domestic purposes (in liters) per day at your
household level? Drinking Bathing Cooking Cleaning Toilet Watering
animal
Watering
garden
Other Total
22. How far is the water source from your home?
Water at premises 100-200 m 201-300m 301-400m 401 and above.
23. Total collection time?
Water and premises 1-10 minutes 11-20 minutes 21-30 minutes 31 and above

170
24. Do you have water meter connection?
Yes No
25. If yes, what is the mode of payment for water bill?
Monthly on flat rate progressive rate Free/ no bill
26. Average water bill per month of the households.
Rs……………….
27. Satisfaction of the households about the existing available water services
Indicators.
Indicators Satisfactory Neutral Dissatisfactory
Distance from the source
Quantity of water available
Pressure of water
Monthly charges applied for the services
Discrimination in Distribution of the
service
Quality of water
28. Do you have any issue related to water at home?
Yes No
29. If yes for Q-28, then check the problem, please.
Quantity of water is not sufficient
Pressure is low
Source of water is too far
Water is contaminated and quality of water is not good
Discrimination in water distribution
All of the above
30. What issues do you face regarding water services? Please prioritize it on the basis
of severity in Numbers i.e. 1, 2, 3……...and so on.

171
I. Quantity problem
Problems priority
Low pressure
Power outage
Illegal Connection
Hours of water supply
Non-Revenue Water
II. Infrastructure problem
Problem Priority
Rusted and damage pipes
Unplanned water supply distribution system
lack of investments in water supply infrastructure
Distribution pipes along with sewerage/drainage system
Network capacity to cope with growing demand
No priority 0
III. Quality of water
Problem Water color is not good Water smell is not good. Taste is not good No priority
Priority 0
31. What are the main reasons for water contamination? Please tick the relevant box.
Distribution Pipes are rusted and are along with the sewerage line
Source of water is not protecsted
Sucking machine suck contaminated water from drains
Other
32. Do you treat water at home?
Yes No
33. If yes, then state Domestic Method used for water treatment.
boil use water filter strain cloth Chlorination let stand and settled Other

172
34. Why do you treat water?
Quality of water is not good
For safety of my family from water born disease
Above all.
35. Has any of your children whose age is <36 months gone through prevalence of
Diarrhea for the last two weeks?
Yes No
36. If yes, total number of children <36 months of age who have prevalence of
Diarrhea from the last two weeks.
Number of children………………………………..
37. Do you know improved and safe water services?
Yes No
38. Are you willing to pay more for improved water services?
Yes No
39. If yes, what is your main motivation for WTP?
Health risk
Convenience
Sufficient quantity availability
Other
40. Various Bid for improved water services (Sufficient and safe)
Bid NO Bids value (In PKR) Maximum WTP(In PKR)
1 300-350
2 351-400
3 401-550
4 551-600

173
41. What is the main reason for not willing to pay for improved services?
The current service is satisfactory (sufficient and safe)
I have low income
The current bill is high enough, I cannot afford more
It is the responsibility of govt. to provide clean drinking water to all
citizens
I will pay if water quality is improved
Other
Part III. Sanitation
42. How many rooms and bathrooms are there in your residence?
Rooms Bathroom
43. Do the households have access to toilet facility?
Yes No
44. What kind of toilet facilities do your household members usually use? Please tick
the relevant box.
Own toilet facility
Toilet facility of other households
Public toilet facility
Other
All of the above.
45. If own, type of toilet used by the household? Please tick the relevant box.
Flush
VIP latrine/pit latrine with slab
Pit latrine without slab
Public latrine/Hanging latrine
No facility/Bush/field
Other

174
46. What is the Condition of the facility? Tick the relevant box.
Kaccha and Feces and flies on the floor
Semi pakka Feces and Flies on the floor
Pakka without main sewerage line
Pakka with proper sewerage line and hygienic
47. Distance from the toilet facility?
At premises 50 to 100 m 101 to 200 m 200 and above
48. Your residence toilet is connected to main sewerage line system?
Yes No
For yes go to Q-49 and for no, go
to Q-50.
49. If yes, is there any sewerage treatment facility at end point?
Yes No
50. If no, what type of sewer system your house is connected with?
Own septic tanks
Discharge to Drain/water channel/ river/ stream
outside the house
Discharge to the yard
Discharge to the street
Ground hole/Land fil
Other
51. How do you evaluate the surrounding condition of your households?
Pathetic and unhygienic Fair and satisfactory Good and hygienic
52. Are you satisfied with the existing sanitation services?
Yes No

175
53. Indicators of household satisfaction about the existing sanitation services? Please
tick the relevant box.
Indicators Satisfactory Neutral Dissatisfactory
Solid waste management
Clearance of municipal drains
Conservancy &sweeping of the streets
Proper sewage disposal services
54. What issues do you face regarding sanitation? Please prioritize them on the basis
of severity in numbers 1, 2, 3…………and so on.
I. Infrastructure
Issue Priority
Chocked drains
Main sewerage line
Waste water treatment plant
Public latrine
Water supply
Solid wate management
No priority 0
II. Health
Problems Priority
Open defecation problem
Over flow of water in the street
Bad smell
Contagious dieses
Flies in the surrounding

176
55. Did any member of your household get affected from the unhygienic sanitary
services in the last three months?
Yes No
56. If yes then, what type of diseases? Please check the relevant box.
Cough Fever Measles Diarrhea Malaria Typhoid Hepatitis A,
B, C
Other
57. Numbers of affected persons?
Number……………….
58. Do you pay any charges for current sanitation services?
Yes No
59. If yes, then current charges per month?
Rs.……………….
60. Do you want improvement in the existing sanitation services?
Yes No
61. If yes, how much you are willing to pay( In Rupees) per month for ISS?
Services/Amounts 200-250 251-300 301-350
Bid1 Bid2 Bid3
Improved Sanitation services*
Maximum WTP (In PKR)
* Here Improved Sanitation Services mean sewage disposal, solid waste management
and clearance of municipal drains.

177
62. Based on the given indicator evaluate the Performance of the existing water
supply and sanitation service authority.
Indicators poor Fair Good Very good Excellent
Complaint redressal
Planning for the future
Monitoring mechanisms
Revenue collection
Quality WSS
63. If no, what are the reasons for non-payment?
a) ………………………………………………………………………………………
b) ………………………………………………………………………………………
c) ……………………………………………………………………….……………...
d) ………………………………………………………………………………………
e) ………………………………………………………………………………………
What measures should be taken to improve the existing sanitation services?
a) ……………………………………………………………………….……………..
b) ………………………………………………………………………………………

178
Annexure IV: Focus Group Discussion Questionnaire
AN ANALYSIS OF HOUSEHOLD’S DEMAND FOR IMPROVED WATER
AND SANITATION SERVICES TOWARDS BETTER PLANNING IN
PESHAWAR, KHYBER PAKHTUNKHWA.
Expert Opinion Questionnaire
Name of organization…………………….
Designation of the expert……………………………….
Aims and Objectives
To determine the policy gaps and suggest policy recommendations for improved water
and sanitation services.
Questionnaire:
Please answer the following questions, your cooperation will be highly appreciated.
1. What are the objectives and functions of the authority you are working in?
2. What are the current issues and problems regarding water and sanitation in the area?
3. Is the existing water supply in accordance with the Human right recommended
standards? Please explain in detail.
4. What common problems are being faced in achieving the WHO standard and SDGs
objective and better performance in service delivery?
5. Are the available services in accordance with the vision of KP drinking water policy
i.e. “universal access to adequate quantities of potable water”?
6. Regarding KP drinking water policy “the government’s commitment towards
achievement of the relevant Millennium Development Goals (MDGs) and
Sustainable Development Goals (SDGs) targets”. What steps are taken by your
department?
7. Is there any improvement in the existing practices of sanitation? Compare with the
previous one.
8. Steps taken by your department in provision of sanitary environment for the entire
population free from indiscriminate and unhygienic disposal of excreta, wastewater
and solid waste mentioned in the KP draft sanitation policy.
9. What are the constraints in achieving KP sanitation policy options i.e. “In urban
areas all flush latrines shall be connected to sewerage system terminating in sewage
treatment facility”?

179
10. What are the constraints in developing its own provincial water act and sanitation
policy development?
11. What are the policy lapses regarding water and sanitation? Suggest possible
solutions.
12. What is your future planning for the solution of these problems?
13. Performance assessment of the municipal services based on governance principle,
please tick the relevant box.
S. No Governance principal Satisfaction Tick (×)or()
1 Strategic vision Yes
No
2 Participation Yes
No
3 Accountability Yes
No
4 Responsiveness Yes
No
5 Quality of services Yes
No
6 Sustainability Yes
No
7 Rules of Law Yes
No
8 Equity Yes
No
9 Transparency Yes
No
14. Any suggestions:
_________________________________________________________________

180
Annexure V: Average Domestic Water supply in Urban Peshawar
Average Peak Water production in Urban Peshawar Total Discharge (In Hours)
Region/
Town
No of
Ucs
Tube
wells
Average Discharge
(Gallon Per hours)
10 8 5
Town 1 25 255 10700 27.3 21.8 13.6
Town 2 2 3 12000 0.36 0.3 0.18
Town 3 12 113 10000 11.3 9.0 5.65
Town 4 2 7 6500 0.5 0.36 0.25
PDA 2 66 18200 12.0 9.6 6.0
CB 2 33 13200 4.4 3.5 2.2
Total 45 447 55.86 44.56 27.9
Per capita
water
supply
75.80(@30%
NRW)
60.25 37.85
1 US gallon=3.78 litre
1 imperial gallon=4.5

181
Annexure VI: Notification of Revised Rates of Water and Sanitation
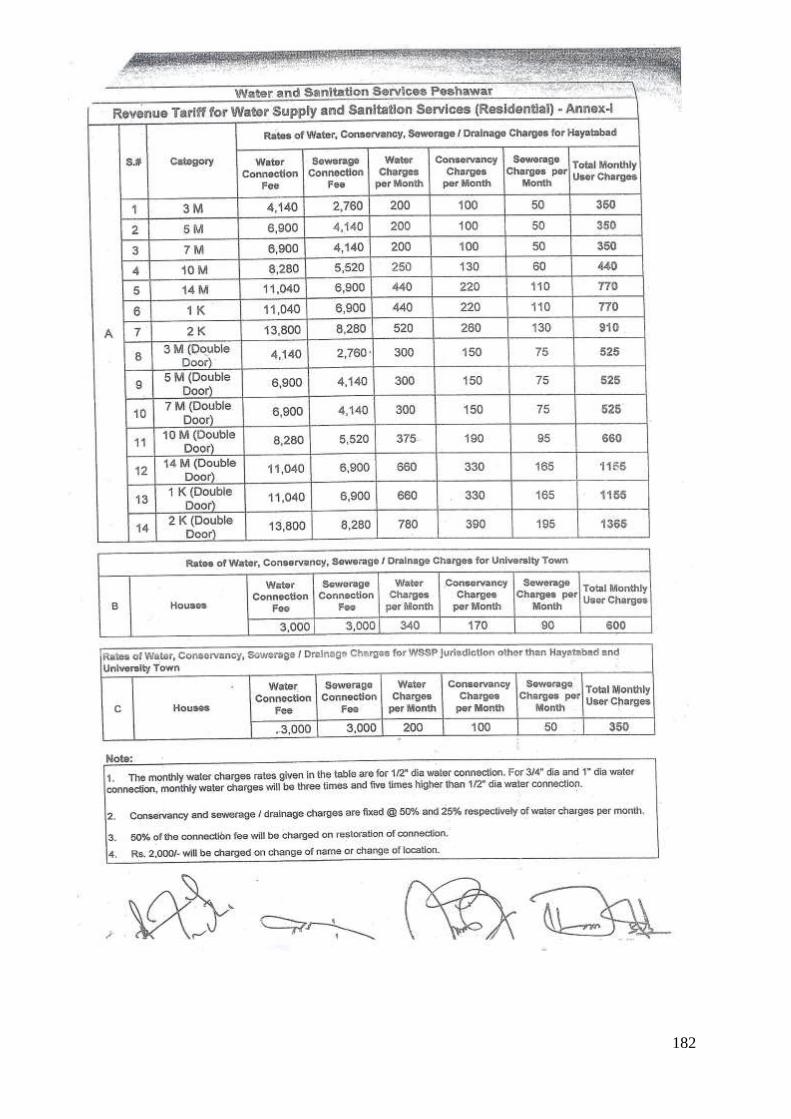
182

183

184

185
Annexure VII: Socio-Economic Characteristics of the Respondents in Urban
Peshawar
Frequency
Total no of
Respondents(N=600)
Percentage (Per
cent)
Age of the Respondents (In Years)
20-30 152 25.3
31-40 187 31.2
41-50 130 21.7
51-60 83 13.8
61-70 35 5.8
71 and above 13 2.2
Marital status of the Household
Single 57 1.5
Married 543 98.5
Size of the Household (In Numbers)
1-6 369 61.5
7-12 196 32.7
13-16 25 4.2
17 and above 10 1.7
Education status of the Family Earning Member
Illiterate 207 34.5
Middle 54 9.0
Matric 214 35.7
Intermediate 71 11.8
Bachelor 45 7.5
Master 8 1.3
Higher 1 0.2
Employment Status of the Respondents
Unemployed 149 24.8
Govt. Employee 157 26.2
Private Employee 162 27.0
Own Business 132 22.0

186
18 1 Mara=272 Square feet.
Income of Household (In PKR)
Up to 50000 295 49.16
51000-100000 187 31.17
100001-150000 63 10.5
151000-200000 38 6.33
200001-250000 10 1.67
251000 and above 7 1.17
Housing occupancy status of the Household
Rent 232 38.67
Own 369 61.33
Plot size of the Household (In Marla18)
≤5 Marla 206 34.4
6-10 Marla 185 30.8
11-15 Marla 140 23.3
16-20 Marla 48 8
> 20 Marla 21 3.5
Type of Houses and Material used in the Construction of House
Mud Houses (Kaccha) 6 1.0
Bricks and Concrete (Pakka) 555 92.5
Mixed 39 6.5