Corporate Social Responsibility Report (Environmental, Social ...
Upload
khangminh22Category
view
3download
0
Munich Personal RePEc Archive
Understanding corporate social
responsibility of the corporate sector to
Sustainable Development Goal for energy
in Nepal
Bista, Raghu
2 December 2018
Online at https://mpra.ub.uni-muenchen.de/100111/
MPRA Paper No. 100111, posted 09 May 2020 13:00 UTC

UNDERSTANDING CORPORATE SOCIAL RESPONSIBILITY
OF THE CORPORATE SECTOR TO SDG 7: ENERGY FOR
ALL: A LESSON OF DEVELOPING COUNTRIES, NEPAL
Dr. Raghu Bir Bista
Assistant Professor, Department of Economics, PMC, Tribhuvan UniversityPost Box No: 9137, Kathmandu, Nepal
E-mail: [email protected]
Abstract:
Sustainable Development Goal (SDG) 7: energy for all is a global agenda to Nepal, where
about 85 percent rural population have not access to energy for lighting and about 40 percent
of the bottom 20 percent extreme poor access energy. The government has been initiating
alternative energy to reduce such huge energy gap. Still it is not sufficient for wider impact.
The corporate sector’s social responsibility is alternative hope for further collaboration.
However, still energy for all campaign is sluggish. In this context, this paper examines CSR
of the corporate sector in Nepal and its contribution in SDG 7: energy for all. The paper has
employed explorative and descriptive method based on secondary and primary data. The
paper finds a better knowledge of stakeholders about CSR but its fund is informal and small.
Its size is unsystematically least. It is voluntarily nature to the corporate sector. Its impact is
narrow. In SDG 7: energy for all, there is no knowledge about SDG 7, no CSR activity and
event because of no mandatory, no knowledge and no idea. Therefore, almost all
stakeholders opine to make it mandatory and prioritized SDG 7: energy for all for its positive
impacts in the society at large and wider.
Key Words: SDG, CSR, Corporate sector and CSR fund, etc.
1. INTRODUCTION
Over a long time, the growing concern on the energy for all has been a serious issue in the world.
Traditional growth theoretical literatures and empirical literatures have given serious attention
on its need and importance at household and business sector. However, the World Development
Reports (2018) shows massive population outside the energy grid. In this critical context,
sustainable development is widely accepted approach in energy for considering future potential
demand without compromising present demand. The approach that emerged first time in the
report of the World Commission on Environment and Development by Brundtland (1987) argues

three pillars integrity for sustainable development: economy, environment and society. In
addition, there are supplementary of additional pillars: culture and institution. In 2015, UN had
made this approach as the 2030 Agenda with 17 Sustainable Development Goals (SDGS) and
169 associated targets for next 15 years. Out of 17 SDGs, SDG 7 relates to ‘energy for all’ for
reducing socio economic vulnerability and hunger for happiness. Thus, SDG conceptualizes its
livelihood ingredient with target of universal access to affordable, reliable and modern energy
services by 2030 by increasing substantial share of renewable energy in the world. In addition,
SDG focus on expanding infrastructure and upgrade technology for supplying modern and
sustainable energy services for all in developing countries, in particular least developed
countries, small island developing states and landlocked developing countries. Thus, SDG makes
energy as the global concern to bring massive population in the energy grid for their energy
secured basic livelihood, welfare and happiness.
On this issue, there are large literatures out of which very relevant literatures are reviewed to
understand energy, growth and welfare of the people. Like as household economy, it is a basic
input of production and processing activities (Boulding, 1973) with the arguments of necessary
input of the production of commodities and then consumption. The energy and growth nexus is
a debate issue in which Boulding (1973) notes that their relationship is so close that there is a
very strong, positive correlation between the input of energy into a society and its gross national
product (GNP). All rich societies have high inputs of energy. Thus, energy is evident of as an
ingredient of growth. Empirically, Costantini and Martini (2010) investigated the causality
between economic growth and energy consumption for different sectors in OECD and non-
OECD countries by using time series data. The result shows similar trends at the shortrun, while
they behave differently toward energy consumption at the long-run in the industrial sector. In
transport, the result is positive but is negative in residential in both countries. Similarly, Cheng-
Lang et al. (2011) tested the basic relationship between real GDP and electricity use in industrial
and residential sectors in Taiwan based on econometric models by using quarterly time series
data from 1982 to 2008. The result is positive in both cases: linear and nonlinear. Abid and Sebri
(2012) examined the Granger causality approach to investigate the relationship between energy
consumption and economic growth in Tunisia during 1980-2007 for the total economy as well as
for the industry sector, transport sector, and residential sector. The result is positive in long term
in Tunisian Economy.

However, few empirical studies have not found positive. Zachariadis (2007) examined causality
between energy consumption and total economy (service and transport sectors) by using time
series database of G7 countries from 1949 to 2004. The result indicates negative. Similarly,
Belloumi (2009) examined the causal relationship between energy consumption and economic
growth for the total economy in Tunisia using time series data during the period 1971-2004. The
result is negative. In short run, Abid and Sebri (2012) in his study finds negative. Therefore, the
energy and growth nexus are still paradox.
Despite such paradox situation between energy and growth nexus, its relationship with household
welfare is positive. Eberhard and van Horen (1995) reviewed the empirical evidence on the
health and wider social impacts of different energy sources in South Africa. The result is that
children living in urban homes reliant on coal inhale more than five times the US EPA
recommended 24-hour limit of 260 mg m -3 , while children living in rural homes reliant on fuel
wood inhale more than nine times the US EPA limit. A health survey conducted as part of the
same study revealed that children from coal-using homes were 190% more likely to develop
respiratory illness (pneumonia, bronchitis, asthma, etc.) lower than children from the electrified
homes. Thus, clean energy has improved household comfort and welfare. Similarly, Domdom et
al, (1999) examined the relationship between energy and education in South Africa, where the
poor household had not energy for lighting, except air polluted fuel wood energy. The result is
that electric illumination significantly increases the number of hours that poor children are able
to spend reading and studying. Thus, energy increases household welfare. Foster and Jean
Philippe (2000) measured the impact of energy intervention on the poor and their welfare-an
illustration from Guatemala by using quantitative indicators. The result is the electricity has
improved welfare of the poor, although they have limited access to the electricity.
Literatures of energy mentions “energy efficiency” or “energy saving” for SDG 7: “energy for
all”. There are alternative thoughts, how can we talk such approaches without energy availability
and accessibility to all. Ongoing debates are on. It is ok in the rich societies. In case of the poor
societies, it is not ok because these societies have not access to energy, except inferior energy in
the wider energy gap scenario, although the developing countries have tried to reach out these
societies through renewable energy. USAID (2008) provides evidence of low intensity of energy
in Africa, Asia and South Asia and then low industrialization and high non-industrialized

activities (farming activities). In SAARC, it is 50 percent in average energy consumption, except
Maldives (100%) and Sri Lanka (85%) (USAID, 2008). Nepal has also. It indicates the higher
growth of energy demand for higher economic growth rate in this region (Bista, 2008, Bista,
2011 & Bista 2016). In this context, there is a growing concern about energy security one side
and another about energy for all to reach out the poor societies.
About G-7 countries, studies indicate to develop and expand renewable energy (UK Parliament,
2007) with save energy, energy we do use is secure and emits as little carbon as possible;
reforming the Renewable Obligation for 2020. South Asian countries have not such level of
attention and efforts for energy security and distribution, except India. In this context, Nepal has
gradually attended on hydro and solar energy production and generation not for energy security
but for energy demand. Its present estimated energy demand is 1508MW out of which energy
supply is about 69 percent. It means 31 percent energy gap, although Nepal has huge water
resource potentials (83,000 MW) (MoF, 2018). Its distribution intensity is higher in urban areas
(95.7%) than rural areas (4.3%)(Bista, 2008, Bista, 2011 & Bista 2016). However, about 82
percent population distributes in rural areas. Only 4.3 percent, it is 0.944 million rural population.
Still, about 21.025 million rural populations (95.7%) have not access to energy. Almost rural
populations are extremely poor using lower inferior energy consumption for heating. Its effects
including indoor pollution induced health, higher health expenses, lower productivity, lower
hours for learning, no television, no radio, no mobile, more leisure time and early sleeping. Out
of total population, almost women, old age and children are more vulnerable (MoF, 2018). In
this critical energy scenario, CSR contribution of the corporate sector to SDG 7: energy for all
may be crucial and query for reducing rural population’s vulnerability and improving socio
economic level of these poor households and rural enterprises development. Few studies (Bista,
2004, Bista, 2005, Bista, 2009 Bista, 2011, Bista, 2017 & Bista, 2018) concern only MNC.
However, none of literatures has focused on CSR for SDG 7: energy for all, despite its critical
scenario. Therefore, this study is relevant.
This study examines the renewable energy as CSR of corporate sector in Nepal and its
contribution in the energy scenario of Nepal. In addition, the study analyzes structure, pattern
and trend of energy scenario in Nepal and the impact of the renewable energy at household level
as target of SDG.

2. METHODOLOGY
2.1. Conceptual Framework
CSR concept emerged in 1917, when Henry Ford initiated social responsibility in terms of value
of all stakeholders’ interests as well as the social welfare of employees and shareholders (Lynach-
Fannnon, 2007). In 1932, Dodd (1932) and Berle (1932) published their article on "For Whom
Are Corporate Managers Trustees?" in a Harvard Law Review. In 1953, Bowen published a book,
Social Responsibilities of the Businessman focusing on the relationship of corporation with
society and need of business ethics (Carroll, 1979). In 1970, Milton Friedman (1970) continued
this debate through his article on "The Social Responsibility of Business Is to Increase Its Profits,"
in the New York Times Magazine. Thus, CSR has received public and academic attention for
social interest. Such evolution of academic perspective has contributed its modern concept. The
literatures (Carroll, 1999; Engardio et al. 2007, Fanto , 1998 and Marinov & Heiman, 1998)
mention CSR as the activities making companies good citizens who contribute to society’s
welfare beyond their own self-interests. In addition, Elhauge (2005) explains CSR as sacrificing
profits in the social interest. In simple, it is social work of the corporate sector in the society.
Similarly, Graff , Joshua and Small (2005), Portney (2005) and Reinhardt (2005) in their papers
have offered similar arguments consistently.
Griffin (1998) defines it as the set of obligations an organization has to protect and enhance the
societal context in which it functions. Social responsibilities of business mean responsibilities of
business towards customers, workers, shareholders and the community (Afful, 2003). The
government of India (2017) mentioned it as mandatory in the Industrial Policy. Miwa (1999)
argue in the similar way in their papers.
For corporate citizenship or responsible business, Carroll (1999) explains CSR having economic
responsibility, legal compliance, ethical and philanthropy. It has three objectives: value creation,
risk management and philanthropy (Figure 1).
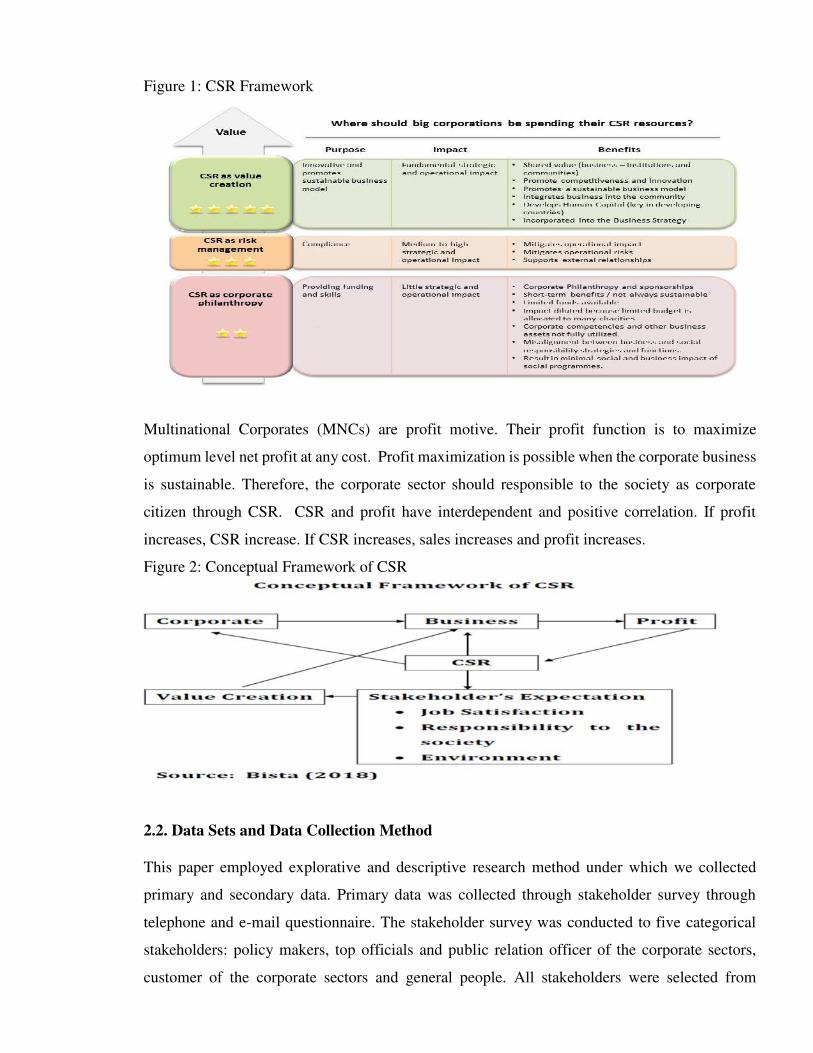
Figure 1: CSR Framework
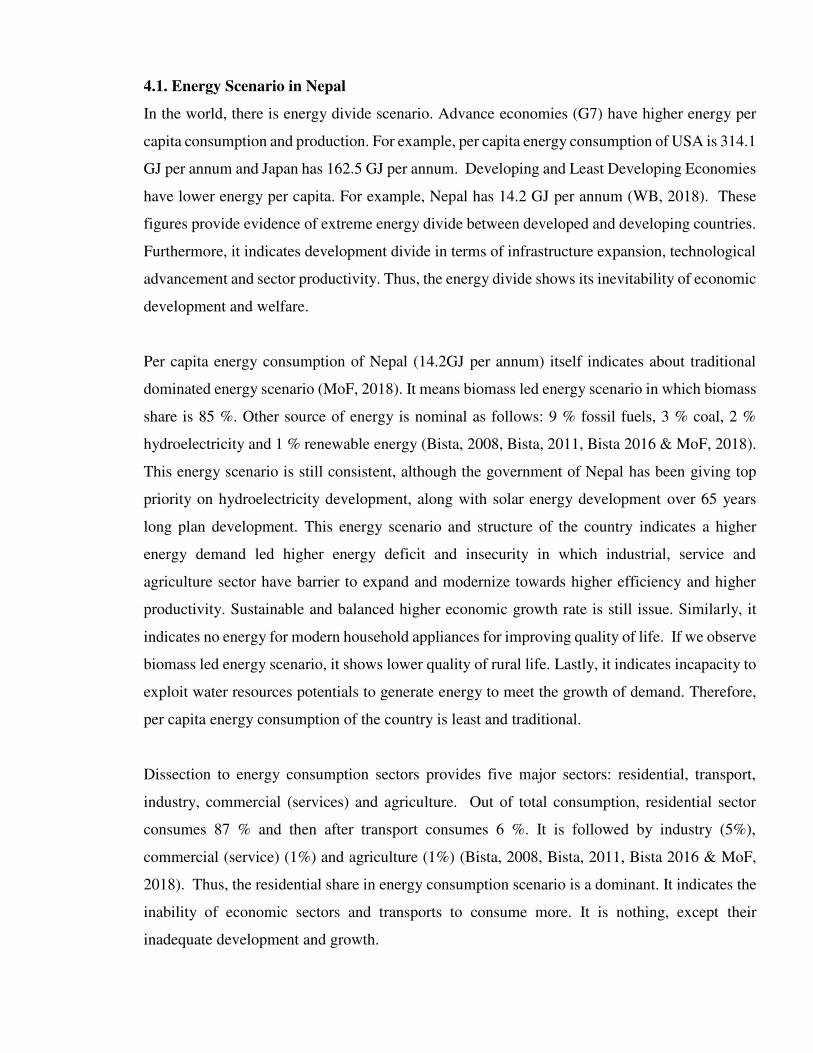
Multinational Corporates (MNCs) are profit motive. Their profit function is to maximize
optimum level net profit at any cost. Profit maximization is possible when the corporate business
is sustainable. Therefore, the corporate sector should responsible to the society as corporate
citizen through CSR. CSR and profit have interdependent and positive correlation. If profit
increases, CSR increase. If CSR increases, sales increases and profit increases.
Figure 2: Conceptual Framework of CSR
2.2. Data Sets and Data Collection Method
This paper employed explorative and descriptive research method under which we collected
primary and secondary data. Primary data was collected through stakeholder survey through
telephone and e-mail questionnaire. The stakeholder survey was conducted to five categorical
stakeholders: policy makers, top officials and public relation officer of the corporate sectors,
customer of the corporate sectors and general people. All stakeholders were selected from

Kathmandu Valley. Its size was 60. It was selected purposively for this study in the limited
resources. The survey schedule was from April 15 to May 15, 2018. In the schedule, reliability
and validity test was followed.
The secondary data and information collected from the published documents of the commercial
banks, telecommunication, airlines and business groups, particularly their published audit report
from 2008 to 2017. Out of total commercial banks (28), we selected 8 commercial banks by using
purposive methods. The selected commercial banks included three different banks: joint venture
banks (NABIL), private banks (Nepal Investment Bank, Mega Bank, Siddhartha Bank, and
Citizen Bank) and public banks (Nepal Bank Limited, Agricultural Development Bank and
Rastriya Banijya Bank). All public Banks provide their services to all 75 districts and almost
villages. The joint venture and private Banks have covered only 70 percent districts, except
Himalayan districts. In addition, in telecommunication, there were selected Nepal Telecom,
Ncell, World Link and Classic Tech. In airlines, there were yeti airlines, Makalu Air and Buddha
Air. Lastly, in the business groups, there were Khetan, Sharada, Vaidya, Panchakanya and
Chaudhary. In addition, the relevant published documents were used for secondary information.
3. STUDY AREA
Nepal is a tiny Himalayan landscape (0.3 % of Asia and 0.03 % of the world) with 147181 km2.
This tininess carries a nature marvelous with divergent ecological beautiful materials (Himalayan
series and wild rivers), along with 83000 MW hydro potential and unexplored ancient cities,
cultures and mystic holiness (MoF, 2018). Remittance intensity in GDP is 29 % (Bista, 2008,
Bista, 2011 & Bista 2016). Despite jumping GDP per capita of 1004US$ and maintaining 5 %
per annum growth the country is still one of 28 poorest of the poor country. The country has 26.4
million with decreasing growth rate of 1.35 % (MoF 2018). Out of total population, about 80 %
population is still rural residents waiting for changing their welfare (Bista, 2008, Bista, 2011 &
Bista, 2016). Despite a beautiful cache development agenda and policy, urban centric
development model has not reached out properly to respond development chronic, lower paid
informal employment, seasonal unemployment and poverty. However, lower energy per capita
consumption drags them in the vicious cycle of poverty and vulnerability.
4. RESULTS AND DISCUSSION
4.1. Energy Scenario in Nepal
In the world, there is energy divide scenario. Advance economies (G7) have higher energy per
capita consumption and production. For example, per capita energy consumption of USA is 314.1
GJ per annum and Japan has 162.5 GJ per annum. Developing and Least Developing Economies
have lower energy per capita. For example, Nepal has 14.2 GJ per annum (WB, 2018). These
figures provide evidence of extreme energy divide between developed and developing countries.
Furthermore, it indicates development divide in terms of infrastructure expansion, technological
advancement and sector productivity. Thus, the energy divide shows its inevitability of economic
development and welfare.
Per capita energy consumption of Nepal (14.2GJ per annum) itself indicates about traditional
dominated energy scenario (MoF, 2018). It means biomass led energy scenario in which biomass
share is 85 %. Other source of energy is nominal as follows: 9 % fossil fuels, 3 % coal, 2 %
hydroelectricity and 1 % renewable energy (Bista, 2008, Bista, 2011, Bista 2016 & MoF, 2018).
This energy scenario is still consistent, although the government of Nepal has been giving top
priority on hydroelectricity development, along with solar energy development over 65 years
long plan development. This energy scenario and structure of the country indicates a higher
energy demand led higher energy deficit and insecurity in which industrial, service and
agriculture sector have barrier to expand and modernize towards higher efficiency and higher
productivity. Sustainable and balanced higher economic growth rate is still issue. Similarly, it
indicates no energy for modern household appliances for improving quality of life. If we observe
biomass led energy scenario, it shows lower quality of rural life. Lastly, it indicates incapacity to
exploit water resources potentials to generate energy to meet the growth of demand. Therefore,
per capita energy consumption of the country is least and traditional.
Dissection to energy consumption sectors provides five major sectors: residential, transport,
industry, commercial (services) and agriculture. Out of total consumption, residential sector
consumes 87 % and then after transport consumes 6 %. It is followed by industry (5%),
commercial (service) (1%) and agriculture (1%) (Bista, 2008, Bista, 2011, Bista 2016 & MoF,
2018). Thus, the residential share in energy consumption scenario is a dominant. It indicates the
inability of economic sectors and transports to consume more. It is nothing, except their
inadequate development and growth.

This scenario has two geographical landscapes: rural and urban. Urban is of 20 % population
meanwhile rural is of 80% of population (CBS, 2011). There are different divides: infrastructure,
social infrastructure, technology, literacy, employment, economic opportunities, accessibility,
information, mobility, income level etc. Energy scenario in urban areas is fossil fuel dominated
(LPG -40.2%, and kerosene-15.8 %). It is supplemented by wood (36.2%), biogas (3.2%), dung
(2.5%), charcoal (0.2%) and crop residual (0.2%)( Bista, 2011b, Bista, 2011c, Bista, 2011d &
Bista, 2013). However, in rural areas, biomass fuel dominates with 95 %. Biomass fuels include
wood (81.4%), dung (9.1%), biogas (2.4%), crop waste (1.8%), charcoal (0.1%). Non-biomass
fuels are LPG (3.9%) and kerosene (1.0%). Thus, urban society consumes fossil fuels and rural
society consumes biomass fuels.
4.1.1. Renewable Energy Sources and Intensity
It is a naked fact that about 85% rural population has not access to clean energy for their welfare
and happiness (Bista, 2011 & Bista, 2016). This critical scenario needs alternative source of
energy: renewable energy to reach out them. Over 65 years plan development practices, the
government has initiated to promote and develop it into five segments: biomass, wind, solar,
biogas and hydropower (small and micro hydropower) (MOF, 2018). Its details are as follows.
• Biomass
Biomass is a major source of energy. Its domination is approximately 85 % (Bista,2011c, Bista,
2011d, Bista 2011e, Bista, 2013 & MoF, 2018). Rural households always use it for cooking and
heating purpose (Bista, 2008, Bista, 2011, Bista,2011c, Bista, 2011d, Bista 2011e, Bista, 2013.
Therefore, it is traditional and indigenous because of its traditional technology, small scale and
unpredictable potentiality (Bista,2011c, Bista, 2011d, Bista 2011e & Bista, 2013). Studies
mention it non-clean energy having indoor air pollution led health hazards (skin, respiratory, eye
allergy etc.) and vulnerability.
The sources of biomass energy are agro residual, fuel wood fodders, grass etc. In agro residual
energy, household extract energy from all residuals of agriculture activities (Bista,2011c, Bista,
2011d, Bista 2011e & Bista, 2013). Mainly, there are the residuals of paddy, maize, wheat, millets
and soybean. Its share is approximately 61 % of total household energy consumption per annum
(MoF, 2018). Household consumes this energy particularly for cooking and then heating.
Despite indoor air pollution and CO2 emission, such indigenous practices have cost free proper

management of agro residuals for energy and organic fertilizer. Therefore, almost rural
households consider it as cooking fuel.
Fuel wood supplements to agro residual in the rural household fuel energy. In Nepal, its coverage
is approximately 40 % of total land (5.8 million ha) having 429 million dry metric ton biomass.
Its contribution share is approximately 40 % in household fuel. Out of total household activities,
its energy contribution is 75 %. It is also traditional form of energy source in household (MoF,
2018). In Himalayan areas, its use is more than Hill and Terai. Its use is better than agro residual
in terms of energy efficiency, cleanliness and scale. In general, households receive fuel wood
from their own forest and plantation and the public forest. In 1950s, 1960s, 1970s and 1980s,
higher forest population ratio maintains forest sustainability. After then, it declined with higher
deforestation rate. Then after, the government-initiated community and lease forest models for
forest conservation and preservation for sustainable supply of fuel wood (Bista,2011c, Bista,
2011d, Bista 2011e & Bista, 2013). In these conservation models, community has property right
and ownership right on forest. Thus, the rural households have received fuel wood in the
sustainable way.
Table 1: Renewable energy distribution
Since 1990, the government has started
improving energy efficiency through the
installation of improved cooking stove
(ICS) so that air pollution and highly
dependency on fuel wood could be
reduced. In 2018, its installation to
household is 0.5 million. In addition, the
government has installed biogas in rural
households through subsidy scheme.
• Hydropower
Hydropower is a secondary source of clean
energy in the country, where approximately
6000 river and rivulets with 45000 km
length and
Renewable Energy No MW Districts
Hydro power
Small Hydro 26 76.7
Mini hydro 40 14.95 31
Micro hydro 864 14.7 59
Pico Hydro 1262 2.45 53
Improved water
mill 7686 46
Biogas
Household 238587 72
Community 61 20
Institutional 111 25
Solar PV
Household 227039 6.31 74
Institutional 259 42
Water Pumping 79 26
Wind
off Grid 26 8.6 11
Biomass
ICS 560167 48
Source: Economic Survey, 2018

174 billion cubic meters discharge have 83000 MW potentials (Bista, 2008, Bista, 2011 & Bista,
2016). In the world, its share is 2.2 % establishing Nepal at second rank after Brazil. Out of 6000
river rivulets, there are four Tibetan plateau origin major rivers: Mahakali, Karanali, Gandaki
and Koshi with consistent water level in both seasons: winter and summer (Bista, 2008, Bista,
2009 & Bista, 2016). However, its utilization situation is just less than 1 % (1044.6 MW) over
six decades plan development (Bista, 2008, Bista, 2011 & Bista, 2016). To accelerate hydro
development, the government has liberalized hydropower development to the private sector as
well as foreign investor (Bista, 2004, Bista, 2005a, Bista, 2005b, Bista, 2009, & Bista 2017). In
coming years, hydropower installation rate is higher than before. Despite our potentiality and our
concern, power deficit is the country’s reality.
Out of 6000 river and rivulets, a large number of small rivers and rivulets are scattered in rural
areas. Studies have identified their feasibility for small and micro hydro projects. Its modality
has attracted local government, NGO, private sector and consumer groups. The government has
promoted to small and micro hydro projects for wider divergence across all over the country so
that the rural people can be a stakeholder as owner and as user to electricity. Its result is 108
MW small and micro hydro projects spreading 59 districts of total districts (77)( Table 1). At
some extent, energy production, distribution and consumption are localized at relatively lower
cost per unit. Households use such electricity only for lighting and television at nighttime and for
small and micro industrial operation at daytime. For example, flour mill, grill factory, packaging,
processing factories, electrical works, harvesting, cleaning etc. Thus, agriculture sector has used
modern machines based on electricity meanwhile non-agriculture sectors are also expanded as
economic activities.
• Solar, Wind and Bio Gas
Solar and Biogas are another emerging source of energy in the country. Rural households are far
from national grid of electricity. Households have not energy for lighting. Studies have found
solar energy as a good reliable alternative. There is 6.8 sunshine hours per day. Its potentiality is
estimated 8GWh per day. Annually, it is 2920Gwh. It is only 0.01 %. Therefore, the government
has subsidy policy to promote solar energy in rural areas of the country. As supplementary, NGO
and INGO have also promoted solar energy. Its capacity is approximately 6.3 MW installing in
74 districts of 77 districts(Table 1). Its distribution is only 0.2 million households(Table 1).
Recently, the government has promoted wind energy at few feasible locations.

Almost rural households farm livestock (MoF, 2018). Livestock provides milk and dungs. Milk
provides protein and cash to the farmers. Dungs provide nutrition to crops in the farm. Studies
have found its potentiality of biogas. It would give clean energy for cooking, heating and lighting.
Then after, it provides organic fertilizer to the farm. Therefore, the government has installed at
0.23 million households in 74 districts (Table 1).
4.2. CSR Characteristics of Corporate Sector
Today’s world business is of big corporate sector. CSR is an important variable of their corporate
governance for more profit, more value creation and more responsibility to the society. Google
is a top corporate in the world. The company has created 1 billion US$ CSR fund. The fund is
used for different philanthropy activities across the world. Therefore, it is not corporate sector’s
philanthropy choice but also mandatory legal provision.
CSR of the corporate sector (Bank and finance, airlines, telecommunication and business groups)
is in their fact and figures disclosure in publication and internet. Whatever objectives of this
corporate sector in CSR events are not meaningful, except its event, activities and impacts at the
society. So far, concern with international norms, values and system of CSR and SDG, CSR of
the corporate sector is very curious in depth about its characteristics. The survey to trap CSR
characteristics of the corporate sector has employed seven indicators: No of Years for CSR,
Regularity in some years, percentage of profit, CSR team, CSR events and CSR disclosure.
The sample corporate sectors are outcomes of the structural adjustment program: globalization,
liberalization and privatization in 1980s. Almost corporate sectors have more than 30 years and
less than 30 years long history. Let us talk about Nepal Bank (1937), NABIL (1984) and Nepal
Investment Bank (1986). Nepal Bank was established in Rana Regime; meanwhile NABIL and
Nepal Investment Bank were immediate after Structural Adjustment Program (SAP) 1980. The
remaining three banks were established after the SAP II: Mega Bank (2010), Siddartha Bank
(2002) and Civil Bank (1993)(Table 2). Similarly, such history relates to airlines,
telecommunication and business groups. This strong background supports the corporate sector
with higher vertical and horizontal growth. However, CSR history of the corporate sector is
unexpectedly least (1 %)( Table 2). Their CSR practices have not a long history.

CSR should be regular as norms, values and culture of corporate sector. Its regular activities and
events have good and positive impact in the society in terms of welfare and development. Survey
shows least size CSR of all corporate sectors. Its activities and events are irregular in terms of
time and theme. Therefore, its impacts are nearly least.
For regular CSR activities and events, its CSR fund should be a big. If it is small, CSR activities
and events will be irregular. Survey shows mixed scenario of CSR fund in the corporate sector.
Interestingly, few corporate sectors have kept systematically certain percent in CSR fund.
However, most corporate sectors have not, although they organize CSR events and activities.
CSR size of the corporate sector is generally 2 % of the profit as international practices. In USA
and European countries, Apple, Google, Microsoft etc. have allocated more than 2 % of their
company’s profit. Survey shows that less than 1 % of their profit. It is negligible without
systematic allocation in CSR fund. Airlines and Banking sectors have less than
telecommunication and business groups(Table 2).
CSR is a responsible and sensitive issue to the corporate sector. Its level depends on institutional
set up in the corporate sector i.e. CSR team. In general, the corporate sector has such team
because it is not only philanthropy but also value and good will creation in the society. Survey
finds no CSR team across the sample corporate sector. It means the level of CSR commitment,
concern, sensitivity and responsibility in the corporate sector. All the corporate sectors have less
commitment, concern, sensitivity and responsibility on CSR in the country(Table 2)
Table 2: CSR characteristicsCSR team, fund
and size are
correlation with
CSR activities
and events. If
CSR team, fund
and size are
strong, CSR
activities and
events will be positively strong. Survey shows negligible CSR team, fund and size having less
CSR activities and events. Survey finds CSR events of all corporate sectors out of which
Indicators Bank &FinanceGroup
TelecommunicationGroup
AirlinesGroup
BusinessGroups
No of Years for CSR 10 6 3 8
Regularity in someyears
yes yes yes yes
CSR Fund yes yes no yes
% of Profit 0.04 0.14 0.03 0.1
CSR team No No No No
CSR events(Mean) 9 12 4 8
CSR disclosure yes yes no no
Source: CSR Disclosure, 2018
telecommunication group has more than Bank and finance, airlines and business group. Airlines
group have least CSR events of all (Table 2).
CSR disclosure is an important means to publicize CSR fund, size, events and themes across
time. This is transparency of the corporate sector. It is a good of corporate governance and ethics.
Like as Apple, Google, Microsoft etc., CSR disclosure is available in the corporate sector’s
websites and the audit reports. Survey finds CSR disclosure in Bank and Finance and
Telecommunication in websites. However, survey finds no CSR disclosure in Airlines and
Business houses in websites.
4.2.1.CSR Fund
CSR fund is an inevitable fund structure of the corporate sector for CSR activities and events for
complete social responsibility of the corporate sector so that the corporate sector could plan CSR
activities and events over a year in accordance with the society’s need and the corporate sector’s
objectives. CSR fund is trick issue to the corporate sector. Survey finds mixed scenario about
CSR fund. Bank and Finance group, Telecommunication group and Business group mention the
availability of CSR fund but Airlines group has not.
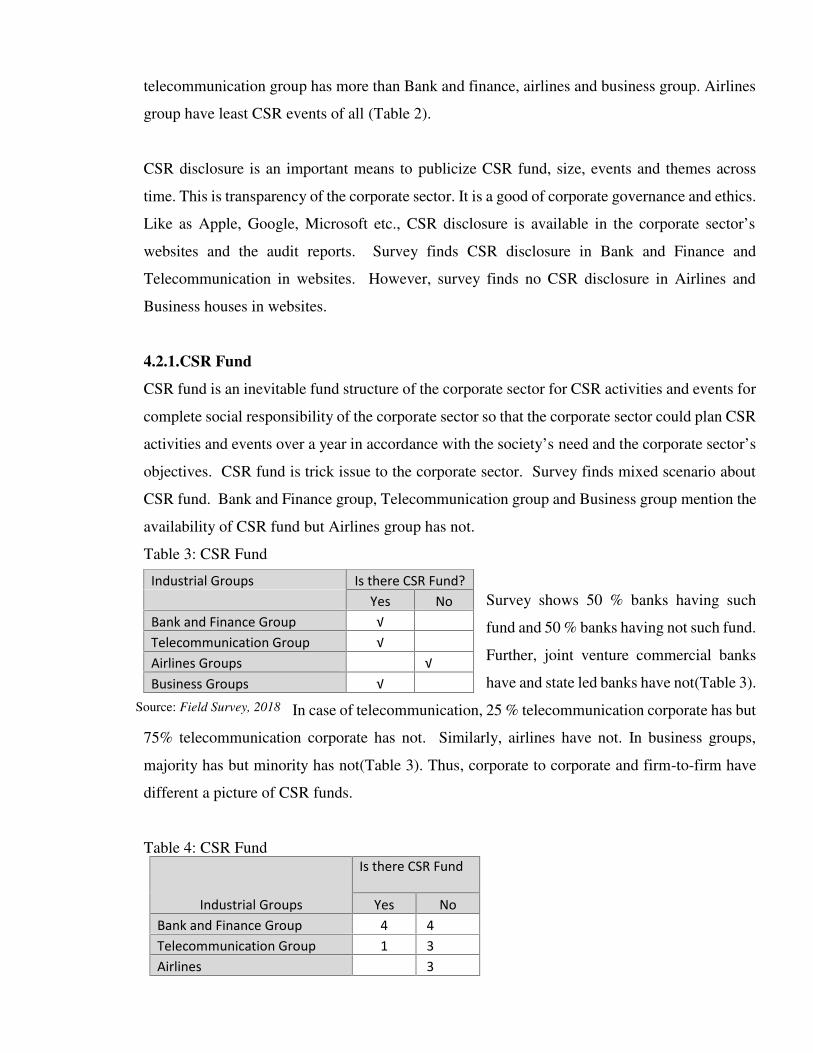
Table 3: CSR Fund
Survey shows 50 % banks having such
fund and 50 % banks having not such fund.
Further, joint venture commercial banks
have and state led banks have not(Table 3).
In case of telecommunication, 25 % telecommunication corporate has but
75% telecommunication corporate has not. Similarly, airlines have not. In business groups,
majority has but minority has not(Table 3). Thus, corporate to corporate and firm-to-firm have
different a picture of CSR funds.
Table 4: CSR Fund
Industrial Groups Is there CSR Fund?
Yes No
Bank and Finance Group √
Telecommunication Group √
Airlines Groups √
Business Groups √
Source: Field Survey, 2018
Industrial Groups
Is there CSR Fund
Yes No
Bank and Finance Group 4 4
Telecommunication Group 1 3
Airlines 3

Keeping CSR fund needs first knowledge
about CSR fund and its need. Survey shows amazingly all corporate staffs having knowledge
about CSR fund (Table 5). Further, survey finds most unsystematic nature of CSR fund, except
few corporate having systematic. In case of airlines, survey finds no mandatory reason of No
CSR fund, although they have knowledge about need of CSR fund (Table 5).
Table 5: Reason for no CSR Fund
Industrial Groups
Knowledge
about CSR fund
Is it
systematic?
Reasons for no CSR fund
Yes No
Yes No No
practice
No
mandatory
No
Culture
No
idea
Bank and Finance Group 8 1 7
Telecommunication Group 41 3
Airlines 3 3 3
Business Groups 5 1 3
Source: Field Survey, 2018
4.2.2. CSR fund Motives
Table 6: CSR motivesSurvey has
found 12
motives of CSR:
concern social
issues, to be
responsible to
the society,
creating social
value in the
society,
promoting
company’s good will, increasing customer, promoting social marketing,
ethical obligation, good cause, pure religious objectives for satisfaction, charity purpose, social
obligation and national cause on which there were scattered distribution of weightage of the
respondents( Table 6). Based on frequency of the respondents, CSR fund has first motive of
promoting company’s good will and then after, it is followed by social obligation as second
motive, national cause as third motive. Its details are in Table 6.
4.2.3. CSR activities of the corporate sectors
Business Groups 3 2
Source: Field Survey, 2018
CSR motives Frequency % Motive Ranking
Concern social issues 1 2 X
To be responsible to the society 4 7 VII
Creating social value in the society 2 3 IX
Promoting company's good will 9 15 I
Increasing customer 2 3 IX
Promoting social marketing 7 12 IV
Ethical obligation 3 5 VIII
Good cause 6 10 V
Pure religious objectives for satisfaction 5 8 VI
Charity purpose 4 7 VII
Social Obligation 9 15 II
National cause 8 13 III
Total 60 100
Source: Field Survey, 2018

Table 7: CSR activitiesThe corporate sectors –Bank
and Finance,
Telecommunication, Airlines
and Business Group have
been conducting different
social cause activities (CSR
activities) in the country to be
social accountable corporate.
CSR disclosure 2018 and
Survey have identified 8 CSR activities including scholarship,
environment, awareness and training, emergency aid, school building, health camp, sanitation
and heritage reconstruction(Table 7).
In Table 8, the corporate sectors have given top three priorities on awareness to the people and
training to the people and employee, school building to rural areas and scholarship to merit,
deprived and girls. Then after, almost all corporate sectors have initiated health camp, emergency
aid, and environmental program: Bagmati Cleaning Campaign and Tree Plantation, Sanitation
and heritage reconstruction.
4.2.4. CSR’s Nature and Provision
Table 8: CSR natureCSR nature and provision
determines CSR allocation of the
corporate sector. Therefore, it is
very important to CSR activities
and events. If it is mandatory, the
corporate sector makes it an
obligatory to allocate CSR. It will
be systematic and institutional. However, if it is voluntarily, it depends
on executive team policy and program. It will be unsystematic and institutional. Its function will
be irregular. Survey finds CSR nature is voluntarily. It means no legal compliance to the
corporate sector(Table 8). Further, the corporate sector is free about CSR.
CSR Activities Frequency % Rank /Priority in CSR
Scholarship 10 17 III
Environment 5 8 VI
Awareness & Training 12 20 I
Emergency Aid 6 10 V
School building 11 18 II
Health camp 8 13 IV
Sanitation 4 7 VII
Heritage
reconstruction 1 2 VIII
Total 60 100
Source: Field Survey, 2018
Industrial Groups
What is CSR's nature
Legal
compliance Voluntarily
Bank and Finance Group √
Telecommunication Group √
Airlines Groups √
Business Groups √
Source: Field Survey, 2018

Table 9: CSR pyramidCSR
pyramids
have
ethical
responsibility, legal provision, and philanthropy and value creation.
International practices show all elements of CSR pyramids. Survey shows philanthropy CSR of
the corporate sectors. In case of Bank and Finance Group and Telecommunication, the corporate
sectors have tried to create good will value through CSR(Table 9). Naturally, the corporate sector
has not understood properly to CSR tool in the corporate governance.
4.2.5.CSR size
Table 10:CSR size
CSR size is also voluntarily
without mandatory provision
because Industrial Policy has
made it voluntarily nature (no
legal compliance) to the corporate
sector and the corporate sector has
not understood the power of CSR tool to create value to their product and services in the society.
Its reflection is a tiny CSR size. Survey shows less than 0.5% and 1% of corporate profit as
Table 11: CSR Fund Size
CSR in all corporate sectors
(Bank and Finance,
Telecommunication, Airlines and
Business Groups)(Table 10). It is
negligible to fulfill the corporate
sector’s social responsibility but
they have freedom to decide about CSR size and use.
Survey shows 0.5% CSR of most corporate sectors and less than 1 % CSR of least corporate
sectors across all corporate sector groups(Table 11).
CSR Pyramids
Bank &FinanceGroup
TelecommunicationGroup
AirlineGroup
BusinessGroup
Ethical responsibility 0 0 0 0
Legal provision 0 0 0 0
Philanthropy 1 1 1 1
Value creation 1 1 0 0
Source: Field Survey, 2018
Industrial Groups CSR size
< 0.5 % <1% <2%
Bank and Finance Group √ √
Telecommunication
Group √ √
Airlines Groups √ √
Business Groups √ √
Industrial Groups CSR Fund size
< 0.5 % <1% <2%
Bank and Finance Group 7 1
Telecommunication
Group 3 1
Airlines Groups 2 1
Business Groups 3 2
Source: Field Survey, 2018

4.3. CSR and SDG Survey with stakeholders
CSR and SDG survey provides the stakeholder’s perception about knowledge, activities,
satisfaction and need of CSR. The survey with stakeholders was conducted at micro scale (60
respondents) in above the sample corporate sectors through telephone and e-mail tools. The
stakeholders include Policy Makers, Top Officials, Public Relation Officers, General Customer
and General People.
4.3.1. About CSR
CSR is new idea to Nepalese corporate sector, although informal and individual philanthropy is
culture in Nepalese society focusing more on humanitarian and religious grounds. Therefore,
stakeholders must have a good knowledge about CSR for effective operational CSR activities in
the society. CSR is not wider yet. Therefore, all stakeholders have a sufficient knowledge and
information about CSR. It would be wrong assumption. Survey shows general customer and
general people have least knowledge about CSR, except policy makers, top officials and public
relation officers. It indicates poor, small scale and irregular CSR activities and events in the
society targeting customer and general people and ineffective transformation of CSR policy from
top level to bottom level.
The survey crosschecks CSR activities of the corporate sector mentioned in their websites and
audit reports. The survey shows mix results in which customer and general people have rejected
CSR activities opined by the policy maker, top officials and public relationship officers. This is
divide opinion among stakeholders. It is possible when CSR activities and events are very small
scale and inconsistent level. Its impacts and benefits are negligible. In another words, CSR
activities and events are just for ad hoc business to the corporate sectors without target of value
creation(Table 12). Naturally, it raises a query about its effectiveness.
Table 12: CSR survey
Respondents
Knowledgeabout CSR
CSR activitiesof the
corporatesector
your satisfactionlevel
should thecorporate
conduct CSR
Yes(%)
No(%)
Yes(%)
No(%)
Good(%)
Poor(%)
Yes(%)
No(%)
Policy Makers 100 100 0 80 20 100
Top Officials 90 10 90 10 70 30 100

The satisfaction
level on CSR
activities and
events of the
corporate sector provides valuable inputs to the corporate sector and policy makers (Table 12).
The survey shows mixed scenario in policy maker, top officials and public relationship officers
with significantly poor satisfaction level, whereas 100 % customer and 100 % general people
have not satisfaction on CSR activities and events of the corporate sector (Table 12). It indicates
ineffectiveness to deliver CSR’s policy objectives to the target
stakeholders for creating good will among them for promoting more sales
of products and services.
In mixed scenario, there is a query about what next. All respondents have opined that the
corporate sector should implement larger and wider CSR activities and events in the society for
its good impacts and effectiveness( Table 12).
4.3.2. CSR of Corporate Sector and Clean Energy
Table 13: use of CSRCSR disclosure 2018 and Survey have
identified 8 CSR activities of the
corporate sector including scholarship,
environment, awareness and training,
emergency aid, school building, health
camp, sanitation and heritage
reconstruction. There is not clean
energy as CSR activity, although the corporate sector of India has active
on clean energy in CSR.
.
Based on CSR disclosure 2018 shows the passive mode of all corporate sector of Nepal on clean
energy, except basic utilities (primary health, literacy, clean drinking water and sanitation and
environment(Table 13).
Pubic Relationofficers 100 100 0 75 25 100
GeneralCustomer 20 80 100 100 100
General People 5 95 100 100 100
Source: Field Survey, 2018
Industrial Groups
Is CSR fund used on clean
Energy?
Active Passive
Bank and Finance Group 8
Telecommunication
Group 4
Airlines Groups 3
Business Groups 5
Source: Field Survey, 2018

Table 14:Priority of CSR fundIn addition, CSR disclosure 2018 shows
only 8 CSR activities in which there is
not listed clean energy. It is not only in
one corporate sector. However, not
almost all corporate sectors have listed
clean energy in the list of CSR activities
(Table 14). Thus, clean energy is still not agenda of the corporate sector
in Nepal.
4.3.3. About CSR and SDG 7: Energy for All
Above data and information on CSR fund and CSR activities and events of the corporate sectors
are irregular and negligible. In this context, SDG 7 is emerging issue to the corporate sector in
Nepal. In the world, the corporate sector plays an important role in the implementation of SDG
by using CSR fund for lighting in the rural village and also clean drinking water and sanitation,
primary health care and literacy campaign. CSR situation is not more hopeful but future is
hopeful. Therefore, with a good and positive hope, the survey is an effort to understand where
the corporate sector in SDG, particularly SDG 7 is: energy for all.
The survey on knowledge about SDG shows mixed scenario in which top officials, public
relationship officers, customers and general people have not knowledge about SDG, except the
policy makers. Thus, almost respondents have not knowledge about SDG.
Table 15: CSR and SDGEnergy is a basic livelihood. Massive rural population has not access to energy. Alternative
energy may be a good initiation. The state agency and non-state actors
have initiated at small scale. It needs the CSR of the corporate sector. In India, the corporate
Industrial Groups
Is clean energy listed in the
priority of CSR Fund?
listed not listed
Bank and Finance Group 8
Telecommunication
Group 4
Airlines Groups 3
Business Groups 5
Source: Field Survey, 2018
Respondents
Knowledgeabout SDG
CSR activities onclean energy ofthe corporate
sectorNo
knowledgeNo
mandatory No Idea
should thecorporate
conduct CSR onclean energy
Yes(%)
No(%)
Yes(%)
No(%)
Yes(%)
No(%)
Yes(%)
No(%)
Good(%)
Poor(%)
Yes(%)
No(%)
Policy Makers 100 100 60 20 20 100
Top Officials 100 100 80 10 10 100
Pubic Relationofficers 100 100 50 25 25 100
GeneralCustomer 100 100 100 100
General People 100 100 100 100
Source: Field Survey, 2018

sector has wider impact in the society on lighting campaign. The survey shows no CSR activity
on lighting campaign (energy for rural households)( Table 15). This acceptance indicates no
social responsibility of the corporate sector to the deprived section of the society through CSR
activity and event. Further, the survey digs out its reasons by using three reasons: no mandatory,
no knowledge and no idea. Almost respondents have a reason of no idea and then no mandatory
and no knowledge.
In this worst CSR on energy for all, the survey finds 100 % respondents on the need of CSR
activity on clean energy. For it, their demand is CSR as legal compliance to the corporate sector
(Table 15).
5. CONCLUSION
CSR knowledge, activities and practices of the corporate sector are better than before, despite its
small, irregular and voluntarily nature. Its focus is only on basic utility of the people: primary
health, literacy, clean drinking water, sanitation, and environment. Therefore, the corporate
sector is unaware about SDG 7: energy for all, along with no CSR activity on this area because
of no mandatory, no knowledge and no idea. Further, the corporate sector is not initiator to CSR
activity to SDG 7: energy for all. Therefore, SDG 7: energy for all is needed to incorporate in the
list of CSR activity and priority at policy and program level for broader good cause of lighting
in rural areas. Then, Nepal can achieve SDG 17 by 2030. Otherwise, the effort of the government
will not be effective to achieve SDG 17.
REFERENCE
Abid, Mehdi and Sebri, Maamar (2012) Energy Consumption-Economic Growth Nexus: Does
the level of Aggregation Matter?, International Journal of Energy Economics and Policy,
2(2): 55-62
Afful, K (2003). “Corporate Social Responsibility”. Organization. July September,
Kathmandu:ODC
Belloumi, M. (2009), Energy consumption and GDP in Tunisia: Cointegration and causalityanalysis. Energy Policy, 37, 2745-2753.
Berle A. A. Jr (1932). “For whom corporate managers are trustees: A note”. Harvard Law
Review. USA: Harvard School of Law 45(8):1365–72.

Bista, R.B. (2004). Foreign Direct Investment in Nepal: Regression analysis in aspect of GDPgrowth and export, Economics Journal of Development Issues, 5(2):93-110.
Bista, R.B. (2005a). Foreign Direct Investment in Nepal. Kathmandu: Center for IntegratedDevelopment Studies
Bista, R.B. (2005b). ‘Direction and effectiveness of trade policy reform: A case study of Indo-Nepal trade development’. Economic Journal of Development Issues, 6(2): 26-35.
Bista, R.B. (2008). Economics of Nepal. Kathmandu: Prativa Publication
Bista, R.B. (2009). ‘Liberalization and Productivity Growth in Nepal: A case of FDI firm’,
published inwww.iioa.org/conferences/18th/papers/files/90_20091229030_ProductivitGrowthofFDIfirm.pdf
Vienna,AustriaBista, R.B. (2011). Economics of Nepal. Kathmandu: New Hira Books
Bista, R.B. (2011a). BIPPA and Foreign Direct Investment in Nepalese Economy: A policyanalysis, Artha Journal, 31(1):1-5
Bista, R.B. (2011b) FDI and Corporate Social Responsibility: A Developing Country Case Studyof Nepal in Corporate Social Responsibility: Critiques, Policies and Strategies editedby Prasenjit Maiti, Sharda Publishing House: Jodhpur India.
Bista, R.B. (2011c) Low Carbon Economy and Developing countries: A Case of Nepalese Forestin the book, Advanced Analytics for Green and Sustainable Economic Development
(ed.) USA: IGI Global.
Bista, R.B. (2011d) An alternative of community forest institution in Nepal in Environment and
sustainable economic development(ed). Raj Kumar Sen and Somnath Hazra, NewDelhi: Deep and Deep Publication.
Bista, R.B. (2011e) Contract forest: Is it alternative to Community Forest, in the book,Environmental Security and Sustainable Development in South Asia New Delhi,India: Global Vision Publishing House.
Bista, R.B. (2013) Environmental Investment in Community Forest Management: A case studyof Mid Hill Nepal, Journal of Environmental Investing 4 (1) :50-69.
Bista, R.B. (2016). Economics of Nepal. Kathmandu: New Hira Books
Bista, R.B.(2017) Liberalization in Nepal: Structure, Determinants and Trends of FDI, Winner
Journal, Indonesia Vol18(1): 33-41, March.
Bista, R.B.(2018) Understanding CSR of Commercial Banks: Evidence of Developing country,Nepal, Kaav International Journal of Law, Finance and Industrial Relations, 5(1):23-33, Jan-Jun.
Boulding, Kenneth E (1973) “The Economics of Energy” The Energy Crisis:Reality or Myth,
Washington: American Academy of Political

Bowden, N., Payne, J. E. (2009), The causal relationship between U.S. energy consumption andreal output: A disaggregated analysis. Journal of Policy Modeling, 31(2), 180-188.
Carroll, A. B. (1999). Corporate Social responsibility. Business & Society, 38, 268-295.
Centre Bureau of Statistics (CBS)(2011). Population Census, Kathmandu: CBS
Cheng-Lang, Y., Lin, H.P., Chang, C.H. (2011), Linear and nonlinear causality between sectoral
electricity consumption and economic growth: Evidence from Taiwan. Energy Policy, 38,
6570- 6573.
Costantini, V. and Martini, C. (2010), The causality between energy consumption and economic
growth: A multi Sectoral Analysis Using Non-Stationary Cointegrated Panel Data. Energy
Economics, 32, 591-603
Dodd E. M Jr(1932). “For whom are corporate managers trustees?” Harvard Law Review
45(7):1145–63.
Domdom, A., Abiad, V. and Pasimio, H. (1999) Rural Electrification Benefit Assessment Study:The Case of the Philippines, ESMAP Draft Report, World Bank, Washington DC.
Eberhard, A. and van Horen, C. (1995) Poverty and Power: Energy and the South African State,
Pluto Press, East Haven, Connecticut.
Elhauge, E(2005). “Corporate managers’ operational discretion to sacrifice corporate profits in
the public interest”. In: Environmental Protection and the Social Responsibility of Firms—
Bruce Hay, Stavins Robert, Vietor Richard, eds. Washington, DC: Resources for the
Future.
Fanto, J. A(1998). “The role of corporate law in French corporate governance”. Cornell
International Law Journal 31:31.
Foster, V. and Jean Philippe, T(2000). Measuring the impact of energy intervention on the poor-
an illustration from Guatemala. Infrastructure for Development. UK: Private Solution
Graff, Z., Joshua, Small, A. (2005). “A Modigliani–Miller theory of altruistic corporate social
responsibility”. B. E. Journals in Economic Analysis and Policy: Topics in Economic
Analysis and Policy 5(1):1–19.
Griffin R.W.(1998). Management 5th edition New Delhi:A.I.T.B.S

Lynch-Fannon, I. (2007). “The corporate social responsibility movement and law’s empire: Is
there a conflict?” Northern Ireland Legal Quarterly 58(1).
Marinov, B and Heiman, B. (1998). “Company law and corporate governance renewal in
transition economies: The Bulgarian dilemma”. European Journal of Law and Economics
6:231–61
Ministry of Finance (MoF)(2018) Economic Survey. Kathmandu: MoF
Miwa, Y.(1999). “CSR: Dangerous and harmful, though maybe not irrelevant”. Cornell Law
Review 84(July):1227–54.
Portney, P.(2005). “Corporate social responsibility: An economic and public policy perspective”.
In: Environmental Protection and the Social Responsibility of Firms—Hay Bruce, Stavins
Robert, Vietor Richard, eds. Washington, DC: Resources for the Future
Reinhardt, F.(2005). “Environmental protection and the social responsibility of firms:
Perspectives from the business literature.” In: Environmental Protection and the Social
Responsibility of Firms—Hay Bruce, Stavins Robert, Vietor Richard, eds. Washington,
DC: Resources for the Future.
Reputation Institute (2017). CSR Ranking Report. USA: Reputation Institute
UK Parliament (2007). “Energy Security”, Research Paper. UK: UK parliament (URL: http://www.parliament.uk)
USAID (2008). Energy Security Quarterly. January New Delhi: USAID SARI/ENERGY
Copyright © 2022 FDOKUMEN