Environmental Factors Affecting Recent Summertime Eelgrass Diebacks in the Lower Chesapeake Bay:...
13
Journal of Coastal Research SI 55 135–147 West Palm Beach, Florida Summer 2008 Environmental Factors Affecting Recent Summertime Eelgrass Diebacks in the Lower Chesapeake Bay: Implications for Long-term Persistence Kenneth A. Moore and Jessie C. Jarvis Virginia Institute of Marine Science The School of Marine Science College of William and Mary 1208 Greate Road Gloucester Point, VA 23061, U.S.A. [email protected] ABSTRACT MOORE, K.A. and JARVIS, J.C., 2008. Environmental factors affecting recent summertime eelgrass diebacks in the lower Chesapeake Bay: implications for long-term persistence. Journal of Coastal Research, SI(55), 135–147. West Palm Beach (Florida), ISSN 0749-0208. We investigated the effects of several environmental factors on eelgrass abundance before, during, and after wide- spread eelgrass diebacks during the unusually hot summer of 2005 in the Chesapeake Bay National Estuarine Re- search Reserve in Virginia. Systematic sampling with fixed transects was used to investigate changes in eelgrass abundance at downriver and upriver regions of the York River Estuary. Concurrently, continuous and discreet mea- surements of water quality were made at fixed stations in each area within the eelgrass beds from 2004 through 2006. Results indicate nearly complete eelgrass vegetative dieback during the July–August period of 2005, in contrast to the more seasonal and typical declines in the summer of 2004. Losses were greatest in the deeper areas of the beds and at the upriver site where light availabilities were lowest. Recovery of eelgrass during 2006 was greater in the downriver area, especially at mid-bed depths. By the fall of 2006, no shoot vegetation remained at the upriver site. In 2005, the frequency and duration of water temperatures exceeding 30C were significantly greater than that of 2004 and 2006. Additionally, the frequencies of low dissolved oxygen excursions of 1–3 mg L 1 during this period were greater in 2005 than 2004 or 2006. These results suggest that eelgrass populations in this estuary are growing near their physiological tolerances. Therefore, the combined effects of short-term exposures to very high summer temper- atures, compounded by reduced oxygen and light conditions, may lead to long-term declines of this species from this system. ADDITIONAL INDEX WORDS: Submerged aquatic vegetation, anoxia, hypoxia, dissolved oxygen, turbidity, light at- tenuation, inorganic phosphorus, nitrate, ammonium, climate change, National Estuarine Research Reserve. INTRODUCTION Within the Chesapeake Bay, beds of eelgrass (Zostera ma- rina L.) have declined precipitously from historical abun- dances in many areas (ORTH and MOORE, 1983). In the York River, a major subestuary where the Chesapeake Bay Na- tional Estuarine Research Reserve in Virginia (CBNERRVA) is located (3713.6 N, 7628.7 W), these declines have been greatest in the most upriver regions of the former eelgrass distribution (ORTH and MOORE, 1983) where anthropogenic inputs from the watershed are typically greatest (MOORE et al., 1997). Although eelgrass beds remain in lower estuary regions, they have been found growing at much shallower depths compared to historical records, and since the late 1990s, overall abundances in these areas have been declining (ORTH et al., 2006). The interactions of environmental factors can have important consequences for eelgrass growth and survival. The effective light requirements of eelgrass can vary as a function of temper- ature (BINTZ et al., 2003; MOORE et al., 1997), sediment char- DOI: 10.2112/SI55-014. acteristics (GOODMAN et al., 1993), or other factors such as epi- phytic fouling (KEMP et al., 2004). In addition, since plant res- piration in eelgrass is supported by internally derived oxygen during the day, as well as that supplied from the water column by diffusion at night, factors that affect the sources and sinks of oxygen to and from the plants can also be very important (HOLMER and BONDGAARD, 2001). For example, GREVE et al. (2005) have associated late summer diebacks of eelgrass in Dan- ish coastal waters with periods of low water-column concentra- tions of oxygen. Low oxygen supply to belowground and meri- stematic tissues can be especially injurious to seagrass through the accumulation of anaerobic metabolites (SMITH et al., 1988) or the accumulation of phytotoxins such as sulfide from the re- ducing sediments (BORUM et al., 2005; PEDERSON et al., 2004) that can negatively affect photosynthesis, nutrient uptake, and growth (GOODMAN et al., 1993; HOMER and BONDGAARD, 2001; PREGNALL et al., 1984). Climate change can have significant impacts on eelgrass as well as other seagrass through temperature increases, at- mospheric and weather changes, and sea level increases (SHORT and NECKLES, 1999). OVIATT (2004) hypothesized
Transcript of Environmental Factors Affecting Recent Summertime Eelgrass Diebacks in the Lower Chesapeake Bay:...
Journal of Coastal Research SI 55 135–147 West Palm Beach, Florida Summer 2008
Environmental Factors Affecting Recent SummertimeEelgrass Diebacks in the Lower Chesapeake Bay:Implications for Long-term PersistenceKenneth A. Moore and Jessie C. Jarvis
Virginia Institute of Marine ScienceThe School of Marine ScienceCollege of William and Mary1208 Greate RoadGloucester Point, VA 23061, [email protected]
ABSTRACT
MOORE, K.A. and JARVIS, J.C., 2008. Environmental factors affecting recent summertime eelgrass diebacks in thelower Chesapeake Bay: implications for long-term persistence. Journal of Coastal Research, SI(55), 135–147. WestPalm Beach (Florida), ISSN 0749-0208.
We investigated the effects of several environmental factors on eelgrass abundance before, during, and after wide-spread eelgrass diebacks during the unusually hot summer of 2005 in the Chesapeake Bay National Estuarine Re-search Reserve in Virginia. Systematic sampling with fixed transects was used to investigate changes in eelgrassabundance at downriver and upriver regions of the York River Estuary. Concurrently, continuous and discreet mea-surements of water quality were made at fixed stations in each area within the eelgrass beds from 2004 through2006. Results indicate nearly complete eelgrass vegetative dieback during the July–August period of 2005, in contrastto the more seasonal and typical declines in the summer of 2004. Losses were greatest in the deeper areas of the bedsand at the upriver site where light availabilities were lowest. Recovery of eelgrass during 2006 was greater in thedownriver area, especially at mid-bed depths. By the fall of 2006, no shoot vegetation remained at the upriver site.In 2005, the frequency and duration of water temperatures exceeding 30�C were significantly greater than that of2004 and 2006. Additionally, the frequencies of low dissolved oxygen excursions of 1–3 mg L�1 during this period weregreater in 2005 than 2004 or 2006. These results suggest that eelgrass populations in this estuary are growing neartheir physiological tolerances. Therefore, the combined effects of short-term exposures to very high summer temper-atures, compounded by reduced oxygen and light conditions, may lead to long-term declines of this species from thissystem.
ADDITIONAL INDEX WORDS: Submerged aquatic vegetation, anoxia, hypoxia, dissolved oxygen, turbidity, light at-tenuation, inorganic phosphorus, nitrate, ammonium, climate change, National Estuarine Research Reserve.
INTRODUCTION
Within the Chesapeake Bay, beds of eelgrass (Zostera ma-rina L.) have declined precipitously from historical abun-dances in many areas (ORTH and MOORE, 1983). In the YorkRiver, a major subestuary where the Chesapeake Bay Na-tional Estuarine Research Reserve in Virginia (CBNERRVA)is located (37�13.6� N, 76�28.7� W), these declines have beengreatest in the most upriver regions of the former eelgrassdistribution (ORTH and MOORE, 1983) where anthropogenicinputs from the watershed are typically greatest (MOORE etal., 1997). Although eelgrass beds remain in lower estuaryregions, they have been found growing at much shallowerdepths compared to historical records, and since the late1990s, overall abundances in these areas have been declining(ORTH et al., 2006).
The interactions of environmental factors can have importantconsequences for eelgrass growth and survival. The effectivelight requirements of eelgrass can vary as a function of temper-ature (BINTZ et al., 2003; MOORE et al., 1997), sediment char-
DOI: 10.2112/SI55-014.
acteristics (GOODMAN et al., 1993), or other factors such as epi-phytic fouling (KEMP et al., 2004). In addition, since plant res-piration in eelgrass is supported by internally derived oxygenduring the day, as well as that supplied from the water columnby diffusion at night, factors that affect the sources and sinksof oxygen to and from the plants can also be very important(HOLMER and BONDGAARD, 2001). For example, GREVE et al.(2005) have associated late summer diebacks of eelgrass in Dan-ish coastal waters with periods of low water-column concentra-tions of oxygen. Low oxygen supply to belowground and meri-stematic tissues can be especially injurious to seagrass throughthe accumulation of anaerobic metabolites (SMITH et al., 1988)or the accumulation of phytotoxins such as sulfide from the re-ducing sediments (BORUM et al., 2005; PEDERSON et al., 2004)that can negatively affect photosynthesis, nutrient uptake, andgrowth (GOODMAN et al., 1993; HOMER and BONDGAARD, 2001;PREGNALL et al., 1984).
Climate change can have significant impacts on eelgrass aswell as other seagrass through temperature increases, at-mospheric and weather changes, and sea level increases(SHORT and NECKLES, 1999). OVIATT (2004) hypothesized

136 Moore and Jarvis
Journal of Coastal Research, Special Issue No. 55, 2008
that declines of eelgrass populations along the western At-lantic during the past 100 years have been associated withperiods of warming. A projected one degree centigrade in-crease in average temperature (NEFF et al., 2000) has beenassociated with short-term pulses of high water temperaturesand low oxygen levels (GARRETT, 1992; NEFF et al., 2000),which can have adverse effects on seagrass survival (GREVE
et al., 2005). PRESTON (2004) has determined through trendanalysis of historical monitoring data from the ChesapeakeBay that the estuary has warmed approximately 0.8–1.1�Csince the mid-20th century. Increased storm frequency andincreased rainfall patterns have been projected for the Ches-apeake Bay region (NAJJAR et al., 2000; POLSKY et al., 2000)and elsewhere (LABAT et al., 2004; ROGERS and MCCARTHY,2000) as a result of climate changes during the next 30 to100 years. Increased rainfall (NEFF et al., 2000) will result inincreased sediment and nutrient inputs (NAJJAR et al., 2000;POLSKY et al., 2000), further decreasing light availability foreelgrass populations in the Chesapeake Bay (MOORE et al.,1996, 1997). Sea level rise associated with climate warmingwill be observed both globally (DOUGLAS, 1991; WARRICK etal., 1996) and locally (GEHRELS et al., 2005; TITUS and NA-RAYANAN, 1995). As shorelines in the Chesapeake Bay arehardened as a result of human occupation, landward trans-gression of intertidal and shallow subtidal regions will belikely reduced and water levels will increase (NAJJAR et al.,2000), limiting seagrass and other littoral habitat. In theChesapeake Bay, eelgrass is growing near the southern limitsof its distribution along the western shore of the Atlantic(KOCH and ORTH, 2003). It could be expected that the effectsof climate change on eelgrass populations might be first ev-ident in areas such as this one that are near the limits of itsgrowth. This might be especially true in regions such as theChesapeake Bay where light and temperature conditionshave been demonstrated to already significantly affect eel-grass growth and reproduction (MOORE et al., 1996, 1997;SILBERHORN et al., 1983).
The highest global surface temperature in more than a cen-tury of instrumented data was recorded in the 2005 calendaryear (Goddard Institute for Space Studies, New York, NY).For the Chesapeake Bay region, unusually high summertimewater temperatures in 2005 were combined with extremelylow dissolved oxygen (DO) levels. For example, summertimeanoxia of bay waters exceeded 2.5 km3 (Chesapeake Bay Pro-gram, 2006). This was 40% greater than in 2004 and morethan 100% greater than similar periods in 2006. During Au-gust at the peak of bay anoxia, the measured bay anoxia vol-ume exceeded 5 km3 (1985–2005 average of 2.3 km3). In ad-dition, historical analysis of wind data for the summers of1997–2005 (CHESAPEAKE BAY PROGRAM, 2005) indicatedthat the region had below normal wind. The mean summerwind speed for 2005 was the lowest recorded during the1997–2005 period, which may have compounded the effectsof high temperatures and other factors on oxygen levels.
In shallow water areas it is possible that short-term hightemperatures may compound the effects of other prolongedenvironmental stresses that are influencing eelgrass persis-tence (GREVE et al., 2005; MOORE et al., 1997). Evaluatingand quantifying these effects requires nearly continuous
measurements of habitat conditions, as well as concurrentmeasurements of seagrass response (MOORE, 2004). In 2004,the National Estuarine Research Reserve System (NERRS)began a program to monitor biological resources including,areas of seagrasses. The NERRS is a network of 27 areasrepresenting different coastal, biogeographic regions of theUnited States that are protected for long-term research, wa-ter-quality monitoring, education, and coastal stewardshipthrough federal-state partnerships (NATIONAL ESTUARINE
RESEARCH RESERVE SYSTEM, 2008). In the Chesapeake Bayregion, the CBNERRVA instituted a study with the objectivesto quantify the local patterns of short-term and interannualvariability of eelgrass beds in the reserve system in the lowerChesapeake Bay and to relate these patterns to environmen-tal and water quality conditions over several years of varyingclimatic conditions. In this study, we investigate the relation-ships between water quality conditions before, during, andafter the summer of 2005, when a large-scale dieback of eel-grass beds occurred in the lower Chesapeake Bay region. Ourspecific questions were twofold: (1) What are the interannualpatterns of variability and distribution of eelgrass growing invarying depths at two sites located along a water quality gra-dient? (2) How do any patterns of change relate to environ-mental and water quality conditions at these sites?
METHODS
Study Sites
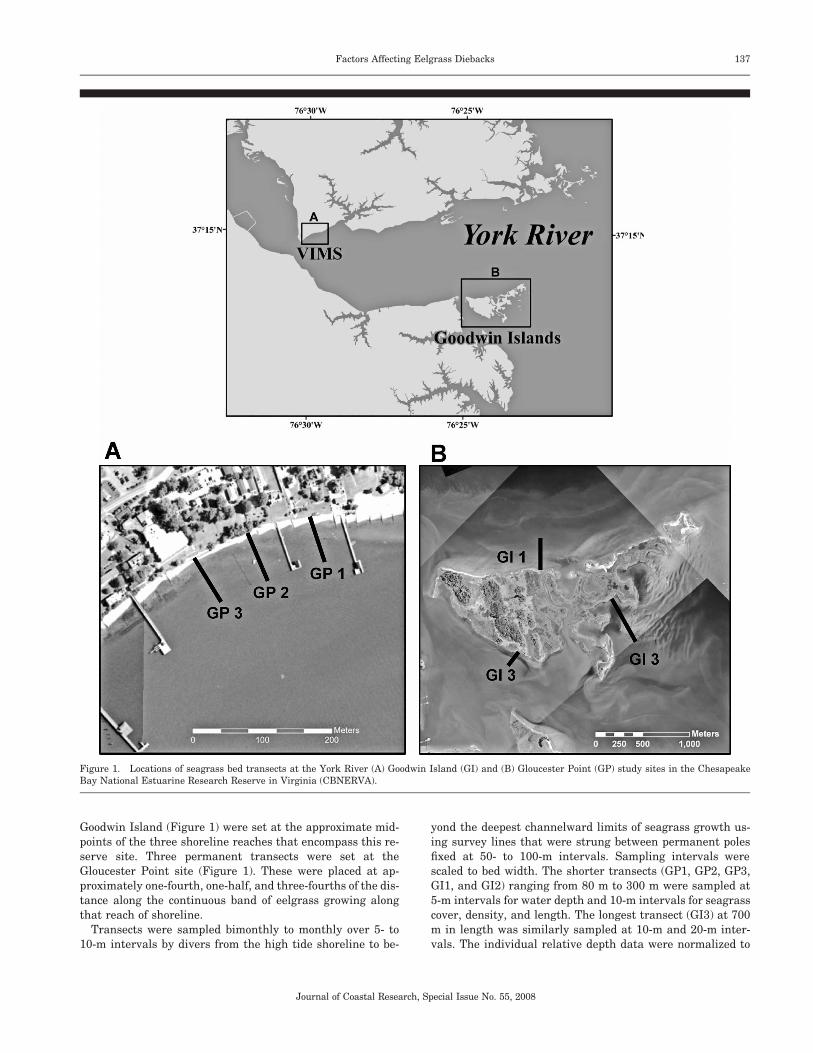
Two sites were chosen for investigation in the York RiverEstuary (Figure 1), which is a tributary of the ChesapeakeBay and the location of reserve sites for CBNERRVA. Eachof the two sites was initially evaluated through review of his-torical yearly aerial photography and ground survey infor-mation so as to be representative of patterns of seagrass dis-tribution and abundance for the region (ORTH et al., 2006).The Goodwin Island (GI) site (37�13� N, 76�23� W) is an islandcomplex located at the mouth of the York River. It is aCBNERRVA reserve site and is an area that has been sur-rounded with seagrass beds for at least the last 70 years(MOORE et al., 2000; ORTH and MOORE, 1983; ORTH et al.,2006). The Gloucester Point (GP) site (37�15� N, 76�30� W) islocated approximately 10 km upriver. It is located near thecurrent upriver limits of seagrass growth in the York system(ORTH et al., 2006). Eelgrass beds declined precipitously inthe region upriver of this site between 1972 and 1974 (ORTH
and MOORE, 1983), and the abundance of vegetation in thisarea can vary from year to year (ORTH et al., 2006). It is asite that has been characterized during at least the past sev-eral decades by higher levels of turbidity and nutrients thandownriver regions of the York River Estuary (MOORE, 2004;MOORE et al., 1996, 1997).
Biological Sampling
A systematic sampling design, consisting of fixed transectslocated perpendicular to the shoreline and extending chan-nelward past the deepest end of the seagrass vegetation, wasused to investigate changes in seagrass abundance across thedepth gradients at each site. Three permanent transects at
137Factors Affecting Eelgrass Diebacks
Journal of Coastal Research, Special Issue No. 55, 2008
Figure 1. Locations of seagrass bed transects at the York River (A) Goodwin Island (GI) and (B) Gloucester Point (GP) study sites in the ChesapeakeBay National Estuarine Research Reserve in Virginia (CBNERVA).
Goodwin Island (Figure 1) were set at the approximate mid-points of the three shoreline reaches that encompass this re-serve site. Three permanent transects were set at theGloucester Point site (Figure 1). These were placed at ap-proximately one-fourth, one-half, and three-fourths of the dis-tance along the continuous band of eelgrass growing alongthat reach of shoreline.
Transects were sampled bimonthly to monthly over 5- to10-m intervals by divers from the high tide shoreline to be-
yond the deepest channelward limits of seagrass growth us-ing survey lines that were strung between permanent polesfixed at 50- to 100-m intervals. Sampling intervals werescaled to bed width. The shorter transects (GP1, GP2, GP3,GI1, and GI2) ranging from 80 m to 300 m were sampled at5-m intervals for water depth and 10-m intervals for seagrasscover, density, and length. The longest transect (GI3) at 700m in length was similarly sampled at 10-m and 20-m inter-vals. The individual relative depth data were normalized to
138 Moore and Jarvis
Journal of Coastal Research, Special Issue No. 55, 2008
Mean Lower Low Water (MLLW), using concurrent waterdepth measurements at the Nation Ocean Survey, Yorktown,Virginia, U.S. Coast Guard Training Center tidal water levelstation located on the York River at a midpoint between thetwo sites (37�13.6� N, 76�28.7� W) as reference. At each 10-or 20-m sampling point, one observation of seagrass speciesbottom cover was made by divers over approximately a 2-m� 2-m area surrounding the transect sampling point. Next,a 0.5-m � 0.5-m quadrat was haphazardly tossed three timeswithin the 2-m � 2-m sampling area, and seagrass cover byspecies was estimated within each tossed quadrate. The coverestimates were standardized to reference photographs of sea-grass cover, and the visual census of seagrass cover was cal-ibrated among individual divers in the field using a range oftest quadrats to assure that they were the same (SHORT etal., 2006). A small, 20-cm-diameter ring was placed over arepresentative vegetation patch within each quadrat, and allshoots were counted. The length of the longest shoot (cm) wasalso measured and recorded. Previous work in eelgrass bedsin this region (MOORE, 2004; ORTH and MOORE, 1988) hasdemonstrated that cover estimates by divers can provide goodestimates of plant biomass.
Water-Quality Sampling
Fixed-station sampling of water quality, including temper-ature, salinity, DO, turbidity, chlorophyll fluorescence, andpH measurements was made at 15-minute intervals at fixedelevations of 0.25 m above the bottom using YSI 6600 EDSdata sondes, following standard YSI (YSI, Inc., YellowSprings, Ohio) and NERRS System-Wide Monitoring Pro-gram protocols (NATIONAL ESTUARINE RESEARCH RESERVE
SYSTEM, 2008). Measurements were made from Januarythrough December of 2004, 2005, and 2006 at the GoodwinIsland site and from March through November of 2004,March through December of 2005, and January through De-cember of 2006 at the Gloucester Point site. Mean waterdepths at both sites were approximately 0.5 m MLLW.
Triplicate subsurface water samples were taken approxi-mately every 14 days at each of the fixed station samplingsites. All samples were obtained sequentially beginning withthe most downriver site and stored in the dark on ice for upto 4 hours before filtering. Nutrients and chlorophyll sampleswere then frozen until analysis. Nitrite, nitrate, ammonium,and orthophosphate were analyzed by flow injection using aLachet QuickChem 8000 Automated Ion Analyzer (Lachat In-struments, Loveland, Colorado). Suspended matter was col-lected on precombusted, Gelman Type A/E glass fiber filters,dried to constant weight at 55�C and combusted at 500�C for5 hours. Chlorophyll a was collected on Whatman GF/F glassfiber filters, extracted in a solvent mixture of acetone, di-methyl sulfoxide, and 1% diethylamine (45 : 45 : 10 by volume)and determined fluorometrically (SHOAF and LIUM, 1976).Chlorophyll concentrations were uncorrected for phaeopig-ments. Diffuse downwelling attenuation of photosyntheticallyavailable radiation (PAR) was determined by triplicate watercolumn profiles of downwelling photosynthetic photon fluxdensity measured with a LI-COR, LI-192, underwater cosine-corrected sensor (LI-COR Biosciences, Lincoln, Nebraska).
These data were obtained concurrently with the water sam-ples. The downwelling attenuation coefficient (Kd) was cal-culated as the decay constant of a negative exponential func-tion according to the Lambert-Beer equation.
RESULTS
Eelgrass Distribution and Abundance
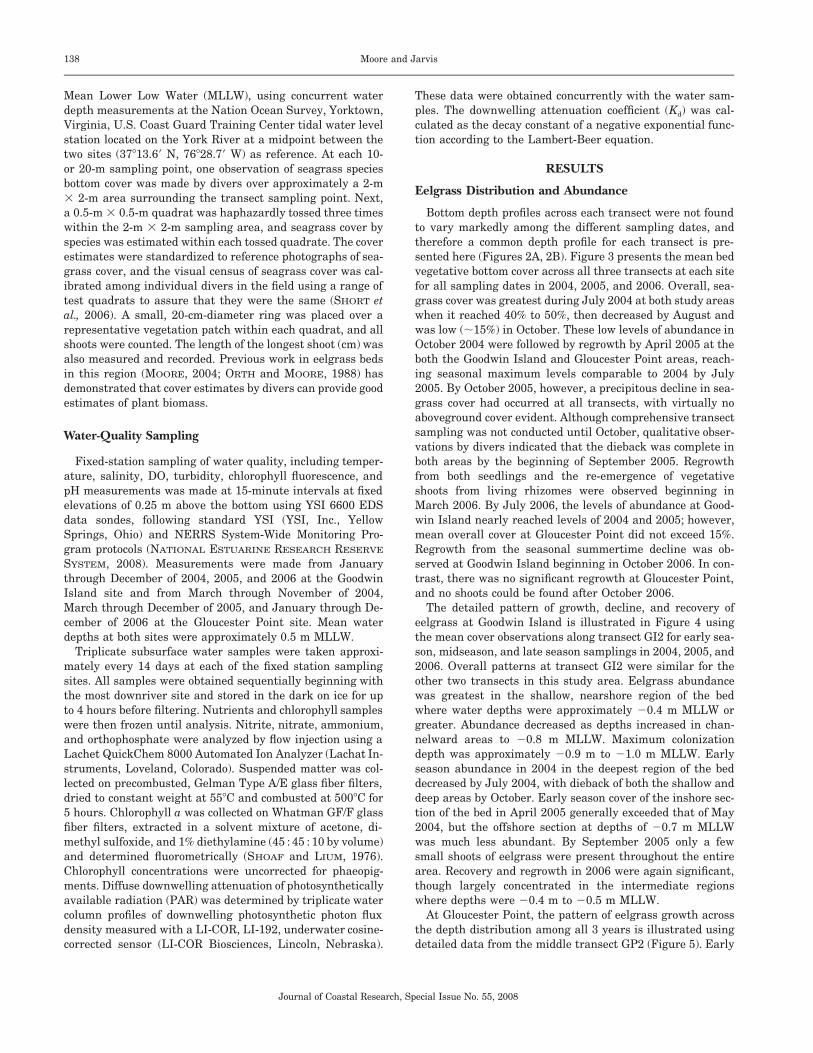
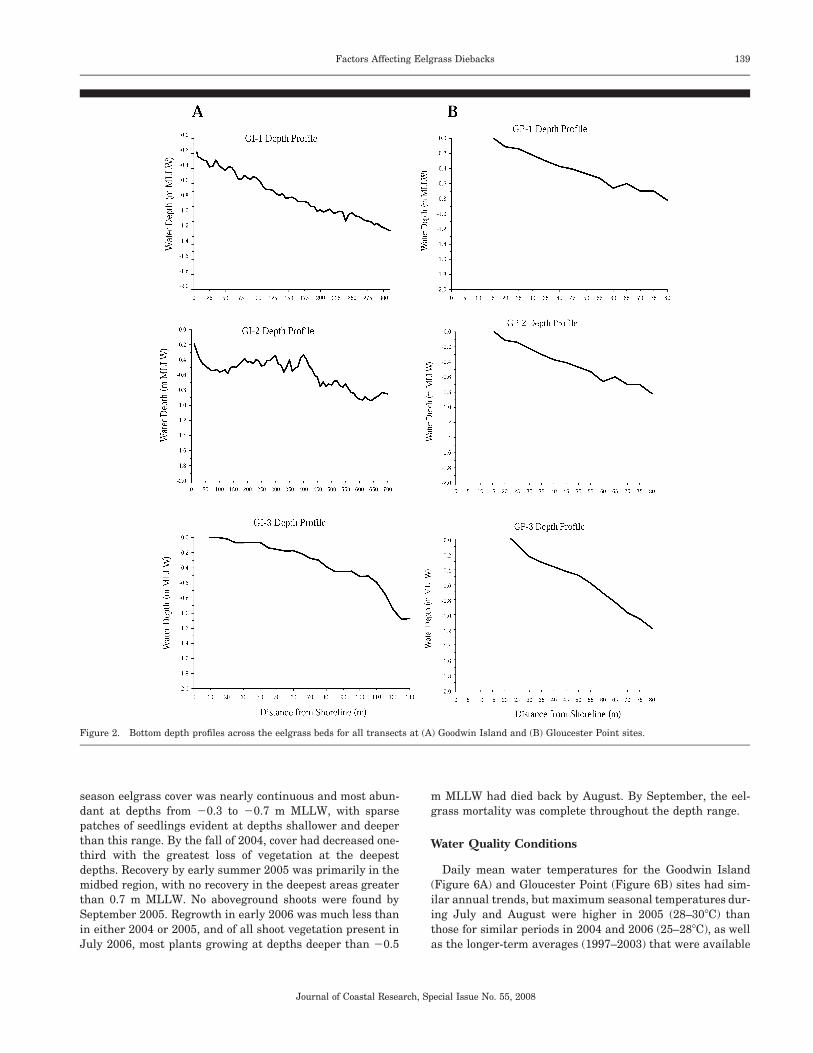
Bottom depth profiles across each transect were not foundto vary markedly among the different sampling dates, andtherefore a common depth profile for each transect is pre-sented here (Figures 2A, 2B). Figure 3 presents the mean bedvegetative bottom cover across all three transects at each sitefor all sampling dates in 2004, 2005, and 2006. Overall, sea-grass cover was greatest during July 2004 at both study areaswhen it reached 40% to 50%, then decreased by August andwas low (�15%) in October. These low levels of abundance inOctober 2004 were followed by regrowth by April 2005 at theboth the Goodwin Island and Gloucester Point areas, reach-ing seasonal maximum levels comparable to 2004 by July2005. By October 2005, however, a precipitous decline in sea-grass cover had occurred at all transects, with virtually noaboveground cover evident. Although comprehensive transectsampling was not conducted until October, qualitative obser-vations by divers indicated that the dieback was complete inboth areas by the beginning of September 2005. Regrowthfrom both seedlings and the re-emergence of vegetativeshoots from living rhizomes were observed beginning inMarch 2006. By July 2006, the levels of abundance at Good-win Island nearly reached levels of 2004 and 2005; however,mean overall cover at Gloucester Point did not exceed 15%.Regrowth from the seasonal summertime decline was ob-served at Goodwin Island beginning in October 2006. In con-trast, there was no significant regrowth at Gloucester Point,and no shoots could be found after October 2006.
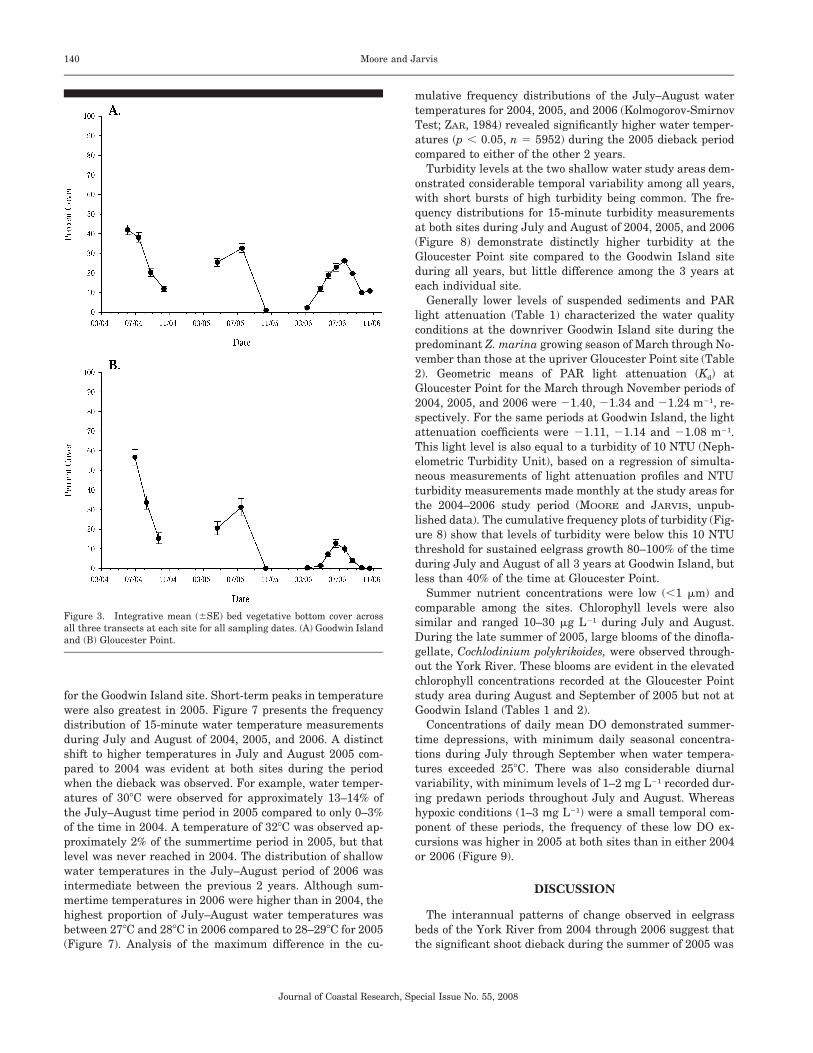
The detailed pattern of growth, decline, and recovery ofeelgrass at Goodwin Island is illustrated in Figure 4 usingthe mean cover observations along transect GI2 for early sea-son, midseason, and late season samplings in 2004, 2005, and2006. Overall patterns at transect GI2 were similar for theother two transects in this study area. Eelgrass abundancewas greatest in the shallow, nearshore region of the bedwhere water depths were approximately �0.4 m MLLW orgreater. Abundance decreased as depths increased in chan-nelward areas to �0.8 m MLLW. Maximum colonizationdepth was approximately �0.9 m to �1.0 m MLLW. Earlyseason abundance in 2004 in the deepest region of the beddecreased by July 2004, with dieback of both the shallow anddeep areas by October. Early season cover of the inshore sec-tion of the bed in April 2005 generally exceeded that of May2004, but the offshore section at depths of �0.7 m MLLWwas much less abundant. By September 2005 only a fewsmall shoots of eelgrass were present throughout the entirearea. Recovery and regrowth in 2006 were again significant,though largely concentrated in the intermediate regionswhere depths were �0.4 m to �0.5 m MLLW.
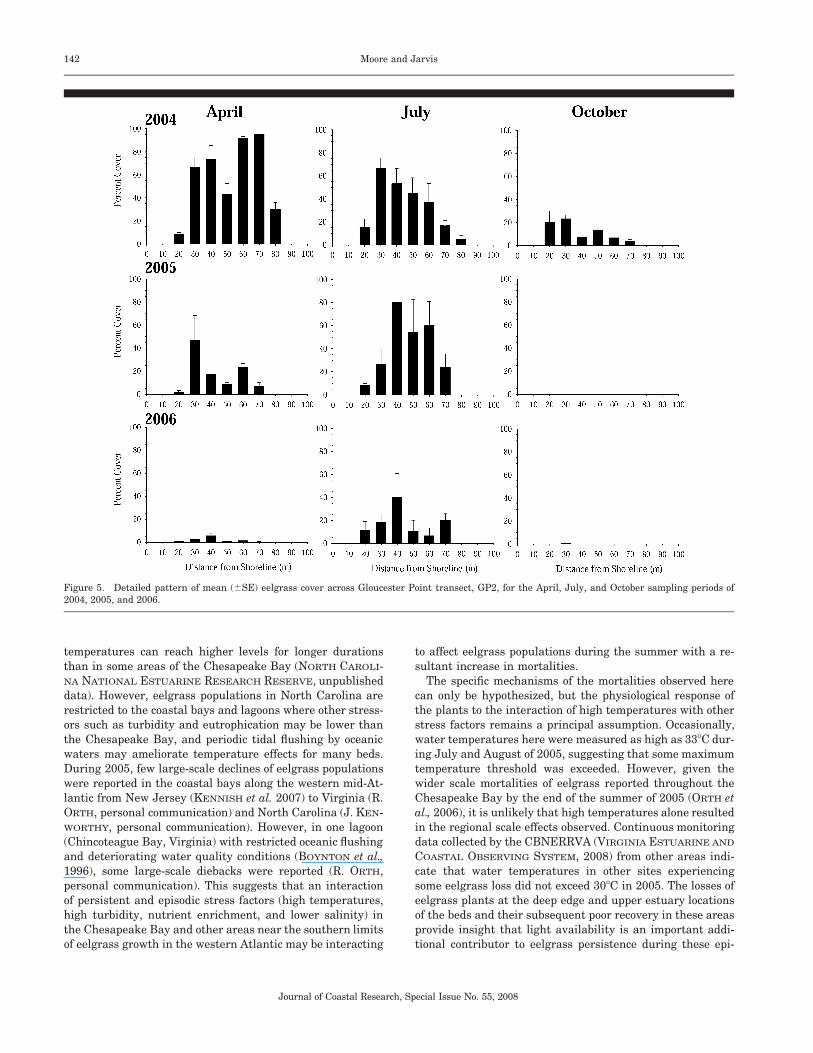
At Gloucester Point, the pattern of eelgrass growth acrossthe depth distribution among all 3 years is illustrated usingdetailed data from the middle transect GP2 (Figure 5). Early
139Factors Affecting Eelgrass Diebacks
Journal of Coastal Research, Special Issue No. 55, 2008
Figure 2. Bottom depth profiles across the eelgrass beds for all transects at (A) Goodwin Island and (B) Gloucester Point sites.
season eelgrass cover was nearly continuous and most abun-dant at depths from �0.3 to �0.7 m MLLW, with sparsepatches of seedlings evident at depths shallower and deeperthan this range. By the fall of 2004, cover had decreased one-third with the greatest loss of vegetation at the deepestdepths. Recovery by early summer 2005 was primarily in themidbed region, with no recovery in the deepest areas greaterthan 0.7 m MLLW. No aboveground shoots were found bySeptember 2005. Regrowth in early 2006 was much less thanin either 2004 or 2005, and of all shoot vegetation present inJuly 2006, most plants growing at depths deeper than �0.5
m MLLW had died back by August. By September, the eel-grass mortality was complete throughout the depth range.
Water Quality Conditions
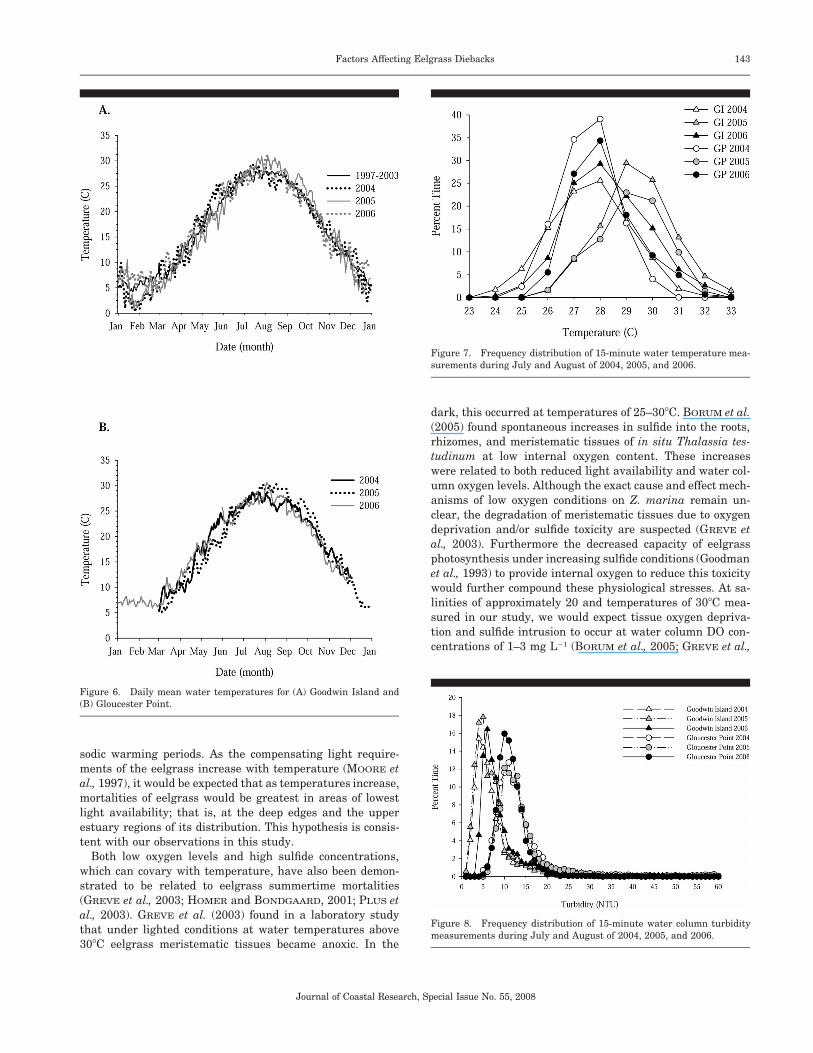
Daily mean water temperatures for the Goodwin Island(Figure 6A) and Gloucester Point (Figure 6B) sites had sim-ilar annual trends, but maximum seasonal temperatures dur-ing July and August were higher in 2005 (28–30�C) thanthose for similar periods in 2004 and 2006 (25–28�C), as wellas the longer-term averages (1997–2003) that were available
140 Moore and Jarvis
Journal of Coastal Research, Special Issue No. 55, 2008
Figure 3. Integrative mean (�SE) bed vegetative bottom cover acrossall three transects at each site for all sampling dates. (A) Goodwin Islandand (B) Gloucester Point.
for the Goodwin Island site. Short-term peaks in temperaturewere also greatest in 2005. Figure 7 presents the frequencydistribution of 15-minute water temperature measurementsduring July and August of 2004, 2005, and 2006. A distinctshift to higher temperatures in July and August 2005 com-pared to 2004 was evident at both sites during the periodwhen the dieback was observed. For example, water temper-atures of 30�C were observed for approximately 13–14% ofthe July–August time period in 2005 compared to only 0–3%of the time in 2004. A temperature of 32�C was observed ap-proximately 2% of the summertime period in 2005, but thatlevel was never reached in 2004. The distribution of shallowwater temperatures in the July–August period of 2006 wasintermediate between the previous 2 years. Although sum-mertime temperatures in 2006 were higher than in 2004, thehighest proportion of July–August water temperatures wasbetween 27�C and 28�C in 2006 compared to 28–29�C for 2005(Figure 7). Analysis of the maximum difference in the cu-
mulative frequency distributions of the July–August watertemperatures for 2004, 2005, and 2006 (Kolmogorov-SmirnovTest; ZAR, 1984) revealed significantly higher water temper-atures (p � 0.05, n 5952) during the 2005 dieback periodcompared to either of the other 2 years.
Turbidity levels at the two shallow water study areas dem-onstrated considerable temporal variability among all years,with short bursts of high turbidity being common. The fre-quency distributions for 15-minute turbidity measurementsat both sites during July and August of 2004, 2005, and 2006(Figure 8) demonstrate distinctly higher turbidity at theGloucester Point site compared to the Goodwin Island siteduring all years, but little difference among the 3 years ateach individual site.
Generally lower levels of suspended sediments and PARlight attenuation (Table 1) characterized the water qualityconditions at the downriver Goodwin Island site during thepredominant Z. marina growing season of March through No-vember than those at the upriver Gloucester Point site (Table2). Geometric means of PAR light attenuation (Kd) atGloucester Point for the March through November periods of2004, 2005, and 2006 were �1.40, �1.34 and �1.24 m�1, re-spectively. For the same periods at Goodwin Island, the lightattenuation coefficients were �1.11, �1.14 and �1.08 m�1.This light level is also equal to a turbidity of 10 NTU (Neph-elometric Turbidity Unit), based on a regression of simulta-neous measurements of light attenuation profiles and NTUturbidity measurements made monthly at the study areas forthe 2004–2006 study period (MOORE and JARVIS, unpub-lished data). The cumulative frequency plots of turbidity (Fig-ure 8) show that levels of turbidity were below this 10 NTUthreshold for sustained eelgrass growth 80–100% of the timeduring July and August of all 3 years at Goodwin Island, butless than 40% of the time at Gloucester Point.
Summer nutrient concentrations were low (�1 m) andcomparable among the sites. Chlorophyll levels were alsosimilar and ranged 10–30 g L�1 during July and August.During the late summer of 2005, large blooms of the dinofla-gellate, Cochlodinium polykrikoides, were observed through-out the York River. These blooms are evident in the elevatedchlorophyll concentrations recorded at the Gloucester Pointstudy area during August and September of 2005 but not atGoodwin Island (Tables 1 and 2).
Concentrations of daily mean DO demonstrated summer-time depressions, with minimum daily seasonal concentra-tions during July through September when water tempera-tures exceeded 25�C. There was also considerable diurnalvariability, with minimum levels of 1–2 mg L�1 recorded dur-ing predawn periods throughout July and August. Whereashypoxic conditions (1–3 mg L�1) were a small temporal com-ponent of these periods, the frequency of these low DO ex-cursions was higher in 2005 at both sites than in either 2004or 2006 (Figure 9).
DISCUSSION
The interannual patterns of change observed in eelgrassbeds of the York River from 2004 through 2006 suggest thatthe significant shoot dieback during the summer of 2005 was
141Factors Affecting Eelgrass Diebacks
Journal of Coastal Research, Special Issue No. 55, 2008
Figure 4. Detailed pattern of mean (�SE) eelgrass cover across Goodwin Island transect, GI2, for the April, July, and October sampling periods of 2004,2005, and 2006.
precipitated by increased frequency and duration of high(�30�C) summertime water temperatures compared to theother years. Additionally, annual aerial photographic map-ping of eelgrass populations in the Chesapeake Bay from thelate spring of 2004 to 2006 demonstrate that the pattern ofthese York River mortalities were characteristic of many eel-grass bed mortalities throughout the lower Chesapeake Bay(ORTH et al., 2006). Therefore the specific responses we mea-sured here may be considered representative of the largerregion. Whereas there were no distinct differences in turbid-ity evident among 3 years at either of the sites, markedlyhigher levels of turbidity and light attenuation in the upriverGloucester Point region of the York, which corresponded togreater eelgrass decline and reduced regrowth, suggests thatestuarine turbidity can compound the negative effects of highwater temperatures on long-term eelgrass survival. Episodicoxygen reductions, which can compound the effects of elevat-ed temperature (BORUM et al., 2005), may also have providedan additional stressor affecting plant dieback.
We found recolonization of eelgrass from summertime mor-tality in 2005 to near predieback levels within 1 year at Good-
win Island. This is similar to that reported by others for eel-grass recolonization after massive mortalities (FREDERIKSEN
et al., 2004; GREVE et al., 2005; PLUS et al., 2003). Howeverour work and that of others suggest that if environmentalconditions are not improved during subsequent years, espe-cially in areas where chronic stressors such as turbidity oreutrophication remain high such as the Gloucester Point site,the potential exists for persistent declines with limited recov-ery due both to limited propagule supply and fundamentalhabitat state change (FREDERIKSEN et al., 2004; MOORE,2004; MOORE et al., 1996, 1997).
The magnitude of summertime temperature differences be-tween years with eelgrass persistence and growth (2004 and2006) and a year with massive dieback (2005) was small(1–2�C) and of limited duration (�5% to 15% difference infrequency). This suggests that populations here are growingnear their upper temperature limit during July and August,and small temperature increases can have profound effects.Interestingly, eelgrass populations are found growing furthersouth into North Carolina (34�32� N, 77�21� W; GREEN andSHORT, 2003) where the climate is much warmer and water
142 Moore and Jarvis
Journal of Coastal Research, Special Issue No. 55, 2008
Figure 5. Detailed pattern of mean (�SE) eelgrass cover across Gloucester Point transect, GP2, for the April, July, and October sampling periods of2004, 2005, and 2006.
temperatures can reach higher levels for longer durationsthan in some areas of the Chesapeake Bay (NORTH CAROLI-NA NATIONAL ESTUARINE RESEARCH RESERVE, unpublisheddata). However, eelgrass populations in North Carolina arerestricted to the coastal bays and lagoons where other stress-ors such as turbidity and eutrophication may be lower thanthe Chesapeake Bay, and periodic tidal flushing by oceanicwaters may ameliorate temperature effects for many beds.During 2005, few large-scale declines of eelgrass populationswere reported in the coastal bays along the western mid-At-lantic from New Jersey (KENNISH et al. 2007) to Virginia (R.ORTH, personal communication) and North Carolina (J. KEN-WORTHY, personal communication). However, in one lagoon(Chincoteague Bay, Virginia) with restricted oceanic flushingand deteriorating water quality conditions (BOYNTON et al.,1996), some large-scale diebacks were reported (R. ORTH,personal communication). This suggests that an interactionof persistent and episodic stress factors (high temperatures,high turbidity, nutrient enrichment, and lower salinity) inthe Chesapeake Bay and other areas near the southern limitsof eelgrass growth in the western Atlantic may be interacting
to affect eelgrass populations during the summer with a re-sultant increase in mortalities.
The specific mechanisms of the mortalities observed herecan only be hypothesized, but the physiological response ofthe plants to the interaction of high temperatures with otherstress factors remains a principal assumption. Occasionally,water temperatures here were measured as high as 33�C dur-ing July and August of 2005, suggesting that some maximumtemperature threshold was exceeded. However, given thewider scale mortalities of eelgrass reported throughout theChesapeake Bay by the end of the summer of 2005 (ORTH etal., 2006), it is unlikely that high temperatures alone resultedin the regional scale effects observed. Continuous monitoringdata collected by the CBNERRVA (VIRGINIA ESTUARINE AND
COASTAL OBSERVING SYSTEM, 2008) from other areas indi-cate that water temperatures in other sites experiencingsome eelgrass loss did not exceed 30�C in 2005. The losses ofeelgrass plants at the deep edge and upper estuary locationsof the beds and their subsequent poor recovery in these areasprovide insight that light availability is an important addi-tional contributor to eelgrass persistence during these epi-
143Factors Affecting Eelgrass Diebacks
Journal of Coastal Research, Special Issue No. 55, 2008
Figure 6. Daily mean water temperatures for (A) Goodwin Island and(B) Gloucester Point.
Figure 7. Frequency distribution of 15-minute water temperature mea-surements during July and August of 2004, 2005, and 2006.
Figure 8. Frequency distribution of 15-minute water column turbiditymeasurements during July and August of 2004, 2005, and 2006.
sodic warming periods. As the compensating light require-ments of the eelgrass increase with temperature (MOORE etal., 1997), it would be expected that as temperatures increase,mortalities of eelgrass would be greatest in areas of lowestlight availability; that is, at the deep edges and the upperestuary regions of its distribution. This hypothesis is consis-tent with our observations in this study.
Both low oxygen levels and high sulfide concentrations,which can covary with temperature, have also been demon-strated to be related to eelgrass summertime mortalities(GREVE et al., 2003; HOMER and BONDGAARD, 2001; PLUS etal., 2003). GREVE et al. (2003) found in a laboratory studythat under lighted conditions at water temperatures above30�C eelgrass meristematic tissues became anoxic. In the
dark, this occurred at temperatures of 25–30�C. BORUM et al.(2005) found spontaneous increases in sulfide into the roots,rhizomes, and meristematic tissues of in situ Thalassia tes-tudinum at low internal oxygen content. These increaseswere related to both reduced light availability and water col-umn oxygen levels. Although the exact cause and effect mech-anisms of low oxygen conditions on Z. marina remain un-clear, the degradation of meristematic tissues due to oxygendeprivation and/or sulfide toxicity are suspected (GREVE etal., 2003). Furthermore the decreased capacity of eelgrassphotosynthesis under increasing sulfide conditions (Goodmanet al., 1993) to provide internal oxygen to reduce this toxicitywould further compound these physiological stresses. At sa-linities of approximately 20 and temperatures of 30�C mea-sured in our study, we would expect tissue oxygen depriva-tion and sulfide intrusion to occur at water column DO con-centrations of 1–3 mg L�1 (BORUM et al., 2005; GREVE et al.,

144 Moore and Jarvis
Journal of Coastal Research, Special Issue No. 55, 2008
Table 1. Mean (�SE) monthly Goodwin Island water quality conditions. (N/A not available, NOx M nitrate�nitrite, NH4 M ammonium, DIP M dissolved inorganic phosphate, CHL a g/l chlorophyll a, TSS mg/l total suspended solids, Kd downwelling light attenuation coefficient.)
Date NOx NH4 DIP CHL a TSS Kd Salinity
2004January 0.8 � 0.3 1.5 � 0.5 0.0 � 0.0 66.3�11.3 25.1 � 3.3 1.2 � 0.1 16.6 � 0.3February 5.8 � 1.2 2.0 � 0.5 0.1 � 0.0 18.7 � 2.1 18.7 � 0.6 0.9 � 0.1 14.7 � 0.2March 4.6 � 0.7 0.4 � 0.1 0.0 � 0.0 14.7 � 2.1 13.3 � 1.6 0.8 � 0.1 16.8 � 0.5April 7.6 � 2.5 0.5 � 0.1 0.0 � 0.0 15.3 � 2.4 17.2 � 2.9 1.0 � 0.1 17.0 � 0.3May 2.3 � 1.0 0.6 � 0.1 0.0 � 0.0 29.2 � 4.7 15.2 � 1.4 1.5 � 0.1 18.6 � 0.2June 0.1 � 0.0 0.3 � 0.0 0.0 � 0.0 20.1 � 1.3 14.5 � 0.9 1.1 � 0.1 18.1 � 1.0July 0.0 � 0.0 0.5 � 0.0 0.1 � 0.0 21.5 � 1.6 12.1 � 0.5 1.0 � 0.0 19.2 � 0.3August 1.2 � 0.5 0.6 � 0.1 0.1 � 0.0 15.9 � 0.8 11.5 � 1.3 1.3 � 0.1 18.5 � 0.1September 0.1 � 0.0 0.4 � 0.1 0.2 � 0.0 27.4 � 1.1 6.8 � 0.4 1.2 � 0.0 15.4 � 0.0October 1.6 � 0.8 0.4 � 0.1 0.0 � 0.0 16.2 � 1.3 7.8 � 0.6 1.1 � 0.1 15.5 � 0.4November 0.2 � 0.1 0.6 � 0.1 0.1 � 0.0 22.1 � 3.7 8.3 � 2.2 1.0 � 0.2 17.5 � 0.1December 4.7 � 0.0 0.6 � 0.1 0.0 � 0.0 15.7 � 0.5 4.8 � 0.9 0.6 � 0.1 16.4 � 0.0
2005January 0.4 � 0.2 0.6 � 0.1 0.0 � 0.0 22.8 � 2.2 5.0 � 0.3 1.3 � 0.1 11.2 � 2.2February 4.6 � 0.3 0.6 � 0.1 0.0 � 0.0 17.5 � 1.0 3.9 � 0.2 1.1 � 0.1 17.0 � 0.3March 2.9 � 1.4 0.3 � 0.1 0.1 � 0.0 31.8 � 2.7 4.0 � 0.3 0.9 � 0.1 16.9 � 0.5April 0.1 � 0.0 0.2 � 0.0 0.0 � 0.0 41.8 � 3.6 6.3 � 1.2 1.6 � 0.2 16.3 � 0.6May 0.1 � 0.0 0.2 � 0.0 0.0 � 0.0 17.0 � 0.8 2.9 � 0.4 1.2 � 0.1 16.5 � 0.1June 0.1 � 0.0 0.5 � 0.1 0.0 � 0.0 13.6 � 0.7 4.8 � 0.2 1.2 � 0.1 16.2 � 0.2July 0.0 � 0.0 0.7 � 0.0 0.1 � 0.0 14.8 � 1.7 5.1 � 0.5 1.1 � 0.1 19.5 � 0.0August 0.0 � 0.0 0.5 � 0.1 0.1 � 0.0 17.9 � 0.6 4.5 � 0.3 1.2 � 0.1 19.9 � 0.1September 0.0 � 0.0 0.3 � 0.0 0.1 � 0.0 11.7 � 0.9 4.1 � 0.4 1.0 � 0.2 21.3 � 0.0October 15.7 � 0.3 0.1 � 0.0 0.3 � 0.0 7.8 � 0.0 2.7 � 0.2 N/A 21.7 � 0.0November 1.6 � 0.0 0.1 � 0.0 0.0 � 0.0 18.4 � 0.4 2.7 � 0.5 1.1 � 0.3 21.3 � 0.0December 0.9 � 0.4 0.4 � 0.1 0.0 � 0.0 11.2 � 0.8 3.4 � 0.1 1.0 � 0.2 20.4 � 0.3
2006January 0.1 � 0.0 0.3 � 0.0 0.0 � 0.0 16.5 � 1.8 7.9 � 2.0 0.8 � 0.1 18.9 � 0.3February 0.1 � 0.0 0.3 � 0.0 0.0 � 0.0 14.4 � 1.9 3.3 � 0.4 0.9 � 0.1 17.9 � 0.2March 0.1 � 0.0 0.3 � 0.1 0.0 � 0.0 6.4 � 0.9 9.0 � 1.0 0.7 � 0.9 18.9 � 0.1April 0.1 � 0.0 0.4 � 0.1 0.0 � 0.0 6.3 � 0.8 9.5 � 1.1 1.1 � 0.1 19.1 � 0.2May 0.2 � 0.0 0.2 � 0.0 0.0 � 0.0 8.7 � 2.5 11.1 � 1.5 1.3 � 0.2 19.1 � 0.4June 0.1 � 0.0 0.6 � 0.2 0.0 � 0.0 8.7 � 0.2 13.6 � 1.5 1.2 � 0.1 20.7 � 0.1July 0.0 � 0.0 0.4 � 0.1 0.0 � 0.0 13.8 � 1.3 12.8 � 1.9 1.3 � 0.0 20.6 � 0.0August 0.3 � 0.1 0.1 � 0.0 0.1 � 0.0 16.7 � 1.4 11.1 � 1.0 1.2 � 0.1 21.3 � 0.6September 0.6 � 0.1 1.4 � 0.3 0.0 � 0.0 16.3 � 0.4 11.5 � 1.9 1.4 � 0.0 20.4 � 0.0October 3.3 � 0.3 3.9 � 0.4 0.5 � 0.1 6.9 � 0.4 5.9 � 0.5 0.8 � 0.1 20.0 � 0.2November 1.9 � 0.1 0.6 � 0.0 0.1 � 0.0 13.7 � 0.1 2.1 � 0.1 1.0 � 0.0 20.0 � 0.0December N/A N/A N/A 19.8 � 4.3 3.5 � 0.5 1.2 � 0.1 17.3 � 0.1
2003). In our study, these levels occurred in predawn anddawn hours approximately 3–5% of the time in July and Au-gust of 2005 and to a lesser extent in 2004. A previous studyat the Goodwin Island site (MOORE, 2004), where water col-umn DO levels were similarly measured within the eelgrasscanopy, episodic low levels were also reported. This suggeststhat episodic low summertime DO conditions have occurredregularly within these eelgrass beds and that the mortalityin 2005 was not singularly related to low water column DO.
Given the mortality of the eelgrass beds observed in theYork River in 2005 and the particularly poor recovery at theGloucester Point site, a projected long-term increase in tem-perature and turbidity for the Chesapeake Bay due to climatechange will be problematic for continued success of eelgrasspopulations in this system. The 2004 through 2006 trajecto-ries for eelgrass growth at both study sites are downward(Figure 3) with no vegetation present and no regrowth evi-dent at Gloucester Point as of November 2006. These down-ward trends parallel similar downward trajectories observedfor eelgrass populations baywide (ORTH et al., 2006). The re-
sults presented here that relate continuous measures of wa-ter quality with concurrent measures of eelgrass bed respons-es suggest these eelgrass populations are near their limits forcontinued growth and survival and that episodic events canhave significant long-term impacts. Increased frequency ofthese episodic stresses may result in the loss of this speciesin certain areas of the Chesapeake Bay.
Alternative strategies for seagrass populations in this re-gion are few. Annual forms of eelgrass have been observed inother regions, and this strategy of reproduction, i.e., seed pro-duction during the first year of growth followed by die offduring the stressful summer, may be one. Little is yet knownabout why or how these annual form populations develop(KEDDY and PATRIQUIN, 1978; MELING-LOPEZ and IBARRA-OBANDO, 1999). In the Chesapeake Bay so far, no annualpopulations have been observed. Other species such as Rup-pia maritima may expand and Halodule wrightii may becomeestablished; however, their lack of effective root structure andother aspects of their growth forms make their survival inmany areas currently vegetated by eelgrass problematic.
145Factors Affecting Eelgrass Diebacks
Journal of Coastal Research, Special Issue No. 55, 2008
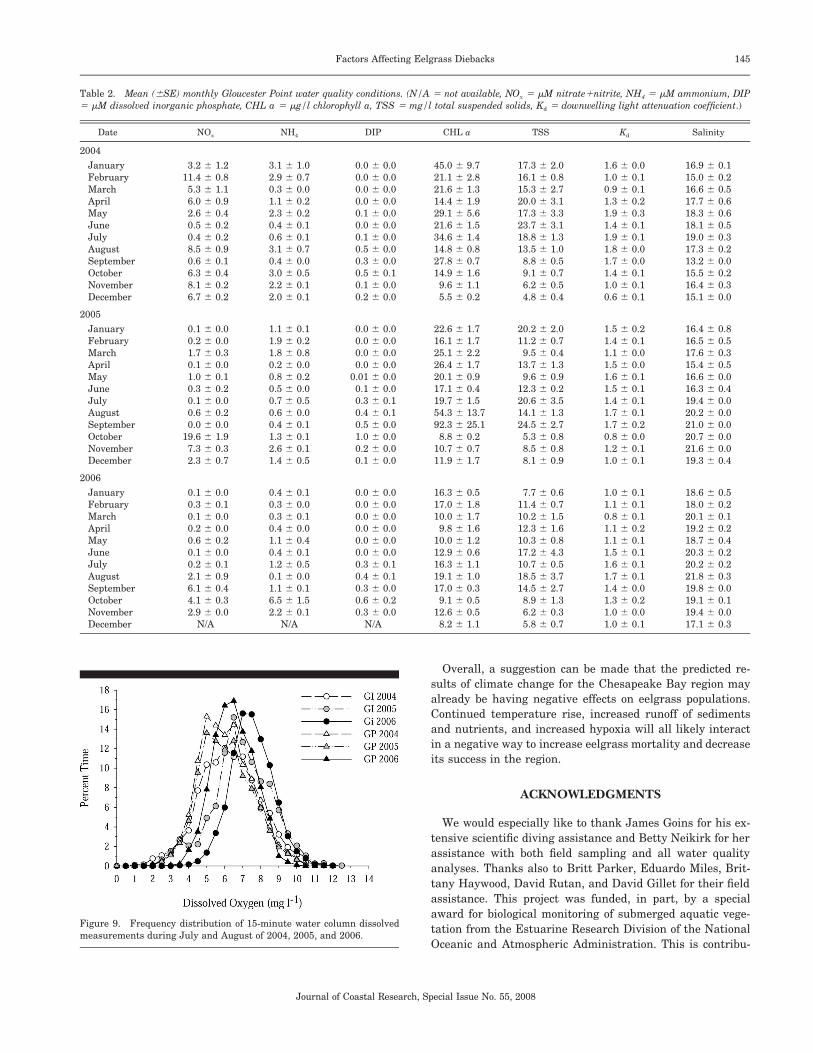
Table 2. Mean (�SE) monthly Gloucester Point water quality conditions. (N/A not available, NOx M nitrate�nitrite, NH4 M ammonium, DIP M dissolved inorganic phosphate, CHL a g/l chlorophyll a, TSS mg/l total suspended solids, Kd downwelling light attenuation coefficient.)
Date NOx NH4 DIP CHL a TSS Kd Salinity
2004January 3.2 � 1.2 3.1 � 1.0 0.0 � 0.0 45.0 � 9.7 17.3 � 2.0 1.6 � 0.0 16.9 � 0.1February 11.4 � 0.8 2.9 � 0.7 0.0 � 0.0 21.1 � 2.8 16.1 � 0.8 1.0 � 0.1 15.0 � 0.2March 5.3 � 1.1 0.3 � 0.0 0.0 � 0.0 21.6 � 1.3 15.3 � 2.7 0.9 � 0.1 16.6 � 0.5April 6.0 � 0.9 1.1 � 0.2 0.0 � 0.0 14.4 � 1.9 20.0 � 3.1 1.3 � 0.2 17.7 � 0.6May 2.6 � 0.4 2.3 � 0.2 0.1 � 0.0 29.1 � 5.6 17.3 � 3.3 1.9 � 0.3 18.3 � 0.6June 0.5 � 0.2 0.4 � 0.1 0.0 � 0.0 21.6 � 1.5 23.7 � 3.1 1.4 � 0.1 18.1 � 0.5July 0.4 � 0.2 0.6 � 0.1 0.1 � 0.0 34.6 � 1.4 18.8 � 1.3 1.9 � 0.1 19.0 � 0.3August 8.5 � 0.9 3.1 � 0.7 0.5 � 0.0 14.8 � 0.8 13.5 � 1.0 1.8 � 0.0 17.3 � 0.2September 0.6 � 0.1 0.4 � 0.0 0.3 � 0.0 27.8 � 0.7 8.8 � 0.5 1.7 � 0.0 13.2 � 0.0October 6.3 � 0.4 3.0 � 0.5 0.5 � 0.1 14.9 � 1.6 9.1 � 0.7 1.4 � 0.1 15.5 � 0.2November 8.1 � 0.2 2.2 � 0.1 0.1 � 0.0 9.6 � 1.1 6.2 � 0.5 1.0 � 0.1 16.4 � 0.3December 6.7 � 0.2 2.0 � 0.1 0.2 � 0.0 5.5 � 0.2 4.8 � 0.4 0.6 � 0.1 15.1 � 0.0
2005January 0.1 � 0.0 1.1 � 0.1 0.0 � 0.0 22.6 � 1.7 20.2 � 2.0 1.5 � 0.2 16.4 � 0.8February 0.2 � 0.0 1.9 � 0.2 0.0 � 0.0 16.1 � 1.7 11.2 � 0.7 1.4 � 0.1 16.5 � 0.5March 1.7 � 0.3 1.8 � 0.8 0.0 � 0.0 25.1 � 2.2 9.5 � 0.4 1.1 � 0.0 17.6 � 0.3April 0.1 � 0.0 0.2 � 0.0 0.0 � 0.0 26.4 � 1.7 13.7 � 1.3 1.5 � 0.0 15.4 � 0.5May 1.0 � 0.1 0.8 � 0.2 0.01 � 0.0 20.1 � 0.9 9.6 � 0.9 1.6 � 0.1 16.6 � 0.0June 0.3 � 0.2 0.5 � 0.0 0.1 � 0.0 17.1 � 0.4 12.3 � 0.2 1.5 � 0.1 16.3 � 0.4July 0.1 � 0.0 0.7 � 0.5 0.3 � 0.1 19.7 � 1.5 20.6 � 3.5 1.4 � 0.1 19.4 � 0.0August 0.6 � 0.2 0.6 � 0.0 0.4 � 0.1 54.3 � 13.7 14.1 � 1.3 1.7 � 0.1 20.2 � 0.0September 0.0 � 0.0 0.4 � 0.1 0.5 � 0.0 92.3 � 25.1 24.5 � 2.7 1.7 � 0.2 21.0 � 0.0October 19.6 � 1.9 1.3 � 0.1 1.0 � 0.0 8.8 � 0.2 5.3 � 0.8 0.8 � 0.0 20.7 � 0.0November 7.3 � 0.3 2.6 � 0.1 0.2 � 0.0 10.7 � 0.7 8.5 � 0.8 1.2 � 0.1 21.6 � 0.0December 2.3 � 0.7 1.4 � 0.5 0.1 � 0.0 11.9 � 1.7 8.1 � 0.9 1.0 � 0.1 19.3 � 0.4
2006January 0.1 � 0.0 0.4 � 0.1 0.0 � 0.0 16.3 � 0.5 7.7 � 0.6 1.0 � 0.1 18.6 � 0.5February 0.3 � 0.1 0.3 � 0.0 0.0 � 0.0 17.0 � 1.8 11.4 � 0.7 1.1 � 0.1 18.0 � 0.2March 0.1 � 0.0 0.3 � 0.1 0.0 � 0.0 10.0 � 1.7 10.2 � 1.5 0.8 � 0.1 20.1 � 0.1April 0.2 � 0.0 0.4 � 0.0 0.0 � 0.0 9.8 � 1.6 12.3 � 1.6 1.1 � 0.2 19.2 � 0.2May 0.6 � 0.2 1.1 � 0.4 0.0 � 0.0 10.0 � 1.2 10.3 � 0.8 1.1 � 0.1 18.7 � 0.4June 0.1 � 0.0 0.4 � 0.1 0.0 � 0.0 12.9 � 0.6 17.2 � 4.3 1.5 � 0.1 20.3 � 0.2July 0.2 � 0.1 1.2 � 0.5 0.3 � 0.1 16.3 � 1.1 10.7 � 0.5 1.6 � 0.1 20.2 � 0.2August 2.1 � 0.9 0.1 � 0.0 0.4 � 0.1 19.1 � 1.0 18.5 � 3.7 1.7 � 0.1 21.8 � 0.3September 6.1 � 0.4 1.1 � 0.1 0.3 � 0.0 17.0 � 0.3 14.5 � 2.7 1.4 � 0.0 19.8 � 0.0October 4.1 � 0.3 6.5 � 1.5 0.6 � 0.2 9.1 � 0.5 8.9 � 1.3 1.3 � 0.2 19.1 � 0.1November 2.9 � 0.0 2.2 � 0.1 0.3 � 0.0 12.6 � 0.5 6.2 � 0.3 1.0 � 0.0 19.4 � 0.0December N/A N/A N/A 8.2 � 1.1 5.8 � 0.7 1.0 � 0.1 17.1 � 0.3
Figure 9. Frequency distribution of 15-minute water column dissolvedmeasurements during July and August of 2004, 2005, and 2006.
Overall, a suggestion can be made that the predicted re-sults of climate change for the Chesapeake Bay region mayalready be having negative effects on eelgrass populations.Continued temperature rise, increased runoff of sedimentsand nutrients, and increased hypoxia will all likely interactin a negative way to increase eelgrass mortality and decreaseits success in the region.
ACKNOWLEDGMENTS
We would especially like to thank James Goins for his ex-tensive scientific diving assistance and Betty Neikirk for herassistance with both field sampling and all water qualityanalyses. Thanks also to Britt Parker, Eduardo Miles, Brit-tany Haywood, David Rutan, and David Gillet for their fieldassistance. This project was funded, in part, by a specialaward for biological monitoring of submerged aquatic vege-tation from the Estuarine Research Division of the NationalOceanic and Atmospheric Administration. This is contribu-
146 Moore and Jarvis
Journal of Coastal Research, Special Issue No. 55, 2008
tion No. 2935 from the Virginia Institute of Marine Science,School of Marine Science, College of William and Mary.
LITERATURE CITED
BINTZ, J.C.; NIXON, S.W.; BUCKLEY, B.A., and GRANGER, S.L., 2003.Impacts of temperature and nutrients on coastal lagoon plant com-munities. Estuaries, 26, 765–776.
BORUM, J.; PEDERSEN, O.; GREVE, T.M.; FRANKOVICH, T.A.; ZIE-MAN, J.C.; FOURQUREAN, J.W., and MADDEN, C.J., 2005. The po-tential role of plant oxygen and sulphide dynamics in die-offevents of the tropical seagrass, Thalassia testudinum. Journal ofEcology, 93, 148–158.
BOYNTON, W.R.; HAGY, J.D.; MURRAY, L.; STOKEE C., and KEMP
W.M., 1996. A comparative analysis of eutrophication patterns ina temperature coastal lagoon. Estuaries, 19, 408–421.
CHESAPEAKE BAY PROGRAM, 2005. Water Quality and AquaticGrass, Summer 2005. Chesapeake Bay Program’s Monitoring andAnalysis Subcommittee, Annapolis, Maryland, Chesapeake Up-date, Issue 4, November 2005. 4p.
CHESAPEAKE BAY PROGRAM, 2006. Chesapeake Bay 2006, WeatherExtremes Lead to Typical Conditions. Chesapeake Bay Program’sMonitoring and Analysis Subcommittee, Annapolis, Maryland,Newsletter, November 2006. 4p.
DENNISON, W.C.; ORTH, R.J; MOORE, K.A.; STEVENSON, J.C.; CAR-TER, V.; KOLLAR, S.; BERGSTROM, P., and BATIUK, R., 1993. As-sessing water quality with submersed aquatic vegetation. Biosci-ence, 43, 86–94.
DOUGLAS, B.C., 1991. Global sea level rise. Journal of GeophysicalResearch, 96, 6981–6992.
FREDERIKSEN, M.; KRAUSE-JENSEN, D.; HOLMER, M., and LAUR-SEN, J.S., 2004. Spatial and temporal variation in eelgrass (Zos-tera marina) landscapes: influence of physical setting. Aquatic Bot-any, 78, 147–165.
GARRETT, C.W., 1992. On global climate change, carbon dioxide andfossil fuel combustion. Progressive Energy Combustion Science, 18,369–407.
GEHRELS, W.R.; KIRBY, J.R.; PROKOPH, A.; NEWNHAM, R.M.; ACH-TERBERG, E.P.; EVANS, H; BLACK, S., and SCOTT, D.B., 2005. On-set of recent rapid sea-level rise in the western Atlantic Ocean.Quaternary Science Reviews, 24, 2083–2100.
GODDARD INSTITUTE FOR SPACE STUDIES. GISS Surface Tempera-ture Analysis, Global Temperature Trends: 2007 Summation.http://data/giss/nasa/gov/gistemp/2007 (accessed May 15, 2008).
GOODMAN, J.L.; MOORE, K.A., and DENNISON, W.C., 1993. Photo-synthetic responses of eelgrass (Zostera marina L.) to light andsediment sulfide in a shallow barrier island lagoon. Aquatic Bot-any, 50, 37–47.
GREEN, E.P. and F.T. SHORT, (eds.), 2003. World Atlas of Seagrasses.Berkeley, California: University of California Press, 298p.
GREVE, T.M.; BORUM, J., and PEDERSEN, O., 2003. Meristematicoxygen variability in eelgrass (Zostera marina). Limnology andOceanography, 48, 210–216.
GREVE, T.M.; KRAUSE-JENSEN, D.; RASMUSSEN, M.B., and CHRISTEN-SEN, P.B., 2005. Means of rapid eelgrass (Zostera marina L.) recolo-nisation in former dieback areas. Aquatic Botany, 82, 143–156.
HOMER, M. and BONDGAARD, E.J., 2001. Photosynthetic and growthresponse of eelgrass to low oxygen and high sulfide concentrationsduring hypoxic events. Aquatic Botany, 70, 29–38.
KEDDY C.J. and PATRIQUIN D.G., 1978. An annual form of eelgrassin Nova Scotia. Aquatic Botany, 5, 163–170.
KEMP, W.M.; BATIUK, R.; BARTLESON, R.; MOORE, K.; BERGSTROM,P.; CARTER, V.; GALLEGOS, C.; HUMNLEY, W.; KARRH, L.; KOCH,E.W.; LANDWEHR, J.; MOORE, K.; MURRAY, L.; NAYLOR, M.; RY-BICKI, N.; STEVENSON, J.C., and WILCOX, D., 2004. Habitat re-quirements for submerged aquatic vegetation in Chesapeake Bay:water quality, light regime, and physical-chemical factors. Estu-aries, 2, 363–377.
KENNISH, M.J.; HAAG, S.M., and SAKOWICZ, G.P. 2007. DemographicInvestigation of Seagrass in the Barnegat Bay-Little Egg Harbor Es-tuary With Assessment of Potential Impacts of Benthic Macroalgae
and Brown Tides. Final Report. New Brunswick, New Jersey: Insti-tute of Marine and Coastal Sciences Rutgers University, 366p.
KOCH, E.W. and ORTH, R.J., 2003. Seagrasses of the Mid-AtlanticCoast of the United States. In: GREEN, E.P. and SHORT, F.T.(eds.), World Atlas of Seagrasses. Berkeley, California: Universityof California Press, pp. 216–223.
LABAT, D.; GODDERIS, Y.; PROBST, J.L., and GUYOT, J.L., 2004. Ev-idence for global runoff increase related to climate warming. Ad-vances in Water Resources, 27, 631–642.
MELING-LOPEZ, A.E. and IBARRA-OBANDO, S.E., 1999. Annual lifecycles of two Zostera marina L. populations in the Gulf of Califor-nia: contrasts in seasonality and reproductive effort. Aquatic Bot-any, 65, 59–69.
MOORE, K.A., 2004. Influence of seagrasses on water quality in shal-low regions of the lower Chesapeake Bay. Journal of Coastal Re-search, Special Issue No. 45, 162–178.
MOORE, K. A.; NECKLES, H.A., and ORTH, R.J., 1996. Zostera ma-rina (eelgrass) growth and survival along a gradient of nutrientsand turbidity in the lower Chesapeake Bay. Marine Ecology Prog-ress Series, 142, 247–259.
MOORE, K.A. and WETZEL, R.L., 2000. Seasonal variations in eel-grass (Zostera marina L.) responses to nutrient enrichment andreduced light availability in experimental ecosystems. Journal ofMarine Biology and Ecology, 244, 1–28.
MOORE, K.A.; WETZEL R.L., and ORTH, R.J., 1997. Seasonal pulsesof turbidity and their relations to eelgrass (Zostera marina L.) sur-vival in an estuary. Journal of Marine Biology and Ecology, 215,115–134.
MOORE, K.A.; WILCOX, D.L., and ORTH, R.J., 2000. Analysis of abun-dance of submersed aquatic vegetation communities in the Ches-apeake Bay. Estuaries, 23, 115–127.
NAJJAR, R.G.; WALKER, H.A.; ANDERSON, P.J.; BARRON, E.J.; BORD,R.J.; GIBSON, J.R.; KENNEDY, V.S.; KNIGHT, C.G.; MEGONIGAL,J.P.; O’CONNOR, R.E.; POLSKY, C.D.; PSUTY, N.P.; RICHARDS,B.A.; SORENSON, L.G.; STEELE, E.M., and SWANSON, R.S., 2000.The potential impacts of climate change on the mid-Atlantic coast-al region. Climate Research, 14, 219–233.
NATIONAL ESTUARINE RESEARCH RESERVE SYSTEM. Background.http://nerrs.noaa.gov (accessed May 15, 2008).
NATIONAL ESTUARINE RESEARCH RESERVE SYSTEM. Monitoring.http://nerrs.noaa.gov/Monitoring/Water.html (accessed May 15,2008).
NEFF, R.; CHANG, H.; KNIGHT, C.G.; NAJJAR, R.G.; YARNAL, B., andWALKER, H.A., 2000. Impact of climate variation and change onmid-Atlantic region hydrology and water resources. Climate Re-search, 14, 207–218.
ORTH, R.J. and MOORE, K.A., 1983. An unprecedented decline in sub-merged aquatic vegetation (Chesapeake Bay). Science, 22, 51–53.
ORTH, R.J. and MOORE, K.A., 1988. Distribution of Zostera marinaL. and Ruppia maritima L. sensu lato, along depth gradients inthe lower Chesapeake Bay, U.S.A. Aquatic Botany, 32, 291–305.
ORTH, R.J.; WILCOX, D.J.; NAGEY, L.S.; OWENS, A.L.; WHITING,J.R., and KENNE, A.K., 2005. 2006 Distribution of submergedaquatic vegetation in Chesapeake Bay. Special Scientific Report#147. Gloucester Point, Virginia: VIMS.
OVIATT, C.A., 2004. The changing ecology of temperate coastal wa-ters during a warming trend. Estuaries, 27, 895–904.
PEDERSEN, O.; BINZER, T., and BORUM, J., 2004. Sulphide intrusionin eelgrass (Zostera marina L.). Plant, Cell and Environment, 27,595–602.
PLUS, M.; DESLOUS-PAOLI, J-M., and DAGAULT, F., 2003. Seagrass(Zostera marina L.) bed recolonisation after anoxia-induced fullmortality. Aquatic Botany, 77, 121–134.
POLSKY, C.; ALLARD, J.; CURRIT, N.; CRANE, R., and YARNAL, B.,2000. The mid-Atlantic region and its climate: past present andfuture. Climate Research, 14, 161–173.
PREGNALL, A.M.; SMITH, R.D.; KURSAR, T.A., and ALBERTE, R.S.,1984. Metabolic adaptation of Zostera marina (eelgrass) to diurnalperiods of root anoxia. Marine Biology, 83, 141–147.
PRESTON, B.L., 2004. Observed winter warming of the ChesapeakeBay estuary (1949–2002): implications for ecosystem manage-ment. Environmental Management, 34, 125–139.
147Factors Affecting Eelgrass Diebacks
Journal of Coastal Research, Special Issue No. 55, 2008
ROGERS, C.E. and MCCARTHY, J.P., 2000. Climate change and eco-systems of the mid-Atlantic region. Climate Research, 14, 235–244.
SHOAF, W.T. and LIUM, B.W., 1976. Improved extraction of chloro-phyll a and b from algae using dimethyl sulfoxide. Limnology andOceanography, 21, 926–928.
SHORT, F.T. and NECKLES, H.A., 1999. The effects of global climatechange on seagrasses. Aquatic Botany, 63, 169–196.
SILBERHORN, G.M.; ORTH, R.J., and MOORE, K.A., 1983. Anthesisand seed production in eelgrass from the Chesapeake Bay. AquaticBotany, 15, 133–144.
SMITH, R.D.; PREGNALL, A.M., and ALBERTE, R.S., 1988. Effects ofanaerobiosis on root metabolism of Zostera marina (eelgrass)—implications for survival in reducing sediments. Marine Biology,98, 131–141.
TITUS, J.G. and NARAYANAN, V.K., 1995. The Probability of Sea-Level Rise. Washington, D.C.: US Environmental Protection Agen-cy, EPA 230-R-96-004.
VIRGINIA ESTUARINE AND COASTAL OBSERVING SYSTEM. Fixed Sta-tions. http://www.VECOS.org (accessed May 15, 2008).
WARRICK, R.A.; LE PROVOST, C.; MEIER, M.F.; OERLEMANS, J., andWOODWORTH, P.L., 1996. Changes in sea level. In: HOUGHTON,J.T.; MEIRA FILHO, L.G.; CALLANDER, B.A.; HARRIS, N.; KATTEN-BERG, A., and MASKELL, K. (eds), Climate Change 1995: The Sci-ence of Climate Change, Cambridge, United Kingdom: CambridgeUniversity Press, pp. 59–405.
ZAR, J.H., 1984. Biostatistical Analysis, 2nd edition. EnglewoodCliffs, New Jersey: Prentice-Hall, Inc., 718 p.