Submerged Aquatic Vegetation: - Chesapeake Bay Trust
121
Submerged Aquatic Vegetation: Behavior Change Research and Program Implementation Recommendations Chesapeake Bay Program 3630 Ocean Ranch Boulevard Oceanside, CA 92056 40 Exchange Place, Suite 1403 New York, NY 10005 Submitted: April 9, 2021
-
Upload
khangminh22 -
Category
Documents
-
view
0 -
download
0
Transcript of Submerged Aquatic Vegetation: - Chesapeake Bay Trust

Submerged Aquatic Vegetation: Behavior Change Research and Program
Implementation Recommendations Chesapeake Bay Program
3630 Ocean Ranch Boulevard Oceanside, CA 92056
40 Exchange Place, Suite 1403 New York, NY 10005
Submitted: April 9, 2021


i | P a g e
Table of Contents Table of Contents ........................................................................................................................................... i
Table of Figures ............................................................................................................................................. ii
Table of Tables .............................................................................................................................................. ii
Acknowledgements ....................................................................................................................................... 1
Action Research ........................................................................................................................................ 1
Steering Committee .................................................................................................................................. 1
1: Research Goals and Background ............................................................................................................... 2
Literature Review ...................................................................................................................................... 2
Behavior Selection .................................................................................................................................... 2
Shoreline Property Owner Survey ............................................................................................................ 3
2: Methodology ............................................................................................................................................. 4
Address List Generation ............................................................................................................................ 4
Sample Selection ....................................................................................................................................... 5
Survey ........................................................................................................................................................ 5
3: Results ....................................................................................................................................................... 6
Demographics ........................................................................................................................................... 6
Boats and Piers .......................................................................................................................................... 6
Property Characteristics ............................................................................................................................ 6
Structures .................................................................................................................................................. 6
Waterfront Activities ................................................................................................................................. 7
Submerged Aquatic Vegetation (SAV) Context ......................................................................................... 7
SAV Actions ............................................................................................................................................... 9
Leaving SAV Alone ................................................................................................................................... 11
SAV-Friendly Piers ................................................................................................................................... 12
Attitudes .................................................................................................................................................. 14
Communication ....................................................................................................................................... 15
Exploratory Analysis ................................................................................................................................ 15
Considering Removal of SAV ............................................................................................................... 15
Change in SAV ..................................................................................................................................... 17
Armor .................................................................................................................................................. 18
Piers .................................................................................................................................................... 21
4: Conclusions and Recommendations ....................................................................................................... 22
Leave SAV Alone ...................................................................................................................................... 22
Build Piers that Extend Beyond SAV ....................................................................................................... 25
Outreach Approach ................................................................................................................................. 27
Considerations for Implementation ........................................................................................................ 29
Appendix A: Submerged Aquatic Vegetation Review Memo ...................................................................... 31
Submerged Aquatic Vegetation Review ..................................................................................................... 31
Purpose and Definition ........................................................................................................................... 31
Background ............................................................................................................................................. 31

Action Research
ii | P a g e
Direct Human Impacts on SAV ................................................................................................................ 32
Recreational and Commercial Boaters ............................................................................................... 32
Shoreline Property Owners ................................................................................................................. 33
Conclusions ............................................................................................................................................. 36
Behavior List ........................................................................................................................................ 36
Next Steps ........................................................................................................................................... 37
References .............................................................................................................................................. 38
Appendix B: Barrier and Benefit Survey ...................................................................................................... 40
Appendix C: Survey Comments ................................................................................................................... 44
Appendix D: Ambassador Script for Outreach ............................................................................................ 48
Table of Figures Figure 1: Map of Addresses in Maryland ...................................................................................................... 4
Figure 2: Waterfront Activities ..................................................................................................................... 7
Figure 3: Perceived Change in SAV ............................................................................................................... 7
Figure 4: Amount of SAV on the Shoreline ................................................................................................... 8
Figure 5: Reasons for Considering Protecting or Restoring SAV ................................................................... 9
Figure 6: Reasons for Considering Removal of SAV .................................................................................... 10
Figure 7: Barriers to Leaving SAV Alone ...................................................................................................... 11
Figure 8: Benefits to Leaving SAV Alone ..................................................................................................... 12
Figure 9: Barriers to Extending Pier ............................................................................................................ 13
Figure 10: Benefits to Extending Pier .......................................................................................................... 13
Figure 11: Shoreline-Related Attitudes ....................................................................................................... 14
Figure 12: Information Sources for Shoreline Management ...................................................................... 15
Figure 13: Barriers for Leaving SAV Alone by Considering Removing......................................................... 16
Figure 14: Benefits for Leaving SAV Alone by Considering Removing ........................................................ 16
Figure 15: Attitudes Toward Shorelines by Consider Removing ................................................................. 17
Figure 16: Barriers to Leaving SAV Alone by Armor .................................................................................... 18
Figure 17: Benefits to Leaving SAV Alone by Armor ................................................................................... 19
Figure 18: Shoreline Attitudes by Armor .................................................................................................... 20
Figure 19: Shoreline Attitudes by Pier ........................................................................................................ 21
Table of Tables Table 1: Responses ........................................................................................................................................ 6
Table 2: Materials Developed for the Outreach Program .......................................................................... 27

1 | P a g e
Acknowledgements This project was a collaborative effort between Action Research and the Chesapeake Bay Program, with
support from many experts within the Chesapeake Bay region.
Action Research Jennifer Tabanico, President
Lori Large, Director of Research Operations
Kaitlin Phelps, Project Director
Dani Ballard, Research Coordinator
Doug McKenzie-Mohr, Scientific Consultant and Community-Based Social Marketing Founder
Kenneth Moore, Scientific Consultant
Steering Committee Co-lead: Rachel Felver, Alliance for the Chesapeake Bay
Co-lead: Brooke Landry, Maryland Department of Natural Resources
Rebecca Golden, Maryland Department of Natural Resources
Tom Guay, Severn River Association
Amy Handen, Environmental Protection Agency
Sally Horner, Magothy River Association
Caitlyn Johnstone, Alliance for the Chesapeake Bay
Morgan Jones, Havre de Grace Maritime Museum Environmental Center
Kelly Leo, The Nature Conservancy
Nancy Merrill, Arundel Rivers Federation
Rebecca Murphy, ShoreRivers
Doug Myers, Chesapeake Bay Foundation
Becky Swerida, Maryland Department of Natural Resources
Beth Wasden, Nanicoke Watershed Alliance
Beth Zinekcer, Underwood and Associates

Action Research
2 | P a g e
1: Research Goals and Background The goal of this work was to improve the health of the Chesapeake Bay and its tributaries through
helping shoreline property owners protect submerged aquatic vegetation (SAV). To achieve this goal, a
steering committee of SAV experts was assembled to provide oversight and expertise. Action Research
was then contracted to complete the work, which began with a literature review followed by a survey of
Maryland shoreline property owners to understand what challenges and situations they face when
considering the SAV in the water alongside their property. This information was gathered to inform the
development of strategies and outreach materials that will help shoreline property owners in the
Chesapeake Bay watershed better manage their shorelines by motivating them to not interfere with SAV
growth and build or extend piers beyond SAV to reduce negative impacts.
Literature Review The Action Research team began by reviewing the existing literature on SAV. The goal of this literature
review was to provide foundational research on the barriers and benefits that property owners may face
when engaging in behaviors that protect SAV near their property. SAV includes aquatic grasses, which
are rooted, flowering plants in the Chesapeake Bay that provide a wide variety of ecological and
economic services. The literature review identified many reasons that property owners either remove
SAV or leave SAV in place, including recreational activities, aesthetics, shoreline use, and property value.
The literature review also revealed that little has been published on specific behaviors related to SAV
issues and that few social science studies have been conducted on this topic. There are many factors
that influence SAV health and abundance, given that it grows in shallow water at the interface of
terrestrial and aquatic environments where anthropogenic impacts are common and sometimes
unavoidable. However, the literature review and consultation with the steering committee determined
that reducing direct removal of SAV was a meaningful pathway to increased health and quantity of SAV,
particularly as SAV populations are currently increasing in areas where homeowners may be unfamiliar
or unaccustomed with its presence. The full review can be found in the Submerged Aquatic Vegetation
Review memo from May 2020, Appendix A.
Behavior Selection Our review of the literature identified a set of eight behaviors related to SAV, listed below.
Behavior list
Behaviors to Encourage
• Leave SAV in place
• Leave shoreline unarmored
• Remove bulkheads/riprap if present
• Extend piers beyond where SAV grow
Behaviors to Discourage
• Hand removal of SAV by resident or hired company on residential property
• Mechanical removal of SAV by hired company on residential property
• Hardening of shoreline via riprap or bulkhead
• Installation of additional single-family docks

3 | P a g e
Through further discussions with the steering committee, it was determined that the most impactful
behaviors, with consideration to those that could be feasibly addressed by the committee and not
currently part of other active campaigns, were “leave SAV in place” and “extend piers beyond where
SAV grows.” These two behaviors were the focus of the next step, a mail survey to Maryland residents.
Shoreline Property Owner Survey Using the findings from the literature review and expert survey research as a foundation, the next step
was to conduct a mail survey to better understand property owners’ current behaviors related to SAV
management, their probability of taking the two beneficial SAV-related actions, and their perceived
barriers and benefits to engaging in these actions. The methodology and results of the shoreline
property owner survey are outlined in the next two sections of this report.

Action Research
4 | P a g e
2: Methodology In September and October of 2020, we administered a mail survey to residents of 600 waterfront
properties along both shores of the Chesapeake Bay in Maryland from the northernmost point of the
Bay down to the state line at the Potomac River. Several specific communities were selected where SAV
is known to be increasing and where removal was reportedly occurring (based on anecdotal reports
from the steering committee). The selected communities were near the Susquehanna Flats (Havre de
Grace vicinity), Middle River, and near other rivers heading south towards and including the Severn, all
in the tidal fresh, oligohaline, and mesohaline salinity zones. An address list of all shoreline properties in
the selected communities was created from state-level GIS data and then 600 addresses were randomly
selected from this list for inclusion in the survey. This process is described in further detail below.
Address List Generation After importing all GIS parcel data for Maryland, we removed counties that had no contact with the
Chesapeake Bay, coastline, or any river or tributary. We then filtered the addresses to select only
residential addresses that were in the targeted regions and mapped where the data indicated with a loss
or a gain in SAV. This process resulted in a final list of property addresses, shown in green below.
Figure 1: Map of Addresses in Maryland

5 | P a g e
Sample Selection We randomly selected 600 addresses from the complete list with the goal of obtaining survey responses
from a minimum of 120 properties (assuming a response rate of at least 20%).
Survey The survey was administered using the Tailored Design Method (TDM)1. In September 2020, selected
properties received a prenotification postcard followed a few days later by a hand-addressed survey
packet with an addressed and stamped return envelope. In October 2020, non-respondents to the initial
mailing received a reminder postcard and a second survey packet. The full survey is attached as
Appendix B.
1 Dillman, Don A., Smyth, Jolene D., Christian, Leah Melani. 2014. Internet, Phone, Mail and Mixed-Mode Surveys: The Tailored Design Method, 4th edition. John Wiley: Hoboken, NJ

Action Research
6 | P a g e
3: Results A total of 600 survey packets were mailed. Of these, 10 were returned as undeliverable. An additional
30 were returned or reported as ineligible (e.g., no shoreline, commercial properties, condominium
complexes). This left a sample size of 560 valid addresses in receipt of a survey. From the 560 valid
addresses, a total of 198 completed surveys were returned. There were also 14 refusals (blank surveys
returned in the pre-stamped envelope). This equates to a response rate of 35.4% which exceeded our
expectations. Table 1 lists each category.
Table 1: Responses
(A) Original Sample
(B) Undeliverable
(C) Ineligibles
(D) Valid
Sample (A – (B+
C))
(E) Refusals
(F) Completes
(G) Response
Rate (F/D)
Total 600 10 30 560 14 198 35.4%
Demographics Most respondents were property owners (97%). Length of property ownership was an average of 23
years (Range = 1 – 118 years). Respondents ranged in age from 23 to 92 years (Average = 62). The
average household size was 2.2 people (15 % had one person, 62% had two people, and 23% had three
or more people). The majority of respondents did not have children under 18 in their household (88%).
Boats and Piers Most respondents had an existing pier (82.6%) or were planning to build one (4.5%). About a third of
respondents’ neighborhoods have a community pier (31.6%). Most of the respondents had a boat
docked along property (62.2%) or docked elsewhere (11.7%).
Property Characteristics Respondents were asked to report which shoreline structures they had on their property, checking all
responses that applied. Most respondents reported having a bulkhead (69.7%). Some respondents had
riprap (20.7%), and a few had a living shoreline (12.6%).
Structures Respondents were asked to indicate which types of building structures they have on their property,
checking all responses that applied. Nearly all had houses (91.9%, N=182). A small number had a
vacation or rental home (7.1%, N=14) or other building (12.6%, N=25).

7 | P a g e
Waterfront Activities Respondents were asked to report the activities they use their waterfront for, checking as many options
as applicable. The most commonly reported activities were power boating (71%),
kayak/canoe/paddleboard (66%), and fishing (65%).
Figure 2: Waterfront Activities
Submerged Aquatic Vegetation (SAV) Context
Change in SAV
Over two-thirds of respondents reported that they have seen an increase in the amount of SAV (64%)
since living at their property. The remainder of responses were split evenly between seeing a decrease
(18%) and no change (18%).
Figure 3: Perceived Change in SAV
9%
10%
46%
53%
54%
65%
66%
71%
0% 10% 20% 30% 40% 50% 60% 70% 80%
Sailing (N=17)
Other (N=20)
Bird Watching/Photography (N=91)
Crabbing (N=105)
Swimming (N=106)
Fishing (N=129)
Kayak, Canoe, or Paddleboard (N=131)
Power boating (N=141)
64%18%
18%
Incease in SAV Decrease in SAV No change in SAV

Action Research
8 | P a g e
Current SAV
About half of respondents reported that either all (18%) or most (26%) of the water by their shoreline
had SAV. Respondents who reported having none (N=17) were skipped forward to the attitudes,
communication, and demographic questions.
Figure 4: Amount of SAV on the Shoreline
Inferential Statistics
Respondents who reported that either all or most of the water by their shoreline had SAV were
significantly more likely (p<.05)2 to report that they had seen an increase in SAV since they had owned
their property. Conversely, respondents who reported very little SAV were more likely (p<.05) to report
that they had seen a decrease in SAV.
2 A p-value of less than .05 indicates there is a less than 5% chance that the results are due to random chance, and the observed difference is statistically significant.
18%
26%
32%
16%
9%
All of it Most of it Some of it Very little None

9 | P a g e
SAV Actions
Restoration or Protection
Two-thirds of respondents (67.8%) reported that they had not considered restoring or protecting the
SAV along their shoreline. There was no statistical difference in responses between those who had
observed an increase and those who had reported a decrease in SAV.
Respondents (32.2%) that had considered restoring or protecting SAV were asked to identify their
primary reason for considering the action. Nearly all respondents who had considered restoring or
protecting SAV reported doing so to improve the health of the Chesapeake Bay (91%), followed by
natural water and shoreline are important to me (41%); see Figure 5. While the question was intended
to be a singular response, most respondents checked multiple boxes. Therefore, the responses do not
add to 100%.
Figure 5: Reasons for Considering Protecting or Restoring SAV
7%
7%
21%
22%
48%
91%
0% 10% 20% 30% 40% 50% 60% 70% 80% 90% 100%
More grasses would look better (N=4)
Other (N=4)
Easier fishing and crabbing (N=12)
Bring more wildlife to my property (N=13)
Natural water and shoreline are important to me (N=28)
Improve the health of the Bay (N=53)

Action Research
10 | P a g e
Removal
Two-thirds of respondents (63.8%) reported that they had not considered removing the SAV along their
shoreline. Respondents who had seen an increase in SAV were more likely to report that they had
considered removing SAV (p<.05). The respondents (28.1%) that considered removing SAV were asked
to identify the primary reason they considered the action. About half of the respondents who had
considered removing SAV would do so to keep grasses off boat (53%) and to make their water easier for
swimming (45%); see Figure 6. While the question was intended to be a singular response, most
respondents checked multiple boxes. Therefore, the responses will not add to 100%.
Figure 6: Reasons for Considering Removal of SAV
The written in reasons listed under Other were varied, but primarily focused on water activities (jet skis,
boats, swimming) and stopping trash from collecting in the SAV.
Community Actions
Very few respondents (13.8%) reported anyone in their community restoring or protecting SAV, while
about a third (33.5%) reported that someone in their community removed SAV.
20%
31%
35%
45%
53%
0% 10% 20% 30% 40% 50% 60%
Keep grassing from washing up on the shoreline (N=11)
Fewer grasses would look better (N=17)
Other reason (N=19)
Easier for swimming (N=25)
Keep grasses off boat (N=29)

11 | P a g e
Leaving SAV Alone Respondents were asked to rate a list of statements about the barriers of leaving SAV to grow
undisturbed using a scale from 0 (strongly disagree) to 10 (strongly agree). The highest ranked barriers
to letting SAV grow undisturbed were making it harder for their household to swim and making their
shoreline less accessible.
Figure 7: Barriers to Leaving SAV Alone
Inferential Statistics
Making it harder for their household to swim had a negative correlation (r = -.165, p<.05) with years of
property ownership, indicating that the concerns about this barrier decreased the longer respondents
had owned their property.
5.20
5.22
5.86
6.52
6.77
0 1 2 3 4 5 6 7 8 9 10
Have an unpleasant smell
Harm my boat
Make it harder for household to boat
Make my shoreline less accessible
Make it harder for household to swim

Action Research
12 | P a g e
Benefits
Respondents were asked to rate a list of statements about the benefits of leaving SAV to grow
undisturbed using a scale from 0 (strongly disagree) to 10 (strongly agree). The highest valued benefit to
letting SAV grow undisturbed was that it was healthy for the Chesapeake Bay, followed by bring(ing)
more wildlife to my property and protect shoreline from erosion. Respondents generally disagreed that
leaving SAV in the water would look attractive or increase property value, indicating that these are not
seen as benefits.
Figure 8: Benefits to Leaving SAV Alone
Inferential Statistics
Looking attractive and increasing property value were positively correlated (r = .210 and r = .211, p<.05)
with years of ownership, indicating that these perceived benefits increased higher the longer
respondents had owned their property.
Permits
Half of respondents were aware that permits were needed for SAV removal, either reporting that yes,
they were required (27.1%) and in some situations (22.9%), while half reported that no, they are not
required (50.0%). Those who had either seen an increase or decrease in the SAV by their property were
more likely (p<.05) to report that they did not need a permit than those who reported no change.
SAV-Friendly Piers The majority of respondents reported having a pier (82.6%, N=147) or were planning on building one
(4.5%, N=8). The remainder (12.9%, N=23) were skipped ahead to the next section, Attitudes, as they did
not have a pier or an intent to build one.
Likelihood
About a quarter (21.7%, N=43) of respondents reported that their pier already extended beyond where
SAV grows. To assess the likelihood of extending piers beyond where SAV grows, respondents who
reported having a pier that does not already extend beyond SAV (N=93) were asked to rate the
likelihood of taking action using a scale from 0 (not at all likely) to 10 (extremely likely). The average
likelihood rating was a 4.86, indicating they leaned toward not acting.
3.88
4.02
5.40
6.58
6.91
7.77
0 1 2 3 4 5 6 7 8 9 10
Look attractive
Increase property value
Make fishing and crabbing easier for household
Protect shoreline from erosion
Bring more wildlife to my property
Be healthy for Chesapeake Bay

13 | P a g e
Barriers
Respondents were asked to rate a list of statements about the barriers of extending their pier beyond
where SAV grows using a scale from 0 (strongly disagree) to 10 (strongly agree). Among respondents,
the most significant barrier to extending the pier was that it would be expensive. Respondents were
moderately concerned about the barriers that it would not make sense for (their) property and would
look out of place. Respondents were not very concerned that it would make (their) pier less accessible.
Figure 9: Barriers to Extending Pier
Benefits
Respondents were asked to rate a list of statements about the benefits of extending their pier beyond
where SAV grows using a scale from 0 (strongly disagree) to 10 (strongly agree).
Figure 10: Benefits to Extending Pier
Among respondents, the primary perceived benefit was allowing access to deeper water. Respondents
rated the benefit for protecting the health of the Chesapeake Bay, protecting fish and crab habitats, and
protecting SAV about equally.
2.86
4.85
5.40
6.89
0 1 2 3 4 5 6 7 8 9 10
Make pier less accessible
Look out of place compared to neighbors
Not make sense for my property
Be expensive
6.36
6.71
6.74
7.85
0 1 2 3 4 5 6 7 8 9 10
Protect SAV
Protect fish and crab habitats
Protect health of Chesapeake Bay
Allow access to deeper water

Action Research
14 | P a g e
Attitudes Respondents were asked to rate a list of statements about their attitudes toward their shoreline using a
scale from 0 (strongly disagree) to 10 (strongly agree). Respondents reported very strong agreement
with protecting the health of the Chesapeake Bay. Respondents also reported high agreement for
enjoying recreational water activities and ability to access the shoreline. Respondents reported both
liking how their shoreline looks currently and wanting their shoreline to look natural. Respondents did
not agree that they have the right to modify shoreline as they want or know all options to maintain
shoreline.
Figure 11: Shoreline-Related Attitudes
Inferential Statistics
I am concerned about shoreline eroding and I know all options to maintain shoreline were correlated (r=
.162 and r = .202, p<.05) with years of ownership, indicating that these attitudes increased the longer
respondents had owned their property.
3.86
4.69
6.58
6.98
7.13
7.22
8.59
9.03
9.43
0 1 2 3 4 5 6 7 8 9 10
I have the right to modify shoreline as I want
I know all options to maintain shoreline
I am concerned about shoreline eroding
I wish I had more fish and wildlife near shoreline
I want shoreline to look natural
I like how shoreline looks
Ability to directly access shoreline is important to me
I enjoy recreational water activities
Protecting health of Chesapeake Bay is important to me

15 | P a g e
Communication Respondents were asked to indicate which sources of information they would use when they have
questions about managing their shoreline and could check all that applied. The majority of respondents
identified Maryland Department of Natural Resources as a preferred source of information (74.3%).
About half of respondents use a web search engine (49.7%), county or city government (46.6%), or MD
Department of Environment (42.9%). About two-thirds of respondents speak to their neighbors (38.2%).
Figure 12: Information Sources for Shoreline Management
Exploratory Analysis Three sets of exploratory analyses were conducted on the perceived barriers and benefits to leaving SAV
alone as well as attitudes on this topic. First, we compared respondents who have and have not
considered removing SAV. Next, we compared respondents who reported an increase, decrease, or no
change in SAV. Finally, we compared respondents based on whether they have the following: boats,
piers, and armor.
Analyses were conducted for the questions related to the barriers and benefits around piers, but no
meaningful statistical differences were found.
Considering Removal of SAV
Two-thirds of respondents (63.8%) reported that they had not considered removing the SAV along their
shoreline, while one-third of respondents (28.1%) had. Each section below outlines the differences in
barrier and benefit ratings for each group.
Barriers to Leaving SAV Alone
Barriers to letting SAV grow were rated by respondents on a scale from 0 (strongly disagree) to 10
(strongly agree) and differences between groups (those that have and have not considered removing
SAV) were analyzed. Respondents who had considered removing SAV perceived all barriers to be
significantly higher than participants who had not considered removing SAV. Compared to the barrier
rankings for the whole sample size, the barriers for those who have considered removing SAV were
ranked the same, but even the lowest ranked barrier, have an unpleasant smell, had a mean rating score
1.0%
3.1%
3.7%
19.9%
22.0%
23.6%
38.2%
42.9%
46.6%
49.7%
74.3%
0.0% 10.0% 20.0% 30.0% 40.0% 50.0% 60.0% 70.0% 80.0%
Media
University
Other
Friends and family
Nonprofit or local ws organization
Contractor
Neighbors
MD Dept of Environment
County or city government
Web search engine
MD Dept of Natural Resources

Action Research
16 | P a g e
of 6.65 for those who have considered removing. The average rating for the full sample size for this
barrier was 5.20. See Figure 13.
Figure 13: Barriers for Leaving SAV Alone by Considering Removing
Statements with a statistically significant difference by respondents who have and have not considered removing SAV are noted
using a “*”.
Benefits to Leaving SAV Alone
Benefits of letting SAV grow were rated by respondents on a scale from 0 (strongly disagree) to 10
(strongly agree) and differences between groups were analyzed. Respondents who had considered
removing SAV perceived all benefits to be significantly lower than participants who had not considered
removing SAV. The benefits for those who have considered removing were generally in the same order
as the whole sample size, with be healthy for Chesapeake Bay, bring more wildlife to my property, and
protect shoreline from erosion at the top. See Figure 14.
Figure 14: Benefits for Leaving SAV Alone by Considering Removing
Statements with a statistically significant difference by respondents who have and have not considered removing SAV are noted
using a “*”.
0
1
2
3
4
5
6
7
8
9
10
*Have an unpleasantsmell
*Harm my boat *Make it harder forhousehold to boat
*Make my shorelineless accessible
*Make it harder forhousehold to swim
Yes, consider removing Not considering removing
0
1
2
3
4
5
6
7
8
9
10
*Increase propertyvalue
*Look attractive *Make fishing andcrabbing easier for
household
*Protect shorelinefrom erosion
*Bring morewildlife to my
property
*Be healthy forChesapeake Bay
Yes, consider removing Not considering removing

17 | P a g e
Attitudes
Attitudes about respondents’ shorelines were rated on a scale from 0 (strongly disagree) to 10 (strongly
agree) and differences between groups were analyzed. About half of the listed attitudes were
significantly different for respondents who were and were not considering removing SAV. The largest
differences were in the following attitude statements: I want my shoreline to look natural, I am
concerned about shoreline eroding, and I have right to modify shoreline as I want. See Figure 15.
Figure 15: Attitudes Toward Shorelines by Consider Removing
Statements with a statistically significant difference by respondents who had and had not considered removing SAV are noted
using an “*”.
Change in SAV
We compared respondents who reported an increase, decrease, or no change in SAV. The only
meaningful statistically significant (p<.05) difference was that respondents who reported an increase in
SAV were more concerned SAV would make it harder for household to boat, with a mean rating of 6.58
as compared to 4.55 for those who reported a decrease and 4.88 for those reporting no change.
0
1
2
3
4
5
6
7
8
9
10
*I have rightto modify
shoreline asI want
I know alloptions tomaintainshoreline
I wish I hadmore fish
and wildlifenear
shoreline
*I amconcerned
aboutshorelineeroding
*I like howshoreline
looks
*I wantshoreline tolook natural
Ability todirectlyaccess
shoreline isimportant to
me
I enjoyrecreational
wateractivities
Protectinghealth of
ChesapeakeBay is
important tome
Yes, consider removing Not considering removing

Action Research
18 | P a g e
Armor
The majority of respondents reported having armor (80.3%). Each section below outlines the differences
in barrier and benefit ratings for each group (armor versus no armor).
Barriers
Barriers to letting SAV grow were rated by respondents on a scale from 0 (strongly disagree) to 10
(strongly agree) and differences between groups (those that have and do not have armor) were
analyzed. Respondents who had armor perceived that the barriers to leaving SAV alone, where it would
make it harder for household to swim and harm my boat to be significantly higher than participants who
did not have armor. See Figure 16.
Figure 16: Barriers to Leaving SAV Alone by Armor
Statements with a statistically significant difference by respondents who do and do not have armor are noted with an “*.”
0
1
2
3
4
5
6
7
8
9
10
*Harm my boat Have an unpleasantsmell
Make it harder forhousehold to boat
*Make it harder forhousehold to swim
Make my shoreline lessaccessible
No armor Yes armor

19 | P a g e
Benefits
Benefits of letting SAV grow were rated by respondents on a scale from 0 (strongly disagree) to 10
(strongly agree) and differences between groups were analyzed. Respondents who had armor perceived
several benefits to be significantly higher, including be healthy for Chesapeake Bay, protect shoreline
from erosion, increase property value, and look attractive. See Figure 17.
Figure 17: Benefits to Leaving SAV Alone by Armor
Statements with a statistically significant difference by respondents who do and do not have armor are noted using a “*”.
0
1
2
3
4
5
6
7
8
9
10
*Look attractive *Increase propertyvalue
Make fishing andcrabbing easier for
household
Bring more wildlifeto my property
*Protect shorelinefrom erosion
*Be healthy forChesapeake Bay
No armor Yes armor

Action Research
20 | P a g e
Attitudes
Attitudes about respondents’ shorelines were rated on a scale from 0 (strongly disagree) to 10 (strongly
agree) and differences between groups were analyzed. Two statements were rated significantly higher
by those without armor - I am concerned about shoreline eroding and I want shoreline to look natural.
See Figure 18.
Figure 18: Shoreline Attitudes by Armor
Statements with a statistically significant difference by respondents who do and do not have armor are noted using a “*”.
0
1
2
3
4
5
6
7
8
9
10
I have rightto modify
shoreline asI want
I know alloptions tomaintainshoreline
*I amconcerned
aboutshorelineeroding
*I wantshoreline tolook natural
I wish I hadmore fish
and wildlifenear
shoreline
I like howshoreline
looks
Ability todirectlyaccess
shoreline isimportant to
me
I enjoyrecreational
wateractivities
Protectinghealth of
ChesapeakeBay is
important tome
No Armor Yes Armor

21 | P a g e
Piers
The majority of respondents reported having a pier (82.6%). Analyses were run on all questions
comparing those who did and did not have piers, but significant differences were only found on the
attitude questions.
Attitudes
Attitudes about respondents’ shorelines were rated on a scale from 0 (strongly disagree) to 10 (strongly
agree) and differences between groups (those with and without a pier) were analyzed. About half of the
listed attitudes were significantly different for respondents who do and do not have a pier. The largest
differences were in I want my shoreline to look natural and I am concerned about shoreline eroding
where respondents without a pier rated these attitudes higher than those with a pier. Significant
differences in ratings were also found for I enjoy recreational water activities and I like how shoreline
looks where those with a pier rated these attitudes higher than those without. See Figure 19.
Figure 19: Shoreline Attitudes by Pier
Statements with a statistically significant difference by respondents who do and do not have a pier are noted using a “*”.
Open-ended Responses
Several questions in the survey included an “other” option; these responses are listed in in Appendix C.
Finally, the last question of the survey asked for additional comments. Many of these responses
included stories about the respondent’s property, from the broken boats and jet skis to concerns about
very dense SAV. Many requested more information on making decisions or assisting with issues, and left
contact information that was removed for the purpose of this report. These are included in Appendix C.
0
1
2
3
4
5
6
7
8
9
10
I have rightto modify
shoreline asI want
I know alloptions tomaintainshoreline
*I like howshoreline
looks
*I enjoyrecreational
wateractivities
I wish I hadmore fish
and wildlifenear
shoreline
Ability todirectlyaccess
shoreline isimportant to
me
*I amconcerned
aboutshorelineeroding
*I wantshoreline tolook natural
Protectinghealth of
ChesapeakeBay is
important tome
Pier No pier

Action Research
22 | P a g e
4: Conclusions and Recommendations This research was conducted to better understand how shoreline property owners perceive and make
decisions about the SAV on their shoreline. The results of this research will assist organizations in the
Chesapeake Bay region to successfully motivate property owners to leave their SAV alone and build
piers that protect SAV. In this section, we provide a strategy table with a summary of key findings and
associated recommendations for motivating property owners to leave their SAV alone. At the end of the
section there is an Outreach Approach subsection which details the outreach materials created for the
program and recommendations for their use. One key finding to note across both behaviors is that the
channel respondents reported using for information (above all others) was Maryland DNR (74%). About
half reported using web searches, local government, and Maryland Department of the Environment.
Leave SAV Alone Overall, respondents perceive low to moderate benefits to leaving SAV alone but face significant
barriers. The health of the Bay, encouraging more wildlife, and preventing erosion were all meaningful
benefits to the full group, and protecting the health of the Bay was by far the top reason respondents
had considered for protecting or restoring SAV.
Habitats
Linking the value of encouraging wildlife to the role and value of SAV is important. There is evidence that
waterfowl populations have rebounded as the colonizing of SAV such as Hydrilla have expanded. A focus
on fisheries, especially nurseries, could be a positive value to highlight to property owners tied to values
of encouraging wildlife. Images of the beauty of underwater fishes and other species swimming among
SAV in outreach materials would provide the connections.
Boating and Jet Skis
Those who considered removing SAV rated all benefits lower, suggesting the need to enhance benefits
across the board. The most important barriers were that SAV is perceived to create challenges with
boating and swimming, especially for those who had considered removing SAV. Best practices for
boating include raising a boat’s motor to avoid cutting SAV and not mooring a boat where it would settle
on the bottom during low tides. SAV have a baffling effect on wakes even in low energy or sheltered
settings. It could be pointed out that jet skis are a big contributor to wakes, and SAV in these areas could
result in less opposition to jet ski use.
Aesthetics
Those who considered removing SAV also ranked aesthetic barriers highly including concerns about
smell, disagreement that SAV looked attractive, and increased property value. The most negative
comments about SAV were from property owners who had canopy formers such as Hydrilla or Milfoil
along their shoreline. Public education could include information on the value of different SAV species.
For example, how and why they grow where they do. The SAV types considered less attractive at the
water surface are the best at reducing wave energy along the shoreline.
Several respondents included comments on their survey about algae growing on the surface of their SAV
canopy. It could be pointed out that algae are not a characteristic of SAV but of excess nutrients from
runoff. The presence of algae may be a good thing as they are sequestering and storing nutrients which
otherwise might produce toxic phytoplankton blooms.

23 | P a g e
Respondents who had considered removing SAV rated a natural shoreline, concern about erosion, and
liking how their shoreline looks significantly lower (less agreement). Respondents who had considered
removing SAV had moderate agreement to the right to modify shoreline.
Other Considerations
Overall, all respondents highly valued protecting the health of the Chesapeake Bay, recreational water
activities, and shoreline access. Several other important findings should be noted regarding outreach for
motivating property owners to leave SAV alone:
• Longer-term property owners were less concerned about SAV and swimming and perceived more benefit from SAV in terms of looking attractive and increasing property value. Longer-term property owners were more likely to report they were concerned about shoreline erosion and know all options to maintain their shoreline. Overall, longer-term residents have lower barriers (easier to motivate), but also may be less likely to seek information as they feel they know the options to maintain their shoreline.
• Respondents who do more activities on their shoreline were more likely to report they enjoy recreational water activities and like how their shoreline looks, and less likely to report they want their shoreline to look natural. As the top barriers to leaving SAV alone are water activity based, those who do more activities have more barriers (harder to motivate).
• About half of respondents were unaware they would need any kind of permit for SAV removal.
• Ownership of the waterway bottom below mean low tide does not appear to be well understood by some property owners. The bottom area does not belong to the shoreline property owner, but to the state, so they are not allowed to do anything to this area without community. This could be promoted in a positive manner by pointing out that it means neighbors cannot do anything which might be detrimental to their shoreline.
• For residents who object to certain SAV, it could be pointed out that they are not invasive, but colonizers and that research has shown they will evolve over time to a more diverse community.
Target Audience
Based on the results, we recommend the strategies initially focus on targeting longer-term residents, as
they reported fewer barriers and more benefits to leaving SAV alone. We also recommend focusing on
areas that have higher levels of SAV, either increasing or already established, as they were more likely to
consider removing SAV.

Action Research
24 | P a g e
Leave SAV Alone Strategy Table
In the strategy table below, we list relevant research findings, link those findings to social science and
marketing tools, and suggest pathways for operationalization.
Research Outcome
Tools Strategy Options/Operationalization
SAV negatively impacts shoreline usage
Education/ Communication
• Outreach will include best practices for boating, swimming, and other waterfront activities with SAV around – both for how to accommodate SAV but also for the activity. This could highlight extending piers beyond SAV, the other behavior that barrier and benefit data was collected on for this work – see next section, Build Piers that Extend Beyond SAV. Boats can also trim their motors in shallow water to avoid getting SAV caught in the motor and damaging the boat.
• If there are situations that should be exceptions, note those specifically (e.g., if there is a specific density of SAV where it should be cut)
• Since SAV, especially when visible at the water surface, is particularly helpful against erosion caused by boat and jet ski wakes, this can be linked to benefits of SAV for waterfront activities.
Low motivation to protect SAV
Normative feedback
• Communicate that most shoreline property owners leave their SAV alone, and highly value the Bay.
• Show simple metrics of how the local region is improving due to the actions of most property owners.
• Highlight well-known and well-respected residents in the area that already leave SAV alone through water-facing shoreline signage (social diffusion).
• This can be linked to the Bay Protector ambassadors referenced in the Bay Protectors for Shoreline Management: Implementation Plan as another social diffusion message that identified ambassadors can distribute through their social channels. The results suggest that those without armor, which is part of the criteria to be a Bay Protector ambassador, may be more likely to leave their SAV alone, given lower barriers and higher benefits.
Lack of knowledge about permitting
Education/ Communication
• Include simple information on when the removal of SAV requires a permit.
• Consider providing simple information on where state owned land starts.
Protecting the health of the Bay; Wildlife
Education/ Communication/ Cognitive Dissonance
• Show beautiful images of SAV and underwater species to evoke a positive emotional response and connection to the Bay where they live and recreate.
• Provide credible, vivid information about how more SAV protects the Bay and brings wildlife to their property. Given that the highest barriers to leaving SAV alone were linked to usage of the shoreline and waterfront activities, messages could link between the health of the Bay, SAV, and ability to continue to engage in their favorite waterfront activities.
25 | P a g e
• Respondents reported valuing the health of Bay as a general attitude. However, when asked if the health of the Bay was a benefit of SAV, it was not valued as highly. Outreach should connect leaving SAV alone to protect the Bay, such as the increase in fish and wildlife and the sequestering of excess nutrients (which may lead to even more growth of algae on their shoreline).
• Cognitive dissonance can motivate actions that are consistent with individual’s values by reminding them of their values (protecting the Bay is very important) and speaking to what behaviors are consistent with those values (leaving SAV alone).
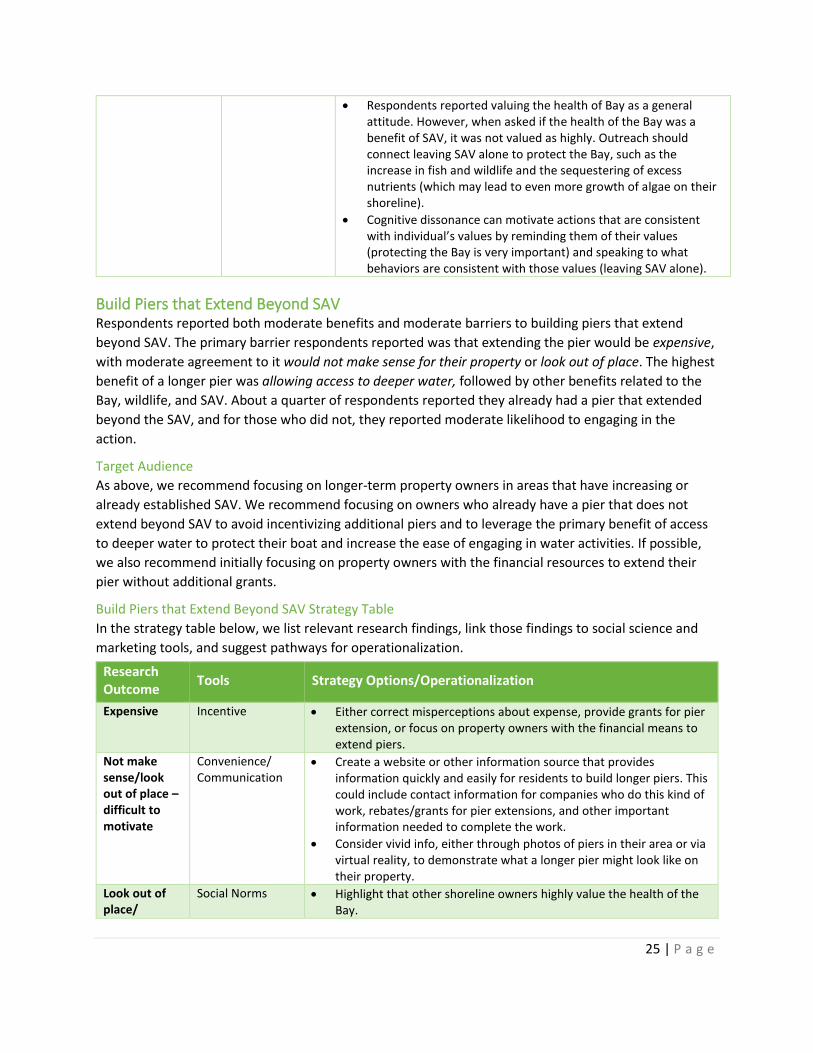
Build Piers that Extend Beyond SAV Respondents reported both moderate benefits and moderate barriers to building piers that extend
beyond SAV. The primary barrier respondents reported was that extending the pier would be expensive,
with moderate agreement to it would not make sense for their property or look out of place. The highest
benefit of a longer pier was allowing access to deeper water, followed by other benefits related to the
Bay, wildlife, and SAV. About a quarter of respondents reported they already had a pier that extended
beyond the SAV, and for those who did not, they reported moderate likelihood to engaging in the
action.
Target Audience
As above, we recommend focusing on longer-term property owners in areas that have increasing or
already established SAV. We recommend focusing on owners who already have a pier that does not
extend beyond SAV to avoid incentivizing additional piers and to leverage the primary benefit of access
to deeper water to protect their boat and increase the ease of engaging in water activities. If possible,
we also recommend initially focusing on property owners with the financial resources to extend their
pier without additional grants.
Build Piers that Extend Beyond SAV Strategy Table
In the strategy table below, we list relevant research findings, link those findings to social science and
marketing tools, and suggest pathways for operationalization.
Research Outcome
Tools Strategy Options/Operationalization
Expensive Incentive • Either correct misperceptions about expense, provide grants for pier extension, or focus on property owners with the financial means to extend piers.
Not make sense/look out of place – difficult to motivate
Convenience/ Communication
• Create a website or other information source that provides information quickly and easily for residents to build longer piers. This could include contact information for companies who do this kind of work, rebates/grants for pier extensions, and other important information needed to complete the work.
• Consider vivid info, either through photos of piers in their area or via virtual reality, to demonstrate what a longer pier might look like on their property.
Look out of place/
Social Norms • Highlight that other shoreline owners highly value the health of the Bay.

Action Research
26 | P a g e
Moderate likelihood
• Create testimonials that communicate how other shoreline owners have overcome barriers and realized benefits of extending piers beyond SAV (e.g., ease of boating and swimming when the water beyond SAV is more accessible). This is linked to the messaging in the Leave SAV Alone Strategy Table.
• Highlight well-known and well-respected residents in the area that already leave SAV alone through water-facing “lawn” signage (social diffusion).
• This can be linked to the Bay Protector ambassadors referenced in the Bay Protectors for Shoreline Management: Implementation Plan as another social diffusion message that identified ambassadors can distribute through their social channels. The results suggest that those without armor, which is part of the criteria to be a Bay Protector ambassador, may be more likely to leave their SAV alone, given lower barriers and higher benefits.
• Alternatively, this program can conduct work with local groups to identify members of the target audience (longer-term property owners in areas with SAV) that have already extended their pier, and approach them about their willingness to distribute the materials through their social channels.
Allow access to deeper water
Education/ Communication
• Communicate the benefits of having access to deeper water for the resident’s use of their property and waterfront
Protecting the health of the Bay; Wildlife
Education/ Communication/ Cognitive Dissonance
• Use cognitive dissonance to motivate actions that are consistent with individual’s values by reminding them of their values (protecting the Bay is very important) and speaking to what behaviors are consistent with those values (leaving SAV alone).
• Respondents reported valuing the health of Bay as a general attitude. However, when asked if the health of the Bay was a benefit of SAV, it was not valued as highly. Outreach should connect extending a pier beyond SAV as a way to protect the Bay.
• Provide credible, vivid information about how more SAV protects the Bay and brings wildlife to their property.

27 | P a g e
Outreach Approach There are a variety of communication channels that are appropriate for this outreach, especially door-
to-door (as possible with local COVID-19 restrictions). Based on results of other shoreline management
work with the Chesapeake Bay Program, Bay Protectors for Shoreline Management: Implementation
Plan, we recommend leveraging social networks when possible, such as visual signage that faces the
water. A subsequent discussion of the survey results and strategy recommendations with Rachel Felver
and Brooke Landry from the Chesapeake Bay Program resulted in the approach and next steps
summarized below.
Audience
The survey results indicated that long-term property owners would be the most likely to adopt
behaviors that protect SAV and therefore will be targeted first, if possible. Property owners who have
existing piers that can be extended can be engaged once there is feedback and lessons learned from this
initial program outreach phase.
Messengers
The key messenger for this program is the Chesapeake Bay Program; however, the Maryland
Department of Natural Resources and the Virginia Institute of Marine Science can be promoted on
additional outreach materials and through presentations, as appropriate.
Materials
This table displays the outreach materials developed for the program, along with their associated
messages, channel, and use of social science tools.
Table 2: Materials Developed for the Outreach Program
Material Message Channel Social Science Tools
Flyer-Poster Leave SAV alone;
Protect SAV to protect the Bay; and
Protect SAV to protect wildlife.
Public places, community gatherings places, trailheads, park kiosks, events
Imagery to evoke emotion to protect;
Education
Social norms
Shoreline sign Commit to leave SAV alone
Provided to property owners in-person by ambassadors.
Commitment
Social diffusion
Self-perception
Door Hanger Rip Card Leave SAV alone;
Correct misconceptions;
Stated function of SAV; Active involvement in monitoring SAV; and
Protect SAV to protect the Bay
Direct drop off at the doorstep of property owners by ambassadors.
Commitment
Education
Social norms
Commitment Card Leave SAV alone In-person by Ambassadors
Commitment
Social norms

Action Research
28 | P a g e
Messages by Material
Flyer-Poster
Two designs:
1: When Bay Grasses are Greener our Bay is Cleaner: Help Protect and Restore the Bay’s Underwater
Grasses
2: When Bay Grasses are Green, our Bay is Clean: Help Protect and Restore the Bay’s Underwater
Grasses
Shoreline Sign
Two designs and one message.
Chesapeake Bay: I Protect Bay Grass Beds
Door Hanger Rip Card
Side 1: When Bay Grasses are Green, our Bay is Clean
Chesapeake Bay is my home. I protect bay grasses because they:
• Provide food and habitat for wildlife;
• Absorb nutrient pollution and trap sediment;
• Help reduce erosion and protect shorelines; and
• Improve water clarity and increase oxygen. Help protect Bay grasses and get involved with your community. Join your local watershed group’s
efforts to help monitor Bay grasses. Go to chesapeakebay.net for more information.
Side 2: THE CHESAPEAKE BAY IS PART OF MY COMMUNITY.
Bay grasses are a critical part of the Chesapeake Bay ecosystem. These grasses provide food and habitat
for countless species and help keep the water clean. Your efforts today ensure a cleaner, greener,
healthier Chesapeake Bay for years to come.
Ways to Help Restore and Preserve Bay Grasses:
• Let Bay grasses grow along your shoreline;
• Fertilize your lawn less, or use a Bay-friendly fertilizer;
• Follow posted speed limits and trim your boat’s motor in shallow water; and
• Keep your shoreline as natural as possible.
Commitment Card
Two postcard style back designs:
1: When Bay Grasses are Greener our Bay is Cleaner: Help Protect and Restore the Bay’s Underwater
Grasses
2: When Bay Grasses are Green, our Bay is Clean: Help Protect and Restore the Bay’s Underwater
Grasses
One message on the back for the commitment:
Chesapeake Bay is my Community
I commit:
• To not removing my Bay grasses;
• To trim my motors in shallow waters;
• To fertilizing my lawn less or using Bay-friendly fertilizers; and
• To follow posted speed limits while boating.

29 | P a g e
Ambassadors
Ambassadors are community group members aligned with non-profit groups and shoreline property
owners who commit to protecting SAV. Their role is to:
• Distribute door hangers;
• Distribute posters to appropriate community locations;
• Distribute shoreline property signs; and
• Gain commitments from shoreline property owners and post them in a public location.
Ambassador Script
A script for conducting outreach in-person to shoreline property owners can be found in Appendix D.
CBT Role
• Recruit community and non-profit groups to become ambassadors who deliver messages and
materials, gain commitments; and
• Identify places to post the posters and commitments from shoreline property owners.
Considerations for Implementation
Roll Out
When deciding to roll out the program consider the different audiences throughout the Bay. Below are
a few questions to discuss to guide a widespread roll out:
• Are there different areas that have lower penetration of the behaviors than other areas?
• How much staff time do your partners have to dedicate to the roll out?
• How much funding do you and your partners have to dedicate to the roll out?
Control Groups
Control groups are an important evaluation component. To test the program, if possible, use a control
group to help you demonstrate that the program is having the desired effect. Below are a few questions
to discuss about the need for control groups:
• Do you need to demonstrate that the program is working? (to management, grant funding
sources, etc.)
• How are the populations of interest different? (i.e., income level, long-term residents versus
newcomers). Make sure the control groups are representative of the target population.
• Can you do a phased roll out? You can use a small portion of the population as a control group,
then after evaluation, roll out to that group.
Delivery Methods
In-person communication channels are the preferred method for this program; however, in-person
could be at the property owner’s doorstep or at a public even. Below are a few questions to discuss
when deciding which method is appropriate for the area:
• Are there certain areas that need the program more than others? If so, focus resources on the
in-person doorstep channel for those areas.

Action Research
30 | P a g e
• Are there gated communities that would rather not be visited at the door? How can you reach
these communities?
• Are the people delivering the materials representative of the neighborhoods they are visiting?
Publicity
Publicizing the program could potentially help notify residents of the ambassadors’ presence in defined
neighborhoods. Below are a few questions to discuss when considering publicizing the program:
• How would you publicize it?
• What would you tell residents to expect?
• If a resident wants materials, where would they get them?
• Would publicizing the program justify the staff resources required?
Evaluation
Evaluating your program allows you to make any necessary program adjustments. Ongoing evaluation
can be measured using direct observation and interviews with shoreline property owners. Below are a
few questions to discuss when determining how to evaluate the program:
• Are there ongoing monitoring surveys that can include questions about the program?
• Can property owners be included in the shoreline monitoring? They could be sent a periodic
mailer that includes a stamped return postcard with a few key questions about the state of their
SAV. They are providing ongoing data and increasing their self-perception of a person who
protects the Bay.
• Are there ongoing community events that can include questions about the program? Like
above, these questions would not be tied to participants but would gauge overall program
awareness.
This project has been funded wholly or in part by the United States Environmental Protection Agency under
assistance agreement CB96341401 to the Chesapeake Bay Trust. The contents of this document do not necessarily
reflect the views and policies of the Environmental Protection Agency, nor the EPA endorse trade names or
recommend the use of commercial products mentioned in this document.

31 | P a g e
Appendix A: Submerged Aquatic Vegetation Review Memo
Submerged Aquatic Vegetation Review
Purpose and Definition The goal of this brief literature review is to lay the foundation for research on the barriers and benefits
that individuals face to engaging in behaviors that protect submerged aquatic vegetation (SAV). SAV
includes aquatic grasses and other flowering plants that root into the sediment of the Chesapeake Bay
(Bay).3 SAV is highly valuable habitat since it provides numerous important ecological functions that are
difficult to replace, including shelter, food, and reproductive space for animals.4 SAV also binds sediment
together, adds oxygen to the water, absorbs nutrient pollution, and reduces erosion.5 Approximately 20
SAV species exist in the Chesapeake Bay, based on the major salinity zones, and have different
tolerances to light and sediment quality.6 As part of the Chesapeake Bay Watershed Agreement, the
Chesapeake Bay Program partners have committed to the goal of achieving and sustaining 185,000 acres
of SAV in the Bay, with a target of 130,000 acres by 2025. In 2018, there were an estimated 91,559 acres
of SAV in the Bay.7
Background There are many ecosystem factors that affect the abundance of SAV in the Bay. Three of the most
influential factors are: changes in watershed land use and increased shoreline development; climate
change; and decreased water quality (nitrogen, phosphorus, sediment).8 These factors will have long-
term impacts on SAV in the Bay, from decreasing populations of SAV species that are less resilient to
changes in temperature, storm frequency, and salinity, to declining viable areas for growth due to poor
3 Chesapeake Environmental Communications. (2017). Submerged Aquatic Vegetation. Retrieved from
http://www.chesapeakedata.com/changingchesapeake/
4 NOAA Southeast Regional Office (2018) Why Is Submerged Aquatic Vegetation Designated As Essential Fish Habitat? NOAA. Retrieved from www.fisheries.noaa.gov/content/why-submerged-aquatic-vegetation-designated-essential-fish-habitat
5 Chesapeake Bay Program. (2020) Underwater Grasses. Retrieved from: https://www.chesapeakebay.net/issues/bay_grasses
6 NCCOS. (2016) Hardened Shorelines Associated with Seagrass Decline in Southern Chesapeake Bay. NOAA. Retrieved from https://coastalscience.noaa.gov/news/researchers-associate-hardened-shorelines-declines-seagrasses-southern-chesapeake-bay/; Dennison, W.C. ; Orth, R.J; Moore, K.A.; Stevenson, J.C.; Carter, V.; Kollar, S.; Bergstrom, P.W.; & Batiuk, R.A (1993). Assessing Water Quality with Submersed Aquatic Vegetation. BioScience, 43:2.pp. 86-94.
7 Chesapeake Bay Program. (2020) Underwater Grasses. Retrieved from: https://www.chesapeakebay.net/issues/bay_grasses
8 Chesapeake Environmental Communications. (2017). Submerged Aquatic Vegetation. Retrieved from http://www.chesapeakedata.com/changingchesapeake/

Action Research
32 | P a g e
water quality and habitat reductions. These factors affect different SAV species in the Bay to varying
degrees, with the previously mentioned effects related to human activities generally having the most
significant impact.9 However, while all three are critical factors to consider for achieving the goal of
increased SAV quality and quantity, these factors are generally beyond the current scope of this project.
This work seeks to change behavior that has a direct physical effect on SAV populations, as opposed to a
secondary effect via improved water quality or reduced climate change impacts. There are numerous
research efforts focused on behaviors that impact water quality and climate change. However, there is
limited existing work exploring direct human effects on SAV. This work acknowledges that water quality,
development, and climate change are critical factors of concern for SAV’s future prosperity. However,
the primary focus of this work is to prioritize and understand direct human impacts on SAV quality and
quantity. The review does also look at some indirect effects on SAV through shoreline modification.
Direct Human Impacts on SAV As human populations have grown in the Chesapeake Bay region, they have had an increasing negative
impact on the shoreline and associated SAV populations. There are also two primary audiences who can
have a direct negative impact on SAV populations – boaters and shoreline property owners.
Recreational and Commercial Boaters
When individuals and organizations operate boats in the Chesapeake Bay, the boats can cause
significant damage to SAV. When commercial and recreational boats run aground while docking, scrape
their boat along the bank, fail to follow speed limits and no-wake laws, or move carelessly through
shallow waterways (such as by revving their motor), they can damage and even kill SAV.10 For example,
shellfish dredges and boat propellers can pull underwater grasses up from the bottom of rivers, streams,
and the Bay, leaving visible marks across grass beds in shallow waters.11 SAV can also get wrapped
around propellers and cause damage to boats, leading to negative attitudes about SAV. Boaters present
a challenge as it is difficult to enforce regulations on such a diverse and large population, and passing
regulations may lack public support.12 While recreational and commercial boaters are meaningful
audiences that influence the health of SAV, there are already significant efforts to directly target these
audiences. These efforts include state regulations and behavior change outreach from organizations
such as the Ocean Foundation and ShoreRivers, with funding from the Chesapeake Bay Trust.
Consequently, this project will focus on the ways that shoreline property owners affect SAV populations.
9 Patrick, C.J., Weller, D.E., Orth, R.J., Wilcox, D.J., & Hannam, M.P. (2017) Land Use and Salinity Drive Changes in
SAV Abundance and Community Composition. Estuaries and Coasts, 40:2. 10 Murphy, R., Valauri-Orton, A., & Hildt, A. (2018) Changing Boater Behavior: A Case Study in Using a Social
Marketing Toolkit to Prevent SAV Damage. ShoreRivers and Ocean Foundation for Chesapeake Bay Trust. Retrieved from https://www.chesapeakebay.net/channel_files/27574/tof_shorerivers_cbt_workshop_presentation.pdf
11 Chesapeake Bay Program. (2020) Underwater Grasses. Retrieved from: https://www.chesapeakebay.net/issues/bay_grasses
12 Chesapeake Bay Program (U.S.). Living Resources Subcommittee. Submerged Aquatic Vegetation Workgroup. (1995). Guidance for Protecting Submerged Aquatic Vegetation in Chesapeake Bay from Physical Disruption.

33 | P a g e
The effectiveness of these efforts has not been evaluated within the scope of this work, but this project
seeks to prioritize audiences and behaviors that have not already been addressed.
Shoreline Property Owners
Shoreline property owners across the Chesapeake Bay can have significant direct and indirect effects on
SAV populations, including through hardening of shoreline, dock construction, and direct removal.
Shoreline Hardening
A common concern reported by many shoreline property owners in the Bay is reduced property size and
harm to infrastructure resulting from shoreline erosion. There are several actions that a property owner
can take to reduce shoreline erosion each having a unique impact on SAV populations. A common
activity for reducing shoreline erosion is to construct armor to harden the shoreline. Shoreline
hardening stabilizes coastal land and protects infrastructure through the construction of bulkheads,
riprap, or other similar structures.13 When shorelines are hardened, the SAV environment may be
disrupted or destroyed due to changes in natural wave energies and sediment transport.14 Comparisons
of SAV beds show reduced coverage, diversity, species richness, and evenness in the distribution of SAV
species in beds adjacent to hardened shorelines compared to natural shorelines.15 SAV beds adjacent to
hardened shorelines also have inhibited recovery times after storms.16 As climate change leads to sea
level rise and increased weather events, shoreline owners may increasingly seek to harden their
property, potentially leading to further reductions in SAV populations.17
Removing Current Armoring. For properties with current armoring, they may be able to remove the
current armoring, even if no further work is done. While armoring a few small sections of shoreline may
have only small-scale adverse impacts, armoring larger areas of shoreline causes changes to occur to the
coastal ecosystem and services they provided.18 For example, installing bulkheads usually increases
nearshore erosion, and can increase erosion on adjoining properties (Nutrient Subcommittee Sediment
Workgroup’s Tidal Sediment Task Force, 2005). Therefore, landowners can improve the health of the
Bay by removing their property’s armoring, if their property has low to moderate erosion potential.
Property owners may be unnecessarily hardening their shoreline as they do not realize their shoreline
does not need that level of erosion protection or believe their shoreline has unique characteristics that
requires armor. In addition, they may need financial incentives to overcome the cost of removal.
13 NCCOS. (2016) Hardened Shorelines Associated with Seagrass Decline in Southern Chesapeake Bay. NOAA.
https://coastalscience.noaa.gov/news/researchers-associate-hardened-shorelines-declines-seagrasses-southern-chesapeake-bay/
14 Koch, E.W. (2001) Beyond light: physical, geological and geochemical parameters as possible submersed aquatic vegetation habitat requirements. Estuaries 24: 1–17.
15 Landry, J.B. & Golden, R.R. (2018) In Situ Effects of Shoreline Type and Watershed Land Use on Submerged Aquatic Vegetation Habitat Quality in the Chesapeake and Mid-Atlantic Coastal Bays. Estuaries and Coasts 41:S101-S113.
16 Ibid. 17 Orth, R.J. et al, (2017). Submersed Aquatic Vegetation in Chesapeake Bay: Sentinel Species in a Changing World.
BioScience, 67:8, Pg 698–712, https://doi.org/10.1093/biosci/bix058
18 NOAA. (2015) Guidance for Considering the Use of Living Shorelines. Living Shorelines Workgroup. Retrieved from https://www.habitatblueprint.noaa.gov/wp-content/uploads/2018/01/NOAA-Guidance-for-Considering-the-Use-of-Living-Shorelines_2015.pdf

Action Research
34 | P a g e
Shoreline property owners have reported that they have a desire to learn customized information about
their shorelines, learn from other shoreline property owners, tend to make decisions about shoreline
management after an erosion event, and want to do the right thing.19
Dock Construction
Single family docks increase water access for shoreline property owners. The increase of these docks is
linked to increased development of the shoreline, a strong economy, the associated increase in
discretionary spending, increased boat sales, and limited mooring and public docking facilities.20
However, the presence of single-family docks off shoreline property has a significant negative impact on
the availability of light for nearshore aquatic life, such as SAV.21 The negative impacts of docks are
numerous, ranging from habitat loss to water pollution to altered water flow, but the most critical
impact for SAV is shading stress.22 While the best action to protect SAV is to not install a dock, there are
also a number of ways to design single family docks that help protect SAV health more than a traditional
dock. This includes placing docks away from SAV beds, using grated decking, avoiding floating or covered
docks, extending the dock to deeper water, minimizing the dock width, maximizing the dock height, and
orienting the dock in a manner that decreases the area and time the space under the dock is shaded
during the day (e.g., as close as possible to North-South). 23
Laws Covering Dock Construction
In Maryland and Virginia, permits for single-family docks require submission of information such as what
land changes must occur, materials used, and other relevant information. The Maryland Department of
Environment cannot issue a license for piers, decks, walkways, or related structures if it would adversely
affect SAV or if the structure would be located over SAV.24 Similarly Virginia requires SAV be considered
19 Colehour + Cohen, Applied Research Northwest, Social Marketing Services, Futurewise and Coastal Geologic
Services (2014) Shore Friendly Final Report. WA Department of Fish and Wildlife and WA State Department of Natural Resources
20 Kelty, R. & Bliven, S. (2003) Environmental and Aesthetic Impacts of Small Docks and Piers: Workshop Report: Developing a Science-Based Decision Support Tool for Small Dock Management, Phase 1: Status of the Science. NOAA Coastal Ocean Program, Decision Analysis Series Number 22. NOAA Coastal Ocean Program, 1305 East-West Highway, Silver Spring, MD, 20910. Copies of the report may be downloaded from http://coastalscience.noaa.gov/documents/dockpier.pdf
21 Beal, J.L., & Schmit, B.S. (2000) The effects of dock height on light irradiance (PAR) and seagrass (Halodule wrightii and Syringodium filliforme) cover, pp. 49-63. In: S.A. Bortone (ed) Seagrasses: Monitoring, Ecology, Physiology, and Management. Boca Raton, Florida. CRC Press.
22 Kelty, R. & Bliven, S. (2003) Environmental and Aesthetic Impacts of Small Docks and Piers: Workshop Report: Developing a Science-Based Decision Support Tool for Small Dock Management, Phase 1: Status of the Science. NOAA Coastal Ocean Program, Decision Analysis Series Number 22. NOAA Coastal Ocean Program, 1305 East-West Highway, Silver Spring, MD, 20910. Copies of the report may be downloaded from http://coastalscience.noaa.gov/documents/dockpier.pdf
23 Fresh, K.L., Wyllie-Echeverria, T., Wyllie-Echeverria, S. & Williams, B.W. (2006) Using light permeable grating to mitigate impacts of residential floats on eelgrass Zostera marina L. in Puget Sound, Washington. Ecological Engineering 28:354-362.; Landry, J.B., Kenworthy, W. J., & Di Carlo, G. (2008) The Effects of Docks on Seagrasses, With Particular Emphasis on the Threatened Seagrass, Halophila johnsonii. Center for Coastal Fisheries and Habitat Research, Protected Resources Division, NMFS
24 Chesapeake Legal Alliance (2019). Existing Chesapeake Bay Watershed Statutes and Regulations Affecting
Submerged Aquatic Vegetation. https://www.chesapeakelegal.org/wp-

35 | P a g e
as a factor for project approval.25 While there are ways around both of these laws, the current permit
system seeks to protect SAV from dock construction.
Direct Removal of SAV
Shoreline property owners may also have direct and specific concerns about SAV itself, and ultimately
seek to remove it. Property owners cite multiple reasons for seeking to remove SAV from shoreline
property including: navigational pathways for boats; swimming (either for perceived entanglement risk
or for discomfort with plants touching skin); hydrodynamics (impaired water flow); fishing; property
value; and aesthetic preferences.26 SAV is more likely to be considered a nuisance if it has a high growth
rate, tall height, high coverage, high biomass, and/or is a monoculture, with height and coverage most
highly related to a negative perception. 27 Other cited reasons for a negative attitude toward SAV
included perceived health risks and unpleasant odors.28 However, the presence of SAV is positively
linked to many types of recreational activities, such as fishing, hunting, and bird watching, as it provides
food, shelter, and habitat for species. 29
Types of Direct Removal
There are two common methods property owners may use to remove SAV: (1) by hand or (2) with larger
equipment/machinery. Anecdotal evidence from members of the SAV goal implementation team also
suggests that herbicides, which are widely available for use in removing SAV in lakes or ponds, may also
be used in some capacity in the Bay.
Hand Removal. Hand removal involves removing the entire plant by hand or with hand tools such as by
pulling, cutting, or raking. These methods are labor-intensive and would typically be employed in a
smaller context. Property owners may use this method on their own, or by hiring a company. A company
may utilize powered- or non-powered hand tools specifically designed to remove SAV. 30
Equipment/Machine Removal. Mechanical harvesters, weed rollers, and rotovators are equipment
designed to remove aquatic plants at a much larger scale. They can cut out wide sections of SAV and
cause significant disturbance to sediments, as well as to the animals that live in SAV. These activities
would typically be taken on a residential property by a professional company, not by the property owner
themselves. Similarly, ground-mowing equipment is available to mow wetland and shoreline vegetation,
content/uploads/2019/07/Existing-Chesapeake-Bay-Watershed-Statutes-and-Regulations-Affecting-SAV-
1.pdf
25 Ibid; K. Moore, personal communication, May 1 2020. 26 Verhofstad, M.J.J.M., & Bakker, E.S. (2019) Classifying nuisance submerged vegetation depending on ecosystem
services. Limnology 20:55–68. 27 Verhofstad, M.J.J.M., & Bakker, E.S. (2019) Classifying nuisance submerged vegetation depending on ecosystem
services. Limnology 20:55–68. 28 Dodds WK, Bouska WW, Eitzmann JL, Pilger TJ, Pitts KL, Riley AJ, Schloesser JT, Thornbrugh DJ (2009)
Eutrophication of US freshwaters: analysis of potential economic damages. EnvironSci Technol 43:12–19 29 Verhofstad, M.J.J.M., & Bakker, E.S. (2019) Classifying nuisance submerged vegetation depending on ecosystem
services. Limnology 20:55–68. 30 Aquatic Ecosystem Restoration Foundation (2003). Best Management Practices Handbook for Aquatic Plant
Management in Support of Fish and Wildlife Habitat

Action Research
36 | P a g e
which does not remove the plant but does significantly damage the habitat. Mowing or harvesting
would also typically be conducted by a professional company.31
Laws Covering Physical Removal of SAV
In Maryland, the Department of Natural Resources (DNR) requires an individual who wishes to remove
SAV on their property to submit a permit application describing why the removal is necessary, the
proposed method of removal, a site plan, and the amount of SAV to be removed. The statute excludes
individuals harvesting fish, shellfish, or crabs. It also excludes individuals, organizations, and government
agencies involved in the construction, operation, or maintenance of agricultural drainage channels.
Furthermore, the statute permits individuals to remove a 60-foot strip of SAV for navigation/boating
access purposes without prior DNR approval. Virginia and Washington, D.C. mandate obtaining a permit
for SAV removal with similar policies and have policies about removal for navigable waters. Virginia has
more specifics on the historical, environmental, and scientific context that allow for more policy
guidance.32 For our foundational research, it is important to keep in mind that the questionable legality
of some SAV removal behaviors may influence survey respondents.
Conclusions This project will explore the reasons that property owners remove SAV and what may motivate them to
leave SAV in place, including recreational activities, aesthetics, shoreline use, and property value. There
are many factors that influence SAV health and abundance, given that it exists within a complex
ecosystem. However, reducing direct removal of SAV is a meaningful pathway to increased health and
quantity of SAV, particularly as populations increase in areas where homeowners may be unfamiliar with
it. Given the information in this literature review, we recommend that our foundational research focus
on the following behaviors:
Behavior List
Behaviors to Encourage
• Leave SAV in place
• Leave shoreline unarmored
• Remove bulkheads/riprap
• Use SAV friendly dock design
31 Aquatic Ecosystem Restoration Foundation (2003). Best Management Practices Handbook for Aquatic Plant
Management in Support of Fish and Wildlife Habitat
32 Chesapeake Legal Alliance (2019). Existing Chesapeake Bay Watershed Statutes and Regulations Affecting Submerged Aquatic Vegetation. https://www.chesapeakelegal.org/wp-content/uploads/2019/07/Existing-Chesapeake-Bay-Watershed-Statutes-and-Regulations-Affecting-SAV-1.pdf

37 | P a g e
Behaviors to Discourage
• Physically hand remove SAV from residential property
• Hire a company to hand remove SAV from residential property
• Hire a company to use equipment to remove SAV from residential property
• Harden shoreline with riprap or bulkhead
• Install additional single-family docks
An additional behavior of interest may be the use of herbicides to remove SAV – however, it is unclear at
this time how frequent this behavior is, as there is no real data on this behavior. In addition, the
questionable legality of such behaviors may present a challenge for research. Given advisement from
the steering committee, this action will be included in a limited fashion as possible.
Next Steps
Based on the information collected in this document, the next step of this project will be to conduct
research with shoreline property owners on the barriers and benefits they face to increasing the
behaviors we seek to encourage and decreasing the behaviors we seek to discourage. We will also
assess the current penetration (e.g., how many shoreline property owners are taking these actions) and
probability (e.g., how willing are property owners to take these actions?) of those behaviors. Finally, we
will collect information on the relevant attitudes and knowledge property owners have about SAV, as
well as their communication preferences.
This project has been funded wholly or in part by the United States Environmental Protection Agency under
assistance agreement CB96341401 to the Chesapeake Bay Trust. The contents of this document do not necessarily
reflect the views and policies of the Environmental Protection Agency, nor does the EPA endorse trade names or
recommend the use of commercial products mentioned in this document.

Action Research
38 | P a g e
References Aquatic Ecosystem Restoration Foundation (2003). Best Management Practices Handbook for Aquatic
Plant Management in Support of Fish and Wildlife Habitat.
Beal, J.L., & Schmit, B.S. (2000) The effects of dock height on light irradiance (PAR) and seagrass
(Halodule wrightii and Syringodium filliforme) cover, pp. 49-63. In: S.A. Bortone (ed) Seagrasses:
Monitoring, Ecology, Physiology, and Management. Boca Raton, Florida. CRC Press. b
Bishop, J. (2020) Living Shorelines: An Environmentally Sensitive Alternative for Protecting your Property
from Shoreline Erosion. Retrieved from: https://www.straughanenvironmental.com/living-
shorelines-an-environmentally-sensitive-alternative-to-protecting-your-property-from-
shoreline-erosion/
Chesapeake Bay Program (U.S.). Living Resources Subcommittee. Submerged Aquatic Vegetation
Workgroup. (1995). Guidance for Protecting Submerged Aquatic Vegetation in Chesapeake Bay
from Physical Disruption.
Chesapeake Bay Program. (2020) Underwater Grasses. Retrieved from:
https://www.chesapeakebay.net/issues/bay_grasses
Chesapeake Bay Program. (2020). Despite record rainfall, underwater grass abundance remains strong.
chesapeakebay.net/news/blog/despite_record_rainfall_underwater_grass_abundance_remains
_strong; Patrick, CJ., Weller, D.E., Ryder, M. (2016). The relationship between shoreline
armoring and adjacent submerged aquatic vegetation in Chesapeake Bay and nearby Atlantic
Coastal Bays. Estuaries and Coasts 39: 158–170
Chesapeake Environmental Communications. (2017). Submerged Aquatic Vegetation. Retrieved from
http://www.chesapeakedata.com/changingchesapeake/
Chesapeake Legal Alliance (2019). Existing Chesapeake Bay Watershed Statutes and Regulations
Affecting Submerged Aquatic Vegetation. https://www.chesapeakelegal.org/wp-
content/uploads/2019/07/Existing-Chesapeake-Bay-Watershed-Statutes-and-Regulations-
Affecting-SAV-1.pdf
Colehour + Cohen, Applied Research Northwest, Social Marketing Services, Futurewise and Coastal
Geologic Services. (2014) Shore Friendly Report. Retrieved from:
https://wdfw.wa.gov/sites/default/files/2019-03/shorefriendly_finalreport.pdf
Dennison, W.C. ; Orth, R.J; Moore, K.A.; Stevenson, J.C.; Carter, V.; Kollar, S.; Bergstrom, P.W.; & Batiuk,
R.A (1993). Assessing Water Quality with Submersed Aquatic Vegetation. BioScience, 43:2.pp.
86-94.
Fresh, K.L., Wyllie-Echeverria, T., Wyllie-Echeverria, S. & Williams, B.W. (2006) Using light permeable
grating to mitigate impacts of residential floats on eelgrass Zostera marina L. in Puget Sound,
Washington. Ecological Engineering 28:354-362.
Kelty, R. & Bliven, S. (2003) Environmental and Aesthetic Impacts of Small Docks and Piers: Workshop
Report: Developing a Science-Based Decision Support Tool for Small Dock Management, Phase 1:
Status of the Science. NOAA Coastal Ocean Program, Decision Analysis Series Number 22. NOAA
Coastal Ocean Program, 1305 East-West Highway, Silver Spring, MD, 20910. Copies of the report
may be downloaded from http://coastalscience.noaa.gov/documents/dockpier.pdf

39 | P a g e
Koch, E.W. (2001) Beyond light: physical, geological and geochemical parameters as possible submersed
aquatic vegetation habitat requirements. Estuaries 24: 1–17.
Landry, J.B. & Golden, R.R. (2018) In Situ Effects of Shoreline Type and Watershed Land Use on
Submerged Aquatic Vegetation Habitat Quality in the Chesapeake and Mid-Atlantic Coastal
Bays. Estuaries and Coasts 41:S101-S113.
Landry, J.B., Kenworthy, W.J., & Di Carlo, G. (2008) The Effects of Docks on Seagrasses, With Particular
Emphasis on the Threatened Seagrass, Halophila johnsonii. Center for Coastal Fisheries and
Habitat Research, Protected Resources Division, NMFS
Murphy, R., Valauri-Orton, A., & Hildt, A. (2018) Changing Boater Behavior: A Case Study in Using a
Social Marketing Toolkit to Prevent SAV Damage. ShoreRivers and Ocean Foundation for
Chesapeake Bay Trust. Retrieved from
https://www.chesapeakebay.net/channel_files/27574/tof_shorerivers_cbt_workshop_presenta
tion.pdf
NCCOS. (2016) Hardened Shorelines Associated with Seagrass Decline in Southern Chesapeake Bay.
NOAA. Retrieved from https://coastalscience.noaa.gov/news/researchers-associate-hardened-
shorelines-declines-seagrasses-southern-chesapeake-bay/
NOAA. (2015) Guidance for Considering the Use of Living Shorelines. Living Shorelines Workgroup.
Retrieved from https://www.habitatblueprint.noaa.gov/wp-content/uploads/2018/01/NOAA-
Guidance-for-Considering-the-Use-of-Living-Shorelines_2015.pdf
NOAA Southeast Regional Office (2018) Why Is Submerged Aquatic Vegetation Designated As Essential
Fish Habitat? NOAA. Retrieved from www.fisheries.noaa.gov/content/why-submerged-aquatic-
vegetation-designated-essential-fish-habitat
Orth, R.J. et al, (2017). Submersed Aquatic Vegetation in Chesapeake Bay: Sentinel Species in a Changing
World. BioScience, 67:8, Pg 698–712, https://doi.org/10.1093/biosci/bix058
Patrick, C.J., Weller, D.E., Orth, R.J., Wilcox, D.J., & Hannam, M.P. (2017) Land Use and Salinity Drive
Changes in SAV Abundance and Community Composition. Estuaries and Coasts, 40:2.
Verhofstad, M.J.J.M., & Bakker, E.S. (2019) Classifying nuisance submerged vegetation depending on
ecosystem services. Limnology 20:55–68.

Action Research
40 | P a g e
Appendix B: Barrier and Benefit Survey Dear Resident,
This survey was sent to you from the Chesapeake Bay Program and the Chesapeake Bay Trust. The information we
collect will assist us in developing outreach materials to help residents protect their property’s shoreline and the water
alongside it for years to come. We would appreciate it if you would complete this short survey. It should take no more
than 10 minutes.
Your household is one of only a select number of Maryland households being asked to complete this important survey, so
your participation is very important to us.
Please return your completed survey by using the postage-paid envelope provided. If for some reason you prefer not to
respond, kindly return the blank survey and we will remove you from future mailings regarding this survey.
If you have any questions, please contact Brooke Landry at [email protected]. Thank you for your time.
Sincerely,
Brooke Landry
Chair, Chesapeake Bay Program’s SAV Workgroup
This project has been funded wholly or in part by the United States Environmental Protection Agency under assistance agreement
CB96341401 to the Chesapeake Bay Trust. The contents of this document do not necessarily reflect the views and policies of the
Environmental Protection Agency, nor does the EPA endorse trade names or recommend the use of commercial products mentioned in
this document.
Section A. This survey is about the shoreline and property where this survey was received. The shoreline is the area where your land
meets the water. If your property does not have a shoreline, please check this box and return the survey. No Shoreline
1. Do you own or rent your shoreline property? Own, for _______ years Rent, for _______ years
2. What structures do you have on the property where this survey was received? Please check all that apply.
House (primary residence) House (vacation/rental property) Other type of building
3. Do you use your waterfront for any of the following? Please check all that apply.
Swimming Launching kayak/canoe/paddle board
Fishing Power boating
Crabbing Sailing
Bird watching/photography Other, please specify:

41 | P a g e
Section B. This section is about underwater grasses, also known as seagrasses or submerged aquatic vegetation (SAV). In the Bay,
there are many species of underwater grasses, including ones that look similar to field grass, with long, tape-like stems, ones that look
more like herbs with short leaves growing right from the stem, and even those that grow in a clumping, bushy manner resembling
shrubbery. They grow under the water, sometimes reaching the water’s surface, and are many shades of green.
For this survey, think of the underwater grasses that may or may not be growing along your property's shoreline.
4. Since you have lived at your waterfront property, have you seen:
An increase in underwater grasses
A decrease in underwater grasses
No change in underwater grasses
5. When you look at the water along your shoreline, how much of the water has underwater grasses, also known as submerged
aquatic vegetation or SAV?
All of it
Most of it
Some of it
Very little
None [SKIP to Question 15 on the back]
6. Have you ever:
a. Considered restoring or protecting the underwater
grasses along your shoreline?
6b. If yes, what is the top reason you have considered restoring or
protecting your underwater grasses? Please choose one.
Yes, please answer Question 6b. → → Easier fishing and crabbing
No, please go to Question 7a. More grasses would look better
Bring more wildlife to my property
Improve the health of the Chesapeake Bay
Natural shorelines and water are important to me
Other:
7. Have you ever:
a. Considered removing any of the underwater
grasses along your shoreline?
7b. If yes, what is the top reason you have considered removing your
underwater grasses? Please choose one.
Yes, please answer Question 7b. → → Easier for swimming.
No, please go to Question 8 on the next page Keep grasses from washing up on my shoreline.
Keep grasses off my boat.
Fewer grasses would look better.
Other:
8. Have you ever heard of anyone in your community restoring or protecting their underwater grasses?
Yes No
9. Have you ever heard of anyone in your community removing their underwater grasses?
Yes No
10. Using a scale from 0 (strongly disagree) to 10 (strongly agree) please rate your agreement with the following statements.
Letting underwater grasses along my shoreline grow undisturbed would… Strongly Disagree Strongly Agree
a. Increase my property value. 0 1 2 3 4 5 6 7 8 9 10

Action Research
42 | P a g e
b. Be healthy for the Chesapeake Bay. 0 1 2 3 4 5 6 7 8 9 10
c. Bring more wildlife to my property. 0 1 2 3 4 5 6 7 8 9 10
d. Make my shoreline less accessible. 0 1 2 3 4 5 6 7 8 9 10
e. Harm my boat. 0 1 2 3 4 5 6 7 8 9 10
f. Make it harder for my household to swim. 0 1 2 3 4 5 6 7 8 9 10
g. Make fishing and crabbing easier for my household. 0 1 2 3 4 5 6 7 8 9 10
h. Protect my shoreline from erosion. 0 1 2 3 4 5 6 7 8 9 10
i. Make it hard for my household to boat. 0 1 2 3 4 5 6 7 8 9 10
j. Have an unpleasant smell. 0 1 2 3 4 5 6 7 8 9 10
k. Look attractive. 0 1 2 3 4 5 6 7 8 9 10
l. Other, please specify:
11. To your knowledge, is a permit required for the removal of underwater grasses along your shoreline?
Yes In some situations No
Section C. This section is about overwater structures, such as fixed or floating piers, wharfs, docks, walkways, or other similar water-
dependent structures constructed on or over tidal wetlands for the purpose of gaining access to the navigable waters.
For this survey, we will refer to all “overwater structures” as “piers.”
12. Does your property have a pier?
Yes No, but we are planning on building one No, and we are not planning to build one [Skip to Question 15, over]
13. Using a scale from 0 (not at all likely) to 10 (extremely likely), when planning a
new pier or renovating an existing pier, how likely are you to use a design that
places or extends the end of the pier beyond where underwater grasses grow?
Not at all likely Extremely likely
0 1 2 3 4 5 6 7 8 9 10
My pier already extends beyond grasses
14. Using a scale from 0 (strongly disagree) to 10 (strongly agree), please rate your agreement with the following statements.
Placing the end of the pier beyond where the underwater grasses grow would… Strongly Disagree Strongly Agree
a. Make my pier less accessible. 0 1 2 3 4 5 6 7 8 9 10
b. Be expensive. 0 1 2 3 4 5 6 7 8 9 10
c. Protect underwater grasses. 0 1 2 3 4 5 6 7 8 9 10
d. Protect fish and crab habitats. 0 1 2 3 4 5 6 7 8 9 10
e. Allow me to access deeper water. 0 1 2 3 4 5 6 7 8 9 10
f. Not make sense for my property. 0 1 2 3 4 5 6 7 8 9 10
g. Look out-of-place compared to neighbors’ piers. 0 1 2 3 4 5 6 7 8 9 10
h. Protect the health of the Chesapeake Bay. 0 1 2 3 4 5 6 7 8 9 10
i. Other, please specify:
Section D. These next statements are about attitudes and opinions you have about your waterfront property.
15. Using a scale from 0 (strongly disagree) to 10 (strongly agree)
please rate your agreement with each of the following statements. Strongly Disagree Strongly Agree
a. I am concerned about my shoreline eroding. 0 1 2 3 4 5 6 7 8 9 10
b. My ability to directly access my shoreline is important to me. 0 1 2 3 4 5 6 7 8 9 10

43 | P a g e
c. I want my shoreline to look natural. 0 1 2 3 4 5 6 7 8 9 10
d. I know all the options to maintain my shoreline. 0 1 2 3 4 5 6 7 8 9 10
e. I enjoy recreational water activities (boating, kayaking, fishing, etc.). 0 1 2 3 4 5 6 7 8 9 10
f. Protecting the health of the Chesapeake Bay is important to me. 0 1 2 3 4 5 6 7 8 9 10
g. I like how my shoreline looks. 0 1 2 3 4 5 6 7 8 9 10
h. I have the right to modify my shoreline as I want. 0 1 2 3 4 5 6 7 8 9 10
i. I wish I had more fish and wildlife near my shoreline. 0 1 2 3 4 5 6 7 8 9 10
Section E. The next question is about your communication preferences.
16. When you have questions about managing your shoreline, where do you look for information? Please check all that apply.
Contractor County or city government
Friends and family Maryland Department of Natural Resources
Neighbors Maryland Department of the Environment
University Media (newspapers, etc.)
Non-profit or local watershed organization Web Search Engine (Google, etc.)
Other, please specify:
Section F. Other Household Information. These questions are used for classification purposes only.
17. Does your community have a community pier, such as one managed by a HOA?
Yes No I do not know
18. Do you have a boat?
Yes, docked in the water along my
property Yes, docked somewhere other than
the water along to my property No
19. Does your waterfront property have any of the following shoreline structures? Please check all that apply.
Bulkhead Riprap Living shoreline Other shoreline structure:
20. In what year were you born?
21. Including yourself, how many people live in your household? __________ How many are children under 18? __________
22. If you have any other comments about underwater grasses, please write them below.
Thank you for your participation!

Action Research
44 | P a g e
Appendix C: Survey Comments
Q3: Do you use your waterfront for any of the following? Other, please specify:
Butterfly garden
Commercial crabbing for 36 years
Community beach, launching (if annual fee paid)
Dog-walking
Ice skating
Invasive hydrylla ruined the water. Used to have boats, jet skis, kayaks.
Jet skiing
Jet skis.
Kayaking.
Oyster gardening
Paddle boarding, relaxing, enjoying view.
Relaxing on the beach.
Scenery
Sitting next to the water
To enjoy the views
Unable to access shoreline directly due to invasive vegetation and steep drop off.
Wacky, fun stuff.
Water skiing
We installed a "living shoreline" to enjoy SAV.
Q6b: If yes, what is the top reason you have considered restoring or protecting your underwater grasses? Other, please specify. It's a vital nursery to many different species.
To prevent shoreline erosion.
Q7b: If yes, what is the top reason you have considered removing your underwater grasses? Other, please specify.
Allow trash to not collect at low tide.
Can't get boat out.
Clogs up jet ski.
Density of grasses are excessive. I won't step in the water along the shoreline because of how thick the grasses are.
Fishing
Grasses get into jet ski pumps.
Harbor snake head fish - not good!
In 2016 there was an abundance of grass. I pulled out some for swimming but it appeared to be Milfoil.
Invasive algae blooms.
It gets in the prop of our power boat.
Jet ski clogs up.
Keep grasses out of boad motor and jet skis.
Less algae blooms, easier fishing
Reduce algae bloom and smell.
So dense it completely covers surface of the water.
They smell.
Trash collects in it.
Trash gets stuck in the grasses. Over-run with some grasses, some are beautiful.
Q10: Letting underwater grasses along my shoreline grow undisturbed would… (Other)
Bad for prop and jet skis.
Encourage underwater life
Make the water clearer
More seaweed results in clearer water. In 2016 you could see to the bottom and see fish swimming.

45 | P a g e
My jet ski sucked grass and is now broken.
Reduce the number of mosquitoes
The algae floats on top of grasses and is very unsightly.
The debris that it collects is disgusting and an eyesore.
The Milfoil is so thick and ends ups giving us fish kills with low oxygen.
Water clarity is desirable. SAV's improve water clarity immensely.
Q14: Placing the end of the pier beyond where the underwater grasses grow would… (Other)
Allow better use of boat lifts at low tide.
Grasses collect algae on top.
Improve my boating.
It is narrow, don't think I would be allowed to extend.
Our entire cove is shallow and grassed in; therefore, there is no possibility of building a pier beyond the grasses.
The grass will grow around the pier and rocks. It's the re-growth grass. As long as the Bay is healthy it will grow.
Q22: If you have any other comments about underwater grasses, please write them below.
1997 there was no grass, 2020 everywhere you look is grass.
A much anticipated dredging project was slated for Bird River. Included in the project were many spurs. Bird River is extremely silted due to sand and gravel strip mining which has been on-going for a very long time. The project has been delayed and all the spurs have been eliminated due to a new requirement that SAV's destroyed in spurs must be mitigated at a 4 to 1 ratio. This is not at all fair to all those who need spurs and made decisions based on getting spurs. Why dredge if you can't get to the channel? SAV's will be destroyed by folks prop dredging to the channel! (contact information removed) Agree they indicate a healthy bay, but this year are totally out of control and interfere with swimming, kayaking, jet skiing, and like I said, the collection of debris from storms is unacceptable.
Can I use something to remove a portion of the grass? It is choking out everything. If yes, what? (contact information removed)
Concerned over invasive underwater grasses choking Bird River. Also, underwater grasses making it impossible to swim at Maxwell Point. Garbage gets trapped. It smells, it burned up my jet ski motor. Friends with boats can no longer come by water. Fish get trapped in it and die. Get rid of it! PLEASE! Grass in Middle River was extremely thick 3 or 4 years ago. Last year there was very little, and not much this year (not even milfoil). The water is no longer clear and very few migratory ducks stopped here this year. Ten years ago we had large flocks of many different ducks. However, oddly enough, there are more fish, and in the past couple weeks, crabs!
Grasses came back a few years ago then disappeared. In 1950's much grass with minnows, crab, fish. Now water dead, too many people pouring chemicals on lawns, taking trees down. Water clear in winter, cloudy in summer - too many boats going too fast.
Have all seaweed - it effects my boating!
How do we get grasses? We do have clams. How can we help cleanup the Bay?
Hydrilla gets really bad July/August where we often can't use or safely get our jet skis out. We have a boat we can't use because of low tide. We were promised dredging a year ago and the low water lever exacerbates the hydrilla. We can fix the issue with hydrilla by dredging!! I acknowledge that grasses place restrictions on use of waterways but I appreciate how much they help with water quality of the bay, how they improve the overall habitat and in turn draw more wildlife to the area.
I am very pro education about environmental issues, however, I am strongly against any more legislation that will limit and/or penalize homeowners when they try to use the water front property they pay such a great price to own. I personally think the grasses that took over our pond last summer were unsightly, but I appreciate the good they do for the health of the environment.
I believe the grass is good for the water. Only concern is that it grows to top of water and collects algae. If you trim it below water it seems to do a lot better. It doesn't choke out the area and fish love it.
I don't know if the grass is good or bad for environment/water. It did ruin my jet ski and wrapped around boat propeller. I would like some grass removed. It also smells bad.
I don't see a lot of underwater grasses. I wonder about vegetation that would help at the end of my property where water goes over the bulkhead. I have always thought there are good and bad grasses. Not sure which is which or if this is true.

Action Research
46 | P a g e
I live on the main part of Middle River. In 2016 a pontoon boat came several times and cut all the seaweed from the beach out at my neighbor's home. Living right next door I can promise you that these grasses were not affecting my neighbor's boating. He has many guests all summer and does not want them to have to swim in seaweed. My understanding was that companies like "Seaweed Solutions" could only remove grasses from the end of your pier out to an area where grasses would not impede boating. I guarantee you they are breaking the law and should be investigated. I've seen so many barges of seaweed being carried to Chesapeake Marine to haul away. I never had grasses until the last couple of years. This year it is so bad, I can't even get my boat in and out without issues. Is there a way to keep the seaweed from getting so dense?
I sold both of my jet skis due to grasses. Never had a problem until 3-4 years ago. However, the grasses make the water clearer.
I support growth of underwater grasses, much of what is there now though are invasive species (hydrilla) so plans on how to support more natural species growth would be beneficial.
I want to support the bay and would like to know how to promote "good" grass.
I would like more info on introducing natural grass to my shoreline.
I would like to restore and replant the grasses at my home! We had dense beds of sea grasses four years ago and they are mostly gone now. Please contact me with info about how I can replant. (Contact information removed)
I would like to understand the connection between the SAVs and the algae that forms on the top - it only forms where there are some grasses and not in deeper channel area - very unsightly and smelly and a pain to get rid of when it dies back as big [?] on the shoreline in the fall. I'd like to know more about the grasses, if they are native or invasive and what to look for.
If MDNR would dredge our creek it would be deeper. The foot of sludge or muck would wash into the dredged area and more grasses would grow, but every year less and less crabs, and grasses grow.
In the early 70's when we purchased this property there were grasses growing along out shoreline. Several years later they began to vanish - now there are none.
Invasive grasses are no good!
Invasive Milfoil has been getting worse every year. I realize SAV's are important but not when we have one overtaking and outcompeting other species. When they die and use up all the oxygen, they die off along with the fish and you can smell it from a far distance. Milfoil is lowering our SAV diversity. I've lived on the Bush River and have seen considerable improvement in SAV's in the river, in particular the past few years. I am planning on riprapping a 100' section in front of my house that continues to erode into the Bush River. However, regulations, permits, etc. are time consuming, complicated, bureaucratically a mess, and expensive so I'm not sure when I will address.
MDE would not permit a bulkhead the full length of my property and now my shoreline is eroding. Grasses between mine and neighboring piers have increased dramatically over the past few years.
My neighbor's waterfront has never had any bulkhead or riprap securing their property/shoreline. Is there any law or agency that would require them to do so? My waterfront is very shallow and is overrun with underwater grass. The grass extends approximately 190 ft. from the shoreline.
Not very pleasant to swim or stand in.
Only that I was under the assumption that when the underwater grass get out of control it is due to fertilizer runoff from surrounding communities. Q16: Didn't know these [MD DNR, MD Dept of the Environment] existed.
Sadly, we know very little about the grasses. Perhaps an educational program should be considered.
Since there are both good and bad grasses, I'm not sure which the survey refers to. Good, of course, is healthy for all.
Thank you! If looking at our property for survey/research, please contact us: (Contact information removed)
Thanks for sending this out to us!
The county has given too many building permits over the years. Building and nature do not agree. We've lived here since 1966, had a lot of seagrasses - all gone!
The grass was extreme this year. Never seen it like that before. Don't know if good or bad.
The proliferation of the invasive hydrilla grasses is destroying the shoreline along my property. Swimming is not an option anymore, fishing and crabbing are difficult and getting by boat from my pier to deeper water is a problem. Please refer to the attached correspondence with Baltimore County government for a full explanation or contact me at (Contact information removed) if you wish to discuss. The underwater grasses in our cove seem to retain algae. This is what is visible from our house and unsightly and degfinitely reduces our property value. There had been an increase in SAV in the past 5 years, however this year there is very little.
There has been an enormous growth of new underwater grasses this year in my cove. I have never seen this much growth before.
They allow unwanted trash to collect at lower tides and clog boaters thru-hulls.

47 | P a g e
They have been coming back!
They should never allow people to remove grass at all from slips around pier, etc. I told my neighbor if in the spring you want to remove the grass or limit growth throw cracked corn in the slip. Carp will feed on the cracked corn and in the process, root up the grass naturally. The grass came back in 2015, 2016, 2017, and 2018 like I remember in the early 1960's. I thought I would never see tht again in my lifetime, but I did. Sincerely, (Contact information removed)
They vary year to year - some years none, some it's so thick it stalls a small boat.
Underwater grass was very common and thick in 2014. Over the last 6 years it has become less dense, and is more useable to fish and crab population to the extent that 100' out from shoreline, completely acceptable in its present state of density.
Underwater grasses are bad in the cove I live in as it makes boating and swimming very unpleasant and damages engines on boats and smells. The runoff on Baltimore County rightaways in our tiny cove is very bad and filling in our cove where our channel has become more shallow over the years and killed the grasses. Dredging our cove was omitted when they dredged Middle River several years ago. No attempt is being made by Baltimore County to top the runoff on the two rightaways on our cove and we residents are the ones putting up with this, not only for shallow water but also polluting the rivers and bay. Concerned citizen
We are happy with the grasses. However, in August when they start to die they smell and can get in the boat motor. We had a lift installed so that should not be an issue.
We are very concerned about wave erosion and damage to bulkhead and boat from motor boats going in and out of Middle River.
We don't mind the grasses, what we really don't like are the algae. When we had a lot of grass, toward the end of the season we would see algae. We don't know where the grass went this year.
We have always had the tall, beautiful grasses but now we have the invasive underwater grasses that are taking over. You can't even see the water anymore near our bulkhead. Feel free to call me or stop by to see how bad it has gotten. (Contact information removed) We have definitely noticed an increase this year, especially along the eddy near our creek mouth. We have been contemplating asking about returning the creek to its natural state for the Bay conservation as we sit on 11 acres with 1000 ft. of waterfront.
We have seen more turtles and eagles this year than in previous years. In 25 years, we have seen the osprey population increase dramatically, as well as snakes, lizards, frogs, and other birds (seagulls, blue jays, cardinals).
We just replaced our bulkhead and stone revetment with a living shoreline.
We live in a condo. The grass grows in June and takes over the shoreline from the bulkhead to about 20-30 feet out. While this doesn't affect me personally, I see boats have trouble with seaweed. The owners of the marina are planning to dredge next to our building. We live on a small creek just off Middle River. We have seen many changes in the amount of SAV over the years. We answered the questions to reflect how things are in the present.
We would like more info on the kind of grasses that currently exist in our water - how to maintain them, promote more growth, while protecting existing grasses. How to ID the grasses so we can promote growth of native grasses. Can we plant native grasses? We are looking into the Gunpowder Valley Conservancy raingardens and micro bio-retention gardens. They don't have funds to build on our property. Are there other organizations that do? We'd like to reduce/eliminate rainwater runoff from the street and other impervious surfaces. I heard about a citizen scientist program where we could monitor our water, collect data, and report it. I have not been able to find any info on the program. Would like more info. (contact info removed) We would need to work with the City of Havre de Grace and our neighbors if bulkhead were to be converted to a living shoreline. We would seriously consider such a project.
Wife doesn't like them, I don't mind them. Not sure why they are back - may be due to power plant that closed.
Would appreciate any assistance the Trust could give us to stop erosion and continue to enhance our natural shoreline.

Action Research
48 | P a g e
Appendix D: Ambassador Script for Outreach
Hello, my name is____________.
I am visiting your home on behalf of [GROUP AFFILIATION or AS YOUR NEIGHBOR]. I am here to give you
some information about the simple ways many of your neighbors in this community are protecting the
Bay.
[HAND OVER FLYER OR DOOR HANGER]
You probably know that your bay grasses provide food and habitat for wildlife, but did you also know
that the grasses absorb nutrient pollution and trap sediment? They also protect your shoreline by
reducing erosion, improving water clarity, and increasing oxygen.
To protect your shoreline and those of your neighbors from erosion, we are asking residents to leave
their bay grasses alone. Let them be, let them grow. While the sea grasses are protecting your shoreline
from erosion, they are also providing nursery habitat to young fishes and water birds.
[SHOW SHORELINE SIGN – APPROPRIATE FOR DOORSTEP]
Oh, you are already doing this, great! To show your commitment to leaving your bay grasses alone, we
are asking residents to display this sign along their shoreline. This will show your neighbors and those
who move past your beautiful shoreline that you are actively protecting the Bay.
Can I count on you to display this sign? Thank you, if you like, I can help you place it now.
[HAND OVER COMMITMENT CARD – APPROPRIATE FOR EVENTS AND DOORSTEP IF YOU HAVE A
DESIGNATED PLACE FOR DISPLAY]
Oh, you are already doing this, great! To show your commitment to leaving your bay grasses alone, we
are asking residents to sign this card. It states, [READ ALOUD]. The cards are being displayed alongside a
beautiful poster of the Bay at [PLACE]. Together, this will show your neighbors and those in the greater
Bay community that you are actively protecting the Bay.
Will you sign this card to commit to leaving your bay grasses alone?
Thank you, here is another one for you to keep. These cards are beautiful and are a reminder of your
commitment.
As I mentioned, the cards are displayed at [PLACE]. Please come see the display and tell your neighbors
about your commitment to protect the Bay.
Additional fallback statements:
Boating – Best practices for boating include raising a boat’s motor to avoid cutting SAV and not mooring
a boat where it would settle on the bottom during low tides. Your bay grasses have a baffling effect on
wakes even in low energy or sheltered shorelines. Jet skis are a big contributor to wakes and bay grasses
could mean in less opposition from your neighbors to jet ski use.
Aesthetics – [INSERT SAV SPECIES SPECIF INFORMATION, AS APPROPRIATE FOR THE AREA] Your sea
grasses while they may not look attractive to you, are quite effective at reducing wave energy along the
shoreline.
Algae – The algae are along your shoreline because of excess nutrients from runoff. The presence of
algae may be a good thing as they are sequestering and storing nutrients which otherwise might
produce toxic phytoplankton blooms.

49 | P a g e
Resident wants more information:
The Chesapeake Bay Trust and [NON-PROFIT] have a lot of information about bay grasses and ways to
boat and swim even in the thicker grass areas. You can contact them or find out more at [SHOW
CONTACT INFORMATION ON THE COMMITMENT CARD OR DOOR HANGER].
Thank you for your time, have a good day.

Report for CBT2 Part 1 – Behavior Training and Consultations Chesapeake Bay Program
3630 Ocean Ranch Boulevard Oceanside, CA 92056
40 Exchange Place, Suite 1403 New York, NY 10005
Submitted: Mar 3, 2020


i | P a g e
Table of Contents 1: Project Goals and Background .................................................................................................................. 1
Community-Based Social Marketing ......................................................................................................... 1
2: CBSM Training ........................................................................................................................................... 2
Training Topics .......................................................................................................................................... 2
Recording and Webinars ........................................................................................................................... 2
Evaluation of the Training ......................................................................................................................... 2
3: Consultations ............................................................................................................................................ 5
Consultation GIT Teams ............................................................................................................................ 5
Appendix A: Training Agenda ........................................................................................................................ 7
Appendix B: Full Evaluation Survey ............................................................................................................. 10
Appendix C: Full Survey Comments ............................................................................................................ 12
Reasons for Attending ............................................................................................................................. 12
Plan to Apply ........................................................................................................................................... 13
Barriers to Applying and Needs to Overcome ........................................................................................ 15
Strengths of the Training ........................................................................................................................ 16
Changes to Improve the Training ............................................................................................................ 17
Additional Comments ............................................................................................................................. 19
Appendix D: Consultation Worksheet ......................................................................................................... 20
Training Follow up ................................................................................................................................... 20
Details ..................................................................................................................................................... 20
Considerations for Selection ................................................................................................................... 21
Pre-Consultation Worksheet ................................................................................................................... 22
Sample Completed Worksheet ............................................................................................................... 23
Action Research Team ............................................................................................................................ 24
Appendix E: Consultation Memos ............................................................................................................... 27


1 | P a g e
1: Project Goals and Background The goal of this work is to use training and webinars to increase the use of community-based social marketing and social
science research to change individual behaviors to achieve environmental outcomes across the Chesapeake Bay
Watershed. While technology and policy can and do play an important part of achieving these environmental outcomes,
motivating individual behavior change also plays a key role, from increasing adoption of new technology to reducing the
impact of water runoff from an individual’s property. To achieve this goal, we conducted a behavior change training,
follow up webinars, and four consultations with workgroups that had specific behavioral goals.
Community-Based Social Marketing CBSM has emerged as an effective alternative to traditional education campaigns (McKenzie-Mohr, 1996; 1999; 2011;
McKenzie-Mohr, Lee, Schultz, & Kotler, 2011; Schultz & Tabanico, 2007; Tabanico & Schultz, 2018). CBSM is based upon
research in the social sciences that demonstrates that behavior change is often most effectively achieved through
initiatives delivered at the community level that focus on removing barriers to an activity while simultaneously
enhancing the activity’s benefits. CBSM brings together knowledge from the field of social marketing with a variety of
behavior change “tools” drawn from social psychology, environmental psychology, and other social sciences. CBSM uses
a five-step process to foster behavior change. These five steps are:
1. Selecting which behaviors to target;
2. Identifying the barriers and benefits to the selected behavior(s);
3. Developing strategies that reduce the barriers to the behavior(s) to be promoted, while simultaneously
enhancing the benefits;
4. Piloting the strategies and determining which are most cost-effective; and
5. Broadly implementing the most cost-effective strategies and conducting ongoing evaluation.

Action Research
2 | P a g e
2: CBSM Training The training was conducted on October 31st, 2019, from 8:45 to 4:30pm, at the Chesapeake Bay Foundation
headquarters, the Philip Merrill Environmental Center, in Annapolis. The training was led by Jennifer Tabanico and
covered the fundamentals of community-based social marketing. The content for the training is often covered in a two-
day training but scheduling only allowed for one day of in-person training. A total of 50 participants were arranged into
ten groups of 4 to 6 people, based on their work topics, from communication to fish habitat, and worked together on
several activities over the course of the training. Follow up webinars were scheduled for January through April 2020.
Training Topics The training began with introductions and an ice breaker at the table, followed by the foundations of CBSM and a
discussion of why information-only campaigns are still often the default. After the first break, the training continued
with step 1 (selecting which behaviors to target), including calculating the results of a weight table and mapping a
behavior chain. The training then introduced step 2 (identifying barriers and benefits) and the groups discussed different
potential research methods prior to lunch. The majority of the remainder focused on step 3 (developing strategies), with
time for the tables to discuss how to apply different strategies. Finally, the end of the session included a discussion of
step 4 (pilot testing) and step 5 (evaluation), and final questions and answers. The full agenda is included in Appendix A
with time points, though the final training was flexible on specific timing to the needs of participants.
Recording and Webinars Prior to the training session, Jennifer Tabanico recorded a one-hour overview session of the one-day session. This
recording was meant for interested individuals who were unable to attend the training, either due to a conflict that day
or limited room size, as well as those who seek to learn more about CBSM in future years. A link to this session is on the
Chesapeake Bay Program Communications Workgroup’s website:
https://www.chesapeakebay.net/who/group/communications_workgroup.
In the first four months of 2020, Jennifer Tabanico and Kaitlin Phelps also recorded four webinars that explored the first
four steps of CBSM in greater depth. A link to each webinar is on the Chesapeake Bay Program Communications
Workgroup’s website. The webinars occurred on the following dates:
Webinar Topic Date
Step 1: Selecting Behaviors January 22, 2020
Step 2: Barrier and Benefit Research February 26, 2020
Step 3: Strategy Development March 25, 2020
Step 4: Piloting and Evaluation April 15, 2020
Evaluation of the Training After the training, the participants were given an evaluation survey that included the following topics:
1. Reason for attending 2. Usefulness and application of the training 3. Ratings for quality of the training 4. Strengths of the training 5. Areas of improvement 6. Additional comments

3 | P a g e
7. Interest in additional follow-up
A total of 36 participants provided a completed survey (72% of the 50 participants). The full survey can be found in
Appendix B. Selected comments are called out in this section, but the full comments are included in Appendix C.
Reasons for Attending
Participants were asked an open-ended question about their reason for attending. The reasons for attending varied,
including that behavior change is part of their work, the fact that the opportunity was free, and that they wanted to use
the information to improve their work projects.
To learn how to effectively convince more people to act in an environmentally beneficial way.
This is an important area to master for working with communities on environmental projects and outreach.
Usefulness and application of the training
Participants rated the usefulness of the training and the ability to apply the training on a scale of 1, not at all, to 7,
extremely. Participants were also asked two open-ended questions; first, how they plan to apply the concepts in their
work and second, the barriers and needs they have to applying these concepts to their work.
On average, participants rated the usefulness of the training a 6.25, and their ability to apply a 5.11. Participants spoke
of how they would apply the concepts in a variety of ways, from starting to explore behaviors, to re-energize and share
with their workgroup and colleagues, incorporating into current campaigns, taking more time to strategize, move away
from education only campaigns, and conducting research.
Think about these topics in everyday life and work and consider them while communicating and asking for action. Ask for
smaller changes and create steps to make it easier and really consider how big some actions are.
Suggest wording/framing of created materials. Use info during development of workgroup of a behavior change tool.
Discourage simple education campaigns.
Start researching the barriers people have to installing living shorelines to determine actions we can take to help motivate and reduce barriers to have more properties install living shorelines.
Participants also reported a variety of challenges and needs, including: Time, money, inability to research as a federal agent, challenging barriers to action, complexity of behaviors, working with people who are not behavioral scientists, expertise. Finding the right opportunities to apply CBSM and gaining support and buy-in from the appropriate team members and
leadership to initiate such a project. Could be overcome by building on the momentum of Chesapeake Bay Program
offering today's training.
Time and money to apply concepts. Need additional training.
Being state regulatory agency, don’t want to appear "preachy" or "demanding" rather the choice is yours - but choose
right. :-)
I feel like I need more time to practice the concepts I learned today. More time and role-playing, that directly relates to
my work would be helpful.
Ratings for Quality of the Training
Participants were asked to rate the training quality, activities, presenter knowledge, training venue, and catering from 1,
poor, to 7, excellent. On average, participants rated the quality of the training a 6.72, the activities a 5.75, the presenter

Action Research
4 | P a g e
knowledge a 6.97, the venue a 6.92, and the catering a 6.48. Participants felt the training, the presenter knowledge, the
venue, and the catering were excellent. Participants felt the activities were fairly good.
Strengths of the Training
Participants were asked what they felt the strengths of the training were. Answers included the examples and case
studies, the presenter, the eventual additional webinars, and the slides.
Tons of tangible, real-world examples were presented for each tool - these were relevant, interactive, and engaging.
Loved the real-world examples. The instructors were extremely knowledgeable, experienced, and articulate. Excellent
overview of the concepts and methods.
Great examples and studies. Very informative! Also, I love the case study handouts. I felt like I needed a 1-pager handout
with the steps and this does that w two good examples.
Training Improvements
Participants were also asked what changes they would suggest for the training. The primary suggestions were more time
for training, which was expected, and more movement in activities.
It makes sense that it was designed for 2 days - lots of info!
More breaks. More active activities instead of just talking in groups, get us up and moving!
Additional Comments
The last open-ended question to participants was simply asking for any additional comments. Most participants left this
blank or expressed gratitude or how this had changed their thought process or excitement for the webinars.
I enjoyed the training. It made me think differently on how to motivate people to engage in an activity. I am interested in
the webinars to see if more details will help me feel more confident in applying these methods.
Contact Information
The last section asked if participants were willing to provide a testimonial, had further questions, wanted to host their
own workshop, or had a project they wanted input on. Eight participants checked at least one box, with most either
being willing to provide a testimonial, host a workshop, or seeking input on a project.

5 | P a g e
3: Consultations The goal of the consultations was to assist groups who are working to change behaviors that impact the health of the
Chesapeake Bay by providing program recommendations that make best use of the community-based social marketing
(CBSM) process and social science research. Each consultation began with a review of group goals, status, needs, and
challenges. After the consultation, a recommendation memo was created based on the information collected from the
pre-consultation worksheet responses, program summary documents, and the two-hour consultation meeting.
Consultation Workgroups The consultations were conducted in January 2020 with the following four workgroups s:
1. Wetlands a. Kevin DuBois – U.S. Department of the Navy and Member, Wetland Workgroup b. Jennifer Greiner – U.S. Fish and Wildlife Service and Coordinator, Habitat Goal Implementation Team c. Pam Mason – Marine Scientist, Virginia Institute of Marine Science and Chair, Wetland Workgroup d. Megan Ossman – Chesapeake Research Consortium and Staffer, Habitat Goal Implementation Team e. Christine Tombleson – Virginia Institute of Marine Science, Marine Scientist
2. Forest Buffers a. Katie Brownson – Watershed Specialist, U.S. Forest Service and Member, Forestry Workgroup b. Sally Claggett – U.S. Forest Service and Coordinator, Forestry Workgroup c. Ryan Davis – Chesapeake Forests Program Manager, Alliance for the Chesapeake Bay d. Nora Jackson – Chesapeake Research Consortium and Staffer, Forestry Workgroup e. Jenny McGarvey- Senior Program Manager, Alliance for the Chesapeake Bay and Member, Forestry
Workgroup f. Teddi Stark – Riparian Forest Buffer and Watershed Forestry Program Manager - Pennsylvania
Department of Conservation and Natural Resources Bureau of Forestry 3. Tree Canopy
a. Katie Brownson – Watershed Specialist, U.S. Forest Service and Member, Forestry Workgroup b. Nora Jackson - Chesapeake Research Consortium and Staffer, Forestry Workgroup c. Lara Johnson – Virginia Department of Forestry d. Julie Mawhorter – U.S. Forest Service and Coordinator, Forestry Workgroup e. Frank Rodgers – Education & Outreach Director, Cacapon Institute and Member, Forestry Workgroup
4. Fish Habitat a. Donna Bilkovic – Virginia Institute of Marine Science and Member, Fish Habitat Workgroup b. Morgan Corey – Chesapeake Research Consortium and Staffer, Sustainable Fisheries Goal
Implementation Team c. Gina Hunt – Maryland Department of Natural Resources and Coordinator, Fish Habitat Workgroup d. Margaret McGinty – Maryland Department of Natural Resources and Member, Fish Habitat Workgroup e. Bruce Vogt – NOAA and Coordinator, Sustainable Fisheries Goal Implementation Team
Prior to the consultation, each team filled out a worksheet about their team and project context (See Appendix D:
Consultation Worksheet). The worksheet was reviewed by Action Research prior to the consultation to ensure the
consultation was structured to best help the teams move forward with strategic use of social science and community-
based social marketing. Action Research also reviewed each teams’ Logic and Action Plan, Management Strategy, and
Chesapeake Progress documents.

Action Research
6 | P a g e
Consultations were conducted over two days – Friday, January 17th and Tuesday, January 21st. Senior Project Manager
Kaitlin Phelps attended all four consultations in person in Annapolis, MD, while President Jennifer Tabanico and
Scientific Advisor Doug McKenzie-Mohr attended via conference call. Workgroup members attended either in person or
via call, based on preference and location.
All four consultations focused primarily on step one of CBSM, selecting which behaviors to target, and resulted in a
memo summarizing the meeting and recommending a pathway for the workgroup through the CBSM process. The
memos are included in Appendix E: Consultation Memos.

7 | P a g e
Appendix A: Training Agenda DATE: October 31, 2019
LOCATION: Philip Merrill Environmental Center; 6 Herndon Avenue; Annapolis, Maryland
TIME: 8:45 am – 4:30 pm
CHECK IN/SOCIAL: 8:45 am – 9:00 am
# OF PARTICIPANTS: 50
WORKSHOP SCHEDULE
7:30 am – 8:45 am FACILITY SET UP/AUDIO TESTING
8:45 am – 9:00 am PARTICIPANT REGISTRATION & CHECK IN
• Issue Name Badges
• Informal Social Time
9:00 am – 9:10 am WELCOME (Katy Phelps)
• Discuss background, purpose, and goals of training
• Introduce self and role on projects in the region
• Discuss consultation opportunities
• Introduce Jennifer
9:10 am – 9:20 am TRAINER INTRODUCTION (Jennifer Tabanico)
• Opening Story (5 min)
o Intro to speaker
• Ground Rules/Announcements (5 min)
o Restroom Locations
o Emergency Exits
o Food/Snacks/Water
o Breaks: 10:30 (15 min); 12:30 (30 min); 2:30 (15 min)
9:20 am – 9:30 am
• Icebreaker Work in Groups (10 min)
o Get to Know Table Mates
▪ Name, Agency, Behavior Change, Favorite Halloween Costume or
Memory
o Choose a Spokesperson
o Come up with a Halloween-Themed Name for your Table
9:30 am – 9:40 am
• Group Introductions (10 min)
o Spokesperson Introduces Table Mates and Spooky Table Name
o ~1 minute per table
9:40 am – 10:00 am CBSM FOUNDATIONS

Action Research
8 | P a g e
• Behavior Matters
o How behavior is related to key ecological outcomes
• Beyond Knowledge and Awareness
o Knowledge deficit model
o Examples of failed campaigns in environment & health
ACTIVITY #1: Discussion. Why do organizations implement information campaigns based on raising knowledge and
awareness?
10:00 am – 10:30 am COMMUNITY-BASED SOCIAL MARKETING
• Brief Overview of Steps
• Case Study: Oceanside Clean Water Program
10:30 am – 10:45 am MORNING BREAK
• Thought Question for Optional Discussion Over Break: How well-positioned is your
organization to implement CBSM? What are your organizational strengths, weaknesses,
needs, or resources?
10:45 am – 11:15 am STEP 1: BEHAVIOR SELECTION
• Identifying outcomes and sectors
• Creating a behavior list
• Prioritizing behaviors: IPPA Chart (1 energy-efficiency, 1 shore birds)
ACTIVITY #2a: Calculate the weights for one line on screen to practice
11:15 am – 11:30 am
• Behavior Chains (Introduce Basic Concept)
ACTIVITY #2b: Introduce sheet of end state behaviors. Write a behavioral chain for one behavior on the list.
Spokesperson from tables report back.
11:30 am – 12:30 pm STEP 2: BARRIER AND BENEFIT RESEARCH OVERVIEW
ACTIVITY #3: Identify research modes for one behavior from the list. Identify appropriate research modes.
Spokesperson from tables report back.
12:30 pm – 1:00 pm LUNCH BREAK
• Thought Question for Optional Discussion Over Lunch: What capacities does your
organization have for conducting: Literature review? Focus groups? Surveys (web, in-
person, phone, online)? Intercept Interviews?
1:00 pm – 1:15 pm STEP 3: DEVELOP STRATEGY
• Overview of Approach
• Case Study: SD County Over-Irrigation or Fort Worth Recycling. Case study demonstrates
clear link between research outcomes (barrier/benefit research) and strategy elements
aimed at reducing barriers/enhancing motivation.

9 | P a g e
1:15 pm – 2:30 pm ADDRESSING BARRIERS
• Education
• Convenience
• Prompts
ACTIVITY #4: Using the list provided or your own behavior, apply education, convenience, or prompts as appropriate.
2:30 pm – 2:45 pm AFTERNOON BREAK
Thought Question for Optional Discussion Over Break: How are strategies typically developed
in your organization? Who is involved? What expertise do they bring?
2:45 pm – 3:45 pm ENHANCING MOTIVATION
• Social Diffusion
• Social Norms
• Commitment/Goal Setting
ACTIVITY #5: Using the list provided or your own behavior, apply social norms, social diffusion, commitment, and/or
goal setting
3:45 pm – 4:00 pm PROCEED WITH CAUTION
• Competition
• Incentives
4:00 pm – 4:15 pm EFFECTIVE COMMUNICATION
4:15 pm – 4:30 pm STEP 4: PILOT TESTING & STEP 5: EVALUATION
4:30 pm – 4:45 pm WRAP UP
• Final Q&A
• Complete Workshop Evaluation
4:45 pm – 5:00 pm PACK UP AND VACATE SPACE

Action Research
10 | P a g e
Appendix B: Full Evaluation Survey Training Feedback Form
Date: Oct 31, 2019 Presenter: Jennifer J. Tabanico Location: Annapolis, MD
Why did you attend this training?
Using a scale from 1 (Not at All) to 7 (Extremely), how useful was the training? Circle your response:
1 2 3 4 5 6 7
Not at All Extremely
Using a scale from 1 (Not at All) to 7 (Extremely), how ready do you feel to apply what you learned today to your work? Circle your response:
1 2 3 4 5 6 7
Not at All Extremely
How do you plan to apply what you learned today to your work?
What barriers do you face to applying these concepts to your work? What would help you overcome those challenges?
Please rate each of the following elements using a scale from 1 (Poor) to 7 (Excellent). Circle your response:
Poor Excellent
a) Overall quality 1 2 3 4 5 6 7
b) Hands-on activities 1 2 3 4 5 6 7
c) Presenter’s knowledge of the subject 1 2 3 4 5 6 7
d) Training venue 1 2 3 4 5 6 7
e) Catering 1 2 3 4 5 6 7

11 | P a g e
What were the strengths of the training?
What changes could be made to improve the training?
Additional comments or suggestions?
OPTIONAL
Please contact me:
I would be willing to provide a testimonial about this training for marketing materials.
I have specific questions about some of the material from the training.
My organization may be interested in sponsoring a training or training.
I would like your input on a program that I am developing.
Other: ______________________________________________________
Name:
Phone:
Email:

Action Research
12 | P a g e
Appendix C: Full Survey Comments The full survey comments are included below.
Reasons for Attending Behavior change is extremely applicable to various aspects of my job
Interested in behavior change for various conservation, fisheries, and environmental issues
This is an important area to master for working with communities on environmental projects and outreach
I was interested in the subject, but it helped that I was offered a free opportunity
It was recommended by my supervisor
Interested in the topic and how CBP can use it and I can share resources w my colleagues
Because I want to make our outreach programs and restoration projects effective, durable, and successful, and our
communication efforts fall short now
To enhance my work + expand the way I think when working with people and for people
Much of the work we have left to do relies on private landowners and science/money alone won't get us over the finish
line. Sustainable actions of landowners that makes it a norm will be more successful. Understanding how to do this is a
first stop. I plan to use this info as a manager and funder to know direction for funding and tasking
To learn about behavior change
Offered free through CBP and GIT chair
Curious about interaction between psychology and environment. Looking for actionable steps to take
To learn how to implement more effective messages and programs
Apply lessons learned to work (education)
To learn more about strategies that can help the members in the CBP stewardship GIT
Professional development/learning opportunity
To learn more about engaging people and learn tools and strategies to make change happen
To incorporate CB social marketing into my education better and outreach efforts
Direct correlation to job - educate general public and hoping to lead to behavior change
Very interested in applying more social science methods in my work, particularly around behavioral change. I'm an
applied anthropologist but not an (actively) practicing one
To improve and reinvigorate management and compliance
Our programs (MWEE and RiverSmart) heavily work in education and outreach AND rely on behavior change to drive
implementation and action projects
Invited as a GIT Coordinator to do so.
Affecting behavior change is a key part of my job
Currently developing an engagement and marketing plan - very helpful
We need to change the behaviors of our rivers residents to make our rivers cleaner
As a staffer for the Wetland and SAV workgroups/habitat goal team - to learn more about this concept and
implementation

13 | P a g e
Honestly, it was mandatory. But its an interesting topic that may factor (tangentially at least) into the messaging and
visuals I produce as a communicator
Learn how to implement behavior change projects Re: shorelines, fishing rules, and habitat projects
To learn about changing people's behaviors to help better implement some of our programs
To learn how to effectively convince more people to act in an environmentally beneficial way
I was invited to participate by my supervisor (which is good b/c I wanted to attend, but wasn't sure I would get chosen)
since there was limited space
To learn tech and tools to better prioritize behaviors and implement strategies
I have a personal interest to see more social science incorporated in environmental work, and from my limited exposure
to CBSM I wanted to learn more tools to use
I'm interested in learning about how to actually get our research change work applied and used by the communities we
live and work in
The opportunity to learn more about getting people to care about the environment. I already understood the basic idea
of "doing it from their perspective/priorities" and was curious how to do it
Plan to Apply I will need to do some more reflecting first on what I've learned but I definitely plan to apply a different framework of
thinking as I move forward with several projects that would benefit from the tools and ideas that were presented
Increase consumption of blue catfish and raise awareness of the issues. Maybe improve catch reporting of watermen
I'll start exploring behaviors in my audience that I may want to address in a behavioral changing project
We want to incorporate climate resiliency into the other workgroups, but they haven't done it yet. We can now use this
process to help change their behavior of not incorporating it
Use concepts to help re-energize workgroup involvement
Research some more, suggest to colleagues considerations for social marketing in future grants/programs. Share
examples when appropriate
Going back through our actions plans to identify planned work that could benefit from a behavior change lens and
rethink the approaches for maximum impact and more effective
Background research, improve survey methods
Right away it will help me articulate my need for staff that have skills to focus on social change
I'm not sure yet. I'm having a hard time distilling my needs to actionable (non-divisible) steps
Figure out how to get an env. Analysis completed before actually required b/c that is when it would be more effective
and meaningful
Will take more time setting up my problems before considering possible solutions. Be more mindful about presenting
information in a way that encourages action
Crafting state park trash campaigns. Share info with coworkers
Ask intern to do project. Using CBSM to change behaviors in parks
Suggest wording/framing of created materials. Use info during development of workgroup of a behavior change tool.
Discourage simple education campaigns
Action Research
14 | P a g e
Planning a future survey
Think about these topics in everyday life and work and consider them while communicating and asking for action. Ask
for smaller changes and create steps to make it easier and really consider how big some actions are
New program developments/ include in RFP responses. Incorporate principles, as able, into existing programming
Just starting anti-litter campaign so this will help drive decisions. Trying to breathe life into a stalled initiative so
hopefully can bring back some attention and enthusiasm
Special projects that are more social science-oriented; trying to increase voluntary adoption of BMPs in agricultural
community; incorporate more community-based social marketing in policy development, particularly around water
quality
Brainstorm w/ firm to implemented BMPs of clients, policy makers, and inspire management agencies
Techniques of program evaluation and tools of enhancing motivation
In listening sessions w/ communities regarding Green Infrastructure projects for climate resiliency
Work with the team to put together a pathway and think through outreach
I'm currently writing a marketing and engagement plan - perfect timing and extremely helpful. I was making many
assumptions - helpful to think about these processes and hot to better approach these topics
We are in the middle of a behavior change project right now with the Ches.Bay.Trust
Bring these ideas back to the SAV and Wetland workgroups. The Wetland group has identified several actions they
would like to take to improve communication w landowners - several of these ideas can be applied to these actions to
make communication more effective and inspire behavior change
I will avoid normalizing negative behaviors by not amplifying examples of pollution/mis-use of green space/etc. I will
continue to highlight the positive role models (including early adopters). I produce stories so I can ask our partners who
their early adopters are, so that i can help "diffuse" them
Look for opportunities to implement on other stressors to fish habitat. Perhaps use our community shoreline projects as
examples to other communities (diffusion)
Start researching the barriers people have to installing living shorelines to determine actions we can take to help
motivate and reduce barriers to have more properties install living shorelines
Part of my mission is to work with Riverkeepers and watershed groups that work directly w volunteers. I want to be able
to help them more effectively influence their volunteers (and the people in their watershed) to be good stewards. I'd
also like to effectively manipulate my workgroup members to be more active in workgroup efforts :)
Talk to workgroup coordinators and figure out what behaviors and barriers exist in getting more participation
Using social commitment, goal setting, social norms, and social diffusion (when possible) to encourage and motivate
teachers to participate in environmental ed. Programs and not cancel programs that they were enrolled in
Interested to apply fish consumption and promoting invasive species on the menu for a Chesapeake Bay speaks
I'm planning to apply what I learned when working on increased engagement for the stream health group and brook
trout groups. I'm currently setting goals for the near 2 years so we want to include it then
It doesn't apply to my current work, but I know I will in the future and it was changed my way of thinking, especially
concerning grants/deliverables

15 | P a g e
Barriers to Applying and Needs to Overcome For when identifying barriers and strategies, we are trying to change the way we work in first incorporating research
about communities and from focus groups instead of applying strategies and projects we think would be good based on
our biases and hunches. But one huge challenge is that as federal govt we can't collect info from more than 10 people
without going through an internal bureaucratic process. Our grantees that are paid by federal dollars can't do this either.
We can overcome by partnering with academic and non-profits, and doing interviews with 9 people
Lack of knowledge of issues, palatability, preparation, etc. have a taste/preparation demonstration w informational
signs, lack of trust of managers/government --> social diffusion of e-reporting program
There is so much to master for this training before being able to apply it
Climate change is a "wicked" problem and very complex. There are behaviors that we want to change and they are
divisible, but we don't even know what all those divisible behaviors are.
Applying concepts from a society/leadership level versus influencing an individual's behavior e.g. acknowledging human-
caused climate change science
Working with people who are not versed in this work. Maybe some basic talking points that boil does the benefits of
using this process before starting programs of information campaigns
1. Capacity and 2. Time
Shifting the "way we always do things" in a partnership is always difficult but add a sense of urgency to getting practices
in place quickly. May not allow for the time it takes to do it right
I don't have direct access to the stakeholders I would like to reach
I am a team of 1. No support, no $, just my brain. Any help of pretty much any kind would be good, but helping ensure
that I am properly prioritizing actions would be great
On a comm team - I inform, don't necessarily call people to action. I can write in a way that invokes audience to take
action
Time/money/expertise
Cannot conduct interviews/surveys as government worker, so must rely on (often biased) literature
As a younger professional, I'm worried about suggesting ideas from what I've learned but I plan to reference this training
to backup my point
Time :)
The nature of my work is more informational forum and we have to rely on other partners to actually do the actions.
This makes it hard to use these strategies from a distance
Time and money to apply concepts. Need additional training.
Being state regulatory agency, don’t want to appear "preachy" or "demanding" rather the choice is yours - but choose
right :)
I feel like I need more time to practice the concepts I learned today. More time and role-playing, that directly relates to
my work would be helpful.
Education <-> proven validation of techniques that will enhance water quality
Time and cost. Interns and outreaching/partnering with communication officers in our office
Living shorelines have not achieved "Social norm" status; general distrust of government programs. Awareness-building

Action Research
16 | P a g e
Need the opportunity to get input on specific application of the materials. Not sure with lots of info coming my way that
I can remember everything
My barriers are super specific - I'm hoping focus groups can help answer questions about these barriers, but its just
tough to get funding support without falling victim to the incentive spiral
Time - this approach requires a lot of planning and strategy
I communicate to a broad audience most often, and so I don't really focus on specific actions as much as inspiring
stewardship generally, by showing people their connection to the watershed. It would be great to identify messages
particularly suited to visual communication (photo and video)
Identifying barriers and benefits, time, $$
Knowing where to get information. Knowing sometimes what to ask. More examples of projects similar to what we want
to do
Time + staff. Not enough of either
I am an environmental staffer and my role is often supportive so I don't always have the authority to impact these
changes; time constraints; social norms; funding. Supervisor support to enact change, more time, more funding
The main barriers to achieving the environmental ed. Goals have to do with barriers outside our direct control (teacher
time, priorities, capacity, etc.) Having buy-in and support from the public school central office would help
Finding the right opportunities to apply CBSM and gaining support and buying from the appropriate team members and
leadership to initiate such a project. Could be overcome by building on the momentum of Chesapeake Bay Program
offering today's training
The biggest barrier I face is a luck with authority. I am not a person in the groups that I work with who others look to for
Guidance and communication strategies. I think that some way for me to portray w the value of this training to others
would be helpful
Just my role/responsibilities, but I imagine the bureaucracy/entrenched ideas of information sharing/education is
"enough" and the way I think about grant deliverables
Strengths of the Training Great examples and studies. Very informative! Also I love the case study handouts. I felt like I needed a 1-pager handout
w the steps and this does that w two good examples
Providing many examples of the strategies used throughout the behavior change process was really helpful; presenter
was very knowledgeable and had on-hand examples related to group focus
Knowledge of presenter. Experience of the organization presenting
The presenter was very knowledgeable about the subjects. There is going to be more training after this day. I like how at
the bottom of this survey you offer your input for someone's program
Really liked the real-world examples
Instructor and materials, examples/slides
Very applicable examples. Timely and relevant.
Clear/visually appealing PowerPoint, lots of great research and examples, great energy (goes a long way)
Presenters knowledge, case studies, exercises

17 | P a g e
Very knowledgeable contractors, good activities
Very thorough and good overview. Relevant examples based on real science
Well-paced. Strong presenter and pertinent info. Relevant and actionable
Presenter was engaging. Examples were interesting and relevant
Presenter use real life examples. Presenter was knowledgeable and a good communicator
Great examples that are relevant to our field. Interesting content.
Great presenter!
The instructor was knowledgeable and engaging. The content was new and interesting to me. There was a lot of content
in 1 day, but I feel like I have good understanding.
Easy to follow and understand
Loved the real-world examples. The instructors were extremely knowledgeable, experienced, and articulate. Excellent
overview of the concepts and methods.
Nice format - systematic coverage of concepts
The trainer (Very knowledgeable). The venue (beautiful, but far from my commute - 1 hour drive)
Practical examples of concepts in action. Humor in delivery
Lots of examples (maybe too many?) Easy to understand tools - thangs to think through. Knowledgeable team/trainers
Trainer was excellent with time! Spot on, great pace, timing, clarity, and clear experience
Application
I really liked all the examples of case studies - they really highlighted these ideas and were memorable
There was a wealth of examples of studies to support principles
So many great examples. The step by step process. Looking forward to follow up webinars. Love that there is follow up
The presenter. Good use of breaks and lunch, not too long, not too short. Efficient use of the day.
Presenter (Jennifer) had very effective and relatable examples of the methods she was conveying. It helped to
understand the methods and materials
Lots of information and good examples. Activities helped group put into practice the info we were learning. Fun and
easy to understand
The top strengths include: How to calculate prioritized behaviors, case study examples, behavior change strategies
Tons of tangible, real-world examples presented for each tool - these were relevant, interactive, and engaging
Sorting people at tables by interest/work where the activities are located is well structured. Great presentation style and
anecdotes.
Engaging and interesting presenter, presentation, the activities, and the specific studies and examples that
demonstrated the concepts
Changes to Improve the Training More interaction throughout the presentation to keep people engaged, particularly as the day goes on
Divide it into several sessions

Action Research
18 | P a g e
The examples provided to be closer linked to the audience. If possible, make it a two day training so that the next day is
more centered around the groups connecting it directly to their work. The presenter would be there more to help
facilitate and answer questions
Interactive visual activities to help understand concepts. E.g. subaction chain -> have index cards, group writes down
subactions and then build the chain
Super long day, too much sitting
Not sure, it was great!
More direct Chesapeake and environmental examples. Highlighting diverse communities
It was a lot to take in (although I know it was 2 days smushed into 1)
Length-information towards end gets lost after long day. Incorporate more types of media into presentation. Switch up
speakers/alternate speakers
Get up and move around
Diversify hands-on activities. Spend less time on introductions. Don't explain everything! Some is common sense
I know this was a scheduling conflict but it was a long day with a lot of information.
More breaks. More active activities instead of just talking in groups, get us up and moving!
Just lots of sitting but hard to avoid
It was a lot to cover in one day, so that’s not the fault of the instructors. It would be great to have more time to test out
the methods beyond the short group exercises
Maybe a few more breaks/activities - but density of info was important
More movement of activities for an 8 hour session. More than one speaker/trainer to keep focus on each topic
Suggestions to step it down to private landowners (audience) on habitat issues (pilot testing) How can door-to-door
messengers apply?
Less examples; more time to noodle with group with facilitators actively engaging with groups
Maybe a few more group activities or questions posed to the group for a few minutes
It makes sense that it was designed for 2 days - lots of info!
It would have been helpful to have group facilitators that could have more effectively direct group activities. It was easy
to go down rabbit holes and not actually do the exercise. A little more time for activities would have helped too,
although I realized we crammed a lot into one day for scheduling
More activities that involve movement so we aren't sitting for so long (but I know this was condensed into 1 day so that
might be hard)
Electronic copy of the presentation. More examples of bad campaigns and how AR would have improved them
Try to get people up and moving around more, or promote more engagement and participation with the Mendi Meter
or similar
I think that this would be much better as a 2 day training (which I know it is supposed to be). Update case studies, some
were over 20 years old
I think that if it was more targeted to what our organizations can do - some of the information, i.e., pros + cons of the
different surveys weren't very relevant. Also include much more complex issues, that's what we will face

19 | P a g e
Additional Comments Thank you!
I enjoyed the training. It made me think differently on how to motivate people to engage in an activity. I am interested
in the webinars to see if more details will help me feel more confident in applying these methods
Thank you for all your time and hard work :)
This is incredible - thank you so much
Great Job!
Did a great job remembering the specific projects of each group throughout the day (and referencing them)
Looking forward to additional webinars to dig deeper
Great, thank you! Didn't know about webinars as a follow up but excited for them.
Thanks so much again - really informative training
Amazing energy for a full day training from Jennifer. I would suggest a research of local impacts of the attendees
Carbs galore. Salads and gluten free options appreciated.
Thanks!
Super helpful training. Would love to see this kind of training made available by CBP for all of our non-profit
neighbors/partners. Riverkeepers would find this particularly beneficial
Thank you for spending time with us and giving us all this useful information
Great training! Look forward to learning more
Great training! Jennifer really knows her stuff and made the training fun
Really enjoyed it and learned a lot! I think it might be fun for the attendees to "practice" one of their examples (like the
social norm elevator example), some people are told do something or sit a certain way and 1 or 2 people are the
"subjects" to see if they go w the group or not

Action Research
20 | P a g e
Appendix D: Consultation Worksheet Changing human behavior is critical for meaningful effects on most environmental issues. Traditional marketing
campaigns that focus on awareness and education typically fail because they do not address the underlying motivations
for behavior. A plethora of research exists to demonstrate that information-intensive approaches do little to foster long-
term changes in behavior. Community-based social marketing (CBSM) has emerged as an effective alternative to these
campaigns. The approach has been used worldwide to effectively motivate behavior change across a wide range of
domains. Read more at cbsm.com.
We look forward to working with you to help you meet your team’s environmental goals by fostering behavior changes
in your target audience. The goal of these two-hour consultations is to provide a starting point for developing and
refining your team’s future behavior change campaign. Depending on your team’s goals, we will help you develop an
actionable plan to: select meaningful behaviors, identify barrier/benefit research strategies, apply a variety of behavior
change tools, design effective program strategies, employ pilot testing, and conduct evaluation.
Training Follow up The consultations serve as a more in-depth, personalized next step after the training. Many of the activities in each of
the GIT teams’ workplans would benefit from the incorporation of behavior change campaigns. During the first SRS
round, almost every single workgroup identified local engagement and communications as areas where significant work
is needed to progress toward meeting your outcomes. Community-Based Social Marketing is a process designed to
inspire behavior change and by learning the foundations of this model, it will help you to understand why looking at
particular audiences, benefits, barriers and behaviors really are vital components in any work you do to meet your
outcomes. The training will provide the foundation – a consultation will apply it to your team’s specific goals and
context.
Details There will be four consultations available for selected projects within the Chesapeake Bay Program (CBP) organization
structure. In each consultation session, Action Research will work with your team in depth to apply CBSM principles,
customizing them to your program and goals, brainstorming solutions to challenges, and provide customized
recommendations that fit your unique circumstances. The session will result in support for the next steps your team can
take to develop your own behavior campaign, such as: (1) how to use existing data to select and prioritize behaviors; (2)
how to conduct barrier/benefit research; and/or (3) how to develop and pilot test strategies. Brief bios of our team
members are available at the end of the end of this document.

21 | P a g e
Considerations for Selection There are only four free consultation spots available. Our goal is to identify teams that are well suited to apply the
consultation recommendations to their projects. We are looking for teams/projects with:
At least one team member attending the October 31st one day training
Defined environmental outcome(s)
Defined target audience(s)
Defined target behavior(s)
Existing foundational audience research, or resources to conduct foundational audience research, if needed1
Responses to the pre-consultation worksheet
We have identified your team as well suited for a consultation. By October 18th, please reach out to Amy Handen
([email protected]) or Rachel Felver ([email protected]) to discuss the opportunity.
1 Foundational audience research can be defined as literature reviews, intercept interviews, focus groups, and mail or phone surveys, with the goal of gathering information about your target audience’s current behaviors, attitudes, challenges, and motivators. The key element is information gathered “outside of the office” – meaning you can make data driven decisions about your audience, rather than based on assumption. Resources needed to conduct research depends on the goals, but likely at least includes staff time to review literature. Research recommendations will be designed with the team’s resources in mind.

Action Research
22 | P a g e
Pre-Consultation Worksheet We suggest starting this worksheet prior to the October 31st training. For any questions contact Katy Phelps ([email protected]).
Team name: __________________________________ Participating members’ names: ____________________________________
Question Answer
What is your projects’ desired environmental outcome?
What are the audiences that have an impact on that goal? Which audiences does your team want to/already target? Why these audiences?
What behaviors can the audience take that significantly impact your desired outcome?
Which of these behaviors do your projects seek to motivate? Why did your team choose these behaviors? Are there other behaviors you want to work on?
What audience research is available to your team on these behaviors? For example, have you surveyed this audience? Has other research been conducted on this audience that you’re aware of?
What resources do you have to complete additional audience research, if needed?
What outreach does your team currently use to influence your behavior(s)? (include these materials with this worksheet)
To change your program, do you need approval from other individuals or groups who would not be present at the consultation?
Are there specific mandates or requirements you must meet in your team’s work?

23 | P a g e
Sample Completed Worksheet The example responses below are not meant to be what the “best” answer would be, but to provide clarity on the questions.
Question Answer
What is your projects’ desired environmental outcome? Improvement in water quality (N, P)
What are the audiences that have an impact on that goal? Which audiences does your team want to/already target? Why these audiences?
Residential, agricultural. We primarily do outreach to agricultural owners because they are using more fertilizer, but we are doing more work with residential run off
What behaviors can the audience take that significantly impact your desired outcome?
1. Reduce fertilizer use 2. Install rain gardens 3. Install rain barrel 4. Xeriscaping
Which of these behaviors do your projects seek to motivate? Why did your team choose these behaviors? Are there other behaviors you want to work on?
We primarily focus on rain gardens right now, as we got a grant to purchase and give workshops on them, and developed a partnership with the local Master Gardeners. We also want to work more on full xeriscaping.
What audience research is available to your team on these behaviors? For example, have you surveyed this audience? Has other research been conducted on this audience that you’re aware of?
We have evaluation surveys from our workshops, and there are case studies on http://chesapeakebehaviorchange.org/. We also leverage the experience of the Master Gardeners
What resources do you have to complete additional audience research, if needed?
We have two staff members who would have availability to do a literature review and to do small scale work. We plan to apply to the Chesapeake Bay Trust for an Outreach and Restoration Grant next cycle to do additional research if needed.
What outreach does your team currently use to influence your behavior(s)? (include these materials with this worksheet)
We currently have our workshop materials and recruitment materials
To change your program, do you need approval from other individuals or groups who would not be present at the consultation?
We need approval from our Board of Directors
Are there specific mandates or requirements you must meet in your team’s work?
Yes, we are mandated to host at least 3 educational workshops a year.

24 | P a g e
Action Research Team Doug McKenzie-Mohr, Scientific Advisor
QUALIFICATIONS
For over three decades Dr. McKenzie-Mohr has been working to
incorporate scientific knowledge on behavior change into the
design and delivery of community programs. He is the founder of
community-based social marketing and the author/co-author of
three books on the topic. One of these books, “Fostering
Sustainable Behavior: An Introduction to Community-Based Social
Marketing,” has been recommended by Time Magazine and with
over 50,000 copies in print has become requisite reading for those
who deliver programs to promote sustainable behavior.
Dr. McKenzie-Mohr has worked internationally with a diverse array of governmental and non-
governmental agencies, assisting them in identifying the barriers to behavior change and in developing
and evaluating community-based social marketing initiatives to overcome these barriers. More than
70,000 program managers have attended workshops on community-based social marketing that he has
delivered internationally. His work has been featured in the New York Times and he is the recipient of
the American Psychological Association’s inaugural award for innovation in environmental psychology
and the World Social Marketing conference’s inaugural award for contributions to the field of social
marketing. He is a former Professor of Psychology at St. Thomas University in New Brunswick, Canada
where he co-founded the Environment and Society program.
EDUCATION
• Ph.D. University of Waterloo
• M.A. University of Waterloo
• B.A. Honors, University of Manitoba (First Class Honors)
SELECTED COMMUNITY BASED SOCIAL MARKETING EXPERIENCE
• Audubon, North Carolina shoreline nesting CBSM strategies
• Agriculture and Agri-food Canada, Reducing farm watershed impacts
• County of San Diego, CBSM Watershed Protection training
• Efficiency Nova Scotia, Residential Energy Conservation CBSM Pilot
• Hawaii Energy, Commercial Energy Conservation CBSM Pilot
• Monterey Bay Aquarium, Advisor Seafood Watch Program
• Ontario Ministry of Natural Resources, Species at Risk Program
• Southwest Florida Water Management District, CBSM watershed protection strategies

25 | P a g e
Jennifer Tabanico, President
QUALIFICATIONS
Ms. Tabanico has 17 years of experience working directly with
government agencies to develop, implement, and evaluate behavior
change campaigns. She has managed projects and maintained
positive communications with a range of public and private clients
including American Forest Foundation, Build it Green, the Oregon
Coast Aquarium, the Cities of Oceanside and San Diego, the Counties
of Orange and San Diego, the New York State Energy Research
Development Authority (NYSERDA), and the Urban Sustainability
Directors Network (USDN). Ms. Tabanico has authored academic and
technical publications in the areas of environmental attitudes, social
influence, and community-based social marketing. Her work has been published in a variety of outlets
including the Journal of Environmental Psychology, Social Influence, Social Marketing Quarterly, and the
Handbook on Household Hazardous Waste.
EDUCATION
• M.A. in Experimental Psychology, California State University San Marcos
• B.A. in Psychology, Minor in Criminology, California State University San Marcos
SELECTED PROJECT EXPERIENCE
Ms. Tabanico is responsible for overall project design and contributing behavioral expertise.
• American Forest Foundation: Audience research to inform outreach to private forest owners;
Development of recommendation for promoting the use of conservation easements and
sustainable harvesting practices.
• City of Cupertino: Audience research and development of two pilot programs to reduce
greenhouse gas emissions (reduce water heater temperature and install smart thermostats).
• County of San Diego Watershed Protection Program: Audience research and outreach
development to promote a range of pollution prevention and water quality protection: (1) pet
waste, (2) over-irrigation, (3) litter, (4) watershed education, and (5) erosion control.
• County of Orange Stormwater Pollution Prevention Program: Audience research and outreach
development to promote a range of pollution prevention and water quality protection: (1) litter,
(2) pesticide use, and (3) public outreach communications.
• National Fish and Wildlife Foundation: Consult on the application of behavioral science to
promote a range behavior changes that support conservation.

Action Research
26 | P a g e
Kaitlin Phelps, Senior Project Manager
QUALIFICATIONS
Over the past 8 years, Ms. Phelps has focused on creating sustainable
communities through effective programming that fosters voluntary
behavior change. Her areas of expertise include strategies to change
behavior, program evaluation, and social science research. She has
applied this expertise across a multitude of environmental and
sustainability topics, including recycling, composting, watershed
stewardship, water conservation, and energy conservation.
EDUCATION
• M.A. in Natural Resources & Environment: Behavior, Education, & Communication, University of Michigan
• B.A. in Environmental Science, Social Sciences, Washington University in St Louis
SELECTED EXPERIENCE
• American Forest Foundation: Survey and focus group audience research to inform outreach to
private forest owners; Development of program recommendation for promoting the use of
conservation easements and sustainable harvesting practices.
• Baltimore County, MD: Research design of pilots focused on environmental education and outreach to reducing litter and pet waste pollution in target watersheds.
• California Efficiency Water Partnership: Online survey research to conserve residential water by increasing replacement of lawns with water efficient landscaping.
• City of Bowie, MD: Research design of pilots to foster tree planting and tree maintenance behaviors.
• City of Sunnyvale, Environmental Services Department: Literature reviews and interview
research and marketing to increase commercial organics recycling.
• Keep American Beautiful Recycling at Work: Online survey research with businesses to understand barriers to recycling in the workplace.
• Massachusetts Department of Environmental Protection and Division of Ecological Restoration: Research and multiple pilots to conserve residential water by reducing summer lawn watering, include mail surveys and intercept interviews.
• New York State Energy Research and Development Authority (NYSERDA): Survey and literature
research on a variety of workplace and individual energy efficiency behaviors.
• StopWaste (County of Alameda, CA): Mail survey and telephone survey audience research to
improve residential organic recycling rates.
• Virginia Department of Forestry: Mail survey to identify woodland landowner barriers to legacy
planning.

27 | P a g e
Appendix E: Consultation Memos The four memos were delivered to each GIT specifically and are included in this section.

Scope 2 – Fish Habitat Consultation
Purpose The goal of the consultations is to assist groups who are working to change behaviors that impact the
health of the Chesapeake Bay by providing program recommendations that make best use of the
community-based social marketing process and social science research. Each consultation began with
a review of goals, status, needs, and challenges that were provided through worksheet responses,
program summary documents, and a two-hour consultation meeting.
The purpose of this document is to summarize the outcomes of the review and consultation meeting
discussion and offer suggestions for strategic next steps. The document begins with a description of
community-based social marketing (CBSM) and a summary of the information collected during the
consultation meeting organized under each of the CBSM steps. Following the summary, we have
provided recommendations for next steps that will guide the Fish Habitat GIT in moving forward with
CBSM.
Community-Based Social Marketing CBSM has emerged as an effective alternative to traditional education campaigns (McKenzie-Mohr,
1996; 1999; 2011; McKenzie-Mohr, Lee, Schultz, & Kotler, 2011; Schultz & Tabanico, 2007; Tabanico
& Schultz, 2018). CBSM is based upon research in the social sciences that demonstrates that behavior
change is often most effectively achieved through initiatives delivered at the community level that focus
on removing barriers to an activity while simultaneously enhancing the activity’s benefits. CBSM brings
together knowledge from the field of social marketing with a variety of behavior change “tools” drawn
from social psychology, environmental psychology, and other social sciences. CBSM uses a five-step
process to foster behavior change. These five steps are:
1. Selecting which behaviors to target;
2. Identifying the barriers and benefits to the selected behavior(s);
3. Developing strategies that reduce the barriers to the behavior(s) to be promoted, while
simultaneously enhancing the benefits;
4. Piloting the strategies and determining which are most cost-effective ; and
5. Broadly implementing the most cost-effective strategies and conducting ongoing evaluation.

Fish Habitats Behavioral Review In 2019, the Chesapeake Bay Program goal implementation teams (GIT) were introduced to CBSM as
a process for developing behavior change programs. Four GITs were selected to receive support from
CBSM experts so that they could more effectively apply the approach to their efforts. The information
below frames the Fish Habitat GIT around the relevant steps of CBSM.
Selecting the Behavior
The two-hour Fish Habitat GIT consultation meeting primarily focused on the first step in CBSM –
selecting which behaviors to target. The Fish Habitat GIT group is tasked with improving habitats where
fish live across the entire Chesapeake Bay. The habitats include submerged aquatic vegetation (SAV),
streams, the water column, wetlands, shorelines, and more. These habitats can be affected by a variety
of stressors, including pollution, climate change, and development. Given the breadth of this endeavor,
the Fish Habitat GIT is understandably uncertain regarding how to prioritize specific sectors and
behaviors over others, which is a key element in CBSM and in effective behavior change. Action
Research worked with the team to discuss the availability of relevant information and data that could be
used to guide prioritization.
The primary environmental outcome sought by the Fish Habitat GIT is to maintain and increase the
quality and quantity of fish habitat. To create successful programs, it is important for organizations to
understand which audiences or sectors would have the greatest impact on their goals.
In discussions with the Fish Habitats GIT, the potential priority habitats include:
• Tidal freshwater;
• Headwaters;
• Non-tidal rivers; and
• Tidal saltwater.
We recommended that the Fish Habitat GIT start by identifying which specific stressors have the most
significant negative consequences on habitats, and if these threats vary by different habitat types. By
identifying the greatest stressors, the GIT can change behaviors that impact the primary stressors.
The stressors identified as most critical were:
• Habitat loss through increased hardened shorelines, which results in
o Loss of breeding and feeding areas;
o Reduced water quality; and
o Reduced connectivity and tidal flow.
• Climate change leading to temperature changes that negatively impact fish health.
• Increased impervious surfaces, leading to increased pollution run-off
o Excessive nutrients;
o Litter;
o Herbicides and pesticides; and
o Other hazardous waste.

Finally, the potential sectors/audiences that were identified as creating these stressors include:
• Landowners;
• Agricultural;
• Local governments; and,
• Contractors.
Our understanding is that the Fish Habitat GIT may currently have insufficient data to develop a full
understanding of what the highest priorities should be for increasing the quality and quantity of fish
habitats. However, using the available data will still allow a more strategic approach to programming
decisions than basing decisions on hunches or convenience. These behavior-focused programs could
then be implemented by various organizations across the watershed to achieve broad changes.
Recommendations Action Research has outlined a set of recommendations based on the available data sources and data
gaps that were identified in the consultation meeting. The recommendations include analysis of existing
data as well as some additional data collection. Overall, we recommend that the Fish Habitat GIT
dedicate resources to refining their understanding of the highest priority sectors and the behaviors that
will be most impactful to increase the quality and quantity of fish habitats. The GIT should refer to the
CBSM webinar series, starting with the one-hour overview, for specific information on these topics and
how to best approach them. As these are recorded, they will be available on the CBP communication
website.1
Narrow Focus by Identifying Key Sectors
The Fish Habitat GIT identified existing work that can be leveraged before any new research is
conducted. This phased approach will help to ensure efficiency in the spending of research funds.
1. Use GIS layers to better understand what land types have the most potential for improved fish
habitat, such as layers that show current land use (residential, agricultural, municipal), existing
wetlands, miles of hardened shoreline, and current erosion rates.
a. This information can be used to answer questions such as, “What geographic area is in
the most need for increased fish habitat?” and “What is the most significant threat to fish
habitat?”
b. Focusing on a specific sector (audience), stressor (threat to fish habitats), and ultimately
a specific behavior, will be critical for successfully motivating action. Barriers and
benefits vary significantly between different actions (e.g., there are different challenges
regarding reducing fertilizer runoff as compared to removing hardened shorelines) and
different audiences (e.g., different challenges exist with agricultural land as compared to
residential land).
2. Review other work to see if there are data that can be leveraged to prioritize sectors or
audiences. Useful data sources may include shoreline permit data, priority habitat funding maps
at a county level, surveys on property owners, and academic research.
1 https://www.chesapeakebay.net/who/group/communications_workgroup

a. Consider if data can be used to create pie charts that mimic the pie charts on energy
usage in the Selecting Behavior webinar (see section on Strategic Selection) to narrow
the team’s focus.
3. Based on the results of bullets one and two:
a. If a top stressor or sector emerges, move to creating a behavior list for that stressor or
sector.
b. If no clear stressor or sector emerges, move to creating a behavior list with the top two
stressors or sectors in mind, and use the additional behavior list data collection effort to
further refine the sector or stressors.
Create a Behavior List
After the sector(s) and stressor(s) have been prioritized, we recommend that the Fish Habitat GIT
create a list of end-state, non-divisible behaviors2 that lead to direct positive impacts on the stressor(s),
and determine what data are available to prioritize the actions. Ultimately, by focusing on behaviors that
have the best combination of impact, probability and penetration, the chance that the improved fish
habitats will be achieved is increased. See the webinar on Selecting Behaviors for more information.
1. Create an initial list of end-state, non-divisible behaviors. See the table below.
# What is the Behavior? Part of behavior chain?
1 YES NO
2 YES NO
3 YES NO
4 YES NO
5 YES NO
2 End-state is defined as by doing the behavior, fish habitat is improved or increased. Non-divisible is defined as the behavior cannot be divided into smaller sub-actions.

Prioritize Behaviors
Conduct a short survey of fish habitat experts to gather independent ratings on the impact of each
behavior. See webinar on Selecting Behaviors (section on Impact) for more information. The survey
might have two impacts, improved water quality and increased population of [species], as well as any
additional impacts of interest, such as increased wetlands or improved climate resiliency. A sample of a
survey to collect impact information from a project focused on human-wildlife conflict reduction is below.
2. Create a table that combines the data from the fish habitat experts with available data on the
penetration (using data such as voluntary reporting, observational data, permit databases, or
surveys/academic research to understand how many members of the target audience have
already taken this action), probability (using survey research or case studies to understand how
likely audience members are to take the action), and applicability (GIS maps of forest
abundance or observational data recorded along the water to understand the percentage of the
audience members that could take the action) of each behavior on the list. .
a. It is possible that not all columns will be filled in. For example, there may not be survey
data about probability, or the current penetration may be dated. However, the GIT can
still prioritize a few behaviors (3 to 5) for further research. The behaviors would be
prioritized based on the weight that is determined by multiplying impact by applicability (if
the other two factors are not available).
b. In this situation, the GIT can include questions about any missing penetration,
probability, and applicability data in the barrier and benefit research and use them to
further prioritize between the top 3 to 5 behaviors.

c. A sample blank table is below. The last column, Weight, is calculated by multiplying
Impact*Probability*Reach*Applicability. The weight is used to prioritize between
behaviors.
Behavior Impact Probability Penetration Reach (1-
Penetration)
Applicability Weight
(I*P*R*A)
Map Behavior Chains Where relevant in the prioritized actions, map the behavior beginning with “Intent to Act” to the
completed action that establishes or preserves a wetland. See webinar on Selecting Behaviors (section
on Behavior Chains) for more information.
1. For example, for a behavior such as, “Plant trees on your residential property” the chain might
look like the following:
2. Mapping the chain can help the GIT identify potential barriers or benefits. For example, the
chain demonstrates that there may be knowledge barriers around tree types or transportation
barriers to obtaining a tree. Further, the chain helps to isolate “chain sections” where programs
may be able to shorten the chain by removing actions (such as, providing tree delivery and
planting). It can also demonstrate visually how difficult an ask a behavior might be and how
important it is to address all the barriers participants face, even after they are sufficiently
motivated to act.
Barrier and Benefit Research
Once the behavior(s) have been selected, we suggest that the Fish Habitat GIT consider selecting a
local community group to collaborate with for the remaining steps. Barriers and benefits can be very
Intention to Plant
Identify SiteDetermine Tree
TypeCheck Soil
QualityContact Utility
Obtain Tree Transport TreeBorrow/Buy
ShovelDig Hole Plant Tree
Determine Watering Schedule
Weed around Tree
Prune TreeRegular
Watering

localized (such as, different social norms or available contractors). The results of the initial two steps
can provide support for local groups to take a more strategic approach to their outreach. This approach
can provide a balance to the Fish Habitat GIT working more broadly across the watershed by
supporting multiple small groups and aggregating their research to inform subsequent research and
programs. However, if the resources are available to conduct broad barrier and benefit research (such
as through state-wide mail surveys), this step could stay with the Fish Habitat GIT, and instead the
strategy development or piloting steps could be reliant on smaller groups.
1. Conduct research on the challenges the target audience faces to taking the prioritized actions.
The format will depend on the audience and budget, as discussed in the Barrier and Benefits
webinar. For example, a residential audience is best studied with either a mail survey or
intercept interviews, depending on the budget, and a school or municipal audience will likely
necessitate door-to-door interviews as a research format.
2. Depending on the budget and generalizability goals, this research can either be conducted
internally, in collaboration with a university, or using a private consultant. Sample questions for
intercept interviews are included as part of the webinar series on Barrier and Benefit research.
3. We recommend that the Fish Habitat GIT communicates with the Wetlands GIT during this
process. While we recommend that Fish Habitat work through the prioritization process on their
own to specifically prioritize fish habitats, collaborating with the Wetland GIT may help research
funding go further.
a. If Fish Habitat decides to focus on behaviors related to increased wetlands, installed
living shorelines, or armor removal, the following resources may be helpful:
b. CBP EPA Scope 13 work by Action Research on living shorelines (in progress);
c. Colehour + Cohen, Applied Research Northwest, Social Marketing Services, Futurewise
and Coastal Geologic Services’ research on removing armoring in Puget Sound; and
d. Nature Conservancy, Ducks Unlimited, NFWF, and Opinion Works’s work on Landowner
Attitudes Toward Wetland Restoration.

Strategy Development & Pilot Testing
As described in the previous barrier and benefit research section, this step may be more successfully
carried out in partnership with local organization(s).
1. Once the barrier and benefit research has been conducted, the findings should be linked to
strategies to help overcome barriers and leverage benefits that are meaningful to the audience.
More information on this topic is available in the Strategy Development webinar. The key
element is linking the barrier directly to a strategy. For example, if the primary barrier is
forgetfulness, prompts are a good strategy to use. However, if forgetfulness is not a barrier,
prompts would not be a useful tool.
2. Depending on the budget and organizational capacity, this research can either be conducted
internally, in collaboration with a university, or using a private consultant with social science
expertise. This ensures that social science tools are strategically paired with research findings
and used intentionally with best practices of implementation.
3. The ultimate form of the end product depends on the research – strategies should not be
developed without fully understanding barriers/benefits unique to this context.
4. Once strategies have been developed, CBSM recommends a small-scale pilot before full
implementation. See the Pilot Testing and Evaluation webinar for more information. If piloting is
successful, the results can be used to develop a “toolkit” type program that can be picked up by
local organizations, such as customizable outreach documents and step-by-step instructions of
how to implement in a local community.
This project has been funded wholly or in part by the United States Environmental Protection Agency
under assistance agreement CB96341401 to the Chesapeake Bay Trust. The contents of this document do
not necessarily reflect the views and policies of the Environmental Protection Agency, nor does the EPA
endorse trade names or recommend the use of commercial products mentioned in this document.

Scope 2 – Forest Buffers Consultation
Purpose The goal of the consultations is to assist groups who are working to change behaviors that impact the
health of the Chesapeake Bay by providing program recommendations that make best use of the
community-based social marketing process and social science research. Each consultation began with
a review of goals, status, needs, and challenges that were provided through worksheet responses,
program summary documents, and a two-hour consultation meeting.
The purpose of this document is to summarize the outcomes of the review and consultation meeting
discussion and offer suggestions for strategic next steps. The document begins with a description of
community-based social marketing (CBSM) and a summary of the information collected during the
consultation meeting organized under each of the CBSM steps. Following the summary, we have
provided recommendations for next steps that will guide the Forest Buffers goal implementation team
(GIT) in moving forward with CBSM.
Community-Based Social Marketing CBSM has emerged as an effective alternative to traditional education campaigns (McKenzie-Mohr,
1996; 1999; 2011; McKenzie-Mohr, Lee, Schultz, & Kotler, 2011; Schultz & Tabanico, 2007; Tabanico
& Schultz, 2018). CBSM is based upon research in the social sciences that demonstrates that behavior
change is often most effectively achieved through initiatives delivered at the community level that focus
on removing barriers to an activity while simultaneously enhancing the activity’s benefits. CBSM brings
together knowledge from the field of social marketing with a variety of behavior change “tools” drawn
from social psychology, environmental psychology, and other social sciences. CBSM uses a five-step
process to foster behavior change. These five steps are:
1. Selecting which behaviors to target;
2. Identifying the barriers and benefits to the selected behavior(s);
3. Developing strategies that reduce the barriers to the behavior(s) to be promoted, while
simultaneously enhancing the benefits;
4. Piloting the strategies and determining which are most cost-effective ; and
5. Broadly implementing the most cost-effective strategies and conducting ongoing evaluation.

Forest Buffers Behavioral Review In 2019, the Chesapeake Bay Program goal implementation teams (GIT) were introduced to CBSM as
a process for developing behavior change programs. Four GITs were selected to receive support from
CBSM experts so that they could more effectively apply the approach to their efforts. The information
below frames the Forest Buffers GIT around relevant steps of CBSM.
Selecting the Behavior
The two-hour Forest Buffer GIT consultation meeting primarily focused on the first step in CBSM -
selecting which behaviors to target. The Forest Buffer GIT is tasked with restoring riparian forest buffer
and conserving existing buffers across the entire Chesapeake Bay. Given the breadth of this endeavor,
the Forest Buffer GIT is understandably uncertain regarding how to prioritize specific sectors and
behaviors over others, which is a key element in CBSM and in effective behavior change. Action
Research worked with the team to discuss the availability of relevant information and data that could be
used to guide prioritization.
The primary environmental outcome sought by the Forest Buffer GIT is to maintain and increase the
quality and quantity of riparian forest buffers, as well as prevent further degradation and
reverse decline of already-impacted habitats. To create successful programs, it is important for
organizations to understand which audiences or sectors would have the greatest impact on their goals.
In discussions with the Forest Buffer GIT, the potential sectors/audiences include:
• Agricultural;
• Homeowners;
• Local governments; and
• Contractors/Technical Service Providers (TSPs).
Our understanding is that the Forest Buffers GIT may currently have insufficient data to develop a full
understanding of what the highest priorities should be for increasing the quality and quantity of forest
buffers. However, using the available data will still allow a more strategic approach to programming
decisions than basing decisions on hunches or convenience. These behavior-focused programs could
then be implemented by various organizations across the watershed to achieve broad changes.
Recommendations Action Research has outlined a set of recommendations based on the available data sources and data
gaps that were identified in the consultation meeting. The recommendations include analysis of existing
data as well as some additional data collection. Overall, we recommend that the Forest Buffer GIT
dedicate resources to refining their understanding of the highest priority sectors and the behaviors that
will be most impactful in terms of increasing forest buffers. The GIT should refer to the CBSM webinar
series, starting with the one-hour overview, for specific information on these topics and how to best
approach them. As these are recorded, they will be available on the CBP communication website.1
1 https://www.chesapeakebay.net/who/group/communications_workgroup

Narrow Focus by Identifying Key Sectors
The Forest Buffers GIT identified existing work that can be leveraged before any new research is
conducted. This phased approach will help to ensure efficiency in the spending of research funds.
1. Use GIS layers to better understand what land types have the most potential for preserving or
increasing forest buffers, such as GIS layers that show current land use (residential, agricultural,
municipal), existing forest buffers coverage, and miles of “bufferable” land.
a. This information can be used to answer questions such as, “What geographic area is in
the most need for increased forest buffers?” and “What is the most significant threat to
forest buffers?”
b. Focusing on a specific sector (audience) and ultimately a specific behavior will be critical
for successfully motivating action. Barriers and benefits vary significantly between
different actions (e.g., there are different challenges regarding a resident planting trees
on their own versus engaging with a program that provides support for tree planting) and
different audiences (e.g., different challenges exist with respect to agricultural land as
compared to residential land).
c. Based on the initial discussion at the consultation meeting, agriculture was identified as
the likely primary audience as the group suspected the greatest opportunity for
enhancing forest buffers existed on agricultural property. This suspicion should be
confirmed by reviewing available data sources.
2. Review other work to see if there are data that can be leveraged to prioritize sectors or
audiences. Useful data sources may include surveys of property owners, regional data on
planting practices, water implementation plan (WIP) goals, and academic research.
a. Consider if data can be used to create pie charts that mimic the pie charts on energy
usage in the Selecting Behaviors webinar (see section on Strategic Selection) to narrow
the team’s focus.
3. Based on the results of bullets one and two:
a. If a top sector emerges, move to creating a behavior list for that sector.
b. If no clear sector emerges, move to creating a behavior list with the top two sectors in
mind, and use the additional behavior list data collection effort to further refine the
sector.

Create a Behavior List
After the sector(s) have been prioritized, we recommend that the Forest Buffer GIT create a list of end-
state, non-divisible behaviors2 that lead to direct positive impacts on increased or conserved forest
buffers, and determine what data are available to prioritize the actions. Ultimately, by focusing on
behaviors that have the best combination of impact, probability and penetration, the chance that the
improved fish habitats will be achieved is increased. See the webinar on Selecting Behaviors for more
information.
1. Create an initial list of end-state, non-divisible behaviors. See the table below, which includes
behaviors mentioned during the consultation meeting. These behaviors focus on the goal of
increased buffers, but the team may want to also consider behaviors that meet the goal of
protecting existing buffers. It is important to note that behaviors 1, 2, and 3, may be further
divisible by the species of trees being planted, if there are likely different barriers with tree
species (such as, higher cost or different actions for prep or maintenance)
# What is the Behavior? Part of behavior chain?
1 Owners DIY planting riparian forest buffers on agricultural land
YES NO
2 Program supported riparian forest buffers planting on agricultural
land YES NO
3 Leaving lands untouched to regrow forests YES NO
4 YES NO
5 YES NO
2 End-state is defined as by doing the behavior, forest buffers are improved or increased. Non-divisible is defined as the behavior cannot be divided into smaller sub-actions.

Prioritize Behaviors
1. Conduct a short survey of forest buffer experts to gather independent ratings on the impact of
each behavior. See webinar on Selecting Behaviors (section on Impact) for more information.
The survey might have two impacts, increased acreage and increased forest buffer health, as
well as any additional impacts of interest, such as improved water quality. A sample of a survey
to collect impact information from a project focused on human-wildlife conflict reduction is
below.
2. Create a table that combines the data from the forest buffer experts with available data on the
penetration (using data such as voluntary reporting of planting, permit databases, GIS data, or
surveys/academic research to understand how many members of the target audience have
already taken this action), probability (using survey research or case studies to understand how
likely audience members are to take the action), and applicability (GIS maps of forest
abundance or observational data recorded along the water to understand the percentage of the
audience members that could take the action) of each behavior on the list.
a. It is possible that not all columns will be filled in. For example, there may not be survey
data about probability, or the current penetration may be dated. However, the GIT can
still prioritize a few behaviors (3 to 5) for further research. The behaviors would be
prioritized based on the weight that is determined by multiplying impact by applicability (if
the other two factors are not available).
b. In this situation, the GIT can include questions about any missing penetration,
probability, and applicability data in the barrier and benefit research and use them to
further prioritize between the top 3 to 5 behaviors.

c. A sample blank table is below. The last column, Weight, is calculated by multiplying
Impact*Probability*Reach*Applicability. The weight is used to prioritize between
behaviors.
Behavior Impact Probability Penetration Reach (1-
Penetration)
Applicability Weight
(I*P*R*A)

Map Behavior Chains
Where relevant in the prioritized actions, map the behavior beginning with “Intent to Act” to the
completed action that establishes or preserves forest buffers. See webinar on Selecting Behaviors
(section on Behavior Chains) for more information.
1. Several behavior chains were mapped during the meeting, below. We recommend that the GIT
draw these chains out so that various forks in the path can be further detailed.
a. For example, once the landowner has done their site selection, they may have an option
of completing the long-term maintenance themselves or with a hired team, which has a
different pathway. Moreover, there may be other paperwork steps in the program
support plantings, or if these chains look different with different tree types.
Behavior Chain – Plant DIY RFB
Intention to Plant Buffer
Identify SiteDevelop a planting
plan
Schedue site visit with technical
service providerPrepare the site
Rent brush hog Hire a contractorControl invasive
species with herbicide
Install watering system
Install a fence around buffer
area
Determine Tree Type(s)
Obtain Tree Purchase shelterObtain planting
equipmentTransport Tree
Dig Holes Plant Trees Install sheltersHire team for maintenance
(optional)
Determine Watering Schedule
Weed around Tree Prune Tree Regular Watering

Behavior Chain – Program supported RFB Planting – Two options
General Program
CREP RFP Planting
Intention to Plant Buffer
Schedule site visit with technical
service provider
Walk property with TSP
Develop a planting plan
Find funding source
Schedule TSP site prep
Schedule TSP completing the
planting
Hire team for maintenance
(optional)
Determine Watering Schedule
Weed around Tree Prune Tree Regular Watering
Intention to Plant Buffer
Travel to farm service agency
office
Complete farm registration paperwork
Schedule site visit with NRCS
Walk property with NRCS
Develop a conservation
plan
Wait for NRCS approval of
plan
Contract TSP from NRCS list
Schedule TSP site prep
Schedule TSP completing the
planting
Hire team for maintenance
(optional)
Determine Watering Schedule
Weed around Tree
Prune TreeRegular
Watering

2. Mapping the chain can help the GIT identify potential barriers or benefits. For example, the
chain demonstrates that there may be knowledge barriers around which tree types are best or
transportation barriers to obtaining a tree. Further, the chain helps to isolate “chain sections”
where programs may be able to shorten the chain by removing actions (such as, providing tree
delivery and planting). It can also demonstrate visually how difficult an ask a behavior might be
and how important it is to address all the barriers participants face, even after they are
sufficiently motivated to act.

Barrier and Benefit Research
Once the behavior(s) have been selected, we suggest that the Forest Buffer GIT consider selecting a
local community group to collaborate with for the remaining steps. Barriers and benefits can be very
localized (such as, different social norms or available contractors). The results of the initial two steps
can provide support for local groups to take a more strategic approach to their outreach. This approach
can provide a balance to the Forest Buffer GIT working more broadly across the watershed by
supporting multiple small groups and aggregating their research to inform subsequent research and
programs. However, if the resources are available to conduct broad barrier and benefit research (such
as through state-wide mail surveys), this step could stay with the Forest Buffer GIT, and instead the
strategy development or piloting steps could include smaller groups.
1. Conduct research on the challenges the target sector faces to taking the prioritized actions. The
format will depend on the audience and budget, as discussed in the Barrier and Benefits
webinar. For example, a residential audience is best studied with either a mail survey or
intercept interviews, depending on the budget, while an agricultural audience may be better
suited for a mail survey or door-to-door interviews, and a commercial audience will likely
necessitate door-to-door interviews as a research format.
2. As this audience is primarily rural or agricultural, there are specific methodologies that can
increase the likelihood of a good sample.
a. First, if conducting a mail survey, obtaining a clean address list will be key – rural lists
often have more bad addresses than a typical urban or suburban list.
b. Second, consider the messenger for the survey/research effort – Who is the most
trustworthy organization for this audience? Agricultural audiences may be less trusting of
governmental groups.
3. Depending on the budget and generalizability goals, this research can either be conducted
internally, in collaboration with a university, or using a private consultant. Sample questions for
intercept interviews are included as part of the webinar series on Barrier and Benefit research.
4. We recommend leveraging existing research on tree planting to understand the range of
potential barriers and benefits that should be included in a research effort. The Forest Buffer
GIT has access to research on agricultural, urban, and suburban audiences who have buffer
gaps as compared to those audiences who do not have buffer gaps, and findings on the
differences between these groups can be leveraged for this work.

Strategy Development & Piloting
As described in the previous barrier and benefit research section, this step may be more successfully
carried out in partnership with local organization(s).
1. Once the barrier and benefit research has been conducted, the findings should be linked to
strategies to help overcome barriers and leverage benefits that are meaningful to the audience.
More information on this topic is available in the Strategy Development webinar. The key
element is linking the barrier directly to a strategy. For example, if the primary barrier is
forgetfulness, prompts are a good strategy to use. However, if forgetfulness is not a barrier,
prompts would not be a useful tool.
2. Depending on the budget and organizational capacity, this research can either be conducted
internally, in collaboration with a university, or using a private consultant with social science
expertise. This ensures that social science tools are strategically paired with research findings
and used intentionally with best practices of implementation.
3. The ultimate form of the end product depends on the research – strategies should not be
developed without fully understanding barriers/benefits unique to this context.
4. Once strategies have been developed, CBSM recommends a small-scale pilot before full
implementation. See the Pilot Testing and Evaluation webinar for more information. If piloting is
successful, the results can be used to develop a “toolkit” type program that can be picked up by
local organizations, such as customizable outreach documents and step-by-step instructions of
how to implement in a local community.
This project has been funded wholly or in part by the United States Environmental Protection Agency
under assistance agreement CB96341401 to the Chesapeake Bay Trust. The contents of this document do
not necessarily reflect the views and policies of the Environmental Protection Agency, nor does the EPA
endorse trade names or recommend the use of commercial products mentioned in this document.

Scope 2 – Tree Canopy Consultation
Purpose The goal of the consultations is to assist groups who are working to change behaviors that impact the
health of the Chesapeake Bay by providing program recommendations that make best use of the
community-based social marketing process and social science research. Each consultation began with
a review of group goals, status, needs, and challenges that were provided through worksheet
responses, program summary documents, and a two-hour consultation meeting.
The purpose of this document is to summarize the outcomes of the review and consultation meeting
discussion and offer suggestions for strategic next steps. The document begins with a description of
community-based social marketing (CBSM) and a summary of the information collected during the
consultation meeting organized under each of the CBSM steps. Following the summary, we have
provided recommendations for next steps that will guide the Tree Canopy goal implementation team
(GIT) in moving forward with CBSM.
Community-Based Social Marketing CBSM has emerged as an effective alternative to traditional education campaigns (McKenzie-Mohr,
1996; 1999; 2011; McKenzie-Mohr, Lee, Schultz, & Kotler, 2011; Schultz & Tabanico, 2007; Tabanico
& Schultz, 2018). CBSM is based upon research in the social sciences that demonstrates that behavior
change is often most effectively achieved through initiatives delivered at the community level that focus
on removing barriers to an activity while simultaneously enhancing the activity’s benefits. CBSM brings
together knowledge from the field of social marketing with a variety of behavior change “tools” drawn
from social psychology, environmental psychology, and other social sciences. CBSM uses a five-step
process to foster behavior change. These five steps are:
1. Selecting which behaviors to target;
2. Identifying the barriers and benefits to the selected behavior(s);
3. Developing strategies that reduce the barriers to the behavior(s) to be promoted, while
simultaneously enhancing the benefits;
4. Piloting the strategies and determining which are most cost-effective ; and
5. Broadly implementing the most cost-effective strategies and conducting ongoing evaluation.

Tree Canopy Behavioral Review In 2019, the Chesapeake Bay Program goal implementation teams (GIT) were introduced to CBSM as
a process for developing behavior change programs. Four GITs were selected to receive support from
CBSM experts so that they could more effectively apply the approach to their efforts. The information
below frames the Tree Canopy GIT around the relevant steps of CBSM.
Selecting the Behavior
The two-hour Tree Canopy GIT consultation meeting primarily focused on the first step in CBSM -
selecting which behaviors to target. The Tree Canopy GIT is tasked with increasing and protecting
urban tree canopy across the entire Chesapeake Bay. Given the breadth of this endeavor, the Tree
Canopy GIT is understandably uncertain regarding how to prioritize specific sectors and behaviors over
others, which is a key element in CBSM and in effective behavior change. Action Research worked with
the team to discuss the availability of relevant information and data that could be used to guide
prioritization.
The primary environmental outcome sought by the Tree Canopy GIT is to maintain and increase the
quality and quantity of urban tree canopies in the Chesapeake Bay. To create successful
programs, it is important for organizations to understand which audiences or sectors would have the
greatest impact on their goals.
In discussions with the Tree Canopy GIT, the potential sectors/audiences include:
• Homeowners;
• Local governments; and,
• Schools.
Our understanding is that the Tree Canopy GIT may currently have insufficient data to develop a full
understanding of what the highest priorities should be for increasing the quality and quantity of tree
canopies. However, using the available data will still allow a more strategic approach to programming
decisions than basing decisions on hunches or convenience. These behavior-focused programs could
then be implemented by various organizations across the watershed to achieve broad changes.
Recommendations Action Research has outlined a set of recommendations based on the available data sources and data
gaps that were identified in the consultation meeting. The recommendations include analysis of existing
data as well as some additional data collection. Overall, we recommend that the Tree Canopy GIT
dedicate resources to refining their understanding of the highest priority sectors and the behaviors that
will be most impactful to increase the quality and quantity of urban tree canopy. The GIT should refer to
the CBSM webinar series, starting with the one-hour overview, for specific information on these topics
and how to best approach them. As these are recorded, they will be available on the CBP
communication website.1
1 https://www.chesapeakebay.net/who/group/communications_workgroup

Narrow Focus by Identifying Key Sectors
The Tree Canopy GIT identified existing work that can be leveraged before any new research is
conducted. This phased approach will help to ensure efficiency in the spending of research funds.
1. Use GIS layers to better understand what land types have the most potential for protecting or
increasing tree canopy, such as layers that show current land use (residential, agricultural,
municipal) and existing tree canopy coverage.
a. This information can be used to answer questions such as, “What geographic area is in
the most need for increased tree canopy?” and “What is the most significant threat to
tree canopy?”
b. Focusing on a specific sector and ultimately a specific behavior will be critical for
successfully motivating action. Barriers and benefits vary significantly between different
actions (e.g., there are different challenges regarding a resident planting trees on their
own versus engaging with a program that provides support for tree planting) and
different audiences (e.g., different challenges exist with respect to public land as
compared to residential land).
c. Based on the initial discussion at the consultation meeting, the residential community
was identified as the likely primary audience as the group suspected the greatest
opportunity for enhancing canopy existed on residential property. This suspicion should
be confirmed by reviewing available data sources.
2. Review other work to see if there are data that can be leveraged to prioritize sectors or
audiences. Useful data sources may include surveys of property owners, regional data on
planting practices, water implementation plan (WIP) goals, and academic research.
a. Consider if data can be used to create pie charts that mimic the pie charts on energy
usage in the Selecting Behaviors webinar (see section on Strategic Selection) to narrow
the team’s focus.
b. It was indicated in the meeting that there was a social marketing database that had tree
planting research, which may be useful for prioritizing sectors, selecting behaviors, and
determining potential barriers and benefits.
3. Based on the results of bullets one and two:
a. If a top sector emerges, move to create a behavior list for that sector.
b. If no clear sector emerges, move to create a behavior list with the top two sectors in
mind, and use the additional behavior list data collection effort to further refine the
sector.

Create a Behavior List
After the sector(s) have been prioritized, we recommend that the Tree Canopy GIT create a list of end-
state, non-divisible2 behaviors that lead to direct positive impacts on increased or conserved tree
canopy, and determine what data are available to prioritize the actions. Focusing on behaviors that
have the best combination of impact, probability and penetration will increasing the chance that an
increase in tree canopy acreage will be achieved. See the webinar on Selecting Behaviors for more
information.
1. Create an initial list of end-state, non-divisible behaviors. See the table below, which includes
behaviors mentioned during the consultation meeting. These behaviors focus on the goal of
increased tree canopy, but the team may want to also consider behaviors that meet the goal of
protecting existing canopy. It is important to note the behaviors may be further divisible by the
species of trees being planted, if there are likely different barriers with tree species (such as,
higher cost or different actions for prep or maintenance).
# What is the Behavior? Part of behavior chain?
1 Owners DIY planting trees on private land YES NO
2 Program supported tree planting on private land YES NO
3 Program supported tree planting on school land YES NO
4 Program supported tree planting on public land YES NO
5 YES NO
2 End-state is defined as by doing the behavior, tree canopy is improved or increased. Non-divisible is defined as the behavior cannot be divided into smaller sub-actions.

Prioritize Behaviors
1. Conduct a short survey of tree canopy experts to gather independent ratings on the impact of each
behavior. See webinar on Selecting Behaviors (section on Impact) for more information. The survey
might have two impacts, increased acreage and increased canopy health, as well as any additional
impacts of interest, such as increased habitat. A sample of a survey to collect impact information
from a project focused on human-wildlife conflict reduction is below.
2. Create a table that combines the data from the tree canopy experts with available data on the
penetration (using data such as voluntary reporting of planting, permit databases, or
surveys/academic research to understand how many members of the target audience have
already taken this action), probability (using survey research or case studies to understand how
likely audience members are to take the action), and applicability (GIS maps of forest
abundance or observational data recorded along the water to understand the percentage of the
audience members that could take the action) of each behavior on the list.
a. The consultation meeting identified that there was likely existing data on tree planting
that could be used for this work. Action Research conducted a pilot in the City of Bowie
on residential tree planting, the results of which could be leveraged, and were sent with
this memo. Additionally, during the meeting, Doug McKenzie-Mohr distributed a study
from TreePeople, conducted by Action Research, on urban planting.
b. It is possible that not all columns will be filled in. For example, there may not be survey
data about probability, or the current penetration may be dated. However, the GIT can
still prioritize a few behaviors (3 to 5) for further research. The behaviors would be
prioritized based on the weight that is determined by multiplying impact by applicability (if
the other two factors are not available).

c. In this situation, the GIT can include questions about any missing penetration,
probability, and applicability data in the barrier and benefit research and use them to
further prioritize between the top 3 to 5 behaviors.
d. A sample blank table is below. The last column, Weight, is calculated by multiplying
Impact*Probability*Reach*Applicability. The weight is used to prioritize between
behaviors.
Behavior Impact Probability Penetration Reach (1-Penetration)
Applicability Weight

Map Behavior Chains
Where relevant in the prioritized actions, map the behavior beginning with “Intention to Act” to the
completed action that establishes or preserves a tree canopy. See webinar on Selecting Behaviors
(section on Behavior Chains) for more information.
1. Several behavior chains were mapped during the meeting, below. We recommend that the GIT
draw these chains out so that various forks in the path can be further detailed.
a. For example, once the homeowner has done their site selection, they may have an
option of completing the process on their own or working with a local government
program, which has a different pathway.
Behavior Chain – Residential DIY
Intention to Plant
Identify SiteDetermine Tree
TypeCheck Soil
QualityContact Utility
Obtain Tree Transport TreeBorrow/Buy
ShovelDig Hole Plant Tree
Determine Watering Schedule
Weed around Tree
Prune TreeRegular
Watering

Behavior Chain – School
2. Mapping the chain can help the GIT identify potential barriers or benefits. For example, the
chain demonstrates that there may be knowledge barriers around tree types or transportation
barriers to obtaining a tree. Further, the chain helps to isolate “chain sections” where programs
may be able to shorten the chain by removing actions (such as, providing tree delivery and
planting). It can also demonstrate visually how difficult an ask a behavior might be and how
important it is to address all the barriers participants face, even after they are sufficiently
motivated to act.
Intention to PlantObtain permission
from school board/principal
Contract with third party to complete
steps through plant tree
Identify Site
Determine Tree Type
Check Soil Quality Contact Utility Obtain Tree
Transport Tree Borrow/Buy Shovel Dig Hole Plant Tree
Determine Watering Schedule
Weed around Tree Prune Tree Regular Watering

Barrier and Benefit Research
Once the behavior(s) have been selected, we suggest that the Tree Canopy GIT consider selecting a
local community group to collaborate with for the remaining steps. Barriers and benefits can be
regionally localized (such as, different social norms or available contractors). The results of the initial
two steps can provide support for local groups to take a more strategic approach to their outreach. This
approach can provide a balance to the Tree Canopy GIT working more broadly across the watershed
by supporting multiple small groups and aggregating their research to inform subsequent research and
programs. However, if the resources are available to conduct broad barrier and benefit research (such
as through state-wide mail surveys), this step could stay with the Tree Canopy GIT, and instead the
strategy development or piloting steps could include smaller groups.
1. Conduct research on the challenges the target audience faces to taking the prioritized actions.
The format will depend on the audience and budget, as discussed in the Barrier and Benefits
webinar. For example, a residential audience is best studied with either a mail survey or
intercept interviews, depending on the budget, and a school or municipal audience will likely
necessitate door-to-door interviews as a research format.
2. Depending on the budget and generalizability goals, this research can either be conducted
internally, in collaboration with a university, or using a private consultant. Sample questions for
intercept interviews are included as part of the webinar series on Barrier and Benefit research.
3. We recommend leveraging existing research on tree planting to understand the range of
potential barriers and benefits that should be included in a research effort. The Forest Buffer
GIT may be able to provide access to a research study on agricultural, urban, and suburban
research on individuals who have buffer gaps compared to those who do not, and findings on
the differences between these groups. Action Research has not reviewed the study but the
information on barriers and benefits for planting buffers may be a good starting point for tree
canopy work.

Strategy Development & Pilot Testing
As described in the previous barrier and benefit research section, this step may be more successfully
carried out in partnership with local organization(s).
1. Once the barrier and benefit research has been conducted, the findings should be linked to
strategies to help overcome barriers and leverage benefits that are meaningful to the audience.
More information on this topic is available in the Strategy Development webinar. The key
element is linking the barrier directly to a strategy. For example, if the primary barrier is
forgetfulness, prompts are a good strategy to use. However, if forgetfulness is not a barrier,
prompts would not be a useful tool.
2. Depending on the budget and organizational capacity, this research can either be conducted
internally, in collaboration with a university, or using a private consultant with social science
expertise. This ensures that social science tools are strategically paired with research findings
and used intentionally with best practices of implementation.
3. The ultimate form of the end product depends on the research – strategies should not be
developed without fully understanding barriers/benefits unique to this context. However,
given our understanding of barriers to tree planting, a program could be designed that provides
a guide for local communities to communicate with residential owners about the benefits
homeowners would receive from trees, leveraging social norms. Given the high level of difficulty
and large amount of knowledge needed to properly plant a tree, the program might lay out how
local communities should provide assistance throughout the planting process. Although they
will be able to reach fewer households, they will be more likely to successfully get trees in the
ground. This approach was recommended by Action Research in our work in the City of Bowie.
This is only provided as an example that could be developed. As the GIT works through the
process, they may not choose to focus on tree planting, but instead on behaviors that increase
the health of existing tree canopies.
4. Once strategies have been developed, CBSM recommends a small-scale pilot before full
implementation. See the Pilot Testing and Evaluation webinar for more information. If piloting is
successful, the results can be used to develop a “toolkit” type program that can be picked up by
local organizations, such as customizable outreach documents and step-by-step instructions of
how to implement in a local community.
This project has been funded wholly or in part by the United States Environmental Protection Agency under assistance agreement CB96341401 to the Chesapeake Bay Trust. The contents of this document do not necessarily reflect the views and policies of the Environmental Protection Agency, nor does the EPA endorse trade names or recommend the use of commercial products mentioned in this document.

Scope 2 – Wetlands Consultation
Purpose The goal of the consultations is to assist groups who are working to change behaviors that impact the
health of the Chesapeake Bay by providing program recommendations that make best use of the
community-based social marketing process and social science research. Each consultation began with
a review of group goals, status, needs, and challenges that were provided through worksheet
responses, program summary documents, and a two-hour consultation meeting.
The purpose of this document is to summarize the outcomes of the review and consultation meeting
discussion and offer suggestions for strategic next steps. The document begins with a description of
community-based social marketing (CBSM) and a summary of the information collected during the
consultation meeting organized under each of the CBSM steps. Following the summary, we have
provided recommendations for next steps that will guide the GIT in moving forward with CBSM.
Community-Based Social Marketing CBSM has emerged as an effective alternative to traditional education campaigns (McKenzie-Mohr,
1996; 1999; 2011; McKenzie-Mohr, Lee, Schultz, & Kotler, 2011; Schultz & Tabanico, 2007; Tabanico
& Schultz, 2018). CBSM is based upon research in the social sciences that demonstrates that behavior
change is often most effectively achieved through initiatives delivered at the community level that focus
on removing barriers to an activity while simultaneously enhancing the activity’s benefits. CBSM brings
together knowledge from the field of social marketing with a variety of behavior change “tools” drawn
from social psychology, environmental psychology, and other social sciences. CBSM uses a five-step
process to foster behavior change. These five steps are:
1. Selecting which behaviors to target;
2. Identifying the barriers and benefits to the selected behavior(s);
3. Developing strategies that reduce the barriers to the behavior(s) to be promoted, while
simultaneously enhancing the benefits;
4. Piloting the strategies and determining which are most cost-effective ; and
5. Broadly implementing the most cost-effective strategies and conducting ongoing evaluation.

Wetlands Behavioral Review In 2019, the Chesapeake Bay Program goal implementation teams (GIT) were introduced to CBSM as
a process for developing behavior change programs. Four GITs were selected to receive support from
CBSM experts so that they could more effectively apply the approach to their efforts. The information
below frames the Wetlands GIT around relevant steps of CBSM.
Selecting the Behavior
The two-hour Wetlands GIT consultation meeting primarily focused on the first step in CBSM - selecting
which behaviors to target. The Wetlands GIT group is tasked with increasing and enhancing wetland
acreage across the entire Chesapeake Bay through efforts that improve water quality, provide
recreational value, slow erosion, provide habitat, protect land from flooding, and store carbon. Given
the breadth of their endeavor, the Wetlands GIT is understandably uncertain regarding how to prioritize
specific sectors and behaviors over others, which is a key element in CBSM and in effective behavior
change. Action Research worked with the team to discuss the availability of relevant information and
data that could be used to guide prioritization.
The primary environmental outcome sought by the Wetland GIT is increasing the acreage of tidal
and non-tidal wetlands in the Chesapeake watershed. To create successful programs, it is
important for organizations to consider which audiences or sectors are most important to target based
on a consideration of which would have the greatest impact on wetlands.
In discussions with the Wetlands GIT, the potential sectors/audiences include:
• Agricultural;
• Residential;
• Municipal/public; and
• Urban/commercial.
Our understanding is that the Wetlands GIT may currently have insufficient data to develop a full
understanding of what the highest priorities should be for increasing the quality and quantity of
wetlands. However, using the available data will still allow a more strategic approach to programming
decisions than basing decisions on hunches or convenience. These behavior-focused programs could
then be implemented by various organizations across the watershed to achieve broad changes.
Recommendations Action Research has outlined a set of recommendations based on the available data sources and data
gaps that were identified in the consultation meeting. The recommendations include analysis of existing
data as well as some additional data collection. Overall, we recommend that the Wetlands GIT dedicate
resources to refining their understanding of the highest priority sectors and the behaviors that will be
most impactful in terms of increasing the acreage of wetlands. The GIT should refer to the CBSM
webinar series, starting with the one-hour overview, for specific information on these topics and how to

best approach them. As these are recorded, they will be available on the CBP communication
workgroup site.1
Narrow Focus by Identifying Key Sectors The Wetlands GIT identified existing work that can be leveraged before any new research is conducted.
This phased approach will help to ensure efficiency in the spending of research funds. This phased
approach will help to ensure efficiency in the spending of research funds.
1. Use GIS layers to better understand what land types have the most potential for increased
wetland acreage, such as layers that show current land use (residential, agricultural, municipal),
miles of hardened shorelines, and existing wetlands.
a. The group discussed that GIS data is problematic for several reasons including age of
data sets, lack of reporting, and funding. These issues are important to report along with
the data to provide context – however, it is our understanding this is the best available
data to make these decisions.
b. This information should be used to answer questions such as, ““What geographic area is
in the most need for increased wetlands?” and “What is the most significant threat to
wetlands?”
c. Focusing on a specific sector (audience), stressor (threat to wetlands), and ultimately a
specific behavior, will be critical for successfully motivating action. Barriers and benefits
vary significantly between different actions (e.g., there are different challenges regarding
a resident creating wetlands on their own versus engaging with a program that provides
support for wetland installation) and different audiences (e.g., different challenges exist
with respect to public land as compared to residential land).
2. Review other work to see if there are data that can be leveraged to prioritize sectors or
audiences. Useful data sources may include shoreline permit data, surveys on property owners,
water implementation plan (WIP) goals, and academic research.
a. Consider if data can be used to create pie charts that mimic the pie charts on energy
usage in the Selecting Behaviors webinar (see section on Strategic Selection). Creating
these charts with the best available data will narrow the GIT’s focus.
3. Based on the results of bullets one and two:
a. If a top sector emerges, move to creating a behavior list for that sector.
b. If no clear sector emerges, move to creating a behavior list with the top two sectors in
mind, and use the additional behavior list data collection effort to further refine the list.
1 https://www.chesapeakebay.net/who/group/communications_workgroup

Create a Behavior List
After the sector(s) have been prioritized, we recommend that the Wetlands GIT create a list of end-
state, non-divisible2 behaviors that lead to direct positive impacts on wetlands, and determine what data
are available to prioritize the actions. Focusing on behaviors that have the best combination of impact,
probability and penetration will increasing the chance that an increase in wetland acreage will be
achieved. See the webinar on Selecting Behaviors for more information.
1. Create an initial list of end-state, non-divisible behaviors. See table below.
# What is the Behavior? Part of behavior chain?
1 YES NO
2 YES NO
3 YES NO
4 YES NO
5 YES NO
2 End-state is defined as by doing the behavior, wetlands are improved or increased. Non-divisible is defined as the behavior cannot be divided into smaller sub-actions.

Prioritize Behaviors
1. Conduct a short survey of wetlands experts to gather independent ratings on the impact of each
behavior. See Selecting Behavior webinar (section on Impact) for more information. The survey
might have two impacts, increased wetland acreage and increased wetland health, as well as
any additional impacts of interest, such improved water quality. A sample of a survey to collect
impact information from a project focused on human-wildlife conflict reduction is below.
2. Create a table that combines the data from the wetland experts with available data on the
penetration (using data such as voluntary reporting of wetlands, permit databases, or
surveys/academic research to understand how many members of the target audience have
already taken this action), probability (using survey research or case studies to understand how
likely audience members are to take the action), and applicability (GIS maps of wetland
abundance or observational data recorded along the water to understand the percentage of the
audience members that could take the action) of each behavior on the list.
a. It is possible that not all columns will be filled in. For example, there may not be survey
data about probability, or the current penetration may be dated. However, the GIT can
still prioritize a few behaviors (3 to 5) for further research. The behaviors would be
prioritized based on the weight that is determined by multiplying impact by applicability (if
the other two factors are not available).
b. In this situation, the GIT can include questions about any missing penetration,
probability, and applicability data in the barrier and benefit research and use them to
further prioritize between the top 3 to 5 behaviors.

c. A sample blank table is below. The last column, Weight, is calculated by multiplying
Impact*Probability*Reach*Applicability. The weight is used to prioritize between
behaviors.
Behavior Impact Probability Penetration Reach (1-
Penetration)
Applicability Weight
Map Behavior Chains
Where relevant in the prioritized actions, map the behavior beginning with “Intention to Act” to the
completed action that establishes or preserves a wetland. See webinar on Selecting Behaviors (section
on Behavior Chains) for more information.
1. For example, for a behavior such as, “Plant trees on your residential property” the chain might
look like the following:
2. Mapping the chain can help the Wetland GIT identify potential barriers or benefits (such as, in
the example chain, the chain demonstrates there may be knowledge barriers around tree types
or transportation barriers to transport a tree), as well as places where programs may be able to
shorten the chain by removing actions (such as, providing tree delivery and planting). It can also
demonstrate visually how difficult an ask a behavior might be and how important it is to address
all the barriers participants face, even after they are sufficiently motivated to act.
Intention to Plant
Identify SiteDetermine Tree
TypeCheck Soil
QualityContact Utility
Obtain Tree Transport TreeBorrow/Buy
ShovelDig Hole Plant Tree
Determine Watering Schedule
Weed around Tree
Prune TreeRegular
Watering

Barrier and Benefit Research
Once the behavior(s) have been selected, we suggest that the Wetlands GIT consider selecting a local
community group to collaborate with for the remaining steps. Barriers and benefits can be very
localized (such as, different social norms or available contractors). The results of the initial two steps
can provide support for local groups to take a more strategic approach to their outreach. This approach
can provide a balance to the Wetlands GIT working more broadly across the watershed by supporting
multiple small groups and aggregating their research to inform subsequent research and programs.
However, if the resources are available to conduct broad barrier and benefit research (such as through
state-wide mail surveys), this step could stay with the Wetlands GIT, and instead the strategy
development or piloting steps could be reliant on smaller groups.
1. Conduct research on the challenges the target audience faces to taking the prioritized actions.
The format will depend on the audience and budget, as discussed in the Barrier and Benefits
webinar. For example, a residential audience is best studied with either a mail survey or
intercept interviews, depending on the budget, and a commercial audience will likely necessitate
door-to-door interviews as a research format.
2. Depending on the budget and generalizability goals, this research can either be conducted
internally, in a collaboration with a university, or using a private consultant. Sample questions for
intercept interviews are included as part of the webinar series on Barrier and Benefit research.
3. This group may also be well served to review the following:
a. CBP EPA Scope 13 work by Action Research on living shorelines (in progress);
b. Colehour + Cohen, Applied Research Northwest, Social Marketing Services, Futurewise
and Coastal Geologic Services’ research on removing armoring in Puget Sound; and
c. Nature Conservancy, Ducks Unlimited, NFWF, and Opinion Works’s work on Landowner
Attitudes Toward Wetland Restoration.

Strategy Development & Pilot Testing
As described in the previous barrier and benefit research section, this step may be more successfully
carried out in partnership with local organization(s).
1. Once the barrier and benefit research has been conducted, the findings should be linked to
strategies to help overcome barriers and leverage benefits that are meaningful to the audience.
More information on this topic is available in the Strategy Development webinar. The key
element is linking the barrier directly to a strategy. For example, if the barrier is forgetfulness,
prompts are a good strategy to use. However, if forgetfulness is not a barrier, prompts would not
be a useful tool.
2. Depending on the budget and organizational capacity, this research can either be conducted
internally, in collaboration with a university, or using a private consultant with social science
expertise. This ensures that social science tools are strategically paired with research findings
and used intentionally with best practices of implementation.
3. The ultimate form of the end product depends on the research – strategies should not be
developed without fully understanding barriers/benefits unique to this context.
4. Once strategies have been developed, CBSM recommends a small-scale pilot before full
implementation. See the Pilot Testing and Evaluation webinar for more information. If piloting is
successful, the results can be used to develop a “toolkit” type program that can be picked up by
local organizations, such as customizable outreach documents and step-by-step instructions of
how to implement in a local community.
This project has been funded wholly or in part by the United States Environmental Protection Agency
under assistance agreement CB96341401 to the Chesapeake Bay Trust. The contents of this document do
not necessarily reflect the views and policies of the Environmental Protection Agency, nor does the EPA
endorse trade names or recommend the use of commercial products mentioned in this document.