Complementary variational principles with fractional derivatives
Upload
independentCategory
view
2download
0
J. Great Lakes Res. 33:122–135Internat. Assoc. Great Lakes Res., 2007
122
Quantification of Historical Changes ofSubmerged Aquatic Vegetation Cover in
Two Bays of Lake Ontario with Three Complementary Methods
Bin Zhu1,*,†, Dean G. Fitzgerald2, Susan B. Hoskins3,Lars G. Rudstam2, Christine M. Mayer4, and Edward L. Mills2
1Department of BiologySyracuse University130 College Place
Syracuse, New York 13244
2Department of Natural Resources900 Shackelton Point Road
Cornell University Biological Field StationBridgeport, New York 13030
3Institute for Resource Information Sciences302 Rice Hall, Cornell University
Ithaca, New York 14853
4Lake Erie Center and Department of Environmental SciencesUniversity of Toledo6200 Bayshore RoadOregon, Ohio 43618
ABSTRACT. Submerged aquatic vegetation (SAV) distribution and coverage were quantified in twobays of Lake Ontario in 1972, 1980 (1982), and 1999–2002, using a combination of aerial photographinterpretation (API), hydroacoustics, and rake sampling. The three methods gave similar estimates ofSAV presence in 2002, supporting our use of API for quantifying SAV changes across decades in bays ofa large lake. The SAV coverage in Sodus Bay increased by 5% between 1972 and 1980 and by 35%between 1980 and 1999–2002 whereas the maximum depth of SAV colonization extended from 5.5 to 6.4m during this period. In Chaumont Bay, the SAV coverage tripled while its maximum depth of occurrenceincreased from 5.1 to 6.1 m from 1982 to 2002. Although the difference in SAV coverage between 1972and 1980 was not larger than the difference between consecutive years in the 2000s, the large increase inSAV coverage between the 1980s and 2000s represents a major ecosystem change in these bays. Thischange was likely caused by increased water clarity in Lake Ontario, which could be associated with theimplementation of the Great Lakes Water Quality Agreement (GLWQA) and the dreissenid mussel inva-sion. Although other factors such as water level, wave exposure, bottom slope, and sediment nutrientsmay be important, they have not changed in a fashion that would predict local increases of SAV cover-age.
INDEX WORDS: Submerged aquatic vegetation (SAV), dreissenid mussels, aerial photograph inter-pretation (API), hydroacoustics, rake sampling, water clarity, Lake Ontario.
*Corresponding author. E-mail: [email protected]†Current address: Finger Lakes Institute, Hobart and William Smith Col-leges, 601 S. Main Street, Geneva, NY 14456

Quantification of SAV Changes in Two Bays of Lake Ontario 123
INTRODUCTION
Submerged macrophytes represent the majorcomponent of submerged aquatic vegetation (SAV)in aquatic ecosystems and help shape the physicaland chemical environment, as well as the biota(Jeppesen et al. 1998, Genkai-Kato and Carpenter2005). For example, SAV affects nutrient dynam-ics, light extinction, temperature regimes, hydrody-namic cycles, and substrate characteristics as wellas other primary producers including epiphytic andepipelic algae (Jeppesen et al. 1998, Rooney et al.2003). Extensive SAV coverage in lake ecosystemsalso affects benthic and pelagic food web dynamicsthat may have cascading effects throughout thesystem (Scheffer et al. 2001). Therefore, quantify-ing SAV coverage and understanding how it re-sponds to changes in environmental variables iscritical to understanding ecosystem and food webresponses to environmental change. In this study,we quantify historical changes in SAV coverage incoastal ecosystems of Lake Ontario using threecomplementary methods and we examine potentialreasons for the observed changes. The methodsthat we present will also enable other researchersand managers to utilize existing images and data toevaluate similar habitat assessment questions else-where.
Past studies have revealed that the maximumdepth of colonization of submerged macrophytes isstrongly linked to water clarity (Chambers andKalff 1985, Hudon et al. 2000, Zhu et al. 2006).Thus, any increase in light penetration is likely topromote SAV expansion to deeper waters(Karatayev et al. 2002, Lammens et al. 2004).Water clarity in the Great Lakes region declinedwith the onset of cultural eutrophication in the1950s (e.g., Beeton 1965). In response, the GreatLakes Water Quality Agreement (GLWQA) be-tween the United States and Canada was enacted in1972 and led to decreased nutrient loadings and ageneral improvement in water transparency in LakeOntario (Millard et al. 2003). In addition, the unin-tended introduction of filter-feeding dreissenidmussels (the zebra mussel, Dreissena polymorphaand the quagga mussel, D. bugensis) also con-tributed to improvement of water clarity (Mills etal. 1994, Zhu et al. 2006). The resulting increasedlight penetration is a key change that can affectecosystem structure and function across entire lakes(see review by Vanderploeg et al. 2002).
It is expected that the increased water clarity willlead to increased coverage of SAV and correspond-
ing ecosystem change in invaded lakes (Karatayevet al. 2002, Lammens et al. 2004). However, only afew studies have investigated the magnitude of thischange in SAV coverage in the Great Lakes basin(Skubinna et al. 1995, Chu et al. 2004, Zhu et al.2006). For example, Zhu et al. (2006) observed thatsubmerged plants responded to increased waterclarity with an extended maximum depth of colo-nization and increased species richness in OneidaLake, NY. Documentation of changes in SAV distri-bution in the Great Lakes bays is limited, althoughseveral local studies and model predictions havebeen attempted (Geis and Kee 1977, Crabtree 2002,Wolter et al. 2005).
In addition to water clarity, the distribution ofSAV in lakes is affected by bottom depth, exposureto wave action, fetch, ice scour, latitude, nutrientavailability, slope, temperature, and water levelfluctuations (Hudon et al. 2000, Rooney et al.2003, Havens et al. 2005). For example, water levelcan determine the location, biomass, and annualproduction of aquatic plants including SAV andemergent plants (Havens et al. 2005). The morpho-metric characteristics of the littoral zone of lakescan also be a major determinant of submergedmacrophyte distribution (e.g., Duarte and Kalff1986). Nutrient enrichment in the sediments due tosedimentation and biological deposition acts to sus-tain SAV growth over a long time period, eventhough nutrient loads and nutrient concentrations inthe water column have been reduced in time(Rooney et al. 2003). These factors may act syner-gistically with changes in water clarity to affectSAV distribution in lakes.
Changes in SAV distribution over time can be as-sessed using interpretation of historical aerial pho-tographs taken for other purposes (Fitzgerald et al.2006), which represents a time-efficient and cost-effective method for habitat assessments(Finkbeiner et al. 2001, Fitzgerald et al. 2006).However, since aerial photo interpretation (API) de-pends on the subjective judgment of the interpreter,the quality of photographs and water clarity(Finkbeiner et al. 2001, McGlone 2004), we alsoemployed hydroacoustic mapping of SAV. Hydroa-coustics uses sound waves, and is therefore not af-fected by water clarity and requires little subjectiveinterpretation owing to the availability of auto-mated classification software (Sabol et al. 2002).Rake sampling of plants was used to complementhydroacoustic mapping to confirm the presence ofSAV and for species identification.
In this paper, we first compared the estimates of
124 Zhu et al.
SAV distribution obtained with API, hydroa-coustics, and rake sampling in 2002 in two bays(Sodus Bay and Chaumont Bay) of Lake Ontario.Then we interpreted historical photographs to as-sess SAV coverage in 1972, 1980 (1982), and 1999-2002. Finally we compared changes of SAV incoastal Lake Ontario with changes in factors thatcould cause the observed expansion of SAV cover-age. Our objectives were: 1) to test the measure-ment accuracy of API relative to hydroacousticsurveys and rake sampling; 2) to quantify the his-torical changes of SAV in Sodus Bay and Chau-mont Bay with API; and 3) to investigate the likelycauses for changes of SAV distribution by compar-isons with measured and inferred ecosystemchanges in Lake Ontario.
METHODS
Study Sites
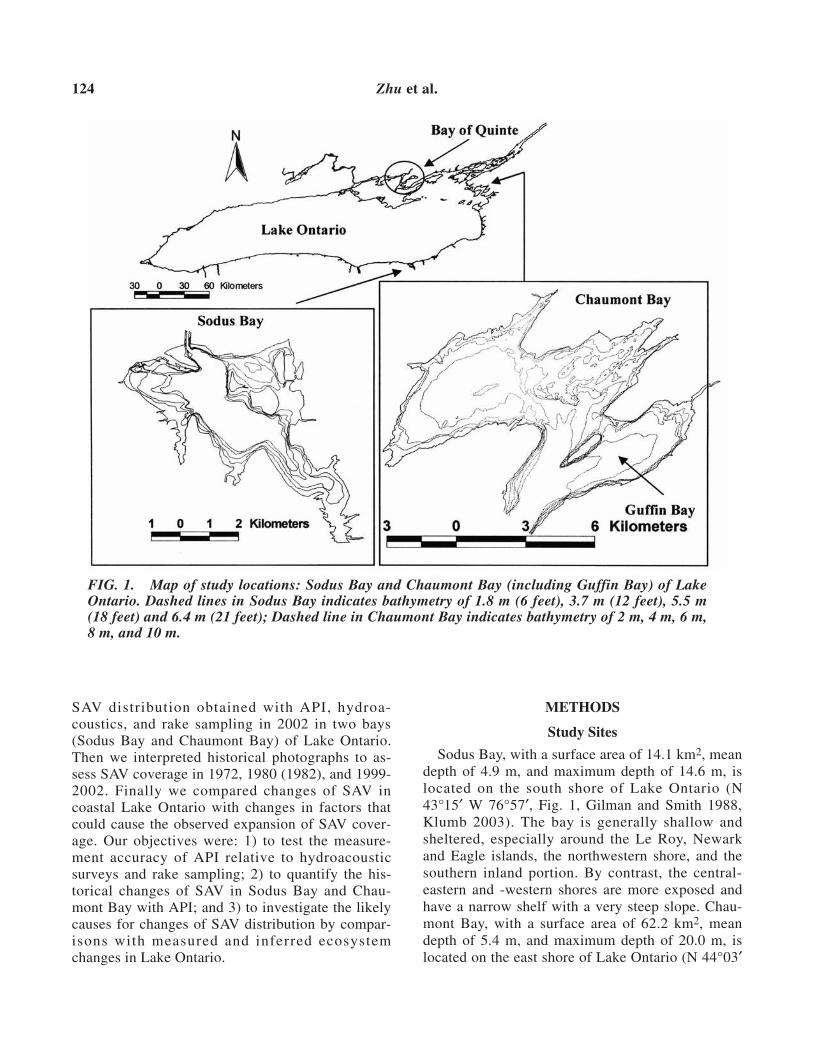
Sodus Bay, with a surface area of 14.1 km2, meandepth of 4.9 m, and maximum depth of 14.6 m, islocated on the south shore of Lake Ontario (N43°15′ W 76°57′, Fig. 1, Gilman and Smith 1988,Klumb 2003). The bay is generally shallow andsheltered, especially around the Le Roy, Newarkand Eagle islands, the northwestern shore, and thesouthern inland portion. By contrast, the central-eastern and -western shores are more exposed andhave a narrow shelf with a very steep slope. Chau-mont Bay, with a surface area of 62.2 km2, meandepth of 5.4 m, and maximum depth of 20.0 m, islocated on the east shore of Lake Ontario (N 44°03′
FIG. 1. Map of study locations: Sodus Bay and Chaumont Bay (including Guffin Bay) of LakeOntario. Dashed lines in Sodus Bay indicates bathymetry of 1.8 m (6 feet), 3.7 m (12 feet), 5.5 m(18 feet) and 6.4 m (21 feet); Dashed line in Chaumont Bay indicates bathymetry of 2 m, 4 m, 6 m,8 m, and 10 m.

Quantification of SAV Changes in Two Bays of Lake Ontario 125
W 76°12′, Fig. 1, Klumb 2003). In this study,“Chaumont Bay” includes both Chaumont Bay andGuffin Bay, which is a natural extension of Chau-mont Bay toward Lake Ontario. The northern partof Chaumont Bay has gentle sloping bottom andlow exposure to wind whereas the southern shorehas steeper bottom slope and high wind exposure.This bay also has rocky shores, varying waterdepths, macrophyte and rock-covered substrates,and shoals well suited for fish spawning (Klumb2003). In both Chaumont and Sodus bays, nuisanceaquatic vegetation has been a great public concern,leading to herbicide applications and mechanicalharvest of SAV in Sodus Bay since 1988 (R.Williams, Wayne County Soil & Water Conserva-tion District, Lyons, New York, personal communi-cation).
Aerial Photograph Interpretation
Aerial photographs used in this study were ob-tained from different sources. All recent images(1999–2002) of Sodus Bay and Chaumont Baywere available as 35 mm color slides from the FarmService Agency county offices of the U.S. Depart-ment of Agriculture (USDA), who contracted lowelevation, land-use inventory flights that also in-cluded lake shorelines. Slides with a clear view ofthe SAV and/or water were printed at a scale of1:10,000 for Sodus Bay (15–31 August 1999–2002)and of Chaumont Bay (early September to late Oc-tober 1999–2002).
Historical images representing the period of cul-tural eutrophication (1972) and the early period ofnutrient abatement (1980 or 1982) were available as1:30,000 scale color photographs collected by theNational Ocean Service of the National Oceanicand Atmospheric Administration (NOAA) on 20August 1972 and 29 September 1980 for Sodus Bayand 25 October 1982 for Chaumont Bay. SAV dis-tribution was mapped for each year and site; inChaumont Bay, the unsatisfactory quality of slidesfor 1999–2002 required the assemblage of a com-posite SAV map.
We followed the guidelines for monitoringcoastal land use and land cover with API accordingto the Coastal-Change Analysis Program (C-CAP)of NOAA (Finkbeiner et al. 2001). Slides werescanned and visually enhanced prior to printing orwere directly enhanced by the commercial devel-oper. Photographs produced from either methodwere suitable for interpretation of SAV distributionby examining differences in color, contrast, shade,
glare, and tint with the consideration of the localmicro-topography and bathymetry (e.g., Finkbeineret al. 2001). The interpretation was delineated onacetate overlays (0.5 mm, Steiner Paper Corpora-tion, Irvington, NJ) and then scaled onto Mylar™overlays (Charette ProPrint film 9104 CharretteCorp. Woburn, MA) registered to U.S. GeologicalSurvey 7.5′ (1:24,000) topographic quadranglemaps using landmark ground control points. TheMylar™ overlays were digitized with a large formatscanner (Scangraphics CF 1000/44, monochrome)and then vectorized using ArcGIS software (Ver-sion 9.0, ESRI, Inc., Redland, CA).
Hydroacoustic Survey
Hydroacoustic surveys, coupled with global posi-tioning systems (GPS), were conducted in SodusBay on 9 September 2002 and in Chaumont Bay on19 September 2002 with most data collected overthe plant beds near shore (Fig. 2 A and B). Datawere collected with a 420-kHz single-beam digitalecho sounder (DT-4000) (BioSonics, Inc., trans-ducer beam angle 6°, pulse length 0.1 ms, pulse rate5 ping·s–1) and analyzed with Visual Analyzer soft-ware and EcoSAV software (BioSonics 2001, Sabolet al. 2002). EcoSAV gave location, bottom depth,plant height and plant cover at each sampling pointdetermined by GPS (every 10–14 pings).Echograms were also inspected with Visual Ana-lyzer for depth adjustment and plant identification.We defined plant beds on the echograms whereechoes extend distinctly from the bottom toward thesurface and were elongated (Sabol et al. 2002). Asa result, we only accepted EcoSAV’s classificationof plants when both of the following criteria weremet: 1) plant height was higher than 0.2 m, and 2)plant cover was greater than 50%. Observations ofrare plant-like echoes in deep water were excludedas they may represent plant material that was up-rooted and transported there. Plants were also notconsidered to be present in water deeper than ninemeters because they are generally not able to toler-ate high water pressure below this depth in lakes(Wetzel 1983).
Maximum depths (Zmax) of plant beds from hy-droacoustics were identified as the depth of thedeepest plant echo continuous with a SAV bed. Foreach such measure, we drew a line perpendicularfrom the location of Zmax to the shoreline. Thepoint where this line intersected the outer edge ofSAV using API image was considered the Zmax

126 Zhu et al.
from API corresponding to the Zmax from hydroa-coustics. This depth was then estimated from bathy-metric maps.
Coverage of SAV from API was calculated di-rectly from ArcGIS software and the potential SAVbeds were estimated from the Zmax and the relation-ships between depth (Z) and area (A) that coversfrom that depth to shore from USGS bathymetrymaps:
A = 0.134* Z3 – 1.446*Z2 + 5.687*Z – 0.959 (1 ≤ Z ≤ 7, R2 = 0.978) for Sodus Bay, and
A = –0.106* Z3 + 1.998*Z2 – 4.443*Z + 7.185(1 ≤ Z ≤ 12, R2 = 0.982) for Chaumont Bay.
Rake Sampling
Hydroacoustic identification of SAV was con-firmed by the simultaneous sampling submerged
FIG. 2. Distribution of submerged aquatic vegetation (SAV) and comparisons of aerial photographinterpretation (API), hydroacoustics, and rake sampling in Sodus Bay and Chaumont Bay. A. Compar-isons of three methods in Sodus Bay. Distribution of SAV from API is shown in the shaded area, hydroa-coustic survey is represented as black line (plant presence) and light gray line (plant absence), and rakesampling locations are indicated as stars (plant presence) and circles (plant absence); B. Comparisons ofthree methods in Chaumont Bay—(see A for the legend); C. Distribution of SAV in Sodus Bay in 1972(black), 1980 (gray), and 1999 (light gray); D. Distribution of SAV in Chaumont Bay in 1982 (black) and1999–2002 (light gray).

Quantification of SAV Changes in Two Bays of Lake Ontario 127
plants with a double-headed rake (Weaver et al.1997). Triplicate samples, oriented in different di-rections, were collected at 49 (Sodus Bay) and 44(Chaumont Bay) locations along the hydroacousticsurvey paths. All submerged plants collected wereidentified to genus or species. Frequency of occur-rence of each species was calculated as the propor-tion of samples taken that contained a species(Skubinna et al. 1995). Plant presence/absence wascompared with classifications from API and hy-droacoustics.
API and Hydroacoustics Comparison
We compared API and hydroacoustics using twoapproaches. First, we determined the regression be-tween maximum depths as detected by API and hy-droacoustics (N = 53) and tested if the relationshipsin two bays were different using ANCOVA (Zar1999). We further determined whether the slope ofthe regression line differed from one and the inter-cept of this line differed from zero using t-test (Zar1999). A slope of one and intercept of zero for therelationship between maximum depth as determinedby API and hydroacoustics would indicate thatthese methods produce equivalent results. Theseanalyses were conducted using the GLM procedureof SAS 9.0 (SAS Institute, Cary, NC). Second, weclassified each point along each transect for whichwe had hydroacoustic data (N = 11,050) using bothhydroacoustics and API. Four categories were usedto determine agreement between the two methods1) both API and hydroacoustics indicate plant pres-ence (P/P), 2) API indicates plant presence andacoustics indicates absence (API-P/Hydro-A), 3)both API and acoustics indicate plant absence(A/A), or 4) API indicates plant absence andacoustics indicates presence (API-A/Hydro-P). Theproportion of points in each category was calcu-lated for every 0.5 m in depth.
Water Clarity and Water Level
Historical data on water clarity since 1972 inSodus Bay and Chaumont Bay are not available. Inorder to place the available contemporary data fromthese two embayments into a long-term context, weexamined data on light extinction coefficient of thelower Bay of Quinte, Lake Ontario from 1972 to2003. The Bay of Quinte is a Z-shaped bay on thenortheastern shore of Lake Ontario with a total areaof 257.4 km2 (Fig. 1, Chu et al. 2004). The bay isdivided into three sections and the lower bay, with
an area of 71.8 km2, connects with Lake Ontarioand is therefore similar to Sodus Bay and Chau-mont Bay in this respect. Data from the lower Bayof Quinte were re-analyzed and revised from Chu etal. (2004). Data for 4 years closest to the studiedyears were used in our analysis (i.e., 1972–1975,1979–1982, and 1999–2002). Contemporary dataon water clarity in Sodus Bay and Chaumont Baywere Secchi depth readings and collected biweeklyfrom May to October, 1995 to 2004 (Mills et al.2006). Water level data of Lake Ontario from 1971to 2004 were acquired from the U. S. Army Corpsof Engineers (Detroit District, Engineering andTechnical Services, Great Lakes Hydraulics andHydrology Office). Only data from April to Sep-tember in the studied years were used because thesemonths are of particular importance for the growthof SAV (Spence 1982, Wetzel 1983). We usedANOVA to compare light extinction coefficients forthe three periods, followed by pair-wise contraststatements to compare any two periods (SAS 9.0,SAS Institute, Cary, NC).
RESULTS
Comparison of API, Hydroacoustics,and Rake Sampling in 2002
Rake sampling identified a total of nine sub-merged macrophytes as well as one macroalgae –muskgrass (Chara sp.) in the two bays (sevenspecies in Sodus Bay and eight in Chaumont Bay).The nine submerged macrophytes were: clasping-leaf pondweed (Potamogeton richardsonii), com-mon waterweed (Elodea canadensis), coontail(Ceratophyllum demersum), Eurasian water milfoil(Myriophyllum spicatum), slender naiad (Najasflexilis), small pondweed (P. pusillus), variablepondweed (P. gramineus), water stargrass(Zosterella dubia), and wild celery (Vallisneriaamericana) (Fig. 3). The most frequently occurringplant was an invasive plant—Eurasian water milfoil(frequency of occurrence was 82% in Sodus Bayand 47% in Chaumont Bay), followed by wild cel-ery and coontail in both bays. Cladophora glomer-ata was the dominant filamentous algae foundattached to SAV.
Classification of SAV presence/absence with rakesampling was similar to the classification based onhydroacoustics and API. Concordance of resultswas generally high between hydroacoustics andrake sampling, whereas the agreement between APIand rake sampling was lower. Hydroacoustics and

128 Zhu et al.
rake sampling coincided in 43 of 49 locations(88%) in Sodus Bay and 42 of 44 (96%) in Chau-mont Bay. API and rake sampling agreed in 42 of49 locations (86%) in Sodus Bay and 32 of 44(73%) in Chaumont Bay. At most sites where theclassification differed between the two methods,rake sampling indicated plant presence and API in-dicated plant absence (7 of 7 such locations inSodus Bay and 9 of 12 such locations in ChaumontBay). These sites were located at the edge of theSAV beds (Figs. 2 A and B).
Because of the large spatial coverage of both APIand hydroacoustics, we had over 5000 data pointsin each bay for comparison of these two methods.Generally hydroacoustics detected deeper SAV thandid API in both Sodus Bay and Chaumont Bay in2002 (Figs. 2 A and B). Based on 53 locations inthe hydroacoustic survey paths, the maximum depthobtained with the two methods was correlated inboth bays and the regressions did not significantlydiffer from each other (ANCOVA, df = 1, F = 2.71,P = 0.106). The regression for all data was: Depth-Hydro = 0.84* DepthAPI + 1.48 (Fig. 4, P < 0.001).The slope of this regression did not differ signifi-cantly from 1.00 (t test, N = 53, t = –1.72, P =0.091). However the intercept was significantly dif-ferent from zero (t test, N = 53, t = 4.35, P < 0.001),indicating consistently deeper SAV detection withhydroacoustics than with API. The maximum depthof SAV was 6.7 m using API and 8.0 m using hy-droacoustics in Sodus Bay and 6.1 m using API and8.5 m using hydroacoustics in Chaumont Bay. Ofthe 53 locations where we measured the maximum
SAV depth with both hydroacoustics and API (Fig.4), nine (17%) gave the same maximum depth, 34%showed a difference of less than 0.3 m, and 87%showed a difference less than 1.5 m. All but two lo-cations showed deeper depth in hydroacoustic mea-surement than in API. The locations with the sameor similar maximum depth with the two methodsoccurred mostly in the northwest portion of SodusBay and the northeast proportion of Chaumont Bay.Differences were most pronounced in the northeast-ern and southeastern shores of Sodus Bay and thesouthern and western shores of Chaumont Bay.
Of the over 11,000 data points classified, hydroa-coustics and API agreed on 63.2%: 60.0% in SodusBay and 66.2% in Chaumont Bay (Table 1). APIfailed to detect SAV in 27–32% of points where hy-droacoustics detected plants. Conversely, hydroa-coustics did not reveal plant presence in 7–8% ofpoints in which API detected plants. The correctlyclassified data points occurred primarily in waterdepth above 4 m for plant presence and below 7.5m for plant absence, indicating higher concordanceof API and hydroacoustics in shallow and deepwater than at medium depths. This was expectedgiven that hydroacoustics detects plants in deeperwater than API. Disagreement between methodsprimarily occurred at depths between 4.0 and 7.5 m,where API underestimated plant occurrence by20–60% in comparison with hydroacoustics. Con-
FIG. 4. Comparison of the maximum depth ofsubmerged aquatic vegetation (SAV) colonizationin Sodus Bay and Chaumont Bay. The regressionis DepthHydro = 0.84* DepthAPI + 1.48 (P < 0.001).Empty circles denote data from Sodus Bay andsolid circles denote data from Chaumont Bay. Thesolid line is the regression line for all data and thedashed line is the 1:1 line.
FIG. 3. The submerged aquatic vegetation (SAV)species and their frequency of occurrence inSodus Bay (white columns) and Chaumont Bay(black column) from rake sampling in 2002.

Quantification of SAV Changes in Two Bays of Lake Ontario 129
versely, hydroacoustics failed to report plant pres-ence in 20–25% of points located at some shallowareas between 0.5 and 2.5 m bottom depth. This isdue to our method of identifying the outer edge ofthe SAV beds with API and assuming continuouscoverage from that edge to shore. These areas prob-ably represent those where wave action, fetch orbottom substrates are unsuitable for SAV (Hudon etal. 2000, Crabtree 2002).
Changes in SAV duringRecent Consecutive Years 1999–2002
To assess the likelihood that observed changes inSAV since the 1970s and 1980s represent responsesto long-term ecosystem changes, we need to assesshow much measured SAV coverage to vary fromone year to the next. Therefore, we compared theSAV coverage measured with API for four consecu-tive years, 1999-2002, in Sodus Bay. For theseyears, the SAV coverage increased from 5.00 km2
in 1999 to 5.37 km2 in 2001 and then decreased to4.77 km2 in 2002 (Table 2). The percentage
changes between every 2 consecutive years rangedfrom 3.6% to 11.2% with an average of 6.2%. Mostof the changes were associated with changes in thearea around the three islands, the southern end ofthe bay, and the northwestern shores. In addition,we estimated the maximum depth of SAV from APIaccording to bathymetry. The maximum depth hada similar trend as the SAV coverage: increasingfrom 5.5 m in 1999 to 7.0 m in 2001 and decreasingto 6.4 m in 2002. The potential SAV coverage esti-mated from depth-area relationships and maximumdepth of the plants increased from 8.9 to 14.0 km2
from 1999 to 2001 and decreased to 12.5 km2 in2002. These values were much larger than coverageestimated from API, mainly because plant beds sel-dom reached the maximum depth observed in thebay. In addition, the extent of the SAV beds did notcoincide with any particular isobath.
Changes in SAV across Three Decades
Significant increases in depth and coverage ofSAV were observed from 1972 to 1980 (1982), and
TABLE 1. Comparison of aerial photograph interpretation (API) with hydroacoustics inSodus Bay and Chaumont Bay in 2002 (numbers in parentheses are proportion to the allsampling points).
Hydroacoustics
Sodus Bay Chaumont Bay
Unit (Points) Presence Absence Presence Absence
1924 429 2954 373Presence (35%) (8%) (53%) (7%)
APIAbsence 1759 1361 1510 740
(32%) (25%) (27%) (13%)
Overall Concordance (%) 60.0 66.2
TABLE 2. Water level, water clarity, coverage and the maximum depth (Zmax) of submerged aquatic veg-etation (SAV) in Sodus Bay and Chaumont Bay, Lake Ontario in 1972, 1980 (1982), and 1999–2002.
Sodus Bay Chaumont Bay
Water Secchi Zmax (m) API Coverage Secchi Zmax (m) API Coverage Year Level (m) Depth (m) from API (km2) Depth (m) from API (km2)
1972 75.2 — 5.5 3.57 — —
1980 75.1 — 5.5 3.751982 74.9 — 5.1 7.16
1999 74.7 2.22 5.5 5.00 5.43 2000 75.0 3.06 6.4 5.18 5.92 2001 74.9 3.78 7.0 5.37 4.82 6.1 21.32002 75.0 2.62 6.7 4.77 5.33

130 Zhu et al.
to 1999–2002 in both embayments (Figs. 2 C andD). To represent this trend, we used the 1999 SAVmap of Sodus Bay as being typical of the SAV dis-tribution in recent years. The maximum depth ofSAV in Sodus Bay did not change until 2000 butthe potential SAV bed increased from 8.9 to 11.3km2 across three decades. The SAV coverage fromAPI increased 5.0% from 3.56 km2 in 1972 to 3.75km2 in 1980, and further increased 35.5% to 5.08km2 in 1999–2002 (Table 2), with expansion partic-ularly around the three island areas in the northeastwhere the water is shallow and less exposed towind (Fig. 2C). In Chaumont Bay, the maximumdepth of SAV increased about 20% from 5.1 m to6.1 m and the potential SAV bed increased about9% from 22.4 to 30.4 km2. The SAV coverage fromAPI almost tripled from the period after 1982 to theperiod 1999-2002 (i.e., 198% areal increase) andSAV expanded to deeper areas at almost every loca-tion along the shoreline; the most extreme increasestook place at the northern shorelines, where waterdepths are shallow (Fig. 2D).
Changes in Water Clarity and Water Level
Changes in water clarity and water level in LakeOntario were studied in order to explain the histori-cal changes of SAV. Water clarity has likely in-creased through 1972–2002. Light extinctioncoefficient in the lower Bay of Quinte showed acontinuous decline from 0.64 in 1972 to 0.32 in2003 and suggests that a similar trend of increasedwater clarity occurred in other embayments of LakeOntario during this period (Fig. 5). When the timeseries was divided into shorter periods correspond-ing to our SAV data for Sodus Bay and ChaumontBay, water clarity was significantly different in1972–1975, 1979–1982, and 1999–2002 (ANOVA,df = 2, F = 63.8, P < 0.001). Water clarity increasedslightly, but not significantly between the1972–1975 and 1979–1982 periods; as light extinc-tion coefficient decreased from 0.67 ± 0.02 (mean ±1 SE) to 0.61 ± 0.02 (ANOVA, contrast, df = 1, F =4.48, P = 0.064). By contrast, between the1979–1982 and 1999–2002 periods there was a rel-atively large and statistically significant decrease inlight extinction, which declined to 0.37 ± 0.02(ANOVA, contrast, df = 1, F = 113.8, P < 0.001).Recent Secchi depth data from Sodus Bay alsoshowed a trend of increase in water clarity, increas-ing from 2.9 m in 1995 to 4.0 m in 2004 (Fig. 5).Water clarity in Chaumont Bay varied between 4.5and 5.9 m with no significant time trend from 1995
to 2004 (Fig. 5, P = 0.349). These data suggest thatrelatively small increases in water clarity occurredbetween 1972 and 1980, but that large increases oc-curred between 1980 and 1999–2002.
Water level (April–September mean) showed nooverall trend in the past 30 years in Lake Ontario(Fig. 6, P = 0.060). The average water level was75.03 ± 0.03 m above mean sea level from 1971 to2004. In the 7 years for which we also have SAVdata, mean water levels were similar but the rangesvaried slightly (Fig. 6). Water level in 1972 was thehighest (75.17 m, range 0.39 m) among the 7 years,whereas 1999 exhibited the lowest mean level andnarrowest range (mean 74.70 m, range 0.23 m). Thehighest range occurred in 2002 (range 0.68 m) witha mean water level of 75.05 m.
Correlations between SAV Zmax /Coverage and Water Clarity / Water Level
The increase in maximum depth of SAV wasmarginally correlated with increase of Secchi depthfrom 1999-2002 in Sodus Bay (Fig. 7A, df = 3, ρ = 0.924, P = 0.075). However there was no sig-nificant correlation between Secchi depth and theSAV coverage during this period (df = 3, ρ = 0.806,P = 0.194) while the correlation from 1999 to 2001was significant (Fig. 7A, df = 2, ρ = 0.998, P =0.041). The lack of correlation from 1999 to 2002
FIG. 5. Changes in water clarity in the Bay ofQuinte, Sodus Bay and Chaumont Bay of LakeOntario. Change in the Bay of Quinte is measuredby light extinction coefficient from 1972 to 2003(—▲▲ —); changes in Sodus Bay (—●● —) andChaumont Bay (—●● —) are measured by Secchidepth from 1995 to 2004. Error bars represent ± 1SE.

Quantification of SAV Changes in Two Bays of Lake Ontario 131
may be due to the unusual decrease of the SAV cov-erage caused by mechanical harvesting and chemi-cal control or the highly variable water levels in2002. Yet the expansion in SAV coverage was cor-related with the increase in water clarity over thelonger period (Fig. 7B). Light extinction from theBay of Quinte and SAV coverage from Sodus Bayin 1972, 1980, 1999, 2000, 2001, and 2002 werehighly correlated (df = 5, ρ = 0.968, P < 0.001).Our analysis also revealed no significant correlationbetween the SAV coverage and either water levels(data not shown, df = 5, ρ = -0.641, P = 0.17) orwater level fluctuations (data not shown, df = 5, ρ =0.174, P = 0.742).
DISCUSSION
Effects of eutrophication on the Great Lakes havebeen widely described since the 1970s (e.g., Crow-der and Bristow 1986), conversely, potential conse-quences of oligotrophication caused by decreasednutrient levels and the dreissenid mussel invasionhave not been as well documented. SAV influencesa range of ecosystem processes (Jeppesen et al.1998, Havens et al. 2005). Therefore changes inSAV maximum depth and coverage in response toecosystem change are of particular interest to bothscientists and managers. Crowder and Painter(1991) stressed the significance of SAV in LakeOntario and urged the development of comprehen-sive SAV maps that would allow for a quantitativeassessment of the response of SAV to ecologicalchanges. Our study is among the first to providecomprehensive maps of SAV coverage for whole
bays. These findings identify a large increase inSAV coverage and maximum depth between theearly 1980s and the 1999–2002 time period but lessextreme changes from 1972 to the early 1980s.
Our approach of aerial photo interpretation fromaccessible sources is a low-cost method allowing tomap SAV over large geographic areas, such as LakeOntario embayments (Fitzgerald et al. 2006). Ourstudy also revealed a good correspondence between
FIG. 6. Mean (dots) and range (bars) of waterlevels (April–September) in Lake Ontario from1971 to 2004. The seven studied years (1972, 1980,1982, 1999, 2000, 2001, and 2002) are shown assolid symbols.
FIG. 7. Correlation between water clarity andmaximum depth / coverage of submerged aquaticvegetation (SAV) in Sodus Bay. A. Correlation inSodus Bay. SAV maximum depth was marginallycorrelated with Secchi depth (df = 3, ρρ = 0.924, P= 0.076) from 1999 to 2002 and SAV coverage washighly correlated with Secchi depth from 1999 to2001 (df = 2, ρρ = 0.998, P = 0.041). B. Correlationbetween light extinction coefficient (from Bay ofQuinte) and SAV coverage in 1972, 1980, 1999,2000, 2001, and 2002. The correlation was signifi-cant (df = 5, ρρ = –0.975, P < 0.001). Data fromChaumont Bay is not shown because only twopoints were available.

132 Zhu et al.
rake sampling and hydroacoustics, as > 88% of thesites were classified identically by the two methods.This supports previous comparisons between hy-droacoustics and field sampling or diver surveys(Sabol et al. 2002). However, our comparisons ofAPI with hydroacoustics and rake sampling indicatethat API underestimates the extent of SAV coveragein deeper water by about 0.8 m on average.Whereas API adequately quantifies the SAV reach-ing the surface or forming dense beds, SAV locatedat the edge of the beds, in deep water or represent-ing less than 50% cover are not included in the as-sessment. Although hydroacoustics assessment isnot affected by water clarity or subjectivity in theinterpretation, we consider that API does neverthe-less provides a useful, albeit conservative, estimateof SAV coverage, and further allows to evaluatehistorical changes (see also Fitzgerald et al. 2006).Most importantly, API provides better spatial cov-erage of SAV distributions than hydroacoustics.Consequently researchers have started to apply APIto studies in estuary, river, and lake ecosystems(McGlone 2004, Wolter et al. 2005, Fitzgerald et al.2006). The combination of these two methods maybe ideal for detecting long-term changes in SAVdistribution.
We demonstrated increases in SAV depth andcoverage as well as increases in water clarity inbays of Lake Ontario. These results are consistentwith the fact that underwater light penetration hasbeen identified as the primary factor controllingSAV distribution (Spence 1982, Wetzel 1983). Theobserved increase in water clarity after 1980s ismostly likely associated with dreissenid mussels(Mills et al. 2003) and this study demonstrated atemporal association of SAV expansion to suitablehabitat and dreissenid invasion (Fig. 7). Similarly,SAV expanded to deeper water after the dreissenidmussel invasions in Oneida Lake, New York, Sagi-naw Bay of Lake Huron, the Bay of Quinte of LakeOntario, and Lake Veluwe in the Netherlands (Sku-binna et al. 1995, Chu et al. 2004, Lammens et al.2004, Zhu et al. 2006). These studies suggest thatincreased light penetration sufficiently explains theobserved increase in depth range of SAV (Cham-bers and Kalff 1985, Genkai-Kato and Carpenter2005). Further, the observed year-to-year changesin SAV coverage and maximum depth between1999 and 2002 in Sodus Bay followed the sametrends as water clarity (Fig. 7A), suggesting that theresponse of SAV to improvements in water claritycan occur from one year to the next. The expectedeffect of water clarity is also similar to predictions
from the relationship between Secchi depth and theSAV maximum depth listed by Hudon et al. 2000,although we observed plants deeper than these pre-dictions. This is likely due to differences in lakeand river systems and other local factors. Thus, wesuggest that water clarity is the major factor deter-mining increases in SAV depth and coverage LakeOntario embayments and that the Dreissena –drivenincrease in lake-wide water clarity is an example ofecosystem engineering (Jones et al. 1997,Karatayev et al. 2002, Mayer et al. 2002, Zhu et al.2006).
In addition to dreissenid grazing, phosphorus re-duction can cause an increase in water clarity, lead-ing to expansion of SAV distribution. For example,plant biomass and coverage in the shallow upperportion of Bay of Quinte increased from 1972 to1979 (Crowder and Bristow 1986) following totalphosphorus reduction (from 22 to 15 µg.L–1) inLake Ontario (Millard et al. 2003). However, waterclarity may have been only marginally affected byphosphorus control as light extinction in the Bay ofQuinte only decreased from 0.67 to 0.61 in thesame years. Assuming a similar pattern of waterclarity change for Sodus Bay, it is not surprisingthat SAV coverage only increased 5% from 1972 to1980. This variation is similar to observed annualvariation (in the order of 6%) of SAV coverage inrecent consecutive years (1999–2002). Althoughthis annual variation can be due to difference inquality of the aerial photographs, human error, orreal differences in SAV coverage, we believe thesedifferences are real as the increase from 1999 to2002 is mirrored by changes in water clarity.
Factors other than water clarity, such as waterlevel, nutrient availability, exposure, and bottomslope can affect SAV distribution (Hudon et al.2000, Crabtree 2002, Vis et al. 2003, Havens et al.2005). Water level can determine the location, bio-mass and annual production of both SAV and emer-gent plants (Vis et al. 2003, Havens et al. 2005).The water level fluctuations observed in our studymay have affected SAV distribution; for example,the largest fluctuation occurred in 2002 when therewas an 11% decrease in SAV coverage in SodusBay. Additionally, water level fluctuations mayhave influenced estimation of SAV depth and cov-erage because the shorelines varied with water lev-els among years but our estimation of shorelinefrom API did not, possibly leading to deeper SAVmaximum depth and larger areal coverage with lowwater. However, water levels did not change dra-matically between our studied years and there were

Quantification of SAV Changes in Two Bays of Lake Ontario 133
no significant correlations between water level orits fluctuation and the SAV coverage. Therefore,water level changes appear to have minimal effecton SAV coverage in Lake Ontario during the studyperiod.
Nutrient enrichment in the sediments may alsocontribute to submerged macrophyte distribution(Rooney et al. 2003). Even though nutrient loadingshave been limited and nutrient concentrations havedecreased in the water column after the implemen-tation of the GLWQA, the temporal sequence ofchanges in nutrient loading to bays and littoral areais probably more complex and heterogeneous fromsite to site than in the central part of lakes. The ac-cumulative nutrient storage in the sediment in thelittoral zone can sustain macrophyte growth for along period. In addition, SAV distribution couldalso be affected by an episodic disturbance, such asHurricane Agnes, which increased sedimentationassociated with storm flows and presumably nutri-ent additions (Hoopes 1974).
Exposure to wind and the bottom slope may alsobe major determinants of SAV presence (Spence1982). The role of exposure in controlling the dis-tributions of aquatic macrophytes is well estab-lished (Hudon et al. 2000, Vis et al. 2003): wavesmay remove biomass, uproot seedlings, and trans-port propagules; waves also indirectly affect SAVthrough the erosion, transport, and deposition ofsediment (Wetzel 1983). In addition, the steepnessof the bottom is decisive for the sediment stabilityalong slope gradients and influences the establish-ment and extent of the vegetation. For example,Duarte and Kalff (1986) reported the shorelineslope can account for up to 72% of the observedvariability in maximum submerged macrophyte bio-mass. The lower exposure to wind and the shallowbottom slope may explain why there were signifi-cant increases in SAV coverage in the regions ofthree islands in Sodus Bay and the northern part ofChaumont Bay but not at other sites. Other periodicfactors, such as weed control, can affect the estima-tion of SAV coverage as well. Part of the decreaseof SAV coverage from 2001 to 2002 in Sodus Baycould be due to the success of chemical control insummer 2001 and earlier mechanical harvest in2002 (R. Williams, Wayne County Soil & WaterConservation District, Lyons, New York, personalcommunication). All these factors may act synergis-tically with changes in water clarity to determinethe extent of SAV distribution in lakes. However,exposure and bottom slope has not changed muchsince 1972 and these factors are therefore not likely
the major causes of the observed changes in SAVcoverage since that time.
The increase of SAV distribution is part of a suiteof changes in ecosystem and food web function inlakes. The Lake Ontario benthic and pelagic foodwebs have changed from 1970–2000, a period ofnutrient reduction and expansion of dreissenid mus-sels (Mills et al. 2003). In other systems similarchanges have been reported (Mayer et al. 2002, Zhuet al. 2006). Fish populations are also likely af-fected by the increase of SAV—we expect benthicfish species to increase and pelagic species to de-cline (Mills et al. 2003, Strayer et al. 2004). Whilesome of the above change may be perceived as pos-itive, the consequences of expanding macrophytedistributions may not be uniformly perceived aspositive by lake users. Dense stands of aquatic veg-etation reduce the aesthetic appeal of the water aswell as some desirable fish species. For example,walleye numbers have been declining since themid-1990s as water clarity and SAV increased inthe Bay of Quinte, Lake Ontario (Chu et al. 2004).This increase in SAV has also been commensuratewith an increase in attached algae like Cladophoraglomerata, which contribute to the shift in phos-phorus balance that is likely enhancing conditionsfor the growth and expansion of SAV (Higgins etal. 2005), thereby instituting a positive feedbacksupporting further expansion of SAV. Improvementof water quality can also facilitate successful colo-nization of non-native species, such as Eurasianwater milfoil—which became the most frequentlyoccurring species in both bays and may suppressand displace native plants (e.g., Madsen et al.1991).
Documentation of the changes in the SAV distri-bution with complementary methods in two bays ofLake Ontario identified large-scale changes overtime, which is most likely caused by increasedwater clarity modified by the bathymetry, exposure,bottom slope, and nutrient availability. Improve-ments in water clarity in Lake Ontario have in-creased the importance of benthic production overpelagic production in the food web, thereby repre-senting an overall alteration of ecosystem func-tion—a process we refer to as benthification (Millset al. 2003, Zhu et al. 2006). Expansion of SAVcoverage from 1972 to 2002 represents one signifi-cant aspect of the process. A similar process of ashift to benthic production in aquatic ecosystemsfollowing invasions by dreissenid mussels has beenobserved other aquatic ecosystems (Strayer et al.2004, Havens et al. 2005). Mapping and quantify-

134 Zhu et al.
ing the historical changes of SAV by using low-costtechnologies like API will help understand the mag-nitude of SAV response to environmental changes,improve understanding of the corresponding sys-tem-wide response, and predict future environmen-tal changes and needs for management.
ACKNOWLEDGMENTS
This work was supported in part by the NOAAaward NA46RG0090 to the Research Foundation ofthe State University of New York from New YorkSea Grant (project R/CE-20). The U.S. governmentis authorized to produce and distribute reprints forgovernmental purposes, notwithstanding any copy-right notation that may appear herein. The viewsexpressed herein are those of the authors and do notnecessarily reflect the views of NOAA or any of itssub-agencies. The authors wish to thank R. ScottMillard, the Great Lakes Laboratory for Fisheries &Aquatic Sciences, Fisheries & Oceans Canada, forsharing water clarity data for the Bay of Quinte,Joshua Tryninewski and Travis Spier from CornellBiological Field Station for helping with the fieldsurveys, and Stephen Smith from IRIS, CornellUniversity for helping with GIS problems duringthe course of this study. Constructive comments onan earlier draft were provided by Dr. C. Hudon, Dr.B. M. Sabol, and Dr. B. Gilman. This is contribu-tion number 238 of the Cornell Biological FieldStation and contribution number 2007.07 of theUniversity of Toledo Lake Erie Center.
REFERENCES Beeton, A. 1965. Eutrophication of the St. Lawrence
Great Lakes. Limnol. Oceanogr. 10:240–254.BioSonics. 2001. EcoSAV: submerged aquatic vegeta-
tion detection and analysis users manual. Seattle,Washington: BioSonics, Inc.
Chambers, P.A., and Kalff, J. 1985. Depth distributionand biomass of submersed aquatic macrophyte com-munities in relation to Secchi depth. Can. J. Fish.Aquat. Sci. 42:701–709.
Chu, C., Minns, C.K., Moore, J.E., and Millard, E.S.2004. Impact of oligotrophication, temperature, andwater levels on walleye habitat in the Bay of Quinte,Lake Ontario. Trans. Am. Fish. Soc. 133:868–879.
Crabtree, D.L. 2002. Coastal habitats and their signifi-cance in te early life histories of fishes in Southeast-ern Lake Ontario. Ph.D. thesis, State University ofNew York, College of Environmental Science andForestry, Syracuse, NY.
Crowder, A., and Bristow, M. 1986. Aquatic macro-phytes in the Bay of Quinte, 1972–82. Canadian Spe-
cial Publication of Fisheries and Aquatic Sciences86:114–127.
———, and Painter, D.S. 1991. Submerged macrophytesin Lake Ontario: current knowledge, importance,threats to stability, and needed studies. Can. J. Fish.Aquat. Sci. 48:1539–1545.
Duarte, C.M., and Kalff, J. 1986. Littoral slope as a pre-dictor of the maximum biomass of submergedmacrophyte communities. Limnol. Oceanogr. 31:1072–1080.
Finkbeiner, M., Stevenson, W., and Seaman, R. 2001.Guidance for benthic habitat mapping: an aerial pho-tographic approach. Technology Planning and Man-agement Corporation. U.S. Department of Commerce.NOAA Technical Report NOAA/CSC/20117-PUB.
Fitzgerald, D.G., Zhu, B., Hoskins, S.B., Haddad, D.E.,Green, K.N., Rudstam, L.G., and Mills, E.L. 2006.Quantifying submerged aquatic vegetation using aer-ial photograph interpretation: application in studiesassessing fish habitat in freshwater ecosystems. Fish-eries 31:9–21.
Geis, J.W., and Kee, J.L. 1977. Coastal wetlands alongLake Ontario and the St. Lawrence River in JeffersonCounty, New York. State University of New York,College of Environmental Science and Forestry, Syra-cuse, NY.
Genkai-Kato, M., and Carpenter, S.R. 2005. Eutrophica-tion due to phosphorus recycling in relation to lakemorphometry, temperature, and macrophytes. Ecology86:210–219.
Gilman, B., and Smith. F. 1988. An inventory of macro-phyte communities in the Wayne County bays of LakeOntario, New York—aquatic vegetation of Sodus Bay,East Bay and Port Bay. Natural Resource Conserva-tion Report, Community College of the Finger Lakes.
Havens, K.E., Fox, D., Gornak, S., and Hanlon, C. 2005.Aquatic vegetation and largemouth bass populationresponses to water-level variations in Lake Okee-chobee, Florida (USA). Hydrobiologia 539:225–237.
Higgins, S.N., Howell, E.T., Hecky, R.E., Guildford, S.J.and Smith, R.E. 2005. The wall of green: The statusof Cladophora glomerata on the northern shores ofLake Erie’s eastern basin, 1995–2002. J. Great LakesRes. 31:547–563.
Hoopes, R.L. 1974. Flooding, as the result of HurricaneAgnes, and its effect on a macrobenthic community inan infertile headwater stream in central Pennsylvania.Limnol. Oceanogr. 19:853–857.
Hudon, C., LaIonde, S., and Gagnon, P. 2000. Rankingthe effects of site exposure, plant growth form, waterdepth, and transparency on aquatic plant biomass.Can. J. Fish. Aquat. Sci. 57 (Suppl. 1):31–42.
Jeppesen, E., Søndergaard, M., and Christoffersen, K.1998. The structuring role of submerged macrophytesin lakes. New York, NY: Springer-Verlag.

Quantification of SAV Changes in Two Bays of Lake Ontario 135
Jones, C.G., Lawton, J.H., and Shachak, M. 1997. Posi-tive and negative effects of organisms as physicalecosystem engineers. Ecology 78:1946–1957.
Karatayev A.Y., Burlakova, L.E., and Padilla, D.K.2002. Impacts of zebra mussels on aquatic communi-ties and their roles as ecosystem engineers. In Inva-sive aquatic species of Europe: distribution, impactsand management. E. Leppakoski, S. Gollasch, and S.Olenin, edds., pp. 433–446. Boston, MA: KluwerAcademic Publishers.
Klumb, R.A. 2003. The role of embayments andnearshore habitats of Lake Ontario as nursery groundsfor young-of-the-year alewives Alosa pseudoharengusand other species. Ph.D. thesis, Cornell University,Ithaca, NY.
Lammens E.H.R.R., van Nes, E.H., Meijer, M.L., andvan den Berg, M.S. 2004. Effects of commercial fish-ery on the bream population and the expansion ofChara aspera in Lake Veluwe. Ecological Modelling177:233–244.
Madsen, J.D., Sutherland, J.W., Blomfield, J.A., Eichler,L.W., and Boylen, C.W. 1991. The decline of nativevegetation under dense Eurasian watermilfoilcanopies. Journal of Aquatic Plant Management29:94–99.
Mayer, C.M., Keats, R.A., Rudstam, L.G., and Mills,E.L. 2002. Scale-dependent effects of zebra musselson benthic invertebrates in a large eutrophic lake.Journal of the North American Benthological Society21:616–633.
McGlone, C. 2004. Manual of photogrammetry. FifthEdition. Bethesda, Maryland: American Society forPhotogrammetry and Remote Sensing.
Millard, E.S., Johannsson, O.E., Neilson, M.A., and El-Shaarawi, A.H. 2003. Long-term, seasonal and spatialtrends innutrients, chlorophyll a and light attenuationin Lake Ontario. In State of Lake Ontario (SOLO):past, present and future, M. Munawar, ed., pp.97–132. Ecovision World Monograph Series, AquaticEcosystem Health & Management Society.
Mills E.L., Leach, J.H., Carlton, J.T., and Secor, C.L.1994. Exotic species and the integrity of the GreatLakes. BioScience 44:666–676.
———, Casselman, J.M., Dermott, R., Fitzsimons, J.D.,Gal, G., Holeck, K.T., Hoyle, J.A., Johannsson, O.E.,Lantry, B.F., Makarewicz, J.C., Millar, E.S.,Munawar, I.F., Munawar, M., O’Gorman, R., Owens,R.W., Rudstam, L.G., Schaner, T., Stewart, T.J. 2003.Lake Ontario: food web dynamics in a changingecosystem (1970–2000). Can. J. Fish. Aquat. Sci.60:471–490.
———, Hoffman, C.E., Gillette, J.P., Rudstam, L. G.,McCullough, R., Bishop, D., Pearsall, W., LaPan, S.,Trometer, B., Lantry, B., O’Gorman, R., and Schaner,T. 2006. 2005 Status of the Lake Ontario ecosystem: a
biomonitoring approach. NYSDEC Lake OntarioAnnual Report 2005, New York Department of Envi-ronmental Conservation.
Rooney, N., Kalff, J., and Habel, C. 2003. The role ofsubmerged macrophyte beds in phosphorus and sedi-ment accumulation in Lake Memphremagog, Quebec,Canada. Limnol. Oceanogr. 48:1927–1937.
Sabol, B.M., Melton Jr., R.E., Chamberlain, R., Doering,P., and Haunert, K. 2002. Evaluation of a digital echosounder system for detection of submersed aquaticvegetation. Estuaries 25:133–141.
Scheffer, M., Carpenter, S.R., Foley, J.A., Folke, C., andWalker, B. 2001. Catastrophic shifts in ecosystems.Nature 413:591–596.
Skubinna, J.P., Coon, T.G., and Batterson, T.R. 1995.Increased abundance and depth of submersed macro-phytes in response to decreased turbidity in SaginawBay, Lake Huron. J. Great Lakes Res. 21:476–488.
Spence, D.H.N. 1982. The zonation of plants in freshwa-ter lakes. Advances in Ecological Research 12:37–125.
Strayer, D.L., Hattala, K.A., and Kahnle, A.W. 2004.Effects of an invasive bivalve (Dreissenapolymorpha) on fish in the Hudson River estuary.Can. J. Fish. Aquat. Sci. 61:924–941.
Vanderploeg, H.A., Nalepa, T.F., Jude, D.J., Mills, E.L.,Holeck, K.T., Liebig, J.R., Grigorovich, I.A., andOjaveer, H. 2002. Dispersal and emerging ecologicalimpacts of ponto-caspian species in the LaurentianGreat Lakes. Can. J. Fish. Aquat. Sci. 59:1209–1228.
Vis, C., Hudon, C., and Carignan, R. 2003. An evalua-tion of approaches used to determine the distributionand biomass of emergent and submerged aquaticmacrophytes over large spatial scales. Aquatic Botany77:187–201.
Weaver, M.J., Magnuson, J.J., and Clayton, M.K. 1997.Distribution of littoral fishes in structurally complexmacrophytes. Can. J. Fish. Aquat. Sci. 54:2277–2289.
Wetzel, R.G. 1983. Limnology. Second edition. Philadel-phia, PA: Saunders College Publishing.
Wolter, P.T., Johnson, C.A., and Niemi, G.J. 2005. Map-ping submergent aquatic vegetation in the US GreatLakes using Quickbird satellite data. InternationalJournal of Remote Sensing 26:5255–5274.
Zar, J.H. 1999. Biostatistical Analysis. 4th edition. UpperSaddle River, NJ: Prentice Hall.
Zhu, B., Fitzgerald, D.G., Mayer, C.M., Rudstam, L. G.,and Mills, E.L. 2006. Alteration of ecosystem func-tion by zebra mussels in Oneida Lake, NY: Impactson submerged macrophytes. Ecosystems 9:1017–1028.
Submitted: 31 March 2006Accepted: 21 November 2006Editorial handling: Christiane Hudon
Copyright © 2022 FDOKUMEN