Collingwood Leisure Centre Aquatic Feasibility Study 2006 Collingwood Leisure Centre Aquatic...
92
Collingwood Leisure Centre Aquatic Feasibility Study 2006
-
Upload
independent -
Category
Documents
-
view
1 -
download
0
Transcript of Collingwood Leisure Centre Aquatic Feasibility Study 2006 Collingwood Leisure Centre Aquatic...
Collingwood Leisure Centre Aquatic Feasibility Study
2006

Collingwood Leisure Centre Aquatic Feasibility Study DRAFT Page 2 of 92
Contents
1 Executive Summary ...............................................................................................................52 Structure of the Report...........................................................................................................83 Planning Framework: .............................................................................................................94 State Policy ............................................................................................................................95 Council Policy.......................................................................................................................10
5.1.1 Council Plan 2005-2009 .......................................................................................105.1.2 Municipal Public Health Plan 2005-2008..............................................................105.1.3 Recreation Strategy Plan 2003/2008....................................................................10
5.2 Previous Reports..........................................................................................................115.2.1 Facilities Master Planning Study : Lacey Management Services 2000................115.2.2 Concept Plan and Detailed Design Report :Sweetnam and Ord 2003.................11
6 Context.................................................................................................................................126.1 Local Government Provision of Aquatic Facilities ........................................................126.2 History ..........................................................................................................................136.3 Facilities & Design........................................................................................................136.4 Program Range............................................................................................................146.5 Performance.................................................................................................................156.6 Participation..................................................................................................................15
6.6.1 Membership Performance ....................................................................................166.6.2 Term Programs – Learn to Swim..........................................................................166.6.3 Aquatic Casual Participation ................................................................................176.6.4 Access Programming ...........................................................................................176.6.5 Financial Performance .........................................................................................18
6.7 Competition ..................................................................................................................196.8 Program Competition ...................................................................................................20
6.8.1 Program range .....................................................................................................216.9 Regional Local Government Review............................................................................236.10 Facility Catchment........................................................................................................246.11 Facility Design / Management Trends..........................................................................266.12 Industry Participation Trends........................................................................................276.13 Health and Fitness Industry..........................................................................................276.14 Overall Participation Trends .........................................................................................276.15 Participation trends for young people...........................................................................286.16 Participation trends for older adults..............................................................................28
7 Research..............................................................................................................................297.1 Theoretical Foundation: Community Benefit of Sport and Recreation .........................297.2 Customer Demographics..............................................................................................30
7.2.1 Changes in demographic profile...........................................................................307.2.2 SEIFA Index .........................................................................................................317.2.3 Population ............................................................................................................327.2.4 Age .......................................................................................................................327.2.5 Family Status........................................................................................................337.2.6 Qualifications/Occupation.....................................................................................337.2.7 Non English Speaking Background......................................................................347.2.8 Housing ................................................................................................................347.2.9 Entertainment and Recreation Spend ..................................................................35
8 Customer Consultation.........................................................................................................368.1 Research Process........................................................................................................368.2 Summary Findings .......................................................................................................378.3 Summary of Customer Feedback.................................................................................388.4 Summary of Consultation Interviews............................................................................39
Collingwood Leisure Centre Aquatic Feasibility Study DRAFT Page 3 of 92
8.5 Summary information Customer surveys. ....................................................................408.6 Facility Benchmarking ..................................................................................................42
8.6.1 CERM...................................................................................................................428.6.2 Demographics of Users........................................................................................428.6.3 Programming........................................................................................................438.6.4 Facility Design ......................................................................................................44
9 Asset Condition ....................................................................................................................4410 Analysis............................................................................................................................47
10.1 SWOT Analysis ............................................................................................................4710.2 Major Issues Impacting Facility Development ..............................................................48
11 Development Priorities .....................................................................................................5012 Demand Forecasting........................................................................................................52
12.1 Aquatic Demand...........................................................................................................5212.1.1 Recreational Swimming........................................................................................5212.1.2 Learn To Swim .....................................................................................................5212.1.3 Schools.................................................................................................................5312.1.4 Aquatic Programs.................................................................................................5412.1.5 Summary ..............................................................................................................54
12.2 Dry Program Demand ..................................................................................................5512.2.1 Health and Fitness Memberships.........................................................................5512.2.2 Fitness Programs .................................................................................................5612.2.3 Summary ..............................................................................................................56
12.3 Community Hub............................................................................................................5712.3.1 Identified Need .....................................................................................................5712.3.2 Policy Framework.................................................................................................57
13 Strategy............................................................................................................................5913.1 Design ..........................................................................................................................5913.2 Aquatic Development ...................................................................................................6113.3 Dry Area and Community Hub Redevelopment ...........................................................6213.4 Aquatic and Dry Development......................................................................................6313.5 Site Elevations..............................................................................................................6413.6 Site Impact ...................................................................................................................6513.7 Planning Implications ...................................................................................................66
13.7.1 Mayors Park Master Planning ..............................................................................6613.7.2 Council Municipal Strategic Statement (MSS)......................................................66Objective 3 To manage potential amenity conflicts between residential and other uses.66Objective 11 To maximise accessibility of community services. .......................................66
21.04-5 Parks, gardens and public open space ................................................................66Objective 14 To ensure that the open space network meets existing and future community needs. 67Objective 16 To protect and enhance the City’s heritage places. .....................................67
13.8 Project Costs ................................................................................................................6813.9 Financial Projections ....................................................................................................69
13.9.1 Operating Performance ........................................................................................6913.9.2 Sources of Finance ..............................................................................................7013.9.3 Financial Projections Cash Flow ..........................................................................7113.9.4 Specific Program Performance.............................................................................7313.9.5 Benchmarking ......................................................................................................74
14 Attachments .....................................................................................................................75
Collingwood Leisure Centre Aquatic Feasibility Study DRAFT Page 4 of 92
Prepared on behalf of Yarra City Council by:
Mal Healey Fruit Group Pty Ltd
Ph: 9687 1592 Fax: 9689 8799

Collingwood Leisure Centre Aquatic Feasibility Study DRAFT Page 5 of 92
1 Executive Summary
An icon for over 25 years The Collingwood Leisure Centre (CLC) has been an icon in the community for over a quarter of a century. Built in 1970 by renowned Architect Daryl Jackson the CLC was one of the first major indoor aquatic and recreation centres developed in Melbourne.
This plan attempts to ensure that the CLC remains relevant and viable into the future.
Inadequate Size for Current Demand Customer consultation, industry benchmarks and previous consulting reports (Lacey Management 2000 and Sweetnam Ord 2003) have all identified that the CLC is too small to cater for the current levels of demand. Overcrowding was a consistent response amongst users from both aquatic and dry program areas. Major areas of overcrowding were experienced in the areas of lap swimming, gym, cardio room, aerobics room and changing facilities.
The overcrowding of the facility provides a disincentive for many residents. This is particularly evident for special needs groups within the community, a review of facility users highlighted that families, CALD communities and people from low incomes were underrepresented in CLC programs and services.
Policy Framework City of Yarra policies highlight the importance of the CLC and other leisure facilities in developing a healthy and connected community. An emphasis is placed on the importance of recreation services being accessible to the community and in actively engaging with target groups such as people on low incomes, CALD communities, older adults, families and people with disabilities. State Government strategies support the continued development and expansion of community recreation facilities; the Fairer Victoria Strategy seeks to reduce the barriers to opportunity, improve access to services and strengthen assistance to disadvantaged groups. It can be clearly argued that the development of the CLC assists in achieving these objectives.
A Changing Demographic The demographic analysis of Yarra reveals a community that in the next ten years will grow by 6%, be wealthier, have higher levels of employment and be more likely to be born in Australia. These indicators have a high correlation with participation in recreational activities and will result in greater demand for programs and services provided within the CLC.
Criteria YarraTotal Population 6% Born in Australia 10% Born Overseas -16% Unemployed -50%
Employed 21% Median Age 31 – 32 (slight ageing)
Median weekly income 120% Mean Household size -9%

Collingwood Leisure Centre Aquatic Feasibility Study DRAFT Page 6 of 92
Key Issues This report identified a number of key issues, which need to be addressed if the CLC is to continue to play a meaningful role within the community. These issues included:
Facility crowding Low participation rates from Children, Families, Pensioners and Concession Card Holders Long-term financial viability of the facility Space allocation for competing programs within the facility The potential creation of a community hub for additional council services
Facility Development Response To address these issues a facility development plan has been presented which provides a facility based solution to these issues. The response includes:
The addition of a leisure pool which can cater for learn to swim programs Enhancing disability access to the main pool areas Relocation of the spa and sauna areas to allow for wellness zone within the aquatic area “Freeing up” space within the main pool to satisfy demand for lap swimming Development of a café area Expanding the male and female changing facilities Integrating these aquatic developments into the dry program expansions previously
endorsed by council The creation of a community hub with programs such as Occasional Care, Maternal Child
and Health, Toy Library and Community Meeting Space.
Community Impact It is predicted that these developments will allow the facility to continue to play an important role into the future by:
Allowing for an increase of 140,000 (43%) annual visits per annum, many of these from families and young people. An increase in net surplus by $358,000 (200%) per annum An increase in access programming by 3333 (40%) per annum
Financial Impact The proposed developments will increase net surplus from $179,000 to $537,000 in four years.
REVENUE Current Post Development VarianceAquatics 618,973 826,473 207,500 Health and Fitness 1,222,382 2,012,399 790,017 Secondary Spend: Café & Merchandise 60,668 115,927 55,259 Miscellaneous 108,916 184,234 75,318 Total Revenue 2,010,938 3,139,033 1,128,094
EXPENDITURE Current Post Development VarianceAquatics 381,939 468,041 86,102 Health and Fitness 310,107 368,254 58,147 Secondary Spend: Café & Merchandise 30,000 61,800 31,800 Miscellaneous 57,616 91,307 33,691 Customer Service / Accounts / Administration 372,894 617,410 244,516 Management Salaries 454,424 546,422 91,998 Operations 224,600 392,018 167,418 Equipment Lease 0 56,275 56,275 Total Expenditure 1,831,579 2,601,527 769,947 Net Annual Result 179,359 537,506 358,147

Collingwood Leisure Centre Aquatic Feasibility Study DRAFT Page 7 of 92
Project Costs The redevelopment is costed at $9.125M, the specific costs of the major stages are outlined in the table below.
The net cash flow analysis provided in the table identifies the net cost to council after ten years. The greatest financial return is achieved in the development of the health club only. However, this development in isolation will not assist the council achieve the many social objectives which are achieved through the expansion of the aquatic facility and integration of the community hub.
Code Development Options
Construction Cost ($)
Total Project Options
Total Project Costs ($)
Net Cash Flow - (10 yrs)
AAquatic Development 4,957,000.00 A 4,957,000.00 -2,465,523.00
B Health Club Only 2,743,959.00 B 2,743,959.00 5,628,415.00 A+B 7,700,959.00 2,017,446.00 C1 Community Hub 1,424,659.00 A+B+C1 9,125,618.00 943,607.00
The project costs have not incorporated the remedial work required to repair / replace the existing roofing structure (approx $300k) or the work involved in remedying the leak to the existing pool structure (cost not identified at time of report).
Project Funding The sources of funds to achieve the $9.12M project are outlined below.
Council Capital Works Budget $3.20M State Government Better Pools Funding $2.28M Council Loan $3.64M Total $9.12M
Planning Framework The redevelopment of the CLC is consistent with the Master Planning for Mayors Park and aligns with the development of this area as a major activity precinct within the community. The development is recommended with a full understanding of the Municipal Strategic Statement. The development of the community hub within the CLC allows for the relocation of the services provided in Darling Gardens, the removal of this building form the park will result in a net gain of parklands for residents. The redevelopment will be conducted in sympathy with the unique design of the current aquatic facility.

Collingwood Leisure Centre Aquatic Feasibility Study DRAFT Page 8 of 92
2 Structure of the Report
This document will provide an overview of the research and consultation process, which has been conducted as part of the Collingwood Leisure Centre Aquatic Feasibility Study.
The purpose of the research and consultation process has been to:Gather appropriate data for decision making and performance measurement Determine perceptions of stakeholders
o What are the strengths, weaknesses of the CLC o What opportunities or threats need to be addressed o How does the CLC rate against like facilities
Understand issues driving change in the current environment Identification of opportunities / threats Engage stakeholders in the planning process
The steps involved in the consultation / research process have included: One: Identifying relevant internal and external research Two: Consultation with stakeholders Three: Identifying the key issues facing CLC Four: An analysis of design options Five: Development of Strategy including Design solutions, Participation Forecasts and
Financial Modelling
The consultation and research information is analysed in this document and the major issues impacting on the CLC are presented.
Priorities for development are provided as the first stage in the development of concept designs for the facility.

Collingwood Leisure Centre Aquatic Feasibility Study DRAFT Page 9 of 92
3 Planning Framework: The following planning documents provide a policy framework for the development of the Collingwood Leisure Centre (CLC). These documents include:
State Government Yarra City Council Fairer Victoria The Council’s 2005/09 Council Plan Go for your Life Initiative City of Yarra Municipal Public Health
Plan 2005 /
Council Recreation Strategy Plan 2003
4 State Policy The State Government has developed an interlocking range of policies based on the premise of creating a thriving economy, quality health and education, a healthy environment, caring communities and a vibrant democracy.
A Fairer Victoria1 is the state governments framework to address disadvantage and respect diversity. Many of a Fairer Victoria Initiates give support to the future development of the Collingwood Leisure Centre including
Reducing Barriers to opportunity Improving access to universal services Strengthening assistance for disadvantaged groups
A fairer Victoria encourages partnerships between communities, non-government organisations and all levels of government to improve service provision at a local level.
The Government has made a commitment to promoting healthy and active communities as part of the Go for Your Life2 initiative. This strategy is a cross government effort to create healthy and resilient communities through promoting the benefits of increased physical activity, healthy eating and community involvement.
1 www.dvc.vic.gov.au 2 www.goforyourlife.vic.gov.au

Collingwood Leisure Centre Aquatic Feasibility Study DRAFT Page 10 of 92
5 Council Policy
5.1.1 Council Plan 2005-2009The council plan 2005 – 2009 outlines the importance of the CLC in assisting in developing a healthy and vibrant community.
A key strategy within the corporate plan is to provide:
‘A healthy connected and active community, which has access to a range of quality recreation and sporting, places, spaces and activities’.
The corporate plan highlighted the importance of encouraging access to council’s facilities and outlined a range of activities designed to increase participation rates of marginalized groups in the community.
The plan acknowledges the challenges associated with maintaining the physical assets of council and provides a framework for ensuring that council continues to invest in the future of facilities such as CLC.
5.1.2 Municipal Public Health Plan 2005-2008The MPHP documents the importance of promoting activity amongst residents and identifies the leisure centres as playing an important role in enhancing opportunities for residents to engage in exercise and in promoting physical activity.
The MPHP acknowledges the importance of increasing activity levels of those who experience barriers to participation such as people on low incomes, CALD communities, older adults, families and people with disabilities. The MPHP recommends a range of membership deals and the introduction of specific programs to increase participation levels of these groups.
5.1.3 Recreation Strategy Plan 2003/2008The recreation plan reinforced council’s commitment to the development of leisure services across the city. The recreation strategy supported the direction of the MPHP and highlighted the importance of providing specific programs and services that will encourage increased participation from target groups such as people from low incomes, CALD communities, older adults, families and people with disabilities.
The recreation plan acknowledged the importance of the CLC in providing recreation opportunities for residents of Yarra, the report also emphasized the need for a coordinated strategy to ensure that the CLC provides services and activities that cater for all residents in particular the target groups identified above.

Collingwood Leisure Centre Aquatic Feasibility Study DRAFT Page 11 of 92
5.2 Previous Reports Since 2000, two studies have been commissioned by the City of Yarra to review the future of the CLC. The key recommendations of these studies are outlined below:
5.2.1 Facilities Master Planning Study : Lacey Management Services 2000The report identified that the CLC required further development to meet changing customer needs and to respond to increasing demand.
The Lacey report highlighted overcrowding, as a significant issue for CLC and that there was a need for:
More gym space, state of the art equipment and café areas More teaching and recreation water space A new children’s / Learners pool A warm water pool for older adults and people with a disability
The report noted the importance of council developing a coordinated approach to the development of the three leisure centres to ensure that services complimented each other. To this end the consultants believed that CLC should be retained as a major indoor venue and expanded to provide specialist facilities for older adults and children’s water play.
5.2.2 Concept Plan and Detailed Design Report :Sweetnam and Ord 2003.
The report which focussed on the provision of health and fitness facilities recommended the redevelopment of the facility to allow for expanded program spaces to include a 400msq gymnasium, 100msq program room and 90sqm multipurpose room. The concept plans identified the need for larger changing areas and provided plan for a 140msq male change and 160msq female change area.

Collingwood Leisure Centre Aquatic Feasibility Study DRAFT Page 12 of 92
6 Context
This section provides an overview of the context in which the facility is currently positioned. Issues such as facility history, competitive environment, facility catchment and industry trends are explored.
6.1 Local Government Provision of Aquatic Facilities The table below provides an overview of the aquatic provision of 25 local governments in Victoria. Based on this sample the City of Yarra has a relative high provision of Aquatic facilities with the Collingwood Leisure Centre 25m indoor pool, Richmond Baths 50m indoor pool and Fitzroy Swimming Pool Outdoor 50m pool.
Based on the broad statistic of population per pool Yarra ranks fourth (23,000) behind the City of Bendigo (7500), City of Ballarat (12,000), and City of Moreland (19,286). In terms of population per indoor pool the City of Yarra ranks second with 34,500 people per indoor pool.
Suburb Population Indoor 25m
Indoor 50m
Outdoor Total pop per pool
pop per ind pool
pop per out pool
Bendigo 60,000 1 7 8 7500 60000 8571 Ballarat 84,000 2 5 7 12000 42000 16800Moreland 135,000 3 0 4 7 19286 45000 33750
Yarra 69,000 1 1 1 3 23000 34500 69000MooneeValley
110,000 3 1 4 27500 36667 110000
Hume 140,000 3 2 5 28000 46667 70000Whittlesea 120,000 2 2 4 30000 60000 60000Stonnington 90,000 1 2 3 30000 90000 45000Nillumbik 61,000 1 1 2 30500 61000 61000Darebin 122,000 2 0 2 4 30500 61000 61000Monash 162,000 3 2 5 32400 54000 81000Banyule 118,000 2 1 3 39333 59000 118000Boroondara 158,000 2 2 4 39500 79000 79000Geelong 198,000 3 2 5 39600 66000 99000Port Phillip 81,000 1 1 2 40500 40500 - Hobsons Bay
83,000 2 2 41500 41500 -
Whitehorse 146,751 1 1 1 3 48917 73376 146751Maroondah 100,000 1 1 2 50000 100000 100000Wyndham 100,000 1 1 2 50000 100000 100000Brimbank 170,000 2 1 3 56667 85000 170000Manningham 114,000 1 1 2 57000 114000 114000Maribyrnong 60,000 1 1 60000 60000 - Glen Eira 123,000 2 2 61500 - 61500Casey 191,000 1 1 1 3 63667 95500 191000GreaterDandenong
133,000 1 1 2 66500 133000 133000
Kingston 135,000 1 1 2 67500 67500 - Knox 150,000 1 1 2 75000 150000 150000

Collingwood Leisure Centre Aquatic Feasibility Study DRAFT Page 13 of 92
6.2 History The Collingwood Leisure Centre was designed in the early 1970’s and opened in 1974. The centre was extensively renovated in 1994 and now comprises a 25m “L shaped” indoor-heated swimming pool, a toddler’s pool, spa and sauna, aerobics room, gymnasium, cardio room and crèche. The facility is located in Mayors Park and sits adjacent to six outdoor tennis courts and a tennis pavilion.
6.3 Facilities & Design The component mix of the centre makes it suitable for a variety of active recreation pursuits including: Fitness Gym, Group Fitness Classes, Lap Swimming, Learn to Swim Classes, Swim Squad Training, Recreational Swimming. In comparison contemporary facilities the aquatic facility design does not cater well for families, toddlers, older adults and people with disabilities.
A detailed assessment of the facilities by architectural consultants Crone McKerrell Lynch3 and Sweetnam Godfrey and Ord4 highlighted the following issues relating to facility design:
The entry foyer and reception area do not have direct visibility over dry and aquatic activity spaces. There is a lack of planned kiosk or merchandise/ retail areas. The children’s toddler pool is inadequate in size. Existing planter Box is Visually Obtrusive. The location of the toddler’s pool is isolated from the remaining pool and is not optimally lit. The location of the family / disabled change room is remote from remaining facilities. The gymnasium and aerobics room are undersized and do not have sufficient storage capacity. The disabled access to the main pool is inadequate. Disabled circulation around the building will need to be considered given the usage of the first floor. The main pool is well lit with natural light. The plant areas seem inadequate in size and storage capacity. The meeting rooms to the north west end of the pool are not ideally located as they require crossing a wet area to access what is a primarily “dry” consultation zone. The Spinning and Yoga Rooms require adequate storage.
In addition to these issues a number of issues impact on the ability to maximise program attendances:
The gym and cardio rooms are not connected and there is limited movement between spaces.
3 As outlined in the Collingwood Leisure Centre Masterplan June 2000 4 As outlined in the Concepts Planning and Design Report 2002

Collingwood Leisure Centre Aquatic Feasibility Study DRAFT Page 14 of 92
The gym and cardio rooms would benefit greatly from a more prominent space within the centre and increased visibility to the main roads. The multi usage nature of the pool does not allow for separate temperatures and depths
specific to activities – this is important for activities such as learn to swim classes, lap swimming and aquatic rehabilitation.
6.4 Program Range
The services provided at CLC go beyond the traditional sport and recreation services, the council in managing the CLC are able to attract a wide range of customer segments in areas of active recreation, lifestyle / wellness programs and social inclusion programs. The model to the right highlights the segments catered for at CLC. These segments are explained in more detail in section 3.7.1
Community Groups
Casual Recreation Families
Casual Recreation
Age
40—60
20—39
10—19
0-10
60 plus
Reason for Use
Community Recreation
Social Inclusion Lifestyle Wellness
Rehabilitation Lifestyle
Market Segments
Sport & Fitness
Education Learn To
ie swim les-sons

Collingwood Leisure Centre Aquatic Feasibility Study DRAFT Page 15 of 92
6.5 Performance A review of the CLC performance highlights a number of trends in membership performance, financial performance and program attendances
6.6 Participation Participation rates at CLC are outlined in the table below. Total attendances at the facility are in excess of 230,000 per annum. In addition to the monthly visits outlined below aquatic attendances are also achieved from Learn to Swim Participants (26,000 per annum), school groups (14,000 per annum) and lane hire groups (17,000).
Participation in the aquatic areas makes up 34% of all uses. Spectators are not included in this figure; including spectators would increase annual attendances to over 300,000 visits per annum.
Sum of Visits Program Type
Year Month Dry Lifestyle Member-
shipMultiSport Other Pool Wet
GrandTotal
2005 2 473 59 4047 67 82 1565 1001 7294 3 1074 94 9472 146 160 3311 2058 16315 4 1112 95 9174 138 161 3560 1436 15676 5 1190 122 10221 174 214 3555 2528 18004 6 987 105 9619 149 224 3313 1944 16341 7 1096 100 9086 136 191 3376 1673 15658 8 1423 118 10107 165 220 3642 2486 18161 9 1352 91 9268 133 264 3732 1471 16311 10 1370 113 9532 149 207 3849 2457 17677 11 1220 103 8686 108 306 3715 2551 16689 12 905 61 6977 71 171 3700 1621 13506 2005 Total 12202 1061 96189 1436 2200 37318 21226 171632
2006 1 1075 47 7807 57 181 5059 395 14621 2 1225 88 8082 68 214 3720 2549 15946 3 1155 103 9383 71 220 4077 1706 16715 4 999 72 7892 59 148 3230 2572 14972 5 72 7 393 16 6 157 86 737 2006 Total 4526 317 33557 271 769 16243 7308 62991
Grand Total 16728 1378 129746 1707 2969 53561 28534 234623 Percentage 7.1% 0.5% 55% 0.7% 1.2% 22% 12%
Collingwood Leisure Centre Aquatic Feasibility Study DRAFT Page 16 of 92
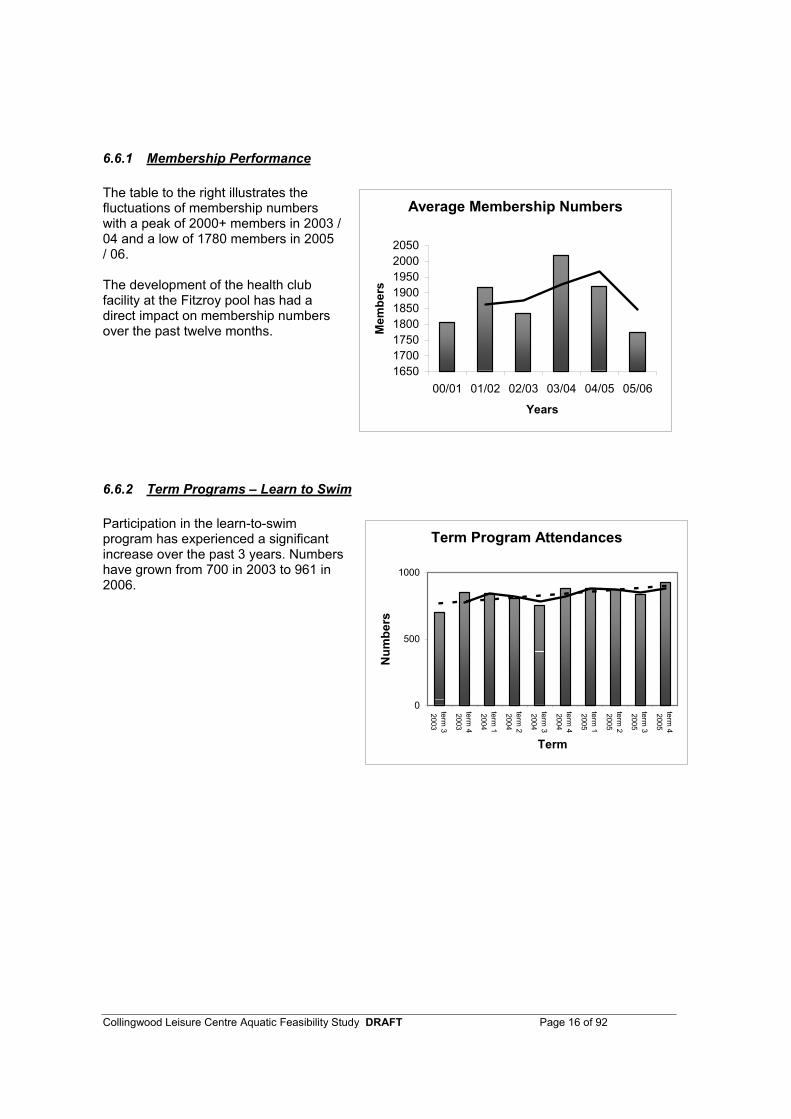
6.6.1 Membership Performance
The table to the right illustrates the fluctuations of membership numbers with a peak of 2000+ members in 2003 / 04 and a low of 1780 members in 2005 / 06.
The development of the health club facility at the Fitzroy pool has had a direct impact on membership numbers over the past twelve months.
Average Membership Numbers
165017001750180018501900195020002050
00/01 01/02 02/03 03/04 04/05 05/06
Years
Mem
bers
6.6.2 Term Programs – Learn to Swim
Participation in the learn-to-swim program has experienced a significant increase over the past 3 years. Numbers have grown from 700 in 2003 to 961 in 2006.
Term Program Attendances
0
500
1000
term 3
2003
term 4
2003
term 1
2004
term 2
2004
term 3
2004
term 4
2004
term 1
2005
term 2
2005
term 3
2005
term 4
2005
Term
Num
bers

Collingwood Leisure Centre Aquatic Feasibility Study DRAFT Page 17 of 92
6.6.3 Aquatic Casual Participation
The table below outlines the casual participation rates in the aquatic areas. The table is significant in highlighting the low participation rates from children (10%), pensioners (3%) and families (1%).
2005 2006 Mar Apr May Jun Jul Aug Sep Oct Nov Dec Jan Feb Total % C of Y Pensioner Entry 73 73 125 153 107 132 122 144 112 150 1191 3 Swim Adult 3023 2841 3024 2603 3003 3165 2757 2741 2819 2648 1088 2919 32631 69 Swim Child 416 565 198 226 262 255 407 381 530 806 506 435 4987 10 Swim Concession 793 795 781 667 823 856 827 925 887 907 302 809 9372 20 Swim Family 27 35 11 9 16 7 5 12 33 68 27 26 276 1
4259 4236 4014 3505 4104 4283 3996 4059 4269 4429 2035 4339 47528
6.6.4 Access Programming
The CLC provides access to a range of community groups. These groups are listed below. Current expansion of the access programming is limited by availability and appropriateness of aquatic space.
Program Indo Chinese Aquaerobics
classes
Alfred Hospital
Gym group
North Yarra Community
Centre
Carlton Senior
Citizens
Accessmembers
SocialOutings
Collingwood English
Languagespeaking
schoolAnnual Total Visits 575 240 240 120 424 175

Collingwood Leisure Centre Aquatic Feasibility Study DRAFT Page 18 of 92
6.6.5 Financial Performance
Financial performance within the facility has decreased since 2003/04. This decrease can be attributed to a net decrease in membership revenue and a net increase in dry program expenditure. Issues such as increased competition form the Fitzroy pool and the ageing facility has been provided to explain the decreased membership revenue.
Years 01/02 02/03 03/04 04/05 05/06
Income Dry Programs 128027 123675 107588 151400 153694 Lifestyle programs 25586 37602 26633 2900 22336 Memberships 1007001 1029214 1178879 1170202 1132725 Multi Sport 55059 66580 47433 40065 29624 Other 60276 50277 22198 21476 21689 Pool 170635 150943 171237 188520 165526 Retail 65086 59584 57531 62247 55718 Wet Programs 301617 315013 302431 365008 368690
Income Total 1813287 1832888 1913930 2001818 1950002 Expenditure Dry Porgrams 302216 315203 242485 260436 301814 Lifestyle Programs 23539 35700 28708 23434 15238 Multisport 23667 6365 7661 5569 9935 Other 930198 971432 984583 1067829 987457 Pool 131646 128992 135478 150495 159716 Retail 29903 39962 34808 40249 37303 Wet Programs 160796 168401 163073 194403 208359
Expenditure Total 1601965 1666055 1596796 1742415 1719822 Total Net 211322 166833 317134 259403 230180

Collingwood Leisure Centre Aquatic Feasibility Study DRAFT Page 19 of 92
6.7 Competition
The recreation industry has enjoyed significant expansion over the past decade. The local government and private sector has invested significant resources in this area in particular the provision of “land based” program opportunities in the form of weight training and group fitness activities. The investment in the land-based activities has been in response to changing customer demands and also as a strategy to improve the financial performance of the facilities.
The Central and Northern Suburbs have experienced this expansion with the upgrading and development of many facilities in the area. The table below outlines this development, the area of focus of these developments has been the health clubs, and this reflects the growth of the fitness market and the cost benefit associated with this development:
Centre Development ResultsCoburg Leisure Centre Extension of Health Club Memberships increased from 800 -
2000Kew Recreation Centre Extension of Health Club Memberships increased from 1800 -
3000Melbourne City Baths Extension of Health Club Memberships have increased from
1250 - 1850Brunswick City Baths Development of Cardio
TheatreMemberships have increased from
1200 - 2200Carlton Baths Development of Community
Gym600 new members
Northcote Aquatic Centre
Extension of Health Club Memberships increased from 1300 – 2600
Mill Park Leisure Centre Redevelopment of Health Club
Memberships increased from 600 - 2200
Fitzroy Swimming Pool Development of Health Club 700 new membersRichmond Recreation Centre
Redevelopment of Health Club
Increased memberships from 800 - 2250
In addition to local government development a number of private operators have expanded operations within a 3-5km radius from the Collingwood Leisure Centre these facilities include Fernwood, Fitness First (2 sites).

Collingwood Leisure Centre Aquatic Feasibility Study DRAFT Page 20 of 92
6.8 Program Competition
The matrix to the right outlines the degree of competition in the community for recreation and health programs. There are high levels of competition for the traditional sport and fitness activities of Health Club, Group Fitness and Lap Swimming. High levels of competition are also evident in health and wellness services such as yoga, massage and rehabilitation. There are relatively low levels of competition for recreation programs servicing the needs of specific community groups and the general health and recreation needs of families.
Customer segmentation and competition is explained further in section 3.7.1 explained in further detail in following table.
Family Recreation
Community groups NESB programs Youth programs Older Adults Learn to swim Classes School Aquatic Por-grams
Health Club / Gym Group Fitness Lap Swimming
Rehabilitation ie Physio Yoga Massage
Community need
General
High
Specific
Low Level of Competition
Programming Matrix
The presence of competition has had the following impacts:
Increased pressure on the 18 – 35 year old fitness market Increased consumer demand for high quality well presented facilities Increased consumer demand for up to date equipment Greater importance on the marketing and sales function of the facility

Col
lingw
ood
Leis
ure
Cen
tre A
quat
ic F
easi
bilit
y S
tudy
DR
AFT
P
age
21 o
f 92
6.8.
1 Pr
ogra
m ra
nge
The
follo
win
g ta
ble
prov
ides
gre
ater
det
ail o
n th
e cu
stom
er s
egm
ents
ser
vice
d by
CLC
and
the
degr
ee o
f com
petit
ion
for e
ach
segm
ent.
Segm
ent
Des
crip
tion
Prov
isio
n at
CLC
Pr
ovis
ion
in C
omm
unity
Le
arn
To…
. Th
is g
roup
is g
ener
ally
the
0 –
13 y
r ol
d an
d en
gage
d in
lear
n to
cla
sses
. Th
e go
al fo
r thi
s gr
oup
is s
kill
acqu
isiti
on, e
duca
tion
and
soci
alis
atio
n.
CLC
cat
ers
for t
his
grou
p w
ithin
the
Lear
n to
Sw
im a
nd s
quad
pro
gram
s.
Lear
n to
Sw
im c
lass
es a
re p
rovi
ded
at
neig
hbou
ring
loca
l gov
ernm
ent s
ites.
Th
ere
is n
o pr
ivat
e le
arn
to s
wim
pr
ogra
ms
in th
e ar
ea.
Teen
age
Th
is s
egm
ent i
s m
otiv
ated
by
the
enjo
ymen
t of a
ctiv
ity a
nd p
artic
ipat
ing
in th
e ac
tiviti
es w
ith th
eir p
eer g
roup
.
The
swim
squ
ad p
rogr
am e
ncou
rage
s te
enag
e pa
rtici
patio
n. T
he p
ool d
esig
n lim
its a
ny s
peci
fic te
enag
e pr
ogra
ms.
Te
enag
ers
are
enco
urag
ed to
acc
ess
the
gym
bet
wee
n 4.
00 –
6.0
0pm
dur
ing
wee
kday
s.
Ther
e is
ver
y fe
w h
ealth
and
fitn
ess
venu
es, w
hich
cat
er fo
r tee
nage
rs, t
he
cost
s as
soci
ated
with
sup
ervi
sion
and
th
e pe
rcei
ved
impa
ct o
n ot
her
mem
bers
, mea
n th
at c
omm
erci
al
venu
es a
re re
luct
ant t
o pr
ovid
e pr
ogra
ms
for t
his
grou
p.
Spo
rt an
d Fi
tnes
s P
redo
min
atel
y 18
– 4
0 th
is g
roup
is
gene
rally
wel
l-edu
cate
d an
d co
ncer
ned
abou
t gen
eral
wel
l bei
ng. T
here
are
m
ore
fem
ales
than
mal
es in
this
gro
up
as M
ales
are
abl
e to
acc
ess
orga
nise
d sp
ort i
n m
ore
num
bers
than
fem
ales
.
CLC
has
ove
r 700
mem
bers
age
d be
twee
n 18
– 4
0 ye
ars.
Gen
eral
ly th
ese
mem
bers
par
ticip
ate
in th
e he
alth
clu
b an
d gr
oup
fitne
ss p
rogr
am. T
his
grou
p is
re
lativ
ely
easy
to a
ttrac
t and
are
m
otiv
ated
by
acce
ss to
a w
ide
rang
e of
pr
ogra
ms
and
up to
dat
e eq
uipm
ent.
Ther
e is
sig
nific
ant c
ompe
titio
n fo
r thi
s se
ctor
. The
re a
bilit
y to
pay
for s
ervi
ces
has
mad
e th
is g
roup
an
attra
ctiv
e m
arke
t for
com
mer
cial
ope
rato
rs. T
his
segm
ent h
as b
een
furth
er d
efin
ed w
ith
the
intro
duct
ion
of fe
mal
e on
ly fi
tnes
s ce
ntre
s su
ch a
s Fe
rnw
ood.
C
asua
l Rec
reat
ion
The
casu
al re
crea
tion
segm
ent i
s ag
ed
18 –
70+
. Thi
s is
a d
iver
se s
egm
ent
with
a v
arie
ty o
f mot
ivat
ions
for
parti
cipa
tion.
The
y sh
are
a ne
ed to
at
tend
on
a ca
sual
bas
is.
Ove
r 40%
of t
he fa
cilit
y us
age
is m
ade
up o
f cas
ual r
ecre
atio
n us
ers.
The
se
grou
ps a
re c
ater
ed fo
r wel
l with
full
acce
ss to
pro
gram
s an
d se
rvic
es
avai
labl
e to
this
seg
men
t (ex
cept
term
pr
ogra
ms)
.
This
gro
up is
gen
eral
ly n
ot c
ater
ed fo
r w
ithin
the
com
mer
cial
sec
tor t
hat
pref
er to
hav
e us
ers
com
mit
to a
m
embe
rshi
p be
fore
usi
ng th
e fa
cilit
ies.
Th
is g
roup
is c
ater
ed fo
r wel
l in
coun
cil’s
out
door
poo
l in
Fitz
roy
and
ther
e is
a s
i gni
fican
t mov
emen
t fro
m

Col
lingw
ood
Leis
ure
Cen
tre A
quat
ic F
easi
bilit
y S
tudy
DR
AFT
P
age
22 o
f 92
Segm
ent
Des
crip
tion
Prov
isio
n at
CLC
Pr
ovis
ion
in C
omm
unity
C
LC to
this
faci
lity
durin
g th
e ho
t m
onth
s.
Com
mun
ity G
roup
s Th
is is
a d
iver
se ra
nge
of g
roup
s in
clud
ing
tradi
tiona
l spo
rting
clu
bs
thro
ugh
to g
roup
s su
ch a
s di
sabi
lity
grou
ps, s
ocia
l gro
ups
and
yout
h gr
oups
. The
goa
ls o
f the
gro
ups
are
equa
lly d
iver
se a
nd in
clud
e fit
ness
he
alth
soc
ial a
nd e
nter
tain
men
t.
CLC
acc
omm
odat
es th
e br
oad
spec
trum
of
com
mun
ity g
roup
s.
Gro
ups
wou
ld h
ave
diffi
culty
ac
cess
ing
priv
ate
faci
litie
s, th
e sp
ace
and
supe
rvis
ion
requ
ired
for t
hese
gr
oups
is n
ot w
arra
nted
bas
ed o
n th
e fe
es, w
hich
they
can
affo
rd to
pay
. Th
e in
trodu
ctio
n of
thes
e gr
oups
w
ithin
the
faci
lity
can
also
hav
e a
nega
tive
impa
ct o
n th
e us
age
of
curr
ent c
lient
ele
and
is n
ot
enco
urag
ed d
urin
g pe
ak ti
mes
. H
ealth
Pro
mot
ion
/ Li
fest
yle
This
gro
up is
pre
dom
inat
ely
in th
e 35
an
d ol
der a
ge g
roup
. The
se in
divi
dual
s pa
rtici
pate
in e
xerc
ise
for t
he g
ener
al
wel
l bei
ng b
enef
its o
r for
reha
bilit
atio
n /
heal
th p
reve
ntio
n re
ason
s. T
he s
ocia
l as
pect
s of
par
ticip
atio
n ar
e im
porta
nt
for t
his
segm
ent.
For i
ndiv
idua
ls in
the
olde
r age
gro
ups
pric
e an
d ac
cess
ibilit
y ar
e im
porta
nt
varia
bles
, whi
ch im
pact
on
parti
cipa
tion.
CLC
has
a s
igni
fican
t num
ber o
f m
embe
rs a
nd c
asua
l par
ticip
ants
in th
is
segm
ent.
Prog
ram
s su
ch a
s w
eigh
t tra
inin
g, s
pa /
saun
a an
d w
elln
ess
activ
ities
attr
act t
his
grou
p.
Ther
e ar
e fe
w c
omm
erci
al p
rovi
ders
w
ho a
ctiv
ely
targ
et th
is s
egm
ent,
ther
e in
abili
ty to
pay
, acc
ess
requ
irem
ents
an
d in
crea
sed
supe
rvis
ion
dem
ands
m
ake
this
gro
up “u
nattr
activ
e” to
oth
er
prov
ider
s.
Fam
ily
This
seg
men
t is
gene
rally
bas
ed
arou
nd th
e us
age
of th
e aq
uatic
leis
ure
spac
es a
nd o
ften
utilis
ed b
y fa
milie
s w
ith y
oung
chi
ldre
n.
The
focu
s is
for l
eisu
re e
xper
ienc
e an
d is
sup
porte
d by
the
avai
labi
lity
of
anci
llary
faci
litie
s su
ch a
s th
e ca
fete
ria.
CLC
doe
s no
t cat
er w
ell f
or th
is g
roup
du
e to
the
limita
tions
with
the
aqua
tic
area
des
ign.
O
utsi
de o
f the
‘lea
rn to
sw
im’ p
rogr
am
ther
e ar
e fe
w o
ppor
tuni
ties
for f
amily
pa
rtici
patio
n in
the
faci
lity.
Com
mer
cial
hea
lth a
nd fi
tnes
s pr
ovid
ers
do n
ot ta
rget
this
seg
men
t.
This
gro
up is
pric
e co
nsci
ous
with
m
any
safe
ty a
nd s
uper
visi
on
cons
ider
atio
ns s
urro
undi
ng th
eir
usag
e.
Collingwood Leisure Centre Aquatic Feasibility Study DRAFT Page 23 of 92
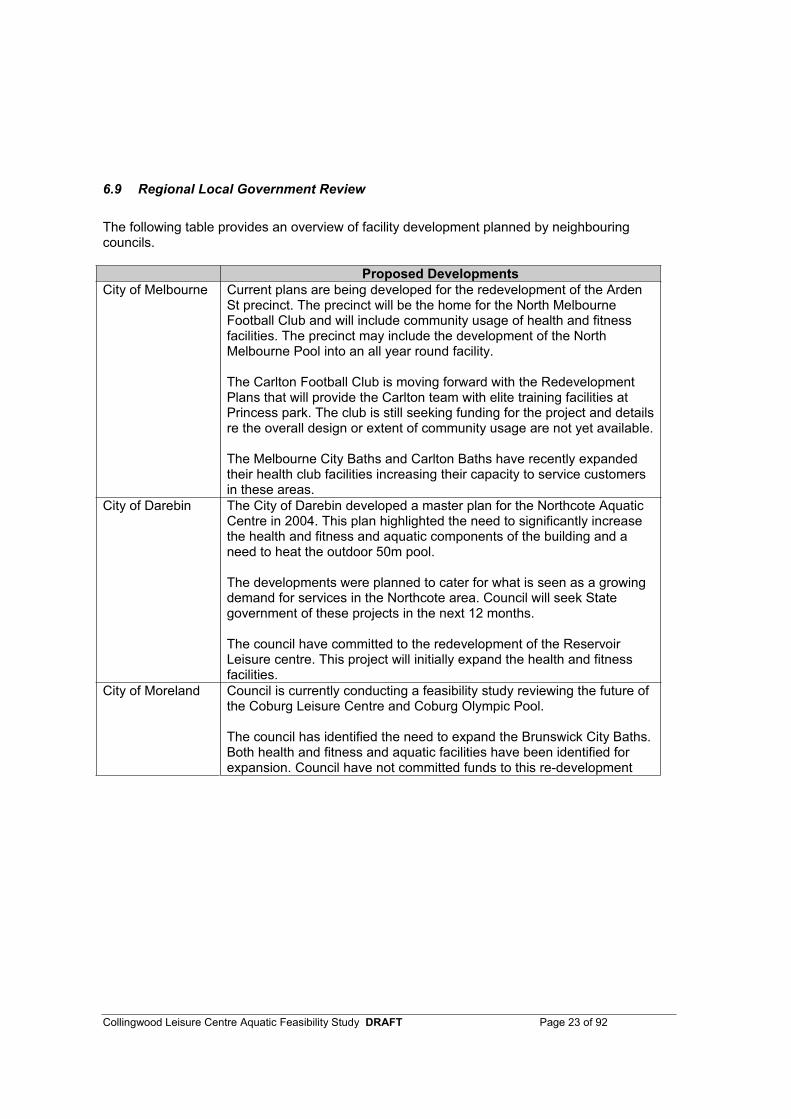
6.9 Regional Local Government Review
The following table provides an overview of facility development planned by neighbouring councils.
Proposed Developments City of Melbourne Current plans are being developed for the redevelopment of the Arden
St precinct. The precinct will be the home for the North Melbourne Football Club and will include community usage of health and fitness facilities. The precinct may include the development of the North Melbourne Pool into an all year round facility.
The Carlton Football Club is moving forward with the Redevelopment Plans that will provide the Carlton team with elite training facilities at Princess park. The club is still seeking funding for the project and details re the overall design or extent of community usage are not yet available.
The Melbourne City Baths and Carlton Baths have recently expanded their health club facilities increasing their capacity to service customers in these areas.
City of Darebin The City of Darebin developed a master plan for the Northcote Aquatic Centre in 2004. This plan highlighted the need to significantly increase the health and fitness and aquatic components of the building and a need to heat the outdoor 50m pool.
The developments were planned to cater for what is seen as a growing demand for services in the Northcote area. Council will seek State government of these projects in the next 12 months.
The council have committed to the redevelopment of the Reservoir Leisure centre. This project will initially expand the health and fitness facilities.
City of Moreland Council is currently conducting a feasibility study reviewing the future of the Coburg Leisure Centre and Coburg Olympic Pool.
The council has identified the need to expand the Brunswick City Baths. Both health and fitness and aquatic facilities have been identified for expansion. Council have not committed funds to this re-development

Collingwood Leisure Centre Aquatic Feasibility Study DRAFT Page 24 of 92
6.10 Facility Catchment
Determining the catchment for the CLC is an important component of the review. A clear definition of the catchment is integral to determining current and future demand.
The diagram below maps the residence of 3615 individual facility users. Information was captured from members; learn to swim members and multi user pass holders. The diagram illustrates the clustering of users; these clusters are most intense within 1-3k from the facility. Other clusters of customers exist and tend to follow major arterial routes to and from the facility, these clusters travel along High Street to Northcote – Thornbury / Reservoir, Heidelberg Road to Fairfield Alphington, Alexandra Parade to Fitzroy and Carlton and Hoddle St to Collingwood and Abbotsford.
The impact of the competition in particular the recent Fitzroy pool and Carlton Baths developments with relatively few customers attending from the suburbs of Fitzroy, Carlton, Carlton, Carlton Nth and Collingwood.
Further catchment analysis is provided in attachment five

Collingwood Leisure Centre Aquatic Feasibility Study DRAFT Page 25 of 92
The table below summarise the data provided in the previous diagram. The following observations can be made:
62% of all customers live less than 2km from the CLC. 90% of all customers live less than 5km from the CLC Customers with bulk visit passes are most likely to travel when compared to other
customer segments.
Member Swim School Visitor Total Distance from CLC (km) No. % No. % No. % No. %0 - 1.9 1448 70 380 65 2021 56 3849 622.0 - 4.9 480 23 182 31 1130 31 1792 285.0 - 9.9 84 4 24 4 244 7 352 6<20 51 2 1 0 195 5 247 4Grand Total 2063 100 587 100 3590 100 6240 100
The physical position of the CLC located on a main road assist in capturing a broad catchment. This is particularly important given the large number of people who travel form outside of Yarra to work. The diagram to the right outlines the top 10 suburbs that people travel from to work within the City of Yarra.
The large numbers of people who travel from Darebin, Moreland and Banyule assist in explaining the large numbers of CLC users from these areas. This fact is important, as there is the potential for the facility to develop both local and regionally appropriate services.

Collingwood Leisure Centre Aquatic Feasibility Study DRAFT Page 26 of 92
6.11 Facility Design / Management Trends
Recent facility developments in the City of Casey, City of Monash, City of Rockingham and the current City of Maribyrnong development has seen the establishment of regional aquatic facilities with features such as wave pools designed to service customers from a large catchment (10 – 15km). These developments are designed to cater for residents within the expanded municipal boundaries.
Other trends within these new developments are: The use of technology to allow fast access for members and multi visit users Large health club facilities (in excess of 450m²) with cardio equipment making up to 50% of the floor space and traditional free weight training areas as little as 20% of the space. (e.g. Casey ARC, Mill Park Leisure Centre) The positioning of warm water areas away from children’s play areas to create a wellness zone for older adults and individual seeking a relaxation experience. (Monash ARC, Maribyrnong Aquatic, Perth Aqua Jetty) Positioning café facilities in the front of facilities so individuals not actually utilising any other components of the facility can access them. The Café becomes a meeting point or destination in its own right. (Monash ARC, Casey ARC, Perth Aqua Jetty, Melbourne Sports and Aquatic Centre, Mill Park Leisure) The location of commercial health professionals within the facility to create a “one stop shop” for customers and a health pathway for rehabilitation clients (Monash ARC, Casey ARC, Perth Aqua Jetty) The separation of wet and dry change rooms to differentiate the service provided in these areas. (Casey ARC, Monash ARC, Perth Aqua Jetty) Family change rooms Separate access points and changing areas for schools programs. (Monash ARC, Broadmeadows Leisure Centre Redevelopment) The use of technology to improve the quality of water within aquatic areas. The use of technology to assist in maintaining pool safety. Technology can be used to detect potential drowning.

Collingwood Leisure Centre Aquatic Feasibility Study DRAFT Page 27 of 92
6.12 Industry Participation Trends
The following is a snap shot of the participation changes occurring in local government aquatic and recreation facilities:
The use of management systems such as monthly debit has had an impact on participation numbers in both memberships and learns to swim numbers. Wellness based activities such as yoga and pilates are on the increase (see next section) Participation rates for older adults have increased significantly in areas such as walking and golf, this has not translated into increased participation in health clubs. Participation in organised sporting competitions has experienced a decline in many sports with the exception of soccer and netball. The demographic and age distribution of health club users has become more defined with the majority of members within the 25 – 35 year old age group.
6.13 Health and Fitness Industry
The health and fitness industry has experienced significant changes since the CLC was developed (1974). The changes have heralded an increased level of commercialism within the industry as more intense competition and changing customer expectations have placed added pressure on local government providers of recreation. The overall participants in health and fitness industry with an increase of over 39% since 20025 in Victoria alone, yet there is increasing competition for these new customers.
6.14 Overall Participation Trends
The following is a snap shot of the participation changes occurring in local government aquatic and recreation facilities:
The activities that the CLC carries out are Aerobics and Fitness, Yoga, Swimming and Aqua aerobics. All of these activities have increased their participation rates in Victoria since 20026.The figures below show the increase in participants and the percentage increase over time.
Activity 2002 2004 % Increase Aerobics and Fitness 603,100 841,00 39.45 Aqua aerobics 30,900 37,000 19.74 Swimming 521,000 656,700 26.05
5 ERASS participation trends 6 ERASS participation trends

Collingwood Leisure Centre Aquatic Feasibility Study DRAFT Page 28 of 92
Yoga 96,800 148,900 53.82
6.15 Participation trends for young people Young people are shifting away from the traditional team sports such as Aussie Rules and cricket to individual and ‘takeaway’ sports that are more convenience based, i.e. centred on the individual.Some of this increase may be attributed to increased choice, but also to the prevalence of childhood obesity and the emphasis on body image.
While the different type of recreation is changing, this group is still the highest participation group across all age groups. This is due to the organised nature of the activities, most of which are based around the education system. School based sports and lessons are still the major driver in recreation participation.
As the children age and reach adolescence they hit a 90% participation rate in organised and unorganised sports and activities.
The table to the right illustrates the changing activity choices of young people as they age. With relevance to CLC 22.9% of children aged 5-8yrs participate in swimming this decreases to 6.7% when for children aged 12 – 14yrs.
Children Activity in Victoria7
5-8yrs 9-11yrs 12-14yrsSwimming 22.9% 17.40% 6.70% Australian Rules 9.6% 13.60% 13.30% Tennis 7.9% 14.10% 11.60% Basketball 7.2% 16.10% 12.60% Netball 3.1% 14.30% 14.30% Skateboarding 30.9% 34.70% 21.90%
6.16 Participation trends for older adults As there is an increased emphasis on health care and superannuation, Australia like the rest of the Western world has an aging population. Through such programs such as Living Longer Living Stronger™ run by the Council of the Aged (COTA)8 there is an increasing emphasis on advocating and promoting the benefits of strength training and raising its profile within the Fitness, Community Health and Aged Care sectors and with older people.
7 ABS (2003) children’s participation in sport and recreation 8 www.cota.org.au

Collingwood Leisure Centre – Aquatic Feasibility Study Page 29 of 92
7 Research
7.1 Theoretical Foundation: Community Benefit of Sport and Recreation The following table provides an overview of the benefits of sport and recreation within communities; these benefits include improving community health, engaging community youth and increasing community pride and spirit. This research highlights the importance of the social and community development role of facilities such as CLC in developing a sense of belonging and spirit in the community.
Author Summary of research
Driscoll and Wood (1999)9
Sport facilities can create community hubs, which people use to develop webs of affiliation and maintain social networks. Sport and recreation make significant social, economic, cultural and environmental contributions to the life of communities.
Curry and White 200210
Sport and Recreation programs in communities have been linked to increased health, decreased crime and associated economic outcomes. Significant research has been completed in this area and includes positive links to; Reduction in crime and other offences (Johnston 1991, Bowers 1999, Cameron and MacDougall 2000), A positive strategy from the Royal commission into Aboriginal Deaths in Custody (Johnston 1991), Diversionary programs to reduce petrol sniffing (Stojanovski 1994, Brady 1984) Health and associated economic and social benefits (AIHW 2000). Sport and recreation activities at the grass roots level also have the potential to stimulate a whole communities spirit and pride (Clark 2001).
Australian Bureau of Statistics (2002)11
Many benefits are associated with participating in sport and physical activity including health, personal development, community involvement and socio-economic benefits
9 Driscoll and Wood (1999): Changes and challenges for rural communities in Victoria 10 Curry and White (2002); Tackling Distance Barriers in Sport Education. Northern Territory University

Collingwood Leisure Centre – Aquatic Feasibility Study Page 30 of 92
Mason (2002)12 A sport participation project in the rural Shire of Pingelly is in the trial phase but initial findings suggest that increasing sport opportunities for children assist in: Increase in regular attendance of students. Improved behaviour of students at school. Reduction in crime rate during the conduct of the program.
7.2 Customer Demographics
This section provides an overview of the Demographics of the City of Yarra. Current and projected profiles of the community will be reviewed; implications of these demographics on participation within CLC will be discussed.
7.2.1 Changes in demographic profileYarra has experienced significant changes in its’ demographic profile over the past decade. Substantial changes charted in Yarra include a drop in the number of residents born overseas, an increase in median weekly wage, a drop in unemployment and an increase in the number employed.
YarraTotal Population 6% Born in Australia 10% Born Overseas -16% Unemployed -50% Employed 21% Median Age 31 – 32 (slight ageing) Median weekly income 120% Mean Household size -9%
Source Yarra MPHP 2005 - 2008
According to the department of sustainability and environment13 the estimated resident population of Yarra will increase from 68,947 people in 2001 to 89,898 people in 2031. This equates to an annual increase of 0.87 percent.
11 Cited in Curry and White (2002); Tackling Distance Barriers in Sport Education. Northern Territory University 12 Mason (2002) Does sport produce better citizens? Department Sport and Recreation Western Australia 13 2004 Victoria in Future Summary - DSE

Collingwood Leisure Centre – Aquatic Feasibility Study Page 31 of 92
7.2.2 SEIFA Index
There has been a significant increase in the level of advantage and wealth for Yarra Residents. This is primarily due to the number of professionals and high-income earners moving into the City. The figure below illustrates the SEIFA14 data across the city. The darker areas being the lowest SEIFA scores.
The figure above highlights the relative’s advantage of communities surrounding CLC in particular Clifton Hill and Fitzroy North. Te SEIFA index of Northcote is slightly lower than Yarra at 100815. This is a particularly important statistic as there is a direct relationship between socio economic status of the community and relative participation rates of these communities.16
14 The SEIFA index is a measurement of overall social disadvantage, accounting for levels of income, educational attainment, unemployment, tenancy and English language proficiency.15 Submission to the Senate from Darebin City Council – Financial Hardship in Australia 16 Stratton etal (2005) Social Correlates of sport and recreation participation by adults. Australian Bureau of Statistics

Collingwood Leisure Centre – Aquatic Feasibility Study Page 32 of 92
7.2.3 Population
The specific population of the suburbs surrounding the CLC are outlined in the table to the right. This is important given the localised catchment of CLC. The population of Northcote South is provided as CLC draws many customers from this suburb.
Totalpopulation*
City of Yarra 67052 Clifton Hill 5164 Collingwood 5081 Fitzroy 8784 Fitzroy North 9904 Abbotsford 4016 Carlton North-Princes Hill 8119 Fairfield-Alphington 2191 Northcote South 21016
7.2.4 Age
The age structure of City of Yarra is dissimilar to the Melbourne Statistical Division. The most significant differences are:
A significantly higher percentage of persons aged 25-34 A lower percentage of persons aged 5-11 A lower percentage of persons aged 12-17 A higher percentage of persons aged 18-24
When reviewing the distribution of ages in neighbouring suburbs it highlights the opportunities that exist for CLC in capturing greater usage from the 0-11 and 50 plus age groups. CLC has been relatively successful in providing programs for the 18 – 49yr old age groups, this age group makes up the majority of the population.
0-4 5-11 12-17 18-24 25-34 35-49 50-59 60 - 84 85
plus TotalCity of Yarra 3153 3413 2713 8618 18984 14606 6484 6052 866 67052 Clifton Hill 273 315 253 524 1346 1304 549 356 50 5164 Collingwood 267 253 227 653 1499 1131 408 386 34 5081 Fitzroy 401 417 335 1043 2538 1902 837 863 111 8784 Fitzroy North 489 526 353 1172 2879 2210 914 947 186 9904 Abbotsford 149 221 141 457 1084 954 410 396 67 4016 Carlton North-Princes Hill 353 373 289 1589 2215 1575 793 695 71 8119 Fairfield-Alphington 109 159 173 225 367 557 291 187 51 2191 Northcote South 1,276 1396 902 1980 4729 5157 1853 2400 520 21,016

Collingwood Leisure Centre – Aquatic Feasibility Study Page 33 of 92
The age distribution of Yarra is positive in terms of participation. Odds ratios of participation in Physical activity are at there greatest for people aged between 18 – 44 years. This age grouping is the largest segment within Yarra.
Source17
7.2.5 Family Status
Families are a significant population group within the City of Yarra. Carlton Nth, Fitzroy Nth, Clifton Hill and Northcote South are the most attractive areas in terms of family populations.
Totalfamilies
City of Yarra 14631 Clifton Hill 1307 Collingwood 1049 Fitzroy 1658 Fitzroy North 2162 Abbotsford 863 Carlton North-Princes Hill 1747 Fairfield-Alphington 481 Northcote South 5236
7.2.6 Qualifications/OccupationThe distribution of educational qualifications across the population of City of Yarra in 2001 showed a highly educated workforce, with significant skills, as indicated by the greater share of households in the high income quartile, the higher percentage of professionals and a bigger proportion working in well-paid industries, such as business services, education and health.
17 Stratton etal (2005) Social Correlates of sport and recreation participation by adults. Australian Bureau of Statistics

Collingwood Leisure Centre – Aquatic Feasibility Study Page 34 of 92
An analysis of the educational qualifications held by the population of City of Yarra and the Melbourne Statistical Division in 2001 revealed significant differences. By comparison with the Melbourne Statistical Division, City of Yarra had:
A larger share of the population with a Bachelor or higher degree; A smaller share of the population with vocational qualifications and; A larger share of the population with an advanced diploma or diploma.
The largest occupations in City of Yarra in 2001 included professionals, clerical, sales and service workers and associate professionals. The major differences in the occupational composition in 2001of the City of Yarra when compared to the Melbourne Statistical Division included a substantially higher share of professionals (+17.3%). There were significant changes in the numbers of persons employed by occupation between 1996 and 2001. The largest net changes were experienced in professionals (+2,727). This trend is expected to increase.
These figures are important when forecasting participation for CLC as Persons employed in professional and advanced service occupations are more likely to be active than persons employed in clerical, trade, transport or labouring occupations. The increasing numbers of professionals moving into Yarra will place additional pressure on CLC programs and services.
7.2.7 Non English Speaking Background
The population speaking a language other than English in City of Yarra combines persons speaking more traditional migrant languages (such as from Europe), with languages more indicative of recent source countries, such as Asian languages. A comparison of the top five non-English languages spoken in City of Yarra with the Melbourne Statistical Division in 2001 shows the major differences were:
A higher share of Vietnamese speakers; A higher share of Greek speakers; A higher share of Chinese languages speakers.
A comparison of the change between 1996 and 2001 reveals a notably decreased proportion of persons speaking non-English languages in City of Yarra.
Council as a particular target group identified CALD clients, proficiency in English has a very significant association with low rate of participation.
7.2.8 Housing
There is a significant concentration of more medium and high-density dwelling types in City of Yarra, which is consistent with a greater degree of similarity in residential land uses. The larger percentage of medium and high-density housing suggests that a greater share of singles and couples would be expected to reside in this area. There was a mix of housing markets in this area in 2001, with a spread of different tenure types. The greatest share of households were renting - other (private renters) (35.5%), followed by homeowners (24.2%) and home purchasers (18.2%). This is related to the general increase in the number of professionals within the catchment area and is expected to continue.

Collingwood Leisure Centre – Aquatic Feasibility Study Page 35 of 92
7.2.9 Entertainment and Recreation Spend
The figure below provides a graphical illustration of household expenditure relating to recreation and entertainment. Clifton Hill, Carlton Nth and Fitzroy Nth are all classified as above average spenders on recreation and entertainment.

Collingwood Leisure Centre – Aquatic Feasibility Study Page 36 of 92
8 Customer Consultation
8.1 Research Process Customer Consultation was undertaken with the objective of ensuring representative input from all user groups. The consultation process was designed to deliver information on:
The future needs of the community Key factors impacting the different user groups use of the facility Current levels of satisfaction
The key sources of information were collected from:
Form of Consultation Methodology
Self complete survey 180 CLC customers representing a wide range of ages and usage profiles filled in a self-complete survey.
In-depth interviews schools In-depth interviews were conducted with representatives of: Local Schools participating in the CLC Swim Lesson Program (7) Local Schools not participating in the CLC Swim Lesson Program (2)
In depth Interviews with community health providers
In-depth interviews were conducted with representatives of: Community Health Centre (2) Senior Citizens Centre (1) Local Health Professionals (2)
Individual Interviews were conducted with staff responsible for key program areas
In-depth interviews were conducted with staff responsible for: Aquatics Aquatic Programs Older Adult Programs Dry Programs
Focus group One focus group was conducted with centre users to uncover general themes impacting on usage for older adults.
Older adults group (4 participants)
In house Customer Surveys A review of the previous in-house customer surveys was completed

Collingwood Leisure Centre – Aquatic Feasibility Study Page 37 of 92
8.2 Summary Findings
Consultations revealed a consistency in feedback from all customer groups.
There was a general level of satisfaction with the customer service, staff quality and program range provided within the facility. The “community feel” of the centre was highlighted as positive attribute.
Customer dissatisfaction centred around facility overcrowding and limited access to equipment in the gym and cardio room.
Overcrowding was a consistent response amongst users from both aquatic and dry program areas. Major areas of overcrowding were experienced in the areas of lap swimming, gym, cardio room, aerobics room and changing facilities.
When questioned about priorities for future development customers reinforced the issue of space provision stating that providing more space for Gym, Cardio Room, Change Room, Lap Swimming and Swim Lessons were the major areas of importance. Improving disability access and increasing opportunities for aquatic play were seen as an important consideration for any proposed development within the facility.
The following pages provide an overview of the customer feedback obtained from the variety of groups involved in the consultation.

Col
lingw
ood
Leis
ure
Cen
tre –
Aqu
atic
Fea
sibi
lity
Stud
y
Page
38
of 9
2
8.3
Sum
mar
y of
Cus
tom
er F
eedb
ack
The
follo
win
g di
agra
m p
rovi
des
an o
verv
iew
of t
he c
usto
mer
feed
back
obt
aine
d fro
m th
e va
riety
of g
roup
s in
volv
ed in
the
cons
ulta
tion
Com
mon
Issu
es
Cro
wdi
ng in
gym
, aqu
atic
and
car
dio
area
s In
crea
sed
aqua
tic p
lay
activ
ities
for
youn
g pe
ople
Se
para
te le
arn
to s
wim
and
war
m w
ater
ex
erci
se a
rea
Incr
ease
siz
e of
cha
nge
room
—se
para
te s
choo
ls c
hang
e ro
oms
Incr
ease
num
ber o
f fam
ily c
hang
e ro
oms
In-h
ouse
sur
veys
Im
prov
e qu
ality
of g
ym
Equ
ipm
ent
Incr
ease
siz
e of
car
dio
Incr
ease
siz
e of
aq
uatic
pla
y In
crea
se a
ctiv
ities
for
aqua
tic p
lay
Focu
s G
roup
Old
er A
dults
In
crea
se w
arm
wat
er a
rea
for e
xerc
ise
and
aqua
pla
y ar
ea
Caf
é st
yle
serv
ice
in fo
yer
Impr
ove
Dis
abili
ty A
cces
s in
aqu
atic
are
as
Scho
ols
(9)
Cro
wdi
ng o
f Aqu
atic
ar-
eas
Lack
of a
vaila
bilit
y in
term
1
and
3 C
onsi
sten
cy o
f ins
truct
ors
Sep
arat
e sc
hool
cha
ngin
g ar
ea
Sep
arat
e sc
hool
ent
ranc
e
Staf
f C
onfli
ct o
f usa
ge in
aq
uatic
are
as
Impr
ove
Sta
ff am
enity
In
crea
sed
aqua
tic p
lay
oppo
rtuni
ties
Incr
ease
siz
e of
dry
pr
ogra
m a
reas
i.e.
gym
an
d ca
rdio
room
Surv
ey R
espo
nses
(180
) O
verc
row
ding
of G
ym, C
ardi
o Ar
ea, A
quat
ic a
rea
Lack
of s
pace
of l
ap s
wim
min
g La
ck o
f spa
ce a
nd fe
atur
es f
or
aqua
pla
y In
crea
se n
umbe
r of f
amily
ch
ange
are
as
Impr
ove
lock
er A
vaila
bilit
yIm
prov
e D
isab
ility
Acc
ess
to
aqua
tic a
reas
Incr
ease
d se
rvic
es fo
r fam
ilies
Com
mun
ity H
ealth
Pro
vid-
ers
(4)
Cro
wdi
ng o
f aqu
atic
are
as
limits
abi
lity
to u
se th
e fa
cil-
ity
Nee
d fo
r des
igna
ted
war
m
wat
er a
rea
for a
quat
ic e
x-er
cise
In
crea
se s
ize
of c
hang
e ro
oms

Col
lingw
ood
Leis
ure
Cen
tre –
Aqu
atic
Fea
sibi
lity
Stud
y
Page
39
of 9
2
8.4
Sum
mar
y of
Con
sulta
tion
Inte
rvie
ws
The
follo
win
g ta
ble
prov
ides
an
over
view
of t
he in
form
atio
n re
ceiv
ed a
s pa
rt of
the
cons
ulta
tion
inte
rvie
ws
Use
r Gro
up
Rea
son
for U
se
Rea
sons
for
Cho
osin
g C
LC
Cur
rent
Sat
isfa
ctio
n Fu
ture
Nee
dsD
evel
opm
ent
Prio
ritie
s Fa
ctor
sin
fluen
cing
use
C
LCS
choo
l Use
rs
Sw
im le
sson
s ar
e an
impo
rtant
co
mpo
nent
of
acad
emic
pro
gram
Pro
xim
ity to
sc
hool
C
ost -
com
petit
ive
Goo
d in
stru
ctor
s C
hang
e R
oom
s ar
e vi
sibl
e (s
afet
y is
sue)
for
supe
rvis
ion
Hap
py w
ith s
taff,
poo
l te
mpe
ratu
re a
nd
inst
ruct
ors.
Po
ol h
all c
an b
e co
ld in
w
inte
r. C
row
ding
is a
big
is
sue.
C
onfli
ct w
ith o
ther
pr
ogra
ms
ie a
qua
aero
bics
noi
se.
Larg
er P
ool
Sep
arat
e ar
e fo
r les
sons
D
eepe
r poo
l fo
r spe
cial
ised
ac
tiviti
es
Larg
er c
hang
e ro
oms
Sep
arat
e sc
hool
s ch
ange
room
s S
epar
ate
scho
ols
entra
nce
Sep
arat
e w
arm
w
ater
poo
l for
cl
asse
s
Ava
ilabi
lity
in te
rm
1 an
d 4
Con
sist
ency
and
qu
ality
of
inst
ruct
ors
Siz
e of
poo
l S
pace
allo
catio
n C
onfli
ct w
ith o
ther
pu
blic
pro
gram
s S
choo
l Non
U
sers
S
wim
less
ons
are
an im
porta
nt
com
pone
nt o
f ac
adem
ic p
rogr
am
Wer
e no
t abl
e to
bo
ok in
for 2
006
due
to b
eing
full
Sugg
este
d ch
ange
s to
bo
okin
g pr
oces
s.
Cro
wdi
ng o
f the
poo
l w
as a
con
cern
“S
quee
zing
into
one
la
ne o
f tw
o la
nes
to 3
0 –
40 s
tude
nts”
Larg
er c
hang
e ro
oms
Dee
per p
ool
for s
peci
alis
ed
activ
ities
i.e.
sa
fety
. S
epar
ate
pool
fo
r cla
sses
Sep
arat
e sc
hool
s ch
ange
room
s S
epar
ate
scho
ols
entra
nce
Ava
ilabi
lity
in te
rm
1 an
d 4
Siz
e of
poo
l S
pace
allo
catio
n C
omm
unic
atio
n w
ith p
rogr
am
coor
dina
tor
Com
mun
ity
Hea
lthP
rovi
ders
Aqu
aero
bics
and
w
ater
exe
rcis
e pr
ogra
ms
wer
e an
im
porta
nt
com
pone
nt in
re
habi
litat
ion
for
clie
nts
and
olde
r ad
ults
Pro
xim
ity to
ce
ntre
s.C
ost
Goo
d in
stru
ctor
s an
d fri
endl
y st
aff.
Hea
lthim
prov
emen
t and
fit
ness
.S
ocia
lisat
ion.
Hig
h le
vels
of
satis
fact
ion
with
sta
ff.
Ofte
n di
fficu
lt w
ith
crow
ded
pool
and
ch
ange
room
s.
Parti
cula
r cha
lleng
e w
hen
scho
ols
are
in th
e ce
ntre
. C
an b
e di
fficu
lt to
ac
cess
equ
ipm
ent i
n fit
ness
are
a In
crea
se a
rea
for l
a p
Incr
ease
the
size
of t
he
mac
hine
w
eigh
ts a
re a
of
gym
, in
crea
se s
ize
of c
hang
ing
room
s A
cces
s co
nsid
erat
ions
fo
r poo
ls
Sep
arat
e w
arm
w
ater
poo
l for
A
quae
robi
cs a
nd
exer
cise
In
crea
se s
ize
of
chan
ging
room
s
Pro
xim
ity
Spa
ce
Sui
tabi
lity
of
prog
ram
are
as
Leve
l of s
pace
co
nflic
t bet
wee
n pr
ogra
ms
and
publ
ic u
sage

Col
lingw
ood
Leis
ure
Cen
tre –
Aqu
atic
Fea
sibi
lity
Stud
y
Page
40
of 9
2
Use
r Gro
up
Rea
son
for U
se
Rea
sons
for
Cho
osin
g C
LC
Cur
rent
Sat
isfa
ctio
n Fu
ture
Nee
dsD
evel
opm
ent
Prio
ritie
s Fa
ctor
sin
fluen
cing
use
C
LCsw
imm
ing
Old
er A
dults
A
n im
porta
nt p
art
of m
aint
aini
ng w
ell
bein
g S
peci
fic re
spon
se
to h
ealth
pro
blem
s
Pro
xim
ity
Com
mun
ity fe
el o
f th
e fa
cilit
y G
ood
inst
ruct
ors
and
frien
dly
staf
f. G
ood
equi
pmen
t
Ver
y sa
tisfie
d M
arke
ting
of o
lder
adu
lt pr
ogra
ms
coul
d be
im
prov
ed
Hav
e ad
apte
d us
age
to
be o
ff pe
ak to
avo
id
busy
tim
es
Res
pons
e to
m
aint
enan
ce is
sues
Mor
e ol
der
adul
ts w
ill be
ne
edin
g th
ese
serv
ices
A
cces
s co
nsid
erat
ions
fo
r poo
ls /
spa
Sep
arat
e aq
uatic
ar
ea fo
r war
m
wat
er e
xerc
ise
C
afé
area
in fr
ont
of c
entre
D
isab
ility
acc
ess
to
pool
s
Acc
ess
to
prog
ram
s P
roxi
mity
C
ost
Qua
lity
staf
f
8.5
Sum
mar
y in
form
atio
n C
usto
mer
sur
veys
.
The
follo
win
g gr
aphs
pro
vide
an
over
view
of t
he re
sults
rece
ived
whe
n cu
stom
ers
wer
e as
ked
to ra
te a
var
iety
of f
acilit
y at
tribu
tes
base
d on
thei
r re
lativ
e im
porta
nce
and
thei
r cur
rent
leve
l of s
atis
fact
ion.
Prio
rity
shou
ld b
e gi
ven
to th
e ar
eas
whe
re th
ere
is a
gap
bet
wee
n th
e cu
stom
er ra
ting
of
impo
rtanc
e an
d th
e ra
ting
prov
ided
for s
atis
fact
ion.
The
grap
hs c
lear
ly s
how
the
prio
rity
area
s of
lap
swim
min
g, g
ym s
pace
, car
dio
room
spa
ce, a
erob
ics
room
spa
ce c
hang
e ro
om s
pace
and
av
aila
bilit
y of
lock
ers.

Col
lingw
ood
Leis
ure
Cen
tre –
Aqu
atic
Fea
sibi
lity
Stud
y
Page
41
of 9
2
Gap
Ana
lysi
s - A
quat
ics
010203040506070
Lap S
wimming Aqu
atic P
lay
Aquati
c Exe
rcise Swim
Less
ons
Spa
Disabil
ityAcc
ess
Outside
Poo
l Hall
Shadin
g Outs
ide
Cri
teri
a
Percentage
Impo
rtanc
e
Satis
fact
ion
Gap
Ana
lysi
s - D
ry P
rogr
am A
reas
01020304050607080
Gym Gym E
quipm
ent Card
ioRoo
m
Cardio
Room
Equipm
ent Aero
bics R
oom Bod
yBalanc
e
Creche
Crit
eria
Percentage
Impo
rtanc
eS
atis
fact
ion
Gap
Ana
lysi
s - A
ncill
ary
Serv
ices
01020304050607080
Chang
e Roo
msLo
ckers Merc
hand
ise
Foodan
dBevera
geSpa
ce to
meet p
eople
Crit
eria
Percentage
Impo
rtanc
eS
atis
fact
ion

Collingwood Leisure Centre – Aquatic Feasibility Study Page 42 of 92
8.6 Facility Benchmarking This section benchmarks the performance of CLC against a number of like facilities. Industry benchmarks and direct comparisons have been used in assessing CLC performance.
8.6.1 CERM
The Centre for Environmental Recreation Management (CERM), provides an industry benchmarking program which CLC has participated in since 1995. The benchmarking highlights that the facility has a higher catchment multiple than the median and achieves a higher surplus and revenue per sqm. The CERM report identified secondary spend as an area performing lower than the median. Given the lack of a kiosk facility at CLC this figure is not surprising.
CLC 1995 CLC 2000 CLC 2002 CERM Median Group (33)
Catchment Multiple 6.8 6.5 6.7 6.4Surplus per visit ($) 0.81 0.45 0.75 (0.34)Secondary Spending ($)
0.18 0.19 0.14 0.50
Receipts per sqm ($) 804 819 852 410
8.6.2 Demographics of Users
The table below allows for a number of observations when CLC is compared to a number of like facilities.
CLC has a lower number of members and casual users qualifying for a concession discount.CLC has a relatively high number of 50 – 65 yr old members. CLC has a slightly lower percentage of female members
Collingwood Reservoir Mill Park Northcote Coburg Participation Members 1800 1500 2162 2445 2050 Member Concession 27 42 44 32 29 Number LTS 961 700 1144 1473 1030 Member Breakdown by Age 13-20 3.00% 6.18% 7.24% 15.00% 15.12% 21-35 33.00% 43.51% 53.25% 55.05% 29.07% 36-50 29.00% 29.31% 29.10% 24.27% 26.54% 50-65 19.00% 16.34% 8.17% 4.34% 6.68% 65plus 4.00% 5.11% 0.99% 0.51% 2.49% Withheld 12.00% 2.00% 17.12% Male 46.00% 41.00% 49.04% 43.00% 42.00% Female 54.00% 59.00% 50.96% 57.00% 58.00% Casual Concession 20% 56% na 32% 38%

Collingwood Leisure Centre – Aquatic Feasibility Study Page 43 of 92
8.6.3 ProgrammingThe following table reviews the program range provided by CLC compared to “like facilities”. CLC provides a comparable range of health and fitness classes for its’ members however has a relatively low level of programs targeted toward specials needs groups in the community.
Collingwood Mill Park Reservoir Northcote CoburgRichmon
dGeneral programs Dry 50 40 33 54 40 49 Aqua 12 5 4 10 9 8 Lifestyle 4 7 1 6 5 5
Sub total 66 52 38 70 54 62
Targeted Older Adults (land) 3 3 1 5 6 3 Older Adults (Aqua) 2 1 5 5 6 Arthritis 3 Wt Mgt Children Non Aqua 2 2 1 1 4 Teenage 2 5 11 5 Disability 3 20 6
Sub total 9 14 30 28 21 3 Total 75 66 68 98 75 65
Other Physiotherapy yes yes yes Massage yes yes yes yes yes Martial Arts yes
Child Care (hrs per week) 13.5 17.5 26 26 20.5 15

Collingwood Leisure Centre – Aquatic Feasibility Study Page 44 of 92
8.6.4 Facility Design
A key issue within the CLC is the development of the Health Club; the scope of the benchmarking was expanded to include collection of data in this area to assist with the future development of this area.
The CLC is the second highest in terms of members per sqm, members per piece of equipment and members per cardio equipment.
Members Health Club
Members Total AreaTotal
EquipmentMembers per
sqmMembers perEquipment
Members perCardio
Collingwood 1800 1620 310 105 5.23 17.14 47.37 Mill Park 2162 1946 458 136 4.25 15.90 47.00 NAARC 2445 2201 360 113 6.11 21.64 69.86 RLC 1310 1179 358 156 3.29 8.40 46.79 Coburg 2050 1845 358 150 5.15 13.67 51.25
The table below reviews change room and car parking provision. The CLC has significantly less space devoted to changing rooms and car parking than other like facilities. This will need to be taken into account if expansion of the facility is undertaken.
Change Rooms Car Park Type Size Toilets Showers Family / Access Regular Access
Collingwood Dual 76 3 6 2 100 6 Mill Park Wet 108 3 4 2 186 6 Dry 66 3 4 RLC Wet 97.5 4 8 8 105 4 Dry 84 3 3 NAARC Dual 120 5 6 3 320 6 Coburg Dual 120 3 5 1 600 4 * Coburg has access to a shopping centre car park, therefore up to 600 parking spaces.
9 Asset Condition
A number of reports have been reviewed to determine the current condition of the assets within the aquatics area of the CLC.
Norton Consultants Mechanical Services Report 2002: This report reviewed the mechanical services installations within the facility. The report reviewed the Main Pool area, Spa Pool, Amenities Area and the Plant Rooms for the Main Pool and Spa. The report provided a positive response in terms of the condition of the asset with minor corrosion in the plant room the only defect detected.
The scope of the report did not include inspection of the heat exchange and sand filter although it was concluded that as the vessels are inspected as part of the scheduled maintenance program they were assessed as being suitable for continued usage.
Norton Consultants Electrical Audit and Report 2002:

Collingwood Leisure Centre – Aquatic Feasibility Study Page 45 of 92
The report reviewed the electrical installation and energy management within the facility. The report concluded that the installation is in good condition however there were signs of ageing, add ons and cable bunching at the light and power board.
Tim Gibney and Associates – Structural Investigation of the CLC Roof Structure 2006: Tim Gibney and Associates were engaged to investigate the structural condition of the roofing structure in particular the cracking that was evident on a number of trusses within the aquatic area.
The report which included an inspection of all structural beams identified a level of structural failure in one beam and recommended further observations be conducted of the bolt joints. The report noted that in the main the roof trusses did not exhibit large deflections, which would indicate that significant slippage of laminations and joints.
Follow up conversations with the contractor highlighted that the life of the trusses could not be guaranteed after 5 yrs. The trusses could be repaired by removing the current roof sheeting and working with the current roofing supports that were viewed as being in good condition.
Initial costs of roof replacement are estimated by Currie Brown Quantity surveyors to be approximately $300,000. This figure has not been included as part of the total project costs.
Leaking of the Main Pool: Council Staff and facility staff have identified concern over the potential leakage of the main pool. This was viewed as being as a result of poor corkage within the guttering of the pool. The extent of this problem was still being determined at the time of this report.
Mechanical Plumbing – Turnover and Bather Load Figures 2006
The maximum bather load for the CLC pools were estimated by Mechanical Plumbing as 101. This suggests that increasing current program loads in the CLC pool and toddler’s pool would not be possible.
Collingwood Volume Plant Area Time Bathers25 Metre 642m3 144m3/hr 475m2 4.45hrs 101Toddlers 16m3 21.6m3/hr 20m2 0.75hrs 8Spa TBA TBA TBA TBA TBA

Col
lingw
ood
Leis
ure
Cen
tre –
Aqu
atic
Fea
sibi
lity
Stud
y
Page
46
of 9
2
20 –
Yea
r Exp
endi
ture
For
ecas
ts -
Mau
nsel
l 200
3 A
20-
year
exp
endi
ture
fore
cast
was
com
plet
ed fo
r the
faci
lity
for 2
003/
04 –
202
3/24
. The
repo
rt ou
tline
d th
e ex
pect
ed s
tatu
tory
, Rea
ctiv
e R
outin
e an
d R
enew
als
that
wer
e ex
pect
ed fo
r the
faci
lity
over
the
20 y
r per
iod.
This
info
rmat
ion
from
200
6/07
– 2
0016
/17
is s
umm
aris
ed in
the
tabl
e be
low
:
Year
20
06/0
720
07/0
820
08/0
920
09/1
020
10/2
011
2011
/201
2 20
12/2
013
2013
/201
420
14/2
015
2015
/201
6To
tal
Are
a
Stat
utor
y
Ex
it em
erge
ncy
light
ing
600
0 0
0 0
0 0
0 0
0 60
0
Fire
Fig
htin
g Eq
uipm
ent
600
0 0
0 0
0 0
0 0
0 60
0
Secu
rity
1000
0
0 0
0 0
0 0
0 0
1000
Air
Con
ditio
ning
(pre
vent
ion)
61
78
0 0
0 0
0 0
0 0
0 61
78
A
ir C
ondi
tioni
ng (r
epai
rs)
3299
0
0 0
0 0
0 0
0 0
3299
R
outin
e
0
Prog
ram
72
93
0 0
0 0
0 0
0 0
0 72
93
Rea
ctiv
e
0
Vand
alis
m
500
0 0
0 0
0 0
0 0
0 50
0
Mec
hani
cal
2200
0 0
0 0
0 0
0 0
0 0
2200
0
Mis
cella
neou
s 41
918
0 0
0 0
0 0
0 0
0 41
918
Ren
ewal
0
Floo
rs
2700
0 0
0 0
0 0
0 0
0 0
2700
0
Wal
ls
1400
0 0
0 0
0 0
2000
0 0
1700
0 0
5100
0
Roo
fing
140,
000
0 0
0 0
0 0
0 0
0 14
0000
M
echa
nica
l 42
000
7600
0 73
000
2300
0 36
000
5000
0 26
000
1300
0 62
7 30
000
3696
27
Plum
bing
El
ectr
ical
20
0 20
0 10
,000
20
0 20
0 20
0 20
0 20
0 20
0 20
0 11
800
M
isce
llane
ous
48,6
00
137,
500
0 0
0 0
0 0
0 0
1861
00
Tota
l
3551
88
2137
00
8300
0 23
200
3620
0 50
200
4620
0 13
200
1782
7 30
200
8689
15
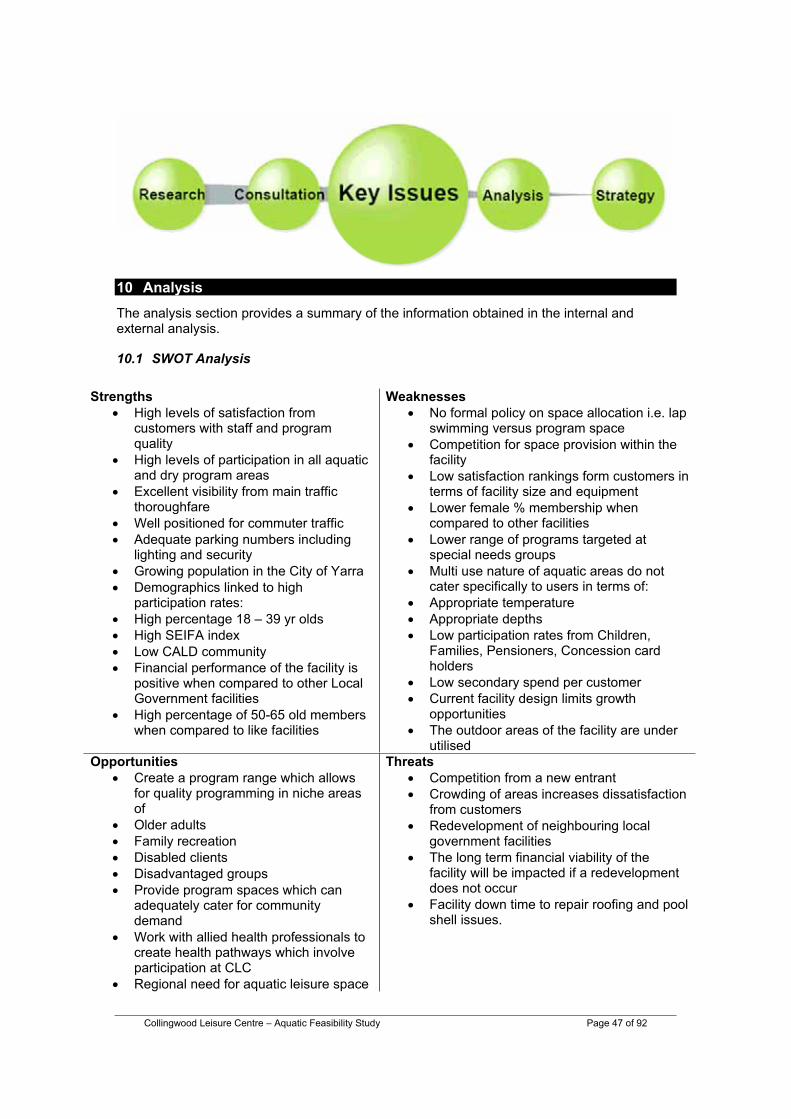
Collingwood Leisure Centre – Aquatic Feasibility Study Page 47 of 92
10 Analysis The analysis section provides a summary of the information obtained in the internal and external analysis.
10.1 SWOT Analysis
StrengthsHigh levels of satisfaction from customers with staff and program quality High levels of participation in all aquatic and dry program areas Excellent visibility from main traffic thoroughfareWell positioned for commuter traffic Adequate parking numbers including lighting and security Growing population in the City of Yarra Demographics linked to high participation rates: High percentage 18 – 39 yr olds High SEIFA index Low CALD community Financial performance of the facility is positive when compared to other Local Government facilities High percentage of 50-65 old members when compared to like facilities
Weaknesses No formal policy on space allocation i.e. lap swimming versus program space Competition for space provision within the facility Low satisfaction rankings form customers in terms of facility size and equipment Lower female % membership when compared to other facilities Lower range of programs targeted at special needs groups Multi use nature of aquatic areas do not cater specifically to users in terms of: Appropriate temperature Appropriate depths Low participation rates from Children, Families, Pensioners, Concession card holdersLow secondary spend per customer Current facility design limits growth opportunitiesThe outdoor areas of the facility are under utilised
Opportunities Create a program range which allows for quality programming in niche areas ofOlder adults Family recreation Disabled clients Disadvantaged groups Provide program spaces which can adequately cater for community demandWork with allied health professionals to create health pathways which involve participation at CLC Regional need for aquatic leisure space
ThreatsCompetition from a new entrant Crowding of areas increases dissatisfaction from customers Redevelopment of neighbouring local government facilities The long term financial viability of the facility will be impacted if a redevelopment does not occur Facility down time to repair roofing and pool shell issues.

Collingwood Leisure Centre – Aquatic Feasibility Study Page 48 of 92
The creation of a community hub at CLC to cater for a range of council services Capitalise on the growth of the health and fitness industry in particular wellness based programs Further develop the outdoor areas of the facility.
10.2 Major Issues Impacting Facility Development
1 Key issue: Facility crowding is a significant concern for current users.
Consultation Research DiscussionConsistent feedback from customers highlighting crowding of all areas of the facility.
Benchmarks with other facilities highlights high usage of aquatic and dry areas. The City of Yarra will continue to experience growth over the next decade placing additional pressure on the facility. Previous planning reports have identified facility crowding as an issue for CLC. Fewer female members than other like facilities.
The issue of overcrowding has been consistent in all internal and external analysis. The facility has demonstrated creative usage of available space however further increases in participation will not be realised without a change to current conditions. The overcrowding issue raises the real threat of customer attrition as they become dissatisfied with the facility.
2 Key issue: Low participation rates from Children, Families, Pensioners and Concession Card Holders
Consultation Research DiscussionLack of activities for families and children was an issue raised by customers. Current facility does not encourage usage from families and young children.
Viewed as a target group in council planning documents. Currently low participation rates when compared to other groups. Fewer programs delivered that target special need groups.
Te current physical facility does not adequately cater for these special needs groups. Pressure for space inhibits the ability to provide programs specifically directed at encouraging participation. The development of specific aquatic program space and aquatic play features will assist management in providing activities which can target participation from these groups.

Collingwood Leisure Centre – Aquatic Feasibility Study Page 49 of 92
3 Key issue: Long term financial viability of the facility
Consultation Research DiscussionCustomer concerns over facility crowding provide a serious risk of ongoing customer attrition from the facility.
Facility is currently performing well when compared to other Local government facilities. Financial performance has decreased over the past three years. Council planning documents highlight the importance of financial sustainability of services.
The council will continue to experience a decreased financial return from the facility unless a development strategy is provided for the facility. Expanding the health and fitness areas are financially the most attractive areas within the facility. Recent experience at Richmond and Fitzroy highlight the financial improvements resulting from the development of the dry program area.
4 Key issue: Policy on space allocation for competing programs within the facility
Consultation Research DiscussionCompeting demands for space in both aquatic and dry areas was an issue for customers and user groups. The programming at the facility attempted to cater for everyone without particularly satisfying the needs of anyone
There was no clear policy direction as to the relative importance of particular programs within the facility.
The development of a clear policy on space allocation (i.e. number of lap lanes available for lap swimmers at peak times) will assist in forecasting space requirements. The role and positioning of the other council leisure facilities is an important component in developing this policy. It is recommended that CLC be positioned as a program pool with programs such as Learn to Swim being able to utilise the entire pool at certain times throughout the week.
5 Key issue: The creation of a community hub for additional council services
Consultation Research DiscussionCouncil internal reports identified a need to relocate the Maternal Child Health service and possible relocation of neighbouring child care services.
A number of councils are developing community hubs as an effective strategy in integrating a range of community services.
The creation of a community hub at CLC could be achieved through the development of flexible multi usage spaces. .

Collingwood Leisure Centre – Aquatic Feasibility Study Page 50 of 92
11 Development Priorities
Based on the key issues identified in the previous section the following table reviews the specific design elements, which are required for the forward planning.
DesignElement
Area Priority Key Issue
Specific Design Brief
Create an indoor aquatic recreation space
Aqua High 1,2,3,4 Provide a 20m X 25m aquatic recreation space. The design should allow for usage as a learn to swim space and also aquatic play. One side should able to be used as a 3 lane 25m learn to swim pool with a similar design to Nunawading pool (attached photo). Indoor space should be a max of 0.9m deep and rely of interactive water features rather than moving water or water depth for entertainment. Consideration should be given to supervision with the main pool and recreational pool to be supervised by one person at off peak times. This space is consistent with the size allocated to newly developed centres - Casey ARC (600sqm), Nunawading (500sqm), Maribyrnong (400sqm), and Knox (400sqm).
Lap Lanes Aqua High 1, 2, 4 Provide for 5 lap swimming lanes with 3 lanes to be available at all times for lap swimming. Depth to be 1.6m – 1.1m. lane widths to be a minimum of 2.0m - 2.2m. Improve disability access to this area.
Access Point for Schools
Aqua High 1,2,3 Create a separate access point for school groups. Consideration should be given to the needs of schools in waiting before and after lessons. An outdoor space may be required which would engage groups during these times.
Expand staff amenity and office space
Add High Provide the following o 1 separate offices for management staff o Open plan staff area for 10 work spaces o Separate change area and locker space
(lower priority) Improve the locker facilities through upgrading lockers and relocating access points
Add Med 1 Provide a space on the concourse near entry to the change rooms that allows for 80 lockers to be installed. Provide a space within the health club area or adjacent to the area that allows for 80 lockers to be installed.
Upgrade the reception area
Add Med 1,3,4 Review the reception area to incorporate following aspects. o Kiosk: The ability to serve from dry and wet
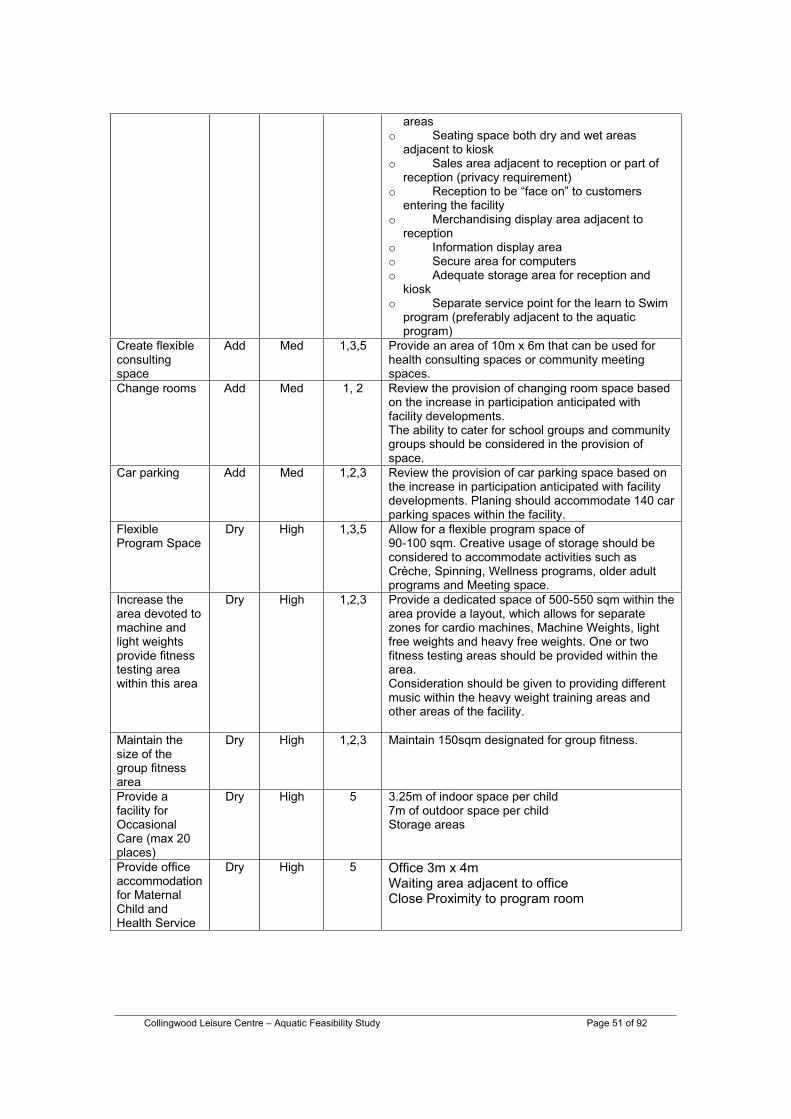
Collingwood Leisure Centre – Aquatic Feasibility Study Page 51 of 92
areas o Seating space both dry and wet areas
adjacent to kiosk o Sales area adjacent to reception or part of
reception (privacy requirement) o Reception to be “face on” to customers
entering the facility o Merchandising display area adjacent to
reception o Information display area o Secure area for computers o Adequate storage area for reception and
kiosk o Separate service point for the learn to Swim
program (preferably adjacent to the aquatic program)
Create flexible consulting space
Add Med 1,3,5 Provide an area of 10m x 6m that can be used for health consulting spaces or community meeting spaces.
Change rooms Add Med 1, 2 Review the provision of changing room space based on the increase in participation anticipated with facility developments. The ability to cater for school groups and community groups should be considered in the provision of space.
Car parking Add Med 1,2,3 Review the provision of car parking space based on the increase in participation anticipated with facility developments. Planing should accommodate 140 car parking spaces within the facility.
Flexible Program Space
Dry High 1,3,5 Allow for a flexible program space of 90-100 sqm. Creative usage of storage should be considered to accommodate activities such as Crèche, Spinning, Wellness programs, older adult programs and Meeting space.
Increase the area devoted to machine and light weights provide fitness testing area within this area
Dry High 1,2,3 Provide a dedicated space of 500-550 sqm within the area provide a layout, which allows for separate zones for cardio machines, Machine Weights, light free weights and heavy free weights. One or two fitness testing areas should be provided within the area. Consideration should be given to providing different music within the heavy weight training areas and other areas of the facility.
Maintain the size of the group fitness area
Dry High 1,2,3 Maintain 150sqm designated for group fitness.
Provide a facility for Occasional Care (max 20 places)
Dry High 5 3.25m of indoor space per child 7m of outdoor space per child Storage areas
Provide office accommodation for Maternal Child and Health Service
Dry High 5 Office 3m x 4m Waiting area adjacent to office Close Proximity to program room

Collingwood Leisure Centre – Aquatic Feasibility Study Page 52 of 92
12 Demand Forecasting
The following demand forecasts are based on the development of a facility with the design features outlined in section 9. In forecasting future demand for the facility the dry program areas and aquatic program areas will be examined separately.
12.1 Aquatic Demand
As previously outlined there is potential for a regional demand for aquatic leisure space in the Inner – Northern Suburbs.
The creation of and appropriate mix of aquatic facilities will enable the facility to cater more effectively for special needs groups such as families, CALD community groups, people from lower incomes and people with a disability. These segments are currently underrepresented in the facility.
12.1.1 Recreational Swimming
It is estimated that recreational swimming numbers could increase by up to 50%. This would take the current participants from approx 50,000 annual visits to a peak of 82,000 annual visits. This usage rate is consistent with the Northcote Aquatic Centre (81,000) and in excess of the Brunswick Baths (60,000). The nearest community facility with a significant aquatic leisure component is the Ashburton Pool, which has in excess of 120,000 annual swims.
The creation of designated leisure and learns to swim space will “free up” additional space within the main pool encouraging increased participation from lap swimmers and water exercise participants.
It is anticipated that the main catchments for the recreational swim visits will remain as Clifton Hill, Carlton Nth, Northcote and Fitzroy. Participation is estimated to grow proportionally more from neighbouring suburbs such as Brunswick, Thornbury and Abbotsford.
12.1.2 Learn To Swim
The growth of the current learn to swim program is inhibited by the size and configuration of the facility. A designated learn to swim space will provide an opportunity to structure a program which can cater for the specific demands of learn to swim participants.
The table below illustrates the projected growth in the ‘learn to swim’ program. The predicted 1350 swim school enrolments represents a significant growth however remains lower than neighbouring facilities such as Northcote Aquatic Centre (1900). The 1350 projection includes 250 - 300 squad program participants.
Projected Growth in LTS Programs
0
500
1000
1500
term 12005
term 22005
term 32005
term 42005
term 12008
term 22008
term 32008
term 42008
Terms
Num
bers
The facility will require 6 teaching spaces to accommodate the forecasted demand.
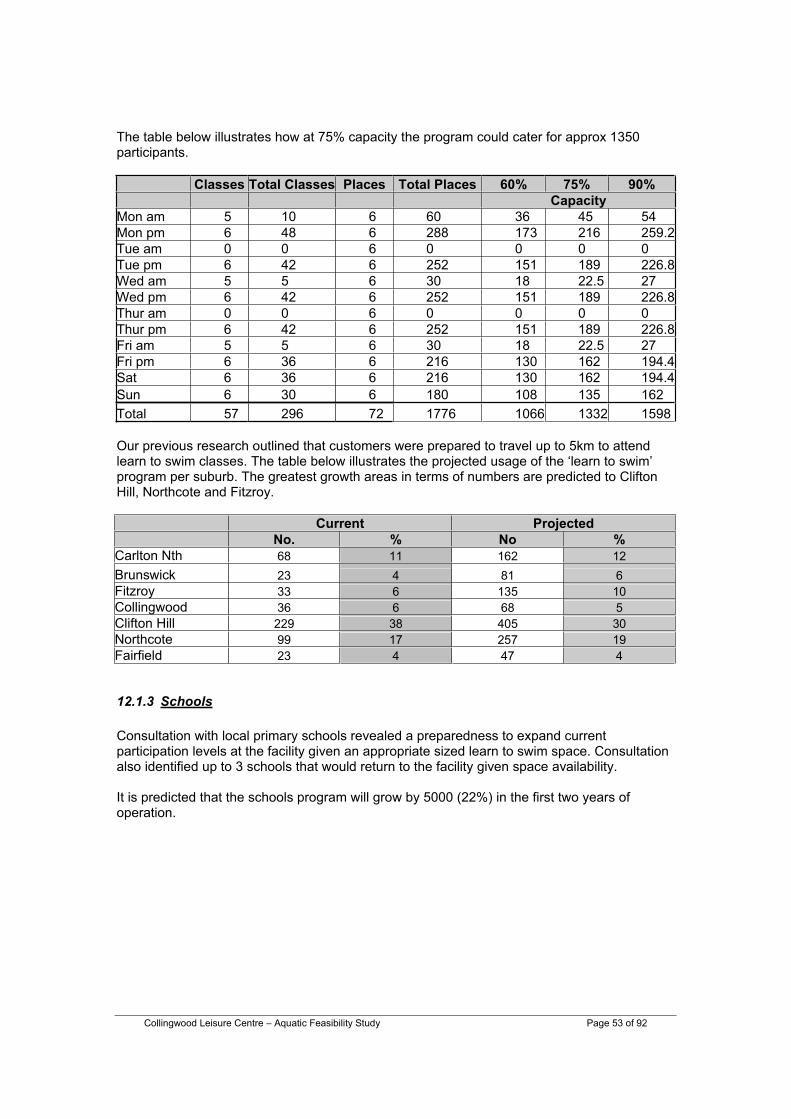
Collingwood Leisure Centre – Aquatic Feasibility Study Page 53 of 92
The table below illustrates how at 75% capacity the program could cater for approx 1350 participants.
Classes Total Classes Places Total Places 60% 75% 90% Capacity
Mon am 5 10 6 60 36 45 54 Mon pm 6 48 6 288 173 216 259.2Tue am 0 0 6 0 0 0 0 Tue pm 6 42 6 252 151 189 226.8Wed am 5 5 6 30 18 22.5 27 Wed pm 6 42 6 252 151 189 226.8Thur am 0 0 6 0 0 0 0 Thur pm 6 42 6 252 151 189 226.8Fri am 5 5 6 30 18 22.5 27 Fri pm 6 36 6 216 130 162 194.4Sat 6 36 6 216 130 162 194.4Sun 6 30 6 180 108 135 162 Total 57 296 72 1776 1066 1332 1598
Our previous research outlined that customers were prepared to travel up to 5km to attend learn to swim classes. The table below illustrates the projected usage of the ‘learn to swim’ program per suburb. The greatest growth areas in terms of numbers are predicted to Clifton Hill, Northcote and Fitzroy.
Current ProjectedNo. % No %
Carlton Nth 68 11 162 12 Brunswick 23 4 81 6Fitzroy 33 6 135 10 Collingwood 36 6 68 5Clifton Hill 229 38 405 30 Northcote 99 17 257 19 Fairfield 23 4 47 4
12.1.3 Schools
Consultation with local primary schools revealed a preparedness to expand current participation levels at the facility given an appropriate sized learn to swim space. Consultation also identified up to 3 schools that would return to the facility given space availability.
It is predicted that the schools program will grow by 5000 (22%) in the first two years of operation.
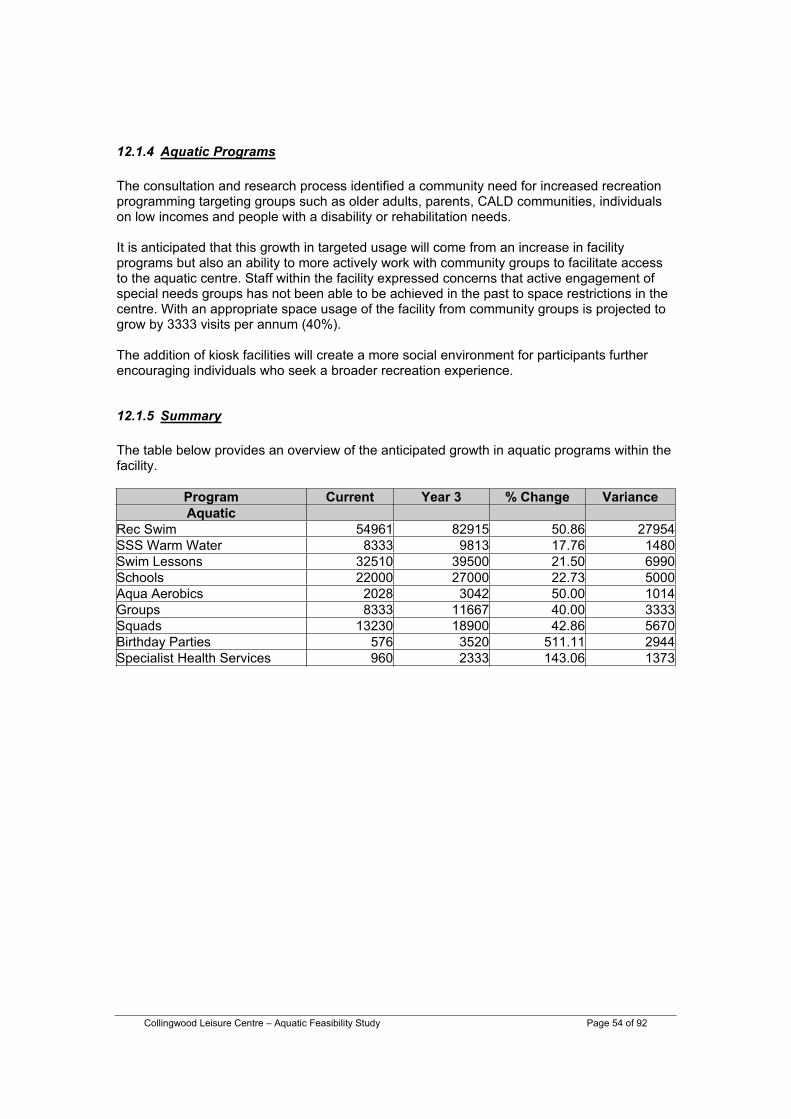
Collingwood Leisure Centre – Aquatic Feasibility Study Page 54 of 92
12.1.4 Aquatic Programs
The consultation and research process identified a community need for increased recreation programming targeting groups such as older adults, parents, CALD communities, individuals on low incomes and people with a disability or rehabilitation needs.
It is anticipated that this growth in targeted usage will come from an increase in facility programs but also an ability to more actively work with community groups to facilitate access to the aquatic centre. Staff within the facility expressed concerns that active engagement of special needs groups has not been able to be achieved in the past to space restrictions in the centre. With an appropriate space usage of the facility from community groups is projected to grow by 3333 visits per annum (40%).
The addition of kiosk facilities will create a more social environment for participants further encouraging individuals who seek a broader recreation experience.
12.1.5 Summary
The table below provides an overview of the anticipated growth in aquatic programs within the facility.
Program Current Year 3 % Change Variance Aquatic
Rec Swim 54961 82915 50.86 27954SSS Warm Water 8333 9813 17.76 1480Swim Lessons 32510 39500 21.50 6990Schools 22000 27000 22.73 5000Aqua Aerobics 2028 3042 50.00 1014Groups 8333 11667 40.00 3333Squads 13230 18900 42.86 5670Birthday Parties 576 3520 511.11 2944Specialist Health Services 960 2333 143.06 1373
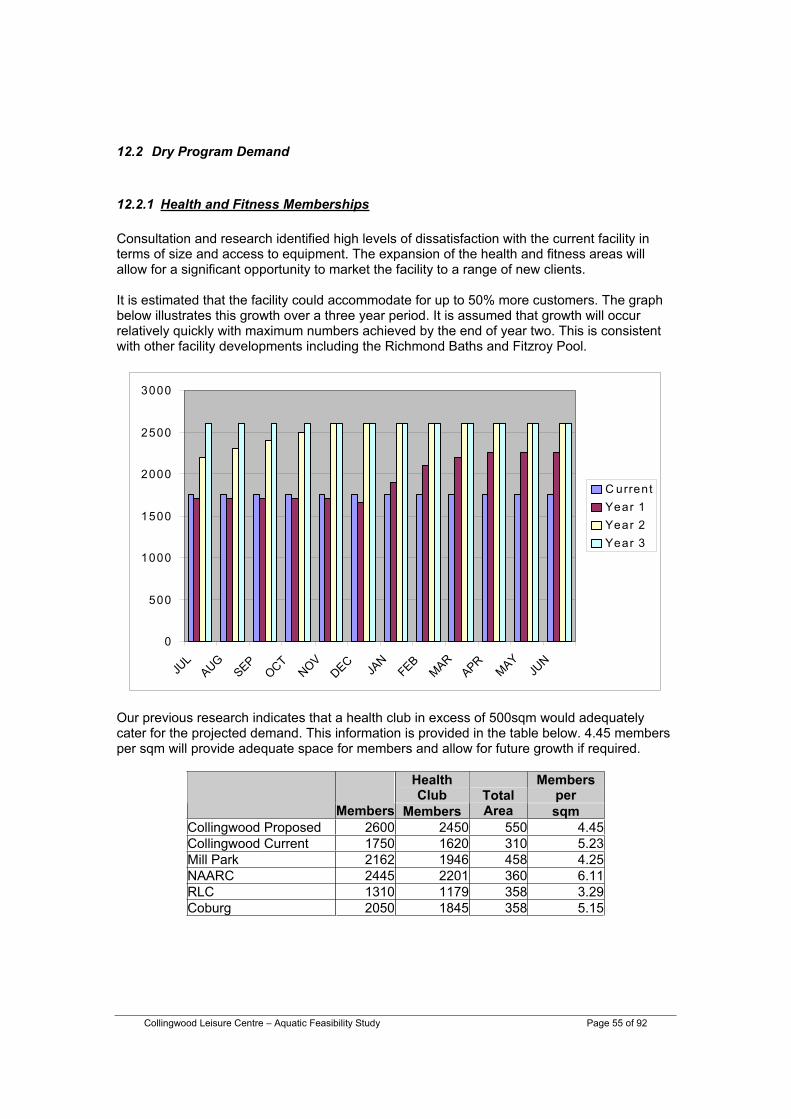
Collingwood Leisure Centre – Aquatic Feasibility Study Page 55 of 92
12.2 Dry Program Demand
12.2.1 Health and Fitness Memberships
Consultation and research identified high levels of dissatisfaction with the current facility in terms of size and access to equipment. The expansion of the health and fitness areas will allow for a significant opportunity to market the facility to a range of new clients.
It is estimated that the facility could accommodate for up to 50% more customers. The graph below illustrates this growth over a three year period. It is assumed that growth will occur relatively quickly with maximum numbers achieved by the end of year two. This is consistent with other facility developments including the Richmond Baths and Fitzroy Pool.
0
500
1000
1500
2000
2500
3000
JUL
AUGSEP
OCTNOV
DECJA
NFEB
MARAPR
MAYJU
N
C urrentYear 1Year 2Year 3
Our previous research indicates that a health club in excess of 500sqm would adequately cater for the projected demand. This information is provided in the table below. 4.45 members per sqm will provide adequate space for members and allow for future growth if required.
HealthClub
Membersper
Members MembersTotal Area sqm
Collingwood Proposed 2600 2450 550 4.45Collingwood Current 1750 1620 310 5.23Mill Park 2162 1946 458 4.25NAARC 2445 2201 360 6.11RLC 1310 1179 358 3.29Coburg 2050 1845 358 5.15

Collingwood Leisure Centre – Aquatic Feasibility Study Page 56 of 92
The growth projections for members are significantly different than aquatic programs. Growth is predicted within the suburbs of Clifton Hill, Fitzroy, Collingwood, Abbotsford and Carlton North. The relative growth in these suburbs is outlined in the table below.
The proposed development at the Northcote Aquatic Centre and established facilities at the Brunswick Baths will limit the growth in these areas; Participation from individuals in Northcote is predicted to decrease due to the gym expansion proposed for this facility.
Current ProjectedNo. % No. %
Inner Nth West 76 4 52 2Carlton Nth 97 5 156 6Fitzroy 215 10 286 11Collingwood 160 8 260 10Abbotsford 37 2 78 3Clifton Hill 914 43 1170 45Northcote 228 11 208 8Fairfield 87 4 91 4
12.2.2 Fitness Programs
The expansion of the dry program areas will allow for an increase in numbers participating in group fitness, multi-sport and personal training programs. Whilst the number of programs may not necessarily expand, the number participating in each program is predicted to grow as a result of the improved amenity.
It is anticipated that the expanded space in the health and fitness areas will assist in attracting increased numbers of targeted participants such as females, older adults, people from low incomes and people with a disability or rehabilitation needs. The enhanced space and equipment range will provide a much less intimidating environment for individuals commencing or recommencing an exercise program.
12.2.3 Summary
The table below outlines the anticipated attendances associated with the dry program development.
Program Current Year 3 % Change Variance Fitness
Group Fitness 8424 9828 16.67 1404Multi-sport 12333 15000 21.62 2667Gym Health Club - Membership 137700 207960 51.02 70260Personal Training 4042 8000 97.90 3958

Collingwood Leisure Centre – Aquatic Feasibility Study Page 57 of 92
12.3 Community Hub
12.3.1 Identified NeedThe Community Hubs Framework presented in the following page presents an overview of community services within the Yarra area. The Clifton Hills area has access to fewer services when compared to the community hubs of Richmond, Collingwood, Abbotsford and Fitzroy North.
Council Planning has identified the need for increased meeting space and occasional places within the Clifton Hill area. This need combined with the isolation of the Darling Gardens Maternal Child and Health Centre presents an opportunity for the development of the Collingwood Leisure Centre into a hub for services within the Clifton Hill area.
It is proposed that the Collingwood leisure centre re development creates an ideal opportunity to develop a community hub within the Clifton Hill area providing the following additional services:
Maternal Child and Health Occasional Care (max 20 places) Children’s Play Groups Parenting Classes Toy Library Community Meeting Space
12.3.2 Policy Framework
The creation of community hubs has been an area of increased interest at a local, state and national area. Research has highlighted the potential for community hubs to enhance the well being of families and children (Taylor, Farrell, Tennent 2004)
From a policy perspective the following policies provide support to the development of integrated services or community hubs:
National Agenda for Early Childhood (2004): Four areas for activity: Healthy Young Families, early learning and care, supporting families and parents, creating child friendly communities. Integrated services are mentioned as a way fwd. FACS Stronger Families Agenda (2004-2008): Importance of cross-sectoral approaches to child and family services: State Government Best Start (2002), Children First Policy (2002):
o The overarching goal of the policy is to improve health, wellbeing and development of young children and provide support and information to parents. This will be achieved through more integrated and collaborative service delivery.
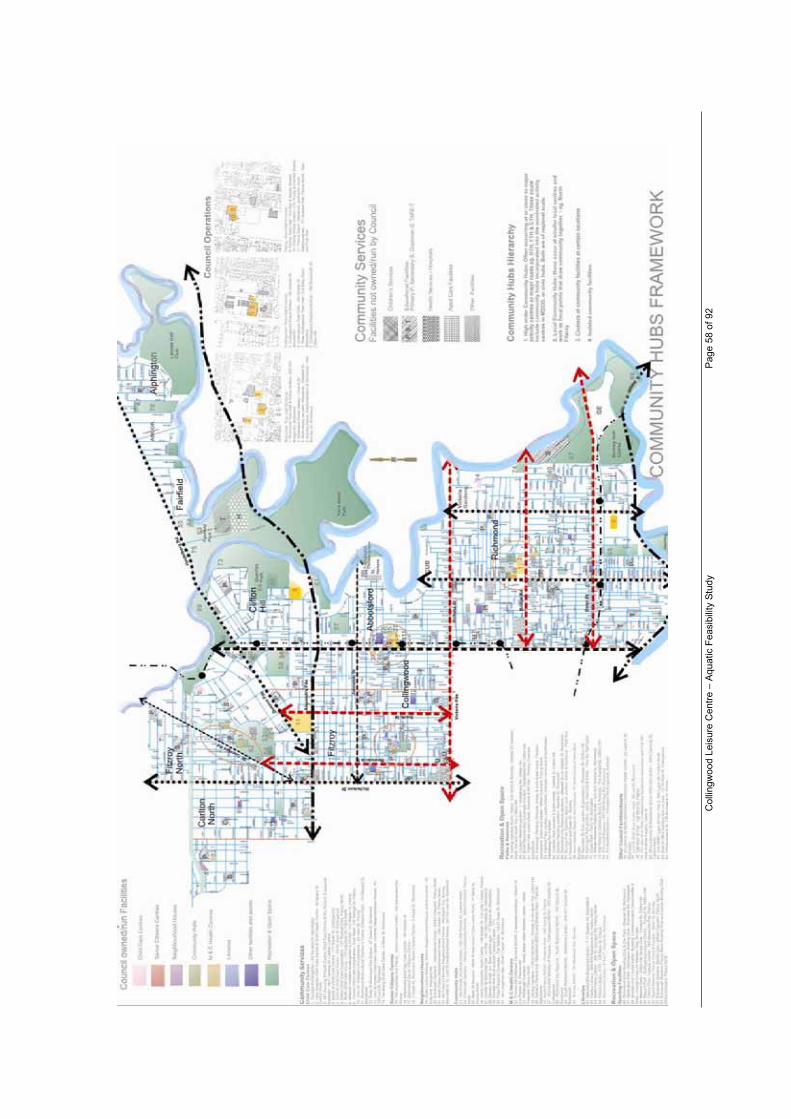
Col
lingw
ood
Leis
ure
Cen
tre –
Aqu
atic
Fea
sibi
lity
Stud
y
Page
58
of 9
2

Collingwood Leisure Centre – Aquatic Feasibility Study Page 59 of 92
13 Strategy
The specific development options are outlined in this section including design options, capital costs and financial forecasts.
13.1 Design Designs are provided in the following pages to illustrate the following:
Aquatic area development Dry Program area and Community Hub Development Total Redevelopment Elevations of proposed development Total Site Impact
Col
lingw
ood
Leis
ure
Cen
tre –
Aqu
atic
Fea
sibi
lity
Stud
y
Page
60
of 9
2

Col
lingw
ood
Leis
ure
Cen
tre –
Aqu
atic
Fea
sibi
lity
Stud
y
Page
61
of 9
2
13.2
Aqu
atic
Dev
elop
men
t

Col
lingw
ood
Leis
ure
Cen
tre –
Aqu
atic
Fea
sibi
lity
Stud
y
Page
62
of 9
2
13.3
Dry
Are
a an
d C
omm
unity
Hub
Red
evel
opm
ent

Col
lingw
ood
Leis
ure
Cen
tre –
Aqu
atic
Fea
sibi
lity
Stud
y
Page
63
of 9
2
13.4
A
quat
ic a
nd D
ry D
evel
opm
ent

Col
lingw
ood
Leis
ure
Cen
tre –
Aqu
atic
Fea
sibi
lity
Stud
y
Page
64
of 9
2
13.5
Site
Ele
vatio
ns

Col
lingw
ood
Leis
ure
Cen
tre –
Aqu
atic
Fea
sibi
lity
Stud
y
Page
65
of 9
2
13.6
Site
Impa
ct

Collingwood Leisure Centre – Aquatic Feasibility Study Page 66 of 92
13.7 Planning Implications
13.7.1 Mayors Park Master PlanningThe redevelopment of the Collingwood Leisure centre is consistent with the Master Planning for the Mayors Park and is consistent with the development of this area as a major activity precinct within the community.
13.7.2 Council Municipal Strategic Statement (MSS)In determining the planning implications of the Re development the Council Municipal Strategic Statement (MSS) was referenced.
The MSS contains local strategies on land use and development in the City of Yarra. It provides a vision in key areas such as City characteristics, sustainability and the local economy. Strategies in the MSS direct Council decisions in such areas as urban design, residential, industrial, commercial and retail land use and heritage conservation.
The following provides a summary of the key findings:
Objective 3 To manage potential amenity conflicts between residential and other uses.
Strategy 3.3 Ensure the location, design and operation of community facilities minimises the potential for negative amenity impacts on the surrounding area.
Response The Redevelopment does not extend beyod the current boundaries of the facility and therefore will not impact negatively on amenity usage.
Objective 11 To maximise accessibility of community services. Strategy 11.1 Encourage community facilities and services to locate within or adjacent to
retail centres and locations that support multi-purpose trips and shared parking arrangements.
Strategy 11.2 Ensure all community facilities are located so that they are easily accessible by public transport.
Response The CLC redevelopment has further integrated services within the facility and encourages multi purpose trips and [parking.
21.04-5 Parks, gardens and public open space
The importance of public open space in an inner city environment is heightened by the density of development, and the limited availability of private open space. Much of the recent and future residential development has and will occur in areas deficient in open space. In these neighbourhoods the provision of ample private open space for new residential development is particularly important. Given that resources to significantly expand Yarra’s open space network are limited, there must be a focus on protecting and enhancing the assets of the existing system as well an equitable system of open space contributions. In all neighbourhoods except Abbotsford, Clifton Hill, and Fairfield and Alphington, this should, where suitable in terms of size and location, be the provision of land.
Response The removal of the Maternal Child and Health Centre in Darling gardens will result in a net increase in public open space for residents.

Collingwood Leisure Centre – Aquatic Feasibility Study Page 67 of 92
Objective 14 To ensure that the open space network meets existing and future community needs.
Strategy 14.3 Avoid the loss of open space and new development in open space unless directly used for sport, leisure or passive recreation.
Strategy 14.4 Ensure new development does not have a negative impact on adjoining open space.
Response The re development will allow increased access to sport and recreation activities with a net gain in access to open space.
Objective 16 To protect and enhance the City’s heritage places. Strategy 16.7 Protect buildings, streetscapes and precincts of heritage significance from
the visual intrusion of built form both within places and from adjoining areas.
Response The redevelopment will be sympathetic to the significant community value of the current building design.

Collingwood Leisure Centre – Aquatic Feasibility Study Page 68 of 92
13.8 Project Costs
Detailed QS costing for the project was provided Curry Brown Quantity Surveys and Page Kirkland Group Construction Consultants provide these cost plans provided in attachment two.
The following table provides a summary of the development options:
Code Development Options Construction Cost ($)
Total Project Options
Total Project Costs ($)
A Aquatic Development 4,957,000.00 A 4,957,000.00 B Health Club Only 2,743,959.00 B 2,743,959.00 A+B 7,700,959.00 C1 Community Hub 1,424,659.00 A+B+C1 9,125,618.00
The total project cost which includes the Aquatic development, Health Club Development and Community Hub Development will be $9,125,618.

Col
lingw
ood
Leis
ure
Cen
tre –
Aqu
atic
Fea
sibi
lity
Stud
y
Page
69
of 9
2
13.9
Fin
anci
al P
roje
ctio
ns
13.9
.1 O
pera
ting
Perf
orm
ance
The
follo
win
g ta
ble
prov
ides
an
over
view
of t
he o
pera
tiona
l fin
anci
al p
roje
ctio
ns fo
r the
2-s
tage
dev
elop
men
t pre
sent
ed in
the
prev
ious
sec
tion.
The
op
erat
iona
l per
form
ance
of t
he fa
cilit
y w
ill im
prov
e fro
m a
cur
rent
sur
plus
of $
179,
359
per a
nnum
to a
pea
k op
erat
ing
surp
lus
(yea
r 4) o
f $54
5,42
9.
Hea
lth C
lub
/ Hub
R
edev
elop
men
t Po
ol R
edev
elop
men
t
REV
ENU
E C
urre
ntYe
ar 1
Ye
ar 2
Ye
ar 3
Ye
ar 4
Ye
ar 5
Ye
ar 6
Ye
ar 7
Ye
ar 8
Ye
ar 9
Ye
ar 1
0 Aq
uatic
s 61
8,97
3 63
7,54
2 70
0,25
8 82
6,47
3
847,
011
86
8,05
9 88
9,63
0 91
1,73
8 93
4,39
4 95
7,61
4 98
1,41
1
Hea
lth a
nd F
itnes
s 1,
222,
382
1,39
9,21
8 1,
860,
536
2,01
2,39
9
2,06
2,40
7 2
,113
,658
2,1
66,1
82 2
,220
,012
2,2
75,1
79 2
,331
,717
2,3
89,6
61
Sec
onda
ry S
pend
: Caf
é &
Mer
chan
dise
60
,668
67
,638
87
,550
11
5,92
7
118,
807
12
1,76
0 12
4,78
5 12
7,88
6 13
1,06
4 13
4,32
1 13
7,65
9
Mis
cella
neou
s 10
8,91
6 12
3,92
2 15
6,49
3 18
4,23
4
188,
812
19
3,50
4 19
8,31
3 20
3,24
1 20
8,29
1 21
3,46
7 21
8,77
2
Tota
l Rev
enue
2,
010,
938
2,22
8,32
0 2,
804,
837
3,13
9,03
3
3,21
7,03
7 3
,296
,981
3,3
78,9
11 3
,462
,877
3,5
48,9
29 3
,637
,120
3,7
27,5
03
EXPE
ND
ITU
RE
Cur
rent
Year
1
Year
2
Year
3
Year
4
Year
5
Year
6
Year
7
Year
8
Year
9
Year
10
Aqua
tics
381,
939
386,
496
441,
599
468,
041
48
2,08
2
496,
545
511,
441
526,
784
542,
588
558,
865
575,
631
H
ealth
and
Fitn
ess
310,
107
343,
832
368,
254
368,
254
37
9,30
1
390,
680
402,
401
414,
473
426,
907
439,
714
452,
906
S
econ
dary
Spe
nd :
Caf
é &
Mer
chan
dise
30
,000
33
,990
43
,260
61
,800
63
,654
65
,564
67
,531
69
,556
71
,643
73
,792
76
,006
M
isce
llane
ous
57,6
16
61,1
33
77,3
50
91,3
07
94,0
46
96,8
67
99,7
73
102,
766
105,
849
109,
025
112,
296
C
usto
mer
Ser
vice
/ A
ccou
nts
/ Adm
inis
tratio
n 37
2,89
4 44
7,72
1 55
7,67
0 61
7,41
0
635,
932
65
5,01
0 67
4,66
1 69
4,90
1 71
5,74
8 73
7,22
0 75
9,33
7
Man
agem
ent S
alar
ies
454,
424
468,
881
497,
281
546,
422
56
2,81
4
579,
699
597,
090
615,
003
633,
453
652,
456
672,
030
O
pera
tions
22
4,60
0 24
9,87
8 32
7,64
3 39
2,01
8
403,
779
41
5,89
2 42
8,36
9 44
1,22
0 45
4,45
6 46
8,09
0 48
2,13
3
Equ
ipm
ent L
ease
25,0
00
50,0
00
50,0
00
50,0
00
53,7
50
53,7
50
53,7
50
53,7
50
57,7
81
57,7
81
Tota
l Exp
endi
ture
1,
831,
579
2,01
6,93
0 2,
363,
056
2,59
5,25
1
2,67
1,60
9 2
,754
,007
2,8
35,0
15 2
,918
,453
3,0
04,3
94 3
,096
,944
3,1
88,1
19
N
et A
nnua
l Res
ult
179,
359
211,
390
441,
781
543,
781
545,
429
54
2,97
4 54
3,89
6 54
4,42
4 54
4,53
6 54
0,17
6 53
9,38
4
Tota
l Usa
ge
320,
015
335,
292
400,
189
460,
055
460,
055
46
0,05
5 46
0,05
5 46
0,05
5 46
0,05
5 46
0,05
5 46
0,05
5
Net
sur
plus
to c
ounc
il 17
9,35
9 21
1,39
0 44
1,78
1 54
3,78
1
545,
429
54
2,97
4 54
3,89
6 54
4,42
4 54
4,53
6 54
0,17
6 53
9,38
4

Col
lingw
ood
Leis
ure
Cen
tre –
Aqu
atic
Fea
sibi
lity
Stud
y
Page
70
of 9
2
13.9
.2 S
ourc
es o
f Fin
ance
The
sour
ces
of fu
nds
for t
he $
9.12
M p
roje
ct a
re o
utlin
ed b
elow
Cou
ncil
Cap
ital W
orks
Bud
get
$3
.20M
Sta
te G
over
nmen
t Bet
ter P
ools
Fun
ding
$2
.28M
Cou
ncil
Loan
$3
.64M
Tota
l
$9.1
2M

Col
lingw
ood
Leis
ure
Cen
tre –
Aqu
atic
Fea
sibi
lity
Stud
y
Page
71
of 9
2
13.9
.3
Fina
ncia
l Pro
ject
ions
Cas
h Fl
ow
The
follo
win
g ta
ble
prov
ides
a c
ash
flow
pro
ject
ion
base
d on
the
oper
atin
g pe
rform
ance
and
sou
rces
of c
ash
pres
ente
d pr
evio
usly
.
Ye
ar 1
Ye
ar 2
Ye
ar 3
Ye
ar 4
Ye
ar 5
Ye
ar 6
Ye
ar 7
Ye
ar 8
Ye
ar 9
Ye
ar 1
0 So
urce
s of
Cas
h R
ate
Year
s
Loan
s (a
ssum
es a
t beg
of y
r) 7%
15
3,64
4,61
8
Sta
te G
over
nmen
t Gra
nt
78
1,00
0 1,
500,
000
C
ounc
il ca
pita
l Wor
ks
200,
000
1,34
0,00
0 1,
660,
000
10,0
00
10,0
00
10,0
00
10,0
00
10,0
00
10,0
00
10,0
00
Oth
er
C
ash
Sur
plus
from
Ope
ratio
ns
21
1,39
0 44
1,78
1 54
3,78
1 54
5,42
9 54
2,97
4
543,
896
544,
424
544,
536
540,
176
539,
384
Tota
l Sou
rces
of C
ash
411,
405
2,56
2,78
1 7,
348,
399
555,
429
552,
974
55
3,89
6 55
4,42
4 55
4,53
6 55
0,17
6 54
9,38
4C
ash
Out
flow
s
Cos
t of r
edev
elop
men
t
200,
000
2,12
1,00
0 6,
804,
618
In
crea
sed
Mai
nten
ance
C
ontin
genc
y
31,8
15
133,
884
133,
884
13
3,88
4 13
3,88
4 13
3,88
4 13
3,88
4 13
3,88
4 A
nnua
l Loa
n R
epay
men
ts (p
aid
qtrly
)
0
39
4,39
7 39
4,39
7 39
4,39
7
394,
397
394,
397
394,
397
394,
397
394,
397
Fund
ing
Cos
t (A
ssum
es p
aid
to
coun
cil)
0
0
0
0
0
0
0
0
0
Tota
l Cas
h O
utflo
ws
200,
000
2,12
1,00
0 7,
230,
830
528,
281
528,
281
52
8,28
1 52
8,28
1 52
8,28
1 52
8,28
1 52
8,28
1A
nnua
l Net
Cas
h flo
w
21
1,40
5 44
1,78
1 11
7,57
0 27
,148
24
,693
25
,615
26
,143
26
,255
21
,895
21
,103
C
umul
ativ
e N
et C
ashf
low
s 21
1,40
5 65
3,18
6 77
0,75
5 79
7,90
3 82
2,59
6
848,
212
874,
355
900,
610
922,
505
943,
607
Out
stan
ding
Loa
ns a
t y/e
0
3,
491,
541
3,32
7,74
8 3,
152,
490
2,96
4,96
4 2,
764,
311
2,54
9,61
2 2,
319,
884
2,07
4,07
5 O
utst
andi
ng R
eser
ves
at y
/e
0
0
0
0
0
0
0
0
0
Tota
l Lia
bilit
ies
03,
491,
541
3,32
7,74
8 3,
152,
490
2,96
4,96
4 2,
764,
311
2,54
9,61
2 2,
319,
884
2,07
4,07
5


13.9.4 Specific Program Performance
The following table outlines the financial performance of operational areas. The developments enable the facility to increase revenue significantly in the key program areas with relatively small increases in expenditure.
Expenditure increases are most prominent in the customer service and administration areas, these increases relate to activities such as customer service, membership administration and marketing, these functions increase as a result of increased participation numbers.
REVENUE Current Year 3 Variance Aquatics 618,973 826,473 207,500 Health and Fitness 1,222,382 2,012,399 790,017 Secondary Spend: Café & Merchandise 60,668 115,927 55,259 Miscellaneous 108,916 184,234 75,318 Total Revenue 2,010,938 3,139,033 1,128,094
EXPENDITURE Current Year 3 Variance Aquatics 381,939 468,041 86,102 Health and Fitness 310,107 368,254 58,147 Secondary Spend : Café & Merchandise 30,000 61,800 31,800 Miscellaneous 57,616 91,307 33,691 Customer Service / Accounts / Administration 372,894 617,410 244,516 Management Salaries 454,424 546,422 91,998 Operations 224,600 392,018 167,418 Equipment Lease 0 50,000 50,000 Total Expenditure 1,831,579 2,595,251 763,672 Net Annual Result 179,359 543,781 364,422 Total Usage 320,015 460,055 140,039
Further financial and usage analysis are provided in attachment three:

Collingwood Leisure Centre – Aquatic Feasibility Study Page 74 of 92
13.9.5 Benchmarking
The following table provides an overview of the performance against the Centre for Environmental Research and Management (CERM) industry benchmarks. This table highlights that the development assists the facility improve on all benchmarks in particular expense recovery, labour costs to recepts and subsidy per visit.
Current YEAR 3 CERM Expense Recovery 109.8% 120.7% 101% Catchment Multiplier 5.33 7.67 6.30 Promotion per prospect $0.14 $0.28 $0.41 Labour Costs to Total receipts 66.4% 50.0% 65.0% Training Cost per % of Payroll 0.7% 1.1% 1.9% Presentation Cost Share 3.8% 3.5% 8.1% Energy Cost Share 4.8% 6.7% 8.9% Secondary Spend $0.19 $0.25 $0.44 Surplus / Subsidy per Visit $0.56 $1.17 ($0.34)
Collingwood Leisure Centre – Aquatic Feasibility Study Page 75 of 92
14 Attachments
Attachment One: Specific Health Club and Swim School Requirements Attachment two: QS Cost Plans Attachment three: Financial Analysis

Collingwood Leisure Centre – Aquatic Feasibility Study Page 76 of 92

Collingwood Leisure Centre – Aquatic Feasibility Study Page 77 of 92
Attachment One: Specific Health Club and Swim School Requirements

Collingwood Leisure Centre – Aquatic Feasibility Study Page 78 of 92
Health Cub Space Requirements
Area Size Equipment required
Cardio Equipment 260m²Area in front of the health club. Able to view up to 6 televisions.
Up to 40 pieces of cardio equipment i.e.: 14 Treadmills 10 Bikes 8 Cross Trainers 4 Steppers 2 Rowers
Machine Weights 180m² Positioned between cardio and heavy weights area
20 pieces of machine based resistance equipment
Free Weights 80 - 100m² Area furthest from entry point. Heavy matting to protect floor
Up to 8 benches Free weights containing 15bar bells assorted weights 30 Dumbbells assorted weights
Stretching 10 – 20m² Area close to cardio equipment
8 mats Access to a wall-mounted bar for stretching.
Fitness Assessment 10 - 20m² Self contained fitness testing area with windows to enable supervision of the whole gym.

Collingwood Leisure Centre – Aquatic Feasibility Study Page 79 of 92
Pool Space Requirements for LTS Program
Pool space needed for the following class types are listed below. This is a guide only and can be modified on busy days.
Class Type Shallow area options Deep areas Parent and babies 5m square
(0.8m)5m square
(1.2m) Preschool to school entry 5m square
(0.8m)4m 6 -10m
(0.8m)2.5m 5m
(1.2m) Level 1 & 2 4m 6 -10m 2.5m 5m
(1.2m) Level 3 & 4 5 m 10 m area 2.0m 25m 2.5m 5m
(1.5m) Level 5 - 7 5 m 10 m area 2.0m 25m 2.0m 5m
(1.5m) Mini Squads 2.0m 25m 2.0m 5m
(1.5m) Adults 5 m 10 m area 2.0m 25m 2.0m 10m
(1.5m) Note:
Brackets indicate suggested depth.
2.0m widths are indicative of a 25m lane this could be as narrow as 1.8m.
Teaching Space Area Required Area1 2m x 25m Main Pool 2 2m X 15m Main Pool 3 2m X 15m Main Pool 4 5m X 9m Learners Pool5 5m X 9m Learners Pool6 5m X 9m Learners Pool
Staff Classes Total Classes Places Total Places 60% 75% 90% Mon am 2 5 10 6 60 36 45 54 Mon pm 8 6 48 6 288 173 216 259.2 Tue am 0 0 0 6 0 0 0 0 Tue pm 7 6 42 6 252 151 189 226.8 Wed am 1 5 5 6 30 18 22.5 27 Wed pm 7 6 42 6 252 151 189 226.8 Thur am 0 0 0 6 0 0 0 0 Thur pm 7 6 42 6 252 151 189 226.8 Fri am 1 5 5 6 30 18 22.5 27 Fri pm 6 6 36 6 216 130 162 194.4 Sat 6 6 36 6 216 130 162 194.4 Sun 5 6 30 6 180 108 135 162
Total 50 57 296 72 1776 1066 1332 1598

Collingwood Leisure Centre – Aquatic Feasibility Study Page 80 of 92
Attachment Two: QS Costing

Collingwood Leisure Centre – Aquatic Feasibility Study Page 81 of 92

Collingwood Leisure Centre – Aquatic Feasibility Study Page 82 of 92
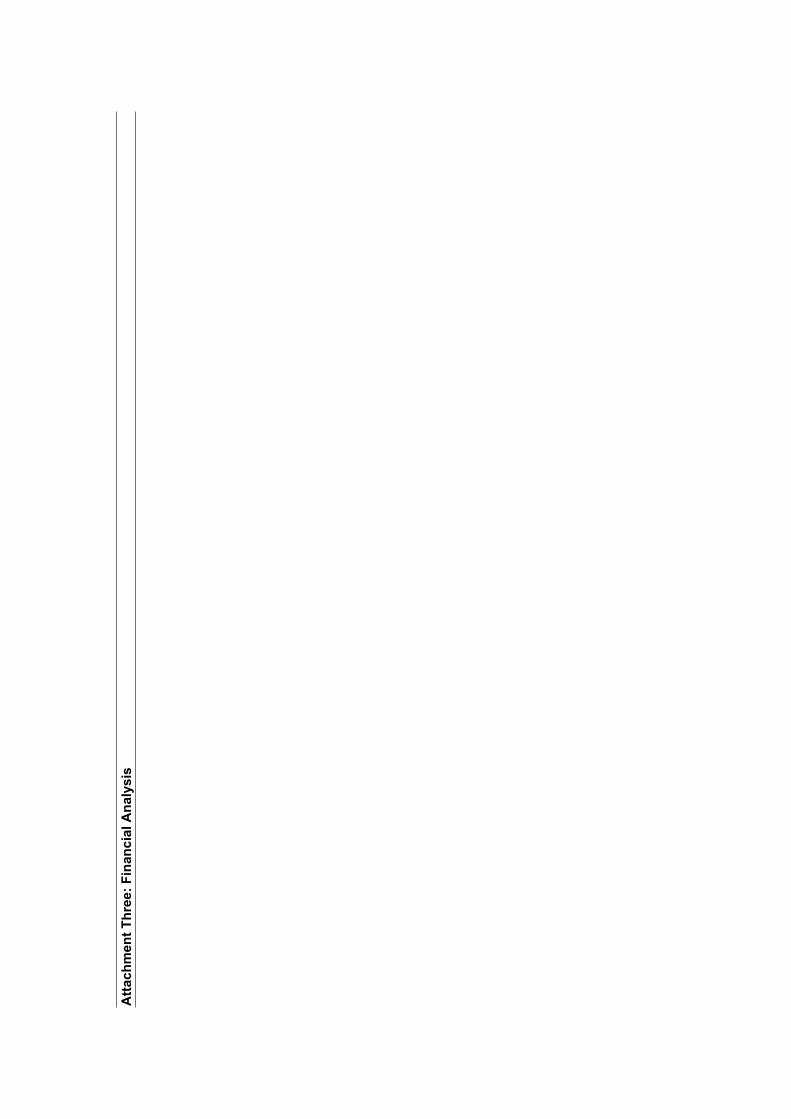
Atta
chm
ent T
hree
: Fin
anci
al A
naly
sis

Col
lingw
ood
Leis
ure
Cen
tre –
Aqu
atic
Fea
sibi
lity
Stud
y
Page
84
of 9
2
INC
OM
EIN
CO
ME
EXPE
ND
ITU
RE
NET
Cur
rent
Post
Dev
elop
men
tYr
3
Varia
nce
Cur
rent
Post
D
evel
opm
ent
Yr3
Varia
nce
Cur
rent
Post
D
evel
opm
ent
Yr3
Varia
nce
Rec
Sw
im
$147
,488
$2
02,4
04
$54,
917
$150
,032
$1
87,0
33
$37,
001
($2,
544)
$15,
371
$17,
915
SS
S /
War
m W
ater
Poo
l $2
5,00
0 $3
1,70
0 $6
,700
$25,
000
$31,
700
$6,7
00
Sw
im L
esso
ns
$277
,961
$3
58,2
92
$80,
332
$153
,907
$1
80,4
28
$26,
521
$124
,054
$1
77,8
64
$53,
811
Scho
ols
$85,
800
$108
,459
$2
2,65
9 $3
4,10
0 $4
3,10
6 $9
,006
$5
1,70
0 $6
5,35
4 $1
3,65
4 A
qua
Aer
obic
s $1
2,90
5 $1
9,93
9 $7
,033
$9
,360
$1
4,46
1 $5
,101
$3
,545
$5
,478
$1
,932
S
quad
s $6
6,36
3 $8
7,55
0 $2
1,18
7 $2
6,04
0 $1
3,59
6 ($
12,4
44)
$40,
323
$73,
954
$33,
631
Birt
hday
Par
ties
$3,4
56
$18,
128
$14,
672
$8,5
00
$29,
417
$20,
917
($5,
044)
($11
,289
)($
6,24
5)H
ealth
Clu
b - M
embe
rshi
p $1
,108
,800
$1
,874
,023
$7
65,2
23
$162
,123
$2
15,8
30
$53,
707
$946
,677
$1
,658
,193
$7
11,5
16
Gro
up F
itnes
s $7
6,58
2 $9
2,02
6 $1
5,44
4 $1
34,7
84
$138
,828
$4
,044
($5
8,20
2)($
46,8
02)
$11,
400
Mul
ti-sp
ort
$37,
000
$46,
350
$9,3
50
$13,
200
$13,
596
$396
$2
3,80
0 $3
2,75
4 $8
,954
C
rèch
e $7
,992
$1
5,31
4 $7
,322
$2
0,29
8 $1
9,20
7 ($
1,09
1)($
12,3
06)
($3,
892)
$8,4
14
Mis
cella
neou
s
$0
$0
$0
$0
$0
G
roup
s $2
5,00
0 $3
6,05
0 $1
1,05
0 $2
,500
$4
,635
$2
,135
$2
2,50
0 $3
1,41
5 $8
,915
S
pons
orsh
ip
$0
$0
$0
$0
$0
Loc
kers
/equ
ipt h
ire
$11,
500
$14,
420
$2,9
20
$2,0
00
$3,0
90
$1,0
90
$9,5
00
$11,
330
$1,8
30
Spe
cial
ist S
ervi
ces
$24,
000
$36,
050
$12,
050
$2,5
00
$2,5
75
$75
$21,
500
$33,
475
$11,
975
Per
sona
l Tra
inin
g $4
0,42
4 $8
2,40
0 $4
1,97
6 $3
0,31
8 $6
1,80
0 $3
1,48
2 $1
0,10
6 $2
0,60
0 $1
0,49
4 C
afé
/ Foo
d $1
0,66
8 $2
5,75
0 $1
5,08
2
$0
$1
0,66
8 $2
5,75
0 $1
5,08
2 M
erch
andi
se
$50,
000
$90,
177
$40,
177
$30,
000
$61,
800
$31,
800
$20,
000
$28,
377
$8,3
77
$0
$0
$0
$0
Cus
tom
er S
ervi
ce W
ages
$201
,694
$2
68,7
55
$67,
061 (
$201
,694
)($
268,
755)
($67
,061
)Ac
coun
ts F
inan
ce
$0
$0
$0
$0
A
dmin
istra
tion
T
elep
hone
$18,
500
$36,
050
$17,
550
($18
,500
)($
36,0
50)
($17
,550
) P
osta
ge
$1
,700
$3
,090
$1
,390
($
1,70
0)($
3,09
0)($
1,39
0) E
quip
men
t Pur
chas
e
$20,
000
$20,
600
$600
($2
0,00
0)($
20,6
00)
($60
0) O
ffice
Sup
plie
s
$23,
500
$32,
960
$9,4
60 (
$23,
500)
($32
,960
)($
9,46
0) B
ank
Cha
rges
$2,2
00
$7,7
25
$5,5
25
($2,
200)
($7,
725)
($5,
525)
Col
lingw
ood
Leis
ure
Cen
tre –
Aqu
atic
Fea
sibi
lity
Stud
y
Page
85
of 9
2
INC
OM
EIN
CO
ME
EXPE
ND
ITU
RE
NET
Cur
rent
Post
Dev
elop
men
tYr
3
Varia
nce
Cur
rent
Post
D
evel
opm
ent
Yr3
Varia
nce
Cur
rent
Post
D
evel
opm
ent
Yr3
Varia
nce
Com
pute
r Sup
port
and
Mai
nten
ance
$3,0
00
$4,1
20
$1,1
20
($3,
000)
($4,
120)
($1,
120)
Cas
h S
ecur
ity
$3
,800
$7
,725
$3
,925
($
3,80
0)($
7,72
5)($
3,92
5) P
rintin
g
$17,
000
$41,
200
$24,
200
($17
,000
)($
41,2
00)
($24
,200
) M
arke
ting
$4
5,00
0 $1
28,7
50
$83,
750
($45
,000
)($
128,
750)
($83
,750
) M
isce
llane
ous
$2
0,00
0
($20
,000
)($
20,0
00)
$0
$20,
000
Uni
form
s
$10,
000
$9,2
70
($73
0)($
10,0
00)
($9,
270)
$730
S
taff
Trai
ning
$6,5
00
$18,
025
$11,
525
($6,
500)
($18
,025
)($
11,5
25)
Lic
ensi
ng S
ubsc
riptio
ns
$1
2,00
0 $1
3,39
0 $1
,390
($1
2,00
0)($
13,3
90)
($1,
390)
Man
agem
ent S
alar
ies
$2
90,0
00
$361
,324
$7
1,32
4 ($2
90,0
00)
($36
1,32
4)($
71,3
24)
Cas
ual D
uty
Man
ager
Wag
es
$1
52,4
24
$166
,558
$1
4,13
4 ($1
52,4
24)
($16
6,55
8)($
14,1
34)
Ope
ratio
ns
E
nerg
y: G
as &
Ele
ctric
ity
$8
8,00
0 $1
75,1
00
$87,
100
($88
,000
)($
175,
100)
($87
,100
) B
uild
ing
and
Pla
nt M
aint
enan
ce
$1
4,00
0 $2
8,84
0 $1
4,84
0 ($
14,0
00)
($28
,840
)($
14,8
40)
Sec
urity
Exp
erie
nce
$5
,500
$6
,695
$1
,195
($
5,50
0)($
6,69
5)($
1,19
5) W
ater
$25,
000
$46,
350
$21,
350
($25
,000
)($
46,3
50)
($21
,350
) P
ool C
hem
ical
s
$20,
000
$41,
200
$21,
200
($20
,000
)($
41,2
00)
($21
,200
) G
arde
ning
Exp
ense
$0
$0
$0
$0
$0
$0
Firs
t Aid
$2,5
00
$3,6
05
$1,1
05
($2,
500)
($3,
605)
($1,
105)
Cle
anin
g E
xpen
se
$6
9,60
0 $9
0,22
8 $2
0,62
8 ($
69,6
00)
($90
,228
)($
20,6
28)
Equ
ipm
ent L
ease
$5
0,00
0 $5
0,00
0 $0
($
50,0
00)
($50
,000
)To
tal I
ncom
e $2
,356
,182
$3,1
39,0
33$1
,128
,094
$1,8
31,5
79$2
,550
,961
$7
19,3
82$1
79,3
59
$588
,071
$408
,712

Col
lingw
ood
Leis
ure
Cen
tre –
Aqu
atic
Fea
sibi
lity
Stud
y
Page
86
of 9
2
Fina
ncia
l Mod
ellin
g C
ollin
gwoo
d Le
isur
e C
entr
e R
edev
elop
men
t
Usa
ge R
epor
t
Cur
rent
YEA
R 1
YE
AR
2
YEA
R 3
YE
AR
4 Y
EAR
5YE
AR
6YE
AR
7YE
AR
8YE
AR
9YE
AR
10
R
ec S
wim
54
961
5
4,96
1
61,
419
82,
915
8
2,91
5
82
,915
8
2,91
5
82,9
15
82,
915
82
,915
8
2,91
5 S
wim
Les
sons
32
510
3
2,51
0
34,
910
39,
500
3
9,50
0
39
,500
3
9,50
0
39,5
00
39,
500
39
,500
3
9,50
0 S
SS
War
m W
ater
Poo
l 83
33
8
,333
8
,921
9,8
13
9
,813
9,8
13
9
,813
9,8
13
9
,813
9,8
13
9
,813
Sc
hool
s
2200
0
22,
000
2
4,00
0
2
7,00
0
27,
000
27,0
00
27,
000
27
,000
2
7,00
0
27,0
00
27,
000
Aqu
a A
erob
ics
2028
2,0
28
2,3
66
3
,042
3,0
42
3
,042
3,0
42
3
,042
3,0
42
3
,042
3,0
42
Squ
ads
13
230
1
3,23
0
13,
860
18,
900
1
8,90
0
18
,900
1
8,90
0
18,9
00
18,
900
18
,900
1
8,90
0 B
irthd
ay P
artie
s 57
6
576
1,0
56
3
,520
3,5
20
3
,520
3,5
20
3
,520
3,5
20
3
,520
3,5
20
Aqu
atic
oth
er
H
ealth
Clu
b - M
embe
rshi
p 13
7700
15
0,70
0
193,
875
207
,960
20
7,96
0
207
,960
20
7,96
0 2
07,9
60
207,
960
207
,960
20
7,96
0 G
roup
Fitn
ess
8424
9,1
26
9,8
28
9
,828
9,8
28
9
,828
9,8
28
9
,828
9,8
28
9
,828
9,8
28
Mul
ti-sp
ort
1233
3
12,
333
1
2,12
8
1
5,00
0
15,
000
15,0
00
15,
000
15
,000
1
5,00
0
15,0
00
15,
000
Crè
che
27
09
3
,326
3
,326
3,3
26
3
,326
3,3
26
3
,326
3,3
26
3
,326
3,3
26
3
,326
M
isce
llane
ous
Gro
ups
8333
8,3
33
1
0,00
0
1
1,66
7
11,
667
11,6
67
11,
667
11
,667
1
1,66
7
11,6
67
11,
667
S
peci
alis
t Hea
lth S
ervi
ces
960
96
0
2
,000
2,3
33
2
,333
2,3
33
2
,333
2,3
33
2
,333
2,3
33
2
,333
Per
sona
l Tra
inin
g 40
42
5
,000
6
,500
8,0
00
8
,000
8,0
00
8
,000
8,0
00
8
,000
8,0
00
8
,000
S
peci
al E
vent
s A
ttend
ance
25
00
2
,500
3
,500
3,5
00
3
,500
3,5
00
3
,500
3,5
00
3
,500
3,5
00
3
,500
Sp
ecta
tors
93
75
9
,375
12,
500
13,
750
1
3,75
0
13
,750
1
3,75
0
13,7
50
13,
750
13
,750
1
3,75
0
To
tal P
artic
ipat
ion
3200
1533
5,29
2
400,
189
46
0,05
546
0,05
5 46
0,05
5 46
0,05
546
0,05
5 46
0,05
546
0,05
546
0,05
5Av
erag
e D
aily
Par
ticip
atio
n 90
4
947
1,1
30
1
,300
1,3
00
1
,300
1,3
00
1
,300
1,3
00
1
,300
1,3
00
Col
lingw
ood
Leis
ure
Cen
tre –
Aqu
atic
Fea
sibi
lity
Stud
y
Page
87
of 9
2
Atta
chm
ent F
our:
Cat
chm
ent A
naly
sis

Col
lingw
ood
Leis
ure
Cen
tre –
Aqu
atic
Fea
sibi
lity
Stud
y
Page
88
of 9
2

Col
lingw
ood
Leis
ure
Cen
tre –
Aqu
atic
Fea
sibi
lity
Stud
y
Page
89
of 9
2

Col
lingw
ood
Leis
ure
Cen
tre –
Aqu
atic
Fea
sibi
lity
Stud
y
Page
90
of 9
2

Col
lingw
ood
Leis
ure
Cen
tre –
Aqu
atic
Fea
sibi
lity
Stud
y
Page
91
of 9
2

Collingwood Leisure Centre – Aquatic Feasibility Study Page 92 of 92