Persistence in Pursuit - Financials - Pakistan Stock Exchange
172
Persistence in Pursuit Integrated Annual Report 2019
-
Upload
khangminh22 -
Category
Documents
-
view
2 -
download
0
Transcript of Persistence in Pursuit - Financials - Pakistan Stock Exchange
About the CoverAtlas Honda remained persistent in its pursuit of building long lasting relationship with the stakeholders by emerging as a market leader of innovative and competitive products. The Company continued to offer the level of engineering integrity with high quality mechanics and extended support that is unmatched. Atlas Honda will continue its enthusiastic yet exemplary journey ahead in the light of "Atlas Way". We aim to remain the stair-stepper as we have in the past.
Persistence in PursuitIntegrated Annual Report 2019

About the CoverAtlas Honda remained persistent in its pursuit of building long lasting relationship with the stakeholders by emerging as a market leader of innovative and competitive products. The Company continued to offer the level of engineering integrity with high quality mechanics and extended support that is unmatched. Atlas Honda will continue its enthusiastic yet exemplary journey ahead in the light of "Atlas Way". We aim to remain the stair-stepper as we have in the past.

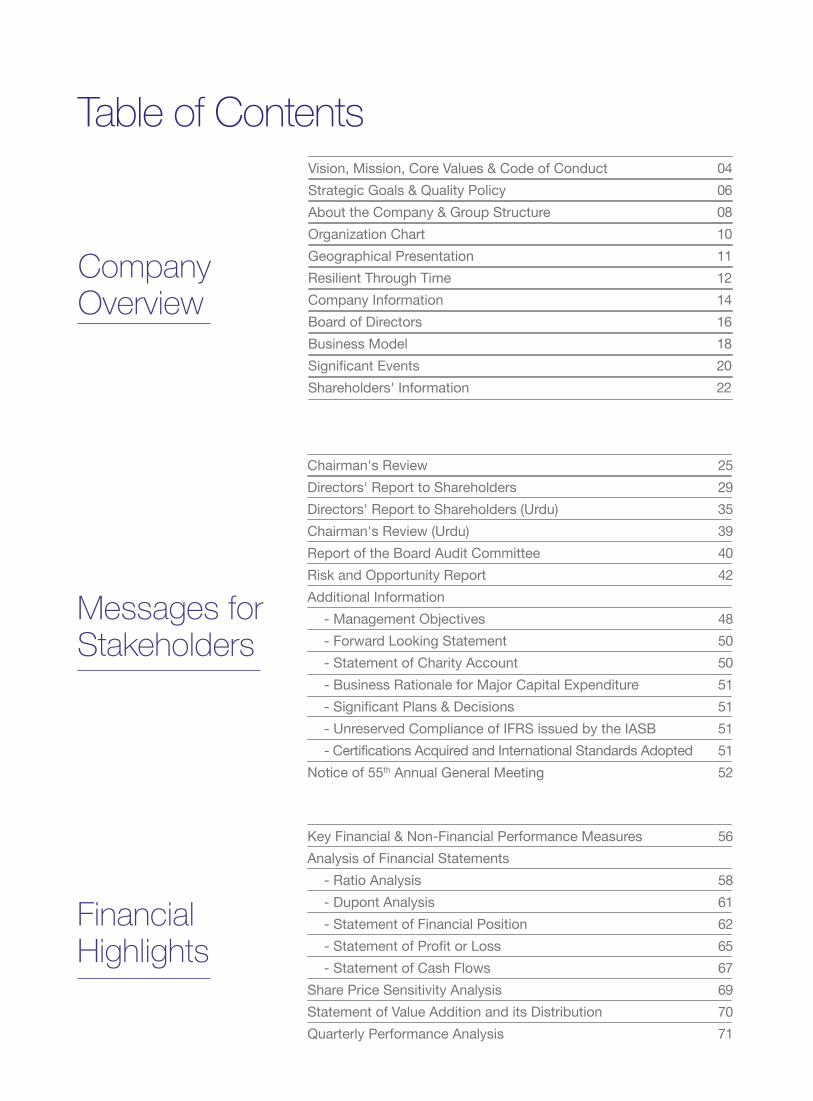
Table of Contents
CompanyOverview
Vision, Mission, Core Values & Code of ConductStrategic Goals & Quality PolicyAbout the Company & Group StructureOrganization ChartGeographical PresentationResilient Through TimeCompany InformationBoard of DirectorsBusiness ModelSignificant EventsShareholders' Information
0406081011121416182022
Messages forStakeholders
252935394042
4850505151515152
Chairman's ReviewDirectors' Report to ShareholdersDirectors' Report to Shareholders (Urdu)Chairman's Review (Urdu)Report of the Board Audit CommitteeRisk and Opportunity ReportAdditional Information - Management Objectives - Forward Looking Statement - Statement of Charity Account - Business Rationale for Major Capital Expenditure - Significant Plans & Decisions - Unreserved Compliance of IFRS issued by the IASB - Certifications Acquired and International Standards AdoptedNotice of 55th Annual General Meeting
FinancialHighlights
56
5861626567697071
Key Financial & Non-Financial Performance MeasuresAnalysis of Financial Statements - Ratio Analysis - Dupont Analysis - Statement of Financial Position - Statement of Profit or Loss - Statement of Cash FlowsShare Price Sensitivity AnalysisStatement of Value Addition and its DistributionQuarterly Performance Analysis

SustainabilityReport
Other Information
161164165166167169
Pattern of ShareholdingProduct PortfolioAtlas Group CompaniesGlossary of TermsFeedback FormInvestors' Education
747576777888939698
102106107109
FinancialStatements
Statement of Compliance with Code of Corporate GovernanceReview Report to the Members on Statement of Compliance with the Code of Corporate GovernanceAuditors' Report to the MembersStatement of Financial PositionStatement of Profit or Loss & Other Comprehensive IncomeStatement of Cash FlowsStatement of Changes in EquityNotes to the Financial Statements
116
118119122
123124125126
About this ReportSustainability Highlights 2019General InformationCEO's Message on SustainabilitySustainability StrategyEnvironmental ProtectionProduct ResponsibilityCorporate CitizenshipVendor ManagementEmployee ManagementDefinition, Methodology and ScopeIndependent Assurance StatementGRI Content Index

SustainabilityReport
CompanyOverview
Message forStakeholders
FinancialHighlights
FinancialStatements
OtherInformation
Market leader in the motorcycle industry, emerging as a global competitive centre of production and exports.
A dynamic growth oriented company through market leadership, excellent in quality and service and maximizing export, ensuring attractive returns to equity holders, rewarding associates according to their ability and performance, fostering a network of engineers and researchers ensuing unique contribution to the development of the industry, customer satisfaction and protection of the environment by producing emission friendly green products as a good corporate citizen fulfilling its social responsibilities in all respects.
Vision
Mission
Code of ConductDirectors and employees are required to comply with the Atlas Honda's Code of Conduct, which is intended to help them put the Company’s ethical principles into practice. The Code of Conduct clarifies the basic principles and standards they are required to follow and the behaviour expected of them. The Code of Conduct can be found at www.atlashonda.com.pk.
Core ValuesOur core values are derived from group’s philosophy which is based on the “Atlas Way”. It enumerates the principlesof “Atlas Culture” and “Atlas System”.
We promote a culture of respectacross the Company and rewardexceptional performances.
Respect, Recognition & Reward
We aim for optimum utilization of our time to increase productivity and improve work/life balance.
Value of Time
We foster meritocracies in hiring,rewarding and promoting the bestpeople based on their merit.
Meritocracy
We trust our abilities and talent tobuild a better, stronger and moredynamic organization.
Self Reliance
We provide education & trainingopportunities to our employees fortheir professional growth.
Education & Training
We deliver high-quality productsto our customers.
Excellence
04

SustainabilityReport
CompanyOverview
Message forStakeholders
FinancialHighlights
FinancialStatements
OtherInformation
05

CustomersOur Customers are the reason and the source of our business. It is our joint aim with our dealers to ensure that the customers enjoy the highest level of satisfaction from use of Honda motorcycles.
QualityTo ensure that our products and services meet the set standards of excellence.
Local ManufacturingTo be the industry leader in indigenization of motorcycle parts.
TechnologyTo develop and maintain distinct business advantages through continuous induction of improved hard and soft technologies.
ShareholdersTo ensure health and viability of business and thus safeguarding shareholders’ interest by maximizing profit. Payment of regular satisfactory dividends and adding value to the shares.
EmployeesTo enhance and continuously update each member’s capabilities and education and to provide an environment which encourages practical expression of the individual potential in goal directed team efforts and compensate them attractively according to their abilities and performance.
Corporate CitizenTo comply with all Government laws, rules and regulations and to maintain a high standard of ethics in all operations and to act as a responsible member of the society.
Strategic Goals
Quality Policy• Commitment to provide high quality motorcycles and parts.
• Right work in first attempt and on time.
• Maintain and continuously improve quality.
• Training of manpower and acquisition of latest technology.
• Safe, clean and healthy environment.
• Market leadership and prosperity for all.
SustainabilityReport
CompanyOverview
Message forStakeholders
FinancialHighlights
FinancialStatements
OtherInformation
06

SustainabilityReport
CompanyOverview
Message forStakeholders
FinancialHighlights
FinancialStatements
OtherInformation
07

SustainabilityReport
CompanyOverview
Message forStakeholders
FinancialHighlights
FinancialStatements
OtherInformation
Atlas Honda Limited boasts a long eventful history of success. The foundation of Atlas Group was laid in the year 1962 by Mr. Yusuf H. Shirazi when “Shirazi Investments (Private) Limited” was formed with an initial capital of Rs. 500,000 and 2 associates by his side. This marked the start of journey which revolutionized the two – wheeler industry in Pakistan. It was the beginning of a ride to glory, aiming to transform the people’s lives by providing simplistic mobility solutions. That spirit drove the chronicles of the nation’s largest motorcycle manufacturing company, showcasing the “Power of Dreams, Generation after Generation.”
Utilizing the funds generated by Shirazi Investments (Private) Limited, Mr. Yusuf H. Shirazi signed a technical collaboration agreement with Honda Motor Company Limited (HMC) in 1963 for the production and sales of Honda motorcycles in
Pakistan. The Company that was formed as a result of this venture was called “Atlas Autos Limited” with its manufacturing facility located in Karachi.
To expand the reach to new markets, Atlas Epak Limited was formed in 1968 with manufacturing facilities based in East Pakistan. However, calamity struck in 1971 as the war in East Pakistan resulted in loss of the sister concern. Despite this massive financial impediment, Atlas Autos remained steadfast and recovered. Later in 1979, another new motorcycle manufacturing plant at Sheikhupura, namely “Panjdarya Limited” was established.
To enhance the technological and production capabilities, a joint venture agreement was entered into in 1988 with HMC. Both Atlas Autos Limited and Panjdarya Limited operated separately until
About the Company & Group Structure
08

SustainabilityReport
CompanyOverview
Message forStakeholders
FinancialHighlights
FinancialStatements
OtherInformation
the two were merged in 1991 and “Atlas Honda Limited” (the Company) came into being.Atlas Honda has stayed persistent in its pursuit to reach newer heights through major achievements during the year with capacity enhancement up to 1.35 million units, increased sales volume and extended product range. As a company, we have always stood by the products with immaculate quality, cutting-edge manufacturing facilities, unmatched skills, and an ever-growing dealership network which has lead us to become what we are today.
Today Atlas is a diversified group dealing in engineering, power generation, financial services and trading. It consists of 16 companies out of which 4 are quoted on the Pakistan Stock Exchange. Atlas shareholders equity and assets stand over 2 billion US dollars; annual sales
nearing 3 billion US dollars . The Group has harmonized professional management and institutionalized the Group shareholding to build businesses that last generation after generation. Atlas has also been playing a leading role as a corporate citizen promoting centers of professional education, contributing to health facilities, helping law enforcement agencies and improving the standard of life.
09
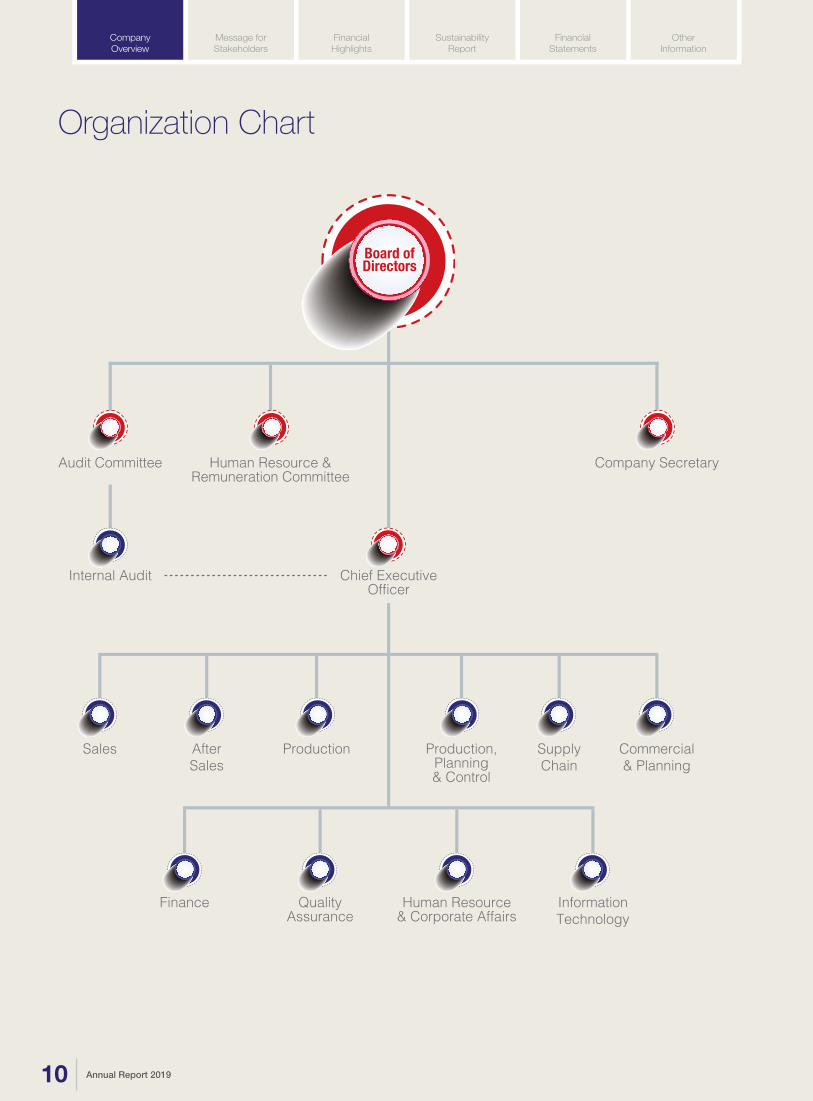
Organization Chart
Human Resource &Remuneration Committee
Company SecretaryAudit Committee
Chief ExecutiveOfficer
Internal Audit
AfterSales
Production Production,Planning& Control
SupplyChain
Commercial& Planning
Sales
Finance QualityAssurance
Human Resource& Corporate Affairs
InformationTechnology
Board ofDirectors
SustainabilityReport
CompanyOverview
Message forStakeholders
FinancialHighlights
FinancialStatements
OtherInformation
10

Geographical Presence
RAHIM YAR KHAN
SHEIKHUPURA
Dealerships & Distribution NetworkAtlas Honda’s Dealerships are spread all over Pakistan.Complete details are available at www.atlashonda.com.pk
Factories: Karachi, Sheikhupura
Registered Office: Lahore
Branch Offices &Customer Care Centres:
Lahore, Multan, Islamabad, Hyderabad, Faisalabad, Rahim Yar Khan
Showroom: Karachi
Head Office: Karachi
SustainabilityReport
CompanyOverview
Message forStakeholders
FinancialHighlights
FinancialStatements
OtherInformation
11

Resilient Through Time1963-2019
Atlas Autos Limited is incorporated as public limited company.
The first technical collaboration agreement is signed between Atlas Autos Limited and Honda Motor Company Limited. The historical ceremony takes place in Tokyo, where Mr. Yusuf H. Shirazi and Mr. Soichiro Honda, founder of Honda Motor Company Limited, graces the occasion.
Atlas Autos becomes the first two wheeler Company in Pakistan to get listed on Stock Exchange.
Commercial production commences with sanctioned annual capacity of 6,000 units.
The Company launches a series of new models. Honda C 50, C 90, and S 90 gained immense popularity among the customers.
An in-house engineering workshop is set up and the Company’s dream of developing a completely localized product takes its first place.
A new model, S110 Deluxe is launched.
The Company launches two of its longest running and most popular production models, the fuel efficient CD70 and high performance CG125.
The Company sends its key engineers and dealers to Japan for training courses.
Panjadarya Limited, an associated Company, is incorporated with its plant facility at Sheikhupura. Second Technical Assistance agreement is signed with Honda Motor Company Limited.
Re-layout, modernization and balancing of manufacturing facility is carried out.
Series of technical seminars on motorcycle technology are held in Pakistan in collaboration with the Association of Technical Scholarships of Japan.
A motorcycle Technical Training Centre is established in Lahore.
Panjadarya Limited commences commercial production.
The 2 stroke MB 100 is launched with a memorable advertising campaign.
New CD70 with econo-power engine is launched.
The Company achieved localization level of 50%.
A Quality Circle Movement, called “Ala Mayar Circle” is started, aiming at improvement in quality control and manufacturing techniques.
The Company organizes the first ever vendor conference.
Engine parts manufacturing plant is installed.
The Company celebrates its 25th year of incorporation.
Honda Motor Company acquires 10% equity in Atlas Autos.
Merger of Panjdarya Limited with Atlas Autos takes place.
1963-1970 1971-1980 1981-1990
SustainabilityReport
CompanyOverview
Message forStakeholders
FinancialHighlights
FinancialStatements
OtherInformation
12

1991-2000 2001-2010 2011-2018
Dealer convention of motorcycle industry is held for the first time in Pakistan.
The new marketing strategy of “5S” Dealership is introduced under which customers can avail the facilities of sales, service, spare parts, second hand motorcycle exchange and special (credit) sales – all under one roof.
The Company achieves localization level of 85%.
The Company crosses the barrier of 100,000 units in 2003.
The new model CD 100 is launched.
The Company extends the capacity at Sheikhupura plant by establishing, state of the art, 500k synchronized Assembly Plant.
The new model CG 125 Deluxe is launched.
The Company hosts the 15th NHC Asia-Oceania Bloc Convention.
SAP, the leading ERP system, is implemented.
The Company surpasses 90% localization record and crossed the 500,000 units barrier in 2011.
The Company becomes the first motorcycle company in Pakistan with all its models compliant with latest emission standards.
The Company launches new models namely Honda CD70 Dream, CG125 Dream, Pridor and CBR series.
The Company celebrates 50 years of the nation’s ride.
Mrs. Yusuf H. Shirazi inaugurates the Company’s 50 years gallery.
The Company acquires shares of Atlas Hitec (Private) Limited.
The Company’s corporate reporting practices are recognized through various awards by ICAP & ICMAP, SAFA, KSE, ACCA & WWF.
First ever Company to announce the engine warranty period of three years.
The Company completes the investment of USD 100 million for a three-year phase wise expansion plan of its motorcycle operations in Pakistan.
The Company celebrates production capacity enhancement at Sheikhupura plant. Mr. Takahiro Hachigo, President & CEO Honda Motor Company graced the occasion.
The Company launches new models namely CB 150F & CB 250F.
The name of new merged Company is changed to Atlas Honda Limited.
CG 125 engine parts manufacturing plant is installed at Sheikhupura plant and new model of CG 125 is launched.
New CD 70 model is introduced with latest ignition technology.
The Company manages to formalize eight technical assistance agreements between Japanese Companies and vendors. Thus, the Company continues to play a key role in transfer of technology and vendor development in Pakistan.
The Company makes its first exports to Bangladesh, Nepal, Sri Lanka, Middle East and Central Asia.
The Company received ISO 9002 certification for both Karachi and Sheikhupura plants.
The Company is ranked among the top ten employers.
SustainabilityReport
CompanyOverview
Message forStakeholders
FinancialHighlights
FinancialStatements
OtherInformation
Atlas Honda has managed to stay resilient through all these years with a strong footing leading to new levels of excellence. The journey has marked some significant milestones that revolve around state-of-the-art facilities, the ever-growing dealership network, and cutting edge manufacturing plants resulting in an unprecedented outcome. Our dynamic spirit and relentless passion has helped us sustain our foundation as one of the oldest companies in Pakistan whilst upholding an undying passion that leads to bigger and greater achievements in the years ahead.
13

SustainabilityReport
CompanyOverview
Message forStakeholders
FinancialHighlights
FinancialStatements
OtherInformation
Company InformationBoard of DirectorsYusuf H. ShiraziChairman
Abid Naqvi Director
Hirofumi Yada Director
Hironobu YoshimuraDirector
Jawaid Iqbal Ahmed Director
Sanaullah QureshiDirector
Yukitoshi FujisakaDirector
Saquib H. ShiraziChief Executive Officer
Marrium AhmedCompany Secretary
Audit CommitteeSanaullah Qureshi Chairman
Abid NaqviMember
Jawaid Iqbal AhmedMember
Muhammad IqbalHead of Internal Audit
Marrium AhmedSecretary
Human Resource & Remuneration CommitteeSanaullah QureshiChairman
Jawaid Iqbal Ahmed Member
Saquib H. ShiraziMember
Faisal IqbalSecretary
ManagementSaquib H. ShiraziChief Executive Officer
Afaq AhmedVice President Marketing
Yukitoshi FujisakaVice President Technical
Hirofumi Yada General Manager Technical
Kashif YasinChief Financial Officer
Faisal IqbalGeneral Manager Human Resources& Administration
Khawaja ShujauddinGeneral Manager Commercial & Planning
Muhammad Qadeer KhanGeneral Manager Plants
Muhammad Rashad RashidGeneral Manager Production, Planning& Control.
Mujahid-ul-Mulk ButtGeneral Manager Sales
Tanvir HyderGeneral Manager Supply Chain & Systems
Zafar IqbalGeneral Manager After Sales
Zia Ul Hassan KhanGeneral Manager Quality Assurance
Auditors Shinewing Hameed Chaudhri & Co.Chartered Accountants
14

SustainabilityReport
CompanyOverview
Message forStakeholders
FinancialHighlights
FinancialStatements
OtherInformation
Legal Advisors
Mohsin Tayebaly & Co.
Tax Advisor
Ernst & Young Ford Rhodes Sidat Hyder,Chartered Accountants
Shares Registrar
Hameed Majeed Associates (Pvt.) LimitedH. M. House, 7-Bank Square,Shahrah-e-Quaid-e-Azam, LahoreTel: (92-42) 37235081-82Fax: (92-42) 37358817
Bankers
Allied Bank LimitedAskari Bank LimitedBank Al-Habib Limited Bank Alfalah LimitedFaysal Bank Limited Habib Bank Limited Khushali Bank LimitedMCB Bank LimitedMeezan Bank LimitedNational Bank of Pakistan Soneri Bank Limited Standard Chartered Bank (Pakistan) Limited The Bank of Tokyo-Mitsubishi UFJ LimitedUnited Bank Limited
Registered Office
1-McLeod Road, Lahore-54000Tel: (92-42) 37225015-17, 37233515-17UAN: (92-21) 111-111-245Fax: (92-42) 37233518, 37351119E-mail: [email protected] Website: www.atlashonda.com.pk
Factories
F-36, Estate Avenue, S.I.T.E., Karachi-75730Tel: (92-21) 32575561-65, 32566775Fax: (92-21) 32563758, 32576193
26-27 KM, Lahore-Sheikhupura Road,Sheikhupura-39321Tel: (92-56) 3406501-8Fax: (92-56) 3406009
Branch Offices &Customer Care Centres
Azmat Wasti Road, MultanTel: (92-61) 4570413-14UAN: (92-61) 111-112-411Fax: (92-61) 4541690
Islamabad Corporate Center,Plot No. 784/785, Golra Road, IslamabadTel: (92-51) 5495781-84, 5495746-47
Makhdoom Altaf Road, West Sadiq CanalBank, Near City School, Rahim Yar KhanTel: (068) 5883415-19Fax: (068) 5883414
2nd Floor, Dawood Centre, Autobhan Road,Hyderabad.Phone: (022) 3411361-9Fax: (022) 34113670
1st Floor, Meezan Executive Tower,4 - Liaquat Road, FaisalabadTel: (92-41) 2541011-7, 2541014
1st Floor, 28-Mozang Road, LahoreTel: (92-42) 36361191-5, 36360740-7
Show Room
West View Building, Preedy Street,Saddar, Karachi.Tel: (92-21) 32720833, 32727607
Customer Contact CentreUAN: (92-42) 111-245-222Toll Free: 0800-245-22Email: [email protected](Within working hours from Monday to Friday)
15

SustainabilityReport
CompanyOverview
Message forStakeholders
FinancialHighlights
FinancialStatements
OtherInformation
Board of Directors
Mr. Sanaullah Qureshi qualified as a Chartered Accountant from Scotland and joined ICI Pakistan Limited in 1962. He worked in different capacities as General Manager and Director in-charge of Finance, Human Resources and various other businesses of ICI. He retired as the Deputy Chairman of ICI in 1993. Mr. Qureshi joined as CEO of Forbes Campbell & Co. Limited, an old established Group dealing in shipping, trading and manufacturing. He retired from Forbes in 1995 and has since worked in advisory capacity with Captain-PQ Chemicals Industries Limited. He is the former President of Management Association of Pakistan and the Chairman of Gillette Pakistan Limited. He previously held directorship in Linde Pakistan Limited (formerly known as BOC Pakistan Limited), Faysal Bank Limited, SSGCL, Atlas Bank Limited and MYK Associates (Private) Limited. He has been on the Board of Atlas Honda Limited since February 2001.
Sanaullah QureshiDirector
Mr. Ahmed is an AMP from Harvard Business School, Boston USA, and IPBM from IMD Lussanne, Switzerland. He is also MBA from IBA Karachi University. He has been working in Atlas Group in various capacities. He has over 49 years of experience in the field of industrial and financial markets of Pakistan. He spearheaded joint venture partnerships of Atlas Group with Honda Japan, JSB Japan, Bank of Tokyo, Asian Development Bank and ING.
Jawaid Iqbal AhmedDirector
Mr. Shirazi is a Law graduate (LLB) with BA (Hons.) and JD (Diploma in Journalism) from Punjab University and AMP Harvard. He served in the financial services of the Central Superior Services of Pakistan for eight years where he authored 50 reports as to how the businesses are carried and tax assessed. He was an instructor in the Finance Services Academy on Law and Accounts. He is the author of seven books including “Aid or Trade” adjudged by the Writers Guild as the best book of the year and continues to be a columnist, particularly on matters – socio – politico – economic.
Mr. Shirazi is the Chairman of Atlas Group, which, among others, has joint ventures with Honda, GS Yuasa and MAN to name a few. Mr. Shirazi has been the President of Karachi Chamber of Commerce and Industry
for two terms. He has been the founder member of Karachi Stock Exchange, Lahore Stock Exchange and International Chamber of Commerce and Industry. He has been on the Board of Harvard Business School Alumni Association and is the Founder President of Harvard Club of Pakistan and Harvard Business School Club of Pakistan. He has been a visiting faculty member at National Defense University, Navy War College and National School of Public Policy. He has been on the Board of Governors of LUMS, GIK and FC College (Chartered University) and Pakistan Institute of Management. Previously, he also served, among others, on the Board of Fauji Foundation Institute of Management and Computer Sciences (FFIMCS) and Institute of Space Technology – Space & Upper Atmosphere Research Commission (SUPARCO).
Mr. Shirazi has been awarded Sitara-e-Eisaar and Sitara-e-Imtiaz the top Civilian Awards. Sitara-e-Imtiaz conferred by the Government of Pakistan recognizes individuals who have made an "especially meritorious contribution to the security or national interests of Pakistan, world peace, cultural or other significant public endeavours”. Sitara-e-Eisaar Award is in recognition of CSR activities in Pakistan. A Distinguished Formanite Award for outstanding achievements as an entrepreneur was awarded by Forman Christian College – University Lahore.
The Government of Japan also acknowledged Mr. Shirazi’s contributions to promote economic relationship between the two countries by conferring the Japanese National Award.
Yusuf H. ShiraziChairman
16

SustainabilityReport
CompanyOverview
Message forStakeholders
FinancialHighlights
FinancialStatements
OtherInformation
Mr. Abid Naqvi is the COO of ACL Capital (Pvt.) Limited, a business development company affiliated with Associated Constructors Ltd. He is also on the Board of Associated Constructors Limited, Alfalah GHP Investment Management Limited and Cherat Packaging Limited. He has worked in the fields of Commercial and Development Banking and Stock Brokerage for a period of over thirty years. He has also worked as CEO of Taurus Securities Limited, a renowned name in the stock brokerage industry. He is a graduate from the University College London, UK in the field of Economics and Finance.
Abid Naqvi Director
Mr. Hironobu Yoshimura has been associated with Honda Motor Company Limited, Japan for more than 30 years. Mr. Yoshimura is graduate from Sophia University, Japan. He joined Honda in 1988 and began his career in Service Technology Division in Japan. Mr. Hironobu Yoshimura has experience in the Automobile industry, having worked in several planning divisions. In his previous assignment, he has worked as Department Manager at Automobile Marketing Planning Office in Honda Motor Company Limited, Japan. From November 1, 2017 he joined Honda Atlas Cars (Pakistan) Limited as President and Chief Executive Officer. He was appointed as a member of the Board of Atlas Honda Limited in April 2018.
Hironobu YoshimuraDirector
Hirofumi YadaDirector
Mr. Yukitoshi Fujisaka joined Honda Motor Company in 1989. He has a vast experience in automobile sector especially in Motorcycle Sales and product development, having worked with Honda ventures in different capacities across the globe. In 2007, he assumed senior management role in the Honda Motor Europe as Product Planning Division General Manager. Later on, he joined Montesa Honda S.A. Spain as President. Thereafter, he joined Honda Motor China Investment (Shanghai Branch) as Director. Before taking over his current responsibilities, he was stationed as the President in the Wuyang Honda Motors, China. He has diversified knowledge of Honda Products and has experience of working in different cultures. He was appointed as a member of the Board of Atlas Honda Limited in April 2018.
Yukitoshi FujisakaDirector
Mr. Hirofumi Yada started his career as a production expert in 1985 at Kumamoto factory of Honda Motor Company Limited. Later, he was transferred to headquarters and was in-charge of production, planning and control for Europe and North America. Before being appointed to Pakistan, he was stationed in Honda of South Carolina as Vice President. His vast experience not only on engineering side but also on factory management side has contributed to the growth of the company in a difficult situation. He has been a member of the Board of Atlas Honda Limited since April 2017.
Mr. Saquib H. Shirazi has been the Chief Executive Officer of Atlas Honda Limited for the last fourteen years. He graduated from the Wharton School of Finance, before completing his Masters from the Harvard Business School. He has worked with the Bank of Tokyo – Mitsubishi UFJ Limited in Japan and is the former CEO of Atlas Investment Bank Limited. At present, he is serving as a member on the Board of Pakistan Petroleum Limited, Pakistan
Cables Limited and Cherat Cement Limited. Previously, he has been on the Boards of National Refinery Limited, Sui Southern Gas Company Limited, PERAC and the Privatization Commission of Pakistan. He has also been on the Board of Harvard Business School’s Global Alumni and served as President for the year from 2006 to 2008. He has been on the Board of Atlas Honda Limited since November 2000.
Saquib H. ShiraziChief Executive Officer
Non-Executive Member Board Audit Committee Member Human Resource & Remuneration CommitteeExecutive Independent 17

SustainabilityReport
CompanyOverview
Message forStakeholders
FinancialHighlights
FinancialStatements
OtherInformation
1
2
3
4
Business ModelOur sustainable approach to sourcing, production, distribution and marketing helps us create value for a wide group of stakeholders, from suppliers to customers. We use our unique strengths and employ our resources and relationships to deliver sustainable growth in earnings for our shareholders. Applying the principles of “Atlas Way” to our business, strengthens our position as a market leader in Pakistan’s two-wheeler industry.
The Company's share capital and
accumulated reserves
The Company'sknowledge base,
product development capabilities &
partnership with Honda Motors
The trusted relationships &
collaborations with customers, regulators, communities & other
stake holders
Atlas Honda's workforce of competent employees
Renewable and non renewable natural
resources
Research andDevelopment
Design andengineering
Developing desirablepremium products
Manufacturing operations
Atlas Culture & Systems
FUELING OUR KEY ACTIVITIES
Atlas Honda’sstate of the art manufacturing
facilities & diversified product portfolio
Finan
cial
Intell
ectu
alHu
man
Man
ufac
ture
dNa
tura
lSo
cial &
Relat
ionsh
ips
OUR CAPITALS
1
2
3
4
18

SustainabilityReport
CompanyOverview
Message forStakeholders
FinancialHighlights
FinancialStatements
OtherInformation
DisciplinedCapital Allocation
Premium-qualitycustomer experiences
Dealers network
5
8
6
7
9
Logistics
Marketing & communications
PKR
CustomersWe develop product that improve our customers' competitiveness
Model launches: CB125F & CG125 SelfMMCs: CD70, CD70 Dream, Pridor, CG125 & CB150F
InvestorsWe generate attractive returns for investors over long term
Return on equity: 20.5%
CommunitiesWe improve the communities that we impact locally,nationally and globally.
Refer to page no. 96 of CSR report.
PartnersWe create partnerships based on collaboration where each partner benefits from the relationship.
Spent with external suppliers: Rs. 63 Billion
EmployeesWe create an environment where each employee is able to be at their best.
Remuneration & Benefits: Rs. 3.32 BillionInvestment in Training: Rs. 38.7 Million
Governing Bodies & RegulatorsWe aim to create trusted relationships with governing bodies and regulators, meeting all legal and regulatory commitments and requirements.
Tax & Levies: Rs. 18.69 Billion.
VALUE CREATION FOROUR STAKEHOLDERS IN 2019
19

SustainabilityReport
CompanyOverview
Message forStakeholders
FinancialHighlights
FinancialStatements
OtherInformation
Women on Wheels
MMCs of Pridor& CB150F
28th Ala Mayar Circle
Technical SkillContest 2018
Dealers’ Convention2018
Best Corporate andSustainability Report 2018
1st Quarter 2nd QuarterBoard of Directors' meeting for the year ended March 31, 2018 was held on April 30, 2018.
Women on Wheels rallies and promotional activities were carried out in Lahore and Faisalabad.
28th Ala Mayar Circle presentations were held atKarachi plant.
Annual General Meeting of the Company for the year ended March 31, 2018 was held on June 28, 2018.
MMCs of Pridor and CB 150 F were launched.
Customers, Dealers and Mechanics get together were held at dealerships in 20 cities.
Board of Directors Meeting of the Company for the quarter ended June 30, 2018 was held on July 30, 2018.
Atlas Honda Limited conducted Dealers’ Convention 2018, in Lahore. The event was attended by our official dealers, senior management and our guests from Asian Honda
Technical Skill Contest 2018 took place at Faletti’s Hotel Lahore. 24 of the best candidates from 8 regions, selected fromAtlas Honda dealers nationwide.
AHL secured 4th position in the "Best Corporate and Sustainability Report 2018" Awards organised by ICAP, ICMAP
A blood donation campaign was arranged in co-ordination with Indus Hospital at Karachi plant.
Significant EventsDuring the Year 2018-19
20

SustainabilityReport
CompanyOverview
Message forStakeholders
FinancialHighlights
FinancialStatements
OtherInformation
Road Safety Rally
MMC of CD70& CD70 Dream
Brand ActivationCampaign
New Model CB125F launched
New Model CG125Slaunched
Pakistan Auto Show’19
3rd Quarter 4th QuarterBOD meeting for 2nd quarter for the approval of half year financial results reviewed by auditors
Company Organized a road safety rally at Lahore, Sialkot and Karachi
MMC of CD70 & CD70 Dream was launched nationwide.
Brand activation campaign across the country
Company Received award at 11th International CSR Summit & Awards 2019 organized by NFEH
4th Honda Safety Rally was held in Karachi on December 25th, 2018 for safety awareness.
BOD meeting for 3rd quarter for the approval of unaudited 3rd quarter financial results. BOD meeting for approval of annual budget 2019-20 was held on March 20,2019
MMC of CG125 was launched.
New Model CB125F & CG125 Self was launched.
Atlas Honda making waves at Pakistan Auto Show’19
Atlas Honda Limited Ranked among top 50 taxpayers by FBR for tax year 2018
Atlas Honda Limited received PRA highest taxpayer’s award.
21

Registered Office
1-McLeod Road, LahoreTel: (92-42) 37225015-17 (92-42) 37233515-17Fax: (92-42) 37233518 (92-42) 37351119___________________________________________________
Exchange Listing
Atlas Honda Limited (the Company) is listed on Pakistan Stock Exchange Limited (PSX).___________________________________________________
Stock Symbol
The stock code for dealing in equity shares of the Company at Pakistan Stock Exchange Limited is ATLH.___________________________________________________
Listing Fees
The annual listing fees for the financial year 2018 - 19 were paid to the PSX and Central Depository Company of Pakistan Limited within the prescribed time limit.___________________________________________________
Statutory Compliance
During the year, the Company has complied with all applicable provisions, filed all returns / forms and furnished all relevant particulars / information as required under the Companies Act, 2017 and allied rules, the listing requirements and any other relevant laws, rules and regulations prescribed by the Securities and Exchange Commission of Pakistan (SECP).___________________________________________________
Annual General Meeting
Date: June 21, 2019Time: 11:00 A.M.Venue: Avari Hotel, 87, Mall Road, Lahore.___________________________________________________
Financial Calendar
April 2019 Audited annual results for the year ended March 31, 2019May 2019 Mailing of annual reports June 2019 Annual General MeetingJuly 2019 Unaudited first quarter financial resultsNovember 2019 Unaudited half year financial resultsJanuary 2020 Unaudited third quarter financial results
Dividend Announcement
The Board of Directors of the Company has proposed a
final cash dividend of Rs. 10 per share (100 %) and bonus shares in the proportion of 1 share for every 5 shares held for the year ended March 31, 2019 subject to approval by shareholders of the Company at the forthcoming Annual General Meeting, in addition to interim dividend of Rs. 10 per share (100%)
Last year, the Company has paid the cash dividend of Rs. 27 per share (270%). ___________________________________________________
Dates of Book Closure
The register of the members and share transfer book of the Company will remain closed from June 07, 2019 to June 21, 2019 (both days inclusive).___________________________________________________
Date of Dividend Payment
The payment of dividend, upon declaration by shareholders at the forthcoming Annual General Meeting, will be made on or after June 21, 2019.
Last year, the Company transferred the cash dividend on June 29, 2018 after approval from shareholders at the 54th Annual General Meeting.___________________________________________________
Circulation of Annual Reports Through CD/DVD/USB
As notified by the Securities and Exchange Commission of Pakistan (SECP) vide SRO 470(1)/2016, dated May 31, 2016, and in continuation with the SRO 787(1)/2014 dated September 08, 2014, further supported by Section 223(6) of the Companies Act 2017 and approved by the Shareholders in the Annual General Meeting of the Company held on June 19, 2017, the Company shall circulate Annual Report 2019 to its shareholders in the form of CD. Any member requiring printed copy of Annual Report 2019 may send a request using a Standard Request Form placed on Company website.___________________________________________________
E-Dividend Mandate (Mandatory)
Under the provisions of Section 242 of the Companies Act, 2017, it is mandatory for a listed company to pay cash dividend to its shareholders only through electronic mode directly into bank account designated by the entitled shareholders. In order to receive dividends directly into their bank accounts, shareholders are requested to fill in Electronic Credit Mandate Form available on Company’s website i.e. http://www.atlashonda.com.pk and send it duly signed along with a copy of CNIC to the Registrar of the Company.
M/s. Hameed Majeed Associates (Private) Limited, H.M. House, 7-Bank Square, Shahrah-e-Quaid-e-Azam, Lahore,
Shareholders’ Information
CompanyOverview
Message forStakeholders
FinancialHighlights
SustainabilityReport
FinancialStatements
OtherInformation
22
Pakistan in case of physical shares. In case shares are held in CDC then Electronic Credit Mandate Form must be submitted directly to shareholder’s broker/ participant/CDC account services.___________________________________________________
Withholding of Tax & Zakat on Dividend
As per the provisions of Section 150 of the Income Tax Ordinance, 2001, the withholding tax is deductible at source on the amount of dividend paid by the Company at the rate of 15% for filers and at the rate of 20% for non-filers.
In the light of clarification from Federal Board of Revenue, all the shareholders who intend to seek exemption from withholding of tax on payment of dividend under clause 47B of Part – IV of the Second Schedule of the Income Tax Ordinance, 2001, are requested to provide the valid Exemption Certificate under section 159(1) of the Income Tax Ordinance, 2001 duly issued by the concerned Commissioner of Inland Revenue in order to claim the said exemption.
Zakat is also deductible at source from the dividend at the rate of 2.5% of the face value of the share, other than corporate holders or individuals who have provided an undertaking for non-deduction of zakat.___________________________________________________
Share Transfer System
The Company’s shares department is operated by M/s. Hameed Majeed Associates (Pvt.) Limited. It is managed by a team of well-experienced professionals and is equipped with the necessary infrastructure and has in place the comprehensive set of systems and procedures for operational activities pertaining to shares and conducting the Registration function.
Share transfers received at the Share Registrar of the Company are registered within 30 days from the date of receipt, provided the documents are complete in all respects.___________________________________________________
Proxies
According to section 137 of the Companies Act, 2017 and Memorandum and Articles of Association of the Company, every shareholder of the Company who is entitled to attend and vote at a General Meeting of the Company can appoint another member as his/her proxy to attend and vote instead of him/her. Every notice calling a General Meeting of the Company contains a statement that a shareholder entitled to attend and vote is entitled to appoint a proxy, who ought to be a member of the Company.
The instrument appointing a proxy (duly signed by the shareholder appointing that proxy) should be deposited at the company/share registrar not less than forty eight hours before the meeting.___________________________________________________
Annual General Meeting and Related Matters
In pursuance of section 132 of the Companies Act, 2017, the Company holds General Meeting of shareholders at least once a year. Every shareholder has a right to attend the Meeting. The notice of such meeting is sent to all shareholders at least 21 days before the meeting and also advertised in at least one English and Urdu newspaper.
All shares issued by the Company carry equal voting rights. Generally, matters at the general meetings are decided by a show of hands in the first instance. The voting by show of hands operates on the principle of “One Member-One Vote”. If majority of the shareholders raise their hands in favour of a particular resolution, it is taken as passed, unless a poll is demanded.___________________________________________________
Issues Raised in Last Annual General Meeting
General clarifications were sought by the shareholders on the Company’s published Annual Report, however, no significant issue was raised during the 54th Annual General Meeting of the Company held on June 28, 2018.___________________________________________________
Website of the Company
The Company is operating the website www.atlashonda.com.pk containing updated information regarding the Company. The website contains the financial results of the Company together with the Company’s profile, the Atlas Group philosophy and products of the Company.___________________________________________________
Change of Address / E-Mail Address
All registered shareholders should send information of changes of addresses and e-mail address, if any to the share registrar of the Company:
M/s. Hameed Majeed Associates (Pvt.) Limited.H.M. House, 7-Bank Square, Shahrah-e-Quaid-e-Azam, LahorePhone: +92 (42) 37235081-82Fax : +92 (42) 37358817___________________________________________________
Capital Structure
The paid up capital of the Company is Rs. 1,034 Million represented by 103.4 Million shares of Rs. 10/- each. The balance sheet footing stands at Rs. 31.9 Billion and net worth of Rs. 16 Billion.
The Company is a subsidiary of Shirazi Investment (Private) Limited holding 52.43% shareholding. Another major shareholder is Honda Motor Company Limited – Japan holding 35% of the shares.
Details of shares held by Directors / Sponsors / Executives are given in the Pattern of Shareholding.
CompanyOverview
Message forStakeholders
FinancialHighlights
SustainabilityReport
FinancialStatements
OtherInformation
23
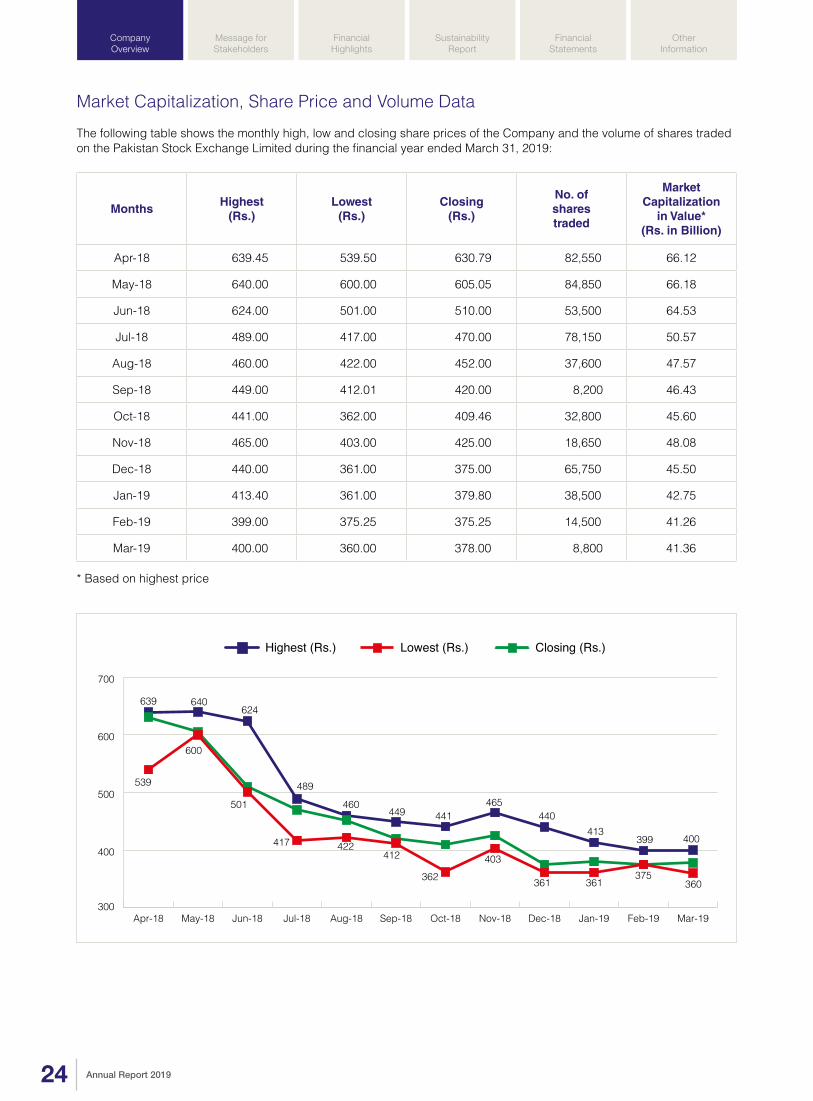
Market Capitalization, Share Price and Volume Data
The following table shows the monthly high, low and closing share prices of the Company and the volume of shares traded on the Pakistan Stock Exchange Limited during the financial year ended March 31, 2019:
MonthsHighest
(Rs.)Lowest
(Rs.)Closing
(Rs.)
No. ofsharestraded
MarketCapitalization
in Value* (Rs. in Billion)
Apr-18 639.45 539.50 630.79 82,550 66.12
May-18 640.00 600.00 605.05 84,850 66.18
Jun-18 624.00 501.00 510.00 53,500 64.53
Jul-18 489.00 417.00 470.00 78,150 50.57
Aug-18 460.00 422.00 452.00 37,600 47.57
Sep-18 449.00 412.01 420.00 8,200 46.43
Oct-18 441.00 362.00 409.46 32,800 45.60
Nov-18 465.00 403.00 425.00 18,650 48.08
Dec-18 440.00 361.00 375.00 65,750 45.50
Jan-19 413.40 361.00 379.80 38,500 42.75
Feb-19 399.00 375.25 375.25 14,500 41.26
Mar-19 400.00 360.00 378.00 8,800 41.36
300
400
500
600
700
Mar-19Feb-19Jan-19Dec-18Nov-18Oct-18Sep-18Aug-18Jul-18Jun-18May-18Apr-18
Highest (Rs.) Lowest (Rs.) Closing (Rs.)
539
600
501
417 422412
362403
361 361375
360
639 640624
489
460449 441
465440
413399 400
* Based on highest price
CompanyOverview
Message forStakeholders
FinancialHighlights
SustainabilityReport
FinancialStatements
OtherInformation
24

This has been a year of strong performance as the Company sold more motorcycles than ever before and launched new products designed to deliver outstanding customer experience. The Company continued to equip itself to be able to stay ahead of the curve. With a promising product portfolio, enhanced competitiveness and balanced installed capacity, the Company is poised to sustain its market leadership in the years to come.
I am pleased to present the 55th Annual Report of the Company for the year ended March 31, 2019.
Macroeconomic Overview
The country’s economic progress was undermined by challenges around maintaining a stable exchange reserves position and containing the twin deficits. GDP growth projection has been revised downwards to 3.5%. CPI inflation has risen considerably to 7.2% due to increase in energy prices and unfolding impact of depreciation of Pak Rupee. Fiscal deficit is expected to hit a six year high of 6.9% of GDP due to negligible improvement in revenues and increase in debt and security-related expenditures. On the external front, fiscal measures have started to reflect improvement. The current account deficit has reduced to USD 9.6 Billion in 9MFY19, down by 29% from same period of last year. This contraction is mainly attributable to a steep fall of 5% in overall import bill of USD 39.3 Billion, while exports posted a mixed trend. Home remittances remained strong with growth of 8.7% and stood at USD 16 Billion.
Financing of the current account deficit, nevertheless, remained a challenge, due to insufficient inflows. The new government garnered bilateral sources for balance of payment support while simultaneously entering into bailout negotiations with International Monetary Fund. State Bank of Pakistan’s (SBP) foreign exchange reserves gradually recovered to USD 10.5 Billion. However, these are still less than three months’ import cover. Pak rupee lost more than one-third of its total value during 2018, but nevertheless remained stable since end of November 2018 and closed at 141. A bearish sentiment prevailed in stock market throughout the year as PSX 100 Index closed at 38,649 points at the end of March 2019. With the aforesaid evolving macroeconomic situation, the SBP increased its policy rate to 10.75% to achieve stability. This represents a cumulative increase of 5% since January 2018.
Agriculture
Agriculture sector provides a base for Pakistan’s economic development. However, during the year, the performance of this sector remained mixed. The latest estimates for major crops are expected to fall short of the levels achieved last year. A substantial decline was observed in the production of major Kharif crops mainly due to water shortages. The output of wheat, being the major Rabi crop, is affected due to weak fertilizer off take and unfavourable weather conditions. However, the recent surge in the prices of agricultural products has partially neutralized the effects of these losses which ensured liquidity in the rural areas.
Large Scale Manufacturing (LSM)
The industrial sector is witnessing the brunt of the slowdown in both public and private consumption. Resultantly, LSM shrank by 1.72% during 9MFY19 compared to a remarkable growth of 6.1% during the financial year 2017-18. This subdued performance can largely be attributed to a deceleration in the construction-allied industries and consumer durables as recent monetary and fiscal measures have affected domestic demand. Given initial plans of the ruling Government, some adjustment policy steps can be expected, but given the precarious conditions, near term measures are critical for industrial growth.
The Two Wheeler Industry
The two-wheeler industry in Pakistan provides inexpensive means of transportation to a large segment of the country’s population. After three consecutive years of double-digit growth, this year, the industry’s growth was dampened and was recorded at 5% compared to the previous year. Given the macroeconomic context, purchasing power of customers was affected which contained demand for consumer durables including two wheelers. On the other hand, better security situation, improved remittances, higher trend of urbanization and demographic shift to youth provided much needed support.
The Company
The Company is systematically laying the foundations for long-term success and notwithstanding a challenging environment during the year, remained on its growth course. On the basis of sound finances and a strong core business, it is positioning
Chairman’s Review
CompanyOverview
Message forStakeholders
FinancialHighlights
SustainabilityReport
FinancialStatements
OtherInformation
25

itself for the future: with outstanding products and services, forward-looking business model and technologies and with an organization appropriate to the markets’ changing dynamics. Segmental Review
The Company continued to sustain its market leadership with strengthened customer connect, superior brand salience, upgrade of existing products, launch of new products and superior customer service. Further, it continued to expand its dealer network with the objective to increase overall market share. During the year, the Company delivered a record number of motorcycles once again and achieved sales of 1,135k units representing growth of 4.3% over last year.
Amidst tough competition, 70 cc motorcycles continue to form the largest chunk of motorcycle sales in Pakistan and the Company continued to secure highest market share through its brands “CD 70” and “CD 70 Dream”. The Company has achieved growth of 11% over sales of last year in this category. Strong domestic demand was further reinforced through active marketing activities and introduction of minor model changes. Demand for the Company’s product in 100 cc segment, “Pridor”, remained promising. This model aims to provide customers a product powered by “commuting with comfort and maximum fuel efficiency”. Econo run competitions, free checkup camps and other exciting campaigns were carried out to further penetrate the market. The higher CC category (125 cc and more) is persistently gaining share in the overall motorcycle industry. The Company continued to reinforce its leadership by offering products that meet customers’ expectation in terms of design, power and functionality. During last quarter of the outgoing year, the Company launched two new models namely “CB 125F” and “Self – powered CG 125” to meet customers’ expectations that were well received by the market. The Company’s model in the 150cc category “CB 150 F” continued to receive an encouraging response. The bike has been designed to fulfill customers’ needs and aspirations for mobility, while setting benchmarks in technology and style.
The Company strongly believes that its Spare Parts (SP) business helps in increasing the overall customer experience and more importantly reduces the total cost of ownership of a two-wheeler. During the year, the Company was able to enhance sales of Atlas Honda “Genuine Parts” through a larger & improved product portfolio, improved packaging and creative marketing ideas and registered an encouraging growth of 13.6%. Further, a number of advertising and customer care campaigns were organized to emphasize the importance of using genuine parts and oil for proper maintenance of motorcycles. These efforts along with a wider distribution network helped achieve revenue of over Rs. 8.3 Billion. However, existence of spurious and unscrupulous vendors in the largely unorganized spare parts market continues to pose a threat to businesses in the organized sector.
Performance Scorecard
Notwithstanding tough headwinds, the Company can look back on an overall positive business performance in the year ended March 31, 2019. Despite some slight downward trends in figures, the Company’s results of operations, financial position and net assets are indicative of a solid financial condition. The Company achieved net sales of Rs. 82.4 Billion as compared to Rs. 77.5 Billion in last year, up by 6%. The increase was mainly due to volume growth. However, gross profit declined from Rs. 8.3 Billion to Rs. 6.6 Billion, down by 21%. This was due to significant surge in material prices on account of depreciation of Pak Rupee against USD and Japanese Yen. Sales and marketing expenses rose to Rs. 1.9 Billion, a year on year increase of 4% which is attributable to higher volumes, new model launch activities and spending on promotional campaigns to support core business. Administrative expenses remained same over the corresponding period primarily due to measures introduced to maximize cost efficiencies. Other income, net of financial charges, contributed Rs. 624 Million to the bottom line, 35.4% higher than the comparative period. Resultantly, the Company achieved profit before tax of Rs. 4.6 Billion during the year ending March 31, 2019, representing a decrease of 26%. Net profit after tax was Rs. 3.2 Billion from 4.7 Billion, a decrease of 31% over last year. This translated into Earnings per Share (EPS) of Rs. 31.0 as against Rs. 45.1 of last year.
Sales Volume(in units)
2018
Sales Volume
2017
920
,671
1,0
88,4
01
1,1
35,8
40
2019
Sales & Gross Margin(Rs. in Million)
2018
Sales Gross Margin
2017
64,
534
6,55
6
8,29
1
6,77
9
77,
479
82,
413
2019
Profit after tax(Rs. in Million)
2018
Profit after tax
2017
3,7
52
4,6
64
3,2
09
2019
CompanyOverview
Message forStakeholders
FinancialHighlights
SustainabilityReport
FinancialStatements
OtherInformation
26

Atlas Honda Limited has been a debt free Company for the past eight years and therefore incurs no borrowing cost. Finance cost represents bank charges on transactional cost paid to banks for collection from customers on behalf of the Company throughout Pakistan. Free cash flow from operations during the year stood at Rs. 1.7 Billion. This has been deployed in capital assets, short term investments and payment of dividend. Additions to capital assets mainly represent expansion of production facilities and balancing, modernization and replacement of existing manufacturing facilities.
During the year, the Company contributed an amount of Rs. 18.7 Billion to the Government and its agencies on account of various taxes and levies. The Atlas Group, of which the Company is a constituent member, contributed Rs. 61 Billion in all towards the national exchequer. This makes Atlas Group one of the highest taxpayer in the country with over 1% of Government’s total revenue.
Dividend Policy
The Company has a long tradition of impressive distribution of profits to its shareholders. Keeping up with the same and taking into consideration the strategic views, business needs and the Company’s financial position, for the year, the Board of Directors is pleased to propose final cash dividend of Rs. 10 per share and bonus share issue @ 20% (i.e. 1 bonus share for every 5 shares held). This is in addition to an interim dividend of Rs. 10 per share declared in October 2018, aggregating a total dividend of Rs. 20 per share.
Manufacturing Excellence
The Company continues to invest in the resources and capabilities that underpin its success. During the year under review, the capacity of Engine Machining Area and Die Casting was upgraded to 1.35 Million units. The Company effectively responded to the changing business needs through flexible production planning. Despite a record number of changes on assembly lines, product quality was maintained and stable production was achieved through extensive training and monitoring. Automation themes were introduced by utilizing in-house resources to achieve process optimization. This helped the Company in achieving the highest ever sales of 1,135k units. The Company recognizes that development of resources across its supply chain is critical for maintaining its long term competitiveness. Accordingly, the Company is in constant collaboration with its suppliers for utilizing their expertise and benefiting from increased economies of scale.
The Company continued to work on projects for reduction in energy and fuel consumption as part of its sustainable development initiatives. During the year, the Company completed installation of 336.7KW solar panels at Karachi plant. This initiative, along with the results of “Waste Heat Recovery” for utilizing heat emissions from Heat Treatment Shop, helped to control electricity bills despite continuous rise in energy prices. Further, maintenance of 5-S and safety is being stressed upon through regular audits and evaluation of compliance.
Awards
During the year under review, the Company received following awards in recognition for its efforts:
• Top 50 Taxpayers Award for Tax Year 2018 by Federal Board of Revenue;• Award by Punjab Revenue Authority (PRA);• Best Corporate Report Award in “Engineering Sector” by the Joint Committee of ICAP and ICMAP;• Awards by National Forum for Environment & Health in the categories of Corporate Social
Responsibility Report, Research & Publication and Environment & Waste Management.
Future Outlook
Challenges at both, international and domestic fronts, require a well thought out and decisive policy response to ensure stability in the tough phase ahead. On the economic side, taking stock of the evolving developments, it is evident that measures addressing structural problems are required. This, together with clarity on external funding arrangements, will provide the much needed support to the balance of payments position. For Pakistan, CPEC remains the largest source of foreign
Earnings per share(Rs. per share)
2018
Earnings per share
2017
36.
29
45.
10
31.
03
2019
Cash Dividend(Rs. in Million)
2018
Cash Dividend
2017
1,9
13
2,7
92
2,0
68
2019
CompanyOverview
Message forStakeholders
FinancialHighlights
SustainabilityReport
FinancialStatements
OtherInformation
27

investment. With Prime Minister’s upcoming visit to China, both countries are entering the next phase under which areas of cooperation are to be expanded. Rising input costs on the back of higher energy prices and the lagged impact of exchange rate depreciation are likely to maintain upward pressure on inflation despite moderation in aggregate demand. Short term measures for fiscal consolidation need to be complimented with implementation of medium term structural reforms. Once the economy regains its balance, it is expected that the economy will resume its growth momentum, which would boost the demand for two wheelers also.
The Company has laid the foundation for long term sustainable leadership and is committed to achieve profitable growth, financial flexibility and operational excellence. It is going through a dynamic phase where skills, technologies and scales are being developed for this decade and the next. Going forward, the Company is confident that it will continue leading the industry with its installed capacity and improved competitiveness. Principles of “Atlas Way” and “Atlas Systems” will always be a constant source of guidance for the Company in all spheres of the organization.
Acknowledgment
The Atlas Group takes great pride in its joint venture with Honda Motor Company Limited and would like to acknowledge their continued support and cooperation in maintaining high standards of excellence. I take this opportunity to thank our valued customers for the trust they continue to place in us, the management team for its sincere efforts, the Board of Directors for their guidance, Mr. Saquib H. Shirazi for his inspiring leadership and all stakeholders - Bankers, Dealers, Vendors, Associates and Shareholders for helping build Atlas Honda Limited into a unique company.
Date: April 24, 2019 Yusuf H. Shirazi
CompanyOverview
Message forStakeholders
FinancialHighlights
SustainabilityReport
FinancialStatements
OtherInformation
28

The Directors of the Company are pleased to present their report together with the 55th Annual Report of the Company along with Audited Financial Statements for the year ended March 31, 2019.
Operating Results
The operating results of the Company are summarized as follows:
Year ended Year endedMarch 31, March 31,
2019 2018------Rupees in ‘000------
Profit before taxation 4,615,323 6,264,846Taxation
Current 1,165,899 1,567,943
Prior Years 232,285 3,012
Deferred 8,480 30,256
1,406,664 1,601,211
Profit after taxation 3,208,659 4,663,635
Dividends and Appropriations
The Directors have recommended a final cash dividend of Rs. 10 (2018: Rs. 27) per share, and bonus shares in the proportion of 1 share for every 5 shares held.
Accordingly, the appropriation of profit will be as under:Year ended Year endedMarch 31, March 31,
2019 2018------Rupees in ‘000------
Profit available for appropriation 5,833,646 6,934,537
Appropriation:
Transfer to General Reserves - 1,500,000
Interim Cash Dividend 100% (2018: Nil) 1,034,066 -
Final Cash Dividend 100% (2018: 270%) 1,034,066 2,791,979
Bonus Shares 20% (2018: Nil) 206,813 -
2,274,945 4,291,979
Un-appropriated profit carried forward 3,558,701 2,642,558 Earnings per Share
The Basic and Diluted earnings per share after tax is Rs. 31.03 (2018: Rs. 45.10).
Holding Company
Shirazi Investments (Pvt.) Limited, incorporated in Pakistan, is the holding company of Atlas Honda Limited with 52.43% shares.
Chairman’s Review
The Chairman’s review included in the Annual Report deals inter alia with the nature of business, performance of the Company, explanation of significant deviations from last year, future prospects and uncertainties.
Directors’ Report to Shareholders
CompanyOverview
Message forStakeholders
FinancialHighlights
SustainabilityReport
FinancialStatements
OtherInformation
29

Board of Directors and its Committees
The Board:The Board comprises of one independent Director, three executive and four non-executive Directors. The Directors of the Company were re-elected in Extraordinary General meeting of the Company held on March 14, 2017. On March 30, 2018, Mr. Yasutaka Uda and Mr. Susumu Mitsuishi resigned as Directors and Mr. Yukitoshi Fujisaka and Mr. Hironobu Yoshimura were appointed in their places respectively on April 5, 2018.
Human Resource and Remuneration (HR&R) CommitteeThe Committee meets to review and recommend all elements of the compensation, organization and employee development policies relating to the senior executives’ remuneration and to approve all matters relating to the remunerations of the executive directors and members of the management committee. The CEO of the Company and the Head of HR of Atlas Honda attended the Human Resource and Remuneration Committee meeting. The committee met once during 2018 - 19.
Board Audit Committee (BAC)The Board Audit Committee assists the Board in fulfilling its oversight responsibilities, primarily in reviewing and reporting financial and non-financial information to share-holders, systems of internal control and risk management and the audit process. It has the autonomy to call for information from management and to consult directly with the external auditors or advisors as considered appropriate. The Chief Financial Officer regularly attends the Board Audit Committee meetings by invitation to present the accounts. After each meeting, the Chairman of the Committee reports to the Board. The committee met 4 times during 2018-19.
Meetings of the Board and its Committees in 2018-19
During the year, four meetings of Board of Directors (BOD), four meetings of the BAC and one meeting of the HR&R Committee were held. All the meetings were held in Pakistan. The attendance of the Directors and the number of their directorships in listed companies, including Atlas Honda Limited are as follows:
S.No. Director Directorship Status
Committee Attendance
BoardAudit
Committee
HR &Remuneration
Committee
Board ofDirectors
BoardAudit
Committee
HR &Remuneration
Committee
1 Mr. Yusuf H. Shirazi 4 Re-elected on March 14, 2017 - - 3/5 - -
2 Mr. Saquib H. Shirazi 3 -do- - √ 5/5 - 1/1
3 Mr. Sanaullah Qureshi 1 -do- √ √ 4/5 3/4 1/1
4 Mr. Abid Naqvi 2 -do- √ - 4/5 3/4 -
5 Mr. Jawaid Iqbal Ahmed 1 -do- √ √ 5/5 4/4 1/1
6 Mr. Hirofumi Yada 1 Appointed on April 20, 2017 - - 4/5 - -
7 Mr. Yukitoshi Fujisaka 1 Co-opted on April 5, 2018 - - 5/5 - -
8 Mr. Hironobu Yoshimura 2 -do- - - 5/5 - -
Performance Evaluation of Board of Directors and Committees of the Board
The evaluation of Board’s role of oversight and its effectiveness is continual process, which is appraised by the Board itself. The core areas of focus are:
• Alignment of corporate goals and objectives with the vision and mission of the Company;• Strategy formulation for sustainable operations;• Board’s independence; and• Evaluation of Board’s Committees’ performance in relation to discharging their responsibilities set out in respective
terms of reference.
Review of CEO’s Performance
The performance of the CEO is formally appraised through the evaluation system which is based on quantitative and qualitative values. It includes the performance of the business, the accomplishment of objectives with reference to profits, organization building, succession planning and corporate success.
CompanyOverview
Message forStakeholders
FinancialHighlights
SustainabilityReport
FinancialStatements
OtherInformation
30

Directors’ Remuneration
The remuneration of the Board members is approved by the Board itself. However, in accordance with the code of corporate governance, it is ensured that no Director takes part in deciding his own remuneration. The Company does not pay remuneration to non-executive directors except fee for attending the meetings. In order to retain the best talent, the Company’s remuneration policies are structured in line with prevailing industry trends and business practices. For information on remuneration of Directors and CEO in 2018-19, please refer notes to the Financial Statements.
External Auditors
The retiring auditors M/s ShineWing Hameed Chaudhri & Co. Chartered Accountants, being eligible, offered themselves for re-appointment. The Audit Committee has recommended their re-appointment as auditors of the Company for the year 2019-20.
Internal Control Framework
The report on internal control Framework, is presented in the ‘Sustainability Report’, which forms a part of this Annual Report.
Internal Audit
Atlas Honda has an independent Internal Audit function. The Board Audit Committee quarterly reviews the appropriateness of resources and authority of this function. The Head of Internal Audit functionally reports to the Audit Committee. The Board Audit Committee approves the audit plan, based on an annual and quarterly assessment of the operating areas. The Internal Audit function carries out reviews on the financial, operational and compliance controls, and reports on findings to the Board Audit Committee, Chief Executive and the divisional management.
Material changes
There have been no material changes since March 31, 2019 to date of the report and the Company has not entered into any commitment during this period, which would have an adverse impact on the financial position of the Company.
Pattern of Shareholding
The pattern of shareholding of the Company is annexed to this report.
Communication
The Company focuses on the importance of the communication with the shareholders. The annual, half yearly and quarterly reports are distributed to them within the time specified in the Companies Act, 2017. The activities of the Company are updated on its web site at www.atlashonda.com.pk, on timely basis.
Safeguarding of Records
The Company puts great emphasis for storage and safe custody of its financial records. The Company is using SAP for recording its financial information. The access to electronic documentation has been secured through implementation of a comprehensive password protected authorization matrix in SAP-ERP system.
Business Continuity Plan
As part of Business Continuity Plan, remote disaster recovery sites have been adequately set up for maintaining backup server and data in case our primary server encounters any issues.
Human Resource Management
Human resource planning and management is one of the most important considerations with the senior management. The Company has established a HR&R Committee which is involved in the selection, evaluation, compensation and succession planning of key management personnel. It is also involved in recommending improvements in the human resource policies and procedures and their periodic review. The details of human resource policies are presented in the ‘Sustainability Report’ which forms an integral part of this Annual Report.
Health, Safety and Environment
We strongly believe in maintaining the highest standards in health, safety and environment (HSE) to ensure the well-being of the people who work with us as well as of the communities where we operate.
CompanyOverview
Message forStakeholders
FinancialHighlights
SustainabilityReport
FinancialStatements
OtherInformation
31
Corporate Social Responsibility
The Company considers social, environmental, and ethical matters in the context of the overall business environment. The Company is committed to work in the best interest of all the stakeholders, in particular the community in which we live and forms our customer base. The report on Corporate Social Responsibilities, including its approach to health and safety, human resources, social, environmental and other related issues are presented in the ‘Sustainability Report’, which forms a part of this Annual Report.
Statement of Value Addition and its Distribution and Risk Management
The ‘Statement of Value Addition and its Distribution’ and ‘Risk and Opportunity Report’ are annexed to this report.
Corporate and Financial Reporting Framework
The Directors confirm the compliance with Corporate and Financial Reporting Framework of the Securities and Exchange Commission of Pakistan and Code of Corporate Governance for the following matters:
• The financial statements, prepared by the management of the Company, fairly present its state of affairs, the results of its operations, cash flows and changes in equity.
• The Company has maintained proper books of account.
• Appropriate accounting policies have been consistently applied in preparation of the financial statements and accounting estimates are based on reasonable and prudent judgments.
• International Financial Reporting Standards, as applicable in Pakistan, have been duly followed in preparation of the financial statements.
• There has been no material departure from the best practices of Corporate Governance, as detailed in the Regulations of Rule Book of Pakistan Stock Exchange.
• The system of internal control is sound in design and has been effectively implemented and monitored. The process of monitoring internal controls will continue as an ongoing process with the objective to further strengthen the controls and bring improvements in the system.
• There is no doubt about the Company’s ability to continue as a going concern.
• A summary of key operating and financial data of the Company is annexed.
• Information about taxes and levies is given in notes to the accounts.
• The Company operates a contributory provident fund scheme for all employees and Defined benefit gratuity fund scheme for its management/non-management employees. The value of investments based as at March 31, 2019 are as follows:
√ Provident Fund Rs. 788.02 Million √ Gratuity Fund ◽ Management Staff Rs. 218.53 Million ◽ Non-Management Staff Rs. 85.67 Million
On behalf of the Board of Directors
Karachi: April 24, 2019 Saquib H. Shirazi Chief Executive Officer
CompanyOverview
Message forStakeholders
FinancialHighlights
SustainabilityReport
FinancialStatements
OtherInformation
32


The Board Audit Committee (the Committee) comprises of 3 members all of them are Non-Executive Directors. The names and profiles of the Audit Committee members are given on Page No. 117 of the Annual Report 2019. The incumbent members are qualified finance professionals and the Committee as a whole possess significant economic, financial and business acumen.
The Chief Executive Officer (CEO), the Chief Financial Officer (CFO) and the Internal Auditors attend the Committee meetings by invitation while the Committee meetings are attended by the External Auditors on requirement basis.
Financial StatementsThe Committee has concluded its annual review of the conduct and operations of the Company during the year ended March 31, 2019, and reports that:
• The financial statements of the Company for the year ended March 31, 2019 have been prepared on a going concern basis under requirements of Companies Act 2017, incorporating the requirements of the Code of Corporate Governance, International Financial Reporting Standards and other applicable regulations.
• These financial statements present a true and fair view of the Company’s state of affairs, results of operations, profits, cash flows and changes in equity of the Company for the year under review.
• In line with the Auditors (Reporting Obligations) Regulations, 2018 issued by SECP, contents of the Audit Report for year 2018 have changed significantly compared to previous year and the Auditors have issued unmodified audit reports in respect of the above financial statements for the year 2019.
• Appropriate accounting policies have been consistently applied except for the changes, if any, which have been appropriately disclosed in the financial statements.
• The Committee reviewed quarterly, half yearly and annual financial statements of the Company and recommended them for approval of the Board of Directors.
• All core & other applicable International Accounting Standards were followed in preparation of financial statements of the Company on a going concern basis, for the financial year ended March 31, 2019, which present fairly the state of affairs, results of operations, profits, cash flows and changes in equities of the Company.
• Accounting estimates are based on reasonable and prudent judgement.
• Proper and adequate accounting records have been maintained by the Company in accordance with the Companies Act, 2017 and the external reporting is consistent with management process and adequate for shareholders' needs.
• The Chairman of the Board, Chief Executive Officer and the Chief Financial Officer have endorsed the separate and consolidated financial statements of the Company, while the Directors’ Report is signed by the Chief Executive Officer. They acknowledge their responsibility for true and fair presentation of the Company’s financial condition and results, compliance with regulations, applicable accounting standards and establishment and maintenance of internal controls and systems of the Company.
• Accounting estimates are based on reasonable and prudent judgment. Proper and adequate accounting records have been maintained by the Company in accordance with the Companies Act, 2017. The financial statements comply with the requirements of the Fourth Schedule to the Companies Act, 2017 and the external reporting is consistent with management processes and adequate for shareholder needs.
• All related party transactions have been reviewed by the Committee prior to approval by the Board.
• The Company has issued a “Statement of Compliance with the Code of Corporate Governance” which has also been reviewed and certified by the External Auditors of the Company.
• Understanding and compliance with Company codes and policies has been affirmed by the members of the Board, the Management and employees of the Company. Equitable treatment of shareholders has also been ensured.
• Trading and holdings of Company’s shares by Directors & executives or their spouses were notified in writing to the Company Secretary along with the price, number of shares, form of share certificates and nature of transaction which were notified by the Company Secretary to the Board within the stipulated time. All such holdings have been disclosed in the Pattern of Shareholding. The Annual Secretarial Compliance Certificates are being filed regularly within stipulated time.
• Closed periods were duly determined and announced by the Company, precluding the Directors, the Chief Executive Officer and Executives of the Company from dealing in Company shares, prior to each Board meeting involving announcement of interim / final results, distribution to shareholders or any other business decision, which could materially affect the share market price of Company, along with maintenance of confidentiality of all business information.
Risk Management and Internal Controls• The Company has developed a sound mechanism for identification of risks and assigning appropriate criticality level
and devising appropriate mitigation measures which are regularly monitored and implemented by the management across all major functions of the Company and presented to the Audit Committee for information and review.
Report of the Board Audit Committee
CompanyOverview
Message forStakeholders
FinancialHighlights
SustainabilityReport
FinancialStatements
OtherInformation
40

• The Company has devised and implemented an effective internal control framework which also includes an independent internal audit function.
• The Internal Audit department is responsible for monitoring of compliance, inherent and other risks associated with the internal controls and other areas of operations of the Company.
• The Company’s approach towards risk management has been disclosed in the risk assessment portion of this Report. The types and detail of risks along with mitigating measures are disclosed in relevant section of the Annual Report.
Internal Audit• The Company’s system of internal controls is sound in design and has been continually evaluated for effectiveness and
adequacy.
• The Audit Committee has ensured the achievement of operational, compliance, risk management, financial reporting and control objectives, safeguarding of the assets of the Company and the shareholders’ wealth at all levels within the Company.
• The Internal Audit function has carried out its duties under the charter defined by the Committee. The Committee has reviewed material Internal Audit findings, taking appropriate action or bringing the matters to the Board’s attention where required.
• Audit Committee has provided proper arrangement for staff and management to report to Audit Committee in confidence, concerns, if any, about actual or potential improprieties in financial and other matters. Adequate remedial and mitigating measures are applied, where necessary.
• The Head of Internal Audit has direct access to the Chairman of the Audit Committee and the Committee has ensured staffing of personnel with sufficient internal audit acumen and that the function has all necessary access to Management and the right to seek information and explanations.
• Coordination between the External and Internal Auditors was facilitated to ensure efficiency and contribution to the Company’s objectives, including a reliable financial reporting system and compliance with laws and regulations.
External Auditors• The statutory auditors of the Company, M/s. ShineWing Hameed Chaudhri & Co., Chartered Accountants, have
completed the Audit of financial statements of the Company for the year ended March 31, 2019 and review of the "Statement of Compliance with the Code of Corporate Governance" for the year ended March 31, 2019 and shall retire on the conclusion of the 55th Annual General Meeting.
• The Audit Committee has discussed the audit process and the observation, if any, of the auditors regarding the preparation of the financial statements including compliance with the applicable regulations or any other issues.
• The Auditors attended all the Audit Committee meetings where their reports were discussed. The Auditors also attended General Meetings of the Company during the year and have confirmed attendance of the 55th Annual General Meeting scheduled for June 21, 2019. The Auditors have also indicated their willingness to continue as Auditors.
• The Auditors do not provide any services other than external audit of the Company. The audit firm has no financial or other relationship of any kind with the Company except that of External Auditors.
• Being eligible, M/s. ShineWing Hameed Chaudhri & Co., Chartered Accountants have offered themselves to be reappointed as Auditors for the financial year 2020. The Committee has recommended them to the Board for reappointment for the year ending March 31, 2020.
Annual Report 2019• The Company has issued a very comprehensive Annual Report which besides presentation of the financial statements
and the Directors’ Reports of the Company, also discloses other information much in excess of the regulatory requirements to offer an in depth understanding about the management style, the policies set in place by the Company, its performance during the year, and future prospects to various stakeholder of the Company.
• The information has been disclosed in the form of ratios, trends, graphs, analysis, explanatory notes and statements etc., and the Audit Committee believes that the Annual Report 2019 gives a detailed view of how the Company evolved, its state of affairs and future prospects.
The Audit Committee• The Audit Committee believes that it has carried out responsibilities to the full, in accordance with Terms of Reference
approved by the Board which included principally the items mentioned above and the actions taken by the Audit Committee in respect of each of these responsibilities. Evaluation of the Board performance, which also included members of the Audit Committee was carried out separately and is detailed in the Annual Report.
CompanyOverview
Message forStakeholders
FinancialHighlights
SustainabilityReport
FinancialStatements
OtherInformation
41

We manage and monitor risks and the factors that could impact our plans for long-term sustainable growth.
Defining RiskRisks are uncertain events that could materially impact business objectives – negative for threats and positive for opportunities. We recognise that risk is inherent in all business activities and must be balanced when assessing returns. Successful management of these risks is therefore key to accomplishing our strategic objectives and the long-term sustainable growth of our business. Enterprise Risk Management (ERM) is used as a system to identify, assess, control and continually monitor key risks that could affect our business objectives.
Risk ManagementTo achieve an informed understanding of our tolerance for risks when delivering our overall business plan, we must be mindful that the objective of risk management is not necessarily to eliminate risk, but to ensure that the risks we do accept remain within a predetermined level of acceptability and control while pursuing value-enhancing opportunities. The ultimate goal of risk management within Atlas Honda Limited is to continually assess the control environment to prevent and build resilience against any internal or external shocks, both anticipated and unforeseen.
Risk and Opportunity Report
Our Enterprise Risk Management (ERM) framework
Strategy formulation
Management has developed a set of objectives that represent stakeholders’ expectations and are the lead indicators for determining the success level of the Company. In order to ensure the achievement of the set objectives, management adopts certain strategies. These strategies are approved by the Board of Directors and are subject to change, depending upon any changes in the external business environment or internal organizational factors.
Risk Assessment
Businesses face numerous uncertainties that can pose potential threats to our objectives and if not addressed, may culminate in loss. Such uncertainties can arise both from external events as well as internal factors within the organization.
Counter measures
Upon identification of risk factors, counter measures are devised to mitigate their impacts. The severity of the risk will determine the criticality of the counter measure and will accordingly set its priority for action. Risks and their related counter strategies are monitored on continuous basis and evaluated for any changes in related impacts.
Governance
The Board of Directors is responsible for approving Company’s risk management policy. The Board of Directors also provides guidelines on strategic matters and organizational objectives. The business units are responsible for managing risks at operational level. However, the Company-level risk management is the responsibility of the Risk Management Function (RMF) which comprises of the treasury department. RMF reports its results / findings / observations to the Risk Management Committee. The Committee regularly reviews the business risk profile, risk management policy, risk assessment procedures, related counter strategies and also advice on future actions. The Committee then reports the outcomes of their reviews to the CEO. The Board of Audit Committee also reviews and assesses the adequacy of risk management for its effectiveness in risk mitigation.
Opportunity analysis
The Company has adequate processes and procedures in place for identifying potential gaps in the external environment which, if the Company has adequate resource, may be exploited as opportunities to improve performance. Based on its analysis, we have identified the various opportunities in current economic landscape:
RIS
K A
ND
RE
SIL
IEN
CE
CompanyOverview
Message forStakeholders
FinancialHighlights
SustainabilityReport
FinancialStatements
OtherInformation
42

Risk HorizonWe recognise the need to anticipate and prepare for future challenges and trends that may develop and that could materially affect our long-term business success. Our risk horizon enables us to proactively anticipate forthcoming issues to inform our strategy creation process.
1 Please refer to our 15 principal risks on next page
CompanyOverview
Message forStakeholders
FinancialHighlights
SustainabilityReport
FinancialStatements
OtherInformation
43

Risks are identified, assessed and measured against a defined set of criteria to consider the likelihood of occurrence and potential impact to the business, facilitated by our ERM framework. Plotting our principal risks on a risk map helps to visualise each risk profile as well as targeting to bring each risk back within a tolerable level.
3. Risk Category• Strategic • Legal • Operational • Financial
Principal risks at a glance
Our principal risksCurrentyear’s
rankingExchange rate fluctuations
Commodity price
Market Competition
Intellectual property rights protectionInformation and cybersecurities
Economic and political environment
Talent and Capability
Unethical and prohibited business practices
Competitive business efficiency
Change in technology
Product liability and recalls
Counterparty Default
Safe working environment
Regulations and compliance
Dependence on vendors for success of our business
(1)
(2)
(3)
(4)
(5)
(6)
(7)
(8)
(9)
(12)
(13)
(15)
(11)
(10)
(14)
The potential impact and likelihood of our key risks
Likelihood
Impa
ct
LikelyPossibleUnlikely
Mat
erial
Mod
erat
eIm
mat
erial
9
10
13
14
15
11
12
78
6
5
4
3
2 1
Risks that are highly likely to occur and could materiallyimpact our ability to reach our business objectives.
Risks that are unlikely to materialise and unlikely to materially impact our business
Risks that remain at tolerable levels but couldimpact the business unless monitored and managed.
Key
Current risks
1. Materiality ApproachMateriality is defined by the management as a degree of measure significant to the interests of the Company and its stakeholders. Determination of when such degree is achieved is a matter of management's best judgement. A risk is considered material if, in management's view, its occurrence is reasonably expected to prevent the Company from achieving its key objectives and expectations.
2. Key Source of UncertainityWithin the automotive industry, uncertainties stem from various sources including changes in the economy, technology, government regulations, relative prices and market dynamics.
Our Principal Risks
CompanyOverview
Message forStakeholders
FinancialHighlights
SustainabilityReport
FinancialStatements
OtherInformation
44

The principal risks faced by Atlas Honda Limited are outlined below. The risks discussed are not exhaustive and the Company may be subject to other risks not specifically outlined in this Annual Report.
Strategic ConsequencesSources Mitigations Opportunities
Currentyear’s
ranking
1. Market CompetitionThere is increasing competition among market participants in the entry level segment. Further, new models are being introduced in the premium segment. Accordingly, product positioning is becoming increasingly important due to revised dynamics of the two wheeler market.
The technological development together with scarcity of specialist resources could result in a significant change in the two wheeler industry.
Inability to successfully maintain the position and strength of our products as well as failing to develop new products that meet customer preferences, could impact demand for our products.
We are committed to make quality products and meeting the demand of our customers while enhancing product innovation and ensuring customer satisfaction to maintain the competitive edge. We placed due emphasis on monitoring markets and competitors to be able to understand and pre-empt external dynamics and remain competitive.
Strengthen our products by creating greater brand association into our expanding product portfolio and services.
(3)
2. Change in Technology Technology shift may render production process obsolete and cost inefficient. Delay in the launch of technologically intensive products, or if the technology in our products becomes relatively obsolete, could impact our sales.
Given our wide spread distribution of sales, changes in the external environment could have a significant impact on the demand for our products and supply chain.
External
External
External
We continue to invest substantially on expansion projects, modernization and up gradation of our production facilities. Further, we continue to focus on investment in new and existing models to meet the latest standards.
We continue to closely monitor political and macroeconomic developments. Accordingly, we maintain a balanced retailsales profile across key sales regions. Further, in order to avoid the risk of disruption, we operate two production facilities and have a diversified vendor base .
Timely investment in our production facilities brings efficiency in our processes. Substantial changes to themarket enable us to focus on launching industry defining products as well as strengthening partnershipwith our global partner.
It helps us to ensure continuity of operations without disruption in supply.
(14)
3. Economic andpolitical environment
(6)
Our expanding presence increases exposure to changes in the economic and political environment as well as other external factors (i.e.adverse law and order situations, natural disasters etc.) may impact our business.
Operational ConsequencesSources Mitigations Opportunities
4. Dependence on vendors forsuccess of our business
(8)
5. Information andcyber securities
(5)
Our expanding trend increasesthe risk of capacity and financial bottlenecks caused by supplier delivery failures and insufficient utilization, of production capacities at suppliers end.
New and emerging technologies bring unprecedented threats to internet-connected devices while recent global hacking incidents impacting the geopolitical environment indicate an increase in the motivation to instigate cyber attacks.
Failure of, or weaknesses in, vendors’ financial condition, production and distribution capabilities, and lack of alignment with vendors’ B2B systems impairs our investments and prevents from achieving our production goals.
External
External Breach of IT security causingcontrolled or critical data to be lost, made inaccessible, corrupted or accessed by unauthorised users.
Our focus on diversfied vendor base and their performance maintains our reputation as a quality leader in the two wheeler industry.
We aim to maintain a strongIT control environment, andby monitoring and reactingto emerging cyber and security threats. We striveto embed deeper, more intelligent controls over time.
We maintain close contact with vendors and seek to ensure that respective goals are communicated, understood and aligned, to deliver mutually acceptable performance. Furthermore diverse vendor representation avoids dependence on any single vendor.
We strive to implement consistent security policies and procedures as well as educating staff, vendors andsuppliers to embed best practices by implementing internal tools to detectand mitigate the current and emerging cyber security threats.
Currentyear’s
ranking
CompanyOverview
Message forStakeholders
FinancialHighlights
SustainabilityReport
FinancialStatements
OtherInformation
45

Operational Consequences Mitigations Opportunities
6. Talent and Capability (9)
7. Safe working environment (10)
(15)
The expanding scenario requires us to recruit competent personnel and properly incentivise existing staff to achieve Company's strategy.
We are subject to a rapidly evolving safe working environment, associated, laws, regulations and policies that impact our manufacturing facilities.
Inability to attract and retain the critical capabilities and skills needed in sufficient numbers and to effectively organise, deploy and incentivise our people to deliver our strategy, business plan and projects.
Sources
Internal
Internal
Internal
Failure to provide safe working environment may lead to illness, injury, loss of working time and civil claims.
Targeted personnel development and training is helping to generate ideas and suggestions that make significant contributions to our success. Further it is enabling us to secure sufficient number of qualified young workforce with the potential to become the next generation of highly skilled specialists and executives.
We are committed to protecting and preserving the human rights of our employees, those working in supply chain and those who may be impacted by operations.
Attracting, rewarding and retaining the right people with the right skills in a planned and targeted way, including regular benchmarking of remuneration and continuing a strong focus on individual development and succession planning.
We have a Health & Safety "Plan, Do, Check, Act" framework for managing risk in the workplace. We continuously monitor site conditions and drive corrective action through audit followup.
8. Product liability and recallsPotential defects and quality deficiencies could increase our exposure to risks associated with product liability.
Increases in related costs and warranty claims as well as longer-term impacts on sales due to adverse reputational effects could occur. In addition, we could be the subject of class actions or other large-scale lawsuits as a consequence.
Enhanced product connectivity provide opportunities for us to identify and remedy potential faults more efficiently.
We regularly monitor theservice data of products and issue technical updates to minimise warranty claims.
Currentyear’s
ranking
Consequences Mitigations Opportunities
9. Regulations and compliance (7)
10. Intellectual property (IP)rights protection
(4)
(12)
We are subject to a rapidly evolving regulatory landscape with associated laws, regulations and policies including environmental regulations.
Protection of IP rights is necessary in order to prevent its infringement and unauthorised use by third parties.
We may incur additional compliance costs, including incremental investments to avoid facing significant civil and regulatory penalties.
Failure to protect IP increases the risk that third parties could copy features of our products from which we derive competitive advantage.
To operate in a stable market with least volatility and low occurrence of unforseen variables.
We have developed a team of qualified and experienced professionals in the management team to ensure compliance with all applicable laws, rules and regulations. Further, we actively participate in various government level forums for recommending appropriate measures.
We have a dedicated team of in-house specialists that manage matters relating to IP to ensure that robust processes are followed to protect our IP, by means of patents, registered designs, trademarks and copyrights.
11. Unethical and prohibitedbusiness practicesOur continuing expansion exposes us to increased diversity and complexity of legal and other frameworks and, as such, it becomes subject to maintaining legal and ethical standards across all locations in which we operate.
Non-compliance with ethical and/or legal practices may materially impact our reputation and could result in restrictions being placed on operations, causing business disruption.
We are committed to conduct business in an ethical manner to instill a reputation of trust and reliance. Such qualities foster greater business relationships with the supplier base,governments and partnerships with other third parties.
Our code of conduct sets out the behaviour that is expected of the staff, including conforming to the highest moral and ethical standards and complying with applicable laws, including anti-bribery, corruption and competition laws, sanctions and export controls.
Legal and compliance
Currentyear’s
ranking
The development ofIP protection right enablesadditional revenue by preventing counterfeiters to grab our market share while enhancing our profile as a leader in the two wheeler industry.
Sources
External
External
Internal
CompanyOverview
Message forStakeholders
FinancialHighlights
SustainabilityReport
FinancialStatements
OtherInformation
46

Consequences Mitigations Opportunities
12. Exchange rate fluctuations (1)Devaluation of Pak Rupee against foreign currencies may adversely affect our financial performance.
Generally, a stronger Yen and Dollar adversely impacts our earnings because the value of overseas raw material is eroded.
Sources
External
External
External
External
We continue to investigate further opportunities to develop our global footprint, which may result in greater natural hedging of our currency exposures by aligning the currency profile of cost with sales.
Currency transaction risk is managed through financial derivatives (Forward Contracts) in line with the hedging policy approved by the Company's Board.
(2)14. Commodity priceCommodity price risk poses financial risk on our performance and profitability. This may occur due to fluctuations in the prices of commodities that are out of control of the entity.
Sharp fluctuations in commodity prices are creating significant business challenges as they can affect production costs, product pricing and earnings . This price volatility makes it imperative for an entity to manage the impact of commodity price fluctuations across its value chain to effectively manage its financial performance and profitability.
We continue to investigate further opportunities towards localisation of key raw material inputs.
We have agreements in place with suppliers to counter short term fluctuations in material prices.
15. Competitive businessefficiency
(13)
We continuously tend to optimise operating efficiency. However, there is a risk that these programmes do not deliver projected efficiencies and anticipated benefits may not accrue as expected.
If we are unable to deliver the desired benefits from these programmes, the business results may be adversely impacted and our ability to compete successfully over the longer term could be affected.
We are focused on developing business tools to realise greater degrees of efficiency. Furthermore, our expansion plans present opportunities to invest in world class facilities and enhanced capabilities.
We have launched certain initiatives to reduce product and business complexity, to benefit from economies of scale, and we have robust project management processes in place to ensure set targets are met.
16. Counterparty Default (11)Counterparty defaults poses risk of impairment of assets.
Payment defaults of counter parties may leave us with inadequate resources for discharging our obligations.
We maintain a strong financial position and performance which is reflective of our scale of operations, effort of employees and expectations of all stakeholders.
Counterparty risk management procedures are carried out continuously in order to monitor credit worthiness of business partners.
FinancialCurrentyear’s
ranking
CompanyOverview
Message forStakeholders
FinancialHighlights
SustainabilityReport
FinancialStatements
OtherInformation
47

Additional Information
To operate in a stable market being compliant with all relevant laws of the Country.
To expand sales in two wheeler industry.
To maintain industry leadership in two wheeler industry.
To ensure continuity of operations without disruptions in supply
Strategy Maintain team of qualified and experienced professionals to ensure compliance with all applicable laws, rules and regulations.
Sales expansion through focus on product quality & innovation, expanding dealer's network, efficient after sales services and availability of financial solutions to boost customers' purchasing power.
We continuously focus on upgrading production facilities to maximize efficiency and to ensure compliance with International standards and latest technology.
From the outset, production structures and processes are designed with a view to minimizing any potential damage and its probability of occurrence. In order to ensure uninterrupted and smooth supplies of raw material and components, more than one supplier are inducted which shares its production and delivery plan on B2B network.
Nature Short to Long term Short to Long term Long term Short term
Priority High High High High
KPI Monitored
Number of non compliances and reporting awards
Sales and profitability Capital expenditure, market share and production efficiency ratio
Current ratio and idle days
Resource allocated
Human capital, Intellectual capital and Financial capital
Human capital, Financial capital, Manufactured capital and Social and relationship capital
Financial capital and Manufactured capital
All capitals
Actual Results
There were no non-compliances reported by any Government body or institution during the year. Company’s corporate reporting practices were recognized through following awards:
- Best Corporate Report Award by the Joint Committee of ICAP and ICMAP.
- Top 50 taxpayer award by FBR
- Highest taxpayer award by PRA
- Award by National Forum for Environment & Health (NFEH) for efforts in sustainability areas.
Total sales for the year were1,135,840 units which represents 4% increase from last year.
2 new models namely “CB125F” and “CG 125S” were introduced in the market. Further, we are the only Company in Pakistan which provides 3 years’ warranty for all engine parts.
We have incurred Capital expenditure of Rs. 2.1 Billion during the year for the improvement, maintenance and expansion of our production facilities.
We achieved uninterrupted production during the year with undisrupted supplies from vendors. Further, regular audits are conducted to ensure that backup plans are effectively in place to mitigate any operational interruptions.
Obj
ectiv
e
01 Obj
ectiv
e
02 Obj
ectiv
e
03 Obj
ectiv
e
04
Management Objectives
Based on the analysis of risk and opportunities identified in the report, the relationship between the Company’s objectives, strategy along with priority and performance indicators (financial & non financial) used by the management to evaluate actual results are summarized below in the table:
CompanyOverview
Message forStakeholders
FinancialHighlights
SustainabilityReport
FinancialStatements
OtherInformation
48

To recruit and retain the best people and provide adequate training to ensure high quality skilled force.
To ensure health and safety of employees in workplaces.
To ensure environment friendly products and processes.
To ensure optimum cost level
Strategy We have developed comprehensive and well-structured procedures for recruitment, training, compensation, periodic appraisals and succession planning in order to ensure staff development and retention.
We recognize the importance of a healthy working environment and therefore safety of employees is our top priority. The employees are informed about best HSE practices through regular internal communication channels We conduct risk assessments that address all the hazards that might cause harm in workplace. Extraction and evacuation drills are conducted regularly and staff is frequently trained for crisis management.
Our defined policy for the protection of environment from emissions and hazardous discharges, ongoing monitoring and maintenance activities coupled with investment in new technology, efficiency enhancing measures, continuous measurements, follow ups and reporting are carried out to ensure that we achieve our desired goals. Solid hazardous waste is disposed-off through Environmental Protection Agency’s legitimate contractors. Recycling is also done, to the maximum extent, where possible.
We keep our cost at an optimum level through strict governance policies and cost reduction measures
Nature Short to Medium term Short to Medium term Short to Long term Short/Medium term
Priority High High High High
KPI Monitored
Workforce related ratios Number of accidents Carbon emission, water usage
Profitability ratios
Resource allocated
Human capital and Financial capital
Human capital, Manufactured capital, Financial capital and Social and relationship capital
Manufactured capital, Financial capital and social and relationship capital
Financial capital, Human capital and Manufactured capital
Actual Results
The details of training programs mentioned on page no. 103 of the Sustainability Report
No majors accidents occurred during the year at any of the Company's facilities, a testament to the effectiveness of Company's safetypolicies.
For achievements in environmental protection, see the section of "Environment" in the Sustainability report on page no. 88
Our net profitability for the year amounted to Rs. 3.2 Billion.
Obj
ectiv
e
05 Obj
ectiv
e
06 Obj
ectiv
e
07 Obj
ectiv
e
08
Significant Changes in Objectives & Strategies There have been no significant changes in objectives and strategies of the Company as compared to previous year. Further the identified KPIs continue to remain relevant in the near future.
CompanyOverview
Message forStakeholders
FinancialHighlights
SustainabilityReport
FinancialStatements
OtherInformation
49

Forward Looking StatementAnalysis of prior period’s forward looking disclosures/Status of Projects
As indicated last year, the earnings of the Company will remain under pressure on account of devaluation of PKR against other currencies and increase in material prices. Our earnings were partially supported by improved revenues achieved through our promise to deliver the best quality products. Further the launch of new models in the 125cc category also helped in supporting sales volumes. Also, the increase in treasury income and controlled operating expenses provided much needed support to the Company in achieving sustainable margins.
Further, during the year the Company successfully completed the expansion of production capacity to 1.35M units along with the import and installation of dies and jigs pertaining to launch of two new models.
Forward looking statement
2019-20 is likely to be a challenging year as economic forecasters and The International Agencies revised down the GDP growth forecast to less than 3%. The CPI inflation has risen considerably due to increase in energy prices and unfolding impact of depreciation of Pak Rupee. However, the Government is continuously taking various fiscal and monetary measures to correct the imbalances in the economy. Going forward, we believe that these steps will put the economy on a long term growth trajectory again.
Despite fragile economic conditions, we are well positioned with leading products and services. We are increasingly succeeding in addressing new targets, utilizing market potential and strengthening our market position nationwide. We will consistently implement our strategy, thus creating the basis for further growth. We expect both unit sales and revenue to be higher than previous year, and will try to achieve better earnings than current year. However, devaluation of Pak Rupee and constant increase in material prices may keep profit margins under pressure.
The Company is also making efforts to improve operational efficiencies and optimize the utilization of its available resources.
Source of Information and assumptions used for projections/forecasts
The Company prepares annual budgets and forecasts to manage business more effectively. The forecasting is done keeping in view the historical data and figures. Projections are developed based on macro and micro economic indicators, markets trends & research, International and local material price forecasts, data from regulatory & taxation authorities, seasonal variations and competitors’ actions etc. Internal capacities are reviewed based on available data and alignment is planned to achieve desired results.
Information is also generated internally from critical functions of the Company including Marketing, Manufacturing & Operations, Technology & Engineering, Human Resources, Finance etc., and the information so collected is collaborated with the data compiled from the sources mentioned earlier for preparation of meaningful and practical forecasts which are adopted as formal plans for the Company after approval by the Board.
Statement of Charity AccountWe paid an amount of around Rs.62.6 Million for the year 2019 to Atlas Foundation. Th Foundation has played its role in promoting centers of professional education, contributing to health facilities, helping law enforcement agencies and improving quality of life with the commitment that what has come from the society should be shared with the society. The Foundation has built a school in collaboration with The Citizen Foundation having capacity for 400 students at present. Most of the children belong to poor families of farmers and labourers living in the neighbouring areas.
CompanyOverview
Message forStakeholders
FinancialHighlights
SustainabilityReport
FinancialStatements
OtherInformation
50

Business Rationale for Major Capital ExpenditureAtlas Honda Limited has been growing steadily. During the last few years, the Company has expanded and enhanced the production capacity of its plant to position itself to meet the growing demand of motorcycles in the local market.
We have a systematic procedure for evaluating the requirements of capital expenditure. The capital expenditure is primarily focused on Balancing Modernization and Replacement (BMR), capacity expansion, safety and sustainability for continued production of premium products while focusing on energy conservation and environment protection. Exhaustive financial evaluation is also carried out which includes payback period, NPV/IRR, cash flow requirements and other financial analysis techniques.
Significant Plans & Decisions Atlas Honda has a long history of continuous investment in its facilities. The Company believes in step by step investments forcapacity expansion and BMR. These investments proves our commitment to provide our customers with unmatchable qualityproducts. As a result of this direction, the Company has successfully completed the capacity expansion up to 1,350k units / annum this year. The Company is committed to identify new markets and expand its dealerships which provides avenue of business growth and provide our shareholders the desired return on their investments. For customers to feel “Buy of joying”, the Company has launched 2 new models in 125 cc category. Further, it also introduces 4 Minor model changes to its model line up. The response to these initiatives were very encouraging and Company, in future, will keep investing in its models. The Company’s focus on localization has always helped it in successfully dealing with challenges of devaluation. Accordingly, it will continue to identify various opportunities for localization of parts, material and dies & jigs. This, in turn, will help to save our country’s valuable exchange reserves. Controlling plant cost, improvement in its productivity and business process improvements will remain another significant area of focus. As a part of its initiative for sustainable development, the Company has planned to launch another mega project for solar panels installation at its plant. Also, a part of its vendor development initiatives, it will keep investing in improving vendor capabilities.
Unreserved Compliance of IFRS issued by the IASB Company’s financial statements have been prepared in accordance with the approved accounting standards as applicable in Pakistan. Approved accounting standards comprise of such International Financial Reporting Standards (IFRS) issued by the International Accounting Standards Board (IASB) as are notified under the Companies Act, 2017. In case requirements differ, the provisions or directives of the Companies Act, 2017, shall prevail.
Note 4.2 of the financial statements specifies the standards and interpretations which are yet to be effective in Pakistan. The Company believes that the impact of these standards and interpretations does not have any material impact on the financial statements.
Certifications Acquired and International Standards AdoptedCertification acquired and international standards adopted for best corporate and sustainability reporting practices are as follows: • ISO certifications relating to Environment and health and safety (ISO 9001:2008 Quality Management System, ISO
140001:2004 Environmental Management System and OHSAS 18001:2007 Occupational Health & Safety Assessment Series (OH&S Management System)
• Sustainability reporting standards
• Integrated reporting framework
CompanyOverview
Message forStakeholders
FinancialHighlights
SustainabilityReport
FinancialStatements
OtherInformation
51

Notice is hereby given that the Fifty Fifth Annual General Meeting of the members of Atlas Honda Limited will be held on Friday June 21, 2019, at 11:00 A.M., at the Avari Hotel, Mall Road, Lahore, to transact the following businesses:
Ordinary Business
1. To confirm the minutes of the Annual General Meeting held on June 28, 2018.
2. To receive, consider and adopt the Annual Audited Financial Statements of the Company for the year ended March 31, 2019, together with the Directors’ and Auditors’ reports thereon.
3. To appoint auditors and fix their remuneration for the year ending March 31, 2020. The retiring auditors M/s. ShineWing Hameed Chaudhri & Co., Chartered Accountants, being eligible have offered themselves for reappointment.
4. To consider and approve the payment of final cash dividend for the year ended March 31, 2019 @ 100% i.e. Rs. 10 per share as recommended by the Board. This is in addition to interim cash dividend @100% i.e. Rs. 10 per share already paid.
Special Business
5. To consider and approve the bonus share issue @ 20% (one bonus share for every five shares held) for the year ended March 31, 2019 as recommended by the Board of Directors.
To consider, and if thought fit, to pass with or without modification, the following resolutions as Ordinary Resolutions:
“RESOLVED that a sum of Rs. 206,813,230 be capitalized out of the Company's profit available for appropriation for issuing 20,681,323 fully paid ordinary shares of Rs. 10/- each as bonus shares, to be allotted to those shareholders whose names appear in the register of members at the close of business June 06, 2019, in proportion of 1 (one) bonus share for every 5 (five) shares held by the member. The said shares shall rank pari passu with the existing shares of the Company in all respect except that they do not qualify for final cash dividend declared for the year ended March 31, 2019.”
“FURTHER RESOLVED that fractional shares of the members shall be consolidated into whole shares and sold in the stock market and the sale proceeds shall be donated to any charitable institution.”
“FURTHER RESOLVED that the directors be and are hereby authorized to give effect to this resolution and to do or cause to do all acts, deeds and things that may be necessary or required for the issue, allotment and distribution of bonus shares.”
The Statement under Section 134(3) of the Companies Act, 2017, pertaining to the special business referred to above is being circulated to the members along with the Notice of the Meeting.
Other Business
6. To transact any other business with the permission of the Chair.
By Order of the Board
Karachi: May 31, 2019 Marrium Ahmed Company Secretary
Notice of 55th Annual General Meeting
CompanyOverview
Message forStakeholders
FinancialHighlights
SustainabilityReport
FinancialStatements
OtherInformation
52

Notes:
i. Closure of Share Transfer Books
The share transfer book of the Company will remain closed from June 07, 2019 to June 21, 2019 (both days inclusive). The transfers received at Company’s Share Registrar namely M/s. Hameed Majeed Associates (Private) Limited, H.M. House, 7-Bank Square, Shahrah-e-Quaid-e-Azam, Lahore, Pakistan by the close of business on June 06, 2019 will be considered in time for determination of entitlement of shareholders to cash dividend and to attend and vote at the meeting.
ii. Participation in Annual General Meeting
A member entitled to attend, speak and vote at this Annual General Meeting shall be entitled to appoint another member, as a proxy to attend and vote on his / her behalf. The instrument appointing Proxy must be received at the Registered Office or Share Registrar of the Company not less than 48 hours before the time of the meeting. For the convenience of the members a Proxy Application Form is dispatched with the Annual Report 2019.
iii. Change of Address
Members holding physical shares are requested to notify any change in their addresses immediately to our Share Registrar, M/s. Hameed Majeed Associates (Private) Limited, H.M. House, 7-Bank Square, Shahrah-e-Quaid-e-Azam, Lahore, Pakistan.
iv. Further Guidelines for CDC Account Holders
Any Individual Beneficial Owner of CDC, entitled to vote at this Meeting, must bring his / her original Computerized National Identity Card (CNIC) to prove identity, and in case of proxy, a copy of shareholder’s attested CNIC must be attached with the proxy form. Representatives of corporate members should bring the usual documents required for such purpose.
CDC Account Holders will also have to follow the under mentioned guidelines as laid down in Circular 1 dated January 26, 2000 issued by the Securities and Exchange Commission of Pakistan (SECP).
A. For Attending the Meeting:
(i) In case of individuals, the account holder or sub-account holder and / or the person whose securities are in group account and their registration details are uploaded as per the regulations, shall authenticate identity by showing his / her original Computerized National Identity Card (CNIC) or original passport at the time of attending the Meeting.
(ii) Members registered on CDC are also requested to bring their particulars, I.D. numbers and account numbers in CDS.
(iii) In case of corporate entity, the Board of Directors’ resolution / power of attorney with specimen signature of the nominee shall be produced (unless it has been provided earlier) at the time of meeting.
B. For Appointing Proxies:
(i) In case of individuals, the account holder or sub-account holder and / or the person whose securities are in group account and their registration detail is uploaded as per the regulations, shall submit the proxy form as per the above requirement.
(ii) The proxy form shall be witnessed by the person whose name, address and CNIC number shall be mentioned on the form.
(iii) Attested copies of CNIC or the passport of the beneficial owners and the proxy shall be furnished with the proxy form.
(iv) The proxy shall produce his / her original CNIC or original passport at the time of meeting.
(v) In case of corporate entity, the Board of Directors’ resolution / power of attorney with specimen signature shall be submitted (unless it has been provided earlier) along with proxy form to the Company.
CompanyOverview
Message forStakeholders
FinancialHighlights
SustainabilityReport
FinancialStatements
OtherInformation
53

v. Circulation of Annual Audited Accounts via Email / CD / USB / DVD or Any Other Media
SECP through its SRO 470(1)/2016, dated May 31, 2016, has allowed companies to circulate the annual balance sheet, profit and loss account, Auditors’ report and Directors’ report etc (“annual audited accounts”) to its members through CD/DVD/USB at their registered addresses. In view of the above, the Company has sent its Annual Report 2019 to its shareholders in the form of CD. Any member requiring printed copy of Annual Report 2019 may send a request using a Standard Request Form placed on Company website.
Members are hereby informed that pursuant to SECP SRO 787(1)/2014 dated September 8, 2014, and under section 223(6) of the Companies Act 2017, circulation of Audited Financial Statements and Notice of Annual General Meeting has been allowed in electronic format through email.
In compliance with the above requirements, soft copies of the Annual Report 2019 are being emailed to the members having opted to receive such communication in electronic format. Other members who wish to receive the Annual Report 2019 in electronic form may file an application as per the form provided on the Company’s website in compliance with the subject SRO. The members who have provided consent to receive Annual Report 2019 can subsequently request any other media including hard copy which shall be provided free of cost within seven days.
Members are also requested to intimate any change in their registered email addresses in a timely manner, to ensure effective communication by the Company.
vi. Video Conference Facility
If the Company receives consent from members holding in aggregate 10% or more shareholding residing at a geographical location, to participate in the meeting through video conference at least 10 days prior to date of meeting, the Company will arrange video conference facility in that city subject to availability of such facility in that City. The Company will intimate Members regarding venue of video conference facility at least 5 days before the date of the Annual General Meeting along with complete information necessary to enable them to access such facility.
I/We, _______________________________________ of _________________, being a member of Atlas Honda Limited, holder of __________________________ ordinary share(s) as per Registered Folio/CDC Account No. ______________________ hereby opt for video conference facility at ____________________________.
_____________________ Signature of Member
vii. Dividend Mandate
Under the provisions of Section 242 of the Companies Act, 2017, it is mandatory for a listed Company to pay cash dividend to its shareholders only through electronic mode directly into bank account designated by the entitled shareholders. In order to receive dividends directly into their bank accounts, shareholders are requested to fill in Electronic Credit Mandate Form available on Company’s website i.e. http://www.atlashonda.com.pk and send it duly signed along with a copy of CNIC / NTN to the Registrar of the Company M/s. Hameed Majeed Associates (Private) Limited, H.M. House, 7-Bank Square, Shahrah-e-Quaid-e-Azam, Lahore, Pakistan in case of physical shares. In case shares are held in CDC then Electronic Credit Mandate Form must be submitted directly to shareholder’s broker/ participant/CDC account services.
viii. Unclaimed Dividend
Pursuant to Section 244 of the Companies Act, 2017, any shares issued or dividend declared by the Company, which remain unclaimed or unpaid for a period of three years from the date it becomes due/payable shall vest with the Federal Government after compliance of procedures prescribed under the Companies Act, 2017. Section 244(I)(a) of the Act requires the Company to give a 90 days’ notice to the members to file their claims with the Company. Further SECP vide Direction No. 16 of 2017 issued on July 07, 2017 directed all listed Companies to issue such notice to the members and submit statement of unclaimed shares or dividend or any other instruments which remain unclaimed or unpaid for a period of three years from the date it is due and payable as of May 30, 2017.
ix. Details of Beneficial Ownership
Attention of corporate entities / legal persons is also invited towards SECP Circular No. 16 and 20 of 2018. Respective shareholders (corporate entities / legal persons) are advised to provide the information pertaining to ultimate beneficial owners and / or other information as prescribed in the subject SECP Circulars to the Share Registrar of the Company.
CompanyOverview
Message forStakeholders
FinancialHighlights
SustainabilityReport
FinancialStatements
OtherInformation
54

x. Zakat Declaration (CZ-50)
Zakat will be deducted from the dividends at source at the rate of 2.5% of the paid-up value of the share (Rs. 10 each) and will be deposited within the prescribed period with the relevant authority. In case of claiming exemption, please submit your Zakat Declaration under Zakat and Ushr Ordinance, 1980 and Rule 4 of Zakat (Deduction and Refund) Rules, 1981, CZ-50 Form with our Share Registrar. Physical shareholders are requested to submit the said declaration to our Share Registrar in the proper manner. The Shareholders must write Atlas Honda Limited’s name and their respective CDS A/C # or Folio numbers on Zakat Declarations at relevant place.
xi. Withholding Tax on Dividend Pursuant to the provisions of Finance Act, 2018, different rates are prescribed for deduction of withholding tax on the
amount of dividend paid by the companies, as under:
‘Filer’ of Income Tax Return 15.0%
‘Non - filer’ of Income Tax Return 20.0%
The ‘Filer’ is defined as a taxpayer whose name appears in the Active Tax-payers List (ATL) issued by Federal Board of Revenue (FBR) from time to time.
To enable the Company to withhold tax @ 15% for filers, all the shareholders are advised to ensure that their names appear in the latest available ATL on FBR website, otherwise tax on their cash dividend will be deducted @ 20% for non-filers.
In case of joint shareholder, each shareholder is to be treated individually as either a filer or non-filer and tax will be deducted on the basis of shareholding of each shareholder as may be notified by the shareholders, in writing as follows, to our share registrar, or if no such notification is received each shareholder shall be assumed to have an equal number of shares:
FolioCDS
Total Shares
Principal Shareholder Joint Shareholder
Name & CNIC No.
Shareholding proportion
(no. of shares)
Name & CNIC No.
Shareholding proportion
(no. of shares)
The required information must reach the share registrar of the Company by the close of business on June 06, 2019 otherwise it will be assumed that the shares are equally held by Principal shareholder and Joint shareholder(s).
As per FBR’s clarification, the valid exemption certificate under section 159 of the ordinance is mandatory to claim exemption of withholding tax under clause 47B of part IV of 2nd Schedule of the Income tax Ordinance, 2001. Those who fall in the category mentioned in the aforesaid clause must provide valid tax exemption certificate to our share registrar, otherwise tax will be deducted on dividend amount as per rates prescribed in Section 150 of the Income tax Ordinance, 2001.
xii. E-Voting
Members can also exercise their right of E-voting subject to the requirements of S. 143 - 145 of the Companies Act 2017 and the applicable clauses of the Companies (Postal Ballot) Regulations 2018.
xiii. Placement of Financial Statements on Website:
The Financial Statements of the Company for the year ended March 31, 2019 along with reports have been placed on the website of the Company:
https://www.atlashonda.com.pk/financial-reports/
Statement Under Section 134(3) of the Companies Act 2017
The Statement sets out the material facts concerning the Special Business, given in agenda item no. 5 of the Notice that will be considered by the members.
The Board of Directors has recommended to the members of the Company to approve 20% fully paid bonus issue for the year ended March 31, 2019 and thereby capitalize a sum of Rs. 206,813 thousand. The Directors have also recommended that all the fractional bonus shares shall be consolidated and the Directors be authorized to consolidate and sell the fractional shares so combined in the stock market and the sale proceeds shall be donated to any charitable institution.
The directors are interested in the business only to the extent of their entitlement of dividends and bonus shares as ordinary shareholders.
CompanyOverview
Message forStakeholders
FinancialHighlights
SustainabilityReport
FinancialStatements
OtherInformation
55

SustainabilityReport
CompanyOverview
Message forStakeholders
FinancialHighlights
FinancialStatements
OtherInformation
Key Financial & Non FinancialPerformance Measures
56
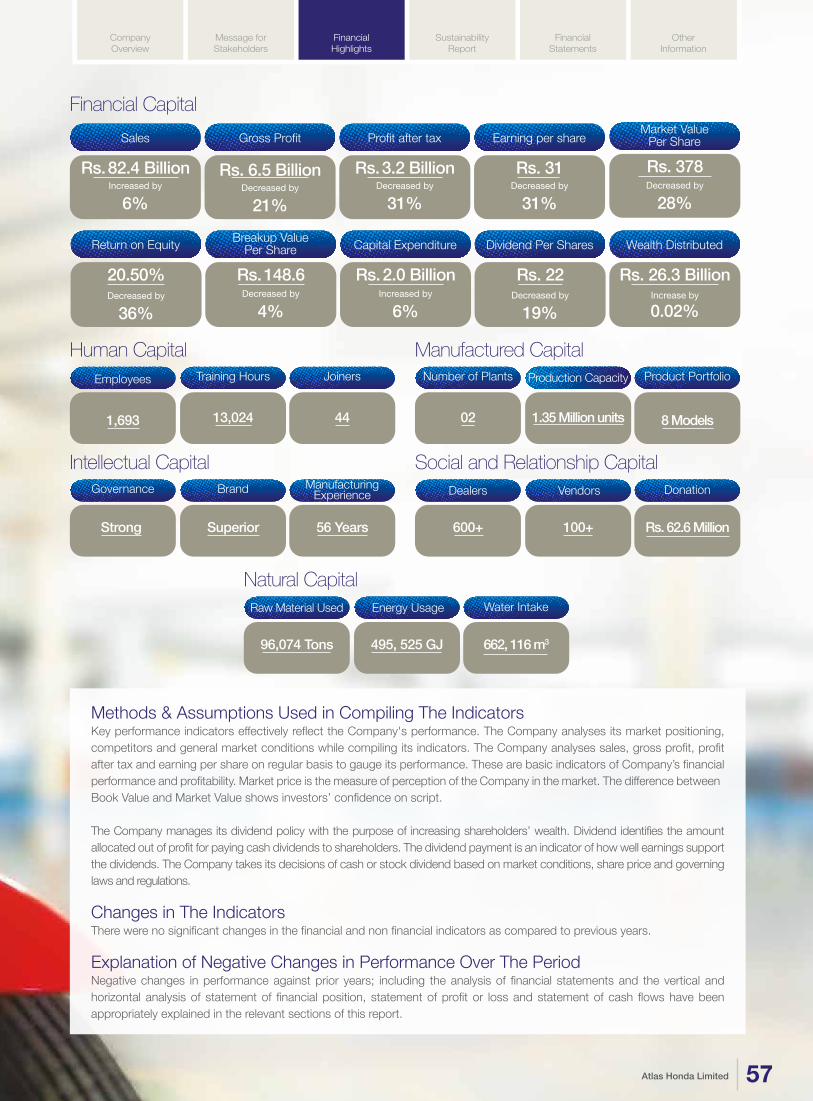
SustainabilityReport
CompanyOverview
Message forStakeholders
FinancialHighlights
FinancialStatements
OtherInformation
Methods & Assumptions Used in Compiling The IndicatorsKey performance indicators effectively reflect the Company's performance. The Company analyses its market positioning, competitors and general market conditions while compiling its indicators. The Company analyses sales, gross profit, profit after tax and earning per share on regular basis to gauge its performance. These are basic indicators of Company’s financial performance and profitability. Market price is the measure of perception of the Company in the market. The difference between Book Value and Market Value shows investors’ confidence on script.
The Company manages its dividend policy with the purpose of increasing shareholders’ wealth. Dividend identifies the amount allocated out of profit for paying cash dividends to shareholders. The dividend payment is an indicator of how well earnings support the dividends. The Company takes its decisions of cash or stock dividend based on market conditions, share price and governing laws and regulations.
Changes in The IndicatorsThere were no significant changes in the financial and non financial indicators as compared to previous years.
Explanation of Negative Changes in Performance Over The PeriodNegative changes in performance against prior years; including the analysis of financial statements and the vertical and horizontal analysis of statement of financial position, statement of profit or loss and statement of cash flows have been appropriately explained in the relevant sections of this report.
Natural CapitalRaw Material Used
96,074 Tons
Energy Usage
495, 525 GJ
Water Intake
662, 116 m3
Human CapitalEmployees
1,693
Training Hours
13,024
Joiners
44
Manufactured CapitalNumber of Plants
02
Production Capacity
1.35 Million units
Product Portfolio
8 Models
Breakup ValuePer Share
Rs. 148.6
Capital Expenditure
Rs. 2.0 Billion
Return on Equity
20.50%Decreased by
36%Decreased by
4%
Wealth Distributed
Rs. 26.3 BillionIncrease by
0.02%
Dividend Per Shares
Rs. 22Decreased by
19%Increased by
6%
Financial CapitalGross Profit
Rs. 6.5 Billion
Profit after tax
Rs. 3.2 Billion
Earning per share
Rs. 31
Market ValuePer Share
Rs. 378Decreased by
21%
Sales
Rs. 82.4 BillionIncreased by
6%Decreased by
31%Decreased by
31%Decreased by
28%
Intellectual CapitalGovernance
Strong
Brand
Superior
ManufacturingExperience
56 Years
Social and Relationship CapitalDealers
600+
Vendors
100+
Donation
Rs. 62.6 Million
57

Particulars 2019 2018 2017 2016 2015 2014
Profitability Ratios
Gross profit margin % 8.0 10.7 10.5 10.3 10.2 9.5 Profit before tax margin % 5.6 8.1 7.9 7.4 7.1 6.0 Net profit margin % 3.9 6.0 5.8 5.5 5.1 4.5 Return on capital employed % 27.9 40.4 39.5 37.3 34.7 33.4 Return on equity - before tax % 29.4 42.8 42.0 40.0 37.8 37.2 Return on equity - after tax % 20.5 31.9 30.9 29.7 27.4 27.7 Return on assets % 10.1 16.2 16.3 16.6 15.6 15.2 Earnings before interest, tax, depreciation and
amortization (EBITDA) Rs. In Million 5,723.6 7,174.0 5,905.9 4,753.4 3,898.4 3,329.2EBITDA margin % 6.9 9.3 9.2 8.6 8.5 7.5
Equity Ratios
Cash dividend per share (declared) Rs. 20.00 27.00 18.50 14.5 12.0 10.0 Stock dividend per share (bonus shares
declared for the year) Rs. 2.00 - - - - - Bonus shares declared for the year No. in ‘000 20,681.00 - - - - - Earning per share Rs. 31.0 45.1 36.3 29.0 22.7 19.4 Price earning ratio Times 12.2 11.6 15.4 13.3 14.7 15.1 Market price per share for the year Rs. 378.0 525.0 559.7 385.0 335.0 292.6 - maximum value Rs. 640.0 657.0 620.0 414.8 405.3 299.0 - minimum value Rs. 360.0 470.0 362.0 320.1 209.0 171.0 Break up value per share Rs. 148.6 154.7 128.2 106.4 89.3 76.5 Dividend yield % 5.8 5.1 3.3 3.8 3.6 3.4 Dividend cover Times 1.4 1.7 2.0 2.0 1.9 1.9 Dividend pay out % 70.9 59.9 51.0 49.9 52.8 51.7 Plough back ratio % 29.1 40.1 49.0 50.1 47.2 48.3 Cost of equity % 5.3 5.1 3.3 3.8 3.6 3.4
Efficiency Ratios
Assets turnover Times 2.6 2.7 2.8 3.0 3.0 3.4 Fixed assets turnover Times 9.6 10.3 10.1 10.2 9.6 9.9 Inventory turnover Times 16.8 23.4 23.0 22.3 18.2 16.1 Debtors turnover Times 83.4 104.4 104.8 83.8 74.7 85.9 Creditors turnover Times 5.4 5.9 6.4 7.7 8.1 8.8 Capital employed turnover Times 4.9 5.0 5.0 5.0 4.9 5.5
Operating Cycle
Period of inventory holding Days 22 16 16 16 20 23 Period of collection from debtors Days 4 3 3 4 5 4 Period of payments to creditors Days (73) (70) (63) (53) (50) (46)Operating cycle Days (47) (50) (44) (32) (25) (19)
Liquidity / Leverage Ratios
Current ratio Times 1.4 1.6 1.6 1.7 1.8 1.7 Quick ratio Times 1.1 1.4 1.4 1.4 1.5 1.3 Debt to equity / financial leverage ratio Times ------------------------------------------------- Debt Free ---------------------------------------Total liabilities to equity Times 1.08 0.99 0.93 0.85 0.71 0.82 Interest cover Times 179.76 276.68 197.99 265.69 397.05 335.67 Operating leverage ratio % (413.5) 114.7 149.9 122.2 708.6 427.9 Cash to current liabilities Times 0.5 0.7 0.6 0.6 0.6 0.5 Cash flow from operations to sales % (0.02) 10.1 10.0 10.0 6.1 7.9
Six Years Analysis of Financial StatementsFinancial ratios
CompanyOverview
Message forStakeholders
FinancialHighlights
SustainabilityReport
FinancialStatements
OtherInformation
58

Six Years Analysis of Financial StatementsFinancial ratiosProfitability RatiosThe Company remained focused towards delivering upon its objective of sustainable profitable growth through value creation. The momentum of increasing profitability continued over the period of five years on account of increased sales volume, stable exchange rates and cost efficiencies. However, In the year 2019, despite increase in the sales volume, the profitability was reduced on account of challenging micro economic landscape. The main reasons were increase in raw material prices, devaluation of PKR against other currencies and continued inflation. This translated into gross profit margin and net profit margin of 8.0% and 3.9% respectively. Consequently the return on equity and capital employed moved from 31.9% and 40.4% to 20.5% and 27.9% respectively in comparison with last year.
Investment / Market RatiosWith reduced profitability on account of conditions explained above, the Company’s earnings per share was recorded at Rs. 31.0 per share as compared to Rs. 45.1 per share in 2018. However, Price to earnings ratio increased to 12.2 times as compared to 11.6 times in 2018 as the closing market price of Company’s share recorded at Rs. 378 per share as compared to Rs. 525 at the close of 2018.
The breakup value of Company's share declined to Rs.148.6 per share as compared to Rs.154.7 per share due to payment of interim dividend.
In order to generate valuable returns for its stakeholders, the Company's dividend payout ratio for 2019 was recorded at 70.9% against 59.9% last year, translating into cumulative cash dividend (interim and final) per share of Rs.20/ share and stock dividend of Rs.2/ share in the year 2019 as compared to cash dividend of Rs.27 per share last year.
1
3
5
7
201920182017201620152014
Net Profit Margin
3.9
6.0
5.8
5.5
5.1
4.5
(Per
cent
age)
3.9 Percent
Gross Profit Margin
5
7
9
11
201920182017201620152014
9.5 10
.2
10.3
10.5
10.7
8.0
(Per
cent
age)
8.0 Percent
40
50
60
70
80
201920182017201620152014
Dividend Payout
70.9
59.9
51.0
49.952
.8
51.7
(Per
cent
age)
70.9 Percent
5
30
35
40
201920182017201620152014
Return on Equity
20.5
31.9
30.9
29.7
27.4
27.7
(Per
cent
age)
20.5 Percent
15
10
20
25
20.5
10
18
26
34
42
50
201920182017201620152014
(Rup
ees)
Earning Per Share
31.0
45.1
36.3
29.0
22.7
19.4
Rs. 31.0 Per Share
(Rup
ees) (Tim
es)
0
100
200
300
400
500
600
201920182017201620152014
Market Value vs Price Earning Ratio
378.
0
525.
0
559.
7
385.
0
335.
0
292.
6
15.1 14.713.3
15.4
11.6 12.2
8
10
12
14
16
18
20
Rs. 378.0 per share 12.2 Times
Return on Capital Employed
8
18
28
38
48
201920182017201620152014
27.9
40.4
39.5
37.3
34.7
33.4
27.9 Percent
(Per
cent
age)
CompanyOverview
Message forStakeholders
FinancialHighlights
SustainabilityReport
FinancialStatements
OtherInformation
59

Six Years Analysis of Financial StatementsFinancial ratios
Liquidity RatiosThe current ratio of 1.40 times slightly declined over last year of 1.60 due to continued investments in capacity expansion, new models and localization of critical parts. Quick ratio was recorded at 1.10 times, maintaining an average of 1.3 times over six years period. As compared to 2018, it declined by 0.3 times owing to higher closing inventory.
Cash to current liabilities has declined to 0.5 times in 2019 as compared to 0.7 times last year due to payment of interim dividend and maintenance of LC margin for imports as per SBP's requirement.
(Tim
es)
12
15
18
21
24
201920182017201620152014
Inventory Turnover
16.8
23.4
23.0
22.3
18.2
16.1
16.8 Times
0
1
2
3
4
201920182017201620152014
(Tim
es)
Assets Turnover
2.62.72.83.
0
3.03.
4
2.6 Times
2
4
6
8
10
201920182017201620152014
(Tim
es)
Creditors Turnover
5.45.
96.4
7.78.
18.8
5.4 Times
60
70
80
90
100
110
201920182017201620152014
(Tim
es)
Debtors Turnover
83.4
104.
4
104.
8
83.8
74.7
85.9
83.4 Times
0.5
1.0
1.5
2.0
201920182017201620152014
(Tim
es)
Quick Ratio
1.1 Times
1.1
1.4
1.4
1.41.
5
1.3
0.0
0.2
0.4
0.6
0.8
201920182017201620152014
(Tim
es)
Cash to Current Liabilities
0.5
0.7
0.6
0.6
0.6
0.5
0.5 Times
0.5
1.0
1.5
2.0
201920182017201620152014
(Tim
es)
Current Ratio
1.4
1.6
1.61.
71.8
1.7
1.4 Times
CompanyOverview
Message forStakeholders
FinancialHighlights
SustainabilityReport
FinancialStatements
OtherInformation
Activity / Turnover RatiosThe asset turnover ratio slightly declined from 2.7 times in 2018 to 2.6 times in 2019 on account of expanding asset base. This is due to capacity & BMR investments in property, plant and equipment and increase in working capital needs.
The inventory turnover witnessed a downward trend from 23.4 times in 2018 to16.8 times in 2019 mainly due to increase in stock in trade. The higher stock in trade is on account of increased raw material prices, exchange devaluation and to meet the future anticipated demand in the market. This resulted in inventory turnover of 22 days as compared to 16 days of last year.
This year, the Company has received impressive sales orders from its institutional clients. Resultantly, more orders from institutional clients increased the average value of debtors. Accordingly, the debtor turnover increased to 4 days in 2019 as compared to 3 days in 2018. This translated into debtors turnover of 83.4 times as compared to 104.4 times of last year.
The creditor turnover days have increased to 73 days compared to 70 days in 2018. This is in line with the increase in overall production level of the Company.
This translated into an overall operating level cycle of negative 47 days as compared to negative 50 days last year.
60

Net Sales increased by 6% driven by volumetric growth and pricing impact. However, the devaluation of currency and increase in raw material prices has shrunk the net profit by 31%. This translated in net profit margin of 3.9% which resulted in return of equity of 20.9%.
There is a negligible increase of 0.4% in total assets. The increase in capital expenditure along with an increase in stock in trade is off-setted by decrease in short term investments and cash at bank which were utilised in the payment of interim dividend and aforesaid capacity expansion. This resulted in return on asset ratio of 10%.
DuPont AnalysisFor the Year Ended March 31, 2019 Rupees in Million
RETURN ONEQUITY
20.9%
OwnershipRatio
48.1%
Return onAssets
10.1%
Net P
rofit
Mar
gin
3.9%
2.6 Times
Assets turnover
Net ProfitMargin
PKR 31,955
TotalAssets
PKR 15,365
OwnersEquity
3.9%
PKR 22,465
CurrentAssets
PKR 9,490
Non-CurrentAssets
PKR 82,413 Sales
PKR 79,204 Total Cost
PKR 996
Non-CurrentLiabilities
PKR 15,593
CurrentLiabilitiesPKR 16,589
TotalLiabilities
PKR 31,955
TotalAssets
PKR 82,413Sales
PKR 3,209
NetIncome
PKR 15,365
Owners’equity
Dupont Analysis 2019 2018
Tax Burden 30.48% 25.56%
Interest Burden 0.56% 0.36%
EBIT 5.63% 8.12%
Asset Turnover 2.6 2.7
Debt/Equity Ratio 51.91% 49.72%
ROE 20.9% 32.3%
CompanyOverview
Message forStakeholders
FinancialHighlights
SustainabilityReport
FinancialStatements
OtherInformation
61

Particulars 2019 2018 2017 2016 2015 2014
-----------------------------------------------------Rupees in ‘000--------------------------------------------------------
Assets
Non Current AssetsProperty, plant & equipment 8,950,633 7,976,101 6,961,919 5,817,700 4,982,552 4,552,816 Intangible asset 168,924 44,905 37 5,379 12,774 4,781 Long term investments 323,497 324,899 292,342 245,508 216,283 - Long term loans and advances 33,467 31,481 30,108 28,027 27,198 26,396 Long term deposits 13,882 22,573 17,339 14,937 12,986 9,632
Total non current assets 9,490,403 8,399,959 7,301,745 6,111,551 5,251,793 4,593,625
Current AssetsStores,spares and loose tools 725,754 650,160 539,104 489,415 421,339 400,424 Stock in trade 5,069,836 2,599,530 2,123,831 1,863,482 1,660,529 2,042,602 Trade debts 1,116,000 861,224 623,331 608,420 704,597 520,321 Loans and advances 43,794 40,107 38,921 35,877 41,235 35,305 Trade deposits and prepayments 1,007,128 137,663 120,562 64,770 59,568 50,679 Short term investments 5,261,724 8,400,246 7,080,669 5,876,554 4,119,696 3,691,241 Accrued mark-up/interest 37,614 15,557 21,470 16,842 10,857 11,130 Other receivables 573,080 15,528 6,627 4,910 3,674 4,666 Taxation-net 1,149,424 725,750 732,706 542,121 99,185 - Bank balances 7,480,159 9,981,615 7,053,784 4,755,020 3,409,200 2,843,738
Total current assets 22,464,513 23,427,380 18,341,005 14,257,411 10,529,880 9,600,106
Non Current Assets Classifiedas Held for Sales - - - - - 171,459
Total assets 31,954,916 31,827,339 25,642,750 20,368,962 15,781,673 14,365,190
Equity & Liabilities
EquityShare capital 1,034,066 1,034,066 1,034,066 1,034,066 1,034,066 1,034,066 Reserves 14,331,698 14,966,654 12,223,467 9,968,057 8,204,479 6,879,247
Total equity 15,365,764 16,000,720 13,257,533 11,002,123 9,238,545 7,913,313
Non Current Liabilities
Retirement benefits 296,409 262,882 228,443 214,620 195,145 192,042 Deferred taxation 700,024 698,042 670,968 566,749 578,249 637,558
Total non current liabilities 996,433 960,924 899,411 781,369 773,394 829,600
Current Liabilities
Trade and other payables 15,592,719 14,865,695 11,485,806 8,585,470 5,769,734 5,577,694 Taxation - net - - - - - 44,583
Total current liabilities 15,592,719 14,865,695 11,485,806 8,585,470 5,769,734 5,622,277
Total equity and liabilities 31,954,916 31,827,339 25,642,750 20,368,962 15,781,673 14,365,190
Six Years Analysis of Financial StatementsStatement of Financial Position
CompanyOverview
Message forStakeholders
FinancialHighlights
SustainabilityReport
FinancialStatements
OtherInformation
62

Six Years Analysis of Financial StatementsStatement of Financial Position
———————— Horizontal Analysis ———————— ————————— Vertical Analysis —————————
Particulars 2019 vs
2018
2018 vs
2017
2017 vs
2016
2016 vs
2015
2015 vs
2014
2014 vs
2013 2019 2018 2017 2016 2015 2014
--------------------------------------------------------------- Percentage ------------------------------------------------------------------
Assets
Non Current AssetsProperty, plant & equipment 12 15 20 17 9 3 28 25 27 29 32 32 Intangible asset 276 121,265 (99) (58) 167 (14) 1 0 0 0 0 0 Long term investments (0) 11 19 14 100 - 1 1 1 1 1 0 Long term loans and advances 6 5 7 3 3 3 0 0 0 0 0 0 Long term deposits (39) 30 16 15 35 15 0 0 0 0 0 0
Total non current assets 13 15 19 16 14 3 30 26 28 30 33 32
Current AssetsStores,spares and loose tools 12 21 10 16 5 3 2 2 2 2 3 3 Stock in trade 95 22 14 12 (19) (6) 16 8 8 9 11 14 Trade debts 30 38 2 (14) 35 1 3 3 2 3 4 4 Loans and advances 9 3 8 (13) 17 6 0 0 0 0 0 0 Trade deposits and prepayments 632 14 86 9 18 6 3 0 0 0 0 0 Short term investments (37) 19 20 43 12 126 16 26 28 29 26 26 Accrued mark-up/interest 142 (28) 27 55 (2) (4) 0 0 0 0 0 0 Other receivables 3,591 134 35 34 (21) (26) 2 0 0 0 0 0 Taxation-net 58 (1) 35 447 100 (100) 4 2 3 3 1 0 Bank balances (25) 42 48 39 20 4 23 31 28 23 22 20
Total current assets (4) 28 29 35 10 27 70 74 72 70 67 67
Non Current Assets Classifiedas Held for Sales - - - - (100) 100 - - - - - 1
Total assets 0.4 24 26 29 10 20 100 100 100 100 100 100
Equity & Liabilities
EquityShare capital - - - - - 25 3 3 4 5 7 7 Reserves (4) 22 23 21 19 20 45 47 48 49 52 48
Total equity (4) 21 20 19 17 21 48 50 52 54 59 55
Non Current Liabilities
Retirement benefits 13 15 6 10 2 13 1 1 1 1 1 1 Deferred taxation 0 4 18 (2) (9) (8) 2 2 3 3 4 5
Total non current liabilities 4 7 15 1 (7) (4) 3 3 4 4 5 6
Current Liabilities
Trade and other payables 5 29 34 49 3 22 49 47 45 42 37 39 Taxation - net - - - - (100) 100 - - - - - -
Total current liabilities 5 29 34 49 3 23 49 47 45 42 37 39
Total equity and liabilities 0.4 24 26 29 10 20 100 100 100 100 100 100
CompanyOverview
Message forStakeholders
FinancialHighlights
SustainabilityReport
FinancialStatements
OtherInformation
63

Horizontal Analysis
EquityAtlas Honda Limited’s share capital remained unchanged during the last six years at Rs. 1.034 Billion. The reserves of the company increased gradually over the period primarily due to profit retention for financing the future growth. Resultantly the total shareholders’ equity stood at Rs.15.4 Billion with an increase of 94% since 2014.
Non Current LiabilitiesNon current liabilities, comprising of deferred taxation and retirement benefits increased by 20% since 2014 primarily due to accumulation of leave absences.
Current LiabilitiesCurrent liabilities increased from Rs.5.6 Billion in 2014 to Rs. 15.6 Billion in 2019 primarily due to increase in customer advances and trade related payables, which are in line with the increase in sales and production trends respectively.
Non Current AssetsProperty, plant & equipment, intangible assets and long term investments constitute the Company’s non-current assets. Investment in capacity expansion plan besides routine capital expenditure has resulted in net increase of Rs. 4.4 Billion since 2014 to Rs. 8.9 Billion in property, plant and equipment. As a part of its strategy for diversification, Atlas Honda Limited has acquired equity stakes of 29.23% in Atlas Hitec (Private) Limited in 2015 with an investment of Rs. 0.2 Billion.
Current AssetsCurrent Assets mainly comprises of stores and spares, stock in trade, trade debts, other receivables, short term investments and cash & bank balances. Stock levelssurged from Rs.2.4 Billion in 2014 to Rs.5.8 Billion in 2019 due to higher production levels. Similarly trade debts
increased from Rs. 0.5 Billion in 2014 to Rs. 1.1 Billion in 2019 on account of higher sales volume. Further the short term investments and cash balances increased from Rs. 6.5 Billion in 2014 to Rs. 12.7 Billion in 2019. Resultantly, the total current assets increased from Rs. 9.6 Billion in 2014 to Rs. 22.5 Billion in 2019.
Vertical AnalysisTrade & Other PayablesTrade and other payables increased by Rs. 0.7 Billion as compared to last year in line with the increase in production levels.
Property, Plant & EquipmentProperty, plant and equipment increased by Rs. 0.9 Billion as compared to last year mainly on account of capacity expansion, dies and jigs for new models and BMR.
Stores & Stock in TradeStores and stock in trade increased by Rs. 2.6 Billion as compared to last year due to devaluation of Rupee and increase in raw material prices. Further higher level of inventory is maintained in accordance with the increased production requirement.
Trade Deposits & PrepaymentsTrade deposits and prepayments increased by Rs. 0.9 Billion as compared to last year due to State Bank’s imposition of the requirement to maintain 100% cash margin on letter of credit.
Other ReceivablesOther receivables has increased by Rs. 0.6 Billion as compared to last year on account of unadjusted sales tax receivable from the government.
Six Years Analysis of Financial StatementsStatement of Financial Position
0
5,000
10,000
15,000
20,000
25,000
201920182017201620152014
22,4
65
23,4
27
18,3
41
14,2
57
10,5
30
9,60
0
Rs. 22,465 Million
(Rup
ees
in M
illion
)
0
5,000
10,000
15,000
20,000
201920182017201620152014
15,3
66
16,0
01
13,2
58
11,0
02
9,23
9
7,91
3
Rs. 15,366 Million
(Rup
ees
in M
illion
)
0
2,000
4,000
6,000
8,000
10,000
201920182017201620152014Rs. 8,951 Million
8,95
1
7,97
6
6,96
2
5,81
8
4,98
3
4,55
3
(Rup
ees
in M
illion
)
0
3,000
6,000
9,000
12,000
15,000
18,000
201920182017201620152014
15,5
93
14,8
66
11,4
86
8,58
5
5,77
0
5,62
2
Rs. 15,593 Million
(Rup
ees
in M
illion
)
CompanyOverview
Message forStakeholders
FinancialHighlights
SustainabilityReport
FinancialStatements
OtherInformation
64

Six Years Analysis of the Financial StatementsStatement of Profit or LossParticulars 2019 2018 2017 2016 2015 2014
----------------------------------------------------Rupees in ‘000------------------------------------------------------- Profit and Loss Account
Sales 82,412,548 77,478,845 64,534,021 55,022,415 45,772,177 44,478,713
Cost of sales (75,856,677) (69,188,101) (57,754,987) (49,376,506) (41,098,571) (40,253,929)
Gross Profit 6,555,871 8,290,744 6,779,034 5,645,909 4,673,606 4,224,784
Sales and marketing expenses (1,924,062) (1,852,057) (1,630,773) (1,456,152) (1,314,231) (1,293,938)
Administrative expenses (640,209) (634,594) (602,343) (499,915) (432,622) (430,054)
Other income 1,097,636 877,908 916,333 637,074 543,924 420,651
Other operating expenses (463,793) (445,037) (404,740) (310,682) (245,132) (223,989)
Share of profit of an AssociatedCompany - net of tax 15,698 50,607 61,084 43,475 26,283 -
Profit from operations 4,641,141 6,287,571 5,118,595 4,059,709 3,251,828 2,697,454
Finance cost (25,818) (22,725) (25,853) (15,280) (8,190) (8,036)
Profit before taxation 4,615,323 6,264,846 5,092,742 4,044,429 3,243,638 2,689,418
Taxation (1,406,664) (1,601,211) (1,340,263) (1,042,630) (892,747) (687,858)
Profit after taxation 3,208,659 4,663,635 3,752,479 3,001,799 2,350,891 2,001,560
————— Horizontal Analysis ————— —————— Vertical Analysis ——————
Particulars2019 vs
2018
2018 vs
2017
2017 vs
2016
2016 vs
2015
2015 vs
2014
2014 vs
20132019 2018 2017 2016 2015 2014
------------------------------------------------------- Percentage ----------------------------------------------------------Profit and Loss Account
Sales 6.4 20.1 17.3 20.2 2.9 5.1 100.0 100.0 100.0 100.0 100.0 100.0
Cost of sales 9.6 19.8 17.0 20.1 2.1 4.2 (92.0) (89.3) (89.5) (89.7) (89.8) (90.5)
Gross Profit (20.9) 22.3 20.1 20.8 10.6 14.8 8.0 10.7 10.5 10.3 10.2 9.5
Sales and marketing expenses 3.9 13.6 12.0 10.8 1.6 7.3 (2.3) (2.4) (2.5) (2.6) (2.9) (2.9)
Administrative expenses 0.9 5.4 20.5 15.6 0.6 11.0 (0.8) (0.8) (0.9) (0.9) (0.9) (1.0)
Other income 25.0 (4.2) 43.8 17.1 29.3 30.4 1.3 1.1 1.4 1.2 1.1 0.9
Other operating expenses 4.2 10.0 30.3 26.7 9.4 17.6 (0.6) (0.6) (0.6) (0.6) (0.5) (0.5)
Share of profit of an AssociatedCompany - net of tax (69.0) (17.2) 40.5 65.4 100.0 - 0.0 0.1 0.1 0.1 0.1 -
Profit from operations (26.2) 22.8 26.1 24.8 20.6 21.7 5.6 8.1 7.9 7.4 7.1 6.0
Finance cost 13.6 (12.1) 69.2 86.6 1.9 (17.4) (0.03) (0.03) (0.04) (0.03) (0.02) (0.02)
Profit before taxation (26.3) 23.0 25.9 24.7 20.6 21.8 5.6 8.1 7.9 7.4 7.1 6.0
Taxation (12.1) 19.5 28.5 16.8 29.8 14.7 (1.7) (2.1) (2.1) (1.9) (2.0) (1.5)
Profit after taxation 24.3 24.3 25.0 27.7 17.5 24.5 3.9 6.0 5.8 5.5 5.1 4.5
CompanyOverview
Message forStakeholders
FinancialHighlights
SustainabilityReport
FinancialStatements
OtherInformation
65

Horizontal Analysis Sales & Gross Profit
The Company remained focused towards delivering objective of sustainable growth through value creation. The momentum of increasing sales continued over the period of six years on account of positive market demand. It resulted in sales revenue of Rs. 82.4 Billion in 2019 with an achievement of cumulative average growth rate of 13% over six years period. The cost of sales was recorded at Rs. 75.8 Billion with a cumulative average growth rate of 14% since 2014, on account of volume growth, devaluation, increase in raw material prices and other inflationary Factors. Resultantly, Gross profit margin declined from 9.5% to 8.0%.
Selling General and Administrative Expenses
SG&A increased from Rs. 1.72 Billion in 2014 to 2.56 Billion in 2019 with a cumulative average growth rate of 8% over six years period owing to higher volumes and rising inflationary prices. However, as a percentage of sales they remained well under control and decreased from 3.9% to 3.1%.
Other Operating Income Other operating income increased from Rs. 0.4 Billion in 2014 to Rs. 1.1 Billion in 2019 over the period of six years with cumulative average growth rate of 21%. This is on account of investment of surplus funds in TDRs, mutual funds and income from associate.
Other Operating Expenses Other operating expenses increased from Rs. 0.2 Billion in 2014 to Rs. 0.5 Billion in 2019 over the period of six years with cumulative average growth rate of 16 %. It mainly comprises of provision for workers’ welfare funds and workers’ profit participation funds that were directly related to profits.
Taxation The variation in taxation charge remained in line with profitability of the Company. The effect of gradual reduction in applicable corporate tax rates, however subdued by the levy of super tax.
Vertical Analysis Gross Profit Although the revenue has increased from Rs. 77.5 Billion to Rs. 82.4 Billion as compared to last year, the gross profit has decreased from Rs. 8.3 Billion to Rs. 6.6 Billion because of increase in raw material prices, currency devaluation and inflationary factors.
Profit After Tax Net profit after tax reduced from Rs. 4.6 Billion to Rs. 3.2 Billion as compared to last year mainly because of increase in manufacturing and operating costs as explained above in addition to higher tax charge.
Six Years Analysis of the Financial StatementsStatement of Profit or Loss
0
15,000
30,000
45,000
60,000
75,000
90,000
2019201820172016201520140
2
4
6
8
10
12
82,4
13
77,4
79
64,5
34
55,0
22
45,7
72
44,4
79
(Rup
ees
in M
illion
)
Percentage
Rs. 82,413 Million 8.0 Percent
9.510.2 10.3 10.5 10.7
8.0
0
2,000
4,000
6,000
8,000
10,000
2019201820172016201520146,
556
8,29
1
6,77
9
5,64
6
4,67
4
4,22
5
Rs. 6,556 Million
(Rup
ees
in M
illion
)
0
300
600
900
1,200
201920182017201620152014
1,09
8
878916
637
544
421
Rs. 1,098 Million
(Rup
ees
in M
illion
)
0
1,000
2,000
3,000
4,000
5,000
201920182017201620152014
3,20
9
4,66
4
3,75
2
3,00
2
2,35
1
2,00
2
Rs. 3,209 Million
(Rup
ees
in M
illion
)
CompanyOverview
Message forStakeholders
FinancialHighlights
SustainabilityReport
FinancialStatements
OtherInformation
66

Six Years Analysis of the Financial StatementsStatement of Cash Flows
Free Cash Flow Analysis
Particulars 2019 2018 2017 2016 2015 2014
----------------------------------------------Rupees in ‘000------------------------------------------------- Cash Flow Statement
Cash flows from operating activities (12,804) 7,803,002 6,435,417 5,523,178 2,808,104 3,531,566
Cash flows from investing activities 1,308,414 (2,970,748) (2,643,558) (2,947,543) (1,216,243) (2,813,658)
Cash flows from financing activities (3,797,066) (1,904,423) (1,493,095) (1,229,815) (1,026,399) (614,158)
Net increase / (decrease) in cash & cash equivalent (2,501,456) 2,927,831 2,298,764 1,345,820 565,462 103,750
Particular 2019 2018 2017 2016 2015 2014
----------------------------------------------Rupees in ‘000-------------------------------------------------
Profit before taxation 4,615,323 6,264,845 5,092,742 4,044,429 3,243,638 2,689,418
Adjustment non cash items 514,399 544,432 336,768 415,624 415,323 -
Changes in working capital (3,424,484) 2,435,753 2,407,852 2,567,844 304,551 1,005,789
1,707,257 9,247,048 7,839,379 7,029,913 3,965,527 3,697,221
Less: Capital expenditure (2,041,487) (1,924,438) (1,979,303) (1,536,704) (1,093,375) (960,890)
Free Cash flows (334,230) 7,322,610 5,860,076 5,493,209 2,872,152 2,736,331
——————— Horizontal Analysis ——————— ——————— Vertical Analysis ———————
Particulars2019 vs
2018
2018 vs
2017
2017 vs
2016
2016 vs
2015
2015 vs
2014
2014 vs
20132019 2018 2017 2016 2015 2014
----------------------------------------------------------------- Percentage --------------------------------------------------------------------Cash Flow Statement
Cash flows fromoperating activities (100.2) 21.3 16.5 96.7 (20.5) 59.9 0.5 266.5 280.0 410.4 496.6 3,403.9
Cash flows frominvesting activities (144.0) 12.4 (10.3) 142.3 (56.8) 143.7 (52.3) (101.5) (115.0) (219.0) (215.1) (2,711.9)
Cash flows fromfinancing activities 99.4 27.5 21.4 19.8 67.1 32.6 151.8 (65.0) (65.0) (91.4) (181.5) (592.0)
Net increase / (decrease) in cash & cash equivalent (185.4) 27.4 70.8 138.0 445.0 (82.4) 100.0 100.0 100.0 100.0 100.0 100.0
CompanyOverview
Message forStakeholders
FinancialHighlights
SustainabilityReport
FinancialStatements
OtherInformation
67

Analysis of Cash flows, Liquidity & Financing arrangements.
Cash flow from Operating Activities. Cash flow from operating activities witnessed significant fluctuations since 2014. The net cash used from operations stood at Rs. 0.01 Billion in 2019 against Rs. 3.5 Billion of 2014, with the cumulative average growth rate of -132%. This is mainly on account of decrease in profitability, higher investment in stock, LC margins maintained with the banks and sales tax refundable.
Cash flow from Investing Activities.
The cash flows generated in investing activities were Rs. 1.3 Billion in 2019 as compared to cash out flow of Rs. 2.8 Billion used in 2014 with cumulative average growth rate of -186%. Investment in fixed capital expenditures and short term investment were main constituents of cash outflow from investing activities.
Cash flow from Financing Activities.
There is no long term cash borrowings. The net cash out flow from financing activities has increased from Rs. 0.61 Billion to Rs. 3.8 Billion which comprises of dividend payments only.
Six Years Analysis of the Financial StatementsStatement of Cash Flows
Strategy to overcome liquidity problems. The company has implemented a proactive cash management system to ensure smooth working capital management. Internal cash generation, secured through sales revenues and returns from our diversified equity investments used to meet liquidity requirements of the company. As no reliance is placed on external borrowings, which ensures no financial cost.
Treasury management system ensures availability of an effective mechanism for investment of surplus funds on favourably effective rates, which contribute to the investment income, while also ensuring sufficient funds are available for operational requirements.
Controls on customer advances optimizes the revenue realization, whereas income streams from our strategic equity investments further augment cash flows.
Liquidity Arrangement and Financing Arrangement
The Company believes in financing through cash generations from operations rather than long term financing. Accordingly, it takes no borrowing and maintain “Debt Free” status since past seven years.
10,000,000
8,000,000
6,000,000
4,000,000
2,000,000
(2,000,000)
(4,000,000)
(6,000,000)
-
2014 2016 2017 2018 20192015
Cash flows from operating activites Cash flows from investing activites Cash flows from financing activites
CompanyOverview
Message forStakeholders
FinancialHighlights
SustainabilityReport
FinancialStatements
OtherInformation
68

Share Price Sensitivity AnalysisThe Company’s share price is interlinked with Company’s financial performance and has positive correlation with the factors influencing the Company’s performance.
In prevailing business scenario, management considers the following factors to which the performance and share price of the Company may be sensitive.
20%
10%
0%
-10%
-20%Mar-19Apr-18 May-18 Jun-18 Jul-18 Aug-18 Sep-18 Oct-18 Nov-18 Dec-18 Jan-19 Feb-19
PSX 100 Index ATLH (PSX)
Agriculture
Pakistan’s economy is predominantly agricultural in character. This sector contributes around 18.9% to GDP and absorbs 42.3% of labour force. Almost 62% of the country’s population abodes in rural areas, and is linked with agriculture for their livelihood. This sector plays a pivotal role in the performance of the Company. Agricultural growth is contingent on crop acreage, weather conditions, availability of irrigation water & farm inputs, and support prices. The years when these factors are favourable, company’s sales boost due to increase in farmers’ income.
Law and Order:
Favourable and consistent political system provides ideal environment for the business to thrive. On the other hand, unstable law and order jeopardize the business growth. Law and order situation directly impacts the performance of the company. Aggravated law and order situation causes upheaval in the business activities. Volatile government policies, transportation strikes, sit-in protests and hindrance in supply chain affect Company’s sales. In recent years several measures, taken by law enforcement agencies to counter terrorism and crime, have positively impacted the company’s performance.
Plant Operations:
Stable plant operations lead to higher and better production efficiencies. Disruptions at production facilities negatively affect the financial performance of the Company and therefore, may affect the share price.
Capital and money markets:
The Company’s short term investments amount to Rs. 5.3 Billion, which mainly comprise of those in open ended mutual funds. These funds largely invest in capital and money market. Trends in these markets determine the Net Asset Value (NAV) of these funds and as a result, also affect the company’s financial performance.
Interest rates:
With effective and efficient treasury management the Company has maintained a strong liquidity position and debt free status since last 8 years. Funds approximating Rs. 7.5 Billion are held in bank savings account and term deposit receipts which generates treasury income. Therefore, any change in the interest rate leads to a change in income. However, increase in interest rates by SBP directly affects the sale of the motorbikes based on consumer financing.
Exchange rate fluctuations:
Company is exposed to fluctuations in foreign currency exchange rates owing to the import of plant and machinery, raw material and related items. The Company has to bear currency exchange rate fluctuation risk. Hence, the devaluation of Pak rupee against US dollar and Japanese Yen directly affects the Company’s profit by inflating import cost.
Material price volatility:
Steel, aluminium, paints etc are the major raw materials used in production of motorcycles. These materials form major proportion of the total cost incurred by the Company every year. Therefore, variation in the material prices directly affects the gross profit of the company which in turn may affect the share price.
Energy crises:
One of the most crucial factors for the survival of manufacturing segment in the country is the availability of gas and electricity shaping its performance. Disrupted supply of gas and electricity forces businesses to resort to expensive alternatives like diesel generators, which then directly affect the Company’s financial well-being.
Sensitivity Index:
Low Medium High
CompanyOverview
Message forStakeholders
FinancialHighlights
SustainabilityReport
FinancialStatements
OtherInformation
69

Year ended March 31
% 2019 % 2018
(Rupees in ‘000)
Value Addition
Net sales including sales tax 98.84% 95,251,120 98.97% 89,604,928
Other operating income 1.16% 1,113,334 1.03% 928,515
100.00% 96,364,454 100.00% 90,533,443
Bought in materials and services -72.66% (70,022,884) -70.91% (64,198,965)
Value Added 27.34% 26,341,570 29.09% 26,334,478
Value Distribution
To Government
Income tax, sales tax, custom & excise duties, 70.94% 18,687,432 64.65% 17,025,928
workers funds, EOBI & social security contribution
and local taxes
To Employees
Remuneration & benefits 12.60% 3,319,241 14.03% 3,694,209
To Society
Donations 0.24% 62,648 0.20% 51,649
To Providers of capital
Dividends for shareholders 8.64% 2,274,945 10.60% 2,791,979
Retained for re-investment and future growth 7.58% 1,997,304 10.52% 2,770,713
Total Value Distributed 100.00% 26,341,570 100.00% 26,334,478
Statement of Value Addition and its Distribution
CompanyOverview
Message forStakeholders
FinancialHighlights
SustainabilityReport
FinancialStatements
OtherInformation
70.94%
12.60%
8.64%
7.58%
0.24% To Employees
To Society
To Providers of capital
To Goverment
Retained for re-investmentand future growth
2018: 10.52%2018: 64.65%
2018: 10.60%
2018: 0.20%
2018: 14.03%
70
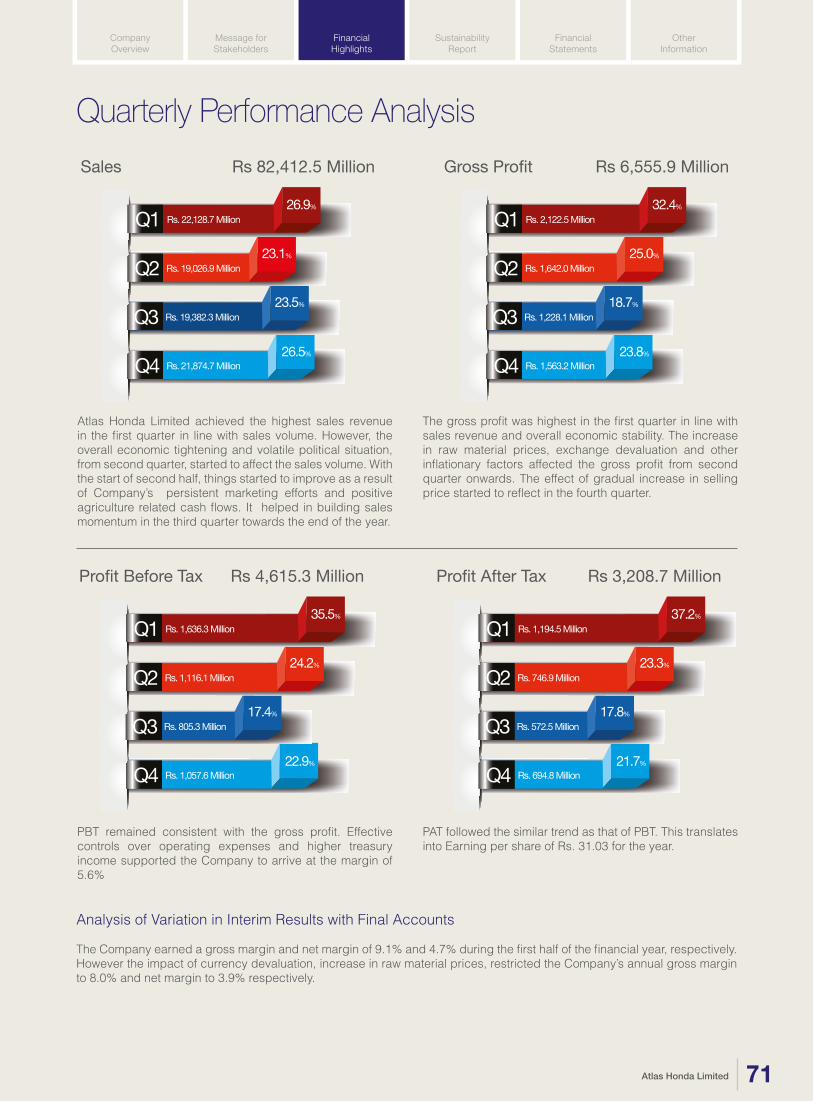
Atlas Honda Limited achieved the highest sales revenue in the first quarter in line with sales volume. However, the overall economic tightening and volatile political situation, from second quarter, started to affect the sales volume. With the start of second half, things started to improve as a result of Company’s persistent marketing efforts and positive agriculture related cash flows. It helped in building sales momentum in the third quarter towards the end of the year.
The gross profit was highest in the first quarter in line with sales revenue and overall economic stability. The increase in raw material prices, exchange devaluation and other inflationary factors affected the gross profit from second quarter onwards. The effect of gradual increase in selling price started to reflect in the fourth quarter.
PBT remained consistent with the gross profit. Effective controls over operating expenses and higher treasury income supported the Company to arrive at the margin of 5.6%
PAT followed the similar trend as that of PBT. This translates into Earning per share of Rs. 31.03 for the year.
Quarterly Performance Analysis
Analysis of Variation in Interim Results with Final Accounts The Company earned a gross margin and net margin of 9.1% and 4.7% during the first half of the financial year, respectively.However the impact of currency devaluation, increase in raw material prices, restricted the Company’s annual gross margin to 8.0% and net margin to 3.9% respectively.
Sales Rs 82,412.5 Million
Q4 Rs. 21,874.7 Million26.5%
Q3 Rs. 19,382.3 Million23.5%
Q2 Rs. 19,026.9 Million23.1%
Q1 Rs. 22,128.7 Million26.9%
Gross Profit Rs 6,555.9 Million
Q4 Rs. 1,563.2 Million23.8%
Q3 Rs. 1,228.1 Million18.7%
Q2 Rs. 1,642.0 Million25.0%
Q1 Rs. 2,122.5 Million32.4%
Profit Before Tax Rs 4,615.3 Million
Q4 Rs. 1,057.6 Million22.9%
Q3 Rs. 805.3 Million17.4%
Q2 Rs. 1,116.1 Million24.2%
Q1 Rs. 1,636.3 Million35.5%
Profit After Tax Rs 3,208.7 Million
Q4 Rs. 694.8 Million21.7%
Q3 Rs. 572.5 Million17.8%
Q2 Rs. 746.9 Million23.3%
Q1 Rs. 1,194.5 Million37.2%
CompanyOverview
Message forStakeholders
FinancialHighlights
SustainabilityReport
FinancialStatements
OtherInformation
71

Sustainability Report 2019• About the report• Sustainability Highlights 2019• General Information• CEO’s Message on Sustainability• Sustainability Strategy• Environmental Protection• Product Responsibility• Corporate Citizenship• Vendor Management• Employee Management• Definition, methodology and scope• Independent Assurance Statement• GRI Content Index
7372 Annual Report 2019 Atlas Honda Limited

ASSURANCE
The report was externally reviewed by Corporate Social Responsibility Center Pakistan (CSRCP), an independent reviewer, in compliance with GRI Standards and ISAE 3000 (2003) standard. The statement of the independent external reviewer describing the activities carried out and the expression of opinion is provided on page 107.
About the reportREPORTING PERIOD Financial year 2019 (April 01, 2018 to March 31, 2019)
REPORTING CYCLE Annual
DATE OF PUBLICATION OFPREVIOUS REPORT June 01, 2018
AVAILABLE VERSION Online and printed versions are available in English. Online version can beaccessed from www.atlashonda.com.pk
GLOBAL REPORTING INITIATIVE This report has been prepared in accordance with the GRI Standards:Core Option. The GRI content index is available on page 109.
REPORT CONTENT
The contents of this report are based on the results of our engagement with stakeholders and requirements of the Global Reporting Initiative (GRI) Sustainability Reporting Standards. All material topics which are important to our business strategy, represent impacts on economy, environment and society and are of interest to various stakeholders & the Company are included in this report.
CONTACT FOR FEEDBACK
We value feedback and welcome comments on our reporting. For any questions or suggestions, please get in touch with our sustainability reporting team.Address: 1-Mcleod Road, Lahore-54000Phone: +92-42-37225015-17, 37233515-17Email: [email protected]
SustainabilityReport
CompanyOverview
Message forStakeholders
FinancialHighlights
FinancialStatements
OtherInformation
74 Annual Report 2019


General InformationOwnership and Legal formAtlas Honda Limited is a public limited company listed on the Pakistan Stock Exchange. It is a joint venture between Shirazi Investments (Private) Limited (SIL) and Honda Motor Company Limited, with SIL holding 52.43% of issued, subscribed and paid-up capital as at March 31, 2019. Headquarters and Operations The Company operates in Pakistan and is engaged in manu-facturing and marketing of motorcycles, spare parts and engine oil. The registered office of the Company is located at Lahore whereas its manufacturing & assembly facilities are located at Karachi and Sheikhupura with branches, customer care centers, warranty & training center and other offices located at Karachi, Hyderabad, Multan, Lahore, Faisalabad, Rahim Yar Khan and Islamabad.
Scale of the CompanyDuring the year ended March 31, 2019, net sales of the Company amounted to Rs. 82.4 billion, with sales of more than one million motorcycles. Net profit for the year amounted to Rs. 3.2 billion while total capitalization was Rs. 31.9 million with equity of Rs. 15.4 billion. The workforce of the Company comprised of 1,693 permanent employees as at March 31, 2019. The Company does not hire employees on part-time or temporary basis.
Supply ChainThe supply chain of the Company spans from procurement of machinery, raw materials, semi-finished & finished parts, services and other inputs from local and foreign vendors to delivery of finished motorcycles and parts to customers through a country-wide network of dealers. The Company’s supply chain is both labor and capital intensive. During the
year, the Company paid Rs. 80.4 million to its supply chain partners on account of purchases of goods and services.
Activities, Brands, Products & Services and Mar-kets ServedThe Company serves the need of automotive sector in Pakistan. The Company’s customers mainly include dealers and institutions. The Company manufactures and sells various types of motorcycles in the categories of 70cc, 100cc, 125cc and 150cc through a nation-wide network of dealers. The Company also markets motorcycle parts & engine oil and offers after-sale services through its dealer network. Atlas Honda does not sell any product that is banned in any market.
Memberships and External InitiativesAtlas Honda is a member of the following major associations: 1. Pakistan Automotive Manufacturers Association2. Pakistan Business Council 3. Federation of Pakistan’s Chambers of Commerce and Industry4. Chambers of Commerce and Industry of: • Karachi • Lahore • Sheikhupura • Overseas Investors5. Management Association of Pakistan6. Marketing Association of Pakistan
The Company does not provide any funding to these associa-tions. However, it takes part, through sponsorship or otherwise in events, such as exhibitions, seminars and workshops organized by these associations.
Further, in addition to the Company’s internally developed charters, code of conduct and guidelines, the Company is committed to various externally developed initiatives, charters and principles. Please refer page 51 for more details.
Significant ChangesThere were no major changes in the Company’s supply chain, locations, operations and organizational structure during the year. However, it continued to make significant investments for capacity expansion as per plans. Further, during the year, the Company launched new models in 125cc category.
Employee Distribution - Region wise
Sheikhupura Plant Karachi Plant Regional Offices
463
1,003
227
SustainabilityReport
CompanyOverview
Message forStakeholders
FinancialHighlights
FinancialStatements
OtherInformation
76 Annual Report 2019

CEO’s Message on Sustainability“We, as a market leader, see it as an obligation to do business in a responsible and sustainable way. It has become increasingly imperative for companies in today’s challenging environment to balance their planetary and societal responsibilities with the pressures to meet commercial expectations.” I am pleased to present our 7th Sustainability Report and reconfirm Atlas Honda’s commitment to sustainability. This report focuses on describing how we contribute in protection of environment and how we continue to pursue our business in coexistence with local communities. Our sustainability framework helps us to manage our performance to ensure our business continues to grow for generations to come. One of our primary focus has been to strengthen our engagement with internal and external stakeholders on issues that are of importance. This allows us to prioritize activities within our business strategy. Our efforts are designed to create solutions that drive growth for our stakeholders while minimizing impact on the planet. As we expand our capabilities to do more for our customers, we are focusing on resource management that encourages reuse and recycling of finite resources. The passion of commitment of our people is a key driving force to our success and we are committed to investing in our employees. During the year, our teams continued to endeavor and reduce carbon emissions, conserve energy, save water, properly manage waste, produce quality products, raise safety awareness, ensure responsible sourcing of inputs and focus on training & development of our employees. Looking ahead, we will continue doing what’s right for our business and what’s right for communities. Because at the end of the day, our long term success is intertwined with the well-being of people we serve.
I would like to sincerely thank our partner, Honda Motor Company Limited, for their contribution and constant guidance throughout Atlas Honda’s persistent journey of value creation for all its stakeholders.
Saquib H. ShiraziKarachi: April 24, 2019 Chief Executive Officer
SustainabilityReport
CompanyOverview
Message forStakeholders
FinancialHighlights
FinancialStatements
OtherInformation
77Atlas Honda Limited

Governance StructureAtlas Honda’s governance framework provides a sound structure for effective and responsible decision-making within the organization. The highest decision-making is carried out at the shareholders’ meetings, supported by the Board of Directors. The Board has an oversight of the risks and opportunities arising from the Company’s activities and is responsible for identifying the direction, strategies & objectives and for monitoring the implementation of the same by management.
Board of DirectorsThe Company has an experienced and dynamic Board with the right blend of skills to develop strategies. Presently, the Board comprises of eight Directors, including four non-executive Directors, three executive Directors and one independent Director. Non-executive Directors are elected to enhance objectivity. The Company does not have a defined quota for Board of Directors based on gender, ethnicity or age group. The Chairman is responsible for the overall discharge of the Board’s duties. The office of the Chairman and the Chief Executive Officer (CEO) are separate and the Chairman is a non-executive Director.
The Chairman of the Board of Directors is selected from within the Board. The statute requires the Board to formulate Audit Committee and Human Resource & Remuneration Committee. Additionally, the Board may from time to time establish committees, to assist it by focusing on specific responsibilities in greater detail than is possible for the Board as a whole, reporting to the Board and making any necessary recommendations.
All the matters including election, appointment and disclosure of interest are governed by the statutory requirements and regulations laid down by SECP and PSX. There were no non-compliances identified during the year. Further details about the Directors and matters carried out during the year can be found in the Director’s profile and Statement of Compliance with the Code of Corporate Governance on page 16 and 116 respectively.
Representation of Female Director on the BoardThe new Code of Corporate Governance requires listed companies to have representation of female directors on Board from the date of next election. Accordingly, the Company will have at-least one female member after the forthcoming election of Directors.
Roles and Responsibilities of the BoardThe Board provides leadership to the Company in a manner that promotes its long-term success, thereby maximizing value for the stakeholders. It also sets the direction for the Company’s values, ethics & business policies and practices. The Board exercises all powers granted to it by the Companies Act, 2017 with responsibility, diligence, and in compliance with the legal framework after due deliberations in its meetings. These include but are not limited to, appointment of key management positions, approval of annual budgets including capital expenditures, investments in new ventures and approval of related party transactions. Financial statements of the Company, including interim and final dividends and review of internal / external audit observations regarding the overall control environment including effectiveness of the control procedures, are also approved by the Board. An independent Internal Audit department ensures continuous compliance and monitoring of formal policies and effectiveness of the internal control framework, designed by the Board for the conduct of
Sustainability Strategy
AppointsExternalAuditor
Appoints CEO
Elects Board
Assist CEO indischarging dayto day functions
Shareholders
ChiefExecutive Officer
(CEO)
Board ofDirectors
ManagementTeam
AuditCommittee
HumanResource &
RemunerationCommittee
FunctionalCommittees
Internal AuditDepartment
ExternalAuditor
SustainabilityReport
CompanyOverview
Message forStakeholders
FinancialHighlights
FinancialStatements
OtherInformation
78 Annual Report 2019

the Company’s business. The Audit Committee is tasked to report compliance thereof to the Board, at least once every quarter of the year.
Formal Orientation and Director’s Training ProgramOn appointment, Directors take part in an “Induction Program” which is aimed at broadening their knowledge and understanding regarding the Company’s business. The orientation program is designed to apprise the Directors regarding the expectations of the majority shareholders and their
responsibilities. The Directors are also encouraged to attend courses which provide information and training relating to their duties, responsibilities, powers and potential liabilities. The Chairman, in collaboration with the Company Secretary and senior management, is responsible to ensure that the Board members are provided, at all times, with the information necessary for them to effectively discharge their duties and responsibilities. The Company Secretary also arranges an appropriate Director’s Training Program in line with the mandatory requirements of the Code of Corporate Governance.
Committee Roles and responsibilities of committee Number ofmembers
Frequencyof meeting
Audit Committee
Human Resource and Remuneration Committee
Three Quarterly
Three Once a year
• Monitors the integrity of the financial statements and reporting and makes recommendation to the Board for its approval
• Oversight of external auditor: to consider findings and recommendations arising from the external audit process
• Review of compliance procedures to ensure adherence to applicable legal and regulatory standards and internal policies
• Monitoring the effectiveness of the internal control processes and the internal audit function
• Oversight of risk management
• Recommending Human Resource management policies to the Board
• Recommending to the Board about selection, evaluation, compensation and succession planning of CEO, VP, CFO, Company Secretary and Head of Internal Audit
• Consideration and approval of recommendations for key management positions who report directly to CEO and VP
• Recommending to the Board a policy framework for determining remuneration of directors
• Undertaking annual evaluation of the Board of Director’s performance
Remuneration of Executive, Non-Executive and Independent DirectorsThe Company has a comprehensive policy for fixing executive Directors’ remuneration. In order to attract well qualified and experienced Directors, the Company’s remuneration policies are structured in line with prevailing industry trends and business practices. As per the applicable legal and regulatory requirements, the remuneration of the Board members is approved by the Board itself. However, in accordance with the Code of Corporate Governance, it is ensured that no director takes part in deciding their own remuneration.
The Company does not pay remuneration to non-executive Directors including independent directors except a fee for attending meetings of the Board. For information on remuneration of the Directors and CEO in 2018-19, please refer note 35 to the Financial Statements on page 153. Policy for Retention of Fee Earned by Executive Directors for Services in Other Companies as Non-executive DirectorsThe Company’s CEO is treated as an executive Director on the Board by virtue of the Companies Act, 2017. In addition,
Committees of the Board and Terms of ReferenceEach committee of the Board has a written ‘Terms of Reference’ outlining their duties and responsibilities. The
committees report on their activities and results to the Board. The table below summarizes the terms of reference, number of members and frequency of meetings of the committees.
SustainabilityReport
CompanyOverview
Message forStakeholders
FinancialHighlights
FinancialStatements
OtherInformation
79Atlas Honda Limited

he holds position as a non-executive Director on the Boards of Pakistan Cables Limited, Cherat Packages Limited and eleven private companies of Atlas Group. Fee paid, if any, by these companies are in compliance with policies of respective companies which have been approved by their Board of Directors. Executive directors other than CEO of the Company do not hold directorship position in any other company.
Security Clearance of Foreign DirectorsEvery foreign Director who is nominated for election on the Board of Directors of the Company is required to furnish documents which are then submitted to the Ministry of Interior for security clearance.
Board’s Performance EvaluationThe evaluation of Board’s role of oversight and its effectiveness is a continual process, which is appraised by the Board itself. The core areas of focus are:• Alignment of corporate goals and objectives with the vision and mission of the Company;• Strategy formulation for sustainable operation;• Board’s independence; and• Evaluation of the Board’s Committees’ performance in
relation to discharging their responsibilities set out in respective terms of reference.
The Company does not have a policy to involve an external consultant to carry out an evaluation of the Board’s performance.
Chairman’s Review on the Performance of the BoardReview by the Chairman on the Company’s performance, which is derived through the guidance received by the management from the Board of Directors, has been outlined in Chairman’s Review. Further detailed explanations have been covered throughout the Annual Report.
Roles & Responsibilities of Chairman & CEOThe Chairman’s role is primarily to guide long-term strategic planning of the Company including:
• Presiding over the Board and ensuring that all relevant information has been made available to the Board;
• Defining the Company’s philosophy and objectives;• Safeguarding shareholders’ interest in the Company;• Responsible for building the Company’s image nationally
and globally;• Ensuring the appropriate recording and circulation of the
minutes of the meeting to the Directors and officers entitled to attend the Board meetings;
• Major spokesman of the Company, responsible for liaison with the senior most levels of the Federal and Provincial Governments;
• Overseeing the Company’s macro approaches and public relations in the broad sense, including its relations with public organizations and other companies; and
• Commitments and de-commitments of strategic investments.
The CEO is responsible for reporting the Company's performance to the Board of Directors. He is also responsible for all matters pertaining to operations of the Company under directions of the Board of Directors. His responsibilities include:
• To plan, formulate and implement strategic policies;• To build and maintain amicable relations with government
departments, trade associations and regulatory bodies;• To ensure the achievement of productivity and profitability
targets and that the Company operates efficiently;• To ensure that the chain of command in the Company is
clear to facilitate the maintenance of discipline, the roles and duties of all managers clearly define their functions to ensure accountability;
• To maintain a regular review of duties and functions of the staff to ensure that there are no duplications of efforts in office methods and procedures and that all operations are carried out efficiently and economically;
• To chalk out human resource policies for achieving high professional standards, overall progress / betterment of the Company as a whole;
• To ensure that proper succession planning for all levels of hierarchy exists in the Company and is constantly updated;
• To ensure welfare and training of the staff in accordance with the Company’s policy and government regulations which are applicable from time to time;
• To ensure that open and progressive atmosphere is created among employees giving them a sense of participation and providing them with an opportunity to give their best;
• To ensure that every employee is treated equally as an individual regardless of his designation; career development is on merit basis and each employee is helped to develop their performance through continuous study and training so as to form a team in which all levels of employees work together with common goals to strengthen the position of the Company;
• To ensure that necessary coordination exists between various departments of the Company to achieve smooth and effective operations;
• To ensure that technical information made available to the Company under Technical Service or Royalty Agreements are used solely in the manufacturing of approved products and the staff of the Company maintains strict confidentiality of such information;
• To ensure that the Company’s interests and assets are properly protected & maintained and all the required Government obligations are complied with in a timely manner;
• To maintain close liaison with the Government, customers, suppliers and sales offices;
• To pay all Government dues on or before due date and obtain all refunds due from the Government;
• To ensure proper functioning of the Management Committees of the Company of which he is the Chairman;
• To prepare and present personally to the Board of Directors the following reports/details:
- Annual business plan, cash flow projections and long term plans.
- Budgets including capital, manpower and overhead budgets along with variance analysis.
- Quarterly operating results of the company in terms of its operating divisions & segments.
- Promulgations or amendment of the law, rules or regulations, accounting standards and such other matters as may affect the Company.
- Reviewing performance against budgets / targets, revenue and capital expenditure, profits, other administration,
SustainabilityReport
CompanyOverview
Message forStakeholders
FinancialHighlights
FinancialStatements
OtherInformation
80 Annual Report 2019

Committees Reporting to the CEOThe CEO is supported by committees that facilitate him in the performance of his duties. These committees meet frequently and ensure implementation of sustainability framework in various aspects of Atlas Honda's operations. The implementation of the framework is ensured by various departmental heads who report the activities and progress to
these committees. Input is also acquired from associated third parties through the Company’s process of stakeholders’ engagement. The implementation of sustainability framework is frequently monitored by Internal Audit function along with the annual assurance from an independent expert before reporting the results to the stakeholders.
commercial, personnel and other matters of importance to the Company.
• To always keep the line of communication open with the competitors for taking joint actions for mutual benefits;
• To be responsible for publicity of the Company’s products consistent with the company’s image and with a view to maximizing sales;
• To ensure that the Company operates with minimum staffing and paperwork.
CEO’s Performance ReviewThe performance of the CEO is formally appraised through the evaluation system which is based on quantitative and qualitative values. It includes the performance of the business, the accomplishment of objectives with reference to profits, organization building, succession planning and corporate success.
Committee Roles and responsibilities of committee Number ofmembers
Frequencyof meeting
NineBusiness EthicsCommittee Twice a year
ManagementCommittee Twelve Monthly
• Reviewing and forwarding long term plans, capital and expense budget, development and stewardship of business plans
• Maintaining healthy environment• Providing advice to CEO in normal course of business
Risk ManagementCommittee Three Monthly
• Identifies and propose strategies to mitigate risks, on a timely basis, in accordance with a well-structured risk management process
Environment,Health, Safetyand SecurityCommittee
Six Monthly• Ensures compliance with applicable Environmental,
Health, Safety and Security (EHS&S) laws and regulations
SocialResponsibilityCommittee
Five Quarterly• Ensures compliance with Social Performance
Governance Framework
• Effective communication and reinforcement of ethical values & best practices in the business
• Ensuring compliance with the Company’s 3R principles (Respect, Reward and Recognition)
TreasuryCommittee Three Monthly
• Oversight of day to day treasury & investment matters • Approval of short term investment decisions• Ensuring subsequent approval of all the decisions by
Board
SustainabilityReport
CompanyOverview
Message forStakeholders
FinancialHighlights
FinancialStatements
OtherInformation
81Atlas Honda Limited
Governance Practices Exceeding Legal Requirements The Company’s commitment to the highest levels of moral and ethical values is demonstrated by voluntary adoption of best business practices in addition to the stipulated regulatory requirements. Some of the governance practices exceeding legal requirements that have been adopted by the Company include: • Best reporting practices recommended by ICAP/ICMAP;• Adoption of Pakistan Stock Exchange criteria for selecting
top companies; • Disclosure of various financial analysis including ratios,
reviews, risk matrix and graphs etc., and• Implementation of aggressive Health, Safety and
Environment strategies to ensure safety of employees and equipment.
Related PartiesThe Company maintains a comprehensive and updated list of all related parties. Names of all such related parties along with whom the Company had entered into transactions during the year, along with the nature of their relationship and percentage holdings have been appropriately disclosed in Note 36 of the Financial Statements.
As per the requirements of fourth schedule of the Companies Act 2017, detailed disclosure regarding related party transactions have been presented in note 36 to the Financial Statements.
Risk ManagementThe Company has an entity-wide risk management processes for identifying, evaluating and managing the principal risks. The Board is responsible for the systems of internal control and risk management and for reviewing each year the effectiveness of those systems. The key features of the Company’s entity-wide risk management and internal control process include:• The Audit Committee, on behalf of the Board, considers
the effectiveness of the internal control procedures during the financial year. It reviews reports from the internal and external auditors and reports its conclusions to the Board.
• A Risk Management Committee is responsible for reviewing the key risks and the strategies to mitigate/ counter these risks.
• The Company’s Internal Audit function carries out the continuing assessments of the quality of risk management and control, reports to the management and the Audit Committee on the status of specific areas identified for improvement and promotes effective risk management in the lines of business processes.
During the year, the Committee discharged its responsibilities and reported the matters in Report of the Audit Committee.
Compliance and Integrity ManagementThe Company’s Code of Conduct (the Code) provides guidelines on ethical standards. It covers issues such as bribery and corruption, fraud, insider trading, legal compliance, conflicts of interests, human rights and discrimination. The Code includes a commitment to conduct the Company’s business with due regard to the interests of all stakeholders and the environment. The Code requires compliance with all applicable laws and regulations as a minimum standard. In essence, the guidelines to the Code outline the Company’s
approach to ethics management, which includes all elements recognized as best practices in ethics management. The Code guides interactions with all the stakeholders, including employees, vendors and customers.
The Code is reviewed annually and any changes therein are approved by the Board. The same is communicated to all the employees, vendors, service providers and customers and is available on the Company’s website.
Whistleblower PolicyThe Company’s purpose and values set the standard for how it does business and actively encourage openness, integrity and accountability. The Company’s Whistleblower Policy has been developed to ensure that concerns are raised regarding actual or suspected contraventions of the Company’s ethical and legal standards freely and without fear of repercussions. The policy provides a number of avenues for disclosure including internally through managers and Business Ethics Committee. Matters reported are investigated by the Internal Audit function and it is determined whether there is evidence to support the matter raised or to refute it. Information regarding any incident is reported to the Audit Committee. The reports include details of the matter, measures taken and the status of any investigation. During the year, no such incidences were reported.
Privacy and Data ProtectionThe stakeholders are understandably concerned about how their personal information is used and shared and they want to feel confident that data communicated or stored online is secure. The Company works regularly to enhance robust processes and systems that protect customers’ and employees’ data and to raise awareness about the importance of data protection and privacy through the Company’s IT Governance Policy which is summarized below:• The members of Management Committee are responsible
for required compliance in their respective functional areas, at all locations.
• The General Manager Systems is responsible for its implementation, maintenance, compliance and for suggesting new areas as per technology enhancement.
Conflict of Interest PolicyThe Company has a policy in place to ensure that any conflict of interest is properly disclosed, recorded and addressed, upholding the interests of the company. In line with the provisions of Companies Act, 2017, every Director is required to disclose his interest in writing to the Company Secretary, in respect of any contract/appointment, etc. Such disclosures are circulated to the Board. Interested Directors do not participate in voting on the said resolution and it is properly recorded in the minutes of the Board meeting and also entered in the statutory register maintained for this purpose.
Insider TradingThe Company has a clearly defined policy relating to insider trading which requires all the relevant employees to maintain confidentiality of inside information at all times. The purpose of this policy is to set forth guidelines on purchase or sale of securities while in possession of inside information. The Company is in compliance with the requirements issued by SECP relating to maintenance of register of persons having access to inside information by designated senior management
SustainabilityReport
CompanyOverview
Message forStakeholders
FinancialHighlights
FinancialStatements
OtherInformation
82 Annual Report 2019

officer in a timely manner and maintained proper record including basis for inclusion or exclusion of names of persons from the said list.
Anti-corruption and Human RightsAnalysis of risks related to corruption is a continual process at Atlas Honda and no corrupt practices are tolerated. The Company’s Code of Conduct contains explicit requirement about Business Integrity and Anti-corruption, which every employee is required to adhere to. The Company has a dedicated internal audit department to implement the risk management systems. The department directly reports the findings to Audit Committee for taking appropriate action. No incidence of corruption was reported during the year.
Grievance/Feedback SystemThe Company believes in protecting interest of its investors and shareholders. The shareholders give their feedback in General Meetings and are encouraged to do so. It allows the Company to have a good understanding of their views on operations and decisions. Accordingly, a “Grievance/ Feedback System” has
been established that provides an avenue for reporting and resolution of all complaints/queries on timely basis.
A designated e-mail address has been created which is [email protected] to facilitate investors for submission of queries/grievances and feedbacks. In addition, complaints and suggestions can also be received in writing, duly addressed to Company Secretary. All grievances/queries are resolved and communicated to the investors on timely basis after due verification procedures.
Board’s Role in Shaping Sustainability PolicyThe Board provides direction on sustainability policy and initiatives to enhance the positive impacts and reduce the negative impacts on the economy, environment and society. The execution of the Board’s directives and policies is carried out by the respective management teams and performance is reviewed by the Board. The Board also oversees operating & financial performance, risk management & internal controls and compliance with legal requirements.
Sustainability Strategy FrameworkThe Company’s sustainability strategy focuses on crafting long-term value and providing a level playing field for future generations to meet their needs. This goal can only be attained through the efficient use of available resources, commitment to creating sustainable products and solutions and treating the environment and people equitably and with respect. The commitment of doing business in a sustainable way sets the Company apart from its competitors, leading to customer satisfaction, appreciation, brand recognition and increasing product demand. The Company’s Sustainability Strategy Framework supports its business strategy and is aligned with the Company’s purpose. The framework has five key areas of focus:a) Environmental Protectionb) Product Responsibility
c) Corporate Citizenshipd) Employee Managemente) Vendor ManagementThe Company is guided by its sustainability framework while making efforts for creating sustainable value for all its stakeholders. This framework is a product of Atlas Group's fundamental business doctrine - the “ATLAS WAY”. It comprises of the principles of the “ATLAS CULTURE” and the “ATLAS SYSTEMS”. The principles of the Atlas Way cover all departments, operations, activities and aspects of business and provide ideal guidelines for their progressive development. The ultimate goal is to obtain excellence in operations and quality in products without compromising on protection of environment and interest of society at large.
ATLAS WAY
ATLAS SYSTEMS ATLAS CULTURE
• Corporate Governance• The 3 Rs – Respect, Recognition and Reward• Value of time• Recruitment and career advancement based on integrity, merit, experience and skills• Education and training of staff and descendants• Self-reliance• Leading by example• Humility and Excellence• Living within one’s means, saving for the future and donating for good cause• To be happy and healthy
• Management by Objectives (MBO) to align activities towards agreed company goals• Implementing 7S vision (Strategy, Structure, System, Style, Staff, Skills and Shared values) for the company• Inducting and retaining competent and skilled staff – right man for the right job• Using BCG model for strategic direction• Creating values through implementations of internal controls (SOPs and policy manuals)• Management development to produce performers, organization builders and strategists• Active participation in management meetings for continuous performance improvements• Ensuring accuracy and control of information / data through efficient MIS• Judicious sharing of profitability between employee bonuses, dividend payout and profit retention
We Look Beyond Horizons
SustainabilityReport
CompanyOverview
Message forStakeholders
FinancialHighlights
FinancialStatements
OtherInformation
83Atlas Honda Limited

The Company ensures adherence to best practices for reporting sustainability issues through application of its framework and GRI Standards. The Company’s sustainability framework defines the way it conducts business which is supported by policies, guidelines, values and management tools. It commits the Company to consider and take responsibility for the long term economic, social and environmental implications of the Company’s decisions and to work in partnership with all stakeholders across its value chain to maximize positive impacts.
The following diagram summarizes the Company’s framework and approach to sustainability:
Stakeholder EngagementBeing the largest manufacturer of motorcycles in the country, both the Company’s manufacturing activities and its products have significant effect on the environment as well as on diverse groups of stakeholders. Simultaneously, the views, decisions and actions of these groups have an impact on the success of the Company’s business. The Company, therefore, engages in an ongoing dialogue regarding sustainability topics with its stakeholders in relevant markets and at all locations. This allows the Company to understand the issues, formulate strategies and deliver according to their expectations.
The engagement process starts with the identification of stakeholders. The Company defines stakeholders as those who are potentially affected by the Company’s operations or
who have an interest in or influence on the Company’s business. Stakeholders are identified and then prioritized on the basis of nature of relationship, influence, responsibility, dependency proximity and willingness & ability to engage. Consultation is then carried out with the identified stakeholders to gain input on topics which are of interest to stakeholders or which can significantly affect us. The Company’s range of stakeholders includes shareholders/investors, employees, customers, dealers, vendors, local community, government & regulators, industry associations & representative bodies and media. Process and frequency of consultations with stakeholders, topics identified and the Company’s responses to the same are as follows:
Stakeholders Frequency and methodof engagement Topics identified Strategy
Shareholders/Investors
Ongoing• Dedicated webpage for
investors• Notices, circulars,
announcements and interim reports
Annual • Annual General Meeting• Annual reports
Individuals,corporate and
other organizations
that have invested capital
• Sustained good return on investment through strategic and organic growth• Exemplary governance practices• Sound risk management
• Strong leadership, commitment to growth & value creation• Focus on good corporate governance and ethics
Labour Relations R
etur
ns
Effluents
Prac
tices
Communities
Impact Anti Competitive behaviour
Pres
ence
Employm
ent &
EnergyWater
Materia
l
Econ
omic
Emissions &
Health & SaferyLo
cal P
rocu
rem
ent
Local
Indirect Economic Anti Corruption &
Market
Guid
elines
Managem
ent T
ools
Policies
Values
Environmental Performance Indica
tors
Social Performance IndicatorsEc
onom
ic Pe
rform
ance
Indicators
Env
ironm
enta
l Pro
tect
ion Product Responsibility
Corporate Citizenship
Employee Management Ven
dor M
anagement
SustainabilityReport
CompanyOverview
Message forStakeholders
FinancialHighlights
FinancialStatements
OtherInformation
84 Annual Report 2019

Stakeholders Frequency and methodof engagement Topics identified Strategy
Employees
Ongoing• Communication through immediate supervisors, management, intranet• Newsletters and other communications• Whistle blowing mechanism• Training and development programsBi-Annual • Performance Appraisals
Core assets who implement
all of management’s
decisions, strategic and operational
• Remuneration and benefits, personal development, training and health & safety• Clearly defined roles, responsibilities & goals, performance management and development
• Provision of competitive remuneration and benefit packages as per industry benchmarks• Enforcement of stringent safety measures, on-going training and education programs, open communication
Customers
Ongoing• Communication through sales service & warranty centers, conferences, exhibitions, events and seminars• Dedicated customer care section on the Company’s website and call center
End-users of the Company’s
products
• Product/service quality and availability• Safe product use• Correct product information• Transparent communication
• Production of high quality products• Efficient supply chain• Capacity expansion to meet demand• Focus on after-sale service
Dealers
Ongoing• B2B links connecting us with dealers• Dealer training and education programsAnnual• Dealer’s convention
Distributors of the Company’s
products
Return on investment, equal business opportunities, transparent communication
Nurture and protect partnerships that result in mutually beneficial outcomes
Vendors
Ongoing• Audits and visits for vendor development and compliance with quality standards• B2B linkAnnual• Vendor convention and Vendor Excellence Awards (ALAMAYAR)
Businesses that provide
raw materials and services which are key
to the Company’s
manufacturing process
• Shared development• Supply chain sustainability• Contract terms that are reasonable and as per market norms• Timely payment• Opportunity for discussion and negotiation
• Opportunity to compete for business on the basis of clear and transparent procedures & evaluation criteria• Mutually beneficial relationships where all parties integrate talent, resources and efforts to exceed expectations
Localcommunity
Ongoing• Seminars, rallies and other awareness campaigns on various issues including road safety, healthy livelihood, education and welfare• Internships, management trainee programs and factory visits of members including students from local community
Local society and
neighborhood
Creation of employment and business opportunities, investment in infrastructure, environmental protection initiatives
• Undertake community development programs• Support sports, cultural, art and other events and create opportunities for employment and business• Undertake environmental protection initiatives
SustainabilityReport
CompanyOverview
Message forStakeholders
FinancialHighlights
FinancialStatements
OtherInformation
85Atlas Honda Limited

Stakeholders Frequency and methodof engagement Topics identified Strategy
Government ®ulators
Ongoing• Filing of statutory forms, documents prescribed returns, assessments and other information as per applicable laws and regulations• Participation in government initiatives, regulation and policy working groups
Federal & provincial
governments, Securities and
Exchange Commission of
Pakistan, Pakistan Stock
Exchange
Compliance with legal and regulatory requirements and adherence to policiesand guidelines
• Ensure compliance with legal and regulatory requirements• Contribute to the economy through taxes and other payments
Industry associations & representative bodies
Ongoing• Representations in activities of local trade and industry associations, meetings, visits and training programs etc.• Providing periodical operational data
Auto sector specific
association and various
business councils
Compliance with regulations and protection of interest of members of associations and representative bodies
Ensure compliance and actively participate in key business and industry initiatives within the constraints of legal frameworks and requirements
Media
Ongoing• Media releases, briefings, presentations, interviews and information on social media page
Representatives from print,
online broadcast and social media
Information on the operations, growth prospects and sustainability practices, economic contribution
Timely communication of information on relevant subjects
Materiality AnalysisThe Company uses GRI Standard GRI 101 Foundation 2016 reporting principles of sustainability context, materiality, completeness and stakeholder inclusiveness, for defining report content. These principles have been consistently applied at varying degrees during identification, prioritization and validation steps, while defining material topics for this report.
The Company maintains an up to date understanding of its material topics through engagement and dialog with key
stakeholders, as well as by monitoring the Company’s business context and the relevant trends. This approach helps the Company understand stakeholder perception and the Company’s ability to evaluate its ability to create and sustain value. Based on the results of the stakeholder engagement, review of industry specific issues and internal analysis, following materiality matrix has been developed.
Materiality Matrix
• Employment & labour relations
• Material
• Energy
• Training and education
• Procurement practices
• Local communities
• Marketing & labeling
• Health and safety
• Emissions
• Water
• Effluents & waste
• Human rights
• Anti-corruption & anti-competitivebehavior
• Economic returns
• Grievance Mechanisms• Market presence • Indirect economic impacts
Moderate
• Transport • Public policy
• Supply chain impacts• Compliance
Significance of Environmental, Social and Economic Impacts
Influ
ence
on
Stak
ehol
der A
sses
smen
t and
Dec
isio
n
High
HighM
oderate
SustainabilityReport
CompanyOverview
Message forStakeholders
FinancialHighlights
FinancialStatements
OtherInformation
86 Annual Report 2019

The matrix divides up the topics to show those which have high impacts and those which have moderate impacts of Atlas Honda’s activities and which are highly relevant and those which are moderately relevant to its stakeholders. The prioritization of topics is based on materiality analysis for non-financial risks as per GRI standards. The severity, likelihood and relevance to business objectives and stakeholder’s interests were the guiding principles during this analysis. The risks associated with each material topic are analyzed and actions are recommended for prevention or
mitigation of negative impacts and maximization of positive impacts. The content and scope of this report is also derived from this matrix.
The boundaries for material topics have been identified on the basis of their impacts whether lying within the organization or outside the organization. The reporting principles for defining report content from GRI Standard GRI 101 Foundation 2016 have been used while identifying the boundaries for material topics.
Economic returns Critical for economic contribution and ability to deliver value Atlas Honda to stakeholders Energy Impact on depleting finite resources and environmental impact Atlas Honda of use of non-renewable sources Emissions Environmental impact due to emissions Atlas Honda, its customers, its vendors Materials Depleting raw material resources affecting finite resources Atlas Honda Effluents & Waste Environmental impact through incretion, dumping and Atlas Honda discharge of waste Water Environmental impact due to depleting water reserves leading Atlas Honda to water scarcity Anti-corruption and Impact on competition, negation of competition and equal Atlas Honda, its vendors,anti-competitive behavior opportunity rights as per applicable laws and regulations its dealers Human rights Impact on the basic rights of people defined in charters Atlas Honda, its vendors, and conventions its dealers Local communities Impact of operational activities and developments around Atlas Honda plant site for economic development Indirect economic impacts Impacts on the surrounding communities and socio-economic Atlas Honda development Health & Safety Impacts on health of workforce affecting productivity and Atlas Honda consumers concerns Employment and labor Diversified workforce for better productivity and compliance Atlas Hondarelations with applicable laws and regulations Training & Education Impact on workforce ability to effectively contribute to operational Atlas Honda success affecting organization’s ability to create value Marketing & Labelling Provision of customer centric product information and Atlas Honda, its dealers compliance with applicable laws and regulations Compliance Compliance with applicable laws and regulations Atlas Honda Supply chain impacts Impact due to activities of supply chain partners Atlas Honda, its vendors, its dealers Market presence Economic contribution and job opportunities for local community Atlas Honda Procurement practices Economic contribution and creation of business opportunities Atlas Honda through local sourcing Grievance mechanism Identification of negative practices and provision of advice on Atlas Honda ethical concerns
Material Topic BoundaryWhy is the topic material?
SustainabilityReport
CompanyOverview
Message forStakeholders
FinancialHighlights
FinancialStatements
OtherInformation
87Atlas Honda Limited

Environmental Protection
Environmental PolicyThe Company’s Environmental Policy covers every aspect of the Company’s operations, whether they are directly or indirectly related to design, engineering, manufacture, distribution and service:
COMPLIANCE Comply with requirements of environmental legislation and local regulations as a responsible corporate citizen
ENERGY AND RESOURCECONSERVATION
Establish and implement management programs to encourage energy conservation and reduce consumption of resources.
Prevent, where possible, and reduce generation of emissions and waste throughout the production processes & ensure safe disposal.
KNOWLEDGE AND EDUCATION Promote relevant environmental protection knowledge and activities through education and training.
KAIZEN - CONTINUOUSIMPROVEMENT
Initiate and extend environmental protection activities from our own operations and to those of our business partners including parts manufacturers, general suppliers and dealers.
PREVENTION AND REDUCTION
Environment Management SystemEMS is intended to formalize procedures for managing and reducing environmental footprint. It helps the Company organize and analyze, in a timely manner, the environmental impacts that result from its business operations. It also helps the Company in developing solutions to address those impacts.
The Company’s EMS is based on relevant legislation such as the Pakistan Environmental Protection Law, international standards and Honda’s guidelines, as well as best practices. The management system is certified in accordance with ISO 14001:2015, an international certification for EMS.
The Company conducts internal and external audits of its EMS and strives for further improvement. During the year, the Company identified tasks as a result of in-house reviews and made improvements accordingly. Periodic visits by representatives from Environmental Protection Agency (EPA) are also facilitated to ensure compliance with regulatory requirements.
No non-compliances have been reported during the year. Further, no environment-related complaints were received through the Company’s formal grievance mechanism during the reporting period.
Management ApproachEnvironmental protection is fundamental to the Company’s sustainability strategy. In view of challenges such as climate change, pollution and scarcity of resources, Atlas Honda aims to be the most resource-efficient mobility solution provider in Pakistan. The Company’s focus lies on increasing the energy and resource efficiency of its production processes and on reducing emissions and waste. These measures allow the Company to minimize impacts on the environment, make a contribution towards achievement of Honda’s Environmental Vision and reduce costs. Environment related issues arising from energy & resource consumption, emissions, effluents & waste and water are managed by the Company’s Production & HSE departments in coordination with other departments. Necessary procedures are defined and implemented to
achieve targets. The Company has a continuously evolving Environmental Management System (EMS) in place which is supported by the Company’s Environmental Policy to ensure effectiveness of processes, monitoring and continual improvement in the Company’s environmental performance.
Green practices are being implemented at all locations of the Company and those of its business partners. Awareness is being raised by the Company through continuous training and development programs for its suppliers as well as employees. In recognition of its efforts for protection of environment, the Company has been presented with an Award by National Forum for Environment & Health (NFEH), for the year 2018, in the category of Environment & Waste Management.
SustainabilityReport
CompanyOverview
Message forStakeholders
FinancialHighlights
FinancialStatements
OtherInformation
88 Annual Report 2019

Life Cycle AssessmentThe Company’s applies a product lifecycle approach for management of environmental impacts, which considers the entire lifecycle - from product development to purchasing, manufacturing, sales & service, use, recycling and administration. This approach makes it easier to identify opportunities, minimize or enhance impacts and understand boundaries in every
aspect of the Company’s business. It also helps the Company understand how its actions and impacts are interrelated. The Company also applies the precautionary principle, whereby it acts responsibly despite not having the full scientific knowledge of negative impacts, to ensure the Company stays ahead of potential risks.
Major initiatives in each domain based on impacts identifiedLife Cycle Stages
• Environment friendly product design• Efficient use of raw material, energy and other resources• Focus on reduced waste and emissions• Integrate future requirements into development plans
Development
• Purchase of raw material from environmental friendly sources• Increased use of renewable raw materials and materials with sustainable characteristics• Implementation of environmental standards within the supply chain• Promotion of transparency and resource efficiency• Training and improvement programs
• Environmental management system• Improved resource efficiency • Reduced wastewater and emissions initiatives• Reuse of water
• Fuel efficient products
• Increased parts collection, reuse and recycling• Eliminating harmful materials to enable higher quality recycled materials• Promoting proper recycling and providing technical support
• Environmental management• Energy and resource conservation• Promotion of “Green Building” design
Purchasing
Manufacturing
• Promotion of “green dealers”• Dealers with 5S certification • Introduction of efficiencies in transportation• Efficient use of packaging• Use of returnable containers
Sales and Service
In-use
End-of-life
Administration
Energy Consumption and EmissionsThe Company monitors energy consumption and emissions on regular basis to identify and incorporate best practices and to improve the Company’s energy management. Both the Company’s manufacturing plants are located away from protected areas to minimize the effects of CO2 and other greenhouse gases on such areas. The Company’s primary sources of energy are grid based electricity, natural gas and diesel. Other sources include solar energy. However, currently only a small part of the total energy is being derived from solar panels. The Company is making efforts to increase the share of renewable sources of energy.
Accurate data on energy consumption and emissions is obtained from management systems. The conversion factors are sourced from U.S. Energy Information Administration. The Company uses previous year as base year to measure energy consumption and emissions. This enables the Company to
address irregularities and implement necessary measures to ensure the Company’s performance is on track. Collecting comprehensive data helps in understanding not only the energy savings, but also the economic benefits that can be achieved through specific measures. This year, an energy audit was also conducted by an independent third party licensed by Association of Energy Engineers, USA. The objective of the audit was to understand the energy flows within the Company’s plant and to identify opportunities to reduce the amount of energy consumption.
The energy consumption during the year was 495,525 GJ. Compared to 2018, the total energy consumption during the year under review increased by 6.6% on account of higher production level. However, the energy consumption per motorcycle remained constant at 435 KJ/Motorcycle despite rise in energy prices.
SustainabilityReport
CompanyOverview
Message forStakeholders
FinancialHighlights
FinancialStatements
OtherInformation
89Atlas Honda Limited
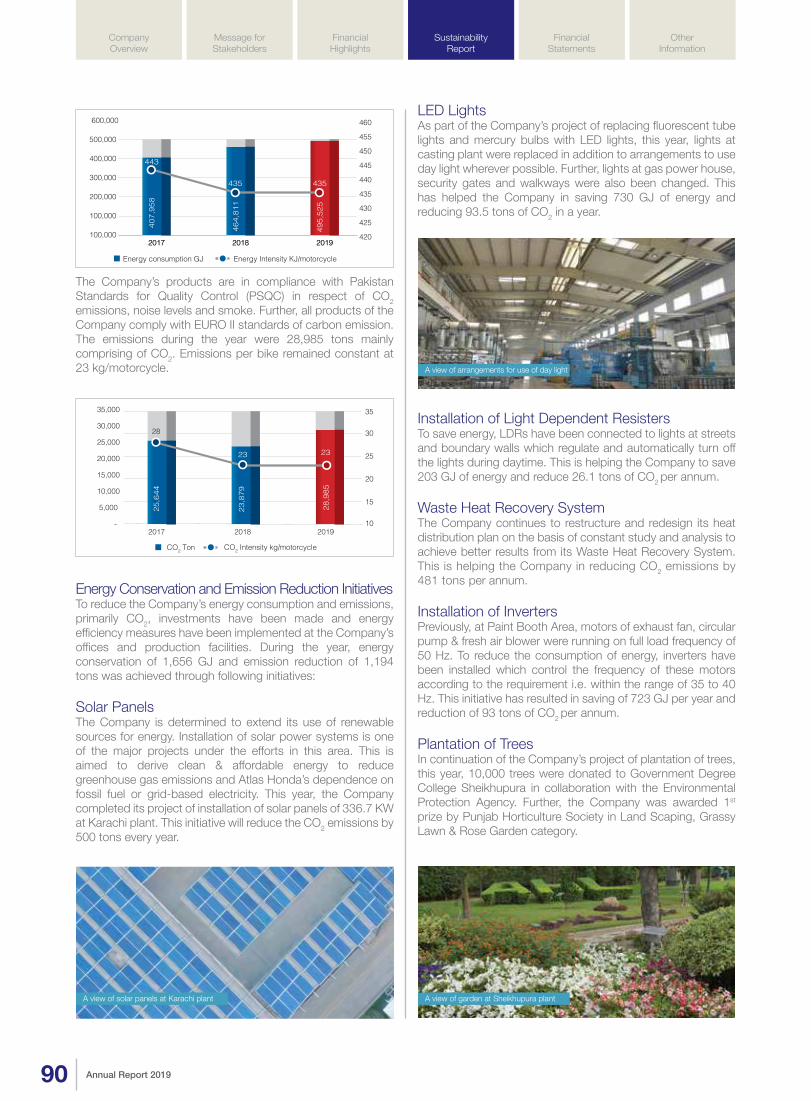
The Company’s products are in compliance with Pakistan Standards for Quality Control (PSQC) in respect of CO2 emissions, noise levels and smoke. Further, all products of the Company comply with EURO II standards of carbon emission. The emissions during the year were 28,985 tons mainly comprising of CO2. Emissions per bike remained constant at 23 kg/motorcycle.
Energy Conservation and Emission Reduction InitiativesTo reduce the Company’s energy consumption and emissions, primarily CO2, investments have been made and energy efficiency measures have been implemented at the Company’s offices and production facilities. During the year, energy conservation of 1,656 GJ and emission reduction of 1,194 tons was achieved through following initiatives:
Solar Panels The Company is determined to extend its use of renewable sources for energy. Installation of solar power systems is one of the major projects under the efforts in this area. This is aimed to derive clean & affordable energy to reduce greenhouse gas emissions and Atlas Honda’s dependence on fossil fuel or grid-based electricity. This year, the Company completed its project of installation of solar panels of 336.7 KW at Karachi plant. This initiative will reduce the CO2 emissions by 500 tons every year.
LED LightsAs part of the Company’s project of replacing fluorescent tube lights and mercury bulbs with LED lights, this year, lights at casting plant were replaced in addition to arrangements to use day light wherever possible. Further, lights at gas power house, security gates and walkways were also been changed. This has helped the Company in saving 730 GJ of energy and reducing 93.5 tons of CO2 in a year.
Installation of Light Dependent Resisters To save energy, LDRs have been connected to lights at streets and boundary walls which regulate and automatically turn off the lights during daytime. This is helping the Company to save 203 GJ of energy and reduce 26.1 tons of CO2 per annum.
Waste Heat Recovery SystemThe Company continues to restructure and redesign its heat distribution plan on the basis of constant study and analysis to achieve better results from its Waste Heat Recovery System. This is helping the Company in reducing CO2 emissions by 481 tons per annum.
Installation of InvertersPreviously, at Paint Booth Area, motors of exhaust fan, circular pump & fresh air blower were running on full load frequency of 50 Hz. To reduce the consumption of energy, inverters have been installed which control the frequency of these motors according to the requirement i.e. within the range of 35 to 40 Hz. This initiative has resulted in saving of 723 GJ per year and reduction of 93 tons of CO2 per annum.
Plantation of TreesIn continuation of the Company’s project of plantation of trees, this year, 10,000 trees were donated to Government Degree College Sheikhupura in collaboration with the Environmental Protection Agency. Further, the Company was awarded 1st prize by Punjab Horticulture Society in Land Scaping, Grassy Lawn & Rose Garden category.
100,000
Energy consumption GJ Energy Intensity KJ/motorcycle
100,000
200,000
300,000
400,000
500,000
600,000
201920182017420
425
430
435
440
445
450
455
460
201920182017
407,
958
443
435 435
464,
811
495,
525
5,000
-
10,000
15,000
20,000
25,000
30,000
35,000
10
15
20
25
30
35
201920182017
25,6
44
28
23
28,9
85
23,8
79
23
CO2 Ton CO2 Intensity kg/motorcycle
A view of arrangements for use of day light
A view of solar panels at Karachi plant A view of garden at Sheikhupura plant
SustainabilityReport
CompanyOverview
Message forStakeholders
FinancialHighlights
FinancialStatements
OtherInformation
90 Annual Report 2019

Material, Effluents & Waste At Atlas Honda, environmentally friendly use of raw materials is taken into account as early as the development phase through life cycle engineering. The Company’s supply chain and material cycles have been shaped accordingly. Natural resources are being used in the most efficient manner with the objective to minimize depletion of the planet's resources. The
Company is working to replace artificial materials with renewable materials wherever it makes technical, business and environmental sense and is socially viable. Consumption of raw materials, having substantial impact on the environment, is closely monitored and treated according to the Company’s environment policy. Following table shows the materials used:
Renewable /Non-renewable Material Unit 2017 2018 2019
Ferrous castingNon-Ferrous casting
Oil paintsLubricants
RubberPlastic
Non-RenewableNon-RenewableNon-RenewableNon-Renewable
BothNon-Renewable
TonTonTonKLTonTon
63,5968,474210
1,2115,5824,000
71,8508,692273
16856,3514,585
75,2369,102286
1,6276,6504,800
Hazardous/Non-Hazardous
Waste by disposalmethod Unit 2017 2018 2019
Non-Hazardous
Non-Hazardous
Hazardous
Non-Hazardous
Ton
Ton
Ton
m3
8,712
88
nil
250
9,647
580
130
250
8,785
315
136
250
Recycling/Reuse(metal scrap, packing, plastic)
Landfill (waste sludge)
Incineration - mass burn(sludge, oil contaminated waste)
On-site storage(in-house scrap yard)
Waste resulting from the Company’s production processes mainly includes waste water, metal, plastic & rubber scrap, packing, used oil. Waste water is treated through Waste Water Treatment Plant before it is released in sewerage drains. The remaining waste and effluents are discharged through incineration, recycling, landfill and disposal to legitimate contractors at certified waste disposal facilities. During the year, 10,665 tons of waste was released with the reduced intensity of 9% per motorcycle. There were no significant spills during the year.
Packing Wastage The Company uses recycled packing material for parts to reduce waste and minimize impact on the environment. Use of returnable packaging whenever possible has reduced the Company’s packing waste by 3.5 ton per year.
Aluminum Wastage In aluminum casting process, aluminum is obtained in raw shape initially. During the finishing process wasted aluminum is reused with new material at specific ratio leading to wastage reduction and efficient usage of non-renewable material. This year, this has helped reduce solid waste by 89.6 tons.
IncinerationIncineration is performed to treat solid hazardous waste with controlled combustion, reduce the release of greenhouse gases and save landfill space. Through this process, solid waste is collected, crushed and moved into a heating chamber. Ash generated by burning process is disposed, while gases produced are filtered and exhausted through a chimney. The Company has successfully incinerated 136 tons of hazardous waste this year, in coordination with EPA certified third party.
Reuse of Scrap ToolsEfforts have been made to identify tools used in one process can be reused in another process. This has enabled the Company to reuse tools obtained from engine machining area in production process of camshaft and crankshaft. This has resulted in reuse of tools weighing more than 1 ton per year.
WaterThe Company seeks to reduce its water footprint by promoting water-saving practices amongst employees and adopting
9,600
9,800
10,000
10,200
10,400
10,600
10,800
7
8
9
10
11
12
201920182017
9,98
0
11
10
10,6
65
10,3
57
9
Waste Ton Waste Intensity kg/motorcycle
A view of the packaging material being reused
SustainabilityReport
CompanyOverview
Message forStakeholders
FinancialHighlights
FinancialStatements
OtherInformation
91Atlas Honda Limited

water-efficient technologies and equipment wherever possible. The majority of the Company’s water use is attributable to its production processes, cooling and water consumed by employees. Main areas of action are thoughtful use and reuse of water and safe disposal of treated wastewater. Most of the water consumed is drawn from earth which is not designated as a protected area whereas the size or volume of the water body cannot be estimated reliably.
Water consumption and discharge is recorded through flow meters installed at water tanks and treatment plant, respectively. During the year, 662,116 cubic meters of water was consumed with a reduced intensity of 2% per vehicle as compared to the last year. After proper treatment, water used in manufacturing process is released back to environment. Such treatment removes pollutants from the water and makes the same suitable for safe drainage. During the year, 98,832 cubic meters (9.5%) of the water was recycled.
Waste Water Treatment PlantWater is used throughout the Company’s production processes which results in wastewater. To prevent the waste water from
being discharged as produced, waste water from all over the plant is collected and treated to remove the harmful pollutants, at Waste Water Treatment Plant. The Company, as a responsible organization abides by the legal requirements of waste water treatment as well as meets “Punjab Environmental Quality Standards”. This year, around 569,284 cubic meter of water was treated and safely drained into the sewerage.
Reuse of Water Water used in cooling of dies is collected in reservoirs, filtered and reused. This is helping save 58 liter per vehicle of water. Further, at pre-treatment line of paint shop, parts are treated by dipping into water tanks due to which water spills. A process has been developed through which spilled water is collected, filtered and reused. Through this, 1.26 liter per vehicle is being saved.
Visual Monitoring of Casting MachinesIn casting area, water pipes have been redesigned to enable visual monitoring of consumption of water during the cooling process of dies. Around 7,109 cubic meters water has been saved through this initiative.
600,000
610,000
620,000
630,000
640,000
650,000
660,000
670,000
300
400
500
600
700
800
900
201920182017
657,
124
709
603
662,
116
645,
006
582
Water cubic meter Water intensity Litre/motorcycle
A view of the Waste Water Treatment Plant
SustainabilityReport
CompanyOverview
Message forStakeholders
FinancialHighlights
FinancialStatements
OtherInformation
92 Annual Report 2019

Product Responsibility
Management ApproachThe Company is committed to offer sustainable mobility solutions by maintaining the quality of products, ensuring customer safety, appropriate marketing and providing best after-sale service. The Company is continuously expanding its business and providing customers with a diversified selection of quality products. In addition, the Company keeps expanding its sales and service network across Pakistan. To ensure customer satisfaction, the Company takes dealer training initiatives and encourages customer feedback. Further, Company provides safety training to customers throughout the year. The Company follows Honda’s vision and takes into account health and safety impacts of its products to ensure safety of customers and other road users. Constant monitoring and regular reviews are carried out on all business aspects and processes in order to ensure they continue to comply with the Company‘s commitment to produce quality products.
Product QualityAtlas Honda aims to be a company trusted by its customers for its quality products. The Company focuses on quality at every stage, from the planning of new products through
development, manufacturing, distribution and sales to after-sales. The Company evaluates its products’ performance and health & safety impacts. Information derived is used to develop and implement effective solutions. During the year, all products of the Company were in compliance with requirements concerning health and safety impacts.
Honda’s Quality CycleThe Company’s global partner, Honda Motor Company Limited follows a uniform quality strategy worldwide. In order to live up to the high quality standards, quality assurance activities are governed by a central body at cross band level.By applying and reflecting design and development expertise at the preparation and production stages, the Company is able to deliver enhanced quality through the creation of drawings designed to facilitate manufacturing, as well as develop manufacturing control techniques that limit process variability. Post-sale, improvements are made to product quality based ton an analysis of customer’s feedback. These improvements are reflected in our know-how for the next round of design and development.
Design &Development
Implement quality assurancefrom the drawing stage by utilizing
design and manufacturingexpertise to facilitate
manufacturing.
ProductionConduct rigorous
Conduct rigorous inspection of parts, completed vehicles and
takes steps to ensure no damage occurs during transport.
Quality informationInformation from customers
and markets throughoutthe country is collected and analyzed with improvements
quickly made to quality(market qualityimprovement
system).
Production preparationPrepare quality assurance in
production processes by building manufacturing controls that
limit process variability.
Sales & ServiceMarket quality issues after sales
are dealt with by dealerships, which collect quality information
from customers in a timely manner.
SustainabilityReport
CompanyOverview
Message forStakeholders
FinancialHighlights
FinancialStatements
OtherInformation
93Atlas Honda Limited

Marketing & After-Sale Service
Product & Service LabelingFor product information and display, the Company does not only comply with strict local laws and regulations, but also places strong emphasis on safety, human rights, environmental issues and ethical standards. Product labeling is a key feature of the Company’s products display which helps in marketing the product and contains detailed instructions for users. In order to convey product information, an Owner’s Manual is provided to each customer with purchase of each product; it contains all information relating to operation including safe use and maintenance. At the time of delivery, technical features are explained to the customer through demonstration. Moreover, no incidents of non-compliance with regulations and voluntary codes concerning the product and service labeling were reported as all of the Company’s products were in compliance.
Marketing Communication & Anti-Competitive BehaviourThe Company facilitates its customers by providing information and purchasing support services and staying connected through website and social media including Facebook, Twitter and Instagram. Online presence enables the Company: • To stay connected with customers round the clock; • To help customers in locating the nearest dealers;
• To provide customers with detailed information pertaining to product features and cost.
The Company makes sure that its advertisement content does not depict any anti-competitive behavior & intentions and abstains from any kind of malicious, offensive or anti-social content in all its marketing communications at all levels. No incidents of non-compliance with regulations and voluntary codes concerning the provision and use of product and marketing communications, including advertising, promotion and sponsorship have been reported during the year. Further, there was no legal action taken against the Company relating to any anti-competitive behaviour, anti-trust and monopoly pactices.
Customer ConfidentialityThe Company has implemented a B2B system to administer, control and store data centrally for smooth functioning of its business. Stringent privacy guidelines are in place to ensure security of critical data pertaining to customers. The Company has also developed a business continuity and disaster recovery plan to ensure business continuity. Owing to these measures, there has been no non-compliance pertaining to breach of customer privacy and loss of customer data during the year.
Customer FeedbackThe Company is aware that customer expectations and inputs are critical for bringing improvements in product quality and making it more user-friendly. Data on customer complaints and expectations is collected through external survey institutions, market surveys and visits to dealerships. The Company also maintains a track of time taken to resolve complaints. During the year 2018-19, the customer contact center satisfactorily responded to a total of 22,141 calls received from customers regarding complaints, comments and information about the Company’s products.
Quality Improvement Programs
PROGRAM OBJECTIVE
Vendor Improvement Program (VIP)
Service Instructor Quality Program (SIQP)
Training of service and dealers Staff
Quality Control (QC) Foreman course
To establish Quality Management System (QMS) at vendor end to control process rejections and improve quality management skills of suppliers.
To foster high quality, dedicated service staff and standardize training delivery across the company as per Honda standards. Future trainers are trained to achieve proficiency in training, communication skills and key instructional abilities.
A one day training program to improve their skills of judging the problem pertaining to a claim to ensure timely and efficient rectification.
A two day program to understand how to put into practice the quality control techniques and approaches needed in quality assurance activities in manufacturing.
A view of the owner’s manual
SustainabilityReport
CompanyOverview
Message forStakeholders
FinancialHighlights
FinancialStatements
OtherInformation
94 Annual Report 2019

Dealers ConventionDealers are at fore-front and each dealership is vitally important to the Company’s continued success. Therefore, the Company only engages with dealers who have the ability to consistently represent its brand. The Company organizes various training sessions to further enrich their skills. During the year, 329 training camps were held which were attended by 13,557 trainees including our staff, mechanics and dealers.
The Company provides its dealers with information on mid and long-term strategies, products, and services in a timely manner. The Company strives to cultivate a relationship of trust and improve communication with dealers and between each other through various sales, service and parts dealer conventions. During the year, 25 conventions were organized in which 14,763 dealers participated.
Free Checkup, Oil Change & Test RidesThe Company organizes a number of customer relationship building activities such as free checkup camps, test rides and oil change activities at different locations throughout the year.This strengthens the Company’s bond with its customers and addresses their concerns. In 2018-19, more than 89,000 customers were served at 769 free checkup camps and 36 oil change camps were held. Mega free checkup camps were arranged on March 23, 2019, to serve customers through camps at over 300 towns.
Customer SafetyThe Company’s safety vision is aligned with Honda’s Global Safety Slogan. Further. the efforts to create a safe environment for road users are marked by the Company’s education and awareness initiatives and campaigns.
Safety Riding Training and EducationThis year, the Company trained 365 safety advisors at dealerships across all regions. These trainings are aimed at
improving users’ riding skills, road signs knowledge and know-how regarding electrical & mechanical maintenance. Further, follow ups were conducted covering 516 safety advisors throughout the network. Safety advisors then in turn imparted the knowledge to customers at dealerships. Further, the safety riding school in collaboration with City Traffic Police, Lahore continued to educate and train young riders.
Safety lectures are an important feature of the Company’s road safety program. Every year the Company engages various institutes, universities and colleges to hold these lectures that impart useful information and help reduce chances of accidents. Following are the details of activities carried out during the year under the banner of safety education:
• Safety riding training & lectures to employees of law enforcement agencies and various organizations such as USAID, Nestle, Unilever, Honda Cars, Rescue 1122 (2,560 Participants)
• Safety lectures to students from various educational institutions (17,100 Participants)
Safety Riding Awareness CampaignsThe Company coordinates with traffic police department to create awareness about the use of indicators, side mirrors and helmets. Under this campaign, the Company distributed more than 200,000 pamphlets in Lahore, Karachi, Islamabad, Chakwal and Gujranwala. Moreover, 1,035 helmets and 1,250 sets of back view mirrors were distributed. Around 5,750 lights were checked and replaced.
This year, additional efforts were made to raise awareness regarding Separate Left Lane for motorcyclists. This was done through distribution of brochures, placement of standees, steamers & pylons and social media. Rallies and safety walks were also organized in Lahore, Karachi and Islamabad. On February 23, 2019, a Safety Awareness Rally on “Left Lane Awareness” was organized by the Company in collaboration with Safety Wing of Emergency Services Academy (ESA).
Moreover, 4th Atlas Honda Safety Rally was held in Karachi on December 25, 2018 in which more than 800 customers participated. Gifts and coupons were distributed amongst participants.
A view of the Dealers Convention
A view of a free check-up camp
A view of a safety rally
SustainabilityReport
CompanyOverview
Message forStakeholders
FinancialHighlights
FinancialStatements
OtherInformation
95Atlas Honda Limited

Corporate Citizenship
Management ApproachThe Company believes that its activities contribute in overcoming societal challenges while also creating added value for the Company. Atlas Honda is fulfilling its responsibilities as a good corporate citizen through ongoing involvement in socially beneficial activities tailored for well-being of local communities. The Company’s approach is driven by the needs of communities at its locations identified through surveys, social media pages, focal groups and meetings. The Company has integrated this perspective into its development plans and overall strategy to garner the trust of and remain close to local residents. Further, the Company has a grievance mechanism in place for filing of issues with Manager Operations at both plants of the Company. During the year, no significant negative effects on local communities were identified.
Implementation and monitoring of social activities at the Company’s locations are routed through senior managers in HR, Admin & Corporate Affairs department who are also responsible for review and analysis of monthly progress of such initiatives. Progress is reported to the senior management on a continuous basis.
The Company’s commitments & initiatives for society mainly focus on three categories: health, education and other communal initiatives.
HealthEconomic progress of a country is highly dependent on healthy individuals. The Company aims to play its role for improvement of health of people including those directly associated with it. In this regard, following initiative was undertaken during the year:
Blood Donation Campaign Through volunteerism, the Company engages and supports its employees in efforts to give back to society. A two-day blood donation camp was organized in collaboration with Indus Hospital wherein 73 associates from different departments volunteered and donated blood to help those in need.
Education & TrainingAn educated and skilled nation is critical for socioeconomic development of a country. The Company believes that improving access to education & training is one of the most long-lasting investments it can make for the society. In this regard, following activities were carried out to support education & training:
Paid Internships The Company’s internship program offers an opportunity to undergraduate students which helps them in building their career foundations. Such programs give hands-on experience to interns which cannot be obtained in classrooms and is a great way for them to acquaint themselves with the field of their interest. This also helps the Company to discover quality employees for future. During the year, 230 students from reputable universities including NED university, NUST, Quaid-e-Azam university, IoBM, SZABIST, Iqra university, PAF KIET and LUMS, successfully completed their internships.
A view of the blood donation camp
Students from various universities
SustainabilityReport
CompanyOverview
Message forStakeholders
FinancialHighlights
FinancialStatements
OtherInformation
96 Annual Report 2019

SOS Training InstituteThe SOS Technical Training Institute trains deserving boys and girls every year to help them break the cycle of poverty, earn a decent and dignified living and develop themselves to become productive members of the society. Demand driven technical education and vocational training in the field of automobile and electrical engineering is provided by experienced instructors. To support the Institute’s efforts, the Company has sponsored training of 145 students this year. Further, equipment/hardware support was also provided.
Industrial VisitsThe Company facilitates students and officials from various institutes and allows them to visit its Karachi and Sheikhupura plants. This year 250 students from NUST, NED university, IBA Karachi, SOS Technical Training Institute and College of Aviation Safety Management visited the plants and observed the process of production of motorcycles and parts. Visitors took keen interest in the assembly line and appreciated the precision exhibited by the workers.
Shab-e-HunarThe Hunar Foundation is one of the largest non-profit organization offering technical and vocational training across Pakistan. The Foundation organized a fundraising event Shab-e-Hunar in Lahore. The aim of the event was to raise awareness and funds for education of students at Hunar Institutes in Punjab. The Company partnered with the Hunar Foundation as one of the sponsors of the event and helped them in raising funds.
Communal InitiativesThe Company acknowledges that the community initiatives are a investment that works hand-in-glove with its overall business strategy and values. Therefore, the Company collaborates with various stakeholders to address social issues and carry out initiatives that matter to local people.
DonationThe Company supports Atlas Foundation, a welfare and charitable organization formed with a mission of betterment of society with particular emphasis on health and education. It provides assistance to the needy and deserving without discrimination, directly and/or through organizations of repute in the field of Health, Education and General Welfare.
The Company recognizes the foundation’s role in improving quality of life of local communities and donates at least one
percent of our profits to it, every year. In 2018-19, the Company made a contribution of Rs. 62.6 million.
The Company does not make any contributions to any political party or for any political purpose to any individual or body.
Women on WheelsThe Company has been undertaking initiatives to empower women and help them to be more independent and be able to contribute more effectively in the society. Such initiatives include training and distribution of motorcycles under project of Women on Wheels. The project has been initiated by Government of Punjab in various districts. This year, customized CD 70 Dream Pink bikes were distributed amongst 500 women. In addition, rallies in the cities of Lahore, Multan, Sargodha, Faisalabad and Rawalpindi were also organized.
Women in Business and Leadership Conference Pakistan Society of Training and Development organized 11th Women in Business Leadership Conference in which the Company participated as a sponsor. The aim of the conference is to bring successful women from all over Pakistan and engage them in initiatives to uplift women and encourage them to rise to their full potential.
Paint Work at Wagah BorderA ceremony is conducted every day at the border with much splendor which includes a parade, closing of international gates and the lowering of the flags. Seating arrangements are available for thousands of spectators who come to watch the ceremony. Exclusive seats are reserved for women. This year, the Company facilitated painting of chairs at the border in collaboration with border control authorities.
Promoting SportsTo keep up with the larger objective of nation building, the Company remains committed to support and nurture multiple disciplines of sports. In this regard, the Company sponsored following sports events:• 13th CNS Open International Squash Championship held in Karachi;• 26th Sindh Women’s Swimming Championship held in Karachi
A view of Women’s Rally in Lahore
Students at SOS Training Institute
SustainabilityReport
CompanyOverview
Message forStakeholders
FinancialHighlights
FinancialStatements
OtherInformation
97Atlas Honda Limited
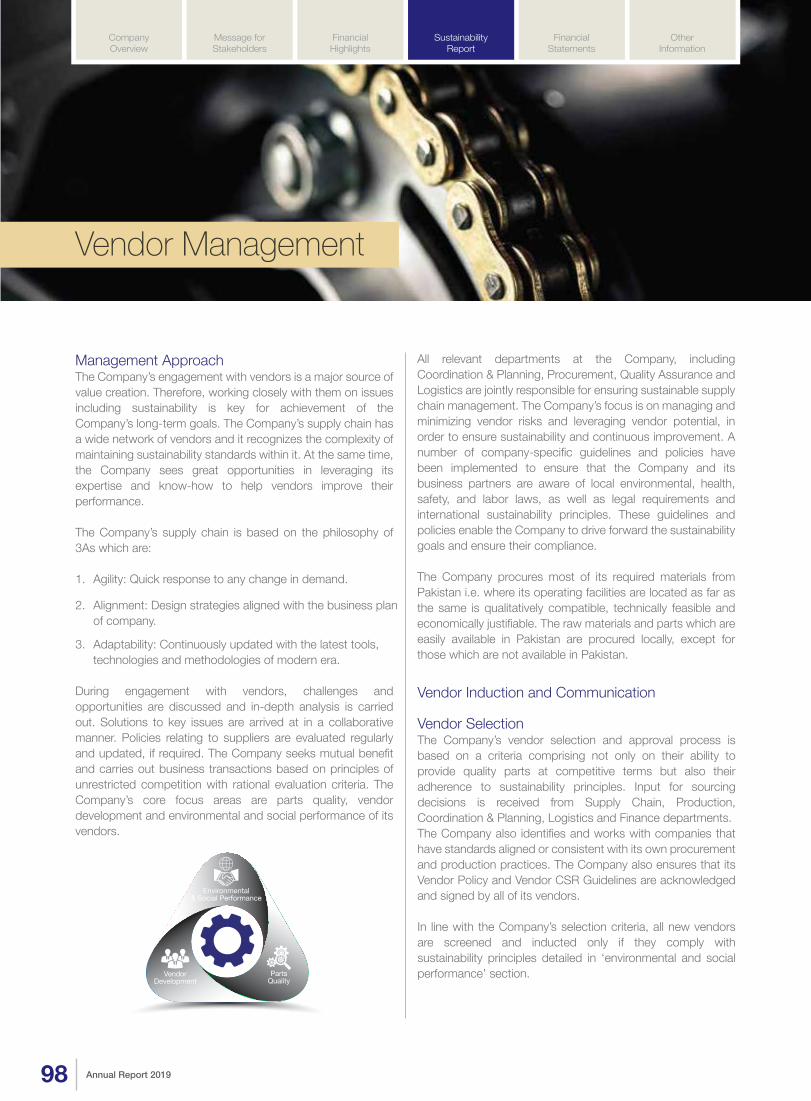
Vendor Management
Management ApproachThe Company’s engagement with vendors is a major source of value creation. Therefore, working closely with them on issues including sustainability is key for achievement of the Company’s long-term goals. The Company’s supply chain has a wide network of vendors and it recognizes the complexity of maintaining sustainability standards within it. At the same time, the Company sees great opportunities in leveraging its expertise and know-how to help vendors improve their performance. The Company’s supply chain is based on the philosophy of 3As which are:
1. Agility: Quick response to any change in demand.
2. Alignment: Design strategies aligned with the business plan of company.
3. Adaptability: Continuously updated with the latest tools, technologies and methodologies of modern era.
During engagement with vendors, challenges and opportunities are discussed and in-depth analysis is carried out. Solutions to key issues are arrived at in a collaborative manner. Policies relating to suppliers are evaluated regularly and updated, if required. The Company seeks mutual benefit and carries out business transactions based on principles of unrestricted competition with rational evaluation criteria. The Company’s core focus areas are parts quality, vendor development and environmental and social performance of its vendors.
All relevant departments at the Company, including Coordination & Planning, Procurement, Quality Assurance and Logistics are jointly responsible for ensuring sustainable supply chain management. The Company’s focus is on managing and minimizing vendor risks and leveraging vendor potential, in order to ensure sustainability and continuous improvement. A number of company-specific guidelines and policies have been implemented to ensure that the Company and its business partners are aware of local environmental, health, safety, and labor laws, as well as legal requirements and international sustainability principles. These guidelines and policies enable the Company to drive forward the sustainability goals and ensure their compliance.
The Company procures most of its required materials from Pakistan i.e. where its operating facilities are located as far as the same is qualitatively compatible, technically feasible and economically justifiable. The raw materials and parts which are easily available in Pakistan are procured locally, except for those which are not available in Pakistan.
Vendor Induction and Communication
Vendor SelectionThe Company’s vendor selection and approval process is based on a criteria comprising not only on their ability to provide quality parts at competitive terms but also their adherence to sustainability principles. Input for sourcing decisions is received from Supply Chain, Production, Coordination & Planning, Logistics and Finance departments. The Company also identifies and works with companies that have standards aligned or consistent with its own procurement and production practices. The Company also ensures that its Vendor Policy and Vendor CSR Guidelines are acknowledged and signed by all of its vendors.
In line with the Company’s selection criteria, all new vendors are screened and inducted only if they comply with sustainability principles detailed in ‘environmental and social performance’ section.
Environmental& Social Performance
VendorDevelopment
PartsQuality
SustainabilityReport
CompanyOverview
Message forStakeholders
FinancialHighlights
FinancialStatements
OtherInformation
98 Annual Report 2019

Vendor DiversityThe Company recognizes that a diverse supply base is an integral part of growth and success. It is crucial to deliver the promise of providing the best mobility solutions. The Company is committed to work with and developing businesses by creating opportunities and initiatives that enable diverse vendors to grow into profitable and sustainable enterprises. The Company continues to foster productive relationships with entrepreneurs from a wide range of backgrounds to meet its customers’ needs and expectations.
Business to Business Communication PortalOpen and transparent communication with fair and consistent behaviors is a key component in establishing strong and lasting relationships with the Company’s vendors. The Company has made available various forums for engagement at different levels, including regional vendor meetings, business unit reviews, quarterly business update calls and participation in events organized by vendors and industry associations. In addition, Business to Business link has been established which allows the Company’s supply chain department and vendors to communicate without delays. It has helped to achieve:
• Real Time Communication; • Paper less Environment; • On-Time Receiving & delivery; and • Improvement in efficiency and effectiveness of Supply Chain.
Further, this portal enables evaluation and appraisal of vendors on the basis of standardized quality and timely deliveries.
Parts Quality The Company aims to keep its customers’ trust by emphasizing on importance of quality throughout its supply chain. To achieve this objective, the Company binds its vendors to establish and operate within a quality assurance system. Apart from the Company’s objective of procuring inspection free parts, its vendors validate that parts delivered through their manufacturing processes meet the drawings accurately and achieve target of 0.1% rejection for incoming parts. Following measures were taken to achieve these quality objectives:
Vendor Improvement Program (VIP)The Company assists its vendors in improving quality and operations through various initiatives especially the Company’s VIP program launched few years ago. This program focuses on following six core areas:
• Drawing & Specification Control • Dies & Tool Management • In Process Inspection System • Incoming Inspection • Final Inspection System • Warranty Analysis system
Certificates are awarded to vendors at the time of completion
of the program. Further, they are reviewed and audited each year for recertification. Continuous follow up is carried out by VIP designated team which comprises of the Company’s employees from Supply Chain and Quality Assurance department. This year, 10 more vendors were analyzed and assessed under this program.
Supplier Quality ManagementSQM is an extension of Vendor Improvement Program aimed to reduce vendors’ incoming rejection level. It addresses and emphasizes on supply of high quality parts that satisfy the needs and exceed the expectations of the Company’s customers. This year, 9 suppliers were trained under this program.
ALA MAYAR Quality EventALA MAYAR Quality Event is an initiative where the Company’s vendors are encouraged to participate and collaborate to solve problems, add value and introduce innovation. Circles are formed where the Company’s employees and those of its vendors work together to discuss issues and devise solutions. This year, more than 120 themes were presented by the Company’s vendors out of which three best themes each from Karachi & Sheikhupura plants were awarded on basis of a pre-defined criteria. The 28th ALA MAYAR Awards were distributed at our Annual Vendor Conference 2018 held on April 21, 2018.
Vendor DevelopmentThe Company encourages its vendors to invest in their facilities including their manufacturing capacity and new technology. The idea is to ensure that the Company’s vendors remain well-equipped to meet the demands of business while earning attractive returns on their investments. Since, the Company is going through a phase wise capacity expansion, it is a prerequisite that its vendors upgrade their operations accordingly to support the said expansion. This year, an investment of Rs. 0.3 billion was made by the Company’s vendors in this regard.
The Company also believes in developing and strengthening competencies and skills of its vendors apart from their manufacturing capacities. For the purpose, the Company has been providing major technological assistance to its vendors, resulting in enhancement of their engineering skills and creation of employment opportunities.
CEO Saquib H. Shirazi addressing at the event
SustainabilityReport
CompanyOverview
Message forStakeholders
FinancialHighlights
FinancialStatements
OtherInformation
99Atlas Honda Limited

Environmental and Social PerformanceThe Company applies the same level of scrutiny to its suppliers with regards to labor rights, human rights, health, social and environmental requirements as it does to its own operations. The Company’s goal is to follow best practices and enable its vendors to replicate the same and be accountable for their sustainability performance.
Guidelines to VendorsCorporate Social Responsibility is embedded in the Company’s day to day operations in a clear and practical manner. All products and services are regularly monitored for their impact on society and the environment. Given the increased expectations regarding sustainability, the Company recognizes that it is essential to share its approach to sustainability with its vendors. In this regard, following guidelines have been issued to vendors. The Company believes that these guidelines help its vendors in maintaining a shared understanding of sustainability, to carry out initiatives
proactively and to continue growing together.
• Establish and monitor a company-wide social management system;
• Prevent climate change via reducing GHG emissions; • Optimize packaging and establish efficient logistics
operations in order to reduce waste disposal and transport emissions;
• Prevent pollution and contamination of air, water, soil, etc; • Enforce proper disposal of waste and implement
optimum recycling of waste and disposals etc; and • Compliance with laws and regulations along with
commitment to protect human rights.
All vendors are monitored and evaluated against these guidelines and based on such evaluation, the Company has not come across any significant actual or potential negative impact of its supply chain or vendors’ on labor practices, human rights and society requiring termination of relationship.
Certificate Distribution to vendor for reducing emissions
Emissions Reduction CaravanIn 2014, the Company undertook an initiative called ‘Emissions Reduction Caravan’ for its vendors. Since then, under this initiative, the Company’s supply chain engineers are working in close coordination with major vendors to reduce their environmental footprint. Technical guidance is being provided for process improvements focused on production efficiency, energy conservation, material recycling, reuse and reduction in CO2 emission. 35 vendors from both plants, covering 76% of total purchases have participated and achieved the target of reduction in CO2 emission by 1%.
Logistics OperationsThe Company’s supply chain operations manage the transportation of parts and components from its vendors to manufacturing facilities (“inbound” freight) while logistics operations ensure the same for finished motorcycles from the Company’s plants to its dealerships (“outbound” freight). With activities coordinated regionally, the responsibilities include designing and operating the transportation network and devising high-quality and efficient packaging to protect materials in transit. Freight emissions are influenced by a wide and complex range of inter-related factors, including the mode of transportation, the efficiency of the equipment used and the design of the freight network. The Company finds the most effective ways of achieving reductions through:
• Improving the design and operation of transportation networks
• Increasing vehicle utilization • Increasing the use of greener modes of transport such as
using rail network
Environmental Impact Assessment SurveyEvery year, the Company participates in environmental impact assessment survey developed by Honda Motor Japan. This year, 35 vendors were assessed on basis of following criteria:
• Direct & Indirect GHG Emissions • Green Purchasing Guideline • Chemical Substance Management • Environmental Management System • Energy Conservation Guidelines • Water Resources Guidelines • Pollution Prevention Guidelines • Biodiversity Guidelines
None of the selected vendors were identified as having any significant actual and potential negative environmental impacts.
Human Rights & Working ConditionsRespecting and protecting human rights - the fundamental and inalienable rights and freedoms to which all people are entitled - is at the core of the Company’s labor practices. The Company aims to ensure that everything it makes or that others make for the Company is consistent with local laws and the Company’s commitment to protecting human rights. The Company has implemented strict requirements within its operations and for suppliers to protect the rights of employees as detailed in following guidelines issued: • Eliminate discrimination and ensure zero harassment at
workplace in any aspect of employment based on race, ethnicity, nationality, religion, gender, or other characteristics;
• Avoid employment of workers who do not meet the legal minimum working age of each country and region; • Avoid practicing forced labor. Guarantee that all labor is
voluntary and those employees are free to leave their jobs; • To comply with the laws & regulations regarding minimum
wages, overtime, wage deductions, performance-based pay and other remuneration;
• To obey with the laws & regulations regarding the setting of employees’ working hours (including overtime) and granting of scheduled days off and paid annual vacation time etc; and
• Ensure a safe and healthy working environment for all associates.
Responsible Sourcing of MineralsInternational regulations such as the Dodd-Frank Act in the United States obligate companies to disclose the origin of certain raw materials to ensure that “conflict minerals”, such as
tin, tungsten, tantalum and gold from the Democratic Republic of Congo or neighboring states, do not enter their products through their supply chain. The Company, therefore, monitors all vendors to make sure they do not source raw materials from the affected regions. Using a structured survey process and by working closely with vendors for increased supply chain transparency, the Company obtains confirmation that its suppliers and their upstream suppliers are obtaining material free from conflict minerals. Furthermore, the Company provides clear guidelines for suppliers and raises awareness on conflict mineral related issues through education and support. The Company also collaborates with a cross-industry group called Conflict-Free Sourcing Initiative (CFSI) in this regard. In order to be confirmed as conflict free, the smelters and refiners are required to pass an independent third-party audit. The results from this year’s survey confirmed that our supply chain is based on conflict free sourcing.
SustainabilityReport
CompanyOverview
Message forStakeholders
FinancialHighlights
FinancialStatements
OtherInformation
100 Annual Report 2019
Emissions Reduction CaravanIn 2014, the Company undertook an initiative called ‘Emissions Reduction Caravan’ for its vendors. Since then, under this initiative, the Company’s supply chain engineers are working in close coordination with major vendors to reduce their environmental footprint. Technical guidance is being provided for process improvements focused on production efficiency, energy conservation, material recycling, reuse and reduction in CO2 emission. 35 vendors from both plants, covering 76% of total purchases have participated and achieved the target of reduction in CO2 emission by 1%.
Logistics OperationsThe Company’s supply chain operations manage the transportation of parts and components from its vendors to manufacturing facilities (“inbound” freight) while logistics operations ensure the same for finished motorcycles from the Company’s plants to its dealerships (“outbound” freight). With activities coordinated regionally, the responsibilities include designing and operating the transportation network and devising high-quality and efficient packaging to protect materials in transit. Freight emissions are influenced by a wide and complex range of inter-related factors, including the mode of transportation, the efficiency of the equipment used and the design of the freight network. The Company finds the most effective ways of achieving reductions through:
• Improving the design and operation of transportation networks
• Increasing vehicle utilization • Increasing the use of greener modes of transport such as
using rail network
Environmental Impact Assessment SurveyEvery year, the Company participates in environmental impact assessment survey developed by Honda Motor Japan. This year, 35 vendors were assessed on basis of following criteria:
• Direct & Indirect GHG Emissions • Green Purchasing Guideline • Chemical Substance Management • Environmental Management System • Energy Conservation Guidelines • Water Resources Guidelines • Pollution Prevention Guidelines • Biodiversity Guidelines
None of the selected vendors were identified as having any significant actual and potential negative environmental impacts.
Human Rights & Working ConditionsRespecting and protecting human rights - the fundamental and inalienable rights and freedoms to which all people are entitled - is at the core of the Company’s labor practices. The Company aims to ensure that everything it makes or that others make for the Company is consistent with local laws and the Company’s commitment to protecting human rights. The Company has implemented strict requirements within its operations and for suppliers to protect the rights of employees as detailed in following guidelines issued: • Eliminate discrimination and ensure zero harassment at
workplace in any aspect of employment based on race, ethnicity, nationality, religion, gender, or other characteristics;
• Avoid employment of workers who do not meet the legal minimum working age of each country and region; • Avoid practicing forced labor. Guarantee that all labor is
voluntary and those employees are free to leave their jobs; • To comply with the laws & regulations regarding minimum
wages, overtime, wage deductions, performance-based pay and other remuneration;
• To obey with the laws & regulations regarding the setting of employees’ working hours (including overtime) and granting of scheduled days off and paid annual vacation time etc; and
• Ensure a safe and healthy working environment for all associates.
Responsible Sourcing of MineralsInternational regulations such as the Dodd-Frank Act in the United States obligate companies to disclose the origin of certain raw materials to ensure that “conflict minerals”, such as
tin, tungsten, tantalum and gold from the Democratic Republic of Congo or neighboring states, do not enter their products through their supply chain. The Company, therefore, monitors all vendors to make sure they do not source raw materials from the affected regions. Using a structured survey process and by working closely with vendors for increased supply chain transparency, the Company obtains confirmation that its suppliers and their upstream suppliers are obtaining material free from conflict minerals. Furthermore, the Company provides clear guidelines for suppliers and raises awareness on conflict mineral related issues through education and support. The Company also collaborates with a cross-industry group called Conflict-Free Sourcing Initiative (CFSI) in this regard. In order to be confirmed as conflict free, the smelters and refiners are required to pass an independent third-party audit. The results from this year’s survey confirmed that our supply chain is based on conflict free sourcing.
SustainabilityReport
CompanyOverview
Message forStakeholders
FinancialHighlights
FinancialStatements
OtherInformation
101Atlas Honda Limited

Employee Management
Management ApproachThe Company ensures long-term employee development by seeking out the right employees, making the most of their talents, developing potential and ensuring employability. The Company strives to unlock the potential of human resources management and resultantly, add value to its business. A corporate culture guided by the principles of the Atlas Way (as described in Sustainability Strategy) forms the basis of the Company’s efforts in this area.
The Company has policies in place covering all aspects of employment, including employee relations, training, equal opportunity and health & safety of its workforce. The Company fully complies with applicable labor and health & safety laws and regulations that prohibit forced, compulsory and child labor. The Company is committed to the observance of fair working conditions and human rights. Gender equality and respect for diversity is deep rooted in the Company’s culture to encourage talented individuals with diverse backgrounds to demonstrate their full potential and evolve into leaders. The Company is continuously working to upgrade its human resources expertise, practices, systems, and service quality. As part of the Company’s talent management, performance appraisals are carried out which help in identification of career development and training needs. This also helps the Company in ensuring a fair reward system. Further, the Company’s performance is constantly evaluated through surveys and awards.
Recruitment and RetentionTo sustain its market leadership, the Company aims to attract, recruit and retain the best talent. The Company’s ability to offer unique opportunities, such as a diverse and supportive work environment, helps differentiate Atlas Honda from other employers and attracts high-performing professionals who are competent and highly skilled. Recruitment and retention of appropriate workforce becomes more crucial as the Company has been undergoing a phase wise capacity expansion plan. A uniform policy for hiring, job placement and human resource development is followed. A comprehensive “Employee Orientation Training Program / Onboarding Program” has been designed to provide an overview of the Company’s culture and processes to all new joiners.
Employee CompositionThe Company’s employees’ composition is as follows. No major variations have been reported. Futher, the data has been compiled by the Company’s human resource department as per actual and no assumptions have been made.
Workforce – by location
229 458
1,006
Karachi Plant Shekhupura Plant Regional Office
Workforce – by age
1,071
329293
Age <30 Age <30-50 Age 50 Male Female
Workforce – by gender
31
1,662
A view of recruitment drive
SustainabilityReport
CompanyOverview
Message forStakeholders
FinancialHighlights
FinancialStatements
OtherInformation
102 Annual Report 2019

Diversity and Inclusion The Company values equality, diversity and inclusion. Merit-based recruitment practices have been adopted and equal employment opportunities for all regardless of race, religion, gender, marital status and age or disability are being made available by the Company. During the year, no incidents of discrimination were reported. For hiring workers, equal weightage is given to candidates from across the country. The Company also focuses on recruitment and qualification of local personnel as a way of developing the local communities and regions in which it operates.
The Company hires men and women with vast experiences, from different industry backgrounds, cultures, beliefs and ethnicities. This ensures that the Company is able to adapt to the changing needs of business. However, it is currently a challenge for the entire auto industry in Pakistan to attract sufficient number of female employees. Various initiatives are being undertaken to enhance the participation of women. During the year, 7 female executives were hired. Female staff is entitled to three-month maternal leave. During the year under review, three female associates availed maternal leave Women’s day was celebrated at all the offices and the female staff was given an opportunity to discuss and share their views and expectations.
The Company also supports creation of job opportunities for persons with disabilities through provision of additional facilities and appropriate training. Currently, 21 individuals, who are differently-abled, are working for the Company.
Career Development and TrainingThe Company believes in the principle of “Organization Development through Self-Development” and places great emphasis on capacity and skill building. Life-long learning is promoted through the 70:20:10 formula, where 70% learning comes from an individual’s performance at their current job, 20% from coaching and 10% from formal training. Accordingly, the Company provides a broad range of opportunities to its employees in form of on-the-job learning, mentoring programs, trainings and courses. Such programs include various in-house, national and international programs. The Company also provides support to its employees for higher education and management courses at renowned business schools such as Harvard Business School and INSEAD. A number of rotational programs are strategically and systematically implemented to give employees the experience needed to serve at management positions.
The Company’s efforts, during the year under review, for training and development of its employees are presented in the following table:
Attrition – by location
188
24
Karachi Plant Shekhupura Plant Regional Office
Attrition – by age
39
9
2
Age <30 Age <30-50 Age 50 Male Female
Attrition – by gender
5
45
New hires – by location
12 11
21
Karachi Plant Shekhupura Plant Regional Office
37
5
2
New hires – by age
Age <30 Age <30-50 Age 50
Workforce – by gender
37
7
Male Female
Women’s day celebrations
A glimpse of one of the training session
SustainabilityReport
CompanyOverview
Message forStakeholders
FinancialHighlights
FinancialStatements
OtherInformation
103Atlas Honda Limited

Internal Training Programs
No. of Persons trained in internal training
External Training Programs
Foreign Training Programs
No. of Persons trained in external trainings
Trainings days
Training hours
Average training hours per year per employee
Average training days per employee
24
361 (Female: 16)
25
10
128 (Female: 2)
1,628 (Female: 92)
13,024 (Female: 736)
26.14
2.2 (Female: 2.0)
Performance Appraisal and Reward SystemThe Company adheres to all laws and regulations with regard to employee benefits, including minimum wages and separation benefits. Basic salaries and packages are set on the basis of education and experience of the employees. Compensation packages offered are competitive and equitable and are in line with the industry benchmarks. These include salaries, bonus, health care benefits, transportation allowances, company provided vehicles, fuel allowances and retirement benefits. An employee’s salary is adjusted based on the results of performance evaluations. The Company only provides full time employment and does not offer part time jobs.
All employees undergo performance appraisals twice a year. Annual Performance Appraisal is used as a basis for positioning of personnel within the Company and determination of annual increment. High performing individuals are promoted to higher grades and are awarded higher increments. The Company’s performance management policy, under the Individual Development Program for management cadre employees, requires determination of areas of focus for internal and external trainings necessary for creation of future leaders.
Long serving employees are recognized through award of gold medals for their association with the company for 15 years or more.
Employees’ Engagement and ConnectivityThe Company supports the creation of a high performing work environment by ensuring a balance between personal and professional lives of its employees. The Company believes in a culture of inclusion and well-being that inspires employee engagement for better productivity. For this, the Company organizes various activities such as family day, picnics, sports and other activities which provide employees an opportunity for leisure.
Further, every year an “Employee Vitality Level Survey” is conducted wherein the management and middle management associates participate to rate the Company on 5 Engagement
Factors. The mean score of the survey conducted this year was 4.9 out of 6. Area of focus identified through the survey was performance management. Accordingly, our human resource department is working to improve the policies so as to meet employee expectations in a timely manner.
Human Rights and Relations with CBAThe Company is responsible for creation of an environment free of discrimination and harassment, in which all individuals are treated with respect, equality and dignity and have equal opportunities. Human rights violations of any sort is not tolerated. Key management practices including: a guarantee of voluntary labor, observance of working hours, respect for diversity and workplace health and safety are continuously reinforced at the Company. The Company makes every effort to engage in sincere discussions with its employees about any issues that exist or might arise. This helps in maintaining a relationship of mutual trust. Moreover, an appropriate notification period is allowed before implementation of any change that can have an impact on employees. The Company recognizes the rights of employees to set up their representation and carry out collective bargaining to regulate working conditions. Constructive dialogue, negotiations and consultations are carried out with labor unions, when needed, at both our plants. All non-management employees are covered under CBA, which cover more than 11% of total permanent employees.
The Company strongly discourages any form of child labor and firmly complies with local regulations concerning legal minimum age requirement for work permits. The Company has a mechanism of periodical evaluation of its vendors for any possible violation of human rights. The Company does not have any child labor within its operations nor is it aware of any such cases at its suppliers. There were no complaints reported during the year related to violation of human rights.
Health and SafetyThe Company is committed to ensure the health and safety of its employees, contractors and visitors. Aspects related to this area are documented in contracts and agreements with the trade union. The risks of injury, death or ill-health of our employees and those who work with the Company is a fundamental concern and have a significant impact on our operations. The Company is striving to create a dynamic working environment that is conducive to the mental and physical well-being of its employees. Issues relating to employee safety and health are managed in accordance with the Health, Safety & Environment policy of the Company at all its sites.
The responsibility for health and safety impacts rests with the General Manager Human Resource. The management approach comprises of health and safety policy, procedures and guidance documents. Health and safety committees are operational at each plant as per applicable laws and best available practices. The meetings of these committees are held on a regular basis to monitor health and safety issues and recommend improvements.
During the year 2018-19, no major fatalities and injuries were reported. Important guidelines derived from the HSE policy have been displayed at prominent places within the Company
A glimpse of picnic organised for employees
SustainabilityReport
CompanyOverview
Message forStakeholders
FinancialHighlights
FinancialStatements
OtherInformation
104 Annual Report 2019

premises to manage safe working environment. Further, the Company undertook following steps to promote healthy mindset and safety amongst employees:
• To address various health, safety and environment related issues regular, HSE flyers are disseminated. To date, topics covered include updates on rain emergency, earthquake and road safety.• During the year, 41 training sessions on basic first aid and steps in case of emergency due to fire have been conducted. 1,415 associates from various departments actively participated and were imparted with knowledge of an emergency action plan. Hands on training on handling fire extinguishers, fire blankets and fire hydrants was part of the training sessions.• A safety program was initiated by HSE department under which shop in-charges were trained on various HSE related matters and were made responsible to train their
subordinates. During the year, 242 trainings sessions were conducted creating awareness about general electric safety, fire prevention & emergency response planning, use of personal protective equipment, chemical safety, first aid, slip, trip & fall prevention and forklift safety.
A glimpse of safety awareness sessions
SustainabilityReport
CompanyOverview
Message forStakeholders
FinancialHighlights
FinancialStatements
OtherInformation
105Atlas Honda Limited

Definition, methodology and scopeThe Sustainability Report is issued by us to disseminate information about our economic, environmental and social impacts to our stakeholders, enabling them to make informed decisions.
This section provides definitions, methodology guide and information on scope of the report. Unless otherwise specified or required by the context in which they are used, the terms “Atlas Honda” or “the company” or “we” refer to the Atlas Honda Limited and do not include its associated companies.
The information and data contained in this report relates to financial year 2019 (April 1, 2018 to March 31, 2019). The data presented in the report includes all plants and offices of Atlas Honda and does not include data on its associated companies.
The quality of the information contained in the report is in compliance with principles for defining report content and quality of the report as per GRI Standards.
The compilation of data has been done on the basic scientific measurement and mathematical calculus methods on actual basis, but in some cases where actual data is unavailable due to some reasons; different logical methodologies are used for calculations. The usage of any such method is mentioned at respective places in the report, where applicable. The data measurement techniques are same as used for previous year.
There has been no change in the reporting period, scope, boundary or measurement methods applied in the report. There are no changes that can significantly affect the comparability of data from period to period. Previous years’ figures have been regrouped/ rearranged wherever found necessary to conform to this year’s classification. Preparation of the sustainability report is part of annual reporting process subject to independent review, analysis and approval of relevant authorities. We make every effort to ensure the accuracy of the sustainability information contained in this report. From time to time, however, figures may be updated. The online pdf version of the sustainability report will be considered the most current version and takes precedence over any previously printed version.
The Sustainability Report is:• prepared by the sustainability reporting team that coordinates and engages relevant functions;• approved by the Board of Directors;• subject to an independent review by Corporate Social Responsibility Centre Pakistan, an independent reviewer, in compliance with GRI Sustainability Reporting Standards and ISAE 3000 (2003);• published and freely available for download from the publication section of the company website (www.atlashonda.com.pk).
SustainabilityReport
CompanyOverview
Message forStakeholders
FinancialHighlights
FinancialStatements
OtherInformation
106 Annual Report 2019

SustainabilityReport
CompanyOverview
Message forStakeholders
FinancialHighlights
FinancialStatements
OtherInformation
Office No. 01,3rd Floor, VIP Square,
I-8 Markaz, Islamabad.Phone: +92-51-4861116
Fax: +92-51-4938022E-mail:[email protected]
Web: www.csrcp.com
Independent Assurance Statement for the Atlas Honda Limited Sustainability Report 2019Corporate Social Responsibility Centre Pakistan (CSRCP) performed an independent review of the Atlas Honda Limited (AHL) Sustainability Report 2019, which was prepared ‘in accordance’ with Global Reporting Initiative’s (GRI) Standards’ Core option. The objective of the critical independent review is to provide AHL’s Management with an independent opinion about the quality of the report and adherence to the principles of Inclusivity, Materiality, and Responsiveness.
Responsibility of AHL and of CSRCPThe Management of AHL is responsible for the preparation of the Sustainability Report and for the information and statements contained within it. The Management is responsible for determining the sustainability goals, performance and for establishing and maintaining appropriate performance management and internal control systems from which the reported information is derived.
Our responsibility is to express independently a conclusion on the Sustainability Report as defined within the scope of work to The Management of AHL only in accordance with the terms of reference agreed with them. We do not accept or assume any responsibility for any other purpose or to any other person or organization. Any reliance any such third party may place on the report is entirely at its own risk.
Scope of AssuranceCSRCP was asked to express an opinion in relation to the review scope which includes the following aspects:
– Review of the policies, initiatives, practices and performance described in the non-financial - qualitative and quantitative information (sustainability performance) reported and referenced in the report.
– Evaluation of the disclosed information in the report to check adherence to the GRI’s Universal and Topic Specific Standards.
– Adherence to ISAE 3000 (Revised) to provide limited assurance on performance data within the Sustainability Report.
– Adherence to the principles of Inclusivity, Materiality and Responsiveness.
Assurance methodologyOur activities included a desk review of the final draft report. We communicated with AHL to determine the accuracy and authenticity of the report content, data points, methodologies and policies around the organization’s social, environmental and economic data and activities.
Our procedures on this engagement included:
– Critical review of the Sustainability Repot 2019 and respective Content Index to check consistency and adherence to GRI´s Universal and Topic-Specific Standards
– Evaluation of the report adherence to the in accordance: Core option
– Analysis of the report content against principles of Inclusivity, Materiality and Responsiveness
– Elaboration of an adjustment report– Final review of the report content
The work was planned and carried out to provide limited, rather than absolute assurance and we believe that the desk review of the AHL Sustainability Report completed by CSRCP provides an appropriate basis for our conclusions.
Opinion
GRI Standards in accordance option AHL declares the report to be in accordance with GRI Standards: Core option. CSRCP evaluated the quality of the application of GRI Universal and Topic Specific Standards. Based on the evaluation, CSRCP made a series of recommendations to compete the content or adjust the disclosure level in the Content Index, which have been accepted by the company. Based on the rectifications, we can confirm that the report is attending the above mentioned ‘in accordance’ option, giving a complete overview of AHL’s sustainability governance and management systems in place to report on a relevant set of disclosures related to the identified material topics.
Main Conclusions on Adherence to Principles of Inclusivity, Materiality and Responsiveness
Inclusivity – addresses the stakeholders’ participa-tion in the process of developing and implementing a transparent and strategic sustainability manage-ment process.• AHL report addresses how company identifies and
engages with different stakeholders, including AHL focus for engagement and AHL response. The material issues emerging from the stakeholder engagement were collected, prioritized and the results are fairly reflected in the report.
• It is important that AHL carries out a sustainability specific engagement and demonstrate a deeper perspective on stakeholders’ concerns discussed in these sessions and how AHL utilizes stakeholders’ input in strategic decision making.
107Atlas Honda Limited

SustainabilityReport
CompanyOverview
Message forStakeholders
FinancialHighlights
FinancialStatements
OtherInformation
Muhammad Arfan Nazir,Director,Corporate Social Responsibility Centre Pakistan.
Muhammad Imran, Muhammad Imran & Co., Cost & Management Accountants Pakistan. ICMAP Membership # 1382
Materiality – issues required by stakeholders to make decisions on the organization’s economic, environmental and social performance.• Material issues have been identified by AHL in a Materiality
Matrix which considers the influence on stakeholder assessment and decisions and the significance of environmental, social and economic impacts, using a commonly accepted approach. The parameters of risks and opportunities were considered in the materiality determination process, which makes the process more focused on prioritizing issues relevant to AHL.
• AHL material topics of human rights, health and safety, employment and labor practices and supply chain impacts having outreach in the supply chain are monitored by AHL. However it is necessary that company discloses more details about current status of suppliers towards these material topics, AHL approach to managing the associated impacts and methodology towards assessing its supply chain impacts on these material topics.
Responsiveness – addresses the action taken by the organization as a result of specific stakehold-ers’ demands.• AHL has appropriate policies and externally certified quality,
environmental and health & safety management systems, which involve a high level of analysis of risks, non-compliance and corrective actions.
• Sustainability management at AHL maintains high level support, conforming AHL’s commitment to address sustainability challenges, stakeholder concerns, and promoting sustainable practices in its supply chain. It would be recommendable to define adequate sustainability targets for material topics to demonstrate AHL commitment towards better management of the impacts.
Statement of conclusionBased on the scope of our work and the assurance procedures we performed using the ISAE 3000 (Revised)
assurance standard, we conclude that nothing has come to our attention that causes us to believe that the information in AHL’s Sustainability Report 2019 is in all material aspects not fairly stated.
We confirm that the report is aligned with the requirements of the GRI Standards and reports its material topics in an adequate manner. The compliance with GRI Standards has been disclosed in more detail in the Content Index which provides overview of which standards have been fully complied and which have been partially complied in the report. In our opinion AHL has appropriate systems for collection, aggregation and analysis of the data presented in the report.
Limitations and exclusionsExcluded from the scope of our work is any verification of information relating to:
• Physical verification of data, content of AHL’s Sustainability Report;
• Positional statements (expression of opinion, belief, aim or future intention of AHL) and statements of future commitment.
Statement of independence, impartiality and com-petenceCSRCP operates strict conflict of interest checks and has confirmed our independence to work on this engagement with AHL. The members of the review team have not provided consulting services and were not involved in the preparation of any part of the report. CSRCP is a consulting firm specialized in sustainability. The review team has the required combination of education, experience, training and skills for this engagement.
Islamabad, May 24, 2019
108 Annual Report 2019

GRI Content Index
Key
The following table lists all disclosures in accordance with the GRI Standards included in the report and helps the reader in locating content within the document. Each disclosure is followed by reference to the appropriate pages in this report or other publicly available sources.
Fully disclosedPartially disclosed
GRI STANDARD DISCLOSURENUMBER DISCLOSURE TITLE PAGE OMISSION
& REASON
GRI 101: FOUNDATION 2016GENERAL DISCLOSURESGRI 102: GENERALDISCLOSURES 2016
GRI 101 does not contain any disclosure requirements
ORGANIZATIONAL PROFILE
102-1102-2102-3102-4102-5102-6102-7102-8102-9102-10102-11102-12102-13
102-14
102-16
102-18
102-40102-41102-42102-43102-44
102-45102-46102-47102-48102-49102-50102-51102-52102-53102-54102-55102-56
76767676767676767676897676
77
4
78
84-86104
84-8684-8684-86
10674, 86-87
871061067474747474
109-113107-108
Name of the organizationActivities, brands, products, and servicesLocation of headquartersLocation of operationsOwnership and legal formMarkets servedScale of the organizationInformation on employees and other workersSupply chainSignificant changes to the organization and its supply chainPrecautionary Principle or approachExternal initiativesMembership of associations
Statement from senior decision-maker
Values, principles, standards, and norms of behavior
Governance structure
List of stakeholder groups Collective bargaining agreementsIdentifying and selecting stakeholders Approach to stakeholder engagementKey topics and concerns raised
Entities included in the consolidated financial statements Defining report content and topic boundaries List of material topics Restatements of informationChanges in reporting Reporting period Date of most recent report Reporting cycleContact point for questions regarding the report Claims of reporting in accordance with the GRI StandardsGRI content indexExternal assurance
SustainabilityReport
CompanyOverview
Message forStakeholders
FinancialHighlights
FinancialStatements
OtherInformation
STRATEGY
ETHICS AND INTEGRITY
GOVERNANCE
STAKEHOLDER ENGAGEMENT
REPORTING PRACTICE
109Atlas Honda Limited

GRI STANDARD DISCLOSURENUMBER DISCLOSURE TITLE PAGE OMISSION
& REASON
MATERIAL TOPICSECONOMIC PERFORMANCEGRI 103: MANAGEMENTAPPROACH 2016
GRI 201: ECONOMICPERFORMANCE 2016
103-1103-2103-3201-1201-3
8778-8378-83
70132-133,143
Explanation of the material topic and its boundaryThe management approach and its componentsEvaluation of the management approachDirect economic value generated and distributedDefined benefit plan obligations and other retirement plans
87102-103102-103
104
103
MARKET PRESENCEGRI 103: MANAGEMENTAPPROACH 2016
GRI 202: MARKETPRESENCE 2016
103-1103-2103-3202-1202-2
Explanation of the material topic and its BoundaryThe management approach and its componentsEvaluation of the management approachRatios of standard entry level wage by gendercompared to local minimum wage Proportion of senior management hired from thelocal community
879696
96-97
INDIRECT ECONOMIC IMPACTSGRI 103: MANAGEMENTAPPROACH 2016
GRI 203: INDIRECT ECONOMICIMPACTS 2016
103-1103-2103-3203-1
Explanation of the material topic and its BoundaryThe management approach and its componentsEvaluation of the management approachInfrastructure investments and services supported
87989898
PROCUREMENT PRACTICESGRI 103: MANAGEMENTAPPROACH 2016
GRI 204: PROCUREMENTPRACTICES 2016
103-1103-2103-3204-1
Explanation of the material topic and its BoundaryThe management approach and its componentsEvaluation of the management approachProportion of spending on local suppliers
8783838383
ANTI-CORRUPTIONGRI 103: MANAGEMENTAPPROACH 2016
GRI 205:ANTI-CORRUPTION 2016
103-1103-2103-3205-1205-3
Explanation of the material topic and its BoundaryThe management approach and its componentsEvaluation of the management approachOperations assessed for risks related to corruptionConfirmed incidents of corruption and actions taken
8793-9493-94
94
ANTI-COMPETITIVE BEHAVIOURGRI 103: MANAGEMENTAPPROACH 2016
GRI 206: ANTI-COMPETITIVEBEHAVIOUR 2016
103-1103-2103-3206-1
Explanation of the material topic and its BoundaryThe management approach and its componentsEvaluation of the management approachLegal actions for anti-competitive behavior, anti-trust,and monopoly practices
8788-8988-89
91
MATERIALSGRI 103: MANAGEMENTAPPROACH 2016
GRI 301: MATERIALS 2016
103-1103-2103-3301-1
Explanation of the material topic and its BoundaryThe management approach and its componentsEvaluation of the management approachMaterials used by weight or volume
8788-8988-8989-9089-9089-90
ENERGYGRI 103: MANAGEMENT APPROACH 2016
GRI 302: ENERGY 2016
103-1103-2103-3302-1302-3302-4
Explanation of the material topic and its BoundaryThe management approach and its componentsEvaluation of the management approachEnergy consumption within the organizationEnergy intensityReduction of energy consumption
8788-8988-8991-9291-92
WATERGRI 103: MANAGEMENTAPPROACH 2016
GRI 303: WATER 2016
103-1103-2103-3303-1303-3
Explanation of the material topic and its BoundaryThe management approach and its componentsEvaluation of the management approachWater withdrawal by sourceWater recycled and reused
SustainabilityReport
CompanyOverview
Message forStakeholders
FinancialHighlights
FinancialStatements
OtherInformation
110 Annual Report 2019
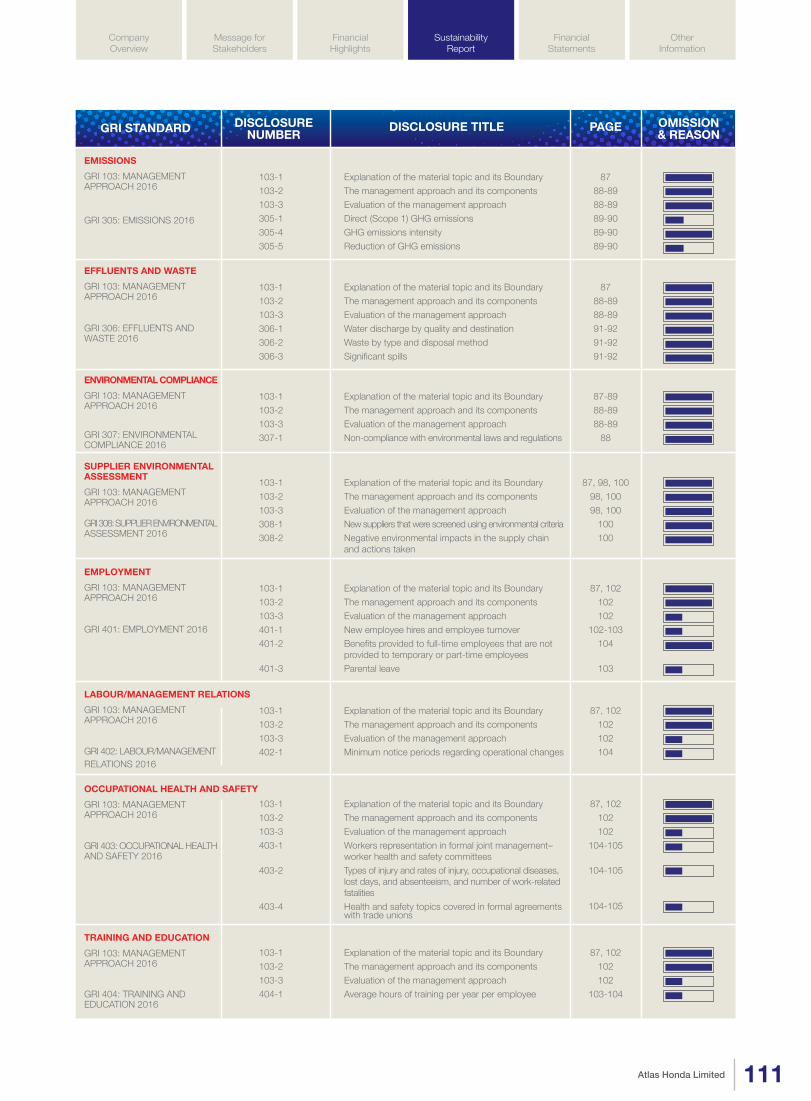
GRI STANDARD DISCLOSURENUMBER DISCLOSURE TITLE PAGE OMISSION
& REASON
8788-8988-8989-9089-9089-90
EMISSIONSGRI 103: MANAGEMENTAPPROACH 2016
GRI 305: EMISSIONS 2016
103-1103-2103-3305-1305-4305-5
Explanation of the material topic and its BoundaryThe management approach and its componentsEvaluation of the management approachDirect (Scope 1) GHG emissionsGHG emissions intensityReduction of GHG emissions
8788-8988-8991-9291-9291-92
EFFLUENTS AND WASTEGRI 103: MANAGEMENTAPPROACH 2016
GRI 306: EFFLUENTS ANDWASTE 2016
103-1103-2103-3306-1306-2306-3
Explanation of the material topic and its BoundaryThe management approach and its componentsEvaluation of the management approachWater discharge by quality and destinationWaste by type and disposal methodSignificant spills
87-8988-8988-89
88
ENVIRONMENTAL COMPLIANCEGRI 103: MANAGEMENTAPPROACH 2016
GRI 307: ENVIRONMENTALCOMPLIANCE 2016
103-1103-2103-3307-1
Explanation of the material topic and its BoundaryThe management approach and its componentsEvaluation of the management approachNon-compliance with environmental laws and regulations
87, 98, 10098, 10098, 100
100100
SUPPLIER ENVIRONMENTALASSESSMENT GRI 103: MANAGEMENTAPPROACH 2016
GRI 308: SUPPLIER ENVIRONMENTALASSESSMENT 2016
103-1103-2103-3308-1308-2
Explanation of the material topic and its BoundaryThe management approach and its componentsEvaluation of the management approachNew suppliers that were screened using environmental criteriaNegative environmental impacts in the supply chainand actions taken
87, 102102102
102-103104
103
EMPLOYMENT GRI 103: MANAGEMENTAPPROACH 2016
GRI 401: EMPLOYMENT 2016
103-1103-2103-3401-1401-2
401-3
Explanation of the material topic and its BoundaryThe management approach and its componentsEvaluation of the management approachNew employee hires and employee turnoverBenefits provided to full-time employees that are notprovided to temporary or part-time employeesParental leave
87, 102102102104
LABOUR/MANAGEMENT RELATIONS GRI 103: MANAGEMENTAPPROACH 2016
GRI 402: LABOUR/MANAGEMENTRELATIONS 2016
103-1103-2103-3402-1
Explanation of the material topic and its BoundaryThe management approach and its componentsEvaluation of the management approachMinimum notice periods regarding operational changes
87, 102102102
104-105
104-105
104-105
OCCUPATIONAL HEALTH AND SAFETYGRI 103: MANAGEMENTAPPROACH 2016
GRI 403: OCCUPATIONAL HEALTH AND SAFETY 2016
103-1103-2103-3403-1
403-2
403-4
Explanation of the material topic and its BoundaryThe management approach and its componentsEvaluation of the management approachWorkers representation in formal joint management–worker health and safety committeesTypes of injury and rates of injury, occupational diseases,lost days, and absenteeism, and number of work-relatedfatalitiesHealth and safety topics covered in formal agreementswith trade unions
87, 102102102
103-104
TRAINING AND EDUCATIONGRI 103: MANAGEMENTAPPROACH 2016
GRI 404: TRAINING ANDEDUCATION 2016
103-1103-2103-3404-1
Explanation of the material topic and its BoundaryThe management approach and its componentsEvaluation of the management approachAverage hours of training per year per employee
SustainabilityReport
CompanyOverview
Message forStakeholders
FinancialHighlights
FinancialStatements
OtherInformation
111Atlas Honda Limited

GRI STANDARD DISCLOSURENUMBER DISCLOSURE TITLE PAGE OMISSION
& REASON
103-104103-104
Programs for upgrading employee skills and transitionassistance programsPercentage of employees receiving regular performanceand career development reviews
404-2
404-3
87, 102102102
78, 103104
DIVERSITY AND EQUAL OPPORTUNITYGRI 103: MANAGEMENTAPPROACH 2016
GRI 405: DIVERSITY AND EQUALOPPORTUNITY 2016
Explanation of the material topic and its BoundaryThe management approach and its componentsEvaluation of the management approachDiversity of governance bodies and employeesRatio of basic salary and remuneration of women to men
103-1103-2103-3405-1405-2
87, 102102102103
NON-DISCRIMINATIONGRI 103: MANAGEMENTAPPROACH 2016
GRI 406: NON-DISCRIMINATION2016
Explanation of the material topic and its BoundaryThe management approach and its componentsEvaluation of the management approachIncidents of discrimination and corrective actions taken
103-1103-2103-3406-1
87, 102102102104
FREEDOM OF ASSOCIATION AND COLLECTIVE BARGAININGGRI 103: MANAGEMENTAPPROACH 2016
GRI 407: FREEDOM OFASSOCIATION AND COLLECTIVEBARGAINING 2016
Explanation of the material topic and its BoundaryThe management approach and its componentsEvaluation of the management approachOperations and suppliers in which the right to freedomof association and collective bargaining may be at risk
103-1103-2103-3407-1
87, 102102102104
CHILD LABOURGRI 103: MANAGEMENTAPPROACH 2016
GRI 408: CHILD LABOUR 2016
Explanation of the material topic and its BoundaryThe management approach and its componentsEvaluation of the management approachOperations and suppliers at significant risk for incidentsof child labor
103-1103-2103-3408-1
87, 102102102104
HUMAN RIGHTS ASSESSMENTGRI 103: MANAGEMENTAPPROACH 2016
GRI 412: HUMAN RIGHTSASSESSMENT 2016
Explanation of the material topic and its BoundaryThe management approach and its componentsEvaluation of the management approachOperations that have been subject to human rightsreviews or impact assessments
103-1103-2103-3412-1
87, 969696
96-97
96-97
LOCAL COMMUNITIESGRI 103: MANAGEMENTAPPROACH 2016
GRI 413: LOCALCOMMUNITIES 2016
Explanation of the material topic and its BoundaryThe management approach and its componentsEvaluation of the management approachOperations with local community engagement, impactassessments, and development programsOperations with significant actual and potential negativeimpacts on local communities
103-1103-2103-3413-1
413-2
SustainabilityReport
CompanyOverview
Message forStakeholders
FinancialHighlights
FinancialStatements
OtherInformation
87, 98, 10098, 10098, 100
100100
SUPPLIER SOCIAL ASSESSMENTGRI 103: MANAGEMENTAPPROACH 2016
GRI 414: SUPPLIER SOCIALASSESSMENT 2016
Explanation of the material topic and its BoundaryThe management approach and its componentsEvaluation of the management approachNew suppliers that were screened using social criteriaNegative social impacts in the supply chain and actions taken
103-1103-2103-3414-1414-2
87, 93939393
93
CUSTOMER HEALTH AND SAFETYGRI 103: MANAGEMENTAPPROACH 2016
GRI 416: CUSTOMER HEALTHAND SAFETY 2016
Explanation of the material topic and its BoundaryThe management approach and its componentsEvaluation of the management approachAssessment of the health and safety impacts of productand service categoriesIncidents of non-compliance concerning the health andsafety impacts of products and services
103-1103-2103-3416-1
416-2
112 Annual Report 2019

GRI STANDARD DISCLOSURENUMBER DISCLOSURE TITLE PAGE OMISSION
& REASON
87, 9393939494
94
MARKETING AND LABELINGGRI 103: MANAGEMENTAPPROACH 2016
GRI 417: MARKETING ANDLABELING 2016
Explanation of the material topic and its BoundaryThe management approach and its componentsEvaluation of the management approachRequirements for product and service information and labelingIncidents of non-compliance concerning product andservice information and labelingIncidents of non-compliance concerning marketingcommunications
103-1103-2103-3417-1417-2
417-3
87, 93939394
CUSTOMER PRIVACYGRI 103: MANAGEMENTAPPROACH 2016
GRI 418: CUSTOMERPRIVACY 2016
Explanation of the material topic and its BoundaryThe management approach and its componentsEvaluation of the management approachSubstantiated complaints concerning breaches ofcustomer privacy and losses of customer data
103-1103-2103-3418-1
82-83, 8782-8382-8382-83
SOCIOECONOMIC COMPLIANCEGRI 103: MANAGEMENTAPPROACH 2016
GRI 419: SOCIOECONOMICCOMPLIANCE 2016
Explanation of the material topic and its BoundaryThe management approach and its componentsEvaluation of the management approachNon-compliance with laws and regulations in the socialand economic area
103-1103-2103-3419-1
SustainabilityReport
CompanyOverview
Message forStakeholders
FinancialHighlights
FinancialStatements
OtherInformation
113Atlas Honda Limited

SustainabilityReport
CompanyOverview
Message forStakeholders
FinancialHighlights
FinancialStatements
OtherInformation
Financial Statements• Statement of Compliance with Code of Corporate Governance• Review Report to the Members on Code of Corporate Governance• Auditors’ Report to the Members• Statement of Financial Position• Statement of Profit or Loss & Other Comprehensive Income• Statement of Cash Flows• Statement of Changes in Equity• Notes to the Financial Statements
114

SustainabilityReport
CompanyOverview
Message forStakeholders
FinancialHighlights
FinancialStatements
OtherInformation
115

This statement is being presented to comply with the Listed Companies (Code of Corporate Governance) Regulations, 2017. The Company has applied the principles contained in the Listed Companies (Code of Corporate Governance) Regulations, 2017 in the following manner:
1. Total Number of directors are eight as per following:
a. Male Eight
b. Female None
2. The composition of Board of Directors is as follows:
Category Names
Independent Director Mr. Abid Naqvi
Executive Directors Mr. Saquib H. Shirazi
Mr. Yukitoshi Fujisaka
Mr. Hirofumi Yada
Non-Executive Directors Mr. Yusuf H. Shirazi
Mr. Hironobu Yoshimura
Mr. Sanaullah Qureshi
Mr. Jawaid Iqbal Ahmed
The independent director meets the criteria of independence under clause 1(b) of the CCG.
3. The directors have confirmed that none of them is serving as a director on more than five listed companies, including Atlas Honda Limited (excluding the listed subsidiaries of listed holding companies where applicable).
4. The Company has prepared a Code of Conduct and has ensured that appropriate steps have been taken to disseminate it throughout the Company along with its supporting policies and procedures.
5. The Board has developed a vision/mission statement, overall corporate strategy and significant policies of the Company. A complete record of particulars of significant policies along with the dates on which they were approved or amended has been maintained.
6. All the powers of the Board have been duly exercised and decisions on relevant matters have been taken by Board / shareholders as empowered by the relevant provisions of the Act and these Regulations.
7. The meetings of the Board were presided over by the Chairman and, in his absence, by a director elected by the Board for this purpose. The Board has complied with the requirements of the Act and the Regulations with respect to frequency, recording and circulating minutes of meetings of Board.
8. The Board of directors has a formal policy and transparent procedures for remuneration of directors in accordance with the Act and the Regulations.
9. The Board has arranged Directors’ Training program for the following directors during the year:• Mr Yukitoshi Fujisaka• Mr. Hirofumi Yada• Mr. Hironobu Yoshimura
Statement of Compliance with the Code of Corporate Governance
CompanyOverview
Message forStakeholders
FinancialHighlights
SustainabilityReport
FinancialStatements
OtherInformation
116

After the above training, as of March 31, 2019 all Directors have either obtained certification under the Directors’ Training Program or have obtained exemption from the Directors’ Training Program.
10. The Board has approved appointment of Chief Financial Officer, Company Secretary and Head of Internal Audit, including their remuneration and terms and conditions of employment and complied with relevant requirements of the Regulations.
11. Chief Financial Officer and Chief Executive Officer duly endorsed the financial statements before approval of the Board.
12. The Board has formed committees comprising of members given below:
a) Audit Committee
Mr. Sanaullah Qureshi Chairman
Mr. Abid Naqvi Member
Mr. Jawaid Iqbal Ahmed Member
b) HR and Remuneration Committee
Mr. Sanaullah Qureshi Chairman
Mr. Jawaid Iqbal Ahmed Member
Mr. Saquib H. Shirazi Member
13. The terms of reference of the aforesaid committees have been formed, documented and advised to the committee for compliance.
14. The frequency of meetings of the committee were as per following:
Audit Committee Quarterly
HR and Remuneration Committee On required basis
15. The Board has set up an effective internal audit function.
16. The statutory auditors of the Company have confirmed that they have been given a satisfactory rating under the quality control review program of the ICAP and registered with Audit Oversight Board of Pakistan, that they or any of the partners of the firm, their spouses and minor children do not hold shares of the company and that the firm and all its partners are in compliance with International Federation of Accountants (IFAC) guidelines on code of ethics as adopted by the ICAP
17. The statutory auditors or the persons associated with them have not been appointed to provide other services except in accordance with the Act, these regulations or any other regulatory requirement and the auditors have confirmed that they have observed IFAC guidelines in this regard.
18. We confirm that all other requirements of the Regulations have been complied with.
On behalf of the Board of Directors
Saquib H. ShiraziKarachi: April 24, 2019 Chief Executive Officer
CompanyOverview
Message forStakeholders
FinancialHighlights
SustainabilityReport
FinancialStatements
OtherInformation
117

We have reviewed the enclosed Statement of Compliance with Listed Companies (Code of Corporate Governance) Regulations, 2017 (the Regulations) prepared by the Board of Directors of Atlas Honda Limited (the Company) for the year ended March 31, 2019, in accordance with the requirements of regulation 40 of the Regulations.
The responsibility for compliance with the Regulations is that of the Board of Directors of the Company. Our responsibility is to review whether the Statement of Compliance reflects the status of the Company’s compliance with the provisions of the Regulations and report if it does not and to highlight any non-compliance with the requirements of the Regulations. A review is limited primarily to inquiries of the Company’s personnel and review of various documents prepared by the Company to comply with the Regulations. As a part of our audit of the financial statements we are required to obtain an understanding of the accounting and internal control systems sufficient to plan the audit and develop an effective audit approach. We are not required to consider whether the Board of Directors’ statement on internal control covers all risks and controls or to form an opinion on the effectiveness of such internal controls, the Company’s corporate governance procedures and risks. The Regulations require the Company to place before the Audit Committee, and upon recommendation of the Audit Committee, place before the Board of Directors for their review and approval, its related party transactions and also ensure compliance with the requirements of section 208 of the Companies Act, 2017. We are only required and have ensured compliance of this requirement to the extent of the approval of the related party transactions by the Board of Directors upon recommendation of the Audit Committee. We have not carried out procedures to assess and determine the Company’s process for identification of related parties and that whether the related party transactions were undertaken at arm’s length price or not.
Based on our review, nothing has come to our attention which causes us to believe that the Statement of Compliance does not appropriately reflect the Company’s compliance, in all material respects, with the requirements contained in the Regulations as applicable to the Company for the year ended March 31, 2019.
SHINEWING HAMEED CHAUDHRI & CO.CHARTERED ACCOUNTANTSKARACHI
DATED: 24 APRIL, 2019
Review Report on the Statement of Compliance Contained in Listed Companies (Code of Corporate Governance) Regulations, 2017
CompanyOverview
Message forStakeholders
FinancialHighlights
SustainabilityReport
FinancialStatements
OtherInformation
118

Opinion
We have audited the annexed financial statements of Atlas Honda Limited (the Company), which comprise the statement of financial position as at March 31, 2019, and the statement of profit or loss and other comprehensive income, the statement of changes in equity, the statement of cash flows for the year then ended, and notes to the financial statements, including a summary of significant accounting policies and other explanatory information, and we state that we have obtained all the information and explanations which, to the best of our knowledge and belief, were necessary for the purposes of the audit. In our opinion and to the best of our information and according to the explanations given to us, the statement of financial position, the statement of profit or loss and other comprehensive income, the statement of changes in equity and the statement of cash flows together with the notes forming part thereof conform with the accounting and reporting standards as applicable in Pakistan and give the information required by the Companies Act, 2017 (XIX of 2017), in the manner so required and respectively give a true and fair view of the state of the Company’s affairs as at March 31, 2019 and of the profit and other comprehensive loss, the changes in equity and its cash flows for the year then ended. Basis for Opinion We conducted our audit in accordance with International Standards on Auditing (ISAs) as applicable in Pakistan. Our responsibilities under those standards are further described in the Auditors’ Responsibilities for the Audit of the Financial Statements section of our report. We are independent of the Company in accordance with the International Ethics Standards Board for Accountants’ Code of Ethics for Professional Accountants as adopted by the Institute of Chartered Accountants of Pakistan (the Code) and we have fulfilled our other ethical responsibilities in accordance with the Code. We believe that the audit evidence we have obtained is sufficient and appropriate to provide a basis for our opinion. Key Audit Matters Key audit matters are those matters that, in our professional judgment, were of most significance in our audit of the financial statements of the current period. These matters were addressed in the context of our audit of the financial statements as a whole, and in forming our opinion thereon, and we do not provide a separate opinion on these matters.
Following are the Key Audit Matters:
S.No. Key Audit Matter How the matter was addressed in our audit
1. Capitalization of property, plant and equipment
As disclosed in notes 3 and 6 to the financial statements, the Company, during the year, incurred significant capital expenditure with additions of Rs.2,189,349 thousand made to its operating fixed asset on account of balancing, modernization & replacement, capacity expansion projects and introduction of new model.
We identified capital expenditure incurred during the year as a key audit matter as this represents significant transactions and involves certain judgemental area such as capitalization of eligible cost as per accounting and reporting standards.
Our audit procedures in respect of this area included:
Obtained an understanding of the management controls over capitalization and on a sample basis, tested relevant controls over authorization and recording in the system.
On a sample basis, tested the costs incurred with underlying supporting documentations i.e. purchase orders, delivery challans, supplier invoices, payment and other relevant documents.
Evaluate the nature of costs on a sample basis to ensure capitalization criteria of relevant accounting and reporting standards.
Ensured the adequacy of the related disclosures and assessed these are in accordance with the applicable financial reporting standards and the Companies Act, 2017.
Report on the Audit of the Financial Statements
CompanyOverview
Message forStakeholders
FinancialHighlights
SustainabilityReport
FinancialStatements
OtherInformation
119

2. Revenue recognition
Refer notes 5.23, 25 and 38 to the financial statements. The Company has generated revenue from sales of motorcycle and spare parts. The revenue recognition is identified as a key audit matter due to its significance as key indicator for performance of management and creates an inherent risk that revenue could be misstated to meet targets.
Our audit procedures in respect of this area included:
Obtained an understanding of the Company’s processes and related internal controls for revenue recognition and on a sample basis, tested the effectiveness of those controls.
On a sample basis compared sales transactions near the statement of financial position date to assess whether transactions are recorded in relevant accounting period. Performed test of details on a sample basis with underlying documentations by inspecting and comparing customer orders, delivery challans, invoices and other related documents. Ensured the adequacy of the related disclosures in accordance with the applicable financial reporting standards and the Companies Act, 2017.
Information Other than the Financial Statements and Auditors’ Report Thereon Management is responsible for the other information. The other information comprises the information included in the Company’s Annual Report for 2019, but does not include the financial statements and our auditors’ report thereon. Our opinion on the financial statements does not cover the other information and we do not express any form of assurance conclusion thereon. In connection with our audit of the financial statements, our responsibility is to read the other information and, in doing so, consider whether the other information is materially inconsistent with the financial statements or our knowledge obtained in the audit or otherwise appears to be materially misstated. If, based on the work we have performed, we conclude that there is a material misstatement of this other information, we are required to report that fact. We have nothing to report in this regard. Responsibilities of Management and Board of Directors for the Financial Statements Management is responsible for the preparation and fair presentation of the financial statements in accordance with the accounting and reporting standards as applicable in Pakistan and the requirements of Companies Act, 2017 (XIX of 2017) and for such internal control as management determines is necessary to enable the preparation of financial statements that are free from material misstatement, whether due to fraud or error.
In preparing the financial statements, management is responsible for assessing the Company’s ability to continue as a going concern, disclosing, as applicable, matters related to going concern and using the going concern basis of accounting unless management either intends to liquidate the Company or to cease operations, or has no realistic alternative but to do so. Board of directors are responsible for overseeing the Company’s financial reporting process.
Auditors’ Responsibilities for the Audit of the Financial Statements Our objectives are to obtain reasonable assurance about whether the financial statements as a whole are free from material misstatement, whether due to fraud or error, and to issue an auditors’ report that includes our opinion. Reasonable assurance is a high level of assurance, but is not a guarantee that an audit conducted in accordance with ISAs as applicable in Pakistan will always detect a material misstatement when it exists. Misstatements can arise from fraud or error and are considered material if, individually or in the aggregate, they could reasonably be expected to influence the economic decisions of users taken on the basis of these financial statements.
As part of an audit in accordance with ISAs as applicable in Pakistan, we exercise professional judgment and maintain professional skepticism throughout the audit. We also:
• Identify and assess the risks of material misstatement of the financial statements, whether due to fraud or error, design and perform audit procedures responsive to those risks, and obtain audit evidence that is sufficient and appropriate to provide a basis for our opinion. The risk of not detecting a material misstatement resulting from fraud is higher than for one resulting from error, as fraud may involve collusion, forgery, intentional omissions, misrepresentations, or the override of internal control.
• Obtain an understanding of internal control relevant to the audit in order to design audit procedures that are appropriate in the circumstances, but not for the purpose of expressing an opinion on the effectiveness of the Company’s internal control.
CompanyOverview
Message forStakeholders
FinancialHighlights
SustainabilityReport
FinancialStatements
OtherInformation
120

• Evaluate the appropriateness of accounting policies used and the reasonableness of accounting estimates and related disclosures made by management.
• Conclude on the appropriateness of management’s use of the going concern basis of accounting and, based on the audit evidence obtained, whether a material uncertainty exists related to events or conditions that may cast significant doubt on the Company’s ability to continue as a going concern. If we conclude that a material uncertainty exists, we are required to draw attention in our auditors’ report to the related disclosures in the financial statements or, if such disclosures are inadequate, to modify our opinion. Our conclusions are based on the audit evidence obtained up to the date of our auditors’ report. However, future events or conditions may cause the Company to cease to continue as a going concern.
• Evaluate the overall presentation, structure and content of the financial statements, including the disclosures, and whether the financial statements represent the underlying transactions and events in a manner that achieves fair presentation.
We communicate with the board of directors regarding, among other matters, the planned scope and timing of the audit and significant audit findings, including any significant deficiencies in internal control that we identify during our audit.
We also provide the board of directors with a statement that we have complied with relevant ethical requirements regarding independence, and to communicate with them all relationships and other matters that may reasonably be thought to bear on our independence, and where applicable, related safeguards.
From the matters communicated with the board of directors, we determine those matters that were of most significance in the audit of the financial statements of the current period and are therefore the key audit matters. We describe these matters in our auditors’ report unless law or regulation precludes public disclosure about the matter or when, in extremely rare circumstances, we determine that a matter should not be communicated in our report because the adverse consequences of doing so would reasonably be expected to outweigh the public interest benefits of such communication.
Report on other Legal and Regulatory Requirements Based on our audit, we further report that in our opinion:
a) proper books of account have been kept by the Company as required by the Companies Act, 2017 (XIX of 2017);
b) the statement of financial position, the statement of profit or loss and other comprehensive income, the statement of changes in equity and the statement of cash flows together with the notes thereon have been drawn up in conformity with the Companies Act, 2017 (XIX of 2017) and are in agreement with the books of account and returns;
c) investments made, expenditure incurred and guarantees extended during the year were for the purpose of the Company’s business; and
d) zakat deductible at source under the Zakat and Ushr Ordinance, 1980 (XVIII of 1980), was deducted by the Company and deposited in the Central Zakat Fund established under section 7 of that Ordinance.
The engagement partner on the audit resulting in this independent auditors’ report is Raheel Ahmed.
SHINEWING HAMEED CHAUDHRI & CO.CHARTERED ACCOUNTANTSKARACHI
DATED: 24 APRIL, 2019
CompanyOverview
Message forStakeholders
FinancialHighlights
SustainabilityReport
FinancialStatements
OtherInformation
121

2019 2018
ASSETS Note ---- Rupees in ‘000 ----
Non current assetsProperty, plant and equipment 6 8,950,633 7,976,101 Intangible assets 7 168,924 44,905 Long term investments 8 323,497 324,899 Long term loans and advances 9 33,467 31,481 Long term deposits 13,882 22,573
9,490,403 8,399,959 Current assetsStores, spares and loose tools 10 725,754 650,160 Stock-in-trade 11 5,069,836 2,599,530 Trade debts 12 1,116,000 861,224 Loans and advances 13 43,794 40,107 Trade deposits and prepayments 14 1,007,128 137,663 Accrued mark-up / interest 37,614 15,557 Other receivables 15 573,080 15,528 Taxation - net 1,149,424 725,750 Short term investments 16 5,261,724 8,400,246 Bank balances 17 7,480,159 9,981,615
22,464,513 23,427,380 31,954,916 31,827,339
EQUITY AND LIABILITIESEquityShare capital 18 1,034,066 1,034,066 Reserves 19 14,331,698 14,966,655
15,365,764 16,000,721 Non current liabilitiesStaff retirement benefits 20 296,409 262,882 Deferred taxation 21 700,024 698,042
996,433 960,924 Current liabilitiesTrade and other payables 22 15,500,137 14,802,091 Unclaimed dividend 92,582 63,603
15,592,719 14,865,694 16,589,152 15,826,618
Contingencies and commitments 24 31,954,916 31,827,339
The annexed notes 1 to 45 form an integral part of these financial statements.
Statement of Financial PositionAs at March 31, 2019
Yusuf H. Shirazi Saquib H. Shirazi Kashif YasinChairman Chief Executive Officer Chief Financial Officer
CompanyOverview
Message forStakeholders
FinancialHighlights
SustainabilityReport
FinancialStatements
OtherInformation
122

Statement of Profit or Loss andOther Comprehensive IncomeFor the Year Ended March 31, 2019
2019 2018Note --- Rupees in ‘000 ---
Sales 25 82,412,548 77,478,845
Cost of sales 26 (75,856,677) (69,188,101)
Gross profit 6,555,871 8,290,744
Sales and marketing expenses 27 (1,924,062) (1,852,057)
Administrative expenses 28 (640,209) (634,594)
Other income 29 1,097,636 877,908
Other operating expenses 30 (463,793) (445,037)
Share of net profit of an Associate 15,698 50,607
Operating profit 4,641,141 6,287,571
Finance costs 31 (25,818) (22,725)
Profit before taxation 4,615,323 6,264,846
Income tax expense 32 (1,406,664) (1,601,211)
Profit for the year 3,208,659 4,663,635
Other comprehensive income:
Items that will not be reclassified to profit or loss
Remeasurements of staff retirement benefit obligation (24,070) (10,607)
Income tax relating to this remeasurement 6,499 3,182
Other comprehensive loss for the year - net of tax (17,571) (7,425)
Total comprehensive income for the year 3,191,088 4,656,210
-------- Rupees --------
Earnings per share - basic and diluted 33 31.03 45.10
The annexed notes 1 to 45 form an integral part of these financial statements.
Yusuf H. Shirazi Saquib H. Shirazi Kashif YasinChairman Chief Executive Officer Chief Financial Officer
CompanyOverview
Message forStakeholders
FinancialHighlights
SustainabilityReport
FinancialStatements
OtherInformation
123
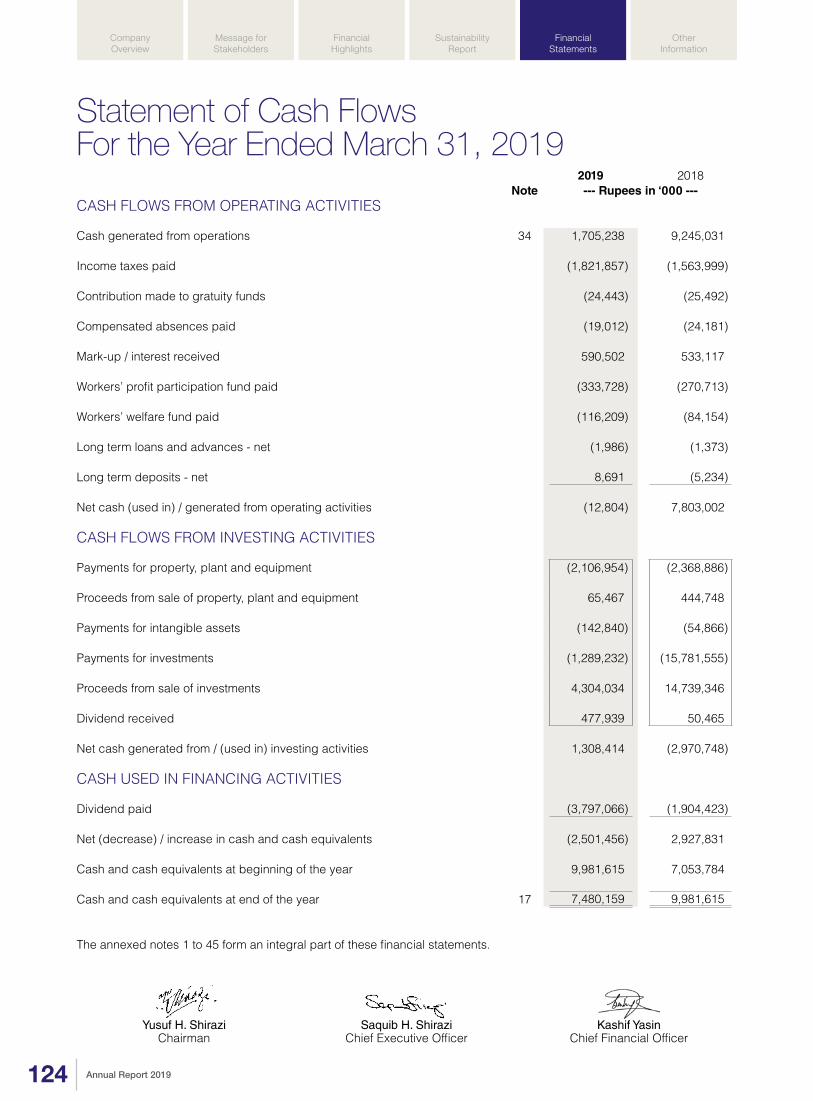
Statement of Cash FlowsFor the Year Ended March 31, 2019
2019 2018Note --- Rupees in ‘000 ---
CASH FLOWS FROM OPERATING ACTIVITIES
Cash generated from operations 34 1,705,238 9,245,031
Income taxes paid (1,821,857) (1,563,999)
Contribution made to gratuity funds (24,443) (25,492)
Compensated absences paid (19,012) (24,181)
Mark-up / interest received 590,502 533,117
Workers’ profit participation fund paid (333,728) (270,713)
Workers’ welfare fund paid (116,209) (84,154)
Long term loans and advances - net (1,986) (1,373)
Long term deposits - net 8,691 (5,234)
Net cash (used in) / generated from operating activities (12,804) 7,803,002
CASH FLOWS FROM INVESTING ACTIVITIES
Payments for property, plant and equipment (2,106,954) (2,368,886)
Proceeds from sale of property, plant and equipment 65,467 444,748
Payments for intangible assets (142,840) (54,866)
Payments for investments (1,289,232) (15,781,555)
Proceeds from sale of investments 4,304,034 14,739,346
Dividend received 477,939 50,465
Net cash generated from / (used in) investing activities 1,308,414 (2,970,748)
CASH USED IN FINANCING ACTIVITIES
Dividend paid (3,797,066) (1,904,423)
Net (decrease) / increase in cash and cash equivalents (2,501,456) 2,927,831
Cash and cash equivalents at beginning of the year 9,981,615 7,053,784
Cash and cash equivalents at end of the year 17 7,480,159 9,981,615
The annexed notes 1 to 45 form an integral part of these financial statements.
Yusuf H. Shirazi Saquib H. Shirazi Kashif YasinChairman Chief Executive Officer Chief Financial Officer
CompanyOverview
Message forStakeholders
FinancialHighlights
SustainabilityReport
FinancialStatements
OtherInformation
124

Statement of Changes in EquityFor the Year Ended March 31, 2019
Share Capital
Capital reserves Revenue reserves
TotalShare Premium
Gain on Sale of Land
General Reserve
Unappro-priatedProfit
---------------------------------- Rupees in ‘000 ----------------------------------
Balance as at April 1, 2017 1,034,066 39,953 165 6,992,000 5,191,349 13,257,533
Transfer to general reserve - - - 1,000,000 (1,000,000) -
Transaction with owners in their capacity as owners
Final dividend for the year ended March 31, 2017 at the rate of Rs.18.50 per share - - - - (1,913,022) (1,913,022)
Total comprehensive income for the year ended March 31, 2018
Profit for the year - - - - 4,663,635 4,663,635
Other comprehensive loss - - - - (7,425) (7,425)
- - - - 4,656,210 4,656,210
Balance as at March 31, 2018 1,034,066 39,953 165 7,992,000 6,934,537 16,000,721
Transfer to general reserve - - - 1,500,000 (1,500,000) -
Transaction with owners in their capacity as owners
Final dividend for the year ended March 31, 2018 at the rate of Rs.27.0 per share - - - - (2,791,979) (2,791,979)
Interim dividend for the half year ended September 30, 2018 at the rate of Rs.10.0 per share - - - - (1,034,066) (1,034,066)
Total comprehensive income for the year ended March 31, 2019
Profit for the year - - - - 3,208,659 3,208,659
Other comprehensive loss - - - - (17,571) (17,571)
- - - - 3,191,088 3,191,088
Balance as at March 31, 2019 1,034,066 39,953 165 9,492,000 4,799,580 15,365,764
The annexed notes 1 to 45 form an integral part of these financial statements.
Yusuf H. Shirazi Saquib H. Shirazi Kashif YasinChairman Chief Executive Officer Chief Financial Officer
CompanyOverview
Message forStakeholders
FinancialHighlights
SustainabilityReport
FinancialStatements
OtherInformation
125

Notes to the Financial StatementsFor the Year Ended March 31, 20191. LEGAL STATUS AND OPERATIONS
Atlas Honda Limited (the Company) was incorporated as a public limited company on October 16, 1962 under the Companies Act, 1913 (now the Companies Act, 2017) and its shares are quoted on Pakistan Stock Exchange Limited. The registered office is located at 1- McLeod Road, Lahore. The Company is principally engaged in progressive manufacturing and marketing of motorcycles and spare parts.
The Company is a subsidiary of Shirazi Investments (Private) Limited, which holds 52.43% of issued, subscribed and paid-up capital of the Company as at March 31, 2019.
The geographical location and addresses of the Company’s business units including plants are as follows:
Business unit Geographical location and address
Registered office 1 - McLeod Road, Lahore
Manufacturing plant
Karachi F-36, Estate Avenue, S.I.T.E., Karachi
Sheikhupura 26-27 Km, Lahore-Sheikhupura Road, Sheikhupura
Branch offices
Lahore 1st Floor, 28-Mozang Road, Lahore
Islamabad Plot No. 784/785, Golra Road, Islamabad
Faisalabad 1st Floor, Meezan Executive Tower, Liaquat Road, Faisalabad
Multan Azmat Wasti Road, Multan
Hyderabad 2nd Floor, Dawood Centre, Autobhan Road, Hyderabad
Rahim Yar Khan Makhdoom Altaf Road, West Sadiq Canal Bank, Near City School, Rahim Yar Khan
2. BASIS OF PREPARATION
2.1 Statement of compliance
These financial statements have been prepared in accordance with the accounting and reporting standards as applicable in Pakistan. The accounting and reporting standards applicable in Pakistan comprise:
- International Financial Reporting Standards (IFRS) issued by the International Accounting Standards Board (IASB) as notified under the Companies Act, 2017;
- Islamic Financial Accounting Standards (IFAS) issued by the Institute of Chartered Accountants of Pakistan as notified under the Companies Act, 2017; and
- Provision of and directives issued under the Companies Act, 2017.
Where provision of and directives issued under the Companies Act, 2017 differ from the IFRS, the provision of and directives issued under the Companies Act, 2017 have been followed.
2.2 Basis of measurement
These financial statements have been prepared under the historical cost convention except for certain financial instruments, which are carried at fair values and staff retirement benefit - gratuity which is carried at present value of defined benefit obligation net of fair value of plan assets.
CompanyOverview
Message forStakeholders
FinancialHighlights
SustainabilityReport
FinancialStatements
OtherInformation
126

2.3 Functional and presentation currency
These financial statements are presented in Pakistani Rupees, which is the functional currency of the Company and figures are rounded off to the nearest thousand of Rupees.
2.4 Critical accounting estimates and judgements
The preparation of financial statements in conformity with approved accounting standards requires management to make judgements, estimates and assumptions that affect the application of policies and the reported amount of assets, liabilities, income and expenses.
The estimates and judgements are based on historical experience and various other factors that are believed to be reasonable under the circumstances and are continually evaluated. The resulting accounting estimates will, by definition, seldom equal the related actual results. The estimates and underlying assumptions are reviewed on an on-going basis. Revisions to accounting estimates are recognised in the period in which the estimates are revised if the revision affects only that period, or in the period of the revision and future periods. Judgements made by management in application of the approved accounting standards that have significant effect on the financial statements and estimates with a significant risk of material adjustments in the next year are discussed in respective policy note. The areas involving significant estimates or judgements are:
(i) Estimated useful life of property, plant and equipment and intangible assets [notes 5.1 and 5.2];
(ii) Provision for slow moving inventories [notes 5.9 and 5.10];
(iii) Estimate of payables and receivables in respect of staff retirement benefit schemes [notes 5.15 and 22.7];
(iv) Estimate of provision for warranty [note 5.20]; and
(v) Estimation of current and deferred tax [note 5.21].
3. SUMMARY OF SIGNIFICANT TRANSACTIONS AND EVENTS
Capital expenditure
During the year, the Company incurred major capital expenditure as part of its plan for capacity expansion, balancing, modernization & replacement (BMR) and introduction of new products. This is reflected in operating fixed assets note 6.
New model
The Company launched its new models in the 125cc category named as CB 125F and CG 125S (self) in January 2019 and February 2019 respectively.
Interim dividend
The Company declared interim dividend in October 2018 at the rate of Rs.10 per share aggregating to Rs.1,034,066 thousand.
For detailed performance review of the Company, refer Directors’ Report.
4. NEW AND AMENDED STANDARDS AND INTERPRETATIONS
4.1 Standards, amendments to approved accounting standards effective in current year
New and amended standards and interpretations mandatory for the first time for the financial year beginning April 1, 2018:
(a) IFRIC 22 Foreign currency transactions
The interpretation clarifies which date should be used for translation when a foreign currency transaction involves an advance payment or receipt. The related item is translated using the exchange rate on the date that the advance foreign currency was paid or received and the prepayment or deferred income was recognised. The Company’s accounting treatment is already in line with this interpretation.
The other new standards, amendments to approved accounting standards and interpretations that are mandatory for the financial year beginning on April 1, 2018 are considered not to be relevant or to have any significant effect on the Company’s financial reporting and operations.
CompanyOverview
Message forStakeholders
FinancialHighlights
SustainabilityReport
FinancialStatements
OtherInformation
127

4.2 Standards, amendments to approved accounting standards and interpretations that are not yet effective and have not been early adopted by the Company
The following new standards and amendments to approved accounting standards are not effective for the financial year beginning on April 1, 2018 and have not been early adopted by the Company:
(a) IFRS 9 Financial instruments Effective date: June 30, 2019
IASB has published the complete version of IFRS 9, ‘Financial instruments’, which replaces the guidance in IAS 39. This final version includes requirements on the classification and measurement of financial assets and liabilities. It also includes an expected credit losses model that replaces the incurred loss impairment model currently being used. The standard is not likely to have material impact on the Company’s financial statements.
(b) IFRS 15 Revenue from contracts with customers Effective date: July 1, 2018
IFRS 15 will replace IAS 18 which covers contracts for goods and services and IAS 11 which covers construction contracts. IFRS 15 introduces a single five-step model for revenue recognition and establishes a comprehensive framework for recognition of revenue from contracts with customers based on a core principle that an entity should recognise revenue representing the transfer of promised goods or services to customers in an amount that reflects the consideration to which the entity expects to be entitled in exchange for those goods or services. The Company is yet to assess the full impact of this standard.
(c) IFRS 16 Leases Effective date: January 1, 2019
IFRS 16 will affect primarily the accounting by lessees and will result in the recognition of almost all leases on statement of financial position. The standard removes the current distinction between operating and financing leases and requires recognition of an asset (the right to use the leased item) and a financial liability to pay rentals for virtually all lease contracts. An optional exemption exists for short-term and low-value leases. The accounting by lessors will not significantly change. Some differences may arise as a result of the new guidance on the definition of a lease. Under IFRS 16, a contract is, or contains, a lease if the contract conveys the right to control the use of an identified asset for a period of time in exchange for consideration. The Company has yet to assess the full impact of this standard on its financial statements.
(d) IAS 12 Income taxes Effective date: January 1, 2019
This amendment as part of the annual improvement 2015-2017 cycle, clarifies that all income tax consequences of dividends (including payments on financial instruments classified as equity) are recognised consistently with the transactions that generated the distributable profits – i.e. in profit or loss, other comprehensive income or equity. The amendments are not likely to have material impact on the Company’s financial statements.
(e) IAS 23 Borrowing costs Effective date: January 1, 2019
The amendment is part of the annual improvement 2015-2017 cycle. The amendment clarifies that the general borrowings pool used to calculate eligible borrowing costs exclude only borrowings that specifically finance qualifying assets that are still under development or construction. Borrowings that were intended to specifically finance qualifying assets that are now ready for their intended use or sale – or any non-qualifying assets – are included in that general pool. This amendment will be applied prospectively to borrowing costs incurred on or after the date an entity adopts the amendments. The amendments are not likely to have material impact on the Company’s financial statements.
(f) IFRIC 23 Uncertainty over income tax treatment Effective date: January 1, 2019
The interpretation clarifies the accounting for income tax when there is uncertainty over income tax treatment under IAS 12. The interpretation requires the uncertainty over tax treatment be reflected in the measurement of current and deferred tax. The amendments are not expected to have a material impact on the Company’s financial statements.
There are number of other standards, amendments and interpretations to the approved accounting standards that are not yet effective and are also not relevant to the Company and therefore, have not been presented here.
5. SIGNIFICANT ACCOUNTING POLICIES
The principal accounting policies applied in the preparation of these financial statements are set out below. These polices have been consistently applied to all the years presented, unless otherwise stated.
CompanyOverview
Message forStakeholders
FinancialHighlights
SustainabilityReport
FinancialStatements
OtherInformation
128

5.1 Property, plant and equipment
Owned assets
The Company has adopted cost model for its property, plant and equipment. Property, plant and equipment except for freehold land and capital work-in-progress are stated at cost less accumulated depreciation and impairment loss, if any. Freehold land is stated at cost less impairment loss, if any. Cost includes expenditure that is directly attributable to the acquisition of the asset, including any borrowing cost (note 5.24). The cost of a self constructed asset includes cost of materials, labour and other overheads that are directly attributable to bringing the asset to a working condition for its intended use, costs of dismantling / removing the asset and restoring the site on which it is located. Items of property, plant and equipment individually costing Rs. 25,000 or less are charged to the statement of profit or loss as and when purchased.
Capital work-in-progress is stated at cost accumulated up to the reporting date less accumulated impairment loss, if any. Capital work-in-progress is recognised as an operating fixed asset when it is made available for its intended use.
Where major components of an item of property, plant and equipment have different useful lives, they are accounted for in the books of account as separate items of property, plant and equipment.
Subsequent costs including major renewals and improvements are included in the carrying amount of the asset or are recognised as a separate asset, as appropriate, only when it is probable that the future economic benefits associated with the asset will flow to the Company and the cost of the asset can be measured reliably. The carrying amount of the replaced part is derecognised at the time of replacement. Normal repair and maintenance and day-to-day servicing are charged to the statement of profit or loss as and when incurred.
Depreciation is charged to the statement of profit or loss using reducing balance method except for dies and jigs, office equipment, computers and accessories and furniture & fixtures, without considering extra shifts. Depreciation on dies and jigs, office equipment, computers and accessories and furniture & fixtures is charged to the statement of profit or loss using straight line method. Depreciation on additions is charged from the month in which the asset is available for use while no depreciation is charged for the month in which the asset is disposed-off.
The depreciation methods, useful lives and residual values of items of property, plant and equipment are reviewed periodically and altered if circumstances or expectations have changed significantly. Any change or adjustment in depreciation method, useful lives and residual values is accounted for as a change in accounting estimate under IAS 8, ‘Accounting policies, changes in accounting estimates and errors’ and is applied prospectively in the financial statements by adjusting the depreciation charge for the period in which the amendment or change has been made and for future periods.
Disposal of an item of property, plant and equipment is recognised when significant risk and rewards, incidental to the ownership of that asset, have been transferred to the buyer. Gains and losses on disposals are determined by comparing the carrying amount of that asset with the sales proceeds and are recognised within ‘other income / other operating expenses’ in the statement of profit or loss.
Leased assets
Lease that substantially transfers all the risks and rewards incidental to the ownership of an asset to the Company is classified as finance lease. Upon initial recognition, the leased asset is measured at an amount equal to the lower of its fair value and present value of minimum lease payments. Subsequent to the initial recognition, the asset is accounted for in accordance with the accounting policy applicable for owned assets.
5.2 Intangible assets
These are stated at cost less accumulated amortisation and impairment losses, if any and represent cost of software licenses, SAP implementation & support cost and license fee of certain products / components that are being manufactured by the Company under technology transfer arrangements.
Costs associated with maintaining these assets are charged to the statement of profit or loss as and when incurred. However, costs that are directly attributable to the identifiable asset and have probable economic benefits exceeding one year, are recognised as intangible asset. Direct costs include purchase cost of the asset, salaries and other service benefits of staff deployed towards development of the asset and other related overheads. Expenditure incurred in respect of design, construction and testing of an intangible asset are also added to the carrying amount of that asset.
Expenditure which enhances or extends the performance of the asset beyond its original specifications is recognised as a capital improvement and added to the original cost of the asset.
CompanyOverview
Message forStakeholders
FinancialHighlights
SustainabilityReport
FinancialStatements
OtherInformation
129

All intangible assets are estimated to have definite useful lives and are amortised from the month the software / license is acquired, made available for use or extended support cost is incurred, using the straight line method over a period of 2 to 5 years.
5.3 Impairment of non-financial assets
Non-financial assets are reviewed at each reporting date to identify circumstances indicating occurrence of impairment loss or reversal of previous impairment losses, if any. An impairment loss is recognised for the amount by which the asset’s carrying amount exceeds its recoverable amount. The recoverable amount is the higher of an asset’s fair value less cost to sell and value in use. Reversal of impairment loss is restricted to the original cost of the asset.
5.4 Investments in equity instruments of an Associate
Investment in an Associate is accounted for using the equity method of accounting. Under the equity method, the investment is initially recognised at cost, and the carrying amount is increased or decreased to recognise the Company’s share of profit or loss of the investee after the date of acquisition.
The Company’s share of post acquisition profit or loss is recognised in the statement of profit or loss, and its share of post acquisition movements in other comprehensive income is recognised in other comprehensive income with the corresponding adjustment to the carrying amount of the investment. When the Company’s share of losses in an Associate equals or exceeds its interest in the Associate, the Company does not recognise further losses, unless it has incurred legal or constructive obligations or made payments on behalf of the Associate.
The Company determines at each reporting date whether there is any objective evidence that the investment in the Associate is impaired. If this is the case, the Company calculates the amount of impairment as the difference between the recoverable amount of the Associate and its carrying value and recognises the amount adjacent to share of profit / loss of an Associate in the statement of profit or loss.
5.5 Financial assets
5.5.1 Classification
The Company classifies its financial assets in the following categories: at fair value through profit or loss, loans and receivables, held to maturity and available-for-sale. The classification depends on the purpose for which the financial assets were acquired. Management determines the classification of its financial assets at initial recognition.
(a) Financial assets at fair value through profit or loss
Financial assets at fair value through profit or loss are financial assets held for trading. A financial asset is classified in this category if acquired principally for the purpose of selling in short term. Derivatives are also categorised as held for trading unless they are designated as hedges. Assets in this category are classified as current assets.
(b) Loans and receivables
Loans and receivables are non-derivative financial assets with fixed or determinable payments that are not quoted in an active market. They are included in current assets, except for maturities greater than 12 months after the end of the reporting period, in which case, these are classified as non-current assets.
(c) Held to maturity financial assets
Held to maturity financial assets are non-derivative financial assets with fixed or determinable payments and fixed maturity with a positive intention and ability to hold till maturity.
(d) Available-for-sale financial assets
Available-for-sale financial assets are non-derivative that are either designated in this category or not classified in any of the other categories. They are included in non-current assets unless the investment matures or management intends to dispose it off within 12 months of the end of the reporting date.
5.5.2 Recognition and measurement
Regular purchases and sales of financial assets are recognised on the trade-date – the date on which the Company commits to purchase or sell the asset. Investments are initially recognised at fair value plus transaction costs for all financial assets not carried at fair value through profit or loss. Financial assets carried at fair value through profit or loss are initially recognised at fair value, and transaction costs are expensed in the statement of profit or loss. Financial assets are derecognised when the rights to receive cash flows from the investments have expired or have been transferred and the Company has transferred substantially all risks and rewards of ownership. Available-for-sale financial assets and financial assets at fair value through profit or loss are subsequently carried at fair value. Loans and receivables and held to maturity investments are subsequently carried at amortised cost using the effective interest method.
CompanyOverview
Message forStakeholders
FinancialHighlights
SustainabilityReport
FinancialStatements
OtherInformation
130

Gains or losses arising from changes in fair value of the ‘financial assets at fair value through profit or loss’ category are presented in the statement of profit or loss within ‘other income / other operating expenses’ in the period in which they arise. Dividend income from financial assets at fair value through profit or loss is recognised in the statement of profit or loss as part of ‘other income’ when the Company’s right to receive payments is established.
Changes in the fair value of monetary and non-monetary securities classified as available-for-sale are recognised in ‘Other comprehensive income’.
When securities classified as available-for-sale are sold or impaired, the accumulated fair value adjustments recognised in equity are included in the statement of profit or loss as ‘gains / losses from investment securities’.
Interest on available-for-sale securities and held to maturity investments is calculated using the effective interest method and is recognised in the statement of profit or loss as part of ‘other income’. Dividend income from available-for-sale equity instruments is recognised in the statement of profit or loss as part of ‘other income’ when the Company’s right to receive payments is established.
The Company assesses at the end of each reporting period whether there is objective evidence that a financial asset or a group of financial assets is impaired. If any such evidence exists for available-for-sale financial assets, the cumulative loss - measured as the difference between the acquisition cost and the current fair value, less any impairment loss on that financial asset previously recognised in profit or loss - is removed from equity and recognised in the statement of profit or loss. Impairment losses recognised in the statement of profit or loss on equity instruments are not reversed through the statement of profit or loss. Impairment testing of other receivables is described in note 5.11.
5.6 Financial liabilities
Financial liabilities are recognised at the time when the Company becomes a party to the contractual provisions of the instrument. All financial liabilities are recognised initially at fair value less directly attributable transactions costs, if any, and subsequently measured at amortised cost using effective interest method.
A financial liability is derecognised when the obligation under the liability is discharged or cancelled or expired. Where an existing financial liability is replaced by another from the same lender on substantially different terms or the terms of an existing liability are substantially modified, such an exchange or modification is treated as a derecognition of original liability and recognition of a new liability and the difference in respective carrying amounts is recognised in the statement of profit or loss.
5.7 Off-setting financial instruments
Financial assets and liabilities are off-set and the net amount reported in the statement of financial position when there is a legally enforceable right to off-set the recognised amounts and there is an intention to settle on a net basis or realise the asset and settle the liability simultaneously. The legally enforceable right must not be contingent on future events and must be enforceable in the normal course of business and in the event of default, insolvency or bankruptcy of the Company or the counter party.
5.8 Derivative financial instruments and hedging activities
Derivatives are initially recognised at fair value on the date a derivative contract is entered into and are subsequently re-measured at their fair values. The method of recognising the resulting gain or loss depends on whether the derivative is designated as a hedging instrument. If so, the nature of the item being hedged. The Company designates certain derivatives as either fair value hedge or cash flow hedge.
(a) Fair value hedge
Fair value hedge represents a hedge of the fair value of a recognised asset or liability or a firm commitment. Changes in the fair value of a derivative that is designated and qualify as fair value hedge is recorded in the statement of profit or loss, together with any changes in the fair value of the hedged asset or liability that are attributable to the hedged risk. The carrying value of the hedged item is adjusted accordingly.
(b) Cash flow hedge
Cash flow hedge represents a hedge of a highly probable forecast transaction. The effective portion of changes in the fair value of derivatives that are designated and qualify as cash flow hedges is recognised in other comprehensive income. The gain or loss relating to the ineffective portion is recognised immediately in the statement of profit or loss. Amounts accumulated in equity are reclassified to the statement of profit or loss in the periods when the hedged item affects the statement of profit or loss.
5.9 Stores, spares and loose tools
Stores, spares and loose tools are stated at lower of cost and net realisable value. The cost of inventory is based on weighted average cost. Items-in-transit are stated at cost accumulated up to the reporting date. The Company reviews the carrying amounts of stores, spares and loose tools on an on-going basis and provision is made for obsolescence if there is any change in usage pattern and physical form. Impairment is also made for slow moving items.
CompanyOverview
Message forStakeholders
FinancialHighlights
SustainabilityReport
FinancialStatements
OtherInformation
131

5.10 Stock-in-trade
Stock-in-trade are stated at the lower of cost and net realisable value. Cost of raw materials and components represent invoice values plus other charges incurred thereon. Cost of inventory is based on weighted average cost. Cost in relation to work-in-process and finished goods represent direct cost of raw materials, wages and appropriate manufacturing overheads. Goods in transit are valued at cost accumulated up to the reporting date.
The Company reviews the carrying amount of stock-in-trade on an on-going basis and as appropriate, inventory is written down to its net realisable value or provision is made for obsolescence if there is any change in usage pattern and physical form of related inventory.
Net realisable value is the estimated selling price in the ordinary course of business less costs necessary to be incurred in order to make the sale.
5.11 Trade debts and other receivables
Trade and other receivables are initially recognised at original invoice amount which is the fair value of consideration to be received in future and subsequently measured at cost as reduced by appropriate provision for receivables considered to be doubtful. A provision is established when there is objective evidence that the Company will not be able to collect all amounts due according to the original terms of receivables. The amount of provision is charged to the statement of profit or loss. Trade and other receivables considered irrecoverable are written-off.
Exchange gains and losses arising in respect of trade and other receivables in foreign currency are added to the carrying amount of the receivables.
5.12 Cash and cash equivalents
Cash and cash equivalents are carried in the statement of financial position at cost. For the purpose of cash flow statement, cash and cash equivalents represent balances with banks.
5.13 Non current assets held for sale
Non current assets are classified as assets held for sale when their carrying amount is to be recovered principally through a sale transaction rather than continuing use and sale is considered highly probable. They are stated at the lower of carrying amount and fair value less cost to sell.
5.14 Share capital
Ordinary shares are classified as equity and recognised at their face value.
5.15 Retirement and other service benefit obligations
5.15.1 Defined contribution plans
A defined contribution plan is a post employment benefit plan under which an entity pays fixed contribution into a separate entity and will have no legal or constructive obligation to pay further amounts. Obligation for contribution to a defined contribution plan is recognised as an employee service benefit expense in the statement of profit or loss when it is due.
The Company operates defined contribution plans for its permanent employees excluding expatriates, through either one of the following ways:
• a recognised provident fund; or
• voluntary pension schemes managed by Atlas Asset Management Limited, a related party, under the Voluntary Pension System Rules, 2005, viz., Atlas Pension Fund and Atlas Pension Islamic Fund.
All the newly appointed employees are offered voluntary pension scheme only. However, those employees who are provident fund trust members, have the option to opt for either of two above-mentioned defined contribution plans.
Equal monthly contributions at the rate of 11% of the basic salary are made to the fund / scheme both by the Company and the employees. The fund is a separate legal entity and its assets are being held separately under the control of its Trustees.
CompanyOverview
Message forStakeholders
FinancialHighlights
SustainabilityReport
FinancialStatements
OtherInformation
132

5.15.2 Defined benefit plans
Defined benefit plan is a post-employment benefit plan other than the defined contribution plan. Defined benefit plans define an amount of gratuity that an employee will receive on retirement, usually dependent on one or more factors such as age and years of service. The liability recognised in the statement of financial position is the present value of the defined benefit obligation at the end of the reporting period less the fair value of the plan assets.
The Company has established separate funded gratuity schemes for its management and non-management staff who completes qualifying period of service. Contributions under the schemes are made on the basis of actuarial valuation using Projected Unit Credit Method, related details of which are given in note 22.7 to the financial statements.
The amount arising as a result of re-measurements are recognised in the statement of financial position immediately, with a charge or credit to other comprehensive income in the periods in which they occur. Past service cost are recognised immediately in the statement of profit or loss.
5.15.3 Compensated absences
Employees’ entitlement to annual leaves is recognised when they accrue to the employees. A provision, based on actuarial valuations, is made for the estimated liability for annual leaves as a result of services rendered by employees up to the reporting date. Current service cost, actuarial gains or losses and past service cost are recognised immediately in the statement of profit or loss.
5.16 Trade and other payables
Liabilities for trade and other payables are carried at their amortised cost, which approximate fair value of the consideration to be paid in future for goods and services received, whether or not billed to the Company.
5.17 Obligation under finance lease
Total outstanding obligation under the lease arrangements less finance cost attributable to future periods is presented as liability. Finance cost under the lease arrangements is distributed over the lease term so as to produce a constant periodic rate of finance cost on the balance of principal liability outstanding at the end of each period.
5.18 Operating leases / ijarah
Operating leases / ijarah in which a significant portion of the risks and rewards of ownership are retained by the lessor / Muj’ir (lessor) are classified as operating leases / ijarah. Payments made during the year are charged to the statement of profit or loss on a straight-line basis over the period of the lease / ijarah.
5.19 Provisions
Provisions are recognised when the Company has a present legal or constructive obligation as a result of past events and it is probable that outflow of resources embodying economic benefits will be required to settle the obligation and a reliable estimate of the amount can be made. Provisions are reviewed at each reporting date and adjusted to reflect current best estimate.
5.20 Warranty
The Company recognises the estimated liability to repair or replace damaged parts of products still under warranty at the reporting date on the basis of historical claim information. The Company offers 3 years’ warranty on all engine spare parts and six months warranty on all other spare parts of its motorcycles. The ratio of warranty claims filed during the year to previous year’s sales is taken into account for determining the estimated liability.
5.21 Taxation
The tax expense for the year comprises current and deferred tax. Tax is recognised in the statement of profit or loss, except to the extent that it relates to items recognised in other comprehensive income or directly in equity. In this case, the tax is also recognised in other comprehensive income or directly in equity, respectively.
Current tax
The current tax charge is calculated on the basis of the tax laws enacted or substantively enacted at the reporting date. The charge for current tax also includes adjustments, where considered necessary, to provision for tax made in the previous years arising from assessments framed during the year for such years.
CompanyOverview
Message forStakeholders
FinancialHighlights
SustainabilityReport
FinancialStatements
OtherInformation
133
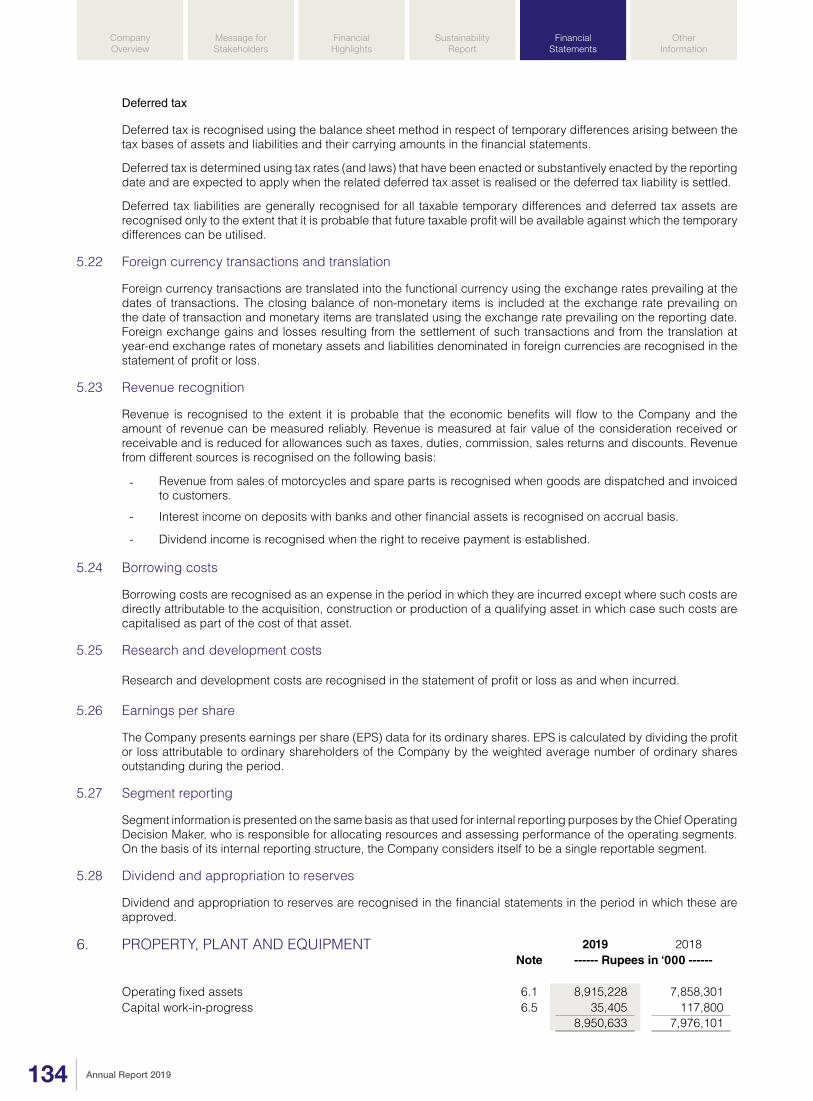
Deferred tax
Deferred tax is recognised using the balance sheet method in respect of temporary differences arising between the tax bases of assets and liabilities and their carrying amounts in the financial statements.
Deferred tax is determined using tax rates (and laws) that have been enacted or substantively enacted by the reporting date and are expected to apply when the related deferred tax asset is realised or the deferred tax liability is settled.
Deferred tax liabilities are generally recognised for all taxable temporary differences and deferred tax assets are recognised only to the extent that it is probable that future taxable profit will be available against which the temporary differences can be utilised.
5.22 Foreign currency transactions and translation
Foreign currency transactions are translated into the functional currency using the exchange rates prevailing at the dates of transactions. The closing balance of non-monetary items is included at the exchange rate prevailing on the date of transaction and monetary items are translated using the exchange rate prevailing on the reporting date. Foreign exchange gains and losses resulting from the settlement of such transactions and from the translation at year-end exchange rates of monetary assets and liabilities denominated in foreign currencies are recognised in the statement of profit or loss.
5.23 Revenue recognition
Revenue is recognised to the extent it is probable that the economic benefits will flow to the Company and the amount of revenue can be measured reliably. Revenue is measured at fair value of the consideration received or receivable and is reduced for allowances such as taxes, duties, commission, sales returns and discounts. Revenue from different sources is recognised on the following basis:
- Revenue from sales of motorcycles and spare parts is recognised when goods are dispatched and invoiced to customers.
- Interest income on deposits with banks and other financial assets is recognised on accrual basis.
- Dividend income is recognised when the right to receive payment is established.
5.24 Borrowing costs
Borrowing costs are recognised as an expense in the period in which they are incurred except where such costs are directly attributable to the acquisition, construction or production of a qualifying asset in which case such costs are capitalised as part of the cost of that asset.
5.25 Research and development costs
Research and development costs are recognised in the statement of profit or loss as and when incurred.
5.26 Earnings per share
The Company presents earnings per share (EPS) data for its ordinary shares. EPS is calculated by dividing the profit or loss attributable to ordinary shareholders of the Company by the weighted average number of ordinary shares outstanding during the period.
5.27 Segment reporting
Segment information is presented on the same basis as that used for internal reporting purposes by the Chief Operating Decision Maker, who is responsible for allocating resources and assessing performance of the operating segments. On the basis of its internal reporting structure, the Company considers itself to be a single reportable segment.
5.28 Dividend and appropriation to reserves
Dividend and appropriation to reserves are recognised in the financial statements in the period in which these are approved.
6. PROPERTY, PLANT AND EQUIPMENT 2019 2018Note ------ Rupees in ‘000 ------
Operating fixed assets 6.1 8,915,228 7,858,301 Capital work-in-progress 6.5 35,405 117,800
8,950,633 7,976,101
CompanyOverview
Message forStakeholders
FinancialHighlights
SustainabilityReport
FinancialStatements
OtherInformation
134

Freehold lands
Leasehold lands
Buildings on
freehold land
Buildings on
leasehold land
Plantand
machineryDies
and jigsFactory
equipmentOffice
equipmentComputers
and accessories
Furniture and
fixtures
Electric and gas fittings
Vehicles Total
------------------------------------------------------------------------------------------------- Rupees in ‘000 -------------------------------------------------------------------------------------------------As at April 1, 2017
Cost 225,082 34,132 1,323,309 255,533 7,996,922 1,214,698 395,022 40,702 188,850 98,833 454,662 344,359 12,572,104
Accumulated depreciation - (11,553) (362,688) (119,453) (3,577,254) (839,648) (161,344) (27,679) (154,289) (54,798) (224,372) (140,440) (5,673,518)
Net book amount 225,082 22,579 960,621 136,080 4,419,668 375,050 233,678 13,023 34,561 44,035 230,290 203,919 6,898,586
Year ended March 31, 2018
Opening net book amount 225,082 22,579 960,621 136,080 4,419,668 375,050 233,678 13,023 34,561 44,035 230,290 203,919 6,898,586
Additions - - 227,265 52,211 1,482,901 219,576 104,881 20,891 26,338 12,650 33,790 133,916 2,314,419
Disposals
Cost - - (7,583) - (912,757) (40,691) (1,208) (2,323) (5,568) (1,716) (2,321) (82,701) (1,056,868)
Accumulated depreciation - - 4,015 - 521,057 32,249 913 2,323 5,407 1,716 1,839 31,702 601,221
- - (3,568) - (391,700) (8,442) (295) - (161) - (482) (50,999) (455,647)
Depreciation charge - (513) (98,546) (16,102) (463,706) (182,689) (26,381) (6,078) (18,090) (14,540) (24,242) (48,170) (899,057)
Closing net book amount 225,082 22,066 1,085,772 172,189 5,047,163 403,495 311,883 27,836 42,648 42,145 239,356 238,666 7,858,301
As at March 31, 2018
Cost 225,082 34,132 1,542,991 307,744 8,567,066 1,393,583 498,695 59,270 209,620 109,767 486,131 395,574 13,829,655
Accumulated depreciation - (12,066) (457,219) (135,555) (3,519,903) (990,088) (186,812) (31,434) (166,972) (67,622) (246,775) (156,908) (5,971,354)
Net book amount 225,082 22,066 1,085,772 172,189 5,047,163 403,495 311,883 27,836 42,648 42,145 239,356 238,666 7,858,301
Year ended March 31, 2019
Opening net book amount 225,082 22,066 1,085,772 172,189 5,047,163 403,495 311,883 27,836 42,648 42,145 239,356 238,666 7,858,301
Additions 109,201 - 226,155 34,362 1,022,275 431,238 74,630 12,612 20,502 14,375 105,818 138,181 2,189,349
Disposals (note 6.4)
Cost - - (7,812) - (11,139) - (2,259) (61) (465) (1,139) (9,537) (103,902) (136,314)
Accumulated depreciation - - 6,207 - 8,374 - 1,408 61 435 1,139 6,615 43,243 67,482
- - (1,605) - (2,765) - (851) - (30) - (2,922) (60,659) (68,832)
Depreciation charge (note 6.3) - (513) (112,214) (18,718) (543,980) (221,862) (35,730) (9,173) (20,202) (16,037) (27,217) (57,944) (1,063,590)
Closing net book amount 334,283 21,553 1,198,108 187,833 5,522,693 612,871 349,932 31,275 42,918 40,483 315,035 258,244 8,915,228
As at March 31, 2019
Cost 334,283 34,132 1,761,334 342,106 9,578,202 1,824,821 571,066 71,821 229,657 123,003 582,412 429,853 15,882,690
Accumulated depreciation - (12,579) (563,226) (154,273) (4,055,509) (1,211,950) (221,134) (40,546) (186,739) (82,520) (267,377) (171,609) (6,967,462)
Net book amount 334,283 21,553 1,198,108 187,833 5,522,693 612,871 349,932 31,275 42,918 40,483 315,035 258,244 8,915,228
Annual rate of depreciation (%) 1.79 10 10 10 25 10 20 25 20 10 20
6.1 Operating fixed assets
CompanyOverview
Message forStakeholders
FinancialHighlights
SustainabilityReport
FinancialStatements
OtherInformation
135

6.2 Freehold lands of the Company are located at Sheikhupura with an area of 247,799 square yards and leasehold lands of the Company are located at Karachi with an area of 27,543 square yards.
6.3 Depreciation expense of Rs.978,326 thousand (2018: Rs.829,370 thousand) has been charged in ‘Cost of sales’ and Rs.85,264 thousand (2018: Rs.69,687 thousand) in ‘Administrative expenses’.
6.4 Details of operating fixed assets disposed-off during the year:
Description Cost Accumulated depreciation
Net book amount
Sale proceeds
Gain / (loss)
Method of disposal
Sold to:
------------------ Rupees in ‘000 ------------------ Items with individual net book
amount exceedingRs.500,000 each
Buildings on freehold land 3,250 (2,602) 648 674 26 Negotiation Industrial Engineering, Plot # 31 C,
Mominpura, Lahore.Plant and machinery
4,160 (3,032) 1,128 320 (808) Scrap Dawood Hussain Contractor, A7/53, Street No.74, G-104, Aagrah Taj, Karachi.
2,362 (1,733) 629 6 (623) Scrap ST Traders, 1-I, New Malik park,Baghatpura, Lahore.
6,522 (4,765) 1,757 326 (1,431)Electric and gas fittings
1,030 (420) 610 80 (530) Scrap ST Traders, 1-I, New Malik park,Baghatpura, Lahore.
1,771 (176) 1,595 48 (1,547) Scrap Roshan Traders, Baway Di Kuttiya,Lahore Road, Sheikhupura.
2,801 (596) 2,205 128 (2,077)
Vehicles 2,243 (224) 2,019 2,019 - Company policy Atlas Autos (Pvt.) Ltd., a related party,
Federation House, Clifton, Karachi. 1,250 (181) 1,069 1,069 - Company policy Atlas Autos (Pvt.) Ltd., a related party,
Federation House, Clifton, Karachi. 1,220 (20) 1,200 1,200 - Company policy Atlas Autos (Pvt.) Ltd., a related party,
Federation House, Clifton, Karachi. 1,199 (336) 863 863 - Company policy Atlas Autos (Pvt.) Ltd., a related party,
Federation House, Clifton, Karachi. 742 (12) 730 730 - Company policy Atlas Autos (Pvt.) Ltd., a related party,
Federation House, Clifton, Karachi. 732 (73) 659 659 - Company policy Atlas Autos (Pvt.) Ltd., a related party,
Federation House, Clifton, Karachi. 657 (140) 517 517 - Company policy Atlas Autos (Pvt.) Ltd., a related party,
Federation House, Clifton, Karachi. 1,270 (42) 1,228 1,228 - Company policy Atlas Autos (Pvt.) Ltd., a related party,
Federation House, Clifton, Karachi. 1,124 (328) 796 796 - Company policy Atlas Autos (Pvt.) Ltd., a related party,
Federation House, Clifton, Karachi. 1,250 (42) 1,208 1,208 - Company policy Atlas Autos (Pvt.) Ltd., a related party,
Federation House, Clifton, Karachi. 2,205 (368) 1,837 1,837 - Company policy Atlas Autos (Pvt.) Ltd., a related party,
Federation House, Clifton, Karachi. 1,991 (865) 1,126 1,126 - Company policy Atlas Autos (Pvt.) Ltd., a related party,
Federation House, Clifton, Karachi. 758 (222) 536 536 - Company policy Atlas Autos (Pvt.) Ltd., a related party,
Federation House, Clifton, Karachi. 2,315 (790) 1,525 1,525 - Company policy Honda Altas Cars (Pakistan) Ltd., a related party,
43 Multan Road, Lahore. 1,991 (865) 1,126 1,126 - Company policy Atlas Foundation, a related party, 2nd floor,
Federation house, Karachi.
Employees of the Company
2,158 (1,286) 872 872 - Company policy Mr. Noman Khan (Key management personnel) 2,156 (954) 1,202 1,202 - Company policy Mr. Khawaja Shujauddin (Key management personnel)
Balance carried forward 25,261 (6,748) 18,513 18,513 -
CompanyOverview
Message forStakeholders
FinancialHighlights
SustainabilityReport
FinancialStatements
OtherInformation
136

Description Cost Accumulated depreciation
Net book amount
Sale proceeds
Gain / (loss)
Method of disposal
Sold to:
------------------ Rupees in ‘000 ------------------ Vehicles Employees of the Company
Balance brought forward 25,261 (6,748) 18,513 18,513 - 2,007 (1,191) 816 816 - Company policy Mr. Manzoor Qadir 1,985 (99) 1,886 1,886 - Company policy Mr. Zahid Saleem 1,663 (720) 943 943 - Company policy Mr. Ehsan ul Haq 1,637 (950) 687 687 - Company policy Mr. Muhammad Qamer Bashir 1,637 (950) 687 687 - Company policy Mr. Raja Mohsin Ghafoor 1,637 (1,008) 629 629 - Company policy Mr. Kalb Hassan Rizvi 1,637 (1,008) 629 629 - Company policy Mr. Afrasiab Khan 1,348 (341) 1,007 1,007 - Company policy Mr. Tanvir Hyder (Key management personnel) 1,204 (409) 795 795 - Company policy Mr. Furqan Ashraf 1,174 (407) 767 767 - Company policy Mr. Aman Manzar 1,109 (502) 607 607 - Company policy Mr. Kamran Sami 1,109 (458) 651 651 - Company policy Mr. Waleem Abbas 1,083 (54) 1,029 1,029 - Company policy Mr. Sohail Khan
861 (184) 677 677 - Company policy Mr. Abdul Wahid 778 (246) 532 532 - Company policy Mr. Jamil Ahmad 778 (265) 513 513 - Company policy Mr. Usman Ali Qureshi 732 (106) 626 626 - Company policy Mr. Zia ul Qadir 527 (26) 501 501 - Company policy Mr. Muhammad Yasir Riaz
Ex-Employees of the Company 1,646 (580) 1,066 1,066 - Company policy Mr. M Tayyab Hassan 1,204 (482) 722 722 - Company policy Mr. Hasan Matloob 1,812 - 1,812 1,812 - Company policy Mr. Amjad Ali 1,174 (360) 814 814 - Company policy Mr. Mohammad Ilyas Gujjar
802 (164) 638 638 - Company policy Mr. Khalil Rehman 732 (72) 660 660 - Company policy Mr. Noman Yousuf
55,537 (17,330) 38,207 38,207 - 68,110 (25,293) 42,817 39,335 (3,482)
Various assets having net book amount up to Rs. 500,000 each 68,204 (42,189) 26,015 26,132 117
Year Ended: March 31, 2019 136,314 (67,482) 68,832 65,467 (3,365)
Year Ended: March 31, 2018 1,056,868 (601,221) 455,647 444,748 (10,899)
2019 2018
6.5 Capital work-in-progress Note ------ Rupees in ‘000 ------
Civil works 3,519 2,604
Plant and machinery 22,727 1,764
Dies and jigs - 18,708
Factory equipment 7,863 58,099
Office equipment - 998
Computers and accessories - 96
Furniture and fixtures 81 6,976
Electric and gas fittings 1,215 10,067
Vehicles 6.5.1 - 18,488
35,405 117,800
CompanyOverview
Message forStakeholders
FinancialHighlights
SustainabilityReport
FinancialStatements
OtherInformation
137

6.5.1 Includes advance of Nil (2018: Rs.4,380 thousand) made to Honda Atlas Cars (Pakistan) Limited - a related party.
7. INTANGIBLE ASSETS Software licenses
SAP implemen-tation and
support cost
License fee Total
---------------------- Rupees in ‘000 ---------------------- As at April 1, 2017
Cost 57,981 38,041 5,216 101,238
Accumulated amortisation (57,944) (38,041) (5,216) (101,201)
Net book amount 37 - - 37
Year ended March 31, 2018
Opening net book amount 37 - - 37
Additions (note 7.1) 2,466 - 52,400 54,866
Amortisation charge (391) - (9,607) (9,998)
Closing net book amount 2,112 - 42,793 44,905
As at March 31, 2018
Cost 60,447 38,041 57,616 156,104
Accumulated amortisation (58,335) (38,041) (14,823) (111,199)
Net book amount 2,112 - 42,793 44,905
Year ended March 31, 2019
Opening net book amount 2,112 - 42,793 44,905
Additions (note 7.1) 4,070 - 138,770 142,840
Amortisation charge (note 26.1) (1,402) - (17,419) (18,821)
Closing net book amount 4,780 - 164,144 168,924
As at March 31, 2019
Cost 64,517 38,041 196,386 298,944
Accumulated amortisation (59,737) (38,041) (32,242) (130,020)
Net book amount 4,780 - 164,144 168,924
Annual rate of amortisation (%) 50 20 20
7.1 During the year, the Company paid Rs.138,770 thousand (2018: Rs.52,400 thousand) to Honda Motor Company Limited, Japan - a related party, for licence fee and drawings of new product.
8. LONG TERM INVESTMENTS 2019 2018Note ------ Rupees in ‘000 ------
Unquoted
Associate - equity accounted investment 8.1 323,497 324,899 Others - available for sale 8.2 - -
323,497 324,899
8.1 Equity accounted investment - Atlas Hitec (Private) Limited
Balance at beginning of the year 324,899 292,342 Share of profit for the year - net of tax 15,698 50,607 Dividend received during the year (17,100) (18,050)Balance at end of the year 323,497 324,899
8.1.1 Investment in Atlas Hitec (Private) Limited (AHPL) represents 19,000,000 fully paid ordinary shares of Rs.10 each representing 29.23% (2018: 29.23%) of its issued, subscribed and paid-up capital as at March 31, 2019. AHPL was incorporated in Pakistan as a private limited company on September 13, 2012 and its principal activity is to manufacture and sale any kind of automobile parts and allied products.
CompanyOverview
Message forStakeholders
FinancialHighlights
SustainabilityReport
FinancialStatements
OtherInformation
138

8.1.2 The summary of financial information / reconciliation of AHPL as of March 31, 2019 is as follows:
2019 2018Summarised Statement of Financial Position ------ Rupees in ‘000 ------
Non current assets 467,300 524,600 Current assets 789,600 750,700
1,256,900 1,275,300 Non - current liabilities 38,200 50,200 Current liabilities 127,297 128,900
166,140 179,100 Net assets 1,091,403 1,096,200 Reconciliation to carrying amountOpening net assets 1,096,200 984,822 Profit for the year 51,900 173,174 Other adjustments 1,803 (46)Dividend paid during the year (58,500) (61,750)
Closing net assets 1,091,403 1,096,200
Company’s share % 29.23% 29.23%
Company’s share 319,026 320,428
Goodwill 4,471 4,471
Carrying amount of investment 323,497 324,899
Summarised Statement of profit or loss
Revenue 2,348,700 2,272,000
Profit before tax 65,300 224,100
Profit after tax 51,900 173,174
8.1.3 The financial information of AHPL is based on unaudited financial statements for the year ended March 31, 2019.
2019 20188.2 Others - available for sale Note ------ Rupees in ‘000 ------
Arabian Sea Country Club Limited200,000 ordinary shares of Rs.10 each - cost 2,000 2,000 Less: Impairment in the value of investment 2,000 2,000
- -Automotive Testing & Training Centre (Private) Limited50,000 ordinary shares of Rs.10 each - cost 500 500 Less: Impairment in the value of investment 500 500
- - - -
9. LONG TERM LOANS AND ADVANCES
Considered goodLoans and advances to:
Related parties - Key Management Personnel 1,292 2,544Other employees 65,958 64,153
9.1 67,250 66,697Less: amounts due within twelve months and
Shown under current assets: 13Related parties - Key Management Personnel 1,292 2,057Other employees 32,491 33,159
33,783 35,216 33,467 31,481
CompanyOverview
Message forStakeholders
FinancialHighlights
SustainabilityReport
FinancialStatements
OtherInformation
139
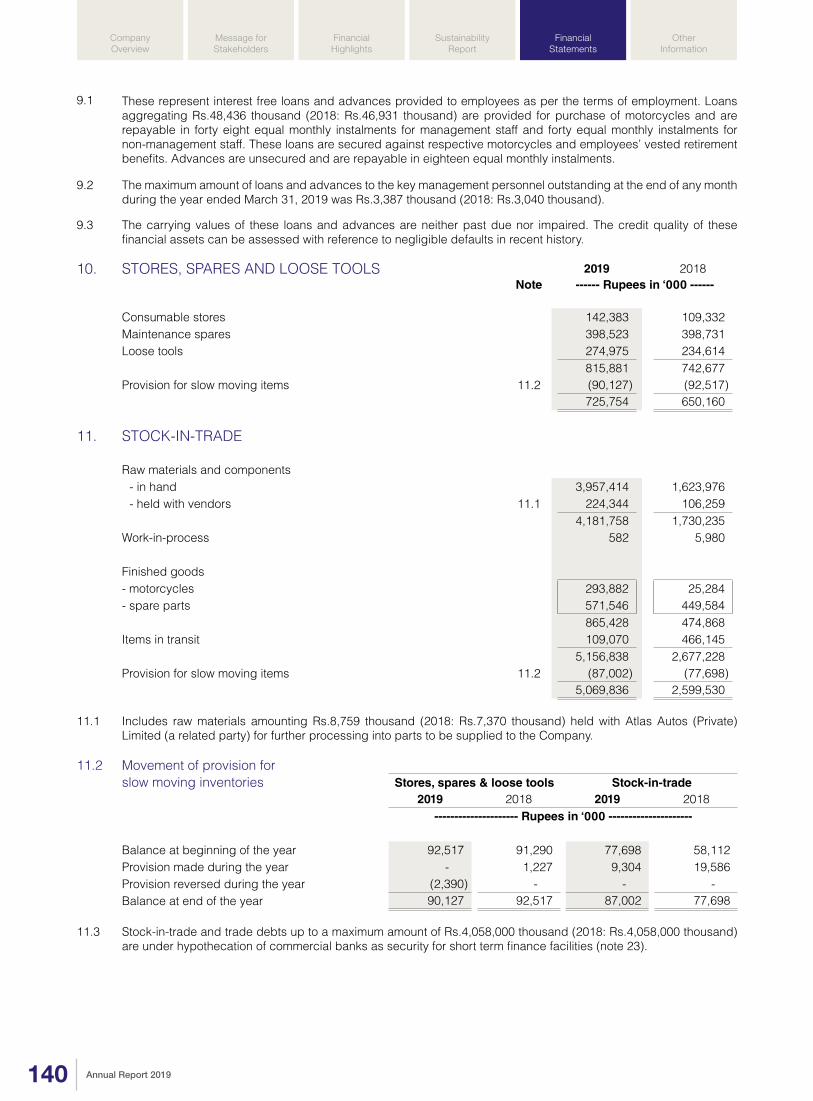
9.1 These represent interest free loans and advances provided to employees as per the terms of employment. Loans aggregating Rs.48,436 thousand (2018: Rs.46,931 thousand) are provided for purchase of motorcycles and are repayable in forty eight equal monthly instalments for management staff and forty equal monthly instalments for non-management staff. These loans are secured against respective motorcycles and employees’ vested retirement benefits. Advances are unsecured and are repayable in eighteen equal monthly instalments.
9.2 The maximum amount of loans and advances to the key management personnel outstanding at the end of any month during the year ended March 31, 2019 was Rs.3,387 thousand (2018: Rs.3,040 thousand).
9.3 The carrying values of these loans and advances are neither past due nor impaired. The credit quality of these financial assets can be assessed with reference to negligible defaults in recent history.
10. STORES, SPARES AND LOOSE TOOLS 2019 2018Note ------ Rupees in ‘000 ------
Consumable stores 142,383 109,332 Maintenance spares 398,523 398,731 Loose tools 274,975 234,614
815,881 742,677 Provision for slow moving items 11.2 (90,127) (92,517)
725,754 650,160
11. STOCK-IN-TRADE
Raw materials and components- in hand 3,957,414 1,623,976 - held with vendors 11.1 224,344 106,259
4,181,758 1,730,235 Work-in-process 582 5,980
Finished goods- motorcycles 293,882 25,284 - spare parts 571,546 449,584
865,428 474,868 Items in transit 109,070 466,145
5,156,838 2,677,228 Provision for slow moving items 11.2 (87,002) (77,698)
5,069,836 2,599,530
11.1 Includes raw materials amounting Rs.8,759 thousand (2018: Rs.7,370 thousand) held with Atlas Autos (Private) Limited (a related party) for further processing into parts to be supplied to the Company.
11.2 Movement of provision for slow moving inventories Stores, spares & loose tools Stock-in-trade
2019 2018 2019 2018--------------------- Rupees in ‘000 ---------------------
Balance at beginning of the year 92,517 91,290 77,698 58,112 Provision made during the year - 1,227 9,304 19,586 Provision reversed during the year (2,390) - - - Balance at end of the year 90,127 92,517 87,002 77,698
11.3 Stock-in-trade and trade debts up to a maximum amount of Rs.4,058,000 thousand (2018: Rs.4,058,000 thousand) are under hypothecation of commercial banks as security for short term finance facilities (note 23).
CompanyOverview
Message forStakeholders
FinancialHighlights
SustainabilityReport
FinancialStatements
OtherInformation
140

12. TRADE DEBTS 2019 2018Note ------ Rupees in ‘000 ------
Considered good
Export - secured 12.1 - 16,811 Local - unsecured 1,116,000 844,413
1,116,000 861,224
12.1 These trade debts are secured against letters of credit issued by customers in favour of the Company.
12.2 The maximum aggregate amount of trade receivable from related parties at the end of any month during the year was Rs.195,487 thousand (2018: Rs.15,943 thousand).
12.3 At March 31, 2019, trade debts aggregating to Rs.46,755 thousand (2018: Rs.72,042 thousand) were past due but not impaired. These relate to various customers for which there is no recent history of default. The ageing analysis of these trade debts is as follows:
2019 2018Note ------ Rupees in ‘000 ------
Past due within 30 days 45,320 69,434 Past due beyond 30 days 1,435 2,608
46,755 72,042
13. LOANS AND ADVANCES
Considered good
Current portion of long term loans and advancesto key management personnel and other employees 9 33,783 35,216
Loans to employees 13.1 342 523 Advances to suppliers, contractors and others 9,669 4,368
43,794 40,107
13.1 These represent interest free welfare and festival loans provided to employees in accordance with Company’s policy and have maturities up to ten months.
13.2 The carrying values of loans and advances are neither past due nor impaired. The credit quality of these financial assets can be assessed with reference to negligible defaults in recent history.
14. TRADE DEPOSITS AND PREPAYMENTS 2019 2018Note ------ Rupees in ‘000 ------
Trade deposits - unsecured and considered good 6,203 34,550 Prepayments 14.1 113,451 103,113 Margin against letters of credit 887,474 -
1,007,128 137,663
14.1 Includes prepayments of Rs.47,698 thousand (2018: Rs.38,919 thousand), Rs.35,583 thousand (2018: Rs.28,963 thousand) and Rs.4,838 thousand (2018: Rs.4,400 thousand) to Atlas Insurance Limited, Shirazi Investments (Private) Limited and Atlas Foundation, related parties respectively.
15. OTHER RECEIVABLES 2019 2018------ Rupees in ‘000 ------
Unsecured and considered goodSales tax receivable - net 565,692 - Duty drawback receivable 5,672 10,927 Others 1,716 4,601
573,080 15,528
CompanyOverview
Message forStakeholders
FinancialHighlights
SustainabilityReport
FinancialStatements
OtherInformation
141

16. SHORT TERM INVESTMENTS - At fair value 2019 2018through profit or loss Note ------ Rupees in ‘000 ------
2019 2018 --- Number of units --- Related parties
8,249,552 9,585,583 Atlas Money Market Fund 4,162,477 5,006,166 396,267 - Atlas Islamic Capital Preservation Plan 199,279 - 175,289 759,826 Atlas Islamic Stock Fund 88,105 427,228 145,853 3,865,912 Atlas Income Fund 76,307 2,051,330 26,332 342,127 Atlas Stock Market Fund 15,291 224,839
113 105 Atlas Sovereign Liquid Fund 12 11 32 30 Atlas Islamic Income Fund 17 16
4,541,488 7,709,590
Others 2,548,499 2,441,171 Lakson Money Market Fund 271,214 254,255 3,743,327 3,591,972 Lakson Income Fund 398,699 375,595
795,579 772,598 National Investment (Unit) Trust 50,320 60,803 53 50 NIT Government Bond Fund 1 1
172 10 NIT Islamic Equity Fund 2 2 720,236 690,656
5,261,724 8,400,246
17. BANK BALANCES 2019 2018Note ------ Rupees in ‘000 ------
Cash at banks in:- current accounts (including US$ 11 thousand) 148,504 87,629 - savings deposit accounts 17.1 831,655 1,393,990 - term deposit receipts / treasury bills 17.2 6,500,000 8,499,996
7,480,159 9,981,615
17.1 Savings deposit accounts carry mark-up up to 9.39% (2018: 5.70%) per annum.
17.2 Term deposit receipts (TDR) have maturity of 30 days (2018: 30 days) from respective date of acquisition. TDRs carry mark-up at the rates ranging from 11.10% to 11.20% (2018: 6.15% to 6.50%) per annum. Treasury bill had maturity (2018: 29 days) from date of acquisition and carried mark-up at the rate of (2018: 6.10%) per annum.
18. SHARE CAPITAL
18.1 Authorised capital
2019 2018 2019 2018--- Number of shares --- ------ Rupees in ‘000 ------
150,000,000 150,000,000 Ordinary shares of Rs.10 each 1,500,000 1,500,000
18.2 Issued, subscribed and paid-up capital
2019 2018--- Number of shares ---
6,352,748 6,352,748 Ordinary shares of Rs.10 eachfully paid in cash 63,528 63,528
96,794,565 96,794,565 Ordinary shares of Rs.10 eachissued as fully paid bonus shares 967,945 967,945
259,300 259,300 Ordinary shares of Rs.10 each issued as fully paid forconsideration other than cash 2,593 2,593
103,406,613 103,406,613 1,034,066 1,034,066
CompanyOverview
Message forStakeholders
FinancialHighlights
SustainabilityReport
FinancialStatements
OtherInformation
142

18.3 Ordinary shares of the Company held by 2019 2018the related parties as at March 31 -- Number of shares --
Shirazi Investments (Private) Limited 54,220,693 54,220,693 Honda Motor Company Limited, Japan 36,192,315 36,192,315 Atlas Insurance Limited 2,931,728 2,931,728
93,344,736 93,344,736
18.4 The holders of ordinary shares are entitled to receive dividends as declared from time to time and are entitled to one vote per share at general meetings of the Company. All shares rank equally with regard to Company’s residual assets.
19. RESERVES 2019 2018------ Rupees in ‘000 ------
Capital reservesShare premium 39,953 39,953 Gain on sale of land 165 165
40,118 40,118
Revenue reservesGeneral reserve: - at beginning of the year 7,992,000 6,992,000 - transferred from unappropriated profit 1,500,000 1,000,000 - at end of the year 9,492,000 7,992,000 Unappropriated profit 4,799,580 6,934,537
14,291,580 14,926,537 14,331,698 14,966,655
20. STAFF RETIREMENT BENEFITS 2019 2018Note ------ Rupees in ‘000 ------
Compensated absences 20.1 254,120 241,681 Provision for gratuity 22.7 42,289 21,201
296,409 262,882
20.1 Compensated absences
Balance at beginning of the year 241,681 228,443 Provision for the year 31,451 37,419
273,132 265,862 Encashed during the year (19,012) (24,181)Balance at end of the year 254,120 241,681
20.1.1 Includes liability in respect of key management personnel aggregating to Rs.40,573 thousand (2018: Rs.31,261 thousand).
21. DEFERRED TAXATION - Net 2019 2018------ Rupees in ‘000 ------
The liability for deferred taxation comprises temporary differences relating to:
Accelerated tax depreciation 847,307 852,111 Provision for slow moving inventories (47,246) (50,476)Compensated absences (67,781) (71,668)Warranty obligations (12,933) (18,390)Staff retirement benefit - gratuity (19,323) (13,535)
700,024 698,042
CompanyOverview
Message forStakeholders
FinancialHighlights
SustainabilityReport
FinancialStatements
OtherInformation
143

22. TRADE AND OTHER PAYABLES 2019 2018Note ------ Rupees in ‘000 ------
Creditors 22.1 5,060,110 3,005,807 Accrued liabilities 22.2 1,727,824 2,451,241 Royalty payable 22.3 990,607 958,635 Warranty obligations 45,629 62,014 Advances from customers 22.4 6,993,562 7,021,657 Retention money 12,746 31,569 Sales tax payable - net - 477,701 Workers’ profit participation fund 22.5 249,161 333,728 Workers’ welfare fund 22.6 81,216 116,373 Payable to staff retirement benefit funds - gratuity 22.7 30,153 24,444 Provision for Sindh government infrastructure fee 277,991 207,949 Others 22.9 31,138 110,973
15,500,137 14,802,091
21.1 Movement in deferred taxation
Accelerated tax
depreciation
Unrealized gain on
investments
Provision for slow moving inventories
Compens- ated
absences
Warranty obligations
Staffretirement benefit - gratuity
Total
------------------------------ Rupees in 000 ------------------------------
At April 1, 2017 792,679 18,924 (44,279) (67,705) (17,256) (11,395) 670,968 Charge / (credited) to:Profit and loss account 59,432 (18,924) (6,197) (3,963) (1,134) 1,042 30,256Other comprehensive income - - - - - (3,182) (3,182)
59,432 (18,924) (6,197) (3,963) (1,134) (2,140) 27,074At March 31, 2018 852,111 - (50,476) (71,668) (18,390) (13,535) 698,042Charge / (credited) to:Profit and loss account (4,804) - 3,230 3,887 5,457 711 8,481Other comprehensive income - - - - - (6,499) (6,499)
(4,804) - 3,230 3,887 5,457 (5,788) 1,982At March 31, 2019 847,307 - (47,246) (67,781) (12,933) (19,323) 700,024
22.1 Includes Rs.25,637 thousand (2018: Rs.35,842 thousand) and Nil (2018: Rs.289 thousand) due to Atlas Hitec (Private) Limited and Pakistan Cables Limited (related parties) respectively.
22.2 Includes Rs.747 thousand (2018: Rs.2,635 thousand) due to Honda Motor Company Limited, Japan - a related party.
22.3 Includes Rs.985,521 thousand (2018: Rs.952,385 thousand) due to Honda Motor Company Limited, Japan - a related party.
22.4 These represent advances from customers against sale of motorcycles & parts and carry no mark-up.
2019 201822.5 Workers’ profit participation fund (the Fund) Note ------ Rupees in ‘000 ------
Balance at beginning of the year 333,728 270,713 Allocation for the year 30 246,352 333,190 Interest on funds utilised in the
Company’s business 31 2,809 538 582,889 604,441
Paid to trustees of the Fund (333,728) (270,713)Balance at end of the year 249,161 333,728
22.6 Workers’ welfare fund
Balance at beginning of the year 116,373 102,687 Charge for the year 81,216 116,373 Adjustment for prior year (164) (18,533)
30 81,052 97,840 197,425 200,527
Payment made during the year (116,209) (84,154)Balance at end of the year 81,216 116,373
CompanyOverview
Message forStakeholders
FinancialHighlights
SustainabilityReport
FinancialStatements
OtherInformation
144

22.7 Staff retirement benefit - gratuity
22.7.1 The Company has established two separate funded gratuity schemes for its management and non-management staff, who completes qualifying period of service.
22.7.2 These benefit plans are trustee-administered funds and are governed by local regulations which mainly includes Trust Act, 1882, the Companies Act, 2017, Income Tax Rules, 2002 and Rules under the Trust deed of the Plans. Responsibility for governance of the Plans, including investment decisions and contributions schedules lies with the board of trustees. The Company appoints the trustees and all trustees are employees of the Company.
22.7.3 The latest actuarial valuations of the Funds as at March 31, 2019 were carried out using the ‘Projected Unit Credit Method’. Details of the Funds as per the actuarial valuations are as follows:
Management Non-management Total
2019 2018 2019 2018 2019 201822.7.4 Reconciliation -------------------------------- Rupees in ‘000 -----------------------------
Present value of defined benefit obligationat March 31 - note 22.7.5 350,107 321,813 38,449 36,621 388,556 358,434
Fair value of plan assets at March 31 - note 22.7.6 (218,525) (260,280) (85,671) (86,119) (304,196) (346,399)
(Receivable from) / payable to related parties in respect of transferees (11,918) 33,610 - - (11,918) 33,610
119,664 95,143 (47,222) (49,498) 72,442 45,645 Less: payable within next twelve months 30,153 24,444 - - 30,153 24,444
89,511 70,699 (47,222) (49,498) 42,289 21,201
22.7.5 Movement in the present value of
defined benefit obligation
Balance at beginning of the year 321,813 328,371 36,621 38,370 358,434 366,741 Benefits paid (21,110) (19,829) (2,752) (4,054) (23,862) (23,883)Current service cost 23,609 18,767 1,170 1,205 24,779 19,972 Interest expense 27,803 24,660 3,179 2,867 30,982 27,527 Remeasurement on obligation (1,631) 4,774 231 (1,767) (1,400) 3,007 Payable to related parties
in respect of transferees (377) (34,930) - - (377) (34,930)Balance at end of the year 350,107 321,813 38,449 36,621 388,556 358,434
22.7.6 Movement in the fair value of plan assets
Balance at beginning of the year 260,280 262,154 86,119 86,134 346,399 348,288 Contributions 24,443 25,492 - - 24,443 25,492 Benefits paid (21,110) (19,829) (2,752) (4,054) (23,862) (23,883)Interest income 21,259 18,983 7,332 6,433 28,591 25,416 Remeasurement (20,443) (5,206) (5,028) (2,394) (25,471) (7,600)Payable to related parties
in respect of transferees (45,904) (21,314) - - (45,904) (21,314)Balance at end of the year 218,525 260,280 85,671 86,119 304,196 346,399
22.7.7 Expense / (income) recognised in the
statement of profit or loss
Current service costs 23,609 18,767 1,170 1,205 24,779 19,972 Net interest expense / (income) 6,544 5,677 (4,153) (3,566) 2,391 2,111
30,153 24,444 (2,983) (2,361) 27,170 22,083
CompanyOverview
Message forStakeholders
FinancialHighlights
SustainabilityReport
FinancialStatements
OtherInformation
145

Management Non-management Total 2019 2018 2019 2018 2019 2018
-------------------------------- Rupees in ‘000 -----------------------------22.7.8 Remeasurement recognised in
other comprehensive income
(Loss) / gain from change infinancial assumptions (2,070) 5,392 (720) 607 (2,790) 5,999
Experience loss / (gain) 438 (618) 951 (2,374) 1,389 (2,992)Loss on remeasurement of
plan assets 20,443 5,206 5,028 2,394 25,471 7,600 Net remeasurements 18,811 9,980 5,259 627 24,070 10,607
22.7.9 Net recognised liability
Net liability / (asset) at beginning of the year 95,143 86,211 (49,498) (47,764) 45,645 38,447 Charge / (income) for the year 30,153 24,444 (2,983) (2,361) 27,170 22,083 Contributions made during the year (24,443) (25,492) - - (24,443) (25,492)Remeasurement recognised in
other comprehensive income 18,811 9,980 5,259 627 24,070 10,607 Recognised liability / (asset) as at March 31 119,664 95,143 (47,222) (49,498) 72,442 45,645 Less: payable within next twelve months 30,153 24,444 - - 30,153 24,444
89,511 70,699 (47,222) (49,498) 42,289 21,201 22.7.10 Actual return on plan assets 817 13,777 2,348 2,285 3,165 16,062
22.7.11 Plan assets comprise of:
Fixed income instruments 117,116 133,165 46,620 45,747 163,736 178,912 Mutual fund securities 100,728 125,342 37,471 39,676 138,199 165,018 Others 681 1,773 1,580 696 2,261 2,469
218,525 260,280 85,671 86,119 304,196 346,399
22.7.12 The expected return on plan assets was determined by considering the expected returns available on the assets underlying the current investment policy. Expected yields on fixed interest investments are based on gross redemption yields as at the reporting date.
22.7.13 Significant actuarial assumptions and sensitivity:
Management Non-management2019 2018 2019 2018
----------------------------- % per annum -----------------------------
Discount rate at March 31 13.25 8.75 13.25 8.75 Expected rate of increase in future salaries - first year 9.00 9.00 9.00 9.00
- long term 12.25 7.75 12.25 7.75 Demographic assumptions - Mortality rates (for death in service) SLIC
(2001-05)SLIC
(2001-05)SLIC
(2001-05)SLIC
(2001-05)- Rates of employee turnover Moderate Moderate Moderate Moderate
The sensitivity of the defined benefit obligation to changes in principal assumptions is:
Impact on defined benefit obligationChange in assump-
tions
Increase in assumptions
Decrease in assumptions
------ Rupees in ‘000 ------
Discount rate 1.00% 363,112 417,563 Future salary increase 1.00% 415,723 364,304 Withdrawal rates : light 384,501 Withdrawal rates : heavy 390,118
The above sensitivity analysis are based on a change in an assumption while holding all other assumptions constant. In practice, this is unlikely to occur, and change in some of the assumptions may be correlated. When calculating the sensitivity of the defined benefit obligation to significant actuarial assumptions, the same method (present value of defined benefit obligation calculated with the projected unit credit method at the end of reporting period) has been applied as when calculating the defined benefit liability recognised within the statement of financial position.
The method and types of assumptions used in preparing the sensitivity analysis did not change compared to the previous period.
CompanyOverview
Message forStakeholders
FinancialHighlights
SustainabilityReport
FinancialStatements
OtherInformation
146

22.7.14 Expected charge and income to management and non-management gratuity plans for the year ending March 31, 2020 are Rs.38,505 thousand and Rs.4,705 thousand respectively.
22.7.15 The weighted average duration of defined benefit obligation for management and non-management plans is 6.80 years and 4.26 years respectively. The expected maturity analysis of undiscounted retirement benefits is as follows:
Less thana year
Between 1 - 2 years
Between 2 - 5 years
Over 5 years
Total
March 31, 2019 ----------------------------- Rupees in ‘000 -----------------------------
Management staff 21,088 69,797 127,348 325,677 543,910 Non-management staff 4,268 4,562 19,864 47,734 76,428 Total 25,356 74,359 147,212 373,411 620,338
22.7.16 Historical information
2019 2018 2017 2016 2015---------------------- Rupees in ‘000 ----------------------
Present value of defined benefit obligation 388,556 358,434 366,741 345,259 324,883 Fair value of plan assets 304,196 346,399 348,288 316,879 284,007 Deficit provided in financial statements 84,360 12,035 18,453 28,380 40,876
22.8 Payable to staff retirement benefit funds - gratuity includes liability in respect of key management personnel aggregating to Rs.65,941 thousand (2018: Rs.53,313 thousand).
22.9 Other liabilities include vehicle deposits under Company’s vehicle policy aggregating Rs.15,584 thousand (2018: Rs.14,279 thousand) and Rs. Nil (2018: Rs.85,026 thousand) payable against provincial levies.
23. SHORT TERM BORROWINGS - Secured
Short term finance facilities available from various commercial banks under mark-up arrangements aggregate to Rs.2,540,000 thousand (2018: Rs.2,740,000 thousand) and are secured against pari passu hypothecation charge over the Company’s stock-in-trade and trade debts to extent of Rs.4,058,000 thousand (2018: Rs.4,058,000 thousand). The rates of mark-up of these facilities during the year ranged from 7.02% to 11.99% (2018: 6.24% to 7.50%) per annum. These facilities are expiring on various dates by March 31, 2020.
The facilities for opening letters of credit as at March 31, 2019 aggregated to Rs.4,036,000 thousand (2018: Rs.3,640,000 thousand) of which the amount remained unutilised at year end was Rs.2,509,052 thousand (2018: Rs.1,356,257 thousand). These finance facilities are also secured against pari passu joint hypothecation charge on stocks-in-trade and trade debts of the Company.
24. CONTINGENCIES AND COMMITMENTS
24.1 Contingencies
24.1.1 Various cases have been filed against the Company by some former employees for reinstatement of service and are pending in different courts of Pakistan. The management is confident that outcome of these cases will be in favour of the Company and hence no provision is made in these financial statements.
24.1.2 Guarantees aggregating to Rs.782,422 thousand (2018: Rs.901,410 thousand) have been issued by commercial banks to government and semi government institutions for import of raw materials and supply of goods.
24.2 Commitments
24.2.1 Commitments outstanding for letters of credit relating to capital expenditure, raw materials and components as at March 31, 2019 aggregated to Rs.1,526,948 thousand (2018: Rs.2,283,743 thousand).
24.2.2 Commitments outstanding for capital expenditure other than through letters of credit as at March 31, 2019 aggregated to Rs.6,789 thousand (2018: Rs.59,122 thousand).
24.2.3 The Company has entered into ijarah arrangements for vehicles with various banks. Aggregate commitments for these ijarah arrangements as at March 31, are as follows:
CompanyOverview
Message forStakeholders
FinancialHighlights
SustainabilityReport
FinancialStatements
OtherInformation
147

2019 2018Note ------ Rupees in ‘000 ------
Not later than one year 60,749 36,406 Later than one year and not later than five years 70,387 63,739
131,136 100,145
25. SALES - Net
Gross sales- local 95,522,477 89,677,263 - export 250,380 458,891
95,772,857 90,136,154 Less: - trade discount and commission 521,737 531,226 - sales tax 12,838,572 12,126,083
13,360,309 12,657,309 82,412,548 77,478,845
26. COST OF SALES
Opening stock of finished goods 474,868 537,753 Cost of goods manufactured 26.1 70,366,787 63,550,978 Purchases during the year 5,880,450 5,574,238
76,247,237 69,125,216 Closing stock of finished goods (865,428) (474,868)
75,856,677 69,188,101
26.1 Cost of goods manufactured
Opening stock of work-in-process 5,980 4,636 Raw materials and components consumed 26.2 60,629,205 53,758,498 Direct labour 26.3 1,254,458 1,386,114 Technical directors’ remuneration 2,675 2,048 Staff salaries, wages and other benefits 26.3 1,095,551 1,214,000 Stores consumed 702,184 757,903 Fuel and power 742,885 688,411 Insurance 135,752 112,546 Rent, rates and taxes 171,464 134,902 Ijarah rentals 40,517 31,551 Repair and maintenance 444,788 553,997 Royalty including provincial taxes 26.4 3,700,264 3,648,492 Technical assistance fee 52,757 51,639 Travelling, conveyance and entertainment 103,284 84,112 Postage and telephone 9,293 7,708 Printing and stationery 26,635 27,613 Vehicle running expenses 34,830 28,765 Depreciation 6.3 978,326 829,370 Canteen 134,176 130,986 Newspapers, magazines and subscriptions 1,950 2,919 Amortisation 7 18,821 9,998 Provision for slow moving inventories - net 11.2 6,914 20,813 Marking fee 74,590 69,765 Other manufacturing expenses 70 172
70,367,369 63,556,958 Closing stock of work-in-process (582) (5,980)
70,366,787 63,550,978
26.2 Raw materials and components consumed
Opening stock 1,730,235 1,279,491 Purchases during the year 63,080,728 54,209,242
64,810,963 55,488,733 Closing stock (4,181,758) (1,730,235)
60,629,205 53,758,498
CompanyOverview
Message forStakeholders
FinancialHighlights
SustainabilityReport
FinancialStatements
OtherInformation
148

26.3 Direct labour and staff salaries, wages & other benefits include Rs.74,954 thousand (2018: Rs.69,440 thousand) in respect of staff retirement benefits.
26.4 Royalty charged in these financial statements pertains to Honda Motor Company Limited having registered office at 1-1, Minami-Aoyama 2-chome, Minato-ku, Tokyo 107-8556, Japan, Toyo Denso Company Limited having registered office at 10-4, 2-Chome, Shinbashi Minato-ku, Tokyo, Japan and Yamada Manufacturing Company Limited having registered office at 1296-2, Koubayashi, Isesaki, Gunama, Japan.
27. SALES AND MARKETING EXPENSES 2019 2018 Note ------ Rupees in ‘000 ------
Directors’ remuneration 36,564 40,717 Staff salaries and other benefits 27.1 347,833 355,403 Travelling, conveyance and entertainment 111,958 89,622 Vehicle running expenses 19,692 15,490 Rent, rates and taxes 61,171 60,982 Advertisement and sales promotion 560,587 546,898 Repairs and maintenance 6,117 16,861 Gas and electricity 14,355 12,601 Freight outward 518,896 500,043 Printing and stationery 4,200 4,318 Postage and telephone 20,930 19,267 First free service charges 203,764 174,180 Insurance 15,018 13,245 Newspapers, magazines and subscriptions 2,273 1,804 Others 704 626
1,924,062 1,852,057
27.1 Staff salaries and other benefits include Rs.25,096 thousand (2018: Rs.29,589 thousand) in respect of staff retirement benefits.
28. ADMINISTRATIVE EXPENSES 2019 2018 Note ------ Rupees in ‘000 ------
Non executive directors’ fee 20,695 20,685 Staff salaries and other benefits 28.1 312,304 341,514 Travelling, conveyance and entertainment 17,837 22,358 Rent, rates and taxes 8,946 8,123 Insurance 5,534 4,416 Repairs and maintenance 13,176 24,252 Legal and professional charges 35,860 27,752 Gas and electricity 1,388 1,559 Newspapers, magazines, fees and subscriptions 4,903 3,699 Postage and telephone 2,769 3,446 Printing and stationery 16,340 20,307 Vehicle running expenses 13,766 10,209 Staff training 38,657 24,905 Depreciation 6.3 85,264 69,687 Donation 28.2 62,648 51,649 Others 122 33
640,209 634,594
28.1 Staff salaries and other benefits include Rs.22,590 thousand (2018: Rs.20,996 thousand) in respect of staff retirement benefits.
28.2 Donation of Rs.62,648 thousand (2018: Rs.50,927 thousand) charged in these financial statements is paid to Atlas Foundation, 2nd Floor, Federation House, Shara-e-Firdousi, Clifton, Karachi (the Foundation). Mr. Yusuf H. Shirazi, Chairman and Mr. Jawaid Iqbal Ahmed, the Director of the Company are also the Directors of the Foundation.
CompanyOverview
Message forStakeholders
FinancialHighlights
SustainabilityReport
FinancialStatements
OtherInformation
149

29. OTHER INCOME 2019 2018Note ------ Rupees in ‘000 ------
Income from financial assets
Mark-up / interest on savings deposit accounts,term deposit receipts and treasury bills 29.1 612,559 527,204
Gain on sale of investments at fair value through profit or loss 4,034 12,864 Fair value gain on investments at fair value through profit or loss 1,973 16,183 Dividend income 32,427 3,321 Net foreign exchange gains 1,749 - Income from investments in related parties
Gain on sale of investments at fair value through profit or loss - 104,299 Fair value gain on investments at fair value through profit or loss - 144,022 Dividend income 428,412 29,094 Income from assets other than financial assets
Commission income 1,110 1,726 Scrap sales 14,094 37,854 Others 1,278 1,341
1,097,636 877,908
29.1 Mark-up / interest at the rates ranging from 5.48% to 11.25% (2018: 5.8% to 6.70%) per annum has been earned during the year on savings deposit accounts, term deposit receipts, treasury bills and Pakistan investment bonds.
30. OTHER OPERATING EXPENSES 2019 2018Note ------ Rupees in ‘000 ------
Workers’ profit participation fund 22.5 246,352 333,190 Workers’ welfare fund 22.6 81,052 97,840 Auditors’ remuneration 30.1 3,297 2,919 Net foreign exchange loss - 189 Fair value loss on investments at fair
value through profit or loss from related parties 75,571 - Loss on sale of investments at fair
value through profit or loss from related parties 54,156 - Loss on disposal of operating fixed assets 3,365 10,899
463,793 445,037
30.1 Auditors’ remuneration
Fee for:- audit of annual financial statements 1,500 1,500 - review of half yearly financial information 212 212 - review of Code of Corporate Governance 91 91 - audits of retirement funds and workers’ profit participation fund 250 250 - certifications for payment of royalty, technical fee and dividend 947 569 - out of pocket expenses 297 297
3,297 2,919
31. FINANCE COSTS 2019 2018Note ------ Rupees in ‘000 ------
Interest on workers’ profit participation fund 22.5 2,809 538 Bank and other financial charges 23,009 22,187
25,818 22,725
CompanyOverview
Message forStakeholders
FinancialHighlights
SustainabilityReport
FinancialStatements
OtherInformation
150

2019 201832. INCOME TAX EXPENSE ------ Rupees in ‘000 ------
Current taxCurrent tax on profits for the year 1,165,899 1,567,943 Adjustments for current tax of prior years 232,285 3,012
1,398,184 1,570,955 Deferred taxOrigination and reversal of temporary differences 78,364 30,256 Impact of change in tax rate (69,884) -
8,480 30,256 1,406,664 1,601,211
32.1 Numerical reconciliation of income tax expense to prima facie tax
Profit before income tax expense 4,615,323 6,264,846 Tax at the applicable rate of 29% (2018: 30%) 1,338,444 1,879,454 Tax effect of: - amounts not deductible for tax purposes 348,079 316,713 - amounts deductible for tax purposes butnot taken to the statement of profit or loss (411,402) (351,097) - income not subject to tax / income subject to final tax regime / tax credits (191,482) (264,652) - Associate’s result reported net of tax (1,987) (12,475)Adjustments for current tax of prior years and super tax 316,532 3,012 Deferred tax 8,480 30,256 Income tax expense 1,406,664 1,601,211
32.2 The provision for current year tax represent tax on taxable income at the rate of 29%. According to management, the tax provision made in the financial statements is sufficient. A comparison of last three years of income tax provision with tax assessed is presented below:
2018 2017 2016
Income tax provision for the year - accounts 1,567,943 1,159,131 1,065,822 Income tax as per tax assessment 1,564,837 1,141,516 1,049,136
32.3 Section 5A of the Income Tax Ordinance, 2001 imposes tax at the rate of 5% of accounting profit before tax on every public company other than a scheduled bank or modaraba, that derives profits for a tax year but does not distribute at least 20% of accounting profit through cash dividend within six months of the end of said tax year.
The Board of Directors in their meeting held on April 24, 2019 has distributed sufficient cash dividend for the year ended March 31, 2019 (refer note 44) which complies with the above stated requirements. Accordingly, no provision for tax on undistributed profits has been recognised in the financial statements for the year ended March 31, 2019.
33. EARNINGS PER SHARE 2019 2018------ Rupees in ‘000 ------
33.1 Basic earnings per share
Net profit for the year 3,208,659 4,663,635
--- Number of shares ---
Weighted average ordinary shares in issue 103,406,613 103,406,613
-------- Rupees --------
Earnings per share 31.03 45.10
33.2 Diluted earnings per share
No figures for diluted earnings per share have been presented as the Company has not issued any instruments carrying options which would have an impact on earnings per share when exercised.
CompanyOverview
Message forStakeholders
FinancialHighlights
SustainabilityReport
FinancialStatements
OtherInformation
151

34. CASH GENERATED FROM OPERATIONS 2019 2018Note ------ Rupees in ‘000 ------
Profit before taxation 4,615,323 6,264,846 Adjustments for:Depreciation 1,063,590 899,057 Amortisation 18,821 9,998 Provision for compensated absences 31,451 37,419 Provision for gratuity 27,170 22,083 Provision for slow moving inventories - net 6,914 20,813 Mark-up / interest on savings deposit accounts and
term deposit receipts (612,559) (527,204)Loss / (gain) on sale of investments at fair value
through profit or loss 50,122 (117,163)Fair value loss / (gain) on investments at fair value
through profit or loss 73,598 (160,205)Net foreign exchange (gain) / loss (1,749) 189 Dividend income (460,839) (32,415)Workers’ profit participation fund 249,161 333,728 Workers’ welfare fund 81,052 97,840 Loss on disposal of operating fixed assets 3,365 10,899 Share of net profit of an Associate (15,698) (50,607)Changes in working capital 34.1 (3,424,484) 2,435,753
1,705,238 9,245,031
2019 201834.1 Changes in working capital ------ Rupees in ‘000 ------
Increase in current assets - Stores, spares and loose tools (73,204) (112,283) - Stock-in-trade (2,479,610) (495,285) - Trade debts (254,776) (237,893) - Loans and advances (3,687) (1,186) - Trade deposits and prepayments (869,465) (17,101) - Other receivables (557,552) (8,901)
(4,238,294) (872,649)Increase in current liabilities: - Trade and other payables 813,810 3,308,402
(3,424,484) 2,435,753
34.2 Cash flows from operating activities - Direct method
Receipts from customers 82,129,677 79,503,549 Mark-up / interest received 590,502 533,117 Payments to trade suppliers, service providers and employees (80,417,734) (70,265,125)Income taxes paid (1,821,857) (1,563,999)Contributions made to gratuity funds (24,443) (25,492)Compensated absences paid (19,012) (24,181)Workers’ profit participation fund paid (333,728) (270,713)Workers’ welfare fund paid (116,209) (84,154)
(12,804) 7,803,002
CompanyOverview
Message forStakeholders
FinancialHighlights
SustainabilityReport
FinancialStatements
OtherInformation
152

35. REMUNERATION OF CHIEF EXECUTIVE OFFICER, DIRECTORS AND EXECUTIVES
The aggregate amounts charged during year in respect of remuneration and fee, including certain benefits, to the Chief Executive Officer, Directors and Executives of the Company are given below:
--------------- Directors --------------- Executives
Chief Executive Officer Others 2019 2018 2019 2018 2019 2018--------------------------------- Rupees in ‘000 ---------------------------------
Managerial remuneration and fee 20,691 19,158 23,370 22,733 182,566 155,332 Rent and utilities 9,896 9,162 - - 87,314 74,289 Bonus 3,895 10,340 - - 33,867 83,383 Retirement benefits 1,979 1,832 - - 17,463 14,164 Medical and other reimbursable expenses 103 225 - - 5,082 4,185
36,564 40,717 23,370 22,733 326,292 331,353 Number of persons 1 1 5 5 75 72
35.1 The Chief Executive Officer, three Directors and two expatriate executives are provided with free use of Company maintained cars and telephones at residences. Two Directors and two expatriate executives are also provided with furnished accommodation.
36. RELATED PARTIES
Related parties comprise of the Holding Company, Associated Companies, staff retirement funds, directors and key management personnel. The Company in the normal course of business carries out transactions with various related parties. Details of related parties (with whom the Company has transacted) along with relationship and transactions with related parties, other than those which have been disclosed elsewhere in these financial statements, are as follows:
36.1 Name and nature of relationship
a) The Holding Company
Shirazi Investments (Private) Limited - 52.43% shares held in the Company
b) Associated Companies due to significant influence
Honda Motor Company Limited - 35.00% shares held in the Company (note 36.1.1)
Atlas Hitec (Private) Limited - 29.23% shares held by the Company
c) Associated Companies due to common directorship
Atlas Engineering Limited Atlas Asset Management Limited
Atlas Autos (Private) Limited Atlas Power Limited
Atlas Die Casting (Private) Limited Atlas Foundation
Atlas Battery Limited Honda Atlas Cars Pakistan Limited
Atlas Insurance Limited Atlas Metals (Private) Limited
Shirazi Trading Company (Private) Limited Atlas Global, FZE (note 36.1.2)
Honda Atlas Power Products (Private) Limited Pakistan Cables Limited
d) Associated companies under common management
Atlas Worldwide General Trading LLC (note 36.1.3) Atlas Aluminium Limited
36.1.1 Honda Motor Company Limited (HMCL) is a company incorporated in Japan, having registered office at 1-1, Minami-Aoyama 2-chome, Minato-ku, Tokyo 107-8556, Japan. HMCL holds 35% shares in the Company. Mr. Takahiro Hachigo is the Chief Executive Officer of HMCL. Major line of business of HMCL are motorcycles, automobiles, power products and financial services. Auditors have expressed unqualified opinion on the financial statements of HMCL for the year ended March 31, 2018.
CompanyOverview
Message forStakeholders
FinancialHighlights
SustainabilityReport
FinancialStatements
OtherInformation
153

36.1.2 Atlas Global FZE (AG) is a Free Zone establishment with limited liability in the Jebel Ali Free Zone, Dubai, UAE formed under the Law 9 of 1992 and implementing regulations issued there under by Jebel Ali Free Zone. The registered office of AG is P.O. Box 17442, Dubai, UAE. Mr. Iftikhar H. Shirazi is the Chief Executive Officer of AG. Major line of business of AG is general trading activities. Auditors have expressed unqualified opinion on the financial statements of AG for the year ended June 30, 2018.
36.1.3 Atlas Worldwide General Trading (L.L.C) (AWWT) established with limited liability in Dubai formed under Federal Law 2 of 2015 by Dubai, UAE. The registered office of AWWT is Office 311, Nasir Ahmed Nasir Lootah Building, Khalid Bin Al Waleed Road, Dubai, UAE. Mr. Iftikhar H. Shirazi is the Chief Executive Officer of AWWT. Major line of business of AWWT is general trading activities. Auditors have expressed unqualified opinion on the financial statements of AWWT for the year ended June 30, 2018.
2019 201836.2 Transactions with related parties ------ Rupees in ‘000 ------
The holding company
Sales of:
- goods and services 787 723
- operating fixed assets - 502
Purchases of operating fixed assets - 5,550
Rent 152,805 122,681
Dividend paid 2,006,166 1,003,083
Associated companies
Sales of:
- goods and services 1,362,803 1,057,093
- operating fixed assets 22,800 466,170
Purchases of:
- goods and services 21,659,701 20,188,202
- operating fixed assets 149,523 118,215
License and drawings fee paid 138,770 52,400
Sale of units in mutual funds 3,900,000 11,951,415
Purchase of units in mutual funds 861,626 13,003,508
Royalty paid 3,760,462 3,571,617
Export commission paid 1,507 5,767
Technical assistance fee 42,485 14,007
Commission income 1,110 1,726
Rent 20,017 18,207
Insurance premium paid 371,441 320,651
Insurance claims received 21,069 11,499
Reimbursement of expenses - net 9,939 2,862
Dividend paid 1,447,590 723,795
Donation paid 62,648 50,927
Dividend received 445,512 47,144
Other related parties
Contributions paid to:
- gratuity funds 24,443 25,492
- provident funds / pension schemes 64,019 60,525
Key Management Personnel
- salaries and other employment benefits 146,947 136,654
- sale of vehicles under company policy 3,081 1,632
The related party status of outstanding balances as at March 31, 2019 is included in ‘Long term loans and advances - note 9, ‘Trade deposit and prepayments - note 14’, ‘Staff retirement benefits - note 20’ and ‘Trade and other payables - note 22’ respectively. These are settled in ordinary course of business.
CompanyOverview
Message forStakeholders
FinancialHighlights
SustainabilityReport
FinancialStatements
OtherInformation
154

37. FINANCIAL RISK MANAGEMENT
37.1 Financial risk factors
The Company has exposure to the following risks from its use of financial instruments:
- market risk (including foreign exchange risk, interest rate risk and price risk);- credit risk; and- liquidity risk.
The Company’s Board of Directors has overall responsibility for the establishment and oversight of the Company’s risk management framework. The Board is also responsible for developing and monitoring the Company’s risk management policies.
The Company’s overall risk management programme focuses on the unpredictability of financial markets and seeks to minimise potential adverse effects on the Company’s financial performance. Risk management is carried out by a treasury department under policies approved by the Board of Directors. The treasury department identifies, evaluates and hedges financial risks. The Board provides written principles for overall risk management, as well as written policies covering specific areas, such as foreign exchange risk, interest rate risk, credit risk, use of derivative and non-derivative financial instruments and investment of excess liquidity.
(a) Market risk
Market risk is the risk that changes in market prices, such as foreign exchange rates, interest rates and equity prices will affect the Company’s income or the value of its holdings of financial instruments. The objective of market risk management is to manage and control market risk exposures within acceptable parameters, while optimising the return.
Foreign exchange risk
Foreign exchange risk is the risk that the fair value of future cash flows of a financial instrument shall fluctuate because of changes in foreign exchange rates.
The Company operates internationally and is exposed to foreign exchange risk arising from various currency exposures, primarily with respect to the Japanese Yen and the US Dollar. Foreign exchange risk arises from future commercial transactions and recognised assets and liabilities. The Company’s exposure to foreign currency risk at the reporting date is as follows:
2019 2018Japanese US Japanese US
Yen Dollars Yen Dollars------ in ‘000 ------ ------ in ‘000 ------
Cash at bank / trade debts - 11 - 204 Trade and other payables (788,788) (39) (888,013) (238)Net exposure (788,788) (28) (888,013) (34)
The following significant exchange rates have been applied:
2019 2018 2019 2018Average rate Reporting date rate
-------------------- Rupees --------------------
Pakistani Rupee to Japanese Yen 1.16 0.98 1.27 1.09 Pakistani Rupee to US Dollar 128.89 106.30 140.70 115.50
At March 31, 2019, if the Pakistani Rupee had strengthened / weakened by 5% against Japanese Yen and US Dollar with all other variables held constant, profit before tax for the year would have been higher / (lower) by the amount shown below mainly as a result of net foreign exchange gains / (losses) on translation of foreign denominated financial assets and liabilities.
2019 2018Effect on profit for the year: ------ Rupees in ‘000 ------
Pakistani Rupee to Japanese Yen 50,088 48,343 Pakistani Rupee to US Dollar 197 196
50,285 48,539
CompanyOverview
Message forStakeholders
FinancialHighlights
SustainabilityReport
FinancialStatements
OtherInformation
155

Interest rate risk
Interest rate risk represents the risk that the fair values or future cash flows of financial instruments will fluctuate because of change in market interest rates.
The Company is exposed to interest rate risk on balances with banks in savings deposit accounts and term deposit receipts. Deposits in bank savings accounts held at variable interest rates expose the Company to cash flow interest rate risk and term deposit receipts issued by the banks at fixed interest rates give rise to fair value interest rate risk. Significant interest rate risk exposures are primarily managed by a suitable mix of deposits. At March 31, 2019, the Company’s interest bearing financial assets amounted to Rs.7,331,655 thousand (2018: Rs.9,893,986 thousand).
At March 31, 2019, if the interest rate on the Company’s deposits had been 1% higher / lower with other variables held constant, profit before tax for the year would have been higher / (lower) by Rs.8,317 thousand (2018: Rs.13,940 thousand) mainly as a result of higher / (lower) interest income.
Price risk
Price risk represents the risk that the fair values or future cash flows of financial instruments will fluctuate because of changes in market prices (other than those arising from foreign exchange risk or interest rate risk), whether those changes are caused by factors specific to the individual financial instrument or its issuer, or factors affecting all similar financial instruments traded in the market.
The Company is exposed to price risk because of investments in mutual fund securities aggregating to Rs.5,261,724 thousand (2018: Rs.8,400,246 thousand) as changes in Net Asset Value (NAV) of mutual funds affects the Company. The Company is not exposed to commodity price risk. To manage its price risk arising from investments in mutual funds, the Company diversifies its portfolios.
At March 31, 2019, if fair value (NAV) had been 5% higher / lower with all other variables held constant profit before tax for the year would have higher / (lower) by Rs.263,086 thousand (2018: Rs.420,012 thousand).
(b) Credit risk
Credit risk represents the risk of financial loss being caused if counter party fails to perform as contracted or discharge an obligation. The Company’s credit risk arises from deposits with banks & financial institutions, loans & advances, deposits, trade debts, investments, accrued mark-up / interest and other receivables.
The carrying amounts of financial assets represent the maximum credit exposure. The financial assets exposed to credit risk amounted to Rs.13,984,890 thousand (2018: Rs.19,387,586 thousand) as at March 31, 2019 and are as follows:
2019 2018------ Rupees in ‘000 ------
Long term loans and advances 33,467 31,481 Long term deposits 13,882 22,573 Trade debts 1,116,000 861,224 Loans and advances 34,125 35,739 Trade deposits 6,203 34,550 Accrued mark-up / interest 37,614 15,557 Other receivables 1,716 4,601 Short term investments 5,261,724 8,400,246 Bank balances 7,480,159 9,981,615
13,984,890 19,387,586
The maximum exposure to credit risk for trade debts at the reporting date by geographic region is as follows:
2019 2018------ Rupees in ‘000 ------
Pakistan 1,116,000 844,413 Bangladesh - 16,811
1,116,000 861,224
CompanyOverview
Message forStakeholders
FinancialHighlights
SustainabilityReport
FinancialStatements
OtherInformation
156

The maximum exposure to credit risk for trade debts by type of counter party as at reporting date is as follows:
2019 2018------ Rupees in ‘000 ------
Government Departments 6,050 35,891 Defence Institutions 964,893 698,612 Others (including exports) 145,057 126,721
1,116,000 861,224
Out of the total financial assets credit risk is concentrated in trade debts, investments in mutual funds securities and deposits with banks as they constitute 99% (2018: 99%) of the total financial assets. Significant part of sales of the Company occurs against advance payments, therefore, trade debts mainly arise from export sales and local sales that were made to Government and Defence Institutions. The Company believes that it is not exposed to any specific credit risk in respect of those trade debts.
The credit quality of loans and receivables can be assessed with reference to their historical performance with no or negligible defaults in recent history and no losses incurred. The credit quality of Company’s bank balances and investments in mutual funds securities can be assessed with reference to the external credit ratings as follows:
RatingBanks Short term Long term AgencyConventionalAllied Bank Limited A1+ AAA PACRAAskari Bank Limited A1+ AA+ PACRABank Al Habib Limited A1+ AA+ PACRABank Alfalah Limited A1+ AA+ PACRADeutsche Bank AG F-1 A- FITCHFaysal Bank Limited A1+ AA PACRAHabib Bank Limited A-1+ AAA JCR-VISHabib Metropolitan Bank Limited A1+ AA+ PACRAKhushhali Bank Limited A-1 A+ JCR-VISMCB Bank Limited A1+ AAA PACRANational Bank of Pakistan A1+ AAA PACRASoneri Bank Limited A1+ AA- PACRAStandard Chartered Bank (Pakistan) Limited A1+ AAA PACRAUnited Bank Limited A-1+ AAA JCR-VISShariah CompliantBankIslami Pakistan Limited A1 A+ PACRAMeezan Bank Limited A1+ AA+ JCR-VISMutual Funds Rating AgencyAtlas Income Fund AA-(f) PACRAAtlas Islamic Income Fund AA-(f) PACRAAtlas Money Market Fund AA(f) PACRAAtlas Sovereign Liquid Fund AA(f) PACRALakson Money Market Fund AA(f) PACRALakson Income Fund A+(f) PACRANational Investment (Unit) Trust AM2++ PACRA
(c) Liquidity risk
Liquidity risk reflects the Company’s inability in raising funds to meet commitments. The Company manages liquidity risk by maintaining sufficient balances with banks. At March 31, 2019 there is no maturity mismatch between financial assets and liabilities that exposes the Company to liquidity risk.
37.2 Capital management
The Company’s objectives when managing capital are to safeguard its ability to continue as a going concern so that it can continue to provide returns for shareholders and benefits for other stakeholders and maintain an optimal capital structure to reduce the cost of capital. The capital structure of the Company is equity based with no financing through long term or short term borrowings.
CompanyOverview
Message forStakeholders
FinancialHighlights
SustainabilityReport
FinancialStatements
OtherInformation
157

37.3 Financial instruments by category
Loans and receivables
At fair value through profit and loss
Financial assets as per statement 2019 2018 2019 2018of financial position ------ Rupees in ‘000 ------ ------ Rupees in ‘000 ------
Long term loans and advances 33,467 31,481 - - Long term deposits 13,882 22,573 - - Trade debts 1,116,000 861,224 - - Loans and advances 34,125 35,739 - - Trade deposits 6,203 34,550 - - Accrued mark-up / interest 37,614 15,557 - - Other receivables 1,716 4,601 - - Short term investments - - 5,261,724 8,400,246 Bank balances 7,480,159 9,981,615 - -
8,723,166 10,987,340 5,261,724 8,400,246
Financial liabilities measured at amortised cost
Financial liabilities as per 2019 2018statement of financial position ------ Rupees in ‘000 ------
Trade and other payables 7,990,789 6,708,286
37.4 Fair value measurement of financial instruments
Fair value is the price that would be received to sell an asset or paid to transfer a liability in an orderly transaction between market participants at the measurement date. Underlying the definition of fair value is the presumption that the Company is going concern and there is no intention or requirement to curtail materially the scale of its operation or to undertake a transaction on adverse terms.
The carrying values of all financial assets and liabilities reflected in the financial statements are a reasonable approximation of their fair values.
The table below analyses financial instruments carried at fair value, by valuation method. The different levels have been defined as follows:
- Quoted prices (unadjusted) in active markets for identical assets or liabilities [Level 1].
- Inputs other than quoted prices included within level 1 that are observable for the asset or liability, either directly (that is, as prices) or indirectly (that is, derived from prices) [Level 2].
- Inputs for the asset or liability that are not based on observable market data (that is, unobservable inputs) [Level 3].
The following table presents the Company’s financial assets that are measured at fair value at March 31, 2019 and March 31, 2018.
March 31, 2019Level 1 Level 2 Level 3 Total
--------------------------- Rupees in ‘000 ---------------------------Assets - Recurring fair value measurementFinancial assets at fair value through profit or lossShort term investments 5,261,724 - - 5,261,724
March 31, 2018Level 1 Level 2 Level 3 Total
--------------------------- Rupees in ‘000 ---------------------------
Assets - Recurring fair value measurementFinancial assets at fair value through profit or lossShort term investments 8,400,246 - - 8,400,246
CompanyOverview
Message forStakeholders
FinancialHighlights
SustainabilityReport
FinancialStatements
OtherInformation
158

There were no transfers amongst the levels during the current and preceding year. The Company’s policy is to recognise transfer into and transfers out of fair value hierarchy levels as at the end of the reporting periods
Valuation techniques used to determine fair values
Level 1: The fair value of financial instruments traded in active markets is based on quoted market prices at the reporting date. A market is regarded as active if quoted prices are readily and regularly available from an exchange, dealer, broker, industry group, pricing service, or regulatory agency, and those prices represent actual and regularly occurring market transactions on an arm’s length basis. These instruments are included in Level 1.
Level 2: The fair value of financial instruments that are not traded in an active market is determined by using valuation techniques. These valuation techniques maximize the use of observable market data where it is available and rely as little as possible on entity specific estimates. If all significant inputs required to determine fair value of instrument are observable, the instrument is included in Level 2.
Level 3: If one or more of the significant inputs is not based on observable market data, the instrument is included in Level 3.
There were no other material Level 1, 2 or 3 assets or liabilities during the current and preceding year.
38. ENTITY-WIDE INFORMATION
38.1 The Company markets and sells motorcycles and spare parts. Breakdown of net revenues for both the products of the Company is as follows:
2019 2018------ Rupees in ‘000 ------
Motorcycles 74,379,378 70,412,715 Spare parts 8,033,170 7,066,130
82,412,548 77,478,845
38.2 Export sales are made to Afghanistan and Bangladesh. Result of the Company’s revenue from external customers in Pakistan is Rs.82,162,939 thousand (2018: Rs.77,025,720 thousand) and total revenue from external customers from other countries is Rs.249,609 thousand (2018: Rs.453,125 thousand).
38.3 All the non-current assets of the Company are located in Pakistan.
38.4 The Company’s customer base is diverse with no single customer accounting for more than 10% of net revenue.
39. PLANT CAPACITY AND ACTUAL PRODUCTION 2019 2018--- Number of units ---
Capacity - Motorcycles 1,350,000 1,250,000
Production 1,140,830 1,086,700
The Company has completed the capacity expansion in March, 2019.
The capacity of the plants are determined based on a certain product mix and number of working days.
40. NUMBER OF EMPLOYEES Factory Others2019 2018 2019 2018
Total number of employees 1,459 1,385 234 226Average number of employees 1,482 1,507 224 209
41. PROVIDENT FUND RELATED DISCLOSURE
The Company operates defined contribution provident fund (the Fund) maintained for its permanent employees. Equal monthly contributions at the rate of 11% of the basic salary are made to the Fund both by the Company and the employees. The following information is based on un-audited financial statements of the Fund for the year ended March 31, 2019:
CompanyOverview
Message forStakeholders
FinancialHighlights
SustainabilityReport
FinancialStatements
OtherInformation
159

2019 2018------ Rupees in ‘000 ------
Size of the Fund - Total assets 788,024 894,830 Fair value of investments 768,260 875,760 Cost of investments 777,333 863,830 Percentage of investments made 98.64% 96.54%
41.1 The investments out of provident fund have been made in accordance with the provisions of section 218 of the Act and conditions specified thereunder.
42. SHAHRIAH SCREENING DISCLOSURE
----------- 2019 ----------- ----------- 2018 -----------
ConventionalShahriah
CompliantConventional Shahriah
Compliant--------------- Rupees in 000 ---------------
Short term investments 4,974,321 287,403 7,973,000 427,246 Bank balances 7,414,372 65,787 9,964,738 16,877 Revenue - 82,412,548 - 77,478,845
Other incomea) Mark-up / interest on savings deposit
accounts and term deposit receipts 612,559 - 527,204 - b) (Loss) / gain on sale of investments
at fair value through profit or loss (28,667) (21,455) 109,726 7,437 c) Fair value (loss) / gain on investments
at fair value through profit or loss (62,422) (11,176) 199,256 (39,051)d) Dividend income 460,838 1 7,164 25,251 e) Others including exchange gain on
actual currency - 18,231 - 40,921
43. CORRESPONDING FIGURES
The corresponding figures have been rearranged and reclassified, wherever considered necessary for the purposes of comparison and better presentation; the effect of which is not material.
44. EVENT AFTER REPORTING PERIOD
The Board of Directors, in their meeting held on April 24, 2019, (i) approved the transfer of Rs. Nil (2018: Rs.1,500,000 thousand) from unappropriated profit to general reserve and (ii) proposed a final cash dividend of Rs.10.0 (2018: Rs. 27.0) per share and issue of bonus shares at the rate of 20% (2018: Nil) i.e. 1 bonus share for every 5 shares held (2018: Nil), amounting to Rs.1,034,066 and Rs. 206,813 respectively, for approval of the members at the Annual General Meeting to be held on June 21, 2019.
The financial statements for the year ended March 31, 2019 do not include the effect of the proposed appropriations, which will be accounted for in the financial statements for year ending March 31, 2020.
45. DATE OF AUTHORIZATION FOR ISSUE
These financial statements were authorised for issue on April 24, 2019 by the Board of Directors of the Company.
CompanyOverview
Message forStakeholders
FinancialHighlights
SustainabilityReport
FinancialStatements
OtherInformation
Yusuf H. Shirazi Saquib H. Shirazi Kashif YasinChairman Chief Executive Officer Chief Financial Officer
160

Pattern of ShareholdingAs at March 31, 2019Shareholders' Category Number of Number of
shareholders shares held Percentage
Associated Companies, Undertakings and Related Parties:Atlas Insurance Limited 1 2,931,728 2.84%Honda Motor Company Limited 1 36,192,315 35.00%Shirazi Investments (Pvt) Limited 1 54,220,693 52.43%
3 93,344,736 90.27%
NIT and ICP:National Bank Of Pakistan Trustee Department 1 26,421 0.03%IDBP (ICP Unit) 1 762 0.00%
2 27,183 0.03%
Directors, CEO and their Spouse(s) and minor children & Associates:Mr. Yusuf H.Shirazi & Associates 3 3 0.00%Mr.Saquib H. Shirazi (CEO) 1 1 0.00%Mr. Sanaullah Qureshi 1 400 0.00%Mr. Hirofumi Yada 1 1 0.00%Mr. Hironobu Yoshimura 1 1 0.00%Mr. Yukitoshi Fujisaka 1 1 0.00%Mr. Abid Naqvi 1 501 0.00%Mr. Jawaid Iqbal Ahmed 1 1 0.00%
10 909 0.00%
Executives - 0.00%
Public Sector Companies and Corporations - 0.00%
Banks, Development Finance Institutions, Non-Banking Finance Institutions, InsuranceCompanies, Modaraba and Mutual Funds. 10 553,366 0.54%
Individuals 1,502 9,342,987 9.03%
Others 25 137,432 0.13%
Total 1,552 103,406,613 100.00%
Shareholders holding 10% or more voting interest
Honda Motor Company Limited 36,192,315 35.00% Shirazi Investments (Pvt) Limited 54,220,693 52.43%
There was no trading in the shares of the Company by Directors, their spouses, and minor children.
CompanyOverview
Message forStakeholders
FinancialHighlights
SustainabilityReport
FinancialStatements
OtherInformation
161

Pattern of ShareholdingAs at March 31, 2019
No. of Shareholders
ShareholdingsTotal
Shares Held520 From 1 To 100 12,747
363 From 101 To 500 75,870
170 From 501 To 1,000 112,297
283 From 1,001 To 5,000 639,058
70 From 5,001 To 10,000 504,500
45 From 10,001 To 15,000 534,675
19 From 15,001 To 20,000 342,094
11 From 20,001 To 25,000 236,812
9 From 25,001 To 30,000 323,787
5 From 30,001 To 35,000 159,580
2 From 35,001 To 40,000 76,845
5 From 40,001 To 45,000 214,104
5 From 45,001 To 50,000 232,858
2 From 50,001 To 55,000 102,540
1 From 60,001 To 65,000 63,060
1 From 65,001 To 70,000 66,601
2 From 70,001 To 75,000 146,152
3 From 75,001 To 80,000 228,998
4 From 80,001 To 85,000 328,124
1 From 85,001 To 90,000 85,703
2 From 90,001 To 95,000 183,071
6 From 95,001 To 100,000 595,751
2 From 110,001 To 115,000 227,696
2 From 120,001 To 125,000 244,698
4 From 125,001 To 130,000 505,892
1 From 150,001 To 155,000 151,715
2 From 160,001 To 165,000 325,955
1 From 175,001 To 180,000 176,841
1 From 195,001 To 200,000 199,459
2 From 245,001 To 250,000 490,956
1 From 265,001 To 270,000 267,566
1 From 315,001 To 320,000 318,625
1 From 325,001 To 330,000 327,889
1 From 530,001 To 535,000 531,450
1 From 1,025,001 To 1,030,000 1,027,908
1 From 2,930,001 To 2,935,000 2,931,728
1 From 36,190,001 To 36,195,000 36,192,315
1 From 54,220,001 To 54,225,000 54,220,693
1,552 103,406,613
CompanyOverview
Message forStakeholders
FinancialHighlights
SustainabilityReport
FinancialStatements
OtherInformation
162

* Note: Included in Associated Companies
Atlas Insurance Ltd. 2,931,728 shares
Honda Motor Company Ltd. 36,192,315 shares, Shirazi Investments (Pvt) Ltd. 54,220,693 shares,
Pattern of ShareholdingAs at March 31, 2019
Shareholders' CategoryNumber of
shareholdersNumber of shares held
Percentage
Directors, CEO their spouse and minor children and Associates 10 909 0.00
* Associated Companies, undertakings and related parties 3 93,344,736 90.27
NIT and ICP 2 27,183 0.03
Banks, Development Finance Institutions,
Non-Banking Finance Institutions
Insurance Companies
Modarabas and Mutual Funds 10 553,366 0.54
General Public
Local 1502 9,342,987 9.03
Foreign
Others
Joint Stock Companies 23 136,460 0.13
Cooperative Society 1 971 0.00
Trustee of Iftikhar Shirazi Family Trust 1 1 0.00
1552 103,406,613 100.00
CompanyOverview
Message forStakeholders
FinancialHighlights
SustainabilityReport
FinancialStatements
OtherInformation
163

SustainabilityReport
CompanyOverview
Message forStakeholders
FinancialHighlights
FinancialStatements
OtherInformation
Genuine Parts
Product Portfolio
164

SustainabilityReport
CompanyOverview
Message forStakeholders
FinancialHighlights
FinancialStatements
OtherInformation
Genuine Parts
Product Portfolio
CompanyOverview
Message forStakeholders
FinancialHighlights
SustainabilityReport
FinancialStatements
OtherInformation
165

SustainabilityReport
CompanyOverview
Message forStakeholders
FinancialHighlights
FinancialStatements
OtherInformation
ACCA Association of Chartered Certified Accountants AGM Annual General Meeting AHL Atlas Honda Limited AHPL Atlas Hitec (Private) Limited AMP Advance Management Program ATL Active Tax-payers List AGM Annual General Meeting B2B Business to Business BCR Best Corporate Report BCG Boston Consulting Group BSR Best Sustainability Report BOD Board of Director CAGR Cumulative Average Growth Rate CCG Code of Corporate Governance CDC Central Depository Company of Pakistan Limited CDS Central Depository System CEO Chief Executive Officer CFO Chief Financial Officer CKD Completely Knocked Down CNIC Computerized National Identity Card COO Chief Operating Officer CPEC China - Pakistan Economic Corridor CSR Corporate Social Responsibility CO2 Carbon di Oxide CBA Collective Bargaining Agent DFI Development Finance Institutions EOBI Employee Old-Age Benefits Institution EPS Earnings per Share ERP Enterprise Resource Planning - software EMS Environment Management System EPA Environmental Protection Agency FBR Federal Board of Revenue GAAP Generally Accepted Accounting Principles GDC Gravity Die Casting GDP Gross Domestic Product GRI Global Reporting Initiative GHG Green House Gases GJ Gigajoule GRI Global Reporting Initiative HMC Honda Motor Company HPDC High Pressure Die Casting HSE Health Safety Environment HR Human Resource IAS International Accounting Standards IASB International Accounting Standards Board IBA Institute of Business Admisnistration ICAP Institute of Chartered Accountants of Pakistan ICMAP Institute of Cost and Management Accountants of Pakistan IFAC International Federation of Accountants IFAS Islamic Financial Accounting Standards
Glossary of TermsAcronym Description Acronym Description
IFRS International Financial Reporting Standards ISO International Standardization Organization ISAE International Standard on Assurance Engagements IT Information Technology KSE Karachi Stock Exchange KJ Kilojoule KW Kilo Watt LLB Bachelor of Law LNG Liquefied Natural Gas LPG Liquefied Petroleum Gas LTD Limited LSM Large Scale Manufacturing m3 Cubic meter MOU Memorandum of Understanding MMC Minor Model Change MSCI Morgan Stanley Capital International MIS Management Information System MTO Management Trainee Officer MW Mega Watt NAV Net Asset Value NBFI Non-Banking Financial Institutions NHC New Honda Circle NED NED University of Engineering and Technology NEQS National Environmental Quality Standards NFEH National Forum for Health & Environment NGO Non-Governmental Organization NUST National University of Science and Technology PBT Profit Before Taxation PERAC Public Employee Retirement Administration Commission PSX Pakistan Stock Exchange PAAPAM Pakistan Association of Automotive Parts & Accessories Manufacturers QA Quality Assurance QC Quality Control RCSM Risk and Counter Strategy Matrix RMF Risk Management Function SAFA South Asian Federation of Accountants SAP Standard Application Protocol - ERP system SECP Securities and Exchange Commission of Pakistan SRO Statutory Regulatory Order SWOT Strength Weaknesses Opportunities Threats SSGC Sui Southern Gas Company Limited SNG Synthetic Natural Gas SZABIST Syed Zulfikar Ali Bhutto Institute of Science & Technology TDR Term Deposit Receipt UET University of Engineering and Technology USA United States Aid VIP Vendor Improvement Program VP Vice President WWF World Wildlife Fund
166
SustainabilityReport
CompanyOverview
Message forStakeholders
FinancialHighlights
FinancialStatements
OtherInformation
ACCA Association of Chartered Certified Accountants AGM Annual General Meeting AHL Atlas Honda Limited AHPL Atlas Hitec (Private) Limited AMP Advance Management Program ATL Active Tax-payers List AGM Annual General Meeting B2B Business to Business BCR Best Corporate Report BCG Boston Consulting Group BSR Best Sustainability Report BOD Board of Director CAGR Cumulative Average Growth Rate CCG Code of Corporate Governance CDC Central Depository Company of Pakistan Limited CDS Central Depository System CEO Chief Executive Officer CFO Chief Financial Officer CKD Completely Knocked Down CNIC Computerized National Identity Card COO Chief Operating Officer CPEC China - Pakistan Economic Corridor CSR Corporate Social Responsibility CO2 Carbon di Oxide CBA Collective Bargaining Agent DFI Development Finance Institutions EOBI Employee Old-Age Benefits Institution EPS Earnings per Share ERP Enterprise Resource Planning - software EMS Environment Management System EPA Environmental Protection Agency FBR Federal Board of Revenue GAAP Generally Accepted Accounting Principles GDC Gravity Die Casting GDP Gross Domestic Product GRI Global Reporting Initiative GHG Green House Gases GJ Gigajoule GRI Global Reporting Initiative HMC Honda Motor Company HPDC High Pressure Die Casting HSE Health Safety Environment HR Human Resource IAS International Accounting Standards IASB International Accounting Standards Board IBA Institute of Business Admisnistration ICAP Institute of Chartered Accountants of Pakistan ICMAP Institute of Cost and Management Accountants of Pakistan IFAC International Federation of Accountants IFAS Islamic Financial Accounting Standards
Glossary of TermsAcronym Description Acronym Description
IFRS International Financial Reporting Standards ISO International Standardization Organization ISAE International Standard on Assurance Engagements IT Information Technology KSE Karachi Stock Exchange KJ Kilojoule KW Kilo Watt LLB Bachelor of Law LNG Liquefied Natural Gas LPG Liquefied Petroleum Gas LTD Limited LSM Large Scale Manufacturing m3 Cubic meter MOU Memorandum of Understanding MMC Minor Model Change MSCI Morgan Stanley Capital International MIS Management Information System MTO Management Trainee Officer MW Mega Watt NAV Net Asset Value NBFI Non-Banking Financial Institutions NHC New Honda Circle NED NED University of Engineering and Technology NEQS National Environmental Quality Standards NFEH National Forum for Health & Environment NGO Non-Governmental Organization NUST National University of Science and Technology PBT Profit Before Taxation PERAC Public Employee Retirement Administration Commission PSX Pakistan Stock Exchange PAAPAM Pakistan Association of Automotive Parts & Accessories Manufacturers QA Quality Assurance QC Quality Control RCSM Risk and Counter Strategy Matrix RMF Risk Management Function SAFA South Asian Federation of Accountants SAP Standard Application Protocol - ERP system SECP Securities and Exchange Commission of Pakistan SRO Statutory Regulatory Order SWOT Strength Weaknesses Opportunities Threats SSGC Sui Southern Gas Company Limited SNG Synthetic Natural Gas SZABIST Syed Zulfikar Ali Bhutto Institute of Science & Technology TDR Term Deposit Receipt UET University of Engineering and Technology USA United States Aid VIP Vendor Improvement Program VP Vice President WWF World Wildlife Fund
Your comments for adding value to the report
Name :
Designation :
Organization :
Contact Details :
Telephone : :
Please mail your feedback to :
Email: [email protected]
Sustainability Report 2019Feedback Form
Details of information provided on issues covered in the report
Clarity of the information provided in the report
The quality of design and layout of the report
Comprehensive Adequate Not adequate
High Medium Low
Excellent Good Average
167

168


About the CoverAtlas Honda remained persistent in its pursuit of building long lasting relationship with the stakeholders by emerging as a market leader of innovative and competitive products. The Company continued to offer the level of engineering integrity with high quality mechanics and extended support that is unmatched. Atlas Honda will continue its enthusiastic yet exemplary journey ahead in the light of "Atlas Way". We aim to remain the stair-stepper as we have in the past.
Persistence in PursuitIntegrated Annual Report 2019