Emergence of directional bias in tau deposition from axonal ...
24
UCSF UC San Francisco Previously Published Works Title Emergence of directional bias in tau deposition from axonal transport dynamics. Permalink https://escholarship.org/uc/item/9xs0m599 Journal PLoS computational biology, 17(7) ISSN 1553-734X Authors Torok, Justin Maia, Pedro D Verma, Parul et al. Publication Date 2021-07-27 DOI 10.1371/journal.pcbi.1009258 Peer reviewed eScholarship.org Powered by the California Digital Library University of California
-
Upload
khangminh22 -
Category
Documents
-
view
1 -
download
0
Transcript of Emergence of directional bias in tau deposition from axonal ...

UCSFUC San Francisco Previously Published Works
TitleEmergence of directional bias in tau deposition from axonal transport dynamics.
Permalinkhttps://escholarship.org/uc/item/9xs0m599
JournalPLoS computational biology, 17(7)
ISSN1553-734X
AuthorsTorok, JustinMaia, Pedro DVerma, Parulet al.
Publication Date2021-07-27
DOI10.1371/journal.pcbi.1009258 Peer reviewed
eScholarship.org Powered by the California Digital LibraryUniversity of California

RESEARCH ARTICLE
Emergence of directional bias in tau
deposition from axonal transport dynamics
Justin TorokID1*, Pedro D. MaiaID
2, Parul VermaID3, Christopher MeziasID
3, Ashish Raj3*
1 Department of Computational Biology and Medicine, Weill Cornell Medical School, New York, New York,
United States of America, 2 Department of Mathematics, University of Texas at Arlington, Arlington, Texas,
United States of America, 3 Department of Radiology and Biomedical Imaging, University of California at San
Francisco, San Francisco, California, United States of America
* [email protected], [email protected] (JT); [email protected] (AR)
Abstract
Defects in axonal transport may partly underpin the differences between the observed
pathophysiology of Alzheimer’s disease (AD) and that of other non-amyloidogenic tauopa-
thies. Particularly, pathological tau variants may have molecular properties that dysregulate
motor proteins responsible for the anterograde-directed transport of tau in a disease-specific
fashion. Here we develop the first computational model of tau-modified axonal transport that
produces directional biases in the spread of tau pathology. We simulated the spatiotemporal
profiles of soluble and insoluble tau species in a multicompartment, two-neuron system
using biologically plausible parameters and time scales. Changes in the balance of tau
transport feedback parameters can elicit anterograde and retrograde biases in the distribu-
tions of soluble and insoluble tau between compartments in the system. Aggregation and
fragmentation parameters can also perturb this balance, suggesting a complex interplay
between these distinct molecular processes. Critically, we show that the model faithfully rec-
reates the characteristic network spread biases in both AD-like and non-AD-like mouse
tauopathy models. Tau transport feedback may therefore help link microscopic differences
in tau conformational states and the resulting variety in clinical presentations.
Author Summary
The misfolding and spread of the axonal protein tau is a hallmark of the pathology of
many neurodegenerative disorders, including Alzheimer’s disease and frontotemporal
lobar dementia. How tau misfolding causes disorders with distinct neuropathology and
clinical presentations is the subject of ongoing research. Although current evidence sug-
gests that the specific conformations tau adopts affect where it spreads throughout the
brain, a mechanistic explanation has remained elusive. Here we propose that the
conformer-specific dysregulation of axonal transport can lead to directionally biased
spread, and we employ a mathematical model to explore how tau spreads between neu-
rons in the context of this transport feedback mechanism. We find that conformation-spe-
cific feedback is flexible enough to explain bias in either direction and thoroughly explore
how this bias emerges as a function of the model’s key parameters. Further, the model
PLOS Computational Biology | https://doi.org/10.1371/journal.pcbi.1009258 July 27, 2021 1 / 23
a1111111111
a1111111111
a1111111111
a1111111111
a1111111111
OPEN ACCESS
Citation: Torok J, Maia PD, Verma P, Mezias C, Raj
A (2021) Emergence of directional bias in tau
deposition from axonal transport dynamics. PLoS
Comput Biol 17(7): e1009258. https://doi.org/
10.1371/journal.pcbi.1009258
Editor: Michele Migliore, National Research
Council, ITALY
Received: March 18, 2021
Accepted: July 7, 2021
Published: July 27, 2021
Peer Review History: PLOS recognizes the
benefits of transparency in the peer review
process; therefore, we enable the publication of
all of the content of peer review and author
responses alongside final, published articles. The
editorial history of this article is available here:
https://doi.org/10.1371/journal.pcbi.1009258
Copyright: © 2021 Torok et al. This is an open
access article distributed under the terms of the
Creative Commons Attribution License, which
permits unrestricted use, distribution, and
reproduction in any medium, provided the original
author and source are credited.
Data Availability Statement: All code for running
the model and the analysis pipeline are contained
in the following GitHub repository: https://github.
com/Raj-Lab-UCSF/Tau_Transport/. All data files
are hosted on the author’s cloud for public use:

reproduces the temporal evolution of directionality observed in two classes of in vivo tauo-
pathy models, demonstrating that transport feedback is sufficient to explain differential
tau spread as a function of conformation.
1 Introduction
Despite manifest differences in clinical presentation, the pathology of many progressive neuro-
degenerative diseases is linked to aberrant protein misfolding and aggregation. Indeed, in Alz-
heimer’s disease (AD) [1], frontotemporal lobar degeneration (FTLD) [2], Parkinson’s disease
[3], Huntington disease [4], and in amyotrophic lateral sclerosis [5], there are one or more pro-
teinaceous species that appear to spread throughout the brain and induce neuronal dysfunc-
tion and death. Both in vitro experiments with cultured neurons [6–10] and in vivo work with
animal models of neurodegeneration [11–13] have confirmed that these prion-like assemblies
can spread directly between neurons by traveling within axonal fibers and traversing the syn-
apse. Although the mechanisms by which these misfolded protein agents arise, propagate, and
contribute to pathology remain incompletely understood, they do play a central role in the
progression of neurodegenerative diseases [14, 15].
Tauopathy, the pathological accumulation and spread of misfolded aggregates of microtu-
bule-associated protein tau, is among the most common types of proteinopathies implicated in
neurodegenerative disease, including AD, FTLD, Pick’s disease, and others. The recent discov-
ery that there are phosphoepitopes of tau that distinguish AD from FTLD-type disorders sug-
gests a direct link between the specific conformer of misfolded tau and disease diagnosis [16–
18]. Heterogeneity in tau hyperphosphorylation and misfolding also exists between AD
patients, giving rise to distinct clinical phenotypes [19]. An appealing hypothesis for explaining
how specific tau conformations lead to distinct patterns of neurodegeneration is that although
these tau species can all spread between connected brain regions via white matter tracts, their
propensities to travel in the anterograde (i.e. from presynaptic to postsynaptic cell) or retro-
grade (i.e. postsynaptic to presynaptic) directions may not be equal. Recent work by our group
has lent further support for this hypothesis, wherein we found that mouse tauopathy models
with tau species that developed in the presence of amyloid-β showed a marked preference to
migrate in the retrograde direction, while no consensus directional bias emerged among amy-
loid-negative models [20]. However, there are no models to date that explore how this direc-
tional bias arises.
Mechanistically, conformer-specific dysregulation of active transport could explain differ-
ential biases in the direction of tau spread between diseases. In healthy neurons, energy-driven
active transport within the axon is governed by the complex interplay of motor proteins, their
cargoes, and the microtubules along which they travel [21, 22]. Early in AD, hyperphosphory-
lated tau misfolds and aggregates in the axon; as the disease progresses, it causes the break-
down of the axon initial segment barrier and enters the somatodendritic compartment [23–
25]. In vitro experiments provide direct evidence that active transport is regulated by axonal
tau concentration: a primary anterograde-directed motor protein, kinesin-1, is physically
obstructed by microtubule-bound tau, while the retrograde-directed motor protein, dynein,
remains mostly unaffected except at aphysiological concentrations [26, 27]. Disease-mimick-
ing tau variants limit this endogenous ability to inhibit kinesin-1 [28–30], while neurofibrillary
tangles (NFTs) knock down kinesin-1 [31]. Since anterograde-directed and retrograde-
directed motor proteins are in a constant state of “tug-of-war” whose outcome ultimately gov-
erns the direction and rate of cargo transport, including that of tau itself [27, 29, 32], the
PLOS COMPUTATIONAL BIOLOGY Emergence of directional bias in tau deposition from axonal transport dynamics
PLOS Computational Biology | https://doi.org/10.1371/journal.pcbi.1009258 July 27, 2021 2 / 23
https://drive.google.com/file/d/
1ZYeZ99V5h8n2cUvYBUiF2TOeKVAtHc65/view.
Funding: This work was funded through Grant
#RF1AG062196 from the NIH National Institute on
Aging (NIH-NIA) awarded to AR. The funders had
no role in study design, data collection and
analysis, decision to publish, or preparation of the
manuscript.
Competing interests: The authors have declared
that no competing interests exist.

pathological effects of tau on kinesin-1 specifically provide an underexplored basis for the
conformer-specific spatial patterns of NFTs observed in vivo and clinically. Using a computa-
tional model to simulate the effects of kinesin regulation by tau on its spatial deposition pat-
terns, therefore, could provide the needed conceptual link between the biochemical properties
of specific tau conformers and the observed directional spread bias. While detailed models of
tau axonal transport exist [33], there have been no explorations to date of the consequences of
pathological tau feedback on axonal transport.
In the present work, we model two distinct species of pathological tau in a closed two-neu-
ron system under biologically plausible conditions, demonstrating the impact of transport
feedback has on their spatial concentration profiles over time. This model yields the following
insights: (i) The balance of transport feedback parameters alone is sufficient to develop strong
directional biases in both the anterograde and retrograde directions. (ii) The rates of aggrega-
tion and fragmentation in the model exert a dramatic effect on the steady-state configuration
of the system as well, indicating that processes of interconversion between soluble and insolu-
ble tau species are inextricably linked to how transport feedback influences the system. (iii)
This nonlinear system converges to a steady state over a wide range of initial conditions. (iv)
Despite its simplicity, the transport feedback model produces biases that quantitatively match
those that develop at the network level both in AD-like and non-AD-like mouse tauopathy
models [20]. Taken together, these results demonstrate that a simple transport feedback mech-
anism can explain how different tau conformers, which have unique molecular properties, can
develop distinct directional biases and propagate differentially across the brain.
2 Results
2.1 Model scope
We construct a system of partial differential equations (PDEs) to model the concentration pro-
files along a single spatial axis of two biophysically distinct species of pathological tau: solubletau, such as misfolded monomers and small oligomers, and insoluble tau, such as larger fila-
ments and tangles. See Fig 1 for a full schematic of the system. The dynamics of each species
depend upon the biological compartment in which it resides: the presynaptic and postsynaptic
somatodendritic (SD) compartments, the axon, the axon initial segment (AIS), and the synap-
tic cleft (SC) are modeled distinctly. These two tau species can interconvert through the oppos-
ing processes of fragmentation and aggregation (Eq 5). For both biophysical and mathematical
(see for instance the work of Kuznetsov and Kuznetsov [35]) reasons, we model the effective
transport of the mobile, soluble species as two component processes: diffusion and active
transport, the latter of which only occurs within the axonal compartment. The effective veloc-
ity of active transport within the axon, v (Eq 1), is a function of the local concentrations of the
soluble and insoluble species, because each can perturb the effective anterograde transport rate
of kinesin [28, 29, 31]. Specifically, we allow soluble tau to increase effective anterograde trans-
port velocity through the parameter δ and insoluble tau to decrease it through the parameter �
(Table 1). Since the effective retrograde transport velocity is unaffected by pathological tau [26,
27], directional bias of tau transport is governed by the balance of δ and � acting upon antero-
grade transport rate. Diffusion between the SD and axonal compartments is hindered by the
physical barriers of the AIS and SC, leading to slow, concentration-gradient-dependent mix-
ing. We thoroughly explore the dependence of model behavior on these two transport-specific
parameters below; see Methods: Model Description for a complete explanation of the develop-
ment and implementation of our model and Table 2 for a summary of the processes modeled
in each biological compartment.
PLOS COMPUTATIONAL BIOLOGY Emergence of directional bias in tau deposition from axonal transport dynamics
PLOS Computational Biology | https://doi.org/10.1371/journal.pcbi.1009258 July 27, 2021 3 / 23

2.2 Model regimes
We first explored how the balance of δ and � affected the dynamics of tau in three distinct
regimes. For each instance, we initiated the model with a uniform concentration of soluble tau
n in the axonal compartment only and zero insoluble tau m anywhere. See S1 Table for a full
list of the parameters used for each condition.
2.2.1 Anterograde-biased regime. Fig 2a and S1 Video show the simulation results for
our two-species model with δ� �, which emulates a condition where soluble tau exerts a
strong effect on enhancing kinesin processivity but insoluble tau has a minimal effect on inhib-
iting it. We depict the concentrations of n and m, as well as the calculated concentration flux
of n, jnet (obtained by numerically evaluating Eq 4 post hoc), at five time points between model
Fig 1. Model System. Schematized version of the one-dimensional system that we simulate. We model two distinct species of pathological tau, soluble
(red) and insoluble (blue), across within a multi-compartment model mimicking the two-neuron system shown in the top panel. The main biological
phenomena captured in this model are diffusion (blue box), active transport (green box), species interconversion through fragmentation and
aggregation (purple box), and a diffusion-based barrier to inter-compartmental spread (brown dashed lines).
https://doi.org/10.1371/journal.pcbi.1009258.g001
PLOS COMPUTATIONAL BIOLOGY Emergence of directional bias in tau deposition from axonal transport dynamics
PLOS Computational Biology | https://doi.org/10.1371/journal.pcbi.1009258 July 27, 2021 4 / 23
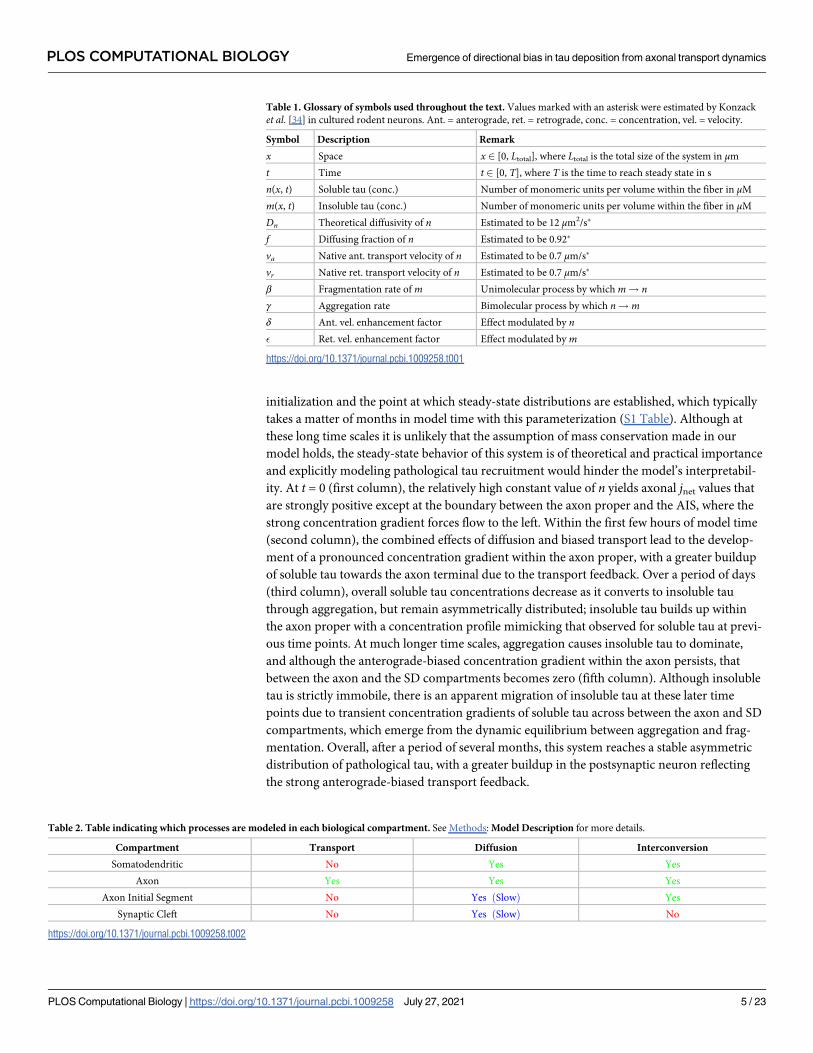
initialization and the point at which steady-state distributions are established, which typically
takes a matter of months in model time with this parameterization (S1 Table). Although at
these long time scales it is unlikely that the assumption of mass conservation made in our
model holds, the steady-state behavior of this system is of theoretical and practical importance
and explicitly modeling pathological tau recruitment would hinder the model’s interpretabil-
ity. At t = 0 (first column), the relatively high constant value of n yields axonal jnet values that
are strongly positive except at the boundary between the axon proper and the AIS, where the
strong concentration gradient forces flow to the left. Within the first few hours of model time
(second column), the combined effects of diffusion and biased transport lead to the develop-
ment of a pronounced concentration gradient within the axon proper, with a greater buildup
of soluble tau towards the axon terminal due to the transport feedback. Over a period of days
(third column), overall soluble tau concentrations decrease as it converts to insoluble tau
through aggregation, but remain asymmetrically distributed; insoluble tau builds up within
the axon proper with a concentration profile mimicking that observed for soluble tau at previ-
ous time points. At much longer time scales, aggregation causes insoluble tau to dominate,
and although the anterograde-biased concentration gradient within the axon persists, that
between the axon and the SD compartments becomes zero (fifth column). Although insoluble
tau is strictly immobile, there is an apparent migration of insoluble tau at these later time
points due to transient concentration gradients of soluble tau across between the axon and SD
compartments, which emerge from the dynamic equilibrium between aggregation and frag-
mentation. Overall, after a period of several months, this system reaches a stable asymmetric
distribution of pathological tau, with a greater buildup in the postsynaptic neuron reflecting
the strong anterograde-biased transport feedback.
Table 1. Glossary of symbols used throughout the text. Values marked with an asterisk were estimated by Konzack
et al. [34] in cultured rodent neurons. Ant. = anterograde, ret. = retrograde, conc. = concentration, vel. = velocity.
Symbol Description Remark
x Space x 2 [0, Ltotal], where Ltotal is the total size of the system in μm
t Time t 2 [0, T], where T is the time to reach steady state in s
n(x, t) Soluble tau (conc.) Number of monomeric units per volume within the fiber in μM
m(x, t) Insoluble tau (conc.) Number of monomeric units per volume within the fiber in μM
Dn Theoretical diffusivity of n Estimated to be 12 μm2/s�
f Diffusing fraction of n Estimated to be 0.92�
va Native ant. transport velocity of n Estimated to be 0.7 μm/s�
vr Native ret. transport velocity of n Estimated to be 0.7 μm/s�
β Fragmentation rate of m Unimolecular process by which m! nγ Aggregation rate Bimolecular process by which n!mδ Ant. vel. enhancement factor Effect modulated by n� Ret. vel. enhancement factor Effect modulated by m
https://doi.org/10.1371/journal.pcbi.1009258.t001
Table 2. Table indicating which processes are modeled in each biological compartment. See Methods: Model Description for more details.
Compartment Transport Diffusion Interconversion
Somatodendritic No Yes YesAxon Yes Yes Yes
Axon Initial Segment No Yes ðSlowÞ YesSynaptic Cleft No Yes ðSlowÞ No
https://doi.org/10.1371/journal.pcbi.1009258.t002
PLOS COMPUTATIONAL BIOLOGY Emergence of directional bias in tau deposition from axonal transport dynamics
PLOS Computational Biology | https://doi.org/10.1371/journal.pcbi.1009258 July 27, 2021 5 / 23

2.2.2 Retrograde-biased regime. We then simulated the condition where transport feed-
back is strongly biased in the opposite direction (�� δ; Fig 2b and S2 Video). Unlike the pre-
vious condition, the lack of strong anterograde feedback parameter causes simple diffusion to
dominate over the first few hours, leading to a largely symmetric concentration profile of solu-
ble tau (second column). It is only when appreciable aggregation occurs at an intermediate
time scale (third column) that an asymmetric profile is allowed to develop, as the buildup of
insoluble tau leads to a net negative active transport velocity and leftward migration of soluble
tau. The net deposition in the presynpatic SD compartment only grows more pronounced
Fig 2. Model regimes are determined by tau transport feedback parameters δ and �. (a) Simulation results where δ = 1 and � = 0.01, which leads to a
strong anterograde bias that emerges within hours and persists even at longer time scales. (b) Simulation results where δ = 0.01 and � = 1, which leads to
a strong retrograde bias that only emerges at intermediate-to-late time scales. (c) Simulation results where δ = 1 and � = 0.35, which leads to an initial
anterograde bias that is counteracted at intermediate time scales, leading to a uniform distribution of tau deposition at steady state.
https://doi.org/10.1371/journal.pcbi.1009258.g002
PLOS COMPUTATIONAL BIOLOGY Emergence of directional bias in tau deposition from axonal transport dynamics
PLOS Computational Biology | https://doi.org/10.1371/journal.pcbi.1009258 July 27, 2021 6 / 23

over time (fourth and fifth columns), leading to an overall retrograde-biased concentration
profile at steady state. Taken together with the results from the previous simulation, it is appar-
ent that the δ and � feedback parameters independently and consequentially impact how path-
ological tau is distributed throughout this two-neuron system.
2.2.3 Net-unbiased regime. We further explored how these two modes of transport feed-
back can interact by setting both δ and � values to be significantly greater than 0 (Fig 2c and S3
Video). Initially, as in the anterograde-dominant condition (Fig 2a), there is a pronounced
asymmetric profile of soluble tau biased towards the axon terminal due to the strong positive
kinesin feedback (second column). This bias persists even at longer time scales as aggregation
allows insoluble tau to accumulate (third and fourth columns); however, the presence of insol-
uble tau begins to counteract the initial anterograde transport bias. At steady state (fifth col-
umn), the net balance between δ and � leads to a nearly flat concentration profile across all
compartments and roughly equal deposition between the presynaptic and postsynaptic SD
compartments.
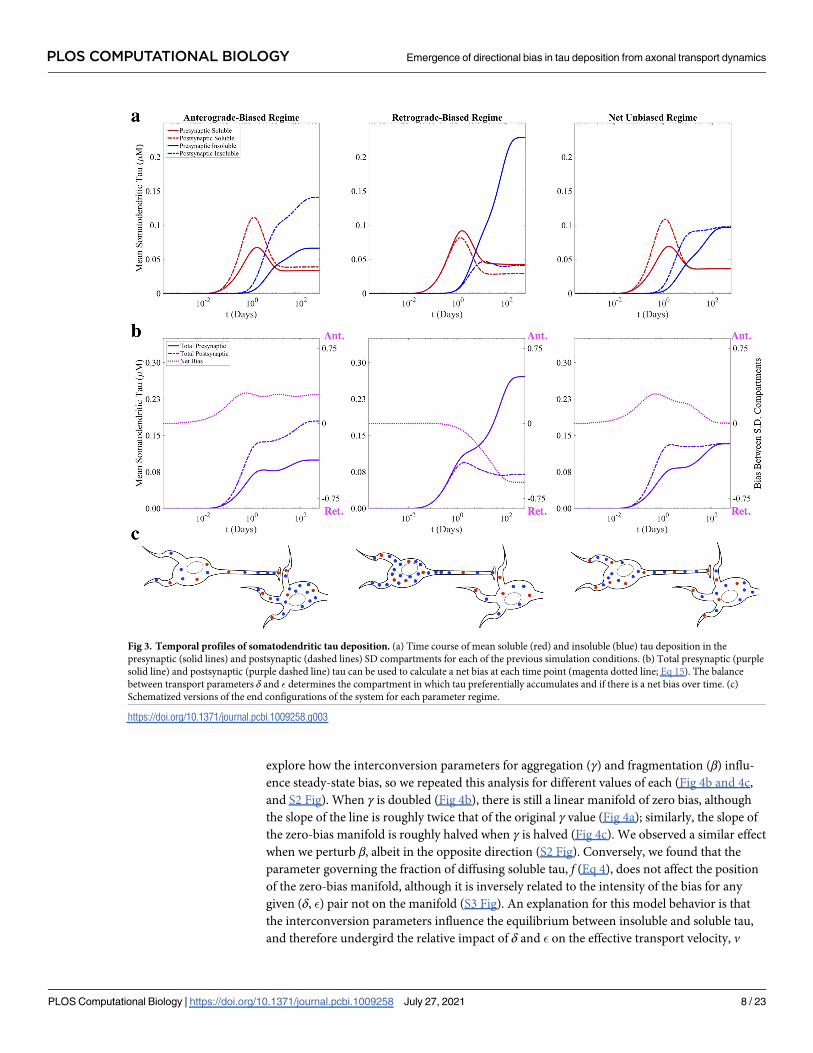
2.3 Somatodendritic tau deposition over time
We summarize the results of the three parameter regimes described above by plotting the
mean pathological tau concentrations in each of the SD compartments across all time points of
the simulation (Fig 3). Initially there is no tau of either species in the presynaptic or postsynap-
tic SD compartment, but at early model times (t< 1 day), diffusion allows soluble tau to
migrate into both. In the anterograde-biased parameter regime (Fig 3a, left panel), soluble tau
accumulates faster in the postsynaptic SD compartment relative to the presynaptic, which at
longer time scales is converted to a persistent net accumulation of insoluble tau. Conversely,
soluble tau concentrations stay at similar levels in both SD compartments up to a period of
around 1 day of model time in the retrograde-biased regime (Fig 3a, center panel), where the
accumulation of insoluble tau in the axonal compartment biases transport towards to the pre-
synaptic SD compartment. Presynaptic accumulation of insoluble tau steadily increases at lon-
ger time scales while postsynaptic insoluble tau stays roughly flat, as active transport continues
to push soluble tau in the retrograde direction that then forms insoluble tau through aggrega-
tion. In the net unbiased regime (Fig 3a, right panel), the resulting distributions match that of
the anterograde biased regime through a period of around 1 day, until the accumulation of
insoluble tau inside the axon produces a counteracting retrograde bias that leads to roughly
equal concentrations of both species in each compartment. These results can be summarized
by the a single “bias” metric, which we define as the difference between total postsynaptic tau
and total presynaptic tau divided by total somatodendritic tau (Fig 3b, magenta dotted lines);
by this convention, zero bias indicates equal deposition between SD compartments, with posi-
tive values indicating anterograde bias and negative values indicating retrograde bias. The
steady-state configurations of each parameter regime are schematized in Fig 3c, exemplifying
how the δ and � transport parameters alone strongly influence how tau is distributed between
presynaptic and postsynaptic neurons.
2.4 Aggregation and fragmentation rates perturb transport feedback
We more thoroughly explored the parameter dependence of the steady state by calculating the
SD bias as defined above across a broad range of transport bias parameter values, keeping all
other conditions the same as the previous simulations (Fig 4a and S1 Table). We found a linear
manifold separating (δ, �) pairs that result in a net postsynaptic accumulation of tau (red) from
those resulting in presynaptic accumulation (blue), indicating that it is the ratio of these two
parameters that ultimately governs the end state of the system. However, we also wanted to
PLOS COMPUTATIONAL BIOLOGY Emergence of directional bias in tau deposition from axonal transport dynamics
PLOS Computational Biology | https://doi.org/10.1371/journal.pcbi.1009258 July 27, 2021 7 / 23
explore how the interconversion parameters for aggregation (γ) and fragmentation (β) influ-
ence steady-state bias, so we repeated this analysis for different values of each (Fig 4b and 4c,
and S2 Fig). When γ is doubled (Fig 4b), there is still a linear manifold of zero bias, although
the slope of the line is roughly twice that of the original γ value (Fig 4a); similarly, the slope of
the zero-bias manifold is roughly halved when γ is halved (Fig 4c). We observed a similar effect
when we perturb β, albeit in the opposite direction (S2 Fig). Conversely, we found that the
parameter governing the fraction of diffusing soluble tau, f (Eq 4), does not affect the position
of the zero-bias manifold, although it is inversely related to the intensity of the bias for any
given (δ, �) pair not on the manifold (S3 Fig). An explanation for this model behavior is that
the interconversion parameters influence the equilibrium between insoluble and soluble tau,
and therefore undergird the relative impact of δ and � on the effective transport velocity, v
Fig 3. Temporal profiles of somatodendritic tau deposition. (a) Time course of mean soluble (red) and insoluble (blue) tau deposition in the
presynaptic (solid lines) and postsynaptic (dashed lines) SD compartments for each of the previous simulation conditions. (b) Total presynaptic (purple
solid line) and postsynaptic (purple dashed line) tau can be used to calculate a net bias at each time point (magenta dotted line; Eq 15). The balance
between transport parameters δ and � determines the compartment in which tau preferentially accumulates and if there is a net bias over time. (c)
Schematized versions of the end configurations of the system for each parameter regime.
https://doi.org/10.1371/journal.pcbi.1009258.g003
PLOS COMPUTATIONAL BIOLOGY Emergence of directional bias in tau deposition from axonal transport dynamics
PLOS Computational Biology | https://doi.org/10.1371/journal.pcbi.1009258 July 27, 2021 8 / 23

(Eq 1). For example, when aggregation rate is increased and there is comparatively more insol-
uble than soluble tau in the system, the � value required to achieve the same value of v is
reduced, which ultimately determines how pathological tau is apportioned between SD com-
partments. The diffusing fraction parameter (f), by contrast, changes the extent to which axo-
nal transport, as opposed to diffusion, influences the overall distribution of tau in the system
and therefore affects the strength of � and δ to the same extent. We conclude that, although the
time course of SD tau deposition is a complex function of the interconversion and transport
parameters (Fig 3), the steady state can be characterized in terms of a linear combination of
these parameters.
2.5 Robustness to initial conditions
The previous simulations were initiated with a constant concentration of soluble pathological
tau inside the axonal compartment. To explore model dependence on initial conditions, we re-
ran the model with the same parameters as above but “seeded” either the postsynaptic or pre-
synaptic SD compartment with a high constant concentration of insoluble tau (anterograde-
biased, retrograde-biased, and net-unbiased parameter regimes shown in S4, S5 and S6 Figs,
respectively); this partly mimics in vitro experiments where two connected neurons are kept
microfluidically isolated [10]. Because only soluble tau can diffuse or be transported, the initial
dose of insoluble tau must first undergo the relatively slow process of fragmentation before tau
of either species can migrate to neighboring compartments, and so it takes a period of days
before tau begins to build up in the opposite SD compartment. However, once steady state is
established, the spatial concentration profiles of both species are indistinguishable from those
yielded under the constant axonal soluble tau initial conditions (Fig 2). To more thoroughly
explore the robustness of this apparent convergence to a single fixed point, we simulated 100
random initial conditions with the same total tau mass (i.e. the same spatial integral of n plus
m) as in Fig 2 and plotted the relative pairwise error between model instances as a function of
time (Fig 5). In all three parameter regimes, convergence to the same fixed point is assured,
despite the initial conditions themselves being quite divergent from each other. While we
Fig 4. Steady-state bias analysis as a function of aggregation rate. (a) Steady-state bias (postsynaptic SD tau—presynaptic SD tau / total SD tau)
across a range of δ and � parameter values where all other parameter values are identical to those of the previous simulations. There is a zero-bias linear
manifold that emerges, whose best-fit line has a slope of approximately 2.8. (b) Steady-state bias for the same range of δ and � parameter values where
aggregation rate (γ) is doubled. The linear zero-bias manifold has a slope of*5.8, roughly twice that of the original aggregation rate. (c) Steady-state
bias for the same range of δ and � parameter values where γ is halved. Here the slope of the linear manifold is*1.4, or approximately half that of the
original aggregation rate.
https://doi.org/10.1371/journal.pcbi.1009258.g004
PLOS COMPUTATIONAL BIOLOGY Emergence of directional bias in tau deposition from axonal transport dynamics
PLOS Computational Biology | https://doi.org/10.1371/journal.pcbi.1009258 July 27, 2021 9 / 23

cannot conclude from these simulations that this system of PDEs does not exhibit multistabil-
ity at other sets of parameter values, it does suggest that with these biologically plausible condi-
tions, there is a single steady state that is strictly dictated by model parameterization, not initial
conditions.
2.6 Comparison to mouse tauopathy models
Although our transport feedback model is robust enough to explain a wide range of apparent
directional biases in this two-neuron system, a lingering question is how applicable it is to invivo models of tauopathy. We therefore parameterized our model such that the bias in SD tau
deposition over time could match the apparent directionality bias observed within mouse
models of tauopathy at the network level [20]. In this study, network bias was parameterized as
the extent to which the spread of tau over the brain network is biased along retrograde-
directed or anterograde-directed connections and its value was fit at each experimental time
point using regional tau deposition data from a wide variety of mouse tauopathy models. Fig 6
shows the apparent directionality bias in several mouse models [11, 13, 36, 37] (gray data
points) alongside the temporal evolution of SD bias starting from a uniform axonal concentra-
tion of soluble tau (magenta dotted lines), where we have separated mouse models based on
whether tau conformers were formed in the presence of Aβ (AD-like, panel a) or not (non-
AD-like, panel b). In both cases, we see good concordance (R2� 0.4) between transport model
bias and network bias over the same time scale (S7 Fig). The tendency for an increasingly
strong retrograde bias in tau propagation over time is captured by a high value of the kinesin
inhibition parameter �. The early anterograde bias present in the non-AD-like studies also
requires a high value of the kinesin rate enhancement parameter δ in contrast to the AD-like
Fig 5. Perturbation of initial conditions does not affect steady state. We plot the relative pairwise error between model instances with randomly
generated initial conditions using (a) the anterograde, (b) the retrograde, or (c) the net unbiased parameterizations (gray lines are representative sample
traces). There is universal convergence at long time scales, suggesting that for these parameter values the model has a single fixed point.
https://doi.org/10.1371/journal.pcbi.1009258.g005
PLOS COMPUTATIONAL BIOLOGY Emergence of directional bias in tau deposition from axonal transport dynamics
PLOS Computational Biology | https://doi.org/10.1371/journal.pcbi.1009258 July 27, 2021 10 / 23

studies. This suggests a weaker interaction between the soluble tau assemblies formed in the
presence of amyloid with kinesin than those formed in its absence. There is also a higher
aggregation to fragmentation rate ratio for the AD-like studies, which similarly induces stron-
ger and earlier retrograde biases. Given the relative paucity of data against which we compare
the transport model, we cannot claim that these parameterizations uniquely fit each set of
tauopathy models. Rather, our model highlights two biophysical mechanisms—aggregation to
fragmentation rate ratio and differential interactions between soluble tau and kinesin—that
can explain the differences between the network biases that develop in AD-like and non-AD-
like mouse models. Together, these results support axonal transport feedback as a plausible
mechanistic link between differences in tau conformation and the resulting divergence in
whole-brain networked spread patterns.
3 Discussion
3.1 Transport bias as a mechanism for explaining directional bias
The present work demonstrates, for the first time, how directional bias can emerge on a micro-
scopic level as a consequence of active transport feedback by pathological tau species. The cen-
tral finding is that the model’s free parameters, which include aggregation rate, fragmentation
rate, and the transport feedback modifiers (Fig 1), strongly determine the spatial segregation
of pathological tau over time and at steady state, with enough inherent robustness to explain
both anterograde-biased spread and retrograde-biased spread. At model initiation, a combina-
tion of diffusion and anterograde-biased transport (assuming sufficiently high δ) determines
Fig 6. Tau transport feedback recaptures the directionality of mouse tauopathy models. (a) The AD-like mouse models explored by [20] exhibit a
strong retrograde bias that becomes more pronounced over time, which can be replicated in the two-neuron system with weak anterograde-directed
transport feedback (low δ relative to �). (b) The non-AD-like mouse models similarly have a trend towards increasing retrograde bias, although to a
lesser extent than the AD-like studies and there is evidence of early anterograde bias, which is captured by fixing both δ and � at high values. For all
studies, we first linearly transform the bias parameter, s, used by [20] onto the [−1, 1] scale of our SD bias estimates before plotting. Refer to S2 Table for
a full parameterization of both simulations and Methods: Analysis. Studies included: [11, 13, 36, 37].
https://doi.org/10.1371/journal.pcbi.1009258.g006
PLOS COMPUTATIONAL BIOLOGY Emergence of directional bias in tau deposition from axonal transport dynamics
PLOS Computational Biology | https://doi.org/10.1371/journal.pcbi.1009258 July 27, 2021 11 / 23

how soluble tau is distributed at early time points (Fig 2, first two columns). At intermediate
and late time points, where aggregation has allowed sufficient concentrations of insoluble tau
to accumulate in the axon, negative feedback proportional to the value of � drives tau back
towards the presynaptic SD compartment (Fig 2, final three columns). Indeed, the temporal
evolution of SD tau concentrations exhibits three phases of behavior for all three parameter
regimes: (i) an initial rise in soluble tau (bias between compartments influenced by positive
transport feedback); (ii) a fall in SD soluble tau coupled with a rise in SD insoluble tau as aggre-
gation occurs; (iii) final re-equilibration (Fig 3a). These phases are a direct consequence of
phenomena operating under dramatically different time scales, with transport and diffusion
being faster processes than interconversion and inter-compartmental spread. Despite minor
differences in trajectories over time, this system of coupled nonlinear PDEs has a single fixed
point over a broad range of initial conditions and parameter regimes (Fig 5), which suggests
that steady-state bias can be characterized, as suggested by Fig 4, S2 and S3 Figs, as a well-
behaved function of the internal parameters. Our results indicate that even a relatively simple,
concentration-dependent feedback mechanism (Eq 1) is sufficient to drive a wide range of
model behaviors.
3.2 Comparison with in vivo mouse models
Our model behavior shows good agreement (R2� 0.4) with in vivo models of tauopathic dis-
ease at the regional level: for both AD-like and non-AD-like mouse models, we can parameter-
ize our transport feedback model to produce biases in somatodendritic tau deposition that
match the longitudinal trends in network spread bias (Fig 6 and S7 Fig) [20]. Specifically, we
show that a parameter regime with high � relative to δ can reproduce directional bias trends in
AD-like mouse models, while for the non-AD-like models we better capture bias with higher δ(S2 Table). The model regimes chosen also exhibit different balances of aggregation and frag-
mentation parameters, with a relatively higher aggregation rate in AD-like mouse models; this
tends to further strengthen the bias imposed by � relative to δ (Fig 4 and S2 Fig). These two
effects act in concert to produce retrograde directional biases in AD-like tau models that are
stronger and have earlier onsets than those observed in non-AD-like models. Therefore, we
suggest that an amyloidogenic microenvironment may produce tau conformers that have
higher rates of aggregation relative to fragmentation and/or differential interactivity with kine-
sin. amyloid-β has long been considered to be the best biomarker available for distinguishing
AD from other dementias, and more recently positive amyloid status has been shown to be
strongly related to the presence of the p181 tau phosphoepitope in patients [16, 18]. Although
the indirect and direct interactions between amyloid-β and tau are complex and the subject of
intense scrutiny, our work suggests that tau conformers cultured in the presence of amyloid-βmay have specific properties impacting axonal transport that merit further exploration.
3.3 Limitations
There are several important limitations to the present work. Most notably, due to the paucity
of data measuring intra-axonal tau in the disease state, it is challenging to directly fit our
model parameters or validate our findings. Although in vitro time-lapse microscopy studies of
tau transport kinetics have been conducted with both tau in its native conformation and pseu-
dophosphorylated variants [28, 29], there have been no investigations of pathological tau
dynamics that determine concentration profiles over time in single neurons. We also note
that, because there are few studies for which direct regional quantification of mouse tau
pathology is available and each study reports at most four time points, our comparison
between model bias and network directional bias suffers from limited statistical power. Our
PLOS COMPUTATIONAL BIOLOGY Emergence of directional bias in tau deposition from axonal transport dynamics
PLOS Computational Biology | https://doi.org/10.1371/journal.pcbi.1009258 July 27, 2021 12 / 23

model’s single spatial dimension does not represent the complex geometry of the SD compart-
ments, preventing us from accurately modeling missorting between the dendritic spines and
the rest of the soma; accordingly, we only compare the mean concentrations in these compart-
ments (Figs 3 and 4). The AIS and SC are modeled as identical diffusion-limiting barriers save
for the lack of interconversion in the SC, which is implausible given their true dimensions and
biological properties. Firstly, it is unlikely that these two barriers are equally impermeable to
all tau species, as we encoded here. It is likewise inaccurate to assume that it is a purely diffu-
sive process that facilitates tau migration across the cell membranes on either side of the SC or
through the structural mesh of the AIS, but our choice was motivated by our expectation that
transport rate across these boundaries should be roughly proportional to the concentration
difference across them. An intriguing possibility for future modeling work is to incorporate a
concentration-dependent permeability; for instance, tau missorting into the SD compartment
is a consequence of AIS breakdown, which suggests a dynamic λ [25]. Finally, we entirely
neglect the conversion of healthy tau to pathological soluble tau, pathological tau clearance,
and the spread of tau outside of the two-neuron system from our model since these effects
would hinder model interpretability.
3.4 Applications to other neurodegenerative diseases
Axonal transport feedback may also play a role in disorders such as Parkinson’s disease (PD)
and amyotrophic lateral sclerosis (ALS). Experimental and clinical studies have reported prion
like spreading of misfolded protein assemblies along the white matter tracts of the brain in
these disorders, and mathematical models successfully captured key features of their neuropa-
thology [38–41]. Because migration along axonal fibers is necessary for infiltration into areas
of the brain beyond regions where pathology initiates, how the axonal active transport machin-
ery interacts with misfolded assemblies of α-synuclein, TDP-43, and SOD1 remains an open
question. There is evidence that α-synuclein interacts with both kinesin-1 and dynein [32],
and down-regulates them at high levels [42]. It is therefore possible that α-synuclein, as we
have explored here with tau, perturbs the balance of axonal transport in a conformer-specific
fashion, potentially explaining some of the clinical heterogeneity observed in PD [43, 44]. Sim-
ilarly, axonal transport defects in both directions are a consistent and early feature of ALS [45],
with evidence of directionally biased spread of SOD1 in a transgenic mouse model [46].
Although evidence of the dual feedback mechanism for pathological tau explored here is less
clear for these diseases, incorporating the effects of transport defects could lead to better pre-
dictive models for non-tauopathic proteinopathies.
3.5 Integrating axonal transport at a network level
A necessary extension to the current work will be to scale up the two-neuron system of PDEs
explored here to a network of regions, which will facilitate parameter fitting and allow us to
directly compare our model output to histopathological data. Conformer-specific parameters
such as aggregation rate and the transport feedback modifiers should be globally invariant to
avoid overfitting; that is, they should not depend on the compartment in which the pathologi-
cal tau resides. Then, using inter-regional connectivity to weight pathology spread, we can
directly simulate how tau transport feedback effects spread in a macroscopic sense [20, 47–50].
Explaining directionally biased spread in mouse models of tauopathy is the most natural
immediate fit to the current work, as there are many models for which tau pathology has been
extensively detailed [11, 13, 36, 37] and the mouse mesoscale connectivity atlas [51] separates
efferents from afferents, giving “anterograde” and “retrograde” a precise anatomical meaning.
Application to humans is more challenging given that diffusion tensor imaging cannot
PLOS COMPUTATIONAL BIOLOGY Emergence of directional bias in tau deposition from axonal transport dynamics
PLOS Computational Biology | https://doi.org/10.1371/journal.pcbi.1009258 July 27, 2021 13 / 23

typically determine the orientation of white matter tracts. However, a hybrid-species connec-
tome that encodes directionality for evolutionarily conserved connections has been success-
fully used to model the spread of neuropathology in progressive supranuclear palsy [52].
3.6 Summary
We have demonstrated that transport feedback is a simple and sufficient mechanism to explain
a broad range of directional biases in tau spread in a two-neuron system. Although much
about tau biology in healthy and pathological states remains poorly understood, and many
other factors besides tau conformational status may contribute to the progression of tauo-
pathic diseases, it is increasingly clear that there are disease-specific tau conformers that have
distinct patterns of spread. We anticipate that differences between tau conformers in their
endogenous ability to regulate kinesin, in addition to disparities in aggregation and fragmenta-
tion rates (among others), is a parsimonious mechanism that, coupled with networked, trans-
synaptic spread, drives not only heterogeneity within a given tauopathy but also the distinct
pathophysiologies of different tauopathies.
4 Methods
4.1 Model description
We use a coupled system of partial differential equations (PDEs) to model the concentrations
of two species of pathological tau: soluble n(x, t), which can travel via diffusion and activetransport processes (the net balance of which determines the effective transport of pathological
tau), and insoluble tau m(x, t), which is immobile. These two species interconvert through two
opposing processes: (i) aggregation, a bimolecular reaction between one unit of n and one unit
of either n or m to form m; and (ii) fragmentation, a unimolecular reaction by which a unit of
m breaks apart to form a unit of n. We did not model healthy tau concentrations or recruit-ment, the process by which tau loses its native conformation via aberrant post-translational
modifications such as hyperphosphorylation, fragmentation, and acetylation to adopt a patho-
logical, prion-like conformation. As such, the total mass in the system is conserved, since frag-
mentation and aggregation act symmetrically on n and m. The unique feature of this model is
that we incorporate the feedback these two species provide on kinesin, with soluble tau
enhancing kinesin processivity [28–30] and insoluble tau inhibiting it [31]. Mathematically,
we propose the following relationship for the effective transport velocity:
vðn;mÞ � va � ð1þ dnÞð1 � �mÞ � vr ; ð1Þ
where va and vr are the baseline anterograde and retrograde velocities of tau, respectively, δ is a
nonnegative parameter governing the enhancement of kinesin processivity in response to solu-
ble pathological tau, and � is a nonnegative parameter governing the reduction of kinesin pro-
cessivity in response to insoluble pathological tau. In this expression we have assumed that on
the time scale of the simulation (days), the characteristic “start-and-stop” dynamics of molecu-
lar motors, where motor binding and unbinding events happen within fractions of a second
[53], can be subsumed into effective velocity parameters. We anticipate that the separation of
time scales between characteristically “slow” processes such as aggregation and fragmentation
and the “fast” dynamics of motor-microtubule interactions allows us to time-average the latter
without a loss of generality. By convention, positive v implies net transport from presynaptic
to postsynaptic neuron (i.e. anterograde transport). The various compartments of this two-
neuron system necessarily have different properties that should be modeled distinctly, and we
PLOS COMPUTATIONAL BIOLOGY Emergence of directional bias in tau deposition from axonal transport dynamics
PLOS Computational Biology | https://doi.org/10.1371/journal.pcbi.1009258 July 27, 2021 14 / 23

discuss the particulars of each compartment below. Refer to Table 1 and the text below for a
complete description of the parameterization of the model.
4.1.1 Axonal compartment. Given the axon’s high aspect ratio, which restricts movement
of n parallel to its long axis whether it is diffusing or being actively transported by molecular
motors, we collapse the three-dimensional geometry of this system onto one dimension [35].
First we use the following expressions for diffusive flux (jdiff) and transport flux (jactive) of n:
jdiffðnxÞ ¼ � Dn � nx ; ð2Þ
jactiveðn;mÞ ¼ vðn;mÞ � n ; ð3Þ
where parameter Dn is the diffusivity of soluble pathological tau, nx denotes the partial deriva-
tive of n with respect to x, and v(n, m) is given by Eq 1. Under the assumptions that i) active
transport and diffusion are mutually exclusive processes and ii) the processes of attachment
and detachment from molecular motors and microtubules are sufficiently “fast” on the simula-
tion time scale, we define the net flux of n, jnet, in the following way:
jnetðn;m; nxÞ � f � jdiffðnxÞ þ ð1 � f Þ � jactiveðn;mÞ ; ð4Þ
where f is the average fraction of soluble pathological tau that is undergoing diffusion at any
given time. While we estimate f based on measurements made by Konzack et al. [34] using
pseudophosphorylated tau to mimic disease, we recognize that there is considerable uncer-
tainty in this parameter and therefore demonstrate how it influences the model (see Results:
Parameter Dependence of Steady-State Bias; S3 Fig). It is also worth noting that the diffusiv-
ity value measured by Konzack et al. [34] in cultured rodent neurons of 11 μm2/s is the effec-
tive diffusivity rate utilized in jnet, since Dn � f = 12μm2/s � 0.92 = 11μm2/s. The dynamics of
interconversion of n and m as described above are governed by the following expression:
Gðn;mÞ � bm � gnðnþmÞ ; ð5Þ
where we subsume the intricate dynamics of fragmentation and aggregation into two parame-
ters, β and γ. Combining these definitions, we arrive at the PDEs governing the dynamics of nand m inside the axon:
@naxon
@t¼ �
@
@xjnetðn;m; nxÞ þ Gðn;mÞ ; ð6Þ
@maxon
@t¼ � Gðn;mÞ ; ð7Þ
where jnet is given by Eq 4 and Γ is given by Eq 5.
4.1.2 Somatodendritic compartments. Our two-neuron system incorporates two soma-
todendritic (SD) compartments, corresponding to the presynaptic and postsynaptic cell bod-
ies, which are modeled identically. For the purposes of this model, we focus on the overall
amounts of SD tau—particularly the differences between presynaptic and postsynaptic neu-
rons—that result from the tau dynamics within the axon. Although a one-dimensional model
cannot be used to precisely model the spatial distributions of tau in these compartments,
which have complex, three-dimensional geometries, a one-dimensional approximation is suffi-
cient to capture the mean somatodendritic tau concentrations. We therefore greatly simplify
the system by modeling these compartments as one-dimensional segments 200μm in length.
The dynamics of the SD compartments only differ from the axonal compartment regarding
the active transport of n. We do not expect transport to be more efficient than diffusion in the
PLOS COMPUTATIONAL BIOLOGY Emergence of directional bias in tau deposition from axonal transport dynamics
PLOS Computational Biology | https://doi.org/10.1371/journal.pcbi.1009258 July 27, 2021 15 / 23

soma, and transport in the dendrites is both distinct from that in the axons and beyond the
scope of our model. Therefore, the governing equations are given by:
@nSD
@t¼ �
@
@xjdiffðnxÞ þ Gðn;mÞ ; ð8Þ
@mSD
@t¼ � Gðn;mÞ : ð9Þ
4.1.3 Axon initial segment. The axon initial segment (AIS) constitutes the first 20–60 μm
of the axonal length beyond the hillock, and has several features that distinguish it from the
axon proper. The intricate mesh of structural proteins occupying the AIS serves as a barrier
that restricts the free intermixing of axoplasm and cytoplasm components. For tau in particu-
lar, it serves as a one-way molecular sieve that allows tau to migrate from the SD compartment
to the axon, but not the reverse [54]. Indeed, an early feature of AD pathology is the missorting
of tau in the SD compartment following a compromise of AIS integrity [23, 25, 55]. We model
the AIS as having a length of 40 μm with dynamics similar to the SD compartments, with the
exception that the effective diffusivity of n is modified by the free parameter λ, whose value is
fixed at a value much less than one:
@nAIS
@t¼ � l �
@
@xjdiffðnxÞ þ Gðn;mÞ ; ð10Þ
@mAIS
@t¼ � Gðn;mÞ : ð11Þ
In this way, the AIS serves as a fixed diffusion-based barrier over the course of the
simulation.
4.1.4 Synaptic cleft. The synaptic cleft (SC) is the narrow extracellular space between the
axon terminus of the presynaptic neuron and the dendrite of the postsynaptic neuron, through
which the neurotransmitters that mediate the flow of information carried by action potentials
are released and taken up [56]. Trans-synaptic spread of pathological tau is thought to be the
dominant mechanism by which tau migrates between neurons in the brain [11, 23], although
the precise molecular mechanisms by which it traverses the SC remain the subject of intense
scrutiny [57, 58]. For our purposes, the SC acts as a barrier that restricts free diffusion of nbetween presynaptic and postsynaptic neurons, and, in the absence of a more precise way of
describing its dynamics, we chose to model it identically to the AIS, with the exception that we
do not allow m to accumulate or n to aggregate, given the true spatial constraints of the syn-
apse:
@nSC
@t¼ � l �
@
@xjdiffðnxÞ ; ð12Þ
@mSC
@t¼ 0 : ð13Þ
We have chosen to use the same parameter λ, which governs the effective diffusivity of n,
for both the AIS and the SC for two reasons. One, we lack quantitative experimental studies
from which these effective permeabilities can be ascertained, although these barriers are likely
to be differentially permeable to pathological tau in a neuron-subtype-specific and conformer-
specific way. Two, from a modeling perspective, this allows us to cleanly explore the effects of
PLOS COMPUTATIONAL BIOLOGY Emergence of directional bias in tau deposition from axonal transport dynamics
PLOS Computational Biology | https://doi.org/10.1371/journal.pcbi.1009258 July 27, 2021 16 / 23

the axonal transport parameters δ and � given the lack of mechanistic knowledge about how
pathological tau migrates out of the axonal compartment.
4.2 Numerical implementation
We utilize the MATLAB parabolic and elliptical PDE solver pdepe, which efficiently discre-
tizes a system of one-dimensional PDEs over a specified spatial mesh and solves the resulting
system of differential algebraic equations (DAEs) using ode15s [59].
4.2.1 Initial conditions. Aside from analyses where we directly explored the effect of
model initialization (see Results: Robustness to Initial Conditions; Fig 5), for all simulation
results presented herein, we specify a constant n concentration of 0.2 μM within the axonal
compartment and 0 elsewhere at t = 0. We also stipulate that there are no insoluble aggregates
at the start of the simulation. This condition simulates the initiation of tau pathology in the
axon and its resulting spread to neighboring, otherwise unaffected neuron cell bodies, as is
hypothesized to occur in early tauopathic disease [23, 60]. Although the “true” initial configu-
ration of the system would be the healthy state with no n or m anywhere, with n gradually
added to the system through the conversion of healthy tau in the axon (i.e. recruitment), this
process depends upon poorly characterized time-dependent concentration profiles of healthy
tau and numerous other species (e.g. axonal kinases and phosphatases) and goes beyond the
scope of the present work. Since the focus of our model is how different pathological tau spe-
cies, once formed, may have apparent directional biases as a function of their propensity to
aggregate, fragment, and regulate axonal transport, we believe that our choice of initial condi-
tions sufficiently describes an early state of pathology in tauopathic diseases.
4.2.2 Spatial mask and boundary conditions. We modify the dynamics across compart-
ments using discontinuous, binary spatial masks and simulate the whole system in one call of
pdepe. These masks allow us to turn “on” and “off” processes such as active transport and
interconversion depending on x position. This methodological choice allows us to take full
advantage of the efficient pdepe algorithm and grants us the flexibility to define 1-D geome-
tries of arbitrary complexity. Additionally, it eschews the need to encode complicated bound-
ary conditions for each compartment and then couple them at each time step, which would
introduce significant inaccuracies. We use zero-flux Neumann boundary conditions at x = 0
(left boundary of the presynaptic SD compartment) and x = Ltotal (right boundary of the post-
synaptic SD compartment), ensuring that mass in the system is conserved at every time point.
While these boundaries are not impermeable in the open biological system of the brain on the
time scale of the simulation, we chose not to include leakage because it would reduce model
interpretability and cannot be accurately simulated without also explicitly modeling the con-
centration profiles in all neighboring cells. In order to minimize inaccuracies due to the lack of
differentiability introduced by the spatial mask while maintaining short computation times
per simulation, we specify an inhomogeneous spatial mesh that is very fine within 10 μm of
each compartment boundary on either side and coarser elsewhere.
4.2.3 Parameterization. For the effective transport parameters that were estimated in a
comparable in vitro system, we rely upon the experimental work of Konzack et al. in cultured
rodent neurons [34]. The interconversion parameters in S1 Table, which are more challenging
to estimate with high precision in a cellular context, were tuned to yield biologically plausible
rates of insoluble tau accumulation. The transport feedback parameters, whose impact on
model behavior is the primary focus of the present work, were each varied within a range of 0
to 1.
PLOS COMPUTATIONAL BIOLOGY Emergence of directional bias in tau deposition from axonal transport dynamics
PLOS Computational Biology | https://doi.org/10.1371/journal.pcbi.1009258 July 27, 2021 17 / 23

4.3 Analysis
4.3.1 Assessment of steady state. In lieu of directly solving a boundary value problem to
find steady-state distributions, which poses a challenge given the discontinuities in the spatial
derivatives between biological compartments, we found steady-state distributions by simulat-
ing the model equations out to sufficiently long times where the distributions no longer appre-
ciably change. We make this assessment precise by calculating the approximate rate of change
of the distributions, DtDt ðtÞ:
Dt
DtðtÞ ¼
jnðtÞ � nðt � 1Þj1þ jmðtÞ � mðt � 1Þj
1
jnðtÞj1þ jmðtÞj
1
=Dt : ð14Þ
We plot this rate of change over time and show that it converges to effectively zero at the
end time of our simulations (S1 Fig).
4.3.2 Directional bias. We assess the bias in tau deposition over time, B(t), as a
simple function of the mean concentrations in the two somatodendritic compartments as
follows:
BðtÞ �ð�npostðtÞ þ �mpostðtÞÞ � ð�npreðtÞ þ �mpreðtÞÞ
�npostðtÞ þ �mpostðtÞ þ �npreðtÞ þ �mpreðtÞ; ð15Þ
where �npreðtÞ, �mpreðtÞ, �npostðtÞ, and �mpostðtÞ are the mean soluble and insoluble tau concentra-
tions in the presynaptic and postsynaptic SD compartments at time t, respectively. In this
way, a bias value of 1 represents purely anterograde-biased deposition in the postsynaptic
SD compartment, a bias value of -1 represents purely retrograde-biased deposition in the pre-
synaptic SD compartment, and a bias value of 0 indicates equal deposition in both
compartments.
4.3.3 Bias manifold calculation. The topology of the δ-� parameter space at steady state is
of keen interest and we sought to characterize the zero-bias manifold: the boundary between
parameter combinations that result in anterograde-biased deposition and those that result in
retrograde-biased deposition. To calculate these linear manifolds, we first fit a cubic polyno-
mial to the steady-state bias values, B(tSS) (Eq 15), with respect to � for each unique δ value.
The real root of each of these polynomials in the [0, 1] domain represents the (δ�, ��) pair at
which the model would exhibit zero net bias at steady state. We then fit a line to these (δ�, ��)values to get a linear parameterization of the zero-bias manifold.
4.3.4 Random initialization. For each model instance, we set the concentration of n and
m in each somatodendritic compartment and at ten equally spaced points within the axonal
compartment to be a random number between 0 and 1. We then linearly interpolate between
these values across the full spatial domain and normalize both distributions such that the total
mass is the same as the original initial condition (see Methods: Initial Conditions).
4.3.5 Parameter fitting. We varied β, γ, δ, �, and f within reasonable ranges
([1 × 10−8,1 × 10−5] for β and γ; [0, 1] for δ and �; and [0.5,1] for f) to find parameterizations
with good fits to network bias data so that we could demonstrate that the model can plausibly
recreate the time dependence of directional bias. The parameterizations in S2 Table do not
uniquely identify the models of best fit; however, the differences between the two sets of
parameters remain (e.g. higher γ to β ratio for AD-like mouse models) consistent for other
parameterizations with comparable fits. We chose these specific parameterizations because
they achieve excellent concordance with network bias and differ only in three parameters (β, γ,
and δ).
PLOS COMPUTATIONAL BIOLOGY Emergence of directional bias in tau deposition from axonal transport dynamics
PLOS Computational Biology | https://doi.org/10.1371/journal.pcbi.1009258 July 27, 2021 18 / 23
Supporting information
S1 Table. Table of all parameter values used in the simulations shown in Figs 2, 3 and 5;
see Methods for a full description of each parameter. Values marked with an asterisk were
estimated from Konzack et al. [34].
(XLSX)
S2 Table. Table of parameter values used in the simulations shown in Fig 6; unlisted
parameters have identical values as in S1 Table.
(XLSX)
S1 Fig. Convergence of individual simulations to steady state. The rate of change of tau dis-
tributions (Eq 14) for the three parameter regimes explored in the main text (S1 Table)
approaches zero within the time scale of the simulation. Notably, at mid-to-late model times,
convergence is well approximated by an exponential, with similar rates of decay for all three
parameter regimes (right panels).
(TIF)
S2 Fig. Steady-state analysis as a function of fragmentation rate β. (a) Steady-state bias
(postsynaptic SD tau—presynaptic SD tau / total SD tau; see Eq 15) across a range of δ and �
parameter values where all other parameter values are identical to those of the previous simula-
tions. There is a zero-bias linear manifold that emerges, whose best-fit line has a slope of
approximately 2.8. (b) Steady-state bias for the same range of δ and � parameter values where
aggregation rate (β) is doubled. The linear zero-bias manifold has a slope of *1.4, roughly half
that of the original fragmentation rate. (c) Steady-state bias for the same range of δ and �
parameter values where β is halved. Here the slope of the linear manifold is *5.8, or approxi-
mately twice that of the original fragmentation rate.
(TIF)
S3 Fig. Steady-state analysis as a function of diffusive tau fraction f. The overall strength of
the net bias at any given pair of δ and � values is inversely proportional to f, but it does not
affect the line of zero bias (dashed lines), in contrast to γ and β.
(TIF)
S4 Fig. Somatodendritic seeding, anterograde-biased parameter values. Seeding in either
SD compartment converges to the same steady state as the axon-only initial condition in the
anterograde-biased parameter regime (Fig 2a). Parameter values used identical to those in S1
Table.
(TIF)
S5 Fig. Somatodendritic seeding, retrograde-biased parameter values. Seeding in either SD
compartment converges to the same steady state as the axon-only initial condition in the retro-
grade-biased parameter regime (Fig 2b). Parameter values used identical to those in S1 Table.
(TIF)
S6 Fig. Somatodendritic seeding, net-unbiased bias parameter values. Seeding in either SD
compartment converges to the same steady state as the axon-only initial condition in the net-
unbiased parameter regime (Fig 2c). Parameter values used identical to those in S1 Table.
(TIF)
S7 Fig. Transport model bias versus mouse network bias scatterplot. Scatterplot showing
the relationship between mouse network bias across several tauopathy studies and the bias
PLOS COMPUTATIONAL BIOLOGY Emergence of directional bias in tau deposition from axonal transport dynamics
PLOS Computational Biology | https://doi.org/10.1371/journal.pcbi.1009258 July 27, 2021 19 / 23

predicted by the transport model at equivalent time points. The adjusted R2 values for each set
of studies are listed in the legend.
(TIF)
S1 Video. Video of the complete simulation summarized in Fig 2a.
(MP4)
S2 Video. Video of the complete simulation summarized in Fig 2b.
(MP4)
S3 Video. Video of the complete simulation summarized in Fig 2c.
(MP4)
Acknowledgments
We thank Dr. Daniel Gardner for his helpful suggestions on revising the manuscript. We also
thank Dr. Yi Wang for his insight and his critical support of this project.
Author Contributions
Conceptualization: Justin Torok, Pedro D. Maia, Ashish Raj.
Data curation: Christopher Mezias.
Formal analysis: Justin Torok, Pedro D. Maia, Parul Verma.
Funding acquisition: Ashish Raj.
Methodology: Justin Torok, Pedro D. Maia, Parul Verma.
Project administration: Ashish Raj.
Software: Justin Torok.
Supervision: Ashish Raj.
Validation: Christopher Mezias.
Visualization: Justin Torok.
Writing – original draft: Justin Torok.
Writing – review & editing: Justin Torok, Pedro D. Maia, Parul Verma, Christopher Mezias,
Ashish Raj.
References
1. Querfurth HW, LaFerla FM. Alzheimer’s Disease. N Engl J Med. 2010; 362:329–344. https://doi.org/10.
1056/NEJMra0909142 PMID: 20107219
2. Cairns NJ, Bigio EH, Mackenzie IRA, Neumann M, Lee VMY, Hatanpaa KJ, et al. Neuropathologic diag-
nostic and nosologic criteria for frontotemporal lobar degeneration: Consensus of the Consortium for
Frontotemporal Lobar Degeneration. Acta Neuropathologica. 2007; 114:5–22. https://doi.org/10.1007/
s00401-007-0237-2 PMID: 17579875
3. Stefanis L. α-Synuclein in Parkinson’s disease. Cold Spring Harbor Perspectives in Medicine. 2012; 2
(2). https://doi.org/10.1101/cshperspect.a009399 PMID: 22355802
4. Moore RC, Xiang F, Monaghan J, Han D, Zhang Z, Edstrom L, et al. Huntington disease phenocopy is a
familial prion disease. American Journal of Human Genetics. 2001; 69(6):1385–1388. https://doi.org/
10.1086/324414 PMID: 11593450
5. Lee S, Kim HJ. Prion-like Mechanism in Amyotrophic Lateral Sclerosis: are Protein Aggregates the
Key? Experimental Neurobiology. 2015; 24(1):1–7. https://doi.org/10.5607/en.2015.24.1.1 PMID:
25792864
PLOS COMPUTATIONAL BIOLOGY Emergence of directional bias in tau deposition from axonal transport dynamics
PLOS Computational Biology | https://doi.org/10.1371/journal.pcbi.1009258 July 27, 2021 20 / 23

6. Freundt EC, Maynard N, Clancy EK, Roy S, Bousset L, Sourigues Y, et al. Neuron-to-neuron transmis-
sion of α-synuclein fibrils through axonal transport. Annals of Neurology. 2012; 72(4):517–524. https://
doi.org/10.1002/ana.23747 PMID: 23109146
7. Pecho-Vrieseling E, Rieker C, Fuchs S, Bleckmann D, Esposito MS, Botta P, et al. Transneuronal prop-
agation of mutant huntingtin contributes to non-cell autonomous pathology in neurons. Nature Neurosci-
ence. 2014; 17(8):1064–1072. https://doi.org/10.1038/nn.3761 PMID: 25017010
8. Feiler MS, Strobel B, Freischmidt A, Helferich AM, Kappel J, Brewer BM, et al. TDP-43 is intercellularly
transmitted across axon terminals. Journal of Cell Biology. 2015; 211(4):897–911. https://doi.org/10.
1083/jcb.201504057 PMID: 26598621
9. Takeda S, Wegmann S, Cho H, Devos SL, Commins C, Roe AD, et al. Neuronal uptake and propaga-
tion of a rare phosphorylated high-molecular-weight tau derived from Alzheimer’s disease brain. Nature
Communications. 2015; 6:1–15. https://doi.org/10.1038/ncomms9490 PMID: 26458742
10. Katsikoudi A, Ficulle E, Cavallini A, Sharman G, Guyot A, Zagnoni M, et al. Quantitative propagation of
assembled human Tau from Alzheimer’s disease brain in microfluidic neuronal cultures. Journal of Bio-
logical Chemistry. 2020; 295(37):13079–13093. https://doi.org/10.1074/jbc.RA120.013325 PMID:
32699110
11. Clavaguera F, Bolmont T, Crowther RA, Abramowski D, Frank S, Probst A, et al. Transmission and
spreading of tauopathy in transgenic mouse brain. Nature Cell Biology. 2009; 11(7):909–913. https://
doi.org/10.1038/ncb1901 PMID: 19503072
12. Luk KC, Kehm V, Carroll J, Zhang B, O’Brien P, Trojanowski JQ, et al. Pathological α-synuclein trans-
mission initiates Parkinson-like neurodegeneration in nontransgenic mice. Science. 2012; 338
(6109):949–953. https://doi.org/10.1126/science.1227157 PMID: 23161999
13. Kaufman SK, Thomas TL, Del Tredici K, Braak H, Diamond MI. Characterization of tau prion seeding
activity and strains from formaldehyde-fixed tissue. Acta neuropathologica communications. 2017; 5.
https://doi.org/10.1186/s40478-017-0442-8 PMID: 28587664
14. Frost B, Diamond MI. Prion-like mechanisms in neurodegenerative diseases. Nature Reviews Neuro-
science. 2010; 11(3):155–159. https://doi.org/10.1038/nrn2786 PMID: 20029438
15. Brundin P, Melki R, Kopito R. Prion-like transmission of protein aggregates in neurodegenerative dis-
eases. Nature Reviews Molecular Cell Biology. 2010; 11:301–307. https://doi.org/10.1038/nrm2873
PMID: 20308987
16. Janelidze S, Mattsson N, Palmqvist S, Smith R, Beach TG, Serrano GE, et al. Plasma P-tau181 in Alz-
heimer’s disease: relationship to other biomarkers, differential diagnosis, neuropathology and longitudi-
nal progression to Alzheimer’s dementia. Nature Medicine. 2020; 26:379–386. https://doi.org/10.1038/
s41591-020-0755-1 PMID: 32123385
17. Palmqvist S, Janelidze S, Quiroz YT, Zetterberg H, Lopera F, Stomrud E, et al. Discriminative Accuracy
of Plasma Phospho-tau217 for Alzheimer Disease vs Other Neurodegenerative Disorders. JAMA—
Journal of the American Medical Association. 2020; 324(8):772–781Ja. https://doi.org/10.1001/jama.
2020.12134 PMID: 32722745
18. Thijssen EH, La Joie R, Wolf A, Strom A, Wang P, Iaccarino L, et al. Diagnostic value of plasma phos-
phorylated tau181 in Alzheimer’s disease and frontotemporal lobar degeneration. Nature Medicine.
2020; 26:387–397. https://doi.org/10.1038/s41591-020-0762-2 PMID: 32123386
19. Dujardin S, Commins C, Lathuiliere A, Beerepoot P, Fernandes AR, Kamath TV, et al. Tau molecular
diversity contributes to clinical heterogeneity in Alzheimer’s disease. Nature Medicine. 2020; 26:1256–
1263. https://doi.org/10.1038/s41591-020-0938-9 PMID: 32572268
20. Mezias C, Raj A. The role of directionality in determining spatiotemporal tau pathology differs between
AD-like and non-AD-like mouse models. bioRxiv. 2020;.
21. Encalada SE, Goldstein LSB. Biophysical Challenges to Axonal Transport: Motor-Cargo Deficiencies
and Neurodegeneration. Annual Review of Biophysics. 2014; 43(1):141–169. https://doi.org/10.1146/
annurev-biophys-051013-022746 PMID: 24702007
22. Scholz T, Mandelkow E. Transport and diffusion of Tau protein in neurons. Cellular and Molecular Life
Sciences. 2014; 71(16):3139–3150. https://doi.org/10.1007/s00018-014-1610-7 PMID: 24687422
23. Braak H, Braak E. Neuropathological stageing of Alzheimer-related changes. Acta Neuropathologica.
1991; 82:239–259. https://doi.org/10.1007/BF00308809 PMID: 1759558
24. Ballatore C, Lee VMY, Trojanowski JQ. Tau-mediated neurodegeneration in Alzheimer’s disease and
related disorders. Nature Reviews Neuroscience. 2007; 8:663–672. https://doi.org/10.1038/nrn2194
PMID: 17684513
25. Zempel H, Dennissen FJA, Kumar Y, Luedtke J, Biernat J, Mandelkow EM, et al. Axodendritic sorting
and pathological missorting of Tau are isoform-specific and determined by axon initial segment
PLOS COMPUTATIONAL BIOLOGY Emergence of directional bias in tau deposition from axonal transport dynamics
PLOS Computational Biology | https://doi.org/10.1371/journal.pcbi.1009258 July 27, 2021 21 / 23

architecture. Journal of Biological Chemistry. 2017; 292(29):12192–12207. https://doi.org/10.1074/jbc.
M117.784702 PMID: 28536263
26. Dixit R, Ross JL, Goldman YE, Holzbaur ELF. Differential regulation of dynein and kinesin motor proteins
by tau. Science. 2008; 319:1086–1089. https://doi.org/10.1126/science.1152993 PMID: 18202255
27. Chaudhary AR, Berger F, Berger CL, Hendricks AG. Tau directs intracellular trafficking by regulating
the forces exerted by kinesin and dynein teams. Traffic. 2018; 19:111–121. https://doi.org/10.1111/tra.
12537 PMID: 29077261
28. Cuchillo-Ibanez I, Seereeram A, Byers HL, Leung K, Ward MA, Anderton BH, et al. Phosphorylation of
tau regulates its axonal transport by controlling its binding to kinesin. The FASEB Journal. 2008;
22:3186–3195. https://doi.org/10.1096/fj.08-109181 PMID: 18511549
29. Rodrıguez-Martın T, Cuchillo-Ibañez I, Noble W, Nyenya F, Anderton BH, Hanger DP. Tau phosphory-
lation affects its axonal transport and degradation. Neurobiology of Aging. 2013; 34(9):2146–2157.
https://doi.org/10.1016/j.neurobiolaging.2013.03.015 PMID: 23601672
30. Stern JL, Lessard DV, Hoeprich GJ, Morfini GA, Berger CL. Phosphoregulation of Tau modulates inhibi-
tion of kinesin-1 motility. Molecular Biology of the Cell. 2017; 28(8):1079–1087. https://doi.org/10.1091/
mbc.E16-10-0728 PMID: 28251926
31. Sherman MA, Lacroix M, Amar F, Larson ME, Forster C, Aguzzi A, et al. Soluble conformers of Aβ and
tau alter selective proteins governing axonal transport. Journal of Neuroscience. 2016; 36(37):9647–
9658. https://doi.org/10.1523/JNEUROSCI.1899-16.2016 PMID: 27629715
32. Utton MA, Noble WJ, Hill JE, Anderton BH, Hanger DP. Molecular motors implicated in the axonal trans-
port of tau and α-synuclein. Journal of Cell Science. 2005; 118:4645–4654. https://doi.org/10.1242/jcs.
02558 PMID: 16176937
33. Kuznetsov IA, Kuznetsov AV. Simulating the effect of formation of amyloid plaques on aggregation of
tau protein. Proceedings of the Royal Society A: Mathematical, Physical and Engineering Sciences.
2018; 474 (2220). https://doi.org/10.1098/rspa.2018.0511 PMID: 30602936
34. Konzack S, Thies E, Marx A, Mandelkow EM, Mandelkow E. Swimming against the tide: Mobility of the
microtubule-associated protein tau in neurons. Journal of Neuroscience. 2007; 27(37):9916–9927.
https://doi.org/10.1523/JNEUROSCI.0927-07.2007 PMID: 17855606
35. Kuznetsov IA, Kuznetsov AV. Can numerical modeling help understand the fate of tau protein in the
axon terminal? Computer Methods in Biomechanics and Biomedical Engineering. 2016; 19(2):115–
125. https://doi.org/10.1080/10255842.2014.994119 PMID: 25563412
36. Boluda S, Iba M, Zhang B, Raible KM, Lee VMY, Trojanowski JQ. Differential induction and spread of
tau pathology in young PS19 tau transgenic mice following intracerebral injections of pathological tau
from Alzheimer’s disease or corticobasal degeneration brains. Acta Neuropathologica. 2015; 129:221–
237. https://doi.org/10.1007/s00401-014-1373-0 PMID: 25534024
37. Hurtado DE, Molina-Porcel L, Iba M, Aboagye AK, Paul SM, Trojanowski JQ, et al. Aβ accelerates the
spatiotemporal progression of tau pathology and augments tau amyloidosis in an Alzheimer mouse
model. American Journal of Pathology. 2010; 177(4):E4376–E4385. https://doi.org/10.2353/ajpath.
2010.100346
38. Henderson MX, Cornblath EJ, Darwich A, Zhang B, Brown H, Gathagan RJ, et al. Spread of α-synuclein
pathology through the brain connectome is modulated by selective vulnerability and predicted by net-
work analysis. Nature Neuroscience. 2019; 22:1248–1257. https://doi.org/10.1038/s41593-019-0457-5
PMID: 31346295
39. Pandya S, Zeighami Y, Freeze B, Dadar M, Collins DL, Dagher A, et al. Predictive model of spread of
Parkinson’s pathology using network diffusion. NeuroImage. 2019; 192:178–194. https://doi.org/10.
1016/j.neuroimage.2019.03.001 PMID: 30851444
40. Meier JM, van der Burgh HK, Nitert AD, Bede P, de Lange SC, Hardiman O, et al. Connectome-Based
Propagation Model in Amyotrophic Lateral Sclerosis. Annals of Neurology. 2020; 87(5):725–738.
https://doi.org/10.1002/ana.25706 PMID: 32072667
41. Pandya S, Maia PD, Freeze B, Menke RAL, Talbot K, Turner MR, et al. Modelling seeding and neuroan-
atomic spread of pathology in amyotrophic lateral sclerosis. bioRxiv. 2021 jan;.
42. Chu Y, Morfini GA, Langhamer LB, He Y, Brady ST, Kordower JH. Alterations in axonal transport motor
proteins in sporadic and experimental Parkinson’s disease. Brain. 2012; 135(7):2058–. https://doi.org/
10.1093/brain/aws133 PMID: 22719003
43. Foltynie T, Brayne C, Barker RA. The heterogeneity of idiopathic Parkinson’s disease. Journal of Neu-
rology. 2002; 249:138–145. https://doi.org/10.1007/PL00007856 PMID: 11985378
44. De Pablo-Fernandez E, Lees AJ, Holton JL, Warner TT. Prognosis and Neuropathologic Correlation of
Clinical Subtypes of Parkinson Disease. JAMA Neurology. 2019; 76(4):470–479. https://doi.org/10.
1001/jamaneurol.2018.4377 PMID: 30640364
PLOS COMPUTATIONAL BIOLOGY Emergence of directional bias in tau deposition from axonal transport dynamics
PLOS Computational Biology | https://doi.org/10.1371/journal.pcbi.1009258 July 27, 2021 22 / 23

45. Soo KY, Farg M, Atkin JD. Molecular motor proteins and amyotrophic lateral sclerosis. International
Journal of Molecular Sciences. 2011; 12(12):9057–9082. https://doi.org/10.3390/ijms12129057 PMID:
22272119
46. Ayers JI, Fromholt SE, O’Neal VM, Diamond JH, Borchelt DR. Prion-like propagation of mutant SOD1
misfolding and motor neuron disease spread along neuroanatomical pathways. Acta Neuropathologica.
2016; 131(1):103–114. https://doi.org/10.1007/s00401-015-1514-0 PMID: 26650262
47. Raj A, Kuceyeski A, Weiner M. A Network Diffusion Model of Disease Progression in Dementia. Neuron.
2012; 73(6):1204–1215. https://doi.org/10.1016/j.neuron.2011.12.040 PMID: 22445347
48. Iturria-Medina Y, Sotero RC, Toussaint PJ, Evans AC. Epidemic Spreading Model to Characterize Mis-
folded Proteins Propagation in Aging and Associated Neurodegenerative Disorders. PLoS Computa-
tional Biology. 2014; 10:e1003956. https://doi.org/10.1371/journal.pcbi.1003956 PMID: 25412207
49. Raj A, LoCastro E, Kuceyeski A, Tosun D, Relkin N, Weiner M. Network Diffusion Model of Progression
Predicts Longitudinal Patterns of Atrophy and Metabolism in Alzheimer’s Disease. Cell Reports. 2015;
10(3):359–369. https://doi.org/10.1016/j.celrep.2014.12.034 PMID: 25600871
50. Weickenmeier J, Kuhl E, Goriely A. Multiphysics of Prionlike Diseases: Progression and Atrophy. Physi-
cal Review Letters. 2018; 121:158101. https://doi.org/10.1103/PhysRevLett.121.158101 PMID:
30362787
51. Oh SW, Harris JA, Ng L, Winslow B, Cain N, Mihalas S, et al. A mesoscale connectome of the mouse
brain. Nature. 2014; 508:207–214. https://doi.org/10.1038/nature13186 PMID: 24695228
52. Pandya S, Mezias C, Raj A. Predictive model of spread of progressive supranuclear palsy using direc-
tional network diffusion. Frontiers in Neurology. 2017; 8:692. https://doi.org/10.3389/fneur.2017.00692
PMID: 29312121
53. Kolomeisky AB. Motor proteins and molecular motors: How to operate machines at the nanoscale. Jour-
nal of Physics Condensed Matter. 2013; 25(46). https://doi.org/10.1088/0953-8984/25/46/463101
54. Leterrier C. The axon initial segment: An updated viewpoint. Journal of Neuroscience. 2018; 38
(9):2135–2145. https://doi.org/10.1523/JNEUROSCI.1922-17.2018 PMID: 29378864
55. Sun X, Wu Y, Gu M, Liu Z, Ma Y, Li J, et al. Selective filtering defect at the axon initial segment in Alzhei-
mer’s disease mouse models. Proceedings of the National Academy of Sciences of the United States of
America. 2014; 111(39):14271–14276. https://doi.org/10.1073/pnas.1411837111 PMID: 25232037
56. Zuber B, Nikonenko I, Klauser P, Muller D, Dubochet J. The mammalian central nervous synaptic cleft
contains a high density of periodically organized complexes. Proceedings of the National Academy of
Sciences of the United States of America. 2005; 102(52):19192–19197. https://doi.org/10.1073/pnas.
0509527102 PMID: 16354833
57. Wang Y, Balaji V, Kaniyappan S, Kruger L, Irsen S, Tepper K, et al. The release and trans-synaptic
transmission of Tau via exosomes. Molecular Neurodegeneration. 2017; 12(5). https://doi.org/10.1186/
s13024-016-0143-y PMID: 28086931
58. Katsinelos T, Zeitler M, Dimou E, Karakatsani A, Muller HM, Nachman E, et al. Unconventional Secre-
tion Mediates the Trans-cellular Spreading of Tau. Cell Reports. 2018; 23(7):2039–2055. https://doi.
org/10.1016/j.celrep.2018.04.056 PMID: 29768203
59. Skeel RD, Berzins M. A Method for the Spatial Discretization of Parabolic Equations in One Space Vari-
able. SIAM Journal on Scientific and Statistical Computing. 1990; 11:1–32. https://doi.org/10.1137/
0911001
60. Ittner LM, Gotz J. Amyloid-β and tau—A toxic pas de deux in Alzheimer’s disease. Nature Reviews Neu-
roscience. 2011 feb; 12(2):67–72. https://doi.org/10.1038/nrn2967 PMID: 21193853
PLOS COMPUTATIONAL BIOLOGY Emergence of directional bias in tau deposition from axonal transport dynamics
PLOS Computational Biology | https://doi.org/10.1371/journal.pcbi.1009258 July 27, 2021 23 / 23