Determination of the structure of $\tau$ decays in the reaction e+e- --> $\tau^{+}\tau^{-}$ -->...
10
El .S EV 1 El/ 13 October 1994 Physics Le~e~B 337 (1994) 383-392 PHYSICS LETTERS B Determination of the structure of 7-decays in the reaction e+ e - • 7-+7-- p+p, p- z,, and a precision measurement of the z-neutrino helicity ARGUS Collaboration H. Albrecht a, T. Hamacher a, R.R Hofmann a, T. Kirchhoff a, R. Mankel a,l, A. Nau a S. Nowak a'l, D. Ref3ing u, H. Schr6der a, H.D. Schulz a, M. Walter a'l, R. Wurth b, C. Hast b, H. Kapitza u, H. Kolanoski b, A. Kosche b, A. Lange b, A. Lindner b, M. Schieber b, T. Siegmund b, B. Spaan b H. Thurn b, D. T6pfer b, D. Wegener b, p. Eckstein e, M. Schmidtler c, M. Schramm e, K.R. Schubert c, R. Schwierz c, R. Waldi c, K. Reim d, H. Wegener d, R. Eckrnann e, H. Kuipers ~, O. Mai e, R. Mundt e, T. Oest e, R. Reiner e, W. Schmidt-Parzefall e, j. Stiewe f, S. Werner f, K. Ehret g, W. Hofmann g, A. Htipper g, K.T. Kxl6pfle g, J. Spengler g, R Krieger h,6, D.B. MacFarlane ~,v, J.D. Prentice h.6, RR.B. Saull h,7, K. Tzamariudaki h,7, R.G. Van de Water h.6, T.-S. Yoon h,6, C. Frankl i, M. Schneider i, S. Weseler i, G. Kernel J, P. Kri~anJ, E. Kri~ni6J, T. PodobnikJ, T. ZivkoJ, V. Balagura k, I. Belyaev k, S. Chechelnitsky k, M. Danilov k, A. Droutskoy k, Yu. Gershtein k, A. Golutvin k, I. Korolko k, G. Kostina k, D. Litvintsev k, V. Lubimov k, E Pakhlov k, S. Semenov k, A, Snizhko k, I.Tichomirov k, Yu. Zaitsev k a DESE Hamburg, Germany b hlstitut fiir Physik 2, Universitdt Dortmund, Germany c Institutfiir Kern- und 3 Teilchenphysik-,Technische Universitdt Dresden, Germany d Physikalisches Institut 4, Univerritdt Erlangen-Nffrnberg, Germany e 11. lnstitut far Experimentalphysik, Universitdt Hamburg, Germany f 5 Institut fiir Hochenergiephysik , Universitdt Heidelberg, Germany g Max-Planck-lnstitutfiir Kernphysik, Heidelberg, German), h Institute of Particle Physics 8,Canada i lnstitutfiir Experimentelle Kernphysikg,Universitdt Karlsruhe, Germany J lnstitut J. Stefan and Oddelek za fiziko lo, Univerza v Ljubljani, Ljubljana, Slovenia k Institute of Theoretical and Experimental Physics, Moscow, Russia Received 3 August 1994 Editor: K. Winter Elsevier Science B.V. SSDI0370-2693(94)01101-X
Transcript of Determination of the structure of $\tau$ decays in the reaction e+e- --> $\tau^{+}\tau^{-}$ -->...

El .S EV 1 El/
13 October 1994
Physics L e~e~B 337 (1994) 383-392
PHYSICS LETTERS B
Determination of the structure of 7- decays in the reaction e+ e - • 7-+7-- p + p , p - z,, and a prec i s ion m e a s u r e m e n t o f the
z-neutrino helicity
ARGUS Collaboration
H. Albrecht a, T. Hamacher a, R.R Hofmann a, T. Kirchhoff a, R. Mankel a,l, A. Nau a
S. Nowak a'l, D. Ref3ing u, H. Schr6der a, H.D. Schulz a, M. Walter a'l, R. Wurth b, C. Hast b, H. Kapitza u, H. Kolanoski b, A. Kosche b, A. Lange b, A. Lindner b, M. Schieber b,
T. Siegmund b, B. Spaan b H. Thurn b, D. T6pfer b, D. Wegener b, p. Eckstein e, M. Schmidtler c, M. Schramm e, K.R. Schubert c, R. Schwierz c, R. Waldi c, K. Reim d, H. Wegener d, R. Eckrnann e, H. Kuipers ~, O. Mai e, R. Mundt e, T. Oest e, R. Reiner e, W. Schmidt-Parzefall e, j. Stiewe f, S. Werner f, K. Ehret g, W. Hofmann g, A. Htipper g,
K.T. Kxl6pfle g, J. Spengler g, R Krieger h,6, D.B. MacFarlane ~,v, J.D. Prentice h.6, RR.B. Saull h,7, K. Tzamariudaki h,7, R.G. Van de Water h.6, T.-S. Yoon h,6, C. Frankl i,
M. Schneider i, S. Weseler i, G. Kernel J, P. Kri~anJ, E. Kri~ni6J, T. PodobnikJ, T. ZivkoJ, V. Balagura k, I. Belyaev k, S. Chechelnitsky k, M. Danilov k, A. Droutskoy k, Yu. Gershtein k,
A. Golutvin k, I. Korolko k, G. Kostina k, D. Litvintsev k, V. Lubimov k, E Pakhlov k, S. Semenov k, A, Snizhko k, I.Tichomirov k, Yu. Zaitsev k
a DESE Hamburg, Germany b hlstitut fiir Physik 2, Universitdt Dortmund, Germany
c Institutfiir Kern- und 3 Teilchenphysik-,Technische Universitdt Dresden, Germany d Physikalisches Institut 4, Univerritdt Erlangen-Nffrnberg, Germany
e 11. lnstitut far Experimentalphysik, Universitdt Hamburg, Germany f 5 Institut fiir Hochenergiephysik , Universitdt Heidelberg, Germany
g Max-Planck-lnstitutfiir Kernphysik, Heidelberg, German), h Institute o f Particle Physics 8,Canada
i lnstitutfiir Experimentelle Kernphysikg,Universitdt Karlsruhe, Germany J lnstitut J. Stefan and Oddelek za fiziko lo, Univerza v Ljubljani, Ljubljana, Slovenia
k Institute o f Theoretical and Experimental Physics, Moscow, Russia
Received 3 August 1994 Editor: K. Winter
Elsevier Science B.V. S S D I 0 3 7 0 - 2 6 9 3 ( 9 4 ) 0 1 1 0 1 - X

384 ARGUS Collaboration/Physics Letters B 337 (1994) 383-392
Abstract
Using the ARGUS detector at the DORIS II storage ring we have investigated the Lorentz structure of the electroweak interaction in semi-hadronic r decays. Spin correlations in the process e+e - --+ r+r - --~ F~rr+¢r ° vr~r-rr ° are exploited for a measurement of the normalized product of the vector (gv) and axial vector (ga) couplings of the r lepton, YAV = 2 Re{gag~, } / ([gv {2+ Iga [2). The correlations are sensitive to the product of the couplings in both r decays: y2av = TAr ( r - v , W - ) yav(r + --+ ~,W +) , which can be interpreted as the product of the neutrino helicities: T2AV = - h ( v , ) h ( ~ , ) . The measured value, T2AV = 1.044 ± 0.057 d: 0.060, determines the relative sign of the neutrino helicities. Assuming CP invariance, the absolute value lYav[ = 1.022 + 0.028 :tz 0.030 was found to be in excellent agreement with the Standard Model. The contribution of scalar (gs) or pseudoscalar (gp) couplings was also investigated. No evidence for a scalar-like coupling was found.
The investigation of the third lepton family, the r lepton and the r neutrino, remains a subject of major importance in particle physics [ 1 ]. Since the measured leptonic r branching ratios are in good agreement with the predictions based on new measurements of the r mass and lifetime [2] , the tau sector is consistent with a universal electroweak interaction. Nevertheless, the expected incompleteness of the Standard Model due to the lack of an explanation for particle masses and coupling strengths motivates further searches for deviations from theory.
One of the most promising ways to look for physics beyond the Standard Model is through a detailed in- vestigation o f the Lorentz Structure o f r decays. The decay of this heavy lepton should be much more sen- sitive to new couplings having non V - A structure than those of the lighter leptons. Therefore several experi- mental tests of the Lorentz structure have previously been performed, e.g. the determination of the Michel
l DESY, IfH Zeuthen 2 Supported by the German Bundesministerium ftir Forschung
und Technologic, under contract number 054DO5 IP. 3 Supported by the German Bundesministerium far Forschung
und Technologic, under contract number 056DDI 1P. 4 Supported by the German Bundesministerium ftir Forschung
und Technologic, under contract number 054ER12P. 5 Supported by the German Bundesministerium ftir Forschung
und Technologic, under contract number 055HD21P. 6 University of Toronto, Toronto, Ontario, Canada. 7 McGill University, Montreal, Quebec, Canada. 8 Supported by the Natural Sciences and Engineering Research
Council, Canada. 9 Supported by the German Bundesministerium fiJr Forschung
und Technologic, under contract number 055KAI 1P. l0 Supported by the Ministry of Science and Technology of the
Republic of Slovenia and the Internationales Biiro KfA, Jiilich.
parameters in purely leptonic r decays [3] and the measurement of the p polarisation in the process r - --+ 7r - ¢r ° v r [ 4]. The observation of parity violation in the three-pion final state allowed the first measurement of the helicity of the r neutrino [5] . A combined mea- surement of the r polarisation and the r neutrino he- licity has been performed on Z --+ r + r - events [6] .
In this paper a precise measurement of the value of y2av = Y A v ( r - ~ v ~ W - ) Y A v ( T + ~ ~rW +) is presented, where T a v is the normalized product o f the vector ( g v ) and axial v e c t o r ( g a ) decay constants of the r lepton:
2 Re{gag~} ( 1 ) T a r - igvl 2 + [gAI 2 •
Since the parameter Y2AV can be interpreted as the prod- uct of the neutrino helicities, y2av = - h ( v ~ ) h ( ~ ) , the measurement determines the relative sign of the neu- trino helicities, as well as the absolute value of Y A V .
The contribution from scalar ( g s ) and pseudoscalar ( g t , ) couplings in r decays has also been investigated. The applied method has been developed and exten- sively tested with simulated data, as described in re [8] . Therefore, only the basic ideas of the analysis method are described here.
Angular correlations between the final state hadrons of the reaction
e + e - ~ r + r - ~ ~ r r + T r ° v ~ c r - c r ° (2)
are analysed to determine the electroweak interaction in semi-hadronic r decays. The electromagnetic pro- duction of the r leptons of reaction (2) leads to cor- related lepton spins because opposite spins are sup- pressed by a factor 2 m ~ c 4 / s ~ 1 / 16 for center-of-

ARGUS Collaboration/Physics Letters B 337 (1994) 383-392 385
mass energies ~ around 10 GeV. These correlations should be distinguished from polarized r leptons gen- erated via Z ° exchange at much higher energies. Us- ing the final state hadrons as spin analysers makes the structure of the coupling in 7- decays observable.
The analysis of the Lorentz structure of semi- hadronic 7- decays presented here comprises four parts: the selection of events of reaction (2), the in- vestigation of signal and background contributions to the data, the measurement of the parameter Yav and the determination of scalar-like couplings.
The analysed data sample was collected with the ARGUS detector at the e+e - storage ring DORIS II at center-of-mass energies between 9.4 GeV and 10.6 GeV. The ARGUS detector is a 47r magnetic spectrometer described in [ 7]. The event sample cor- responds to an integrated luminosity of 387 p b - 1, with about 373 000 produced r pairs.
The ~- pairs of reaction (2) were selected from a special two-prong data sample containing more than five million events preselected with moderate cuts, mainly to reject Bhabha events. Two charged tracks from a main vertex with minimum transverse momenta o f p r > 60 MeV/c and with zero net charge were re- quired. Neutral energy deposits in the calorimeter with energies larger than 150 MeV and a minimum polar angle of I cos0[ < 0.92 were accepted as photon can- didates. We further constrained the data by rejecting events with less than two photons. This resulted in a sample of about 260 900 events.
To ensure good trigger conditions, we restricted both charged tracks to the barrel region of the detector, I cos 01 < 0.75. Since the 7- lepton pairs are produced back-to-back with large momenta their decay prod- ucts typically point into opposite hemispheres. The characteristic 1-versus- 1 topology of the charged par- ticles was selected by requiring: cos(p1, P2) < - 0 . 5 . The same angle was restricted to a maximum value of cos(p~,p2) > - 0 . 9 to reduce the background from the more collinear Bhabha and/x pair events. To take into account the possibility that a shower cluster pro- duced by a charged track can fake a photon, we re- quired photon candidates to satisfy a minimum open- ing angle c o s ( r l , p r ) < 0.990, where ri is defined as the direction between the main vertex and the im- pact point of a charged track at the calorimeter. A large suppression of two-photon reactions, hadronic processes and other QED processes was achieved with
the following parabola cut on the relationship between the transverse momentum balance and the total visible momentum of charged and neutral particles:
n
I Z PTil i=1
n
> (5" ( Z [ p i [ " ¢/Ecm s --0.5) 2 -'[- 0.1) GeV/c. i=1
Each photon was assigned to the hemisphere of the charged track closest to it, and either one or two pho- tons were permitted in each. The reconstruction of 7r°s was performed in two different ways depending on the number of detected photons. I f only one photon was found in a given hemisphere, a minimum energy of 1 GeV was required for it to be compatible with being a 'single-cluster zr °'. Photons from such high energy 7r°s often merge into a single cluster in the electro- magnetic calorimeter, the fraction of merged clusters rising from 5% for pion energies of 1 GeV to 60 % for 3 GeV [4]. If a two-photon system was found in one hemisphere, its invariant mass was restricted to a region within ±100MeV/c 2 of the nominal zr ° mass and the system had to yield a X 2 < 9 when kinemati- cally constrained to the 7r ° mass.
Assuming the pion mass for both charged tracks without any attempt to use dE/dx or time-of-flight measurements for particle identification, exactly one (7r±rr °) system was reconstructed in each hemi- sphere. To further reduce the background the invariant mass of each system was required to lie close to the nominal p mass because the decay r - ~ zr-Tr%,T is known to be dominated by 7-- --~ p-gT :
0.5 GeV/c 2 < rn(zr±Tr °) < 1.1 GeV/c 2 .
Since the 7- direction of flight has to be reconstructed (see likelihood analysis), the angle O(pp+,pp_ ) be- tween the two p momenta and the two decay angles 0 + ( p , i , po± ) between the momenta of the 7- leptons and the p mesons had to fulfill the condition:
O(pp+, pp- ) -k- O- (p~- , pp- ) + 0 + (pr+, pp+ )
> 180 ° .
1707 events passed this last requirement. To proceed further requires a quantitative knowledge of the differ- ent background contributions to the data sample. We

386 ARGUS Collaboration / Physics Letters B 337 (1994) 383-392
discuss in detail the background from the following sources: - e+e - annihilation into hadrons, - two-photon reactions, - radiative Bhabha events, - z pair events with one or both T decays faking the
decay mode ~-+ ---+ 7r±Tr°~,~. The background contribution from non-T pair events was found to be very small. These events were rejected effectively through application o the parabola cut and the restriction on the reconstructed p mass.
To determine the number of hadronic background events we used 624 867 qq events which were gen- erated with the LUND Monte Carlo program (ver- sion 6.2 and 6.3) [9] including initial state radiation. Only 7 events satisfied all selection criteria. Scaling to the measured integrated luminosity yielded 13.9 :k 5.2 events expected in the data.
The strongest background contribution from two- photon reactions is the process YY ~ ~r-Tr° 7r+'rr°. A major fraction of this final state is produced as a p+p- system [ 10]. A data sample with simulated two-photon events of this type was investigated to determine the corresponding background fraction. The number of events which passed the selection was scaled to the data by studying a phase space region populated predominantly by two-photon events: _ n ( n
I ~'-~i=1 PTi[ < (5 • ~ i = 1 IPil " c / E c m s - 0 . 5 ) 2 q-
0.1) GeV/c - and (~;"=~ IP/I c/E~ms) < 0.5. After correcting for the expected number of ~- events in this phase space region an estimate of 17.3 d: 10.7 two-photon events in the data was derived.
In consideration of the good particle identification properties of the ARGUS detector, we regarded all events with sufficiently high electron likelihoods for both charged tracks as radiative Bhabha events. A neg- ligible number of 1.0 4- 1.0 events was found to re- main in the selected data sample. Without the p mass restriction this number would increase to 19 events.
The study of background events from other ~- decays was based on a simulated data sample of a few hundred thousand ~" pair events generated with the KORALB event generator (version 2.2) [ 11 ] 11 After feeding this Monte Carlo sample through a simulation of the
ll A sign error in the matrix element programmed in KORALB affecting the spin correlations has been corrected.
Table 1 Branching ratios used in the Monte Carlo simulations. The ex- pected background contributions from ~" events where one ~.:1: __. ~r±cr°z,r is faked by another mode are also indicated.
Decay channel Branching ratio [2,13] Expected events
r - ---* e - P e r t (17.9-t-0.1)% 13.24-3.0 r - --~/z-trout ( 17.3 4- 0.2)% 5.5 4- 1.9 ~'- --~ ~ ' - l ' r (11.1 4- 0.2)% 4.7 4- 1.7 z - ~ ~r-27r0~,r (8.3 4- 0.4)% 335.3 4- 27.8 r - ---~ 7r- 3~°~,~ (1 .14-0.2)% 22.14-4.3 ~'- ~ K - v r (0.854-0.14)% 0.04- 1.2 z - ---~K*(892)-vr (1.224-0.13)% 52.04-8.4
ARGUS detector [ 12] a detailed investigation of the different background channels and a determination of their selection efficiencies was made.
A major part of the background (about 70%) is due to the decay ~-± --~ 7r±Tr°Tr°~,~ of one or both r leptons with one ¢r ° escaping detection. This hadronic final state originates from the decay a~ --~ p+~r ° . There- fore, the loss of the zr ° from the direct al t: decay results in background events which cannot be distinguished from signal events by the applied selection criteria. Two other important background sources are due to the decays r ± ~ 7r ± 3¢r°v~ and r ± ---, K* (892) 4"v~.
The expected background from events where one ~-± ~ ~r±Tr°l,~ decay is faked by other decay modes is given in Table 1
together with the branching ratios used for the var- ious decay channels. The errors include statistical and systematic uncertainties. Table 2 gives a compilation of the different signal and background classes and the corresponding contributions to the selected data.
The likelihood method described in detail in Ref. [8] was applied to determine the parameter Y~v. This method exploits all the kinematical information of re- action (2) if the r direction of flight is known. Al- though this vector cannot be measured directly with the ARGUS detector, it can be reconstructed within a twofold ambiguity using the kinematical informa- tion of the observed hadronic decay products of the r pairs [ 8]. The squared matrix element entering the likelihood function has been derived in [8] and can be written as
]M(aly~v)12=C[A(ot)+y2avB(~)] , (3)
with C a factor independent of 3'~v and a represents
A R G U S C o l l a b o r a t i o n / P h y s i c s Le t ters B 3 3 7 (1994) 3 8 3 - 3 9 2
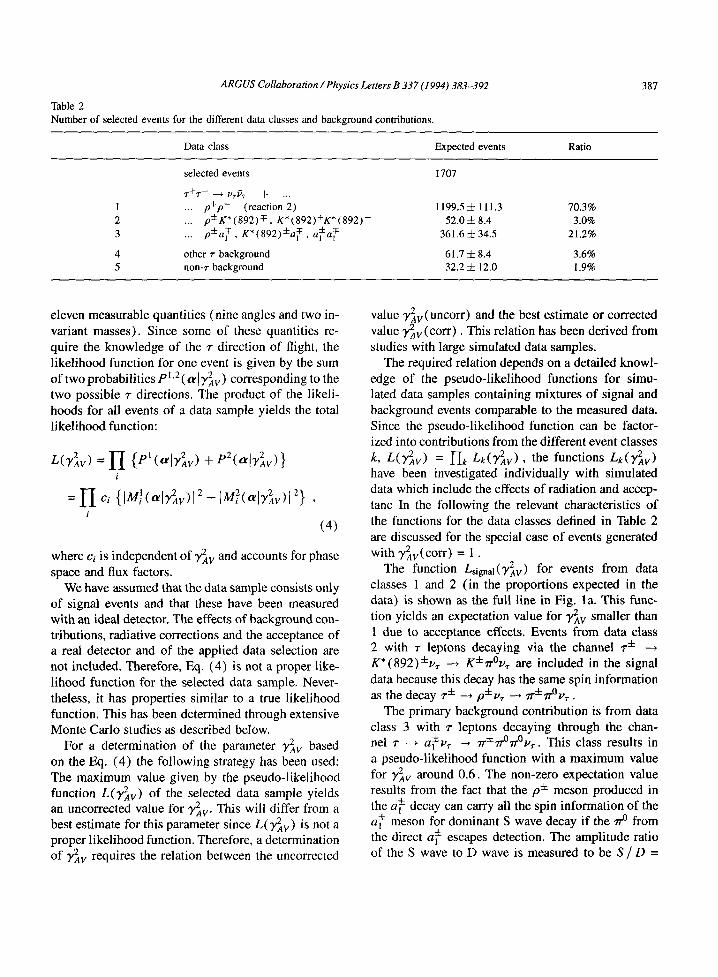
Table 2 Number of selected events for the different data classes and background contributions.
387
Data class Expected events Ratio
selected events 1707
,r+,r - ~ l,r~ r + ... 1 ... p + p - (reaction 2) 1199.5 ± 111.3 70.3% 2 ... p + K * ( 8 9 2 ) ~:, K*(892)+K*(892) - 52.0:t :8.4 3.0% 3 ... p~:aTl , K*(892) : / : a~ , al:ka~ 361.64-34.5 21.2%
4 other ~" background 61.7 4- 8.4 3.6% 5 non-~- background 32.2 4- 12.0 1.9%
eleven measurable quantities (nine angles and two in- variant masses). Since some of these quantities re- quire the knowledge of the ~- direction of flight, the likelihood function for one event is given by the sum of two probabilities P 1,2 ( f f l y 2 V ) corresponding to the two possible ~- directions. The product of the likeli- hoods for all events of a data sample yields the total likelihood function:
i
= H ¢i {IM)(,~lg,2av)l 2 + IM/Z(al~'Zav)l z} , i
(4)
where ci is independent of y2 v and accounts for phase space and flux factors.
We have assumed that the data sample consists only of signal events and that these have been measured with an ideal detector. The effects of background con- tributions, radiative corrections and the acceptance of a real detector and of the applied data selection are not included. Therefore, Eq. (4) is not a proper like- lihood function for the selected data sample. Never- theless, it has properties similar to a true likelihood function. This has been determined through extensive Monte Carlo studies as described below.
For a determination of the parameter y2av based on the Eq. (4) the following strategy has been used: The maximum value given by the pseudo-likelihood function L(Y2av) of the selected data sample yields an uncorrected value for T2av . This will differ from a best estimate for this parameter since L(T2AV) is not a proper likelihood function. Therefore, a determination of y2AV requires the relation between the uncorrected
value y~v(Uncorr) and the best estimate or corrected value y~v(corr) . This relation has been derived from studies with large simulated data samples.
The required relation depends on a detailed knowl- edge of the pseudo-likelihood functions for simu- lated data samples containing mixtures of signal and background events comparable to the measured data. Since the pseudo-likelihood function can be factor- ized into contributions from the different event classes k, L(Y2AV) = I L Lk(T2AV), the functions Lk(rZv) have been investigated individually with simulated data which include the effects of radiation and accep- tanc In the following the relevant characteristics of the functions for the data classes defined in Table 2 are discussed for the special case of events generated with yZv(corr) = 1.
The function 2 L s i g n a l ( T A V ) for events from data classes 1 and 2 (in the proportions expected in the data) is shown as the full line in Fig. la. This func- tion yields an expectation value for T2av smaller than 1 due to acceptance effects. Events from data class 2 with r leptons decaying via the channel ~'+ K*(892)+z,, .4 K+Tr°v~ are included in the signal data because this decay has the same spin information as the decay r + -4 p-t-v r --~ ,n-t-TrOVr.
The primary background contribution is from data class 3 with r leptons decaying through the chan- nel ~- --+ a~z,, ~ ~+rr°~-°Vr. This class results in a pseudo-likelihood function with a maximum value for y2AV around 0.6. The non-zero expectation value results from the fact that the p i meson produced in the a~ decay can carry all the spin information of the a~ meson for dominant S wave decay if the 1r ° from the direct a~ escapes detection. The amplitude ratio of the S wave to D wave is measured to be S / D =

388
1.0
0.8
0.5
0.4
0.2
0.0 0.0
ARGUS Collaboration / Physics Letters B 337 (1994) 383-392
" / x • j +
i •
• Z x
/ . • x
/ ' . . .
L , . i , - . - t " " , I , " ; + ' . . l . . . . h . . . . i , ~ ' ; ' . .
0.2 0.4 0.6 0.8 I .0
L( 72AV )
1.0
....................................... '"If I O.B " ,~ ',
b) 0.6
O. 4 ~
O, 2 ] ~
0.0 ~y2 0.0 0.2 0.4 0.6 0.8 1.0 V
Fig. 1. a) Pseudo-likelihood function for simulated signal (full line) and background data (dashed line) as expected for the selected data sample. The right (left) dotted line corresponds to background from data classes 3 (4 and 5). b) Comparison of the pseudo-likelihood function for the selected data sample (full line) with the one for a simulated data sample containing a comparable mixture of signal and background events (dashed line). The dotted line represents a function using only the energy-energy correlation of the two p mesons.
-0 .11 4-0.02 [ 5 ]. Therefore, this background contri- bution has nearly the same angular momentum struc- ture as the signal data. This is not the case if the ~.0 pro- duced by the p± is lost. Since this pseudo-likelihood function is important for the determination of Y2av we have compared the simulated background with mea- sured background by requiring an additional 7r ° in one hemisphere of the data selection described above. We then calculated the two corresponding pseudo- likelihood functions without using the additional ~°s of these events. Data and simulation were found to be
in good agreement. The backgrounds from other 7" decays (data class
4) and from non-+- decays (data class 5) yield sim- ilar pseudo-likelihood functions with maxima at T2AV = 0. Fig. la shows the functions for the dif- ferent background classes separately, as well as the pseudo-likelihood function of the total background. The product of the simulated signal and background functions yields a pseudo-likelihood function (dashed line in Fig. lb) with a maximum at significantly lower values of T~v than the pure signal function.

ARGUS Collaboration/Physics Letters B 337 (1994) 383-392 389
1.0
7 ~ v ( u n c ° r r ) 0.9
0.8
0.7
0.6
0.5
0.4
i T
r
0,6 0.7 0.8 0.9 1.0 1.1 1.2 7~v(c°rr)
Fig. 2. Uncorrected values for ~mv derived from simulated pseudo-likelihood functions versus the corrected values used in the event generation. The full line represents a linear fit to the data. The dashed lines illustrate the correction of ~av(Uncorr) for the measured data.
The pseudo-likelihood function for the selected data sample (full line in Fig. lb) yields an uncorrected 3~2AV value of
72av(Uncorr) = 0.856 ± 0.056.
The statistical error was derived from the width of the function and has been checked using the distribution of uncorrected values "Y~v (unc°rr) for simulated data samples containing the same number of signal and background events as expected in the measured data. Since the pseudo-likelihood function is in good agree- ment with the function for simulated data generated with "Y~v = 1 no significant deviation from the Stan- dard Model value for y2AV can be expected from the data. A comparison with a pseudo-likelihood function constructed using only the energy-energy correlation between the two p mesons is presented in Fig. lb. Given that the same data sample has been analysed, the advantage of using the likelihood method, based on all available information, is obvious.
To derive the required relationship between the corrected and uncorrected values of y2AV large data samples containing signal and background events in the same ratio as in the selected data sample were pro- duced with different values of y~tv(COrr). The events were generated with radiative corrections and fed through a full detector simulation. The calculation of
the corresponding pseudo-likelihood functions results in uncorrected values 3~2av(Uncorr) for the simulated data samples. These are shown versus the corrected values y2av(corr) in Fig. 2. A straight line fit yields the following relation:
y2av(Uncorr) = al [y2zv(COrr) -- 1] + a0, (5)
with: al = 0.988±0.125, a0 = 0.812±0.019, O'a20a ~ = 0.002 a n d X 2 t / d . o . f . - 5 . 0 / 4 . The errors are due to the statistical uncertainties caused by the limited Monte Carlo statistics of about 1.5 million generated events.
The pseudo-likelihood function for the selected data sample together with the derived linear relation be- tween the corrected and uncorrected values results in a determination of the parameter y2av :
Y2Av(COrr ) = 1.044 ± 0.057 ± 0.060,
where the first error is due to the statistical uncertainty and the second is due to systematic uncertainties. The different contributions to the systematic uncertainty are summarized in Table 3. A variation in the admix- ture of the background classes to the data of 30 per- cent yields only a small contribution to the systematic error. In order to investigate systematic effects due to the event generation and detector simulation on the ac- ceptance function we varied the criteria of the data se-

390
lection. No significant influence on the measurement of y2av could be observed. The systematic error given in Table 3 reflects the limited statistics of simulated and measured data available for these checks. The un- certainties in the parameters of the linear relation de- scribed above yield only a minor contribution to the systematic error.
Combining the measurement of the sign of YAV by the ARGUS collaboration in 1990 [5] with the result of this analysis, we arrive at a very precise determi- nation of the parameter YAV:
TAV = 1.022 ± 0.028 ± 0.030.
A R G U S Collaboration / Physics Letters B 337 (1994) 383-392
Table 3 Compilation of systematic errors for y2av.
The analysis of contributions from scalar-like cou- plings in ~- decays is based on a matrix element for re- action (2) which includes scalar-like couplings. These couplings are defined in such a way [8] that gs = ge corresponds to a pure left (right) handed coupling for the (anti) neutrino. For the vector-like couplings gv = ga is assumed and all couplings gi are assumed to be real. Terms proportional to (g] + gZ e) are neglected.
A scalar-like coupling in z decays results in an asymmetry in the subprocess h ± ~ ~-±¢r ° due to an interference between the decay of a p± meson and
± the decay of a scalar particle hscalar. This asymmetry becomes observable in the distribution of cos a ± = ^ 7r ~ ~ h:~ ^ 4 -
ph:~em • p r + cm , w h e r e p h + cm d e n o t e s t h e n o r m a l i s e d
pion momentum in the rest frame of the hadronic sys- ^h :L tern h ± and Pr~cm is the normalised h ± momentum
in the 7 -+ rest frame:
Error sources O-sys (3~av)
background admixture 0.038 event generation and detector simulation 0.040 Monte Carlo statistics 0.024
total 0.060
the system (Q2 = m2±~0). Experimentally, one can only determine the global coefficient of the antisym- metric part of Eq. (6). Since this will be in general a quickly varying function of Q2, we have analysed the data in intervals of Q2. A decomposition of the different factors can only be carried out under the ad- ditional assumptions described below.
Due to the reconstruction of the ~" axis cos a can only be measured within a twofold ambiguity. The in- fluence of this uncertainty on a measurement of the antisymmetric term in Eq. (6) has been investigated with simulated data by comparing cos a values cal- culated with the real and the reconstructed ~" axes. In the latter case both possible cos a values for each event were used and weighted by 0.5. The compari- son yielded a reduction of the antisymmetric contri- bution by a factor 1.81 ± 0.04. This factor was found to be independent of the chosen Q2 interval and of the asymmetry used for the simulated input function.
In Fig. 3, the cos a - distributions for background
1 d F s ( r + --, 7ri~r°vr)
Ftot(Q 2) d cos a ± 2
3 QZ mr -- a± = 2m~ + 4Q~: 1 + Q~: cos 2
7z gs gv + g---'----~P Re {fs (Q] : ) X ( Q ~ ) } cos a +]
with:
(6)
X ( Q ~ ) = mr 1
V/ ' F ; ( Q ± ) Q~ ( Q ~ : - 4 m ~ ) ' 2 •
The vector or pion form factor ' 2 F~(Q+) describes a (~r±zr °) system in a vector state and the scalar form factor fs (Q~) corresponds to a scalar hadronic sys- tem. Both functions depend on the invariant mass of
su d and acceptance corrected data are compared in four Q2 intervals with the distributions for pure V - A simulated data (ideal detector, no background). The error bars account for the limited statistics of the data and the uncertainty in the background subtraction and the acceptance correction. A fit to the data with the function
N ( c o s a ) =A [ I + B c o s 2 a + C c o s a ]
yields a value for the parameter C in each interval. These values are presented in Table 4 for the cos a - and cos a + distributions. Since all values for the pa- rameter C are consistent with zero, no evidence for a scalar-like coupling can be found in the data.
A determination of the scalar-like coupling (gs + ge ) / gv requires a parametrisation of the form factors. The pion form factor can be sufficiently well described

ARGUS Collaboration/Physics Letters B 337 (1994) 383-392 391
/o.ol 0.500 < V/-~/GeV < 0.690
80.0 I . . . . ' ' • " •
60.0
40.0 i
20 .0
0 .0 . . . . ~ ' ' ' 1.0 -0 .5 0 .0 0.5 1 . 0
00 .0
60 .0
40 ,0
20.0
0.0 1.0
0.690 < v ~ / G e V _< 0.776
J I . . . .
--0.5 0.0 0.5 LO
50,0
4 0 . 0
30.0
20.0
10.0
0.0
0.776 ~ v/-~lGeV ~_ 0.850 50.0
0.850 < x / ' ~ / G e V < 1.100
4 0 . 0
3 0 . 0
20.0
10.0
0.0 COS O[
- t .O - 0 .5 0 .0 0 .5 l .O - t ,O -0 .5 0 .0 0 ,5 1.0
Fig. 3. Distribution of cos a - for background subtracted and acceptance corrected data (points with error bars) and for simulated data of reaction (2) with an ideal detector (histogram) in intervals of Q2. The lines represent fits to the data.
Table 4 Fit parameters C ( a 2 ) , average values for Re{X(Q2 , ) } = Re{mr/(F~(Q2,) VQ2 (Q~ _ 4m~) ) , } and estimates for scalar-like couplings
in intervals of Q2.
Q2 intervals C(Q 2) (x2/d.o.f.) (Re{X(Q2)}) fs (gs + gp) /gv
cos a - data
cos a + data
0.500 _< ~ /~ /GeV < 0 .690 -0.174i0.262 (4.5/7) 1.424-0.76 -0.2234-0.356 0.690 < V/~/GeV _< 0.776 -0.0134-0.185 (4.2/7) 0.284-0.17 -0.0844-1.202 0.776 < V/~/GeV < 0 .850 -0.0994-0.110(2.7/7) -0.184-0.10 1.0004-1.242 0.850 < X/~/GeV _< 1.100 -0.0804-0.124(5.0/7) -0.664-0.21 0.2204-0.349
0.500 < V/-~/GeV < 0.690 0.004 4- 0.289 (1.9/7) 1.39 4- 0.72 0.005 4- 0.378 0.690 < V/~/GeV < 0.776 -0.0644-0.162(5.1/7) 0.284-0.18 -0.4164-1.085 0.776 < V/~/GeV _< 0 . 8 5 0 0.0564-0.071 (3.1/7) -0.184-0.11 -0.5664-0.796 0.850 < V/-~/GeV < 1.100 -0.0524-0.158 (2.8/7) -0.694-0.21 0.1374-0.418

392
by a Breit-Wigner:
F ~ ( Q 2) = v '~ cos 0 c 2 m p
ARGUS Collaboration / Physics Letters B 337 (1994) 383-392
m~ - Q2 _ i rpmp
with mp = 0.776 G e V / c 2 and Fp = 0.149 G e V / c 2, The scalar form factor is, however, unknown. There- fore, we have assumed a simple constant behaviour for it: f s ( Q 2) = f s , where fs is real. This provides a plausible l imit for the complete mass range. With this assumption we have averaged R e { X ( Q 2) } over Q2 separately in each Q2 interval (Table 4) . After cor- recting the fit parameters C for the ambiguity in the reconstruction of the r axes, the ratios of the corrected parameters C with the average values ( Re {X(Q2) } ) become estimates for ( g s + gp ) / gv f ~ . The weighted mean of these estimates yields:
gs + ge fs = 0.006 4- 0 .175. gv
Systematic uncertainties from sources other than the l imited background statistics and the acceptance correction were found to be small and have been ne- glected. In part icular the weighted mean is indepen- dent of a reasonable variation of the parameter mp and of the chosen Q2 intervals. The following upper l imit for scalar-l ike couplings is derived:
gs + gP - - f s < 0.29 (90%c.1 . ) .
g v
An independent check using a l ikel ihood method based on a matrix element extended to include scalar- l ike couplings has been performed in analogy to the determination o f the parameter T2AV. The results for this method, which exploits all available information of reaction (2 ) , indicate that the cos a a: asymetry analysis already has in fact a nearly optimal sensitivity. The l ikel ihood method yields a comparable l imit for scalar-l ike couplings.
In conclusion, we have used spin correlations in semi-hadronic r decays to measure the value of the pa-
rameter Y2A V = "~ A V ( ' I ' - ~ l.'r W - ) ")/ a v ( "l "+ -'-+ ~'r W + )
with high precision. The determined negative sign of the product of the neutrino helicities, h ( v , ) and h ( ~ r ) , and the absolute value, T A r = 1.022 4- 0.028 4- 0.030, are in excellent agreement with the Standard Model. An investigation into the asymmetry in the de- cay angular distribution of charged pions produced in
the decay r + ~ ~-:kff°~,r allowed a determination of an upper l imit for scalar-like couplings in r decays. No evidence for deviations from a pure V - A coupling could be found.
It is a pleasure to thank U. Djuanda, E. Konrad, E. Michel, and W. Reinsch for their competent techni- cal help in running the experiment and processing the data. We thank Dr. H. Nesemann, B. Sarau, and the DORIS group for excellent operation of the storage ring. The visiting groups wish to thank the DESY di- rectorate for the support and kind hospital i ty extended to them,
References
[1] Reviews are given in: A.J, Weinstein, R. Stroynowski, Ann. Rev. Nucl. Part. Sci. 43 (1993) 457; C. Kiesling, in "High Energy Electron-Positron Physics", eds. A. Ali, P, SiSding, World Scientific, Singapore (1989) 177; B.C. Barish, R. Stroynowski, Phys. Rep. 157 (1988) I.
[2] A. Schwarz, "r Physics", Invited talk presented at the XVI International Symposium on Lepton-Photon Interactions, Cornell University, Ithaca (New York), August 10-15, 1993.
[ 3 ] H. Albrecht et al. (ARGUS), Phys. Lett. B 316 (1993) 608; H. Albrecht et al. (ARGUS), Phys. Lett. B 246 (1990) 278; H. Janssen et al. (Crystal Ball), Phys. Lett. B 228 (1989) 273; S. Behrends et al. (CLEO), Phys. Rev. D 32 (1985) 2468.
[4] H. Albrecht et al. (ARGUS), Z. Phys. C. 56 (1992) 339. [5] H. Albrecht et al. (ARGUS), Phys. Lett. B 250 (1990) 164. [6] D. Buskulic et al. (ALEPH), Phys. Lett. B 321 (1994) 168. [7] H. Albrecht et al. (ARGUS), Nucl. Instr. Meth. A 275
(1989) 1, [8] H. Thum, H. Kolanoski, Z. Phys. C. 60 (1993) 277. [9] B. Andersson et al., Phys. Rep. 97 (1983) 31; Phys. Lett.
B 199 (1987) 291. [ 10l H. Albrecht et al. (ARGUS), Phys. Lett. B 217 (1989) 205. [ 11 ] S. Jadach, Z. Was, "Monte Carlo Simulation of the Process
e+e - ---+ r+r - , r :t: ---* X + Including Radiative O(ot 3) QED Corrections, Mass and Spin Effects", Comp. Phys. Commun. 36 (1985) 191; "KORALB Version 2.1 - An Upgrade with TAUOLA Library of r Decays", Comp. Phys. Comman. 64 (1991) 267; S. Jadach, LH. Kiihn, Z. Was, "TAUOLA - A Library of Monte Carlo Programs to Simulate Decays of Polarized r Leptons", Comp. Phys. Commun. 64 (1990) 275.
[ 12] H. Gennow, "SIMARG: A Program to simulate the ARGUS detector", DESY internal report, DESY F15-85-02 (1985).
[ 13] H. Kolanoski, "Hadronic r Decays", Invited talk presented at the 5th International Symposium on Heavy Flavour Physics, Montreal, Canada, July 6-10, 1993.