An isometry-invariant spectral approach for protein-protein docking
Upload
independentCategory
view
1download
0
Effect of dietary protein and lipid levels and
protein–energy ratio on growth indices, feed
utilization and body composition of freshwater prawn,
Macrobrachium rosenbergii (de Man 1879) post larvae
Ashraf M A-S GodaFish Nutrition Laboratory, National Institute of Oceanography and Fisheries (NIOF), Cairo, Egypt
Correspondence: A M A-S Goda, 28 Niseem Asaad Street, Medan El-Afdal^Shobra, Post No. 11231, Cairo, Egypt. E-mail: goda_ash
Abstract
A grow-out experiment was designed to determinethe e¡ect of di¡erent dietary protein, lipid levelsand protein^energy (P:E) ratio on growth perfor-mance and feed utilization of the freshwater prawn,Macrobrachium rosenbergii post larvae (PL) culture inpond net enclosures (hapa, 3.75m�3 each) for 12weeks (84 days). The experimental treatments wereassigned in triplicate. Six test diets were formulatedto contain three di¡erent protein levels (300, 350and 400 g kg�1 diet) and two lipid levels (100 and140 g kg�1diet) in a factorial manner (3 � 2) to pro-vided six di¡erent dietary P:E ratio: 16, 17, 18, 19,20 and 21mg CPkJ�1g�1). The result showed thatthe highest signi¢cant (P � 0.05) survival rate,growth indices and feed utilization were observedfor M. rosenbergii PL fed a diet with a P:E ratio of17mg CPkJ�1g1, whereas, the lowest value wasrecorded for prawns fed a diet with a P:E ratio of20mg CPkJ�1g�1.Whole body contents of proteinand lipid were highest (P � 0.05) when fed diets with21 and 17mg CPkJ�1g�1 respectively. Concerningdietary protein levels, the highest (P � 0.05) valuesfor survival and growth indices were observed forPL fed a diet containing 300 g kg�1 diet protein. Thesame trend was observed for PL fed a diet with100 g kg�1diet lipid level, irrespective of dietary pro-tein levels. A diet containing 300 g kg�1 protein and100 g kg�1 lipid with a dietary P:E ratio of 17mgCPkJg�1 is recommended to stimulate growthperformance and nutrients utilization e⁄ciency ofM. rosenbergii PL.
Keywords: protein^energy ratio, freshwater prawn,post larvae, growth, net enclosure
Introduction
Giant freshwater prawnMacrobrachium rosenbergii isan important species and has become an importantpart of the rice-¢sh and small scale carp^tilapia poly-culture ecosystem in developing countries (Giap,Yi &Lin 2005; Hossain & Islam 2006). The annual globalproduction of freshwater prawns (excluding cray¢shand crabs) has signi¢cantly increased from 50000metric tons (Mt) in 1995 to 4280000 Mt in 2003(New 2005; FAO 2006). The success of commercialproduction ofM. rosenbergii post larvae (PL) dependson the e⁄cient use of available food sources (Free-man 1990). Low e⁄ciency of commercial prawn PLdiets has been attributed to the limited knowledge oflarval nutritional needs (de Barros & Valenti 2003).Cost of aquaculture feed, which is directly related toprotein content, appears to be the major limiting fac-tor which in£uences the economic feasibility ofprawn farming. Therefore, expensive dietary proteinshould be optimally utilized to support rapid growthrather than for maintenance of the cultured animal(Bautista1986).The estimated optimum dietary protein level inM.
rosenbergii has been investigated (Balazs & Ross1976;Milliken, Fortner, Fair & Siek1980; Ashmore, Stanley,Moore & Malecha 1985; Ang, Lee & Law 1992; Das,Saad, Ang, Law & Harmin1996), including the e¡ect
Aquaculture Research, 2008, 39, 891^901 doi:10.1111/j.1365-2109.2008.01947.x
r 2008 TheAuthorJournal Compilationr 2008 Blackwell Publishing Ltd 891
of dietary protein levels on PL stages (D’Abramo &Sheen 1994; Sharma & Reddy 1996; El-Sayed 1997;Teshima, Koshio & Ishikawa 2006). The proteinrequirement ofM. rosenbergii is considered to be lowerdue to the lowest nitrogen (N) needed for mainte-nance compared with the marine prawn Marsupe-naeus japonicus (Guillaume 1997; Teshima, Koshio,Ishikawa & Kanazawa 2001; Teshima et al. 2006).However, optimum dietary protein levels of prawnsdepend on many factors such as age, feeding level,protein quality, dietary energy level and sources.One of the major problems associated with dietary
protein utilization is the dietary energy level andsources. Shiau and Lan (1996) reported that dietaryprotein requirements are closely related to dietaryenergy levels. Growth and metabolism are sustainedby the energygenerated from the catabolismof eitherdietary protein or non-protein energy sources.With-out additional alternative energy sources (carbohy-drates and lipids) to meet energy demands in thediet, some of the dietary protein consumed will haveto be degraded to support the energy demands for tis-sue synthesis and metabolism (Hawkins & Bayne1991). E⁄cient diets contain su⁄cient non-proteinsources that are metabolized to meet general energyrequirements, allowing an organism to direct themaximum level of available dietary protein togrowth; this is known as the protein sparing e¡ect(Johnston, Calvert, Crear & Carter 2003; Wilkinson2003). The e¡ectiveness of the protein sparing e¡ectof carbohydrates and lipids is related to the ratio ofprotein to energy ratio (P:E ratio) in the diet. How-ever, excess protein in the diet will be metabolizedby prawns as a source of energy, and nitrogen willbe excreted as ammonia and could inhibit prawngrowth (Lim & Persyn 1989). Therefore, the ratio ofP:E in feeds for prawns is an important considerationfor the formulation of cost-e¡ective and environmentfriendly diets (Corte¤ s-Jacinto, Villarreal-Colmenares,Civera-Cerecedo & Mart|¤ nez-Co¤ rdova 2003).Onlya few studies have been considering optimum
dietary P:E ratio for early nursery phase of M. rosen-bergii PL. Currently, most of the nutritional require-ments studies of prawns have been carried out onsub-adults and adults stages (Gitte & Indulkar2005). The relatively long larval period (18^35 days)and low larval survival are disadvantages to the com-mercial culture of M. rosenbergii (Keysami, Saad,Sijam, Daud &Alimon 2007). However, relevant prac-tical diet information needs to be developed to sus-tain higher growth, survival and feed e⁄ciency ofprawnPLs.Therefore, the present studywas designed
to determine the e¡ect of dietary protein and lipid le-vels and P:E ratio on growth performance and feedutilization of M. rosenbergii PL in small-scale pondnet enclosures.
Materials and methods
Experimental prawns and culture techniques
Experimental grow-out production was carried outat the Experimental Farm of the National Instituteof Oceanography and Fisheries (NIOF), Cairo, Egypt,for 12 weeks (84 days). The PL of freshwater prawn,M. rosenbergii, with an average initial body weight of20.8 � 0.2mg were obtained from Savt-Kalid hatch-ery, General Authority for Fish Resources Develop-ment, El-Bhira Hatchery, El-Bhira Governorate,Egypt. Before trial, the prawns were acclimated toexperimental condition for 2 weeks in a concretepond (8 � 4 � 1m). During this period, PLs werefed a commercial tilapia diet (28% CP, ZooControlCompany,6 October City, Cairo, Egypt) at10% of bodyweight. The daily ration was divided into two equalamounts and o¡ered twice a day (09.00 and 12.00hours).Six experimental treatments were assigned in tri-
plicate. Experiments were conducted in small-scalehapa [3.75m3 each with e¡ective dimension(L �W � H) of 1.25 � 2.0 � 1.5m respectively].Each culture hapa was provided with four 30-cmlong,16-mm diameter black polyvinyl chloride (PVC)pipes to minimize cannibalism during molting assuggested by Mariappan and Balasundaram (2004).All hapas were put in a running system pond withaverage volume of 2000m3 and 1.5m water depth.The pond was supplied with freshwater from theDarawa Irrigation Baranch, Kalubiya, Governorate.The turnover rate of water was 0.7m�3 pond�1
day�1 and prawns were held under natural light(12:12 h light:dark schedule). The pond was aeratedby paddle wheels (working for 45min and rest for15min h�1). Each hapa was stocked with 150 1-month-old PL (84 PLm�2). These stocking densitieswere based on the hapa net enclosures bottom area(2.5m�2) according to (FAO 2002). Mortality andlimb loss were recorded at 08.00 hours, once a day.
Ingredient characterization
Fish meal (999 Con-Kix Fish Meal, Triple Nine FishProteina.m.b.a.,Thybor�n, Denmark) was purchased
Dietary P:E ratio for freshwater prawnM. rosenbergii AM A-S Goda Aquaculture Research, 2008, 39, 891^901
r 2008 TheAuthor892 Journal Compilationr 2008 Blackwell Publishing Ltd, Aquaculture Research, 39, 891^901
from ZooControl Company (6 October City, Cairo,Egypt). Poultry by-product meal was obtained fromrendering plants in Egypt (El-Kalubia SlaughterHouse, Banha, Kalubia, Egypt). The feed-grade of soy-bean meal, wheat bran and yellow corn were pur-chased from a commercial feed manufacturer[Animal Production Islamic Company (APICO),Dokki-El-Giza, Egypt]. Soybean oil, linseed oil andstarchwere purchased from local markets.
Experimental diets
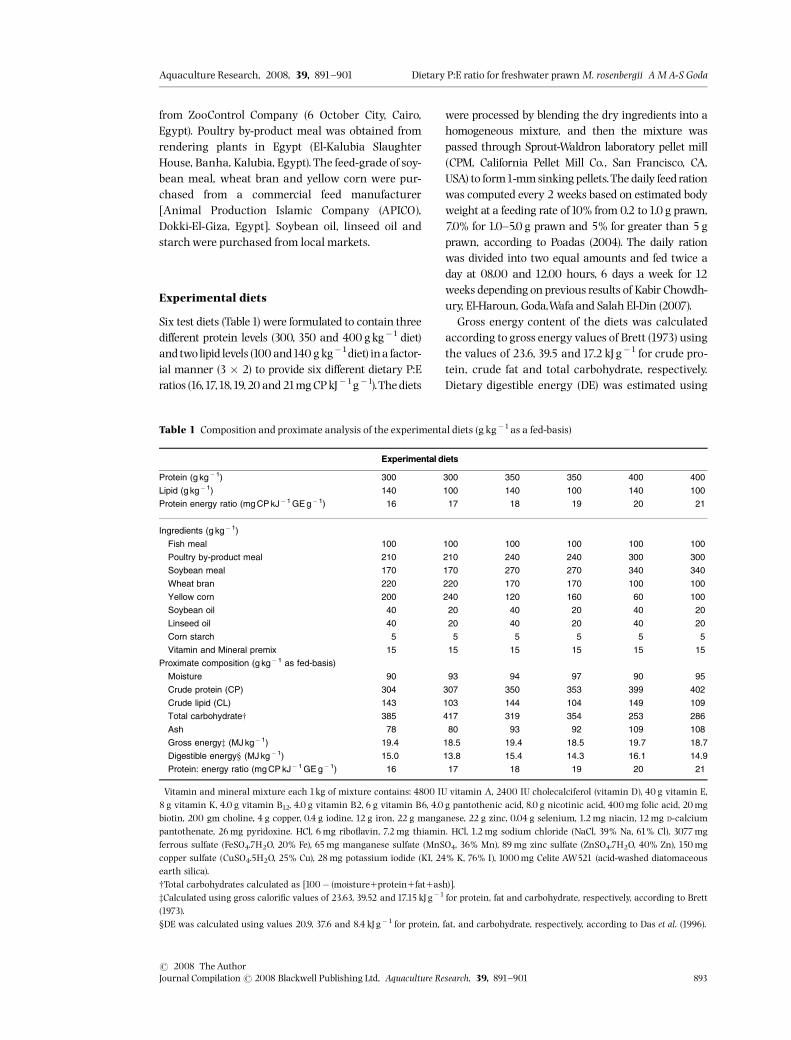
Six test diets (Table1) were formulated to contain threedi¡erent protein levels (300, 350 and 400 g kg�1 diet)and two lipid levels (100and140 g kg�1diet) ina factor-ial manner (3 � 2) to provide six di¡erent dietary P:Eratios (16,17,18,19,20and21mgCPkJ�1g�1).The diets
were processed by blending the dry ingredients into ahomogeneous mixture, and then the mixture waspassed through Sprout-Waldron laboratory pellet mill(CPM, California Pellet Mill Co., San Francisco, CA,USA) to form1-mmsinking pellets.The daily feed rationwas computed every 2 weeks based on estimated bodyweight at a feeding rate of10% from 0.2 to1.0 g prawn,7.0% for 1.0^5.0 g prawn and 5% for greater than 5 gprawn, according to Poadas (2004). The daily rationwas divided into two equal amounts and fed twice aday at 08.00 and 12.00 hours, 6 days a week for 12weeks depending on previous results of Kabir Chowdh-ury, El-Haroun, Goda,Wafa and Salah El-Din (2007).Gross energy content of the diets was calculated
according to gross energy values of Brett (1973) usingthe values of 23.6, 39.5 and17.2 kJg�1 for crude pro-tein, crude fat and total carbohydrate, respectively.Dietary digestible energy (DE) was estimated using
Table 1 Composition and proximate analysis of the experimental diets (g kg�1as a fed-basis)
Experimental diets
Protein (g kg�1) 300 300 350 350 400 400
Lipid (g kg�1) 140 100 140 100 140 100
Protein energy ratio (mg CP kJ�1 GE g� 1) 16 17 18 19 20 21
Ingredients (g kg�1)
Fish meal 100 100 100 100 100 100
Poultry by-product meal 210 210 240 240 300 300
Soybean meal 170 170 270 270 340 340
Wheat bran 220 220 170 170 100 100
Yellow corn 200 240 120 160 60 100
Soybean oil 40 20 40 20 40 20
Linseed oil 40 20 40 20 40 20
Corn starch 5 5 5 5 5 5
Vitamin and Mineral premix� 15 15 15 15 15 15
Proximate composition (g kg� 1 as fed-basis)
Moisture 90 93 94 97 90 95
Crude protein (CP) 304 307 350 353 399 402
Crude lipid (CL) 143 103 144 104 149 109
Total carbohydratew 385 417 319 354 253 286
Ash 78 80 93 92 109 108
Gross energyz (MJ kg� 1) 19.4 18.5 19.4 18.5 19.7 18.7
Digestible energy‰ (MJ kg�1) 15.0 13.8 15.4 14.3 16.1 14.9
Protein: energy ratio (mg CP kJ� 1 GE g�1) 16 17 18 19 20 21
�Vitamin and mineral mixture each 1kg of mixture contains: 4800 IU vitamin A, 2400 IU cholecalciferol (vitamin D), 40 g vitamin E,8 g vitamin K, 4.0 g vitamin B12, 4.0 g vitamin B2, 6 g vitamin B6, 4.0 g pantothenic acid, 8.0 g nicotinic acid, 400mg folic acid, 20mgbiotin, 200 gm choline, 4 g copper, 0.4 g iodine, 12 g iron, 22 g manganese, 22 g zinc, 0.04 g selenium, 1.2mg niacin, 12mg D-calciumpantothenate, 26mg pyridoxine. HCl, 6mg ribo£avin, 7.2mg thiamin. HCl, 1.2mg sodium chloride (NaCl, 39% Na, 61% Cl), 3077mgferrous sulfate (FeSO4.7H2O, 20% Fe), 65mg manganese sulfate (MnSO4, 36% Mn), 89mg zinc sulfate (ZnSO4.7H2O, 40% Zn), 150mgcopper sulfate (CuSO4.5H2O, 25% Cu), 28mg potassium iodide (KI, 24% K, 76% I), 1000mg Celite AW521 (acid-washed diatomaceousearth silica).wTotal carbohydrates calculated as [100� (moisture1protein1fat1ash)].zCalculated using gross calori¢c values of 23.63, 39.52 and 17.15 kJg�1 for protein, fat and carbohydrate, respectively, according to Brett(1973).‰DE was calculated using values 20.9, 37.6 and 8.4 kJg�1 for protein, fat, and carbohydrate, respectively, according to Das et al. (1996).
Aquaculture Research, 2008, 39, 891^901 Dietary P:E ratio for freshwater prawnM. rosenbergii AMA-S Goda
r 2008 TheAuthorJournal Compilationr 2008 Blackwell Publishing Ltd, Aquaculture Research, 39, 891^901 893

values of 20.9,37.6 and 8.4 kJ�1g�1for crude protein,crude fat and carbohydrate, respectively, according toDas et al. (1996).
Water quality
Water quality parameters, such as temperature, dis-solved oxygen (DO), pH and ammonia, were moni-tored to ensure that water quality remained wellwithin the limits recommended for the PL prawn.Water temperature was recorded daily at13.00 hoursusing a mercury thermometer suspended at 30-cmdepth. Dissolved oxygenwas measured at 6.00 hoursusing YSI model 56 oxygen meter (Yellow SpringsInstrument, Yellow Springs, OH, USA) and pH byusing a pH meter (Orion pH meter, Abilene,TX, USA).Ammonia and alkalinity were measured at weeklyintervals, according toAPHA (1989).
Growth indices
To estimate the growth performance indices duringthe experimental period, initial and ¢nal as well asintermediate samples weights of individual prawnswere measured using an electronic balance with anaccuracy of 0.001g. The ¢rst sampling was con-ducted on the 30th day after stocking and at a15-day interval thereafter. The quantity of daily dietwas adjusted accordingly. Mean ¢nal body weight(FBW) of each experimental treatment was deter-mined by dividing total prawn weight of each hapaby the number of prawns.Weight gain (WG), speci¢cgrowth rate (SGR), feed conversion ratio (FCR), pro-tein e⁄ciency ratio (PER), protein productive value(PPV), fat retention (FR), energy retention (ER) andsurvival rate (SR) were calculated using the followingequations:
WG ¼ Final body weight ðgÞ� Initial body weight ðgÞ:
SGR ¼ ðln FBW� ln IBWÞ=t� 100;
where FBW is ¢nal body weight (g); IBW is initialbody weight (g); ln5 natural logarithmic; t 5 timein days.
FCR ¼ Feed intake ðgÞ=weight gain ðgÞ;
PER ¼ weight gain ðgÞ=protein intake ðgÞ;
PPV ¼ ðprotein gain ðgÞ=protein intake ðgÞÞ� 100;
FR ¼ ðfat gain ðgÞ=fat intake ðgÞÞ � 100;
ER ¼ ðenergy gain ðkJÞ=energy intake ðkJÞÞ � 100;
Survival rate ðSRÞ ¼ðfinal number of prawns=
initial number of prawns� 100:
Analytical methods
At the beginning of the trial, a random pooled sam-ples of three healthy individual groups (40 PL each)of M. rosenbergii PL was selected, weighed and wereimmediately sacri¢ced and frozen at �20 1C for as-sessment of the initial proximate body composition.At the termination of the feeding trial, 15 prawnswere randomly sampled from each experimentaltreatment (¢ve prawns in each replicate) to assess¢nal proximate body composition.The proximate composition of diets and whole
body prawns were determined according to proce-dures of AOAC (1995). The prawns were pooled foreach hapa and oven-dried at105 1C for 24 h to deter-mine the moisture content. Ash content was deter-mined by incineration at 550 1C for 12 h. Crudeprotein was determined by micro-Kjeldhal method,N% � 6.25 (using a Kjeltech autoanalyzer, Model1030, Tecator, H˛gan�s, Sweden) and crude fat bysoxhlet extractionwith diethyl ether (40^60 1C).
Statistical analysis
Statistically analyzed data were performed by analy-sis of variance (ANOVA) using MSTAT-C version 4 soft-ware (MSTAT-C 1987). The e¡ect of di¡erent dietaryP:E ratios on FBW,WG, FI, SGR, FCR, feed utilizationindices and proximate body composition data weresubjected to a one-way ANOVA. The interactionbetween the main e¡ects factors (dietary proteinand lipid) was evaluated by a factorial design(3 � 2). The lipid factor had two levels, 100 and140 g kg�1, while the protein factor had three levels,300, 350 and 400 g kg�1. Duncan’s multiple rangetest was used to compare di¡erences between treat-ment means when signi¢cant F values were observed(Duncan1955), at P � 0.05 level. All percentage datawere arc-sine transformed before statistical analyses(Zar 1984). However, data are presented untrans-formed in all tables to facilitate comparisons.
Results
All conditions of the experimental evaluation in thepresent study were apparently satisfactory and fell
Dietary P:E ratio for freshwater prawnM. rosenbergii AM A-S Goda Aquaculture Research, 2008, 39, 891^901
r 2008 TheAuthor894 Journal Compilationr 2008 Blackwell Publishing Ltd, Aquaculture Research, 39, 891^901

under the optimal standards de¢ned for nutritionalevaluations in freshwater prawn, M. rosenbergii PL.The water temperature ranged from 27.8 to29.1 � 0.9 1C, DO from 5.0 to 6.1 � 0.8mg L�1, pHfrom 7.0 to 7.8 � 0.3, ammonia from 0.23 to0.28 � 0.1mg L�1 and alkalinity from 175 to184 � 5.1mg L�1.Proximate composition of the experimental diets is
shown in Table 1. Protein^energy ratios range from16.0 to 21.0mg CPkJ�1GE g�1.The total dietary pro-tein range from 304 to 402 g kg�1, carbohydraterange from 253 to 417 g kg�1, lipid range from103 to149 g kg�1, while gross energy range from 18.5 to19.7MJ kg�1and DE varied from13.8 to16.1MJ kg�1
diet.Survival rate ranged from 72.3% to 88.5%. The
highest signi¢cant (P � 0.05) value of SR (88.5%)was observed for PL fed the diet with P:E ratio of a17mg CPkJ�1g�1 (17:1). Final body weight, feed in-take (FI),WG, SGRand FCRare shown inTable 2. Thehighest (P � 0.05) FBW,WG and SGR were observedfor prawns fed the diet with a P:E ratio of17:1followedin decreasing order with no signi¢cant e¡ect by diet-ary a P:E ratio of18mg CPkJ�1g�1 (18:1). The lowestvalue was recorded for prawns fed the diet with a P:Eratio of 20mg CPkJ�1g�1 (20:1). The prawns fed thediet with a P:E ratio of17:1exhibited signi¢cantly bet-ter (P � 0.05) FCR than those fed the other diets,while the worst FCR value was recorded in prawnsfed the diet with a P:E ratio of 20:1.The highest (P � 0.05) values of PER, PPV, FR and
ER (Table 4) were observed for prawn fed the diet
containing a P:E ratio of 17:1, while no clear trendwas showed for the lowest PER, PPV, FRand ERvalues.No signi¢cant di¡erence was observed between
experimental treatments for whole body moisture(%) and gross energy content (Table 5). However,whole body protein (%) and lipid (%) showed thehighest (P � 0.05) values when fed diets containingP: E ratios of 21:1 and 17:1 respectively. The oppositetrend was observed for lowest (P � 0.05) values ofwhole body protein and lipid.With respect to dietary protein levels, irrespective
of dietary lipid levels, the highest (P � 0.05) values ofSR, FBW,WG, SGR and better FCRwere observed forPL fed the diet containing 300 g kg�1 protein, whilePL fed the diet with 100 g kg�1 lipid recorded thehighest values of SR, FBW,WG, SGR and better FCR,irrespective of dietary protein levels. The same trendwas observed for the highest values of PER, PPV, FRand ER. However, regarding dietary lipid levels, nosigni¢cant di¡erence was shown as the e¡ect of diet-ary lipid levels on proximate body composition ofM. rosenbergii PL. Prawn PL fed the diet containing400 g kg�1 protein showed the highest (P � 0.05)values of body protein compared with di¡erent diet-ary protein levels, irrespective of dietary lipid levels.
Discussion
Over the duration of the present study, no signi¢cantdi¡erences were observed in thewater quality indicesbetween the experimental treatments. The water
Table 2 Growth performance of freshwater prawn,Macrobrachium rosenbergii PL fed the di¡erent experimental diets for12weeks
Initial weight(gprawn�1)
Finalweight(gprawn�1)
Survivalrate (%)
Feed intake(gprawn�1)
Weight gain(gprawn�1)
Specific growthrate (% day)
Feed con-version ratio
P:E ratio (mg CP kJ� 1 GE g� 1) (CP/L)
16:1 (300/140) 0.02 � 3.0 5.5 � 1.8b 81.5 � 1.3b 10.4 � 1.9b 5.5 � 1.8b 6.7 � 1.8b 1.9 � 0.4a
17:1 (300/100) 0.02 � 3.0 7.7 � 1.7a 88.5 � 1.1a 11.4 � 2.5b 7.7 � 1.1a 7.1 � 1.9a 1.5 � 0.2c
18:1 (350/140) 0.02 � 3.0 7.1 � 1.7a 81.5 � 1.8c 12.2 � 2.4a 7.1 � 1.1a 7.0 � 1.7a 1.7 � 0.4b
19:1 (350/100) 0.02 � 3.0 5.4 � 1.2bc 73.3 � 1.5cd 10.1 � 2. 6b 5.4 � 1.9c 6.6 � 1.2b 1.9 � 0.7a
20:1 (400/140) 0.02 � 3.0 5.3 � 2.0c 72.3 � 1.1d 9.9 � 2.1c 5.3 � 1.7b 6.6 � 1.2c 1.9 � 0.8a
21:1 (400/100) 0.02 � 3.0 5.9 � 1.3b 80.0 � 1.3b 10.9 � 1.8a 5.9 � 1.3b 6.8 � 1.8b 1.9 � 0.5a
Protein level (g kg� 1)
300 0.02 � 3.0 6.6 � 1.7a 85.0 � 1.6a 10.9 � 1.1b 6.6 � 1.0a 6.9 � 1.3a 1.6 � 0.7c
350 0.02 � 3.0 6.3 � 1.3b 77.4 � 2.1b 11.2 � 1.6a 6.3 � 1.3b 6.9 � 1.2a 1.8 � 0.4b
400 0.02 � 3.0 5.6 � 1.6c 76.2 � 1.5c 10.4 � 1.7c 6.3 � 1.4b 6.7 � 1.8b 1.9 � 0.5a
Lipid level (g kg�1)
100 0.02 � 3.0 6.3 � 1.4a 80.6 � 2.2a 10.8 � 2.1 6.3 � 1.5a 6.9 � 1.4a 1.7 � 0.4b
140 0.02 � 3.0 6.0 � 1.0b 78.4 � 1.8b 10.8 � 1.9 6.0 � 1.3b 6.8 � 1.2b 1.8 � 0.7a
Values ( � SD, N53). Means in within same column sharing the same superscript are not signi¢cantly di¡erent (Po0.05).
Aquaculture Research, 2008, 39, 891^901 Dietary P:E ratio for freshwater prawnM. rosenbergii AMA-S Goda
r 2008 TheAuthorJournal Compilationr 2008 Blackwell Publishing Ltd, Aquaculture Research, 39, 891^901 895

quality parameters were shown to be within theacceptable range for prawns species (Boyd &Zimmerman 2000).Diets were formulated using highly digestible in-
gredients similar to those used on experimental dietsdesigned for prawns and other decapods crustaceans(Shiau1998; Campan� a 2001; D’Abramo 2002; Corte¤ s-Jacinto et al. 2003). During the present work an at-tempt was made to maintain similar environmentalcondition in all hapa culture, especially for the im-pact of nutrition on prawn molting frequency byusing four black polyvinyl chloride (PVC) pipes for
each hapa, which might have helped the prawns tominimize cannibalism while overcoming moltingstress (Mariappan & Balasundaram 2004). Moltingof decapods crustaceans is a¡ected by external envir-onmental factors such as temperature, salinity, lightintensity, pollutants and also by internal factors as-sociated with nutritional state and hormones(Cheng, Liu, Cheng & Chen 2003); however, unsuita-ble diets have been mentioned as a major reason forincreasing mortality during the ¢rst molt stress andlater stages (Yao, Zhao,Wang, Zhou, Hu, Duan & An2006). In the present study, the highest (P � 0.05)
Table 3 Dietary nutrient e⁄ciencyof freshwater prawn,MacrobrachiumrosenbergiiPL fed the di¡erent experimental diets for12 weeks
Protein intake(g fish�1)
Protein gain asenergy (% ER)
Lipid intake(g fish�1)
Fat gain asenergy (% ER)
Gross energyintake (kJ fish�1)
P:E ratio (mg CP kJ�1 GE g� 1) (CP/L)
16:1 (300/140) 3.2 � 0.6d 62.5 � 2.5d 1.5 � 0.2b 37.5 � 1.4b 200.2 � 5.1bc
17:1 (300/100) 3.5 � 0.8c 64.9 � 1.6c 1.2 � 0.3cd 34.6 � 1.2b 210.4 � 7.3b
18:1 (350/140) 4.3 � 0.6ab 71.8 � 1.5b 1.8 � 0.2a 41.3 � 1.8a 237.2 � 5.4a
19:1 (350/100) 3.6 � 0.4bc 67.5 � 1.8bc 1.1 � 0.2d 32.6 � 1.0bc 187.2 � 3.9d
20:1 (400/140) 4.0 � 0.7b 77.4 � 1.4a 1.5 � 0.1b 28.4 � 1.5 c 194.9 � 5.2c
21:1 (400/100) 4.4 � 0.5a 79.6 � 1.6a 1.2 � 0.1cd 20.5 � 2.0d 204.0 � 3.9bc
Protein level (g kg� 1)
300 3.4 � 0.4c 63.7 � 2.7c 1.4 � 0.2b 36.1 � 1.5a 205.3 � 4.1b
350 4.0 � 0.3b 69.7 � 1.5b 1.5 � 0.1a 36.5 � 1.6a 212.2 � 3.7a
400 4.2 � 0.5a 78.5 � 1.4a 1.4 � 0.2b 24.5 � 1.2b 199.5 � 3.9c
Lipid level (g kg� 1)
100 3.8 � 0.6 70.7 � 1.7 1.2 � 0.2b 29.2 � 1.5b 200.5 � 5.2b
140 3.8 � 0.4 70.6 � 1.4 1.6 � 0.2a 35.7 � 1.8a 210.8 � 4.1a
Values ( � SD, N53). Means in within same column sharing the same superscript are not signi¢cantly di¡erent (Po0.05).
Table 4 Feed e⁄ciency indices of freshwater prawn,Macrobrachium rosenbergii PL fed the di¡erent experimental diets for12weeks
Protein efficiencyratio
Protein productivevalue Fat retention Energy retention
P:E ratio (mg CP kJ�1 GE g� 1) (CP/L)
16:1 (300/140) 1.7 � 0.5b 26.3 � 2.5b 18.7 � 2.5b 14.0 � 1.5bc
17:1 (300/100) 2.2 � 1.0a 30.9 � 2.3a 29.2 � 1.3a 18.1 � 1.1a
18:1 (350/140) 1.7 � 0.5b 25.6 � 1.4b 14.4 � 2.3c 13.8 � 1.8bc
19:1 (350/100) 1.5 � 0.4b 22.8 � 1.4c 20.0 � 3.2b 13.6 � 1.3c
20:1 (400/140) 1.3 � 0.4c 23.4 � 1.5bc 14.0 � 2.7c 14.3 � 1.4b
21:1 (400/100) 1.3 � 0.6c 25.6 � 2.5b 13.3 � 2.3d 14.4 � 2.6b
Protein level (g kg� 1)
300 2.0 � 0.6a 28.6 � 1.9a 24.0 � 1.4a 16.1 � 1.6a
350 1.5 � 0.5b 24.2 � 1.1b 17.0 � 2.1b 13.7 � 1.9c
400 1.3 � 0.6c 24.5 � 1.7b 13.7 � 2.3c 14.4 � 1.9b
Lipid level (g kg� 1)
100 1.7 � 0.3a 26.4 � 1.8a 20.8 � 1.9a 16.4 � 1.5a
140 1.5 � 0.4b 25.1 � 1.6b 15.7 � 2.1b 14.0 � 1.7b
Values ( � SD, N53). Means in within same column sharing the same superscript are not signi¢cantly di¡erent (Po0.05).
Dietary P:E ratio for freshwater prawnM. rosenbergii AM A-S Goda Aquaculture Research, 2008, 39, 891^901
r 2008 TheAuthor896 Journal Compilationr 2008 Blackwell Publishing Ltd, Aquaculture Research, 39, 891^901
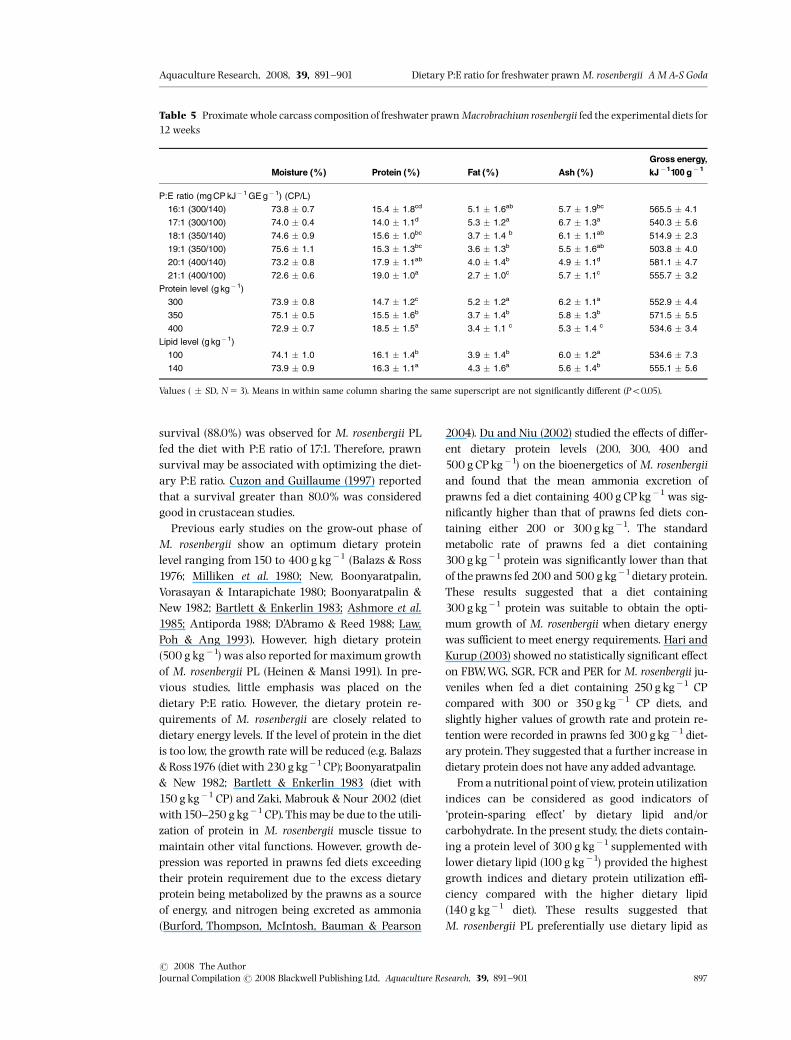
survival (88.0%) was observed for M. rosenbergii PLfed the diet with P:E ratio of 17:1. Therefore, prawnsurvival may be associated with optimizing the diet-ary P:E ratio. Cuzon and Guillaume (1997) reportedthat a survival greater than 80.0% was consideredgood in crustacean studies.Previous early studies on the grow-out phase of
M. rosenbergii show an optimum dietary proteinlevel ranging from150 to 400 g kg�1 (Balazs & Ross1976; Milliken et al. 1980; New, Boonyaratpalin,Vorasayan & Intarapichate 1980; Boonyaratpalin &New 1982; Bartlett & Enkerlin 1983; Ashmore et al.1985; Antiporda 1988; D’Abramo & Reed 1988; Law,Poh & Ang 1993). However, high dietary protein(500 g kg�1) was also reported for maximum growthof M. rosenbergii PL (Heinen & Mansi 1991). In pre-vious studies, little emphasis was placed on thedietary P:E ratio. However, the dietary protein re-quirements of M. rosenbergii are closely related todietary energy levels. If the level of protein in the dietis too low, the growth rate will be reduced (e.g. Balazs& Ross1976 (diet with 230 g kg�1CP); Boonyaratpalin& New 1982; Bartlett & Enkerlin 1983 (diet with150 g kg�1 CP) and Zaki, Mabrouk & Nour 2002 (dietwith150^250 g kg�1CP).This may be due to the utili-zation of protein in M. rosenbergii muscle tissue tomaintain other vital functions. However, growth de-pression was reported in prawns fed diets exceedingtheir protein requirement due to the excess dietaryprotein being metabolized by the prawns as a sourceof energy, and nitrogen being excreted as ammonia(Burford, Thompson, McIntosh, Bauman & Pearson
2004). Du and Niu (2002) studied the e¡ects of di¡er-ent dietary protein levels (200, 300, 400 and500 gCPkg�1) on the bioenergetics of M. rosenbergiiand found that the mean ammonia excretion ofprawns fed a diet containing 400 gCPkg�1 was sig-ni¢cantly higher than that of prawns fed diets con-taining either 200 or 300 g kg�1. The standardmetabolic rate of prawns fed a diet containing300 g kg�1 protein was signi¢cantly lower than thatof the prawns fed 200 and 500 g kg�1dietary protein.These results suggested that a diet containing300 g kg�1 protein was suitable to obtain the opti-mum growth of M. rosenbergii when dietary energywas su⁄cient to meet energy requirements. Hari andKurup (2003) showed no statistically signi¢cant e¡ecton FBW,WG, SGR, FCR and PER for M. rosenbergii ju-veniles when fed a diet containing 250 g kg�1 CPcompared with 300 or 350 g kg�1 CP diets, andslightly higher values of growth rate and protein re-tention were recorded in prawns fed 300 g kg�1 diet-ary protein. They suggested that a further increase indietary protein does not have anyadded advantage.Froma nutritional point of view, proteinutilization
indices can be considered as good indicators of‘protein-sparing e¡ect’ by dietary lipid and/orcarbohydrate. In the present study, the diets contain-ing a protein level of 300 g kg�1 supplemented withlower dietary lipid (100 g kg�1) provided the highestgrowth indices and dietary protein utilization e⁄-ciency compared with the higher dietary lipid(140 g kg�1 diet). These results suggested thatM. rosenbergii PL preferentially use dietary lipid as
Table 5 Proximate whole carcass composition of freshwater prawnMacrobrachium rosenbergii fed the experimental diets for12 weeks
Moisture (%) Protein (%) Fat (%) Ash (%)Gross energy,kJ�1100 g�1
P:E ratio (mg CP kJ� 1 GE g� 1) (CP/L)
16:1 (300/140) 73.8 � 0.7 15.4 � 1.8cd 5.1 � 1.6ab 5.7 � 1.9bc 565.5 � 4.1
17:1 (300/100) 74.0 � 0.4 14.0 � 1.1d 5.3 � 1.2a 6.7 � 1.3a 540.3 � 5.6
18:1 (350/140) 74.6 � 0.9 15.6 � 1.0bc 3.7 � 1.4 b 6.1 � 1.1ab 514.9 � 2.3
19:1 (350/100) 75.6 � 1.1 15.3 � 1.3bc 3.6 � 1.3b 5.5 � 1.6ab 503.8 � 4.0
20:1 (400/140) 73.2 � 0.8 17.9 � 1.1ab 4.0 � 1.4b 4.9 � 1.1d 581.1 � 4.7
21:1 (400/100) 72.6 � 0.6 19.0 � 1.0a 2.7 � 1.0c 5.7 � 1.1c 555.7 � 3.2
Protein level (g kg� 1)
300 73.9 � 0.8 14.7 � 1.2c 5.2 � 1.2a 6.2 � 1.1a 552.9 � 4.4
350 75.1 � 0.5 15.5 � 1.6b 3.7 � 1.4b 5.8 � 1.3b 571.5 � 5.5
400 72.9 � 0.7 18.5 � 1.5a 3.4 � 1.1 c 5.3 � 1.4 c 534.6 � 3.4
Lipid level (g kg�1)
100 74.1 � 1.0 16.1 � 1.4b 3.9 � 1.4b 6.0 � 1.2a 534.6 � 7.3
140 73.9 � 0.9 16.3 � 1.1a 4.3 � 1.6a 5.6 � 1.4b 555.1 � 5.6
Values ( � SD, N53). Means in within same column sharing the same superscript are not signi¢cantly di¡erent (Po0.05).
Aquaculture Research, 2008, 39, 891^901 Dietary P:E ratio for freshwater prawnM. rosenbergii AMA-S Goda
r 2008 TheAuthorJournal Compilationr 2008 Blackwell Publishing Ltd, Aquaculture Research, 39, 891^901 897

the main dietary energy source at lower levels tospare dietary protein for maximum growth (Tables 3and 4). A similar result was obtained by D’Abramoand New (2000) for freshwater prawn,M. rosenbergii.The optimumP:E ratio for growth of juvenile fresh-
water prawns was reported by El-Kholy (1995) to be19.4^22.0mg CPkJ�1GE g�1 diet. El-Sayed (1997)concluded that a diet containing 350 g kg�1 proteinand 14.6MJGE kg�1 with a P:E ratio of 23.9mgCPkJ�1GE g�1 supported the best performance ofM. rosenbergii juveniles. Zaki et al. (2002) found thata diet containing 350 g kg�1 CP and15.1MJ�1GE kg�1 diet (re-calculated P:E ratio of23.2mgCPkJ�1GE g�1) supported the fastestgrowth for juvenile M. rosenbergii. Pezzato, Barros,Sampaio, Falcon, Goncalves and Hisano (2003) re-ported that a diet containing 350 g kg�1 CP and15.1MJ�1GE kg�1 diet (re-calculated P:E ratio of23.3mgCPkJ�1GE g�1) supported the best WG andFCR for PL M. amazonicum (Crustacea, Decapoda).They concluded that growth indices, feed utilizationand body composition of the prawn M. amazonicumclosely depend on the protein and energy contents ofthe feed. Mitra, Chattopadhyay and Mukhopadhyay(2005) reported that isocaloric diets of 13.4MJ kg�1
containing CP from 350 to 400 g kg�1 (re-calculatedP:E ratio from 26.1 to 29.9mgCPkJ�1GE g�1) weresuitable for growth of M. rosenbergii in clear watersystems that do not contain natural foods. Recently,Teshima et al. (2006) studied the daily protein levelneeded for maintenance and body protein incrementfor M. rosenbergii PL and showed that diets contain-ing 350 g kg�1 CP and 17.2MJ kg�1 (re-calculatedP:E ratio of 20.7mgCPkJ�1g�1 diet) were optimumfor prawn growth performance. However, the abovecon£icting results may be attributed to variation ofdietary protein and energy fed, prawn age stage,stocking size, density, protein quality, feeding leveland culture systems.Results of the present study showed that
M. rosenbergii PL fed the diet with 17:1 P:E ratiorecorded the highest growth indices as well as feedutilization. Diets having P:E ratios of 17:1 and 18:1were similar in growth response and feed utilization.The values of FCR for diets containing P:E ratio of17:1and 18:1 (1.5 and 1.7 respectively) were superior tothose values obtained by El-Sayed (1997), Hari andKurup (2003), Kumar, Sahu, Saharan, Reddy andKumar (2006), Teshima et al. (2006) and Cuvin-Aralar, Aralar, Laron and Rosario (2007). However,freshwater prawn PL fed diets with a di¡erent P:Eratio from19:1 to 21:1may not have enough available
energy to spare all the protein for tissue formation,thus resulting in growth reduction. A decrease inweight gain beyond the optimum CP:GE ratio hasbeen previously observed in some studies withprawns species (El-Sayed 1997; Teshima et al. 2001;Pezzato et al. 2003), where the reduction in the reten-tion of synthesized protein appears to be a conse-quence of excess dietary protein over dietary energy(Teshima et al. 2006). This imbalance in dietary opti-mum CP:GE ratio for crustaceans results in higherprotein degradation and lower retention of synthe-sized protein (Hewitt 1992). However, the presentwork clearly revealed that the optimum dietary pro-tein levels determined without rigorous measure-ments of dietary P:E ratio may be feasible only underrather limited conditions. The dietary P:E ratio is amore important consideration for the formulation ofM. rosenbergii diets comparedwith either dietary pro-tein content or energy levels. Therefore, it is neces-sary to develop diets di¡erent in P:E ratios for eachgrow-out stage of prawns.In the present study, natural food items in the pond
may have satis¢ed a part of the protein requirementof PL prawn M. rosenbergii, which are classi¢ed asomnivorous benthophagic (Gonza� lez-Pen� a, Ander-son, Smith & Moreira 2002). Consequently, this mayexplain why pond-cultured M. rosenbergii could befed a diet containing lower dietary protein levels and¢sh meal, compared with M. rosenbergii grown in-doors. However, no measurement of natural foodwas made during the present study; therefore, it isdi⁄cult to state the extent to which natural foodscontributed to the diet ofM. rosenbergii PL.
Conclusion
An understanding of the bioenergetics of culturedprawns and the interaction of dietary componentsare essential to formulate an adequate requirementsdiet. However, the ratio of protein to energy ina diet isa more important consideration for the formulationof cost-e¡ective environmental friendly prawn dietscompared with either protein or energy content. Theresults revealed that a dietary P:E ratio of17mgCPkJ�1GE g�1 supports growth performanceand dietary nutrient utilization forM. rosenbergii PL.Moreover, sparing dietary protein with dietary lipidwas achieved for the diet containing 300 g kg�1pro-tein and 100 g kg�1 lipid. Further research is stillneeded to determine the relevant dietary levels ofP:E ratio for all age stages of prawns under commer-cial culture condition.
Dietary P:E ratio for freshwater prawnM. rosenbergii AM A-S Goda Aquaculture Research, 2008, 39, 891^901
r 2008 TheAuthor898 Journal Compilationr 2008 Blackwell Publishing Ltd, Aquaculture Research, 39, 891^901
Acknowledgements
The author would like to express his sincerest grati-tude to Prof. Dr MamdouhT. Kheir and Dr MohamedA.-H. Wafa the National Institute of Oceanographyand Fisheries, Cairo, Egypt (NIOF), for their technicalassistance. The author also would like to express hissincerest gratitude to Prof. Dr Osama M. El-Husseiny,Islamic company (APICO), Egypt, for the ingredientsused in this study.
References
Ang K.J., LeeY.M. & LawA.T. (1992) Protein requirement forbrood stock Macrobrachium rosenbergii. In: Abstractsof the 3rd Asian Fisheries Forum, 26^30 October 1992,Singapore, pp. 188 (Abstract). Asian Fisheries Society,
Manila, Philippines.
Antiporda J.L. (1988) Optimum dietary protein requirementfor Macrobrachium rosenbergii juveniles. NACA/WP/86/45. FAOResearchConducted under Secondment of YoungScientists Programmer. Network of Aquaculture Centers inAsia Bangkok,Thailand.
AOAC (Association of O⁄cial Analytical Chemists) (1995)O⁄cial Methods of Analysis. AOAC,Washington, DC, USA,1234pp.
APHA (American Public Health Association) (1989) Stan-dard Methods for the Examination ofWater andWastewater,17th edn, pp. 1411. American Public Health Association,NewYork, NY, USA.
Ashmore S.B., Stanley R.W., Moore L.B. & Malecha S.R.(1985) E¡ect on growth and apparent digestibility of dietsvarying in grain source and protein level in Macrobra-chium rosenbergii. Journal of theWorld Mariculture Society16, 205^216.
Balazs G.M. & Ross E. (1976) E¡ect of protein source and levelon growth performance of the captive freshwater prawn.Aquaculture 76, 299^313.
Bartlett P. & Enkerlin E. (1983) Growth of the prawnMacro-brachium rosenbergii in asbestos asphalt ponds in hardwater and on a low protein diet. Aquaculture 30,353^356.
Bautista L. (1986) The response ofMacrobrachiumrosenbergiijuveniles to varying protein/energy ratio in test diets.Aquaculture 53, 229^234.
Boonyaratpalin M. & NewM.B. (1982) Evaluation of diets forMacrobrachium rosenbergii reared in concrete ponds.In: Developments in Aquaculture and Fisheries Science,Giant Prawn Farming, Vol. 10 (ed. by M.B. New), pp. 246^256. Elsevier Scienti¢c Publishing, Amsterdam, theNetherlands.
Boyd C. & Zimmerman S. (2000) Grow-out systems ^ waterquality and soil management. In: Freshwater Prawn Cul-ture^The Farming of Macrobrachium rosenbergii (ed. byM.B. New &W.C.Valenti), pp. 221^238. Blackwell Science,Oxford, UK.
Brett J.R. (1973) Energy expenditure of sockeye salmonOncorhynchus nerka,during sustainedperformance. Journalof the Fisheries Research Board of Canada 30,1799^1809.
Burford M.A.,Thompson R.P., McIntosh R.P., Bauman R.H.& Pearson D.C. (2004) The contribution of £occulated ma-terial to shrimp (Litopenaeus vannamei) nutrition in ahigh-intensity, zero-exchange system. Aquaculture 232,525^537.
Campan� a T.A. (2001) Digestibility of vegetal and animal in-gredients and diets for juvenile and pre-adult redclawCherax quadricarinatus. M.Sc. Thesis. CIBNOR, S.C. LaPaz, B.C.S. Mexico.
ChengW., Liu C.-H., Cheng C.-H. & Chen J.-C. (2003) Osmol-alityand ionbalance in giant river prawn,Macrobrachiumrosenbergii, subjected to changes in salinity: role of sex.Aquaculture Research 34,555^560.
Corte¤ s-Jacinto E.,Villarreal-Colmenares H., Civera-CerecedoR. & Mart|¤ nez-Co¤ rdova R. (2003) E¡ect of dietary proteinlevel on growth and survival of juvenile freshwater cray-¢sh, Cherax quadricarinatus (Decapoda: Parastacidae).Aquaculture Nutrition 9, 207^213.
Cuvin-AralarM.L.A., Aralar E.V., LaronM.&RosarioW. (2007)Culture of Macrobrachium rosenbergii (De Man1879) in ex-perimental cages in a freshwater eutrophic lake at di¡erentstocking densities. Aquaculture Research 38, 288^294.
Cuzon G. & Guillaume J. (1997) Energy and protein: energyratio. In: Crustacean Nutrition (EU) (ed. by L.R.
D’Abramo, D.E. Conklin & D.M. Akiyama), pp. 51–
70. The World Aquaculture Society (WAS), Baton
Rouge, LA, USA.
D’Abramo L.R. (2002) Challenges in developing successfulformulated feed for culture of larval ¢sh and crustaceans.In: Avances en Nutricio¤ n Acu|¤ colaVI. Memorias delVI Sim-posium Internacional de Nutricio¤ n Acu|¤ cola. 3 al 6 deSeptiembre del 2002 (ed. by L.E. Cruz-SuaŁ rez, D. Ricque-Marie, M.Tapia-Salazar, M.G. Gaxiola-Corte¤ s & N. Simoes),pp.143^151. Cancu¤ n, Quintana Roo, Me¤ xico.
D’Abramo L.R. & NewM.B. (2000) Nutrition, feeds and feed-ing. In: Freshwater Prawn Culture (ed. by M.B. New &W.C.Valenti), pp. 203^220. Blackwell Science, Oxford, UK.
D’Abramo L.R. & Reed L. (1988) Optimal dietary protein levelfor juvenile freshwater prawnMacrobrachium rosenbergii.In: Annual Conference of theWorld Mariculture Society,19,1988,Washington. Proceeding, pp. 27. The World Aqua-
culture Society (WAS), Washington, USA.
D’Abramo L.R. & Sheen S.S. (1994) Nutritional requirements,feed formulation practices for intensive culture of thefreshwater prawn, Macrobrachium rosenbergii. Reviews inFisheries Science 2,1^21.
Das N.N., Saad C.R., Ang K.J., LawA.T. & Harmin S.A. (1996)Diet formulation for Macrobrachium rosenbergii (de Man)broodstock based on essential amino acid pro¢le of itseggs. Aquaculture Research 27,543^555.
de Barros H.P. & ValentiW.C. (2003) Food intake ofMacrobra-chium rosenbergii during larval development. Aquaculture216,165^176.
Aquaculture Research, 2008, 39, 891^901 Dietary P:E ratio for freshwater prawnM. rosenbergii AMA-S Goda
r 2008 TheAuthorJournal Compilationr 2008 Blackwell Publishing Ltd, Aquaculture Research, 39, 891^901 899

Du L. & Niu C-J. (2002) E¡ect of dietary protein level on bioe-nergetics of the giant freshwater prawn, Macrobrachiumrosenbergii (De Man, 1879) (Decapoda, Natantia). Crusta-ceana 75,875^889.
Duncan D.B. (1955) Multiple range and Multiple F test. Bio-metric11,1^112.
El-Kholy A.M. (1995) Studied of feeding and production ofprawns. M.Sc. Thesis, Faculty of Agriculture, AlexandriaUniversity, Alexandria, Egypt.
El-Sayed A.F.M. (1997) Growth rates and feed e⁄ciency ofthe freshwater prawnMacrobrachium rosenbergii fed vary-ing protein and energy levels. Bulletin of National Instituteof Oceanography and Fisheries, Egypt 23,539^448.
FAO (Food and Agricultural Organization) (2002) Farming ofFreshwater Prawns: AManual for the culture of the giant riv-er prawn (Macrobrachium rosenbergii). FAO Fisheries Tech-nical Paper 428. Food and Agriculture Organization,Rome, Italy.
FAO (Food and Agricultural Organization) (2006) The Stateof the World Fisheries and Aquaculture (SOFIA) 2005.Data extracted from the FAO Fisheries Global Aquacul-ture Production Database for freshwater crustaceans.Fisheries Global Aquaculture Production Database forfreshwater crustaceans. At: http: www.Fao.org/docrep/009/A0699e/A0699e00.htm.
Freeman J.A. (1990) Regulation of tissue growth in crusta-cean larvae by feeding regime. The Biological Bulletin(Woods Hole, MA) 178, 217^221.
Giap D.H.,Yi Y. & Lin C.K. (2005) E¡ect of di¡erent fertiliza-tion and feeding regimes on the production of integratedfarming of rice and prawnMacrobrachium rosenbergii (DeMan). Aquaculture Research 36, 292^299.
Gitte M.J. & Indulkar S.T. (2005) Evaluation of marine ¢shmeat incorporated diets on growth and survival of post-larvae of Macrobrachium rosenbergii (de Man). Asian Fish-eries Science18,323^334.
Gonza� lez-Pen� a M.D.C., Anderson A.J., Smith D.M. &MoreiraG.S. (2002) E¡ect of dietary cellulose on digestion inthe prawn Macrobrachium rosenbergii. Aquaculture 211,291^303.
Guillaume J. (1997) Protein and amino acids. In: CrustaceanNutrition. Vol. 6. Advances in World Aquaculture (ed. byL.R. D’Abramo, D.E. Conklin & D.M. Akiyama), pp.26^50. Louisiana, USA.
Hari B. & KurupM.B. (2003) Comparative evaluation of diet-ary protein levels and plant-animal protein ratios inMacrobrachium rosenbergii (de Man). AquacultureNutrition 9,131^137.
Hawkins A.J.S. & Bayne B.L. (1991) Nutrition of marine mus-sels: factors in£uencing the relative utilizations of proteinand energy. Aquaculture 94,177^196.
Heinen J.M. & Mansi M.J. (1991) Feed and feeding schedules forindoor nursery culture of post-larval freshwater prawns.Journal of theWorld Aquaculture Society 22,118^127.
Hewitt D.R. (1992) Response of protein turnover in thebrown tiger prawn Penaeus esculentus to variation in
dietary protein content. Comparative Biochemistry andPhysiology (A) 103,183^187.
Hossain M.A. & Islam M.S. (2006) Optimization of stockingdensity of freshwater prawn Macrobrachium rosenbergii(de man) in carp polyculture in Bangladesh. AquacultureResearch 37,994^1000.
Johnston D.J., Calvert K.A., Crear C.G. & Carter C.G. (2003)Dietary carbohydrate/lipid ratios and nutritional condi-tion in juvenile southern rock lobster Jasus edwardsii.Aquaculture 220,667^682.
Kabir Chowdhury M.A., El-Haroun E.R., Goda A.M.A.-S.,Wafa M.A. & Salah El-Din S.A. (2007) Growth perfor-mance of post-larval freshwater prawn Macrobrachiumrosenbergii (deMan1879) at di¡erent dietary protein levelsand feeding times. Aquaculture 2007, science for sustain-able aquaculture, February, 2007, San Antonio Conven-tion Center, San Antonio, Texas, USA,World AquacultureSocietyAnnual Meeting 2007.
Keysami M.A., Saad C.R., Sijam K., Daud H.M. & AlimonA.R. (2007) E¡ect of Bacillus subtillis on growth develop-ment and survival of larvaeMacrobrachium rosenbergii (deMan). Aquaculture Nutrition13,131^136.
Kumar P., Sahu N.P., Saharan N., Reddy A.K. & Kumar S.(2006) E¡ect of dietary source and level of chitin ongrowth and survival of post-larvaeMacrobrachium rosen-bergii. Journal of Applied Ichthyology 22,363^368.
LawA.Y., PohY.T. & Ang K.J. (1993) Least-cost feed formula-tion for juvenile Macrobrachium rosenbergii (de Man) byusing the linear programming technique. Pertanika Jour-nal ofTropical Agricultural Science16,119^127.
Lim C. & Persyn A. (1989) Practical Feeding^PenaeidShrimps. In: Nutrition and Feeding of Fish (ed. byT. Lovell),pp. 205^222.Van Nostrand Reinhold, NewYork, NY, USA.
Mariappan P. & Balasundaram C. (2004) E¡ect of shelters,densities, and weight groups on survival, growth andlimb loss in the freshwater prawn, Macrobrachium nobilii(HendersonandMatthai,1910). Journal of Applied Aquacul-ture15,51^63.
Milliken M.R., FortnerA.R., Fair P.H. & Siek L.V. (1980) In£u-ence of dietary protein concentration on growth, feedconversion and general metabolism of juvenile prawnMacrobrachium rosenbergii. Proceeding of World Maricul-ture Society114,382^399.
Mitra G., Chattopadhyay D.N. & Mukhopadhyay P.K. (2005)Nutrition and feeding in freshwater prawn Macrobra-chium rosenbergii farming. Aqua Feeds: Formulation andBeyond 2(1),17^19.
MSTAT-C Version 4 (1987) Software program for the design andanalysis of agronomic research experiments. Michigan StateUniversity, Mississippi, MI, USA.
New M.B. (2005) Freshwater prawn farming: global status,recent research and a glance at the future. AquacultureResearch 36, 210^230.
New M.B., Boonyaratpalin M.,Vorasayan P. & IntarapichateS. (1980) An assessment of the performance of Macrobra-chium rosenbergii fed simple non-vitamin-supplemented
Dietary P:E ratio for freshwater prawnM. rosenbergii AM A-S Goda Aquaculture Research, 2008, 39, 891^901
r 2008 TheAuthor900 Journal Compilationr 2008 Blackwell Publishing Ltd, Aquaculture Research, 39, 891^901

pelleted diets. Internal Report for UNDP/FAO Programmerfor the Expansion of Freshwater Prawn Farming (inThailand).Working PaperTHA,75,008/WP/80/16.
Pezzato L.E, Barros M.M., Sampaio F.G., Falcon D.R.,Goncalves G.S. & Hisano H. (2003) Dietary energy proteinratio for Macrobrachium rosenbergii. Acta ScientiarumAnimal Sciences Maringa 25, 235^241.
Poadas B.C. (2004) E¡ects of two palletized feed formula-tions on experimental freshwater prawn, Macrobrachiumrosenbergii, pond production, processing and costs. Jour-nal Applied Aquaculture16,155^165.
Sharma M. & ReddyA.K. (1996) Intensive culture of fresh-water prawnMacrobrachium rosenbergii in cement tanks.Fisheries Chimes16, 25^26.
Shiau S.Y. (1998) Nutrient requirements of penaeid shrimps.Aquaculture164,77^93.
Shiau S.Y. & Lan C.W. (1996) Optimal dietary protein leveland protein to energy ratio for growth of grouper (Epine-phelus malabaricus). Aquaculture145, 259^266.
Teshima S., Koshio S., Ishikawa M. & Kanazawa A. (2001)Protein requirement of the prawn Marsupenaeus
japonicus estimated by a factorial method. Hydrobiologia449, 293^300.
Teshima S., Koshio S. & Ishikawa M. (2006) Protein require-ments of the freshwater prawnMacrobrachium rosenbergiievaluated by the factorial method. Journal of the WorldAquaculture Society 37(2),145^153.
Wilkinson S. (2003) Getting themost out of your feed Part II:the role of macronutrients.NACA, AquacultureAsia,VIII2,6^9.
Yao J.-J., ZhaoY.-L.,Wang Q., Zhou Z.-L., HuX.-C., DuanX.-W.& An C.-G. (2006) Biochemical compositions and diges-tive enzyme activities during the embryonic developmentof prawn, Macrobrachium rosenbergii. Aquaculture 253,573^582.
Zaki M.A., Mabrouk H.A. & NourA.A. (2002) Optimum diet-ary protein levels and stocking density for fresh-waterprawnMacrobrachium rosenbergii juveniles reared in con-crete basins. Egyptian Journal of Animal Production 7,161^168.
Zar J.H. (1984) Biostatistical Analysis. Prentice-Hall, Engle-wood Cli¡, NJ, USA.
Aquaculture Research, 2008, 39, 891^901 Dietary P:E ratio for freshwater prawnM. rosenbergii AMA-S Goda
r 2008 TheAuthorJournal Compilationr 2008 Blackwell Publishing Ltd, Aquaculture Research, 39, 891^901 901
Copyright © 2022 FDOKUMEN