A quantitative FRET approach to characterize protein-protein ...
243
Dissertation zur Erlangung des Doktorgrades der Fakultät für Chemie und Pharmazie der Ludwig-Maximilians-Universität München A quantitative FRET approach to characterize protein-protein interactions in living cells Elisabeth Susanna Butz aus Worms, Deutschland 2017
-
Upload
khangminh22 -
Category
Documents
-
view
1 -
download
0
Transcript of A quantitative FRET approach to characterize protein-protein ...

Dissertation zur Erlangung des Doktorgrades
der Fakultät für Chemie und Pharmazie
der Ludwig-Maximilians-Universität München
A quantitative FRET approach to characterize
protein-protein interactions in living cells
Elisabeth Susanna Butz
aus
Worms, Deutschland
2017

Erklärung
Diese Dissertation wurde im Sinne von § 7 der Promotionsordnung vom 28. November
2011 von Herrn Prof. Dr. Christian Wahl-Schott betreut.
Eidesstattliche Versicherung
Diese Dissertation wurde eigenständig und ohne unerlaubte Hilfe erarbeitet.
München, den 21.09.2017
_____________________________
(Elisabeth S. Butz)
Dissertation eingereicht am 21.09.2017
1. Gutachter: Prof. Dr. Christian Wahl-Schott
2. Gutachter: Prof. Dr. Martin Biel
Mündliche Prüfung am 20.11.2017

meinen Eltern

Reid, Robert, Artist, photographer by Highsmith, Carol M.
[Second Floor, North Corridor. Mural depicting Understanding by Robert Reid.
Library of Congress Thomas Jefferson Building, Washington D.C.]. Photograph. Retrieved from the Library of Congress,
<https://www.loc.gov.item/2007684512/>.
Wisdom is the principal thing;
therefore get wisdom; and with all thy getting, get understanding. Proverbs 4:7


Table of contents
1 Abbreviations and symbols I
2 List of manuscripts IV
3 Summary VI
Zusammenfassung VIII
4 Introduction 1 4. 1 Principles of SE-FRET and E-FRET 1 4. 2 Calculation of binding curves 9 4. 3 Application of FRET to identify intermolecular interaction partners 13
4. 3. 1 An epilepsy-causing mutation in Kv7.2 affects calmodulin binding 15 4. 3. 2 Two-pore channel 2 and its role in the endolysosomal system 17 4. 3. 3 Peripherin 2 and its role in photoreceptor outer segments 22
5 Aims of the thesis 26
6 Short summary of manuscripts 27 6. 1 Quantifying macromolecular interactions in living cells using FRET two-hybrid assays 27 6. 2 Uncoupling PIP2-calmodulin regulation of Kv7.2 channels by an assembly destabilizing epileptogenic mutation 28 6. 3 High susceptibility to fatty liver disease in two-pore channel 2-deficient mice 29 6. 4 TPC2 polymorphisms associated with a hair pigmentation phenotype in humans result in gain of channel function by independent mechanisms 30 6. 5 Peripherin-2 couples rhodopsin to the CNG channel in outer segments of rod photoreceptors 31 6. 6 Peripherin-2 differentially interacts with cone opsins in outer segments of cone photoreceptors 32 6. 7 AAV Vectors for FRET-based analysis of protein-protein interactions in photoreceptor outer segments 33 6. 8 Peripherin-2 and Rom-1 have opposing effects on rod outer segment targeting of retinitis pigmentosa-linked peripherin-2 mutants 34
7 References 35
8 Publications 42
9 Acknowledgement 45
10 Appendix 46

Abbreviations and symbols | I
1 Abbreviations and symbols
Abbreviations
Ca2+ calcium
CaM calmodulin
CFP cyan fluorescent protein
CNG cyclic nucleotide-gated channel
CNGB1 cyclic nucleotide-gated channel subunit B1
EGF epidermal growth factor
EGFR epidermal growth factor receptor
Em emission
ES endolysosomal system
Ex excitation
FRET Förster resonance energy transfer
GFP green fluorescent protein
HEK human embryonic kidney
Kv7.2 voltage-gated potassium channel 7.2
L-opsin long wavelength opsin
LDL low density lipoprotein
mTOR mechanistic target of rapamycin
mTORC1 mechanistic target of rapamycin complex 1
NAADP nicotinic acid adenine dinucleotide phosphate
NAFLD non alcoholic fatty liver disease
nm nano meter
OS outer segment
PDGFR β platelet-derived growth factor receptor β
PIP2 phosphatidylinositol 4,5-bisphosphate
PI(3,5)P2 phosphatidylinositol 3,5-bisphosphate
rAAV recombinant adeno-associated virus
SE sensitized emission
S-opsin short wavelength opsin
SNARE soluble N-ethylmaleimide-sensitive factor attachment receptor
Stx syntaxin

Abbreviations and symbols | II
TEM transmission electron microscopy
TM transmembrane domain
TPC two-pore channel
TRP transient receptor potential
TRPML mucolipin family of TRP channels
YFP yellow fluorescent protein
Symbols
𝜀!"!(436) molar extinction coefficient of CFP at 436 nm
𝜀!"#(436) molar extinction coefficient of YFP at 436 nm
Ab fraction of acceptor molecules bound by donor
Afree fraction of unbound acceptor molecules
CFPEST estimated number of CFP molecules
CFPFRET (436, 535, direct) fluorescence signal from a CFP molecule acquired through the
FRET cube
Db fraction of donor molecules bound by acceptor
Dfree fraction of unbound donor molecules
E true or efficient FRET efficiency
EA apparent FRET efficiency as determined by SE-FRET
ED apparent FRET efficiency as determined by E-FRET
EMAX maximal FRET efficiency
FC measure of sensitized emission
G calibration constant; ratio between sensitized emission and
donor dequenching
Kd,EFF dissociation constant
MA proportionality constant relating to the acceptor pathway
MD proportionality constant relating to the donor pathway
RA1 constant relating to the spectral properties of YFP
RD1 constant relating to the spectral properties of CFP
SCFP (D, 436, 480) fluorescence measurement from a donor-only sample acquired
through the CFP cube
SCFP (DA, 436, 480) fluorescence measurement from a sample expressing both
donor and acceptor acquired through the CFP cube

Abbreviations and symbols | III
SFRET (A, 436, 535) fluorescence measurement from an acceptor-only sample
acquired through the FRET cube
SFRET (D, 436, 535) fluorescence measurement from a donor-only sample acquired
through the FRET cube
SFRET (DA, 436, 535) fluorescence measurement from a sample expressing both
donor and acceptor acquired through the FRET cube
SYFP (A, 500, 535) fluorescence measurement from an acceptor-only sample
acquired through the YFP cube
SYFP (DA, 500, 535) fluorescence measurement from a sample expressing both
donor and acceptor acquired through the YFP cube
YFPEST estimated number of YFP molecules
YFPFRET (436, 535, direct) fluorescence signal from a YFP molecule acquired through the
FRET cube

List of Manuscripts | IV
2 List of manuscripts
This thesis is based on the following publications, which are referred to in the text by their
roman numerals (I-VIII):
I. Elisabeth S. Butz*, Manu Ben-Johny*, Michael Shen, Philemon S. Yang, Lingjie Sang, Martin Biel, David T. Yue, Christian Wahl-Schott Quantifying macromolecular interactions in living cells using FRET two-hybrid assays 2016, Nature Protocols, 11(12): 2470-2498
* equal contribution II. Araitz Alberdi*, Carolina Gomis-Perez*, Ganeko Bernardo-Seisdedos, Alessandro
Alaimo, Covadonga Malo, Juncal Aldaregia, Carlos Lopez-Robles, Pilar Areso, Elisabeth S. Butz, Christian Wahl-Schott, Alvaro Villarroel Uncoupling PIP2-calmodulin regulation of Kv7.2 channels by an assembly destabilizing epileptogenic mutation 2015, Journal of Cell Science, 128(21), 4014-4023 * equal contribution
III. Christian Grimm, Lesca M. Holdt*, Cheng-Chang Chen*, Sami Hassan*, Christoph
Müller, Simone Jörs, Hartmut Cuny, Sandra Kissing, Bernd Schröder, Elisabeth S. Butz, Bernd Northoff, Jan Castonguay, Christian A. Luber, Markus Moser, Saskia Spahn, Renate Lüllmann-Rauch, Christina Fendel, Norbert Klugbauer, Oliver Griesbeck, Albert Haas, Matthias Mann, Franz Bracher, Daniel Teupser, Paul Saftig, Martin Biel, Christian Wahl-Schott High susceptibility to fatty liver disease in two-pore channel 2-deficient mice 2014, Nature Communications, 5:4699 * equal contribution

List of Manuscripts | V
IV. Yu-Kai Chao*, Verena Schludi*, Cheng-Chang Chen, Elisabeth S. Butz, O.N. Phuong Nguyen, Martin Müller, Jens Krüger, Claudia Kammerbauer, Manu Ben-Johny, Angelika Vollmar, Carola Berking, Martin Biel, Christian Wahl-Schott, Christian Grimm TPC2 polymorphisms associated with a hair pigmentation phenotype in humans result in gain of channel function by independent mechanisms 2017, accepted in Proceedings of the National Academy of Sciences
* equal contribution V. Elvir Becirovic*, O.N. Phuong Nguyen*, Christos Paparizos, Elisabeth S. Butz,
Gabi Stern-Schneider, Uwe Wolfrum, Stefanie M. Hauck, Marius Ueffing, Christian Wahl-Schott, Stylianos Michalakis, Martin Biel Peripherin-2 couples rhodopsin to the CNG channel in outer segments of rod photoreceptors 2014, Human Molecular Genetics, 23(22), 5989-5997
* equal contribution VI. O.N. Phuong Nguyen, Sybille Böhm, Andreas Gießl, Elisabeth S. Butz, Uwe
Wolfrum, Johann H. Brandstätter, Christian Wahl-Schott, Martin Biel, Elvir Becirovic Peripherin-2 differentially interacts with cone opsins in outer segments of cone photoreceptors 2016, Human Molecular Genetics, 25(12), 2367-2377
VII. Elvir Becirovic, Sybille Böhm, Ong N. P. Nguyen, Lisa M. Riedmayr, Verena
Hammelmann, Christian Schön, Elisabeth S. Butz, Christian Wahl-Schott, Martin Biel, Stylianos Michalakis AAV vectors for FRET-based analysis of protein-protein interactions in photoreceptor outer segments 2016, Frontiers in Neuroscience, 10:356
VIII. Sybille Böhm*, Lisa M. Riedmayr*, O.N. Phuong Nguyen, Andreas Gießl, Toni Liebscher, Elisabeth S. Butz, Christian Schön, Stylianos Michalakis, Christian Wahl-Schott, Martin Biel, Elvir Becirovic Peripherin-2 and Rom-1 have opposing effects on rod outer segment targeting of retinitis pigmentosa-linked peripherin-2 mutants 2017, Scientific Reports, 7(1):2321 * equal contribution

Summary | VI
3 Summary
The ability of proteins to specifically interact with each other is a key feature in the
regulation of biological processes. Knowledge about interaction partners and
characterization of protein-protein interactions contribute to the understanding of proper
protein function and cell physiology. In particular, Förster resonance energy transfer
(FRET) is a suitable method to analyze interactions between proteins in living cells.
In my PhD thesis, I established a quantitative FRET approach that aims to evaluate binding
curves for interaction partners. Moreover, I applied the quantitative FRET approach to study
biological questions, including the investigation of putative interaction partners of the
endolysosomal ion channel two-pore channel 2 (TPC2), the Kv7.2 potassium channel and
the photoreceptor-specific transmembrane protein peripherin 2.
Diverse FRET approaches exist to date. However, while most protocols report the FRET
efficiency to conclude whether or not two partners may interact with each other, the
application described in manuscript I computes calibrated FRET efficiencies from
fluorescent measurements using three-filter cubes and correlates the FRET efficiencies to
the concentration of donor and acceptor molecules to determine binding curves, which bear
information about maximal FRET efficiencies and relative binding constants for individual
FRET pairings. Calibration factors that represent the optical properties of the imaging setup
and the fluorophores are crucial for quantitative measurements. A detailed description how
to assess these factors is provided. The quantitative FRET approach is very robust as both
donor-centric (E-FRET) and acceptor-centric (SE-FRET) efficiencies are obtained
simultaneously from multiple cells.
The method was further applied to investigate protein-protein interactions of membrane
proteins.
First of all, in manuscript II, an epilepsy-causing mutation in the Kv7.2 potassium channel
was shown to be implicated in a reduced calmodulin binding affinity to the channel, which
affects channel regulation.
A second study identified SNARE proteins, such as syntaxin 7 and syntaxin 6, as novel
interaction partners of the intracellular ion channel TPC2 (manuscript III), revealing TPC2
as a putative member of the late endosome-lysosome fusion machinery. In manuscript IV,
the impact of polymorphic variants of TPC2 on channel dimerization and mTOR binding
was investigated.

Summary | VII
Furthermore, in a study covered by manuscripts V and VI, rhodopsin as well as S- and
M-opsins were identified as novel interaction partners of the retinal protein peripherin 2 in
rods and cones, respectively. The binding domain underlying the interaction between
peripherin 2 and rhodopsin, could be assigned to the fourth transmembrane domain of
peripherin 2. Moreover, it could be demonstrated that disease-associated mutations in
peripherin 2 attenuated this particular binding, suggesting differential pathophysiological
consequences of disrupted interactions in rods and cones. In manuscript VIII, peripherin 2
and its homolog Rom-1 were shown to have opposing effects on rod outer segment targeting
of disease-linked peripherin 2 mutants by evaluating their binding affinities. Peripherin 2 is
a scaffold protein exclusively expressed in outer segments of rods and cones. As
photoreceptors are polarized cells, FRET measurements were not only performed on
transfected HEK293 cells but also on acutely isolated outer segments of virally transduced
murine photoreceptors (manuscript VII).
In summary, this thesis provides a general approach to robustly quantify interactions
between FRET protein pairings and demonstrates that this quantitative FRET approach
could successfully be applied to study protein-protein interactions in biological contexts.
More specifically, novel interaction partners of TPC2 and peripherin 2 were identified. In
addition, disease-associated mutations in peripherin 2 and Kv7.2 were shown to affect
protein binding affinities.
The results gained in this thesis demonstrate that protein interactions play a crucial role in
the regulation of proper protein function. Loss of binding partners or a reduced binding
affinity to particular proteins may result in pathophysiological conditions. A deeper
knowledge about molecular interactions will contribute to the understanding of cellular
mechanisms, etiology of diseases and may further evaluate putative targets of
pharmacological interest.

Zusammenfassung | VIII
Zusammenfassung
Eine fundamentale Eigenschaft von Proteinen in der Regulation biologischer Prozesse ist es,
spezifisch miteinander wechselzuwirken. Kenntnisse über Interaktionspartner und die
Charakterisierung von Protein-Protein Wechselwirkungen tragen somit zum Verständnis
von Proteinfunktion und Zellphysiologie bei. Die Förster Energie Resonanztransfer (FRET,
Förster Resonance Energy Transfer) stellt eine besonders geeignete Anwendung dar, um
Proteinwechselwirkungen in lebenden Zellen zu untersuchen.
In der vorliegenden Dissertation, wurde eine quantitative FRET Methode entwickelt, mit
dem Ziel, Bindungskurven für Proteininteraktionspartner zu erstellen. Darüber hinaus wurde
die quantitative FRET Methode angewendet, um biologischen Fragestellungen
nachzugehen. Im Besonderen wurden mögliche Interaktionspartner des endolysosomalen
Zwei-Poren-Ionenkanals TPC2 (two-pore channel 2), des spannungsaktivierten
Kaliumkanals Kv7.2 (voltage-gated potassium channel 7.2) und des Photorezeptor-
spezifischen Transmembranproteins Peripherin 2 untersucht.
Bislang gibt es verschiedene FRET Anwendungen. Während die meisten Anwendungen die
bloße FRET Effizienz ausgeben, um zu beurteilen, ob Proteine miteinander wechselwirken
oder nicht, wird in Manuskript I eine Anwendung beschrieben, bei der kalibrierte FRET
Effizienzen von 3-Filter Fluoreszenzmessungen berechnet werden. Diese FRET Effizienzen
können mit den Konzentrationen von Donor und Akzeptor Molekülen korreliert werden, um
Bindungskurven zu erstellen, die Informationen über maximale FRET Effizienzen und
relative Bindungsaffinitäten einzelner FRET Interaktionspartner enthalten.
Kalibrationsfaktoren, die optische Eigenschaften des FRET Gerätes und der
Fluoreszenzproteine enthalten, sind unerlässlich für quantitative Messungen. Eine
ausführliche Beschreibung wie diese Faktoren bestimmt werden, wird in dieser Arbeit
geboten. Die quantitative FRET Methode ist sehr robust, da sowohl Donor-bezogene
(E-FRET) als auch Akzeptor-bezogene (SE-FRET) Effizienzen simultan von mehreren
Zellen gemessen werden.
Die Methode wurde des Weiteren angewendet, um Protein-Protein Interaktionen zwischen
Membranproteinen zu untersuchen. Zunächst konnte in Manuskript II gezeigt werden, dass
eine Epilepsie verursachende Mutation im Kaliumkanal Kv7.2 eine verminderte
Calmodulin-Bindung an diesen zur Folge hat, was die Regulation des Kanals beeinträchtigt.

Zusammenfassung | IX
In einer zweiten Studie konnten die SNARE Proteine Syntaxin 6 und Syntaxin 7 als direkte
Interaktionspartner des intrazellulären Ionenkanals TPC2 identifiziert werden
(Manuskript III). Diesese Ergebnisse legen nahe, dass TPC2 ein Mitglied der
endolysosomalen Fusionsmachinerie ist. In Manuskript IV wurden die Auswirkungen
zweier Polymorphismen im TPC2 Ionenkanal auf die Dimerisierung des Kanals sowie auf
dessen Bindungsaffinität zu mTOR untersucht.
In einer weiteren Studie, die die Manuskripte V und VI umfasst, wurden sowohl
Rhodopsin in Stäbchen als auch S- und M-Opsine in Zapfen als neue Interaktionspartner des
retinalen Proteins Peripherin 2 identifiziert. Als Bindungsdomäne, die der Interaktion
zwischen Rhodopsin und Peripherin 2 unterliegt, konnte die vierte Transmembrandomäne
von Peripherin 2 ermittelt werden. Darüber hinaus konnte gezeigt werden, dass
krankheitsassoziierte Mutationen in Peripherin 2 Wechselwirkungen abschwächen, was
möglicherweise pathologische Konsequenzen in Stäbchen bzw. Zapfen zur Folge haben
kann. In Manuskript VIII konnten Peripherin 2 und dem homologen Protein Rom-1
gegensätzliche Rollen beim Transport von krankheitsassoziierten Peripherin 2 Mutanten in
die Außensegmente von Stäbchen-Photorezeptoren zugewiesen werden. Peripherin 2 is ein
„Gerüstprotein“, das einzig in den Außensegmenten von Photorezeptoren vorkommt.
Photorezeptoren sind polarisierte Zellen. Daher wurden FRET Messungen nicht nur in
HEK293 Zellen durchgeführt, sondern auch in akut isolierten Außensegmenten von viral
transduzierten Mausphotorezeptoren (Manuskript VII).
Zusammenfassend bietet die vorliegende Arbeit eine allgemeine Anwendung, um robuste
Wechselwirkungen zwischen FRET Proteinpartnern zu charakterisieren. Es konnte
außerdem gezeigt werden, dass die quantitative FRET Methode erfolgreich angewendet
werden kann, um Proteinwechselwirkungen im biologischen Kontext zu untersuchen. Neue
Interaktionspartner von TPC2 und Peripherin 2 konnten identifiziert werden. Des Weiteren,
konnte gezeigt werden, dass krankheitsassoziierte Mutationen in Peripherin 2 und dem
Kv7.2 Kanal Proteinbindungen abschwächen.
Die Ergebnisse dieser Arbeit zeigen, dass Proteininteraktionen eine entscheidende Rolle in
der Regulation von spezifischen Proteinfunktionen haben. Ein Verlust von
Bindungspartnern oder eine Reduktion der Bindungsaffinität zu bestimmten Proteinen kann
möglicherweise pathophysiologische Konsequenzen haben. Ein tieferes Verständnis von
Interaktionen auf molekularer Ebene wird zur Aufklärung zellulärer Mechanismen und
Krankheitsursachen führen und wird weiterhin mögliche Ziele von pharmakologischem
Interesse hervorbringen.

Introduction | 1
4 Introduction
Since its initial description by Theodor Förster in 1948 (Förster, 1948), Förster resonance
energy transfer (FRET) has become an invaluable tool for the evaluation of molecular
distance between specific pairs of cellular proteins. Förster proposed that the rate of
resonance energy transfer depends on the sixth power of the donor-to-acceptor separation
distance. It is this strong dependence on separation distance that makes FRET imaging
suitable to detect molecular interactions on a 1 nm – 10 nm scale (Förster, 1948; Stryer and
Haugland, 1967; Vogel et al., 2006). This resolution is substantially higher than that of
conventional fluorescence microscopy (Hell, 2006; Lakowicz, 2006).
Accompanied by the advent of suitable genetically encoded green fluorescent protein (GFP)
color mutants (Miyawaki et al., 1997; Patterson et al., 2001; Shaner et al., 2005) that can be
fused to the protein of interest, the FRET methodology has become a widely used tool to
study protein-protein interactions.
In the following, I will introduce a novel approach to characterize FRET interactions
quantitatively. It measures the apparent FRET efficiency and correlates it to the fraction of
donor and acceptor molecules in a cell. Considering a large cohort of cells with excess
donor and excess acceptor molecules, respectively, the approach allows to decipher binding
curves and to robustly quantify the maximal FRET efficiency for a given interaction pair. In
the end, three projects will be introduced, in which the FRET approach was applied.
4. 1 Principles of SE-FRET and E-FRET
FRET occurs when a donor fluorophore is excited and nonradiatively transfers energy to a
nearby acceptor molecule (physical principles are nicely summarized in(Clegg, 1992; Jares-
Erijman and Jovin, 2003; Kenworthy, 2001). Three prerequisites concerning fluorescent
proteins must be fulfilled in order for FRET to occur (Vogel et al., 2006): First, the emission
spectrum of the donor must overlap the excitation spectrum of the acceptor. A typical pair
of fluorescent proteins is CFP and YFP or optimized color mutants of those, respectively.
(Patterson et al., 2001; Patterson et al., 2000). Fluorescence spectra of CFP and YFP are
illustrated in figure 1. Secondly, the fluorophores need to be located within a distance of
less than 2 times the Förster distance, typically less than 10 nm. Finally, the emission dipole
moment of the donor and the excitation dipole moment of the acceptor must be

Introduction | 2
appropriately oriented to each other: FRET declines when the dipole moments are not
oriented in parallel and eventually becomes zero when the dipole moments are
perpendicular to each other.
Figure 1 | Excitation (dashed lines) and emission (solid lines) spectra of CFP (cyan) and YFP (green). The emission spectrum of CFP overlaps the excitation as well as the emission spectrum of YFP.
In the presence of FRET, a characteristic double-peaked spectrum arises from a sample
expressing both binding partners at the same time (Figure 2A). The energy transfer from
donor to acceptor is reflected in the decrease of donor emission (‚donor quenching’) as well
as in an increase of acceptor emission (‚sensitized emission’).
Hence, there are two ways to quantify FRET: For SE-FRET measurements, the increase in
acceptor emission, e.g. YFP, is quantified. As this approach focusses on changes in acceptor
emission, it is an acceptor-centric approach. Accordingly, the efficiency of FRET transfer
can be expressed related to SE. In that case, the apparent FRET efficiency (EA) is given by
the amount of measured SE in relation to maximal SE that occurs for a FRET efficiency of
1. Alternatively, the FRET efficiency can be quantified from donor quenching. The apparent
FRET efficiency (ED) is then given by the ratio of the amount of measured donor quenching
in relation to the total CFP fluorescence after photobleaching. This approach is termed
E-FRET, and represents a donor centric approach focusing on the decrease in donor
emission.

Introduction | 3
Figure 2 | Spectral properties of FRET (A) Shown is the emission spectrum that arises from a specimen, in which CFP and YFP are coexpressed, in the presence (black line) and absence (gray line) of FRET. FRET results in a decreased donor fluorescence (donor quenching) as well as in an increased acceptor fluorescence (sensitized emission). (B) Illustration of components that contribute to the fluorescence signal at 535 nm emission. Total emission at 535 nm is composed of direct CFP emission (point 3), direct YFP emission (point 5) and YFP emission due to FRET (points 4 -5). CFP emission is maximal at 440 nm (point 2). (C) Excitation (dashed line) and emission (solid line) spectra of CFP. SCFP and SFRET indicate CFP emission in response to excitation at 436 nm when measured through the CFP or FRET cube, resp. (D) Excitation (dashed line) and emission (solid line) spectra of YFP. SYFP and SFRET indicate YFP emission measured though the YFP cube (excitation at 500 nm) or FRET cube (excitation at 436 nm), resp..
Determination of FRET as „real“ net increase in acceptor fluorescence is considerably
complicated, as several components contribute to the detectable acceptor emission (Figure
2B). The emission at 535 nm, the peak of YFP emission (Point 1), is the sum of direct CFP
emission (donor bleed-through, Point 3) and YFP emission (Point 4), which in turn
comprises YFP emission due to direct excitation (acceptor cross-excitation, Point 5) and
YFP emission due to FRET (sensitized emission, Point 4 – 5).
The fluorescence measurements required for the computation of SE-FRET and E-FRET are
obtained using three fluorescent filter cubes. Two of the filter sets are optimized to acquire

Introduction | 4
specific donor (CFP cube) or acceptor (YFP cube) emission when illuminated at the peak of
the respective excitation spectrum. A third cube allows the detection of acceptor’s emission
following excitation of the donor (FRET cube).
For the derivations, I will use the following definitions of fluorescence signals: a
fluorescence signal measured through a particular cube is defined as SCUBE(DA, Ex, Em)
where „cube“ denotes CFP, YFP or FRET cube; „D“ indicates donor, „A“ acceptor and
„AD“ denotes both; „Ex“ indicates excitation wavelength, „Em“ denotes emission
wavelength. A fluorescence signal from a particular CFP or YFP molecule is denoted as
XFPCUBE(Ex, Em, Direct/ FRET) where „Ex“ indicates excitation wavelength and „Em“
represents emission wavelength. „Direct/FRET“ corresponds to the mode of excitation of
the given molecule.
The expected donor bleed-through (Figure 2B; Point 3), i.e. the CFP fluorescence in the
emission channel of the acceptor (535 nm) due to the overlap in the emission spectra of CFP
and YFP, can be quantified using a predetermined spectral constant RD1 (Figure 2C). This
constant is derived from cells expressing donor molecules only.
𝑅!! = 𝐶𝐹𝑃!"#$$#%& !" !"!
𝐶𝐹𝑃!"#$$#%& !" !"# =
𝑆!"#$ (𝐷, 436, 535)𝑆!"# (𝐷, 436, 480)
The ratio of CFP emission at 535 nm and CFP emission at 480 nm is the same in every
sample that expresses CFP. Hence, the ratio RD1 can be used to optically isolate the pure
CFP signal at 535 nm in a sample expressing both donor and acceptor when knowing the
CFP emission at 480 nm.
Accordingly, donor bleed-through can be quantified by the equation:
𝐶𝐹𝑃!"#! 436, 535,𝑑𝑖𝑟𝑒𝑐𝑡 = 𝑅!! ∙ 𝑆!"#(𝐷𝐴, 436, 480)
Furthermore, excitation at 436 nm light through the FRET cube induces a small fraction of
YFP emission at 535 nm. Since excitation at 500 nm only excites YFP but not CFP, direct
YFP excitation can be determined using the YFP cube and a predetermined spectral ratio
RA1 (Figure 2D), which is measured from cells expressing acceptor molecules only. The
shape of the emission spectrum is independent of excitation wavelength and intensity: only
the amplitude of the emission spectrum changes over excitation wavelength (shape
invariance of emission spectrum) (Lakowicz, 2006). Accordingly, the ratio RA1 is defined as
the fractional excitation of YFP through the FRET cube relative to the YFP cube:

Introduction | 5
𝑅!! = 𝑌𝐹𝑃!"#$$#%& !" !"! !"#! !"# !"#$%&%$'( 𝑌𝐹𝑃!"#$$#%& !" !"! !"#! !"" !"#$%&%$'(
= 𝑆!"#$ (𝐴, 436, 535)𝑆!"# (𝐴, 500, 535)
Consequently, the cross-excitation of YFP through the FRET cube in cells expressing both
YFP and CFP may be revealed by the equation:
𝑌𝐹𝑃!"#$ 436, 535,𝑑𝑖𝑟𝑒𝑐𝑡 = 𝑅!! ∙ 𝑆!"#(𝐷𝐴, 500, 535)
In summary, RD1 and RA1 are determined in cells in which acceptor or donor alone are
expressed and then applied to transform signals obtained from cells in which a mixture of
acceptor and donor are expressed. The ratios depend only on the spectral properties of donor
and acceptor molecules, and are independent of the excitation power, the concentrations of
donor or acceptor in the field of view and the possibility of binding and FRET between
donor and acceptor molecules.
Finally, the contribution of sensitized emission of YFP through the FRET cube can be
calculated as
C FRET D1 CFP A1 YFP(DA,436,535) (DA,436,480) (DA,500,535)F S R S R S= − ⋅ − ⋅
The fluorescence intensities measured with the three cubes contain not only information
about the amount of FRET in the sample but are also dependent on the instrumentation used
(filters, objectives, detectors etc.). Thus, the FC signal obtained is not necessarily
comparable to that gained in experiments performed using other equipment (Vogel et al.,
2006). Hence, the measurement of FC needs to be converted into an universal FRET
efficiency, which should be the same for a particular sample regardless of the
instrumentation used.
To this end, two more instrument-specific calibration constants, i.e. G and
𝜀!"# (436)/ 𝜀!"# (436), need to be determined from FRET experiments using a set of CFP-
YFP dimers (see below, Figure 4). 𝜀!"# (436)/ 𝜀!"# (436) represents the ratio of acceptor to
donor fluorescence intensity for equimolar concentrations in the absence of FRET. G is
defined as the ratio of sensitized acceptor emission to the amount of donor dequenching and
depends on the spectral properties of the fluorophores as well as the optical components

Introduction | 6
installed in the FRET imaging setup, including excitation light source, filter cubes and
objective (Figure 3). However, G is constant for a particular fluorophore pair and imaging
setup (Chen et al., 2006).
The FRET efficiency EA is linearly related to FC and is computed as the ratio of sensitized
emission (Figure 2B; Point 4) to the emission of YFP due to direct excitation (Figure 2B;
Point 5), corrected by the calibration constant 𝜀!"# (436)/ 𝜀!"# (436):
C YFPA b
A1 YFP CFP
(436)(DA,500,535) (436)FE E A
R Sεε
= ⋅ =⋅
The very same fluorescence intensity measurements can be used to nondestructively
calculate the net decrease in donor fluorescence due to FRET. As mentioned above, the
quenching of CFP is expressed as the FRET efficiency ED. ED can be computed from FC and
the calibration constant G:
CD b
C D1 CFP (DA,436,480)FE E D
F G R S= ⋅ =
+ ⋅ ⋅

Introduction | 7
Figure 3 | Schematic illustration of optical components of a typical FRET imaging setup. All essential optical components within the excitation pathway (1 – 6a) as well as the emission pathway (6b – 10) are shown. Excitation light from a light source (1) passes excitation filters (2 and 3), a dichroic mirror (4) and an objective (5) before it excites a fluorescent specimen (6) with a particular excitation spectrum (6a). The emission pathway comprises the emission spectrum of the fluorophore (6b), an objective (7), a dichroic mirror (8), an emission filter (9) and the detector (10).
As mentioned above, G and 𝜀!"# (436)/ 𝜀!"# (436) are determined in experiments using a
set of dimer constructs, in which CFP and YFP molecules are connected by a linker with
variable size (Figure 4A). For each dimer construct, CFP and YFP molecules become
expressed in a strict 1:1 ratio and interact with defined efficiency. Accordingly, sensitized
emission equals the amount of donor dequenching, i.e. EA equals ED. Equations for EA and
ED (see previous page) can be combined and a rearrangement yields the following equation:
FCRA1 ⋅ SYFP(DA,500,535)
= −GRD1 ⋅ SCFP(DA,436,480)RA1 ⋅ SYFP(DA,500,535)
+εCFP(436)εYFP(436)
The equation has the form of a straight line, y = mx + b, where x and y can be
experimentally determined from direct fluorescent measurements (Figure 4B). The y-
intercept of this relation corresponds to the three cube FRET calibration constant

Introduction | 8
𝜀!"# (436)/ 𝜀!"# (436), whereas the slope determines the E-FRET calibration constant G.
By using a set of dimers with different efficiencies, both calibration constants can be
reliably calculated.
Alternatively, both constants can be computed based on the known optical properties of the
imaging setup, including transmission rates of filter cubes and spectral properties of the
fluorophores. Both approaches are specified in detail in manuscript I.
Figure 4 | Experimental determination of calibration constants G and 𝜀!"# (436)/ 𝜀!"# (436). (A) Schematic illustration of CFP-YFP dimer constructs harboring a defined number of glycines (G) as a linker. The individual distance between both fluorophores results in different FRET efficiencies. (B) Each dimer gives rise to FC/(RA1 ∙ SYFP) and (RD1 ∙ SCFP) /(RA1 ∙ SYFP) coordinates that can be plotted onto the y-axis and x-axis of the graph, resp.. The graph is fitted by a straight line. G can be calculated from the slope of the line, whereas the y-intercept yields information about the calibration constant 𝜀!"# (436)/ 𝜀!"# (436).
It is important to emphasize that EA and ED depend on the fraction of acceptor molecules
that are bound to donor molecules (Ab) and the fraction of donor molecules with an
associated acceptor (Db), respectively. In other words, EA and ED would change with
different Ab and Db, respectively. The true or genuine FRET efficiency (E) is obtained if Ab
or Db equals 1 (as it is true for dimers), as given by the following equations:
This relation can be utilized to calculate binding curves for FRET pairings as outlined in the
next paragraph.
A b b DE E A E E D E= ⋅ = = ⋅ =

Introduction | 9
4. 2 Calculation of binding curves
A very powerful application of quantitative FRET measurements arises from the possibility
to determine the fraction of bound donor and acceptor molecules within a single cell. The
measured FRET efficiencies (both EA and ED) obtained from multiple cells can then be
displayed as a function of the concentration of CFP-tagged or YFP-tagged molecules
allowing to calculate individual binding curves for putative interaction partners (Ben Johny
et al., 2013; Erickson et al., 2001; Erickson et al., 2003).
In order to determine the concentration of donor and acceptor, it is essential to estimate the
total number of donor (CFPEST) and acceptor (YFPEST) molecules for a given cell from three
cube FRET measurements. In principle, the concentration is proportional to the total YFP
and CFP fluorescence corrected for FRET.
These calculations require two more constants, G and 𝜀!"# (436)/ 𝜀!"# (436) (see paragraph
4.1). G incorporates information about light attenuation within the acceptor pathway (MA
constant) as well as within the donor pathway (MD constant) by the equation:
𝐺 = 𝑀!
𝑀! ∙ 𝜀!"# (436)𝜀!"# (436)
The ratio MA/MD can be experimentally determined using a set of CFP-YFP dimers as
shown in figure 4. Alternatively, individual values for both MA and MD can be theoretically
calculated based on the optical properties of an imaging setup, i.e. transmission rates of
excitation and emission filter, intensity profile of the lamp, quantum yields and fluorescent
spectra of the fluorophores.
Although the ratio MA/ MD, instead of their precise absolute values, is relevant for the
purpose of obtaining relative binding affinities, it is necessary to look at them individually
when converting fluorescence measurements into total number of YFP (YFPEST) and CFP
molecules (CFPEST). The fluorescence signal measured using the YFP cube is free of any
contribution from CFP. As MA is a measure of the attenuation of brightness of YFP (when
viewed through the FRET cube), the total number of YFP molecules can be estimated by:
FRET A1 YFPEST
A A
(436,535,direct) (DA,500,535)YFP R SYFPM M
⋅= =

Introduction | 10
It is more complex to estimate the total number of CFP molecules from CFP intensity, as a
considerable portion of CFP fluorescence is quenched during the FRET measurement. The
expected CFP intensity after photobleaching can be estimated by dividing the CFP intensity
measured through the CFP cube before photobleaching by the apparent E-FRET efficiency:
prebleach D1 CFPpostbleach
D D
(436,535,direct) (DA,436,480)(436,535,direct)1 1
CFP R SCFPE E
⋅= =
− −
In analogy to YFPEST calculation, the total number of CFP molecules in a given cell is
related to the corrected total CFP intensity in the absence of FRET by the proportionality
constant MD, thus:
D1 CFP A A1 YFPEST
D
(DA,436,480) (DA,500,535)R S E R SCFPM
⋅ + ⋅ ⋅=
For the evaluation of a binding curve, it is necessary to obtain FRET efficiencies from a
large cohort of cells expressing the fluorophore-tagged interaction partners with different
levels of protein expression. The FRET efficiencies EA and ED depend on the fractional
binding of acceptor and donor, respectively, which differ among individual cells with
concentrations of the molecules. Thus, each cell gives rise to a single apparent EA and ED
value (along with individual concentrations of donor and acceptor) and measurements from
many cells are required to collect data points that populate each segment of a binding curve
(Figure 5). Although a broad range of donor and acceptor concentrations may result already
from stochastic expression in a cell population, one can evoke various ratios in CFP to YFP
expression by adjusting the transfection ratios or by the choice of different promoters
(Erickson et al., 2003). For binding curves, EA is plotted as a function of free donor
concentration (Dfree) or ED is plotted as a function of free acceptor concentration (Afree).
Both Dfree and Afree are computed based on estimates of CFPEST and YFPEST. The binding
curve is then calculated by imposing a simple binding model and by performing a data
fitting including all acquired measurements.

Introduction | 11
Figure 5 | Schematic representation of binding curves (A) Putative interaction partners tagged to CFP and YFP fluorophores, resp.. (B, C) Binding curves obtained by SE-FRET (B) and E-FRET (C) measurements. FRET efficiencies EA and ED are plotted against the fraction of free donor (Dfree) and free acceptor (Afree), resp.. One dot represents data obtained from an individual cell. The black line results from curve fitting. Binding isotherms reach a saturating plateau with increasing free donor and acceptor concentration that bears information about maximal FRET efficiency EMAX. Note that points at low Dfree in panel B correspond to points at high Afree in panel C (red circles). Likewise, blue circles in panel B and C correspond to each other.
Based on a bimolecular binding reaction where a 1:1 complex is formed,
the experimentally determined apparent SE-FRET (EA) and E-FRET (ED) efficiencies are
linked to the free concentrations of donor (Dfree) and acceptors (Afree) by the following
relations:
The maximal efficiency (EMAX) equals the true efficiency (E) and should be, as it is true for
Kd,EFF, the same for a 1:1 binding interaction, regardless whether resulting from SE-FRET
or E-FRET calculations (Ben Johny et al., 2016). Accordingly, with CFPEST and YFPEST,
Afree and Dfree can be computed as follows:
freemax max
free d,EFFA b
DE E A ED K
= ⋅ = ⋅+
freemax max
free d,EFFD b
AE E D EA K
= ⋅ = ⋅+
2EST d,EFF EST EST d,EFF EST d,EFF EST
free
( ) 42
YFP K CFP YFP K CFP K CFPA
− − + − − + ⋅ ⋅=

Introduction | 12
Initially, guessed values for EMAX and Kd,EFF are required to solve this expressions.
Subsequently, data from various cells are fitted iteratively using a nonlinear least-squares
regression analysis to estimate Dfree and Afree in individual cells. The parameters EMAX and
Kd,EFF are then adjusted until the squared errors ((EA, predicted – EA)2 and (ED, predicted – ED)2 )
are minimized.
Figure 5 illustrates typical binding curves resulting from SE-FRET and E-FRET
measurements. The slope, in particular Kd,EFF, bears information about the relative binding
affinity between two binding partners, whereas the saturating portion of the curve represents
EMAX, the true efficiency, which is required to calculate the molecular distance between two
FRET partners.
2EST d,EFF EST EST d,EFF EST d,EFF EST
free
( ) 42
CFP K YFP CFP K YFP K YFPD
− − + − − + ⋅ ⋅=

Introduction | 13
4. 3 Application of FRET to identify intermolecular interaction partners
The method was implemented using Calmodulin (CaM) and two of its known interaction
partners as model (Figure 6).
CaM is a small protein that regulates numerous calcium-mediated processes. It has two
lobes (C- and N-domain), each containing two high affinity calcium-binding sites. Upon
calcium binding, CaM undergoes a conformational change, which regulates subsequent
CaM-binding to different target proteins (Chin and Means, 2000).
Initially, the interaction between CaM and Myosin V was investigated (Figure 6A). Myosin
V is a motor protein that transports cargo in non-muscle cells, such as melanocytes,
epithelial cells and neurons (Trybus, 2008). As characteristic for myosins, it possesses four
structural domains, a motor domain containing the actin and ATP-binding site, a lever arm
that is composed of six CaM-binding motifs (IQ domains), and an alpha-helical rod region
followed by a globular tail, which is important for cargo binding (Houdusse et al., 2006;
Trybus, 2008). In the absence of calcium, each IQ motif is bound to an apo-CaM (calcium-
free) molecule (Houdusse et al., 1996), thus stabilizing the motor protein. From structural
studies it is well known that a single CaM molecule binds to an IQ motif (Houdusse et al.,
2006) resulting in a strict 1:1 binding stoichiometry. Low calcium levels lead to a
conformational change in CaM accompanied by an activation of myosin, whereas high
calcium levels inhibit motility and processive movements by dissociating CaM from one or
more of the IQ domains (Houdusse et al., 2006).
For FRET measurements, only a fragment of myosin V, a single IQ domain, was used as
FRET partner (Figure 6A) and measurements were performed under low calcium levels.
The IQ domain was fused to YFP and coexpressed with CFP tagged CaM in HEK293 cells.
Figure 6A shows SE-FRET as well as E-FRET binding curves arising from the interaction
between CaM and IQMYOSINV. Apparent FRET efficiencies EA and ED were plotted as a
function of the corresponding fraction of free donor and acceptor, respectively. Each gray
dot represents a single cell. It is important to emphasize that three cube measurements from
an individual cell were used to calculate both the apparent FRET efficiencies EA (for
SE-FRET) and ED (for E-FRET). The whole data set was subsequently used to determine a
binding relation for the FRET partners.
For a 1:1 binding interaction, the binding relation obtained by SE-FRET equals the one
obtained by E-FRET (Ben-Johny et al., 2016). Accordingly, the maximal or true FRET

Introduction | 14
efficiency for CaM-CFP and IQMYOSINV-YFP could robustly be quantified from the
saturating portion of the binding curve and was calculated to be EMAX = 0.21.
Figure 6 | Binding curves arising from CFP-tagged calmodulin (CaM) and YFP-tagged isolated IQ-domain of the myosin V neck domain (A) and the voltage-gated Cav1.2 channel (B). In both panels, interaction partners are schematically shown on the left, appendant SE-FRET and E-FRET measurements are shown in the middle and on the right, resp.. Gray dots represent measurements from individual cells and the black curve indicates the binding relation between the interaction partners, as calculated based on the Langmuir relation. Note that the same raw data, i.e. fluorescence intensity measurements, were used to calculate SE-FRET (EA) and E-FRET (ED) efficiencies. Further note, that the fitted binding curve (black curve) obtained by SE-FRET equals the one obtained by E-FRET (see manuscript I).
Next, the binding between CaM and the IQ domain of the voltage-gated calcium channel
Cav1.2 was studied (Figure 6B). Cav1.2 is a L-type calcium channel, most important in
cardiac myocytes and various neuronal cells (Ben-Johny and Yue, 2014; Minor and
Findeisen, 2010). It possesses an intracellular C-terminal domain consisting of an EF hand
and an IQ domain. Under calcium free conditions, apo-CaM is associated with the IQ
domain. Upon calcium binding to CaM, its interaction with the IQ domain gets stronger.
Elevated intracellular calcium concentrations lead to a conformational change in CaM
rendering the Cav1.2 channel inactive. This feedback regulation mechanism, called CDI –
calcium dependent inactivation, is common for various voltage-gated calcium channels
(reviewed in(Ben-Johny and Yue, 2014).

Introduction | 15
Binding curves resulting from interaction between CaM and IQCAv1.2 are shown in figure
6B. FRET measurements were done under high intracellular calcium-conditions upon
application of ionomycin. CaM was tagged to CFP, whereas IQCAv1.2 was fused to YFP. As
the IQCAv1.2 domain is only a C-terminal fragment of the channel, its expression resulted in a
cytosolic distribution. CaM and the IQCAv1.2 domain interact in a 1:1 binding stoichiometry
(Ben Johny et al., 2012). Indeed, the binding relation obtained by SE-FRET equals the one
obtained by E-FRET and EMAX = 0.35 could be calculated for CaM-CFP and IQCAv1.2-YFP
(Figure 6B).
In conclusion, the novel FRET approach presented in this thesis can readily be used to
quantitatively characterize protein interactions. It was consequently applied – with project-
related modifications – in several individual projects, which will be introduced in the
following sections.
4. 3. 1 An epilepsy-causing mutation in Kv7.2 affects calmodulin binding
Encouraged by the achievements in quantitatively detecting FRET interactions, CaM
regulation of Kv7.2 potassium channel was further investigated.
The Kv7.2 channel belongs to the family of Kv voltage-gated potassium channels that
comprises five members (Kv7.1 – Kv7.5), encoded by the mammalian KCNQ1-5 genes.
Kv7.1 and Kv7.4 subunits are mainly expressed in the heart and inner ear, respectively,
whereas Kv7.2, Kv7.3 and Kv7.5 subunits are highly expressed in the brain and peripheral
nervous system (reviewed in(Brown and Passmore, 2009; Jentsch, 2000). In neurons, Kv7.2
subunits can homotetramerize or form heterotetramers with Kv7.3 and Kv7.5 subunits
(Brown and Passmore, 2009). Neuronal Kv channels are especially important in regulating
the excitability of neurons since they potently suppress repetitive firing of action potentials
(Brown and Passmore, 2009; Robbins, 2001). Consistent with this, they suppress seizures,
and dysfunctions of neuronal Kv channels are implicated in various neurological diseases
such as epilepsy, autism and schizophrenia (Jentsch, 2000)
The common core structure of Kv channels is composed of six transmembrane segments
with a voltage-sensing domain (S1-S4), a pore domain (S5-S6) and intracellular N- and C-
terminal regions (Figures 7A, B). The large intracellular C-terminus harbors four helical
regions (denoted as A-D domains) and is critical for assembly, trafficking and interaction
with various signaling proteins (Chung, 2014;(Haitin and Attali, 2008). The AB domain is

Introduction | 16
important for channel gating. It binds some lipids and several proteins, including CaM.
Helix D is suggested to be crucial for oligomerization of the channel subunits, whereas helix
C is supposed to be a structural linker.
Figure 7 | Identification of an epileptogenic mutation as destabilizer for the calmodulin assembly to the voltage-gated potassium channel Kv7.2 (A) Graphical illustration of Kv7.2. The large intracellular C-terminus harbors 4 helical regions (denoted as A-D) with distinct functions. (B) Graphical illustration of a calmodulin (CaM) bound channel assembly. Note that only two subunits are represented. (C) Three cube FRET measurements evaluating the binding between CFP-tagged CaM and schematically indicated YFP-tagged truncated proteins. The reported binding between AB and CaM could be confirmed (left, positive control), while CD and CaM showed no specific binding (middle left, negative control). The high FRET efficiency between ABCD and CaM (middle right) was attenuated upon insertion of an epilepsy-causing mutation (L609R) in helix D (right), suggesting a destabilizing effect of L609R on channel oligomerization with functional consequences (see manuscript II).
In this study, the role of an epileptogenic mutation in the Kv7.2 C-terminal D domain in
CaM binding was investigated using FRET.

Introduction | 17
To this end, C-terminal fragments containing either the AB domain, CD domain, wildtype
full length C-terminus or the full length C-terminus bearing an epilepsy-causing L609R
mutation (Richards et al, 2004) were fused to YFP and the binding to CaM, tagged to CFP,
for each fragment was investigated in HEK293 cells (Figure 7B).
CaM binding to the AB domain could be confirmed (Sachyani et al., 2014; Villarroel et al.,
2014), whereas no FRET between CaM and the CD domain occurred. This is in line with
previous studies that rule out a role for CD helices in CaM binding (Sachyani et al., 2014;
Yus-Najera et al., 2002). The binding relation obtained for the full length C-terminal
fragment and its interaction partner CaM was very strong, even stronger than that between
the single AB domain and CaM. This suggests an enhanced binding affinity mediated by the
presence of the CD domains and concomitant tetramerization of the channel subunits,
causing a subsequent clustering of donor and acceptor molecules. The mutation within the D
domain of the channel destabilized the tetramerization of the channel and resulted in a
substantial loss of CaM binding affinity.
These results strongly support the hypothesis that impaired CaM-binding to the channel
contributes to the pathophysiology in epilepsy. Beside its physiological impact, the study
validated the application of the FRET approach in a novel study.
4. 3. 2 Two-pore channel 2 and its role in the endolysosomal system
The FRET approach was moreover applied to study putative binding partners of the ion
channel TPC2. FRET measurements were thereby challenged as the channel is
intracellularly located within the endolysosomal system (ES).
The ES is specialized for the breakdown of proteins, lipids and other molecules and present
in all mammalian cells (Figure 8A). The ES comprises intracellular membrane-enclosed
compartments such as early and late endosomes, recycling endosomes, lysosomes and
lysosome-related organelles (Grant and Donaldson, 2009; Luzio et al., 2007b; Repnik et al.,
2013). Each organelle is suggested to be a transient, but distinct, compartment that
elaborates into the next stage by maturation (e.g. early to late endosome) or fusion (e.g. late
endosome to lysosome). Each stage is thereby characterized by a unique set of biomolecules
resulting particularly in different pH environments and protein-activity states and,
accordingly, in diverse organelle-associated functions (Bonifacino and Glick, 2004; Huotari
and Helenius, 2011; Luzio et al., 2007a; Luzio et al., 2000). The lysosome is the terminal

Introduction | 18
degradation organelle (Xu and Ren, 2015). Moreover, it plays a role in sensing nutrient
availability and autophagy (Cang et al., 2013; Medina et al., 2015).
Figure 8 | TPC2 and the endolysosomal system (A) The endolysosomal system comprises vesicles such as early and late endosomes (EE and LE), recycling endosomes (RE), lysosomes (LY) and lysosome-related

Introduction | 19
(Figure 8 continued) organelles (e.g. autophagosomes (AP)). NU: Nucleus (B) Two-pore channel 2 (TPC2) has 12 transmembrane domains and two pore domains on each subunit. Two subunits assemble to build a functional channel. (C) Graphical illustration of a fusion event between endolysosomal vesicles. SNARE proteins from different membranes assemble upon a local increase in cytosolic calcium concentration. The calcium channel which provides calcium has not been identified so far. (D) Under nutrient-rich conditions, mTORC1 blocks TPC2 activity by direct interaction. Upon starvation, mTORC1 translocates from the lysosome resulting in increased TPC2 activity. (E) FRET measurements evaluating the interaction between TPC2 and Stx6 and Stx7, resp. Shown are average Fc values obtained from HEK293 cells overexpressing the indicated FRET pairs. (F) Representative binding curve arising from quantitative FRET measurements on cerulean-tagged TPC2 and citrine-tagged mTOR. FRET efficiencies (EA) were plotted as a function of the corresponding free donor fraction. Clustered values from 3-6 individual cells were binned, gray dots represent the average values (± S.E.M.). (Manuscripts III and IV).
Two-pore channels (TPCs) have recently emerged as a group of endolysosomal cation
channels (Grimm et al., 2017; Patel, 2015). Their name refers to two pore domains that are
found on each subunit (Figure 8B). TPCs belong to the family of transient receptor potential
(TRP) channels and are distantly related in particular to the mucolipin family of TRP
channels (TRPML channels). Two TPC members, TPC1 and TPC2, are encoded by the
human and murine genome.
Different findings hint at a role for TPC2 in endolysosomal trafficking, in particular
lysosomal fusion (Grimm et al., 2014; Hockey et al., 2015; Lin-Moshier et al., 2014; Ruas
et al., 2014). TPC2 is implicated in trafficking defects of the bacterial cholera toxin B (Ruas
et al., 2010), EGF/EGFR and LDL-cholesterol trafficking (Grimm et al., 2014) as well as
delayed degradation of platelet-derived growth factor receptor β (PDGFR β) (Ruas et al.,
2014). Similarly, mice lacking both TPCs are resistant to Ebola virus infection, most
probably due to defective fusion between endosomal membrane and viral membrane
(Sakurai et al., 2015). Moreover, two independent interactome screens revealed putative
interaction partners for TPC2 that are involved in intracellular vesicle trafficking and fusion
processes, such as Rab- and soluble N-ethylmaleimide-sensitive factor attachment receptor
(SNARE-) proteins (Grimm et al., 2014; Lin-Moshier et al., 2014).
Rab proteins are important for the initiation of a fusion event. They function as markers for
membrane identity and recruit SNARE proteins (Jahn et al., 2003). SNARE proteins are the
engines that drive membrane fusion. Each organelle is outfitted with a unique set of vesicle
(v-)-SNARES and target (t-)-SNARES. Recruited by Rab proteins, a distinct v-SNARE
assembles with a unique cognate t-SNARE at the appropriate target membrane (Chen and
Scheller, 2001; Kummel and Ungermann, 2014). Once the SNARE complex is assembled, it
generates the energy to overcome the energy barrier of lipid bilayer merging. Both
homotypic and heterotypic fusion events in the ES require a local increase in cytosolic

Introduction | 20
calcium in order to occur (Luzio et al., 2007a; Pryor et al., 2000). The molecular identity of
the calcium source remains to be identified (Figure 8C).
As it is true for TPC1, no disease has been associated with a mutation in the TPCN2 gene so
far. In humans, two TPC2 polymorphisms, namely M484L and G734E, are linked to
pigmentation variants in hair color (Figure 8B) (Sulem et al., 2008). Recently, a direct role
for TPC2 in pigmentation has been postulated (Ambrosio et al., 2016; Bellono et al., 2016).
According to these studies, it is most likely that pH regulation and melanin production in
melanocytes depend on the activation state of TPC2. TPC2-deficient melanosomes, the
melanin producing organelles in melanocytes, showed an increase in pH and size, resulting
most likely in an enhanced tyrosinase activity and increased melanin production. In contrast,
TPC2 activation or overexpression had the opposite effect.
The activation mechanism of TPCs remains to be fully elucidated but has been reported to
involve the second messenger nicotinic acid adenine dinucleotide phosphate (NAADP) and
the endosomal membrane lipid phosphatidylinositol 3,5-bisphosphate (PI(3,5)P2) (Brailoiu
et al., 2009; Calcraft et al., 2009; Zong et al., 2009). The mechanism underlying NAADP
activation is currently a matter of debate as NAADP-induced TPC calcium currents are not
seen consistently (Ruas et al., 2015; Ruas et al., 2010; Wang et al., 2012). NAADP
activation may be mediated by a yet unknown protein that binds to TPCs in order to open
the channel (Grimm et al., 2017; Marchant et al., 2012).
Moreover, mechanistic target of rapamycin (mTOR) (Perl, 2015), part of the mTOR
complex 1 (mTORC1), has been identified as a mediator that blocks TPC activation after
ATP stimulation by direct protein-protein interaction (Cang et al., 2013). mTOR is a
nutrient sensing kinase. Under nutrient-rich conditions, it is recruited to the lysosomal
membrane, from where it is liberated upon starvation (Figure 8D) (Perl, 2016).
Polymorphic TPC2 variants in the context of channel gating and pigmentation have not yet
been characterized.
FRET experiments accompanied two studies dealing with TPC2. First, it was investigated,
whether TPC2 directly interacts with lysosome-associated SNARE proteins, such as
syntaxin 6 (Stx6) or Stx7 (Figure 8C, E). Second, dimerization between wildtype TPC2 and
its polymorphic variants as well as the binding to mTOR was assessed (Figure 8D, F).

Introduction | 21
FRET measurements on intracellular organelles are highly complex. The system is three-
dimensional; endolysosomal vesicles are very motile and dynamic and undergo steadily
homo- and heterotypic fusion events. Since TPC2 resides in diverse endolysosomal
organelles, its interaction partner can be located on the same membrane structure or on
different vesicles.
It is therefore of great importance to choose biological controls considering proteins with a
similar physiological function and distribution. In case of the first study dealing with TPC2
and SNARE proteins (Figure 8E) the positive control was Stx7 and Vamp7, two SNARE
proteins known to reside on the same vesicles and interact with each other (Bogdanovic et
al., 2002; Pryor et al., 2004), while in the TPC2 polymorphism study, another lysosomal
transmembrane protein (TMEM192) was used as negative control.
For the experiment shown in figure 8E, FC values rather than universal FRET efficiency
(EA) values were calculated, as the set-up specific calibration constants G and
𝜀!"#(436)/ 𝜀!"#(436) were not yet implemented at that time point. The FC values shown
represent the average of FC values obtained from multiple cells within a sample. FC values
(see page 5) are set-up specific. They contain information derived solely from intensity
measurements without calibration, i.e. consideration of spectral properties of the
fluorophore and light attenuation. Only when knowing the calibration constants, it is
possible to determine the fraction of bound donor and bound acceptor molecules,
respectively, and, accordingly, to determine robust binding curves. It is not ensured that FC
values represent the maximal FRET efficiency of a binding pair. Or simply said, it is not
known which point of the binding curve is represented by the FC value. However, it is valid
to compare values between samples, provided that the cells were treated in the same way
and that the expression ratio – ensured by the amount of cDNA transfection – of interaction
partners (donor and acceptor) is the same in every condition.
Once the calibration constants G and 𝜀!"# (436)/ 𝜀!"# (436) were determined and the novel
FRET approach was implemented on the imaging setup, it was possible to calculate binding
curves from endolysosomal channel proteins as well. Figure 8E shows a representative
binding curve for wildtype TPC2 and mTOR, where EA is plotted as a function of Dfree.
Values populate each portion of the binding isotherm. For clarity, values for individual cells
were binned and only the averaged values for the binned groups of cells are shown.
However, the binding isotherm was calculated from raw data.
Data was measured under nutrient-rich conditions, when mTOR is supposed to be
associated with the lysosomal membrane (Figure 8D).

Introduction | 22
4. 3. 3 Peripherin 2 and its role in photoreceptor outer segments
Furthermore, FRET was used to examine the role of peripherin 2 in photoreceptor outer
segments (OS) (Figure 9). Peripherin 2 is a photoreceptor-specific scaffold protein located
in the OS of both rods and cones (Figure 9A-D) (Stuck et al., 2016). The OS of
photoreceptors are built up as a stack of membrane discs (Figure 9B). In rods, the discs are
intracellular and thus physically separated from the plasma membrane. In cones, the discs
are invaginations of the plasma membrane (Mustafi et al., 2009; Sung and Chuang, 2010).
The region, where the lateral membrane segments of the disc membrane faces the plasma
membrane is called rim region (Figure 9B, C). Here, the phototransduction cascade is
anchored. There is evidence that peripherin 2 resides primarily in the rim region and
structurally stabilizes the phototransduction cascade (Ding et al., 2015). Peripherin 2 plays a
crucial role in the biogenesis of photoreceptors and is assigned to be important for
membrane curvature (Arikawa et al., 1992; Ding et al., 2015) and membrane fusion
(Boesze-Battaglia et al., 1997; Boesze-Battaglia et al., 1998) in photoreceptor disc
formation. It has been shown that peripherin 2 binds to the beta-subunit of the rod cyclic
nucleotide gated channel 1 (CNGB1) as well as to both isoforms of the glutamin acid-rich
protein (GARP) (Poetsch et al., 2001; Ritter et al., 2011) suggesting a stabilizing role in
connecting the plasma membrane to neighboring rim regions (Stuck et al., 2016).
Furthermore, its homologue Rom-1 has been identified as an interaction partner (Bascom et
al., 1992). In cones, however, peripherin 2 does not interact with the CNG channel (Conley
et al., 2010) pointing to a differential role of peripherin 2 in rods and cones.
More than 100 disease-causing mutations in the human peripherin 2 gene (PRPH2/RDS) are
known to date (Boon et al., 2008). The majority of the mutations are point mutations located
in exon 2, which encodes for a part of a large extracellular/intradiscal loop as well as for a
part of transmembrane domain 4 (TM4) (Figure 9D). Remarkably, some of the mutations
lead to defects of rod photoreceptors in the affected individuals whereas others affect cones
only (Boon et al., 2008; Wells et al., 1993). The molecular mechanisms underlying these
distinct mutations have not been elucidated so far.
During the progress of this thesis, protein interactions between peripherin 2 and putative
binding partners, with an emphasis on rhodopsin and cone opsins, were assessed. More
specifically, the binding affinities of mutant peripherin 2 and the newly identified
interaction partners were analyzed. In particular, the G266D, P210L and C214S mutations,

Introduction | 23
which are linked to retinitis pigmentosa (Sohocki et al., 2001) and the V268I mutation,
associated with adult vitelliform macular dystrophy (Felbor et al., 1997) were investigated.
Figure 9 | Peripherin 2 is a scaffold protein in the outer segments (OS) of photoreceptors (A) The retina has a laminated structure and contains a variety of cell types. The outermost layer consists of photoreceptors, where the phototransduction takes place (Purves, 2001). (B) Rods and cones are highly polarized cells. The OS of photoreceptors are built up with a stack of membrane discs. The red boxes indicate the rim region.
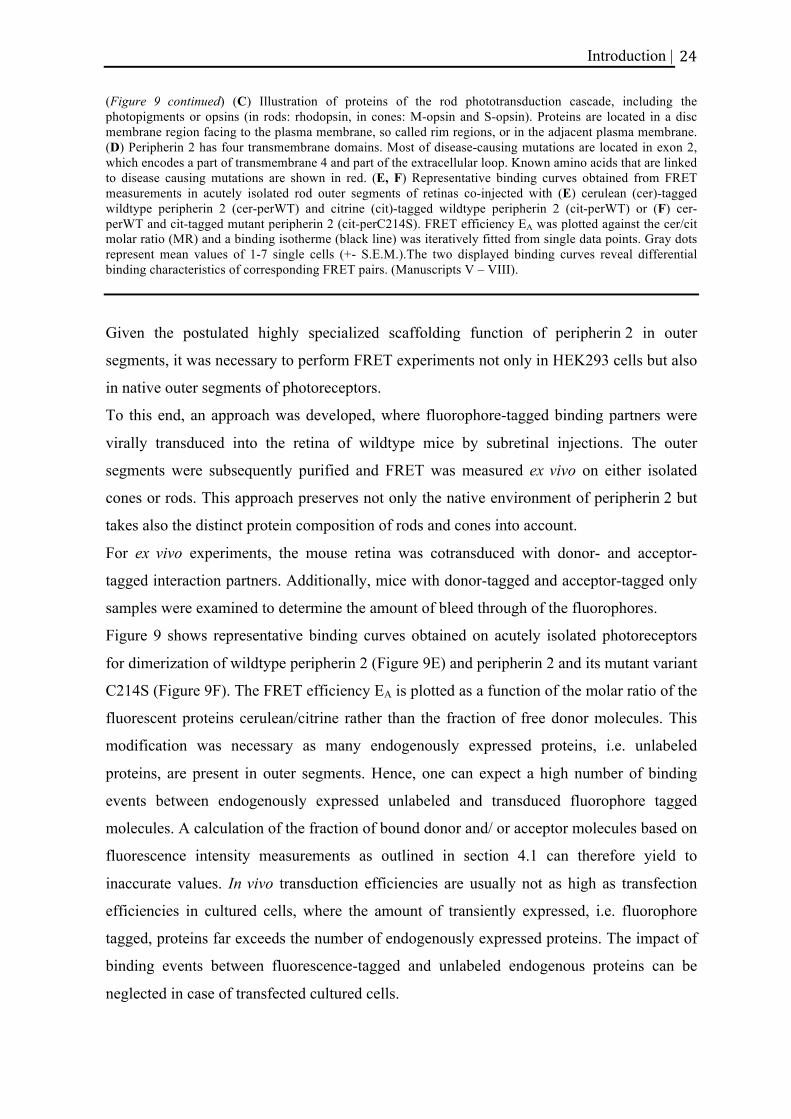
Introduction | 24
(Figure 9 continued) (C) Illustration of proteins of the rod phototransduction cascade, including the photopigments or opsins (in rods: rhodopsin, in cones: M-opsin and S-opsin). Proteins are located in a disc membrane region facing to the plasma membrane, so called rim regions, or in the adjacent plasma membrane. (D) Peripherin 2 has four transmembrane domains. Most of disease-causing mutations are located in exon 2, which encodes a part of transmembrane 4 and part of the extracellular loop. Known amino acids that are linked to disease causing mutations are shown in red. (E, F) Representative binding curves obtained from FRET measurements in acutely isolated rod outer segments of retinas co-injected with (E) cerulean (cer)-tagged wildtype peripherin 2 (cer-perWT) and citrine (cit)-tagged wildtype peripherin 2 (cit-perWT) or (F) cer-perWT and cit-tagged mutant peripherin 2 (cit-perC214S). FRET efficiency EA was plotted against the cer/cit molar ratio (MR) and a binding isotherme (black line) was iteratively fitted from single data points. Gray dots represent mean values of 1-7 single cells (+- S.E.M.).The two displayed binding curves reveal differential binding characteristics of corresponding FRET pairs. (Manuscripts V – VIII).
Given the postulated highly specialized scaffolding function of peripherin 2 in outer
segments, it was necessary to perform FRET experiments not only in HEK293 cells but also
in native outer segments of photoreceptors.
To this end, an approach was developed, where fluorophore-tagged binding partners were
virally transduced into the retina of wildtype mice by subretinal injections. The outer
segments were subsequently purified and FRET was measured ex vivo on either isolated
cones or rods. This approach preserves not only the native environment of peripherin 2 but
takes also the distinct protein composition of rods and cones into account.
For ex vivo experiments, the mouse retina was cotransduced with donor- and acceptor-
tagged interaction partners. Additionally, mice with donor-tagged and acceptor-tagged only
samples were examined to determine the amount of bleed through of the fluorophores.
Figure 9 shows representative binding curves obtained on acutely isolated photoreceptors
for dimerization of wildtype peripherin 2 (Figure 9E) and peripherin 2 and its mutant variant
C214S (Figure 9F). The FRET efficiency EA is plotted as a function of the molar ratio of the
fluorescent proteins cerulean/citrine rather than the fraction of free donor molecules. This
modification was necessary as many endogenously expressed proteins, i.e. unlabeled
proteins, are present in outer segments. Hence, one can expect a high number of binding
events between endogenously expressed unlabeled and transduced fluorophore tagged
molecules. A calculation of the fraction of bound donor and/ or acceptor molecules based on
fluorescence intensity measurements as outlined in section 4.1 can therefore yield to
inaccurate values. In vivo transduction efficiencies are usually not as high as transfection
efficiencies in cultured cells, where the amount of transiently expressed, i.e. fluorophore
tagged, proteins far exceeds the number of endogenously expressed proteins. The impact of
binding events between fluorescence-tagged and unlabeled endogenous proteins can be
neglected in case of transfected cultured cells.

Introduction | 25
Although information about donor and/ or acceptor concentrations is lacking, plotting EA as
a function of the molar ratio of cerulean/ citrine, i.e. the ratio of cerulean/ CFP and
citrine/ YFP fluorescence, yields a saturating binding relation, which reveals information
about relative binding affinities.
Altogether, protein-protein interactions could robustly be quantified, even in highly
specialized cell types, such as photoreceptors.

Aims of the thesis | 26
5 Aims of the thesis
The objective of the present thesis was to learn more about protein-protein interactions
using FRET. The focus was thereby on a quantitative FRET method originally developed by
Erickson et al.. In 2010, the group of David T. Yue provided a nondestructive acceptor-
centric method for detecting the strength of FRET interactions, termed FRET ratio, from
fluorescent measurements obtained with three filter cubes. They furthermore provided a
way to calculate the fraction of acceptor molecules bound to donor molecules in a cell.
However, a methodological approach how to convert FRET ratios into universal FRET
efficiencies was lacking. Moreover, it was not clarified how to determine the fraction of
bound acceptor without knowing detailed spectral properties of the particular imaging setup.
Aim 1 can consequently be specified as follows:
To establish a quantitative FRET approach that allows to determine both acceptor-
centric and donor-centric FRET efficiencies and binding isotherms while including
control of setup calibration and collisional FRET corrections.
The thesis further aims (Aim 2)
to uncover molecular interactions in a biological context by applying quantitative
FRET measurements.
Specifically, the following questions were addressed:
(1) Can the FRET approach established in Aim 1 be validated in a biological context?
(2) Does an epileptogenic mutation affect the binding of calmodulin to Kv7.2 potassium
channel?
(3) Does TPC2 interact with members of the endolysosomal fusion machinery?
Do polymorphic variants of TPC2 affect binding characteristics as compared to
wildtype TPC2?
(4) Does peripherin 2 in rod photoreceptors interact with other proteins of the
phototransduction cascade except the rod CNGB1 channel subunit? Does peripherin 2
interact with proteins of the phototransduction cascade in cone photoreceptors?
Do some disease-associated mutations affect peripherin 2 interactions?

Short summary of manuscripts | 27
6 Short summary of manuscripts
6. 1 Quantifying macromolecular interactions in living cells using
FRET two-hybrid assays
Elisabeth S. Butz*, Manu Ben-Johny*, Michael Shen, Philemon S. Yang, Lingjie
Sang, Martin Biel, David T. Yue, Christian Wahl-Schott
2016, Nature Protocols, 11(12): 2470-2498
*equal contribution
This manuscript demonstrates a FRET approach to quantitatively assess binding affinities in
living cells.
FRET-based assays have been employed to study molecular interactions of a broad range of
biological molecules including ion channels, G-protein coupled receptors, immunoglobulins
and cytosolic enzymes. Commonly, it is desired to quantify molecular interactions by
determining binding constants and true FRET efficiencies for these interactions. However,
such experiments require quantification of relative concentrations of interacting proteins and
thus quantitative FRET microscopic approaches.
In this study, we describe an approach for robust quantification of relative binding affinities
of protein-protein interactions by measuring FRET efficiency nondestructively. SE-FRET as
well as E-FRET analysis can be performed on the same set of data, while control
measurements allow to correct for collisional FRET.
The protocol includes a detailed step-by-step protocol comprising sample preparation, data
aquisition and analysis. Furthermore, we outline in-depth how to calibrate the imaging setup
and control for idiosyncrasies of the optical elements.
This manuscript is part of a collaboration with the group of Prof. David Yue (Johns Hopkins
University, Baltimore, United States).

Short summary of manuscripts | 28
6. 2 Uncoupling PIP2-calmodulin regulation of Kv7.2 channels by an
assembly destabilizing epileptogenic mutation
Araitz Alberdi*, Carolina Gomis-Perez*, Ganeko Bernardo-Seisdedos, Alessandro
Alaimo, Covadonga Malo, Juncal Aldaregia, Carlos Lopez-Robles, Pilar Areso,
Elisabeth S. Butz, Christian Wahl-Schott, Alvaro Villarroel
2015, Journal of Cell Science, 128(21), 4014-4023
*equal contribution
The publication deals with the calmodulin (CaM) regulation of the Kv7.2 potassium channel
and shows that the phosphatidylinositol 4,5-bisphosphate (PIP2) dependency of the channel
is affected by the assembly of distant intracellular channel domains involving different
CaM-binding modes.
With quantitative FRET measurements, in particular, we investigated the structural
assembly of Kv7.2 and its influence on CaM binding. The channel has a large intracellular
domain, containing four helical regions (A-D) and assembles as a tetramer with a coiled-coil
formation between the distal D helices. It could be demonstrated that the CaM binding site
is located within the AB helical regions, as the FRET efficiency between CaM and soluble
CD fragments was completely lost. However, a disruption of the coiled-coil structure by an
epilepsy-causing mutation within the D helix (L609R) abolished CaM interaction indicating
that a coiled-coil formation is essential for CaM regulation of Kv7.2.
This study is part of a collaboration with Prof. Alvaro Villarroel and his group from
University of Bilbao, Spain.
Declaration of Contribution: All quantitative FRET measurements shown in this paper,
were conducted on our FRET imaging setup. I supervised Araitz Alberdi during a short term
stay in our lab and conducted FRET measurements during the revision process of the
publication. Additionally, I analyzed all FRET experiments.
Quantitative FRET experiments account for the substantial key statements of this
publication.

Short summary of manuscripts | 29
6. 3 High susceptibility to fatty liver disease in two-pore channel 2-
deficient mice
Christian Grimm, Lesca M. Holdt*, Cheng-Chang Chen*, Sami Hassan*, Christoph
Müller, Simone Jörs, Hartmut Cuny, Sandra Kissing, Bernd Schröder, Elisabeth S.
Butz, Bernd Northoff, Jan Castonguay, Christian A. Luber, Markus Moser, Saskia
Spahn, Renate Lüllmann-Rauch, Christina Fendel, Norbert Klugbauer, Oliver
Griesbeck, Albert Haas, Matthias Mann, Franz Bracher, Daniel Teupser, Paul Saftig,
Martin Biel, Christian Wahl-Schott
2014, Nature Communications, 5:4699
*equal contribution
TPC2 is a non-selective cation channel localized to vesicles along the endolysosomal
pathway, which plays a crucial role in trafficking, breakdown and receptor-mediated
recycling of macromolecules. In the liver, receptor-mediated uptake of low-density
lipoproteins (LDLs) and subsequent endolysosomal transport is essential for hepatic
cholesterol homeostasis and plasma lipoprotein metabolism and dysfunction within this
pathway results in liver disease such as non-alcoholic fatty liver disease (NAFLD).
In this publication, we showed that a lack of TPC2 leads to an accumulation of LDL-
cholesterol and EGF/EGF-receptor by conducting trafficking assays in mouse embryonic
fibroblasts and hepatocytes derived from TPC2-deficient mice. The defects are most likely
due to a failure in late endosome to lysosome fusion. On systemic level, TPC2-deficient
mice are more susceptible to hepatic cholesterol overload and liver damage than wildtype
mice as seen after a Western-type diet rich in cholesterol, which is consistent with NAFLD.
Our results render TPC2 as a key player for trafficking within the endolysosomal pathway
that might be involved in the homeostatic control of macromolecules and cell metabolites.
Declaration of Contribution: I conducted all FRET measurements and concomitant analysis.
I designed and engineered cDNA plasmids used in the study.
Quantitative FRET experiments revealed a direct interaction between TPC2 and Stx7, a
SNARE protein crucial for homo- & heterotypic lysosomal fusion, indicating TPC2 as the
putative Ca2+-permeable channel that may provide local calcium for fusion.

Short summary of manuscripts | 30
6. 4 TPC2 polymorphisms associated with a hair pigmentation
phenotype in humans result in gain of channel function by
independent mechanisms
Yu-Kai Chao*, Verena Schludi*, Cheng-Chang Chen, Elisabeth S. Butz, O.N.
Phuong Nguyen, Martin Müller, Jens Krüger, Claudia Kammerbauer, Manu Ben-
Johny, Angelika Vollmar, Carola Berking, Martin Biel, Christian Wahl-Schott,
Christian Grimm
2017, accepted in Proceedings of the National Academy of Sciences
*equal contribution
Two human polymorphisms in the endolysosomal cation channel TPC2 (M484L and
G734E) are associated with a shift from brown to blond hair color. On cellular level, this is
most probably due to a regulatory role of TPC2 in pH and size of melanosomes, which
controls the amount of melanin produced. However, a functional characterization of the
polymorphic TPC2 variants was lacking.
In this study, we investigated the polymorphic channel characteristics. Both polymorphisms
were found to lead to a gain of function by independent mechanisms. Whereas the M484L
variant leads to an increased basal channel activity, the G734E variant is less prone to ATP
inhibition.
Genotyping of more than 100 blond hair and brown/ black haired individuals confirmed that
wildtype individuals are more brown haired, whereas polymorphic variants were
predominantly found in blond haired individuals. Finally, in fibroblasts isolated from
selected donors, the key electrophysiological in vitro findings were successfully validated.
Declaration of Contribution: I supervised Verena Schludi in FRET experiments and
analyzed FRET data.
FRET experiments were conducted to assess the TPC2 wildtype and polymorphic variant
dimerization and their binding to mTOR.

Short summary of manuscripts | 31
6. 5 Peripherin-2 couples rhodopsin to the CNG channel in outer
segments of rod photoreceptors
Elvir Becirovic*, O.N. Phuong Nguyen*, Christos Paparizos, Elisabeth S. Butz,
Gabi Stern-Schneider, Uwe Wolfrum, Stefanie M. Hauck, Marius Ueffing, Christian
Wahl-Schott, Stylianos Michalakis, Martin Biel
2014, Human Molecular Genetics, 23(22), 5989-5997
*equal contribution
Peripherin 2 is a tetraspanin transmembrane protein localized in the outer segments of
photoreceptors. Mutations in peripherin 2 in rod photoreceptors are associated with retinitis
pigmentosa in humans, a degenerative retinal disease eventually leading to blindness.
In this publication, we unraveled a direct interaction of peripherin 2 with two essential
proteins of the rod phototransduction cascade, namely CNGB1a, a core subunit of the rod
cyclic nucleotide-gated (CNG) channel, and rhodopsin, a light-sensitive protein, by
employing in vivo and in vitro imaging, biochemical and immunoaffinity methods.
In order to identify components of the CNG channel complex, a preliminary affinity
purification of mouse retinal proteins was followed by mass spectrometry. In combination
with FRET measurements and co-immunoprecipitations, we consequently found that
peripherin 2 links CNGB1a to rhodpsin. Moreover, FRET measurements utilizing C-
terminally truncated peripherin 2 showed that transmembrane domain 4 (TM4) is central to
the binding of the tetraspanin protein to rhodopsin. Interestingly, a retinitis pigmentosa
associated mutation (G226D) found within TM4 selectively abolished the binding of
peripherin 2 to rhodopsin.
In summary, the study sheds light on the role of peripherin 2 in the phototransduction
complex and suggests a direct contribution of the protein to the pathophysiology of retinitis
pigmentosa.
Declaration of Contribution: I performed and analyzed all in vitro in in vivo FRET
measurements in HEK293 cells and in outer segments of native photoreceptors.
The results gained in the FRET experiments, highlight the physiological role of peripherin 2
and are central to the study.

Short summary of manuscripts | 32
6. 6 Peripherin-2 differentially interacts with cone opsins in outer
segments of cone photoreceptors
O.N. Phuong Nguyen, Sybille Böhm, Andreas Gießl, Elisabeth S. Butz, Uwe
Wolfrum, Johann H. Brandstätter, Christian Wahl-Schott, Martin Biel, Elvir
Becirovic
2016, Human Molecular Genetics, 25(12), 2367-2377
In Becirovic et al., 2014 (Manuscript V, section. 6.5), we demonstrated a direct interaction
between peripherin 2 and the rod opsin. However, the role of peripherin 2 in cone outer
segments remained elusive.
In this study, we show that peripherin 2 localized in cone outer segments binds to both
S-opsin and M-opsin with different affinities by using a combination of
co-immunoprecipitation, quantitative FRET measurements and transmission electron
microscopy (TEM) based immunolabeling experiments.
FRET measurements of the respective interactions revealed a reduced binding affinity of
peripherin 2 to S-opsin compared to its interaction with M-opsin, which could be confirmed
by subsequent TEM studies. Furthermore, quantitative FRET measurements in acutely
isolated cone outer segments showed that the cone-degeneration causing V268I mutation in
peripherin 2 selectively reduced binding to M-opsin without affecting the peripherin 2
interaction to S-opsin or rhodopsin.
These results point to a so far unknown role of peripherin 2 in cones and further underline
the importance of direct interaction between the scaffold protein peripherin 2 and opsins.
Declaration of Contribution: I performed all in vitro in in vivo FRET measurements in
HEK293 cells and in outer segments of native photoreceptors. I supervised Sybille Böhm in
FRET experiments.
This publication represents a FRET-based study that reveals novel interaction partners of
peripherin 2 in cone photoreceptors and examines the effect of peripherin 2 mutations on
binding affinities.

Short summary of manuscripts | 33
6. 7 AAV Vectors for FRET-based analysis of protein-protein
interactions in photoreceptor outer segments
Elvir Becirovic, Sybille Böhm, Ong N. P. Nguyen, Lisa M. Riedmayr, Verena
Hammelmann, Christian Schön, Elisabeth S. Butz, Christian Wahl-Schott, Martin
Biel, Stylianos Michalakis
2016, Frontiers in Neuroscience, 10:356
The successfully performed ex vivo FRET measurements on acutely isolated OS of
photoreceptors in manuscripts V (Section 6.5) and VI (Section 6.6) resulted in the
publication of a methodological paper, which describes for the first time how to combine
AAV-vector mediated co-delivery of genetically encoded FRET partners in mouse models
with subsequent quantitative FRET measurements. In this paper, a rapid and robust protocol
for monitoring protein-protein interactions in acutely isolated photoreceptor OS of both rods
and cones was established. Using recombinant adeno-associated virus (rAAV)-mediated
gene transfer, fluorescently labeled FRET partners were delivered to their genuine
expression locus. Critically, a high co-transduction efficiency is central for the success of
the experiment. The procedure can be used to analyze protein-protein interactions of wild
type or mutant OS proteins in their native environment. Moreover, the principal approach
should be readily be transferable to other cell types.
Declaration of Contribution: I performed and analyzed the FRET experiments. In addition, I
optimized sample preparation for FRET measurements and contributed to writing of the
manuscript.

Short summary of manuscripts | 34
6. 8 Peripherin-2 and Rom-1 have opposing effects on rod outer segment
targeting of retinitis pigmentosa-linked peripherin-2 mutants
Sybille Böhm*, Lisa M. Riedmayr*, O.N. Phuong Nguyen, Andreas Gießl, Toni
Liebscher, Elisabeth S. Butz, Christian Schön, Stylianos Michalakis, Christian
Wahl-Schott, Martin Biel, Elvir Becirovic
2017, Scientific Reports, 7(1):2321
*equal contribution
Peripherin 2 forms homomeric protein complexes as well as heteromeric complexes with its
homolog Rom-1 in photoreceptor OS. Mutations in the peripherin 2 gene are associated
with autosomal dominant retinitis pigmentosa (adRP), whereas mutations in
Rom-1 cause digenic RP only in combination with a heterozygous mutation in peripherin 2.
Rom-1 is thus suggested to function as genetic modifier that influences disease progression.
Until now it is not known how the different complexes assembled by various combinations
of wildtype and mutant peripherin 2 or Rom-1, which can be formed in heterozygous
patients, result in adRP.
In this study, two adRP-linked peripherin 2 mutants, namely P210L and C214S, were
analyzed with regard to binding characteristics, subunit assembly, and rod OS targeting in
heteromeric complexes containing wildtype, mutant peripherin 2 and/or Rom-1. These
complexes can be formed in patients heterozygous for peripherin 2 mutations.
The results show that both mutants are misfolded and mislocalized. Moreover, their binding
to wildtype peripherin 2 and Rom-1 was strongly decreased. Finaly, both mutants are
preferentially forming non-covalent dimers with wildtype peripherin 2 and Rom-1.
However, only complexes containing a wildtype peripherin 2 could be transported to the rod
OS. Other complexes were retained in the inner segments.
In conclusion, the study reveals opposing roles of wildtype peripherin 2 and Rom-1 in rod
OS targeting of adRP-linked peripherin 2 mutants.
Declaration of Contribution: I supervised Sybille Böhm in FRET experiments and analyzed
part of the FRET data.

References | 35
7 References
Ambrosio, A.L., Boyle, J.A., Aradi, A.E., Christian, K.A., and Di Pietro, S.M. (2016). TPC2 controls pigmentation by regulating melanosome pH and size. Proc Natl Acad Sci U S A 113, 5622-5627.
Arikawa, K., Molday, L.L., Molday, R.S., and Williams, D.S. (1992). Localization of peripherin/rds in the disk membranes of cone and rod photoreceptors: relationship to disk membrane morphogenesis and retinal degeneration. J Cell Biol 116, 659-667.
Bascom, R.A., Manara, S., Collins, L., Molday, R.S., Kalnins, V.I., and McInnes, R.R. (1992). Cloning of the cDNA for a novel photoreceptor membrane protein (rom-1) identifies a disk rim protein family implicated in human retinopathies. Neuron 8, 1171-1184.
Bellono, N.W., Escobar, I.E., and Oancea, E. (2016). A melanosomal two-pore sodium channel regulates pigmentation. Sci Rep 6, 26570.
Ben Johny, M., Yang, P.S., Bazzazi, H., and Yue, D.T. (2013). Dynamic switching of calmodulin interactions underlies Ca2+ regulation of CaV1.3 channels. Nat Commun 4, 1717.
Ben-Johny, M., Yue, D.N., and Yue, D.T. (2016). Detecting stoichiometry of macromolecular complexes in live cells using FRET. Nat Commun 7, 13709.
Ben-Johny, M., and Yue, D.T. (2014). Calmodulin regulation (calmodulation) of voltage-gated calcium channels. J Gen Physiol 143, 679-692.
Boesze-Battaglia, K., Kong, F., Lamba, O.P., Stefano, F.P., and Williams, D.S. (1997). Purification and light-dependent phosphorylation of a candidate fusion protein, the photoreceptor cell peripherin/rds. Biochemistry 36, 6835-6846.
Boesze-Battaglia, K., Lamba, O.P., Napoli, A.A., Jr., Sinha, S., and Guo, Y. (1998). Fusion between retinal rod outer segment membranes and model membranes: a role for photoreceptor peripherin/rds. Biochemistry 37, 9477-9487.
Bogdanovic, A., Bennett, N., Kieffer, S., Louwagie, M., Morio, T., Garin, J., Satre, M., and Bruckert, F. (2002). Syntaxin 7, syntaxin 8, Vti1 and VAMP7 (vesicle-associated membrane protein 7) form an active SNARE complex for early macropinocytic compartment fusion in Dictyostelium discoideum. Biochem J 368, 29-39.
Bonifacino, J.S., and Glick, B.S. (2004). The mechanisms of vesicle budding and fusion. Cell 116, 153-166.

References | 36
Boon, C.J., den Hollander, A.I., Hoyng, C.B., Cremers, F.P., Klevering, B.J., and Keunen, J.E. (2008). The spectrum of retinal dystrophies caused by mutations in the peripherin/RDS gene. Prog Retin Eye Res 27, 213-235.
Brailoiu, G.C., Brailoiu, E., Parkesh, R., Galione, A., Churchill, G.C., Patel, S., and Dun, N.J. (2009). NAADP-mediated channel 'chatter' in neurons of the rat medulla oblongata. Biochem J 419, 91-97, 92 p following 97.
Brown, D.A., and Passmore, G.M. (2009). Neural KCNQ (Kv7) channels. Br J Pharmacol 156, 1185-1195.
Calcraft, P.J., Ruas, M., Pan, Z., Cheng, X., Arredouani, A., Hao, X., Tang, J., Rietdorf, K., Teboul, L., Chuang, K.T., et al. (2009). NAADP mobilizes calcium from acidic organelles through two-pore channels. Nature 459, 596-600.
Cang, C., Zhou, Y., Navarro, B., Seo, Y.J., Aranda, K., Shi, L., Battaglia-Hsu, S., Nissim, I., Clapham, D.E., and Ren, D. (2013). mTOR regulates lysosomal ATP-sensitive two-pore Na(+) channels to adapt to metabolic state. Cell 152, 778-790.
Chen, H., Puhl, H.L., 3rd, Koushik, S.V., Vogel, S.S., and Ikeda, S.R. (2006). Measurement of FRET efficiency and ratio of donor to acceptor concentration in living cells. Biophys J 91, L39-41.
Chen, Y.A., and Scheller, R.H. (2001). SNARE-mediated membrane fusion. Nat Rev Mol Cell Biol 2, 98-106.
Chin, D., and Means, A.R. (2000). Calmodulin: a prototypical calcium sensor. Trends Cell Biol 10, 322-328.
Clegg, R.M. (1992). Fluorescence resonance energy transfer and nucleic acids. Methods Enzymol 211, 353-388.
Conley, S.M., Ding, X.Q., and Naash, M.I. (2010). RDS in cones does not interact with the beta subunit of the cyclic nucleotide gated channel. Adv Exp Med Biol 664, 63-70.
Ding, J.D., Salinas, R.Y., and Arshavsky, V.Y. (2015). Discs of mammalian rod photoreceptors form through the membrane evagination mechanism. J Cell Biol 211, 495-502.
Erickson, M.G., Alseikhan, B.A., Peterson, B.Z., and Yue, D.T. (2001). Preassociation of calmodulin with voltage-gated Ca(2+) channels revealed by FRET in single living cells. Neuron 31, 973-985.
Erickson, M.G., Liang, H., Mori, M.X., and Yue, D.T. (2003). FRET two-hybrid mapping reveals function and location of L-type Ca2+ channel CaM preassociation. Neuron 39, 97-107.

References | 37
Felbor, U., Schilling, H., and Weber, B.H. (1997). Adult vitelliform macular dystrophy is frequently associated with mutations in the peripherin/RDS gene. Hum Mutat 10, 301-309.
Förster, T. (1948). Intermolecular energy migration and fluorescence. Annalen der Physik 2, 55-75.
Grant, B.D., and Donaldson, J.G. (2009). Pathways and mechanisms of endocytic recycling. Nat Rev Mol Cell Biol 10, 597-608.
Grimm, C., Chen, C.C., Wahl-Schott, C., and Biel, M. (2017). Two-Pore Channels: Catalyzers of Endolysosomal Transport and Function. Front Pharmacol 8, 45.
Grimm, C., Holdt, L.M., Chen, C.C., Hassan, S., Muller, C., Jors, S., Cuny, H., Kissing, S., Schroder, B., Butz, E., et al. (2014). High susceptibility to fatty liver disease in two-pore channel 2-deficient mice. Nat Commun 5, 4699.
Haitin, Y., and Attali, B. (2008). The C-terminus of Kv7 channels: a multifunctional module. J Physiol 586, 1803-1810.
Hell, S. (2006). Handbook of biological confocal microscopy 3rd edn (New York: Springer Science + Buisness).
Hockey, L.N., Kilpatrick, B.S., Eden, E.R., Lin-Moshier, Y., Brailoiu, G.C., Brailoiu, E., Futter, C.E., Schapira, A.H., Marchant, J.S., and Patel, S. (2015). Dysregulation of lysosomal morphology by pathogenic LRRK2 is corrected by TPC2 inhibition. J Cell Sci 128, 232-238.
Houdusse, A., Gaucher, J.F., Krementsova, E., Mui, S., Trybus, K.M., and Cohen, C. (2006). Crystal structure of apo-calmodulin bound to the first two IQ motifs of myosin V reveals essential recognition features. Proc Natl Acad Sci U S A 103, 19326-19331.
Houdusse, A., Silver, M., and Cohen, C. (1996). A model of Ca(2+)-free calmodulin binding to unconventional myosins reveals how calmodulin acts as a regulatory switch. Structure 4, 1475-1490.
Huotari, J., and Helenius, A. (2011). Endosome maturation. EMBO J 30, 3481-3500.
Jahn, R., Lang, T., and Sudhof, T.C. (2003). Membrane fusion. Cell 112, 519-533.
Jares-Erijman, E.A., and Jovin, T.M. (2003). FRET imaging. Nat Biotechnol 21, 1387-1395.
Jentsch, T.J. (2000). Neuronal KCNQ potassium channels: physiology and role in disease. Nat Rev Neurosci 1, 21-30.
Kenworthy, A.K. (2001). Imaging protein-protein interactions using fluorescence resonance energy transfer microscopy. Methods 24, 289-296.

References | 38
Kummel, D., and Ungermann, C. (2014). Principles of membrane tethering and fusion in endosome and lysosome biogenesis. Curr Opin Cell Biol 29, 61-66.
Lakowicz, J.R. (2006). Principles of Fluorescence Spectroscopy (New York: Springer).
Lin-Moshier, Y., Keebler, M.V., Hooper, R., Boulware, M.J., Liu, X., Churamani, D., Abood, M.E., Walseth, T.F., Brailoiu, E., Patel, S., et al. (2014). The Two-pore channel (TPC) interactome unmasks isoform-specific roles for TPCs in endolysosomal morphology and cell pigmentation. Proc Natl Acad Sci U S A 111, 13087-13092.
Luzio, J.P., Bright, N.A., and Pryor, P.R. (2007a). The role of calcium and other ions in sorting and delivery in the late endocytic pathway. Biochem Soc Trans 35, 1088-1091.
Luzio, J.P., Pryor, P.R., and Bright, N.A. (2007b). Lysosomes: fusion and function. Nat Rev Mol Cell Biol 8, 622-632.
Luzio, J.P., Rous, B.A., Bright, N.A., Pryor, P.R., Mullock, B.M., and Piper, R.C. (2000). Lysosome-endosome fusion and lysosome biogenesis. J Cell Sci 113 ( Pt 9), 1515-1524.
Marchant, J.S., Lin-Moshier, Y., Walseth, T.F., and Patel, S. (2012). The Molecular Basis for Ca2+ Signalling by NAADP: Two-Pore Channels in a Complex? Messenger (Los Angel) 1, 63-76.
Medina, D.L., Di Paola, S., Peluso, I., Armani, A., De Stefani, D., Venditti, R., Montefusco, S., Scotto-Rosato, A., Prezioso, C., Forrester, A., et al. (2015). Lysosomal calcium signalling regulates autophagy through calcineurin and TFEB. Nat Cell Biol 17, 288-299.
Minor, D.L., Jr., and Findeisen, F. (2010). Progress in the structural understanding of voltage-gated calcium channel (CaV) function and modulation. Channels (Austin) 4, 459-474.
Miyawaki, A., Llopis, J., Heim, R., McCaffery, J.M., Adams, J.A., Ikura, M., and Tsien, R.Y. (1997). Fluorescent indicators for Ca2+ based on green fluorescent proteins and calmodulin. Nature 388, 882-887.
Mustafi, D., Engel, A.H., and Palczewski, K. (2009). Structure of cone photoreceptors. Prog Retin Eye Res 28, 289-302.
Patel, S. (2015). Function and dysfunction of two-pore channels. Sci Signal 8, re7.
Patterson, G., Day, R.N., and Piston, D. (2001). Fluorescent protein spectra. J Cell Sci 114, 837-838.
Patterson, G.H., Piston, D.W., and Barisas, B.G. (2000). Forster distances between green fluorescent protein pairs. Anal Biochem 284, 438-440.

References | 39
Perl, A. (2015). mTOR activation is a biomarker and a central pathway to autoimmune disorders, cancer, obesity, and aging. Ann N Y Acad Sci 1346, 33-44.
Perl, A. (2016). Activation of mTOR (mechanistic target of rapamycin) in rheumatic diseases. Nat Rev Rheumatol 12, 169-182.
Poetsch, A., Molday, L.L., and Molday, R.S. (2001). The cGMP-gated channel and related glutamic acid-rich proteins interact with peripherin-2 at the rim region of rod photoreceptor disc membranes. J Biol Chem 276, 48009-48016.
Pryor, P.R., Mullock, B.M., Bright, N.A., Gray, S.R., and Luzio, J.P. (2000). The role of intraorganellar Ca(2+) in late endosome-lysosome heterotypic fusion and in the reformation of lysosomes from hybrid organelles. J Cell Biol 149, 1053-1062.
Pryor, P.R., Mullock, B.M., Bright, N.A., Lindsay, M.R., Gray, S.R., Richardson, S.C., Stewart, A., James, D.E., Piper, R.C., and Luzio, J.P. (2004). Combinatorial SNARE complexes with VAMP7 or VAMP8 define different late endocytic fusion events. EMBO Rep 5, 590-595.
Purves (2001). Neuroscience. In Neuroscience, A.G. Purves D, Fitzpatrick D., ed. (Sunderland (MA): Sinauer Associates).
Repnik, U., Cesen, M.H., and Turk, B. (2013). The endolysosomal system in cell death and survival. Cold Spring Harb Perspect Biol 5, a008755.
Ritter, L.M., Khattree, N., Tam, B., Moritz, O.L., Schmitz, F., and Goldberg, A.F. (2011). In situ visualization of protein interactions in sensory neurons: glutamic acid-rich proteins (GARPs) play differential roles for photoreceptor outer segment scaffolding. J Neurosci 31, 11231-11243.
Robbins, J. (2001). KCNQ potassium channels: physiology, pathophysiology, and pharmacology. Pharmacol Ther 90, 1-19.
Ruas, M., Chuang, K.T., Davis, L.C., Al-Douri, A., Tynan, P.W., Tunn, R., Teboul, L., Galione, A., and Parrington, J. (2014). TPC1 has two variant isoforms, and their removal has different effects on endo-lysosomal functions compared to loss of TPC2. Mol Cell Biol 34, 3981-3992.
Ruas, M., Galione, A., and Parrington, J. (2015). Two-Pore Channels: Lessons from Mutant Mouse Models. Messenger (Los Angel) 4, 4-22.
Ruas, M., Rietdorf, K., Arredouani, A., Davis, L.C., Lloyd-Evans, E., Koegel, H., Funnell, T.M., Morgan, A.J., Ward, J.A., Watanabe, K., et al. (2010). Purified TPC isoforms form NAADP receptors with distinct roles for Ca(2+) signaling and endolysosomal trafficking. Curr Biol 20, 703-709.
Sachyani, D., Dvir, M., Strulovich, R., Tria, G., Tobelaim, W., Peretz, A., Pongs, O., Svergun, D., Attali, B., and Hirsch, J.A. (2014). Structural basis of a Kv7.1 potassium

References | 40
channel gating module: studies of the intracellular c-terminal domain in complex with calmodulin. Structure 22, 1582-1594.
Sakurai, Y., Kolokoltsov, A.A., Chen, C.C., Tidwell, M.W., Bauta, W.E., Klugbauer, N., Grimm, C., Wahl-Schott, C., Biel, M., and Davey, R.A. (2015). Ebola virus. Two-pore channels control Ebola virus host cell entry and are drug targets for disease treatment. Science 347, 995-998.
Shaner, N.C., Steinbach, P.A., and Tsien, R.Y. (2005). A guide to choosing fluorescent proteins. Nat Methods 2, 905-909.
Sohocki, M.M., Daiger, S.P., Bowne, S.J., Rodriquez, J.A., Northrup, H., Heckenlively, J.R., Birch, D.G., Mintz-Hittner, H., Ruiz, R.S., Lewis, R.A., et al. (2001). Prevalence of mutations causing retinitis pigmentosa and other inherited retinopathies. Hum Mutat 17, 42-51.
Stryer, L., and Haugland, R.P. (1967). Energy transfer: a spectroscopic ruler. Proc Natl Acad Sci U S A 58, 719-726.
Stuck, M.W., Conley, S.M., and Naash, M.I. (2016). PRPH2/RDS and ROM-1: Historical context, current views and future considerations. Prog Retin Eye Res 52, 47-63.
Sulem, P., Gudbjartsson, D.F., Stacey, S.N., Helgason, A., Rafnar, T., Jakobsdottir, M., Steinberg, S., Gudjonsson, S.A., Palsson, A., Thorleifsson, G., et al. (2008). Two newly identified genetic determinants of pigmentation in Europeans. Nat Genet 40, 835-837.
Sung, C.H., and Chuang, J.Z. (2010). The cell biology of vision. J Cell Biol 190, 953-963.
Trybus, K.M. (2008). Myosin V from head to tail. Cell Mol Life Sci 65, 1378-1389.
Villarroel, A., Taglialatela, M., Bernardo-Seisdedos, G., Alaimo, A., Agirre, J., Alberdi, A., Gomis-Perez, C., Soldovieri, M.V., Ambrosino, P., Malo, C., et al. (2014). The ever changing moods of calmodulin: how structural plasticity entails transductional adaptability. J Mol Biol 426, 2717-2735.
Vogel, S.S., Thaler, C., and Koushik, S.V. (2006). Fanciful FRET. Sci STKE 2006, re2.
Wang, X., Zhang, X., Dong, X.P., Samie, M., Li, X., Cheng, X., Goschka, A., Shen, D., Zhou, Y., Harlow, J., et al. (2012). TPC proteins are phosphoinositide- activated sodium-selective ion channels in endosomes and lysosomes. Cell 151, 372-383.
Wells, J., Wroblewski, J., Keen, J., Inglehearn, C., Jubb, C., Eckstein, A., Jay, M., Arden, G., Bhattacharya, S., Fitzke, F., et al. (1993). Mutations in the human retinal degeneration slow (RDS) gene can cause either retinitis pigmentosa or macular dystrophy. Nat Genet 3, 213-218.
Xu, H., and Ren, D. (2015). Lysosomal physiology. Annu Rev Physiol 77, 57-80.

References | 41
Yus-Najera, E., Santana-Castro, I., and Villarroel, A. (2002). The identification and characterization of a noncontinuous calmodulin-binding site in noninactivating voltage-dependent KCNQ potassium channels. J Biol Chem 277, 28545-28553.
Zong, X., Schieder, M., Cuny, H., Fenske, S., Gruner, C., Rotzer, K., Griesbeck, O., Harz, H., Biel, M., and Wahl-Schott, C. (2009). The two-pore channel TPCN2 mediates NAADP-dependent Ca(2+)-release from lysosomal stores. Pflugers Arch 458, 891-899.

Publications | 42
8 Publications
Original Publications
Chen C-C*, Butz ES*, Chao Y-K, Grishchuk Y, Becker L, Heller S, Slaugenhaupt SA, Biel M, Wahl-Schott C, Grimm C (2017) Small molecules for early endosome specific patch-clamping Cell Chem Biol 24(7):907-916.e4 * Authors contributed equally Böhm S, Riedmayr LM, Nguyen O.N., Gießl A, Liebscher T, Butz ES, Schön C, Michalakis S, Wahl-Schott C, Biel M and Becirovic E (2017) Rom-1 prevents rod outer segment targeting of retinitis pigmentosa-linked peripherin-2 mutants. Sci Rep May 24:7(1):2321. doi: 10.1038/s41598-017-02514-5 Chen C-C*, Cang C*, Fenske S, Butz E, Chao Y-K, Biel M, Ren D, Wahl-Schott C, Grimm C (2017) Patch clamp technique to characterize ion channels in enlarged individual endolysosomes Nat Protoc 12(8):1639-1658 Butz ES*, Ben-Johny M*, Shen M, Yang PS, Sang L, Biel M, Yue DT, Wahl-Schott C (2016) Quantifying macromolecular interactions in living cells using FRET two-hybrid assays. Nat Protoc 11(12): 2470-2498 * Authors contributed equally Becirovic E., Böhm S., Nguyen O.N., Riedmayr L.M., Hammelmann V., Schön C., Butz E.S., Wahl-Schott C., Biel M., Michalakis S. (2016) AAV Vectors for FRET-Based analysis of protein-protein interactions in photoreceptor outer segments., Front Neurosci. 28;10:356. doi: 10.3389/fnins.2016.00356. Nguyen O.N., Böhm S., Gießl A., Butz E.S., Wolfrum U., Brandstätter J.H., Wahl-Schott C., Biel M., Becirovic E. (2016) Peripherin-2 differentially interacts with cone opsins in outer segments of cone photoreceptors. Hum Mol Genet. 15;25(12):2367-2377 Alberdi A, Gomis-Perez C, Bernardo-Seisdedos G, Alaimo A, Malo C, Aldaregia J, Lopez-Robles C, Areso P, Butz E, Wahl-Schott C, Villarroel A. (2015) Uncoupling PIP2-calmodulin regulation of Kv7.2 channels by an assembly destabilizing epileptogenic mutation. J Cell Sci. 2015 Nov 1;128(21):4014-23. doi: 10.1242/jcs.176420. Butz E., Peichl L., Müller B. (2014) Cone bipolar cells in the retina of the microbat Carollia Perspicillata. J Comp Neurol doi: 10.1002/cne.23726 Grimm C., Holdt L.M., Chen C.-C., Hassan S., Müller C., Jörs S., Cuny H., Kissing S., Schröder B., Butz E., Northoff B., Castonguay J., Luber C.A., Moser M., Spahn S.,

Publications | 43
Lüllmann-Rauch R., Fendel C., Klugbauer N., Griesbeck O., Haas A., Mann M., Bracher F., Teupser, D., Saftig P., Biel M., Wahl-Schott C. (2014) High susceptibility to fatty liver disease in two-pore channel 2-deficient mice, Nature Commun., 5:4699. doi: 10.1038/ncomms5699 Becirovic E.*, Nguyen ON.*, Paparizos C., Butz E., Stern-Schneider G., Wolfrum U., Hauck SM., Ueffing M., Wahl.Schott C., Michalakis S., Biel M. (2014) Peripherin-2 couples rhodopsin to the CNG channel in outer segments of rod photoreceptors Hum Mol Genet 23(22):5989-97. doi: 10.1093/hmg/ddu323 Müller B., Butz E., Peichl L., Haverkamp S. (2013) The rod pathway of the microbat retina has bistratified rod bipolar cells and tristratified AII amacrine cells, J Neurosci, 33(3): 1014-1023; doi: 10.1523/JNEUROSCI.2072-12.2013 Weissbach A., Djarmati A., Klein C., Dragasević N., Zühlke C., Raković A:, Guzvić M., Butz E., Tönnies H., Siebert R., Petrović I., Svetel M., Kostić V.S., Lohmann K. (2010) Possible genetic heterogeneity of spinocerebellar ataxia linked to chromosome 15 Movement Disorders 25(11):1577-82 doi: 10.1002/mds.22857 Review Grimm C., Butz E., Chen C.C., Wahl-Schott C., Biel M. (2017) From mucolipidosis type IV to Ebola: TRPML and two-pore channels at the crossroads of endo-lysosomal trafficking and disease., Cell Calcium Apr 23. pii: S0143-4160(17)30046-5. doi: 10.1016/j.ceca.2017.04.003. Submitted manuscripts Chao Y.K.*, Schludi V.*, Chen C.C., Butz E.S., NguyenO.N.P., Müller M., Krüger J., Kammerbauer C., Ben-Johny M., Vollmar A., Berking C., Biel M., Wahl-Schott C., Grimm C. (2017) TPC2 polymorphisms associated with a hair pigmentation phenotype in humans result in gain of channel function by independent mechanisms., submitted to Proceedings to the National Academy of Science (PNAS) Conference participations and Poster C.C. Chen, E. Butz, E. Plesch, Y.K. Chao, F. Bracher, C. Wahl-Schott, M. Biel, C. Grimm Characterization of TRPML3 currents in endolysosomal system CRC/TRR152 Symposium, 28. Sep. – 1. Oct. 2016, Herrsching

Publications | 44
Butz E., Chen C.C., Hassan S., Armandi G., Griesbeck O., Wahl-Schott C., Biel M. Neuronal phenotype of TPC2-deficient mice CRC/TRR152 Symposium, 28. – 31. Oct. 2015, Herrsching C. Grimm, E. Butz, C.C. Chen, M. Biel, C. Wahl-Schott High susceptibility to non-alcoholic fatty liver disease in two-pore channel 2-deficient mice (2940-POS) Biophysical Society 59th Annual Meeting, 7. – 11. Feb. 2015, Baltimore E. Butz, M. Biel, C. Wahl-Schott Quantitative FRET approach to monitor binding affinities between ion channesl and its putative interaction partners, Sommer School 18. – 20. Jul. 2014, Frauenchiemsee

Acknowledgement | 45
9 Acknowledgement
Hiermit möchte ich mich bei allen bedanken, die das Entstehen dieser Doktorarbeit möglich gemacht haben. Es war eine sehr prägende und lehrreiche Zeit für mich. Mein aufrichtigster Dank gilt im Besonderen...
... Prof. Dr. Martin Biel für die Aufnahme in den Arbeitskreis, die andauernde Förderung und die finanzielle Unterstützung, die die Verwirklichung vieler Projekte erst möglich gemacht hat. ... Prof. Dr. Christian Wahl für die gute Betreuung, die stete Ermutigung und Förderung. Lieber Christian, vielen Dank für das Vertrauen, das Du in mich gesetzt hast! ... Dr. Dr. Christian Grimm für die kontinuierliche wissenschaftliche und moralische Unterstützung, die Geduld und gute Zusammenarbeit über das Dissertationsthema hinaus. Lieber Christian, es war immer sehr motivierend, mit Dir zu arbeiten! ... Dr. Elvir Becirovic für das Angebot, mich in seine Projekte einzubringen und das freundliche Überlassen einzelner Abbildungen. Danke, dass Du mich immer in die thematischen Hintergründe einbezogen hast! ... Dr. Manu Ben Johny für die interessante Zeit an der Johns Hopkins in Baltimore und den intensiven wissenschaftlichen Austausch. ... Dr. Verena Hammelmann für die vielen geduldigen und aufrichtigen Antworten auf all meine Fragen. ... Dr. Cheng-Chang Chen und Yu-Kai Chao für die gute Zusammenarbeit. It was a pleasure working with you! ... Verena Schludi für viele Jahre kollegiale Sitznachbarschaft, unermüdlichen Optimismus und gute Laune. ... meinen treuen Studenten Renè Rötzer, Anna Rößing und Tamara Kiwitt für ihre Hilfe, Unterstützung und Motivation in einer für mich sehr stressigen Zeit. ... den aktuellen wie auch ehemaligen Kollegen des gesamten Arbeitskreises für die angenehme Arbeitsatmosphäre, anregende Diskussionen und die Hilfsbereitschaft; viele lustige gemeinsame Abende und auch für das ein oder andere Gläschen Wein zur richtigen Zeit.
Von ganzem Herzen möchte ich meiner Familie, insbesondere meinen Eltern und Geschwistern, für ihre konstante Unterstützung und das große Vertrauen danken, das sie in mich setzen. Ohne euren Rückhalt hätte ich so einiges nicht geschafft!

Appendix | 46
10 Appendix
In the following, manuscripts I to VIII are reprinted:
I. Butz et al., (2016) Quantifying macromolecular interactions in living cells using
FRET two-hybrid assays, Nature Protocols, 11(12): 2470-2498
II. Alberdi et al., (2015) Uncoupling PIP2-calmodulin regulation of Kv7.2 channels by
an assembly destabilizing epileptogenic mutation, Journal of Cell Science, 128(21),
4014-4023
III. Grimm et al., (2014) High susceptibility to fatty liver disease in two-pore channel 2-
deficient mice, Nature Communications, 5:4699
IV. Chao et al., (2017) TPC2 polymorphisms associated with a hair pigmentation
phenotype in humans result in gain of channel function by independent mechanisms
2017, accepted in Proceedings of the National Academy of Sciences
V. Becirovic et al., (2014) Peripherin-2 couples rhodopsin to the CNG channel in outer
segments of rod photoreceptors Human Molecular Genetics, 23(22), 5989-5997
VI. Nguyen et al., (2016) Peripherin-2 differentially interacts with cone opsins in outer
segments of cone photoreceptors Human Molecular Genetics, 25(12), 2367-2377
VII. Becirovic et al., (2016) AAV vectors for FRET-based analysis of protein-protein
interactions in photoreceptor outer segments Frontiers in Neuroscience, 10:356
VIII. Böhm et al., (2017) Peripherin-2 and Rom-1 have opposing effects on rod outer
segment targeting of retinitis pigmentosa-linked peripherin-2 mutants Scientific
Reports, 7(1):2321

©20
16 M
acm
illan
Pu
blis
her
s L
imit
ed, p
art
of
Sp
rin
ger
Nat
ure
. All
rig
hts
res
erve
d.
protocol
2470 | VOL.11 NO.12 | 2016 | nature protocols
IntroDuctIonFRET is a powerful technique used to probe close-range molecu-lar interactions and to estimate atomic-scale distances. Physically, the FRET phenomenon manifests as a dipole–dipole interaction between closely juxtaposed fluorescent molecules. For instance, after photoexcitation, a fluorophore may de-excite through direct emission of a photon of appropriate wavelength. However, in the presence of a nearby acceptor, the donor nonradiatively transfers energy to the acceptor molecule, resulting in quenched donor fluorescence—a phenomenon termed FRET. The excited acceptor molecule may subsequently emit a photon with a shifted spec-trum. In principle, by monitoring the hue of the emitted photon, one can detect a molecular interaction and infer the approximate spatial arrangement of the two molecules. The physical principles underlying FRET and its application as a spectroscopic ruler have been reviewed at length in the past1,2.
With the advent of an expanded color palette of genetically encoded fluorophores, the FRET methodology has garnered much interest in regard to studying biological systems3. To date, several strategies have been used to determine FRET efficiencies nondestructively4–10. Traditional approaches such as acceptor photobleaching quantify the donor fluorescence before and after photodestruction of the acceptor. This approach requires the sample to be exposed to high-intensity light, often resulting in cellular phototoxicity. The destructive nature of this popular approach means that only a single FRET measurement can be attained. Nondestructive assays assess FRET efficiency from brief low-intensity light pulses, enabling rapid and dynamic measure-ments with relatively minimal photodamage.
Development of the protocolThe FRET two-hybrid assay is a valuable method for detecting and quantifying binding interactions between biological mac-romolecules in living cells. A single cell is considered to be a ‘biological cuvette’, and FRET efficiency is systematically meas-ured between pairs of fluorophore-tagged molecules from many
single cells for quantitative determination of bimolecular interac-tions. The protocol presented here provides the theoretical and experimental framework to integrate two existing FRET two-hybrid approaches: 33-FRET and E-FRET. This analysis enables microscope-dependent calibration constants to be experimentally determined, apparent donor- and acceptor-centric FRET efficien-cies to be computed, and robust, reproducible binding curves of high quality to be obtained—permitting rigorous biochemical analysis in living cells.
The methodology and formalism elaborated here is built upon work by Erickson et al. that was first applied to characterize the interaction of the Ca2+-binding protein calmodulin with the L-type Ca2+ channel complex9,10. In this experimental paradigm, fluorescence measurements are obtained from three distinct filter cubes. The filters are chosen to specifically detect donor, acceptor and FRET signals. The use of three filter cubes allows for accurate dissection of the FRET signal from pure donor and acceptor signals, leading to its name 33-FRET. The ‘sensitized emission’ or the net increase in acceptor fluorescence due to FRET is computed from these measurements. Importantly, this metric corresponds to an acceptor-centric measurement of FRET, and the efficiencies computed are reported as ‘EA’. The very same measurements can be used to nondestructively calculate the net decrease in donor fluorescence due to FRET. This metric corre-sponds to FRET efficiencies obtained using donor dequenching or acceptor photobleaching methods. This methodology is termed ‘E-FRET’ and corresponds to a donor-centric FRET measurement denoted here as ‘ED’. Experimental determination of both 33-FRET and E-FRET efficiency measurements rely on two instrument- specific constants that need to be either computed based on the optical properties of the imaging system (Supplementary Note 1, Supplementary Data 1) or experimentally determined using a series of cyan fluorescent protein–yellow fluorescent pro-tein (CFP–YFP) dimers (‘Determination of calibration constants using dimers’ section).
Quantifying macromolecular interactions in living cells using FRET two-hybrid assaysElisabeth S Butz1,3, Manu Ben-Johny2,3, Michael Shen2, Philemon S Yang2, Lingjie Sang2, Martin Biel1, David T Yue2 & Christian Wahl-Schott1
1Center for Integrated Protein Science CIPS-M and Zentrum für Pharmaforschung, Department Pharmazie; DZHK (German Center for Cardiovascular Research), partner site Munich Heart Alliance, Munich, Germany. 2Calcium Signals Laboratory, Department of Biomedical Engineering, The Johns Hopkins University School of Medicine, Baltimore, Maryland, USA. 3These authors contributed equally to this work. Correspondence should be addressed to M.B.-J. ([email protected]) or C.W.-S. ([email protected]).
Published online 10 November 2016; corrected online 1 December 2016 (details online); doi:10.1038/nprot.2016.128
Förster resonance energy transfer (Fret) is a versatile method for analyzing protein–protein interactions within living cells. this protocol describes a nondestructive live-cell Fret assay for robust quantification of relative binding affinities for protein–protein interactions. unlike other approaches, our method correlates the measured Fret efficiencies to relative concentration of interacting proteins to determine binding isotherms while including collisional Fret corrections. We detail how to assemble and calibrate the equipment using experimental and theoretical procedures. a step-by-step protocol is given for sample preparation, data acquisition and analysis. the method uses relatively inexpensive and widely available equipment and can be performed with minimal training. Implementation of the imaging setup requires up to 1 week, and sample preparation takes ~1–3 d. an individual Fret experiment, including control measurements, can be completed within 4–6 h, with data analysis requiring an additional 1–3 h.

©20
16 M
acm
illan
Pu
blis
her
s L
imit
ed, p
art
of
Sp
rin
ger
Nat
ure
. All
rig
hts
res
erve
d.
protocol
nature protocols | VOL.11 NO.12 | 2016 | 2471
Once 33-FRET or E-FRET efficiencies are determined, the FRET two-hybrid assay correlates these efficiencies with the free con-centrations of donor or acceptor molecules, respectively. The first important step in the workflow is the experimental determination of the total number of donor and acceptor proteins present in any given cell based on the total YFP and CFP fluorescence cor-rected for quenching due to FRET. Data from many single cells are then compiled to construct a single binding curve. In practice, the stochastic expression of CFP and YFP molecules in cells yields a broad range of free donor or acceptor concentrations, and each cell populates various segments of a binding curve.
Theoretical underpinnings of the FRET two-hybrid assayFor the illustrative experiments described in this protocol, the FRET measurement setup (Fig. 1) is composed of a wide-field fluorescence microscope, a xenon-lamp-based excitation system, a motorized turret containing three filter cubes and a photomulti-plier-based detection system (Figs. 1 and 2). Any donor–acceptor fluorescent protein pairs that are suitable for FRET measure-ments, together with matched filter cubes, can be used for these experiments11. We will describe the method for the enhanced CFP–enhanced YFP (CFP–YFP) donor–acceptor pair, which is a popular choice for FRET. Three filter cubes are required: a CFP cube, a FRET cube and a YFP cube (Table 1). As the venus–cerulean FRET pairs are highly similar to CFP–YFP pairs, the same filter cubes can be used, although the instrument-specific calibration constants should be explicitly measured for these pairs, given their distinct quantum yields.
For typical FRET experiments, proteins of interest are fused to either CFP or YFP, and expressed pairwise in mammalian HEK293 cells. Fluorescence signal from each cell is analyzed using three filter cubes (Table 1) to compute apparent FRET efficiencies. Illumination of the sample at the peak of the donor excitation spectrum (λ ~ 436 nm) results in a double-peaked spectrum com-posed of CFP emission superimposed on YFP emission. In part, the net YFP fluorescence is the result of weak direct excitation
by the 436-nm light (~1–3%). In addition, with FRET, CFP transfers energy to YFP, resulting in quenching of the CFP fluo-rescence (observed at ~480 nm) and an enhancement in the YFP fluorescence detected at ~535 nm (ref. 12). FRET can be measured either as the fractional increase in the acceptor inten-sity (‘sensitized emission’) or as the fractional decrease in the donor intensity (‘donor quenching’) (Fig. 3a). In the first case, the apparent FRET efficiency (EA), is given by the amount of measured sensitized emission in relation to maximal sensi-tized emission that would be present for a FRET efficiency of 1. Alternatively, FRET can be measured using donor dequenching, in which case the apparent FRET efficiency (ED), will be the ratio of the enhancement in CFP fluorescence acceptor photobleach-ing to the total CFP fluorescence after photobleaching (Fig. 3b). In this protocol, we use a nondestructive approach to determine ED that uses an experimentally determined calibration constant (G factor) that relates the enhancement in YFP fluorescence to the decrease in CFP fluorescence (Fig. 3). In this protocol, we follow the mathematical conventions defined in Erickson et al.9, and the fluorescence signal measured through a particular cube is defined as Scube(DA, λex, λem), where cube denotes a CFP, YFP or FRET cube; D denotes donor, A denotes acceptor and DA denotes both; λex denotes excitation wavelength; and λem denotes emis-sion wavelength. In addition, fluorescence signal from a particular CFP or YFP molecule may be represented as XFPcube(λex, λem, direct/FRET) when measured with excitation light of wavelength λex, emission of wavelength λem. direct/FRET corresponds to the mode of excitation of the given molecule9,10.
Determination of spectral factors RD1, RD2 and RA1. Calculation of EA and ED requires robust dissection of sensitized emission (Fig. 4). This determination is complicated by spectral overlap between donors (CFP) and acceptors (YFP) resulting from their broad excitation and emission spectra. Three confounding factors may obfuscate computation of FRET efficiencies (Fig. 2). First, the overlap in the emission spectra of CFP and YFP could lead
Filter cube turret
Viewing eyepiece
PMT detector
PMT housing
Oculars
Arc lamp
DeltaRam
4 Knobs to control aperture size
Measure/view knob
Electronic box
Arc lamp
a
DeltaRam
b
Figure 1 | Equipment setup for FRET imaging. (a) Photograph of the FRET setup comprising an inverted microscope and a photomultiplier detection system (PMT detector and PMT housing). The PMT housing contains an eyepiece and four knobs to control the aperture size. The measure/view knob is set to direct the light to either the eyepiece for visualization or the PMT for data acquisition. All major components are indicated. Note that the CCD camera connected to our microscope is not necessary to perform the FRET two-hybrid assays described here. (b) For excitation, a DeltaRam monochromator containing a xenon arc lamp is used; the one shown has knobs to adjust the slit width for excitation light.

©20
16 M
acm
illan
Pu
blis
her
s L
imit
ed, p
art
of
Sp
rin
ger
Nat
ure
. All
rig
hts
res
erve
d.
protocol
2472 | VOL.11 NO.12 | 2016 | nature protocols
to a small bleed-through of CFP fluorescence in the FRET cube (emission~535 nm). The expected bleed-through can be quanti-fied from cells expressing CFP alone at the peak of their absorp-tion spectrum (~436 nm) and computing the fractional emission through the FRET cube—RD1 = SFRET(D, 436, 535)/SCFP(D, 436, 480). This strategy is effective, as CFP fluorescence can be isolated from cells expressing both CFP and YFP, using the CFP cube. The effective CFP fluorescence bleed-through in the FRET cube is then
CFP R S DADFRET direct ( , , ) ( , , ) ( )436 535 436 480 11= ⋅ CFP
RD1 ~ 0.25 for our experimental setup. RD1 values are typically stable, as they probe the emission properties of CFP, and dras-tic changes in these values may signify changes in the detection subsystem such as diminished detector sensitivity or aging of emission filters.
Second, a small fraction of YFP is cross-excited by the 436-nm light through the FRET cube. The direct YFP signal can be optically isolated using the YFP cube with negligible CFP excitation (Fig. 4). The ratio RA1 is defined as the fractional excitation of YFP through the FRET cube relative to the YFP cube—RA1 = SFRET(A, 436, 535)/SYFP(A, 500, 535). The cross-excitation of YFP through the FRET cube in cells expressing both YFP and CFP can be unmixed by computing:
YFP R S DAFRET A1 YFPdirect( , , ) ( , , ) ( )436 535 500 535 2= ⋅
RA1 ~ 0.03 for our experimental setup. Experimentally, some day-to-day variability in RA1 values is observed due to changes in xenon arc lamp spectra or the excitation subsystem.
(1)(1)
(2)(2)
Third, a small fraction of CFP molecules may be directly excited through the YFP cube, leading to overestimation of the total YFP signal, YFPYFP(500, 535, direct). RD2 is the ratio of CFP fluores-cence output through the YFP cube relative to the CFP cube:
R S D S DD2 YFP = ( , , )/ ( , , ) ( )500 535 436 480 3CFP
The corrupting CFP signal through the YFP cube is then:
CFP direct S DAYFP D2 CFP( , , ) ( , , ) ( )500 535 436 480 4= ⋅R
In practice, the ratio RD2 is negligibly small (~0.009 for our exper-imental setup). This factor can be a concern in cells in which CFP values far exceed YFP values. FRET efficiency estimation is prone to substantial errors in this case.
In summary, RD1 and RA1 are determined in cells in which acceptor or donor alone are individually expressed and then applied to transform signals from different cells containing both acceptors and donors. Critically, these ratios are independent of the excitation intensity (I0) and the number of donors (ND) or acceptors (NA) in the field of view; instead, they depend only on the spectral properties of the donor or acceptor, respectively (Fig. 4). These ratios can be used to optimize or troubleshoot the FRET experimental setup while establishing the method and testing associated hardware components.
Determination of FRET efficiencies. Once spectral ratios are determined, EA and ED can be calculated based on the fluo-rescence measurements from the CFP, YFP and FRET cubes according to equations (5–7) in Box 1 (Supplementary Note 2).
(3)(3)
(4)(4)
Abs
orpt
ion
and
emis
sion
spe
ctra
350 500 650Wavelength (nm)
(6a) Fluorophore excitation
(6b) Fluorophore emission
(6) Cell
(10) Detector
(3) Excitation filter
(1) Light source
(1) (6a) (2–5) (6a) (7–10)
N • I0 (�) • [ �XFP(�) ] �min ≤ � ≤ �max• QY
XFP • [ ƒ
XFP(�)] �min ≤ � ≤ �max
• QYCFP • [ ƒCFP(�)]520 nm < � < 550 nm
• QYYFP
• [ ƒYFP(�)]520 nm < � < 550 nm
F(480)ˆG(436)
MD = [�CFP(�) ]426 nm < � < 446 nm
MA = [�YFP(�) ]426 nm < � < 446 nm
ba
(5) Objective
(4) Dichroicmirror
(7) Objective
(8) Dichroic mirror
(9) Emission filter
(2) Additional excitation filter
Figure 2 | Schematic of optical components of the FRET setup for a given filter cube and fluorophore. (a) The excitation pathway (1–6a) consists of the light source (1), excitation filters (2 and 3), a dichroic mirror that reflects the excitation light (4), a 40× objective (5) and the excitation spectrum of the fluorophore contained in a cell (6, 6a). The emission pathway (6b–9) consists of the emission spectrum and the quantum yield (QY) of the fluorophore expressed in the cell (6b), the objective (7), the dichroic that transmits the emission light (8), the emission filter (9) and the detector (10). (b) Top: Fluorescence intensity output can be calculated from setup-specific optical components in the excitation (1–6a) and emission pathways (6b–9) by multiplying together all relevant parameters: XFP is the fluorophore in question. N is the number of fluorophores excited, I0 represents the overall intensity of the excitation lamp (over all wavelengths) and εXFP(λ) represents the wavelength-dependent absorption properties of the fluorophore as given by the excitation spectrum of the fluorophore. The optical properties of the excitation pathway, such as the spectral properties of the excitation light source and the spectral properties of the excitation filter and dichroic mirror of the cube, are incorporated into the wavelength range depicted. fXFP(λ) and QYXFP correspond to the emission spectrum and QY of the fluorophore. The spectral properties of the dichroic mirror and the emission filter of the FRET filter cube, as well as frequency-dependent sensitivity of the PMT detector, are incorporated into the wavelength range shown. MD and MA correspond to the brightness of a single donor and acceptor fluorophore.

©20
16 M
acm
illan
Pu
blis
her
s L
imit
ed, p
art
of
Sp
rin
ger
Nat
ure
. All
rig
hts
res
erve
d.
protocol
nature protocols | VOL.11 NO.12 | 2016 | 2473
The graphical interpretation of this computation is shown in Figure 4a. Sensitized emission of YFP is calculated by realizing that emission at 535 nm (Fig. 4a, point 1) is the sum of direct CFP emission (donor bleed-through; Fig. 4a, point 3), YFP emis-sion due to direct excitation (acceptor cross-excitation; Fig. 4a, point 5) and YFP emission due to FRET excitation (FC; Fig. 4a, points 4 and 5). The contribution of direct CFP emission at 535 nm (Fig. 4a, point 3) is computed based on CFP measurement using the CFP cube (Fig. 4a, point 2) and the spectral ratio RD1. The contribution of YFP emission due to direct excitation (Fig. 4a, point 5) is determined based on YFP cube measurement (Fig. 4d) and the spectral ratio RA1. The 33-FRET efficiency EA is computed as the ratio of sensitized emission (Fig. 4a, points 4 and 5) to the emission of YFP due to direct excitation (Fig. 4a, point 5), cor-rected by a calibration constant that represents the ratio of extinc-tion coefficients (Box 1). This latter factor (RA1 · SYFP(DA, 500, 535) · εCFP(436)/εYFP(436)) is the maximal sensitized emission of YFP observable if EA = 1. By contrast, the E-FRET computation converts the sensitized emission of YFP (FC; Fig. 4a, points 4 and 5) to an equivalent quenching of CFP fluorescence due to FRET by the calibration constant G. E-FRET reports the ratio of the CFP quenching to total CFP output in the absence of FRET.
An important distinction is that EA and ED depend on the bound fraction of the donor (Ab) and acceptor (Db), respectively. As Ab or Db approaches 1, the apparent efficiency equals true efficiency (E). We will use a quantitative description of the total number of CFP and YFP molecules in a cell along with a 1:1 bind-ing model to calculate Db or Ab and to resolve a binding relation. The following section will define and outline the experimental strategy for determination of the instrument-specific calibration constants εYFP(436)/εCFP(436) and G.
Determination of calibration constants for 33-FRET and E-FRET. The instrument-specific calibration constants (εYFP(436)/εCFP(436) and G) can either be computed by analysis of the optical properties of the FRET experimental setup or be experimentally determined using CFP–YFP dimers tethered with variable size linkers (Fig. 5a). Here, we adopt the second approach, using four distinct CFP–YFP dimers to deduce these coefficients. The plas-mids encoding various dimers have been deposited to Addgene13. The genetic fusion of CFP and YFP ensures that the stoichiometry is 1:1 and Ab=Db=1. The apparent FRET efficiencies for these constructs, measured using 33-FRET and E-FRET, must equate:
E E A E E D EA b b D= ⋅ = = ⋅ = ( )8
Thus, rearranging equations (6 and 7) in Box 1 yields equation (9), a convenient expression to experimentally determine the calibration constants.
(8)(8)
F
R SG
R S
R SC
A1
CFP
YFPDA
DA, 436, 480)
DA, 5⋅= − ⋅
⋅YFP
D
A( , , )
(
(500 5351
1 000, 535CFP
YFP)
( )
( )( )+ e
e436
4369
Here, SYFP(DA, 500, 535) and SCFP(DA, 436, 480) are direct measurements of the CFP–YFP dimer using the YFP and CFP cubes. FC corresponds to sensitized emission of YFP, deter-mined as described by equation (5) (Box 1), and RA1 and RD1 are spectral factors. Equation (9) in fact describes a straight line, y = m ⋅ x + b where
xR S
R Sy
F
R S= ⋅
⋅=
⋅D1 CFP
A1 YFP
C
A1
DA, 436, 480)
DA, 500, 535)and
(
( (YFP DDA, , )500 535
both experimentally determined. The intercept of this relation cor-responds to the 33-FRET calibration constant εCFP(436)/εYFP(436), whereas the slope determines the E-FRET calibration constant G (Fig. 5b). The x and y pair of values are computed individually for each cell for a given dimer, and the complete data set is plotted to obtain the calibration constants.
Calculation of the total number of CFP and YFP molecules. The apparent 33-FRET and E-FRET efficiencies depend on the bound fraction of acceptors (Ab) and donors (Db) in a cell, respectively (Box 2, equations (10,12,15–23); Supplementary Note 3). To calcu-late the bound fractions, the total concentrations of CFP (CFPEST) and YFP (YFPEST) are estimated from single cells expressing an
(9)(9)
table 1 | Properties of the filter cubes present in the FRET rig.
cube excitation Dichroic emission
CFP 426–446 nm T455lp 460–500 nm
YFP 490–510 nm T515lp 520–550 nm
FRET 426–446 nm T455lp 520–550 nm
Amount of donorquenching
SCFP|after– SCFP|before
No FRET
FRET
Sensitizedemission
FC
450 500 550 600
Emission wavelength (nm)
a
EA =
ED =
Measured sensitized emission
Measured amount of donor quenching
Maximal sensitized emission if E = 1
Total donor fluorescence in the absence of FRET
Sensitized emission
Amount of donor quenchingG =
b
CFP YFP
Figure 3 | Spectral properties of FRET. (a) Double-peaked spectrum arising from CFP and YFP coexpressing cells in the presence (black line) and absence of FRET (gray line). FRET reduces donor fluorescence (donor quenching) and increases acceptor fluorescence (sensitized emission). (b) Sensitized emission can be measured and converted into FRET efficiency using the general formula for EA presented in box 1. Sensitized emission can also be used for the determination of ED by using a nondestructive FRET approach instead of acceptor photobleaching. This method requires the determination of the G factor, a factor that converts the amount of sensitized emission into donor dequenching (box 1).

©20
16 M
acm
illan
Pu
blis
her
s L
imit
ed, p
art
of
Sp
rin
ger
Nat
ure
. All
rig
hts
res
erve
d.
protocol
2474 | VOL.11 NO.12 | 2016 | nature protocols
interacting pair of donor and acceptor proteins. For noninteracting fluorophores, the fluorescence intensity is proportional to the total number of fluorophores in the given cell. As previously described by Erickson et al.9, we use proportionality constants MA and MD for YFP and CFP molecules, respectively, to convert fluorescence intensities into the effective number of molecules9,10. These pro-portionality coefficients encode the brightness of the two fluoro-phores viewed using the FRET cube (λex ~ 436 and λem ~ 535).
The fluorescence signal measured using the YFP cube (SYFP(DA, 500, 535)) is devoid of any contribution from CFP. Thus, the total number of YFP molecules can be estimated as follows:
YFPYFP
M
R S
MESTFRET
A
A1 YFP
A
436, 535, direct) DA, 500, 535)= = ⋅( ((10))
(10)(10)
CFP(direct) + YFP(direct)+ YFP(FRET)
YFP(direct) +YFP(FRET)
YFP(direct)
Emission
Excitation
CFP FRET YFP
436 436 500
535 535480
SCFP SFRET SYFP
Filter cubes
CFP(direct)
a b
dc
e
Flu
ores
cenc
e ou
tput
Totalemission
CFP
YFP
1
4
5
3
400
CFP YFP1 1
0 0
Nor
mal
ized
spe
ctru
m
Nor
mal
ized
spe
ctru
m
500
Ex ExEmEm
RD1 =
RD1 = RA1 =
RA1 =
RA1 =
600
SFRET(D, 436, 535)
SFRET(A, 436, 535)SCFP(D, 436, 480)
SYFP(A, 500, 535)
� (nm)
400300
Excitation subsystem
G(436)
N • I0 • C1 • [�CFP (�)]� = 426–446 nm• QYCFP • C2 • [ ƒCFP(�)]� = 520–550 nm N • I0 • C1 • [�YFP (�)]� = 426–446 nm• QYYFP • C2 • [ ƒYFP(�)]� = 520–550 nm
N • I0 • C1 • [�YFP (�)]� = 490–510 nm• QYYFP • C2 • [ ƒYFP(�)]� = 520–550 nmN • I0 • C1 • [�CFP (�)]� = 426–446 nm• QYCFP • C2 • [ ƒCFP(�)]� = 460–500 nm
[�YFP (�)]� = 426–446 nm
[�YFP (�)]� = 490–510 nm
G(436)
G(436)
G(500)
G(500)
G(436)
Emission subsystem Excitation subsystem Emission subsystem
500 600
=
� (nm) 400300 500 600� (nm)
2
F(535)
›
F(480)
›
F(535)
›
F(535)
›
RD1 =[ fCFP(�)]� = 520–550 nm
[ fCFP(�)]� = 460–500 nm
=F(535)
›
F(480)
›
Figure 4 | Components of the fluorescence signal at 535-nm emission. (a) Combined emission spectrum of donor and acceptor. Maximal emission of CFP at 480 nm (point 2). The total fluorescence signal at 535 nm (point 1) is composed of donor bleed-through (point 3), fluorescence emission due to acceptor cross-excitation (point 5) and sensitized emission due to FRET (points 4 and 5). (b) Specifications of CFP, FRET and YFP filter cubes. Excitation: excitation wavelength, emission: emission wavelength. SCFP, SFRET and SYFP are the output signals measured using the CFP, the FRET and the YFP filters, respectively. The detailed filter parameters are elaborated in table 1. (c) Excitation (Ex) and emission (Em) spectra of CFP. SFRET(D, 436, 535) and SCFP(D, 436, 480) are the fluorescence signals measured at emission wavelengths of 535 nm and 480 nm, respectively, after excitation at 436 nm. From these signals, RD1 is calculated as indicated. (d) Excitation and emission spectra of YFP. SFRET(A, 436, 535) and SYFP(A, 500, 535) are the fluorescence signals measured at an emission wavelength of 535 nm after excitation at 436 nm or 500 nm, respectively. From these signals, RA1 is calculated as indicated. (e) RA1 and RD1 values mainly depend on the excitation lamp and detector response. Excitation subsystem: all parameters related to the excitation pathway. Emission subsystem: all parameters related to the emission pathway. Fluorescence intensity output is calculated according to the expression in Figure 2b (top). The ratio RD1 depends only on factors derived from the emission pathway; all factors from the excitation pathway cancel out. Therefore, RD1 reflects maturation of fluorescent proteins, which influences fCFP(535) and fCFP(480), as well as detector functions such as quantum efficiency, high voltage gain and stability of the detection. The ratio RA1 depends only on factors derived from the excitation pathway; all factors from the emission pathway cancel out. RA1 therefore reflects the number of fluorophores that may be affected by bleaching between the recordings of the two cubes, and fluctuations of the excitation lamp between the two recordings. Tabulation of RD1 and RA1 over a period of days and weeks (Fig. 9a,b) is very useful when establishing the method, as they serve to evaluate the stability of the light source (RA1) and the detector (RD1). FRET cannot be reliably measured until both values are stable. Differences between corresponding filters—e.g., the excitation filter of the CFP and the FRET cube or the excitation filter of the YFP and the FRET cube—are negligible. All variables are as defined in Figure 2.

©20
16 M
acm
illan
Pu
blis
her
s L
imit
ed, p
art
of
Sp
rin
ger
Nat
ure
. All
rig
hts
res
erve
d.
protocol
nature protocols | VOL.11 NO.12 | 2016 | 2475
MA = εYFP(436) · fYFP(535) · QYYFP , where εYFP(436) is the aver-age molar extinction coefficient of YFP over the bandwidth of the FRET cube excitation filter (Table 1); fYFP(535) is the average YFP emission spectrum over the bandwidth of the FRET cube emission filter (Table 1); and QYYFP is the quantum yield of YFP (0.61). The emission spectrum fYFP(λ) is normalized to have unitary area. The proportionality constant is related to the brightness of a single YFP molecule probed using the FRET cube. This approximation relies on the fact that optical transfer functions for the excitation and emission paths of the microscope are nearly constant over the respective bandwidths. Although the MA value can be computed for any microscope system, the precise value is not essential.
By contrast, the estimation of the total number of CFP mol-ecules from CFP intensity is more complex, as FRET results in quenching of the donor signal. There are two methods of com-pensating for this loss. First, FRET efficiency determined by the E-FRET method is equivalent to that determined by the donor dequenching method. Thus, the expected CFP intensity after acceptor photobleaching can be estimated by dividing the CFP intensity measured through the CFP cube before photobleaching by the apparent E-FRET efficiency, as shown in equation (11).
CFPCFP
postbleachprebleach
(436, 535, direct) 436, 535, direct
=( ))
1
DA, 436, 480)
1D1 CFP
−
= ⋅−
E
R S
E
D
D
( ( )11
The total number of CFP molecules in a given cell is related to the corrected total CFP intensity in the absence of FRET (CFPpostbleach(436, 535, direct)) by proportionality constant MD. Thus,
CFPR S
E MDEST
D CFP
D
DA, 436, 480)
(1= ⋅
− ⋅1 12
(
)( )
(11)(11)
(12)(12)
Here, MD = εCFP(436) · fCFP (535) QYCFP, and εCFP(436) is the average molar extinction coefficient of CFP over the excitation bandwidth of the FRET cube (Table 1); fCFP(535) is the average CFP emission over the emission bandwidth of the FRET cube (Table 1); and QYCFP is the quantum yield of CFP (0.4).
A second strategy is to add the amount of fluorescence signal lost via FRET to the quenched CFP intensity by adding the term EA · YFPFRET(436, 535, direct) · MD/MA. This correction factor assumes a 1:1 donor–acceptor stoichiometry. The total number of CFP molecules is given by
CFPR S E R S
MESTD CFP A A YFP
D
DA, 436, 480) DA, 500, 535= ⋅ + ⋅ ⋅1 1 13( ( )
( )
The two strategies will yield similar estimates for CFPEST, but equa-tion (13) is valid only for a 1:1 interaction. For the purposes of obtaining relative binding affinities, calculating the precise value of MA or MD individually is not critical; however, the ratio of MA to MD is crucial. The parameter MA/MD can be obtained experi-mentally from the calibration constants for 33-FRET and E-FRET efficiency, as the ratio of slope to intercept from equation (9).
M
MGA
D
CFP
YFP= e
e( )
( )( )
436
43614
This relation depends upon the fact that G = (fYFP(535) · QYYFP)/( fCFP(535) · QYCFP), which is the ratio of the quantum yields of the two fluorophores and the probability of emitting a photon of the given wavelength. Once MA/MD is determined, one possibility is to set MD = 1. This maneuver would scale the relative binding affinities by an arbitrary scale factor. For our FRET setup, the MA/MD value was found to be 0.440. MA and MD can also be calculated based on the optical properties of the imaging system (Fig. 2).
(13)(13)
(14)(14)
Box 1 | Experimental computation of 33-FRET and E-FRET The measurement of FRET efficiencies using 33-FRET and E-FRET for CFP–YFP FRET pairs relies on fluorescence measurements from three cubes: (1) SCFP(DA, 436, 535) or the CFP cube; (2) SYFP(DA, 436, 480) or the YFP cube; and (3) SFRET(DA, 436, 535) or the FRET cube. These fluorescence measurements are then used to spectrally unmix the contribution of sensitized emission of YFP through the FRET cube using the spectral ratios RD1 and RA1 as follows:
F S R S R SC FRET D1 CFP A1 YFPDA, 436, 535) DA, 436, 480) DA, 500,= − ⋅ − ⋅( ( ( 5535) ( )5
The FRET efficiency as ascertained by the 33-FRET method is proportional to the ratio of sensitized emission to the direct excitation of YFP. Thus,
E E AF
R SA bC
A1 YFP
YFP
CFPDA, 500, 535= ⋅ =
⋅ ( )( )( )
( )ee
436436
6
Similarly, the FRET efficiency as ascertained by the E-FRET method is given by the equation:
E E DF
F G R SD bC
C D1 CFP DA, 436, 480= ⋅ =
+ ⋅ ⋅ ( )( )7
Computation of FRET efficiencies by both methods require the instrument-specific calibration constants εYFP(436)/εCFP(436) and G. The procedure to experimentally determine these coefficients is outlined in Procedure Steps 78–99. These equations importantly assume a low-excitation limit at which the excitation power is low enough that there is no substantial ground-state depletion. Derivations for all equations are given in supplementary note 2.
(5)(5)
(6)(6)
(7)(7)

©20
16 M
acm
illan
Pu
blis
her
s L
imit
ed, p
art
of
Sp
rin
ger
Nat
ure
. All
rig
hts
res
erve
d.
protocol
2476 | VOL.11 NO.12 | 2016 | nature protocols
The strategy for theoretical computation of MA and MD is out-lined in Supplementary Note 1 and Supplementary Data 1.
Calculation of binding curves. FRET efficiency measurements from many individual cells are collectively analyzed to deduce binding curves. The stochasticity in the expression of CFP- and YFP-tagged proteins among different cells allows for high vari-ability in free donor and acceptor concentrations, yielding a saturating relationship for the apparent 33-FRET and E-FRET efficiencies. Accordingly, either EA is plotted as a function of free donor concentration (Dfree) or ED is plotted as a function of free acceptor concentration (Afree). Both Dfree and Afree are computed based on estimates of CFP and YFP concentrations (CFPEST and YFPEST, respectively) and by imposing a simple binding model on the entire data set. For a 1:1 binding interac-tion, the two curves should yield identical maximal efficiencies (Emax values) and relative binding affinities (Kd,EFF values). The maximal FRET efficiency (obtained with either Db = 1 or Ab = 1) reflects the overall spatial arrangement of the CFP and YFP molecules in the complex.
Procedurally for each individual cell, 33-FRET (EA) and E-FRET (ED) efficiencies are computed based on equations (6 and 7), respectively. YFPEST and CFPEST are determined using equations (10 and 12), respectively. The data from many cells are then fit iteratively using a nonlinear least-squares procedure that com-putes Dfree and Afree values for each individual cell based on a simple Langmuir binding isotherm with the dissociation constant Kd,EFF. The equations used in this fitting procedure are provided in Box 2. Both Dfree and Afree, the independent variables of the FRET two-hybrid binding curves, are computed based on the relative dissociation constant Kd,EFF, CFPEST and YFPEST, and requires an iterative nonlinear least-squares fitting procedure, as described in Box 2 (equations (10,12,15–23)). Typically, fluorescence measure-ments from 20 to 30 cells are used to obtain an evenly sampled ‘complete’ binding relation. Once a fit is obtained, EA and ED are plotted against Dfree and Afree, respectively. The maximal FRET efficiencies (Emax values), the saturating portion of the Langmuir relation, can often be estimated independently of the iterative fitting procedure. In general, EA,max (the maximal EA value) and ED,max (the maximal ED value) can be constrained to be between 0 and 1. Similarly, Kd,EFF cannot be negative, and the practical upper limit is influenced by other factors (e.g., collisional FRET). These considerations provide constraints to obtain robust fits for both 33-FRET and E-FRET. Figure 6 shows an example FRET two-hybrid binding curve.
Determination of spurious FRET. One additional confounding factor to consider when evaluating binding interactions using the FRET two-hybrid assay is the possibility of spurious FRET. When fluorophores are present at high bulk concentrations, a donor and an acceptor may be within the Förster distance by random chance and would undergo FRET even in the absence of a genuine under-lying binding interaction. Accordingly, to obtain reliable 33-FRET or E-FRET binding curves, the contribution of spurious FRET must be subtracted. Unlike with binding interactions, spurious 33-FRET and E-FRET efficiencies are linearly proportional to the concentration of donors and acceptors, respectively. As the total fluorescence intensity from a single cell is proportional to the total number of CFP or YFP molecules in the cell, the magnitude
of spurious FRET by the 33-FRET and E-FRET methods can be related to the measured CFP and YFP fluorescence intensity by the following equations11:
E R DR
V
R S
MA,spuriouscell
D1 CFP
D= ⋅ ⋅ ⋅ = ⋅ ⋅ ⋅−
−2
310
2
3
10203 27
203 27
p p(( )24
33= ⋅−
m SFRET CFP
E R AR
V
R S
MD,spuriouscell
A1 YFP
A= ⋅ ⋅ ⋅ = ⋅ ⋅ ⋅−
−2
310
2
3
10203 27
203 27
p p(( )25
= ⋅m SE-FRET CFP
Here, R0 corresponds to the Förster distance, Vcell is the volume of the cell, RD1 and RA1 are spectral factors and MD and MA are the calibration constants defined earlier. As CFP and YFP share a similar structure, the slopes of the two spurious FRET relations are related,
mR
R
M
MmE-FRET
A1
D1
D
A FRET=
−33 26( )
Empirically, spurious FRET can be obtained through fluorescence measurements from roughly 10–15 cells coexpressing untagged CFP and YFP molecules. As monomeric fluorescent proteins are typically used, the FRET efficiencies obtained correspond to spurious FRET and not to an underlying binding reaction. The 33-FRET efficiencies obtained are subsequently plotted against the CFP intensity, whereas the corresponding E-FRET efficien-cies are plotted against the YFP intensities, and the respective slopes are estimated. Once the two relations are obtained, the FRET efficiencies obtained from each cell with the interacting
(24)(24)
(25)(25)
(26)(26)
1
4 GYEP GFP
GFP
GFP
GFP
YEP
YEP
YEP
10 G
40 G
80 G
10a b100Practical range
High-efficiencydimers
G
(RD1 • SCFP)/(RA1 • SYFP)
�C/�Y
Low-efficiencydimers
1 10
No. of glycines
1000
0
= –GFC
RA1 • SYFP
�C(440)
�Y(440)+
RD1 • SCFP
RA1 • SYFP
FC
RA1 • SYFP
Figure 5 | Calibration experiments using cells expressing CFP–YFP dimers of high, intermediate and low FRET efficiency. (a) Schematic representation of individual dimers in which CFP and YFP are linked by a defined number of glycines (G), resulting in different FRET efficiencies. (b) For each dimer, FC/(RA1·SYFP) coordinates and (RD1·SCFP)/(RA1·SYFP) coordinates are calculated and then plotted onto the graph. A higher FRET efficiency corresponds to higher donor quenching and a lower SCFP values. Therefore, high-FRET-efficiency dimers are localized more to the left on the x axis with respect to lower-FRET-efficiency dimers. Similarly, a higher FRET efficiency implies higher sensitized emission. Therefore, high-FRET-efficiency dimers are localized more to higher values of the y axis with respect to lower-FRET-efficiency dimers. The gray area on the graph indicates the predicted range of possible FRET efficiencies, which is usually <40%. The graph is fit by a straight line. The slope of the line is –G and the y intercept yields the excitation ratio of CFP and YFP: εCFP(436)/εYFP(436).

©20
16 M
acm
illan
Pu
blis
her
s L
imit
ed, p
art
of
Sp
rin
ger
Nat
ure
. All
rig
hts
res
erve
d.
protocol
nature protocols | VOL.11 NO.12 | 2016 | 2477
Box 2 | Determination of FRET binding curves For a simple one-step bimolecular binding interaction with 1:1 stoichiometry,
D A DAd EFF
+,
the experimentally measured apparent 33-FRET (EA) and E-FRET (ED) efficiencies must relate to the free concentrations of donors (Dfree) and acceptors (Afree) by Langmuir isotherms:
E E A ED
D KA = ⋅ = ⋅+max maxbfree
free d,EFF
E E D EA
A KD = ⋅ = ⋅+max maxbfree
free d,EFF
For any given cell, the total number of YFP molecules is related to the YFP intensity through the YFP cube and is given by
YFPR S
MESTA1 YFP
A
DA=
⋅ ( , , )500 535
Note that MA is a microscope-specific calibration constant. Similarly, the total number of CFP molecules in a given cell is related to the CFP intensity measured through the CFP cube and is given by
CFPR S
E MESTD1 CFP
D D
DA=
⋅− ⋅( , , )
( )436 480
1
To construct FRET two-hybrid binding curves, guessed Emax and Kd,EFF values are initially used to estimate Dfree and Afree concentrations for each individual cell, given the total YFPEST and CFPEST concentrations determined by the following equations:
DCFP K YFP CFP K YFP K
freeEST d,EFF EST EST d,EFF EST d,EF=
− − + − − + ⋅( )2 4 FF EST⋅ YFP2
Once Dfree is estimated, Afree can be computed as
A YFP CFP Dfree EST EST free= − −( )
Alternatively, a symmetric formula for Afree based on equation (16) can be derived as follows:
AYFP K CFP YFP K CFP K
freeEST d,EFF EST EST d,EFF EST d,EF=
− − + − − + ⋅( )2 4 FF EST⋅ CFP2
The bound fraction of donor and acceptor molecules can be computed as follows:
D D CFPb free EST = −1 /
A A YFPb free EST = −1 /
Subsequently, predicted EA,pred and ED,pred values are determined for each cell by substituting computed Dfree and Afree estimates with the guessed Kd,EFF and Emax values into equations (14 and 15). Both Emax and Kd,EFF are then iteratively optimized to simultaneously minimize the error in predicted EA or ED versus experimentally determined EA or ED for each cell i by a least-squares criteria:
K E
i i
i
E E
d,EFF max
A,pred A,
min ( )−∑ 2
K E
i i
i
E E
d,EFF max
D,pred D,
min ( )−∑ 2
Notice that the Dfree and Afree values for each cell are recomputed after each iteration. Derivations for all equations are given in supplementary text 2 and 3.
(15)(15)
(16)(16)
(10)(10)
(12)(12)
(17)(17)
(18)(18)
(19)(19)
(20)(20)
(21)(21)
(22)(22)
(23)(23)

©20
16 M
acm
illan
Pu
blis
her
s L
imit
ed, p
art
of
Sp
rin
ger
Nat
ure
. All
rig
hts
res
erve
d.
protocol
2478 | VOL.11 NO.12 | 2016 | nature protocols
pair of CFP- and YFP-tagged molecules is corrected for spurious FRET by the following equations:
E E m Si iA,corrected A FRET CFP= − ⋅
−33
E E m Si iD,corrected D E FRET YFP= − ⋅−
One important consideration pertains to studying FRET between molecules residing in a restricted volume in certain subcellular localizations such as the plasma membrane. For such proteins, the slope of the spurious FRET relation can be unusually high, as the effective volume in the given compartment is smaller. One strategy for quantifying the magnitude of spurious FRET between proteins in such subcellular compartments is to localize CFP and YFP to these environments through appropriate target-ing sequences. Importantly, FRET binding assays are suitable for studying the interaction of cytosolic binding partners with plasma membrane proteins such as voltage-gated Ca2+ channels9,14. For such experiments, a transmembrane binding partner such as the CaV1.3 pore-forming α-subunit is fused to YFP, and a cytosolic partner such as CaM is fused to CFP (ref. 14). Experimentally, the slope of the spurious FRET curve can be estimated by coexpress-ing CFP- or YFP-tagged membrane proteins with freely diffusing YFP or CFP. Practically, given this arrangement, the slope of the spurious FRET curve is quite similar to that obtained when CFP and YFP are freely diffusing entities14 (Supplementary Note 4). Finally, for the interaction of two membrane-localized proteins, an important consideration is the relative size of the binding part-ners. As many transmembrane proteins, such as ion channels, are large in size, the tagged fluorophores tend to be further apart and less likely to interact by chance, resulting in low spurious FRET.
Estimation of FRET distance. The maximum FRET efficiencies for a given CFP–YFP dimer pair depend on a variety of factors, including the distance between the CFP and YFP molecules, an orientational factor (κ2) and spectral overlap between the donor
(27)(27)
(28)(28)
emission and acceptor excitation. FRET efficiency between a donor and an acceptor molecule is given by
ER
R
=
+
1
10
6
where R is the distance of separation between the CFP and YFP molecules, and R0 is the Förster distance where E = 0.5. Often, the two fluorophores are assumed to be randomly oriented with respect to each other, allowing for theoretical estimation of R0 = 4.9 nm for a CFP–YFP pair. Thus, the approximate molecular distance between the donor and acceptor is
⇒ = −
R RE
E0 61
For example, a FRET efficiency of 0.15 corresponds to a molec-ular distance of 6.5 nm between CFP and YFP. Maximal FRET efficiencies range between 0.10 and 0.40 for fluorescent proteins as the b-barrel structure impedes close apposition of the two fluorophores15,16.
Overview of the procedureAn overview of the experimental design of the FRET assay is out-lined in Figures 7 and 8. The first section of the protocol outlines the setup and calibration of the FRET microscope, including soft-ware customization for data acquisition (Steps 1–21), construc-tion of a high-voltage-gain lookup table (HV-LUT; Steps 22–41) and other cell-based calibration measurements to ensure stable and reliable acquisition of FRET data (Steps 42–48). In the sec-ond section, we describe the steps for conducting routine FRET two-hybrid assays, including all control measurements (Fig. 8, Steps 100–128). A custom analysis sheet is provided, along with a detailed workflow for data analysis.
(29)(29)
(30)(30)
Partner A
Partner B
YFP
E-FRET
CFPFRETpair
0 0
EA ED
0 Dfree 0 Afree
Adjust CFP/YFP expression
Low donor,excess acceptor
Excess donor,low acceptor
Excess donor,low acceptor
Low donor,excess acceptor
33-FRETa b c
Figure 6 | Conceptual graph of FRET binding curves. (a) Diagram depicts hypothetical FRET binding partners A and B, tagged with YFP and CFP, respectively. Both molecules are coexpressed in single cells. (b) 33-FRET efficiency (EA) values measured from single cells were plotted versus Dfree, the concentration of free donor molecules (CFP—B molecules), to form a binding isotherm. The relative expression of CFP and YFP molecules in a cell is adjusted to attain a broad range of free donor concentrations. Cells with excess donor molecules will fall on the plateau of the isotherm. (c) E-FRET efficiency values (ED) for single cells plotted versus Afree, the free concentration of acceptor molecules (YFP—A), also form a binding isotherm. Note that the point located at low Dfree in panel b (red circle) corresponds to the point located at high Afree in panel c. Likewise, the point located at high Dfree in panel b (blue circle) corresponds to the point located at low Afree in panel c.
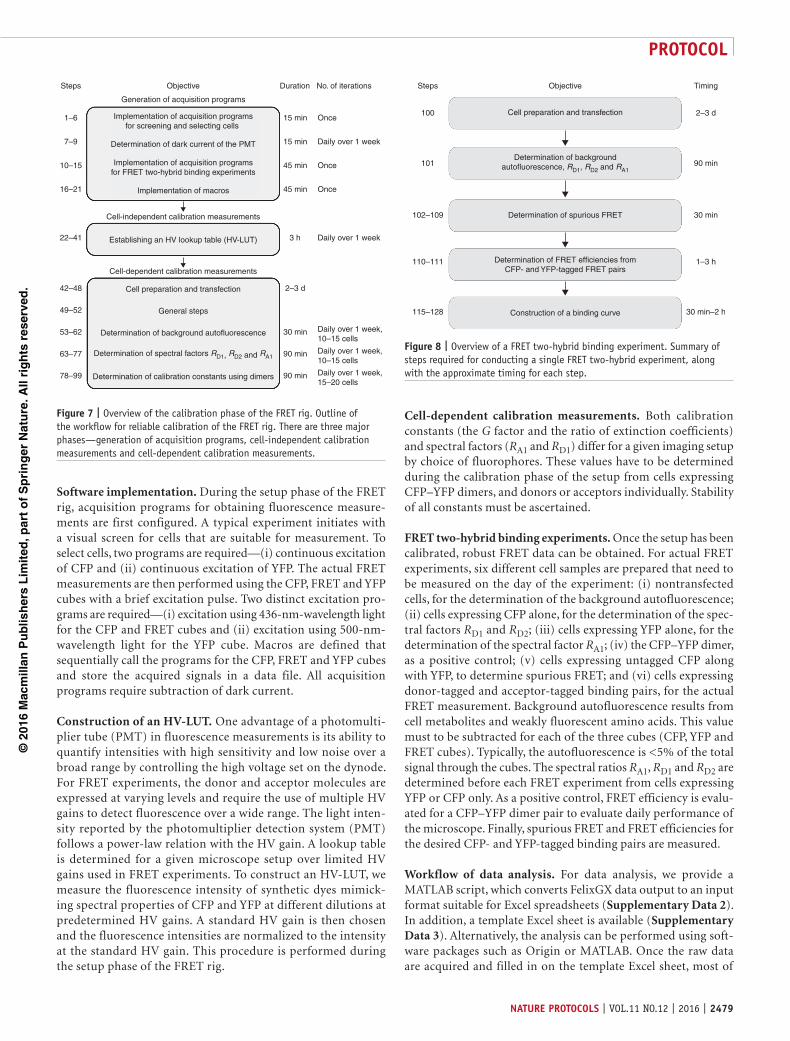
©20
16 M
acm
illan
Pu
blis
her
s L
imit
ed, p
art
of
Sp
rin
ger
Nat
ure
. All
rig
hts
res
erve
d.
protocol
nature protocols | VOL.11 NO.12 | 2016 | 2479
Software implementation. During the setup phase of the FRET rig, acquisition programs for obtaining fluorescence measure-ments are first configured. A typical experiment initiates with a visual screen for cells that are suitable for measurement. To select cells, two programs are required—(i) continuous excitation of CFP and (ii) continuous excitation of YFP. The actual FRET measurements are then performed using the CFP, FRET and YFP cubes with a brief excitation pulse. Two distinct excitation pro-grams are required—(i) excitation using 436-nm-wavelength light for the CFP and FRET cubes and (ii) excitation using 500-nm- wavelength light for the YFP cube. Macros are defined that sequentially call the programs for the CFP, FRET and YFP cubes and store the acquired signals in a data file. All acquisition programs require subtraction of dark current.
Construction of an HV-LUT. One advantage of a photomulti-plier tube (PMT) in fluorescence measurements is its ability to quantify intensities with high sensitivity and low noise over a broad range by controlling the high voltage set on the dynode. For FRET experiments, the donor and acceptor molecules are expressed at varying levels and require the use of multiple HV gains to detect fluorescence over a wide range. The light inten-sity reported by the photomultiplier detection system (PMT) follows a power-law relation with the HV gain. A lookup table is determined for a given microscope setup over limited HV gains used in FRET experiments. To construct an HV-LUT, we measure the fluorescence intensity of synthetic dyes mimick-ing spectral properties of CFP and YFP at different dilutions at predetermined HV gains. A standard HV gain is then chosen and the fluorescence intensities are normalized to the intensity at the standard HV gain. This procedure is performed during the setup phase of the FRET rig.
Cell-dependent calibration measurements. Both calibration constants (the G factor and the ratio of extinction coefficients) and spectral factors (RA1 and RD1) differ for a given imaging setup by choice of fluorophores. These values have to be determined during the calibration phase of the setup from cells expressing CFP–YFP dimers, and donors or acceptors individually. Stability of all constants must be ascertained.
FRET two-hybrid binding experiments. Once the setup has been calibrated, robust FRET data can be obtained. For actual FRET experiments, six different cell samples are prepared that need to be measured on the day of the experiment: (i) nontransfected cells, for the determination of the background autofluorescence; (ii) cells expressing CFP alone, for the determination of the spec-tral factors RD1 and RD2; (iii) cells expressing YFP alone, for the determination of the spectral factor RA1; (iv) the CFP–YFP dimer, as a positive control; (v) cells expressing untagged CFP along with YFP, to determine spurious FRET; and (vi) cells expressing donor-tagged and acceptor-tagged binding pairs, for the actual FRET measurement. Background autofluorescence results from cell metabolites and weakly fluorescent amino acids. This value must to be subtracted for each of the three cubes (CFP, YFP and FRET cubes). Typically, the autofluorescence is <5% of the total signal through the cubes. The spectral ratios RA1, RD1 and RD2 are determined before each FRET experiment from cells expressing YFP or CFP only. As a positive control, FRET efficiency is evalu-ated for a CFP–YFP dimer pair to evaluate daily performance of the microscope. Finally, spurious FRET and FRET efficiencies for the desired CFP- and YFP-tagged binding pairs are measured.
Workflow of data analysis. For data analysis, we provide a MATLAB script, which converts FelixGX data output to an input format suitable for Excel spreadsheets (Supplementary Data 2). In addition, a template Excel sheet is available (Supplementary Data 3). Alternatively, the analysis can be performed using soft-ware packages such as Origin or MATLAB. Once the raw data are acquired and filled in on the template Excel sheet, most of
Steps
1–6
7–9
10–15
16–21
22–41
42–48
49–52
53–62
63–77
78–99
Objective
Generation of acquisition programs
Cell-independent calibration measurements
Cell-dependent calibration measurements
Cell preparation and transfection
General steps
Determination of background autofluorescence
Determination of spectral factors RD1, RD2 and RA1
Determination of calibration constants using dimers
Establishing an HV lookup table (HV-LUT)
Implementation of acquisition programsfor screening and selecting cells
Implementation of acquisition programsfor FRET two-hybrid binding experiments
Implementation of macros
Determination of dark current of the PMT
No. of iterationsDuration
Once
Once
Once
Daily over 1 week
Daily over 1 week
Daily over 1 week,10–15 cells
Daily over 1 week,10–15 cells
Daily over 1 week,15–20 cells
15 min
15 min
45 min
45 min
3 h
2–3 d
30 min
90 min
90 min
Figure 7 | Overview of the calibration phase of the FRET rig. Outline of the workflow for reliable calibration of the FRET rig. There are three major phases—generation of acquisition programs, cell-independent calibration measurements and cell-dependent calibration measurements.
TimingObjectiveSteps
100
101
102–109
110–111
115–128 Construction of a binding curve
Determination of FRET efficiencies fromCFP- and YFP-tagged FRET pairs
Determination of backgroundautofluorescence, RD1, RD2 and RA1
Determination of spurious FRET
Cell preparation and transfection 2–3 d
90 min
30 min
1–3 h
30 min–2 h
Figure 8 | Overview of a FRET two-hybrid binding experiment. Summary of steps required for conducting a single FRET two-hybrid experiment, along with the approximate timing for each step.

©20
16 M
acm
illan
Pu
blis
her
s L
imit
ed, p
art
of
Sp
rin
ger
Nat
ure
. All
rig
hts
res
erve
d.
protocol
2480 | VOL.11 NO.12 | 2016 | nature protocols
the analysis is performed automatically, as the worksheets and relevant cells are linked with each other. The dimer analysis sheet calculates the G factor, the MA/MD ratio and the ratio of extinction coefficients. For the actual fitting procedure, points are calculated for each dimer, averaged across cells for each dimer and plotted on the graph. A least-squares linear fit is obtained by adjusting slope and y intercept. The sheet for the FRET two-hybrid binding data subtracts background signals and deposits the corrected signals in the binding curve sheet. This sheet calculates all FRET parameters with and without correction for spurious FRET, and it graphically displays binding curves for EA versus Dfree and ED versus Afree. Finally, nonlinear curve fitting is performed in order to obtain the binding curves defined by the Emax and Kd,EFF values.
Applications of the assay and target audienceThe method is of interest to researchers characterizing protein–protein interactions within living cells, wherein such interactions correspond to cellular signaling events. As FRET efficiencies are obtained nondestructively, this methodology can be applied to quantitatively monitor both dynamic and steady-state aspects of binding interactions. FRET-based assays have been used to study a wide range of biological molecules, including ion channels, G-protein-coupled receptors, immunoglobulins and cytosolic enzymes such as protein kinase A and Ca2+/calmodulin-depend-ent kinase II, as well as numerous other enzymes and recep-tors9,17–19. This methodology has been applied extensively to study the binding of voltage-gated Ca2+ channel holomolecules or subsegments with various channel-interacting proteins such as calmodulin9,10,20,21, the auxiliary CaVb subunit22, G proteins23,24 and members of the small GTPase family25,26. In addition, the comparative ease of obtaining relative binding affinities using the FRET two-hybrid assay has enabled systematic characterization of mutational effects on a binding interface such as the CaM-binding segment of the CaV1.3 channel20,21. FRET binding assays are also well suited for studying binding of molecules in distinct subcel-lular localizations such as the interaction between STIM1 in the ER membrane and Orai1 channel in the plasma membrane27,28.
Advantages of the assayThis method has several advantages as compared with alternative FRET approaches. It is possible to quantitatively describe protein–protein interactions in living cells with binding curves from which relative affinities can be derived. Furthermore, the assay is robust because two independent metrics for FRET efficiencies (donor-centric and acceptor-centric) are determined and correlated. Molecular FRET distances can be calculated based on maximal FRET. Unlike acceptor photobleaching, the assay is completely nondestructive9,13. The specificity of the calculated FRET efficien-cies is high, as spurious FRET is measured and subtracted from total binding curves11,21. Any cell type, such as cultured cells or primary cells, can be used25,29–32. These cells can be transfected by standard transfection or viral gene transfer25. Finally, this method can be readily translated to a dynamic FRET assay28,33.
Technologically, one important advantage is that the approach can be highly automated and data acquisition and analysis is fast34. In principle, a single binding curve can be obtained within an hour, excluding time required for cell culture. Furthermore, the method exploits relatively inexpensive and widely accessible equipment, and therefore can be easily implemented. Minimally, a
simple wide-field epifluorescence microscope including a motor-ized filter wheel, an excitation system composed of an optically stabilized xenon arc lamp, and a detection system consisting of a PMT and housing is sufficient.
Limitations of the assayOne disadvantage of the PMT-based system for determining FRET efficiencies is the lack of subcellular spatial resolution. For certain applications, determining spatial variation in FRET may lend important insights into biological function. This limitation can be overcome by using either a camera-based or a confocal imaging system. Such applications may require further cali-bration measurements to account for chromatic and spherical aberration of the objective and may require additional lookup tables to account for detector gains (e.g., for charge-coupled device (CCD) cameras). For confocal imaging, stability of opti-cal parts and fluctuations of laser power may pose substantial challenges35. Confocal imaging setups may also be expensive. This approach is also less suited to high-throughput experi-ments. However, the method could potentially be implemented using a flow-cytometry-based system34,36. In addition, the cur-rent approach is not well suited to extremely fast and highly dynamic processes, as the time required to switch filter cubes can be hundreds of milliseconds. Faster imaging could be attained using multiple PMT detectors and filter wheels. Moreover, as changes in binding would alter only fluorescence measurements from the CFP and FRET cubes, only these measurements need to be obtained simultaneously and rapidly. Over a very short period of time, the changes in direct YFP fluorescence would be negligible. Thus, the protocol described here can be adapted to study fast time-scale events. Finally, the protocol assumes a single-step binding interaction with a 1:1 stoichiometry for determining relative dissociation constants. These constants could be experimentally ascertained if the maximal 33-FRET and E-FRET efficiencies are identical37.
table 2 | Plasmids for FRET analysis.
name Description catalog number
ECFP Untagged donor for spectral factors
84951
EYFP Untagged acceptor for spectral factors
84952
YFP–G4–CFP Dimer for calibration 84953
YFP–G10–CFP Dimer for calibration 84954
YFP–G40–CFP Dimer for calibration 84955
YFP–G80–CFP Dimer for calibration 84956
ECFP–CaMWT Donor-tagged binding partner
84957
EYFP–Myosin Va IQ Acceptor-tagged binding partner
84959
EYFP–CaV1.2 IQ Acceptor-tagged binding partner
84958

©20
16 M
acm
illan
Pu
blis
her
s L
imit
ed, p
art
of
Sp
rin
ger
Nat
ure
. All
rig
hts
res
erve
d.
protocol
nature protocols | VOL.11 NO.12 | 2016 | 2481
Comparison with alternative approachesThere are numerous methods available for detecting FRET efficien-cies from biological systems that are suitable to a variety of applica-tions2. Acceptor photobleaching or donor dequenching is a classic and widely used technique that measures the fractional enhance-ment in donor fluorescence upon photodestruction of the asso-ciated acceptor molecule. As such, this intensity-based technique does not require any instrument-specific calibration constants. Although simple to perform, this technique is destructive and is substantially more time-consuming. A second method of obtain-ing FRET efficiencies quantitatively is fluorescence lifetime imaging microscopy38. This technique measures changes in the fluorescence lifetime of donor molecules to infer FRET in a spatially resolved manner. Lifetime measurements can be attained using either a time-resolved fluorescence response to a brief pulse of light or through frequency domain measurements39. Moreover, it can be used in conjunction with multiphoton excitation to further enhance spa-tial resolution and sensitivity39,40. The use of multiphoton excita-tion could make this technique suitable to in vivo applications40. Although powerful for studying biological systems, one disadvan-tage is that this method requires expensive equipment that may preclude its widespread application39. In addition, many fluores-cent proteins exhibit multiexponential fluorescence decays and may therefore confound accurate detection of fluorescence lifetimes39. Moreover, the concentration of acceptor molecules is generally not considered, and therefore this method is not typically used to quantitatively characterize the strength of binding interactions.
A key confounding factor in intensity-based measurements of FRET is the possibility of spectral cross talk as a consequence of the broad excitation and emission spectrum observed for typical fluorescent proteins. Spectral FRET measures the known spectrum of donor and acceptor molecules to unmix these con-founding factors and estimate FRET efficiency by determining the full spectrum of the donor41–44. However, such measurements will also require expensive equipment to characterize fluorescence signals across a large spectrum.
Binding curves have been measured using approaches similar to the 33-FRET method described here45–48. First, plotting apparent acceptor-centric FRET efficiencies as a function of the ratio of CFP and YFP fluorescence intensity yields a saturating relation-ship that can be analyzed to determine changes in conformation or relative affinity45,46. A similar approach can be used to relate donor-centric FRET efficiencies as a function of the ratio of the number of YFP molecules to the number of CFP molecules in a cell by a saturating Langmuir relation47. However, the fitting constant in this method does not correspond to dissociation con-stants47. Moreover, this method also requires fluorescence lifetime imaging microscopy measurements for calibration47,49. Finally, the E-FRET (donor-centric) efficiencies can be correlated with the free concentration of acceptors to obtain a relative dissociation constant48. In all cases, a 1:1 binding stoichiometry is assumed.
Experimental designRobust quantitative determination of FRET requires a well- calibrated microscope setup, a stable excitation source and a linear detection system, as described in the following section.
Setting up and calibrating the FRET rig. During the initial setup of the FRET rig, identical measurements required for routine
FRET experiments (Figs. 7 and 8) are performed, generating large data sets from which the HV-LUT, the spectral factors and the FRET efficiency calibration constants are determined. The stability of these constants is confirmed over a period of a week. Large fluctuations in these constants will result in mis-estimation of FRET efficiency, adding to noise in FRET binding assays and often leading to irreproducible results.
Stability of the excitation light source. As FRET two-hybrid assay uses corrected total fluorescence output to estimate the concen-trations of donors and acceptors, instability in the excitation source may lead to variable reporting of relative binding affinities. Commonly, xenon arc lamps are used for exciting fluorophores. An intrinsic problem of arc-lamp-based excitation systems is the short-term fluctuations of fluorescence output. Therefore, it is helpful to use xenon lamps equipped with a computer-controlled optical feedback system. Ideally, the feedback system measures lamp intensity output and adjusts any short-term fluctuations via a servo-controlled feedback system by regulating the power supply. Such systems are available from Newport (Oriel Research Xenon arc lamp (cat. no. 66477-150XF-R1) plus Light Intensity Controller LIK-LMP). Alternatively, a monochromator system that is driven by a stabilized power supply can be used in order to minimize intensity fluctuations. Furthermore, LED-based systems with or without optical feedback stabilization or temperature control are also available. Irrespective of the system used, excita-tion intensity output should be set to the low or middle dynamic range to minimize photobleaching. If necessary, neutral-density filters or optical grids (fluorescence intensity manager for Leica microscopes) can be used to reduce excitation intensity. We use a 150 W xenon arc lamp with slit widths of the monochromator output adjusted to 5 nm.
Stability of the emission light detector. Instability in the emission detector may also contribute to mis-estimation of total donors and acceptors, resulting in unreliable reporting of relative binding affinity. We use a PMT-based detection system. The advantage of the PMT is that the detection gain can be controlled over a wide range by changing the high voltage. Certain photodiode-based systems have a limited detection range and may necessitate further optimization. Another advantage of the photomultiplier system is that HV gain can be controlled by the software, which allows for very fast and automated data acquisition. CCD camera systems, which are also equipped with a gain control, are suit-able for quantitative FRET experiments and require calibrations similar to those of PMT-based systems. However, FRET experi-ments using camera-based setups are more complex, as chromatic aberration may result in spatially varying spectral ratios35.
Linear response of the emission light detector. Our FRET-based binding assay relies on robust determination of the number of donor and acceptor fluorophores in a given cell. It is therefore critical that fluorescence intensity measured using the PMT be linearly dependent on the concentration of fluorophores. In some cases, PMT detectors have been shown to respond nonlinearly to the intensity of the incident light44,50,51, although some non-linearities could be corrected50. Therefore, we confirmed a lin-ear relation between the fluorescence intensity measured using the PMT and the concentration of fluorophores determined

©20
16 M
acm
illan
Pu
blis
her
s L
imit
ed, p
art
of
Sp
rin
ger
Nat
ure
. All
rig
hts
res
erve
d.
protocol
2482 | VOL.11 NO.12 | 2016 | nature protocols
by characterizing the fluorescence output of droplets of the synthetic dyes Alexa Fluor 514 and Proflavin, which mimic the spectral properties of YFP and CFP, respectively35. Indeed, the net fluorescence intensity was linearly dependent on the
concentrations of Alexa Fluor 514 (Supplementary Fig. 1a) and Proflavin (Supplementary Fig. 1b). These results suggest that fluorescence intensity measured using our PMT setup is linearly proportional to the number of fluorophores in a cell.
MaterIalsREAGENTS
Sodium chloride (NaCl; VWR, cat. no. 27810)Potassium chloride (KCl; Carl Roth, cat. no. 6781)Magnesium chloride hexahydrate (MgCl2·6H2O; Carl Roth, cat. no. 2189)Calcium chloride dihydrate (CaCl2·2H2O; VWR, cat. no. 22317)Glucose monohydrate (Carl Roth, cat. no. 6887)HEPES (Sigma-Aldrich, cat. no. H3375)Sodium hydroxide (NaOH; VWR, 28244) ! cautIon Sodium hydroxide is a corrosive alkali. Wear protective gear while handling to avoid contact with skin and eyes.Poly-l-lysine hydrobromide (Sigma-Aldrich, cat. no. P2636)Polyethylenimine (PEI; Polysciences, cat. no. 23966-2)Cell sample of choice; here, we use the example of HEK293 cells (DSMZ, cat. no. ACC 305) ! cautIon For cell lines used in your research, it is essential to ensure that the cells are authentic and free from contamination such as mycoplasma.DMEM (low glucose) (Gibco, cat. no. 21885)FBS (Biochrom, cat. no. S 0615)Penicillin/streptomycin (P/S; Biochrom, cat. no. A2212)Alexa Fluor 514 succinimidyl ester (Molecular Probes, cat. no. A3-0002)Proflavin hemisulfate salt hydrate (Sigma-Aldrich, cat. no. P2508) ! cautIon Proflavin is toxic and an irritant. Wear appropriate eye shields and gloves when handling this compound.Plasmid constructs (see Table 2); all plasmids used in the PROCEDURE are available from Addgene (http://www.addgene.org)
EQUIPMENTMicrotubes, 1.5 ml (e.g., Sarstedt, cat. no. 72.690.001)Glass-bottom dishes, 35 mm (In Vitro Scientific, cat. no. D35-20-1.5-N). crItIcal Cell culture dishes with glass bottoms are recommended for imaging. The glass bottom is optimized for minimal autofluorescence. For complete adherence of cells, it is recommended to coat dishes with poly-l-lysine (PLL; see Equipment Setup).Inverted fluorescence microscope (Leica, cat. no. DMI6000B)HC PL APO 40×/1.3 oil-immersion objective (Leica, cat. no. 11506329)CFP-filter cube, excitation: ET436/20×, dichroic: T455lp, emission: ET480/40 m, transmission rate 93–97% (Chroma Technology, cat. no. 49001)YFP-filter cube, excitation: ET500/20×, dichroic: T515lp, emission: ET535/30 m, transmission rate 93–97% (Chroma Technology, cat. no. 49003)FRET-filter-cube, excitation: ET436/20×, dichroic: T455lp, emission: ET535/30 m, transmission rate 93–97% (Chroma Technology, cat. no. 49052)DeltaRamX (Horiba)Xenon short arc lamp type (Ushio, model no. UXL-75XE)C-mount adaptor (specific for Leica microscope type)Microscope photometer (Horiba, model no. D-104 B)PMT housing (Horiba, model no. 914)PMT (Horiba, model no. R1527)FelixGX v4.3.6904 (Horiba)Excel 2013 (Microsoft Corporation)MATLAB vR2014b (MathWorks)
REAGENT SETUPFRET imaging buffer For typical FRET two-hybrid assays, a bath (Tyrode’s solution, containing 140 mM NaCl, 5 mM KCl, 1 mM MgCl2, 2 mM CaCl2, 10 mM glucose and 10 mM HEPES in ddH2O) is used. Adjust the pH to 7.4 with 5 M NaOH. Prepare aliquots and store them at −20 °C for up to 1 year. Thawed aliquots can be stored at 4 °C for up to 1 week.HEPES buffer Dissolve 2.38 g of HEPES in 1 liter of ddH2O to attain a final concentration of 10 mM, and adjust the pH to 7.0 with 5 M NaOH. The buffer can be stored at 4 °C for up to 1 year.
•••
••••
•••
•••••
•
••
•••
•
•
•••••••••
Alexa Fluor 514 dye (1 mg/ml) Dissolve 1 mg in 1 ml of HEPES buffer and incubate the mixture overnight at room temperature (22 °C). The stock solution may be stored at 4 °C and is stable for several months. Prepare dilutions on the day of use with HEPES buffer. crItIcal It is important to protect this solution from light to prevent photobleaching.Proflavin dye (100 mg/ml) Mix a total of 100 mg with 1 ml of HEPES buffer, and vortex and centrifuge the mixture for 1 min at 10,000g at room temperature to remove undissolved particles. This stock solution can be stored at 4 °C and is stable for several months. Prepare all dilutions freshly with HEPES buffer on the day of use. crItIcal It is important to protect this solution from light to prevent photobleaching.Growth medium Supplement 450 ml of DMEM low-glucose medium with 50 ml of heat-inactivated FCS (10% (vol/vol) final) and 5 ml of P/S (1% (vol/vol) final). Store the medium at 4 °C for up to 4 weeks.Transfection medium To 50 ml of unsupplemented DMEM low-glucose medium, add 250 µl of P/S (1% (vol/vol) final). Store the medium at 4 °C for up to 4 weeks.Polyethylenimine transfection reagent Prepare 25 ml of a 1 mg/ml polyeth-ylenimine (PEI) stock solution in endotoxin-free ddH2O with pH adjusted to 7.0. Sterilize the solution using a 0.22-µm syringe filter, prepare aliquots and store them at −20 °C. A working stock can be stored at 4 °C for up to 4 weeks.Poly-l-lysine stock (50 mg/ml) Dissolve 100 mg of PLL in 2 ml of ddH2O for a poly-l-lysine (PLL) stock solution. The stock solution can be stored at 4 °C for up to 6 months.
EQUIPMENT SETUP
Preparation of imaging dishes Wash glass-bottom cell culture dishes with 80% (vol/vol) ethanol and let them dry completely. Coat each dish with 600 µl of 1:50,000 PLL dilution for 30 min at room temperature. Aspirate the PLL solution, wash twice with ddH2O and allow the dishes to dry. Once dried, the dishes may be stored at room temperature for a few days.
Microscope Our measurements were obtained using a Leica DMI6000B inverted fluorescent microscope equipped with a motorized turret and a 40× objective (Fig. 1). The microscope is furnished with a motorized filter-wheel that enables rapid switching of filter cubes within 300 ms. If you are using filter cubes other than those listed in EQUIPMENT section, it is critical to ensure that the filter designs permit optimal transmission of desired optical signals.
Fluorescence excitation system We use a DeltaRamX monochromator containing a xenon short arc lamp (Fig. 1) for excitation. The excitation intensity of this light source can be adjusted by manually setting the slit control, which we typically set to 5 nm. For quantitative FRET microscopy, a stable excitation light source is essential. Arc-lamp-based excitation systems have the disadvantage of long-term decay in fluorescence output due to aging of the excitation lamp. To ensure long-term stability, the intensity of the lamp should be adjusted often to yield a target amount of YFP bleaching in a fixed time interval. For example, when the monochromator slits are opened to ~5 nm, the YFP bleaches to ~60% of initial intensity within 440 s. Repeat this measurement monthly and adjust the output of the xenon lamp, so that the reference value is reached. In practice, this adjustment can be attained by simply adjusting the slit width of the monochromator or by adjusting the power supply. Alternatively, excitation light intensity in the objective plane can be measured using a power intensity meter. The excitation light bulb needs to be replaced based on the lifetime of the light bulb used.
Fluorescence detection system The fluorescence intensity is detected by a PMT (Horiba) consisting of photometer housing and a PMT. In the analog mode, the PMT can operate at different HV gains, allowing for fluorescence measurement over a broad intensity range. The aperture can be adjusted by four aperture control knobs and, for the example used in PROCEDURE, is set to the size of a single HEK293 cell. A viewing scope enables control of

©20
16 M
acm
illan
Pu
blis
her
s L
imit
ed, p
art
of
Sp
rin
ger
Nat
ure
. All
rig
hts
res
erve
d.
protocol
nature protocols | VOL.11 NO.12 | 2016 | 2483
the aperture size and positioning of the relevant cell within the viewing area. Light beams arising from the sample can be directed to either the PMT or the eyepieces by toggling to the ‘Measure’ or ‘View’ position. To protect the PMT, the toggle is set to the ‘Measure’ position only when fluorescence signals are acquired.Data acquisition and analysis We use FelixGX for signal acquisition and control of the monochromator and individual detector gains. Offline data
analysis is performed with a custom-written MATLAB script and a customized Excel spreadsheet, which are provided as Supplementary Data 2 and 3, respectively. In principle, any commercially available image acquisition and data analysis software can be used. For automatization of the workflow, custom-written programs (e.g., with MATLAB) can be used to control all critical components of the system (e.g., light source, microscope, and filter cube turret).
proceDureGeneration of acquisition programs for screening and selecting cells ● tIMInG 15 min crItIcal Steps 1–21 describe how to generate appropriate acquisition programs for FRET two-hybrid-binding assays using the FelixGX software. Alternatively, customized software (e.g., MATLAB) can be used to operate the monochromator. Independent of the data acquisition software used, key parameters such as the wavelength for excitation and emission, the duration of fluorescence recording and the sampling rate of data digitalization can be set as outlined here. Other parameters that are unique to the detection system or the excitation system may differ and will need to be specified according to the hardware used.1| If you are using FelixGX for data acquisition, confirm that ‘914 default gain’ is set to 950. This value is set incorrectly by the supplier and impedes the correct performance of the PMT. To set this value, start FelixGX and click the ‘DeltaRamAnalog’ tab (supplementary Fig. 2) to open the hardware configuration window (supplementary Fig. 3a). Set the parameter to 950. Then validate and close the window.
2| Create an acquisition program for continuous illumination of donor fluorescence (Steps 2–5). This program is suitable for screening and selecting fluorescent cells. In FelixGX, select the ‘Setup’ tab in the left lower corner of the main graphical user interface (supplementary Fig. 2); this opens the ‘Setup’ window. The window has 10 tabs; choose the ‘Acquisition Type’ tab and select ‘Timebased’ (supplementary Fig. 3b).
3| Select ‘Acquisition Settings’ from the ‘Setup’ window (supplementary Fig. 4a) and specify the excitation wavelength for the CFP cube. The excitation wavelength needs to match the center wavelength of the individual excitation filter (e.g., 436 nm for CFP excitation). In the panel on the right side, set duration of the data acquisition to 600 s. The continuous illumina-tion mode usually has an acquisition duration of 5–10 min. Set the sampling rate to 100 points per s and accept. All other settings can be left as default. crItIcal step Users are encouraged to implement acquisition programs that match the properties of their given imaging setup. The sampling rate, acquisition duration and excitation wavelength may therefore be adjusted to yield good signals without inducing photobleaching.
4| Select ‘PMTs’ from the ‘Setup’ window (supplementary Fig. 4b). Specify the gain voltage (e.g., 850 V) and accept. For screening of cells, it is convenient to use a standard HV gain of 850 V.
5| Save the program, e.g., as ‘continuous CFP excitation’. This program will be invoked to screen for appropriate cells to collect FRET data and terminated after an appropriate cell is chosen. Note that the cells will never be exposed for the full acquisition duration, in order to avoid photobleaching effects.
6| Create an acquisition program for continuous illumination of acceptor fluorescence. Repeat Steps 2–5 and create a similar acquisition program for YFP illumination. Use the same settings, except for excitation wavelength, which should be set to match YFP excitation wavelength (e.g., 500 nm).
Determination of the dark current of the pMt ● tIMInG 15 min7| All specific programs require the dark current of the detector to be subtracted. To quantify the dark current, completely isolate the detector from incoming light by setting the photometer knob to ‘View’ (Fig. 1) and direct the light beam toward the oculars of the microscope. This blocks the light beam to the photometer and protects the PMT from saturation. crItIcal step Daily measurements of dark current evaluate the stability of the detection pathway and are important during the setup phase of the FRET rig.
8| Place the CFP filter cube in the light beam. Start continuous CFP illumination (e.g., using the program set up in Steps 2–5) and record the signal for ~10 s.

©20
16 M
acm
illan
Pu
blis
her
s L
imit
ed, p
art
of
Sp
rin
ger
Nat
ure
. All
rig
hts
res
erve
d.
protocol
2484 | VOL.11 NO.12 | 2016 | nature protocols
9| Calculate the average signal of the trace acquired in Step 8. Using FelixGX, go to ‘Math’ → ‘Trace Math’ → ‘Average’ (supplementary Fig. 2) and read out the value in the pop-up window. This value is the dark current of the PMT, which needs to be subtracted in all acquisition programs (Steps 12 and 13).
Generation of acquisition programs for Fret two-hybrid binding experiments ● tIMInG 45 min10| To conduct actual FRET measurements, create acquisition programs for the donor and acceptor using shorter acquisition durations (in the range of milliseconds to seconds). The pulse length needs to be adjusted so that it is long enough to have an optimal fluorescence signal without inducing photobleaching. To do this, repeat Steps 2 and 3 for excitation of CFP using the same settings, except for duration of acquisition, which should be set to 1 s (supplementary Fig. 4a).
11| Set the gain voltage to ‘600’, as described in Step 4.
12| Implement subtraction of dark current from the acquired signal, using the specific dark current value determined in Steps 7–9. In FelixGX, select ‘Backgrounds’ from the ‘Setup’ window (supplementary Fig. 4c). Note that the term ‘Background’ used in this window refers to the dark current caused by spontaneous discharge of electrons by the PMT, where-as the term ‘autofluorescence background’ refers to fluorescence intensity of cells lacking fluorophores typically generated by cellular metabolites. The dark current signal defines the lower limit of the resolution of the detection system. To activate dark current subtraction, select ‘Manual Input’ and activate the option ‘Use Background’ by clicking the box and ‘Accept’.
13| Select ‘Traces’ from the ‘Setup’ window (supplementary Fig. 4d) and specify the dark current value obtained in Step 9 (–0.2957 mV, for our system). Specify a name for the acquisition program (e.g., ‘CFP 600’), activate ‘Visible Graph’ by clicking the box and ‘Accept’.
14| For the purpose of signal acquisition for binding curves, it is necessary to implement acquisition programs designated to detect signals with different detector gains. Usually, gains from 600 V to 1,150 V are in the operational range of the detector. Repeat Steps 10–13, but in Step 11 set the gain voltage to the desired value (e.g., ‘650’). Save the program with an appropriate name (e.g., ‘CFP 650’) and repeat this step for further HV gains. We recommend implementation of acquisition programs with intervals of 50 V. When this step has been successfully completed, 12 programs for specific HV gain will have been created.
15| Create analogous acquisition programs for YFP excitation by repeating Steps 10–14, but instead specify the excitation wavelength to be 500 nm for the YFP cube.
Generation of macros for Fret two-hybrid binding experiments ● tIMInG 45 min crItIcal Steps 16–21 describe how to use the FelixGX software to create separate macros for each HV gain (corresponding to 600–1150 V, in intervals of 50 V) using the acquisition programs created in Steps 10–15. Note that the acquisition protocol for donor excitation is suitable for fluorescence intensity readings using the CFP and FRET filter cubes, whereas the acquisition protocol for acceptor excitation is used to read signals using the YFP filter cube. An example macro sequence might be: donor excitation (CFP cube) → donor excitation (FRET cube) → acceptor excitation (YFP cube). Note that the HV gains used for donor excitation must be the same as those used for acceptor excitation.16| On the main graphical user interface (supplementary Fig. 2), select the ‘Action’ tab to open the ‘Macro’ window (supplementary Fig. 5). Click the green ‘+’ button in the upper left corner of the window to open the ‘Macro Editor’ window (supplementary Fig. 5a).
17| To add a pause step to the macro, highlight ‘Pause’ from the list on the left side and click the ‘Add’ button (supplementary Fig. 5b). This adds ‘Pause [indefinite]’ to the macro window (black panel) on the left side of the list. During an experiment, the pause point allows the appropriate filter cube to be brought into position.
18| Next, add the acquisition protocol for donor excitation at the first HV gain (e.g., ‘CFP 600’) to the macro by selecting ‘Run Acquisition (existing)’ from the list, and choosing the ‘CFP 600’ protocol from the pop-up list (supplementary Fig. 5c).
19| Repeat Steps 17 and 18 to add pause steps and acquisition protocols for the FRET cube and the YFP cubes at HV gain of 600 V. Pause steps need to be added between each of the protocols for the three individual cubes and after the final acquisition protocol, as shown in supplementary Figure 5, to allow switching of filter cubes when conducting a macro.
20| Save the macro with a name that specifies the HV gain—e.g., ‘FRET 600’.

©20
16 M
acm
illan
Pu
blis
her
s L
imit
ed, p
art
of
Sp
rin
ger
Nat
ure
. All
rig
hts
res
erve
d.
protocol
nature protocols | VOL.11 NO.12 | 2016 | 2485
21| Repeat Steps 16–20 for all remaining gains. Once successfully completed, a total of 12 macros corresponding to each of the specific HV gains will have been created.
establishment of an HV-lut to normalize pMt gains ● tIMInG 3 h daily over 1 week22| Place an empty imaging dish on the microscope stage.
23| For background measurements, pipette 80 µl of HEPES buffer onto one edge of the empty dish.
24| Cover the dish with a lid in order to prevent rapid evaporation of the buffer.
25| Using bright-field illumination, navigate the objective to the border of the solution and focus. Subsequently, navigate toward the center of the solution and turn off bright-field illumination.
26| Direct the light beam to the PMT and obtain measurements using the ‘FRET 600’ macro. Repeat for all predetermined PMT HV gains. These measurements will give you 12 data points for each filter cube.
27| Rename the data set with a descriptive name and export as ‘Export Group’. This creates a .txt file that can be read and converted to Excel-compatible data using the provided MATLB script (supplementary Data 2).
28| Navigate to another region of the solution and repeat Steps 25–27 for at least 6–8 more spots of solution. Make sure to record several different positions in each dish.
29| Pipette 80 µl of a 1:10,000 dilution of Alexa Fluor 514 dye onto another edge of the imaging dish and ensure that the solutions remain well separated. Alternatively, a new imaging dish can be used. crItIcal step Make sure that the dye solution is homogeneous and that no undissolved or contaminating particles reside in the light beam.
30| Collect fluorescence signals with all available gains, as described in Steps 25–27. Reject data if the fluorescence signal collected is beyond saturation of the PMT detector or if the signal-to-noise ratio is low.
31| Navigate carefully to another region of the dye solution, and repeat the measurement (as described in Step 30) for at least eight more regions.
32| Repeat Steps 29–31 using two more dilutions of the Alexa Fluor 514 dye—e.g. 1:2,000 and 1:50,000 dilutions. Using the three different dilutions, fluorescence signals will be obtained that cover a broad range of the PMT gains.? troublesHootInG
33| Use a new imaging dish and repeat Steps 29–31 with 80 µl of Proflavin at a 1:10,000 dilution.
34| Collect data for 1:2,000 and 1:100,000 dilutions of Proflavin dye, as described in Steps 29–31. Again reject data by criteria set in Step 30.? troublesHootInG
35| Export the data as ‘Export Group’. For computation of the HV-LUT, read the exported data files derived from measure-ments of different dilutions of Proflavin and Alexa Fluor 514 dye and background measurements (Steps 27 and 35) using the provided MATLAB script (supplementary Data 2), as described in Steps 36–41.
36| Subtract the background fluorescence from the dye measurements and use background-subtracted values for further calculations. The resulting table provides signal amplifications for each gain.
37| For Alexa Fluor 514 dye, use only signals that are measured using the FRET and YFP cubes. Similarly, for Proflavin dye, analyze only signals that are measured using the FRET and CFP cubes. Remove all other signals.
38| Normalize all signals to gain HV800 by dividing by the appropriate LUT factor. This yields the normalized amplification factor for each gain. The normalized amplification factor for gain HV800 will be 1.

©20
16 M
acm
illan
Pu
blis
her
s L
imit
ed, p
art
of
Sp
rin
ger
Nat
ure
. All
rig
hts
res
erve
d.
protocol
2486 | VOL.11 NO.12 | 2016 | nature protocols
39| For each dye dilution, average the normalized fluorescence signals from all three filter cubes. This gives signals for HV600–HV1150 for the CFP cube, the YFP cube and twice for the FRET cube.
40| Visualize the data for the CFP cube, the YFP cube and the FRET cube by plotting HV gains (x axis) against the normalized amplification factors. The power-law relation can be visualized on a logarithmic plot. In this case, the relation forms a straight line. Exclude outliers at the extreme gains for each dye concentration.
41| Average normalized signals from different dilutions for the CFP and YFP cubes. Pool FRET cube signals measured by either of the dyes and average. The outcome is the final HV-LUT.
cell preparation and transfection for calibration of the setup ● tIMInG 2–3 d42| Seed HEK293 cells at a density of 1 × 10⁵ to 5 × 10⁵ cells in 2 ml of growth medium on a 35-mm glass-bottom dish at least 2 d before the experiment. Prepare at least one imaging dish per sample. Refer to the table below to assess the total number of cell dishes needed for setup calibration.
sample purpose plasmid number of dishes to prepare
Background Determining background fluorescence according to Steps 53–62 No transfection 1
Donor only Determining RD1 and RD2 values according to Steps 63–73 Untagged CFP 1
Acceptor only Determining RA1 value according to Steps 74–77 Untagged YFP 1
Dimer Determining G-factor and MA/MD value according to Steps 78–99 YFP–G4–CFP YFP–G40–CFP YFP–G80–CFP
3 (1 dish per dimer plasmid)
crItIcal step It is important that cells be well separated after seeding and after transfection. For FRET experiments, only single fluorescent cells are used, in order to avoid collection of light from adjacent cells.
43| Transfer cells to an incubator (37 °C and 10% CO2 atmosphere) and allow them to grow overnight to a density of 60% confluence.
44| For transfection of cDNA plasmids, we use 25-kDa linear polymer PEI. Bring the transfection medium (serum free), transfection reagent PEI and relevant plasmids to room temperature and place them in a laminar flow work bench.
45| In a sterile 1.5-ml microtube, dilute 400–1,200 ng of appropriate cDNA plasmids in 200 µl of transfection medium.
46| Add PEI (1 mg/ml) to the diluted DNA mixture at a 3:1 ratio of total PEI (µg):total DNA (µg) to prepare DNA-containing liposomes. For example, for 1 µg of CFP plasmid, 3 µg of PEI would be added. The optimal PEI:cDNA ratio can vary between 1:1 and 3:1 and may need to be adjusted to obtain optimal protein expression.
47| Incubate the cDNA/PEI mixture for 5–15 min at room temperature, and subsequently add this mixture to the cells.
48| Incubate the cells for 24–72 h at 37 °C and 10% CO2 atmosphere to allow for expression of the protein of interest. This time window needs to be individually adjusted to account for variability in rates of expression for proteins of interest.
preparation for Fret two-hybrid binding experiments ● tIMInG 20 min49| Set the aperture of the adjustable pinhole or iris of the photometer (Fig. 1) to an appropriate size so as to acquire the fluorescence signal from an individual cell. In general, keep the size of the pinhole to a minimum; it should be just larger than a typical cell in order to reduce background fluorescence and enhance signal-to-noise ratio. This aperture is set before experimentation and maintained throughout the duration of each experiment. The pinhole is placed at the center of the field of view, as chromatic and spherical aberrations of the objective are least near the center of the optical axis. As a rule of thumb, only cells with a fluorescence signal at least seven times higher than background autofluorescence should be considered. This rule applies to the CFP and YFP cubes only, not to the FRET cube.
50| Turn on the fluorescence arc lamp at least 20 min before the experiment to ensure stable light output.

©20
16 M
acm
illan
Pu
blis
her
s L
imit
ed, p
art
of
Sp
rin
ger
Nat
ure
. All
rig
hts
res
erve
d.
protocol
nature protocols | VOL.11 NO.12 | 2016 | 2487
51| Open the FelixGX software or equivalent software to control the monochromator and to acquire fluorescence measurements.
52| Ensure that the ‘Measure/View’ knob of the photometer is set to ‘View’ mode at all times other than during data acquisition, in order to protect the PMT from saturation.
Determination of background autofluorescence ● tIMInG 30 min daily over 1 week53| Place a dish containing untransfected cells (background sample from Step 43) on the microscope stage.
54| Use bright-field illumination to bring a cell into focus (choose a cell with representative morphology).
55| Center the cell to the field of view of the pinhole by moving the microscope stage.
56| Toggle the photomultiplier to the ‘Measure’ position to enable fluorescence measurement.
57| Acquire fluorescence signals with all three filter cubes (CFP, FRET and YFP cubes) for all predetermined HV gains (i.e., ‘FRET 600’ macro to ‘FRET 1150’ macro). Start with the ‘FRET 600’ macro. Switch the filter cubes when prompted. For each cell, there will be 12 signals per filter cube.
58| Rename the data set with a unique descriptive notation (e.g., ‘Cell 1’) and export as ‘Export Group’.
59| Repeat Steps 54–58 for 10–15 more cells and export the data.
60| For calculation of background autofluorescence, open MATLAB and execute the ‘ReadFRETdata’ script (supplementary Data 2) for the data containing background measurements from Step 58. The MATLAB script converts the FelixGX data output to an input format suitable for Excel spreadsheets. The file exported in Step 58 contains data acquired from a single cell for the complete set of gains. The MATLAB script returns the average value of each trace for the fluorescence signals obtained with the CFP, FRET and YFP filter cubes. Alternatively, mean data can be computed with FelixGX or other software.
61| Open the Template Excel sheet provided as supplementary Data 3. Start with ‘Cell 1’ and paste data from Step 60 into the ‘Background’ worksheet (supplementary Fig. 6). In column D the HV gain is specified, and in columns E–G the fluorescence signals specified in the header are deposited.
62| Repeat Steps 60 and 61 for the remaining files containing background data (from Step 59) and paste them into the provided space for ‘Cell 2’, ‘Cell 3’ and so on. in the Excel sheet. In the ‘Background’ worksheet, the average value of all cells for each gain and filter cube is automatically calculated (column: K8–M19) and transferred to all other sheets except the ‘HV lookup’ worksheet.? troublesHootInG
Determination of the spectral factors RD1 and RD2 ● tIMInG 45 min daily over 1 week 63| Place a dish containing cells expressing untagged CFP (donor sample, from Step 48) on the microscope stage. Move the CFP filter cube to within the light beam and start the ‘Continuous CFP excitation’ protocol.
64| Select an isolated fluorescent cell and place it into the field of view of the pinhole. Once a suitable cell is chosen, terminate the fluorescence illumination until you are ready to perform data measurement, in order to diminish photobleaching. If necessary, the bright-field light source can be used to position the cell.
65| Choose an appropriate HV gain for fluorescence measurement. The optimal HV gain depends on the expression level of the transfected plasmid and should match the brightness of the cell. Start with the ‘FRET 800’ macro when initially screening a sample. This standard gain is appropriate for intermediate-expressing cells. Switch to a higher or lower HV gain if necessary. For a sufficiently high signal-to-noise ratio, output signals between 100 mV and 4 V are required.
66| Load the appropriate macro, toggle the photomultiplier to the ‘Measure’ position and record data by starting the macro. Switch the filter cubes when prompted. You will obtain three fluorescence intensity signals from this measurement. The signal through the FRET cube yields SFRET(D, 436, 535), the signal through the CFP cube yields SCFP(D, 436, 480), and the signal through the YFP cube yields SYFP(D, 500, 535).
67| Rename the recording with an informative title and export as ‘Export Group’.

©20
16 M
acm
illan
Pu
blis
her
s L
imit
ed, p
art
of
Sp
rin
ger
Nat
ure
. All
rig
hts
res
erve
d.
protocol
2488 | VOL.11 NO.12 | 2016 | nature protocols
68| Follow Steps 64–67 for an additional 10–15 individual cells. Select cells that express CFP at variable levels in order to collect data at different HV gains.
69| Calculate the spectral factors RD1 and RD2 from the data acquired in Steps 67 and 68 using the Template Excel sheet pro-vided as supplementary Data 3, or create your own analysis template. If you are using the Template Excel file, convert the data obtained in Step 67 using MATLAB as described in Step 60 and paste them into columns E–G (raw data) of the ‘RD value’ worksheet (supplementary Fig. 7). Continue for all cells acquired in Step 68. crItIcal step The spectral ratios RD1 and RD2 are specific for a given FRET setup and need to be determined for each individual FRET setup. It is necessary to verify these values before daily experiments.? troublesHootInG
70| For each cell, specify the HV gain at which the signal was recorded in column D.
71| Subtract background signals for the corresponding HV gain from each trace. In the ‘RD value’ worksheet of the Excel spreadsheet, background subtraction is automatically performed (columns: I–K).
72| Calculate the RD1 value by dividing the background-subtracted FRET signal by the background-subtracted CFP signal (RD1 = SFRET(D, 436, 535)/SCFP(D, 436, 480)). This step is automatically performed in the Excel worksheet. The RD2 value is also calculated at this point (RD2 = SYFP(D, 500, 535)/SCFP(D, 436, 480)). For our setup, RD2 is so small that it will not be further considered.
73| Average the RD1 and RD2 values from single cells (data in column M) to obtain the overall RD1 and RD2 values (cells P9 and Q9). The calculated RD1 value is automatically transferred to the dimer sheet and the binding curve analysis (‘BC analysis’) sheet for further analysis.
Determination of the spectral factor Ra1 ● tIMInG 45 min daily over 1 week74| For determination of spectral factor RA1, use YFP-only-expressing cells (from Step 48) and follow Steps 63–68 using 500-nm excitation and ‘Continuous YFP excitation’ for selection of cells. Again, measure 10–15 individual cells.
75| Read out the data using MATLAB (Step 60), paste these values into columns E–G (raw data) of the ‘RA value’ worksheet (supplementary Data 3, supplementary Fig. 7) and specify the HV gain in column D. The background is automatically subtracted (columns I–K). crItIcal step The spectral ratio RA1 is specific to an individual FRET setup and needs to be determined for each individual FRET setup. It is necessary to verify the value before daily experiments.? troublesHootInG
76| Calculate the RA1 ratio by dividing the background-subtracted FRET signal by the background-subtracted YFP signal (RA1 = SFRET(A, 436, 535)/SYFP(A, 500, 535)). The value is automatically computed in the Excel sheet, column M.
77| Average the RA1 values from single cells to obtain the mean RA1 value (cell P9). The calculated RA1 value is automatically transferred to the ‘Dimer’ sheet and the ‘BC Analysis’ sheet for further analysis.
Determination of calibration constants using dimers ● tIMInG 90 min daily over 1 week78| For determination of FRET efficiencies from dimers, place cells expressing a dimer plasmid (e.g., YFP–G4–CFP, from Step 48) under the microscope.
79| Under continuous CFP illumination, select an isolated cell expressing the dimer at an intermediate level.
80| Switch to continuous YFP illumination and inspect the YFP expression of the cell.
81| Switch to bright-field illumination and center the cell in the visual field.
82| Direct the light beam to the photomultiplier and center the cell in the pinhole aperture of the photometer.
83| Record fluorescence intensities with an appropriate gain as described in Step 65. Choose a gain so that the signal falls into a range between 100 mV and 4 V.? troublesHootInG

©20
16 M
acm
illan
Pu
blis
her
s L
imit
ed, p
art
of
Sp
rin
ger
Nat
ure
. All
rig
hts
res
erve
d.
protocol
nature protocols | VOL.11 NO.12 | 2016 | 2489
84| Export the data and repeat Steps 78–83 for at least 15 cells. Choose cells with different expression levels.
85| Collect data for multiple dimers (each dimer separately, for example Y–G40–C, Y–G80–C) by following Steps 78–84. crItIcal step We recommend measuring three cube fluorescence measurements from all dimers across several days. Once a stable calibration curve is calculated, it is sufficient to determine FRET efficiencies for one dimer daily.? troublesHootInG
86| For calculation of FRET efficiencies from dimers, read data files acquired in Step 84 using MATLAB and paste them into columns E–G of the ‘Dimer’ worksheet (supplementary Fig. 8).
87| Specify the gain used for each cell in column D.
88| Subtract the corresponding background value from each measurement (columns J–L).
89| Calculate the Fc/(RA1 · SYFP) value according to equation (5) (box 1) using the computed RD1 and RA1 values (Steps 73 and 77; Excel spreadsheet cell F2 and cell F3), respectively.
90| Continue with data from cells expressing each of the distinct dimers (Step 85) and repeat Steps 86–88 for analysis and calculate the Fc/(RA1 · SYFP) values of these dimers. The sheet calculates the average Fc/(RA1 · SYFP) value for each dimer and deposits it in column O in the cell indicated.
91| To analyze the dimer series experiment, open the ‘Dimer Analysis’ worksheet provided in the Excel spreadsheet (supplementary Fig. 9).
92| Transfer the background-subtracted raw data (SCFPFRET, SFRETFRET, SYFPFRET) from Steps 89 and 90 to the ‘Dimer Analysis’ worksheet, columns D–G.
93| For each cell from Step 92, compute FC according to equation (5) and subsequently compute the Fc/SYFP and SCFP/SYFP values using the background-subtracted raw data. This step is automated in the worksheet (columns H–J, subheader ‘Calibration by Dimer Series’).
94| Substitute actual RA1 and RD1 values measured daily (in contrast to dimers) in the equations RD1/RA1 · SCFP/SYFP and 1/RA1 · Fc/SYFP. These values represent the x and y coordinates for individual points (columns K,L) in the graph (top right). crItIcal step For a FRET two-hybrid binding experiment, the RA1 and RD1 values should be updated each day, to account for daily fluctuations. By contrast, it is sufficient to use measurements from dimers acquired during the calibration phase of the rig.
95| Plot the data from Step 94 in a linear diagram. In the Excel sheet, data are automatically plotted in the top graph on the right-hand side. Data points for each dimer cluster together.
96| Calculate the mean SCFP/SYFP · RD1/RA1 and FC/(RA1 · SYFP) values for each dimer construct (columns M and N) and plot them into a graph, as shown in the lower graph on the right-hand side in the worksheet.
97| Compute a linear regression line for the data obtained in Step 96 and calculate both the y intercept and the slope of the regression. The values are used to determine the G factor and MA/MD value. Copy the y intercept and slope and paste them into cells T56 and T57, respectively, of the ‘Dimer Analysis’ worksheet. Please note that this step needs to be performed manually.
98| From the data obtained in Step 97, calculate the εYFP(436)/εCFP(436) value by dividing 1 by the y intercept, and calculate the MA/MD value by dividing the negative slope (G factor) by the y intercept. These values should be pasted into cells W56 and W57. Please note that this step needs to be performed manually.
99| Set MD to 1 in order to obtain MA (MA then equals the MA/MD ratio). Alternatively, the computed MD value could be set here. In the latter case, the MA value is then set such that MA/MD is as experimentally determined. Transfer the MA/MD ratio and the εYFP(436)/εCFP(436) value to cells F7 and F10 of the ‘BC Analysis’ sheet. Please note that this step needs to be performed manually (supplementary Data 3).

©20
16 M
acm
illan
Pu
blis
her
s L
imit
ed, p
art
of
Sp
rin
ger
Nat
ure
. All
rig
hts
res
erve
d.
protocol
2490 | VOL.11 NO.12 | 2016 | nature protocols
cell preparation and transfection to perform a Fret two-hybrid experiment ● tIMInG 2–3 d100| For a FRET two-hybrid experiment, seed and transfect cells as described in Steps 42–48. The table below lists the samples required for an experiment. Prepare experimental cells as required according to the experimental design. Depending on the expression efficiency of the cDNA plasmids, it may be necessary to prepare more than one imaging dish for coexpres-sion of interacting partners (biological samples), in order to achieve variable expression levels, which is fundamental to the outcome of the binding assay. We recommend starting with a 1:1 transfection (CFP-tagged protein:YFP-tagged protein) and to subsequently adjust the ratio to obtain varying ratios of donor and acceptor expression. crItIcal step To obtain a completely populated binding curve, it is important to achieve variability in expression levels of interaction partners. In our experience, a PEI transfection reagent is best suited to obtaining heterogeneous expression levels. However, we encourage researchers to test other transfection reagents for their particular cDNA plasmid.
sample purpose plasmid number of dishes to prepare
control cells
Background Determining background fluorescence (Step 101) No transfection 1
Donor only Determining RD1 and RD2 values (Step 101) Untagged CFP 1
Acceptor only Determining RA1 value (Step 101) Untagged YFP 1
Dimer (optional) Positive control (Step 101) e.g., YFP–G4–CFP 1
Spurious FRET Determining collisional FRET (Steps 102–109) Cotransfect untagged CFP and untagged YFP
1
experimental cells
Biological samples Determining the interaction of proteins Cotransfect protein- tagged CFP and YFP
1 or morea
Control biological samples Positive control 1 or morea
aDepending on experimental design.
Measurement of background, spectral factors Ra1 and RD1, and dimer control ● tIMInG 90 min101| Measure and analyze the control samples from Step 100 as described in Steps 53–84 in order to determine the following: background autofluorescence (background sample, Steps 53–62), RD1 and RD2 values (donor-only sample, Steps 63–73), RA1 value (acceptor-only sample, Steps 74–77) and the efficiency of one dimer to ensure stability of measurements between experimental days (dimer sample, Steps 78–84, for one dimer). It is recommended to include one dimer per experimental day in routine FRET experiments. crItIcal step The background autofluoresence results from cellular metabolites and weakly fluorescent amino acids in proteins. These contaminating factors may vary daily depending on the cell conditions. It is therefore critical to measure autofluorescence background before each FRET experiment and use these values for analysis. crItIcal step On a calibrated setup, it is sufficient to measure 5–8 cells, as the values are expected to be reasonably stable within a cell preparation. If the RA1 and RD1 values are not stable, FRET cannot be measured reliably.
Determination of spurious Fret ● tIMInG 30 min 102| For the determination of spurious FRET, acquire fluorescence signals from cells expressing untagged CFP and YFP molecules (from Step 100) according to Steps 79–83.
103| Repeat signal acquisition for 10–15 cells and export data.
104| Use the MATLAB script to import the raw data obtained in Step 103 into columns D–F of the ‘Spurious FRET’ worksheet (supplementary Fig. 10). In column C, specify the HV gain.
105| For each measurement, subtract the corresponding appropriate background value (columns H–J).
106| Calculate Fc/(RA1 · SYFP) (column K) and EA (column M) according to equations (5 and 6), respectively. The values for RA1 and RD1 are picked from cells F3 and F4.

©20
16 M
acm
illan
Pu
blis
her
s L
imit
ed, p
art
of
Sp
rin
ger
Nat
ure
. All
rig
hts
res
erve
d.
protocol
nature protocols | VOL.11 NO.12 | 2016 | 2491
107| Determine CFPEST, taking the HV-LUT (Sheet 9) into consideration to normalize for different HV gains. Calculate CFPEST according to equation (12) (automatically performed in the Excel worksheet, column L). The RD1 and MD values required for this calculation are chosen from cells F4 and F5.
108| Plot EA as a function of CFPEST and perform a linear regression on the data points (graph on the right-hand side in the worksheet).
109| Transfer the slope of the regression line to cell P7.
Determination of Fret efficiencies from cFp- and YFp-tagged Fret pairs ● tIMInG 1–3 h110| For the determination of FRET efficiencies from CFP- and YFP-tagged biomolecular interaction partners, record signals from at least 25 cells according to Steps 79–83. Perform measurements on imaging dishes transfected with different ratios of CFP- and YFP-tagged proteins, if necessary. crItIcal step For binding analysis, it is necessary to choose cells with varying expression of CFP- and YFP-labeled proteins. Inspect the sample carefully under both CFP and YFP excitation, and preferentially include cells displaying varying ratios of CFP and YFP expression. This variability in cellular expression is critical to populating both the rising and saturating portions of the FRET two-hybrid binding curve (Fig. 6).? troublesHootInG
111| To calculate the FRET efficiencies of CFP- and YFP-tagged interaction proteins, read fluorescence intensities obtained in Step 110 using MATLAB and paste the data into columns E–G of the ‘Samples’ worksheet.
112| Specify the gain used for each cell in column D.
113| From each measurement, subtract the corresponding appropriate background value (columns J–L).
114| Calculate FC/(RA1 · SYFP) using the RA1 and RD1 values from cells G2 and G3, respectively. This is automated in the Excel template. These values are further used for construction of a binding curve and automatically linked to the ‘BC Analysis’ worksheet.
construction of a binding curve ● tIMInG 30 min–2 h115| The table on the top left of the ‘BC Analysis’ worksheet is subdivided into three sections (supplementary Fig. 11). The left part contains the FRET parameters. Here, RA1 (cell F4), RD1 (cell F5), MA (F8) and the MA/MD ratio (F10) are collected from the linked worksheets. Calculate MD (cell F9) according to supplementary note 1 and supplementary Data 1 and transfer the εYFP(436)/εCFP(436) value (cell F7) manually from the ‘Dimer Analysis’ worksheet. The middle part of the table contains parameters required for spurious FRET correction. Here, the slopes of the spurious FRET relations for 33-FRET (cell I5; SpFRET_E_3Cube) and EFRET (cell I6; SpFRET_E_EFRET) are tabulated. Confirm that the values in the left and the middle part of the table have been correctly transferred from the individual sheets linked to this table. The right part of the table contains parameters relevant for the fitting procedure (Steps 121–128).
116| Make sure that background-subtracted values, including the respective gains and the FC/(RA1 · SYFP) values from Steps 113 and 114 are transferred from the ‘Samples’ worksheet into columns D–H of the ‘BC Analysis’ worksheet.
117| Calculate the EA and ED efficiencies according to equations (6 and 7) presented in box 1 and deposit the values in columns I and K, respectively. This step is automatically performed in the Excel sheet.
118| Correct the EA and ED efficiencies for spurious FRET (automated in columns J and L of the Excel sheet) according to equations (27 and 28), respectively, and the parameters presented in the top table in the ‘BC Analysis’ worksheet.
119| Total CFPEST (column M) and YFPEST (column N) are calculated according to equations (10 and 12), respectively, using parameters specified in the top table (‘BC Analysis’ worksheet). Ensure that both formulas are corrected for HV gain, that the background is subtracted from the raw signals and that efficiencies are corrected for spurious FRET.
120| Divide CFPEST by YFPEST. For dimers, this value is expected to be ~1 (column O). crItIcal step For FRET-binding curves, only cells with a CFP/YFP ratio <20 are probed. Importantly, a CFP fluorescence value that is too large, in comparison with the YFP fluorescence value, could corrupt the measurement of sensitized emission

©20
16 M
acm
illan
Pu
blis
her
s L
imit
ed, p
art
of
Sp
rin
ger
Nat
ure
. All
rig
hts
res
erve
d.
protocol
2492 | VOL.11 NO.12 | 2016 | nature protocols
and lead to large errors in measured FRET efficiencies. These general criteria must be adjusted to account for the quantum yields of the fluorescent pairs and the microscopy setup.? troublesHootInG
121| To fit a binding curve to FRET data, FRET efficiencies (EA and ED), as well as CFPEST and YFPEST values, have to be calculated for each individual cell as specified in Steps 115–120. For the fitting procedure, the right-hand side of the table (‘BC Analysis’ worksheet), the graphs titled ‘three cube FRET’ and ‘E-FRET’ (‘BC Analysis’ worksheet), and columns P–AA are relevant (supplementary Data 3). Placeholders for Kd,EFF, EA,max and ED,max have been prepared in the right-hand side of the table. These parameters are called Kd,EFF, EA,max and ED,max and have been deposited in cells K4, K6 and K7, respectively. SUM_Err_3Cube (cell K8) and SUM_Err_EFRET (K9) represent the sum of squared error between predicted and experimentally observed EA and ED values. Total Error (K10) is the sum of both types of error (SUM_Err_3Cube + SUM_Err_EFRET). The parameters ND/NA (K5) and ND/NA exp (K11) are the theoretical and the experimentally observed stoichiometries of the binding reaction and are assumed to be 1 in a 1:1 binding reaction, as presented in the example data set. The idea of the fitting procedure is as follows: By analyzing the entire data set, a nonlinear least-square fitting procedure is performed to obtain an estimate of the Dfree and Afree values (columns P and Q), the maximal efficiencies EA,max and ED,max (K6 and K7), and the relative binding affinity Kd,EFF of the binding reaction (K4). To obtain approximations of the parameters EA,max or ED,max and Kd,EFF for the single-site binding model, a visual fit is performed first. Start with initial guesses for Kd,EFF (cell K4), EA,max (K6) and ED,max (K7). The final fit for the binding curve is obtained following an iterative fitting procedure.
122| According to equations (17 and 19) in box 2, estimate Dfree and Afree and deposit the values in columns P and Q of the sheet. Both Dfree and Afree change as Kd,EFF changes. Thus, it is helpful to visualize the data points on the corresponding test binding curve during the fitting procedure. Accordingly, both 33-FRET (EA) and E-FRET (ED) are plotted against Dfree and Afree, respectively (top graphs, middle and right). To build an intuition for the procedure, manually change the Kd,EFF value and observe how the Dfree and Afree values change. In addition to Dfree and Afree, Ab and Db are calculated according to equations (20 and 21) (box 2) and deposited into columns R and S, respectively.
123| In parallel, predicted EA and ED values are calculated according to equations (6 and 7) (box 1) and deposited into columns T and V. From predicted EA and ED values and experimentally determined EA and ED values, the errors ‘EA pred Error’ (column U) and ‘ED pred Error’ (column W) are calculated. The sums of ‘ED pred Error’, ‘EA pred Error’, and ‘total error’ are deposited in cells K8, K9 and K10, respectively.
124| Iteratively adjust the fitting parameters to obtain a best fit (lowest errors). Maximal FRET efficiencies and Kd,EFF values should be identical for 33-FRET (EA,max) and E-FRET (ED,max) for a 1:1 binding stoichiometry.
125| Subsequently, use the Excel solver to optimize these parameters using the visual fit parameters from Steps 125–128 as initial guesses. Open the Excel solver by clicking ‘Data’ → ‘Solver’ (supplementary Fig. 12)52. In case the Excel solver is not activated, activate it by clicking ‘Folders’ → ‘Options’ → ‘Add-Ins’. Choose ‘Excel-Add-Ins’ in the ‘Manage’ drop-down menu, and hit the ‘OK’ button. In the ‘Add-Ins’ window, check the ‘Solver’ checkbox and click ‘OK’. When asked to confirm, choose ‘Yes’.
126| In the ‘Solver Parameters’ window, specify entries for ‘Set Target Cell’, ‘Equal To’, ‘By Changing Variable Cells’ and ‘Subject to the Constraints’. supplementary Figure 12 shows how the parameters are set. ‘Set Target Cell’ determines which value is to be optimized. In the sample spreadsheet, this is set to cell K10 (supplementary Fig. 12a), which is the total error (e.g., SumErr_3Cube plus SumErr_3Cube). In this case, 33-FRET and E-FRET curves are fitted simultaneously. If you would like to fit the 33-FRET graph alone, the target cell to be optimized needs to be set to cell K8 (SumErr_3Cube; supplementary Fig. 12b); if you would like to fit the E-FRET curve alone, then set target cell to K9 (SumErr_ECube).
127| Set ‘Min’ in the ‘Equal To’ selection. ‘By Changing Variable Cells’ defines the adjustable parameters, which in our case are Kd,EFF, EA,max and ED,max, contained in cells K4, K6 and K7, respectively. In ‘Subject to the Constraints’ impose constraints on the adjustable parameters. Here, it is useful to constrain Kd,EFF, EA,max and ED,max to ≥0.
128| In the ‘Solver Parameters’ window (supplementary Fig. 12), click the ‘Solve’ button to initialize Solver. Now, a prediction is calculated and the difference is calculated according to equations (22 and 23) (box 2). The solver now minimizes the sum-of-square errors between predicted and observed values. The results are deposited in cells K4, K6 and K7.

©20
16 M
acm
illan
Pu
blis
her
s L
imit
ed, p
art
of
Sp
rin
ger
Nat
ure
. All
rig
hts
res
erve
d.
protocol
nature protocols | VOL.11 NO.12 | 2016 | 2493
? troublesHootInGTroubleshooting advice can be found in table 3.
● tIMInGImplementation and calibration of the FRET imaging setup: 1-week periodSteps 1–6, generation of acquisition programs for screening and selecting cells: 15 minSteps 7–9, determination of the dark current of the PMT: 15 minSteps 10–15, generation of acquisition programs for FRET two-hybrid binding experiments: 45 minSteps 16–21, generation of macros for FRET two-hybrid binding experiments: 45 minSteps 22–41, establishment of an HV-LUT: 3 h daily over 1 weekSteps 42–48, cell preparation and transfection for calibration of the setup: 2–3 dSteps 49–52, preparation for FRET two-hybrid binding experiments: 20 minSteps 53–62, determination of background autofluorescence: 30 min daily over 1 weekSteps 63–77, determination of spectral factors RD1 and RD2: 45 min daily over 1 weekSteps 74–77, determination of the spectral factor RA1: 45 min daily over 1 weekSteps 78–99, determination of calibration constants using dimers: 90 min daily over 1 weekStep 100, cell preparation and transfection to perform a FRET two-hybrid experiment: 2–3 dStep 101, measurement of background, spectral factors RA1 and RD1, and dimer control: 90 minSteps 102–109, determination of spurious FRET: 30 min
table 3 | Troubleshooting table.
step problem possible reason solution
32, 34 Not all HV gains are covered Fluorescence intensity of the dyes does not match the detection range
Prepare new dilutions
62 Automated background subtraction is not correct
The link within the Excel sheet is not correctly defined
Check and redefine the lookup function in the Excel spreadsheet
69 Large intra-experimental fluctuations in RD1 values
Problem with detector Check hardware settings; stabilize the detector
Large interexperimental fluctuations in RD1 values
Problem with detector Check hardware settings; stabilize the detector
Filters are aging Exchange filter sets
75 Large intra-experimental fluctuations in RA1 values
Unstable excitation lamp Prewarm the excitation lamp; stabilize power supply; exchange lamp bulb
Large interexperimental fluctuations in RA1 values
Unstable excitation lamp Stabilize power supply; exchange lamp bulb
Systematic shift and drift of RA1 value, which is not improved by changing the light bulb
Filters are aging Exchange filter sets
83 PMT saturation Fluorescence intensity is too high Use a lower HV gain; retransfect cells
85 RA1 and RD1 values are stable but FC/RA1*SYFP and FRET efficiencies vary considerably for one dimer
Related to fluorophore maturation Use cerulean and venus fluorescent proteins instead of CFP and YFP
110 Less variation in expression levels Suboptimal transfection of cells Transfect a smaller amount of cDNA; wait longer for expression
Data points do not populate all phases of a binding curve
No variability in expression levels of interacting partners
Transfect different ratios of CFP- and YFP-tagged proteins
120 CFPEST/YFPEST ratio is much larger than 1 for dimers
Degradation of cDNA Use another batch of plasmids

©20
16 M
acm
illan
Pu
blis
her
s L
imit
ed, p
art
of
Sp
rin
ger
Nat
ure
. All
rig
hts
res
erve
d.
protocol
2494 | VOL.11 NO.12 | 2016 | nature protocols
Steps 110–114, determination of FRET efficiencies from CFP- and YFP-tagged FRET pairs: 1–3 hSteps 115–128, construction of a binding curve: 30 min–2 h.
antIcIpateD resultsIndicators of a successful microscope setupA stable FRET microscopy setup is critical for high-quality quantitative FRET experiments. The three key indicators of a successful setup are as follows: Stability of the excitation light source indicated by stable RA1values. The RA1 value is mainly determined by the excitation system (Fig. 4) and is measured daily while establishing the FRET setup and during the course of FRET –two-hybrid experiments. Short-term (i.e., day-to-day and over the course of a single experiment) fluctuations in fluorescence output and/or intensity of the arc lamp are indicated by variability of RA1 values (Fig. 9; table 4). For our setup, the range of RA1 values is 0.025–0.045 for YFP and should be stable in cells (Fig. 9a). RA1 measurements using dyes should also be very stable (for our setup, the range of RA1 values for Alexa514 dye was 0.049–0.058). An important cause of highly variable RA1 values is fluctuations of the excitation lamp caused by an unstable power supply or intensity fluctuations of the light bulb. When RA1 values are stable when measured using the Alexa Fluor 514 dye but unstable in cells, the problem may pertain to cell transfection and fluorophore maturation. Standardization of cell transfection and culture conditions will alleviate this potential problem. Long-term decay (i.e., over the course of several months) in fluorescence output due to aging of the excitation lamp is indicated by variation in RA1 values over the course of several months and needs to be compensated for, as outlined in Equipment Setup. Stability of the detection system, indicated by RD1values. RD1 mainly depends on the emission pathway, in particular, on the detector (Fig. 4). Thus, stability of the emission light detector is indicated by low variability of RD1 values. However, for RD1 values to faithfully represent stability of the detection system, the following system parameters must be low: the dark current of the PMT; the noise level associated with empty glass imaging dishes; and background fluorescence in nontrans-fected cells. Representative and acceptable values for these parameters are given in table 4. For our setup, the range of RD1 values obtained for Proflavin dye was 1.025–1.049, and the observed range of RD1 values for CFP was 0.24–0.27 (Fig. 9b). RD1 can be roughly calculated for the filter cubes used from the emission spectrum of CFP and also from the quantum
•
•
0.05
RA
1
RD
1
00
No. of days No. of days
20 200 600 800 1,000 1,200
PMT HV, high voltage (V)
Am
plifi
catio
n fa
ctor
(nor
mal
ized
to H
V =
800
V)
10
0.5 20
0
a b c
Figure 9 | Stability of spectral correction factors and amplification factors. (a) Typical daily variation in RA1 values observed over 20 experimental days. (b) Daily variation in RD1 values, observed over the same time period. (c) Plot of the normalized amplification factor (Step 41) obtained based on intensity measurements of fluorescent dyes versus high voltage shows a power-law relation. Amplification factors are normalized to a standard PMT HV gain of 800 V. PMT HV, photomultiplier tube high voltage.
table 4 | Background and RA1, RD1 and RD2 values (at HV gain 800).
entity cFp cube Fret cube YFp cube
Blank cells (autofluorescence) 0.0129 mV (±0.0001) 0.0132 mV (±0.0001) 0.0097 mV (±0.0001)
Noise from empty imaging dish 0.0923 mV (±0.0001) 0.0729 mV (±0.0001) 0.0443 mV (±0.0001)
Noise from imaging buffer 0.0109 mV (±0.0001) 0.0093 mV (±0.0001) 0.0082 mV (±0.0001)
Dark current range 0.2957 mV (±0.005) 0.2957 mV (±0.005) 0.2957 mV (±0.005)
Ra, RD values
RD1 value 0.2651 (±0.0001)
RD2 value 0.0008 (±3.8E-05)
RA1 value 0.03394 (±5.079E-05)Values are means (n = 15) ± s.e.m.

©20
16 M
acm
illan
Pu
blis
her
s L
imit
ed, p
art
of
Sp
rin
ger
Nat
ure
. All
rig
hts
res
erve
d.
protocol
nature protocols | VOL.11 NO.12 | 2016 | 2495
efficiency of the detector used. Deviation of the experimentally determined RD1 value from the theoretical value suggests a likely malfunction of the detection system or the PMT. Possible causes of deviations include incorrect mode of operation for the PMT (photon counting instead of analog) or specific hardware settings in the configuration panel of the software. Importantly, the detector is nonlinear below a HV gain of 600 V and may contribute to unreliable measurements. We recommend recording of data from dim cells at a high HV gain. The optimal HV range is 600–1, 150 V. For very dim cells that may require an HV gain of 1,150 V or above, the signal-to-noise ratio decreases, which makes them are prone to measurement errors. Stability of the HV-LUT for the PMT. Stability of the HV-LUT is indicated by low fluctuations of individual values for a given gain, as presented in Figure 9c and table 5. Before determination of the HV-LUT, it is absolutely required that RD1 and RA1 recordings be stable in cells throughout all HV gains. The lookup table is typically determined using fluorescence dyes and can be verified by measuring intensity signals from fluorescent cells using a range of HV gain settings during the calibration phase of the FRET rig (table 5). In addition, intensity recordings from nontransfected cells should be used for validation of the table. Once the lookup table has been generated, it can be repeated yearly to confirm reproducibility of the system.
assessing the outcome of Fret –two-hybrid analysisOnce the RD1 and RA1 values are stable and an HV-LUT is obtained, actual FRET measurements can be performed. For FRET experiments, five controls are required in addition to the FRET measurements from CFP- and YFP-tagged binding pairs; these help gauge the validity of the FRET experiment:
Background autofluorescence in untransfected cells RA1 values from YFP-only-expressing cells RD1 values from CFP-only-expressing cells Measurements from cells expressing CFP–YFP dimers to generate a calibration curve Measurement of spurious FRET from cells expressing CFP and YFP monomers
Background autofluorescence values in untransfected cells, RA1 values from YFP-only-expressing cells and RD1 values from CFP-only-expressing cells need to be stable, and there are four quality checks to ensure the validity of these measurements:
•
•••••
table 5 | Lookup table for PMT HV gain factor.
pMt high-voltage HV (V)amplification factor SX(HV)/SX(800 V) (mean ± s.e.m.)
600 0.118 ± 0.001
650 0.214 ± 0.002
700 0.371 ± 0.002
750 0.617 ± 0.002
800 1
850 1.579 ± 0.003
900 2.420 ± 0.008
950 3.647 ± 0.013
1,000 5.427 ± 0.025
1,050 7.961 ± 0.050
1,100 11.306 ± 0.059
1,150 16.231 ± 0.140
20
10
00 1 2
Fc
RA1 • SYFP
(RD1 • SCFP)/(RA1 • SYFP)
C/ Y = 18.6
G = 8.3
ε ε
YFP–G4–CFP
YFP–G10–CFP
YFP–G40–CFP
YFP–G80–CFP
Y–G4–C Y–G40–C
Y–G10–C Y–G80–C
EA(mean ± s.e.m.)
0.296 ± 0.001 0.299 ± 0.004
0.223 ± 0.003
0.158 ± 0.002
0.116 ± 0.002
0.228 ± 0.002
0.156 ± 0.002
0.116 ± 0.001
ED(mean ± s.e.m.)
a b
Figure 10 | Determination of the G factor and the excitation ratio using dimers. (a) Calibration line obtained from CFP and YFP dimers connected by linkers of either 4, 10, 40 or 80 glycine (G) residues. Mean values are given by the larger colored circles. Individual data points are the smaller open colored points. From the linear regression line (black line), the G factor (slope) and the ratio of excitation coefficients (y intercept) are determined. (b) Table shows mean 33-FRET and E-FRET values experimentally determined for the various CFP–YFP dimers transfected into HEK293 cells, computed using equations for 33-FRET (EA, equation 6) and E-FRET (ED, equation 7) with experimentally determined calibration factors (n = 12–15).

©20
16 M
acm
illan
Pu
blis
her
s L
imit
ed, p
art
of
Sp
rin
ger
Nat
ure
. All
rig
hts
res
erve
d.
protocol
2496 | VOL.11 NO.12 | 2016 | nature protocols
(1) Inspect RA1 values: if negative RA1 values are obtained (RA1 < 0), autofluorescence intensity recordings are not stable and are possibly overestimated.(2) Inspect FRET efficiencies: efficiencies <0 suggest that RD1 values are not stable and may be overestimated.(3) For YFP-only-expressing cells, FRET efficiency should equal 0. If not, RA1 has not been determined correctly.(4) For CFP-only-expressing cells, SFRET(DA, 436, 453) – RD1·SCFP(DA, 436, 480) should be zero. If not, RD1 has not been determined correctly.The measurements of several CFP–YFP dimers are used to calculate a calibration curve from which the G factor and the excitation ratio are determined (Fig. 10). Depending on the donor and acceptor fluorophores used, the variation of individual data points of this curve is more or less pronounced. Given that RD1 and RA1 values are stable, variations in FRET efficiencies are larger for CFP and YFP dimers compared with cerulean and venus pairs. The cerulean and venus pairs may mature faster and more completely (~100%), resulting in more robust FRET measurements. For CFP–YFP dimers, EA and ED should be the same, and plotting ED versus EA should result in the line of unity. Furthermore, the experimentally determined CFPEST (ND) and YFPEST (NA) values should be equal, as the two fluorophores are tethered. Deviation from equality would suggest proteolysis or immature proteins. The range of FRET efficiencies for the set of dimers used is between 10 and 40%.
Spurious FRET is determined by using cells expressing CFP and YFP monomers (Fig. 11a) and plotting EA and ED versus CFPEST and YFPEST, respectively. The relationship should be linear. This value is subtracted from binding curves in order to
EYFP YFP
YFP
FRETpair
FRETpair
CFP
ECFP
0.3
0
0.3
0
0.3
0
0.5
0
0.5
0
EA
EA
EA
0.3
0
ED
ED
ED
0 2.5Dfree = CFPEST
0 2.5Afree = YFPEST
0 2.5
Dfree
0 2.5
Afree
0 2.5Dfree
0 2.5
Afree
Spurious FRET Spurious FRET
33-FRET E-FRET
Myosin Vneck domain
IQ
N 1 2 3 4 5 6 C
6
CFP
CFP N C
N C
ECFP-CaMWT
CaV1.2carboxy-tail
EF1–2 IQ
N C
YFP
FRETpair
ECFP–CaMWT
a
b
c
Figure 11 | Examples of spurious FRET and FRET two-hybrid binding curves. (a) Left, diagram illustrates untagged CFP and YFP FRET pair used to determine spurious FRET by 33-FRET (middle) and E-FRET (right). (b) Left, schematic of a FRET two-hybrid assay evaluating the binding of CFP-tagged calmodulin (CFP–CaMWT) to the sixth YFP-tagged myosin Va IQ domain (YFP-IQ) at resting Ca2+ concentrations. Middle, 33-FRET computed from three cube fluorescence measurements from single cells expressing both YFP-IQ and CFP–CaMWT, plotted against the free concentration of donor molecules (CFP–CaMWT), reveal a robust binding curve. Right, E-FRET efficiency computed from the same fluorescence measurements is plotted against the free acceptor concentration (YFP-IQ). Note that estimates for the maximum or saturating FRET efficiency (Emax) and the relative binding affinity (Kd,EFF) are identical using the 33-FRET and E-FRET methods (Dfree or Afree at half-saturation, respectively). (c) Robust binding of YFP-tagged IQ domain from the voltage-gated Ca2+ channel CaV1.2 to CFP–CaMWT at elevated cellular Ca2+ conditions. Format as in panel b. Note again that the binding isotherms estimated are identical using the 33-FRET and E-FRET methods (black fit).

©20
16 M
acm
illan
Pu
blis
her
s L
imit
ed, p
art
of
Sp
rin
ger
Nat
ure
. All
rig
hts
res
erve
d.
protocol
nature protocols | VOL.11 NO.12 | 2016 | 2497
quantify FRET as a result of binding. Spurious FRET can also occur between two dimers. The amount of spurious FRET depends on the cell volume. As splitting of the cells during cell culture can change cell volume on a day-to-day basis, spurious FRET control experiments need to be performed daily.
Example results from two FRET two-hybrid binding assays are shown in Figure 11b,c. Figure 11b presents representative graphs for 33-FRET and E-FRET binding curves between myosin Va IQ peptide and calmodulin under low Ca2+ conditions. Figure 11c presents representative graphs for 33-FRET and E-FRET binding curves for interaction of CaV1.2 IQ peptide with calmodulin under elevated Ca2+ conditions. From the graph it is evident that all points are localized very closely to the fitted line, indicating low noise in FRET measurement. The results illustrate the high-affinity binding of calmodulin to the distal IQ segment of myosin Va (Fig. 11b) and the IQ domain of CaV1.2 (Fig. 11c) at basal cytosolic Ca2+ levels. The differences in maximal apparent FRET efficiencies for CaM binding to the two IQ domain peptides indicate that their binding conforma-tions may be distinct. The high affinity binding for both IQ domain peptides fit with in vitro binding assays53,54. Together, these results demonstrate that FRET two-hybrid assays are well suited for in-depth quantification of macromolecular interactions in living cells.
Note: Any Supplementary Information and Source Data files are available in the online version of the paper.
acknoWleDGMents We thank R. Rötzer, A. Rößing, T. Kiwitt and W. Yang for excellent technical support. This work was supported by funding from the German Research Foundation (SFB/TRR 152 TP12 to M.B., SFB/TRR 152 TP06 to C.W.-S. and SFB 870 TP B05 to C.W.-S.) and the National Institute of Mental Health (R01 MH065531 to D.T.Y. and M.B.-J.). D.T.Y. passed away on December 23, 2014. He was a remarkable teacher, inspirational scientist and a generous colleague. He pioneered the development and the usage of FRET two-hybrid assays to elucidate the mechanistic underpinnings of voltage-gated Ca2+ channels. His scientific brilliance and personal charm are greatly missed in the scientific community.
autHor contrIbutIons E.S.B., M.B.-J., D.T.Y. and C.W.-S. developed and/or designed the study. E.S.B. and M.B.-J. collected and analyzed the data. M.S. and L.S. furnished initial experimental data for dimer calibrations. M.B.-J. and D.T.Y. provided theoretical derivations. M.S., M.B.-J. and P.S.Y. constructed YFP- and CFP-tagged constructs and dimers. E.S.B., M.B.-J. and C.W.-S. wrote the manuscript and created the figures. M.B. discussed and commented on the manuscript.
coMpetInG FInancIal Interests The authors declare no competing financial interests.
Reprints and permissions information is available online at http://www.nature.com/reprints/index.html.
1. Clegg, R.M. Fluorescence resonance energy transfer and nucleic acids. Methods Enzymol. 211, 353–388 (1992).
2. Jares-Erijman, E.A. & Jovin, T.M. FRET imaging. Nat. Biotechnol. 21, 1387–1395 (2003).
3. Shaner, N.C., Steinbach, P.A. & Tsien, R.Y. A guide to choosing fluorescent proteins. Nat. Methods 2, 905–909 (2005).
4. Berney, C. & Danuser, G. FRET or no FRET: a quantitative comparison. Biophys. J. 84, 3992–4010 (2003).
5. Gordon, G.W., Berry, G., Liang, X.H., Levine, B. & Herman, B. Quantitative fluorescence resonance energy transfer measurements using fluorescence microscopy. Biophys. J. 74, 2702–2713 (1998).
6. Xia, Z. & Liu, Y. Reliable and global measurement of fluorescence resonance energy transfer using fluorescence microscopes. Biophys. J. 81, 2395–2402 (2001).
7. Youvan, D.C. & Marrs, B.L. Molecular genetics and the light reactions of photosynthesis. Cell 39, 1–3 (1984).
8. Zal, T. & Gascoigne, N.R. Photobleaching-corrected FRET efficiency imaging of live cells. Biophys. J. 86, 3923–3939 (2004).
9. Erickson, M.G., Alseikhan, B.A., Peterson, B.Z. & Yue, D.T. Preassociation of calmodulin with voltage-gated Ca(2+) channels revealed by FRET in single living cells. Neuron 31, 973–985 (2001).
10. Erickson, M.G., Liang, H., Mori, M.X. & Yue, D.T. FRET two-hybrid mapping reveals function and location of L-type Ca2+ channel CaM preassociation. Neuron 39, 97–107 (2003).
11. Erickson, M.G., Moon, D.L. & Yue, D.T. DsRed as a potential FRET partner with CFP and GFP. Biophys. J. 85, 599–611 (2003).
12. Miyawaki, A. et al. Fluorescent indicators for Ca2+ based on green fluorescent proteins and calmodulin. Nature 388, 882–887 (1997).
13. Chen, H., Puhl, H.L. III, Koushik, S.V., Vogel, S.S. & Ikeda, S.R. Measurement of FRET efficiency and ratio of donor to acceptor concentration in living cells. Biophys. J. 91, L39–L41 (2006).
14. Yang, P.S., Johny, M.B. & Yue, D.T. Allostery in Ca(2)(+) channel modulation by calcium-binding proteins. Nat. Chem. Biol. 10, 231–238 (2014).
15. Broussard, J.A., Rappaz, B., Webb, D.J. & Brown, C.M. Fluorescence resonance energy transfer microscopy as demonstrated by measuring the activation of the serine/threonine kinase Akt. Nat. Protoc. 8, 265–281 (2013).
16. Ormo, M. et al. Crystal structure of the Aequorea victoria green fluorescent protein. Science 273, 1392–1395 (1996).
17. Lohse, M.J., Nuber, S. & Hoffmann, C. Fluorescence/bioluminescence resonance energy transfer techniques to study G-protein-coupled receptor activation and signaling. Pharmacol. Rev. 64, 299–336 (2012).
18. Zhang, J., Ma, Y., Taylor, S.S. & Tsien, R.Y. Genetically encoded reporters of protein kinase A activity reveal impact of substrate tethering. Proc. Natl. Acad. Sci. USA 98, 14997–15002 (2001).
19. Takao, K. et al. Visualization of synaptic Ca2+/calmodulin-dependent protein kinase II activity in living neurons. J. Neurosci. 25, 3107–3112 (2005).
20. Bazzazi, H., Ben Johny, M., Adams, P.J., Soong, T.W. & Yue, D.T. Continuously tunable Ca(2+) regulation of RNA-edited CaV1.3 channels. Cell Rep. 5, 367–377 (2013).
21. Ben Johny, M., Yang, P.S., Bazzazi, H. & Yue, D.T. Dynamic switching of calmodulin interactions underlies Ca2+ regulation of CaV1.3 channels. Nat. Commun. 4, 1717 (2013).
22. Takahashi, S.X., Miriyala, J., Tay, L.H., Yue, D.T. & Colecraft, H.M. A CaVbeta SH3/guanylate kinase domain interaction regulates multiple properties of voltage-gated Ca2+ channels. J. Gen. Physiol. 126, 365–377 (2005).
23. Agler, H.L. et al. G protein-gated inhibitory module of N-type (ca(v)2.2) ca2+ channels. Neuron 46, 891–904 (2005).
24. Karpenko, I.A. et al. Selective nonpeptidic fluorescent ligands for oxytocin receptor: design, synthesis, and application to time-resolved FRET binding assay. J. Med. Chem. 58, 2547–2552 (2015).
25. Chang, D.D. & Colecraft, H.M. Rad and Rem are non-canonical G-proteins with respect to the regulatory role of guanine nucleotide binding in Ca 1.2 regulation. J. Physiol. 593, 5075–5090 (2015).
26. Yang, T., Xu, X., Kernan, T., Wu, V. & Colecraft, H.M. Rem, a member of the RGK GTPases, inhibits recombinant CaV1.2 channels using multiple mechanisms that require distinct conformations of the GTPase. J. Physiol. 588, 1665–1681 (2010).
27. Yamashita, M., Somasundaram, A. & Prakriya, M. Competitive modulation of Ca2+ release-activated Ca2+ channel gating by STIM1 and 2-aminoethyldiphenyl borate. J. Biol. Chem. 286, 9429–9442 (2011).
28. Muik, M. et al. Dynamic coupling of the putative coiled-coil domain of ORAI1 with STIM1 mediates ORAI1 channel activation. J. Biol. Chem. 283, 8014–8022 (2008).
29. Murphy, J.G. et al. AKAP-anchored PKA maintains neuronal L-type calcium channel activity and NFAT transcriptional signaling. Cell Rep. 7, 1577–1588 (2014).

©20
16 M
acm
illan
Pu
blis
her
s L
imit
ed, p
art
of
Sp
rin
ger
Nat
ure
. All
rig
hts
res
erve
d.
protocol
2498 | VOL.11 NO.12 | 2016 | nature protocols
30. Ruiz-Velasco, V. & Ikeda, S.R. Functional expression and FRET analysis of green fluorescent proteins fused to G-protein subunits in rat sympathetic neurons. J. Physiol. 537, 679–692 (2001).
31. Kern, A., Albarran-Zeckler, R., Walsh, H.E. & Smith, R.G. Apo-ghrelin receptor forms heteromers with DRD2 in hypothalamic neurons and is essential for anorexigenic effects of DRD2 agonism. Neuron 73, 317–332 (2012).
32. Albizu, L. et al. Time-resolved FRET between GPCR ligands reveals oligomers in native tissues. Nat. Chem. Biol. 6, 587–594 (2010).
33. Bazzazi, H. et al. Novel fluorescence resonance energy transfer-based reporter reveals differential calcineurin activation in neonatal and adult cardiomyocytes. J. Physiol. 593, 3865–3884 (2015).
34. Lee, S.R., Sang, L. & Yue, D.T. Uncovering aberrant mutant PKA function with flow cytometric FRET. Cell Rep. 14, 3019–3029 (2016).
35. Tadross, M.R., Park, S.A., Veeramani, B. & Yue, D.T. Robust approaches to quantitative ratiometric FRET imaging of CFP/YFP fluorophores under confocal microscopy. J. Microsc. 233, 192–204 (2009).
36. Shrestha, D., Jenei, A., Nagy, P., Vereb, G. & Szollosi, J. Understanding FRET as a research tool for cellular studies. Int. J. Mol. Sci. 16, 6718–6756 (2015).
37. Ben-Johny, M., Yue, D.N. & Yue, D.T. A novel FRET-based assay reveals 1:1 stoichiometry of apocalmodulin binding across voltage-gated Ca and Na ion channels. Biophys. J. 102, 125a–126a (2012).
38. Koushik, S.V., Chen, H., Thaler, C., Puhl, H.L. III & Vogel, S.S. Cerulean, venus, and venusY67C FRET reference standards. Biophys. J. 91, L99–L101 (2006).
39. Sun, Y., Day, R.N. & Periasamy, A. Investigating protein-protein interactions in living cells using fluorescence lifetime imaging microscopy. Nat. Protoc. 6, 1324–1340 (2011).
40. Yasuda, R. Imaging spatiotemporal dynamics of neuronal signaling using fluorescence resonance energy transfer and fluorescence lifetime imaging microscopy. Curr. Opin. Neurobiol. 16, 551–561 (2006).
41. Thaler, C., Koushik, S.V., Blank, P.S. & Vogel, S.S. Quantitative multiphoton spectral imaging and its use for measuring resonance energy transfer. Biophys. J. 89, 2736–2749 (2005).
42. Zeug, A., Woehler, A., Neher, E. & Ponimaskin, E.G. Quantitative intensity-based FRET approaches—a comparative snapshot. Biophys. J. 103, 1821–1827 (2012).
43. Leavesley, S.J., Britain, A.L., Cichon, L.K., Nikolaev, V.O. & Rich, T.C. Assessing FRET using spectral techniques. Cytometry A 83, 898–912 (2013).
44. Mustafa, S., Hannagan, J., Rigby, P., Pfleger, K. & Corry, B. Quantitative Forster resonance energy transfer efficiency measurements using simultaneous spectral unmixing of excitation and emission spectra. J. Biomed. Opt. 18, 26024 (2013).
45. Bykova, E.A., Zhang, X.D., Chen, T.Y. & Zheng, J. Large movement in the C terminus of CLC-0 chloride channel during slow gating. Nat. Struct. Mol. Biol. 13, 1115–1119 (2006).
46. Takanishi, C.L., Bykova, E.A., Cheng, W. & Zheng, J. GFP-based FRET analysis in live cells. Brain Res. 1091, 132–139 (2006).
47. Hoppe, A.D. & Swanson, J.A. Cdc42, Rac1, and Rac2 display distinct patterns of activation during phagocytosis. Mol. Biol. Cell 15, 3509–3519 (2004).
48. Chen, H., Puhl, H.L. III & Ikeda, S.R. Estimating protein-protein interaction affinity in living cells using quantitative Forster resonance energy transfer measurements. J. Biomed. Opt. 12, 054011 (2007).
49. Hoppe, A., Christensen, K. & Swanson, J.A. Fluorescence resonance energy transfer-based stoichiometry in living cells. Biophys. J. 83, 3652–3664 (2002).
50. Chen, Y., Mauldin, J.P., Day, R.N. & Periasamy, A. Characterization of spectral FRET imaging microscopy for monitoring nuclear protein interactions. J. Microsc. 228, 139–152 (2007).
51. Levy, S. et al. SpRET: highly sensitive and reliable spectral measurement of absolute FRET efficiency. Microsc. Microanal. 17, 176–190 (2011).
52. Kemmer, G. & Keller, S. Nonlinear least-squares data fitting in Excel spreadsheets. Nat. Protoc. 5, 267–281 (2010).
53. Findeisen, F. & Minor, D.L. Jr. Structural basis for the differential effects of CaBP1 and calmodulin on Ca(V)1.2 calcium-dependent inactivation. Structure 18, 1617–1631 (2010).
54. Martin, S.R. & Bayley, P.M. Calmodulin bridging of IQ motifs in myosin-V. FEBS Lett. 567, 166–170 (2004).

Supplementary Figure 1
Linearity of fluorescence detection subsystem
(a) Fluorescence intensity measured through the YFP cube is linearly proportional to the concentration of Alexa Fluor 514
dye. This result illustrates the linearity of the PMT detector enabling robust estimation of number of acceptor molecules.
(b) Fluorescence intensity measured through the CFP cube is also linearly proportional to the concentration of Proflavin
dye.
Nature Protocols: doi:10.1038/nprot.2016.128

Supplementary Figure 2
Main graphical user interface of Felix GX
(a) The tab “Delta Ram Analog” (right upper corner) is clicked to open the “Hardware Configuration” window
(Supplementary Fig. 2a). (b) The setup tab is selected (left lower corner) to open the “Setup” window (Supplementary
Fig. 2b). (c) The “Action” tab opens the “Macro” window from which the “Macro Editor” window is opened
(Supplementary Fig. 4).
Nature Protocols: doi:10.1038/nprot.2016.128

Supplementary Figure 3
The “Hardware Configuration” window and the “Setup” window.
(a) Settings for the “Hardware Configuration” window. (b) Settings for the “Setup” window. From the 10 tabs in the
“Setup” window select “Acquisition Type” and click the option “Timebased”.
Nature Protocols: doi:10.1038/nprot.2016.128

Supplementary Figure 4
Parameter settings specific for Timebased acquisition in the “Setup window”.
(a) Acquisition settings; (b) PMTs; (c) Backgrounds; (d) Traces tab.
Nature Protocols: doi:10.1038/nprot.2016.128

Supplementary Figure 5
Setup of Macros using the “Macro” and the “Macro Editor” window.
(a) Open the “Macro” window by clicking the “Action“ tab in the main graphical user interface (Supplemental Fig. 1).
Click the green “+” button to open the “Macro Editor” window (b and c). In this window, different actions (listed on the
left hand side) can be added to the macro (list on the black panel on the right hand side). In this example, a pause step (b)
and a protocol (Run Acquisition; c) is added to the macro by clicking the Add tab.
Nature Protocols: doi:10.1038/nprot.2016.128

Supplementary Figure 6
Data input field of the Background sheet.
(a) Raw data pasted into the respective columns from measurements using CFP- FRET- and YFP-cubes at a distinct HV
gain. (b) The excel sheet contains 9 individual sub sheets (labeled from left to right: Background, RD-value (CFP), RA-
value (YFP), Dimer sheet, Dimer Analysis, Spurious FRET, Samples (FRET sample data), BC Analysis and HV lookup.
Nature Protocols: doi:10.1038/nprot.2016.128

Supplementary Figure 7
Data input field of the RD-value (CFP) and the RA-value (YFP) sheets.
Raw data are pasted into the respective columns on the left hand side from measurements in (a) CFP-only or (b) YFP-
only expressing cells using CFP- FRET- and YFP-cubes at a distinct HV gain. Background subtraction and RA value
calculation is performed automatically. (c) The mean RD and RA value, resp., is calculated on the right hand side (gray
panel). Statistical values (Standard deviation of the mean (SEM), Minimum (Min) and Maximum (Max)) provide a useful
tool to assess the variability of the values. Note that only the mean RD1 and RA1 values are used for subsequent analysis.
Nature Protocols: doi:10.1038/nprot.2016.128

Supplementary Figure 8
Data input field of the Dimer sheet.
(a) Raw data are pasted into the respective columns on the left hand side from measurements in CFP-YFP dimer
expressing cells using CFP- FRET- and YFP-cubes at a distinct HV gain. Raw data for individual cells are collected
separately for a given dimer as indicated. (b) Background subtracted values are shown on the right. RA1 and RD1 values are
automatically picked from RD-value (CFP) and the RA-value (YFP) sheets. Statistics are shown on the right hand side
(Mean, SEM).
Nature Protocols: doi:10.1038/nprot.2016.128

Supplementary Figure 9
Dimer analysis sheet.
(a) Columns D-G list background subtracted raw data from the “Dimer” sheet. Data for individual cells are collected
separately for a given dimer as indicated in Column B. RA1 and RD1 values are automatically transferred from “RD-value
(CFP)” and the “RA-value (YFP)” sheets (grey panel on the top, left). Columns H-P comprise calculations as outlined in
Procedure Step 97. (b) The graph (column K plotted against column L) depicts data points for individual cells. For each
dimer, cells cluster together. In the table below, the mean values of EA and ED for each dimer as well as mean values of
the x- and y- coordinates (from columns M and N) are indicated. (c) The latter can be plotted in a new graph and analyzed
by a linear regression line. In this template, the regression line is automatically computed and the resulting equation
displayed in the graph. Note, that the y-intercept and the slope of this line is copied to cell T56 and T57 respectively for
further analysis.
Nature Protocols: doi:10.1038/nprot.2016.128

Supplementary Figure 10
Data input field of the “Spurious FRET” sheet.
(a) Raw data from cells expressing untagged eCFP and eYFP are transferred to respective cells in Columns C-G. (b)
Background-subtraction as well as subsequent calculation of Fc/(RA1*SYFP), CFPEST and EA (columns K-M) is
automatically performed referring to the constants in the gray panel at the upper left. (c) The graph at the right hand side,
illustrates CFPEST as a function of EA. The slope of the regression line is used for spurious FRET correction in the “BC
analysis sheet”. The equation of the regression line is automatically displayed in the graph. The slope is subsequently
entered into cell “P7” linked to the “BC analysis” sheet.
Nature Protocols: doi:10.1038/nprot.2016.128

Supplementary Figure 11
Data input field of the binding curve analysis (“BC analysis”) sheet.
(a) Background subtracted raw data (columns D-H) are automatically adopted from the “Samples” sheet. The principal
calculation steps required in order to solve binding curves are automatically performed in columns I-W for each
(biological) cell according Steps 117-130 outlined in the Procedure section. (b) The table in the upper left of the
worksheet contains all parameters (columns F and I) necessary to correct for spectral properties and spurious FRET.
Thereby, all values except the excitation ratio ((Ɛ YFP(440)/Ɛ CFP(440)) are automatically transferred from previously
analyzed sheets. Values for KdEff, EAmax and EDmax (Column K) are place holders that are adjusted during the fitting
procedure. (c) Graphs shown displays data points for individual biological cells (blue dots) and the fitted binding
isotherme (black lines). The graphs represent data for 33-FRET (Dfree plotted against EA) and E-FRET (Afree plotted against
ED) and allow a control of the fitting procedure.
Nature Protocols: doi:10.1038/nprot.2016.128

Supplementary Figure 12
Setting up Excel Solver for optimizing 33-FRET and E-FRET binding parameters.
(a) Least squares optimization of Cell K8 (Sum_Err_3Cube) by changing both KD_eff (KD,EFF, relative affinity) and
EAmax (EA,max, maximum 33-FRET efficiency). In this scenario, two constraints are EAmax>0, and Kd_eff>0 in
accordance with physical principles. (b) Least squares optimization of Cell K10 (Total Error) by changing both KD_eff
(KD,EFF, relative affinity), EAmax (EA,max, maximum 33-FRET efficiency), and EDmax (ED,max, maximum E-FRET
efficiency). Three constraints are imposed: EDmax>0, EAmax>0, and Kd_eff>0.
Nature Protocols: doi:10.1038/nprot.2016.128

1
SupplementaryNote1|TheoreticalcalculationofMDandMA
The microscope specific calibration coefficients MD and MA correspond to the effective brightness of a single donor or acceptor molecule when observed through the FRET cube. Accordingly,
For the computation of these constants, spectra of CFP and YFP, the intensity profile of the xenon lamp as well as the transmission rates of the FRET filter cube provided in sheets 1-6 (Supplementary Data 1) are used. In this section, it is described how to use the FRET Excel spreadsheet to calculate MD and MA.
The Excel spreadsheet for theoretical calculation of MD and MA is composed of eight different worksheets (Supplementary Data 1). To activate these worksheets eight different tabs are present on the bottom of the excel sheet. In the input worksheets raw data are collected for the excitation and emission spectra of CFP and YFP (Sheet 1; labeled “1 ECFP Excitation Spectrum”; Sheet 2, labeled “2 ECFP Emission Spectrum”; Sheet 3 “3 EYFP Excitation Spectrum” and Sheet 4, labeled “4 EYFP Emission Spectrum”). The spectra of the fluorophores are experimentally determined from suspended HEK293 cells expressing ECFP and EYFP. The spectrum of the xenon arc lamp is deposited in Sheet 5 (labeled “5 Lamp profile”). The transmission spectrum of the emission filter and the excitation filter as well as the transmission and reflection spectrum of the dichroic mirror (all for the FRET filter cube) are collected in Sheet 6 (labeled “6 FRET Filter Cube”). Based on the data deposited in sheets 1-6, MD and MA are theoretically calculated in Sheet 7 (labeled “7 Calculation MD (CFP)”) and Sheet 8 (labeled “8 Calculation MA (YFP)”), respectively
1 | In the Worksheet “1 ECFP Excitation Spectrum”, the wavelength and intensity raw data of the CFP excitation spectrum are given in column A and B respectively. Table 1 is present in sheet 1-4 and is taken from (Patterson et al., 2001). In column C, the maximum peak (at 437 nm) of the excitation spectrum of CFP is scaled to the maximal molecular extinction coefficient for CFP ( ; red box in Table 1). In addition, the maximal peak of the CFP excitation spectrum is normalized to 1 (Column D). Values in Column D are transferred to sheet 7 (labeled “7 Calculation MD (CFP)”), column E.
2 | Worksheet “2 ECFP Emission Spectrum” contains raw fluorescence intensity data for CFP emission (Column B) for wavelengths ranging from 420nm – 600nm (Column A). Col D contains the CFP emission spectrum from column B and scaled to a maximum value of 1 at wavelength 475nm. The normalized spectrum is copied to column O of sheet 7. Col C contains the emission spectrum of CFP taken from column D and scaled in such a way that the integral equals the quantum yield of CFP (QYCFP = 0.4; (Patterson et al., 2001)). This is done by integrating the normalized spectrum from Column D over the entire range of wave lengths yielding the value of 65.11. The value of the integral is deposited in the table of sheet 7 (Cell
CFP 430 450 CFP 505 575 CFP[ ] [ ]DM f QY
YFP 430 450 YFP 505 575 YFP[ ] [ ]AM f QY
1 1max 26000M cm
Nature Protocols: doi:10.1038/nprot.2016.128

2
D4). The integral is then used to normalize the emission spectrum by dividing the entire spectrum by 65.11 and multiplying by the quantum yield of CFP (0.4; Column C).
3 | In the Worksheet “3 EYFP Excitation Spectrum”, the wavelength and intensity raw data of the YFP excitation spectrum are given in column A and B respectively. In column C, the maximum peak of the excitation spectrum of YFP is scaled to the maximal molecular extinction coefficient for YFP ( ; red box in Table 1). In addition, the maximal peak of the YFP excitation spectrum is normalize to 1 (Column D). Column D is transferred to sheet 8 (labeled “8 Calculation MA”, column E).
4 | Worksheet “4 EYFP Emission Spectrum” contains raw fluorescence intensity data for YFP emission (Column B) for wavelengths ranging from 400nm – 700nm (Column A). Column D contains the YFP emission spectrum from column B and scaled to a maximum value of 1 at a wavelength of 527nm. The normalized spectrum is copied to column O of Sheet 8 (“8 Calculation MA”). Column C contains the emission spectrum of YFP taken from column D and scaled in such a way that the integral equals the quantum yield of YFP (QYCFP = 0.61). This is done by integrating the normalized spectrum from Column D over the entire range of wave lengths yielding the value of 39.53. The value of the integral is deposited the table of sheet 8 (Cell D4). The integral is then used to normalize the emission spectrum by dividing the entire spectrum by 39.53 and multiplying by the quantum yield of YFP (0.61; Column C).
5 | In the worksheet “5 lamp profile” the wavelength and intensity raw data of the intensity spectrum of the excitation arc lamp are given in column A and B respectively. Column C contains the spectrum from column B normalized to a peak value of 1. Column C is transferred to column B in sheets 7 and 8.
6 | In worksheet “6 FRET filter cube” the wavelength (Column A) and intensity raw data of the transmission spectrum of the excitation filter (Column B), the emission filter (Column C) and the dichroic mirror (Column D) for the FRET cube are given. The reflection spectrum of the dichroic mirror is presented in column E. The spectra are all transferred to column C (excitation filter), column D (reflection of dichroic), column P (transmission of the dichroic) and column Q (emission filter) in sheets 7 and 8, resp..
7 | The top of sheet 7 contains the extinction coefficient for CFP (Cell D2) which is here 0.26μ (please note that units are different from (Patterson et al., 2001)) and
the quantum yield of CFP (Cell D3). The value for the integral of the entire CFP emission spectrum normalized to maximum emission of 1 (Cell D4) is picked from Sheet 2 (“2 ECFP Emission Spectrum”, cell D183). In addition, there are 5 place holders (D5-D9) for the excitation integral (D5; Ex integral), the emission integral (D6, Em integral), The MD (D7) and the MA value (D8), and the MA/MD ratio (D9). The calculation of these five parameters are given below.
8 | The lower part of sheet 7 contains spectral data for the excitation pathway (Column A-F) and the emission pathway (Column N-R). For the excitation pathway the data are the wavelengths (Column A), the intensity spectrum of the xenon arc lamp (Column B), the transmission spectrum of the excitation filter (Column C), the reflection spectrum of the dichroic (Column D)
1 1max 84000M cm
Nature Protocols: doi:10.1038/nprot.2016.128

3
and the excitation spectrum for CFP (Column E). The spectra are all taken from sheets 1, 5 and 6 and represent the versions normalized to a maximum of one at the specified wavelength. They are plotted in graph A. Column F is calculated by multiplying together the values contained in column B-E. The result is plotted in graph B. For the emission pathway the data are the wavelengths (Column N), the emission spectrum for CFP (Column O), the transmission spectrum of the dichroic (Column P) and the emission filter (Column Q). The spectra are all taken from sheets 2 and 6 and represent the versions normalized to a maximum of one at the specified wavelength. They are plotted in graph C. Column R is calculated by multiplying together the values contained in columns O-Q. The result is plotted in Graph D.
9 | The excitation integral is calculated by integrating the data contained in Column F (Graph B) and deposited in Cell L7 and D5.
10 | The emission integral is calculated by integrating the data contained in Column R (Graph D) and deposited in Cell W7 and D6.
11 | MD is calculated by scaling the excitation and emission integral (D5 and D6) by multiplying it by the maximal extinction coefficient (Cell D2) and by dividing it by the integral of the entire emission spectrum (Cell D4) times the quantum yield (Cell D3). The result is deposited in Cell D7.
12 | MA is picked from cell D7 in sheet 8.
13 | MA/MD is calculated by dividing Cell D8 by Cell D7 and deposited in Cell D9.
14 | Sheet 8 (“8 Calculation MA”) has an analogous design as Sheet 7. However, it contains spectral properties that are specific for YFP. The top of Sheet 8 contains the extinction coefficient for YFP (Cell D2) which is 0.84μ (please note that units are different from (Patterson et al., 2001)) and the quantum yield of YFP (Cell D3) picked from Table 1. The value for the integral of the entire YFP emission spectrum normalized to maximum emission of 1 (Cell D4) is picked from Sheet 4 (“4 EYFP Emission Spectrum”, cell D134). In addition, there are 3 place holders (D5-D7) for the excitation integral (Cell D5; Ex integral), the emission integral (D6, Em integral) and the MA value (D7). Excitation and emission spectra for YFP are deposited in columns E and O, respectively. The calculation of the values for the excitation integral and emission integral and the graphs are analogous as described for CFP.
Note that both MA and MD are independent of Io, the overall intensity of the arc lamp, and the constant C that accounts for optical transmission properties of the microscope other than the filter cubes. For our setup, the calculated values are MA = 0.6320 and MD = 0.14149.
References
Patterson G, Day RN, Piston D (2001) Fluorescent protein spectra. J Cell Sci 114:837-838.
Nature Protocols: doi:10.1038/nprot.2016.128

4
Supplementary Note 2 | Determination of 33-FRET and E-FRET efficiencies
The experimental determination of 33-FRET and E-FRET efficiencies depend on the robust measurement of fluorescence intensities using three filter cubes as summarized in Box 1. Here, we present a formalism to model the fluorescence output from a single cell expressing two types of fluorophores, a donor assumed to be the cyan fluorescent protein (CFP) and an acceptor assumed to be the yellow fluorescent protein (YFP). In the dark, all fluorophores are assumed to be in their ground state (D, donor and A, acceptor) and upon photoexcitation convert to an excited state (D* and A*). Relaxation from the excited state results in the release of a photon. Each cell is assumed to contain ND total donor molecules and NA total acceptor molecules (Supplementary Note 2 Fig. 1a). Moreover, the fraction of donor molecules bound to an acceptor in each cell is given by Db, and the fraction of acceptor molecules bound to a donor is given by Ab. Only the bound fraction of fluorophores is able to undergo FRET. The epifluorescence microscope setup measures the total fluorescence intensity from single cells using three filter cubes: the CFP cube (Supplementary Note 2 Fig. 1b), the YFP cube (Supplementary Note 2 Fig. 1c), and the FRET cube (Supplementary Note 2 Fig. 1d). There are two key sets of microscope specific parameters to define: (1) the wavelength-specific propensity of the excitation subsystem to excite a given fluorophore and (2) the wavelength-specific efficacy of the detection subsystem to detect the emitted photons.
First, we consider the propensity of a given fluorophore to be excited using the given microscope setup. For any filter cube x, the excitation rate (in units of transitions per second) of a single ground-state fluorophore is given by I0·Gx(y, ex,x). The variable I0 denotes the intensity of the light emitted by the arclamp, y specifies the type fluorophore we are concerned with (either D or A), and ex,x denotes the particular wavelength of the excitation light used to excite the fluorophore. Notice that Gx(D, ex,x) is a constant that incorporates the spectral properties of the lamp, optical properties of the excitation filter and dichroic mirror of the cube x, and the wavelength-dependent absorption properties of the fluorophore given by its molar extinction coefficient x(). For example, for the CFP cube I0·GCFP(D, ex,CFP) signifies the rate of excitation for a single CFP fluorophore given the properties of the CFP filter cube.
Second, we introduce the term Fx(y, em,x) to denote the fluorescence output of the photomultiplier tube (PMT) in response to photons emitted by the fluorophore y when measured using the filter cube x. Here, Fx(y, em,x) is a constant that incorporates the emission spectrum of fluorophore within the wavelength limits specified by em,x, the optical properties of the dichroic mirror and the emission filter of cube x, and the spectral response properties of the PMT detector. For example, FCFP(D, em,CFP) corresponds to the output transfer function for photons emitted from a single donor molecule (D) measured using the CFP cube. Figure Sxb-d provides a visual representation of these instrument specific constants. We now develop an explicit model for the donor and acceptor fluorescence output as a result of direct excitation or through FRET.
Nature Protocols: doi:10.1038/nprot.2016.128

5
Direct excitation of acceptor molecules
To deduce the fluorescence output of acceptor molecules when evaluated through the YFP cube, we consider the YFPX(ex,x, em,x, direct) branch (pathway 3) of the state transition diagram shown in Fig. Sxe. The probability that an acceptor molecule is in the excited state is given by,
(S1.1)
In general, for the purposes of fluorescence measurements, the typical data acquisition times (several milliseconds) are substantially longer than the characteristic fluorescence relaxation time (several nanoseconds) such that the system could be assumed to have reached steady state. Moreover, in typical FRET experiments, the excitation power used is sufficiently low that there is minimal ground state depletion for either A fluorophores (PA ~ 1). This assumption could be experimentally verified by testing for linearity of fluorescence output with respect to the excitation light intensity. Thus, the steady-state probability of an acceptor molecule occupying the excited state follows the relation,
(S1.2)
Next, we consider the emission-detection subsystem to estimate the rate of emission of photons from an excited acceptor and the efficacy by which such photons are detected. The rate of excited acceptor relaxations that result in the emission of a photon is given by . Thus, the total fluorescence output by all acceptor molecules in a cell is given by,
(S1.3)
Substituting S1.2 into S1.3 and exploting the fact the quantum yield of the acceptor is given by,
yields the relation,
(S1.4)
Note that the emission transfer function X em,x( , )F A now incorporates the QYA of the acceptor,
X em,x A X em,xˆ( , ) ( , )F A QY F A . Note that this equation specifies the YFP intensity due to direct
excitation through any filter cube. For example, the YFP intensity due to direct excitation through YFP cube would be given by, Similarly, the YFP intensity due to direct excitation through the FRET cube is given by,
**
0 x ex,x A A,nr( , ) ( )AA A
dPI G A P k k P
dt
*AAk P
*X em,x
ˆ ( , )A A AN k P F A
AA
A A,nr
kQY
k k
*0 x ex,x*
A,nr
( , )0
( )A
AA
I G AdPP
dt k k
x ex,x em,x 0 x ex,x X em,x( , ,direct) ( , ) ( , )AYFP N I G A F A
YFP 0 YFP YFP(505,535,direct) ( ,505) ( ,535)AYFP N I G A F A
FRET 0 FRET FRET(440,535,direct) ( , 440) ( ,535)AYFP N I G A F A
Nature Protocols: doi:10.1038/nprot.2016.128

6
Direct excitation of donor molecules
To model the fluorescence emission of donor molecules when evaluated through the CFP cube, we first consider the CFPX(ex,x, em,x, direct) branch (pathway 1) of the complete state transition diagram shown in Fig. Sxe. Here, to obtain the total CFP emission due to direct excitation, we must consider two populations of CFP molecules: (1) the fraction of free donor molecules and (2) the fraction of donor molecules bound to an acceptor. As with acceptor molecule, we assume a low excitation limit such that there is minimal ground state depletion for donor (D) fluorophores (PD ~ 1). Thus, for free donor molecules, the steady-state probability of occupying the excited state follows the relation,
(pathway 1) (S1.5)
However, as donor molecules bound to an acceptor can de-excite through FRET, the probability that such fluorophores are excited is governed by the equation,
(pathway 2) (S1.6)
Next, we consider the emission-detection subsystem to estimate the rate of emission of photons from an excited donor and the efficacy by which such photons are detected. The rate of excited donor relaxations that result in the emission of a photon is in general given by . Thus, the total fluorescence output by both free and bound donor molecules is given by,
(S1.7)
Given that the quantum yield of the donor fluorophore is given by,
and by defining X em,x D X em,xˆ( , ) ( , )F D QY F D , Eq. S1.7 simplifies to yield the equation,
(S1.8)
*0 ex,x* *
0 ex,x D D,nrD D,nr
( )( ) ( ) 0
( )DD
D D D D
I GdPI G P k k P P
dt k k
*0 x ex,x* *
0 x ex,x D D,nr TD D,nr T
( , )( , ) ( )
( )D
D D D
I G DdPI G D P k k k P P
dt k k k
*D Dk P
0 ex,x 0 x ex,xb X em,x b X em,x
D D,nr D D,nr T
( ) ( , )ˆ ˆ(1 ) ( , ) ( , )( ) ( )
DD D D D
I G I G DN D k F D N D k F D
k k k k k
D D,nrx ex,x em,x 0 x ex,x X em,x b b
D D,nr T
( )( , ,direct) ( , ) ( , ) (1 )
( )D
k kCFP N I G D F D D D
k k k
DD
D D,nr
kQY
k k
*0 x ex,x* *
0 x ex,x D D,nrD D,nr
( , )( , ) ( )
( )D
D D D
I G DdPI G D P k k P P
dt k k
Nature Protocols: doi:10.1038/nprot.2016.128

7
Excitation of acceptor molecules as a result of FRET
The third key quantity of concern is YFP fluorescence output as a result of excitation by FRET or the YFPx(ex,x, em,x, FRET) branch (pathway 2) of the complete state transition diagram in Fig Sxe. In order for YFP molecules to be excited by FRET, they have to be associated with CFP molecules. Moreover, as before we assume ‘low-exciation limit’ (PD ~ 1, PA ~ 1) and that the data acquisition time is long enough for the system to reach steady-state. First, we consider the probability of exciting a donor molecule,
(S1.9)
Next, we consider the rate of excitation of the bound acceptor molecule. At steady state,
(S1.10)
Substituting Eq. S1.9 in S1.10 yields,
(S1.11)
Next, we consider the emission-detection subsystem to estimate the rate of emission of photons from an excited acceptor and the efficacy by which such photons are detected. The rate of excited acceptor relaxations that result in the emission of a photon is in general given by . Thus, the total fluorescence output by YFP molecules excited by FRET is given by,
(S1.12)
Importantly, the total number of bound complexes is given by ND·Db = NA·Ab. Moreover, the output transfer function is also defined as X em,x A X em,x
ˆ( , ) ( , )F A QY F A . Substituting these identities into S1.12 yields,
(S1.13)
Equations S1.4, S1.8, and S1.13 form three master equations that could be used to deduce either the 33-FRET efficiency or the E-FRET efficiency as outlined in subsequent section.
Deducing 33-FRET efficiency
The 33-FRET efficiency measures sensitized emission or the fractional increase in acceptor intensity due to FRET. The term sensitized emission in Box 1 Eq. 5 corresponds to YFPx(ex,x, em,x, FRET). Thus,
(S1.14)
*0 x ex,x* *
0 x ex,x D D,nr TD D,nr T
( , )( , ) ( )
( )D
D D D
I G DdPI G D P k k k P P
dt k k k
** * * *T
T A A A,nrA,nr
( )( )
AD A A D
A
dP kk P P k k P P P
dt k k
* T0 x ex,x
A,nr D D,nr T
1( , )
( ) ( )AA
kP I G D
k k k k k
*A Ak P
*b A X em,x
Tb 0 x ex,x X em,x
A,nr D D,nr T
ˆ ( , )
1 ˆ ( , ) ( , )( ) ( )
D A
D AA
N D P k F A
kN D I G D k F A
k k k k k
Tx ex,x em,x b 0 x ex,x X em,x
D D,nr T
( , , FRET) ( , ) ( , )( )A
kYFP N A I G D F A
k k k
x ex,x em,x x ex,xA
x ex,x em,x x ex,x
( , , FRET) ( , )
( , ,direct) ( , )
YFP G AE
YFP G D
Nature Protocols: doi:10.1038/nprot.2016.128

8
Notice, the factor GA(ex,x)/GD(ex,x) is an instrument specific parameter that normalizes for the differences in the propensity for the donor and acceptor to absorb light. Substituting Eq. S1.13 and S1.4 into S1.14 yields,
(S1.14)
Simplifying this relation yields,
(S1.15)
Thus, the apparent 33-FRET efficiency is the true FRET efficiency multiplied by the fraction of acceptor molecules that are bound. The experimental strategy to unscramble the parameter YFPx(ex,x, em,x, FRET) from corrupting factors is described in Box 1.
Tb 0 x ex,x X em,x
D D,nr T x ex,xA
0 x ex,x X em,x x ex,x
( , ) ( , )( ) ( , )
( , ) ( , ) ( , )
A
A
kN A I G D F A
k k k G AE
N I G A F A G D
TA b b
D D,nr T( )
kE A E A
k k k
Nature Protocols: doi:10.1038/nprot.2016.128

9
Deducing E-FRET efficiency
E-FRET is a donor centric measure that estimates the fractional quenching of donor fluorescence due to FRET. Thus, the E-FRET efficiency corresponds to
(S1.16)
where CFPFRET|before is the quenched CFP fluorescence intensity before acceptor molecules are photobleached and CFPFRET|after is the intensity after all acceptor molecules are photobleached.
Importantly, CFPFRET|after is an indirect measure that corresponds to the modified state transition diagram shown in Fig. 1f. For this modified system,
(S1.17)
The fluorescence output for a single donor fluorophore would be proportional to the rate of excited donor relaxations that result in the emission of a photon. Accordingly, the total fluorescence output of CFPFRET|after is given by,
(S1.18)
Utilizing the fact that X em,x D X em,xˆ( , ) ( , )F D QY F D , Eq. S1.17 simplifies to
(S1.19)
By contrast, CFPFRET|before is a direct measure that corresponds to CFPX(ex,x, em,x, direct) branch of state transition diagram in Fig. S1e. To relate CFPFRET|after with CFPFRET|before, we reconsider Eq. S1.8,
Simplifying this relation, we obtain
(S1.20)
Substituting Eq. S1.19 to S1.20 yields,
(S1.21)
FRET|after FRET|beforeD
FRET|after
CFP CFPE
CFP
D D,nrx ex,x em,x 0 x ex,x X em,x b b
D D,nr T
T0 x ex,x X em,x b b
D D,nr T
( )( , ,direct) ( , ) ( , ) (1 )
( )
( , ) ( , ) (1 ) 1( )
D
D
k kCFP N I G D F D D D
k k k
kN I G D F D D D
k k k
*0 x ex,x* *
0 x ex,x D D,nrD D,nr
( , )( , ) ( )
( )D
D D D
I G DdPI G D P k k P P
dt k k
*D Dk P
0 x ex,x*FRET|after D X em,x X em,x
D D,nr
( , )ˆ ˆ( , ) ( , )( )D D D D
I G DCFP N P k F D N k F D
k k
FRET|after 0 x ex,x X em,x( , ) ( , )DCFP N I G D F D
x ex,x em,x 0 x ex,x X em,x
T0 x ex,x X em,x b
D D,nr T
( , ,direct) ( , ) ( , )
( , ) ( , )( )
D
D
CFP N I G D F D
kN I G D F D D
k k k
x ex,x em,x FRET|after
T0 x ex,x X em,x b
D D,nr T
( , ,direct)
( , ) ( , )( )D
CFP CFP
kN I G D F D D
k k k
Nature Protocols: doi:10.1038/nprot.2016.128

10
Also recall that the total number of bound complexes must be the same, therefore ND·Db = NA·Ab. Thus,
(S1.22)
Now, substituting S1.13 into Eq. S1.22 yields,
(S1.23)
Rearranging this equation yields,
(S1.24)
Importantly, Eq. S1.24 confirms the intuition that CFP intensity after photobleaching is the sum of the quenched CFP intensity before photobleaching and amount of quenching reported as the sensitized emission corrected for emission properties of YFP molecules versus CFP molecules.
Substituting Eq. S1.24/S1.23 into S1.16, yields
Defining the microscope specific gain factor,
(S1.25)
yields the E-FRET equation shown in Box 1 Eq. 7,
(S1.26)
To deduce ED in terms of fundamental parameters in Fig. Sxe, we substitute Eq. S1.13 and Eq S1.8 into Eq. S1.26 and further simplify to obtain,
(S1.27)
x ex,x em,x FRET|after
TA b 0 x ex,x X em,x
D D,nr T
( , ,direct)
( , ) ( , )( )
CFP CFP
kN A I G D F D
k k k
FRET|before x ex,x em,x
X em,xFRET|after x ex,x em,x
X em,x
( , ,direct)
( , )( , , )
( , )
CFP CFP
F DCFP YFP FRET
F A
X em,xFRET|after FRET|before x ex,x em,x
X em,x
( , )( , , )
( , )
F DCFP CFP YFP FRET
F A
X em,xx ex,x em,x
FRET|after FRET|before X em,xD
X em,xFRET|afterx ex,x em,x FRET|before
X em,x
( , )( , , )
( , )( , )
( , , )( , )
F DYFP FRET
CFP CFP F AE
F DCFPYFP FRET CFP
F A
X em,x
X em,x
( , )
( , )
F AG
F D
x ex,x em,xD
x ex,x em,x x ex,x em,x
( , , )
( , , ) ( , , )
YFP FRETE
YFP FRET CFP direct G
Tb 0 x ex,x X em,x
D D,nr TD
0 x ex,x X em,x
b Tb
D D D,nr T
( , ) ( , )( )
( , ) ( , )
( )
A
D
D
kN A I G D F A
k k kE
N I G D F A
N D kE D
N k k k
Nature Protocols: doi:10.1038/nprot.2016.128

SupplemDiagram corresponthe fractbound. (bcorresponthe YFP essential transition
mentary Notdepicts a si
nds to total ion of donob) Diagram nds to microand FRET cfor compu
n diagram if
te 2 Figurengle cell connumber of d
or molecule illustrates thoscope speccube. (e) Comutation of 3acceptor mo
e 1 | Theorentaining binddonor molecbound and
he input and ific parametmplete state 3-FRET and
olecules wer
etical underpding partnercules and NA
d Ab correspoutput of th
ters. (c – d)transition di
d E-FRET. re photobleac
rpinnings of rs tagged to A acceptor m
ponds to frahe CFP cube Diagram iliagram that (f) Diagram
ched.
f 33-FRET aCFP and YF
molecules. Daction of acce. GX(D,ex,x
llustrates inpspecifies flum illustrate
and E-FRETFP moleculeDb corresponceptor molex) and FX(D,put and outpuorescence os modified
11
T. (a) es. ND nds to ecules ,ex,x) put of output
state
Nature Protocols: doi:10.1038/nprot.2016.128

12
Supplementary Note 3| Determination of binding affinities from FRET measurements
As elaborated in Box 1, the 33-FRET and E-FRET efficiencies depend on the fraction of acceptor (Ab) and fraction of donor molecules (Db) that are bound respectively. Both Db and Ab in fact depend on the total number of donor and acceptor molecules and relative binding affinity. For typical FRET experiments, we consider a binding interaction with a 1:1 stoichiometry. Moreover, the bound state is assumed to conform to a unique with a characteristic FRET efficiency (E). These assumptions allow for fitting a simple Langmuir isotherm to the experimental data yielding an estimate for the binding affinity. Though more complex binding models can be evaluated using FRET, the increased number of states often implies the lack of a unique solution and multiple parameter sets may fit the data.
Consider the simple 1:1 binding model with dissociation constant Kd,
As FRET experiments are typically conducted at steady-state, (S2.1)
Since, the total concentration of acceptor molecules T free[ ] [ ] [ ]A A AD , the fraction of bound acceptor molecules is given by, (S2.2)
The 33-FRET efficiency is thus, (S2.3)
where Emax is the FRET efficiency when all acceptor molecules are bound. Similarly, since the total concentration of donor molecules T[ ] [ ] [ ]D D AD , the fraction of bound donor molecules is given by, (S2.4)
Thus, the E-FRET efficiency is given by, (S2.5)
In both cases to obtain a binding relation, we must deduce the free concentration of donor and acceptor molecules.
dKA D AD
free freed
[ ][ ]
[ ]
A DK
AD
freeb
T free free d
[ ][ ] [ ]
[ ] [ ] [ ] [ ]
AAD ADD
D D AD A K
freeb
T free free d
[ ][ ] [ ]
[ ] [ ] [ ] [ ]
DAD ADA
A A AD D K
freeA max b max
free d
[ ]
[ ]
DE E A E
D K
freeD max b max
free d
[ ]
[ ]
AE E D E
A K
Nature Protocols: doi:10.1038/nprot.2016.128

13
Importantly, fluorescence measurements from single cells are proportional to the total number of fluorophores. Accordingly, we restate Eq. S2.3 and Eq. S2.5 in terms of number of fluorophores. Thus, (S2.6)
Similarly, (S2.7)
Indeed, for a 1:1 stoichiometry interaction, the fraction of acceptors bound is given by, Ab = (ND – NDfree)/ NA. Note that ND – NDfree corresponds to the number of bound donor-acceptor complexes. Thus, Eq. S2.6 can be rewritten as (S2.8)
Rearranging this equation, (S2.9)
Solving this equation yields, (S2.10)
Since the number of bound complexes are the same, . Thus, (S2.11) Substituting Eq. S2.10 into Eq. S2.11 yields, (S2.12) Importantly, the total number of acceptor (NA) and donor (ND) molecules in a cell can be estimated based on fluorescence measurements as outlined below. First, for YFP molecules the fluorescence intensity due to direct excitation viewed through the FRET cube can be obtained from Eq. S1.4 as, (S2.13)
The number of acceptor molecules is then,
(S2.14)
freeb
free d cell avogadro
D
D
NA
N K V N
freeb
free d cell avogadro
A
A
ND
N K V N
D free free
A free d cell avogadro
D D
D
N N N
N N K V N
2Dfree D A d cell avogadro Dfree d cell avogadro D( ) 0N N N K V N N K V N N
A d cell avogadroDfree
2A d cell avogadro d cell avogadro D
( )
2
( ) 4
2
D
D
N N K V NN
N N K V N K V N N
A Afree D DfreeN N N N Afree A D DfreeN N N N
D d cell avogadroAfree
2A d cell avogadro d cell avogadro D
2
( ) 4
2
A
D
N N K V NN
N N K V N K V N N
FRET 0 FRET FRET(440,535,direct) ( , 436) ( ,535)AYFP N I G A F A
FRET0 EST
FRET FRET
(436,535,direct)
( , 436) ( ,535)A
YFPI N YFP
G A F A
Nature Protocols: doi:10.1038/nprot.2016.128

14
The factors, GFRET(A,440) and FFRET(A,535) correspond to microscope specific calibration factors. In cells that express both YFP and CFP, YFPFRET(440,535, direct) can be estimated from the YFP cube measurement by the relation,
(S2.15)
Thus, (S2.16)
Similarly the total number of donor molecules (ND) could be estimated based on the fluorescence intensity of CFP molecules through the FRET cube. However, one confounding factor is quenching of CFP fluorescence as a result of FRET to nearby YFP molecules. The amount of quenching could be corrected for based on Eq. S1.19. Here,
(S2.17)
Note that,
(S2.18)
where ED is the E-FRET efficiency. Thus, Eq. S2.17 simplifies to,
(S2.19)
This expression can be rearranged to obtain,
(S2.20)
Note once again the denominator corresponds to microscope specific calibration factors. Moreover, CFPFRET(440, 535, direct) could be estimated based of fluorescence measurement from the CFP cube as follows:
(S2.21)
Eq. S2.21 could be substituted into Eq. S2.20 to obtain,
(S2.22)
An alternative formulation is shown in main text Eq. 13 where the CFP signal lost due to FRET is added as a correction term.
FRET A1 YFP(436,535,direct) (DA,500,535)YFP R S
FRET 0 x X
T0 x X b
D D,nr T
(436,535,direct) ( , 436) ( ,535)
( , 436) ( ,535)( )
D
D
CFP N I G D F D
kN I G D F D D
k k k
FRET 0 x X D(436,535,direct) ( , 436) ( ,535) (1 )DCFP N I G D F D E
Tb b D
D D,nr T( )
kD D E E
k k k
FRET D0 EST
FRET
(436,535,direct) / (1 )
( , 436) ( ,535)DFRET
CFP EI N CFP
G D F D
A1 YFP A1 YFP0 EST
FRET FRET A
( ,500,535) ( ,500,535)
( , 436) ( ,535)A
R S DA R S DAI N YFP
G A F A M
FRET D1 CFP(436,535,direct) (DA,436,480)CFP R S
D1 CFP D D1 CFP0 EST
FRET FRET D D
( , 436,480) / (1 ) ( , 436,480)
( , 436) ( ,535) (1 )D
R S DA E R S DAI N CFP
G D F D M E
Nature Protocols: doi:10.1038/nprot.2016.128

15
Both Eq. S2.16 and Eq. S2.22 provide experimentally determined estimates for total number of acceptor and donor molecules respectively. Thus, we now reconsider Eq. S2.10 by multiplying both RHS and LHS by I0,
(S2.23)
Now, we could redefine, Eq. S2.23 based on parameters experimentally determined (i.e. Eq.
S2.16 and Eq. S2.22). If we define, 0 Dfree freeI N D , an effective concentration of free donor
molecules and d,EFF 0 d cell avoK I K V N , then
(S2.24)
Similarly, if 0 Afree freeI N A then Eq. S2.11 could be rewritten as,
(S2.25)
These two equations, namely Eq. S2.24 and Eq. S2.25 allows one to determine the free concentrations of donor and acceptor molecules and effective binding affinities through the iterative procedure described in Box 2.
Notice that the computation of CFPEST and YFPEST requires the knowledge of both
D FRET FRET( ,436) ( ,535)M G D F D and A FRET FRET( , 436) ( ,535)M G A F A . However, only the
ratio MA/MD can be reliably determined experimentally using various CFP-YFP dimers. The individual values MA and MD are, in fact, calculated from the parameters of optical elements in the microscope. Reassuringly, our theoretical calculation yielded an MA/MD ratio that was highly similar to the experimentally determined value. Even, since these values are computed based on manufacturer’s specifications for various optical elements, they are only approximate. In our experiments, we followed a simple procedure whereby we computed the MD value based on specifications of our optical elements, and then set the MA value by multiplying this theoretically determined MD value by the experimentally determined ratio MA/MD (from dimer experiments). Here, we explore how a miscomputation of the theoretical MD value may affect the measured Kd,EFF.
Suppose the true MD value ( trueDM ) relates to the estimated MD value ( *
DM ) by
true *D DM M (S2.26)
0 0 A 0 d cell avogadro0 Dfree
20 0 A 0 d cell avogadro 0 d cell avogadro 0 D
( )
2
( ) 4
2
D
D
I N I N I K V NI N
I N I N I K V N I K V N I N
2EST EST d,EFF EST EST d,EFF d,EFF EST
free
( ) ( ) 4
2
CFP YFP K CFP YFP K K CFPD
free EST EST freeA YFP CFP D
Nature Protocols: doi:10.1038/nprot.2016.128

16
Here is an error term. Since the MA/MD can be experimentally determined and therefore assumed to be ratio of the true MA and MD values (i.e. true true
A D/M M ), the estimated MA value is
given by,
true true
* * *A A AA D D true
D experimental D
M M MM M M
M M
(S2.27)
Reconsidering Eq. S2.16 and substituting in Eq. S2.27, we can relate the experimentally estimated YFPEST ( *
ESTYFP ) to the true value trueESTYFP as follows:
(S2.28) Similarly, we can relate the experimentally computed CFPEST ( *
ESTCFP ) to the true value trueESTYFP
by substituting Eq. S2.26 into Eq. S2.22, (S2.29) Now substituting Eqs. S2.28 and S2.29 into S2.23, we could determine the true free concentration of donor molecules, true
freeD , by the following equation:
(S2.30) Rearranging this equation, (S2.31) We could in fact redefine * true
d,EFF d,EFFK K and * truefree freeD D , yielding
(S2.32)
*true ESTA1 YFP A1 YFP
0 EST true *A A
( ,500,535) ( ,500,535)A
YFPR S DA R S DAI N YFP
M M
*D1 CFP D1 CFP EST
0 EST true *D D D D
( , 436,480) ( , 436,480)
(1 ) (1 )D
R S DA R S DA CFPI N CFP
M E M E
* *EST EST
d,EFFtrue
0 Dfree
2* * *EST EST EST
d,EFF d,EFF
2
4
2
free
CFP YFPK
I N D
CFP YFP CFPK K
* *EST EST d,EFFtrue
0 Dfree free
2* * *EST EST d,EFF d,EFF EST
2
4 +
2
CFP YFP KI N D
CFP YFP K K CFP
* * *EST EST d,EFF*
0 Dfree free
2* * * * *EST EST d,EFF d,EFF EST
2
4 +
2
CFP YFP KI N D
CFP YFP K K CFP
Nature Protocols: doi:10.1038/nprot.2016.128

17
Experimentally, then the error in estimation of MD by factor would simply result in a scaled relative dissociation constant, * true
d,EFF d,EFF 0 cell avo dK K I V N K (2.33)
But this ambiguity is computationally no different than lacking knowledge of the I0 value. In the extreme case, if we do not have an estimate of MD, we could simply set *
D 1M . Thus, trueDM
, and the measured relative affinity is * trued,EFF D 0 cell avo dK M I V N K . Finally to compare across
experimental setups, we could compare measured affinities for a robust construct and deduce the pertinent scaling factors.
Nature Protocols: doi:10.1038/nprot.2016.128

18
Supplementary Note 4 | Theoretical basis of concentration-dependent FRET
One important challenge for robust analysis of binding interactions using FRET 2-hybrid is that of concentration-dependent or spurious FRET. If the bulk concentrations of expressed fluorescent proteins are high, then a freely-diffusing donor molecule may, by chance, be sufficiently close to a freely-diffusing acceptor molecule to elicit FRET despite the absence of a specific binding interaction. How do we account for concentration dependence of spurious FRET? Empirically, if CFP and YFP fluorophores are co-expressed in HEK293 cells, the 33-FRET and E-FRET efficiencies appear to be linearly dependent on the total concentration of CFP (CFPEST) or YFP (YFPEST) respectively (Supplementary Fig. 1). In this section, we furnish a theoretical analysis that supports the linear dependence of spurious FRET efficiency on the total concentration of fluorophores. This discussion follows the derivation presented in Erickson et al1.
For 33-FRET, consider an acceptor molecule at position r = 0 as shown in Supplementary Note 4 Fig. 1a. The probability that a donor molecule (D) resides within a spherical shell of radius r and r + dr of the acceptor molecule is given by,
2 27D avo
3( ) [D] 4 (10 L Å )/P r dr N r dr (S3.1)
Here, [D] denotes the (molar) concentration of donor molecule, Navo represents Avogadro’s number. The shell radius r is assumed to be in units of angstrom. The expected FRET efficiency (EA) for randomly dispersed donors at all distances is given by,
60
A D 6 600
( )R
E P r drR r
(S3.2)
Note that the two fluorophores are assumed to be of negligible molecular size and therefore can be infinitesimally close to each other. Substituting S3.1 into S3.2 yields,
62 27 0
A avo 6 600
227 6
avo 0 6 600
3
3
[D] 4 (10 L/
[D] 4 (10
Å )
Å ) L/
RE N r dr
R r
rN R dr
R r
(S3.3)
Simplifying this expression,
327 6
A avo 0 3 30 0 0
2 27 327 3avo 0
3
avo 0
1[D] 4 (10 L/ arctan
3
24[D] (10[D] (10 0
33
Å )
))2
rE N R
R R
N RN R
(S3.4)
Nature Protocols: doi:10.1038/nprot.2016.128

19
As shown in main text Eq. 24, the fluorescence intensity of the donor fluorophore is proportional to concentration of donors ([D] = ND / (Navo·Vcell) = ((RD1 ·SCFP) / MD) / (Navo·Vcell), thus,
3
2 27 32 27 30
D1 CFP D1 0A CFP CFP 3 -FRET
D cell D cell
2(10 ) )2 (103
3
RR S R RE S S m
M V M V
(S3.5)
Hence, the spurious FRET efficiency is linearly proportional to the fluorescence intensity of the donor molecules in the given cell. Note that the estimate here is an upper limit for the spurious FRET efficiency as the donor and acceptor molecules were assumed to be of negligible size. Nonetheless, the slope of the spurious FRET curve could be estimated experimentally.
A similar relation could be determined for spurious FRET between a membrane-localized acceptor fluorophore and a cytosolic donor fluorophore. Consider the fluorophore arrangement shown in Supplementary Note 4 Fig. 1b. By symmetry, the probability of finding a donor fluorophore within distance r and dr would be exactly half as in Supplementary Note 4 Fig. 1a. Therefore, the spurious FRET slope would be half that of Eq. S3.5 but nonetheless linear with respect to the fluorescence intensity of the donor molecule.
Finally, in the case that both donor and acceptor fluorophores are tethered to membrane proteins, these molecules are restricted to the membrane as shown in Supplementary Note 4 Fig. 1c. Thus, the probability of finding a donor molecule within the distance r and r + dr can be obtained by considering the thin cylindrical shell,
8 2D surface
2( ) 2 (10 Å )m /P r dr D r dr (S3.6)
Note that Dsurface is the surface density of the donor fluorophore in the membrane (units of
number of molecules / m2). The expected FRET efficiency (EA) for randomly dispersed donors at all distances is given by,
(S3.7)
(S3.8)
60
A D 6 600
68 2 0
surface 6 600
8 2 6surface 0 6 6
00
8 2 2sur
2
e 02
a
2
f c
( )
2 (10 m /
2 (10
Å )
Å ) m /
32 (10 m /
9Å )
RE P r dr
R r
RD r dr
R r
rD R dr
R r
D R
Nature Protocols: doi:10.1038/nprot.2016.128

20
The fluorescence intensity of the donor fluorophore is proportional to the number of donors in the membrane, thus Dsurface = ND / SAmem = ((RD1 ·SCFP) / MD) / SAmem,
(S3.10)
Again, notice that the spurious 33-FRET efficiency is linearly proportional to the fluorescence intensity of the CFP molecule. Importantly, as the molecules are constrained to the membrane the slope of the spurious FRET efficiency may be prohibitively large. Intuitively, this result stems from the enhanced crowding of fluorophores as a result of restricted planar diffusion. Experimentally, this large spurious FRET may be estimated by localizing donor and acceptor fluorescent proteins to the membrane by lipidation.
3
2 8 2 20
D1 CFPA CFP 3 -
2
FRETD
32 (10 m /
9ˆ
Å )
mem
RR S
E S mM SA
Nature Protocols: doi:10.1038/nprot.2016.128

Supplemfor theorare localia thin sphmembranradius r membranshell of r
mentary Notetical analysized to the cherical shellne, we consid
and thicknene, then to eradius r and t
te 4 Figure sis of spurioytosol. Thusl of radius r der probabiless dr. (c) estimate sputhickness dr
1 | Geometrus FRET rels, we considand thickne
lity of findinIf both donurious FRETr.
ric arrangemlations. (a) Her the proba
ess dr (b) If ng a donor mnor and acceT relations,
ment of donoHere, both dability of findthe acceptor
molecule in theptor fluorowe would c
or and accepdonor and acding a donorr molecule ihe thin hemiophores are consider the
ptor fluorophcceptor moler molecule ws localized tispherical shrestricted to
e thin cylind
21
hores ecules within to the
hell of o the drical
Nature Protocols: doi:10.1038/nprot.2016.128

RESEARCH ARTICLE
Uncoupling PIP2-calmodulin regulation of Kv7.2 channels by anassembly destabilizing epileptogenic mutationAraitz Alberdi1,*, Carolina Gomis-Perez1,*, Ganeko Bernardo-Seisdedos1, Alessandro Alaimo1,Covadonga Malo1, Juncal Aldaregia1, Carlos Lopez-Robles1, Pilar Areso2, Elisabeth Butz3,Christian Wahl-Schott3 and Alvaro Villarroel1,‡
ABSTRACTWe show that the combination of an intracellular bi-partite calmodulin(CaM)-binding site and a distant assembly region affect how an ionchannel is regulated by a membrane lipid. Our data reveal thatregulation by phosphatidylinositol(4,5)bisphosphate (PIP2) andstabilization of assembled Kv7.2 subunits by intracellular coiled-coilregions far from the membrane are coupled molecular processes.Live-cell fluorescence energy transfer measurements and directbinding studies indicate that remote coiled-coil formation createsconditions for different CaM interaction modes, each conferringdifferent PIP2 dependency to Kv7.2 channels. Disruption of coiled-coil formation by epilepsy-causing mutation decreases apparentCaM-binding affinity and interrupts CaM influence on PIP2 sensitivity.
KEY WORDS: Coiled-coil, Leucine zipper, Calmodulin, PIP2, KCNQ,Epilepsy, M-current, Allosteric
INTRODUCTIONPhosphatidylinositol(4,5)bisphosphate (PIP2) is aminor (<1%) acidicphospholipid found in the inner leaflet of the cellmembrane and playsa vital part in cellular signaling by directly interacting with membraneproteins, including Kv7 potassium channels (Gamper and Shapiro,2007; Suh and Hille, 2008; Hille et al., 2014; Zaydman and Cui,2014). Function of Kv7 channels is absolutely dependent on PIP2(Zaydman and Cui, 2014) and activation of phospholipase C, andsubsequent PIP2 hydrolysis causes downregulation of their activity,which in turn lowers the threshold for activity (Brown et al., 2007),orchestrating excitability in brain, heart, skeletalmuscle and inner ear.Related diseases encompass epilepsy, autism, schizophrenia, cardiacarrhythmias, hearing loss and sudden death (Soldovieri et al., 2011;Dvir et al., 2014a; Maljevic and Lerche, 2014).The five members of the Kv7 family of non-inactivating voltage-
dependent potassium channels share a common architecture,differing from that of Kv1–Kv4 channels in lacking an N-terminalT1 tetramerization domain. Instead, and in common with a largegroup of channels, such as Eag, Erg, SK, CNG and TRP channels,present multiple calmodulin (CaM; Uniprot P62161)-bindingdomains followed by a tetrameric coiled-coil segment (Jenke et al.,2003; Tsuruda et al., 2006). Kv7 channels have a large intracellular
C-terminal region, ranging from 320 to 500 residues in size,containing four helical regions (A–D), which can be conceptuallydivided into three parts. Immediately after the last S6 transmembranesegment, the intracellular membrane proximal half (AB) is importantfor CaM binding and channel gating. Three-dimensional (3D)reconstitution locates the intracellular distal part (helixD) far from themembrane (Dvir et al., 2014b), which directs oligomerization andpartner specificity (Yus-Nájera et al., 2002; Howard et al., 2007;Haitin and Attali, 2008). The AB and D helices are connected byhelix C, indispensable for function, and a linker of variable length.Mutagenesis suggests that, in addition to the S4–S5 linker and theproximal C-terminus, helix C contributes to PIP2 regulation (Dviret al., 2014b; Zaydman and Cui, 2014). CaM binding is essential forKv7 channels to exit from the endoplasmic reticulum, and influencesheteromeric assembly of Kv7.2/3 channels and subsequentenrichment at the axonal initial segment (Yus-Nájera et al., 2002;Devaux et al., 2004; Chung et al., 2006; Etxeberria et al., 2008;Haitin and Attali, 2008; Alaimo et al., 2009; Cavaretta et al., 2014;Chung, 2014; Liu and Devaux, 2014). CaM regulatory mechanismsthat change the gating behavior proceed through an effect onsensitivity to PIP2 (Kosenko et al., 2012; Kosenko and Hoshi, 2013;Zaydman et al., 2013; Kang et al., 2014). The interlinker betweenhelices A and B is not essential for function, although it plays acritical role in PIP2 regulation for Kv7.3, but not in Kv7.1 andKv7.2 channels (Hernandez et al., 2008; Aivar et al., 2012; Sachyaniet al., 2014).
In contrast to the obligatory role of helices ABC for Kv7.2channel function, helix D is dispensable (Schwake et al., 2006;Nakajo and Kubo, 2008). The helix D coiled-coil bundle has beenlargely considered as a passive stitch, with little active role otherthan to convey stability to the tetramer and specificity during theformation of heteromeric assemblies (Schmitt et al., 2000; Jenkeet al., 2003; Maljevic et al., 2003; Schwake et al., 2006; Howardet al., 2007). Whilst this is undoubtedly part of its function, we findthat this structure has a more active role by indirectly influencingPIP2 dependency.
Here, we identified a mechanism to modulate, at a distance,regulation by PIP2. We monitored the relative distance/orientationof the ABCD domain by live-cell fluorescence resonance energytransfer (FRET) assays in conjunction with analysis of whole-cellcurrents. The observations we made explain how the tetramericconformation of helix D can functionally influence CaM binding toa distal site, and, in turn, how a pathological mutation affectingtetramer stability modifies Kv7.2 activity.
RESULTSCalmodulin binds to Kv7.2 AB with a 1:1 stoichiometryCalmodulin is a bi-functional protein, with two highly homologouslobes (N and C) joined by a flexible linker, each capable of engagingReceived 24 June 2015; Accepted 9 September 2015
1Unidad de Biofısica, Consejo Superior de Investigaciones Cientıficas, CSIC, UPV/EHU, Barrio Sarriena s/n, Leioa 48940, Spain. 2Departament de Farmacologıa,UPV/EHU, Universidad del Paıs Vasco, Barrio Sarriena s/n, Leioa 48940, Spain.3Department of Pharmacy, Center for Drug Research and Center for IntegratedProtein Science Munich (CIPSM), Ludwig-Maximilians-Universitat, Munchen81377, Germany.*These authors contributed equally to this work
‡Author for correspondence ([email protected])
4014
© 2015. Published by The Company of Biologists Ltd | Journal of Cell Science (2015) 128, 4014-4023 doi:10.1242/jcs.176420
Journal
ofCe
llScience

targets adopting an α-helix configuration (Villarroel et al., 2014).Helix A of Kv7.2 presents a marked preference for fetching theC-lobe, whereas helix B anchors more favorably to the N-lobe(Alaimo et al., 2014) and these features are present on thecrystallographic Kv7.1 [AB/CaM] complex (Sachyani et al.,2014). To place the data of this report into physical perspective,Fig. 1 shows a tentative disposition of CaM on Kv7.2 forming a ringunder the pore that complies with numerous restrictions fromdifferent studies (Mruk et al., 2012; Xu et al., 2013; Alaimo et al.,2014; Sachyani et al., 2014) (see Materials and Methods). Oneimportant feature derived from the 3D structure of the Kv7.1[ABCD/CaM] complex is that the helix D coiled-coil is separatedfrom the membrane by the CaM ring (Sachyani et al., 2014)(Fig. 1A).To investigate in more detail the interaction with the Kv7.2
CaM-binding domain, we co-expressed CaM and a constructbearing the Kv7.2 CaM-binding elements (helices A and B,residues G313–R530) to produce the recombinant complex inbacteria. The intervening A–B linker (residues Y372–T501), whichis not essential for Kv7.2 function (Aivar et al., 2012), wasremoved to improve protein yield. We found by size exclusionchromatography (SEC) that the purified material migrated with anapparent molecular mass of 35.3 kDa, which is close to theexpected size for a 1:1 [CaM/AB] globular complex (16.7+13.6=30.3 kDa; Fig. 1C). Thus, similar to Kv7.1 or Kv7.4 [AB/CaM] complexes studied in vitro (Wiener et al., 2008; Xu et al.,
2013), the Kv7.2 [AB/CaM] complex adopts a 1:1 stoichiometryin solution.
The helix D L609R mutation disrupts coiled-coil formationWe studied next the consequences of the helix D L609R mutation[equivalent to L637R in the long Kv7.2 splice variant (Richardset al., 2004)] found in patients with hereditary benign familialconvulsions (Richards et al., 2004), which is predicted to interruptcoiled-coil formation (Lupas and Gruber, 2005; Schwake et al.,2006) (Fig. 1B). To this end, non-tagged CaM and ABCDC-terminally tagged with a fluorescent protein were co-expressedin bacteria, and the resulting complexes were purified and analyzed.The SEC elution volume was consistent with a 4:4 [ABCD/CaM]globular complex. In contrast, the larger elution volume of theL609R mutant indicated that no stable tetramers were formed(Fig. 1C). In addition, the fastest non-denaturing electrophoreticpattern of [ABCD-L609R/CaM] compared with [ABCD/CaM]indicates disruption of the complex (Fig. 1D). Thus, the L609Rmutation impedes the adoption of a stable tetrameric coiled-coilconfiguration.
Helices CD do not interact with calmodulin and the [ABCD/calmodulin] complex is compactIt has been suggested that FRET results between isolated domains ofCa2+ voltage-dependent channels and CaM can be applied to theentire protein (Ben Johny et al., 2013). Inspired by this precedent,
100 140 180 220
Elution Volume
ABCD-YFPL609R-YFPAB
+CaM
1
233444445
A
C
B
-Lobe
C-Lobe
K+
D
L609
D
Coi
led-
coil
prop
ensi
ty
Amino acid position560 600 640
0.4
0.8Helix C Helix D
WT
L609R
PIP2
-------LLLoL b
C
KKKKKKKKKKKKKKKKKKKKKKKKKKKKKKKKKKKKKKKKKKKKKKKKKKKKKKKKKKKKKKKKKKKKKKKKKKKKKKKKKKKKKKKKKKKKKKKKKKKKKKKKKKKKKKKKKKKKKKKKKKKKKKKKKKKKKKKKKKKKKKKKKKKKKKKKKKKKKKKKKKKKKKKKK+++
D
L609
PIP2222
B
A
N
S4
Fig. 1. The L609R mutation disrupts coiled-coil formation. (A) Structural model of the CaM ring under the membrane based on the crystallographic co-ordinates and synchrotron X-ray data of the [AB/CaM] Kv7.1 and [ABCD/CaM] Kv7.1 complexes, respectively (Sachyani et al., 2014), the [B/CaM] Kv7.4 complex(Xu et al., 2013), helix D Kv7.4 and Kv7.1 tetrameric bundles (Howard et al., 2007; Wiener et al., 2008), and the model derived from internal TEA-CaM blockade(Mruk et al., 2012). The disposition of helix C and the CD linker are unknown (dashed lines). Only the selectivity filter, the S4 (salmon), S5 and S6 segments(green), S4–S5 linker (salmon) and post-S6 segment (salmon) of two potassium channel subunits are shown for clarity. The distance between the inner leaflet ofthemembrane and L609 is∼10 nm in this model. (B) Coiled-coil probabilities of helices C and D for wild-type Kv7.2 and the L609Rmutant computed using COILS(http://www.ch.embnet.org/software/COILS_form.html). (C) Size exclusion chromatographyof the indicated constructs. Normalized absorbance is plotted againstelution volume. All samples were loaded at a concentration of 20 µM. Theoretical molecular masses (in kDa) are: 103 for [ABCD-YFP/CaM], 412 for [ABCD-YFP/CaM]4, 206 for [ABCD-YFP/CaM]2 and 30 for [AB/CaM]. (D) Gel electrophoresis of the indicated samples in the absence of SDS. YFP (29 kDa) and BSA(66.5 kDa), which present different degrees of oligomerization, served as a ruler for molecular mass. On top of the BSA bands the presumed number of moleculesin the oligomer is indicated (Friedman et al., 1993). The computed molecular mass of the ABCD-YFP construct is 57 kDa and that of CaM is 17 kDa. Thefluorescence image of the same gel is shown on the right.
4015
RESEARCH ARTICLE Journal of Cell Science (2015) 128, 4014-4023 doi:10.1242/jcs.176420
Journal
ofCe
llScience

the interaction between CaM and the C-terminal Kv7.2 domain wasanalyzed by FRET in living cells. Cyan fluorescent protein (CFP)and yellow fluorescent protein (YFP) exhibit 50% energy transfer ata distance of ∼5 nm and measurable transfer up to 8 nm (Pattersonet al., 2000). The ratio of the integral of CFP/YFP emission isolatedafter spectral unmixing is directly proportional to the FRETefficiency. The FRET index between CaM and helices AB wasimportant (Fig. 2A,E), whereas between helices CD and CaM it wasinsignificant (Fig. 2B,E,G). These data reinforce the initialconclusion, based on yeast two-hybrid interaction trap and pull-down assays, that helices CD do not contribute directly to CaMbinding (Yus-Nájera et al., 2002). Similarly, a role of CD helices hasbeen discarded for CaM binding to Kv7.4 and Kv7.1 channels (Xuet al., 2013; Sachyani et al., 2014). In contrast, an increased FRETindex compared with that of AB was observed between CFP-CaMand YFP-ABCD (Fig. 2C,E), which is an expected consequence ofhaving multiple donors and acceptors within the FRET distance[<8 nm (Patterson et al., 2000; Vogel et al., 2006); Fig. 2F]. Basedon the structure of the related Kv1.2 channel (Long et al., 2005), two
fluorescent proteins in the same channel should be ∼5.6 nm apart(assuming they are in adjacent subunits) or 7.9 nm apart (assumingthey are in non-adjacent subunits). In agreement with thisinterpretation, disruption of helix D coiled-coil by the L609Rmutation resulted in a FRET index comparable to that of AB(Fig. 2D,E). The differences in FRET efficiency were apparent atlow free donor or acceptor concentrations, where collisional orspurious FRET is negligible (Fig. 2G; Figs S1, S2). Thus CaM andAB from different subunits are within FRET distance in thetetrameric complex brought together by helix D.
Tetramerization of the distal helix D positions A helices fromdifferent subunits within FRET distanceTo gain further insights into the [Kv7.2/CaM] complex, the impactof tetramerization on the separation between A helices ofneighboring subunits was gauged by FRET analysis, attachingCFP or YFP at the N-terminus, upstream of helix A. Thisconfiguration allowed the assessment of the transfer of energybetween adjacent subunits, which was virtually undetectable
60000 2000 4000
CD
60000
0.15
0.30 EA
Dfree (CFP-CaM) 0 2000 4000 6000
AB
0 2000 4000
ABCD
0 2000 4000 6000
ABCD-L609R
G
****
1.0
2.0
YFP/CFP
AB
AB
CD
L609
R
CD
450 510 570
AB
YFP
A B
CFP
CD
450 510 570
YFP
D
CFP
ABCD
450 510 570
YFP
A B
D
CFP
ABCD-L609R
450 510 570
CFP
YFP
A B
DL609R
A
B
C
D
E
CFP referenceCrude spectrum Computed YFP
F
ABCD ABCD-L609R
(97) (110)
(188)
(91)***
Fig. 2. FRET between calmodulin and ABCD is reduced by the helix D L609Rmutation. (A–D) Emission spectra (green) after excitation at 405 nm from cellsexpressing CFP-CaM and YFP-target protein. The orange trace is the computed FRET emission from the YFP-tagged target protein and the cyan plot is thereference emission of CFP. Note in B the negligible bleed through due to direct excitation of YFP at 405 nm. (E) FRET indexes between CFP-CaM and theindicated constructs. (F) Cartoon illustrating how, as a result of tetramerization, each donor could be within FRET distance of two or more acceptors. Disruption ofcoiled-coil formation would cause separation/re-orientation of the donor–acceptor pairs, which now would function as independent entities. (G) Binding curve inwhich the FRET strength between CFP-CaM and the indicated YFP-labeled proteins is plotted versus concentration of free CFP-CaM from each individual cell(Ben et al., 2013) (n>25). EA, acceptor-centric FRET efficiency; Dfree, free donor concentrations in arbitrary units.
4016
RESEARCH ARTICLE Journal of Cell Science (2015) 128, 4014-4023 doi:10.1242/jcs.176420
Journal
ofCe
llScience

between CFP-AB and YFP-AB (Fig. 3A, compare cyan and greentraces). In contrast, a clear FRET signal was detected betweenCFP-ABCD and YFP-ABCD (Fig. 3B,E), indicating that theseparation of the N-termini is below 8 nm in the tetramericcomplex. Disruption of the helix D coiled-coil formation by theL609R mutation resulted in a large reduction of the FRET index(Fig. 3C,D), reinforcing the view that helix D is critical for bringingA helices close together.
Calmodulin re-orients the A helices of neighboring subunitsThree-dimensional structural data indicate that the ABCD domaincan be envisioned as a flower bouquet with the tetrameric coiled-coil helix D corresponding to the pedestal (Sachyani et al., 2014)(Fig. 1). We can imagine the bunch in two extreme situations: in acompact arrangement or with flaccid stacks positioning the flowerstowards the periphery (Fig. 3G). FRET can distinguish betweenclosed and spread configurations, because in the first case donorsand acceptors from neighboring [CaM/AB] complexes will bewithin FRET distance. With this idea in mind, the impact ofelevating CaM levels was monitored. The FRET index recordedafter disruption of tetramerization by the L609R mutation was low,and increased after CaM elevation (Fig. 3C,D; compare green andsalmon plots), whereas no significant changes were revealed whenhelix D was missing (Fig. 3A). In contrast, a prominent FRET indexwas obtained for the CFP-ABCD and YFP-ABCD pair, whichalmost doubled with elevated CaM levels (Fig. 3B). Thus CaMleads to a rearrangement, probably by compaction (Fig. 3G), of thedisposition of helix A in the ABCD complex. This compaction alsotakes place for the L609R mutant, but it does not reach the distant/orientation values of the ABCD complex. Furthermore, the FRETindex was significantly reduced in cells overexpressingneurogranin, an apo-calmodulin-binding protein (Villarroel et al.,
2014) that is expected to diminish CaM availability (Fig. 3F). Theseresults suggest that CaM favors, by mass action, the adoption of anovel organization of the ABCD domain, and that this newconfiguration is favored by helix D acquiring a tetrameric coiled-coil formation.
Coiled-coil formationbyhelixD increasescalmodulin-bindingaffinityThe changes on FRET suggest that CaM can bind to ABCD in atleast two different configurations, resulting in an equilibriumscheme between a minimum of three states (Fig. 4A). A testableconsequence of the incorporation of an additional binding mode isthat the apparent binding affinity should decrease after disruption ofhelix D-mediated tetramer formation by L609R (Fig. 4). Usinge-FRET methodology (Chen et al., 2006) we resolved the bindingcurve in which the FRET strength between CFP-CaM andYFP-ABCD is plotted cell-by-cell versus concentration of freeYFP-ABCD (Ben Johny et al., 2013). This revealed that, besidesdecreasing maximal FRET, the L609Rmutation led to a reduction inapparent binding affinity (Fig. 4B). To further evaluate the impact ofthis mutation in CaM binding in a more controlled in vitro setting,recombinant ABCD and ABCD-L609R proteins were produced inbacteria and purified in the absence of CaM (Alaimo et al., 2009).The refolded monodisperse CaM-binding domains weresubsequently assayed in vitro for binding to dansylated CaM(D-CaM) (Alaimo et al., 2013b; Bonache et al., 2014). Inaccordance with theory and with results obtained by using livecells, the elimination of the presumed additional binding mode wasaccompanied by a clear decrease in apparent binding affinity for theL609R mutant (Fig. 4C,D). In the tetramer, the packing suggeststhat binding of one CaM might affect binding to another CaM.However, the Hill coefficient (Edelstein and Le, 2013) of the dose–
ABCD/ABCD
450 510 570
YFP
A B
D
CFP
AB
D
ABCD/L609R
450 510 570
YFP
A B
CFP
ABDL609R
D
L609R/L609R
450 510 570
YFP
A BD
CFP
ABD
L609R
AB/AB
450 510 570
YFP
A B
CFP
ABCFPReference +CaM
1.6
YFP
/CFP
ABCD/ABCD
ABCD/L609R
L609R/L609R
AB/AB
CaM + + + +
A
C
B
D
E
G
Spread Compact
+CaM
(48) (46)
(157)
(178)
(49)(95)
(41)(79)
***
******
***
(51)
(57)
1.2
YFP/
CFP
Nrg +ABCD/ABCD
F
Fig. 3. Elevation of calmodulin levels leads to increased FRET in tetrameric ABCD. (A–D) Comparison of the impact of elevation of CaM levels on theemission spectra (green versus salmon) after excitation at 405 nm from cells co-expressing the indicated regions of Kv7.2 tagged with CFP and YFP at theN-termini. The reference CFP emission spectrum is plotted in blue. The deviation of the green and salmon traces from the blue plot provides a visual indication ofchanges in FRET. (E) Summary of FRET indexes measured under normal (gray) and elevated (salmon) CaM conditions. (F) Comparison of the impact ofoverexpression of Neurogranin (Nrg, green) to reduce CaM levels on spectral FRET between CFP-ABCD and YFP-ABCD. (G) Cartoon illustrating how CaMengaging AB in an additional binding mode could form a sort of ‘lock washer’ that compacts the proximal region of ABCD, bringing together donors and acceptorsfrom different subunits.
4017
RESEARCH ARTICLE Journal of Cell Science (2015) 128, 4014-4023 doi:10.1242/jcs.176420
Journal
ofCe
llScience

responses did not change as a consequence of coiled-coil disruption,suggesting that tetramerization has minor or no effect on potentialco-operativity between CaM molecules (Fig. 4C).
The effect of elevated calmodulin on PIP2 dependencydiffers between WT and L609R mutant channelsCells expressing Kv7.2, complemented or not with CaM, wereexamined by whole-cell recording (Fig. 5A,B) to explore the
functional consequences of the tetramerization-disrupting mutationon CaM-dependent function, such as current density and PIP2dependency. Current density was not significantly affected by thismutation (Fig. 5), whereas there was a remarkable 18 mV right shiftof the conductance–voltage relationship (Fig. 5C). The decrease inCaM-binding affinity caused by the L609R mutation should tend toreduce the ensemble occupancy of the four CaM-binding sites on aKv7.2 channel. A similar decline in the steady-state occupancy
A B
0 1000 2000 30000.0
0.2
0.4
Fluo
resc
ence
in
crea
se (%
)
ABCDL609R
10 100 10000
40
80
120
9.2 nM30.8 nM
Protein concentration (nM)
-Ca2+
C
ED
L609R
AFree
D
ABCDL609R
10 100 1000
15.1 nM59.5 nM
+Ca2+
= +
=
Fig. 4. Disruption of coiled-coil formation results inreduced calmodulin-binding affinity. (A) Schemeillustrating how coiled-coil formation can lead to a three-state binding model (top) compared with a two-state modelin the absence of tetramerization (bottom). (B) The bindingcurve in which the FRET strength between CFP-CaM andYFP-ABCD (black line) or YFP-ABCD-L609R (red line) isplotted cell-by-cell versus concentration of free YFP-ABCD. The shaded boxes indicate the concentrationrange in arbitrary units producing half-maximal e-FRET.ED, donor-centric FRET efficiency; Afree, free acceptorconcentrations in arbitrary units. (C) Dose–responserelationship of normalized D-CaM fluorescence emissionincreases with purified monodisperse recombinant GST-ABCD proteins in the absence of Ca2+. The lines are theresult of fitting aHill equation to the data, and the EC50 fromthe fit is indicated in the figure. Hill coefficients for ABCDand L609R were 1.80±0.15 and 2.15±0.17, respectively(n=3). (D) Dose–response relationship of normalizedD-CaM fluorescence emission increase in the presence of3.9 µM free Ca2+. The lines are the result of fitting a Hillequation, and the EC50 values from the fit are indicated inthe figure. Hill coefficients for ABCD and L609R were3.07±0.39 and 2.83±0.18, respectively (n=3).
+-
-110 -50 10
0.2
0.6
1.0
18 mV
Kv7.2
L609R
I/Im
ax(ta
il)
Prepulse Voltage (mV)
CaM
+-
**
(pA/
pF @
-30
mV
(tail)
0
50
100
(30)
(26)
(15)
(19)
Kv7.2
+ CaM+
L609R
2 nA
0.5 s
Kv7.2 L609R
+ CaM + CaM
A
B C
-3030 mV
-110 Δ20 mV
+ Sponge
Sponge
+ Sponge
(18)***
Fig. 5. The L609R mutation causes a rightshift of the voltage dependency andprecludes the effect of elevated calmodulinin current density. (A) Exemplar whole-cellcurrent relaxations evoked at different potentialsfor the indicated channels under resting (gray),elevated CaM (red) and reduced (green)conditions. CaM availability was reduced with aCaM sponge. (B) Summary of current densitiescomputed at −30 mV as the difference in quasi-instantaneous current after a prepulse to−110 mV (all channels closed) and +30 mV (allchannels opened). Note that this protocol isinsensitive to voltage-dependent shifts within abroad voltage range. (C) Normalized tail I–Vrelationship. The lines are fits of Boltzmannrelationships to the data with the followingparameters (V½, slope in mV): wt, −33.2±1.0,12.3±0.8; wt+CaM, −32.9±1.0, 13.5±0.9; wt+sponge, −15.6±2.1, 13.3±1.6; L609R, −15.5±1.1, 10.4±0.9; L609R+CaM, −17.4±1.6, 10.5±1.2.
4018
RESEARCH ARTICLE Journal of Cell Science (2015) 128, 4014-4023 doi:10.1242/jcs.176420
Journal
ofCe
llScience

should occur when the concentration of free CaM is critically low.To test this idea, the properties of Kv7.2 channels in a low CaMenvironment were evaluated. Under reduced CaM conditions therewas a significant decrease in current density, consistent with the roleof CaM on Kv7.2 trafficking (Etxeberria et al., 2008). Remarkably,there was a 17 mV right shift of the conductance–voltagerelationship (Fig. 5). Similar effects were observed in cellsexpressing neurogranin (n≥12, not shown). Thus both disruptionof coiled-coil formation and low CaM availability led to similarchanges in the conductance–voltage relationship, with a strongcorrelation with the impact on the proximity/orientation of theABCD domains.The voltage-dependent phosphatase Danio rerio voltage sensing
phosphatase (DrVSP) was used to address the impact on PIP2dependence. To avoid voltage errors associated with the largecurrents evoked at the extreme voltages required to activate DrVSP(see Fig. 6A), series resistance compensation for the patch electrodewas set to >95% (Sherman et al., 1999). The comparison of currentrelaxations before and after DrVSP activation demonstrated that theL609R mutant was more resistant to activation of the voltage-dependent phosphatase (Fig. 6B). Furthermore, a similar increase inresistance to DrVSP activation was observed for wild-type channelsunder low CaM conditions, which is comparable to that in channelscarrying the L609R mutation. Importantly, in contrast to wild-typechannels, the response of the mutant channel to activation of DrVSPwas insensitive to CaM elevation (Fig. 6C). Thus disruption of helixD coiled-coil changes voltage dependency and perturbs theadoption of additional CaM-binding modes and subsequentchange on PIP2 dependency in Kv7.2 channels.
DISCUSSIONDespite their fundamental importance in regulation and signaling,allosteric mechanisms are, in general, poorly understood (Motlaghet al., 2014). Here, we show that PIP2 dependency is affected at adistance by the formation of a coiled-coil tetrameric bundle. Thedata are consistent with a mechanism involving different CaM-binding modes, which confer differential PIP2 sensitivity to Kv7.2channels.The data reveal that the pathogenic L609R mutation [equivalent to
L637R in the long Kv7.2 splice variant (Richards et al., 2004)]
destabilizes the helix D-dependent tetramerization of the C-terminalregion of Kv7.2. In addition, this mutation reduces the apparentaffinity for CaM binding, and leads to increased resistance to theaction of a voltage-dependent phosphatase that reduces PIP2concentration at the plasma membrane. A plausible consequence ofthe reduction of CaM affinity is that CaM occupancy of the channel isdiminished, and, on average, not all four sites of the tetramericchannel would be engaged in a given instant. A similar reduction inthe number of resident CaM molecules can be achieved by loweringCaM availability, which led to increased resistance to DrVSP action,similar to that seen for the helixD-mutated channels. In addition, bothwild-type channels when CaM is scarce and L609Rmutant channelsunder resting CaM levels present a >17 mV right shiftedconductance–voltage relationship, meaning that two differentsituations that lead to low CaM occupancy converge towards asimilar voltage dependency and increased resistance to PIP2depletion. Although results obtained with isolated domains may notapply to the full-length channel, the agreement between in vitro dataand those obtained by using live cells favor the argument that theseevents are related, and are consistent with the idea that the effect onPIP2 sensitivity is a consequence of the changes on CaM residence.
How can helix D affect CaM binding? Neither our new FRETdata, nor previous studies using yeast two hybrid assays, or studies onKv7.1 or Kv7.4, have exposed any hint of direct CaM interactionwith helices CD (Yus-Nájera et al., 2002; Howard et al., 2007;Wiener et al., 2008; Xu et al., 2013). In addition, small angle X-rayscattering of the related Kv7.1 subunit (Sachyani et al., 2014) revealsthat there is no physical contact between helix D and the [AB/CaM]complex. Therefore, we conclude that the impact of helix D in CaMbinding is indirect. In addition to previous functional and structuraldata (Alaimo et al., 2013a; Sachyani et al., 2014), the helixD-dependent changes in CaM-binding affinity unveiled here supportthe concept of the occurrence of more than one binding mode. Thedecrease in FRET for the L609R mutant underscores the importanceof coiled-coil formation by helix D in this process. The changes inhomo-FRET efficiency between ABCD modules are a clearindication that the A helices re-orient, come closer, or both, whenmore CaM is available. Either new CaM molecules are entering thecomplex, or existing CaM molecules are engaging in new bindingmodes, such as intrasubunit and intersubunit binding modes.
***Kv7.2
1 nA
1 sL609R
+CaM
1nA1 s
DrVSP activation
inhibition
Reference
+100 mV
-110 mV
-20 mV
0
20
40
60
80
Kv7.2 L609R
+CaM +
A
B
C
(12)
(20)
(18)(11)***
****
(9)
Sponge +
+Sponge
Before A�er
% C
urre
nt R
educ
tion
Fig. 6. Disruption of coiled-coil formation affects calmodulin-dependent regulation of PIP2 sensitivity. (A) Scheme of thevoltage protocol used for DrVSP activation (top) and exemplarcurrent recorded from a cell expressing Kv7.2 channels to illustratecurrent inhibition quantification. (B) Exemplar current relaxationsbefore (dark gray traces) and after DrVSP activation in restingconditions and overexpressing CaM (red traces) or overexpressinga CaM-binding protein –‘sponge’– to sequester CaM (green).(C) Averaged current reduction after activation of DrVSP for theindicated Kv7 configurations, in resting conditions and withelevated (red) or reduced (green) CaM.
4019
RESEARCH ARTICLE Journal of Cell Science (2015) 128, 4014-4023 doi:10.1242/jcs.176420
Journal
ofCe
llScience

The CaMN-lobe has a significant preference to anchor to helix B,whereas the C-lobe binds more favorably to the IQ site located inhelix A (Alaimo et al., 2014). In the context of the full-lengthchannel, both helices in the [AB/CaM] complex could originate fromthe same subunit (intrasubunit binding) or from two adjacentsubunits (intersubunit binding). Intersubunit binding requiresplacing AB helices from contiguous subunits within CaM reach,i.e. <4 nm (Villarroel et al., 2014). Indeed, Kv7.2 models derivedfrom trigonometric restrictions obtained with pore blockers tetheredto CaM as calipers, position the lobe anchoring sites of nearby CaMmolecules under 4 nm (Mruk et al., 2012) (Fig. 1A). In addition,besides the precedents for bridged configurations in other channels(Schumacher et al., 2001; Sarhan et al., 2012; Villarroel et al., 2014),the crystallographic structure of Kv7.1 [AB/CaM] has been trappedwith CaM embracing helices A and B from different subunits(Sachyani et al., 2014). We have previously shown by whole-cellrecording that precluding CaM binding to helix A or to helix Bresults in non-functional channels, but, remarkably, both mutantchannels complement each other, restoring function when co-expressed (Alaimo et al., 2013a). Furthermore, at submicromolarconcentrations, CaM links two Kv7.2 AB domains in vitro,anchoring helix A of one subunit to helix B of another subunit(Alaimo et al., 2013a). Therefore, we consider reasonable thehypothesis that, by bringing together the AB helices fromadjacent subunits thanks to helix D coiled-coil formation, eachCaM lobe can engage with the complementary helix from aneighboring subunit.Consideration of our new data together with prior work leads us to
propose an extension of the CaMmodulation hypothesis to include aswitch betweenCaMbinding-modes, whichmay correspond to intra-and intersubunit engagement or different degrees of occupancyof themultiple CaM-binding sites, providing distant control of PIP2sensitivity by the tetramerization domain. The structures of manyconfigurations are presently unknown, but homology modelingconfirms the plausibility of these arrangements. In the context of thefull-channel, with the restrictions imposed by the pore-formingregions preceding helix A, the approximation of these helices causedby CaM elevation should translate in a movement of the whole[ABCD/CaM] complex relative to the pore. A doubling in FRETindex in the presence of elevatedCaM (Fig. 3) could be accounted forby less than 6% reduction in the separation of the fluorophores, i.e. adisplacement <0.5 nm, a magnitude comparable to the verticaltranslation of the cytoplasmic domain observed between thestructures of Kir2.2 channels with and without PIP2 (Hansen et al.,2011).It is not known if the helix D tetramer de-oligomerize and re-
oligomerize as part of the normal channel function, allowing forphysiological allosteric control of channel activity. Beyondsupporting different CaM-binding modes and affecting channelassembly, the helix D coiled-coil domain may also serve as ascaffold for interactions with other proteins that regulate channelactivity (Marx et al., 2002; Kass et al., 2003; Wiener et al., 2008).Thus, helix D may act as an antenna, funneling relatively distantinteractions towards the pore by changing indirectly the way thechannel engages with CaM.The data provide a basis for theoretical generalization of an
allosteric mechanism. Many ion channels, such as Kv7, Eag, Erg,SK, CNG and TRP, present multiple CaM-binding domainsfollowed by a tetrameric coiled-coil bundle (Jenke et al., 2003;Tsuruda et al., 2006), but other elements could assume theequivalent conceptual roles. The ingredients are two bi-functionaltarget–receptor components, plus a mechanism that brings two or
more targets in close vicinity. By controlling at a long distance theproximity between the binding sites, the receptor could engage thetarget in different configurations, ultimately affecting activity.
PIP2 is strictly required for the operation of Kv7 channels, and itis currently thought that parts of the channel from well-separatedregions of the linear sequence fold to bring together several basicresidues to create a binding pocket (Zaydman and Cui, 2014). Theconcept is that the interacting basic residues do not represent astructurally selective binding site; rather they form positivelycharged clouds that would attract any acidic lipid. PIP2 would be theprincipal target because it is the most abundant multiply-phosphorylated lipid of the plasma membrane (Suh and Hille,2008). By reconfiguring the CaM ring underneath the pore, thecloud envelope in contact with PIP2 at the inner leaflet of themembrane could change, such that the orientation of lysine, arginineor histidine residues making electrostatic contacts with the chargedphosphate groups will be controlled at a distance by helix D. Afuzzy organization of the PIP2-binding surface like this may help toexplain the puzzling similar effects in channel-PIP2 sensitivity oflow and elevated CaM levels. Defects in channel-PIP2 sensitivitythrough interfering mutations can lead to disease (Logothetis et al.,2010). It is attractive to hypothesize that mutations not located at thebinding site that disrupt channel-PIP2 dependency, such as L609Rdescribed here and which was found in a patient with an epilepticcondition (Richards et al., 2004), could also lead to disease.
MATERIALS AND METHODSMolecular biologyThe human isoform 3 Kv7.2 (Y15065) cDNA was provided by T. Jentsch(Leibniz-Institut für Molekulare Pharmakologie, Berlin, Germany) and thecDNA encoding rat CaM was provided by the group of J.P. Adelman(Vollum Institute, Portland, OR, USA). The subunits tagged at theN-terminal with CFP or YFP were cloned into pCDNA3.1 and wepreviously confirmed that these N-terminal tags have no impact on theelectrophysiological properties of the channel (Soldovieri et al., 2006;Gómez-Posada et al., 2010; Gómez-Posada et al., 2011). Point mutationswere constructed by polymerase chain reaction (PCR)-based mutagenesis.Dr-VSP-IRES-GFP from zebrafish was provided by Y. Okamura (OsakaUniversity, Osaka, Japan). The CaM sponge, which has CFP and YFPflanking the apoCaM-binding site of neuromodulin, was provided byD.J. Black (University of Missouri, Missouri, USA). For in vitroco-expression experiments, CaM was subcloned into the pOKD4 vector.C-terminal channel sequences were fused to a custom-made circularlypermuted Venus variant of YFP (Shinege; China) and subcloned intopPROEX-HTc vector. Rat neurogranin (NM_024140.2) tagged with a mycepitope at the N-terminus was cloned into pcDNA3.1 hys/myc A vector.
Homology modelingThe portrayed structure in Fig. 1 is an extension of model 3 proposed byMruk et al., which places key residues of the CaM N- and C-lobes at adistance relative to the Kv7.2 pore compatible with the effects of a poreblocker tethered to CaM with chains of varying length (Mruk et al., 2012),and adequate for it being linked to S6, assuming that the IQ site adopts asimilar disposition as that in the Kv7.1 [AB/CaM] complex (Sachyani et al.,2014), and presents a kink as predicted by sequence analysis (Alaimo et al.,2014). The structural models of [N-lobe/helix B] complexes fromKv7.1 andKv7.4 nicely superimpose, and are consistent with nuclear magneticresonance (NMR) data obtained for the Kv7.2 [AB/CaM] complex (Xuet al., 2013; Alaimo et al., 2014; Sachyani et al., 2014). In turn, the structuralcrystallographic X-ray-based model for the Kv7.1 [C-lobe/helix A] complexis compatible with NMR observations of the Kv7.2 [AB/CaM] complex(Alaimo et al., 2014; Sachyani et al., 2014), and is almost identical to everyother solved complex of apo-C-lobe (Ca2+ free) with peptides containing anIQ motif (IQxxθR, θ=bulky apolar residue), a motif that is present in helix Aof every Kv7 channel (Yus-Nájera et al., 2002; Villarroel et al., 2014).
4020
RESEARCH ARTICLE Journal of Cell Science (2015) 128, 4014-4023 doi:10.1242/jcs.176420
Journal
ofCe
llScience

Finally, helix D has been placed at a distance from the CaM-binding site,according to the envelope observed by small-angle X-ray scattering (SAXS)for the Kv7.1 [ABCD/CaM] complex in solution (Sachyani et al., 2014).This disposition places PIP2 and L609 of helix D more than 10 nm apart.
Fluorescence spectroscopyRecombinant proteins ABCD, ABCD-L609R (both fused to GST) and CaMwere produced as described previously (Alaimo et al., 2009). Fluorometricexperiments using dansyl-CaM (D-CaM), CaM dansylation, sample andbuffers preparation and fluorescent measurements were performed asdescribed previously (Alaimo et al., 2013b; Bonache et al., 2014).
Recombinant protein production, purification and native gelelectrophoresisFusion proteins were expressed in Escherichia coli [BL21(DE3)] grown inlysogeny broth (LB) medium at 37°C and induced at OD600 nm=0.6–0.8 with0.5 mM isopropyl β-D-1-thiogalactopyranoside (IPTG) for 5 h. Cells wereharvested by centrifugation at 5000 g for 20 min at 4°C, and cell pellets werefrozen at −20°C. Thawed cell pellets were lysed in lysis buffer (mM: 120KCl, 3 imidazole, 1 phenylmethylsufonyl fluoride (PMSF), 10 K-HEPES;pH 7.4), and one tablet of protease inhibitor without EDTA (Roche AppliedScience, Penzberg,Germany), and passed three times through a homogenizer(Emulsiflex). Insoluble material was precipitated by centrifugation for30 min at 25,000 g at 4°C. The resulting soluble fraction, which containedthe fusion protein, was applied to a 5 ml cobalt-charged column (no. 28-9537-67, GE Healthcare, Little Chalfont, UK), and pre-equilibrated in washbuffer (mM: 120 KCl, 10 K-HEPES; pH 7.4). Increasing amounts ofimidazole were used for washing. Sample elution proceeded on a lineargradient from 30 to 300 mM imidazole on an ÄKTA fast protein liquidchromatography (FPLC) system. Imidazole was removed by dialysisovernight at 4°C in cellulose membrane tubing (no. D927-100FT, Sigma-Aldrich, St Louis, MO, USA) with agitation against 1 litre of fluorescencebuffer (mM: 125 KCl, 5 NaCl, 1 MgCl2, 10 EGTA, 10 Tris; pH 7.4. Fusionproteins were then applied to a Superdex 200 pg 26/600 column (no. 28-9893-36, GE Healthcare) and eluted in the same buffer. Positive fractionswere pooled together and concentrated using a 3 kDa cut-off Amicon ultra-15 concentrator (no. UFC900308, EMDMillipore, Billerica, MA, USA) in afixed angle rotor at 3500 g. Protein concentration was measured at 462 nm,equalized to 4 µM and samples with 5% of glycerol were run in 7% non-denaturing (‘native’) gels (without SDS).
Cell culture and transfectionHEK293T cells (HEK 293T/17, ATCC, CRL-11268) were maintained in5% CO2 at 37°C in Dulbecco’s modified Eagle’s medium (DMEM, Sigma-Aldrich), supplemented with non-essential amino acids (Sigma, Madrid,Spain) and 10% fetal bovine serum (FBS; Lonza, Madrid, Spain). Transienttransfection for imaging was performed using polyethylenimine (PEI)25 kDa (no. 23966-22g, PolySciences, Eppelheim, Germany), whereas forelectrophysiology experiments lipofectamine 2000 (Invitrogen) was usedfollowing manufacturer’s instructions. All experiments were performed48 h after transfection.
Electrophysiological measurementsWhole-cell patch recordings of HEK293T cells were obtained at roomtemperature (21–25°C). Cells were bathed in the following solution (mM):140 NaCl, 4 KCl, 2 CaCl2, 2 MgCl2, 10 Na-HEPES and 5 D-glucose,adjusted to pH 7.4 with NaOH. The osmolarity was adjusted with mannitolto ∼315 mosmol/l. Pipettes were pulled from borosilicate glass capillaries(Sutter Instruments, USA) using a Narishige micropipette puller (PC-10;Narishige Instrument Company, Japan). All experiments to test the impactof DrVSP (0.5 µg cDNA per 35 mm dish) were carried out with 100% seriesresistance compensation using a VE-2 amplifier (Alembic Instruments,Canada) equipped with an Rs Compensator (Sherman et al., 1999).
We applied the traditional voltage protocol as in the original descriptionof the M-current (Adams et al., 1982). This protocol takes advantage of thelack of inactivation of the M-channels, and allows removing potential‘invasion’ of the signal by other inactivating currents. Our protocol to study
the sensitivity to DrVSP activation is similar to that used by Hille andcollaborators (Falkenburger et al., 2010). DrVSP was activated by a 200 msjump to +100 mV, and the voltage was returned to the holding potential of−20 mV. Jumps to−110 mV, beyond the K+ reversal potential, were appliedto close the channels. Upon returning to the holding potential, aninstantaneous current jump (corresponding to leak current) followed by aslowly developing outward relaxation (corresponding to the opening of theM-channels) was recorded. The size of the outward relaxation before andafter the +100 mV jump was used to estimate the effect of DrVSP activationon M-current size (Adams et al., 1982; Villarroel, 1994).
Pipettes were filled with an internal solution containing (mM): 125KCl, 5MgCl2, 5 EGTA, 5 Na2ATP and 10 K-HEPES, adjusted to pH 7.2 with KOHand the osmolarity adjusted to ∼300 mosmol/l with mannitol (Gómez-Posada et al., 2010). The amplitude of the Kv7 current was defined as thepeak difference in current relaxation measured at −30 mV after 500–1500 ms pulses to −110 mV (all channels closed) and to +30 mV (allchannels opened). The data were acquired and analyzed using pCLAMPsoftware (version 8.2), normalized in Excel (Microsoft, Madrid, Spain) andplotted using SigmaPlot (SPSS Corporation, Madrid, Spain). Data areshown as means±s.e.m. The differences between the means were evaluatedusing Student’s unpaired t-test, where values of P≤0.05 were consideredsignificant. The number of cells in each experiment is indicated inparentheses in the figures. The results are from two or more independentbatches of cells. In all figures *, ** and *** indicate significance at P<0.05,P<0.01 and P<0.001, respectively.
Spectral FRET measurementsSingle transiently transfected HEK293 cells were maintained in buffersolution composed of (mM): 140 NaCl, 5 KCl, 1 MgCl2, 2 CaCl2, 10glucose and 10 Na-HEPES; pH 7.4 at room temperature. For CFP-CaMbinding to YFP-tagged KV7.2 C-terminal region (devoid of any membraneanchoring region) the transfection ratio used was 1:5 with a total of 0.6 µgDNA per M35 dish. Control experiments expressing CFP alone or CFPtogether with YFP at a 1:5 ratio demonstrated that contamination of the CFPemission signal due to direct YFP excitation at 405 nm was <1% (Fig. S1).For assembly experiments, the ratio was 1:1 (1 µg of each FCP-taggedABCD and 2 µg of CaM or 2 µg of empty pcDNA3.1 his/myc C vector).Images were recorded 48 h after transfection using a Nikon D EclipseTE2000-U fluorescence microscope (Nikon Instruments, Tokyo, Japan)equipped with a confocal scanning head and a spectral detector module.Images were captured using a 60× oil objective (numerical aperture 1.43),with the pinhole opened (150 µm) and using the 405 nm laser line(Coherent, Santa Clara, CA, USA) or the 488 nm line (Melles-Griot,Rochester, NY, USA) for direct CFP or YFP excitation, respectively.Cytosolic regions of interest (ROI) from cells displaying a clear signal afterexcitation with the 488 nm laser line were included in the analysis. Thespectral detector allows simultaneous recording of 32 images, eachregistering a 5 nm band of the spectrum, covering 450–610 nm. Afterspectral unmixing, the area under the spectra was measured and a FRETindex was calculated as FRET index=YFP405/CFP405.
e-FRET measurementsFluorescence intensities of YFP and CFP were recorded from single cellsusing a Leica DMI6000B inverted epifluorescence microscope and a dualemission photometric system (Till Photonics, Gräfelfing, Germany).Excitation was done at 436±7.5 nm or 500±7.5 nm, applied at 2 Hz usinga Polychrome V as light source. Epifluorescence emission was detected by aphotodiode, digitized (Mini Digi1B; Molecular Devices) and acquired usingClampex 10 software (Molecular Devices). FRET filter cubes were(excitation, long-pass beam-splitter, emission): CFP (ET436/20x; T455lp;ET480/40m), YFP (ET500/20x; T515lp; ET535/30m) and FRET (ET436/20x; T455lp; ET535/30m) (Chroma Technology). e-FRET efficiencies(ED) were determined using ED=(SFRET−RD1×SCFP−RA×SYFP)/(SFRET−RD1×SCFP−RA×SYFP+G×SCFP). SFRET, SCFP and SYFP denotefluorescence intensities derived from measurements in individual cells co-expressing YFP- and CFP-tagged proteins with the respective filter cube(excitation, emission): SFRET (500±7.5 nm, 535±15 nm), SCFP (436±7.5 nm, 480±20 nm) and SYFP (500±7.5 nm, 535±15 nm). RD1 and RA
4021
RESEARCH ARTICLE Journal of Cell Science (2015) 128, 4014-4023 doi:10.1242/jcs.176420
Journal
ofCe
llScience

are experimentally predetermined constants from measurements applied tosingle cells expressing only CFP- or YFP-tagged molecules that correct fordonor bleed trough and acceptor cross excitation. G factor represents theratio of sensitized acceptor emission to quenched donor emission due toFRET, and was experimentally determined to be 4.13 using CFP fused toYFP with linkers of varying length (4, 40 and 80 amino acids). The CFP/YFP ratio was between 1:5 and 5:1, which is expected to yield reliableresults.
d-FRET measurementsFluorescence intensities of YFP and CFP were recorded from single cellsusing a Leica DMI6000B inverted epifluorescence microscope and a 914photomultiplier detection system (PTI, Canada). Excitation was done at436±7.5 nm or 500±7.5 nm, applied with a DeltaRam X monochromatorincluding an arc lamp (PTI, Canada) as light source. Epifluorescenceemission was acquired using FelixGX software (PTI, Canada).
FRET efficiency for d-FRET (EA), which is defined as the fractionalincrease in YFP emission caused by FRET, was calculated using EA={[SFRET−(RD1)(SCFP)]/[(RA1)(SYFP)]−1}×(εYFP/εCFP); SFRET, SCFP andSYFP denote fluorescence intensities derived from measurements inindividual cells co-expressing YFP- and CFP-tagged proteins with therespective filter cube.
FRET data were analyzed using Clampfit 10.0 (Molecular Devices), andMicrosoft Office Excel software. Data plotting, curve fitting and statisticalanalysis were performed using Sigma-Plot 12 software (SPSS Corporation).All values are presented as means±s.e.m. for the indicated number (n) ofexperiments. Student’s t-test was used to compare means of two groups fromdata with a normal distribution. Statistical analysis was performed usingSigmaPlot software. *P<0.05, **P<0.01 and ***P<0.001 indicatesignificance.
Competing interestsThe authors declare no competing or financial interests.
Author contributionsA.V. conceived the project. A. Alberdi, C.G.-P. and A.V. designed the experimentsand analyzed the data. A.Alb., C.G.-P., G.B.-S., C.V., A. Alaimo, J.A. and C.L.-R.performed the experiments. A. Alberdi, C.G.-P., E.B. and C.W.-S. contributedanalytical or experimental tools. A. Alberdi, C.G-.P., G.B-.S., A. Alaimo, P.A. andA.V. analyzed the data. A.V. wrote the paper with critical inputs from A. Alberdi,C.G.-P., P.A. and C.W.-S. All authors approved the final version of the manuscript.The experiments were performed at Unidad de Biofısica, Leioa, Spain andDepartment of Pharmacy, Center for Drug Research and Center for IntegratedProtein Science Munich (CIPSM), Ludwig-Maximilians-Universitat, Germany.
FundingThis work was supported by grants from the Spanish Ministry of Economy andCompetitiveness (BFU2012-39883), the Spanish Ion Channel Initiative Consoliderproject (CSD2008-00005), and the Basque Government (SAIOTEK SA-2006/00023 and 304211ENA9). A. Alaimo was funded by a Universidad del Paıs Vascopostdoctoral fellowship. A. Alberdi held a JAE-predoctoral Consejo Superior deInvestigaciones Cientıficas fellowship co-financed with European SocialFunds (JAEPre_2010_00711). G.B.-S. holds a fellowship from the BasqueCountry Government (BFI-2011-159). C.M. was funded by the Spanish Ministryof Economy and Competitiveness (PTA2012) and co-financed by FundacionBiofısica Bizkaia.
Supplementary informationSupplementary information available online athttp://jcs.biologists.org/lookup/suppl/doi:10.1242/jcs.176420/-/DC1
ReferencesAdams, P. R., Brown, D. A. andConstanti, A. (1982). Pharmacological inhibition ofthe M-current. J. Physiol. 332, 223-262.
Aivar, P., Fernandez-Orth, J., Gomis-Perez, C., Alberdi, A., Alaimo, A.,Rodrıguez, M. S., Giraldez, T., Miranda, P., Areso, P. and Villarroel, A.(2012). Surface expression and subunit specific control of steady protein levels bythe kv7.2 helix A-B linker. PLoS ONE 7, e47263.
Alaimo, A., Gomez-Posada, J. C., Aivar, P., Etxeberria, A., Rodriguez-Alfaro,J. A., Areso, P. and Villarroel, A. (2009). Calmodulin activation limits the rate of
KCNQ2 K+ channel exit from the endoplasmic reticulum. J. Biol. Chem. 284,20668-20675.
Alaimo, A., Alberdi, A., Gomis-Perez, C., Fernandez-Orth, J., Gomez-Posada,J. C., Areso, P. and Villarroel, A. (2013a). Cooperativity between calmodulin-binding sites in Kv7.2 channels. J. Cell Sci. 126, 244-253.
Alaimo, A., Malo, C., Areso, P., Aloria, K., Millet, O. and Villarroel, A. (2013b).The use of dansyl-calmodulin to study interactions with channels and otherproteins. Methods Mol. Biol. 998, 217-231.
Alaimo, A., Alberdi, A., Gomis-Perez, C., Fernandez-Orth, J., Bernardo-Seisdedos, G., Malo, C., Millet, O., Areso, P. and Villarroel, A. (2014).Pivoting between calmodulin lobes triggered by calcium in the Kv7.2/calmodulincomplex. PLoS ONE 9, e86711.
Ben Johny, M., Yang, P. S., Bazzazi, H. and Yue, D. T. (2013). Dynamic switchingof calmodulin interactions underlies Ca2+ regulation of CaV1.3 channels. Nat.Commun. 4, 1717.
Bonache, M. A., Alaimo, A., Malo, C., Millet, O., Villarroel, A. and Gonzalez-Mun iz, R. (2014). Clicked bis-PEG-peptide conjugates for studying calmodulin-Kv7.2 channel binding. Org. Biomol. Chem. 12, 8877-8887.
Brown, D. A., Hughes, S. A., Marsh, S. J. and Tinker, A. (2007). Regulation of M(Kv7.2/7.3) channels in neurons by PIP2 and products of PIP2 hydrolysis:significance for receptor-mediated inhibition. J. Physiol. 582, 917-925.
Cavaretta, J. P., Sherer, K. R., Lee, K. Y., Kim, E. H., Issema, R. S. and Chung,H. J. (2014). Polarized axonal surface expression of neuronal KCNQ potassiumchannels is regulated by calmodulin interaction with KCNQ2 subunit. PLoS ONE9, e103655.
Chen, H., Puhl, H. L., III, Koushik, S. V., Vogel, S. S. and Ikeda, S. R. (2006).Measurement of FRET efficiency and ratio of donor to acceptor concentration inliving cells. Biophys. J. 91, L39-L41.
Chung, H. J. (2014). Role of calmodulin in neuronal Kv7/KCNQ potassium channelsand epilepsy. Front. Biol. 9, 205-215.
Chung, H. J., Jan, Y. N. and Jan, L. Y. (2006). Polarized axonal surface expressionof neuronal KCNQ channels is mediated by multiple signals in the KCNQ2 andKCNQ3 C-terminal domains. Proc. Natl. Acad. Sci. USA 103, 8870-8875.
Devaux, J. J., Kleopa, K. A., Cooper, E. C. and Scherer, S. S. (2004). KCNQ2 is anodal K+ channel. J. Neurosci. 24, 1236-1244.
Dvir, M., Peretz, A., Haitin, Y. and Attali, B. (2014a). Recent molecular insightsfrom mutated IKS channels in cardiac arrhythmia. Curr. Opin. Pharmacol. 15,74-82.
Dvir, M., Strulovich, R., Sachyani, D., Ben-Tal Cohen, I., Haitin, Y., Dessauer, C.,Pongs, O., Kass, R., Hirsch, J. A. and Attali, B. (2014b). Long QT mutations atthe interface between KCNQ1 helix C and KCNE1 disrupt IKS regulation by PKAand PIP2. J. Cell Sci. 127, 3943-3955.
Edelstein, S. J. and Le Novere, N. (2013). Cooperativity of allosteric receptors.J. Mol. Biol. 425, 1424-1432.
Etxeberria, A., Aivar, P., Rodriguez-Alfaro, J. A., Alaimo, A., Villace, P., Gomez-Posada, J. C., Areso, P. and Villarroel, A. (2008). Calmodulin regulates thetrafficking of KCNQ2 potassium channels. FASEB J. 22, 1135-1143.
Falkenburger, B. H., Jensen, J. B. and Hille, B. (2010). Kinetics of PIP2
metabolism and KCNQ2/3 channel regulation studied with a voltage-sensitivephosphatase in living cells. J. Gen. Physiol 135, 99-114.
Friedman, P. N., Chen, X., Bargonetti, J. and Prives, C. (1993). The p53 protein isan unusually shaped tetramer that binds directly to DNA. Proc. Natl. Acad. Sci.USA 90, 3319-3323.
Gamper, N. and Shapiro, M. S. (2007). Regulation of ion transport proteins bymembrane phosphoinositides. Nat. Rev. Neurosci. 8, 921-934.
Gomez-Posada, J. C., Aivar, P., Alberdi, A., Alaimo, A., Etxeberrıa, A.,Fernandez-Orth, J., Zamalloa, T., Roura-Ferrer, M., Villace, P., Areso, P.et al. (2011). Kv7 channels can function without constitutive calmodulin tethering.PLoS ONE 6, e25508.
Gomez-Posada, J. C., Etxeberria, A., Roura-Ferrer, M., Areso, P., Masin, M.,Murrell-Lagnado, R. D. and Villarroel, A. (2010). A pore residue of the KCNQ3potassium M-channel subunit controls surface expression. J. Neurosci. 30,9316-9323.
Haitin, Y. and Attali, B. (2008). The C-terminus of Kv7 channels: a multifunctionalmodule. J. Physiol. 586, 1803-1810.
Hansen, S. B., Tao, X. and MacKinnon, R. (2011). Structural basis of PIP2
activation of the classical inward rectifier K+ channel Kir2.2. Nature 477, 495-498.Hernandez, C. C., Zaika, O. and Shapiro, M. S. (2008). A carboxy-terminal inter-
helix linker as the site of phosphatidylinositol 4,5-bisphosphate action on Kv7 (M-type) K+ channels. J. Gen. Physiol. 132, 361-381.
Hille, B., Dickson, E. J., Kruse, M., Vivas, O. and Suh, B. C. (2014).Phosphoinositides regulate ion channels. Biochim. Biophys. Acta 1851, 844-856.
Howard, R. J., Clark, K. A., Holton, J. M. and Minor, D. L., Jr. (2007). Structuralinsight into KCNQ (Kv7) channel assembly and channelopathy. Neuron 53,663-675.
Jenke, M., Sanchez, A., Monje, F., Stuhmer, W., Weseloh, R. M. and Pardo, L. A.(2003). C-terminal domains implicated in the functional surface expression ofpotassium channels. EMBO J. 22, 395-403.
4022
RESEARCH ARTICLE Journal of Cell Science (2015) 128, 4014-4023 doi:10.1242/jcs.176420
Journal
ofCe
llScience

Kang, S., Xu, M., Cooper, E. C. and Hoshi, N. (2014). Channel-anchored proteinkinase CK2 and protein phosphatase 1 reciprocally regulate KCNQ2-containingM-channels via phosphorylation of calmodulin. J. Biol. Chem. 289, 11536-11544.
Kass, R. S., Kurokawa, J., Marx, S. O. and Marks, A. R. (2003). Leucine/isoleucine zipper coordination of ion channel macromolecular signalingcomplexes in the heart. Roles in inherited arrhythmias. Trends Cardiovasc.Med. 13, 52-56.
Kosenko, A. and Hoshi, N. (2013). A change in configuration of the calmodulin-KCNQ channel complex underlies Ca2+-dependent modulation of KCNQ channelactivity. PLoS ONE 8, e82290.
Kosenko, A., Kang, S., Smith, I. M., Greene, D. L., Langeberg, L. K., Scott, J. D.and Hoshi, N. (2012). Coordinated signal integration at the M-type potassiumchannel upon muscarinic stimulation. EMBO J. 31, 3147-3156.
Liu, W. and Devaux, J. J. (2014). Calmodulin orchestrates the heteromericassembly and the trafficking of KCNQ2/3 (Kv7.2/3) channels in neurons.Mol. Cell.Neurosci. 58, 40-52.
Logothetis, D. E., Petrou, V. I., Adney, S. K. and Mahajan, R. (2010).Channelopathies linked to plasma membrane phosphoinositides. Pflugers Arch.460, 321-341.
Long, S. B., Campbell, E. B. and MacKinnon, R. (2005). Crystal structure of amammalian voltage-dependent Shaker family K+ channel. Science 309, 897-903.
Lupas, A. N. and Gruber, M. (2005). The structure of α-helical coiled coils. Adv.Protein Chem. 70, 37-38.
Maljevic, S. and Lerche, H. (2014). Potassium channel genes and benign familialneonatal epilepsy. Prog. Brain Res. 213, 17-53.
Maljevic, S., Lerche, C., Seebohm, G., Alekov, A. K., Busch, A. E. and Lerche, H.(2003). C-terminal interaction of KCNQ2 and KCNQ3 K+ channels. J. Physiol.548, 353-360.
Marx, S. O., Kurokawa, J., Reiken, S., Motoike, H., D’Armiento, J., Marks, A. R.andKass, R. S. (2002). Requirement of a macromolecular signaling complex for βadrenergic receptor modulation of the KCNQ1-KCNE1 potassium channel.Science 295, 496-499.
Motlagh, H. N., Wrabl, J. O., Li, J. and Hilser, V. J. (2014). The ensemble nature ofallostery. Nature 508, 331-339.
Mruk, K., Shandilya, S. M. D., Blaustein, R. O., Schiffer, C. A. and Kobertz, W. R.(2012). Structural insights into neuronal K+ channel-calmodulin complexes. Proc.Natl. Acad. Sci. USA 109, 13579-13583.
Nakajo, K. and Kubo, Y. (2008). Second coiled-coil domain of KCNQ channelcontrols current expression and subfamily specific heteromultimerization by saltbridge networks. J. Physiol. 586, 2827-2840.
Patterson, G. H., Piston, D. W. and Barisas, B. G. (2000). Forster distancesbetween green fluorescent protein pairs. Anal. Biochem. 284, 438-440.
Richards, M. C., Heron, S. E., Spendlove, H. E., Scheffer, I. E., Grinton, B.,Berkovic, S. F., Mulley, J. C. andDavy, A. (2004). Novelmutations in the KCNQ2gene link epilepsy to a dysfunction of the KCNQ2-calmodulin interaction. J. Med.Genet. 41, e35.
Sachyani, D., Dvir, M., Strulovich, R., Tria, G., Tobelaim, W., Peretz, A., Pongs,O., Svergun, D., Attali, B. and Hirsch, J. A. (2014). Structural basis of a Kv7.1potassium channel gatingmodule: studies of the intracellular C-terminal domain incomplex with calmodulin. Structure 22, 1582-1594.
Sarhan, M. F., Tung, C.-C., Van Petegem, P. and Ahern, C. A. (2012).Crystallographic basis for calcium regulation of sodium channels. Proc. Natl.Acad. Sci. USA 109, 3558-3563.
Schmitt, N., Schwarz, M., Peretz, A., Abitbol, I., Attali, B. and Pongs, O. (2000). Arecessive C-terminal Jervell and Lange-Nielsen mutation of the KCNQ1 channelimpairs subunit assembly. EMBO J. 19, 332-340.
Schumacher, M. A., Rivard, A. F., Bachinger, H. P. and Adelman, J. P. (2001).Structure of the gating domain of a Ca2+-activated K+ channel complexed withCa2+/calmodulin. Nature 410, 1120-1124.
Schwake, M., Athanasiadu, D., Beimgraben, C., Blanz, J., Beck, C., Jentsch,T. J., Saftig, P. and Friedrich, T. (2006). Structural determinants of M-type KCNQ(Kv7) K+ channel assembly. J. Neurosci. 26, 3757-3766.
Sherman, A. J., Shrier, A. and Cooper, E. (1999). Series resistance compensationfor whole-cell patch-clamp studies using a membrane state estimator. Biophys. J.77, 2590-2601.
Soldovieri, M. V., Castaldo, P., Iodice, L., Miceli, F., Barrese, V., Bellini, G., delGiudice, E. M., Pascotto, A., Bonatti, S., Annunziato, L. et al. (2006).Decreased subunit stability as a novel mechanism for potassium currentimpairment by a KCNQ2 C terminus mutation causing benign familial neonatalconvulsions. J. Biol. Chem. 281, 418-428.
Soldovieri, M. V., Miceli, F. and Taglialatela, M. (2011). Driving with no brakes:molecular pathophysiology of Kv7 potassium channels. Physiology 26, 365-376.
Suh, B.-C. and Hille, B. (2008). PIP2 is a necessary cofactor for ion channelfunction: how and why? Annu. Rev. Biophys. 37, 175-195.
Tsuruda, P. R., Julius, D. and Minor, D. L., Jr. (2006). Coiled coils direct assemblyof a cold-activated TRP channel. Neuron 51, 201-212.
Villarroel, A. (1994). On the role of arachidonic acid in M-current modulation bymuscarine in bullfrog sympathetic neurons 61. J. Neurosci. 14, 7053-7066.
Villarroel, A., Taglialatela, M., Bernardo-Seisdedos, G., Alaimo, A., Agirre, J.,Alberdi, A., Gomis-Perez, C., Soldovieri, M. V., Ambrosino, P., Malo, C. et al.(2014). The ever changing moods of calmodulin: how structural plasticity entailstransductional adaptability. J. Mol. Biol. 426, 2717-2735.
Vogel, S. S., Thaler, C. and Koushik, S. V. (2006). Fanciful FRET.Sci. STKE 2006,re2.
Wiener, R., Haitin, Y., Shamgar, L., Fernandez-Alonso, M. C., Martos, A.,Chomsky-Hecht, O., Rivas, G., Attali, B. and Hirsch, J. A. (2008). The KCNQ1(Kv7.1) COOH terminus, a multitiered scaffold for subunit assembly and proteininteraction. J. Biol. Chem. 283, 5815-5830.
Xu, Q., Chang, A., Tolia, A. and Minor, D. L., Jr. (2013). Structure of a Ca2+/CaM:Kv7.4 (KCNQ4) B-helix complex provides insight into M current modulation.J. Mol. Biol. 425, 378-394.
Yus-Najera, E., Santana-Castro, I. and Villarroel, A. (2002). The identification andcharacterization of a noncontinuous calmodulin-binding site in non-inactivatingvoltage-dependent KCNQpotassium channels. J. Biol. Chem. 277, 28545-28553.
Zaydman, M. A. and Cui, J. (2014). PIP2 regulation of KCNQ channels: biophysicaland molecular mechanisms for lipid modulation of voltage-dependent gating.Front. Physiol. 5, 195.
Zaydman, M. A., Silva, J. R., Delaloye, K., Li, Y., Liang, H., Larsson, H. P., Shi, J.and Cui, J. (2013). Kv7.1 ion channels require a lipid to couple voltage sensing topore opening. Proc. Natl. Acad. Sci. USA 110, 13180-13185.
4023
RESEARCH ARTICLE Journal of Cell Science (2015) 128, 4014-4023 doi:10.1242/jcs.176420
Journal
ofCe
llScience

Fig. S1. Emission spectra of the different fluorophores excited at 405 nm (donor excitation
wavelength, cyan trace, left image) or 488 nm (acceptor excitation wavelength, yellow trace,
right image). The regions of interest selected to generate the spectra are indicated with red
squares. Note that the presence of helices CD prevents the constructs from reaching the nucleus.
450 510 570
CFP alone
CFP
450 510 570
CFP
ABCD
YFP
A B
D
450 510 570
CD
YFP
D
CFP
A
C
B
D
450 510 570
YFP alone
YFP
405 nm 488 nm 405 nm 488 nm
405 nm 488 nm 405 nm 488 nm
J. Cell Sci. 128: doi:10.1242/jcs.176420: Supplementary information
Jour
nal o
f Cel
l Sci
ence
• S
uppl
emen
tary
info
rmat
ion

Fig. S2. The binding curve in which the FRET strength between CFP-CaM and YFP-AB or
YFP-CD is plotted cell-by-cell versus concentration of free YFP-tagged acceptor (n >25).
25000
CD
25000
0.15
0.30ED
Afree (YFP-Target)
0
AB
J. Cell Sci. 128: doi:10.1242/jcs.176420: Supplementary information
Jour
nal o
f Cel
l Sci
ence
• S
uppl
emen
tary
info
rmat
ion

ARTICLE
Received 14 Mar 2014 | Accepted 10 Jul 2014 | Published 21 Aug 2014
High susceptibility to fatty liver disease in two-porechannel 2-deficient miceChristian Grimm1, Lesca M. Holdt2,*, Cheng-Chang Chen1,*, Sami Hassan1,*, Christoph Muller3, Simone Jors4,
Hartmut Cuny1,*,w, Sandra Kissing5, Bernd Schroder5, Elisabeth Butz1, Bernd Northoff2, Jan Castonguay6,
Christian A. Luber7,w, Markus Moser7, Saskia Spahn1, Renate Lullmann-Rauch8, Christina Fendel9,
Norbert Klugbauer6, Oliver Griesbeck10, Albert Haas9, Matthias Mann7, Franz Bracher3, Daniel Teupser2,
Paul Saftig5, Martin Biel1 & Christian Wahl-Schott1
Endolysosomal organelles play a key role in trafficking, breakdown and receptor-mediated
recycling of different macromolecules such as low-density lipoprotein (LDL)-cholesterol,
epithelial growth factor (EGF) or transferrin. Here we examine the role of two-pore channel
(TPC) 2, an endolysosomal cation channel, in these processes. Embryonic mouse fibroblasts
and hepatocytes lacking TPC2 display a profound impairment of LDL-cholesterol and
EGF/EGF-receptor trafficking. Mechanistically, both defects can be attributed to a dysfunction
of the endolysosomal degradation pathway most likely on the level of late endosome to
lysosome fusion. Importantly, endolysosomal acidification or lysosomal enzyme function are
normal in TPC2-deficient cells. TPC2-deficient mice are highly susceptible to hepatic
cholesterol overload and liver damage consistent with non-alcoholic fatty liver hepatitis.
These findings indicate reduced metabolic reserve of hepatic cholesterol handling. Our results
suggest that TPC2 plays a crucial role in trafficking in the endolysosomal degradation
pathway and, thus, is potentially involved in the homoeostatic control of many macro-
molecules and cell metabolites.
DOI: 10.1038/ncomms5699
1 Department of Pharmacy—Center for Drug Research and Center for Integrated Protein Science Munich (CIPSM), Ludwig-Maximilians-Universitat, 81377Munchen, Germany. 2 Institute of Laboratory Medicine—University Hospital Munich, 81377 Munich, Germany. 3 Department of Pharmacy, Ludwig-Maximilians-Universitat Munchen, 81377 Munchen, Germany. 4 2nd Department of Internal Medicine, Klinikum rechts der Isar, Technical University ofMunich, 81675 Munchen, Germany. 5 Institute of Biochemistry, Christian-Albrechts-Universitat Kiel, 24118 Kiel, Germany. 6 Institute for Experimental andClinical Pharmacology and Toxicology, Albert-Ludwigs-Universitat Freiburg, Freiburg, Germany. 7 Max-Planck-Institute for Biochemistry, Am Klopferspitz 18,82152 Martinsried, Germany. 8 Institute of Anatomy, Christian-Albrechts-Universitat Kiel, 24098 Kiel, Germany. 9 Institute for Cell Biology, RheinischeFriedrich-Wilhelms-Universitat Bonn, 53121 Bonn, Germany. 10 Max-Planck-Institute of Neurobiology, Am Klopferspitz 18, 82152 Martinsried, Germany.* These authors contributed equally to this work. w Present addresses: RMIT University, Melbourne, VIC 3001, Australia (H.C.); Novo NordiskResearch Center, Seattle, Washington 98109, USA (C.A.L.). Correspondence and requests for materials should be addressed to M.B. (email:[email protected]) or to C.W.-S. (email: [email protected]).
NATURE COMMUNICATIONS | 5:4699 | DOI: 10.1038/ncomms5699 | www.nature.com/naturecommunications 1
& 2014 Macmillan Publishers Limited. All rights reserved.

Endo/lysosomal vesicle trafficking is important for many cellsand organ systems. In the liver, receptor-mediated uptake oflow-density lipoproteins (LDLs) and subsequent intra-
cellular transport is essential for hepatic cholesterol homoeostasisand plasma lipoprotein metabolism. Dysfunction within thispathway results in liver disease such as non-alcoholic fatty liverdisease (NAFLD), which is associated with increased cardio-vascular and liver-related mortality1. NAFLD is the mostcommon cause of chronic liver disease in Western Europe andthe United States2,3. It has been estimated that as many as 30% ofadults in these countries have NAFLD2. This liver disease hasthus emerged as a substantial public health concern. Thespectrum of NAFLD ranges from simple lipid accumulation inhepatocytes (steatosis) in absence of alcohol, which is consideredrelatively benign, to steatosis with liver damage, inflammationand fibrosis (non-alcoholic steatohepatitis (NASH)) andprogressive liver disease, including cirrhosis and hepatocellularcarcinoma4. The hallmark of NAFLD is hepatic neutral lipidaccumulation, mainly triacylglycerol and cholesterol ester (CE).The roles of both triglycerides and free fatty acid accumulation inNAFLD have been elucidated in many studies5. By contrast, therole of cholesterol in NAFLD has been less extensively studied butis gaining increasing attention1,6–8.
Recent studies have demonstrated that cholesterol metabolismand trafficking might play an important role in the pathogenesisof NAFLD and NASH1. Cholesterol is highly enriched in LDLsand is taken up by the liver via receptor-mediated endocytosis ofthe LDL–LDL receptor complex at the plasma membrane. Afterinternalization, membrane vesicles containing this complex fuseto early endosomes. Subsequently, LDL receptors and its ligandLDL are separated in the sorting endosome and distributed bytwo major routes: the recycling pathway transports LDL receptorproteins back to the plasma membrane; the degradation pathwaytraffics LDL to late endosomes and lysosomes. This pathwayinvolves maturation of early endosomes into multivesicularbodies/late endosomes which finally fuse with lysosomes9–15.LDL-cholesterol exits from late endosomes and lysosomes and iseither metabolized to bile acids (BAs) and excreted, stored as CEsin lipid droplets or exported from hepatocytes into the plasma.
While the principle pathways of LDL transport in theendolysosomal vesicle system are well characterized, the distinctproteins involved in these processes are largely unknown.Interesting candidate proteins, which might regulate endolysoso-mal trafficking, and fusion processes are cation channels presentin the membrane of endolysosomal vesicles. Recently identifiedcation channels that may generate Ca2þ signals duringendolysosomal fusion events and thereby vesicle trafficking are
the two-pore channels (TPCs)16,17. Two different TPC subtypesexist in mouse and man, TPC1 and TPC2. There is evidencethat TPC1 is mainly present in the proximal endosomal system,and TPC2 is predominantly expressed on late endosomes andlysosomes16,18,19. The activation mechanism of TPCs is complexand has been suggested to involve the second messenger nicotinicacid adenine dinucleotide phosphate (NAADP) and theendolysosomal membrane lipidphosphatidylinositol (3,5)-bisphosphate (PI(3,5)P2)17,18,20–24. Independent of what thenature of the endogenous ligand of these channels might be,there is substantial evidence that on activation TPCs mediate therelease of Ca2þ from lysosomal stores. Patch-clamp21,22,24, lipidbilayer and calcium imaging experiments18,25,26 indicate thatTPCs are Ca2þ permeable channels and, hence, may directlyconfer Ca2þ release from endosomes/lysosomes.
Here, we demonstrate that TPC2-deficient cells displayprofound trafficking defects in the endolysosomal degradationpathway. We provide evidence that TPC2 cation channelsmay directly be involved in Ca2þ signalling necessary forendolysosomal fusion processes. On the whole-animal level, wedemonstrate that loss of TPC2 leads, as a result of the observedtrafficking defects, to enhanced hepatic cholesterol accumulation,hyperlipoproteinaemia, and to NASH. These findings indicate areduced metabolic reserve of hepatic cholesterol handling. Ourresults suggest that TPC2 plays a crucial role in endolysosomaltrafficking in the endolysosmal degradation pathway and, thus, ispotentially involved in the homoeostatic control of manymacromolecules and cell metabolites.
ResultsLoss of TPC2 impairs trafficking in the degradation pathway.To test whether TPC2 is implicated in endolysosomal trafficking,we disrupted the Tpc2 gene in the mouse (Fig. 1a). In this mouseline, exon 7 of TPC2, which encodes TMD5 and part of thepore-loop of domain I, is globally deleted (Fig. 1a). This targetingstrategy results in non-functional ion-channel proteins and isdifferent from the strategies used for two mouse lines publishedbefore17,18. The deletion of the TPC2 gene was confirmedby genomic DNA analysis using Southern blot (not shown),PCR strategies, immunocytochemistry and western blotting(Supplementary Fig. 1a,b). Reverse-transcription PCR (RT–PCR)revealed the absence of exon 7 of TPC2 in TPC2� /� murineembryonic fibroblasts (MEFs) and hepatocytes (SupplementaryFig. 1b). In addition, we generated a TPC2 antibody to detectTPC2 protein. In agreement with the RT–PCR results,TPC2 protein was totally absent in TPC2� /� MEFs in
Figure 1 | Generation and characterization of TPC2 knockout mice. (a) Targeting strategy for the generation of TPC2� /� mice and validation. The
targeted exon 7 of the mTPC2 gene encodes TMD5 and part of the pore-loop of domain I. Exons 6–8 are represented by boxes. The targeting vector
contains two loxP sites (green triangles), and a neo cassette flanked by two FLP recombination target (FRT) sites (blue triangles). (b) Representative
immunofluroscence (IF) images of WT and TPC2� /� MEFs (stained with anti-TPC2 and Cy5) as well as WT and TPC2� /� liver cryosections (stained
with anti-TPC2 and Alexa-488). Cell nuclei were visualized with Hoechst (MEFs) or 4’,6-diamidino-2-phenylindole (DAPI) (liver). Scale bars, 20 mm.
(c) Current–voltage relations of currents recorded from single-WT and -TPC2� /� lysosomes in the presence of 50 nM NAADP or 10mM PI(3,5)P2.
Lysosomes were isolated from vacuolin-treated WT and TPC2� /� MEFs before measurements. (d,e) Population data for current amplitudes at � 200 mV
obtained from experiments as shown in a; **Po0.01, ***Po0.001, two-way analysis of varicane (ANOVA) followed by Bonferroni’s post hoc test (d) or
unpaired Student’s t-test (e). (f) Expression and distribution of selected marker proteins for endosomes and lysosomes were unaffected in TPC2� /�
compared with WT MEFs. Shown are representative confocal images of WT and TPC2� /� MEFs labelled with anti-EEA1, LAMP1 or LAMP2 and
Alexa-488. Nuclei were visualized with DAPI. Scale bar, 20mm. For additional markers, see Supplementary Fig. 1. (g) Representative electron microscope
images of WT and TPC2� /� liver sections. BC, bile canaliculus; LY, lysosome; Mito, mitochondrion; RER, rough endoplasmic reticulum. Scale bars,
500 nm. (h,i) Measurement of endolysosomal pH in WTand TPC2� /� cells. Late endocytic compartments of WT and TPC2� /� MEFs were labelled with
dextran-Oregon Green 514. (h) Fluorescence intensity ratios were calculated for defined pH values as described in the Methods section. (i) Lysosomal
pH values in WT and TPC2� /� MEFs were calculated using the calibration curves presented in h and determined under basal conditions, without amino
acids (� aa, EBSS), and without both, aa and glucose (� aa, � glc). Baf. A1 was used as positive control; n.s., not significant, unpaired Student’s t-test.
Data points in d,e,h and i are given as mean±s.e.m.
ARTICLE NATURE COMMUNICATIONS | DOI: 10.1038/ncomms5699
2 NATURE COMMUNICATIONS | 5:4699 | DOI: 10.1038/ncomms5699 | www.nature.com/naturecommunications
& 2014 Macmillan Publishers Limited. All rights reserved.

immunocytochemistry experiments, while it could be detectedin wild-type (WT) MEFs (Fig. 1b). Western blot analysis of WTand TPC2� /� liver samples confirmed absence of TPC2 proteinin TPC2� /� livers (Supplementary Fig. 1b). In lysosomesprepared from TPC2� /� MEFs, currents elicited by postulatedactivators of TPC2, NAADP and PI(3,5)P2 were strongly reduced(Fig. 1c–e). NAADP-dependent currents in WT lysosomes
displayed a bell-shaped dose-response relationship (Fig. 1d) asreported previously25,26.
Expression and distribution of the early endosomal markersEEA1, Rab4 and Rab5, the late endosomal/lysosomal markersLAMP1, LAMP2, LIMP2 and CD63 or the recycling endosomalmarkers TfR, Rab4 and Rab11 were comparable in WTand TPC2� /� cells (Fig. 1f and Supplementary Fig. 1c–e).
6 7 8
N C
1 2 3 4 5 6 1 2 3 5 6+
+4+
+P P
Domain I Domain II
Lumen
Cytosol
1f 3r
2f 3r
1827 bp
290 bp
WT
a
6 7 NEO
loxP FRT
6 8
Cre mediated excision
Targeting
KO
1f 3r379 bp
loxP
2x
WT
TP
C2–
/–
Golgi
LY
LY
LY
Mito
Mito
Mito
Mito
BC
Mito
RER
LY
LY
LYBCMito
Mito
Mito
LY
anti
LAM
P1
WT TPC2–/–
anti
EE
A1
anti
LAM
P2
Early endosomeLate endosome/Lysosome
c e
–200 100Voltage [mV]
Cur
rent
(pA
)–20
–40
–6010nM 50nM 200nM
(4)
***
(8)(3)
(4)
(3)
(5)
curr
ent[p
A]
NAADP
–25
–20
–15
–10
–5
0
Vm = –200 mVVm = –200 mV
TPC2–/–WT
(3)
(3)
**–80
–60
–40
–20
0
Cur
rent
(pA
) TPC2–/–WT
WT + NAADP
d
TPC2–/– + NAADP
WT + PI(3,5)P2
b
f
h
g
i
0
2
4
6
pHly
soso
me
WTTPC2–/–
4.04.55.05.56.06.50.0
0.4
0.8
1.2
1.6
2.0
2.4
2.8
Baf.A1pH
488/
440
TPC2–/–WT
basal –aa –aa/–glc
WT MEF
WT MEF
TPC2–/– MEF
TPC2–/– MEF
WT Liver TPC2–/– Liver
Ant
i-TP
C2-
Cy5
Ant
i-TP
C2-
Ale
xa48
8A
nti-T
PC
2-C
y5
TPC2–/– + PI(3,5)P2
10 μM PI(3,5)P2
NATURE COMMUNICATIONS | DOI: 10.1038/ncomms5699 ARTICLE
NATURE COMMUNICATIONS | 5:4699 | DOI: 10.1038/ncomms5699 | www.nature.com/naturecommunications 3
& 2014 Macmillan Publishers Limited. All rights reserved.

Overexpression of the constitutively active Rab5 variantRab5(Q79L) induced the formation of characteristic enlargedRab5-positive vesicles both in WT and TPC2� /� MEFs,indicating that early endosomal fusion is functioning normally(Supplementary Fig. 1f). Ultrastructural analyses of WT andTPC2� /� liver samples using electron microscopy revealed noobvious alterations in the endolysosomal system (Fig. 1g). Inparticular, the number of endolysosomal vesicles did not showany deviations between the two genotypes. Notably, lysosomaldeposits which have been reported in lysosomal storage diseasessuch as mucolipidosis type IV27,28 could not be detected inTPC2� /� mice.
Finally, steady-state endolysosomal pH values were similar inTPC2� /� and WT MEFs. This result was obtained in twodifferent, independently generated WT and TPC2� /� batchesof MEFs: 5.08±0.1 for WT versus 4.93±0.06 for TPC2� /�
(batch-1) and 4.87±0.03 for WT versus 4.89±0.02 for TPC2� /�
(batch-2) (Fig. 1h,i and Supplementary Fig. 1g–i). Even understarvation conditions (EBSS buffer (� aa) or starvation buffer(� aa/� glc)), no significant differences in endolysosomalpH between WT and TPC2� /� were observed (again twoindependently generated MEF cell lines (batch-1 and batch-2)were tested) (Fig. 1i and Supplementary Table 1). In addition, thepH dependent, endolysosomal processing of cathepsin D andcathepsin L was examined. In the acidic environments of lateendosomes and lysosomes, the mature forms of cathepsin D andcathepsin L are produced after proteolytic removal of thepropeptide. We found that the generation of mature forms ofcathepsin D and L was not impaired in TPC2� /� MEFscompared with WT (Supplementary Fig. 1j). Specificity of thedetected bands was controlled by analysing lysates from therespective cathepsin� /� MEFs in parallel.
Next, we assessed the functional consequences of a loss ofTPC2 for trafficking processes in the endolysosomal degradationpathway (Fig. 2a), the main subcellular localization of TPC2. Thispathway can be tested by using labelled LDL which binds to itsreceptor and is internalized into the cell via endocytosis10.Subsequently, LDL dissociates from the receptor and is passed onto late endosomes and lysosomes, from where cholesterol isreleased into the cytosol (Fig. 2a). A trafficking or fusion defectwithin this pathway would lead to accumulation of LDL invesicles proximal to the defect. We used LDL-BodipyFL to testthis hypothesis and found that the number of LDL-positivevesicles per cell was significantly increased in TPC2� /�
compared with WT MEFs (Fig. 2b–d). This effect was observedat a broad range of LDL concentrations and after different pulse/chase times (Fig. 2c,d). LDLR expression in WT and TPC2� /�
MEFs was found to be similar as determined by quantitative
western blot experiments (normalized to glyceraldehyde3-phosphate dehydrogenase) (Fig. 2e and SupplementaryFig. 2a). As an independent test for the same pathway, weperformed experiments using labelled EGF (epithelial growthfactor; AlexaFluor488-EGF)29. These experiments revealed thatEGF accumulation is increased in TPC2� /� compared with WTMEFs (Fig. 2f–h). This finding was confirmed in independentlygenerated MEFs (batch-2) (Supplementary Fig. 2b,c). In addition,in primary hepatocytes isolated from TPC2� /� mice, thenumber of EGF-positive vesicles per cell was also significantlyincreased compared with WT hepatocytes, whereas EGFRexpression in WT and TPC2� /� livers was not significantlydifferent (Fig. 2i and Supplementary Fig. 2d,e). To further assesswhether the increased accumulation was caused by decreaseddegradation, the time course of EGF degradation after uptake wasmeasured. MEFs were incubated with a saturating concentrationof EGF (4 mg ml� 1), followed by defined chase times beforefixation (Fig. 2j,k). In TPC2� /� MEFs, the fluorescencedecreased significantly slower compared with WT MEFs.
To further determine the identity of the endolysosomal vesicleswhere EGF accumulates in TPC2� /� cells, we co-labelled cellswith markers for early endosomes (Rab5), late endosomes (Rab7),and late endosomes/lysosomes (LAMP1), and found that about57% of the EGF-positive vesicles showed co-labelling with Rab7and 41% with LAMP1, but only about 5% with Rab5, indicatingthat accumulation occurs rather in the late section of theendolysosomal system than in early endosomes (Fig. 2l,m).
Taken together, these results suggested that EGF/EGFR andLDL-cholesterol transport and degradation are impaired inTPC2� /� cells, and the endolysosomal transport machineryappeared to be saturated significantly faster in TPC2� /� than inWT cells.
Calcium and TPC2 channels are critical for trafficking.Endolysosomal trafficking defects can be caused by multiplefactors. They can result from defects in enzymatic degradation ofmacromolecules, which is the underlying cause of most lysosomalstorage disorders. Impaired trafficking can also be caused bydefects in the acidification of endolysosomal organelles, defectiveionic homoeostasis or defects in endolysosomal fusion and fissionprocesses. Defects in acidification of endolysosomal vesicles havebeen reported before to be the primary cause for the observedtrafficking abnormalities for example, in mucolipidosis type IV,which is caused by mutations in the lysosomal cation channelTRPML1 (refs 27,30,31). However, endolysosmal pH appearsnormal in TPC2� /� cells. Another attractive hypothesis forimpaired endolysosomal trafficking is a defect in vesicle fusion or
Figure 2 | TPC2 deletion leads to LDL and EGF/EGFR trafficking defects in the degradation pathway. (a) Cartoon illustrating endolysosomal degradation
and recycling pathways. In the degradation pathway (endo/lysosomal axis) EGF/EGFR and LDL are degraded. In the recycling pathway LDLR and Tf/TfR
are recycled. Cholesterol can exit the endolysosomal system from late endosomes or lysosomes. LE, late endosome; LY, lysosome; C, free cholesterol.
(b) Representative confocal images of WT and TPC2� /� MEFs incubated with 3mg ml� 1 LDL-BodipyFL. Cell nuclei were visualized with Hoechst.
(c) Average numbers of LDL-positive vesicles per cell after an incubation time of 30 min at concentrations as indicated. (d) Average numbers of LDL-
positive vesicles per cell after different incubation times at a concentration of 1 mg ml� 1. (e) Quantitative western blot data showing average protein levels
of LDLR in WT and TPC2� /� MEFs. (f) Representative confocal images of WT and TPC2� /� MEFs incubated with 0.3 mg ml� 1 AlexaFluor488-EGF.
(g) Average numbers of EGF-positive vesicles per cell after an incubation time of 30 min at concentrations as indicated. (h) Average numbers of
EGF-positive vesicles per cell after different incubation times at a concentration of 0.3mg ml� 1, followed by a 2-h chase period. (i) Average numbers of
EGF-positive vesicles per cell from similar experiments with freshly prepared WT and TPC2� /� hepatocytes. (j) Representative confocal images of
TPC2� /� and WT MEFs incubated with 4mg AlexaFluor488-EGF for 30 min and chased for defined time intervals in EGF-free DMEM before fixation.
(k) Time course of EGF degradation obtained from experiments as shown in j. (l) Representative confocal images of WT and TPC2� /� MEFs incubated
with 1mg ml� 1 AlexaFluor488-EGF for 30 min, fixed and stained with anti-LAMP1, anti-Rab5 and anti-Rab7 antibody, respectively, and Cy5 as secondery
antibody. (m) Quantification of experiments as shown in l. All data points are given as mean±s.e.m. of at least three independent experiments, each.
At least two independently generated WT and TPC2� /� MEF cell lines were analysed; n.s., not significant, ***Po0.001, **Po0.01, *Po0.05 (c,d,g,h and
k: two-way anlysis of variance (ANOVA) followed by Bonferroni’s post hoc test; e and i: unpaired Student’s t-test). All scale bars, 20mm.
ARTICLE NATURE COMMUNICATIONS | DOI: 10.1038/ncomms5699
4 NATURE COMMUNICATIONS | 5:4699 | DOI: 10.1038/ncomms5699 | www.nature.com/naturecommunications
& 2014 Macmillan Publishers Limited. All rights reserved.

EGF/EGFRLDL/LDLR
Tf/TfRLDLRTf/TfR
Merge (Hoechst) LDL (μg ml–1)
EGE (μg ml–1)
0.3
LDL
pos.
ves
icle
s pe
r ce
ll
50
40
30
20
10
0
80
70
60
50
40
30
20
10
0
EG
F p
os. v
esic
les
per
cell
WT
TP
C2–
/–W
T
WT
TP
C2–
/–
WT
TP
C2–
/–
TP
C2–
/–
n.s.
WT
TP
C2–
/–W
T
WT
TP
C2–
/–
WT
WT
TP
C2–
/–
TP
C2–
/–
TP
C2–
/–
n.s.
*
*
1 3 10
0.03 0.1 0.3 1 3
n.s.
*
LDL
EGF
EGF/EGFRLDL
MVB
ME
FM
EF
WT
TPC2–/–
WT
TPC2–/–
WT
30’+0’ 30’+5’ 30’+30’ 30’+60’
TPC2–/–
Merge
Merge
Merge
EGF/EGFRLDL
LEEGF/EGFR
LDL
C LY
1 μg ml–1 LDL
5’
25
0.6
0.5
0.4
0.3
0.2
0.1
0
WT
TP
C2–
/–
20
15
10
5LDL
pos.
ves
icle
s pe
r ce
ll
Rel
. LD
LR e
xpre
ssio
n (%
, qW
B)
0
WT
0.3 μg ml–1 EGF Hepatocytes
EGF (μg ml–1)0.1
**
EG
F p
os. v
esic
les
per
cell
35
30
25
20
15
10
5
0
WT
TP
C2–
/–
TP
C2–
/–
TP
C2–
/–W
T
WT
TP
C2–
/–W
TT
PC
2–/–
n.s.*
*
5’
*** **
***
EG
F p
os. v
esic
les
per
cell
EG
F (
mer
ge w
ith H
oech
st)40
35
30
25
20
15
10
5
0
110
TPC2–/–
WT
100
90
80
70
60
50
40
EG
F p
os v
esic
les
per
cell
% V
esic
les
pos.
for
EG
F a
nd m
arke
r
30
20
105
Chase time after preinc. (min)15 25 35 45 55
WT
TP
C2–
/–W
TT
PC
2–/–
WT
TP
C2–
/–W
TT
PC
2–/–
n.s.
20’ 30’ 60’
20’ 30’ 60’
***n.s.
Merge (Hoechst)
EGF Anti-Rab5
Anti-Rab7
Anti-LAMP1
EGF
EGF
*
*** ***
70
60
50
40
30
20
10
0
Rab
5
Rab
7
LAM
P1
NATURE COMMUNICATIONS | DOI: 10.1038/ncomms5699 ARTICLE
NATURE COMMUNICATIONS | 5:4699 | DOI: 10.1038/ncomms5699 | www.nature.com/naturecommunications 5
& 2014 Macmillan Publishers Limited. All rights reserved.

fission processes. It has been postulated before that Ca2þ isrequired for vesicular fusion processes and thereby regulatestrafficking of vesicular cargo proteins30,32,33. In accordancewith this hypothesis, we found that in WT MEFs chelation ofcytosolic Ca2þ by 1,2-bis(2-aminophenoxy)ethane-N,N,N0,N0-tetraacetic acid tetrakis(acetoxymethyl ester) (BAPTA-AM)
mimics the effect on EGF trafficking observed in TPC2� /�
MEFs (Fig. 3a,b). This effect was dose dependent (Fig. 3a,b).By contrast, in TPC2� /� MEFs, EGF accumulation was notsignificantly changed by BAPTA-AM (Fig. 3a,b). Ethyleneglycol-bis(b-aminoethyl)-N,N,N0,N0-tetraacetoxymethyl ester (EGTA-AM), which has much slower binding kinetics than
EGF
BA
PT
A-A
M 0
.3 m
M
0.03 0.30.1
WT
BA
PT
A-A
M 0
.03
mM
BAPTA-AM (mM) in PBS
BA
PT
A-A
M 0
.03
mM
BA
PT
A-A
M 0
.03
mM
TP
C2
–/–
TP
C2
–/–
TP
C2
–/–
Merge (Hoechst)
EGF GFP-TPC2 Merge (Hoechst)
EGF TRPML1-GFP Merge (Hoechst)
EGF GFP-TPC2(N257A Merge (Hoechst)
EGF Merge (Hoechst)
WT
TPC2–/–
TPC2–/–
24
20
16
EG
F p
os. v
esic
les
per
cell
12
8
4
0
0.30
0
5
NT+ GFP-TPC2+ TRPML1-GFP+ GFP-TPC2(N257A)
10
15
EG
F p
os. v
esic
les
per
cell
20
25
30
35
TPC2–/– MEF
*
0 40 80Time (s)
120 160
0.40 TPC2–/–
0.50
0.60
F34
0/F
380
0.70 Baf.A1
Baf.A1
EGTA
WT
TP
C2–
/–
WT
TP
C2–
/–
WT
TP
C2–
/–
WT
TP
C2–
/–
WT
WT
TPC2–/–WT
TP
C2–
/–
0.300 200
Time (s)
400
0.40
0.50
0.60
F34
0/F
380
0.70
EGTA
Nig.
Nig.
**
**
0.16
0.12
0.08
ΔF34
0/F
380
0.04
0.00
a b d
e
c
f g
Figure 3 | Effects of BAPTA-AM or TPC2 overexpression on endolysosomal trafficking in WT and TPC2� /� MEFs. (a) Representative images of WT
and TPC2� /� MEFs incubated with 0.1 mg ml� 1 AlexaFluor488-EGF (5 min), followed by an incubation with 0.1 mg ml� 1 AlexaFluor488-EGF in the
presence of either 0.03 mM or 0.3 mM BAPTA-AM (25 min) in PBS. Cell nuclei were visualized with Hoechst. Scale bar, 20mm. (b) Average numbers of
AlexaFluor488-EGF-positive vesicles per cell after incubation with BAPTA-AM at different concentrations as described in a. (c,d) Effect of 2 mM
bafilomycin A1 (Baf. A1; c) or 10mM nigericin (Nig.; d) on cytosolic calcium levels in WT and TPC2� /� MEFs loaded with fura-2. Shown are representative
calcium imging experiments (mean of n¼ 10 cells, each). Measurements were performed in the presence of 2 mM EGTA. (e) Summary of Baf. A1 and
Nig. experiments; bars represent values 150 s (bafilomycin) or 450 s (nigericin) after compound application (n¼ at least five experiments with 5–10 cells,
each). (f) TPC2 WT, the inactive TPC2 mutant TPC2(N257A), or TRPML1 WT were fused to green fluorescent protein (GFP), overexpressed in TPC2� /�
MEFs and incubated with 1mg ml� 1 AlexaFluor555-EGF (red). Shown are representative images after fixation of the respective MEF cell line as indicated.
Cell nuclei were visualized with Hoechst. Scale bar, 20mm. (g) Average numbers of EGF-positive vesicles per cell taken from experiments as shown in e.
Non-transfected (NT) TPC2� /� cells in close proximity to cells transfected with the respective cDNAs served as positive controls for each experiment.
All data points are given as mean±s.e.m. *Po0.05, **Po0.01, unpaired Student’s t-test.
ARTICLE NATURE COMMUNICATIONS | DOI: 10.1038/ncomms5699
6 NATURE COMMUNICATIONS | 5:4699 | DOI: 10.1038/ncomms5699 | www.nature.com/naturecommunications
& 2014 Macmillan Publishers Limited. All rights reserved.

BAPTA-AM, had no significant effect on EGF accumulation(Supplementary Fig. 2).
Bafilomycin A1 (Baf. A1)—a cell-permeant inhibitor of thevacuolar-type Hþ -ATPase, results in loss of the lysosomal/lateendosomal proton gradient and eventually leads to the depletionof luminal calcium34. By using Baf. A1 (in the absence ofextracellular calcium), we demonstrate that loss of TPC2(TPC2� /� MEF) causes a significant elevation in cytosoliccalcium compared with WT, suggesting that loss of TPC2 maylead to an increased retention of calcium in the endolysosomallumen (Fig. 3c,e). Similar results were obtained when theKþ /Hþ exchanger nigericin was used instead of Baf. A1(ref. 35) (Fig. 3d,e). Taken together, these results suggest that asignificantly higher amount of calcium is retained in intracellularacidic compartments in TPC2� /� compared with WT cells. Toconfirm that the Ca2þ required for EGF trafficking depends onthe presence of TPC2, we performed rescue experiments inTPC2� /� MEFs and found that overexpression of WT TPC2 inTPC2� /� MEFs leads to a rescue of the EGF-trafficking defects(Fig. 3f,g). The remaining EGF accumulation was not significantlydifferent from the amount of EGF accumulating in WT MEFs atthe respective EGF concentration (Fig. 2g). Notably, a non-conducting TPC2 mutant (TPC2-N257A)21 was not sufficient torescue trafficking defects, suggesting that ion flux through TPC2is necessary for the rescue. Furthermore, the rescue is specific forTPC2 because TRPML1, another Ca2þ permeable and PI(3,5)P2-activated cation channel in lysosomes36, did not rescue EGF-trafficking defects observed in TPC2� /� MEFs (Fig. 3f,g).
In vivo cholesterol accumulation in TPC2-deficient mice. Giventhe pronounced impairments in LDL and EGF traffickingobserved in TPC2� /� MEF cell lines and hepatocytes, wehypothesized that defects might also be present in an in vivomodel. Therefore, WT and TPC2� /� mice were fed with astandard diet (SD) or a Western-type diet rich in cholesterol (CD)for 6 weeks, respectively37. Analysis of TPC2� /� mice fed withSD indicated that these mice appeared identical to their WTlittermates as determined by morphological and histologicalstudies. The lack of a gross phenotype in TPC2� /� mice on SDis not surprising, since SD contains relatively little cholesterol(r0.02% w/w). On this diet, the cholesterol requirement of theanimals is achieved primarily through de novo biosynthesis38.
We next tested the effect of a diet rich in cholesterol (1.25%cholesterol; CD). The intake of cholesterol per day on thisdiet is approximately 20–30 times above the amount anaverage animal synthesizes to maintain homoeostasis when itsdietary needs are not being met38. The average liver weight/bodyweight ratio of TPC2� /� on CD was significantly increasedcompared with WT on CD (Fig. 4a), while this parameterwas similar in WT and TPC2� /� on SD. Importantly, there wasno difference in total body weight between the two groups ofmice, suggesting the absence of obesity in the TPC2� /� mice.On macroscopic examination, more than 95% (n¼ 21) ofTPC2� /� livers (CD) displayed changes in colour rangingfrom slightly yellow to strongly yellow (Fig. 4b,c). Onlyabout 5% of the livers looked normal. In contrast, 76% of WTlivers (CD) looked normal while 24% displayed a light yellowcolour (n¼ 21). Livers from WT and TPC2� /� mice on SD didnot display visible changes in colour (n¼ 13 and n¼ 21,respectively).
The prominent yellow colour of the livers from TPC2� /�
mice on CD is highly suggestive for hepatosteatosis (fatty liver).An analysis of the free and total hepatic cholesterol levels (freecholesterol and CEs) revealed that in SD-fed WT and TPC2� /�
mice, there was no difference in free and total liver cholesterollevels (Fig. 5a–c). After CD treatment, free and total cholesterollevels were elevated in both mouse lines. In TPC2� /� mice,cholesterol levels were significantly higher than in WT mice(Fig. 5a–c). In particular, total cholesterol levels includingCEs were dramatically increased in TPC2� /� liver samples(Fig. 5a–c). In line with the biochemically observed hepaticoverload of cholesterol and CEs in TPC2� /� mice on CD, liverparaffin sections from TPC2� /� mice on CD displayed strongaccumulation of lipid droplets of different sizes predominantly inperiportal hepatocytes (Fig. 5d). The histologic pattern isconsistent with/resembles non-alcoholic fatty liver disease whichis characterized by a microvesicular periportal hepatosteatosis.Signs of periportal and pericellular fibrosis were seen in liversections from TPC2� /� mice on CD (Fig. 5e). The strongaccumulation of lipid droplets was further confirmed by electronmicroscopy of liver sections from TPC2� /� mice on CDcompared with WT on CD (Fig. 5f). Filipin39–42 stainings furtherconfirmed a strong accumulation of cholesterol in TPC2� /�
hepatocytes after CD treatment (Fig. 6a). A macroscopic analysisof gallbladders isolated from WT and TPC2� /� mice on CD
SD CD
***9
8
7
6
Ave
rage
live
rw
eigh
t/bod
y w
eigh
t (%
)
5
WT CD (n = 21)
TPC2–/– CD (n = 21)
76.2%
52.4%
19%4.8%
23.8%Liver colour
NormalSlightly yellow
Strongly yellowYellow
23.8%
WT SD
TPC2–/– SD
WT CD
TPC2–/– CD
n.s.
4
3
2
1
0W
T
TPC2 –/
–W
T
TPC2 –/
–
a b c
Figure 4 | Analysis of liver samples isolated from WT and TPC2� /� mice. (a) Bar diagram showing average liver weight/body weight ratios (in %) of
WT and TPC2� /� mice treated for 6 weeks with SD or CD, respectively. **Po0.01, two-way analysis of variance (ANOVA) followed by Bonferroni’s
post hoc test. (b) Shown are representative liver samples isolated from 10–12-week-old male WT and TPC2� /� mice, treated with either SD or CD for six
consecutive weeks. Scale bar, 10 mm. (c) Pie charts showing the percentage of slightly to strongly yellow-stained liver samples isolated from WT and
TPC2� /� mice treated with CD. Livers of SD-treated mice looked 100% normal.
NATURE COMMUNICATIONS | DOI: 10.1038/ncomms5699 ARTICLE
NATURE COMMUNICATIONS | 5:4699 | DOI: 10.1038/ncomms5699 | www.nature.com/naturecommunications 7
& 2014 Macmillan Publishers Limited. All rights reserved.

revealed the presence of large gallstones in TPC2� /�
gallbladders (Supplementary Fig. 3a).To test whether the severe cholesterol overload of TPC2� /�
livers causes compensatory hepatic changes, a pathway analysis ofdifferentially regulated genes was performed in TPC2� /�
and WT mice on SD and CD diet. This analysis revealedsignificant enrichment of genes involved in lipid metabolism and
molecular transport (Supplementary Table 2). In line with anincreased hepatic pool of free cholesterol, transcriptionalupregulation of hepatic enzymes involved in BA and CEsynthesis as well as BA efflux was observed in TPC2� /�
compared with WT mice on CD, while enzymes involved inhepatic cholesterol synthesis were downregulated (Fig. 6b)43–45.LDLR expression levels were comparable in livers from WT
60,000
50,000
40,000
Cou
nts
(a.u
.)
WT
TP
C2–
/–W
TT
PC
2–/–
WT
TP
C2–
/–W
TT
PC
2–/–
WT
TP
C2–
/–
Ave
rage
free
live
r ch
oles
tero
lle
vels
(pe
ak a
rea)
Ave
rage
tota
l liv
er c
hole
ster
olle
vels
(pe
ak a
rea)
WT
WT
TP
C2–
/–
TP
C2–
/–
WT
WT
TP
C2–
/–
TP
C2–
/–
30,000
20,000
10,000
0
9 100
20,000
40,000
60,000
80,000
******
n.s.
n.s.
After 2 h ethanolic NaoHSD
SD
PV
PV
PV
Nu
Nu
Nu
PVPV
PVPV
PV
PV
PV
PV
PV
PV
PVPV
PV
CVCV
CV
CV
CV
CV
PV
PV
PV
PV
PV
PV
PV
PV
PVPV
CVCV
CV
CV
BD
BD
BD
BD
CV
CV
CV
SD SD
CD CD CD
SDCD
CD
CD
CD
100,000 2,500,000
2,000,000
750,000
500,000
250,000
011
Time (min)
Cholestane (IS)
WT CD
TPC2–/– CD Total cholesterol
Figure 5 | Hepatic cholesterol overload, liver damage and hyperlipoproteinaemia in TPC2� /� mice. (a) Representative gas chromatogram (m/z
217þ 368) of total cholesterol and internal standard (IS) after alkaline hydrolysis in liver tissue prepared from male WT and TPC2� /� mice on CD.
(b) Average hepatic levels of unesterified free cholesterol in male WT and TPC2� /� mice on SD or CD as indicated (GC split ratio 3). (c) Average
total liver cholesterol levels, determined after alkaline ester hydrolysis (GC split ratio 15). (d) Representative images of liver paraffin sections of male WT
and TPC2� /� mice on SD or CD diet, respectively, stained with haematoxylin–eosin (HE). BD, bile duct; PV, portal vein; CV, central vein. Scale bars,
100mm (SD left, CD left) and 20mm (SD right, CD right). White arrows point to some lipid droplets visible in CD WT sections. (e) Representative images
of liver paraffin sections stained with Sirius Red. PV, portal vein; CV, central vein. Scale bars, 100mm. Black arrows point to areas of pericellular fibrosis
in CD-treated TPC2� /� livers. (f) Representative electron microscope images of WT and TPC2� /� liver sections after CD treatment. Nu, nucleus;
scale bars, 5 mm. Data points in b and c are given as mean±s.e.m. (b and c: two-way analysis of variance (ANOVA) followed by Bonferroni’s post hoc test;
n.s., not significant, ***Po0.001.
ARTICLE NATURE COMMUNICATIONS | DOI: 10.1038/ncomms5699
8 NATURE COMMUNICATIONS | 5:4699 | DOI: 10.1038/ncomms5699 | www.nature.com/naturecommunications
& 2014 Macmillan Publishers Limited. All rights reserved.

and TPC2� /� mice on SD (data not shown), while a significantdownregulation was observed in livers from TPC2� /� mice onCD compared with WT on CD (Fig. 6b). Expression of theABC transporters ABCA1, ABCG5 (sterolin-1) and ABCG8(sterolin-2) was not significantly upregulated (Fig. 6b). Ananalysis of faecal BA content and composition revealed anincrease in BA excretion in CD compared with SD-fed animals,which was, however, independent of the genotype(Supplementary Fig. 3b). In liver, only one type of BA wasconsistently detectable: cholic acid. While desoxycholic acid wasnot detectable in liver samples of SD-fed animals, it was
detectable in 40% of the investigated CD-fed TPC2� /�
animals (Supplementary Fig. 3c).We further assessed functional hepatic consequences of the
measured cholesterol accumulation by determining liver-specificenzyme levels in the peripheral blood. While no differences inenzyme levels indicating liver damage such as glutamatedehydrogenase or alanine transaminase were found in mice onSD, significantly increased glutamate dehydrogenase and alaninetransaminase values (Fig. 6c and Table 1) were detected inTPC2� /� mice compared with WT on CD. Taken together,these findings indicate that in addition to hepatic cholesterol
TP
C2–
/– (
CD
)
Filipin Filipin
Filipin
PV BA synthesisC synthesisCE synthesis
C effluxC uptake
BA uptakeBA efflux
*
***
*
* *
* ***
*
*
220
200
180
160
140
120
100
80
60
40
20
0
Cyp
7a1
Aca
t1A
cat2
Hm
gcr
Cyp
51T
m7s
f2H
sd17
b7S
oat1
Soa
t2S
lc10
a1S
lco1
a1A
bcc3
Ost
βA
bca1
Abc
g5A
bcg8 Ld
lr
Rel
. exp
ress
ion
com
pare
d w
ith 1
00%
WT
PV
Filipin
GLDH SD
***
n.s.
n.s. n.s.
n.s.
n.s.
**
WT SDTPC2–/– SDWT CDTPC2–/– CD
EGF/EGFRLDL
LE
MVB
C C
LY
ERTPC2–/–
↑ CE
( ↑ BA)
↓ C synth.
**
250
200
150
100
50
0
CD
140
120
100
80
60
40
20
0
HDL LDL VLDL
n.s.
*
*
n.s.
70
60
50
40
30
20
10
0
Ave
rage
live
r en
zym
e se
rum
leve
ls (
U l–1
)
Ave
rage
ser
um to
tal c
hole
ster
ol (
mg
dl–1
, Clin
. che
m.)
Ave
rage
ser
um c
hole
ster
ol le
vels
(m
g dl
–1, U
ltrac
entr
.)ALAT
WT
(C
D)
Figure 6 | Cholesterol accumulation in liver tissue isolated from TPC2� /� and WT mice and gene expression profile. (a) Representative images of
liver cryosections of WT and TPC2� /� mice on CD diet, stained with filipin (0.05 mg ml� 1 in PBS for 2 h) to visualize free cholesterol. Scale bars, 100mm
(left) and 20mm (right). (b) Relative expression (WT compared with TPC2� /� on CD) of hepatic transcripts coding for proteins involved in: bile acid (BA)
synthesis (Cholesterol-7-alpha-hydroxylase, Cyp7a1), cholesterol synthesis (Acat1 (acetyl-CoA acetyltransferase 1, mitochondrial), Acat2 (acetyl-CoA
acetyltransferase 2, cytosolic), Hmgcr (HMG-CoA reductase), Cyp51 (Lanosterol 14a-demethylase), Tm7sf2 (delta(14)-sterol reductase), cholesterol ester
(CE) synthesis (Soat1 and Soat2 (sterol O-acyltransferase 1 and 2)), BA efflux (Abcc3 (canalicular multispecific organic anion transporter 2), Ostb (organic
solute transporter beta)), BA uptake (Slc10a1 (Naþ -taurocholate cotransporting polypeptide, Ntcp), Slco1a1 (organic anion-transporting polypeptide,
Oatp), sterol/cholesterol efflux transporters (Abca1, Abcg5, Abcg8) and cholesterol uptake (Ldlr). *Po0.05, **Po0.01, ***Po0.001, unpaired Student’s
t-test. Expression of Hmgcr and Ldlr was determined by quantitative RT–PCR and normalized to beta actin. (c) Average liver enzyme levels (GLDH
(glutamate dehydrogenase) and ALAT (alanine transaminase) in male WT and TPC2� /� mice on SD or CD as indicated. (d) Average serum total
cholesterol levels in male WT and TPC2� /� mice on SD or CD. (e) Average HDL-, LDL- and VLDL-cholesterol levels in serum of male WT and TPC2� /�
mice on SD or CD diet. **Po0.01, ***Po0.001, two-way analysis of variance (ANOVA) followed by Bonferroni’s post hoc test; n.s., not significant.
(f) Cartoon illustrating hypothetical model of cholesterol accumulation. Cholesterol accumulates in LEs in TPC2� /� cells due to a delay or impairment of
LE/LY fusion/trafficking processes (symbolized by the red flash); C, free cholesterol; CE, cholesterol ester; BA, bile acid. All data points are given as
mean±s.e.m.
NATURE COMMUNICATIONS | DOI: 10.1038/ncomms5699 ARTICLE
NATURE COMMUNICATIONS | 5:4699 | DOI: 10.1038/ncomms5699 | www.nature.com/naturecommunications 9
& 2014 Macmillan Publishers Limited. All rights reserved.

overload, liver damage was present in TPC2� /� mice after CDtreatment.
Since the liver is the key organ in regulating lipoproteinmetabolism, we next determined systemic changes in lipopro-teins. In WT and TPC2� /� mice fed with SD, we found nodifferences in total cholesterol as well as HDL- (high-densitylipoprotein), LDL- or VLDL-cholesterol (very low-densitylipoprotein cholesterol) plasma levels (Fig. 6d,e). However, inmice on CD, total blood cholesterol levels as well as LDL- andVLDL-cholesterol levels were strongly elevated. Notably, LDL-and VLDL-cholesterol levels were significantly more increased inTPC2� /� than in WT mice. Serum HDL-cholesterol levels aswell as protein, triglyceride and glucose levels were similar withinboth groups (Table 1). Finally, faecal total cholesterol levels wereincreased in CD compared with SD-fed animals. However, hereno significant differences were detectable between the genotypes(Supplementary Fig. 3d).
DiscussionHere, we show that TPC2� /� mice are more susceptible tocholesterol and CE accumulation in the liver than WT mice. Thisaccumulation is not caused by extrahepatic factors, becausesimilar accumulation is seen in single-cell experiments. Themacroscopic and histological presentation of TPC2� /� livers,the increased cholesterol accumulation and increase in hepatictransaminases indicate fatty liver and liver damage, and areconsistent with the clinical picture of NAFLD and NASH.
The clinical phenotype can be explained by specific defects invesicle trafficking along the endolysosomal degradation pathwayin the TPC2� /� mouse. In the absence of TPC2, receptors andcargoes such as LDL or EGF/EGFR, which are transported alongthe degradation pathway, accumulate rapidly in intracellularvesicles of TPC2� /� but not WT cells. This finding suggests thatTPC2 channels are critically involved in the regulation ofendolysosomal trafficking along this pathway. Since TPC2channels are specifically expressed on late endosomes andlysosomes, it is likely that TPC2 regulates or enhances the finaltransport or fusion step between these two organelles. Consistentwith this hypothesis, deletion of TPC2 leads to a partial block intransport and accumulation of LDL-cholesterol and LDL CEsproximal to the fusion defect in the prelysosomal vesicle pool, inparticular late endosomes (Fig. 6f). LDL-derived CEs arenormally hydrolysed to free cholesterol by lysosomal and lateendosomal acid lipase and subsequently exported from theendolysosomal system. Due to prelysosomal accumulation, morecholesterol may exit via late endosomes in TPC2� /� mice andthus increase the free cholesterol pool in the cytosol. It is wellknown that an increased free cholesterol pool at the endoplasmic
reticulum (ER) induces CE formation and deposition in lipiddroplets as well as downregulation of endogenous cholesterolsynthesis (Fig. 6f)43,44. In line with this theory, we found that CEsare increased in TPC2� /� mice. CEs are generated from freecholesterol by Soat1 and Soat2 (sterol O-acyltransferase 1 and 2).These enzymes are upregulated in livers of TPC2� /� mice. ERenzymes involved in endogenous cholesterol synthesis aredownregulated. Finally, serum VLDL levels are elevated inTPC2� /� mice on CD (Fig. 6e). While this elevation could becaused by an increase in hepatic VLDL production, the possibilityof a reduced VLDL clearance cannot completely be ruled out.
Together, these results indicate that in TPC2� /� hepatocytes,secondary ER-dependent processes are induced. This could eitherbe caused by a globally increased free cholesterol pool oralternatively by misrouting of free cholesterol to the ER. Such amisrouting effect could be caused by a decreased flux ofcholesterol from late endosomes to lysosomes with an upregula-tion of alternative trafficking pathways from late endosomes tothe ER. In support of this notion, there is increasing evidence ofcontact sites between late endosomes and the ER46–48, as well asevidence for direct vesicular and non-vesicular transport ofcholesterol to the ER from late endosomes49,50.
How could a proposed role of TPC2 for vesicular traffickingand fusion be explained mechanistically? We demonstrate that inMEFs, TPC2 is critically involved in the generation of a currentspecifically activated by the known TPC2 activators NAADP andPI(3,5)P2. It has been shown that PI(3,5)P2 concentrationsincrease from early to late endosomes9,11,15. Thus, in theabsence or in the presence of very low levels of PI(3,5)P2, TPC2may conduct only very small currents and progressively start toopen on maturation toward late endosomes as PI(3,5)P2 graduallyrises. Opening of TPC2 channels in late endosomes could initiatethe final fusion between late endosomes and lysosomes. Here, wedemonstrate that vesicle trafficking in the endo/lysosomaldegradation pathway requires Ca2þ and ion flux throughTPC2. The most likely interpretation is that Ca2þ flowsdirectly through TPC2 channels. TPC2 has been shownpreviously to conduct Ca2þ (refs 18,21,22,24) and we confirmhere that endogenous TPC2 channels are permeable to calcium(Supplementary Fig. 4). Opening of TPC2 channels may lead toCa2þ efflux from vesicles directly into microdomainssurrounding Ca2þ -dependent proteins of the fusion machineryand thereby induce fusion. Anchoring of TPC2 within the cellularfusion machinery is supported by interactions with specificSNARE proteins such as STX7 and additional proteincomponents of SNARE complexes which were identified byproteomics-based interaction screens, and confirmed byfluorescence resonance energy transfer analyses and co-immunoprecipitation experiments (Supplementary Fig. 5a–g
Table 1 | Summary of serum parameters.
WT SD TPC2� /� s.d. ANOVA WT CD TPC2� /� CD ANOVAMean±s.e.m. Mean±s.e.m. Mean±s.e.m. Mean±s.e.m.
Total cholesterol (mg dl� 1) 78±5.8 72.0±5.7 n.s. 139.5±9.6 210.3±18.0 ***GLDH (U l� 1) 14.9±2.8 17.1±2.9 n.s. 32.3±4.8 49.4±5.0 *ALAT (U l� 1) 33.7±9.6 44.9±11 n.s. 34.9±8.4 60.8±7.7 *ASAT (U l� 1) 145.3±34 199.4±6.7 n.s. 118.6±23 155.4±34.5 n.s.Total protein (g dl� 1) 4.4±0.2 4.1±0.2 n.s. 4.4±0.1 4.2±0.2 n.s.Glucose (mg dl� 1) 163.9±12.0 170.7±12.0 n.s. 186.7±14.0 183.2±16.9 n.s.Triglycerides (mg dl� 1) 42.1±3.4 41.1±6.8 n.s. 33.8±2.9 28.3±5.0 n.s.
ANOVA, analysis of variance; ALAT, alanine transaminase; ASAT, aspartate transaminase; CD, cholesterol; GLDH, glutamate dehydrogenase; n.s. not significant; SD, standard diet; TPC, two-pore channel;WT, wild type.Table summarizing data shown in Fig. 6 c,d and additional serum parameters in WT and TPC2� /� mice on SD and CD. Values are given as mean±s.e.m. (two-way ANOVA followed by Bonferroni’s posthoc test, *Po0.05, ***Po0.001).
ARTICLE NATURE COMMUNICATIONS | DOI: 10.1038/ncomms5699
10 NATURE COMMUNICATIONS | 5:4699 | DOI: 10.1038/ncomms5699 | www.nature.com/naturecommunications
& 2014 Macmillan Publishers Limited. All rights reserved.

and Supplementary Table 3)51–53. Alternatively, ionic fluxthrough TPC2 channels could also be part of an indirectmechanism which provides Ca2þ . In this scenario, cationsother than Ca2þ flowing through TPC2 would act on adownstream channel, which in turn provides Ca2þ . Naþ andKþ have also been shown to permeate through TPC2channels17,20. Given the proposed close structural assembly ofTPCs and the fusion machinery (Supplementary Fig. 5g),depolarization by Naþ efflux through TPC2 may alsoelectrostatically facilitate fusion between two vesicularmembranes as suggested by the model of Wang et al.17 Similarevents may be relevant for TPC1 within the proximal endosomalpathway.
Defects in the endolysosomal trafficking and cellular proces-sing of LDL-cholesterol have been implicated in human diseasessuch as Niemann Pick disease and Wolman’s disease (CE storagedisease) where CEs accumulate in late endosomes and lysosomesdue to a severely diminished activity of cholesterol exportproteins NPC1 and NPC2 or lysosomal acid lipase54. Here, wedemonstrate that loss of TPC2 results in a defect which is moredistally located in the endolysosomal LDL-cholesterol traffickingpathway. Loss of TPC2 increases the risk of developing NAFLDand NASH. These diseases themselves are independent oftraditional cardiovascular risk factors and the metabolicsyndrome associated with increased risk for cardiovasculardisease. Furthermore, in obese individuals these diseases aremarkers of insulin resistance and diabetes. Notably, TPC2� /�
mice are highly susceptible to NAFLD and NASH, while obesityand impaired glucose tolerance are not observed. This findingsuggests that TPC2� /� mice have a reduced metabolic reserve inhepatic cholesterol handling, which leads to NAFLD even in theabsence of obesity and impaired glucose tolerance. The increasedsusceptibility of TPC2� /� mice to NAFLD is clinically highlyrelevant because this disease affects up to one-third of thepopulation worldwide and may cause adverse cardiovascularoutcome and increased cardiovascular mortality.
MethodsGeneration of TPC2� /� knockout mice. TPC2� /� mice were generated bydeleting exon 7 and introducing an early stop codon. We generated a targetingvector that, after homologous recombination, resulted in a modified TPC2 allelecarrying two loxP sites flanking exon 7. A neoR cassette, which was used forG418/geneticin selection, was removed with Flp recombinase before the ES cellswere injected into host blastocysts to generate chimeric mice. After germlinetransmission and continued breeding, PCR with genomic DNA from progeny ofWT, heterozygous and homozygous animals showed proper recombination andinheritance of the TPC2lox allele. Subsequently, exon 7 was deleted by pairingTPC2lox mice with mice expressing Cre-recombinase under a cytomegaloviruspromoter. Exon 7 encodes TMD5 and part of the pore-loop in domain I of TPC2.Animals were used under approved animal protocols and University of Munich(LMU) Institutional Animal Care Guidelines.
Whole-lysosome planar patch-clamp experiments. For whole-lysosome planarpatch-clamp recordings, isolated intact lysosomes from HEK293 cells or MEFswere prepared by differential centrifugation as described previously21,22,55.HEK293 cells stably expressing murine TPC2 or the TPC2 mutant TPC2(N257A),both N-terminally fused to green fluorescent protein and subcloned intopcDNA5FRT vector with hygromycin resistance (Invitrogen) were used. Toinvestigate STX7 effects on TPC2, a double stable HEK293 cell line was generatedcoexpressing murine STX7, N-terminally fused to mCherry (in pcDNA3 vectorwith geneticin (G418) resistance) and TPC2 as described above. The planar patch-clamp technology combined with a fast internal perfusion system (Port-a-Patch,Nanion Technologies) was applied as described previously21,22,55. Currents wererecorded using an EPC-10 patch-clamp amplifier and PatchMaster acquisitionsoftware (HEKA). Data were digitized at 40 kHz and filtered at 2.8 kHz. Meanendolysosomal capacitance was 1.01±0.04 pF (n¼ 47). For all experiments,salt-agar bridges were used to connect the reference Ag-AgCl wire to the bathsolution to minimize voltage offsets. Unless otherwise stated, cytoplasmic solutioncontained 60 mM KF, 70 mM K-MSA (methanesulfonate), 0.2 mM Ca-MSA, 4 mMNa-MSA, 10 mM HEPES (pH adjusted with KOH to 7.2). Luminal solution was60 mM Ca-MSA, 85 mM Na-MSA, 1 mM MgCl2, 10 mM HEPES (pH adjusted
with NaOH to 4.6 (refs 17,20)). Mannitol was used to adjust osmolarity.For the application of PI(3,5)P2 (A.G. Scientific) or NAADP (Tocris Bioscience),cytoplasmic solution was completely exchanged by PI(3,5)P2- or NAADP-containing solution.
Endolysosomal trafficking experiments. For trafficking experiments,AlexaFluor488-EGF, AlexaFluor555-EGF or LDL-BodipyFL (Life Technologies)were used. MEFs from WT and TPC2� /� mice were seeded on glass coverslips in24-well plates and grown in Dulbeccos modified eagles medium (DMEM) with10% fetal bovine serum at 37 �C and 5% CO2 for 48 h. Cells were treated withvarying concentrations of labelled LDL or EGF and incubated for different timeintervals at 37 �C and 5% CO2. Cells were subsequently washed in DMEMcontaining no fetal bovine serum and fixed with ice-cold methanol for 5 min at� 20 �C or chased before fixation for defined time intervals at 37 �C and 5% CO2 inDMEM containing no fetal bovine serum, as indicated in the respective figurelegends. Hoechst nuclear staining (Hoechst 33342) was performed in PBS buffer(5 mg ml� 1). Cells were incubated at room temperature for another 30 min, washedtwice with PBS and embedded in Cell Lab Fluoromount-G Slide MountingMedium (Beckman Coulter). In the degradation format, cells were incubated asdescribed above with a saturating concentration of AlexaFluor488-EGF(4 mg ml� 1) for 30 min, washed and incubated for different chase times asindicated. For data quantification, ImageJ software was used. In each experiment,numbers were calculated based on the total number of vesicles (dots) per imagedivided by the number of cells (nuclei) per image. The term ‘cell’ is used instead of‘confocal cell section’.
Endolysosomal pH measurements. Endolysosomal pH measurements wereperformed by ratiometric fluorescence imaging as described previously56. MEFswere seeded on imaging dishes (145 mm glass bottom, PAA Laboratories, Germany)and grown overnight in DMEM supplemented with 1 g l� 1 bovine serum albuminin the presence of 500mg ml� 1 of the pH-sensitive fluorophore Oregon Green 514conjugated to dextran (70,000 MW, Life Technologies). In order to allow clearanceof early endocytic compartments and ensure specific localization of the dye in thelate endocytic pathway, cells were chased in DMEM at 37 �C for 1 h in the presenceof bovine serum albumin followed by 1-h incubation in serum-free medium beforeimaging for basal pH determination. To assess lysosomal pH under starvationconditions, the chase procedure was replaced by either 2-h incubation withoutamino acids (EBSS) or 2-h incubation without both, amino acids and glucose(110 mM NaCl, 45 mM NaHCO3, 5 mM KCl, 2 mM CaCl2, 1 mM MgCl2,pH 7.4)20. As a control for increased lysosomal pH, 200 nM Baf. A1 (SigmaAldrich) were applied during the 1-h incubation in serum-free medium under basalconditions. Ratiometric imaging was performed using an Olympus FV1000confocal laser scanning microscope. Cells were excited alternately by lighttransmitted from a 440-nm laser diode or a multiline argon laser at 488 nm (Showaelectronics model GLS3135). In both cases, images were acquired at an emissionwavelength of 535±20 nm using a charge-coupled device-camera. At the end ofevery experiment, an in situ calibration was performed for each genotype byincubating the cells with isotonic Kþ buffer solutions (145 mM KCl, 10 mMglucose, 1 mM MgCl2 and 20 mM of either HEPES, MES or acetate, pH rangingfrom 4.0 to 7.0), containing 10 mg ml� 1 of the ionophorenigericin. The resultingfluorescence intensity ratios (488/440) were fitted to the Boltzmann equation tointerpolate pH values from the experimental ratio data.
Calcium imaging experiments. Calcium imaging experiments were performedusing fura-2 as described previously57. Briefly, WT and TPC2� /� MEFs cells wereplated onto glass coverslips, and after 24 h, cells were loaded for 1 h with thefluorescent indicator fura-2-AM (4 mM; Invitrogen) in a standard bath solutioncontaining (in mM) 138 NaCl, 6 KCl, 2 MgCl2, 2 CaCl2, 10 HEPES and 5.5D-glucose (adjusted to pH 7.4 with NaOH). Cells were washed in 2 mM EGTA for30 min before measurement. Calcium imaging was performed using amonochromator-based imaging system (Polychrome IV monochromator, TILLPhotonics). Compounds were applied in the presence of 2 mM EGTA.
Immunocyto- and immunohistochemistry, electron microscopy.Immunocytochemistry was performed as described previously58. Histology,immunohistochemistry and electron microscopy experiments were performedaccording to standard protocols. For further details, please refer to Supplementarymethods.
Serum cholesterol levels and expression profiling in liver. Male TPC2� /� andWT mice were fed with standard chow diet (SD) or a high-cholesterol containingWestern-type diet (1.25% cholesterol, 15% fat, 0.5% Na-cholate; ssniff GmbH,Soest, Germany) for 6 weeks. Throughout the text, we refer to this diet by calling itcholesterol diet or CD. On the day of euthanasia, food was removed from the cageand approximately 8 h later, mice were killed as described59 and blood was drawnby left-ventricular puncture in EDTA-containing syringes. Cell counting wasperformed after 1:4 dilution with PBS in an automated hematology analyzer(Sysmex). Lipoproteins were isolated by sequential ultracentrifugation from 60 ml
NATURE COMMUNICATIONS | DOI: 10.1038/ncomms5699 ARTICLE
NATURE COMMUNICATIONS | 5:4699 | DOI: 10.1038/ncomms5699 | www.nature.com/naturecommunications 11
& 2014 Macmillan Publishers Limited. All rights reserved.

of plasma at do1.006 g ml� 1 (VLDL) 1.006rdr1.063 g ml� 1 (intermediate- andlow-density lipoprotein (IDL and LDL, respectively)) and d41.063 g ml� 1 (high-density lipoprotein (HDL)) in a TL100 ultracentrifuge (Beckman). Cholesterol wasdetermined enzymatically by using a colorimetric method (Roche).
RNA from liver samples of TPC2� /� and WT mice fed with SD (WT n¼ 4;TPC2� /� n¼ 4) or CD (WT n¼ 4; TPC2� /� n¼ 4) was isolated as describedpreviously60. RNA was labelled and hybridized to Illumina Mouse Ref-8 v2.0Expression Bead Chips and arrays were scanned with an Illumina iScan microarrayscanner. Bead level data pre-processing was done in Illumina Genome Studiofollowed by quantile normalization and background reduction according tostandard procedures in the software. Of the 425,600 annotated RefSeq transcriptsthat were covered by the arrays, a total of 4,598 transcripts were upregulated ordownregulated in TPC2� /� mice with fold changes 420% compared withWT control. Of these, 2,159 transcripts were differentially regulated in livers ofmice on SD and 3,288 partially overlapping transcripts were differentially regulatedin livers of mice on CD. Using the Ingenuity Pathways Analysis software(www.ingenuity.com), most significantly enriched biological functions in WT andTPC2� /� mice were identified and levels of significance were determined usingFisher’s exact tests implemented in the software61. Alternatively, expression of Ldlr(50-primer 50-TGGGTCATCGCCCTGCT-30 , 30-primer 50-TTCCTGCTGCATGAGTCTTCT-30, probe 50FAM-50-CTGGCTGCTGCCGGAGTTGCA-30TAMRA),Egfr (50-primer 50-CCTATGCCACGCCAACTGTAC-30, 30-primer 50-GATGGCCACACTTCACATCCT-30 , probe 50FAM-50-TATGGATGTGCTGGGCCAGGTCTTC-30TAMRA) was assessed in liver samples by quantitative RT–PCR andnormalized to glyceraldehyde 3-phosphate dehydrogenase (50-primer 50-TGTCCGTCGTGGATCTGACG-30 , 30-primer 50-CCAAGATGCCCTTCAGTGGG-30 ,probe 50FAM-50-CGCCTGGAGAAACCTGCCAAGTATGATGAC-30TAMRA).
Determination of hepatic cholesterol by gas chromatography massspectrometry. Gas chromatography mass spectrometry analysis was performedon a Varian 3800 gas chromatograph coupled with a Varian Saturn 2200 ion trap.The stationary phase was an Agilent VF-5 ms capillary column with 30 m� 0.25mm inner diameter and 0.25 mm film thickness. The mobile phase was helium at aconstant flow rate of 1.4 ml min� 1. The inlet temperature was 250 �C, injectionvolume 1 ml (split ratio 3 for free liver cholesterol and 15 for total liver cholesterolafter alkaline ester hydrolysis). The GC oven started at 70 �C, ramped up to 270 �C(heating rate 50 �C min� 1), followed by a gradient of 5 �C min� 1 up to 310 �C.Transfer line temperature was 270 �C and the ion-trap temperature was 200 �C. MSscanned from 8.5 to 12.0 min at a mass range of 100–550 m/z (electron ionization,70 eV). The peak areas of characteristic ions forcholesterol tetramethylsilane ether(368 m/z) and for cholestane (217 m/z) were used for data analysis. The mean valueof each double-injected sample (n¼ 5) was used for statistical analysis. For detailsof sample preparation, please refer to Supplementary methods.
Statistical analysis. Details of statistical analyses and n values are provided inthe methods subsections or the figure legends. Statistical analyses were carriedout using Origin 7.5 and GraphPad Prism 5. All error bars are depicted asmean±s.e.m. Statistical significance was determined via Student’s t-test, one-wayanalysis of variance followed by Tukey’s post test, or two-way analysis of variancefollowed by Bonferroni’s post hoc test, unless stated otherwise. Significance isdenoted on figures as outlined in the legends. Statistics were derived from at leastthree independent experiments.
References1. Min, H. K. et al. Increased hepatic synthesis and dysregulation of cholesterol
metabolism is associated with the severity of nonalcoholic fatty liver disease.Cell Metab. 15, 665–674 (2012).
2. Bhatia, L. S., Curzen, N. P., Calder, P. C. & Byrne, C. D. Non-alcoholic fattyliver disease: a new and important cardiovascular risk factor? Eur. Heart J. 33,1190–1200 (2012).
3. Tiniakos, D. G., Vos, M. B. & Brunt, E. M. Nonalcoholic fatty liver disease:pathology and pathogenesis. Annu. Rev. Pathol. 5, 145–171 (2010).
4. Postic, C. & Girard, J. Contribution of de novo fatty acid synthesis to hepaticsteatosis and insulin resistance: lessons from genetically engineered mice.J. Clin. Invest. 118, 829–838 (2008).
5. Browning, J. D. & Horton, J. D. Molecular mediators of hepatic steatosis andliver injury. J. Clin. Invest. 114, 147–152 (2004).
6. Chen, Y. et al. Inflammatory stress exacerbates hepatic cholesterolaccumulation via disrupting cellular cholesterol export. J. Gastroenterol.Hepatol. 27, 974–984 (2012).
7. Musso, G., Gambino, R. & Cassader, M. Cholesterol metabolism and thepathogenesis of non-alcoholic steatohepatitis. Prog. Lipid Res. 52, 175–191(2013).
8. Hendrikx, T., Walenbergh, S. M., Hofker, M. H. & Shiri-Sverdlov, R. Lysosomalcholesterol accumulation: driver on the road to inflammation duringatherosclerosis and non-alcoholic steatohepatitis. Obes. Rev. 15, 424–433 (2014).
9. Cullen, P. J. Endosomal sorting and signalling: an emerging role for sortingnexins. Nat. Rev. Mol. Cell Biol. 9, 574–582 (2008).
10. Goldstein, J. L. & Brown, M. S. The LDL receptor and the regulation of cellularcholesterol metabolism. J. Cell Sci. Suppl. 3, 131–137 (1985).
11. Gruenberg, J. Lipids in endocytic membrane transport and sorting. Curr. Opin.Cell Biol. 15, 382–388 (2003).
12. Luzio, J. P., Parkinson, M. D., Gray, S. R. & Bright, N. A. The delivery ofendocytosed cargo to lysosomes. Biochem. Soc. Trans. 37, 1019–1021 (2009).
13. Luzio, J. P., Gray, S. R. & Bright, N. A. Endosome-lysosome fusion. Biochem.Soc. Trans. 38, 1413–1416 (2010).
14. Saftig, P. & Klumperman, J. Lysosome biogenesis and lysosomal membraneproteins: trafficking meets function. Nat. Rev. Mol. Cell Biol. 10, 623–635(2009).
15. Wenk, M. R. & De Camilli, P. Protein-lipid interactions and phosphoinositidemetabolism in membrane traffic: insights from vesicle recycling in nerveterminals. Proc. Natl Acad. Sci. USA 101, 8262–8269 (2004).
16. Ruas, M. et al. Purified TPC isoforms form NAADP receptors with distinctroles for Ca(2þ ) signaling and endolysosomal trafficking. Curr. Biol. 20,703–709 (2010).
17. Wang, X. et al. TPC proteins are phosphoinositide-activated sodium-selectiveion channels in endosomes and lysosomes. Cell 151, 372–383 (2012).
18. Calcraft, P. J. et al. NAADP mobilizes calcium from acidic organelles throughtwo-pore channels. Nature 459, 596–600 (2009).
19. Rietdorf, K. et al. Two-pore channels form homo- and heterodimers. J. Biol.Chem. 286, 37058–37062 (2011).
20. Cang, C. et al. mTOR regulates lysosomal ATP-sensitive two-pore Naþchannels to adapt to metabolic state. Cell 152, 778–790 (2013).
21. Schieder, M., Rotzer, K., Bruggemann, A., Biel, M. & Wahl-Schott, C. A.Characterization of two-pore channel 2 (TPCN2)-mediated Ca2þ currents inisolated lysosomes. J. Biol. Chem. 285, 21219–21222 (2010a).
22. Schieder, M., Rotzer, K., Bruggemann, A., Biel, M. & Wahl-Schott, C. Planarpatch clamp approach to characterize ionic currents from intact lysosomes. Sci.Signal. 3, pl3 (2010b).
23. Morgan, A. J. & Galione, A. Two-pore channels (TPCs): current controversies.Bioessays 36, 173–183 (2014).
24. Jha, A., Ahuja, M., Patel, S., Brailoiu, E. & Muallem, S. Convergent regulation ofthe lysosomal two-pore channel-2 by Mg2þ , NAADP, PI(3,5)P2 and multipleprotein kinases. EMBO J. 33, 501–511 (2014).
25. Pitt, S. J. et al. TPC2 is a novel NAADP-sensitive Ca2þ release channel,operating as a dual sensor of luminal pH and Ca2þ . J. Biol. Chem. 285,35039–35046 (2010).
26. Zong, X. et al. The two-pore channel TPCN2 mediates NAADP-dependentCa(2þ )-release from lysosomal stores. Pflugers Arch. 458, 891–899 (2009).
27. Miedel, M. T. et al. Membrane traffic and turnover in TRP-ML1-deficient cells:a revised model for mucolipidosis type IV pathogenesis. J. Exp. Med. 205,1477–1490 (2008).
28. Curcio-Morelli, C. et al. Functional multimerization of mucolipin channelproteins. J. Cell. Physiol. 222, 328–335 (2010).
29. Carpenter, G. & Cohen, S. 125I-labeled human epidermal growth factor.Binding, internalization, and degradation in human fibroblasts. J. Cell Biol. 71,159–171 (1976).
30. Morgan, A. J., Platt, F. M., Lloyd-Evans, E. & Galione, A. Molecularmechanisms of endolysosomal Ca2þ signalling in health and disease. Biochem.J. 439, 349–374 (2011).
31. Martina, J. A., Lelouvier, B. & Puertollano, R. The calcium channel mucolipin-3is a novel regulator of trafficking along the endosomal pathway. Traffic 10,1143–1156 (2009).
32. Hay, J. C. Calcium: a fundamental regulator of intracellular membrane fusion?EMBO Rep. 8, 236–240 (2007).
33. Pryor, P. R., Mullock, B. M., Bright, N. A., Gray, S. R. & Luzio, J. P. The roleof intraorganellar Ca(2þ ) in late endosome-lysosome heterotypic fusion andin the reformation of lysosomes from hybrid organelles. J. Cell Biol. 149,1053–1062 (2000).
34. Wong, C. O., Li, R., Montell, C. & Venkatachalam, K. Drosophila TRPML isrequired for TORC1 activation. Curr. Biol. 22, 1616–1621 (2012).
35. Moreno, S. N. & Zhong, L. Acidocalcisomes in Toxoplasma gondii tachyzoites.Biochem. J. 313, 655–659 (1996).
36. Dong, X. P. et al. PI(3,5)P(2) controls membrane trafficking by direct activationof mucolipin Ca(2þ ) release channels in the endolysosome. Nat. Commun. 1,38 (2010).
37. Peet, D. J. et al. Cholesterol and bile acid metabolism are impaired in micelacking the nuclear oxysterol receptor LXR alpha. Cell 93, 693–704 (1998).
38. Osono, Y., Woollett, L. A., Herz, J. & Dietschy, J. M. Role of the low densitylipoprotein receptor in the flux of cholesterol through the plasma and across thetissues of the mouse. J. Clin. Invest. 95, 1124–1132 (1995).
39. Zhang, M. et al. Cessation of rapid late endosomal tubulovesicular trafficking inNiemann-Pick type C1 disease. Proc. Natl Acad. Sci. USA 98, 4466–4471(2001).
40. Soyombo, A. A. et al. TRP-ML1 regulates lysosomal pH and acidic lysosomallipid hydrolytic activity. J. Biol. Chem. 281, 7294–7301 (2006).
ARTICLE NATURE COMMUNICATIONS | DOI: 10.1038/ncomms5699
12 NATURE COMMUNICATIONS | 5:4699 | DOI: 10.1038/ncomms5699 | www.nature.com/naturecommunications
& 2014 Macmillan Publishers Limited. All rights reserved.

41. Lloyd-Evans, E. et al. Niemann-Pick disease type C1 is a sphingosine storagedisease that causes deregulation of lysosomal calcium. Nat. Med. 14, 1247–1255(2008).
42. Shen, D. et al. Lipid storage disorders block lysosomal trafficking byinhibiting a TRP channel and lysosomal calcium release. Nat. Commun. 3, 731(2012).
43. Soccio, R. E. & Breslow, J. L. Intracellular cholesterol transport. Arterioscler.Thromb. Vasc. Biol. 24, 1150–1160 (2004).
44. Martin, S. & Parton, R. G. Lipid droplets: a unified view of a dynamic organelle.Nat. Rev. Mol. Cell Biol. 7, 373–378 (2006).
45. Alrefai, W. A. & Gill, R. K. Bile acid transporters: structure, function,regulation and pathophysiological implications. Pharm. Res. 24, 1803–1823(2007).
46. Eden, E. R., White, I. J., Tsapara, A. & Futter, C. E. Membrane contacts betweenendosomes and ER provide sites for PTP1B-epidermal growth factor receptorinteraction. Nat. Cell Biol. 12, 267–272 (2010).
47. van der Kant, R., Zondervan, I., Janssen, L. & Neefjes, J. Cholesterol-bindingmolecules MLN64 and ORP1L mark distinct late endosomes with transportersABCA3 and NPC1. J. Lipid Res. 54, 2153–2165 (2013).
48. Friedman, J. R., Dibenedetto, J. R., West, M., Rowland, A. A. & Voeltz, G. K.Endoplasmic reticulum-endosome contact increases as endosomes traffic andmature. Mol. Biol. Cell 24, 1030–1040 (2013).
49. Holtta-Vuori, M. & Ikonen, E. Endosomal cholesterol traffic: vesicularand non-vesicular mechanisms meet. Biochem. Soc. Trans. 34, 392–394 (2006).
50. Du, X. & Yang, H. Endosomal cholesterol trafficking: protein factors at aglance. Acta Biochim. Biophys. Sin. (Shanghai) 45, 11–17 (2013).
51. Antonin, W. et al. A SNARE complex mediating fusion of late endosomesdefines conserved properties of SNARE structure and function. EMBO J. 19,6453–6464 (2000).
52. Mullock, B. M. et al. Syntaxin 7 is localized to late endosome compartments,associates with Vamp 8, and is required for late endosome-lysosome fusion.Mol. Biol. Cell 11, 3137–3153 (2000).
53. Prekeris, R., Yang, B., Oorschot, V., Klumperman, J. & Scheller, R. H.Differential Roles of Syntaxin 7 and Syntaxin 8 in endosomal trafficking. Mol.Biol. Cell 10, 3891–3908 (1999).
54. Rosenbaum, A. I. & Maxfield, F. R. Niemann-Pick type C disease: molecularmechanisms and potential therapeutic approaches. J. Neurochem. 116, 789–795(2011).
55. Schenkman, J. B. & Cinti, D. L. Preparation of microsomes with calcium.Methods Enzymol. 52, 83–89 (1978).
56. Steinberg, B. E. et al. A cation counterflux supports lysosomal acidification.J. Cell Biol. 189, 1171–1186 (2010).
57. Grimm, C., Jors, S., Guo, Z., Obukhov, A. G. & Heller, S. Constitutive activity ofTRPML2 and TRPML3 channels versus activation by low extracellular sodiumand small molecules. J. Biol. Chem. 287, 22701–22708 (2012).
58. Schroder, J. et al. Deficiency of the tetraspanin CD63 associated with kidneypathology but normal lysosomal function. Mol. Cell Biol. 29, 1083–1094 (2009).
59. Teupser, D., Persky, A. D. & Breslow, J. L. Induction of atherosclerosis bylow-fat, semisynthetic diets in LDL receptor-deficient C57BL/6J and FVB/NJmice: comparison of lesions of the aortic root, brachiocephalic artery, andwhole aorta (en face measurement). Arterioscler. Thromb. Vasc. Biol. 23,1907–1913 (2003).
60. Holdt, L. M., Thiery, J., Breslow, J. L. & Teupser, D. Increased ADAM17 mRNAexpression and activity is associated with atherosclerosis resistance in LDL-receptor deficient mice. Arterioscler. Thromb. Vasc. Biol. 28, 1097–1103 (2008).
61. Holdt, L. M. et al. Alu elements in ANRIL non-coding RNA at chromosome9p21 modulate atherogenic cell functions through trans-regulation of genenetworks. PLoS Genet. 9, e1003588 (2013).
AcknowledgementsWe thank Phuong Nguyen, Maximiliane Geerds, Berit Noack and Elisabeth Schulze(LMU Munich) for technical support. CathL� /� MEFs were provided by Dr ThomasReinheckel (Institute of Molecular Medicine and Cell Research, Freiburg). Anti-LIMP2antibody was provided by Dr Michael Schwake (Institute of Chemistry, Biochemistry III,Bielefeld). Mice expressing Cre-recombinase under a cytomegalovirus promoter werekindly provided by Professor Dr Freichel, Heidelberg. We further thank ProfessorDr Fassler, Max-Planck-Institute for Biochemistry, Munchen for his comments on themanuscript. This work was supported, in part, by funding of the German ResearchFoundation (DFG grants WA2597, GR4315 and SPP1580), the Bavarian ResearchFoundation, and by the SME innovation program ‘ZIM’ of the German Federal Ministryof Economics and Technology (BMWi).
Author contributionsC.G. designed, collected and analysed data, and wrote the manuscript. C.W.-S. andM.B. wrote and edited the manuscript. L.M.H., C.-C.C., S.H., S.J., H.C., S.K., B.S., E.B.,B.N., C.M., J.C., C.A.L., S.S., M.M., R.L.-R. and C.F. designed, collected and/or analyseddata. N.K., O.G., A.H., M.M., F.B., D.T. and P.S. edited the manuscript. All of the authorsdiscussed the results and commented on the manuscript.
Additional informationSupplementary Information accompanies this paper at http://www.nature.com/naturecommunications
Competing financial interests: The authors declare no competing financial interests.
Reprints and permission information is available online at http://npg.nature.com/reprintsandpermissions/
How to cite this article: Grimm, C. et al. High susceptibility to fatty liver disease intwo-pore channel 2-deficient mice. Nat. Commun. 5:4699 doi: 10.1038/ncomms5699(2014).
NATURE COMMUNICATIONS | DOI: 10.1038/ncomms5699 ARTICLE
NATURE COMMUNICATIONS | 5:4699 | DOI: 10.1038/ncomms5699 | www.nature.com/naturecommunications 13
& 2014 Macmillan Publishers Limited. All rights reserved.


Supplementary Fig. 1. Characterization of TPC2 knockout mice. (a) Representative genotyping results obtained from samples prepared from tails and MEFs of WT, TPC2-/- and heterozygous mice. (b) RT-PCR (left) and Western blot (right) results obtained from WT and TPC2-/- samples prepared from MEFs, primary hepatocytes, or liver tissue lysates (membrane preparations). (c) Expression and distribution of selected marker proteins for endosomes and lysosomes were unaffected in TPC2-/- compared to WT MEFs. Shown are confocal images of WT and TPC2-/- MEFs labeled with antibodies against CD63 antigen, LIMP2, and TfR visualized with Alexa488 as secondary antibody. Nuclei were visualized with DAPI. Scale bar = 20 µm. (d) Average numbers of vesicles positive for selected markers shown in c and in Fig.1f. (e) Expression and distribution of different Rab proteins in TPC2-/- and WT MEFs. Antibodies against Rab4, 5, and 11 were used and proteins were visualized with Cy5 as secondary antibody. Nuclei were stained with DAPI. Scale bar = 20 µm. (f) Overexpression of the constitutively active Rab5(Q79L) variant in TPC2-/- and WT MEFs showing characteristic enlarged Rab5 positive vesicles. (g-i) Measurement of endolysosomal pH. Late endocytic compartments of WT and TPC2-/- MEFs were labeled with dextran-Oregon Green 514. In situ calibration procedure: Cells were bathed in extracellular solution of defined pH. After extracellular application of the ionophore nigericin intracellular pH was clamped to the pH value of the extracellular solution. (g) Fluorescence images are presented as overlay of fluorescence emission at 535 nm upon excitation at 440 nm (blue) and 488 nm (green), respectively. Scale bar = 20 µm. (h) Fluorescence intensity ratios were calculated for defined pH values and a calibration curve was constructed. (i) Lysosomal pH values in WT and TPC2-/- MEFs were calculated using calibration curves presented in f (Batch-2 MEFs; for Batch-1 MEFs see Fig.1h-i) and determined under basal conditions, without amino acids (-aa, EBSS), and without amino acids and glucose (-aa, -glc); n.s. not significant, unpaired Student’s t-test. (j) Proteolytic processing of cathepsin D and cathepsin L in WT and TPC2-/- MEFs was analyzed by Western blotting. CathD-/- and CathL-/- MEFs were used as controls. All data points are given as mean ± SEM. For Western blotting the anti-TPC2 antibody was used as described in Fig.1b. For RT-PCR the following oligonucleotides were used for genotyping: 5’-atgcctaatccagatggctc-3’ (sense), 5’-cctcagcctcaagatgagtg-3’ (sense), and 5’-tggacatgcaacaggctctc-3’ (antisense). Using a second forward primer that binds within the loxP sites, and therefore does not work in knockout mice/cells, results in three bands: 1827 bp (WT), 379 (TPC2-/-), and 290 bp (WT). PCR conditions were chosen so that only the two shorter bands were amplified. The following oligonucleotides were used for RT-PCR: 5’-ctgctgcagaattcctccatgat-3’ (forward) and 5’-aacaagcttcctatcaaggtgaa-3’ (reverse) (PCR1: expected fragments: 322 bp for WT and 246 bp for TPC2-/-), 5’-aacctgtggctgctggcctactt-3’ (forward) and 5’- ggtagccacggaactgattatag-3’ (reverse) (PCR2: expected fragments: 493 bp for WT and 417 bp for TPC2-/-), and 5’-atccacctgtgtctcttcaccat-3’ (forward) and 5’-ggtagccacggaactgattatag-3’ (reverse) (PCR3). The latter forward primer binds to exon 7 which is lost in TPC2-/- animals. Expected fragment size for WT: 283 bp.


Supplementary Fig. 2. LDLR expression in MEFs, confocal images of EGF accumulation in TPC2-/- hepatocytes, Egfr levels in liver samples from TPC2-/- and WT mice, and effect of EGTA-AM on EGF trafficking. (a) Representative Western blot showing expression of LDLR protein in WT and TPC2-/- MEFs (calculated band size = 93 kDa; actual band size of 120 kDa is expected according to manufaturer’s guidelines (http://www.abcam.com/ldl-receptor-antibody-ab14056.html)). Quantification was repeated in 3 independent experiments using GAPDH expression as reference. Western blot quantification was performed using ImageLab software (Bio-Rad Laboratories). (b) Confocal images of WT and TPC2-/- MEFs (Batch-2; MEFs were generated independently from MEFs used in Fig.2 (Batch-1)) incubated with 0.3 µg/ml AlexaFluor488-EGF for 30 min before fixation. Cell nuclei were visualized with Hoechst. Scale bar = 20 µm. (c) Average numbers of EGF positive vesicles/cell from experiments as shown in b. (d) Quantitative RT-PCR results showing average expression levels of Egfr in liver samples from WT and TPC2-/- mice, normalized to Gapdh. (e) Confocal images of WT and TPC2-/- primary hepatocytes incubated with 0.1 µg/ml AlexaFluor488-EGF for 30 min before fixation. Cell nuclei were visualized with Hoechst. Scale bar = 20 µm. Data points in c and d are given as mean ± SEM. **p<0.01, unpaired Student’s t-test. (f) Representative images of WT and TPC2-/- MEFs incubated with 0.1 µg/ml AlexaFluor488-EGF (5 min), followed by an incubation with 0.1 µg/ml AlexaFluor488-EGF in the presence of either 0.1, 0.5 mM, 1.5 mM EGTA-AM, or 0.3 mM BAPTA-AM (25 min) in PBS. Cell nuclei were visualized with Hoechst. Scale bar = 20 µm.

Supplementary Fig. 3. Macroscopic analysis of gallbladders, analysis of cholesterol content in feces, and analysis of BA content and composition in liver and feces. (a) Representative image of gallstone containing gallbladder isolated from CD fed TPC2-/- mice. Scale bar = 1 mm. (b-c) Average fecal (b) and liver (c) BA levels in WT and TPC2-/- mice on SD or CD as indicated; n.d. = not detectable. Unknown BA = ketocholic acid or cholic acid with an additional double bond. (d) Average fecal levels of unesterified free cholesterol in WT and TPC2-/- mice on SD or CD as indicated. All data points are presented as mean ± SEM.

Supplementary Fig. 4. NAADP-activated TPC2 currents in WT MEFs are Na+ and Ca2+ permeable. (a) Whole-lysosome recordings of NAADP-evoked TPC2-like currents (50 nM NAADP) under bi-ionic conditions with 107 mM luminal Ca2+, 165 mM cytoplasmic K+ or 165 mM cytoplasmic Na+ at pH 4.6. (b) Current recordings revealed that Erev is 77 ± 4 mV (n = 8) and -14 ± 7 mV (n = 6), respectively. Data are presented as mean ± SEM. The relative permeability of TPC2 for monovalent and divalent cations was assessed by determining the reversal potential with 107 mM luminal Ca2+ and 165 mM cytoplasmic K+ or Na+. NAADP evoked TPC2-like current recordings under these bi-ionic conditions revealed that the estimated permeability ratios for PCa/PK and PCa/PNa were about 340 (n = 8) and 0.7 (n = 6), respectively. These ion substitution analyses demonstrate that endogenous TPC2 is permeable for Ca2+ and Na+ but much less for K+. For further details see Supplementary Methods.


Supplementary Fig. 5. Identification of proteins associated with TPC2. (a) Logarithmized and normalized ratios of forward and reverse SILAC immunoprecipitation experiments of GFP-tagged murine TPC2 versus their corresponding control cell lines; annotated proteins shown as black dots were more abundant in the pull-down of the tagged cell line with p<0.05 (Significance B) in both the forward and reverse experiments. Grey dots represent proteins that were not significant interaction partners. For more details refer to Supplementary Table 2. (b) Confocal images showing colocalization of TPC2 and STX7 in a subset of intracellular vesicles of transiently transfected WT MEFs. For comparison, STX7 and STX12/13 did not colocalize in the same vesicles confirming that these proteins are confined to distinct vesicle pools. Scale bars = 20 µm. (c) FRET ratios between Cer-tagged TPC2 and Cit-tagged STX7 or STX6, and control combinations. Positive control: Cit-tagged STX7 and Cer-tagged Vamp7. Negative controls: Cit-tagged STX7 or Cit-tagged STX6 and Cerulean vector, respectively. ***p<0.001, one-way ANOVA followed by Tukey’s post test, n = number of measured cells. (d) Representative co-immunoprecipiation experiment of HEK293 cells coexpressing myc-TPC2 and mCherry-STX7. Lysates (L) were immunoprecipitated (E) with anti-myc, blotted and probed with anti-mCherry or anti-myc. (e) Current-voltage relations of TPC2 currents from single lysosomes stably coexpressing TPC2 and STX7 in the presence of 10 µM PI(3,5)P2 or 50 nM NAADP. Lysosomes were isolated from HEK293 cells pretreated with vacuolin (1 µM for 2 h). Further shown are control TPC2 currents activated by 10 µM PI(3,5)P2, 10 µM PI(4,5)P2, (negative control), or 50 nM NAADP, recorded from lysosomes expressing TPC2 only. These results suggest that TPC2 channel properties remain unaltered by the interaction with STX7, while close proximity to or direct interaction with endolysosomal SNARE proteins such as STX7 would allow spatially and temporally restricted Ca2+ signalling through TPC2 at the fusion complex. (f) Population data for current amplitudes at -200 mV obtained from experiments shown in f; n = number of measured cells, unpaired Student’s t-test. (g) Cartoon displaying potential model of TPC2 involvement in fusion processes between late endosomes (LE) and lysosomes (LY) by directly or indirectly interacting with components of the fusion machinery such as syntaxins. Besides interaction with STX7, the proteomics and FRET results suggest possible interactions of TPC2 with other SNARE proteins and complexes containing e.g. STX6. Data points in c and f are presented as mean ± SEM.

Lysosomal pH
Batch-1 WT
Batch-1 TPC2-/-
Batch-2 WT
Batch-2 TPC2-/-
basal 4.93 ± 0.06 5.08 ± 0.1 4.89 ± 0.02 4.87 ± 0.03
-aa 5.1 ± 0.08 5.15 ± 0.23 4.79 4.79
-aa -glc 4.97 ± 0.01 5.05 ± 0.15 4.96 ± 0.01 5.01 ± 0.13
Baf.A1 > 6.5 > 6.5 > 6.5 > 6.5
Supplementary Table 1. Lysosomal pH measurements. Summary (mean ± SEM) for the conditions described in Fig. 1i and Supplementary Fig. 1i. Bafilomycin A1 (Baf. A1) was used as positive control. Molecular and cellular functions
CD (p-value) Molecules (n) SD (p-value) Molecules (n)
Lipid Metabolism 1.47x10-09 399 2.36x10-08 281
Molecular Transport 1.47x10-09 397 1.17x10-06 340
Small Molecule Biochemistry 1.47x10-09 485 2.36x10-08 331
Cell Death and Survival 1.61x10-08 740 5.88x10-08 512
Cell-To-Cell Signaling and Interaction 1.59x10-06 347 3.11x10-04 102
Cellular Movement 2.67x10-06 454 1.21x10-05 325
Carbohydrate Metabolism 2.86x10-06 275 9.57x10-08 195
Cellular Function and Maintenance 4.14x10-05 292 2.56x10-04 319
Cellular Development 8.44x10-05 561 2.80x10-05 301
Cellular Growth and Proliferation 8.44x10-05 711 2.80x10-05 501
Protein Synthesis 1.18x10-04 370 3.03x10-04 201
Cell Morphology 4.82x10-04 165 2.33x10-05 266
Supplementary Table 2. Gene set enrichment data. Gene set enrichment analysis of differentially regulated genes in livers isolated from TPC2-/- and WT mice on SD and CD, respectively. Molecular and cellular functions with ≥200 molecules are given. Data are sorted according to most significant p-value of enrichment in CD mice.

Gene name
Forward experiment Reverse experiment
log2 ratio H/L Significance B log2 ratio L/H Significance B
TPC2 4.7 3.74E-13 3.6 1.69E-02
SYNGR2 3.9 8.76E-10 5.7 6.99E-05
BCAP31 4.2 5.83E-11 5.0 5.99E-04
ARL8B 3.9 1.36E-09 5.0 6.00E-04
VAMP3;VAMP2 3.7 5.68E-09 4.7 1.14E-03
RTN4 3.0 3.26E-06 4.6 1.50E-03
STX12 4.9 2.58E-14 4.6 1.76E-03
RPN1 3.9 9.28E-10 4.5 2.18E-03
VTI1B 4.2 4.04E-11 4.4 2.39E-03
LMAN1 4.0 7.21E-10 4.0 6.38E-03
BAT3;BAG6 2.9 7.66E-06 3.9 8.01E-03
TMX1 4.0 2.99E-10 3.8 9.80E-03
HMGB2 4.0 5.48E-10 3.6 1.43E-02
RAB14 3.2 8.42E-07 3.5 1.72E-02
VPS45 4.8 9.18E-14 3.5 1.98E-02
RAB1A 3.6 2.26E-08 3.5 2.01E-02
TFRC 5.4 6.32E-17 3.5 2.03E-02
STX6 4.2 4.15E-11 3.4 2.19E-02
RAB1B;RAB1C 3.4 9.32E-08 3.3 2.90E-02
STX7 4.0 3.30E-10 3.2 3.18E-02
TMED10 4.0 6.21E-10 3.2 3.40E-02
RAB11A;RAB11B 3.3 2.72E-07 3.2 3.46E-02
SYNGR1 4.1 2.26E-10 3.1 3.76E-02
TMED9 3.7 6.36E-09 3.1 3.81E-02
ATP6V0D1 4.1 1.23E-10 3.1 4.23E-02
CPD 2.6 4.49E-05 3.1 4.26E-02
SCAMP3 4.1 1.29E-10 3.0 4.33E-02
Supplementary Table 3. Results of SILAC immunoprecipitation experiments. Logarithmized and normalized ratios of forward and reverse SILAC immunoprecipitation experiments of GFP-tagged murine TPC2 versus their corresponding control cell lines; Listed are the hits shown in Supplementary Fig. 3a as black dots. SNARE proteins including endolysosomal syntaxins are highlighted in red.

Supplementary Methods
Isolation of hepatocytes and MEFs from TPC2-/- and WT mice.
To generate primary hepatocyte cultures, livers from 8- to 12-week-old male TPC2-/- and
WT mice were digested by a standard in situ 2-step retrograde collagenase-perfusion
technique (Liberase-Blendzyme-3; Roche, Penzberg, Germany). Hepatocytes were
separated from nonparenchymal cells by subsequent low-speed centrifugation (4x at 50 g
for 2 minutes at 4°C). Isolated hepatocytes were seeded on collagen-coated glass cover
slips in 24-well plates at a density of 2.5 x 10⁵ cells/ml in Williams Medium-E (Sigma)
supplemented with 5% FBS, 2 mmol/L L-glutamine, 100 U penicillin/ml, and 100 μg
streptomycin/ml. Immortalized MEFs were generated as previously described1, 2.
FRET measurements.
Measurements of single-cell FRET, based on aggregate (nonspatial) fluorescence
recordings were performed and analyzed using the Three-Cube-FRET method as
described previously3.
For measurements, transiently transfected HEK293 cells were maintained in buffer
solution composed of 140 mM NaCl, 5 mM KCl, 1 mM MgCl2, 2 mM CaCl2, 10 mM
Glucose, 10 mM Na-HEPES pH 7.4 at RT. Fluorescence intensities of the GFP variants
Citrine and Cerulean were recorded using an Axiovert 200 inverted epifluorescence
microscope and a dual emission photometric system (Till Photonics). Excitation was done
at 440 ± 7.5 nm or 505 ± 7.5 nm, applied with a frequency of 2 Hz with light from a
Polychrome V. Epifluorescence emission was detected by a photodiode, digitized (MINI
DIGI1B; Molecular devices) and analysed using Clampex 10 software. The FRET ratio,
which is defined as the fractional increase in YFP emission caused by FRET, was
calculated using FR = [SFRET-(RD1)(SCFP)]/[(RA1)(SYFP)]. SFRET, SCFP and SYFP denote
fluorescence intensities derived from measurements in individual cells coexpressing
Citrine- and Cerulean-tagged proteins with the respective filter cube (excitation, emission):
SFRET (440 ± 7.5 nm, 542 ± 13.5 nm), SCFP (440 ± 7.5 nm, 483 ± 16 nm) and, SYFP (505 ±

7.5 nm, 542 ± 13.5 nm). RD1 and RA1 are experimentally predetermined constants from
measurements applied to single cells expressing only Cerulean- or Citrine-tagged
molecules.
Co-immunoprecipitation and Western blotting.
For co-immunoprecipitation experiments, TPC2 and STX7 were N-terminally tagged with
c-myc or mCherry, respectively. Anti c-myc MicroBeads (μMACS c-myc Isolation Kit) were
used for co-immunoprecipitation and experiments were performed according to the
manufacturer’s protocol (Miltenyi Biotec GmbH). HEK293 cells were transiently transfected
with single plasmids or with combinations of the expression vectors using calcium
phosphate. Transfected cells were washed with cold PBS 48 h after transfection and lysed
in ice-cold precipitation assay buffer consisting of Tris-HCl (50 mM), NaCl (150 mM),
EDTA (1 mM), and Triton X-100 (1%). Western blots were incubated for 1 h at RT in 5%
(w/v) dry milk powder (AppliChem GmbH) in TBST (milk). Subsequently the blots were
incubated overnight at 4 °C with antiserum diluted in milk. The following antiserum dilutions
were used: 1:1000 for monoclonal 9E10 anti c-myc antibody and 1:1000 for anti mCherry
antibody (Clontech). The blots were washed four times for 10 min each at RT in TBST.
Detection was performed with HRP coupled anti mouse secondary antibodies (1:1000;
SantaCruz) and ECL solution using the BioRad ChemiDoc MP imaging system.
For detection of LDLR and GAPDH in WT and TPC2-/- MEFs the following antibodies were
used in a dilution 1:1000, each: anti LDLR (abcam ab52818) and anti GAPDH (Cell
signaling D16H11). For detection of TPC2 and Na+/K+-ATPase in WT and TPC2-/- liver
membrane preparations the following antibodies were used in a dilution 1:1000, each: anti
TPC2 (generated as described below) and anti Na+/K+-ATPase (Developmental Studies
Hybridoma Bank).
Proteomics-based TPC2 interaction screens.
Cell Culture for SILAC experiments: For stable isotope labeling, HEK293 cells were
cultured in SILAC-DMEM media (DMEM devoid of arginine and lysine) with 10% FBS, 100
U penicillin/ml and 100 µg streptomycin/ml. “Light” and “heavy” media were prepared by
adding 84 mg/ml 13C6/15N4 L-arginine and 146 mg/l 13C6/
15N2 L-lysine (Sigma Isotec) or the
corresponding non-labeled amino acids, respectively4. Cells were grown for seven
passages to ensure full labeling and “heavy” labeled cells were transfected with GFP-

TPC2. In parallel, a “reverse” experiment was performed by transfecting the “light” cells
with GFP-TPC2 instead. Immunoprecipitation and in-gel digestion: Immunoprecipitation
was performed using Chromotek’s GFP Trap according to manufacturer’s protocol.
Immunoprecipitations of the corresponding SILAC conditions were combined, bound
proteins eluted from beads by heating with 2x LDS-Sample buffer (NuPAGE, Invitrogen) at
70 °C for 10min and separated by 1D-SDS PAGE (4-12% Bis-Tris Mini Gel, Invitrogen).
After visualization using Colloidal Blue Staining Kit (Invitrogen), gel pieces were excised
from the gel and subjected to reduction, alkylation and in-gel digestion with sequence
grade modified trypsin (Promega) as described5. After digestion, peptides were extracted
with 30% acetonitrile/3% trifluoroacetic acid in water, concentrated in a speedvac, and
desalted using StageTips before analysis by MS6. LC-MS/MS analysis: Peptides were
separated by reverse phase chromatography using in house-made C18 microcolumns (75
µm ID packed with ReproSil-Pur C18-AQ 3 µm resin, Dr. Maisch GmbH) in a 130 min
gradient from 9% to 45% acetonitrile in 0.5% acetic acid at a flow rate of 200 nl/min using
a Proxeon EASY-nLC II, which was directly connected to a LTQ-Orbitrap VELOS mass
spectrometer via a nanoelectrospray ion source (Thermo Fisher Scientific). The LTQ-
Orbitrap VELOS was operated in the data-dependent mode to simultaneously measure full
scan MS spectra in the Orbitrap and the ten most intense ions in the LTQ part by
collisionally induced dissociation, respectively. Background ions were reduced by using an
ABIRD device (ESI Source Solutions). Data processing and analysis: Raw files were
analyzed with the in-house built software MaxQuant7. The derived peak list was searched
with Andromeda8 as a database search engine for peptide identifications against the
human Uniprot database containing mouse TPC2 protein sequences combined with 248
common contaminants and concatenated with the reversed version of all sequences. Fixed
modification of cysteine carbamidomethylation and variable modifications for methionine
oxidation and protein N-acetylation were specified. Full tryptic specificity was required and
a maximum of two missed cleavages accepted. The minimum peptide length was set to 6
amino acids. Parent MS masses and fragment MS/MS ions were searched with an initial
mass tolerance of up to 7 ppm and 0.5 Da, respectively. Search results were processed
with MaxQuant and filtered with a false discovery rate of 0.01. The re-quantification feature
was enabled. Protein identification required at least one unique peptide for each protein
group. Forward and reverse experiments were analyzed together and ratios of the

reversed experiment were inverted. Specific interactors were determined by using
Significance B statistics as indicated in the figure. The p-value for the significance of
enrichment had to be <0.05 in both the forward and reverse experiment.
Immunocytochemistry, histology, immunohistochemistry, and electron microscopy.
The following primary antibodies were used in immunocytochemistry experiments to label
endo/lysosomal markers: anti EEA1 (C45B10, Cell Signaling), anti Rab4 (abcam
ab13252), anti Rab5 (2143S, Cell Signaling or abcam ab18211), anti Rab7A (NBP1-
87174, Novus Biologicals), anti Rab11 (abcam ab3612), anti CD63 antigen9, anti LAMP1
(1D4B; Developmental Studies Hybridoma Bank), anti LAMP2 (ABL93; Developmental
Studies Hybridoma Bank), anti LIMP210, and anti TfR (H68.4, Invitrogen). Briefly, cells
grown on coverslips were fixed in 4% (w/v) paraformaldehyde in PBS and permeabilised
with 0.2% saponin. Alternatively, cells were fixed with ice-cold methanol for 5 min at -20
°C. Alexa488 (MoBiTec) or Cy5 (Jackson ImmunoResearch) were used as secondary
antibodies for detection. Nuclei were visualised with DAPI (4,6-diamidino-2-phenylindole,
Sigma-Aldrich) that was included into the mounting medium containing Mowiol 4-88 (EMD
Millipore) and the anti-fading reagent DABCO (1,4-diazabicyclo[2,2,2]octane, Sigma-
Aldrich) or with Hoechst as indicated in the respective figure legend. Images from optical
sections were acquired with an FV1000 confocal laser scanning microscope (Olympus) or
with a Zeiss LSM 510.
For macroscopic analysis livers from TPC2-/- and WT mice were removed and imaged
using the Zeiss Stemi SV11 microscope. Images were processed with Adobe Photoshop
by extracting livers automatically and placing them on a black background.
For histological analysis, livers were removed, fixed in 4% PFA for 20 hours, embedded in
paraffin, and sectioned. Serial 3.5 μm thick sections were stained with hematoxylin-eosin.
For immuohistochemical analysis, livers were fixed in 4% PFA for 2 hours at 4ºC, washed
in PBS, cryoprotected with increasing concentrations of 10%, 20%, and 30% sucrose
solutions prepared in PBS, and embedded in O.C.T. Tissue Tek. Serial 10 µm thick
cryosections were stained with 0.05 mg/ml Filipin (Sigma F-9765) in PBS for 2h at RT,
followed by nuclei co-staining with ToPro-3 (Invitrogen). Samples were washed in PBS and
viewed by fluorescence microscopy using a UV filter set. Images were taken with a Zeiss
Axiowert 200M microscope or confocal Olympus FV10i microscope.

For electron microscopic examination, tissues from TPC2-/- and WT mice were perfused
transcardially with glutaraldehyde (6% in PBS). Tissue blocks of liver were rinsed in
phosphate buffer, postfixed in OsO4 for 2 h, and embedded in araldite according to routine
procedures. Semithin sections were stained with toluidine blue. Ultrathin sections were
stained with uranyl acetate and lead citrate, and examined with a Zeiss EM 900
microscope.
Generation of a TPC2 specific antibody.
To raise an antibody specific for TPC2, rabbits were immunized with a C-terminal peptide
of the TPC2 protein (N-Cys_Phe[705]-His[726]-C). After immunization, complete serum
was affinity purified against the peptide using the SulfoLink® Immobilization Kit for
Peptides (Thermo Scientific) according to the manufacturer’s protocol and an ÄKTAprime
(GE Healthcare) plus chromatography system. Antibody elution was performed by applying
a linear acid gradient starting from pH 7 to pH 2.
Sample preparation for the determination of hepatic cholesterol by GC-MS.
Sodium hydroxide solution (2 M) was added to aliquots of liver (40-120 mg) to obtain a
final tissue concentration of 10 mg/ml. The vials were stored at 80° C for 2 h, and
occasionally shaken. After cell lysis the content of every vial was partitioned into 50 µl
samples for analysis of hepatic unesterified cholesterol and 100 µl samples for hepatic
total cholesterol content analysis (n = 5). For alkaline hydrolysis aliquots were transferred
into 4 ml glass vials containing 900 µl ethanolic NaOH solution (1 M) and stored at 60° C
for 2 h. After saponication, 500 µl were transferred into 15 ml centrifuge tubes, and 5 ml
water, 100 µl of internal standard solution (cholestane in MTBE, 10 µg/ml), and 900 µl
MTBE were added. The mixtures were shaken and centrifuged at 2,500 x g for 5 min. The
organic layer was transferred into 2.0 ml microcentrifuge tubes containing 40 mg of a
mixture (7:1) of anhydrous sodium sulphate and PSA (Agilent Technologies). The lysate
was extracted a second time with another 800 µl of MTBE. The second organic extract
was also added to the microcentrifuge vial and the mixture was shaken and centrifuged at
9,000 x g for 5 min. Finally 900 µl of the purified organic phase were transferred into an
autosampler vial and 100 µl of silylation reagent mixture MSTFA/TSIM (9:1) (Macherey-
Nagel) was added.

Determination of bile acids in liver by gas chromatography-mass spectrometry.
Sample preparation: 1 ml of the cell lysate (n = 3) was transferred into 4 ml glass vials
containing 1 ml ethanolic NaOH solution (1 M) for alkaline hydrolysis and stored at 60° C
for 2 h. After saponication 1 ml was transferred into a 15 ml centrifuge tube, and 5 ml
hydrochloric acid (1 M), 500 µl of internal standard solution (ergosterol in MTBE, 50 µg/ml),
and 500 µl MTBE were added. The mixture was shaken and centrifuged at 2,500 x g for
5 min. Each lysate was extracted with another 1 ml of MTBE. The organic extracts were
combined, 1 ml was transferred into an autosampler vial and evaporated to dryness under
a gentle stream of nitrogen. The butyl ester formation of the free carboxylic group of bile
acids was arranged according to literature17. Thus, the dried extract was mixed with 50 µl
HCl (36%) and 200 µl n-butanol. The mixture was stored at 60 °C for 4 h. After
esterification the solvents were removed under a stream of nitrogen. The silyation of free
hydroxyl groups was carried out with 200 µl TSIM at 60 °C for 30 min. The resulting
mixture was mixed with 300 µl MTBE and 1 µl was injected into the GC-MS system (see
below).
Determination of bile acids and unesterfied cholesterol in feces by gas
chromatography-mass spectrometry.
Sample preparation: the collected feces were comminuted after drying at 60 °C for 1 h.
The samples (30-90 mg) were weighed into 4 ml glass vials and 4 M NaOH (water:ethanol;
1:1) was added to obtain a final solution of 25 mg/ml. The vials were stored at 80° C for 2 h
and occasionally shaken. The mixtures were centrifuged at 2,500 x g for 5 min. Aliquots of
500 µl were transferred into 15 ml centrifuge tubes containing 5 ml HCl (1 M). The further
work-up steps are described above.
Instrumental conditions: the inlet temperature was 270 °C, injection volume 1 µl (split ratio
3 for feces analyses and splitless for liver analyses). The GC oven started at 70 °C ramped
up to 270 °C (heating rate 50 °C/min), followed by a gradient of 1 °C/min up to 290 °C, and
of 50 °C/min to 310 °C (total run time 30 min). The MS was switched on for feces analyses
after 14 min and for liver samples after 16 min (cholesterol cut-off). Transfer line
temperature was 270 °C and the ion trap temperature was 200 °C. The MS scanned from
a mass range of 70 to 650 m/z (EI, 70 eV). The peak areas of characteristic ions of TMS

ethers/butyl esters of bile acids and sterols were used for data analysis: cholesterol
368 m/z, ergosterol (internal standard) 468 m/z, cholic acid 410 m/z, chenodesoxycholic
acid 412 m/z, desoxycholic acid 255 m/z, lithocholic acid 414 m/z, β/γ/ω-muricholic acid
195 m/z, and unkown BA (keto cholic acid or cholic acid with additional double bond). The
muricholic acids were identified according to literature18. The mean value of each double
injected sample was used for statistical analysis.
Calculation of relative cation permeabilites.
The reversal (zero-current) potential, Erev, for NAADP-mediated currents in enlarged
lysosomes was determined from current-voltage relations measured in response to
NAADP during voltage-clamp ramp protocols (+100 to -200 mV, 500 ms). The relative
permeability of PCa/Px, where x is a monovalent ion (Na+ and K+), was estimated by the
following bi-ionic equation (I)11-13, derived from the Goldman-Hodgkin-Katz (GHK) voltage
equation:
PCa/Px = γX[X]Cyto/(γCa 4[Ca2+]Luminal){exp(ErevF/RT)}{1+exp(ErevF/RT)} (I)
where R, T, Erev, and γ are, respectively, the gas constant, absolute temperature (RT),
Faraday constant, reversal potential, and activity coefficient. Activity coefficients of KF (γK)
and NaF (γNa) were 0.7514. Activity coefficients of KMSA (γK’) and NaMSA(γNa’) were
likewise 0.7515. Activity coefficient of CaMSA was 0.52 similar to CaCl216. All results are
presented as mean ± SEM. An unpaired t-test was performed for the comparison between
two groups. Values of p < 0.05 were considered significant.
Supplementary references
1. Jat, P. S., Cepko, C. L., Mulligan, R. C., and Sharp, P. A. Recombinant retroviruses
encoding simian virus 40 large T antigen and polyomavirus large and middle T
antigens. Mol. Cell. Biol. 6, 1204-1217 (1986).
2. Xu, J. Preparation, culture, and immortalization of mouse embryonic fibroblasts.
Curr. Protoc. Mol. Biol. 28, 28.1. (2005).
3. Erickson, M. G., Liang, H., Mori, M. X., Yue, D. T. FRET two-hybrid mapping
reveals function and location of L-type Ca2+ channel CaM preassociation. Neuron
39, 97-107 (2003).
4. Ong, S. E., Blagoev, B., Kratchmarova, I., Kristensen, D. B., Steen, H., Pandey, A.,
Mann, M. Stable isotope labeling by amino acids in cell culture, SILAC, as a simple
and accurate approach to expression proteomics. Mol. Cell. Prot. 1, 376-386
(2002).
5. Shevchenko, A., Wilm, M., Vorm, O., Mann, M. Mass spectrometric sequencing of
proteins silver-stained polyacrylamide gels. Anal. Chem. 68, 850-858 (1996).
6. Rappsilber, J., Ishihama, Y., Mann, M. Stop and go extraction tips for matrix-
assisted laser desorption/ionization, nanoelectrospray, and LC/MS sample
pretreatment in proteomics. Anal. Chem. 75, 663–670 (2003).
7. Cox, J., Mann, M. MaxQuant enables high peptide identification rates, individualized
p.p.b.-range mass accuracies and proteome-wide protein quantification. Nat.
Biotechnol. 26, 1367–1372 (2008).
8. Cox, J., Neuhauser, N., Michalski, A., Scheltema, R. A., Olsen, J. V., and Mann, M.
Andromeda: a peptide search engine integrated into the MaxQuant environment. J.
Prot. Res. 10, 1794-1805 (2011).
9. Schröder, B., Wrocklage, C., Hasilik, A., and Saftig, P. Molecular characterisation of
'transmembrane protein 192' (TMEM192), a novel protein of the lysosomal
membrane. Biol. Chem. 391, 695-704 (2010).
10. Zachos, C., Blanz, J., Saftig, P., Schwake, M. A critical histidine residue within
LIMP-2 mediates pH sensitive binding to its ligand β-glucocerebrosidase Traffic 13,
1113-1123 (2012).
11. Fatt, P., Ginsborg, B. L. The ionic requirements for the production of action
potentials in crustacean muscle fibres. J. Physiol. 142, 516-543 (1958).
12. Hille, B. Ion Channels of Excitable Membranes, 3rd Ed., pp. 441–470, Sinauer
Associates, Inc., Sunderland, MA (2001).

13. Xu, H., Jin, J., DeFelice, L. J., Andrews, N. C., Clapham, D. E. A spontaneous,
recurrent mutation in divalent metal transporter-1 exposes a calcium entry pathway.
PLoS Biol. 2, e50 (2004).
14. Robinson, R. A. and Stokes, R.H. Electrolyte Solutions, Butterworth and Co.
(Publishers) Ltd., London, 2nd edition (1965).
15. Bonner, O. D. Study of methanesulfonates and trifluoromethanesulfonates.
Evidence for hydrogen bonding to the trifluoro group J. Am. Chem. Soc. 103, 3262-
3265 (1981).
16. Dani, J. A., Sanchez, J. A., Hille, B. Lyotropic anions. Na channel gating and Ca
electrode response. J. Gen. Physiol. 81, 255-281 (1983).
17. Batta, A. K., Salen, G., Rapole, K. R., Batta, M., Batta, P., Alberts, D., Earnest, D.
Highly simplified method for gas-liquid chromatographic quantitation of acids and
sterols in human stool. J. Lipid Res. 40, 1148-1154 (1999).
18. Kumar, B. S., Chung, B. C., Lee, Y. J., Yi, H. J., Lee, B. H., Jung, B. H. Gas
chromatography-mass spectrometry based simultaneous quantitative analytical
method for urinary oxysterols and bile acids in rats. Anal. Biochem. 408, 242-252
(2011).

Submission PDF
TPC2 polymorphisms associated with a hairpigmentation phenotype in humans result in gain ofchannel function by independent mechanismsYu-Kai Chao1, Verena Schludi1, Cheng-Chang Chen1, Elisabeth Butz1, O. N. Phuong Nguyen1, Martin Müller1, JensKrüger2, Claudia Kammerbauer1, Manu Ben-Johny3, Angelika Vollmar4, Carola Berking5, Martin Biel6, ChristianWahl-Schott7, Christian Grimm1
1LMU Munich, 2Universität Tübingen, 3Johns Hopkins University, 4University of Munich, 5Ludwig-Maximilian University, 6Ludwig-Maximilians-UniversityMunich, 7Center for Integrated Protein Science CIPS-M and Zentrum für Pharmaforschung
Submitted to Proceedings of the National Academy of Sciences of the United States of America
Two-pore channels (TPCs) are endolysosomal cation channels.Two members exist in humans, TPC1 and TPC2. Functional rolesassociated with the ubiquitously expressed TPCs include VEGF-induced neoangiogenesis, LDL-cholesterol trafficking and degra-dation, physical endurance under fasting conditions, autophagyregulation, the acrosome reaction in sperm, cancer cell migration,and intracellular trafficking of pathogens such as Ebola virus orbacterial toxins, e.g. cholera-toxin. In a genome-wide associationstudy for variants associated with human pigmentation character-istics two coding variants of TPC2, rs35264875 (encoding M484L)and rs3829241 (encoding G734E), have been found to be associ-ated with a shift from brown to blond hair color. In two recentfollow-up studies a role for TPC2 in pigmentation has been furtherconfirmed. However, these human polymorphic variants have notbeen functionally characterized until now. The development ofendolysosomal patch-clamp techniques has made it possible toinvestigate directly ion channel activities and characteristics in iso-lated endolysosomal organelles. We applied this technique here toscrutinize channel characteristics of the polymorphic TPC2 variantsin direct comparison with wild-type. We found that both polymor-phisms lead to a gain of channel function (GOF) by independentmechanisms. We next conducted a clinical study with more than100 blond and brown/black haired individuals. We performed agenotype/phenotype analysis and subsequently isolated fibrob-lasts from WT and polymorphic variant carriers for endolysosomalpatch-clamp experimentation to confirm key in-vitro findings.
TPC | TPC2 | two-pore channel | polymorphism | pigmentation
Two-pore channels (TPCs) are endolysosomal cation chan-nels which are distantly related to the endolysosomal TRP chan-nels of the TRPML subfamily on the one hand and the voltage-gated calcium channels on the other hand. Two members existin humans, TPC1 and TPC2. Functional roles associated withthe ubiquitously expressed TPCs include VEGF-induced neoan-giogenesis (1), endolysosomal LDL-cholesterol trafficking anddegradation (2), physical endurance under fasting conditions (3),autophagy regulation (4-5), the acrosome reaction in sperm (6),intracellular trafficking of certain pathogens such as filoviridae,e.g. Ebola or Marburg virus (7), bacterial toxins, e.g. cholera-toxin (8), and a role in cancer cell migration (9). A few yearsago, Sulem and colleagues (10) presented results from a genome-wide association study for variants associated with human pig-mentation characteristics among 5,130 Icelanders, with follow-up analyses in 2,116 Icelanders and 1,214 Dutch individuals fromwhich they claimed that two coding variants of hTPC2 (SNPs),rs35264875 (encoding M484L) and rs3829241 (encoding G734E),were associated with a shift from brown to blond hair color. Veryrecently, Ambrosio and colleagues (11) as well as Bellono et al.(12) confirmed a role for TPC2 in pigmentation by showing thatTPC2 regulates the pH and size of melanosomes, thus controllingthe amount of melanin produced. Consequently, loss of TPC2
activity by knockout or knockdown leads to a strong increase ofmelanin production and melanosomal pH.
Hence, it seemed intriguing to functionally investigate thesepolymorphic TPC2 variants. We investigated the activity of WThTPC2 side-by-side with hTPC2(G734E) and hTPC2(M484L) aswell as the double mutant isoform (M484L/G734E). First, weapplied the endolysosomal patch-clamp technique in combina-tion with small molecule activators and blockers of TPC2 to di-rectly assess channel activity. Secondly, we performed moleculardynamics simulations of TPC2 based on the recently publishedstructures of TPC1 (13-14) to investigate structural changes dueto the SNPs. These results were corroborated by ion substitutionexperiments to assess pore sizes. Furthermore, we genotypedmore than 100 blond and brown/black haired human individualsand isolated fibroblasts from selected donors to confirm key in-vitro findings and the results of the genome-wide associationstudy by Sulem and colleagues (10).
ResultsHuman TPC2 WT and polymorphic variants show comparablesubcellular distribution but differences in basal activity andtheir response to PI(3,5)P2. Wild-type (WT) hTPC2 and thepolymorphic variants containing either M484L, G734E, or bothM484L and G734E show similar subcellular distribution whenoverexpressed in HEK293 cells (SI Fig. S1A). All variants localize
Significance
Polymorphisms in the endolysosomal cation channel TPC2have been suggested to lead to a shift in human hair colorfrom brown to blond. In two further studies a role for TPC2 inmelanosomal pH-regulation was postulated. Electrophysiolog-ical data on how these polymorphisms affect channel gatingand activity are however missing. We show here that bothpolymorphisms lead to a gain of channel function by differentmechanisms. In M484L sensitivity to its endogenous ligandPI(3,5)P2 is strongly increased while in G734E channel inacti-vation by ATP is reduced. These findings are corroborated bymolecular dynamics and ion substitution experiments. Further-more, >100 blond and brown/black haired human individualswere genotyped and fibroblasts isolated from selected donorsto confirm key in-vitro findings.
Reserved for Publication Footnotes
1234567891011121314151617181920212223242526272829303132333435363738394041424344454647484950515253545556575859606162636465666768
www.pnas.org --- --- PNAS Issue Date Volume Issue Number 1--??
69707172737475767778798081828384858687888990919293949596979899100101102103104105106107108109110111112113114115116117118119120121122123124125126127128129130131132133134135136

Submission PDFFig. 1. Effect of PI(3,5)P2 on endolysosomal vesicles expressing either human TPC2 WT or polymorphic variants. (A) Cartoon showing the estimated positions ofthe polymorphisms (SNPs) M484L and G734E. (B-E) Shown are representative basal and PI(3,5)P2 (1 μM) activated currents in vacuolin enlarged endolysosomalvesicles expressing either hTPC2 WT, hTPC2(M484L), hTPC2(G734E), or hTPC2(M484L/G734E) C-terminally fused to YFP. (F) Statistical summary of data asshown in b-e. Shown are average current densities at -100 mV. (G) PI(3,5)P2 dose-response curves for hTPC2 WT and hTPC2(M484L) and hTPC2(G734E). In allexperiments, currents were elicited by applying 500-ms voltage ramps from -100 to +100 mV every 5 s. In all statistical analyses mean values of at least 5-10independent experiments are shown, each. To test for statistical significance the one-way ANOVA test followed by Tukey’s post-test was applied. ***,indicatesp<0.001, **, indicates p<0.01.
Fig. 2. Effect of ATP on human TPC2 WT and poly-morphic variants using the respective EC50 values ofPI(3,5)P2 as activating concentrations. (A-C) Represen-tative PI(3,5)P2 (diC8) activated currents in vacuolinenlarged hTPC2 WT and hTPC2 SNP expressing en-dolysosomal vesicles using the respective EC50 valuesas activating PI(3,5)P2 concentrations and differentconcentrations of ATP as indicated to block the cur-rents. (D) ATP dose response curves from experimentsas shown in A-C. In all experiments currents wereelicited by applying 500-ms voltage ramps from -100to +100 mV every 5 s. To test for statistical significancethe Student’s t-test, unpaired was applied. * indicatesp<0.05.
to intracellular vesicular structures which are positively stainedwith Lysotracker (SI Fig. 1A). A calculation of the Pearson cor-relation coefficients (PCC) resulted in similar numbers for colo-
calization with Lysotracker for all variants (SI Fig. 1B). Westernblot analysis demonstrated that expression levels of the differentvariants in endolysosomal membranes are not significantly differ-
137138139140141142143144145146147148149150151152153154155156157158159160161162163164165166167168169170171172173174175176177178179180181182183184185186187188189190191192193194195196197198199200201202203204
2 www.pnas.org --- --- Footline Author
205206207208209210211212213214215216217218219220221222223224225226227228229230231232233234235236237238239240241242243244245246247248249250251252253254255256257258259260261262263264265266267268269270271272

Submission PDF
Fig. 3. Effect of rapamycin and torin-1 on human TPC2 WT and G734E. (A-B) Representative PI(3,5)P2 (1 μM) activated currents in vacuolin enlarged hTPC2WT and hTPC2(G734E) expressing endolysosomal vesicles and the respective blocking effects of 2 μM torin-1 or 1 μM rapamycin. Cells were incubated withtorin-1 for 12 hours or with rapamycin for 10 minutes before experimentation. Currents were measured in the absence of ATP. (C) Statistical summary of dataas shown in A-Bincluding respective basal currents. Shown are average current densities at -100 mV. To test for statistical significance the one-way ANOVAtest followed by Tukey’s post-test was applied to basal and PI(3,5)P2 conditions, respectively. ***, ### indicate p<0.001, ## indicates p<0.01.
Fig. 4. Ion substitution experiments and molecular dynamics simulations. (A-D) Endolysosomal patch-clamp experiments showing PI(3,5)P2-activated hTPC2WT (A-B) or hTPC2(M484L) (C-D) currents under bi-ionic conditions with luminal Na+ and bath solutions containing the following monovalent cations,respectively: Li+, K+, Rb+ and Cs+. (B, D) Expanded view of A and C, showing that the reversal potentials are shifted to negative voltage in M484L variant. (E)Summary of data as shown in A-D. Shown are the relative permeabilities (PX/PNa) of the different cations plotted against the diameter of cations. The dashedlines are fitted to Equation 1 (see method section for details). (F) Schematic representation of the TPC2 simulation system. The channel (grey) is embedded ina fully solvated POPC bilayer (transparent surfaces). As the channel has a conic shape the bilayer is bent locally. To cope with this effect always two channelmodels were embedded in antiparallel fashion into a larger bilayer patch. (G) Enlargement of the selectivity filter omitting part of the protein. D276, N273and A272 which are present symmetrically on both subunits are shown in VdW representation. (H) The pore radius of TPC2 is shown at the height of A272for WT (blue) and the M484L variant (red) simulated in presence of PI(3,5)P2. A representative window at the end of the independent simulations was chosenwhich presumably resembles an opening event. One of two M484L pores showed a dilation of more than 1 Å for almost 10 ns.
273274275276277278279280281282283284285286287288289290291292293294295296297298299300301302303304305306307308309310311312313314315316317318319320321322323324325326327328329330331332333334335336337338339340
Footline Author PNAS Issue Date Volume Issue Number 3
341342343344345346347348349350351352353354355356357358359360361362363364365366367368369370371372373374375376377378379380381382383384385386387388389390391392393394395396397398399400401402403404405406407408

Submission PDF
Fig. 5. Characterization of human fibroblasts isolated from TPC2 WT donors or donors carrying TPC2 polymorphisms. (A-B) Data summarizing sequencingresults obtained from human genomic DNA samples. Shown in A is the genotype distribution (in %) of individuals with either blond hair or brown/blackhair, e.g. 23.9% of the brown/black hair donors but only 5.8% of the blond hair donors are genotype WT. In contrast, 26.1% of the blond hair donors arehomozygous for E (homE) at position 734 while only 10.4% of the brown/black hair donors are homE. Shown in B is the phenotype distribution (in %) ofall genotyped individuals, e.g. 80% of all individuals with the genotype WT have brown/black hair while only 20% have blond hair. In contrast, 72% of allindividuals with the genotype homE at position 734 and 71.4% of all individuals with the genotype L homozygous (homL) at position 484 are blond. Thetotal numbers of donors were 67 (brown/black hair) and 69 (blond hair), respectively. (C) Examples of human donor genotyping results. Shown are respectivesequences around position 484 (Leu/Met) and 734 (Gly).(D-E) Representative endolysosomal patch-clamp experiments showing PI(3,5)P2 (10 μM) activatedcurrents in vacuolin enlarged fibroblast endolysosomes isolated from donors homozygous for WT, M484L, and G734E. The TRPML channel activator ML-SA1was used to demonstrate that TRPML currents were comparable in size in all fibroblast lines, in contrast to PI(3,5)P2 mediated currents. (F) Statistical summaryof data shown in D-E. Two independent donor fibroblast samples were used for each WT and M484L. One sample was used for G734E. Shown are the pooledaverage current densities at -100 mV of at least 5 independent experiments, each. To test for statistical significance one-way ANOVA test followed by Tukey’spost-test was applied. ***,indicates p<0.001, *, indicates p<0.05.
ent (SI Fig. 1C and D). Treatment with vacuolin increased thesize of endolysosomal vesicles to a similar extent in all variants(SI Fig. 1E). Finally, dimerization efficiencies of TPC2 WT andthe polymorphic variants were comparable as assessed by FRETexperimentation (SI Fig. 2).
The two polymorphisms are found in very different parts ofthe protein. While M484L resides in the second transmembranedomain of the second channel domain, G734E is found in the C-terminus of the protein (Fig. 1A), suggesting different functionalconsequences.
We next performed endolysosomal patch-clamp experiments.Here, we found striking differences between the respective vari-ants. The polymorphic variant M484L as well as the doublepolymorphic variant showed, compared to WT, a significantlyincreased basal channel activity as well as a significantly increasedchannel activity after stimulation with PI(3,5)P2 (3, 15). In con-trast, G734E showed similar mean basal and stimulated activationlevels as WT. (Fig. 1B-F and SI Fig. 3A). Average capacitancevalues were comparable for all variants indicating that differencesin channel activity were not due to differences in the size ofthe patched vesicles (SI Fig. 3B). Dose-response measurementsrevealed an EC50 of 1138 ± 376 nM for WT compared to 216 ± 55nM for M484L while G734E was not significantly different from
WT with an EC50 of 827 ± 183 nM (Fig. 1G; increased potency).In addition, the maximum response level was increased by two tothree fold, depending on the PI(3,5)P2 concentration, in M484Lcompared to WT or G734E (Fig. 1G; increased efficacy).
Differences in ATP inhibition between TPC2 WT and poly-morphic variants. We next assessed the inhibition of activatedTPC2 WT and polymorphic variants by ATP. Block of TPCactivity by ATP has been demonstrated before and was shownto be physiologically relevant during cell starvation (3). We con-firm here that the channel activities of WT TPC2 and also thepolymorphic variants M484L and G734E are efficiently blockedby applying high concentrations of ATP (1 mM). However, dose-response measurements revealed significant differences in theIC50 values which were generated for each variant based on theirindividual PI(3,5)P2 EC50 values (Fig. 2A-D). When we usedthe individual PI(3,5)P2 EC50 values to activate we obtained thefollowing IC50 values for the ATP block: WT (91 ± 19 μM), G734E(351 ± 37 μM), and M484L (102 ± 6 μM). These data demonstratethat significantly less ATP is necessary to block WT TPC2 orM484L variant activities compared to the G734E variant. Similarresults were obtained when we used the individual PI(3,5)P2 EC80values or a fixed concentration of 1 μM PI(3,5)P2 to activate. Therespective IC50 values for the ATP block were: WT (179 ± 15 μM)
409410411412413414415416417418419420421422423424425426427428429430431432433434435436437438439440441442443444445446447448449450451452453454455456457458459460461462463464465466467468469470471472473474475476
4 www.pnas.org --- --- Footline Author
477478479480481482483484485486487488489490491492493494495496497498499500501502503504505506507508509510511512513514515516517518519520521522523524525526527528529530531532533534535536537538539540541542543544

Submission PDF
and G734E (384 ± 39 μM) for PI(3,5)P2 EC80 as well as WT (4 ±2 μM) and G734E (133 ± 71 μM) for the fixed concentration of 1μM PI(3,5)P2 (SI Fig. 4).
In summary these data suggest that both M484L and G734Evariants are gain of function (GOF) polymorphisms.
Effect of mTOR inhibitors. ATP is known to activate mTOR(mechanistic target of rapamycin (16)) and mTOR is the medi-ator that inhibits TPC2 by direct protein-protein interaction asrecently shown (3). To further investigate the cross-talk betweenchannel activity and ATP inhibition, we tested the effect of mTORinhibitors such as rapamycin and torin-1 on TPC2 channel ac-tivity. Both compounds were found previously to enhance TPC2channel activity by blocking the TPC2 inhibitor mTOR (3). Wefound that inhibition of mTOR increased TPC2(G734E) channelactivity more efficiently than WT activity, suggesting a strongereffect of mTOR on WT compared to G734E. In contrast, thechannel activity of the M484L isoform could not be furtherenhanced under the same conditions (for M484L a PI(3,5)P2concentration of 1 μM is a saturating concentration; EC50 = 216± 55 nM) (Fig.3A-C and SI Fig. 5A-B).
Ion substitution experiments. To further corroborate thefindings obtained for the M484L variant, we performed ion sub-stitution experiments and molecular dynamics simulations basedon the recently published structures of AtTPC1 (13-14). In ionsubstitution experiments using the endolysosomal patch-clamptechnique, we found differences in the estimated pore diametersbetween WT and M484L while there were no obvious differencesbetween WT and G734E (Fig. 4A-E and SI Fig. 5C-E). We usedmonovalent cations (sodium, lithium, rubidium, and cesium) in aconcentration of 160 mM, each, to estimate the pore diametersof TPC2 WT and the M484L variant (Fig. 4A-E). We determinedpermeability ratios relative to Na+ (PX/PNa) from the bionicreversal potentials, which resulted in estimations of 3.7 Å and 3.9Å for the minimum pore diameter of TPC2 WT and the M484Lvariant, respectively. The estimation for the G734E variant diam-eter resulted in the same value as for WT (3.7 Å) (SI Fig. 5E).These data suggest that M484L not only contributes to largercurrent amplitudes but also influences channel conformation andthe narrowest part of the pore region.
Molecular dynamics simulations confirm dilated pore inhTPC2(M484L) variant. Multiple models of the TPC2 channelwere submitted to prolonged molecular dynamics simulations ofat least 100 ns, each. WT and M484L variant were simulated withPI(3,5)P2 resembling the experimental layout. As each simulationsystem contained two channel models a total of over 800 ns wasavailable for analysis. All models showed a high degree of stabilitypreserving their overall structure and a continuous water columnthrough the pore. For one of the two M484L models a dilation ofthe pore could be observed in the presence of PI(3,5)P2 for ∼10ns around position A272. The pore radii of the dilated M484Lpore were compared with the WT pore (Fig. 4F-H). This findingsuggests that the M484L mutation affects pore dynamics, furthercorroborating the data presented on the estimation of the poresizes of TPC2 WT and M484L by ion substitution experimenta-tion. Notably, Schieder et al. (17) had reported previously thatTPC2 mutant isoform N273A (next to A272) shows a pore blockand Wang and colleagues (15) reported that the D276K mutationlikewise leads to a pore block and loss of PI(3,5)P2 response,emphasizing the importance of this region for channel activity.
Endogenous TPC2 channel activity in human donor fibrob-lasts. Next, we screened, more than 100 blond and brown/blackhaired human donors for TPC2 polymorphisms and identifiedindividuals which were either homozygous for WT, M484L, orG734E, or individuals which were heterozygous for the respec-tive polymorphisms (Fig. 5A-B). The obtained genotyping resultswere found to correlate well with the data published by Sulemet al. (10). Thus, the percentage of DNA samples isolated from
blond haired individuals which are homozygous for either M484Lor G734E was 7.2% and 26.1% (n = 69), respectively, whileDNA samples isolated from brown, dark brown, or black hairedindividuals were in only 2.9% of the cases homozygous for M484Land in only 10.4% of the cases homozygous for G734E (n = 67).Among the blond haired donors we found only 5.8% to be ho-mozygous for WT. Vice versa among individuals with brown/blackhair 23.9% were found to be homozygous for WT (Fig. 5A).
We subsequently isolated fibroblasts from selected individ-uals and analysed them using the endolysosomal patch-clamptechnique (Fig. 5C-F). While we found only small endogenousPI(3,5)P2 currents in WT or G734E fibroblast endolysosomes,significantly increased PI(3,5)P2-mediated channel activity wasdetectable in endolysosomes isolated from donor fibroblasts ho-mozygous for M484L, essentially confirming the in-vitro findings.For ATP dose-response measurements the PI(3,5)P2-mediatedcurrents in G734E endolyosomes were too small. As an activationcontrol we used the TRPML-channel activator ML-SA1 (18).TRPML channel currents activated with ML-SA1 were not sig-nificantly different between M484L, G734E, and WT endolyso-somes, suggesting that the differences in PI(3,5)P2 response arenot due to differences in TRPML channel activity (Fig. 5C-E).In summary, these data confirm the strong GOF found for theM484L variant in overexpressing HEK293 cells and the data fur-ther confirm the increased association of the M484L and G734Evariants with blond hair color compared to the WT TPC2 isoform.
Discussion
We show here that the TPC2 variants M484L and G734E, re-ported previously to be associated with a shift in human haircolor from brown to blond display distinct functional differencescompared to WT. We used overexpressing HEK293 cells and en-dogenously expressing fibroblasts to functionally characterize therespective variants. In endolysosomal patch-clamp experimentswe found that both variants show a gain of channel function com-pared to WT (SI Fig. 6). While basal activity and activation withPI(3,5)P2 was increased in M484L, affecting both efficacy andpotency of PI(3,5)P2, inhibition of channel activity by ATP wasless sensitive in G734E compared to WT (SI Fig. 6). The M484Lpolymorphism leads to structural changes affecting the pore di-ameter of TPC2. Thus, M484L displays a significant pore dilationcompared to WT as demonstrated by molecular dynamics simula-tions and ion substitution experiments. The G734E variant is lessresponsive to ATP and more sensitive to mTOR inhibitors thanWT, the latter one suggesting that the weaker ATP effect may bemediated by mTOR. While torin-1 is a selective ATP-competitiveinhibitor of mTOR which effectively blocks phosphorylation ofmTOR, rapamycin and related inhibitors form a complex with theintracellular immunophilin FKBP12; the resulting complex theninteracts with and inhibits mTOR (19-20). Despite these differentmTOR inhibitory mechanisms, both torin-1 and rapamycin resultin a stronger increase in G734E activity compared to WT, furtheremphasizing that the differences in ATP block may be directlymediated via mTOR and downstream effects. Nevertheless, wecannot fully exclude the possibility of mTOR independent ATPeffects.
Remarkably, human TPC2 cDNAs used for functional studiesin past publications were often polymorphic variants. Thus, forexample Calcraft et al. (21) had used a TPC2 variant clonedfrom HEK293 cells containing both polymorphisms: M484L andG734E. Pitt et al. (22) had used a variant of human TPC2containing the G734E polymorphism (GenBank accession no.AY029200) and Brailoiu et al. (23) had used the IMAGE clone5214862 (GenBank accession no. BC063008) which also containsthe polymorphism G734E. Thus, it seems that WT hTPC2, at leastin its recombinant form has not always been used as a referencein the existing publications.
545546547548549550551552553554555556557558559560561562563564565566567568569570571572573574575576577578579580581582583584585586587588589590591592593594595596597598599600601602603604605606607608609610611612
Footline Author PNAS Issue Date Volume Issue Number 5
613614615616617618619620621622623624625626627628629630631632633634635636637638639640641642643644645646647648649650651652653654655656657658659660661662663664665666667668669670671672673674675676677678679680

Submission PDF
In accordance with recent findings by Ambrosio et al. (11)as well as Bellono et al. (12), claiming that loss of TPC2 leadsto increased melanin production, an increase in TPC2 channelactivity as found here for the two SNPs would be expected toresult in the opposite effect, a decrease in melanin production.Located in the basal epidermis and in hair follicles, melanocytesof the integument are responsible for hair coloration through pro-duction of melanin pigments in melanosomes (24). Two types ofpigment are known to give hair its color: eumelanin and pheome-lanin. Eumelanin has two subtypes, black and brown, which de-termine the darkness of the hair color. A low concentration ofbrown eumelanin results in blond hair, whereas a higher con-centration of eumelanin will color the hair brown/black. Melaninproduction is strongly dependent on the activity of the enzymetyrosinase (TYR). TYR activity is optimal at neutral pH (25-27). To achieve neutralization of melanosomal pH, the properfunction of a cascade of ion transporters seems to be required(27). Consequently, polymorphisms in any of such transportersor ion channels rendering them dys- or malfunctional may leadto changes in melanosome pH and thus to changes in melaninproduction as suggested recently by Ito et al. (27). For TPC2this hypothesis has now been supported by works published byAmbrosio and colleagues (11) and Bellono et al. (12). Thus, lossof TPC2 leads to an increase in melanosomal pH and melaninproduction while overexpression of TPC2 leads to a decreasein melanin production. Like TPC2 overexpression, an increasein TPC2 activity would be expected to result, in a decreasedmelanosomal pH and thus a decrease in melanin production. Thiswould consequently explain the shift in hair color from brown toblond.
In addition to hair coloration, altered TPC2 channel activitymay also impact human health, in particular under challengingconditions such as physical stress or infections. TPC2 knockoutmice show an increased susceptibility to hypercholesterinemiaand fatty liver hepatitis compared to WT when fed with a highcholesterol diet (2), they show a decreased physical enduranceunder fasting conditions (3), and they are less susceptible todistinct viral infections (7). Migration of cancer cells and theformation of metastases was recently found to be reduced inTPC2 knockdown cells or after pharmacological inhibition ofTPC2 (9). We therefore speculate that humans carrying the GOFpolymorphisms M484L or G734E or both may have, in particularunder stress conditions, an altered susceptibility for diseasesthat are associated with the endolysosomal system. In addition,it may also be possible that changes in TPC2 activity affectmelanosomes differently than lysosomes, e.g. due to differencesin pH regulatory mechanisms with different consequences forhuman physiology and pathophysiology.
Materials and MethodsMolecular biology. All human TPC2 variants were generated from hTPC-2(M484L/G734E)-mCherry, a kind gift by Prof. Dr. Michael Zhu (Houston).Point mutations were removed from constructs by site-directed mutagenesisusing QuikChange (Agilent) according to the procedures outlined in themanufacturer’s manual or by overlap PCR-experimentation. C-terminallyfused YFP versions of WT and the polymorphic TPC2 variants were generatedfrom the respective mCherry constructs and subcloned into pcDNA3.1 vector.Constructs used for FRET experiments are described in the methods sectionand the figure legend in more detail.
Endolysosomal membrane preparations. To evaluate expression levelsof TPC2 WT and variants in endolysosomal membranes, HEK293 cells weretransfected with TPC2-constructs (YFP-tagged), respectively. Preparation ofendolysosomes was performed as described previously (17, 28). For im-munoblotting, antibodies were used in the following dilutions: rabbit anti-Rab7, 1:500 (cell signaling, 2094S); mouse anti-GFP, 1:2000, mouse anti-HRP 1:2000 (sc-2031, Santa Cruz), and rabbit anti HRP, 1:1000 (NA934V, GEHealthcare).
Molecular modeling. A model for TPC2 was constructed usingSchrödinger Prime based on PDB ID 5E1J (14) with the UniProt sequenceQ8NHX9 (21). Default settings were used employing the multichain protocolmodeling both subunits simultaneously. Always two of the resulting modelswere embedded into a POPC bilayer in antiparallel orientation to reduce
lateral stress following protocols described earlier (29-30) and solvated withSPC water. CaCl2 was added to balance the overall charge and to achievenearly physiological ion concentrations. Employing GROMACS-5.1 the pe-riodic system was energy minimized and constraints on the protein weregradually reduced (31-33). A total of 100 ns each were simulated with a timestep of 2 fs for the WT, WT with PI(3,5)P2, M484L and M484L with PI(3,5)P2.Two equivalents per pore were placed in vicinity of M484L into the bilayerfor the corresponding simulations. Neighbor searching was performed every40 steps. The PME algorithm was used for electrostatic interactions with acut-off of 1.2 nm and verlet cut-off scheme. A reciprocal grid of 192 x 120 x120 cells was used with 4th order B-spline interpolation. A single cut-off of1.2 was used for van der Waals interactions. Temperature coupling to 310K was done with the V-rescale algorithm. Semiisotropic pressure couplingto 1 bar in the plane and perpendicular to it was done with the Berendsenalgorithm. For all simulations the 53a6 force field were used with parametersfor POPC adapted from (29) and adapted for PI(3,5)P2 from (34). The analysiswas performed using GROMACS tools, VMD, Schrödinger and hole2 (31, 35-37).
FRET experiments. Measurements of single-cell FRET, based on aggre-gate (nonspatial) fluorescence recordings were performed and analyzedusing the three-cube-FRET method as described previously (38). For mea-surements, transiently transfected HEK293 cells were maintained in buffersolution composed of 140 mM NaCl, 5 mM KCl, 1 mM MgCl2, 2 mM CaCl2,10 mM Glucose, 10 mM Na-HEPES pH 7.4 at room temperature (RT). Fluo-rescence intensities of YFP or the GFP variants Citrine and Cerulean wererecorded using a LEICA DMI6000B inverted epifluorescence microscope anda photomultiplier detection system (PTI, Canada). Excitation was done at436nm ± 2.5 or 500 nm ± 2.5 with a DeltaRam monochromator (Horiba,Canada). Epifluorescence emission was detected by a photomultiplier (PMT914) and acquired on a personal computer using FelixGX software (Horiba,Canada). Three cube FRET filter cubes were as follows (excitation, long-pass beamsplitter, emission): CFP/Cerulean (ET436/20x; T455lp; ET480/40m),YFP/Citrine (ET500/20x; T515lp; ET535/30m) and FRET (ET436/20x; T455lp;ET535/30m) (Chrome technology). The FRET ratio, which is defined as thefractional increase in YFP emission caused by FRET, was calculated using FR= [SFRET-(RD)(SCer)]/[(RA)(SCit)]. SFRET, SCer and SCit denote fluorescence inten-sities derived from measurements in individual cells co-expressing Citrine-or Cerulean-tagged proteins with the respective filter cube (excitation,emission): SFRET (436 nm ± 10, 535 nm ± 15), SCFP (436nm ± 10, 480 nm ± 20)and, SYFP (500nm ± 10, 535 nm ± 15). RD and RA are experimentally predeter-mined constants from measurements applied to single cells expressing onlyCerulean- or Citrine-tagged molecules that correct for donor bleed throughor acceptor cross excitation. FRET efficiencies (EA) can be calculated from FRsusing the following equation (39):
ɛcitrine and ɛcerulean are the setup specific average molar extinction coefficientsfor citrine and cerulean, respectively, over the precise bandwidth of theFRET cube excitation filter. In our setup, the calculated molecular extinctioncoefficient ratio is ɛcitrine (436) / ɛcerulean (436) = 0.0563. Data were analyzedusing FelixGX (Horiba PTI, Canada) and Microsoft Excel (Microsoft).
Whole-endolysosomal patch-clamp experiments. For whole-endolysosomal patch-clamp recordings, isolated intact endolysosomesfrom HEK293 cells were manually isolated after vacuolin treatment for atleast 2 hours. Human TPC2 WT and polymorphic TPC2 variants (C-terminallyfused to YFP) were transiently transfected into HEK293 cells using TurboFectTransfection Reagent (ThermoFisher). Currents were recorded using anEPC-10 patch-clamp amplifier and PatchMaster acquisition software (HEKA).Data were digitized at 40 kHz and filtered at 2.8 kHz. Cytoplasmic solutioncontained 140 mM KMSA, 5 mM KOH, 4 mM NaCl, 0.39 mM CaCl2, 1 mMEGTA and 20 mM HEPES (pH adjusted with KOH to 7.2). Luminal solutionwas 140 mM NaMSA, 5 mM KMSA, 2 mM CaMSA, 1 mM CaCl2, 10 mMHEPES and 10 mM MES (pH adjusted with MSA to 4.6). For the applicationof PI(3,5)P2 (A.G. Scientific) and ATP-Mg (Sigma), cytoplasmic solutionwas completely exchanged by compound containing solution. Torin-1 andrapamycin were purchased from Tocris and LC Laboratories, respectively.All recordings were performed at 23-25 °C. For experiments using ATP andmTOR inhibitors, cell density was 50-60 % and the time spent outside theincubator was 30 minutes.
To estimate the pore diameter of TPC2 WT and M484L, the relativepermeability ratios of cations relative to Na+ were plotted against thediameter of the respective monovalent cations as indicated in Fig.4. Thefollowing equation was applied (40):
where a is the diameter of the permeating cation, k is a constant factor, andd is the pore diameter (41). The ionic radii of Li+, K+, Rb+ and Cs+ are 0.6,1.33, 1.48 and 1.69 Å (42). To calculate the permeability ratios the followingequation was used:
681682683684685686687688689690691692693694695696697698699700701702703704705706707708709710711712713714715716717718719720721722723724725726727728729730731732733734735736737738739740741742743744745746747748
6 www.pnas.org --- --- Footline Author
749750751752753754755756757758759760761762763764765766767768769770771772773774775776777778779780781782783784785786787788789790791792793794795796797798799800801802803804805806807808809810811812813814815816

Submission PDF
where V is the reversal potential, R is the gas constant, F is the Faradayconstant, and T is the temperature in Kelvin. To determine the relativeNa+ (PX+/PNa+) permeabilities of TPC2 WT and M484L, whole-endolysosomerecordings were performed using ramp protocols (+100 to -100 mV with 500ms increments). The bath solution contained 160 mM (pH 7.2, HEPES 5 mM)of the respective cations (as indicated in the Fig.) and the pipette solutionscontained 160 mM NaCl (pH 7.2, HEPES 5 mM). The recordings were startedwith symmetric Na+ solutions. The cytoplasmic solution was then exchangedwith the respective monovalent cation containing solution.
Human donor DNA purification and sequencing. Human genomic DNAwas obtained from adult male and female individuals using the GentraPuregene Buccal Cell Kit (Qiagen), according to manufacturer’s instructions.Briefly, buccal cells were collected by scraping the inside of the mouth10 times. For cell lysis, the collection brush was incubated in lysis solu-tion at 65 °C for at least 15 min. Proteins were precipitated and cen-trifuged. To precipitate DNA, the supernatant was added to isopropanoland glycogen solution. The pellet was washed with 70 % ethanol andair-dried before resuspension in DNA hydration solution. Samples wereincubated at 65 °C for 1h, followed by incubation at RT overnight to
dissolve the DNA. Genomic DNA fragments were amplified using gene-specific primers (hTPC2(M484L) genomic DNA-forward: 5’-GGTGTTCCTGGT-GCTGGA-3’; hTPC2(M484L) genomic DNA-reverse: 5’-ACAGCCTCTAGTCCTCA-GGG-3’; hTPC2(G734E) genomic DNA-forward: 5’-GGCCACCTACCAGATGACT-3’; hTPC2(G734E) genomic DNA-reverse: 5’-CGGACGTCACCTGCACAG-3’. AllDNA sequencing services were done by Eurofins MWG Operon.
Isolation of human fibroblasts. Human genomic DNA sampling andhuman fibroblast isolation were approved by the LMU Ethics Committee(headed by Prof. Dr. Eisenmenger; reference number: 254-16). Acquisitionof human material was performed after obtaining written informed consentby the donors. Primary fibroblasts were isolated by Prof. Dr. Carola Berkingand colleagues, Department of Dermatology, LMU Munich from the skin ofhealthy adult donors. Epidermis was separated from dermis using dispaseII (10 mg/ml in PBS pH 7.2 -7.4; Sigma #D4693) and dermis was digestedin collagenase (1 mg/ml in DMEM Medium; Sigma #C0130) for 22 h atroom temperature. Fibroblasts were cultured in DMEM with glutamine (LifeTechnologies, Inc.) and 10% FBS (FBS Superior, Biochrom #S0615). They wereused for experiments at passage 3-7.
Statistical analysis. Details of statistical analyses and n values are pro-vided in the methods subsections or the figure legends. Statistical analyseswere carried out using Origin 7.5 and GraphPad Prism 5. All error bars aredepicted as mean ± SEM. Significance is denoted on figures as outlinedin the legends. Statistics were derived from at least three independentexperiments.
1. Favia A, et al. (2014) VEGF-induced neoangiogenesis is mediated by NAADP and two-porechannel-2-dependent Ca2+ signaling. Proc Natl Acad Sci USA 111(44):E4706-4715.
2. Grimm C, et al. (2014) High susceptibility to fatty liver disease in two-pore channel 2-deficientmice. Nat Commun 5:4699.
3. Cang C, et al. (2013) mTOR regulates lysosomal ATP-sensitive two-pore Na+ channels toadapt to metabolic state. Cell 152:778-790.
4. García-Rúa V, et al. (2016) Endolysosomal two-pore channels regulate autophagy in car-diomyocytes. J Physiol 594:3061-3077.
5. Lin PH, et al. (2015) Lysosomal two-pore channel subtype 2 (TPC2) regulates skeletal muscleautophagic signaling. J Biol Chem 290(6):3377-3389.
6. Arndt L, et al. (2014) NAADP and the two-pore channel protein 1 participate in the acrosomereaction in mammalian spermatozoa. Mol Biol Cell 25(6):948-964.
7. Sakurai Y, et al. (2015) Ebola virus. Two-pore channels control Ebola virus host cell entryand are drug targets for disease treatment. Science 347(6225):995-998.
8. Ruas M, et al. (2010) Purified TPC isoforms form NAADP receptors with distinct roles forCa(2+) signaling and endolysosomal trafficking. Curr Biol 20:703-709.
9. Nguyen P, et al. (2017) Two-pore channel function is crucial for migration of invasive cancercells. Cancer Res 77:1427-1438.
10. Sulem P, et al. (2008) Two newly identified genetic determinants of pigmentation in Euro-peans. Nat Genet 40(7):835-837.
11. Ambrosio AL, Boyle JA, Aradi AE, Christian KA, Di Pietro SM (2016) TPC2 controlspigmentation by regulating melanosome pH and size. Proc Natl Acad Sci USA 2016 May 2.pii: 201600108. [Epub ahead of print]
12. Bellono NW, Escobar IE, Oancea E (2016) A melanosomal two-pore sodium channelregulates pigmentation. Sci Rep 6:26570.
13. Kintzer AF, Stroud RM (2016) Structure, inhibition and regulation of two-pore channel TPC1from Arabidopsis thaliana. Nature 531(7593):258-262.
14. Guo J, et al. (2016) Structure of the voltage-gated two-pore channel TPC1 from Arabidopsisthaliana. Nature 531(7593):196-201.
15. Wang X, et al. (2012) TPC Proteins Are Phosphoinositide-Activated Sodium-Selective IonChannels in Endosomes and Lysosomes. Cell 151:372-383.
16. Perl A (2015) mTOR activation is a biomarker and a central pathway to autoimmunedisorders, cancer, obesity, and aging. Ann N Y Acad Sci 1346(1):33-44.
17. Schieder M, Rötzer K, Brüggemann A, Biel M, Wahl-Schott C (2010) Planar patch clampapproach to characterize ionic currents from intact lysosomes. Sci Signal 3(151):pl3.
18. Shen D, et al. (2012) Lipid storage disorders block lysosomal trafficking by inhibiting a TRPchannel and lysosomal calcium release. Nat Commun 3:731.
19. Faivre S, Kroemer G, Raymond E (2006) Current development of mTOR inhibitors asanticancer agents. Nat Rev Drug Discov 5(8):671-688.
20. Hausch F, Kozany C, Theodoropoulou M, Fabian AK (2013) FKBPs and the Akt/mTORpathway. Cell Cycle 12(15):2366-2370.
21. Calcraft PJ, et al. (2009) NAADP mobilizes calcium from acidic organelles through two-porechannels. Nature 459:596-600.
22. Pitt SJ, et al. (2010) TPC2 is a novel NAADP-sensitive Ca2+ release channel, operating as adual sensor of luminal pH and Ca2+. J Biol Chem 285:35039-35046.
23. Brailoiu E, et al. (2009) Essential requirement for two-pore channel 1 in NAADP-mediatedcalcium signaling. J Cell Biol 186(2):201-209.
24. Borges CR, Roberts JC, Wilkins DG, Rollins DE (2001) Relationship of melanin degradationproducts to actual melanin content: application to human hair. Anal Biochem 290(1):116-125.
25. Ancans J, et al. (2001) Melanosomal pH controls rate of melanogenesis, eume-lanin/phaeomelanin ratio and melanosome maturation in melanocytes and melanoma cells.Exp Cell Res 268(1):26-35.
26. Smith DR, Spaulding DT, Glenn HM, Fuller BB (2004) The relationship betweenNa(+)/H(+) exchanger expression and tyrosinase activity in human melanocytes. Exp CellRes 298(2):521-534.
27. Ito S, Wakamatsu K (2011) Human hair melanins: what we have learned and have not learnedfrom mouse coat color pigmentation. Pigment Cell Melanoma Res 24(1):63-74.
28. Chen CC, et al. (2014) A small molecule restores function to TRPML1 mutant isoforms
responsible for mucolipidosis type IV. Nat Commun 5:4681.29. Krüger J, Fischer WB (2008) Exploring the conformational space of Vpu from HIV-1: a
versatile adaptable protein. J Comput Chem 29(14):2416–2424.30. Sommer B, et al. (2011) CELLmicrocosmos 2.2 MembraneEditor: A Modular Interactive
Shape-Based Software Approach To Solve Heterogeneous Membrane Packing Problems. JChem Inf Model:110419120935062.
31. Abraham MJ, et al. (2015) GROMACS: High performance molecular simulations throughmulti-level parallelism from laptops to supercomputers. SoftwareX 1:19–25
32. Krüger J, Fischer WB (2010) Structural implications of mutations assessed by moleculardynamics: Vpu1-32 from HIV-1. Eur Biophys J 39(7):1069–1077.
33. Avbelj M, et al. (2014) Activation of lymphoma-associated MyD88 mutations via allostery-induced TIR-domain oligomerization. Blood 124(26):3896–3904.
34. Holdbrook DA, et al. (2010) Stability and membrane orientation of the fukutin transmem-brane domain: a combined multiscale molecular dynamics and circular dichroism study.Biochemistry 49(51):10796–10802.
35. Humphrey W, Dalke A, Schulten K (1996) VMD: visual molecular dynamics. J Mol Graph14(1):33–8, 27–28.
36. Jacobson MP, et al. (2004) A hierarchical approach to all-atom protein loop prediction.Proteins Struct Funct Bioinforma 55(2):351–367.
37. Smart OS, Goodfellow JM, Wallace BA (1993) The pore dimensions of gramicidin A. BiophysJ 65(6):2455–2460.
38. Butz ES, et al. (2016) Quantifying macromolecular interactions in living cells using FRETtwo-hybrid assays. Nat Protoc 11(12):2470-2498.
39. Nguyen ON, et al. (2016) Peripherin-2 differentially interacts with cone opsins in outersegments of cone photoreceptors. Hum Mol Genet 2016 pii:ddw103.
40. Owsianik G, Talavera K, Voets T, Nilius B (2006) Permeation and selectivity of TRP channels.Annu Rev Physiol 68:685-717.
41. Bormann J, Hamill OP, Sakmann B (1987) Mechanism of anion permeation through channelsgated by glycine and gamma-aminobutyric acid in mouse cultured spinal neurones. J Physiol385:243-286.
42. Robinson RA and Stokes RH (2002) Electrolyte Solutions: Second Revised Edition (DoverBooks on Chemistry) Second Edition, Revised Edition
AcknowledgementsWe thank Kerstin Skokann, Melanie Wallisch, and Berit Noack (LMU
Munich) for technical support. We thank Dr. Bernd Schröder (Universityof Kiel, Germany) for kindly providing the human TMEM192 cDNA. Wefurther thank Prof. Dr. Michael Zhu (University of Texas Medical Schoolat Houston, TX, USA) for kindly providing the human TPC2(M484L/G734E)-mCherry cDNA. This work was supported, in part, by funding of the GermanResearch Foundation (SFB/TRR152 TP04 to C.G., TP06 to C.W.-S., and TP12 toM.B.) and by funding of the NCL Foundation Hamburg, Germany. Authorcontributions C.G. designed the study, collected and analyzed data, andwrote the manuscript. Y.-K.C., C-C.C., E.B., J.K., C.K., Y.S., M.M., M.B.-J., andO.N.P.N. designed experiments and/or collected, and/or analysed data. C.B.performed donor surgery. C.W.-S., M.B., and A.V. edited the manuscriptand provided funding. In addition, F.B. designed syntheses. All of the au-thors discussed the results and commented on the manuscript. Additionalinformation Supplementary Information includes three figures and can befound with this article online at http://www.pnas.org/ Competing financialinterests: The authors declare no competing financial interests.
817818819820821822823824825826827828829830831832833834835836837838839840841842843844845846847848849850851852853854855856857858859860861862863864865866867868869870871872873874875876877878879880881882883884
Footline Author PNAS Issue Date Volume Issue Number 7
885886887888889890891892893894895896897898899900901902903904905906907908909910911912913914915916917918919920921922923924925926927928929930931932933934935936937938939940941942943944945946947948949950951952

Submission PDF
We thank Kerstin Skokann, Melanie Wallisch, and Berit Noack (LMU Munich) for technicalsupport. We thank Dr. Bernd Schröder (University of Kiel, Germany) for kindly providingthe human TMEM192 cDNA. We further thank Prof. Dr. Michael Zhu (University of TexasMedical School at Houston, TX, USA) for kindly providing the human TPC2(M484L/G73-4E)-mCherry cDNA. This work was supported, in part, by funding of the German ResearchFoundation (SFB/TRR152 TP04 to C.G., TP06 to C.W.-S., and TP12 to M.B.) and by fundingof the NCL Foundation Hamburg, Germany.Author contributionsC.G. designed the study, collected and analyzed data, and wrote the manuscript. Y.-K.C.,C-C.C., E.B., J.K., C.K., Y.S., M.M., M.B.-J., and O.N.P.N. designed experiments and/or
collected, and/or analysed data. C.B. performed donor surgery. C.W.-S., M.B., and A.V. editedthe manuscript and provided funding. In addition, F.B. designed syntheses. All of the authorsdiscussed the results and commented on the manuscript.Additional informationSupplementary Information includes three figures and can be found with this article onlineat http://www.pnas.org/Competing financial interests: The authors declare no competing financial interests.
953954955956957958959960961962963964965966967968969970971972973974975976977978979980981982983984985986987988989990991992993994995996997998999100010011002100310041005100610071008100910101011101210131014101510161017101810191020
8 www.pnas.org --- --- Footline Author
10211022102310241025102610271028102910301031103210331034103510361037103810391040104110421043104410451046104710481049105010511052105310541055105610571058105910601061106210631064106510661067106810691070107110721073107410751076107710781079108010811082108310841085108610871088

Chao et al.
Supporting information
TPC2 polymorphisms associated with a hair pigmentation phenotype in humans result in gain of channel function by independent mechanisms. Yu-Kai Chao1*, Verena Schludi1*, Cheng-Chang Chen1, Elisabeth Butz1, O.N.
Phuong Nguyen1, Martin Müller1, Jens Krüger2, Claudia Kammerbauer3, Manu
Ben-Johny4, Angelika Vollmar1, Carola Berking3, Martin Biel1, Christian Wahl-
Schott1#, and Christian Grimm1#
1Department of Pharmacy - Center for Drug Research and Center for Integrated Protein Science Munich (CIPSM), Ludwig-Maximilians-Universität München, Germany; 2High-Performance and Cloud Computing Group, Zentrum für Datenverarbeitung, Universität Tübingen, Germany; 3Department of Dermatology, Medical Faculty, Ludwig-Maximilians-Universität München, Germany; 4Calcium Signals Laboratory, Department of Biomedical Engineering, The Johns Hopkins University School of Medicine, Baltimore, Maryland, USA.

+ V
acu
olin
WT
WT Lysotracker DR Merge
AhTPC2-YFP
+ V
acu
olin
LM lysates
130 kDa
100 kDaAnti-GFP
Anti-Rab725 kDa
M4
84
L/G
73
4E
G7
34
E
M4
84
L
WT
D
0
5
10
15
20
Re
l. e
xp
r. (
norm
. to
Ra
b7
)
M4
84
L/G
73
4E
G7
34
E
M4
84
L
WT
C
B
E
M4
84
LG
73
4E
WT
WT G734E
M484L M484L/G734E
0.0
0.2
0.4
0.6
0.8
M4
84
L/G
73
4E
G7
34
E
M4
84
L
WT
Zoom-in
M4
84
L/G
73
4E
PC
C (
lyso
tra
cke
r)

SI Figure 1
Human TPC2 WT and polymorphic variants: expression, subcellular distribution and vacuolin effect. (A) Shown are representative laser scanning images of hTPC2 WT and the polymorphic variants hTPC2(G734E), hTPC2(M484L), and hTPC2(M484L/G734E), all C-terminally fused to YFP and overexpressed in HEK293 cells using TurboFect. All isoforms showed a punctuated pattern and colocalized with Lysotracker DR (deep red). Scale bars = 10 μm (zoom-in images: scale bars = 5 μm). (B) PCC (Pearson correlation coefficients) calculated from images as shown in A using ImageJ software and the JACoP colocalization plugin (images were taken from n = 3 independent experiments). (C-D) Depicted in C are representative western blot data showing specific bands for hTPC2 WT and the polymorphic variants hTPC2(G734E), hTPC2(M484L), and hTPC2(M484L/G734E) fused to YFP, respectively, and detected with an anti-GFP antibody in lysosomal membranes (LM). LM were purified from whole cell lysates. The bands recognized with anti-Rab7 antibody were used as reference for the lysosomal preparations. Shown in D is the quantification of the data presented in C (n = 3 independent experiments) using Image Lab Software. All variants showed no significant differences in their relative expression levels. (E) The effect of vacuolin on all isoforms was comparable. Shown are representative laser scanning images of the respective variants overexpressed in HEK293 cells. Cells were treated for 4 hours with 1 μM vacuolin. Scale bars = 10 μm.

0
0.1
0.2
0.3
0 0.5 1 1.5 2 2.5 3
EAhTPC2(M484L) + hTPC2(M484L)
0
0.1
0.2
0.3
0 0.5 1 1.5 2 2.5 3
EAhTPC2(M484L/G734E) + hTPC2(M484L/G734E)
hTPC2(G734E) + hTPC2(G734E)
0
0.1
0.2
0.3
0 0.5 1 1.5 2 2.5 3
EA
D free
D free
D free
D free
0
0.1
0.2
0.3
0 0.5 1 1.5 2 2.5 3
EAhTPC2 WT + hTPC2 WT
A
0.00
0.05
0.10
0.15
0.20
0.25
M4
84
L/G
73
4E
G7
34
E
M4
84
L
WT
Dimers
FR
ET
eff
icie
ncy
E (
D >
0.5
)A
free
B
WT
+ C
it. ve
cto
r
WT
+ T
ME
M1
92

SI Figure 2
FRET experiments to assess TPC2 WT and polymorphic variant dimerization. (A)
Shown are the respective FRET efficiencies (EA) for binned groups of HEK293 cells
overexpressing hTPC2 WT or the polymorphic variants hTPC2(G734E),
hTPC2(M484L), or hTPC2(M484L/G734E), N-terminally fused to Citrine or Cerulean,
respectively, plotted versus Dfree, forming a binding curve. As negative control the
lysosomal transmembrane protein hTMEM192 C-terminally fused to Cerulean was co-
transfected with Citrine-hTPC2 WT. As a second negative control co-transfection of
Cerulean-hTPC2 WT with empty Citrine-vector was used. (B) Statistical summary of
data as shown in A using Dfree > 0.5 as cutoff. In all statistical analyses mean values
of at least 3 independent experiments (n = 10-15 cells each) are shown, each. To test
for statistical significance one-way ANOVA test followed by Tukey’s post-test was
applied. No significant differences were found between the TPC2 variants.

0
-1000
-2000
-3000
-4000
-5000
Curr
ent
densitie
s (
pA
/pF
)
0
1
2
3
Sin
gle
capacitance v
alu
es (
pF
)
Basal current PI(3,5)P2
M484LM484L
G734EG734E
WTWT
M484L/G734EM484L/G734E
M48
4L
G73
4EWT
M48
4L/G
734E
n.s.
** **
*** ***
***
***
BA

SI Figure 3
Effect of PI(3,5)P2 on endolysosomal vesicles expressing either human TPC2 WT
or polymorphic variants. (A) Single values of current densities (at -100 mV)
measured in endolysosomal patch-clamp experiments as shown in Fig.1. Currents
were elicited with PI(3,5)P2 (1 μM). To test for statistical significance the one-way
ANOVA test followed by Tukey’s post-test was applied. ***, indicates p<0.001, **,
indicates p<0.01. (B) Single capacitance values for the vesicles measured in the
experiments presented in Fig.1.

C
A
B
hTPC2(WT)
-600
-100 voltage [mV] 100
cu
rre
nt
[pA
]
-1200
-900
-300
hTPC2(G734E)
-600
-100 voltage [mV] 100
cu
rre
nt
[pA
]
-1200
-900
-300
+ATP100 nM1 µM10 µM100 µM
1 mM300 µM
+ATP100 nM1 µM10 µM100 µM
1 mM300 µM
PI(3,5)P2
EC80
PI(3,5)P2
EC80
Cu
rre
nt d
en
sity (
pA
/pF
)
-1000
-500
0
-1500
0.01 0.1 1 10 100 1000 10000
PI(3,5)P2
EC80
ATP (µM)
WT
G734E
hTPC2
*
PI(3,5)P2
1 µM
Cu
rre
nt d
en
sity (
pA
/pF
)
-1000
-500
0
-1500
0.01 0.1 1 10 100 1000 10000
ATP (µM)
WT
G734E
hTPC2
* *
hTPC2(WT)
-300
-100 voltage [mV] 100
cu
rre
nt
[pA
]
-600
-450
+ATP
-150
hTPC2(G734E)
-300
voltage [mV] 100
cu
rre
nt
[pA
]
-600
-450
-150
+ATP100 nM1 µM10 µM100 µM1 mM
100 nM1 µM10 µM100 µM1 mM
PI(3,5)P2
1 µM
PI(3,5)P2
1 µM
-100
F
D
E

SI Figure 4
Effect of ATP on human TPC2 WT and G734E using the respective EC80 values of PI(3,5)P2 as activating concentrations or a fixed concentration of 1 μM. (A-B) Representative PI(3,5)P2 (diC8) activated currents in vacuolin enlarged hTPC2 WT and hTPC2(G734E) expressing endolysosomal vesicles using the respective EC80 values as activating PI(3,5)P2 concentrations and different concentrations of ATP as indicated to block the currents. (C) ATP dose response curves from experiments as shown in A-B. (D-E) Similar experiments as in A-B using a fixed PI(3,5)P2 concentration of 1 μM as activating concentration and different concentrations of ATP as indicated to block the currents. (F) ATP dose response curves from experiments as shown in D-E. In all experiments currents were elicited by applying 500-ms voltage ramps from -100 to +100 mV every 5 s. To test for statistical significance the Student’s t-test, unpaired was applied. * indicates p<0.05.

-200
Cytoplasmic:
160 Na+
160 Li160 K160 Rb160 Cs
+ PI(3,5)P
Luminal: 160 Na+
++
++
2
1 2 3
Px/
PN
a
1.0
0.8
0.6
0.4
0.2
0.0
Ionic diamter [Å]
hTPC2(WT)hTPC2(G734E)
Li+
K+Rb+
Cs+
C D
E
50
-100
-150
-50
hTPC2(G734E)hTPC2(G734E) zoom-in
-400
-600
400
200-100 voltage [mV]
curr
en
t
10050
[pA
]
-100 voltage [mV]
curr
en
t
10050
[pA
]
B
M484L
0
500
1000
1500
2000
2500
Basal PI(3,5)P2
Ave
rage
cur
rent
den
sitie
s (p
A/p
F)
Torin-1 - + - - + - Rapamycin - - + - - +
hTPC2(M484L)
-500
-100 voltage [mV] 100
curr
en
t[p
A]
-2500
-2000
-1500
-1000
A
- Torin/Rapamycin+ Torin
PI(3,5)P2
+ Rapamycin

SI Figure 5
Effect of mTOR inhibitors on M484L and ion substitution experiments for G734. (A) Representative PI(3,5)P2 (1 μM) activated currents in vacuolin enlarged hTPC2(M484L) expressing endolysosomal vesicles and the respective blocking effects of 2 μM torin-1 or 1 μM rapamycin. Cells were incubated with torin-1 for 12 hours or with rapamycin for 10 minutes before experimentation. Currents were measured in the absence of ATP. (B) Statistical summary of data as shown in A including respective basal currents. Shown are average current densities at -100 mV. (C) Endolysosomal patch-clamp experiments showing PI(3,5)P2-activated hTPC2(G734E) currents under bi-ionic conditions with luminal Na+ and bath solutions containing the following monovalent cations, respectively: Li+, K+, Rb+ and Cs+. (D) Expanded view of C. (E) Summary of data as shown in C-D. Shown are the relative permeabilities (PX/PNa) of the different cations plotted against the diameter of cations. The dashed lines are fitted to Equation 1 (see method section for details).

pA
/pF
PI(3,5)P2
WT / G734E
pA
/pF
PI(3,5)P2
A
B
WT / M484L
pA
/pF
ATP
PI(3,5)P EC2 50
pA
/pF
ATP
PI(3,5)P EC2 50
WT
C OI
C OI
PIP2f (ATP)
f (ATP)
M484L
C O
C O
PIP2
I
If (ATP)
f (ATP)
G734E
C O
C O
PIP2
I
If (ATP)
f (ATP)
0
1
C

SI Figure 6 Model for the different channel properties in TPC2 variants. (A) Shown are schematic PI(3,5)P2 dose-response curves (DRCs) of WT versus M484L (A, left) and WT versus G734E (A, right). (B) Schematic ATP DRCs of WT versus M484L (B, left) and WT versus G734E (B, right) using the respective EC50 concentrations of PI(3,5)P2 to activate. Compared to WT the DRC for PI(3,5)P2 is changed in the M484L variant while the ATP inhibition curve is not. The opposite effect can be seen when comparing WT with the G734E variant: Compared to WT the DRC for PI(3,5)P2 is unchanged in the G734E variant while the ATP inhibition curve is changed. Therefore, the overall system response is determined by the difference in DRC for PI(3,5)P2 in the M484L variant while it is determined by the ATP inhibition curve in the G734E variant. Gain of function in the M484L variant is evident by the increased maximal PI(3,5)P2 activation current density (increased efficacy) and by the lower EC50 for PI(3,5)P2 (increased potency) compared to WT (A). At a fixed ATP concentration one would expect the same fractional block in WT and the M484L variant (inhibition curve is identical; B, left). However, this fractional block is determined by the DRC for PI(3,5)P2 and depends on the PI(3,5)P2 concentration. Inhibition of mTOR which likely mediates the ATP effect on TPC2 would revert the block and increase current density in both channel variants. The fractional increase would likewise be determined by the DRC for PI(3,5)P2 and depend on the PI(3,5)P2 concentration. The dashed grey lines and red double arrows (A, left) indicate the range for further increase in channel activity at the EC50 of WT. At this concentration M484L has almost reached its activation plateau. If the activating PI(3,5)P2 concentration is at the EC50 of WT, then mTOR inhibition would result in a smaller increase in activity in M484L compared to WT. (A, right) In WT and G734E the DRC and EC50 values for PI(3,5)P2 are similar. By contrast, the ATP inhibition curve is shifted to higher ATP concentrations in G734E (B, right). Thus, at the same ATP concentration (= activation of mTOR) WT would be blocked more efficiently than G734E. Inhibition of mTOR would increase channel activity in both WT and G734E. However, at the same PI(3,5)P2 concentration (see Fig. 3) the increase in activity would be expected to be stronger in G734E than in WT. (C) Model of the effects shown in A
and B. Left panel, WT: In the absence of PI(3,5)P2, the channels can open but the openings are very rare. This is indicated by the equilibrium constant biased toward the closed state. Upon binding to PI(3,5)P2, the channels can open much better as the equilibrium is biased towards the open state. Thus, addition of PI(3,5)P2 will increase the currents substantially. Inactivation: ATP binding to mTOR triggers channel inactivation, possibly via a two-step process. First activated mTOR binds to an effector interface, and then that triggers a conformational change that manifests as inactivation. Moreover, channels unbound to PI(3,5)P2 will preferentially enter the inactivated state. Center panel, M484L: C1 to O1 and C0 to O0 are enhanced as a result of the pore-dilation. Right panel, G734E: Activation process is not affected but the ATP sensitivity is reduced with no effect on the activation.

Peripherin-2 couples rhodopsin to the CNGchannel in outer segments of rod photoreceptors
Elvir Becirovic1,2,{, O.N. Phuong Nguyen1,2,{, Christos Paparizos1,2, Elisabeth S. Butz1,2, Gabi
Stern-Schneider3, Uwe Wolfrum3, Stefanie M. Hauck4, Marius Ueffing4,5, Christian Wahl-Schott1,2,
Stylianos Michalakis1,2 and Martin Biel1,2,∗
1Munich Center for Integrated Protein Science CIPSM and 2Department of Pharmacy, Center for Drug Research,
Ludwig-Maximilians-Universitat Munchen, Munchen, Germany, 3Cell and Matrix Biology, Institute of Zoology,
Johannes-Gutenberg Universitat Mainz, Mainz, Germany, 4Research Unit Protein Science, Helmholtz Center Munich,
German Research Center for Environmental Health GmbH, Munchen, Germany and 5Center for Ophthalmology, Institute
for Ophthalmic Research, Tubingen, Germany
Received May 5, 2014; Revised and Accepted June 19, 2014
Outer segments (OSs) of rod photoreceptors are cellular compartments specialized in the conversion of lightinto electrical signals. This processrelies on the light-triggered change in the intracellular levels of cyclic guano-sine monophosphate, which in turn controls the activity of cyclic nucleotide-gated (CNG) channels in the rod OSplasma membrane. The rod CNG channel is a macromolecular complex that in its core harbors the ion-conduct-ing CNGA1 and CNGB1a subunits. To identify additional proteins of the complex that interact with the CNGB1acore subunit, we applied affinity purification of mouse retinal proteins followed by mass spectrometry. In com-bination with in vitro and in vivo co-immunoprecipitation and fluorescence resonance energy transfer (FRET),we found that the tetraspanin peripherin-2 links CNGB1a to the light-detector rhodopsin. Using immunoelectronmicroscopy, we found that this peripherin-2/rhodopsin/CNG channel complex localizes to the contact region be-tween the disk rims and the plasma membrane. FRET measurements revealed that the fourth transmembranedomain (TM4) of peripherin-2 is required for the interaction with rhodopsin. Quantitatively, the binding affinityof the peripherin-2/rhodopsin interaction was in a similar range as that observed for rhodopsin dimers.Finally, we demonstrate that the p.G266D retinitis pigmentosa mutation found within TM4 selectively abolishesthe binding of peripherin-2 to rhodopsin. This finding suggests that the specific disruption of the rhodopsin/per-ipherin-2 interaction in the p.G266D mutant might contribute to the pathophysiology in affected persons.
INTRODUCTION
Outer segments (OSs) of rod photoreceptors harbor all essentialproteins of the phototransduction cascade including theG-protein-coupled receptor rhodopsin, the guanylyl cyclase,the phosphodiesterase and the rod cyclic nucleotide-gated(CNG) channel. Most of these proteins localize to highly struc-tured intracellular membrane stacks (disks), which are physical-ly separated from the plasma membrane (1). One exception is theCNG channel, which is exclusively found in the plasma mem-brane (2). Moreover, the periphery of disks facing the plasmamembrane, referred to as disk rims, contains a set of proteins
that differ from that of the remaining part of the disks. Previousstudies revealed that the rod CNG channel is directly connected tothe disk rims via a direct protein–protein interaction of the glu-tamic acid-rich (GARP) domain of the CNGB1a subunit and thedisk rim-specific tetraspanin peripherin-2 (3,4). Peripherin-2 is ascaffolding protein reported to be responsible for the diskmorphogenesis and for membrane fusion processes (5,6). Muta-tions in peripherin-2 are associated with severe retinal diseases(http://www.retina-international.org last accessed 26 June2014). The vast majority of these mutations are linked to auto-somal dominant retinitis pigmentosa (adRP), a degenerativeretinal disease that affects rod photoreceptors and often results
† E.B. and O.N.P.N. contributed equally to this study.
∗To whom correspondence should be addressed at: Department Pharmazie, Pharmakologie fur Naturwissenschaften, Ludwig-Maximilians-UniversitatMunchen, Butenandtstr. 5–13, D-81377 Munchen, Germany. Tel: +49 89218077327; Fax: +49 89218077326; Email: [email protected]
# The Author 2014. Published by Oxford University Press. All rights reserved.For Permissions, please email: [email protected]
Human Molecular Genetics, 2014, Vol. 23, No. 22 5989–5997doi:10.1093/hmg/ddu323Advance Access published on June 24, 2014
at Universitaetsbibliothek M
uenchen on Decem
ber 22, 2016http://hm
g.oxfordjournals.org/D
ownloaded from

in complete blindness. Here, we combined in vivo and in vitrobiochemical, imaging and immunoaffinity methods to show thatperipherin-2 in rod OSs binds to rhodopsin and the CNGB1asubunit of the CNG channel. Moreover, we demonstrate that thefourth transmembrane domain (TM4) of peripherin-2 is essentialfor its interaction with rhodopsin and that a single adRP-associated point mutation in TM4 of peripherin-2 abolishes thisinteraction while leaving the binding to CNGB1a unaffected.These results indicate that peripherin-2 operates as an adaptorprotein in the disk rims that physically couples the rod CNGchannel to the phototransduction cascade. This physical couplingbetween rhodopsin and the CNG channel suggests that photo-transduction in rod OS is more spatially confined than it hasbeen known so far and could help to gain new insights on the func-tional and structural role of the disk rim microcompartment in therod OS. Finally, we conclude that the adRP phenotype in patientscarrying a mutation in TM4 of peripherin-2 most probably resultsfrom the specific disruption of the peripherin-2/rhodopsininteraction in the disk rims.
RESULTS
Identification of CNGB1a-interacting proteins
To identify novel components of the rod photoreceptor, CNGchannel complex of retinal lysates of light-adapted 6-week-old-mice were immunopurified using an antibody directedagainst the C-terminus of the CNGB1a subunit of the rod CNGchannel and analyzed by quantitative mass spectrometry.Lysates of age-matched, CNGB1-deficient mice served as nega-tive control. Among the list of OS-specific CNGB1a-interactingproteins, we identified rhodopsin and peripherin-2 (Supplemen-tary Material, Table S1). Reciprocal co-immunoprecipitations(co-IPs) from retinal lysates using either an anti-rhodopsin anti-body (Fig. 1A) or an anti-CNGB1a antibody (Fig. 1B) confirmedthat rhodopsin, peripherin-2 and CNGB1a are present in thesame channel complex. Importantly, no specific bands wereobserved when performing the co-IPs with retinal lysates fromCNGB1-knockout mice (Fig. 1B, lane 2) or when a controlIgG was used instead of the anti-CNGB1a antibody (Fig. 1A,lane 2). In addition to monomeric rhodopsin, the anti-rhodopsinantibody detected bands corresponding to rhodopsin oligomers(i.e. dimers, trimers and tetramers) pointing to a very tight inter-action between rhodopsin molecules, which persisted underSDS–PAGE conditions. To get a more direct view on the local-ization of rhodopsin and CNGB1a in rod OSs, we employedimmunoelectron microscopy in retinal sections (Fig. 1C). Immu-nogold particles of different diameters co-labeled with the anti-rhodopsin and anti-CNGB1a antibodies, respectively, revealedthat CNGB1a is localized in close proximity to rhodopsin.
Analysis of the rod opsin/peripherin-2/CNGB1a complexin HEK293 cells
In previous studies, it was shown that peripherin-2 binds to theN-terminal GARP domain of CNGB1a (3,4). However, an inter-action between peripherin-2 and rhodopsin or between rhodop-sin and CNGB1a has not been reported so far. To address thisissue, we performed co-IPs in HEK293 cells expressing differentcombinations of the chromophore-free rod apo-opsin (herein
referred to as rod opsin), peripherin-2 and the rod CNGchannel subunits (Fig. 2A and B). Surprisingly, in the absenceof peripherin-2, rod opsin did not assemble with CNGB1a nordid it interact with this subunit when both subunits of thenative CNG channel (CNGB1a + CNGA1) were present(Fig. 2A). In contrast, when peripherin-2 was co-expressedtogether with rod opsin and CNGB1a, the CNGB1a subunitcould be co-immunoprecipitated with the anti-rhodopsin anti-body (Fig. 2B). Moreover, peripherin-2 was binding to rodopsin in the absence of CNGB1a (Fig. 2B). Taken together, theco-IP experiments indicate that rod opsin requires peripherin-2to interact with CNGB1a. We therefore postulated thatperipherin-2 physically links rod opsin and CNGB1a by simul-taneously binding to both proteins.
To test this hypothesis, we applied fluorescence resonanceenergy transfer (FRET) that allows detection and quantificationof protein–protein interactions (Fig. 2C). We tagged the proteinsC-terminally with either citrine or cerulean and then used therespective fusion protein pairs for FRET measurements. Inagreement with the immunoprecipitation data, we obtainedrobust FRET signals for rod opsin/peripherin-2 and as well asfor peripherin-2/CNGB1a. Quantitatively, FRET ratios (FRs)of these pairs were in a similar range. However, they were some-what lower than FRs obtained for rod opsin or peripherin-2homodimers (see also Fig. 1A and B). In agreement with previ-ous findings (3,4), our FRET data also revealed a robust inter-action between peripherin-2 and the soluble GARP2, whichcorresponds to the N-terminal portion of CNGB1a. Importantly,the FR obtained for the rhodopsin/CNGB1a FRET pair was onlyslightly above background confirming that there is no specificinteraction between these two proteins.
In vitro FRET unveils binding characteristicsof rod opsin and peripherin-2
To narrow down the region in peripherin-2 that is required for theinteraction with rod opsin, we determined the FRs between thecerulean-tagged rod opsin and citrine-tagged peripherin-2 har-boring C-terminal truncations (Fig. 3A). While deletion of theC-terminus downstream of the fourth transmembrane segment(Prph2_C1-citr) had no effect on the interaction with rodopsin, additional truncation of the TM4 domain (citr-Prph2_C2)abolished binding to rod opsin (Fig. 3A). In the latter truncationmutant (containing only three transmembrane segments), citrinewas fused to the N-terminus to ensure that (like in C-terminallytagged peripherin-2 variants containing four transmembranedomains) citrine faces the cytoplasmic side of the cell. Import-antly, the position of the tag did not interfere with the principalinteraction with rod opsin because FRs of the peripherin-2/rodopsin pairs were in a comparable range for either N- orC-terminally tagged peripherin-2 (Fig. 3A).
In order to specifically examine protein interactions in theplasma membrane and to determine binding curves of the rodopsin/peripherin-2 interaction, confocal FRET experimentswere performed in HEK293 cells (Fig. 3B and C). MaximalFR values (FRmax) obtained with this approach for rod opsin/peripherin-2 and rod opsin/rod opsin pairs, respectively, werein good agreement with the FR obtained in standard (non-confocal) FRET (Fig. 3A). As expected, confocal FRmax
values were consistently higher than the corresponding
5990 Human Molecular Genetics, 2014, Vol. 23, No. 22
at Universitaetsbibliothek M
uenchen on Decem
ber 22, 2016http://hm
g.oxfordjournals.org/D
ownloaded from

non-confocal FRs. On the basis of confocal FRET measure-ments, the relative binding affinity of the rod opsin/peripherin-2interaction was calculated to be �80% of the rod opsin/rod opsininteraction.
FRET measurements in isolated rod OSs
To demonstrate that rhodopsin is bound to peripherin-2 in nativerod photoreceptors, FRET constructs were expressed in themurine retina using AAV8-vectors, which contain the humanrhodopsin promoter (Fig. 4A).Three to four weeks after subret-inal injection of viral vectors, robust expression of individualconstructs was observed (Fig. 4B). The expression was restrictedto rod OSs indicating that the fluorophores did not interfere withthe ciliary transport (Fig. 4B). OSs isolated using a self-designedquick protocol appeared to be intact with regard to their structureand shape (Fig. 4C). Figure 4D shows co-expression of a
representative FRET pair (rhodopsin-cerulean and peripherin-citrin) in an isolated rod OS. As expected for a native system,FRs were throughout smaller as found upon heterologousexpression in HEK293 cells (Fig. 4E). This difference mostprobably can be ascribed to the fact that the unlabeled wild-typeproteins in vivo interfere with the FRET constructs leading to thereduction of the absolute FRET signal. Qualitatively, however,results in rod OSs were consistent with the results in HEK293cells. Highest FRs were observed for the rhodopsin homomer.Importantly, there was also clear FRET between rhodopsinand peripherin-2 with the FR being slightly higher for theN-terminally as compared with the C-terminally taggedperipherin-2. In contrast, in good agreement with previousstudies (4,7), no FRET was observed for rhodopsin androd-specific GARP2 protein.
An adRP-linked mutation in TM4 of peripherin-2 disruptsbinding to rhodopsin
As mentioned before, mutations in peripherin-2 have been asso-ciated with adRP. Thus, we were wondering whether some ofthese mutations may lead to an impaired rhodopsin binding.To address this issue, we analyzed whether some adRP-linkedmutations are localized in TM4 of peripherin-2, the domainthat we found to be crucial for binding to rhodopsin (cf.Fig. 3A). Indeed, one adRP-associated mutation (p.G266D) (8)was found in TM4 and was located in the transmembraneregion most proximal to the intradiskal portion of peripherin-2(Fig. 5A). Consequently, we tested whether this mutation inter-feres with the binding of peripherin-2 to rhodopsin. Using FRET(Fig. 5B) and co-IP (Fig. 5C) experiments from HEK293 cells,we demonstrate that the p.G266D mutant abolishes binding torod opsin. To further demonstrate the specificity of thisfinding, we analyzed the effects of two additional peripherin-2mutations on rhodopsin binding. Interestingly, the exchange ofthe glycine residue at position 266 and glutamate at position276 by the neutral amino acid alanine (p.G266A and p.E276A,respectively) did not affect the binding to rhodopsin (Fig. 5Band C). Importantly, the interaction of single peripherin-2mutants with CNGB1a was not affected as shown by additionalco-IP experiments from HEK293 cells (Fig. 5D). This indicatesthat the lack of binding of the p.G266D mutant most probably isnot due to its overall folding deficiency. Notably, for co-IPexperiments, we used membrane preparations, and in the re-spective input controls, we could not observe any difference inthe membrane expression levels of the mutants compared withthe wild-type peripherin-2 (Fig. 5C and D, input controls),which argues against the lack of the membrane expression ortransport deficits for any of the mutants analyzed.
DISCUSSION
In this study, we show that peripherin-2 forms a stable proteincomplex with both rhodopsin and the rod CNG channel in rodOS. Several lines of evidence support this conclusion. First, anti-bodies specific for the rod CNGB1a subunit immunoprecipitatedrhodopsin from murine retinal lysates. Similarly, immunopreci-pation with rhodopsin-specific antibodies pulled downCNGB1a. In both sets of experiments, peripherin-2 was
Figure 1. CNGB1a, peripherin-2 and rhodopsin are assembled in a proteincomplex in rod OS. (A) Retinal lysates of wild-type (WT) mice were immunopre-cipitated with an anti-rhodopsin antibody (a-Rho) or a nonspecific control IgG(a-IgG). Precipitated samples were analyzed in immunoblots (IB) using a-Rhoand antibodies directed against the CNGB1a subunit (a-B1a) and peripherin-2(a-Prph2) as indicated. (B) Left, retinal lysates of WT and CNGB1-knockoutmice (B12/2) were immunoprecipitated with a-B1a and probed with a-Rho,a-B1a and a-Prph2. Right, loading control containing 10% of the proteinlysate used for the co-IP in the left panel. (C) Immunoelectron microscopyimages of longitudinal (left) and transversal (right) sections of rod OS co-stainedwith small-diameter immunogold particles coupled toa-B1a and large-diameterparticles coupled to a-Rho, respectively. Co-localization of large and small par-ticles is marked by arrows. Scale bar, 100 nm.
Human Molecular Genetics, 2014, Vol. 23, No. 22 5991
at Universitaetsbibliothek M
uenchen on Decem
ber 22, 2016http://hm
g.oxfordjournals.org/D
ownloaded from

identified in the immunoprecipitated complex. Experiments inHEK293 cells revealed that rhodopsin does not directly bind tothe CNG channel but rather requires peripherin-2 as a molecularlinker to form a complex with the channel. FRET experimentsstrongly supported this ‘bridging’ function of peripherin-2.Based on our confocal FRET measurements, the relativebinding affinity for the peripherin-2/rhodopsin interaction wasin the similar range as for the rhodopsin/rhodopsin homomer.To the best of our knowledge, the absolute binding affinity ofrhodopsin homomers was not determined so far. However, inour co-IP experiments, rhodopsin dimers and oligomers couldbe detected even under stringent SDS–PAGE and reducing con-ditions. Based on this, we expect the absolute binding affinity ofrhodopsin homomers to be rather high. These results indicatethat rhodopsin binds to peripherin-2 with a high affinity that iscomparable with that of the rhodopsin homomer. Our biochem-ical and FRET experiments in isolated OSs strongly support thepresence of rhodopsin dimers and oligomers in the native tissue.This is in line with recent studies providing strong evidence forthe existence of rhodopsin dimers and oligomers in the nativeenvironment (9–11). In this study, we also identified themolecular determinants required for the rhodopsin/peripherin-2
interaction. As the major portion of both proteins is residing inthe disk membrane of rod OS, it seems reasonable to assumethat the interaction occurs via the transmembrane helices. Insupport of such a model, deletion of transmembrane domain 4in peripherin-2 abolished binding to rhodopsin. Moreover, asingle glycine to aspartate exchange at the position 266 in theTM4 of peripherin-2 that was previously reported in patients suf-fering from adRP (8) resulted in loss of binding to rhodopsin.Importantly, binding to CNGB1a was unaffected in the G266Dmutant suggesting that the pathophysiological impact of this mu-tation relies on the impairment of the interaction with rhodopsin.The functional role of intradiskal and intracellular domainsof peripherin-2 was examined in numerous studies (12).However, to our best knowledge, only one study addressed therole of a transmembrane domain of this protein showing thatthe glutamate residue at position 276 in TM4 was crucial fordisk morphogenesis (13). Interestingly, the exchange of thischarged amino acid to alanine (E276A) did not affect the inter-action with rhodopsin. Similarly, the G266A mutation also hadno effects on the peripherin-2/rhodopsin complex formation.These results suggest that introduction of charged residues onposition 266 disrupts the binding of peripherin-2 to rhodopsin
Figure 2. Peripherin-2 binds to both rod apo-opsin and CNGB1a. (A) Lysates from HEK293 cells co-transfected with rod apo-opsin (rOps), CNGB1a (B1a) andGFP-tagged CNGA1 (A1_GFP) were immunoprecipitated with a-Rho and probed with antibodies as indicated. (B) Co-IP from HEK293 cells co-expressing myc-tagged Prph2, rOps and B1a as indicated. Immunoprecipitates were analyzed witha-myc,a-Rho anda-B1a antibodies. Single transfection of peripherin-2 served asnegative control for nonspecific binding to the beads (third lane from right). (C) FRET measurements from HEK293 cells co-transfected with different OS-specificproteins to monitor homomeric and heteromeric protein–protein interactions. Fret ratios for the single FRET pairs are as follows: rOps/rOps, FR ¼ 3.03+0.14;Prph2/Prph2, FR ¼ 2.84+0.17; rOps/Prph2, FR ¼ 2.45+0.13; Prph2/B1a, FR ¼ 2.30+0.33; Prph2/GARP2, FR ¼ 2.03+0.17; rOps/B1a, FR ¼ 1.29+0.13. Numbers of independent measurements (n) are given in brackets.
5992 Human Molecular Genetics, 2014, Vol. 23, No. 22
at Universitaetsbibliothek M
uenchen on Decem
ber 22, 2016http://hm
g.oxfordjournals.org/D
ownloaded from

whereas neutral amino acids at the same position do not affectthis interaction. Taken together, our data point to a key role ofTM4 for the peripherin-2/rhodopsin interaction and suggestthat impaired binding to rhodopsin may contribute to the patho-physiology of peripherin-2 mutations.
As is evident in Figure 5C and D, two bands for wild-typeperipherin-2 are detected in the inputs and co-IP experiments.The upper band of peripherin-2 is most likely not a result of gly-cosylation because our protein samples were deglycosylatedprior to the SDS–PAGE. Intriguingly, the relative intensitiesof the two bands correlate with the number of negative chargesin TM4. In the G266D mutant that contains two negativecharges (E276 and D266), the upper band is stronger than thelower band. In contrast, in G266A and wild type containingone negative charge in TM4 (E276), the lower band is strongerthan the upper band. Finally, in the E276A mutant containingno negative charge, only the lower band is visible. A potentialeffect of charges on the conformation and relative mobility ofperipherin-2 would be in agreement with previous findingsshowing that single mutants can lead to a differential electro-phoretic mobility of the corresponding protein (14).
Finally, we used FRET and immunoelectron microscopy todirectly demonstrate that rhodopsin and CNGB1a are locatedin close proximity in rod OS. Overall, our results are consistentwith the model shown in Figure 6. The novel aspect of this modelis that peripherin-2 by binding to both, rhodopsin and the CNG
channel, physically couples the most proximal protein of thelight transduction cascade (rhodopsin) with the most distalprotein (the CNG channel) in a narrow spatial microcompart-ment encompassing the disk rims and the neighboring plasmamembrane. One could imagine two principal scenarios wherethe supramolecular organization of these proteins might berelevant. First, the complex could play a structural role in the for-mation and maintenance of rod OS structure. Mutations inperipherin-2 as well as in rhodopsin are associated with impaireddisk morphogenesis and stability resulting in shortened anddeteriorated rod OS (15–18). Structural impairments of OS arealso seen upon mutation of ROM1, another photoreceptor-specific protein that binds to peripherin-2 (19), and in CNGB1a-knockout mice lacking the peripherin-2-binding GARP domain(20). Taken together, these findings imply that the integrity of therhodopsin/peripherin-2/ROM1/CNG channel complex is crucialformorphogenesisand long-termstabilityof rodOS.Loss or func-tional impairment of any of the constituents of the complex willthus lead to more or less severe structural defects. In support toa structural roleof the rhodopsin/peripherin-2 interaction, the add-ition of rhodopsin to the reconstituted peripherin-2/ROM1complex in lipid vesicles was recently reported to induce theformation of disk rim-like structures in vitro (21).
Thesecond scenario refers to a functional role of the complex invisual transduction. By binding to both, rhodopsin and the CNGchannel, peripherin-2 helps to generate a microcompartment in
Figure 3. FRET-based determination of the binding characteristics of the rod opsin/peripherin-2 interaction. (A) Left, schematic representation of peripherin-2 con-structs used to determine the FRs shown in the right panel. Citrine was fused to either the N- or C-terminus of peripherin-2. Numbered black boxes (1–4) represent thetransmembrane domains of peripherin-2. Right, FR of the peripherin-2 constructs co-expressed with rOps-cerulean. Numbers of independent measurements (n) aregiven in brackets. Fret ratios for the single FRET pairs are as follows: rOps/Prph2-citr, FR ¼ 2.45+0.13; rOps/Prph2_C1-citr, FR ¼ 2.19+0.23; rOps/citr-Prph2_C2, FR ¼ 1.29+0.11; rOps/citr-Prph2, FR ¼ 2.73+0.15. (B) Representative confocal images of FRET channels (Donor, FRET, Acceptor andMerge) of single HEK293 cells used for the calculation of the FRs are shown in C. Scale bar ¼ 3 mm. (C) Results of the confocal FRET imaging obtained from mea-surements of plasma membrane-restricted regions of single cells (black squares). FR was plotted against the cerulean/citrine molar ratio (cer/citr MR) to obtain FRmax
and the binding curves.
Human Molecular Genetics, 2014, Vol. 23, No. 22 5993
at Universitaetsbibliothek M
uenchen on Decem
ber 22, 2016http://hm
g.oxfordjournals.org/D
ownloaded from

the rim disk region that could have evolved to optimize the sensi-tivity and precision of light transduction. Recently, it was reportedthat a substantial portion of the rod phosphodiesterase (PDE6) islocated at the disk rims of rod OS (22). GARP2 that was shownto bind PDE6, peripherin-2, and the CNG channel subunits(3,23,24) could serve as an adaptor protein that anchors PDE6to the disk rim. Another study also reported a physical interactionof PDE6 and the rod CNG channel (25). The proposed complexwould be exquisitely efficient because the distance between thelight harvesting rhodopsin, the guanosine monophosphate(cGMP)-hydrolyzing PDE6 and the channel that translateschanges in cGMP in changes of the Na+/Ca2+ flux would beextremely short. In contrast to rhodopsin, the CNG channeland peripherin-2 were reported to be absent in the centraldisk region (2,26,27). Consequently, in this region, rhodopsinis physically uncoupled from the CNG channel. At themoment, only one can speculate about the exact functionalrole of the differential microcompartmentalization of rhodop-sin in the central and peripheral part of the disks. Owing tothe shorter diffusion distance for cGMP, however, the diskrim-associated complex is expected to operate at lower light in-tensities and faster kinetics. Such an optimization could be im-portant in rods, which are tailored to detect extremely low lightlevels. In contrast, in the less light-sensitive cones, coupling ofthe light sensor to the channel seems less important. In agree-ment with this hypothesis, the cone CNG channel subunitslack the GARP domain that is required for the interactionwith peripherin-2 (3,28,29).
MATERIALS AND METHODS
Animals
All procedures concerning animals were performed with permis-sion of local authorities (Regierung von Oberbayern).
Molecular biology
Full-length CNGB1a, GARP2, peripherin-2 and rhodopsin werePCR-amplified from mouse retinal cDNA and subcloned into thepcDNA3.1Myc/His expression vector (Invitrogen). For FRETmeasurements and for in vitro co-IP studies, the FRET-opti-mized YFP and CFP derivatives citrine or cerulean (30–32)were introduced N- or C-terminally to the respective constructsby standard cloning procedures. Peripherin-2 deletion mutationswere obtained by site-directed mutagenesis (QuikChange Light-ning Mutagenesis Kit, Agilent Technologies) and overlap PCRtechniques. All constructs amplified by PCR were completelysequenced prior to use. For the FRET studies on rod OS, theappropriate FRET constructs were subcloned to the previouslydescribed single-stranded pAAV2.1 vector (33) containing ahuman rhodopsin (hRHO) promoter.
Retina preparation and protein biochemistry
For in vivo co-IPs and for quantitative mass spectrometry,freshly dissected retinas were homogenized in 1% TritonX-100 solution under normal daylight illumination, which
Figure 4. FRET in isolated rod OS from WT mice injected with different rAAV constructs. (A) Schematic view of the constructs used for the rAAV-mediated trans-duction of retinas from P14 C57/Bl6N WT mice. hRHO, human rhodopsin promoter. (B) Representative confocal images of retinal sections from mice expressingrhodopsin-cerulean (left) and citrin-peripherin-2 (right). OS, outer segment; IS, inner segment; ONL, outer nuclear layer. (C) Bright-field images of an isolatedOS isolated from mouse retina. (D) Representative confocal image of a single OS used for FRET measurements and co-expressing rhodopsin-cerulean (donor)and peripherin-2-citrin (acceptor), respectively. Scale bar ¼ 2 mm. (E) Results of the FRET measurements for different FRET pair combinations. Numbers of inde-pendent measurements (n) are given in brackets. FRET ratios for the single FRET pairs are as follows: Rho/Rho, FR ¼ 2.14+0.09; Rho/citr-Prph2, FR ¼ 1.49+0.09; Rho/Prph2-citr, FR ¼ 1.30+0.07; Rho/GARP2, FR ¼ 0.97+0.07.
5994 Human Molecular Genetics, 2014, Vol. 23, No. 22
at Universitaetsbibliothek M
uenchen on Decem
ber 22, 2016http://hm
g.oxfordjournals.org/D
ownloaded from

results in bleached rhodopsin. Subsequently, cell debris wasremoved by 5000×g centrifugation for 15 min, and protein con-centration of the supernatant was determined by Bradford. Formass spectrometry, 50 ml of the magnetic beads (Dynabeadsw
Protein A, Invitrogen) were pre-incubated with 5 mg of theCNGB1 antibody (34) in a total volume of 500 ml of PBS for2 h at 48C. After the removal of PBS, the pre-coupled beadswere incubated over night at 48C with 500 mg of total retinalprotein per single reaction. Next steps were performed accordingto manufacturer’s instructions. After the removal of magneticbeads, the immunoaffinity purified proteins were analyzed viaLC MS/MS as described previously (35).
For in vivo co-IP experiments, anti-B1a, anti-rhodopsin[mouse anti-Rho 1D4, Thermo Scientific) and anti-peripherin-2(mouse anti-Prph2 2B7 (36)] antibodies were used followed bythe same protocol as described earlier for the mass spectrometry.The anti-B1a antibody recognizes the distal C-terminus of therod-specific CNGB1a and the olfactory-specific CNGB1bsubunit (34). Immunopurified proteins were separated on a6–12% SDS–PAGE gradient gel and proceeded for westernblotting. Antibodies were used in the following dilutions:rabbit anti-B1a, 1 : 1000; mouse anti-Prph2, 1 : 1000; mouse
anti-Rho, 1 : 2000; mouse anti-myc, 1 : 2000 (Cell Signaling);mouse anti-GFP (Clontech), 1 : 2000. In vitro co-IPs wereperformed as described previously (23). Rod opsin signalsfrom untreated HEK293 protein lysates are detected as a smearon western blot owing to an extensive rod opsin glycosylation.Hence, prior to the sample loading to the SDS–PAGE gel, adeglycosylation step was included using PNGase F (NewEngland Biolabs) according to the instructions of the manufac-turer. For in vitro co-IPs with the anti-myc or anti-GFP antibody,the mMACS GFP or myc-tagged beads were used (MiltenyiBiotec). All steps were performed in accordance with themanufacturer’s protocol.
Photometric FRET measurements
Digital FRET measurements were performed as described (37).For confocal FRET measurements, HEK293 cells were grown in5-cm cell culture dishes (Greiner bio-one) and transiently trans-fected using the calcium phosphate method. After 24–48 h, thecells were washed and maintained in buffer solution composedof 140 mM NaCl, 5 mM KCl, 1 mM MgCl2, 2 mM CaCl2, 10 mM
glucose, 10 mM Na-HEPES, pH 7.4, at room temperature.
Figure 5. adRP-associated mutation in TM4 of peripherin-2 abolishes binding to rhodopsin. (A) Schematic view of the positions of the mutations in the TM4 ofperipherin-2 analyzed in B–C (black arrows). (B) FRET experiment from HEK293 cells co-transfected with rod opsin and peripherin-2 wild-type (WT) ormutant constructs, respectively. FRET ratios for the single FRET pairs are as follows: Rho/G266D, FR ¼ 1.58+0.05; Rho/G266A, FR ¼ 1.98+0.09; Rho/E276A, FR ¼ 2.14+0.14; Rho/WT, FR ¼ 2.26+0.08. (C) Co-IP from HEK293 cells co-expressing rhodopsin and GFP-tagged wild-type or mutant peripherin-2constructs. (D) Co-IP from HEK293 cells co-expressing CNGB1a and GFP-tagged wild-type or mutant peripherin-2 constructs. All peripherin-2 constructs in C and Dwere detected with the GFP-specific antibody (a-GFP).
Human Molecular Genetics, 2014, Vol. 23, No. 22 5995
at Universitaetsbibliothek M
uenchen on Decem
ber 22, 2016http://hm
g.oxfordjournals.org/D
ownloaded from

Cells were imaged using a Leica TCS SP8 confocal microscopewith a 20× water objective (1.0 numerical aperture). Excitationof cerulean was performed with a 448-nm laser followed byemission measurements between 483+ 16 nm. Citrine wasexcited with a 514-nm laser beam, and emission was measuredbetween 542+ 17 nm. FRET images were obtained by448-nm excitation and 542+ 17-nm emission. Cerulean,FRET and citrine images were acquired simultaneously, andall images were performed under the same laser intensity, photo-multiplier gain and pinhole settings. The intensities of the signalswere subtracted from the background, and FRs were calculatedaccording to the three cube FRET equations described in (37).Cell membrane was defined as region of interest, and imagesof cells with over- or under-saturated cerulean or citrinesignals were omitted from further analysis. For the conversionof fluorescence intensities obtained from measurements incells expressing separate cerulean- and citrine-labeled proteinsinto molar cer/citr ratios, we used a correction factor, R ¼ 3(37). To calculate FRmax and to obtain the binding curves, FRsof the respective FRET pairs were plotted versus the cer/citrratios and fitted to a hyperbolic function: (P1 × X)/(P2 + X). Xis the FRET values of the single cells and P1 and P2 were calcu-lated by 100 iterations for each FRET pair. P1 is the limitingvalue of the function and equals FRmax. For the determinationof the relative binding affinity, the following equation wasused: (FRmaxPrph2/FRmaxrOps) × 100.
Statistics
All values are given as mean+SE, and n is the number ofanimals or trials. Unless stated otherwise, an unpaired student’st-test was performed for the comparison between two groups.Statistical significance is given as follows: ∗P , 0.05; ∗∗P ,0.01; ∗∗∗P , 0.001. If multiple comparisons were made, signifi-cance was tested by analysis of variance followed by Dunnett’stest. For analysis of the LC MS/MS data, one-way ANOVAwas used.
Preparation of OSs
Single retinas were dissected and transferred to 200 ml of PBS.The OSs were mechanically separated by mixing the solutionfor 10–20 s on a standard shaking device. The solution wasspun for few seconds to remove cell debris. The supernatant con-taining the OSs was transferred to cell culture dishes (ibiTreat,ibidi, Martinsried, Germany). Prior to the FRET measurements,the OSs were allowed to sediment for �15 min.
rAAV preparation and subretinal injections
The production of single-strand AAVs and the procedure ofsubretinal injections were described previously (33). A total of108–1010 rAAV particles were delivered by a single injection.
Immunoelectron microscopy
The preparation for immunoelectron microscopy was performedas previously described (38). Labeled LRWhite ultrathinsections were analyzed in a transmission electron microscope(Tecnai 12 BioTwin; FEI, Eindhoven, The Netherlands).Images were obtained with a charge-coupled device camera(SIS Megaview3; Surface Imaging Systems), acquired by ana-lySIS (Soft Imaging System) and processed with Adobe Photo-shop CS. Antibodies used were as follows: anti-B1a, anti-Rhoand anti-Prph2 (PER5H2) (39).
SUPPLEMENTARY MATERIAL
Supplementary Material is available at HMG online.
ACKNOWLEDGEMENTS
We thank Berit Noack for excellent technical support. We alsothank Muna Naash and Robert Molday for the gift of theperipherin-2 antibody.
Figure 6. Peripherin-2 couples the CNG channel to the phototransduction cascade in rod OS. (A) Simplified paradigm of protein–protein interactions in the disk rimregion of OS. Peripherin-2 simultaneously binds to its homolog ROM1, to CNGB1a and to rhodopsin. The soluble GARP2 undergoes multiple protein–protein inter-actions with CNGB1a, CNGA1, phosphodiesterase (PDE6) and peripherin-2 as indicated by the dashed line. Gt, transducin. (B) Tentative model of the CNGB1a/peripherin-2/rhodopsin complex. Note that the exact portion of rhodopsin that binds to TM4 of peripherin-2 is not known and is only tentatively assigned in thiscartoon.
5996 Human Molecular Genetics, 2014, Vol. 23, No. 22
at Universitaetsbibliothek M
uenchen on Decem
ber 22, 2016http://hm
g.oxfordjournals.org/D
ownloaded from

Conflict of Interest statement. None declared.
FUNDING
This work was supported by the Deutsche Forschungsge-meinschaft; the FAUN-Stiftung, Nurnberg (to U.W.); the Euro-pean Community FP7/2009/241955 (SYSCILIA) (to U.W.); andthe Bundesministerium fur Bildung und Forschung, (HOPE2)(grant number 0314106 to U.W.).
REFERENCES
1. Sung, C.H. and Chuang, J.Z. (2010) The cell biology of vision. J. Cell Biol.,190, 953–963.
2. Cook, N.J., Molday, L.L., Reid, D., Kaupp, U.B. and Molday, R.S. (1989)The cGMP-gated channel of bovine rod photoreceptors is localizedexclusively in the plasma membrane. J. Biol. Chem., 264, 6996–6999.
3. Poetsch, A., Molday, L.L. and Molday, R.S. (2001) The cGMP-gatedchannel and related glutamic acid-rich proteins interact with peripherin-2 atthe rim region of rod photoreceptor disc membranes. J. Biol. Chem., 276,48009–48016.
4. Ritter, L.M., Khattree, N., Tam, B., Moritz, O.L., Schmitz, F. and Goldberg,A.F. (2011) In situ visualization of protein interactions in sensory neurons:glutamic acid-rich proteins (GARPs) play differential roles forphotoreceptor outer segment scaffolding. J. Neurosci., 31, 11231–11243.
5. Boesze-Battaglia, K. and Goldberg, A.F. (2002) Photoreceptor renewal: arole for peripherin/rds. Int. Rev. Cytol., 217, 183–225.
6. Conley, S.M., Stuck, M.W. and Naash, M.I. (2012) Structural and functionalrelationships between photoreceptor tetraspanins and other superfamilymembers. Cell Mol. Life Sci., 69, 1035–1047.
7. Korschen, H.G., Beyermann, M., Muller, F., Heck, M., Vantler, M., Koch,K.W., Kellner, R., Wolfrum, U., Bode, C., Hofmann, K.P. et al. (1999)Interaction of glutamic-acid-rich proteins with the cGMP signallingpathway in rod photoreceptors. Nature, 400, 761–766.
8. Sohocki, M.M., Daiger, S.P., Bowne, S.J., Rodriquez, J.A., Northrup, H.,Heckenlively, J.R., Birch, D.G., Mintz-Hittner, H., Ruiz, R.S., Lewis, R.A.et al. (2001) Prevalence of mutations causing retinitis pigmentosa and otherinherited retinopathies. Hum. Mutat., 17, 42–51.
9. Fotiadis, D., Liang, Y., Filipek, S., Saperstein, D.A., Engel, A. andPalczewski, K. (2003) Atomic-force microscopy: rhodopsin dimers in nativedisc membranes. Nature, 421, 127–128.
10. Knepp, A.M., Periole, X., Marrink, S.J., Sakmar, T.P. and Huber, T. (2012)Rhodopsin forms a dimer with cytoplasmic helix 8 contacts in nativemembranes. Biochemistry, 51, 1819–1821.
11. Suda, K., Filipek, S., Palczewski, K., Engel, A. and Fotiadis, D. (2004) Thesupramolecular structure of the GPCR rhodopsin in solution and native discmembranes. Mol. Membr. Biol., 21, 435–446.
12. Goldberg, A.F. (2006) Role of peripherin/rds in vertebrate photoreceptorarchitectureand inherited retinaldegenerations. Int.Rev.Cytol.,253, 131–175.
13. Goldberg, A.F., Ritter, L.M., Khattree, N., Peachey, N.S., Fariss, R.N.,Dang, L., Yu, M. and Bottrell, A.R. (2007) An intramembrane glutamic acidgoverns peripherin/rds function for photoreceptor disk morphogenesis.Invest. Ophthalmol. Vis. Sci., 48, 2975–2986.
14. Shi, Y., Mowery, R.A., Ashley, J., Hentz, M., Ramirez, A.J., Bilgicer, B.,Slunt-Brown, H., Borchelt, D.R. and Shaw, B.F. (2012) AbnormalSDS-PAGE migration of cytosolic proteins can identify domains andmechanisms that control surfactant binding. Protein Sci., 21, 1197–1209.
15. Humphries, M.M., Rancourt, D., Farrar, G.J., Kenna, P., Hazel, M., Bush,R.A., Sieving, P.A., Sheils, D.M., McNally, N., Creighton, P. et al. (1997)Retinopathy induced in mice by targeted disruption of the rhodopsin gene.Nat. Genet., 15, 216–219.
16. Lem, J., Krasnoperova, N.V., Calvert, P.D., Kosaras, B., Cameron, D.A.,Nicolo, M., Makino, C.L. and Sidman, R.L. (1999) Morphological,physiological, and biochemical changes in rhodopsin knockout mice. Proc.Natl Acad. Sci. USA, 96, 736–741.
17. Sanyal, S. and Jansen, H.G. (1981) Absence of receptor outer segments in theretina of rds mutant mice. Neurosci. Lett., 21, 23–26.
18. Travis, G.H., Sutcliffe, J.G. and Bok, D. (1991) The retinal degenerationslow (rds) gene product is a photoreceptor disc membrane-associatedglycoprotein. Neuron, 6, 61–70.
19. Clarke, G., Goldberg, A.F., Vidgen, D., Collins, L., Ploder, L., Schwarz, L.,Molday, L.L., Rossant, J., Szel, A., Molday, R.S. et al. (2000) Rom-1 is
required for rod photoreceptor viability and the regulation of diskmorphogenesis. Nat. Genet., 25, 67–73.
20. Zhang, Y., Molday, L.L., Molday, R.S., Sarfare, S.S., Woodruff, M.L., Fain,G.L., Kraft, T.W. and Pittler, S.J. (2009) Knockout of GARPs and thebeta-subunit of the rod cGMP-gated channel disrupts disk morphogenesisand rod outer segment structural integrity. J. Cell Sci., 122, 1192–1200.
21. Kevany, B.M., Tsybovsky, Y., Campuzano, I.D., Schnier, P.D., Engel, A.and Palczewski, K. (2013) Structural and functional analysis of the nativeperipherin-ROM1 complex isolated from photoreceptor cells. J. Biol.
Chem., 288, 36272–36284.
22. Chen, J., Yoshida, T. and Bitensky, M.W. (2008) Light-inducedtranslocation of cyclic-GMP phosphodiesterase on rod disc membranes inrat retina. Mol. Vis., 14, 2509–2517.
23. Michalakis, S., Zong, X., Becirovic, E., Hammelmann, V., Wein, T.,Wanner, K.T. and Biel, M. (2011) The glutamic acid-rich protein is a gatinginhibitor of cyclic nucleotide-gated channels. J. Neurosci., 31, 133–141.
24. Pentia, D.C., Hosier, S. and Cote, R.H. (2006) The glutamic acid-richprotein-2 (GARP2) is a high affinity rod photoreceptor phosphodiesterase(PDE6)-binding protein that modulates its catalytic properties. J. Biol.
Chem., 281, 5500–5505.
25. Bennett, N., Ildefonse, M., Crouzy, S., Chapron, Y. and Clerc, A. (1989)Direct activation of cGMP-dependent channels of retinal rods by the cGMPphosphodiesterase. Proc. Natl Acad. Sci. USA, 86, 3634–3638.
26. Molday, R.S., Hicks, D. and Molday, L. (1987) Peripherin. A rim-specificmembrane protein of rod outer segment discs. Invest. Ophthalmol. Vis. Sci.,28, 50–61.
27. Molday,R.S., Molday,L.L., Dose,A., Clark-Lewis, I., Illing, M., Cook,N.J.,Eismann, E. and Kaupp, U.B. (1991) The cGMP-gated channel of the rodphotoreceptor cell characterization and orientation of the amino terminus.J. Biol. Chem., 266, 21917–21922.
28. Conley, S.M., Ding, X.Q. and Naash, M.I. (2010) RDS in cones does notinteract with the beta subunit of the cyclic nucleotide gated channel. Adv.
Exp. Med. Biol., 664, 63–70.
29. Molday, R.S. and Molday, L.L. (1998) Molecular properties of thecGMP-gated channel of rod photoreceptors. Vision Res., 38, 1315–1323.
30. Griesbeck, O., Baird, G.S., Campbell, R.E., Zacharias, D.A. and Tsien, R.Y.(2001) Reducing the environmental sensitivity of yellow fluorescent proteinmechanism and applications. J. Biol. Chem., 276, 29188–29194.
31. Rizzo, M.A., Springer, G.H., Granada, B. and Piston, D.W. (2004) Animproved cyan fluorescent protein variant useful for FRET. Nat.Biotechnol.,22, 445–449.
32. Zacharias, D.A., Violin, J.D., Newton, A.C. and Tsien, R.Y. (2002)Partitioning of lipid-modified monomeric GFPs into membranemicrodomains of live cells. Science, 296, 913–916.
33. Koch, S., Sothilingam, V., Garcia Garrido, M., Tanimoto, N., Becirovic, E.,Koch, F., Seide, C., Beck, S.C., Seeliger, M.W., Biel, M. et al. (2012) Genetherapy restores vision and delays degeneration in the CNGB1(2/2) mousemodel of retinitis pigmentosa. Hum. Mol. Genet., 21, 4486–4496.
34. Huttl, S., Michalakis, S., Seeliger, M., Luo, D.G., Acar, N., Geiger, H., Hudl,K., Mader, R., Haverkamp, S., Moser, M. et al. (2005) Impaired channeltargeting and retinal degeneration in mice lacking the cyclicnucleotide-gated channel subunit CNGB1. J. Neurosci., 25, 130–138.
35. Hauck, S.M., Dietter, J., Kramer, R.L., Hofmaier, F., Zipplies, J.K., Amann,B., Feuchtinger, A., Deeg, C.A. and Ueffing, M. (2010) Decipheringmembrane-associated molecular processes in target tissue of autoimmuneuveitis by label-free quantitative mass spectrometry. Mol. Cell Proteomics,9, 2292–2305.
36. Conley, S.M., Stricker, H.M. and Naash, M.I. (2010) Biochemical analysisof phenotypic diversity associated with mutations in codon 244 of the retinaldegeneration slow gene. Biochemistry, 49, 905–911.
37. Shaltiel, L., Paparizos, C., Fenske, S., Hassan, S., Gruner, C., Rotzer, K.,Biel, M. and Wahl-Schott, C.A. (2012) Complex regulation ofvoltage-dependent activation and inactivation properties of retinalvoltage-gated Cav1.4 L-type Ca2+ channels by Ca2+-binding protein 4(CaBP4). J. Biol. Chem., 287, 36312–36321.
38. Wolfrum, U. and Schmitt, A. (2000) Rhodopsin transport in the membrane ofthe connecting cilium of mammalian photoreceptor cells. Cell Motil.
Cytoskeleton, 46, 95–107.
39. Connell, G., Bascom, R., Molday, L., Reid, D., McInnes, R.R. and Molday,R.S. (1991) Photoreceptor peripherin is the normal product of the generesponsible for retinal degeneration in the rds mouse. Proc. Natl Acad. Sci.
USA, 88, 723–726.
Human Molecular Genetics, 2014, Vol. 23, No. 22 5997
at Universitaetsbibliothek M
uenchen on Decem
ber 22, 2016http://hm
g.oxfordjournals.org/D
ownloaded from

O R I G I N A L A R T I C L E
Peripherin-2 differentially interacts with cone opsins in
outer segments of cone photoreceptorsO.N. Phuong Nguyen1,2, Sybille Bohm1,2, Andreas Gießl3, Elisabeth S. Butz1,2,Uwe Wolfrum4, Johann H. Brandst€atter3, Christian Wahl-Schott1,2,Martin Biel1,2,* and Elvir Becirovic1,2,*1Munich Center for Integrated Protein Science CIPSM, 81377 Munchen, Germany, 2Department of Pharmacy—Center for Drug Research, Ludwig-Maximilians-Universit€at Munchen, 81377 Munchen, Germany, 3Department ofBiology, Animal Physiology, Friedrich-Alexander Universit€at Erlangen-Nurnberg, 91058 Erlangen, Germany and4Cell and Matrix Biology, Institute of Zoology, Johannes-Gutenberg Universit€at Mainz, 55128 Mainz, Germany
*To whom correspondence should be addressed at: Department Pharmazie—Pharmakologie fur Naturwissenschaften, Ludwig-Maximilians-Universit€atMunchen, Butenandtstr. 5-13, D-81377 Munchen, Germany. Tel: þ49-89-2180-77316; Fax: þ49-89-2180-77326; Email: [email protected](E.B); Department Pharmazie—Pharmakologie fur Naturwissenschaften, Ludwig-Maximilians-Universit€at Munchen, Butenandtstr. 5-13, D-81377Munchen, Germany. Tel: þ49-89-2180-77328; Fax: þ49-89-2180-77326; Email: [email protected] (M.B)
AbstractPeripherin-2 is a glycomembrane protein exclusively expressed in the light-sensing compartments of rod and conephotoreceptors designated as outer segments (OS). Mutations in peripherin-2 are associated with degenerative retinaldiseases either affecting rod or cone photoreceptors. While peripherin-2 has been extensively studied in rods, there is onlylittle information on its supramolecular organization and function in cones. Recently, we have demonstrated thatperipherin-2 interacts with the light detector rhodopsin in OS of rods. It remains unclear, however, if peripherin-2 also bindsto cone opsins. Here, using a combination of co-immunoprecipitation analyses, transmission electron microscopy (TEM)-based immunolabeling experiments, and quantitative fluorescence resonance energy transfer (FRET) measurements in coneOS of wild type mice, we demonstrate that peripherin-2 binds to both, S-opsin and M-opsin. However, FRET-basedquantification of the respective interactions indicated significantly less stringent binding of peripherin-2 to S-opsincompared to its interaction with M-opsin. Subsequent TEM-studies also showed less co-localization of peripherin-2 and S-opsin in cone OS compared to peripherin-2 and M-opsin. Furthermore, quantitative FRET analysis in acutely isolated cone OSrevealed that the cone degeneration-causing V268I mutation in peripherin-2 selectively reduced binding to M-opsin withoutaffecting the peripherin-2 interaction to S-opsin or rhodopsin. The differential binding of peripherin-2 to cone opsins and themutant-specific interference with the peripherin-2/M-opsin binding points to a novel role of peripherin-2 in cones and mightcontribute to understanding the differential penetrance of certain peripherin-2 mutations in rods and cones. Finally, ourresults provide a proof-of-principle for quantitative FRET measurements of protein-protein interactions in cone OS.
IntroductionRod and cone photoreceptors are the light sensing cells of theretina conferring dim and daylight/color vision, respectively.
The tetraspanin peripherin-2 (PRPH2) is a glycosylated mem-brane protein localized in the light detecting compartments ofrods and cones referred to as outer segments (OS). Mutations in
Received: February 2, 2016. Revised: March 16, 2016. Accepted: March 17, 2016
VC The Author 2016. Published by Oxford University Press.All rights reserved. For permissions, please e-mail: [email protected]
2367
Human Molecular Genetics, 2016, Vol. 25, No. 12 2367–2377
doi: 10.1093/hmg/ddw103Advance Access Publication Date: 30 March 2016Original Article
at Universitaetsbibliothek der L
MU
Muenchen on D
ecember 22, 2016
http://hmg.oxfordjournals.org/
Dow
nloaded from

PRPH2 are among the leading causes of autosomal dominantdegenerative retinal disorders, which can either affect rod orcone photoreceptors (1,2). PRPH2 mutations primarily affectingthe rods almost exclusively lead to autosomal dominant retini-tis pigmentosa (adRP), a disease characterized by a progressiverod degeneration. In contrast, PRPH2 mutations primarily af-fecting the cones often result in adult vitelliform macular dys-trophy (AVMD). Recently, we demonstrated that the differentialpenetrance of PRPH2 mutations in rods and cones can partiallybe explained by differential effects of the single mutations onmRNA splicing in the affected photoreceptors (3). However,some of the mutants did not exert an effect on mRNA splicingsuggesting additional disease mechanisms. In another study,we identified the rod-specific light detecting G-protein coupledreceptor rhodopsin as a novel PRPH2 interacting protein in OS ofrods. In addition, we showed that the adRP-causing G266D mu-tation in transmembrane domain 4 (TM4) of PRPH2 specificallydisrupted this binding (4). Other studies identified the solublevariant of the glutamic acid-rich protein (GARP2), the GARP-region containing rod cyclic nucleotide-gated (CNG) channelB-subunit (CNGB1a), the PRPH2 homologue ROM-1 and melanor-egulin as proteins interacting with PRPH2 in rods (5–7).However, with the exception of ROM-1 (8,9), no additionalPRPH2 interacting proteins were found in cones.Comprehensive analysis of protein-protein interactions incones has been hampered by technical limitations as cones ac-count for a very small percentage of photoreceptors in mam-mals (�3%, (10)). Furthermore, compared with rods, OS of conesare smaller in both, length and diameter (http://webvision.med.utah.edu/book/part-v-phototransduction-in-rods-and-cones/phototransduction-in-rods-and-cones/). Cone OS often containphototransduction proteins which are homologous to the mem-bers of the rod phototransduction cascade. The rhodopsin ho-mologous proteins in cones are referred to as cone opsins.Cones of most mammals express two different types of opsins,which differ in their light absorption spectra: the middle wave-length absorbing M-opsin and the short wavelength absorbingS-opsin (10). Based on the relatively low homology between rho-dopsin and cone opsins, it is unclear whether PRPH2 binds tocone opsins in vivo. Here, using different methodological
approaches including quantitative fluorescence resonanceenergy transfer (FRET) measurements in transduced coneOS, we provide evidence that PRPH2 binds to both, M-opsin andS-opsin, albeit the binding to M-opsin was significantly strongerthroughout all experiments. We also show that the AVMD-linked V268I mutant in TM4 of PRPH2 selectively attenuatesbinding to M-opsin. These results provide novel insights intothe physiology and pathophysiology of PRPH2 in cones. Finally,our study shows that FRET-based approaches are well suited toquantitatively analyze protein-protein interactions in vivo insmall cellular compartments like cone OS.
ResultsCo-immunoprecipitation analysis of the PRPH2/opsininteraction in transiently transfected HEK293 cells
In an attempt to examine the interaction of PRPH2 with coneopsins, we transiently co-expressed murine C-terminallymyc-tagged PRPH2 with murine C-terminally GFP-tagged M-or S-opsin in HEK293 cells (Fig. 1A). Reciprocal co-immuno-precipitations (co-IPs) on membrane preparations with eithera GFP- or myc-specific antibody revealed robust interaction ofPRPH2 with both opsins (Fig. 1B–E). Importantly, no interac-tion was observed when co-expressing PRPH2 with C-termi-nally GFP-tagged HCN2, (hyperpolarization-activated cyclicnucleotide-gated cation channel, subunit 2), another unre-lated transmembrane protein shown to be expressed in theretina (Fig. 1F and G) (11).
Given the high structural homology of photoreceptor opsins,it appeared reasonable to assume that cone disease-linked mu-tations in TM4 of PRPH2 might also interfere with binding tocone opsins. Screening of TM4-specific PRPH2 mutations identi-fied one AVMD-associated mutant very close to the adRP-linkedG266D mutation. This mutation leads to a valine to isoleucineexchange at position 268 (V268I, Fig. 2A). Cross-species align-ment revealed a 100% conservation of this valine residue amongmammals and birds, whereas zebrafish and Xenopus laevis con-tain methionine or leucine at this position (Fig. 2B). However,isoleucine is not present at position 268 in any of the species.
Figure 1. Reciprocal co-IPs from transfected HEK293 cells indicate stable PRPH2/cone opsin interaction. (A) Scheme of the C-terminally myc-tagged WT PRPH2 (P-WT)
and C-terminally GFP-tagged M-opsin, S-opsin and HCN2 constructs used for the co-IPs shown in B–G. B–G, co-IPs using membrane preparations from HEK293 cells co-
transfected P-WT/S-opsin (B and C), P-WT/M-opsin (D and E), and P-WT/HCN2 (F and G) combinations and the single transfected respective controls. For co-IPs, myc (a-
myc, B, D and F) or GFP (a-GFP, C, E and G) specific antibodies were used. IB, immunoblotting; IP, immunoprecipitation.
2368 | Human Molecular Genetics, 2016, Vol. 25, No. 12
at Universitaetsbibliothek der L
MU
Muenchen on D
ecember 22, 2016
http://hmg.oxfordjournals.org/
Dow
nloaded from

Given that the cone dominant symptoms of the V268I mutant inaffected individuals are caused by changes in binding to opsins,we hypothesized that such changes should be restricted to coneopsins and should not affect the PRPH2/rhodopsin interaction.To test this assumption, we co-expressed wild type (WT) PRPH2and the V268I mutant with chromophore-free S-opsin, M-opsinand rod apo-opsin (herein referred to as rod opsin) in HEK293cells and conducted another set of co-IP experiments. As ex-pected, no differences in binding of WT and V268I mutant torod opsin could be detected (Fig. 2C). However, this mutation re-vealed differential effects on the binding to cone opsins.Interestingly, whereas the interaction of the V268I mutant to M-opsin was significantly reduced, no significant changes could beobserved with respect to its binding to S-opsin. In addition tothese mutant-specific differences, we also detected differencesin the binding of WT PRPH2 to the single opsins. In this context,the strongest binding was detectable for the PRPH2/rod opsininteraction followed by the PRPH2/M-opsin and PRPH2/S-Opsininteraction (Fig. 2C). Together, these results indicate that PRPH2differentially binds to cone opsins and that the V268I mutantspecifically deteriorates the PRPH2/M-opsin binding.
FRET-based quantification of WT and V268I PRPH2/opsin binding in transiently transfected HEK293 cells
To quantify the single interactions, we performed FRET mea-surements of the respective PRPH2/opsin combinations intransfected HEK293 cells. For this purpose, we used WT or mu-tant PRPH2 constructs C-terminally tagged with cerulean and
C-terminally citrine-tagged opsins, respectively (Fig. 3A). Thesingle PRPH2 and opsin constructs were robustly expressed andlargely co-localized in HEK293 cells (Fig. 3B). Importantly, subse-quent results of the FRET measurements in living HEK293 cellsnicely confirmed our observations obtained from co-IP experi-ments. First, robust FRET signals, plotted as FRET ratios (FRs) (4),could be measured for all WT PRPH2/opsin interactions (Fig. 3C).Very similar to the co-IP results, the highest FR could bedetected for the PRPH2/rod opsin interaction (FR¼ 2.57 6 0.15)and the lowest FR for the PRPH2/S-opsin FRET pair(FR¼ 1.53 6 0.04). Second, compared to the WT PRPH2/M-opsinFR (FR¼ 2.01 6 0.11), the V268I/M-opsin FR was significantly re-duced (FR¼ 1.34 6 0.14). In contrast, no significant changescould be obtained when comparing WT and V268I mutant withregard to their binding to rod opsin or S-opsin (V268I/rod opsin,FR¼ 2.54 6 0.18, V268I/S-opsin, FR¼ 1.13 6 0.10). Taken together,FRET measurements from transfected HEK293 cells consistentlyconfirm the co-IP results showing differential effects of WT andV268I mutant PRPH2 binding to rod or cone opsins.
In vivo co-IP and TEM studies of the PRPH2/opsininteraction in cones
To analyze if cone opsins also interact with PRPH2 in vivo, weconducted co-IPs from membrane preparations of 8-week oldWT mice using the PRPH2-specific antibody (Prph2 2B7, (12)).This approach led to a robust enrichment of the M-opsin bandand to a faint, but detectable band for S-opsin (Fig. 4A). This re-sult is compatible with our data from HEK293 cells suggesting
Figure 2. WT and V268I mutant differentially bind to cone opsins. (A) Schematic illustration of the mutant position in TM4 of PRPH2. (B) clustal cross-species sequence
alignment (Clustal Omega 1.2.1) of TM4 shows high conservation of the valine at position 268 among representative mammals and birds. In Xenopus laevis and
zebrafish, this position is occupied by methionine and leucine, respectively. (C) co-IPs using membrane preparations from HEK293 cells co-transfected with different
combinations of C-terminally myc-tagged WT or V268I PRPH2 mutant and C-terminally GFP-tagged cone opsins or untagged rod opsin as indicated. PRPH2 constructs
co-transfected with cone opsins were immunoprecipitated with a GFP antibody (left panel), those co-transfected with rod opsin were immunoprecipitated with a rho-
dopsin-specific antibody (a-Rho, Rho1D4). The IP showing the reduced binding of the V268I mutant to M-opsin is highlighted in a red dashed box.
2369Human Molecular Genetics, 2016, Vol. 25, No. 12 |
at Universitaetsbibliothek der L
MU
Muenchen on D
ecember 22, 2016
http://hmg.oxfordjournals.org/
Dow
nloaded from
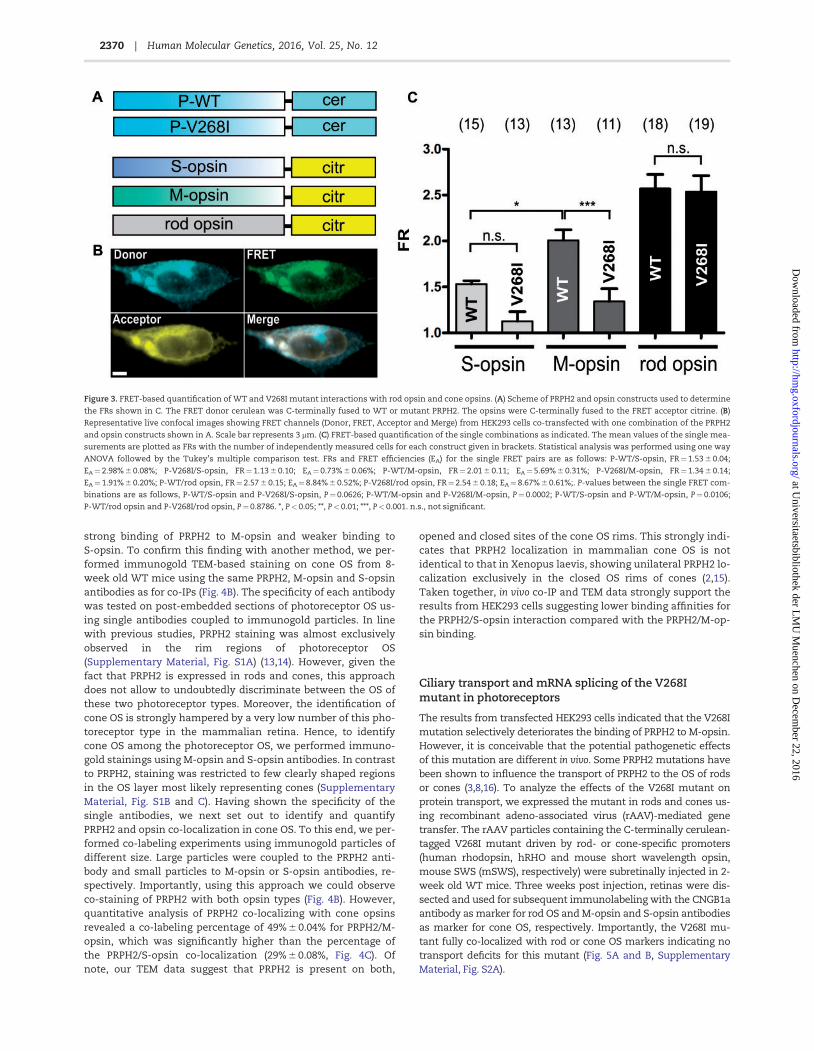
strong binding of PRPH2 to M-opsin and weaker binding toS-opsin. To confirm this finding with another method, we per-formed immunogold TEM-based staining on cone OS from 8-week old WT mice using the same PRPH2, M-opsin and S-opsinantibodies as for co-IPs (Fig. 4B). The specificity of each antibodywas tested on post-embedded sections of photoreceptor OS us-ing single antibodies coupled to immunogold particles. In linewith previous studies, PRPH2 staining was almost exclusivelyobserved in the rim regions of photoreceptor OS(Supplementary Material, Fig. S1A) (13,14). However, given thefact that PRPH2 is expressed in rods and cones, this approachdoes not allow to undoubtedly discriminate between the OS ofthese two photoreceptor types. Moreover, the identification ofcone OS is strongly hampered by a very low number of this pho-toreceptor type in the mammalian retina. Hence, to identifycone OS among the photoreceptor OS, we performed immuno-gold stainings using M-opsin and S-opsin antibodies. In contrastto PRPH2, staining was restricted to few clearly shaped regionsin the OS layer most likely representing cones (SupplementaryMaterial, Fig. S1B and C). Having shown the specificity of thesingle antibodies, we next set out to identify and quantifyPRPH2 and opsin co-localization in cone OS. To this end, we per-formed co-labeling experiments using immunogold particles ofdifferent size. Large particles were coupled to the PRPH2 anti-body and small particles to M-opsin or S-opsin antibodies, re-spectively. Importantly, using this approach we could observeco-staining of PRPH2 with both opsin types (Fig. 4B). However,quantitative analysis of PRPH2 co-localizing with cone opsinsrevealed a co-labeling percentage of 49% 6 0.04% for PRPH2/M-opsin, which was significantly higher than the percentage ofthe PRPH2/S-opsin co-localization (29% 6 0.08%, Fig. 4C). Ofnote, our TEM data suggest that PRPH2 is present on both,
opened and closed sites of the cone OS rims. This strongly indi-cates that PRPH2 localization in mammalian cone OS is notidentical to that in Xenopus laevis, showing unilateral PRPH2 lo-calization exclusively in the closed OS rims of cones (2,15).Taken together, in vivo co-IP and TEM data strongly support theresults from HEK293 cells suggesting lower binding affinities forthe PRPH2/S-opsin interaction compared with the PRPH2/M-op-sin binding.
Ciliary transport and mRNA splicing of the V268Imutant in photoreceptors
The results from transfected HEK293 cells indicated that the V268Imutation selectively deteriorates the binding of PRPH2 to M-opsin.However, it is conceivable that the potential pathogenetic effectsof this mutation are different in vivo. Some PRPH2 mutations havebeen shown to influence the transport of PRPH2 to the OS of rodsor cones (3,8,16). To analyze the effects of the V268I mutant onprotein transport, we expressed the mutant in rods and cones us-ing recombinant adeno-associated virus (rAAV)-mediated genetransfer. The rAAV particles containing the C-terminally cerulean-tagged V268I mutant driven by rod- or cone-specific promoters(human rhodopsin, hRHO and mouse short wavelength opsin,mouse SWS (mSWS), respectively) were subretinally injected in 2-week old WT mice. Three weeks post injection, retinas were dis-sected and used for subsequent immunolabeling with the CNGB1aantibody as marker for rod OS and M-opsin and S-opsin antibodiesas marker for cone OS, respectively. Importantly, the V268I mu-tant fully co-localized with rod or cone OS markers indicating notransport deficits for this mutant (Fig. 5A and B, SupplementaryMaterial, Fig. S2A).
Figure 3. FRET-based quantification of WT and V268I mutant interactions with rod opsin and cone opsins. (A) Scheme of PRPH2 and opsin constructs used to determine
the FRs shown in C. The FRET donor cerulean was C-terminally fused to WT or mutant PRPH2. The opsins were C-terminally fused to the FRET acceptor citrine. (B)
Representative live confocal images showing FRET channels (Donor, FRET, Acceptor and Merge) from HEK293 cells co-transfected with one combination of the PRPH2
and opsin constructs shown in A. Scale bar represents 3 mm. (C) FRET-based quantification of the single combinations as indicated. The mean values of the single mea-
surements are plotted as FRs with the number of independently measured cells for each construct given in brackets. Statistical analysis was performed using one way
ANOVA followed by the Tukey’s multiple comparison test. FRs and FRET efficiencies (EA) for the single FRET pairs are as follows: P-WT/S-opsin, FR¼1.53 6 0.04;
EA¼2.98% 6 0.08%; P-V268I/S-opsin, FR¼1.13 6 0.10; EA¼0.73% 6 0.06%; P-WT/M-opsin, FR¼2.01 6 0.11; EA¼5.69% 6 0.31%; P-V268I/M-opsin, FR¼1.34 6 0.14;
EA¼1.91% 6 0.20%; P-WT/rod opsin, FR¼2.57 6 0.15; EA¼8.84% 6 0.52%; P-V268I/rod opsin, FR¼2.54 6 0.18; EA¼8.67% 6 0.61%;. P-values between the single FRET com-
binations are as follows, P-WT/S-opsin and P-V268I/S-opsin, P¼0.0626; P-WT/M-opsin and P-V268I/M-opsin, P¼0.0002; P-WT/S-opsin and P-WT/M-opsin, P¼ 0.0106;
P-WT/rod opsin and P-V268I/rod opsin, P¼0.8786. *, P<0.05; **, P<0.01; ***, P<0.001. n.s., not significant.
2370 | Human Molecular Genetics, 2016, Vol. 25, No. 12
at Universitaetsbibliothek der L
MU
Muenchen on D
ecember 22, 2016
http://hmg.oxfordjournals.org/
Dow
nloaded from

Recently, we demonstrated that the cone dominance ofsome PRPH2 mutants goes along with their specific effects onmRNA splicing. In this context, we provided evidence for threedifferent splice isoforms of PRPH2 to exist in rods and cones,which include the unspliced, the intron 1 retention, and the cor-rectly spliced variant. In particular, some of the mutants associ-ated with cone diseases led to increased splice efficiencies ofthe correctly spliced PRPH2 variant in cones, which represents
the only splice isoform translated into protein (3). To excludeany effects of the V268I mutant on mRNA splicing, we per-formed splicing analysis in cones of WT mice transduced withthe same PRPH2 minigenes under the same conditions as de-scribed (3). The analysis of mRNA splicing of all three PRPH2 iso-forms revealed no changes between the V268I mutant and itsWT counterpart (Supplementary Material, Fig. S3A–D). Taken to-gether, we could exclude effects of the V268I mutation on
Figure 4. In vivo co-IP and TEM images of cone OS co-immunolabeled with PRPH2 and cone opsin antibodies. (A) co-IPs using membrane preparations from isolated ret-
inas of light-adapted 8-week old C57/BL6J WT mice. Immunoprecipitation was conducted with the PRPH2-specific antibody (a-Prph2, Prph2 2B7). Control co-IP was per-
formed with IgGs (a-IgG). (B) Representative TEM images of post-embedded longitudinal cone OS sections from 8-week old light-adapted WT mice co-labeled with large
diameter gold particles coupled to the PRPH2 antibody and small diameter gold particles coupled to M-opsin (a-M-opsin) or S-opsin (a-S-opsin) specific antibody, re-
spectively. The specificity of the antibodies was proven in Supplementary Material, Figure S1 showing TEM images of photoreceptor OS labeled with the single antibod-
ies. White arrows indicate co-localization of large and small gold particles. Scale bar¼100 nm. (C) quantification of the PRPH2/cone opsin co-localization. Shown are
the co-localization percentages of PRPH2/S-opsin and PRPH2/M-opsin gold particles originating from 6 (PRPH2/S-opsin) or 11 (PRPH2/M-opsin) different cone OS. The
total number of gold particles counted was 58 for PRPH2/S-opsin and 178 for PRPH2/M-opsin, respectively. Statistical analysis was done with the unpaired Student’s
t-test, P¼0.0195.
2371Human Molecular Genetics, 2016, Vol. 25, No. 12 |
at Universitaetsbibliothek der L
MU
Muenchen on D
ecember 22, 2016
http://hmg.oxfordjournals.org/
Dow
nloaded from

protein transport and mRNA splicing suggesting other diseasemechanisms for this mutant.
FRET measurements of WT and V268I PRPH2/opsininteractions in murine photoreceptors
In our previous study, we demonstrated that quantitative FRETcan in principle be used for analysis of protein-protein interac-tions in acutely isolated rod OS (4). Given the very low percent-age of cones (�3%) and the smaller size of cone OS in themammalian retina, it is unclear whether FRET measurementsare also suitable for detection and quantification of protein-
protein interactions in cone OS. Hence, we set out to establishFRET-based analysis of protein-protein interactions in isolatedcone OS. To this end, we transduced cones with the samePRPH2/cone opsin FRET combinations as shown in Figure 3A us-ing the rAAV-mediated gene transfer. All PRPH2/cone opsinFRET constructs were driven by the mSWS promoter. To analyzethe effects of the V268I mutant on rhodopsin binding in rod OS,the respective WT and V268I FRET constructs were virally trans-duced to rods using the hRHO promoter. The titer-matchedrAAV particles (1010 particles/injection) containing the FRETpairs were subretinally injected in 2-week old WT mice. Fourweeks post injection, the OS of four pooled retinas for eachFRET pair were isolated with the self-designed quick protocol as
Figure 5. Expression of the V268I mutant in murine cones and FRET-based quantification of WT and V268I mutant interactions in isolated cone OS. (A and B)
Representative confocal images of co-immunolabeled retinal sections from subretinally rAAV-injected C57/BL6J WT mice expressing C-terminally cerulean-tagged
V268I mutant (V268I_cer) under the control of the mSWS promoter. Immunolabeling was performed on retinal cryosections of light-adapted animals 3 weeks post in-
jection using M-opsin (A) or S-opsin (B) antibodies described in Figure 4. The expression of the mutant was visualized by cerulean fluorescence. OS, outer segment. IS,
inner segment. ONL, outer nuclear layer. Scale bar¼5 mm. C, Representative confocal FRET channel images from isolated cone OS of rAAV-injected C57/BL6J WT mice
co-expressing one combination of the FRET constructs described in Figure 3A under the control of the mSWS promoter. Scale bar¼1 mm. D, FRET-based quantification
of the single combinations as indicated. The mean values of the single measurements are plotted as FRs with the number of independently measured cone OS for each
combination given in brackets. Statistical analysis was performed using one way ANOVA followed by the Tukey’s multiple comparison test. FRs and FRET efficiencies
for the single FRET pairs are as follows: P-WT/S-opsin, FR¼2.17 6 0.15; EA¼6.59% 6 0.46%; P-V268I/S-opsin, FR¼1.59 6 0.10; EA¼3.32% 6 0.21%; P-WT/M-opsin,
FR¼3.31 6 0.37; EA¼13.01% 6 1.45%; P-V268I/M-opsin, FR¼1.74 6 0.16; EA¼4.12% 6 0.38%; P-WT/rod opsin, FR¼1.46 6 0.16; EA¼2.59% 6 0.28%; P-V268I/rod opsin,
FR¼1.48 6 0.18; EA¼ 2.70% 6 0.33%. P-values between the single FRET combinations are as follows, P-WT/S-opsin and P-V268I/S-opsin, P¼0.4263; P-WT/M-opsin and
P-V268I/M-opsin, P¼ 0.0001; P-WT/S-opsin and P-WT/M-opsin, P¼0.0126; P-WT/rod opsin and P-V268I/rod opsin, P¼0.9323. *, P<0.05; **, P<0.01; ***, P<0.001. n.s., not
significant.
2372 | Human Molecular Genetics, 2016, Vol. 25, No. 12
at Universitaetsbibliothek der L
MU
Muenchen on D
ecember 22, 2016
http://hmg.oxfordjournals.org/
Dow
nloaded from

described (4). Importantly, to ensure for comparability, FRETmeasurements of all constructs were conducted on the sameday under the same conditions. The FRET approach addressingthe PRPH2 WT or V268I/rhodopsin interaction in rods(Supplementary Material, Fig. S2B) led to a large number of la-beled rod OS showing high co-expresssion rates of citrine andcerulean fluorophores up to 90%. Similar co-transduction ratesin rods were observed in our recent study (4). As expected, in ex-periments addressing PRPH2 WT or V268I/cone opsin interac-tion, the vast majority of the isolated OS originated from rodsand did not show any fluorescence (data not shown).Occasionally, we observed citrine or cerulean fluorescence insmall-sized OS-like structures most likely representing the OSof cones (Fig. 5C). In contrast to rods, the percentage of cone OSco-expressing both FRET fluorophores was markedly lower (upto 30%). Despite the lower co-transduction efficiency of theFRET fluorophores, this approach led to the identification of asufficient number of cone OS, enabling a comparative and quan-titative analysis of the single protein-protein interactions.Overall, the resulting FRET measurements from isolated OS arelargely comparable to those obtained from the HEK293 cells(Fig. 5D). First, for WT PRPH2, a robust FRET signal could be ob-tained with both M-opsin and S-opsin indicating that these pro-teins indeed interact in vivo. Quantitatively, however, the FR ofPRPH2/M-opsin (FR¼ 3.31 6 0.37) was significantly higher thanthat of the PRPH2/S-opsin (FR¼ 2.17 6 0.15) FRET pair. Second,the FR of the V268I PRPH2/M-opsin (FR¼ 1.73 6 0.16) was signifi-cantly attenuated compared with the FR of WT PRPH2/M-opsin.By trend, but not significantly, a reduction of the FR was also ob-served for the V268I PRPH2/S-opsin FRET pair (FR¼ 1.59 6 0.10).Third, in rod OS, no significant differences could be measuredwhen comparing the FRs between the WT PRPH2/rhodopsin(FR¼ 1.46 6 0.16) and the V268I PRPH2/rhodopsin FRET pairs(FR¼ 1.48 6 0.18). Notably, compared to the FRET results fromHEK293 cells, the FRs were consistently higher for PRPH2/coneopsin interaction, and consistently lower for the PRPH2/rhodop-sin FRET pair. The latter finding is in line with the results fromour previous study (4). The consistently higher FRs for thePRPH2/cone opsin binding in vivo (in particular that for thePRPH2/M-opsin FRET pair) indicate that these interactions couldhave strong physiological relevance.
DiscussionIn this study, we provide evidence for a stable interaction be-tween PRPH2 and cone opsins. This finding is supported by sev-eral methodological approaches in living HEK293 cells and incone OS. Consistently, co-IPs and quantitative FRET measure-ments in transiently transfected HEK293 cells and in cone OSsuggested more stringent binding of PRPH2 to M-opsin in com-parison to the PRPH2/S-opsin interaction. This was confirmedby TEM-studies on WT murine cone OS showing a significantlyhigher percentage of co-localization for PRPH2 and M-opsinwhen compared to PRPH2 and S-opsin. Overall, these findingsare consistent with the model shown in Figure 6. The physiolog-ical importance of this differential interaction of PRPH2 withcone opsins remains unclear. Most cones express both opsintypes, however, some of them contain either S- or M-opsin (10).Interestingly, S-opsin and M-opsin expressing cones are un-equally distributed in the retina with M-opsin expressing cones(referred to as M-cones) being preferentially found in the dorsalpart and S-opsin expressing cones (also known as S-cones) be-ing present predominantly in the ventral part of the retina (10).It remains to be clarified if the differential binding of PRPH2 to
cone opsins is related to the dorso-ventral gradient of M- orS-cones. In a recent study, it was shown that M-opsin and S-Opsin are mislocalized throughout the cone photoreceptor of acone-dominant mouse model expressing a PRPH2 mutant thatexhibits localization deficits (C150S) (8). Similar effects on pro-tein localization were not reported for rhodopsin. One possibleexplanation for these observations is that the PRPH2/cone opsininteraction is specifically required for the concurrent transportof these proteins to the cone OS. The potential relevance of thePRPH2/M-opsin interaction in cone OS is supported by the factthat the V268I AVMD-linked mutant in TM4 of PRPH2 selectivelyattenuates the binding of PRPH2 to M-opsin without affectingother possible disease-causing parameters like protein localiza-tion or mRNA splicing. Interestingly, this mutant did not signifi-cantly alter the binding to rhodopsin or S-opsin. Given the sameevolutionary origin and the resulting structural homology ofphotoreceptor opsins, it is not surprising that their binding toPRPH2 is mediated by the same domain. However, even thoughthe V268I mutant is in very close proximity to the G266D muta-tion, only the latter interferes with the PRPH2/rhodopsin inter-action. This finding implies that different moleculardeterminants within the same domain have evolved to ensurefor the specificity of the PRPH2 binding to rhodopsin or cone op-sins. The V268I mutant is associated with AVMD, a diseasecharacterized by late onset degeneration of cones. In contrast tothe adRP-linked G266D mutation, which almost completelyabolishes binding of PRPH2 to rhodopsin (4), the V268I mutationresults only in a moderate attenuation of its binding to M-opsinindicating that a portion of M-opsin still is able to form proteincomplexes with PRPH2. This finding is consistent with the mildand late-onset symptoms reported in AVMD patients carryingthe V268I mutation (17). Transgenic mice expressing differentPRPH2 mutations have been proven as a valid model to analyzethe structural and functional importance of PRPH2 in rods andcones (9,18–21). The exact course of retinal degeneration causedby the V268I mutation requires the generation of appropriatetransgenic mouse models and is beyond the scope of this study.
Comparative analysis of FRs from HEK293 cells and rod orcone OS revealed an inverse correlation between the PRPH2/rhodopsin and PRPH2/cone opsin interaction. Although thePRPH2/cone opsin FRs were higher in cone OS compared withHEK293 cells, the opposite was the case for the PRPH2/rhodop-sin FRET pairs. The latter finding is in line with the results fromour previous study (4). These differences in FRET betweenHEK293 cells and photoreceptor OS might be explained by thespecific molecular composition of rod and cone OS. First, in ourrecent study using reverse transcriptase-polymerase chain re-action (RT-PCR) from fluorescence-activated cell (FAC)-sortednative rods, we demonstrated that the relative rhodopsin/PRPH2 mRNA expression is �9:1 (3). Given the overwhelmingevidence showing that rhodopsin forms dimers and high-orderoligomers in rod OS (4,22,23) most of the labeled rhodopsin mol-ecules used for FRET in our study most probably do not bind toPRPH2, but rather are assembled to rhodopsin di- and oligo-mers, leading to an overall reduction of the FRET signal. In con-trast, RT-PCR from FAC-sorted native cones revealed that themRNA expression levels for PRPH2 and cone opsins are verysimilar (3,24). This more or less balanced PRPH2/cone opsinmRNA expression is expected to result in similar PRPH2 andcone opsin protein levels and might explain the higher FRs forthe PRPH2/cone opsin interaction in isolated cone OS whencompared with the PRPH2/rhodopsin interaction in rod OS.Second, several studies have shown that PRPH2 interacts withthe rod CNG channel B-subunit CNGB1a in the disc rim regions
2373Human Molecular Genetics, 2016, Vol. 25, No. 12 |
at Universitaetsbibliothek der L
MU
Muenchen on D
ecember 22, 2016
http://hmg.oxfordjournals.org/
Dow
nloaded from

of rod OS (4,7,25). In contrast, PRPH2 does not bind to theCNGB1a homologous CNG B-subunit in cones (CNGB3) that lacksthe N-terminal GARP domain (26). Based on this, it is temptingto speculate that PRPH2 is spatially less flexible in rods than incones, thus allowing only a small portion of rhodopsin mole-cules to interact. Similar molecular constraints are not expectedto occur in transiently transfected HEK293 cells, which are notknown to express any of the OS-specific proteins analyzedherein. This might explain the higher FRs for the PRPH2/rhodop-sin interaction obtained in these cells. Rods and cones show re-markable differences with respect to their light sensitivity orlight response and adaptation kinetics. So far, the molecular de-terminants of the functional differences between these two celltypes are not fully understood (27). This raises the option thatthe PRPH2/opsin interaction may also partially contribute toshaping the typical physiological features of cones.Conclusively, using different methodological approaches, thisstudy identified cone opsins as novel interaction partners ofPRPH2 in cone OS suggesting a novel physiological role of PRPH2in these cells. In addition, the selective reduction of the PRPH2/M-opsin binding observed for the AVMD-linked, TM4-specificV268I mutant might contribute to explain the differential pene-trance of some PRPH2 point mutations in rods and cones.
Materials and MethodsAnimals
All procedures concerning animals were performed with per-mission of local authorities (Regierung von Oberbayern).Anesthesia was performed by subcutaneous injection of keta-mine (40 mg/kg body weight) and xylazine (20 mg/kg bodyweight). Euthanasia was performed by cervical dislocation.
Molecular biology
Full-length sequences for M-opsin and S-opsin were RT-PCRamplified from mouse retinal cDNA and subcloned into the
pcDNA3.1 expression vector (Invitrogen). For FRET measure-ments and for in vitro co-IP studies, GFP and the FRET optimizedYFP and CFP derivatives citrine or cerulean (28–30) were C-ter-minally introduced to the respective constructs by standardcloning procedures. PRPH2 and rhodopsin FRET constructs werepreviously described (4). PRPH2 V268I mutation was obtained bysite directed mutagenesis (QuikChange Lightning MutagenesisKit, Agilent Technologies). For mRNA splicing analysis, WT andV268I mutant PRPH2 minigene constructs were cloned as previ-ously described (3). All constructs amplified by PCR were com-pletely sequenced prior to use. For the FRET studies on rod orcone OS and the mRNA splicing analysis in cones, the respectiveFRET or PRPH2 minigene constructs were subcloned to the pre-viously described single stranded pAAV2.1 vector (pAAV2/8 YF,(31)) containing a hRHO or mSWS promoter.
Protein biochemistry
For co-IPs in transiently transfected HEK293 cells (calcium phos-phate transfection), cells were harvested 48 h post transfec-tion and membrane preparations were conducted as described(32). co-IPs were performed with the anti-myc (9B11, CellSignaling), anti-GFP (JL-8, Clontech) or anti-Rhodopsin (Rho1D4,ThermoScientific) antibody using Protein A or Protein G mag-netic beads (novex by life technologies). All steps were per-formed in accordance to the manufacturer’s protocol. Rod andcone opsin signals from untreated HEK293 membrane prepara-tions are detected as a smear on western blot due to an exten-sive opsin glycosylation. Hence, prior to the sample loading tothe SDS–PAGE gel, a deglycosylation step was included usingPNGase F (New England Biolabs) according to the instructions ofthe manufacturer.
For in vivo co-IPs, freshly dissected retinas of light adaptedWT C57 BL/6J animals were homogenized in membrane prepa-ration buffer using the Potter S homogenizer (B. Braun).Subsequently, membrane preparations were performed fol-lowed by co-IPs using the anti- PRPH2 (mouse anti-Prph2 2B7,
Figure 6. PRPH2 differentially interacts with M-opsin and S-opsin in cone OS. (A and B) Simplified paradigm of PRPH2 protein-protein interactions in the cone OS based
on the results of this and previous studies. (A) In lamellar rim regions of S-opsin expressing cones (S-cones), PRPH2 presumably simultaneously binds to its homolog
ROM-1 and to S-opsin. However, a large portion of the PRPH2/ROM-1 complexes probably remains unbound to S-opsin. (B) In lamellar rim regions of M-opsin expressing
cones (M-cones), larger portions of the PRPH2/ROM-1 complexes are expected to be bound to M-opsin. Similar to S-opsin, M-opsin molecules outside of the rim regions
are very likely not bound to PRPH2 complexes.
2374 | Human Molecular Genetics, 2016, Vol. 25, No. 12
at Universitaetsbibliothek der L
MU
Muenchen on D
ecember 22, 2016
http://hmg.oxfordjournals.org/
Dow
nloaded from

(12)) antibody. The membrane preparation and co-IP protocolswere identical to those described above for the HEK293 cells.
For immunoblotting, antibodies were used in following dilu-tions: mouse anti-Prph2, 1:1000; mouse anti-Rho, 1:2000; mouseanti-myc 1:2000; mouse anti-GFP, 1:2000.
Photometric FRET measurements
FRET measurements were performed as described (33). In short,HEK293 cells were transiently transfected using the calciumphosphate method. Twenty four to 48 h post-transfection, thecells were washed and maintained in buffer solution composedof 140 mM NaCl, 5 mM KCl, 1 mM MgCl2, 2 mM CaCl2, 10 mM glu-cose, 10 mM Na-HEPES, pH 7.4, at room temperature (RT).Isolated rod and cone OS were maintained in the same buffersolution at RT for 20 min to let the OS attach to the dish.Fluorescence intensities of cerulean and citrine were recordedusing a Leica DMI6000B inverted epifluorescence microscopeand a 914 photomultiplier detection system (PTI, Canada).Excitation was performed at 436 6 2.5 nm or 500 6 2.5 nm with aDeltaRam monochromator (Horiba, Canada) and emission wasdetected by a photomultiplier (PMT 914) and acquired on a per-sonal computer using FelixGX software (Horiba, Canada). ThreeCube FRET filter cubes were as follows (excitation, longpassbeamsplitter, emission): CFP/cerulean (ET436/20�; T455lp;ET480/40m), YFP/citrine (ET500/20�; T515lp; ET535/30m) andFRET (ET436/20�; T455lp; ET535/30m) (Chroma technology). Thefluorescence intensities (S) were measured in individual cellsco-expressing cerulean-and citrine-tagged proteins with the re-spective filter cube (excitation, emission): SFRET (436 6 10 nm,535 6 15 nm), Scerulean (436 6 10 nm, 480 6 20 nm) and Scitrine
(500 6 10 nm, 535 6 15 nm). The intensities of the signals weresubtracted from the background and FRs were calculated ac-cording to the three cube FRET equation described in (33). FRETefficiencies (EA) can be calculated from FRs using the followingequation:
EA ¼ FR� 1½ � � ecitrineð436Þeceruleanð436Þ
ecitrine and ecerulean are the setup specific average molar extinc-tion coefficients for citrine and cerulean, respectively, over theprecise bandwidth of the FRET cube excitation filter. Inour setup, the calculated molecular extinction coefficient ratiois ecitrine (436)/ecerulean (436)¼ 0.0563. FRET data were analyzedusing FelixGX (Horiba PTI, Canada) and Microsoft Excel(Microsoft).
Preparation of OS
Preparation of rod OS was conducted as described (4). Cone OSwere isolated using the same protocol.
rAAV preparation and subretinal injections
The production of single-strand AAVs (rAAV 2/8 YF) containingeither the hRHO or mSWS promoter and the procedure of subre-tinal injections were described previously (31). 1010 rAAV parti-cles were delivered by a single injection on postnatal day 14.Three weeks post injection, all injected retinas were analyzedfor the fluorescence using scanning laser ophthalmoscopy(Spectralis, Heidelberg Eye Instruments).
Immunohistology
For immunohistology, WT C57 BL/6J mice were injected on P14with the respective rAAV particles. Three weeks post injection,the retinas were dissected and processed for immunohistologyas described (34). We used the rabbit anti-CNGB1a (1:2000, (35)),rabbit anti-M-opsin (1:300, EMD Millipore) or rabbit S-opsin(1:300, EMD Millipore) antibody as marker for rod and cone OS,respectively. Retinal images were obtained by the TCS SP8 con-focal scan microscope (Leica), acquired with the LASAF software(Leica) and processed with the ImageJ software (NationalInstitutes of Health).
Post-embedding immunoelectron microscopy
The isolated retinae were fixed in 0.1% glutaraldehyde and 4%paraformaldehyde for 3 h at RT and processed further as de-scribed previously (36). After dehydration and embedding in LRWhite Resin (Plano, Agar Scientific), retinas were briefly poly-merized at 4 �C under indirect ultraviolet light (350 nm) for 48–60 h. After being sectioned on an ultramicrotome (ReichertUltracut E), retina sections (60–70 nm) were collected onPioloform coated nickel grids and etched with saturated sodiumperiodate solution (Sigma-Aldrich) at RT for 3–5 min. Followingpre-incubation in 0.1% Tween 20 (Sigma-Aldrich), the sectionswere blocked in 50 mM NH4Cl (Sigma-Aldrich) and blocking solu-tion (0.5% cold-water fish gelatine and 0.1% ovalbumin, bothSigma-Aldrich). After incubating the retina in primary antibod-ies (4 �C, 60 h), the sections were washed once with PBS andtwice in IgG-gold buffer (blocking solution including 0.01%Tween 20, 0.5 M NaCl) and incubated for 2 h with correspondingFab-conjugated nanogold antibodies prepared with gold parti-cles (Science Services, Aurion; diluted in IgG-gold buffer).Post-fixation in 1% glutaraldehyde for 10 min and air-dryingwas followed by silver intensification as described (37). All pri-mary antibodies used for post-embedding (anti-Per 2B7, anti-M-opsin and anti-s-opsin) were described above.
Image preparation
Post-embedded immunoelectron sections were stained withuranylacetate and lead citrate (Leica). Ultrathin sections wereexamined and photographed by using a Zeiss EM10 electron mi-croscope (Zeiss) and a Gatan SC1000 OriusTM CCD camera(Gatan) in combination with DigitalMicrographTM software(Gatan). Representative images were chosen based on the in-spection of several hundred slices from independent experi-ments. Micrographs were adjusted for contrast and brightnessby using Adobe Photoshop CS6 (Adobe Systems).
mRNA splicing analysis in cones
Splicing analysis of PRPH2 minigenes was performed as described(3). Briefly, WT C57 BL/6J mice were injected on P14 using respec-tive WT or V268I PRPH2 minigenes. Three weeks post injection,the retina fluorescence was confirmed by fundus photography(see above). Subsequently, four of the dissected fluorescent ret-inas for each PRPH2 minigene were pooled and used for RNA iso-lation with the RNeasy Mini Kit (Qiagen) according to theinstructions of the manufacturer. Equal concentrations (1 mg) ofthe isolated total RNA from each sample were applied for the sub-sequent cDNA synthesis (Revert Aid First Strand cDNA SythesisKit, Life Technologies). All experiments were performed on thesame day under the same conditions. For semi-quantitative
2375Human Molecular Genetics, 2016, Vol. 25, No. 12 |
at Universitaetsbibliothek der L
MU
Muenchen on D
ecember 22, 2016
http://hmg.oxfordjournals.org/
Dow
nloaded from

analysis of the single PRPH2 minigenes, three RT-PCR reactionswere conducted with variable number of cycles ranging between30 and 33 cycles. The absolute intensities of the single splicebands were determined using the Image Lab software (BioRad).
Statistics
All values are given as mean 6 SEM, and n is the number of tri-als. Unless stated otherwise, an unpaired Student’s t-test wasperformed for the comparison between two groups. Statisticalsignificance is given as follows: *, P< 0.05; **, P< 0.01; ***,P< 0.001. If multiple comparisons were made, significance wastested by analysis of variance (one way ANOVA) followed by theTukey’s multiple comparison test.
Supplementary materialSupplementary Material is available at HMG online.
Acknowledgements
We thank Berit Noack and Nadja Schroder for excellent techni-cal support. We also thank Stylianos Michalakis for critical com-ments on this manuscript and Muna Naash for the gift of theperipherin-2 antibody.
Conflict of Interest statement. None declared.
FundingThis work was supported by the Deutsche Forschungsgemeinschaft[BE 4830/1-1].
References1. Boon, C.J., den Hollander, A.I., Hoyng, C.B., Cremers, F.P.,
Klevering, B.J. and Keunen, J.E. (2008) The spectrum of retinaldystrophies caused by mutations in the peripherin/RDSgene. Prog. Retin. Eye Res., 27, 213–235.
2. Stuck, M.W., Conley, S.M. and Naash, M.I. (2016) PRPH2/RDS andROM-1: historical context, current views and future consider-ations. Prog. Retin. Eye Res., 52, 47–63.
3. Becirovic, E., Bohm, S., Nguyen, O.N., Riedmayr, L.M., Koch,M.A., Schulze, E., Kohl, S., Borsch, O., Santos-Ferreira, T.,Ader, M. et al. (2016) In Vivo analysis of disease-associatedpoint mutations unveils profound differences in mRNAsplicing of peripherin-2 in rod and cone photoreceptors.PLoS Genet., 12, e1005811.
4. Becirovic, E., Nguyen, O.N., Paparizos, C., Butz, E.S., Stern-Schneider, G., Wolfrum, U., Hauck, S.M., Ueffing, M., Wahl-Schott, C., Michalakis, S. et al. (2014) Peripherin-2 couplesrhodopsin to the CNG channel in outer segments of rod pho-toreceptors. Hum. Mol. Genet., 23, 5989–5997.
5. Bascom, R.A., Manara, S., Collins, L., Molday, R.S., Kalnins,V.I. and McInnes, R.R. (1992) Cloning of the cDNA for a novelphotoreceptor membrane protein (rom-1) identifies a diskrim protein family implicated in human retinopathies.Neuron, 8, 1171–1184.
6. Boesze-Battaglia, K., Song, H., Sokolov, M., Lillo, C.,Pankoski-Walker, L., Gretzula, C., Gallagher, B., Rachel, R.A.,Jenkins, N.A., Copeland, N.G. et al. (2007) The tetraspaninprotein peripherin-2 forms a complex with melanoregulin, aputative membrane fusion regulator. Biochemistry, 46,1256–1272.
7. Poetsch, A., Molday, L.L. and Molday, R.S. (2001) The cGMP-gated channel and related glutamic acid-rich proteins inter-act with peripherin-2 at the rim region of rod photoreceptordisc membranes. J. Biol. Chem., 276, 48009–48016.
8. Chakraborty, D., Conley, S.M., Stuck, M.W. and Naash, M.I.(2010) Differences in RDS trafficking, assembly and functionin cones versus rods: insights from studies of C150S-RDS.Hum. Mol. Genet., 19, 4799–4812.
9. Chakraborty, D., Ding, X.Q., Conley, S.M., Fliesler, S.J. andNaash, M.I. (2009) Differential requirements for retinal de-generation slow intermolecular disulfide-linked oligomeri-zation in rods versus cones. Hum. Mol. Genet., 18, 797–808.
10. Applebury, M.L., Antoch, M.P., Baxter, L.C., Chun, L.L., Falk,J.D., Farhangfar, F., Kage, K., Krzystolik, M.G., Lyass, L.A. andRobbins, J.T. (2000) The murine cone photoreceptor: a singlecone type expresses both S and M opsins with retinal spatialpatterning. Neuron, 27, 513–523.
11. Muller, F., Scholten, A., Ivanova, E., Haverkamp, S.,Kremmer, E. and Kaupp, U.B. (2003) HCN channels are ex-pressed differentially in retinal bipolar cells and concen-trated at synaptic terminals. Eur. J. Neurosci., 17, 2084–2096.
12. Conley, S.M., Stricker, H.M. and Naash, M.I. (2010)Biochemical analysis of phenotypic diversity associatedwith mutations in codon 244 of the retinal degenerationslow gene. Biochemistry, 49, 905–911.
13. Arikawa, K., Molday, L.L., Molday, R.S. and Williams, D.S. (1992)Localization of peripherin/rds in the disk membranes of coneand rod photoreceptors: relationship to disk membrane mor-phogenesis and retinal degeneration. J. Cell Biol., 116, 659–667.
14. Molday, R.S., Hicks, D. and Molday, L. (1987) Peripherin. Arim-specific membrane protein of rod outer segment discs.Invest. Ophthalmol. Vis. Sci., 28, 50–61.
15. Han, Z., Anderson, D.W. and Papermaster, D.S. (2012)Prominin-1 localizes to the open rims of outer segment la-mellae in Xenopus laevis rod and cone photoreceptors.Invest. Ophthalmol. Vis. Sci., 53, 361–373.
16. Loewen, C.J., Moritz, O.L., Tam, B.M., Papermaster, D.S. andMolday, R.S. (2003) The role of subunit assembly in periph-erin-2 targeting to rod photoreceptor disk membranes andretinitis pigmentosa. Mol. Biol. Cell, 14, 3400–3413.
17. Felbor, U., Schilling, H. and Weber, B.H. (1997) Adult vitelli-form macular dystrophy is frequently associated with muta-tions in the peripherin/RDS gene. Hum. Mutat., 10, 301–309.
18. Akimoto, M., Cheng, H., Zhu, D., Brzezinski, J.A., Khanna, R.,Filippova, E., Oh, E.C., Jing, Y., Linares, J.L., Brooks, M. et al.(2006) Targeting of GFP to newborn rods by Nrl promoter andtemporal expression profiling of flow-sorted photoreceptors.Proc. Natl. Acad. Sci. U S A., 103, 3890–3895.
19. Ding, X.Q., Nour, M., Ritter, L.M., Goldberg, A.F., Fliesler, S.J.and Naash, M.I. (2004) The R172W mutation in peripherin/rds causes a cone-rod dystrophy in transgenic mice. Hum.Mol. Genet., 13, 2075–2087.
20. Kedzierski, W., Lloyd, M., Birch, D.G., Bok, D. and Travis, G.H.(1997) Generation and analysis of transgenic mice express-ing P216L-substituted rds/peripherin in rod photoreceptors.Invest. Ophthalmol. Vis. Sci., 38, 498–509.
21. Stricker, H.M., Ding, X.Q., Quiambao, A., Fliesler, S.J. andNaash, M.I. (2005) The Cys214–>Ser mutation in peripherin/rds causes a loss-of-function phenotype in transgenic mice.Biochem. J., 388, 605–613.
22. Gunkel, M., Schoneberg, J., Alkhaldi, W., Irsen, S., Noe, F.,Kaupp, U.B. and Al-Amoudi, A. (2015) Higher-order architectureof rhodopsin in intact photoreceptors and its implication forphototransduction kinetics. Structure, 23, 628–638.
2376 | Human Molecular Genetics, 2016, Vol. 25, No. 12
at Universitaetsbibliothek der L
MU
Muenchen on D
ecember 22, 2016
http://hmg.oxfordjournals.org/
Dow
nloaded from
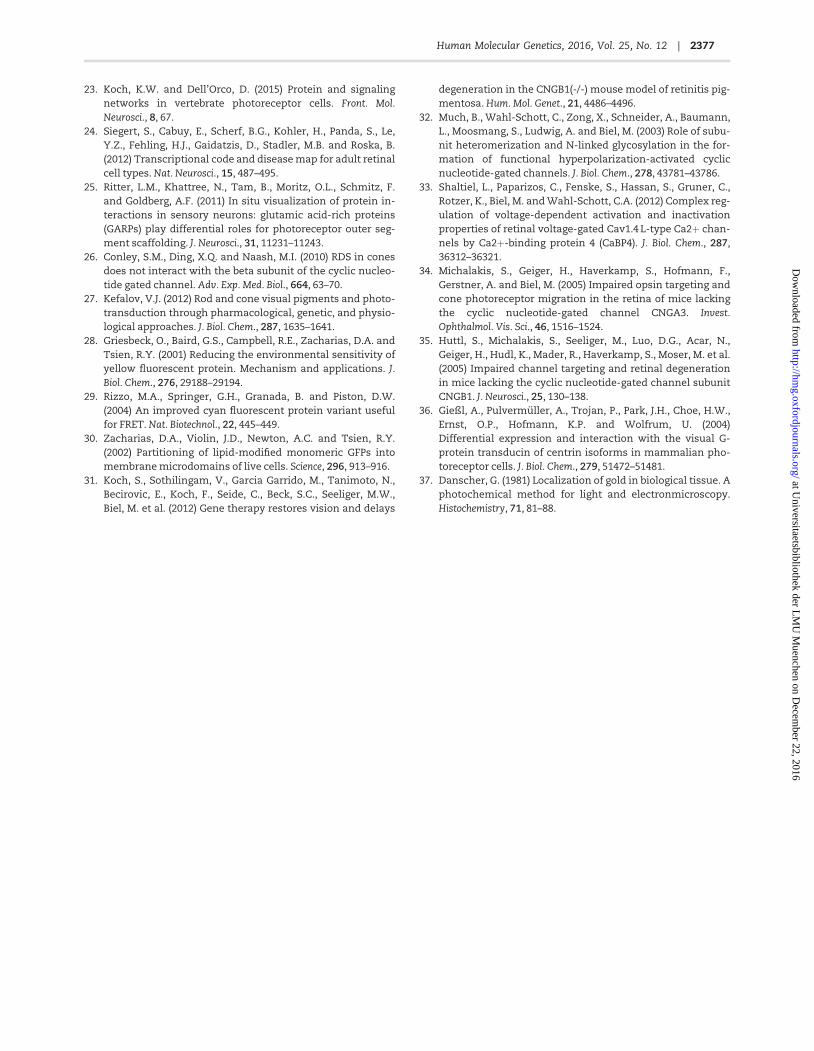
23. Koch, K.W. and Dell’Orco, D. (2015) Protein and signalingnetworks in vertebrate photoreceptor cells. Front. Mol.Neurosci., 8, 67.
24. Siegert, S., Cabuy, E., Scherf, B.G., Kohler, H., Panda, S., Le,Y.Z., Fehling, H.J., Gaidatzis, D., Stadler, M.B. and Roska, B.(2012) Transcriptional code and disease map for adult retinalcell types. Nat. Neurosci., 15, 487–495.
25. Ritter, L.M., Khattree, N., Tam, B., Moritz, O.L., Schmitz, F.and Goldberg, A.F. (2011) In situ visualization of protein in-teractions in sensory neurons: glutamic acid-rich proteins(GARPs) play differential roles for photoreceptor outer seg-ment scaffolding. J. Neurosci., 31, 11231–11243.
26. Conley, S.M., Ding, X.Q. and Naash, M.I. (2010) RDS in conesdoes not interact with the beta subunit of the cyclic nucleo-tide gated channel. Adv. Exp. Med. Biol., 664, 63–70.
27. Kefalov, V.J. (2012) Rod and cone visual pigments and photo-transduction through pharmacological, genetic, and physio-logical approaches. J. Biol. Chem., 287, 1635–1641.
28. Griesbeck, O., Baird, G.S., Campbell, R.E., Zacharias, D.A. andTsien, R.Y. (2001) Reducing the environmental sensitivity ofyellow fluorescent protein. Mechanism and applications. J.Biol. Chem., 276, 29188–29194.
29. Rizzo, M.A., Springer, G.H., Granada, B. and Piston, D.W.(2004) An improved cyan fluorescent protein variant usefulfor FRET. Nat. Biotechnol., 22, 445–449.
30. Zacharias, D.A., Violin, J.D., Newton, A.C. and Tsien, R.Y.(2002) Partitioning of lipid-modified monomeric GFPs intomembrane microdomains of live cells. Science, 296, 913–916.
31. Koch, S., Sothilingam, V., Garcia Garrido, M., Tanimoto, N.,Becirovic, E., Koch, F., Seide, C., Beck, S.C., Seeliger, M.W.,Biel, M. et al. (2012) Gene therapy restores vision and delays
degeneration in the CNGB1(-/-) mouse model of retinitis pig-mentosa. Hum. Mol. Genet., 21, 4486–4496.
32. Much, B., Wahl-Schott, C., Zong, X., Schneider, A., Baumann,L., Moosmang, S., Ludwig, A. and Biel, M. (2003) Role of subu-nit heteromerization and N-linked glycosylation in the for-mation of functional hyperpolarization-activated cyclicnucleotide-gated channels. J. Biol. Chem., 278, 43781–43786.
33. Shaltiel, L., Paparizos, C., Fenske, S., Hassan, S., Gruner, C.,Rotzer, K., Biel, M. and Wahl-Schott, C.A. (2012) Complex reg-ulation of voltage-dependent activation and inactivationproperties of retinal voltage-gated Cav1.4 L-type Ca2þ chan-nels by Ca2þ-binding protein 4 (CaBP4). J. Biol. Chem., 287,36312–36321.
34. Michalakis, S., Geiger, H., Haverkamp, S., Hofmann, F.,Gerstner, A. and Biel, M. (2005) Impaired opsin targeting andcone photoreceptor migration in the retina of mice lackingthe cyclic nucleotide-gated channel CNGA3. Invest.Ophthalmol. Vis. Sci., 46, 1516–1524.
35. Huttl, S., Michalakis, S., Seeliger, M., Luo, D.G., Acar, N.,Geiger, H., Hudl, K., Mader, R., Haverkamp, S., Moser, M. et al.(2005) Impaired channel targeting and retinal degenerationin mice lacking the cyclic nucleotide-gated channel subunitCNGB1. J. Neurosci., 25, 130–138.
36. Gießl, A., Pulvermuller, A., Trojan, P., Park, J.H., Choe, H.W.,Ernst, O.P., Hofmann, K.P. and Wolfrum, U. (2004)Differential expression and interaction with the visual G-protein transducin of centrin isoforms in mammalian pho-toreceptor cells. J. Biol. Chem., 279, 51472–51481.
37. Danscher, G. (1981) Localization of gold in biological tissue. Aphotochemical method for light and electronmicroscopy.Histochemistry, 71, 81–88.
2377Human Molecular Genetics, 2016, Vol. 25, No. 12 |
at Universitaetsbibliothek der L
MU
Muenchen on D
ecember 22, 2016
http://hmg.oxfordjournals.org/
Dow
nloaded from

Suppl. Fig. 1 Immunogold TEM labeling of photoreceptor OS confirms the specificity of
peripherin-2 and cone opsin antibodies. A-C, Representative TEM images of post-
embedded rod and cone OS sections from 8-week old light-adapted C57/BL6J WT mice
labeled with gold particles coupled to peripherin-2 (A), M-opsin (B), or S-opsin (A) specific
antibodies. Note that the concentrations for S-opsin and M-opsin antibodies were higher than
those used for co-labeling experiments shown in Fig. 2, resulting in stronger staining of cone
OS. However, even under these high concentrations of M-opsin and S-opsin antibodies, no
staining of rod OS was detectable, demonstrating the specificity of the respective antibodies.

Suppl. Fig. 2 Immunolabeling of the V268I mutant in murine rods and confocal images
of FRET channels in isolated rod OS. A, Co-immunolabeling of retinal sections from WT
mice subretinally injected with rAAV particles containing C-terminally cerulean-tagged
V268I mutant (V268I_cer) under the control of the human rhodopsin (hRHO) promoter.
CNGB1a antibody (B1a) was used as marker for rod OS. Scale bar = 10 µm. B,
Representative confocal FRET channel images from isolated rod OS of WT mice co-injected
with rAAV particles containing the P-V268I_cer/Rhodopsin_citr FRET pair as described in
Fig. 3A under the control of the hRHO promoter. Scale bar = 1 µm.

Suppl. Fig. 3 mRNA splicing of the V268I mutant in cones. A, Representative RT-PCR
from retinal cDNA generated from total RNA of WT animals injected on P14 with rAAV
PRPH2 minigene constructs harboring the mSWS promoter. The respective minigenes, RT-
PCR primers, and detailed experimental conditions were recently described (1). Ctrl, control
containing the cDNA from non-transduced retina. The single bands of the relevant splice
products are highlighted by arrows: i) unspliced, ii) intron 1 retention, and iii) correctly
spliced, respectively. (B-D) Semi-quantitative analysis of the relative signal intensity
percentages of the unspliced (B), intron 1 retention (C), and correctly spliced (D) PRPH2
transcripts. For both, WT and V268I peripherin-2 minigenes, the mean percentage of the
intensities of these three splice variants relative to the total intensity (given as sum of the
single intensities) was calculated from five RT-PCR analyses. Significance was calculated
using the unpaired student’s t-test. P-values are as follows: unspliced, p = 0.2075; intron 1
retention, p = 0.1332; correctly spliced, p = 0.8654.
References
1 Becirovic, E., Bohm, S., Nguyen, O.N., Riedmayr, L.M., Koch, M.A., Schulze, E.,
Kohl, S., Borsch, O., Santos-Ferreira, T., Ader, M. et al. (2016) In Vivo Analysis of Disease-
Associated Point Mutations Unveils Profound Differences in mRNA Splicing of Peripherin-2
in Rod and Cone Photoreceptors. PLoS Genet, 12, e1005811.

PROTOCOLSpublished: 28 July 2016
doi: 10.3389/fnins.2016.00356
Frontiers in Neuroscience | www.frontiersin.org 1 July 2016 | Volume 10 | Article 356
Edited by:
Hildegard Büning,
University of Cologne, Germany
Reviewed by:
Peter Christian Kloehn,
University College London, UK
Jiajie Diao,
University of Cincinnati, USA
*Correspondence:
Elvir Becirovic
Stylianos Michalakis
Specialty section:
This article was submitted to
Neurodegeneration,
a section of the journal
Frontiers in Neuroscience
Received: 20 April 2016
Accepted: 14 July 2016
Published: 28 July 2016
Citation:
Becirovic E, Böhm S, Nguyen ONP,
Riedmayr LM, Hammelmann V,
Schön C, Butz ES, Wahl-Schott C,
Biel M and Michalakis S (2016) AAV
Vectors for FRET-Based Analysis of
Protein-Protein Interactions in
Photoreceptor Outer Segments.
Front. Neurosci. 10:356.
doi: 10.3389/fnins.2016.00356
AAV Vectors for FRET-Based Analysisof Protein-Protein Interactions inPhotoreceptor Outer Segments
Elvir Becirovic 1, 2*, Sybille Böhm 1, 2, Ong N. P. Nguyen 1, 2, Lisa M. Riedmayr 1, 2,
Verena Hammelmann 1, 2, Christian Schön 1, 2, Elisabeth S. Butz 1, 2, Christian Wahl-Schott 1, 2,
Martin Biel 1, 2 and Stylianos Michalakis 1, 2*
1Department of Pharmacy – Center for Integrated Protein Science Munich (CiPSM), Ludwig-Maximilians-Universität
München, Munich, Germany, 2Department of Pharmacy – Center for Drug Research, Ludwig-Maximilians-Universität
München, Munich, Germany
Fluorescence resonance energy transfer (FRET) is a powerful method for the
detection and quantification of stationary and dynamic protein-protein interactions.
Technical limitations have hampered systematic in vivo FRET experiments to study
protein-protein interactions in their native environment. Here, we describe a rapid and
robust protocol that combines adeno-associated virus (AAV) vector-mediated in vivo
delivery of genetically encoded FRET partners with ex vivo FRET measurements. The
method was established on acutely isolated outer segments of murine rod and cone
photoreceptors and relies on the high co-transduction efficiency of retinal photoreceptors
by co-delivered AAV vectors. The procedure can be used for the systematic analysis of
protein-protein interactions of wild type or mutant outer segment proteins in their native
environment. Conclusively, our protocol can help to characterize the physiological and
pathophysiological relevance of photoreceptor specific proteins and, in principle, should
also be transferable to other cell types.
Keywords: fluorescence resonance energy transfer, FRET, adeno-associated viral vectors, AAV, protein-protein
interaction, photoreceptor, outer segment
INTRODUCTION
The outer segments (OS) of rod and cone photoreceptors are highly specialized cilia harboring allproteins involved in light-induced phototransduction (Arshavsky and Burns, 2012). Mutations ingenes encoding these proteins lead to untreatable diseases that severely impair rod and/or conestructure and/or functionality (Berger et al., 2010). The majority of these genes encode proteinsthat are organized in large macromolecular complexes assembled by networks of homomericand/or heteromeric protein-protein interactions (Roepman and Wolfrum, 2007). To decipherpathomechanisms underlying the retinal disorders and to develop appropriate treatments, theidentification and characterization of these networks is inevitable. So far, the vast majority of OSprotein-protein interaction studies in photoreceptors were performed using classical biochemicaltechniques (Goldberg et al., 1995; Loewen and Molday, 2000; Poetsch et al., 2001; Jastrzebska et al.,2004; Michalakis et al., 2011; Knepp et al., 2012). However, the biochemical techniques have severallimitations: (i) They strongly rely on the availability of antibodies with high affinity and specificity,(ii) they do not necessarily reflect “true” interactions since, due to the tissue homogenization, some

Becirovic et al. AAVs for FRET in Photoreceptors
proteins may randomly interact even though they are spatiallyseparated in vivo, (iii) they do not allow for dynamicmeasurements, and (iv) exact quantification of interactions israther difficult as many different technical parameters whichmight influence the interaction must be controlled rigorously.
With regard to these obstacles, FRET is superior to thebiochemical approaches. One important constraint of FRET isthe fact that it requires the co-expression of the fluorescentlytagged molecules in a given cell type. This can be easilyhandled in heterologous expression systems, however, in complexorganisms like mammals the application of FRET has beenhampered by the laborious and time consuming generation oftransgenic animals. Therefore, only a few FRET-based studieswere performed in vivo, most of them using FRET biosensors foranalysis of spatiotemporal dynamics of small signaling molecules(Hovan et al., 2010; Hirata et al., 2012; Wen et al., 2013;Kumagai et al., 2014). Here, we describe a protocol for systematicmonitoring of protein-protein interactions without the necessityof generating transgenic animals. The technique utilizes adeno-associated virus (AAV) vectors that are valuable tools for in vivogene transfer into brain and retinal neurons (Schön et al.,2013; Murlidharan et al., 2014; Trapani et al., 2014; Zacchignaet al., 2014). AAVs lead to long-term ectopic expression of thetransgene in mammals and thus can be used as a rapid alternativeto the generation of transgenic animals. We have already usedAAV mediated viral gene expression in retinal neurons in ourprevious studies (Becirovic et al., 2014, 2016; Nguyen et al.,2016).
The protocol allows for rapid and robust measurementsof sensitized acceptor emission FRET on isolated virallytransduced murine photoreceptor OS. The complete procedurecan be performed within 3 weeks on wild type animalsand requires only limited expertise and special equipment(Figure 1). We show that this method is suitable for thedetection and quantification of protein-protein interactions ofproteins involved in the pathogenesis of hereditary degenerativeretinal diseases. We propose the application of this method forFRET-based protein-protein interaction studies in other primarycilia of many cell types to study the pathogenesis of otherciliopathies.
Experimental ProcedureThe genes of interest encoding each of the protein-proteininteraction partners are C- and/or N-terminally fused tothe genes encoding citrine or cerulean, two FRET-optimizedderivatives of YFP and CFP, respectively (Griesbeck et al.,2001; Rizzo et al., 2004). Each of these constructs is thencloned into the multiple cloning site of a rAAV cis-plasmidcontaining the rod photoreceptor specific human rhodopsin(hRHO) (Allocca et al., 2007) or murine short wavelength opsin(mSWS) promoter (Michalakis et al., 2010a), a Woodchuckhepatitis virus posttranscriptional regulatory element (WPRE),and a bovine growth hormone polyadenylation signal (BGHpA). Subsequently, each rAAV cis plasmid is co-transfectedwith the trans (AAV helper and Adeno helper) plasmidsinto HEK293T cells using triple Ca2+ phosphate transfection.rAAV particles are then purified in a multistep procedure
that yields high titers of approx. 1013 vector genomes (vg)per ml. For FRET measurements, 1 × 10⁹ total vg of eachconstruct is delivered into the subretinal space of anesthetizedmice. For co-transduction experiments of two titer-matchedconstructs a total number of 2 × 10⁹ total vg is injected.The co-transduction efficiency was up to 90% in rods andup to 30% in cones after co-delivery of mixtures of tworAAVs. The isolation of rod or cone OS was performed10–14 days post-injection using a modified version of themechanical share method (Mitchell et al., 2009). Three cubeFRET measurements were carried out using a slightly modifiedversion of the protocol described previously (Erickson et al.,2003; Shaltiel et al., 2012; Ben Johny et al., 2013). The isolatedOS were stable for several hours after isolation, which inprinciple also allows for dynamic FRET measurements of singleinteractions.
Using this method, we were able to confirm severalhomomeric and heteromeric protein-protein interactions in rodOS that had been previously observed using other (biochemical)methods. In addition, we also identified novel protein-proteininteractions in OS of rods and cones. Furthermore, wedemonstrate that FRET is applicable to quantify the effectsof disease associated point mutations on protein-proteininteractions in these compartments. Conclusively, we show thatour FRET protocol enables robust qualitative and quantitativemeasurements of protein-protein interactions in small cellularcompartments like photoreceptor OS.
Advantages of the MethodCompared to FRET and other ex vivo measurements of protein-protein interactions, which are currently widely used, thismethod has several advantages:
(i) It can be performed within 3 weeks including theproduction of specific rAAVs. The isolation of OS can becarried out within a few minutes and yields a high quantityof OS of adequate quality and purity.
(ii) It allows for systematic analysis of protein-proteininteractions ex vivo in a specialized small compartmentwith preserved native morphology.
(iii) It is principally transferable to analyses of protein-proteininteractions in ciliary compartments of other tissues (e.g.,respiratory cilia and olfactory cilia). This is of specialimportance for deciphering the disease mechanisms of alarge group of diseases known as ciliopathies.
(iv) As isolated OS are stable for up to 6 h, the method can alsobe used for dynamic FRET measurements.
(v) The protocol was established in wild type mice. Thus, itallows for systematic analysis of disease mechanisms ofsingle disease associated point mutations without the timeconsuming generation of transgenic animals.
(vi) It can in principle be used to determine the relative bindingaffinities of single interactions.
(vii) The co-transduction efficiency for two constructs was upto 90% for rod OS and up to 30% for cone OS. Hence,a sufficient number of OS co-expressing both proteins ofinterest can be isolated from a single animal.
Frontiers in Neuroscience | www.frontiersin.org 2 July 2016 | Volume 10 | Article 356

Becirovic et al. AAVs for FRET in Photoreceptors
FIGURE 1 | Schematic overview of the main steps of the procedure. AAV vectors encoding the FRET fusion proteins are produced in HEK293T cells (day 1–10).
Single AAV vectors and combinations of AAVs encoding the FRET partners are delivered into the subretinal space of wildtype mice (day 11). Ten days later, OS are
isolated for ex vivo FRET measurements.
(viii) In principle, it can be adapted for the establishment ofFRET measurements on retinas of living animals.
(ix) Due to its easy handling our protocol should also betransferable to other tissues or organisms.
Limitations of the MethodThere are a few limitations of themethod, which can be overcomeby appropriate techniques or conditions:
(i) With respect to the packaging capacity of rAAVs (5 kb)(Trapani et al., 2014), this method seems less suitable foranalysis of protein-protein interactions of large proteins.However, there are several approaches showing that largertranscripts can also be packaged into rAAVs, even thoughwith lower efficiencies (Trapani et al., 2014).
(ii) The endogenous wild type proteins in the OS of transducedphotoreceptors interfere with the labeled constructs andlead to overall lower FRET efficiencies than expectedfrom in vitro experiments (incomplete labeling) (Becirovicet al., 2014). This limitation should be of relevance onlyif weak interactions are expected. This issue could beovercome by using appropriate single or double knock-out animals, which lack expression of the endogenous(unlabeled) proteins of interest.
(iii) So far, we found no short or long term toxic effectsof the fluorophores on the structural integrity of theretina, which is consistent with previous studies (Bennettet al., 1999; Becirovic et al., 2014). However, we cannotexclude that large amounts of specific cerulean- or
citrine-tagged proteins could have toxic effects thatinfluence photoreceptor function and morphology.Therefore, to exclude any toxic effects, we suggest usinghistological analysis of retinal cross sections prior to theactual FRET measurements for each construct.
(iv) In the case of three cube FRET, in addition to thesimultaneous delivery of two FRET partners, injections ofsingle FRET constructs are also necessary. They serve asbleed-through and crosstalk controls for the determinationof the FRET efficiencies.
(v) Overexpression of the tagged proteins by strong promotersmight result in an artefactual FRET signal. To excludethis possibility, additional controls might be necessary.In this context, the most eligible control is to use pointmutations within the protein-protein interaction site of one(or both) FRET partners. If the protein interaction interfaceis not known, artefactual FRET signal can be excluded byoverexpressing other proteins not expected to interact withthe respective FRET partner.
(vi) Bulky fluorescent tags could possibly hinder propertrafficking or localization of the fusion protein (Feilmeieret al., 2000). In addition, they might influence the properfolding and the stability of the protein. In turn, incorrectfolding may also affect the fluorophore itself and leadto little or no fluorescence (Waldo et al., 1999). Ifthese problems occur, they can be overcome by varyingthe position of the fluorescent tag within the proteinor by placing a short linker sequence between tag andprotein.
Frontiers in Neuroscience | www.frontiersin.org 3 July 2016 | Volume 10 | Article 356

Becirovic et al. AAVs for FRET in Photoreceptors
MATERIALS AND EQUIPMENT
AnimalsAll procedures were performed on P14-21 C57BL/6J micewith permission from local authorities (District Governmentof Upper Bavaria). Anesthesia was performed by subcutaneousinjection of ketamine (40mg/kg body weight) and xylazine(20mg/kg body weight). Euthanasia was performed by cervicaldislocation.
Reagents• Sodium chloride (NaCl; VWR, cat. no. 27810.364)• Potassium chloride (KCl; Carl Roth, cat. no. 6781.1)• Magnesium chloride hexahydrate (MgCl2 × 6H2O; Carl Roth,
cat. no. 2189.1)• Calcium chloride dihydrate (CaCl2 × 2H2O; VWR, cat. no.
22317.230)• Glucose monohydrate (Carl Roth, cat. no. 6887.1)• HEPES sodium salt (VWR, cat. no. A16516.22)• Sodium hydroxide, 5M (NaOH; VWR, 28244.295)• KAPA SYBR FAST Universal x2 qPCRMasterMix (peqlab, cat.
no. 07-KK4600-01)• Poly-L-lysine, 1mg/ml (Sigma, cat. no. P2636)• Polybrene/Hexadimethrine bromide (Sigma, cat. no. 107689)• Dextran (Sigma, cat. no. 95771)• BES sodium salt (Sigma, cat. no. B2891)• AAV cis (for cloning of the expression cassette) and trans
plasmids (encoding for Cap, Rep and adenoviral helper genes)can be obtained from various sources including Penn VectorCore (http://www.med.upenn.edu/gtp/vectorcore) or fromUNC Vector Core (http://www.med.unc.edu/genetherapy/vectorcore,seealsoRef. Grieger et al., 2006)
• Benzonase (VWR, cat. no. 1.01695.0001)• OptiPrep (Progen, cat. no. 1114542)• Disodium hydrogen phosphate (Na2HPO4; Sigma, cat. no.
S9763)• Sodium dihydrogen phosphate (NaH2PO4; Sigma, cat. no.
S5011)• Tris(hydroxymethyl)aminomethane (TRIS; VWR, cat. no.
71003-490)• Phenol red (Sigma, cat. no. P3532)• Tween 20 (Sigma, cat. no. P2287).
Equipment for rAAV Preparation andSubretinal Injection• Vortexer• Microcentrifuge tubes, 1.5ml• Microcentrifuge tubes with screw cap, 1.5ml• ibidi µ-dish, 35mm, low (ibidi, cat. no. 80131)• Room temperature bench top centrifuge (1.5ml tube rotor)• Petri dishes, 3 cm• Forceps• Polystyrene tubes, 50ml• Cell culture dishes, 15 cm• Cell scraper (VWR, cat. no. 734-1111)• Liquid nitrogen
• Quick-Seal polypropylene tubes, 39ml (Beckman, cat. no.342141)
• Glass pipettes• Peristaltic pump MINIPULS 3 (Gilson, cat. no. n/a)• Quick-Seal Cordless Tube Topper kit, 50Hz (Beckman, cat.
no. 358313)• Beckman Coulter J2-MC high speed centrifuge (Beckman, cat.
no. n/a)• JA-10 Rotor, Fixed Angle, Aluminum, 6× 500ml, 10,000 rpm,
17,700× g (Beckman, cat. no. 369687)• Beckman Coulter Optima LE-80K ultracentrifuge (Beckman,
cat. no. n/a)• 70 Ti Rotor, Fixed Angle, Titanium, 8 × 39mm, 70,000 rpm,
504,000× g (Beckman, cat. no. 337922)• Syringe needle, 21-gauge• Syringe, 5ml• Sterile syringe filters with acrylic housing, 0.2µm, cellulose
acetate (VWR, cat. no. 28145-477)• HiTrap Q FF sepharose column, 5ml (GE Healthcare, cat. no.
17-5156-01)• Superloop, 50ml (GE Healthcare, cat. no. 19-7850-01)• ÄKTAprime plus chromatography system (GEHealthcare, cat.
no. 11-0013-13)• PrimeView 5.31 software (GE Healthcare, cat. no. 28-9949-61)• Amicon Ultra-4 centrifugal filter units, 100 kDa (Millipore,
cat. no. UFC810024)• LightCycler 480 multiwell plate 96 (Roche, cat. no.
04729692001)• LightCycler 480 Sealing Foil (Roche, cat. no. 04729757001)• LightCycler 480 Instrument II real-time PCR amplification
and detection instrument (Roche, cat. no. 05015278001)• NanoFil syringe, 10µl (World Precision Instruments, cat. no.
NANOFIL)• NanoFil 34-gauge beveled needle (World Precision
Instruments, cat. no. NF34BV-2)• Nanodrop 2000c UV-Vis spectrophotometer (peqlab, ca. no.
91-ND-2000C)• Dexpanthenol eye and nose salve, 5% (Bepanthen, Bayer Vital
GmbH, cat. no. 1578681)• OPMI 1 FR pro surgical microscope (Zeiss, cat. no. n/a)• Gentamicin 5 mg/g and dexamethasone 0.3 mg/g eye
salve (Dexamytrex, Dr. Gerhard Mann GmbH, cat. no.2747789)
• Dissection stereomicroscope Stemi 2000 (Zeiss, cat. no.495005-0022-000)
• Epifluorescence microscope Axioplan 2 imaging (Zeiss, cat.no. n/a).
Equipment for Three Cube FRETMeasurements• Inverted fluorescent microscope (Leica, cat. no. DMI6000B)• HC PL APO 63x/1.40-0.60 oil immersion objective (Leica, cat.
no. 11506349)• Cerulean filter cube, excitation: ET436/20x, Dichroic: T455lp,
emission: ET480/40m, transmission rate 93–97% (ChromaTechnology, cat. no. 49001)
Frontiers in Neuroscience | www.frontiersin.org 4 July 2016 | Volume 10 | Article 356

Becirovic et al. AAVs for FRET in Photoreceptors
• Citrine filter cube, excitation: ET500/20x, Dichroic: T515lp,emission: ET535/30m, transmission rate 93–97% (ChromaTechnology, cat. no. 49003)
• FRET filter cube, excitation: ET436/20x, Dichroic: T455lp,emission: ET535/30m, transmission rate 93–97% (ChromaTechnology, cat. no. 49052)
• DeltaRamX monochromator (Horiba, cat. no. n/a)• D-104 B microscope photometer (Horiba, cat. no. n/a)• Xenon short arc lamp type UXL-75XE (Ushio Inc. Japan, cat.
no. n/a)• PMT housing 914 (Horiba, cat. no. n/a)• R1527 photomultiplier (Horiba, cat. no. n/a)• FelixGX software (Horiba, cat. no. n/a)• MATLAB R© R2014b (MathWorks. Inc., cat. no. n/a)• Excel software (Microsoft Corporation, cat. no. n/a).
Buffers and Solutions2x BBS transfection solution Final component concentrationsare 45mMBES, 280mMNaCl, 1.5mMNa2HPO4. Adjust the pHto 6.95 and sterile filtrate. Prepare 50ml aliquots and store themat 4◦C for up to 1 year.
Lysis Buffer Final component concentrations are 150mMNaCl, 50mM TRIS. Adjust the pH to 8.5 and sterile filtrate.Prepare freshly before use.
15% iodixanol solution Final component concentrations are1x PBS (phosphate buffered saline), 1mM MgCl2, 2.5mM KCl,1M NaCl, 15% Optiprep. Add phenol red (use 1% solution) adlibitum until the solution is visibly colored. Store at 4◦C for up to1 week.
25% iodixanol solution Final component concentrations are1x PBS, 1mM MgCl2, 2.5mM KCl, 25% Optiprep. Add phenolred (use 1% solution) ad libitum until the solution is visiblycolored. Store at 4◦C for up to 1 week.
40% iodixanol solution Final component concentrations are1x PBS, 1mMMgCl2, 2.5mMKCl, 1MNaCl, 40%Optiprep. Thesolution remains uncolored. Store at 4◦C for up to 1 week.
60% iodixanol solution Final component concentrations are1mM MgCl2, 2.5mM KCl, 60% Optiprep. Add phenol red (use1% solution) ad libitum until the solution is visibly colored. Storeat 4◦C for up to 1 week.
PBS-MK solution Final component concentrations are 1xPBS, 1mM MgCl2, 2.5mM KCl. Sterile filtrate and store at 4◦Cfor up to 1 week.
Buffer A Final component concentrations are 20mM TRIS,15mMNaCl. Adjust the pH to 8.5. Store at 4◦C for up to 1 week.
Buffer B Final component concentration is 2.5M NaCl.Adjust the pH to 8.5. Store at 4◦C for up to 1 week.
FRET imaging solution Final component concentrations are140mM NaCl, 5mM KCl,
1mM MgCl2, 2mM CaCl2, 10mM glucose, 10mM HEPESsodium salt. Adjust the pH with 5M NaOH to 7.4. Prepare 50mlaliquots and store them at −20◦C for up to 1 year. Store thawedaliquots at 4◦C for up to 1 week.
FRET Imaging SetupImaging dishes We recommend the use of commerciallyavailable glass-bottomed cell-culture dishes for imaging. They
should be coated with Poly-L-lysine to ensure completeadherence and immobilization of OS. In our hands, the use ofpre-coated dishes (e.g., ibiTreat, ibidi) resulted in insufficient OSadherence.
Inverted epifluorescent microscope, excitation source, and
detection All measurements were performed using a LeicaDMI6000B inverted fluorescent microscope equipped with amotorized turret and a 63x oil objective. Themicroscope containsa motorized filter-wheel enabling rapid switching of filter cubeswithin 300ms. Of note, the 40x oil objective is also suitable forFRET measurements on isolated OS. The fluorescent intensityis detected by a photomultiplier detection system including aphotomultiplier tube (Horiba). As excitation source, we usea DeltaRam monochromator containing a 150W xenon highstability lamp. The use of a conventional LED lamp is alsosuitable. However, it is crucial to achieve a stable uniformillumination.
Excitation filter, emission filter, and dichroic mirror
The following filter cubes are present in our microscope: Adonor cube containing a cerulean excitation filter, T455lpdichroic mirror and a cerulean emission filter; an acceptorcube with a citrine excitation filter, T515lp dichroic mirror,and a citrine emission filter. Furthermore a FRET cubecontaining a cerulean excitation filter, T455lp dichroicmirror and a citrine emission filter. In case of using amonochromator as excitation source, the excitation filters areoptional.
Software and data acquisition For photometric FRETmeasurements, we employ the three cube FRET method(Erickson et al., 2003; Shaltiel et al., 2012; Ben Johny et al.,2013) that utilizes the detection of fluorescence intensitiesfrom a specimen using three filter cubes. The excitationsource (DeltaRam monochromator) and appendant excitationparameters (e.g., wavelength, pulse duration) are therebycontrolled via the software FelixGX, whereas the filter switchis done manually. Fluorescence intensity signals are acquiredwith the FelixGX software and deciphered with a custom-writtenMATLAB script. Subsequent analysis is performed using Excel oran adequate data processing software.
STEPWISE PROCEDURES
Production and Titer Determination ofrAAVsTransfection, Harvesting, and Lysis of HEK293T CellsThe production and handling of recombinant pseudotypedAAV2-derived vectors is subject to biosafety level 1. For a detailedprotocol on AAV production, see ref. (Grieger et al., 2006). 24 hbefore transfection, confluent 15-cm-dishes of HEK293T cellswere split into 15 15-cm-dishes for each construct. For calciumphosphate transfection, the components listed in Table 1 (theamounts are adjusted for transfection of 15 15-cm-dishes) wereadded in a 50-ml polystyrene tube. The following two equationsare used to calculate the amount of pAd Helper plasmid andAAV2/8 Cap/Rep plasmid needed for the pre-transfection mixdescribed in Table 1, respectively:
Frontiers in Neuroscience | www.frontiersin.org 5 July 2016 | Volume 10 | Article 356

Becirovic et al. AAVs for FRET in Photoreceptors
x (amount of pAd Helper) =m (transgene AAV) × MM (pAd Helper)
MM (transgene AAV)=
270 µg × 9509 gmol
MM (transgene AAV)
y(
amount of AAV 2/8 Rep/Cap)
=m
(
transgene AAV)
×MM(
AAV 2/8 Rep/Cap)
MM(
transgene AAV) =
270 µg × 4523 gmol
MM(
transgene AAV)
MM =molar mass of double stranded plasmid.While vortexing the pre-transfection mix in the polystyrene
tube at maximum speed, 15ml 2x BBS was added dropwise. Themixture was incubated at room temperature for 4–5min and2ml of the transfection mix was added dropwise to each 15-cm-dish of ∼80% confluent HEK293T cells. Transfected cellswere then incubated at 37◦C and 5% CO2 atmosphere for 24 h.Subsequently, the medium from transfected cells was replacedand the cells were incubated at 37◦C and 10% CO2 atmospherefor additional 24 h. 48 h post transfection, the cells were harvestedby scraping them from each 15-cm-dish. Cell suspensions werecollected from 15 dishes in a 500-ml-centrifuge-tube. The cellswere centrifuged at 2000 × g for 15min at 4◦C (4000 rpmin a J2-MC Beckman centrifuge using a JA-10 rotor). Aftermedium removal, the cell pellet was gently resuspended in7.5ml lysis buffer (volume for cell pellet harvested from 1515-cm-dishes) and transferred into 50-ml-polystyrene-tubes.The cell suspension was shock-freezed in liquid nitrogen andsubsequently thawed at 37◦C. Freeze-thaw cycle was repeated twoadditional times. The resulting cell suspension can be stored at−80◦C overnight.
Gradient Centrifugation and Purification of rAAVsBenzonase was added to the thawed cell suspension to a finalconcentration of 50 U/ml followed by an incubation at 37◦C for30min. Subsequently, the cells were pelleted via centrifugationat 2000 × g for 25min at 4◦C. The virus-containing supernatantwas transferred into a Beckman Quick-Seal polypropylene tube.To form the iodixanol gradient, a sterile, long glass pipette,and a Gilson MINIPULS3 pump were used. First, the virus-containing phase was underlaid with 7ml 15% iodixanol, thenwith 5ml 25% iodixanol, followed by 5ml 40% iodixanol, and atlast with 6ml 60% iodixanol. To avoid mixing of the layers, thepump should be run at the slowest speed. Polypropylene tubes
TABLE 1 | Reagents for a pre-transfection mix of one transgene AAV
construct.
Reagent Amount
Transgene AAV cis plasmid (Michalakis et al., 2010b;
Koch et al., 2012)
270µg
pAd Helper plasmid (pAdDeltaF6 Auricchio et al., 2001) x µg
AAV2/5 (Hildinger et al., 2001) or AAV2/8 (Gao et al.,
2002) Rep/Cap plasmid
y µg
Polybrene (8mg/ml) 15µl
Dextran (10mg/ml) 1500µl
2.5M CaCl2 1500µl
Double-distilled water ad 15ml
The listed amounts are for transfection of 15 15-cm-dishes of HEK293T cells.
were filled up and accurately balanced with PBS-MK. Prior tocentrifugation, the tubes were sealed with the Beckman TubeTopper. Centrifugation was performed at 361.000 × g for 1 h45min at 18◦C (70.000 rpm in an Optima LE-80K Beckmanultracentrifuge using a 70 Ti rotor). During centrifugation, thevirus-containing fraction should accumulate in the 40% phase.After centrifugation, the tube was pierced at the top near theseal for pressurization. To collect the virus-containing phase, a21-gauge-needle was used with a 5-ml-syringe to pierce the tubethrough the side at the lower end of the 40–60% interface. Duringthis step, the open site of the needle tip should face the 40% phase.Approximately 5ml of the 40% phase were collected. The virus-containing phase can be stored in a 15-ml-polystyrene-tube at−80◦C until proceeding with the purification step.
For purification, the virus-containing phase was thawedon ice. HiTrap Q FF sepharose column and superloop wereconnected with the ÄKTAprime plus chromatography system.For collection of the purified fractions, 1.5-ml-centrifuge-tubeswere loaded into the tube rack. Dropsync unit was adjusted toposition 1. The HiTrap Q FF sepharose column was equilibratedwith 25ml of buffer A at 10ml/min flow rate. Manual run modewas selected with 1.0ml/min flow rate, 1ml fraction size, and themeasuring curves were put to starting point via autozero. Virusphase was diluted 1:1 with buffer A prior to application to theÄKTAprime plus systemwith a 10ml syringe to fill the superloop.The virus dilution from the superloop was injected into theÄKTAprime plus system and 1ml fractions were collected in1.5-ml-tubes. During this step, the UV and conductance curvesshould be monitored via the Äktaprime software. When theconductance curve has reached basal values, the ÄKTAprime plussystem was switched to 100% buffer B at 10ml/min flow rateand 0ml fraction size to purge the sepharose column from theremaining virus dilution. To wash out the remaining salt fromthe system, sterile, double-distilled water was used at 10ml/minflow rate.When the conductance curve reached zero, the washingstep was continued for additional 5min. All of the collected 1-mlfractions within the plateau phase of the conductance curve werepooled. The purified and pooled virus fractions can be stored in a15-ml-polystyrene-tube at−80◦C until continuing with the virusconcentration step.
Concentration of rAAVsFor virus concentration, the purified virus fraction was firstthawed on ice. 4ml of the fraction was then transferred to anAmicon centrifugal filter unit and was centrifuged at 2000 × gfor 10min at 20◦C (4000 rpm in a Beckman centrifuge using aJA-10 rotor). The flow-through was discarded and the cycles of4ml virus fraction transfer and subsequent centrifugation wererepeated until the complete virus was loaded to the column and∼500µl remained in the filter unit. The concentrated virus was
Frontiers in Neuroscience | www.frontiersin.org 6 July 2016 | Volume 10 | Article 356

Becirovic et al. AAVs for FRET in Photoreceptors
washed with 1ml 0.014% Tween/PBS-MK by pipetting up anddown five times. The virus suspension was then centrifuged at2000 × g at 20◦C until 100µl of concentrated virus suspensionremained in the filter unit. The supernatant was aliquoted andstored in 1.5-ml screw cap tubes. Virus suspensions were stored at−80◦C until determination of virus titer and subretinal injection.
Titer Determination of rAAVsFor titer determination, the virus suspension was diluted1:500 with double-distilled water. 5µl of virus dilution, astandard sample, and double-distilled water were used forquantitative real-time PCR according toTables 2, 3. For standardpreparation, a small fragment within the WPRE (woodchuckhepatitis virus posttranscriptional regulatory element) of thepAAV2.1 vector was amplified via PCR. The correspondingprimers are listed in Table 4. The PCR product was purified aftergel electrophoresis and DNA concentration was determined witha spectrophotometer (Nanodrop 2000c). The concentration ofthe standard for 1010 copies per 5µl was calculated according tothe following equation:
c
(
pg
µl
)
=1010 × 660× 1012 pg
mol× fragment size
6.022× 10²³ 1mol
× 5µl
c is the concentration of the standard for 1010 copies per 5µl;660 × 1012 pg/mol is the mean molar mass of a base
pair (deoxyribosyladenosine with deoxyribosylthymidine ordeoxyribosylcytidine with deoxyribosylguanosine);
6.022× 10²³/mol is the Avogadro constant;The size of the amplified WPRE fragment is given in base
pairs.A 10-fold serial dilution was made to obtain standards
at different concentrations. 5µl of a standard were usedto determine the virus titer via quantitative real-time PCR.Standards were stored at−20◦C until use.
Subretinal Injection of rAAV VectorsThe procedure of subretinal rAAV injection was carried out asdescribed by (Mühlfriedel et al., 2013) with slight modifications.The NanoFil 34-gauge beveled needle was sterilized before eachexperiment. The 10-µl NanoFil syringe was preloaded with thevirus suspension under exclusion of air bubbles. The mouse wasanesthetized via intraperitoneal injection of xylazine (20mg/kg)and ketamine (40mg/kg). Five percent dexpanthenol eye salvewas applied to the non-injected eye and the anesthetized mouse
TABLE 2 | Pipetting scheme for quantitative real-time PCR.
Reagent Volume (µl)
Template plasmid (50–100 ng)/standard/double-distilled water
(negative control)
5,0
KAPA SYBR FAST Universal x2 qPCR MasterMix 10,0
WPREqF (10 pmol/µl) 1,0
WPREqR (10 pmol/µl) 1,0
Double-distilled water ad 20,0
was placed on a 37◦C heating plate. The eye was dilated with1% atropine and 0.5% tropicamide solution. The eye funduswas focused with a stereomicroscope until blood vessels becameclearly visible. The outer layers of the eye (sclera, choroidea,and retinal pigment epithelium) were then penetrated with theneedle in a 60◦ angle. When the needle was visible beneath theretina, 1µl (containing approx. 109 rAAV particles) of virussuspension was gradually applied freehand. For the co-deliveryof two constructs, a 1:1 mixture of titer matched rAAVs wasused. The formation of a clearly visible injection bleb indicateda correct application to the subretinal space. The needle wasslowly removed from the eye, which was subsequently treatedwith gentamicin 5 mg/g and dexamethasone 0.3 mg/g eye salve.The anesthetized mouse was placed under a heat lamp andwas monitored until awaking from narcosis. If available, opticalcoherence tomography (OCT) was conducted immediately aftersubretinal injection to monitor the injection procedure and thedegree of subretinal detachment (Mühlfriedel et al., 2013).
Dissection of Murine Retinas and Isolationof Photoreceptor Outer SegmentsThe mouse was sacrificed 10 days post injection and the injectedeye was proptosed by placing blunt forceps around the opticnerve close to its exit from the eye. The globe was then transectedalong the equator with a sharp razor blade or scalpel and thevitreous body was removed by carefully pushing it out of theincision with a thin needle. The forceps was pushed upwards todetach the retina from the optic nerve and from the pigmentepithelium. The upward movement was gradually continueduntil the retina lay free on the forceps. The isolated retinawas transferred into a petri dish filled with phosphate bufferedsaline (PBS). The expression or co-expression of fluorescentfusion proteins was analyzed by an epifluorescence microscope(Axioplan 2 imaging, Zeiss). As described in Figure 2A, the retinawas transferred into a 1.5-ml-microcentrifuge-tube containing100µl PBS. In case of weak expression or in case of isolatingcone OS, two (or more) retinas can be pooled at this stage
TABLE 3 | Program steps of quantitative real-time PCR for titer
determination.
Step Phase Temperature (◦C) Time Cycle numbers
1 Initial Denaturation 95 10min 1
2 Denaturation 95 10 s 40
3 Annealing 60 5 s
4 Elongation 72 20 s
5 Final elongation 72 5min 1
TABLE 4 | Primer sequences for quantitative real-time PCR and standard
preparation.
Primer for amplification of standard
fragment
Sequence (5′ to 3′)
WPREqF AGTTCCGCCGTGGCAATAGG
WPREqR CAAGGAGGAGAAAATGAAAGCC
Frontiers in Neuroscience | www.frontiersin.org 7 July 2016 | Volume 10 | Article 356

Becirovic et al. AAVs for FRET in Photoreceptors
FIGURE 2 | OS preparation and FRET. (A) Overview of the protocol for the OS preparation and for the subsequent FRET measurements. (B) Representative
images of isolated OS at different time points after the isolation. Scale bar, 3µm.
to ensure a sufficient number of fluorescent OS. The OS wereseparated from the retina by vortexing for 15–30 s. Vortexingshould not surpass 30 s as excessive shearing disrupts theshape of OS. Afterwards, centrifugation was conducted at 500× g for 30 s and the supernatant was carefully transferredto a fresh 1.5-ml-microcentrifuge-tube without disturbing thepellet. The supernatant contained the OS fraction suitable forFRET measurements. If desirable, the quality and fluorescenceof purified OS can be analyzed (Figure 2B) on a standardepifluorescence or confocal microscope by transferring 5–10µlof supernatant on microscope slides topped with cover slips.
FRET Measurements on Isolated OuterSegmentsSetup of FRET Microscope, Software, and OS SampleCalculation of three cube sensitized acceptor emission FRETrequires data for FRET donor (cerulean) only and acceptor(citrine) only samples (Erickson et al., 2003; Shaltiel et al., 2012;Ben Johny et al., 2013). Therefore, in addition to the fluorescencesignals from OS co-expressing cerulean and citrine constructs,OS expressing cerulean- or citrine-tagged proteins only must be
imaged as well. For optimized signal acquisition, we recommendto start the FRET measurements with OS co-expressing bothcerulean- and citrine-tagged FRET partners (hereinafter referredto as FRET sample).
Purified OS solution was diluted in 400µl FRET imagingsolution and was transferred to the center of an imagingdish. FRET measurements should be performed on singleOS as fluorescence from adjacent OS might interfere withthe measurements. Therefore, the density of OS should beadjusted in order to allow for detection of single fluorescentOS within the defined region of interest on the imaging setup(image-plane pinhole). As the density of transduced OS varieswith transduction and purification efficiency, it is necessary toindividually adjust the amount of OS for each preparation. TheOS were allowed to sediment to the bottom for 10–15min atroom temperature. The fluorescence lamp was turned on at least30min prior to the experiment to ensure stable illumination.The image-plane pinhole was set to an appropriate size thatallows monitoring of a single OS, which was positioned in thecenter of the axial beam path. This position must not be changedthroughout the entire FRET measurements performed on thesame day. The FelixGX software was started to acquire the
Frontiers in Neuroscience | www.frontiersin.org 8 July 2016 | Volume 10 | Article 356

Becirovic et al. AAVs for FRET in Photoreceptors
fluorescence intensities. An oil-immersion and high-resolutionobjective (40x or higher) was used and immersion medium wasapplied. The imaging dish was placed onto the sample holderand bright field illumination was used to focus on OS. IndividualOS were identified based on their characteristic morphology asshown in Figure 2B.
Measurements on the FRET SampleFor measurements of FRET samples, OS that express sufficientlevels of both citrine and cerulean were used. A fluorescent OSwas placed in the center of the optic field and fluorescence fromadjacent cells invading the optic field was excluded. Gain andfluorescence intensity settings were adjusted in order to achievean appropriate signal prior to the first signal acquisition. Allsubsequent data must be acquired under the same conditions.Fluorescence intensities were collected with the cerulean cube,FRET cube, and citrine cube. The settings for the single cubes areas follows:
For cerulean cube: 426–446 nm excitation filter, T455lpdichroic mirror, and 460–500 nm emission filter; for citrine cube:490–510 nm excitation filter, T515lp dichroic mirror, and 510–550 nm emission filter; for FRET cube: 426–446 nm excitationfilter, T455lp dichroic mirror, and 510–550 nm emission filter.
The data for a single OS was acquired according to thefollowing sequence: cerulean excitation was started and thesignals with the cerulean cube followed by the FRET cube wereobtained. Then, citrine excitation was carried out and the signalwith the citrine cube was obtained. 25–35 individual OS weremeasured. To subtract the OS autofluorescence, the same threecube protocol as described above was applied to ∼10 OS that donot express citrine or cerulean within the corresponding sample.
Cerulean-only Expressing PreparationOS with varying expression levels of cerulean were used. For eachOS, the fluorescence intensity was measured with the cerulean,FRET, and citrine filter cube according to the same protocol asdescribed above for the FRET sample. Data from at least 15 OSwere collected. To subtract the OS autofluorescence, the cerulean,FRET, and citrine cube were measured for ∼10 OS that do notexpress cerulean within the same sample.
Citrine-only Expressing PreparationOSwith varying expression levels of citrine were chosen. For eachOS, the fluorescence intensity was measured with the cerulean,FRET, and citrine filter cube according to the same protocol asdescribed above for the FRET sample. Data from at least 15 OSwere collected. To subtract the OS autofluorescence, the cerulean,FRET, and citrine cube were measured for ∼10 OS that do notexpress citrine within the same sample.
Data AnalysisThe data set consists of three data points per OS, i.e., oneintensity value for each filter cube. As controls, we additionallyincluded data points measured from non-fluorescent OS forbackground subtraction as well as from cerulean-only andcitrine-only expressing OS for donor bleed-through and cross-excitation corrections, respectively. The data was transferred toan Excel sheet or an adequate data processing program. For the
10 non-fluorescent OS measured for each of the preparations,i.e. FRET, cerulean-only and citrine-only, the mean intensityvalues were calculated. These mean values were subtracted fromeach data point of the particular preparation to adjust forbackground fluorescence. In order to correct for donor bleed-through, the correction constant RD1 for each of the single datapoints gathered from the cerulean-only expressing preparationwas calculated by dividing the intensities captured with theFRET-cube by those obtained from the cerulean-cube. In orderto correct for acceptor cross-excitation, the correction constantRA for each single data point gathered from the citrine-onlyexpressing preparation was calculated by dividing the intensitiescaptured with the FRET-cube by those obtained from thecitrine-cube. The mean value for both constants, RD1 and RA,was calculated. Usually, a value of ∼0.25 for cerulean (donor-bleed through) and 0.03 for citrine (acceptor cross-excitation)was obtained in our setup. However, these values might differwith fluorophore variant, protein tag, and imaging setup. Thecalculated constants were used for donor bleed-through andacceptor cross-excitation to evaluate the FRET ratio (FR) for eachsingle measurement according to the following equation:
FR =SFRET − RD1 · Scerulean
RA · Scitrine
Scerulean, Scitrine, and SFRET are intensity signals acquired withrespective filter cubes (FRET, cerulean, and citrine) in aFRET specimen and RA, RD1 are predetermined factors forcalibration issues (RA: Acceptor cross-excitation, RD1: Donorbleed-through). Depending on the imaging setup and, inparticular, the filter set used for experiments, a considerableamount of cerulean fluorescence may be detected by the citrinecube. To correct for this, an additional donor bleed-troughcorrection constant RD2 should be calculated by dividing thecerulean fluorescence intensity obtained with the citrine cube bythe one detected with the cerulean cube. Accordingly, the FRequation was adjusted to: (Erickson et al., 2003)
FR =SFRET − RD1 · Scerulean
RA · (Scitrine − RD2 · Scerulean)
In our FRET setup, RD2 was negligibly small and could thusbe ignored. However, it should be rigorously tested for eachindividual imaging setup. The mean value of the previouslyobtained data was calculated. The mean value representsthe overall FR. Note that the FR values are instrumentationdependent. FRET efficiencies (EA) (which are independent ofthe setup used) can be easily calculated from the FR using thefollowing equation:
EA = [FR− 1] ·εcitrine(436)
εcerulean(436)
εcitrine and εcerulean are the FRET setup specific average molarextinction coefficients for citrine and cerulean, respectively.
TroubleshootingProblems, possible underlying reasons and advices concerningcritical steps of the procedure can be found in Table 5.
Frontiers in Neuroscience | www.frontiersin.org 9 July 2016 | Volume 10 | Article 356

Becirovic et al. AAVs for FRET in Photoreceptors
TABLE 5 | Troubleshooting.
Problem Possible Reason Solution
Low titer. Transfection reagents do not have sufficient transfection
efficiency.
Test transfection reagents for their efficiencies.
Requantify plasmid concentration used for transfection.
pH of HEK293T cell medium is not optimal for transfection. Remove HEK293T dishes from incubator immediately
before transfection.
The sequence of the ITRs (inverted terminal repeats) within
the plasmid is not intact, thus replication and packaging of
the rAAV vector is inefficient.
Check for the presence of SmaI and/or Eam1105I
restriction sites within the palindromic ITR sequence. In
case of unexpected restriction fragment band pattern,
repeat cloning using an intact rAAV vector.
The injection bleb in the subretinal
space is not visible under the
surgical/stereomicroscope.
The eye shows damages or opacity of the cornea. Make sure to choose only mice with clear, intact eyes for
subretinal injection. Check the eyes under the
stereomicroscope.
Virus suspensions diluted with double-distilled water to
adjust the particle concentration do not show optical
refraction as clear as the virus suspension in 0.014%
Tween/PBS-MK.
Dilute with 0.014% Tween/PBS-MK to adjust virus
particle concentration. If the suspension is too viscous,
dilute with double-distilled water at a maximum ratio of
1:2 (water-to-virus suspension).
The injection angle is not optimal. Adjust the injection angle to ∼60◦.
Loss of many OS. Removal of the pigment epithelium and ciliary body after
retina isolation with foreceps may result in loss of many OS.
Proceed with the next step without any removal of
undesirable tissue.
Protein expression level is too low, thus
leading to a too weak or absent
fluorescence signal.
Virus suspension is not (completely) injected into the
subretinal space.
Make sure to see a clear injection bleb as this indicates
the correct injection to the subretinal space. An injection
into the upper layers of the eye such as sclera or
choroidea causes a bleb outside at the globe. If the
needle is intravitreal, it can be clearly and sharply seen
under the stereomicroscope. By contrast, a needle in the
subretinal space (injection angle at ∼60◦) appears rather
blurred. Keep the injection needle for at least 20 s in the
bleb to ensure proper delivery of the desired volume. If
possible, perform OCT measurements on the
anesthetized mouse after injection to confirm
detachment of the retina at the injection position.
Virus titer has not been determined correctly. Double check the virus titer. Otherwise, repeat the virus
production.
Time Schedule• Transfection of HEK293T cells: 48 h• Isolation of rAAV: 2–4 h (varies depending on number of
dishes to be harvested)• Gradient purification and rAAV concentration: 6 h (for 2
different rAAV constructs)• Titer determination via quantitative real-time PCR: 2 h• Preparation of standards for titer determination: 2 h• Subretinal injection: 20min (per mouse)• rAAV transduction of murine retina and protein expression:
10 days• Isolation of photoreceptor OS: 10min (per eye)• FRET imaging: 5–9 h (depending on number of retinas to be
analyzed)• Data analysis: 2–3 h (depending on number of measurements
to be processed).
ANTICIPATED RESULTS AND DISCUSSION
In this protocol, we demonstrate that robust FRET signalscan be measured for well-known homomeric and heteromeric
interactions of different membrane and soluble proteins in OSof rod and cone photoreceptors. Representative results are foundin our previous publications (Becirovic et al., 2014; Nguyenet al., 2016). Selected data from these publications are presentedin the modified graphs shown in Figure 3. FRET is given asFRET efficiencies (EA) which can be easily calculated from theFRET ratios (FR) as shown in the “Data Analysis” Section. Itis noteworthy to mention that the mean value of EA may notrepresent the maximal FRET efficiency (EA max). EA max can becalculated if a relatively high variability of the cerulean/citrinemolar ratios is present in FRET measurements. If this is the case,single FRET values can be plotted against the cerulean/citrineintensity ratios to obtain the binding curves and to calculateEA max. A comparison of EA max between different constructsallows for the determination of relative binding affinities. SinceEA max is directly proportional to the binding affinity, ourmethodin principle should also allow for comparisons of relative bindingaffinities of single protein-protein interactions in an isolatedsubcellular compartment.
Taken together, our protocol enables the measurement ofrobust FRET signals ex vivo in small and highly specialized
Frontiers in Neuroscience | www.frontiersin.org 10 July 2016 | Volume 10 | Article 356

Becirovic et al. AAVs for FRET in Photoreceptors
FIGURE 3 | FRET measurements in isolated photoreceptor OS. (A) Schematic depiction of the single constructs used for the subretinal injection and for the
determination of the FRET efficiencies (EA) shown in (C). (B) Representative confocal images of single isolated rod OS co-expressing C-terminally tagged peripherin-2
and rhodopsin. The excitation wavelength and emission filter settings used to obtain the single channels (Donor, FRET and Acceptor) are summarized in the “Stepwise
Procedures” section. Scale bar, 1.5µm. (C) Results of the FRET measurements for different FRET pair combinations given as mean values ± standard error of the
mean (SEM). Numbers of independent measurements (n) are given in brackets. EA values for the single FRET pairs are as follows: Rho-Rho, EA = 10.45 ± 0.78;
Rho-citr-P, EA = 4.52 ± 0.82; Rho-P-citr, EA = 2.76 ± 0.65; Rho-GARP2, EA = 0.26 ± 0.65; (D) Schematic view of the single constructs used for the subretinal
injection and for the determination of the FRET efficiencies (EA) shown in (F). (E) Representative confocal images of single isolated cone OS co-expressing C-terminally
tagged peripherin-2 and cone opsin. Scale bar, 1.5µm. (F) Results of the FRET measurements (given as mean values ± SEM) for different FRET pair combinations as
indicated. Numbers of independent measurements (n) are given in brackets. EA values for the single FRET pairs are described elsewhere (Nguyen et al., 2016).
cellular compartments of mammalian cells like OS of murinephotoreceptors. This allows for the systematic analysis of protein-protein interactions in a physiological or pathophysiologicalcontext of the photoreceptor biology. In particular, it can be usedto analyze the effects of disease-associated mutations on protein-protein interactions. OS of photoreceptors are modified cilia.Ciliopathies encompass a very large group of genetic disorderscompromising the functional or structural integrity of cilia.Since the isolation of ciliary compartments from other tissues(i.e. kidney, lung, brain, olfactory epithelium) is well-established(Mitchell et al., 2009), our protocol should also be transferableto analyses of protein-protein interactions in any other ciliatedtissue. In non-dividing cells, rAAVs lead to an episomal andlong-term expression of the respective gene for up to severalyears (Trapani et al., 2014). Thus, FRET measurements can beperformed on several time points during the development of thetissue. Finally, our protocol could also provide an experimentalbasis for the establishment of FRET measurements in the retinaof living animals by means of fundus ophthalmoscopy combinedwith e.g., conventional fluorescence imaging, 2-photon imaging,
multiphoton FLIM-FRET, or near infrared-FRET fluorescencelifetime imaging (Abe et al., 2013; Johnsson et al., 2014).
AUTHOR CONTRIBUTIONS
EB designed the protocol with contribution from SM. EB,SB, ON, LR, VH, CS, and ESB performed the experiments,EB, SB, ON, and ESB analyzed the results. EB, ON, ESB,and SM wrote the manuscript with contribution from CWand MB.
FUNDING
This work was supported by the DeutscheForschungsgemeinschaft (DFG, BE 4830/1 1).
ACKNOWLEDGMENTS
We thank Elisabeth Schulze and Berit Noack for excellenttechnical support.
Frontiers in Neuroscience | www.frontiersin.org 11 July 2016 | Volume 10 | Article 356

Becirovic et al. AAVs for FRET in Photoreceptors
REFERENCES
Abe, K., Zhao, L., Periasamy, A., Intes, X., and Barroso, M. (2013). Non-invasive in vivo imaging of near infrared-labeled transferrin in breast cancercells and tumors using fluorescence lifetime FRET. PLoS ONE 8:e80269. doi:10.1371/journal.pone.0080269
Allocca, M., Mussolino, C., Garcia-Hoyos, M., Sanges, D., Iodice, C., Petrillo,M., et al. (2007). Novel adeno-associated virus serotypes efficiently transducemurine photoreceptors. J. Virol. 81, 11372–11380. doi: 10.1128/JVI.01327-07
Arshavsky, V. Y., and Burns, M. E. (2012). Photoreceptor signaling: supportingvision across a wide range of light intensities. J. Biol. Chem. 287, 1620–1626.doi: 10.1074/jbc.R111.305243
Auricchio, A., Hildinger, M., O’Connor, E., Gao, G. P., and Wilson, J. M. (2001).Isolation of highly infectious and pure adeno-associated virus type 2 vectorswith a single-step gravity-flow column. Hum. Gene Ther. 12, 71–76. doi:10.1089/104303401450988
Becirovic, E., Bohm, S., Nguyen, O. N., Riedmayr, L. M., Koch, M. A., Schulze,E., et al. (2016). In vivo analysis of disease-associated point mutationsunveils profound differences in mRNA splicing of peripherin-2 in rod andcone photoreceptors. PLoS Genet. 12:e1005811. doi: 10.1371/journal.pgen.1005811
Becirovic, E., Nguyen, O. N., Paparizos, C., Butz, E. S., Stern-Schneider, G.,Wolfrum, U., et al. (2014). Peripherin-2 couples rhodopsin to the CNG channelin outer segments of rod photoreceptors.Hum. Mol. Genet. 23, 5989–5997. doi:10.1093/hmg/ddu323
Ben Johny, M., Yang, P. S., Bazzazi, H., and Yue, D. T. (2013). Dynamic switchingof calmodulin interactions underlies Ca2+ regulation of CaV1.3 channels. Nat.Commun. 4, 1717. doi: 10.1038/ncomms2727
Bennett, J., Maguire, A. M., Cideciyan, A. V., Schnell, M., Glover, E., Anand,V., et al. (1999). Stable transgene expression in rod photoreceptors afterrecombinant adeno-associated virus-mediated gene transfer to monkeyretina. Proc. Natl. Acad. Sci. U.S.A. 96, 9920–9925. doi: 10.1073/pnas.96.17.9920
Berger,W., Kloeckener-Gruissem, B., andNeidhardt, J. (2010). Themolecular basisof human retinal and vitreoretinal diseases. Prog. Retin. Eye Res. 29, 335–375.doi: 10.1016/j.preteyeres.2010.03.004
Erickson, M. G., Liang, H., Mori, M. X., and Yue, D. T. (2003). FRET two-hybrid mapping reveals function and location of L-type Ca2+ channelCaM preassociation. Neuron 39, 97–107. doi: 10.1016/S0896-6273(03)00395-7
Feilmeier, B. J., Iseminger, G., Schroeder, D., Webber, H., and Phillips, G. J. (2000).Green fluorescent protein functions as a reporter for protein localizationin Escherichia coli. J. Bacteriol. 182, 4068–4076. doi: 10.1128/JB.182.14.4068-4076.2000
Gao, G. P., Alvira, M. R., Wang, L., Calcedo, R., Johnston, J., and Wilson, J.M. (2002). Novel adeno-associated viruses from rhesus monkeys as vectorsfor human gene therapy. Proc. Natl. Acad. Sci. U.S.A. 99, 11854–11859. doi:10.1073/pnas.182412299
Goldberg, A. F., Moritz, O. L., and Molday, R. S. (1995). Heterologous expressionof photoreceptor peripherin/rds and Rom-1 in COS-1 cells: assembly,interactions, and localization of multisubunit complexes. Biochemistry 34,14213–14219. doi: 10.1021/bi00043a028
Grieger, J. C., Choi, V. W., and Samulski, R. J. (2006). Production andcharacterization of adeno-associated viral vectors. Nat. Protoc. 1, 1412–1428.doi: 10.1038/nprot.2006.207
Griesbeck, O., Baird, G. S., Campbell, R. E., Zacharias, D. A., and Tsien,R. Y. (2001). Reducing the environmental sensitivity of yellow fluorescentprotein. Mechanism and applications. J. Biol. Chem. 276, 29188–29194. doi:10.1074/jbc.M102815200
Hildinger, M., Auricchio, A., Gao, G., Wang, L., Chirmule, N., and Wilson,J. M. (2001). Hybrid vectors based on adeno-associated virus serotypes2 and 5 for muscle-directed gene transfer. J. Virol. 75, 6199–6203. doi:10.1128/JVI.75.13.6199-6203.2001
Hirata, E., Yukinaga, H., Kamioka, Y., Arakawa, Y., Miyamoto, S., Okada, T.,et al. (2012). In vivo fluorescence resonance energy transfer imaging revealsdifferential activation of Rho-family GTPases in glioblastoma cell invasion.J. Cell Sci. 125(Pt 4), 858–868. doi: 10.1242/jcs.089995
Hovan, S. C., Howell, S., and Park, P. S. (2010). Forster resonance energy transferas a tool to study photoreceptor biology. J. Biomed. Opt. 15, 067001. doi:10.1117/1.3505023
Jastrzebska, B., Maeda, T., Zhu, L., Fotiadis, D., Filipek, S., Engel, A., et al.(2004). Functional characterization of rhodopsin monomers and dimersin detergents. J. Biol. Chem. 279, 54663–54675. doi: 10.1074/jbc.M408691200
Johnsson, A. K., Dai, Y., Nobis, M., Baker, M. J., McGhee, E. J., Walker, S.,et al. (2014). The Rac-FRET mouse reveals tight spatiotemporal controlof Rac activity in primary cells and tissues. Cell Rep. 6, 1153–1164. doi:10.1016/j.celrep.2014.02.024
Knepp, A. M., Periole, X., Marrink, S. J., Sakmar, T. P., and Huber, T.(2012). Rhodopsin forms a dimer with cytoplasmic helix 8 contactsin native membranes. Biochemistry 51, 1819–1821. doi: 10.1021/bi3001598
Koch, S., Sothilingam, V., Garcia Garrido, M., Tanimoto, N., Becirovic, E., Koch,F., et al. (2012). Gene therapy restores vision and delays degeneration in theCNGB1(−/−) mouse model of retinitis pigmentosa. Hum. Mol. Genet. 21,4486–4496. doi: 10.1093/hmg/dds290
Kumagai, Y., Naoki, H., Nakasyo, E., Kamioka, Y., Kiyokawa, E., and Matsuda,M. (2014). Heterogeneity in ERK activity as visualized by in vivo FRETimaging of mammary tumor cells developed in MMTV-Neu mice. Oncogene34, 1051–1057. doi: 10.1038/onc.2014.28
Loewen, C. J., and Molday, R. S. (2000). Disulfide-mediated oligomerization ofPeripherin/Rds and Rom-1 in photoreceptor disk membranes. Implications forphotoreceptor outer segment morphogenesis and degeneration. J. Biol. Chem.
275, 5370–5378. doi: 10.1074/jbc.275.8.5370Michalakis, S., Muhlfriedel, R., Tanimoto, N., Krishnamoorthy, V., Koch, S.,
Fischer, M. D., et al. (2010a). Restoration of cone vision in the CNGA3−/−mouse model of congenital complete lack of cone photoreceptor function.Mol.
Ther. 18, 2057–2063. doi: 10.1038/mt.2010.149Michalakis, S., Mühlfriedel, R., Tanimoto, N., Krishnamoorthy, V., Koch, S.,
Fischer, M. D., et al. (2010b). Restoration of cone vision in the CNGA3−/−mouse model of congenital complete lack of cone photoreceptor function.Mol.
Ther. 18, 2057–2063. doi: 10.1038/mt.2010.149Michalakis, S., Zong, X., Becirovic, E., Hammelmann, V., Wein, T., Wanner,
K. T., et al. (2011). The glutamic acid-rich protein is a gating inhibitorof cyclic nucleotide-gated channels. J. Neurosci. 31, 133–141. doi:10.1523/JNEUROSCI.4735-10.2011
Mitchell, K. A., Szabo, G., and Otero Ade, S. (2009). Methods for the isolationof sensory and primary cilia–an overview. Methods Cell Biol. 94, 87–101. doi:10.1016/S0091-679X(08)94004-8
Mühlfriedel, R., Michalakis, S., Garrido, M. G., Biel, M., and Seeliger, M.W. (2013).Optimized technique for subretinal injections in mice.Methods Mol. Biol. 935,343–349. doi: 10.1007/978-1-62703-080-9_24
Murlidharan, G., Samulski, R. J., and Asokan, A. (2014). Biology of adeno-associated viral vectors in the central nervous system. Front. Mol. Neurosci.
7:76. doi: 10.3389/fnmol.2014.00076Nguyen, O. N., Bohm, S., Giessl, A., Butz, E. S., Wolfrum, U., Brandstatter, J.
H., et al. (2016). Peripherin-2 differentially interacts with cone opsins in outersegments of cone photoreceptors.Hum.Mol. Genet. doi: 10.1093/hmg/ddw103.[Epub ahead of print].
Poetsch, A., Molday, L. L., and Molday, R. S. (2001). The cGMP-gated channeland related glutamic acid-rich proteins interact with peripherin-2 at therim region of rod photoreceptor disc membranes. J. Biol. Chem. 276,48009–48016. doi: 10.1074/jbc.M108941200
Rizzo, M. A., Springer, G. H., Granada, B., and Piston, D. W. (2004). An improvedcyan fluorescent protein variant useful for FRET. Nat. Biotechnol. 22, 445–449.doi: 10.1038/nbt945
Roepman, R., and Wolfrum, U. (2007). Protein networks and complexes inphotoreceptor cilia. Subcell. Biochem. 43, 209–235. doi: 10.1007/978-1-4020-5943-8_10
Schön, C., Biel, M., and Michalakis, S. (2013). Gene replacement therapyfor retinal CNG channelopathies. Mol. Genet. Genomics 288, 459–467. doi:10.1007/s00438-013-0766-4
Shaltiel, L., Paparizos, C., Fenske, S., Hassan, S., Gruner, C., Rotzer, K.,et al. (2012). Complex regulation of voltage-dependent activation andinactivation properties of retinal voltage-gated Cav1.4 L-type Ca2+ channels
Frontiers in Neuroscience | www.frontiersin.org 12 July 2016 | Volume 10 | Article 356

Becirovic et al. AAVs for FRET in Photoreceptors
by Ca2+-binding protein 4 (CaBP4). J. Biol. Chem. 287, 36312–36321. doi:10.1074/jbc.M112.392811
Trapani, I., Puppo, A., and Auricchio, A. (2014). Vector platforms for genetherapy of inherited retinopathies. Prog. Retin. Eye Res. 43C, 108–128. doi:10.1016/j.preteyeres.2014.08.001
Waldo, G. S., Standish, B. M., Berendzen, J., and Terwilliger, T. C. (1999). Rapidprotein-folding assay using green fluorescent protein. Nat. Biotechnol. 17,691–695. doi: 10.1038/10904
Wen, L., Thunemann, M., Feil, S., Hillenbrand, M., Vachaviolos, A., Ott, T., et al.(2013). Analysis of cGMP signalling with transgenic mice expressing FRET-based cGMP sensors. BMC Pharmacol. Toxicol. 14, 1–2. doi: 10.1186/2050-6511-14-s1-p76
Zacchigna, S., Zentilin, L., and Giacca, M. (2014). Adeno-associated virus vectorsas therapeutic and investigational tools in the cardiovascular system. Circ. Res.114, 1827–1846. doi: 10.1161/CIRCRESAHA.114.302331
Conflict of Interest Statement: The authors declare that the research wasconducted in the absence of any commercial or financial relationships that couldbe construed as a potential conflict of interest.
Despite hosting the research topic together with one of the authors of thismanuscript, the handling Editor state that the process met the standards of a fairand objective review.
Copyright © 2016 Becirovic, Böhm, Nguyen, Riedmayr, Hammelmann, Schön, Butz,
Wahl-Schott, Biel andMichalakis. This is an open-access article distributed under the
terms of the Creative Commons Attribution License (CC BY). The use, distribution or
reproduction in other forums is permitted, provided the original author(s) or licensor
are credited and that the original publication in this journal is cited, in accordance
with accepted academic practice. No use, distribution or reproduction is permitted
which does not comply with these terms.
Frontiers in Neuroscience | www.frontiersin.org 13 July 2016 | Volume 10 | Article 356

1Scientific RepoRts | 7: 2321 | DOI:10.1038/s41598-017-02514-5
www.nature.com/scientificreports
Peripherin-2 and Rom-1 have opposing effects on rod outer segment targeting of retinitis pigmentosa-linked peripherin-2 mutantsSybille Böhm1,2, Lisa M. Riedmayr1,2, O. N. Phuong Nguyen1,2, Andreas Gießl 3, Toni Liebscher1,2, Elisabeth S. Butz1,2, Christian Schön1,2, Stylianos Michalakis1,2, Christian Wahl-Schott1,2, Martin Biel1,2 & Elvir Becirovic1,2
Mutations in the photoreceptor outer segment (OS) specific peripherin-2 lead to autosomal dominant retinitis pigmentosa (adRP). By contrast, mutations in the peripherin-2 homolog Rom-1 cause digenic RP in combination with certain heterozygous mutations in peripherin-2. The mechanisms underlying the differential role of peripherin-2 and Rom-1 in RP pathophysiology remained elusive so far. Here, focusing on two adRP-linked peripherin-2 mutants, P210L and C214S, we analyzed the binding characteristics, protein assembly, and rod OS targeting of wild type (perWT), mutant peripherin-2 (perMT), or Rom-1 complexes, which can be formed in patients heterozygous for peripherin-2 mutations. Both mutants are misfolded and lead to decreased binding to perWT and Rom-1. Furthermore, both mutants are preferentially forming non-covalent perMT-perMT, perWT-perMT, and Rom-1-perMT dimers. However, only perWT-perMT, but not perMT-perMT or Rom-1-perMT complexes could be targeted to murine rod OS. Our study provides first evidence that non-covalent perWT-perMT dimers can be targeted to rod OS. Finally, our study unravels unexpected opposing roles of perWT and Rom-1 in rod OS targeting of adRP-linked peripherin-2 mutants and suggests a new treatment strategy for the affected individuals.
The tetraspanin peripherin-2 is exclusively expressed in outer segments (OS), specific light detecting compart-ments of photoreceptors. Peripherin-2 forms homo- and heteromeric protein complexes in OS. The core homo-meric peripherin-2 unit is the non-covalent tetramer, which can also assemble into covalently linked octamers and higher-order oligomers1–3. These homomeric peripherin-2 complexes are crucial for proper OS morphology and architecture4. Peripherin-2 also forms heteromeric complexes with its homolog Rom-1, however, the func-tional importance of these complexes remained unclear2, 5, 6. Autosomal dominant retinitis pigmentosa (adRP) is the most frequent hereditary retinal disorder characterized by progressive loss of vision due to rod photoreceptor degeneration. Mutations in the peripherin-2 gene (PRPH2) are among the most common causes for adRP7, 8. Interestingly, despite the high sequence identity (approx. 35%) and the high structural conservation of Rom-1 and peripherin-22, 9, mutations in Rom-1 are not clearly linked to monogenic adRP. Some homozygous Rom-1 mutations, however, cause digenic RP in combination with a heterozygous mutation in PRPH2, suggesting that Rom-1 could function as genetic modifier that shapes the disease progression10, 11. Nevertheless, the molecular mechanisms underlying the postulated modifier function of Rom-1 have not been determined yet12. The majority of adRP-linked peripherin-2 mutants are located within the large loop domain connecting the transmembrane domain 3 and 4, also known as EC2 or D2 loop domain13, 14. Some adRP-linked peripherin-2 mutants in EC2 were shown to influence the subunit assembly15, 16. In this context, it was postulated that peripherin-2 tetramerization
1Center for Integrated Protein Science Munich CiPSM, Ludwig-Maximilians-Universität München, Munich, Germany. 2Department of Pharmacy – Center for Drug Research, Ludwig-Maximilians-Universität München, Munich, Germany. 3Department of Biology, Animal Physiology, Friedrich-Alexander Universität Erlangen-Nürnberg, Erlangen, Germany. Sybille Böhm and Lisa M. Riedmayr contributed equally to this work. Correspondence and requests for materials should be addressed to E.B. (email: [email protected])
Received: 19 January 2017
Accepted: 12 April 2017
Published: xx xx xxxx
OPEN

www.nature.com/scientificreports/
2Scientific RepoRts | 7: 2321 | DOI:10.1038/s41598-017-02514-5
is crucial for rod OS targeting. However, this conclusion was drawn from experiments addressing pure homo-typic perMT complexes16. Nevertheless, due to the autosomal dominant fashion of PRPH2-linked adRP, different combinations of peripherin-2 protein complexes (perWT-perWT, perMT-perMT, perWT-perMT, Rom-1-perWT, and Rom-1-perMT) can be formed in heterozygous patients carrying wild type and mutant PRPH2 alleles. In addition, each of these complexes can exist in different equilibria of mono-, di- and tetramers and higher-order oligomers, respectively. This high complexity precluded a more accurate investigation of how subunit assembly might influ-ence the rod OS targeting of the single peripherin-2 protein complexes.
In previous studies, we provided a proof-of-principle for FRET-based quantitative analysis of protein-protein interactions in isolated rod and cone OS17–19. Recently, we also reported that the two adRP-linked mutations (perP210L and perC214S) located within the highly conserved tetraspanin PxxCC motif are mislocalized to rod inner segments (IS) when expressed in wild type mice using adeno-associated virus (AAV) vectors20. Other studies demonstrated that perC214S affects homotypic mutant interactions and the heteromerization with Rom-121, 22. Despite these findings, little is known about the specific binding characteristics of this and other peripherin-2 mutants to perWT or Rom-1 in their native environment (e.g. rod OS). Moreover, the precise contribution of perWT and Rom-1 on binding properties, subunit assembly, and rod OS targeting of the respective perWT-perMT and Rom-1-perMT complexes is not clear. Nevertheless, such information is crucial to understand the full com-plexity of PRPH2-linked adRP and for developing successful treatments for the disease. Here, combining differ-ent methods we provide novel insights into the binding characteristics, subunit assembly, and rod OS targeting of perP210L and perC214S mutants. We show that perWT and Rom-1 form heterodimers with both peripherin-2 mutants. However, only perWT-perMT but not Rom1-perMT complexes could be targeted to rod OS suggesting unexpected opposing roles of peripherin-2 and Rom-1 in rod OS targeting of adRP-linked peripherin-2 mutants.
ResultsperC214S and perP210L show reduced binding to perWT and Rom-1. In our recent work, we demon-strated that, in contrast to perC214S and perP210L, eight additional disease-linked peripherin-2 D2 loop domain mutants did not affect rod OS targeting20 (Fig. 1a). One possible mechanism, which might explain the mislocali-zation of perC214S and perP210L in rod photoreceptors, is that these mutants might affect binding to perWT and/or to Rom-1. To examine this possibility, we performed co-immunoprecipitation (co-IP) experiments from HEK293T cells co-transfected with the respective peripherin-2 mutants and perWT or Rom-1, respectively. Only perC214S and perP210L attenuated the binding to perWT, while binding of other peripherin-2 mutants to perWT remained unaffected (Fig. 1b). Very similar results were obtained in co-IPs addressing the binding of the single peripherin-2 mutants to Rom-1 (Fig. 1c).
P210 and C214 are crucial for the proper folding of the distal D2 loop. The proline at position 210 (P210) and the cysteine at position 214 (C214) are part of the highly conserved tetraspanin PxxCC motif, whose function has not been clearly determined yet. The reduced binding of perC214S and perP210L to perWT suggests that these residues could either i) be crucial for proper folding of peripherin-2 or ii) represent the protein-protein interaction interface. Using CD spectroscopy, a recent study suggested that C214S impedes protein folding by increasing the percentage of ß-sheets concomitant with a decrease in helices in the D2 loop23. However, it remained unclear which part(s) of the D2 loop is (are) affected by this mutation. To address this issue more directly, we established a protease digestion assay on membrane preparations from HEK293T cells expressing citrine-tagged WT and mutant peripherin-2 transgenes. For this purpose, we took advantage of the fact that endogenously expressed proteases are regularly present in these preparations. In addition, membrane prepa-rations are expected to retain the native protein structure as they are isolated without detergents or reducing agents. Protein cleavage occurs on the exposed domain regions, which are accessible for endogenous pro-teases. Accordingly, improper protein folding could lead to masking of existing or to an exposure of hidden protease cleavage sites. Using a GFP antibody that recognizes the N-terminal citrine tag of our peripherin-2 constructs, we could detect three peripherin-2 bands at 61.5 kDa, 52.4 kDa and 42.5 kDa (Fig. 1d). The calculated size of full-length citrine-tagged peripherin-2 is 66.5 kDa, however, even in presence of protease inhibitors, the full-length perWT was always detected as a 61.5 kDa band. By contrast, the 52.4 kDa and 42.5 kDa could only be detected in the protease cleavage assay in the absence of protease inhibitors and upon incubation of the samples at 37 °C. Using the 61.5 kDa band as reference, we calculated the cleavage sites for the 42.5 kDa and for the 52.4 kDa band. The cleavage site for the 42.5 kDa band corresponds to the peripherin-2 region around the highly conserved tetraspanin CCG motif (Fig. 1a). This band was also present in all peripherin-2 mutants suggesting proper folding at this part of the protein. By contrast, the 52.4 kDa band was completely absent for perC214S and perP210L, whereas other mutations did not show any considerable differences to perWT. The protease cleavage site for the 52.4 kDa band is calculated to be located within the distal part of the D2 loop domain next to the transmembrane domain 4 (Fig. 1a). Hence, these results suggest that perC214S and perP210L lead to a structural rearrangement of the distal part of the D2 loop domain.
A recent study suggested that peripherin-2 residues 165–182 are crucial for homomeric interactions24. However, it remained unclear whether the perC214S and perP210L residues or flanking regions might also contribute to this type of interactions. To test this possibility, we performed a peptide competition assay using a peptide corresponding to the residues 201–220 of native human peripherin-2. Provided that the positions P210 and C214 participate in peripherin-2 homomerization, this peptide should compete with the binding and, hence, result in a reduction of homomeric protein-protein interactions. However, in subsequent co-IP experiments even in the presence of a very high peptide concentration (10 mM), we could not detect any decrease in peripherin-2 binding compared to the peptide-free approach (Fig. 1e). This suggests that this region is not directly involved in homo-meric peripherin-2 protein-protein interactions.

www.nature.com/scientificreports/
3Scientific RepoRts | 7: 2321 | DOI:10.1038/s41598-017-02514-5
Quantification of perWT, perMT, and Rom-1 protein-protein interactions in HEK293T cells using FRET. Recently, we reported that three cube FRET is suitable for quantification of homomeric and heteromeric interactions of different photoreceptor specific proteins including peripherin-2. In particular, it has been demon-strated that FRET can be used to calculate the relative binding affinities of these proteins in HEK293T cells17. Consequently, using this approach we examined the binding properties of the different homo- and heteromeric perWT, perMT, and Rom-1 protein complexes. Binding curves can be calculated if the relative expression of the FRET fluorophores (given as molar ratio, MR) varies between the single FRET measurements. By plotting the FRET efficiency (EA) values against the corresponding cerulean/citrine MR, we observed a sufficient variability
Figure 1. Effects of peripherin-2 mutants on protein-protein interactions and D2 loop folding. (a) left, Topology of peripherin-2. The dashed rectangle highlights the distal part of the D2 loop. Right, Schematical enlargement of the distal D2 loop showing the hitherto identified disease-linked peripherin-2 mutations in this region (highlighted in green). The position of mutants analyzed in (b–d) are marked by red arrows (for perP210L and perC214S) or by black arrowheads in case of the remaining mutants. The calculated protease cleavage sites from d are indicated by a white (corresponding to the 42.5 kDa band) or black (corresponding to the 52.4 kDa band) pacman. The position of the peptide (aa 201–220) used for the competition assay shown in (e) (pept201–220) is highlighted by the gray line. (b–c) Co-Immunoprecipitations (co-IPs) from membrane preparations of HEK293T cells transiently transfected with the respective N-terminally citrine-tagged mutants and C-terminally myc-tagged perWT (perWT-myc) (b) or Rom-1 (Rom-1-myc) (c) using the myc-specific antibody (anti-myc). The single mutants were detected using the GFP-antibody, which also specifically recognizes citrine. IB, immunoblotting. (d) Protease cleavage experiments on membrane preparations from HEK293T cells transiently transfected with the single citrine-tagged peripherin-2 mutants as indicated. The molecular weight of the single bands (arrows) was calculated from five independent western blot experiments. (e) Co-IPs from membrane preparations of HEK293T cells co-transfected with myc- and citrine-tagged perWT in presence (left lane, 10 mM) or absence of the peptide.

www.nature.com/scientificreports/
4Scientific RepoRts | 7: 2321 | DOI:10.1038/s41598-017-02514-5
of the FRET fluorophore expression for each combination. The maximal FRET efficiency (EAmax) was calculated from the binding curve for saturable binding as described previously17 and is proportional to the binding strength of the respective protein complex in the equilibrium. Analysis of EAmax for the different perWT and perMT com-binations allowed us to draw several important conclusions. First, robust and unusually high EAmax values could be observed for the perWT only FRET pair (34.2%, Fig. 2a and Supplementary Table 1). These values are close to the highest theoretically possible 40% FRET efficiency for proteins tagged with bulky fluorophores like citrine or cerulean and highlight the strength of protein-protein interactions in homomeric peripherin-2 complexes. Second, EAmax was only slightly decreased for the perP210L only (30.7%) and perC214S only (26.47%) FRET pairs when compared to perWT only (Fig. 2b,c and Supplementary Table 1), suggesting that mutants are still largely capable of self-interacting. By contrast, both, perWT-perP210L (9.44%) and the perWT-perC214S (8.58%) combina-tions, led to a robust decrease in EAmax (Fig. 2d,e and Supplementary Table 1). Next, we also determined the EAmax values for Rom-1 co-expressed with each, perWT and perMT. When compared to perWT only, EAmax for the Rom-1-perWT interaction was noticeably lower (15.64%) indicating that heteromeric Rom-1-perWT complexes bind less tight than their homomeric perWT only counterparts (Fig. 2f and Supplementary Table 1). Second, both, Rom-1-perP210L and Rom-1-perC214S combinations, led to reduced EAmax values when compared to the Rom-1-perWT interaction (6.58% and 6.32%, respectively, Fig. 2g,h and Supplementary Table 1). Finally, we also calculated the percentage of EAmax reduction for both peripherin-2 mutants relative to perWT only and to the perWT-Rom-1 FRET pair. When compared to perWT only, the EAmax values were reduced to 28% for the perWT-perP210L and to 25% for the perWT-perC214S FRET pair, respectively. By contrast, relative to the Rom-1-perWT FRET pair, the EAmax values were reduced to 42% for the Rom-1-perP210L and to 40% for the Rom-1-perC214S combination, respectively (Supplementary Table 1). This suggests that binding of both peripherin-2 mutants to perWT is more strongly affected than binding to Rom-1.
Figure 2. Quantification of homo- and heteromeric perWT, perMT, and Rom-1 protein-protein interactions using FRET. (a–h) FRET experiments from living HEK293T cells transiently co-transfected with the respective citrine- (citr) or cerulean (cer)-tagged peripherin-2 or Rom-1 constructs as indicated. To obtain the binding curves, FRET efficiency (EA) was plotted against the cerulean/citrine molar ratio (cer/citr MR). The dots represent mean values of 1–7 single FRET measurements ± SEM. EAmax, maximal FRET efficiency. The single EAmax, values and the numbers of independent measurements (n) for each combination are summarized in Supplementary Table 1.

www.nature.com/scientificreports/
5Scientific RepoRts | 7: 2321 | DOI:10.1038/s41598-017-02514-5
Taken together, our FRET results indicate that, although with reduced efficiencies, both mutants in principle retain their ability to self-interact and to form complexes with perWT or with Rom-1.
Subunit assembly of homo- and heteromeric perWT, perMT, and Rom-1 complexes. Sucrose density gradient centrifugation (SDGC) allows for a separation of different covalently or non-covalently linked protein complexes across a sucrose gradient according to their specific molecular weight. Using SDGC, previous studies analyzed the impact of peripherin-2 mutants including perC214S on homotypic perMT-perMT or heterotypic Rom-1-perMT interactions on subunit assembly16, 21, 22, 25. To examine the complexes which can be formed in heterozygous patients more systematically, we performed a set of sedimentation velocity experiments of differ-entially tagged perWT, perMT, and Rom-1 combinations (perWT only, perP210L only, perC214S only, perWT-perP210L, perWT-perC214S, Rom-1-perWT, Rom-1-perP210L, and Rom-1-perC214S) transiently expressed in HEK293T cells. In line with previous work, we found the perWT complexes only in sucrose gradient fractions containing the non-covalent tetramers as well as in fractions containing the disulfide-linked octamers under non-reducing con-ditions (Fig. 3a). By contrast, when expressed alone, perP210L was primarily detected as monomer, non-covalent dimer, and aggregates, but some complexes were also found as disulfide-linked tetramers and octamers (Fig. 3b). Similar to perP210L, perC214S was predominantly detected in monomer, non-covalent dimer, and aggregate fractions when expressed alone (Fig. 3c). In presence of perWT, perP210L was primarily detected in the fractions containing monomers and non-covalent dimers, and only weak signal was found in the non-covalent tetramer fractions (Fig. 3d). Moreover, in this combination the SDGC pattern for perWT slightly differed from the perWT only situa-tion. The most striking difference was that a substantial perWT signal could now also be seen in the non-covalent dimer fractions (Fig. 3d). Given that no considerable amounts of perWT were detectable in this fraction for perWT only (cf. Fig. 3a), we concluded that the non-covalent dimer fraction most likely consists of perWT-perP210L dimers. When co-expressed with perC214S, perWT reasonably decreased the percentage of perC214S aggregates (Fig. 3e). Moreover, in presence of perWT the majority of perC214S was found in the non-covalent dimer fractions and as perC214S monomers. However, in contrast to the perWT-perP210L combination, a strong perC214S signal could also be detected in the non-covalent tetramer fractions. Finally, in the perWT-perC214S combination, we could also robustly detect perWT in the non-covalent dimer fractions (Fig. 3e). Taking into account that perWT alone does not homodimerize (cf. Fig. 3a) and that perC214S alone does not form non-covalent tetramers (cf. Fig. 3c), we con-cluded that the non-covalent dimer and tetramer fractions in the perWT-perC214S combination most likely contain perWT-perC214S dimers and tetramers, respectively (Fig. 3e).
Next, we analyzed the SDGC fractions from HEK293T cells co-expressing Rom-1-perWT, Rom-1-perP210L, and Rom-1-perC214S complexes. As expected, in the Rom-1-perWT combination a robust Rom-1 signal was found in non-covalent tetramer fractions (Fig. 3f). In addition, Rom-1 was also detected in non-covalent dimer and mon-omer fractions. No considerable amounts of perWT were found in these fractions suggesting that no Rom-1-perWT heterodimers are present under these conditions (Fig. 3f). When analyzing Rom-1-perP210L and Rom-1-perC214S combinations, the perP210L and perC214S mutants were almost exclusively found in the non-covalent dimer and mon-omer fractions (Fig. 3g,h). In contrast to the Rom-1 signal from the Rom-1-perWT combination, in presence of the perP210L and perC214S mutants Rom-1 was almost exclusively detected in dimer and monomer fractions (Fig. 3g,h). Based on this, we concluded that Rom-1 predominantly forms non-covalent dimers with both mutants.
Taken together, our SDGC results suggest that perWT-perMT and Rom-1-perMT protein complexes are mainly built of non-covalent dimers.
Rod OS targeting of homo- and heteromeric perWT, perMT, and Rom-1 complexes. Our FRET and SDGC experiments from HEK293T cells strongly suggest that both peripherin-2 mutants are in principle capable of forming complexes with perWT and Rom-1. This prompted us to analyze the protein targeting of these complexes in rod photoreceptors. For this purpose, we used rAAV vector gene delivery to express various combinations of perWT, Rom-1, and perMT and analyze their transport/localization in mouse photoreceptors. It has been shown previously that subretinal co-administration of two rAAVs encoding different transgenes results in very high co-transduction efficiencies in rods17. For delivery to rod photoreceptors, rAAV vectors with a rod specific human rhodopsin pro-moter were used. To allow for discrimination between perWT or Rom-1 and perMT expression, we fused cerulean to the N-terminus of perWT and Rom-1, and citrine to the N-terminus of perMT, respectively. The rAAVs containing the different peripherin-2 and Rom-1 constructs were subretinally injected to P14 wild type mice. Subsequent analysis of peripherin-2 localization was examined four weeks post injection by detecting citrine and cerulean fluorescence on retinal slices from injected animals. When expressed alone, citrine and cerulean were retained in the rod IS (Suppl. Fig. 1). In accordance with our previous observations20, both mutants were also completely mislocalized to the IS (Fig. 4a,b). The localization pattern of perP210L and perC214S was remarkably different. perP210L showed a spotted large vesicular-like expression, whereas perC214S was distributed throughout the rod IS. Interestingly, how-ever, simultaneous co-delivery of titer-matched perWT and perMT led to a noticeable rescue and substantial rod OS targeting of perP210L and perC214S (Fig. 4c,d). In addition, the rAAV-mediated co-delivery of perWT also rescued the vesicle-like expression pattern of perP210L in the rod IS (Fig. 4c). Finally, we also assessed whether co-administration of titer-matched rAAVs expressing transgenic Rom-1 together with perP210L or perC214S leads to a similar rescue effect. When co-expressed with perWT, both, Rom-1 and perWT were exclusively found in rod OS (Fig. 5a). However, transgenic Rom-1 did not noticeably promote perMT protein targeting to the OS. By contrast, a substantial amount of transgenic Rom-1, most likely the Rom-1-perMT heterodimers, was retained in the rod IS (Fig. 5b,c).
Taken together, these experiments demonstrate that simultaneous co-delivery of transgenic perWT rescues the targeting of the perP210L and perC214S mutants to rod OS. However, simultaneous co-delivery of transgenic Rom-1 and perP210L or perC214S resulted in substantial retention of Rom-1 in the rod IS. In combination with the results obtained from SDGC experiments, these findings strongly indicate that perWT-perMT, but not Rom-1-perMT het-erodimers, can be efficiently targeted to rod OS.

www.nature.com/scientificreports/
6Scientific RepoRts | 7: 2321 | DOI:10.1038/s41598-017-02514-5
Figure 3. SDGC of different perWT, perMT, and Rom-1 combinations. Shown are representative immunoblots (left panel) and the corresponding statistics (right panel) for each C-terminally myc- or flag-tagged combination as indicated. Each blot consists of 11 fractions collected across the 5–20% sucrose gradient. All fractions were normalized to the DNA standard mixed to the protein solution prior to SDGC as described in the methods section. The single peripherin-2 or Rom-1 complexes can be found in following fractions: octamers: fraction 3–6; tetramers: fraction 6–8; dimers: fraction 9–10; monomers: fraction 10–11. Immunoblottings were performed with antibodies recognizing either the myc-tag (first row of the left panel) or the flag-tag (second row of the left panel), respectively. For quantification, the percentage of total immunoreactivity related to the number of single fractions for non-covalent or covalent complexes and aggregates was plotted against the 11 collected fractions. The fractions containing the non-covalent dimers are highlighted by a dashed rectangle. The single values (percentages and numbers of independent experiments) for all combinations are summarized in Supplementary Table 2. Fractions containing the DNA standards (975 kDa, 325 kDa, 130 kDa and 49 kDa) are marked accordingly.

www.nature.com/scientificreports/
7Scientific RepoRts | 7: 2321 | DOI:10.1038/s41598-017-02514-5
Analysis of the perWT-perMT binding properties in rod OS using FRET. FRET and co-IP experiments in HEK293T cells revealed a reduced apparent binding of both peripherin-2 mutants to perWT. This finding could be best explained by decreased binding affinities of the perWT-perMT interaction and/or decreased initial binding kinetics of the mutants to perWT. However, in HEK293T cells co-transfected with perWT and perMT each mutant can also exist as monomers or could undergo self-interactions (i.e. as dimers or aggregates, cf. Fig. 3b–e). As all these combinations would contribute to the overall FRET signal, the apparent reduction of EAmax in HEK293T cells does not allow for discrimination between the mechanisms described above. To examine this issue directly, we took advantage of the fact that perMT targeting to rod OS is rescued only upon co-delivery of transgenic perWT. Consequently, in contrast to HEK293T cells, in rescued rod OS all perMT protein must be arranged in complexes with perWT. This happenstance allowed us to draw direct conclusions about the perWT-perMT binding properties under close-to-native conditions by measuring FRET in isolated “rescued” rod OS. For this purpose, we co-injected wild type mice on P14 with the respective perWT and perMT FRET pairs. At four weeks post injec-tion we isolated the rod OS and measured FRET on single OS co-expressing both, cerulean-tagged perWT and citrine-tagged perMT (Fig. 6a–c). Robust FRET signals could be measured for all combinations. Importantly, the cerulean/citrine molar ratios substantially varied between the single rod OS, which also allowed us to calculate the binding curves. Remarkably, in contrast to the FRET results from HEK293T cells, the EAmax from isolated rod
Figure 4. Rod OS targeting of perWT-perMT complexes. (a–d) Confocal images of immunostained retinas injected with citrine-tagged mutants (citr-perP210L (a) and citr-perC214S (b)), or co-injected with the respective mutants and the N-terminally cerulean-tagged perWT (cer-perWT, (c–d)). CNGB1a antibody (B1a, red) was used for specific staining of rod OS. Scale bar, 30 µm.
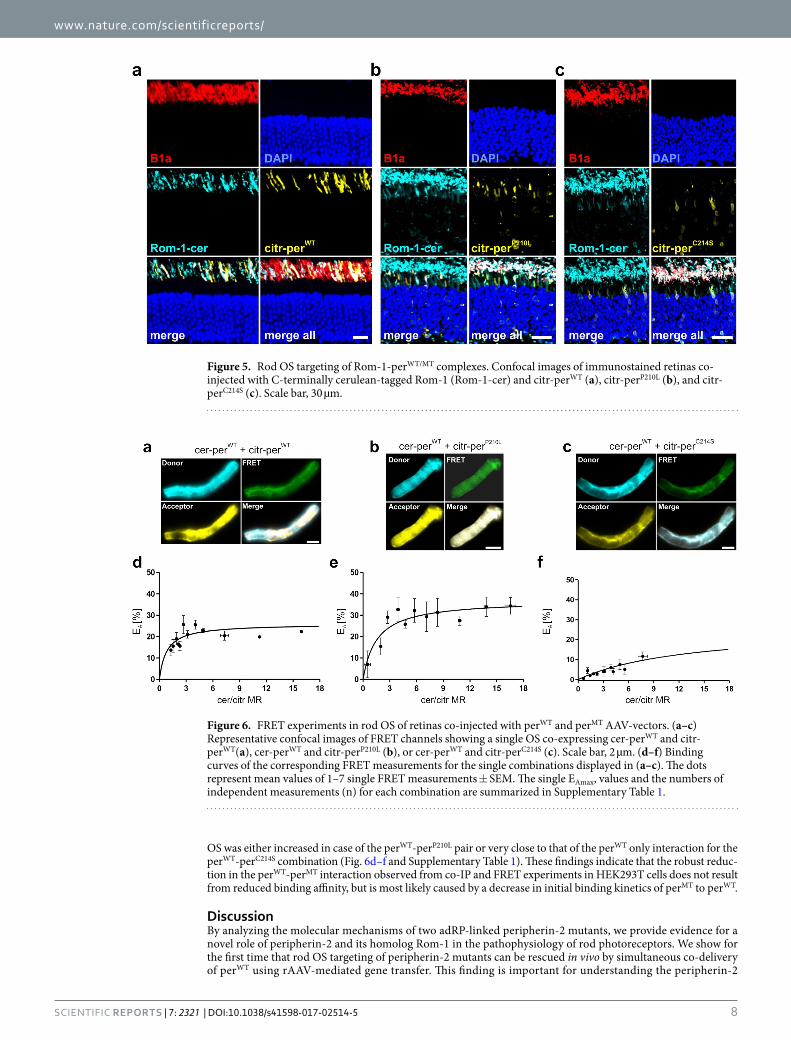
www.nature.com/scientificreports/
8Scientific RepoRts | 7: 2321 | DOI:10.1038/s41598-017-02514-5
OS was either increased in case of the perWT-perP210L pair or very close to that of the perWT only interaction for the perWT-perC214S combination (Fig. 6d–f and Supplementary Table 1). These findings indicate that the robust reduc-tion in the perWT-perMT interaction observed from co-IP and FRET experiments in HEK293T cells does not result from reduced binding affinity, but is most likely caused by a decrease in initial binding kinetics of perMT to perWT.
DiscussionBy analyzing the molecular mechanisms of two adRP-linked peripherin-2 mutants, we provide evidence for a novel role of peripherin-2 and its homolog Rom-1 in the pathophysiology of rod photoreceptors. We show for the first time that rod OS targeting of peripherin-2 mutants can be rescued in vivo by simultaneous co-delivery of perWT using rAAV-mediated gene transfer. This finding is important for understanding the peripherin-2
Figure 5. Rod OS targeting of Rom-1-perWT/MT complexes. Confocal images of immunostained retinas co-injected with C-terminally cerulean-tagged Rom-1 (Rom-1-cer) and citr-perWT (a), citr-perP210L (b), and citr-perC214S (c). Scale bar, 30 µm.
Figure 6. FRET experiments in rod OS of retinas co-injected with perWT and perMT AAV-vectors. (a–c) Representative confocal images of FRET channels showing a single OS co-expressing cer-perWT and citr-perWT(a), cer-perWT and citr-perP210L (b), or cer-perWT and citr-perC214S (c). Scale bar, 2 µm. (d–f) Binding curves of the corresponding FRET measurements for the single combinations displayed in (a–c). The dots represent mean values of 1–7 single FRET measurements ± SEM. The single EAmax, values and the numbers of independent measurements (n) for each combination are summarized in Supplementary Table 1.

www.nature.com/scientificreports/
9Scientific RepoRts | 7: 2321 | DOI:10.1038/s41598-017-02514-5
biology in photoreceptors and has implications for the development of future gene therapies for patients with PRPH2 mutations. Peripherin-2 is crucial for proper rod OS structure and development. This function was pro-posed to be dose-dependent in rods suggesting that reduced dosage of peripherin-2 (less than 60–80% of the wild type level) induces retinal degeneration26, 27. In line with the postulated dose-dependency, transgenic mice expressing the perC214S mutant show reduced amounts of mutant protein in rod OS (due to mislocalization or protein degradation) which results in haploinsufficiency22. Interestingly, genetic supplementation of perWT on the perC214S mutant background led to a noticeable rescue of the retinal function28. Although helpful in initial stages of therapy development, the application spectrum of genetic supplementation is restricted to model organisms. By contrast, rAAV-mediated gene delivery has proven to be a very promising technique for therapeutic interven-tion on retinal diseases like retinitis pigmentosa in mammals29–32. Our data suggest that rAAV-mediated gene supplementation of perWT could support a rescue of perMT targeting defects to rod OS in adRP patients carrying mislocalizing peripherin-2 mutations. We could not detect any detrimental effects on outer nuclear layer (ONL) thickness in fully developed retinas of WT animals co-injected with perWT and perMT transgenes six months post injection (Suppl. Fig. 2). However, we cannot exclude the possibility that rescue of perMT rod OS targeting by perWT gene supplementation would initiate retinal degeneration in patients heterozygous for these mutations. Consequently, prior to gene therapy, the long-term effects of the mutant rescue on retinal degeneration should be tested in appropriate animal models.
In mice co-injected with rAAVs expressing labeled peripherin-2 and Rom-1 transgenes, it is not possible to estimate the contribution of the endogenous murine peripherin-2 and Rom-1 on the perMT rescue. However, our observation that both mutants are mislocalized to the rod IS and lead to reduced protein expression suggests that the endogenous protein levels were not sufficient to rescue perMT localization. Of note, in heterozygous transgenic knock-in mice expressing perC214S, the mutant protein remains in the inner segments and is highly prone to degradation22. These results are very similar to our observations from wild type mice injected with the transgenic perC214S mutant. With respect to this finding, it can be concluded that the rAAV-mediated delivery of transgenic perC214S mutant to wild type mice largely reflects the native situation in mice heterozygous for this mutant. The fact that perC214S is not targeted to rod OS suggests that perWT-perC214S complexes most likely are not formed under these conditions. However, as discussed above, additional rAAV-mediated delivery of perWT pre-sumably exceeds the critical levels necessary for perWT-perMT complex formation, highlighting the critical role of peripherin-2 dosage in pathophysiology of photoreceptors.
Our study also provides novel insights into the structural impacts of perP210L and perC214S on folding of the D2 loop domain. We show that perP210L and perC214S lead to a structural rearrangement of the distal part of the D2 loop domain around the aa position 260. It is conceivable that perP210L and perC214S may also lead to structural changes in other parts of the D2 loop, which could not be covered by our assay. However, our data suggest that folding changes induced by perP210L and perC214S most likely do not elicit structural rearrangements of the proxi-mal half of the D2 loop close to the highly conserved tetraspanin CCG motif.
P210 and C214 are located within the PxxCC motif, which is conserved among most tetraspanins33. While both cysteine residues of the motif were shown to be involved in intramolecular peripherin-2 disulfide bond formation21, 34, the role of the proline residue remained unknown. Peripherin-2 belongs to the subfamily of non-conventional tetraspanins34, thus, it remains to be clarified if the PxxCC motif has a similar role on protein folding in other tetraspanins. Interestingly, other mutants in close proximity to the P210 and C214 position (i.e. perV209I or perS212T) did not change the accessibility of the proteases in our assay. This emphasizes the crucial role of the proline at position 210 and cysteine at position 214 for the proper folding of the D2 loop domain. Furthermore, our results suggest that the apparent reduction of perMT binding to perWT in co-IP and in FRET experiments from HEK293T cells is most likely caused by protein misfolding. Our FRET experiments on isolated rod OS indicate that this apparent decrease in binding to perWT does not result from reduced binding affinities, but rather seems to be a consequence of reduced initial binding kinetics of perP210L and perC214S to perWT. In other words, this suggests that the first step of perMT binding to perWT is impeded, however, once bound, the affinity of both mutants to perWT remains largely unchanged. These results are well matched on our peptide competition assay indicating that the PxxCC motif does not represent the interface for homomeric peripherin-2 interactions. EAmax values resulting from the transgenic perWT were higher in HEK293T cells compared to the rod OS. This dif-ference could be caused by non-labeled endogenous peripherin-2 or Rom-1 in the retina, which are also expected to bind to transgenic perWT (incomplete labeling). However, the perWT EAmax values from isolated rod OS are still in a very high range highlighting the suitability of the FRET approach to addressing peripherin-2 oligomerization in these compartments.
When correlating our results from SDGC to those obtained from rod OS targeting experiments (Fig. 7 and Suppl. Fig. 3), two very important conclusions could be drawn: 1) Non-covalent perWT-perMT dimers can be formed and targeted to rod OS. 2) Non-covalent Rom-1-perMT heterodimers are stacked in the inner seg-ments. The first deduction is very surprising as non-covalent tetramerization was considered to be crucial for peripherin-2 targeting to rods16. This conclusion was drawn from different sets of experiments in previous studies: i) When analyzing perWT complexes isolated from OS, no dimers could be detected35. ii) Tetramerization-deficient peripherin-2 mutants could not be targeted to rod OS16. iii) Peripherin-2 mutants which preferentially form homodimers are not targeted to rod OS16. However, none of these experiments is sufficient to state if perWT-perWT or perWT-perMT dimers can also be targeted to rod OS. First, perWT does not form dimers in SDGC experiments when expressed alone, which explains its absence in rod OS under physiological conditions. Second, only rod OS targeting of pure perMT complexes was examined so far16. Consequently, to the best of our knowledge, this is the first study addressing the principle capability of perWT-perMT dimers to be targeted to rod OS. The finding that Rom-1-perMT heterodimers cannot be targeted to rod OS suggests that Rom-1 cannot fully compensate for the peripherin-2 function in rods under these conditions. Currently, one can only speculate about the physio-logical role of these opposing effects of peripherin-2 and Rom-1 in terms of binding and targeting of misfolded

www.nature.com/scientificreports/
1 0Scientific RepoRts | 7: 2321 | DOI:10.1038/s41598-017-02514-5
peripherin-2 mutants. A recent study revealed that Rom-1 promotes the trafficking of the Y141C peripherin-2 mutant in vitro and converts the cone-dominant pattern dystrophy to RP phenotype in vivo12. Similar effects are not expected to occur for the C214S or P210L mutation, as Rom-1 cannot promote targeting of these mutants to rod OS. Together, these findings indicate that Rom-1 might play a yet undefined role in pathophysiology of retinal diseases as a mutation-dependent disease modifier.
Rom-1 and peripherin-2 are also expressed in cones and many mutations in peripherin-2 (but not in Rom-1) are linked to retinal diseases primarily affecting cone photoreceptors13. Despite some advances, the molecular mechanisms underpinning this differential penetrance of peripherin-2 mutants in rods and cones are still not fully understood. In light of our results, it is tempting to speculate that Rom-1 might be one of the key players shaping the penetrance of peripherin-2 mutants in rods and cones. Finally, in the context of gene therapy, the postulated novel function of Rom-1 raises the possibility that the efficiency of gene supplementation therapy of adRP-associated peripherin-2 point mutations could be improved by co-delivering peripherin-2 with Rom-1.
MethodsAnimals. The studies were carried out in accordance with the approved guidelines of the local commit-tee of laboratory animal care (District Government of Upper Bavaria) and German Laws on animal welfare (Tierschutzgesetz). Anesthesia was performed by intraperitoneal injection of ketamine (40 mg/kg body weight) and xylazine (20 mg/kg body weight). Euthanasia was performed by cervical dislocation.
Molecular biology. For expression in rods, the single human peripherin-220 and Rom-1 transgenes were subcloned to the pAAV2/8 YF vector30 containing the human Rhodopsin (hRHO) promoter using standard clon-ing techniques. For expression in HEK293T cells (LentiX 293 T Cell Line, Clontech Laboratories, Mountain View, CA, USA), the peripherin-2 and Rom-1 transgenes were subcloned to the standard pcDNA3.1 vector (Invitrogen, Waltham, MA, USA). Peripherin-2 mutants were introduced by site directed mutagenesis (QuikChange Lightning Site-Directed Mutagenesis Kit, Agilent Technologies, Santa Clara, CA, USA). All transgenes were sequenced prior to use.
Protein biochemistry. For co-immunoprecipitations (co-IPs) transiently transfected HEK293T cells were harvested 48 hours post transfection and membrane preparations were conducted as described36. Co-IPs were performed with the anti-myc antibody (9B11, Cell Signaling Technology, Danvers, MA, USA) using Protein G magnetic beads (Novex, Thermo Fisher Scientific, Waltham, MA, USA) according to the manufacturer’s protocol.
For western blotting, injected retinas of light adapted wild type C57BL6/J animals were used four weeks post injection. The dissected retinas were homogenized in membrane preparation buffer using the Potter S homoge-nizer (B. Braun Diessel Biotech, Melsungen, Germany).
For peptide competition assay, the peripherin-2 peptide (peptide sequence CDGRYLVDGVPFSCCNPSSPR) was obtained from jpt Innovative Peptide Solutions (Berlin, Germany). The peptide was added to the respec-tive membrane preparation and the solution was incubated with the myc-antibody-coupled magnetic beads for 30 min at room temperature. The co-IPs containing the peptide-free membrane preparations were processed under identical conditions. For the native protease cleavage assay, membrane preparations36 of transfected HEK293T cells were incubated for 5 h at room temperature (RT) and processed for western blotting. No protease inhibitors were added to the membrane preparations prior to the incubation. For immunoblotting, antibodies were used in following dilutions: mouse anti-myc (see above), 1:2000; mouse anti-GFP (Clontec, Takara Bio Inc., Shiga, Japan), 1:2000; mouse anti-ATPase (anti alpha3, ab2826, Abcam, Cambridge, UK), 1:2000.
Sucrose density gradient centrifugation. For sucrose density gradient centrifugation, HEK293T cells were transiently transfected with the respective peripherin-2 constructs. Cells were harvested 48 h post transfection and homogenized in a lysis buffer comprising 0.5% Triton X-100, 150 mM NaCl and 2 mM CaCl2 using the Potter S homogenizer (see above). Continuous density gradients of 5–20% (wt/vol) sucrose were pre-pared by underlayering 0.5 ml of 5%, 10%, 15% and 20% sucrose containing 0.1% Triton X-100 and 10 mM N-ethylmaleimide (Sigma-Aldrich, St. Louis, MO, USA). The gradient was left at RT for 1 h to facilitate diffusion
Figure 7. Rod OS targeting of perMT dimeric complexes. The rod photoreceptor localization of different perMT-containing dimers (perWT-perMT, Rom-1-perMT and perMT only) is symbolized by a dashed rectangle. The position of the D2 loop is highlighted in red and the D2 loop misfolding caused by perMT is symbolized by an incision.

www.nature.com/scientificreports/
1 1Scientific RepoRts | 7: 2321 | DOI:10.1038/s41598-017-02514-5
and chilled on ice for 30 min prior to sample application. To determine the weight of single peripherin-2 and Rom-1 protein complexes in each immunoblot, DNA standards of defined molecular weights (75 bp–20.000 bp, i.e. 49 kDa–13,000 kDa, GeneRuler 1 kb Plus (Thermo Fisher Scientific, Waltham, MA, USA)) were mixed to lysates containing 200 µg of the respective proteins. The mixture was carefully layered on top of the gradient and centrifuged at 46,700 rpm for 2 h at 4 °C in a Beckman Coulter Optima L-80K Ultracentrifuge (Beckman Coulter Biomedical GmbH, Munich, Germany). Afterwards, the centrifuge tube was punctured and fractions were col-lected dropwise (5 drops/tube). Fractions from each sucrose gradient were separately used for immunoblotting with myc- or flag-specific antibodies and for agarose gel electrophoresis to detect the DNA standards. The suit-ability of DNA standards was first validated for perWT only. As shown in Fig. 3a, perWT gives rise to well-defined fractions of non-covalent tetramers, covalent octamers, and high-order oligomers. The molecular weight of the DNA in the same fractions very nicely correlated with the molecular weights of the corresponding perWT com-plexes. Therefore, for each of the remaining immunoblots, DNA standards were used to determine the fractions containing the different perWT, perMT, or Rom-1 complexes.
Photometric FRET Measurements. 3 cube FRET was performed as described in detail in Butz et al.37 with modifications published in Becirovic et al. and Nguyen et al.18, 19. Briefly, transfected HEK293T cells and isolated rod OS were measured in a FRET imaging solution comprising 2 mM CaCl2, 10 mM glucose, 10 mM HEPES sodium salt, 5 mM KCl, 1 mM MgCl2, 140 mM NaCl, pH 7.4, at RT. 3 cube FRET measurements were conducted using a Leica DMI6000B inverted fluorescent microscope (Leica, Wetzlar, Germany) in combination with a photomultiplier detection system including a photomultiplier tube (Horiba, London, Ontario, Canada). As excitation source, a DeltaRamX monochromator was used and FRET data were acquired with FelixGX soft-ware (Horiba, London, Ontario, Canada). FRET filter cubes were as follows (excitation, dichroic mirror, emis-sion): cerulean/CFP (ET436/20 × ; T455lp; ET480/40m), FRET (ET436/20 × ; T455lp; ET535/30m) and citrine/YFP (ET500/20 × ; T515lp; ET535/30m) (Chroma technology, Vermont, USA). The fluorescence intensities were measured in single cells co-expressing varying, but sufficient levels of cerulean- and citrine-tagged proteins with the respective filter cube. Subsequent FRET ratios (FR) were calculated from the signal intensities according to the 3 cube FRET equation described in Shaltiel et al.38. Apparent FRET efficiencies (EA) at given cerulean/citrine molar ratios (MR) were obtained from equation (1):
= − ⋅ε
εE [FR 1] (436)
(436) (1)Acitrine
cerulean
εcitrine and εcerulean represent the setup specific average molar extinction coefficients for the fluorophores citrine or cerulean, respectively. FRET data were analyzed using FelixGX software (see above) and Excel (Microsoft Corporation, Redmond, Washington, USA).
Binding curves were calculated using equation (2):
=⋅
+E E MR
K MR (2)AAmax
EAmax is the maximal FRET efficiency that can be calculated for saturated donor concentrations and K is an analogon of the dissociation constant. Ex vivo FRET experiments were conducted on single rod OS isolated from six pooled retinas for each FRET pair.
rAAV preparation and subretinal injections. The production of single-strand AAVs (rAAV 2/8 YF) containing the hRHO promoter and the subretinal injection technique were described previously30. 1010 rAAV particles were delivered subretinally to wild type C57Bl6/J mice by a single injection on postnatal day 14. Four weeks post injection, all injected retinas were analyzed for fluorescence using scanning laser ophthalmoscopy (Spectralis, Heidelberg Engineering, Dossenheim, Germany).
Preparation of outer segments. A detailed procedure of rod OS preparation was described recently17, 19. Briefly, mice were sacrificed four weeks post injection and the isolated retinas were collected in a 1.5-ml reaction tube containing 100 µl of PBS. The OS were separated from the retina by vortexing for 15–30 s and centrifug-ing for 30 s at 500 × g. Afterwards the OS containing supernatant was collected and used for subsequent FRET measurements.
Immunohistology and Confocal Microscopy. For immunohistology, wild type C57BL6/J mice were injected on P14 with the respective rAAV particles. Four weeks post injection, the retinas were dissected and processed for immunohistology as described39. Retinal and OS images were obtained by the TCS SP8 confocal scan microscope (Leica, Wetzlar, Germany), acquired with the LASX software (Leica, Wetzlar, Germany), and processed with the ImageJ software (National Institutes of Health, Bethesda, MD, USA). We used the rabbit anti-CNGB1a antibody (1:10.00040) as marker for rod outer segments. Citrine was excited with the 514 nm laser and detected with the Hybrid (HyD) detector using a 520–540 nm emission filter. Cerulean was excited using the 448 nm laser and detected via the HyD detector with a 460–480 nm emission filter. Images were taken using the 40x and 63x objectives.
Confocal scanning laser ophthalmoscopy and optical coherence tomography. Confocal scan-ning laser ophthalmoscopy (cSLO) and optical coherence tomography (OCT) were performed 6 months post injection using a modified Spectralis HRA + OCT system (Heidelberg Engineering, Dossenheim, Germany) as

www.nature.com/scientificreports/
1 2Scientific RepoRts | 7: 2321 | DOI:10.1038/s41598-017-02514-5
described recently41. Fluorescence signals were examined at 488 nm excitation for citrine/cerulean detection (BP 550/49 nm emission filter).
Statistics. All values are given as mean ± SEM, and n is the number of trials. For multiple comparisons one-way ANOVA followed by the Tukey’s test was used.
Data availability. All data generated or analyzed during this study are included in this published article (and its Supplementary Information files).
References 1. Goldberg, A. F. & Molday, R. S. Subunit composition of the peripherin/rds-rom-1 disk rim complex from rod photoreceptors:
hydrodynamic evidence for a tetrameric quaternary structure. Biochemistry 35, 6144–6149 (1996). 2. Stuck, M. W., Conley, S. M. & Naash, M. I. PRPH2/RDS and ROM-1: Historical context, current views and future considerations.
Prog. Retin. Eye. Res. 52, 47–63 (2016). 3. Goldberg, A. F. Role of peripherin/rds in vertebrate photoreceptor architecture and inherited retinal degenerations. Int. Rev. Cytol.
253, 131–175 (2006). 4. Goldberg, A. F., Moritz, O. L. & Williams, D. S. Molecular basis for photoreceptor outer segment architecture. Prog. Retin. Eye. Res.
55, 52–81 (2016). 5. Moritz, O. L. & Molday, R. S. Molecular cloning, membrane topology, and localization of bovine rom-1 in rod and cone
photoreceptor cells. Invest. Ophthalmol. Vis. Sci. 37, 352–362 (1996). 6. Loewen, C. J. & Molday, R. S. Disulfide-mediated oligomerization of Peripherin/Rds and Rom-1 in photoreceptor disk membranes.
Implications for photoreceptor outer segment morphogenesis and degeneration. J. Biol. Chem. 275, 5370–5378 (2000). 7. Daiger, S. P., Sullivan, L. S. & Bowne, S. J. Genes and mutations causing retinitis pigmentosa. Clin. Genet. 84, 132–141 (2013). 8. Ferrari, S. et al. Retinitis pigmentosa: genes and disease mechanisms. Curr. Genomics 12, 238–249 (2011). 9. Bascom, R. A. et al. Cloning of the cDNA for a novel photoreceptor membrane protein (rom-1) identifies a disk rim protein family
implicated in human retinopathies. Neuron 8, 1171–1184 (1992). 10. Dryja, T. P., Hahn, L. B., Kajiwara, K. & Berson, E. L. Dominant and digenic mutations in the peripherin/RDS and ROM1 genes in
retinitis pigmentosa. Invest. Ophthalmol. Vis. Sci. 38, 1972–1982 (1997). 11. Kajiwara, K., Berson, E. L. & Dryja, T. P. Digenic retinitis pigmentosa due to mutations at the unlinked peripherin/RDS and ROM1
loci. Science 264, 1604–1608 (1994). 12. Conley, S. M., Stuck, M. W., Watson, J. N. & Naash, M. I. Rom1 converts Y141C-Prph2-associated pattern dystrophy to retinitis
pigmentosa. Hum. Mol. Genet. (2017). 13. Boon, C. J. et al. The spectrum of retinal dystrophies caused by mutations in the peripherin/RDS gene. Prog. Retin. Eye. Res. 27,
213–235 (2008). 14. Stenson, P. D. et al. The Human Gene Mutation Database: building a comprehensive mutation repository for clinical and molecular
genetics, diagnostic testing and personalized genomic medicine. Hum. Genet. 133, 1–9 (2014). 15. Goldberg, A. F. & Molday, R. S. Defective subunit assembly underlies a digenic form of retinitis pigmentosa linked to mutations in
peripherin/rds and rom-1. Proc. Natl. Acad. Sci. USA. 93, 13726–13730 (1996). 16. Loewen, C. J., Moritz, O. L., Tam, B. M., Papermaster, D. S. & Molday, R. S. The role of subunit assembly in peripherin-2 targeting to
rod photoreceptor disk membranes and retinitis pigmentosa. Mol. Biol. Cell 14, 3400–3413 (2003). 17. Becirovic, E. et al. Peripherin-2 couples rhodopsin to the CNG channel in outer segments of rod photoreceptors. Hum. Mol. Genet.
23, 5989–5997 (2014). 18. Nguyen, O. N. et al. Peripherin-2 differentially interacts with cone opsins in outer segments of cone photoreceptors. Hum. Mol.
Genet. 25, 2367–2377 (2016). 19. Becirovic, E. et al. AAV Vectors for FRET-Based Analysis of Protein-Protein Interactions in Photoreceptor Outer Segments. Front.
Neurosci. 10, 356 (2016). 20. Becirovic, E. et al. In Vivo Analysis of Disease-Associated Point Mutations Unveils Profound Differences in mRNA Splicing of
Peripherin-2 in Rod and Cone Photoreceptors. PLoS Genet. 12, e1005811 (2016). 21. Goldberg, A. F., Loewen, C. J. & Molday, R. S. Cysteine residues of photoreceptor peripherin/rds: role in subunit assembly and
autosomal dominant retinitis pigmentosa. Biochemistry 37, 680–685 (1998). 22. Stricker, H. M., Ding, X. Q., Quiambao, A., Fliesler, S. J. & Naash, M. I. The Cys214–> Ser mutation in peripherin/rds causes a loss-
of-function phenotype in transgenic mice. Biochem. J. 388, 605–613 (2005). 23. Chakraborty, D., Rodgers, K. K., Conley, S. M. & Naash, M. I. Structural characterization of the second intra-discal loop of the
photoreceptor tetraspanin RDS. FEBS J. 280, 127–138 (2013). 24. Ding, X. Q., Stricker, H. M. & Naash, M. I. Role of the second intradiscal loop of peripherin/rds in homo and hetero associations.
Biochemistry 44, 4897–4904 (2005). 25. Ding, X. Q. et al. The R172W mutation in peripherin/rds causes a cone-rod dystrophy in transgenic mice. Hum. Mol. Genet. 13,
2075–2087 (2004). 26. Kedzierski, W. et al. Deficiency of rds/peripherin causes photoreceptor death in mouse models of digenic and dominant retinitis
pigmentosa. Proc. Natl. Acad. Sci. USA. 98, 7718–7723 (2001). 27. Nour, M., Ding, X. Q., Stricker, H., Fliesler, S. J. & Naash, M. I. Modulating expression of peripherin/rds in transgenic mice: critical
levels and the effect of overexpression. Invest. Ophthalmol. Vis. Sci. 45, 2514–2521 (2004). 28. Nour, M., Fliesler, S. J. & Naash, M. I. Genetic supplementation of RDS alleviates a loss-of-function phenotype in C214S model of
retinitis pigmentosa. Adv. Exp. Med. Biol. 613, 129–138 (2008). 29. Rossmiller, B., Mao, H. & Lewin, A. S. Gene therapy in animal models of autosomal dominant retinitis pigmentosa. Mol. Vis. 18,
2479–2496 (2012). 30. Koch, S. et al. Gene therapy restores vision and delays degeneration in the CNGB1(−/−) mouse model of retinitis pigmentosa. Hum.
Mol. Genet. 21, 4486–4496 (2012). 31. Petrs-Silva, H. & Linden, R. Advances in gene therapy technologies to treat retinitis pigmentosa. Clin. Ophthalmol. 8, 127–136
(2014). 32. Ali, R. R. et al. Restoration of photoreceptor ultrastructure and function in retinal degeneration slow mice by gene therapy. Nat.
Genet. 25, 306–310 (2000). 33. Seigneuret, M., Delaguillaumie, A., Lagaudriere-Gesbert, C. & Conjeaud, H. Structure of the tetraspanin main extracellular domain.
A partially conserved fold with a structurally variable domain insertion. J. Biol. Chem. 276, 40055–40064 (2001). 34. Conley, S. M., Stuck, M. W. & Naash, M. I. Structural and functional relationships between photoreceptor tetraspanins and other
superfamily members. Cell. Mol. Life Sci. 69, 1035–1047 (2012). 35. Goldberg, A. F., Moritz, O. L. & Molday, R. S. Heterologous expression of photoreceptor peripherin/rds and Rom-1 in COS-1 cells:
assembly, interactions, and localization of multisubunit complexes. Biochemistry 34, 14213–14219 (1995).

www.nature.com/scientificreports/
13Scientific RepoRts | 7: 2321 | DOI:10.1038/s41598-017-02514-5
36. Much, B. et al. Role of subunit heteromerization and N-linked glycosylation in the formation of functional hyperpolarization-activated cyclic nucleotide-gated channels. J. Biol. Chem. 278, 43781–43786 (2003).
37. Butz, E. S. et al. Quantifying macromolecular interactions in living cells using FRET two-hybrid assays. Nat. Protoc. 11, 2470–2498 (2016).
38. Shaltiel, L. et al. Complex regulation of voltage-dependent activation and inactivation properties of retinal voltage-gated Cav1.4 L-type Ca2+ channels by Ca2+ -binding protein 4 (CaBP4). J. Biol. Chem. 287, 36312–36321 (2012).
39. Michalakis, S. et al. Impaired opsin targeting and cone photoreceptor migration in the retina of mice lacking the cyclic nucleotide-gated channel CNGA3. Invest. Ophthalmol. Vis. Sci. 46, 1516–1524 (2005).
40. Huttl, S. et al. Impaired channel targeting and retinal degeneration in mice lacking the cyclic nucleotide-gated channel subunit CNGB1. J. Neurosci. 25, 130–138 (2005).
41. Schon, C. et al. Loss of HCN1 enhances disease progression in mouse models of CNG channel-linked retinitis pigmentosa and achromatopsia. Hum. Mol. Genet. 25, 1165–1175 (2016).
AcknowledgementsThe authors thank Berit Noack and Nadja Gießl for their excellent technical support. This work was supported by the Deutsche Forschungsgemeinschaft, grant number BE 4830/1-1 (to E.B.), and Deutsche Forschungsgemeinschaft SFB 870 P05 and P15, TRR 152 P06 (to C.W-S). The funders had no role in study design, data collection and analysis, decision to publish, or preparation of the manuscript.
Author ContributionsE.B. designed research; E.B., S.B., L.M.R., O.N.P.N., A.G., T.L., and E.S.B performed research; E.B., S.B., L.M.R., C.S., S.M., C.W.S., and M.B. analyzed data; E.B., S.B., L.M.R., S.M., and M.B. wrote the paper.
Additional InformationSupplementary information accompanies this paper at doi:10.1038/s41598-017-02514-5Competing Interests: The authors declare that they have no competing interests.Publisher's note: Springer Nature remains neutral with regard to jurisdictional claims in published maps and institutional affiliations.
Open Access This article is licensed under a Creative Commons Attribution 4.0 International License, which permits use, sharing, adaptation, distribution and reproduction in any medium or
format, as long as you give appropriate credit to the original author(s) and the source, provide a link to the Cre-ative Commons license, and indicate if changes were made. The images or other third party material in this article are included in the article’s Creative Commons license, unless indicated otherwise in a credit line to the material. If material is not included in the article’s Creative Commons license and your intended use is not per-mitted by statutory regulation or exceeds the permitted use, you will need to obtain permission directly from the copyright holder. To view a copy of this license, visit http://creativecommons.org/licenses/by/4.0/. © The Author(s) 2017

Peripherin-2 and Rom-1 have opposing effects on rod outer segment
targeting of retinitis pigmentosa-linked peripherin-2 mutants
Sybille Böhm1,2#, Lisa M. Riedmayr1,2#, O.N. Phuong Nguyen1,2, Andreas Gießl3, Toni
Liebscher1,2, Elisabeth S. Butz1,2, Christian Schön1,2, Stylianos Michalakis1,2,
Christian Wahl-Schott1,2, Martin Biel1,2 and Elvir Becirovic1,2*

Supplementary Figure 1: Expression profile of citrine and cerulean in transduced
photoreceptors. Scale bar, 30 µm.

Supplementary Figure 2: Long-term effects of perWT and perMT expression on retinal
degeneration in transduced murine photoreceptors. A, Representative confocal
scanning laser ophthalmoscopy (cSLO) of mice injected with the single constructs as
indicated. Note that, in contrast to the confocal microscope settings, citrine and cerulean
fluorescence (white signal) cannot be distinguished using cSLO. B, measurements of the
outer nuclear layer (ONL) thickness of injected animals using optical coherence
tomography. The single values are as follows: citr-perWT (n=4) 100.3 ± 2.7 µm; citr-perP210L
(n=6) 100.0 ± 2.5 µm; citr-perC214S (n=4) 100.0 ± 1.9 µm; citr-perWT + citr-perP210L (n=4)
100.3 ± 2.0 µm; citr-perWT + citr-perC214S (n=4) 98.5 ± 3.3 µm. Statistical analysis was done
with one-way ANOVA followed by the Tukey’s test for multiple comparisons. n.s., not
significant.

Supplementary Figure 3: Tentative model of perMT protein assembly and rod OS
targeting in presence or absence of transgenic perWT and Rom-1. For reasons of
clarity, octamers, higher-order oligomers, and aggregates are not included in this model.
The rectangle highlights the major SDGC fraction(s) for the single homo- or heterogenic
interactions and the arrow length correlates with the preferential direction within the
equilibrium. The misfolding of the distal part of the D2 loop caused by both mutants is
symbolized by an incision. The localization of the respective constructs in rod
photoreceptors (right panel) is indicated by colored bars symbolizing color-coded perWT,
perMT, or Rom-1 constructs. The bar thickness represents the estimated relative amount
of the detected constructs in the respective compartment.

Supplementary Table 1: FRET measurements from HEK293T cells and from isolated rod OS.
WT-WT WT-P210L WT-C214S P210L-P210L C214S-C214S WT-ROM1 ROM-1-P210L ROM-1-C214S WT-WT WT-P210L WT-C214SEAmax 34.2 9.44 8.58 30.7 26.47 15.64 6.58 6.32 25.96 37.12 26.47
% of WT-WT or WT-ROM-1 28 25 90 77 42 40 143 102
n 53 53 50 53 54 48 48 48 45 32 44
rod OSHEK293T

Supplementary Table 2: Quantification of the SDGC experiments. Values are given as mean values ± SEM.
1 2 3 4 5 6 7 8 9 10 11
Non-covalent 0.00 0.00 0.00 2.78 ± 2.78 9.33 ± 0.71 11.53 ± 1.38 11.70 ± 2.15 10.98 ± 2.06 2.65 ± 2.65 2.76 ± 2.76 1.68 ± 1.68
Disulfide bond 0.00 2.05 ± 2.05 4.73 ± 2.39 7.97 ± 1.60 11.78 ± 1.26 12.46 ± 1.50 7.61 ± 0.57 0.00 0.00 0.00 0.00
Non-covalent 0.00 0.00 0.00 0.00 0.00 0.00 0.00 0.00 2.10 ± 2.10 20.35 ± 4.66 19.00 ± 6.53
Disulfide bond 0.00 0.00 0.00 0.00 2.86 ± 2.86 5.44 ± 3.16 4.81 ± 2.79 5.78 ± 2.13 2.67 ± 2.67 1.78 ± 1.78 0.00
Aggregate 0.00 0.00 2.08 ± 2.08 8.28 ± 3.17 10.83 ± 1.53 8.80 ± 3.07 3.18 ± 2.67 2.02 ± 1.78 0.00 0.00 0.00
Non-covalent 0.00 0.00 0.00 0.00 2.61 ± 2.61 4.36 ± 4.36 3.42 ± 3.42 3.34 ± 3.34 18.23 ± 13.07 27.29 ± 14.59 5.20 ± 5.20
Aggregate 7.28 ± 3.77 7.65 ± 4.20 5.27 ± 5.27 4.03 ± 4.03 6.78 ± 6.78 4.53 ± 4.53 0.00 0.00 0.00 0.00 0.00
Non-covalent 0.00 1.74 ± 1.74 2.84 ± 2.84 3.13 ± 3.13 5.13 ± 3.15 4.33 ± 2.80 2.07 ± 2.07 4.45 ± 2.73 23.39 ± 4.14 27.42 ± 5.71 12.38 ± 5.53
Disulfide bond 0.00 0.00 0.00 0.00 0.00 0.00 0.00 0.00 0.00 0.00 0.00
Aggregate 0.00 1.36 ± 1.36 0.00 2.01 ± 1.27 3.57 ± 2.37 3.94 ± 2.49 2.23 ± 2.23 0.00 0.00 0.00 0.00
Non-covalent 0.00 0.00 0.00 0.00 2.37 ± 2.37 1.85 ± 1.85 9.13 ± 1.95 11.07 ± 4.26 10.79 ± 5.76 11.68 ± 3.67 0.00
Disulfide bond 3.68 ± 3.68 4.67 ± 4.67 6.60 ± 3.45 7.86 ± 4.13 12.61 ± 0.59 11.95 ± 2.62 3.35 ± 3.35 2.40 ± 2.40 0.00 0.00 0.00
Non-covalent 0.00 0.00 0.00 0.00 4.45 ± 2.64 5.22 ± 3.09 5.91 ± 3.74 16.61 ± 3.49 12.33 ± 4.41 20.32 ± 4.78 19.65 ± 10.11
Aggregate 0.00 0.00 5.87 ± 3.60 7.81 ± 2.74 1.82 ± 1.82 0.00 0.00 0.00 0.00 0.00 0.00
Non-covalent 0.00 0.00 0.00 0.00 1.45 ± 1.45 1.67 ± 1.12 5.95 ± 1.39 3.40 ± 1.90 6.41 ± 0.57 7.52 ± 0.92 4.11 ± 4.11
Disulfide bond 5.51 ± 2.76 8.75 ± 1.12 10.40 ± 0.57 11.06 ± 0.38 11.38 ± 0.63 9.58 ± 0.63 7.24 ± 0.64 3.46 ± 1.90 2.11 ± 2.11 0.00 0.00
Non-covalent 0.00 0.00 0.00 0.00 8.22 ± 0.86 10.20 ± 1.46 6.34 ± 3.17 4.70 ± 4.70 2.77 ± 2.77 0.00 0.00
Disulfide bond 8.48 ± 4.42 10.61 ± 1.81 10.18 ± 1.60 9.69 ± 1.87 10.50 ± 2.20 10.41 ± 1.38 7.92 ± 0.20 0.00 0.00 0.00 0.00
Non-covalent 0.00 0.00 0.00 1.45 ± 1.45 5.40 ± 2.89 14.96 ± 2.60 17.61 ± 1.74 18.26 ± 9.93 19.35 ± 3.61 8.99 ± 5.91 3.61 ± 3.61
Disulfide bond 0.00 0.00 0.00 0.00 3.49 ± 1.85 4.55 ± 2.65 2.33 ± 2.33 0.00 0.00 0.00 0.00
Non-covalent 0.00 0.00 0.00 0.00 0.00 0.00 0.00 4.56 ± 4.56 22.76 ± 2.11 31.48 ± 6.45 28.67 ± 9.40
Disulfide bond 0.00 0.00 0.00 0.00 0.00 0.00 0.00 0.00 0.00 0.00 0.00
Aggregate 0.00 5.60 ± 5.60 0.00 0.00 5.01 ± 5.01 1.93 ± 1.93 0.00 0.00 0.00 0.00 0.00
Non-covalent 0.00 0.00 0.00 0.00 0.00 0.00 0.00 0.00 19.68 ± 9.84 43.50 ± 2.28 36.82 ± 12.12
Disulfide bond 0.00 0.00 0.00 0.00 0.00 0.00 0.00 0.00 0.00 0.00 0.00
Non-covalent 0.00 0.00 0.00 0.00 0.00 4.59 ± 4.59 4.91 ± 4.91 0.00 29.00 ± 2.51 31.53 ± 3.67 24.34 ± 3.41
Aggregate 0.00 0.00 0.00 0.00 5.64 ± 5.64 0.00 0.00 0.00 0.00 0.00 0.00
Non-covalent 0.00 0.00 0.00 0.00 0.00 0.00 0.00 2.43 ± 2.43 28.57 ± 6.38 26.46 ± 2.94 21.20 ± 2.41
Disulfide bond 0.00 0.00 0.00 0.00 0.00 0.00 1.75 ± 1.75 6.79 ± 4.15 10.18 ± 0.14 2.60 ± 2.60 0.00
Immunoreactivity (% of Total)
n = 4
n = 3
n = 5
C214S + Rom-1
IB: anti-myc
Fraction
WT
P210L + WT
IB: anti-myc
C214S
P210L
P210L + WT
IB: anti-flag
n = 4
n = 3
n = 3
n = 3
n = 3
C214S + Rom-1
IB: anti-flag
C214S + WT
IB: anti-myc
C214S + WT
IB: anti-flag
WT + Rom-1
IB: anti-myc
WT + Rom-1
IB: anti-flag
P210L + Rom-1
IB: anti-myc
P210L + Rom-1
IB: anti-flag