ECONOMIC VALUATION OF SELECTED WETLANDS IN THE ...
99
ECONOMIC VALUATION OF SELECTED WETLANDS IN THE BREEDE CATCHMENT Final Report Report to the DEPARTMENT OF ENVIRONMENTAL AFFAIRS & DEVELOPMENT PLANNING (DEA&DP) By appointment EScience Associates (Pty) Ltd Theo Fischer (EScience Project Manager) Donovan Kotze (Wetland Ecologist) Daniel Marais (Economist) Bennie Haasbroek (Hydrologist) Malin Govender (EScience Manager) Project No. EADP 975 2019
-
Upload
khangminh22 -
Category
Documents
-
view
1 -
download
0
Transcript of ECONOMIC VALUATION OF SELECTED WETLANDS IN THE ...
ECONOMIC VALUATION OF SELECTED
WETLANDS IN THE BREEDE CATCHMENT
Final Report
Report to the
DEPARTMENT OF ENVIRONMENTAL AFFAIRS & DEVELOPMENT
PLANNING (DEA&DP)
By appointment
EScience Associates (Pty) Ltd
Theo Fischer (EScience Project Manager)
Donovan Kotze (Wetland Ecologist)
Daniel Marais (Economist)
Bennie Haasbroek (Hydrologist)
Malin Govender (EScience Manager)
Project No. EADP 975
2019

ii
Steering Committee
Annabel Marian Horn – Project Manager – Resource Economist - DEA&DP
Wilna Kloppers – Director – DEA&DP
Marlé Kunneke – Water Quality Manager – DEA&DP
Nancy Job – Wetland Ecologist – SANBI
GIS Specialists
Sub-directorate Spatial Information Management – DEA&DP
James Pugin – EScience
This publication should be cited as: Department of Environmental Affairs and
Development Planning, 2019. Economic Valuation of Selected Wetlands in the
Breede Catchment, Cape Town, South Africa: DEA&DP
ACKNOWLEDGEMENTS
Funding for this study was provided by the Department of Environmental Affairs and Development
Planning (DEA&DP). The maps in Figures 3-5, were produced by the Sub-Directorate Spatial
Information Management, DEA&DP, Western Cape Government.

iii
Abstract
Wetlands which fall within the catchments of water supply dams have the potential to make important contributions in terms of water-related ecosystem services, particularly water quality enhancement. At the same time wetlands are facing growing threats and continued degradation. Despite this, there has been very limited valuation of the contribution of South African wetlands and their rehabilitation to water quality enhancement and other water-related ecosystem services. Thus, an assessment is being undertaken of three wetlands in the Theewaterskloof Dam, which makes a critical contribution to City of Cape Town as supplied by Western Cape Water Supply System. The three wetlands, namely Elandskloof, Vyeboom and Du Toits, represent a diversity of catchment contexts, functional capabilities and degradation pressures. The Elandskloof lies downstream of extensive orchards and Villiersdorp town, including an informal settlement and discharge from the town’s wastewater treatment works, and there is a very high demand for water quality enhancement from this wetland. However, the wetland is currently degraded and its capability for dealing with this demand appears limited. Some potential for rehabilitation exists, but this is constrained because much of the wetland lies below the full supply level of the Theewaterskloof Dam. Vyeboom also has a moderately high demand for water quality-related services, which is largely matched by the current high capability of the wetland, although this capability is under imminent severe threat from active erosion, for which Working for Wetlands have begun implementing erosion control interventions to arrest any further degradation. The Du Toits wetland, which is currently still largely intact and not under any imminent threat, has a low demand for water quality-related services given that its catchment comprises largely natural vegetation. An economic valuation is being undertaken of the monetary value of key ecosystem services provided by these three wetlands, with each wetland assessed for both a degraded state compared with an intact (rehabilitated) state. The valuation encompasses the development of an economic valuation model, which includes a nutrient reduction (water quality enhancement) model, a sediment retention model, and a carbon storage model. In addition, a hydrology model has been set up to inform the nutrient reduction and sediment retention model. Furthermore, the quantified monetary assessment is supplemented by a qualitative assessment of the intrinsic value of the wetlands in terms of biodiversity conservation, which is not amenable to being assessed through economic valuation. The results of this valuation are presented and discussed in relation to the specific contexts of the three wetlands.
Keywords: Breede Valley, Theewaterskloof Dam, Wetland Service, Wetland Economic Valuation,
Hydrological modelling

iv
TABLE OF CONTENTS
Abstract iii
TABLE OF CONTENTS ........................................................................................................................ iv
LIST OF FIGURES ................................................................................................................................ vi
LIST OF TABLES ................................................................................................................................. vii
ACRONYMS AND ABBREVIATIONS .................................................................................................. ix
1. Introduction/ Background ........................................................................................................ 11
Concept methodology for valuation of wetland services ........................................................... 12
2. Description of the three wetlands in terms of impacts, present ecological state and demand and rehabilitation measures. .............................................................................................. 13
Key attributes of, and impacts to, the three wetlands ............................................................... 13 Present Ecological State (PES) of the three wetlands .............................................................. 20 Ecosystem services supply and demand .................................................................................. 21 Intrinsic value of the three wetlands (and rehabilitation of these wetlands) for biodiversity
conservation ............................................................................................................................. 26 Rehabilitation interventions for the three wetlands: some preliminary suggestions ................. 27
An overview of the rehabilitation interventions ............................................................ 27 A description of key interventions included in the rehabilitation .................................. 29
A comparison of key functional attributes of the three wetlands for “Without rehabilitation” and “With rehabilitation” scenarios .................................................................................................. 32
3. Hydrological model for the Theewaterskloof Dam wetlands ............................................... 35
Introduction ................................................................................................................................ 35 Study area ................................................................................................................................. 35 Rainfall....................................................................................................................................... 39 Reservoirs ................................................................................................................................. 40 Canals and pipelines ................................................................................................................. 42 Land -and Water-use ................................................................................................................. 42
Invasive Alien Plants (IAP) and Commercial Forestry ................................................ 42 Irrigation Water Use ..................................................................................................... 44 Domestic water supply and return flows...................................................................... 45
Measured flow data ................................................................................................................... 45 Wetlands.................................................................................................................................... 48
Sub-Module description ............................................................................................... 48 Evapotranspiration ....................................................................................................... 50 Parameter estimation .................................................................................................. 51
Rainfall-runoff model setup and calibration ............................................................................... 52
Purpose ....................................................................................................................... 52 Model configuration ..................................................................................................... 55 Model calibration and optimisation .............................................................................. 55
Wetland water balances ............................................................................................................ 58 Conclusions and recommendations .......................................................................................... 61
4. Wetland Service Economic Evaluation................................................................................... 62
Monetary valuation in perspective ............................................................................................. 62 Positioning the economic valuation model ................................................................................ 63 Intrinsic value of the three wetlands and rehabilitation for biodiversity conservation ............... 63 Motivation for economic model parameter assumptions ........................................................... 64
Contribution of wetland rehabilitation to nutrient reduction ......................................... 64 Contribution of wetland rehabilitation to carbon storage in the three wetlands .......... 66 Contribution of wetland rehabilitation to sediment trapping in the three wetlands ...... 67
Hydrological model output requirement .................................................................................... 68 Nutrient reduction model ........................................................................................................... 69 Sediment retention model ......................................................................................................... 72 Carbon storage value model ..................................................................................................... 73

v
Tourism and cultural value model ............................................................................................. 73 Cost-benefit analysis model ...................................................................................................... 74 Further rehabilitation scenario case studies.............................................................................. 76
4.11.1 Potential degradation of the Du Toits Wetland .............................................................. 77 4.11.2 Potential further degradation of the Elandskloof Wetland ............................................. 79
5. Conclusions and Recommendations ...................................................................................... 85
LIST OF REFERENCES ....................................................................................................................... 86
APPENDIX A: WETLAND PRESENT ECOLOGICAL STATE SUMMARY ........................................ 90
APPENDIX B: ALGEBRAIC LAYOUT TO EXPLAIN THE GENERATION OF SHADOW VALUES FOR THE NUTRIENT REDUCTION MODEL ............................................................................................... 92
APPENDIX C: HYDROLOGICAL CALIBRATION RESULTS ............................................................. 94

vi
LIST OF FIGURES
Figure 1: Wetlands around Theewaterskloof ......................................................................................................... 11
Figure 2: Summary of Methodology ...................................................................................................................... 12
Figure 3: Wetlands of Theewaterskloof Dam – 1961 ............................................................................................ 17
Figure 4: Wetlands of Theewaterskloof Dam – 1993 ............................................................................................ 18
Figure 5: Wetlands of Theewaterskloof Dam – 2018 ............................................................................................ 19
Figure 6: Wetland areas currently under orchards identified as strategically located in terms of the interception of nutrients/pollutants from the upstream catchment if rehabilitated (outlined in green)............................................ 28
Figure 7: Study area Map ...................................................................................................................................... 36
Figure 8: Western Cape Water Supply System (WCWSS) ................................................................................... 37
Figure 9:Long-term cumulative annual catchment rainfall variation ...................................................................... 40
Figure 10: Area-capacity relationship for registered farm dams in the Theewaterskloof Dam Catchment ............ 41
Figure 11: Distribution of irrigated agriculture in the 3 main sub-areas of the WCWSS according to the 2017 survey (green = irrigated agriculture, red boundaries = WCWSS sub-areas. ................................................................... 44
Figure 12 : Flow balance diagram through the WRSM2000/Pitman wetland module (adapted from (Bailey, 2015) .............................................................................................................................................................................. 48
Figure 13: An example to illustrate the purpose of rainfall-runoff modelling, model calibration and scenario based simulated hydrology. ............................................................................................................................................. 54
Figure 14 : WRSM2000/Pitman rainfall runoff model network diagram. ................................................................ 56
Figure 15: Integrated wetlands parameter optimisation calibration results ............................................................ 57
Figure 16: Part of the monthly water balance for 3 wetlands in the Theewaterskloof Catchment at Present Day development level. Cumulative areas at the back of the graphs show wetland inflows and cumulative bars in front of the areas are the total outflow from the wetland, showing the lag between inflow and outflows. .................... 60
Figure 17: The benefits pyramid illustrating the total economic value as part of the total system value Source: Snaddon et al. (2018) ............................................................................................................................................ 62

vii
LIST OF TABLES
Table 1: Key hydro-geomorphic (HGM) and hydrological features of the three wetlands ..................................... 13
Table 2: Plant species commonly occurring in the three wetlands ........................................................................ 14
Table 3: Anthropogenic impacts on the three wetlands ......................................................................................... 15
Table 4: Present Ecological State of the three wetlands expressed on a scale of 100% (Pristine) to 0% (critically impacted) and ecological category expressed on a scale of A to F....................................................................... 21
Table 5: Current supply and demand for different ecosystem services rated on a scale of very low (0) to very high (********) for the three wetlands ............................................................................................................................. 22
Table 6: Rationale for the ecosystem services ratings assigned to the three wetlands in Table 5 ........................ 23
Table 7: Key overarching rehabilitation objectives for the existing natural/ semi-natural areas of the three wetlands (EK=Elandskloof, VB=Vyeboom, DK=Du Toits) and implications for wetland functioning ..................................... 29
Table 8: Rehabilitation interventions proposed for the Elandskloof Wetland ......................................................... 30
Table 9: Rehabilitation interventions proposed for the Vyeboom wetland excluding the clearing of invasive alien plants (Snaddon, et al., 2018) ............................................................................................................................... 31
Table 10: A preliminary qualitative/semi-quantitative assessment of key functional attributes of the three wetlands for “Without rehabilitation” and “With rehabilitation” scenarios. Percentages given in the table refer to proportional extent of the wetland, and the most prominent differences between the “With rehabilitation” and the “Without rehabilitation” scenarios are highlighted in red. ..................................................................................................... 32
Table 11: Quinary areas in the Theewaterskloof Dam Catchment. ....................................................................... 37
Table 12 : Point rainfall stations used for long-term catchment rainfall data input ................................................ 39
Table 13: Reservoir information for the Study Area .............................................................................................. 42
Table 14: Simulated reduction in run off due to invasive alien plants per quinary catchment. .............................. 43
Table 15: Comparison between Verified Legal and Western Cape 2017 Crop Survey (km2) ............................... 44
Table 16: Irrigated areas per quinary catchment. .................................................................................................. 46
Table 17: Measured flow gauging sites in the Theewaterskloof Dam catchment. ................................................. 47
Table 18: Estimated annual total evapo-transpiration for groups of wetland plants. ............................................. 50
Table 19: Approximate distribution of plant groups per wetland, and associated monthly evapotranspiration (pre alien clearing of Elandskloof) ................................................................................................................................ 50
Table 20: Wetland parameters used during this simulation ................................................................................... 52
Table 21: Example of historical yield analysis of Midmar Dam to illustrate the importance of long-term simulations of hydrological variability ....................................................................................................................................... 53
Table 22: Water balances for the Present Day Development Level Scenario ....................................................... 58
Table 23: Assumed range in Total N and Total P assimilation for Vyeboom wetland under Intact and degraded scenarios ............................................................................................................................................................... 65
Table 24: Assumed range in Total N and Total P assimilation for Elandskloof Wetland under Intact and degraded scenarios ............................................................................................................................................................... 66
Table 25: Projected sediment retention for Vyeboom and Elandskloof wetlands .................................................. 67
Table 26: Flow and nutrient removal rate statistics for the three wetlands in intact condition ............................... 70
Table 27: Nutrient removal rate statistics for the three wetlands in a degraded condition ..................................... 71
Table 28: Wastewater treatment works statistics ................................................................................................. 71
Table 29: Configuration of sediment retention model ............................................................................................ 72

viii
Table 30: Configuration of carbon storage model ................................................................................................ 73
Table 31: Rehabilitation initiative net present value estimation for the Vyeboom wetland .................................... 75
Table 32: Rehabilitation initiative net present value estimation for the Du Toits wetland ...................................... 78
Table 33: Rehabilitation initiative net present value estimation for the Elandskloof wetland (part 1) .................... 80
Table 34: Rehabilitation initiative net present value estimation for the Elandskloof Wetland (part 2) .................... 82
Table 35: Rehabilitation initiative net present value estimation for the Elandskloof wetland (part 3) .................... 84

ix
ACRONYMS AND ABBREVIATIONS
Abbreviation Meaning
Capex Capital Expenditure
CBA Critical Biodiversity Area
CPI Consumer Price Index
DK Du Toits Kloof Wetland
DTM Digital terrain model
DWAF Department of Water Affairs and Forestry
DWS Department of Water and Sanitation
EK Elandskloof Wetland
FEPA Freshwater Ecosystem Protected Area
GIS Geographic information systems
HGM Hydrogeomorphic (features)
IAP Invasive Alien Plants
IB Irrigation Board
MAE Mean annual evaporation
MAP Mean annual precipitation
MAR Mean annual runoff
MASL Metres above sea level
Opex Operational expenditure
PES Present Ecological State
ROI Return on investment

x
RSA Republic of South Africa
SAPWAT WRC software for estimation of crop irrigation requirements.
TC Tonnes of Carbon
TEV Total Economic Values
TSV Total Value of Ecosystems
TWK Theewaterskloof
VB Vyeboom Wetland
WAAS Water availability assessment study
WCWSS Western Cape Water Supply System
WMA Water Management Area
WR2012 Water Resources of South Africa 2012
WRPM Water Resource Planning Model
WRSM2000 Water Resources Simulation Model 2000, a.k.a. Pitman Rainfall Runoff
Model
WRYM Water Resources Yield Model
WTW Water Treatment Works
WWTW Waste Water Treatment Works
ZAR South African Rand
11
1. INTRODUCTION/ BACKGROUND
Wetlands ecosystems are vital ecological infrastructure that provide valuable services to people and
are important biodiversity assets. Wetlands help to buffer flood waters, soak up water to release more
gradually over time, filter sediments, purify water, and provide forage for livestock and refuge for
numerous species. While remarkably resilient in many ways, wetlands are vulnerable to a range of
direct, indirect and cumulative impacts.
Figure 1: Wetlands around Theewaterskloof
Some of the wetlands in the Upper and Middle Breede River Catchment that feed into the
Theewaterskloof Dam (See Figure 1) are under threat, predominantly from agriculture and invasive
alien plants, and pollutants from both agriculture and urban settlement.
This study will focus on key wetlands in the Theewaterskloof Dam area, so as to compare the impacts
of agriculture (Vyeboom), and urban settlement (and agriculture) (Elandskloof) with a pristine wetland
(Du Toits). The Theewaterskloof Dam is an important source of water for the Western Cape, and as
such it is important to establish the value of the wetlands through which water drains into this dam.
12
Concept methodology for valuation of wetland services
Figure 2 gives a diagrammatic representation of the methodology to be undertaken for the economic
valuation of selected wetlands in the Breede catchment. This study would aim to focus on three key
wetlands in the Theewaterskloof Dam area. This would include Vyeboom wetlands, as well as wetlands
within the Du Toits River flowing from Franschhoek - both palmiet wetlands, and the Elandskloof
Wetland, all of which flow into Theewaterskloof dam.
Figure 2: Summary of Methodology
13
2. DESCRIPTION OF THE THREE WETLANDS IN TERMS OF IMPACTS,
PRESENT ECOLOGICAL STATE AND DEMAND AND REHABILITATION
MEASURES.
Key attributes of, and impacts to, the three wetlands
The three wetlands are all valley bottom wetlands within a Table Mountain Group sandstone setting,
but vary according to how strongly channelled they are and their predominant hydrological zones (Table
1). In particular, the Elandskloof is the most strongly channelled and has a considerably more limited
extent of the permanently saturated zone than the other two wetlands (Table 1).
Table 1: Key hydro-geomorphic (HGM) and hydrological features of the three wetlands
Elandskloof Vyeboom Du Toits
HGM units,
listed from
upstream to
downstream
end of the
wetland
Channelled valley
bottom
1. Weakly channelled/
unchanelled valley
bottom
1. Channelled valley bottom
2. Channelled valley
bottom
2. Weakly channelled/
unchanelled valley bottom
3. Weakly channelled/
unchanelled valley
bottom
3. Channelled valley bottom with
multiple channels on a major
alluvial fan and from tributaries
feeding the fan
Hydro-
geological
type setting
All three wetlands and their catchments are underlain by Table Mountain Group
(TMG) sandstone. Vyeboom HGM 1 and Du Toits HGM 2 would appear to have
possible links with groundwater given the wide lateral extent of permanently
saturated areas. However, this requires more detailed hydrological investigation to
confirm. All HGM units are likely to be supplied by interflow, which is shallower and
less sustained than the groundwater.
Predominant
hydrological
zones1
Predominantly
temporary zone
Predominantly
permanent zone in HGM
1 and 3 and good
representation of
temporary, seasonal and
permanent zones in
HGM 2
Predominantly permanent zone
in HGM 2 and good
representation of temporary,
seasonal and permanent zones
in HGM 1 and 3
Sediment
type
Predominantly
sandy sediments,
with localized silty
areas. Organic soil
is absent.
Predominantly sandy
sediments with organic
soil deposits1 especially
in HGM 1
Predominantly sandy sediments
with organic soil deposits1
especially in HGM 2

14
1 The organic soil deposits, although containing some coarse fibric material and sand, are generally
composed predominantly of relatively fine organic particles, which is likely to result in a relatively low
hydraulic conductivity of the material. In Vyeboom the average depth of the organic soil deposit is about
0.5 m and in Du Toits it is about 0.9 m (Kotze, 2015).
The vegetation of Elandskloof contrasts markedly with the other two wetlands. Firstly, indigenous
bulbous plants, restios and ferns are lacking (Table 2). Secondly, at the time of the first assessment
within this project, prior to alien plant clearing, almost all (94%) of the commonly occurring plant species
were either alien species or indigenous species which are favoured/tolerant of human disturbance, while
in Vyeboom and Du Toits wetlands, such species constitute 38% and 26% respectively of the commonly
occurring species (Table 2).
Table 2: Plant species commonly occurring in the three wetlands
Elandskloof Vyeboom Du Toits
Sedges/
rushes Juncus effusus*
Juncus puctorius
Isolepis prolifera*
Carpha glomerata
Hellmuthia membranaceae
Isolepis prolifera*
Juncus lomatophyllus*
Juncus punctorius
Prionium serratum
Carpha glomerata
Cyperus thunbergii
cf Epischoenis gracilis
Isolepis prolifera*
Prionium serratum
Grasses Cynodon dactyon*
Paspalum distichum*
Paspalum urvillei**
Phragmites australis*
Paspalum distichum*
Pennisetum macrourum
Merxmuelera cincta
Restios -
Platycaulos major
Willdenowia sulcata
Elegia capensis
Restio paniculatus,
Bulbous
plants - Watsonia aletroides
Wachendorfia thyrsiflora Wachendorfia thyrsiflora
Herb Conyza bonariensis**
Bidens pilosa**
Xanthium strumarium**
Persicaria lapathifolia**
Laurembergia repens
Shrubs Cliffortia strobilifera* Cliffortia strobilifera* Cliffortia strobilifera*

15
Sesbania punicea**
Stoebe plumosa*
Rubus fructicosus**
Erica leutea
Rubus fructicosus**
Fern
Pteridium aquilinum*
cf Thelypteris confluens
Pteridium aquilinum*
cf Thelypteris confluens
Trees Acacia mearnsii**
Acacia saligna**
Salix fragilis**
Acacia mearnsii**
Leucadendron salicifolium
Metrosideros angustifolia
Pinus sp.**
Acacia mearnsii**
Psoralea aphylla
Psoralea pinnata
Brabejum stellatifolium
Searsia augustifolia
*Indigenous species tolerant of /favoured by high levels of human disturbance
**Alien species
The three wetlands vary greatly in terms of type and level of impact (Table 3). Elandskloof has been
subject to the greatest variety of impacts and the highest impact severity, both directly within the wetland
and arising from its upstream catchment (Table 3). The Du Toits wetland has the least severe impacts
of the three wetlands, both directly and from the upstream catchment, and could justifiably be described
as pristine, as would be borne out by the limited occurrence of alien species and indigenous species
tolerant of /favoured by high levels of human disturbance, as reported in Table 2. Vyeboom is
intermediate in terms of impact severity.
Table 3: Anthropogenic impacts on the three wetlands
Types of impact Elandskloof Vyeboom Du Toits
Deep flooding by the
dam
Takes place over a
large proportion of the
wetland
Confined to the
lowermost toe of the
wetland
Confined to the
lowermost toe of
the wetland
Erosional incision
Prior to recent clearing
of IAPs was localized
and limited in extent but
increased in extent
along the channel as a
result of the
destabilizing effects of
the clearing
A single moderately
active erosion headcut is
present in HGM1.
Several very active
erosion headcuts are
present in HGM 31.
Localized and very
limited in extent
Invasive alien plant
(IAP) cover
~25% aerial cover of
the wetland prior to
clearing, predominantly
Acacia mearnsii and
Salix fragilis trees
~20% aerial cover of the
wetland, predominantly
Acacia mearnsii and
trees
~3% aerial cover
of the wetland,
predominantly
Acacia mearnsii
trees

16
Alterations to Mean
Annual Runoff (MAR)
from the wetland’s
catchment
MAR likely to be slightly
reduced overall by IAPs
in the upstream
catchment, but
countered by irrigation
return flows and
releases from
Villiersdorp wastewater
treatment works.
MAR likely to be reduced
overall by IAPs and
irrigation abstraction in
the upstream catchment.
MAR likely to be
slightly reduced
overall by IAPs
and tree
plantations in the
upstream
catchment.
Alterations to the
seasonal pattern of
water supply [to be
reviewed in the light
of the hydrological
assessment]
Irrigation return flows
and wastewater
treatment works
releases likely to have
increased dry season
inputs.
Irrigation return flows
likely to have increased
dry season inputs
Little change
anticipated.
Alterations to the
quality of water [to be
reviewed in the light
of the hydrological
assessment and
water quality results]
Extensive orchards in
the wetland’s catchment
as well as the urban
area of Villiersdorp,
including an informal
settlement and
wastewater discharge
are likely to have
significantly
compromised water
quality entering the
wetland in terms of
nutrients, biocides and
E coli.
Extensive orchards in the
slopes immediately
adjacent to the wetland
are likely to have
contributed to increased
nutrients and biocides.
The catchment is
largely natural
vegetation and
impacts on water
quality are
anticipated to be
negligible.
Extent of conversion
of the wetland to
orchards
Approximately 37% of
the wetland has been
converted to orchards
Approximately 25% of the
wetland has been
converted to orchards &
farm dams
No orchards
present in the
wetland.
Level of historical
disturbance of
currently natural/
semi-natural areas 2
Very high Moderate
Generally low but
moderate in HGM
unit 3.
1 The destabilizing effects of the abundant wattle trees growing in the predominant water flow area
through the wetland appears to have been an important factor contributing to the initiation of the headcut
in HGM1, in the Vyeboom Wetland. As elaborated upon in the main text, the loss of vegetation in the
downstream toe of the wetland, which is flooded when the Theewaterskloof Dam is at a high level
appears to be the principle factor precipitating the erosion in HGM 3.
2 Wetland maps of the region that have been developed through satellite imagery (Figure 5) have been
compared with aerial photography images (Figure 3 and Figure 4). Theewaterskloof Dam did not exist
in 1961 as seen in the aerial photo in Figure 3, as it was built in 1978. Very high level of disturbance
17
impacts can be noted in Elandskloof, moderate impacts in the Vyeboom while generally low impacts in
the Du Toits wetlands over the historical period depicted in the images. The full extent of
Theewaterskloof Dam is shown in the aerial photo of 1993, in figure 4, whereas the dam is in a period
of drought in 2018, in Figure 5.
Scale: 1: 58.108
Date: 01 November 2019
Reference No: 2019_157
Data Source: WCG
Figure 3: Wetlands of Theewaterskloof Dam – 1961

18
Scale: 1: 58.108
Date: 01 November 2019
Reference No: 2019_157
Data Source: WCG
Figure 4: Wetlands of Theewaterskloof Dam – 1993

19
Scale: 1: 58.108
Date: 01 November 2019
Reference No: 2019_157
Data Source: WCG
Figure 5: Wetlands of Theewaterskloof Dam – 2018
One of the key differences between the Elandskloof Wetland and the other two Wetlands, is that a large
portion of the Elandskloof Wetland lies below the full supply level of the Theewaterskloof dam, whereas
in the other two wetlands only a small portion at the downstream end of both of these wetlands lies
below the dam’s full supply level. Even so, in the case of the Elandskloof, the fluctuating level of the
dam appears to have a potentially major wetland impact by precipitating head-ward erosion of an
extensive area of wetland lying immediately upstream of the dam and extending below the full supply
level of the dam. This begins during a period when the dam is full or near-full and the lowermost portion
of the wetland becomes flooded, which in turn drowns the vegetation covering this area. When the
level of the dam drops, which is often rapid, the downstream portion of the wetland is left without
vegetation and exposed to erosion. Furthermore, the base level of the wetland, previously provided by
the highwater level of the dam, is now often several metres below wetland, and therefore has no
controlling influence over water flowing out of the wetland, further amplifying the vulnerability of the
wetland to erosion.

20
Where the downstream portion of the wetland is unchanelled or weakly channelled (as is the case in
the Vyeboom Wetland) it is particularly vulnerable to the destabilizing effect of a greatly fluctuating dam
level, as is evidenced by the fact that the lower portion of the Vyeboom Wetland is currently actively
eroding, and the main erosion headcut has advanced 390 m in 14 years based on comparison of the
2004 Google Earth image with that from 2018. Without any intervention it is likely to erode to at least
the mid portion of the wetland. The Du Toit Wetland also includes such potentially vulnerable areas in
its lower portion, but to date has shown little evidence of any advancing heacut/s. This is perhaps
because the wetland is much broader and flow more widely dispersed at the interface with the dam
than in the Vyeboom Wetland.
Present Ecological State (PES) of the three wetlands
The Present Ecological State (PES) of the three wetlands was assessed using WET-Health Level 1B
(Macfarlane et al. 2018) with field verification1. This involved a two-step process, the first step being a
land-cover based desktop assessment and the second step being an adjustment of the desktop
assessment based primarily on field verification to identify any misclassification of land-cover classes
and the presence of key point source impacts. Verification also included reference to Google Earth
imagery and relevant reports, notably Gorgens, (2016).
The primary basis for the WET-Health Level 1B assessment is a determination of the spatial extent of
different land-use types in the wetland, its immediate buffer, the buffer surrounding any streams feeding
the wetland and the remainder of the wetland’s catchment. The method then combines the respective
extent measures with predetermined impact intensity scores associated with different land-use types
(given on a scale of 0 [no impact] to 10 [critical impact]). For example, the impact intensity score on
hydrology for orchards in a wetland (which is typically associated with a high level of artificial drainage)
is 7 while for semi-natural vegetation it is only 1. The WET-Health assessment also takes into account
the hydrogeomorphic type of the wetland. For example, Vyeboom was identified as a channelled valley
bottom with substantial lateral inputs and therefore the influence of the adjacent land-uses are
automatically weighted relatively high compared with the distant upstream catchment.
In the Elandskloof Wetland, field verification in this study, showed that extensive areas of what was
mapped as Natural/minimally impacted was, in fact, moderately degraded land, while in Du Toits
wetland, a localized area mapped as Natural/minimally impacted was semi-natural drained. Within
Vyeboom the key land-cover adjustment was changing a portion of the wetland mapped incorrectly as
cultivated lands to orchards and vineyards (although of little consequence for the PES score as they
have similar impacts on the wetland). In all three wetlands, the key adjustment made to land-cover in
the wetland’s catchment was to account for the high degree of under-mapping of invasive alien plants.
The desktop land-cover based assessment did not include point-sources of pollution, and the impact
on the water-quality component of Elandskloof wetland was adjusted to take account of the outflow from
the Villiersdorp sewage works located 640 m upstream of the wetland.
The PES scores for the three wetlands, which take all of the field-verified land-cover and point source
impacts into account, are presented in Table 4. These results demonstrate that the sites represent a
gradation in ecological state from Elandskloof at the one extreme having a low PES and the second
lowest possible ecological category, whilst Du Toits wetland at the other extreme having the highest
PES category (confirming it to be aptly described as a pristine wetland) and finally, Vyeboom occupying
1 All GIS analyses for the WET-Health assessment were undertaken by Tumisho Ngobela of the
Freshwater Consulting Group

21
an intermediate position. Not surprisingly, the PES gradation from Elandskloof through Vyeboom to Du
Toits shows inversely related occurrence impacts reported for these respective wetlands, displayed in
the Table 3.
In terms of the different components of PES, Table 4 demonstrate that vegetation was consistently the
lowest or close to the lowest scoring of the four components of PES, followed by hydrology and water
quality, while geomorphology was consistently the highest scoring component of PES.
Table 4: Present Ecological State of the three wetlands expressed on a scale of 100% (Pristine) to 0%
(critically impacted) and ecological category expressed on a scale of A to F
Components of PES Combined
overall
PES Hydrology Geomorphology Water
quality
Vegetation
Elandskloof PES Score (%) 36% 64% 40% 15% 38%
Ecological
category
E C E F E
Vyeboom PES Score (%) 52% 74% 55% 57% 59%
Ecological
category
D C D D D
Du Toits PES Score (%) 93% 96% 92% 84% 91%
Ecological
category
A A A B A
Ecosystem services supply and demand
A preliminary scoping assessment of the supply and demand for a range of different ecosystem services
was undertaken for the three wetlands. This was based on the guidance provided by WET-EcoServices
(Kotze, et al., 2008), and consideration of key attributes of the wetlands and their particular catchment
and landscape contexts. The ecosystem services ratings are presented in Table 5 and the rationale
underlying these ratings in Table 6.

22
Table 5: Current supply and demand for different ecosystem services rated on a scale of very low (0) to very high (********) for the three wetlands
ECOSYSTEM SERVICE
Elandskloof Vyeboom Du Toits
Current supply
Current demand
Current supply
Current demand
Current supply
Current demand
RE
GU
LA
TIN
G A
ND
SU
PP
OR
TIN
G S
ER
VIC
ES
Flood attenuation **** 0 **** 0 ***** 0
Stream flow regulation
* * *** * *** *
Sediment trapping1 ** ******* *** **** ****** ***
Phosphate removal ** ******** **** *** ***** *
Nitrate removal ** ******** ***** ***** ****** **
Toxicant removal2 ** ******* ***** ***** ****** **
E. coli removal *** ******** ****** *** ****** *
Carbon storage * ******** ***** ******** ******* ********
PR
OV
ISIO
NIN
G
SE
RV
ICE
S
Water supply * **** ******* ****** ****** **
Harvestable natural resources
*** 0 *** 0 0
Food for livestock **** *** *** 0 *** 0
Cultivated foods ******* ******* ******* ******* 0 0
CU
LT
UR
AL
SE
RV
ICE
S Tourism & recreation *** *** *** ** **** *****
Education and research
* ***** ***** ***** ******* *****
Cultural significance * ** ** ** ** ****
1This also includes what would be described as erosion control
2This includes removal of biocides, heavy metals and other toxicants (not measured in this study)
3The high Escherichia coli (E. coli) levels periodically entering the Elandskloof Wetland are confirmed
based on data supplied by the Breede Gouritz Catchment Management Agency of recent monthly
sampling (June to August 2019) of E coli in the Elandskloof River shortly upstream of the Elandskloof
wetland. Concentrations of up to 2200 cfu/100ml were recorded, which is considered unacceptable for
swimming. Further confirmation is from sampling data from 2015 to 2018 from the outflow of the
Villiersdorp wastewater treatment works (Marthinus, 2019), which indicates that the works was non-
compliant in terms of Faecal coliforms for 75% of the samples taken.

23
Table 6: Rationale for the ecosystem services ratings assigned to the three wetlands in Table 5
Ecosystem
service
Rationale
Flood
attenuation
All three wetlands have features generally conducive to the attenuation of floods,
namely that the stream channels do not contain major flows but spill out across the
wetland (especially frequent in Vyeboom and Du Toits), longitudinal slopes are
gentle and the hydraulic resistance offered by the robust vegetation is generally
high. This hydraulic resistance has reduced in the Elandskloof post alien clearing.
At all three wetlands, demand for these services (and streamflow regulation below)
is minimal because of their specific location immediately upstream of a major dam
with a level that remains almost permanently well below fully supply level, as argued
for by Snaddon et al, (2018).
Stream flow
regulation
In the case of Vyeboom and Du Toits it appears that the wetlands are sustained to
some extent by groundwater (see Table 1), which in turn may contribute to
streamflow. The contribution of water to the downstream environment has been
moderately compromised by invasive alien trees in the Vyeboom Wetland and
severely compromised in the Elandskloof Wetland, prior to alien clearing.
Sediment
trapping
The features described above for the attenuation of floods (e.g. the frequent
occurrence of channel overspill across the wetland, especially frequent in Vyeboom
and Du Toits) also contribute to the effectiveness of the wetlands in trapping
sediment. As described in Table 3, the trapping of sediment has been greatly
compromised in both Elandskloof and Vyeboom as a result of erosion linked with the
fluctuating level of the Theewaterskloof Dam.
For all three wetlands, the demand for sediment trapping is high given that the
wetlands are located at inflows directly into the Theewaterskloof Dam, for which
sediment entering the dam would contribute to a loss of dam storage capacity. The
Theewaterskloof Dam, which has the largest storage capacity of all dams in the
Western Cape Water Supply System (WCWSS), is critical for water supply for
human use, primarily for domestic and industrial water supply to Cape Town metro
as well as for irrigation more locally.
Phosphate
removal
Phosphates and many toxicants are adsorbed to sediments. Thus, the greater the
extent to which wetlands trap new sediment (see above) the greater will be the
extent to which the wetland removes these associated pollutants (Hemond & Benoit,
1988).
The demand for phosphate removal is high for all three wetlands given the location
of the three wetlands at major inflows directly into the Theewaterskloof Dam, which,
as described above, is critical for water supply. Further adding to the demand for
phosphate removal by Elandskloof Wetland is the fact that this wetland is fed by
runoff from the urban area of Villiersdorp, including a sewage works and informal
settlement, which are likely to contribute to elevated phosphate loads to the wetland.
Some additional phosphates may also arise from the orchards in the catchments of
Elandskloof and Vyeboom, but these sources are likely to be lower than from the
24
Villiersdorp sources, particularly as sediment-adsorbed phosphates would be the
main source and sediment loss from the orchards appears relatively low. The close-
to-completely-natural catchment of the Du Toits Wetland is taken as having very
limited sources of phosphates, nitrates and toxicants.
Nitrate
removal
The primary process by which nitrates are removed from runoff water in wetlands is
denitrification, which requires prolonged soil saturation leading to anaerobic
conditions (Sather and Smith, 1984; Reddy and Patrick, 1984). In this respect the
much greater proportional extent of the wetter hydrological zones in the Vyeboom
and Du Toits wetlands than in the Elandskloof are more favourable. Another
important factor is the pattern of low flows. Much of assimilation by wetlands of
nutrients/pollutants, particularly those not carried by sediment, takes place during
low flow periods, when waters are shallower and residency times in the wetland
longer, which affords the wetland greater opportunity to assimilate pollutants
contained in the water. In addition, the more diffusely that flows are spread
throughout the wetlands (vs. being concentrated by a channel in only a small portion
of the wetland) then the greater is the contact of the water column with sediments
and biologically active surfaces in the wetland ( (Kadlec & Kadlec, 1979); (Hammer,
1992)). Again, in this respect the much more diffuse flows in the Vyeboom and Du
Toits Wetlands than in the Elandskloof are more favourable.
As for phosphate removal, the demand for nitrate removal is high given the location
of the three wetlands at inflows into a dam which is critical for water supply. Further,
the demand for nitrate removal by Elandskloof and Vyeboom Wetlands is likely to
result from nitrates in the irrigation return-flows from the orchards in the wetlands’
catchments, and in the case of Elandskloof additional nitrate sources from
Villiersdorp town.
Toxicant
removal
Toxicants are taken to encompass a wide range of chemicals, including biocides and
metals (e.g. mercury) which are assimilated through a wide variety of processes.
Given that many toxicants are adsorbed to sediments, sediment trapping is one of
the key processes for toxicant removal. Many metals are adsorbed very effectively
to in situ organic sediments, making the accumulation of soil organic material
another key mechanism for removal of metals (Wieder and Lang 1986; (McCarthy &
Venter, 2006). In addition many biocides are most rapidly degraded under
anaerobic conditions (Gambrell and Patrick 1988). Thus, the much greater extent of
the wetter hydrological zones and occurrence of organic soils (together with more
diffuse flows) in the Vyeboom and Du Toits Wetlands are taken as key factors
contributing to their being more effective than the Elandskloof in toxicant removal.
As for phosphates and nitrates, the demand for toxicant removal is high given the
location of the three wetlands at inflows into a dam which is critical for water supply.
Further adding to the demand for toxicant removal are the sources of toxicants in the
catchments of the Vyeboom and Elandskloof Wetlands, especially biocides from all
of the intensive agricultural operations with high levels of herbicide application in
both catchments. In addition, Elandskloof is fed by runoff from the urban area of
Villiersdorp, likely to contribute to elevated metals.
Escherichia
coli removal
Key factors contributing to the removal of Escherichia coli are spreading of low flows
across the wetland as shallow water with long residency times, which exposes the
bacteria to predation, toxic substances such as root secretions and natural die back
(Hemond & Benoit, 1988). The much more diffuse flows in the Vyeboom and Du
Toits Wetlands than in the Elandskloof are therefore more favourable in terms of

25
Escherichia coli removal. Nonetheless, low flows in Elandskloof are generally
shallower compared with the predominantly narrower excavated channel leading
from Villiersdorp town to the wetland, thereby contributing to Escherichia coli
removal.
As for nutrients and toxicants, demand is high given the location of the three
wetlands at inflows into a dam which is critical for water supply. Further adding
greatly to the demand for Escherichia coli removal by the Elandskloof Wetland are:
(1) the major sources of Escherichia coli from the Villiersdorp sewage works and
informal settlement upstream of the Elandskloof Wetland; and (2) a high level of
recreational water use by the yacht club which is located very close to the outflow of
the Elands stream and would therefore have much less of a dilution effect from the
Theewaterskloof Dam than would be the case for locations in the dam which were
much further away from this outflow.
Carbon
storage
There is a considerable global demand for carbon storage given the climate change
implications and global social cost of carbon emissions (Nordhaus, 2017).
The globally important contribution of carbon sinks made by wetlands, particularly
those supporting organic soils, is widely recognized (Mitsch, et al., 2013). Thus, a
key factor considered in scoring the carbon storage of the three wetlands is the
volume of organic soil present, which was estimated as 1 095 733 m3 for the Du
Toits 383 153 m3 for Vyeboom (Kotze, 2015) but absent in the Elandskloof Wetland.
Further confirmation of the much lesser importance of Elandskloof for carbon
storage arises from its much lower level of wetness (and associated anaerobic
conditions) than the other two wetlands. Prolonged anaerobic conditions promote
the accumulation of organic matter by impeding its decomposition, and thus, for a
given climate, those wetland zones subject to the most extended wet periods tend to
have the highest amounts of organic matter (Tiner & Veneman, 1988).
Water
supply
The Vyeboom and Du Toits Wetlands, which appear to be sustained to some extent
by groundwater (see Table 1) and support extensively permanently flooded areas,
are much better than the Elandskloof Wetland in terms of direct water supply.
Currently the Du Toits and Elandskloof are not used for direct water supply.
However, some of the farmers with orchards adjacent to the Vyeboom abstract
water from the wetland, and the recent drying out of a portion of the wetland as a
result of the draining effect of recent gully erosion has already begun to impact
negatively on this service for the farmer directly affected (H Nieuwoudt 2019.
Personal communication. Working for Wetlands, George)
Harvestable
natural
resources
In all three wetlands, particularly the Du Toits Wetland, there are natural resource
(e.g. fynbos for the florist industry and restios and rushes for craft production) which
could potentially be harvested to a limited extent. However, currently there is no
harvesting taking place of these resources.
Food for
livestock
The natural vegetation of Vyeboom and Du Toits has a relatively low value as
livestock grazing. Portions of the Elandskloof which are not heavily invaded by
Acacia mearnsii and A. saligna provide grazing of moderate value, mainly by the
grass Cynodon dactylon. Currently only Elandskloof wetland is used for livestock
grazing.

26
Cultivated
foods
The contribution of the wetlands to cultivated foods was scored based on the fact
that extensive areas of the Vyeboom and Elandskloof Wetlands have been
converted to orchards but currently no cultivation takes place in Du Toits Wetland.
Tourism &
recreation
Key features considered when scoring a wetland in terms of supplying a
tourism/recreation experience are its scenic beauty and the presence of charismatic
species. Du Toits was considered the most scenic, followed by Vyeboom and then
Elandskloof, which was the least scenic at the time of the assessment, given the
dense infestations of invasive alien plants and the presence of solid waste e.g.
bricks and old tyres. The alien vegetation has now been cleared and it is hoped that
in time indigenous vegetation will re-establish or the site will be rehabilitated. A
positive feature at Elandskloof was the presence of the charismatic Cape clawless
otter. For demand, a key feature is location in relation to tourism routes, with Du
Toits located directly on a major tourism route between Franschoek and other tourist
destinations such as Hermanus, but the other two wetlands are less directly linked to
such a route.
Education &
research
Key factors considered when scoring supply of the education this service were: (1)
presence of existing studies, e.g. Rebelo (2017) and Rebelo et al. (2018); (2) the
PES of the site in terms of providing a good representative of its type; and (3) the
presence of organic sediment as a repository of information on past climates,
vegetation etc. (Mulders, et al., 2017). Demand was scored in terms of the need for
understanding of a critically endangered wetland type.
Cultural
Significance
Based on limited available information no known cultural sites are present in the
three wetlands, but one could argue that the orchards and fynbos in the wetlands
form part of the local cultural landscape. Demand for cultural experience was rated
somewhat higher for Du Toits given its closer links with a tourist route, and that
cultural experience is a component of the overall tourism experience.
A key overall trend seen in the ratings of supply and demand for ecosystem services for these wetlands
in Table 5 is that the demand for water quality-related services is particularly high at Elandskloof, but
the current capability of the wetland to deal with this demand (as expressed in the supply scores) is
limited. Although lower than Elandskloof, Vyeboom also has a high demand for quality-related services,
which is largely matched by the current high capability of the wetland, although this capability is likely
to be substantially reduced in the absence of the “pre-emptive” rehabilitation measures, as described
later in the report. Du Toits Wetland has a low demand for water quality-related services, and its greatest
contribution to a specific service for which demand is currently high is that of carbon storage.
Intrinsic value of the three wetlands (and rehabilitation of these wetlands)
for biodiversity conservation
Most of the Du Toits Wetlands falls within a formally protected area managed by Cape Nature. The
small portion of the Du Toits Wetland falling outside of the protected area and most of the Vyeboom
Wetland have been classified as aquatic Critical Biodiversity Areas (CBAs) in the Western Cape Spatial
Biodiversity Plan (Pool-Stanvliet, et al., 2017). The vegetation type covering both the Du Toits and
Vyeboom Wetlands is Elgin Shale Fynbos, which has been identified as critically endangered owing to
the irreversible loss of natural habitat (Pool-Stanvliet, et al., 2017). The fact that in addition to
representing a critically endangered type, Du Toits is a very large wetland in good condition and with
high connectivity to other natural areas makes it intrinsically valuable from a biodiversity conservation

27
perspective. Vyeboom also has a relatively high intrinsic value, but this is somewhat lower than Du
Toits Wetland owing to its smaller size and lower ecological condition, as reported in the section on
Present Ecological State (PES) of the wetlands.
The sub-catchment in which the Vyeboom Wetland lies has been identified as a Freshwater Ecosystem
Protected Area (FEPA) catchment, and it not only supports a good condition river but also the
endangered giant redfin, Pseudobarbus skeltoni, which is endemic to the Breede River (Snaddon, et
al., 2018). It is possible that this is one of the three last remaining populations of this newly described
species (Chakona & Swartz, 2013); (Snaddon, et al., 2018). Smallmouth bass (Micropterus dolomieu),
an alien fish species with a potentially devastating impact on indigenous fish populations, occurs in
Theewaterskloof Dam. However, it appears to be absent upstream of the Vyeboom wetland where the
giant redfin is located, and it seems that the weakly channelled sections of the Vyeboom, where water
flows are spread amongst dense palmiet beds are serving as an important barrier to the upstream
movement of small-mouth bass in the dam (Snaddon K, 2019. Personal communication. Freshwater
Research Centre, Cape Town). The active headcut erosion in the Vyeboom Wetland is causing the
ingress into the weakly channelled palmiet beds of a much less obstructed channel. In the absence of
rehabilitation, this ingress poses a considerable threat not only to vegetation habitat in the wetland
(through its desiccation) but could indirectly threaten the giant redfin by allowing the smallmouth bass
much less restricted access to the Upper Riviersonderend Stream. Therefore, it can be appreciated
that in halting the headcut erosion, the rehabilitation will make a key contribution to sustaining the
intrinsic biodiversity value of the wetland and its broader sub-catchment. Similarly, control of invasive
alien plants, which pose a considerable long term threat to both the Du Toits and Vyeboom Wetlands,
will make a key contribution to sustaining the intrinsic biodiversity value of these wetlands and their
broader sub-catchments.
The intrinsic value of Elandskloof Wetland for biodiversity conservation is considerably lower than the
Du Toits and Vyeboom. As reported for the PES of the wetland, the vegetation is in a very poor
condition and was dominated by alien species and indigenous species which are generalists/pioneer.
In addition, the area has been so dominated for several decades, and therefore the on-site seedbank
of native plants is likely to be severely depleted. Therefore, although Elandskloof Wetland occurs within
Elgin Shale Fynbos, it is an extremely poor representation of wetland vegetation of this type.
Nonetheless, it is important to emphasize that despite its low contribution in terms of floristic
conservation, this wetland has value for the conservation of wetland habitat more generally. It also has
recognized value for wetland-dependent fauna. For example, the wetland supports Cape clawless otter
(Aonyx capensis) which are categorized as a near threatened species, which although having a large
distribution range, has a spatial area of occupied habitats which is much smaller and unknown,
particularly due to the widespread habitat destruction and pollution problems (Jacques, et al., 2015). It
should be noted further that at a local level the Elandskloof Wetland is one of a very few remaining
natural/semi-natural wetland areas in the landscape, and although not very well connected to other
natural/semi-natural wetland areas, it makes an important contribution to improving the connectivity of
this landscape. The proposed rehabilitation interventions at Elandskloof, in particular the control of
invasive alien trees, are anticipated to improve wetland and aquatic habitat provided by the wetlands,
thereby enhancing the current intrinsic value for biodiversity conservation.
Rehabilitation interventions for the three wetlands: some preliminary
suggestions
An overview of the rehabilitation interventions
Two main modes of rehabilitation are considered for the assessment.
28
• Rehabilitation of the existing natural/ semi-natural wetland areas by halting degradation and
improving functioning of these areas.
• Rehabilitation of wetland already completely transformed to orchards by withdrawing the
orchards from the wetland and returning as much functionality to the wetland as possible.
It is recognized that the opportunity costs associated with the latter are likely to be very high given the
considerable capital investment in the development of these wetland areas as orchards. Furthermore,
it is recognized that widespread withdrawal of orchards may threaten the viability of the fruit production
operations as a result of the lost productive area. Thus, the latter mode of rehabilitation is considered
only for very limited strategic areas within the selected wetlands.
In terms of rehabilitation of wetland already completely transformed to orchards within the three
wetlands this study has identified areas which are currently under orchards and which if withdrawn
would likely be most strategically located in terms of the interception of nutrients/pollutants from the
upstream catchment, and these constitute a total 14.4 ha in the Elandskloof wetland and 6.1 ha in the
Vyeboom wetland (Figure 6).
Figure 6: Wetland areas currently under orchards identified as strategically located in terms of the
interception of nutrients/pollutants from the upstream catchment if rehabilitated (outlined in green).
In terms of rehabilitation of the existing natural/ semi-natural wetland areas, a few key rehabilitation
objectives have been identified for the respective three sites based on the impacts and threats facing
these respective wetlands (Table 4). As can be seen from Table 5, removal of invasive alien trees is
required at all sites and Du Toit requires no further rehabilitation measures. In contrast, Vyeboom and
Elandskloof require several additional rehabilitation interventions (Table 7 ).

29
Table 7: Key overarching rehabilitation objectives for the existing natural/ semi-natural areas of the
three wetlands (EK=Elandskloof, VB=Vyeboom, DK=Du Toits) and implications for wetland functioning
Key overarching
objectives
Implications of the rehabilitation for wetland functioning Wetland
EK VB DK
Remove invasive
alien trees
The replacement of tall invasive alien trees with shorter
shrubs and graminoids which have a much smaller
transpiring leaf area, and therefore a much lower total
evaporation from the wetland, which, in turn, increases
the supply of water downstream.
Better protection of the soil.
Reduced level of uniform shading of the channel,
leading to improved habitat.
Promote robust
herbaceous
vegetation in the
channel bed and
banks
Favourable conditions for the enhanced assimilation of
nutrients (through direct uptake and more importantly by
creating microhabitat for microbes responsible for the
assimilation such as denitrifying bacteria).
The accumulation of sediment in the channel will be
promoted (see below for implications of this effect).
Reduce channel
incision and
promote the
accumulation of
sediment in the
channel
The capacity of the channel is decreased, thereby
increasing the frequency and extent of bank overspill,
which in turn increases the incidence of flooding across
the wetland and the benefits associated with this
flooding, in particular the trapping of sediment.
Reduced loss of sediment to the downstream
environment.
Halt the advance of
headcut erosion
threatening to alter
diffuse flow
portions of the
wetland into
strongly channelled
portions
By preventing the conversion of diffuse flow portions of
the wetland into strongly channelled portions the
concentration of flows and drying out of these portions of
the wetland would be prevented. In turn the loss of
desiccated organic soil to mineralization would also be
prevented.
Direct reduced loss of sediment to the downstream
environment
A description of key interventions included in the rehabilitation
The rehabilitation interventions in the Elandskloof Wetland have been designed specifically taking into
account the following impacts and constraints of the site:
• An extensive portion of the wetland is periodically flooded when the dam levels are high. In
addition to precluding this wetland from ever being rehabilitated to anywhere near pristine
condition, the direct influence of the dam mitigates against vegetation cover directly by the
water being too deep for most species to tolerate. In addition, it acts indirectly through wave

30
action by removing soil, in particular the topsoil, so that when the dam level drops a much less
favourable growth medium to support plant growth remains.
• Several sections of stream channel are incised.
• One section of the stream channel has been artificially straightened.
• The site has been subject to widespread historical disturbance and the vegetation was
previously dominated by alien species and pioneer indigenous species, but with the recent
clearing of extensive stands of the alien tree species Salix fragilis and Acacia mearnsii located
mainly adjacent to the streams, some recovery is anticipated in the future.
• Although highly modified, the Elands Stream has prior to alien clearing showed signs of aquatic
fauna, including Cape clawless otter spoor and Malachite kingfisher diving after prey in one of
the pools in the Elands Stream.
While impacting negatively on biodiversity and water conservation, the Salix fragilis trees appear to
serve a useful ecological function by dissipating wave action when the dam levels are high, and
therefore reducing disturbance of the area and loss of sediment in some of the wetland. Therefore, in
terms of shoreline protection and soil conservation, with the removal of these trees it would probably
be important to replace them with indigenous plants. Morella serrata and Salix mucronata are two
indigenous tree species tolerant of prolonged flooding which are recommended.
Considering possible opportunities as well as taking into account the impacts and constraints described
above for the Elandskloof Wetland, several wetland rehabilitation measures are proposed (Table 8).
Table 8: Rehabilitation interventions proposed for the Elandskloof Wetland
Description of intervention Specific objective of the intervention Cost estimate
Anchored log boom lines/brush
fences (constructed from cleared
invasive alien trees) orientated at
right angles to the shoreline and
located in recently deposited
sediment and stream outflow areas
Dissipation of wave energy and
protection of the soil or recently
deposited sediment
To be
determined
Earthworks to close off the inflow and
outflow to the artificially straightened
section of channel.
Redirect flows into the original sinuous
stream channel. No need to re-fill but
left to increase depression storage
capacity of the wetland.
To be
determined
Two strategically located low weirs in
the stream channel located in areas
downstream of active incision of the
channel.
Halt active headcut erosion and
incision of the stream channel.
To be
determined
Sloping of banks in some severely
incised sections of channel and use
of bio-jute blanket and ecologs, as
well as revegetation along banks and
toe of banks
Stabilize the banks and prevent further
erosion and soil loss
To be
determined
Lines of robust herbaceous wetland
vegetation planted at right angles to
Protection of soil/sediment against
wave energy, wash and wind.
To be
determined
31
the flow across recently deposited
sediment and stream outflow areas.
Create more favourable conditions for
the assimilation of nutrients.
Removal of invasive alien trees
Reduce increased evaporative loss of
water and improve habitat, both for
aquatic life in the stream and for the
wetland more generally.
To be
determined
Planting of indigenous trees where
Salix fragilis trees have been
removed.
Dissipation of wave energy and
protection of the soil or recently
deposited sediment, especially in areas
which would become exposed with the
clearing of Salix fragilis
To be
determined
A rehabilitation plan with costing for all of the interventions in Vyeboom has been developed by
(Snaddon, et al., 2018) and this provides the basis for the specific interventions given in Table 9. The
estimate by (Snaddon, et al., 2018) of the extent of invasive alien plants in Vyeboom and du Toits
Wetlands will also be used.
Table 9: Rehabilitation interventions proposed for the Vyeboom wetland excluding the clearing of
invasive alien plants (Snaddon, et al., 2018)
Description of intervention Specific objective of the intervention Cost estimate
(R)
Sloping and use of bio-jute blanket
and ecologs, as well as
revegetation along banks and toe
of banks
To stabilise the banks in order to prevent
further erosion and soil mobilisation
R35 550
Sloping with rock-pack Stabilise the head-cut and prevent further
erosion and soil mobilisation
R6 119
Sloping of bank and installation of
groynes as well as revegetation
with Palmiet along the toe of the
bank
To stabilise the bank and prevent further
erosion as well as to divert water to the right
of the channel
R248 320
Extension of an existing earthen
berm
To prevent any lateral erosion into the
channel and divert water into a controlled re-
entry point
R4 781
A series of geo-cell concrete
chutes
Stabilise several head-cuts that are
threatening the upstream wetland and
prevent further erosion and soil mobilisation
that would contribute to sediment loads
entering Theewaterskloof Dam
R1 889 994

32
Rock Masonry Chute To stabilise the head-cut and prevent further
erosion of the wetland
R17 958
Rock-pack To reduce high energy flows through channel
and prevent further erosion of the head-cut
R7 994
TOTAL R2 210 717
Unlike the rehabilitation of the natural/semi-natural areas for which individual interventions have been
costed, a much coarser estimate has been undertaken for the rehabilitation of wetland areas currently
under orchards. These areas will require extensive blocking of artificial drains and reference is made
to costs of comparable historical projects reported by Kotze et al. (2018) and accounting for inflation.
A comparison of key functional attributes of the three wetlands for
“Without rehabilitation” and “With rehabilitation” scenarios
Having identified the rehabilitation measures to be undertaken in the natural/semi-natural wetland
areas, and the specific objectives of these interventions (Table 8 and Table 9) a preliminary assessment
was made of key functional attributes of the wetland for a “Without rehabilitation” scenario compared to
a “With rehabilitation” scenario (Table 10).
Table 10: A preliminary qualitative/semi-quantitative assessment of key functional attributes of the three
wetlands for “Without rehabilitation” and “With rehabilitation” scenarios. Percentages given in the table
refer to proportional extent of the wetland, and the most prominent differences between the “With
rehabilitation” and the “Without rehabilitation” scenarios are highlighted in red.
Elandskloof1 Vyeboom Du Toits
Without
rehabilitation
With
rehabilitation
Without
rehabilitation
With
rehabilitation
Without
rehabilitation
With
rehabilitation
Pattern of
low flows
Strongly
channelled
90% 88% 30% 15% 15% 15%
Moderately
channelled
5% 5% 15% 10% 30% 30%
Intermediate 3% 4% 10% 10% 30% 30%
Diffuse flow 2% 3% 45% 65% 25% 25%
Occurrence
of high flows
across the
wetland
1 in >5
years over
most of the
wetland
1 in 3 years
over most of
the wetland
In most
years, but
excluding
the strongly
channelled
portion
In most
years, but
excluding
the strongly
channelled
portion
In most
years, but
excluding
the strongly
channelled
portion
In most
years, but
excluding
the strongly
channelled
portion

33
Hydrological
zonation
Temporary 88% 83% 45% 30% 35% 35%
Seasonal 11% 15% 35% 37% 32% 32%
Permanent 1% 2% 20% 33% 33% 33%
Extent of
invasive
alien trees
50% <0.1% 40% <0.1% 6% <0.1%
1This refers to the situation when the level of the dam is such that the dam shoreline lies below the
outlet of the wetland.
From Table 10 it can be seen that the degree to which functional attributes will be enhanced by
rehabilitation is clearly greatest in Vyeboom, followed by Elandskloof, and much less in Du Toits, where
it is associated with clearing of invasive alien trees alone. The most important contribution at Vyeboom
Wetland is in diffuse flow occupying 20% more of the overall wetland area (a change from 45% to 65%
of the wetland) and strongly channelled areas being correspondingly less prominent with rehabilitation
than without. Rehabilitation would cause water flows to be much more spread out in the wetland, and
therefore contribute greatly to increasing the contact between the water column and wetland sediments
and vegetation of the Vyeboom Wetland. This would significantly increase the capacity of the wetland
to assimilate nutrients and pollutants.
Given the overall size of the natural/semi-natural area of Vyeboom of 235 ha, then the 20% enhanced
diffuse flow through rehabilitation, constitutes a total of 47 ha. In terms of modelling the effect of the
rehabilitation on the assimilation of nutrients/pollutants, the key difference between the two scenarios
is that 47 ha dominated by diffuse low flows, extensive permanent soil saturation and high levels of soil
organic matter present in the “With rehabilitation” scenario is replaced with 47 ha of concentrated flow
and predominantly temporary soil saturation and much lower levels of soil organic matter in the “Without
rehabilitation” scenario.
In the 81 ha area of semi-natural vegetation in the Elandskloof wetland the “With rehabilitation” scenario
results in only a 2 ha shift from strongly channelled to areas of intermediately to diffusely spread flows
compared with the “Without rehabilitation” scenario, based on the change in flow patterns shown in
Table 10.
A total of 37 ha of the Vyeboom Wetland which supports organic soil is under threat from actively
advancing headcuts and associated erosion gullies. In the absence of any rehabilitation interventions
it is likely that these erosion gullies will advance through these areas and have a strong draining effect
on the organic soil material which they contain. Given the average depth of 0.5 m of organic material
across this area, this translates into 185 000 m3 of organic soil material under threat.
While Du Toits Wetland holds by far the greatest volume of organic soil material out of the three
wetlands, estimated as 1 095 733 m3 (Kotze, 2015), this is not under any immediate observable threat
for which rehabilitation interventions have been planned. In the long term, control of wattle trees
eliminates the threat to this organic material posed by the drying effect and destabilization of channels
in the wetland posed by these trees in the absence of effective control.
The lower gullies of the Vyeboom Wetland feed directly into the Theewaterskloof Dam, and therefore
all of the sediment eroded out of these gullies will be deposited in the dam. Although the eroding

34
channel below the road crossing is currently not connected by a clearly defined channel to the outflow,
at the current rate of advance of the main lower gully, this is likely to take place resulting in sediment
eroding from this channel being readily transported into the Theewaterskloof dam. In contrast, sediment
eroded from the upper erosion gully flows through a weakly channelled portion of the wetland (not
threatened by gully erosion) before entering a well-defined channel carrying it directly into the
Theewaterskloof. For the purposes of the economic assessment it is assumed that half of the sediment
lost from the upper gully would be deposited in this weakly channelled area rather than being carried
down into the Theewaterskloof Dam.

35
3. HYDROLOGICAL MODEL FOR THE THEEWATERSKLOOF DAM
WETLANDS
Introduction
This section of the report will describe the development of a representative hydrological model for the
Theewaterskloof Dam wetlands. The WRSM2000-Pitman Model has been:
• configured,
• calibrated at all the observed streamflow sites including the Theewaterskloof Dam inflow
record, and
• used to simulate flows through the applicable wetlands for historical conditions and for the
Present Day (2009) Development Level Scenario.
The following Sections of the report will provide an overview of the study area and the various sets of
input data required to configure an integrated hydrological model for all areas upstream of the
Theewaterskloof Dam, including all the wetlands. References are made to the sources of the data or
assumptions made for each type of input data. The results from the model calibration will also be
presented. Subsequently the three wetland balances are provided for a Present Day (2009)
development level scenario.
Study area
The study area consists of three quaternary catchment areas that feed into the Theewaterskloof Dam,
i.e. H60A, B & C. The Theewaterskloof Dam catchment consist of an enclosed valley with mountainous
borders which surrounds approximately 80% of the catchment. The steep hills surround flat valley areas
on which extensive irrigated agriculture, farm dams and the larger reservoirs can be found. Altitudes
vary from 1500 meters above sea level (masl) in the South West to 320 masl at the Theewaterskloof
Dam wall in the South East.
To more accurately determine the long-term wetland water balances, the quaternary catchments were
further divided into quinary catchments as indicated in Figure 7.

36
Figure 7: Study area Map
Table 11 provides the reference number, description, catchment area, Mean Annual Precipitation
(MAP) and Mean Annual Evaporation (MAE) for each of the quinary catchments. The MAP for each of
the quinary catchments were generated from the WR2012 source dataset (Dent, et al., 1987) and
catchment boundaries were determined using 1:50 000 contour maps overlaid on Google Earth satellite
images.
As can be seen from Table 11 the MAP for the catchment varies between 547 to 2329 mm/annum,
which influences the demands in different parts of the catchment significantly. Table 11 also shows that
78% of the surface runoff generated upstream from Theewaterskloof Dam first flows through wetlands
before reaching the dam. The Theewaterskloof Dam supplies approximately 36% of the Western Cape
Water Supply System (WCWSS - Figure 8) Historical Firm Yield (Department of Water Affairs (DWA),
2012) which means that the wetlands in these 3 quaternary catchments filters approximately 28% of
the entire WCWSS’s yield.

37
Figure 8: Western Cape Water Supply System (WCWSS)
Table 11: Quinary areas in the Theewaterskloof Dam Catchment.
Catchment
# Description
Area
(km2)
MAP
(mm/annum)
MAE: S-Pan
(mm/annum)
H60A1 Catchment for main channel inflow to Vyeboom Wetland
(Gauged: H6H008) 39 2329 1440
H60A2 Mountainous areas surrounding Vyeboom Wetland, causing
lateral inflows 11 1263 1440
H60A3 Irrigation upstream from Vyeboom Wetland, causing lateral
inflows 20 1016 1440
H60A4 Vyeboom Wetland 2 976 1440
H60A Total 73 1751 1440
H60B1 Catchment for main channel inflow to Du Toits Wetlands
#1&2 18 1755 1465
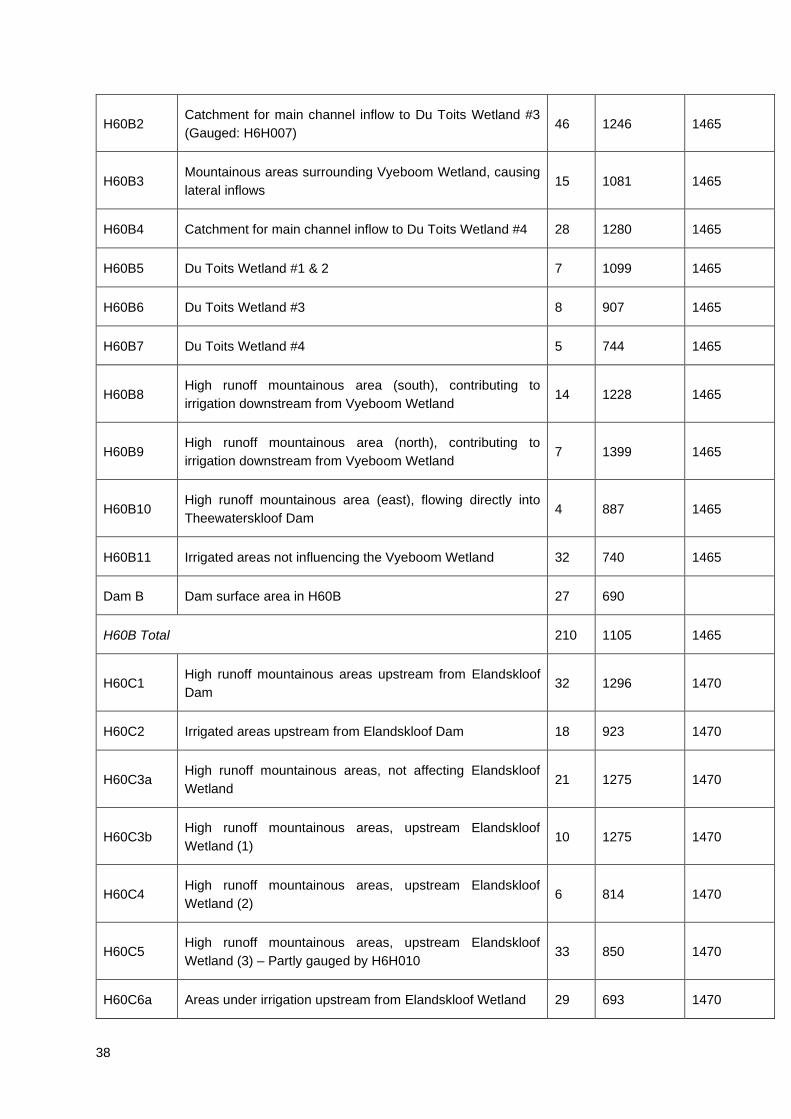
38
H60B2 Catchment for main channel inflow to Du Toits Wetland #3
(Gauged: H6H007) 46 1246 1465
H60B3 Mountainous areas surrounding Vyeboom Wetland, causing
lateral inflows 15 1081 1465
H60B4 Catchment for main channel inflow to Du Toits Wetland #4 28 1280 1465
H60B5 Du Toits Wetland #1 & 2 7 1099 1465
H60B6 Du Toits Wetland #3 8 907 1465
H60B7 Du Toits Wetland #4 5 744 1465
H60B8 High runoff mountainous area (south), contributing to
irrigation downstream from Vyeboom Wetland 14 1228 1465
H60B9 High runoff mountainous area (north), contributing to
irrigation downstream from Vyeboom Wetland 7 1399 1465
H60B10 High runoff mountainous area (east), flowing directly into
Theewaterskloof Dam 4 887 1465
H60B11 Irrigated areas not influencing the Vyeboom Wetland 32 740 1465
Dam B Dam surface area in H60B 27 690
H60B Total 210 1105 1465
H60C1 High runoff mountainous areas upstream from Elandskloof
Dam 32 1296 1470
H60C2 Irrigated areas upstream from Elandskloof Dam 18 923 1470
H60C3a High runoff mountainous areas, not affecting Elandskloof
Wetland 21 1275 1470
H60C3b High runoff mountainous areas, upstream Elandskloof
Wetland (1) 10 1275 1470
H60C4 High runoff mountainous areas, upstream Elandskloof
Wetland (2) 6 814 1470
H60C5 High runoff mountainous areas, upstream Elandskloof
Wetland (3) – Partly gauged by H6H010 33 850 1470
H60C6a Areas under irrigation upstream from Elandskloof Wetland 29 693 1470
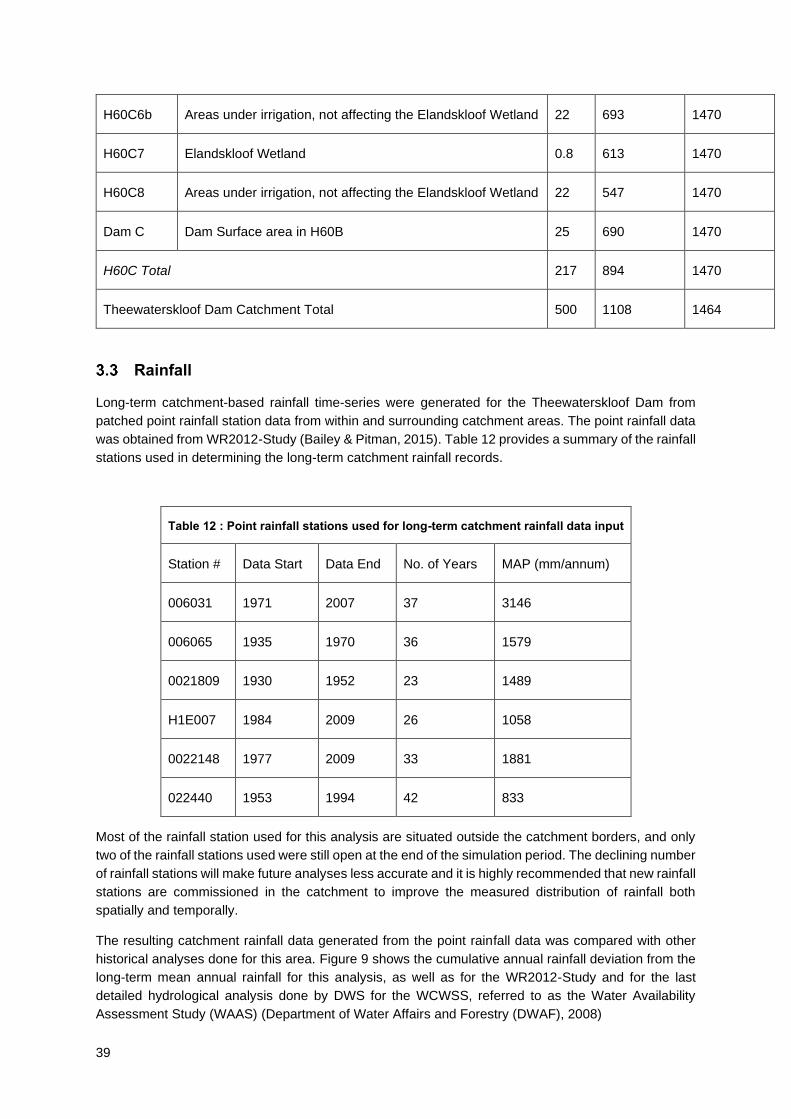
39
H60C6b Areas under irrigation, not affecting the Elandskloof Wetland 22 693 1470
H60C7 Elandskloof Wetland 0.8 613 1470
H60C8 Areas under irrigation, not affecting the Elandskloof Wetland 22 547 1470
Dam C Dam Surface area in H60B 25 690 1470
H60C Total 217 894 1470
Theewaterskloof Dam Catchment Total 500 1108 1464
Rainfall
Long-term catchment-based rainfall time-series were generated for the Theewaterskloof Dam from
patched point rainfall station data from within and surrounding catchment areas. The point rainfall data
was obtained from WR2012-Study (Bailey & Pitman, 2015). Table 12 provides a summary of the rainfall
stations used in determining the long-term catchment rainfall records.
Table 12 : Point rainfall stations used for long-term catchment rainfall data input
Station # Data Start Data End No. of Years MAP (mm/annum)
006031 1971 2007 37 3146
006065 1935 1970 36 1579
0021809 1930 1952 23 1489
H1E007 1984 2009 26 1058
0022148 1977 2009 33 1881
022440 1953 1994 42 833
Most of the rainfall station used for this analysis are situated outside the catchment borders, and only
two of the rainfall stations used were still open at the end of the simulation period. The declining number
of rainfall stations will make future analyses less accurate and it is highly recommended that new rainfall
stations are commissioned in the catchment to improve the measured distribution of rainfall both
spatially and temporally.
The resulting catchment rainfall data generated from the point rainfall data was compared with other
historical analyses done for this area. Figure 9 shows the cumulative annual rainfall deviation from the
long-term mean annual rainfall for this analysis, as well as for the WR2012-Study and for the last
detailed hydrological analysis done by DWS for the WCWSS, referred to as the Water Availability
Assessment Study (WAAS) (Department of Water Affairs and Forestry (DWAF), 2008)

40
Figure 9:Long-term cumulative annual catchment rainfall variation
Figure 9therefore shows how the annual catchment rainfall fluctuated over time above and below the
long-term mean on a cumulative basis. Descending parts of the line shows consecutive years of lower
than average annual rainfall and ascending parts show consecutive year with above average rainfall.
The previous comparative studies show large cumulative dry and wet periods up to 1975 and much
smaller cumulative dry and wet periods post-1975. This artificial trend seen in the previous analyses
are partly due to (a) making use of point rainfall data with long-term trends not supported by surrounding
rainfall stations and (b) the inherent difference in how rainfall was monitored in South Africa pre-1975.
Both these issues were resolved by careful selection of point rainfall station data record periods. The
trends between all the studies still compares well in terms of dry and wet periods, however this study’s
annual rainfall pattern fluctuates more evenly around the mean, and do not show the usual discrepancy
between pre- and post-1975 rainfall measurement.
Reservoirs
Detailed information on the Elandskloof and Theewaterskloof dams were obtained from DWS:
Hydrological Services. This included latest survey data (for area-capacity relationship calculations) as
well as the detailed daily water balance information for calibration purposes. The DWS: Dam Safety
database were used to obtain capacity and surface area information for twenty six (26) registered dams
in the Theewaterskloof Catchment. A relationship between the provided full supply area and capacities
of the registered dam were determined and is provided in Figure 10. The figure therefore shows the
known capacities and related full supply surface areas for several farm dams in the Theewaterskloof
Catchment. Fitting an 2nd order polynomial trend line through the known area-capacity relationship
produced an equation for dams in the Theewaterskloof Dam catchment.

41
Figure 10: Area-capacity relationship for registered farm dams in the Theewaterskloof Dam Catchment
Additional farm dams that did not appear in the Dam Safety Database were identified on Google Earth
and their surface area were digitised. The above relationship was then used to determine the additional
farm dam capacities. The total farm dam and major dam full supply capacities and related areas for the
Theewaterskloof Catchment are provided in Table 13.
It should be noted that due to the highest water demands occurring in the dry season, farmers tend to
fill farm dams during the wet winter seasons. This behaviour was also incorporated into the model
configuration to ensure that irrigation from farm dams have representative assurance of irrigational
water supply.
The function used in the WRSM2000 to represents the relationship between the volume of water in a
dam and the corresponding surface area is given by the equation:
Area = a * Volumeb
Where:
a = coefficient in the volume-surface area relationship (known as the A-value);
b = power in the volume-surface area relationship (known as the B-Value);
Volume = volume of water in the dam (million m3);
Area = surface area of water in the dam, corresponding to Volume (km2).

42
Detailed dam survey data is available for the Theewaterskloof and the Elandskloof Dams. The survey
data was used to derive the required B-Values for each of the dams (the A-Value is derived by using
the dam’s full supply capacity and full supply area for any given B-value). When detailed survey data is
not available (such as in the case of lumped farm dams), a default value of 0.6 is assumed.
Table 13: Reservoir information for the Study Area
Reservoir Description Full Supply Area (km2) Net Full Supply
Capacity (106m3)
B-Value applied
Theewaterskloof Dam 51.2 479.3 0.68
Elandskloof Dam 0.6 11.0 0.68
Farm dams in H60A
(Scheme and Non-
Scheme)
0.4 2.7 0.60
Farm dams in H60B
(Scheme and Non-
Scheme)
0.2 1.5 0.60
Farm dams in H60C 0.4 2.9 0.60
Total: 497.4
Canals and pipelines
The Vyeboom Irrigation Board has a pipeline abstracting directly from the Theewaterskloof Dam. Water
is provided under pressure to irrigators with assumed 5% transmission losses. Over the 24 years of
monitored data the average supply was 8.4 million m3/annum. Present Day (2009) development was
calculated based on the average supply from 2005 – 2009 which was 9.1 million m3/annum.
The Elandskloof Irrigation Board supplies irrigators downstream from the Elandskloof Dam as well as
Villiersdorp with water via a system of ground canals that covers both the left and right bank of the river.
The historical measured canal water supply was 10.7 million m3/annum between 1988 to 2009, with
Present Day (2009) water requirements assumed as 11.5 million m3/annum according to the annual
average between 2005 and 2009. Transmission losses were assumed to be 30% overall, although
ground canals have losses in excess of 50%. This is to account for some of the losses returning to
rivers and dams.
Land -and Water-use
Invasive Alien Plants (IAP) and Commercial Forestry
Commercial Forestry data from the WR2012 Study was used for this analysis. There was only one
areas (H60C1) that had commercial forestry activity of 3.8 km2 of Pine plantations which were verified
on Google Earth historically. The total Present Day (2009) area under commercial forestry has however
reduced to only 1.0 km2.

43
IAP data was obtained from the publication “The impacts of different degrees of Invasive Alien Plant
Invasion on yields from the Western Cape Water Supply System” (Gorgens, 2016). The tables in the
report as well as the map of distribution of plants in the catchment were used to disaggregate the rough
spatial aggregation of condensed areas that is provided in the report. Table 14 provides an overview of
the area of IAPs that was indicated per quinary. In the final model configuration only 4 of the 13 quinary
catchments were simulated to have IAP’s, since Google Earth verification of the remainder of the areas
showed that it is highly unlikely to have so much vegetation, let alone IAP’s in the given areas. The
simulated reduction in runoff due to IAPs is also provided in Table 14.
Table 14: Simulated reduction in run off due to invasive alien plants per quinary catchment.
Quinary Catchment Condensed Area of IAPs
(km2)
% in Riparian Zone Present Day (2009)
water use (million
m3/annum)*
H60A1* 6.28 0.00 7.9
H60A2 1.9 0.36 -
H60B1 3.12 0.36 -
H60B2* 11.10 0.00 7.3
H60B3 2.46 0.36 -
H60B4* 9.65 0.36 7.2
H60B8 2.33 0.36 -
H60B9 1.23 0.36 -
H60B10 0.67 0.36 -
H60C1&2* 8.02 0.59 5.7
H60C3 5.22 0.36 -
H60C4 1.05 0.36 -
H60C5 5.68 0.36 -
Total 58.71 28.0
* - Quinary catchments where possible IAPs could occur based on Google Earth assessment of total
vegetation coverage for quinary.

44
Irrigation Water Use
Listed Irrigation Board irrigated areas and quotas for the Western Cape Water Supply System
(WCWSS) were compared with the Western Cape Government Department of Agriculture’s detailed
crop survey from 2017. The Listed Irrigation Board and Government Water Scheme’s irrigated areas
were approved by the Minster of Water Affairs and Forestry in 1999 as being Existing Lawful Water Use
in accordance to Article 33 of the National Water Act of 1998. Table 15 provides a comparison between
the two sources of information’s areas under irrigation for the Theewaterskloof Dam catchment.
Table 15: Comparison between Verified Legal and Western Cape 2017 Crop Survey (km2)
Source Listed Legal 2017 Survey
Vyeboom Irrigation Board 18.63 18.73
Elandskloof Irrigation Board 19.09 18.32
Direct from Theewaterskloof Dam 15.64 11.51
Local runoff
7.21
Total 53.36 55.77
Figure 11 shows the distributions of irrigated fields according to the 2017 Survey in the 5 irrigation sub-
areas.
Figure 11: Distribution of irrigated agriculture in the 3 main sub-areas of the WCWSS according to the
2017 survey (green = irrigated agriculture, red boundaries = WCWSS sub-areas.
45
As can be seen the total areas under irrigation compare well, and the 2017 Crop Survey data was
therefore accepted for use in the model as the 2009 development level irrigation distribution. The 2017
Survey shapefiles database was therefore used to determine irrigation areas, crops and irrigation
methods for each of the affected quinary catchments. Personal communications with the Elandskloof
and Vyeboom Irrigation boards also allowed for more detailed disaggregation of the irrigation demands
and return flows, to ensure that only irrigation upstream or lateral from wetlands are included in return
flow calculations.
SAPWAT was used in each quinary to determine crop-irrigation method requirements for each area
and an area weighted representative crop was generated with an assumed efficiency. SAPWAT is a
daily crop requirements simulation software package that calculates the crop requirements based on
the crop type, the irrigation method and the hydro-climatic conditions of the crop. SAPWAT, developed
by the Water Research Commission, is widely used throughout South Africa by agricultural engineers
and water resource planners, amongst others (Van Heerdan & Walker, 2016). Return flows were
assumed as 50% of the non-effective irrigation application efficiency (see Table 16).
Table 16 provides the breakdown of irrigated areas, quotas, Present Day (2009) long-term water
requirements and supply for all quinary catchment areas. Table 16 shows that the irrigation in the
Theewaterskloof Catchment has a long-term irrigation requirement far less than the quota (61% of
quota). The low irrigation requirements are due to the relative high rainfall, low evaporation and due to
the very high irrigation system efficiency. Furthermore, the irrigation requirements were met 99% of the
time on over the 80-year monthly period. Most of the irrigation is provided either through a dedicated
pipeline or canal system from a major reservoir or from farm dams which are filled during the wet winter
months.
Through this detailed analysis the impact of irrigation water requirements and return flow on individual
wetlands could be simulated. Return flows from irrigated areas were relatively small compared to runoff
that feeds the wetlands, partly due to the high irrigation system efficiency of the irrigation schemes
upstream from the wetlands.
Domestic water supply and return flows
Villiersdorp can abstract 0.694 million m3/annum directly from the Elandskloof Government Water
Scheme as well as from the Kommissieskraal River. Additionally, there are boreholes with an estimated
yield of 0.2 million m3/annum. The Water Treatment Works (WTW) has a maximum capacity of 1.081
million m3/annum. The Wastewater Treatment Works (WWTW) has a capacity of 0.66 million m3/annum
of which 0.3 million m3/annum is reused by the municipality for irrigating the parks and sports fields
(Department of Water Affairs, 2011). The average annual measured outflow from the WWTW between
October 2015 and September 2019 was 0.18 million m3/annum, compared to the long term annual
simulated inflow into the Elands River upstream from the Elandskloof Wetland of 44.5 million m3/annum.
In the dry, summer months the % of WWTW outflows are on average 8% of the total inflow to the
wetland.
Measured flow data
Two DWS streamflow gauging weirs with historically measured flow data used during the calibration of
the WRSM2000/Pitman model, are situated within the Theewaterskloof Dam catchment, one each
upstream from the Du Toits and the Vyeboom wetlands. The two streamflow gauging weirs are H6H007
and H6H008 respectively. The two gauging weirs measured a significant amount of runoff into the
Theewaterskloof Dam but were unfortunately closed in 1992, after 28 years of data recording.
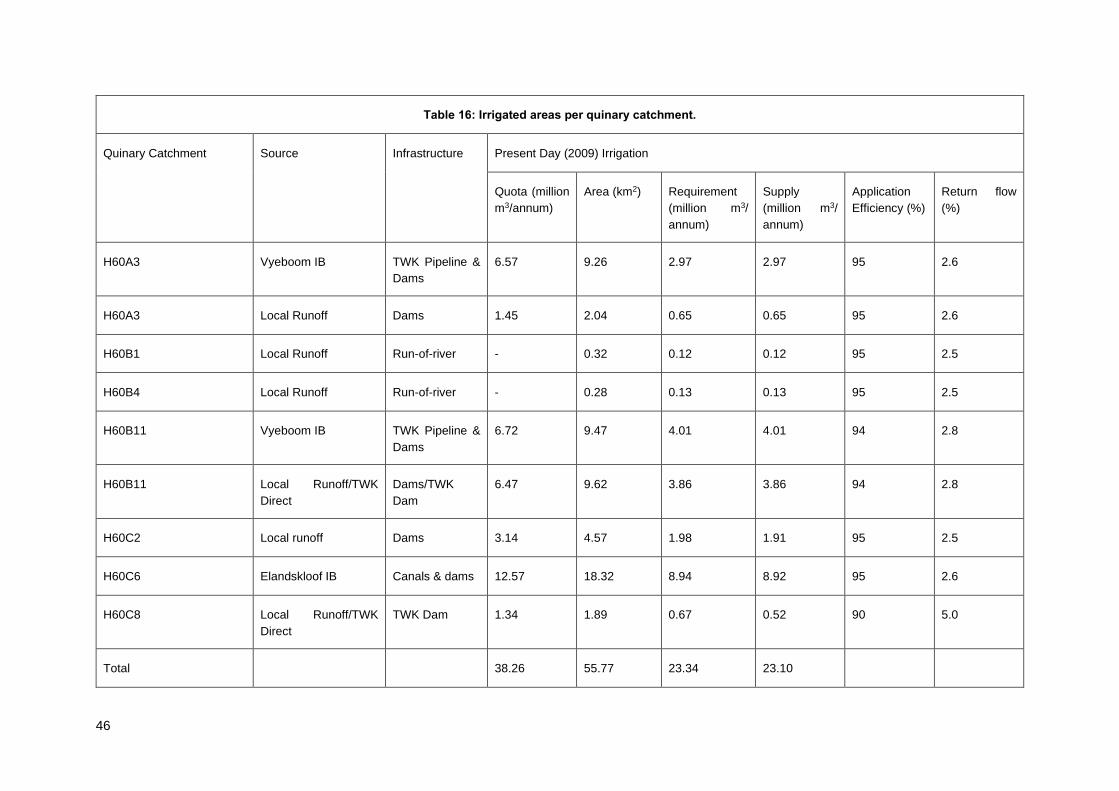
46
Table 16: Irrigated areas per quinary catchment.
Quinary Catchment Source Infrastructure Present Day (2009) Irrigation
Quota (million
m3/annum)
Area (km2) Requirement
(million m3/
annum)
Supply
(million m3/
annum)
Application
Efficiency (%)
Return flow
(%)
H60A3 Vyeboom IB TWK Pipeline &
Dams
6.57 9.26 2.97 2.97 95 2.6
H60A3 Local Runoff Dams 1.45 2.04 0.65 0.65 95 2.6
H60B1 Local Runoff Run-of-river - 0.32 0.12 0.12 95 2.5
H60B4 Local Runoff Run-of-river - 0.28 0.13 0.13 95 2.5
H60B11 Vyeboom IB TWK Pipeline &
Dams
6.72 9.47 4.01 4.01 94 2.8
H60B11 Local Runoff/TWK
Direct
Dams/TWK
Dam
6.47 9.62 3.86 3.86 94 2.8
H60C2 Local runoff Dams 3.14 4.57 1.98 1.91 95 2.5
H60C6 Elandskloof IB Canals & dams 12.57 18.32 8.94 8.92 95 2.6
H60C8 Local Runoff/TWK
Direct
TWK Dam 1.34 1.89 0.67 0.52 90 5.0
Total
38.26 55.77 23.34 23.10

47
Upstream from the Elandskloof wetland, the Elandskloof Dam and all its components are measured by
DWS as H6R002. The components include the releases to the canal system, any spills or releases via
the dam wall and the monthly volume of water stored by the dam. Rainfall and evaporation data from
the Theewaterskloof Dam and all the different monitored components of the dam are used to calculate
the daily and monthly inflow to the reservoir. This inflow record is then used to calibrate the model
against for the area upstream of the dam. All historical releases from the dam is also incorporated into
the model to contribute towards the Elandskloof Wetland inflow estimation.
So as for the Elandskloof Dam, DWS have a daily and monthly inflow calculation record for the
Theewaterskloof Dam. This dam however has many more components in the inflow calculation than
Elandskloof Dam, including five (5) pipeline and transfer tunnel meters. This calculated inflow record
was used to calibrate the overall inflow from the three (3) quaternary catchment areas into the
Theewaterskloof Dam. Table 17 provides a summary of the four (4) measure runoff sites used during
the calibration process of the WRSM2000/Pitman Model.
Table 17: Measured flow gauging sites in the Theewaterskloof Dam catchment.
Number: H6H007 H6H008 H6R001 H6R002
Gauge name: Du Toits River
@ Purgatory
Uitspan
Riviersonderen
d @ Swarte
Water
Riviersonderend
River @
Theewaterskloof Dam
Elands River
@ Elandskloof
Dam
Catchment Area
(km2):
46 38 498 50
Latitude: -33.93869 -34.0623 -34.07741 -33.95214
Longitude: 19.17077 19.07244 19.28993 19.28453
Record Start: 1964/03/14 1964/04/18 1979/06/18 1975/05/14
Record End: 1992/09/07 1992/09/07 2019/02/21 2018/10/24
Raw MAR up to
2009 (million m3/
annum):
37.6 60.6 21.9 303.2
Patched MAR up to
2009 (million m3/
annum):
37.8 68.3 22.6 303.2

48
Wetlands
This section will describe the wetland sub-module of the WRSM2000/Pitman model and is followed by
the parameters used to simulate the water balance in each of the three (3) analysed wetlands.
Sub-Module description
The “Comprehensive” Wetland sub-module of the WRSM2000/Pitman Model is an improvement on the
previous, more simplified version of the wetlands sub-module which initially modelled a wetland like a
reservoir. The latest version represents a wetland more realistically as a defined channel that meanders
through a wetland (either off-channel or in-channel), feeding it with water only when the river channel
capacity is exceeded, and spilling back into the channel at different storage states. The flow of water
between channel and wetland can be in the form of overbank spillage or via channels, or a combination
of both. This wetland-module has successfully been applied in the Kafue River (Zambia) and the
Pongolo River (RSA) (Bailey, 2015).
Figure 12 provides a diagram illustrating the flow balance through the wetland module in the
WRSM2000/Pitman Model, with a subsequent discussion of the different components thereafter.
Figure 12 : Flow balance diagram through the WRSM2000/Pitman wetland module (adapted from (Bailey,
2015)
Wetland storage (in-or off-channel)
Wetland storage Main channel
Qus
Qds
Qin
Qout
Qloc
Qabs
Qabs
Qloc
Qout
Qin
Qus
Qds
Qevap
Qevap

49
One of the main drivers for the wetland balance is the simulated upstream main channel inflow to the
wetland (Qus). The upstream inflow usually represents the flow from the total upstream catchment area
which are continuously connected to the wetland storage areas or only under certain flow conditions.
The latter conditions usually occur when there is a well-defined main channel such as in the case of
strong perennial rivers, where an off-channel storage wetland often only fills under higher flow
conditions. Other, more localised simulated runoff (usually lateral inflow) is also catered for in the
module (Qloc). The localised runoff has direct access to the wetland storage area and is not limited by
flow conditions in the main channel. Another function also exists for wetland abstractions done directly
from the wetland storage area (Qabs).
A real wetland has many links, where water can flow from the main channel to the wetland storage area
and back into the channel, depending on water levels. The flow from the main channel to the wetland
storage area (Qin) and from the storage area to the main channel (Qout) are regulated by several module
parameters. The monthly wetland water storage balance is calculated using Q in, nominal monthly
storage status of the wetland, net monthly evaporation (Qevap is the difference between the month’s
evaporation and rainfall) and Qout (Bailey, 2015). If known, the wetland’s Evapotranspiration is used
during the calculation of the Qevap value. The following wetland structural parameters are used to
influence the monthly wetland balance:
Physical parameters:
Snom = Nominal wetland storage volume (million m3)
Anom = Nominal wetland surface area (km²)
B-Value = Constant in wetland area-capacity equation Area =A x StorageB.
Where B = 0.1 is a bathtub shape and B = 0.9 is a V-shaped storage area
Flow into wetland storage area (Qin):
Qbf = Channel capacity above which spillage into wetland occurs (million m3 per
month) – the “bf” refers to Baseflow, which is often used to estimate this parameter
Kin = Proportion of Qus above Qbf flowing into wetland
Flow from the wetland storage (Qout):
Kout = Proportion of wetland storage above Snom returned to the main channel
Qds = Flow in the river downstream from the wetland, as calculated for each month
as: Qds = Qus – Qin + Qout
Groundwater components such as interflow, baseflow and recharge are not explicitly modelled in the
WRSM2000/Pitman wetland module. However, two runoff generating methods in the model, i.e. Sami-
and Hughes- methods (Bailey, 2015)., provides estimations of surface-groundwater interactions.
Recharge can be simulated outside of the wetland module and abstracted from the monthly wetland
storage balance while interflow is usually included in the main channel and lateral inflow simulated
runoff. However often the wetland storage has a relatively impermeable layer of organic material that
hampers recharge and adds lateral contributions to baseflow directly to the wetland storage.
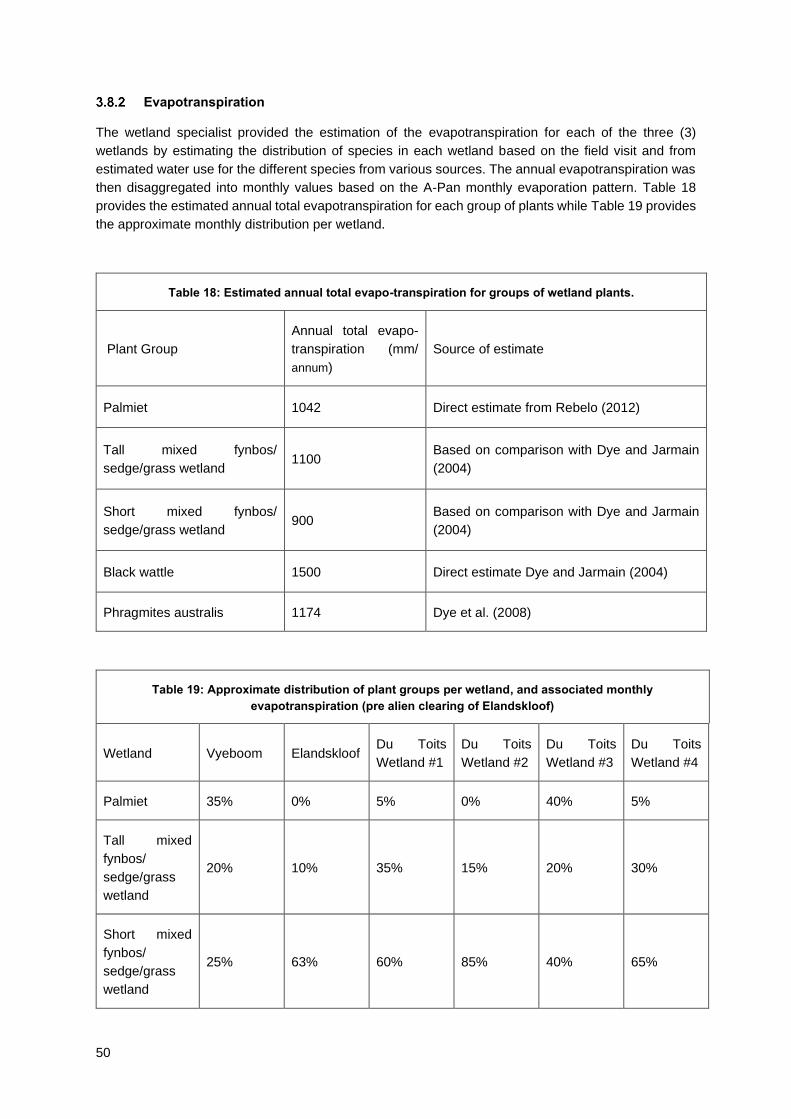
50
Evapotranspiration
The wetland specialist provided the estimation of the evapotranspiration for each of the three (3)
wetlands by estimating the distribution of species in each wetland based on the field visit and from
estimated water use for the different species from various sources. The annual evapotranspiration was
then disaggregated into monthly values based on the A-Pan monthly evaporation pattern. Table 18
provides the estimated annual total evapotranspiration for each group of plants while Table 19 provides
the approximate monthly distribution per wetland.
Table 18: Estimated annual total evapo-transpiration for groups of wetland plants.
Plant Group
Annual total evapo-
transpiration (mm/
annum)
Source of estimate
Palmiet 1042 Direct estimate from Rebelo (2012)
Tall mixed fynbos/
sedge/grass wetland 1100
Based on comparison with Dye and Jarmain
(2004)
Short mixed fynbos/
sedge/grass wetland 900
Based on comparison with Dye and Jarmain
(2004)
Black wattle 1500 Direct estimate Dye and Jarmain (2004)
Phragmites australis 1174 Dye et al. (2008)
Table 19: Approximate distribution of plant groups per wetland, and associated monthly
evapotranspiration (pre alien clearing of Elandskloof)
Wetland Vyeboom Elandskloof Du Toits
Wetland #1
Du Toits
Wetland #2
Du Toits
Wetland #3
Du Toits
Wetland #4
Palmiet 35% 0% 5% 0% 40% 5%
Tall mixed
fynbos/
sedge/grass
wetland
20% 10% 35% 15% 20% 30%
Short mixed
fynbos/
sedge/grass
wetland
25% 63% 60% 85% 40% 65%

51
Black wattle 20% 25% 0% 0% 0% 0%
Phragmites
australis 0% 2% 0% 0% 0% 0%
Annual Total
(mm/annum) 1110 1075 977 930 997 967
Oct (mm) 97 94 86 81 87 85
Nov (mm) 138 133 121 115 124 120
Dec (mm) 171 166 151 144 154 149
Jan (mm) 179 173 157 150 160 156
Feb (mm) 149 144 131 125 134 130
Mar(mm) 126 122 111 105 113 109
Apr (mm) 68 66 60 57 61 59
May (mm) 36 35 32 30 33 32
Jun (mm) 27 26 23 22 24 23
Jul (mm) 25 24 22 21 22 22
Aug (mm) 36 35 32 30 33 32
Sep (mm) 59 57 52 49 53 51
Parameter estimation
The two physical model parameters of a wetland, i.e. the nominal wetland storage volume (Snom) and
the nominal wetland surface area (Anom) are usually the only parameters that can be measured. A survey
is usually not available, however the surface areas of the wetlands can be digitised from Google Earth,
as was done for this analysis. Assumptions regarding the wetland’s average depth then provides the
estimated capacity of the wetland. The B- Factor, indicating the area-capacity relationship or cross-
section shape of the wetlands are usually deduced from Digital Terrain Models (DTMs) or field visits.
The effects of groundwater recharge and baseflow contribution can’t currently be simulated directly by
the Wetland sub-module. However, using the Sami-Runoff sub-module a small catchment that
represents each wetland area could be configured and all surface and relevant groundwater flows could
subsequently be routed into the wetland sub-module to calculate the wetland balances. This was
however a cumbersome process and adjustment of the Sami parameters to account for the wetland

52
area characteristics (especially due to the shallow impervious organic layer underneath the wetland)
showed that recharge into deeper groundwater and contributions from groundwater.
In Section 3.9 the process of calibrating upstream and lateral inflows to the wetlands are discussed in
more detail. Also included in this Section is a summary of the process undertaken to optimise the rest
of the wetland sub-module parameters to allow for the best calibration fit between the simulated
wetlands outflows and the overall Theewaterskloof Dam calculated dam balance inflow. The
parameters used for the different wetlands are provided in Table 20.
Table 20: Wetland parameters used during this simulation
Wetland Vyeboom Du Toits #3 Elandskloof
Area (km2) 2.50 7.70 0.76
Capacity (106m3) 1.83 5.62 0.55
B-Value* 0.60 0.60 0.60
Bank-full flow (106m3) 1.94 1.04 0.89
Contribution after bank-full (%) 0.01 0.01 0.01
Spill after full wetland (%) 0.71 0.71 0.71
MAP (mm/annum) 976 907 613
MAE (mm/annum) – See Table 19 1111 998 1075
Note: * - See Section 3.4 for a detailed description of the B-Value
Rainfall-runoff model setup and calibration
Purpose
The main drivers for all surface and groundwater resource availability are primarily precipitation (mainly
rainfall in South Africa), evaporation and catchment characteristics. Surface and groundwater resources
are scattered throughout South Africa due to the highly variable nature of rainfall, spatially and
temporally. Most of the surface water resources in South Africa is generated on only 30% of the land
surface, and the long-term variability is significant, running over decades, causing long lasting
hydrological droughts (periods of below average rainfall) that occurs in different spatial locations often
simultaneously throughout the country.
In order to confidently describe hydrological variability in any stream, river or reservoir, the longest
possible measured streamflow record is required to ensure that as much as possible monthly and inter-
annual variation in the streamflow can be observed and described. Table 21 provides an example of
Midmar Dam’s firm yield calculation different periods of observed or simulated data would have been
used.

53
Table 21: Example of historical yield analysis of Midmar Dam to illustrate the importance of long-term
simulations of hydrological variability
Period of analysis Number of years in analysis Firm Yield (million m3/annum)
1930 – 1934 5 81
1930 – 1939 10 69
1930 - 1949 20 69
1930 – 1969 40 69
1930 - 1989 60 36
Table 21 illustrates that between 1969 and 1989 a severe drought influenced the inflow to Midmar Dam
which dramatically reduced the analysed long-term yield capability of the resource compared to doing
the same analysis using shorter observed/simulated hydrology.
Unfortunately, streamflow gauging stations in South Africa only measure larger catchments and most
of the gauges were only established after the 1970’s which allows for only 40 to 50 years of observed
streamflow gauging. Observed streamflow data also includes changing land- and water-use upstream
from the site. In contrast to observed streamflow, there are a multitude of historic rainfall gauges across
the country running from the late 1800’s.
Due to rainfall being the primary driver behind runoff generation, a rainfall-runoff model (such as the
WRSM2000/Pitman) can be used to simulate long-term streamflow based on long-term rainfall while
considering historic changes in land- and water-use upstream from observed streamflow gauges.
Figure 13 illustrates the purpose of rainfall-runoff modelling, model calibration and scenario based
simulated hydrology. Plate (a) of Figure 13 shows the typical long-term observed (annual) rainfall and
streamflow data available for a catchment area upstream from a flow gauging site.
By setting up a rainfall-runoff model that includes the long-term rainfall, evaporation and growth in
historic land- and water-use for the catchment, historic simulated streamflow at the streamflow gauging
site can be generated, illustrated by the blue dashed line in Plate (b) of Figure 13. Plate (b) also shows
how the streamflow reduced over time as land- and water-use increased, and a new major dam was
constructed upstream from the site.
Importantly any rainfall-runoff model needs to represent reality accurately, and this is ensured by a
process called calibration. Calibration involves comparing observed streamflow data against simulated
streamflow at the same site over the calibration period and adjusting the model’s simulated runoff
generating parameters until an acceptable fit is achieved between the simulated and observed data.
Plate (b) of Figure 13 shows the calibration period of the example and the relatively good fit that was
achieved over that period of simulated and observed data.
Once a reasonable calibration has been achieved the rainfall-runoff model can then be used for what-
if scenarios to make long-term hydrological impact and water resource planning decisions. The main
scenario is always to generate simulated natural hydrology, where all upstream land- and water-use
are removed from the model to simulate what would the flow have been if there was no upstream
development over the long-term (see Plate (c) of Figure 13). The scenario used in this analysis is
referred to as Present Day Development scenario, where the model is configured to have all current

54
infrastructure, land- and water-use development as it is for a specific date, but constant over the whole
simulation period.
Figure 13: An example to illustrate the purpose of rainfall-runoff modelling, model calibration and
scenario based simulated hydrology.
a) Available Data
b) Calibrate model against observed streamflow
c) Simulate long-term scenarios, e.g. long-term simulated natural streamflow
Land-and water-use increase Rapid increase in land-and water-use
increase
Major dam constructed
Calibration period

55
Model configuration
The catchment configuration upstream of Theewaterskloof Dam was defined by a WRSM2000/Pitman
model network diagram, and the associated input datasets and the designed network was then
configured in a calibration setup of the model. Figure 14 provides the network diagram for the
Theewaterskloof Dam catchment area. All wetlands in the catchment were explicitly modelled (red
circles) and the main channel and lateral inflow streams to each wetland were defined according to the
observed catchment layout.
Model calibration and optimisation
The process of calibrating the model followed these steps:
• Calibrate H6H007 (main channel upstream from Du Toits #3 wetland)
• Calibrate H6H008 (main channel upstream from Vyeboom wetland)
• Calibrate H6R002 (inflow to Elandskloof Dam, upstream from Elandskloof wetland)
• Transfer runoff parameters from above calibrations to remaining catchments flowing
directly into Theewaterskloof Dam and check against dam inflow calculation.
• Optimise wetland parameters using Evolutionary Optimisation tool in Excel.
The monthly simulated versus observed flow charts for the 4 calibration stations mentioned above are
provided in Appendix C. In Appendix C, Table C-1 provides the Sami sub-module’s calibration
parameters used for the final calibration of the Theewaterskloof Dam catchment.
To determine the wetland parameters, the WRSM2000/Pitman wetland module was replicated in a
spreadsheet. The spreadsheet replica was then configured to represent all the wetlands upstream from
the Theewaterskloof Dam. Input provided to the spreadsheet replica included the simulated main
channel and lateral inflows time-series, rainfall and evaporation time-series, and the Snom, Anom and
assumed B-Value for the combined wetlands (see Section 3.8 for explanation of parameters).
An Excel based Evolutionary Solver was then used to obtain the combined wetland parameters that
provides the best sum of absolute differences fit between the simulated wetlands outflows and the
portion of the Theewaterskloof Dam’s calculated inflow record that is affected by the wetlands. Figure
15 provides the final integrated wetlands’ simulated outflow versus observed Theewaterskloof Dam’s
calculated inflow data charts.
The optimised parameters were then disaggregated to individual wetlands sub-module replica
spreadsheets with associated Present Day (2009) development level upstream and lateral inflows. The
final parameters used for the different wetlands are provided in Table 22.

56
Figure 14 : WRSM2000/Pitman rainfall runoff model network diagram.

57
Figure 15: Integrated wetlands parameter optimisation calibration results
a) Simulated wetland monthly storage fluctuation
b) Simulated: Total monthly wetlands outflows + other direct inflows. Observed: TWK Dam inflow
c) Simulated: Average monthly wetlands outflows + other direct inflows. Observed: TWK Dam inflow
outflow TWK Dam inflow
d) Simulated: Annual wetlands outflows + other direct inflows. Observed: TWK Dam inflow
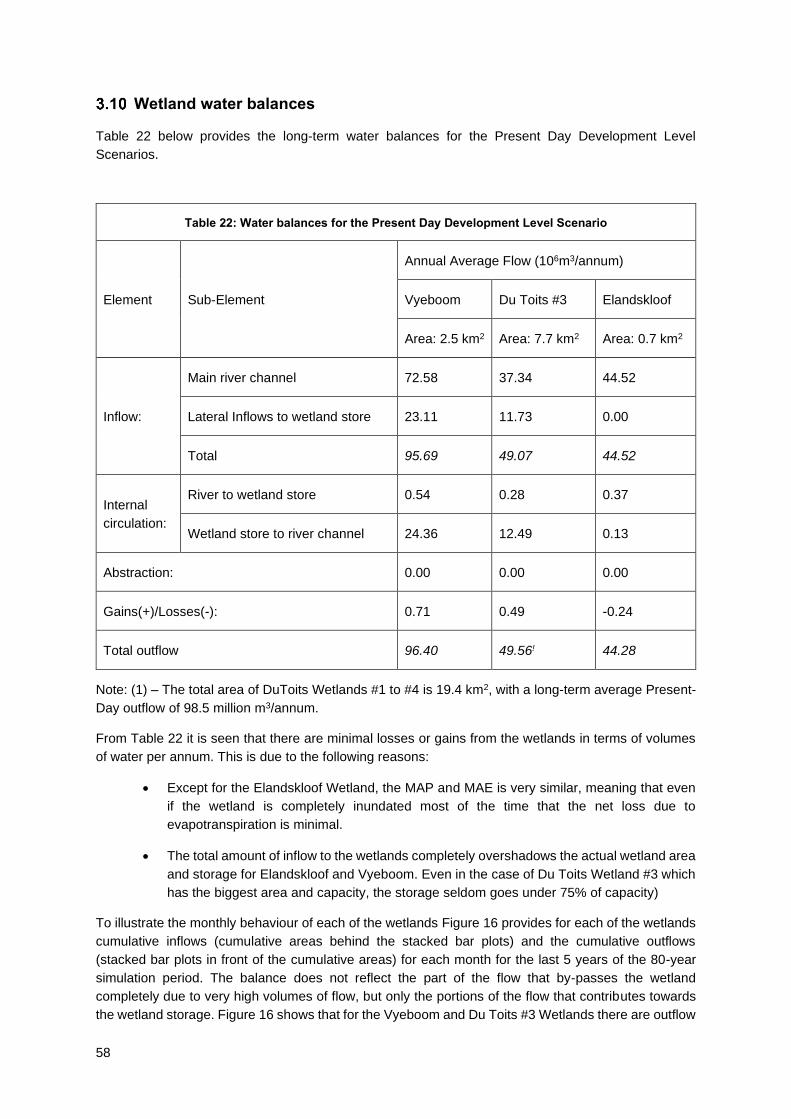
58
Wetland water balances
Table 22 below provides the long-term water balances for the Present Day Development Level
Scenarios.
Table 22: Water balances for the Present Day Development Level Scenario
Element Sub-Element
Annual Average Flow (106m3/annum)
Vyeboom Du Toits #3 Elandskloof
Area: 2.5 km2 Area: 7.7 km2 Area: 0.7 km2
Inflow:
Main river channel 72.58 37.34 44.52
Lateral Inflows to wetland store 23.11 11.73 0.00
Total 95.69 49.07 44.52
Internal
circulation:
River to wetland store 0.54 0.28 0.37
Wetland store to river channel 24.36 12.49 0.13
Abstraction: 0.00 0.00 0.00
Gains(+)/Losses(-): 0.71 0.49 -0.24
Total outflow 96.40 49.56! 44.28
Note: (1) – The total area of DuToits Wetlands #1 to #4 is 19.4 km2, with a long-term average Present-
Day outflow of 98.5 million m3/annum.
From Table 22 it is seen that there are minimal losses or gains from the wetlands in terms of volumes
of water per annum. This is due to the following reasons:
• Except for the Elandskloof Wetland, the MAP and MAE is very similar, meaning that even
if the wetland is completely inundated most of the time that the net loss due to
evapotranspiration is minimal.
• The total amount of inflow to the wetlands completely overshadows the actual wetland area
and storage for Elandskloof and Vyeboom. Even in the case of Du Toits Wetland #3 which
has the biggest area and capacity, the storage seldom goes under 75% of capacity)
To illustrate the monthly behaviour of each of the wetlands Figure 16 provides for each of the wetlands
cumulative inflows (cumulative areas behind the stacked bar plots) and the cumulative outflows
(stacked bar plots in front of the cumulative areas) for each month for the last 5 years of the 80-year
simulation period. The balance does not reflect the part of the flow that by-passes the wetland
completely due to very high volumes of flow, but only the portions of the flow that contributes towards
the wetland storage. Figure 16 shows that for the Vyeboom and Du Toits #3 Wetlands there are outflow

59
from the wetland for several months after the inflow to the wetlands has resided. Only a small portion
of the main channel’s flow contribute towards the wetland storage but that most of the storage is filled
by lateral flows. This is most probably due to the shape of the wetlands and the very high flows that
pass through the wetlands into the Theewaterskloof Dam. The Vyeboom Wetland is nearly always fully
inundated since it has the largest main and lateral inflow of all the wetlands. The Vyeboom Wetland
area is relatively small compared to Du Toits’ #3 wetland, therefore the evapotranspiration from
Vyeboom is less than Du Toits’ #3 wetland. Elandskloof Wetland is very small with higher
evapotranspiration causing very little wetland outflows.

60
Figure 16: Part of the monthly water balance for 3 wetlands in the Theewaterskloof Catchment at Present Day development level. Cumulative areas at the back of the graphs show wetland inflows and cumulative bars in front of the areas are the total outflow from the wetland, showing the lag between inflow and outflows.
Vyeboom Wetland
Elandskloof Wetland
Du Toits #3 Wetland
61
Conclusions and recommendations
This study has shown that a rainfall-runoff model which is adequately calibrated could provide relatively
detailed water balances for a wetland without the flows in the wetland being monitored. The water
inflows and evapotranspiration fluxes could assist in estimating nutrient removal capabilities of the
wetland.
Although the wetland sub-module has several flow routing parameters, an Excel solver could potentially
be used to estimate these parameters if most of the upstream wetland inflows are calibrated against
observed data and there is another flow gauging station downstream from the wetland that could be
used to calibrate the wetland outflows against. Several optimal answers could however be obtained and
selecting the set of parameters that most likely describe the functioning of the wetland should be
selected as the final solution.
In this analysis, the capacity of the wetland is far exceeded by the total wetland inflow for most months.
As can be seen from Table 22, the lateral inflows contribute the most to the inflow to the wetland store
since it flows directly into the wetland storage, which causes most of the main channel inflow bypassing
or flooding the wetland storage.
The hydrological input to the economic evaluation is a long-term monthly simulation of outflows from
the wetland storage (where plants have had access to the water) plus the associated monthly nett
evapotranspiration losses (evapotranspiration minus the rainfall). The efficiency of the nutrient removal
is associated with the area of plants that has direct access to the water. This efficiency fluctuates from
month to month depending on the wetland storage level and therefore the area of plants that have direct
access to the water. It is key to understand the capacity and area of the wetland plants to not to over-
estimate the wetland’s nutrient removal capabilities. For example, if the total flow that enters the main
channel plus the lateral inflows would have been used for the valuation, there would have been an
overestimation of 3.7 times of the actual inflow to the wetland that would be available for nutrient
removal.
The following recommendations are made
• Rainfall: Nine (9) rainfall stations were still open in 2012 within the Theewaterskloof Dam
catchment (Agricultural Research Council, South African Weather Service and Department of
Water and Sanitation stations combined). Only 2 of these stations’ data was usable in this
analysis. With the alarming rate of rainfall station closures in South Africa and due to the
importance of this catchment to the WCWSS it is suggested that new rainfall stations are
opened and maintained to support future water resource and other analyses, especially closer
to the or in the mountains.
• Flow gauging stations: Due to the large amount of flow that passes through flow gauges
H6H007 (above Du Toits Wetland #3) and H6H008 (above Vyeboom Wetland), the current
initiatives to reinstate these flow gauges is strongly supported. The gauges are crucial for future
assessments of the water resources in this catchment. H6H010 (above Elandskloof Wetland)
is still active today, however the quality of the measurement at this gauge is uncertain –
comparison with simulated values show far lower runoff than what can be accounted for by the
estimated reduction in MAP of this catchment. Dependable measurements at this relatively
pristine catchment would be of great benefit.
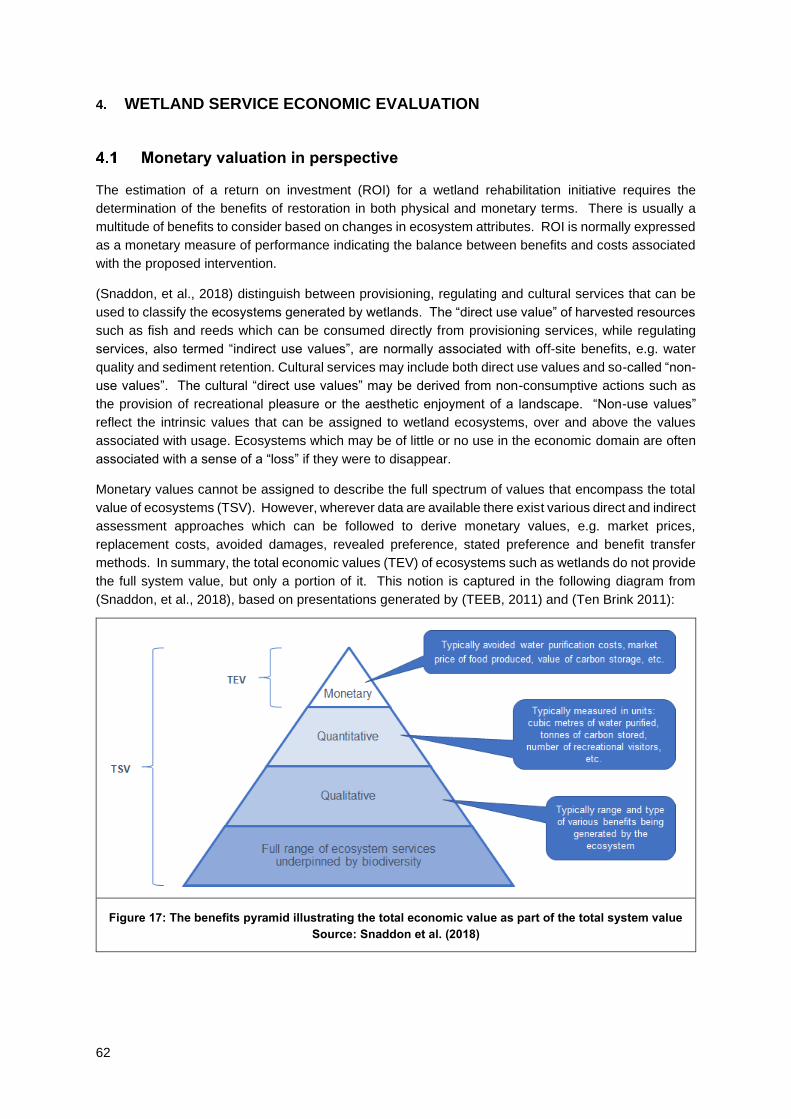
62
4. WETLAND SERVICE ECONOMIC EVALUATION
Monetary valuation in perspective
The estimation of a return on investment (ROI) for a wetland rehabilitation initiative requires the
determination of the benefits of restoration in both physical and monetary terms. There is usually a
multitude of benefits to consider based on changes in ecosystem attributes. ROI is normally expressed
as a monetary measure of performance indicating the balance between benefits and costs associated
with the proposed intervention.
(Snaddon, et al., 2018) distinguish between provisioning, regulating and cultural services that can be
used to classify the ecosystems generated by wetlands. The “direct use value” of harvested resources
such as fish and reeds which can be consumed directly from provisioning services, while regulating
services, also termed “indirect use values”, are normally associated with off-site benefits, e.g. water
quality and sediment retention. Cultural services may include both direct use values and so-called “non-
use values”. The cultural “direct use values” may be derived from non-consumptive actions such as
the provision of recreational pleasure or the aesthetic enjoyment of a landscape. “Non-use values”
reflect the intrinsic values that can be assigned to wetland ecosystems, over and above the values
associated with usage. Ecosystems which may be of little or no use in the economic domain are often
associated with a sense of a “loss” if they were to disappear.
Monetary values cannot be assigned to describe the full spectrum of values that encompass the total
value of ecosystems (TSV). However, wherever data are available there exist various direct and indirect
assessment approaches which can be followed to derive monetary values, e.g. market prices,
replacement costs, avoided damages, revealed preference, stated preference and benefit transfer
methods. In summary, the total economic values (TEV) of ecosystems such as wetlands do not provide
the full system value, but only a portion of it. This notion is captured in the following diagram from
(Snaddon, et al., 2018), based on presentations generated by (TEEB, 2011) and (Ten Brink 2011):
Figure 17: The benefits pyramid illustrating the total economic value as part of the total system value
Source: Snaddon et al. (2018)

63
Positioning the economic valuation model
The economic valuation of the conditions of the three wetlands and related rehabilitation proposals
constitutes the monetary assessment in this assignment. It will focus on the quantitative aspects that
are required to address the questions stated in the terms of reference to this assignment:
• How much are the wetlands worth in terms of both the intrinsic ecosystem and economic
values that are provided by the ecosystem services?
• How do the three wetlands in different states of degradation or pristine condition in the
Theewaterskloof compare and what would be the value, approach, and cost of
rehabilitating the more degraded wetlands to the level of the more pristine wetland?
The economic valuation model acts as the culmination of the assessment of the wetland conditions in
terms of hydrology, geomorphology, and vegetation. The goal is to understand the wetlands in both
economic and intrinsic value as part of the role of water management within the broader hydrological
systems, taking the flows of the systems and the rainfall of the region into account.
In order to achieve the above, the economic valuation model consists of five sections, i.e.
• a nutrient reduction (water quality enhancement) model,
• a sediment retention model,
• a carbon storage model,
• a tourism value model, and
• a cultural value model.
The quantified results are supplemented by a qualitative discussion on intrinsic values, for example
intangible aspects that cannot be addressed by the economic valuation.
The discussion will commence with a view on the intrinsic value of the three wetlands, followed by a
motivation for base assumptions and expected rehabilitation impacts on nutrient removal rates, carbon
storage, and sediment retention. A brief discussion of the hydrology model output that would feed into
the economic valuation model will follow before a more detailed outlook is provided on the nutrient
reduction model, the sediment retention model, the carbon storage value model, and the tourism and
cultural value models. The output from these models feeds the cost-benefit analysis model, from which
the required inferences on the economic value of the wetlands and the viability of proposed
rehabilitation/restoration initiatives may be derived.
Intrinsic value of the three wetlands and rehabilitation for biodiversity
conservation
Most of the Du Toits Wetlands fall within a formally protected area managed by Cape Nature. The small
portion of the Du Toits Wetland falling outside of the protected area and most of the Vyeboom Wetland
have been classified as aquatic Critical Biodiversity Areas (CBAs) in the Western Cape Spatial
Biodiversity Plan (Pool-Stanvliet, et al., 2017). The vegetation type covering both the Du Toits and
Vyeboom Wetlands is Elgin Shale Fynbos, which has been identified as critically endangered owing to
the irreversible loss of natural habitat (Pool-Stanvliet, et al., 2017). The fact that in addition to
representing a critically endangered type, Du Toits is a very large wetland in good condition and with
high connectivity to other natural areas makes it intrinsically extremely valuable from a biodiversity
conservation perspective. Vyeboom also has a relatively high intrinsic value, but this is somewhat lower
than Du Toits Wetland owing to its smaller size and lower ecological condition, as reported in the section
on Present Ecological State (PES) of the wetlands.

64
The sub-catchment in which the Vyeboom Wetland lies has been identified as a Freshwater Ecosystem
Protected Area (FEPA) catchment, and it not only supports a good condition river but also the
endangered giant redfin, Pseudobarbus skeltoni, which is endemic to the Breede River (Snaddon, et
al., 2018). It is possible that this is one of the three last remaining populations of this newly described
species (Chakona and Swartz 2013; Snaddon et al., 2018). Smallmouth bass (Micropterus dolomieu),
an alien fish species with a potentially devastating impact on indigenous fish populations, occurs in
Theewaterskloof dam. However, it appears to be absent upstream of the Vyeboom Wetland where the
giant redfin are located, and it seems that the weakly channelled sections of the Vyeboom, where water
flows are spread amongst dense palmiet beds are serving as an important barrier to the upstream
movement of small-mouth bass in the dam (Snaddon K, 2019. Pers comm. Cape Town). The active
headcut erosion in the Vyeboom Wetland is causing the ingress into the weakly channelled palmiet
beds of a much less obstructed channel. In the absence of rehabilitation, this ingress poses a
considerable threat not only to vegetation habitat in the wetland, through its desiccation, but could
indirectly threaten the giant redfin by allowing the smallmouth bass much less restricted access to the
upper Riviersonderend stream. Therefore, it can be appreciated that in halting the headcut erosion, the
rehabilitation will make a key contribution to sustaining the intrinsic biodiversity value of the wetland and
its broader sub-catchment. Similarly, control of invasive alien plants, which pose a considerable long
term threat to both the Du Toits and Vyeboom Wetlands, will make a key contribution to sustaining the
intrinsic biodiversity value of these wetlands and their broader sub-catchments.
The intrinsic value of Elandskloof Wetland for biodiversity conservation is considerably lower than the
Du Toits and Vyeboom. As reported for the Present Ecological State (PES) of the wetland, the
vegetation is in a very poor condition and prior to clearing in 2018 was dominated by alien species and
indigenous species which are generalists/pioneer. Therefore, although Elandskloof wetland occurs
within Elgin Shale Fynbos, it is an extremely poor representation of wetland vegetation of this type.
Nonetheless, it is important to emphasize that despite its low contribution in terms of floristic
conservation, this wetland has value for the conservation of wetland habitat more generally. It also has
recognized value for wetland-dependent fauna. For example, prior to alien clearing, the wetland
supported the Cape clawless otter (Aonyx capensis) which are categorized as a near-threatened
species, which although having a large distribution range, has a spatial area of occupied habitats which
is much smaller and unknown, particularly due to the widespread habitat destruction and pollution
problems (Jacques et al. 2015). It should be noted further that at a local level the Elandskloof Wetland
is one of a very few remaining natural/semi-natural wetland areas in the landscape, and although not
very well connected to other natural/semi-natural wetland areas, it makes an important contribution to
improving the connectivity of this landscape. The proposed rehabilitation interventions at Elandskloof,
in particular, the control of invasive alien trees, are anticipated to improve wetland and aquatic habitat
provided by the wetlands, thereby enhancing the current intrinsic value for biodiversity conservation.
Motivation for economic model parameter assumptions
Contribution of wetland rehabilitation to nutrient reduction
Inferred removal of total N (Nitrogen) and total P (Phosphorus) by the study area wetlands under
different scenarios is based primarily on the comprehensive and systematic survey of rigorous site-
based studies examining the effectiveness of created or restored freshwater wetlands for N and P
removal by Land et al. (2016) as well as referring to the results of Turpie et al. (2010) and Rebelo et al.
(2018). Land et al. (2016) report that, on average, created or restored wetlands removed 1840 kg
ha−1year−1 (fairly close to the results of Turpie et al. (2010)) of total N and 150 kg ha−1year−1 of total P.
It was decided to apply these average values to intact wetland in the study area with moderate to high
level of hydraulic contact (interaction) with flows through the wetland. This would apply to the currently
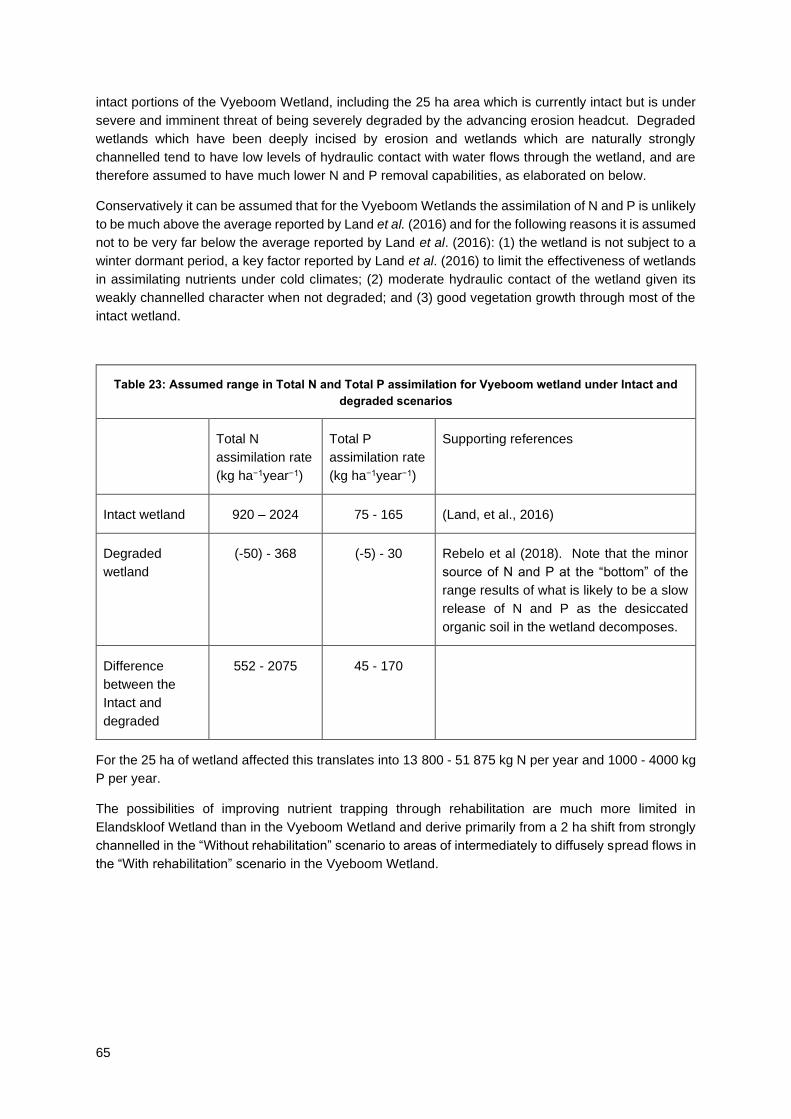
65
intact portions of the Vyeboom Wetland, including the 25 ha area which is currently intact but is under
severe and imminent threat of being severely degraded by the advancing erosion headcut. Degraded
wetlands which have been deeply incised by erosion and wetlands which are naturally strongly
channelled tend to have low levels of hydraulic contact with water flows through the wetland, and are
therefore assumed to have much lower N and P removal capabilities, as elaborated on below.
Conservatively it can be assumed that for the Vyeboom Wetlands the assimilation of N and P is unlikely
to be much above the average reported by Land et al. (2016) and for the following reasons it is assumed
not to be very far below the average reported by Land et al. (2016): (1) the wetland is not subject to a
winter dormant period, a key factor reported by Land et al. (2016) to limit the effectiveness of wetlands
in assimilating nutrients under cold climates; (2) moderate hydraulic contact of the wetland given its
weakly channelled character when not degraded; and (3) good vegetation growth through most of the
intact wetland.
Table 23: Assumed range in Total N and Total P assimilation for Vyeboom wetland under Intact and
degraded scenarios
Total N
assimilation rate
(kg ha−1year−1)
Total P
assimilation rate
(kg ha−1year−1)
Supporting references
Intact wetland 920 – 2024 75 - 165 (Land, et al., 2016)
Degraded
wetland
(-50) - 368 (-5) - 30 Rebelo et al (2018). Note that the minor
source of N and P at the “bottom” of the
range results of what is likely to be a slow
release of N and P as the desiccated
organic soil in the wetland decomposes.
Difference
between the
Intact and
degraded
552 - 2075 45 - 170
For the 25 ha of wetland affected this translates into 13 800 - 51 875 kg N per year and 1000 - 4000 kg
P per year.
The possibilities of improving nutrient trapping through rehabilitation are much more limited in
Elandskloof Wetland than in the Vyeboom Wetland and derive primarily from a 2 ha shift from strongly
channelled in the “Without rehabilitation” scenario to areas of intermediately to diffusely spread flows in
the “With rehabilitation” scenario in the Vyeboom Wetland.

66
Table 24: Assumed range in Total N and Total P assimilation for Elandskloof Wetland under Intact and
degraded scenarios
Total N
assimilation rate
(kg ha−1year−1)
Total P
assimilation rate
(kg ha−1year−1)
Supporting references
Intact wetland 920 - 2024 75 - 165 (Land, et al., 2016)
Degraded
wetland
276 - 607 23 - 50 Rebelo et al., (2018). Note that no
organic soil is present to release nutrients
in the degraded state.
Difference
between the
Intact and
degraded
313 - 1 748 25 - 142
For 2 ha of wetland affected this translates into 626 - 3496 kg N per year and 50 - 284 kg P per year.
As indicated, no interventions are planned in the close-to-pristine Du Toits Wetland which are
anticipated to contribute to improvements in N and P removal, and therefore in terms of N and P
removal, no difference is anticipated between the “Without rehabilitation” and the “With rehabilitation”
scenarios.
Contribution of wetland rehabilitation to carbon storage in the three wetlands
It is anticipated that the primary contribution of the proposed rehabilitation to carbon storage will be at
Vyeboom. Organic soils cover an estimated 71 ha of the Vyeboom Wetland, with an average depth of
0.54 m, giving a total volume of organic soil of 383 153 m3 (Kotze, 2015). The average organic matter
content of the soil in Vyeboom wetland was estimated as 26% (Kotze, 2015). This translates to 15.1%
C based on the Van Bemmelen Factor:
% Soil Organic Carbon =% Soil Organic Matter
1.724=
26%
1.724= 15.1%
as recommended by Grundling et al., (2017). This further represents 30.2 kg C per m3 of soil, based
on the bulk density trend related to increasing percentage soil organic matter content reported by
Grundling et al., (2017), which for the Vyeboom organic soil was taken as 0.2 g cm-3. Given the total
volume of organic soil of 383 153 m3, as estimated by Kotze (2015), the total stock of carbon in this
material is 11 571 TC (Tonnes of Carbon).
Approximately 25 ha, constituting 35% (i.e. 4 050 TC) of the organic soil area in Vyeboom is under
immediate threat from the currently active erosion head-cuts in the wetland. The potential depletion of
soil carbon stocks in the wetland by this threat was estimated in consultation with Grundling P-L (2019,
pers comm, Department of Environmental Affairs, Pretoria) and Pretorius L (2019, pers comm.,
University of KwaZulu-Natal, Durban). A conservative estimate is that in the absence of rehabilitation
interventions to halt this erosion, 30% of this carbon will be severely desiccated, decomposed and
released into the atmosphere. However, given that the drying out of the organic soil greatly increases
the risks of ground fires and the release of additional carbon into the atmosphere through combustion,
a potentially much higher proportion of the overall carbon stock could be released into the atmosphere,
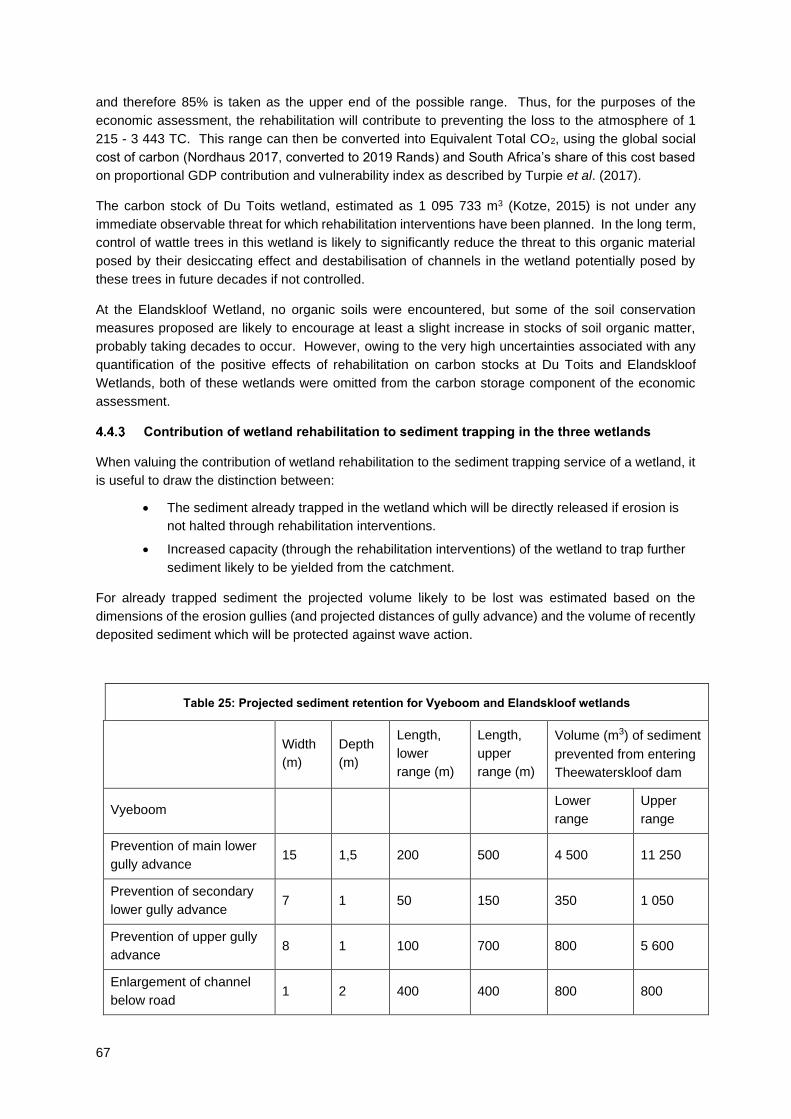
67
and therefore 85% is taken as the upper end of the possible range. Thus, for the purposes of the
economic assessment, the rehabilitation will contribute to preventing the loss to the atmosphere of 1
215 - 3 443 TC. This range can then be converted into Equivalent Total CO2, using the global social
cost of carbon (Nordhaus 2017, converted to 2019 Rands) and South Africa’s share of this cost based
on proportional GDP contribution and vulnerability index as described by Turpie et al. (2017).
The carbon stock of Du Toits wetland, estimated as 1 095 733 m3 (Kotze, 2015) is not under any
immediate observable threat for which rehabilitation interventions have been planned. In the long term,
control of wattle trees in this wetland is likely to significantly reduce the threat to this organic material
posed by their desiccating effect and destabilisation of channels in the wetland potentially posed by
these trees in future decades if not controlled.
At the Elandskloof Wetland, no organic soils were encountered, but some of the soil conservation
measures proposed are likely to encourage at least a slight increase in stocks of soil organic matter,
probably taking decades to occur. However, owing to the very high uncertainties associated with any
quantification of the positive effects of rehabilitation on carbon stocks at Du Toits and Elandskloof
Wetlands, both of these wetlands were omitted from the carbon storage component of the economic
assessment.
Contribution of wetland rehabilitation to sediment trapping in the three wetlands
When valuing the contribution of wetland rehabilitation to the sediment trapping service of a wetland, it
is useful to draw the distinction between:
• The sediment already trapped in the wetland which will be directly released if erosion is
not halted through rehabilitation interventions.
• Increased capacity (through the rehabilitation interventions) of the wetland to trap further
sediment likely to be yielded from the catchment.
For already trapped sediment the projected volume likely to be lost was estimated based on the
dimensions of the erosion gullies (and projected distances of gully advance) and the volume of recently
deposited sediment which will be protected against wave action.
Table 25: Projected sediment retention for Vyeboom and Elandskloof wetlands
Width
(m)
Depth
(m)
Length,
lower
range (m)
Length,
upper
range (m)
Volume (m3) of sediment
prevented from entering
Theewaterskloof dam
Vyeboom Lower
range
Upper
range
Prevention of main lower
gully advance 15 1,5 200 500 4 500 11 250
Prevention of secondary
lower gully advance 7 1 50 150 350 1 050
Prevention of upper gully
advance 8 1 100 700 800 5 600
Enlargement of channel
below road 1 2 400 400 800 800
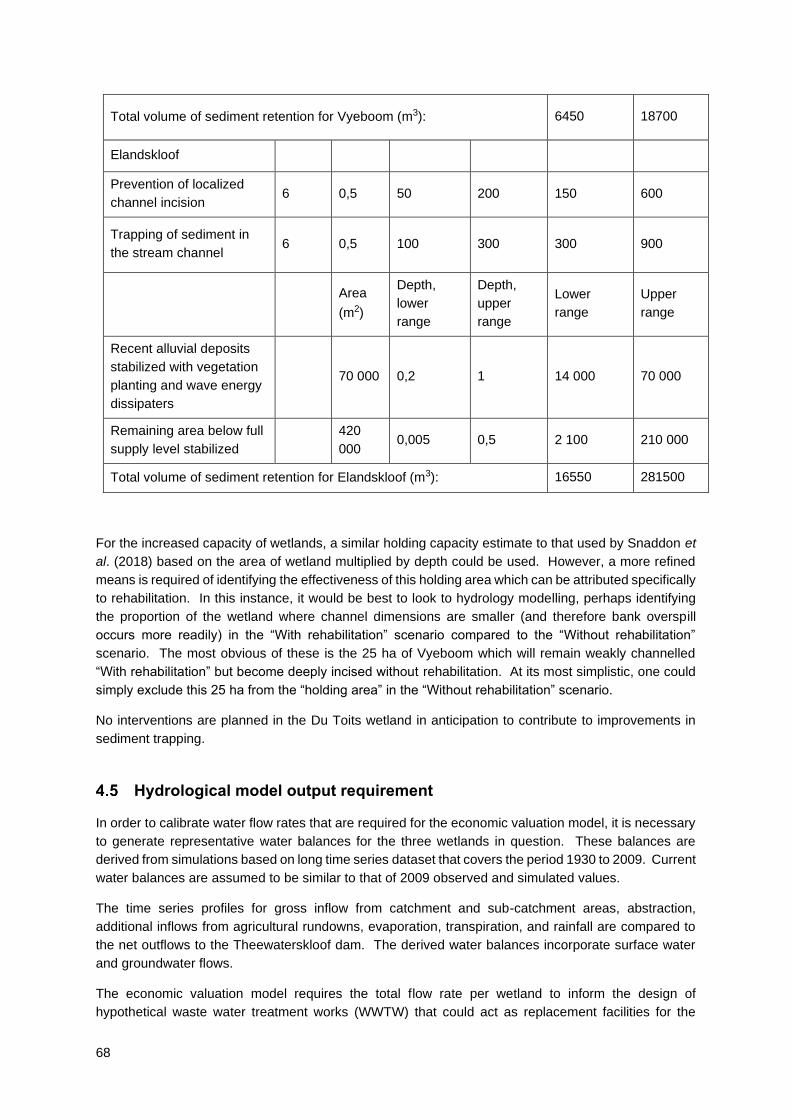
68
Total volume of sediment retention for Vyeboom (m3): 6450 18700
Elandskloof
Prevention of localized
channel incision 6 0,5 50 200 150 600
Trapping of sediment in
the stream channel 6 0,5 100 300 300 900
Area
(m2)
Depth,
lower
range
Depth,
upper
range
Lower
range
Upper
range
Recent alluvial deposits
stabilized with vegetation
planting and wave energy
dissipaters
70 000 0,2 1 14 000 70 000
Remaining area below full
supply level stabilized 420
000 0,005 0,5 2 100 210 000
Total volume of sediment retention for Elandskloof (m3): 16550 281500
For the increased capacity of wetlands, a similar holding capacity estimate to that used by Snaddon et
al. (2018) based on the area of wetland multiplied by depth could be used. However, a more refined
means is required of identifying the effectiveness of this holding area which can be attributed specifically
to rehabilitation. In this instance, it would be best to look to hydrology modelling, perhaps identifying
the proportion of the wetland where channel dimensions are smaller (and therefore bank overspill
occurs more readily) in the “With rehabilitation” scenario compared to the “Without rehabilitation”
scenario. The most obvious of these is the 25 ha of Vyeboom which will remain weakly channelled
“With rehabilitation” but become deeply incised without rehabilitation. At its most simplistic, one could
simply exclude this 25 ha from the “holding area” in the “Without rehabilitation” scenario.
No interventions are planned in the Du Toits wetland in anticipation to contribute to improvements in
sediment trapping.
Hydrological model output requirement
In order to calibrate water flow rates that are required for the economic valuation model, it is necessary
to generate representative water balances for the three wetlands in question. These balances are
derived from simulations based on long time series dataset that covers the period 1930 to 2009. Current
water balances are assumed to be similar to that of 2009 observed and simulated values.
The time series profiles for gross inflow from catchment and sub-catchment areas, abstraction,
additional inflows from agricultural rundowns, evaporation, transpiration, and rainfall are compared to
the net outflows to the Theewaterskloof dam. The derived water balances incorporate surface water
and groundwater flows.
The economic valuation model requires the total flow rate per wetland to inform the design of
hypothetical waste water treatment works (WWTW) that could act as replacement facilities for the

69
wetlands. The nutrient reduction performance of such hypothetical WWTWs is meant to match that of
the wetlands while ensuring the same water throughput. The expected range of flow rates that such
facilities should be able to provide, would be determined by inter-percentile ranges. It is often the case,
where conclusive evidence for selecting a specific inter-percentile range cannot be sourced, to use the
inter-quartile range as default position. Therefore, as a departure point for further analyses, it is
suggested that the inter-quartile range be used for the simulated flows.
The connection between the hydrology and water quality model is based on an assumption of the
principle that flow rates would correlate with nutrient removal rates. It is recognised that extremely high
flow rates may spill over the usual flow profiles and will lead to unproductive removal of nutrients in the
spill-over profile areas. The efficiency of nutrient removal is associated with the area of plants that has
direct access to the water. In order to limit flow considerations to the domain where the assumed linear
relationship between flow rate and removal rate applies, it is assumed in the economic model that flow
rates will only vary in the interquartile range, i.e. 25%-75% (interquartile) of the probability distributions
of flows that the hydrology model generates.
Nutrient reduction model
In order to derive the economic values of the nominated three wetlands areas feeding into the
Theewaterskloof dam, the focus is on the indirect use value method, with special reference to the
“minimisation of replacement costs” approach as propounded by (Grossman, 2012). This has been
developed in terms of flood risk reduction and nutrient abatement constraints that need to be specified
for the assessment.
The indirect use approach corroborates the arguments of (Grossman, 2012) that the public goods
characteristic of many ecosystem services turns out to undervalue the contribution of floodplains and
wetlands for public use. Thus, it is useful to generate a notion of the economic value that can be
substantiated in quantification to supplement the intrinsic values that exist for the wetlands in question.
The main focus is on the nutrient abatement model which was constructed in MS Excel and is based
on a minimisation of replacement cost problem statement as explained in (Grossman, 2012). It will
subscribe to the fundamental conditions that:
• All alternative processes considered must be able to deliver similar services as the
natural wetlands,
• The considered processes should not result in a shift in demand by society if such
alternatives were to be implemented, and
• The optimal alternative choice should be the least cost option.
The (Grossman, 2012) approach would be valid if all constraints are linear. However, in practice, it is
generally found to be more accurate when one considers the capital expenditure (capex) on
infrastructure to be nonlinear, i.e. to allow for economies of scale in the required capex as a function of
throughput, raised to a power factor which falls within the range of zero to one. In such a case the
above formulation can only be solved by nonlinear techniques. The Lagrange multipliers (shadow
prices) can still be generated from the calculations but the allowed ranges of stable accuracy disappear,
i.e. the shadow prices are only applicable at the specific levels associated with the determined solution.
However, this is not seen as a serious impediment as the models are specified in Excel and can quickly
complete nonlinear solution runs. Lagrange multipliers are generally referred to as reduced gradients
in nonlinear problems but provide the same interpretation as shadow prices. A layout of the optimisation
problem configuration used in this study is expounded in Appendix B.

70
The nonlinear problem generally yields more accurate results than the linear programming (LP)
problem, due to the fact that nonlinear formulations provide better descriptions of reality than linear
approximations. The only downside to the nonlinear approach is that there is no guarantee that a global
optimal value can be found – the optimal solutions are always of a local nature. However, by
commencing the search for optimal solutions from different starting points, the probability of finding a
global solution approaches unity.
The water balance outputs from the hydrological model provide for extensive time series of water flows,
reflecting normal, as well as extreme conditions on a monthly basis. The time series exhibit extreme
outliers that cannot always be considered representative of “normal” conditions. In order to be usable
in the economic valuation model, the probability profiles of the observed phenomena are better
described by inter-quartile ranges which can be estimated from the observed time-series data.
Besides the flow rate input, the nutrient reduction model also needs to be informed by nutrient
assimilation statistics. The required statistical outlook is derived from the observations and opinions
discussed in Section 4.4.1 above. A view on the expected average flow rates and nutrient reduction
performance statistics for the wetlands in an intact condition can be summarised in the following table:
Table 26: Flow and nutrient removal rate statistics for the three wetlands in intact condition
A similar view, reflecting the nutrient removal rates for the three wetlands in a degraded condition, is
summarised in the following table:
Wetland statistics Du Toits Vyeboom Elandskloof
Surface area m2 7 669 716 2 424 025 749 855
ha 767 242 75
Volume m3 5 598 892 1 769 539 547 394
Flow rate l/s 1 537 2 980 1 327
m3/a 48 484 323 93 981 137 41 843 677
Ml/d 132.8 257.5 114.6
Volume turnover rate days 42.15 6.87 4.77
N-removal rate mg/l 23.29 3.80 2.64
kgN/a 1 128 982 356 817 110 379
kgN/ha/a 1 472 1 472 1 472
P-removal rate mg/l 1.90 0.31 0.22
kgP/a 92 037 29 088 8 998
kgP/ha/a 120 120 120
Wetlands statistics Du Toits Vyeboom Elandskloof
N-removal rate mg/l 2.52 0.41 0.79
kgN/a 121 948 38 542 33 106
kgN/ha/a 159 159 442
P-removal rate mg/l 0.20 0.03 0.07
kgP/a 9 587 3 030 2 737
kgP/ha/a 13 13 37

71
Table 27: Nutrient removal rate statistics for the three wetlands in a degraded condition
Expected averages are derived from the minima and maxima that are generated from the hydrological
model output and the opinionated discussion in Section 4.4.1. The expected levels are based on an
equally weighted distribution between the minima and maxima.
The nutrient reduction model generates indirect replacement values based on estimated capex and
operating expenses (opex) of reference size WWTW designs. The capex and opex references are
taken from (Cullis, et al., 2018) and (Snaddon, et al., 2018). The basic WWTW statistics applied in the
nutrient reduction model can be summarised as follows:
Table 28: Wastewater treatment works statistics
Since the actual wetland flow rates are significantly larger than the reference rates listed in Table 28, it
has to be scaled up to reflect the appropriate designs of the hypothetical replacement WWTW. The
principle of scaling-up needs to reflect the economies of scale for the various throughput rates. This
can be achieved by applying the following power factor relationship:
𝐶1 = (𝑄1
𝑄0
)𝑝
𝐶0
In this function the desired design throughput (Q1) is divided by the reference throughput (Q0) and the
resulting ratio raised to the power p, with p adopting a value between zero and one, to reflect economies
of scale. The ratio-ed throughput is then multiplied by the reference cost (C0, e.g. R7 million per Ml/d
throughput for the 8.0 Ml/d reference case) to obtain the scaled cost (C1). Following Cullis et al (2018),
the power factor p is assumed to be 0.75 in this study. This is considered a reasonable assumption as
chemical plant facilities are typically costed with power factors varying between 0.5 and 1.0.
The operating cost of the hypothetical WWTW also includes a cost for collection of wetlands water
inflows and distribution of treated water to the originally located outflows. This would be required if the
water feed to the Theewaterskloof Dam needs to be diverted to WWTW facilities that are not located
on-site.
The nutrient reduction model is configured to generate monetary values per wetland, subject to
conditions of state (intact or degraded), as well as minimum, average or maximum flow rates and
nutrient reduction rates. The estimated wetland values can then be applied in rehabilitation or
restoration projects to determine the values of such initiatives.
The capability of the nutrient reduction model can be illustrated by evaluating the rehabilitation of a 25
ha area in the Vyeboom wetland, mentioned in section 4.4.1.The said 25 ha area is currently intact but
Reference case WWTW throughput Ml/d 8.0
m3/a 2 920 000
Reference case WWTW installation costs R/(Ml/d) 7 000 000
Plant depreciation period yr 15
Reference case water collection/distribution cost R/m3 0.50
R/a 1 460 000
Operating & maintenance cost per total annual cost Ratio 0.47
Operating & maintenance cost per capex Ratio 0.118
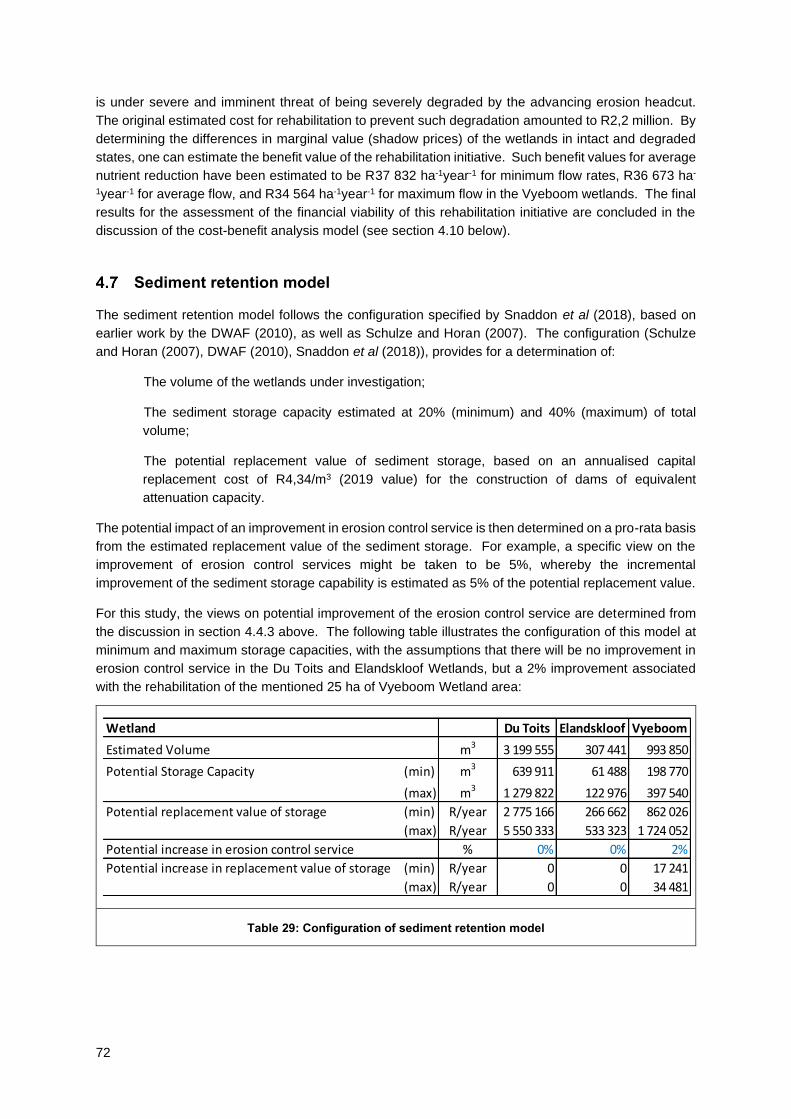
72
is under severe and imminent threat of being severely degraded by the advancing erosion headcut.
The original estimated cost for rehabilitation to prevent such degradation amounted to R2,2 million. By
determining the differences in marginal value (shadow prices) of the wetlands in intact and degraded
states, one can estimate the benefit value of the rehabilitation initiative. Such benefit values for average
nutrient reduction have been estimated to be R37 832 ha-1year-1 for minimum flow rates, R36 673 ha-
1year-1 for average flow, and R34 564 ha-1year-1 for maximum flow in the Vyeboom wetlands. The final
results for the assessment of the financial viability of this rehabilitation initiative are concluded in the
discussion of the cost-benefit analysis model (see section 4.10 below).
Sediment retention model
The sediment retention model follows the configuration specified by Snaddon et al (2018), based on
earlier work by the DWAF (2010), as well as Schulze and Horan (2007). The configuration (Schulze
and Horan (2007), DWAF (2010), Snaddon et al (2018)), provides for a determination of:
The volume of the wetlands under investigation;
The sediment storage capacity estimated at 20% (minimum) and 40% (maximum) of total
volume;
The potential replacement value of sediment storage, based on an annualised capital
replacement cost of R4,34/m3 (2019 value) for the construction of dams of equivalent
attenuation capacity.
The potential impact of an improvement in erosion control service is then determined on a pro-rata basis
from the estimated replacement value of the sediment storage. For example, a specific view on the
improvement of erosion control services might be taken to be 5%, whereby the incremental
improvement of the sediment storage capability is estimated as 5% of the potential replacement value.
For this study, the views on potential improvement of the erosion control service are determined from
the discussion in section 4.4.3 above. The following table illustrates the configuration of this model at
minimum and maximum storage capacities, with the assumptions that there will be no improvement in
erosion control service in the Du Toits and Elandskloof Wetlands, but a 2% improvement associated
with the rehabilitation of the mentioned 25 ha of Vyeboom Wetland area:
Table 29: Configuration of sediment retention model
Wetland Du Toits Elandskloof Vyeboom
Estimated Volume m3 3 199 555 307 441 993 850
Potential Storage Capacity (min) m3 639 911 61 488 198 770
(max) m3 1 279 822 122 976 397 540
Potential replacement value of storage (min) R/year 2 775 166 266 662 862 026
(max) R/year 5 550 333 533 323 1 724 052
Potential increase in erosion control service % 0% 0% 2%
Potential increase in replacement value of storage (min) R/year 0 0 17 241
(max) R/year 0 0 34 481

73
Carbon storage value model
The carbon storage value model configuration (Kotze, 2015), (Grundling, et al., 2017), (Turpie, et al.,
2017), (Mills & Hunter, 2018), also follows a configuration specified by (Snaddon, et al., 2018), based
on earlier work by (Kotze, 2015), (Grundling, et al., 2017), (Turpie, et al., 2017), and (Mills & Hunter,
2018). The layout provides for a determination of:
• A conservative estimate of the potential organic carbon stocks (ton C), based on a carbon
matter soil depth of 0.15m, carbon matter density of 0.1 (minimum) to 0.4 g/cm3
(maximum), 15.1% carbon content of carbon matter;
• The economic costs avoided by sequestering or avoiding the loss of carbon to the
atmosphere, which translates to a global social cost of R7,38/ton C (2019 value).
The potential impact of an improvement in carbon capture service is then determined on a pro-rata
basis from the estimated economic avoided cost associated with carbon storage. For example, a
specific view on the improvement of carbon storage services might be taken to be 5%, whereby the
incremental improvement of the carbon storage capacity is estimated at 5% of the economic avoided
cost.
For this study, the views on potential improvement of the carbon storage service are determined from
the discussion in section 4.4.2 above. The following table illustrates the configuration of this model at
minimum and maximum carbon matter density, with the assumptions that there will be no improvement
in carbon storage service in the Du Toits and Elandskloof wetlands, but a 35% improvement associated
with the rehabilitation of the mentioned 25 ha of Vyeboom wetland area:
Table 30: Configuration of carbon storage model
Tourism and cultural value model
As in the case of the sediment retention and carbon storage models, the approach by the following
authors (Snaddon, et al., 2018) acted as a guideline for the configuration of the tourism and cultural
value models - (Turpie, 2003), The guidelines provided by Snaddon et al., (2018) were informed by
the work of (Turpie, 2003) and (Turpie, et al., 2017).
The recreation and tourism value of the wetlands is dependent on the surface area covered by the
wetland, as well as the accessibility. Wetlands that are larger and accessible by major roads normally
have a higher average value per ha than those in more remote locations. For this study, the tourism
Wetland Du Toits Elandskloof Vyeboom
Conservative estimate of potential organic (min) ton C 16 525 0 11 572
carbon stocks (max) ton C 66 100 0 46 290
Potential value of carbon to South Africa (min) R/yr 126 901 0 88 869
(max) R/yr 507 605 0 355 475
Potential increase in service % 0% 0% 10%
Potential increase in value of carbon to (min) R/yr 0 0 8 799
South Africa (max) R/yr 0 0 35 195

74
value is assumed to vary in the range of R45 - R203 per hectare per year (Turpie, et al., 2017), and
(Snaddon, et al., 2018) values, updated to reflect 2019 prices.
The cultural value of the wetlands is also associated with its surface area and based on an estimated
R9,26 per hectare per year (2019 value). This is an updated estimate, based on the findings of Snaddon
et al, (2018) who derived their estimate from the contingent valuation study of (Turpie, 2003).
Cost-benefit analysis model
The culmination point of the economic valuation is configured in the cost-benefit analysis model. The
final inferences can be derived from the net present values for potential benefits lost and costs of
rehabilitation initiative budgets. The nutrient reduction, sediment retention, carbon storage, tourism,
and cultural value models provide the potential benefits that would be lost if the wetlands were to be
allowed to degrade.
The benefit estimations could be affected by the current state of degradation of the wetland, as well as
views on the expected changes to erosion control services, carbon storage, tourism and cultural values
that are associated with potential rehabilitation initiatives. Facilities are provided for these effects to be
driven from the cost-benefit analysis model.
The capex and opex input to this model constitutes the cost requirements of specific rehabilitation
initiatives. A once-off (capital) outlay is allowed in the first year of the assessment, supplemented by
operating expenses in the same and subsequent years. This can also be used as a method to spread
the rehabilitation initiative costs over a multi-year period.
The net outcome is reported in terms of a net present value of differences between benefits and costs.
In addition to that, a return on investment (ROI) is also determined for any specific rehabilitation initiative
outlay.
In order to determine appropriate net present values, the nominal growth in benefits and costs are
associated with the consumer price index (CPI). The appropriate discount rate (cost of capital) is
assumed to be determined by the long-term bond rates derived from the South African yield curves for
bonds with maturities longer than 15 years. Such bonds currently allow for yields of around 10% per
annum. Investment in rehabilitation initiatives would not be without some form of investment, project
implementation, and operational risks. A conservative estimate of ±3% risk premium is therefore
advised, which brings the cost of capital to ±13%. The discount rate used in this study is thus 13%.
Although the cost-benefit analysis model allows for 80-year period estimates, the final year (year 80)
numbers contain residuals to allow the cost-benefit assessment to cover an indefinite period.
It is recognised that benefits lost due to degradation would not necessarily manifest its full potential in
the initial period. The cost-benefit analysis, therefore, allows for the impact to be ramped up over time
in the form of a logistic curve, for the degradation profile, see Table 31. The desired deterioration profile
can be achieved by means of a two-parameter Weibull function specification, which allows a multitude
of profile variants to be specified by adjusting only two parameters. As an example, the financial viability
of the rehabilitation of the Vyeboom wetland as discussed in section 4.6, of which 25 ha could potentially
become degraded over time if left unattended, yielded the following outcome:
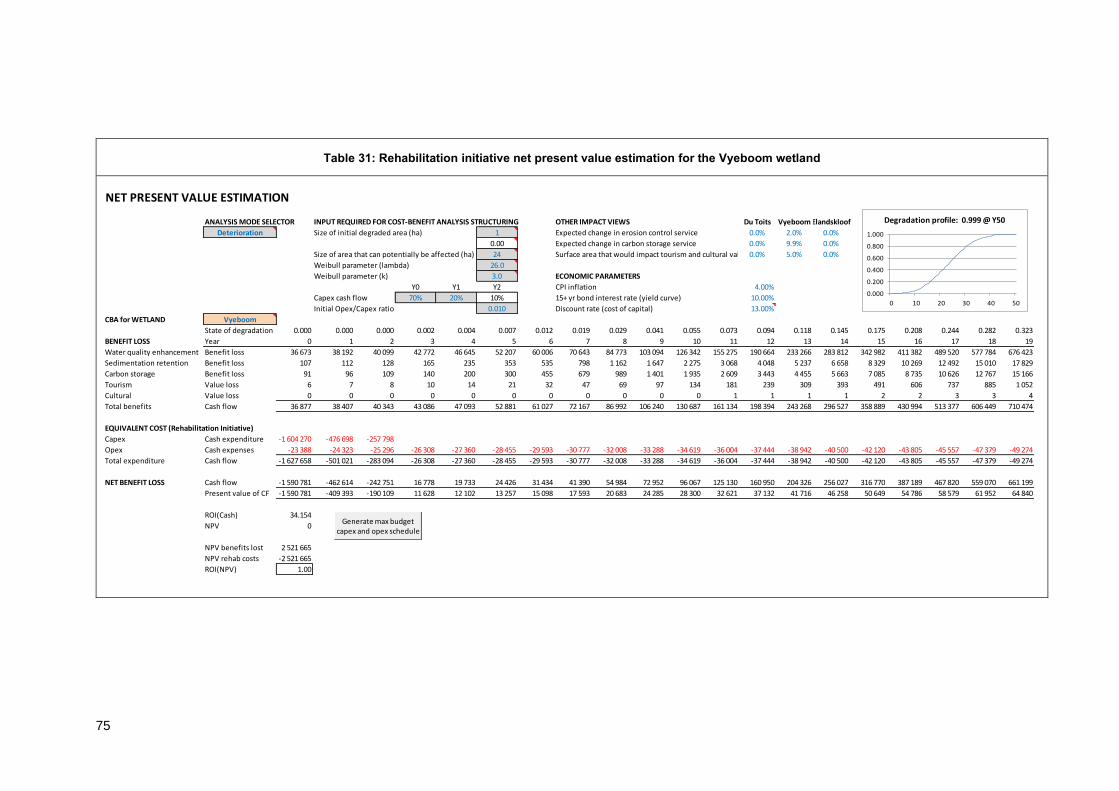
75
Table 31: Rehabilitation initiative net present value estimation for the Vyeboom wetland
ANALYSIS MODE SELECTOR INPUT REQUIRED FOR COST-BENEFIT ANALYSIS STRUCTURING OTHER IMPACT VIEWS Du Toits Vyeboom Elandskloof
Deterioration Size of initial degraded area (ha) 1 Expected change in erosion control service 0.0% 2.0% 0.0%
0.00 Expected change in carbon storage service 0.0% 9.9% 0.0%
Size of area that can potentially be affected (ha) 24 Surface area that would impact tourism and cultural values0.0% 5.0% 0.0%
Weibull parameter (lambda) 26.0
Weibull parameter (k) 3.0 ECONOMIC PARAMETERS
Y0 Y1 Y2 CPI inflation 4.00%
Capex cash flow 70% 20% 10% 15+ yr bond interest rate (yield curve) 10.00%
Initial Opex/Capex ratio 0.010 Discount rate (cost of capital) 13.00%
CBA for WETLAND Vyeboom
State of degradation 0.000 0.000 0.000 0.002 0.004 0.007 0.012 0.019 0.029 0.041 0.055 0.073 0.094 0.118 0.145 0.175 0.208 0.244 0.282 0.323
BENEFIT LOSS Year 0 1 2 3 4 5 6 7 8 9 10 11 12 13 14 15 16 17 18 19
Water quality enhancement Benefit loss 36 673 38 192 40 099 42 772 46 645 52 207 60 006 70 643 84 773 103 094 126 342 155 275 190 664 233 266 283 812 342 982 411 382 489 520 577 784 676 423
Sedimentation retention Benefit loss 107 112 128 165 235 353 535 798 1 162 1 647 2 275 3 068 4 048 5 237 6 658 8 329 10 269 12 492 15 010 17 829
Carbon storage Benefit loss 91 96 109 140 200 300 455 679 989 1 401 1 935 2 609 3 443 4 455 5 663 7 085 8 735 10 626 12 767 15 166
Tourism Value loss 6 7 8 10 14 21 32 47 69 97 134 181 239 309 393 491 606 737 885 1 052
Cultural Value loss 0 0 0 0 0 0 0 0 0 0 0 1 1 1 1 2 2 3 3 4
Total benefits Cash flow 36 877 38 407 40 343 43 086 47 093 52 881 61 027 72 167 86 992 106 240 130 687 161 134 198 394 243 268 296 527 358 889 430 994 513 377 606 449 710 474
EQUIVALENT COST (Rehabilitation Initiative)
Capex Cash expenditure -1 604 270 -476 698 -257 798
Opex Cash expenses -23 388 -24 323 -25 296 -26 308 -27 360 -28 455 -29 593 -30 777 -32 008 -33 288 -34 619 -36 004 -37 444 -38 942 -40 500 -42 120 -43 805 -45 557 -47 379 -49 274
Total expenditure Cash flow -1 627 658 -501 021 -283 094 -26 308 -27 360 -28 455 -29 593 -30 777 -32 008 -33 288 -34 619 -36 004 -37 444 -38 942 -40 500 -42 120 -43 805 -45 557 -47 379 -49 274
NET BENEFIT LOSS Cash flow -1 590 781 -462 614 -242 751 16 778 19 733 24 426 31 434 41 390 54 984 72 952 96 067 125 130 160 950 204 326 256 027 316 770 387 189 467 820 559 070 661 199
Present value of CF -1 590 781 -409 393 -190 109 11 628 12 102 13 257 15 098 17 593 20 683 24 285 28 300 32 621 37 132 41 716 46 258 50 649 54 786 58 579 61 952 64 840
ROI(Cash) 34.154
NPV 0
NPV benefits lost 2 521 665
NPV rehab costs -2 521 665
ROI(NPV) 1.00
NET PRESENT VALUE ESTIMATION
Generate max budget capex and opex schedule
0.000
0.200
0.400
0.600
0.800
1.000
0 10 20 30 40 50
Degradation profile: 0.999 @ Y50

76
For this assessment, it was assumed that the initial state of the Vyeboom wetland is almost pristine
(only 1 ha degraded), but that a further 24 ha would degrade over a period of 50 years, following a
typical logistic evolution pattern. Furthermore, it is assumed that the wetland nutrient reduction
performance and flow rates would remain on an average level for the future. By balancing the total
investment to offset the potential loss in benefits, if the 25 ha should become degraded, it is evident
that an amount of R1 627 658 can be afforded in the initial period (Year 0), followed by R501 021 and
R283 094 in the two following years. It would be possible to allow further expenses on the upkeep of
the wetland in the subsequent years, albeit by smaller amounts which may be CPI-inflated. The
expenditure over the initial and first two years amounts to R2 411 773, which is slightly more than the
estimated cost of the rehabilitation project (R2 210 717). This indicates that the proposed rehabilitation
initiative would be financially viable under average conditions. The net present value of the total
expenditure on the rehabilitation project equals the total estimated benefit loss, i.e. R2 521 665.
The rehabilitation project budget ceiling (R2 521 665) is based on an assumption of average water flow
and nutrient removal capabilities of the Vyeboom wetland. Similar analyses for the minimum and
maximum conditions of water flow and nutrient removal capability can be constructed to determine a
range of budget values, which is indicative of the confidence level of the estimated average value. In
this particular scenario, it was found that the estimated value could vary between R2,7 million to R2,4
million, depending on the assumptions for minimum and maximum conditions for water flow and nutrient
removal. This results in a coefficient of variation of less than 10%, which means that the estimated
average allowable expenditure of R2,52 million can be accepted as a valid estimate with an acceptable
level of certainty.
In terms of benefits lost due to the degradation of the wetland, it would appear that the water quality
impact dominates the valuation (>95% of the total value lost).
Besides estimating the potential maximum expenditure that could be allowed on rehabilitation projects,
the model indicates that the marginal economic value of the Vyeboom wetland would fall from
~R896000 per ha per year (in 2019 Rand value) to ~R860000 per ha per year if the 25-ha area would
be allowed to degrade over the expected 50 year period.
The analyst needs to be aware of the fact that the view on the progression of the potential degradation
process, which is captured in the logistic evolution pattern, can contribute significantly to the present
value of the total value lost over the 50-year period. It is advised to generate a range of values to
quantify the potential impacts and then to select expected results in such a manner that the argument,
which describes the degradation process, can be corroborated. If instead of a logistic profile, the
wetland is assumed to be already in a state of accelerated deterioration, the rehabilitation project budget
for Vyeboom Wetlands will increase. An updated view on the deterioration profile could justify the latest
estimated cost for rehabilitation of the 25-ha area; the budget could increase to allow R4,4 million to be
spent on the project. The budget may increase even further once the other intrinsic benefits described
are considered in the analysis
Further rehabilitation scenario case studies
A potential degradation scenario for the Vyeboom wetland situation was addressed in sections 4.6 and
4.10 above. Similar potential degradation scenarios have been generated for the Du Toits and
Elandskloof Wetlands. In the following discussion, these scenarios are stated and then put to the
valuation model to determine the maximum allowed budgets for rehabilitation initiatives.

77
4.11.1 Potential degradation of the Du Toits Wetland
The Du Toits Wetland currently has a very low extent of invasive alien trees but does have a few
scattered black wattle trees mainly along some of the drainage lines within the wetland. At the current
very low level of infestation, these trees are having minimal impact on the ecological condition and
ecosystem services provided by the wetland. However, if control measures were to cease then the
extent of black wattle trees along the drainage lines of the wetland is likely to increase progressively
over time, starting especially within the localized disturbed portions of the wetland.
Once a dense canopy of black wattle trees has developed along extensive sections of drainage line
(likely within the next 20-30 years) this canopy is likely to out-compete most of the indigenous
herbaceous vegetation. This, together with the relatively high incidence of black wattle trees falling
over in riparian situations, will destabilize the drainage lines, thereby greatly increasing the risks of
erosion.
The effect of the fluctuating dam level (described for the Vyeboom) is likely to further contribute to
increased risk of erosion in the lowermost portions of the wetland. Therefore, although under much
less imminent risk of degradation than the Vyeboom Wetland, in the absence of any invasive alien
clearing, the Du Toits Wetland is likely to be subject to degradation in the long term. Considering the
factors described above, a plausible future scenario is that in the absence of alien plant control, within
the next 50 years, between 40 ha and 90 ha of the wetland is likely to become heavily infested with
invasive alien plants and severely degraded.
The valuation model assumptions derived from this scenario are the following:
• Initial degraded area (current situation) is approximately 0.5 ha (insignificant in comparison to
the total wetland surface area).
• Degradation will follow a logistic evolution pattern over a 50-year period
• The area which would be totally degraded in Year 50 is assumed to be 65 ha (say halfway
between 40 and 90 ha). This magnitude of the potentially degraded area is selected purely for
demonstration purposes – in practice, the analyst might prefer to generate outcomes for 40 ha
and 90 ha cases in order to provide a range of outcomes.
• The wetland nutrient reduction performance and flow rates would remain on an average level
for the future.
The valuation model layout for this assessment would then be as set out in Table 32:

78
Table 32: Rehabilitation initiative net present value estimation for the Du Toits wetland
ANALYSIS MODE SELECTOR INPUT REQUIRED FOR COST-BENEFIT ANALYSIS STRUCTURING OTHER IMPACT VIEWS Du Toits Vyeboom Elandskloof
Deterioration Size of initial degraded area (ha) 0.5 Expected change in erosion control service 0.5% 0.0% 0.0%
0.00 Expected change in carbon storage service 8.0% 0.0% 0.0%
Size of area that can potentially be affected (ha) 64.5 Surface area that would impact tourism and cultural values4.0% 0.0% 0.0%
Weibull parameter (lambda) 26.0
Weibull parameter (k) 3.0 ECONOMIC PARAMETERS
Y0 Y1 Y2 CPI inflation 4.00%
Capex cash flow 70% 20% 10% 15+ yr bond interest rate (yield curve) 10.00%
Initial Opex/Capex ratio 0.010 Discount rate (cost of capital) 13.00%
CBA for WETLAND Du Toits
State of degradation 0.000 0.000 0.000 0.002 0.004 0.007 0.012 0.019 0.029 0.041 0.055 0.073 0.094 0.118 0.145 0.175 0.208 0.244 0.282 0.323
BENEFIT LOSS Year 0 1 2 3 4 5 6 7 8 9 10 11 12 13 14 15 16 17 18 19
Water quality enhancement Benefit loss 3 493 3 660 4 000 4 708 6 003 8 135 11 385 16 057 22 487 31 031 42 063 55 973 73 150 93 983 118 845 148 081 182 000 220 861 264 861 314 126
Sedimentation retention Benefit loss 18 21 34 71 145 274 474 766 1 172 1 714 2 417 3 305 4 405 5 741 7 338 9 217 11 400 13 901 16 735 19 910
Carbon storage Benefit loss 25 29 47 98 202 381 659 1 065 1 629 2 383 3 360 4 595 6 124 7 982 10 202 12 815 15 849 19 327 23 267 27 680
Tourism Value loss 4 4 7 15 32 60 104 168 256 375 528 723 963 1 255 1 604 2 015 2 492 3 039 3 659 4 353
Cultural Value loss 0 0 0 0 0 0 0 0 0 0 0 0 1 1 1 1 2 2 2 3
Total benefits Cash flow 3 540 3 713 4 089 4 892 6 382 8 850 12 621 18 056 25 544 35 502 48 368 64 596 84 643 108 963 137 990 172 130 211 743 257 131 308 525 366 071
EQUIVALENT COST (Rehabilitation Initiative)
Capex Cash expenditure -770 524 -228 956 -123 819
Opex Cash expenses -11 233 -11 682 -12 150 -12 636 -13 141 -13 667 -14 213 -14 782 -15 373 -15 988 -16 628 -17 293 -17 984 -18 704 -19 452 -20 230 -21 039 -21 881 -22 756 -23 666
Total expenditure Cash flow -781 756 -240 638 -135 969 -12 636 -13 141 -13 667 -14 213 -14 782 -15 373 -15 988 -16 628 -17 293 -17 984 -18 704 -19 452 -20 230 -21 039 -21 881 -22 756 -23 666
NET BENEFIT LOSS Cash flow -778 216 -236 925 -131 880 -7 743 -6 759 -4 817 -1 592 3 274 10 171 19 514 31 741 47 303 66 659 90 259 118 538 151 900 190 703 235 250 285 769 342 405
Present value of CF -778 216 -209 668 -103 281 -5 367 -4 146 -2 615 -765 1 392 3 826 6 496 9 351 12 332 15 379 18 428 21 417 24 287 26 984 29 458 31 667 33 578
ROI(Cash) 39.099
NPV 0
NPV benefits lost 1 211 144
NPV rehab costs -1 211 144
ROI(NPV) 1.00
NET PRESENT VALUE ESTIMATION
Generate max budget capex and opex schedule
0.000
0.200
0.400
0.600
0.800
1.000
0 10 20 30 40 50
Degradation profile: 0.999 @ Y50

79
By balancing the total investment to offset the potential loss in benefits, if the 65 ha should become
degraded, it is evident that an amount of R1 211 144 can be afforded to be spent on the rehabilitation
initiative described in the above scenario.
4.11.2 Potential further degradation of the Elandskloof Wetland
Much of Elandskloof Wetland is already degraded. However, the fact that a large proportion of the
semi-natural area of the wetland lies below the full supply level of the Theewaterskloof Dam severely
limits rehabilitation options in this wetland. Nonetheless, some possibilities exist for improving the
ecological condition and functionality of this wetland. The following is a plausible rehabilitation scenario:
• 2 ha of wetland, which is currently degraded, will be rehabilitated by redistributing low flows into
this area, thereby increasing by 2 ha the extent of wetland through which low flows are
distributed diffusely amongst dense herbaceous vegetation. Although a relatively small area,
this is anticipated to significantly increase the capacity of wetland for the assimilation of
nutrients.
• 30 ha of wetland currently infested with invasive alien trees has been cleared. In the absence
of clearing, within the next 50 years, the 30 ha would be likely to have expanded in extent to
between 45 ha and 60 ha. The full 81 ha of the semi-natural area of the wetland is unlikely to
become infested given the deep flooding that occurs periodically in the lowermost elevations of
the wetland.
• 34 ha of wetland currently exposed to unmitigated wave-action erosion from the
Theewaterskloof Dam will be protected, thereby facilitating improved vegetation cover and
reduced erosion in this area.
This is a composite scenario consisting of three parts. The valuation model was employed to assess
each of the sections independently, then to be aggregated to yield a view on the total expenditure that
can be afforded on the proposed combination of rehabilitation initiatives.
The first part addresses the rehabilitation of the specific 2 ha area. The valuation model assumptions
derived from this part of the composite scenario are the following:
• Initial degraded area (current situation) is 2 ha.
• The affected area is not expected to increase in the future.
• The wetland nutrient reduction performance and flow rates would remain on an average level
for the future.
The valuation model layout for this assessment is displayed in Table 33.
By balancing the total investment to offset the potential loss in benefits if the 2 ha should remain
degraded, it is evident that an amount of R140 124 can be afforded to be spent on its rehabilitation.

80
Table 33: Rehabilitation initiative net present value estimation for the Elandskloof wetland (part 1)
ANALYSIS MODE SELECTOR INPUT REQUIRED FOR COST-BENEFIT ANALYSIS STRUCTURING OTHER IMPACT VIEWS Du Toits Vyeboom Elandskloof
Deterioration Size of initial degraded area (ha) 2.0 Expected change in erosion control service 0.0% 0.0% 0.0%
0.03 Expected change in carbon storage service 0.0% 0.0% 0.0%
Added area that can potentially be affected (ha) 0 Surface area that would impact tourism and cultural values0.0% 0.0% 0.0%
Weibull parameter (lambda) 26.0
Weibull parameter (k) 3.0 ECONOMIC PARAMETERS
Y0 Y1 Y2 CPI inflation 4.00%
Capex cash flow 70% 20% 10% 15+ yr bond interest rate (yield curve) 10.00%
Initial Opex/Capex ratio 0.010 Discount rate (cost of capital) 13.00%
CBA for WETLAND Elandskloof
State of degradation 0.000 0.000 0.000 0.002 0.004 0.007 0.012 0.019 0.029 0.041 0.055 0.073 0.094 0.118 0.145 0.175 0.208 0.244 0.282 0.323
BENEFIT LOSS Year 0 1 2 3 4 5 6 7 8 9 10 11 12 13 14 15 16 17 18 19
Water quality enhancement Benefit loss 11 160 11 607 12 071 12 554 13 056 13 578 14 121 14 686 15 274 15 885 16 520 17 181 17 868 18 583 19 326 20 099 20 903 21 739 22 609 23 513
Sedimentation retention Benefit loss 0 0 0 0 0 0 0 0 0 0 0 0 0 0 0 0 0 0 0 0
Carbon storage Benefit loss 0 0 0 0 0 0 0 0 0 0 0 0 0 0 0 0 0 0 0 0
Tourism Value loss 0 0 0 0 0 0 0 0 0 0 0 0 0 0 0 0 0 0 0 0
Cultural Value loss 0 0 0 0 0 0 0 0 0 0 0 0 0 0 0 0 0 0 0 0
Total benefits Cash flow 11 160 11 607 12 071 12 554 13 056 13 578 14 121 14 686 15 274 15 885 16 520 17 181 17 868 18 583 19 326 20 099 20 903 21 739 22 609 23 513
EQUIVALENT COST (Rehabilitation Initiative)
Capex Cash expenditure -89 146 -26 489 -14 325
Opex Cash expenses -1 300 -1 352 -1 406 -1 462 -1 520 -1 581 -1 644 -1 710 -1 779 -1 850 -1 924 -2 001 -2 081 -2 164 -2 251 -2 341 -2 434 -2 532 -2 633 -2 738
Total expenditure Cash flow -90 446 -27 841 -15 731 -1 462 -1 520 -1 581 -1 644 -1 710 -1 779 -1 850 -1 924 -2 001 -2 081 -2 164 -2 251 -2 341 -2 434 -2 532 -2 633 -2 738
NET BENEFIT LOSS Cash flow -79 286 -16 234 -3 660 11 092 11 536 11 997 12 477 12 976 13 495 14 035 14 596 15 180 15 787 16 419 17 076 17 759 18 469 19 208 19 976 20 775
Present value of CF -79 286 -14 366 -2 866 7 687 7 075 6 512 5 993 5 516 5 076 4 672 4 300 3 957 3 642 3 352 3 085 2 839 2 613 2 405 2 214 2 037
ROI(Cash) 6.675
NPV 0
NPV benefits lost 140 124
NPV rehab costs -140 124
ROI(NPV) 1.00
NET PRESENT VALUE ESTIMATION
Generate max budget capex and opex schedule
0.000
0.200
0.400
0.600
0.800
1.000
0 10 20 30 40 50
Degradation profile: 0.999 @ Y50

81
The second part addresses the rehabilitation of the 30 ha of the Elandskloof Wetland previously infested
with invasive alien trees. The valuation model assumptions derived from this part of the composite
scenario are the following:
• Initial degraded area (current situation) is 30 ha.
• Degradation will follow a logarithmic evolution pattern over a 50-year period. Since the
infestation is already substantial, the initial deterioration rate is expected to be substantial, and
would not pick slowly as in the case of a logistic evolution pattern.
• The area which would be totally degraded in Year 50 is assumed to be 53 ha (say about
halfway between 45 and 60 ha). This magnitude of the potentially degraded area is selected
purely for demonstration purposes – in practice, the analyst might prefer to generate outcomes
for 45 ha and 60 ha cases in order to provide a range of outcomes.
• The wetland nutrient reduction performance and flow rates would remain on an average level
for the future.
The valuation model layout for this assessment is displayed in Table 34.
By balancing the total investment to offset the potential loss in benefits if the degraded area should
increase from 30 ha to 53 ha, it is evident that an amount of R2 962 966 can be afforded to be spent
on the rehabilitation of the currently infested 30 ha area.

82
Table 34: Rehabilitation initiative net present value estimation for the Elandskloof Wetland (part 2)
ANALYSIS MODE SELECTOR INPUT REQUIRED FOR COST-BENEFIT ANALYSIS STRUCTURING OTHER IMPACT VIEWS Du Toits Vyeboom Elandskloof
Deterioration Size of initial degraded area (ha) 30.0 Expected change in erosion control service 0.0% 0.0% 0.0%
0.40 Expected change in carbon storage service 0.0% 0.0% 30.7%
Added area that can potentially be affected (ha) 23 Surface area that would impact tourism and cultural values 0.0% 0.0% 15.3%
Weibull parameter (lambda) 10.0
Weibull parameter (k) 1.0 ECONOMIC PARAMETERS
Y0 Y1 Y2 CPI inflation 4.00%
Capex cash flow 70% 20% 10% 15+ yr bond interest rate (yield curve) 10.00%
Initial Opex/Capex ratio 0.010 Discount rate (cost of capital) 13.00%
CBA for WETLAND Elandskloof
State of degradation 0.000 0.095 0.181 0.259 0.330 0.393 0.451 0.503 0.551 0.593 0.632 0.667 0.699 0.727 0.753 0.777 0.798 0.817 0.835 0.850
BENEFIT LOSS Year 0 1 2 3 4 5 6 7 8 9 10 11 12 13 14 15 16 17 18 19
Water quality enhancement Benefit loss 167 405 186 803 206 229 225 726 245 340 265 114 285 092 305 316 325 829 346 674 367 891 389 523 411 613 434 203 457 335 481 053 505 399 530 418 556 155 582 655
Sedimentation retention Benefit loss 0 0 0 0 0 0 0 0 0 0 0 0 0 0 0 0 0 0 0 0
Carbon storage Benefit loss 0 0 0 0 0 0 0 0 0 0 0 0 0 0 0 0 0 0 0 0
Tourism Value loss 585 753 919 1 084 1 248 1 411 1 575 1 738 1 902 2 067 2 234 2 402 2 572 2 745 2 920 3 099 3 281 3 467 3 657 3 852
Cultural Value loss 7 8 10 12 14 16 18 20 21 23 25 27 29 31 33 35 37 39 41 43
Total benefits Cash flow 167 997 187 565 207 158 226 822 246 602 266 541 286 684 307 074 327 753 348 764 370 150 391 952 414 214 436 979 460 288 484 186 508 717 533 924 559 853 586 550
EQUIVALENT COST (Rehabilitation Initiative)
Capex Cash expenditure -1 885 024 -560 121 -302 914
Opex Cash expenses -27 481 -28 580 -29 723 -30 912 -32 148 -33 434 -34 772 -36 163 -37 609 -39 113 -40 678 -42 305 -43 997 -45 757 -47 587 -49 491 -51 471 -53 529 -55 671 -57 897
Total expenditure Cash flow -1 912 504 -588 701 -332 637 -30 912 -32 148 -33 434 -34 772 -36 163 -37 609 -39 113 -40 678 -42 305 -43 997 -45 757 -47 587 -49 491 -51 471 -53 529 -55 671 -57 897
NET BENEFIT LOSS Cash flow -1 744 508 -401 136 -125 479 195 910 214 453 233 107 251 913 270 911 290 144 309 651 329 472 349 647 370 217 391 221 412 701 434 695 457 246 480 395 504 182 528 652
Present value of CF -1 744 508 -354 988 -98 268 135 776 131 528 126 521 120 998 115 154 109 140 103 078 97 058 91 152 85 411 79 874 74 565 69 504 64 699 60 154 55 870 51 842
ROI(Cash) 8.600
NPV 0
NPV benefits lost 2 962 966
NPV rehab costs -2 962 966
ROI(NPV) 1.00
NET PRESENT VALUE ESTIMATION
Generate max budget capex and opex schedule
0.000
0.200
0.400
0.600
0.800
1.000
0 10 20 30 40 50
Degradation profile: 0.993 @ Y50

83
The third part addresses the rehabilitation of the 34 ha of the Elandskloof Wetland currently exposed to
unmitigated wave-action erosion from the Theewaterskloof Dam. The valuation model assumptions
derived from this part of the composite scenario are the following:
• Initial degraded area (current situation) is 34 ha.
• The affected area is not expected to increase in the future.
• The wetland nutrient reduction performance and flow rates would remain on an average level
for the future.
The valuation model layout for this assessment is displayed in Table 35.
By balancing the total investment to offset the potential loss in benefits if the 34 ha should remain
exposed to unmitigated wave-action erosion, it is evident that an amount of R2 382 112 can be afforded
to be spent on the rehabilitation of the currently affected 34 ha area.
A combination of rehabilitation initiatives, with total cost amounting to R5,49 million can, therefore, be
employed to address all the issues raised in the Elandskloof scenario description.
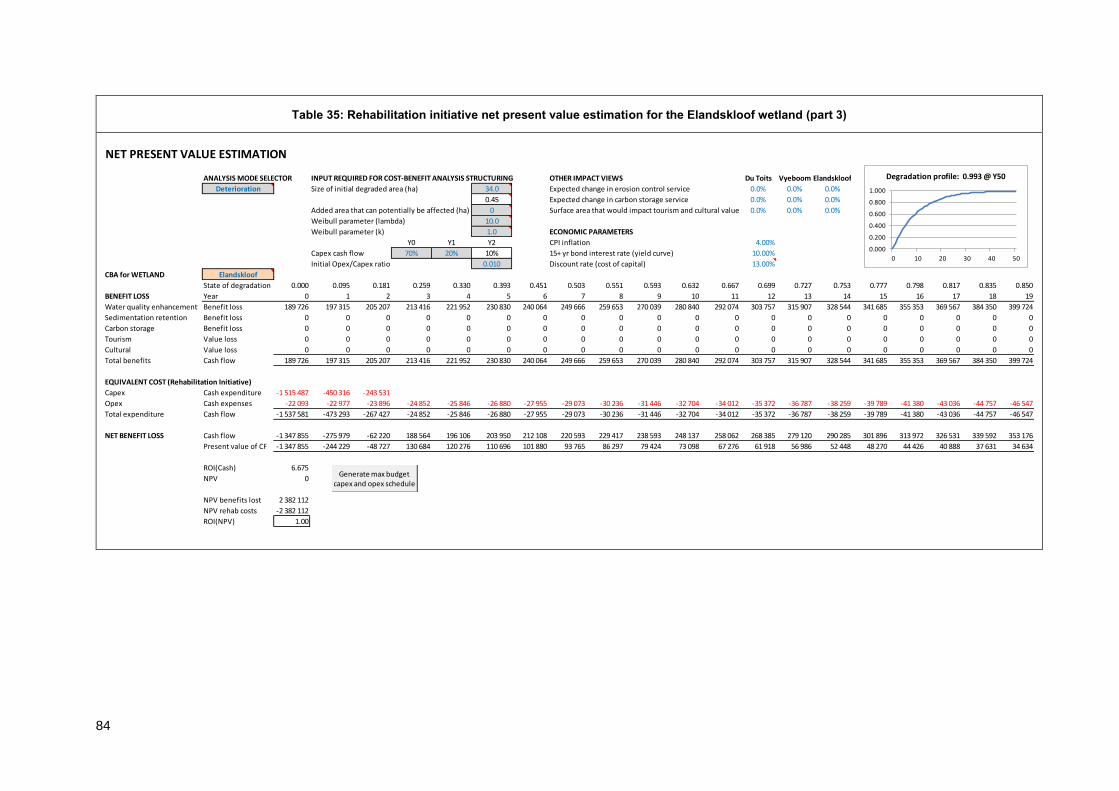
84
Table 35: Rehabilitation initiative net present value estimation for the Elandskloof wetland (part 3)
ANALYSIS MODE SELECTOR INPUT REQUIRED FOR COST-BENEFIT ANALYSIS STRUCTURING OTHER IMPACT VIEWS Du Toits Vyeboom Elandskloof
Deterioration Size of initial degraded area (ha) 34.0 Expected change in erosion control service 0.0% 0.0% 0.0%
0.45 Expected change in carbon storage service 0.0% 0.0% 0.0%
Added area that can potentially be affected (ha) 0 Surface area that would impact tourism and cultural values 0.0% 0.0% 0.0%
Weibull parameter (lambda) 10.0
Weibull parameter (k) 1.0 ECONOMIC PARAMETERS
Y0 Y1 Y2 CPI inflation 4.00%
Capex cash flow 70% 20% 10% 15+ yr bond interest rate (yield curve) 10.00%
Initial Opex/Capex ratio 0.010 Discount rate (cost of capital) 13.00%
CBA for WETLAND Elandskloof
State of degradation 0.000 0.095 0.181 0.259 0.330 0.393 0.451 0.503 0.551 0.593 0.632 0.667 0.699 0.727 0.753 0.777 0.798 0.817 0.835 0.850
BENEFIT LOSS Year 0 1 2 3 4 5 6 7 8 9 10 11 12 13 14 15 16 17 18 19
Water quality enhancement Benefit loss 189 726 197 315 205 207 213 416 221 952 230 830 240 064 249 666 259 653 270 039 280 840 292 074 303 757 315 907 328 544 341 685 355 353 369 567 384 350 399 724
Sedimentation retention Benefit loss 0 0 0 0 0 0 0 0 0 0 0 0 0 0 0 0 0 0 0 0
Carbon storage Benefit loss 0 0 0 0 0 0 0 0 0 0 0 0 0 0 0 0 0 0 0 0
Tourism Value loss 0 0 0 0 0 0 0 0 0 0 0 0 0 0 0 0 0 0 0 0
Cultural Value loss 0 0 0 0 0 0 0 0 0 0 0 0 0 0 0 0 0 0 0 0
Total benefits Cash flow 189 726 197 315 205 207 213 416 221 952 230 830 240 064 249 666 259 653 270 039 280 840 292 074 303 757 315 907 328 544 341 685 355 353 369 567 384 350 399 724
EQUIVALENT COST (Rehabilitation Initiative)
Capex Cash expenditure -1 515 487 -450 316 -243 531
Opex Cash expenses -22 093 -22 977 -23 896 -24 852 -25 846 -26 880 -27 955 -29 073 -30 236 -31 446 -32 704 -34 012 -35 372 -36 787 -38 259 -39 789 -41 380 -43 036 -44 757 -46 547
Total expenditure Cash flow -1 537 581 -473 293 -267 427 -24 852 -25 846 -26 880 -27 955 -29 073 -30 236 -31 446 -32 704 -34 012 -35 372 -36 787 -38 259 -39 789 -41 380 -43 036 -44 757 -46 547
NET BENEFIT LOSS Cash flow -1 347 855 -275 979 -62 220 188 564 196 106 203 950 212 108 220 593 229 417 238 593 248 137 258 062 268 385 279 120 290 285 301 896 313 972 326 531 339 592 353 176
Present value of CF -1 347 855 -244 229 -48 727 130 684 120 276 110 696 101 880 93 765 86 297 79 424 73 098 67 276 61 918 56 986 52 448 48 270 44 426 40 888 37 631 34 634
ROI(Cash) 6.675
NPV 0
NPV benefits lost 2 382 112
NPV rehab costs -2 382 112
ROI(NPV) 1.00
NET PRESENT VALUE ESTIMATION
Generate max budget capex and opex schedule
0.000
0.200
0.400
0.600
0.800
1.000
0 10 20 30 40 50
Degradation profile: 0.993 @ Y50

85
5. CONCLUSIONS AND RECOMMENDATIONS
The Theewaterskloof Dam is an important source of water for the Western Cape, particularly Cape
Town, and as such it is important to establish the value of the wetlands through which water drains into
this dam. An economic valuation was done on three individual wetlands in the dam’s catchment area,
in order to establish the necessary perspective for the valuation of the wetlands a brief introduction of
the catchment feeding into the wetland has been provided, highlighting the relation to the wetland and
the surrounding geomorphic structures. This has been supplemented by a detailed description of the
wetland functioning and performance in terms of the current status and expected future degradation or
rehabilitation scenarios. Using the wetland description and catchment data, the hydrological functioning
of the wetlands has been described in terms of the long-term internal water balances of the wetlands
as simulated by a calibrated rainfall-runoff model. The economic valuation could then be determined
from wetland scenario descriptions, water balances and basic assumptions on nutrient uptake rates.
In order to supplement a qualitative discussion of the intrinsic value of the wetlands in this study, a
quantifiable economic valuation of a wetland was constructed by assembling a set of models which
describe the functional values of the wetland in terms of water quality enhancement (nutrient removal),
retention of sediment, storage of carbon, tourism potential and the manifestation of cultural values. The
contribution from the nutrient removal model strongly dominates all other factor contributions.
The nutrient removal model is informed primarily by a simple water quality model which is based on the
difference in nitrogen and phosphorous assimilation capacity of intact and degraded wetlands. It is also
informed by the hydrological assessment of water flows that occur frequently in the particular wetland
area. The determination of an economic valuation is primarily based on the indirect use value method,
with a special focus on the “minimisation of replacement costs”.
Besides the capability to determine marginal economic values for the wetland under various conditions,
the economic model developed in this study can also provide a good indication of the maximum
allowable expenditure that can be afforded on rehabilitation projects to curb or prevent various wetland
degradation processes. Such an economic assessment assumes a long-term period (typically 50+
years) over which the somewhat degraded wetland would degrade even further. The monetary value
difference between the current state and that expected if degradation would continue, provides useful
justification for budgets associated with rehabilitation interventions. The assessed outcomes are
generally found to be valid estimates with an acceptable level of certainty.
The economic models do, however, exclude potentially important ecosystem services and would likely
result in rather conservative valuations of wetlands. Some potentially important ecosystem services
that have not been included, are:
• The assimilation of toxicants, notably xenobiotic toxicants arising from the relatively high
level of biocide application over extensive areas of the catchment,
• The assimilation of pathogens, notably E. coli, with direct implications in terms of the export
of fruit, and
• Local storage of water (available for direct use by adjacent farmers).
It is recommended that these ecosystem services be included in future models if this information is
available to enhance the value estimates. Valuations that include these factors may provide more
detailed models, but based on the observations in this study, it will probably still be dominated by the
nutrient removal contributions.

86
LIST OF REFERENCES
BAILEY AK (2015) WRSM2000/Pitman Water Resources Simulation Model for Windows – Theory July
2015. Pretoria: Water Research Commission.
BAILEY AK & PITMAN WV (2015) Water Resources of South Africa, 2012 (WR2012). Pretoria: Water
Research Commission.
CHAKONA A (2013) Pseudobarbus skeltoni, the Giant redfin minnow that evaded scientists for over a
century. South African Institute for Aquatic Biodiversity (SAIAB). URL:
https://www.saiab.ac.za/uploads/files/saiab_q3_2013_featured_research_chakona_final_for_web.pdf
CHAKONA A and SWARTZ ER (2013) A new redfin species, Pseudobarbus skeltoni (Cyprinidae,
Teleostei) from the Cape Floristic Region, South Africa. Zootaxa 3686 565–577
CLULOW AD, EVERSON CS, JARMAIN C and MENGISTU M (2012) Water-Use of the Dominant
Natural Vegetation Types of the Eastern Shores Area, Maputaland. WRC Report No. 1926/1/12.
Pretoria: Water Research Commission.
CULLIS JDS, ROSSOUW N, DU TOIT G, PETRIE D, WOLFAARDT G, DE CLERCQ W and HORN A
(2018) Economic risks due to declining water quality in the Breede River catchment. Pretoria: Water
Research Commission. Water SA 44 3. URL: http://dx.doi.org/10.4314/wsa.v44i3.14, ISSN 1816-7950.
DENT MC, LYNCH SD AND SCHULZE RE (1987) Mapping Mean Annual and Other Rainfall Statistics
Over Southern Africa. Durban: University of Natal.
DEPARTMENT OF WATER AFFAIRS (DWA) (2012). Pre-feasibility and Feasibility Studies for
augmentation of the Western Cape Water Supply System by means of further surface water
developments. Pretoria: Department of Water Affairs.
DEPARTMENT OF WATER AFFAIRS AND FORESTRY (DWAF), 2008. The Assessment of Water
Availability in the Berg Catchment (WMA 19) by means of Water Resource Related Models. Report No.
5: Update of Catchment Hydrology. Volume No. 3: Peripheral Rivers. DWAF Ref No. P
WMA19/000/00/0408. Pretoria: DWAF.
DEPARTMENT OF WATER AFFAIRS AND FORESTRY (DWAF) (2010) The nature, distribution and
value of aquatic ecosystem services of the Olifants, Inkomati and Usutu to Mhlatuze Water
Management Areas. Contract Report by Anchor Environmental Consultants for Department: Water
Affairs. 362pp.
DYE P and JARMAIN C (2004) Water use by black wattle (Acacia mearnsii): implications for the link
between removal of invading trees and catchment streamflow response. South African Journal of
Science 100 40–44.
DYE P J, JARMAIN C, LE MAITRE D, EVERSON C S, GUSH M and CLULOW A (2008) Modelling
vegetation water use for general application in different categories of vegetation. WRC Report No.
1319/1/08. Water Research Commission, Pretoria.
GAMBRELL RP and PATRICK WH (1988) The influence of redox potential on the environmental
chemistry of contaminants in soils and sediments. In: HOOK D D, Me KEE WH, SMITH HK, GREGORY
J, BURRELL VG, DeVOE MR, SOJKA R, GILBERT E, BANKS R. STOLZY LH, BROOKS C,
MATHEWS TD, SHEAR TH, (eds.) The ecology and management of wetlands Volume 2: Management,
use and value of wetlands. Croom Helm, London.

87
GORGENS A (2016) The impacts of different degrees of alien plant invasion on yields from the Western
Cape Water Supply System: final report. Report prepared by Aurecon South Africa (Pty) Ltd. Century
City, South Africa
GROSSMAN M (2012) Economic value of the nutrient retention function of restored floodplain wetlands
in the Elbe River basin. Ecological Economics 83 108–117.
GRUNDLING PL, GRUNDLING AT, PRETORIUS L, MULDERS J and MITCHELL S (2017) South
African peatlands: ecohydrological characteristics and socio-economic value. WRC Report No.
2346/1/17 ISBN 978-1-4312-0892-0.
HAMMER DA (1992) Creating freshwater wetlands. Lewis Publishers, Baco Raton. 449pp.
HEMOND HF, and BENOIT J (1988) Cumulative impacts on water quality functions of wetlands.
Environmental Management 12 639-653.
JACQUES H, REED-SMITH J and SOMERS M J (2015) Aonyx capensis. The IUCN Red List of
Threatened Species 2015: e.T1793A21938767. URL: http://dx.doi.org/10.2305/IUCN.UK.2015-
2.RLTS.T1793A21938767.en (Accessed 05 March 2019).
KADLEC RH, and KADLEC JA (1979) Wetlands and water quality. In: GREESON PE, CLARK JR,
and CLARK JE, (eds.) Wetland functions and values: the state of our understanding. American Water
Resources Association, Minneapolis.
KOTZE DC (2015) A survey of organic soils in the upper Riviersonderend catchment. Unpublished
report submitted to the WWF, Cape Town.
KOTZE DC (2018) Chapter 2: The ecosystem services provided by the Inland Aquatic Environment in
South Africa. South African National Biodiversity Assessment 2018: Technical Report. Volume 2: Inland
Aquatic Environment. South African National Biodiversity Institute, Pretoria. Report Number: CSIR
report number, SANBI/NAT/NBA2018/2019/Volx/A.
KOTZE DC, MARNEWECK GC, BATCHELOR L, LINDLEY DS and COLLINS NB (2008) WET-
EcoServices: A technique for rapidly assessing ecosystem services supplied by wetlands. WRC Report
No TT 339/09. Water Research Commission, Pretoria.
KOTZE DC, TERERAI F and GRUNDLING PL (2018) Assessing, with limited resources, the ecological
outcomes of wetland restoration: a South African case. Restoration Ecology. URL:
http://onlinelibrary.wiley.com/doi/10.1111/rec.12891/suppinfo
LAND M, GRANÉLI W, GRIMVALL A, HOFFMANN CC, MITSCH WJ, TONDERSKI KS and
VERHOEVEN JTA (2016) How effective are created or restored freshwater wetlands for nitrogen and
phosphorus removal? A systematic review. Environmental Evidence 5 (1) 9.
MACFARLANE DM, OLLIS DJ and KOTZE DC (2018). Tools for assessing the Present Ecological State
of wetland ecosystems. WRC Project K5/2549: WET-HEALTH (Version 2.0). Draft report submitted to
the Water Research Commission.
Marthinus, H., 2019. Personal communication. s.l.:s.n.
MCCARTHY TS and VENTER J (2006) Increasing pollution levels on the Witwatersrand recorded in
the peat deposits of the Klip River Wetland. South African Journal of Science 102 27-34.
MILLS A and HUNTER R (2018) Restoration of wetlands on the Agulhas Plain is unlikely to generate
peat. South African Journal of Science 114 (1/2) 3.

88
MITSCH WJ, BERNAL B, NAHLIK AM, MANDER U, ZHANG L ANDERSON CJ, JØRGENSEN SE,
and BRIX H (2013) Wetlands, carbon, and climate change. Landscape Ecology 28 583–597.
MULDERS J, CRAFFORD J and HARRIS K (2017) The socio-economic value of peatlands in South
Africa. In: Grundling PL, Grundling AT, Pretorius L, Mulders J and Mitchell S. South African Peatlands:
Ecohydrological characteristics and socio-economic value. WRC Report No. 2346/1/17. Water
Research Commission, Pretoria.
NORDHAUS WD (2017) Revisiting the social cost of carbon. Proceedings of the National Academy of
Sciences of the United States of America 144 (7)1518-1523
POOL-STANVLIET R, DUFFELL-CANHAM A, PENCE EG and SMART R (2017) The Western Cape
Biodiversity Spatial Plan Handbook. CapeNature, Stellenbosch
REBELO AJ (2012) An ecological and hydrological evaluation of the effects of restoration on ecosystem
services in the Kromme River system, South Africa. MSc thesis, University of Stellenbosch.
REBELO AJ (2017) Ecosystem Services of Palmiet Wetlands: The Role of Ecosystem Composition and
Function. PhD thesis, University of Antwerp and Stellenbosch University.
REBELO AJ, EMSENS WJ, MEIRE P and ESLER KJ (2018) Quantification of water purification in South
African palmiet wetlands. Water Science and Technology 78 1199-1207.
REDDY KR, and PATRICK WH (1984) Nitrogen transformations and loss in flooded soils and
sediments. CRC Critical Reviews in Environmental Control 13 273-309.
SATHER JH, and SMITH RD (1984) An overview of major wetland functions and values. Fish and
Wildlife Service. United States Department of the Interior, Washington.
SCHULZE RE and Horan MJC (2007) Soils: Hydrological Attributes. In: Schulze RE (Ed) South African
Atlas of Climatology and Agrohydrology. Water Research Commission.
SNADDON K, DIETRICH J, FORSYTHE K and TURPIE J (2018) Prioritisation of wetlands for water
security in priority dam catchments in the Western Cape supply system. Submitted to: The Nature
Conservancy. Freshwater Research Centre.
SNADDON K (2019) Personal communication. Freshwater Research Centre, Cape Town.
The Economics of Ecosystems and Biodiversity (TEEB) (2011) The Economics of Ecosystems and
Biodiversity for National and International Policy Making. URL: http://doc.teebweb.org/wp-
content/uploads/2014/04/TEEB-in-national-and-international-Policy-Making2011.pdf
TEN BRINK P (2011) The Economics of Ecosystems and Biodiversity (TEEB) - Policy applications of
ecosystem accounts. Presentation to Expert Meeting on Ecosystem Accounts, 5 - 7 December 2011,
London, UK. Hosted by the Office for National Statistics and the Department for Environment, Food,
and Rural Affairs of the United Kingdom. URL:
https://unstats.un.org/unsd/envaccounting/seeaLES/egm/Disc_issue1.ppt
TURPIE JK (2003) The existence value of biodiversity in South Africa: how interest, experience,
knowledge, income and perceived level of threat influence local willingness to pay. Ecological
Economics 46 199-216.
TURPIE J, DAY E, ROSS-GILLESPIE V and LOUW A (2010) Estimation of the water quality
amelioration function and value of wetlands: a case study of the Western Cape, South Africa. In: Turpie

89
J and Malan H (eds.) Wetland valuation. Vol II: Wetland valuation case studies. WRC Report No. TT
441/09. Water Research Commission, Pretoria.
TURPIE JK, FORSYTHE KJ, KNOWLES A, BLIGNAUT J, LETLEY G (2017) Mapping and valuation of
South Africa’s ecosystem services: A local perspective. Ecosystem Services 27 (B) 179-192.
VAN HEERDAN PS & WALKER S (2016) Upgrading of SAPWAT3 as a Management Tool to Estimate
the of Crops. Pretoria: Water Research Commission.
WIEDER RK and LANG GE (1986) Fe, Al, Mn, and S chemistry in Sphagnum peat in four peatlands
with different metal and sulphur input. Water Soil and Air Pollution 29 309-320.

90
APPENDIX A: WETLAND PRESENT ECOLOGICAL STATE SUMMARY
Du Toits Kloof
Elandskloof
Wetland name
Assessment Unit
Wetland area (Ha)
PES Assessment HYDROLOGY GEOMORPHOLOGY WATER QUALITY VEGETATION
Impact Score 0.7 0.4 0.8 1.6
PES Score (%) 93% 96% 92% 84%
Ecologica l Category A A A B
Combined Impact Score
Combined PES Score (%)
Combined Ecologica l Category
Hectare Equiva lents
Wetland PES Summary
Du Toits
Du Toits wetland
767.8 Ha
0.9
91%
A
700.1 Ha
Confidence
Low: Relatively low probabi l i ty of connection to regional aqui fer but miss ing
information on the degree of connecti tivi ty, the lowering of the water table, and/or
groundwater qual i ty
Wetland name
Assessment Unit
Wetland area (Ha)
PES Assessment HYDROLOGY GEOMORPHOLOGY WATER QUALITY VEGETATION
Impact Score 6.7 3.5 5.0 8.5
PES Score (%) 33% 65% 50% 15%
Ecologica l Category E C D F
Combined Impact Score
Combined PES Score (%)
Combined Ecologica l Category
Hectare Equiva lents
Wetland PES Summary
Elandskloof
Elandskloof wetland
139.2 Ha
6.2
38%
E
53.1 Ha
Confidence
Low: Relatively low probabi l i ty of connection to regional aqui fer but
miss ing information on the degree of connecti tivi ty, the lowering of the
water table, and/or groundwater qual i ty

91
Vyeboom
Wetland name
Assessment Unit
Wetland area (Ha)
PES Assessment HYDROLOGY GEOMORPHOLOGY WATER QUALITY VEGETATION
Impact Score 4.8 2.6 4.5 4.3
PES Score (%) 51.9% 74.2% 54.8% 57.0%
Ecologica l Category D C D D
Combined Impact Score
Combined PES Score (%)
Combined Ecologica l Category
Hectare Equiva lents
4.1
58.7%
D
214.8 Ha
Confidence
Low: Relatively low probabi l i ty of connection to regional aqui fer but miss ing
information on the degree of connecti tivi ty, the lowering of the water table, and/or
groundwater qual i ty
Vyeboom wetland
366.2 Ha
Wetland PES Summary
Vyeboom

92
APPENDIX B: ALGEBRAIC LAYOUT TO EXPLAIN THE GENERATION OF SHADOW
VALUES FOR THE NUTRIENT REDUCTION MODEL
The Terms of Reference (TOR) for this project demands that shadow prices be used to determine the
marginal value of the nutrient reduction capability of the wetlands under investigation. This is often used
to indicate the value of restoration or rehabilitation projects.
The TOR is also clear in recommending the shadow price determination approach as expounded by
(Grossman, 2012). Moreover, the TOR demands that the shadow prices be determined in MS Excel.
From the TOR discussion it is evident that the reader of the final report would have a satisfactory
understanding of elementary optimisation theory which defines the concept of “shadow prices” as the
marginal impact of unitary changes in the constraints postulated by linear or nonlinear optimisation
problems.
It is also understood that the reader of the final report would be in a position to code and read
formulations in MS Excel, for which a basic to intermediate skills-level is required.
The following layout explains the formulation of the optimisation problem to enable the generation of
the shadow prices for the evaluated wetlands or the initiatives that might be implemented to
restore/rehabilitate the said wetlands.
B.1 The power law of costing
The configuration of the economic valuation model requires the introduction of the power law that is
commonly used to scale the costs of chemical treatment plants, based on throughput. The principle of
scaling needs to reflect the economies of scale for the various throughput rates. This can be achieved
by applying the following power factor relationship:
𝐶𝑜𝑠𝑡Scaled = (𝑇ℎ𝑟𝑜𝑢𝑔ℎ𝑝𝑢𝑡Scaled
𝑇ℎ𝑟𝑜𝑢𝑔ℎ𝑝𝑢𝑡Ref
)𝑝
𝐶𝑜𝑠𝑡Ref
In this function the desired design throughput is divided by the reference throughput and the resulting
ratio is raised to the power p, with p adopting a value between zero and one, to reflect economies of
scale. The ratio-ed throughput is then multiplied by the reference cost to obtain the scaled cost. In
this study the power factor p is assumed to be 0.75.
B.2 The configuration of the optimisation problem
A variety of options can be defined to act as replacement process for the nutrient assimilation function
of wetlands. Each of these processes has an associated cost of operation, which is composed of a
capital expenditure and an operating expense component. The composite costs for the listed processes
are scaled by the power law to reflect the throughput of the wetlands for which the valuation needs to
be conducted.
Since the least cost options, or combination of options, need to be found in the optimisation estimation,
the optimisation problem is set up as a minimisation of weighted costs that subscribes to the
fundamental conditions that:
• All alternative processes considered must be able to deliver similar services as the natural
wetlands,
• The considered processes should not result in a shift in demand by society if such alternatives
were to be implemented, and

93
• The optimal alternative choice should be the least cost option.
The algebraic layout of the optimisation problem is therefore captured in the following expressions:
𝐶 = 𝑚𝑖𝑛 ∑ 𝑐𝑖(𝑥𝑖)𝑝
𝑖
subject to:
𝑇𝑅 = ∑ 𝑞(𝑥𝑖)
𝑖
0 ≤ 𝑥𝑖 ≤ 1
where the indices and variables are denoted by:
i: process unit
p: power law factor
x: implementation level of a process based on the ratio of variable area to total wetland area
c: function describing the composite scaled cost of an alternative process
C: total cost of implementing a combination of optional processes
Q: nutrient removal capacity associated with the alternative process
TR: target nutrient load reduction
In order to solve the above optimisation model, mathematicians use Lagrange multipliers that are
associated with each of the constraints. These multipliers are also referred to as “shadow prices” and
indicate the marginal increase or decrease of the objective function (that for C above) value when the
levels of constraint are individually adjusted by one unit. The incremental adjustment for constraint xi
would relate to a 1 hectare partial adjustment in wetland surface area.
B.3 MS Excel solutions to the optimisation problem
The standard version of MS Excel has a Solver add-in that does all the calculations to solve the above
optimisation problem and which produces internally generated reports from which the shadow prices
can be extracted.
The approach by (Grossman, 2012) is adopted in this study, whereby the restoration of the wetland is
allowed as an optional “alternative” process, but for which the xi- value must be forced to converge to
zero. The reduced gradient value (Lagrange multiplier) for this option is then recorded as the shadow
price associated with the wetland.

94
APPENDIX C: HYDROLOGICAL CALIBRATION RESULTS
H6H007: Main channel upstream Du Toits #3 Wetland

95
H6H008: Main channel upstream Vyeboom Wetland

96
H6R002: Elandskloof Dam Inflow, upstream of Elandskloof Wetland

97
H6R001: Theewaterskloof Dam

98
Table C-1: WRSM2000/Pitman model calibration parameters
Quinary RU POW GPOW SL HGSL ST FT HGGW ZMIN ZAVE ZMAX PI TL R Max
Disch
%Evap AreaEvap
H60B1 15 1 1 0 0 100 80 5 0 250 1.5 0.1 0 4 5% 15.75
H60B2 1 1 1 0 0 100 80 5 0 250 1.5 0.1 0 4 5% 13.74
H60B3 10 1 1 0 0 100 80 5 0 250 1.5 0.1 0 4 5% 12.59
H60B4 17 1 1 0 0 100 80 5 0 250 1.5 0.1 0 4 5% 13.80
H60B8 20 1 1 0 0 100 80 5 0 250 1.5 0.1 0 2 5% 11.72
H60B9 21 1 1 0 0 100 80 5 0 250 1.5 0.1 0 2 5% 12.26
H60B10 19 1 1 0 0 100 80 5 0 250 1.5 0.1 0 4 5% 11.36
H60B11 22 2 2 0 0 150 0 7 0 200 1.5 2.5 0 5 5% 0.47
H60A1 2 1 1 0 0 100 80 5 0 250 1.5 0.1 0 4 5% 20.70
H60A2 12 1 1 0 0 100 80 5 0 250 1.5 0.1 0 4 5% 13.39
H60A3 13 2 2 0 0 150 0 7 0 200 1.5 2.5 0 5 5% 0.56
H60C1&2 23 1 1 0 0 350 25 5 0 400 1.5 0.3 0 4 5% 8.52
99
H60C3 24 1 1 0 0 100 80 5 0 250 1.5 0.1 0 4 5% 13.79
H60C4&5 25 1 1 0 0 350 25 5 0 400 1.5 0.3 0 4 5% 6.70
H60C6 26 2 2 0 0 150 0 7 0 200 1.5 2.5 0 5 5% 0.57
H60C8 28 2 2 0 0 150 0 7 0 200 1.5 2.5 0 5 5% 0.16