
doctor of pbfts;opbp - CORE
282
"INFLOWS OF FDI IN INDIA SINCE 1991: A CASE STUDY OF PHARMACEUTICAL INDUSTRY" THESIS SUBMITTED FOR THE AWARD OF THE DEGREE OF doctor of pbfts;opbp IN ECONOMICS BY GULSHAN AKHTAR UNDER THE SUPERVISION OF DR. (Mrs.) ZEBA SHEEREEN DEPARTMENT OF ECONOMICS ALIGARH MUSLIM UNIVERSITY ALIGARH (INDIA)-202002 2012
-
Upload
khangminh22 -
Category
Documents
-
view
1 -
download
0
Transcript of doctor of pbfts;opbp - CORE
"INFLOWS OF FDI IN INDIA SINCE 1991: A CASE STUDY OF PHARMACEUTICAL
INDUSTRY"
THESIS SUBMITTED FOR THE AWARD OF THE DEGREE OF
doctor of pbfts;opbp IN
ECONOMICS
BY GULSHAN AKHTAR
UNDER THE SUPERVISION OF DR. (Mrs.) ZEBA SHEEREEN
DEPARTMENT OF ECONOMICS ALIGARH MUSLIM UNIVERSITY
ALIGARH (INDIA)-202002 2012

1 1 NOV 2014
T8954

Dedicated ga, My Parents

DR. (Mrs.) ZEBA SHEEREEN
Phone no. 0571-2700920 I405(otfice) 1406 (Chairman) Mobile +91-9760249728 zebasheereen(ayahoo.co.in
Department of Economics Aligarh Muslim University
Aligarh 202002 (UP) India
Certificate
This is to certily that GULSHAN AKHTAR, En. No. W-0685, has completed her
thesis entitled: "Inflows of Foreign Direct Investment in India since 1991: A Case
Study of Pharmaceutical Industry" under my supervision. Department of
Economics, AMU, Aligarh. To the best of my- knowledge and belief, the work is of
original nature and has not been submitted in part or full for any degree or diploma of
this or any other university. It also fulfils the requirements for the award of degree for
Doctor of Philosophy in Economics at Aligarh Muslim University, Aligarh. India.
airman DR. (Mrs.) Zeba Sheereen (Supervisor)

Contents
Particulars Page Numbers Preface Acknow ledcement Vii-Viii
List of Tables ix-xi List of Figures xii-xiii
List of Boxes and Charts xiv Abbreviations xv-xviii
Chapter-1: Introductory Background and Theoretical Approaches of the Study 1-21 1.1 Introduction :...................................................................................................... 1 1.2 Foreign Direct Investment :................................................................................2 1.3 Benefits of Foreign Direct Investment :............................................................. 3 1.4 Costs of Foreign Direct Investment :..................................................................4 1.5 Economic, Political and Social Effects of Foreign Direct Investment :............. 5 1.6 Foreign Direct Investment and Economic Development:................................. 7 1.7 Effects of Foreign Direct Investment: Theories and Approaches:.................... 8
1.7.1 Theories of Foreign Direct Investment under Perfect Market Condition:.. 9
1.7.2 Theories of Foreign Direct Investment under Imperfect Market Condition: ...................................................................................................................11
1.8 Locational Factors that Influence Foreign Direct Investment Inflows in India: . ......................................................................................................................... 14
1.9 Importance of Foreign Direct Investment for Growth and Development in India:................................................................................................................17
1.10 Conclusion :......................................................................................................19 1.1 1 References :...................................................................................................... 20 Chapter-2: Review of Literature and Research Design of the Study 22-48 2.1 Introduction :.................................................................................................... 22 2.2 Statement of the problem :................................................................................ 22 2.3 Review of Literature :.......................................................................................23 2.4 Research Gap :.................................................................................................. 39 2.5 Scope of the Study :.............................................................. 2.6 Objectives of the Study :...................................................................................40 2.7 Hypotheses of the Study :................................... ......41 2.8 Source of Data. .. ..............................................41 2.9 Span of Time of the Studv :..............................................................................42 2.10 Research Methodology :................................................................................... 42

2.1 1 Design of the Study :........................................................................................43
2.12 Limitations of the Study: ................................................................................. 43
2.13 Conclusion :...................................................................................................... 44
2.14 References :...................................................................................................... 45
Chapter-3: Economic Liberalization and Foreign Direct Investment Policies in India 49-103
3.1 Introduction :.................................................................................................... 49
3.2
FDI and Gross Domestic Product Ratio :...................................................62 Evolution of FDI Policy in India :.................................................................... 65
FDI Inflows in Pre-reform Period :............................................................65
The Phase of Cautious and Selective Attitude towards FDI (1948-1967):65
The Phase of Restrictive Attitude towards FDI (1968-1979). .................. 66
The Phase of Semi-Liberalization (1980-1990) :.......................................68
Trends of FDI Inflows during Pre-reform Period: Before 1991 .............. 69
Country-wise break-up of FDI flows during Pre-reform Period:.............. 70
Sector-wise break-up of FDI Inflow during Pre-reform Period:............... 72
FDI inflows in Post-reform Period: Since 1991 :.............................................73
Trends of FDI during Post-reform Period:................................................ 80
Route-wise FDI Inflows during Post-reform Period :................................ 82
Country-wise break-up of FDI Inflows during Post-reform Period:......... 84
Sector-wise break-up of FDI Inflows during Post-reform Period :............86
State-wise break-up of FDI Inflows during Post-reform Period :..............89
FDI in India: Reasons for Slow Intlows :.........................................................91
Attitude of Foreign Investors towards India:............................................ 91
PolicyFramework :................................................................................... 92
Procedures:................................................................................................ 94
Foreign Investment Promotion Board :......................................................95
Quality of Infrastructure ....................................................... ....................96
Pro-labour laws :........................................................................................ 96
Corruption:................................................................................................ 97
3.2.1
3.2.2
3.2.3
3.2.4
3.2.5
3.2.6
3.2.7
3.3
3.3.1
3.3.2
Global FDI Trends and Pattern of Flows :........................................................ 50
Trends of Global FDI Flow :...................................................................... 50
National Regulatory Changes Introduced by Countries of the World:..... 55
Comparing Performance and Potential :.................................................... 57
Inward FDI Performance Index :................................................................59
Inward FDI Potential Index :...................................................................... 60
Global Competitiveness Index :................................................................. 61
3.3.3
3.3.4
3.3.5
3.3.6
3.3.7
3.4
3.4.1
3.4.2
3.4.3
3.4.4
3.4.5
3.5
3.5.1
3.5.2
3.5.;
3.5.4
3.5.=
3.5.6
3.5.7
I

3.5.S Obstacles and Delays :...............................................................................97
3.6 C onclusion :......................................................................................................99 3.7 Re tcrrence :..................................................................................................... 101
Chapter-4: Pharmaceutical Industry in India: An O~ers'iew 104-155 4.1 Introduction' .................................................................................................. 104
4.2 Global Pharmaceuticals Industry :.................................................................. 104 4.2.1 Global Pharmaceutical Research and Development :.............................. 106 4.2 .2 Global Pharmaceutical Exports and Imports:.......................................... 106
4.3 Indian Pharmaceutical Industry: Historical background:..............................108 4.3.1 Indian Pharmaceutical Industry from 1900 to 1970 :...............................109 4.3.2 Indian Pharmaceutical Industry from 1970 to 1990 :............................... 110 4.3.3 Indian Pharmaceutical Industry after 1995: Post TRIPs Period :............. 112
4.4 Policy changes for Development of Pharmaceutical Industry in India:........ 112 4.5 Nature of Indian Pharmaceutical Industry .................................................... 116 116 4.6 Rationale for growth of Indian Pharmaceutical Industry:............................ 117 4.7 Trends in Production of Indian Pharmaceutical Industry ............................. 118 4.8 Pharmaceuticals Export and Import in India :................................................121 4.9 Direction of Indian Pharmaceutical Export and Import: ............................... 125 4.10 Research and Development in Indian Pharmaceutical Industry ................... 130
4.10.1 New Chemical Entities (NCEs) :..............................................................137 4.10.2 Abbreviated New Drug Applications (ANDAs) :....................................137 4.10.3 Drug Master Files (DMFs) :..................................................................... 139 4.10.4 Patent Protection :....................................................................................141
4.11 Contract Research and Manufacturing Services (CRAMS) :.........................143 4.12 Employment in Indian Pharmaceutical Industry:.......................................... 144 4.13 Chinese Threat and India Pharmaceutical Industry :......................................146 4.14 Strength, Weakness, Opportunities and Threats (SWOT) Analysis of Indian
Pharmaceutical Industry' ............................................................................... 146 4.15 Indian Pharmaceutical Industry in Global Market :.......................................148 4.16 Issues arising out of WTO Regime :...............................................................149 4.17 Conclusion :.................................................................................................... 150 4.18 Reference' ...................................................................................................... 152 Chapter -5: A Statistical Approaches to FDl in Indian Pharmaceutical Sector: 'Test of
Hypotheses 156 -194 5.1 Introduction: .................................. ................................................................ 156 5.2 Policies regarding FDI in the Pharmaceutical Sector:................................... 157 5.3 Effects of FDI in Indian Pharmaceutical Industry :........................................ 159
5.3.1 Competitive Effects :................................................................................ 159
111

5.3 .2 Imitation and demonstration Effects :...................................................... 161
5.3.3 Transfer of Technology Effects .................................. 2
5.3.4 Research and Development Effects :........................................................ 163
5.3.5 Human Capital Effects :........................................................................... 164
5.3.6 Industrial Management Etfects :.............................................................. 165
5.3.7 Linkage Effects :.................... ..................................................................167
5.4 Trends and Patterns of FDI Inflow in Indian Pharmaceutical Industry:........ 168
5.5 Investment in Pharmaceutical Industry and the FDI Inflows .......................177
5.6 Production of Pharmaceutical Industry and the FDI Inflows:...................... 180
5.7 Export of Pharmaceutical Industry and the FDI Inflows ..............................182
5.8 Profitability of Pharmaceutical and the FDI Inflows:.................................... 185
5.9 Employment and FDI Inflows in Pharmaceutical Industry:.......................... 189
5.10 Conclusion :.................................................................................................... 191
5.11 References:.................................................................................................... 193
Chapter-6: Conclusion Recommendations and suggestions 195-215 6.1 Introduction' ..................................................................... ........ 195 .....................
6.2 Suggestions and Recommendation :.................................. ...........202 ..................
6.2.1 Strategies and Implication for FDI in Indian Economy :.........................202
6.2.2 Strategies and Implication for FDI in Indian Pharmaceutical Industry: .208
6.3 Direction for Further Research' ..................................................................... 215
Bibliography 216-242 Appendix xix-xxx', ii
IV

Preface
FDI plays crucial role in bridging the gap between capital required and capital
available domestically. It has played a significant role in shaping Indian economy
since the first half of the decades of I980's. Globalization has further emphasized the
need of FDI in different sectors of the economy to fall in line with the global
production standards. Most of the countries of the world have evolved their economic
policies to attract foreign investors creating further pressure for the economy in India.
Basically. FDI plays multidimensional role in the overall development of the host
country. It may generate benefits through bringing non-debt creating foreign capital
resources, technology up-gradation, skill enhancement, new employment, spillovers
and allocative efficiency effects. It plays a complementary role in over all capital
formation and filling the gap between domestic saving and investment. At the macro
level it is a non-debt creating source of additional external finances. At the micro
level it is expected to boost output, technology, skill level, employment and linkages
with other sectors and the regions of the host economy. There are also costs and
benefits for the countries involved both the investing country and the host country.
There is a fundamental disagreement on what constitutes the costs and benefits of FDI
from the perspectives of the two countries. This disagreement is indicated by the big
gap between those holding pro-globalization and those with anti-globalization, views.
Moreover, sharing the gains of welfare between the host country and the home
country depends not only on given market scenario, but also on the relative strength
of the two countries in bargaining over the terms and conditions governing a
particular FDI project. It is not necessarily an optimal market condition that one
country's gains must be accompanied by other country's loss.
Kindleberger (1969) argues that the relationship arising from the FDI process is not a
`zero-sum game'. For an effective FDI both countries must believe that the expected
benefits to them must be greater than the costs. Such a trust and confidence are the
essence of an agreement to be reached to initiate the understanding projects. Of
course, such an assessment is in its ex-ante sense that often leads to a departure in the
ex-post torn. This gives the foundation of the present study that tbcuses on the FDI in
Indian Pharmaceutical Industry.
v

Pharmaceutical industry has universally emerged an important driver in the economy
and this is a `life-line' industry. The importance of this sector is that its products can
neither be substituted nor replaced. In fact, India is one of few developing countries
which have comparative advantages in this sector. Pharmaceutical industry currently.
accounts for nearly 2% of the GDP and 12% of India's manufacturing sector and is a
leading export sector. The Indian Pharmaceutical Industry today is in the front rank of
India's science-based industries with wide ranging capabilities in the complex field of
drug manufacture and technology. It ranks very high in the third world, in terns of
technology, quality and range of medicines manufactured. Indian pharmaceutical
sector produces the entire range of medicines from simple headache pills to
sophisticated antibiotics and complex cardiac compounds; almost every type of
medicine is now made indigenously. In terms of trade balance it is the only Indian
sector after apparels that have consistently given positive trade balance and is growing
around 1.5 to 1.6 times of the country's GDP growth rate and is known as recession
tree sector. Presently, 70 percent domestic requirement in bulk drugs and almost all
the demands for formulations are met. Coping well with the rapid changes in this
sector the world over, the Indian Phannaceutical Industry has done well in the last
few decades.
The study has dealt with the role of FDI in pharmaceutical industry for the period
from 1991-2008. Performances and appraisals of pharmaceutical industry have been
done in terms of trends in production, investment, profit, export and employment. The
same parameters have been taken to explore the nature of interrelation between the
FDIs vis-a-vis trends in production, investment profit, export and employment of
pharmaceutical sector in India.
vi

Acknowledgement
I sincerely otter my prayer to the ALMIGHTY ALLAH for best owing on me great
mercifulness and the choicest blessing without which I could have never completed
this ww ork.
I would like to express my feelings of tremendous admiration to my supervisor DR.
(Mrs.) Zeba Sheereen, Associ0.te.Professor, Faculty of Social Science, Economics
Department. Women's College AMU, Aligarh, for her scholarly supervision and
effective guidance. She is the one who inspired me to take the present research topic
and then, guided me at every step in the long way of research.
I also express my utter gratitude to Professor Nisar Ahmad Khan, Department of
Economics. AMU. Aligarh and DR. Faiyaz Ahmad, Lecturer, Department of
Commerce, Women's College, AMU, Aligarh for their particular co-operation and
encouragement throughout the period of the study.
My warm gratitude to Mr. B. K. Singh, Director, Department of Pharmaceutical.
Ministry of Chemicals and Fertilizers, New Delhi for providing the statistical data
related to my work without which I couldn't have completed my thesis.
Special thanks to the co-operative staff of the Department of Economics, AMU,
Aligarh particularly Mr. Buniyad Ali Khan, incharge, seminar library & Mr. Aqeel
Ahmad, office incharge. I am also thankful to the staff of Maulana Azad library,
AMU. Aligarh and Ratan Tata Library, Delhi University, New Delhi; for providing
every type of available data and information related to my work.
I shall remain highly indebted to my parents Mr. Akhtar Alam & Mrs. Shahnaz
Akhtar (especially my dearest mother), who appreciated and supported me to work
cheerfully putting up with all kinds of inconveniences and difficulties. I am really
grateful to them. Special thanks to my elder sister, Shabnam Haque and brother-in-
law. E.H. Yusufi: my sweetest nephews & niece Ahdullah Haque. Farhatullah Haque.
Inzema-mul Haque & Saima Haque: my younger sister Huma Akhtar.
have deep sense of appreciation for my husband for providing me moral support,
love and cooperation for the completion of this work.
vu

Last but not the least. it would be noteworthy to mention the name of my friends DR.
Shahina Parveen, qtr. Nasim Ansari, Mr. Jiyaur Rahman and Mr. Tariq Masood.
research scholars. Department of Economics. AMU, Aligarh, Ms. Shazia Z. Khan.
research scholar. Department of Philosophy, AMU, Aligarh, DR Nazim Faridi.
Department of Management and Business Administration. AMU, Aligarh, for their
invaluable suggestion to complete my work.
Despite all the efforts to make the thesis free from error, there may still some left
unnoticed for what the author takes all the responsibility.
GULSHAN AK.HTAR
viii

List of Tables
Title of Table Page Number
I. 'fable 3.1 Trends in Global regional Inflows of
FDI. 1991-2008 (USS billions) 51
2. Table 3.2- Share of FDI inflows in Developing Countries:
Selected Asian Countries (1991-2008) 54
3. Table 3.3-National Regulatory changes :1991-2008 56
4. Table 3.4- Inward FDI Performance Index of some selected Countries 60
5. Table 3.5-Inward FDI Potential Index of some selected Countries 61
6. Table 3.6- FDI Inflows and GDP in India: 1991-2008 (USS billions) 63
7. Table 3.7-FDI Inflows in India approval Vs actual
during 1980-1990 (US$ million) 70
8. Table 3.8-FDI inflows by Country of origin
during 1981-1990 (US$ million) 71
9. Table 3.9-Sector-wise distribution of FDI Inflows
during 1981-1990 (USS million) 72
10. Table 3.10-FDI in India approval Vs actual
during 1991-2008 (US$ million) 81
11. Table 3.1 I-Route-wise FDI Inflows in India (US$ million) 83
12. Table 3.12-FDI Inflows by Country of origin
during 1992-2008 (USS million) 85
13. 'fable 3.13(A)-Sector-wise distribution of FDI Inflows
during 1992-2000 (US$ million) 87
14. Table 3.13(B)-Sector-wise distribution of FDI Inflows
during April 2000 to April 2010 (USS million) 88
15. Table 3.14-State-wise distribution of FDI Inflows
during April 2000 to April 2010 (USS million) 90
16. Table 4. 1 -Global Pharmaceutical sales by region (2006-08)
(USS billions) 105
17. Table 4.2-Major Exporter of Pharmaceutical products in the World
(2008) (USS billions) 107
8. Table 4.3-Major Importer of Pharmaceutical products in the World
Ix

(2008) (USS billions) 108
19. Table 4.4-Market shares of MMNCs and Indian Companies in the
Pharmaceutical Industry in India ill
20. 'Fable 4.5-Production of Bulk drugs and Formulations
at current Prices in India (1990-2008) (USS million) 120
21. Table 4.6-CAGR of Production in the Pharmaceutical Industry in India 121
22. Table 4.7-Value of export and Import of Drugs & Pharmaceuticals
in India (1990-2008) (USS million) 123
23. Table 4.8-CAGR of Pharmaceutical export, Import and Trade balance 124
24. Table 4.9-Top ten destination of Indian Pharmaceutical
Exports (1991-2008) (USS million) 127
25. Table 4.10-Top ten destination of Indian Pharmaceutical
Imports (1991-2008) (USS million) 129
26. Table 4.1 1-R&D expenditure of leading Indian Pharmaceutical
Companies (1998-2008) (USS million) 132
27. Table 4.12-Trends in R&D expenditure in Indian Pharmaceutical
Industry (1991-2008) (USS million) 134
28. Table4.13-Investment trends in Indian Pharmaceutical
Industry (1991-2008) (USS million) 135
29. Table 4.14(A)-Country-wise ANDAs approvals (2007-08) 138
30. Table 4.14(B)-Company-wise ANDAs filing from India as upto 2008 139
31. Table 4.15(A)-Country-wise DMF files with USFDA (2008) 140
32. Table 4.15(B)- Company-wise DNIF filed from India as upto 2008 141
33. Table 4.16-Top ten Indian applicants for Patent from Pharmaceutical
Sector 2008 142
34. Table 4.17-Employment level in Indian Pharmaceutical
Industry (1995-2008) 145
3. Table 5.1-Greenfield FDI in the Pharmaceutical and health
Biotechnology sector by source region and activity (2002-06) 170
36. Table 5.2-Industry analysis: Number of Projects by activity (2003-08) 171
37. Table 5.3(A)-FDI inflows in Indian Pharmaceutical Sector
(1991-2008) (USS million) 174
38. "Fable 5.3(B)-Statistical description of total FDI and FDI in
Pharmaceutical Industry (1991-2008) 176
x

39. Table 5.4-FDI in Indian Pharmaceutical Sector during 1991-2008
(Technical & Financial) 176
40. Table 5.5(A)-Statement of Investment in Pharmaceutical
Industry and the Inflows of FDI (1991-2008) (USS million) 178
41. Table 5.5(B)-Regression estimates of Pharmaceutical
Investment against the FDI Inflows (1991-2008) 179
42. Table 5.6(A)- Statement of total Production of Pharmaceutical
Industry and the Inflows of FDI (1991-2008) (USS million) 181
43. Table 5.6(B)-Regression estimates of Pharmaceutical total
Production against the FDI Inflows (1991-2008) 182
44. Table 5.7(A)- Statement of Export of Pharmaceutical
Industry and the Inflows of FDl (1991-2008) (USS million) 183
45. Table 5.7(B)-Regression estimates of Pharmaceutical
Exports against the FDI Inflows (1991-2008) 185
46. Table 5.8(A)- Statement of Net Profit (PAT) of Pharmaceutical
Industry and the Inflows of FDI (1991-2008) (USS million) 186
47. Table 5.8(B)-Regression estimates of Pharmaceutical
Profits (PAT) against the FDI Inflows (1991-2008) 188
48. Table 5.8(C)- Regression estimates of FDI Inflows against the
Pharmaceutical Profits (PAT) (1991-2008) 188
49. Table 5.9(A)- Statement of Employment of Pharmaceutical
Industry and the Inflows of FDI (1995-2008) 190
50. Table 5.9(B)- Regression estimates of Employment in
Pharmaceutical against the FDI Inflows (1995-2008) 191
xl

List of Figures
Title of Figures Page Number
i. Figure 31: Trends in global regional inflows of FDI during
1991-2008 52
2. Figure 3.2: Shares of FDI inflows in developing countries: Selected
Asian countries during 1991.2008 55
3. Figure 3.3: National regulatory changes during 1991-2008 56
4. Figure 3.4: India's FDI inflows and GDP during 1991-2008 64
5. Figure 3.5: FIN inflows in India- Approval Vs actual during 1980-1990 70
6. Figure 3.6: FDI inflows by country of origin during 1981-1990 71
7. Figure 3.7: Sector-wise distribution of FDl inflows during 1981-1990 73
8. Figure 3,8: FDI in India- Approval Vs actual during 1991-2008 82
9. Figure 3.9: Route-wise FDI inflows in India during 1991-2008 84
10. Figure 3.10: Country-wise FDI share (%) during 1992-2008 86
1i. Figure 3.11: Sector-wise distribution of FDI inflows during 1992-2000 88
12. Figure 3.12: Sector-wise distribution of FDI inflows during 2000 to 2010 89
13. Figure 3.13: State-wise FDI inflows during April 2000 to April 2010 91
14. Figure 4.1: Global pharmaceutical sales by region during 2006-08 106
15. Figure 4.2: Major exporters of pharmaceutical products in the world 107
16. Figure 4.3: Major importers of pharmaceutical products in the world 108
17. Figure 4.4: Market share of MNCs and Indian companies in the
pharmaceutical industry in India 112
18. Figure 4.5: Production of bulk dugs and formulation in India during
1990-2008 121
19. Figure 4.6: Export and import of pharmaceuticals in India during
1990-2008 124
20. Figure 4.7: Top ten destinations of Indian pharmaceutical exports during
1991-2008 128
21. Figure 4.8: Top ten destinations of Indian pharmaceutical imports during
1991-2008 130
22. Figure 4.9: R&D expenditure of the leading Indian pharmaceutical
companies during 1998-2008 133
23. Figure 4.10: R&D expenditure in Indian pharmaceutical industry during

1995-2008 135
24. Figure 4.11: Investment trends in Indian Pharmaceutical industry
during 1991-2008 136
25. Figure 4.12: Country-wise ANDAs approvals during 2007-08 138
26. Figure 4.13: Company-wise ANDAs tiling from India upto 2008 139
27. Figure 4.14: Country-wise D vtFs tiled with USFDA (2008) 140
28. Figure 4.15: Company-wise DMFs filed from India upto 2008 141
29. Figure 4.16: Top ten Indian applicants for patents from pharmaceutical
in 2008 142
30. Figure 4.17: Level of employment in Indian Pharmaceutical industry
during 1995-2008 145
31. Figure 5.1: FDI inflow in pharmaceutical sector during 1991-2008 175
32. Figure 5.2: Investment in pharmaceutical industry and the inflow of FDI
during 1991-2008
179
33. Figure 5.3:Total production of pharmaceutical industry and the
inflow of FDI during 1991-2008 182
34. Figure 5.4: Export of pharmaceutical industry and the inflow of
FDI during 1991-2008 184
35. Figure 5.5: Profits (PAT) of pharmaceutical industry and the
inflow of FDI during 1991-2008 187
36. Figure 5.6: Employment of pharmaceutical industry and the
inflow of FDI during 1991-2008 191

List of Boxes and Charts
Title of Boxes & Charts Page Number
1. Box 3.1: Matrix of inward FDI performance and potential (2006) 58
2. Box 3.2: Liberalization of FDI Policies WE
3. Box 3.3: Various incentives scheme for attracting FDI 80
4. Chart 4.1: Evolution of Indian Pharmaceutical industry 114
xlv

Abbreviations/ Acronyms
ANDA Abbreviated New Drug Application
API Active Pharmaceutical Ingredient
ASEAN Association of South-Cast Asian Nations
ASSOCHAM' The Associated Chambers of Commerce and Industry of India
BCPW Bengal Chemical and Pharmaceutical Work
BDMA Bulk Drug Manufacturers Association
BIFR Board for Industrial and Financial Reconstruction
BOPs Balance of Payments
BR Basic Requirement
BRICS Brazil, Russia, India, China and South Africa
CAUR Compound Annual Growth Rate
CCI Competition Commission of India
CDRI Central Drug Research Institute
CDSCO Central Drugs Standards Control Organization
CENVAT Central Value Added Tax
cGMP Current Good Manufacturing Practice
CII Confederation of Indian Industry
CMIE
CNS
Centre for Monitoring Indian Ecommni~
Central Nervous System
CRAMS Contract Research and Manufacturing Services
CST Central Sales Tax
CV Coefficient of Variation
CVS Cardiovascular System
DCGI Drugs Controller General of India
DDPB Drug Development Promotion Board
DGCIS Directorate General of Commercial Intelligence and Statistics
DGFT Director General of Foreign Trade
DIPP Department Of Industrial Policy and Promotion
DMF Drug Master File
DNA Deoxyribo Nucleic Acid
DOP Department of Pharmaceutical
EE Efficiency Enhancers
xv

EHTP Electronic Hardware Technology Park
EPUs Export Processing Units
EPZs Export Promotion Zones
EXIM Export and Import
FDI Foreign Direct Investment -
FDIP1 Foreign Direct Investment in Pharmaceutical Industry
FEMA Foreign Exchange Management Act
FERA Foreign Exchange Regulation Act
FERs Foreign Exchange Reserves
FIB Foreign investment Board -
FICCI Federation of Indian Chambers of Commerce and Industry
FIIA Foreign investment Implementation Authority
FIPB Foreign Investment Promotion Board
FIPC Foreign Investment Promotion Council
FPCI First Pharmaceutical Census of India
FPI Foreign Portfolio Investment
FRBMA Fiscal Responsibility and Budget Management Act
ETA Foreign Technological Agreement
FTC Fast Track Committee
FTZs Free Trade Zones
GATS General Agreement on Trade in Services
GCi Global Competitive Index
GCP Good Clinical Practice i
GCR Global Competitive Report
GDP Gross Domestic Product
GM? Good Manufacturing Practice
GPCS Global Personal Communications by Satellites
GSK Glaxo Smith Klain
HAL Hindustan Antibiotics Limited
HIV-AIDS Human Immunodeficiency Virus- Acquired Immune Deficiency
Syndrome
HPB Health Protection Board
IBEF India Brand Equity Foundation 1, -'
IBRD international Bank for Reconstruction and Development
xvi

IC RA Internet Content Rating Association
IDMA Indian Drug Manufacturers Association
IDPL Indian Drugs and Pharmaceuticals Limited
IMF International Monetary Fund
IOC Indian Oil Corporation
IPI Indian Pharmaceutical Industry
IPRs Intellectual Property Rights
1SF Innovations and Sophistication Factors
ISP Internet Service Provider
IT Information Technology
JB1C Japan Bank for international Cooperation
JICA Japan International Cooperation Agency
KPO Knowledge Process Outsourcing
LDCs Less Developed Countries
LERMS Liberalized Exchange Rate Management System
M&As Mergers and Acquisitions
MHRA Medicines control Healthcare products Regulatory Agency
MIGA Multilateral Investment Guarantee Agency
MNCs Multi-National Corporations
MNEs Multi-National Enterprises
MNFs Multi-National Firms
MOHFW Ministry of Health and Family Welfare
MRTP Monopolies and Restrictive Trade Practices
MSR Medical Sales Representatives
NCEs New Chemical Entities
NCMP National Common Minimum Program
NDDR Novel Drug Delivery Research
NDDS Novel Drug Delivery Systems
NIP New Industrial Policy
NIPER National Institute of Pharmaceutical Education and Research
NPP National Pharmaceutical Policy
NRIs Non Resident Indians
OCBs Overseas Corporate Bodies
OECD Organization for Economic Co-operation and Development
xvit
OEDC Office of Epidemiology and Disease Control
OGL Open General List
OLI Ownership, Location, and Internationalization
OLS Ordinary Least Squares
ONGC Oil and Natural Gas Corporation
OPPI Organization of Pharmaceutical Producers of India
PhRMA Pharmaceutical Research and Manufacturing of America
PMP Phased Manufacturing Programme
PRDSF Pharmaceutical Research and Development Support Fund
R&D Research and Development
RBI Reserve Bank of India
SAP Structural Adjustments Programme
SD Standard Deviation
SDR Special Drawing Right
SEZs Special Economic Zones
SIA Secretariat for Industrial Assistance
SPV Special Purpose Vehicle
SSI Small Scale Industry
SWOT Strengths, Weaknesses, Opportunities, and Threats
TB Tuberculosis
TFP Total Factor Productivity
TGA Therapeutic Goods Administration
TNCs Translational Corporations
TRIPs Trade-Related aspects of Intellectual Property Rights
UK United Kingdom
UN United Nations
UNCTAD United Nations Conference on Trade and Development
UNICEF United Nations International Children's Emergency Fund
US United States
USFDA United States Food and Drug Administration
VAT Value Added Tax
WEF World Economic Forum
WHO World Health Organization
WTO World Trade Organization

iapter
Introductory Background and Theoretical Approach of the Study
1.1 Introduction:
Most of the present day developing countries of the world have set out a planned
programme for accelerating the pace of their economic development. In any country
planning for industrialization and aiming to accomplish a target rate of growth there is
need for resources. The resources can be mobilized through domestic as well as
foreign sources. As far as the domestic sources are concerned, they may not be
sufficient to acquire a certain rate of growth. Generally domestic saving is less than
the required amount of investment. Besides the very process of industrialization calls
for import of capital goods which cannot be locally produced. So, there comes the
need for foreign resources. They not only supplement the domestic saving but also
provide the host country t with extra foreign exchange to import essentials for
economic development. Thus foreign resources are craved for filling the saving
investment gap and foreign exchange gap. They are available to developing countries
in mainly three types.
1. Export of goods and services
2. External aid
3. Foreign investment
Export of goods and services contribute to foreign exchange but they can rneet only a
small fraction of' the total demand for foreign resources.
External aid from foreign governments and international institution by increasing the
rate of home savings and removing the foreign exchange gap permits the utilization of
previously underutilized resources and capacity. But generally aid is tied and distorts
the allocation of resources. Therefore its use has been on the decline.
The third type of foreign resources is foreign investment which is of two types.
1. Foreign Portfolio Investment (FPI)
2. Foreign Direct Investment (FDI)
Foreign Portfolio Investment involves (a) purchase of existing bonds and stocks with
the sole objective of obtaining dividends or capital gains and (h) investment in new
1 Host country refers to a country that receives an inflow of FD1 while I tome country refers to a country that tZenerates an out flow of FI)t.

cluupterr -- I
issues of international bonds and debentures by the financial institution or foreign
government.
The FDI is an Investment that involves a long term relationship and control by a
resident entity of one country. in a firm located in a country other than that of the
investing firm.FDI is assumed to take place when an investor has acquired 100o or
more of the voting power of a firm located in a foreign economy (IMF. 2004).
1.2 Foreign Direct Investment:
There is no specific definition of FDI owing to the presence of many authorities like
OECD, IBRD, IMF and UNCTAD. All these bodies try to illustrate the nature of FDI
with certain measuring methodologies. Generally speaking FDI refers to capital flows
from abroad that invest in the production capacity of the economy and are usually
preferred over other forms of external finance because they are non-debt creating,
non-volatile and their returns depends on the performance of the projects financed by
the investors. EDI also facilitates international trade and transfer of knowledge, skills
and technology. It is also described as a source of economic development,
modernisation and employment generation, whereby the over all benefits triggers
technology spillovers, assists in human capital formation, contributes to international
integration and particularly exports, helps to create a more competitive business
environment, enhances enterprise development, increases total factor productivity and
improves efficiency of resource use. Hence, FDI means the transfer of financial
capital, technology and other skills like managerial, marketing and accounting
expertise and practices. This relates costs and benefits for the countries involved both
the home country and the host country.
Considerable attempts have been made to assess as to what costs are borne and what
benefits are enjoyed by the two countries. There is even fundamental disagreement on
what constitutes the costs and benefits of FDI from the perspectives of the two
countries. This disagreement is indicated by the big gap between those holding free
market views and those with anti-globalization. Sharing: of the welfare gains between
the host country and the home country depends not only on given market scenario but
also on the relative strength of the two countries in bargaining over the terms and
conditions governing a particular FDI project. It is not necessarily an optimal market
condition that one country's gain must be accompanied with other country's loss. For

Clulpi 'r I
an effective FDI both countries must believe that the expected benefits to them must
be greater than the costs. Such trusts are the essence of an agreement to be reached to
initiate the underlying project.
1.3 Benefits of Foreign Direct Investment:
One of the advantages of FDI is that it helps in the economic development of the
particular country where the investment is being made. This is especially applicable
for the economically developing countries. During the decade of the 1990s FDI was
one of the major external sources of financing for most of the countries that were
growing from an economic perspective. It has also been observed that FDI has helped
several nations when they have faced economic hardships.
An instance of this could be seen in some countries of the East Asian region. It was
observed that during the global financial crises of 1997-98 (in East Asian countries)
the amount of FDI made in these countries was pretty steady, though the other forms
of cash inflows like debt flows and portfolio equity had suffered major setbacks.
Similar observations have been made in Latin America in the 1980s and in Mexico in
1994-95.
FDI also permits the transfer of technologies. This is done basically in the way of
provision of capital inputs. The importance of this factor lies in the fact that this
transfer of technologies cannot be accomplished by way of trading of goods and
services as well as investment of financial resources. It also assists in the promotion
of the competition within the local input market of a country. It can also bring in
advanced technology and skill set in a country. There is also some scope for new
research activities being undertaken.
Inflow of FDI also helps in the development of human capital resources through
training on the operations of a particular business. The profits that are then generated
can be used for the purpose of making contributions to the revenues of corporate taxes
of the recipient country.
Besides all this the other major advantages of FDI are that it helps in the creation of
new jobs in a particular country, thereby increasing the salaries of' the workers. This
enables them to get access to a better lifestyle and more facilities in life.
FDI assists in increasing the income that is generated through revenues realized by
taxation. due to the development of the manufacturing sector of the recipient country.

Chapter I
It also plays an essential role in the context of rise in the productivity of the host
countries. Their companies get an opportunity to explore newer markets through
exports that allows them to cash in on their superior technological resources, and
thereby generate more income and profits. It has also been observed that as a result of
receiving FDI. the recipient countries can keep their rates of interest at a lower level,
thus enabling the business entities to borrow finance at lesser rates of interest. The
biggest beneficiaries of these facilities are the small and medium-sized business
enterprises.
However, little evidence is available on the impact of FDI on the rural economy and
on the poverty. But FDI inflows are associated with higher economic growth, which is
critically important for poverty reduction. Besides FDI indirectly benefits poor by
creating better employment and earning opportunities for unskilled labour in the
developing countries like India.
1.4 Costs of Foreign Direct Investment:
Recent years have seen increased public concern that the benefits of FDI have yet to
be demonstrated and that, where it exists, they may not be shared equitably in the
society. The cost of FDI occurs mostly in case of matters related to operation,
distribution of the profits made on the investment and the personnel.
The situations in countries like Ireland, Singapore, Chile and China corroborate such
an opinion. It is normally the responsibility of the host country to limit the extent of
impact that may be made by the FDI. They should be making sure that the entities that
are making the FDI in their country adhere to the environmental, governance and
social regulations that have been laid down in the country. The various cost of FDI is
understood the most in matters of strategic importance like national security and
defence.
It has been observed that certain foreign policies are adopted that are not appreciated
by the workers of the recipient country. FDI is also disadvantageous for the ones who
are making the investment themselves. FDI may entail high travel and
communications expenses. The differences of language and culture that exist between
the country of the investor and the host country could also pose problems in case of
FDI. Besides that there is considerable instability in a particular geographical region.
This causes a lot of problem to the investor.
4

Chapter— I
Another. major disadvantage of FDI is that there is a chance that a company may lose
out on its ownership to an overseas company. This has often caused many companies
to approach FDI with a certain amount of caution.
The size of the market, as well as, the condition of the host country also influences the
FD[. In case the host country does not have good bilateral relations with their more
advanced neighbours, it poses a lot of challenge for the investors. The government of
the host country also faces problems over the control of those companies that are
functioning as the wholly owned subsidiary of an overseas company. This leads to
serious issues since investor is not completely obedient to the economic policies of
the country where they have invested the money. At times there have been adverse
effects of FDI on the balance of payments (BOPs) of a country. As more foreign
investors invest in the country, the demand for domestic currency rises. Consequently
the value of domestic currency appreciates. Appreciation of domestic currency causes
loss of competitiveness of exports as they become costlier. Cheaper imports and
costly exports further add to current account deficit in BOP.
1.5 Economic, Political and Social Effects of Foreign Direct Investment:
The controversy of expectation and realization would not have taken place if the host
country had achieved what the classical economist suggested with relation to the
effects of FDI. They pioneered the positive theories of FDI that stipulates that FDI
flows are in consequences of mobility of capital towards profit maximization. Since in
most cases the host countries lack capital which is essential factor of production, such
inflows are desirable from the point of global efficiency. It is further complemented
by the surplus and cheap labour that most of these host countries often enjoy, which
serves the condition of cost minimization vis-a-vis profit maximization. This is the
argument of classical economists that suffers from over simplification. Market is not
perfect in nature. the varieties of imperfections are so much that the MNFs
(Multinational Firms) are able to exploit the host country without their knowledge and
forcing the host country to adopt protectionist approach. Such worries sometime lead
to over protectionism. This is a departure from the classical proposition and quite
often utilised by the multinationals to he even more aggressive. They take their
protection as well by means of further manipulation of market imperfections in the
form of transfer pricing, shadow pricing, dumping, monopolistic competitions. At the
5

C'Implel. — 1
end, there are welfare losses on the part of host countries in the form of departure
from efficiency optimality and constant return to scale. Quite often the multinationals
are encompassed world-wide and have accumulated so much wealth that it become a
real threat to the stability of the host country. These are often categorized as the
economic effects of FDI. There are political effects as well which are not really
isolated from the economic effects. Sovereignty of host countries can be at stake in
case of taking very protective policies. Instances are there that political government
had been over thrown while taking nationalization policies of FDIs. The modern
system of FDI contributing to different political parties of the host countries does
have political implications as well. These are the political parties having the
potentials of making governments in future. The social issues are mainly concerned
with the creation of enclaves and foreign elite in the host country as well as the
cultural effects on the local population i.e. custom and tastes. Naturally social issues
are more likely to arise when there are significant economic, social and cultural
differences between the home and host countries.
The economic effects of FDI can be classified into macro and micro effects. The usual
convention in analyzing the macro effects of FDI is to treat it as a rise in foreign
borrowing if there is unemployment and capital shortage (as it is typically the case in
developing countries). Such borrowing leads to a rise in output and income in the host
country. Under these conditions FDI will have a beneficial effect on balance of
payments but an uncertain effect on the terms of trade (depending on whether the
impact of increased output falls on imports substitutes or exports). The micro effects
of FDI concerns structural changes in the economic and industrial organization. For
example an important issue is whether FDI is contributive to the creation of a non
competitive environment or conversely to a worsening of the monopolistic or
oligopolistic elements in the host country. In general the micro effects concern
individual firms and individual industries. Particularly those that are closely
associated and exposed to FDI
Like the theories of FDI there is significant over lapping in the discussion of these
effects. Like. the provision of capital as performed by FDI overlaps significantly with
the effect on the balance of payments and the effect on output. Moreover technology
is believed to be the main channel through which FDI affects growth and productivity.

Chapter - I
During the past few decades the activities of `MNFs have grown at a phenomenal rate.
The MNFs perform their business activities which can be broadly classified as direct
investment including FDI, technology transfer, Mergers and Acquisitions.
Collaborations, Joint Ventures 10O°'0 subsidiaries and marketing of' financial services.
However, their main instrumentality of business is primarily through FDI. The
significance of FDI in the world economy is much less controversial than its influence
on economic growth, although an overwhelming majority of country's economic now
explicitly regard FDI as an integral and crucial part of their growth strategy.
Since India's economic liberalization in the 1990's the role of FDI in the growth and
development of the developing countries is ever greater and significant. The origin of
World Trade Organization (WTO) in January 1995 has further given boost these
economies to go in a long way for more FDI in a varieties of arrangement such as
joint ventures, technological collaboration etc.
1.6 Foreign Direct Investment and Economic Development:
It has been observed that the economically developing as well as underdeveloped
countries is dependent on the economically developed countries for financial
assistance that would help them to achieve some amount of economical stability.
The economically developed countries, on their part, can assist these countries
financially by investing in these countries. This financial assistance can be
channelized into various sectors of the economy. The channelization is normally done
on the basis of the requirements of particular sectors.
FDI has a major role to play in the economic development of the host country. Over
the years. FDI has helped the economies of the host countries to obtain a launching
pad from where they can make further improvements. This trend has manifested itself
in the last seventeen years. Any form of FDI pumps in a lot of capital resources and
technological knowledge into the economy of a country.
'['his helps in taking the particular host economy ahead. The fact that the foreign direct
investors have been able to play a significant role vis-a-vis the economic development
of the recipient countries has been due to the fact that these countries have changed
their economic stances and have allowed the foreign direct investors to come in and
improve their economies.
7

Chapter — 1
It has been observed that the FDI has been able to improve the infrastructural
condition of a country. Besides that the private sector companies are not always
interested in undertaking activities that help in improving the infrastructure of the
country. This is because the gains from these infrastructural activities are made only
in the long term; there are no short term benefits as such. So as infrastructural sector
is one of the most crucial and capital intensive sector but due to insufficiency of
domestic capital FDI play an important role.
It can also assist in helping economically underdeveloped countries build their own
research and development bases that can contribute to the technological development
of the country. This is a very crucial contribution as most of these countries are not
able to perlbrm these functions on their own. These assistances come in handy,
especially in the context of the manufacturing and services sector of the particular
country, that are able to increase their productivity and ultimately advance from an
economic point of view. The health sector of many a recipient country has been
benefited by the FDI through availability of financial and technological and marketing
skills.
Besides infusion of capital FDI could also be provided in the form of technology. This
is an indirect way in which FDI plays an important part in the context of economic
development. Another important contribution of FDI is in the field of educational
sector. It can help in assisting the host countries to set up mass educational programs
that help them to educate the disadvantaged sections of the society. Such assistance is
often provided by the non-governmental organizations in the form of subsidies.
The standard of living of the general public of the host country could be improved as
a result of the FDI made in a country. Thus it may be said that it plays an important
role in the overall economic and social development of a country.
1.7 Effects of Foreign Direct Investment: Theories and Approaches:
The significance of FDI is being recognized globally since it has accelerated
remarkably in the last decades and many of the major corporations of most developed
countries have taken their production of goods and services to many diverse parts of
the world. Investments are more often to take place where locational and comparative
advantages are present and FDI is usually concentrated in the regions where the
industry in question will perform most efficiently. In order to compete in foreign
8

Chapter - I
markets, multinational MNCs (Multinational Corporations) take advantage of their
firm-specific resources, such as technological and marketing skill (Blomstrom &
Kokkv,1997)
There are several reasons for a firm to undertake FDI. It can be market- seeking
(horizontal) or resource- seeking (vertical) FDI. Market- seeking FDI takes place when
a MNC invests because of domestic market size, prospects for market growth,
transportation costs and the need to be close to potential customers. Resource- seeking
FDI seeks comparative advantages such as access to raw material, cheap input and low
cost of labour.
To analyze the determinants and effects of FDI a large number of studies have been
conducted till now. In a land mark study, Agarwal (1980) examined the different
aspects pertaining to FDI theories under perfect market conditions. The study used
different variables such as differential rate of return, the portfolio diversification and
the market size. He also examined the theories under imperfect market conditions.
Similar kind of discussion has also been organized in other alternative ways. For
example Boddcwyn (1985) souped the theories according to conditions and
participating circumstances for FDI. Kojima and Ozawa (1984) differentiated between
micro and macro model of FDI. The following theories pertaining to FDI have been
critically appreciated.
1.7.1 Theories of Foreign Direct Investment under Perfect Market Condition:
1. Differential Rate of Return
2, Portfolio Diversification Theory
3. Output and Market Size Approach
According to the differential rate of return approach, FDI is the result of capital
flowing from the countries having higher returns. the evaluation of investment
decisions is done by comparing the marginal return with the marginal cost of capital.
If the marginal return is higher in other countries than at home and assuming that the
marginal cost of capital is the same for both types of investment then the investment
decision will be in favour of other countries rather than home country. In the late
1950's this theory gained popularity when the FDI in manufacturing sector from USA
increased sharply in F.urope. At that time after tax fate of returns of US subsidiaries in
manufacturing were above the rate of return on US domestic manufacturing.
I

Chapter — I
However, this relationship did not last long. During the 1960's US FDI in Europe
continued to rise oven when the rate of return were high in domestic manufacturing
(Hufbaur. 1975). These hypotheses have been tested in many ways. Some authors
even tried to find a positive relationship between the ratios of firm's FDI to its
domestic investment and the ratio of its foreign profits to its domestic profits. Others
tried to relate FDI and the rate of foreign profits usually after allowing for a certain
time lag. Another approach was to examine the relationship between relative rates of
return in several countries and the allocation of FDI in these countries (Lizondo,
1991).
Agarwal (1980) argued on the validity of these empirical studies as it did not provide
strong supportive evidence mainly due to difficulties in measuring anticipated profits.
In most cases reported profits were used to represent anticipated profits. However
reported profit may differ from the anticipated profits. Besides it does not explain
some aspects of FDL Since this theory argues that capital flows from countries with
low rate of return to countries with high rates of return which is assumed implicitly
that there is a single rate of return with in a country. Thus the theory failed to explain
why there are some countries experiencing simultaneous inflows and outflows of
FDIs. Thus the theory of differential rates of return failed to explain the determinants
of FDI flows.
The theory of portfolio diversification provides a useful foundation for explaining the
nature and causes of FIN flows. It emphasized that the role of risk in choosing among
the various available projects should also be taken into consideration. FDI across
countries takes place due to the goals of risk diversification. Hence FDI decisions are
guided by assessment of anticipated returns and risk diversification. This follows the
theory of portfolio diversification of not putting all the eggs in the same basket. It has
been seen empirically that some of the highly profitable MNCs concentrates in few
regions rather than going for wider diversification. This contradicts the theory of
diversification. The theory however is an improvement over the differential rates of
return theory because of the inclusion of risk factor. Of course an individual investor
can reduce risk even by means of making his own portfolio diversified rather than the
firm itself goes for diversification. The other point that remains unexplained by this
theory is that it does not explain about the concentration of FDI in some industries
than in others.
10

Chaptei.— 1
The `output approach' takes into consideration the variable of output (sales), while the
market size approach considers the host country's Gross Domestic Product or Gross
National Product as the proxy for sales potential. The relevance of output for FDI can
be derived from the neo-classical model of domestic investment theory whereas the
relevance of host country's market size has generally been postulated rather than
derived from a theoretical model. Despite the lack of explicit empirical backing the
market size model has been very popular and a variable representing the size of the
host country appears in a large number of empirical studies.
1.7.2 Theories of Foreign Direct Investment under Imperfect Market
Condition:
Theories under imperfect market condition are reviewed as follows:
1. Industrial organization.
2. Internalization theory.
3. Product cycle theory.
4. Eclectic or OU theory.
5. Oligopolistic Reaction Theory.
6. New Trade Theory.
Rymer (1976) was the first researcher who pointed out that the structure of market
and the specific characteristics of firm play an important role in explaining the FDI.
He advocated that the existence of MNFs depends on market imperfections. 'there are
two important types of market imperfections namely structural imperfections and
transaction cost imperfections. Structural imperfections help the MNF in increasing
its market strength through economies of scale, advantages of knowledge, distribution
network, product diversification and credit advantages. While the transaction cost
imperfection makes profit for the MNFs to substitute on internal market for external
transactions. The study of structural imperfections led to the industrial organization
theory of FDI whereas the study of transaction cost gave rise to the internalization
theory of FDI (Graham & Krugman, 1989). The Industrial organization theory argues
that a MNF faces a number of disadvantages in case of competition with domestic
firms. These difficulties include the problems of managing operations, dealing with
different cultures, legal system, languages, customer preferences. technological
standards etc. Despite these disadvantage a MNF enjoy some firm specific advantages

Chapter — I
with respect to domestic firms. The merits of MNF are their brand name, patent,
protected superior technology, marketing managerial skills, cheaper sources of
financing, preferential access to market and economics of scale. However, it is
observed that the industrial organization theory is not complete as it did not explain as
to why the competition must take the form of FDI.
The Internalization theory (Buckeye & Casson, 1976) states that the existence of FDI
as a result of firms replacing market transaction with tormal transactions. This is a
way of avoiding market imperfection for intermediates inputs. Modem business
follows many activities in addition to the daily activities of producing goods and
services. These other activities include marketing, R & D and training of labour which
are related with the flow of intermediate goods mostly in the form of knowledge and
expertise. However the market imperfections make it difficult to price some of the
intermediate goods (Coase, 1937). The main characteristics of this theory is treating
markets on the one hand and firms on the other as alternative modes of organizing
production. The internalization of markets beyond national boundaries leads to the
formation of MNFs which result in FDI. This process continues till the equalization of
costs and benefit from internalization is complete. This is also known as general
theory of FDI. Ruwnan (1980) opines that most of the hypotheses for FDI are the
particular cases of the internalization theory. The theories of imperfect condition arc
attributed to three basic elements i.e. industrialization in a country, internalization in a
country and presence of location factor. The central theme of this theory is that FDI
would be attracted by favourable supply conditions which have their origin in those
factors underlying industrialization, internalization and location. It does not call into
question the demand conditions for an integrated plan of FDIs.
Vernon (1966) introduced the product cycle theory to explain the nature and causes of
FDI. According to this theory direct foreign investment is a natural and climatic stage
in the life cycle of a new product introduced to the market by oligopolistic firms. The
product first appears as innovations and ultimately become completely standardized.
Innovation can be the result of reacting with more severe competition or can be
outcome of exploiting new profit opportunity. Vernon's theory viewed "direct foreign
investment as diffusive mechanism or solution to the problem of intensifying
competition at both home and abroad. The perfect example illustrating the Vernon's
theory is the manufacturing of electronics.
12

Chapter - 1
The Eclectic theory of FDI also known as the Ownership Location and Internalization
(OLI) paradigm of FDI was first propounded by Dunning (1977, 1979, and 1988)
which combined three theories of FDI namely industrial organizational theory,
location theory and internalization theory. According to him three conditions must be
satisfied if a firm wants to be a MNF. Firstly, the firm must have some ownership
advantages with respect to other firms. Secondly, it should have other advantages like
sell or lease to other firms. Lastly, the firm must be more beneficial to use these
advantages with some inputs located in other countries. It also postulates that
advantages of this theory are not likely to be uniform since all countries, industries,
enterprises and are likely to change over a period of time. However, the Eclectic
theory does not consider the risks associated with the trade groupings, floating
exchange rate and the super structure of global credit system (Dunning, 1979).
Knickerbocker (1973) gave the `Oligopolistic Reaction theory'. This theory explained
that the FDI by one firm will lead to propogate the other tines to do the same in order
to maintain their market share (Graham, 1978). In this perspective Hufaur (1975)
contradicted that "due to increased industrial concentration, the competitors compete
among themselves to achieve cost or marketing advantages over each other. But this
increases in industrial concentration between different products of MNFs with their
expenditure on R&D. An important implication of this theory is that the process of
FDI by MNFs in self limiting due to increased concentration in home and other
market the competition will increase amongst them and this will reduce the intensity
of Oligopolistic reaction. A major criticism of this theory is that it does not recognize
FDI as one of the several methods of foreign investment and it has also failed to give
reasons for the start of foreign investment process.
Helpman and Krugman (1985) developed the `new trade theory of FDI in response to
the failure of classical trade theories of incorporating concepts observed in actual
flows of international trade such as intra-industry trade. The new trade theories
contributed by constructing general equilibrium trade models which could include
increasing return to scale. imperfect competition and product differentiation. The
main assumption in these theories was about single plant national firms, which limited
the usefulness of these models explaining FDI. But the earlier trade theory failed to
incorporate together MNCs and FDI. However during the eighties and nineties,
Markusen (1995) and other researchers modified the new trade models to allow for
13

Chapter—
inclusion of MNCs and FDI. An important contribution of new trade theory models
incorporating MNCs is that they can be used to analyze a firm's decision between FDI
and exports. The decision between foreign production and exports revolves around the
"Proximity concentration trade-off', where MNCs compare trade costs to the costs of
producing at several locations. The proximity concentration trade off' has resulted in
the idea of two primary forms of FDI, i.e. horizontal and vertical.
The above discussions dealt with some important theories related to the nature and
causes of FDI flows in the world. An attempt has been made here to concentrate on
the nature of FDI flows in India.
1.8 Locational Factors that Influence Foreign Direct Investment Inflows in
India:
1. Market Size:
Market size is one of the most important considerations in making investment
locational decisions. The attractiveness of large market is related to large potential for
local sales, because domestic sales are more profitable then exports especially in
larger countries such as India where economies of scale can be eventually reaped.
Also such countries offer more diverse resources which make local sourcing more
flexible, India is one of the largest markets with a huge growing affluent middle class
(300 million). According to IMF (2011) in terms of Purchasing Power Parity India
ranked the third largest in the world, with a gross domestic product of US $ 4.46
trillion while in USD exchange-rate terms, it is the 13Lh largest in the world, with a
GDP of US $ 800.8 billion. Furthermore. India is the second fastest growing major
economy in the world, with a GDP growth rate of 9.2% at the end of the first quarter
of 2007- 2008. The higher GDP, the better is the country's economic health and better
is the prospects that the direct investment will be profitable. Hence GDP has a
positive influence on direct investment from abroad.
2. Economic Stability of the Country:
Monetary and fiscal policies determine the parameters of economic stability such as
the interest rates, tax rates and the state of external and budgetary balances which
influences the investment rates, as described below:
14

Chapter —1
a) Interest rates:
Interest rates affect the cost of capital in a host country, directly affecting one of the
determinants of the investment decision. The effects of interest rates on FDI are
smaller than on domestic investment because MNCs normally have a greater choice
of sources of financing. It was 4.25 percent in the year 2009.
b) Level of External Indebtedness:
It is expected to have a negative impact on FN inflows. The level of indebtedness
shows the burden of repayment and debt servicing on the economy thus making the
country less attractive for foreign investor. India's external debt stood at US$221.2
billion in 2008 which was 18.8 percent of GDP (Economic survey 2007-08).
c) Debt Service Ratio:
This is represented by total debt service as a percentage of total income of the
country. The higher this ratio, the higher will be the burden of the country to service
the debt out of the income of the country. '[he FDI inflows are expected to increase
with a small debt service ratio. Thus this variable is having negative correlation with
FDI in flows. It was 4.4 percent in the year 2008 (Economic survey 2009-10:143).
d) Foreign Exchange Reserves:
The higher the level of foreign exchange reserves (FERs) in terms of import cover
reflects the strength of external payments position and helps to improve the
confidence of the investors. Hence a positive relationship is expected between the
FERs and the inflow of FDI. It was USS254.6 billion in 2008.
e) Exchange Rate Regime:
Exchange rate represents the investment climate in the country. High exchange rate
will erode the profitability of foreign investment, increase the cost of production and
introduce distortions in the host country's economy. Hence a negative relationship can
be expected between the exchange rate and the flow of foreign capital. Exchange rate
of the Indian rupees vis-a-vis the SDR, US dollar, Pound sterling and Euro were 68.6,
43.4, 80.2 and 63.7 respectively in 2008.
I) Inflation Rate:
A high rate of inflation is a sign of internal tension and of the inability of the
government and the central hank to balance the budget and to restrict the supply of
money. As a rule, the higher the inflation rate, the less will be the FDI inflows. A
negative relationship is expected. Recently it is very high (9.9 % in 2009).
15

Chapter —
g) Deficit in the Balance of Payment:
A large deficit in Balance of Payment indicates that the country lives beyond its
means. The danger increases that free capital movement will be restricted and that it
will be more difficult to transfer the profit from the direct investment into the home
country. Hence a negative relationship can be expected. In the year 2008 it has US$ -
118.4.
3. Availability of Human Capital:
The continued expansion of MNCs in the past was a response of differential
availability of factor endowments in different countries. Cheap and productive labour
reduces the cost of production and yields high profitability. Low wage rates and
higher labour productivity thus is expected to have a positive effect on FD[ inflows.
India has 16 percent of world population with 402 million (2001) labour force.
Besides India has a large pool of trained manpower, with 700,000 science graduates
and engineers qualifying annually. This includes 122000 chemists around 50,000
pharmacists, 150,000 chemistry post graduates and chemical engineers and
approximately 1500 Ph.D.
4. Availability of Natural Resources:
The availability of natural resources (raw material) for manufacturing is one of the
most important factors in investment decision making. If the resources are available
locally the cost of production remains low, as the cost of transportation is saved. It is
the sustained availability of the resources which matter in the investment decisions.
Nature has bestowed upon India a number of mineral resources. Ample deposits of
coal, iron, bauxite, mica, manganese, gypsum, chromate and limestone are found in
Indian territory.
5. Economic Policies of the Host Country:
Economic policies includes the industrial policies, trade policies, tax structure, the
intellectual property protection regime, bilateral investment treaties, regional
integration frameworks, multilateral investment framework and so on of a country.
Government policies are possible determinants of FDI since the government considers
FDI flows as a means to fight unemploytnent and increase national growth rate.
6. Infrastructure Facilities:
The establishment of industry requires a highly developed infrastructure. The
developments of roads, rail, electricity and communication system are important
16

C'ha ter — 1
inti'astructural facilities which are essential for the development of the industry. These
factors are responsible for the attraction of FDI and the lack of which becomes a
hindrance.
7. Agglomeration Effects:
Agglomerations also have significant effects on attracting FDI_ Agglomeration
economies arise from the presence of other firms, other industries, as well as from the
availability of skilled labour force. It correspond to positive spillovers form investors
already producing in this area. This gives rise to economies of scale and positive
externalities, including knowledge spillovers, specialized labour and intermediate
inputs. Thus high FDI today implies high FDI tomorrow.
1.9 Importance of Foreign Direct Investment for Growth and Development in
India:
After independence it was realized that the economy was in a bad condition and in
need of massive reconstruction. There was shortage of capital, productive facilities
manpower and entrepreneurs. The infrastructure of the country inherited was not
compatible for production. The technological know- how was poor. Policy makers at
that time realized the importance of foreign capital and technology to furnish the
needs. The political leadership of "Swadeshi" at that time was rather sceptic due to
the bitter experiences of British rule. They by- passed the real need of foreign capital
and technology in the forms of restrictive policies. Through these policies provided
the country with a foundation of local technology in the manual form backed by low
capital. That created enough employment opportunities for the poor economy of India
but compared to the global development of technology the indigenous technology
lacked efficiency. By 1950s the policy makers felt the importance of foreign capital
and technology in the country. The first five year plan introduced to allow foreign
investment at least in the agriculture sector. I lowever during 1960s and 1970s there
were a number of collaboration with Russia particularly in the power. petroleum. Coal
mining, steel and Iron. drugs and pharmaceutical sectors. But the country was vet to
accept the investment of capitalist countries in view of their nature of exploitation.
The congress party in the 1980's made the economy more liberalized by permitting a
number of sectors including telecommunication, infrastructure, banking and
information technology open for foreign investments. It was observed that the initial
17

Cliuter — /
experiences were not bad as the locally protected tirms availed the opportunity of
becoming more competitive at the global standards.
In India the lure of non-debt creating FDI flows has galvanized successive
governments since 1990-91. Now the government talks about ensuring S25 billion
FDl flows into India as the minimum consideration for achieving the economic
growth target of 8 percent per annum. Because the sustained flow of FDI would give
the economy a smooth ride to banish the twin dangerous of endemic poverty and huge
un-employment and cope with the vast investment requirements of maintaining the
rickety infrastructure and creating more facilities.
Therefore, in the line of globalization foreign capital and technology was realized as
an urgent need for the development of the economy. Consequently in 1991, the
government of India introduced new economic policy' with policy of liberalization.
Most of the sectors were allowed for foreign investment except very few like defence
and strategic sectors. The emergence of the WTO made these a kind of obligation.
The commitment of the country with the WTO and the IMF made official
withdrawals of all restrictive policies in favour of investment climate of global
standards. Now India is committed to provide one of the best investment opportunities
of FDI i.e. ranked second position according to Global Business Policy Council
(2005). Within a span of about 18 years FDI in India has increased nearly 165 times
from 1991 to 2008 and attracted more than 1 billion US dollar per year. Except
defence and strategic sectors all the sectors of the economy are now ready for FDI.
The statistics highlight the role of FDI in the growth and development of the Indian
economy.
The pharmaceutical industry of India has also observed a transition during this period.
The technology of the sector observed a tremendous development and the quality of
output improved remarkably. The sector now contributes 90 percent of domestic
consumption and a sizeable figure to the export of India. This indicates that the
intensity of production and promotion of FDI inflows in the sector have increased
significantly. It may be argued that the development of pharmaceutical industry in
India is an outcome of the flow of FDI in the sector.
1S

(Barter - I
1.11) Conclusion:
FDI play multidimensional role in the o\ erall development of the host country. It may
generate benefits through bringing non-debt creating foreign capital resources,
technology upgradation, skill enhancement, new employment. spillovers and
allocative efficiency effects. It plays a complementary role in over all capital
formation and filling the gap between domestic saving and investment. At the macro
level it is a non-debt creating sources of additional external finances. At the micro
level it is expected to boost output, technology, skill level, employment and linkages
with other sectors and the regions of the host economy. Thus FDI acts as a catalyst for
domestic industrial development and considered to be an important vehicle for
economic development. According to Chaturvedi (201 1) the value of Karl Pearson
correlation is found to be +0.89 means a high degree correlation between FD1 and
economic development. While FDI has many disadvantages also like increased
market concentration, foreign interference, damages to the nations customs and
culture etc. The major factors that attract FDI in India are huge market size, low cost
and skilled labour, sound macroeconomic development, abundant natural resources
etc.
A theoretical review on FDI has revealed that the different theories have led emphasis
on varied micro and macro factors, which as a result, influence the foreign investment
in an economy. It is therefore inappropriate to assess the role of FD1 through the
application of single theory and what is needed in the present globalizing economy of
the world is to blend and combine the indigenous and exogenous factors impinging
upon the decision for inviting foreign investment in an economy.
In the succeeding chapter an attempt is made to review the literature on the subject
matter of FD1 in different sectors of the economy with special reference to
pharmaceutical industry. The study has further presented the statement of the
problem, objectives, scope and scheme of chapterisation. Research design and
methodology suitably carved out keeping in mind the hypotheses formulated to
critically examine the role of FDI in promotion of pharmaceutical industry in India.
19

Chapter — I
1.11 References:
I. Agarwal, Janwna P. (1980). "Determinants of Foreign Direct Investment: A
Survey", weltwirtschaflliches Archie, 116 Heft 4:739-773.
2. Blomstrom Magnus and An Kokko (1997)." Regional integration and
Foreign Direct Investment", World Bank Policy Research, Working Paper
1750, Cambridge.
3. Boddewyn, J.J. (1985). "Theories of Foreign Direct Investment and
Disinvestment: A Classificatory Note", Management International Review
25(1).
4. Buckeye, Peter J. and Mark Casson, (1976). "The Future of the MNFs",
London Macmillan.
5. Chaturvedi, Ila (2011). "Role of FDI in Economic Development of India:
Sectoral Analysis", International Conference on Technology and Business
Management Jaipuria Institute of Management, Ghaziabad (March 28-30).
6. Cease, R.H. (1937), "The Nature of the Finn" Economica, 4(16): 386-405
(November).
7. Dunning, John H. (1977) "Trade Location of Economic activity and the
MNE: A Search for Aq Eclectic Approach" in the International Allocation of
Economic Activity. Ed by B. Ohlin, P.O. Hsselbom and P.T. Wijkman,
Macmillan. London: 395 418.
8. Dunning, John H. (1979), "Explaining Changing Pattern of International
Production in Defence of Eclectic Approach", Oxford Bulletin of Economics
and Statistics, 41.
9,
Dunning, John H. (1988). "The Eclectic Paradigm of International
Production-A Restatement and Some Possible Extension", Journal of
International Business Studies. 19 (spring).
10. Economic Survey (2007-08), Planning Commission, Government of India,
New Delhi.
11. Economic Survey (2009-10), Planning Commission, Government of India,
New Delhi: 143.
12. Global Business Policy Council (2005). "FDI Confidence Index", 8, GBPC.
20

Chapter - I
13. Graham, Edward M. and Paul R. Krugman (1989). "Foreign Direct
Investment in U.S.", Washington Institute for International Economies.
14. Graham, Edward. M. (1978), "Translation Investment by Multinational
Firms: A Rivalistic Phenomenon". Journal of Post Keynesian Economics, 1.
15. Hclpman, E. and P.R. Krugman (1985). "Market Structure and Foreign
Trade" The Massachusetts Institute of Technology Press, Cambridge.
16. Hutbour, G.C. (1975). "The MNCs and direct investment in International
Trade and Finance: Frontiers of Research", ed. by Peter B. Kenen,
Cambridge, England, Cambridge University Press.
17. Hymer, S.H. (1960). "The International Operations of National Firms: A
Study of Direct Foreign Investment", Ph.D. Thesis, Massachusetts Institute
of Technology (Published by NIT Press 1976).
18. IMF (2004). "Foreign Direct Investments, Trends. Data Availability,
Concepts and Recording Practices", IMF, February 9 (online).
19. Knickerbocker, Fredric T. (1973), "Oligopolistic Reaction and Multinational
Enterprises, Boston: Division of Research", Harvard University Press,
Graduate School of Business Administration.
20. Khan, A.Q. (1999). "Emerging Dimensions of Global Fund Flows
Management: A Focus on India". Unpublished Project, Department of
Commerce AMU, Aligarh: 15.
21. Kojima, Kiyoshi and, Turutomo Ozawa (1984) "Micro and Macro-Economic
Model of Direct Foreign Investment towards a Synthesis", Hitotsuabashi
Journal of Economics, 25, (June).
22. Lizondo, Saul J. (1991), "Foreign Direct Investment" in Occasional Paper
77. A Study by the Research Department of the IMF (March).
23. Markusen, J.R. (1995), "The Boundaries of MNEs and the Theory of
International Trade", Journal of Economic Perspective 9:169-189.
24. Rugtnan, Alan M. (1980), International as a General Theory of Foreign
Direct Investment: A Re-appraisal of the Literature". Weltwirtschaftliches
Archie, 116, Heft 2.
25. Vernon, Reynold (1966), "International Investment and International Trade
in the Product Cycle", Quarterly Journal of Economics. 80: 190-207 (May).
21

Chapter - 2
Review of Literature and Research Design of the Study
2.1 Introduction:
India resorted to liberalization regime by opening the economy and paving the way
for foreign investment. During the post liberalization period since 1991 different
issues emerged as regard to inflow of FDI in India.
As India suffered technological backwardness and institutional rigidities in such a
scenario pharmaceutical industry was the only potential to the beneficiary of
economic liberalization through FDI. However, this is the optimistic part of the
consequences. There is a pessimistic part not ignorable either. Economists quite often
belong to either of two view points.
The pessimistic group led by Charles Kindlebcrgcr (1992) viewed FDI as a source for
exploitation for the host countries by multinationals. Such exploitation ranges from
inappropriate technology, labour exploitation, transfer pricing etc. to high repatriation
and economic exploitation. The optimistic group, led by the famous development
economist Michael Todaro (1999) opines a careful scrutiny of the host country to
ensure capital formation, technological development, employment generation and
promotion of living standards. FDI in pharmaceutical industry in India had not been
informed of this consequence and the present study aims to analyze these.
2.2 Statement of the problem:
The advent of FDI in the Indian economy has given birth to a number of interesting
and noteworthy problems which are discussed below:
I) The entry of FDI would give rise to economics of scale and higher
productivity by the use of latest technology. It is well known that FDI brings
with it latest technology that is being used in the developed countries. So the
host country gets the advantages of the use of latest technology. Besides FDI
brings novel concepts of managerial skills.
2) FDI generates more employment. With the inflow of FDI in a developing
economy, the investment process gets boost and a large number of projects
start that lead to the generation of employment in almost every sector of the
economy. It also provides an opportunity to the idle work force of the host
countries.
22

Chapter r -
3) FDI paves the way to have large volume of foreign exchange. It helps in
enhancing exports tor the host country. So the increase will directly influence
the foreign exchange of the host country, which consequently helps it to
maintain large volume of lareign exchange and improve its BOP position.
4) Another significant issue which has cropped up in the wake of FDI is the
development of social sector. The Indian industries are predominantly labour
intensive. Human capital in terms of quality was not a big problem in India
due to its huge population added emphasis must be laid on the quality and
efficiency in work by MNCs. FDI also enhanced our educational system.
Since 2003, the Indian government has been allowing 100% FDI in education,
which means that foreign schools, colleges and universities can set up wholly
subsidiaries in India.
The pharmaceutical industry has been chosen for research for many reasons. First this
sector play an important social role for it is directly concerned with the health of the
people which is a basic need of every citizen. Second is that the contribution of the
pharmaceutical companies in the spheres of production, earning foreign exchange and
investment in Indian economy has been quite significant. Third, this industry is a
research based one. R&D activity is one of the basic needs of the industry.
The role of FDI is an important consideration for the fast growing pharmaceutical
industry as FDI always helped in boosting exports with the setting up of the state-of-
the art infrastructure facilities and latest technological skills, which further helps the
export industry to stay afloat in the international competitiveness and sustained
growth which, emergence of the pharmaceutical industry as one of the fastest Bowing
among all the industries, especially in terms of exports. Therefore by taking into
consideration all these it is inferred that FDI has a very important role play in the
development of economies like India, which is lagging far behind in growth and
development as compared to other developed countries.
2.3 Review of literature:
A lot of research has already been done across the globe for analyzing the various
aspects of FDI. In the development literature, well reflected in the international as
well as the Indian discourse, there has been a lot of debate generated about inflows of
23

Chapter - 2
FDI for different sectors and their impact. Some of the major works are reviewed
here. For simplification purpose the studies have been divided into two categories.
The Global Perspective:
Bransteeter or al. (2007) in their study of "Intellectual Property Rights, Imitation and
FDI: Theory and Evidence" tried to analyses the effect of strengthening Intellectual
Property Rights (IPRs) on the level and composition of industrial development in the
developing countries. They developed a North South Product cycle model in which
Northern innovation, Southern imitation and FDI are all endogenous variables. The
study predicts that IPR reform in the South leads to increased FDI from the North as
the Northern firms shift production to the Southern affiliates. This FDI accelerates
Southern industrial development. Resides as the production shifts to the South, the
Northern resources will be reallocated to R&D, driving an increase in the global rate
of innovation. The study finds that MNCs expand the scale of activities in reforming
countries after the IPR reforms.
Analyzing the influence of strengthening IPRs on FDI inflow, Glass and Saggi (2000)
in their paper "Intellectual Property Right and FDI" developed a product cycle model
with endogenous innovation, imitation and FDI and determined how stronger
intellectual property rights protection in South affects innovation, imitation and FDI.
They find that stronger IPR protection keeps multinational safer from imitation, but
no more so than Northern firms. Hence FDI decreases with strengthening of Southern
IPR Protection because an increase in the list of invitation crowds-out FDI through
tighter southern resource scarcity.
A study carried out in an edited volume by Narula and Lall (2006) `Understanding
FDI Assistant Economic Development" emphasizes the factors that led to an
optimization of the benefits from FDI for the host country. Despite the diversity of the
countries covered and the methodology used in the study, it points to a basic paradox.
"With weak local capabilities, industrialization has to be more dependent on FDI.
However, FDI cannot drive industrial growth without local capabilities." They clearly
show that market forces cannot substitute for the role of the government and argue in
favour of a proactive industrial policy. Therefore FDI per se does not provide growth
opportunities unless the domestic industrial sector exists which has the necessary
technological capacity to profit for the externalities from MNC activity.
Blourstrom and Kokko (2005) in their study "The Economics of Foreign Direct
Investment" suggest that the use of investment incentives to attract more EDT is
24

('Iicip er - 2
nonnallv not an efficient way to raise national welfare. The strongest theoretical
motives for financial subsidies to attract investment are spillovers of foreign
technology and skills to local industry. They argue that these benefits may not be an
automatic consequence of foreign investment. The potential spillover benefits are
realized only if the local firms have the ability and motivation to invest in absorbing
foreign technology and skills. To motivate subsidization of foreign investment, it is,
therefore necessary at the same time to support learning and investment in local firms
as well.
Haskel et al. (2004) in their study "Does Inward FDI Boost the Productivity of the
Domestic firms" tried to find out whether there are any productivity spillover from
FDI to the domestic firms and if so, how much should the host countries be willing to
pay to attract FDI to their countries. Using plant level panel covering U.K.
manufacturing during 1973-1992 they estimate a positive correlation between
domestic plants, Total Factor Productivity (TFP) and the foreign affiliates share of
activity in that industry. The study suggest that a 10 percent point increase in foreign
presence in the UK industry raises the TFP of that industry's domestic plants by about
0.5 percent. These estimates are used to calculate the job value of these spillovers.
And calculated values appear to be less than per job incentives that the government
has granted in some cases.
In the study on "Human capital formation and FDI in Developing Countries, Lyamoto
(2003) has taken a view of the complex linkages between the activities of the MNCs
and the policies of host developing countries. The study indicates that a high level of
human capital is one of the key components for attracting FDI as well as for the host
countries to get maximum benefits from these activities. He finds that one way to
improve human capital formation and attract more FDI is to provide a strong
incentive for MNCs and investment promotion agencies to participate in formal
education and vocational training for workers employed with domestic firms. Besides
FDI promotion activities can target high value added MNCs that are more likely to
bring new skills and knowledge to the economy that can be tapped by the domestic
enterprises.
In an interesting article "Intellectual Property Rights. Technology and Economic
Development: Experiences of Asian Countries" Kumar (2003) critically examined the
role of intellectual property protection regime with reference to Asian countries. The
study indicates that the top 10 countries account for 84 percent of global resources
25

('hainc~r -
spent on R&D activity with controlled 94 percent of the technological output in terms
of patent taken out in the US and receive )l percent of global cross border royalties
and technology license fees annually. Therefore it affects the prices of a large number
of important drugs and thus affects the health systems in poorer countries and lead to
income transfer from poorer to richer countries. Besides, it will adversely affect the
manufacturing activity in developing countries and may increase their imports but
does not guarantee increased FDI inflows, access to technological R&D investment in
tropical diseases. He suggests that developing countries should build adequate
provisions for compulsory licensing in their IPR legislation in order to safeguard them
from possible abuses of monopoly power obtained by patent owners. Government
may impose regulation of prices of essential drugs to protect the poor masses from the
price increases and provides increased technical assistance and R&D funding to local
enterprises to help them in building up their local capabilities.
Kumar (2001) in his study entitled "Infrastructure Availability, FDI Inflows and their
Export Orientation: A Cross Country Exploitation" analyses the role of infrastructure
availability in determining the attractiveness of countries for FDI inflows for export
orientation of MNCs production. He posits that the investment by the governments in
providing efficient physical infrastructure facilities to improve the investment climate
for FDI. The estimates corroborate the fact that infrastructure availability does
contribute to the relative attractiveness of a country towards FDI by MNCs, holding
other factors constant. He suggested that infrastructure development should he an
integral part of the strategy to attract FDI inflows in general and export-oriented
production from MNCs in particular.
In an important article "Do stronger patents induce more innovation? Evidence from
the 1988 Japanese Patent law reforms" Sakakibara and Branstetter (2001) examine the
impact of patent right expansion on the inducement of innovative effort by firms.
They find no evidence of a statistically or economically significant increase in either
R&D spending or innovative output that could plausibly be attributed to these
reforms. They conclude that Japanese firms changed the structure of their patent
applications to exploit the new law, but it failed to induce discernible increases in
R&D or innovative output.
Aitken and Harrison (I 999) in their article "Do Domestic firms Benefits from FDI?"
estimated the impact of FDI on productivity growth and spillovers using panel data
for Venezuelan Manufacturing firms during 1975-1989. The study liiund foreign
26

C'hcr/fter -
firms exhibited higher labour productivity. After controlling for size and capital
intensity, the foreign firms are found to be higher in import and export intensity and
paid higher wages than their domestic counterparts, and also that the foreign tines are
found to be a higher contributor to the foreign exchange earnings compared to their
domestic counterparts. The most important conclusion of the study is that although
results strongly support the relation between increased foreign equity participation
and individual firms' performance, but this increase in foreign ownership variable has
a significant negative impact on domestically owned firms, suggesting that an
increase in foreign investment decreases the productivity amongst domestic firms.
Thus, productivity improvement as a result of technology gains is only limited to the
firms that are directly linked to the foreign firms (Joint Venture firms).
De Mello (1999) in his article "Foreign direct investment-led growth: evidence from
time series and panel data" has conducted time series as well as panel data estimation
for a sample covering 15 developed and 17 developing countries for the period 1970-
90 of the relationships between FDI, capital accumulation, output and productivity
growth. The study suggests that effect of FDI on growth or on capital accumulation
and total factor productivity (TFP) varies greatly across countries. The panel data
estimation suggests a positive impact of FDI on output growth for developed and
developing country sub-samples. However, the effect of FDI on capital accumulation
and TFP growth varies across developed (technological leaders) and developing
countries (technological followers). FDI has a positive effect on TFP growth in
developed countries but a negative effect in developing countries but the pattern is
reversed in case of effect on capital accumulation. He infers from these findings that
the extent to which FDI is growth-enhancing depends on the degree of
complementarily between FDI and domestic investment. The degree of
substitutability between foreign and domestic capital stocks appears to be greater in
technologically advanced countries than in developing countries. Developing
countries may have difficulty in using and diffusing new technologies of MNEs.
Mansfield (1994) in his study of "Intellectual Property Protection FDI and
Technology Transfer" provided a new insight into the IPR-FDI linkage. His analysis
based on survey data indicates that IPR regimes are relevant for some but not all types
of FDI decisions. He found that IPR protection is much more relevant about
investment in R&D facilities than for FDI in sales and distribution outlets.
Furthermore, he found sharp differences in the perceptions of industries about the
,7

Chapter - 2
importance of' IPR regimes in their decisions about FDI. The pharmaceutical industry
4
reported that IPRs played a major role in their decisions about Investment in joint
ventures abroad.
Analyzing the influence of IPRs in encouraging FDI Maskus (1998) in his study "The
Role of IPRs in Encouraging FDI and Technology Transfer In strengthening IPRs in
Asia: Implications for Australia". tinds that while there is evidence that strengthening
IPRs can be an effective means of inducing additional FDI inflow, it is only one
component among a broad set of factors. Emerging economies must recognize the
complementary relationship amongst IPRs. market liberalization and deregulation,
technological development policies and competition regimes. He suggests that given
the complexity and trade offs for market participants, governments and emerging
economies should devote considerable attention and analysis of the strategies to
achieve net gains from stronger IPRs.
Kirim (1985) in his study "Reconsidering Patent and Economic Development: A case
study of the Turkish Pharmaceutical Industry" presents a weak interrelation in
between patent protection and FDI. The study argued that the rate of new drug
introduction in the Turkish market did not decline after abolishing patent protection
i.e. after 1961. He concluded that inspite of the elimination of patents, investments
continued to flow into Turkey's Pharmaceutical Industry. Hence no simple causal link
can be made between patents and FDI.
Another interesting article "Regulation of Pharmaceuticals in Developing Countries
Legal Issues and Approaches" conducted by Jayasuriya (1985), provides a much
needed introduction to some of the important legal issues concerned with the
regulation of pharmaceuticals in developing countries and describes some possible
approaches to establishing a manageable regulatory framework. He argues that
consideration ought to be given to the administrative and operation mechanism
needed to translate the laws into action. The study traces the laws and experience of a
number of the developing countries to assist the policy makers and to show what can
he done with limited resources in the context of conditions prevailing in the
developing countries.
hall (1974) in his thought provoking article "International Pharmaceuticals Industry
Op
and LDCs: Il-Costs and alternatives" analyses the characteristics of the international
pharmaceutical industry. The study highlighted that LDCs gain little or nothing and
may even lose from granting patents on inventions developed, published and worked

('11apter -
abroad and it increases the monopoly power of foreign investors. I-ie pointed out that
LDCs would face the problem of internally processing and marketing of drugs, but it
is the sensible distribution system that would be able to deliver the pharmaceutical
goods at prices far below. Thus this study suggests the best ways to deal with the
various long-run problems. Like LDC to move towards a socially owned indigenous
pharmaceutical industry and copy foreign technology brand names and market the
product through official agencies.
The Indian Perspective:
Duperon and Cinar (2010) in their recent article `'Global Competition Versus
Regional Interest: FDI and Pharmaceuticals in India" has shown that there is trade-off
between the ability of nations to attract FDI and moderate the price of drugs to levels
conducive for widespread distribution. Furthermore, there are additional concerns for
the impact of FDI on domestic industries relative to the displacement of domestically
held equity as foreign firms entered the marketplace. They predicted that emerging
markets will account for sales equal to those in US and the top five European Union
markets combined by 2017. The study highlighted that India provides one of the most
conducive environments for firms looking to establish Knowledge Process
Outsourcing (KPO) operations. Infrastructural developments and policy revisions
have spurred substantial economic growth in India over the last decades, and it's
uniquely desirable labour force enhances the viability of profits for foreign
knowledge-based firms. India holds roughly three percent of the global market for
outsourcing. According to them corruption is one of the major barrier that could
potentially disrupt the inflow of FDI via the inherent risk of illegitimacies. The study
suggested that transparent policies are essential to attract long term investments.
Rai (2009) in his study on effect of TRIPs on inflows of FDI particularly in
pharmaceutical sector titled "Effect of the TRIPs — Mandated Intellectual Property
Rights on FDI in developing countries: A case study of Indian Pharmaceutical
Industry" tried to find out impact of strong patent regime on the technology transfer in
the developing countries. "I'he study found that simply enhancing patent protection
may not necessarily result in a corresponding increase in FDI in the Indian
pharmaceutical sector. It indicates that the "gravity" type variables, "agglomeration
benefits" like rapid growth in GDP. huge market size, accelerating economic reforms
and opening up of the economy and a well developed pharmaceutical sector were the
dominant determinants of FDI in the pharmaceutical sector. He suggested that India
29

Chapter - 2
needs to provide incentives for foreign investors and remove the barriers to foreign
investment and technology transfer into India and to further improve its investment
environment condition such as political and legal factors to absorb ioreign capital and
advanced technology.
Mathiyazhagan and Sahoo (2008) in their study "Do FDI Inflows Benefits the Major
Sectors in India?" analyses the impact of FDI at the sectoral level on the Indian
economy. The study used panel co-integration model test of the nine core-sectors
namely, power & fuel, electrical equipment, transport, chemicals, food processing
industries, metallurgical, drugs pharmaceuticals, textiles and industrial machineries
with four variables i.e, FDI, export, gross output and labour productivity from 1991-
92 to 2004-05. The study revealed that the only sector in India that has enjoyed a
positive relation between export and FDI is drugs and pharmaceutical. It may be due
to the attraction of many global drug majors to source their production from India.
Also due to more numbers of Greenfield investment projects which have expanded
their exports through overseas affiliates by the parent companies. They conclude that
the advent of FDI has not helped to yield a positive impact on the Indian economy at
the sectoral level. Further, they suggested the opening up of its export oriented sectors
so that a higher growth of the economy can be achieved through the growth of these
sectors.
Aditya and Nigam (2007) in his work "Globalization in the Indian Pharmaceutical
Industry — FDI spillovcrs and implications on Domestic Productivity: 1991-2007",
made an attempt to analyze and study the impact of globalization in the
pharmaceutical industry and FDI spillovers in various forms to the domestic
pharmaceutical industry in terms of domestic productivity and competitiveness etc.
The study reveals that the spillover effects have had a manifold impact on the Indian
pharmaceutical industry, with the new WTO patent regime introduced in 2005, the
foreign players have found greater security in operating in India and due to the
spillover effects of a competitive environment, the domestic players have
substantially increased their productivity, probability and hence compete on stronger
footing with the incoming pharmaceutical firms.
Another important article presented by Bergman (2006) entitled "FDI and Spillover
Effects in the Indian Pharmaceuticals Industry' analyses the impact of FDI on Indian
domestic pharmaceutical industry. The study shows that there has been positive
impact from FDI in the pharmaceutical industry and the MNCs in India have
30

Chapter - 2
positively contributed to the growth and development of the industry. Spillover effects
through imitation. industrial management skills and competition were explicitly
observed in the industry. Such effects were generated not only in product
development, but also in marketing and documentation techniques. The foreign firm's
presence has indirectly encouraged domestic firms to increase their managerial efforts
and to adopt some of the marketing techniques used by MINCs. Further the presence
of foreign tines has intensified competitive pressure in the industry and stimulated
domestic firms to use accessible resources more efficiently. The study emphasized
that the presence of FDI in the pharmaceutical industry does not mean automatic
spillover effects. It depends on the development of the domestic firms and the efforts
of domestic firms to invest in learning and imitation. The study suggested that in
order to promote FDI and maximize future spillover effects, policies should be
investor friendly with a clear developing strategy. The policies that India should
encourage are for the domestic firms to invest more in R&D and technology
upgradation, especially the small firms. Public investment in higher education,
preferably sciences based are necessary for future progress in innovative research and
also in order to attract more FDI.
Kumari (2007) in her study "Liberalization, TRIPs and Technological Behaviour of
Firms in Indian Pharmaceutical Industry" tried to identify the factors determining
technology imports for firms in the Indian Pharmaceutical sector. The study is based
on firm level data for the period 1995-2004 with variable firm's growth, export
intensity, size of firms, profitability of firms, foreign equity participation, research &
development intensity and age of the firms. It is found that firms' capability has been
very important for motivating technology imports to take advantage of liberalization
policies and free challenges under TRIPs. The study revealed that larger, older and
firms with foreign equity participation have been importing more technology. Profit is
not a significant determinant of technology imports. Due to lack of product patent and
risk of copycat by domestic firms, foreign firms usually preferred intra-firm
technology transfer. A complementary relationship has been found between foreign
technology acquisition and R&D intensity. Further, she suggested that smaller finns
should also take advantage of new technology by growing larger through mergers,
acquisitions or partnership with either large domestic or foreign firms.
Pradhan et al. (2006) in their study "Export-orientation of foreign manufacturing
affiliates in India: Factors, tendencies and implications" tried to estimate the export
31

Chapter - 2
contribution of foreign affiliates in Indian industries and analyzed the factors that
determine the propensity of foreign affiliates to undertake export activities. The
studies found that volume of exports by tbbreign affiliates have grown significantly
across industries with rising export intensities. Their export's propensities are more
sensitive to the size of the domestic market. In a liberalizing, host country like India
foreign firms export intensity is strongly dependent on the domestic firms because,
domestic firms' exports activity has a strong positive impact on foreign firms. they
also found that foreign affiliates in India have significantly lower export intensities in
R&D and advertising — intensive industries and local competition seems to have
played a negative role in the export orientation of foreign affiliates. Foreign firms are
likely to focus more on domestic market when they are faced with rising local
competition.
Jha (2007) in his interesting article "Options for Indian Pharmaceutical Industry in the
Changing Environment" has focused on the factors that are influencing the structure
and growth of the Indian Pharmaceutical industry in the new scenario. The study used
sample of 15 companies (9 domestic and 6 MNCs) since 1995 with respect to their
export orientation, import dependence, investment, option of bulk drugs versus
formulations and stimulus to R&D. The study showed that although India has become
a net exporter of pharmaceuticals, import dependence of bulk drugs has steadily
increased over the last decades. As far as the Indian affiliations of the multinational
pharmaceutical companies are concerned, their shares of both the bulk drugs and
formulation are declining and their investment preferences have shifted towards
financial securities. In the field of R&D no Indian pharmaceutical company has been
capable of taking a potential drug from the investigation stage to the stage of final
market launch and collaboration with NINCs is the norms. It results in biases in the
choice of therapeutically areas towards lifestyle-related diseases. Further, he suggests
that in India the role of government is of utmost importance. The break-through drugs
typically come out of government funded laboratories. Therefore, government funded
research organizations have to expand their role by partnering with private sector,
A recent study entitled "FDI and Growth of Manufacturing sector: An Empirical
study in Post-reform India" conducted by Sahoo (2005) presents an analytical view
for the impact of FDl on total factor productivity of six core manufacturing industries
namely, food products, chemicals, drugs and pharmaceuticals, general engineering,
electrical and electronics in India with a number of variables such as output, labour,
32

Chapter -
capital, net sales etc. the study argued that FDI would help in augmenting the
domestic production via various spillover effects to the domestic fines. FDI is one of
the effective routes of technology diffusion in the host country especially for the
developing countries perspective. Besides. economic reforms in terms of releasing
various growth inducing forces would have helped the domestic fuzes more than the
foreign firms because reforms unleashed a comparative environment for the domestic
firms to move in terms of greater modernization and expansion drive. The study has
further emphasized that at manufacturing sector level, domestic fines have registered
a marginal positive Total Factor Productivity (TFP) growth as compared to foreign
firms. Moreover domestic firms have performed exceedingly well in drugs and
pharmaceuticals industry with maximum TFP growth of above 7 percent. It is only in
the drugs and pharmaceutical and electronics sector that the presence of foreign firms
has been helpful for the domestic firms to experience a reduction in dispersion of
productivity. His suggestion is to encourage FDI in these two sectors i.e. drugs and
pharmaceutical and electronics which will have more beneficial effects on domestic
firms operating in these sectors.
In a different study titled "WTO Regime, Host Country Policies and Global Patterns
of MNE Activity: Recent Quantitative Studies and India's Strategic Response" Kumar
(2001) analyzed the role of structural, geopolitical and policy factors in shaping the
patterns of MNEs activity and focus on the role of host government policies and on
the implications of the emerging WTO regime in their light. He was of the opinion
that a more restrictive FDI policy regime affects the investment climate in general but
it may improve the quality of inflows that come. On the other hand his findings have
stressed that IPR regime does not affect the investment climate in a host country.
Strengthening of IPR regime is in tune with TRIPs Agreement's obligation in India
and has the prospect of adversely affecting the domestic R&D activity especially in
the chemicals and pharmaceuticals industry by choking the domestic industry's access
to knowledge spillovers from the R&D activity in other countries in the form of
product development which formed the basis of process innovative activity of Indian
enterprises. The study emphasized that FDI provides only necessary conditions and
are effective only in the presence of responsive local entrepreneurship that is willing
to complement imported knowledge with extensive in-house technological effort on
absorption, adaptation continuous updating and eventually on innovation. Further, he
33

(Jul/ncr - 2
suggested restricted use of foreign brand names for domestic operative and encourage
national enterprises to develop local brand names.
Chaudhuri (2005) in his book "The WTO and India's Pharmaceutical Industry: Patent
Protection. TRIPs and Developing Countries" focuses on an interesting fact that while
the technology gap between Indian and foreign firms was non-existent before the
therapeutic revolution around 1940, it started increasing later when foreign firms
began investing in R&D while the Indian firms concentrated on developing alternate
processes for known drugs. He concludes that since the mid 1990s the Indian private
sector has started investing in R&D for new drugs. A number of new chemical entities
have also been developed which are at different stages of development, but none of
the Indian companies is engaged in the entire process of drug development, because
they do not yet, have all the skills and the funds required. The model that the Indian
companies have adopted is to develop new molecules and license out the molecules to
the MNCs at early stages of clinical development. As a result the Indian companies
are not targeting neglected disease effectively, but diseases of MNCs interest.
Another important article presented by Lalitha (2002) "Indian Pharmaceutical
Industry in WTO Regime: A SWOT analysis". The study revealed an insignificant
relationship between Patent Protection and location of R&D activity emerges. The
study emphasized that less focus on tropical diseases, dumping, slow pace of research
in the field of biotechnology, delays in processing of the patent application, lack of
understanding of various clauses under the TRIPs agreements among the industry
members, lack of quality standards, high mergers and acquisitions etc. are the major
problems of Indian Pharmaceutical industry. Study further, suggests that Indian
Pharmaceutical industry should adopt various strategies such as producing off
patented products, new patented products by acquiring compulsory licensing,
collaborate with multinationals not only in R&D and manufacturing but also in
marketing new patented products and improving the standards of production to widen
the export market.
Pradhan (2002) in his paper "FDI spillovers and local productivity growth: evidence
from Indian Pharmaceutical industry" has shown that although FDI might generate
development process by competitive effects, human capital effect, demonstration
effect and linkages effect, but it may also lead to crowding-out of local capabilities
and market credit rationing for small size local firms by reducing their access to
capital or raising costs of borrowing. Further. the presence of foreign fines per se may
34

('liupiL - 2
not he important for productivity growth in the domestic sector. It is only when
domestic firms have already grown large or have been engaged in innovative
activities that the FDI spillover `corks. The study suggests that the policy efforts
should be directed towards encourage R&D and concentration of the size of domestic
firms in the industry. This will be more desirable than passively liberalizing the FDI
policy. The policy incentives should he towards indigenous technological capability
building and ensuring the firms easy access to new technology from overseas which is
crucial for enhancing efficiency of domestic enterprises.
Feinberg and Majumdar (2001) in their paper "Technology Spillovers from FDI in
Indian Pharmaceutical Industry", has shown the average size of MNC. is more than
twice the size of the average Indian firms in terms of total sales. Yet, the average
wage bill to total production ratio for MNC is approximately the same as that of
Indian firms. Besides MNC were more profitable than Indian firms. However MNCs
and Indian firms are equally raw materials intensive. Further. Indian firms are more
R&D intensive with 0.34 percent than NINCs with 0.22 percent. Further, it concludes
that only MNCs gained from each other's R&D spillovers while Indian firms gained
nothing.
In another article "Manufacturing Drugs without TNCs: Status of the Indigenous
Sector in India" Chaudhuri (1984) found that out of the 63 TNCs in the drugs industry
only 32 firms produce bulk drugs. As far as quality of drugs concerned the study show
that it is not true that TNCs never manufacture and sell sub-standard drugs. Because
the fact is that the TNCs do not operate in India as independent entities and depend on
the indigenous sector for bulk drugs and formulations. Thus the sale of drugs of
proper quality by the TNCs reflects not only the capability of the TNCs but also that
of the indigenous sector to produce such drugs. He concluded that, the TNCs may not
produce in India at the lowest cost at which they are capable of doing due to over
pricing of imports. Technology would not he a bottleneck for undertaking the task of
replacing most of the manufacturing activities of the TNCs, but there may be other
constraints, financial, entrepreneurial etc.
Singh (1985) in his book "Multinational Corporation and Indian Drug Industry" tried
to examine issues arising out of the activities of MNCs in the pharmaceutical industry.
The major findings of the study are that pharmaceutical MNCs enjoy tremendous
market power in India. This is reflected in their monopolistic and oligopolistic hold on
various sub-drug market of the country. Drug MNCs in India have not only raised
35

Chapter -
funds locally but also exported huge funds by way of remittance and due to the
regulated Indian drug market, MNCs have also diversified their activities towards
more profitable areas of production.
Johari (19t 3) in his study "Business Strategies of MNCs in India: A case study of
Drugs and Pharmaceutical Industry" tried to analyze the business strategies of drug
multinationals in India. The sample of the study includes 24 multinationals based in 7
countries. The study indicated that the majority of the companies have been affected
by controls on prices of drugs. Further that the policies pursued by the drug
companies are based on certain quantitative indicators which could lead to wrong
conclusions being drawn.
Basu et al. (2007) in their paper "Foreign Direct Investment in India: Emerging
1-lorizon". focused on to study the qualitative shift in the FDI inflows in India as in-
depth study of in the last fourteen odd years. It reveals that the country is not only cost
effective but also hot destination for R&D activities. The study also finds out R&D as
a significant determining factor for FDI inflows for most of the industries in India.
But it also reveals strong negative influence of corporate tax on FDI inflows.
Gakhar (2007) in her book "FDI in India 1947 to 2007: Policies Trends and outlook"
analyses various determinants and deterrents that influence FDI inflows in India. The
study revealed that although India has one of the most transparent and liberal FDI
regimes among the developing countries with strong macroeconomic fundamentals,
its share in FDI inflows is dismally low. The country still suffers from weakness and
constraints in teens of policy and regulatory framework, which restricts the inflows of
FDI. The study pointed out that the present policy of FDI is applicable in all the
sectors of the economy but there is a need to have a selective approach to the entry of
foreign capital in various sectors. The study has listed eleven internal and eight
external determinants of FDI amongst which foreign investment policy and procedure
ranks first and is the most important determinant in India. This is followed by
Industrial Policy environment, financial market, foreign exchange regulation and so
on. On the other hand bureaucratic delays and wide spread corruption, poor
infrastructure facilities, pro-labour laws, high corporate tax, political rise and weak
intellectual property rights etc. are the major deterrents of FDI inflows in India.
Further she suggests measures such as empowering the state governments with regard
to FDI, developing fast track clearance system for legal disputes, developing basic
infrastructure and improving India's image as an investment destination.
36
Chapter -
Aggrawal (2007) in the paper "the influence of labour markets on FDI: Some
empirical explorations in export oriented and domestic market seeking FDI across
Indian states" has shown that there are wide variations in the FDI inflow across the
states of India. Only seven states namely Andhra Pradesh, Tamil Nadu, Maharashtra,
Gujarat. \ est Bengal, Uttar Pradesh and Kerala accounted for over 97 percent of the
total amount of export-oriented FDI and 83 percent of total FDI approvals during
1991-2001. The presence of EPZs was found to be a relevant pull factor in attracting
export-oriented FDI. Further, while explaining the sensitivity of FDI to labour market
conditions, the study revealed that labour market rigidities and labour costs are more
pronounced for export oriented FDI than for domestic market seeking FDI.
Infrastructure and regional development are found to be key factors in attracting
higher FDI, both in the export and domestic market seeking sectors.
In order to provide foreign investors a latest picture of investment environment in
India, Hu (2006) in his study "India's suitability for FDI" analyses various
determinants that influence FDI inflows to India including economic growth,
domestic demand, currency stability, government policy and labour force availability
against other countries that are attracting FDI inflows. Analyzing the new finding it is
interesting to note that India has some competitive advantage in attracting FDI
inflows, like a large pool of high quality labour force which acts as an absolute
advantage against other developing countries like China and Mexico. In consequence
this study argues that India is an ideal investment destination for foreign investors.
In another study "Liberalization FDI flows and Development: Indian Experience in
the 1990s" Kumar (2005) has shown that although the magnitude of FDI inflows has
increased but in the absence of policy direction much of the FDI has gone into
services and soft technology consumer goods industries bringing down the share of
manufacturing and technology intensive industries. This is in sharp contrast to the
East Asian countries: in terms of technology and R&D the manufacturing affiliates of
MNEs in India seem to be spending a relative small proportion of their turnover on
R&D activity after controlling for extraneous influences. The study came out that
overall economic performance continues to exercise a major influence on the
magnitude of FDI inflows by acting as an indicator device for foreign investors about
the growth prospects for the potential host economy. So, paying attention to
macroeconomic performance indicators such as growth rates of industry through
public investments in socio-economic infrastructure and other supportive policies and
;7

Chapter - 2
creating a stable and enabling environment is essential. Investments made by
governments in building local capabilities for higher education and training in
technical disciplines, centers of excellence and in other aspects of national innovation
systems would crowd-in FDl inflows.
Johnson (2004) in his work "The Effects of FDI Inflows on Host Country Economic
Growth" discusses the potential of FDI inflows to affect host country economic
growth. The paper argues that FDI should have a positive effect on economic growth
as a result of technology spillovers and physical capital inflows. The empirical part of
the paper finds indications that FDI inflows boost economic growth in developing
economies but not in developed economies. He has assumed that the direction of'
causality goes from inflow of FDI to host country economic growth. However,
economic growth could itself' cause an increase in FDI inflow. Economic growth
increases the size of the host country market and strengthens the incentives for market
seeking FDI. This could result in a situation where FDI and economic growth are
mutually supporting. However, for most of the developing economies growth is
unlikely to result in market seeking FDI due to the low income levels. Therefore,
causality is primarily expected to run from FDI inflows to economic growth for these
economies.
Aganval (1980) in his interesting paper "Determinants of FDI: A Survey" found that
factors such as comparative labour costs, size of the country, the nature of exchange
rate regime and political factors including political instability are the general
determinants of FDI in less developed countries. Further he also stressed about the
capacity of' the developing country to absorb investment, which largely depends on
the amount of population and skills in the country.
In the light of the above literature reviews we conclude that most of studies conducted
so far indicate that the key factor which affects economic growth is technology. FDI
is one of the effective routes of technology diffusion in the host country particularly
from the developing countries perspective. Economic reforms would have helped the
domestic firms more than the foreign firms because reforms unleash a competitive
environment for the domestic firms to move in terms of greater modernization and
expansion drive. Although foreign firms cannot work In vacuums, domestic firms
provide the environment in which they nourish. Therefore. FDI for economic
development does not mean automatic spillover effects. It depends on the
development of domestic firms and their efforts to invest in learning by watching and
38

Chapter - 2
doing. the level of FDI also plays an important role, because whenever it is relatively
low, an insignificant result will be the outcomes and vice-versa.
Similarly almost all the reviews have revealed that there has been a positive impact
from FDI in the pharmaceutical industry. These MNCs in India have positively
contributed to the growth and development of the industry. Huge population, cheap
and skilled labour force, large english speaking people, well developed chemical
industry; low cost for developing new drugs, liberalized policy regime are the major
pull factors for attracting FDI in pharmaceutical industry. While weak IPRs, poor
social and economic infrastructure, price control, corruptions, pro labour laws etc are
the major hindrance in the smooth inflow of FD in Indian pharmaceutical industry,
However, not much study has been done focusing particularly on the impact of FDI
on Indian pharmaceutical industry, investment, foreign exchange earnings (exports)
profits and employment.
2.4 Research Cap:
FDI has received considerable attention from academics with respect to its role and
implications in India. Studies are also available on the FDI inflows for different
sectors, such as telecommunication, fast moving consumer goods and capital goods,
information technology, infrastructure and services. Comparative studies for different
regions are also available. However. it is found that there is limited organized study
on the FDI inflows in pharmaceutical industry in India. The industry has experienced
considerable changes over last few decades. Initially, the sector was based on
endogenous technology, but now the era of technological development has emerged
and our economy has been opened to new areas and challenges and totally new global
scenario.
During the last new decades, the pharmaceutical sector has been experiencing a
remarkable growth pattern. Charges have also taken place in respect of teelmology.
Such changes are largely attributed to the inflows of FDI in India. The present study
deals with pharmaceutical sector in relation to the FDI inflows in this sector. 'I he
study aims to emphasis the linkages between the inflow of FDI in pharmaceutical
industry and its growth and development after the initiation of economic reform.
39

Chapter -
2.5 Scope of the Study:
FDI has grown considerably in its importance In Indian economy. After liberalization
its role has changed significantly. Earlier the amount of FDI was low conforming to
some selected sectors, but now the inflow of FDI has grown tremendously and almost
in all the sectors of the economy. The proposed study is therefore directed towards
examining the varied aspects of the inflow of the FDI in the Indian economy general
and pharmaceutical industry particular since 1991. It also tries to highlight the
problems hindering the smooth inflow of FDI in India. The study has also dealt with
the problems and the future prospects of the growth of pharmaceutical industry.
2.6 Objectives of the Study:
The study aims to assess the nature of FDI inflows in India's pharmaceutical industry
since the initiation of economic reforms in 1991 and attempts to seek its effects on
certain aspects of development. In the light of the research gap, this proposed study is
designed to cover the following objectives:
1) To examine the significance and assess the various aspects pertaining to
performance of the FDI in India viz-a-viz sector-wise, country-wise, state-
wise and year-wise during pre and post reform period.
2) To analyze the growth and development trend of Indian pharmaceutical
industry and its contribution to Indian economy.
3) The study will further focus on the inflow of FDI in Indian pharmaceutical
industry since economic reforms.
4) To highlight the dynamic potential and future prospects of FDI inflow in
the Indian pharmaceutical industry.
5) To analyze the future dynamic potential of the pharmaceutical sector with
further FDI inflow in India in the era of new WTO regime.
6) Finally, to come out with the findings and conclusion of the study and to
otter some pragmatic suggestions for increasing FDI inflows in India to
benefit the whole economy in general and pharmaceutical sector in
particular.
4()

Chapter - 2
2.7 Hypotheses of the Study:
\1 ith the advent of the economic liberali ation in India the FDI has undoubtedly
increased manifold as compared to the pre-liberalization period. Under the liberalized
regime pharmaceutical industry has been accorded special attention by the
government of India to attract FDI. Accordingly various incentives and plans have
been launched. Against this background the following hypotheses have been set:
1) The changes in the policy and development strategy may not maximize the
gains from FDI after the initiation of new economic reforms.
2) It is hypothesized that the opening of the economy and liberalization of
investment policies has non-beneficial influence on the pharmaceutical
sector.
3) There is no significant relationship between the inflows of FDI in
pharmaceutical industry in India and growth and development of
pharmaceutical sector in India.
4) It is further hypothesized that, there is no significant evidence of increase
in production, employment, profit, investment and exports of drugs with
an increase in the inflow of FDI in pharmaceutical industry.
2.8 Source of Data:
The present study relies mainly on secondary data (Published and unpublished). The
sources include World Investment Report, World Development Report, World Health
Report published by World Health Organization. International Trade Statistics
published by World Trade Organization (WTO), FDI Data Cell, Department of
industrial policy & promotion (DIPP),New Delhi, Reserve Bank of India Bulletin and
annual reports, Handbook of Statistics on the Indian Economy, Statistical Abstract in
India, Secretarial of Industrial Approval newsletter (SIA),CDSCO (Central Drugs
Standards Control Organization), CMIE (Centre for Monitoring Indian Economy),
BDMA (Bulk Drug Manufacturers Association). OPPI (Organization of
Pharmaceutical Producers of India), IDMA (Indian Drug `ianufacturers Association),
DGCIS (Directorate General of Commercial Intelligence and Statistics)., CDRI
(Central Drug Research Institute), Department of Pharmaceuticals etc. and different
publications of different ministries such as ministry of chemicals and fertilizers,
ministry of commerce. Articles published in the Journals and Periodicals of national
41

Chapter• -
and international repute will be made good use of in order to study the ditferent
aspects of the FDI in pharmaceutical industry Annual Report of the selected
pharmaceutical companies is also utilized.
2.9 Span of Tine of the Study:
The period of the study under consideration is from 1991 to 2008. The rationale
behind the choice of the period is that FDI has played an important role in Indian
economy since the economic liberalization.
2.10 Research Methodology:
In the light of the above objectives and the hypotheses formulated, an attempt has
been made to analyses the impact of FDI inflows in pharmaceutical industry with
respect to production, exports, employment, sales, investment and profitability during
the period from 1991 to 2008.
Methodology is a way of systematically solving the research problems. It may be
understood as a science of studying how research is done scientifically. The study
frequently makes use of to the statistical tool like CAGR, Mean, Standard Deviation
(SD), Coefficient of Variance (CV), Minimum & Maximum values of variables. Both
correlation and regression techniques are used as well developing on the nature of
relation between and among variables. The classical Regression technique of
Ordinary Least Square (OLS) method is used for the linear approximation of the
relation. The time series analysis of regression equation takes the following forms:
Y= a-ht
Where, Y', is the estimated value of the concerned variable.
`a' is the constant part of the variable.
`b' is the annual change of the least square method and
`t' is the year varying from 1991 to 2008.
The study will evoke a multivariate regression comprising the lagged and time
ariables in consideration as well. For the test of hypotheses the standard t-test is done
to find out whether the coefficients and intercepts are statistically significant or not at
5° 0 level. The regression estimators are tested by F-test at 5%% level.
42

('lull)/('/' - 2
the oodne» of fit has been hNpothetical by above 50%, as the rule in general R-
%\ith hi1-Iher values \\iII indicate stronger dependence of' dependent variables on the
FDt t10 in pharmaceutical sector in India.
Durbin-\\ atson (d) test is used for finding auto correlation among t the variables:
Lt 2(ut — Gt-1)L
~ 1=1 ut
It is imhk the ratio ut'the sum of'squared differences in successive residuals to the
residual ,um of squares its Value must lies in hct ecn ()-d=4. When. d-0>2 it
indicates positive first order autocurreiatiun. When d=O it indicates no auto correlation
and \\ hen d-21-4 it indicates nest ative correlation.
2.11 Design of the Study :
the ,tuj\ i, di \ ided into six chapters. The first chapter deals \\ ith the introductory
background and theoretical approach of the study. The second chapter is concerned
ith the re 10 of literature and methodological issues. Chapter third is devoted to the
mcralI scenario of' the economic policy changes of the Indian economy in the pre- and
post reform period. An over ie%\ of pharmaceutical industry in India since economic
liberalization \\ill be the focuses in chapter tour. Chapter lire \ill be a statistical
analysis t 1 test of h\pothesis) \\ith regard to the role of FDI iii f1cnrs in
pharmaceutical sector in India. Finally chapter six is by \\a\ of conclusions and
suggestions
2.12 limitations of the Studs:
Since all the economic or scientific studies are faced with various types of limitations
and this stud\ is also no exception. During, the compilation of the present thesis work,
researcher found and faced a number ot'difficulties. Some of thcnl are as ti Ilows:
I. \Ithough enough data on FDI as available \v ith 1(131, 1)1 PP. \'l iii istry of'
Commerce& Industry. UNC'l'AD. but there \\as no consistenc\ and similarity
in the data \\hlch effected conlparahiliu.
'. I I)I in the post liberalization period as easily and up-to date available but
consistent and continuous FDI data on pre-liheraliiation period as dil'ficuIt to
find as no organization has made eft'rts to compile it till date.
43

Chapter - 2
3. Due to inadequacy of time series data from related agencies, and insufficient
homogenous data from different sources, the time series data is used for
certain variables and the averages are used at certain other occasions.
Therelore. the trends, growth rates and estimated regression coefficients may
deviate from the true ones.
4. Department of pharmaceutical under ministry of chemical & fertilizers
separately originated since 2008 therefore; there was dearth of detailed FDI
data availability on this sector. The only source of data was FDI data cell,
DIPP New Delhi. In addition there was inconsistency in the year-wise data on
pharmaceutical sector and the pre-liberalization period of this sector.
5. Since this research relies on secondary sources so it has to be taken with all its
limitations.
2.13 Conclusion:
The present chapter provided some reviews of literatures and research design of the
study. The methodological issues related to the source of data, rationality of the
selection of time period, method of statistical interpretation are given. Hypotheses are
also presented. The next chapter deals with the liberalization policies that play a vital
role in the inflow of FDI in India and growth trends of FDI in India.
44

'hu/pler - 2
2.14 References:
1. Aditva K.R. Bajaj and Swastik Nifam (2007) "Globalization in the Indian
Pharmaceutical Industry -- FDI spillovers and implications on Domestic
Productivity: 1991-2007". research project. IIM Ahmadabad (Decemher).
2. Agarwal, J.P. (1980). "Determinants of Foreign Direct Investment: A survey".
Weltwirtschattliches Archiv, 116: 739-773.
3. Aggar al, Aradhna (2007). Paper presented at the seminar on India and
Globalization: A seminar in Honour of Professor N.S. Siddharthan, New Delhi.
4. Aitken. Brian, J. and Ann E. Harrison (1999). "Do domestic firms Benefits from
Direct Foreign Investment? Evidence from Venezuela", American Economic
Review, 89: 605-618.
5. Basu P., Nayak N.C, Archana (2007): "Foreign Direct Investment in India
Emerging Horizon", Indian Economic Review, XXXXII (2):255-266 (Mumbai).
6. Bergman, Annika (2006). "FDI and Spillover Effects in the Indian
Pharmaceutical Industry" RIS - Discussion Papers # 113, August, RIS Research
and Information System for Developing Countries, New Delhi.
7. Blomstrom, M. and A. kokko (2005). "The Economics of Foreign Direct
Investment", NBER Working Paper # 168, National Bureau of Economic
Research, Cambridge.
8. Bransteeten, Lee, R.Fisman, C.Foley, and K.Saggi. (2007). "Intellectual Property
Rights, Imitation and Foreign Direct Investment: Theory and Evidences", NBER,
Working Paper # 13033. National Bureau of Economic Research, Cambridge.
9. Chaudhuri, Sudip (1984). "Manufacturing Drugs Without TNCs: Status of
Indigenous Sector in India" Economic and Political Weekly, Sameeksha Trust
Publication, XIX (31, 32, and 33): 1341-1375 (Mumbai).
10. Chaudhuri, Sudip (2005). "The WTO and India's Pharmaceutical Industry: Patent
Protection. TRIPs and Developing Countries." Oxford University Press, New
Delhi.
11. Dc Mello. Jr Luii R.. (1999) `Foreign direct investment-led growth: evidence
from time series and panel data'. Oxford Economic Papers, 51: 133-154.
12. Duperon, Williont O. and F. Mine Cinar (2010). "Global Competition Versus
Regional Interest: FDI and Pharmaceuticals in India", Journal of International
Commercial Law and Technology. 5(4): 181-200.
45

Chapter - 2
13. Feinberg, Susan E. and Sumit K. Majumdar (2001). -Technology spillovers from
Foreign Direct Investment in the Indian Pharmaceutical Industry", Journal of
International Business Studies, Third Quarter, 32(3): 421-437
14. Ghakar. Kamlesh (2007). "Foreign Direct Investment in India 1947to 2007:
Policies, Trends and Outlook" New Century Publication, New Delhi.
IS. Glass, Amy Jocelyn and Kamal Saggi (2002). "Intellectual Property Rights and
Foreign Direct Investment" Journal of International Economics, 56: 387-410.
16. Haskel, E. Jonathan, C.S. Pcreria, and J.M. Slaughter (2004). "Does Inward
Foreign Direct Investment Boost the Productivity of the Domestic Finns",
NBER, Working Paper # 8724, National Bureau of Economic Research,
Cambridge.
17. Hu, Peng (2006). "India's Suitability for Foreign Direct Investment", Working
Paper # 553, International Business with Special Reference to India, University
of Arizona.
18, Jayasuriya, D.C. (1985). "Regulation of Pharmaceuticals in developing countries
Legal Issues and Approaches", WHO, Geneva.
19. Jha, Ravinder (2007). "Options for Indian Pharmaceutical Industry in the
Changing Environment" Economic & Political Weekly, Sameeksha Trust
Publication, XLII (39): 3958-3967 (Mumhai).
20. Johnson, Andreas (2004):"The Effects of FDI Inflows on Host Country
Economic Growth htto:'hvww. infra.kth.se Acesis \ research\nublicationsyworkine
21. John, L.M. (1983). "Business Strategies of Multinational Corporation: A case
study of Drugs & Pharmaceutical Industry", Vision Book, New Delhi.
22, Kindleberger, Charles (1992). "International Economics", Irvin Irwin, London.
23. Kirin, A.S. (1985). "Reconsidering Patents and Economic Development: A case
study of the Turkish Pharmaceutical Industry", World Development, 13(2): 227-
228 (February).
24. Kumar, Nagesh (2003). "Intellectual Property Rights, Technology and Economic
Development: Experiences of Asian Countries, Economic and Political Weekly,
Sameeksha Trust Publication, XXXVIII (3): 209-224 (Mumbai).
25. Kumar, Nagesh (2001). "Infrastructure Availability FDI Inflows and their Export
Orientation: A Cross Country Exploration", Research and Information System
for Developing Countries t 1.2 (20's November).
46

C'litiptcr -
26. Kumar, Nagesh (2001 a). "WTO Regime. I-lot Country Policies and Global
Patterns of NINE activity: Recent Quantitative Studies and India's Strategic
Response, Economic and Political Weekly, Sameeksha Trust Publication,
XXXVI(1): 39-49 (Mumbai).
27. Kumar. Nagesh (2005). "Liberalization, Foreign Direct Investment Flows &
Development: Indian Experience in the 1990s", Economic and Political Weekly,
Sameeksha Trust Publication. XXXX (14): 1459-1468 (Mumbai).
28. Kumari, Anita (2007). "Liberalization, TRIPs and Technological Behaviour of
Firms in Indian Pharmaceutical Industry". International Review of Business
Research Papers, 3 (1): 12-22 (March).
29. Lalitha, N. (2002). "Indian Pharmaceutical Industry in WTO Regime: A SWOT
Analysis", Economic and Political Weekly, Sameeksha Trust Publication,
XXXVII (34): 3542-3554 (Mumbai).
30. Lall, Sanjay (1974). "International Pharmaceutical Industry and Less Developed
Countries: II-Costs and alternatives" Economic and Political Weekly, Sameeksha
Trust Publication, IX (48): 1990-1994 (Mucnhai).
31. Lyamota, Koji (2003). "Human Capital Formation and FDI in Developing
Countries", OECD Working Paper # 211, OECD Development Centre.
32. Mansfield, E. (1994). "Intellectual Property Protection Foreign Direct Investment
and Technology Transfer", IFC Discussion Paper 19, Washington D.C., World
Bank.
33. Maskus, Keith (1998). "The Role of IPRs in Emerging FDI and Technology
Transfer. In Strengthening IPRs in Asia: Implications for Australia", University
of Colorado, Australian Economic Paper # 346: 348-349.
34. Mathiyazhagan, Maathai K. and Dukhabandhu Sahoo (2008). "Do Foreign Direct
Investment Inflows Benefits the Major Sectors in India?". ISAS Working Paper
No. 38, 18 February, National University of Singapore (NUS), Singapore.
35. Narula, Rajesh and S. Lall (eds.) (2006). "Understanding FDI Assisted Economic
Development", Rutledge. London, New York.
36. Pradhan, J.P. (2002). "FDI spillovers and local productivity growth evidence
from Indian pharmaceutical Industry". Artha Vijnana, XLIV (3-4):317-332 &
MPRA Paper „ 17080 (September).
37. Pratihan, Java Prakash, Keshab Das and Malnia Paul (2006). "Export-Orientation
of Foreign Manufacturing: Affiliates in India: Factors, Tendencies and 47

Chapter - 2
Implications", ISID Working Paper 2006/08, Institute of Studies in Industrial
Development, New Delhi (August).
38. Rai, Rajnish Kumar (2009). "Effects of the TRIPS Mandated Intellectual Property
Rights on Foreign Direct Investment in Developing Countries: A case study of
the Indian Pharmacemical Industry." The Journal of World Intellectual Property,
11(5-6):404-431. http:/,dx.doi.or 0.l 1 I l!i.1747-1796. 2008.003 40. x.
39. Sahoo, Rajib Kumar (2005). "FDI and Growth of Manufacturing Sector: An
Empirical Study in Post-reform India" unpublished thesis, Institute of Social
Economic Change, Nagarbhawi, Bangalore (September).
40. Sakakibara, Mariko and Lee Branstetter (2001). "Do stronger patent induce more
innovation? Evidence from the 1988 Japanese Patent law reforms", RAND
Journal of Economics, 32(1): 77-100 (Spring).
41. Singh S. (1985). "Multinational Corporation and Indian Drug Industry" Deep and
Deep Publication, New Delhi.
42. Todaro, Michael (1999). "Economic Development", Prentice Hall, Illinois.

Chapter - 3
Economic Liberalization and Foreign Direct Investnment Policies in India
3.1 Introduction:
Liberalization moves of developing nations in eighties in general and adoption of
liberal trade policy regimes for attracting FDI in particular have driven global regional
FDI inflows to these countries. Apart from the evident benefits of capital inflows such
as, supplementing domestic savings and investments and creation of employment and
income, it is transfer of new technology and management expertise from parent firms
to the foreign affiliates in the host country, which probably stands as the most
justifiable and legitimate ground for initiation of a liberal policy towards FDI. It is in
this backdrop that an enabling policy framework, put in a broad and transparent
manner and its effective implementation play an essential role not only in attracting
FD1 but also reaping maximum benefits from it in terms of enhancing the efficiency
of resource use and economic growth and therefore the overall development of the
national economy.
The country is endowed with rich natural resources including minerals, forest, vast
agricultural land and a large pool of manpower. It has largest reservoirs of the
technical and skilled manpower in the world; hence FDI is not a new phenomenon in
India. The MNCs with their variety of arrangements such as FDI, technology transfer,
joint ventures and subsidiaries were present even at the time when India attained
independence. Industrial Policy Resolutions of 1948, 1956 and subsequent policies
have accorded special emphasis on the considerably increasing role of foreign funds
in India.
The policy towards foreign investment in India has undergone substantial changes,
from a more restrictive FDI policy to a liberal FDI, since the introduction of the
economic reforms in July 1991. The New Industrial Policy (NIP) announced on July
24, 1991 marks a historic change in India's economic mindset towards industrial
development and liberalization of FDI policy. There were numerous incentives
including industrial estates EPZs (Export Promotion Zones), Export Processing Units
(EN. s) and recently developed technology parks have attracted considerable
attention. In addition, a broad spectrum of financial incentives in the form of tax
holidays, business services are offered by central and other state authorities to
encourage economic development. 1lence the policy statement has clarified India's
49

Chapter - 3
stand on liberalizing the FDI policy, while emphasizing the importance of FDI in
increasing efficiency in all sectors through several attendant advantage that the FDI
brings in forms of technology transfer, marketing expertise, introduction of modern
management techniques and new possibilities for promotion of exports. The FDI
policy statement under NIP thus clearly underscores the relative merits of FDI in
promoting India's economic growth and development.
3.2 Global FDI Trends and Pattern of Flows:
The importance of FDI as an instrument of economic development and growth was
felt immensely after world debt crisis of eighties. Gradual decline of non-equity
sources of foreign capital gave further impetus to non-debt creating foreign capital
which comes in the form of equity investment viz. FDI and foreign portfolio
investment. In addition, most important drivers of the FDI and internationalization of
production network owes to the increasing globalization of firms resultant on the
liberalization moves most of the countries, especially developing nations and the
advent of information and communication technology.
3.2.1 Trends of Global Fl)! Flow:
Global regional flows of FDI have witnessed manifold growth during the period from
1991 to 2008, representing a more than ten-fold increase from a level of US $ 158.94
billion in 1991 to US $ 1697.0 billion in 2008 (Table 3.1).
The major share of FDI flow of about 62 percent during 1991-98 was towards the
developed countries, leaving nearly 34 percent to developing countries. The share of
developing countries has shown a steady improvement during this entire period,
which increased from about 26 percent in 1991 to a high of 41 percent in 1994
(LT'CTAD 2001). The decline in the developed countries share of FDI inflows during
the same period could be attributed to locatiomal shift of the business activities of
TNCs to developing countries. The implications of decreasing share of FDI inflows
into developed countries and its resultant increase of FDI flows to developing
countries was far-reaching and more desirable from the viewpoint of convergence of
economic growth across countries.
50

Chalice' -
Table 3.1: Trends in Global Regional Inflows of FDl (1991-2008). (In US S billions)
Year Total Inflows Developed
Countries
Developing
Countries
Share of
Developing
Countries
1991 158.9 114.8 41.7 26.2
1992 175.8 120.3 51.1 29.1
1993 219.4 133.9 78.8 35.9
1994 256.0 145.1 104.9 41.0
1995 331.1 203.5 113.3 34.2
1996 384.9 219.7 152.5 39.6
1997 477.9 271.4 187.4 39.2
1998 690.9 472.6 194.1 28.1
1999 1086.8 828.4 231.9 21.3
2000 1388.0 1108.0 252.5 18.2
2001 817.6 571.5 219.7 26.9
2002 678.8 489.9 157.6 23.2
2003 559.6 366.6 172.0 30.7
2004 N.A. 396.0 N.A. N.A.
2005 959.0 611.0 316.0 33.0
2006 1411.0 941.0 413.0 29.3
2007 1979.0 1248.0 500.0 27.3
2008 1697.0 962.0 621.0 37.0
Notes: (a) Classification of developing countries is as per the UNCTAD. (b) Percentage share may not sum up to 100 due to reporting errors.
Source: Compiled from UNCTAD. world investment report, United Nations (various issues).
51

Chapter - 3
Figure 3.1: Trends in Global Regional Inflows of FDI (1991-2008)
0
1500 con
o
D 0
O~ 00 00 00 00 00 O~ i 00 00 00 00 00 00 00 00 00 00 00
Years
f Total Inflows +Developed Cowiries ~- Dev~ebpalg Cou tries + Share of Devebp4 Courtrios
The TNCs which function as the major source of the carriers of the cross—border
investment the increasing trend of FDI inflow from developed countries to developing
countries could serve to a greater extent in closing the `objects and ideas gaps' that a
developing nation might have in the process of economic development, thus,
facilitating convergence of economic growth and bridging the gap between developed
and developing countries (Romer, 1993: 543-573). There has been improvement in
the shares of developing nations from about 21 percent in 1999 to 31 percent in 2003.
There after due to financial and economic crisis, global FDI inflows fell from a
historic high of US $ 1979 billion in 2007 to US$1697 in 2008 (14 percent decline)
(Table 3.1). In 2009 inflows fell further to 44 percent as compared with their level in
2008 (UNCTAD, 2009: 3). A slow recovery is expected in future.
The crisis also changed the investment landscape, of developing and transition
economies. The share of developed and developing countries in the global FDI inflow
was 57% and 37% respectively in 2008. FDI flows to developing countries when
52

('haptc'r - 3
compared with all other capital flows, constituted a major component, accounting for
more than 72 percent of all resources flows (UNCTAD. 2004). It is interesting to note
that while global FDI inflow increased more than ten times, the increase for
developed and developing nations was more than eight and fifteen times respectively
during 1991-2008. As tar as compound annual growth rate (CAGR) are concerned
for the total FDI inflows, and to developed and developing countries was 22.76%.
17.87% and 24.28% respectively during 2005-08.
Within the developing countries, FDI flows to Asian countries remained dominant
throughout the period which rose from a mere US S 23 billion in 1991 to a high level
of US S 146 billion and thereafter it registered a slowdown to US $ 107 billion in
2003. Several micro, macro and institutional factors were responsible for the
continued decline in inward FDI flows during 2001-2003 (UNCTAD 2003). In this
entire period the growth prospects for many countries remained uncertain including
the performance of major stock markets, which stayed below from the peak of 2002.
At micro level, lowered profitability coupled with high debt equity ratio continued to
force large companies to downsize their operations.
China emerged as the top recipient of FDI inflows in Asian countries with a
percentage share of 17.4 percent in developing countries total FDI inflows in 2008.
Other Asian countries such as Hong Kong and Singapore received 10.1 percent and
3.7 percent respectively. However India's share in developing countries total FDI in
the region was lower than the above mentioned countries but higher than the
Philippines and Taiwan with 6.7%, 0.2% and 0.9% respectively in 2008 (Table 3.2).
The success of Asian countries in attracting FDI lies in an investment climate
characterized by growing markets and favourable regulatory framework (UNCTAD,
1995). India and China share many similarities in terms of market size and
advantageous cheap skilled labour force permeated with huge potential for future
growth.
13

Chu pier - i
Table 3,2: Share of Fill Inflos's in Developing Countries: Selected Asian Countries (1991-2008). (In percent)
S.
No.
Developing
countries 1991 1992 1993 1994 1995 1996 1991 1998 1999 2000 2001 2002 2003 2004 2005 2006 .'007 2008
I, China 10.5 21.8 34.9 32.2 31.6 26.4 23.6 23.4 17.4 16.1 21.3 33.5 31.1 22.0 21.7 16.8 l5. 17.4
2. 1lung Kong 4.1 4.0 4.6 7.S S.S 6.9 6.1 7.6 10.6 24.5 10.8 6.1 79 12.4 10.7 10.4 10.3 10.1
3. Indonesia 1.8 3.5 2.5 2.0 3.8 4.1 2.5 -0.1 -0.8 -1.8 -1.4 0.1 -0.4 0.7 1.6 II 1.3 1.3
4. Korea
Republic 1.1 1.4 0.8 1.0 1.6 1.5 1.5 2.6 4.1 3.4 1.7 I.9 2.2 2.8 2.2 1.1 0.5 1.2
. 11alaysia 3.9 10.1 6.4 4.4 5.1 4.8 3.5 1.4 1.7 1.5 0.3 2.0 1.4 1.7 1.2 1.4 1.6 1.3
6. Philippines 1.2 9.5 1.6 1.5 1.3 1.0 0.7 1.1 0.7 0.5 0.5 1.1 0.2 0.3 0.3 0.7 0.6 0.2
7. Singapore 8.6 4.3 6.1 8.2 7.8 6.8 7.0 4.1 7.0 6.8 6.8 3.6 6.6 5.4 6.0 6.4 6.0 3.7
8. Taiwan 2.5 1.1 1.2 1.3 1.4 1.2 1.2 0.1 1.3 2.1 1.9 0.9 0.3 0.7 0.5 1.7 1.5 0.9
9. Thailand 3.2 4.1 2.3 1.3 1.8 1.5 2.0 3.9 2.6 1.3 1.7 0.7 1.1 0.5 I.I 2.2 2.1 1.6
10. India 0.4 0.5 0.7 0.9 1.9 1.7 1.9 1.4 0.9 0.9 1.6 2.2 2.5 2.0 2.0 4.7 4.7 6.7
Note: Classification of developing counties as per the UNCTAD. Source: Compiled from UNCTAD, World Investment Report, United Nations (various issues).

40
35
30
25
10
5
0
-5
Chapter - 3
Figure 3.2:
Share of FDI Infows in Devebpirg Countries Selected Asian Coflries (1991.2008)
+Hong Kong Indonesia Korea Repubbc
} MalaN'sia Ph pines
9+ Spore Taiwan
f Thailand India
3.2.2 National Regulatory Changes Introduced by Countries of the World:
National laws and regulations related to FDI shows that 110 new FDI related
measures were introduced by a total of 55 countries in 2008 (Table 3.3). Of these 85
measures were more favourable to FDI as compared to 1991, where only 35 countries
changed their investment regime, of which 80 measures were more favourable to
attract foreign investment.
55

Chapter - 3
Table 3.3: National ReQulatoiv Changes (1991-20081.
Year Countries that changed their investment regime
Number of regulatory changes
Number of regulatory change that made FDI more favourable
1991 35 82 80 1992 43 77 77 1993 56 100 99 1994 49 110 108 1995 63 112 106 1996 66 114 98 1997 76 150 134 1998 60 145 136 1999 65 139 130 2000 70 150 147 2001 71 207 193 2002 72 246 234 2003 82 242 218 2004 103 270 234 2005 92 203 162 2006 91 177 142 2007 58 98 74 2008 55 110 85
auuj~c. t,umpIicu irurn ur i Au, woria inves meni Keport, 2UUI and 1UU5.
Figure 3.3 : Nat J ReiIatory Ctw s (1991-2008)
40 250
o 150 E
100
so •2 o
Years
}Countries that charged then iuvestment regm '-Number ofregilatoryy charges
Number of regulatory change that made FDI more &~ourabb
56
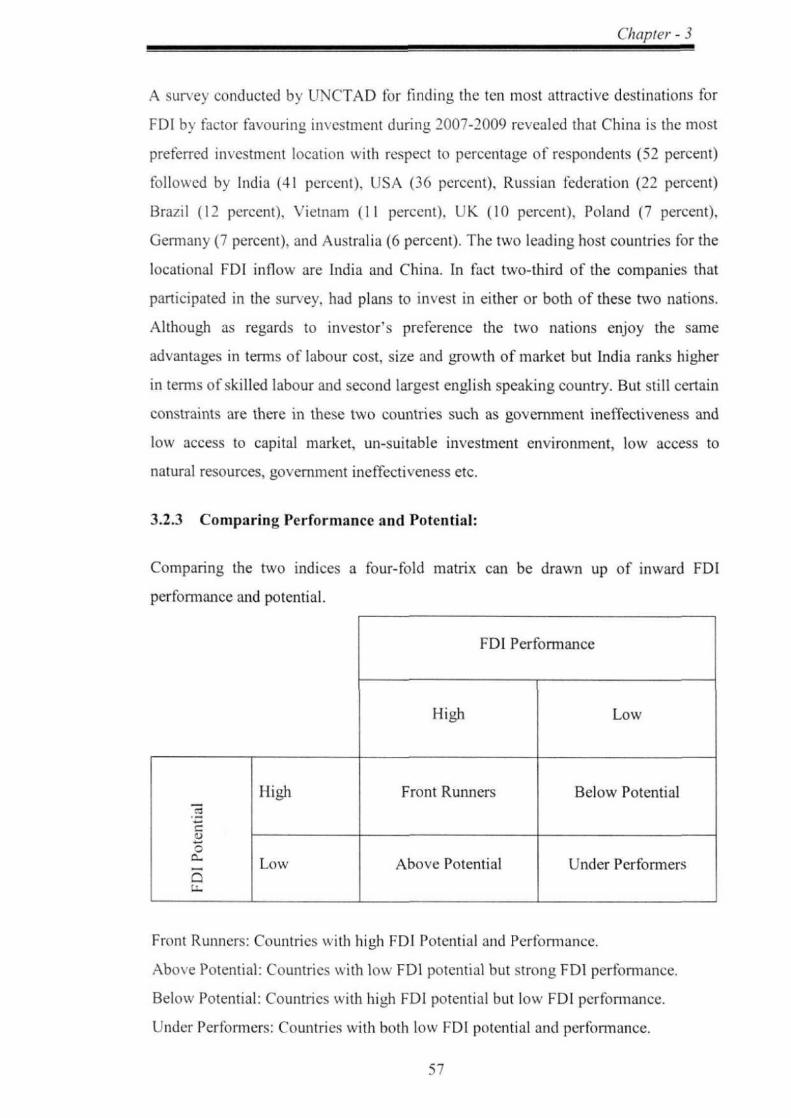
Chapter - 3
A survey conducted b\ UNC'TAD fbr finding the ten most attractive destinations for
FDI by factor favourin investment during, 2007-2009 revealed that China is the most
preferred investment location with respect to percentage of respondents (52 percent)
followed by India (41 percent). USA (36 percent), Russian federation (22 percent)
Brazil (12 percent), Vietnam (1 l percent). ['K (10 percent), Poland (7 percent).
Germany (7 percent), and Australia (6 percent). The two leading host countries for the
locational FDI inflow are India and China. In fact two-third of the companies that
participated in the survey, had plans to invest in either or both of these two nations.
Although as regards to investor's preference the two nations enjoy the same
advantages in terms of labour cost, size and growth of market but India ranks higher
in terms of skilled labour and second largest english speaking country. But still certain
constraints are there in these two countries such as government ineffectiveness and
low access to capital market, un-suitable investment environment, low access to
natural resources, government ineffectiveness etc.
3.2.3 Comparing Performance and Potential:
Comparing the two indices a four-told matrix can be drawn up of inward FDI
performance and potential.
FDI Performance
High Low
High Front Runners Below Potential
Low Above Potential Under Performers P
Front Runners: Countries with high FDI Potential and Performance.
Above Potential: Countries with low FDI potential but strong FDI performance.
Below Potential: Countries with high FDI potential but low FDI performance.
Under Performers: Countries with both low FDI potential and pertorriance.
57

Chapter - 3
Based on the above matrix, the result for the year 2006 is given below. Though FDI in
India is showing increasing trends it is still ranked as an under performer, when the
performance and potential is compared with other countries in the world (Box 3.1).
Important reasons for the low levels of FDI inflows registered until recently are low
GDP per capita, low literacy rate, poor social and economic infrastructure, uncertainty
about government, high tax rates and huge corruption, rigid labour laws etc.
Box 3.1: Matrix of Inward FDI Performance and Potential (2006). HIGH PERFORMANCE LOW PERFORMANCE
Front Runners Below Potential Azerbaijan, Bahamas, Bahrain, Algeria, Argentina, Australia, Belgium, Brunei, Darussalam, Austria, Belarus, Brazil, Canada, Bulgaria, Chile, Croatia, Cyprus, China, Denrnark, Finland, France, the Czech Republic, the Dominican Germany, Greece, Ireland, Islamic Republic, Estonia, Ilong Kong Republic of Iran, Italy, Japan,
y (China), Hungary, Iceland, Israel, Kuwait, the Libyan Arab Jordan, Kazakhstan, Lativa, Jamahiriya, Vlaxico, Norway, Lithuania, Luxembourg, Malaysia, Portugal, Qatar, the Republic of Malta, Mongdia, the Netherlands, Korea, the Russian Federation, Newzealand, Oman, Panama- Slovenia, Spain, Switzerland, Poland, Romania, Saudi Arabia. Taiwan Province of China. the Singapore, Slovakia, Sweden, United State and the Bolivarian Thailand, Trinidad & Tobago, Republic of Venezuela. Tunisia, Ukraine, United Arab Emirates and United Kingdom Above Potential Under-Performers Albania, Armenia, Botswana, Angola, Bangladesh, Benin, Colombia, Cango, Costa- Rice, Bolivia, Burkina Faso, Cameroon, Egypt, Ethiopia, the Gambia, Coted'Ivoire, the Democratic Georgia, Guinea, Guyana, Republic of Congo, Ecuador, El Honduras, Jamaica, Kyrgyzstan, Salvador. Gabon, Ghana, Lebanon, Moldova, Namibia, Guatemala, Haiti, India, Indonesia,
V Nicaragua, Nigeria, Peru, Sierra Kenya, Madagascar, Malawi, Mali, e Leone Sudan. Tajikistan, the FYR ' Morocco, Mozambique, Myanmar, i of Macedonia, Togo, Uganda, the Nepal, Niger, Pakistan, Papua, New y° Republic of Tanzania, Uruguay, Guinea, Paraguay, Philippines,
o Vietnam and Zambia. Rwanda, Senegal, South Africa, Sri Lanka, Suriname, the Syrian Arab Republic, Turkey Uzbekistan, Yemen and Zimbabwe.
Source: Compiled from UNCTAD, World Investment Report, 2008.
58
Chajplcr - 3
3.2.4 Inward FDI Performance Index:
The inward FDI Performance index of the UNCLAD is an instrument to compare the
relative performance of countries in attracting FDI inflows. This measure ranks
countries by the FDI they receive relative to their economic size'. It is the ratio of a
country's share in global inward FD( tlows to its share in global GDP`'. There are a
large number of other variables, which influence the FDI inflows to an economy, but
these factors influence may vary under varying degree of openness and regimes.
Under similar conditions the size of the economy can be a major determinant of FDI.
The value of index which ranges between greater and lesser than one indicates
countries power of receiving higher amount of FDI relative to its size and countries
receiving lesser amount of FDI relative to its size respectively. However a negative
value of the index which is an infrequent occurrence can mean the disinvestment by
MNCs during the year.
It is evident that India has an index that is significantly lower than other Asian
countries like Singapore, Malaysia, Indonesia and Korea since its index value is
below one. Now it has shown a gradual improvement over subsequent periods from
0.066 during 1988-90, to 0.155 during 1998-2000 and upto 0.215 during 2001-02
(Table 3.4). India ranked 112 in a total of 141 selected countries considered for FDI
Performance index computation during 2005-07 (UNCTAD, 2008). This
improvement shows that the policy regime in India must be slowly moving towards a
more open economy by shedding the protectionist economic policies. However, India
also shows deterioration in terms of the ranking of the Indices. If India has to compete
strongly for more FDI than larger reforms are required at the macro-economic front.
l . I he inward FIN Perti)nnance index is shown for a three year period to offset annual fluctuations in the data. This indices covers 141 economies for as much of the period as the data permit. however some countries could not be ranked in the early years for the lack of data.
2. The inward FDI performance index methodology is given as: INDi [(FDIi) (FDIW)] [(GDPi) / (GDPw)l where 'I' is the country and 'w is the world and 'INDi' is inward FDI performance index of the i' country as given in World Investment Report.
59

Chapter - 3
Tahle 34: Inward FDI Performance Index of some Selected Countries. 1988-1990
Country 1998-2000 2000-2002 2003-2005 2005-2007
Rank Index Rank Index Rank Index Rank Index Rank Index
China 46 1.033 51 1.198 50 1_331 53 NA 75 NA
Hong
Kong 3 5.292 2 6.033 2 6.508 6 NA 2 NA
India 98 0.066 119 0.155 121 0.215 115 NA 112 NA
Indonesia 56 0.794 137 -0.570 121 -0528 127 NA 104 NA
Republic
of Korea 81 0.369 91 0.587 107 0330 116 NA 124 NA
Malaysia 4 4.355 49 1,248 70 0.923 71 NA 69 NA
Philippines 30 1.689 87 0.641 90 0.618 109 NA 101 NA
Singapore I 13.599 7 3.737 6 4.755 5 NA S NA
Thailand 17 2.562 44 1.375 80 0.753 66 NA 56 NA
United
States 41 1.115 78 0.805 92 0.589 118 NA 116 NA
Note: I he data shown for the three years periods moving average. NA: Refers to not available- Source: Compiled from UNCTAD, World Investment Report (various issues).
3.2.5 Inward FDI Potential Index:
The inward FDI potential index3 of the UNCTAD is an instrument to compare the
relative potential of different countries in attracting FDI inflows on the basis of the
selected 12 socio-economic variables apart from market size affecting inward FDI
flows. Countries are ranked by value of the index computed through a composite
score. The USA remained in the first place throughout the period 1988-2006
(UNCTAD, 2008). India improved its rank to 84 h̀ position during 2004-06 with its
value of the index featuring a continuous improvement from 0.120 during pre-reform
period (1988-90) to 0.159 during 2000-02 in the post reform period (Table 3.5).
China, the largest recipient of FD[ in the developing world, was positioned 31 during
2004-2006 by the FDI potential ranking. While China's FDI inflows were higher than
USA in recent years in terms of potentiality index, USA still remained the top FDI
3. The inward FDI potential index is shown for the three year period moving average to offset annual fluctuations in the data The index covers t41 countries for the period covered. For methodology see www.unctad.org.
60

Chapter - 3
destination by various socio-economic variables. As compared to its economy's size
India lags behind many countries such as Singapore, Hong Kong and Korea.
Table 3.5: Inward FDI Potential Index of some Selected Countries.
Country 1988-1990 -- 1998-2000 2000-2002 2003-2005 2004-2006
Index Rank Index Rank Index Rank Index Rank Index Rank
China 0.176 45 0.255 42 0.273 39 NA 32 NA 31
Hong Kong 0.355 17 0.426 13 0.413 12 NA 13 NA 12
India 0.120 72 0.156 91 0.159 89 NA 83 NA 84
Indonesia 0.177 42 0.161 85 0.163 82 NA 94 NA 97
Republic of
Korea 0.312 20 0.410 17 0.387 18 NA 15 NA 18
Malaysia 0.205 38 0.302 32 0.292 32 NA 33 NA 36
Philippines 0.110 76 0.193 69 0.212 57 NA 70 NA 75
Singapore 0.402 13 0.500 2 0.465 4 NA 3 NA 2
Thailand 0.182 40 0.225 53 0.215 54 NA 59 NA 61
United
States 0.727 1 0.706 1 0.659 1 NA 1 NA 1
Note: (a) The data shows three years moving average. (b) The indices are measured on a scale of 0 (minimum potential) to I (maximum potential)
NA: Refers to not available. Source: Compiled from UNCTAD, World Investment Report (various issues).
3.2.6 Global Competitiveness Index:
Another method of assessing the investment potential of an economy for its ranking
on global competitiveness is the Global Competitive Index (GCI). This
comprehensive index was developed by the World Economic Forum (WEF) 2008 to
measure national competitiveness and is published in the Global Competitive Report
(GCR). It takes into account the micro and macro-economic foundation of national
competitiveness, in which competitiveness is defined as the set of institutions, policies
and factors that determine the level of productivity of a country and involves static
and dynamic components. The overall GCI is the weighted average of three major
components: (a) Basic Requirements (BR) namely, institution. infrastructure,
macroeconomic stability. health and primary education, (b) Efficiency Enhancers
(EE) i.e. higher education and training. goods market efficiency, labour market
61

Chapter - 3
efficiency. financial market sophistication, technological readiness and market size
and (c) Innovations and Sophistication Factors (ISF); i.e. business sophistication, and
innovation.
Amongst the 131 countries for which GCi was computed, the US is ranked the
highest with an overall index of 5.67, India was at 48 h̀ places and is still below that of
China at 35. In terms of the components, India holds relatively low rank for BR i.e.
74, but higher ranks for EE i.e. 31 and even higher for ISF i.e. 26 as compared to
China (WEF, 2008).
3.2.7 FDI and Gross Domestic Product Ratio:
FDI inflows as a percentage to GDP is another indicator by which one can measure
the cumulative FDI absorption relative to the size of an economy. It also signifies the
relative openness of an economy vis-a-vis its other competing countries.
A country with a FDIIGDP ratio, greater than unity is reckoned to have received more
FDI than that implied by the size of its economy. It indicates that the country may
have a comparative advantage in production or better growth prospects reflecting
larger market size for foreign firms. However if the economy has the ratio value of
less than one then it shows that the country may be protectionist and backward.
Hence, FDI/GDP ratio is an index of the prevailing investment climate in the host
country.
The share of FDI inflows in GDP in India has been very small in absolute terms
remaining less than one during 1991 to 2005 (Table 3.6). However, the ratio improved
dramatically to 1.66 percent in 2006; thereafter it rose to 2.05 percent in 2007 and
2.13 percent in 2008, which reflect the growth in the domestic economy,
improvement in the investment climate as well as the buoyancy in FDI flows. As far
as CAGR of FDI inflow, GDP, and FDUGDP ratio is concerned it was 27.33%.
8.96% and 14.02% respectively during the entire period of 1991-2008.
62

('lt(lj)tc~1 - i
Table 3.6: FDI Inflows and GDP in India (1991-2008). (In USS billion)
Year FDI GDP (current
market price)
FDI/GDP
( percent)
1991-92 0.17 288.43 0.06
1992-93 0.39 290.35 0.13
1993-94 0.65 275.38 0.24
1994-95 1.37 323.80 0.42
1995-96 2.14 367.62 0.58
1996-97 2.77 389.11 0.71
1997-98 3.68 420.47 0.88
1998-99 3.08 424.33 0.73
1999-00 2.44 453.33 0.54
2000-01 2.91 467.80 0.62
2001-02 4.22 482.93 0.87
2002-03 3.13 505.05 0.62
2003-04 2.63 591.37 0.44
2004-05 3.76 694.93 0.54
2005-06# 5.55 840.47 0.66
2006-07# 15.73 945.69 1.66
2007-08# (P) 24.58 1198.03 2.05
2008-09# (QE) 27.33 1284.44 2.13
Note: (a) GDP used Base yearl999-2000. #: Base year 2004-05. P' refers to provisional,
'QE' refer to quick estimates Data from 1993 onward are based on FEDAI (Foreign Exchange Dealers Association of India) indicatives rates. During 1991-93data are based on official exchange rate. (b)(iDP figures are given in rupees. These have been converted to USS figures by using the average cxchan_e rates for relevant financial years obtained from RBI. Ilandbook of statistics on Indian I-c nomvv 2010 (www.rhi.ort.in Source: Compiled from handbook of Statistics of the Indian Economy. RRI, 2007& 2010, Mumbai.
63

0
Charter • 3
fi11: is FDI
'FtMIPa 1fGUP It ICI
64

Chapter - 3
3.3 Evolution of FDI Policy in India:
For the purpose of analysis the study has been divided in two broad categories.
1) FDI inflows in Pre-reform period.
2) FDI inflows in post-reform period.
3.3.1 FDI Inflows in Pre-reform Period:
At the time of independence, the attitude towards foreign capital was one of fear and
distrusts due to previous exploitative role played by the Britishers. The legal and
constitutional framework governing FDI in India consisted of a complex jumble of
legislative enactment and policy directions designed primarily for the regulation of
domestic investment. The government exercised complete discretion and authority in
interpreting and applying these legal and policy provisions to shape and control the
FDI. The indoor government policy towards FDI before economic reform may be
discussed under three different phases. Though these are not directly separable, it is
convenient to look at these three phases.
3.3.2 The Phase of Cautious and Selective Attitude towards FDI (1948-1967):
After independence India adopted highly protective approach towards foreign capital
though it was too ambitious towards the import of foreign capital. The industrial
policy resolution of 1948 acknowledged the need for foreign capital to supplement the
domestic saving in financing higher levels of investment. However it advocated an
effective Indian control over the management of such foreign capital to ensure its
regulation in the national interests (Gopiunath, 1997: 454). The suspicious hostility
found expresses in the industrial policy of 1948, which although recognizes the role of
foreign investment in the country emphasized that its regulation was necessary for
national concerns. The aforesaid attitude resulted in obstruction of capital imports. In
1949 Prime Minister JL Nehru emphasizes the necessity of foreign capital to
parliament that it is necessary to supplement domestic capital but also to secure
scientific, technical and industrial knowledge and capital equipment. Furthermore,
Prime Minister JL Nehru has made a statement in 1949 giving three important
assurances to foreign investors.
65

( /ulpter - 3
' India would not make any discrimination between ti~reign and domestic
Investors.
Foreign exchange. permitting reasonable facilities would he given to foreign
investors for remittance of profits and repatriation of capital.
In case of nationalization of undertaking fair and equitable compensation
would be paid to foreign investors.
Though restrictions on FDI were relaxed but majority ownership and control was
preferred in local hands except those industries using highly sophisticated technology
and for export oriented sectors. A crisis in financial resource mobilization during
1956-61 has further liberalized its attitude towards FDI. In a hid to attract foreign
investment to finance foreign exchange component of projects a host of incentives
and concessions were introduced.
In 1961 foreign investment were welcomed in those industries which were earlier
reserved for the public sector such as drugs, aluminum, heavy electrical equipment,
fertilizers and synthetic rubber etc. The government also assured to treat equally
foreign firms at par with domestic tines. By a declaration issued on June 2, 1950, the
government assured the foreign capitalists that they could remit the profits on foreign
investment made by them in the country (Mishra & Puri, 2002: 700). The policy
statement of government issued on 1949 continued till 1956 industrial policy
resolution, which had opened up immense field for foreign participation. The
government failure to control TNCs especially the large oil companies who imported
crude oil from the parent companies and shipped it their own tankers has led to the
formation of the oil and natural gas commission (ONGC) and Indian Oil Corporation
(IOC) in 1955 and 1959 respectively primarily with the objective of reducing the
monopoly of the oil companies (Martinussen, 1988). This policy of state intervention
also confronted to `commanding heights' of the objective of the 1950 industrial policy
resolution.
3.3.3 The Phase of Restrictive Attitude towards FDI (1968-1979):
In the late 1960's the effects of foreign economic domination and foreign exchange
drain have brought the tightening of the restrictions for FDI. regime. The liberalization
of the policy towards foreign capital till mid 1960's have resulted in the outflows on
account of remittance of dividends, profits. royalties and technical fees grew sharply
66
Chapter - 3
and become a significant proportion of the foreign exchange account of the country.
This has resulted in foreign exchange crisis in the late 1960's and has led to the
streamlining of procedures for foreign collaboration approvals and the adoption of a
restrictive attitude.
In 1968, on the recommendation of the Mudaliar Committee on foreign
collaborations, Foreign Investment Board (FIB) was set up to deal with the case of
foreign investments and collaborations with a maximum limit of 40 percent to the
paid up equity capital of the company and upto Rs. 20 million share capital. The cases
exceeding this limit was considered special and referred to the cabinet committee. A
sub-committee of the FIB was empowered to approve cases involving foreign
collaborations in which the proportion of foreign equity held did not exceed 25
percent with an upper limit to Rs. 10 million. The administrative ministers were
authorized to approve cases involving purely technical collaborations. Foreign
investors unaccompanied by technology were not permitted (Kumar, 1994: 34).
During this period, FDI was restricted on those coming without technical
collaborations. Government also listed the industries where foreign participation was
not desirable on the ground of local capabilities. Payment of royalties and fees was
also capped to certain limits. Restrictions were also extended with respect to renewal
of foreign collaborations and guidelines to use Indian consultancy services.
In 1969 a more precise policy was evolved, Industries were divided into three groups,
i.e. (i) foreign collaborations was not considered necessary (ii) FDI with technical
collaboration, (iii) and only technical collaboration. Though, foreign collaborations
were entertained in two out of the three industrial groups, viz., (i) FDI with technical
collaboration, (ii) and only technical collaboration.
The regulatory framework for FDI continued and was further consolidated with the
enactment of Foreign Exchange Regulation Act (FERA), 1973. FERA required
foreign companies to undergo compulsory registration under Indian corporate
legislation upto a foreign equity holding of 40 percent. As a result of which flexibility
of FERA was extended to foreign companies engaged in tea plantations, exports
oriented business and high technology and high priority areas (Kumar 1998: 1322).
'the exemptions given in FERA were for the following categories of non-resident
companies. First companies were permitted to hold 74 percent of equity abroad if
exports were of more than 60 percent of outputs. Second, permission for 51 percent of
equity holding was allowed if 60 percent of the company's turnover was in core sector 67

with 10 percent of export commitment. Third. 100 percent export oriented companies
were allowed 100 percent equity holding. Nevertheless, there was no discrimination
between domestic and foreign companies apart from FERA companies.
During, 1970. regulatory regime was tightened. as reflected in the industrial policy
statement of 1977, which prohibited foreign collaborations in certain industries on the
ground that indigenous technology in these industries had sufficiently developed.
These industries included metallurgical, mechanical, engineering, rubber, chemical
(other than fertilizers) and drugs and pharmaceutical industry.
The regulatory framework under FERA was a partial success due to foreign exchange
constraint, to some extent the objective of equity dilution was also fulfilled. As a
result, the number of foreign branches came down considerably from 500 in 1974 to
300 in 1980 (Martinussen, 1988). Several sectors of the industry were closed to
foreign firms altogether. In many others, official entry conditions were so
cumbersome and restrictive that new foreign capital inflows were effectively blocked.
Thus, while achieving very little in the context of existing TNCs, FERA was effective
in scaring away potential investors. The period from 1970-80 was the most restrictive
from the point of view of FDI mainly because implementation of FERA was the
principal item on the agenda of policy makers.
However, to promote exports, during this period the Government established free
trade zones (FTZs) at Kandla (Gujarat) and Santa-Cruz (Mumbai) in 1965 and 1972
respectively.
In 1973, more specific policy was evolved, detailing the number of industries where
foreign companies could operate with or without FDI. Once again, the restrictions of
FDI were made to sectors producing basic intermediate, capital and consumer goods.
At the same time, the foreign equity limit was revised upward from 40 percent to 49
percent in high technology and priority sectors and foreign participation was limited
to only government joint ventures.
3.3.4 The Phase of Semi-Liberalization (1980-1990):
During this period, a partial liberal attitude towards foreign investment came into
being with the announcement of industrial policy of 1980 and 1982 and Technology
Policy of 1983. This phase was characterized by changes in the policy direction such
as de-licensing some of the industrial rules and promotion of Indian manufacturing
68

(hxpcer - 3
exports, emphasizing on modernization of industries through liberalized imports of
capital goods and technology. The restrictive features of Monopoly Restriction and
Trade Policy (MRTP) Act were also liberalized. The policy changes, specilie to
foreign investments included (i) setting up of four new Export Processing Zones
(EPZs) for attracting foreign companies and (ii) relaxation of FERA for 100 percent
Export Oriented Units (EOUs). Besides relaxation on 40 percent ceiling on foreign
ownership was given and also on rules and procedures regarding payments of
royalties and technical fees. This period marks the trade liberalization by tariff
reduction and shifting of large number of items from import licensing to Open
General Licensing (OGL). Further in March 1990 Government abolished industrial
licensing for new units, for fixed investment upto Rs 250 million (Rs. 750 million for
export oriented units) and units located in recognized backward areas (Kumar 1994:
53). The foreign collaboration was freely allowed provided that the royalty payment
did not exceed 5 percent on domestic sales and 8 percent on exports.
All the measures adopted during this phase in fact enabled India to further move
ahead with the process of liberalization, Privatization and globalization.
3.3.5 Trends of FBI Inflows during Pre-reform Period: Before 1991:
After independence the cautious FDI policy was resulted in a low level of FDI inflow
in India. The amount of FDI increased from US$ 79 million in 1980 to reach a peak
level US $ 252 million in 1989 thereafter it declined US $ 237 million in 1990 (Table
3.7). The overall FDI inflow during 1980 to 1990 was fluctuating. FDI increased three
times during the period of 1980-1990 and the CAGR (actual) wasl9.05% during the
same period of time.

Chapter - 3
Table 3.7: FDI Inflow in India: Approval Vs Actual during 1980-90. (USS million)
Year Approval Actual % growth (Actual)
1980 11.2 79.0 - 1981 12.5 92.0 16.5
1982 66.2 72.0 -21.7
1983 61.0 6.0 -91.7
1984 99.4 19.0 216.7
1985 102.9 106.0 457.9
1986 84.9 118.0 11.3
1987 83.1 212.0 79.7
1988 172.3 91.0 -57.1
1989 195.2 252.0 176.9
1990 73.3 237.0 -6.0 Source: Compiled from India's Investment Center. New Delhi and UNCTAD, World Investment
Report (various issues).
Figure 3.5 : FDI Inflow in India, Approval vs. Actual during 1980-90
Years
* Approval ♦- Actual -- percent growth (Actual)
3.3.6 Country-wise break-up of FDI flows during Pre-reform Period:
There was almost a fluctuating trend during the 1981 to 1990. The important feature
is that except Germany (its share declined from US$6.2 million in 1980 to 5.5 million
in 1990) almost all the countries have positive trend in FDI in inflows in India. In the 70

80
60
40
20
0
Chapter - 3
year 1981 the top five investing countries were Germany, USA, UK, Japan and
Switzerland and together they accounted for 86 percent of total FDI inflows. In 1990,
the top five investing countries are USA, Switzerland, Germany, UK and Italy and
together, they accounted nearly 57 percent of FDI inflows (Table-3.8).
Table: 3.8- FDI Inflows by Country of origin during 1981-1990. (In USS million)
Year/
Country USA Germany Japan UK Italy Switzerland Others Total
1981 2.6 6.2 0.7 0.8 0.1 0.5 1.6 12.5
1982 5.3 3.7 26.5 1.7 4.2 1.2 23.6 66.2
1983 13.7 4.8 15.9 9.7 1.1 1.1 14.7 61.0
1984 7.9 2.5 5.4 1.6 0.7 0.4 80.9 99.4
1985 32.3 9.6 12.7 3.0 5.6 0.7 38.1 102.0
1986 23.3 16.0 4.6 6.1 1.9 2.6 30.4 84.9
1987 22.8 7.6 5.3 6.5 2.3 6.8 31.8 83.1
1988 69.8 22.3 12.5 10.0 22.0 1.2 34.5 172.3
1989 38.3 74.2 5.4 20.6 4.3 4.8 47.6 195.2
1990 19.7 5.4 2.9 5.2 3.9 7.7 28.5 73.3 Note: Data are on approval basis and has been transferred from the exchange rate taken from the International Financial Statistics (Year Book) IMF, 2003. Source: Compiled from Indian Investment Center.
Figure 3.6: t00 FDI Inflows by Country of Origin during 1981-1990
Years
-&USA ♦-Germany *-Japan -e-UK 4-Italy Switzerland Others
71

Chapter - 3
3.3.7 Sector-wise break-up of FDI Inflow during Pre-reform Period:
The top five sectors which have attracted the bulk of FDI were industrial machinery,
chemicals, mechanical engineering, electrical and electronics and metallurgy and
together they accounted for 54.87 percent in the year 1981. In 1990, the top five
sectors were electrical and electronics, chemicals. industrial machinery, mechanical
engineering and metallurgy and together they accounted 68.14 percent of the total
FDI inflows (Table-3.9).
As regards sector-wise distribution of foreign collaborations in terms of number, the
largest number of 1678 out of a total 7486 during this period was in electrical and
electronics sector with a share of 22.4 percent followed by industrial machinery with
21.7 percent, chemical industry, mechanical engineering with 10.1 percent and
transport sector with 6.7 percent (Gakhar, 2006: 64).
Table: 3.9- Sector-wise distribution of FDI inflows during 1981-1990. (In US million)
_ L 1I l v. O C U
Lr ^ rC O
1981 1.2 1 2.7 1.2 0.1 5.1 11.3 54.87
1982 35 1 2.1 0.6 0.3 20.4 59.4 65.66
1983 0.8 7.7 2 2.3 0.5 20.4 33.7 39.47
1984 62.4 5 4.7 4 2.2 0.7 79 99.11
1985 7.1 24.4 2.7 6.8 12 10.7 63.7 83.20
1986 23.8 23 0.8 6.4 10.9 1 65.9 98.48
1987 31.3 14.2 6.2 1.3 1 5.8 59.8 90.30
1988 25.1 28.3 3.1 9 9.5 30.3 105.3 71.23
1989 57.5 24.4 2.5 3.9 12.4 25.8 126.5 79.60
1990 8.6 9.8 4.5 3.6 1.3 13 40.8 68.14 Note: Note: Data are on appro%al basis and has been transferred from the exchange rate taken from the International Financial Statistics (Year Book) I11:, 2003. Source: Compiled from Reserve Bank of India Bulletin (various issues).
72

70
60
50
40
30 20
10
0
ab~
Chapter - 3
Figure 3.7: Sector-wise Distrbition of FDl Inflows durng 1981-1990
Years
* Chemicals t Eiectrical& Industrial Mechanical ♦- Metallurgy Others Electronics Machinery Engineering
3.4 FDI inflows in Post-reform Period: Since 1991:
After mid 1990 the political disturbances along with other economic problem gave rise to severe financial crisis in the Indian economy. The high rate of inflation, fiscal deficit and political instability downgraded the international credit of the country. This resulted in the erosion of the international community's confidence on our economy. The outflow of deposits especially by NRIs, a virtual stoppage of remittances from Indian workers in the Gulf countries and a sudden break out of Gulf war in January 1991 exacerbated the balance of payments crisis. The foreign exchange became so scanty that, it was insufficient to pay even for one week imports. As a result the economic liberalization process was introduced under Structural Adjustment Programme (SAP) with the support of IMF and the World Bank. This culminated into a series of economic reforms in 1991 along with a host of industrial policy reforms. NIP 1991 recognized the role of FDI in the process of industrial development in India in terms of bringing greater competitiveness and efficiency and also modernization, technological upgradation, creation a sound base for export promotion and above all integrating India with rest of the world. The major highlights of NIP 1991 changes are as under:
Abolition of industrial licensing system except for 18 industries specified in the Annex-Il of the statement, which includes those industries which manufactured, hazardous chemicals and items of elitists consumption or of national concerns social well being and the environment concerns.
73

Chaptci' - 3
Ceiling of 40 percent foreign equity under FERA was done away with.
Removal of registration under %1RTP Act.
Foreign investment promotion board (IFIPB) was established and has been
authorized to provide a single window clearance for all project proposals
regarded by it.
Introduction of the dual approval system for FDI proposals viz. (1) through an
automatic approval channel for FDI in 35 priority sectors by RBI upto equity
participation 51 percent and (ii) through formal government of India channel
via FIPB/SIA.
Existing companies were allowed to hike their foreign equity upto 51 percent in
priority sector.
%- Liberalization in the use of foreign brands name.
Abolition of phased manufacturing programme (PMP) for high local content.
r Dilution of dividend balancing conditions and its related exports obligation
except in case of 22 consumer goods industries.
Removal of restrictions of FDI in low technology sectors.
> Automatic permission for technology agreement in high priority industries.
Removal of condition for FDI with necessary technology agreements.
Liberalization of technology imports.
Permission for Non-Resident Indians (NRIs) and Overseas Corporate Bodies
(OCBs) under automatic route with repatriation of capital income to invest up
to 100 percent equity in high priority industries.
India became a signatory to the convention of the Multilateral Investment
Guarantee Agency (MIGA) for protection of foreign investments. It protects the
foreign investors from non-commercial risks including risks of expropriation.
The MRPT Act has been amended to remove the threshold limits of assets in
respect of MRTP companies and dominant undertaking. This eliminates the
requirement of prior approval undertaking. Also eliminates the requirement of
prior approval of the government of India for establishment of new
undertakings, expansion of undertakings, mergers. amalgamation and takeovers
and appointment of directors under certain circumstances.
Foreign investment in the power sector is actively encouraged and can take
place either in the form a joint venture foreign equity.
74

('liapter - 3
r Provisions of FERA have been liberalized through an ordinance dated January
9, 1993, as a result of which companies with more than 40 percent of foreign
equity are also now treated on par with fully Indian owned companies.
- Reduced tari ft' rates on a number of items and made the rupees partially
convertible, under which 60 percent of export earning were converted at the
market determined exchange rate under the provision of liberalized exchange
rate management system (LERMS). Further, in 1993 rupees was made fully
convertible.
Tax rate on short term capital gain were reduced from 75 percent to 30 percent.
An Electronic Hardware Technology Park (EHTP) scheme was set up to permit
100 percent equity participation.
All these measures adopted during 1991 marked a major departure of FDI policies
adopted before 1991 and ushered a new era for FDI in India. These initial measures
underwent revision and further liberalization measures were introduced subsequently
after 1991 to project India as one of the top host countries for FDI. Following are the
major reforms that came into being specifically in 1997, 2000 and post 2000.
In December 1996, the government permitted automatic approval for FDI upto 74
percent through RBI in 9 categories of industries. The catalog of items for automatic
approvals of foreign equity by RBI was expanded by including 3 industries relating to
mining business for foreign equity upto 50 percent and 13 additional industries for
foreign equity upto 51 percent. The 48 industries related to mining business eligible
for automatic approval upto 50 percent foreign equity and another set of industries
suitable for 74 percent foreign equity was also considered. Besides, this also includes
a number of other industries, which were crucial for rapid growth of the economy.
Since 28 February 1996, NRIs were allowed to invest funds on non-repatriation basis
in money markets mutual fund floated by public and private sector financial
institutions and commercial banks.
In January 1997 another 13 industries were brought under 51 percent foreign equity
participation and 9 other high priority industries in metallurgical and infrastructure
sectors were earmarked for equity participation which was raised upto 74 percent and
100 percent for NRIs. A total of 1 1 l sectors were put under automatic approval with
equity cap of upto 100 74 51i 49 and 24 percent. Further procedural simplification
was brought in the automatic FD f approval channel. The earlier practice of obtaining
prior approval was dispensed of and the companies were allowed to inform RBI after 75

('lh(Ij)ter - 3
shares were issued to non-resident companies. The FIPB relocated from prime
minister's office to Secretariat for Industrial Approval. Ministry of Commerce and
Industry. Government of India.
Foreign Investment Promotion Council (FIPC) was set up by the government with a
more target-oriented approach towards FDI Promotion. The basic function of the
council was to identify specific sectors / projects within the country that requires FDI
and target the specific regions and countries of the world for its mobilization.
In 1998 NRIs were allowed to purchase shares in Indian companies in the secondary
market subject to a limit of 5 percent of the company's total equity with 10 percent
limit for aggregate NRIsiOCBs investment in the companies. State Bank of India
launched a Resurgent India Bond Scheme denominated in the foreign currencies and
was open to both NRIs,'OCBs and the bank acting in fiduciary capacity on behalf of
them. The projects for electricity generation, transmission and distribution, roads and
highways, ports, harbours and vehicular tunnels were permitted foreign equity
participation upto 100 percent under the automatic route', provided foreign equity
does not exceed Rs. 1500 crores. The government allowed 49 percent of the total
equity in companies producing Global Personal Communications by Satellites
(GPCS) Services etc.
In August 1999 government of India set up Foreign Investment Implementation
Authority (FIIA) within the ministry of industry to facilitate quick translation of FDI
approvals into implementation by providing a pro-active one step after care service to
foreign investor like helping them obtain necessary approvals and sorting their
operational problems. FIIA is assisted by Fast Track Committee (FTC) which has
been established in 30 Ministries / Departments of Government of India for
monitoring and resolution of difficulties for sector specific projects (Chopra, 2004:
123).
In the year 2000 FDI policies have been further liberalized and all FDIs were
permitted under the automatic approval route, except for a small negative list. The
dividend balancing conditions for FDI in 22 consumer goods industries were dropped.
The existing upper limit for Rs. I500 crores for FDI in projects involving electricity
generation, transmission and distribution (other than automatic reactor plants) was
4. Under automatic route does not require any prior approval either by govt. or Reserve Bank of India. The investors are only required to notify the concerned regional office to the Rf3f within 30 days of receipt of inward remittances and file the required documents with that office within 30 days of issue of shares of foreign investors.
76
O ~`5 CIuupu'r -3
also dispensed with. The traditional EPZs were renamed as SEZs. It proposed the 100
percent FDI investment by the automatic route in manufactured activities except for
the followings (a) arm and ammunition, explosives and allied items of defence
equipment. defence aircraft and warship, (b) narcotic and psychotropic substances and
hazardous chemicals (c) atomic substances (d) distillation and brewing of alcoholic
drink (e) cigarette! cigar and manufactured substances. In addition, the manufacturing
units in SEZs were not subject to routine examination by customs. The inputs are
allowed on self-certification basis, and the duty free materials are allowed for five
years. Besides this a host of procedural simplification and operation were made like
record keeping, inter unit transfer, sub-contracting, disposal of absolute materials etc
(Economic Survey 2001-02: 119). Besides this a comprehensive package for
development of SEZs including entitlement of these zones to procure duty free
equipment, raw materials components etc. whether imports or purchased locally was
introduced. Reduction in peak custom duty from 35 percent to 30 percent and it also
provided an indication to further reductionirationalization in these duties into only
two slabs of 10 percent for raw materials and components and 20 percent for final
products (Economic Survey 2002-2003). From November 1'` 2000 the EPZs at
Kandla Santa Cruz, Kochi and Surat have been converted into SEZs. Approval has
also been given for setting up SEZs at Manguneri (Tamil Nadu), Posita (Gujarat),
Kulpi (West Bengal) Paradeep (Orissa), Bhadohi and Kanpur (Uttar Pradesh) Kaki
Nanda (Andhra Pradesh), Drongiri (Maharashtra) and Indore (Madhya Pradesh).
In most of the manufacturing sectors such as textiles, paper, basic chemicals, non-
metallic mineral products, metal products, plastic, rubber, drugs and pharmaceuticals,
ship or boat building, machinery and equipment and automobiles 100 percent FDI is
permitted with automatic approval. In addition to above sectors such as hotels,
tourism, courier services, airport, township, urban infrastructure facilities like roads,
bridges, mass rapid transit system and manufacture of building materials in all metros
including associated commercial development of real-estates also permitted 100
percent FDI, but FDI limit to 24 percent continue for SSIs and 26 percent for defence
equipment in the year 2001.
The steering committee on FDI was set up by the planning commission in August
2001 under Chairmanship of N.K. Singh which submitted its report in September
2002 to the Prime Minister. It recommended that the ban on FDI in retail trade should
not be lifted while for other sector such as oil marketing, petroleum exploration, 77

Chapter - 3
banking and financial services and real estates was raised to limit of 100 percent.
According to committee the main reason for low level of FDI in several sectors was
due to the absence of a credible regulatory framework.
In 2004, the National Common Minimum Programme (NCMP) declares that PDl will
continue to be encouraged and actively sought after especially in areas of
infrastructure, high technology and exports.
The peak rate of custom duty for non-agricultural products was reduced from 20
percent to 15 percent in 2005. An additional 108 items, including 30 items in the
category of textile products, i.e. hosiery were identified for de-reservation from the
ambit of SSIs to help textiles and clothing exports in the post-quota regime. The
emphasis on infrastructure development continued with the decision to set up a
Special Purpose Vehicle (SPV) for large infrastructure projects. The SEZ bill was
passed by Parliament in June 2005 and provides many attractive fiscal incentives and
tax concessions for the developers as well as manufacturers. It provided confidence
and stability to domestic and foreign investors and signal the government's
commitment to SEZs policy. At present there are 15 functional SEZs and in principle
approval has been given to 62 others (Economic Survey 2006-2007: 154).
Due to financial constraint and declining production in agriculture, 100 percent FDI is
permitted under the automatic route in floriculture, horticulture development of seeds,
animal husbandry, pisiculture, aquaculture and cultivation of vegetables and
mushrooms under controlled conditions and services related to agro and allied sectors
(Annexure-1).
Progressive and phased liberalization measures adopted for promoting FD[ during the
post-reform period created a much-desired environment for business growth and FD[
inflows in India. The most important among all are abolition of industrial licensing
requirement for business set up (except for few industries of strategic and
environmental and locational concerns), gradual hiking up FDI ceiling in a phased
manner (Box 3.2), increasing the number of sectors under automatic route and
keeping few sectors such as industries requiring compulsory licensing, manufacturing
items reserved for SSIs and investment locations attracting locational restrictions,
liberalization of foreign exchange regulations by way of simplification of procedures
for making inward and outward remittances, rationalization of both direct and indirect
tax structure, rupee made fully convertible on trade account, removal of quantitative
restriction on imports, financial sector reforms and decontrol of interest rates and the 78

Chapter - 3
Fiscal Responsibility and Budget Management Act (FRBMA) enacted in 2003. Apart
from these, there were also several simplifications of procedures as part of investment
facilitation, such as electronic tiling of applications, online chat facility with the
applicants, online status on registration/ disposal of applications and dedicated e-mail
facility for investment related queries to facilitate and hassle free FDI promotion in
the country.
Box 3.2: Liberalization of FDI Policies. Pre 1991 1991 1997 2000 Post 2000
Allowed Upto 51 Upto Upto 100 More sectors
selectively percent under 74/5 1/49 24 in percent under opened equity
upto 40 "Automatic 111 sectors "Automatic cap raised,
percent Route" for 35 under Route in all conditions,
priority sectors "Automatic sectors except relaxed,
Route", 100 a small foreign
percent in negative list exchange
some sectors management
Source: Compiled from Economics Survey, Planning Commission. Government of India, (various
issues) and Media reports.
Apart from the above policy measures for attracting FDI, the Central Government and
most of the State Governments offer various incentives to attract FDI in most desired
sectors and also for directing investment to underdeveloped regions. Incentives like
100 percent profit deduction are available for infrastructure, 100 percent tax deduction
for exports and undertakings in SEZs and various capital subsidy and fiscal incentives
are offered for encouraging FDI in underdeveloped northeastern states by the Central
Government and several State Governments, incentives are also available for
facilitating FDI projects such as single window approval system for setting up
industrial units, making exemption of fees.'duty for electricity, registration and stamp,
giving rebate on land cost, reserving plots for NRIs and EOUs, offering tax
concessions etc. (Box 3.3).
These policy changes intended for making India an investors, `friendly destination'
for FDI has undergone more than a decade's experience. On the other hand, some FDI
restrictions have been imposed by the government of India in order to protect the
interest of the country. Sectors such as retail trading (except single brand product
79

('1 apta• -
retaining given in 26.c). atomic energy, lottery business and gambling and betting are
prohibited.
Box 3.3: Various Incentives Schemes for Attracting FDI.
1) 100 percent protit deduction for developing, maintaining and
operating infrastructure facilities.
2) Tax exemption of 100 percent on export profits for 10 years.
3) Deduction in respect of certain inter-corporate dividends to the ~
C U
extent of dividend declared. C
4) Various capital subsidy schemes and fiscal incentives for
expansion in the north eastern region.
5) Tax deduction of 100 percent on profit for 5 years and 50
percent for the next two years for undertaking in the SEZs.
1) Single window approval system for setting up industrial
• units.
E v 2) Electricity duty, registration fees and stamp duty exceptions.
o -- 3) Reservation of plots for NRIs, EOUs and foreign investment
projects.
v > 4) Rebate on land costs, tax concessions and octroi refunds.
5) Interest rate and fixed capital subsidy.
Source: Compiled from Economic Survey, Planning Commission, Government of India, (various issues) and media report.
3.4.1 Trends of FDI during Post-reform Period:
The 1991, New economic policy measures reversed the past policies to rebuild
foreign investors confidence in making investment outlets in India. During initial
years of the reform periods, there used to be a large gap between FDI pledged during
approval and actual FDI inflows realized in the country. The large difference between
approval and actual FDI inflows during the early period from 1991 to 1998 may be
due to liberalization process (Table 3.10). Further, during this period, many sectors
were kept outside the FDI and those sectors that were available for FDI were tagged
with upper limit, and other terms and conditions in the form of special case-by-case
approval if the FDI proposal was outside the automatic channel. Besides, investors
were cautious about continuity of the policy changes in future. These factors led to the
80

t haptc~~ - .i
large difference in FDI actual inflows and approvals. which subsequently narrowed
down during 1998 to 2000.
Table 3.10: FDI in India: Approvals Vs Actual during 1991-2008. (VS S million)
Year (April- Approval
March)
Actual
Share of Inflows
Approval (percent)
percent growth (Actual)
199l-92 527 165 31.31 -
1992-93 1976 393 19.89 138.18
1993-94 2428 654 26.94 66.41
1994-95 3178 1374 43.23 110.09
1995-96 11439 2141 18.72 55.82
1996-97 11484 2770 24.12 29.38
1997-98 10984 3682 33.52 32.92
1998-99 7532 3083 40.93 -16.27
1999-2000 4266 2439 57.17 -20.89
2000-2001 5754 2908 50.54 19.23
2001-2002 3160 4222 133.60 45.18
2002-2003 1654 3134 189.48 -25.77
2003-2004 1353 2634 194.68 -15.95
2004-2005 1913 3759 196.50 42.71
2005-2006 1610 5546 344.47 47.54
2006-2007* NA 15726 - 183.56
2007-2008* NA 24581 - 56.30
2008-2009* NA 27331 - 11.19 Note: There is difference in aggregate FDI inflows data reported by RBI and SIA. Ministry of
Commerce & Industry. Government of India. the difference may be due to errors and emissions. Autust- march Includes stock swap of shares USS 3.2 billion for year 2006-2007 and US$ 5 billion for the
ear _'00--3005. Source: Economic Survey 2004-2005. Government of India, New Uelhi and SIA Newsletter (various FIN fact'hcets).
E1

Chapter -3
F1.e 3.8: F[M in lode: Approvrk Vi AMW dtiig 1991-2008
E
.1
30000 27000 2M 10000
0
a Obi Q q Obi G Q ~ 'V O O O all O. P O. O. O. O1 O• . .4 ' e 1 \ \ \ \ \ 1 Q0. O O O O O O O
\ 'V 'V .Y C O C
l~5
• Appio 1 t ..-1 '- S of h*WS Aro i (patdti) t p e 1 gUwth (Ac )
As far as amount of FDI is concerned it has been increased from US$ 165 million in
1991 to US$ 4222 million in 2001, but thereafter it declined to US$ 3134 and US$
2634 in the year 2002 and 2003 respectively. However 2004 it has shown increasing
trend. Similarly, growth rate too fluctuated during 1991 to 2009. In the year 1998,
1999, 2002 and 2003 it was negative i.e. -16.3, -20.9, -25.8 and -15.9 percent
respectively. Thereafter it increased to a high level of in 2006 i.e. 183.56%. The
CAGR of actual FDI inflow is 24.28% during 1991-2008.
3.4.2 Route-wise FDI Inflows during Post-reform Period:
There are two main channels for the entry of FDI in India, the SIAIFIPB and the RBI
Automatic Approval Route. From the inception economic reforms in India in 1991
until the year 2000, most of the FDI came through the government route as there was
strict monitoring of the approvals, therefore, FDI coming through the SIA/FIPB route
was greater than the FDI coming through the RBI route (Table 3.11). However, there
has been a dilution of this trend in the past several years. With the investment boom in
India and different states competing for attracting FDI, the government has eased
foreign investment regulations leading to a spurt in FDI coming through the RBI
route, which is a positive sign. During 1991, 54.1 percent of total FDI was channeled
through the SIA/FIPB route in contrast to 45.9 percent through the RBI route. The
route wise FDI inflows fluctuated till 1998. During 1998, the FDI inflows through the
82

Chapter - 3
SIA/F[PB route accounted for 62.1 percent of total FDI inflows, while through RBI
only 7.3 percent. Thereafter, there was an increase in share of inflows through the
RBI's automatic route, a decrease in the share or inflows through the SIA/FIPB,
whereas the share of inflows through acquisition existed between 30 to 20 percent.
Table 3.11: Route-wise FDI Inflows in India (1991 -2008). (In US$ million)
Year FIPB &
SIA Route
RBI Automatic
Route
Inflows through
acquisition of existing share#
RBI various
NRI schemes*
Total
1991 (Aug.- 78
Dec.) - - 66 144
1992 188 18 - 59 265
1993 340 79 - 189 608
1994 511 116 - 365 992
1995 1264 169 - 633 2066
1996 1677 180 88 600 2545
1997 2824 242 266 290 3622
1998 2086 155 1028 91 3360
1999 1474 181 467 83 2205
2000 1474 395 479 81 2429
2001 2142 720 658 51 3571
2002 1450 813 1096 2 3361
2003 934 509 637 - 2080
2004 1055 1179 980 - 3214
2005 1136 1558 1661 - 4355
2006 1534 7121 2465 - 11120
2007 2586 8889 4447 - 15922
2008 3209 23651 6169 - 33029
Total 25962 45975 20441 2510 94888 Note: 1. Inflows through ADRs GDRs,FCCBs against FDI approvals have not been included. 3. 4 Data poor to 1996 not provided by the RBI. 3. * From 2003, RBI's various NRI aehemea inflows included under the heading RBI's Automatic
Route Source: SIA Newsletter April 2009 http://siadipp nic in/ptiblicat'new,lTtr'atig2003/index.httn
83

Chapter - 3
Figure 3.9: Roue-wse FDI Inflows u In" (1991 to 2008)
rr.
20000
t0D00
5000
r r r v +, l N N N N N N Year
+ FFB & SIA Route -RBIAutomatic Route blows through acquisition of existing share# RBI ranaus NRI schemes'
3.4.3 Country-wise break-up of FDI Inflows during Post-reform Period:
Changing composition of FDI inflows by country of origin is another feature observed
during post-reform period. The important feature is that almost all the leading investing
countries have responded positively in response to liberalization policies. During the
initial period of 1992-98 out of aggregate FDI inflows of US$ 9990 million (Table 3.12)
79.8 percent of FDI inflows were from top ten countries such as Mauritius (30.7 percent)
followed by the USA (18.1 percent), the UK (4,7 percent), Germany (6.4 percent) and so
on. Mauritius is a major source of FDI inflows because of its 'tax haven' status. Double
taxation avoidance agreement that India entered with Mauritius had become an additional
benefits in the form of reducing tax liability for TNCs from the USA and the UK to route
their investments through Mauritius. Although the share of USA has declined
considerably, however these countries are still the largest source of FD1 inflows. During
the period 1992 to 2008 percentage shares of FDI inflows from top ten countries
underwent a compositional shift in favour of Mauritius, Singapore and the USA
comprising 45.12 percent, 10.04 percent and 9.92 percent of the total inflows of FDI
worth US$ 72718 million. With share of the UK 5.8 percent, Germany 3.3 percent, and
Netherlands 4.3 percent and so on. Together they account for nearly 84.9 percent of total
FDI inflows.
84

('hapler - i
Table 3.12: FDI Inflows by Country of Origin during 1992.2008.
(L.SS nilfion) S.
No. Countries
1992-
93
1993-
94
1994.
95
1995.
96
1996-
97
1997-
98
1998-
99
1999.
2000
2000.
01
2001.
02
2002-
03
2003.
04
2014.
05
1005.
06
2006.
07
2097-
08
2008-
09(P) 1 otal
Share
percent
I. 1-fauritius NA NA 197 507 846 900 590 501 843 1863 534 381 830 1363 3780 9518 10165 32898 45.12
2. USA 12 99 203 195 241 687 453 355 310 364 268 297 469 346 106 950 123(i 212 9,92
3. U.K. 7 98 144 71 54 NA NA NA 61 45 224 157 84 261 1809 508 690 4213 5.79
4. Germany 21 35 35 100 166 151 114 31 113 74 103 69 143 45 116 486 611 .1413 3.32
S. Netherlands 11 47 45 59 134 159 53 83 76 68 94 197 196 50 559 601 682 3104 4.27
6. Japan 26 37 95 61 97 164 235 142 156 143 66 67 1?2 86 80 457 266 3300 3.16
7. France 9 10 11 NA NA NA NA NA 93 88 63 34 41 13 I00 136 437 1030 1.41
8. Singapore 3 10 25 60 76 NA NA NA 32 54 39 IS 64 166 582 3827 3360 7303 16.04
9. Switzerland 35 23 26 NA NA NA NA NA 8 6 35 5 64 68 57 19.2 135 654 0.90
10. South
Korea NA NA 12 24 6 333 85 8 14 3 IS 22 14 61 68 86 NA 761 1.05
II. Others 136 45 76 351 446 562 470 462 194 280 327 218 300 762 1014 3180 2597 10910 15.03
12. Total 280 404 612 1419 2057 2956 2000 1581 1910 2988 1658 1462 2320 3220 8871 18541 30179 72118 100.00
Note: NA rulers to Not Available. P: Refer to Provisional
Data in this table related to only equity capital under the RBI Automatic route and the Government route. Acquisition by shares of Indian companies by Non-Resident under section FEMA. 1999 and equity capital of unincorporated bodies are not included.
Source: Compiled from Annual Report, Reserve Bank of India (various issues).

Chapter - 3
Figure 3.10: Country-wise FDl Share(%)
$
■ Mauritius
I$ ■ USA ■ U.K.
■ Germany ■ Netherlands
~, ■ Japan $ France
"'$ Singapore Switzerland South Korea
Others $
a$
3.4.4 Sector-wise break-up of FDI Inflows during Post-reform Period:
Liberalization of FDI policy is also responsible for a changing sectoral distribution of
FDI inflows in India. Manufacturing and other sectors which was dominating the
aggregate FDI inflows during 1990 came down due to the emergence of services
sector as an important recipient of FDI. During 1992-2000 engineering sector was the
top most sector for receiving FDI with 20.4 percent followed by electronics &
electrical equipment (12.5 percent), chemicals and allied product (11.7 percent),
services (9.4 percent), Finance (7.6 percent), computers (5.8 percent), food and dairy
products (5.8 percent) and pharmaceuticals (2.6 percent) of the total worth US$
13485. Their share together stood at 76.32 percent (Table 3.13A). On the other hand
during 2000 to 2010 service sector has attracted the largest amount of FDI with a
percent share of 20.35 followed by computer software with 8.5 percent,
telecommunications 7.9 percent and soon. Together these top ten sectors accounted
for 65.30 percent of total inflow during the same period (Table 3.13B).
86

('haj'ier - 3
'fable 3,I3;\: Sector-wise distribution of FDI Inflows during 1992.20110.
(L'SS million)
1 1999- Share Sector 1992.93 1993-94 1994-95 1995-96 1996.97 1997-98 1998-99 2000.01 Total
2000 percent
EnPeering 70 33 132 252 730 580 428 326 273 2824 20.94
Chemical and Allied 47 72 141 117 304 257 376 120 131 1581 11.72
Product
Finance 4 42 98 270 217 148 185 20 40 1024 7.59
Food and Dairy Product 28 44 61 85 238 112 19 121 75 783 5.81
Services 2 20 93 100 15 321 368 116 226 1261 9.35
Computers 8 8 10 52 59 139 106 99 306 787 5,84
Drugs & 3 50 10 55 48 34 28 54 62 344 2.55
Phannaceuticals
Electronics & Electrical 33 57 56 130 154 645 228 172 213 1688 12.52
Equipment
Others 85 79 276 348 292 720 262 553 578 3193 23.68
Total 280 405 877 1419 2057 2956 2000 1581 1910 13485 l00.0O
Note: Includes shares under section S of FEMA 1999 from 1995-96. Source: Compiled from, Annual Report, Reserve Bank of India (various Issues).

Chapter - 3
Figure 3.11 .
Sector-Wis1 Distribution of FDI ins during 1992-2000
21% 24%
12%
13%
6% 6% 9%
• E,irerii • Chemcal and Abed Product • Figme • Food and Daly Product • Services • Computers
Drugs & Ptamncerfic Ekctron1Es & Eicctncal FquQr11CR Others
Table 3.13B: Sector-wise distribution of FDI Inflows during April 2000 to April 2010. Sectors Amount of FDI Inflows Percentage
of Inflows in terms of
US$
In Rupees Crores
In US$ million
Service Sector 106992.07 23995.66 20.35 Computer Software Hardware 44611.13 10044.41 8.52 Telecommunication 42619.88 9360.76 7.94 Housing & Real Estates (including Cineplex, Multiplex, Integrated Township & Commercial Complex etc.
37614.76 8411.77 7.13
Construction Activity 36065.91 8136.35 6.90 Power 21466.46 4750.32 4.03 Automobile Industry 20863.91 4607.06 3.90 Metallurgical Industry 13844.71 3220.78 2.73 Petroleum and Natural Gas 12026.07 2782.74 2.35 Drugs & Pharmaceutical 7586.01 1707.52 1.45 Others 182666.34 40925.49 34.70 Total 526357.25 117942.86 100.00 Note: (1) Sector-wise FDI inflows data re-classified as per segregation of data from April 2000 onwards. (2)
Percentage of Inflows worked out in terms of USS and the above amount of inflows received through FIPB/SIA route, RBI's automatic route and acquisition of existing shares only.
Source: Compiled from, SIA Newsletter, Fact Sheet on FDI from August 1991 to April 2010.
88

Chapter - 3
Figure 3.12 Sector-wse FDI inflows 20% (2000-10)
35%
• Service Sector • Computer Software Hardware • TeIecon minicaion • Housing& Real Estates ■ Construction Activity
Power ■ Automobile Industry 1% 8% • Metallurgical Industry 2% • Petroleum and Natural Ges 3% 7% • Drugs & Pharmaceutical
4% ■ Others 4% 7%
3.4.5 State-wise break-up of FDI Inflows during Post-reform Period:
India is a Union of States with a strong central government. In practice, even in the
absence of major constitutional reform, the balance of centre-state relations is
beginning to shift from centralization to a greater acceptance of regional autonomy.
Economic reforms assigned greater power to state governments and provoked greater
competition among them. The 1995 decision to allow state governments to retain
foreign exchange income was a landmark. State governments were free to identify the
industries in which they wanted investment and to negotiate independently, although
final clearance has still to be obtained from the FIAB (Foreign Investment Approval
Board) or the RBI, depending on the size of investment. Greater financial autonomy
has generally been welcomed by emerging regional elites. Business, with a high
degree of regional concentration prefers to deal directly with MNCs rather than
through many additional layers of central bureaucracy. Regional politicians appreciate
that foreign investments in their states have created fresh employment and thus
freeing resources for social welfare purposes. Orissa and Bihar are ranked as the worst
states; to invest Bihar is graded the lowest due to lack of infrastructure facilities, low
literacy rate and lowest purchasing power in the country however their position are
improved now. The North and North Eastern States of Jammu & Kashmir, Assam,
Arunachal Pradesh, Meghalaya, Mizoram, Manipur and Nagaland do not even figure
on investors maps. Though they have a high investment potential in the field of
tourism, huge hydropower potential scope for gains from border trades but the
inadequate infrastructure, high security maintenance, spread of terrorist activities and
89

CltciptC,. — i
natural calamities makes them unattractive of FDI_ The state wise trends in FDI shows
that the RBI's regional offices at Maharashtra, New Delhi, Karnataka, Gujarat and
Tamil Nadu and others have been the largest recipients of FDI in terms of cumulative
FDI inflows with percentage share of 35.2 percent, 20.5 percent, 6.3 percent, 5.8
percent and 4.9 percent respectively from April 2000 to April 2010 (Table 3.14).
These states are known for their strong industrial base (like Gujarat) or as the software
huh (like Karnataka and Delhi) and could be attributed to their better resources,
infrastructure facilities, investors friendly, policies like single window clearance and
investment promotion schemes like SEZs. Their share stood at 79.67 percent of total
FDI inflow during the same period.
Table 3.14: State-wise distribution of FDI Inflows during April 2000 to April 2010.
(In US$ million) RBI's Regional
Office* State covered Amount of
FDI inflows percent
with FDI inflow
Mumbai Maharashtra, Dadar and Nagar Haveli, Daman & Diu 39631 35.24
New Delhi Delhi, Part of UP & Haryana 23055 20.50 Bangalore Karnataka 7035 6.26 Alunadabad Gujarat 6517 5.79 Chennai Tamil Nadu, Pondicherry 5527 4.91
Hyderabad Andhra Pradesh 4735 4.21 Kolkata West Bengal, Sikkim, Andaman and
Nicobar Islands 1393 1.24
Chandigarh Chandigarh, Punjab, Haryana and Himachal Pradesh 749 0.67
Panaji Goa 488 0.43 Jaipur Rajasthan 469 0.42 Others - 22869 20.33 Total - 112468 100.00 Note: Includes equity capital components only. * Refer to the region-wise FDI inflows are classified as per RBI's Regional Office received I=DL
inflows. furnished by RBL Mumbai. Source: Compiled front, SIA Newsletter, Fact Sheet on FIN from August 1991 to April 2010.
90

Chapter - 3
Figure 3.13:
State avise FDI inflow (° o)
0.42% 20.33%
0.43"/% _ 0.67%
1.24%
4.9 /~ 4.21%
4]t
5.73%
6.26%
■ Mumbai
■ New Delhi
■ Bangalore 35.24% ■ Ahmedabad
• Chcnnai • Hyderabad
Kolkata Chandigarh
Panaji Jaipur
20.50% Others
3.5 FDI in India: Reasons for Slow Inflows:
It has been observed that in absolute figures the FDI inflows in India is impressive but
compared to the global flows the share of India is far from satisfactory. Since, India is
a late comer in opening up her economy so it is unable to attract sufficient amount of
FDI as compared to other developing countries. This is basically linked to its socio-
economic set up and policies taken after independence. The review presents broad
generalization based on the perceptions of potential foreign investors and independent
consultants who interact closely with them. It is argued that FDI is expected to play a
supplementary and subsidiary role since it was used as a vehicle for technology
transfer. The complete web of regulatory control and bureaucratic intervention
accompanied by inadequate infrastructure is also regarded as major constraints. Here
are some of the major policy impediments:
3.5.1 Attitude of Foreign Investors towards India:
All investments either foreign or domestic are made under the expectation of future
profits. The economy benefits if economic policy contributes to the congenial
investment climate of the economy. This brings up competition, creates a well
functioning modem regulatory system and discourages artificial monopolies created
91

Chapter - 3
by the Government through entry barriers. The recognition and understanding of these
facts can result in a more positive attitude towards FDI.
There have been some real changes in the policy of the government of India towards
foreign investment since 1990s, but foreign investors are still looked at with some
suspicion. As per the traditional view some unhappy events in the past have a
multiplier effect by adversely affecting the business environment in India. Besides the
"Made in India" label is not conceived by the world as Synonymous with quality
(Steering Committee, 2002: 21) when a foreign investor considers making any new
investment decision, it goes through four stages in the decision making process and
action cycle that is (a) Screening (b) Planning (c) Implementing (d) Operating and
expanding. The biggest barrier for India is at the screening stage itself in the action
cycle. "Often India looses out at the screening stage itself' (Boston Consultancy
Group). This is primarily because we do not get across effectively to the decision-
making "board room" levels of corporate entities where a final decision is taken. Our
promotional effort is quite often of a general nature and not corporate specific. India
is, moreover, a multi-cultural society and a large number of MNC do not understand
the diversity and the multi-plural nature of the society. Though in several cases, the
foreign investor is discouraged even before he seriously considers a project, 220 of
the Fortune 500 companies have some presence in India and several surveys (JBIC,
Japan Exim bank, A T Kearney) show India as the most promising and profitable
destination. On the other hand China is viewed as more business oriented because its
decision making is faster and has more FDI thexidly policies.
3.5.2 Policy Framework
Most of the problems for investors arise because of domestic policy rules and
procedures different from the FDI policy per se or its rules and procedures. The FDI
policy, which has a lot of positive features, is summarized first, before highlighting
the domestic policy related difficulties that are commonly the focus of adverse
comment by investors and intermediaries.
a) FDI Policy: India has one of the most transparent and liberal FDI regimes
among the emerging and developing economies. By FDI regime we mean
those restrictions that apply to foreign nationals and entities but not to Indian
nationals and htdian owned entities. The differential treatment is limited to a
92

Chapter - 3
few entry rules spelling out the proportion of equity that the foreign entrant
can hold in an Indian (registered) company or business. There are a few
banned sectors and some sectors with limits on foreign equity proportion. The
entry rules are clear and well defined and equity limits for foreign investment
in selected sectors such as telecom quite explicit and well known. Most of the
manufacturing sectors have been for many years on the 100 percent automatic
route. Foreign equity is limited only in production of defence equipment (26
percent). In the case of infrastructure services, there is a clear dichotomy.
Highways and roads, ports, inland waterways and transport, and urban
infrastructure and courier services are on the 100 per cent automatic route.
India also has a clear policy of FDI in services, with 100 per cent automatic
entry into many services such as construction, townships/resorts, hotels,
tourism, films, IT/ISP/email/voice mail, business services & consultancy,
renting and teasing, medical/heatth, education, advertising and wholesale
trade. The financial intermediation section has sectoral caps like insurance (26
percent) (Steering Committee: 32).
b) Domestic Policy: The domestic policy framework affects all investment,
whether the investor is Indian or foreign. To an extent, foreign companies or
investors that have set up an Indian company or Joint Venture have become
indigenized and thus can operate more or less competitively with other Indian
company. They adjust themselves to the environment.
Among the policy problems that have been identified by surveys as acting as
additional hurdles for FDI are laws, regulatory systems and Government
monopolies that do not have contemporary relevance. Labour laws discourage
the entry of Greenfield FDI because of the fear that it would not be possible to
downsize if and when there is a downturn in business. SSI reservations further
limit the possibility of entering labour intensive sectors for export. More
flexible labour laws that improve work culture and enhance productivity and
SSI de-reservations will help attract employment generating FDI inflows of
the kind seen in South East Asia in the seventies and eighties and in China
since the nineties (Steering Committee, 2002:24-25).
The Urban Land Ceiling Acts and Rent Control Acts in States are a serious
constraint on the entire real estate sector. This is another sector that has
attracted large amounts of FDI in many countries including China.
93

Chapter - 3
Weak credibility of regulatory system and multiple and conflicting roles of
agencies and government has an adverse impact on new FDI investors which
is greater than on domestic investors. All monopolistic have a strong self-
interest in preventing new entrants who can put competitive pressures. In the
past government monopoly in infrastructure sectors has slowed down policy
reform FDI was discouraged by the feet the pressure exerted by government
monopolies through their parent departments would bias the regulatory system
against new private competitions (Steering Committee, 200224-25).
It is alleged that persistent fears of impending "fiscal crisis" is another
constraint, and that a well articulated strategy for medium term fiscal
consolidations would address these concerns.
Through the foreign trade and tariff regime for SEZs approximates a genuine
free trade zone the other elements of the policy framework and procedures
remain virtually the same as in the domestic tariff area. The SEZs are therefore
still not fully on par with the export zones of China with respect to labour
intensive production (Steering committee: 24-25).
3.5.3 Procedures:
According to Boston Consulting Group, investors find it frustrating to navigate
through the tangles of bureaucratic controls and procedures. Bureaucracy and red tape
topped the list of investor concerns as they were cited by 39 per cent of respondents in
the A T Kearney survey. Of the three stages of a project, namely general approval
(e.g. FDI investment licence for items subject to licence), clearance (project specific
approvals e.g. environmental clearance for specific location and product) and
implementation, the second was the most oppressive. Three-fourth of the respondents
in the survey indicated that (post-approval) clearances connected with investment
were the most affected by India's red tape. According to CII (2002) study a typical
power project requires 43 central government clearances and 57 state government
level (including the local administration) clearances. Similarly the numbers of
clearance for a typical mining project are 37 at the central government level and 47 at
the state government level. though the number of approvals or clearances may not
always he much lower in the OEDC countries like the USA and Japan the regulatory
process is transparent with clear documentation requirements and decision rules based
94

C hapter - 3
largely on self certification and generally implemented through the legal profession.
The government has set up an inter-ministerial committee to examine the existing
procedures for investment approvals and implementations of projects and suggest
measures to simplify and speed up the process for both public and private investment.
The committee which was set up in September 2002 has submitted part I of its report
(dealing with public sector projects) to the government. A sub-group of the committee
is specifically looking into simplification of procedures relating to private investments
(Qamar. 2003: 36).
The FICCI (2001) study similarly cites centre-state duality as creating difficulties at
both the approval and project implementation stage. These studies find that the
bureaucracy in general is quite unhelpful in extending infrastructural facilities to any
project that is being set up. This leads to time and costs overruns. At an operational
level multiple returns have to be tiled every month. One effect of these bureaucratic
delays is the low levels of realization of FDI inflows vis-a-vis the proposals cleared.
3.5.4 Foreign Investment Promotion Board:
The delays mentioned by foreign investors are not at the stage of FDI approval per se
i.e. at the entry point whether through RBI automatic route or FIPB approval. The
FIPB considers application on the basis of notified guidelines and disposes them
within a 6-8 week time frame, as has been laid down by the cabinet. The entire
process of FIPB application starting from their registration through the listing on
FIPB agenda and their final disposal and dispatch on official communication is placed
on website which adds to the transparency of decision making and enhances investor
confidence. Similarly the underlying advisory support in the form of online chat
facility and dedicated e-mail facility for existing and prospective investors has created
an investor friendly image. A FICCI study on "Impediments to Investment" (2002)
has acknowledged that the central level FIPB clearances have been successfully
streamlined. The FIPB approval system has also rated as world class independent
surveys conducted by CII (2000) and JICA (www.ticci.org.in).
The FIIA framework has also been strengthened recently by adoption of a six-point
strategy. This includes close interaction with companies at both operational and board
room level followed up with administrative ministers, state governments and other
concerned agencies and sector specific approach in resolving investment related
95

( Iuijncr - 3
problems. The major implementation problems are encountered at the state level as
projects that the regional meeting and for foreign investors under the FIIA cleared by
industry secretary are now turning out to the problem solving platforms (Steering
Committee, 2002:27).
However according to Mayararn (2004) the establishment of FIIA to facilitate quick
translation of FDI approvals into its implementation provides a proactive one stop
after care service to foreign investors. The FIIA has created fast track committees in
30 ministers.' department in the central government. The constitution of the FIIA is
almost the same as the FIPB: whereas the secretariat for the FIPB is in the finance
ministry that of the FIIA is in DIPP. However by creating two distinct bodies FIPB
and FIIA the system has become more complex and confusing.
3.5.5 Quality of Infrastructure:
Poor infrastructure affects the productivity of the economy as a whole and hence it's
GDP per capita GDP. It also reduces the comparative advantage of industries that
are more intensive in the use of such infrastructure. Furthermore poor infrastructure
has a greater effect on export production than on production for the domestic market.
Inadequate and poor quality roads, railways and ports, raise export cost vis-a-vis,
global competitors having better quality and lower cost infrastructure. As a foreign
direct investor planning to set up an export base in developing or emerging countries
has the option of choosing between India and other locations with better infrastructure
and hence India fails in attracting export oriented FDI (Mohiuddin, 2003: 11).
Problems in the power sector are reported to be a quite highly significant deterrent of
FDI inflow in India. Besides lack of proper port facilities, warehouses are also known
to be a significant deterrent of FDI in India.
3.5.6 Pro-labour laws:
Pro-labour laws or lack of exit policy in India is reported as the one of the major
macro-economic harriers to FDI inflow in the country. Foreign investors wanted that
there should be flexibility in the labour market conditions. There is excessive trade
unionism in India. In most of the big organizations working in India there is a
multiplicity of trade unions and if they get united on any issue then without conceding
to their demand, the work is almost impossible. Even if they remain isolated from
96

Chapter - 3
each other than even satisfying some of the unions could not serve the purpose and
work is obstructed by others. This is mainly because of the illiterate labour and also
due to vested interest of their leaders.
Similarly labour laws discourage the entry of Greenfield FDI because of the fear that
it would not be possible to downsize it if and when there is a downturn in business.
Labour laws, rules and procedures have led to deterioration in the work culture and
the comparative advantage that is even beginning to be recognized by responsible
trade unions. Pursuant to the announcement in the 2001-02 budget that labour laws
would be reformed, a Group of Ministers was set up to work out the modalities. The
Group of Ministers would suggest specific changes in the laws for the approval of the
Cabinet (Steering committee, 2002:24).
3.5.7 Corruption:
Corruption in India is another major impediment to FDI inflow in the country. It is a
consequence of the nexus between Bureaucracy, politics and criminals. India is now
no longer considered a soft state. In 2011 India was ranked 95" out of 178 countries
in "I ransparetcy International's Corruption Perceptions Index.
Corruption has a negative impact on the level of investment and economic growth, on
the quality of infrastructure and on the productivity of public investment (Tanzi and
Davoodi, 1997), on health care and education services (Gupta ct al, 2000), and on
income equality (Gupta, et a(,1998). All these factors are found to be important
determinants of FDI location. Therefore, foreign investors tend to avoid investing in
India with high levels of corruption.
3.5.8 Obstacles and Delays:
According AT Kearney survey (2001), almost all the respondents replied that they
experienced bureaucratic problems in India; they reported bureaucratic delays as a
very important deterrent of FDI inflow in India. Most of foreign firms reported that
there was a large time gap in submitting proposal and getting the project cleared. Due
to delay in the start of the project critical problems emerge such as cost of the project
increased and they lost interest in the project. This brought uncertainty in business
environment. In terms of the ease of doing business India ranks 133 s̀ in the world
while Singapore rank 1'; Malaysia 23"~ and China 89. The number of days it takes in
97

Chapter - 3
India to enforce a contract is 1420 whereas 150 days in Singapore, 300 days in the US
and 406 days in China. Similarly, for the time taken to close a business it takes 9
months in Singapore, 20 months in China and 7 years in India (Economic Survey,
2009-10: 28).
According to Sengupta et al. (1997, Economic Times) bureaucratic red tapism is a
significant impediment to FDI inflows and underlines that the reform of inefficient
bureaucratic practices at the state level is even more pressing than at the centre. There
is evidence that after having got the nod from the centre, foreign investor needs
additional 30 or 40 approvals at the state level.
Taxes levied on transportation of goods from state to state (such as control and entry
tax) adversely impact the economic environment for export production. Such taxes
lead to both cost and time delays on movement of inputs used in production of export
products as well as in transport of the letter to the ports. Differential sale and excise
taxes (centre and state) on small and large companies are found to be a deterrent to
FDI in sector such as textiles (McKinsey 2001). Investment could raise the
productivity and quality of textiles and thus make them competitive in global market
remain unprofitable because they cannot overcome the tax advantages given to small
producers in the domestic market (Steering Committee 2002: 30).
The services sector received 20.4 percent of total FDI in India. As a state subject the
states have to take the lead in simplifying and modernizing the policy and rules
relating to this sector. At the local level issues pertaining to land acquisition, land use
change, power connection, building plan approval are sources of project
implementation delay. The state level issues were considered by the Govindrajan
committee with a view to seeing how they can be alleviated.
Thus, according to Gakhar (2006) foreign investment policy and procedures are the
most important deterrent to FDI inflows in India which rank first with average score
3.10. Growing fiscal deficit in the budgets of the central and states government is
another impediment of ED] inflow in India. The time consuming clearance procedures
with wide spread corruption, lack of proper infrastructure, pro labour laws, non-
transparcncy in policy guidelines and political interference and instability and so on
are the major factors of low FDI inflows in India. According to Michael Gadbaw,
Chairman of India Interest Group set up by US businesses interest in India" strict
measures should be adopted to deal with such tendency". The FDI policy which has a
lot of positive features is summarized first before highlighting the domestic policy
98

Chapter - 3
related difficulties that are commonly the focus of adverse comment by investors and
intermediaries.
3.6 Conclusion:
FDI has played a significant role in the growth and development of the world
economy, particularly in India. Our GDP has been grown four-fold since the year
1991. According to World Development Report (2010) India ranked 3 h̀ in terms of
PPP (purchasing power parity). It is also the 10 h̀ largest economy in terms of US
dollar exchange rate. Furthermore, India is also the second fastest growing economy
in the world with the highest economic growth rate. Though, China is the largest
recipient of FDI but India is also increasingly becoming an important destination for
FDI in Asia. Progressive liberalization of FDI policy has strengthened investor
confidence with opening up of new sectors like integrated township, defence industry
tea plantation etc. India's capacity as a host nation in attracting FDI has been
enhanced during the post reforms period, but the quantum of FDI inflows relative to
its size has been low as compared to other developing countries in general and some
of the Asian countries like China in particular. Main reasons for these low FDI
inflows has been related to the investment climate, poor infrastructure, foreign
exchange rate fluctuation and business facilitation, which are comparatively at lower
level. However, during pre liberalization period FDI increased at CAGR of 19.05%
while during post liberalization period it has grown 24.28%. This indicates that
liberalization has had a positive impact on FDI inflows in India. Since 1991 FDI
inflows in India has increased approximately by more than 165 times as compared to
pre liberalization period.
Yet, it is important to note that the focus should not just be on the absolute amount of
gross FDI inflows but also on the type. More specifically, while India has experienced
an infusion of FDI inflows in recent times, a large portion of the new inflow have
been in the form of Brownfield investment (M&As). Given that the latter does not
necessarily imply new capital infusion into a country. the macroeconomic
consequences of the two types of FDI can be quite different. The focus should not just
be on the amount of Greenfield FDI inflows but also the positive externalities to be
derived from them, including in terms of technological development.
99

Chapter - ?
With growing importance of FDI, host countries seek not just more such investment,
but are also increasingly interested in its quality in terms of benefits for sustainable
economic development. The impact of FDI depends on how closely they integrate in
the local production process through sourcing raw-materials locally. The next chapter
deals with the study on the growth and development of pharmaceutical industry. An
attempt is made to famish a detailed of production, investment, R&D expenditure,
new chemical entity etc. in the Indian pharmaceutical sector in this chapter.
IOU

Chapter - 3
3.7 Referrence:
I. Chopra, Chanchal (2004). 'Foreign Investment in India: Liberalization and
WTO -The Emerging Scenario", Deep and Deep Publication Pvt. Ltd., New
Delhi: 123.
2. Confederation of Indian Industry (2000). `Foreign Direct Investment in India:
How can $ 10 billion of Annual Inflows be Realized", New Delhi (January).
3. Confederation of Indian Industry (2002). "From Crumbs to Riches: Reorienting
Foreign Direct Investment in India", New Delhi.
4. Economic Survey (1992-93). Planning Commission, Government of India, New
Delhi: 110.
5. Economic Survey (2001-02). Planning Commission, Government of India, New
Delhi: 119.
6. Economic Survey (2002-03). Planning Commission, Government of India, New
Delhi.
7. Economic Survey (2006-07). Planning Commission, Government of India, New
Delhi: 154.
8. Economic Survey (2009-10). Planning Commission, Government of India, New
Delhi: 28.
9. Federation of Indian Chambers of Commerce & Industry (2001). "The
Experience of Foreign Direct Investors in India", New Delhi (April).
1O.Gakhar, Kamlesh (2006). "Foreign Direct Investment in India 1947 to 2007:
Policies, Trends and Outlook", New Century Publication, New Delhi: 62-64.
1 I. Gopinath, 1. (1997). "Foreign Investment in India: Policy Issues, Trends and
Prospects", Occasional paper, New Delhi, 8(5).
12. Gupta, S., H. Davoodi, and E. Tiongson (2000). "Corruption and the Provision
of health Care and Education Services", IMF Working Paper # 116.
Washington: International Monetary Fund.
13. Gupta, S., H. Davoodi, and R. Alonso-Terme, (1998) "Does Corruption Affect
Income Inequality and Poverty?", IMF Working Paper k 76. Washington,
International Monetary Fund.
14. http://www.ficci.org.in.
15. Kearney, AT. Inc. (2001). "Global Business Policy Council", FDI Confidence
Audit: India, Alxandric, Verginia, USA.
101

Chapter - 3
16. Kumar, Nagesh (1994). "Multinational Enterprises and Industrial Organization:
The case of India". Sage Publication, New Delhi: 24.
17. Kumar, Nagesh (1998). "Liberalization and Changing Patterns of Foreign Direct
Investments: Has India's Relative Attractiveness as a Host of FDI Improved?"
Economic and Political Weekly, Sameeksha Trust Publication, 33(22): 1321-
1329 (_Mumbai).
18.Martinussen, J. (1988). "Transnational Corporations in a Developing Economy:
The Indian Experience", Sage Publication, New Delhi.
19.Mayaram, Arvind (2004). "Don't let go of the foreign ]land", The Economic
Times, a" August: 10.
20.McKincey&Company (2001). `Identifying the Barriers to Rapid Employment
and Output Growth in India", McKinsey Global Institute, New York, June.
21.Mishra, S.K. and V.K. Puri (2002). "Indian Economy", Himalayan Publication,
New Delhi: 700.
22. Mohiuddin, Yasmin (2003). "Foreign Direct Investment: A Comparison of India
and China", International Seminar on Business Education in the New
Millennium, held at Department of Commerce, AMU, Aligarh: II (I't 2"a
March).
23.Nabhi's Manual for foreign collaboration and investment in India (2002).
Nabhi's Publication, New Delhi: 70-75.
24.Qamar, Furgan (2003). "Foreign Direct Investment in India: Policy Initiatives
and Contemporary Status", International Seminar on Business Education in the
New Millennium, held at Department of Commerce, AMU, Aligarh: 36 (I~'-2"a
March).
25.Report of the Steering Group on FDI (2002). Planning Commission,
Government of India, Academic Foundation Publication, New Delhi: 27.
26. Romer, Paul M. (1993). "Idea Gaps and Objects Gaps in Economic
Development", Journal of Monetary Economics, 32: 543-573.
27.Sengupta, N.K., A. Banik and R. Kathuria (1997). "Qualitative Aspects of FDI
Inflows: The Case of India". The Economic Times. 7 h̀ January.
28.Tanzi, V., and H. Davoodi, (1997). "Corruption, Public Investment and
Growth", IMF Working Paper 4 139. Washington, International Monetary Fund.
29.UNCTAD (2007). "World Investment Prospects Survey 2007-09", New York
and Geneva, United Nations.
102

Chapter - 3
30. World Economic Forum (2008). "The Global Competitiveness Report, 2007-
2008.
31 World Investment Report (1995). "Transnational Corporations and
Competitiveness", UNCTAD. New York and Geneva, United Nations.
32. World Investment Report (2001). "Promoting linkages", UNCTAD, New York
and Geneva, United Nations.
33. World Investment Report (2003). "FDI Policies for Development: National and
International Perspective", UNCTAD, New York and Geneva, United Nations.
34. World Investment Report (2004). "The shift towards services", UNCTAD, New
York and Geneva, United Nations.
35.World Investment Report (2008). "Transnational Corporations and the
Infrastructure Challenge", UNCTAD, New York and Geneva, United Nations.
36. World Investment Report (2009). "Transnational Corporations, Agricultural
Production and Development", UNCTAD, New York and Geneva, United
Nations: 3.
103

Chapter-4
Pharmaceutical Industry in India: An Overview
4.1 Introduction:
Health is defined both as cause and effect of economic development, and the
pharmaceutical industry is especially recognized in the `UN Millennium Development
Goals' as an actor that can contribute to economic development. Pharmaceutical
industry is classified as one of the most high-tech and capital-intensive industries. It is
considered as the `life line' industry because its products play a crucial role in
remedifying the suffering of diseased persons It is also significant contributor to the
strength of any economy by creating jobs for millions and contributing to the export
earnings. The distinctive feature of this industry is such that the goods produced by
this sector can neither be substituted nor replaced. The pharmaceutical industry is one
of the basic industries of the country and included in the priority list of the economic
development programmes.
Health for all is India's national objective. This objective can only be met by the
increased production of the cheapest and safer drugs to the public.
4.2 Global Pharmaceuticals Industry:
The origins of modem pharmaceutical industry can be traced back to the late 19'h
century, when dye stuffs were found to have antiseptic properties. Roche, Ciba-Geigy
and Sandoz all started as ancestry dyestuff companies which moved into synthetic
pharmaceuticals and eventually become global players. In 1980s many
pharmaceutical companies were doing well financially, and large investments were
made in R&D. However, the global pharmaceutical industry is now facing declining
R&D productivity, increasing generic substitution in the prescription area of drugs,
and loss of income due to patent expiration. There has been a decline in profitability
for a number of major global titms, due to expiry of some major patents and also from
increased governmental interventions (ICRA, 2004). Thus, many companies have
started to form alliances and merged with other firms in order to strengthen their
presence. Outsourcing of production and research activity is increasing as firms are
constantly looking for cheaper alternatives. Outsourcing is carried out in certain parts
of the production chain and is expected to expand further in the future.
104

Chapter--I
Fhe majority of `global pharmaceutical sales originate in the 'Triad' (US, European
Union and Japan). and together they are accounting for over 80°0 of the world market.
The global pharmaceutical sales have grown from USS 334 billion in 1999 to USS
773 billion in 2008 and further to USS 776 billion in 2009 and is expected to grow to
USS 880 billion in 201 l(IMS health 2009).
At the regional level. US is the major pharmaceutical market accounting for around
45°,'0 of global pharmaceutical sales, followed by Europe (24°0) and Japan (11%)
(Priolker, 2009). Out of 15 major big pharma' companies eight of them are from
USA, and the USA based company Pfizer sells 25 major pharmaceutical products
most of which are block buster drugs. (Davidson and Greblov 2005:3).
As per IMS health Inc. the highest regional global pharmaceutical sales was in North
America with 40.3% share in the year 2008 followed by Europe (32%) Asia, Africa
and Australia (1 1.8%) (Table-4.1).
The leading global pharmaceutical companies are Pfizer with 5.7% market share
followed by Glaxo Smith Kline (GSK) (5.6%), Sanofi Aventis (5%) and others.
Together, the top ten companies accounted for 39.1% of total global pharma market
sale (IMS health 2009).
Table-4.1: Global Pharmaceutical Sales by Region (2006-081. Sales USS Billion Market Share (%)
No. Region 2006 2007 2008 2006 2007 2008
1 North 289.9 304.5 3118 47.7 45.9 40.3 America
2. Europe 181.8 206.2 247.5 29.9 31.1 32.0
3 Asia, Africa 52.0 62.2 90.8 8.6 9.4 11.8 & Australia
4. Japan 56.7 58.5 76.6 9.3 8.8 9.9
5 Latin 27.5 32.0 46.5 4.5 4.8 6.0 America Total 607.9 663.5 773.1 100.0 100.0 100.0
Note: Ranked by 2008 Global sales Source: 1MS Health Inc.
1. Rig pharma term referring to companies with very large sales, revenues generally in excess of USS billion.
105

Chapter-4
Figure 4.1 : Global Pharmaceutical Sales by Region (2006-08)
60
so
40
30
20
10 M 2006 2007 2008
Years • North America ■ Europe ■ Asia, Africa & Australia • Japan ■ Latin America
4.2.1 Global Pharmaceutical Research and Development:
Research and development is the back-bone of the pharmaceutical industry. Countries are increasingly looking at innovation and R&D as key drivers of competitive growth in this sector. USA is the biggest hub for pharmaceutical R&D. According to pharmaceutical research and manufacturing of America (PhRMA) in the year 2005 USA has spent more than US$ 50 billion in pharmaceutical R&D, followed by Europe ($25 billion) and Japan ($8 billion) (EXIM Bank, 2007: 28). At the company level Pfizer spent $7.9 billion in the year 2008, followed by Novartis ($7.2), Roche ($7.2) (Appendix-II).
4.2.2 Global Pharmaceutical Exports and Imports:
The share of pharmaceutical products in world exports has grown over the years. It was 1.7% in 2000 which has increased to 2.6% in 2005 (Exim Bank 2007: 29). European Union as a bloc was the largest exporter accounting for 68.7% of total global pharmaceutical exports in 2008 followed by Switzerland (10.4%), USA (9.0%), China (1.9) and others. India occupies 6th position (1.4%). Together their shares stood at 96.8% of global pharmaceutical exports (Table-4.2).
106

Chapter-4
Table-4.2: Major Eznorters of Pharmaceutical Products in the World (20091. Exporters Value (US$ Billions) % Share
European Union (27)* 293.3 68.7 Switzerland 44.2 10.4 USA 38.3 9.0 China 8.1 1.9 Canada 6.2 1.4 India 5.8 1.4 Singapore 5.0 1.2 Israel 4.8 1.1 Jordan 3.7 0.9 Australia 3.3 0.8 Total 412.7 96.8 Note: • refers to 27 number of member countries of EU. Source: compiled from International Trade Statistics, 2009. World Trade Organization
Figure 4.2: Major Exporters of Pharmaceutical Products in the World (2008)
1.4 1.4 1,2 1.1 0.90.8
1.9
10.4 • European Union (27) • Switzerland • USA ■ China • Canada • India
Sr spore Israel Jordan Australia
European Union as a bloc was also the largest importer of pharmaceutical products. In the year 2008 they imported 56.4% of world pharmaceutical imports followed by USA (14%), Switzerland (4.2%), Japan (2.7%) and others. Together their share stood at 87.4% of world pharmaceutical imports (Table- 4.3).
107

Chapter-4
Table 43: Major Imnorters of Pharmaceutical Products in the World (20081. Imports Value (US$ Billions) % Share
European Union (27)* 240.5 56.4 USA 59.9 14.0 Switzerland 17.8 4.2 Japan 11.4 2.7 Canada 11.0 2.6 Russian Federation 9.2 2.2 Australia 7.1 1.7 China 5.5 1.3 Brazil 5.0 1.2 Turkey 4.7 1.1 Total 372.1 87.4 Note: • reters to 27 number of member countries of EU. Source: compiled from International Trade Statistics, 2009. World Trade Organization
Figure 4.3: Major Imports of Pharmaceutical Products in the World (2008)
1.71.31.2 1.1 2.2
2 6 `'
14
• Etropean Union (27) • USA • Swtaerlard • Japan • Canada • Russian Federation
Australia China Brazil Turkey
4.3 Indian Pharmaceutical Industry: Historical background:
Before, we study the pharmaceutical industry in India, a few points on the healthcare
in the country would be necessary. India has about 16% of world's population 18% of
world's mortality, 20% of world's morbidity but only 1 % of the world healthcare
investment. As per Indian statistics the country has a total population of 1.15 billion
(2008) of this 32.2%, 63.1% and 4.6%, of the population are in the age group of under
108

1 Sycars. 15-64 years and over 65 years respectively. Human Development Report
(2011) ranked India as 134'f' on the Human Development Index. The Indian health
care system is the most privatized in the world with 83% of healthcare expenses being
borne privately. It also lacks specialized medical personnel. It had 6 physicians per
10,000 people in the year 2007 while developed countries such as Russia Federation
has 43. Switzerland has 41.and the USA and UK has 27 physicians per 10,000 people
in the same year. Pharmaceutical expenditure as a percentage of total expenditure on
health accounted for 50°c to 80%. The epidemiological data show that the tour major
diseases from which the people of India suffer from are H1V-AIDS, TB, cancer and
infectious diseases. As far as Indian pharmaceutical industry is concerned, it
constitutes 2% of the world market. The annual per capita drug expenditure is USS3
(Aggarwal et al 2006: 109).
The history of modern Indian pharmaceutical industry (IPI) dates back to the early
twentieth century when increased nationalism gave rise to greater interest in science,
including pharmaceuticals. The foundation to two firms, which are still in existence
today, marks the start of the modern pharmaceutical industry. One is Bengal Chemical
and Pharmaceutical Work (BCPW) Ltd. set up in Kolkata by Acharya PC Ray in
1901. The other is Alembic Chemical Works Co. Ltd. in Vadodara by TK Grajjar
,Rajmitra and BD Amin in 1907 (Amin, 1939: 1-7). Both the companies began an
important shift from traditional methods to a more scientific approach to the
discovery, development and manufacture of pharmaceuticals. At the early stage of
development, Indian pharmaceutical companies relied heavily on foreign companies
for their bulk drug requirements. The development of the IPI can be divided into three
phases, which are presented below.
4.3.1 Indian Pharmaceutical Industry from 1900 to 1970:
The pharmaceutical industry which had a scanty production scale of Rs. 100 million
in 1947 (Pradhan and Alakshendra 2006: 3) was completely dominated by
multinationals with more than 900o of the domestic market share. These MNCs which
were primarily trading and marketing subsidiaries of global firms were least interested
in local production. Besides this India adopted the British patents and design act 1911,
which granted product patent for a period of 14 years. This regime prohibited any
kind of reverse engineering and processes developments by their domestic counter
109

Chapter-4
parts. There were only few domestic firms in this sector even they were not capable of
local production of bulk drugs due to lack of required technological capabilities. As a
result of which drugs prices in India were amongst the highest in the world.
Soon after independence India received technical and financial assistance from
international organizations, such as the WHO and UNICEF, to set up the two giant
plants. The public unit Hindustan Antibiotics Limited (HAL) was established in 1954
and was provided with technical support, purchasing of equipment and machinery
from the WHO and UNICEF. Indian drugs and Pharmaceuticals Limited (IDPL),
another public sector enterprise, got access to import technology from overseas and
developed more modern manufacturing facilities (Narayana, 1984). IDPL was
provided financial assistance, technology and know-how by Soviet Union_ These
public units produced critical drugs, such as penicillin and other anti-infective
medicine. Currently both IDPL and HAL have been declared as sick units by the
Board for Industrial and Financial Reconstruction (BIFR) and their contribution to
production is negligible. But both these companies gave a tremendous boost to
indigenous efforts to the private sector and contribute to its success. I'hcy created new
confidence that India could also manufacture drugs in a big way (Anand, 1988).A
large mass of technology was imported into India between 1950-1970.Many leading
entrepreneurs got their training from these companies. The founder of Dr. Reddy's,
one of the largest pharmaceutical companies in India today, worked at the IDPL,
before he took off to start his own company.
Multinationals are a part of India's pharmaceutical foundation in addition to public
sector. India was attractive to foreign firms mainly due to its large market and
increasing demand for drugs. At that time there was lack of competition in the 1PI,
and the MNCs did well in India. They had good knowledge and technology to
develop antibiotics and synthetic drugs and had advantage of their financial assets and
management abilities. Consumer preference for foreign world-wide known drugs was
also an added advantage for the MNCs in India. They were aggressive in marketing
and managed to create a market for themselves in branded products. The foreign firms
had more or less, a monopoly in the Indian pharmaceutical market at this time.
4.3.2 Indian Pharmaceutical Industry from 1970 to 1990
This period of 1970-1990 is very significant for the IPI since a few important changes
that had implications on the growth of the IPI took place during this period. One of
110

C. hutpf'i -4
the key changes was the implementation of the new Indian Patent Act (( 970) in 1972.
Through this legislation the government abolished the product patent regime act of
1911. The Patent Act of 1972 ensured that a tine could now patent only a single
method or process for any particular drug. The patent tern was reduced to 5 years
from the grant of the patent or 7 years from application filing. (Fink, 2000). The
objective behind the new patent laws was to break the foreign companies monopoly
and encourage domestic pharmaceutical companies to grow. Thereafter the IPI
focused on reverse engineering. Between 1970 and 2005 India became a hot bed of
firms like Cipla Ltd which focused their capabilities on developing cheap processes
for globally patented drugs. They used Indian Patent Act to their advantage to
compete against global pharmaceutical companies in domestic market and also in
global markets.
The growth of the market for generic pharmaceuticals in the US provided an
opportunity for Indian manufacturers of generic drugs. According to DG Shah
(Secretary General of the Indian Pharmaceutical Alliance),"It helped that the IPI had
built its generic capabilities by then and could be the first mover in the US market." In
1999 a total 193 manufacturing plants in India complied with USFDA (US Food and
Drug Control, Administration) regulations. These plants represented 41% of all
complying plants in Japan, Taiwan, Korea and India. All these development meant
that by 2004 Indian firms enjoyed a 77% share in the domestic market compared to
23% share of global pharmaceutical companies. The situation had been completely
reversed from the early 1970s (Table-4.4).
Table-4.4: Market shares of 1\INCs and Indian Companies in the Pharmaceutical Industry in India.
Year MNCs (%) Indian Companies (%) 1952 38 62 1970 68 32 1980 50 50 1991 40 60 1998 32 68
2004 23 77 2008 19 8l
Source: S. Chaudhuri (2005): The 1WTO and India's Pharmaceuticals Industry: Patent Protection TRIPs and Developing Countries''. Oxford University Press, New Delhi and CMtli prowess database. \lumbai.

Chapter-4
Ffgure 4.4: Market Shares ofMNCs and Indian Companies in the PM.nWec.utioal Industry in India
0 .0 90
j SO
I
60
SO
♦O
"o 20
to II JJ 1952 1970 1980 1991 1998 2004 2008
Veers
• MNCs (%) • Indian Companies (%)
4.3.3 Indian Pharmaceutical Industry after 1995- Post TRIPs Period:
Because of continuously declining shares of MNCs the developed countries were increasingly keen to reverse India's patent regime, even as Indian negotiators voiced concerns about the welfare effects of the higher domestic drug prices caused by stronger patents. But India eventually acquiesced to pressure from the developed countries by singing the WTO- TRIPs agreement in late 1994. It made a commitment to implement a globally consistent product patent regime by 2000. Changes to India's laws included 20 years patent term and the new law became effective from January l, 2005. The Product Patent Act (2005) was framed to maintain the competitiveness of Indian companies in the global generic pharmaceutical industry while ensuring consistency with the requirements of TRIPs. The post TRIPs period has seen considerable debate over where India's pharmaceutical industry is heading under the new patent system. As a result there were 413 product patent applications for cancer drugs at the Indian patent offices, 350 of them filed by MNCs. The evaluation of IPI can be shown in the following chart (chart-1).
4.4 Policy changes for Development of Pharmaceutical Industry in India:
The government of India is strived hard to put pharmaceutical industry on the sound track of growth and development from late 1980s. Pharmaceutical industry in India is flourishing at an accelerated rate and it is assumed that soon India will be a global pharma super power in global pharmaceutical industry.
112

Chapter-4
The Government of India has taken some strategic policy (including fiscal and EXIM)
changes to move in that direction, which arc briefly described as follows: (NPP,
2006).
> The earlier policy of procuring industrial licensing for all kind of drugs has
been abolished (it has recently been done for the last remaining bulk drugs
produced by the use of recombinant DNA technology, bulk drugs requiring
in-vivo use of nucleic acids and specific cell tissue targeted formulations).
However, the need for obtaining manufacturing license under drugs and
cosmetics Act, 1940 continues for all units, whether organized or small scale.
The state drug controllers are authorized to issue such licenses in most cases.
➢ Now, FD1 upto 100% is permitted, subject to stipulations laid down from time
to time in the industrial policy through the automatic route in the case of all
bulk drugs cleared by the drug controller general India (DCGI) and their
intermediates and formulation. Recently bulk drugs produced by the use of
recombinant DNA technology, bulk drugs requiring in-vivo use of nucleic
acid as the active principles and special cell/tissues targeted formulation have
also been allowed this facility. Besides 100% EOUs and units of EPZs enjoy
a package of incentives and facilities, which include duty free imports of all
type of capital goods, raw materials and consumables in addition to tax
holidays against export.
➢ Automatic approval for Foreign Technology Agreement (ETA) is already
available in the cases of all the bulk drugs cleared by DCGI and their
intermediates and formulation, except bulk drugs produced by the use of
recombinant DNA technology, bulk drugs requiring in vivo use of nucleic
acids as the active principles and specific cell/tissue targeted formulations.
➢ Imports of drugs and pharmaceuticals are regulated through EXIM (Export
and Import) policy and presently all items except those requiring clearance
under the Narcotics and Psychotropic substances Act 1985 are allowed under
OGL (Open General List). Further a centralized system of registration has
been introduced under the Drugs and Cosmetic Act and rules made under
these are administered by Ministry of Health and Family welfare (MOHF W).
113

(Jiapt'r-a
Chart-l: Evaluation of Indian Pharmaceutical Industry. Phase V Innovation and Research
• New Intellectual Properly Law
• Discover Research
• Convergence Phase IV Growth Phase
Rapid Expansion of Domestic Market Development
Phase Ill Development • Research Phase Orientation
• Process Development
Phase II Government • Production Control Infrastructure
• Indian Patent Act Creation Phase I Early Years 1970 • Export Initiative
• Market share • Drug Price domination by Capped foreign • Local Companies companies begin to make an
• Relative absence impact of Indian companies
1970 1980 1990 2000 2010 7 Source: Akshay Lal, IPI, Evolution, Trends and Opportunities, www.ranbaxy.com.
114

Chapter-4
➢ Exports are permitted in accordance with the EXI_VI policy and relevant
procedures/rules formulated for the purpose by Director General of Foreign
Trade (DGFT). Further, the exporters are allowed imports of inputs on duty free
basis for export production. As a result, the industry has shown commendable
export performance, the trade balance being positive.
➢ In order to provide a boost to the pharmaceutical exports government constituted
a separate pharmexil (Pharmaceutical export promotion council) on 12 May,
2004. This council undertakes activities such as promoting exports, preparing
country profiles, assessing export potential across the countries and to have
gcater degree of interaction internationally.
➢ As recommended by Mashelkar Committee in 1999, a Pharmaceutical Research
and Development Support Fund (PRDSF) with a corpus of Rs.150 crores have
been set up under the administrative control of the Department of Science and
Technology. A Drug Development Promotion Board (DDPB) to administer the
utilization of PRDSF has also been set up.
➢ Product patent in pharmaceuticals has been introduced in the country, with effect
from January I, 2005 by amending the patent Act 1970 in conformity with
TRIPs agreement.
➢ The revised schedule M2 of the drugs and cosmetic Act 1940 related to GM?
(Good Manufacturing Practices) has cone into effect from Pt July 2005. This
would in the long run strengthen the pharmaceutical industry as a producer of
quality medicines.
➢ VAT has been introduced in India with effect from 1s` April 2005 and on
medicines it has been kept at 4% only.
➢ Clinical trials are essential for drug development and therefore, schedule Y of
the drugs and cosmetics Rule 1945 has been amended to allow for multicentric
concurrent clinical trials in India Under these rules clinical trials have been
defined and it has been made mandatory to take approval for conducting any
type of clinical trials in India. Besides this GCP (Good Clinical Practices)
guidelines have been published and made mandatory.
2 Schedule NI implies Conditions with which premise., licensed for the manufacture of drugs. should continn.
115

Chapter-4
> National Institutes of Pharmaceutical Education and Research (NIPER) under the
aegis of ministry of chemicals and fertilizers is an institute of National
importance established by an of the Act of Parliament and is engaged in training
human resources in the field of pharmaceutical science. Government has decided
to set up 6 new NIPERs indifferent regions of the country.
D The creation of department of pharmaceutical on July I, 2008 also encourages
the growth and diversity of this sector. As a new initiative the first
pharmaceutical census of India (FPCI) was launched during 2007-08 to obtain
the best and reliable data base for the sector.
D In union budget 2008-09 finance minister P. Chidambaram brought down excise
duty from 16% to 8% and zero excise duty on anti AIDS drugs. Resides 125%
weighted deduction granted on expenditure for out sourced R&D, exemption of
excise duty and 5% reduction in custom duty on certain specific life saving
drugs and bulk drugs used in the manufacture of Anti-AIDS drugs. This augurs
well for the industry. Besides this the rate of CST has been reduced from 3% to
2% from 1" April 2008 and reduction in the general rate of CENVAT from 16%
to 14% on medicines. The budget 2008-09 further reduced the excise duty across
the board by 4%. This effectively meant reduction from 8% to 4% on
formulation and 14% to 10% on bulk drugs. Whereas specific reduction in taxes
for pharmaceutical goods will lead to a balanced industrial development in the
pharmaceutical sector where there has been lopsided development especially in
tax havens like Himachal Pradesh, Sikkim and Uttaranchal (express pharma
2008).
> A special scheme for setting up pharmaceutical parks for providing all facility
under one roof in the country is provided and this scheme is based on Public
Private Partnership.
4.5 Nature of Indian Pharmaceutical Industry:
The Pharmaceutical Industry is different from other manufacturing industries in respects
that the demand of Pharmaceutical products is of a different nature than other products.
In this industry the choice- maker i.e. the physician and the buyer i.e. the patient are
completely separated i.e. medicines are the only commodity in which the end-user (the
paying patient) does not decide what to buy and at what cost. the doctor prescribes and
116

Chapter-4
the patient pays. Besides the demand of these products is price inelastic. Pharmaceutical
industry comes under orange category3 with due consideration from environmental and
ecological perspective. The unique feature of IN is that it comprises mainly small and
medium enterprises who contribute 42% of total pharmaceutical production and 62% of
total employment.
4.6 Rationale for growth of Indian Pharmaceutical Industry:
The pharmaceutical industry in India is very heterogeneous in nature but has shown a
CAGR of 12-15% during post reform period. Higher growth rate is expected in future
due to a number of socio-economic transformations occurring in the economy such as:
➢ Life expectancy is on a rise- The average life expectancy in India is now (35 years
(2010) as compared to 58 years in the 1990. India's improving healthcare
delivery infrastructure has ensured the continued rise in life expectancy. The
consequent increase in life expectancy drives the growing proportion of an aging
population of the 60 age-group which will account for 11% of total population
by 2021. This will give further boost to the growth of the pharrnaceutical
industry.
> Rising population- With a population approximating 12 billion, India is
potentially a huge market fur the pharmaceutical industry. The growing middle-
class of around 300 million people has an increasing disposable income and
higher healthcare expectations. Around 1/3's of the middle class can afford
quality private healthcare services, and this number is constantly growing. This
increased healthcare spending offer, greater opportunities for the pharmaceutical
market.
➢ Rising Income of Indian Households- The number of middle-income households
(income S 2,275—$ 12,500) is expected to rise significantly. This will translate
3. 'Green category encompasses all non-obnoxious and non-hazardous industries. These industries do not discharge effluent of polluting nature_'fhen comes Orange: an effluent generated by this category can he
controlled using proven technology like conventional effluent treatment plants. Gaseous emissions by
these companies can also be controlled using proven technology, whereas the Red category encompasses
all those industries having obnoxious and hazardous processes and effluents of highly polluting nature.
117

Chaplet-4
into greater spending power in healthcare, further boosting the pharmaceutical
industry.
Increased Consumer Expenditure on Healthcare- The years of 2000-2005 saw a
shift in the Indian consumer's mindset, as evidenced by the increasing priority
accorded to healthcare as a proportion of overall consumer expenditure. During
this period, consumer expenditure on health goods and medical services showed a
CAGR of 12.4%.
7 increasing Penetration of Health insurance- In contrast to the developed
countries, where insurers pay more than 80% of the individual's healthcare cost,
Indian insurers contribute a very small proportion. At present only 3% of the
healthcare cost of an Indian patient is paid by insurers; 80o of costs are borne by
the individual. However, the insurance sector shows significant improvement, as
evidenced by the 37.3% increase in the number of policies sold in 2003 2004
compared to 2001-2002.
➢ Changing Disease Profile- The Indian population is experiencing a shift in
disease profiles. Traditionally, the acute disease segment held a significant share
of the Indian pharmaceutical market. But with increase in affluence, rise in life
expectancy and the start of lifestyle related conditions, the disease profile is
gradually shifting towards a growth in the chronic diseases segment. India has the
largest pool of diabetic patients in the world., with more than 41 million people
suffering from the disease; this is projected to reach 73.5million in 2025.
4.7 Trends in Production of Indian Pharmaceutical Industry:
The Indian pharmaceutical sector is a mixture of both organized and unorganized firms.
They range from large firms that are either subsidiaries of MNCs or wholly Indian
companies to medium and small sized companies. As per directory of pharmaceutical
manufacturing units in India (2007), there are 10563 pharmaceutical manufacturers
across the country, as against the commonly quoted figure of 23,000 manufacturing
units. Out of these 10563 units, 8174 (77.4%) manufacturing formulation and remaining
2389 (22.6%) are engaged in manufacturing of bulk drugs. Pharmaceutical industry in
Indian is highly fragmented, having about 300 units in the organized sector including 45
MNCs and 5 public sector enterprises. These firms account for 70% of India's total
production of pharmaceuticals.
Its

Chapter-4
Similarly the IPI arc very unevenly distributed according to their manufacturing units. As
per Mashelkar Committee (200 3) more than 75% drug manufacturing licenses are in 7
states namely, Maharashtra, Gujarat, Tamil Nadu, Andhra Pradesh, Karnataka, West
Bengal and Goa, whereas 10 states namely Bihar, Delhi, Haryana, Kerala, Madhya
Pradesh, Orissa, Punjah, Rajasthan, Andaman & Nicohar, Island and Uttar Pradesh
account for 20% of drug manufacturing units. The remaining I states and union
territories have only 5% of manufacturing plants. The chief reason for this regional
pharmaceutical imbalance is that almost all of the total 22 pharmaceutical & biotech
SEZs are located in the states of Andhra Pradesh, Maharashtra, Gujarat and Karnataka
(Express pharma, 2007).
The process of drug manufacturing has two interlinked components (a) bulk drugs (b)
formulation. The domestic formulation market can be further classified into: (i) retail and
(ii) institutional drug market. In India institutional drug market is quite limited
accounting only 15% of total formulations sales (IBEF, 2008:4). The bulk drug industry
closely resembles a perfectly competitive market; there is large number of players in
almost all the bulk drugs markets with none enjoying market dominance. But the
formulation market in India as elsewhere in the world is dominated by the large
companies. Additionally the IPI manufacture close to 500 bulk drugs belonging to
several therapeutic segments such as anti-infective, pain management, cardiovascular
(CVS), Central Nervous System (CNS) and anti-diabetics and formulation is made for
around 60,000 packs in 60 therapeutic categories are made (Jha, 2007:3959). Although
formulations account for a large share of the overall pharmaceutical production in value
terms the proportionate share of bulk drugs has been increasing. Since the mid 1990s
India's strong base in the chemical industry facilitated the development of bulk drug
manufacture reverse engineering and competitiveness contribute. During 1990-91 to
1995-96 both bulk drugs and formulations production were going at 6% and 5% CAGR
respectively. Thereafter the growth rate of bulk drugs production was higher than the
formulation. But it is important to note that during 2005-06 to 2008-09 the growth rate
of bulk drugs production was nearly half (14%) as compared to the growth rate of
formulation production i.e. 24% (Table-4.6).
Bulk drugs began to be produced in the country on a large scale from 1970 onwards. The
most rapid growth of both hulk drugs and formulation has taken place from the 1990s
onwards. As a result production of bulk drugs sharply increased from I US$417.1 million
in 1990-91 to US$3503.2 million in 200S-09. Currently, India is the third largest bulk 119

(Iza rter-4
drugs producer after China and Italy and will expect to be the second largest after China
in future (Express Pharma. 2010a). Similarly formulation production increased from
USS2194.3 million to USS 15390.8 million over the same years (Table 4.5). Growth rate
of the production of bulk drugs revealed the same increasing trends since 1998. Whereas
formulation shown fluctuating trends which was highest in 2007 (32%).
Table-4.5: Production of Bulk Drugs and Formulation at Current Prices in India (1990-2008).
(USS million & %
Year Bulk Drug Production
Growth Rate
Formulation Production
Growth Rate
Total Production
"" Growth
Rate
1990-91 417.1 - 2194.3 - NA - 1991-92 396.5 -4.9 2114.5 -3.6 2510.6 - 1992-93 444.0 12.0 2316.6 9.6 2760.6 10.0 1993-94 420.4 -5.3 2197.5 -5.1 2617.8 -5.2 1994-95 483.4 15.0 2527.1 15.0 3010.5 15.0 1995-96 562.3 16.3 2816.4 11.4 3810.7 26.6 1996-97 617.5 9.8 2964.4 5.3 4286.8 12.5 1997-98 722.6 17.0 3324.5 12.1 4677.4 9.1 1998-99 762.2 5.5 3360.3 1.1 4560.0 -2.5 1999-00 876.3 15.0 3703.0 10.2 5086.4 11.5 2000-01 1009.6 15.2 4087.8 10.4 5655.2 11.2 2001-02 1152.3 14.1 4471.2 9.4 5761.7 1.9 2002-03 1343.4 16.6 4976.3 11.3 6317.2 9.6 2003-04 1658.6 23.5 5942.5 19.4 7665.3 21.3 2004-05 1994.3 20.2 7052.1 18.7 9295.5 21.3 2005-06 NA - NA - 10390.2 11.8 2006-07 2676.6 - 10072 - 11922.3 14.7 2007-08 3346.7 25.0 13256.9 31.6 15734.6 32.0 2008-09 3503.2 4.7 15390.8 16.1 17567.6 11.6
Note: During 1990 to 1994 figures do not includes production from unorganized sector which is estimated at an additional 35% of the production.
NA: refers to not available, #: Estimated value. ;; : Total production included bulk drug production, ti~rmulation production and over-the-counter
production Source: Compiled from Bulk Dnig manufacturer association Hyderabad and Indian drug manufacturer association %lumbai, data bank. RBI I handbook of statistics on Indian economy. 2009 Economic Survey _2008-09. Govt. of India, and ('MIL "Industry market size and shares (various years).
120

Chapter-4
P FI aie 43: Production of Bi.1 Drugs and FonniaWn in India (1990-2008)
15000
10000
socx —u 0I i ■ ■—rte■ U ■ U ■
1111111 04}
11111111 ~y~8 i
Years +B I Drug Production - Fomii tnn Productpn -Total Prodt mn
Table-4.6: Compound Annual Growth Rate of Production in the Pharmaceutical Industry in India.
Year Bulk Drugs Formulations 1990-91 to 1995-96 6.0 5.1 1996-97 to 2004-05 15.4 10.9 1991-92 to 2004-05 13.1 9.2 2006-07 to 2008-09 14.4 23.6
Source: Same as Table-4.6
Interestingly, in 1980-81, exports constituted only five per cent of the total bulk drug
production. This figure grew rapidly to touch 19 per cent by 1986-87 and by 1994;
around 50 per cent was exported. Today almost 80-90 percent of the total bulk drug
production is exported.
4.8 Pharmaceuticals Export and Import in India:
IPI has emerged as a global player, satisfying a significant portion of world generic
drugs4 needs. It is not only because of low cost manufacturing, operations and research
base but also a combination of additional factors like process improvements in bulk
drugs, faster recruitment for conducting clinical trials, availability of skilled manpower
and developed regulatory skills. India exports pharmaceuticals to more than 200
countries around the world including highly regulated markets of USA, Western Europe,
Japan and Australia, and as ranked 17th largest pharma exporter in the world. Since 1987-
88 India's exports have exceeded import. It had grown from US$ 96.3 million in 1980-
81 (Chaudhuri,2005:45) to US$ 448.5 million in 1990-91, further US$ 3.3 billion in
4. A generic drug is usually introduced in the market after the patent expiry date of the original molecule. It is identified after its chemical name rather than the branded advertised name. Generic drugs are carried out though reverse engineering of molecules to arrive at the same chemical structure as the original drug.
121

Chapter-4
2005 and US $ 6.3 billion in 2008 (Table 4.7). In the late 90s India's exports more than
doubled and accounted nearly 40% of total industrial production and approximately 30%
of its revenues.
Additionally IPI is one of the foreign exchange earning sectors in India. An increase in
foreign exchange reserves reduces the costs of liquidity risk. It also leads to a decline in
consumption, although investment and economic growth may improve when the tradable
sector is capital intensive i.e. pharma sector. Enhanced foreign exchange reserves help
the Indian economy for preventing sudden reversals in capital flows. Foreign exchange
earnings by pharma sector increased tremendously from LESS 285.9 million in 1991 to
US$6890.1 million in 2008. But the percentage share of foreign exchange earnings by
pharma sector to the total foreign exchange is 2.7% (2008) and shown fluctuating trends
during entire period.
India has enjoyed trade surplus since 1987-88, and it has increased to US$14.3 mil lion in
the year 1988 to USS215.6 million in 1990 and further USS4.3 billion in 2008-09. It was
expected that India's exports will show strong growth in future because US$60 billion
patented drugs lost their patent protection in the US and Western Europe (Appendix-Ill).
ASSOCHAM predicts that Indian companies will capture at least 30% of the
replacement market of generic drugs. One of the basic reasons for this dramatic exports
expansion seems to be the efforts of Indian pharmaceutical companies to develop their
own marketing and trade supporting centers in the developed countries and emergence of
generic segments as cheaper alternatives to branded products. Most of the Indian firms
have built their own brand-names and formulations in developed countries market and
are known for their internationally certified manufacturing facilities for quality and
safety. Apart from these advantages. Indian firms are also leveraging benefits from
forging strategic and marketing alliance with local liras in the destination markets. As
far as CAGR of pharmaceutical exports are concerned, it is 16% during 1991 to 2008.
Similarly the CAOR of imports and balance of trade are 11.6 % and 20.1% respectively
over the same period of time (Table-4.8). Other important factors for enhancing Indian
pharmaceutical exports are:
➢ Declining profit margin in domestic market,
➢ Extreme price competitive nature of domestic market,
Opening up of semi regulatory markets of Eastern Europe, Japan and many other
Africa counties.
122

cnnpfer-4
Table-0 7; Value of Export and Import of Drugs and F1(ormaceotieals in India (1990.21$08). 1$i million & %)
Toll Eaport
Grmv(h Rals(6)
Total hnpods
Growh Kte;to)
Trade Balance tCoI.2 CoI.4)
Year aa1h
Rate( %)
Phamacearial as a %of India's
total manufactured
eap0its
Intansharein
*nrIC Phan enical Eapnn
PhamtaFEN Growth Rater%)
",6 Shm'e of pha:maFEE (0ulFE
1990-91 44R5 22.9 - 21S6 43 NA N.A N4 1991.92 564.4 25,8 244.3 4.9 320.1 48.5 4.8 NA 265.a 3.1
1992.93 • 54.5 49 242A ',8 302,1 .5,6 3.8 0.9 312.9 9.4 1'-
I993-94 5677 4.2 2392 -I.? 3281 3.6 3.8 09 361.7 7. 19
199495 04.9 22.7 3135 31,1 382.3 169 3.9 1.0 941 47.. 2.1
995-96 525 -4.5 7864 23.] 138.6 -63.7 43 10 771.1 427 3.6
96-9i 70 34.4 579,1 499 116.7 -8.6 5.0 09 8129 )a 3,1
19a7A6 8:4' 16.8 6218 'Al 21$^_3 59,E i5 09 9])9 144
1998•99 C.) -02 595.2 -43 221.1 Ll 5.8 1,0 971,9 3,0
I!~'quad! 010.1 K.7 ti27.6 54 281.9 14.5 5.2 10 11052 ?9
201001 .069.4 115 6637 59 4052 43S 4,3 0 115 13.6 30
2P2602 1198 Il 889 313 11; 2.8 41 1.1 15720 252 29
2002-[3 15197 26° 589.1 -33.4 9302 1971 5.0 1.0 19821 26.1 2.6
210;-04 2105 285 636.3 7!9 14687 57,9 52 1,0 2612.3 21.B 23
2104-0 211§ 707 692.9 6.9 2059 40.1 £,9 12 3007.3 15.1 2.I
2K S-Cfi 1l.9 tLS t0Z33 4^.8 127b.1 8' 4.8 ID 36412 11.1 2.1
22010' 3tisi19 Ill 1395.: 26.5 2396,8 7.1 4.7 2 4911.9 349 2.5
2007-8' 55043 49,1 1630.3 259 3814.,4 617 7 I' 62262 26,F 2.0,
2008-09 6157 13,7 :970,5 2a9 41S6.5 t6 42 14 6390, 03 2.7
Yde: 41`ipures arc pruvisinrml Source: Compilul Gna Drug S9snufaD:una Aswieialinn (Indial, IadianDrug ManLIae1arer Assc ialioa lumual Publica(ioa (various iasued, J.molm' G.reral m`Cummere:al
Inlellipcc aril Sraris'.ics Kolkala, Epetls and icrpans Cgmea are in rupees. These h vc been convened :c CSS figures by using the aver ge exdrange rate for rlevanl financial years iniained from RBI, Handbook of alalis1ies ou Indian Economy 2010 (wunr.rbi.atg,fa ),Department of Pherm&ceulital GUI New Delhi @ United Nations"InremauorvaI Trade Statistics year heria (vanous gears)
123

Chapter-4
Agura4.6: Fort and Import of PhanlMccuticals India (1990-2008).
8"
6000
SDDO
4000
3000
2000 "' 1000
0
Years
• Total Econs -~- Total Inports .► Trade Balance t P1mma FEZ
Table-4.8: Compound Annual Growth Rate of Pharmaceutical Export, Import and Trade Balance.
Year Pharmaceutical Export
Pharmaceutical Imports
Pharmaceutical Trade Balance
1990-1995 4.2 9.8 -4.5 1990-2000 7.8 13.8 -0.2 2001-2008 26.7 17.0 37.9 1991-2008 16.0 11.6 20.1
Source: Same as table 4.7
y Exports have growth to constitute a major source of revenue for India's major
pharmaceutical companies including Cipla Dr. Reddy's and Ranbaxy5 whose
collective exports accounting for more than 50% of their total annual turnover. In
2005-06 Ranbaxy derived nearly 80% of sales revenue from exports and
international acquisition. whereas Dr. Reddy's and Cipla drive 66% and 50%
respectively.
Most Indian pharmaceutical companies have significant competitive advantages
in R&D to build a generic product pipeline; which includes high technical skill
levels in the development of non-infringing processes, bio-equivalent
formulations and development of regulatory submissions at lower cost.
➢ Labour costs in India are about 1/7th the level in developed countries and offer an
apparent cost advantages.
Many blockbusters drugs in the US market are seeing the expiry of their patents
over the coming years.
5. Since 2008 Ranbaxy is subsidiary of Japanese pharmaceutical Daichii Sankyo. 124

Chnnrer-4
> Over the years Abbreviated New Drug Application (ANDA) & Drug Master File
(DMF) tiling of key Indian pharmaceutical players has grown, to become
comparable to that of key global players.
> Apart from availability of cheaper labour India also has many local
manufacturing equipment manufacturers. These equipments arc of high quality
and low cost, therefore reducing the cost of capital.
Y Competition in the India's domestic formulation market has made it inevitable for
API suppliers to continuously develop alternative production methods to improve
yield or reduce costs. This ensures that India has a significant cost advantage due
to process engineering.
Therefore, exports constitute a substantial part of the total production with15% CACR,
while the domestic market grows at 5% only. The formulations constitute nearly 55% of
the total exports and the rest 45% comes fl-um bulk drugs. Currently there are around
3000 registered exporters of which 1500 are active exporters in India. Maharashtra leads
in pharmaceutical exports with a share of 38% followed by Andlua Pradesh, Haryana,
Gujarat, Karnataka, Tamil Nadu, Delhi, and Chandigarh with the shares of 23%, 8%,
8% , 6%, 4%, 3% and 2% respectively (Pharmaxil. 2009).
Pharmaceutical export as a percent of India's total manufactured exports has shown
fluctuating trend during 1991 to 2008, this currently stands in 4.7%. Shares of Indian
pharmaceutical export in world pharmaceutical export has also shown increasing trend
(Table-4.7).
4.9 Direction of Indian Pharmaceutical Export and Import:
India's pharmaceuticals export is to more than 200 countries. On a country wise basis the
top five destinations of India's pharmaceutical products during 2007-08 are the USA
(19%), Germany (4.7%), Russia (4%), U.K. (3.7%) and China (2.8%) (Tahle-4.9). All
the major Indian pharmaceutical companies are looking at the global market to accelerate
their growth performance. These include such potential regulated markets as the US.
Japan and Europe. the semi regulated markets of BRICS (Brazil, Russia, India China and
South Africa) countries and least regulated markets of Afi9ca, middle east and South East
Asia. India has become a very important source of generic drugs for the developing
countries and one of the leading suppliers of cheapest AIDS drugs to the world. India
125

Chapter-4
exported US$1.35 billion worth of pharmaceuticals to Asia and $497.7 million to
ASEAN countries. (DO?, 2009).
India's largest single export market continues to be the US, which is also the world's
largest generic drug market. Pharmaceutical exports to US grew from US$53.9 million in
1991-92 to $1546.9 million in 2008. But, as a percentage of total exports to the US, it
declined slightly from 171% in the year 2002 to 14.3% in 2005 (Table-4.9). This decline
can he attributed to, such factors as introduction of authorized generic drugs by domestic
US pharmaceutical giants, lagging profits, declining generic drug prices and growing
competition from other low cost countries, particularly Israel, China, Korea and those
from East Europe.
India's top tell export destinations arc USA, Gennany, Russia, UK, China, Brazil,
Canada, Italy. Singapore and Japan which together accounting for about 60% of total
Indian pharmaceutical exports in 1991 and 37% in 2008. But now the Indian
pharmaceutical exports destination have turned more towards African, South East Asian
and Other developing countries (Table-4.9).
126

C hap/er--I
"table-4.9: Top Ten Destinations of Indian Pharmaceutical Exports (1991-2008). (USS million and %)
G
1991- 53.9 64.7 127.0 16.8 0.3 NA 4.5 8.4 13.3 11.8 500.0 92# (10.8) (12.9) (25.4) (3.4) (0.1) (0.9) (1.7) (2.7) (2.4)
1992- 52.8 65.2 36.9 15.1 0.8 NA 5.1 12.2 9.7 9.5 420.0 93# (12.6) (15.5) (8.8) (3.6) (0.2) (1.2) (2.9) (2.3) (2.3)
1993- 56.7 56.2 66.2 16.3 2.0 NA 4.5 7.6 10.0 8.0 471.7 94# (12.0) (11.9) (14.0) (3.5) (0.4) (1.0) (1.6) (2.1) (1.7)
1994- 85.8 91.2 89.8 23.6 6.3 2.9 10.6 17.9 22.7 20.4 800.4 95 (10.7) (11.4) (11.2) (2.9) (0.8) (0.4) (1.3) (2.2) (2.8) (2.5)
1995- 126.9 102.4 90.9 34.2 10.8 5.1 10.5 21.6 26.0 14.4 1020.6 96 (12.4) (10.0) (8.9) (3.4) (1.1) (0.5) (1.0) (2.1) (2.5) (1.4)
1996- 141.0 103.8 109.0 42.1 26.0 9.4 13.1 31.7 48.0 21.9 1224.1 97 (11.5) (8.5) (8.9) (3.4) (2.1) (0.8) (1.1) (2.6) (3.9) (1.8)
1997- 159.3 112.0 106.1 60.0 37.1 15.6 17.2 43.3 40.0 23.8 1459.9 98 (10.9) (7.7) (7.3) (4.1) (2.5) (1.1) (1.2) (3.0) (2.7) (1.6)
1998- 172.2 89.3 47.6 47.1 42.7 25.0 23.6 37.0 39.3 27.7 1486.7 99 (11.6) (6.0) (3.2) (3.2) (2.9) (1.7) (1.6) (2.5) (2.6) (1.9)
1999- 166.1 80.3 122.9 49.3 46.0 42.8 25.7 38.4 55.3 28.4 1670.6 00 (9.9) (4.8) (7.4) (3.0) (2.8) (2.6) (1.5) (2.3) (3.3) (1.7)
2000- 215.5 94.0 108.9 53.9 57.1 80.2 36.7 31.7 47.0 30.6 1914 01 (11.3) (4.9) (5.7) (2.8) (3.0) (4.2) (1.9) (1.7) (2.5) (1.6)
2001- 345.1 105.8 101.2 59.3 80.3 73.7 31.4 25.2 42.3 31.8 2068.2 02 (16.7) (5.1) (4.9) (2.9) (3.9) (3.6) (1.5) (1.2) (2.0) (1.5)
2002- 455.7 161.7 107.2 89.0 92.9 76.1 52.9 36.5 43.9 50.1 2655.5 03 (17.1) (6.1) (4.0) (3.4) (3.5) (2.9) (2.0) (1.4) (1.7) (1.9)
2003- 492.2 211.2 140.0 109.1 102.3 87.1 90.1 63.3 48.3 55.1 3312.7 04 (14.9) (6.4) (4.2) (3.3) (3.1) (2.6) (2.7) (1.9) (1.5) (1.7)
2004- 604.0 206.5 172.2 130.4 121.2 109.0 110.2 67.7 53.1 64.1 3973 05 (15.2) (5.2) (4.3) (3.3) (3.1) (2.7) (2.8) (1.7) (1.3) (1.6)
2005- 715.5 253.0 242.8 187.7 177.0 140.4 118.6 95.4 86.6 70.6 4994.6 06 (14.3) (5.1) (4.9) (3.8) (3.5) (2.8) (2.4) (1.9) (1.7) (1.4)
2006- 989.2 296.7 291.8 199.1 151.6 171.6 124.2 111.4 91.2 72.2 5939.1 07 (16.6) (5.0) (4.9) (3.4) (2.6) (2.9) (2.1) (1.9) (1.5) (1.2)
2007- 1451.1 359.8 309.1 284.9 218.5 191.7 196.1 117.1 99.7 90.8 7644.0 08 (19.0) (4.7) (4.0) (3.7) (2.9) (2.5) (2.6) (1.5) (1.3) (1.2)
2008- 1546.9 314.0 330.8 268.5 122.3 221.9 237.5 110.6 NA NA 8610.1 09 (18.0) (3.6) (3.8) (3.1) (1.4) (2.6) (2.8) (1.3)
Note: # During 1991-92 to 1993-94 figures were in rupees, these have been converted to USS figures by using the average exchange rates for the relevant financial years obtained from RBI. Handbook of statistics of Indian economy 2008 (www.rbi.org.in), Figures in the parenthesis are percentage shares.
Source: Compiled from CMIE '.Foreign Trade and 130Ps". (various issues) Centre for Monitoring Indian Economy Pvt. Ltd.. Mumbai
127

Chapter-4
Rgnre 4.7.
Top Ten Destinations of Indian Pharr ceutkal Fats (1991.2008)
1800
1600
1400
1200
1000
600
400
0
}USA • Cemnny } Russia 'UK
*Canada +h*, f Singapore +Japan
gftggftftft Yeas
With the growth of the pharmaceutical industry and increase in production, this sector
has also seen an increasing trend in imports. Major pharmaceutical suppliers include
China (41%), Switzerland (13%), USA (11%), Germany (5%), Denmark (4%), Italy
(3%) and others. Together these top ten importing countries i.e. China, Switzerland,
USA, Germany, Denmark, Italy, France, UK. Japan and Netherland accounted for nearly
72% in the 1991 and 84% of total pharmaceutical imports in the year 2008 (Table 4.10).
128

C'ltupter-4
"Table-4.10: Top Ten Destinations of Indian Pharmaceutical Imports (1991-2008).
(US$ million and °o )
i - .h 1991- 11.9 21.9 17.2 14.6 0.4 18.2 11.2 13.0 6.5 14.0 180.1 92# (6.6) (12.2) (9.6) (8.1) (0.2) (10.1) (6.2) (7.2) (3.6) (7.8)
1992- 16.4 19.1 26.8 16.6 4.6 25.5 10.2 12.8 4.8 17.7 222.8 93t (7.4) (8.6) (12.0) (7.4) (2.1) (11.4) (4.6) (5.7) (2.2) (7.9)
1993- 12.1 19.9 24.2 9.5 11.7 14.5 9.5 12.2 7.1 15.0 189.8 94» (6.4) (10.5) (12.8) (5.0) (6.2) (7.6) (5.0) (6.4) (3.7) (7.9)
1994- 16.5 28.8 41.5 9.8 37.2 19.7 14.8 20.1 9.2 19.5 298.6 95 (5.5) (9.6) (13.9) (3.3) (12.5) (6.6) (5.0) (6.7) (3.1) (6.5)
1995- 19.9 45.3 50.5 13.4 74.3 27.2 16.0 21.3 9.7 23.5 406.6 96 (4.9) (11.2) (12.4) (3.3) (18.3) (6.7) (3.9) (5.2) (2.4) (5.8)
1996- 12.0 25.8 40.6 8.3 58.7 23.9 9.8 22.2 8.5 16.7 307.1 97 (3.9) (8.4) (13.2) (2.7) (19.1) (7.8) (3.2) (7.2) (2.8) (5.4)
1997- 19.0 40.5 30.0 13.1 65.6 20.7 33.3 32.6 12.1 21.4 389.8 98 (4.9) (10.4) (7.7) (3.4) (16.8) (5.3) (8.5) (8.4) (3.1) (5.5)
1998- 31.4 37.2 28.9 10.9 71.3 17.1 21.9 26.0 12.9 18.8 383.8 99 (8.2) (9.7) (7.5) (2.8) (18.6) (4.5) (5.7) (6.8) (3.4) (4.9)
1999- 33.0 29.2 28.1 13.9 73.0 30.0 18.4 26.4 11.5 18.4 373.4 00 (8.8) (7.8) (7.5) (3.7) (19.6) (8.0) (4.9) (7.1) (3.1) (4.9)
2000- 29.0 26.7 35.0 14.8 70.0 12.4 21.2 23.8 12.2 18.4 373.0 01 (7.8) (7.2) (9.4) (4.0) (18.8) (3.3) (5.7) (6.4) (3.3) (4.9)
2001- 32.8 33.6 37.4 NA 105.2 18.8 18.3 19.9 8.9 20.8 426.2 02 (7.7) (7.9) (8.8) (24.7) (4.4) (4.3) (4.7) (2.1) (4.9)
2002- 86.7 50.6 42.2 22.5 150.2 34.0 32.3 19.7 12.5 18.8 593.2 03 (14.6) (8.5) (7.1) (3.8) (25.3) (5.7) (5.4) (3.3) (2.1 (3.2)
2003- 72.4 57.4 28.5 28.2 184.9 43.4 25.2 30.7 11.7 21.3 644.2 04 (11.2) (8.9) (4.4) (4.4) (28.7) (6.7) (3.9) (4.8) (1.8) (3.3)
2004- 83.5 66.3 42.0 23.9 202.1 29.2 24.2 29.1 13.1 27.1 705.1 05 (11.8) (9.4) (6.0) (3.4) (28.7) (4.1) (3.4) (4.1) (1.9) (3.6)
2005- 123.7 96.1 63.0 39.2 356.5 38.6 36.0 30.2 14.1 21.3 1027.6 06 (12.0) (9.4) (6.1) (3.8) (34.7) (3.8) (3.5) (2.9) (1.4) (2.1)
2006- 243.6 107.3 91.3 39.7 469.2 55.7 37.1 34.5 16.8 16.3 1292.3 07 (18.9) (8.3) (7.1) (3.1) (36.3) (4.3) (2.9) (2.7) (1.3) (1.3)
2007- 227.1 163.9 98.4 71.4 686.6 51.9 49.0 40.0 20.7 17.0 1668.2 08 (13.6) (9.8) (5.9) (4.3) (41.2) (3.1) (2.9) (2.4) (1.2) (1.0)
2048- 273.0 204.6 104.6 76.1 698.7 70.0 55.4 48.1 22.5 17.9 1876.6 09 (14.5) (10.9) (5.6) (4.1) (37.2) (3.7) (3.0) (2.6) (1.2) (1.0)
Note: -during 1991-92 to 1993-94 figures was in rupees. These have been converted to US$ figures by using average exchange tables for the relevant financial years obtained from RBI. Handbook of statistics of India's Lconomy 2008.
Source: Same as table 4. IO
129
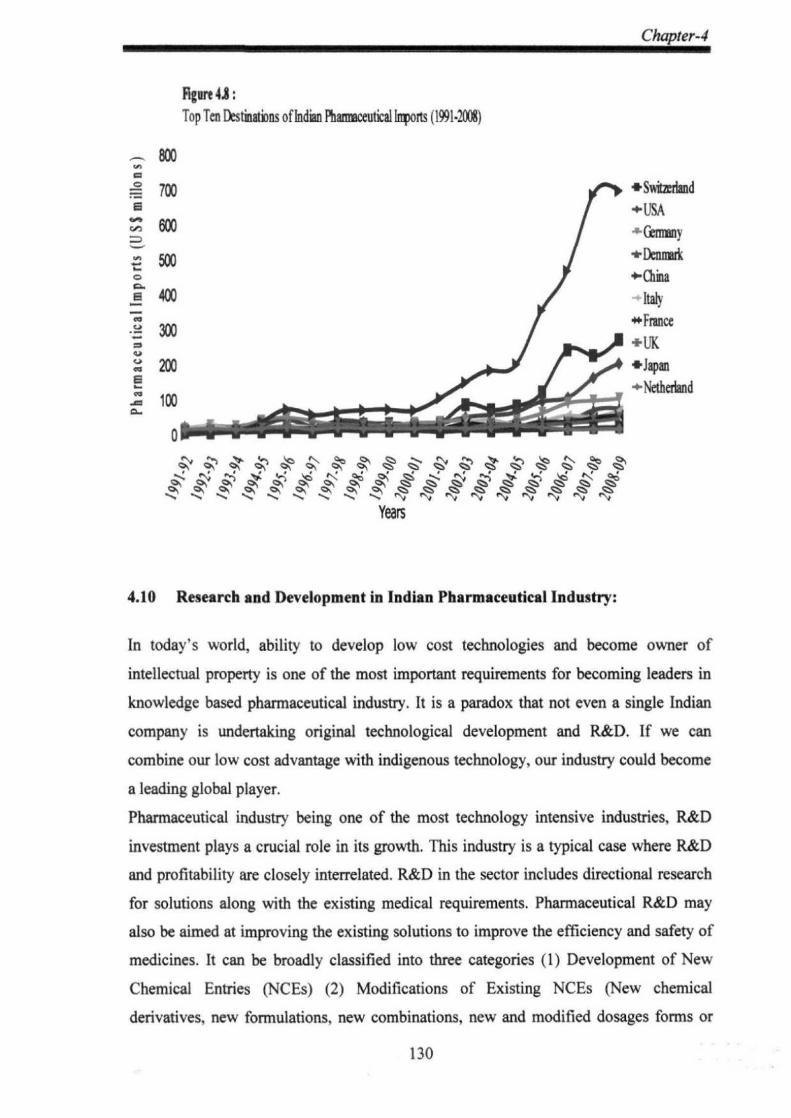
Chapter-4
Figure 4.8: Top Ten Destinations of Indian Fbammcutica1 lkonts (1991.2008)
800
_ 100
1 500
E 400
= 300
CV (~
0
f S itie hand +USA 4- Cininy • Dennrk }chin
ltaly. France
+UK }Japan +Netherland
Years
4.10 Research and Development in Indian Pharmaceutical Industry:
In today's world, ability to develop low cost technologies and become owner of intellectual property is one of the most important requirements for becoming leaders in knowledge based pharmaceutical industry. It is a paradox that not even a single Indian company is undertaking original technological development and R&D. If we can combine our low cost advantage with indigenous technology, our industry could become a leading global player. Pharmaceutical industry being one of the most technology intensive industries, R&D investment plays a crucial role in its growth. This industry is a typical case where R&D and profitability are closely interrelated. R&D in the sector includes directional research for solutions along with the existing medical requirements. Pharmaceutical R&D may also be aimed at improving the existing solutions to improve the efficiency and safety of medicines. It can be broadly classified into three categories (1) Development of New Chemical Entries (NCEs) (2) Modifications of Existing NCEs (New chemical derivatives, new formulations, new combinations, new and modified dosages forms or
130

Chapter-4
Novel Drug Delivery System (NDDS)6 (3) Development of new process for
manufacturing drugs (whether old or new) or generic products. Till recently, R&D in
Indian pharmaceutical companies has been primarily of the third type i.e. generic
products.
An important reason why Indian companies undertake R&D for generic drugs is because
new drug development is a costly, time consuming and risky business. The activities can
be broadly classified into pre-clinical and clinical stages. The objective of the pro-clinical
stage is to develop a promising molecule which is safe in animal testing. At the clinical
stage, the molecule is tested on humans and is developed for manufacturing and
marketing. The fully capitalized cost of a new drug has been estimated to be USS847
million abroad (DiMasi of al, 2003:151-185).
However, the Indian private sector started investing in R&D for developing new drugs
only since the mid 1990s when TRIPs came into effect. It was initiated by Dr. Reddy's
and Ranbaxy. Thereafter., a few other companies have also joined in. At present, there are
about 15 Indian pharmaceutical companies which have been set up or are in the process
of setting up new research centers with NDDR as a major objective. Ranbaxy has spent
the largest amount of USS108.5 million in the year 2008 followed by Dr. Reddy's
laboratories US$81.3 million, Sun pharnra US$66 million and others (Table 4.11). It is
indicated that in 2008-09 top ten leading companies together spent US$484.1 million on
R&D including that on new drug development. However as can been seen this amount of
(USS484.I million) is much less than what is spent (US$847 million) by developed
countries on a single new drugs.
6 NDDS- Traditionally the must common term of drug adminis [ration was or a I administration. However, it has been found to be not very effective way of dclivenng drugs to the body. Besides focusing on mode of administrate on NDDS a focuses on finding new dssage forms so Ilse effectivencso of the drugs enhanced.
131

fable-4.l I: R&D Expenditure of the Leading Indian Pharmaceutical Companies (1998-2008), (l'SS million)
p •' n r~ n n n n n _ r~
.. .'
w
' .' U
w a x a ro a J a C N
1998 10.4 i
2.7 2.4 6.2 - 4.6 - 0.8 - 1.0 - 5.6 - 2.2 • NA -
1999 12.S 212.6 72.5 8.4 3S.S 4.9 6.3 1.2 60.7 23 128.2 7.0 25.0 3.3 50.0 NA
2000 12.7 -0.5 5.1 66.0 4.5 6.7 7.1 -15.1 5.6 12.7 2.3 88.3 4.5 92.0 5.1 -26.4 1.8 47 NA
2001 16.3 28.5 10.8 110.9 5.3 18.9 6.4 -10.8 8.9 AS 2.5 11.9 4.7 4.6 4.7 -9.0 1.3 -28.7 NA
2002 39.5 142.2 15.2 40.9 7.0 32.1 7.0 10.1 7.8 •12.1 6.4 150.9 6.4 36.8 10.7 129.6 2.9 126.6 7.8
2003 59.2 49.9 30.3 98.7 20.8 197.5 12.9 84.0 18.9 141.5 7.9 24.5 8.6 34.6 12.2 14,3 4.7 63.9 10.1 29.5
2004 73,1 23,4 43.9 45.2 28.0 34.7 15.3 18.8 22.7 20.4 10.8 35.4 14.9 73.1 21.7 77.6 10.8 129.1 18.5 82.2
2005 110.2 50.8 57.6 31.1 32.4 15.7 18.4 20.2 27.0 18.7 10.6 -1.5 19.8 33.4 35.1 61.8 12.2 13.2 24.5 32.7
2006 85.2 2.2.7 47.5 •17.6 44.6 37.5 30.5 65.7 27.4 1.4 9.9 -6.2 16.3 -17.6 38.9 ' 10.5 117.0 Hs 31.4 28.1
2007 111.4 311." 59.6 25.5 67.6 51.5 36.8 20.8 32.4 18.5 10.4 4.8 22.0 34.9 56.2 44.6 23.5 38.2 49.3 57.3
2008 108.1 2.6 S 1.3 36.6 66.1 -2.1 38.0 33 30.6 •5.5 11.8 12.9 26.0 18? 56.2 0.1 4.1 -82.3 61.5 24.6
Note: (R. rcicrs to (ironlh Rate. N;1 rcters to Not Available.
Source: Compiled from Annual Report (Various years) and websites of the respected companies.
132

0.0 1998 1999 2000 2001 2002
Years 2003 2004 2005 2006 2007 2008
120.0
•E 100.0
80.0
60.0
40.0
+ Ranbaxy s - Dr. Reddy's -*- Sun Phaims t W odk- hardt +Cadila t G ernmrk {- Torrent —Cipla +Auro- bindo
-Lupin
Chapter-4
Figure 4.9: R&D E enditure ofthe Indian Leading Phartnaceutical Companies (1998-2008)
Another reason that forced Indian companies to enhance their R&D efforts and
investment is changes in patent law under TRIPs obligation preventing the reverse
engineering of patent molecules. Consequently moving in the value chain of R&D during
pre TRIPs period from process development accounted for 65%, NDDS 39% and NCEs
5%. In post TRIPs era this changed and accounted for 35%, 35% and 30% respectively.
According to Chaturvedi and Chataway (2006) earlier only about 2% of total sales was
spent on R&D but now, the average R&D expenditure has gone up to around 5-6% in
2003-04. Among these companies Ranbaxy, Dr. Reddy's, Cipla, Wockhardt, Torrent etc
are prominent investors.
Though, spending on R&D in relation to the GDP has increased over the years in India,
but the difference between their spending and that of the developed countries still
remains considerably high. India spends approximately 0.88% of its GDP on R&D
which is quite low compared to countries like China ( 1.4% of GDP) and other
developed countries spending more than 2% of their GDP (Patnaik et al., 2009). The
growing trends of R&D expenditure may be a good sign but not a sufficient condition to
ensure rising competitiveness for Indian Pharmaceutical sector. As Ernst and Young
estimated R&D expenditure as a percentage of sales in India was 1.4% in 2001 which
has increased 9.9% in the year 2008. During 1991-2008 the CAGR is 21.71%. It is
important to note that during the period of 1995 to 2008, R&D expenditure of the
domestic pharma companies (29.8%) was much higher compared to foreign firms
(21.4%) (Table-4.12). Foreign companies started spending more only after
133

C ltuplt'r-4
implementation of "I'RIPs period. It is further indicated that R&D intensity in India has
improved over the period of time particularly during post TRIPS era. While, India has
consistently increased its R&D expenditure and enjoyed a favourable trade balance in
pharmaceutical products, its export share in the world market is still less than one and
half per cent. At this juncture, it is important for the government to encourage the small
and medium firms by providing low cost finance for research with subsidy facilities for
indigenous research activities.
Table-4.12: Trends of R&D Expenditure in India Pharmaceutical Industry (1991-2008.
(US8 million)
Year Domestic R&D Exp.
Foreign R&D Exp.
Total R&D Exp.
Growth rate (%)
R&D Intensity
1990-91 - - 34.6 - NA
1991-92 - - 35.5 2.6 0.01
1992-93 - - 36.8 3.7 0.01
1993-94 - - 39.8 8.2 0.01
1994-95 - - 44.7 12.3 0.01
1995-96 24.9 19.8 44.7 0.0 0.01
1996-97 40.3 23.6 63.9 43.0 0.02
1997-98 40.8 24.6 65.4 2.3 0.01
1998-99
1999-00
37.3
50.7
21.9
18.5
59.2
69.2
-9.5
16.9
0.01
0.01
2000-01 57.2 20.1 77.3 11.7 0.01
2001-02 92.2 23.3 115.5 49.4 0.02
2002-03 123 22.6 145.6 26.1 0.02
2003-04 147.4 49.9 197.3 35.5 0.02
2004-05 239.4 76.5 315.9 60.1 0.03
2005-06 346.3 115.8 462.1 46.3 0.04
2006-07 408.6 180.1 588.7 27.4 0.04
2007-08 574.3 168.4 742.7 26.2 0.04
2008-09 638.9 161.3 800.2 7.7 0.05 Note: During 1990-1994 do not find separate data for domestic & foreign expenditure. Source: Compiled from Indiastat database & Bulk Drub_ Manufacturers Association India Note: R&l) Intensity defined as the ratio of expenditures by a firm on R&D to the firm's sales (Net Sales).
134

Chapter-4
Figure 4.10 : R&D Fipenditure in India Pham*ceutical Industry (1995-2008)
BOO
ii,iiii,I,I,i,
C 600 500
200 loo
0
Years
f Domestic R&D Ems. -Foreign R&D Dc. -Total R&D Eq.
During 1991-2008 with CAGR of 27.33% India's investment level is indicated a healthy growth rate (Table-4.13). Availability of skilled researchers, protection of IPRs, availability of patient, level of local skills, legal environment, physical, infrastructure, low cost research and access to scientific cluster etc are the main determinants of pharmaceutical R&D in India.
Table-4.13: Investment trends in Indian Pharmaceuticals industry (1991-2008). (USS million & %)
Year Investment Growth Rate (%) 1991 38.4 - 1992 46.5 21.1 1993 126.9 172.9 1994 238.1 87.6 1995 233.7 -1.8 1996 265.1 13.4 1997 345.9 30.5 1998 385.9 11.6 1999 572 48.2 2000 581.4 1.6 2001 511 -12.1 2002 550.5 7.7 2003 957.7 74.0 2004 1324.1 38.3 2005 1628.8 23.0 2006 2446.1 50.2 2007 4123.5 68.6 2008 4117.1 -0.2
Source: Compiled from CMIE "Industry Financial Aggregates and Ratio (Various years). Investment figures in rupees. These have been converted to USS by using the average exchange ratio for the relevant financial years obtained by RBI handbook of statistic on Indian economy, 2009.
135

Chapter-4
Figure 4.11 : Investment in Indian Pfiam~aceuticals industry (1991-2008).
4500
—4000 3500 3000
2500
2000
1500
1000
50 ___ •• •••••••
Years
A major criticism often levied against the IPI is that it focuses mainly on reverse engineering and spends less on R&D investment. Hence in order to strengthen the pharmaceutical industry's R&D capabilities and to identify the support required by them to undertake domestic R&D, a committee was setup in 1999 by the name of
Pharmaceutical Research and Development Committee (PRDC). To promote R&D in pharmaceutical government also established department of pharmaceutical which is working as a separate body under ministry of chemicals and fertilizers from July 1, 2008, Additionally Government of India has taken a number of initiatives to promote R&D activities in this sector such as: 1. Weighted tax reduction of 125% to the sponsor of sponsored research
programmes in universities approved technological institution and national laboratories.
2. Weighted tax reduction of 150% of R&D expenditure incurred in the in house R&D centers (approved by Department of Scientific and Industrial Research, Government of India) of companies engaged in biotechnology, production of drugs.
3. Income tax holidays of ten consecutive assessment years for commercial R&D companies.
4. Reduction in custom duty from 7.5% to 5% on 15 specified machinery for pharmaceutical and biotechnology sector.
136

Chaper4
5. Pass through status to be granted to venture capital funds in respect of
investments in venture capital under takings in biotechnology (Budget 2007-08).
4.10.1 New Chemical Entities (NCEs):
New chemical entities is an expensive time consuming and risky business, as 10,000
molecules enter the drug discovery stage but only one drug is approved for marketing.
There are many NCEs which are at different stages of development. The largest spenders
are Dr. Reddy's and Nicholas Piramal, Ranbaxy. Some of these have successfiuly
completed pre-clinical trial and are at different stages of clinical trials.
According to H. Kajaria (Executive director of Pharma KPMG) Indian Pharmaceutical
companies have spend $ 500 million in the year 2010 on NCE research and expected to
spend $ 1.2 billion by 2015.
Dr. Reddy's has 4 molecules in its NCE pipeline in 2008. Similarly Sun pharma,
Nicholas Piramal, Wockhardt, Ranbaxy Zydus Cadila and Lupin have four, thirteen, five,
seven, four and four respectively (Appendix-IV). Recently Ranbaxy launched India's
first new drug, SynriamTM, for the treatment of uncomplicated Plasmodium falciparum
malaria, in adults.
It is important to note that none of these companies is engaged in the entire process of
dmg development because they do not have all the skills and the finds required.
4,10.2 Abbreviated New Drug .Applications (ANDAs):
For marketing a formulation to USA, Indian companies are required to file an ANDA.
When a company files an ANDA it is required to mention the suppliers of the bulk drugs
and DMF numbers. This is an expensive and time consuming process and the approval
may take up to five years. Of the total ANDAs approved in the USA, 30% is of Indian
making, the second place next to USA. Various other agencies like Medicines control
healthcare products regulatory agency (MHRA) U.K, Therapeutic Goods Administration
(TGA) Australia and Health Promotion Board (HPB) Canada are also being filed from
India. There are 13? (29%) ANDAs approved during 2007-08 followed by Israel 40
(9%) Germany 25 (5%), Canada 24 (5%) and others (Table 4.14A). (DOP, 2009-10). As
far as domestic companies are concerned in the year 2008 Ranbaxy submitted 6 ANDAs
in the USA and has the largest basket of products in the US market with 142 approved
drugs and another 98 application were pending for approved (DOP, 2008). It is followed
137

Chapter-4
by Dr. Reddy's (70), Sun Pharma (53), Wockhardt (23), Cadila (34), Glanmark (40) and
Aurobindo (67), (Table 4.14(B)).
fable- 4.14(A): Country-wise ANDAs Approvals (2007-08). Country In Number Share %
USA 169 38
India 132 29
Israel 40 9
Germany 25 5
Canada 24 5
Switzerland 19 4
Iceland 14 3
Jordan 11 2
China NA NA
Others 25 5 Source: Compiled from DeDartment of Pharmaceutical. Annual Reuort 2009-10. Government of
India, New Delhi.
Figure 4.12: Country Wise ANDAs Approvals (2007-08)
55% 2 2% 3 3% 44%
55%
38 38% 55%
9 9%
29 29%
■ USA ■ India ■ Israel • Germ any • Canada
Switzerland ■ Iceland • Jordan • China • Others
138

Chapter-4
Table- 4.14 (B): Company-wise ANDAs filing from India as up to 2008. (In numbers)
Company ANDAs filing as on 31 March 2008
ANDA Approvals as on 31 March 2008
Ranbaxy 241 142 Dr. Reddy's 122 70
Sun Pharma Indus 142 53 Wockhardt 57 23
Cadila Healthcare 81 34
Glenmark 51 40
Torrent 11 4 Aurobindo 128 67
Lupin 90 34 Cipla j NA NA
Source: Compiled from Annual Report of Respected Companies.
Figure 4.13: Company Wise ANDAs filing from India as up to 2008 (%)
7%
30j% 14%
1%
9/o
7% 1S%
5% 11%
• Ranbaxy • Dr. Reddy's • Sun Phanm Indus • Wockhardt • Cadila Healthcare
C,lenmark • Torrent • Aurobindo • Lupin • Cipla ■ Cip la
4.10.3 Drug Master Files (DMFs):
For exporting bulk drugs to USA, Indian manufacturers are required to file a DMF. The
company filing a DMF is required to submit confidential detailed information on kind of
equipment, location of the plant. description of production facility process chemistry,
raw materials specification, stability data etc. The cost of filing a DMF can be estimated
to be US$200,000 depending on the product (the steps involved in the processes and the
139

Chapter-4
number of test to be done etc) (Chaudhuri, 2005: 188). One-third of all DMFs with
USFDA come out of Indian facilities. Now India has the highest number of FDA
approved Plants (119) in addition to 84, MI-IRA approved plant in UK. Recently, 1735
(3 1 %) DMFs were filed by India which is higher than Spain Italy, China and Israel put
together, followed by USA (20%), Italy (13%), and Others (Table 4.15(A)). Company
wise Dr. Reddy's has the largest DMFs (55) in the year 2008 (Table 4.15(B)).
Table-4.15 (A): Country-wise DMFs Filed with USFDA (2008). Country In Number Share %
India 1735 31 USA 1054 20 Italy 679 13
China 563 10 Japan 311 6
Germany 286 5 Spain 248 5 France 200 4
Switzerland 163 3 Israel 162 3
Source: Compiled from, Annual Report 2009-10, Department of Pharmaceutical, Government of India.
Figure 4.14: Country Wise DMF Filed with USFDA (2008)
■ 3%■ 3% ■ 4%
■ 5%
5%
■ 100/0
■ 13%
• India ■ USA • Italy ■ China • Japan
Germany • Spain • France • Switzerland • Israel
■ 31%
■ 20%
A DMF is submitted to gain the confidence for out-sourcing. The growing number of
DMF also signifies the increase in the number of contracts that Indian players have
garnered.
140

Chapter-4
Table- 4.15 (B): Company-wise DMFs Filed from India as upto 2008. (In numbers)
Company DMF Filing with USFDA as on 31 March 2008
Global DMF filings as on 31 March 2008
Ranbaxy NA 271 Dr. Reddy's 127 281
Sun Pharmaceutical NA 101 Wockhardt 8 NA
Cadila Healthcare 59 NA Glenmark 30 37
Torrent 6 23 Aurobindo 122 1017
Lupin NA NA Cipla 87 NA
Source: Compiled from, Annual Report of Respected Companies # On December 2007
Figure 4.15: Company µise DMF Filed as upto 2008
271
281
101
37 23
1017
■ Ranba, , U Dr. Reddy's ■ Sun Pharmaceutical • Wockhardt • Cadila Heahhcare
Ckn nark • Torrent • Aurobindo • Lupin • Cipla
4.10.4 Patent Protection:
The principal economic rationale for granting patent is that it will stimulate investment
for research and innovation. Patent protection is considered to be important in the
pharmaceutical sector because, the costs of developing a new drug are high and the costs
of developing process for manufacturing a new drug are low (Grabowski 2002). Till the
early 1970s India essentially has a product patent regime in pharmaceutical. It was
abolished in 1972 (Patent Act 1970). Many economists argued that Indian patent Act
1970 was crucial in the growth of the Indian pharmaceutical sector because it gave space
to Indian companies to develop alternate process which they did so successfully.
After establishment of WTO, TRIPS came in to effect with introduction of full product
patent protection in all fields including pharmaceutical. After TRIPs, India had to 141

Chapter-4
introduce product patent by January I, 2005. The term of patents is now for 20 years.
All the product patent applications held in the mail box7 are also required to be taken up
for examination from January 1, 2005. Currently a total of 35218 patent applications
were in field out of which, 6040 (17%) are from domestic companies and 29178 from
foreign applicants (Economic times, 2009) Dr. Reddy filed the largest number of patent
applications (147) followed by Ranbaxy (101), Avesthagen Ltd., (66) and others (Table
4.16).
Table-4.16: Top Ten Indian Applicants for Patents from Pharmaceutical Sector (2008).
Company Application Filed in Number Dr. Reddy's 147 Ranbaxy 101 Avesthagen Ltd. 66 Cadila Healthcare Ltd 57 Matrix Laboratories Ltd 54 Orchid Chemical & Pharmaceutical Ltd 22 Aurobindo Pharma 22 Jubilant Organosys Ltd 21 Ind Swift Laboratories Ltd 19 Panacea Biotech Ltd. 15 Source: Compiled from, Annual Report (2008-09), Office of Controller General of Patents, Designs,
Trademarks and Geographical Indication. Government of India, New Delhi.
Figure 4.16 Top Ten Indian Applicants for Patents from Pharmaceutical Industry (2008).
15 19
147 ,p
21 n n
54
57 101
66
■ Dr. Reddy's • Ranbaxy M Avesthagen Lid. ■ Cadila Healthcare Ud • Matrix laboratories Ud
Orchid Pharmaceutical Lid • Aurobindo Pharma • Jubilant Organosys Ud • Ind Swift Laboratories Ud ■ Panacea Biotech Ltd.
7. The mail box is a facility introduced through the first amendment to the patent Act in 1999. It allows filing of applications for product patents for drugs, agrochemicals and food products discovered drug the period January 1995 December 2004 The patent office will begin examination these application from January and any patent based on the mail box filings if granted will be effective for 20 years from the date of mail box application.
142

Chapter-4
4.11 Contract Research and Manufacturing Services (CRAMS):
Recently contract manufacturing' has emerged as a new growth strategy for many Indian
pharmaceutical companies, by offering contract services like marketing, research,
clinical trials, data management and laboratory services to global pharmaceutical
companies (India infolinc, 2000). The process of out-sourcing brings substantial
economic gains to global firms as they give contract for the production of their products
to those who can work cost effectively and qualitatively thus relieving them to focus on
their core competencies and high value-added operations like research and marketing.
For Indian firms out-sourcing not only provides additional sources of revenue, but also
access to new technologies, marketing networks and best business practices abroad.
Important reason for CRAMS lbr sweeping across the sectors is severe cost pressure of
global market. India is the fastest growing custom manufacturing out-sourcing
destination with a growth rate of 43%, which is thrice of the global market rate. The
developed pharmaceutical industry is increasingly facing cost pressures due to rising
manpower cost, higher regulatory risk and also the R&D productivity of these players
has gone down significantly in recent years. In addition, the process of getting approval
for new products in regulated markets requires strict compliance of quality norms, which
is stringent and is also subject to high legal risk. It is causing MNCs to out-source part of
their R&D and manufacturing activities to low cost destinations like India. About a third
of total R&D investment by the global pharmaceutical industry, estimated at $40 - $50
billion, could be made in India over the next 10 years.
Hence India is emerging as the global hub Ior CRAMS due to its low cost advantage and
world class quality standards as per the GMP norms. The diverse disease profile and
abundance of patient in the country provides better ground for clinical trials. India has
leveraged this advantage to attract clinical trials process out sourced by the companies
involved in innovation. Majority of the contract manufacturing deals relate to production
of APIs and intermediates, in which India possesses competence. Ranhaxy was the first
Indian companies to adopt the strategy of contract manufacturing, licensing and
collaborative research to strengthen it competitive strength in Indian and overseas
market. Nicholas Piramal, Sharun Chemicals. Devis Lab. Dishman Pharma, Cadila
Healthcare, Lupin and Aurobindo Pharma are some of the companies which have
S. Contact manufacturing is manufacturing ofa product by a job shop on behalf ofan external customer. Normally, the customer supplies the drawings and specifications as well as the quality control criteria.
143

C liapter-4
witnessed impressive growth in revenues from their CRAMs business. Consequently.
India's share of the global out sourcing market is too grown from 2.2% in 2008 to 3.5%
in 2010 (Express Pharma. 2010a). Besides Indian contract manufacturing segment was
worth around S350 million in 2007, S605 million in 2008 and is expected to grow up to
['SS 1 billion in 2010. It is growing at a rate of 25% per annum.
This phenomenon now covers a wider range of inter firm cooperation like strategic
marketing alliances, collaborative research and out-licensing. On 1" March 1997 and
June 1998 Dr. Reddy Licensed out its two molecules namely Balagtilazone and
Ragaglitazar to Novo Nordisk of Denmark for further development (India Infoline,
2004).
Further, India is among the fastest growing clinical trial`' destinations, with a growth rate
of two and half times the overall market growth rate. The country also participate in 7%.,0
of global phase III and 3.2% of phase II trials with industry sponsored trials
demonstrating a CAGR of 39% between 2004-08 (Ernst &Yong, 2010: 45-46)
4.12 Employment in Indian Pharmaceutical Industry:
In the last decade the pharmaceutical industry has grown by CAGR 12-15%. The rapid
expansion of pharmaceutical sector has opened up several job opportunities. As per
KMPG (2006) pharmaceutical industry employs 29 million people (5 million direct and
24 million indirect). It indicates that pharmaceutical employment has increased nearly
twice since 1995 and is growing with 4% CAGR (Table-4.17). In major Indian states like
Maharashtra, Gujarat and Andhra Pradesh this sector employs the largest number of
people. The ministry of pharmaceutical has estimated that this sector has created around
2.2 million employment opportunities. Besides this the industry offers great employment
opportunities for researchers and other skilled workers due to the factors like increasing
out-sourcing and expansion of the sector. The concept of pharma retail chain that has
gained momentum in the recent years has also created numerous employment
opportunities.
9. A clinical trial is a research -study to answer specific questions about vaccines or new therapies or new ways of using known treatments. It also called medical research and research studies are used to determine whether new drugs or treatments are both safe and effective. Carefully conducted clinical trials are the fastest and safest way to tittd treatmei is that %vork.
144

Chapter-4
Table-4.17: Emulovment level in Indian nharmaceutical industry (1995-2008).
Years No. of Employees in Pharma sector Growth Rate (%)
1995 181497 1996 204609 12.7 1997 211614 3.4 1998 189295 -10.5 1999 213999 13.1 2000 243410 13.7 2001 233704 -4.0 2002 226416 -3.1 2003 223556 -1.3 2004 240791 7.7 2005 265396 10.2 2006 290021 9.3 2007 336211 15.9 2008 353692 5.2
Source: Bulk Drug Manufacturers association in India, Hyderabad.
Flgure-4.17: Employment Level in Indian pharmaceutical industry
o 400000
350000
€ 300000 r
200000 .s
1 uiiil 50000
0 100000 •
='11111111111 1995 1996 1997 1998 1999 2000 2001 2002 2003 2004 2005 2006 2007 2008
Year
■ No. of Employees in Phanna sector
145

('Iiapter--t
4.13 Chinese Threat and India Pharmaceutical Industry:
India and China account for 7% of world pharmaceutical industry in value terms with
revenues of US$28 billion (www.industrychannel.com). Chinese Pharmaceutical
industry is 4.5 times larger in size than the Indian industry. It is growing at 17% annually
in comparison to 12-15%'% growth rate of Indian Pharmaceutical. Besides this China has
also established a large number of profit oriented R&D institutions, which are
independent of government funding in contrast to institutions in India which are mostly
dependent on government funding. FDI in Chinese pharmaceutical sector is 20 times
more than in India.
Currently, China is being touted as the biggest threat to the IPI, as Chinese producers
have gained market share in various developed and developing countries by dumping
products at low cost. Almost 60% to 70% of our pharmaceutical requirement of
intermediates is sourced from China. Recently, China cracked down on its chemical
industry in order to enforce environmental legislation leading to short supply of chemical
intermediates, increasing their prices uneconomically for Indian drug manufacturers. On
one hand, this severely affected bottom lines of Indian companies while on the other
hand their supply schedules were also disturbed. Indian drug companies largely depend
on imports from China for bulk drugs. It was 2.9% in 2004-05 and increased to 5.1% in
2008-09 (Express Pharma, 2010a). India must reduce its dependency for these
intermediates on China. However; Indian pharmaceutical companies have shown
remarkable resilience. Their pharmaceutical products are far superior in quality and
safety to Chinese companies, which rely on ancillaries that roll out products of in
consistent quality.
4.14 Strength, Weakness, Opportunities and Threats (SWOT) Analysis of Indian
Pharmaceutical Industry:
Indian pharmaceutical was of at critical crossroad where key decision by firms and
government set the direction and chart the course for the sector from 2005 onwards.
Hence it is fruitful to do SWOT analysis at this stage and identify strength, weakness.
opportunity's and threats so that something can be done to claim as well grab larger
share of the domestic as well as global phanna market. SWOT analysis focuses on the
internal and external environment examining strength and weakness in the internal
environment and opportunity and threat in the external environment. 146

Chapter-4
Strength: Huge population of over a billion, and large middle class population, large
volume of production, high demand for modern medicines especially in rural areas,
lowest cost of production with a skilled labour force, sound chemical industry and
excellent chemistry with process reengineeting skills, strong and well developed
manufacturing base, high standard of purity as India has the largest number of USFDA
approved plant, increasing liberalized government policies and existence of a world class
cold chain infrastructure are the major strength of Indian pharmaceutical sector.
Weakness: Price regulation, lack of product patent low barriers to entry leads to intense
competition adversely affecting growth in value terms, non-availability of major
intermediates for bulk drugs, dependence on imports from China, lack of experience to
exploit efficiently new patent regime, low level of strategic planning for future, low
share in world pharmaceutical production, low level of R&D expenditure, absence of
association between institute and industry and production of counterfeit drugs are the
main weakness of Indian pharmaceutical sector.
Opportunities: Existence of product patent and a large number of drugs going off patent
in the US and Europe during 2005-2011, lowest cost producer, largest number of
USFDA approved plant outside the USA, incredible exports potentials, increasing
income of the middle class, globalization i.e. easier international trading with opening of
new markets, and increasing aging population in India and abroad are the main
opportunities for 121. Additionally, India has emerged as the centre of "healthcare
tourism" in the entire world. It has the potential to attract one million medical tourists per
year. Apollo clinics have spread across 37 locations in India and abroad. It is the largest
private healthcare service provider in Asia and 3 1̀ largest in the world. It provides
healthcare at a fraction of cost compared to developed world.
Threats: Implementation of VAT, dumping of bulk drugs and formulations by
neighbouring countries particularly China, non tariff barriers imposed by developed
countries and competition from MNCs, high cost of discovery for new products and
fewer discoveries, low growth of domestic formulation market as compared to export.
Cheap import of bulk drugs from China are the major threats for IPI. However, on the
quality front India is better placed relative to China.
147

Chapter-4
4.15 Indian Pharmaceutical Industry in Global Market:
The global market for pharmaceutical industry has shown tremendous growth over the
past decade. But the geographic spread of this growth has been very uneven. Large
markets in the world are USA (45%), Europe (24%) and Japan (11%). China contributed
2% and India's contribution was a meager I ,8% (Pi iolkar, 2009),
The Indian industry is highly fragmented with no firm controlling more than 7% of the
market (ICRA, 2004:82). The top ten companies in India hold approximately 37% of the
market, which is lower than the global structure of 44%. IPI has been consistently
growing at a 12-15% (CAGR) as against global average of 4-7% during 2008-13 (Times
of India, 2009). One of the unique features of Indian pharmaceutical market is that it has
dominated branded generic (80%) and rest (14%) generic-generic drugs market (Yes
Bank Report, 2009). India accounts for 22% of global generic market. Top global
generic players in 2007 were Teva ($9.I billion), Sandoz ($5.8 billion), Mylan ($4.6
billion) and Watson ($2.7 billion). Together they accounted for 47% of the US market in
2009. As compared to these foreign companies Ranbaxy share was $1.7 billion, Dr.
Reddy's SI.7 billion and Wockhardt 0.4 billion (DOP, 2009-10).
India has 793 WHO cGMP (Current Good Manufacturing Practices) approved
Pharmaceutical Plants (DOP, 2009-10). Further India has the highest number of USFDA
approved plant (119 plants) outside the US. India accounts for over 1/3" of Drug master
files and 30% of all approved ANDAs in the USA placing it at the second position next
only to USA. Even in patent challenges India ranks next to USA with a share of 21% of
patent challenges. The country also stands at 3rd position in terms of volume of
production (10% of global share) and 14°i in terms of value (1.5%). Besides this India
has about 2% of the world pharmaceutical market (DOP, 2009).
However, there is a vast gap in the amount of pharmaceutical R&D expenses undertaken
by foreign companies (15-20%) and the Indian companies (5-8%).
It is heartening to observe that India has increased its pharmaceutical exports at a rapid
pace since the 1990s. Our trade balance increased to $200 million in 1990 to $4.3 billion
in 2003. India is top 17"' net exporter in the world. However, irrespective of its
impressive export growth rates. India's share in the global pharmaceutical exports has
not shown much improvement. It is hovering around 1%. Further, as per WHO study
India accounts nearly 113 s̀ of world's spurious drugs market (Sagan et.al, 2006).
148

Chapter-4
Similarly if we compare our per capita drug expenditure to other developed countries it
is quite low i.e. S3 while in USA it is $222. (Aggaiwal of al 2006: 109).
4.16 Issues arising out of \%TO Regime:
The WTO was established on January I. 1995 and is responsible for making and
enforcing rules for trade between nations. Apart from goods the two other broad areas
that WTO covers are services and intellectual property, which previously belonged to the
domestic domain. Accordingly. WTO administers not only the Multilateral Trade
Agreement (MTA) in goods but also the General Agreement on Trade in Services
(GATS) and the Agreement on Trade Related Aspects of Intellectual Property Rights
(TRIPS) which came into existence with WTO. Therefore, the TRIPs agreement was
born to protect the interests of the industry trade and services. India was a signatory
member to the TRIPs agreement.
Certain issues and developments arising out of WTO regime, pose a major challenge to
our manufacturers. Due to TRIPs with GMP compliances schedule M1° compliance was
made mandatory. As GMP is considered as the bench mark of product quality, it is
important not only for maintaining market share in domestic market but also for
accessing extremely competitive export markets. The financial constraints hindered the
small firms from adopting GMP criteria and as a result 9% of SSIs were unable to
comply with it and S% were closed. (Iyear, 2008: II). It adversely affects the production
of bulk drugs and level of employment.
II has been argued that the IPR regime can significantly constrain access to technology
by developing countries and increase their dependence on imports. The domestic firms
would under such circumstances be left with no option but to collaborate with the foreign
firms. Besides a strong patent system can also dissuade innovative activity by domestic
firms whose R&D function is dependent on the spillover effects of other firms, and
therefore they would be adversely affected by the restricted access to these spillovers
(Kumar, 2003: 209-224). A number of studies have examined the effect on prices of medicines during the post
TRIPs period. They have argued that it has stimulated welfare losses for the consumers
in developing countries like India. On account of it a work shop was held at NIPER on
22 April 2006, which tbund that prices of drugs in India have been by and large stable
10. Schedule M-Conditions with which premises, licensed for the manufacture of drugs, should confirm 149

Chapter-4
and no sudden changes in prices have occurred. many reasons have been cited for this
important amongst than are (a) majority of drugs marketed in India are generic (b) a
very large volume of production by pharmaceutical industry (c) acquiring patent do not
automatically translate into product and (d) TRIPs is just one of the many factors
affecting prices.
4.17 Conclusion:
Pharmaceutical industry contributes to the welfare of humanity and provides significant
socio-economic benefits to the society through creation of jobs, supply chains and
community development. The industry also plays an important role in technological
innovation, which may reduce costs of economic activity elsewhere in the economy.
Unlike other consumer goods, prices of medicines arc inelastic in the sense that a rise or
fall in the price of medicine is not going to significantly change the demand for the drug.
IPI is one of the world's largest and most developed, ranking fourth in terms of volume
and thirteenth in terms of value. The country accounts for an estimated 10% of global
production and around 2% of world markets in pharmaceuticals. It has over the years
made significant progress in infrastructure development, technical capability and hence
produced a wide range of phanuaceutical products. The industry now produces bulk
drugs under all major therapeutic groups. It has a sizable technically skilled manpower
with prowess in process development and downstream processing. It has the capital
investment of about US$4.lbillion. It produced bulk drugs of value of US$3.5 billion
and formulations worth US$15.4billion in 2008. Bulk drugs have grown at a rate of
approximately 14%, and formulation by 24% in the nineties. There is an increasing
interest and investment in R&D. It provides employments to 29 million people. The
contribution of pharmaceutical sector in India's GDP is 2% and 12% of manufacturing
sector GDP.
The industry has achieved a global status through firm level strategies industry initiatives
and also with appropriate policy support. Presently, 70% of local requirement for bulk
drugs and almost all the demands for formulations are met by the domestic industry. In
addition to catering to the needs of the domestic demand it is also the leading supplier of
hulk drugs and cheap formulations to the world and engaged in contract manufacturing,
contract research, clinical trials and contracts R&D. Huge population with a large
growing middle class, low cost of production but high quality standard and existence of
150

Chapter-4
good infrastructure are the main strengths of Indian pharmaceutical. China is being
touted as the biggest threat to the WI, but large opportunities exist for Indian companics
internationally as many Indian drug manufacturing facilities conform to international
quality certilicates like USFDA, UK MCA. This provides an advantage to Indian
manufacturers, over Chinese.
151

Chapter-4
4.18 Reference:
I. Agarwal, Abhinav, Kamal Dua, Vaibhav Garg, U.V.S. Sara Akash Taneja (2006).
"Challenges and Opportunities for the Indian pharma industry", Health
Administrator, XX (I&2):109.
2. Amin, B.D. (1939). The rise and growth of the Alembic Chemical Works",
Baroda. Alambic Chemical Work: 1-7.
3. Anand, Nitya (1988). "Drug Research and CSIR, Drugs and Phammaceuticals:
Industry Highlights', Lucknow (January).
4. Biospeclrum (2008) "Rethinking R&D May 7,
www.biospectrum.indiaciol.com.!contextibiobasinss/ 10S05076sp.
5. Budget (2007-08). Ministry of finance, Government of India, New Delhi
www.i ndi a.budget.ni c. in.
6. Cadila Annual Report (2008 & 2009). www.zyduscadila.com
7. Chaturvedi, Kalpana and Joanna Chatway (2006). "Strategic Integration of
Knowledge in Indian Pharmaceutical firms: creating competencies for
innovation "" International Journal Business Innovation and Research, 1(1/2): 27-
50.
8. Chaudhuri, S. (2005). "The WTO and India's Pharmaceutical Industry; patent
protection, TRIPs and Development Counties", Oxford University Press, New
Delhi: 45-188.
9. Davidson, Larry and Gcnradiy Greblov (2005). "The Pharmaceutical Industry in
the Global Economy" Indiana University Kelly School of Business Bloomington,
Indiana: 3.
10. Department of Pharmaceutical (2009), Annual Report 2009-10, Ministry of
Chemical and fertilizers, Government of India. New Delhi.
11. Department of Pharmaceutical (2009), Ministry of Chemical and fertilizers,
Government of India, New Delhi, www. phamta. nic.in.
12. DiMasi, J.A., R.W. Hansen, and H.G. Grabowski (2003). "The Price Innovation:
New Estimates of Drug Development Costs." Journal of Health Economics,
22(2):151-85.
13. Directory of pharmaceutical manufacturing units in India (2007), National
Pharmaceutical Pricing Authority, Government of India, New Delhi.
http://www.nppaindia.nic.in.
152

Chapter-4
14. Dr. Reddy's Annual Report (2009). www.drreddys.com
15. Economic Times (2006). "Jubilant in 5 years contract with Eli-Lilly', 4u' January.
16. Economic Times (2009). 7" January.
17. Ernst & Young (2010). "Doing Business in India", Ernst &Yong Pvt Ltd, Kolkata:
45-46. www.ey.com/india.
18. Expert - Import Bank of India (2007). "Indian Pharmaceutical Industry, Surging
Globally", Occasional Paper # 119, Quest Publication: 28 (August).
19. Express Pharma (2007): "Shaping SEZ". 16-31 December, Fortnightly insight for
pharma professionals. www.cxnrcssuharmtonlinc.com.
20. Express Pharma (2008). "Budget Speak 2008-09" 16-31, March 2008, Fortnightly
insight for phanna professionals, www.expressolianaonlin.com.
21. Express Pharma (2010). "India's CIS business meet held in Munibai. 1-15 August
Fortnightly insight for pharma professionals. www.wpressphanmaontin.eotn.
22. Express Pharma (2010a). '`Strategic Partners in Prosperity: All CRAM Med up"
Fortnightly insight for Pharma Professionals, 16-31
J ui y. w w w. ex Ares s ph ant ao n tine, corn.
23. Fink, C. (2000). "How stronger patent protection in India might affect the
behaviour of transnational pharmaceutical industries", working paper 2352, World
Bank Washington, D.C.
24. BEE (2008), 'Pharmaceuticals: December, 2008", Indian Brand Equity
Foundation (www.ibef org).
25. IBBF (2010)."Pharmaceuticals", Indian Brand Equity Foundation. www.ibeforg
(April).
26. ICRA Ltd. (2004)."Industry Watch: The Indian Pharmaceutical Industry",
Information and credit Rating Agency, New Delhi.
27. India Info line (2004)."Dr. Reddy's Research Foundation pharmacophore, Address
by K.A. Reddy (171h January). httpYlwww.indiainfolin.comlnevi'rcm.html.
28. India Info line, (2000). "Contract manufacturing: Growth Engine for Indian
Pharma Companies?" 16`" August.
29. lycr, Parvathi. K. (2008). "Structure and Performance of Small and Medium Scale
Pharmaceutical Firms", S&T and Industry. India, Science and Technology: 11
30. Jha, Ravinder (2007). "Options for Indian Pharmaceutical Industry in the
Changing Environment", Economic and Political Weekly, Sameeksho trust
Publication, Mumhai, XLII (39): 3958-3967 (Mumbai). 153

31. Kumar. Nagesh (2003). "Intellectual Property Rights, Technology and Economic
Development: Experience of Asian Countries", Economic & Political Weekly,
Samccksha Trust Publicationm Mumbai, XXXVIII (3):221 (Mumbai).
32. Lupin Annual Report (2008-09) wwww.iupiH.eum
33. Mashelkar Committee (2003). "Report of the Export Committee on a
comprehensive examination of Drug Regulatory issues, Including the problem of
spurious drugs", New Delhi, Government of India, Ministry of Health and Family
Welfare, Para 6.3.4:3.
34. Narayana, P.L. (1984)." The Indian Pharmaceutical Industry: Problems and
Prospects", National Council of Applied Economic Research (NCAER), New
Delhi.
35. National Pharmaceutical Policy (2006), Department of Chemical and
Petrochemicals, Government of India, 2005, Part A (281x' December).
36. Patnaik. Anabadhya, Kshitij Chanana, Nakul Kapoor Praful Singhal and
Sudhanshu Pandey (2009). "Indian Pharmaceutical Sector", Project Report;
Managerial Economics, IBS Hyderabad (10th September).
37. Pharmaceutical Policy (2002), Government of India, New Delhi.
38. Pharmaxil (2009), 6 h̀ Annual Report. 2009-10: 8.
39. Piramal Healthcare Annual Report (2006). www.piramal healthcare.com.
40. Pradhan, J.P. (2006) "Global competitiveness of Indian pharmaceutical Industry.
Trends and Strategies", ISID Working paper 2006/05, New Delhi: 13 (June).
41. Pradhan. J.P. and Abhinav Alakshendra (2006). "Overseas acquisition versus
Green-field foreign investment — which Inter nationalization strategy is better for
Indian pharmaceutical Enterprises?" ISTD working paper 2006/07, Institute for
Studies in Industrial Development, New Delhi: 3 (August).
42. Priolkar, Subodh (2009). "Can India be Pharmaceutical Superpower in 2020?"
Pharma Times, 41(1) (January).
43. Ranbaxy Annual Report (2007 & 2008), www.ranbaxy.com.
44. Report (2006). "Impact of TRIPs on pharmaceutical price: with Specific focus on
generics in India", NIPER. Project under the work plan of the WI 10 Biennium
2004-05 and ministry of Health and family welfare, Government of India (220J
April).
45. Roumeliotis, Gregouy (2006). "India geared up for unprecedented manufacturing
growth". In Pharma Technology. Coin (15 f̀1 August). 154

(7w pier-4
46. Sagar, B.P.S., R. Zafar and Aklavya Singh (2006). `Counterfeit, fake and Spurious
Drugs", Health administrator, XIX (1): 65-73.
47. Sun Pharma Annual Report (2007-08), wutiv.sunphaxrWa.tom.
48. Times of India (2009), 1 I October.
49. Wockkardt Annual Report (2007&2009). www.wockhardt.com.
50. www.industrychannel.com/resource/95495treat-china-India-pharmaceutical-
industry.aspex,
51. Yes Bank and OPPI Report (2009). "Indian Pharmaceutical Industry: vision
2015". Yes Bank Ltd. & OPPI, Mumbai.
155

Chaprer - 5
A Statistical Approach to FDI in hrdian pharmaceutical Sector: Test of
Hypotheses.
5.1 Introduction:
As has been mentioned in the earlier chapters the importance of FDI inflows for a
developing economy like India can never be ignored as the FDt inflow not only integrates
the host economy with the world economy, but also acts as a developmental resource in
the form of capital, technology, managerial and marketing know-how and market access
required for sustained economic growth and development. Moreover, FDI inflows can
make the relationship between domestic and foreign enterprises more dynamic in terns
of technology and environment. It is needless to mention that pharmaceutical sector is a
knowledge-based sector; FD[ plays an important role for the development of this sector.
The pharmaceutical industry is perhaps amongst a few sectors in India whose foundation
is built on the process of internalization. Therefore, it has been selected as one of the sun-
rise sector where concerted efforts are being made to attract FDI.
The P31 in the IPI is mainly market- seeking. The advantage for MNCs in the
pharmaceutical industry is that India has a large domestic market with 1.2 billion
populations and a wide disease pattern. Other factors that attract foreign investors are
relatively cheap and skilled labour force and english is widely spoken. which makes
communication easy for foreign investors. The production of pharmaceuticals is also
relatively cheap in India and there is a strong production base in the country. It is easy to
get good quality bulk drugs. Because of India's focus on reverse engineering and
development of production processes, it has high technical competence in production in
the pharmaceutical industry. All this makes this industry attractive for foreign investors.
The industry is also highly competitive among suppliers, which gives the MNCs a good
bargaining position. India has many advantages for foreign investors and consequently,
the country has future potential to become an attractive destination for outsourcing in
drug discovery and clinical research.
The present chapter aims at exploring the nature of interrelation between the FDI in India
and the pharmaceutical industry. The analysis of the chapter concentrates on the absolute
figure first and then provides a statistical analysis of the same. As has been mentioned in
156

Chapler - 5
the introductory chapters, some hypotheses need to he tested with regard to the role of
FDI in the Indian pharmaceutical sector.
Section-A
5.2 Policies regarding FIB in the Pharmaceutical Sector:
The foreign pharmaceutical firms in India have met a restrictive environment. There used
to be perfonuanee requirements for the foreign firms investing in the IPI, in order to
create linkages between foreign and domestic firms.
According to section 29 of FERA, 1973 the foreign companies producing in India were to
dilute their foreign equity holdings to not more than 74%. But the Hathi Committee
(1975) in its report did not find any justification of this exemption and recommenced the
dilution of foreign equity in the pharmaceutical companies to 40% and progressively to
26%.
Drugs policy 1978, was the first comprehensive drugs policy to be announced by the
Indian government in the light of the recommendations of Hathi Committee. It was very
critical for the role of VINCs in a sense that they did not lake much initiative in
developing the industry from the basic stages. It emphasized self-sufficiency in the
production of drugs. The drug policy 1978 imposed restrictions on the FERA companies
which were not applicable to other sectors. The Pharmaceutical MNCs which were
manufacturing formulations only or bulk drugs not involving high technology were
required to reduce foreign equity to 40% or below. Production of bulk drugs and
formulations from basic raw materials involving high technology, were determined
foreign equity by a high I evel.
A number of drugs were reserved for the public sector and the Indian companies
(companies with foreign equity of 40% or below). The government gave production
license to FERA companies only if they were involved in high technology bulk drugs and
related formulations, provided half of the bulk drug manufacture should be sold to other
formulators. Besides, they were required to produce bulk drugs and formulations in the
ratio 1:5 which were further made more restrictive in the drug policy of 1986 by
157

Chap(er - 5
changing the ratio requirement to 1:4. The FERA companies were also denied access to
the scheme of de-licensing introduced for 94 bulk drugs (Chaudhari, 2005: 133-134).
Thus foreign investment increased in a period of stringent regulations along with an
increase in productive capacity though no new MNCs entered in the pharmaceutical
sector, but many big companies such as Ciba-Geigy, Pfizer, Glaxo and Jonson & Jenson
continued and increased their manufacturing activities.
The pharmaceutical industry is one of the key industries that were much largely affected
by the economic reforms. Iu t990s various significant changes occurred in the
pharmaceutical sector. All those drugs which were reserved for the production by the
public sector enterprises were delicensed in two stages. One immediate impact of this
delicensing of the drugs was that its production increased tremendously with increasing
the competition among the domestic companies and foreign companies. The increased
production has positive impact on exports and Balance of Trade (BOT). The government
also increased the automatic approval limit for FDI in the pharmaceutical sector from
40% to 51%in 1994. further it was increased to 74% in March 2000 and 100% in
December 200LWith the modification of drug policy in September 1994, there has been
significant changes in this sector. Industrial licensing for the manufacture of all drugs &
pharmaceutical has been abolished with some exception. Technology imports have been
uncontrolled with automatic approval for foreign technology agreements in the case of
almost all drugs. Later on price control has been substantially diluted i.e. 70% to 50%,
35% and 25% respectively during pre-reforrn period, 1995, 1997 and 2002. Besides this
removal of restrictions on the royalty or technical fee payments, removal of restrictions
on inclusion of restrictive clauses in the agreement and no scrutiny for repetitive imports
etc also imposed. In 1995 government signed the TRIPs agreement. All these measures
resulted in an uneven growth of the domestic pharmaceutical sector.
R&D requirements have been a condition for foreign firms in India. For instance, it was
compulsory for foreign pharmaceutical companies to set up R&D facilities and spend at
least 4 percent on R&D of their turnover annually, if their turnover was more than Rs. 50
million (Dhar and Rao, 2002). To enter into long-term consultancy agreements with
relevant R&D institution in the country, within 2 years of FDI approval, was also an
I 5

Chcipfer - 5
option. Furthermore, technology transfer is one of the main objectives for host countries
attracting FDI.
5.3 Effects of EDT in Indian Pharmaceutical Industry:
FDI is often seen as a catalyst of India's economic growth and development. Importance
of FDI is not only that the foreign investor finances the investment in new plants and
equipment, but it can be a measure of transfer of technology, knowledge and capital for
the host country's industries. Additionally FDT comes with financial and managerial
resources, access to large markets, technical assistance and strategic assets, such as brand
name, which give the host firms domestic and international comparative advantages.
According to Dunning (1970) the foreign company's management and technological
skills from the parent company can be seen as a 'brain-drain in reverse' to the local
economy, as they gain particularly scarce and needed entrepreneurial skills.
The inflow of FDZs into India has increased since the liberalization started. This
influenced the pharmaceutical sector in several ways. The public units that had a
production monopoly in certain drugs were opened up for competition and privatization
(Aggarwal, 2004). Besides, the requirement for certain ratio in bulk drug production
was removed. Equity share and approvals of FDI in the pharmaceutical industry were
relaxed and number of drugs under price control was reduced.
This change in the attitude of Indian government towards FDI stems from the realization
that FDI not only provide financial resources but, also arc a source of technical,
managerial and organizational knowledge which are largely not available in the country.
Therefore, FDI is widely considered as advantageous for the host economy since it can
result in spillover effects by various channels such as increased competition, transfer of
technology and imitation effects (Bergman, 2006: 4-6).
5.3.1 Competitive Effects:
This is the most important indirect benefit that FDI companies may generate in the host
economy. Foreign firms have been a part of the IPI since its initial stage. When the first
time MNCs entered the Indian market, they basically had a monopoly in the industry, and
159

Chapter - .5
thus there were no spillover effects in terms of increased competition. Currently, the
domestic industry is welt developed, which means that MNCs and the domestic firms
compete at the same level. In 1992, thirteen companies of the top twenty had foreign
origins, but today the number of MNCs at the top has decreased because of lower profit
margins and increased competition from domestic firms (Felker et al, 1997). The
presence of MNCs in India has a large impact on the competitive environment in the IPI
and encourages the domestic firms to upgrade their technology and investments in
marketing. This increased competition forces local firms to improve their productivity by
using more efficiently existing resources shifting to sophisticated and advanced
technology providing training to workers and undertaking R&D expenditure to develop
local technologies.
Important factors for a firm to succeed and be able to compete effectively in the
pharmaceutical industry are costs, research orientation, product portfolio, production
capability and marketing & distribution network. The MNCs in India are characterized by
advantage in many of these factors, while their domestic competitors have an advantage
in production capacities and costs. Since the foreign firms do not have cost advantage in
production, they invest large sums in marketing and fieldwork to promote drugs.
Currently, the domestic companies seem to have adopted the MNCs' marketing skill and
strategies to be able to compete. The domestic firms are more or less forced to try to keep
up with the MNCs' marketing abilities and the local firm's increased market share
indicates they have been doing well (Bergman, 2006: 17-18).
The spillover effects from competition can be expected to increase in the future. The
Indian economy is getting increasingly liberalized and the government of India wants to
raise FDI further in the pharmaceutical industry in order to stimulate competition.
With the introduction of the product patent regime in 2005, more research- based
pharmaceutical companies are expected to establish their presence in India. The enhanced
competitive environment in the new patent regime may be difficult for the small-scale
producers. Many of the small-scale producers are lacking production product quality and
many are also inefficient. It will be tough for the small firms to handle the competition
and transition to the new patent regime. It is likely that many small-scale firms have to
lower their production or shut down. Yet, spillover effects from competition lead to the
160

Chapter -5
reduction of inefficient firms, and in the short term unproductive firms are likely to be
swept off the market. On the other hand, in the long term, the industry is likely to develop
because of better allocation of resources (Bergman, 2006: 17-18).
5.3.2 Imitation and demonstration Effects:
The presence of FD[ in the host economy may also lead to diffusion of information on
new technology, production process, quality control techniques, marketing and
management strategy to the domestic firms so as to improve their productivity level.
MNCs have advantages due to their possession of proprietary technology management
and marketing skills. Though FDI these expertise arc brought into host country.
According to Blomstom et al (1999) it represents `learning by watching effects'.
The IPI is basically built upon imitation and demonstration effects through reverse
engineering of foreign developed molecules and technology. The MNCs that entered the
IPI after independence introduced new drugs and technology into the country. The public
policies that were implemented in the 1970s allowed copying and diffusion of
technological knowledge and expertise from foreign firms (Felker et al.1997). Foreign
firms in India have "unwillingly" contributed to the industry's development through
domestic firms imitating their products. Imitation of already existing products has led to
know-how adoption and technological development for the local companies.
Consequently, the spillover effects from imitation of foreign firms technology and
knowledge seem to have been large in the IPI (Bergmann, 2006: 18-19).
Currently, mostly all Indian companies are generic firms. Many of the larger domestic
firms possess advanced technology and it can be argued that the spillovcrs from imitation
are not as strong as in the past. However, there is still scope for spillover effects through
imitation if the MNCs introduce new technology in the Indian industry. With a strong
patent regime for protection of 1PKs, spillover effects through imitation are less likely to
be generated in the future. The adoption of the new patent regime is likely to limit the
imitative R&D carried out in India, which might affect the development in the industry in
the short run. In the long run however, it is argued that an effective protection of 1PR is
necessary for the industry to grow further. India has innovative capabilities and
increasing numbers of domestic firms are investing in R&D for developing new
161

Chapter - 5
molecules. Spillover effects through imitation are probably going to decrease but with the
establishment of more foreign firms, new technology is entering the country and, through
collaboration, demonstration effects can still occur (Bergnnam, 2006: 18-19).
5.3.3 Transfer of Technology Effects:
In terms of technology transfer, spillover effects, can be created if the MNCs use more
advanced technology in their production processes than domestic companies.
Consequently, technology and productivity gaps between the foreign and local firma may
stimulate spillover effects. Technology in the pharmaceutical industry is often very
complex and the need for up-grading the technology is large due to the rapid pace of new
drug discovery and strict requirements of safety and efficiency (Narayana, 1984). Foreign
pharmaceutical affiliates in India receive up to date technology from their parent firm,
both in managerial practices and in manufacturing facilities, which could encourage
spillover effects.
Spillover effects in terms of technology transfer from MNCs in the WI seem to have
taken place at an early stage. The Indian government wanted to build a strong
pharmaceutical industry and welcomed the entry of MNCs in order to strengthen the
domestic industry through their sophisticated technical know-how. The foreign
companies had modern managerial expertise and sophisticated technical knowledge. In
the early stage, foreign pharmaceutical companies invested more in India than the public
and large Indian firms. The MNCs contributed to technology advancement in the
industry, mainly through imitation, and the enhancement in technology from foreign
fines enabled domestic firms to increase productivity and build competitiveness in new
areas (Bergman, 2006: 20).
Currently, the largest Indian domestic firms have advanced technology and science-
based facilities, so the technology gap between the foreign and the large domestic players
is narrow. The MNCs in India made technology available to the domestic industry at an
early stage, but today technology transfer is rather limited. Since the MNCs do not
conduct much R&D in India, the domestic firms' (the larger ones) technology is equally
developed as the MNCs (Table-4.12). Yet, there might be more technology transfer in the
future when the IPRs are protected.
162

('happier - 5
5.3.4 Research and Development Effects:
R&D intensity in the IPI is rather low and the spillover effects from MNCs in terns of
innovative R&D seem to be negligible. The weak patent regime is one of the main causes
for limited R&D activities in India. The MNCs' share in R&D in IPI is very low and the
average intensity was 0.3% of the annual turnover in 1990 and in 2001 it increased to
0.7% (Pradhan, 2003). Though R&D by MNCs has increased in India, but it is still low.
On the other hand, Indian firms have increased their R&D a great deal in the last years.
With the advent of new patent regime, the business models have begun to change and the
larger Indian firms have started to shift towards innovative research and invest heavily in
R&D. Consequently, R&D expenses have increased at a higher rate of 5.07 during the
post-TRIPs period against 3.88 in pre-TRIPs period (Kiran and Mishra, 2009: 148-160).
Currently, there is a vast gap between the R&D expenditure of domestic firms (5-8%)
and global companies (20-25%). An Indian company has never introduced a new product,
based on newly discovered molecules, in the market. To do so, the need of financial
means is immense and the risk is large. Cooperation with a MNC can therefore help
domestic firms in the research process. Thus, there seem to be some potential spillover
effects in R&D through collaboration between foreign and domestic firms. Furthermore,
collaboration projects are expected to be beneficial for the domestic firm since the MNCs
bring in financial means and at the same time help Indian companies to gain international
credibility and move up the learning curve (Bergman, 2006: 22-23).
R&D centers in the IPI have begun to emerge, which increases employment opportunities
and also reverses the brain drain from India (AstraZeneca in Bangalore, Nicholas Piramal
in Mumbai, Wockhardt in Aurangabad, Ranbaxy's center in Gurgaon, Lupin in Pune, and
Sun Pharma in Baroda) (OPPI,2005). The R&D centers attract Indian scientists who
earlier migrated to developed countries to find suitable work opportunities. With the new
patent regime and enhanced work pool of skilled labour, it is very likely that MNCs will
begin innovative research in India in the future. R&D activity is very competitive, Which
can benefit the domestic industry in terms of increased focus on innovation and
improvement. If the foreign companies start to develop R&D units in India, the
competition is likely to increase among the players in the industry. Further spillover
163

Chapter - 5
effects in terms of competition in R&D activities will possibly he generated in the future.
As more domestic companies engage in various parts of the R&D, the knowledge gap
between the firms will decrease and the absorption capability of spillover effects increase
(Bergman, 2006: 22-23).
5.3.5 Human Capital Effects:
An educated, well trained and skilled workforce generally characterizes FDI firms. When
these well trained workers migrate to the domestic fins or start their own enterprises, it
results in local productivity growth (Blomstrom and Persson, 1983; World Investment
report, 1999).
Well trained employees can be a source of a firm's productivity gain when the resources
are used more efficiently. Training and development of employees across all levels is a
key investment area for many of the MNCs. The aim of investment in training is to make
each employee highly productive. According to Bergman (2006), the MNCs provide
more and better training than the average domestic firms. 'thus, there seem to be spillover
effects generated in terms of human capital in the IPI.
Many of the MNCs provide a great deal of in-house training and offer programs for
everyone from top employees to floor staff in the firms. For instance; AstraZeneca has
"focus on creating a strong performance driven culture and improving the capability of its
employees" (AstraZeneca India Ltd. Directors report, 2004). A part of AstraZeneca's
human resource development plan is to train employees abroad. Each year some of the
employees are transferred to other AstraZeneca affiliates to work. The international
transfer can be a future asset for the employees and the firm, since new ideas are
exchanged in different affiliations. It is favourable for the employees, in terms of
internationalization, to receive knowledge and system and corporate culture in foreign
countries. Many of the MNCs in India seem to send their employees to other foreign
affiliates, for training in various departments of the cooperation (Bergman. 2006: 23-24).
GSK invests lots in human resources to strengthen the competence of their workforce in
India. They have trained many people in management positions and factory workers have
received on the job training in GMP, safety and productivity. Manufacturing operational
excellence training and development activities are held at the factories, focusing on
164

Chapter - 5
building awareness, knowledge management and training of staff in manufacturing
practices to increase productivity of the plants (GSK Directors report, 2004). According
to GSK, the multinationals have helped to develop the IPI in terms of educating people,
especially in marketing and scientific communication skills, but also in finance,
machinery operations and maintenance. Through the MNCs' presence in the industry the
domestic timts get access to new ideas and the local workers gain more knowledge about
international practices. The multinational affiliates in India follow the parent companies'
training schemes, which are often well developed, and it can be argued that this
advantage has benefited the Indian industry as a whole in terms of increased know- how
(Bergman, 2006: 24).
The explanation of the higher employee costs is the higher wages paid by the
multinationals. Additionally, the MNCs invest a lot in training of employees in
promotional activities. The fact that the IvINCs focus a lot on the productivity of their
employees creates a strong competitive environment in the industry. The multinationals
in India spend more money on employee costs than their domestic counterparts. It was
7.2% of the income for domestic firms, whereas 11.4% of income for MNCs in 1997
which was increased 7.5% of income for domestic firms and 12% for MNCs in 2004. In
order to keep up with the multinationals, the domestic firms must invest in their work
force too. The employee cost for domestic firms has increased in the last decade. One
reason for the increased costs could be that more qualified employees are hired due to
larger investments in R&D; consequently, higher wages are paid (Bergman, 2006: 24).
A high level of education makes the absorption capacities of spillover effects larger. The
Indian work-force is very well educated and thus the comprehensive educational level in
India increases the possibility for spillover effects from MNCs since it is easy for the
employees to benefit from more advanced foreign management skills and technology.
5.3.6 Industrial Management Effects:
The domestic industry can benefit from FDI through the superior industrial management
skills that the MNCs possess (Dunning, 1970). Because of the threat of market loss,
foreign companies can raise managerial incentives in host- country enterprises. A well
functioning industrial management is very important for a firm's growth and efficient
165

Chapter - 5
management can increase the productivity of the firm significantly. Aggarwal (2004)
finds that insufficient marketing infrastructure and lack of information affect Indian
domestic pharmaceutical firms negatively in terns of export performance. The lack of
marketing skills forces Indian firms to produce for the domestic market instead of
expanding into the global market. It can therefore be argued that spillover effects in terms
of marketing infrastructure are especially important for funs that want to expand
internationally.
The spillover effects in the industrial management area seem to be immense in India's
pharmaceutical industry. The pharmaceutical industry is highly dependent on marketing
and distribution network. The industry's sales promotion is essentially intended for the
physicians, who prescribe the products to the patients and not for the consumer directly.
Medical Sales Representatives (MSRs) consequently have a large influence on
physicians, who often rely on the MSRs regarding new drugs in the market. This calls for
a detailed system of medical knowledge and the marketing representatives need to be
well trained, technically qualified and specialized in the products and their effects on the
patients (Narayana, 1984). Marketing and promotional performance strongly affects the
outcome of the pharmaceutical firms. The MNCs in India have very well developed
marketing techniques and have been able to capture large shares of the market due to
their aggressive marketing performances.
According to GSK, the foreign pharmaceutical firms have contributed a great deal to the
domestic industry in terms of management, organizational and marketing practices. "The
MNCs have brought the latest manufacturing techniques and marketing practices into the
pharmaceutical industry in India". For instance GSK itself was the first firm that
introduced medical promotion activities such as the MSR system in India (Sanglikar,
2005). By introducing new marketing ideas and management techniques that were
unknown in India, spillover effects to local firms were created (Bergman, 2006: 27-28).
The marketing and selling costs have always been higher for MNCs than for domestic
firms in India, It was 6.5% of revenue for Indian firms whereas 10.1% for MNCs in the
year 1997 which was increased 9.6% for Indian firms and 11.2% for MNCs during 2003.
Basic reason for the MNCs higher costs is their concentration in formulations, which
traditionally require more promotional activities than bulk manufacturing. However the
166

Chapter - S
marketing costs have also increased for the domestic players in India. "I'his trend could be
explained by their increased focus on formulation and improved sales infrastructure. The
enhanced importance of brand building, due to the new patent regime and increased
export of products, could also explain the increased costs (Bergman, 2006: 27-28).
Another aspect of benefits from the MNCs, in terms of industrial management, is their
consciousness of quality standards. The foreign companies have always been aware of
quality and safety aspects of manufacturing pharmaceuticals. According to Narayana
(1984) all foreign companies in India, and domestic units collaborating with foreign
firms, are said to be safe from a quality perspective. If a domestic pharmaceutical turn
wants to expand beyond the domestic market it must learn international standards in
regard to the products and production processes. To be able to export to the regulated
markets (in developed countries) the firm must have reached a certain standard in quality
control. Authorities in regulated markets, which are in control of quality of products and
manufacturing facilities, are very strict. It is difficult and expensive to navigate through
the tough regulatory regimes in the developed countries. Extensive company reports for
documentation of production processes and products are required to start exporting and
thus expand into regulated markets. Today, the largest Indian companies have
comprehended the importance of documentation and are able to comply with health and
safety requirements in different countries, thus continuing to expand into the regulated
markets. The presence of foreign fines in India has contributed to increase the awareness
of quality standards in the domestic industry. Since the foreign firms demand high quality
bulk and good manufacturing practices, they indirectly (or directly in some cases) put
pressure on the domestic suppliers to increasing their standards and supply of good
quality bulk. Spillover effects in terms of quality standards are therefore generated in the
industry (Bergman, 2006: 28).
5.3.7 Linkage Effects:
Efficiency spillovers can further operate through subcontracting relationship between
foreign and domestic fines. These vertical inter-firm linkages are beneficial lbr both the
FDI and non-FDI firms. For FDI firms, subcontracting certain production activities to
specialized local firms and concentrating on their core lines of production is a means of
167

Chapter -
achieving cost reduction and efficiency improvement. Subcontracting is also beneficial
for local subcontractors as it provides these firms new markets along with exposure to
new forms of production and management organization and further access to technical
assistance and training support to upgrade their technological capabilities (World Bank,
1997).
Although FDI is associated with these positive spillover effects, this does not rule out
negative effect from it. This aspect of spillovers is often discussed in the context of
crowding out from FDI, which can occur through these two channels:
Product market- FDI firms with ownership (51-100%) enjoy specific advantages such as
superior technological capabilities, skill, new management techniques, marketing
networks, etc. not only overcome entry barriers but also have an edge over domestic
enterprises. Further, due to their large entry size and trans-border operation they enjoy
scale and scope economies. All these factors contribute to the increased market power of
FDI firms and consequent market concentration. On the contrary, domestic fines
characterized by low technological capabilities, high cost, and inefficiency face negative
scale effect as a result of their declining market share. Negative scale, in turn, raises cost
of production of domestic firms and as a result of which these firm face further decline in
their market share. This cumulative impact of the entry of FDI firms on the market
position of domestic firms may lead to crowding out of many small sized domestic firms.
Thus, entry of FDI firms may adversely affect learning and growth of local firms in
competing activities (Markusen and Vemables, 1997; World Investment report, 1999).
Financial market- FDI firms, given their size and other advantages of being a part of a
global system of production, usually have a preferential access to local capital through
financial institutions in the host country. This may lead to credit rationing for small sized
local firms by reducing their access to capital or raising costs of borrowing (World
Investment report. 1999),
5.4 Trends and Patterns of FDI Inflow in Indian Pharmaceutical Industry:
The inflow of FDIs into India has increased since the economic reform i.e. 1991, Annual
FDI inflows in India's pharmaceutical sector have grown steadily from USS 0.3 million
in 1991 to UDS 292 million in 2004, declining to i1S$172 million in 2005 and
168

Chapter - 5
rebounding to US$214.8 million and US$334.1 million in 2006 and 2007 respectively.
Thereafter it again declined and reached to USS 18 .5 million in the year 2008 (Table-
5.3A). It is indicated that the pharmaceutical FDI increased sharply in 2004 (462.6% of
growth rate), decreased in 2005 and then rebounded in 2006. 1'he decline in 2005 may be
attributable to substantial uncertainty as to how India will implement and interpret its
new patent regime. The increase in FDI inflows in IPl has helped in expansion, growth
and development of the industry. This in turn has led to the improvement in the quality of
products.
It is noticeable from the table (Table-5.3A) that the total amount of FDI inflow in India
was only US$165 million in 1991 and over the period it observed an increasing trend to
take a figure of US$27331million in the year 2008, which is almost 166 times that of the
figure of 1991. During the period under consideration it has observed wide fluctuations.
The growth rate indicates considerable fluctuations both positive and negative rates, and
is highest in 2006 (183.6%).
As far as Pharmaceutical FDI inflow is concerned it is indicated that it was only mere
US$0.3 million in 1991 and over the period it also observed an increasing trend and reach
highest US$ 334.1 million in 2007 and thereafter it decline IS$t81.5million in 2008,
which is 605 times that of the of 1991. The growth rate indicates considerable
fluctuations both in positive and negative rates, and highest in 1992 (3600%). The CAGR
of total FDI in India during 1991-2008 was 24.3% whereas FDI in pharmaceutical is 27%
(Table-5.3A).
It is indicated that the percentage share of Pharmaceutical FDI in total FDI increased
considerably after 1991 and reached the highest level in 2004 (7.8%) but thereafter it
declined frequently mainly due to uncertainty about patent regime impact and global
recession.
The largest source of FDI in India's pharmaceutical industry is Mauritius (56.4%).
Singapore is the second largest source (1 1.2%) followed by the USA (5.8). UAE (4.7%),
and Canada (4%). Together they accounted for more than 80% of FDI in this sector
during 2008-09 (DOP, 2009).
169

Chapter - 5
As far as types of FDI are concerned, FDI in India comes in various forms including
Greenfield projects (both the establishment of new facilities and the expansion of existing
one), strategic alliances between foreign and domestic fines and M&As.
During 2002-06 foreign firms undertook about 80 Greenfield investment projects in the
pharmaceutical and health biotechnology sectors. Most of the projects were for new
facilities (83%) rather than expansions of existing facilities (17%). Further R&D was
reported as the focus of most of the projects (59%) followed by manufacturing (26%) and
sales & services (9%) (Bloodgood, 2007: 8-1-16).
The majority of Greenfield project were undertaken by North American firms (51%),
followed by European firths including those outside of the European Union (36%). Both
North American and European Union firms concentrated their investment activities in
R&D, with share of 66% and 62% respectively. The next most frequent investment
activity for North American firms was in sales & services (20%) followed by
manufacturing (15%). Similarly for European Union firms most remaining investment
activity was focused on manufacturing (34%) while only 3% was focused on sales &
services activities (Table-5.1).
Table-5.1: Greenfield FD! in the pharmaceutical and Health Biotechnology Sectors by Source Region and Activity (2002-06).
(In numbers) Activity!
North America Europe Asia Pacific Middle Fast Region
No. of %of No. of %of No. of %of Na of %of
projects Projects projects I Projects projects Projects projects Projects
R&D 27 66 18 62 0 0 2 67
Manufact 1 6 15 10 34 4 57 1 33
wring
Sales & 8 20 1 3 3 43 0 0
Services
Total 41 29 7 3
Note' Because of rounding figures may not total IUU%. Sources: QUO Consulting Ltd. Loco Monitor FDI database. US international trade commission, 2007: 8-11
170

C happtc'r - 5
Furthermore, as far as the issue of quality of FDI is concerned, recently R&D activity has
accounted for the highest number of projects with a total of 34, representing 43% of
investment projects. Among the top business activities, this activity also recorded the
highest average growth rate at 440'0 per annum (Tahle-5.2).
Table-5.2: Industry analysis- Number of Projects by Activity (2003-08). (In numbers)
Business Activities/Year o 0 0 0 N 0
x 0
Average annual
° ° ° 0 ° ° growth
R&D 2 4 10 5 8 5 34 44
Manufacturing 3 8 6 3 3 5 28 NA
Sales, marketing & Support 2 2 3 1 1 9 NA
Design, Development & - 1 1 - 2 1 5 NA testing
Business Services - - 1 - - - I NA
Head quarters - - - 1 - - 1 NA
Logistics, Distribution & - - - - I - I NA Transportation
Retail - 1 - - - - 1 NA
Total 5 16 20 12 15 12 80 42
Source: FDI Market Intelligence. Available at: http: www.fdimarkets.com
It shows that a large number of R&D investment projects are focused on the development
of facilities for clinical research, clinical trials and other such modules that only integrate
the Indian talent and facilities into the global objectives of foreign pharmaceutical firms.
As such these R&D projects have little to do with the needs of local population (Abrol et
al, 2011).
Strategic alliances between multinational and domestic tines are an important part of FDI
in the R&D and manufacturing sectors. In the R&D area, contract research organizations
(CROs) otter pharmaceutical firms a range of services including product development,
clinical trial management. laboratory services, and data management. The top three
reasons. MNCs cite tbbr performing clinical trials in India are the number of potential
171

chapter - 5
clinical trial subjects, cost savings, and the country's disease profile (Bloodgood„ 2007:
R-1.16).
Another major focus of FDI by MNCs in India is outsourced contract manufacturing.
This contract manufacturing includes the production of interutediates, active
pharmaceutical ingredients (APIs), hulk drugs, formulations, and generic drugs. U.S.-
based Pfizer, for example, maintains a single drug manufacturing facility in India, but
also outsources manufacturing to about 20 Indian companies. U.S.-based Merck has
recently decided to outsource 35 percent of its manufacturing processes to developing
countries, and particularly India, in order to substantially reduce costs. According to
Merck, the critical factor" driving the decision to increase Indian investment was the
patent law change. The Indian government has noted that "top MNCs like Pfizer, Merck,
GSK. Sanofi Aventis, Novartis, Teva, etc. are largely depending on Indian companies for
many of their APIs and intermediates".
One important reason for India's strength in the area of contract manufacturing compared
to other emerging markets is the large number of manufacturing facilities that the U.S.
Food and Drug Administration (FDA) have certified. FDA certification allows
pharmaceutical products to be imported into the United States. Outside of the United
States, India has the largest number of FDA approved manufacturing facilities,
numbering 112 in 2008. Another reason for the strength of contract manufacturing is the
large number of scientists and engineers with unique skills in the areas of process
chemistry and biochemistry.
When we come to the patterns of investment by global pharmaceutical firms in the IPI. it
is noted that a large part of the newer investments of foreign firms in manufacturing
activity have largely been for the expansion of formulation activity. Newer investments
in the bulk drug were few and far between. Further after the post TRIPs era situation to
create certainly far more permissive environment for imports. MNCs can be expected to
increase operating freedom to shill to import based production for a number of product
segments. Second their preference for the establishment of new operations through the
incorporation of wholly owned subsidiaries is also confinned. Further quite a large part
of the new FD1 in pharmaceuticals had been devoted for the benefit of M&As and
172

Chapter - 5
takeovers to facilitate the patent firms to increase their control over the operations located
in India.
Royalty figures have been extremely small for the domestic firms. Although the number
of companies paying royalty has declined slightly in 2007 as compared to 2003, there are
still many firms which are acquiring and absorbing new technologies to compete in the
global market. This decline possibly is due to the increasing amount of money spent on
in-house research facilities. Pradhan (2003) reported on the basis of a R&D survey that in
terms of R&D intensity foreign firms are still far behind Indian firms. The observed R&D
intensity of domestic firms, 2.6% compared to foreign firms which is low at 0.74%.
Section-B
The present section is concerned about the statistical approach to FDI in Pharmaceutical
industry. The variables under consideration include FDI, production, investment,
profitability, export and employment. Efforts have also been made to present a profile of
comparison between the total FDI in India and the FDI inflows in the IPI.
It is noticeable that in the year 1991 the actual amount of FDI inflow in India was only
US$165 million in the year 1991 and over the period it observed an increasing trend to
take a figure of USS2733 1 million in 2008, which is almost 166 times that of the figure of
1991 (Table-5.3A). During the period under consideration it has observed wide
fluctuations in the form that the minimum US$165 million and the maximum US$ 27331
million. The growth rate also indicates considerable fluctuation both in positive and
negative rates, which is highest in 2006 (184%). It demonstrates that the inflow is
dictated by the external sources rather than an internal factor. The statistical description
of total FDI and FDI in pharmaceutical sector in terms of mean, SD, CV, t-ratio
minimum, maximum and CAGR.
The average FDI takes a value of USS5919 million with a SD of USS8042.5 million. The
t-ratio suggests that the estimate is statistically significant at 10% level. The CV as high
as 1.36 suggest the fluctuating nature of the variable. The CAGR is 24.3% during 1991-
2008.
173

Chapter - S
Tahle-5.3A: FDI Inflows in Indian Pharmaceutical Sector (1991-2008). (USS million)
Years Amount of total FDI in
India
Growth
Rate (%)
FDI Inflow in PI
Growth
Rate (%)
Percentage of phanna
FDI in total FDI
1991* 165 - 0.3" - 0.18
1992 393 138.2 11.1# 3600.0 2.82
1993 654 66.4 9.8 -11.7 1.50
1994 1374 110.1 51.9 429.6 3.78
1995 2141 55.8 59.5 14.6 2.78
1996 2770 29.4 34.4 -42.2 1.24
1997 3682 32.9 60.0 74.4 1.63
1998 3083 -16.3 23.1 -61.5 0.75
1999 2439 -20.9 18.6 -19.5 0.76
2000 2908 19.2 70.9 281.2 2.44
2001 4222 45.2 82.8 16.8 1.96
2002 3134 -25.8 28.0 -66.2 0.89
2003 2634 -16.0 51.9 85.4 1.97
2004 3759 42.7 292.0 462,6 7.77
2005 5546 47.5 172.0 -41.1 3.10
2006 15726 183.6 2149 1.37
2007** 24581 56.3 334.1 55,5 1.36
2008** 27331 11.2 181.5 -45.7 0.66 Note: * refer Data for August to March
** refer Figures are Provisional 4 refers Data for January to December
Source: Various issues of SIA Newsletter (FDI Data Cell) DIPP, Minixtry of Commerce & Industry, Government of India, New Delhi. Economic Survey (Various issues), Ministry of Finance, Government of India. Ncw Delhi. Handbook of Statistics on Indian Economy, RBC 2009. Department of Pharmaceutical, Annual Report 2009-10, Ministry of chemical & Fertilizes, Government of India, New Delhi Rajya Sabha question number 615 cabled in Rajya Sabha on 25-11-2009 by Mr. Joytiraditya Scindia MOS- MOCC, New Delhi. FDI figures are in rupees, they have been converted to LESS by using average exchange rates for relevant financial years obtained from RBI Handbook of Statistics on Indian Lconomy, 2009.
174

Chapter - 5
Fire: 5.1 FIN inflow in Indiai Nnnxetticd Sector (1991.200*)
,Z 30000 C
25000
20000
LV
a QQ~ Q~~ QQS Q~~ QQb Q~ QQ4 QQ~ 000 00\ 00~ 00~ 00' 00~ OOb ^ ~
Years ti ti
0 M n of total FDI in trdia FDI Inf ow in PI
Similarly FDI inflow in Indian pharmaceutical was only USS0.3 million and over the
period it also observed an increasing trend and reach highest US$334.1 million in 2007
and thereafter it decline US$181.5 million in 2008, which is 605 times that of the figure
of 1991. The growth rates indicate considerable fluctuations both in positive and negative
rates and highest in 1992 (3600%). The share of pharmaceutical industry FDI in total FDI
was 2.05% on an average. The inflow in pharmaceutical takes a mean of US$94.3 million
and a SD of US$ 100.9 million. The fluctuation is demonstrated by the CV of 1.07. The
CAGR is 27% during period under consideration. One of the reasons behind such high
growth rate is the big difference between the minimum and maximum figures of FDI
inflows in pharmaceutical industry. The minimum is US$0.3 million in 1991 and
maximum US$334.1 million in 2007. However, the Durbin-Watson test shows the
positive correlation between these two variables i.e. total FDI inflow and FDIPI (Table-
5.3B).
As far as nature of FDI in the IPI is concerned, it has been bifurcated in terms of
technical and financial nature. In total there are 659 FDI projects in the pharmaceutical
sector that got approval during 1991-2008. The total amount involved is US$ 106.5
billion out of which Pharmaceutical sector share US$1696.7 million. Out of the total 659
projects 386 were of financial nature and 273 of technical nature. The proportion of
financial project is 58.6% and that of technical nature is 41.4%. It seems that FDI in
pharmaceutical industry helps us to overcome both the constraints of poor capital
175

Chapter
'fable-5.3B: Statistical description of total FDI and FDI in Pharmaceutical industry (1991-2008).
(In t: SS million) Total FDI FDI in Pharmaceutical industry
Mean 5919 94.26 SD 8042.5 100.91 CV 1.36 1.07 Minimum 165 0.3 Maximum 27331 334.1 CAGR 24.28 27.03 t-ratio 4.19*** d (Durbin-Watson test) 1.4
***: significant at 10%-a level Source: l able 5.3A
tormation and technological backwardness. However it is indicated that there is
significant decrease in number of financial cases approved since 2004. A similar drop has
been observed in technical cases also since 1998 (Table-5.4).
Table-5.4: FDI in Indian Pharmaceutical Sector during 1991-2008 (Technical & Financial).
Year (Jan-Dec)
No. of FDI cases approved (Financial)
No. of FDI cases approved (Technical)
1991 2 2 1992 9 15 1993 17 17 1994 21 26 1995 19 31 1996 26 19 1997 25 31 1998 16 30 1999 19 24 2000 39 23 2001 41 13 2002 43 18 2003 46 16 2004 45 4 2005 12 1 2006 2 1 2007 1 2 2008 Total
3 386
0 273
Source: Compiled from I)IPI'. SI:\ Newsletter, 2008, New f)elhi.
176

Chapter - 5
5.5 Investment in Pharmaceutical Industry and the FBl Inflows:
It has been observed that the pharmaceutical investment was US$ 38.4 million in 1991
and gradually increased to USS4117.Imillion in 2008, which is almost 107 times that of
1991 figures. The inflow of ED! in Pharmaceutical sector which was only US$030
million in 1991 increased to US$ I81 .5 million in 2008. Hence the share of FDI in total
investment of phamtaceutical industry was 11.8% on an average. The mean of
pharmaceutical industry investment is US$ 1027.4 million with a SD of USS 1282.5
million. The mean of the FDI inflows in the pharmaceutical industry is USS 94.3 million
with a SD of US$ 100.9 million. The t-ratio is statistically significant at 10% level. The
CV is 1.24 in case of the investment in pharmaceutical industry and 1.07 in case of FDI
inflows. This demonstrates the unstable nature of FDI inflows in the industry. (Table-
5.5A).
The growth rate of phamia investment shows fluctuating trend both in positive and
negative rates and was highest in the year 1992 (173%). As far as CAGR of FDI in FDIPI
in investment in pharmaceutical are concerned it was 27% and 27.3% respectively.
An attempt has been made to explore the relation between the investment in
pharmaceutical industry and FDI inflow in pharmaceutical industry. It is hypothesized
that the changes in the investment in pharmaceutical industry is not functionally
depended on the FDI inflow in pharmaceutical industry. In view of the fact that the
investment of pharmaceutical industry depends on a number of variables in addition to
the FDI inflows, there are other variables that have been taken under consideration like
total production, profit and export. The estimates of the empirical multivariate regression
are represented in table (5.5-B). The dependent variable is the investment in
pharmaceutical industry and independent variables arc the FD1 inflow in the
pharmaceutical industry (FDIPI), total production, export and profit. It has been observed
that the regression function takes an F-value of 117.8 which is statistically significant at
5% level. It seems that functional relation assumed by the empirical regression line is true
i.e. the investment in pharmaceutical industry is explainable by the FDI inflows in the
industry. The coefficient of determinants shows that 97% of the variation of the
177

Oici tc'r - 5
dependent variable can be explained by the regression equation. However the coefficients
of slopes are not statistically significant in general.
Table-5.5A: Statement of Investment in Pharmaceutical industry and the Inflows of FDI (1991-2008).
(In USS million & %)
Years FDI Inflow in
Phannaceutical industry
Growth Rate
Pharmaceutical Investment
Growth Rate
% of FDI in total
investment 1991 0.3* - 38.4 - 0.8 1992 11.1* 3600.0 46.5 21.1 23.9 1993 9.8* -11.7 126.9 172.9 7.7 1994 51.9 429.6 238.1 87.6 21.8 1995 59.5 14.6 233.7 -1.8 25.5 1996 34.4 -42.2 265.1 13.4 13.0 1997 60.0 74.4 345.9 30.5 17.3 1998 23.1 -61.5 385.9 11.6 6.0 1999 18.6 -19.5 572.0 48.2 3.3 2000 70.9 281.2 581.4 1.6 12.2 2001 82.8 16.8 511.0 -12.1 16.2 2002 28.0 -66.2 550.5 7.7 5.1 2003 51.9 85.4 957.7 74.0 5.4 2004 292.0 462.6 1324.1 38.3 22.1 2005 172.0 -41.1 1628.8 23.0 10.6 2006 214.8 24.9 2446.1 50.2 8.8
2007** 334.1 55.5 4123.5 68.6 8.1 2008** 181.5 -45.7 4117.1 -0.2 4.4 Mean 94.26 1027.37 SD 100.90 1282.48 CV 1.07 1.25
Minimum 0.30 38.4 Maximum 334.1 4123.5
CAGR 27.0 27.3 t-ratio 5.69***
Note: * refers Data for January to December ** refer Figures are Provisional s' *significant at 10% level Source: Compiled from Various issues of SIA Newsletter (FDI Data Cell) DIPP. Ministry of Commerce & lndustr Government of India. New Delhi. Handbook of Statistics on Indian Economy. RUt. 2009 Department of Pharmaceutical. Annual Report 2009-10. Ministry of chemical & Fertilizes. Government of' India, New Delhi Rajya Sabha question number 615 tabled in Rajva Sabha on 25-1 1-2009 by Mr. Joytiraditya Scindia M1OS- M-tUCL. New Delhi. CMIE "Industry Financial Aggregates and Ratio (Various years). FDIPI & investment figures in rupees. they have been converted to USS by using average exchange rates for relevant financial years obtained from 8131 Handbook of'Statistics on Indian Economy. 2009.

('hapler - 5
Figs. 5.2 knestmcat in Pbwmweuical iniestr) aid the inflow of FI)t (1991-200*)
4500
e 2000 e 15W
1000
e 0
C 'ti "~ •^ b ^ 4 A 6 C~\ 8~ CSC C~h 8b
a a a a Q a
Years
+FDI dhow in Phwmaceviical industry + PtwmacctMicl Imestmci
Most of the coefficients of independent variables are not statistically significant. It is only
export statistically significant at 5% level. The FDI inflow in the pharmaceutical industry
fails to explain the variation in the investment of the industry. However the value of `d'
(Durbin-Watson test) is significant as 0.957 and indicates the positive serial correlation
amongst the variables. It is indicated that export and profit has important positively
significant variables for enhancing the level of investment in pharmaceutical sector while
FDIPI has not.
Modell: Investment =a+ [, FDIPI+02 total production+ 03 profit +04 export +µr--(1).
Investment=-326.06+(-0.086)FDIPI+0.007total production+0.I28profit+0.667export+ gt
Table-Sill: Regression estimates of Pharmaceutical Investment against the FD! Inflows:
Constant FDIPI Total Production Profit Export Coefficient -326.06 -0.086 0.007 0.128 0.667 t-ratio -1.37 -0.071 0.066 0.393 2.67' • R- squared 0.973 F oos 4,13) 117.8 d(Durbin-Watson test) 0.957
'•: significant at 5% level.
179

Chapter - 5
5.6 Production of Pharmaceutical Industry and the FDI Inflows:
The production figures indicate that in 1991 the figure was US$2510.6 million, where as
that increased to US$17567.6 million in 2008 which is seven times higher than that of the
1991. The mean of the variable is US$6868.4 million and the SD's US$ 4463.5 million.
The t-ratio is 6.01 suggesting that the mean is statistically significant at 10% level. The
variable is considerably stable as is demonstrated by a comparatively low coefficient of
variance of 0.65 (Table-5.6A).
The growth rate indicates considerable fluctuations both in positive and negative rates
and highest in the year 2007 (32%). The CAGR of total pharmaceutical production and
FDI inflow in pharmaceutical industry is 1.7% and 27% respectively.
It is tempting to find out whether the production in pharmaceutical industry is a function
of FDI concentrated in that sector. The null hypothesis is that the production of
pharmaceutical industry is not a function of FDI inflows in the sector. The dependent
variable of the regression is the pharmaceutical total production. The independent
variables are the FDIPI, profit, investment and export of the industry. The regression
parameters are represented in table (5.6B). It can be noticed that the regression gives a
good fit. The F-statistic suggests that the null hypothesis of untrue relation should be
rejected at 5% level. The coefficient of determinant is as high as 0.98 to indicate 98% of
the variation in the production of pharmaceutical industry could have been explained by
the regression equation. Durbin-Watson test indicates the positive serial correlation
amongst the variables.
Among the independent variables only the export is statistically significant at 10% level.
The FDI inflow however is not statistically significant to indicate that the production in
the pharmaceutical industry could not be explained by the FDI inflow in the industry. It is
indicated that the export, FDIPI and profit are positively significant for the improvement
of pharmaceutical total production.
Model-2: Production —a+B1 FDTPI+B,profit+93investment-B4export+p,— (2).
Production=2195.74+0.777FD1PI f 0.646protit 10.05investment+2.24export+p1
t80

Chapter -
"Table-5.6A: Statement of Total Production of Pharmaceutical Industry and Inflow of FDI (1991-2008).
(In US$ million & %)
Years FDI Inflow in
Pharmaceutical industry Growth
Rate Pharmaceutical
"I otal Production Growth Rate
1991 0.3* - 2510.6 - 1992 1 1.1 * 3600.0 2760.6 10.0 1993 9.8* -11.7 2617.8 -5.2 1994 51.9 429.6 3010.5 15.0 1995 59.5 14.6 3810.7 26.6 1996 34.4 -42.2 4286.8 12.5 1997 60.0 74.4 4677.4 9.1 1998 23.1 -61.5 4560.0 -2.5 1999 18.6 -19.5 5086.4 11.5 2000 70.9 281.2 5655.2 11.2 2001 82.8 16.8 5761.7 1.9 2002 28.0 -66.2 6317.2 9.6 2003 51.9 85.4 7665.3 21.3 2004 292.0 462.6 9295.5 21.3 2005 172.0 -41.1 10390.2 11.8 2006 214.8 24.9 11922.3 14.7
2007** 334.1 55.5 15734.6 32.0 2008** 181.5 -45.7 17567.6 11.6 Mean 94.26 6868.37 SD 100.90 4463.37 CV 1.07 0.65
Minimum 0.30 2510.62 Maximum 334.1 17567.6
CAGR 27.0 11.7 t-ratio 6.01
Note: * refers Data for January to December ** refer Figures are Provisional *** significant at 10% level Source: Compiled from Various issues of SIA Newsletter (FDI Data Cell) DIPP, Ministry of Commerce & Industry. Government of India. New Delhi. Handbook of Statistics on Indian Economy, RBI. 2009 Department of Pharmaceutical. Annual Report 2009-10, Ministry of chemical & Fertilizes. Government of India, New Delhi Rajya Sabha question number 615 tabled in Rajva Sabha on 25-1 1-2009 by Mr. Joytiraditya Scindia MOS- MOCL. New Delhi. C%IIL "Industry Financial Aggregates and Ratio (Various years). Bulk Drub= Manufacturing Association (India) Statistics. Hyderabad. FDWl & Total production figures in rupees, they have been converted to USS by using average exchange rates fur relevant financial years obtained from RBI Handbook ofStatistics on Indian Economy. 2009
181

Chapter - 5
Figure: 5.3 Total Production of Pharmaceutical industry and inflow of FDI (1991 -2008).
20000
18000
16000
14000
12000
10000
8000
6000
4000
2000 ~► ---
0
a. 3~ 3 ~ d ' Years
. FDl inflow in Pharmaceutical industry — Total Production
Table-5.613: Regression estimates of Pharmaceutical Total Production against the FDI Inflows.
Constant FDIPI Profit Investment Export
Coefficient 2195.74 0.777 0.646 0.05 2.24
t-ratio 6.71*** 0.237 0.743 0.07 3.94***
R-squared 0.984
F(o.os) (4,13) 195.5
d(Durbin-Watson test) 0.479 *** significant at 10% level.
5.7 Export of Pharmaceutical Industry and the FDI Inflows:
Now, we can represent a profile of export of the pharmaceutical sector in terms of amounts. The increasing trend is noticeable (Table-5.7A). In 1991 the export of the industry was only USS564.4million and through a gradual increase it reached at the amount of USS6257 million in 2008, which is nearly eleven times that of the 1991 figure. The average takes a value of US$ I862.2million. The SD is however quite impressive to an amount US$ 1758.7 million. The t-ratio is 5.84 to indicate that the mean is statistically significant at 10% level. The CV is equally high 0.94 suggest that the estimate observes the fair extent of instability (Table-5.7A). An enquiry into the export of the pharmaceutical industry seems relevant as to whether it depends on the flow of FDI in the
182

('{tu1ital' - 5
industry. A similar kind of multivariate regression that has been followed in the earlier
discussion is invoked to explain the nature of the empirical relation.
'hahle-5.7A: Statement of Export of Pharmaceutical Industry and Inflow of F DI (1991-2008).
(In USS million & %)
Years FOE Inflow in Pharmaceutical industry
Growth Rate
Pharmaceutical Ex ort Growth Rate
1991 0.3* - 564.4 - 1992 11.1* 3600.0 544.5 -3.5 1993 9.8* -11.7 567.3 4.2 1994 51.9 429.6 695.8 22.6 1995 59.5 14.6 525.0 -24.5 1996 34.4 -42.2 705.8 34.4 1997 60.0 74.4 824.1 16.8 1998 23.1 -61.5 822.3 -0.2 1999 18.6 -19.5 910.4 10.7 2000 70.9 281.2 1069.4 17.5 2001 82,8 16.8 1198.0 12.0 2002 28.0 -66.2 1519.7 26.9 2003 51.9 85.4 2105.0 38.5 2004 292.0 462.6 2751.9 30.7 2005 172.0 -41.1 3261.9 18.5 2006 214.8 24.9 3691.9 13.2
2007** 334.1 55.5 5505.3 49.1 2008** 181.5 -45.7 6257.0 13.7 Mean 94.26 1862.21
SD 100.90 1758.67 CV 1.07 0.94
Minimum 0.30 544.5 Maximum 334.1 6257.0
CAGR 27.0 16.0 t-ratio 5.84***
Note: * refers Data for January to December ** refer Figures are Provisional ***significant at10%% level Source: Compiled from Various issues of SIA Newsletter (1;DI Data Cell) DIPP, Ministry of Commerce & Industry, Government of India. New Delhi. Handbook of Statistics on Indian Economy, R131. 2009 Department of Pharmaceutical. Annual Report 2009-10, Ministry of chemical & Fertilizes, Government of India. New Delhi Rajyya Sahha question number 615 tabled in Rajya Sabha on 25-11-2009 by Mr. Joytiraditya Scindia MOS- NIOCI_, New Delhi. C\IIF -Industry Financial Aggregates and Ratio (Various years). Bulk Drug Manufacturing Association (India) Statistics. I-Iyderabad. FDIPI & export figures in rupees. they have been converted to US$ by using average exchange rates for relevant financial years obtained from RBI handbook of Statistics on Indian Economy, 2009.
183

Chapter - 5
Figure:5.4 Export of Pharmaceutical Industry and Inflow of FDI (1991-2008).
7000
6000
5000 E
C. , 3000
2000 U-
1000 o U -
Years
f FDI Inflow in Pharmaceutical industry Pharmaceutical Export
Annual growth rate shows a fluctuating trend and highest in the year 2007 (49%). It is
important to note that during the period under consideration the pharmaceutical export
performance was much better as compared to domestic pharmaceutical production. Many
reasons are behind this which have been explained in the earlier chapters. CAGR of
pharmaceutical export is 16% whereas 27% for FDI inflow in pharmaceutical industry.
Table (5.7B) represents the regression estimates of the amount of export of the
pharmaceutical industry against the FDI inflow, total production, profit and investment.
The F-statistic seems quite impressive to suggest that the regression is statistically
significant at 5% level. The coefficient of determinants is impressive too to have
explained as much as 0.99 or 99% of the variation in the export of pharmaceuticals.
However among the coefficient of slopes only total production and investment are
statistically significant at l0% and 5% level respectively. The coefficient of FDl flows in
the pharmaceutical industry fails to demonstrate any significant relation towards the
promotion of export of the industry. However Durbin-Watson test indicates the positive
serial correlation amongst the variables. It is indicated that only total production and
investment is positively significant for pharmaceutical export.
Model-3: Export =a+13,FDIPI+I32total production+03profit+34investment+µf-- (3)
Export=-342.26+(-0.0868)FDIPI+0.243total production+(-0.003)profit+0.533 investment
+ At
184

Chapter - 5
Table-5.7B: Regression estimates of Pharmaceutical Export aaaiust the FDI Inflows. Constant FDIPI Total Production Profit Investment
Coefficient -342.26 -0.0868 0.243 -0.003 0.533
t-ratio -1.656 -0.080 3.94*** -0.009 2.675**
R-squared 0.989
Fioo» (4,13) 281.7
d(Durbin-Watson test) 0.744
•* significant at 50/s level *1' significant at 10% level.
5.8 Profitability of Pharmaceutical and the FDI Inflows:
The profit figure plays a key role in attracting the FD[ inflows. It can he observed that the
profit figures increased throughout the period under study to a considerable extent. In
1991 it was only US$14.1 million and in 2008 it reached the level of USS1356 million.
The increase is by an extent of around ninety-six times. The increase in the profit figure
is indeed surprising and that deserves attention, One of the reasons attributed to the
increase is that the number of firms has also increased during the period. It has increased
from 5156 units in 1979-80 to 20053units in 1999-00. However, it is indicated that during
1995 to 1997 the profit trend was declining. The industry faced a stiff competition during
the late nineties hacked by regional as well as global recession in the same year that must
have contributed to the adversities in the profit performance. Input prices have also been
increased globally during that period coupled with high market campaigning expenses.
The statistical description shows that the mean profit is USS 577.5 million with the SD
587.6 million. The t-ratio is 7.32 which indicates that the mean although is statistically
significant at 10% level. The CV is as high as 1.02 that indicates instability in the nature
of the variable (Table-5.8A).
The growth rate shown a fluctuating trend both in positive and negative rates and highest
in the year 1992 (389.4%). The CAGR of phatnaceutieal profit is 24.4% and 27% for
FDI inflows in pharmaceutical industry.
185
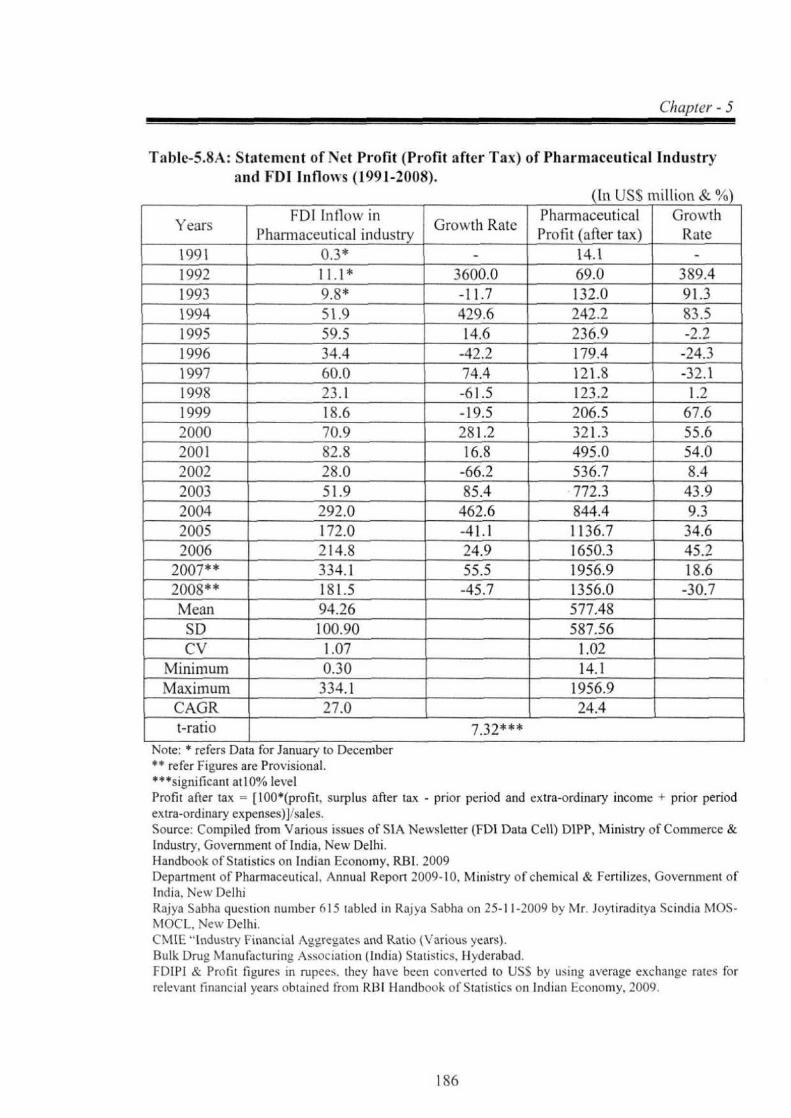
C'1taj~tcr - 5
Tahle-5.8A: Statement of Net Profit (Profit after Tax) of Pharmaceutical Industry and FDI Inflows (1991-2008).
(In USS million & %)
Years FDI Inflow in Pharmaceutical industry Growth Rate Pharmaceutical
Profit (after tax) Growth
Rate 1991 0.3* - 14.1 - 1992 1 1.1 * 3600.0 69.0 389.4 1993 9.8* -11.7 132.0 91.3 1994 51.9 429.6 242.2 83.5 1995 59.5 14.6 236.9 -2.2 1996 34.4 -42.2 179.4 -24.3 1997 60.0 74.4 121.8 -32.1 1998 23.1 -61.5 123.2 1.2 1999 18.6 -19.5 206.5 67.6 2000 70.9 281.2 321.3 55.6 2001 82.8 16.8 495.0 54.0 2002 28.0 -66.2 536.7 8.4 2003 51.9 85.4 772.3 43.9 2004 292.0 462.6 844.4 9.3 2005 172.0 -41.1 1136.7 34.6 2006 214.8 24.9 1650.3 45.2
2007** 334.1 55.5 1956.9 18.6 2008** 181.5 -45.7 1356.0 -30.7 Mean 94.26 577.48 SD 100.90 587.56 CV 1.07 1.02
Minimum 0.30 14.1 Maximum 334.1 1956.9
CAGR 27.0 24.4 t-ratio 7.32***
Note: * refers Data for January to December ** refer Figures are Provisional. ***significant at10% level Profit after tax = [ 100*(profit. surplus after tax - prior period and extra-ordinary income ± prior period extra-ordinary expenses)] sales. Source: Compiled from Various issues of S1A Newsletter (FDI Data Cell) DIPP, Ministry of Commerce & Industry, Government of India, New Delhi. Handbook of Statistics on Indian Economy, RBI. 2009 Department of Pharmaceutical. Annual Report 2009-10. Ministry of chemical & Fertilizes, Government of India, New Delhi Rajya Sabha question number 615 tabled in Rajya Sabha on 25-11-2009 by qtr. Joytiraditya Scindia M1OS- NIOCL. New Delhi, C'\i([ "Industry Financial Aggregates and Ratio (Various years). Bulk Dru!, Nlanufacturini Association (India) Statistics. IIvderabad. FDIPI & Profit figures in rupees. they ha\e been converted to USS by using average exchange rates for relevant financial years obtained from 8131 Handbook of Statistics on Indian I:conomy, 2009.
186

Chapter - 5
Figure: 5.5 Profit after "lax of Pharmaceutical Industry and FDI Inflows in the Industry (1991-2008)
2500
2000
1500
1000
500
L6 0
1r ll ,~ b o~ d 8~ cQ~ 8~ cQh d' 8 C~~ . a°~ % `, q°' s as `. ^; 'Y ~Y ~Y N 4 'b ti ~Y
Years
4 FDI Inflow in Phumaccugicui industry +Pharawceutical Profit (after tax)
Efforts have been made to explore the functional relation between the two variables of
the profitability in the pharmaceutical industry and the FDI inflows in the industry. It has
been argued that the hypothesis can be of either direction, profit may be the function of
FDI inflow, or may be the FDI inflow is the function of the profit figures. In the former
case, it is assumed that the profit of the industry depends on the FDI inflows. In the later
case it is because of the profit in the sector which attracts foreign investment in the
industry. In the regression analysis, both the functional relations will be taken under
consideration.
The first regression assumes that profit in the sector of pharmaceuticals depends on the
FDI flows. In addition to the FDI flows there are other independent variables like earlier
discussion on total production, export and investment. The F-statistic suggests that the
null hypothesis of untrue regression relation cannot be rejected at 5% level. It is shows
that the regression demonstrates an impressive regressive fit in terms of R-square. The
coefficient of determinants shows that 0.908 or 91% of the variation in the profit figures
could have been explained by the regression function. Among the independent variables
FDIPI is the only variable which is statistically significant at 1% level. However, Durbin-
Watson test indicates the positive serial correlation. It is indicated that FDIPI and total
production has significantly positive impact on pharmaceutical profit (Table-5.8B).
Model-4: Profit =a+(iFDIPI+ I32total production+p3export+34investment+µr---(4).
Profit--121.37+1.87FDtPl+0.063tota1 production+(-0.002)export+0.09investment+ g,
187

('Itapter - 5
Table-5.8B: Regression estimates of Pharmaceutical Profit against the FDI Inflows.
Constant FD 11'! Total Production Export Investment
Coefficient -121.37 1.87 0.063 -0.002 0.09
t-ratio -0.57 2.11 * 0.743 -0.009 0.393
R-squared 0.908
Flo) (4.13) 32.0
d(Durbin-Watson test) 1.59
*~igniticant at 1% level
Now regression assumes that FDIPI depends on the profitability. Table 5.8C represents
the regression parameters of the multivariate form of regression of FDI flows in
pharmaceutical against the profitability of pharmaceutical, total production, export and
investment variables of the FDI inflows. It can be observed that the F-statistic is 10.98 to
indicate that the regression function is a true functional relation. Coefficient of
determinant demonstrated the 0.772 or 77.2% of the variation in the FDI flows has been
explained by the profit figures of the industry. Among the independent variables only
profit variable happened to have a statistically significant at 1% level to suggest that it
may be that the profit figure of the industry is a representative one in consideration to the
decision making of the FDI in Indian pharmaceutical sector. However, the coefficients of
slopes are not statistically significant in general and the Durbin-Watson test shows the no
first-order auto correlation.
Model5: FDIPI =a+131profit+li,total production+B3export+l34investment+per (5).
FDIPI=-7.26-0.14profit+0.006total production+(-0.006)export+(-0.005)investment+ p,
Table-5.8C: Regression estimates of FDI Inflows against the Pharmaceuticals Profit.
Constant Profit Total
Production Export Investment Coefficient -7.26 0.14 0.006 -0.006 -0.005
t-ratio -0.12 2.1 1 * 0.237 -0.080 -0.071
IZ-squared 0.772
F )) (4.13) 10.98
d(Durbin-Watson test) 2.5
**significant at 1°0 level.
188
Chapter - 5
5.9 Employment and FDf Inflows in Pharmaceutical Industry:
There is an old debate that foreign investment in India might jeopardize the employment
opportunities due to the adaptation of automation especially in technology intensive
sector like pharmaceuticals. Bearing in mind a comparison between employment
generation and FDI inflows seems relevant. It can be seen from the table (fable-5.9A)
that the employment figure of the industry remained almost static despite the FDI flows.
The stagnant nature of employment in pharmaceutical industry is mainly attributed to the
utilization of high automation to reduce the operating costs. It has been observed that
technological advancement has created a few direct job opportunities. The reason for this
opening up of the service providing facilities by the firms with latest technology that
requires fewer workers. The same is evidential from the fact that during the last few years
most of the firms have opened their service stations throughout the country. The
employment increased from 181497 employees in 1995 to 353692 in 2008. The mean
figure of employment in pharmaceutical industry is 243872.2 with a SD of only 51406.6
leading to a t-ratio 3.91 significant at 10% level. The CV is only 0.21 which is amazing
and suggesting the stable nature of the variable. One of the main reasons behind such
impressive statistics is that the period under consideration has severely been constrained
by the availability of data. The data were available from 1995-2008.
The relation between employment in pharmaceutical industry and FDI in the industry are
provided in the table 5.9B. The dependent variable is the employment. The independent
variables are the FDTPI, total production, export and investment. It has been hypothesized
that changes in the employment in pharmaceutical depends on the FDI inflows in the
industry. The regression parameters are not however very satisfactory. In F-statistic was
significant to indicate that the null hypothesis of untrue relation can he rejected at 5%
level. Regarding the coefficient of determinants shows highly significant as 97% of the
variations could have been explained by the ordinary regression. Among independent
variables the coefficient of total production and export are significant at 5% level.
However, Durbin—Watson test indicates no first-order auto correlation among them.
189

Chapl er - 5
Table-5.9A: Statement of Employment of Pharmaceutical Industry and FDI Inflows (1995-2008).
(In numbers & %)
Years FDI Inflow in
Phartnaceutical industry
Growth Rate
No. oCEmployees in Pharmaceutical Sector
Growth Rate
1991 0.3* - NA - 1992 111* 3600.0 NA - 1993 9.8* -11.7 NA - 1994 51.9 429.0 NA - 1995 59.5 14.6 181497 - 1996 34.4 -42.2 204609 12.7 1997 60.0 74.4 211614 3.4 1998 23.1 -61.5 189295 -10.5 1999 18.6 -19.5 213999 13.1 2000 70.9 281.2
16.8 - 243410
--- 233704 13.7
2001 82.8 -4.0 -~ 2002 28.0 -66.2 226416 -3.1 2003 519 85.4 223556 -1.3
2004 292.0 462.6 240791 7.7 2005 172.0 -41.1 265396 10.2 2006 214.8 24.9 290021 9.3
2007** 334.1 55.5 336211 15.9 2008** 181.5 -45.7 353692 5.2 Mean 94.26 243872.2 SD 100.90 51406.6 CV 1.07 0.21
Minimum 0.30 181497 Maximum 334.1 353692
CAGR 27.0 4.0 t-ratio 3.91***
Note: * refers Data for January to December +r refer Figures are Provisional ++^ significant at 100/, level
Source: Compiled from Various issues of SIA Newsletter (FDI Data Cell) DIP?. Ministry of Commerce & Industry. Government of India- New Delhi. Handbook of Statistics on Indian Economy, RBI. 2009 Department of Pharmaceutical Annual Report 2009-10, Ministry of chemical & Fertilizes, Government of India, New Delhi Rajya Sabha question number 615 tabled in Rajya Sabha on 23-11-2009 by Mr. Joytiraditya Scindia MOS- MOCL, New Delhi. CMIE Industry Financial Aggregates and Ratio (Various years). Bulk Drug Manufacturing Association (India) Statistics Hyderabad.
190 THESIS

Chapter - 5
Figure: 5.6 Employment of Pharmaceutical Industry and FDI Inflows E 400000 U
350000
.2 300000
E 250000
200000
150000
a 100000
50000
0 b p q ON a ~a a a
Years f FDI Inflow in Pharmaceutical industry +No. of Employees in Pharmaceutical Sector
Model6:Employment--u+O j FDIPI+02tota1prodtxnoH+fbexpert+04profst+esinuwtment+µt
—(6).
Employment= 36246.1+ (-24.61) FDIPI +55.38+ (-111.33) export+ (-9.18) profit +
14.53investment + p,
Table-5.9B: Regression Estimates of Employment in Pharmaceuticals against FDI Inflow.
Constant FDIPI Total
Production Export Profit Investment
Coefficient 36246.1 -24.61 55.38 -111.33 -9.18 14.53
t-ratio 0.73 -0.44 3.14** -2.74** -0.58 1.12
R-squared 0.971
F oos) (5,8) 53.8
d(Durbin-Watson test) 2.17 **: Significant at 5% level.
5.10 Conclusion:
Efforts have been made in the present chapter to explore the role of FDI in the
pharmaceutical sector. It has been noticed that there has been ample opportunity for the
concentration of FDI in the sector particularly export and profitability of the sector. It
revealed that 97% of pharma investment variation can be explained by the regression
191

Chapter - 5
equation. Amongst the independent variables it is only export which is statistically
significant to pharma investment. However d-test indicated positive auto correlation
amongst the variables. Similarly 98% of variation in pharma total production can he
attributed by the regression equation. Among the independent variables only export is
statistically significant while `d' test indicated positive auto correlation amongst the
variables. 99% of variation in pharma export can be explained by regression equation and
total production and investment are statistically significant with positive d' test
correlation amongst the variables. As far as FDIPI and pharma profitability are
concerned, it indicated that 91% of variation in profit can be attributed by regression
equation. It is noticeable that only FD[PI is only statistically significant and 'd' test
indicated positive correlation amongst the variables. Besides 97% of variation in pharma
employment can be explained by the regression equation. It is only total production that
is statistically significant butd' test shows negative correlation. It is mainly due to
pharma sector being highly technology based sector. However employment opportunities
are created in allied services due to pharma sector.
The rate of return in the sector during the period under study observed a tremendous
increase. The classical theory suggests that FDI seeks high returns. Based on that theory,
there should be an influx of foreign investment in Indian pharmaceutical sector. But there
has been limited statistical observation in support of this view. This indicates that
structural constraints still play a crucial role in the inflow of FDI in India. The economy
is yet to create the investment climate required for the increased inflow of the FDI.
Besides, it has been noticed by empirical studies, that most of the variables of the
pharmaceutical sector are not functionally related with the FDI inflow in the
pharmaceutical sector. However, FD[ inflow in the pharmaceutical sector is attracted
because of high rate of return. All these evidence indicated the imperfections of the
market that must be the greatest hindrance of India shining to shine in the global arena.
192

Chapter - 5
5.11 References:
I. Abrol, Dinesh, Pramod Prajapati and Nidhi Singh (2011). "Globalization of the
Indian Pharmaceutical Industry: Implications for the direction, distribution and
diversity in dnig innovation", National Institute of Science, Technology and
Development Studies (NISTADS), New Delhi.
2..Aggarwal, Aradhna (2004). "Strategic Approach to Strengthening the International
Competitiveness in the Knowledge Based Industries : The Indian Pharmaceutical
Industry ", Research and Information System for the Non-Aligned and other
Developing Countries, Discussion Paper # 80/2004, New Delhi (September).
3. Astra Zeneca Pharma India Ltd. Director Report (2004) & Prowess Data base
Centre for Monitoring Indian Economy, Mumbai.
4. Bergman, Annika (2006). "ED! and Spillover Effects in the Indian Pharmaceutical
Industry" ,Research and Information System for the Non-Aligned and other
Developing Countries, Discussion Paper 4 113, New Delhi: 1-44 (August).
5. Blomstrom, M, H Pcrsson (1983). °Foreign investment and Spillover Efficiency in
an Underdeveloped Economy: Evidence from the Mexican Manufacturing
Industry", World Development, 11: 493-501.
6. Blomstrom, Magnus, Steven Globennan,Ari Kokko (1999). "The determinants of
Host Country Spillovers from Foreign Direct Investments: Review and Synthesis
of the Literature". The European Institute of Japanese Studies, Stockholm School
of Economics, Working paper k 76.
7. Bloodgood, Laura (2007). "Competitive Conditions for Foreign Direct investment
in India", US International Trade Commission, Office of Economics, Washington
DC: 8-10.
8. Chaudhuri, S. (2005). "The WTO and India's Pharmaceutical Industry; patent
protection, TRIPS and Development Counties", Oxford University Press, New
Delhi: 133-134.
9. Dhar, Biswajit and Niranjan Rao (2002). "Transfer technology for successful
integration into the global economy: A Case study of the Indian pharmaceutical
industry", UNCTAD, Working paper 4 22, United Nations, New York and
Geneva.
193

Chapter - S
10. DOP (2009). Annual Report. Ministry of Commerce and Industry, Government of
India. New Delhi.
II. Dunning, J. (1970). "Studies in International Investments", The Pitmen Press Bath,
George Allen and Unwin Ltd.
12.Felker, Greg, Shekhar Chauduri, Katalin Gyorgy (1997). "The Pharmaceutical
Industry in India and Hungary-Policies: Institutions and Technological
Development" World Batik paper # 392.
13.Ilathi committee (1975). `Report of the committee on Drugs and Pharmaceuticals
Industry", Ministry of Petroleum and Chemical, New Delhi: 86-91.
14. Kiran, Ravi and Sunita Mishra (2009). "Performance of the Indian Pharmaceutical
Industry in Post TRIPS Period: A Firm Level Analysis", International Review of
Business Research Paper, 5(6): 148-160 (November).
15.Markusen, JR and AJ Venables (1997). "Foreign Direct Investment as a Catalyst
for Industrial Development", National Bureau of Economic Research, 1050
Massachusetts Avenue, Cambridge.
16.Narayana,P.L. (1984). The Indian Pharmaceutical Industry: Problems and
Prospects", The National Council of Applied Economic Research, New Delhi.
17, OPPI (2005). "Speech of the Persident Mr. Ranjit Shahan", 39 h̀ Animal General
Meeting, Mumbai (24 h̀ September).
18.Pradhan, J.P. (2003). "Liberalization Firm Size and R&D Performance: A Firm
Level Study of Indian Pharmaceutical Industry", Research and Information System
for the Non-Aligned and other Developing Countries, Discussion Paper 40(2003,
New Delhi.
19. Sanglikar,N.Y. (2005), Senior General manager Corporate Communication, GSK
Pharmaceutical.
20. World Bank (1997). "Malaysia Enterprise Training, Technology and Productivity",
A world hank Country Study, Washington DC.
21.World Investment report (1999). "FDl and the Challenges of Development",
UNCTAD, New York.
194

Chapter -6
Conclusion, Recommendations and Suggestions
6.1 Introduction:
The sweeping changes introduced since 1991 mark a radical departure from the past
and reflect a positive approach towards foreign investment. The changes provide
freedom to foreign investors to enter the Indian economy. In terms of openness to
FD[ entry, the prevailing Indian policy is favourably placed in tents of
competitiveness with other major FDI receiving countries in Asia.
The new industrial policy resolution, initiated economic reforms in July 1991. The
industrial policy reforms 1991 have substantially reduced the industrial licensing
requirement, removed restrictions on expansion and facilitated easy access to direct
foreign investment. One of the key focus areas of our reforms is the redefinition of
the respective roles of the public and private sector, within the private sector the
contribution of foreign investment. There is recognition that the private sector
including foreign investors has a significant role to play in raising the standard of
living and infrastructure services in the country. Therefore due to 1991 reforms the
flow of private capital in the form of FDI enhanced. The inflow of FDI in India has
experienced considerable growth but compared to other developing nations, India
has lagged behind. Whereas China could attract around one-fourth of the global
foreign investment, India attracts only about 2% of FDI inflows. This indicates that
India, despite being 10th largest economy with economic liberalization, has failed to
attract sufficient amount of FDI during the period under study.
From my study, it is evident that FDI is considered to be an important vehicle for
economic development in India. It impacts the country's trade balance, improving
labour standards and skills, transfer of technology and innovative ideas and the
general business climates. It also provides opportunities for technological transfer
and up-gradation, access to global managerial skills and practices, optimal utilization
of human capabilities and natural resources, making indigenous industry
internationally competitive, opening up exports markets, access to international
quality goods & services and augmenting employment opportunities.
In addition it is also obvious that although FDI is beneficial for an economy yet, its
effectiveness depends upon its meaningful use and it's directing to the areas/ sectors
where shortage of domestic capital investment is felt. More specifically from the
195

Chapter-6
development point of view FDI process is related to export oriented areas. •Fhis
process not only provides financial resources managerial expertise, technologies and
entrepreneurial skills through the channel of NMNCs. The FDI policy has to be
constantly reviewed towards this end and necessary steps should be taken to make
India a most favourable destination for FDI. The focus of FDI should be to maximize
its contribution to India's development and welfare rather than maximizing the
magnitude of inflows.
However, the presence of FDI in Indian economy in general and pharmaceuticals
industry in particular does not mean automatic positive effects. It depends on the
development of the domestic firms and the endeavors of domestic firms to invest in
learning and imitation. Therefore, the benefits from FDI don't accrue automatically
and evenly across the country and sectors. In order to reap the maximum benefits
from FDI, there is a need to establish a transparent broad and effective enabling
policy environment for investment and to put in place appropriate framework for
their implementation. Such an environment must provides incentives for innovations
and improvement of skills and contribute towards improved competitiveness. The
cumulative amount of FDI inflows during August 1991 to February 2011 is
US$145249 million.
From the previous chapters. it can also be deduced that since the liberalization policy
of 1991, the FDI approvals have increased but the actual inflows have been
comparatively less. This is because of the intentions of the foreign investors having
not matched with the performance. It may also be attributed to lack of political
stability, inability of the political decisions, improper unanimity between the centre
and the states government, conflict in political parties' ideologies regarding FDI and
corruption etc.
The study concluded that FDI inflows and economic development have shown
significant growth during post-reform period (since 1991 onwards). The CAGR of
actual FE)] inflows during 1991-2008 comes out to be as high as 24.28% as
compared to 19.05% during pre-reform period. Similarly the GDP growth rate which
had collapsed to 0.5% in 1991-92 rebounded to more than 9% during 2005-08 and
8.4% during 2010-11. Other important macroeconomic indicators also improved i.e.
Gross Domestic Savings had increased from 22% in 1991-92 to 32.3% in 2010-I I.
Similarly Gross Domestic Capital Formation had raised 22.5% to 35.1% during the
same period of time. Besides that India has also improved considerably on the
196

Chapter -6
external sector front such as the current account balance, capital account, foreign
exchange reserves and overall improvement in BOPs during post retbrm period.
Sector-wise break-up of FDI inflow during Post reform period revealed that the most
leading sector is the services sector which received an approval of USS23995.7
million. This was shared 20.35% of total amount approved. Computer and IT sector
has also registered a good share of 3.52%. Infrastructure sector including
communication housing & real estates posted a growth of 794%, 7.13% and 6.90%
respectively. Together they accounted for more than 50% of the total FDI approved
in India. While in the pre-reform period, the top five sectors which have attracted the
bulk of FD[ were chemicals, industrial machinery, mechanical engineering, electrical
& electronics and metallurgy and together they accounted for about 68% of total FDI
inflows. However, pharmaceutical sector which was at 8 h̀ place during 1991-2007
declined to 12 h̀ place after 2007 mainly due to impact of the new patent law and
global recession. But the position has now improved.
The total amount of FDI inflow in India comes from these major countries. Mauritius
tops the list with a percentage of 45.12%. Singapore is the second country having an
approval of 10.04% followed by the USA (9.92%), 12K (5.79%) and Germany
(3.32%). These top five countries concentrate nearly 75% of the total approval of
FDI during the period under consideration.
Similarly the largest source of FDI in India's pharmaceutical industry is Mauritius
(56.4%). Singapore is the second largest source (11.2%) followed by the USA (5.8),
UAE (4.7%), and Canada (4%), together they accounted for more that 80% of FDI
in this sector during 2008-09. The state-wise FDI trends reveals that Maharashtra
tops the list with a percentage share of 35.24% followed by New Delhi with a share
of 20.50%, Karnataka (6.26%), Gujarat (5.79%) and Tamil Nadu (4.91%). Together
they accounted more than 70% of the total FDI inflows during 2000-10. It is
important to note that 75% of pharmaceutical manufacturing production is done by
these states Maharashtra, Gujarat, Tamil Nadu, Andhra Pradesh, Karnataka, West
Bengal and Goa. This may he attributed to their better resources, good infrastructure
and investor friendly policies. It is further observed that FDI inflows have positive
impact on the Indian economy in general and pharmaceutical in particular. It is
observed that though larger FDI inflows in these states have had a favourable impact
on the economy and pharmaceutical sector, but it has also led to wider regional
disparities.
197

Chapter -6
Furthermore, while analyzing FD1 in Leans of country-wise, sector-wise and state-
wise, it may also be concluded that although there has been an impressive growth in
the magnitude of PDI inflows but they are still small when compared to the potential
of India in terms of its investment opportunities and need. The present time is the age
of borderless world, a world where physical distances has no matter. The need of
time is not to reverse the process of globalization and FDI but to take bold steps to
solve the problem created by the process of globalization. There is only one way
forward i.e. more interactions, more interrelation, more coordination and cooperation
between domestic and foreign investment. "therefore, well thought strategy and
cautions approach should be adopted, so that Indian and foreign companies
contribute to the economy simultaneously.
The statistical analysis of the study revealed that in the year 1991 the actual amount
of FDI inflow in India was only US$165 million and but over the period it observed
an increasing trend to take a figure of US$2733 Imillion in 2008, which is almost 166
times that of the figure of 1991. However, during the period under consideration it
has experienced some fluctuations with going down to the minimum of IJS$165
million to the maximum of US$ 27331 million. The growth rate also indicates
considerable fluctuations both in positive and negative rates. it was highest in 2006
(184%). This demonstrates that the inflow is dictated by the external sources rather
than internal factors, The average Fill takes a value of US$5919 million with a SD
of USS8042.5 million. The t-ratio suggests that the estimate is statistically significant
at 10% level. The CV as high as 1.36 suggest the fluctuating nature of the variable.
The CAGR is 24.3% during 1991-2008.
While FDl inflow in Indian pharmaceutical was only US$0.3 million and over the
period it also observed an increasing trend and reach highest US$334.1 million in
2007 and thereafter it declined to US$181.5 million in 2008, which is 605 times that
of the figure of 1991. The growth rates indicates considerable fluctuations both in
positive and negative rates and highest was in 1992 (3600%). The share of
pharmaceutical industry FDI in total FDI was 2.05% on an average. The inflow in
pharmaceutical takes a mean of USS94.3 million and a SD of US$ 100.9 million.
The fluctuation is demonstrated by the CV of 1.07. The growth rate is 27% during
period of consideration. One of the reasons behind such high growth rate is the big
difference between the minimum and maximum value of FDI inflows in
198

('ha/ncr -6
pharmaceutical industry. However, the Durbin-Watson test shows the positive
correlation between these two variables i.e. total FDI and FDIPI.
It has been observed that the pharmaceutical investment was US$ 38.4 million in
1991 and it gradually increased to [ USS41 17. I million in 2009, which is almost 107
times that of 1991 figures. The inflow of FD1 in Pharmaceutical sector was only
h'SSO.30 million in 1991 and increased to USS 181.5 million in 2008. The share of
FD1 in total investment of pharmaceutical industry was 11.8% on an average. The
mean of pharmaceutical industry investment is USS 1027.4 million with a SD of USS
1282.5 million. The mean of the FDI flows in the pharmaceutical industry is USS
94.3 million with a SD of US$ 100.9 million. The t-ratio is statistically significant at
10% level. The CV is 1.24 in case of the investment in pharmaceutical industry and
1.07 in case of the FDI inflows to demonstrate the unstable nature of FDI inflows in
the industry.
It has been further observed that the regression function takes an F-value of 117.8
which is statistically significant at 5% level. It seems that functional relation
assumed by the empirical regression line is true that the investment in
pharmaceutical industry is explainable by the FDI inflows in the industry. The
coefficient of determinants shows that 97% of the variation of the dependent variable
could have been explained by the fit. However the coefficients of slopes are not
statistically significant in general.
Most of the coefficients of independent variables are not statistically significant
except for export which statistically significant at 5% level. The FDI inflow in the
pharmaceutical industry fails to explain the variation in the investment of the
industry. However the value of d' (Durbin-Watson test ) is significant as 0.957 and
indicates the positive serial correlation amongst the variables. It is indicated that
whereas export and profit are important positive significant variables for enhancing
the level of investment in pharmaceutical sector while FDIPI has not.
The total production figures indicate that in 1991 the figure was US$2510.6 million,
where as it increased to USS 17567.6 million in 2008 which is seven times higher
than that of the 1991. The mean of the variable is USS6868.4 million and the SD is
USS 4463.5 million. The t-ratio is 6.01 suggesting that the mean is statistically
significant at 10% level. The variable is considerably stable as is demonstrated by a
comparatively low coefficient of variance of 0.65.
199

Chapter-6
It can be noticed that the regression gives a good fit. The F-statistic suggests that the
null hypothesis of untrue relation should be rejected at 5% level. The coefficient of
determinant is as high as 0.98 to indicate 98% of the variation in the production of
pharmaceutical industry could have been explained by the regression equation.
Durbin-Watson test indicates the positive serial correlation among the variables.
Among the independent variables only the export is statistically significant at 10%
level whereas FDI inflow is not statistically significant to indicate that the production
in the pharmaceutical industry could not be explained by the FDI inflow in the
industry. However, it is indicated that the export, FDIPI and profit are positively
significant for the improvement of phannaceutical total production.
In 1991 the export of the industry was only US$564.4million and through a gradual
increase it took the amount of t7S$6257 million in 2008, which is nearly eleven
times that of the 1991 figure. The average lakes a value of US$ 1862.2million. The
SD is however quite impressive at an amount of US$ 1758.7 million. The t-ratio is
5.84 to indicate that the mean is statistically significant at 10% level. The CV is
equally high at 0.94 suggesting that the estimate observes the fair extent of
instability.
The F-statistic suggests that the regression is statistically significant at 5% level. The
coefficient of determinants is as high as 0.99 or 99% of the variation in the export of
pharmaceuticals. However among the coefficient of slopes only total production and
investment are statistically significant at 10% and 5% level respectively. The
coefficient of FDI inflows in the pharmaceutical industry fails to demonstrate any
significant relation towards the promotion of export from the industry. However
Durbin-Watson test indicates that there is a positive serial correlation amongst these
variables. It is indicated that only total production and investment is positively
significant for pharmaceutical export..
The amount of earned profit plays a key role in attracting the FDI inflows. It can be
observed that the profit in pliarma increased throughout the period under
consideration, whereas in 1991 it was only USS14.1 million but by 2008 it reached to
a level of US$135G million. The increase is around ninety-six times. One of the
reasons attributed to this is that the number of firms has also increased during the
period. However, it is indicated that during 1995 to 1997 the profit trend was
declining. The industry faced a stiff competition during the late nineties backed by
regional as well as global recession in the same year of that must have contributed to
200

Chapte r -6
the adversities in the profit performance. Input prices also increased globally during
that period coupled with high market campaigning expenses.
The statistical description shows that the mean profit is US$ 5775 million with the
SD 587.6 million. The t-ratio is 7.32 which indicate that the mean is statistically
significant at 10% level. The CV is as high as 1.02 which indicates instability in the
nature of the variable.
The F-statistic suggests that the null hypothesis of untrue relation can he rejected at
5% level. The coefficient of determinants shows that 0.908 or 91 % of the variation in
the profit figures could have been explained by the regression function. Among the
independent variables FDIPI is the only variable which is statistically significant at
1% level. However, Durbin-Watson test indicates the positive serial correlation. It is
indicated that FDIPI and total production has significantly positive impact on
pharmaceutical profit. It can be observed that the F-statistic is 15.8 to indicate that
the regression function is a true functional relation. Coetfieient of determinant
demonstrated the 0.772 or 77.2% of the variation in the FIJI flows can be explained
by the profit of the industry. Among the independent variables only profit variable
happened to be statistically significant at 1% level. This suggests that it may be the
profit of the industry which is the main consideration in the decision making of the
FDl in Indian pharmaceutical sector. However, the coefficients of slopes are not
statistically significant in genera]. and the Durbin-Watson test shows the no first-
order auto correlation.
The employment increased from 181497 employees in 1995 to 353692 in 2008. The
mean figure of employment in pharmaceutical industry is 243872.2 with a SD of
only 51406.6 leading to a t-ratio 3.91, significant at 10% level. The CV is only 0.21
which is amazing and suggesting the stable nature of the variable. One of the main
reasons behind such impressive statistics is that the period under consideration has
severely been constrained by the availability of data. The data were available only
from 1995-2008. The regression parameters are not however very satisfactory. The
F-statistic was significant to indicate that the null hypothesis of untrue relation can
be rejected. Regarding the coefficient of determinants it is highly significant as 97%
of the variations could have been explained by the ordinary regression. Among
independent variables the coefficient of total production and export are significant at
5% level. However, Durbin—Watson test indicates no first-order auto correlation
among them.
201

Chapter -6
6.2 Suggestions and Recommendation:
The FDI inflow in India in absolute figure is quite impressive, but when compared to
global flows, it is far from satisfaction. Thus, India at the moment needs a well-
balanced strategy for enhanced FDI inflows.
In the context of the importance of FDI inflows in the Indian economy as a whole and
phamtaceutical sector in particular. We propose the following measures to attract FDI
in India.
6.2.1 Strategies and Implication for FDI in Indian Economy:
Legal and Regulatory Framework and FDI Policy:
Indian government has enacted laws for regulation FD[ from time to time
keeping in view both national and international business environment. Before
1991, FERA was constituted in 1973 for regulation of foreign investment.
Nowadays a newly formulated FEMA is taking care of foreign investment
regulation. But, the real problem is that all these Acts and different bodies
constituted by the government are playing a regulatory role. The need of the
hour is to enact a law which should play a promotional role apart from
regulation. The government should now emphasis the national investment of
FDI and takes care of such sensitive issues like double taxation, single point
clearance tar investors, eliminating separate clearance at central and states
level.
As the volume of FDI is increasing significantly there are also many fold
increase in the problems faced by the foreign investors. The procedures for
getting government clearance are very complex especially for the first time
investors. So taking in consideration these problems, a non-governmental
society or council should be setup with help and encouragement from the DIPP
for helping out these investors. These council/societies should operate on a
non-profit basis and supply information, approval and clearance services to the
foreign investors.
Economic conditions are critical for attracting FDI, but investor friendly
policies and facilitation centers that reduce the transaction costs of planning
and engaging with regulatory compliance are also critical. Ilowever, sometimes
policies are over friendly to FDI while transaction costs (including tax and
202

Chapter -6
other regulatory issues) of investment remain high for domestic players and this
can be counter-productive. Such asymmetric treatment of domestic and foreign
investment can lead to `round-tripping' i.e. where domestic investors route
their investment through a foreign country to avail the policy benefits of FDI.
India has seen significant "round-tripping" activity. Since 2000 Mauritius share
in FDI inflows to India has been very high and it can be safely argued that a
significant portion of FDI originating out of Mauritius is of the `round-tripping'
variety. So it is a trade-off between rigid and liberal regulatory framework. The
government should check it carefully.
➢ State Infrastructure Law and FDI Policy:
For a long time it has been emphasized, the key to economic development apart
from economics is the infrastructure development. Because a well developed
infrastructure will play a vital role in attracting FDI. In the light of this different
states should consider framing special laws directing investment first in
infrastructure and then to other sectors of the economy, covering both domestic
as well as foreign investment. Some states have already initiated this process of
enacting law for infrastructure development. Andhra Pradesh and Karnataka are
the two states which have taken the lead in this; others like Maharashtra, Tamil
Nadu, Gujarat are in line.
There should be a joint effort both by central and state government and some
kind of coordination committee should be constituted to take up critical issues,
which sometimes create problems between states and central government. For
example, recently in the case of FDI approval in multiple retail sector was
severely opposed by the states. Besides issues such as environmental clearance.
industrial relation etc. members from corporate should also be included for
broader acceptability.
➢ Institutional Changes and Policy for FDI:
The DIPP plays a pivotal role in regulating FDI, with the help from FIPB, SIA
and FIIA and recently CCI (Competition Commission of India). The FIPB
which works out the modalities before the approval stage and appraises the
proposal should be empowered to grant central level registration, excise
registration and income tax registration and DGFI registration, custom excise
registration. This will augment the process approvals of FDI proposals.
203

Chapter -6
The FIIA should he given freedom to frame business rules so that it can fix the
time frame tor investment proposals both at central and state levels. The role of
cabinet committee should be curtailed in assessment of proposals and FIIA
should be empowered which will reduce approval time. A registration cell
related to FDI should be set up so that data base can he maintained of FDI
projects. It will ensure accelerated approvals of FDI.
- Raising FDI Sectoral Caps and other Allied Issues:
Attracting FDI is a major issue for India for the overall development of the
economy. But there are many barriers attached which restrict the smooth inflow
of FDI. The sectoral limits which are enforced should be properly evaluated in
an explicit manner and should be justified. Otherwise, the sectoral caps which
are not properly justified should be removed.
Reduction in Transaction Costs and Improvement of Infrastructure:
More than any FDI policy it is the level of business comfort and profitability of
operation that attract FDI. Transaction costs of operating business in India
remain prohibitive and infrastructure and logistical support is too weak. India
first must become a competitive production base where people would want to
invest. Implementation of trade facilitation reforms will lead to stronger trade
linkages with rest of the world.
Decentralization of Administration Process:
India's FDI policy process still remains highly centralized in New Delhi and
that is another major impediment in effective competition between states and
efficacy in administration of FDI initiatives in many parts of India. Although
thing have improved in terms of decentralization but, the entire FDI policy
environment still remains in centered around New Delhi and not the state
capitals where they should he given the diversity of India's economic
prospects.
Reduce Overly Bureaucratic Facilities:
India's bureaucratic setup maintains several investment and trade promotion
bodies that work at cross purposes. There are too many 'single windows' and
investment development commissions working at the same time. There is also a
lack of policy consistency. There needs to be a real `single window' that draws
204

Chapter-6
from the sectoral expertise of the different ministries and more importantly the
private sector.
➢ Proper Coordination between Centre and States:
While many policy barriers have been removed on FDI in India, results have at
Limes been disappointing due to administrative harriers at the state level as well
as lack of coordination between the central and state governments. There need
to be greater coordination between the centre and states to ensure that the
substantial foreign interest in investing in India gets translated into actual
investment flows to the state. An example of this is the proposed USS 12
billion investment, India's single largest FDI investment by South Korean steel
giant Posco. Posco signed an agreement in June 2005 to set up a steel plant in
Orissa but as on March 2008, the steel plant is yet to be start construction, let
alone any operations. The government should check above kind of problems
which foreign investor faced.
Y Need for Simple and Transparent FDI Facilitation Structure:
Currently, in India the FDI facilitation structure is quite complex. The IIC
(Indian Investment Centre) which was originally mandated to pursue these
objectives is almost defunct now. Till 1991, the Department of Economic
Affairs was the nodal department that dealt with foreign investment policy and
regulated the flow of FDI. But the SIA, which accepted and approved foreign
investment application, functioned in the ministry of industries. Post 1991, the
subject of foreign investment policy has been with the D[PP but SIA, as it is
now known is no longer the secretariat for FIPB. The finance secretary chairs
the FIPB and all foreign investment cases arc processed in the finance ministry.
The process has been further complicated by the establishment of FIIA in 1999,
to facilitate quick translation of FDI approvals into implementation, provide a
proactive one-stop aftercare service to foreign investors. The FIIA has created
FTCs (Fast Track Committees) in 30 ministries/departments in the central
government. The constitution of FIIA is almost the same as the FIPB. Whereas
the secretariat for FIPB is in the finance ministry, that of the FIIA is DIPP. It is
clear that by creating two distinct bodies. FIPB and FI[A the system has now
become more complex and confusing. Further currently, CCI has empowered
to regulate the Brownfield investment in the pharmaceutical industry. Thus, it
205

Chapter -6
is suggested that one stop department or agency should be established which
should take care of the whole process of FDI in India.
➢ Investment Opportunities in North-Eastern Region:
The North-East which has got its definite entity due to its peculiar physical,
natural, economic, social and cultural characteristics and is the poorest and
remotest part of the country is yet to enjoy significant share of the benefits of
liberalized process due to one or other factors. Though India has become one of
the power magnate of FDI in Asia (after. China), the inflows of it in the North-
East is quite meager. A unique competitive advantage of the region is its
strategic location. Almost 98% of its boarders from India's international
boundaries as well as most attractive tourist destinations are found here.
It is deduced in the chapter 3rd that almost half of the FD] is received by only
few developed states like Maharashtra. Delhi, Gujarat. Karnataka and Tamil
Nadu due to better infrastructure and a more developed industrial and financial
sector. That is FDI has been concentrated in relatively developed states where
large amount of public investment has been made and transportation and
communication facilities are more developed. Keeping in view the strategic
importance of North-East region, it is suggested that the economic development
of this extremely backward regions should not be left. Public investment has to
be increased to ensure that adequate infrastructure is created in this region to
provide the pre condition for private investors to come forward and make
investment in future and to ensure that regional disparities do not widen too
much in India.
➢ Liberalization in Exit Barriers:
An exit policy needs to be formulated so that firms can enter and exit freely
from the market. While the reforms implemented so far have helped remove the
entry barriers, the liberalization of exit barriers has yet to take place. This is a
major deterrent to large volumes of FDI flowing to India. While it would be
incorrect to ignore the need and potential merit of certain safeguards, it is also
important to recognize that safeguards if wrongly designed and/or poorly
enforced would turn into barriers that may adversely affect the health of the
firm.
206

Chapter -6
➢ Need for more Flexible Labour Laws:
In India large firms are not allowed to retrench or layoff any workers or close
down the units without the permission of the state government. While, the law
was enacted with a view to monitor unfair retrenchment and layoff, in effect it
has turned out to he a provision for job security in privately owned large firms.
This is very much in the line with the job security provided to public sector
employees. Labour-intensive manufacturing exports require competitive and
flexible enterprises that can vary their employment according to changes in
market demand and changes in technology, so India remains an unattractive
base for such production in part because of the continuing obstacles to flexible
management of the labour force.
➢ Reduction in Tariff and Corporate Tax Rates:
India's tariff rates are still among the highest in the world, and continue to
block India's attractiveness as an export platform for labour-intensive
manufacturing production. Much greater openness is required which among
other things would include further reduction of tariff rates. Most importantly,
tariff rates on imported capital goods used for export, and on imported inputs
into export production, should be duty free.
Presently corporate tax rate in East Asia are generally in the range of 10 to 25%
compared with a rate of 42.02% (tax rate of 40% plus surcharge of 2% plus
cess of 3%) for foreign companies in India. High corporate tax rate is definitely
a major disincentive to foreign corporate investment in India. Therefore, it is
suggested that the tax policy should he rationalized and rates should be such
that it gives makes international investor's investment a profitable one.
➢ Stability in Macro-Economic Fundamentals:
Rationalization and liberalization of FDI policy may be necessary but not
sufficient for expanding FD[ inflows. The overall macro-economic
performance continues to exercise a major influence on the magnitude of FDI
inflows by acting as a signaling device for foreign investors about the growth
prospect for potential host economy. Hence, paying attention to macro-
economic pertorntanec indicators such as growth rates of industry through
public investments in socio-economic infrastructure and other supportive
policies and creating a stable and enabling environment would crowd-in FDI
207

Chapter -6
inflows. Studies have shown those policies that facilitate domestic investment
also pull in FDI inflows. While investment incentives may not be very
efficient, active promotion of FDI. by developing certain variable projects and
getting key MNEs in them, could be useful in attracting investments in
desirable directions.
➢ Reduce Level of corruption:
The high corruption in India is another important impediment in FDI inflows. It
is an intractable problem. Corruption in India is a consequence of the nexus
between bureaucracy, politics and criminals. Indian administrate on is tainted
with scandals and the country is at 95 h̀ place with score 3.1 out of 178
countries where corruption is rampant as per the 'Corruption Perception Index
2011" released by Transparency International India (in this index scored ranges
from 0 to 10 where 10 refer to highly clean and 0 refers to highly corrupt).
The effect of corruption on FDI shows in context of the costs of doing business.
Since foreign investors have to pay extra, costs in the form of bribes in order to
get licenses or government permits to conduct investment, it raises costs of
investment. Moreover corruption increases uncertainty because these kinds of
agreements are not enforceable in the courts. It has negative impact on level of
investment and economic growth, quality of infrastructure and on the
productivity of the public investment, healthcare and education. All these
factors are found to be important determinants of FDI.
For checking corruption full proof laws should be made so that there is no
room for discretion for politician and bureaucrats. The role of the politician
should be minimized. Application of the evolved policies should be left in the
hands of independent commission and authority in each area of public interest.
Local bodies, independent of the government like Lok-pals, Lok-adalats and
Central vigilance commission should be formed
6.2.2 Strategies and Implication for FDI in Indian Pharmaceutical
Industry:
Over a period of time the IPI has promoted, integrated, and induced self-
sustained growth of the Indian economy. However, there is a pressing need to
lift up the sector as an impetus of industrial growth and employment and to
208
Chapter -6
achieve a high degree of value addition in the country. IPI is currently
recognized as global pharmacy of developing world and has distinction of
providing quality healthcare at affordable cost. The IPI is currently divided
into three-tier structure. Large MNCs operates as originator drug companies,
generic companies along with large Indian generic companies and medium
and small scale industries. Pharmaceutical industry contributed nearly 12% of
India's manufacturing sector GDP and around 2% of the country's GDP
during 2008-09. Besides this drugs & pharmaceuticals, have been consistently
5'" largest exported principal commodity of the country for the last several
years. In terms of trade balance it is the only Indian sector after apparels that
have consistently given positive trade balance and it growing around 1.5-1.6
times of country GDP growth rate. Furthermore it is a net earner of foreign
exchange and this kept increasing throughout the years since 1991. Its
turnover also witnessed a tremendous growth over the past few years i.e. from
US$2857.14 million in 1990-91 to US$20787.40 million in 2009-10 i.e. raised
more than seven-folds. From simple headache pills to sophisticated antibiotics
and complex cardiac compounds, almost every type of medicine is now made
indigenously.
At the global arena WI ranks very high and is placed third in the world in
terms of technology, quality and range of medicines manufactured. The
country now ranks third world-wide by volume of production also and 14ih by
value of production. Globally it ranks 4 h̀ in terms of generic production and
3'a largest bulk drugs producers in the world it ranks 17'h in terms of export
value of bulk drugs & formulations. India account for over one-third of DMFs
in USA and 30% of all approved ANDAs in the US. Even in patent challenges
India ranks 2"d only next to USA with a share of 21% of patent challenges.
The 1990s witnessed the strongest performance of the IPI on several fronts.
Not only did the industry exceed its output expansion of the previous decades,
but it actually became a net foreign exchange earner. This performance
followed the changes in the policy orientation of the Indian economy that took
place in 1991. Industry thus took advantages of the unshackling of the
industrial sector during the 1990s from the controls imposed by the
government. the rapid opening up of what had been largely an insulated
209
Chapter -6
economy to international trade and investment brought about a swill response
from the leading firms in the pharmaceutical industry.
The production of bulk drugs rose from US$396.5 million in 1991 to
US$3503.2 million in 2008 showing a CAGR of 14.4% during 2006-08. The
production of formulation on the other hand increased from USS2114.5
million to US$ 15390.8 million during the same period of time with CAGR of
23.6%. A noteworthy feature of the analysis is that during 2005-08 the CAGR
of bulk drugs production was nearly half as compared to the growth rate of
formulations production. It is indicated that formulation production increases
at a faster rate as compared to the bulk drugs production. This reveals that IPI
is shifting from the production and trading of less value added goods (bulk
drugs) to high value added goods (formulations) during post-reform period.
Similarly the export performance of the pharmaceutical industry is also very
remarkable given that it has been the only amongst the major industrial sector
to have consistently generated trade surplus irrespective to global crisis. Indian
pharmaceutical export increased from USS 564.4 million in 1991 to USS
6257.0 million in 2008. 'trade balance also increased US$ 320.1 million to
US$4286.5 million during the same period of time. As a result this sector
contributes nearly 5% of India's total manufactured exports. India's share in
world pharmaceutical export also improved from 0.9% in 1992 to 1.4% in the
year 2008.
The pharmaceutical industry is severely technological and capital intensive
and India is one of the very few developing countries that has comparative
advantages in the industry. However despite the impressive growth of this
sector and low costs production there are several concerns which needs to be
addressed. Like accessibility and affordability of medicines by the common
man, instituting standards of quality, strengthening the fragmented regulatory
system, sustaining growth of generic etc.
The IN responded to economic reforms in many different ways. Firms like
Cipla. Zydus and Lupin etc improved their manufacturing efficiency and
established large production facilities. While firms like Sun pharma, Torrent
and Wockhdardt etc re-structured and shifted their technology focus, product
basket and market focus. Special emphasis was given to marketing and
distribution networks by almost all leading firms during this time. Besides,
210

Chapter -6
domestic leaders substantially increased their in-house R&D investment and
implemented new approaches of drug/product development.
Furthermore moving the value chain of R&D in year 2000 process
development account 65%, NODS 30% and NCEs 5%, where in 2005 it was
35%, 35% and 30% respectively.
The presence of foreign firms boosts the competitive environment in the
pharmaceutical sector and spillover effects are generated through the
elimination of insufficient firms and faster adoption of technology. It will be
further increased in near future due to TRIPs implementation. Besides the
MNCs invest a lot in training and positive externalities in the form of human
capital development seem to be generated. Further, the MNCs are highly
aware of quality standards for products and production processes which seem
to have positive impact to the domestic industry to improve their products
quality, continually in the future due to new patent law and enhanced
investment climate. Currently, domestic firms have invested more in R&D
than they did in pre-reform period and this competition in terms of R&D can
stimulate further competition and growth in the industry.
Therefore the impact of FDI on IPI manifolds. With the new WTO patent
regime the foreign players have found greater security in operating in the
India. Due to the spillover effects of a competitive environment the domestic
players have substantially increased their productivity, profitability and are on
stronger footing with the incoming pharmaceutical firms. In facts domestic
players have started challenging MNCs in their own country.
The development of Indian talent and adoption of managerial techniques by
domestic firms has made India a preferred destination of FDI. This is a
positive spiral of the spillover effects of FDI. Due to earlier FDI infusions the
human capital has been upgraded which in turn is attracting more FDI. Hence
the spillover effects are evident in increasing the productivity of the IPl and
have resulted in India gaining respect as a global player.
FDI in the IPI is mainly market-seeking. India's advantage for MNCs in the
pharmaceutical industry is first of all the large domestic market, with a more
than one billion population. Wide disease pattern, relatively cheap manpower
and skilled labour are other factors that attract foreign investors. English is
widely spoken language, which makes communication easy for foreign
211

Chapler -6
investors. The production of pharmaceuticals is also relatively cheap in India
as there is a strong production base in the country. It is easy to get good
quality bulk drugs, which is attractive for foreign firms. Because of India's
focus on reverse engineering and the development of production processes, it
has high technical competence in production in the pharmaceutical industry,
which makes this industry attractive to foreign investors. The industry is also
highly competitive among suppliers which give the MNCs a good bargaining
position. India has many advantages for foreign investors and consequently
the country has future potential to become an attractive destination for out-
sourcing in drugs discovery and clinical trials.
From the analysis of FDI in pharmaceutical industry it has been observed that
the share of pharmaceutical industry's FDI in total FDI inflows was 2.05% on
an average during the period under consideration.
In order to promote PDI and maximize further spillover effects, polices should
be investor friendly, with a clear developing strategy. The policies in India
should encourage domestic firms to invest more in R&D and technology up-
gradation and human resources by providing suitable fiscal and financial
incentives.
SMEs (Small and Medium Enterprises) contribute 42% of total
pharmaceutical production and 62% of total employment. Government should
ensure that the SSI grows at a healthy rate as it is employment intensive
sector. Lack of awareness in the area of patenting of technology, GMP, GCP
and GLP is an issue with SMEs. Government with the help of BDMA and
IDMA can conduct awareness camps for SMEs. This will not only help these
units to match the expectations of developed market but also help in retaining
or bringing back our talent abroad as specialists in this area. Further, schemes
to promote compliance of schedule Ni, improvement in quality by adopting
international regulatory standards and technology upgradation with special
focus on the SSis.
Currently, corporate players in this sector including the MNCs whose costs are
prohibitively high are looking at the pharmaceutical SMEs in India to out-
source their production and research programmes. This has opened up a big
opportunity for SMEs pharmaceutical. But they face one major impediment in
grabbing this opportunity. Their research facilities do not match with the
212

Chapler -6
western standards, although their manufacturing capabilities are excellent.
Indian SMEs are finding it difficult to keep up with the pace of R&D in
technologically advanced countries. The prime reason for the Indian SMEs
lagging behind the developed countries is the severe shortage of fund they are
facing. To overcome this problem, the Indian SMEs pharmaceutical can adopt
the CRAMS practice. This time-tested business is practiced elsewhere in the
world and can provide a highly effective financial boost to SMEs in India.
Since R&D in pharmaceutical is a highly risky venture, there is dire need to
give incentive through tax concession on a permanent basis. It is suggested
that the tax holidays should be at least 20-25 years because the development of
any molecule takes at least 15-20 years.
The level of FDI in all industry is an important factor for possible spillover
effects. When the level of FDI is relatively low in an industry it can lead in
insignificant result. This is also the case in the IPI. This should be enhanced by
providing more investor friendly policies.
Government at various levels should take active part in disseminating
knowledge about the IPRs and the possible strategies that can be adopted by
the industry. Lesson should he drawn from the Chinese experience where
systematic efforts were taken to educate the bureaucrats, policy makers and
the industry about the WTO and product patent in pharmaceutical industry.
India will have to strengthen the patent examination process and speed up the
processing procedures. Besides, a strong institutional and judicial framework
will have to be set up for monitoring the price, to prevent infringement and
trade dress cases of patent products respectively.
Emphasize also has to be given to the macroeconomic policies, such as the
monetary policy, fiscal policy, foreign trade policy, the exchange rate policy
and FDI policy so that they are in tune with the requirement of the growth of
the pharmaceutical sector.
With India emerging as a major hub for Contract Research particularly clinical
trials it is important to ensure good clinical practices in the country.
Animal testing is essential in drug discovery. Effective solution is needed for
undertaking NCEs based discovery research to solve the difficulties
encountered in conducting toxicity studies in bigger animals, The approval
213

Chapter -6
process for animal imports, animal experiment protocol, needs to be
streamlined and expedited.
Spurious drugs are a sensitive issue affecting not only the level of FDI but also
health of the people as well as the prestige of the country's pharmaceutical
trade interest. Steps should be taken by the government to counter threat of
spurious drugs.
Price regulation is another major impediment for FDI inflows in Indian
pharmaceutical sector. Focus on price monitoring rather price control is
required. Apart from this resolution of data exclusivity law will help in
increasing confidence among foreign companies.
It may be noted that reforms are required at regulatory/policy level too.
Presently both central and state governments regulate pharmaceutical sector.
While states regulatory authorities are responsible for regulating
manufacturing, sales and distribution of drugs, the central regulation approves
new drugs, clinical trials, control imports of drugs and also coordinates among
the states bodies. Hence, drug regulation and price control should be with the
same agency so that an integrated regulatory system exists in the economy.
Strengthening the regulatory system is also required in the context of new
patent regime. There is a need to simplify procedures and shorten the time line
for various approvals. Strengthening of regulatory system with respect to data
protection is also crucial. These measures will help in attracting more FDI
particularly in R&D in India.
Technological cooperation with the MNCs stimulates growth in the
manufacturing and R&D spaces of the domestic industry. Recently, with the
fear that if MNCs take over Indian companies it will lead to an oIigopolistic
market situation and increasing drug price (However various studies have
shown that drug prices almost stable currently). Due to this now FDI upto
100% in Greenfield projects will remain under automatic route but in the
Browntirld projects it will need to go via government approval route. The
same approval which is presently done the FIPB but in future it will be by the
CCI. Movement to restrict FDI in this way will a retrogressive step in the
financial reform process in the country, adversely affecting FDI not only in the
pharmaceutical sector but possibly tar beyond it. ]fence, the Government
should rethink in this matter.
214

Chapter-6
6.3 Direction for Further Research:
The present study has dealt with the role of the FDI in pharmaceutical industry for the
period from 1991-2008. Performance appraisal of pharmaceutical industry has been
done in terms of examining the trends in production, investment, export and
employment in pharmaceutical sector. The same parameters have been taken to assess
the role of FDI viz-a-viz production, investment, export and employment.
However, the study has not taken the segment-wise analysis of FDI inflows in
pharmaceutical industry i.e. bulk drugs and formulations. Since India is the third
largest bulk drug manufacturer there is scope for the research in future in these
segments.
215

Bibliographv
Bihlioirraphy
Books:
Agarwal, Jamuna P. (1980). "Determinants of Foreign Direct Investment: A
Survey", weltwirtschaftliches Archie, 116 Heft 4.
Buckeye, Peter J. and Mark Casson (1976). The Future of the MA/Ps",
Macmillan, London.
Caves, R.E. (1982). 'Multinational Enterprise and Economic Analysis ", Harvard
University, Cambridge University Press.
Chaudhuri, Sudip (2005). "The VI?O and India's Pharmaceutical Industry: Patent
Protection, TRIPs and Developing Countries", Oxford University Press, New
Delhi.
Chaturvedi, S.K. (2007). "Foreign Investment Laws and its Impact on Labour".
Deep and Deep Publication, Pvt- Ltd., New Delhi.
Chopra, Chanchal (2004). "Foreign Investment in India: Liberalization and WTO-
The Emerging Scenario ", Deep and Deep Publication Pvt. Ltd., New Delhi.
Cohen, Stephen D. (2007). "AINCs and Foreign Direct Investment- Avoiding
Simplicity, Embracing Complexity ", Oxford University Press.
Correa, Carlos M. (2000). - Intellectual Property Rights, the WTO and
Developing Countriers: The TRIPS Agreement and Policy Option", Zen Book
Ltd., London.
Dunning, S.H. & R. Narula (2004). 'Multinationals and Industrial
Competitiveness A New Agenda", Edward Elgar Publishing Limited,
Cheltenham.
Dunning, J.H. (1970). ' Studies in International Investments -, The Pitman Press
Bath, George Allen and Unwin Ltd.
216

Bibliography
Dunning, J.H. (1981). `International Production and the Multinational
Enterprises ", Allen and Unwin Ltd.
Dunning, .1.1I. and Sarianna M. London (2008). "Multinational Enterprises and
the Global Economy Edward Elgar Publication Ltd, USA.
Dunning, John 11. (1977). 'Trade Location of Economic activity and the MOVE: A
Search for an Eclectic Approach ", in the International Allocation of Economic
Activity. ed. by R. Ohlin, P.O. Hsselborn and P.T. WiJkman, Macmillan,
London.
Ghakar, Kamlesh (2007). "Foreign Direct Investment in India 1947to 2007:
Policies, Trends and Outlook", New Century Publication, New Delhi.
Govindaraj, R. and G. Chellaraj (2002). The Indian Pharmaceutical Sector:
Issues and Options for Health Sector Reforms ", World Bank Publications.
Gujarati, Damodar N. (2005). "Basic Econometrics", 4' edition, Tata McGraw-
Hill, New Delhi.
Hufbaur, G.C. (1975). "The MNCs and direct investment in International Trade
and Finance: Frontiers of Research", ed. by Peter B. Kenen, Cambridge
University Press, England.
Johri, L.M. (1983). "Business Strategies of Multinational Corporation: A case
study ofDrugs & Pharmaceutical Industry", Vision Book, New Delhi.
Joshi, Vijay, and 1. M. D. Little (1996). "Indians Economic Reforms /991-200/",
New York, Clarendon Press.
Kidron, Michal (1965). "Foreign Investment in India ", Oxford, London.
Kindleherger, Charles (1992). "International Economics", Irvin Irwin, London.
Kumar, Nagesh (1994). ' Multinotional Enterprises and Industrial Organization:
The case of India ", Sage Publication, New Delhi.
217

Iiibliographv
Martinussen, J. (1988). "Transnationa( Corporations in a Developing Economy:
The Indian Experience ", Sage Publication, New Delhi.
Narula, Rajesh and S. Lail (eds.) (2006). "Understanding FDI Assisted Economic
Development ", Rutledge, London & New York.
Pradhan, J.P. and P.P. Sahu (2008). "Transnationalization of Indian
Pharmaceutical SMEs", Bookwcll Publishen, New Delhi.
Reekie, W. (1975). "The Economics of the Pharmaceutical Industry", Macmillan,
London.
Singh, R.K. and V.S.Kulkarni (2006). '['DI and Economic Development';
Abhijeet Publication, New Delhi.
Singh, S. (1985). "Multinational Corporation and Indian Drug Industry" Criterion
Publication, New Delhi.
Thakur, Anil Kumar and T.K.Shandilya (2007). "FDI in India, Problems and
Prospects ", Deep and Deep Publication Pvt. Ltd., New Delhi.
Todaro, Michael (1999), "Economic Development", Prentice Hall. Illinois.
Vaitsos, C.V. (1974). "Inter Country Income Distribution and Transnational
Enterprises", Oxford, Clarenden Press.
Theses / Dissertations:
Adil, Maybool (1994). "Flow of Foreign Direct Investment from USA to India",
PhD Thesis, Department of Commerce, AMU, Aligarh.
Ahmad, Khaliq (1985). 'Problems and Prospects of the Heavy Drugs Industry in
India ", M.Phil Dissertation, Department of Commerce, AMU, Aligarh.
Ahmad, Khaliq (1987). "Marketing Strategies of Drugs and Pharmaceutical
Industry in the Public Sector ", Ph.D. Thesis, Department of Commerce, AMU.
Aligarlr.
218

Bibliocraphv
Alam, Qaiser (2004). ''Trends of [DI in Selected Asian Countries during 1990s-
with Special Reference to India ", Ph.D. Thesis, Department of Economics,
AMU, Aligarh.
Chatterjee, Sumana (2009).' An Economic Analysis of Foreign Direct Investment
in Jr idia", Ph.D. "Thesis, Department of Economics, Vadodara, Gujarat.
Gupta, R.K. (1974). "Management of Corporate Earnings in Pharmaceutical
Industry", Ph.D. Thesis, Department of Commerce. University of Delhi, (yew
Delhi.
Hymer, S.H. (1960). The International Operations of National Firms: A Study of
Direct Foreign Investment ", Ph.D. Thesis, Massachusetts Institute of
Technology (Published by NIT Press 1976).
Khan, Mohd. Ahsan (2004). "A Study of Foreign Direct Investment inflows in
Automobile Industries in India since Liberalization ", Ph.D. Thesis, Department
of Commerce, AMU, Aligarh.
Kumar, Nagesh (1980). "Evolution of Direct Foreign Investment in India: A Case
Study of and pharmaceutical Concerns ", M.Phil. Discrtation, Department
of Economics, Delhi School of Economics, University of Delhi, New Delhi.
Naved, Asif (1999). ''Economic Liberalization and Trends in Foreign Direct
Investment in India", Ph.D. Thesis, Department of Commerce, AMU. Aligarh.
Rehmani, Suhel A.K. (2000). "Problems and Prospects of the Foreign Direct
Investment in India (A Case Study of US investment)", Ph.D. Thesis,
Department of Commerce, AMU, Aligarh.
Sahoo, Rajib Kumar (2005). "FDI and Growth of Manufacturing Sector: An
Empirical Study in Post-reform India ", Ph.D. Thesis, Institute of Sociul
Economic Change, Nagarbhawi, Bangalore (September).
219

Bibliography
Singh, Ajit (2000). "Foreign investment in India's Infrastructural Sector since
1991: A Case Study of Power Sector ", Ph.D. Thesis, Department of Commerce,
AMU, Aligarh.
Singh, Neclam (1986). "Foreign Ownership Size and Performance of a firm: A
Case Study of Indian Pharniacewical Industry", Ph.D. Thesis, Department of
Economics, Delhi School of Economics, University of Delhi, New Delhi.
Walia, Mini (2009). "A Study of Patent Law and Policy under WTO Regime with
reference to Pharmaceutical Industry in India", Ph.D. Thesis, Department of
Commerce & Business Studies, Jamia Millia Islamia, New Delhi.
Articles 1 Papers:
Abrol, Dinesh, Pramod Prajapati and Nidhi Singh (2011). "Globalization of the
Indian Pharmaceutical Industry: Implications for the direction, distribution and
diversity in drug innovation ", International Journal of institutions and
Economics, 3(2) (National Institute of Science, Technology and Development
Studies, New Delhi).
Acemoghy Daron, and Joshua Linn (2004), "Market Size in Innovation: Theory
and Evidence from the Pharmaceutical Industry", Quarterly Journal of
Economics. (August).
Agarwal, Abhinav, Kamal Dua, Vaibhav Carg, U.V.S. Sara Akash Taneja
(2006). "Challenges and Opportunities_ for the Indian pharma industry", Health
Administrator, XX (1 &2).
Aggarwal, Aradhna (2004). "Strategic Approach lo Strengthening the
International Competitiveness in the Knowledge Based Industries : The Indian
Pharmaceutical Industry", Research and Information System for the Non-
Aligned and other Developing Countries. Discussion Paper # 8012004, New
Delhi (September).
Aggarwal, Aradhna (2007). Paper presented at the seminar on India and
Globalization: A seminar in Honour of Professor N.S. Siddharthan, New Delhi.
220

Bibliography
Agosin, M.R. and Ricardo Mayer (2000). 'Foreign lntestmeni in Developing
Countries: Does it Crowd in Domestic Investment?", UNCTAD Discussion
Paper 4 146, Geneva, UNCTAD.
Aitken, Brian J. and Ann E. Harrison (1999). 'Do domestic /inns Benefits from
Direct Foreign Inrestment? Evidence from l'enentela ", American Economic
Review, 89.
Amin, B.D. (1939). "The rise and growth of the Alembic Chemical Works'",
Baroda, Alembic Chemical Work.
Anand, Nita (1988). "Drug Research and CSIR, Drugs and Pharmaceuticals:
Industry Highlights", Lucknow (January).
Antonakis, K. (2001). "The dynamics of technological innovation: the case of the
pharmaceutical industry ", Research Policy, 30.
Athreye, S. and Kapur (2001). "Private Foreign Investment in India, Pain or
Panacea?", World Economy, 24.
Athukorala, P., S..Tayasuriya and E. Oczkowski (1995). "Multinational Firma
and Export Performance in Developing Countries: Some Analytical Issues and
New Empirical Evidence ', Journal of Development Economics, 46.
Attaran, A. ( 2004). "How do patents and economic policies affect access to
essential medicines in developing countries? "', Health Affairs 23(3),
Bajpai, N. and J.D. Sachs (2000). " Foreign Direct Investment in India : Issues
and Problems", Harvard Institute for International Development, Development
Discussion Paper #759, Harvard University (March).
Balasubramanyam, V.N. and David Sapsford (2007). "Does India a lot more
FD/? ", Economic and Political Weekly. Sameeksha Trust Publication, Mumbai
XLI1(17).
Baldia, Sonia (2007). "Knowledge Process Outsourcing to India: Important
Considerations for U.S. Companies'', in Doing Business in India: Critical Legal
221

Bibliography
Issues for U.S. Companies, by Ashish S Prasad and Mark L Shwartz, Practicing
Law Institute, New York.
Basu, P., N.C. Nayak. Archana (2007). Foreign Direct Investment in India
Emerging Horizon ", Indian Economic Review, Mumbai, XXXXI 1 (2).
Bergman, Annika (2006). "FDI and Spillover Elfects in the Indian Pharmaceutical
Industry", Research and Information System for the Non-Aligned and other
Developing Countries, Discussion Paper # 113, New Delhi (August).
Biospeetrunt (2008). 'Bethinking R&D", May7,
www.biospectrurn.indiacioLcom/contextibiobusiness/10805076.asp.
Blomstrom, M. and Ari kokko (2005). The Economics of Foreign Direct
Investment", NBER Working Paper n 168, National Bureau of Economic
Research, Cambridge.
Blomstrom, Magnus and Ari Kokko (1997). "Regional integration and Foreign
Direct Investment", World Bank Policy Research, Working Paper # 1750,
Cambridge.
Blomstroin, Magnus, H. Persson (1983). "Foreign investment and Spillover
Efficiency in an Underdeveloped Economy: Evidence from the Mexican
Mamtfacturinglndustry", World Development, 11.
Blumstrom, Magnus, Steven Globerman, An Kokko (1999). "The determinants
of Host Country Spillovers from Foreign Direct Investments: Review and
Synthesis of the Literature", The European Institute of Japanese Studies,
Stockholm School of Economics, Working paper # 76.
Bloodgood, Laura (2007). "Competitive Conditions for Foreign Direct investment
in India", US International Trade Commission, Office of Economics,
Washington DC.
Boddewyn, J.J. (1985). "Theories of Foreign Direct Inr'estment and Disinvestment:
A Classificatory Note ", Management International Review 25(1).
222

Bibliography
Bransteeten, Lee, R.Fisman. C.Foley, and K.Saggi. (2007). "Intellectual
Property Rights, Imitation and Foreign Direct Investment: Theory and
Evidences ", NBER, Working Paper # 13033, National Bureau of Economic
Research, Cambridge.
Budget (2007-08). Ministry of finance. Government of India, New Delhi
wnnv. indi a. bud gct. nic. in.
Business Standard (2011). "Ministries debate FD! in Pharma", 26 April, New
Delhi.
Calvet, A.L. (1981). "A synthesis offoreign direct investment theories and theories
of the multinational firm", Journal of International Business Studies
(Spring/Summer).
Chadha, Alka (2006). "Destination India for the Pharmaceutical Industry", Delhi
Business Review, 7 (1).
Chaturvedi, Ila (2011). ' Role of FDI in Economic Development of India: Sectoral
Analysis ", International Conference on Technology and Business Management,
Jaipuria Institute of Management, Ghaziabad (28-30'" March).
Chaturvedi, Kalpana and Joanna Chatway (2006). "Strategic Integration of
Knowledge in Indian Pharmaceutical firms: creating competencies for
innovation' International Journal Business Innovation and Research, 1(1/2).
Chaturvedi, Kalpana, Joanna Chataway and David Wield (2007). 'Policy,
Markets and Knowledge: Strategic Synergies in Indian Pharmaceutical Firms",
Technology Analysis and Strategic Management, 19 (5).
Chaudhuri, Sudip (1997). "The Evolution of the Indian Pharmaceutical
Industry'. in G.Felker et a]. (eds) The Pharmaceutical Industry in India and
Hungary: Policies, Institutions and Technological Development, World Bank
Technical Paper # 392.
223

Bibliography
Chaudhuri, Shuhham, Pinelopi K. Goldberg, and Panic Jia (2006). "Estimating
the Effects of Global Patent Protection in Phunnaceuticals: A Case Stadv of'
Quinolones in India ', The American Economic Review (American Economic
Association). December, 96(5).
Chaudhuri, Sudip (1984). "Manu/achtring Drugs Without JIVCs: Status of Indigenots Sector in India", Economic and Political Weekly, Sameeksha Trust
Publication, Mumbai, XIX (31, 32, and 33).
Chhihber, Pradeep K., and Sumit K. Majumbdar(1999). "Foreign Ownership
and Profitability: Property Rights, Control, and the Performance of Firms in
Indian Industry", Journal of Law and Economics, The University of Chicago
Press, 42(1) (April).
Coase, R.H. (1937), "The Nature of the Firm ", Economica, 4(16). (November).
Confederation of Indian Industry (2000). Foreign Direct Investment in India:
How can $ 10 billion of Annual Inflows be Realized, New Delhi, (January).
Confederation of Indian Industry (2002). From Crumbs to Riches: Reorienting
Foreign Direct Investment in India. 2002, New Delhi,
Davidson, Larry and Gennadiy Greblov (2005). "The Pharmaceutical Industry in
the Global Economy", Indiana University Kelly School of Business
Bloomington, Indiana.
De Mello, Jr. Lutz R. (1999). "Foreign direct investment-led growth: evidence
from time series and panel data ", Oxford Economic Papers, 51.
Department of Pharmaceutical (2009). Annual Report 2009-10, Ministry of
Chemical and fertilizers, Government of India. New Delhi. www.phamia.nic.in.
224

Bibliography
Ohar, Biswajit and C. Niranjan Rao and Veena Gupta (2002). "Transfer of
Technology for Successful Integration into the Global Economy: A Case Study
of the Pharmaceutical Gtdustrtij in India ", United Nations, New York and
Geneva.
Dhar, Biswajit and Niranjan Rao (2002). "Transfer Technology for Successf el
Integration into the Global Economy: A Case Study of the Indian
Pharmaceutical Industry", IINCTAD Working Paper h 22, United Nations,
Geneva.
DiMasi, J.A., R.W. Hansen, and H.G. Grabowski (2003). "The Price Innovation:
New Estimates of Drug Development Costs'", Journal of Health Economics,
22(2).
Directory of Pharmaceutical Manufacturing Units in India (2007), National
Pharmaceutical Pricing Authority, Government of India, New Delhi.
httpJlwww.nppaiiidia.tuc_in.
Doing Business Report (2011). World Bank, Washington DC.
Dubey, D.P. (1996). "Globalization and its Impact on the Indian Pharmaceutical
indzisirv"", www.revolutionarydemocracy.orgirdv5nl,'phannacy.htm .
Dunning, J.H. & A.M. Rugman (1985). "The Injl once ofHwners Dissertation on
the Theory of Foreign Direct Investment", American Economic Review, 75(2).
Dunning, J.H. (1981). "Explaining the International Direct Investment Position of Countries: Towards a Dynamic or Developmental Approach
weltwirtschaftliches Archiv. 117.
Dunning, John H. (1979). "Explaining Changing Pattern of International
Production in Defence of Eclectic Approach ', Oxford Bulletin of Economics
and Statistics, 41.
225

Bibliography
Dunning, John H. (1988). "The Eclectic Paradigm of International Production-A
Restatement and Some Possible Extension", Journal of International Business
Studies, 19 (spring).
Duperon, Wiltiom O. and E. Mine Cinar (2010). "Global Competition Versus
Regional Interest: FDI and Pharmaceuticals in India", Journal of International
Commercial Law and Technology, 5(4).
Economist (2005). "Prescription for Change: A Survey of Pharmaceuticals
Economist, 18-24 (June).
Economist Intelligence Unit (2011). "World investment prospects to 2011-
Foreign direct investment and the challenge of political risk", Written with the
Columbia Program on International fnvestment,CEl-DR,Dominican Republic
Export & investment Centre.wwwcei-rd.gov.do
Ernst & Young (2010). "Doing Business in India ". Ernst &Yong Pvt Ltd, Kolkata,
www.ey.com/india.
Expert—Import Bank of India (2007). 'Indian Pharmaceutical Industry, Surging
Globally`, Occasional Paper # 119, Quest Publication (August).
Express Pharma (2007). "Shaping SEZ", 16-31 December, Fortnightly insight for
pharma professionals. www.expresspharmaonline.com.
Express Pharma (2008). "Budget Speak 2008-09", 16-31, March, Fortnightly
insight for pharma professionals. www.expresspharmaonline.
Express Pharma (2010). 'India's CIS business meet held in Mutnbai", 1-15
August. Fortnightly insight for pharma professionals.
www express pharm a. on l i n e. corn.
Express Pharma (20111a). ".Strategic Partners in Prosperity: All LRAM Med up ".
Fortnightly insight for Pharma Professionals, 16-31
July. www.expresspharma. online. corn.
226

Bibliography
Express Pharma (2011). "Cap on [DI in phania industry- Is it necessary? ", 1-15
February, Fortnightly insight for phanna professionals,
www.expresspharinaonline.com.
Federation of Indian Chambers of Commerce & Industry (2001). "Ihe
Experience of Foreign Direct Investors in India ", New Delhi (April).
Feinberg, Susan E. and Sumit K. Majumdar (2001). "Technology spillovers from
Foreign Direct Investment in the Indian Pharmaceutical Industry", Journal of
International Business Studies, Third Quarter, 32(3).
Felker, Greg. Shekhar Chauduri, Katalin Gyorgy (1997). The Pharmaceutical
Industry in India and Hungary-Policies: Institutions and Technological
Development". World Bank paper # 392.
FICCI (2005). "Competitiveness of the Indian pharmaceutical industry in the new
product parent Regime", FICCI Report for National Competitiveness Council,
New Delhi (March).
Fink, C. (2000). "How stronger patent protection in India might affect the
behaviour of transnational pharmaceutical industries ", working paper # 2352,
World Bank Washington, D.C.
Flowers, E. B. (1976). ' Oligopolistic Reactions in European and Canadian Direct
Investment in the United States ", Journal of International Business Studies, 7.
Fry, Maxwell J. (1993). "Foreign Direct Investment in a Macro Economic
Framework — Finance, Efficiency, Incentives and Distortions ", World Bank,
Policy Research Working paper, 4 1141, Washington D.C.
Glass, Amy Jocelyn and Kamal Saggi (2002). "Intellectual Property Rights and
Foreign Direct Investment', Journal of International Economics, 56.
Global Business Policy Council (2001). "[DI Confidence Audit: India",
Alxandric, Virginia, A.T. Kearney, Inc., USA.
Global Business Policy Council (2005). "FDI Confidence Index ", 8, GBPC.
227

Bibliography
Grabowski, Henry (2002). "Patents, Innovation and Access to New Medicines",
Journal of International Economic Law, 5(4), December.
Grace, Cheri (2004). The Effect of Changing intellectual Properiv on
Pharmaceutical Indusrry Prospects in India and China. Considerations for
Access to Medicines'', Government. Department for International Development,
DFID Health Systems Resource Centre, London, Fretwells Ltd.
Graham, Edward M. (1974). "Oligopolistic reaction and European direct
investment in the Uniled States", Harvard Business School.
Graham, Edward M. and Paul R. Krugman (1989). "Foreign Direct Investment
in U.S. ", Washington Institute for International Economies.
Gupta, S., H. Davoudi, and E. Tiungson (2000). "Corruption and the Provision of
Health Care and Education Services', IMF Working Paper # 116, Washington:
International Monetary Fund.
Gupta, S., H. Davoodi, and R. Alonso-Terme, (1998). 'Does Corruption Affect
Income Inequality and Poverty? IMF Working Paper # 76, Washington,
International Monetary Fund.
Hamied, Y.K. (1993). "Patens and the Pharmaceutical industry: A Review 'l
Presentation at the international conference on patents regime, Cipla Ltd, New
Delhi.
Handa, Kewal (2011). "Should FDI in pharma be regulated? ", 8Ih April, Financial
Express.
Hasan, R., D. Mitra and K. V. Ramaswamy ( 2003). "Trade Reforms. Labor
Regulations and Labor- Demand Elasticities: Evidence from India", NBER
Working Paper 9879, (July).
Haskel, E. Jonathan, C.S. Pereria, and J.M. Slaughter (2004). "Does Innard
Foreign Direct Investment Boost the Productivity of the Dontestfe Firms'
228
Bibltagrnphv
NBER. Working Paper # '8724, National Bureau of Economic Research,
Cambridge.
Hathi Committee (1975). "Report of the committee on Drugs and Pharmaceuticals
Industry", Ministry of Petroleum and Chemical, New Delhi.
Helpman, E. and P.R. Krugman (1985). "Market Structure and Foreign Trade",
The Massachusetts Institute of Technology Press, Cambridge.
Helpman, Elhanan (2006). "Trade, FIJI and the organization of Jirms ". Journal of
Economic Literature, XLJV(3).
Henrik, Hansen and Rand John (2006). "On the Causal Links between FIJI and
Growth in Developing Countries ", World Economy, 29.
Hu, Peng (2006). ' India's Suitability for Foreign Direct Investment'1 Working
Paper # 553. International Business with Special Reference to India, University
of Arizona.
Husain, Shahbaaz (2012). "Foreign Direct Investment in Indian Pharmaceutical
Industry ", Research Paper. Symbiosis Law School. Pone (I 01h January).
Hymer, S. H. (1976). "The international operations of national firms: A study of
direct foreign investment ". Cambridge, MA: MIT Press (1960).
IBEF & Ernst & Young (2010), 'Pharmaceuticals ', April,Haryana.www.ibef.org.
IBEF (2(08). "Pharmaceuticals: December, 2008", Indian Brand Equity
Foundation (www.ibef.org).
IBEF (2010). "Pharmaceuticals", April, Indian Brand Equity Foundation.
www.ibef.org,
ICRA (2002). "ICR/ Industry Watch Series -The Indian Pharmaceutical Industry',
compiled by ICRA Information Services, ICRA, Mumbai.
229

Bibliography
ICRA Ltd. (2004). "Industry Watch- The Indian Pharmaceutical Industry
Information and Credit Rating Agency, New Delhi.
Idea & Insights (2011). "Did liberalization help India's Pharma Indusiry?", April,
Indian Institute of Management , Bangalore.
IN1F (2004). "Foreign Direct Investments, hrends, Data Availability, Concepts and
Recording Practices", IMF, 9(I ' February, (online).
India Intoline (2000). "Contract manfacturing: Growth Engine for Indian
Pharma Companies?', 16'" August .
India Infoline (2004). "Dr. Reddy's Research Foundation Pharmacophore",
Address by K.A. Reddy, 17 t̀' January.
http;Uwww.indiainfoline.conr/nevi,rere.htmi.
lyer, Pary athi. K.(2008). "Structure and Performance of Small and Medium Scale
Pharmaceutical Firms", S&T and Industry, India, Science and Technology.
James, B.G. (1977). "The Future of Multinational Pharmaceutical Industry in
1990", Associated Business Programmes Ltd. London.
Jayasuriya, D.C. (1985). "Regulation of Pharmaceuticals in developing countries
Legal Issues and Approaches", WHO, Geneva.
Jha, Ravinder (2007). "Options for Indian Pharmaceutical Industry in the
Changing Environment", Economic and Political Weekly, Sameeksha Trust
Publication, Mwnbai, XLII (39).
Johnson, Andreas (2004). "The Effects ofFD!Jnflow.s on Host Country Economic
Growth ". http://www.infra.kth.se\cesis\rescarch\publications\working
Joseph, Reji K. (21011). The R&D Scenario in Indian Pharmaceutical Industry
R1S DP`y176, Research and information System for Developing Countries, New
Delhi (December).
230

Bibllo,erapin'
Joshi, Hemant N. (2003). "Analysis of the Indian Pharmaceutical Industry: With
Emphasis on Opportunities in 2005 ". Pharmaceutical Technology (January).
Kalsekar, Maliesh (2003). 'the Indian Pharmaceuticals Market — An Overview ,
ORG-MARG. AC Nielson. Mumbai.
Kathuria,V. (2002). Liberalization, ED! and Productivity Spillover: An Analysis
of Indian Manufacturing Firms", Oxford Economic Paper, 54(4).
Katrak, H. (1985). "Imported technology, enterprise size and R&D in a newly
industrializing country: The Indian experience ", Oxford Bulletin of Economics
and Statistics (August).
Katrak, H. (1989). 'Imported technologies and R&D in a newly industrializing
country: the experience of Indian enterprises", Journal of Development
Economics, 31 (1).
Katrak, H. (1990). 'Imports of technology and the technological effort of Indian
enterprises", World Development, 18(3).
Khan, A.Q. (1999). "Emerging Dimensions of Global Fund Flows Management. A
Focus on India", Unpublished Project, Department of Commerce AMU,
Aligarh,
Kiran, Ravi and Sunita Mishra (2009). 'Performance of the Indian
Pharmaceutical Industry in Post TRIPS Period: A Firm Level Analysis",
International Review of Business Research Paper, Nonmember, 5(6).
Kirim, A.S. (1985). "Reconsidering Patents and Economic Development: A case
study of the Turkish Pharmaceutical Industry", World Development, 13(2)
(February).
KMPC (2008). "Investing in India ", KPMG_inIndia, in.kpmg.com.
Knickerbocker, Fredric T. (1973). ° Oligopolistic Reaction and hfndtinational
Enterprises. Boston: Division of Research ", Harvard University Press, Graduate School of Business Administration.
231
Bibliography
Knowledge/Wharton (2006). Where will Indian Drug Companies be in Five
Years? Everywhere - If They Innovate ", Report Prepared by
Knowledgc((yWhadon in collaboration with Bain & Company, at <www. Bain.
com' bainweb/ pdfs / ems /marketing
bain"/%201ndia%2OPharma%20FINAL%203-21 06.pdfl, accessed 16 September
2006.
Kojima, Kiyoshi and, Turutomo Onawa (1984). "Micro and Macro-Economic
Model of Direct Foreign Investment towards a Synthesis", Hitotsuabashi
Journal of Economics, 25 (June 25).
Kokko, A., Ruben Tansini and Mario C. Zejan (1996). "Local Technological
Capacity and Productivity Spillovers from FDI in the Uruguayan
Manufacturing Sector', The Journal of Development Studies, 32(4).
Kumar, N. and M. Saqib (1996). "Firm size, opporhmfties for adaptation and in-
house R&D activity in developing countries: the case of Indian manufacturing';
Research Policy, 25(5).
Kumar, Nagesh (1991). "Mode of rivalry and comparative behaviour of
multinational and local enterprises: The case of Indian manufacturing ", Journal
of Development Economics, 35.
Kumar, Nagesh (1998). "Liberalization and Changing Patterns of Foreign Direct
Investments Has India's Relative Attractiveness as a Host of FDI Improved? ",
Economic and Political Weekly, Samccksha Trust Publication, Mumbai, 33(22).
Kumar, Nagesh (2001). ''Infrastructure Availability FDI Inflows and their Export
Orientation: A Cross Country Exploration ", Research and Information System
for Developing Countries fl 1.2 (20i November).
Kumar, Nagesh (2001 a). ` WTO Regime, Hot Country Policies and Global
Patterns of MNE actiri(v: Recent Quantitative Studies and India's Strategic
Response", Economic and Political Weekly, Sameeksha Trust Publication,
Mumbai, XXX V I(1).
1'1

/3!l)iV) rrplry
Kumar, Nagesh (2003). "Intellectual Property Rights, Technology and Economic
Development. Experiences of Asian Countries ", Economic and Political
Weekly, Sameeksha Trust Publication, Mumbai, XXXVIII (3).
Kumar, Nagesh (2005). "Liberalization, Foreign Direct Investment Flows &
Development: Indian Experience in the 1990s'. Economic and Political Weekly,
Sameeksha Trust Publication, Mumbai XXXX (14).
Kumar, Nagesh and Jaya Prakask Pradhan (2002). "Foreign Direct Investment,
Externalities and Economic Growth in Developing Countries: Some Empirical
Explorations and Implications for WTO Negotiations on Investment", Research
and Information System for Developing Countries Discussion Paper 4 27/2002.
Kumari, Anita (2007). "Liberalization, TRIPS and Technological Behaviofur of Firms in Indian Pharmaceutical Industry ", International Review of Business Research Papers, 3 (1) (March).
Lalitha, N. (2002). "Indian Pharmaceutical Industry in WTO Regime: A SWOT
Analysis ", Economic and Political Weekly, Sameeksha Trust Publication,
Mumbai XXXVII (34).
Lalitha, N. (2002a). "TRIPS and Pharmaceutical Industry: issues of Strategic Importance", Review of Development and Change, I (7).
Lall, S. and P. Streeten (1977). "Foreign Investment Transnational's and
Developing Countries ", Macmillan, London.
Lall, Sanjay (1974). 'International Pharmaceutical Industry and Less Developed
Countries: 1I-Costs and alternatives", Economic and Political Weekly,
Sameeksha Trust Publication, Mumbai IX (4R).
Lanoszka, Anna (2003). "The Global Politics of Intellectual Property Rights and
Pharmaceutical Drug Policies in Developing Countries ", International Political
Science Review, Sage Publications 24 (2) (April).
233

Bih flu LU -'
Laura, Alfaro (2003). "Foreign Direct Investment and Growth: Does the Sector
Matter?", Ifarvard Business School (April).
Li, Ling, Lan Kang and Shilpa Genrela (2008). "China Versus India— Reality
Check for Pharma R&D", The KomwFerry International.
www.kornferryasia.com.
Lizondo, Saul J. (1991). "Foreign Direct Investment, in Occasional Paper 77, A
Study by the Research Department of the IMF (March).
Lyamota, Koji (2003). 'human Capital Formation and FDI in Developing
Countries", OECD Working Paper 4 211, OECD Development Centre.
Mansfield, E. (1994). "Intellectual Property Protection Foreign Direct Investment
and Technology Transfer", IFC Discussion Paper 19, Washington D.C., World
Bank.
Markusen, J.R. (1995). The Boundaries ofAINEs and the Theory of International
Trade ", Joumal of Economic Perspective 9.
Markusen, J.R. and A.J. Venables (1997). "Foreign Direct Investment as a
Catalyst for Industrial Development", National Bureau of Economic Research,
1050 Massachusetts Avenue, Cambridge.
Mashelkar Committee (2003). "Report of the Export Committee on a
comprehensive examination of Drug Regulatory Issues, Including the problem
of spurious drugs ', New Delhi, Government of India, Ministry of Health and
Family Welfare, Para 6.3.4.
Maskus, Keith (1998). "The Role of IPRs in Emerging FDI and Technology
Transfer. In Strengthening IPRs in Asia: Implications for Australia ", Australian
Economic Paper 4 346, University of Colorado, Australia.
Mathiyazhagan, Maathai K. and Dukhabandhu Sahoo (2008). "Do Foreign
Direct Investment Tnfox;s Benefits the Major Sectors in India? ", ISAS Working
Paper if 38, National University of Singapore (NUS), Singapore (18 h̀ February).
234

Bibliography
Mayaram, Arvind (2004). 'Don't let go of the foreign Hand", The Economic
Times, 6th August.
McKinsey & Company (2001). Achieving Quantum Leap in India's FDI,
McKinsey Global Institute, New York (June).
McKinsey & Company (2001a). Identifying the Barriers to Rapid Employment
and Output Growth in India, McKinsey Global Institute, New York (June).
Ministry of Petroleum and Chemicals (1971). "Drugs Prices Control: Aims &
Achievements"', Government of India, New Delhi.
blohiuddin, Yasmin (2003). "Foreign Direct Investment: A Comparison of India
and China'. International Seminar on Business Education in the New
Millennium, held at Department of Commerce, AMU, Aligarh (March P'
Moon, Hwy-Chang and Thomas W. Roeh] (2001). "Unconventional foreign
direct investment and the imbalance theory', International Business Review 10.
Nair, M.D. (2011). "Fast Emerging Trends in the Global Pharmaceutical
industry 'The Pharma review, Kongposh publication Pvt. Ltd, New Delhi
(November- December).
Narayana, P.L. (1984). 'The Indian Pharmaceutical Industry: Problems and
Prospects", National Council of Applied Economic Research (NCAER), New
Delhi.
National Pharmaceutical Policy (2006), Department of Chemical and
Petrochemicals, Government of India, 2005, Part-A (28's December).
Nayyar, Deepak (1978). "T'ransnationad Corporation and Manufactured Exports
from the poor countries ", The Economic Journal.
Nigel Pain & Wakclin Katharine (1998). "Export Performance and the Role of
Foreign Direct Investment", The Manchester School, 66.
235

Bibliography
NIIICl4I (1999). "Factors affecting the growth of prescription drugs expenditures;
Issue brief', Ministry of Health & Family Welfare, National institute of Health
Care Management Foundation (July).
Norgue, J. (1990). ''Parents and pharmaceuticals Drugs; Understanding the
Pressures on developing countries ", Journal of world Trade, World Bank
Washington 24(6).
OPPI (2005). "Speech of the Persident Mr. Ranjit Shahani ", 39th Annual General
Meeting, Mumbai (September 241h ).
ORC-%IARC (2004). "ORG [MS Retail Store Audit for Pharmaceutical Products
in India ", ORG-MARL Private Limited, AC Nielson, December, Baroda.
Patnaik, Anahadhya, Kshitij Chanana, Nakul Kapoor Praful Singhal and
Sudhanshu Pandey (2009). "Indian Pharmaceutical Sector". Project Report;
Managerial Economics, IBS Hyderabad (l0" September).
Pharmaceutical Policy (2002). Department of Chemical and Fertilizer,
Government of India, New Delhi.
Pradhan, J.P. (2002). "FDI spillovers and local productivity growth evidence from
Indian pharmaceutical Industry', Artha Vijnana, XLIV (3-4) & MPRA Paper #
17080 (September).
Pradhan, J.P. (2003). "Liberalization firm Size and R&D Performance: A Firm
Level Study of Indian Pharmaceutical Industry", Research and Information
System for the Non-Aligned and other Developing Countries, Discussion Paper
# 40/2003, New Delhi.
Pradhan, J.P. (2006). "Global competitiveness of Indian pharmaceutical Industry.
Trends and Strategies", ISID Working paper 2006/05, New Delhi (June).
Pradhan, .J.P. (2006). "Quality of foreign direct investment, knowledge spillovers
and host country productivity". ISID Working Paper # 2006 /09, Institute for
Studies in Industrial Development, New Delhi,
236

Bibliographv
Pradhan. J.Y. and :Ahhinav Alakshendra (2006). "Overseas acquisition versus
Greenlield . forei n inrc'stment — which Inter nationalization strategy is better for
Indian pharmaceutical Enterprises ", ISID working paper 2006:07, Institute for
Studies in Industrial Development. New Delhi (August) .
Pradhan, J.P., Keshab Das and \Iahua Paul (2006). "Export-Orientation of
Foreign Manufacturing A/Jiliates in India: Factors, Tendencies and
Implications ", ISID Working Paper 2006/08, Institute of Studies in Industrial
Development, New Delhi (August).
Pratiyogita Darpan (2009). "General Studies: Indian economy". Upkar
Publications. Agra.
Priolkar Subodh (2009). "Can India be Pharmaceutical Superpower in 2020? ",
Pharma Times, 41(1) (January).
Rai, Rajnish Kumar (2009). "Effects of the JRIPs Mandated Intellectual Property
Rights on Foreign Direct Investment in Developing Countries: A case study of
the Indian Pharmaceutical industry ". The Journal of World Intellectual
Property, 11(5-6). http:f"dx.doi.org,' 10.1111/j. 1747-1 796.2008.00340.x.
Raizada B. (2002). "intellectual Property, Technology and Policy Framework -
Experience of India in the Pharmaceutical Sector ", Document prepared for the
WIPO national Seminar on Industrial Property and the Patent Cooperation
Treaty (PCT) organized by the World Intellectual Property Organization
(WIPO) in cooperation with the Republic of Mauritius Port-Louis (15 h̀ and 16 h̀
July).
Rao, K.S., M.R. Chalapati, Murthy and K.V.K. Ranganathan (1999). "Foreign
Direct Investments in the Post Liberalization Period: An Overview ", Journal of
Indian School of Political Economy. ISID. New Delhi. 1 1(3) (July-September).
Rau, B.S. and P.V. Appaji (2012). Global Pharmaceutical Trade and
Contribution of India ". The Phanna review, Kongposh publication Pvt. Ltd,
New Delhi
237

Bibliogrnplry
Ray, Tapan (2010). Indian Pharmaceutical Market in a New Paradigm :Win
some and Win some more'", Director General Organization of Pharmaceutical
Producers of India, Dill- 10th Life Science & Healthcare Conference &
Workshop 21' —23"d September. Dubai.
Report (2006). ''Impact of TRIPS on pharmaceutical price. with Specific focus on
generics in India ", NIPER, Project under the work plan of the WHO Biennium
2004-05 and ministry of Health and family welfare, Government of India (22
April).
Report of the Steering Group on FBI (2002). Planning Commission, Government
of India, Academic Foundation Publication, New Delhi.
Robert, Tancer (1999). "Investing in the Pharmaceutical Industry, The American
School of International Management.
Robin, M. Leichenko & A. Erickson Rodney (1997). "Foreign Direct Investment
and .State Export Performance ". Journal of Regional Science, 37.
Romer, Paul M. (1993). "Idea Gaps and Objects Gaps in Economic
Development". Journal of Monetary Economics, 32.
Roumeliotis Gregouy (2006). "India geared up for unprecedented manufacturing
growth ", in Pharma Technology. Corn (15ih August).
Rugman, Alan M. (1980). `International as a General Theory of Foreign Direct
Investment. A Re-appraisal of the Literature"", Wcltwirtschaftliches Archive,
116, Hell 2.
Sagar, B.P.S., R. Zafar and Aklavya Singh (2006). "'Counterfeit, Jake and
Spurious Drugs ", Health administrator, XIX (1).
Sakakibara, Mariko and Lee Branstetter (2001). ' Do stronger patent induce
more innovation? Evidence /ion the 1988 Japanese Patent law reforms
Journal of Economics, 32(1) (spring).
238
Bibliography
Scherer, Frederic M. (1993). "Pricing, Profits, and Technological Progress in the
Pharmaceutical Industry ", Journal of Economic Perspectives, 7(3) (summer).
Schneider, F. and B. Frey (1985). "Economic and Political Determinants of Foreign Direct Investment ", World Development, 13.
Sengupta, N.K., A. Banik and R. Kathuria (1997). "Qualitative Aspects of FDI
Inflows: The Case ofIndia ", The Economic Times, 7"' January.
Serven, Luis and Soliman Andres (1992). "Private investment and macro
economic adjustment —A Survey ", World Bank Research Observer, 7.
Shanmugasundaram, G. (2011), "Foreign Direct Invesimen! and Small Scale
Drug Inductty in India", The Pharma review, Kongposh publication Pvt. Ltd,
New Delhi (May-June).
Sharma, K. (2000). "Export Growth in India: Has FDI Played a Role?",
Economic Growth Centre Discussion Paper #816, Yale University.
Singh, Kulwinder (2005). "Foreign Direct Investment in India: A Critical Analysis
of FDI From 1991-2005", Centre for Civil Society, Research internship
Programme. New Delhi.
Singh, Malvinder Mohan (2006). "Will India become the global centre for
pharmaceutical research & development? ", Journal of Generic Medicines: The
Business Journal for the Generic Medicines Sector DOI:
10.1057/palgrave.jgm.4940119 ,3 (3); 194-200, Sage Publication, New Delhi.
http://jgtn.sagepub.com/content/3/3/ 194.
Sjoholm, F. (1999). "Technology, Gap, Competition and .Spillover from Direct
Foreign Investment: Evidence from Establishment Dala", The Journal of
Development Studies, 36(l) (October).
Sriuivasan, S. (2011). "Dangers of FD] in pharma`, October 13, Business Line,
The Hindu.
239

Biblio¢raphv
Sun, Huishun (2001). "Foreign Direct Investment and Regional Export
Peformance in China ", Journal of Regional Science, 41.
'lanzi, V. and H. Davoodi (1997). "Corruption, Pnhlic Investment and Growth",
IMF Working Paper # 139. Washington, International Monetary Fund.
Topalova, P. (2004). 'trade Liberalization and fnn productivity: the case of India", LMF Working Paper WP/04128.
Tripatby, Ishita G, Surendra S. Yadav and Seems Sharma. (2011). -EDT
Inflows into Indian Pharmaceutical Industry: An Analysis of Trends and
Constraints'. Journal of Intellectual Property Rights (16 h̀ July).
Tsai, Pan-Long (1991). "Determinants of'FD1 in Taiwan: an Alternative Approach
with Time Series data ", World Development, 14.
Tybout, J. and M. Westbrook (1995). "Trade Liberalization and the Dimensions
of Efficiency Change in the Mexican Manufacturing Industries", Journal of
International Economics, 39.
1T CTAD (2007). "World Investment Prospects Survey 2007-09", New York and
Geneva, United Nations.
Unel, Bulent (2003). "Productivity Trends in India's Manufacturing Sectors in the
Last Two Decade", IMF Working Paper, WP/03/22.
Vachani, Sushil (1997). "Economic liberalization's effect on sources of competitive
advantage of different groups of companies: The case of India ", International
Business Review, 6(2) (April).
Vernon, Reynold (1966). "International Investment and International "Trade in the
Produce Cycle'. Quarterly Journal of Economics, 80. (May).
Wheeler Avid and Mody Ashoka (1992), "International Investment location
Decisions_ The case of US /inns ". Journal of International Economics, 33.
240

Biblio, rn,nln
World Bank (1997). "_Malaysia Enterprise Training, Technology and
Productivity ", A world bank Country Study, Washington DC.
World Economic Forum (2008). The Global Competitiveness Report ", 2007-
2008.
World Investment Report (1995). "Transnational Corporations and
Competitiveness ', UNCTAD, New York and Geneva, United Nations.
World Investment report (1999). "FDI and the Challenges of Development
UNCTAD, New York.
World Investment Report (2001). ''Promoting linkages'". UNCTAD, New York
and Geneva, United Nations.
World Investment Report (2003). 'FDI Policies for Development: National and
International Perspective", UNCTAD, New York and Geneva, United Nations.
World Investment Report (2004). "The shift towards services'", UNCTAD, New
York and Geneva, United Nations.
World Investment Report (2008). "Transnational Corporations and the
Infrastructure Challenge ", UNCTAD, New York and Geneva, United Nations.
World Investment Report (2009). "Transnatlonal Corporations, Agricultural
Production and Development", UNCTAD, New York and Geneva, United
Nations_
World Trade Organization (2009). 'International Trade Statistics", Annual
Trade Statistics, Statistics Database, World Trade Organization, Geneva,
World Trade organization (2010). "International Trade Statistics 2010'", ISBN
978-92-870-3739-8 Switzerland. www.wto.org.
Yes Bank and OPP] Report (2009). "'Indian Pharmaceutical Industry: vision
2015 ", Yes Bank Ltd. & OPPI, Mumbai.
241

Bibliography
Websites:
http://dipp.nic.in
http://dipp.nic.in/fdi_statisties/india_fdi index.him
http://en.wikipedia.org
http://finmin. rile. in/capital market/capital market, asp
http ;//planningcommission.gov.in
http://wwwficci.org.in.
http://www.ibef.org
http://www.indianindusiry.com
http://www.startbizindia.in/indiafdi_ trend.php
www.amezon.com
www.dtreddys.com
www.expressphanna.online.com.
www indiabudget.nic.in
www. industrychauuel.com
www.lupin.com
www p i ram al heal thcare. corn
www.ranbaxy.com
www.sunpharma.com
www.uuctad.org
www.wockhardt.com
242

Appendix-I: Sector-specific policy for FDI- At a glance.
In the following sectors/activities, FDI is allowed up-to the litnit indicated below subject to other conditions as indicated (31 March 2008).Sectorgl limits on FDI (2008). Sr. No. Q
Q — W >.
c
v°¢ v' I Agriculture
1. Floriculture, Autom Horticulture, 100% atic Development of Seeds, Animal Husbandry, Pisciculture, Aqua- culture and Cultivation of Vegetables & Mushrooms under controlled conditions and services related to agro and allied sectors. Note: Besides the above, FDI is not allowed in any other agricultural sector/activity _
2. Tea Sector, including Subject to divestment of 26% tea plantation 100% FIBP equity in favour of Indian
partner/lndian public within 5 Note: Besides the above, years and prior approval of FDI is not allowed in any State Government concerned other plantation in case of any change in sector/activity future land use.
II Industry li A Mining 3. Mining covering Subject to Mines & Minerals
exploration and 100% Autom (Development & Regulation) mining of diamonds & ado Act, 1957 www.minesnic.in precious stones; gold, Press Note 18 (1998) and silver and minerals. Press Note 1 (2005) are not
applicable for setting up 100% owned subsidiaries in so far as the mining sector is concerned, subject to a declaration from the applicant that he has no existing joint venture for the same area and /or the particular mineral.
xix

4. Coal & Lignite mining Subject to provisions of Coal for captive 100% Autom Mines (Nationalization) Act, consumption by power atic 1973 projects, www.coal.nic.in and iron & steel, cement production and other eligible activities permitted under the Coal Mines (Nationalization) Act, 1973.
5. Mining and mineral Subject to sectoral separation of titanium 100% FIPB regulations and the Mines bearing minerals and and Minerals (Development ores, its value addition & Regulation) Act, 1957 and and integrated activities, the following conditions- Note: FDI will not be allowed in mining of i. value addition facilities are "prescribed substances" set up within India along with listed in Government of transfer of technology; India notification No. ii. disposal of tailing during S.O. 61(E) dt. 18.1.2006 the mineral separation shall issued by the Department be carried out in accordance of Atomic Energy under with regulations framed by the Atomic Energy Act, the Atomic Energy 1962. Regulatory Board such
Atomic Energy (Radiation Protection) Rules 2004 and the Atomic Energy (Safe Disposal of Radioactive Wastes) Rules 1987.
II B Manufacturing
6. Alcohol- Distillation & 100% Autom Subject to license by Brewing atic appropriate authorit
7. Cigars & Cigarettes- 100% FIPB Subject to industrial license Manufacture under the Industries
(Development & Regulation) Act, 1951
8. Coffee& Rubber 100% Autom processing & atic warehousing
9. Defence production 26% FIPB Subject to licensing under Industries (Development & Regulation) Act, 1951 and guidelines on FOE in production of arms & a11111111n1tion.
xx

10. Hazardous chemicals. 100% Autom Subject to industrial license viz.. hydrocyanic acid atic under the Industries and its derivatives: (Development & Regulation) phosgene and its Act, 1951 and other sectoral derivatives; and regulations isocyanatcs and diisocyantes of hydrocarbon.
11. Industrial explosives - 100% Autom Subject to industrial license Manufacture atic under Industries
(Development & Regulation) Act, 1951 and regulations under Explosives Act, 1898
12. Drugs & 100% Autom Pharmaceuticals atic including those involving use of recombinant DNA technology
11 C Power
13, Power including 100% Autom Subject to provisions of the generation (except atic Electricity Act, 2003 Atomic energy); www.00wermin.nic.in transmission, distribution and Power Trading.
III Services
14. Civil Aviation Sector
(i) Airports-
a. Greenfield projects 100% Autom Subject to sectoral atic regulations notified by
Ministry of Civil Aviation www civilaviation.nic. in
h. Existing projects 100% FIPB Subject to sectoral beyond regulations notified by
74% Ministry of Civil Aviation www.civilaviation.nic. in
(ii) Air Transport Services including Domestic Scheduled Passenger Airlines; Non-Schedules Airlines; Chartered Airlines: Cargo Airlines; Helicopter and Seaplane Services
C. Scheduled Air Transport 49%- Autom Subject to no direct or Services/ Domestic FD[; atic indirect participation by Scheduled Passenger 100%- foreign airlines and sectoral Airline for regulations.
NRI investme fit
Xxi

d. Non-Scheduled Air 74°- Autom Subject to no direct or Transport Service Non- FDI atic indirect participation by Scheduled airlines. l00° - t()reign airlines in Non- Chartered airlines, and ti)r NRIs Scheduled and Chartered Cargo airline~ investme airlines. Foreign airlines are
nt allowed to participate in the equity of companies operating Cargo airlines. Also subject to sectoral regulations.
e. Helicopter 100% Autom Foreign airlines are allowed Services/Seaplane atic to participate in the equity of services requiring companies operating DGCA approval Helicopter and seaplane
airlines. Also subject to sectoral regulations.
(iii) Other services under Civil Aviation Sector
f. Ground Handling 74%- Autom Subject to sectoral Services FDI atic regulations and security
100%- clearance. for NRIs investme lit
g. Maintenance and Repair 100% Autom organizations, flying atic training institutes; and technical training institutions
15. Asset Reconstruction 49% FIPB Where any individual Companies (only investment exceeds 10% of
FDI) the equity, provisions of Section 3(3)(t) of Securitization and Reconstruction of Financial Assets and Enforcement of Security Interest Act, 2002 should be complied with. www.finmin.nic.in
16. Banking - Private sector 74% Autom Subject to guidelines for (FDI+FII atic setting up branches /
subsidiaries of foreign banks issued by RBI.

17. Broadcasting
a. FM Radio FDI +FII FIPB Subject to Guidelines notified investme by Ministry of Int'Ormation &
nt Broadcasting. up to www.mib.nic.in 20%
b. Cable network 49% FIPB Subject to Cable Television (FDI+FII Network Rules (1994)
Notified by Ministry of Information & Broadcasting. www.mib.nic.in
c. Direct-To-Home 49% FIPB Subject to guidelines issued (FDI+FII by Ministry of Information &
Broadcasting. Within www.mib.nic.in this limit, FDI compone nt not to exceed 20%
d. Setting up 49% FIPB Subject to Up-linking Policy hardware facilities (FDI+FII notified by Ministry of such as up-linking, ) Information & Broadcasting. HUB, etc www.mib.nic.in
e. Up-linking a News 26% FIPB Subject to guidelines issued & Current Affairs FDI+FII by Ministry of Information & TV Channel Broadcasting.
www.mib.nic.in f. Up-linking a Non- 100% FIPB Subject to guidelines issued
news & Current by Ministry of Information & Affairs TV Broadcasting. Channel www.mib.nic.in
18. Commodity Exchanges 49%(FD FIPB FII purchases shall be I+FII) restricted to secondary Investme market only. nt by No foreign investor/entity, Register including persons acting in ed FII concert, will hold more than under 5% of the equity in these PIS will companies. be limited to 23°,'0
and investme nt under FDI

canying packages, parcels and other items which do not come within the ambit of the Indian Post Office Act, 1898.
21. Credit Information Companies
Scheme limited to 26%.
19. Construction 100% Autom Development projects, atic including housing, commercial premises, resorts, educational institutions, recreational facilities, city and regional level infrastructure, townships.
Note:: FDl is not allowed in Real Estate , Business i
Subject to conditions notified vide Press Note 2 (2005 Series) including: a. minimum capitalization of US$ 10 million for wholly owned subsidiaries and i.S$ 5 million for joint venture. The funds would have to be brought within six months of commencement of business of the Company.
b. Minimum area to be developed under each project- 10 hectares in case of development of serviced housing plots; and built-up area of 50,000 sq. mts. in case of construction development project; and any of the above in case of a combination project.
[Note 1: For investment by NRls. the conditions mentioned in Press Note 2 2005 are not applicable. Note 2: For investment in SEZs, Hotels & Hospitals, conditions mentioned in Press Note 2(2005) are not
Subject to existing laws and exclusion of activity relating to distribution of letters, which is exclusively reserved for the State. www.indiapost. gov.in
49 % FIPB Foreign Investment in CIC (FDI+FII will be subject to Credit
Information Companies lnvestme (Regulation) Act, 2005. Lit by Flt investment will be subject Register to the conditions that ed FII (a) No single entity should under i directly or indirectly hold

PIS will more than 10% equity he (b) Any acquisition in excess limited of 1% will have to be to 24% reported to RBI as a reporting only in requirement; and the CICs (c) Flls investing in CICs listed at shall not seek a the representation on the Board Stock of Directors based upon their Exchang shareholding. es within the overall limit of 49% foreign investme nt.
22. Industrial Parks both 100% Autom Conditions in Press Note setting up and in atic 2(2005) applicable for established Industrial construction development Parks projects would not apply
provided the Industrial Parks meet with the under- mentioned conditions- i. it would comprise of a minimum of 10 units and no single unit shall occupy more than 50% of the allocable area; ii. the minimum percentage of the area to be allocated for industrial activity shall not be less than 66% of the total allocable area.
23. Insurance 26% Autom Subject to licensing by the atic Insurance Regulatory &
Development Authority www.irda.nic.in
24. Investing companies in 100% FIPB Where there is a prescribed infrastructure / services cap for foreign investment, sector (except telecom only the direct investment sector) will be considered for the
prescribed cap and foreign investment in an investing company will not be set off against this cap provided the foreign direct investment in such investing company does not exceed 49% and the
xxv

management of the investing tympany is with the Indian owners.
Non-Banking Finance Companies 25.
Merchant 100% Autom Subject to: i) Banking atic a. minimum capitalization
norms for fund based NBFCs ii) Underwriting portfolio - USS 0.5 million to be
Management Services brought upfront for FDI up to iii) Investment Advisory 51%; US$ 5 million to be
Services brought upfront for FDI iv) Financial Consultancy above 51% and up to 75%;
and US$ 50 million out of v) Stock Broking which US$ 7.5 million to be
brought upfront and the vi) Asset balance in 24 months for FD[
Management beyond 75% and up to 100%. vii) Venture Capital
it minimum capitalization viii) Custodial Services norms for non-fund based
NBFC activities- US$ 0.5 ix) Factoring million.
x) Credit Rating c. foreign investors can set up Agencies 100% operating subsidiaries
xi) Leasing & Finance without the condition to disinvest a minimum of 25%
xii) Finance of its equity to Indian entities subject to bringing in US$ 50
xiii) Housing million without any Finance restriction on number of
xiv) Forex Broking operating subsidiaries without bringing additional
xv) Credit card capital. Business
xvi) Money d. joint venture operating changing business NBFC's that have 75% or
xvii) Micro credit less than 75% foreign Rural credit investment will also be
xiii) allowed to set up subsidiaries for undertaking other NBFC activities subject to the subsidiaries also complying with the applicable minimum capital inflow.
e. compliance with the guidelines of the RBI.
xxvi

f. The minimum capitalization norms would apply would be applicable where the foreign holding in a NBFC(both direct and indirect) exceeds the limits indicated at (a) above
26 j Petroleum & Natural Gas sector
a. Refining 49% in FIPB Subject to Sectoral policy case of (in case www.pctroleum.nic.in and no PSUs of divestment or dilution of 100% in PSUs) domestic equity in the case of Autom existing PSUs. Private atic compani (in case es of
private compa hies)
b. Other than 100% Autom Subject to sectoral Refining and atic regulations issued by including market Ministry of Petroleum & study and Natural Gas formulation; www.petroleum.nic.in investment/ financing; setting up infrastructure for marketing in Petroleum & Natural Gas sector.
27. Print i'ledia
a. Publishing of 26% FIPB Subject to Guidelines notified newspaper and by Ministry of Information & periodicals Broadcasting. dealing with www.mib.nic.in news and current affairs
b. Publishing of 100% FIPB Subject to guidelines issued scientific by Ministry of Information & magazines/ Broadcasting. specialty www.mib.nic.in journals, periodicals

28. Telecommunications
u. Basic and 74% Autom Subject to guidelines notified cellular, Unified (Includin atie in the PN 3(2007) Access Services, g up to National/ F. FTI, 49%. International NRI. FIPB Long Distance, FCCBs, beyond V-Sat, Public ADRs, 49%. Mobile Radio GDRs, Trunked converti Services ble (PVTRTS), preferen Global Mobile ce Personal shares, Communications and Services proportio (GMPCS) and - other value nate added telecom foreign services equity in
Indian promoter si Investing Compan
b. ISP with 74% Autom Subject to licensing and gateways, radio- atic security requirements notified paging, end-to- up to by the Dept. of end bandwidth. 49%. Telecommunications.
FIPB www.dotindia.com beyond 49%.
C. (a) ISP without 100% Autom Subject to the condition that gateway, atic such companies shall divest (b) infrastructure up to 26% of their equity in favour provider 49%. of Indian public in 5 years, if providing dark FIPB these companies are listed in fibre, right of way,duct beyond other parts of the world. Also space,tower (Category 1); 49%, subject to licensing and (c) electronic security requirements, where mail and voice required. mail www.dotindia.com
d. Manufacture of 100% Autom Subject to sectoral telecom atic requirements. equipments www.dotindia.com

29. Trading
a. Wholesale/cash 100% Autom & catry trading atic
b. Trading for 100% exports Autom
die
c. Trading of items 100% Subject to the condition that sourced from small scale the test marketing approval sector FIPB will be for a period of two
years and investment in setting up manufacturing
d. Test marketing 100% facilities eomonrences of such items for which a simultaneously with test company has approval FIPB marketing. for manufacture
Subject to guidelines for FDI in trading issued by
c. Single Brand 51% Department of Industrial product retailing Policy & Promotion vide
FIPB Press Note 3 (2006 Series).
30. Satellites - 74% FIPB Subject to Sectoral guidelines Establishment issued by Department of and operation Space'ISRO
www.isro.org 31. Special 100% Autom Subject to Special Economic
Economic Zones atic Zones Act, 2005 and the and Free Trade Foreign Trade Policy. Warehousing www.sczindia.nic.in Zones covering setting up of these Zones and setting up units in the Zones
Source :Gnvernnunt of India, Mini. try of Commerce & Industry, Department of Industrial Policy & Promotion, SIA(FC Section), Press Note 7 2t 0081

Appendix-II: Top Ten Pharmaceutical Companies with R&D Investment of the World (2009).
In USS Billion and %
S.1o. Company Global R&D 2008 Top Selling drug Expenditure Pfizer 44.2 7.9 Liptor-12.4 (USA) (5.7) (17.9) Lyrica-2.6 Celebrax-2.5
GSK 43.0 5.2 Serctide/Advair-6.0 2 Valtrex-1.7 (UK) (5.6) (12.1) Lamictal-1.4
Sanoti Aventis 38.7 6.5 Lovenox-39
3' (France) (5.0) (16.8) Plavix-3.7 Lantus-3.5
Novartis 36.0 7.2 DiovaniCodiovan-5.7 4. (Switzerland) (4.7) (20.0) Gleevec/Glivec-3.7
Zometa- 1.4
Astra Zeneca 31.6 5.1 Nexium - 5.2
5' (UK) (4.1) (16.1) Seroquel -4.5 Crestor-3.6
Johnson & Remicade-3.7 6. Johnson 24.6 5.1 Topamax- 2.7
(USA) (3.2) (20'7) Procrit - 2.5
Merck 23.6 4.8 Singulair 4.4
7' (USA) (3.1) (20.3) Cozaar/Hyzaar 3.6 Fosamax 1.6
Roche 21.0 7.2 Mabthera/Rituxan 5.6 8. (Switzerland) (2.7) (34.3) Avastin 4.9
Herceplin 4.8 Zyprexa - 4.7
9. Eli Lilly (.) (19g) Cy nbalta 2.7 Gemzar - 1.6
Wyeth 19.0 3.4 Effexor 3.9 10. (USA) (2.5) (17.9) Prevnac 2.7
Enbrel 2.6 Note: Figure are in parenthesis are in percentage are getting on the total global sales
in 2008 ($773 billion) Source: http//www.scribed.com/doc/21016515/top-5pharmaceutical companies
pharm-exec
xxx

Appendix-I11: Some Major Potential Patent Expirations (2009-2011).
Brand Name Company indication 2008 Sales (USS million)
2009
vacid Novartis Ulcers. lcers. Gastroesopha.el reilux disease
X948 `
Topamax Ortho-McNeil Seizure disorders, nmig;raine, headache 2356
Valtrex GSK Viral infections 2020
Adderall XR Shire Attention deficit hyper activity disorder 1585
Ambien CR Sanofi Aventis In somhia 986 Pulmicort Res pules AstraZeneca Asthma 876
Cell Cept Roche "Trans plant rejection 777 Clarinex Sherin Allergies 251 Fosamax Plus D Merck Osteoporosis 240 Casodex AstraZeneca Prostate cancer 228 Prandin Novo Nordisk Type 2 diabetes 153
2010
Effexor XR \Vycth Depression, anxiety panic disorder 2791
Flomax Boehringer Inglheim Benigin Prostatic Hypertrophy 1318
Cozaar Merck High Blood Pressure 731 Arimidex Astra Zeneca Breast Cancer 617 Hyzaar Merck High Blood Pressure 548
Aldara Graceway Actinic Keratosis genital warts, skin cancer 375
Mirapex Boehringer In elheim Restless legs Syndrome 344
Differin Galderana Acne 282 Astelin Meda Allergic rhinitis 273 Ra amune Wyeth Transplant rejection 136
2011 Li itor Pfizer High Cholestrol 6392 Actos Takeda Type I1 diabetes 2569 Zyprexa Lilly Schizophrenia, Bipolar Disorder 1853 Leva uin Ortho-McNeil Bacterial infections 1719 Arice t Eisai Al zheimers disease 1224 Xalatan Pfizer Glaucoma, Ocular hypertension 494 Caduct Pfizer High Blood Pressure 418 Patanol Alcoa Allergic Conjuctivitis 256 Ternodar Schering Brain Cancer 224 Tazorac Alloran Acne 109 Accolate Astra Zeneca Asthma . 44
Note: Ranked by US Sales Source: Meed Cos 2009 Drug 'Trend Report

Appendix-I\': Major NCEs Pipeline of Indian Companies.
Company with code Indication Status Dr. Reddv's Lab DRL I "422 Dyslipidemia, atherosclerosis and
associated cardiovascular diseases. Phase I DRF 2593 Diabetes Licensed out to Rheoscience in 2004,
now in Phase III DRF 1042 Oncology Abandoned after partner Clintech
couldn't raise fund for Phase 11 DRF 10945(Perlecan) Metabolic disorder Phase I completed —showed little
progress so was abandoned DRL 11605 Metabolic disorder Preclinical abandoned in 2007 DRL 16536 Metabolic disorder Preclinical abandoned in 2007 DRF 4848 Anti-inflammatory Preclinical abandoned in 2003 DRF 3188 Cancer. viral infections and immuno
stimulation Preclinical abandoned in 2003
DRF 4158 Insulin sensitizer for type 2 diabetics Out-licensing partner Novartis suspended clinical trials in Jan. 2002
DRF 2725 Insulin sensitizer for type 2 diabetics Out-licensing partner Novo Nordisk suspended clinical trials in 2002
Glenmark GRC 3886 Chronic obstructive pulmonary Trials on COPD proved inconclusive.
disease, asthma Test are on for asthma GRC 8200 Diabetes type 2 Phase II completed GRC 6211 Osteoarthritic pain, incontinence.
neuropathic pain Out-licensing partner Eli Lilly suspended clinical trials in early October 2008.
GRC 4039 Rheumatoid arthritis, multiple sclerosis
Phase I completed
GRC 10693 Neuropathic pain, osteoarthritis and other inflammatory pain
Phase I completed
GRC 15300 Pain In phase I trials GBR 500 Sclerosis, inflammatory disorder In phase I trials GBR 600 Anti platelet, adjunct to PCU acute In phase I trials
coronary syndrome Lupin LL 4858 Anti-TB In phase 11 trials LL 3348 Anti soriasis In phase II trials LL 4218 Anti- psoriasis In phase II trials LL 2011 Anti-migraine In phase III trials Piramal Healthcare P 276 Mantle cell lymphoma, malignant
melanoma, multiple myeloma and head and neck cancer
In phase 11 trials
P 1446 Once logy In phase I trials P1736 Type 2 diabetes In phase I trials IIPS 31807- I HF* Rheumatoid and psoriasis Phase 11 completed IIPH 30907* Dermatology Phase II completed 1IPB 00105-Ber-A01 * Chronic myeloid leukemia In phase 1 11 PP 9706642* Herpes Preclinical development P 3914 Non-steroidal anti-inflammatory drug Preclinical development PM 181104 Methicillin-resistant staphylococcus
aureus \"ancuHrvem-resistant Preclinical development

cnterococcu Ranbaxv RBX 11160 Malaria In phase ill RX 9341 Urinary incontinence Phase I completed RBX 7796 Allergic rhinitis and asthma phase 11 clinical trial RBX 10558 ll slipidemia phase II clinical trial RBX 2258 Benign prostatic hyperplasia Triials suspended by out-licensing
partner Schwarz phurma in Nov. 2004 RBX 7644 Anti-bacterial Development suspended during phase
II in 2003 RBX 9001 Benign prostatic hyperplasia Development suspended during
reclnical development in 2003 REX 6198 Benign prostatic hyperplasia Development suspended during
preclinical develo meet in 2003 Wockhardt WCK 771 Antibiotic Phase 11 clinical trial WCK 1152 Respiratory infection Phasc I clinical trial WCK 2349 Respiratory infection Phase I clinical trial WCK 4873 Toxicity Pre-clinical stage Zvdus Cadilahealthcare ZYHI Dysli idemia In phase lii ZYH2 Diabetes In phac I ZYH7 D sli idemia In phase ZY1400 Inflammation and pain In haseI Sun Pharma SUN 1334H Allergic rhinitis perennial rhinitis
urticaria Going on in phase III
SUN 44 CNS related disorder Pre-clinical stage SUN 09 Muscles asticity Pre-clinical stage SUN 461 Asthma Pre-clinical stage
Now This list is not exhaustive, numbers of other NCL are at various stages of development by Indian Companies Details are not available in annual report on web sites.
• Refer to herbal drugs Source: Compiled from Company amival report and websites.

Appendix-V: Statistical Description.
Model 1: OT S, using observations 1991-2008 (T = 18) Dependent variable: Investment
Coefficient Sid. Error t-ratio p -value const -326.059 237.91 -1.3705 0.19373 FDIPI -0.0860531 1.20843 -0.0712 0.94431 Export 0.666618 0.2492 2.6750 0.01908 ** TotalProductio 0.00675118 0.102077 0.0661 0.94827 Profit 0.127784 0.324877 0.3933 0.70045
Mean dependent var 1027.372 S.D. dependent var 1282.483 Sum squared resid 750567.8 S.E. of regression 240.2831 R-squared 0.973157 Adjusted R-squared 0.964897 F(4, 13) 117.8226 P-value(F) 4.49e-10 Log-likelihood -121.2848 Akaike criterion 252.5696 Schwarz criterion 257.0215 llannan-Quinn 253.1835 rho 0.520709 Durbin-Watson 0.957345
Model 2: OLS, using observations 1991-2008 (T = 18) Dependent variable: Total Production
Coefficient Std. Error t-ratio p-value const 2195.74 327.421 6.7062 0.00001 *** FDIPI 0.776981 3.27639 02371 0.81624 Profit 0.645916 0.869542 0.7428 0.47080 Investment 0.0498239 0.753328 0.0661 0.94827 Export 2.24207 0.569116 3.9396 0-00169 ***
Mean dependent var 6868.367 S.D. dependent var 4463.493 Sum squared resid 5539213 S.E. of regression 652.7582 R-squared 0.9S3645 Adjusted R-squared 0.978613 F(4, 13) 195.4665 P-value(F) 1.Sle-II Log-likelihood -139.2738 Akaike criterion 288.5476 Schwarz criterion 292.9995 Hannan-Quinn 289.1615 rho 0.677381 Durbin-Watson 0.479206
xxxv

Model 3: OLS. using observations 1991-2008 (T = 18) Dependent variable: Export
Coca//icient Sc]. Error t-ratio p-value -342.258 206.743 -1.6555 0.12176
-0.0868289 1.08006 -0.0804 0.9371 5 0.242714 0.0616095 3.9396 0.00169 ***
-0.0026928 0.292105 -0.0092 0.99278 0.532576 0.199091 2.6750 0.01908 **
1862.207 S.D. dependent var 1758.673 599646.1 S.E. of regression 214.7711 0.988596 Adjusted R-squared 0.985086 281.7254 P-value(F) 1.74e-12
-119.2644 Akaike criterion 248.5288 252.9807 Hannan-Quinn 249.1427 0.567258 Durbin-Watson 0.743543
const FDIPI Total Productio Profit Investment
Mean dependent var Sum squared resid R-squared F(4, 13) Log-likelihood Schwarz criterion rho
Model 4: OLS, using observations 1991-2008 (T = 18) Dependent variable: Profit
Coefficient Sid. Error 1-ratio p-value const -121.372 213.363 -0.5689 0.57915 FDIPI 1.86564 0.885687 2.1064 0.05516 Investment 0.0920361 0.233991 0.3933 0.70045 Export -0.00242762 0.263339 -0.0092 0.99278 Total Productio 0.0630374 0.084862 0.7428 0.47080
Mean dependent var 577.4833 S.D. dependent var 587.5560 Sum squared resid 540593.6 S.E. of regression 203.9219 R-squared 0.907886 Adjusted R-squared 0.879544 F(4, 13) 32.03255 P-value(F) 1.28e-06 Log-likelihood -118.3314 Akaike criterion 246.6627 Schwarz criterion 25I.1 146 Hannan-Quinn 247.2766 rho 0.125665 Durbin-Watson 1.594459
xxxvi

Model 5: OLS. using observations 1991-2008 (T = 18) Dependent variable: FDIPI
Coe%f cient Std. furor t-ratio p-vahte const -7.26783 58.3691 -0.1245 0.90281 Export -0.00572278 0.0711855 -0.0804 0.93715 Total Productio 0.00554371 0.0233768 0.2371 0.81624 Investment -0.00453121 0.0636308 -0.0712 0.94431 Profit 0.136394 0.0647511 2.1064 0.05516
Mean dependent var 94.26111 S.D. dependent var 100.9064 Sum squared resid 39521.88 S.E. of regression 55.13751 R-squared 0.771676 Adjusted R-squared 0.701423 F(4, 13) 10.98416 P-value(F) 0.000407 Log-likelihood -94.78903 Akaike criterion 199.5781 Schwarz criterion 204.0299 Hannan-Quinn 200.1919 rho -0.279627 Durbin-Watson 2.498313
Model 6: OLS, using observations 1995-2008 (T = 14) Dependent variable: Employment
Coefficient Std. Error t-ratio Jp-i'altre 36246.1 49611.3 0.7306 0.48587 -24.6071 56.4256 -0.4361 0.67429 -111.332 40.6183 -2.7409 0.02541 ** 55.3844 17.6482 3.1382 0.01384 ** -9.1821 15.7628 -0.5825 0.57626 14.531 13.008 1.1171 0.29638
243872.2 S.D. dependent var 51406.62 9.93e+08 S.E. of regression 1 1 138.87 0.971 107 Adjusted R-squared 0.953049 53.77695 P-value(F) 6.07c-06
-146.4026 Akaike criterion 304.8052 308.6395 1-lannan-Quinn 304.4502
-0.114040 Durbin-Watson 2.173104
const FDIPI Export Total_Productio Profit Investment
Mean dependent var Sum squared resid R-squared F(5, 8) Log-likelihood Schwarz criterion rho


![Degree of Doctor of Philosophy [Ph.D.,] - Manonmaniam ...](https://static.fdokumen.com/doc/165x107/631d000f6c6907d368018f38/degree-of-doctor-of-philosophy-phd-manonmaniam-.jpg)