DOCTOR OF PHILOSOPHY (PhD) - LPU
199
Development of innovative clean-up technology (Biofilters) for effective degradation of textile dye in industrial wastewater effluent A Thesis Submitted to For the award of DOCTOR OF PHILOSOPHY (PhD) in BIOTECHNOLOGY By Deepika Bhatia (Regd: 11211691) Supervised by Co-Supervised by Prof. Rameshwar. S. Kanwar Dr. Joginder Singh (Vice Chancellor) (Associate Professor) SCHOOL OF BIOENGINEERING AND BIOSCIENCES LOVELY PROFESSIONAL UNIVERSITY PUNJAB 2018
-
Upload
khangminh22 -
Category
Documents
-
view
1 -
download
0
Transcript of DOCTOR OF PHILOSOPHY (PhD) - LPU

Development of innovative clean-up technology
(Biofilters) for effective degradation of textile dye in
industrial wastewater effluent
A
Thesis
Submitted to
For the award of
DOCTOR OF PHILOSOPHY (PhD)
in
BIOTECHNOLOGY
By
Deepika Bhatia
(Regd: 11211691)
Supervised by Co-Supervised by
Prof. Rameshwar. S. Kanwar Dr. Joginder Singh
(Vice Chancellor) (Associate Professor)
SCHOOL OF BIOENGINEERING AND BIOSCIENCES
LOVELY PROFESSIONAL UNIVERSITY
PUNJAB
2018

DECLARATION
I hereby declare that the thesis entitled, “Development of innovative clean-up technology (Biofilters)
for effective degradation of textile dye in industrial wastewater effluent” submitted for Ph.D.
Biotechnology Degree to Department of Biotechnology, Lovely Professional University is entirely
original work and all ideas and references have been duly acknowledged. The dissertation has not been
formed the basis for the award of any other degree.
Deepika Bhatia
Reg. No. 11211691

CERTIFICATE
This is to certify that Miss. Deepika Bhatia has completed her Ph.D. thesis in Biotechnology titled
“Development of innovative clean-up technology (Biofilters) for effective degradation of textile
dye in industrial wastewater effluent” under my guidance and supervision. To the best of my
knowledge, the present work is the result of her original investigations and study. No part of this thesis
has been submitted for any other degree or diploma.
The thesis is fit for the submission of the partial fulfilment of the conditions for the award of degree of
Ph.D. in Biotechnology.
Signature of Supervisor
Prof. Dr. Rameshwar S. Kanwar
Vice Chancellor
Lovely Professional University
Jalandhar-Delhi, G.T. Road (NH-1), Phagwara, Punjab (INDIA) -144411
C.F. Curtiss Distinguished Professor (Agricultural and Biosystems Engineering)
Iowa State University, Ames, IA 50011, USA
Signature of Co-Supervisor
(Dr. Joginder Singh Panwar)
Associate. Professor
Department of Biotechnology
Lovely Professional University
Jalandhar-Delhi, G.T. Road (NH-1), Phagwara, Punjab (INDIA) -144411
DATE:

ABSTRACT
Mitigation strategies to contain the deleterious effect of textile industry effluents have captured
the interest of researchers. The discharge of untreated textile industry effluent in the
environment have negative impacts on the ecology and environment of biosphere. This thesis
research resulted in conducting several studies to determine the impact of textile industry on
water quality and developing innovative green technologies for effective treatement of textile
industry wasterwater. In the first study, the effluents from different textile industries of
Ludhiana were collected for one year (2014-15). Effluents being discharged from textile units
of Ludhiana are the major sources of water pollution at the receiving drain known as Buddha
Nallah. Seasonal variations in physico-chemical characteristics like pH, temperature, TDS,
BOD, COD and TSS were observed at two selected sites on Buddha Nallah. Results of this
study clearly indicated that the values of these water quality parameters were much higher
compared to the permissible limit of WHO for surface water streams. The maximum value of
pH was observed in the summer season (8.78+0.470 and 8.51+0.411) and lowest pH values
were observed during the rainy season (7.38+0.48 and 7.11+0.59) for both sites, respectively.
Suspended solids were found to be highest in the autumn season for both sites and lowest in
summer. The values of BOD and COD of effluent were very high throughout all seasons. pH
values as high as 900 mg/L and 580 mg/L were observed for COD and BOD, respectively. The
present study highlights the need for treatment of textile effluents before they are discharged
into water bodies. Moreover, the systematic study of correlation between various physico-
chemical parameters of effluent was also studies, which not only helps us to determine the
quality of water but also quantifies the concentration of pollutants in water. The results of this
study clearly indicated that strong positive correlation exists between pH and water
temperature, TDS, TSS, BOD and COD for both sites in the autumn season. For Site 1, in rainy
monsoon season, a strong positive correlation was observed between pH, BOD, COD and water
temperature. TDS data showed positive correlation between TSS, BOD and COD. For site 2,
in rainy monsoon season, water temperature and TSS exhibited negative correlation with other
water quality parameters. In the present study, water temperature also showed positive
correlation with TDS. Also, TDS has a weak positive correlation with COD but exhibited
strong correlation with BOD for both sites in the winter season. In summer season, for both
sites, moderate positive correlation was observed between pH, water temperature and TDS.
BOD has a moderate positive correlation with COD and TSS. This study highlights the need
for the treatment of textile industry effluents before they discharged into water bodies.

Second study was conducted to collect locally occurring bacteria from a stream receiving the
textile industry wastewater in the city of Ludhiana, India. From hundreds of bacteria present
in the wastewater; six strains of bacteria were isolated which has the potential to remove dye
contaminants from the polluted water. These isolated bacteria were tested for their decolorizing
potential of dyes [namely, disperse red 167.1 (rubine BL), disperse red 167 (dark red 2B),
disperse blue 60 (blue BG) and disperse red 54 (scarlet RR)] within 24 hours after inoculation
at different concentration (50 ppm, 150 ppm and 250 ppm). The biochemical and molecular
characterization resulted in the identification of isolated bacteria as Bacillus subtilis
(KX034562), Paenochrobactrum glaciei (KX034561), Brevibacillus panacihumi
(KX034559), Bacillus cereus (KX034566), Bacillus sphaericus (KX034564), and
Paenibacillus pocheonensis (KX034565). Therefore, in this study, an attempt was made to
develop the bacterial consortium containing six efficient dye degrading bacteria after
investigating their compatibility and synergistic activities among each other. Initially a loop
full of individual bacterial pure cultures were inoculated separately in minimal media and
incubated for 24 h at 30ºC. For the development of bacterial consortium, 6 h old cultures were
then transferred aseptically into nutrient medium followed by 24-hour incubation period at
30ºC. The consortium thus obtained was used as the source of inoculum for decolorization
assay with individual bacterial sp. for decolorization of selected azo-disperse dyes. Among
these bacteria, B. cereus showed the highest potential for decolorization of disperse red 54 (up
to 84.17 %) and 76.29% for disperse blue 60 in 24 hours; P. glaciei showed 84.80%
decolorization rate for disperse red 167 in 24 hours; consortium displayed highest rate of
decolorization for disperse red 167.1 (82.76 %). The bacterial consortium also exhibited
maximum rate of decolorization for disperse red 54 (83.46%) in 24 hours. Furthermore,
enzyme analysis was carried out to ensure decolorization of selected dyes by these bacteria.
The results indicated the involvement of extracellular enzymes, azoreducatse and laccase for
this purpose. The FTIR and GC-MS analysis of extracts proved the degradation of selected
dyes to yield metabolites. The phytotoxicity assay was also carried out to assess the toxicity of
parent dye and the extracted metabolites. The results showed a significant difference in the
germination index, shoot and root length of Triticum aestivum by parent dye as compared to
extracted metabolites. The overall result of this study shows clearly that naturally occurring
bacteria in wastewater bodies can be used to develop economically viable bio-filters to remove
textile industry pollutants from rivers and streams to improve the ecological conditions of
polluted rivers and create healthy environmental conditions for marine life.

A third study was conducted develop bio-filters by using low cost agricultural biological
materials as a substrate/matrix for the immobilization of consortium for the removal of dyes
from aqueous solution. Therefore, the third study was conducted for the immobilization of the
bacterial consortium on corncobs for the efficient treatment of disperse red 167.1 (rubine BL).
This study helped us to understand and determine, if the design of biofilter and equations
developed from lab-based column studies can describe environmental conditions that occur in
the "real world."
Affectionately
Dedicated
To
My Beloved Parents and My Loving Sister Sheetal
and My Friend Harsh

Acknowledgement
Strength doesn’t come from what you can do, it comes from overcoming the things you
once thought you couldn’t
First of all, I am thankful to the almighty God (Shiv Baba) for blessing me to complete my
work peacefully and successfully. It was my mother’s dream that I complete my doctorate
degree, therefore, I did my best in fulfilling my mother’s dream with her uncountable blessings
from heaven.
The time I spent at LPU to complete my PhD degree, has been a wonderful and an amazing
experience which is going to be of great help in the coming years to achieve my own distinction
in the society. The unforgettable inspiration and constant encouragement provided by all, was
the dynamic force and source of motivation that enabled me to complete my thesis in the
present form. The constant guidance from my mentors, right direction, cooperation, love and
care came in my way. I owe my heartfelt thanks to all those who supported me and gave me
sense of satisfaction that I feel at this stage of my career. It is my privilege to express my sincere
sense of gratitude and whole-hearted indebtedness to my guide, Pro. Dr. Rameshwar. S.
Kanwar, for his valuable guidance and persistent encouragement believing in me and in my
potential. I thank him for giving me an opportunity to work on this challenging problem under
him and for his patience and generous support till the completion of this thesis. He has been a
constant source of inspiration throughout my thesis. His sincere and honest efforts, hard work,
and enthusiasm in research always motivated me to do more. My sincere thanks to my co-guide
Dr. Joginder Singh, Associate Professor, Department of Biotechnology, Lovely Professional
University, for his valuable time. My overwhelming thanks go to Mrs. Rashmi Mittal (Pro-
Chancellor), Mr. Ashok Mittal (Chancellor) and Dr. Monika Gulati (Registrar) LPU for their
motivation and support. I would like to thank Dr. Loviraj Gupta (Executive Dean) for his co-
operation and support.
I owe my sincere thanks to Dr. Neeta Raj Sharma (Associate Dean), School of
Bioengineering and Biosciences, who cooperated well on this thesis research and helped me
during my research work which greatly enriched my knowledge and inspired me all the time.
I am very thankful for her unconditional support and heartfelt help. I am also thankful to IC-
IMPACTS and Department of Biotechnology (DBT), New Delhi for providing me
opportunity to work as as junior research fellow during the entire course of my research work.
I would like to thank Dr. Ashish Vyas (HOD) Department of Microbiology, Dr. Umesh
Gautam (HOD) Department of Biotechnology and Dr. Joydeep Dutta (HOD) Department of
Zoology, for their support.
I cannot forget the valuable conversation and suggestion of Dr. Rahul V. Khandare
(Associate Professor), Shivaji University, Kolhapur. I have often looked towards him for
valuable suggestion, and he always helped me whenever I needed support in my research.
I would like to pay my thanks to Dr. Anand, Satwant Mam, Anil Sir (DRD), Anil Bhaiya and
our Lab assistants, Mukesh sir, John Sir, Gajender sir, Mr. Aman Bhatti, Rajesh Sir, Manoj Sir,
Varun Sir and Mr. Kuldeep for providing all possible laboratory facilities to carry out
experiments during my research. The sophisticated laboratory assistance and opportunity
provided by Era mam, Pradeep and Ghyanshyam sir, SAI lab, Thapar University, Patiala for
GC-MS analysis is gratefully acknowledged.
Millions of thanks to all the people that I met during my PhD degree program for their pleasant
company, conversations, help and friendship with Hari Bhakta and Shivika. I will never
forget the memorable days I spent in project lab 28-405 with them.
I would like to thank my heartiest close friend Harsh for giving such lovely memories that
boosted me whenever I got stressed, and finally his constant care, blessing and support helped
me to achieve my goal. I would like to express my thanks to my friends Alakhdeep and Suman
didi who supported me on this journey.
My parents deserve special mention for their inseparable support who never doubted my
abilities and their prayers for me since my childhood. I am thankful from the bottom of my
heart to my father Mr. Ashok Bhatia, my mother late. Mrs. Kanta Bhatia, my dearest sister
Sheetal and rest of my relatives for their unconditional love and eternal support. I cannot find
the words to describe how much I am grateful to them.
Mummy and Papa, thanks for your constant support and enthusiasm. I dedicate this dissertation
to my parents as an expression of my appreciation and love. The time I have spent here at
Lovely Professional University in pursuit of my master’s and doctorate degrees will be

unforgettable throughout my life. I would like to express my heartiest appreciation to all those
who have helped make my time at LPU a great experience.
(Deepika Bhatia)
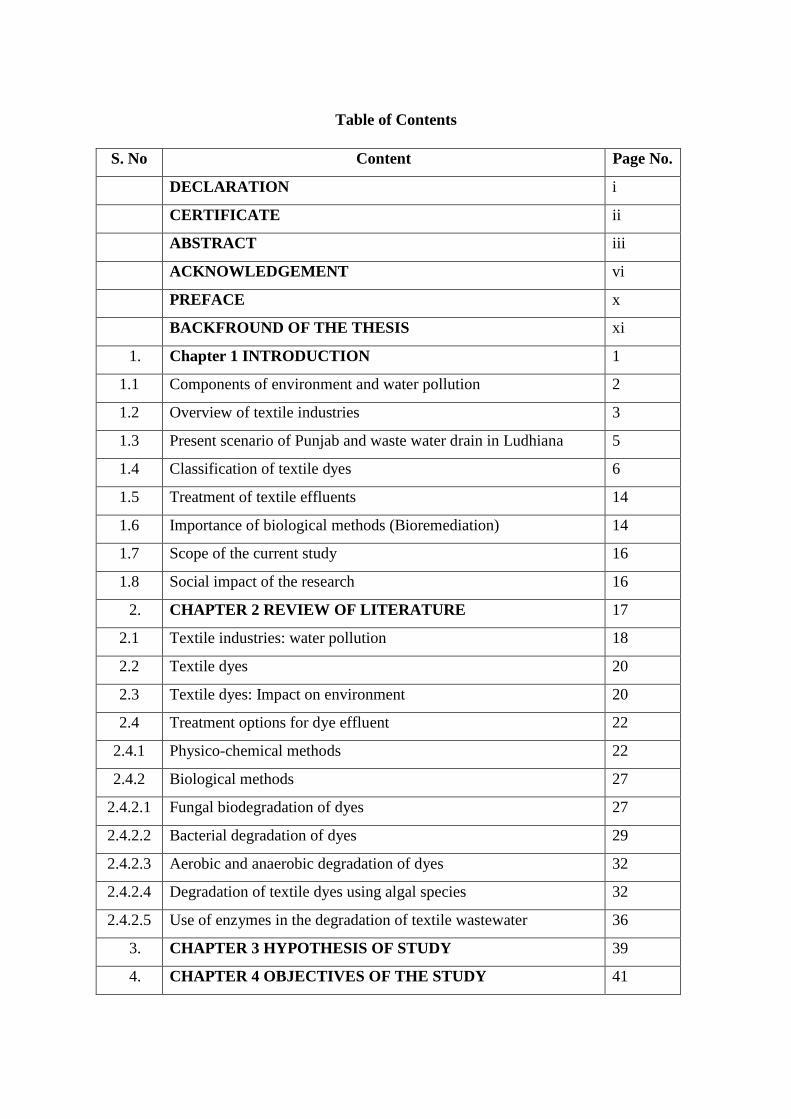
Table of Contents
S. No Content Page No.
DECLARATION i
CERTIFICATE ii
ABSTRACT iii
ACKNOWLEDGEMENT vi
PREFACE x
BACKFROUND OF THE THESIS xi
1. Chapter 1 INTRODUCTION 1
1.1 Components of environment and water pollution 2
1.2 Overview of textile industries 3
1.3 Present scenario of Punjab and waste water drain in Ludhiana 5
1.4 Classification of textile dyes 6
1.5 Treatment of textile effluents 14
1.6 Importance of biological methods (Bioremediation) 14
1.7 Scope of the current study 16
1.8 Social impact of the research 16
2. CHAPTER 2 REVIEW OF LITERATURE 17
2.1 Textile industries: water pollution 18
2.2 Textile dyes 20
2.3 Textile dyes: Impact on environment 20
2.4 Treatment options for dye effluent 22
2.4.1 Physico-chemical methods 22
2.4.2 Biological methods 27
2.4.2.1 Fungal biodegradation of dyes 27
2.4.2.2 Bacterial degradation of dyes 29
2.4.2.3 Aerobic and anaerobic degradation of dyes 32
2.4.2.4 Degradation of textile dyes using algal species 32
2.4.2.5 Use of enzymes in the degradation of textile wastewater 36
3. CHAPTER 3 HYPOTHESIS OF STUDY 39
4. CHAPTER 4 OBJECTIVES OF THE STUDY 41

5. CHAPTER 5 MATERIALS AND METHODS 45
5.1 Study area 46
5.2 Chemicals 46
5.3 Sampling and field investigation 47
5.3.1 Analysis of textile effluent samples for physico-chemical
parameters
47
5.3.1 Data interpretation 49
5.3.3 Correlation coefficients 49
5.4 Selection of dyes 49
5.4.1 Spectral Analysis of selected azo-disperse dyes [to check
absorption maxima (λmax) of dyes]
50
5.4.2 FTIR analysis of dyes 50
5.4.3 Isolation and purification of dye decolorizing bacteria 51
5.4.4 Dye decolorization assay at shaking condition 52
5.4.5 Biochemical, morphological and physiological characterization of
bacterial isolates
52
5.4.6 Molecular characterization of bacterial isolates: DNA extraction
PCR amplification of 16S rRNA gene
52
5.5 Biocompatibility assay of efficient dye degrading bacteria for dyes 54
5.6 Development of consortium 54
5.7 Analytical methods: dye decolorization assay 54
5.7.1 Analysis of degradation products: GC-MS analysis and FTIR 55
5.8 Toxicology study of dyes: Phytotoxicity assay 55
5.8.1 Phytotoxicity assay 55
5.9 Screening of bacterial isolates for the activity of dye degrading
enzymes
56
5.9.1 Preparation of cell free extract 56
5.9.2 Screening for enzymatic activities 56
5.10 Development of bio-filter: continuous column studies 57
5.10.1 Preparation and characterization of bio-adsorbent 57
5.10.2 Analysis of surface characterization and morphology of corncob 57
5.10.2.1 Electrical conductivity (EC) and pH 57
5.10.2.2 Bulk Density of corn cob particles 57

5.10.2.3 Particle Density of corn cob particles 57
5.10.2.4 Scanning electron microscopic analysis 58
5.10.2.5 XRD analysis 58
5.10.2.6 FTIR characterization 58
5.11 Immobilization of bacterial consortium on corn cob 58
5.12 Operation of continuous column: experimental set up 59
5.12.1 Analysis and breakthrough modelling of column data 60
5.12.1.1 Adams-bohrat model 61
5.12.1.2 Thomas model 62
6. CHAPTER 6 RESULTS AND DISCUSSIONS 63
6.1 Analysis of textile effluent samples for physio-chemical
parameters
64
6.1.1 Correlation between various physio-chemical parameters of two
different sites in different seasons
67
6.2 Selection and properties of textile dyes 76
6.2.1 Spectrum study: Spectral analysis of dyes 76
6.2.2 FTIR analysis of dyes 76
6.3 Isolation and screening of bacterial strains from textile effluent
and soil
78
6.3.1 Biochemical, morphological and physiological characterization of
bacterial isolates
80
6.4 Biocompatibility assay of efficient dye degrading bacteria for dyes 85
6.5 Development of consortium 86
6.6 Dye decolorization assay with six efficient dye degrading bacteria
(individually) and with consortium at different concentrations of
dye (50 mg/L; 150 mg/L and 250 mg/L)
88
6.7 Screening of bacterial isolates for the activity of dye degrading
enzymes
96
6.7.1 Preparation of cell free extract 96
6.7.2 Screening for enzymatic activities: azoreductase and laccase 96
6.8 Analysis of dye degraded metabolites: characterization of
degraded products of dye
100

6.8.1 Analysis of degraded products of disperse red 167: FTIR analysis
100
6.8.1.1 GC-MS analysis of dye decolorized medium: Proposed
degradation pathway for disperse red 167
102
6.8.2 Analysis of degraded products of disperse red 167.1: FTIR
analysis
106
6.8.2.1 GC-MS analysis of dye decolorized medium: Proposed
degradation pathway for disperse red 167.1
106
6.8.3 Analysis of degraded products of disperse blue 60: GC-MS
analysis and proposed degradation pathway for disperse blue 60
111
6.8.3.1 Analysis of degraded products of disperse blue 60 112
6.8.4 Analysis of degraded products of disperse blue 60: FTIR analysis 116
6.8.4.1 Analysis of degraded products of disperse red 54: GC-MS analysis
and proposed degradation pathway for disperse red 54
116
6.9 Toxicology study of dyes: Phytotoxicity assay 120
6.9.1 Effect of selected azo- disperse dyes (three different
concentrations) and decolorized/degraded dye solutions on
Triticum aestivum seed germination, root length and shoot length
121
6.10 Analysis of surface characterization and morphology of corncob 129
6.10.1 Physico-chemical characteristics of corncob 129
6.10.2 SEM characterization 130
6.10.3 XRD Interpretation of corncob after immobilization and
adsorption of dye
131
6.10.4 FTIR Characterization 134
6.11 Immobilization of bacterial consortium on corn cob 135
6.12 Operation of continuous column: experimental set up 136
6.12.1 Analysis and breakthrough modelling of column data 137
6.12.1.1 Effect of bed height on adsorption 138
6.12.1.1 Effect of initial dye concentration on adsorption 139
6.12.2 Thomas model 141
6.12.3 Adams-bohart model 143
7. CHAPTER 7- SUMMARY AND CONCLUSIONS 145
7.1 Future recommendations 146

8. Bibliography 150
9. LIST OF APPENDICES 183
9.1 List of Publications 184

List of Tables
S. No Table
Page
no.
1. Advantages and disadvantages of existing various physico-chemical
methods available for treatment of textile dyes
24
2. Decolorization of various textile dyes by bacterial culture 30
3. Decolorization of different dyes under anaerobic conditions by
bacterial cultures.
31
4. Decolorization of different dyes under aerobic conditions by
bacterial culture
34
5. Decolorization of different dyes by various algae 35
6. Involvement of different enzymes for the treatment of textile dyes 36
7. Use of various biosorbent material used to remove dyes from
wastewater
41
8. Properties of selected textile dyes 50
9. Functioning parameters of the glass column experimental set up 59
10. Physicochemical parameters analysis of selected sites of Ludhiana
(2014-15)
70
11. Physicochemical parameters analysis at site-1 in Ludhiana (2014-
15)
71
12. Physicochemical parameters analysis at site-2 in Ludhiana (2014-
15)
72
13. Spectral Analysis of dyes [to check absorption maxima (λmax) of
dyes]
76
14. Percent decolorization of four selected dyes by 15 bacterial isolates
(isolate 1 to isolate 15; 50mg/L in 24 h)
79
15. Biochemical, morphological and physiological characterization of
bacterial isolates
84
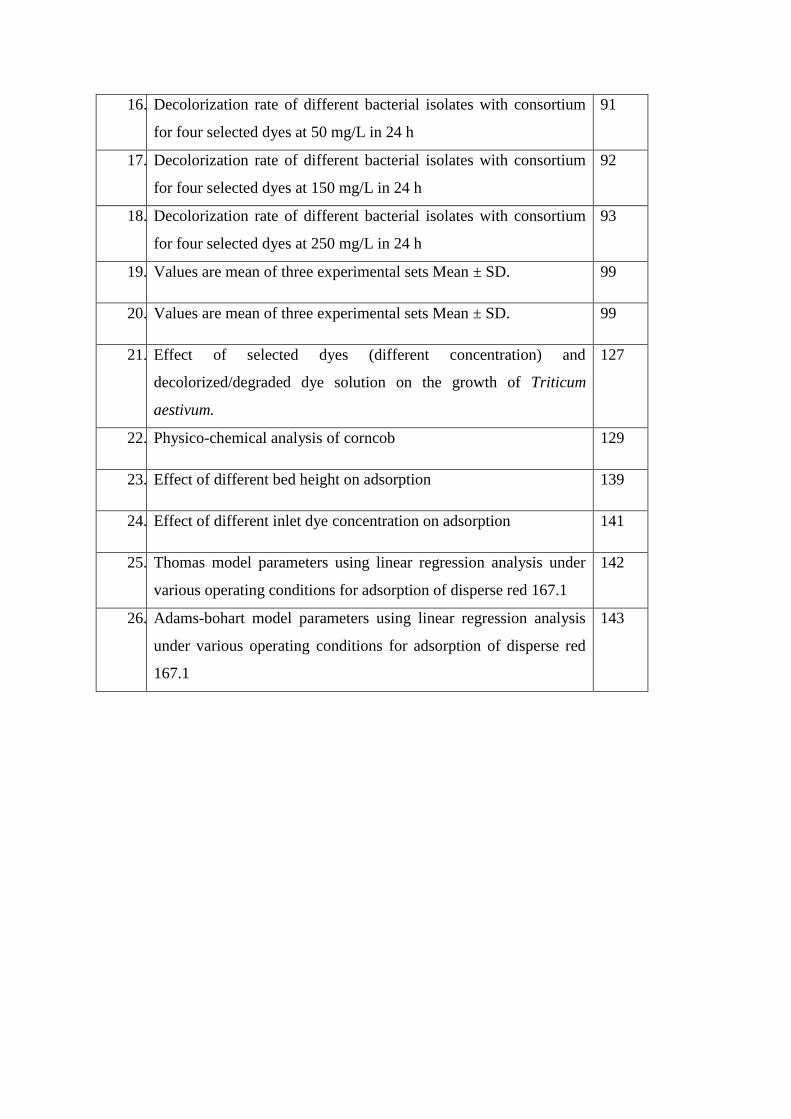
16. Decolorization rate of different bacterial isolates with consortium
for four selected dyes at 50 mg/L in 24 h
91
17. Decolorization rate of different bacterial isolates with consortium
for four selected dyes at 150 mg/L in 24 h
92
18. Decolorization rate of different bacterial isolates with consortium
for four selected dyes at 250 mg/L in 24 h
93
19. Values are mean of three experimental sets Mean ± SD. 99
20. Values are mean of three experimental sets Mean ± SD. 99
21. Effect of selected dyes (different concentration) and
decolorized/degraded dye solution on the growth of Triticum
aestivum.
127
22. Physico-chemical analysis of corncob 129
23. Effect of different bed height on adsorption 139
24. Effect of different inlet dye concentration on adsorption 141
25. Thomas model parameters using linear regression analysis under
various operating conditions for adsorption of disperse red 167.1
142
26. Adams-bohart model parameters using linear regression analysis
under various operating conditions for adsorption of disperse red
167.1
143

i
List of Figures
S. No Figures
Page
no.
1. An overview of the waste generated by processing steps in textile
industries and various biological methods for effluent treatment
04
2. Prominent way of classification of dyes 06
3. Classification of synthetic dyes (derived from inorganic/organic
compounds)
09
4. Classification of dyes based on the nature of their chromophoric groups 12
5. Buddha Nallah flows through the city Ludhiana. 5(A) Buddha Nallah
carries industrial and domestic waste; 5(B) Point of confluence where
Buddha Nallah merges with river Sutlej
46
6. The map of Ludhiana showing the sampling sites (Site-1 and Site-2,
shown in red) on Buddha Nallah drain
48
7. Grouping of parameters for monitoring of textile effluent 49
8. Key steps for isolation of efficient dye degrading bacteria and elucidation
of dye degradation pathway
51
9. Experimental setup of continuous column 60
10. The correlation matrix for the physicochemical parameters of Site 1 and
Site 2 in four seasons. 10(A) Autumn season (Site 1); 10(B) Autumn
season (Site 2); 10(C) Rainy monsoon season (Site 1); 10(D) Rainy
monsoon season (Site 2); 10(E) Summer season (Site 1); 10(F) Summer
season (Site 2); 10(G)Winter season (Site 1); 10(H) Winter season (Site
2)
73
11. Graphs showing average seasonal variations of various selected
physicochemical parameters of different seasons of Site 1 and Site 2
Ludhiana, Punjab. (June 2014 - 15). 11(A) Seasonal variations of pH;
11(B) seasonal variations of water temperature; 11(C) Seasonal variations
of total dissolved solids (TDS); 11(D) Seasonal variations of total
suspended solids (TSS); 11(E) Seasonal variations of biochemical oxygen
74
ii
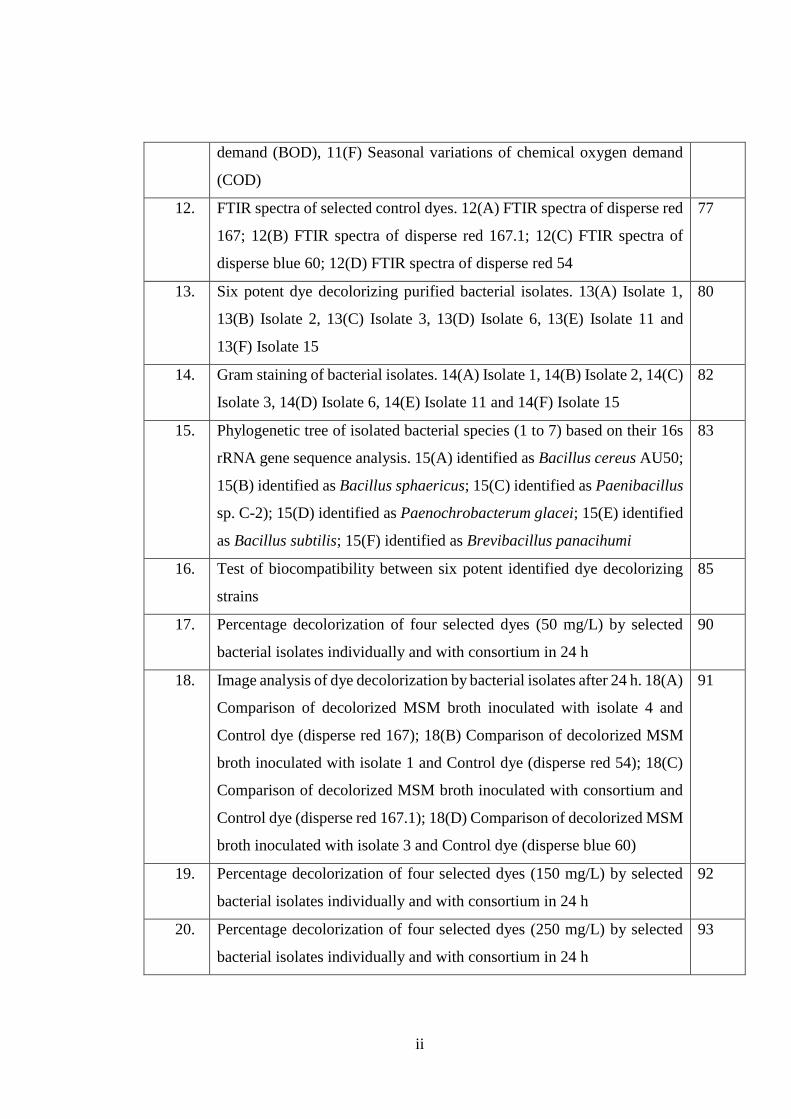
demand (BOD), 11(F) Seasonal variations of chemical oxygen demand
(COD)
12. FTIR spectra of selected control dyes. 12(A) FTIR spectra of disperse red
167; 12(B) FTIR spectra of disperse red 167.1; 12(C) FTIR spectra of
disperse blue 60; 12(D) FTIR spectra of disperse red 54
77
13. Six potent dye decolorizing purified bacterial isolates. 13(A) Isolate 1,
13(B) Isolate 2, 13(C) Isolate 3, 13(D) Isolate 6, 13(E) Isolate 11 and
13(F) Isolate 15
80
14. Gram staining of bacterial isolates. 14(A) Isolate 1, 14(B) Isolate 2, 14(C)
Isolate 3, 14(D) Isolate 6, 14(E) Isolate 11 and 14(F) Isolate 15
82
15. Phylogenetic tree of isolated bacterial species (1 to 7) based on their 16s
rRNA gene sequence analysis. 15(A) identified as Bacillus cereus AU50;
15(B) identified as Bacillus sphaericus; 15(C) identified as Paenibacillus
sp. C-2); 15(D) identified as Paenochrobacterum glacei; 15(E) identified
as Bacillus subtilis; 15(F) identified as Brevibacillus panacihumi
83
16. Test of biocompatibility between six potent identified dye decolorizing
strains
85
17. Percentage decolorization of four selected dyes (50 mg/L) by selected
bacterial isolates individually and with consortium in 24 h
90
18. Image analysis of dye decolorization by bacterial isolates after 24 h. 18(A)
Comparison of decolorized MSM broth inoculated with isolate 4 and
Control dye (disperse red 167); 18(B) Comparison of decolorized MSM
broth inoculated with isolate 1 and Control dye (disperse red 54); 18(C)
Comparison of decolorized MSM broth inoculated with consortium and
Control dye (disperse red 167.1); 18(D) Comparison of decolorized MSM
broth inoculated with isolate 3 and Control dye (disperse blue 60)
91
19. Percentage decolorization of four selected dyes (150 mg/L) by selected
bacterial isolates individually and with consortium in 24 h
92
20. Percentage decolorization of four selected dyes (250 mg/L) by selected
bacterial isolates individually and with consortium in 24 h
93
iii
21. FTIR spectrum of decolorized disperse red 167. 21(A) after 18 h and
21(B) after 24 h
101
22. 22(A) Gas chromatogram of metabolites of disperse red 167 degradation
after 24 h; 22(B) Mass spectrum of metabolites of disperse red 167
degradation after 24 h
103
23. Proposed degradation pathway for degradation of disperse red 167 104
24. 24(A) Gas chromatogram of metabolites of disperse red 167.1
degradation after 24 h; 24(B) Mass spectrum of metabolites of disperse
red 167.1 degradation after 24 h
105
25. FTIR spectrum of decolorized disperse red 167.1; 26(A) after 18 h and
26(B) after 24 h
105
26. Proposed pathway for degradation of disperse red 167.1 109
27. 27(A) Gas chromatogram of metabolites of disperse blue 60 degradation
after 24 h; 27(B) Mass spectrum of metabolites of disperse blue 60
degradation after 24 h
110
28. FTIR spectrum of decolorized product of disperse blue 60 after 18 h and
24 h
113
29. Proposed pathway for degradation of disperse blue 60 114
30. FTIR spectrum of metabolites of disperse red 54 degradation 30(A) after
18 and 30(B) after 24 h
115
31. Mass spectrum of disperse red 54 after degradation 118
32. Proposed pathway for degradation of disperse red 54 119
33. Phytotoxicity assay. 33(A) Plates showing the growth of T. aestivum in
the presence of disperse red 167 (dark red 2B); dye metabolites and
control (distilled water), 33(B) Plates showing the growth of T. aestivum
in the presence of disperse red 167.1 (rubine BL); dye metabolites and
control (distilled water), 33(C) Plates showing the growth of T. aestivum
in the presence of disperse blue 60 (Blue BG); dye metabolites and control
(distilled water), 33(D) Plates showing the growth of T. aestivum in the
presence of disperse red 54 (scarlet RR); dye metabolites and control
(distilled water)
124
iv
34. Phytotoxicity assay. 34(A) Effect of disperse red 167 and dye metabolites
on root and shoot length of T. aestivum; 34(B) Effect of disperse red 167.1
and dye metabolites on root and shoot length of T. aestivum; 34(C) Effect
of disperse blue 60 and dye metabolites on root and shoot length of T.
aestivum. 34(D) Effect of disperse red 54 and dye metabolites on root and
shoot length of T. aestivum
125
35. SEM images of corncob. 35(A) Raw corncob; 35(b) corncob after
immobilization of bacteria consortium, and (36C and 36D) after
adsorption of dye solution
131
36. XRD patterns of raw corncob 132
37. XRD patterns of immobilized corncob 132
38. XRD patterns of immobilized corncob after dye adsorption 133
39. FTIR spectra of corncob. 39(A) raw corncob; 39(B) after immobilization
of bacteria consortium; 39(C) after adsorption with dye
134
40. Experimental setup of continuous column 137
41. Standard calibration for disperse red 167.1 138
42. Effect of bed height (10cm and 15cm) on breakthrough curve 139
43. Effect of inlet dye concentration disperse red 167.1 on breakthrough curve 140

PREFACE
Ludhiana, is the hub of textile industry in Punjab. It is famous for dyeing and printing of textile
fabric. Day by day, an increase in the usage of chemical-based dyestuff and their direct or
indirect release into the natural surface water body (Buddha Nallah) is contaminating the
environment and posing a great ecological hazard to the people of Ludhiana city. Considering
this grave situation, the current study is focused to assess the contamination load of the
effluents released by textile industries located in the vicinity of Buddha Nallah. Also, an effort
was made to isolate and identify indigenous bacterial strains which are capable of degrading
the selected azo-disperse dyes and to develop biofilters. The use of microorganism (bacteria)
for the removal of dyes from textile effluent will serve two purposes - a cost effective and an
environmental-friendly approach for bio-degradation of textile dyes.
The selected bacterial species were examined to check their potential to degrade the selected
dyes. It was considered that the dye was utilized as an energy source for bacteria showing
decolorization. The mechanisms underlying the dye degradation by bacteria were also
explored. The possible role of dye degrading enzymes and degraded products after dye
degradation were examined. Consortium of bacteria has been developed and utilized by
immobilizing on adsorbent for removal of dyes, which provided an insight into the execution
of the microbe-based methodology aimed at bioremediation of textile wastewaters from “lab
to field”.

1
INTRODUCTION
Chapter 1

2
INTRODUCTION
1.1 Components of environment and water pollution
Environmental pollution has caused multi-dimensional impacts on the ecology and human
health. Water pollution is one of the major concerns faced by the modern world among all
environmental problems (Abhilash et al., 2009). According to United Nations water report
in 2006, “there is enough water for everyone” but mismanagement and corruption have
resulted in limited access to it (UNDP, 2006). Gradually, the human beings are exploiting
every natural resource and using them in an uncontrolled manner which is resulting into
the addition of new pollutants into the environment i.e. anthrosphere. Currently the
anthrosphere regulates the lithosphere, hydrosphere and atmosphere, which eventually
affect the biosphere. Good quality water is needed to maintain and sustain a life for all
species on this planet including humans. Increasing population and economic
development have an accelerating role in environmental pollution. Discharge of untreated
industrial and municipal wastewater to surface water bodies is the main cause for surface
and groundwater pollution. Contamination of water resources has occurred at an alarming
pace since the beginning of industrialization in the 20th century, especially in developing
countries like India which has caused environmental pollution affecting not only the human
population but also flora and fauna.
Historical trend shows that for the last several decades, industrialization and urbanization
has contributed mainly in polluting water bodies. Various forms of pollutants mingle in
water causing aesthetic as well as adverse effect on both aquatic and human life. Different
kinds of contaminants present in wastewaters from agro-industries, factories and municipal
plants have been polluting water bodies for decades, resulting in the growth of disease-
causing pathogens, bacteria, hormones, heavy metals, dyes, sediments, pesticides and other
organic and inorganic compounds (Acuner and Dilek, 2004). Industries like textile
industries consume tons of water each year and discharge large volumes of wastewater in
the water bodies (Puvaneswari et al., 2006).
3
1.2 Overview of textile industries
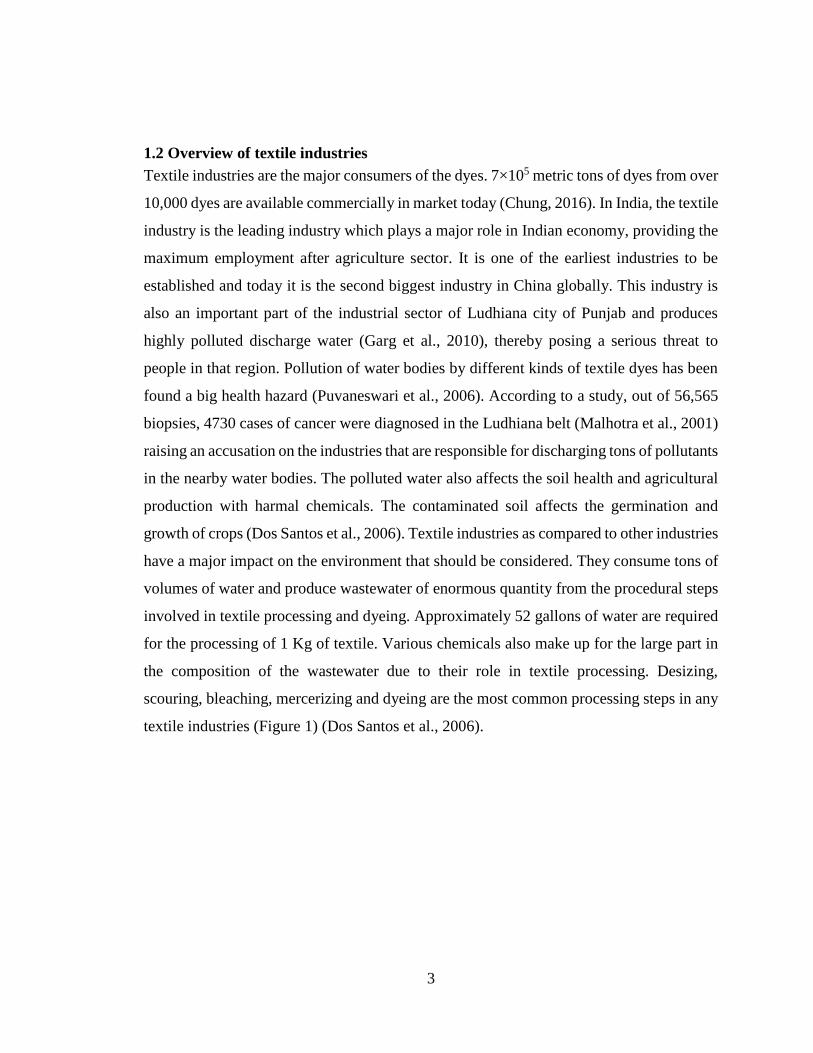
Textile industries are the major consumers of the dyes. 7×10⁵ metric tons of dyes from over
10,000 dyes are available commercially in market today (Chung, 2016). In India, the textile
industry is the leading industry which plays a major role in Indian economy, providing the
maximum employment after agriculture sector. It is one of the earliest industries to be
established and today it is the second biggest industry in China globally. This industry is
also an important part of the industrial sector of Ludhiana city of Punjab and produces
highly polluted discharge water (Garg et al., 2010), thereby posing a serious threat to
people in that region. Pollution of water bodies by different kinds of textile dyes has been
found a big health hazard (Puvaneswari et al., 2006). According to a study, out of 56,565
biopsies, 4730 cases of cancer were diagnosed in the Ludhiana belt (Malhotra et al., 2001)
raising an accusation on the industries that are responsible for discharging tons of pollutants
in the nearby water bodies. The polluted water also affects the soil health and agricultural
production with harmal chemicals. The contaminated soil affects the germination and
growth of crops (Dos Santos et al., 2006). Textile industries as compared to other industries
have a major impact on the environment that should be considered. They consume tons of
volumes of water and produce wastewater of enormous quantity from the procedural steps
involved in textile processing and dyeing. Approximately 52 gallons of water are required
for the processing of 1 Kg of textile. Various chemicals also make up for the large part in
the composition of the wastewater due to their role in textile processing. Desizing,
scouring, bleaching, mercerizing and dyeing are the most common processing steps in any
textile industries (Figure 1) (Dos Santos et al., 2006).

4
Figure-1: An overview of the waste generated by processing steps in textile industries
and various biological methods for effluent treatment
The main pollutants of textile wastewater originate from the dyeing and finishing steps.
These steps involve dyeing of the fibers with the permanent color as per desire which is
further processed into final commercial products (Kim et al., 2003). Frequent fluctuations
in different water quality parameters have been observed in water bodies due to the
discharge of textile wastes with high chemical oxygen demand (COD), biochemical
oxygen demand (BOD), pH, color, and salinity (Hari et al., 1994). Different organic
compounds, dyes and chemicals used in dry and wet processing steps in industries define
the waste water composition (Senthilkumar et al., 2011). Sizing agent is applied prior to
fabric production which eases the weaving process and later removed from woven fabric
by wetting process. This removing process known as desizing is add up to 50% of organic
loading in wastewater discharge from the industry (Feitkenhauer, 2003).
5
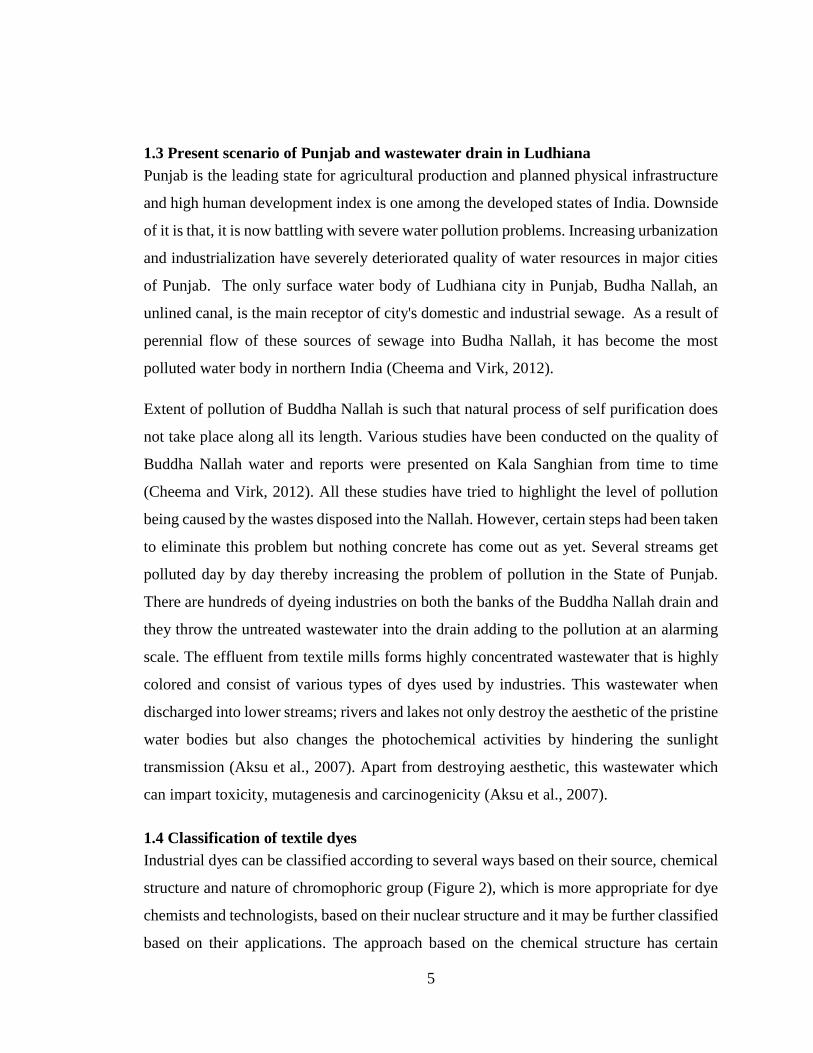
1.3 Present scenario of Punjab and wastewater drain in Ludhiana
Punjab is the leading state for agricultural production and planned physical infrastructure
and high human development index is one among the developed states of India. Downside
of it is that, it is now battling with severe water pollution problems. Increasing urbanization
and industrialization have severely deteriorated quality of water resources in major cities
of Punjab. The only surface water body of Ludhiana city in Punjab, Budha Nallah, an
unlined canal, is the main receptor of city's domestic and industrial sewage. As a result of
perennial flow of these sources of sewage into Budha Nallah, it has become the most
polluted water body in northern India (Cheema and Virk, 2012).
Extent of pollution of Buddha Nallah is such that natural process of self purification does
not take place along all its length. Various studies have been conducted on the quality of
Buddha Nallah water and reports were presented on Kala Sanghian from time to time
(Cheema and Virk, 2012). All these studies have tried to highlight the level of pollution
being caused by the wastes disposed into the Nallah. However, certain steps had been taken
to eliminate this problem but nothing concrete has come out as yet. Several streams get
polluted day by day thereby increasing the problem of pollution in the State of Punjab.
There are hundreds of dyeing industries on both the banks of the Buddha Nallah drain and
they throw the untreated wastewater into the drain adding to the pollution at an alarming
scale. The effluent from textile mills forms highly concentrated wastewater that is highly
colored and consist of various types of dyes used by industries. This wastewater when
discharged into lower streams; rivers and lakes not only destroy the aesthetic of the pristine
water bodies but also changes the photochemical activities by hindering the sunlight
transmission (Aksu et al., 2007). Apart from destroying aesthetic, this wastewater which
can impart toxicity, mutagenesis and carcinogenicity (Aksu et al., 2007).
1.4 Classification of textile dyes
Industrial dyes can be classified according to several ways based on their source, chemical
structure and nature of chromophoric group (Figure 2), which is more appropriate for dye
chemists and technologists, based on their nuclear structure and it may be further classified
based on their applications. The approach based on the chemical structure has certain
6
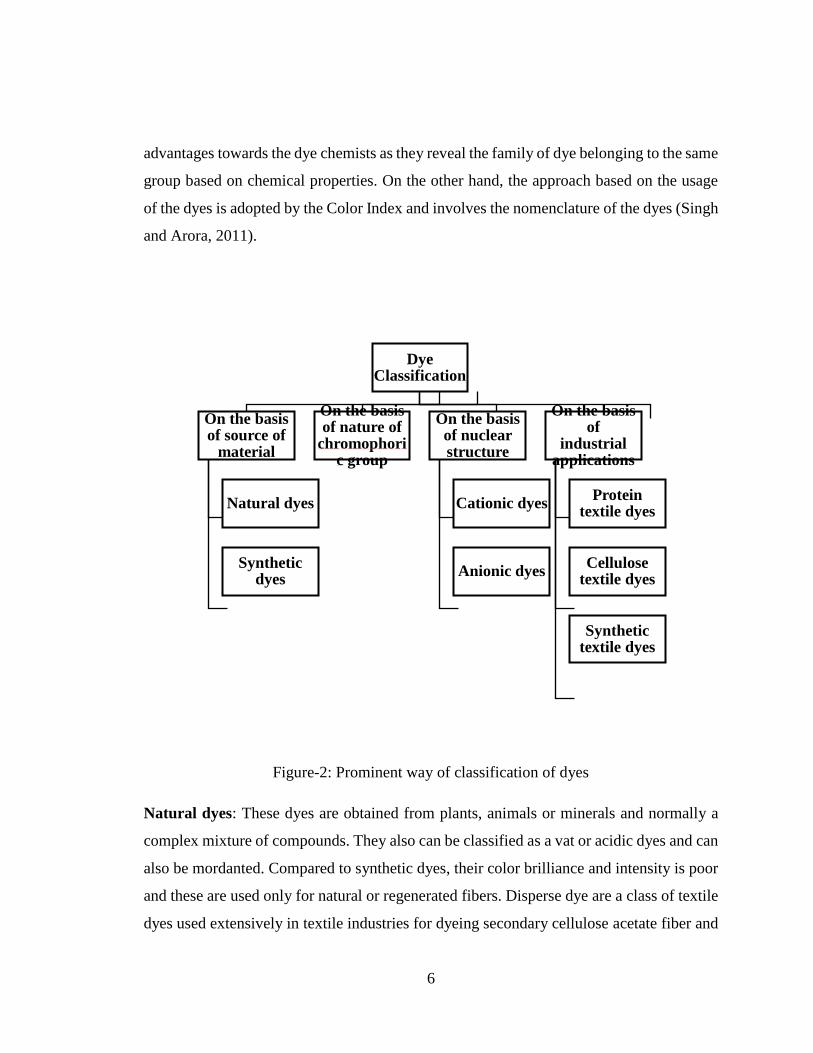
advantages towards the dye chemists as they reveal the family of dye belonging to the same
group based on chemical properties. On the other hand, the approach based on the usage
of the dyes is adopted by the Color Index and involves the nomenclature of the dyes (Singh
and Arora, 2011).
Figure-2: Prominent way of classification of dyes
Natural dyes: These dyes are obtained from plants, animals or minerals and normally a
complex mixture of compounds. They also can be classified as a vat or acidic dyes and can
also be mordanted. Compared to synthetic dyes, their color brilliance and intensity is poor
and these are used only for natural or regenerated fibers. Disperse dye are a class of textile
dyes used extensively in textile industries for dyeing secondary cellulose acetate fiber and
Dye Classification
On the basis of source of
material
Natural dyes
Synthetic dyes
On the basis of nature of
chromophoric group
On the basis of nuclear structure
Cationic dyes
Anionic dyes
On the basis of
industrial applications
Protein textile dyes
Cellulose textile dyes
Synthetic textile dyes
7
polyesters, which is an important group of synthetic fibers. They are non-ionic, insoluble
dye with substituted azo, anthraquinone or diphenylamine groups. Among them, azo
disperse dyes are the widely used dyes and account for about 50% use in textile industries
around the world. Its tinctorial strength and low cost of manufacturing makes it an
alternative for other derivative disperse dyes making them the most common group of
synthetic dyes that are discharged in the environment (Saratale et al., 2011). Even 1 ppm
of the dye can make a significant impact in the visibility of water. Toxicological studies of
these dyes have shown toxic effects on daphnids suggesting its toxic potential in other
living organisms too (Bae and Freeman, 2007). Some of the azo disperse dyes remains
unaltered when treated in sewage treatment plant (Forgacs et al., 2004) and other studies
carried out have showed that 85% of these dyes remain undegraded even after activated
sludge process (De Aragao et al., 2005).
Synthetic dyes: The classification of synthetic dyes is shown in Figure 3. Easy
applicability and cost effectiveness in synthesis along with diversity of available colors as
compared to that of other natural dyes are few reasons why synthetic dyes have been used
widely. The uses of synthetic dyes have been widely found in tanneries, paper and pulp
industry, cosmetic industries etc.
A separate classification which addresses the method of dyes application and to a certain
extent the chemical structure of the dyes has been developed. This classification system is
as follows:
Acid dyes: These dyes are generally known for large molecular structures. They have one
or more carboxylic salts or sulfonic acid functional groups. Fibers are dyed with acidic
dyes in acidic solution which develop a positive charge in the fiber and help in the binding
of the dye. Cotton, wools are the kinds of fiber that develop a positive charge in acidic
solutions. Acidic dyes are generally colorfast for light and laundering. But mordanting
improves the overall fastness of acidic dye. They can be further divided into three groups
based on their application and wet fastness. Leveling acid dyes are small molecular dyes
with better color fastness and require highly acidic dye bath. Milling acidic dyes have better

8
wash fastness with dull shades and with lesser leveling quality. They are applied from
dilute acetic acid solution. Their molecules are larger than leveling dyes. Super milling
dyes have high color fastness and wet fastness. They have poor leveling ability. Their
molecules are larger and require neutral dye bath solution.
Direct dyes: These are the special class of dyes used for dyeing cellulosic fibers due to
their high affinity and their smaller molecular size. Their molecules are long, narrow and
flat, as a result, they can easily diffuse into the fiber. Direct dyes often contain one or more
azo groups attached to the aromatic chromophore. Since the charge of the fiber is not a
factor in dyeing with direct dyes, they require basic dye bath for dyeing. In basic dye bath
cellulosic fibers shows better stability. These dyes are categorized into 3 categories. Class
A dyes have better leveling ability compared to class B and class C even in higher salt
concentration. Class B and C have poor leveling ability but can be improved by adjusting
the salt concentration or raising the dye bath temperature as in the case of class C direct
dyes. Though direct dyes are colorfast to cellulosic fibers but it can be made better by
mordanting.
Mordant dyes: These dyes are acid dyes with some extra sites that react with metal salt
mordant. These dyes have also got acid salt anion groups just like acid dyes. These dyes
are engineered to chelate with metal ions forming an organometallic complex with higher
color fastness and lesser solubility. The mordanting step can be applied with various
combinations to achieve dyeing with mordant dye. The mordanting can be applied after
dyeing, or before dyeing or along with dyeing. Though post-mordanting is found to be
more effective.

9
Figure-3: Classification of synthetic dyes (derived from inorganic/organic compounds)
Synthetic dyes
Direct dyes Vat dyesSulphur
dyesOrganic pigments
Reactive dyes
Disperse dyes
Acid dyes Basic dyesMordant
dyesSolvent
dyesOptical
brightener
10
Salts like aluminum, chromium, iron, copper are used commonly as mordants.
Reactive dyes: The reactive dyes contain the basic structure of mordant, acid or direct dye
with an additional reactive group, capable of binding covalently with the fiber. Due to their
specific reactivity property, these dyes are limited some of the fibers like cellulosic fiber,
nylon or protein fibers. These dyes have excellent fastness due to their reactivity. These
dyes require slightly acidic or basic conditions for rapid and successful reaction with the
fiber. Reactive dyes with a world market share of 60–70% are widely used in industries
(Campos et al., 2001).
Basic dyes: These are the colored cationic salts of amine derivatives. Since they are
cationic in nature, they migrate towards the negatively charged portion of the fiber. Though
the color brilliance and intensity of the dye is excellent but the color fastness is very poor.
Mordanting with complexing agent improves the colorfastness of the dye. They are applied
in mildly acidic or neutral solutions. They are applied to fibers like cellulosic, protein;
nylon specially modified synthetic fibers or acrylic fibers.
Vat dyes: These dyes are usually water-insoluble. These dyes have to be solubilised by
reducing them in the presence of a base and then apply to fibers. The dyes are usually
anthraquinone or indigoids derivatives. These are applied at low temperatures. After
application of the reduced dye, the dye has to be re-oxidized using air or treatment with
mild oxidizing agents. Removal of loosely held surface dyes can provide good color
fastness. These can also be applied readily to synthetic and cellulosic fibers but are avoided
in protein fibers due to their high basicity.
Sulfur dyes: These dyes are a complex of aromatic compounds with sodium polysulfide.
Sulfur dyes, just like vat dyes are reduced in the presence of bases prior to their application
to the fibers and are re-oxidized after dyeing. Either air or oxidizing agents like hydrogen
peroxides are used for the re-oxidizing purpose. They are also found in solubilised leuco
form like vat dyes. They are inexpensive and show moderate color fastness.

11
Azoic dyes: Azoic dyes or naphthol dyes are made by a coupling reaction of an aromatic
alcohol or amine with diazonium salts. These contain the azo group.
The fabric is dyed by applying the coupling component like aromatic alcohol or amines
which are immersed in a solution containing diazonium salts. Due to its instability, the
process is carried out at the near room temperature. These dyes have moderate fastnesses
which can be improved by mordanting. The presence of one or more R1-N=N-R2 bonds is
the characteristic property of azo dye. Azo dyes are synthetic organic colorants that are
widely used in the industries relating to textiles, foods, printing, tattooing, and cosmetics
and in clinical settings (Chen et al., 2005). These become pollutants once they are released
into the environment (Suzuki et al., 2001). Azo dyes are usually recalcitrant to conventional
wastewater treatment. Several methods such as adsorption, chemical treatment, and
electrochemical processes have been adopted and proved to be costly which also produce
large volume of sludge. More studies are now focused on the methods involving biological
treatments (Chen, 2006). Many microorganisms such as bacteria, fungi, and yeast have
been observed to decolorize azo dyes by biosorption and biodegradation (Gou et al., 2009).
Therefore, the biologically degrading dyes have potential advantages in developing
decolorizing bio-treatment of wastewater (Suzuki et al., 2001).
Disperse dyes: Disperse dyes were developed to dye fabrics having hydrophobic properties
like acetate, nylon, polyester and other synthetic fibers. They are small polar molecules
containing either anthraquinone or azo groups. They do not have charged anionic or
cationic groups in their structure. They are partially soluble in water and hence are
dispersed with surfactants in the dye bath. The dyes are solubilized in small steps and the
fiber is dyed until all the dyes get exhausted. These dyes have good light and wash-fastness
but have fume fading problem. Some of the disperse dyes can be used to dye thermoplastic
fibers by sublimation method due to their appreciable vapor pressure.
xii
Solvent dyes: These dyes resemble other dye classes but their uniqueness lies in their
solubility in alcohols and chlorinated hydrocarbons due to the presence of certain
groups in their structure. They are applied to fibers which have poor dyeability in
aqueous solutions.
Pigments: These are the class of insoluble color compounds which cannot bind to fibers
readily and need to be fixed by using an adhesive compound that locks it down in the
fiber material. The pigments dyes have moderate to poor fastness as they are just surface
treated.
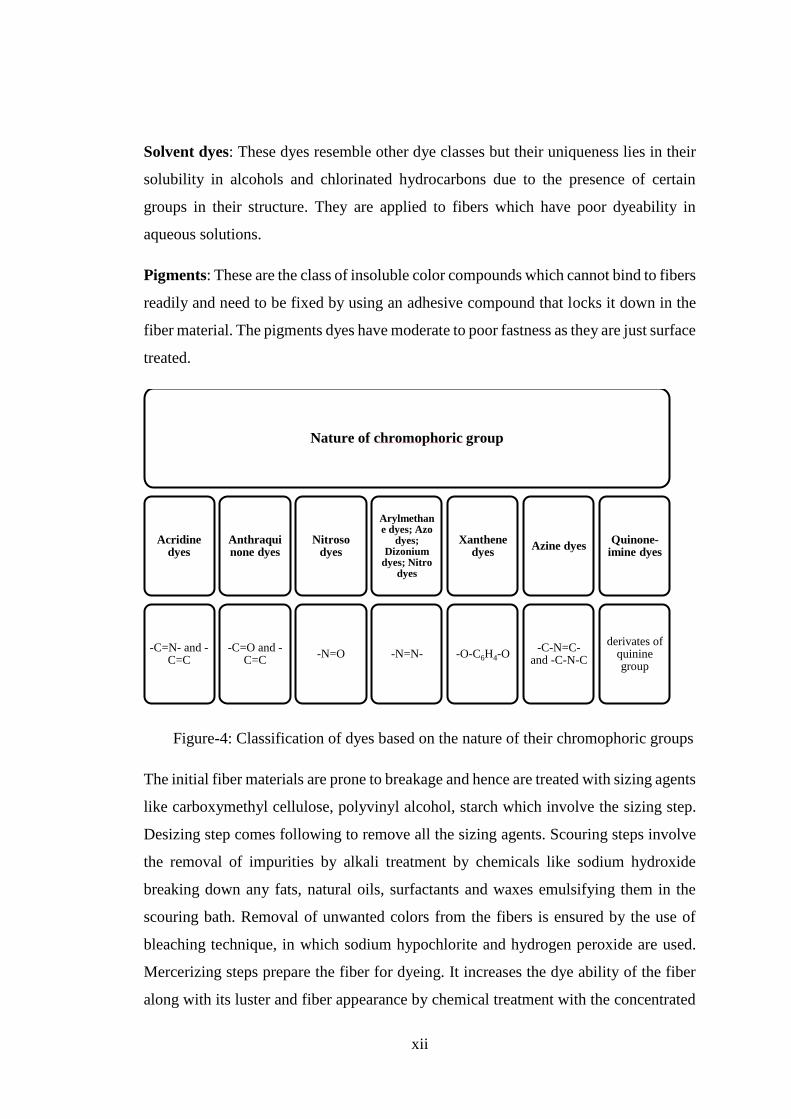
Figure-4: Classification of dyes based on the nature of their chromophoric groups
The initial fiber materials are prone to breakage and hence are treated with sizing agents
like carboxymethyl cellulose, polyvinyl alcohol, starch which involve the sizing step.
Desizing step comes following to remove all the sizing agents. Scouring steps involve
the removal of impurities by alkali treatment by chemicals like sodium hydroxide
breaking down any fats, natural oils, surfactants and waxes emulsifying them in the
scouring bath. Removal of unwanted colors from the fibers is ensured by the use of
bleaching technique, in which sodium hypochlorite and hydrogen peroxide are used.
Mercerizing steps prepare the fiber for dyeing. It increases the dye ability of the fiber
along with its luster and fiber appearance by chemical treatment with the concentrated
Nature of chromophoric group
Acridine dyes
-C=N- and -C=C
Anthraquinone dyes
-C=O and -C=C
Nitroso dyes
-N=O
Arylmethane dyes; Azo
dyes; Dizonium
dyes; Nitro dyes
-N=N-
Xanthene dyes
-O-C6H4-O
Azine dyes
-C-N=C-and -C-N-C
Quinone-imine dyes
derivates of quinine group

xiii
alkali solution and acid solutions. This step especially requires large volumes of water,
both for dying in the dye bath and rinsing step. For enhancing the dye absorption by the
fiber, many chemicals like metals, sulfide, formaldehyde surfactants and salts are used.
The chemicals required can range from inorganic compounds to organic products. More
than 7000 chemicals are involved in the dyeing process. These chemicals, if untreated
before discharge in the wastewater, can cause harmful effects. Of all the steps involved,
wet processing steps produce the highest amount of wastewater containing the diverse
chemicals and most importantly the synthetic dyes of different chromophoric groups
like azo, anthraquinone, triaryl methane etc (Figure 4). Out of the 800,000 tons dyes
used per year, 60-70% of them belong to the azo class of dye. None of the synthetic
dyes provide a 100% fixation and as a result, a good amount of the unfixed dye make
their way into the wastewater which is estimated to be present in concentrations of up
to 500mg/ml (Pearce et al., 2003).
At the end of 19th century, synthetic dyes almost completely replaced the natural dyes
since its accidental discovery by an English chemist W.H. Perkin in 1856. Since then
thousands of synthetic dyes are developed and manufactured (Wesenberg et al., 2003).
Synthetic fibers like polyester and nylon posed a challenge to the natural dyestuffs
leading to their replacement and mass production of synthetic dyestuffs. The discovery
of chromogen during the early textile industrial set up led to the discovery of almost all
types of textile dyes which used today. The annual production of synthetic dye exceeds
a production of 700,000 metric tons each year (Toh et. al., 2003). Some of the countries
like Russia, India, China, and South Korea are the major producers of synthetic dyes
with China leading, producing 28% of the global dye need annually (Wesenberg et al.,
2003). In the year 1999, the synthetic dye industry was worth USD 6.6 Billion markets
with Asia holding 42% of the share (Torres et al., 2003). Among all the dyestuffs
produced globally, Azo dyes are estimated to make up about 70% by weight (Pinheiro
et al., 2004). Thus, azo dyes make up for the largest group of synthetic colorant and of
huge environmental significance. Due to their relative ease of manufacturing and other
suitable characteristics like stability to light degradation, temperature, varying color
availability, oxidizing agents, as well as microbial attack, they are the considered dye

xiv
of choice for several dying industries like textile industries, papermaking industries,
printing industries etc (Torres et al., 2003).
Dyes are resistant against light, water as well as oxidizing agents and as a result these
are very reluctant to remove from environment once they are released. Therefore, its
treatment by any conventional treatment process becomes pretty much useless (Shaul,
1991). Treatment of wastewater containing dyes is very cumbersome process and
difficult as a result of wide ranges of pH, salt concentration and chemicals present in
the water.
1.5 Treatment of textile effluents
Variety of effective physical and chemical treatment methods are commercially
available but most of them are either expensive or not adaptable to a wide range of dyes,
as a result these do not completely solve the problem of complete decolorization of dyes
in industrial effluents.
The methods which are involved in removing the colors before discharging into the
environment are adsorption, flocculation, coagulation etc. These methods, due to high
cost and large sludge production, pose a serious limitation. Therefore, economical and
environment-friendly techniques are required for the removal or degradation of dyes
from the wastewater. Biological methods which have capabilities of bioconversion of
organic pollutants to stable nontoxic product (Kuhad et al., 2004) have currently been
viewed as alternative methods. These methods are environmental friendly, less energy
intensive and effective.
1.6 Importance of biological methods (Bioremediation)
Bioremediation of wastewater involves the use of living organisms, primarily
microorganisms, to degrade the environmental contaminants into less toxic forms.
These naturally occurring bacteria and fungi or plants that are locally available to
degrade or detoxify substances, hazardous to human health and/or the environment. The
microorganisms may be indigenous to a contaminated area or they may be isolated from
elsewhere and brought to the contaminated site. Contaminanting compounds are
transformed by living organisms through reactions that take place as a part of their
metabolic processes. Biodegradation of a compound is often a result of the actions of

xv
multiple organisms. When microorganisms are imported to a contaminated site to
enhance degradation, that process is known as bio-augmentation. Bacteria are most
commonly used microorganism for bioremediation processes. For decolorization of
dyes in wastewaters a Phanerochaete chrysosporium which is a white rot fungus has
been used extensively (Kirk et al., 1992) which is also correlated with its ability to
synthesize lignin degrading exoenzymes such as lignin and manganese peroxidases
(MnP) (Harazono et al., 2003) or Laccases (Sharma et al., 2009).
It is found that biodegradation of dyes is less effective via activated sludge treatment
unit. But further, many microbes such as algae, bacteria, fungi and yeasts have been
reported which have the ability to decolorize and mineralize the dyes under favourable
environment conditions. Significant literature is available which discuss about the
microbiological and physiochemical approached for decolorization of dyes (Banat et
al., 1996). The treatment by microbes facilitate as the cheap and eco-friendly approach
for removal of toxic dyes and metals from textile effluent. Due to diverse nature of
microbes, they serve as the invaluable tool for biotreatment of effluent (Olukanni et al.,
2006). Different biotechnology approaches have been considered by researchers as a
potent approach for remediation of pollutant in an eco-friendly manner (Robinson et
al., 2001).
Many reports have been documented which discuss the ability of bacteria to decolorize
the dye, either in its pure form or in consortium (Robinson et al., 2001). The microbial
consortium shows significant advantages in comparison to pure isolated for the
degradation of synthetic dyes (Pal and Vimala, 2012). As different isolate may amend
dye components over different positions or may expend the degraded products
produced via other strain for further degradation (Forgacs et al., 2004). Documented
literature proposes to use the microbes for remediating of dye and metal constituents
from contaminated soil and water (Robinson et al., 2001). Thus, we need to explore the
role of microbes for the restoration of our natural resources especially belonging to
Ludhiana District of Punjab, the hub of textile sector, India.
The present study is a step towards the development of eco-friendly approach for the
large-scale problem (effluent) prevailing due to the operation of textile dyeing units.
The primary focus is to isolate the dye decolorizing bacteria from textile effluent
xvi
collected from Ludhiana district, Punjab, India and the assessment of these isolates to
degrade the chosen commonly used dyes i.e. disperse dyes were analysed. The success
of biotreatment was achieved when the treated water showed the effective result for
germination of Triticum aestivum, which favour the usage of treated water in irrigation
and life-supporting processes. Although, the microbes are omnipresent in nature, and
continuous exposure of these toxic dyes evolves these microbes to detoxify and
decolorize the chemical agents. The hypothesis of this study was that, the bacteria under
constant exposure to the synthetic dyes alone, can be effectively used in remediating
the textile mediated water pollution.
1.7 Scope of the current study
The conventional effluent treatment technologies in the form of physical and chemical
treatment systems are not sufficient for the treatment of textile wastewater due to the
presence of recalcitrant azo bonds and low biodegradability of textile dyes. Moreover,
these methodologies are costly, inefficient and have less adaptability to diverse
categories of dyes. In comparison, bioremediation is cost effective, safe and an
economically feasible technique. Therefore, in the present study we focused on the use
of naturally occuring for the degradation and decolorization of disperse dyes that are
being used in the textile industries of Ludhiana city, Punjab, India.
1.8 Social impact of the research
• We are providing a biological technique for decolorization of various textile
dyes.
• Use of adapted microorganism (bacteria) for the treatment of textile effluents
containing dyes will serve dual purposes at the same time, one is low cost and
another is eco-friendly approach for degradation of dyes.
• We are trying to improve the existing water quality for aquatic life and use of
treated wastewater for irrigation purposes.

REVIEW OF
LITERATURE

Chapter 2
REVIEW OF LITERATURE
2.1 Textile industries and water pollution
The textile industry has been one of the major polluters of surface and ground water
resources because it uses as many as 8,000 chemicals and huge amount of water.
Several reports suggest that an average sized textile industry consumes about 1.6
million litres of water per day for the production of about 8,000 kg of fabric (Khandare
et al., 2015). According to the World Bank, 17% to 20% of textile industry water
pollution originates by the steps used for dyeing and printing treatments that apply to
the fabric (Holkar et al., 2016). The wastewater discharged from textile dyeing industry
contains a total of 72 toxic chemicals out of which 30 chemicals cannot be removed by
waste treatment processes (Chen and Burns 2006). The demand of chemical based
textile dyes have increased significantly due to their cost-effectiveness and high
stability of various parameters like temperature and light in contrast to natural dyes.
This leads to discharge of highly polluted effluents (Couto, 2009). These textile dyes,
which are readily soluble in water, have resulted in negative effects on the fragile
ecosystems around the industries and represent serious environmental problems.
Textile effluent due to its dark color usually blocks sunlight, which hinders the life of
aquatic organisms (Ghaly et al., 2014). Currently, the dyes used in the textile mills are
approximately ten thousand in number, out of which azo-dyes constitute the biggest
and very recalcitrant category of dyes on a commercial scale (Chung and Chen, 2009).
The release of these synthetic azo-dyes in the environment has detrimental effect on all
forms of life (Singh and Arora, 2011). Textile printing and dyeing processes include
pretreatment of fabric, dyeing with synthetic dyes, printing and finally finishing steps
with each step leads to water contamination.
Organic and inorganic solid materials, acids and bases, coloring agents are the major
contaminants present in the wastewater. Tannin and lignin are the coloring agents which
assign color to the fabric (Singh et al., 2012). Dyeing basically includes application of
dyes under appropriate conditions, to produce colored fabrics. In contrast, printing
includes application of dyes to a restricted area on the fabric that is selected for applying
the abstract of the design (Gausa and Abubakar, 2015). Finishing processes comprise
softening, cross-linking and water proofing but all these steps lead to water
contamination (Babu et al., 2015). With these processing steps, different phases of
production do exist, such as yarn and fabric formation, wet processing and textile
fabrication. However, synthetic dyes pose rampant health hazards when they react with
other chemicals and form non-degradable by-products. The presence of heavy metals
(such as Cu, As, Pb, Cd, Ni and Co), soaps, detergents, sulphur and acetic acid have
been reported by researchers to cause toxic effects. Organic materials such as
formaldehyde based agents use to fix the dyes to fabric, chlorinated agents use to
remove stain, softeners based on hydrocarbons, and certain other non-biodegradable
synthetic chemical agents are carcinogenic. The effluent coming from textile dyeing
mills is not only toxic, but it is also enriched by the presence of mutagenic, and
teratogenic as well as carcinogenic chemicals (Novotny et al., 2006). For instance, the
well-known carcinogen, benzidine, is the parent component of most of the azo dyes,
which poses a threat to living organisms (De Aragao et al., 2005). The experimental
studies on animal model conducted by Raj et al., (2015) showed that the main class of
textile dyes, i.e. azo dyes is directly connected to bladder cancer in humans; to splenetic
sarcomas; hepatocarcinomas which is the main cause of aberration of chromosomes in
mammalian cells. Sudova et al., (2007) reported that malachite green being an
important carcinogenic agent has been shown to cause serious effect on human
reproductive system and on the immune system. Disperse blue 291 dye has been
reported to cause nucleotide substitution in the DNA and addition or deletion of some
base pairs which leads towards some errors in genetic code (De Aragao et al.,
2005). Due to high thermal and photo stability of dyes, dyes can persist in the water
environment for longer time period if left untreated. For instance, reactive Blue-19 in
hydrolyzed form, having a half-life of about 46 years at 25°C and pH 7.0, can persist in
polluted waters for years (Carmen and Daniela, 2012). Therefore, in current study an
effort has been made to review the entire literature on cost effective and eco-friendly
methods to degrade textile dyes present in textile effluents using biological approaches.
2.2 Textile Dyes
A total of about 10,000 different types of dyes currently being used in textile industry
and more than 7 x 10⁵ tons of synthetic dyes are produced worldwide annually (Anburaj

et al., 2011). Dyes are used for imparting color to the fabric because of the presence of
chromophoric groups in their structure. The solubility of these dyes in water also
differentiates them from one another. Dyes are predominantly classified on the basis of
fibers on which it is to be imprinted and the chemical/physical nature of these dyes
(Wesenberg et al., 2003). Chromophores mainly comprise a group of atoms which gives
distinct color to the dye whereas the color enhancer named auxochromes is achieved
by the electron substitution either by removing or donating. Chromophores contain
functional groups such as –N═N–, –C═O, –NO2 and O=(C6H4)=O (quinoid
assemblies) whereas the auxochromes of the functional groups such as –NH3, –COOH,
–OH and –SO3H (Srinivasan and Viraraghavan, 2010). Waqas et al., (2015) studied
different auxochromes and classified into different categories of reactants, which could
be acid or base, or astringic or disperse, pigmented, vat, anionic or in grain form, and
also may be in dissolved or undissolved form. Dyes are also categorized on the basis of
the reactive groups that are in association with -OH and -SH through the covalent bond
formation which are then used on different fibers such as cotton, silk, nylon, and wool.
2.3 Textile Dyes: Impact on environment
The biggest threat to the environment is presence of untreated dyes in water bodies
because many of these reactive dyes hinder the photosynthetic process of hydrophytes
by blocking the light to penetrate, which further leads to the synthesis of toxic
substances that are harmful against the marine organisms (Wang et al., 2009). The
marine organisms are not the only one which is affected, but the flora and fauna of
marine environment, soil fertility, and plant growth are also affected by toxic
substances present in dyes. The colored discharge water from industries increases water
pollution and are visually unpleasant (Damodhar and Reddy, 2013). Several studies
have shown the unpleasant reality of these dyes which are initiator of cerebral
carcinoma and skeletal abnormalities in the fetus. Murugesan and Kalaichelvan (2003)
revealed that toxic aromatic amines are formed under the oxygen deficient environment
in receiving media due to the discharge of untreated dye effluent. Some of the reports
on azo dyes showed their linkage with many types of cancers of different organs such
as bladder, spleen, liver and normal aberrations in model organisms and chromosomal
deformities in mammalian cells (Murugesan and Kalaichelvan, 2003).

The major challenge associated with the treatment of wastewater containing dyes is
related to degradation process. Different types of microbes have been employed under
anaerobic environment for decolorizing the azo based dyes. Kirk and Farrel, (2017)
studied the action mechanism of decolorization of azo bonded dyes under anaerobic
condition using bacteria where electron transfer directly to the azo dyes resulting in
bacterial catabolism and ATP generation. Nevertheless, Damodhar and Reddy, (2013)
stated in their research that no bacteria catabolize the azo dyes for the synthesis of ATP
as the final product instead, these azo dyes are reduced by Fe2+ or H2S producing
inorganic compounds under the anaerobic environment. Islam and Huda (2016)
heightened the problems associated with discharge of effluents from textile industries
causing hindrance in the photosynthesis process and affecting the marine bodies and
phytoplankton negatively. The effluent discharged from these textile industries impart
corrosive traits as well as additions to their physical traits such as unpleasant smell,
decreased dissolved oxygen in water, and increase in insoluble materials in water. The
colloidal substances present in the effluent when merge with fresh water streams alter
water turbidity. Therefore, these dissolved impurities give rise in the salt level in the
water, which makes it inappropriate for human consumption and irrigation. Cr and SO3
are the toxic contaminants posing a serious threat to marine life and microorganism that
are useful for the purification of the water streams. Sudden change in the amount of
dissolved oxygen takes place due to the presence of nitrates, nitrites, starch and sulfides
(Asamudo et al., 2005). Debris remains of organic materials such as starch cotton are
degraded by bacteria which increases the demand for dissolved oxygen in water.
Different chemicals used in textile processing cause the variation in pH in the water
affecting the marine life (Singh et al., 2011). Solids which are dissolved in the effluent
get settled on the surface of the sewers and cause corrosion to waste treatment pipes.
Untreated textile industry discharge to water bodies poses a greater risk to ecosystems
(Singh et al., 2011).
The effluent from textile industries affects negatively to soil fertility, plant growth and
productivity of plants and make the plants susceptible to pathogens. This affects plant
germination, seed survival, shoot and root length, etc. Chlorophyll content of the plants
also decreases if textile industry effluent is used for irrigation. The decline in plant

protein, carbohydrates, and chlorophyll is a clear indication of toxic effects of textile
dye effluents on plants (Jayanthy et al., 2014).
It has been found in the clinical trial of model organisms that azo dyes are responsible
for the formation of liver nodules. Also, laborers working in the azo dye industries
have shown susceptibility of developing the bladder cancer. A number of the azo dyes
prompt the formation of nodes in liver in the experimental models (Puvaneswari et al.,
2006). It is also suggested that laborers have high chances of bladder cancer as they are
extremely exposed to large amounts of benzidine based azo bonded dyes (Golka et al.,
2008). Puvaneswari et al., (2006) studied the consequences encountered on releasing
benzidine and benzidine analogue to model organisms such as canines, hamsters, and
mice, which provides the outcome indicating existence of probable aromatic amines
and their associated N-acetylated derivative in their urine which can be tumorigenic.
These studies clearly show that some of dye products used in the textile industry can
cause cancer and other ailments in humans and other aquatic life.
2.4. Treatment Options for Dye Effluent
Nowadays, the concern is primarily focused on developing economical and effective
methods to treat wastewater discharge from the textile industries to protect the
aquatic life in water bodies. Therefore, the methods could be physico-chemical,
biochemical or the combination of both which can provide effective technologies in
removing contaminants from wastewater coming from the textile industries. Wesenberg
et al., (2003) reported that physical and chemical methods can be cost-effective but they
do not guarantee the complete elimination of the contaminants.
2.4.1 Physico-chemical methods
Although physico-chemical methods of wastewater treatment are easy to use, but these
methods may not be always cost effective and environmental friendly (Gaehr et al.,
1994). High electricity consumption is required with less output because of generations
of the high number of byproducts and sludge which cannot be reused (Fajardo et al.,
2016). These methods are not single step rather multistage treatment process with long
retention time is the necessity. Generally, the chemical approaches are utilized for
elimination of organic contaminants by employing coagulation as well as flocculation
approaches (Ukiwe et al., 2014). Kim et al., (2002) highlighted efficacy of the
coagulation treatment against the insoluble dye material on comparing with the soluble
dye material in the water. The chemicals which are used in coagulation processes,
precipitation as pH modification are highly expensive. Major issues which limit the use
of chemical method includes dewatering, pH modification, high levels of residues
associated in the supernatant, cost towards precipitation, sludge generation and its
disposes. The merits and demerits of various physio-chemical methods used for
treatment of textile dyes are represented in Table 1. This table indicates that physio-
chemical methods are available for treatment of textile industry effluents, but energy
and environmental costs are high.
Adsorption, ion-exchange, oxidation process and irradiation are a few of the physical
approaches that have been used for treating wastewater and have provided valuable
results (Aplin et al., 2000). Significant absorption ability of the acid dye was shown by
the absorbent chitin as it comprises amino nitrogen. Daassi et al., (2016) conveyed that
waste materials contain an ample number of adsorbents which have the ability to
decolorize the dye as well as colored organic material that provide color to the media
even at low prices. Adegoke and Bello (2015) acknowledged about the activated carbon
and its adsorption capability which has the potential to treat both acid and basic dyes.
Abu-Saied et al., (2013) provided the insight about the inability of the adsorption
method in treating the undissolved dye materials and finding the alternative desorption
method. The irradiation technique has the potential in treating different colored water
of small volume but requires high amount of dissolved oxygen. Whereas, the ion
exchange methods manifest more deteriorating results in treating different dyes and
show inadequate response in the presence of other additives in the same wastewater.

Table-1: Advantages and disadvantages of existing various physico-chemical methods available for treatment of textile dyes
S. No Physico-chemical
methods
Applications Merits Demerits References
1 Carbon nanotubes Point-of-use, heavily degradable
contaminants (pharmaceuticals,
antibiotics)
Highly accessible sorption
sides, bactericidal,
reusable
High production
costs, possibly health
risk
Qu et al., (2013)
2 Cucurbituril A cyclic polymer with hydrophobic
cavity and low solubility in
aqueous solutions used for
decolourization of dyes
Good sorption capacity for
various dyes
High cost Ramalho et al., (2002)
3 Electrochemical
destruction
Environmental compatible, as its
main reagent, the electron, is a
clean reagent
Breakdown compounds are
non-hazardous
High cost of
electricity
El-Ashtoukhy et al.,
(2013)
4 Ion exchange A ion-exchange resin captures
charged ions formed due to
breakdown of dyes
Regeneration: no
adsorbent loss
Not effective for all
kind of dyes
Raghu and Basha, (2007)
5 Irradiation It generates radical species which
reacts rapidly with textile dyes and
leads to the destruction of its
chemical structure.
Effective oxidation at lab
scale
Requires a lot of
dissolved O2
Chen et al., (2006)
6 Ozonation A powerful disinfection and a
strong oxidant to remove colour
and odour, eliminating trace toxic
synthetic organic compounds and
assisting in coagulation
Applied in gaseous state
only
Short half-life (20
min)
Al-Kadsi et al., (2004)
7 Nanoparticles (Ag,
ZnO, TiO2, coated
ceramic filters)
Large surface area, small diffusion
resistance, high adsorption
capacity, fast adsorption
equilibrium
Offers an effective and
economic way to
environmental
bioremediation protection
Leaching problem Hosseinnia et al., (2010)

8 Nanoadsorbents Point-of-use, removal of organics,
heavy metals, bacteria
high specific surface,
higher adsorption rates,
small footprint
high production costs Gehrke et al., (2015)
9
Nanometals and
nanometal oxides
Removal of heavy metals (arsenic)
and radionuclides, media filters,
slurry reactors, powders, pellets
short intraparticle diffusion
distance compressible,
abrasion-resistant,
magnetic photocatalytic
(WO3, TiO2)
less reusable Gehrke et al., (2015)
10 Membranes and
membrane
processes
All fields of water and wastewater
treatment processes
reliable, largely automated
process
Relative high energy
demand,
Concentrated sludge
production
Gehrke et al., (2015)
11 Magnetic
Nanoparticles
Wastewater Treatment Provides stability,
Protection from oxidation,
provides surface to which
contaminant specific
ligands are attached.
In vitro cytotoxicity Costa et al., (2011)
12 Peat Peat’s ability of cationic exchange
is its exclusive property
Good adsorbent due to
cellular structure
Specific surface
areas for adsorption
are lower than
activated carbon
Wang et al., (2011)
13 Polymeric Nano
adsorbents
(dendrimers)
Removal of organics and heavy
metals
Bifunctional (inner shell
adsorbs organics, outer
branches adsorb heavy
metals), reusable
Complex multistage
production process
Chou and Lien, (2011)
14 Photochemical with
H2O2
The generation of highly reactive
and non-selective hydroxyl
radicals, which are able to degrade
many organic pollutants
No sludge production Formation of
byproducts
Lodha et al., (2010)
15 Sodium
Hypochlorite
The strong oxidizing potential of
sodium hypochlorite towards the
Initiates and accelerates
cleavage of azo bond
Release of aromatic
amines
Wang et al., (2011)

decolourization /degradation of
dyes
16 Silica gel The high surface area, good
sedimentation ability and great
adsorption of SiO2 particles
facilitates significant dye
degradation
Effective for basic dye
removal
Side reactions
prevent
Zhao et al., (2008)
17 Wood chips Wood chips had positive effects for
degradation of the dyes from
wastewater as they provide are
natural environment for living
microorganisms
Good sorption capacity for
acid dyes
Requires long
retention times
Turgay et al., (2011)
18 Zeolites Disinfection processes Controlled release of
nanosilver, bactericidal
Reduced active
surface through
immobilization of
nanosilver particles
Turgay et al., (2011)
2.4.2 Biological methods
Biological methods, i.e. degradation of dyes with the biological phenomenon such as
bioremediation is an eco-friendly and economical technique with less operating time for
removal of dyes from textile effluent (Ekambaram et al., 2016).
Biological based methods employed for degradation of the effluent from the textile industries
have been successfully used. The biological degradation (i.e. bioremediation) is economically
feasible, environmental-friendly and generates less volume of sludge when compared with
other techniques. It causes the degradation of synthetic dyes to a comparatively less toxic
inorganic compound because of breakdown of bond (i.e. chromophoric group) and finally helps
in removal of color (Babu et al., 2015). The catabolism of the azo dyes takes place in two steps,
firstly the dyes underwent through the breaking of the azo bonds forming the amines, and
secondly the aromatic amines are further catabolized to small non-toxic molecules under
aerobic environment (Chequer et al., 2011). The techniques are being developed to use the
ability of bacteria to survive under the aerobic and anoxic conditions for the complete
degradation of the azo bonds formed within the dyes.
Leena and Selva, (2008) gave the insight that biological process is efficient in reducing the
COD and turbidity but inefficient in removing the color. Muda et al., (2013) reported success
and benefit of the two-phase process in developing biological methods for decolorization in a
future where the first phase involves anaerobic processes followed by aerobic process.
2.4.2.1 Fungal biodegradation of dyes
Different fungal species have been reported in the literature and several species have been tried
for treating the wastewater discharge from textile dyeing industries (Aust, 1990). Combinations
of aerobic and anaerobic treatment by different microbes have shown promising results for
biological degradation of textile dyes (Lade et al., 2012). Several studies on fungal based dye
decolorization have been conducted to replace present chemical and physical treatment
methods (Placido et al., 2016). Phanerochaete chrysosporium emerges as an efficient
remediation model for treating the effluent from textile, pulp and paper industries which
contains polycyclic aromatic hydrocarbon (PAH). Senthilkumar et al., (2014) studied
Phanerocheate chrysosporium, which produces extracellular enzymes such as, laccase and
lignin peroxidase mediated decolorization of various dyes. Singh and Singh (2010) examined
another fungus named as Trichoderma harzianum which has been employed for the cleaning
the effluent from the textile industry. A fixed amount of Congo red and Bromophenol blue
dyes were completely degraded by fungal mycelium by using semi-solid PDA medium. This
study showed that the medium containing Congo red, Direct green, Bromophenol blue, Acid

red and Basic blue inhibited the growth of Trichoderma harzianum in comparison to the control
treatment (growth in the medium without dye). Out of these dyes, Bromophenol blue was found
to show the maximum growth inhibitory effect (43%). For bioremediation, diverse fungal
cultures were used due to their characteristic features such as the fast growth, large amount of
biomass and wide hyphal spectra which made fungus more effective as compared to the
bacteria (Anastasi et al., 2013). Chairin et al., (2013) cited filamentous fungi as an effective
degrader under certain niches because of their high surface-to-cell ratio. Singh et al. (2012)
studied Aspergillus strain (MMF3) and optimized NaCl concentration for the effective
degradation of textile dye orange 3R and reported efficiency about 96% on the 5th day under
ideal conditions. At 1.0% concentration of NaCl, the rate of decolorization of dye was 56%.
With further increase in NaCl concentration up to 2.0%, the rate of dye decolorization
decreases up to 42%. Maximum dye decolorization rate was observed on the 5th day at various
NaCl concentrations. Due to high decolorization ability and ability to function in naïve
conditions made this fungal strain of interest in biological treatment of the effluents of dyeing
mills. Verma et al., (2012) reported the ability of marine derived fungus which can degrade the
Reactive Blue-4 dye belonging to the category of anthraquinone dye and can also be utilized
in bioremediation process. Degradation procedure works in two steps involving first the partial
treatment of purified laccase and then with compounds (with low molecular weight) as the final
enzymatic degradation process. The results confirmed 29% reduction in total carbon and a
twofold reduction in toxicity. Corso et al., (2012) reported the paramorphogenic form of
Aspergillus oryzae, which has been exploited for biosorption of azo dyes present in industrial
wastewater. Chairin et al., (2013) studied decoloration and deprivation of bisphenol-A and
other synthetic dye by using the laccase enzyme isolated from Trametes polyzona strain
WR710-1. Anthraquinone dye (Reactive Blue 4) which showed decolorization of about 61%
and reduced the COD by twofold in 12 hr as a result of laccase treatment. Characterization of
metabolites synthesized during the whole process was done by mass spectrometry, UPLC, and
UV-vis spectroscopy.
Biodegradation coupled with ozonation has been investigated recently for eliminating tannins
along with dyes to minimize pollutant load in the effluent. Various fungal cultures, namely
Penicillium sp. and Aspergillus niger have been extensively studied for the biodegradation of
wattle extract and various synthetic dyes. This hybrid model of biodegradation and ozonation
proved very successful for removal of tannins and dyes. The ozonation was better off than
chemical methods when combined with biodegradation due to its better rate of degradation.
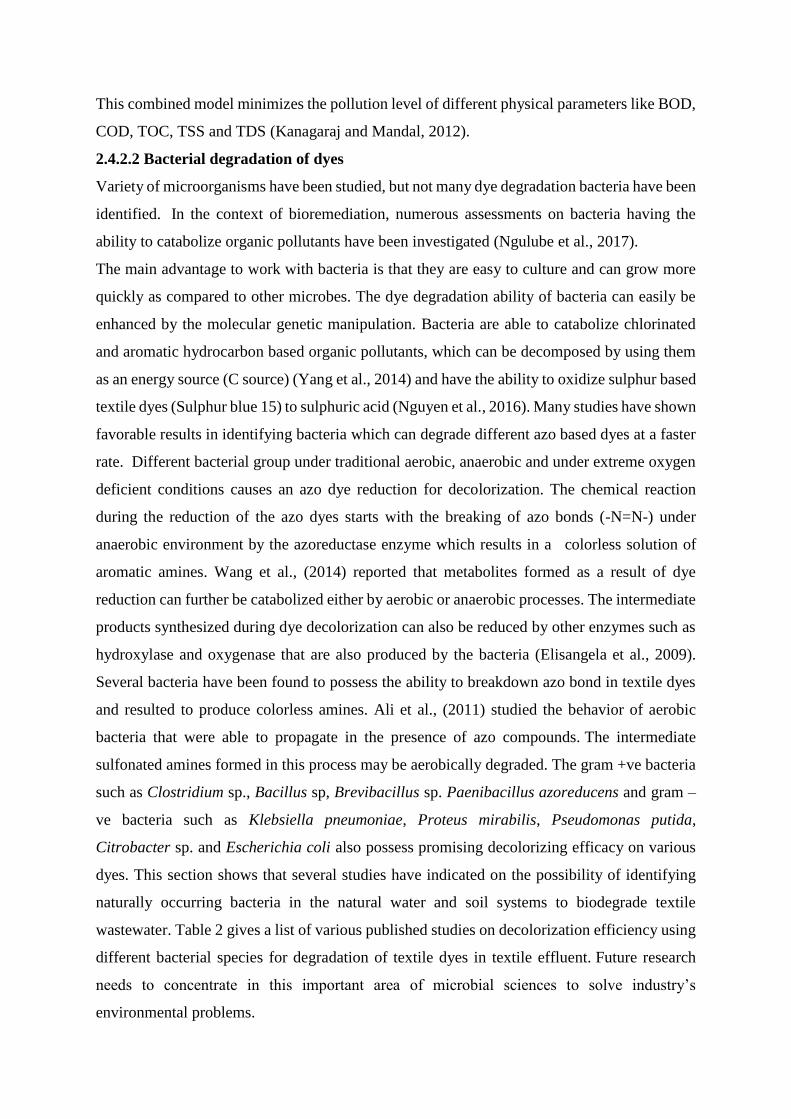
This combined model minimizes the pollution level of different physical parameters like BOD,
COD, TOC, TSS and TDS (Kanagaraj and Mandal, 2012).
2.4.2.2 Bacterial degradation of dyes
Variety of microorganisms have been studied, but not many dye degradation bacteria have been
identified. In the context of bioremediation, numerous assessments on bacteria having the
ability to catabolize organic pollutants have been investigated (Ngulube et al., 2017).
The main advantage to work with bacteria is that they are easy to culture and can grow more
quickly as compared to other microbes. The dye degradation ability of bacteria can easily be
enhanced by the molecular genetic manipulation. Bacteria are able to catabolize chlorinated
and aromatic hydrocarbon based organic pollutants, which can be decomposed by using them
as an energy source (C source) (Yang et al., 2014) and have the ability to oxidize sulphur based
textile dyes (Sulphur blue 15) to sulphuric acid (Nguyen et al., 2016). Many studies have shown
favorable results in identifying bacteria which can degrade different azo based dyes at a faster
rate. Different bacterial group under traditional aerobic, anaerobic and under extreme oxygen
deficient conditions causes an azo dye reduction for decolorization. The chemical reaction
during the reduction of the azo dyes starts with the breaking of azo bonds (-N=N-) under
anaerobic environment by the azoreductase enzyme which results in a colorless solution of
aromatic amines. Wang et al., (2014) reported that metabolites formed as a result of dye
reduction can further be catabolized either by aerobic or anaerobic processes. The intermediate
products synthesized during dye decolorization can also be reduced by other enzymes such as
hydroxylase and oxygenase that are also produced by the bacteria (Elisangela et al., 2009).
Several bacteria have been found to possess the ability to breakdown azo bond in textile dyes
and resulted to produce colorless amines. Ali et al., (2011) studied the behavior of aerobic
bacteria that were able to propagate in the presence of azo compounds. The intermediate
sulfonated amines formed in this process may be aerobically degraded. The gram +ve bacteria
such as Clostridium sp., Bacillus sp, Brevibacillus sp. Paenibacillus azoreducens and gram –
ve bacteria such as Klebsiella pneumoniae, Proteus mirabilis, Pseudomonas putida,
Citrobacter sp. and Escherichia coli also possess promising decolorizing efficacy on various
dyes. This section shows that several studies have indicated on the possibility of identifying
naturally occurring bacteria in the natural water and soil systems to biodegrade textile
wastewater. Table 2 gives a list of various published studies on decolorization efficiency using
different bacterial species for degradation of textile dyes in textile effluent. Future research
needs to concentrate in this important area of microbial sciences to solve industry’s
environmental problems.
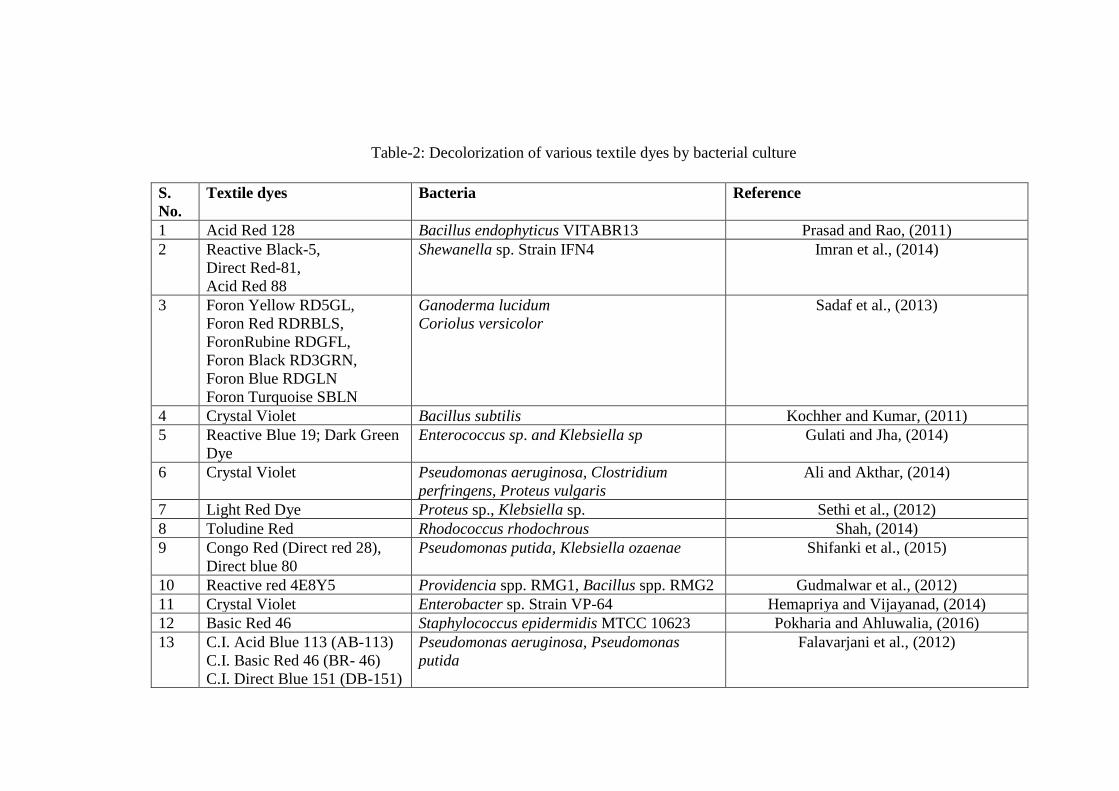
Table-2: Decolorization of various textile dyes by bacterial culture
S.
No.
Textile dyes Bacteria Reference
1 Acid Red 128 Bacillus endophyticus VITABR13 Prasad and Rao, (2011)
2 Reactive Black-5,
Direct Red-81,
Acid Red 88
Shewanella sp. Strain IFN4 Imran et al., (2014)
3 Foron Yellow RD5GL,
Foron Red RDRBLS,
ForonRubine RDGFL,
Foron Black RD3GRN,
Foron Blue RDGLN
Foron Turquoise SBLN
Ganoderma lucidum
Coriolus versicolor
Sadaf et al., (2013)
4 Crystal Violet Bacillus subtilis Kochher and Kumar, (2011)
5 Reactive Blue 19; Dark Green
Dye
Enterococcus sp. and Klebsiella sp Gulati and Jha, (2014)
6 Crystal Violet Pseudomonas aeruginosa, Clostridium
perfringens, Proteus vulgaris
Ali and Akthar, (2014)
7 Light Red Dye Proteus sp., Klebsiella sp. Sethi et al., (2012)
8 Toludine Red Rhodococcus rhodochrous Shah, (2014)
9 Congo Red (Direct red 28),
Direct blue 80
Pseudomonas putida, Klebsiella ozaenae Shifanki et al., (2015)
10 Reactive red 4E8Y5 Providencia spp. RMG1, Bacillus spp. RMG2 Gudmalwar et al., (2012)
11 Crystal Violet Enterobacter sp. Strain VP-64 Hemapriya and Vijayanad, (2014)
12 Basic Red 46 Staphylococcus epidermidis MTCC 10623 Pokharia and Ahluwalia, (2016)
13 C.I. Acid Blue 113 (AB-113)
C.I. Basic Red 46 (BR- 46)
C.I. Direct Blue 151 (DB-151)
Pseudomonas aeruginosa, Pseudomonas
putida
Falavarjani et al., (2012)

C.I. Direct Brown 2 (DB-2)
Mixture of four dyes (Mix)
14 Provisional Pink Bacillus sp., Aeromonas hydrophila sp. Celia and Suruthi, (2016)
15 Congo Red Bacillus pumillus Modi et al., (2015)
16 Indigo Dye Actinomyces sp. (PK07), Pseudomonas sp.
(PK18), Stenotrophomonas sp. (PK23),
Staphylococcus sp. (PK28)
Rajendran et al., (2015)
17 Alizarin Burkholderia sp. Sharma and Sharma, (2015)
18 Drimarene Red Bacillus sp. SG2 Oak et al., (2016)
19 Methyl red and Navy blue Bacillus sp. Ezhilarasu, (2016)
20 Remazol Blue Pseudomonas aeruginosa, Ochrobactrum sp. Kilic and Donmez, (2012)
Table-3: Decolorization of different dyes under anaerobic conditions by bacterial cultures
S. No. Textile dyes Bacteria Reference
1 Congo Red and DB 38 Escherichia coli Isik and Sponza, (2003)
2 Methyl-Orange Pseudomonas sp. Silveria et al., (2009)
3 Reactive Dye Red 22 Escherichia coli Chang and Kuo, (2000)
4 Congo Red and Reactive
Black 38
Pseudomonas sp. Isik and Sponza, (2003)
5 Reactive Blue 13 Pseudomonas sp. Lin et al., (2010)
6 Congo Red Mutant Bacillus sp. ACT2 Gopinanth et al., (2009)
7 Napthol Green B Shewanella oneidensis MR-1 Xiao et al., (2012)
8 Reactive Violet 5R Bacterial mixed culture- SB4 Jain et al., (2012)
9 Remozol Orange Pseudomonas aeruginosa Sarayu et al., (2010)
10 Methyl Red Halomonas elongata, Escherichia coli Eslami et al., (2016)
11 Methyl Red Aeromonas jandaei strain SCS5 Sharma et al., (2016)
12 Mono Azo Dye Clostridium perfringens Morrison and John, (2016)
2.4.2.3 Aerobic and anaerobic degradation of dyes
Panswad and Luangdilok (2000) have reported that reduction of azo bonds can further
be catabolized under ideal aerobic environment as shown by Eq. (1) below:
Ar -N=N-Aŕ +4e- +4H+ ArNH2 + H2NAŕ……………………………Eq. (1).
Van der Zee and Villaverde, 2005 conducted anaerobic study and found that organic
carbon is needed as the energy source for catabolizing dyes into decolorized water
under anaerobic environment. This shows the carbon source could be a simple source
such as C6H12O6, C2H3O2- or a complex source such as tapioca or whey which is most
extensively used for to complete anaerobic reaction for the decolorizing process. Table
3 emphasize list of various studies conducted by different researchers on the
decolorization of azo bonded dyes under anoxic environments.
Recently, many strains of bacteria were isolated that have the ability of decolorizing
the azo dyes under aerobic environments. Palanivelan et al., (2014) reported that
different bacterial strains need organic carbon as a source of energy for their growth.
But certain bacteria have also been reported who possess the ability to survive on the
azo complex as it utilizes it as a source of carbon (Pandey et al., 2007). Bacteria contain
enzymes that cause the splitting of –N=N– bonds lead to amine formation and use them
as carbon and energy source for their growth. These types of bacterial isolates are highly
substrate sensitive. Xenophilus is one of these kinds of bacterial strains. Four such
bacterial strains have been isolated which utilizes methyl red as sole source of carbon.
The two of such bacterial strains are Vibrio logei and P. nitroreducens. No existence of
the amine product was assessed in the growth medium signifying degradation of the
media (Adedayo et al., 2004). Table 4 highlight various studies conducted on the
decolorization of wastewater by using different aerobic bacterial communities. These
studies show that the possibility of isolating right bacterial strains for developing
bioreactors for decontaminating textile wastewaters.
2.4.2.4 Degradation of textile dyes using algal species
Algae is generally found in fresh water as well as in saltwater and are being extensively
studied as a bio-sorbent (Devi et al., 2015). Due to their large surface area and binding
ability, algae have the highest bio-sorption potential and electrostatic force of attraction
for contaminants in the wastewater. Several studies have shown that metabolization of
contaminant present in the wastewater is of has various forms such as -OH, RCOO−, -
NH2, and PO43- and get absorbed on the algae surface (Al-Fawwaz and Abdullah, 2016).
Decolorization of the dye by algae involves three different mechanisms. First, algae
utilize the chromophores to harvest the algal biomass, CO2 and H2O; second algae
contribute to the conversion of the chromophore material to the non-chromophore
material; and third, the resulting chromophore is adsorbed onto the algal biomass
(Alvarez et al., 2015). Many studies have been reported showing effective use of the
algae against azo dye degradation by producing the azoreductase enzyme for
decolorization (Telke et al., 2008). It has also been reported that species such as
Chlorella pyrenoidosa for methylene blue (Pathak et al., 2015) and Oscillotoria are
effective in azo dye degradation into aromatic amine that are further catabolized into
organic compounds. Some studies have reported that different algae species utilize azo
dyes as C and N source for their growth (Waqas et al., 2015). Table 5 gives a list of
various references of several studies that have been conducted on the use of different
types of algae and consortium of algae cultures to remove textile dyes and other
contaminants from textile industry effluent.

Table-4: Decolorization of different dyes under aerobic conditions by bacterial cultures
S.
No.
Textile Dyes Bacteria Reference
1 Reactive Red 22 Pseudomonas luteola Chang et al., (2001)
2 Acid Blue 25 Klebsiella sp. Prasad, (2015)
3 Remazol Blue Bacillus megaterium, Micrococcus
luteus, Bacillus pumilus
Karatay et al., (2015)
4 Acid Scarlet 3R Scheffersomyces spartinaeTLHS-SF1 Tan et al., (2016)
5 Reactive Orange 4 Lysinibacillus sp Saratale et al., (2015)
6 Reactive Black 5 (RB 5) Pseudomonas entomophila BS1 Khan and Malik, (2015)
7 Reactive Blue 5 Streptococcus thermophilus Zhang et al., (2015)
8 Congo Red Acinetobacter baumannii YNWH 226 Li et al., (2015)
9 Methylene Blue Shewanella onediensis MR-1 Liu et al., (2016)
10 Reactive Green-
19Remazol Navy Blue
Reactive Red-198
Enterococcus durans GM13 Das and Mishra, (2016)
11 Reactive Red M8B Bacillus subtilis Arulazhagan, (2016)
12 Reactive Blue 222,
Reactive Black 5
Pseudomonas sp. D4, Salmonella sp. D7,
Aeromonas sp. D11, Klebisiella sp. D22,
Bacillus sp. D31
Mohamed, (2016)
13 Congo Red, Evans Blue
and
Eriochrome Black T
Staphylococcus lentus Chaieb et al., (2016)
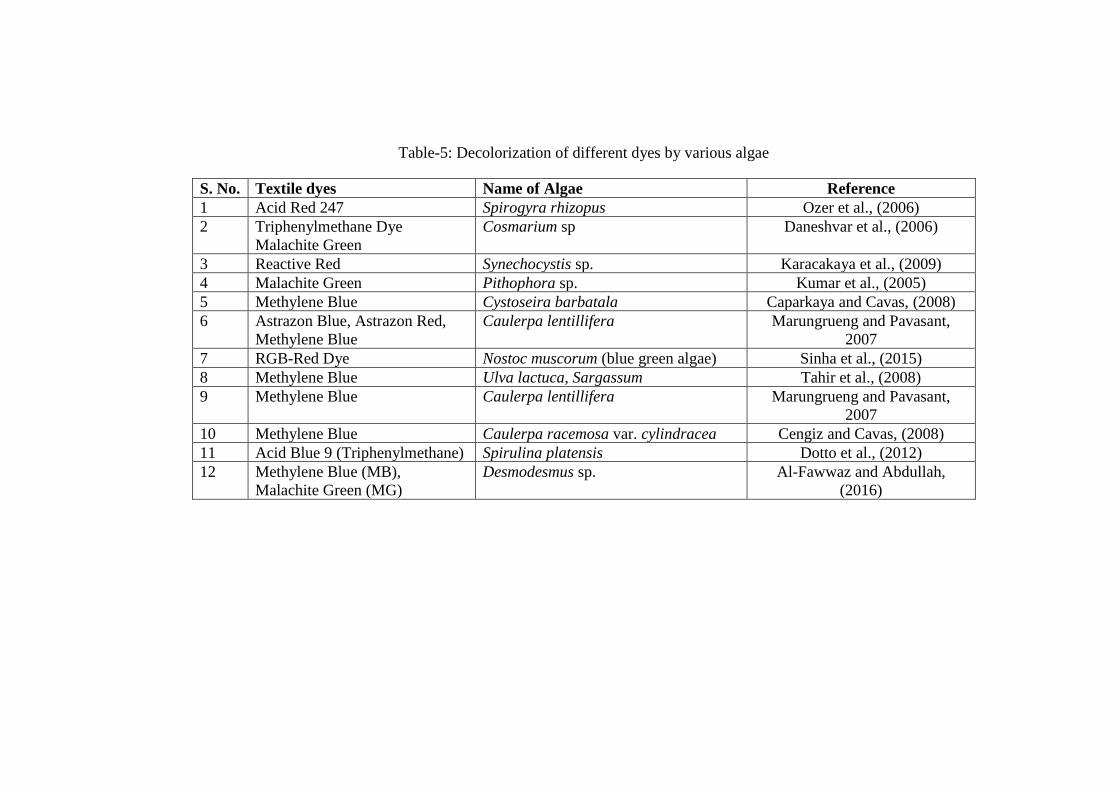
Table-5: Decolorization of different dyes by various algae
S. No. Textile dyes Name of Algae Reference
1 Acid Red 247 Spirogyra rhizopus Ozer et al., (2006)
2 Triphenylmethane Dye
Malachite Green
Cosmarium sp Daneshvar et al., (2006)
3 Reactive Red Synechocystis sp. Karacakaya et al., (2009)
4 Malachite Green Pithophora sp. Kumar et al., (2005)
5 Methylene Blue Cystoseira barbatala Caparkaya and Cavas, (2008)
6 Astrazon Blue, Astrazon Red,
Methylene Blue
Caulerpa lentillifera Marungrueng and Pavasant,
2007
7 RGB-Red Dye Nostoc muscorum (blue green algae) Sinha et al., (2015)
8 Methylene Blue Ulva lactuca, Sargassum Tahir et al., (2008)
9 Methylene Blue Caulerpa lentillifera Marungrueng and Pavasant,
2007
10 Methylene Blue Caulerpa racemosa var. cylindracea Cengiz and Cavas, (2008)
11 Acid Blue 9 (Triphenylmethane) Spirulina platensis Dotto et al., (2012)
12 Methylene Blue (MB),
Malachite Green (MG)
Desmodesmus sp. Al-Fawwaz and Abdullah,
(2016)
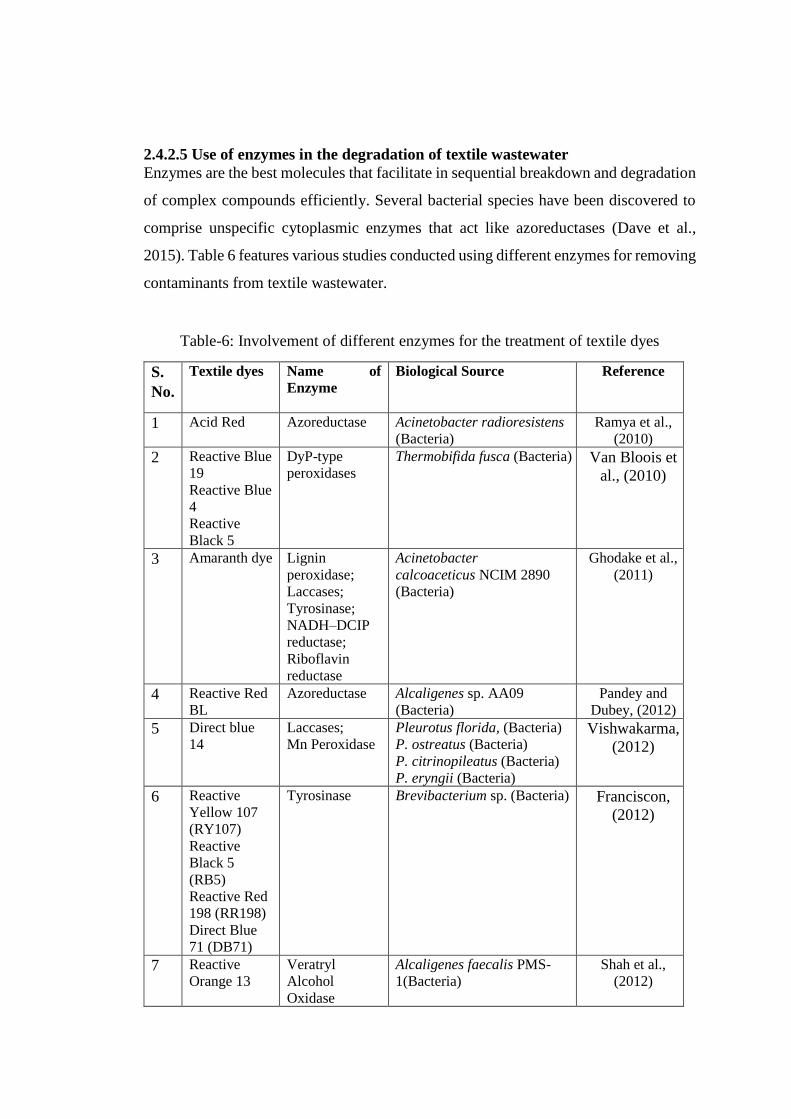
2.4.2.5 Use of enzymes in the degradation of textile wastewater
Enzymes are the best molecules that facilitate in sequential breakdown and degradation
of complex compounds efficiently. Several bacterial species have been discovered to
comprise unspecific cytoplasmic enzymes that act like azoreductases (Dave et al.,
2015). Table 6 features various studies conducted using different enzymes for removing
contaminants from textile wastewater.
Table-6: Involvement of different enzymes for the treatment of textile dyes
S.
No.
Textile dyes Name of
Enzyme
Biological Source Reference
1 Acid Red Azoreductase Acinetobacter radioresistens
(Bacteria)
Ramya et al.,
(2010)
2 Reactive Blue
19
Reactive Blue
4
Reactive
Black 5
DyP-type
peroxidases
Thermobifida fusca (Bacteria) Van Bloois et
al., (2010)
3 Amaranth dye Lignin
peroxidase;
Laccases;
Tyrosinase;
NADH–DCIP
reductase;
Riboflavin
reductase
Acinetobacter
calcoaceticus NCIM 2890
(Bacteria)
Ghodake et al.,
(2011)
4 Reactive Red
BL
Azoreductase Alcaligenes sp. AA09
(Bacteria)
Pandey and
Dubey, (2012)
5 Direct blue
14
Laccases;
Mn Peroxidase
Pleurotus florida, (Bacteria)
P. ostreatus (Bacteria)
P. citrinopileatus (Bacteria)
P. eryngii (Bacteria)
Vishwakarma,
(2012)
6 Reactive
Yellow 107
(RY107)
Reactive
Black 5
(RB5)
Reactive Red
198 (RR198)
Direct Blue
71 (DB71)
Tyrosinase Brevibacterium sp. (Bacteria) Franciscon,
(2012)
7 Reactive
Orange 13
Veratryl
Alcohol
Oxidase
Alcaligenes faecalis PMS-
1(Bacteria)
Shah et al.,
(2012)
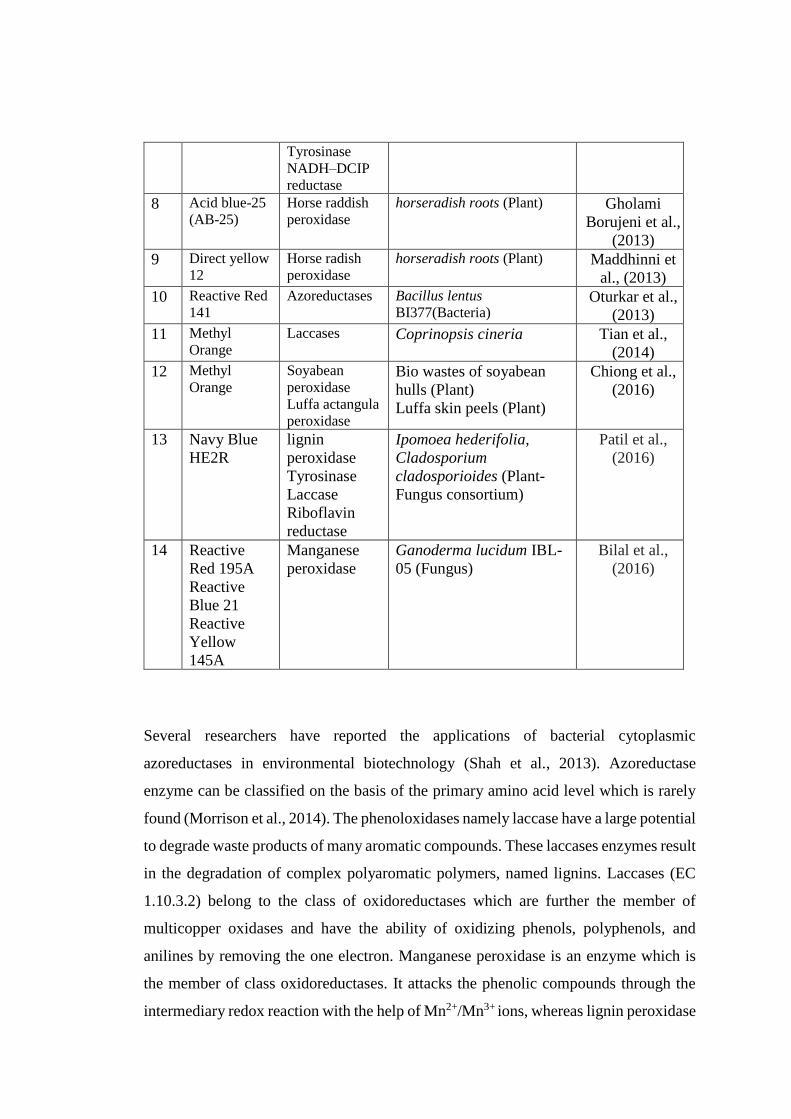
Tyrosinase
NADH–DCIP
reductase
8 Acid blue-25
(AB-25)
Horse raddish
peroxidase
horseradish roots (Plant) Gholami
Borujeni et al.,
(2013)
9 Direct yellow
12
Horse radish
peroxidase
horseradish roots (Plant) Maddhinni et
al., (2013)
10 Reactive Red
141
Azoreductases Bacillus lentus
BI377(Bacteria) Oturkar et al.,
(2013)
11 Methyl
Orange
Laccases Coprinopsis cineria Tian et al.,
(2014)
12 Methyl
Orange
Soyabean
peroxidase
Luffa actangula
peroxidase
Bio wastes of soyabean
hulls (Plant)
Luffa skin peels (Plant)
Chiong et al.,
(2016)
13 Navy Blue
HE2R
lignin
peroxidase
Tyrosinase
Laccase
Riboflavin
reductase
Ipomoea hederifolia,
Cladosporium
cladosporioides (Plant-
Fungus consortium)
Patil et al.,
(2016)
14 Reactive
Red 195A
Reactive
Blue 21
Reactive
Yellow
145A
Manganese
peroxidase
Ganoderma lucidum IBL-
05 (Fungus)
Bilal et al.,
(2016)
Several researchers have reported the applications of bacterial cytoplasmic
azoreductases in environmental biotechnology (Shah et al., 2013). Azoreductase
enzyme can be classified on the basis of the primary amino acid level which is rarely
found (Morrison et al., 2014). The phenoloxidases namely laccase have a large potential
to degrade waste products of many aromatic compounds. These laccases enzymes result
in the degradation of complex polyaromatic polymers, named lignins. Laccases (EC
1.10.3.2) belong to the class of oxidoreductases which are further the member of
multicopper oxidases and have the ability of oxidizing phenols, polyphenols, and
anilines by removing the one electron. Manganese peroxidase is an enzyme which is
the member of class oxidoreductases. It attacks the phenolic compounds through the
intermediary redox reaction with the help of Mn2+/Mn3+ ions, whereas lignin peroxidase
attacks the non-phenolic methoxy substituted lignin subunits which behave as substrate
(Hosseinzadeh et al., 2016).
Laccase enzyme employs the mechanism of free radical that is non-specific in nature
for executing the degradation of the dyes of azo without forming toxic aromatic amines.
97% decolorization of Orange G azo dye was obtained by Trametes versicolor (Casas
et al., 2007). Kalme et al., (2007) obtained effective results by the use the laccase
enzyme (recovered from the Pseudomonas desmolyticum strain NCIM 2112) showing
100% degradation of dyes such as Direct blue-6 and Red HE7B. All above studies
clearly show the role of different enzymes in removing various contaminants from
industry discharged wastewaters. These studies were not conducted to determine the
long-term effect on aquatic life in water bodies in case some enzymes are released into
water bodies during the decontamination process. Therefore, more research is needed
to investigate the effect of different wastewater treatment technologies on the aquatic
life and environmental health of the ecosystem.
The aim of this study is to gather/fetch information or bring an impression on the new
treatment options available for textile effluent containing chemical based dyes.
Regardless of the actual fact that no uniform and constant standard is available
currently, several countries have set stringent discharging standards. Now a-days many
researchers are trying to find the way out and implementing some new treatment
options, hybrid technology, a combination of physical and biological methods. Though
lot much of the research has been conducted on the decolorization of textile dyes with
existing treatment methodologies, but little research has been conducted on the use of
cutting edge technologies. Extensive literature is available highlighting removal of
textile dyes using various physico-chemical processes such as coagulation, photo
oxidation and chemical based degradation. Hence, this research focuses on the
development biological methods (based on micro-organisms such as bacteria) using
wdye degrading enzymes.

xxiii

i
OBJECTIVES

ii
Objectives: On the basis of above research questions, following objectives were
developed for this study:
• To determine physico-chemical and biological characteristics of textile dyes in
the untreated textile industry wastewater at selected effluent discharge sites
• To isolate, identify, and characterize dye-degrading bacterial strains from textile
industry wastewater
• To develop bacterial consortium for enhanced dye degrading capability in
textile industry wastewater.
• To design and develop clean-up technology (biofilters) for in-situ
bioremediation of textile industy effluents
Thesis Structure
This thesis is written in a chapter format. Chapter 1 gives introduction to the statement
of the problem leading to the proposed study. It gives an overview and classification of
textile dyes and treatment options for textile industry effluent. Chapter 2 comprises of
literature review which describes the relevant studies conducted by various researchers
on this topic and their research findings. Chapter 3 outlines the hypothesis which
includes research questions that drives the direction of the study. Chapter 4 highlights
various objectives of the study. The materials and methods used to achieve the goals of
objectives are described in chapter 5. The results and discussions of this study are given
in chapter 6. Finally, the summary and conclusions of this study are presented in chapter
7.
MATERIAL AND
METHODS

Chapter 5
Material and Methods
5.1 Study area
Ludhiana is a cosmopolitan city of Punjab and a hub of historical heritage, situated at 30 56' N
and 75 52' E, which is positioned about 10 km south of the Sutlej river. The wastewater drain, Buddha
Nallah (old rivulet) runs through the city carrying majority of city’s domestic and industrial sewage
and merges into Sutlej river (Figure 5). This drain gets transformed into a flooding stream during
the monsoon season and pollutes the Sutlej river. Figure 5(B) shows the dark colour of Sutlej river
water where Buddha Nallah enters the Sutlej river.
(A) (B)
Figure-5: Buddha Nallah flows through the city Ludhiana. 5(A) Buddha Nallah carries
industrial and domestic waste; 5(B) point of confluence where Buddha Nallah merges with
river Sutlej
5.2 Chemicals
All the chemicals pertaining to present study were acquired from Loba Chemie Pvt. Ltd.,
Mumbai, India. The mineral Salt Medium (MSM) contained (g/l): Potassium dihydrogen
phosphate KH2PO4 -3.0 g/l; Na2HPO4 - 6.0 g/l; NH4Cl-5.0 g/l; NaCl-5.0 g/l; C6H12O6- 8.0 g/l;
MgSO4- 0.1 g/l (Khalid et al., 2008).
5.3 Sampling and field investigation
In the first part of the study, two textile-dyeing industries designated as site 1 and site 2, were
chosen for this study. These two industries are located on Tajpur road and Bahadur-Ke-road
near the bank of Buddha Nallah (old rivulet) drain in the city of Ludhiana. Textile industry
effluent and surface soil samples were collected monthly for a period of twelve months at two
discharge points. The locations of two sampling stations are shown in Figure 6. The water

samples from textile industry discharge points were collected in the morning between 7 am and
9 am twice a month during the period of June 2014 to May 2015. Sterilized glass bottles
labelled were used to collect water samples using a sample code and then were transported to
the laboratory of School of Biosciences and Bioengineering, Lovely Professional University,
Phagwara, Punjab, in an ice box and stored at 4˚C (Ogunlaja and Aemere, 2009). Total of 48
samples were collected form two selected sites of textile dyeing industries, viz. site 1 and site
2 located at Tajpur road and Bahadur-ke-road, Ludhiana. Various physico-chemical parameters
like pH, total dissolved solids (TDS), total suspended solids (TSS), water temperature (T),
biochemical oxygen demand (BOD) and chemical oxygen demand (COD) were tested (APHA,
2005). In addition, month wise rainfall data (mm) was collected from the “Climate Change and
Agricultural Meteorology department”, Punjab Agricultural University, Ludhiana.
5.3.1 Analysis of textile industry effluent samples for physico-chemical parameters
To analyse different physical and chemical parameters in the water samples collected from
textile industry discharge points, standard methods of APHA, (2005) were followed (Figure 7).
pH of the effluent samples was calculated by using electrometric method and by using digital
desktop, pH Meter (Systronics-335). Water temperature of the wastewater recoderded by using
glass thermometer. Likewise, TDS and TSS data were analyzed by using the gravimetric
method, evaporating dishes, and whatmann filter paper no.1. BOD5 of the wastewater was
measured by Winkler’s method in 300 ml BOD bottles. Likewise, COD was determined by
dichromate refluxe method.
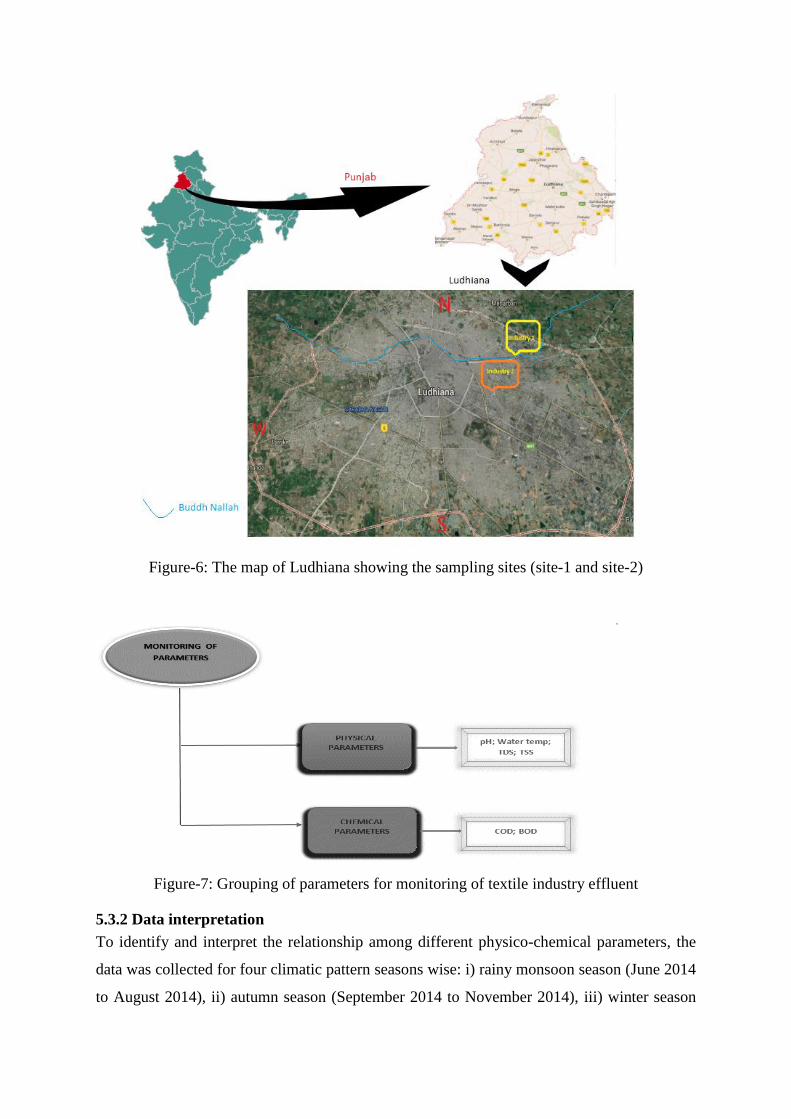
Figure-6: The map of Ludhiana showing the sampling sites (site-1 and site-2)
Figure-7: Grouping of parameters for monitoring of textile industry effluent
5.3.2 Data interpretation
To identify and interpret the relationship among different physico-chemical parameters, the
data was collected for four climatic pattern seasons wise: i) rainy monsoon season (June 2014
to August 2014), ii) autumn season (September 2014 to November 2014), iii) winter season
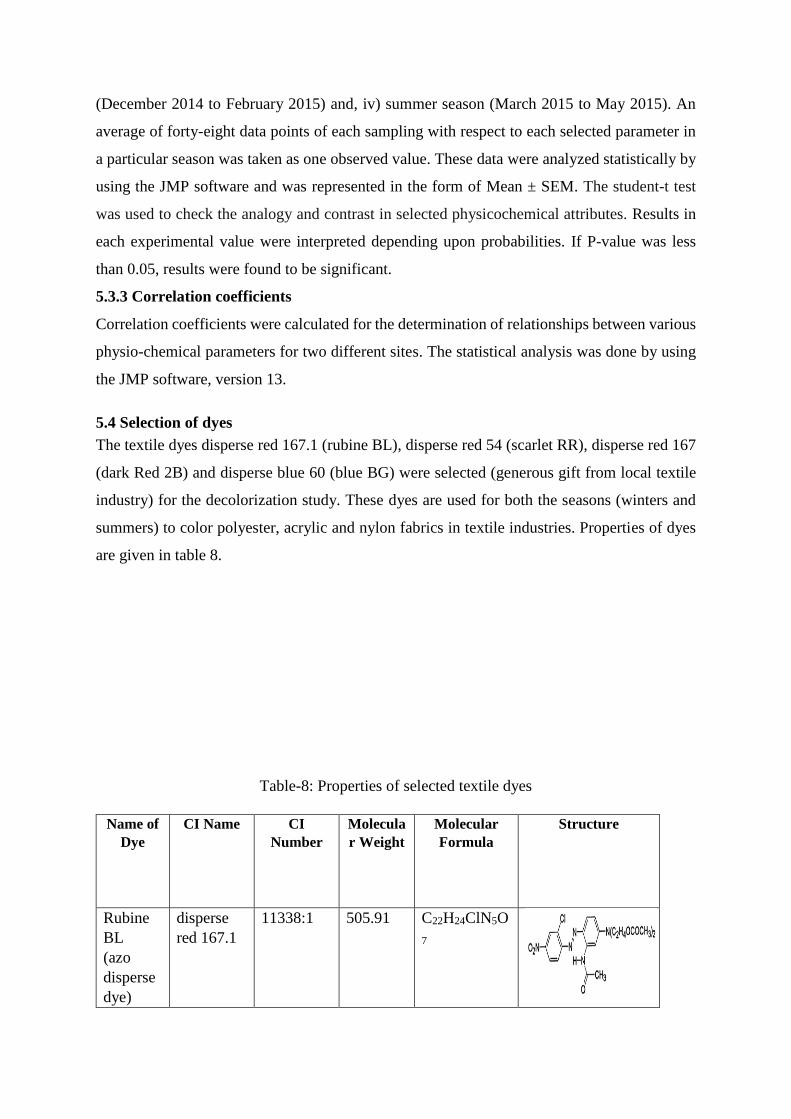
(December 2014 to February 2015) and, iv) summer season (March 2015 to May 2015). An
average of forty-eight data points of each sampling with respect to each selected parameter in
a particular season was taken as one observed value. These data were analyzed statistically by
using the JMP software and was represented in the form of Mean ± SEM. The student-t test
was used to check the analogy and contrast in selected physicochemical attributes. Results in
each experimental value were interpreted depending upon probabilities. If P-value was less
than 0.05, results were found to be significant.
5.3.3 Correlation coefficients
Correlation coefficients were calculated for the determination of relationships between various
physio-chemical parameters for two different sites. The statistical analysis was done by using
the JMP software, version 13.
5.4 Selection of dyes
The textile dyes disperse red 167.1 (rubine BL), disperse red 54 (scarlet RR), disperse red 167
(dark Red 2B) and disperse blue 60 (blue BG) were selected (generous gift from local textile
industry) for the decolorization study. These dyes are used for both the seasons (winters and
summers) to color polyester, acrylic and nylon fabrics in textile industries. Properties of dyes
are given in table 8.
Table-8: Properties of selected textile dyes
Name of
Dye
CI Name CI
Number
Molecula
r Weight
Molecular
Formula
Structure
Rubine
BL
(azo
disperse
dye)
disperse
red 167.1
11338:1 505.91 C22H24ClN5O
7

Dark
Red 2B
(azo
disperse
dye)
disperse
red 167
11338 519.93
C23H26ClN5O
7
Blue BG
(Anthraq
uinone
disperse
dye)
disperse
Blue 60
61104 379.37
C20H17N3O5
Scarlet
RR
(azo
disperse
dye)
disperse
red 54
11131 415.83
C19H18ClN5O
4
5.4.1 Spectral analysis of selected azo-disperse dyes [to check absorption maxima (λmax)
of dyes]
The selected textile dyes were firstly studied for absorption spectrum by using UV-Vis double
beam spectrophotometer (UV-1800, Shimadzu scientific works) in a range of 200nm to 900nm
(Kalyani et al., 2008).
5.4.2 FTIR analysis of dyes
To check the presence of different functional groups, FTIR analysis of selected dyes was done
in the mid IR region of 400-4000 cm-1 with 16 scan speed. The samples were prepared with
spectroscopically pure KBr in the form of pellets (Lade et al., 2012).
5.4.3 Isolation and purification of dye decolorizing bacteria
Second part of this study was to identify and isolate those bacteria from textile industry
wastewater that has the capability to decolorize the dye in wastewater stream. Bacterial strains
were isolated from textile industry wastewater and soil samples on mineral salt medium (MSM)
with serial dilutions from 10-1-10-3 in physiological saline (Khalid et al., 2008) (Figure 8).
Selected isolates were then purified by streaking it again on MSM pentagonal manner. The
purification step was repeated thrice. After purification, the isolated cultures were preserved
in the refrigerator at 4°C for successive decolorization and degradation study of selected dyes
under investigation.

Figure-8: Key steps for isolation of efficient dye degrading bacteria and elucidation of dye
degradation pathway
5.4.4 Dye decolorization assay at shaking condition
Fifteen isolates (IS-1 to IS-15) were cultured for 24 h in 250ml conical flasks having 100ml
MSM broth and. Then, these isolates were modified separately using different concentration of
each dye (50mg/L, 150 mg/L and 250 mg/L). The dye degradation competency of each isolates
was examined under shaking conditions at 150 rpm with
temperature of 37°C in orbital shaking incubator (Khalid et al., 2008). After different interval
of time, the 5 ml of culture media was taken and the sample was centrifuged for 10 min at
10,000 rpm for the separation of bacterial cell mass and supernatant. Thus, supernatant
obtained was used for the analysis of decolorization ability. The test was conducted in
triplicates. Abiotic controls were also included. Furthermore, dye decolorization assays with
15 isolated have been conducted out of which six isolates have been found to be effective in
dye decolorization.
5.4.5 Biochemical, morphological and physiological characterization of bacterial isolates
The six selected bacterial isolates were further examined for their biochemical and physical
characteristics including form, surface of colonies on petri plate, colony color and gram
staining reaction. The biochemical and physiological properties of the selected bacterial
isolates were also examined by catalase, indole, urease, oxidase test, Voges- proskauer and
methyl red tests (Olutiola et al., 2000). The bacterial isolates obtained were then recognized by
observing the characteristic features and comparative analysis of the standard description of
bacterial strains in Bergey’s Manual of Determinative Bacteriology.
5.4.6 Molecular characterization of bacterial isolates: DNA extraction PCR amplification
of 16S rRNA gene
The 16S rRNA investigation was done to identify the bacterial strain which is effective in dye
decolorizing. The isolate 1, 2 and 3 were sent to Samved Biotech
Pvt. Ltd., Ahmedabad (Gujrat), India for identification of these bacterial strain. The PCR was
performed on the isolated DNA to amplify the fragment of 16S rDNA gene. The amplified
DNA of 1500bp size was resolved on the agarose gel and further analyzed for undue
contaminants. For the amplification, the primers 27F (Forward) and 1492R (Reverse) were
used with BDT v3.1 cycle sequencing kit on ABI 3730xl Genetic Analyzer. The BLAST
analysis was done on the obtained sequences by comparing it with the nucleotide database of
GenBank database. On the basis of the highest identity score, the 10 sequences were chosen
and aligned with ClustalW. RDP database was employed for generating Distance matrix with
MEGA 4 was employed for constructing the phylogenetic tree. For assessing the evolutionary
history, the NJ method was employed (Saitou and Nei, 1987). The optimum tree was found to
be of branch length = 0.00631033. The evolutionary distances were calculated with the help of
the Kimura 2-parameter method (Kimura, 1980) and units of the number of base substitutions
per site. The study comprises of 11 nucleotide sequences.
The isolate 6, 11 and 15 were sent to Yaazh Xenomics, East Chennai, Tamilnadu for molecular
characterization. Genomic DNA of the bacteria was extracted using the InstaGeneTM matrix
genomic DNA isolation kit. The protocol involves the following steps: firstly, colony of the
isolated bacterial was collected and suspended in 1ml of sterile water in a microfuge tube. After
that the sample is centrifuged for 1 minute at 10,000 rpm, the supernatant obtained is then
removed. 200 µl of Insta Gene matrix was added to pellet and the microfuge was incubated for
15 minutes at 56°C. Sample is then vortexed at high speed for 10 seconds and after that it is
placed for 8 minutes at 100 °C in water bath in order to give the heat shock. Again, the content
obtained was vortexed at high speed for 10 seconds and centrifuged for 2 minutes at 10,000

rpm. For the PCR reaction, 20µl of the supernatant was used to prepare the 50 µl PCR reaction
mixture. Then, 16S rRNA region was amplified with the help of MJ Research Peltier Thermal
Cycler. The Primer 518F/800R were used for the sequencing of the PCR product. Sequencing
was done with ABI PRISM® BigDyeTM Terminator Cycle Sequencing Kits with AmpliTaq®
DNA polymerase (FS enzyme) (Applied Biosystems). The 16s rRNA sequence obtained was
analyzed with the help of blast tool by assessing the similarity score of the nucleotide which is
already present in the NCBI Database. The phylogeny analysis of the closely related sequence
obtained on performing blast was evaluated with multiple sequence alignment tool, MUSCLE
ver. 3.7 was used (Edgar, 2004). The result obtained by aligning sequences were amended
using the program Gblocks ver. 0.91b. Finally, for the phylogeny analysis, PhyML ver. 3.0
aLRT program was used and HKY85 was used as the Substitution model. For rendering the
phylogenetic tree, program tree Dyn ver. 198.3 was employed (Dereeper et al., 2008).
5.5 Biocompatibility assay of efficient dye degrading bacteria for dyes
To analyze the synergistic activity among isolated bacterial species for the development of
consortium, biocompatibility assay was performed by following the method described by
Nikam et al., (2007). The selected bacterial isolates were spreaded on the growth media and
allowed to grow for 24 h at 37°C. The sterilized discs of 5 mm (whatmann paper no-1)
impregnated with bacterial suspension of individual isolates were placed at the distance of 5
mm from the periphery of petriplates already having growth of cultures inoculated in different
pattern to check the antagonistic/syneristic effect of bacterial cultures on each other.
5.6 Development of consortium
Initially, a loop full of individual bacterial pure cultures were inoculated separately in minimal
media and incubated for 24 h at 30ºC. For the development of bacterial consortium, 6 h old
cultures were then transferred aseptically into nutrient medium followed by 24 h incubation at
30ºC. The consortium thus obtained was used as the source of inoculum for further studies
(Lade et al., 2012; Das and Mishra, 2017)
5.7 Analytical methods: dye decolorization assay
The Absorbance of supernatants withdrawn at different intervals of time were determined at
their maximum absorption wavelength for particular dye which is present in the visible region
by UV-Vis double beam spectrophotometer (UV-1800, Shimadzu scientific works). The
decolorization percentage was assessed by the following formula.
Decolorization percent (%) = (I.A) - (O.B) × 100
(I.A)
Where, I. A= Initial Absorbance and O. B = Observed Absorbance
5.7.1 Analysis of degradation products: GC-MS analysis and FTIR
After decolorization assay, the supernatants, which contains the degraded or biotransformed
products of dye were extracted by centrifugation (10,000 rpm) for 20 min at 4°C. The resultant
supernatant was further added to equal volume of ethyl acetate and mixed strongly to dissolve
metabolites and dried over anhydrous Na2SO4. Further, solvent layer was air-evaporated in
rotary vacuum evaporator. The remaining fractions were scrapped, collected, and dissolved in
2-3 mL of HPLC grade methanol. Finally, the samples were filtered through 0.22 μm syringe
filter (Millipore Millex with PES membrane) and then subjected to FTIR and GC-MS analysis
to confirm biodegradation of dyes (Lade et al., 2012). The samples for FTIR analysis were
prepared by mixing it with spectroscopically pure KBr and analyzed by using the methods
described by Lade et al., (2012). The GC-MS analysis of the fractions was performed by using
a Perkin Elmer MS Engine, equipped with integrated gas chromatograph with a HP1 column
(30 m long, 0.25 mm id, nonpolar). The flow rate of carrier gas (Helium gas) was kept at 1 ml
per minute. The injector temperature was maintained at 280°C with alterations in oven
conditions as follows: Initially maintained at 80°C kept constant for 2 min and increased up to
200°C with 10°C min−1 and finally, raising the temperature up to 280 °C with an increment of
20°C min−1 rate (Jadhav et al., 2009; Kurade et al., 2012). The compounds obtained as a result
were then identified on the basis of mass spectra and using the standard NIST library.
5.8 Toxicology study of dyes: Phytotoxicity assay
5.8.1 Phytotoxicity assay
The phytotoxicity assay was performed to assess the toxicity of selected dyes and the degraded
metabolites with respect to wheat variety PBW 550 (Triticum aestivum) collected from Punjab
Agricultural University, Ludhiana, commonly used in Indian agriculture. Toxicity study was
conducted by following the method of Parshetti et al., (2006).
5.9 Screening of bacterial isolates for the activity of dye degrading enzymes
5.9.1 Preparation of cell free extract
The bacterial cells were subjected to centrifugation (10,000 rpm for 15-20 min at 4°C) and the
resulted supernatant was used for screening of enzyme activities. The separated biomass of
bacterial cells was suspended in 50 mM potassium phosphate buffer (pH 7.4), mildly

homogenized and further sonicated by giving 12 strokes for 30sec with one min interval based
on 60 amplitude keeping sonifier output below 4 °C. The subsequent extracts were then used
as enzyme source (Telke et al., 2008; More et al., 2011).
5.9.2 Screening for enzymatic activities
Azo reductase activity was assayed by following the protocol described by Telke et al., (2008).
The reaction mixture (2 ml) contains 4.45 μM of azo-disperse dye, 50 μM NADH, 1.2 ml of
potassium phosphate buffer (20 mM, pH 7.5). The addition of NADH was done after 4 min
pre-incubation of reaction assay mixture (37 ֩C) and monitored for the decrease in absorbance
(430nm) in UV-VIS spectrophotometer. The reaction was initiated by the addition of 0.2 ml of
the enzyme solution. Azo-disperse dye reduction was calculated by using its molar extinction
coefficient of 0.023 μM−1 cm−1. One unit of azoreductase enzyme activity was defined as
quantity of enzyme required to catalyze 1 μM of substrate min−1 mg of protein−1. All the
enzyme assays were run in triplicates.
The activity of laccase enzyme was monitored by the oxidation of ABTS using the protocol of
More et al., (2011). The assay mixture contained 2.8 mL of 0.5 mM ABTS in 200 mM sodium
acetate buffer of pH 5.5 and 0.2 mL of enzyme and incubated for 5 min at 35°C. The oxidation
of ABTS was determined by observing the increase in spectrophotometer readings (420 nm,
3.6 × 10⁴ M−1 cm−1) resulting in an intense bluish-green color read at 420 nm against a suitable
blank. One unit of laccase enzyme activity was defined as the amount of enzyme required to
oxidize 1 μmol of ABTS substrate min -1 and expressed as units per g of dry substrate (U gds−1).
5.10 Development of bio-filter: continuous column studies
5.10.1 Preparation and characterization of bio-adsorbent
Final part of this research was the development of bio-filter. To accomplish this part of
research, corn cobs were collected from the local market in Phagwara, Punjab and washed with
distilled water. The dried corn cobs were then stored in desiccators to avoid moisture
absorption. After this, the dried corn cobs were grounded and sieved to obtain fraction < 1mm
and were then autoclaved (Miyah et al., 2016; Paliwal et al., 2015).
5.10.2 Analysis of surface characterization and morphology of corncobs
5.10.2.1 Electrical conductivity (EC) and pH
The electrical conductivity and pH of the powdered corncob was measured by preparing a
suspension of 1% (wt./wt.) corncob with distilled water then heated up to 90°C in incubator
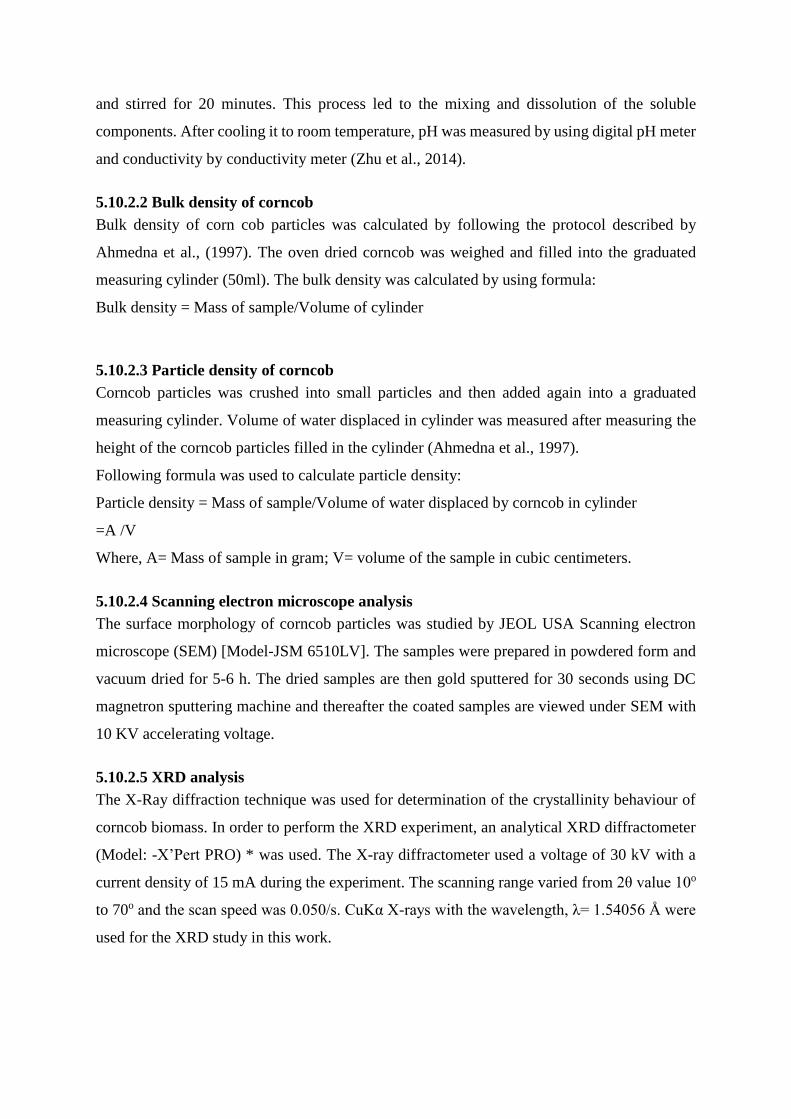
and stirred for 20 minutes. This process led to the mixing and dissolution of the soluble
components. After cooling it to room temperature, pH was measured by using digital pH meter
and conductivity by conductivity meter (Zhu et al., 2014).
5.10.2.2 Bulk density of corncob
Bulk density of corn cob particles was calculated by following the protocol described by
Ahmedna et al., (1997). The oven dried corncob was weighed and filled into the graduated
measuring cylinder (50ml). The bulk density was calculated by using formula:
Bulk density = Mass of sample/Volume of cylinder
5.10.2.3 Particle density of corncob
Corncob particles was crushed into small particles and then added again into a graduated
measuring cylinder. Volume of water displaced in cylinder was measured after measuring the
height of the corncob particles filled in the cylinder (Ahmedna et al., 1997).
Following formula was used to calculate particle density:
Particle density = Mass of sample/Volume of water displaced by corncob in cylinder
=A /V
Where, A= Mass of sample in gram; V= volume of the sample in cubic centimeters.
5.10.2.4 Scanning electron microscope analysis
The surface morphology of corncob particles was studied by JEOL USA Scanning electron
microscope (SEM) [Model-JSM 6510LV]. The samples were prepared in powdered form and
vacuum dried for 5-6 h. The dried samples are then gold sputtered for 30 seconds using DC
magnetron sputtering machine and thereafter the coated samples are viewed under SEM with
10 KV accelerating voltage.
5.10.2.5 XRD analysis
The X-Ray diffraction technique was used for determination of the crystallinity behaviour of
corncob biomass. In order to perform the XRD experiment, an analytical XRD diffractometer
(Model: -X’Pert PRO) * was used. The X-ray diffractometer used a voltage of 30 kV with a
current density of 15 mA during the experiment. The scanning range varied from 2θ value 10o
to 70o and the scan speed was 0.050/s. CuKα X-rays with the wavelength, λ= 1.54056 Å were
used for the XRD study in this work.
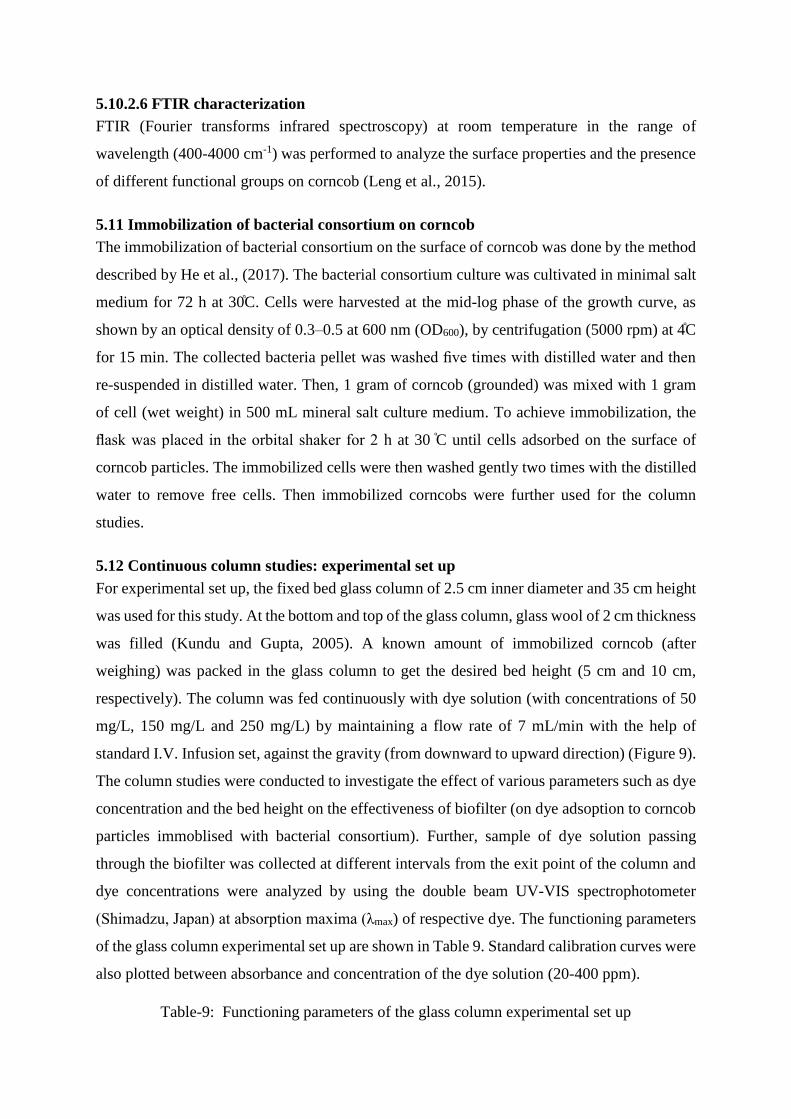
5.10.2.6 FTIR characterization
FTIR (Fourier transforms infrared spectroscopy) at room temperature in the range of
wavelength (400-4000 cm-1) was performed to analyze the surface properties and the presence
of different functional groups on corncob (Leng et al., 2015).
5.11 Immobilization of bacterial consortium on corncob
The immobilization of bacterial consortium on the surface of corncob was done by the method
described by He et al., (2017). The bacterial consortium culture was cultivated in minimal salt
medium for 72 h at 30 ֩C. Cells were harvested at the mid-log phase of the growth curve, as
shown by an optical density of 0.3–0.5 at 600 nm (OD600), by centrifugation (5000 rpm) at 4 ֩C
for 15 min. The collected bacteria pellet was washed five times with distilled water and then
re-suspended in distilled water. Then, 1 gram of corncob (grounded) was mixed with 1 gram
of cell (wet weight) in 500 mL mineral salt culture medium. To achieve immobilization, the
flask was placed in the orbital shaker for 2 h at 30 ֩C until cells adsorbed on the surface of
corncob particles. The immobilized cells were then washed gently two times with the distilled
water to remove free cells. Then immobilized corncobs were further used for the column
studies.
5.12 Continuous column studies: experimental set up
For experimental set up, the fixed bed glass column of 2.5 cm inner diameter and 35 cm height
was used for this study. At the bottom and top of the glass column, glass wool of 2 cm thickness
was filled (Kundu and Gupta, 2005). A known amount of immobilized corncob (after
weighing) was packed in the glass column to get the desired bed height (5 cm and 10 cm,
respectively). The column was fed continuously with dye solution (with concentrations of 50
mg/L, 150 mg/L and 250 mg/L) by maintaining a flow rate of 7 mL/min with the help of
standard I.V. Infusion set, against the gravity (from downward to upward direction) (Figure 9).
The column studies were conducted to investigate the effect of various parameters such as dye
concentration and the bed height on the effectiveness of biofilter (on dye adsoption to corncob
particles immoblised with bacterial consortium). Further, sample of dye solution passing
through the biofilter was collected at different intervals from the exit point of the column and
dye concentrations were analyzed by using the double beam UV-VIS spectrophotometer
(Shimadzu, Japan) at absorption maxima (λmax) of respective dye. The functioning parameters
of the glass column experimental set up are shown in Table 9. Standard calibration curves were
also plotted between absorbance and concentration of the dye solution (20-400 ppm).
Table-9: Functioning parameters of the glass column experimental set up
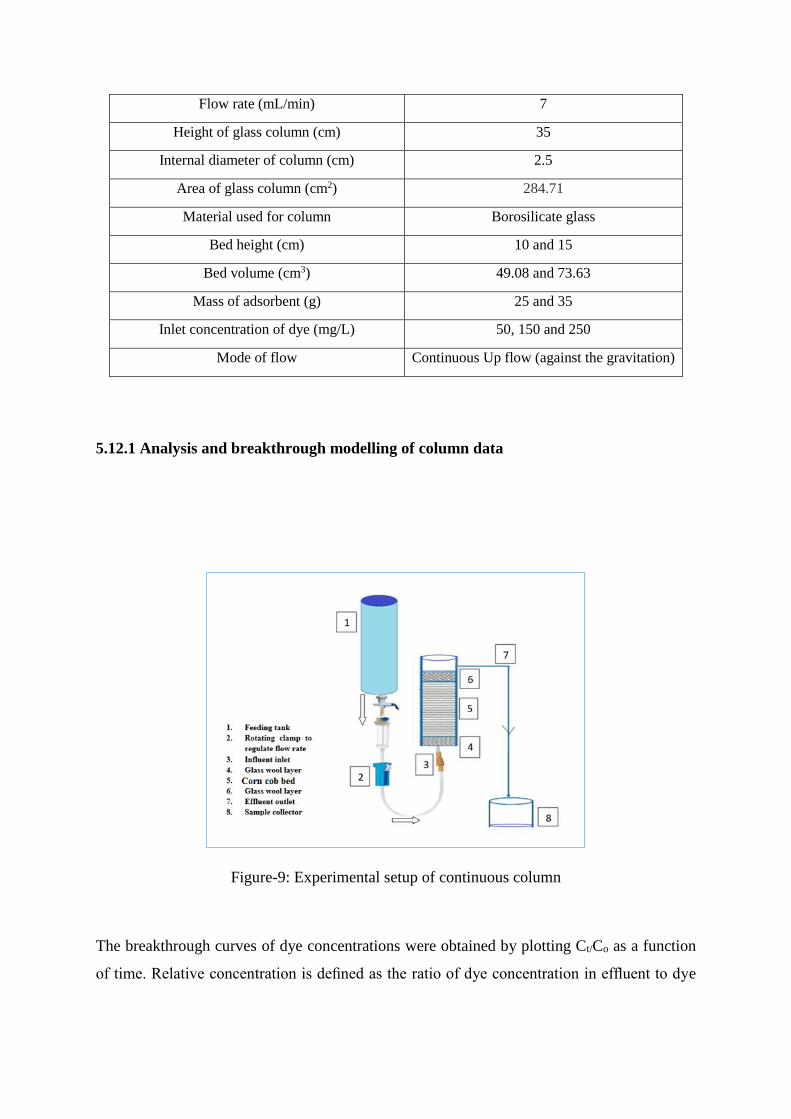
Flow rate (mL/min) 7
Height of glass column (cm) 35
Internal diameter of column (cm) 2.5
Area of glass column (cm2) 284.71
Material used for column Borosilicate glass
Bed height (cm) 10 and 15
Bed volume (cm3) 49.08 and 73.63
Mass of adsorbent (g) 25 and 35
Inlet concentration of dye (mg/L) 50, 150 and 250
Mode of flow Continuous Up flow (against the gravitation)
5.12.1 Analysis and breakthrough modelling of column data
Figure-9: Experimental setup of continuous column
The breakthrough curves of dye concentrations were obtained by plotting Ct/Co as a function
of time. Relative concentration is defined as the ratio of dye concentration in effluent to dye

concentration in an influent (Ct/Co), as a function of time (t in min). The effluent volume can
be calculated as:
Veff = Qttotal (1)
Where, ttotal and Q are the total flow time (min) and volumetric flow rate (mL/min). The total
adsorbed dye (qt) in the column for a given solute concentration and flow rate is calculated
from the following equation:
𝑞𝑡𝑜𝑡𝑎𝑙 =𝑄
1000∫ 𝐶𝑎𝑑 dt
𝑡𝑡𝑜𝑡𝑎𝑙
𝑡0 (2)
where Q (mL/min) is the flow rate and Cad (mg/L) is the adsorbed dye concentration [(inlet
concentration (Co) and outlet concentration (Ct)], and ttotal is the total flow time (min).
Equilibrium dye uptake in the column or maximum capacity of the column (qeq) was defined
by Eq. (3) as the total amount of dye adsorbed (qtotal) per g of the adsorbent (w) at the end of
the total flow time.
𝑞𝑒𝑞 =𝑞𝑡𝑜𝑡𝑎𝑙
𝑤 (3)
5.12.1.1 Adams-bohart model
Bohart-Adams (Hutchins, 1973) model was used to predict the initial part of the breakthrough
curve. The mathematical equation of the model can be written as:
𝑙𝑛𝐶𝑡
𝐶0= 𝑘𝐴𝐵𝐶0𝑡 − 𝑘𝐴𝐵𝑁0
𝑍
𝐹 (4)
where Co (mg/L) is the inlet concentration and Ct (mg/L) is the effluent concentration. kAB
(L/mgmin) is the Adams Bohart kinetic constant, F (cm/min) is the linear velocity which can
be calculated by dividing the flow rate in the column section area, Z (cm) is the bed depth of
column and No (mg/L) is the saturation concentration. A linear plot of ln Ct/Co against time (t)
was determined by the values of kAB and No from the intercepts and slopes of the plot.
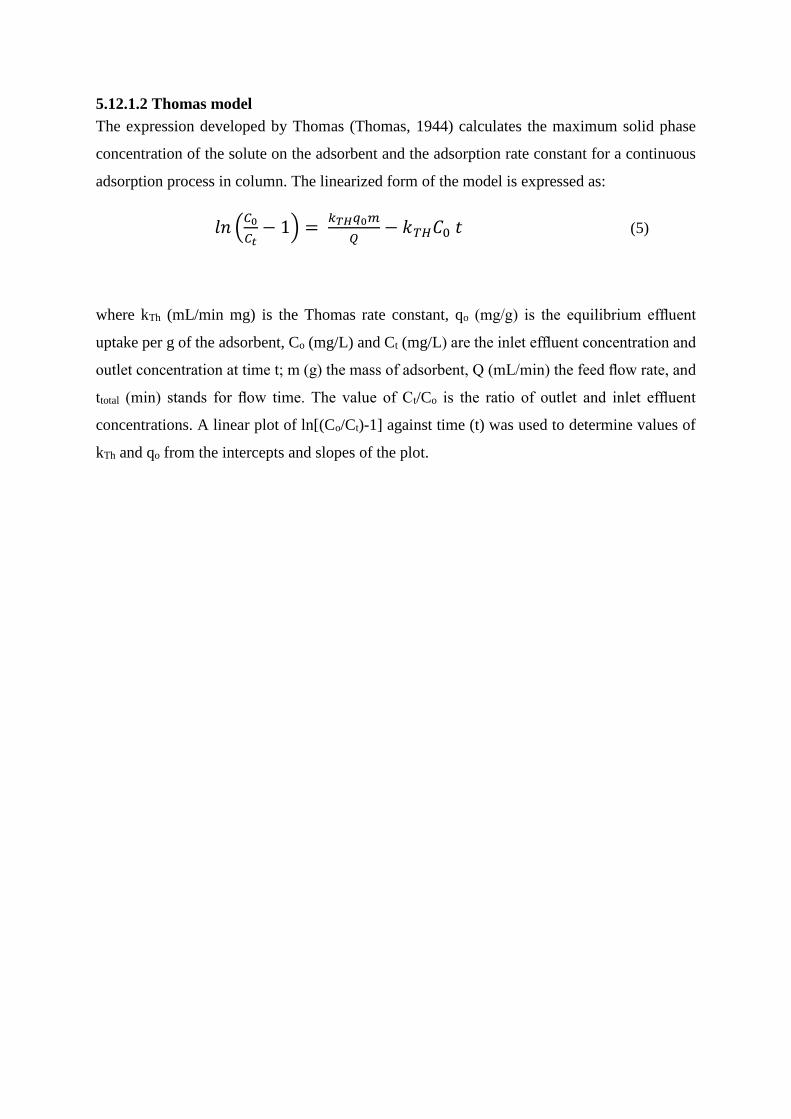
5.12.1.2 Thomas model
The expression developed by Thomas (Thomas, 1944) calculates the maximum solid phase
concentration of the solute on the adsorbent and the adsorption rate constant for a continuous
adsorption process in column. The linearized form of the model is expressed as:
𝑙𝑛 (𝐶0
𝐶𝑡− 1) =
𝑘𝑇𝐻𝑞0𝑚
𝑄− 𝑘𝑇𝐻𝐶0 𝑡 (5)
where kTh (mL/min mg) is the Thomas rate constant, qo (mg/g) is the equilibrium effluent
uptake per g of the adsorbent, Co (mg/L) and Ct (mg/L) are the inlet effluent concentration and
outlet concentration at time t; m (g) the mass of adsorbent, Q (mL/min) the feed flow rate, and
ttotal (min) stands for flow time. The value of Ct/Co is the ratio of outlet and inlet effluent
concentrations. A linear plot of ln[(Co/Ct)-1] against time (t) was used to determine values of
kTh and qo from the intercepts and slopes of the plot.

RESULTS
AND
DISCUSSIONS
Chapter 6
Results and Discussions
6.1 Analysis of textile industry effluent samples for physio-chemical parameters
Discharge of treated and untreated effluents by the textile industries disturbs the
environmental integrity of the region. Two textile dyeing industries identified as site 1 and
site 2, were selected for this study. These two industries are located in the vicinity of
Buddha Nallah drain on Tajpur road and on Bahadur-Ke-road. The results of the
physicochemical properties of the effluent samples collected from these two selected sites
are given in Table 10. The mean and standard deviation in seasonal variation of
physicochemical parameters such as pH, temperature, total dissolved solids (TDS), total
suspended solids (TSS), biochemical oxygen demand (BOD) and chemical oxygen demand
(COD) were calculated from the collected data for the year 2014-15 and are shown in
Tables 11 and 12.
The pH of collected textile effluent samples were analyzed and found to be between 6.1-
10.7, respectively, for two sites against the WHO standards between pH range of 6.5-8.5.
Figure 2 shows the mean seasonal variation of pH at two sites along with the mean seasonal
rainfall. For Site 1 for the summer season, the value of pH was in the alkaline range of
8.78±0.470 (p < 0.05) which is highly significant with similar trends for Site 2, in the range
of 8.51±0.411. The values of pH for the rainy season for site 1, were found to be in range
of 7.38±0.583 as compared to Site 2 of 7.11±0.598 which shows non-significant difference.
Effluent samples from Site 1, in autumn and winter season showed alkaline values of pH
in the range of 8.58±1.40 and 8.33±0.970 (Figure 12A), respectively. Similar results were
obtained for Site 2. The reason for alkaline range pH in effluent water samples is possibly
due to the presence of certain chemicals like NaOCl, sodium hydroxide, various surfactants
and sodium phosphate used in mercerizing the fabric and yarn (Pual et al., 2012). Similar
results were obtained by Ramamurthy et al., (2011) and pH values higher than the observed
range have also been reported by Desai and Kore, (2011), Tiwari and Chauhan, (2006) and
Aher et al., (2007). The low pH values observed in the rainy season were possibly due to
the accumulation of free carbon dioxide and increased rate of respiration by the organisms.

An opposite trend between pH and CO2 has also been reported by Jindal and Rumana,
(2000) for Yamuna River. Indian rivers polluted with industrial effluents have been found
to have alkaline or acidic pH (Gurumayum et al., 2002). The important parameter which
affects many chemical and biological processes in wastewater is temperature. In the present
study, variation in the values of water temperature was observed. The maximum mean
temperature was recorded in summer i.e. 41.16°C ±4.99 and lowest mean temperature in
winter i.e. 39.25°C ±2.25 at site 2 and the maximum mean temperature in the rainy season
was i.e. 40.83°C±2.42 and the minimum temperature was in autumn of 37.66°C±2.58
respectively. Figure 11(B) shows the mean seasonal variation in water temperature at two
sites along with the mean seasonal rainfall. During the rainy monsoon season, the highest
temperature of 45.1°C was observed. If the temperature of effluents being discharged from
industries is high, then it will ultimately affect the properties of the receiving water body.
Temperature may impact the aquatic life in receiving waters. With increase in temperature,
the rate of biological activity will get altered, likewise solubility of oxygen and other gases
will decrease which is harmful to aquatic community. In our research work, with increasing
water temperature, the concentration of dissolved oxygen decreases and similar findings
were also reported by Maurya et al., (2012). Total dissolved solids (TDS) signify the
presence of inorganic (Ca2+, Mg2+, K+, Na+, HCO3-, Cl-, SO42-) and organic matter present
in the form of suspension in water. The mean value of TDS was highest in autumn
2783mg/L±321.26 (p<0.05) and lowest in winter 1456±153.06 for Site 1. Similar trends
were observed for the effluent of Site 2, the maximum value of TDS in autumn i.e.
2678mg/L±346.68 which is highly significant (p<0.05) and minimum in winter season i.e.
1463.8mg/L±164.22; 1618.5mg/L+180.03 in summer and 1783.1±290.37 in monsoon
season (Figure 11C). Overall, the TDS values were higher in autumn and monsoon, while
within the desirable limits of WHO standards in winter. Similar study was done by Paul et
al., (2012) and and they reported higher values of TDS in the range of (2264mg/L-
7072mg/L) in the textile wastewater. Higher TDS affect water quality and is unsuitable for
the portability and industrial applications (Dattaray, 2015). According to the standards of
WHO, the limit for TDS is 500mg/L and maximum limit is 2000mg/L (Paul et al., 2012).
In our study, TDS values were higher in autumn and Monsoon, while within the desirable
limits of WHO in winter. Similar study has been conducted for Godavari River flowing
little downstream from Nanded, Maharastra, by Srinivasrao et al., (2007). They found
similar trends for TDS which causes changes into ionic concentration and nature of the
deposits present at bottom of the river. The low TDS content in the groundwater of the
study area could be either a result of short residence time or because of slow weathering of
granitic or granitic gneiss terrain. Excessive concentration of TDS in ground water affect
the human health, induces unfavorable physiological, aesthetically unsatisfactory for
bathing, washing and increases the boiling point (Jindal and Rumana, 2000). High TDS in
groundwater is due to discharge of wastewater into pit ponds and the lagoons enabling the
waste percolate down to the water table (Dattaray, 2015). The higher TDS values leading
to higher ionic concentration also causes gastro intestinal complications.
Total suspended solids (TSS) is a parameter which is used to assess the quality of waste
water after treatment in waste water treatment Plant. High values of suspended solids
correspond to the use of different kind of synthetic dyes (Mohabansi et al., 2011). The
sediments of size > 0.7 µm - <63 µm and detrital organic matter > 0.7 µm compounds to
suspended solids. In the present investigation, the value of total suspended solids was
recorded in autumn for two sites i.e. 143.5mg/L±75.01 and 139.66mg/L±71.87,
respectively which is higher than the permissible limit given by WHO and minimum value
of TDS was recorded the in rainy season of 86.50mg/L±15.10 for Site 1 and 84g/l ±27.59
for Site 2 in summer. The excessive levels of TSS in water bodies can have significant
detrimental impacts on the physical, chemical and biological properties of the water body
(Bilotta and Brazier, 2008). If this type of effluent is used for irrigation purposes, it will
result in clogging of pores of soil and loss in productivity of soil. Biochemical oxygen
demand (BOD) is the amount of dissolved oxygen required for the biochemical
decomposition of organic compounds and the oxidation of certain inorganic materials (e.g.,
iron, sulfites) Garg et al., (2010). Biochemical oxygen demand indicates the presence of
organic impurities in the effluent. Figure 11(E) clearly shows us that the values for BOD
of the effluent at two sites are more than the permissible limits set by WHO. In the present

study, the highest value for BOD was observed in autumn i.e. 361.67mg/L±130.44 for Site
1 and 341.6mg/L±123.84 for Site 2 which is highly significant (p < 0.05). Nirgude et al.,
(2013) reported similar findings for BOD values of textile industry effluent from vapi
industrial area in Gujrat in the range of 90-678mg/L. The WHO has set the limit of 250
mg/L for chemical oxygen demand (COD). Our study shows that for both the sites; COD
value is greater than of permissible limit set by WHO. The seasonal variation of COD can
be clearly seen in the Figure 11(F). The maximum value for COD was observed in winter
i.e. 810.67mg/L±126.31 for Site 1 and 809.16mg/L±86.39 for Site 2 which is highly
significant (p < 0.05).
The textile industry effluents in the rainy season show COD value as high as 900 mg/L,
which may be due to higher level of pollution in surface runoff generated by monsoon.
Singh et al., (2013) conducted a similar study on collecting textile industry effluents from
7 different dyeing mills and reported high values of BOD and COD of 108-790mg/L and
195-3050 mg/L, respectively. High level of chemical oxygen demands indicates noxious
conditions and presence of resistant organic impurities (Mohabansi et al., 2011).
6.1.1 Correlation between various physio-chemical parameters at two different sites
during four seasons
Correlation is used to evaluate the degree of interdependence and gives a relationship
between two or more experimental variables. The systematic study of correlation between
various physio-chemical parameters of water, not only helps us to determine quality of
water but also quantifies the concentration of pollutants in water. It expresses the extent to
which two variables vary together in either same or opposite directions (Khambete and
Christian, 2014). Therefore, it provides a relative information for implementation of water
quality treatment systems (Verandani and Vardhan, 2012). The correlation between
variables is characterized as strong, in the range of +0.8 to 1 and -0.8 to -1, moderate in the
range of +0.5 to 0.8 and -0.5 to -0.8, and weak in the range of +0.0 to 0.5 and -0.0 to -0.5.
Correlation coefficients among various water quality parameters at two different sites for
different seasons are represented in Figure 10. The results obtained in this study clearly

indicated a strong positive correlation between pH and water temperature, TDS, TSS, BOD
and COD for both sites in autumn season [Figure 10(A) and 10(B)]. Decrease in disoolved
oxygen will lead to increase in biochemical oxygen demand (BOD). However, BOD does
not have direct relationship with TSS. But generally, more dissolved solids in effluent leads
to more organic impurity that is BOD (Srinivasarao et al., 2007). In contrast, for Site 1, in
rainy monsoon season, the strong positive correlation was observed between pH, BOD,
COD and water temperature. TDS showed positive correlation between TSS, BOD and
COD. As DO and BOD have inverse relationship, reduction in DO will lead to increased
BOD in due course of time (Verandani and Vardhan, 2012). Water temperature exhibited
negative correlation with other parameters [Figure 10(C and D)]. For site 2, in rainy
monsoon season, water temperature and TSS exhibited negative correlation with other
parameters. BOD showed positive correlation with TDS and COD for both sites in rainy
monsoon season. In summer season, for both sites, moderate positive correlation was found
between pH, water temperature and TDS. BOD has a moderate positive correlation with
COD and TSS. Abdalla and Hammam, (2014) studied the correlation between BOD and
COD for wastewater treatment plants in Egypt to check the biodegradability indicies to
evaluate the treatment process and improve the performances. Our results for the
correlation between BOD and COD for four different seasons are in accordance with their
study. They reported if the ratio of BOD/COD is greater than 0.6, then the wastewater is
biodegradable. If the BOD/COD ratio is between 0.3-0.6, then biodegrdation process will
be very slow. In comparison, if the ratio of BOD/COD is less than 0.3, then the wastewater
can be treated biologically. In our study, water temperature showed positive correlation
with TDS [Figure 10(E and F)]. In contrast, TDS has a weak positive correlation with COD
but exhibited strong correlation with BOD for both sites in winter season. Our results are
in accordance with the previous study conducted by Hill et al., (2005). Hill et al., (2005)
determined the wastewater quality index and studied statistical interrelationships amongst
different parameters by correlation cofficients and regression analysis. They found positive
correlation between TDS-TSS, TDS-BOD, TDS-COD, TDS-pH, and BOD-COD.

Table-10: Physicochemical parameters analysis of textile industry effluents at two selected sites in Ludhiana (2014-15)
Month Date Season Rain
fall
(mm)
pH Water
Temperature (°C)
TSS
(mg/L)
TDS
(mg/L)
BOD
(mg/L)
COD
(mg/L)
Site 1 Site 2 Site 1 Site 2 Site 1 Site 2 Site 1 Site 2 Site 1 Site 2 Site 1 Site 2
June (2014) 02/06/2014 Rainy
Monsoon
19.8 7.8 7.4 44.5 44.5 75 79 1323 1333 122 121 280 265
16/06/2014 7.5 7.0 43 45.5 87 85 1552 1542 124 123 260 240
July 1/07/2014 Rainy
Monsoon
90.8 6.5 6.1 40 35 114 110 1856 1826 170 175 320 300
15/07/2014 7.2 6.9 38 38 90 86 1950 1930 185 180 280 290
August 1/08/2014 Rainy
Monsoon
32.2 7.5 7.8 40 38 81 79 1978 1958 320 310 416 390
16/08/2014 7.8 7.5 39.5 35.5 72 69 2120 2110 380 340 350 330
September 1/09/2014 Autumn 78.8 7.43 7.2 36.5 35 71 72 2360 2160 580 520 282 272
15/09/2014 7.5 7.6 35 32 70 69 2550 2430 450 470 310 290
October 1/10/2014 Autumn 5.0 10.78 10.2 40 38 265 255 3050 2950 350 320 784 786
15/10/2014 9.9 10 41.5 37.5 190 187 3220 3113 250 270 640 643
November 1/11/2014 Autumn 0.0 8.02 7.9 35.5 32 145 142 2860 2763 280 240 576 546
15/11/2014 7.89 7.7 37.5 35 120 113 2662 2652 260 230 680 590
December 1/12/2014 Winter 14.6 7.33 7.2 38 35.5 84 82 1669 1769 385 345 650 790
15/12/2014 7.5 7.6 40 38 127 117 1624 1526 290 280 990 895
January
(2015)
1/01/2015 Winter 24.6 8.3 8.1 41 40 154 144 1336 1326 145 125 840 855
15/01/2015 8.0 7.9 38 39.5 145 135 1418 1405 190 175 900 895
February 2/02/2015 Winter 38.6 9.9 9.6 40 42 55 52 1386 1358 185 195 700 695
16/02/2015 9.0 8.9 42.5 40.5 82 79 1305 1399 250 230 784 725
March 2/03/2015 Summer 84.6 8.5 8.1 41 40 92 87 1450 1423 220 210 568 548
16/03/2015 9.0 8.7 38 42 78 72 1478 1458 190 170 560 555
April 1/04/2015 Summer 17.5 8.5 8.3 35 32 122 125 1643 1645 152 134 440 435
15/04/2015 8.2 8.1 40 45 114 101 1550 1544 178 158 420 410
May 1/05/2015 Summer 27.2 9.0 8.8 42 42 56 58 1896 1892 130 120 432 420
15/05/15 9.5 9.1 45 46 59 61 1750 1749 155 125 380 375

Table-11: Physicochemical parameters analysis at site-1 in Ludhiana (2014-15)
Parameters
WHO
standard
Summer (Mean± SD) Rainy Monsoon (Mean± SD) Autumn (Mean± SD) Winter (Mean± SD)
Site 1 p value (two
tailed)
Site 1 p value (two
tailed)
Site 1 p value (two
tailed)
Site 1 p value (two
tailed)
pH 6.5-8.5 8.78±0.470 0.024* 7.38±0.487 0.81 8.58±1.40 0.165 8.33±0.970 0.190
Total Suspended
Solids (mg/L)
100 mg/L 86.83±27.58 0.026* 86.50±15.10 0.053 143.5±75.01 0.185 107.8±39.76 0.63
Total dissolved
solids (mg/L)
2000 mg/L 1627.8±171.58 0.000* 1796.5±299.55 0.12 2783.7±321.26 0.00* 1456.3±153.06 5.60E0-6*
Chemical oxygen
demand (mg/L)
250 mg/L 466.67±78.20 0.00004* 317.67±58.10 0.01* 545.33±204.80 0.00* 810.67±126.31 7.35E-07*
Biochemical
oxygen demand
(mg/L)
30 mg/L 170.83±96 7.87E-07* 216.83±107.78 0.000* 361.67±130.44 9.78E-05* 240.83±87.37 0.000*
Water temperature
(°C)
Not exceed
40°C
40.16±3.43 0.907 40.83±2.42 0.419 37.66±2.58 0.051 39.91±1.74 0.901
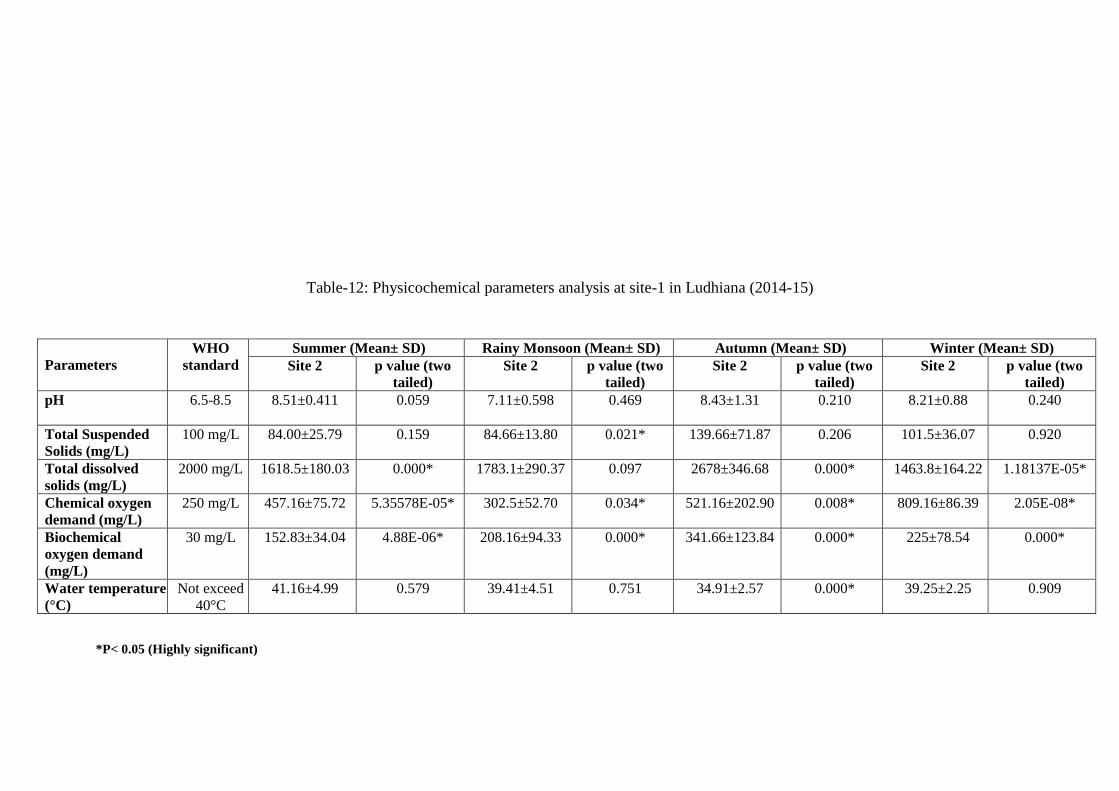
Table-12: Physicochemical parameters analysis at site-1 in Ludhiana (2014-15)
Parameters
WHO
standard
Summer (Mean± SD) Rainy Monsoon (Mean± SD) Autumn (Mean± SD) Winter (Mean± SD)
Site 2 p value (two
tailed)
Site 2 p value (two
tailed)
Site 2 p value (two
tailed)
Site 2 p value (two
tailed)
pH 6.5-8.5 8.51±0.411
0.059 7.11±0.598 0.469 8.43±1.31 0.210 8.21±0.88 0.240
Total Suspended
Solids (mg/L)
100 mg/L 84.00±25.79 0.159 84.66±13.80 0.021* 139.66±71.87 0.206 101.5±36.07 0.920
Total dissolved
solids (mg/L)
2000 mg/L 1618.5±180.03 0.000* 1783.1±290.37 0.097 2678±346.68 0.000* 1463.8±164.22 1.18137E-05*
Chemical oxygen
demand (mg/L)
250 mg/L 457.16±75.72 5.35578E-05* 302.5±52.70 0.034* 521.16±202.90 0.008* 809.16±86.39 2.05E-08*
Biochemical
oxygen demand
(mg/L)
30 mg/L 152.83±34.04 4.88E-06* 208.16±94.33 0.000* 341.66±123.84 0.000* 225±78.54 0.000*
Water temperature
(°C)
Not exceed
40°C
41.16±4.99 0.579 39.41±4.51 0.751 34.91±2.57 0.000* 39.25±2.25 0.909
*P< 0.05 (Highly significant)

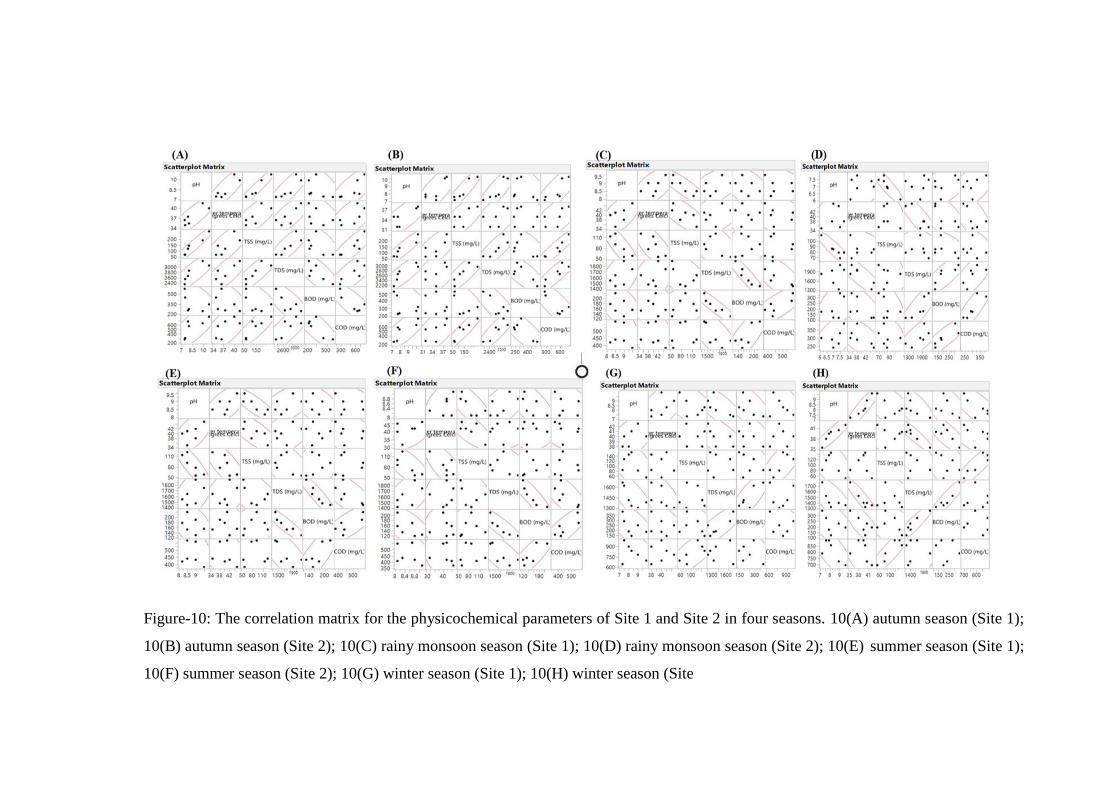
Figure-10: The correlation matrix for the physicochemical parameters of Site 1 and Site 2 in four seasons. 10(A) autumn season (Site 1);
10(B) autumn season (Site 2); 10(C) rainy monsoon season (Site 1); 10(D) rainy monsoon season (Site 2); 10(E) summer season (Site 1);
10(F) summer season (Site 2); 10(G) winter season (Site 1); 10(H) winter season (Site
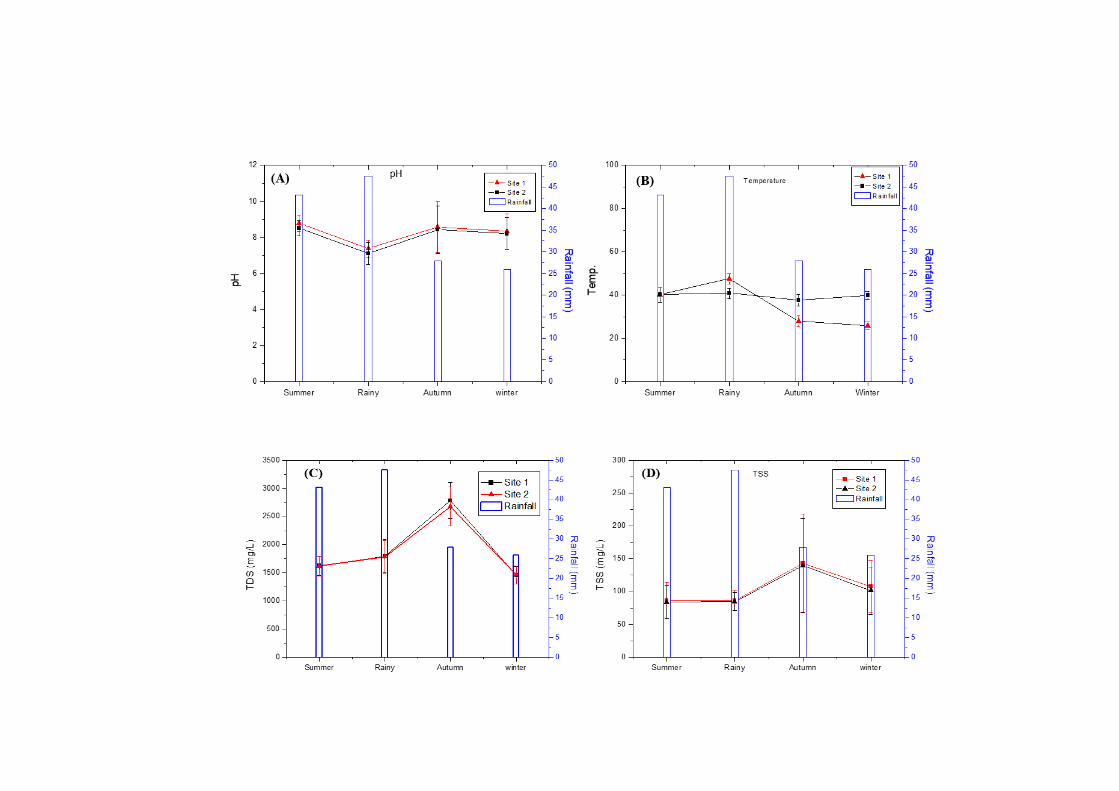

Figure-11: Graphs showing average seasonal variations of various selected physicochemical parameters of different seasons of Site 1 and
Site 2 Ludhiana, Punjab. (June 2014 - 15). 11(A) seasonal variations of pH; 11(B) seasonal variations of water temperature; 11(C) seasonal
variations of total dissolved solids (TDS); 11(D) seasonal variations of total suspended solids (TSS); 11(E) seasonal variations of
biochemical oxygen demand (BOD); .11(F) seasonal variations of chemical oxygen demand (COD)
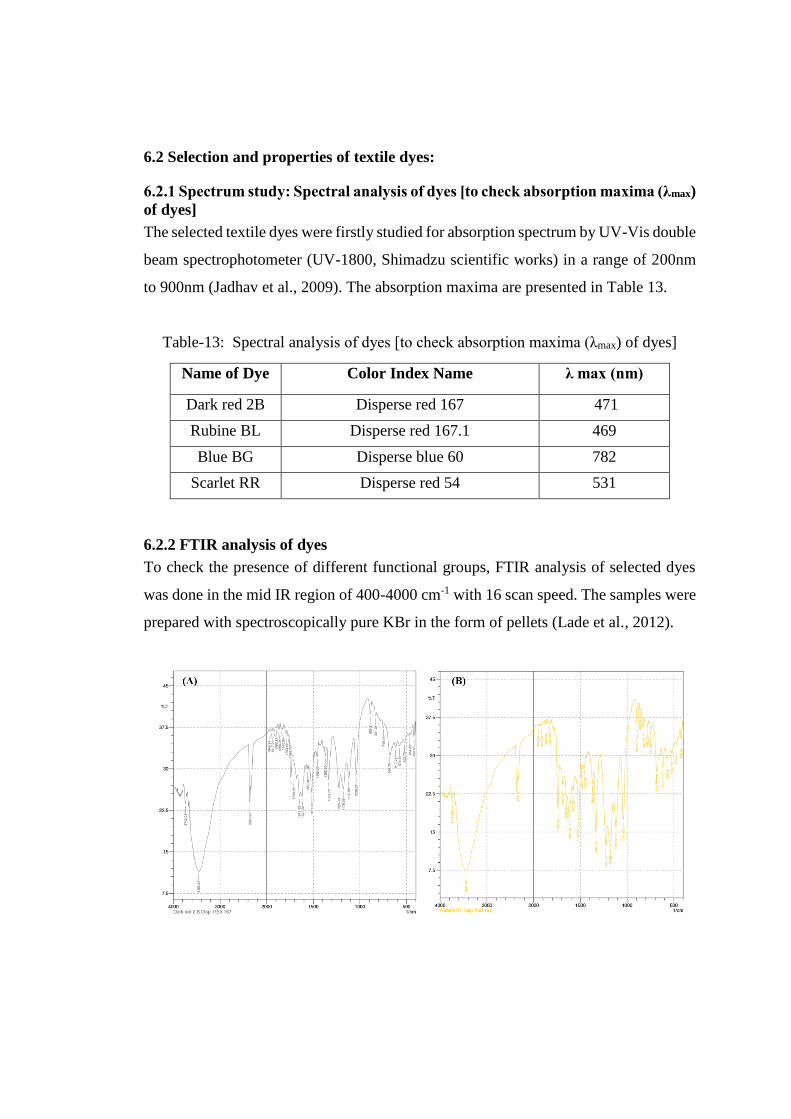
6.2 Selection and properties of textile dyes:
6.2.1 Spectrum study: Spectral analysis of dyes [to check absorption maxima (λmax)
of dyes]
The selected textile dyes were firstly studied for absorption spectrum by UV-Vis double
beam spectrophotometer (UV-1800, Shimadzu scientific works) in a range of 200nm
to 900nm (Jadhav et al., 2009). The absorption maxima are presented in Table 13.
Table-13: Spectral analysis of dyes [to check absorption maxima (λmax) of dyes]
Name of Dye Color Index Name λ max (nm)
Dark red 2B Disperse red 167 471
Rubine BL Disperse red 167.1 469
Blue BG Disperse blue 60 782
Scarlet RR Disperse red 54 531
6.2.2 FTIR analysis of dyes
To check the presence of different functional groups, FTIR analysis of selected dyes
was done in the mid IR region of 400-4000 cm-1 with 16 scan speed. The samples were
prepared with spectroscopically pure KBr in the form of pellets (Lade et al., 2012).

Figure-12: FTIR spectra of selected control dyes. 12(A) FTIR spectra of disperse red
167; 12(B) FTIR spectra of disperse red 167.1; 12(C) FTIR spectra of disperse blue
60; 12(D) FTIR spectra of disperse red 54
The FTIR spectrum of control disperse red 167 is displayed in Figure 12(A). In control
dye, the spectra revealed the presence of peaks at 1575.46 cm-1 for H-N-H bending. The
stretching of (CO)-H was reported at 2852.81 cm-1 and the peak at 1609.65 cm-1 that
showed carbonyl stretching vibration. In control, the peaks at 1560.46 cm-1 and 1621.22
cm−1 is due to the presence of azo groups –N=N– stretching whereas the spectrum of
control disperse red 167.1 is presented in Figure 12(B). The peak in the range of 1595-
1600 cm−1 corresponds to the presence of azo bond (-N=N-), peak at 831 cm−1 for C-H
deformation in alkanes and N-O stretching in nitrites, peak at 734-750 cm−1 for the
presence of benzene ring. Furthermore, the peak at 619.17 cm−1 corresponds to the C–
N stretching in acyclic compounds. The C-N vibrations were found at 1120.68 cm−1, -
OH stretching vibration at 3500–3400 cm−1. Similar functional groups were found on
Rubine GFL by Waghmode et al., (2012) and Pan et al., (2017). The FTIR spectra of
parent disperse blue 60 is shown in Figure 12(C). The parent dye (DB 60) displaying
various peaks in the finger print region for para-disubstituted and meta-disubstituted
benzene rings. The peak at 1741.38 cm-1 corresponds to C=0 stretch and peak at
2945.22 cm-1 for asymmetric CH3 stretch, peak at 1454.38 cm-1 designated C-C stretch
in aromatics, a peak at 945.15 cm-1 for O-H bend of carboxylic acid and presence of
peaks at 677.04 cm-1, 736.83 cm-1,763.84 cm-1 indicates aromaticity or the presence of
benzene ring. A peak at 3439.19 cm-1 for –OH stretching vibration and -NH stretching
vibration, a peak at 1651 cm-1 shows -C=C- stretching. Other peaks at 1516.1 and
1560.46 cm-1 are characteristic of >C=C< (anthraquinone); while peaks at 1651 cm-1 to
>C=O (anthraquinone) (Ortiz et al., 2017; Pan et al. 2017). The FTIR spectra of control
disperse red 54 dye is represented in fig 12(D) which confirms the structure of parent
dye. The peaks at 3321.53 cm-1 corresponds to -N-H stretching as in amines, 1599.04
cm cm-1 for N=N stretching as in azo groups and -C-N stretching as in amides, 1114.89
cm-1 for C–O-H stretching as in alcohols, 1041.6 cm-1 for S–O stretching which
displayed the sulfoxide nature of dye, and 682.82 cm-1 for C–Cl stretching, 2953.13 cm-
1 for –C-H stretching, 1363.72 cm-1 for CH3 vibration, 1442.8 and 1473.66 cm-1
corresponds to CH2 bends and 1737.92 cm-1 for –C=O (ketonic) vibration (Jadhav et
al., 2009; Kurade et al., 2012)
6.3 Isolation and screening of bacterial strains from textile industry effluent and
soil
For second part of this study, water samples and soil samples from textile industry were
collected for the isolation of 15 morphologically different bacterial isolates. The pure
cultures were preserved on nutrient agar medium at 4oC. All 15 isolates were tested
individually for their ability to decolorize four selected textile dyes (disperse red 167,
disperse red 167.1, disperse blue 60 and disperse red 54) separately at the concentration
of 50 mg/L each dye. Dye decolorization efficiency of 15 isolates for decolorization of
each dye is shown in Table 14. All 15 isolates decolorize the dyes with different
capacity ranging from lowest 50.76 ± 0.25 to highest 84.80 ± 0.35 in case of disperse
red 167; 55.30 ± 0.51 to maximum 78.13 ± 0.37 for disperse red 167.1; 54.43 ± 0.55 to
76.29 ± 0.51 for disperse blue 60 and 53.73 ± 0.46 to 84.17 ± 0.16 in case of disperse
red 54. A number of researchers considered textile industry effluent as an efficient
source of potent dye decolorizing bacteria due to the natural adaptation to the higher
dye concentration and its toxic effect (Khehra et al., 2005; Ali et al., 2009; Prasad and
Rao, 2010 and Pokharia and Ahluwalia, 2013).
Table-14: Percent decolorization of four selected dyes by 15 bacterial isolates (isolate
1 to isolate 15; 50mg/L in 24 h)
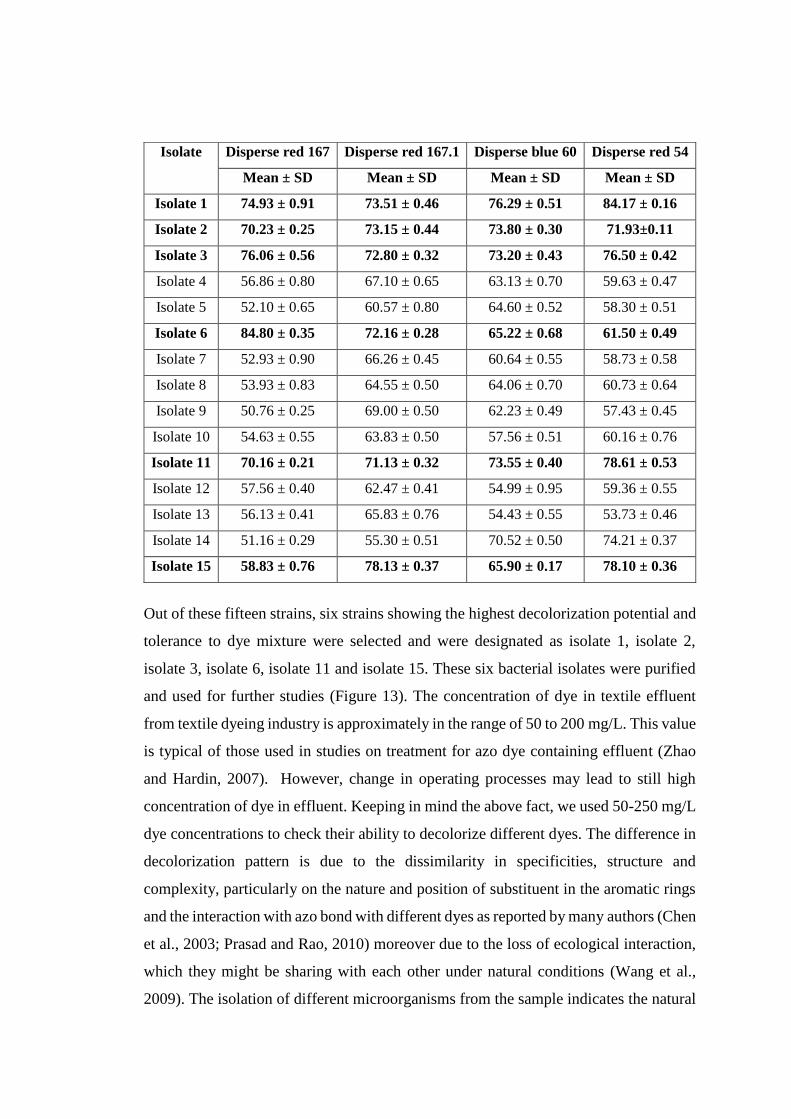
Out of these fifteen strains, six strains showing the highest decolorization potential and
tolerance to dye mixture were selected and were designated as isolate 1, isolate 2,
isolate 3, isolate 6, isolate 11 and isolate 15. These six bacterial isolates were purified
and used for further studies (Figure 13). The concentration of dye in textile effluent
from textile dyeing industry is approximately in the range of 50 to 200 mg/L. This value
is typical of those used in studies on treatment for azo dye containing effluent (Zhao
and Hardin, 2007). However, change in operating processes may lead to still high
concentration of dye in effluent. Keeping in mind the above fact, we used 50-250 mg/L
dye concentrations to check their ability to decolorize different dyes. The difference in
decolorization pattern is due to the dissimilarity in specificities, structure and
complexity, particularly on the nature and position of substituent in the aromatic rings
and the interaction with azo bond with different dyes as reported by many authors (Chen
et al., 2003; Prasad and Rao, 2010) moreover due to the loss of ecological interaction,
which they might be sharing with each other under natural conditions (Wang et al.,
2009). The isolation of different microorganisms from the sample indicates the natural
Isolate Disperse red 167 Disperse red 167.1 Disperse blue 60 Disperse red 54
Mean ± SD Mean ± SD Mean ± SD Mean ± SD
Isolate 1 74.93 ± 0.91 73.51 ± 0.46 76.29 ± 0.51 84.17 ± 0.16
Isolate 2 70.23 ± 0.25 73.15 ± 0.44 73.80 ± 0.30 71.93±0.11
Isolate 3 76.06 ± 0.56 72.80 ± 0.32 73.20 ± 0.43 76.50 ± 0.42
Isolate 4 56.86 ± 0.80 67.10 ± 0.65 63.13 ± 0.70 59.63 ± 0.47
Isolate 5 52.10 ± 0.65 60.57 ± 0.80 64.60 ± 0.52 58.30 ± 0.51
Isolate 6 84.80 ± 0.35 72.16 ± 0.28 65.22 ± 0.68 61.50 ± 0.49
Isolate 7 52.93 ± 0.90 66.26 ± 0.45 60.64 ± 0.55 58.73 ± 0.58
Isolate 8 53.93 ± 0.83 64.55 ± 0.50 64.06 ± 0.70 60.73 ± 0.64
Isolate 9 50.76 ± 0.25 69.00 ± 0.50 62.23 ± 0.49 57.43 ± 0.45
Isolate 10 54.63 ± 0.55 63.83 ± 0.50 57.56 ± 0.51 60.16 ± 0.76
Isolate 11 70.16 ± 0.21 71.13 ± 0.32 73.55 ± 0.40 78.61 ± 0.53
Isolate 12 57.56 ± 0.40 62.47 ± 0.41 54.99 ± 0.95 59.36 ± 0.55
Isolate 13 56.13 ± 0.41 65.83 ± 0.76 54.43 ± 0.55 53.73 ± 0.46
Isolate 14 51.16 ± 0.29 55.30 ± 0.51 70.52 ± 0.50 74.21 ± 0.37
Isolate 15 58.83 ± 0.76 78.13 ± 0.37 65.90 ± 0.17 78.10 ± 0.36
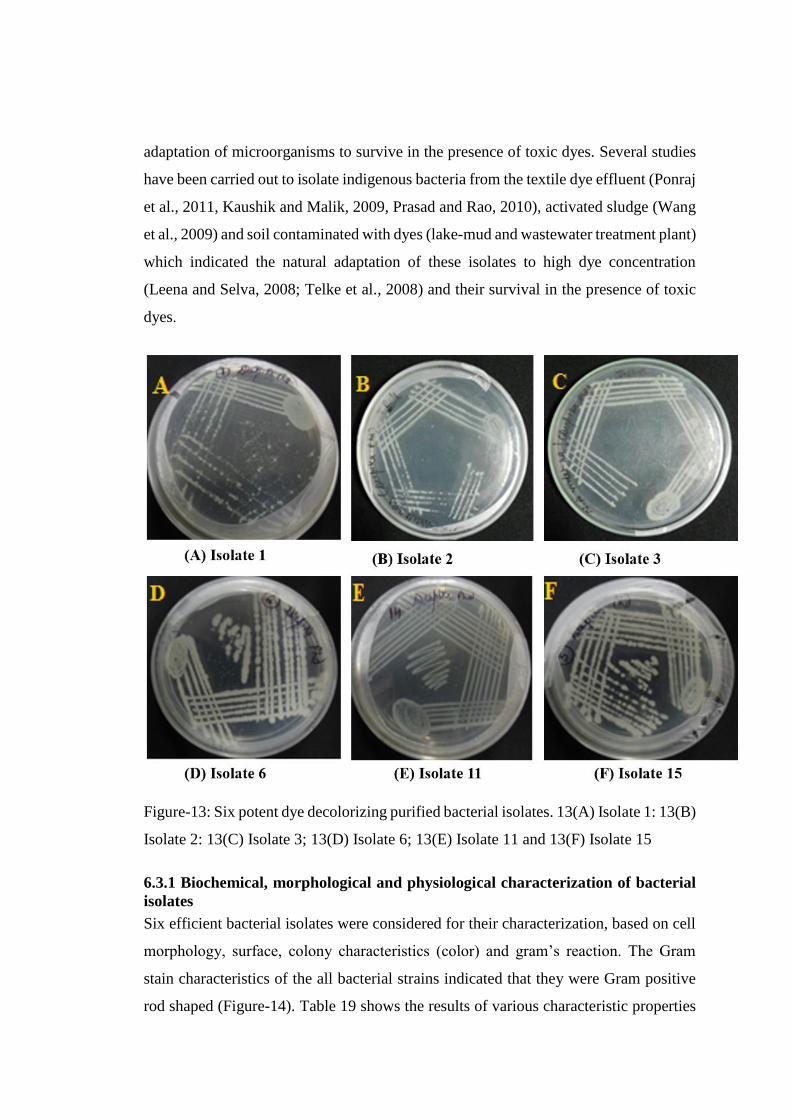
adaptation of microorganisms to survive in the presence of toxic dyes. Several studies
have been carried out to isolate indigenous bacteria from the textile dye effluent (Ponraj
et al., 2011, Kaushik and Malik, 2009, Prasad and Rao, 2010), activated sludge (Wang
et al., 2009) and soil contaminated with dyes (lake-mud and wastewater treatment plant)
which indicated the natural adaptation of these isolates to high dye concentration
(Leena and Selva, 2008; Telke et al., 2008) and their survival in the presence of toxic
dyes.
Figure-13: Six potent dye decolorizing purified bacterial isolates. 13(A) Isolate 1: 13(B)
Isolate 2: 13(C) Isolate 3; 13(D) Isolate 6; 13(E) Isolate 11 and 13(F) Isolate 15
6.3.1 Biochemical, morphological and physiological characterization of bacterial
isolates
Six efficient bacterial isolates were considered for their characterization, based on cell
morphology, surface, colony characteristics (color) and gram’s reaction. The Gram
stain characteristics of the all bacterial strains indicated that they were Gram positive
rod shaped (Figure-14). Table 19 shows the results of various characteristic properties
of six bacterial isolates. The isolates were examined for the biochemical texts as well
(catalase test, indole, urease, oxidase, methyl red and voges proskauer tests). The
isolated bacterial strains appeared white to milky off-white colonies having dry,
mucoid, smooth and ellipsoidal surface with variable size and margins. All bacterial
isolates showed positive tests for catalase and negative for indole, methyl red and voges
proskauer test. Isolate 1 and isolate 2 showed positive results for urease in comparison
to rest of the three isolates which showed negative results for urease test. Besides for
oxidase test, except isolate 15 (displayed negative results), remained five bacterial
isolates were showing positive results. The six most efficient bacterial species were
found to share the main phenotypic features of the genus Bacillus (Table 15). After 16S
rRNA gene sequence analysis all bacterial isolates namely, isolate 1, isolate 2, isolate
3, isolate 6, isolate 11 and isolate 15 were identified by BLAST search and submitted
to NCBI for obtaining accession numbers. Figure 15 shows the phylogenetic
relationship between the isolated bacterial strains and other related bacteria found in
the GenBank database. The homology indicated that the isolate 1 identified as Bacillus
cereus with accession number KX034566, isolate 2 identified as Bacillus sphaericus
(KX034564), isolate 3 identified as Paenibacillus pocheonensis (KX034565), isolate 6
identified as Paenochrobactrum glacei (KX034561), isolate 11 identified as Bacillus
subtilis (KX034562) and isolate 15 identified as Brevibacillus panacihumi
(KX034559).

Figure-14: Gram staining of bacterial isolates. 14(A) Isolate 1; 14(B) Isolate 2; 14(C) Isolate 3;
14(D) Isolate 6; 14(E) Isolate 11 and 14(F) Isolate 15

Figure-15: Phylogenetic tree of isolated bacterial species (1 to 7) based on their 16s rRNA gene
sequence analysis. 15(A) identified as Bacillus cereus AU50; 15(B) identified as Bacillus
sphaericus; 15(C) identified as Paenibacillus sp. C-2); 15(D) identified as Paenochrobacterum
glacei; 15(E) identified as Bacillus subtilis; 15(F) identified as Brevibacillus panacihumi

Table-15: Biochemical, morphological and physiological characterization of bacterial isolates
Bacterial Isolates Isolate 1 Isolate 2 Isolate 3 Isolate 6 Isolate 11 Isolate 15
Morphology Irregular Round Irregular Irregular Irregular Circular
Surface Smooth Smooth; Flat Undulate; Concentric Smooth Dry; Flat Ellipsoidal
Colony color White Off-White Off-White White White Cream-White
Gram reaction Positive Positive Positive Positive Positive Positive
Catalase Test Positive Positive Positive Positive Positive Positive
Indole Test Negative Negative Negative Negative Negative Negative
Urease Test Positive Positive Negative Negative Negative Negative
Oxidase Test Positive Positive Positive Positive Positive Negative
Voges Proskauer Test Negative Negative Negative -- Negative Negative
Methyl Red Test Negative Negative Negative -- Negative Negative
Molecular
Identification
Bacillus
cereus AU 50
Bacillus
sphaericus
Paenibacillus
pocheonensis
Paenochrobactrum
glacei
Bacillus
subtilis
Brevibacillus
panacihumi
NCBI Accession No. KX034566 KX034564 KX034565 KX034561 KX034562 KX034559

6.4 Biocompatibility assay of efficient dye degrading bacteria for dyes
To analyze the synergistic activity among isolated bacterial species for the development
of consortium, biocompatibility assay was performed by following the method
described by Nikam et al., (2007) with slight modifications. The selected bacterial
isolates were spreaded on the growth media and allowed to grow for 24 h at 37°C. 5
mm size sterilized (whatmann paper no 1) discs impregnated with bacterial suspension
of individual isolates were placed at the distance of 5 mm from the periphery of
petriplates already having growth of cultures inoculated in different pattern to check
the antagonistic/syneristic effect of bacterial cultures on each other.
Figure-16: Test of biocompatibility between six potent identified dye decolorizing
strains
After 24 h the growth was observed which was showing no zone of inhibition in any of
the bacterial culture; hence all the bacterial cultures are compatible to each other and
can be proved as a good consortium (Figure 16A to 16F). Our results were similar with
the findings of Anandaraj et al., (2010) in which the species of Rhizobium sp., Bacillus
megaterium and P. fluorescens was compatible with each other in cross streak plate
assay. Thus, treatment of seeds with effective strains of Rhizobium, Bacillus alone or

in combination with other beneficial microorganisms may be preferred, because of their
multiple potentials to control disease, fix nitrogen, increase crop productivity and
improve of soil fertility besides reducing the negative environmental impact associated
with chemical use (Huang and Erickson, 2007). In a similar study to evaluate the
antimicrobial potential of axenic cultures of Bacillus subtilis, Staphylococcus
aureus, Escherichia coli, and Candida albicans was done by cross streak perpendicular
assay (Singh et al., 2016). The above-mentioned isolates were screened for antagonistic
or synergistic activity among each other. The interactions between microbes were
observed by measuring the zone of inhibition (mm).
6.5 Development of consortium
The decolorization of textile dyes by bacteria was found to be quick and more efficient
than any other microbial culture, but individual bacterial isolates may not be able to
degrade the azo-bonded dyes completely. The intermediates may be carcinogenic
amines, which should be degraded further for complete removal of textile dyes from
wastewater effluents (Jadhav et al., 2008). Therefore, the treatment systems should
comprise of mixed microbial cultures which are able to possess maximum
biodegradation of dyes due to synergistic activities and is more advantageous in
comparison to pure individual bacterial cultures (Khehra et al., 2005). Therefore, in this
study, an attempt was made to develop the bacterial consortium containing six efficient
dye degrading bacteria after investigating their compatibility and synergistic activities
among each other (as discussed in previous section under biocompatibility assay).
Initially a loop full of individual bacterial pure cultures were inoculated separately in
minimal media and incubated for 24 h at 30ºC. For the development of bacterial
consortium, 6 h old cultures were then transferred aseptically into nutrient medium
followed by 24 h incubation at 30ºC. The consortium thus obtained was used as the
source of inoculum for further studies (Lade et al., 2012; Das and Mishra, 2017).
Similar study was conducted by Waghmode et al., (2012) for the development of
consortium containing microbial culture of G. geotrichum and B. laterosporus in 100
ml nutrient medium (malt extract). Further this consortium was analyzed for the
degradation of Rubine GFL. Their results indicated that the consortium was showing
better rate of biodecolorization and biodegradation of Rubine GFL in comparison to the
individual organisms. The consortium lead to 100% decolorization of Rubine GFL (50
mg/L) in 30 h with significant reduction in chemical oxygen demand (COD) (79%) and
total organic carbon (TOC) (68%). Our results are in accordance, the consortium
(comprises six bacterial isolates) was showing maximum rate of decolorization (82.76±
0.255%) for disperse red 167.1 (rubine BL) at three different concentrations within 24
h, with increase in enzymatic activities. Our bacterial consortium was also showing
better results for the decolorization (83.46± 0.26%) of disperse red 54 (scarlet RR) in
contrast to individual bacterial isolates. Likewise, the rate of decolorization for disperse
blue 60 was (76.12±0.97%) shown by consortium in contrast to individual bacterial
isolates within 24 h The reason for better decolorization by consortium may be, the
metabolites or by-products produced by individual strains, utilized by the co-existing
strains for further degradation of dye in the form of consortium. Furthermore, this may
lead to the enhancement for enzymatic activity also (Saratale et al., 2009). Our results
are in agreement with the previous findings of Lade et al., (2012). The outcome of their
study indicated that the microbial consortium containing (P. rettgeri strain HSL1
and Pseudomonas sp. SUK1) was showing 99% decolorization for the selected azo
bonded textile dyes viz., reactive black 5, disperse red 78, direct red 81 and reactive
orange 16 at concentration of 100mg/L in 30 h Moreover the previous results obtained
by Saratale et al., (2009) for the development of microbial consortium containing
(Proteus vulgaris NCIM-2027 and Micrococcus glutamicus NCIM-2168), was found
to perform better rather than individual cultures. The consortium developed by this
study was showing complete degradation of scarlet RR with 90% reduction of total
organic carbon and chemical oxygen demand) in 3 h incubation time. The induction of
dye degradaing enzymes such as riboflavin reductase and NADH reductase was
observed in the consortium, which witnessed the involvement of these enzymes during
quick bio-decolorization process of scarlet RR. The earlier study conducted by Kurade
et al., (2012) for the decolorization and degradation of scarlet RR, the consortium of
bacteria and yeast BLGG was showing 98% removal of color in 18 h, 68% decrease in
biochemical oxygen demand and 74% decrease in chemical oxygen demand at 50mg/L
in 48 h.

6.6 Dye decolorization assay with six efficient dye degrading bacteria
(individually) and with consortium at different concentrations of dye (50 mg/L;
150 mg/L and 250 mg/L)
In the present investigation, decolorization of four selected dyes was investigated by
using six selected bacterial species individually and with the developed consortium at
three different concentration (50mg/L, 150mg/L, 250 mg/L). The rate of decolorization
at 50 mg/L with time for the respective dye by bacterial isolates and with consortium is
depicted in Figure 17; at 150 mg/L in Figure 19 and at 250 mg/L in Figure 20. The
image analysis of dye decolorization (50 mg/L) obtained by bacterial isolates and
consortium after 24 h against four selected dyes is displayed in Figure 18. Literature
search revealed that no research has been conducted on the decolorization of disperse
red 167 and 167.1 using a bacreial consortium. To the best of my knowledge no
literature is available for the biodecolorization and biodegradation by microbial system
for azo-bonded disperse red 167 (dark red 2b) till date. Only photocatalytic based
decolorization of coralene dark red 2B is available which is based on the use of calcium
zincate nanoparticles in the presence of sunlight (Madhusudhana et al., 2011). The
results obtained by their study indicated that, the calcium zincate was found to be
suitable for complete decolorization of dark red 2B under solar rays. Our study will be
first finding for the bio-decolorization of disperse red 167 (dark red 2B). Disperse red
167.1 (rubine BL) and disperse red 167 (dark red 2B), both are single azo dyes as a
result there is structure similarity with only difference in side chain group. The
maximum decolorizing efficiency was exhibited by Paenochrobactrum glacei up to
84.80±0.34% for disperse red 167 at 50 mg/L [Figure (17A) and table 16] in 24 h while
for disperse red 167.1, the consortium of bacteria showed highest 82.76±0.25%
decolorization capability for disperse red 167.1 at 50 mg/L in 24 h [Figure (17B) and
table 16]. The other bacterial isolates such as, Bacillus sphaericus, Paenibacillus sp.
C2, Bacillus subtilis displayed moderate percent decolorization i.e. 70.23±0.25%,
76.06±0.55% and 70.16±0.20% for disperse red 167 at 50 mg/L [Figure 17(A)] and
73.15±0.44%, 72.86±0.32% and 71.13±0.32% for disperse red 167.1 at 50 mg/L
[Figure 17(B)]. With increase in concentration of dye, the percent decolorization
decreases with time. The minimum rate of decolorization for disperse red 167 was
exhibited by B. panacihumi (58.83±0.76%) at 50 mg/L (table 16), 52.40±0.45% at 150

mg/L (table 17) in contrast at 250 mg/L the lowest rate of decolorization was displayed
by B. cereus 45.63±0.55% (table 18). In contrast, Bacillus cereus displayed
decolorizing ability up to 74.93±0.90% and 73.51±0.46% in 24 h for disperse red 167
and disperse red 167.1 at 50 mg/L respectively (table 16). The consortium exhibited
71.23±0.25% rate of decolorization at 50 mg/L [Figure 17(A)], 70.10±0.25% at 150
mg/L [Figure 19(A)] and 59.40±0.40% at 250 mg/L for disperse red 167 respectively
[Figure 20(A)]. The results obtained in present study are in agreement with the previous
studies wherein Pseudomonas sp. SUK1 showed 63% decolorization efficiency in 30 h
for Rubine GFL dye at 100 mg/L (Lade et al., 2012) and decolorization of Rubine GFL
dye (50 mg/L) in 30 h by consortium GC-BL containing Brevibacillus laterosporus
MTCC 2298 bacterium was reported by Waghmode et al., (2012). The use of mixed
culture in the form of bacterial consortium offers significant advantages over using
individual bacterial isolates for the decolorization and degradation of chemical based
synthetic dyes. This enhanced decolorization potential of consortium of bacteria in
contrast to individual bacterial isolates is attributed to the reason of synergistic activities
among them (Chen and Burns, 2006). Further, the degraded metabolites produced by
individual bacteria is captured by other bacterial isolates in consortium, and results into
its further degradation, resulting into less toxic products (Moosvi et al., 2005). The
study conducted by Jadhav et al., (2008) clearly revealed that the consortium containing
species of Bacillus VUS and Galactomyces geotrichum MTCC 1360 exhibited 100%
decolorization ability in 2 h at pH 7 while individual bacteria decolorized in 5 h for
100% decolorization of the same dye. Earlier studies indicated that Brevibacillus
laterosporus, was capable to decolorize disperse brown 3REL up to 86% and disperse
brown 118 up to 96% at 50 mg/L in 48 h (Kurade et al., 2012) and 100% decolorization
was recorded in anoxic conditions (Dawkar et al., 2008). Moreover, the consortium
HM4 (comprises four bacterial isolates) developed by Khehra et al., (2005) was capable
to decolorize Acid Red 88 dye in 20 h, whereas the individual bacterial isolates were
taking more than 50 h to achieve decolorization. Therefore, use of microbial consortium
offers considerable potential over the use of individual cultures for the degradation of
dyes since individual cultures may lack the ability to degrade the azo dyes completely.
The highest rate of decolorization for disperse blue 60 (blue BG) was exhibited by B.
cereus 76.29±0.51% [Figure 17(C) and table 16] in 24 h at 50 mg/L, 67±0.95% at 150
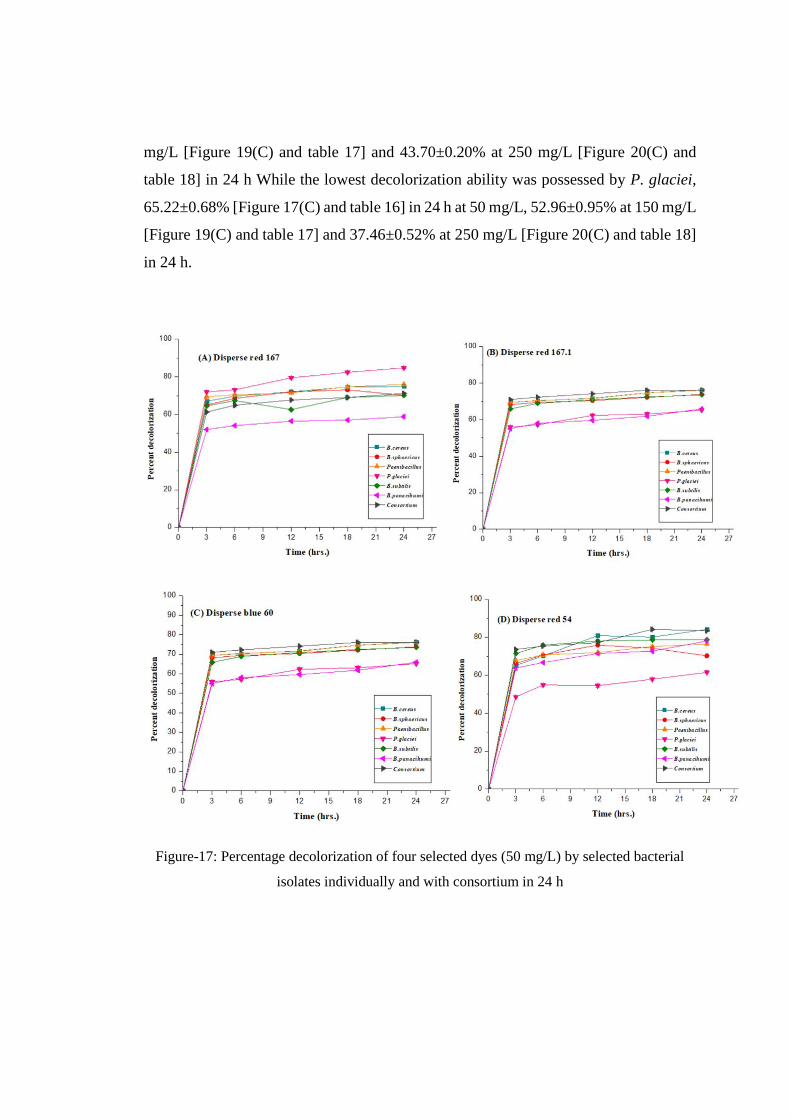
mg/L [Figure 19(C) and table 17] and 43.70±0.20% at 250 mg/L [Figure 20(C) and
table 18] in 24 h While the lowest decolorization ability was possessed by P. glaciei,
65.22±0.68% [Figure 17(C) and table 16] in 24 h at 50 mg/L, 52.96±0.95% at 150 mg/L
[Figure 19(C) and table 17] and 37.46±0.52% at 250 mg/L [Figure 20(C) and table 18]
in 24 h.
Figure-17: Percentage decolorization of four selected dyes (50 mg/L) by selected bacterial
isolates individually and with consortium in 24 h
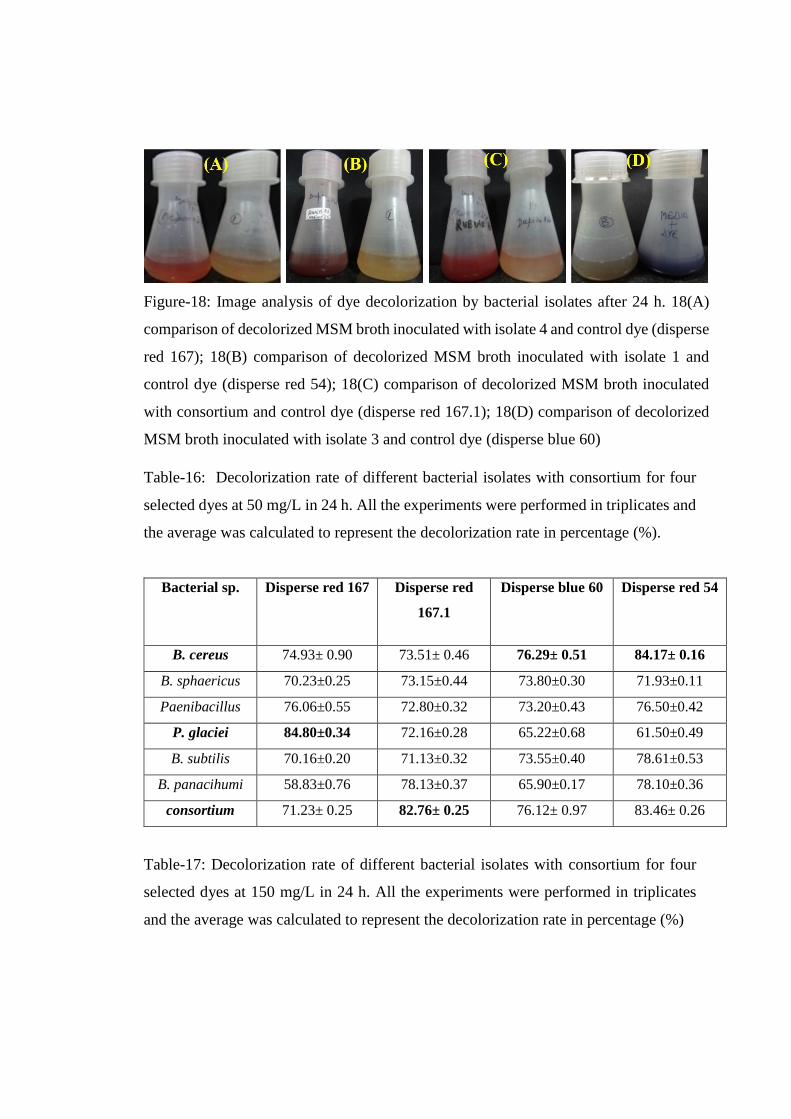
Figure-18: Image analysis of dye decolorization by bacterial isolates after 24 h. 18(A)
comparison of decolorized MSM broth inoculated with isolate 4 and control dye (disperse
red 167); 18(B) comparison of decolorized MSM broth inoculated with isolate 1 and
control dye (disperse red 54); 18(C) comparison of decolorized MSM broth inoculated
with consortium and control dye (disperse red 167.1); 18(D) comparison of decolorized
MSM broth inoculated with isolate 3 and control dye (disperse blue 60)
Table-16: Decolorization rate of different bacterial isolates with consortium for four
selected dyes at 50 mg/L in 24 h. All the experiments were performed in triplicates and
the average was calculated to represent the decolorization rate in percentage (%).
Bacterial sp. Disperse red 167 Disperse red
167.1
Disperse blue 60 Disperse red 54
B. cereus 74.93± 0.90 73.51± 0.46 76.29± 0.51 84.17± 0.16
B. sphaericus 70.23±0.25 73.15±0.44 73.80±0.30 71.93±0.11
Paenibacillus 76.06±0.55 72.80±0.32 73.20±0.43 76.50±0.42
P. glaciei 84.80±0.34 72.16±0.28 65.22±0.68 61.50±0.49
B. subtilis 70.16±0.20 71.13±0.32 73.55±0.40 78.61±0.53
B. panacihumi 58.83±0.76 78.13±0.37 65.90±0.17 78.10±0.36
consortium 71.23± 0.25 82.76± 0.25 76.12± 0.97 83.46± 0.26
Table-17: Decolorization rate of different bacterial isolates with consortium for four
selected dyes at 150 mg/L in 24 h. All the experiments were performed in triplicates
and the average was calculated to represent the decolorization rate in percentage (%)
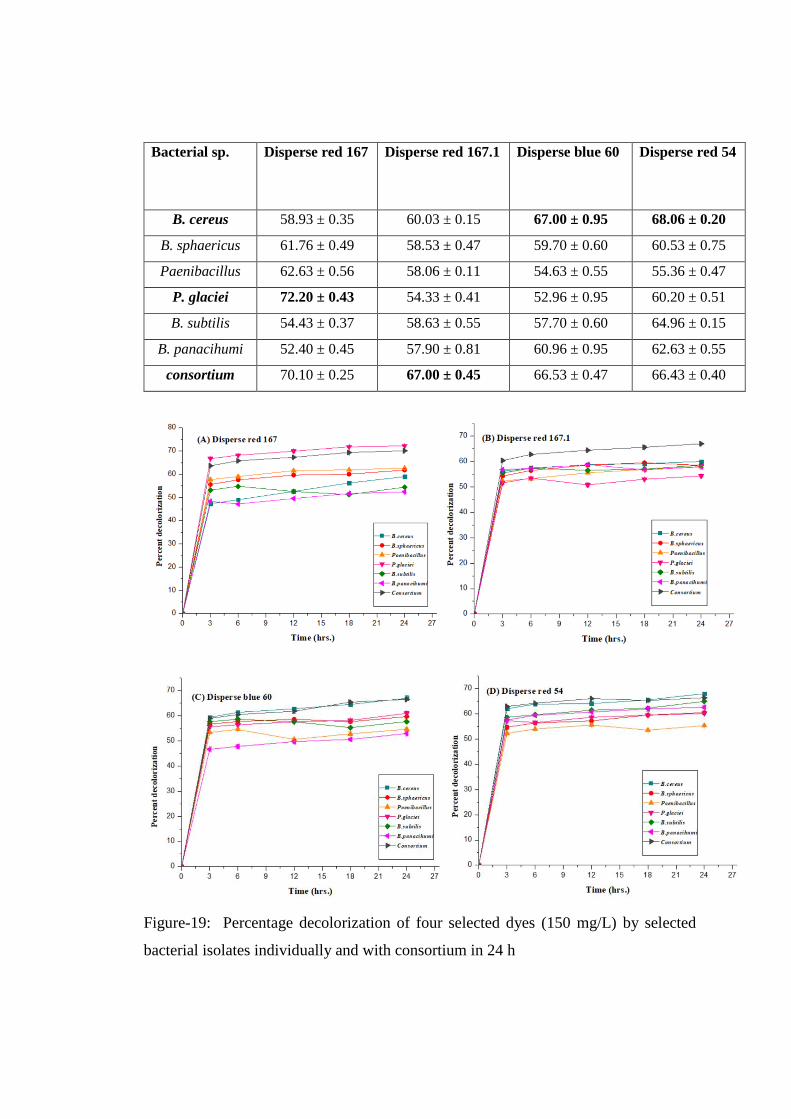
Bacterial sp. Disperse red 167 Disperse red 167.1 Disperse blue 60 Disperse red 54
B. cereus 58.93 ± 0.35 60.03 ± 0.15 67.00 ± 0.95 68.06 ± 0.20
B. sphaericus 61.76 ± 0.49 58.53 ± 0.47 59.70 ± 0.60 60.53 ± 0.75
Paenibacillus 62.63 ± 0.56 58.06 ± 0.11 54.63 ± 0.55 55.36 ± 0.47
P. glaciei 72.20 ± 0.43 54.33 ± 0.41 52.96 ± 0.95 60.20 ± 0.51
B. subtilis 54.43 ± 0.37 58.63 ± 0.55 57.70 ± 0.60 64.96 ± 0.15
B. panacihumi 52.40 ± 0.45 57.90 ± 0.81 60.96 ± 0.95 62.63 ± 0.55
consortium 70.10 ± 0.25 67.00 ± 0.45 66.53 ± 0.47 66.43 ± 0.40
Figure-19: Percentage decolorization of four selected dyes (150 mg/L) by selected
bacterial isolates individually and with consortium in 24 h

Table-18: Decolorization rate of different bacterial isolates with consortium for four
selected dyes at 250 mg/L in 24 h. All the experiments were performed in triplicates
and the average was calculated to represent the decolorization rate in percentage (%)
Bacterial sp. Disperse red 167 Disperse red 167.1 Disperse blue 60 Disperse red
54
B. cereus 45.63 ± 0.55 44.96 ± 0.95 43.70 ± 0.20 55.26 ± 0.55
B. sphaericus 51.56 ± 0.55 43.63 ± 0.55 39.86 ± 0.23 49.60 ± 0.79
Paenibacillus 56.50 ± 0.43 39.76 ± 0.66 39.50 ± 0.45 46.56 ± 0.51
P. glaciei 67.60 ± 0.52 37.60 ± 0.52 37.46 ± 0.41 53.66 ± 0.58
B. subtilis 49.83 ± 0.28 40.06 ± 0.97 40.50 ± 0.76 44.96 ± 0.94
B. panacihumi 47.10 ± 0.10 43.00 ± 0.28 39.23 ± 0.49 47.56 ± 0.49
consortium 59.40 ± 0.40 45.60 ± 0.51 42.63 ± 0.55 54.53 ± 0.46

Figure-20: Percentage decolorization of four selected dyes (250 mg/L) by selected
bacterial isolates individually and with consortium in 24 h
The other bacterial isolates displayed intermediate rate of decolorization in the range of
65-76% at 50 mg/L (table 16), 54-66% at 150 mg/L (table 17) and 39-42% at 250 mg/L
(table 18). Our results are similar to the previous study conducted by Lade et al., (2012)
for the decolorization of reactive blue 172 by employing P. rettgeri-HSL1. These
results indicated that the particular bacteria were capable to decolorize the reactive blue
172 completely in 20 h with significant decrease in chemical oxygen demand (85%)
and total organic carban (52%). Earlier studies reported 90% decolorization efficiency
of Bacillus fusiformis for disperse blue 79 in 32 h at 75 mg/L concentration (Kolekar et
al., 2008). Ponraj et al., (2011) investigated the potential of various bacterial species
isolated from the dye effluent, such as Bacillus and Pseudomonas sps. possessing 89%
decolorization of Orange 3R dye followed by Salmonella sp. (80%) and Klebsiella sp.
(76%) after 144 h Waghmode et al., (2012) reported that glucose and yeast extract act
as electron donors for higher decolorization of textile dyes. Previous study conducted
by Saratale et al., (2009) ascertained that that the use of yeast extract in nutrient medium
is responsible for the maximum decolorization of navy blue HER by T. beigelii. Chen
et al., (2003) also observed the effect of that yeast extract and reported, increase in
percent decolorization of red RBN dye after incorporating yeast in nutrient medium.
For disperse red 54 (scarlet RR), the highest decolorization rate possessed by B. cereus
84.17±0.16% at 50 mg/L [Figure 17(D) and table 16], 68.06±0.20% at 150 mg/L
[Figure (19D) and table 17] and 55.26±0.55% at 250mg /L [Figure (20D) and table 18].
While the lowest decolorization ability was found in P. glaciei, 61.50±0.49% at 50
mg/L (table 16). In comparison Paenibacillus showed lowest rate of decolorization i.e.,
55.36±0.47% at 150 mg/L (table 17) and B. subtilis displayed minimum rate of
decolorization 44.96±0.94% at 250 mg/L (table 18). Our results are in agreement with
the study conducted by Jadhav et al., (2009) for the decolorization of scarlet RR by G.
geotrichum at 100 mg/L. The results indicated that G. geotrichum was capable to
decolorize scarlet RR 100 % in 18 h incubation. In our study, the other bacterial isolates
such as B. sphaericus displayed intermediate rate of decolorizing ability for disperse

red 54 viz., 71.93±0.11% at 50mg/L (table 16), 60.53±0.75% at 150 mg/L (table 17)
and 49.60±0.79% at 250 mg/L (table 18) and and B. panacihumi displayed
78.10±0.36% at 50 mg/L (table 16), 62.63±0.55% at 150 mg/L (table 17) and
47.56±0.49% at 250 mg/L (table 18). The similar trend of decreasing rate of
decolorization of disperse red 54 by other bacterial isolates was observed when
concentration of dye was increased up to 250 mg/L. Similar results were obtained for
the decolorization of textile effluent with maximum decolorization of Scarlet RR by the
consortium (BLGG) developed by Kurade et al., (2012). In contrast to individual
microorganisms, the developed consortium was able to reduce the color produced by
Scarlet RR (50 mg/L) upto 98% within 18 h, whereas the individual pure culture of B.
laterosporus and G. geotrichum could achieve decolorization only upto 61% and 34%
respectively. Similar results of higher rate of decolorization exhibited by consortium of
bacteria and fungal cells for the degradation of textile dye (reactive navy blue) have
been reported by Kadam et al., (2011). Barsing et al., (2011) also reported efficient
biotransformation of sulfonated aromatic amines by bacterial consortium. Earlier
eighteen bacterial isolates belonging to Bacillus sp., Acinetobacter sp., Staphylococcus
sp., and Pseudomonas sp., were found to posses the potential to decolorize textile
effluent containing mixture of dyes (Olukanni et al., 2006). Ajibola et al., (2005)
investigated the capability of S. aureus, B. fragilis, B. subtilis, B. cereus, C.
perifringens, E. coli and Peptostreptococcus sp. to decolorize and degrade indigo Blue
dye present in textile effluent. The previous studies conducted by Joe et al., (2008)
suggested that C. biofermentans (isolated from dye contaminated site) for the effective
decolorization of reactive azo bonded dyes (reactive red 3BA, reactive black 5 and
reactive yellow 3BA) was possessing 90% decolorization efficiency in 36 h incubation.
The results indicated that the C. biofermentans was found to be the suitable
microorganisms for the decolorization of dye contaminated wastewater. The effect of
various carbon sources, nitrogen sources and agricultural waste on decolorization of
rubine GFL was studied by Waghmode et al., (2012). They found that glucose (alone)
as a carbon source was exhibiting 93% of decolorization for rubine GFL but in
combination with NH4Cl and yeast extract, the rate of decolorization was increased
upto 100%.

6.7 Screening of bacterial isolates for the activity of dye degrading enzymes
6.7.1 Preparation of cell free extract
After decolorization assay, the decolorized culture medium was used as a source to
prepare cell free extract for the screening of isolates for the activity of dye degrading
enzymes. The bacterial cells were subjected to centrifugation (10,000 rpm for 15-20
min at 4°C) and the resulted supernatant was used for screening of enzyme activities.
The separated biomass of bacterial cells was suspended in 50 mM potassium phosphate
buffer (pH 7.4), mildly homogenized and further sonicated by giving 12 strokes each
of 30sec with one min interval based on 60 amplitudes keeping sonifier output below 4
°C. The subsequent extracts were then used as enzyme source (Telke et al., 2008).
6.7.2 Screening for enzymatic activities: Azoreductase and laccase
Azo dyes are synthetic dyestuff, which are characterized by the presence of one or more
color imparting groups (chromophores). These synthetic dyes persist in the natural
environment for longer period of time, as they are not degraded easily, making them
recalcitrant (Chequer et al., 2013). Azoreductase is the key enzyme which takes part in
the reduction of azo bond present in the synthetic dyestuffs. Many bacteria initiate the
cleavage of the azo bonds by using NADH/NADPH as an electron donor. Laccases
belongs to the multi copper oxidase family, biocatalyzes the oxidation reaction of
electron rich synthetic chemical based organic substrates and degrades them into
harmless species without releasing toxic metabolites. Laccases are industrially
important enzymes which show potential to degrade azo bonded, polymeric and
heterocyclic organic pollutants and used for bioremediation process (Lade et al., 2012).
Laccases have been broadly studied for their ability to degrade azo bonded dyes
(Novotny et al., 2006). Many workers reported significant role of oxido-reductase
enzymes from bacteria for the degradation of textile dyes (Kalme et al., 2007). In the
present study, further getting insight about the decolorization and degradation
mechanism of selected dye, screening of azo-reductase and laccase enzyme acitivites
were checked (Table 19 and table 20) respectively. The cell free extract was used to
study the enzyme activities involved in the biodecolorization and biodegradation of
selected textile dyes. Results clearly indicated the major role in initial biodegradation
of Disperse Red 167 by azo reductase enzyme for the disruption of azo bond. The

bacterial isolate P. glaeci showed maximum activity for azoreducatse (6.916±0.063) as
compared to other bacterial isolates, likewise it showed maximum activity for laccase
as well (2.338±0.006). The minimum activity for azoreducatse and laccase was shown
by B. subtilis (1.16 ± 0.01) and (0.87 ± 0.15) respectively. In comparison to other
bacterial isolates, consortium showed (6.77 ± 0.04) more activity for azo-reducatse for
the degradation of disperse red 167 (table 23). For the degradation of disperse red
167.1, the consortium of bacterial isolates showed maximum activity for both azo-
reductase and laccase (6.85 ± 0.04) and (2.86 ± 0.03). Similar induction in enzyme
activity was observed in bacterial consortium that involved in the removal of reactive
orange 16 (Jadhav et al., 2010). In the previous studies, azoreductases have been
identified and characterized from various bacteria, such as Xenophilus azovarans,
Pigmentiphaga kullae k24, Bacillus sp. OYI-2 and Enterobacter agglomerans (Maier
et al., 2004). For the proposed degradation pathway of disperse red 167.1, the
involvement of azo-reductase for the cleavage of dye is clearly indicated to produce
three different intermediates. The rest of the bacterial isolates were showing
intermediate activities for both the enzymes. Likewise, for the degradation of
anthraquinone based disperse blue 60, asymmetric cleavage has been occurred to
produce two intermediates. The maximum azoreductase and laccase activity was
showed by B. cereus (5.48 ± 0.02) and (2.75 ± 0.17) respectively. Our findings are in
accordance with the previous findings for the degradation of disperse blue 79, by
(Kolekar et al., 2008), which indicated the induction of azoreductase activity (16.01 ±
0.56) by Bacillus fusiformis KMK5. In the present study, the bacterial isolate 1, (B.
cereus) initiated the asymmetric cleavage of disperse red 54, by possessing maximum
activities for azoreductase (5.26±0.03) and laccase (2.49±0.01). Our results are in
agreement of previous study conducted by Pan et al., (2017), for the biodecolorization
and biodegradation of disperse blue 2BLN by Aspergillus sp. with the induction of
intracellular as well as extracellular ligninolytic enzymes activities (laccase, lignin
peroxidase and Mn-peroxidase). Previous studies on enzymes that catalyzed the
asymmetric reductive cleavage of anthraquinone based dyes are available (Khan et al.,
2013). Jadhav et al., (2009) also reported the involvement of laccase enzyme
(0.067±0.006) for the effective degradation of scarlet RR (disperse red 54). The results
indicated the increase in the activity of enzyme with increase in incubation time. The
consortium (GGBL) was reported by Waghmode et al., (2012) for the activities of
reductive enzymes (azoreductase, riboflavin reductase and NADH reductase) to
degrade rubine GFL. The enzyme azoreductase was induced in consortium GGBL as
compared to individual microbial sp. (G. geotrichum) after decolorization. B.
laterosporus showed higher azoreductase activity as compared to consortium, but in
contrast the decolorization rate was faster in consortium as compared to the individual
organism. The earlier report confirms the use of azoreductase for degradation of dyes
(Asad et al., 2007). The NADH reductase and riboflavin reductase activity were
induced after 15 h of decolorization in consortium as compared to control, but it was
reduced drastically after complete decolorization. Saratale et al., (2009) also reported
similar kind of study for the degradation of scarlet RR and mixture of eight dyes by
consortium comprises (P. vulgaris and M. glutamicus) with the indiction of oxidative
and reductive enzymes. The bacterial consortium of four different bacterial sp. (B.
cereus, P. putida, P. fluorescence and S. acidaminiphila) for the degradation of Acid
red 88, acid red 119, acid red 97 and acid blue 113 by the action of azoreductase was
reported by Khehra et al., (2005). Asad et al., (2007) isolated halophilic and halotolerant
bacteria for the biodecolorization of mixture of textile dyes (5000 mg/L) by
azoreductase enzyme activity and reported 100% decolorization in 96 h.
Table-19: Screening of bacteria isolates and consortium for azo-reductase activity.
Values are mean of three experimental sets Mean ± SD. Data was analysed by oneway
analysis of variance (ANOVA) with Tukey–Kramer multiple comparison test (JMP

software) Mean values followed by different alphabetical letters are significantly
different at *P < 0.05, **P < 0.01, ***P < 0.001
Bacteria
culture
Azo-reductase activity (μM of azo dye reduced mL−1 min−1)
Disperse red
167
Disperse red
167.1
Disperse blue
60
Disperse red
54
Mean ± SD
Mean ± SD
Mean ± SD
Mean ± SD
B. cereus 4.21 ± 0.01D 3.81± 0.05 E 5.48 ± 0.02 B 5.26 ± 0.03 B
B. sphaericus 3.50 ± 0.01E 3.16 ± 0.05 B 4.16 ± 0.04 D 4.47 ± 0.02 D
Paenibacillus 5.33 ± 0.03B 4.76 ± 0.04 D 2.85 ± 0.06 F 3.73 ± 0.06 E
P. glacei 6.91 ± 0.06A 6.12 ± 0.10 A 4.89 ± 0.01 C 4.78 ± 0.08 A
B. subtilis 1.16 ± 0.01F 0.91 ± 0.04 F 2.18 ± 0.01 F 2.37 ± 0.01 E
B. panacihumi 5.33 ± 0.05B 4.92 ± 0.03 C 4.86 ± 0.03 A 4.22 ± 0.05 E
Consortium 6.77 ± 0.04 6.85 ± 0.04 4.79 ± 0.03 5.13 ± 0.04
Table-20: Screening of bacteria isolates and consortium for laccase activity. Values are
mean of three experimental sets Mean ± SD. Data was analysed by oneway analysis of
variance (ANOVA) with Tukey–Kramer multiple comparison test (JMP software).
Mean values followed by different alphabetical letters are significantly different at *P
< 0.05, **P < 0.01, ***P < 0.001
Bacteria
culture
Laccase activity (μM of ABTS oxidized mL−1 min−1)
Disperse red
167
Disperse red
167.1
Disperse blue
60
Disperse red
54
Mean ± SD
Mean ± SD
Mean ± SD
Mean ± SD
B. cereus 1.12 ± 0.01E 0.96 ± 0.07 F 2.75 ± 0.17 A 2.49 ± 0.01 A
B. sphaericus 1.14 ± 0.03E 1.16 ± 0.03 E 1.94 ± 0.04 E 1.62 ± 0.02 C
Paenibacillus 2.03 ± 0.005B 1.95 ± 0.02 E 2.12 ± 0.07 B 1.96 ± 0.03 E
P. glacei 2.33 ± 0.006A 2.03 ± 0.05 B 1.69 ± 0.06 E 1.50 ± 0.09 B
B. subtilis 0.87 ± 0.15F 0.79 ± 0.03 F 0.85 ± 0.04 F 1.07 ± 0.03 F
B. panacihumi 1.97 ± 0.02C 1.83 ± 0.70 C 1.97 ± 0.03 C 1.62 ± 0.02 C
Consortium 1.64 ± 0.02 2.86 ± 0.03 2.20 ± 0.03 2.17 ± 0.04
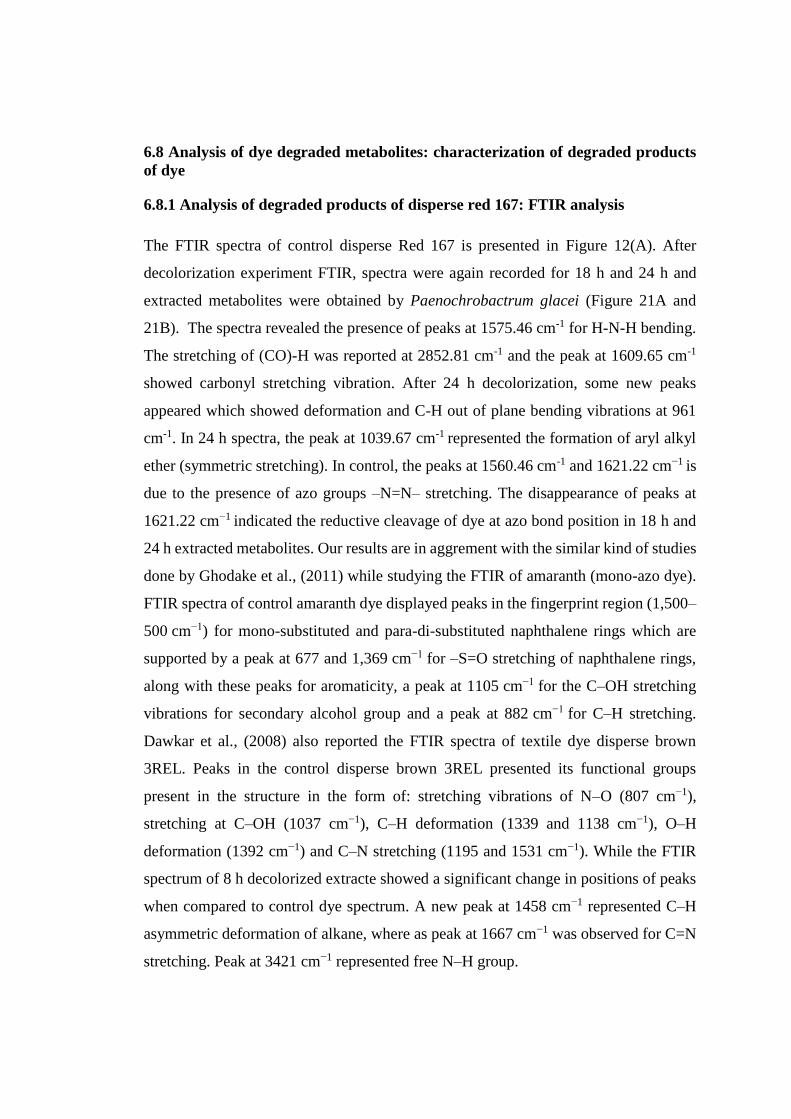
6.8 Analysis of dye degraded metabolites: characterization of degraded products
of dye
6.8.1 Analysis of degraded products of disperse red 167: FTIR analysis
The FTIR spectra of control disperse Red 167 is presented in Figure 12(A). After
decolorization experiment FTIR, spectra were again recorded for 18 h and 24 h and
extracted metabolites were obtained by Paenochrobactrum glacei (Figure 21A and
21B). The spectra revealed the presence of peaks at 1575.46 cm-1 for H-N-H bending.
The stretching of (CO)-H was reported at 2852.81 cm-1 and the peak at 1609.65 cm-1
showed carbonyl stretching vibration. After 24 h decolorization, some new peaks
appeared which showed deformation and C-H out of plane bending vibrations at 961
cm-1. In 24 h spectra, the peak at 1039.67 cm-1 represented the formation of aryl alkyl
ether (symmetric stretching). In control, the peaks at 1560.46 cm-1 and 1621.22 cm−1 is
due to the presence of azo groups –N=N– stretching. The disappearance of peaks at
1621.22 cm−1 indicated the reductive cleavage of dye at azo bond position in 18 h and
24 h extracted metabolites. Our results are in aggrement with the similar kind of studies
done by Ghodake et al., (2011) while studying the FTIR of amaranth (mono-azo dye).
FTIR spectra of control amaranth dye displayed peaks in the fingerprint region (1,500–
500 cm−1) for mono-substituted and para-di-substituted naphthalene rings which are
supported by a peak at 677 and 1,369 cm−1 for –S=O stretching of naphthalene rings,
along with these peaks for aromaticity, a peak at 1105 cm−1 for the C–OH stretching
vibrations for secondary alcohol group and a peak at 882 cm−1 for C–H stretching.
Dawkar et al., (2008) also reported the FTIR spectra of textile dye disperse brown
3REL. Peaks in the control disperse brown 3REL presented its functional groups
present in the structure in the form of: stretching vibrations of N–O (807 cm−1),
stretching at C–OH (1037 cm−1), C–H deformation (1339 and 1138 cm−1), O–H
deformation (1392 cm−1) and C–N stretching (1195 and 1531 cm−1). While the FTIR
spectrum of 8 h decolorized extracte showed a significant change in positions of peaks
when compared to control dye spectrum. A new peak at 1458 cm−1 represented C–H
asymmetric deformation of alkane, where as peak at 1667 cm−1 was observed for C=N
stretching. Peak at 3421 cm−1 represented free N–H group.
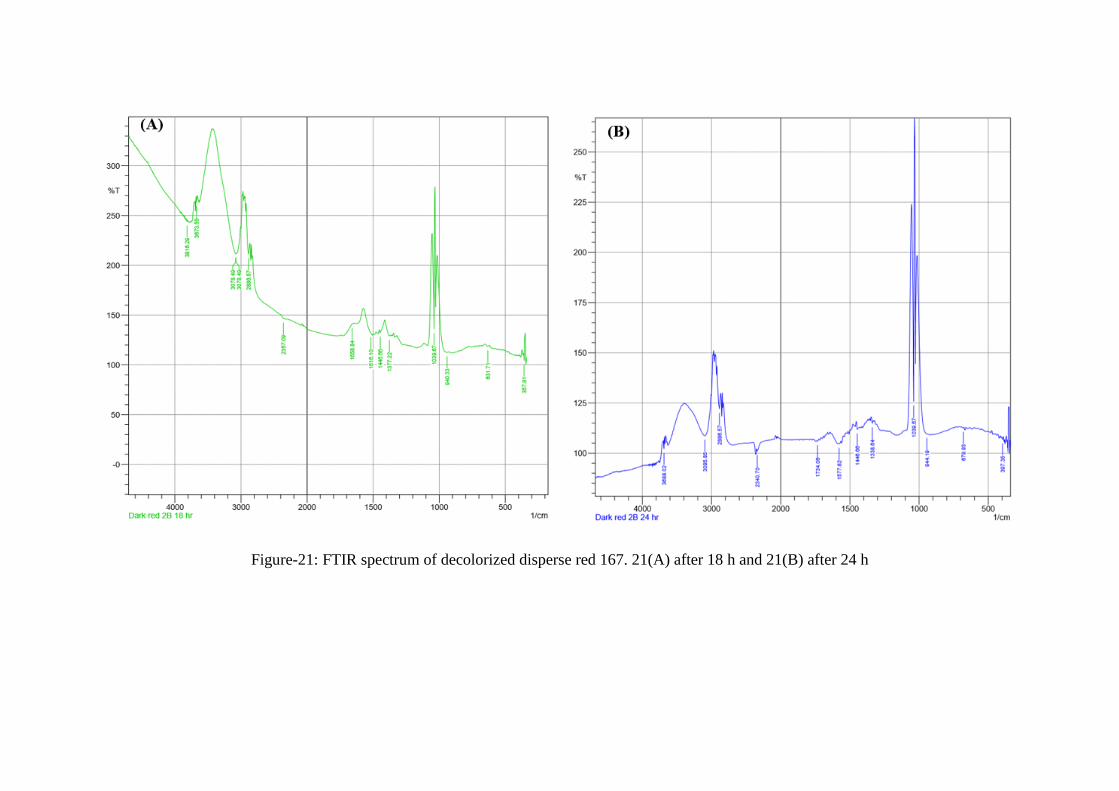
Figure-21: FTIR spectrum of decolorized disperse red 167. 21(A) after 18 h and 21(B) after 24 h

6.8.1.1 GC-MS analysis of dye decolorized medium: Proposed degradation
pathway for disperse red 167
The gas chromatrograph and mass spectrum of disperse red 167 is presented in Figures
22A and 22B, respectively. The GC-MS profile showed that at retention time 16.64,
asymmetric cleavage of disperse red 167 mediated by cleavage of azo bond and by the
action of azo-reductase, yielded two intermediates (Figure 23), intermediate I (2-
chloro-4-nitro-phenylamine; mol wt. 172) and intermediate II (Acetic acid2-[(2-
acetoxy-ethyl)-(4-amino-3-propionylamino-phenyl)-amino]-ethyl ester; mol wt. 351).
Intermediate II after azo-reductase action and dealkylation yielded the metabolite
formic acid 2-[(4-amino-3-formylamino-phenyl)-(2-formyloxy-ethyl)-amino]-ethyl
ester (mol wt-295; M/Z- 292. Furthermore, this metabolite reduced to form the final
metabolite N4, N4-bis(2-methoxylthyl)-.N2-methyl benzene-1,2,4-triamine (mol wt-
253; M/Z-250). Similar kind of study was conducted by Jadhav et al., (2009) for the
degradation of disperse dye scarlet RR by Galactomyces geotrichum MTCC 1360.
These results clearly indicated that the asymmetric cleavage of scarlet RR by the action
of peroxidase enzyme leads to the formation of reactive products. The resultant
products after demethylation and reduction reaction yields two stable intermediates i.e.
2-[ethyl-(4 oxo-3,4-dihydro-quinazolin-2-yl methyl)-amino]-acetamide and 1-chloro-
4-nitro-benzene. The reduction of 1-chloro-4-nitro-benzene give rise to produce 1-
chloro-4nitroso-benzene, which was reduced again to form N-(4chloro-phenyl)-
hydroxylamine, and finally reduced to give the metabolite 4-chloro-phenylamine. The
other intermediate 2[ethyl-(4 oxo-3,4-dihydro-quinazolin-2-yl methyl)-
amino]acetamide was broken down (asymmetrically) to give 2-methyl-3 H quinazoline
4-one and 2-ethylaminoacetamide.
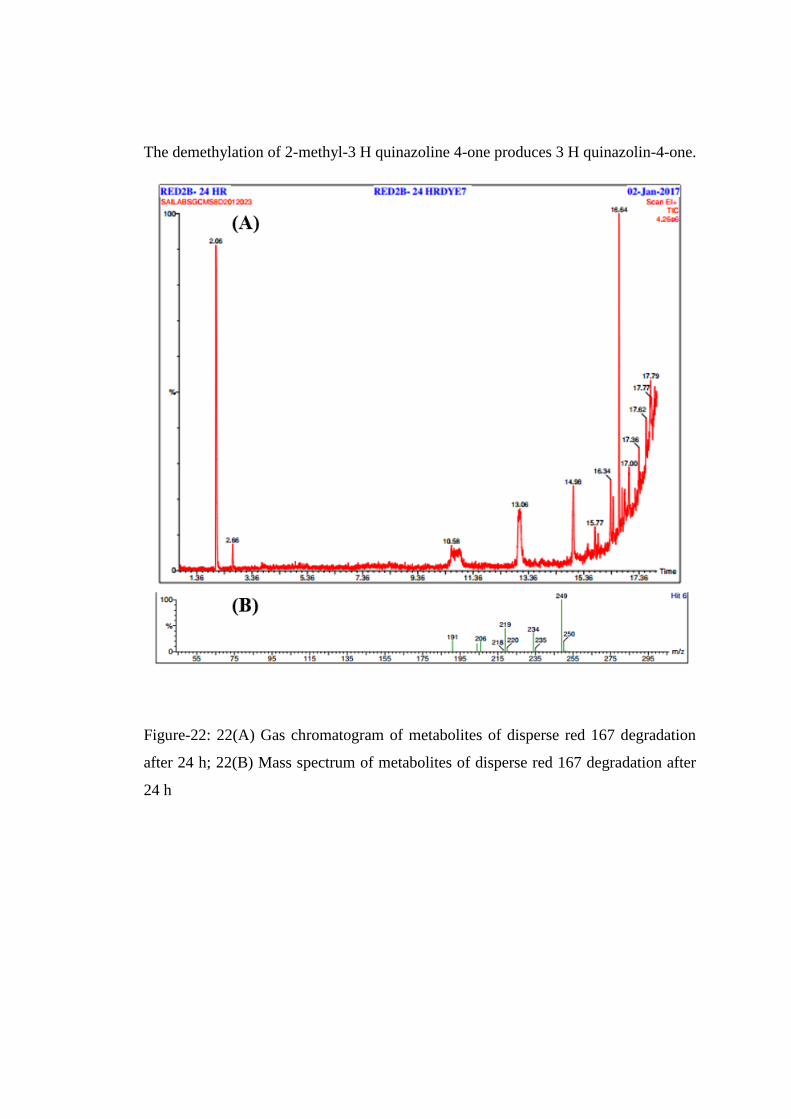
The demethylation of 2-methyl-3 H quinazoline 4-one produces 3 H quinazolin-4-one.
Figure-22: 22(A) Gas chromatogram of metabolites of disperse red 167 degradation
after 24 h; 22(B) Mass spectrum of metabolites of disperse red 167 degradation after
24 h

Figure-23: Proposed degradation pathway for degradation of disperse red 167

Figure-24: 24(A) Gas chromatogram of metabolites of disperse red 167.1 degradation
after 24 h; 24(B) Mass spectrum of metabolites of disperse red 167.1 degradation after
24 h

Figure-25: FTIR spectrum of decolorized disperse red 167.1; 25(A) After 18 h and
25(B) After 24 h
6.8.2 Analysis of degraded products of disperse red 167.1: FTIR analysis
The FTIR spectrum of control disperse red 167.1 (rubine BL) is displayed in Figure
12(B). The peak in the range of 1595-1600 cm−1 for the presence of azo bond (-N=N-),
831 cm−1 for C-H deformation in alkalanes and N-O stretching in nitrites, 734-750 cm−1
for the presence of benzene ring, 619.17 cm−1 for C–N stretching in acyclic compounds,
C-N vibrations at 1120.68 cm−1, peak at 3500–3400 cm−1 for -OH stretching vibration,
peak at 1500–1400 cm−1 was attributable to aromatic C=C stretching frequency. Similar
functional groups were found on Rubine GFL by Waghmode et al., (2012) and Pan et
al., (2017). The FTIR spectra after degradation of disperse red 167.1 is presented in
Figure 25(A and B). The metabolites found after degradation of disperse red 167.1 by
consortium of bacteria showed peak at 1516.1 cm−1 for the presence of nitro (aromatic)
compound –N=O- stretch, peak at 2,857.42–2,926.39 cm−1 for alkanes, 1141.9 cm−1 for
C-H deformation (Jadhav et al., 2009). The disappearance of peak at (1595-1600 cm−1)
showed azo bond reduction by azo-reductase enzyme during decolorization of disperse
red 167.1 by consortium (Waghmode et al., 2012). Absence of major peaks from FTIR
spectra of control dye in contrast to the extracts obtained after decolorization of disperse
red 167.1 displayed the action of enzymatic system of individual isolates in the form of
consortium, responsible for the biotransformation of disperse red 167.1 (Waghmode et
al., 2012).
6.8.2.1 GC-MS analysis of dye decolorized medium: Proposed degradation
pathway for disperse red 167.1
The gas chromatrograph at retention time 16.65 and mass spectrum of disperse red
167.1 is presented in Figure 24(A) and 24(B) respectively. The proposed metabolic
pathway for the degradation of disperse red 167.1 by bacterial consortium after 24 h is
shown in Figure 26). Initially, disperse red 167.1 was scavenged asymmetrically by the
action of laccase to form intermediate I, N,N-Diethyl-benzene-1,4-diamine (mole wt-
164 and m/z at 167) and intermediate II, 2-Chloro-4-nitro-phenylamine (mole-wt-172).
On the other hand, by the action of azo-reductase and after dealkylation, intermediate
III, {[4-amino-3-(formylamino)phenyl]imino}diethane-2,1-diyl diformate was formed

(mole wt-295 and m/z at 292). Further after reduction of intermediate III, final product
was formed N4, N4-bis(2-methylbenzene-1,2,4-triamine (mole wt-253 and m/z at 250).
Similar study was conducted by Waghmode et al., (2012) by using consortium of two
microbial cultures viz., Galactomyces geotrichum and Brevibacillus laterosporus, by
altering the experimental conditions for the biodegradation of Rubine GFL dye. They
ascertained consortium was showing better activity as compared to the individual
organisnsm for the decolorization. The consortium was showing 100% decolorization
of Rubine GFL in 50 mg/L in 30 h with substantial decrease in chemical oxygen
demand i.e. 79% and 68% reduction in TOC (total organic carbon). Wagmode et al.,
(2012) proposed three different degradation pathways for rubine GFL by individual
microbial cultures of Galactomyces geotrichum and Brevibacillus laterosporus as well
as in the form of their consortium. After degradation by G. geotrichum, tyrosinase
(oxidative enzyme) mediated assymetric cleavage occurred, to form two different
metabolites 4-nitrobenzonitrile (mole wt-148 and m/z at 150) and other was
unidentified. In case of B. laterosporus, assymetric cleavage by the induction of azo-
reductase yields two metabolites, 2-(amino methyl)-5-nitroaniline (mole wt- 167 and
m/z at 169) and other was unidentified. Further deamination yields 1-(4-nitrophenyl)
methanamine (mole wt- 152 and m/z at 154) as final product. In comparison, after
degradation by the consortium (G. geotrichum and B. laterosporus), assymetric
cleavage by veratryl alcohol oxidase, gave two primary intermediates (mole wt- 148
and 202) respectively. Furthermore, after activity of reductase enzyme, the intermediate
with mole-wt-148 was converted to 1-(4-nitrophenyl) methanamine (mole wt- 152 and
m/z at 154). After induction of laccase mediated demethylation, the other intermediate
with mole-wt- 202, produced secondary intermediate viz., 3-[(4-diazenylphenyl)
amino] propanenitrile (mole wt- 173 and m/z at 170). Furthermore azo reductase carried
out the reduction of secondary intermediate to produce N-(3-aminopropyl) benzene-
1,4-diamine (mole wt- 165 and m/z at 168). Previous studies also reported the action
of wild plants in the form of consortium was displaying fast biodegradation of remazol
orange 3R dye. Moreover, the intermediates and products formed after decolorization
of dye was less toxic and environmental friendly as compared to the parent dye (Kabra
et al., 2011). Similarly, Telke et al., (2008) reported the biodegradation of reactive red
141 by Rhizobium radiobacter, the oxidative enzymes initiated the cleavage and further

desulfonation occurred to yield naphthalene diazonium (m/z at 155), 1, 3, 5- triazine 2,
4-diol (m/z at 112), p-dinitrobenzene (m/z at 168) and 2-nitroso naphthol (m/z at 171).
Likewise, Jain et al., (2012) conducted the biodegradation of reactive violet 5 by mixed
bacterial culture through enrichment technique on minimal salt media upto 1500 mg/L
dye concentration and 20g/L salt concentration. Mixed bacterial culture was contained
six strains of bacteria namely, (four different species of Bacillus sp.), Lysinibacillus sp.,
and Ochrobacterium sp. They proposed the degradation pathway for the mineralization
of reactive violet 5 dye by using mixed bacterial culture and confirmed the formation
of confirmed the formation of four intermediates viz., 1-diazo-2-naphthol, 4-
hydroxybenzenesulphonic acid, 2-naphthol and benzene sulphonic acid. Jadhav et al.,
(2008) also reported the effect of incubation temperature as a process variable for the
effective degradation of methyl red (azo dye) by employing Galactomyces geotrichum.
They proposed the degradation pathway for the respective dye on the basis of GC-MS
data and confirmed the formation of anthranilic acid as a final product at 5°C incubation
temperature, N-N' dimethyl-p- phenylenediamine as a final product at incubation
temperature 50°C. But both the products were absent at 30°C. Moreover, Bacillus
laterosporus was also considered for the degradation of methyl red into high molecular
mass intermediates by asymmetric cleavage by azo-reductase enzyme and laccase
mediated reactions (Gomare and Govindwar, 2009).

Figure-26: Proposed pathway for degradation of disperse red 167.1

Figure-27: 27(A) Gas chromatogram of metabolites of disperse blue 60 degradation after 24 h; 27(B) Mass spectrum of metabolites of disperse
blue 60 degradation after 24 h

6.8.3 Analysis of degraded products of disperse blue 60: GC-MS analysis and proposed
degradation pathway for disperse blue 60
The GC-MS analysis revealed the formation of various metabolites after the decolorization of
disperse blue 60. The GC chromatograph and mass spectrum of disperse blue 60 is shown in
Figure 27(A and B respectively). Therefore, a pathway has been elucidated for the degradation
of disperse blue 60 by B. cereus (Figure 29). The analysis of biodegradation products of DB60
showed that there is asymmetric cleavage which leads to the formation of 11-
aminopent,6,10,12,16-oxy, 8,14 amino-10-dihydroanthracene and finally reduced to 11-
aminopent, 6,16-oxy,8,14 amino-10-dihydroanthracene having molecular weight 279 which
shows m/z at 281. Further reduction and deamination reaction occurs, to produce 11
aminopent,10-dihydroanthracene (molecular weight-221 and corresponding m/z at 223. The
deamination reaction occurred to give 2,3-dimethyl-9,10-dihydroanthracene (molecular
weight-208, corresponding m/z at 205. Earlier studies conducted by Kolekar et al., (2008) for
the degradation of disperse blue 79 showed that there was asymmetric cleavage of the azo-
bond by the action of azo-reductase which leads to the formation of hydrazine, and other
product is debrominated with removal of bromine, further removal of nitro groups leads to
form dinitrobenzene. Weber and Adams, (1995) studied chemical and sediment mediated
reduction of disperse blue 79, to form 2-bromo-4,6-dinitroaniline. The degradation pathway of
disperse blue 79 obtained after decolorization by B. fusiformis KMK5 is totally dissimilar from
those obtained by chemical and sediment mediation reduction (Weber and Adams, 1995) and
by sequential batch process (Melgoza et al., 2004).
Similarly, the degradation of anthraquinone based disperse blue 2BLN dye was studied by Pan
et al., (2017), which revealed the cleavage of anthraquinone chromophoric group and partial
mineralization of target dye. The results indicated that more than one degradation pathways
have been reported for disperse blue 2BLN dye by Aspergillus sp. XJ2. The cleavage started
by the oxidation reaction initiated by enzymes and opening of ring by hydroxylation, oxidation
polymerization and finally decarboxylation. The metabolic pathway confirms the formation of
ethyl propionate at m/z at 102; 1,3-indanone at m/z at 146 and the formaqtion of hydraquinone
at m/z at 110. Earlier study conducted by Rajkumar et al., (2007) also confirmed the formation
of 1,3-indanone (m/z 146) in the metabolites of ozonation reactive blue 19 by electrochemical
degradation. Dhanve et al., (2008) studied the degradation pathway of di-azo, reactive blue
172 by Exiguobacterium sp. RD3, and proposed the degradation pathway initiated by laccase
and azo-reductase to form naphthalene as a final product at m/z 128.

6.8.3.1 Analysis of degraded products of disperse blue 60
To investigate the possible mechanism or pathway of decolorization of dye, the aliquots
obtained at different time intervals after 18h and 24h, during decolorization process were
scanned in the range of 4000–400 cm-1 wave numbers using FTIR. Results of FTIR after
decolorization were shown in Figure 28(A and B). The IR spectra of parent DB 60 was shown
in Figure 12(C). The parent dye (DB 60) displaying various peaks in the finger print region for
para-disubstituted and meta-disubstituted benzene rings as well as a peak at 1741.38 cm-1 for
C=0 stretch and peak at 2945.22 cm-1 for asymmetric CH3 stretch, a peak at 1454.38 cm-1
designate C-C stretch in aromatics, a peak at 945.15 cm-1 for O-H bend of carboxylic acid and
presence of peaks at 677.04 cm-1, 736.83 cm-1,763.84 cm-1 indicates aromaticity or the presence
of benzene ring (Kolekar et al., 2008). A peak at 3439.19 cm-1 for –OH stretching vibration
and -NH stretching vibration, a peak at 1651 cm-1 shows -C=C- stretching. Other peaks at
1516.1 and 1560.46 cm-1 are characteristic of >C=C< (anthraquinone); while peaks at 1651 cm-
1 to >C=O (anthraquinone) (Ortiz et al., 2017; Pan et al., 2017). While after degradation the
FTIR spectra showed that the peaks at 1363.72 cm-1 to C-C-C (alkanes) and peaks at 1039.67
cm-1 to C-O-C (ester). The IR spectrum of 24 h, decolorized medium displayed a band at 1489.1
cm-1 for –CH2 asymmetric bend. Moreover, the significant change in the FTIR spectrum of
metabolites compared to control spectrum suggest the biotransformation of complex dyes
present in the mixture into simple form (Ortiz et al., 2017).

Figure-28: FTIR spectrum of decolorized product of disperse blue 60 after 18 h and 24 h

Figure-29: Proposed pathway for degradation of disperse blue 60
O
O NH2
NH2
N
O
O
O
CH3
O
O NH2
NH2
NH
O
O
O
O NH2
NH2
NH
MW=279, m/z=281
NH
MW=221, m/z=223
CH3
CH32,3-dimethyl-9,10-dihydroanthracene
MW=208, m/z=205
CH3
O
CH3
Asymmetric cleavage
Reduction
Reduction and deamination
Deamination
+
Disperse Blue 60
11-aminopent,10-dihydroanthracene
11-aminopent,6,16-oxy,8,14 amino-10-dihydroanthracene
11-aminopent,6,10,12,16-oxy,8,14 amino-10-dihydroanthracene
Intermidiate I
MW=379, m/z=379
Figure-30: FTIR spectrum of metabolites of disperse red 54 degradation 31(A) after 18 and 31(B) after 24 h
6.8.4 Analysis of degraded products of disperse blue 60: FTIR analysis
The FTIR spectra of control disperse red 54 dye is represented in Figure 12(D) which
confirms the structure of parent dye. The peaks at 3321.53cm-1 corresponds to -N-H
stretching as in amines, 1599.04 cm cm-1 for N=N stretching as in azo groups and -C-
N stretching as in amides, 1114.89 cm-1 for C–O-H stretching as in alcohols, 1041.6
cm-1 for S–O stretching which displayed the sulfoxide nature of dye, and 682.82 cm-1
for C–Cl stretching, 2953.13 cm-1 for –C-H stretching, 1363.72 cm-1 for CH3 vibration,
1442.8 and 1473.66 cm-1 corresponds to CH2 bends and 1737.92 cm-1 for –C=O
(ketonic) vibration (Jadhav et al., 2009; Kurade et al., 2012) whereas significant change
in the FTIR spectrum was observed after decolorization. The FTIR spectrum of
decolorized medium after different time interval is presented in Figure 30(A and B). In
contrast, the FTIR analysis of the dye metabolites confirmed the CH2 as C-H stretching
at 2935.76 cm-1, and the formation of cross conjugates possessing C=O at 1612.54 cm-
1 (Jadhav et al., 2009). Moreover, the peaks at 1510.31 cm-1 and 1509.35 cm-1
corresponds to the presence of NO2 stretch. This is in the agreement with the results
obtained by GC-MS of the respective dye, which confirmed the formation of
nitrobenzene as one the metabolite at m/z 125. These results clearly indicated that
appearance of new peaks after decolorization with disintegration of some peaks in
control dye, displayed the bonding interactions which supports the biotransformation
of parent dye.
6.8.4.1 Analysis of degraded products of disperse red 54: GC-MS analysis and
proposed degradation pathway for disperse red 54
The mass spectra of disperse red 54 after decolorization is presented in Figure 31. On
the basis of this mass spectrum data, the degradation pathway of the dye has been
elucidated (Figure 32). After 24 h of decolorization, disperse red 54 was mineralised
by the action of azo-reductase to cleave azo bond to form two primary intermediates
i.e. 2-chloro-4-nitroaniline (molecular weight-172 and corresponding m/z at 172 and
aniline (molecular weight-91 and corresponding m/z at 91). On the other side,
asymmetric cleavage was also occurred by the action of laccasse to form third primary
intermediate, methyl 3-[(2-cyanoethyl) amino]propanoate (molecular weight-156 and

corresponding m/z at 156). Further the first primary intermediate underwent
deamination reaction with the removal of amine group to form 1-chloro-3-nitrobenzene
(mole. wt- 157 and m/z at 157) to form final product nitrobenzene (mole. wt-123 and
m/z at 125) with the removal of chlorine. The results are in accordance with the previous
studies conducted by Jadhav et al., (2009) in which 1-chloro-4-nitro-benzene were
formed after the asymmetric cleavage of scarlet RR by peroxidase enzyme. In our study,
the second intermediate underwent oxidation reaction to form phenol (mole. wt-94 and
m/z at 92) to form final product i.e. benzene (mole wt. 78 and m/z at 75) after reduction
initiated by azo-reductase. Further reduction of third intermediate by the same enzyme
to form secondary metabolite, 3-(propylamino)propanenitrile (mole wt- 112 and m/z at
114).
After deamination, disintegration of this secondary metabolite occurred to give final
product N-propylpropan-1-amine (mole.wt- 101 and m/z at 101). Jadhav et al., (2009)
reported different intermediates of disperse red 54 (scarlet RR) degraded by G.
geotrichum. The difference in the formation of intermediates might be due to the
different operating conditions provided to the microbes i.e. shaking condition at 150
rpm and pH-12.0, temperature-50ْ C. The degradation pathway of scarlet RR was also
proposed by Kurade et al., (2012) by bacteria-yeast consortium and individually.
Initially, scarlet RR was cleaved asymmetrically by action of veratryl alcohol oxidase
to give primary intermediate [BL-A], 2-{ethyl[(4-oxo-3,4-dihydroquinolin-2-
yl)methyl]amino} acetamide, (mole.wt-259 and m/z at 257]. Further this intermediate
underwent deamination reaction to form secondary intermediate [BL-B], {ethyl[(4-
oxo-3,4-dihydroquinolin-2- yl)methyl]amino}acetaldehyde (mole.wt-244 and m/z at
244]. The final product [BL-C], 2-(aminomethyl)quinolin4(3H)-one (mole.wt- 174 and
m/z at 172] formed by the removal of aliphatic chain from this secondary intermediate.
The degradation by consortium resulted into asymmetric cleavage of dye by veratryl
alcohol oxidase and laccase to form {ethyl[(4- oxo-3,4-dihydroquinolin-2-
yl)methyl]amino}acetaldehyde (mole wt-244 and m/z at 244] along with the formation
of an unidentified reactive intermediate (Allegre et al., 2006). Further disintegration of
the intermediate by laccase gave the final product, 3,4- dihydroquinoline (mole. wt-
131, m/z at 129). Similar studies were conducted by Saratale et al., (2009) for the

degradation of scarlet RR by consortium (GR) comprises two different bacteria,
Proteus vulgaris and Micrococcus glutamicus. The results indicated reductive cleavage
of azo bonds of dye followed by demethylation reaction to form final product 1,4-
benzenediamine (mole. wt-108 and m/z at 109).
Figure-31: Mass spectrum of disperse red 54 after degradation
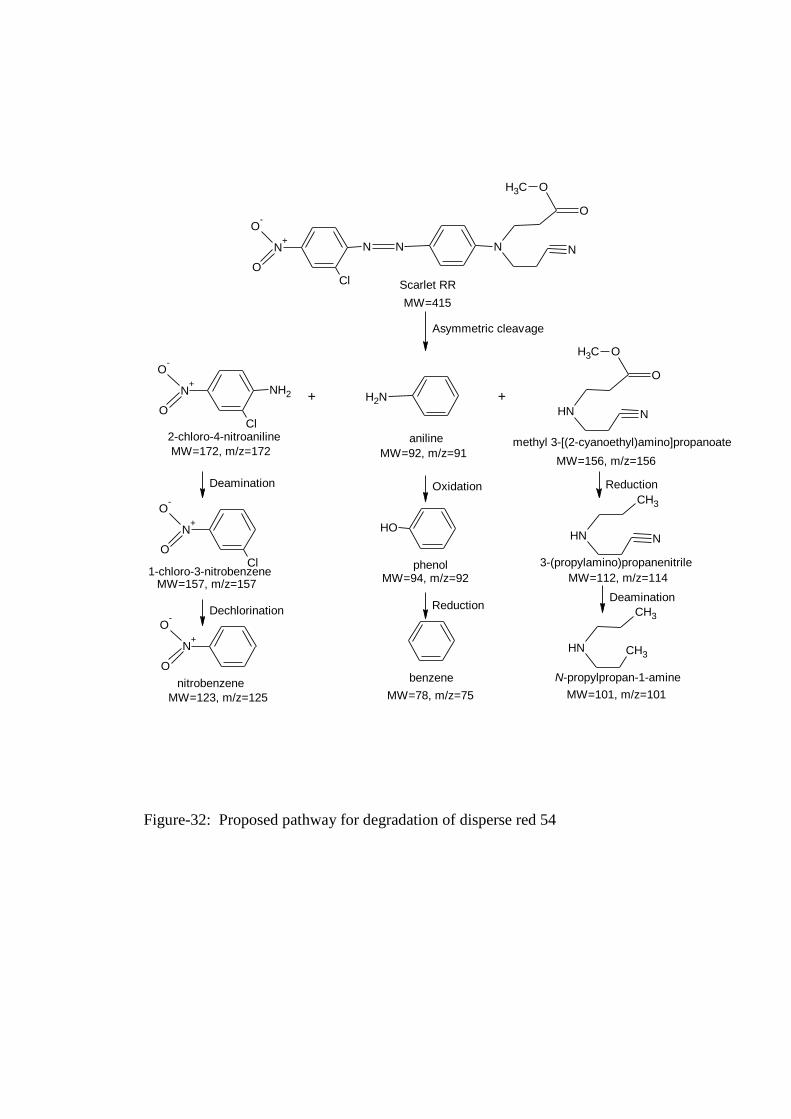
Figure-32: Proposed pathway for degradation of disperse red 54
N NN+
O-
O
N
O
OCH3
N
Cl Scarlet RR
MW=415
Asymmetric cleavage
NH2N+
O-
OCl
NH
O
OCH3
N
MW=156, m/z=156
methyl 3-[(2-cyanoethyl)amino]propanoate
NH2
aniline
MW=92, m/z=91
OH
MW=94, m/z=92phenol
Oxidation
2-chloro-4-nitroaniline
MW=172, m/z=172
NH
CH3
N
Reduction
3-(propylamino)propanenitrile
MW=112, m/z=114
N+
O-
OCl
Deamination
1-chloro-3-nitrobenzeneMW=157, m/z=157
N+
O-
O
Dechlorination
nitrobenzene
MW=123, m/z=125
+ +
NH
CH3
CH3
N-propylpropan-1-amine
MW=101, m/z=101
Deamination
benzene
MW=78, m/z=75
Reduction

6.9 Toxicology study of dyes: Phytotoxicity assay
There has been a global awakening during the last few decades regarding the proper
management of natural resources. Among them, irrigation water is one which becoming
costlier due to increasing demand from agriculture to feed the increasing human
population. Simultaneously, the demand for food is also increasing, which has brought
more and more land under cultivation and focused the attention on the use of fertilizers
and irrigation water at an alarming rate. With these certain limitations, one has to turn
to non-conventional recourses to meet the irrigation water demand. Among others, one
of the most important source of water for irrigation is industrial waste water, which
consists of about 95% water and the rest as organic and inorganic nutrients. Since,
disposal of wastewater is a big problem in urban areas, applying the textile industry
wastewater after treatment to agricultural fields, instead of disposing off in lakes and
rivers, can be better source of irrigation water due to presence of various nutrients (like
N, P, K, Ca, Mg etc.) in wastewater (Saravanamoorthy et al., 2007). There can be both
beneficial and damaging effects of irrigation with waste water on various crops
including vegetables (Saratale et al., 2009) especially the textile industry effluent water
that contains much of undesirable qualities like opacity due to suspended particles,
alkaline pH and toxic synthetic chemicals such as the dyes. The need is to assess
wastewater quality and plant species requirements before using treated waste water for
crops production (Saravanamoorthy et al., 2007). It is very important to know whether
biodegradation of a dye leads to detoxification of the dye or not. This can be done by
performing phytotoxicity and microbial toxicity tests of the original dye and its
biodegradation products. In phytotoxicity studies, the seeds of model plants can be
treated with a particular concentration of the original dye and also with its
biodegradation products. The effect of the treatment on percent germination and length
of plumule and radicle can be evaluated and the results compared with those of the
control (without treatment with dye and its biodegradation products). Improper disposal
of dyeing effluents containing reactive azo dyes causes serious environmental and
health hazards, they are being disposed off in water bodies and this water is being used
for an agriculture purpose. Use of untreated and treated dyeing effluents containing
water for the agriculture purpose has direct impact on the fertility of soil (Telke et al.,

2008). Therefore, it is of concern to assess the phytotoxicity of the textile dye effluent
before and after degradation by any mode of treatment. Seed germination and plant
growth bioassays are the most common techniques used to evaluate the phytotoxicity
(Saratale et al., 2009). Though, chemical treatment is being currently carried out in the
industries that are under pressure to reduce pollutant load, the water that is drained into
the streams is not significantly improved in its qualities. Biological treatment is not only
eco-friendly but also economically friendly. However, there is a need for a careful
examination of presence of any undesirable toxic metabolites. Since, water is a
commodity of high demand in the country, it is imperative to carryout toxicity tests
atleast for the plants as it may be pumped for irrigation purposes (Jadhav et al., 2010).
Therefore, any efficient treatment methodology needs to be evaluated for its
phytotoxicity.
Aromatic sulfonic azo dyes and their metabolic intermediates (sulfonated and
unsulfonated aromatic amines) represent an important group of environmental
pollutants having a toxic nature (Anburaj et al., 2011). Improper disposal of the dye
effluents containing reactive groups cause a serious problem to environment and health.
Such effluents when disposed in the water bodies are of major concern particularly
when such water is to be used in irrigation.
6.9.1 Effect of selected azo-disperse dyes (three different concentrations) and
decolorized/degraded dye solutions on Triticum aestivum seed germination, root
length and shoot length
The last part of this study was to determine the effects of disperse dyes and decolorized
dye metabolites on environmental ecology. This was studied by conducting
experiments on the effects of dye metabolites on seed germination, shoot and root
length using T. aestivum seeds. Phytotoxicity study of selected dyes and the degraded
metabolites obtained after its decolorization is presented in (Table 21). The results of
the toxicity study showed that there was a reduction of rate of germination of seeds
treated with different concentration of dye. Less germination was observed on highest
concentration of dye (250 mg/L). However, relatively more germination was observed
in the seeds treated with dye degradation metabolites. The seeds of Triticum aestivum
moistened with 50, 150 and 250 mg/L disperse red 167 solution exhibited 90%, 80%
and 50% germination (33A) respectively while the seeds moistened with similar
concentrations of disperse red 167.1 solutions exhibited 80%, 70% and 60%
germination, respectively (table 21). In case with disperse red 167, the germination
index was found to be reduced to half (50%) at 250 mg/L dye concentration as
compared to control (treated with distilled water). Whereas the germination index was
80% after 24 h with extracted metabolites of the respective dye. Thus, remediated dye
solution was less toxic in comparison to untreated dye solution. Likewise, the seeds
soaked in similar concentration (50, 150 and 250 mg/L) of disperse blue 60 and disperse
red 54 displayed 90%, 70% and 60% germination index for both dyes at respective
concentration. However, 100% seed germination was observed with control (distilled
water). In case of seeds soaked in decolorized/degraded dye solutions of disperse red
54 displayed 80% germination (33D) while 90% germination was observed with the
metabolites of disperse red 167.1 and disperse blue 60 (Figure 34(B) and 34(C).
Similarly, Pourbabaee et al., (2006) reported 100% inhibition of Triticum aestivum seed
germination, when soaked in 150 mg/L of untreated dye solution, which reduced to
only 10% inhibition for seed germination in presence of remediated dye solution.
Disperse Red 167 affected significantly the elongation of root and shoot compared to
its metabolites obtained after decolorization and degradation (Figure 34A). Similarly,
the reduction in shoot and root length was noticed on increasing the concentration from
50 to 250 mg/L. The shoot length (cm) was 3.73 + 0.20 (50 mg/L); 3.33 + 0.20 (150
mg/L) and minimum 2.76 + 0.15 was noted (250 mg/L) in comparison the extracted
metabolite shows the growth of shoot 3.20 + 0.20, which was significantly different in
contrast to that of parent dye. Likewise, in case of root length, it was maximum at 50
mg/L (5.96 + 0.20), decreased up to 2.63 + 0.15 (250 mg/L) and 4.66 + 0.15 (extracted
metabolite) as represented in (Figure 34A). This specifies the less toxic nature of
degradation metabolites to the plants.
Disperse Red 167.1 also affected the length of root and shoot compared to its
metabolites obtained after decolorization and degradation (Figure 34B). This effect was
noticed on increasing dye concentration from 50 mg/L to 250 mg/L. The shoot length
(cm) was 3.00+ 0.10 (50 mg/L); 2.53+ 0.05 (150 mg/L) and minimum 1.83+ 0.05 was
noted (250 mg/L) in comparison the extracted metabolite shows the growth of shoot

3.20+ 0.20, which was significantly different in contrast to that of parent dye. Likewise,
in case of root length, it was maximum at 50 mg/L (4.73+ 0.20), decreased up to 2.40+
0.10 (250 mg/L) and 4.73+ 0.15 (extracted metabolite) as represented in (Figure 34B).
In the case of disperse red 54 and disperse blue 60, the same trend of reduction in shoot
and root length was observed with increase in dye concentration. But for the extracted
metabolites for both above mentioned dyes, better results were obtained for elongation
of root and shoot. Disperse red 54 (Figure 34D) showed shoot length 3.56±0.20
(50mg/L), 2.70±0.26 (150 mg/L), 1.73±0.20 (250mg/L). Likewise disperse blue 60
(Figure 35C) displayed shoot length, 3.46±0.30 (50 mg/L), 2.53±0.30 (150mg/L),
1.93±0.05 (250mg/L). The minimum root length was observed at 250 mg/L for disperse
red 54 and disperse blue 60, (1.96±0.47) and (1.63±0.32) respectively. In contrast the
extracted metabolites, have shown 3.23±0.25 (shoot length) and 4.03±0.15 root length
for disperse blue 60. Similarly, 3.20±0.20 (shoot length) and 4.10±0.10 (root length)
for disperse red 54. Our results are in accordance with the study conducted by Dawkar
et al., (2008), they reported 80% and 70% germination inhibition and 2-5% reduction
in shoot and root length in T. aestivum upon exposure of untreated Navy blue 2 GL dye.
Ogugbue and Sawidis, (2011) and Parshetti et al., (2006) observed the similar results
of reduced germination rate in T. aestivum with malachite green dye in contrast to its
degradation product and distilled water. Jadhav et al., (2008) also reported 80% and
100% inhibition of seed germination of Sorghum biocolor and Triticum aestivum upon
exposure of untreated scarlet RR dye (disperse red 54) and 10% reduction in
germination upon exposure of tetrazine dye described by Raju et al., (2015). Konwar
and Jha, (2010) reported maximum plant and shoot height in reference plants in
comparison to dye exposed plants. Similar influence of textile industry effluent on
peanut seed germination and shoot length were also reported by Saravanamoorthy et
al., (2007).

Figure-33: Phytotoxicity assay. 33(A) Plates showing the growth of T. aestivum in the
presence of disperse red 167 (dark red 2B), dye metabolites and control (distilled
water); 33(B) Plates showing the growth of T. aestivum in the presence of disperse red
167.1 (rubine BL), dye metabolites and control (distilled water); 33(C) Plates showing
the growth of T. aestivum in the presence of disperse blue 60 (blue BG), dye metabolites
and control (distilled water); 33(D) Plates showing the growth of T. aestivum in the
presence of disperse red 54 (scarlet RR), dye metabolites and control (distilled water)

Figure-34: Phytotoxicity assay. 34(A) Effect of disperse red 167 and dye metabolites
on root and shoot length of T. aestivum
Figure-34: Phytotoxicity assay. 34(B) Effect of disperse red 167.1 and dye metabolites
on root and shoot length of T. aestivum

Figure-34: Phytotoxicity assay. 34(C) Effect of disperse blue 60 and dye metabolites
on root and shoot length of T. aestivum
Figure-34: Phytotoxicity assay. 34(D) Effect of disperse red 54 and dye metabolites
on root and shoot length of T. aestivum
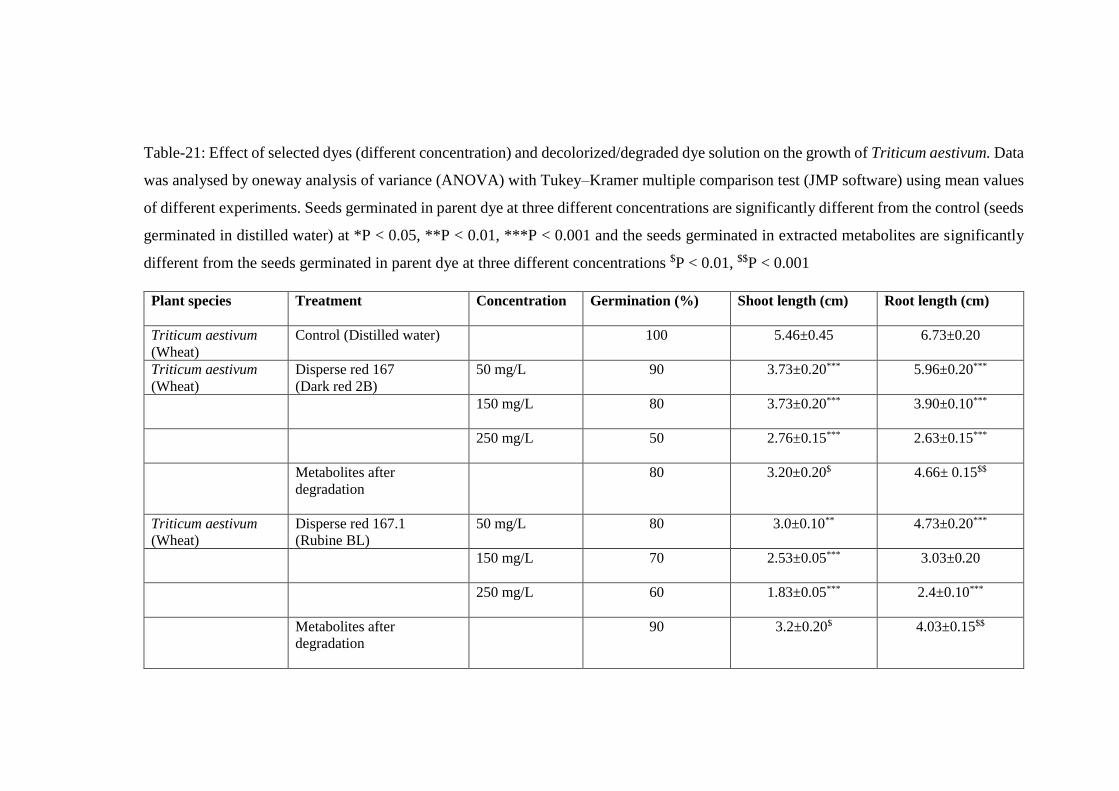
Table-21: Effect of selected dyes (different concentration) and decolorized/degraded dye solution on the growth of Triticum aestivum. Data
was analysed by oneway analysis of variance (ANOVA) with Tukey–Kramer multiple comparison test (JMP software) using mean values
of different experiments. Seeds germinated in parent dye at three different concentrations are significantly different from the control (seeds
germinated in distilled water) at *P < 0.05, **P < 0.01, ***P < 0.001 and the seeds germinated in extracted metabolites are significantly
different from the seeds germinated in parent dye at three different concentrations $P < 0.01, $$P < 0.001
Plant species Treatment
Concentration Germination (%) Shoot length (cm) Root length (cm)
Triticum aestivum
(Wheat)
Control (Distilled water)
100 5.46±0.45 6.73±0.20
Triticum aestivum
(Wheat)
Disperse red 167
(Dark red 2B)
50 mg/L 90 3.73±0.20*** 5.96±0.20***
150 mg/L
80 3.73±0.20*** 3.90±0.10***
250 mg/L
50 2.76±0.15*** 2.63±0.15***
Metabolites after
degradation
80 3.20±0.20$ 4.66± 0.15$$
Triticum aestivum
(Wheat)
Disperse red 167.1
(Rubine BL)
50 mg/L 80 3.0±0.10** 4.73±0.20***
150 mg/L
70 2.53±0.05*** 3.03±0.20
250 mg/L
60 1.83±0.05*** 2.4±0.10***
Metabolites after
degradation
90 3.2±0.20$ 4.03±0.15$$

Triticum aestivum
(Wheat)
Disperse blue 60
(Blue BG)
50 mg/L 90 3.46±0.30*** 4.73±0.20***
150 mg/L
70 2.53±0.30*** 2.42±0.10***
250 mg/L
60 1.93±0.05*** 1.63±0.32***
Metabolites after
degradation
90 3.23±0.25$ 4.03±0.15$$
Triticum aestivum
(Wheat)
Disperse red 54
(Scarlet RR)
50 mg/L 90 3.56±0.20*** 4.63±0.15***
150 mg/L
70 2.70±0.26*** 3.10±0.43***
250 mg/L
60 1.73±0.20*** 1.96±0.47***
Metabolites after
degradation
80 3.20±0.20$ 4.10±0.10$$
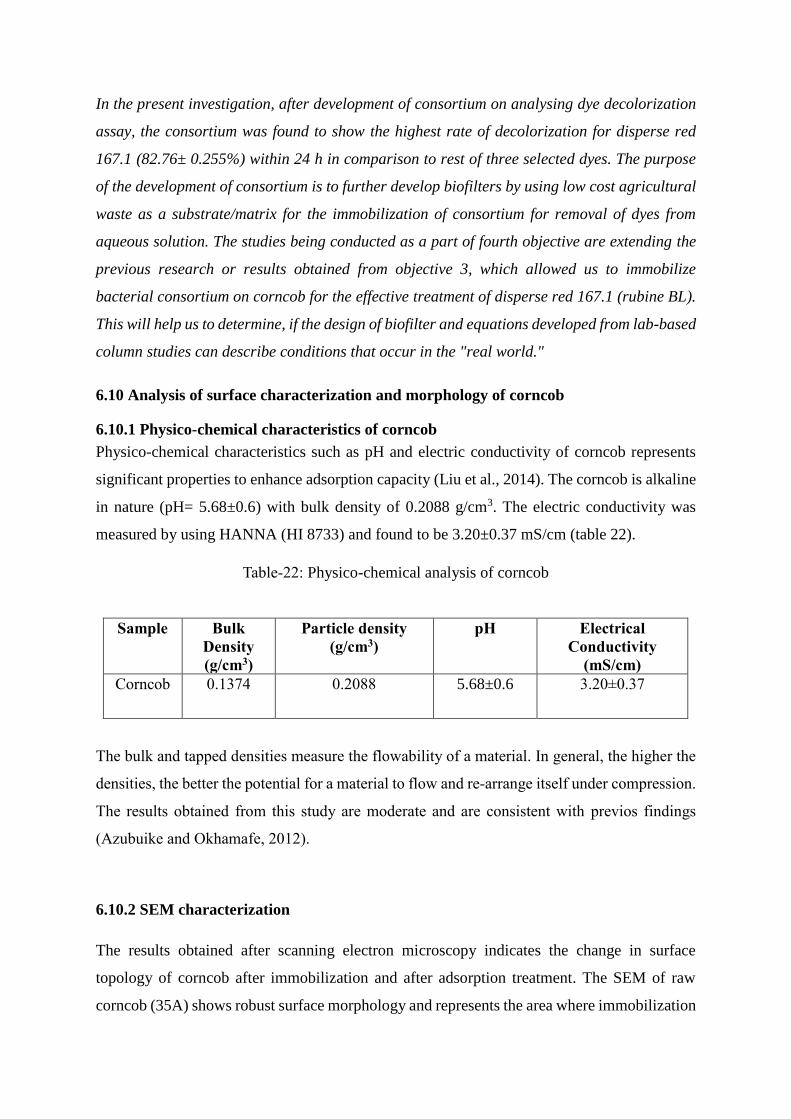
In the present investigation, after development of consortium on analysing dye decolorization
assay, the consortium was found to show the highest rate of decolorization for disperse red
167.1 (82.76± 0.255%) within 24 h in comparison to rest of three selected dyes. The purpose
of the development of consortium is to further develop biofilters by using low cost agricultural
waste as a substrate/matrix for the immobilization of consortium for removal of dyes from
aqueous solution. The studies being conducted as a part of fourth objective are extending the
previous research or results obtained from objective 3, which allowed us to immobilize
bacterial consortium on corncob for the effective treatment of disperse red 167.1 (rubine BL).
This will help us to determine, if the design of biofilter and equations developed from lab-based
column studies can describe conditions that occur in the "real world."
6.10 Analysis of surface characterization and morphology of corncob
6.10.1 Physico-chemical characteristics of corncob
Physico-chemical characteristics such as pH and electric conductivity of corncob represents
significant properties to enhance adsorption capacity (Liu et al., 2014). The corncob is alkaline
in nature (pH= 5.68±0.6) with bulk density of 0.2088 g/cm3. The electric conductivity was
measured by using HANNA (HI 8733) and found to be 3.20±0.37 mS/cm (table 22).
Table-22: Physico-chemical analysis of corncob
Sample Bulk
Density
(g/cm3)
Particle density
(g/cm3)
pH Electrical
Conductivity
(mS/cm)
Corncob 0.1374 0.2088 5.68±0.6 3.20±0.37
The bulk and tapped densities measure the flowability of a material. In general, the higher the
densities, the better the potential for a material to flow and re-arrange itself under compression.
The results obtained from this study are moderate and are consistent with previos findings
(Azubuike and Okhamafe, 2012).
6.10.2 SEM characterization
The results obtained after scanning electron microscopy indicates the change in surface
topology of corncob after immobilization and after adsorption treatment. The SEM of raw
corncob (35A) shows robust surface morphology and represents the area where immobilization
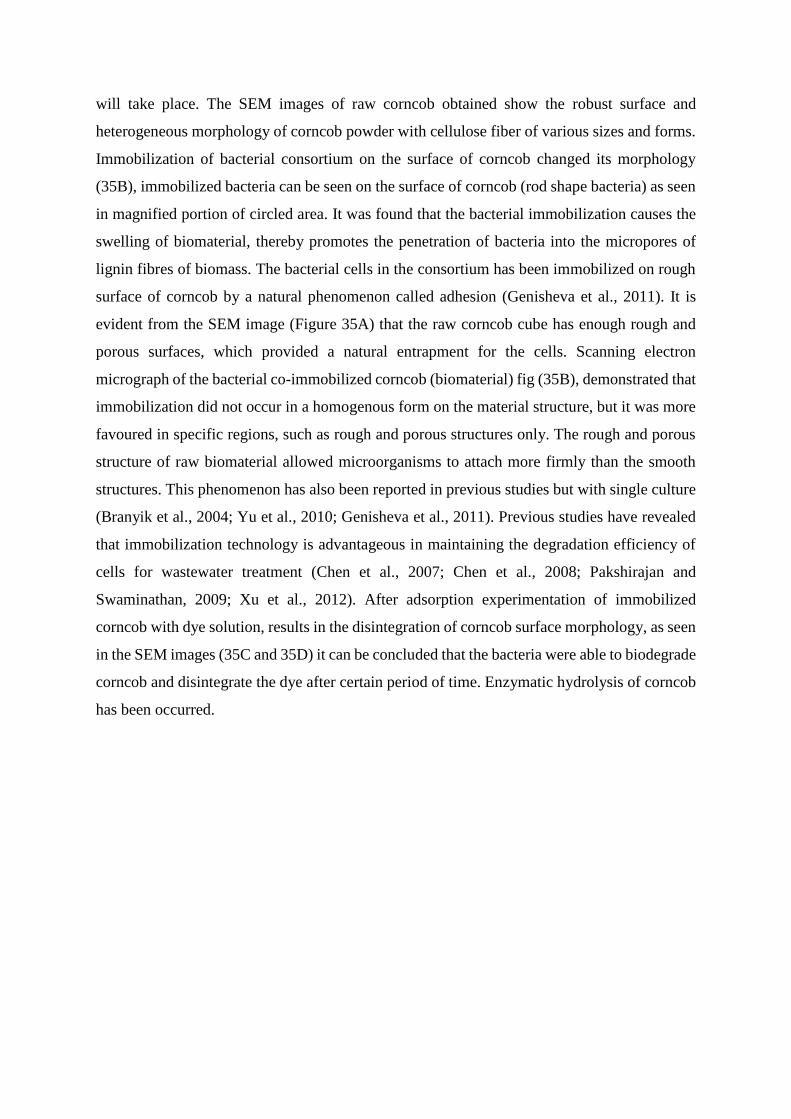
will take place. The SEM images of raw corncob obtained show the robust surface and
heterogeneous morphology of corncob powder with cellulose fiber of various sizes and forms.
Immobilization of bacterial consortium on the surface of corncob changed its morphology
(35B), immobilized bacteria can be seen on the surface of corncob (rod shape bacteria) as seen
in magnified portion of circled area. It was found that the bacterial immobilization causes the
swelling of biomaterial, thereby promotes the penetration of bacteria into the micropores of
lignin fibres of biomass. The bacterial cells in the consortium has been immobilized on rough
surface of corncob by a natural phenomenon called adhesion (Genisheva et al., 2011). It is
evident from the SEM image (Figure 35A) that the raw corncob cube has enough rough and
porous surfaces, which provided a natural entrapment for the cells. Scanning electron
micrograph of the bacterial co-immobilized corncob (biomaterial) fig (35B), demonstrated that
immobilization did not occur in a homogenous form on the material structure, but it was more
favoured in specific regions, such as rough and porous structures only. The rough and porous
structure of raw biomaterial allowed microorganisms to attach more firmly than the smooth
structures. This phenomenon has also been reported in previous studies but with single culture
(Branyik et al., 2004; Yu et al., 2010; Genisheva et al., 2011). Previous studies have revealed
that immobilization technology is advantageous in maintaining the degradation efficiency of
cells for wastewater treatment (Chen et al., 2007; Chen et al., 2008; Pakshirajan and
Swaminathan, 2009; Xu et al., 2012). After adsorption experimentation of immobilized
corncob with dye solution, results in the disintegration of corncob surface morphology, as seen
in the SEM images (35C and 35D) it can be concluded that the bacteria were able to biodegrade
corncob and disintegrate the dye after certain period of time. Enzymatic hydrolysis of corncob
has been occurred.

Figure-35. SEM images of corncob. 35(A) Raw corncob; 35(B) corncob after immobilization
of bacteria consortium, and (35C and 35D) after adsorption of dye solution
6.10.3 XRD Interpretation of corncob after immobilization and adsorption of dye
The XRD pattern of raw corncob (Figure 36), immobilized corncob with consortium (Figure
37) and after dye adsorption is depicted in (Figure 38). The major peak of raw corncob at bragg
2θ angles were observed in XRD pattern at 22.25° and 34.80° are indexed to (002) and (023)
or (004) planes, respectively which confirms the presence of crystallographic plane. These
peaks are characteristic for the crystal form of cellulose I polymorph, this behavior has been
reported by other authors (Favier et al., 1995; De Souza and Borsali, 2004). The major part of
cellulose is in the crystalline form due to intra and intermolecular hydrogen bonding of
hydroxyl groups. Significantly reduced intensity peaks were observed in the crystalline pattern
of the immobilization and after dye adsorption.

Figure-36: XRD patterns of raw corncob
Figure-37: XRD patterns of immobilized corncob
Position [°2Theta] (Copper (Cu))
20 30 40 50 60 70
Counts
0
500
1000
3
Position [°2Theta] (Copper (Cu))
20 30 40 50 60 70
Counts
0
500
1000 4

Figure-38: XRD patterns of immobilized corncob after dye adsorption
6.10.4 FTIR Characterization
Figure-39: FTIR spectra of corncob. 39(A) raw corncob; 39(B) after immobilization of bacteria
consortium and 39(C) after adsorption with dye
Position [°2Theta] (Copper (Cu))
20 30 40 50 60 70
Counts
0
500
1000 6

In order to investigate the surface chemistry of the sample, Fourier Transform Infrared
Spectroscopy (FTIR) analysis was carried out to reveal the presence of several peaks or
functional groups. FTIR spectra of raw corncob (Figure 39A), after immobilization of bacteria
consortium (Figure 39B) and after adsorption with dye are shown in Figure 39C. The Figure
reveals that some peaks in raw corncob are shifted and disappeared which may be due to the
adsorption of dye on immobilized corncob. The broad absorption peak in the range of 3400 cm-
1 corresponds to the O–H stretching vibration of alcohols, phenols and carboxylic acids as in
pectin, cellulose, and lignin, thus showing the presence of “free” hydroxyl groups on the
surface of corncob (Li et al., 2007; Liang et al., 2010). It can also be attributed to the -OH
stretching associated to polar groups linked through intra and intermolecular hydrogen bonding
(Sun et al., 2005). The presence of peak at 564.2 cm-1 indicates the -C≡C-H-C-H bending
functional groups, 1427.37 cm-1 due to –C-H bending, 1642.44 cm-1 due to –C=O stretching,
1515.14 cm-1 due to –N-O stretching, 1162.15 cm-1 due to –C-O stretching, 2926.11 cm-1 due
to –CH stretching and 1250.88 cm-1 –C-N functionalities in raw corncob. The characteristic
peak at 1604.83 cm-1 indicates the presence of aromatic rings and C–H deformation bonds in
the corncob after adsorption of dye (Pasquali and Herrera, 1997). FT-IR data of raw corncob
also shows that the peak at 1731 cm-1 that is assigned to ester acetyl and uronic acid groups in
hemicelluloses or to the ester group of ferulic and p-coumaric acids in lignin and/or
hemicelluloses (Sain and Panthapulakkal, 2006; Sun et al., 2005). This peak practically
disappears in the spectra of corncob after adsorption due to the removal of hemicelluloses after
hydrolysis. A sharp band at 1638 cm-1 in corncob after dye adsorption was also detected and
attributed to H-O-H stretching, measured in KBr which belongs to the absorbed water
molecules associated with the cellulosic fibers (Xiao et al., 2001, Oliveira et al., 2010; Sain
and Panthapulakkal, 2006), which is in aggrement with the XRD pattern of corncob after
adsorption. The peaks at 1424.48 cm-1 and 1322.25 cm-1 corresponded to the C–H in-plane
bending vibrations in methyl group of disperse red 167.1 (Yang and Qiu, 2010 and due to
vibration binding of C–O respectively (Dahri et al., 2014).
The other peak at 1162.2 cm-1 is due to C–O and C–N stretching. The peaks at 2926.11 cm-1
and 1642.44 cm-1 are shifted to 2924.18 and 1637.62 cm-1, respectively. This shift in the
absorption peak suggested the interactions of dye molecules with the functional groups of
corncob (Liang et al., 2010).
6.11 Immobilization of bacterial consortium on corncob
In recent times, the application of immobilized bacterial cell has been receiving increasing
attention in the field of textile effluent decolorization. The agricultural waste materials have
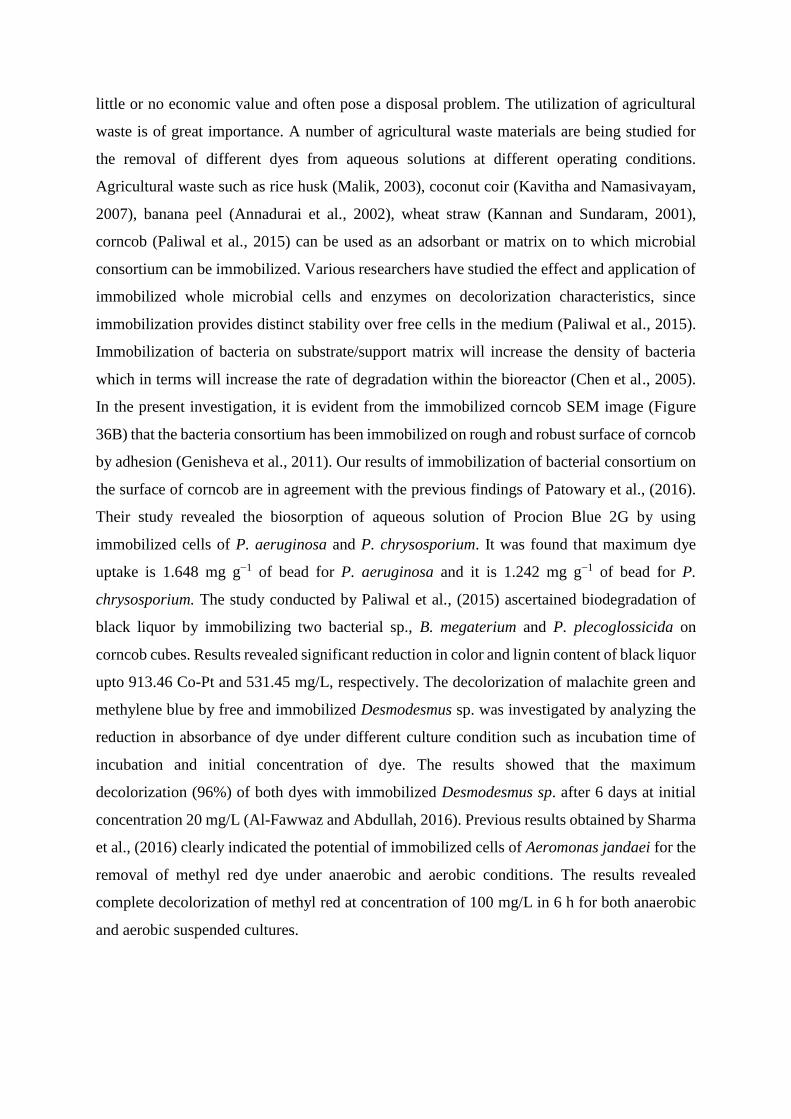
little or no economic value and often pose a disposal problem. The utilization of agricultural
waste is of great importance. A number of agricultural waste materials are being studied for
the removal of different dyes from aqueous solutions at different operating conditions.
Agricultural waste such as rice husk (Malik, 2003), coconut coir (Kavitha and Namasivayam,
2007), banana peel (Annadurai et al., 2002), wheat straw (Kannan and Sundaram, 2001),
corncob (Paliwal et al., 2015) can be used as an adsorbant or matrix on to which microbial
consortium can be immobilized. Various researchers have studied the effect and application of
immobilized whole microbial cells and enzymes on decolorization characteristics, since
immobilization provides distinct stability over free cells in the medium (Paliwal et al., 2015).
Immobilization of bacteria on substrate/support matrix will increase the density of bacteria
which in terms will increase the rate of degradation within the bioreactor (Chen et al., 2005).
In the present investigation, it is evident from the immobilized corncob SEM image (Figure
36B) that the bacteria consortium has been immobilized on rough and robust surface of corncob
by adhesion (Genisheva et al., 2011). Our results of immobilization of bacterial consortium on
the surface of corncob are in agreement with the previous findings of Patowary et al., (2016).
Their study revealed the biosorption of aqueous solution of Procion Blue 2G by using
immobilized cells of P. aeruginosa and P. chrysosporium. It was found that maximum dye
uptake is 1.648 mg g−1 of bead for P. aeruginosa and it is 1.242 mg g−1 of bead for P.
chrysosporium. The study conducted by Paliwal et al., (2015) ascertained biodegradation of
black liquor by immobilizing two bacterial sp., B. megaterium and P. plecoglossicida on
corncob cubes. Results revealed significant reduction in color and lignin content of black liquor
upto 913.46 Co-Pt and 531.45 mg/L, respectively. The decolorization of malachite green and
methylene blue by free and immobilized Desmodesmus sp. was investigated by analyzing the
reduction in absorbance of dye under different culture condition such as incubation time of
incubation and initial concentration of dye. The results showed that the maximum
decolorization (96%) of both dyes with immobilized Desmodesmus sp. after 6 days at initial
concentration 20 mg/L (Al-Fawwaz and Abdullah, 2016). Previous results obtained by Sharma
et al., (2016) clearly indicated the potential of immobilized cells of Aeromonas jandaei for the
removal of methyl red dye under anaerobic and aerobic conditions. The results revealed
complete decolorization of methyl red at concentration of 100 mg/L in 6 h for both anaerobic
and aerobic suspended cultures.

6.12 Operation of continuous column: experimental set up
In the literature, two types of adsorption studies viz., batch mode and continuous flow mode or
column studies has been reported for textile dye removal from aqueous solution. Most of the
researchers prefer to conduct batch mode study because small amount of material (adsorbent)
is required, less time-consuming method and easy to operate. But these batch mode studies are
not convenient for field applications. In other words, the adsorption capacity data obtained
from batch studies may not provide accurate scale-up information regarding the column
operation systems. So, it is very important to check the practical applicability of the adsorbent
in the continuous flow mode. The continuous flow system is an effective process for the
treatment of large scale wastewater volumes and adsorption. So, in the present investigation,
continuous column studies have been conducted for the removal of disperse red 167.1 by
immobilized corncob to check the effect of various parameters viz., dye concentration and the
bed height on adsorption (procedure has been explained in previous chapter under 5.11). The
experimental set for column study is presented in Figure 40. The calibration curve for disperse
red 167.1 (rubine BL) was plotted between absorbance and concentration of the standard dye
solution (Figure 41).
6.12.1 Analysis and breakthrough modelling of column data
In the literature, there are many mathematical models available to describe the adsorption
through a fixed bed continous column. These models use the results of the breakthrough curves.
In the present investigation, two models, thomas and adams-bohart model, were applied to treat
the experimental data in the column.

Figure 40: Experimental setup of continuous column
Figure-41: Standard calibration curve for disperse red 167.1
6.12.1.1 Effect of Bed Height on Adsorption
The effect of bed height on the adsorption of dye by varying the bed height from 10 cm to 15
cm was studied. The experimental set up for this study is shown in Figure 43. As bed height is
increased, dye solution had more time to stay in contact with the adsorbent. This resulted in
y = 0.0089x + 0.026R² = 0.9993
0
0.5
1
1.5
2
2.5
3
3.5
4
0 50 100 150 200 250 300 350 400 450 500
Ab
sorb
ance
Concentration
Rubine BL Standard curveλmax=469nm

higher dye removal from the textile industry effluent which further results in lower dye
concentration in the effluent. From Figure 42, it can be observed that the slope of the
breakthrough curve decreased with increase in bed height, which lead to achieve higher mass
transfer zone. The total adsorption capacity of the bed increased with increase in bed height.
The mass of the sorbent forming the homogeneous fixed bed is proportional to the bed height,
and as a result the number of sorption sites increases with the increase in bed height leading to
a larger sorption capacity of the reactor (Hamdaoui, 2006). At lower adsorbent bed height, axial
dispersion phenomenon predominated and reduced the diffusion of dye (Foo and
Hameed, 2012). Higher uptake was observed at the highest bed height due to an increase in the
surface area of the biosorbent (corncob), which provided more binding sites for the sorption
and this resulted in higher dye removal (Vijayaraghavan et al., 2004). Saha et al., (2012)
reported, as the bed height is increased, the dye molecules have more time to contact with the
biosorbent resulting in higher dye removal efficiency. The break through curve was steeper at
lower bed height. The column parameters obtained from effect of bed height is listed in below
table 23.
Table-23: Effect of different bed height on adsorption
Bed Height
(cm)
qtotal (mg) Mtotal (gm) Veff (ml)
10 17.57 220.5 4410
15 24.54 220.5 4900

Figure-42: Effect of bed height (10 cm and 15 cm) on breakthrough curve
6.12.1.2 Effect of initial Dye Concentration on Adsorption
Effect of initial dye concentration on adsorption was studied by conducting experiments at
different concentrations, 50 mg/L, 150 mg/L and 250mg/L of disperse red 167.1. The following
trend was observed with increase in dye concentration (Figure 43). It can be seen that, at lower
dye concentration, the break through curves are dispersed. The above graph demonstrates that,
change in concentration gradient affects saturation rate and reduces break through time. This
can be explained by the fact that; more adsorption sites will be covered with increase in dye
concentration. The larger the concentration of dye, steeper is the break through curve. With
increase in dye concentration, the driving force for mass transfer will increase. This resulted in
a decreased adsorption zone. The column parameters obtained from effect of initial dye
concentration are given in the table 24. This is due to the fact that high dye concentration leads
to quick saturation of the sorbent, which in turn leads to the earlier breakthrough and exhaustion
time (Hasan et al., 2010). From Figure 44, it can also be seen that more favorable and steep
breakthrough curves were obtained at high influent dye concentration. These results
demonstrated that the change in concentration gradient affects the saturation rate and
breakthrough time (Goel et al., 2005). This can also be explained by the fact that more sorption
sites were being covered as the concentration of the dye increases (Han et al., 2009). This
indicates that with the change in concentration gradient, the saturation rate and breakthrough
time are affected (Ko et al., 2000). In addition, as the influent concentration increases, the dye
loading rate increases, so does the driving force for mass transfer, which resulted a decrease in
the sorption zone length (Ko et al., 2000).
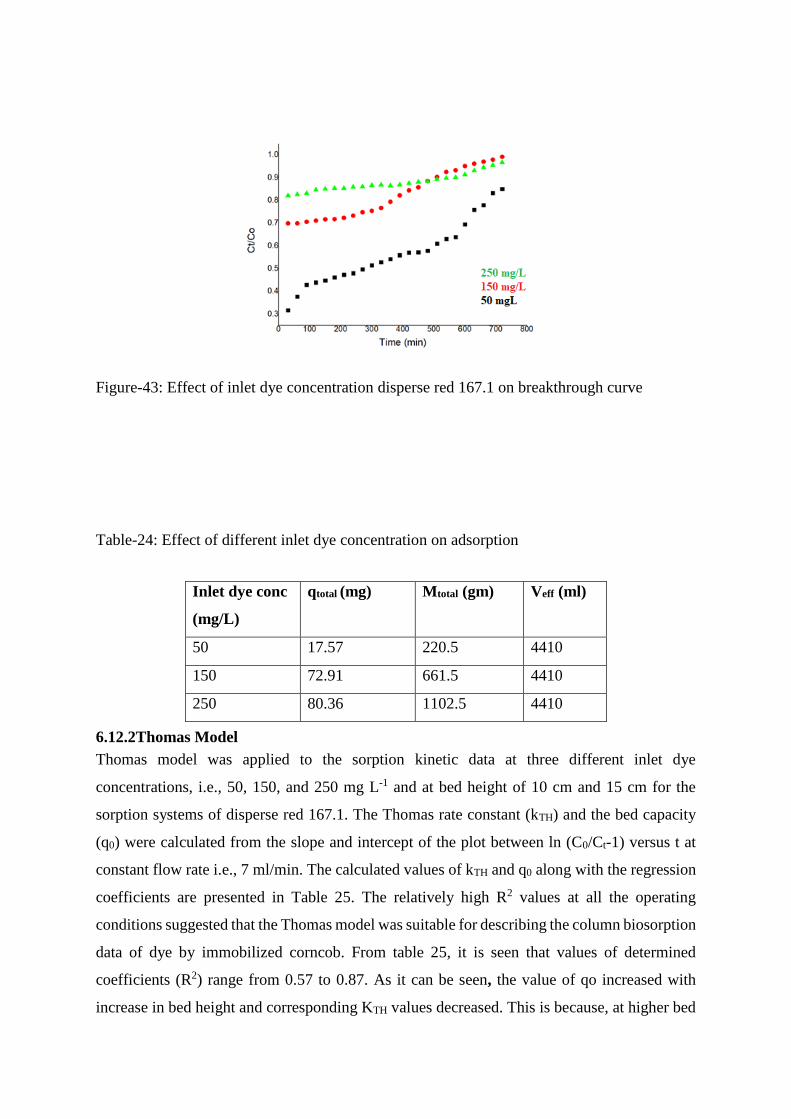
Figure-43: Effect of inlet dye concentration disperse red 167.1 on breakthrough curve
Table-24: Effect of different inlet dye concentration on adsorption
6.12.2Thomas Model
Thomas model was applied to the sorption kinetic data at three different inlet dye
concentrations, i.e., 50, 150, and 250 mg L-1 and at bed height of 10 cm and 15 cm for the
sorption systems of disperse red 167.1. The Thomas rate constant (kTH) and the bed capacity
(q0) were calculated from the slope and intercept of the plot between ln (C0/Ct-1) versus t at
constant flow rate i.e., 7 ml/min. The calculated values of kTH and q0 along with the regression
coefficients are presented in Table 25. The relatively high R2 values at all the operating
conditions suggested that the Thomas model was suitable for describing the column biosorption
data of dye by immobilized corncob. From table 25, it is seen that values of determined
coefficients (R2) range from 0.57 to 0.87. As it can be seen, the value of qo increased with
increase in bed height and corresponding KTH values decreased. This is because, at higher bed
Inlet dye conc
(mg/L)
qtotal (mg) Mtotal (gm) Veff (ml)
50 17.57 220.5 4410
150 72.91 661.5 4410
250 80.36 1102.5 4410
heights, more reactive sites were available. These results are similar to those obtained using
different materials (Yahaya et al., 2011, Chowdhury et al., 2012). Likwise, biosorption of Acid
Blue 15 (AB15) using fresh water macroalga Azolla filiculoides was investigated by Padmesh
et al., (2006). The dye biosorption was favoured at increasing bed height and initial dye
concentration, while the maximum dye biosorption was achieved at minimum flow rate. The
optimum conditions for AB15 uptake were reported at 25 cm of bed height, 5 mL/min of flow
rate and 100 mg/L of initial dye concentration. In the present study, as concentration of dye
increased, qo (max) increased and KTH decreased. This is because, with increase in
concentration, the driving force for adsorption increased (Tan et al., 2008). Our results are in
accordance with the previous study conducted by Han et al., (2009) by using of rice husk for
the adsorption of Congo Red (CR) from aqueous solution in column mode. The effect of several
important parameters such as pH, flow rate, initial dye concentration, existing salt and bed
depth were studied. The results obtained by this study, indicated that biosorption of CR was
initial dye concentration, bed depth and flow rate dependent. In this study, several models were
applied. From the application of Thomas model, a less favourable adsorption of CR was
observed at higher flow rate and lower influent concentration. A better column performance
was obtained when the initial dye concentration increased, due to the increase of driving force
for biosorption. Thus, Thomas model was suitable for adsorption processes where the external
and internal diffusions will not be the limiting step. From Adam-bohart model, the model was
valid for the relative concentration region up to 0.5 but a large discrepancy between the
experimental and predicted curves was observed above this level. Han et al., (2009) studied the
biosoption of methylene blue from aqueous solution by rice husk using fixed-bed column. The
breakthrough curve was affected by pH, influent concentration, flow rate and existed salt.
Results showed that, the breakthrough curves shifted from left to right when the pH of the
influent increased. It was observed that breakthrough occurred faster with higher flow rate. In
this study, two models were applied namely, Thomas and BDST models. By applying Thomas
model, lower influent concentration and higher flow rate were unfavourable to the adsorption
of MB on rice husk column. BDST and Thomas models were applied and both models were
valid.
Table-25: Thomas model parameters using linear regression analysis under various operating
conditions for adsorption of disperse red 167.1

Flow rate
(ml/min)
Bed Height
(cm)
Inlet dye
conc.
(mg/L)
KTH
(L/min.mg)
q0 (mg/gm)
R2
7 10 50 0.003
197 0.84
7 15 50 0.002
327.5 0.68
7 10 150 0.002
362.83 0.87
7 10 250 0.001
485.92 0.57
6.12.3 Adams-bohart Model
The values of adsorption capacity of the adsorbent, N0 and kinetic constant of the model, KAB
determined by linear regression analysis are listed in table 26. The results show that as the bed
height increased, the adsorption capacity (No) increased. The values of KAB decreased. The
adsorption capacity increased with increase in dye concentration. As the bed height increased
from 10 cm to 15 cm, the adsorption capacity increased from 0.67 to 0.99 mg/L with KAB
decreased from 0.012 to 0.002 L/mg.min. From Table 26, it is seen that values of determined
coefficients (R2) range from 0.48 to 0.97.
Table-26: Adams-bohart model parameters using linear regression analysis under various
operating conditions for adsorption of disperse red 167.1
Flow rate
(ml/min)
Bed Height
(cm)
Inlet dye
conc.
(mg/L)
KAB
( L/mg.min)
No(mg/L)
R2
7 10 50 0.012
0.67 0.48
7 15 50 0.002
0.99 0.31
7 10 150 0.001
23.1 0.97
7 10 250 0.001
56 0.96
Han et al., (2009) studied the adsorption of MB by phoenix tree leaf powder in fixed-bed
column. It was observed that the breakthrough time increased as the initial dye concentration
and flow rate decreased, while the bed depth increased. Several models such as Thomas, Adam-
Bohart, Yoon-Nelson, Clark and BDST models were applied to the experimental data. Thomas
and Clark models were found suitable to describe the whole breakthrough curve, while Adam-
bohart model was used to predict the initial part of dynamic process. In our present study, with

increase in bed height, the adsorption capacity increases from 0.67 to 0.99 mg/L. Our findings
are in accordance with the study conducted by Ahmad and Hamed, (2010). They reported the
fixed-bed adsorption of Reactive Black onto granular activated carbon prepared from bamboo
waste. The adsorption system was found performed better with lower influent concentration,
lower flow rate and higher bed height. The highest bed capacity of 39.02 mg/g was reported
using 100 mg/L influent concentration, 80 mm bed height and 10 mL/min of flow rate. Adam-
bohart, thomas and yoon-nelson models were used to fit the adsorption data, and the results
fitted well to Thomas and Yoon-Nelson models with high R2.

SUMMARY AND
CONCLUSIONS

Chapter 7
SUMMARY AND CONCLUSIONS
The primary objective of this study was to investigate the pollution potential of textile industry
effluents draining into Buddha Nallah stream located in Ludhiana, Punjab (India), and develop
eco-friendly technologies determine to treat textile industry wastewater before it is discharged
to water bodies. Therefore, this thesis focuses on the physico-chemical based characterization
of textile industry effluents, isolation of efficient dye degrading microorganism and
identification of microorganisms at molecular level, elucidation of mechanism of dye
degradation, and evaluation of toxicity of control dyes with its degraded metabolites on plant
(T. aestivum). This research further investigates the development of consortium of bacteria and
checking the ability of consortium for decolorization of selected dyes compared to individual
bacteria. The final objective of the thesis was to develop a biofilter by using bio-sorbent in the
form of glass column in lab. The consortium was immobilized on corncob and used as a bio-
sorbent for the treatment of textile dye. The overall goal of this research was to develop eco-
friendly technologies for the treatment of wastewater discharged to waterbodies by the textile
industries.
Following paragraphs give the conclusions of this research in relation to each objectives of the
study:
1.Objective 1: to determine physico-chemical and biological characteristics of textile dyes in
the untreated textile industry wastewater at selected discharge sites effluent. Wastewater
samples from four textile industries were collected during the year 2014-2015 and were
analyzed for various physio-chemical properties. The water quality parameters like BOD,
COD, TSS and TDS of textile effluent were found to be significantly higher than the maximum
permissible limit prescribed by WHO. The results of this study clearly show that textile
industry in Punjab, India, is polluting the local surface water bodies and there is a need to
develop simple, cost-effective and eco-friendly treatment systems for the bio-remediation of
textile effluents.
2.Objective 2: to isolate, identify, and characterize dye-degrading bacterial strains
from textile industry wastewater. To accomplish this objective of this study, study was
conducted and we were successful to isolate and identify indigenously occurring
bacteria in the textile industry effluents with potent dye degrading ability to degrade
the selected azo-disperse dyes (disperse red 167; disperse red 167.1; disperse blue 60
and disperse red 54). Results revealed less toxicity of extracted metabolites in
comparison to parent dyes.
3.Objective 3: to develop bacterial consortium for enhanced dye degrading capability
in textile industry wastewater. The studies conducted in response to this objective
concluded that in the successful development of consortium on analysing dye
decolorization assay. This consortium was found to show the highest rate of
decolorization for disperse red 167.1 (82.76± 0.255%) within 24 h in comparison to
rest of three selected dyes.
4. Objective 4: to design and develop clean-up technology (biofilters) for in-situ
bioremediation of textile industry effluents. In this study, biofilters were developed by
using low cost agricultural waste material (corn-cobs) as a substrate/matrix for the
immobilization of consortium and for the removal of dyes from aqueous solution. This
study concluded that adsorption of dye through a fixed-bed continuous flow column
was dependent on the bed depth and inlet concentration. Also, with the increase in bed
height, dye adsorption capacity of biofilter increases, due to more surface area and more
available adsorption sites. The Thomas and Adams-bohart models were both
successfully used to predict the breakthrough curves. Further studies are needed to scale
up from lab scale to the pilot scale. The results obtained in the fourth objective, can
help us to determine, if the design of biofilter and equations developed from lab-based
column studies can describe conditions that occur in the "real world”.
It can be concluded that, although decolorization is a challenging process to both the
textile industry and the wastewater treatment, the results of this finding suggest a great
potential for bacteria to be used to remove color from dye containing wastewater. The
textile dye is degradable with a concerted effort of bacteria isolated from an effluent
disposal site. Further, it can be suggested that the potential of the bacteria need to be
demonstrated in its application for treatment of dye bearing wastewater using
appropriate practice and through biotechnological approaches for removal of color on
one hand and on another hand Government legislation standards should more stringent
regarding the disposal of untreated textile effluents in natural water bodies. Moreover,

further research on these strains could explore new tools and techniques to evolve viable
and eco-friendly microbial solutions for treatment of textile industrial effluent.
7.1 Future recommendations
In this thesis research, our studies were primarily conducted in the laboratory and we
were successful in developing the conceptual design of a biofilter to treat and clean
industry wastewater. This lab-based technology needs to be scaled up and tested under
real world field conditions. This technology for the upscale process can be patented to
commercialize the technology for helping textile industries.
Taking into consideration the advances in this field, we believe that future research
activities should focus on below mentioned principal areas:
• In the present study, the bioremediation potential of individual bacteria and consortium
has been checked for disperse dyes. In future, the bioremediation potential can be
evaluated for all classes of dyes as different dyes contains variety of chromophores,
auxochrome and complexity of structure.
• We have chosen textile dyes as a contaminant but in the future, the ability of bacterial
consortium can be evaluated for other contaminants present in wastewater such as
pesticides, hormones, heavy metals.
• In the current study, the bacteria have been screened for azo-reducatse and laccase
enzymes for dye degradation. It can be suggested that, purification and characterization
of other dye degrading enzymes can be done and demonstration of their role in
treatment process by setting up immobilized cell and enzyme reactor for treatment of
textile industry effluent. Optimization of process parameters can be carried out in
future.
• We have analysed the toxicity of selected dyes and their metabolites on T. aestivum.
But future research can focus on the extension of toxicity of dye degraded metabolites
on cell line, Daphnia assay, fish toxicity etc. to address human health.
• Our study used corncob as a matrix to immobilize bacteria consortium. Future studies
can use different biosorbents to support matrix in the form of immobilized packed bed
reactor, where bacterial consortium can be impregnated in upscale process.


BIBLIOGRAPHY
Bibliography
Abdalla, K. Z., & Hammam, G. (2014). Correlation between biochemical oxygen demand and
chemical oxygen demand for various wastewater treatment plants in Egypt to obtain the
biodegradability indices. International Journal of Sciences: Basic and Applied Research,
13(1): 42-48.
Abhilash, P. C., Jamil, S., & Singh, N. (2009). Transgenic plants for enhanced biodegradation
and phytoremediation of organic xenobiotics. Biotechnology advances, 27(4): 474-488.
Abu-Saied, M. A., Abdel-Halim, E. S., Fouda, M. M., & Al-Deyab, S. S. (2013). Preparation
and characterization of iminated polyacrylonitrile for the removal of methylene blue from
aqueous solutions. International Journal of Electrochemical Science, 8(4): 5121-5135.
Acuner, E., & Dilek, F. B. (2004). Treatment of tectilon yellow 2G by Chlorella vulgaris.
Process Biochemistry, 39(5): 623-631.
Adedayo, O., Javadpour, S., Taylor, C., Anderson, W. A., & Moo-Young, M. (2004).
Decolourization and detoxification of methyl red by aerobic bacteria from a wastewater
treatment plant. World Journal of Microbiology and Biotechnology, 20(6): 545-550.
Adegoke, K. A., & Bello, O. S. (2015). Dye sequestration using agricultural wastes as
adsorbents. Water Resources and Industry, 12:8-24.
Ado, A., Tukur, A. I., Ladan, M., Gumel, S. M., Muhammad, A. A., Habibu, S., & Koki, I. B.
(2015). A Review on Industrial Effluents as Major Sources of Water Pollution in Nigeria.
Chemistry Journal, 1(5):159-164.
Ahiduzzaman, M., & Islam, A. S. (2016). Preparation of porous bio-char and activated carbon
from rice husk by leaching ash and chemical activation. SpringerPlus, 5(1):1248.
Ahmad, A. A., & Hameed, B. H. (2010). Fixed-bed adsorption of reactive azo dye onto granular
activated carbon prepared from waste. Journal of hazardous materials, 175(1-3):298-303.
Ahmedna, M., Clarke, S. J., Rao, R. M., Marshall, W. E., & Johns, M. M. (1997). Use of
filtration and buffers in raw sugar colour measurements. Journal of the Science of Food and
Agriculture, 75(1): 109-116.
Ajibola, V. O., Oniye, S. J., Odeh, C. E., Olugbodi, T., & Umeh, U. G. (2005). Biodegradation
of Indigo containing textile effluent using some strains of bacteria. Journal of Applied
Sciences, 5(5):853-855.
Aksu, Z., Kiliç, N. K., Ertugrul, S., & Donmez, G. (2007). Inhibitory effects of chromium (VI)
and Remazol Black B on chromium (VI) and dyestuff removals by Trametes versicolor.
Enzyme and Microbial Technology, 40(5):1167-1174.
Al-Fawwaz, A. T., & Abdullah, M. (2016). Decolorization of methylene blue and malachite
green by immobilized Desmodesmus sp. isolated from North Jordan. International Journal
of Environmental Science and Development, 7(2):95.
Ali, D. M., Suresh, A., Praveen Kumar, R., Gunasekaran, M., & Thajuddin, N. (2011).
Efficiency of textile dye decolorization by marine cyanobacterium, Oscillatoria formosa
NTDM02. African Journal of Basic and Applied Sciences, 3(1):9-13.
Ali, H. (2010). Biodegradation of synthetic dyes-a review. Water, Air, & Soil Pollution, 213(1-
4): 251-273.
Ali, S. A. M., & Akthar, N. (2014). A study on bacterial decolorization of crystal violet dye by
Clostridium perfringens, Pseudomonas aeruginosa and Proteus vulgaris. Biological
Science, 4(2):89-96.
Ali, N., Hameed, A., & Ahmed, S. (2009). Physicochemical characterization and
bioremediation perspective of textile effluent, dyes and metals by indigenous bacteria.
Journal of Hazardous Materials, 164(1):322-328.
Al-Kdasi, A., Idris, A., Saed, K., & Guan, C. T. (2004). Treatment of textile wastewater by
advanced oxidation processes—a review. GlobalNEST International Journal, 6(3):222-
230.
Allegre, C., Moulin, P., Maisseu, M., & Charbit, F. (2006). Treatment and reuse of reactive
dyeing effluents. Journal of Membrane Science, 269(1):15-34.
Alvarez, M. S., Rodriguez, A., Sanroman, M. A., & Deive, F. J. (2015). Microbial adaptation
to ionic liquids. Royal Society of Chemistry Advances, 5(23):17379-17382.
American Public Health Association (APHA), American Water Works Association, Water
Pollution Control Federation, & Water Environment Federation. (2005). Standard methods
for the examination of water and wastewater (Vol. 2). American Public Health Association.
Anandaraj, B., & Delapierre, L. R. A. (2010). Studies on influence of bioinoculants
(Pseudomonas fluorescens, Rhizobium sp., Bacillus megaterium) in green gram. Journal of
Bioscience and Technology, 1(2):95-99.
Anastasi, A., Tigini, V., & Varese, G. C. (2013). The bioremediation potential of different
ecophysiological groups of fungi. In Fungi as bioremediators (pp. 29-49). Springer, Berlin,
Heidelberg.

Anburaj, J., Kuberan, T., Sundaravadivelan, C., & Kumar, P. (2011). Biodegradation of azo
dye by Listeria sp. International Journal of Environmental Sciences, 1(7):1760.
Annadurai, G., Juang, R. S., & Lee, D. J. (2002). Use of cellulose-based wastes for adsorption
of dyes from aqueous solutions. Journal of Hazardous Materials, 92(3):263-274.
Aplin, R., & Waite, T. D. (2000). Comparison of three advanced oxidation processes for
degradation of textile dyes. Water Science and Technology, 42(5-6):345-354.
Arulazhagan, P. (2016). A study on microbial decolourization of reactive red M8B by Bacillus
subtilis isolated from dye contaminated soil samples. International Journal of Current
Research in Biology and Medicine, 1(1):1-13.
Asad, S., Amoozegar, M. A., Pourbabaee, A., Sarbolouki, M. N., & Dastgheib, S. M. M.
(2007). Decolorization of textile azo dyes by newly isolated halophilic and halotolerant
bacteria. Bioresource Technology, 98(11):2082-2088.
Asamudo, N. U., Daba, A. S., & Ezeronye, O. U. (2005). Bioremediation of textile effluent
using Phanerochaete chrysosporium. African Journal of Biotechnology, 4(13): 1548-1553.
Aust, S. D. (1990). Degradation of environmental pollutants by Phanerochaete chrysosporium.
Microbial Ecology, 20(1):197-209.
Azubuike, C. P., & Okhamafe, A. O. (2012). Physicochemical, spectroscopic and thermal
properties of microcrystalline cellulose derived from corn cobs. International Journal of
Recycling of Organic Waste in Agriculture, 1(1):9.
Babu, S. S., Mohandass, C., Vijayaraj, A. S., & Dhale, M. A. (2015). Detoxification and color
removal of Congo Red by a novel Dietzia sp. (DTS26)–a microcosm approach.
Ecotoxicology and Environmental Safety, 114:52-60.
Bae, J. S., & Freeman, H. S. (2007). Aquatic toxicity evaluation of new direct dyes to the
Daphnia magna. Dyes and Pigments, 73(1):81-85.
Banat, I. M., Nigam, P., Singh, D., & Marchant, R. (1996). Microbial decolorization of textile-
dye containing effluents: a review. Bioresource Technology, 58(3):217-227.
Barsing, P., Tiwari, A., Joshi, T., & Garg, S. (2011). Application of a novel bacterial
consortium for mineralization of sulphonated aromatic amines. Bioresource Technology,
102(2):765-771.
Bilal, M., Asgher, M., Shahid, M., & Bhatti, H. N. (2016). Characteristic features and dye
degrading capability of agar agar gel immobilized manganese peroxidase. International
Journal of Biological Macromolecules, 86:728-740.
Bilotta, G. S., & Brazier, R. E. (2008). Understanding the influence of suspended solids on
water quality and aquatic biota. Water Research, 42(12):2849-2861.

Branyik, T., Vicente, A., Oliveira, R., & Teixeira, J. (2004). Physicochemical surface
properties of brewing yeast influencing their immobilization onto spent grains in a
continuous reactor. Biotechnology and Bioengineering, 88(1):84-93.
Campos, R., Kandelbauer, A., Robra, K. H., Cavaco-Paulo, A., & Gubitz, G. M. (2001). Indigo
degradation with purified laccases from Trametes hirsuta and Sclerotium rolfsii. Journal of
Biotechnology, 89(2-3):131-139.
Caparkaya, D., & Cavas, L. (2008). Biosorption of Methylene Blue by a Brown Alga
Cystoseira barbatula Kutzing. Acta Chimica Slovenica, 55(3): 547-53.
Carmen, Z., & Daniela, S. (2012). Textile organic dyes–characteristics, polluting effects and
separation/elimination procedures from industrial effluents–a critical overview. In Organic
pollutants ten years after the Stockholm convention-environmental and analytical update.
InTech.
Casas, N., Blanquez, P., Gabarrell, X., Vicent, T., Caminal, G., & Sarra, M. (2007).
Degradation of orange G by laccase: Fungal versus enzymatic process. Environmental
Technology, 28(10):1103-1110.
Celia, M. P., & Suruthi, S. (2016). Textile dye degradation using bacterial strains isolated from
textile mill effluent. International Journal of Applied Research, 2:337-341.
Cengiz, S., & Cavas, L. (2008). Removal of methylene blue by invasive marine seaweed:
Caulerpa racemosa var. cylindracea. Bioresource Technology, 99(7):2357-2363.
Chaieb, K., Hagar, M., & Radwan, N. R. (2016). Biodegradation and decolorization of azo
dyes by adherent Staphylococcus lentus strain. Applied Biological Chemistry, 59(3):405-
413.
Chairin, T., Nitheranont, T., Watanabe, A., Asada, Y., Khanongnuch, C., & Lumyong, S.
(2013). Biodegradation of bisphenol A and decolorization of synthetic dyes by laccase from
white-rot fungus, Trametes polyzona. Applied Biochemistry and Biotechnology, 169(2):
539-545.
Chang, J. S., Chou, C., Lin, Y. C., Lin, P. J., Ho, J. Y., & Hu, T. L. (2001). Kinetic
characteristics of bacterial azo-dye decolorization by Pseudomonas luteola. Water
Research, 35(12):2841-2850.
Chang, J. S., & Kuo, T. S. (2000). Kinetics of bacterial decolorization of azo dye with
Escherichia coli NO3. Bioresource Technology, 75(2):107-111.
Cheema, A., & Virk, A. (2012). Human rights aspects of clean environment: A study of water
pollution in the state of Indian Punjab. Sacha Journal of Human Rights, 2(1):1-14.
Chen, C., Wang, Q., Lei, P., Song, W., Ma, W., & Zhao, J. (2006). Photodegradation of dye
pollutants catalysed by porous K3PW12O40 under visible irradiation. Environmental
Science & Technology, 40(12):3965-3970.
Chen, H. L., & Burns, L. D. (2006). Environmental analysis of textile products. Clothing and
Textiles Research Journal, 24(3):248-261.
Chen, C. Y., Kao, C. M., & Chen, S. C. (2008). Application of Klebsiella oxytoca immobilized
cells on the treatment of cyanide wastewater. Chemosphere, 71(1):133-139.
Chen, C. Y., Kao, C. M., Chen, S. C., Chien, H. Y., & Lin, C. E. (2007). Application of
immobilized cells to the treatment of cyanide wastewater. Water Science and Technology,
56(7):99-107.
Chen, H. (2006). Recent advances in azo dye degrading enzyme research. Current Protein and
Peptide Science, 7(2):101-111.
Chen, H., Hopper, S. L., & Cerniglia, C. E. (2005). Biochemical and molecular characterization
of an azoreductase from Staphylococcus aureus, a tetrameric NADPH-dependent
flavoprotein. Microbiology, 151(5):1433-1441.
Chen, K. C., Wu, J. Y., Liou, D. J., & Hwang, S. C. J. (2003). Decolorization of the textile
dyes by newly isolated bacterial strains. Journal of Biotechnology, 101(1):57-68.
Chequer, F. M. D., Dorta, D. J., & de Oliveira, D. P. (2011). Azo dyes and their metabolites:
does the discharge of the azo dye into water bodies represent human and ecological risks?.
In Advances in treating textile effluent. InTech.
Chequer, F. M. D., de Oliveira, G. A. R., Ferraz, E. R. A., Cardoso, J. C., Zanoni, M. V. B., &
de Oliveira, D. P. (2013). Textile dyes: dyeing process and environmental impact. In Eco-
friendly textile dyeing and finishing. InTech.
Chiong, T., Lau, S. Y., Lek, Z. H., Koh, B. Y., & Danquah, M. K. (2016). Enzymatic treatment
of methyl orange dye in synthetic wastewater by plant-based peroxidase enzymes. Journal
of Environmental Chemical Engineering, 4(2):2500-2509.
Chou, C. M., & Lien, H. L. (2011). Dendrimer-conjugated magnetic nanoparticles for removal
of zinc (II) from aqueous solutions. Journal of Nanoparticle Research, 13(5): 2099-2107.
Chowdhury, Z. Z., Zain, S. M., Khan, R. A., Rafique, R. F., & Khalid, K. (2012). Batch and
fixed bed adsorption studies of lead (II) cations from aqueous solutions onto granular
activated carbon derived from Mangostana garcinia shell. BioResources, 7(3):2895-2915.
Christie, R. M. (2001). Colour chemistry. Royal Society of Chemistry.
Chung, Y. C., & Chen, C. Y. (2009). Degradation of azo dye reactive violet 5 by TiO2
photocatalysis. Environmental Chemistry Letters, 7(4):347-352.

Corso, C. R., Almeida, E. J. R., Santos, G. C., Morão, L. G., Fabris, G. S. L., & Mitter, E. K.
(2012). Bioremediation of direct dyes in simulated textile effluents by a paramorphogenic
form of Aspergillus oryzae. Water Science and Technology, 65(8):1490-1495.
Costa, V. V., Jacinto, M. J., Rossi, L. M., Landers, R., & Gusevskaya, E. V. (2011). Aerobic
oxidation of monoterpenic alcohols catalyzed by ruthenium hydroxide supported on silica-
coated magnetic nanoparticles. Journal of Catalysis, 282(1):209-214.
Couto, S. R. (2009). Dye removal by immobilised fungi. Biotechnology Advances, 27(3):227-
235.
Daassi, D., Zouari-Mechichi, H., Frikha, F., Rodríguez-Couto, S., Nasri, M., & Mechichi, T.
(2016). Sawdust waste as a low-cost support-substrate for laccases production and
adsorbent for azo dyes decolorization. Journal of Environmental Health Science and
Engineering, 14(1):1.
Dahri, M. K., Kooh, M. R. R., & Lim, L. B. (2014). Water remediation using low cost adsorbent
walnut shell for removal of malachite green: equilibrium, kinetics, thermodynamic and
regeneration studies. Journal of Environmental Chemical Engineering, 2(3):1434-1444.
Damodhar, U., & Reddy, M. V. (2013). Impact of pharmaceutical industry treated effluents on
the water quality of river Uppanar, South east coast of India: a case study. Applied Water
Science, 3(2):501-514.
Daneshvar, N., Ayazloo, M., Khataee, A. R., & Pourhassan, M. (2007). Biological
decolorization of dye solution containing Malachite Green by microalgae Cosmarium sp.
Bioresource Technology, 98(6):1176-1182.
Das, A., & Mishra, S. (2016). Decolorization of different textile azo dyes using an isolated
bacterium Enterococcus durans GM13. International Journal of Current Microbiology and
Applied Sciences, 5(7):676-686.
Das, A., & Mishra, S. (2017). Removal of textile dye reactive green-19 using bacterial
consortium: process optimization using response surface methodology and kinetics study.
Journal of Environmental Chemical Engineering, 5(1):612-627.
Dattaray, D. V. (2015). Physico-Chemical Analysis of Ground Water of Man Tahsil From
Maharashtra. Rasayan Journal of Chemistry, 8(3): 355-361.
Dave, S. R., Patel, T. L., & Tipre, D. R. (2015). Bacterial degradation of azo dye containing
wastes. In Microbial Degradation of Synthetic Dyes in Wastewaters (pp. 57-83). Springer,
Cham.

Dawkar, V. V., Jadhav, U. U., Jadhav, S. U., & Govindwar, S. P. (2008). Biodegradation of
disperse textile dye Brown 3REL by newly isolated Bacillus sp. VUS. Journal of Applied
Microbiology, 105(1):14-24.
De Aragao Umbuzeiro, G., Freeman, H. S., Warren, S. H., De Oliveira, D. P., Terao, Y.,
Watanabe, T., & Claxton, L. D. (2005). The contribution of azo dyes to the mutagenic
activity of the Cristais River. Chemosphere, 60(1):55-64.
De Aragao Umbuzeiro, G., Freeman, H., Warren, S. H., Kummrow, F., & Claxton, L. D.
(2005). Mutagenicity evaluation of the commercial product CI Disperse Blue 291 using
different protocols of the Salmonella assay. Food and Chemical Toxicology, 43(1):49-56.
De Souza Lima, M. M., & Borsali, R. (2004). Rodlike cellulose microcrystals: structure,
properties, and applications. Macromolecular Rapid Communications, 25(7):771-787.
Dereeper, A., Guignon, V., Blanc, G., Audic, S., Buffet, S., Chevenet, F., ... & Claverie, J. M.
(2008). Phylogeny. fr: robust phylogenetic analysis for the non-specialist. Nucleic Acids
Research, 36(2): 465-469.
Desai, P. A., & Kore, V. S. (2011). Performance evaluation of effluent treatment plant for
textile industry in Kolhapur of Maharashtra. Universal Journal of Environmental Research
and Technology, 1(4):560-565.
Devi, S., Murugappan, A., & Rajesh Kannan, R. (2015). Sorption of Reactive blue 19 onto
freshwater algae and seaweed. Desalination and Water Treatment, 54(9):2611-2624.
Dhanam, S. (2009). Effect of dairy effluent on seed germination, seedling growth and
biochemical parameter in Paddy. International Journal of Botany and Research, 2(2): 61-
63.
Dhanve, R. S., Shedbalkar, U. U., & Jadhav, J. P. (2008). Biodegradation of diazo reactive dye
Navy Blue HE2R (Reactive Blue 172) by an isolated Exiguobacterium sp. RD3.
Biotechnology and Bioprocess Engineering, 13(1):53-60.
Dos Santos, A. B., Bisschops, I. A. E., & Cervantes, F. J. (2006). Closing process water cycles
and product recovery in textile industry: perspective for biological treatment. Advanced
Biological Treatment Processes for Industrial Wastewaters, 1:298-320.
Dotto, G. L., Lima, E. C., & Pinto, L. A. A. (2012). Biosorption of food dyes onto Spirulina
platensis nanoparticles: equilibrium isotherm and thermodynamic analysis. Bioresource
Technology, 103(1): 123-130.
Edgar, R. C. (2004). MUSCLE: multiple sequence alignment with high accuracy and high
throughput. Nucleic Acids Research, 32(5): 1792-1797.

Ekambaram, S. P., Perumal, S. S., & Annamalai, U. (2016). Decolorization and biodegradation
of remazol reactive dyes by Clostridium species. 3 Biotech, 6(1):20.
El-Ashtoukhy, E. S. Z., El-Taweel, Y. A., Abdelwahab, O., & Nassef, E. M. (2013). Treatment
of petrochemical wastewater containing phenolic compounds by electrocoagulation using
a fixed bed electrochemical reactor. International Journal of Electrochemical Sciences,
8(1): 1534-1550.
Elisangela, F., Andrea, Z., Fabio, D. G., de Menezes Cristiano, R., Regina, D. L., & Artur, C.
P. (2009). Biodegradation of textile azo dyes by a facultative Staphylococcus arlettae strain
VN-11 using a sequential microaerophilic/aerobic process. International Biodeterioration
& Biodegradation, 63(3): 280-288.
Eslami, M., Amoozegar, M. A., & Asad, S. (2016). Isolation, cloning and characterization of
an azoreductase from the halophilic bacterium Halomonas elongata. International journal
of biological Macromolecules, 85: 111-116.
Ezhilarasu, A. (2016). Textile industry Dye degrading by bacterial strain Bacillus sp.
International Journal of Advanced Research in Biological Sciences, 3(3): 211-226.
Fajardo, T., Pinilla, P., Bojaca, V., Pinilla, R., Ortíz, J., & Acevedo Pabón, P. A. (2016). Life
Cycle Assessment to Identify Environmental Improvements in an Aerobic Waste Water
Treatment Plant. Chemical Engineering Transactions, 49:493-498.
Falavarjani, E. R., Khorasani, A. C., & Ghoreishi, S. M. (2012). Microbial Reduction of
Monoazo and Diazo-linked Dyes by Pseudomonas aeruginosa and Pseudomonas putida.
Journal of Pure and Applied Microbiology 6:1559-1570.
Favier, V., Chanzy, H., & Cavaille, J. Y. (1995). Polymer nanocomposites reinforced by
cellulose whiskers. Macromolecules, 28(18):6365-6367.
Feitkenhauer, H. (2003). Anaerobic digestion of desizing wastewater: influence of
pretreatment and anionic surfactant on degradation and intermediate accumulation.
Enzyme and Microbial Technology, 33(2-3):250-258.
Foo, K. Y., & Hameed, B. H. (2012). Dynamic adsorption behavior of methylene blue onto oil
palm shell granular activated carbon prepared by microwave heating. Chemical
Engineering Journal, 203:81-87.
Forgacs, E., Cserhati, T., and Oros, G. (2004). Removal of synthetic dyes from wastewaters: a
review. Environment International, 30(7):953-971.
Franciscon, E., Grossman, M. J., Paschoal, J. A. R., Reyes, F. G. R., & Durrant, L. R. (2012).
Decolorization and biodegradation of reactive sulfonated azo dyes by a newly isolated
Brevibacterium sp. strain VN-15. SpringerPlus, 1(1):37.
Gaehr, F., Hermanutz, F., & Oppermann, W. (1994). Ozonation–an important technique to
comply with new German laws for textile wastewater treatment. Water Science and
Technology, 30(3):255-263.
Garg, R. K., Rao, R. J., Uchchariya, D., Shukla, G., & Saksena, D. N. (2010). Seasonal
variations in water quality and major threats to Ramsagar reservoir, India. African Journal
of Environmental Science and Technology, 4(2).
Garg, S., Singla, C., & Aggarwal, R. (1970). Evaluation of groundwater quality using
contamination index in Ludhiana, Punjab (India). I Control Pollution, 31(1): 33-39.
Gausa, S., & Abubakar, E. (2015). Tie-Dye (adire) among the jukun people. Mgbakoigba:
Journal of African Studies, 4:1-13.
Gehrke, I., Geiser, A., & Somborn-Schulz, A. (2015). Innovations in nanotechnology for water
treatment. Nanotechnology, Science and Applications, 8:1.
Genisheva, Z., Mussatto, S. I., Oliveira, J. M., & Teixeira, J. A. (2011). Evaluating the potential
of wine-making residues and corn cobs as support materials for cell immobilization for
ethanol production. Industrial Crops and Products, 34(1):979-985.
Ghaly, A. E., Ananthashankar, R., Alhattab, M. V. V. R., & Ramakrishnan, V. V. (2014).
Production, characterization and treatment of textile effluents: a critical review. Journal of
Chemical Engineering Process and Technology, 5(1):1-19.
Ghodake, G., Jadhav, U., Tamboli, D., Kagalkar, A., & Govindwar, S. (2011). Decolorization
of textile dyes and degradation of mono-azo dye amaranth by Acinetobacter calcoaceticus
NCIM 2890. Indian Journal of Microbiology, 51(4):501-508.
Gholami-Borujeni, F., Faramarzi, M. A., Nejatzadeh-Barandozi, F., & Mahvi, A. H. (2013).
Oxidative degradation and detoxification of textile azo dye by horseradish peroxidase
enzyme. Fresenius Environmental Bulletin, 22(3):739-744.
Goel, J., Kadirvelu, K., Rajagopal, C., and Garg, V. K. (2005). Removal of lead (II) by
adsorption using treated granular activated carbon: batch and column studies. Journal of
Hazardous Materials, 125(1):211-220.
Golka, K., Heitmann, P., Gieseler, F., Hodzic, J., Masche, N., Bolt, H. M., & Geller, F. (2008).
Elevated bladder cancer risk due to colorants—A statewide case-control study in North
Rhine-Westphalia, Germany. Journal of Toxicology and Environmental Health, Part A,
71(13-14):851-855.
Gomare, S. S., and Govindwar, S. P. (2009). Brevibacillus laterosporus MTCC 2298: a
potential azo dye degrader. Journal of Applied Microbiology, 106(3):993-1004.

Gopinath, K. P., Murugesan, S., Abraham, J., & Muthukumar, K. (2009). Bacillus sp. mutant
for improved biodegradation of Congo red: random mutagenesis approach. Bioresource
Technology, 100(24):6295-6300.
Gou, M., Qu, Y., Zhou, J., Ma, F., & Tan, L. (2009). Azo dye decolorization by a new fungal
isolate, Penicillium sp. QQ and fungal-bacterial cocultures. Journal of Hazardous
Materials, 170(1):314-319.
Gudmalwar R, M., & Kamble, L. H. Biodegradation of reactive red 4E8Y5 by using
Providencia spp. RMG1 and Bacillus spp. RMG2. Journal of Scientific Research and
Reports., 2: 178-188.
Gulati, D., & Jha, I. (2014). Microbial Decolourization of dye reactive blue 19 by bacteria
isolated from dye effluent contaminated soil. International Journal of Current Microbiology
and Applied Sciences, 3(9):913-922.
Gurumayum, S. D., Daimari, P., Goswami, B. S. J., Sarkar, A., and Chaudhury, M. (2002).
Physico-chemical qualities of water and plankton of selected rivers in Meghalaya. Journal
of the Inland Fishries Society of India,34(2):36–42.
Hamdaoui, O. (2006). Dynamic sorption of methylene blue by cedar sawdust and crushed brick
in fixed bed columns. Journal of Hazardous Materials, 138(2), 293-303.
Han, R., Wang, Y., Zhao, X., Wang, Y., Xie, F., Cheng, J., and Tang, M. (2009). Adsorption
of methylene blue by phoenix tree leaf powder in a fixed-bed column: experiments and
prediction of breakthrough curves. Desalination, 245(1-3):284-297.
Harazono, K., Watanabe, Y., and Nakamura, K. (2003). Decolorization of azo dye by the white-
rot basidiomycete Phanerochaete sordida and by its manganese peroxidase. Journal of
Bioscience and Bioengineering, 95(5):455-459.
Hari, O. S., Nepal, M. S. Aryo, and Singh, N. (1994). Combined effect of waste of distillery
and sugar mill on seed germination, seeding growth and biomass of okra. Journal of
Environmental Biology, 3(15):171-175.
Hasan, S. H., Ranjan, D., and Talat, M. (2010). Agro-industrial waste ‘wheat bran’for the
biosorptive remediation of selenium through continuous up-flow fixed-bed column. Journal
of Hazardous Materials, 181(1):1134-1142.
He, S., Zhong, L., Duan, J., Feng, Y., Yang, B., & Yang, L. (2017). Bioremediation of
Wastewater by Iron Oxide-Biochar Nanocomposites Loaded with Photosynthetic Bacteria.
Frontiers in Microbiology, 8:823.
Hemapriya, J., & Vijayanand, S. (2014). Ecofriendly bioremediation of a triphenylmethane dye
by textile effluent adapted bacterial strain vp-64. International Journal of Current
Microbiology Applied Science, 3(9):983-992.
Hill, D. D., Owens, W. E., & Tchounwou, P. B. (2005). Comparative assessment of the
physico-chemical and bacteriological qualities of selected streams in Louisiana.
International Journal of Environmental Research and Public Health, 2(1):94-100.
Holkar, C. R., Jadhav, A. J., Pinjari, D. V., Mahamuni, N. M., & Pandit, A. B. (2016). A critical
review on textile wastewater treatments: possible approaches. Journal of Environmental
Management, 182:351-366.
Hosseinnia, A., Keyanpour-Rad, M., & Pazouki, M. (2010). Photo-catalytic degradation of
organic dyes with different chromophores by synthesized nanosize TiO2 particles. World
Applied Sciences Journal, 8(11):1327-1332.
Hosseinzadeh, P., Mirts, E. N., Pfister, T. D., Gao, Y. G., Mayne, C., Robinson, H., ... & Lu,
Y. (2016). Enhancing Mn (II)-binding and manganese peroxidase activity in a designed
cytochrome c peroxidase through fine-tuning secondary-sphere interactions. Biochemistry,
55(10):1494-1502.
Huang, H. C., and Erickson, R. S. (2007). Effect of Seed Treatment with Rhizobium
leguminosarum on Pythium Damping‐off, Seedling Height, Root Nodulation, Root
Biomass, Shoot Biomass, and Seed Yield of Pea and Lentil. Journal of Phytopathology,
155(1):31-37.
Hutchins, R. A. (1973). New method simplifies design of activated-carbon systems. Chemical
Engineering, 80(19):133-138.
Imran, M., Hafiz, M. A., Asghar, N., Asghar, M., & Crowley, D. E. (2014). Potential of
Shewanella sp. strain IFN4 to decolorize azo dyes under optimal conditions. International
Journal of Agriculture and Biology, 16(3): 578-584.
Isik, M., & Sponza, D. T. (2003). Effect of oxygen on decolorization of azo dyes by
Escherichia coli and Pseudomonas sp. and fate of aromatic amines. Process Biochemistry,
38(8):1183-1192.
Islam, S. M. D., & Huda, M. E. (2016). Water pollution by industrial effluent and
phytoplankton diversity of Shitalakhya River, Bangladesh. Journal of Scientific Research,
8(2):191-198.
Jadhav, J. P., Phugare, S. S., Dhanve, R. S., and Jadhav, S. B. (2010). Rapid biodegradation
and decolorization of Direct Orange 39 (Orange TGLL) by an isolated bacterium
Pseudomonas aeruginosa strain BCH. Biodegradation, 21(3):453-463.

Jadhav, S. U., Ghodake, G. S., Telke, A. A., Tamboli, D. P., and Govindwar, S. P. (2009).
Degradation and detoxification of disperse dye Scarlet RR by Galactomyces geotrichum
MTCC 1360. Journal of Microbiology and Biotechnology, 19:409-415.
Jadhav, S. U., Kalme, S. D., and Govindwar, S. P. (2008). Biodegradation of methyl red by
Galactomyces geotrichum MTCC 1360. International Biodeterioration and
Biodegradation, 62(2):135-142.
Jain, K., Shah, V., Chapla, D., and Madamwar, D. (2012). Decolorization and degradation of
azo dye–Reactive Violet 5R by an acclimatized indigenous bacterial mixed cultures-SB4
isolated from anthropogenic dye contaminated soil. Journal of Hazardous Materials, 213:
378-386.
Jameel, A. A. (2002). Evaluation of drinking water quality in Tiruchirapalli, Tamil Nadu.
Indian Journal of Environmental Health, 44(2):108-112.
Jayanthy, V., Geetha, R., Rajendran, R., Prabhavathi, P., Sundaram, S. K., Kumar, S. D., &
Santhanam, P. (2014). Phytoremediation of dye contaminated soil by Leucaena
leucocephala (subabul) seed and growth assessment of Vigna radiata in the remediated
soil. Saudi Journal of Biological Sciences, 21(4):324-333.
Jindal, R., and Rumana, H. S. (2000). Biomonitoring of water pollution in Western Yamuna
Canal at Yamunanagar, Haryana. Journal of Punjab Accademy of Sciences,2(1): 177–182.
Joe, M. H., Lim, S. Y., Kim, D. H., and Lee, I. S. (2008). Decolorization of reactive dyes by
Clostridium bifermentans SL186 isolated from contaminated soil. World Journal of
Microbiology and Biotechnology, 24(10): 2221-2226.
Kabra, A. N., Khandare, R. V., Waghmode, T. R., and Govindwar, S. P. (2011). Differential
fate of metabolism of a sulfonated azo dye Remazol Orange 3R by plants Aster amellus
Linn., Glandularia pulchella (Sweet) Tronc. and their consortium. Journal of Hazardous
Materials, 190(1): 424-431.
Kadam, A. A., Telke, A. A., Jagtap, S. S., and Govindwar, S. P. (2011). Decolorization of
adsorbed textile dyes by developed consortium of Pseudomonas sp. SUK1 and Aspergillus
ochraceus NCIM-1146 under solid state fermentation. Journal of Hazardous Materials,
189(1): 486-494.
Kalme, S., Ghodake, G., & Govindwar, S. (2007). Red HE7B degradation using desulfonation
by Pseudomonas desmolyticum NCIM 2112. International Biodeterioration &
Biodegradation, 60(4): 327-333.
Kalyani, D. C., Patil, P. S., Jadhav, J. P., and Govindwar, S. P. (2008). Biodegradation of
reactive textile dye Red BLI by an isolated bacterium Pseudomonas sp. SUK1. Bioresource
Technology, 99(11):4635-4641.
Kanagaraj, J., & Mandal, A. B. (2012). Combined biodegradation and ozonation for removal
of tannins and dyes for the reduction of pollution loads. Environmental Science and
Pollution Research, 19(1): 42-52.
Kannan, N., and Sundaram, M. M. (2001). Kinetics and mechanism of removal of methylene
blue by adsorption on various carbons—a comparative study. Dyes and Pigments, 51(1):
25-40.
Karacakaya, P., Kılıç, N. K., Duygu, E., & Dönmez, G. (2009). Stimulation of reactive dye
removal by cyanobacteria in media containing triacontanol hormone. Journal of Hazardous
Materials, 172(2-3):1635-1639.
Karatay, S. E., Kilic, N. K., and Donmez, G. (2015). Removal of Remazol Blue by azoreductase
from newly isolated bacteria. Ecological Engineering, 84:301-304.
Kaushik, P., and Malik, A. (2009). Microbial decolourization of textile dyes through isolates
obtained from contaminated sites. Journal of Scientific and Industrial Research, 68: 325-
331.
Kavitha, D., and Namasivayam, C. (2007). Recycling coir pith, an agricultural solid waste, for
the removal of procion orange from wastewater. Dyes and Pigments, 74(1):237-248.
Khadijah, O., Lee, K. K., and Mohd Faiz, F. A. (2009). Isolation, screening and development
of local bacterial consortia with azo dyes decolourising capability. Malaysian Journal of
Microbiology, 5(1): 25-32.
Khalid, A., Arshad, M., and Crowley, D. E. (2008). Accelerated decolorization of structurally
different azo dyes by newly isolated bacterial strains. Applied Microbiology and
Biotechnology, 78(2): 361-369.
Khambete, A. K., and Christian, R. A. (2014). Statistical analysis to identify the main
parameters to effecting WWQI of sewage treatment plant and predicting BOD.
International Journal of Research in Engineering and Technology, 3(1):186-195.
Khan, S., & Malik, A. (2015). Degradation of Reactive Black 5 dye by a newly isolated
bacterium Pseudomonas entomophila BS1. Canadian journal of microbiology, 62(3):220-
232.
Khan, R., Bhawana, P., and Fulekar, M. H. (2013). Microbial decolorization and degradation
of synthetic dyes: a review. Reviews in Environmental Science and Bio/Technology, 12(1):
75-97.

Khan, S., and Malik, A. (2014). Environmental and health effects of textile industry
wastewater. In Environmental Deterioration and Human Health (pp. 55-71). Springer
Netherlands.
Khandare, R. V., & Govindwar, S. P. (2015). Phytoremediation of textile dyes and effluents:
Current scenario and future prospects. Biotechnology Advances, 33(8): 1697-1714.
Khehra, M. S., Saini, H. S., Sharma, D. K., Chadha, B. S., and Chimni, S. S. (2005).
Decolorization of various azo dyes by bacterial consortium. Dyes and Pigments, 67(1): 55-
61.
Khojare, A. S., Kadu, A. B., Wasnik, P. G., Patil, M. R., & Khojare, B. (2005). Adaptability of
membranes for dairy waste management. Asian Journal of Experimental Sciences, 19(2):
105-112.
Kilic, N. K., & Donmez, G. (2012). Remazol blue removal and EPS production by
Pseudomonas aeruginosa and Ochrobactrum sp. Polish Journal of Environmental Studies,
21(1): 123-128.
Kim, S. H., Kim, T. W., Cho, D. L., Lee, D. H., Kim, J. C., & Moon, H. (2002). Application
of characterization procedure in water and wastewater treatment by adsorption. Korean
Journal of Chemical Engineering, 19(5): 895-902.
Kim, S. Y., Park, C., Kim, T.-K., Lee, J., and Kim, S. W. (2003). COD Reduction and
Decolorization of Textile Effluent Using a Combined Process. Journal of Bioscience and
Bioengineering, 95(1):102–105.
Kimura, M. (1980). A simple method for estimating evolutionary rates of base substitutions
through comparative studies of nucleotide sequences. Journal of molecular evolution,
16(2): 111-120.
Kirk, T. K., and Farrell, R. L. (1987). Enzymatic" combustion": the microbial degradation of
lignin. Annual Reviews in Microbiology, 41(1): 465-501.
Ko, D. C., Porter, J. F., and McKay, G. (2000). Optimised correlations for the fixed-bed
adsorption of metal ions on bone char. Chemical Engineering Science, 55(23): 5819-5829.
Kochher, S., & Kumar, J. (2011). Microbial decolourization of crystal violet by Bacillus
subtilis. In Biological Forum-An International Journal, 3(1): 82-86.
Kolekar, Y. M., Pawar, S. P., Gawai, K. R., Lokhande, P. D., Shouche, Y. S., and Kodam, K.
M. (2008). Decolorization and degradation of Disperse Blue 79 and Acid Orange 10, by
Bacillus fusiformis KMK5 isolated from the textile dye contaminated soil. Bioresource
Technology, 99(18): 8999-9003.

Konwar, D., and Jha, D. K. (2010). Response of Rice (Oryza sativa L.) to Contamination of
Soil with Refinery Effluents under Natural Conditions. Assam University Journal of
Science and Technology, 5(1): 14-22.
Kuhad, R. C., Sood, N., Tripathi, K. K., Singh, A., and Ward, O. P. (2004). Developments in
microbial methods for the treatment of dye effluents. Advances in Applied Microbiology,
56: 185.
Kumar, K. V., Sivanesan, S., & Ramamurthi, V. (2005). Adsorption of malachite green onto
Pithophora sp., a fresh water alga: equilibrium and kinetic modelling. Process
Biochemistry, 40(8): 2865-2872.
Kumar, S. K., Babu, S. H., Rao, P. E., Selvakumar, S., Thivya, C., Muralidharan, S., and
Jeyabal, G. (2016). Evaluation of water quality and hydrogeochemistry of surface and
groundwater, Tiruvallur District, Tamil Nadu, India. Applied Water Science, 1: 12.
Kumar, S. K., Babu, S. H., Rao, P. E., Selvakumar, S., Thivya, C., Muralidharan, S., and
Jeyabal, G. (2017). Evaluation of water quality and hydrogeochemistry of surface and
groundwater, Tiruvallur District, Tamil Nadu, India. Applied Water Science, 7(5): 2533-
2544.
Kundu, S., & Gupta, A. K. (2005). Analysis and modeling of fixed bed column operations on
As (V) removal by adsorption onto iron oxide-coated cement (IOCC). Journal of Colloid
and Interface Science, 290(1): 52-60.
Kurade, M. B., Waghmode, T. R., Kagalkar, A. N., and Govindwar, S. P. (2012).
Decolorization of textile industry effluent containing disperse dye Scarlet RR by a newly
developed bacterial-yeast consortium BL-GG. Chemical Engineering Journal, 184: 33-41.
Lade, H. S., Waghmode, T. R., Kadam, A. A., and Govindwar, S. P. (2012). Enhanced
biodegradation and detoxification of disperse azo dye Rubine GFL and textile industry
effluent by defined fungal-bacterial consortium. International Biodeterioration and
Biodegradation, 72: 94-107.
Leena, R., and Selva, R. D. (2008). Bio-decolourization of textile effluent containing Reactive
Black-B by effluent-adapted and non-adapted bacteria. African Journal of Biotechnology,
7: 18-28.
Leng, L., Yuan, X., Zeng, G., Shao, J., Chen, X., Wu, Z., ... and Peng, X. (2015). Surface
characterization of rice husk bio-char produced by liquefaction and application for cationic
dye (Malachite green) adsorption. Fuel, 155: 77-85.
Li, R., Ning, X. A., Sun, J., Wang, Y., Liang, J., Lin, M., & Zhang, Y. (2015). Decolorization
and biodegradation of the Congo red by Acinetobacter baumannii YNWH 226 and its
polymer production’s flocculation and dewatering potential. Bioresource Technology, 194:
233-239.
Li, F. T., Yang, H., Zhao, Y., and Xu, R. (2007). Novel modified pectin for heavy metal
adsorption. Chinese Chemical Letters, 18(3): 325-328.
Liang, S., Guo, X., Feng, N., and Tian, Q. (2010). Isotherms, kinetics and thermodynamic
studies of adsorption of Cu 2+ from aqueous solutions by Mg 2+/K+ type orange peel
adsorbents. Journal of Hazardous Materials, 174(1): 756-762.
Lin, J., Zhang, X., Li, Z., & Lei, L. (2010). Biodegradation of Reactive blue 13 in a two-stage
anaerobic/aerobic fluidized beds system with a Pseudomonas sp. isolate. Bioresource
Technology, 101(1): 34-40.
Liu, W., Liu, L., Liu, C., Hao, Y., Yang, H., Yuan, B., & Jiang, J. (2016). Methylene blue
enhances the anaerobic decolorization and detoxication of azo dye by Shewanella
onediensis MR-1. Biochemical Engineering Journal, 110: 115-124.
Liu, X., Zhang, Y., Li, Z., Feng, R., and Zhang, Y. (2014). Characterization of corncob-derived
biochar and pyrolysis kinetics in comparison with corn stalk and sawdust. Bioresource
Technology, 170: 76-82.
Lodha, S., Jain, A., & Punjabi, P. B. (2010). A comparative study of photocatalytic degradation
of methylene blue in presence of some transition metal complexes and hydrogen peroxide.
Malaysian Journal of Chemistry, 120: 19-26.
Maddhinni, V. L., Vurimindi, H. B., & Yerramilli, A. (2013). Degradation of azo dye with
horse radish peroxidase (HRP). Journal of the Indian Institute of Science, 86(5):507.
Madhusudhana, N., Yogendra, K., Mahadevan, K. M., and Naik, S. (2011). Photocatalytic
degradation of Coralene Dark Red 2B azo dye using calcium zincate nanoparticle in
presence of natural sunlight: an aid to environmental remediation. International Journal of
Chemical Engineering and Applications, 2(4): 294-298.
Maier, J., Kandelbauer, A., Erlacher, A., Cavaco-Paulo, A., and Gübitz, G. M. (2004). A new
alkali-thermostable azoreductase from Bacillus sp. strain SF. Applied and Environmental
Microbiology, 70(2): 837-844.
Malhotra, V., Shah, B. S., and Sabharwal, S. (2001). Pattern of cancer in Dayanand Medical
College and Hospital, Ludhiana (a ten-year retrospective study). Indian Journal of
Pathology and Microbiology, 44(1): 27-30.
Malik, P. K. (2003). Use of activated carbons prepared from sawdust and rice-husk for
adsorption of acid dyes: a case study of Acid Yellow 36. Dyes and Pigments, 56(3): 239-
249.

Marungrueng, K., & Pavasant, P. (2007). High performance biosorbent (Caulerpa lentillifera)
for basic dye removal. Bioresource Technology, 98(8): 1567-1572.
Maurya, P. K., Zaidi, J., & Pal, A. (2012). Physico-chemical properties of Barua Sagar lake
water, Jhansi, Uttar Pradesh India. Elixir Pollution, 42: 6355-6359.
Melgoza, R. M., Cruz, A., and Buitron, G. (2004). Anaerobic/aerobic treatment of colorants
present in textile effluents. Water Science and Technology, 50(2): 149-155.
Miyah, Y., Lahrichib, A., and Idrissi, M. (2016). Removal of cationic dye–methylene blue–
from aqueous solution by adsorption onto corn cob powder calcined. Journal of Material
and Environmental Science, 7(1): 96-104.
Modi, S., Pathak, B., & Fulekar, M. H. (2015). Microbial synthesized silver nanoparticles for
decolorization and biodegradation of azo dye compound. Journal of Environmental
Nanotechnology 4(2): 37-46.
Mohabansi, N. P., Tekade, P. V., and Bawankar, S. V. (2011). Physico-chemical parameters of
textile mill effluent, Hinganghat, Dist. Wardha (MS). Current World Environment, 6(1):
165-168.
Mohamed, W. S. (2016). Isolation and screening of reactive dye decolorizing bacterial isolates
from textile industry effluent. International Journal of Microbiology Research, 7(1): 01-08.
Moosvi, S., Keharia, H., and Madamwar, D. (2005). Decolourization of textile dye Reactive
Violet 5 by a newly isolated bacterial consortium RVM 11.1. World Journal of
Microbiology and Biotechnology, 21(5): 667-672.
More, S. S., PS, R., & Malini, S. (2011). Isolation, purification, and characterization of fungal
laccase from Pleurotus sp. Enzyme research, 2011: 1-7.
Morrison, J., Dai, S., Ren, J., Taylor, A., Wilkerson, M., John, G., & Xie, A. (2014). Structure
and Stability of an Azoreductase with FAD Cofactor from the Strict Anaerobe Clostridium
perfringens. Protein and peptide letters, 21(6): 523-534.
Morrison, J. M., & John, G. H. (2016). Growth and physiology of Clostridium perfringens
wild-type and ΔazoC knockout: an azo dye exposure study. Microbiology, 162(2): 330-
338.
Muda, K., Aris, A., Salim, M. R., & Ibrahim, Z. (2013). Sequential anaerobic-aerobic phase
strategy using microbial granular sludge for textile wastewater treatment. In Biomass Now-
Sustainable Growth and Use. InTech.
Murugesan, K., & Kalaichelvan, P. T. (2003). Synthetic dye decolourization by white rot fungi.
Journal of Experimental Biology, 41:1076-1087.
Ngulube, T., Gumbo, J. R., Masindi, V., & Maity, A. (2017). An update on synthetic dyes
adsorption onto clay based minerals: A state-of-art review. Journal of Environmental
Management, 191: 35-57.
Nguyen, T. A., Fu, C. C., & Juang, R. S. (2016). Biosorption and biodegradation of a sulfur
dye in high-strength dyeing wastewater by Acidithiobacillus thiooxidans. Journal of
Environmental Management, 182: 265-271.
Nikam, P. S., Jagtap, G. P., and Sontakke, P. L. (2007). Management of chickpea wilt caused
by Fusarium oxysporium f. sp. ciceri. African Journal of Agricultural Research, 2(12): 692-
697.
Novotny, C., Dias, N., Kapanen, A., Malachová, K., Vándrovcová, M., Itävaara, M., & Lima,
N. (2006). Comparative use of bacterial, algal and protozoan tests to study toxicity of azo-
and anthraquinone dyes. Chemosphere, 63(9): 1436-1442.
Nwadiogbu, J. O., Ajiwe, V. I. E., & Okoye, P. A. C. (2016). Removal of crude oil from
aqueous medium by sorption on hydrophobic corncobs: Equilibrium and kinetic studies.
Journal of Taibah University for Science, 10(1): 56-63.
Oak, U., Ghattargi, V., Pawar, S., & Bhole, B. Degradation of Drimarene Red, a reactive textile
dye by an extremophilic Bacillus sp. isolated from fresh water. International Journal of
Applied and Pure Science and Agriculture, 2: 105-113.
Ogugbue, C. J., & Sawidis, T. (2011). Bioremediation and detoxification of synthetic
wastewater containing triarylmethane dyes by Aeromonas hydrophila isolated from
industrial effluent. Biotechnology Research International, 2011: 1-11.
Ogunlaja, O. O., and Aemere, O. (2009). Evaluating the efficiency of a textile wastewater
treatment plant located in Oshodi, Lagos. African Journal of Pure and Applied Chemistry,
3(10): 189-196.
Oliveira, E. E., Silva, A. E., Júnior, T. N., Gomes, M. C. S., Aguiar, L. M., Marcelino, H. R.,
... and Egito, E. S. T. (2010). Xylan from corn cobs, a promising polymer for drug delivery:
Production and characterization. Bioresource Technology, 101(14): 5402-5406.
Olukanni, O. D., Osuntoki, A. A., and Gbenle, G. O. (2006). Textile effluent biodegradation
potentials of textile effluent-adapted and non-adapted bacteria. African Journal of
Biotechnology, 5(20): 837-844.
Olutiola, P.O., O. Famurewa and H.G. Sonntag, 2000. Introduction to General Microbiology:
A Practical Approach. 2nd Edn., Bolabay Publications, Ikeja, Nigeria.
Omar, H. H. (2008). Algal decolorization and degradation of monoazo and diazo dyes. Pakistan
Journal of Biological Sciences 11(10): 1310-1316.
Ortiz, E., Solis, H., Noreña, L., and Loera-Serna, S. (2017). Degradation of Red Anthraquinone
Dyes: Alizarin, Alizarin S and Alizarin Complexone by Ozonation. International Journal
of Environmental Science and Development, 8(4): 255.
Oturkar, C. C., Patole, M. S., Gawai, K. R., & Madamwar, D. (2013). Enzyme based cleavage
strategy of Bacillus lentus BI377 in response to metabolism of azoic recalcitrant.
Bioresource Technology, 130: 360-365.
Ozer, A., Akkaya, G., & Turabik, M. (2006). The removal of Acid Red 274 from wastewater:
combined biosorption and biocoagulation with Spirogyra rhizopus. Dyes and Pigments,
71(2): 83-89.
Padmesh, T. V. N., Vijayaraghavan, K., Sekaran, G., and Velan, M. (2006). Biosorption of
Acid Blue 15 using fresh water macroalga Azolla filiculoides: Batch and column studies.
Dyes and Pigments, 71(2): 77-82.
Pakshirajan, K., & Swaminathan, T. (2009). Biosorption of copper and cadmium in packed bed
columns with live immobilized fungal biomass of Phanerochaete chrysosporium. Applied
Biochemistry and Biotechnology, 157(2): 159.
Pal, S., & Vimala, Y. (2012). Bioremediation and decolorization of Distillery effluent by novel
Microbial Consortium. European Journal of Experimental Biology, 2(3): 496-504.
Palanivelan, R., Rajakumar, S., & Ayyasamy, P. M. (2014). Effect of various carbon and
nitrogen sources on decolorization of textile dye remazol golden yellow using bacterial
species. Journal of Environmental Biology, 35(5): 781.
Paliwal, R., Uniyal, S., and Rai, J. P. N. (2015). Evaluating the potential of immobilized
bacterial consortium for black liquor biodegradation. Environmental Science and Pollution
Research, 22(9): 6842-6853.
Pan, H., Xu, X., Wen, Z., Kang, Y., Wang, X., Ren, Y., & Huang, D. (2017). Decolorization
pathways of anthraquinone dye Disperse Blue 2BLN by Aspergillus sp. XJ-2
CGMCC12963. Bioengineered, 8(5): 630-641.
Pandey, A., Singh, P., & Iyengar, L. (2007). Bacterial decolorization and degradation of azo
dyes. International Biodeterioration & Biodegradation, 59(2): 73-84.
Pandey, A. K., & Dubey, V. (2012). Biodegradation of azo dye Reactive Red BL by
Alcaligenes sp. AA09. International Journal of Engineering Science, 1(12): 51-60.
Panswad, T., & Luangdilok, W. (2000). Decolorization of reactive dyes with different
molecular structures under different environmental conditions. Water Research, 34(17):
4177-4184.
Parshetti, G., Kalme, S., Saratale, G., and Govindwar, S. (2006). Biodegradation of Malachite
Green by Kocuria rosea MTCC 1532. Acta Chimica Slovenica, 53(4).
Pasquali, C. L., and Herrera, H. (1997). Pyrolysis of lignin and IR analysis of residues.
Thermochimica Acta, 293(1-2): 39-46.
Pathak, V. V., Kothari, R., Chopra, A. K., & Singh, D. P. (2015). Experimental and kinetic
studies for phycoremediation and dye removal by Chlorella pyrenoidosa from textile
wastewater. Journal of Environmental Management, 163: 270-277.
Patil, S. M., Chandanshive, V. V., Rane, N. R., Khandare, R. V., Watharkar, A. D., &
Govindwar, S. P. (2016). Bioreactor with Ipomoea hederifolia adventitious roots and its
endophyte Cladosporium cladosporioides for textile dye degradation. Environmental
Research, 146: 340-349.
Patowary, K., Patowary, R., Kalita, M. C., & Deka, S. (2016). Development of an efficient
bacterial consortium for the potential remediation of hydrocarbons from contaminated
sites. Frontiers in microbiology, 7: 1092.
Paul, S. A., Chavan, S. K., & Khambe, S. D. (2012). Studies on characterization of textile
industrial waste water in Solapur city. International Journal of Chemical Sciences, 10(2):
635-642.
Pearce, C. I., Lloyd, J. R., and Guthrie, J. T. (2003). The removal of colour from textile
wastewater using whole bacterial cells: a review. Dyes and Pigments, 58(3): 179-196.
Pinheiro, H. M., Touraud, E., and Thomas, O. (2004). Aromatic amines from azo dye
reduction: status review with emphasis on direct UV spectrophotometric detection in textile
industry wastewaters. Dyes and Pigments, 61(2): 121-139.
Placido, J., Chanagá, X., Ortiz-Monsalve, S., Yepes, M., and Mora, A. (2016). Degradation
and detoxification of synthetic dyes and textile industry effluents by newly isolated
Leptosphaerulina sp. from Colombia. Bioresources and Bioprocessing, 3(1): 6.
Pokharia, A., and Ahluwalia, S. S. (2016). Decolorization of Xenobiotic Azo Dye-Black WNN
by Immobilized Paenibacillus alvei MTCC 10625. International Journal, 4(2), 35-46.
Pokharia, A., and Ahluwalia, S. S. (2013). Isolation and screening of dye decolorizing bacterial
isolates from contaminated sites. Textiles and Light Industrial Science and Technology.
(2013).
Ponraj, M., Gokila, K., and Zambare, V. (2011). Bacterial decolorization of textile dye-Orange
3R. Intern. Journal of Advances Biotechnology and Research 2 (1): 168-177.

Pourbabaee, A. A., Malekzadeh, F., Sarbolouki, M. N., and Najafi, F. (2006). Aerobic
decolorization and detoxification of a disperse dye in textile effluent by a new isolate of
Bacillus sp. Biotechnology and bioengineering, 93(4): 631-635.
Prasad, A., & Rao, K. V. B. (2011). Physicochemical analysis of textile effluent and
decolorization of textile azo dye by Bacillus Endophyticus strain VITABR13.
Environmental Biotechnology, 2(2): 55-62.
Prasad, D. V. (2015). Biodecolorization of Anthraquinone Textile (Acid Blue 25) dye by
Klebsiella sp. Int. J. Rec. Scient. Res, 6, 3216-3222.
Prasad, A. A., and Rao, K. B. (2010). Physico chemical characterization of textile effluent and
screening for dye decolorizing bacteria. Global Journal of Biotechnology And
Biochemistry, 5(2): 80-86.
Puvaneswari, N., Muthukrishnan, J., and Gunasekaran, P. (2006). Toxicity assessment and
microbial degradation of azo dyes. Indian Journal of Experimental Biology, 44(8): 618-
630.
Qu, X., Alvarez, P. J., and Li, Q. (2013). Applications of nanotechnology in water and
wastewater treatment. Water Research, 47(12): 3931-46.
Raghu, S., & Basha, C. A. (2007). Chemical or electrochemical techniques, followed by ion
exchange, for recycle of textile dye wastewater. Journal of Hazardous Materials, 149(2):
324-330.
Raj, D. S., Prabha, R. J., & Leena, R. (1970). Analysis of bacterial degradation of azo dye
congo red using HPLC. I Control Pollution, 28(1).
Rajendran, R., Prabhavathi, P., Karthiksundaram, S., Pattabi, S., Kumar, S. D., & Santhanam,
P. (2015). Biodecolorization and bioremediation of denim industrial wastewater by adapted
bacterial consortium immobilized on inert polyurethane foam (puf) matrix: a first approach
with biobarrier Model. Polish Journal of Microbiology, 64(4): 329-338.
Rajkumar, D., Song, B. J., and Kim, J. G. (2007). Electrochemical degradation of Reactive
Blue 19 in chloride medium for the treatment of textile dyeing wastewater with
identification of intermediate compounds. Dyes and Pigments, 72(1): 1-7.
Raju, K., Vishnuvardhan, V., and Damodharam, T. (2015). Industrial Effluents Effect on
Seedling Growth of Rice and Wheat (Oryza Sativa l. and Triticum Vulgare l.). International
Journal of Recent Scientific Research, 6(7): 4935-4939.
Ramalho, P. A., Scholze, H., Cardoso, M. H., Ramalho, M. T., & Oliveira-Campos, A. M.
(2002). Improved conditions for the aerobic reductive decolourisation of azo dyes by
Candida zeylanoides. Enzyme and Microbial Technology, 31(6): 848-854.
Ramamurthy, N., Balasaraswathy, S., & Sivasakthivelan, P. (2011). Biodegradation and
physico-chemical changes of textile effluent by various fungal species. Romanian Journal
of Biophysics, 21(2): 113-123.
Ramya, M., Iyappan, S., Manju, A., & Jiffe, J. S. (2010). Biodegradation and decolorization of
acid red by Acinetobacter radioresistens. Journal of Bioremediation and Biodegradation,
1: 105.
Robinson, T., McMullan, G., Marchant, R., and Nigam, P. (2001). Remediation of dyes in
textile effluent: a critical review on current treatment technologies with a proposed
alternative. Bioresource Technology, 77(3): 247-255.
Sadaf, S., Bhatti, H. N., & Bibi, I. (2013). Efficient removal of disperse dye by mixed culture
of Ganodermalucidum and Coriolusversicolor. Pakistan Journal of Agricultural Sciences,
50(2): 261-266.
Saha, P. D., Chowdhury, S., Mondal, M., and Sinha, K. (2012). Biosorption of Direct Red 28
(Congo Red) from aqueous solutions by eggshells: Batch and column studies. Separation
Science and Technology, 47(1): 112-123.
Sain, M., and Panthapulakkal, S. (2006). Bioprocess preparation of wheat straw fibers and their
characterization. Industrial Crops and Products, 23(1): 1-8.
Saitou, N., and Nei, M. (1987). The neighbor-joining method: a new method for reconstructing
phylogenetic trees. Molecular Biology and Evolution, 4(4): 406-425.
Saratale, R. G., Saratale, G. D., Govindwar, S. P., & Kim, D. S. (2015). Exploiting the efficacy
of Lysinibacillus sp. RGS for decolorization and detoxification of industrial dyes, textile
effluent and bioreactor studies. Journal of Environmental Science and Health, Part A, 50(2):
176-192.
Saratale, R. G., Saratale, G. D., Chang, J. S., and Govindwar, S. P. (2011). Bacterial
decolorization and degradation of azo dyes: a review. Journal of the Taiwan Institute of
Chemical Engineers, 42(1): 138-157.
Saratale, R. G., Saratale, G. D., Kalyani, D. C., Chang, J. S., and Govindwar, S. P. (2009).
Enhanced decolorization and biodegradation of textile azo dye Scarlet R by using
developed microbial consortium-GR. Bioresource Technology, 100(9): 2493-2500.
Saravanamoorthy, M. D., and Kumari, B. R. (2007). Effect of textile waste water on
morphophysiology and yield on two varieties of peanut (Arachis hypogaea L.). Journal of
Agricultural Technology, 3(2): 335-343.
Sarayu, K., & Sandhya, S. (2010). Aerobic biodegradation pathway for Remazol Orange by
Pseudomonas aeruginosa. Applied Biochemistry and Biotechnology, 160(4): 1241-1253.

Sarkar, B., Chakrabarti, P. P., Vijaykumar, A., and Kale, V. (2006). Wastewater treatment in
dairy industries—possibility of reuse. Desalination, 195(1-3): 141-152.
Senthilkumar, S., Perumalsamy, M., & Prabhu, H. J. (2014). Decolourization potential of
white-rot fungus Phanerochaete chrysosporium on synthetic dye bath effluent containing
Amido black 10B. Journal of Saudi Chemical Society, 18(6): 845-853.
Senthilkumar, M., Gnanapragasam, G., Arutchelvan, V., and Nagarajan, S. (2011) Treatment
of textile dyeing wastewater using two-phase pilot plant UASB reactor with sago
wastewater as co-substrate. Chemical Engineering Journal, 166(1): 10-14.
Sethi, S., Malviya, M. M., Sharma, N., & Gupta, S. (2012). Biodecolorization of Azo Dye by
Microbial Isolates from Textile Effluent and Sludge. Universal Journal of Environmental
Research & Technology, 2(6).
Shah, M. E. A. H., Patel, K., Nair, S., Darji, A., & Maharaul, S. (2013). Microbial Degradation
of Reactive Red by Pseudomonas spp. MPS-2 Journal of Bioremediation and
Biodegradation, 4(2).
Shah, M. (2014). Efficacy of rhodococcus rhodochrous in microbial degradation of toludine
dye. Journal of Petroleum & Environmental Biotechnology, 5: 187-195.
Shah, P. D., Dave, S. R., & Rao, M. S. (2012). Enzymatic degradation of textile dye Reactive
Orange 13 by newly isolated bacterial strain Alcaligenes faecalis PMS-1. International
Biodeterioration & Biodegradation, 69: 41-50.
Shanmugam, V., Kumari, M. and Yadav, K.D. (1999) n-propanol as a substrate for assaying
the lignin peroxidase activity of Phanerochaete chrysoporium. Indian Journal of
Biochemistry and Biophysics, 36: 39-43.
Sharma, R., & Sharma, S. (2015). Biosorption of Alizarin by Burkholderia sp. International
Journal of Current Microbiology and Applied Sciences, 4(2): 112-122.
Sharma, S. C. D., Sun, Q., Li, J., Wang, Y., Suanon, F., Yang, J., & Yu, C. P. (2016).
Decolorization of azo dye methyl red by suspended and co-immobilized bacterial cells with
mediators anthraquinone-2, 6-disulfonate and Fe 3 O 4 nanoparticles. International
Biodeterioration & Biodegradation, 112: 88-97.
Sharma, P., Singh, L., and Dilbaghi, N. (2009). Optimization of process variables for
decolorization of Disperse Yellow 211 by Bacillus subtilis using Box–Behnken design.
Journal of Hazardous Materials, 164(2-3): 1024-1029.
Shaul, G. M., Holdsworth, T. J., Dempsey, C. R., and Dostal, K. A. (1991). Fate of water
soluble azo dyes in the activated sludge process. Chemosphere, 22(1-2): 107-119.

Shinkafi, M. S., Mohammed, I. U., & Audu, A. A. (2015). Degradation and decolourization of
textile dyes effluents. European Journal of Biotechnology and Bioscience, 3(9): 6-11.
Silveira, E., Marques, P. P., Silva, S. S., Lima-Filho, J. L., Porto, A. L. F., & Tambourgi, E. B.
(2009). Selection of Pseudomonas for industrial textile dyes decolourization. International
Biodeterioration & Biodegradation, 63(2): 230-235.
Singh, A. K., Singh, R., Soam, A., & Shahi, S. K. (2012). Degradation of textile dye orange
3R by Aspergillus strain (MMF3) and their culture optimization. Current Discovery, 1(1),
7-12.
Singh, L., & Singh, V. P. (2010). Microbial degradation and decolourization of dyes in semi-
solid medium by the fungus–Trichoderma harzianum. Environment & We: An
International Journal of Science and Technology, 5(3): 147-153.
Singh, R., Gautam, N., Mishra, A., & Gupta, R. (2011). Heavy metals and living systems: An
overview. Indian Journal of Pharmacology, 43(3): 246.
Singh, D., Singh, V., & Agnihotri, A. K. (2013). Study of textile effluent in and around
Ludhiana district in Punjab, India. International Journal of Environmental Sciences, 3(4):
1271.
Singh, K., and Arora, S. (2011). Removal of synthetic textile dyes from wastewaters: a critical
review on present treatment technologies. Critical Reviews in Environmental Science And
Technology, 41(9): 807-878.
Singh, V., Haque, S., Singh, H., Verma, J., Vibha, K., Singh, R., ... and Tripathi, C. K. M.
(2016). Isolation, Screening, and Identification of Novel Isolates of Actinomycetes from
India for Antimicrobial Applications. Frontiers in Microbiology, 7: 1921.
Sinha, S., Nigam, S., & Singh, R. (2015). Potential of Nostoc muscorum for the decolorisation
of textiles dye RGB-Red. International Journal of Pharmacy and Biological Sciences, 6:
1092-1100.
Srinivasan, A., & Viraraghavan, T. (2010). Decolorization of dye wastewaters by biosorbents:
a review. Journal of Environmental Management, 91(10): 1915-1929.
Srinivasrao V., Khan A.W., lova Rani Y.V.S.S and Raghuram M.V. (2007). Variation in
physical characteristic of Godavari river water at rajamundry (A.P.). International Journal
of Aquatic Biology, 22(2): 91-95.
Sudova, E., Machova, J., Svobodova, Z., & Vesely, T. (2007). Negative effects of malachite
green and possibilities of its replacement in the treatment of fish eggs and fish: a review.
Veterinarni Medicina-Praha, 52(12): 527.

Sun, X. F., Xu, F., Sun, R. C., Fowler, P., and Baird, M. S. (2005). Characteristics of degraded
cellulose obtained from steam-exploded wheat straw. Carbohydrate Research, 340(1): 97-
106.
Sun, X. F., Xu, F., Zhao, H., Sun, R. C., Fowler, P., and Baird, M. S. (2005). Physicochemical
characterisation of residual hemicelluloses isolated with cyanamide-activated hydrogen
peroxide from organosolv pre-treated wheat straw. Bioresource Technology, 96(12): 1342-
1349.
Suzuki, Y., Yoda, T., Ruhul, A., and Sugiura, W. (2001). Molecular cloning and
characterization of the gene coding for azoreductase from Bacillus sp. OY1-2 isolated from
soil. Journal of Biological Chemistry, 276(12): 9059-9065.
Tahir, H., Sultan, M., & Jahanzeb, Q. (2008). Removal of basic dye methylene blue by using
bioabsorbents Ulva lactuca and Sargassum. African Journal of Biotechnology, 7(15).
Tan, L., He, M., Song, L., Fu, X., & Shi, S. (2016). Aerobic decolorization, degradation and
detoxification of azo dyes by a newly isolated salt-tolerant yeast Scheffersomyces spartinae
TLHS-SF1. Bioresource Technology, 203: 287-294.
Tan, I. A. W., Ahmad, A. L., and Hameed, B. H. (2008). Adsorption of basic dye using
activated carbon prepared from oil palm shell: batch and fixed bed studies. Desalination,
225(1-3): 13-28.
Tekade, P. V., Mohabansi, N. P., and Patil, V. B. (2011). Study of physico-chemical properties
of effluents from soap industry in Wardha. Rasayan Journal of Chemistry, 4(2): 461-465.
Telke, A., Kalyani, D., Jadhav, J., and Govindwar, S. (2008). Kinetics and Mechanism of
Reactive Red 141 Degradation by a Bacterial Isolate Rhizobium radiobacter MTCC 8161.
Acta Chimica Slovenica, 55(2).
Thomas, H. C. (1944). Heterogeneous ion exchange in a flowing system. Journal of the
American Chemical Society, 66(10): 1664-1666.
Tian, Y. S., Xu, H., Peng, R. H., Yao, Q. H., & Wang, R. T. (2014). Heterologous expression
and characterization of laccase 2 from Coprinopsis cinerea capable of decolourizing
different recalcitrant dyes. Biotechnology & Biotechnological Equipment, 28(2): 248-258.
Tiwari, A., & Chauhan, S. V. S. (2006). Seasonal phytoplanktonic diversity of Kitham lake,
Agra. Magnesium, 7(17.5): 8-18.
Toh, Y. C., Yen, J. J. L., Obbard, J. P., and Ting, Y. P. (2003). Decolourisation of azo dyes by
white-rot fungi (WRF) isolated in Singapore. Enzyme and Microbial Technology, 33(5):
569-575.

Torres, E., Bustos-Jaimes, I., and Le Borgne, S. (2003). Potential use of oxidative enzymes for
the detoxification of organic pollutants. Applied Catalysis B: Environmental, 46(1): 1-15.
Turgay, O., Ersöz, G., Atalay, S., Forss, J., & Welander, U. (2011). The treatment of azo dyes
found in textile industry wastewater by anaerobic biological method and chemical
oxidation. Separation and Purification Technology, 79(1): 26-33.
Ukiwe, L. N., Ibeneme, S. I., Duru, C. E., Okolue, B. N., Onyedika, G. O., & Nweze, C. A.
(2014). Chemical and electrocoagulation techniques in coagulation-floccculationin water
and wastewater treatment-a review. International Journal of Research and Reviews in
Applied Sciences, 18(3): 1.
UNDP (2006). Coping with water scarcity: Challenge of the 21 centaury UN-Water FAO.
Van Bloois, E., Pazmiño, D. E. T., Winter, R. T., & Fraaije, M. W. (2010). A robust and
extracellular heme-containing peroxidase from Thermobifida fusca as prototype of a
bacterial peroxidase superfamily. Applied Microbiology and Biotechnology, 86(5): 1419-
1430.
Van der Zee, F. P., & Villaverde, S. (2005). Combined anaerobic–aerobic treatment of azo
dyes-a short review of bioreactor studies. Water Research, 39(8): 1425-1440.
Verandani, S., & Vardhan, D. (2012). Study of groundwater quality of Ulhasnagar cit y in
Thane district, Maharashtra, India using multivariate and microbial analysis. Research
Journal of Chemistry and Environment, 16: 58-64.
Verma, A. K., Raghukumar, C., Parvatkar, R. R., & Naik, C. G. (2012). A rapid two-step
bioremediation of the anthraquinone dye, Reactive Blue 4 by a marine-derived fungus.
Water, Air, & Soil Pollution, 223(6): 3499-3509.
Vijayaraghavan, K., Jegan, J., Palanivelu, K., and Velan, M. (2004). Removal of nickel (II)
ions from aqueous solution using crab shell particles in a packed bed up-flow column.
Journal of Hazardous Materials, 113(1): 223-230.
Vishwakarma, S. K., Singh, M. P., Srivastava, A. K., & Pandey, V. K. (2012). Azo dye (direct
blue) decolorization by immobilized extracellular enzymes of Pleurotus speciesCellular
and Molecular Biology, 58(1): 21-25.
Wada, M., Chanzy, H., Nishiyama, Y., and Langan, P. (2004). Cellulose IIII crystal structure
and hydrogen bonding by synchrotron X-ray and neutron fiber diffraction.
Macromolecules, 37(23): 8548-8555.
Wagh, C. V., Kokate, S. J., Aher, H. R., and Kuchekar, S. R. (2009). Physico-chemical analysis
of ground water in prarara area, District, Ahmednagar, Maharashtra. Rasaayan Journal of
Chemistry, 2: 234.

Waghmode, T. R., Kurade, M. B., Lade, H. S., and Govindwar, S. P. (2012). Decolorization
and biodegradation of Rubine GFL by microbial consortium GG-BL in sequential
aerobic/microaerophilic process. Applied Biochemistry and Biotechnology, 167(6): 1578-
1594.
Wang, H., Su, J. Q., Zheng, X. W., Tian, Y., Xiong, X. J., & Zheng, T. L. (2009). Bacterial
decolorization and degradation of the reactive dye Reactive Red 180 by Citrobacter sp.
CK3. International Biodeterioration & Biodegradation, 63(4): 395-399.
Wang, N., Liu, J., Buck, R. C., Korzeniowski, S. H., Wolstenholme, B. W., Folsom, P. W., &
Sulecki, L. M. (2011). 6: 2 Fluorotelomer sulfonate aerobic biotransformation in activated
sludge of waste water treatment plants. Chemosphere, 82(6): 853-858.
Wang, X., Cheng, X., Sun, D., Ren, Y., & Xu, G. (2014). Fate and transformation of
naphthylaminesulfonic azo dye Reactive Black 5 during wastewater treatment process.
Environmental Science and Pollution Research, 21(8): 5713-5723.
Waqas, R., Arshad, M., Asghar, H. N., & Asghar, M. (2015). Optimization of factors for
enhanced phycoremediation of reactive blue azo dye. International Journal of Agriculture
and Biology, 17(4).
Weber, E. J., and Adams, R. L. (1995). Chemical-and sediment-mediated reduction of the azo
dye disperse blue 79. Environmental Science and Technology, 29(5): 1163-1170.
Wesenberg, D., Buchon, F., and Agathos, S. N. (2002). Degradation of dye-containing textile
effluent by the agaric white-rot fungus Clitocybula dusenii. Biotechnology Letters, 24(12):
989-993.
Wesenberg, D., Kyriakides, I., and Agathos, S. N. (2003). White-rot fungi and their enzymes
for the treatment of industrial dye effluents. Biotechnology Advances, 22(1-2): 161-187.
Xiao, X., Xu, C. C., Wu, Y. M., Cai, P. J., Li, W. W., Du, D. L., & Yu, H. Q. (2012).
Biodecolorization of Naphthol Green B dye by Shewanella oneidensis MR-1 under
anaerobic conditions. Bioresource Technology, 110: 86-90.
Xiao, B., Sun, X., and Sun, R. (2001). Chemical, structural, and thermal characterizations of
alkali-soluble lignins and hemicelluloses, and cellulose from maize stems, rye straw, and
rice straw. Polymer Degradation and Stability, 74(2): 307-319.
Xu, P., Zeng, G. M., Huang, D. L., Lai, C., Zhao, M. H., Wei, Z., ... and Xie, G. X. (2012).
Adsorption of Pb (II) by iron oxide nanoparticles immobilized Phanerochaete
chrysosporium: equilibrium, kinetic, thermodynamic and mechanisms analysis. Chemical
Engineering Journal, 203: 423-431.
Yahaya, N. K. E. M., Abustan, I., Latiff, M. F. P. M., Bello, O. S., and Ahmad, M. A. (2011).
Fixed-bed column study for Cu (II) removal from aqueous solutions using rice husk based
activated carbon. International Journal of Engineering and Technology, 11(1): 248-252.
Yang, H. Y., Jia, R. B., Chen, B., & Li, L. (2014). Degradation of recalcitrant aliphatic and
aromatic hydrocarbons by a dioxin-degrader Rhodococcus sp. strain p52. Environmental
Science and Pollution Research, 21(18): 11086-11093.
Yang, J., and Qiu, K. (2010). Preparation of activated carbons from walnut shells via vacuum
chemical activation and their application for methylene blue removal. Chemical
Engineering Journal, 165(1): 209-217.
Yu, J., Yue, G., Zhong, J., Zhang, X., and Tan, T. (2010). Immobilization of Saccharomyces
cerevisiae to modified bagasse for ethanol production. Renewable Energy, 35(6): 1130-
1134.
Zhang, C., Xin, Y., Wang, Y., Guo, T., Lu, S., & Kong, J. (2015). Identification of a novel dye-
decolorizing peroxidase, EfeBs, translocated by twin-arginine translocation system in
Streptococcus thermophilus CGMCC 7.179. Applied and Environmental Microbiology,
81(18):6108-19.
Zhao, M., Tang, Z., & Liu, P. (2008). Removal of methylene blue from aqueous solution with
silica nano-sheets derived from vermiculite. Journal of Hazardous Materials, 158(1): 43-
51.
Zhao, X., and Hardin, I. R. (2007). HPLC and spectrophotometric analysis of biodegradation
of azo dyes by Pleurotus ostreatus. Dyes and Pigments, 73(3), 322-325.
Zhu, X., Liu, Y., Zhou, C., Luo, G., Zhang, S., and Chen, J. (2014). A novel porous carbon
derived from hydrothermal carbon for efficient adsorption of tetracycline. Carbon, 77:627-
636.
LIST OF
PUBLICATIONS

LIST OF PUBLICATIONS
Referred journal articles
• Bhatia, D., Sharma, N. R., Singh, J., & Kanwar, R. S. (2017). Biological methods
for textile dye removal from wastewater: A review. Critical Reviews in
Environmental Science and Technology, 47(19): 1836-1876.
• Bhatia, D., Sharma, N. R., Kanwar, R., & Singh, J. (2018). Physicochemical
assessment of industrial textile effluents of Punjab (India). Applied Water Science,
8(3): 83.
• Daljeet Singh Dhanjal, Simranjeet Singh, Deepika Bhatia, Neeta Raj Sharma,
Joginder Singh and Rameshwar S. Kanwar (2018). Pre-treatment of the mun.icipal
wastewater with chemical coagulants. Pollution Research, 37: 32-38
• Bhatia, D., Singh, S., Vyas, A., Rasool, H. I., & Kaur, P. (2014). Studies on Fungal
Strains of Selected Regions of Ludhiana and their Biochemical Characterization.
Current World Environment, 9(1): 192-202.
• Singh, Joginder, Simranjeet Singh, Parvinder Kaur, Priyanka Kapoor, Hakim Ishfaq
Rasool, Jitender Sharma, Sadia Shabir Mir, Bilal Ibrahim, Deepak Vasist, and
Deepika Bhatia. (2014). Biochemical characterization of Tylophora indica and its
immuno-modulatary effect. South Asian Journal of Experimental Biology, 4(2): 61-
67.
Conference presentations
1. Awarded International travel grant to attend Summer Institute 2016 (May 27-
June 5) on Nanotechnology in the areas of infrastructure, water, and health at
University of Alberta, Edmonton, Canada and presented E-poster abstract
entitled “Removal of textile dyes using nano biochar from corn cob” w.e.f.
May 27- June 5, 2016 on Nanotechnology in the areas of infrastructure, water,
and health at Summer institutes 2016, Edmonton, Canada.
2. Attended 6th International Graduate Research Conference (IGRC) on Feb 9-10,
2017 at Chiang Mai University, Thailand and presented an oral paper from
my thesis entitled “Use of Naturally Occurring Bacteria to Clean Textile
Industry Wastewater”

3. Abstract has been selected to participate and present oral presentation entitled
“Removal of Disperse red 167 (dark Red 2B) from aqueous solution using
sustainable adsorbent’’ in World Biotechnology Congress (WBC-2017), on
February 20-22, 2017 at Jawahar Lal Nehru University, New Delhi
4. Awarded International travel grant to attend Summer Institute 2017 (June 1-
June 11) on Sustainable Communities in Low-Resource Settings at University
of British Columbia, Vancouver, Canada.
5. Awarded International travel grant to attend one day Conference (June 29) on
Sustainable Solid Waste Management (SuSWaM 2017) at McGill University,
Montreal, Canada.
6. Abstract entitled “Continuous column studies for the removal of Disperse
red 167 dye by using low cost adsorbent” has been selected to participate in
Innovative Strategies for Sustainable Water Management Conference (ISSWM-
2017) at Lovely Professional University, India
7. Abstract entitled “Bio-Decolorization of Disperse Dyes by Using Naturally
Bacteria” has been selected to participate in Innovative Strategies for
Sustainable Water Management Conference (ISSWM-2017) at Lovely
Professional University, India
8. Attended 12th Agricultural Science Congress, 2015 at National Dairy
Research Institute (NDRI), Karnal, India, as a delegate.
9. Presented Paper entitled ‘Studies on Physico-chemical characterization of
surface water body in Ludhiana, Punjab, India, in conference on “Exploring
Basic and Applied Sciences for Next Generation (EBAS-LPU) on November
14-15, 2014.
10. Attended 3rd Bharatiya Vigyan Sammelan (BVS) and Expo as delegate at
Lovely Professional University (2011)
11. Short term training on “Plant Tissue Culture” at Plants Breeding Dept under
the guidance of Dr S. S Gosal at Punjab Agricultural University (PAU),
Ludhiana, Punjab.
12. Short term training on “Extraction of major metabolites from Tylophora
indica under the guidance of Dr Harmanjeet Kaur at Thapar Univerisity
(TU), Patiala, Punjab.

Patents Filed:
• Ref No: IN201811002650 (Patent Applied) – Filtration Assembly for Wastewater
Treatment (2018)
• Ref No: 201811009348 (Patent Applied) – A Process of Degradation of Textile
Dyes (2018)
• Ref No: 201811009349 (Patent Applied) – A Process to Remove Heavy Metals
from Industrial Effluent using Biochar (2018)
Gene Bank depositions:
• Bhatia,D., Kanwar,R., Das,A. and Singh,J., Paenibacillus pocheonensis strain
DP2 from India 16S ribosomal RNA gene, partial sequence. GenBank Acession
number: KX034565.1
• Bhatia,D., Kanwar,R., Das,A. and Singh,J., Lysinibacillus sphaericus strain
DP2 from India 16S ribosomal RNA gene, partial sequence. GenBank Acession
number: KX034564.1
• Bhatia,D., Kanwar,R., Das,A. and Singh,J., Bacillus cereus strain DP2 from
India 16S ribosomal RNA gene, partial sequence. GenBank Acession number:
KX034563.1
• Bhatia,D., Kanwar,R., Das,A. and Singh,J., Bacillus subtilis strain DB1 from
India 16S ribosomal RNA gene, partial sequence. GenBank Acession number:
KX034562.1
• Bhatia,D., Kanwar,R., Das,A. and Singh,J., Paenochrobactrum glaciei strain
DB1 from India 16S ribosomal RNA gene, partial sequence. GenBank Acession
number: KX034561.1
• Bhatia,D., Kanwar,R., Das,A. and Singh,J., Escherichia coli strain DB1 from
India 16S ribosomal RNA gene, partial sequence. GenBank Acession number:
KX034560.1
• Bhatia,D., Kanwar,R., Das,A. and Singh,J., Brevibacillus panacihumi strain
DB1 from India 16S ribosomal RNA gene, partial sequence. GenBank Acession
number: KX034559.1