doctor of 313bilosiophp - CORE
223
STUDIES ON PLANT SIGNALS AND GROWTH RESPONSES TO HERBIVORY AND ITS SIMULATION THESIS SUBMITTED FOR THE AWARD OF THE DEGREE OF doctor of 313bilosiophp i N BOTANY BY FARHA REHMAN DEPARTMENT OF BOTANY ALIGARH MUSLIM UNIVERSITY ALIGARH (U.P.) INDIA 2013 THEsiA
-
Upload
khangminh22 -
Category
Documents
-
view
0 -
download
0
Transcript of doctor of 313bilosiophp - CORE

STUDIES ON PLANT SIGNALS AND GROWTH RESPONSES TO HERBIVORY AND ITS
SIMULATION
THESIS SUBMITTED FOR THE AWARD OF THE DEGREE OF
doctor of 313bilosiophp i N
BOTANY
BY
FARHA REHMAN
DEPARTMENT OF BOTANY ALIGARH MUSLIM UNIVERSITY
ALIGARH (U.P.) INDIA
2013
THEsiA

Eareed hmad Knan Ph.D.,F.B.S.,F.A.E.B.
Associate (Professor
Department of Botany Aligarh Muslim University Aligarh-202002, India. Mobile: 09808618275 Email: [email protected]
fakhan.bt®amu.ac.in
Date • C 3 — — 2 f 3
Certificate
This is to cert6 that the thesis entitled, "Studies on plant signals
and growth responses to herbivory and its simukItion', submitted for the
degree of (Doctor of Tfiguopfiy in (Botany is a faithful record of the bona de
research work carried out at Aligarh Muslim 'University, Aligarh, India, by
9ifs. Tarfia Wchntan under my guidance and supervision and that no part of it has
been submittedfor any other degree or dipthma •
(Dr. Fareed A. Khan) Research Supervisor

Acknowledgements
First and foremost I thank Almighty Allah. who has helped in giving me enough strength and ability to accomplish this task.
I acknowledge, with all respect and regard to my supervisor Dr. Fareed Ahmad Khan, Associate Professor, Department of Botany for the help and guidance.
His invaluable help, support and teaching shall remain the guiding force for the rest of my life.
I am highly thankful to Prof Firoz Mohammad, Chairman, Department of Botany, Aligarh Muslim University, for providing the necessary facilities during the research work.
I extend my thanks and sense of gratitude to Dr. Shoeba B. Anis, Assistant
Professor, Department of Zoology, for her encouragement and support in various
ways.
I wish to ventilate my humble regards towards Prof Mohd. lq
Department of Botany Jamia Hamdard University and Prof lrshad Mahmood, Dr.
Athar A. Khan, Department of Botany for his kind help in various aspects.
I would like to place on record my profound thanks to Dr. Saeed Ahmad, Jamia Hamdard University, New Delhi for providing GC-MS facility and Dr. Iqbal Ahmad, Bhagalpur University, Bhagalpur, for identification of insects.
I am very thankful to Mr. S.M.A. Badruddin. He always had been a great help
during the course of study.
Very special thanks to Dr. Aslam Khan Assistant Professor, Department of
Zoology, Al-Jazan University Saudi Arabia and Dr. Irshrat Husain, Department of
Law, AM U, Aligarh for their encouragement and support in various ways.
I am highly indebted to Mr. Mohd. Irfan, Mr. Mudassir, Mr. Muzzafar, Mr.
Nadeem, Mr. Ashraf Ms. Rubeena, Meenu Singh, Ms. Deepshikha, Dr. Abhishekh for
their tiresome labour and sparing their valuable time for me during my compilation.
A special note of thanks to all my friends Zehra, Rose, Humera, Bushra,
Rahat, Sheeba, Shweta, Maryam, Athar, Hilal, Meru', for encouragement and support
in various ways.

l am thankful to my invaluable network of supportive, forgiving, generous, loving
seniors and friends, Ur. A hid Ali Anstrri, Dr Farman-ur-Rehman Khan, Jyati
Varshney, Mina Irshad, M Naeem, Asim„caliuddin, Faisal, Satta, Nigar, Naushina,
Kulsum, Nina, Gauhar, Kahkasha, Shania, Bushra, Karita, Rumania, Saba, Seema and
Neha. No words could adequately express all that my family members have done for me
throughout my life. They have always been a source of inspiration, whose constant
admonitions helped me in my academic pursuits..
I am sincerely behold to Mr. Rais A. Khan who very painstakingly worked despite
MS persona! engagements.
I also acknowledge UGC New Delhi for providing the financial assistance as
UGC Non-NET Fellowship, University Sophisticated Instrumentation Facility. AMU,
Aligarh and MIMS for providing 5RM micrographs.
Farha Rehman

CONTENTS
Chapters Page No.
1. INTRODUCTION 1-8
2. REVIEW OF LITERATURE 9-2'7
3. MATERIALS AND METHODS 28-42
4. EXPERIMENTAL RESULTS 43-56
5. DISCUSSION 57- 66
6. SUMMARY 67 — 71
REFERENCES 72 — 94
APPENDIX 95 - 96

CONTENTS Page No.
INTRODUCTION 1-8
REVIEW OF LITERATURE 9-27
Plant defense strategies against herbivory 11
Constitutive plant defenses 11
Trichomes 11
Cuticle 13
Wound periderm 13
Chemical defenses 14 Role ofjasmonic acid against aphid feeding 15
Effect ofjasmonic acid on plant attributes 16
Tri-trophic plant signaling 18 Herbivore strategies to plants 19
Aphid saliva: Composition and effect 19
Simulation of herhivory and signalling 20
Effect of herbivory on plant photosynthesis 21
Role of glucosinolate-myrosinase system against herbivory 22
Effect of herbivory on plant growth attributes 22
Effect on chlorophyll and carotenoid content 24
Herbivory and plant nutrient 24
Volatiles 26
Phenolic compounds 26
Inferences from the review 27
MATERIALS AND METHODS 28-42
Selection of host plant 28
Selection of insects 28
Climatic conditions of Aliearh 28
Preparation ofjasmonic acid solution 29
Filling and sterilization of pots 29
Sowing of seed 29
Experimental set-up 29

Parameters studied 30
Plant growth parameters 30
Biochemical and physiological parameters 31
Histological parameters (light microscopy and SEM details) 31
Yield characteristics 31
Insect population count 31
Experiment 1 31
Experiment 2 32
Experiment 3 32
Experiment 4 32
Experiment 5 33
Sampling technique of experiments 33
Methodology 33
Plant height (shoot and root length) 33
Fresh and dry mass of plant 34
Leaf area 34
Physiological and biochemical parameters 34
Net photosynthetic rate (PN) and stomatal conductance (gs) 34
Total chlorophyll and carotenoid contents 34
Estimation of proline 35
Preparation of standard curve for praline 35
Estimation of total protein 36
Standard curve for total protein 36
Digestion of sample for N, P, K estimation 37
Determination of N, P and K 37
Estimation of nitrogen 37
Preparation of standard curve for nitrogen 38
Estimation of phosphorus 38
Preparation of standard curve for phosphorus 38
Estimation of potassium 39
Preparation of standard curve for potassium 39
Estimation of total phenol 39
Stomata! traits 39

Relative stomata' closure index (RSCI) 40
Scanning electron microscopic (SEM) observations 40
Yield parameters 40
Number of pods per plant 40
Number of seeds per pod 40
Seed yield per plant and 1000 seed mass 41
Length of pod 41
Oil extraction 41
Preparation for mustard leaf volatile organic compounds (VOCs) 41
Gas chromatography-Mass Spectrometry (GC-MS) analysis of VOCs 41
insect population count 42
Aphid population count 42
Beetle population count 42
Statistical analysis 42
EXPERIMENTAL RESULTS 43-56
Experiment 1: Screening of mustard cultivars 43
Experiment 2: Impact of varying levels of aphid herbivory 45
Experiment 3: Plant responses to aphid herbivory along with predatory beetles 49
Experiment 4: Effect of concentrations of jasmonic acid on mustard 52
Experiment 5: Combined effect of jasmonic acid and aphid infestation 53
Estimation of defensive volatile chemicals in aphid injured plants 56
DISCUSSION 57 — 66
SUMMARY 67 — 71
REFERENCES 72 —94
APPENDIX 95 - 96
ANNEXURE

uoganpotqui
[ daidtito

INTRODUCTION
Plants during their life time are exposed to a variety of abiotic and biotic
stresses. The biotic stress encompasses diseases and phytophagous pests including
insect herbivory. Insect pests causes major biotic stress to agricultural crops. Plants
have evolved varying defense mechanisms to resist these biotic stresses. Insect
herbivory leads to the activation of various defense mechanisms in host plants
resulting in qualitative and/or quantitative changes in plant production owing to
alteration in metabolic processes. The diverse distribution of insect herbivores among
their host plants and its effect on the growth and defense strategies of plants has long
been a topic of interest for ecologists. Insects have been the most significant
herbivores and the evolution of defense mechanism in land plants switched the co-
evolution of counter defenses in insects. Herbivory also induces a unique plant
defensive strategy by promoting the activity of natural enemies of the herbivores.
Insects are the primary herbivores in many ecosystems and feed upon a vast variety of
plants ranging from algae to angiosperms. From an agricultural point of view
herbivorous insects are considered major pests and held responsible for substantial
crop losses (Schoonhoven et al., 1998; 2005; Ferry et al., 2006). About 80 % of the
plant materials consumed by insects and their secondary production can equal or exceed that of more conspicuous vertebrate grazers in grassland (Anonymous, 2008;
Farlia-Rehman et al., 2012b).
Indian mustard (Brassica juncea L. Czern. & Coss) belongs to the family
Brassicaceae (formerly Cruciferae) of flowering plants. The plant is erect, green
annual herb of one to two meter height. Foliages are pale green with few hairs
(pubescent) on first few leaves. Leaf blades extend up to petioles. The lower leaves
are deeply notched while upper leaves are narrow and entire; flowers are small yellow with petals arranged diagonally. In Indian sub-continent Brassica juncea is the dominant oilseed crop (Prakash, 1980). Mustard cultivation has gained wider
acceptance among farmers due to its adaptability to both irrigated and rainfed areas.
Oil seed crops in India constitutes about 13 % of the area under agricultural
practices and contribute about 5 % to the gross national product and 1 % value of all agricultural products. India has the distinction of being the world's largest oilseed

Introduction: 2
growing country sharing 25.6 million hectares out of the total 125 million hectares of
land under oilseed cultivation in the entire world. Mustard accounts for 10 % of the
total %%odd production (Downey and Rimmer, 1993). Insect pests (including aphids)
are among one of the major factors of yield losses. The most voraciously attacking
and reproducing aphids of mustard crop includes Lipaphis erysimi (Kaltenbach),
Brevicoryne brassicae (L.) and Ifyzus persicae (Sulz.). These three aphid species
account Ibr about 70-80 % of oil crop losses (Mandal et al., 1994; Swati, 2005).
Among these, mustard aphid (L erysimi, Kalt.) is the key pest of Brassicaceae family.
Severe infestation of this pest often leads to 35-96% loss or complete loss of the
mustard crop (Bakhetia, 1986; Bakhetia and Sekhon, 1989; Choudhury and Pal,
2009). In Aligarh, Indian mustard aphid (L. erysimi) was found most common and
notorious Attacker on different cultivars of mustard crops grown (Farha-Rehman et al.,
2013).
Herbivory is an act of consumption of plant biomass and nutrients by animals
or insects. This key ecosystem process regulates the flow of energy from producers to
consumers (Farha-Rehman et al., 2010). Herbivory affects primary production,
vegetation structure and composition in terrestrial and aquatic ecosystems and
influences a variety of ecosystem properties primarily through differential changes in
survival, productivity, growth and composition of the host plants (Anonymous 2008;
Farha-Rehman et al.. 2012b). The vascular plants evolved various defense strategies
against herbivores but a number of sap-sucking, leaf mining, gall forming herbivores
and nectar feeding insects co-evolved counter defenses (Anonymous, 2008; Farha-
Rehman et al., 2012h). The study of plant defenses against herbivory is not only
important from evolutionary view point but it is also useful in understanding the
extent of its impact on agriculture, human and livestock food sources as well as utility
and survival of plants.
The plant defenses against herbivory are either constitutive or induced.
Constitutive defense are ready-chemical defensive arsenals like routine sequestering
and accumulation of digestibility reducers and toxins, etc. The host plants may also
respond to herbivory by changes in morphological characteristics such as trichornes,
spines, thorns and hairs. Brassica juncea possesses trichomes as a constitutive
morphological defense strategy. These are known to affect the feeding behaviour and

Introduction: 3
performance of some herbivores at various stages of their lives (Fernandes, 1994;
Traw and Dawson, 2002; Agrawal and Fishbein, 2006; Mathur, 2012). The induced
defense includes sequestering of secondary metabolites and morphological and/or
physiological changes in host plants after herbivore infestation. Herbivory and
mechanical wounding triggers the major secondary metabolites to re-sequester and
produce defensive metabolites with low molecular weight (Karban and Baldwin,
1997). These two ways of plant defense (inducible and constitutive), together increase
defensive ability and effectiveness of host plants against herbivory (Anonymous,
2008; Farha-Rehman et al., 2012b). The plants also possess 'direct defense barriers'
which include thick cuticle, trichomes and thorns. The chemical defenses include
sequestering of toxins, repellents and digestibility reducers (van Poecke and Dicke,
2002), Defensive chemicals can be found in all major classes of plant secondary
metabolites which are secreted after herbivore attack. These chemicals include
nitrogen-containing metabolites like alkaloids and glucosinolates, phenolics like
phenylpropanoids and flavonoids as well as terpenoids in addition to defense-related
proteins (van Poecke and Dicke, 2002).
Glucosinolates (CS) are the main secondary metabolites in brassicaceous
plants. The hydrolyzed products of glucosinolates mediated by enzyme myrosinase
play important roles in plant defense and plant-insect communication in several
members of crucifers (Hopkins et al., 2009; Khan et al., 2010). Formation of toxic
isothiocynates (ITC) is the outcome of defense system in the glucosinolate-
myrosinase cycle of family Brassicaceae. It is activated upon tissue damage caused by
the herbivore Isothiocyanates arc degradation products of glucosinolates in mustard
plants and have repellent effect on phytophagous insects. But lepidopteran herbivores
specialized on Brassicaceous plants possess a co-evolved biochemical adaptations to
inhibit the process of isothiocyanates formation. Allyl isothiocyanate (AITC) not only
repel attacking insects and other herbivores through its volatilization but also induce
stomatal closure in Arabidopsis with the production of reactive oxygen species (ROS)
and nitric oxide (NO) and elevation of cytosolic Cat ' (Khokon et al., 2011). These
results raise the possibility that crucifer plants produce ITCs in response to herbivory
and induce stomatal closure leading to suppression of water loss and invasion of fungi
through stomata (Khokon et al., 2011). The secondary metabolites glucosinolate-

Introduction: 4
myrosinase system, therefore, plays a key role in plants defense mechanism, at least in
mustard plants. Some plant volatiles like phytoalexins, phytoanticipius, sulphur
lectins and numerous other classes of secondary metabolites such as hydroxamic
acids, alkaloids, terpenes and C-6 aldehydes are known for their insecticidal activities
(Ahuja et al., 2010; Atri et al., 2012).
The indirect plant defenses involve the attraction of predators through
chemical signaling and thereby triggering their attraction to check and balance the
population of herbivores (De Vos and Jander, 2010). The specialist predators or
parasites of herbivores are signaled through volatile chemicals. Synthesis and release
of these chemical signals are triggered by chemical elicitors or substances contained
in the oral secretion of herbivores. Certain chemicals contained in the saliva of
grazing insects (herbivores) activate the synthesis and release of the plant specific
blends of volatiles with high sensitivity to receptor molecules of predators (De
Moines et al., 2001). Some of these volatile compounds provide important host
location cues to predator insects or parasites that are natural enemies of herbivores
(3e Moraes et al., 2001; farha-Rehman et al., 2010).
Predatory insects are often attracted on simulation of herbivory like
application of jasmonic acid (JA) and mechanical injury by leaf clipping or their
combined effects. Such herbivory simulations often respond like signaling of natural
herbivory (van Kleunen et al., 2004). For instance, the volatile compound, AITC have
multiple roles viz. (a) it repels attacking aphids (b) signal the predatory beetles
(Coccinella sepiempunciata) and (c) induces stomatal closure as part of indirect
defense (Khokon et al., 2011). Many other plants also initiate indirect defenses
through the release of volatiles to attract ladybugs; parasitoid wasps while some other
aphids consuming predatory ladybirds/beetle like Coccinella septumpunctata (De Vos
and Jander, 2010). ladybird (Coccinella sepninzprictioct) is a well known beetle predating upon a wide range of aphids including L. erysimi and found in many
habitats like fields, gardens, forest sea coast, mountains and cities (Hodek and Ilonek,
1996: All and Rizvi, 2009). Both, adults and larvae of ladybird feed on a variety of
other soft bodied herbivorous pests; viz. whitellies, adelgids psyllids, mealy bugs (Ali
and Rana, 2010).

introduction: 5
the host plants vary with genetic variability of eultivars, environment and
physiological status (Atri et al., 2012). To a given stress plants show specific chemical
response from out of complex integrations of many blends of chemicals produced in
the plant. These chemical defenses of plant against herbivory are always at the cost of
photosynthates and in turn, the plant growth and yield. In India and North Europe
aphids are known for incuaing large scale damage to plants either directly by feeding
or by transmitting viral diseases through their stylet (Sekhon. 1999). In India aphids
are known to feed on mustard crop from vegetative to fruiting stages and cause severe
qualitative and quantitative crop losses (Sekhon, 1999). The crop is damaged
maximum at flowering stage due to its high susceptibility at this stage and the
prevailing weather regimes being more conductive to aphid multiplication (Bakhetia
and Brar. 1983).
Aphids with a diversity of 4000 species (worldwide) form a largest group of
phloem feeding insects (Bak et al., 2013). The aphids, by direct phloem_ sap sucking
remove nutrients from out of plants reserve carbon and cause growth stunting of host
plants and alters source-sink carbon allocation patterns (Blackman and Eastop, 1994).
Aphid infestation sometimes also causes gall-formation, chlorosis, necrosis, wilting in
addition to other growth malformations (Guerrieri and Digilio, 2008; Morkunas et at,
2011).
The responses of host plant to aphid attack have been focused in the present
work. Aphids ingest phloem sap from plants through narrow piercing—sucking stylets.
This mechanism of aphid starts with the probing of suitable host organ, piercing
stylets in epidermal mesophyll and parenchyma cells. This mechanical damage by
insect stylets may trigger plant's chemical defense response to infestation (Tjallingii
and Esch, 1993; Goggin, 2007). Long term aphid probing or insect saliva may induce
changes in the chemical nature of the sieve element sap (Telang et al., 1999; Ponder et
al., 2001). Aphids are major agricultural pests because of their unparalleled
reproductive capacity and ability to manipulate host plant's defensive physiology
(Chugh et al., 2013). Aphids feed and suck water and nutrients from the phloem. After
damage of the plant tissues, the toxins of the aphid saliva cause thickening,
crumpling, and downward curling of leaves (Mossier, 2005; Ahuja et al., 2010). Adult
aphids and nymphs are mobile and frequently change their feeding sites several times

Introduction: 6
during their lifetime. The direct consumption of phloem sap by nymphs and adults
from leaves, stem and flowers reduce the pod formation and oil content in grains up to
75 per cent (Sekhon, 1999). The aphid saliva is also toxic to plant tissues. Morkunas
et al. (2008) reported that aphids enter their stylet in plant tissues primarily via
intracellular route and inject saliva. Miles and Peng (1989) found that aphid saliva
was extremely toxic to plant tissues around the stylet tracks. The aphid saliva
disrupted chloroplast and induced hormonal disbalance in the plants (Morkunas et al.,
2008). Aphids secrete a proteinaceous salivary sheath lining the stylet path. The
watery saliva of aphid contains numerous enzymes such as oxidases, pectinases and
cellulases which cause cell wall breakdown and help aphids to penetrate their stylets
easily in plant tissues (Goggin, 2007).
Prolonged aphid infestations can cause premature leaf abscission and induce
defoliation of host plant (Rosenheim et al.. 1997). About half of all insect species are
herbivores and are also responsible for about 5-10 % and often 10-30 % leaf
defoliation every year (Schoonhoven et al., 1998). The loss of leaf area reduced shoot
biomass, number of stem nodes and photosynthesis (Bagwell et al., 1991; Layton et
al., 1996; Rosenheim et al., 1997).
The plant growth regulators such as JA also play an important role in plant
defence against insect attack. Jasmonic acid induces some volatiles to attract predator
insects to feed upon herbivorous insect. Besides these. JA also secures plant growth
and development (Rohwer and Erwin, 2006). The JA mediated signaling to predatory
insect is activated by phloem feeding aphids. But very little is known about the
specific impact of JA on the expression of genes that respond to aphid attack
(KuSnierczyk et al., 2011).
Jasmonic acids are synthesized through the activation of octadecanoid
pathway and regulate various physiological processes in plants such as pollen
maturation. tendril coiling, and senescence in addition to plant defense (Crcelman. and
Mullet, 1997; Steppuhn and Baldwin, 2008). The JA and its volatile methyl ester
(MeJA) act as endogenous regulator of wound-induced chemistry and signal
molecules on insects attack (Baldwin. 1999; Karban et al., 1999; Thaler, 1999a).
Jasmonic acids and its metabolites serve as phloem-mobile long-distance signals and

Introduction: 7
activate the expression of defense genes in distal plant parts, physical and chemical
defense traits through defense signaling (Howe and Schaller, 2008).
External application of JA as spray can induce the emission of a blend of
volatiles from plants often similar to responses induced during herbivore feeding.
Interestingly, Heil (2004) found minimal induction of volatile emission in Phaseolus
lunatus by JA led to secretion of extra floral Elector (FEN) and stronger induction of
herbivore repelling tendency. Such an understanding of the role of JA in tri-trophic
interactions may help in effective use of natural predatory beetles as a facilitator of
biological control of herbivory. Ladybug Coccinella septempunctata is a predatory
beetle (at trophic level) which feeds on herbivorous aphids. It is attracted with the
emission of ally] isothiocyanate or AITC. It is further reported that natural herbivory
nn A/lacaranga temariut (L.) Mtn!. Mg. was reduced by the application of JA (Heil et
al., 2001).
Each plant species has its own unique set of chemical defense and induction of
defenses should not always be attributed to jasmonate application alone. Such
reponses of JA should also not be used to conclude that the plants will be better
defended against pests. JA-induced defenses such as protease inhibitors (PI) may
often lead to the production of PI-resistant digestive enzymes in herbivores without
affecting herbivore performance (Broadway 1995. 2000).
Extra floral nectar induced by JA attracts beneficial insects to plants besides
reduction in herbivore numbers and damage (Arimura et al , 2005; Heil et al., 2001;
Linsenmair et al., 2001). Similar results were observed in Phaseolus lunatus (Heil,
2004). The use of pesticides in agriculture and horticulture directly threatened natural
ecosystem. The targeted use of jasmonate-induced defenses may provide valuable
augmentation of integrated pest management strategies in agriculture and horticulture.
For example, jasmonates may be used to treat localized infestations where a pest
threshold is exceeded with the goal of attracting predators or parasitoids.
It is very important to explore the mechanisms of plant defense against aphids
and to identify the factors that regulate resistance or susceptibility of the host plants.
In the present study aphid and JA induced responses of mustard-aphid-beetle (tri-
trophic model) have been studied. The direct and indirect plant defense system
(biochemical, physical, histological and physiological) etc. have been studied in

Introduction: S
responses to aphid infestation and its simulation through JA application. It is believed
that plant response to aphids is complicated involving several defense strategies
(Thompson and Goggin, 2006). This work examines the effect of aphid infestation
(natural herbivory) and application of JA (simulated herbivory) on physiological and
biochemical alterations in the host plant resultant adaptation to resist aphid infestation
and the behavior of predatory beetle.
The present work was carried out with the following objectives:
I. Screening of five cultivars of mustard (Brassica juncea) to work out least
sensitive and most susceptible cultivars response to a constant number of
aphid (Lipaphis erysimi).
2. To compare the response of screened least sensitive and most susceptible
cultivars of mustard to varying levels of aphid infestation.
3. To find out the effects of predatory beetle (Coccinella septempunctata) on
different levels of aphid population infested on two selected mustard cultivars
4. To compare the relative responses of two screened cultivars of mustard to
varying concentration of JA applications (as simulation of aphid infestation).
5. Combined effect of simulated herbivory (JA) and natural herbivory (aphid) on
resistant and susceptible eultivars of mustard.

Chapter 2
Review of literature

LITERATURE REVIEW
Plants face many abiotie and biotic challenges during their life time. The
abiotic stresses include drought, flooding, temperature fluctuations and metal stress.
However, attack by different kinds of organism, viz. parasites and herbivores are
major biotic challenges for the plant. Herbivory is the act of consumption of specific
plant parts like foliage, stein, root, flower, fruit or seeds by animals or insects
(Rruinsma and Dicke, 2008). I lerbivory depends on the type and intensity of feeding
habit of herbivore. It is a key ecosystem process through which energy is transferred
from autotrophs to heterotrophs (Anonymous, 2008; Farha-Rehman et al., 2012b).
This process also reduces density of plants, and transfers part of biomass and nutrients
to the soil (Anonymous 2008; Parha-Reman et al., 2012h). Insects like aphids and
whitalies feed on the plant sap while spider-mites and thrips feed on the epidermal or
rnesophyll cell contents of the leaves (Watling, 2000). About 950,000 insect species
contribute almost 56% of the diversity of animal kingdom. Of these, about 9000
species of insects are pests and incur major crop losses (Grisworld, 1953). Severe
crop damages by a number of insect herbivores are reported from developed and
developing nations. There are conflicting reports on crop losses by insects. The global
crop damage by insects vary between 35-37% according to one estimate (Atwal and
Dhaliwal, 2003; Farha-Rehman et al., 2010) and 10-20% by another estimate (Ferry et
al., 2003). Insects caused 10-30% annual crop losses in North America, Europe and
Japan, (Atwal and Dhaliwal, 2003). In accordance with their density grass hoppers
(Choreodoeus illustris) could consume 32-79% leaves of Zea mays plants (Farha
Rehman, 2008).
Aphids belong to the family Aphidoidea within order Hemiptera. Aphids are
nefarious plant pests, especially on the members of family Brassieaveae and cause
damage to crop plants by sucking plant sap and transmitting pathogenic viruses
(Rhatia et al., 2011). A slender stylet bundle constitutes the modified mouth parts of
the aphids. The stylet punctures the leaf surface and then penetrates predominantly
through middle lamella to reach the sieve element and suck-in the nutrient-rich
phloem sap (Kaloshian and Walling, 2005), Large concentration of carbohydrates in
the phloem sap create an osmotic imbalance in the aphid gut (Walling, 2008). To

Literature Review : 10
avoid this dehydration, aphids maintain their water balance by occasional feeding
through the xylem (Spitler et al., 1990).
Various species of Brassica are important edible oil crops of India. Brassica
juncea (Indian mustard, locally called 'rai') is the major oil yielding crop among other
species of Brassica of family Brassicaceae (Bhatia et al., 2011). The plants, during
growth are exposed to various biotic (herbivory, fungal, bacterial) stresses and
enhanced the synthesis of primary and secondary metabolites. in this process, a
number of defensive signaling viz. salicylic acid (SA), jasmonic acid (JA), ethylene
and abscisic acid pathways are activated in the plant (Zhao et al., 2007). The
systemically induced defense responses of Brassica species might use complex
defensive mechanisms than a common set of biosynthetic pathways (Jahangir et al.,
2009). Plants under diverse natural stresses are forced to evolve more co-ordained
rather than conflicting defense strategies (Bruce and Pickett, 2007). In case of aphid
infestation, composition of saliva and attacking mechanism, activates selected gene
expression and blocks specific sites of a metabolic pathway, or even metabolize the
plant defense compounds (Jahangir et al., 2009).
Among the biotic stresses, damage caused by aphids is considered as a major
constraint in the growth and productivity of these crops (Bhatia et al., 2011). Different
species of Brassica are infested by a variety of aphid species such as green peach
aphid (Ailyzus persicae), cabbage aphid (Brevicoryne brassicae L.) and mustard aphid
(Lipaphis erysimi Katt.), as reported by Bhatia et al. (2011). Indian mustard (Brassica
juncea) is predominantly infested by 1. erysimi (Atri et al., 2012). All the growth
stages of the crop were attacked by aphids but the greatest damage was done during
the flowering and pod formation stages (Bakhetia, 1991; Bhatia et al., 2011). Retarded
growth, poor seed formation and low oil content are the prominent manifestations of
aphid feeding (Malik and Anand, 1984; Bakhetia, 1987; Atri et al., 2012; Louis and
Shah. 2013). Both the nymphs and adult aphids devitalize crop by sucking the cell sap
(Bakhetia, 1991; Atri et al., 2012). Mustard aphid (L. erysimi Katt.) is one of the most
damaging pests that confronts this crop and is highly host specific, feeding
exclusively on Brassica phloem sap (Bhatia et al., 2011).

Literature Review : 11
Plant defense strategies against herbivory
The plants evolved a broad array of constitutive and induced defenses against
herbivores. Some of these are morphological, and some others chemical in nature
(Vickers, 2011). Constitutive plant defenses include glandular ttichomes, cuticular
waxes, (Wittstock and Gershenzon, 2002) and other structural and chemical defenses
like cell wall modification, synthesis of proteins, secondary metabolites of toxic
nature and predator inviting volatiles (Coggin, 2007). Inducible chemical defenses
include sequestering of a wide variety of toxic, anti-nutritive, or injurious compounds
to repel attacking organisms. These defensive compounds include alkaloids, phenolic
compounds, chitinases, and protease inhibitors (Rohwer and Erwin, 2008).
The defense strategies of some plants to herbivory include avoidance and
tolerance by some plants through diversion of resource allocation to damaged parts
(Vickers, 2011). In some other plants, defense strategy includes induction of R gene
or activation of signalling pathways (Howe and Jander, 2008; Vickers, 2011). The
antixenosis (deterring effect) and antibiosis (toxic for survival) are chemical defenses
(mainly secondary metabolites) of plants (Parsa et al., 2011; Vickers, 2011). The
induced defenses increased the plant fitness in natural environment as in Raphama
raphanistrum (Agrawal, 1999).
The air born volatile signals constitute defensive chemicals (aldehyde,
alcohols and esters) that protect plants from insects and induce intact undamaged
neighbouring plants to produce and emit sesquiterpenes and JA (Engelberth et al.,
2004). The immunity of plant to insect hcrbivory is caused by recognising insect
attack and through released volatile signals from injured cell of neighbour plant
(Howe and hinder, 2008).
Constitutive plant defenses
Plants have evolved many constitutive defense traits to deter herbivores. Some
of the major constitutive morphological plant defense is appended as follows.
Trichomes
Trichomes are the hair like epidermal appendages and are produced by most
plant species (Werker, 2000). The leaf trichomes serve defensive functions like
protection and resistance against herbivores (Levin, 1973; Dalin et al., 2008). In many
plant species, trichome density in new leaves increased after herbivore infestation

Literature Review : 12
(Levin, 1973). But, this constitutive adaptation is also affected by the abundance and
effectiveness of predators and parasitoids feeding on herbivore (Levin, 1973).
'trichomes are composed of cellulose and other substances that constitute low
nutritional value for the insects.
The trichomes vary in shape, size and cellular organisation (Southwood, 1986;
Werker, 2000). Some glandular trichomes release secondary metabolites (e.g.
terpenes and alkaloids) which can be poisonous, repellant, or may trap insects or other
organisms (Duffey, 1986; Hare and Elle, 2002; Rautio et al., 2002). The herbivores
induced production of new leaves with higher density of trichomes and consequently
the foliage consumption by insect fell down (Agrawal, 1999, 2000; Dalin and
Bjorkman, 2003). Irichomes influence insect oviposition and/or feeding in a wide
range of insects and other herbivores (Levin, 1973). Non-glandular trichomes mainly
function as a structural defense against small herbivores (Levin, 1973; Karkkainen et
al., 2004). The trichomes interfered with the movement of insects on the leaf surface
making accessibility to the leaf epidemns difficult for feeding (Southwood, 1986).
The trichomes are relatively soft 'weapons' in plant defense against herbivory
compared to other lethal trait (Dalin et al., 2008). But their presence on host plant
influences both selection behavior and population growth of herbivorous insects
(Dalin et al., 2008). These studies suggest that the trichomes protect host plant from
herbivorous insects.
Leaf trichomes also influenced the performance of herbivore predators. This
may indirectly affect the strength of damage caused by herbivores (Dalin et al., 2008).
The trichomes may have a neutral, negative or positive effect on predators (Dalin et
al., 2008). Both non-glandular and glandular trichomes may have any of these effects
on predators (Obrychi and Tauber 1984; Romeis et al., 1994; Styrsky et al., 2006).
The tiny hooked trichomes on leaves and stems of Memzelia punt*, (Family
Loasaceae) have a detrimental effect on plants against herbivores (Eisner et al., 1998;
Farha-Relunan et al., 2010). 'fhe hooked trichomes adversely affected both herbivore
aphids (Macrosipluan mentz.eliae) and its predator, Coccinellid beetle; Hippodamia
convergens (Eisner et al., 1998; Farha-Rehman et al., 2010).

Literature Review : /3
Cuticle
Cuticle being first contact zone poses a potent resistance to insects (Samuels et
al., 2008; Muller, 2008). Chemical compounds in the cuticle deter the herbivores
directly or have a toxic effect (Muller. 2008; Yeats et al., 2013). Herbivores induced
an additional wax production and biosynthesized secondary metabolites that are
deposited at the plant cuticle (Muller, 2008).
Aphid attack on Beta vulgaris L. (Chenopodiaceae) induced wax production
(Bystrom et al., 1968). But, crystalline epicuticular wax reduced in the leaves of
Sorghum halepense infested by Sipha /lava (Muller, 2008). The infested leaves of
plant became even more susceptible to the aphids than intact plant (Gonzales et al.,
2002). Cuticular lipids perform important function in multitrophic interactions, as
their major constituents can be chemically very similar between cuticles of plants,
herbivores, and their predators (Muller, 2008).
Wound periderm
Franceshi et al. (2005) and Ginzberg (2008) observed the role of periderm in
plant defense mechanism. The formation of wounded periderm al the boundaries of
the damaged region to isolate it from non-wounded healthy tissue is one of the
defensive strategies of the plant. The wound peridemi may prevent from successive
pest invasions and fluid loss (Ginzberg, 2008; lc hihara et al., 2000).
The purpose of wound healing in plants alter herbivore is to minimize the
pathogen invasion and fluid loss (Ginzberg, 2008). Peridemi is a secondary protective
tissue and replaces the damaged epidermis. The inner cell layers of potato tuber
periderm produce high levels of glycoalkaloids, which are toxic secondary
metabolites that are active against pests and pathogens (Krits et al., 2007). The
suberin is the main protective substance deposited in outer wall layers of its cell wall
(Ginzberg, 2008). The rate of establishment of suberized periderm following injury
(e.g. after aphid feeding) is an important factor in the plant resistance to indirect
damage following the wounding such as water loss (Ginzberg, 2008). He also noticed
that periderm formation and their suberization are considered as generalized responses
to wounding. However, developmental staces, biosynthetic pathways of periderm
formation and its suberization are not yet completely known (Ginzberg, 2008).

Literature Review : 14
Chemical Defenses
Antibiosis and antixenosis are widespread defense mechanisms of plains
against aphid herbivory. Some of these are constitutive and others induced one as
reported by Parsa et al. (2011) and Louis and Shah (2013). Inducible antibiosis
defense has been demonstrated recently in Arabidopsis ihaliana in response to
feeding by the aphid A.lyzus persicae (Louis and Shah, 2013). Plants convert indolc
glucosinolate and a secondary metabolite (indol-3 allylmethylglucosinolate) into a
more toxic 4-methoxyindo1-3-ylmethylglucosinolate to defend the injured plants. This
induced defense was localized and not systemic (Kim and Jander, 2007). The
sequestered toxic compounds in a resistant genotype of soybean, subsidized the
feeding and expanded maturation periods of Aphis glycines rnaisumur (Li et al.,
2004). The secondary defensive metabolites including saponins, act as feeding
deterrent to pea aphid Acyrthosiphon pisum and A. pisum, which reduce aphid's
ability to ingest phloem or xylem sap (Golawska, 2007). Saponins also reduce the
growth and reproductive rates of A. pisum (Sylvia et al., 2006). Besides these wide
spread defensive chemicals in leaf tissues affecting feeding abilities of aphids, there
are specific localized deterrents in the phloem (Vickers, 2011). Aphids are phloem
feeders, and cause mechanical tissue damage while inserting their stylcts and hence
pose detection problems for the host plants (Louis and Shah, 2013). Phloem based
defense is a specialized trait induced only in phloem feeding aphids. This strategy
save resource allocation costs and initiates only minimum plant defense upon aphid
infestation (Walling, 2008).
A study on the resistant breeding line of melon (Cucumis metro, AR5) affirmed
that resistance against the cottcni-melon aphid was located within the sieve eletnents
and controlled aphid population by reduced phloem ingestions as well as longer
salivation period (Klingler et al., 1998). These results were possible due to induced
phloem defense traits in resistant lines of melon. In a late,- study Will and van Bel
(2005) revealed that aphids must have thin and strong stylct long enough to reach and
puncture the sieve tubes at a particular she. Against the disturbance of these kinds, the
sieve tubes in angiosperms possess elaborate scaling mechanisms such as protein
plugging and callose sealing which are triggered by a rise in calcium in the sieve
tubes (Giordanengo et al., 2010). The Call- influx in sieve element is mechano-
sensitive and seems to be important for phloem occlusion in response to aphid

Literature Review : 15
infestation as well (Knoblauch et al., 2001; Furth et al., 2009; Khokon, 2011). A
limited cell death around the site of stylet impregnation has also been recorded by
Pegadaraju et al. (2007) and Girling et al. (2008). Further. it is investigated that the
plant biochemical wound response pathways arc involved in the production of aphid-
induced plant volatiles. The infestation of Arabidopsis thaliana by peach—potato
aphid (Myzus persicae), volatile production via octadecanoid pathways and activation
of C011 gene was induced (Girling et al.. 2008; Louis and Shah, 2013). In the case of
arthropod feeding, changes in plant metabolism and gene expression were associated
with both, the general plant defense responses and specific aphid resistance gene
(Moran and Thompson, 2001).
Plant-aphid interaction may activate dual defensive pathways; one species
specific and another general response; common for many plant aphid interactions. The
feeding of Diuraphis noxia (Mordvilko) and Alyzus nicotianae on wheat and tobacco
induced increased expression of glutamate synthatase, an enzyme produced and
deployed in response to many cellular stresses (Walling, 2000; Moran and Thompson,
2001; Smith and Boyko, 2007) .
The predator recruitment through chemical signaling is unique defensive
strategy of plant (Farha-Rehaman et al., 2012a,b; Vickers, 2011). Plants attracted
predatory insects through a special blend of volatile chemical signalling. Several types
of secondary metabolites play an important role against insect attack, for instance;
glucosinolates accumulate in Brassicaceae family on aphid herbivory (Kazana et al.,
2007; Ahuja et al., 2010). The glucosinolates are toxic to aphid herbivores and its
degraded isothiocyanate compounds (in the presence of myrosinase enzyme) signal
the natural enemies of herbivores (Kazana et al., 2007; Ahuja et al., 2010). Infested
turnip plants release higher levels of isothiocyanates than uninfested plants,
promoting attraction of Thaw-Melia rapae a predator (Blande, 2004).
Role of jasnionic acid against aphid feeding
Jasmonic acid is biosynthesized (through ocladecmand pathway) from
polyunsaturated fatty acids via a series of enzymatic reactions and released from
chloroplast membranes (Meyer et al., 1984). Allene oxide synthase (AOS) gene
encodes an enzyme to synthesise 12-oxophytodienoic acid (OPDA), a precursor for
the synthesis of JA (Park et al , 2002). Several genes whose products are involved in

Literature Review : 16
JA biosynthesis or JA-dependent signalling are up-regulated and thus. JA-derived
compounds regulate gene expressional changes (Kehr, 2006). As a result of
transcriptional reprogramming, the production of proteins involved in defense is
promoted (Kehr, 2006) and the metabolite profiles of plants are changed (Mewls et
al., 2006; Kim and Jander 2007; Kanierczyk et al., 2008, 2011) due to application of
JA.
The IA functions in plant defense against insects have been described in
Arabidopsis, tobacco, wheat and sorghum (KuSnierczyk et al., 2011). The exogenous
application of JA or methyl jasmonate (MeJA) induces defense traits (Fritz. 2010).
Korth and Thompson (2006) revealed that JA, McJA and their precursor, OPDA are
potent inducers of proteinase inhibitors (PI), and play important roles in plant
responses to herbivore attack. At gene Level studies, C011, JARLTIK, AxR1,
ATMYC2, LOX and MI genes were found to play important roles in JA mediated
resistance to insect herbivory in many plants (McConn et al., 1997; Moran and
Thompson, 2001; Balbi and Devoto, 2008; Fujita et al., 2009; Morkunas et al., 2011).
Several genes viz. COIL JAR1, TIRL AXRI, ATMYC2, LOX and MI genes have
been found to play important roles in activation of JA and MeJA mediated resistance
to herbivory. "Me expression of these genes activates various sequestering pathways
of defensive volatile production in plants which has been reported by many research
workers as Moran and Thomson (2001), Voelckel et al. (2004); Zhu-Salzman et at
(2004); Park et al. (2006); Boyko at al. (2006); Gao at al. (2007); Smith and Boyko
(2007); Morkunas et al. (2011).
Effect of jasmonic acid on plant attributes
Studies of the last two decades have established the role for jasmonates as
signalling molecules or stress modulating compounds (Thompson and Coggin, 2006;
Fritz et al., 2010; Kusnierezyk et al., 2011). They have been involved in plant
response to wounding and pathogen attack (Farmer and Ryan, 1992; Cireelman and
Mullet, 1997; Baldwin et al., 1997). Because of their ability to provide protection
against biotic and abiotic stresses, jasmonates have been the focus of much attention
in recent years (Tsonev et al., 1998; Mackerness et al., 1999; Wilen et al., 1994). The
JA treatment has positive and significant effect on pigment accumulation (Poonam et
al., 2013). There are some contrary reports which showed that exogenous application

Literature Review : 17
f Me-JA in excised cotyledons of Coati/Wiz pepo inhibited the accumulation of
hlorophyll (Ananiev et al., 2004).
The overall stronger stimulatory effect of JA on photosynthetic pigment
cewnulation could be due to its stronger effect on the chlorophyll biosynthesis
mathway especially during earliest stages of greening (Beale et al., 1978). It is also
eported that the JA treatment may increase cytokinin concentration which enhanced
Larninolevulinic acid either at synthesis level or at its activity level (Poonam et al.,
2013). JA application protects membranes from stress damage (Bandurska et al.,
2003). It was observed that this protection of cell membrane mediated by JA is dose
dependent along with absence or presence of any stress factor (Poonam et al., 2013).
Prolinc is an amino acid which accumulates in plants under high stress (Chen
and Kao, 1993; Gao et al., 2004). It is a stress marker metabolite which protects the
plant from harmful consequences of stress induced oxidative damage and cellular
integrity (Ali et al., 2007, Poonam et at, 2013). The JA treated stressed and non
stressed plants had mixed results on accumulation of proline. In presence of JA, the
stimulation of proline content in heavy metal stressed plants reduced (Chen and Kan,
1993: Gao et al., 2004; Jamalomidi et al., 2013). Jang Soo-Won et al. (2008) and
Jamalomidi et al. (2013) reported that foliar application of MeJA increased
photosynthesis hut, reduced proline content in tobacco plants under NaCI stress. In
contrary, All et al. (2007) found that proline content increased in roots of Panax
ginseng when treated with MeJA. Exogenous application of JA stimulated protein
content in stressed and non stressed plants (Poonam et al., 2013). JA is reported to
induce accumulation of .jasmonate induced stress proteins (JISP) in rice seedlings
(Rakwal and Komatsu, 2001) and their accumulation in peanut seedlings is dose
dependent (Kumari et al., 2006). The JISPS are thylakoid-bounded poly-peptides
(Maslenkova et al., 1992). Most of JA induced polypeptides were identical to one,
induced by abscisic acid (ABA) and sodium chloride (NaC1), leading to assumption
that exogenously applied jasmonates act as stress agents (Popova et al., 2003).
The application of JA improves as well as retard the growth of plants
depending upon chemical analogue and concentration of application. Low
concentrations of MeJA increased the growth of Cynara scolyrnus seedlings, but
higher concentrations reduced the seedling growth (Closas et al„ 2004; Bojorquez-
pereznieto et al., 2013). Foliar application of IA led to a significant change in the

Literature Review: 18
plant metabolism (Redman et al., 2001). The growth and yield of MeJA treated garlic
plant increased in non-drought conditions, but more effectively under drought
conditions (Bideshki and Arvin, 2013).
Tri-trophic plant signalling
The plant defense systems against herbivores are induced through the
oetadecanoid pathway, which in turn attract natural enemies (predators or parasites) of
plant herbivores (Thaler, 1999a). This pathway was inducible by treating plants with
JA or by natural herbivory as noted in case of tomato plants under insect herbivory.
Jasmonic acid increased the the plant defense induced with parasitism of caterpillar,
pests in an agricultural field (Thaler, 19996; Parha-Rehman et al., 2010; 2012b). The
JA and herbivory induced the attraction of carnivores towards herbivores infesting on
lima bean plants (Dicke et al., 1999). Lima bean plants damaged by two spotted
spider mites (Tetranychus urticae) emitted a complex mixture of volatiles. These
volatiles attracted carnivorous mitts (Phyaseadus persinalis) a specialist predator of
spider mites which eliminated entire population of herbivorous spider mite (Dicke et
al., 1999). Induction of volatile synthesis by herbivorous spiders in lima bean plants
resembled to the effects caused by JA treatment (Dicke et al., 1999).
The inference drawn from experimental findings indicate that direct and
indirect plant defenses against herbivores are reduced in jasmonate deficient plants
(Thaler el al., 2002; Farha-Rehman et al., 2010; 20126). Some species of plants only
deterred the herbivores while some other plant species also signaled to natural
enemies of herbivores as an effective indirect defense strategy. It was also found that
damaged wild plants were more attractive to predator mites compared with
undamaged wild plants (Thaler et al, 2002; Farha-Rehman et al. • 2010, 20126). In
both the cases, JA was reported to be an essential regulatory component for the
expression of direct and indirect plant defenses against herbivory (Thaler et at, 2002;
Farha-Rehman et al., 2010, 2012b). Van and Dicke (2004) reported that Arabidopsis
thaliana defend herbivorous insects and mites, through induced volatiles emission
upon herbivory. These volatile guided predators or parasites to reach their herbivorous
prey, and thus benefitted both the plants and carnivores. Similar pattern of indirect
defense has also been noted in case of pine, maize, lima bean etc (Van and Dicke,
2004; Farha-R ehm an et al., 2010, 2012b).

Literature Review : .19
Herbivore strategies to plants
The herbivores evolved mechanisms to obtain food from plants despite the
evolution of diverse ways of plant defenses. Relationship between herbivores and
their host plants often result in reciprocal evolutionary change, called co-evolution
(Futuyma and Slatkin. 1983; Walling et at, 2008). Some herbivores co-evolved ways
to hijack plant defenses by sequestering these chemicals and using them to protect
themselves from predators (Cornell and Hawkins, 2003; Farha-Rehman et al., 2010).
Different types of herbivory affect several plant tissues, besides affecting
primary production, translocation and accumulation of photosynthates to varying
degrees (Anonymous, 2008; Farha-Relunan et al., 2010). In the ecological context
(plant-herbivore-predator interactions), the interdependence of interacting ()monism
on each other is important for their survival in a complex ecosystem (Baalen and
Sabelis, 1993; Marrow et al., 1996). The size of herbivores vary from tiny aphids to
insects and mammals of very large sizes (Futuyma, and Slatkin, 1983; rarha-Rehman
et al., 2010). Insects are the primary herbivores in many ecosystems and feed on a
vast variety of plant species ranging from algae to angiosperms. Insects have been the
most significant herbivores and the evolution of land plants switched the co-evolution
of insects (Farha-Rehman et al., 2010). Herbivory affects a variety of ecosystem
properties primarily through differential changes in survival, productivity and growth
form of plant species (Anonymous, 2008; Farha-Rehman et al., 2010).
Aphid saliva: Composition and effect
As compared with grazing insects, aphid results in minimal wounding damage
to the leaves for they have unique salivary composition (Vickers, 2011). Aphids
produce two types of saliva; the gelling saliva is viscous and contains complex
carbohydrates, phospholipids and proteins that appear to be consistently represented
in the sheath saliva of a number of aphid species (Cherqui and Tjallingii, 2000). The
gelling saliva is secreted when the stylet is penetrated into host tissue and forms a
tight sheath around the stylet as it traverses the plant tissue (Cherqui and Tjallingii,
2000). 'This sealing effect of the gel sheath minimizes any counter reaction from the
plant cells of the host (Tjallingii, 2006; Giordanengo et al., 2010). A second saliva
component is watery. It is produced by aphids containing a variety of hydrolytic
enzymes like pectinases, cellulases, polyphenoloxidases, glucose oxidase and

Literature Review: 20
peroxidases (Miles, 1999). The aphid stylet occasionally punctures a few cells while
inserting to the sieve element and in this process pours a small amount of the watery
saliva into the cells; concomitantly the insect ingests a mixture of the saliva and
cytoplasmic contents of host cell (Martin et al., 1997). This initial sample of
cytoplasm and saliva mixture, allows the aphid to judge suitability of sap and make a
decision on whether to continue feeding on the host (Tjallingii and Eseh, 1993;
Powell et al., 2006). The watery saliva is also delivered into the sieve element when
the insect is feeding from the sieve element (Powell et al., 2006). The enzymes in the
watery saliva collectively help the aphid to repress plant defense responses (Ma et al.,
1990; Cherqui and Tjallingii, 2000; Flannel et al., 2008) and prevent sieve tube from
occlusion through plugging by callose or any other phloem protein (Knoblauch and
Van Bel, 1998; Will and van-Bel, 2005; Giordanengo et al., 2010). The glucose
oxidase commonly occurring in the saliva of Icpidopteran herbivores has also been
identified from the saliva of Alyzus persicae (Harmel et al., 2008) which is
responsible for eliciting local defenses in Arabidopsis (De Vos and fancier, 2009).
Simulation of herbivory and signalling
Realistic herbivory simulations in terms of plant responses were noted on
combining 50 % leaf area clipping and JA spraying on Solidago canadensis rather
than either clipping or JA spraying alone (Van Kleunen et al.. 2004; Farha-Rehman et
al., 2010). Jasmonic acid was a useful plant elicitor for pest management on tomato
plants (Thaler, 1999; Farha-Rehman et al.. 2010). Mechanical wounding with forceps
did not substitute for insect attack on rapeseed and does not mimic well the effects of
diamond-back moth herbivory to the plants (Pontoppidan et al., 2005; Farha-Rehman
et al., 2010).
Engelberth et al. (2004) reported that some plants protect themselves by
airborne signalling against insect herbivore attack. Mechanical damage (simulation
herbivory) or natural hcrbivory induce plant to emit green leaf volatiles including six
carbon aldehydes, alcohols, and esters. These volatiles also induced intact undamaged
neighboring corn seedlings to rapidly produce JA and emit sesquiterpenes (Engelberth
et al., 2004; Farha-Rehman et al., 2010) and to accumulate proline (Farha-Rchman et
al., 2010, 20126). These green leaf volatiles played a key role in plant—plant defense
signaling and plant-insect interactions.

Literature Review: 21
Effect of herbivory on plant photosynthesis
On herbivory, the loss of carbon fixation is more due to inhibition in rate of
photosynthesis in undamaged leaf tissues rather than on leaf area removal (Zangerl et
al., 2002; Nabity et al., 2009; 2013). The removal of only 5 % of the leaf area by
caterpillars reduced photosynthesis by 20 % in the remaining foliage of wild parsnip
(Zangerl et al., 2002), but equally in oak saplings (Aldca et al., 2006). The magnitude
of these effects on photosynthesis, depend in large on the type of feeding damage and
the mode of defense deployed by the plant under attack (Nabity et al., 2009).
Arthropods also damage xylem and phloem, which may alter water transport,
stomatal aperture, and sucrose transport and thereby reduce photosynthesis in
remaining leaf tissue (Welter, I989). Severing tissue vasculature alters leaf hydraulics
and subsequently, nutrient or osmotic transport (Sack and Holbrook, 2006). Insect
attack can induce many defense-related responses and concomitantly reduce the
expression of photosynthesis-related genes (Kessler and Baldwin, 2002).
The sustained reductions in gas exchange and electron transport increased
defense metabolites in wild-type Nicotiana atrennata plants (Nabity et al., 2013). The
suppression in photosynthesis occurred only after sustained defense signaling and
mobilization of defense chemicals (Nabity et at., 2012). Down regulation of
photosynthesis and simultaneous increases in respiration following herbivory occur in
some other plant species synthesizing biocidal defensive compounds e.g. terperzes
(Zangerl et al., 2002: Gog et al., 2005). The stomata] conductance (gs) limits internal
CO2 (C',) and its assimilation in wild-type plants for days after the initial herbivore
attack. The onset of herbivory decreased both gs and C1 indicating that stomata limit
CO, assimilation (Nabity et al., 2013), associated with severed vasculature (Sack and
Ilolbrook, 2006). •
Schroeder et al. (2001) reported in their experiment that plums control their
stomatal apertures in response to various phytohormones and environmental signals to
regulate gas exchange and transpirational water loss as well as to defend invasion of
microorganisms. The stomatal guard cells regulate gas exchange by altering their
shape and aperture (Chen et al., 2012). Precise regulation of leaf gas exchange is
essential as it directly affects photosynthesis, transpiration, xylem translocation, and
plant water potential (Eisinger, 2012).

Literature Review : 22
Role of glocosinnlate-myrosinase system against herbivory
The members of family Brassicaceae are known for accumulating several
secondary metabolites, especially glucosinolates following aphid herbivory (Kazana
et al., 2007; Ahuja et al.. 2010). Glucosinolates are toxic to aphid herbivores and can
be hydrolyzed into isothiocyanates (ITCs) compounds to attract natural enemies of
herbivores (Kazana et al., 2007; Ahuja et al., 2010). The sulphur containing ITCs are
generated on degradation of glucosinolates by the enzymatic reaction of myrosinases
and it has biocidal activity (Yan and Chen, 2007). Ally} isothiocyanate (AITC) is one
of the degradation product of glucosinolates—myrosinase system and its volatilization
help in repelling the attacking herbivores (Lambrix et al., 2001). The synthesis of
AITC and other products on herbivory are shown in the following Plate 1.
Exogenously applied AITC induced stomatal closure in Arahidopsis via
production of reactive oxygen species (ROS) and nitric oxide (NO), and elevation of
cytosolic Cat- (Khokon et al., 2011). Through this mechanism genetic evidences have
demonstrated that AITC-induced stomatal closure required MeJA priming. These
results suggest that crucifer plants produce ITCs to induce stomatal closure, leading to
suppression of water loss and invasion of fungi through stomata (Khokon et al.,
2011). ROS and NO are second messengers which play important roles in McJA and
ABA signaling and stomatal closure (Murata et al., 2001; Bright et al., 2006;
Muncmasa et al., 2007; Islam of al., 2010).
Effect of herbivory on plant growth attributes
In majority of plants, protein, some metabolites and macromolecules (e.g.
peptides, enzymes, lignin, phenolic metabolites and cuticular waxes) can serve as
defense against herbivores (Gottesman and Chauser—Volfson, 2000). Proline is
multifunctional plant metabolite (Szabados and Savoure, 2009). The praline and
protein under stress conditions play important roles in plant defense mechanism. The
accumulation of free proline is stress marker in a number of plant species subjected to
hyperosmotic stress conditions (Oncel et al., 1996; Choudhary et al.. 2005; Kavi
Kishor et al., 2005, Szahados and Savoure 2009). Praline could play crucial role in
phloem feeding elicited water loss therefore induces hyperosmotic and oxidative
stress. Studies have proposed that higher accumulation of proline (up to 80 % of
amino acid pool) is due to stress (Kohl et al., 199k; Schat et al., 1997, Delauney and

DAMAGED TISSUE BY
FEEDING INSECT
Glucosinolate Myrosin
INSECT ATTACK
Chloroplas
Glucosinolate biosynthesis
1W:1J
Endoplasmic reticulum
NUCLEUS transcription
MYROSINASE
GLUCOSINOLATES
yrosinase Storage
in vacuole
(R-N-C=S) Isothiocyanates 4■•■■• 1■1■1110. Nitriles
Epithionitriles Thiocyanates
Allylisothiocyanate (Act as natural insecticides)
Oxazolidine thiones
Plate I. Glucosinolate-myrosinase cycle in mustard (B. juncea) activated on herbivory

Literature Review : 23
Verma, 1993; Kavi Kishore et al., 2005), and under normal conditions up to 5% of
proline accumulates. Higher accumulation of prolinc is due to increased synthesis and
decreased degradation under various stress conditions proline under osmotic stress
conditions; stabilize proteins, cell membranes and subcellular structures (Vanrensburg
et al., 1993), and cellular functions by scavenging reactive oxygen species (Bohnert
and Shen, 1999). Proline is osmoprotective cellular metabolite (Witt et ad., 2012,
Szabados and Savoure, 2010; Mewis et al., 2012). Proline was found
phagostimulatory to locusts when presented on an inert matrix (Haglund, 1980).
Proline (or valine) served as a cue detectable by grasshoppers to lead them to drought-
stressed nitrogen-enriched plants (Haglund, 1980). Plants accumulating excessive free
proline to resist drought stress may also attract to insect predators (Bright et al,
1982).
Although proline is a universal osmolyte and accumulate in response to
several stresses (Oncel et ad., 1996), which may have a role in plant defense reactions
(Kuznetsov and Shcvyakova, 1997), protein degradation is sometimes assumed to be
one of the possible sources for proline accumulation (An et al., 2013). The insect
attack led to a proportionate loss of leaf protein besides increase in prolinc
accumulation in damaged Zea mays leaves (Parha-Rehman et al., 2008, 2012b). The
total soluble protein decreased in infested eucalyptus leaves indicating impaired
protein synthesis (Singla and Grover, 1994). Drain of assimilates towards the insect
directly reduce metabolites in plants (Miles. 1989; IChattab, 2007). Some defensive
proteins block the actions of proteolytic enzymes from herbivores are found in
legumes, tomatoes and other plants and these defensive proteins accumulate in
undamaged tissues in some insect infested plants (Ananthakrishnarn, 2001).
Aphid feeding results in oxidative stress in cabbage ascorbic acid, proline,
phenol peroxidases, oxidases as well as Ca`` and IC+ help in the defense mechanism of
aphid infested cabbage leaves and thereby delay their death (Khattab, 2007).
Ilerbivory generally stimulate excessive accumulation of proline at the cost of
carbohydrate as an adaptive mechanism and there was no significant effect on the
phenolics (Miles, 1989; Khattab, 2005). Proline is capable of movement between
tissues, and serves as a storage compound for carbon and nitrogen and thus protecting
cytoplasmic enzymes and cellular structure (Serrano and Ciaxiola, 1994; Hare and
Cress. 1997; El-Khawas and El-Khawas, 2008). The increased proline level was

Literature Review : 24
reported in aphid infested barley seedlings (Cabrera et al., 1994) and JA applied root
suspension cultures (Ali et al., 2007). The total soluble protein reduced in infested
cabbage and Brassica juncea (Khattab, 2007; Singh and Sinhal, 2011). Moreover, the
reduction in total soluble protein in the infested leaves was concomitant with P level
which affected protein synthesis. Similar results were reported by (Singla and Grover,
1994: Khattab. 2007) who 'bond that the rate of protein synthesis declines during
stress condition.
Effect on chlorophyll and carotenoid content
The aphid feeding induced a senescence-like state in the alfalfa leaf that is
characterized by loss of chlorophyll, decreased levels of soluble protein and fatty
acids (Dillwith et al., 1991). After infestation of aphid, susceptible sorghum plants
down-regulated some chlorophyll component proteins (Zhu-Salzman et al., 2004;
Smith and Boyko, 2007). However, resistant wheat and sorghum plants offer respond
to aphid attack by increased synthesis of chlorophyll or photosystem component
proteins (Salzman, et al., 2005; Smith and Boyko, 2007). Infestation of attack also
reduced chlorophyll levels in cereals (Rafe et al., 1996; Heng-Moss et al., 2003,
Golawska et al., 2010).
The phloem sucking aphids change the cell pH either on the luminal side of
the thylakoid membrane, preventing the formation of zeaxanthin, or on the stroma
side where regeneration of violaxanthin takes place. One of two pathways of natural
degradation of chlorophyll a is the oxidative bleaching pathway. The decline in
chlorophyll level might be due to increased production of defensive compounds
(Janave, 1997; Khattab, 2007; Golawska et al., 2010).
Herhivory and plant nutrient
Nitrogen (N) in the soil is absorbed by the plant in the form of nitrate and
ammonium ions. It is used by plants to synthesize amino acids, proteins and other
complex nitrogenous compounds like chlorophyll. Thus it is essential for plant growth
and development (John et al., 2004; Chen et al., 2010). Phosphates help in the
formation of nucleic acids and high energy phosphate compounds like ATP (Syers et
al., 1986; Wilson et al., 2011; Mochiah et al., 2011). Animals depend on plants for
nitrogen supply in the form of proteins and amino acids (Wilson et al., 2011).

Literature Review : 25
Several studies have emphasized the interaction of aphids and their host
plants, particularly in the context of plant-defensive responses to aphid herbivory (De
Vos et al., 2007; Coggin, 2007). The effect of aphid feeding on host N is independent
of host species (Wilson et al., 2011). Wilson et al. (2011) found that N content
increased significantly in plants colonized by aphid but reduced in heavily colonized
plants. The N enrichment in the aphid-colonized host result into increase of host
nitrate reductase (NR) activity. Studies of the past indicated that high NR activity
under substrate-limiting conditions can result into increased plant N (Merlotti et al.,
1982). The entire process of increase in NR activity from herbivory is not clear. It is
speculated that the elevated NR. activity of aphid-colonized plants results from
transfer of aphid saliva consisting of certain specific biochemical or molecular signals
into the host with aphid saliva (De Vos et al., 2007; Goggin, 2007). There are some
contrary reports in which N content decreased with aphid infestation depending upon
plants species and herbivore insect. Singh and Sinhal (2011) reported that a
significant decline in N content was found in B. juncea infested with two aphid
species as compared to the respective control. The biology of aphid feeding results in
a two-way flux of N between the insect and host plant; aphids extract N from host
plants in the form of free amino acids and deliver N into phloem in the form of aphid
proteins delivered via watery saliva (Multi et al., 2006, 2008; Will et al., 2007;
Wilson et al., 201 1).
The reduction of phosphorus (P) in the infested plants may be due to its direct
drain through phloem sap by aphid (Khattab, 2007) as was evident from the inverse
relationship between aphid population and F content in infested plants (Ridley et al.,
2011). However, there was no significant difference in total N content between
undamaged and insect-damaged plants. But, N-content in two youngest ramets of
Salvinia malesta was most vulnerable to insect damage (Fomo and Semple, 1987).
The damage by Sanwa multiplicalis resulted in a significant loss of K from plant tops
than roots and whole plant (Forno and Scruple, 1987).
The insect damage did not alter the P levels significantly and constituted less
than 0.5% of plant dry weight (Fomo and Semple, 1987). Potassium leaches readily
from mechanical or insect damaged plants (Tukey, 1970; Room and Thomas, 1986)
and loss of K in plants damaged by Cyrtubagous saivinioe corresponded with insect
density (Porno and Semple, 1987). There is no evidence that the K loss affect the

Literature Review : 26
interaction of herbivores insects with their host plant (Fomo and Semple, 1987, Leitte
et al., 2005). But an increase in N content led to decrease insect population (Leitte et
al., 2005).
Volatiles
The phloem-feeding insect inhibits floral volatile production (Walling et al.,
2008; Parija et al , 2012). The production and emission of volatiles may differ with
floral chemistry, mode of herbivores feeding and evolved strategies of hosts and
herbivores. Furthermore., the individuals of Diaeretiella Pupae have feasibly evolved
recognition of certain plant volatiles, and got acclimatized to volatiles chemical cues
whilst developing and emerging out of the aphid mummy (Pope et at, 2008).
Verheggen et al. (2013) recently characterized the volatile cues emitted by turnip
plants (Brassica rapa) under attack by an M. persicae or by the chewing lepidopteran
larva Heliothis virescens and tested the behavioral responses of M. persicue
individuals to the odors of undamaged and herbivore-damaged plants singly or in
combination, as well as to the odor of crushed conspecifics (simulating predation).
Phenolic compounds
It is yet not always easy to demarcate between constitutive and induced
defense related compounds, as constitutively synthesized and stored chemicals may
also be synthesized de novo as a response to herbivore damage (Ding et al., 2000;
Gatehouse, 2002). To add to this complexity, induced metabolic pathways differ when
plants are exposed to different types of herbivory and even species of herbivores. The
induction of phenylpropormid metabolism is implied in the accumulation of newly
formed phenolic compounds in several plants in response to herbivore damage (Ding
et at, 2000, Santiago et al., 2005, 2006). The phenylalanine ammonia lysase (PAL)
activity was enhanced on artificial damage of birch leaf but adjacent leaves did not
show such change in enzymatic activity (Hartley and Fim, 1989). But, PAL activity
was more pronounced in birch leaves on insect damaged and even adjacent
undamaged leaves were signaled for increased PAL activity (Hartley and Firn, 1989).
Phenolic compounds are widely distributed in plants and constitutively present
prior to insect or mammalian herbivory-induced damage. The roles for phenolic
compounds as pre-formed or constitutive defenses against herbivory are well
documented in literature (Ding et al., 2000; Mutikainen et al., 2000; Treutter, 2005;

CEU. INTERIORS
Glycolysis --111PiPhosphoenol- pyruvate
Chorisrnate &cremate rnutase
Prephenate <
PLANT
Cell Exteriors
eb P dr
c,`2 4:04> be 4.4 ir 4.66
c• '‘.. 4to ge cp c 4.
'ca eszt, Lignin 9 (Cell wall ii bound veth
t deterrent effect)
E
'4
Phenylpropanoids
shikimate lunase
Phenylatanne cinnamic acid .4-- PheMialanine anrnora Mese
Arogenate
arogenate isparla:e
prephenate an no transfe,ase
Shikimate-3-phosphate
5-enolefinneykshokimate 3-Phosphate synthase
5-enolpyruvylshikimate -3-phosphate
chor smate synthase
arogenate derydratase
Pentose Phosphate,--10• Erythrose 4-Phosphate Pattnvay
1■411,
1■411.
3-deoxy-D-arabino- lieptulosonate-7-phosphate
7 carbon sugar
3-detrydroquinate synthase
3-dehydroquinate
3-cehstrogvnate dehydratase
3-dehydroshikimate
shikimate detrydrogenase
Shikimate
0
to
0 0
Plate 2: Herbivory induced shikimate pathway and phenyl propanoid pathway facilitate lignin deposition and tannin accumulation in cell wall to deter herbivory.

Literature Review : 27
Santiago et al., 2005, 2006; FarlagReltman et al., 2012a). It includes cell wall bound
phenolics, lignins, suherin, and cuticle associated phenolics as well as stored
compounds with a deterring (anti-feedant) or directly toxic (insecticidal) effect on
herbivores (Walling, 2000). Phenolics are produced in the leaves of poplar on grazing
by gypsy moth larvae, mechanical wounding or treatment with JA (Arnold et al.,
2004). Induced defenses are invoked only after tissue damage has occurred and
potentially defend host plant at a lower cost of energy in terms of loss of biomass.
Thus plants need to balance the allocation of carbon and nitrogen resources between
vegetative and reproductive components to ensure survival in the long term (Walling,
2C00). The pathway of induced synthesis of phenolic compounds is shown in the
Plate 2.
Inferences from the review
In India, mustard (Brassiatu juncea) suffers a substantial growth and yield
loss from aphid infestations. The details of the morhpo-physiological growth
responses of mustard to direct aphid infestation or its simulations are not well known.
The literature review revealed that constitutive and induced defenses in various plant
species may deter or kill the herbivore through certain blends of chemicals with
deterrent or toxic effects may signal the natural predator of its herbivore. 'this
mechanism is also not well studied and explained. In the present work, an attempt has
been made to understand these details.
Chapter 3
Material and Methods
THEs1

MATERIALS AND METHODS
Experiments were conducted on Brassica junceu (L) Cccm & Coss, grown in
the earthen pots, to work out the responses of selected cultivars of mustard plants to
the aphid herbivory and chemically simulated herbivury. The plain protective effects
were induced using JA, a biochemical mimic of herhivory. A detailed account of the
methodology of insect collection, population count, experimental designs and
assessment of plant responses are given below under respective heads.
Selection of host plants
Healthy and authentic seeds of five mustard cultivars viz. AlanIcar, Pusa Jai
Kisan, Vanua, Sakha and Rohini were obtained from National Research Centre on
Plant Biotechnology (NRCPB) of Indian Agricultural Research Institute (TART), New
Delhi. All the five selected cultivars were screened for their relative sensitivities to
aphid infestation. After screening of the cultivars, one most resistant and another most
sensitive cultivar was selected for further experimentation.
Selection of the insects
Three most common aphid herbivores identified and belonging to the order
Orthoptem (Aphididae) were collected from the test crop (Brassica juncea) from the
field. These aphids were Lipaphis erysimi, Brevicoryne brassicae L. and Myzus
persicae. One species of aphid was selected for the present study, viz., Lipaphis erysimi, for further experimental study. The second species under study was
Ladybird; Coccinella septernpuncrata was a predatory beetle at third trophic level.
Aphids and beetles were collected from the agriculture field of Department of
Agriculture, Aligarh Muslim University, Aligarh, India.
Climatic conditions of Aligarh
Aligarh has an area of about 5,024 sq kms, situated at 27°52'N latitude,
78°51'E longitude and 187.45 m altitude above sea level. Severe hot dry summers and
intense cold winters prevail during the year. The winter extends from the mid of
October to the end of March. The monthly average temperature of January, the
Aphid species were identified by Dr, Equbal Ahmad, Associate Professor, P.G. Dept. of Zoology, T. M. Bhagalpur University, Bhagalpur- 312 007. Email:ciubal.tmhuiikahoo.com

Materials and Methods: 29
coldest month, was about 13°C. The minimum temperature for any single day was
5.0°C. The summer extends from April to the end of June and the average temperature
for June is about 34°C, whereas the extreme maximum record is 45.5°C. The monsoon
extends from the end of June to mid of October. The mean annual rainfall was about
847.3 nun. More than 85% of the total rainfall occurred during June to September.
The relative humidity in the winter ranges from 56% to 77% with an average of
66.5%, in of summer, 37% to 49% with an average of 43%; and in monsoon season,
between 63% to 73% with an average of 68%.
Preparation of jasmonic acid solution
Jasmonic acid (TA) was obtained from Sigma-Aldrich Chemicals, USA. Stock
solution (5 mM) was prepared by dissolving the required quantity (105 mg) of the JA
in 5 ml of ethanol, in a 100 ml volumetric flask. Surfactant tween-20 (5 ml) was
added to it and final volume was made up to the mark using DDW. The solution was
stored in air tight bottle in freezer. The three concentrations of JA (0.5, 1.0, 1.5 mM)
were prepared by diluting the above stock solution.
Filling and sterilization of pots
Earthen pots of 25 x 25 cm were autoclaved after filling with garden soil and
compost (3:1). The pots were filled each with 4 kg compost mixture soil. Soil texture
was sandy loam with pH 7.8 and average 1JPK level was 98.72, 8.58 and 108.65 mg
per kg of soil, respectively.
Sowing of seeds
Authentic seeds of five cultivars (cvs.) of B. juncea viz. Alankar, Pusa Jai
Kisan, Varuna, Sakha and Rohini were soaked in 1% HgC12 (mercuric chloride) for 1-
2 minutes then washed 2-3 times with distilled water. Five seeds of equal size were
sown in each pot. "chinning was dune seven days after the germination to leave three
plants of almost equal growth and vigor in each pot.
Experimental set-up
For the all the experiments, ten sets (5 treatments with their 5 respective
controls) of fine meshed net houses were constnicted (Length x Width x Height; 185
cm x 100 cm x 125 cm) supported with iron rods covered from all the sides. The net
of one side was provided with 3 ft. long zip to enter for watering the plants and data

Materials and Methods: 30
recording. The pots inside net houses were arranged in complete randomized design.
Each treatment including control had 5 replicate pots. Each replicate pot had three
plants. Details of the experimental scheme are shown in the Table 1.
table 1. txpenmentai treatment plan awing me mree consecutive years Yearly Plan Experiments Treatments 1 year Experiment 1
Screening of relative susceptibility of 5 mustard cultivars.
40 aphids per plant (45 DAS) of all 5 selected mustard cvs. + control plants (5 cvs., 0 aphid)
II year Experiment 2 Experiment with screened resistant and sensitive cultivar
Experiment 3 Plant response and defense up to ri trophic level (Plant- aphid-beetle) in resistant and sensitive cultivar
Experiment 4 Responses of resistant and sensitive cultivars to JA (simulation of herbivory).
0 aphid 50 aphids 100 aphids. 150 aphids
0 aphid 50 aphids + 2 beetle 100 aphids + 2 beetle 150 aphids + 2 beetle
0.0 mM JA 0.5 mM JA 1.0 mM JA 1.5 mM JA
111 year Experiment 5 Responses of plants to JA (simulation of herbivory) followed by aphid infestation
0.0 mM JA, 0 aphid 0.1 mM JA + 50 aphids 0.1 mM JA + 100 aphids 0.1 mM JA + 150 aphids
Parameters studied
Following parameters were studied:
Plant growth parameters
1. Shoot length (cm)
2. Root length (cm)
3. Plant height (cm)
4. Plant fresh mass (g)
5. Plant dry mass (g)
6. Leaf number per plant
7. Leaf area (cm2)

Materials and Methods: 31
Biochemical and physiological parameters
8. Net photosynthetic rate (PN) and stomatal conductance (gs)
9. Leaf chlorophyll (a, b and total) content (mg g' fresh leaf tissue)
10. Leaf carotenoid level content (mg g t fresh Leaf tissue)
11. Proline content (p mot al fresh leaf tissue)
12. Protein content (mg II dry plant)
13. Nitrogen content (mg g--1 dry plant)
14. Phosphorus content (mg dry plain)
15. Potassium content (mg g-1 dry plant)
16. Total phenol content (mg g' dry plant)
Histological parameters (light microscopy and SEM details)
17. Stomata! density (abaxial, adaxial surface)
18. Relative stomatal closure indices (RSCI)
19. Scanning Electron microscopy (SEM)
Weld characteristics
20. Number of pods per plant
21. Number of seeds per pod
22. Weight of 1000 seeds (g)
23. Seed yield per plant
24. Length of pod (cm)
25. Oil content in seed (mg g-' dry plant)
26. Volatiles estimation (GC-MS)
Insect population count
27. Growth of aphid population (aphid count) per plant
28. Number of beetles attracted per plant
Experiment 1
The first experiment was conducted to work out the relative susceptibility of
five selected cultivars of Brassica juncea viz. Alankar, Pusa Jai Kisan, Varuna, Sakha
and Rohini, exposed to aphid infestation at the rate of 40 aphids per plant at 45 days
after sowing (DAS). The seeds of each selected cultivars of B. juncea were sown in
50 pots (5 replicates for aphid infested cultivars with 5 control of each). Sets of S
replicates of aphid infestation and control were maintained randomly in separate net
houses. The least aphid population bearing cultivar henceforth is referred as least

Materials and Methods: 32
aphid susceptible whereas, highest aphid bearing plant cultivar is considered as most
susceptible cultivar to aphid infestation. Plants were kept in net house during the
entire experimental period in specially designed cages. At 45 DAS each cultivar was
infested with 40 aphids per plant. One set of each variety kept in a separate net house
without aphid infestation served as control. Sampling was done at 60 and 75 DAS to
analyze their comparative responses. Selected parameters from the above list were
taken into account.
Experiment 2
Two varieties of Brossica juncea en. Alankar and Rohini were screened from
Experiment 1 as relatively least sensitive and most sensitive cultivars, respectively.
After 45 DAS, 4 sets (4 x 5 = 20) were placed in separate set of net houses. Plants
were infested with three varying numbers of aphid population (50, 100 or 150 aphids
per plant) and one set of each cultivars was maintained without aphids as control.
Sampling was done at 60 and 75 DAS to record plant growth characteristics and
insect population as in Experiment 1. Physiological, biochemical, yield and other
parameters were studied as enlisted above.
Experiment 3
The aphid resistant cultivar; Alankar and aphid susceptible cultivar; Rohini of
B. juncea were selected for further experimentation (Experiments 2-5). After 45 day
stage, each set of pots (4 x 5) of the two cultivars were placed in separate net houses.
Two sets of both the cultivars were maintained without insect (0 aphid per plant) and
treated as control. The plants (except control) were infested with aphids (Lipaphis erysimo at the rate of 50, 100 or 150 insects per plant, and 5 days later predatory
beetle (Ladybird; Coceinella septempunctata) were introduced in each of the net
house at the rate of 2 beetles per plant. Sampling was done at 60 and 75 DAS to study
the different parameters given in Experiment 2.
Experiment 4
Plants on insect attack synthesize JA to ward off or repels attacking insect and
provide cues to their predatory insects. To work out as if plants treated with JA mimic
insect attack and invite predatory beetle, the 4th experiment was conducted to simulate
natural herbivory. The IA was procured from Sigma Aldrich USA.

Materials and Methods: 33
Plants of each of the selected cultivar (Alankar and Rohini) grown in twenty
pots (4 doses x S replicate; 45 DAS) were placed in separate net houses and sprayed
with JA (0.5. 1.0 and 1.5 mM per plant) in a way that each plant received 2.5 nil JA
solution of varying amounts (0, 0.105, 0,210, 0.315 mg JA). Sampling was done at 60
and 75 DAS to observe the effect of JA on plants. One set of plants was exposed in
open environment ?without insect-net at 60 DAS to invite the beetles on treated plants.
The number of beetles was counted. 'the data of plant responses was recorded as in
Experiment 2.
Experiment 5
In the 5th experiment effect of pre-infestation application of IA on follow-up
aphid infestation was studied. 45 days old plants of the two eultivars i.e. Alankar and
Rohini were treated with JA (1.0 mM; selected from the Experiment 4). At 50 DAS
i.e. after 5 days of pre-treatment, aphids with varying numbers of 50, 100 and 150
aphids per plant were inoculated in JA treated sets. One replica of treated set (4 x 5 =
20) was kept outside to naturally invite the beetles. Sampling was done at 60 and 75
DAS to observe the combined effect of JA on aphid-infestation of plants. The plants
were sampled as in Experiment 2.
Sampling technique of experiments
To study the effect of herbivory and its simulation on growth, biochemical and
physiological characteristics of mustard plants, samplings were done at two vegetative
stages (60 and 75 DAS) of plants and at harvest (120 DAS). For the determination of
growth, one plant from each pot of a set was taken. Single set contained five pots,
therefore, each pot served as a replicate. For growth, destructive sampling was done
and plants were taken to the laboratory. Photosynthetic measurements were made on
intact plants whereas for pigment analyses samples were taken to laboratory. Plants
were cut at the base, and pods were plucked and thrashed manually to record the yield
aspects. Seeds were cleaned and collected separately from each treatment for the
measurements of seed yield and oil content.
Methodology
Plant height (shoots and root length)
For the measurement of root and shoot length, plants were uprooted from the
pots. Shoot and root length was measured manually on a meter scale.

Materials and Methods: 34
Fresh and dry mass of plant
The soil particles from roots were removed by washing. Plants were then
wrapped in blotting sheets to absorb the water, Fresh and dry mass of plants were
weighed individually using electronic balance. The samples were subsequently
transferred in an oven set at 80°C for 72 h. Weight of the dry samples were recorded
with the help of an electronic balance (CY204, Scalteo Ins., Germany).
Leaf area
The leaf area was estimated with the help of millimeter graph sheet. One fully
expanded third leaf was randomly picked from one third upper part of stem from each
replicate. Leaf margin was drawn on graph paper and area was determined by
counting directly the cm2 and mm2. The data was presented in cm2.
Physiological and biochemical parameters
Net photosynthetic rate (PN) and stomata' conductance (gs)
Net photosynthetic rate and stomata! conductance were measured on fully
expanded uppermost leaves of plants using close chamber infra-red gas analyzer
(IRGA, LiCOR, 6200, Lincoln, NE, USA) at light saturating intensity between 11:00-
12:00h. The capacity of leaf chamber was )litre. During measurements, the air,
relative humidity, photosynthetically active radiation (PAR), ambient temperature and
CO2 concentration were 68:_4%, 785±22nmol photons m2s-I , 24±3°C and 350-±5nmol
moi l , respectively.
Total chlorophyll and carotenoid content
Total chlorophyll and carotenoids level in fresh leaves were estimated using
the method of Lichtcnthalcr and Buschman (2001). One hundred mg of fresh leaves
from interveinal area was ground in 10 mL of 80% acetone (Appendix I) using a
mortar and pestle. The suspension was decanted and filtered through a Whatman filter
paper No.1 into a Buchner funnel. The optical density (00) of the solution was read
at 645 and 663 rim for chlorophyll estimation and at 480 and 510 rim for carotenoid
estimation using a spectrophotometer (UV-1700, Shitnadzu, Japan). The chlorophyll
a, chlorophyll b, total chlorophyll and carotenoid contents were calculated using the
following formula.
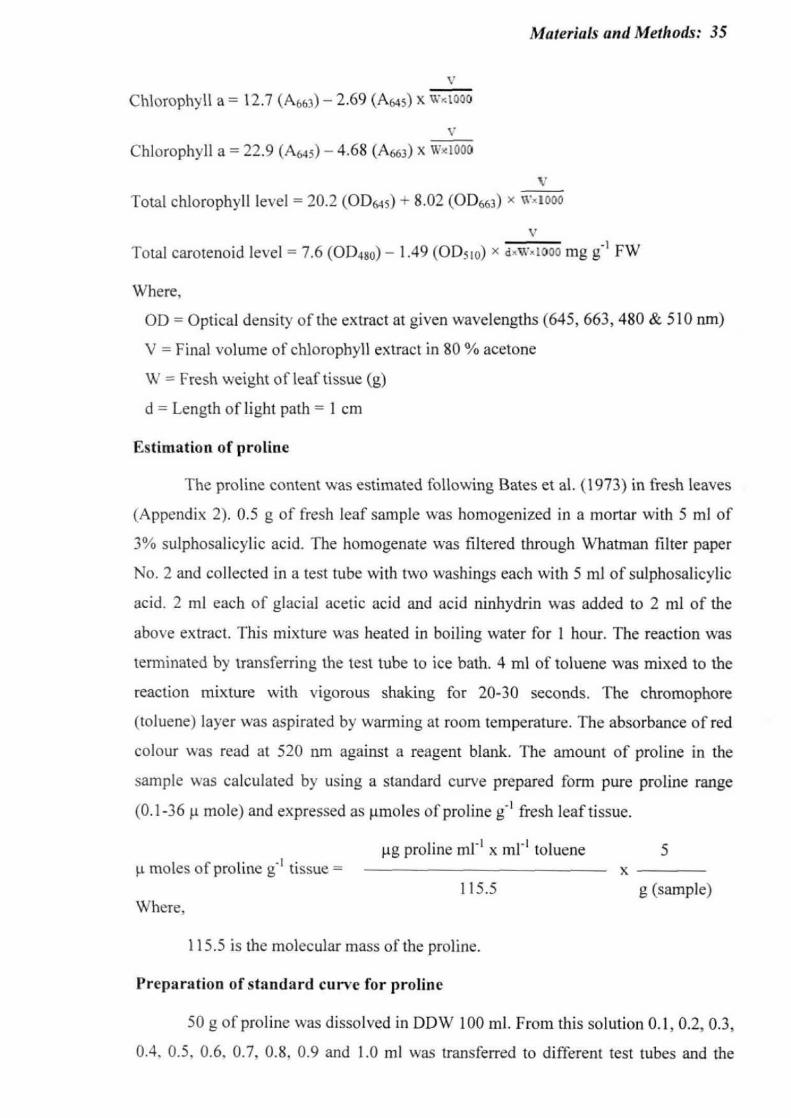
Materials and Methods: 35
Chlorophyll a = 12.7 (A663) — 2.69 (A645) X W4000
Chlorophyll a = 22.9 (A645) — 4.68 (A663) x Nvx1000
V Total chlorophyll level = 20.2 (0D645) + 8.02 (0D663) x wx1000
Total carotenoid level = 7.6 (0D480) — 1.49 (0D510) x dxWx1000 mg g-1 FW
Where,
OD = Optical density of the extract at given wavelengths (645, 663, 480 & 510 nm)
V = Final volume of chlorophyll extract in 80 % acetone
W = Fresh weight of leaf tissue (g)
d = Length of light path = 1 cm
Estimation of proline
The proline content was estimated following Bates et al. (1973) in fresh leaves
(Appendix 2). 0.5 g of fresh leaf sample was homogenized in a mortar with 5 ml of
3% sulphosalicylic acid. The homogenate was filtered through Whatman filter paper
No. 2 and collected in a test tube with two washings each with 5 ml of sulphosalicylic
acid. 2 ml each of glacial acetic acid and acid ninhydrin was added to 2 ml of the
above extract. This mixture was heated in boiling water for 1 hour. The reaction was
terminated by transferring the test tube to ice bath. 4 ml of toluene was mixed to the
reaction mixture with vigorous shaking for 20-30 seconds. The chromophore
(toluene) layer was aspirated by warming at room temperature. The absorbance of red
colour was read at 520 nm against a reagent blank. The amount of proline in the
sample was calculated by using a standard curve prepared form pure proline range
(0.1-361.1 mole) and expressed as Amoles of proline g' fresh leaf tissue.
proline m1-1 x ml-1 toluene 5 moles of proline tissue =
115.5 g (sample) Where,
115.5 is the molecular mass of the proline.
Preparation of standard curve for proline
50 g of proline was dissolved in DDW 100 ml. From this solution 0.1, 0.2, 0.3, 0.4, 0.5, 0.6, 0.7, 0.8, 0.9 and 1.0 ml was transferred to different test tubes and the

Materials and Methods: 36
volume was made to 6 ml using DDW. 5 ml of aqueous sulphosalicylic acid, 2 ml of
glacial acetic acid and 2 ml of acid ninhydrin was added. The test tubes were heated
on a boiling water bath for 30 min. The reaction was immediately terminated by placing test tube in ice bath. 4 ml of toluene was added in each test tube and after 20-25 seconds red colour appeared. The OD of colour was read it at 520 nm using spectrophotometer. A curve between OD and proline content was plotted for
reference.
Estimation of leaf protein content
The protein content was estimated following Lowry et al. (1951) from leaf
tissue (Appendix 3). 50 mg of oven dried leaf powder was transferred in glass
centrifuge tube, to which 5 ml of 50% trichloroacetic acid was added. The solution
was allowed to stand for 30 minutes at room temperature with thorough shaking for
the complete precipitation of the proteins. The material was centrifuged at 4000 rpm for 10 minutes and the supernatant was discarded. 5 ml of IN sodium hydroxide was
added to the residue and mixed well. It was left for 30 min on water bath at 80°C to set so that all the precipitated proteins completely dissolved. After cooling for 15
minutes, the mixture was centrifuged at 4000 rpm for 15 min and the supernatant
containing protein fraction together with three washings with 1N NaOH was collected
in 25 ml volumetric flask. Volume was made up to the mark with 1N NaOH and used for the estimation of proteins. 1 ml sodium hydroxide extract was transferred to 10 ml test tube and 5 ml reagent B was added. The solution was mixed well and allowed to stand for 10 min at room temperature. 0.5 ml folin phenol reagent was added rapidly
with immediate mixing. The blue colour developed. The test tube was left for 30
minutes for maximum colour development. Absorbance of the solution was read at
660 nm. A blank containing DDW, reagent B and folin phenol reagent was run
simultaneously with each sample. The protein contents were calculated by comparing the optical density of each sample with standard curve plotted by taking known graded dilutions of standard solution of bovine serum albumin
Standard curve for leaf protein content
50 mg bovine serum albumin (Fraction V) was dissolved in 50 ml DDW, of
which 10 ml solution was diluted to 50 ml. 1 ml of this solution contained 200 tg
proteins. From this 40, 80, 120, 180, 200 lig solutions was transferred to 5 test tubes

Materials and Methods: 37
separately. The solution in each test tube was diluted to 1 ml with DDW. A Hank of 1
nil DDW was also rim with each set of determinations, 5 ml reagent B was added to
each tube including blank. mixed well and allowed to stand for 10 min. To this
solution 0.5 ml folin phenol reagent was added, mixed well and incubated at room
temperature in the dark for 30 minute. The optical density of blue colour developed
was read at 660 am.
Digestion of sample for leaf IN, P, K estimation
Oven-dried sample (leaf or root) powder (100 mg) was carefully transferred to
a digestion tube and 2 ml of concentrated sulfuric acid was added to it. The contents
of the flask were heated on a temperature controlled assembly for about 2 h. As a
result, the contents of the tube turned black. It was cooled for about 15 min at room
temperature and then 0.5 ml 30 %11202 was added drop by drop and the solution was
heated again till the colour of the solution changed from black to light yellow. After
further cooling for about 30 min, additional 3 to 4 drops of 30 % H202 were added,
followed by heating for another 15 min. It was repeated till the light yellow colour
turned colourless. The digested material was transferred from the tube to a 100 ml
volumetric flask with three washings with de-ionized water. The volume of the
volumetric flask was then made up to the mark (100 ml) with de-ionized water.
Determination of N, P and K
Determination of N, P and K content in leaf was done in peroxide digested
sample (Appendix 4). Nitrogen was *determined by the method of Lindner (1944) and
phosphorus by the method of Fiske and Subba Row (1925). Potassium was
determined using flame photometer I laid (1947). The details of methods are described
as under.
Estimation of nitrogen
10 ml aliquot of the digested material was taken in a 50 ml volumetric flask.
To this, 2 ml of 2.5 N sodium hydroxides and lml of 10% sodium silicate solutions
were added to neutralize the excess of acid and to prevent turbidity, respectively. 'l he
volume was made up to the mark with de-ionized water. In a 10 ml graduated test
tube, 5 ml aliquot of this solution was taken and 0.5 mh Nessler's reagent was added.
The final volume (10 ml) was made with de-ionized water. The contents of the test
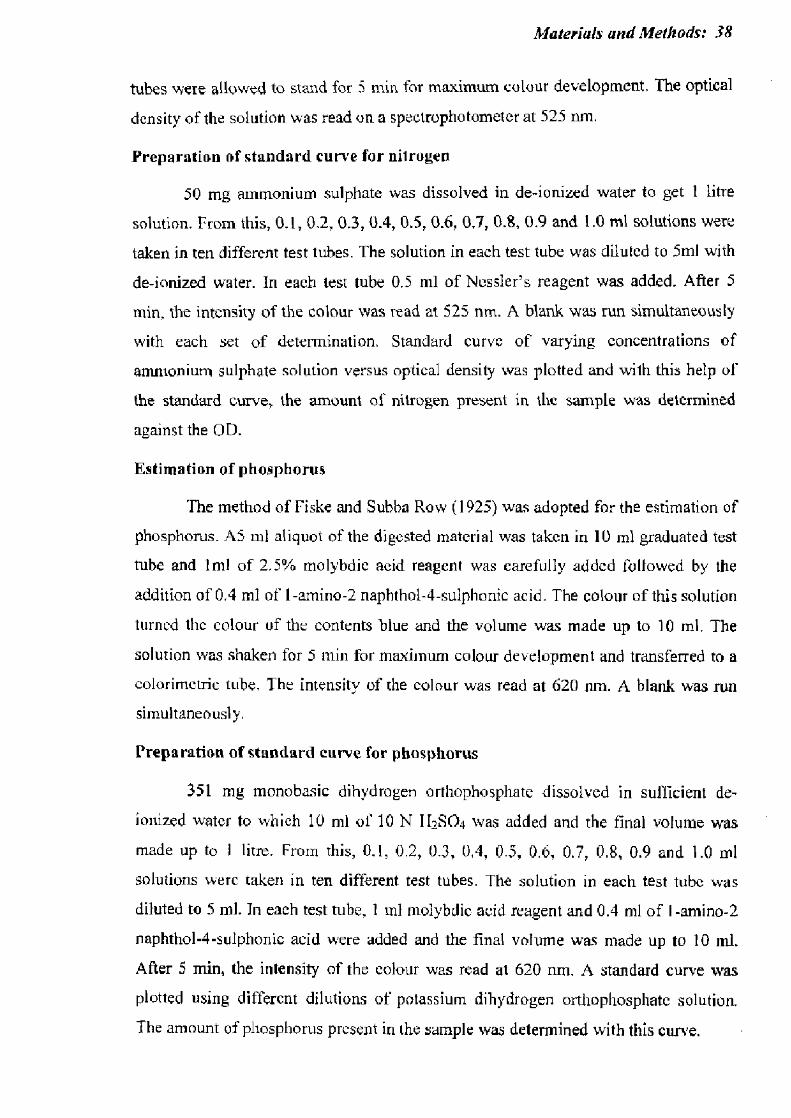
Materials and Methods: 38
tubes were allowed to stand for 5 min for maximum colour development. The optical
density of the solution was read on a spectrophotometer at 525 nm.
Preparation of standard curve for nitrogen
50 mg ammonium sulphate was dissolved in de-ionized water to get 1 litre
solution. From this, 0.1, 0.2, 0.3, 0.4, OS, 0.6, 0.7, 0.8, 0.9 and 1.0 mt solutions were
taken in ten different test tubes. The solution in each test tube was diluted to 5m1 with
de-ionized water. In each test tube 0.5 ml of Nessler's reagent was added. After 5
min, the intensity of the colour was read at 525 nm. A blank was run simultaneously
with each set of determination. Standard curve of varying concentrations of
ammonium sulphate solution versus optical density was plotted and with this help of
the standard curve, the amount of nitrogen present in the sample was determined
against the OD.
Estimation of phosphorus
The method of Fiske and Subba Row (1925) was adopted for the estimation of
phosphorus. AS ml aliquot of the digested material was taken in 10 ml graduated test
tube and lint of 2.5% molybdic acid reagent was carefully added followed by the
addition of 0.4 ml of 1-amino-2 naphthol-4-sulphonic acid. The colour of this solution
turned the colour of the contents blue and the volume was made up to 10 nil. The
solution was shaken for 5 min for maximum colour development and transferred to a
colorinictrie tube. The intensity of the colour was read at 620 nm. A blank was run
simultaneously.
Preparation of standard curve for phosphorus
351 mg monobasic dihydrogen orthophosphate dissolved in sufficient de-
ionized water to which 10 ml of 10 N I IsSO4 was added and the final volume was
made up to 1 litre. From this, 0.1, 0.2, 0.3, 0,4, 0.5, 0.6, 0.7, 0.8, 0.9 and 1.0 ml
solutions were taken in ten different test tubes. The solution in each test tube was
diluted to 5 ml. in each test tube, 1 ml rnolybdic acid reagent and 0.4 ml of I -amino-2
naphthol-4-sulphonie acid were added and the final volume was made up to 10
After 5 min, the intensity of the colour was read at 620 nm. A standard curve was
plotted using different dilutions of potassium dihydrogen orthophosphate solution.
The amount of phosphorus present in the sample was determined with this curve.

Materials and Methods: 39
Estimation of potassium
It was estimated with the help of flame photometer Hald (1947). A 10 ml
aliquot was taken and read by using the filter for potassium. A blank was also run side
by side with each set of determination. The readings were compared with standard
curve plotted using known dilutions of standard potassium chloride solution.
Preparation of standard curve for potassium
Potassium chloride (1.91 g) was dissolved in de-ionized water in 100 ml
volumetric flask and volume made to 100 ml. 1 ml of this solution was diluted to 1
litre. This represents solution of 10 ppm potassium concentration. From this 1, 2, 3, 4,
5, 6, 7, 8, 9 and10 nil solutions were transferred to 10 graduated vials separately. The
solution in each vial was diluted to 10 ml. The diluted solution of each vial was run
separately. A blank was also run with the each set of determination. Standard curve
was prepared using different dilutions of potassium chloride solution versus readings
on the flame photometer.
Estimation of total phenol
Total phenols could be estimated with the Folin-Ciocaltcau reagent using
method of Malick and Singh (1980). These hydroxyl containing aromatic compounds
react with phosphomolybdie acid in Folin-Ciocalteau reagent in alkaline medium and
produce blue colored complex (molybdenum blue; Appendix 5). 1.0 g of plant tissue
sample was grinded with mortar and pestle in 10 volume of 80 °A ethanol.
Homogenate was centrifuged at 10,000 rpm for 20 min. Supernatant was saved and residue was re-extracted five times with 80 % ethanol. Pooled supernatant was dried
and residue was dissolved in 5 ml of distilled water. Different aliquots of 0.2-2.0 ml
were pipetted out into test tubes and volume in each tube was raised to 3 ml. 5 ml of
Folin-Ciocalteau reagent was added following 2 ml of 20 % NaCO3 solution after 3
min and mixed thoroughly. Test tubes were kept in boiling water for exactly 1 min
and then cooled. Absorbance at 650 nm was measured against a reagent blank. The
standard curve was prepared using different concentrations of tannic acid to measure
the total phenol in mg phenol per g of dry material.
Stomata! traits
Stomata] density was studied using clear nail polish impressions on leaf
epidermis following the method of Teare et al (1971). Thin layer of nail polish was

Materials and Methods: 40
applied on one side of rib at the middle of the leaf. A small strip of dear cellophane
type was gently pressed over the dried nail polish. The tap along with leaf surface
impression of nail polish was placed on a slide. The number of stomata were counted
under the light microscope on such leaf surface impression of both adaxial and
abaxial surface in a cm2 area of eye piece (= 0.41 mm2 of leaf surface).
Relative Stomata! Closure Index (RSCI)
RSCI was calculated on adaxial and abaxial surface of leaf with the following
formula:
Where,
RSCI — Ts—Os
Ts
Is = Number of total. stomata
Os = number of open stomata
Scanning Electron Microscopic (SEM) observations
Scanning Electron microscopic observations were preceded by electron
microscopic examination of fresh leaf material by scanning electron microscope (ISM
6510 LV JEOL, Japan). A replication method was employed for electron microscopic
studies of the leaf surface, since the waxy components are removed by standard
fixation and imbedding methods used for ultrastructural examination of cell
organelles. The carbon replicas and pseudoreplicas used were prepared from fresh leaf
material by a method adopted from Juniper and Bradley (1958) and \Vhitecross
(1963). Ultrasonically treated samples were processed to determine whether the
replication technique gives an unaltered picture of waxy surfaces. The electron
microscope used was a modified RCA EMU-2.
Yield parameters
Number of pods per plant
At harvest (120 DAS), number of pods in 5 plants of each treatment were
counted for the average number of pods per plant.
Number of seeds per pod
From each treatment, 10 pods were randomly selected and counted to get
number of seeds in each pod. The average number of seeds per pod was calculated.

Materials and Methods: 4'1
Seed yield per plant and 1004 seed mass
The total seeds from a plant in each treatment were cleared, sun-dried and
weighed to calculate the seed yield per plant. Thousand seeds were subsequently
picked and weighed to record average weight of 1000 seeds of the replicates.
Length of pod
The length of 10 pods. from each treatment was measured on a meter scale for
average pod length.
Oil extraction
The oil was extracted by glass Soxhlet apparatus. Five gram crushed seeds of
each sample was added to a cellulose thimble in triplicate. Soxhlet apparatus was
assembled with the thimbles and a solvent (petroleum ether). The Soxhlet extraction
with petroleum ether solvent was performed on the ground seed samples with 30 min
of immersion, 45 min of washing and 15 min of recovery at 130 °C.
Preparation fur mustard leaf volatile organic compounds (VOCs)
For analysis of mustard VOCs, 5 mL of phosphate huffer solution mixed with
active compound in a 22 ink headspacc vial and kept air-tight by a FIFE-coated
screw cap. A total of 0.25 mL of headspace sample was withdrawn by sampling
syringe to inject into the GC column. The automated sampler minimized the variation
from human error and improved accuracy and repeatability,
Gas Chromatography-Mass Spectrometry (GC-MS) analysis of VOCs
For the evaluation of headspace concentration of VOCs of mustard leaf gas
chromatography mass spectrometry GC-MS of Agilent 7890A series (Germany) was
used. The system was equipped with split-splitless injector and CIC-PAL auto
sampler attached to an apolar IIP-5MS (5% phenyl polymethyl siloxane) capillary
column (30 in x 0.25 mm i.d. and 0 25 um film thickness) and fitted to a mass
detector. One column was connected to a mass spectrum detector, and the other
column to the SCD monitor. This arrangement allowed us to identify VOCs
qualitatively and quantitatively. The columns were operated at constant pressure (8
psi), with a heating rate of 5°C. min-I from 50 to 250°C. MS was operated in electron
ionization mode at 70 eV. GC-MS analysis was carried out at Dept. of Pharmacy,
Jamia Hamdard, N. Delhi.

Materials and Methods: 42
Insect population count
Aphid population count
The whole plant was divided into three parts, (a) vegetative parts (shoots and
leaves), (b) flowering parts and (c) fruiting parts (Kaher and Ratul, 1992). The
number of aphids counted on each part by a grid and projected value method with the
help of magnifying lens. The aphid number on 2.5 cm2 lengths of 10 places on stem
and 10 places of inflorescence was counted and multiplied with the total infected
length of stem and inflorescence. Similarly, the aphid count of mid leaf area was
multiplied with the total leaf area per plant.
Beetle population count
Beetles were manually counted at the selected growth stage of plant in five
plants of each treatment.
Statistical analysis
The data collected was statistically analyzed for two way analysis of variance
(ANOVA) in each Experiment. F-value was calculated and the level of significance
was determined at p < 0.05 using the SPSS statistical program (ver. 12.0 Inc.,
Chicago, USA). Least significant difference (LSD) was calculated for the significance
at p < 0.05.

Chapter 4
Experimental Results

RESULTS
In this section, results of five experiments are presented. These experiments
were conducted to screen five locally grown cultivars of Brassica juncea viz. Alankar,
Pusa Jai Kisan, Varuna, Sakha and Rohini, to find out the least and most sensitive
cultivars to herbivory caused by aphid Lipaphis erysimi. The sensitivity was
determined on the basis of relative response of various growth parameters including
vegetative growth, physiological and biochemical parameters in addition to
population growth of the selected level of aphid population on these cultivars. The
screened cultivars (cv. Alankar as least sensitive and cv. Rohini, the most susceptible
one) were further tried in the following experiments to study the plant signaling to
aphid herbivory and the resulting effects on plant growth. Separate experiments were
conducted to find out the effects of exposure to varying numbers of aphids, combined
effects of aphid and its predatory beetle, effects of treatments of plant with jasmonie
acid (a chemical simulation of natural herbivory) alone or as aphid-pre-infestation
treatment to deter attacking aphids and inviting predatory beetles) on plant growth.
With selected plant growth parameters. morpho-physio-biochemical changes in two
selected cultivars and population growth of aphids and beetles have been studied. The
results are presented as under.
Experiment 1
Screening of five mustard cultivars for aphid attack sensitivity
Five commonly grown cultivars of Brassica juncea namely, Alankar, Pusa Jai
Kisan, Varuna, Sakha and Rohini were selected for the screening experiment. All the
live cultivars of Brassica juncea were inoculated with 40 aphids per plant on 45 days
after sowing (henceforth to be referred as DAS).
Fig. 1-4 shows the aphid population growth, total plant height, shoot length
and root length at 60 and 75 DAS. The cultivars of Brassica juncea have been
arranged in the Fig. 1-4 in accordance with their sensitivity level to aphid population.
Among five selected cultivars, the Alankar was relatively more resistant to aphid
herbivory as growth in aphid population was comparatively least on it followed by
Pusa Jai Kisan, Varuna, Sakha and Rohini (Fig. I). The reductions in plant growth
parameters corresponded with the trends of growth in aphid population from an initial

Results: 44
inoculation of 40 aphids per plant on each cultivar. The highest increase of aphid
population was noted on Brassica juncea cv. Rohini (Fig. I ). The total plant length,
shoot length and root length of different cultivars also decreased in accordance with
the increase in the population of aphid on selected cultivars at varying growth stages
(60 and 75 DAS). The reduction in plant height, shoot length, root length and other
growth parameters were linearly correlated with aphid population (Figure LR I and
10.
The aphid population increased on all selected cultivars as estimated at 60 and
75 DAS (Fig.l). The cultivar Alankar was relatively least susceptible and cultivar
Rohini, the most susceptible one among all selected cultivars. On the basis of the
growth of aphid population and corresponding decrease in the overall growth of host
plants, all five cultivars screened can be arranged in the following increasing order of
sensitivity (from highly resistant to most susceptible cultivar) as Alankar > Pusa Jai
Kisan > Varuna > Sakha > Rohini (Fig. 2- 14 ).
The data summarized in Fig. 5 and 6 shows the effect of inoculation of 40
aphids per plant on leaf number and leaf area of selected cultivars at 60 and 75 DAS.
The aphid infestation reduced the leaf emergence and their expansion as evident from
the data of leaf number and leaf area per plant in selected cultivars, each inoculated
with 40 aphids (Fig. 5, 6). The leaf number and leaf size was badly affected in cultivar
Rohini as compared to other (Fig. 5, 6).
The data on fresh and dry mass of five cultivars of Brassica juncea infested
with 40 aphids at 45 DAS and estimated at 60 and 75 DAS are shown in Fig. 7, 8. The
effect on fresh and dry mass of the selected cultivars followed the trend of other
growth parameters. The level of variation in dry mass of different cultivars was
relatively higher than the variability in other parameters indicating the larger amounts
of carbon were partitioned from host to increasing population of herbivorous aphids
(Fig. 7, 8). The impact of aphid infestation on plant fresh and dry mass was higher at
early stage of plant growth (60 DAS) as compared to late stage (75 DAS) (Fig.7, 8).
The variations in photosynthetic pigments (chlorophyll a, b, total chlorophyll and
carotenoids contents) caused by aphid infestation on all the live selected cultivar was
also studied and the statistically analyzed data are summarized in Fig. 9-12. The aphid
infestation impaired chlorophyll a, b, total chlorophyll and carotenoid contents more

V '
Num
ber o
f aph
ids
160 -
140 -
120 -
100 -
80 -
60 -
40 -
20 1
0 Alankar PJK Varuna Sakha Rohini
60 DAS; LSD at 5% = 6.62 75 DAS: LSD at 5% = 7.81
Cultivars
60 DAS; LSD at 5% = 4.33 75 DAS; LSD at 5% = 5.41
100 -
Pant
leng
th (
cm)
80 -
60 -
40 -
20
0
Alankar l'J K
Varuna Sakha Rohini
Cultivars
Fig. 1, 2. Effect of aphid infestation (40 aphids per plant) on aphid population growth and plant height (cm) of different cultivars of Brassica juncea at 60 and 75 DAS

1 0 -
0 Alankar P.1K Varuna Sakha Rohini
Sho
ot le
ngt
h (c
m)
70 -
60 -
50
40 -
30 -
20 -
60 DAS; LSD at 5% = 3.30 75 DAS; LSD at 5% = 4.48
NI=
Cultivars
60 DAS; LSD at 5% = 1.10 75 DAS; LSD at 5% = 1.62
30 -
25 -
20 -
15 -
10 -
5 -
0
r •
Roo
t len
gth
(cm
)
"
Alankar PJK Varuna
Cultivars Sakha Rohini
Fig. 3,4. Effect of aphid infestation (40 aphids per plant) on shoot length (cm) and root length (cm) of different cultivars of Brassica juncea at 60 and 75 DAS

Ii '7 A
60 DAS; LSD at 5% = 2.91 75 DAS; LSD at 5% = 4.03
70 -
60 - / •
NMI
0
Leaf
num
ber 50 -
40 -
30
20
10 -
Alankar PJK Varuna
Cultivars
Sakha Rohini
60 DAS; LSD at 5% = 2.25 75 DAS; LSD at 5% = 2.56
50 -
40 -
30 - Ei
20 - a
10 -
Alankar PJK Varuna
Cultivars
Sakha Rohini
Fig. 5,6. Effect of aphid infestation (40 aphids per plant) on leaf number and leaf area (cm`) of different cultivars of Brassica juncea at 60 and 75 DAS

MINN •
12 -
V 10 -
8-
Plan
t fre
sh m
ass (
g)
6-
4-
0
60 DAS; LSD at 5% = 0.49 75 DAS; LSD at 5% = 0.75
Varuna
Cultivars
Alankar PJK Sakha Rohini
60 DAS; LSD at 5% = 0.12 75 DAS; LSD at 5% = 0.19
3.0 -
0.5
0.0
Ala Ikar RIK
Varuna Sakha Rohini
Cultivars
Fig.7.8. Effect of aphid infestation (40 aphids per plant) on plant fresh mass (g) and plant dry mass (g) of different cultivars of Brassica juncea at 60 and 75 DAS

I I 60 DAS; LSD at 5% = 0.07 75 DAS; LSD at 5% = 0.08
1.4 -
• 1.1 - LL, 7 1 . 0
15t
0.8 - as 0.6 -
0.4 - 0
Cs 0.2
0.0 A
60 DAS; LSD at 5°i = 0.03 75 DAS; LSD at 5% = 0.04
Ch
loro
ph
yll b
(m
g W
I FM
)
0.7
0.6 -
0.5 -
0.4 -
0.3
0.2 -
0.1 -
0.0
60 DAS; LSD at 5% = 0.10 75 DAS; LSD at 5% = 0.12
2.0 ▪ 1
•
.8 - s
-7t4 1.6 - of 1.4 - E
1.2 - = .= 1.0 -
0
0. ▪ 0.8 - • 0.6 ▪ 0.4 - 0 E- 0.2 -
0.0
•
Alankar
PJK
Varuna
Sakha
Rohini
Cultivars
Fig. 9,10,11. Effect of aphid infestation (40 aphids per plant) on chlorophyll a, b and total chlorophyll of different cultivars of Brassica poicea at 60 and 75 DAS

0.5 -
0.4 -
0.3 -
0.2
Car
oten
oid
leve
l (m
g g''
FM)
0.1 -
0.0 PJK Rohini Sakha Varuna Alankar
Cultivars
PJK Sakha Rohini Varuna Alankar
60 DAS; LSD at 5% = 1.07 75 DAS; LSD at 5% = 1.28
60 DAS; LSD at 5% = 0.022 75 DAS; LSD at 5% = 0.024
20 -F 18 -
- 16 14 - 1
e. 12
Cd 10 8-
0
Cd " 6 4-
c`. 2 -
0
Cultivars
Fig.12, 13. Effect of aphid infestation (40 aphids per plant) on carotenoid (ing gl FM) and proline content (11 mol FM) of different cultivars of Brassica juncea at 60 and 75 DAS

10 -
5-
0
60 DAS; LSD at 5% = NS 75 DAS; LSD at 5% = NS
25
Alankar PJK Varuna
Pro
tein
con
tent
(mg
g"' D
M)
Sakha Rohini
e A
20
15
Cultivars
Fig.14. Effect of aphid infestation (40 aphids per plant) on protein content Ong DM) of different cultivars of Brassica junceu at 60 and 75 DAS

-8 -9 0
-10 as -1 1 -
-12 - -13 - G -14 -15 - -16 T
-I0
y = -0.063x - 5.237 Rz = 0.987**
•
-15 -
- on 7, 3 -25
c -30 -
-35 -
-40
y = -0.239x 4- 2.031 ioN.NI NN.N.N. R2 = 0.970**
-32
-34 -
-36 -
-38 -
-40 -
-42 - Car
oten
oid
cont
ent
y = -0.090x - 26.93 • R2 =0.991**
-44 -14
-16 -
-18 -
-20
-22 -
-24 -
Pro
tein
con
tent
y = -0.192x - 1.762
R2 = 0.995** -15
- -20
- -25 E tip
- -30
-10
-35 -10
r -15
Tot
al c
hlor
ophy
ll
- -20
-25
- -30
-35 20
y = -0.071x + 22.39 R2 = 0.964** 18 ,,...,,,k.,,,..,,,..,..„,,ic,„,„, •
16
60 80 100 120 140 160
% increase in aphid population
14
12
• 10
8 P
rolin
e co
nten
t
60 DAS
60 80 100 120 140 160 % increase in aphid population
Fig. LR- I. Regression line showing the correlation coefficient between per cent variation in selected growth parameters vs percent increase in aphid population on 5 cvs. namely Alankar, Pusa Jai Kisan. Varuna, Sakha, Rohini, respectively (top to down) at 60 DAS. All selected cultivars were initially infested with 40 aphids per plant and increase in aphid counted at 60 DAS. The percent increase in aphid population on each cultivars treated as independent (X-axis) parameters and percent decrease in various growth parameters dependent (Y-axis).

-48 t -16
• y = -0.097x - 18.24
-18 - R2 = 0.872* •
-20 -
-22 -
-24 -
Prot
ein
cont
ent
•
-26 -15 -20 --25 -
.=: -30 - 41 3 -35 - t' -40 -
-45 --50 --55 -34
-36 -
-38 --40 --42 --44 -
Car
oten
oid
cont
ent
-46 -
IIN NN4\N... y = -0.154x - 35.79 R2 =0.992**
• y = -0.229x - 17.93 -15 • R2 = 0.904* - -20
-35
-40
Tota
l chl
orop
hyll
-40 40 - 39 - 38 - 37 - 36 - 35 - 34 - 33 32
50 60 70 Pr
olin
e co
nten
t -10 0 10 20 30 40
r
°A increase in aphid population
75 DAS
-26 -10 0 10 20 30 40 50 60 70
% increase in aphid population
Fig. LR- 11. Regression line showing the correlation coefficient between per cent variation in selected growth parameters vs percent increase in aphid population on 5 cvs. namely Alankar, Pusa Jai Kisan, Varuna, Sakha, Rohini respectively (top to down) at 75 DAS. All selected cultivars were initially infested with 40 aphids per plant and increase in aphid counted at 60 DAS. The percent increase in aphid population on each cultivars treated as independent (X-axis) parameters and percent decrease in various growth parameters dependent (Y-axis)

Results: 45
severely in cv. Rohini than cv Alankar. In all the five cultivars, the loss of
chlorophyll a was relatively more severe than the chlorophyll b (Fig. 9-12).
The statistically analysed data of proline and protein estimates of all five
selected cultivars are summarized in Fig. I3 and 14. It is further evident from the data
that among all the five cultivars, Rohini is the most susceptible and Alankar is most
resistant to selected aphid species (Lipaphis erisimi). The difference in proline content
in both the selected cultivars was higher at 60 days growth stage (Fig.13). The protein
content was significantly higher in cultivars Alankar than Rohini. There was
significant difference in proline and protein content in all the five cultivars (Fig.
13, 14).
Correlation coefficients and regression analysis
The linear regression line between percent increase in aphid population on 5
selected cultivars of B. juncea and variations in growth parameter were plotted (Fig-
LR-I and LR-11). The square of correlation coefficient indicates that the fresh mass,
total chlorophyll and carotenoid contents had strong linear correlations with increase
in aphid population on at 60 DAS (Fig. 1.12-1). At late stage of growth (75 DAS), the
degree of dependence of losses in selected growth parameter over the aphid
population reduced to some extent. The cv. Pusa Jai Kisan followed the cv. .Alankar in
resistance (Fig.- LR II).
Experiment — 2
Impact of varying levels of aphid herbivory
This experiment was conducted to study the comparative response of two
selected cultivars of Bracsica juncea. On the basis of the findings of screening
Experiment 1, the least sensitive culthem of Brusica juncea to aphid infestations was
Alankat and the most sensitive cultivar was Rohini. These two cultivars were selected
for further experiments on growth responses to herbivory, its simulation, related plant
defenses and signaling up to third trophic level. The present Experiment 2, was aimed
to study the effect of varying levels of aphid herbivory (50, 100 and 150 aphid per
plant) on growth and photosynthesis or productivity performances, stress level
(proline content) and yield characteristics of Alankar and Rohini having two different
sets of inherited defensive. tr4115.

Results: 46
In this Experiment, both the selected cultivars were exposed to varying levels
of aphid herbivory (50, 100 and 150 aphid per plant) at 45 DAS. All levels of aphid
infestations adversely affected all the growth and biochemical characteristics of both
the cultivars, as determined at 60 and 75 DAS growth stages. The effects of aphid
herbivory on various plant growth factors were more severe on cultivar Rohini than
cultivar Alankar. It emerged from the present experiment that the cultivar Alankar
despite being relatively resistant among all five screened cultivars showed reductions
in most of the parameters in response to all the levels of aphid population (50, 100,
and 150 per plant) But the losses in almost all growth parameters of cv. Rohini were
more severe than in cultivar Alankar. The highest per cent decrease was recorded in
shoot and root growth (Fig. 15, 16). The increase in level of aphid herbivory increased
the severity of loss in shoot and root length, leaf number and leaf area at 60 and 75
DAS (Fig. 15-18).
The impacts of herbivory by varying populations of aphid on both the selected
cultivars of Brassica liana (Alankar and Rohini) were severe on fresh and dry mass
of plant (Fig. 19, 20). But, percent reductions were higher in cv. Rohini than cv.
Alankar. The impacts of herbivory on all these growth parameters (shoot and root
length, fresh and dry mass, leaf number and leaf area) indicates that aphid herbivory
caused all these losses more severely due to direct consumption of photosynihates
from phloem and resultant alterations in carbon budget (Fig. 15-20).
The chlorophyll a, chlorophyll b, total chlorophyll (mg g' FM) and carotenoid
content (mg CFM) reduced significantly in both the cultivars in response to varying
level of aphid infestation (Fig. 21-24). The severity in loss of chlorophyll and
carotenoid content increased with the level of aphid herbivory (Fig. 21-24). The aphid
herbivory reduced total protein and phenol content (Fie. 25, 26) in the infested plants.
The aphid feeding increased proline accumulation in both the selected cultivars viz.
Alankar and Rohini (Fig. 27). The proline contents were higher in cv. Alankar than in
cv. Rohini. The protein content (mg g1 DM) and total phenol content (mg g-1 FM)
reduced in proportion to the level of aphid herbivory (initially 50,100 and 150 aphid
per plant with a proportional increase at 60 and 75 DAS). The impact of aphid
infestation on protein and phenol content was more severe at early stage (Fig. 25, 26).
The increase in proline content (mg FM) in aphid infested plants was in proportion
to the population of aphid (Fig, 27). All levels of aphid infestation (initial number 50,
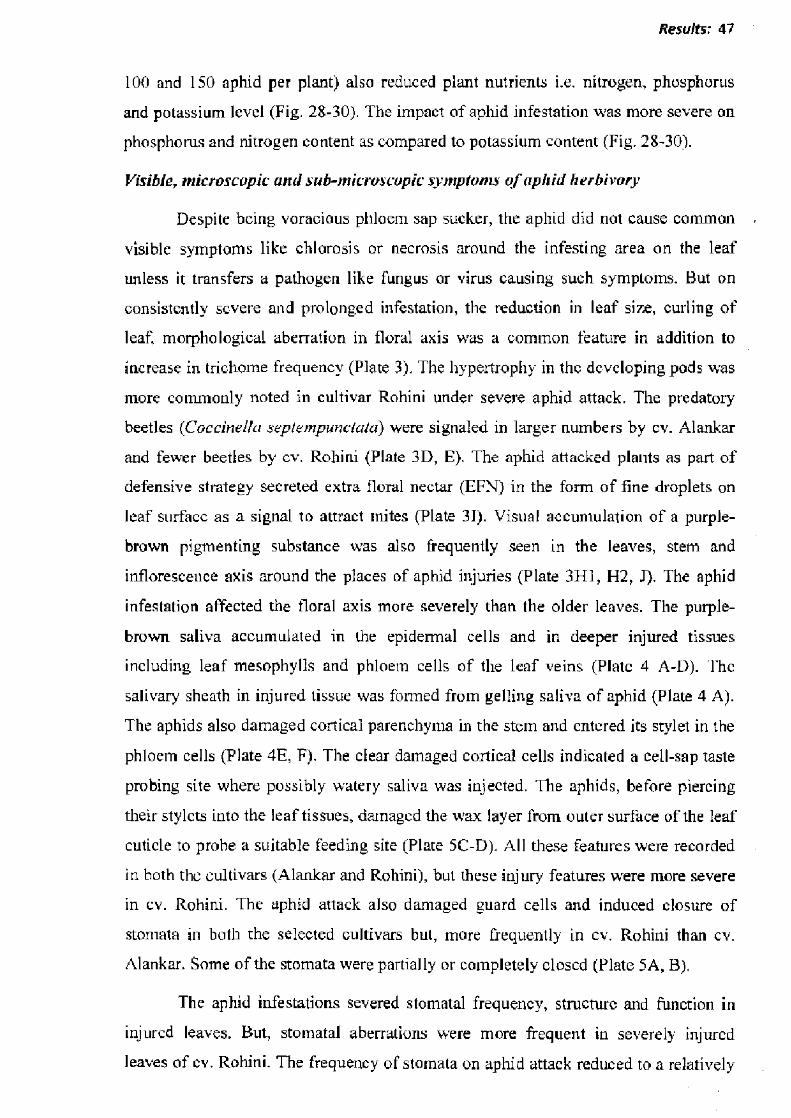
Results: 47
100 and 150 aphid per plant) also reduced plant nutrients i.e. nitrogen, phosphorus
and potassium level (Fig. 28-30). The impact of aphid infestation was more severe on
phosphorus and nitrogen content as compared to potassium content (Fig. 28-30).
Visible, microscopic and sub-microscopic symptoms of aphid herbivory
Despite being voracious phloem sap sucker, the aphid did not cause common
visible symptoms like chlorosis or necrosis around the infesting area on the leaf
unless it transfers a pathogen like fungus or virus causing such symptoms. But on
consistently severe and prolonged infestation, the reduction in leaf site, curling of
leaf, morphological aberration in floral axis was a common feature in addition to
increase in trichome frequency (Plate 3). The hypertrophy in the developing pods was
more conunonly noted in cultivar Rohini under severe aphid attack. The predatory
beetles (Coccinella seplempunelala) were signaled in larger numbers by cv. Alankar
and fewer beetles by cv. Rohini (Plate 3D, E). The aphid attacked plants as part of
defensive strategy secreted extra floral nectar (EFN) in the form of fine droplets on
leaf surface as a signal to attract mites (Plate 31) Visual accumulation of a purple-
brown pigmenting substance was also frequently seen in the leaves, stem and
inflorescence axis around the places of aphid injuries (Plate nil, H2, J). The aphid
infestation affected the floral axis more severely than the older leaves. The purple-
brown saliva accumulated in the epidermal cells and in deeper injured tissues
including leaf mesophylls and phloem cells of the leaf veins (Plate 4 A-D). The
salivary sheath in injured tissue was formed from gelling saliva of aphid (Plate 4 A).
The aphids also damaged cortical parenchyma in the stem and entered its stylet in the
phloem cells (Plate 4E, F). The clear damaged cortical cells indicated a cell-sap taste
probing site where possibly watery saliva was injected. The aphids, before piercing
their stylets into the leaf tissues, damaged the wax layer from outer surface of the leaf
cuticle to probe a suitable feeding site (Plate 5C-D). All these features were recorded
in both the eultivars (Alankar and Rohini), but these injury features were more severe
in cv. Rohini. The aphid attack also damaged guard cells and induced closure of
stomata in both the selected cultivars but, more frequently in cv. Rohini than cv.
Alankar. Some of the stomata were partially or completely closed (Plate 5A, B).
The aphid infestations severed stomata] frequency, structure and function in
injured leaves. But. stomatal aberrations were more frequent in severely injured
leaves of cv. Rohini. The frequency of stomata on aphid attack reduced to a relatively

Plate 3. A comparison of morphological features of defense in mustard cvs. Rohini & Alankar. Trichomes at adaxial surface (A) Rohini. (B) Alankar. Zoomed image of trichomes (C1 ) light microscopic (C,) SEM image. Aphid infested during pod formation (D) Rohini (E) Alankar, and early flowering stage (F)Rohini (G) Alankar. Hypertrophied pods (HI ) Rohini and (H2) Alankar. Extrafloral nectories (EFN) in aphid infested Alankar (I) and symptoms of aphid infestation (J) purpling, leaf curling & wilting.

Plate 4. Anatomical effects of aphid infestation on mustard leaf (A) leaf midrib showing aphid salivation and area of stylet insertion, (B) Trichome (C) saliva on cell wall of midrib (D) abnormal growth on midrib (E) Damage at cell-wall of stem section (F) Disturbed cell-wall and underlying cells near salivation area.

10 mm
55 g .4■1 k 4110
•
Alankar
I 10 1.t
tray-11 F
10µ
■ G
Rohini
%sr
I
1111- 1.
witailowitidf a 0,• .
.0,41-iik v..Z
Plate 5. Comparative leaf surface features in cvs. Alankar (A-D) and Rohini (1-L) under light microscope (10x10x, with corresponding scale bars), zoomed light microscopic image of open (E) and closed (F) stomata of common occurrence in both the cultivars, (G) disintegrated guard cells in cv. Rohini infected with 150 aphids. (H) deformed wax layer in cv. Rohini infected with 150 aphids.

Results: 48
larger extent in cv. Rohini than in cv. Alankar (Fig. 31, 32). The level of impact on
stomata! frequency corresponded with the population of aphids (Fig. 31, 32) in both
the cultivars at 60 and 75 DAS. It is evident from the data of relative stomata closure
index (RSCI) that closure of stomata increased with the aphid population (initially 50,
100 and 150 aphid per plant and subsequent increase) in both the cultivars (Fig. 33,
34). But, frequency of stomata closure was relatively larger in cv. Rohini than cv.
Alankar (Fig. 33, 34).
The rate of net photosynthesis (in terms of u mol CO2 ma seed) and stomata]
conductance (in terms of gas exchange mol ni2 sect) was also recorded in plants
exposed to varying level of aphid infestation (50, 100, and 150 aphid per plant). The
rate of photosynthesis and stomata! conductance reduced in both the cultivars under
varying levels of aphid herbivory (Fig. 35, 36). The rate of photosynthesis and
stomata! conductance decreased with the population of infesting aphid and days of
infestation (Fig. 35, 36). The reduction in the efficiency of photosynthesis and gas
exchange through stomata was higher at the late growth stage i.e. at 75 DAS (Fig. 33,
34).
The aphid infestation had direct impact on the yield of the plant. Substantial
reductions were recorded in the pod length of both the cultivars under varying levels
of aphid herbivory. The pod length of cv. Rohini was more severely affected in
response to all three initial doses of aphid (Fig. 37). The per cent oil content in seeds
also reduced significantly on aphid herbivory (Fig 38). The pod and seed setting was
adversely affected by aphid herbivory as evident from the statistically analysed data
on pod number per plant, seed number per pod and seed outputs per plant (Fig. 39-
42). Significant reduction in all yield parameters caused by aphid infestation in both
the cultivars Alankar and Rohini reduced oil yield (Fig. 38-42).
Aphid and beetle demography
The selected cultivars (Alankar and Rohini) were exposed to 50, 100 and 150
aphids per plant at 45 DAS growth stage and the increase in aphid population was
determined at 60 and 75 DAS. The statistically analysed data are summarized in Fig.
43 and 44. The aphids multiplied more quickly and almost exponentially on both the
cultivars. The increase in aphid population was comparatively more on cv. Rohini
than on cv. Alankar (Fig. 43, 44). The aphid attacked plants were exposed free to

60 DAS; LSD at 5% V=0.486; T=0.687; VxT=0.972 75 DAS; LSD at 5% V=0.655;1=0.926; VxT=1.309
=MI
80 - V I = Alankar V2 = Rohini
60 -
fi 40
-
20
0
60 DAS; LSD at 5% V=0.165; T=0.233; VxT=NS 75 DAS; LSD at 5% V=0.245; T=0.346; VxT=0A89 1
30 -
25 -
20 -
15 -
10 -
5 -
0 \ \ 40. z;,, ee / -, e'' o§ 1" ,41\4'' ..>" ,-)
c-, ."' ,., .4,,.: \‘' ..:.'‘' .•" -.. ' ...1;
Treatment
Fig. 15,16. Effect of aphid infestation (0, 50, 100 and 150 per plant) on shoot and root length (cm) of Brassica juncea cvs. Alankar and Rohini at 60 and 75 DAS
Roo
t len
gth
(cm
)

1 1 60 DAS; LSD at 5% V=0 419; 1-0.592; VxT=NS 1 175 DAS; LSD at 5% 9=0.222; T=0.314; VxT=0444
70 - VI = Alankar
V2 = Rohini 60 -
50 -
40-
a; 30 -
20 -
60 DAS; LSD a 5%V=1.000; T=1.41. ; Vx T=2.001 1 1 25 DAS; LSD a 5% V=1.419; T=2.006: VxT=2.837 tttltr
rE
f 4-
60 -
50
"t 40
30
20
10 -
.z.
'V 'V 41; •I'V
Treatment
Fig. 17, 18. Effect of aphid infestation (0, 50, 100 and 150 per plant) on leaf number and area (cm2) of Brarsica juntea c‘s. Alankar and Rohini al 60 and 75 DAS

60 DAS; LSD at 5% V=0.156; T=0.221; VxT=0.313 75 DAS; LSD at 5% V=0.229; T=0.323; VxT=0.457
IN=
14 - V I = Alankar V2 = Rohini
12 -
10 -
8-
6-
4- -
2-
0
60 DAS; LSD at 5% V=0.039; Th0.056; VxT=0.079 75 DAS; LSD at 5% V=0.057; T=0.081; VxT=0. I 14
3.5 -
3.0 -
2.5 -
2.0 -
1.5 - -X-
1.0 -
0.5
0.0 0. 0
Treatment
Fig. 19, 20. Effect of aphid infestation (0, 50, 100 and 150 per plant) on fresh and dry mass (g) of Brassica juncea cvs. Alankar and Rohini at 60 and 75 DAS
Fres
h m
ass (
g)

1.4 -
1.2 -
1.0 -
0.8 -
0.6 -
0.4 -
0.2
0.0
I= 60 DAS; LSD at 5% V=-0.015; T=0.021; VxT=0.030 75 DAS; LSD at 5% V=0.014; M0.020; VxT=0.028
0.7 -
0.6 -
0.5 -
0.4 -
0.3 -
0.2 -
-H- 4-1
IMO
60 DAS; LSD at 5% V=0.013; T=0.018; VxT=0.026 75 DAS; LSD at 5% V=0.026; T=0.037; VxT=0.052
-1-
\ \
so • S" __,.. b`' vc,. b:`-' ,s0 % (N. ''q e 0
,Co Q 0
n 4-$) ,,,, • 4-7:1 •-... 1. N' ...:4 .1'3-
•••:.%\: 1‘: ...V .... .4 .4'":
Treatment
0.1
0.0
I 2.0 -
1.5 -
1.0 -
0.5 -
0.0
04 E
0 L 0
Ch
loro
ph
yll b
(m
g FM
)
To
tal c
hlo
rop
hyl
l (m
g g"
' FM
)
60 DAS: LSD at 5% V=0.013; T=0.018; VxT=0.026 75 DAS; LSD at 5% V=0.005; T=0.007; VxT=0.01 I
V 1 = Alankar V2 = Rohini
Fig. 21, 22, 23. Effect of aphid infestation (0, 50, 100 and 150 per plant) on chlorophyll a, b and total chlorophyll (mg FM) of Brassica juncea cvs. Alankar and Rohini at 60 and 75 DAS

Car
ote
no
id c
on
ten
t (m
g g-
1 FM
) P
rote
in c
on
ten
t (m
g g
'' DM
)
0.7 -
0.6 -
0.5 -
0.4 -
0.3 -
= 60 75
DAS; DAS;
LSD LSD
at at
5% 5%
V=0.004; V=0.003;
T=0.006; T=0.005;
VxT=0.008 VxT=0.007
I.
V I V2
I
= Alankar = Rohini
IMM
0.2 -
0.1 -
0.0
60 DAS; LSD at 5% V=0.130; T=0.184; VxT=0.261 75 DAS; LSD at 5% V=0.133;1=0.188; VxT=0.266
30 -
25 - I
20 -
15 -
10 -
5-
0 S •o. ,o "
N' ••••\''fr-
t'P `k",
41: ■4\' .f;
Treatment
Fig. 24, 25 Effect of aphid infestation (0, 50, 100 and 150 per plant) on carotenoid content (mg FM) and protein content (mg g,-1 DM) of Brassica juncea cvs. Alankar and Rohini at 60 and 75 DAS

60 DAS; LSD at 5% V=0.019; T=0.027; VxT=0.039 75 DAS; LSD at 5% V=0.055;1=0.078; VxT=0.111
5- V I = Alankar V2 = Rohini
0
60 DAS; LSD at 5% V=0.662; T=0.936; VxT=1.324 75 DAS; LSD at 5% V=0.320;1=0.453; VxT=0.64 I
30 -
25
a 20 - 0
15
10 O
5 - O t. 0
Aso -cs N-11) bs r-d° 04q cf.
\cP1'
Treatment
Fig. 26, 27. Effect of aphid infestation (0, 50, 100 and 150 per plant) on total phenol content (mg g-1 FM) and proline content OA mol g-1 FM) and) of Brassica juncea cvs. Alankar and Rohini at 60 and 75 DAS
MEI

P c
onte
nt (
mg
gl D
M)
K c
onte
nt (
mg
g"' D
M)
60 DAS; LSD at 5% V=0.005; T=0.007; VxT=0.010 1
1 75 DAS; LSD at 5% V=0.039; T=0.055; VxT=0.078 8 -
VI = Alankar V2 = Rohini
6
4 -
/ -
0
11•11111 60 DAS; LSD at 5% V=0.127; T=0.179; VxT=0.253 16 I 75 DAS; LSD at 5% V=0.170; T=0.240; VxT=0.340
14 -
12 - -1- 10- - - - - • - I- 8-
6 - 4-
0
60 DAS; LSD at 5% V=0.152; Th0.215; VxT=NS 75 DAS; LSD at 5% V=0.497; T=0.702; VxT=NS
18 - 16 - 14 -12 -10 - 8 - 6 - 4 -
0 `6°\* ••1"`'
••:■'\ \ \ c; •••%\'‘
Treatment
=MI I I I
N c
onte
nt (m
g g'
i DM
)
Fig. 28, 29, 30. Effect of aphid infestation (0, 50, 100 and 150 per plant) on N, P, and K content (mg DM) of Brass ica juncea cvs. Alankar and Rohini at 60 and 75 DAS

\-4" 0o aQ ԤZ
60 DAS; LSD at 5% V=0.103; 1=0.146; VxT=0.207 75 DAS; LSD at 5% V=0.163;1=0.230; VxT=0.325
NMI
30 -
25 -
- T
15
10 -
5
V I = Alankar V2 = Rohini
No. o
f sto
mat
a
0
MIN 60 75
DAS; LSD at 5% V=0.174; T=0.276; VxT=0.348 DAS; LSD at 5% V=0.192; T=0.271; VxT=0.373 1
18 - 16 14
al 12 - E *Ca 1 0 I I
8 -
z .74 6 -
4-
0 •
"'reit t M CFI t
Fig. 31, 32. Effect of aphid infestation (0, 50, 100 and 150 per plant) on number of stomata on abaxial and adaxial leaf surface of Brassica juncea cvs. Alankar and Rohini at 60 and 75 DAS

I?-
-I-
41' (-F
4.‘ 411;
0.0
60 DAS; LSD at 5% V=0.006; T=0.007; VxT-0.010 75 DAS; LSD at 5% V=0.003; 1=0.004; Nix T=0.006
I
1.2 VI = Alankar
OIS V2 = Rohini 0 1.0 - 1-1-1
V
t 0.8 -
A "" 0.6 -
0.4 -
.0 0., - Q
0.0
I' 1 60 DAS; LSD at 5% V=0.005; T=0.007; VxT=0.009 I 17c DAS- LSD at 5% V=0.008; T=0.010; Vxr=0 013
Treatment
Fig. 33, 34. Effect of aphid infestation (0, 50, 100 and 150 per plant) on relative stomatal closure index (RSCI) of abaxial and adaxial surface of Brassica juncea cvs. Alankar and Rohini at 60 and 75 DAS

ter NNE
14 -
60 DAS; LSD at 5% V=0.269; T=0.381; VxT=0.539 75 DAS; LSD at 5% V=0.296; T=0.418; VxT=0.591
VI = Alankar V2 = Rohini
12 -
10 -
8 -
6 I
0
60 DAS; LSD at 5% V=0.987; T=1.396; VxT=1.974 75 DAS; LSD at 5% V=1.109; T=I.569; VxT=2.218
60 -
50 -
40- c C7 8 E 30 - 74 IS
20 - o V 10 -
0 ob5 1 00
,z,41 boo aS. eSZ
‘P' . 0`.
Treatment
Fig. 35, 36. Effect of aphid infestation (0, 50, 100 and 150 per plant) on net photosynthetic rate (PN; t mol CO2 1112 sec'') and stomatal conductance (ga; mol tn-2 sec'') of Brassica juncea cvs. Alankar and Rohini at 60 and 75 DAS
71- -1-

30
20
10 Oil
cont
ent (
%)
LSD at 5% V=0.021;1-0.029; VxT-0.04I 6
5- VI = Alankar V2 = Rohini
Pod
leng
th (c
m)
4- -1-
3-
2
0
LSD at 5% V=0.621; T=0.878; VxT=1.242 40
0
LSD at 5% V=1.599; T=2.622; VxT=3.199 120 -
100 -
80 - e os
60
0- 40
20
I r r r 1
\ 4, \
a° -0.bc' .$ -cs -0. bc'
, 0.b'' -Cb'' -cs
,A ,A (..° t.'zz e`z 4z 9 ...... ) .9 '' .1N -AN' -.%\' -41: -.1''' -41'
Treatment
Fig. 37, 38, 39 Effect of aphid infestation (0, 50, 100 and 150 per plant) on pod length (cm), oil content (%) and pod plant.' of Brassica juncea cvs. Alankar and Rohini at harvest (120 DAS)
0
-1— -1—

1000
see
d w
eigh
t (g)
V
LSD at 5% V=0.023; T=0.033; VxT=0.046
VI = Alankar V2 = Rohini
0
14 -
12 -
SO - 8 -
6-
4-
2-
0
LSD at 5% V=0.055; T-0.078; VxT=0.111 7-
6 -
5
4 -
3-
2-
0
8
6
4 -
/ -
0
LSD at 5% V=0.143; T-0.202; VxT=0.286
n \
040) s, •o' b'' ..o• I' Nse ,P 4z ' e
,%. (.■° C ., 4)Z
,
1
Treatment
Fig. 40, 41, 42. Effect of aphid infestation (0, 50, 100 and 150 per plant) on yield characteristics of Brassica fume(' cvs. Alankar and Rohini at harvest (120 DAS)

14 -
12
10 -
8
Beet
les a
ttra
cted
2
0
I ] I J
60 DAS; LSD at 5% V=4.539;1=6.419; VxT=9.077 75 DAS; LSD at 5% V=4.811; T=6.804; VxT=9.622
0
V I = Alankar V2 = Rohini
60 DAS; LSD at 5% V=0.288; T=0.408; VxT=0.577 75 DAS; LSD at 5% V=0.087; T=0.123; VxT=0.174
300 -
250 -
• 200 -
▪ 150 -
100
50 -
•0 rj) toQ
:"P ••\\' -.1•• ■c? •:2;
Treatment
Fig. 43, 44 . Population count of aphid and number of beetle attracted after infestation on (0, 50, 100 and 150 per plant) on Brassica juncea cvs. Alankar and Rohini at 60 and 75 DAS

60 DAS 75 DAS
4
E
li -
12 •
10 -
8 -
6 -
4
ll 50 I 011 1511
Aphids pleat'
• A limlsr. 5 - 41004% • 2 279. R.- 0 980
O Robing . • .0 004% • 1 354. • 0 854
33
30
a 23
2 0
1 5
10
11 30
-
100 ISO
Aphids plant"'
• A lankar. •0.0025 • 1 697. R.- 0.990 O Rohm'.' --0 0025 • 1168. R. • 0 992
60 DAS
O Si) 100 ISO
Aphids plant
• A lanlar. , •0 0045 • 1 824. It' - 0 998
0 Rohm' • = -0 001% • 1 389. IV • 0 972
75 DAS
3U 100 ISO
Aphids plant
• Alankar.% Ulltx • 9 OBI. 0.9E4
O Rohm.) - -0 0165 • 3 399: R. 0 853 DAS
60 DAS
O 50 100 150
Aphids plant '
• Alankat. y -0.0285 • 12 43. Il.•• 0 984
0 Rohm.. y = 1134. - 10 44. 0 831 75 DAS
0 50 100 110
Aphids pleat
• A lanl.ar. '. - •0 007% • 3 103. R' • 0 927
O R ohm, % • -0 001% • 2 603. R' 853
75 DAS
2 6
2 1
II Is I 6 I 4
I I.
$.1 100 130
Aphids pleat
• Alankar.) • 0 0555 • 12 77. Ri - 0 993
O Rohinu. ) -00395 • 10 90. R.= 0 9E6
O 30 100 150
Aphids plat'
• Alankar. 069* • 14 110. 997
O Rohini.y = 0 06% • 1303. R'- 0 986
Fig.LR-111. Regression line showing the correlation coefficient between plant growth and biochemical parameters vs aphid population. viz., (A) total chlorophyll, (B) plant fresh mass (C) plant dry mass (D) proline content at 60 and 75 DAS
184
'1 chl
orop
hyll
lms
g M
)
1
1
14
ear
Peel
ine
keel
(It m
ol g
FM
)
22
2u
IS
14
12
10
Prob
er le
vel
ga
ol g
F
M)
20
24 ,
22
20
IS
16
1.4
12
Total c
hle
mph
,11 (m
g g
t
I
I 0
14
I 2
o
0 8
06

N c
aden
t (m
g R
' D
M)
54
52
5 0
48
46
44
42
N t
este
s( lo
ng g
1 D
M)
70
65
60
55
50
45
40
11
10
: - 9
I a 8 A Pr
i 1 7
V 3 6 Z
5
60 DAS
15 DAS
4
la
12 •
• 40 •
35
30
40 •
30
C
E 2
20 • 25
20 10
15
0 I0
4
2
0
60 DAS
0 50 100 150
Aphids plant '
• Alankat. y -0 004s • 5 27. 6R1 . 0 995
O Rohint. y 004x 5 03. R1 . 0 997
75 DAS
O SO 100 ISO
Aphids plant"'
• Alankat. y -0 006x • 6 514, R.= 0 999 O y-•0005x • 5284, R' 0 999
O 50 100 150
Aphids plant'
• Alankar, y ■ -0 024x • 10 31, R' 0 991 O Rohm'. y • -0 031a - 9 055. 0 983
60 DAS 45
O 50 100 150
Aphids plant. '
• Alankat. y = -0 037x - 12 12. R+ = 0 966 O y -0 047x + 1045. R+ - 0 956
7S DAS 50
O So 100 150
Aphids plant
• Alankar, y - -0 07x • 38 50. R' • 0 876 O Rohm,. y 128x • 10 91. - 0 800
O 50 100 ISO
Aphids plant'
• Alankar. y - 092x • 44 55. R.., 0 878 O Rohm. v - -0 154x • 34 50. 0 837
120 DAS 8
6 •
0 50 100 150
Aphids plant.'
• A lankar. y -0 037x • 6 838. It - 0 974
O Rohm'. y = -0 022x • 3713. R1 . 0 970
Fig.LR-IV. Regression line showing the correlation coefficient between plant growth and biochemical parameters vs aphid population. viz., (A) N content (B) net photosynthetic rate IC) stomatal conductance (D) seed yield at 60 and 75 DAS

Results: 49
attract beetles through their inherited defensive traits of signaling via volatile
chemical signaling (VCS). The population of aphid and beetles attracted were counted
at 60 mid 75 DAS. The aphid injured cv. Alankar attracted larger number of aphids
than by the cv. Rohini (Fig. 43, 44).
On the basis of per cent variation in all the parameters of cultivar Alankar and
Rohini under varying levels of aphid herbivory, the responses of various parameters
can be arranged in the following order of decreasing response. Leaf area > total
chlorophyll .> nitrogen > phosphorus > potassium.
Correlation coefficients and regression analysis
The correlation coefficient and regression line between selected parameters
and aphid number per plant were determined. The total chlorophyll content, fresh
mass, dry mass, nitrogen content and net photosynthesis rates, stomata conductance
and seed yield had strong and negative correlation with number of aphid per pliant at
60 and 75 DAS in both the cultivars. But the correlations between the growth variable
of plant and aphid population were stronger in cv. Alankar than cv. Rohini. The
proline content was positively correlated with the increase in aphid population and
remaining parameters (total chlorophyll content, fresh mass, dry mass, nitrogen
content and net photosynthesis rate. stomatal conductance and seed yield) had
negative and significant correlation with aphid infestation level (Fig. LR III and IV).
Experiment -3
Plant responses to aphid herbivory along with predatory beetles
Both the selected cultivars were infested with varying levels of aphids (50.
100, 150 aphid per plant) and 5 days later equal level of predation was induced by
introducing 2 beetles per plant. A set of control without aphids and beetles was also
maintained. The shoot and root length consistently decreased with the increase in
aphid infestation level despite equal level of predation by beetles. The reductions in
shoot and root length were relatively higher M cv. Rohini than Alankar at 60 and 75
DAS (Fig. 45, 46). The impact of aphid infestation on shoot and root length were
higher in cv. Rohini than cv. Alankar irrespective of predation of aphids by beetles
and plant age. It is of significance to mention here that the per cent reductions in
varying growth attributes as recorded in the present study were relatively lesser than

Results: 50
the reductions caused by equal number of aphid inoculation without beetles in the
experiment 2.
The varying levels of aphid infestation adversely affected the leaf initiation
and development as evident from the data on leaf number and leaf area per plant (Fig.
47, 48). The reductions in leaf number and leaf area corresponded with the levels of
aphid infestation irrespective of predation by beetles. The impact of aphid infestation
on the leaf area was relatively more severe at late stage (75 DAS) but, the leaf number
did not show much variation at this stage (Fig. 47, 48). These data indicate that the
expansion of leaf was more severely affected than the leaf initiation on aphid
infestation and their predation by beetles (Fig. 47, 48).
The effects of varying levels of aphid herbivory on fresh and dry mass oh host
plants are summarized in Fig. 49, 50. There were significant reductions in the fresh
and dry mass of the plant. The reductions in fresh mass were higher in cv. Rohini than
in Alankar at early stage but eventual loss in dry mass were relatively more severe at
late stage (75 DAS) (Fig. 49, 50).
The impact of varying levels of aphid herbivory along with their predation by
two beetles was studied on chlorophyll and carotenoid contents in two selected
cultivars of mustard at two growth stages; the data are summarized in (Fig. 51-54).
The aphid infestation affected chlorophyll a and b as well carotenoid content in
proportion to their infestation level. The loss in chlorophyll increased with aphid
number. The chlorophyll was more severely reduced in cv. Rohini than in Alankar.
The predation of equal number of beetles did not apparently affected the severity of
damage caused by aphids (Fig. 51-54).
In this experiment, the total protein and phenol content decreased in the plant
(Fig. 55, 56). The protein was more severely affected in the most susceptible cultivar
Rohini than Alankar even at early stage of growth (60 DAS) as evident from per cent
loss with respect to control plant. The reductions in protein and phenol contents with
respect to aphid infestation level were significant (Fig. 55, 56). The data on the
accumulation of proline in the leaves of selected cultivars under varying levels of
aphid infestation with predation by equal number of beetles are summarized in Fig.
57. The proline content increased in the plant with the level of aphid infestation stress
and the predation by beetles. But the increase in proline content was more in cv.

Results: 51
Alankar (relatively resistant one) than in Rohini (susceptible). The accumulation of
proline was higher at early stage of growth than the late stage (Fig. 57). Reductions in
nitrogen, phosphorous and potassium (N. P and K) content in both the selected
cultivars were also studied in the present experiment. The per cent reductions in NYK
were relatively lesser than other parameters. The per cent reductions in nitrogen and
phosphorous were marginal (Fig. 58-60).
The frequency and relative stomata closure index (RSCI), frequency of
stomata on abaxial and adaxial surfaces of leaf were studied in the present experiment
and the statistically analysed data are summarized in Fig. 61-64. The aphid infestation
affected stomata! frequency more adversely in cv. Rohini than cv. Alankar. The
reductions in stomatal frequency were higher at early stage (Fig. 61, 62). The stomata'
closure was more severe at late stage and high level of aphid infestation. The relative
stomata! closure index was almost equal on abaxial and adaxial surfaces of leaf but,
differed significantly at each leaf surface on varying levels of aphid herbivory (Fig.
63, 64). The aphid infestation adversely affected the rate of net photosynthesis and
stomata conductance. The reductions in rate of photosynthesis were in proportion to
the level of aphid infestation (Fig. 65, 66). The stomatal conductance was more
adversely impaired than the net rate of photosynthetic rate (Fig. 65, 66).
The data on pod length, oil content, pods per plant, seed per pod, mass of 1000
seeds and seed yield per plant were also collected and statistically analysed in the
present study and are summarized in Figs. 67-72. The aphid infestation under beetle
predation reduced pod length, pod formation, seed setting, seed development, seed
yield and oil content adversely. The impact of aphid infestation was more severe on
seed formation and development as well as oil content than the pod length, pods per
plant and seeds per plant (Fig. 67-72).
Aphid demography
In the present experiment, the population of aphid was worked out in both the
cultivars at 60 and 75 DAS. The aphid population was considerably low in cv,
Alankar than in cv. Rohini (Fig. 73) as compared to the aphid population count in
experiment 2 conducted with aphid herhivory alone indicating that beetles reduced the
aphid population.

Sh
oot l
eng
th (
cm)
Roo
t len
gth
(cm
)
80 -
60 -
60 75
DAS; DAS;
LSD LSD
at at
5% V=0.597; Th0.844; VxT=1.194 5% V=0.875; T=1.237; VxT=1.750
Vl = Alankar V2 = Rohini
-1-
40 - -
-E-
20 -
0
60 DAS; LSD at 5% V=0.246; T=0.348; VxT=0.493 75 DAS: LSD at 5% V=0.303; T=0.429; VxT=0.607 OEM
30 -
25 -
20 -
15 -
10 -
5-
0 4° ,,,, 43, o• ,N,, xl• 4 .,,i2, xl• ;1, 4 ,..' C° (., ' 01" 0‘''' C° 0 ." 0
•
1" 4) 0 -....%\ .....% .11P , -Z.': -....•- -41: Si'
Treatment
Fig. 45, 46. Responses of shoot and root length (cm) of Brassica juncea cvs. Alankar and Rohini exposed at 45 DAS to varying level of aphid infestations (0, 50, 100, 150 aphid per plant) and successive predation of aphids (5 days after) by 2 beetle per plant studied at 60 and 75 DAS.

=IS I 1
60 DAS; LSD at 5% V=0.393; T=0.556; VxT=0.786 75 DAS; LSD at 5% V=0.279; T=0.395; VxT=0.559
60 DAS; LSD at 5% V=1.015; T=1.436; VxT=NS 75 DAS; LSD at 5% V=0.330; T=0.466; VxT=0.659
70 - V I = Alankar V2 = Rohini
60 -
50 -
40 - -1-- -1-- 30 -
20 -
10
0
60 -
50 -
40 -
10 -
0
Treatment
Fig. 47, 48. Responses of leaf number and area (cm2) of Brassica juncea cvs. Alankar and Rohini exposed at 45 DAS to varying level of aphid infestations (0, 50, 100, 150 aphid per plant) and successive predation of aphids (5 days after) by 2 beetle per plant studied at 60 and 75 DAS.
Lea
f num
ber
VIM 111=1

60 DAS; LSD at 5% V=0.089; T=0 126; Vta=0 178
14
12
10
L 75 DAS; LSD at 5%
-1--
V-11 086; 1-0 122; Vs 1-11172 V) V2
= Alankar = kohini
a S .e 6
4
2
0
60 DAS; LSD a 5% V-0.026; 1=0.036; Vx T-0.052 75 DAS; LSD at 5% V=0.023; ;160.032) Vx T-0.045
3.5 - -1—
3.0 -
2.5 -
2.0 -
I 5 0.1 -
0.5 -
0.0 ▪ ;■•
.$ 0 %,
•
4
▪
4- .4. ‘• st, •CV
Treatment
Hg. 49, 50. Responses of fresh and dry mass (g) of Brassica iuncea evs. Alankar and Rohini exposed at 45 DAS to varying level of aphid infestations (0, 50, 100, 150 aphid per plant) and successive predation of aphids (5 days after) by 2 beetle per plant studied at 60 and 75 DAS.
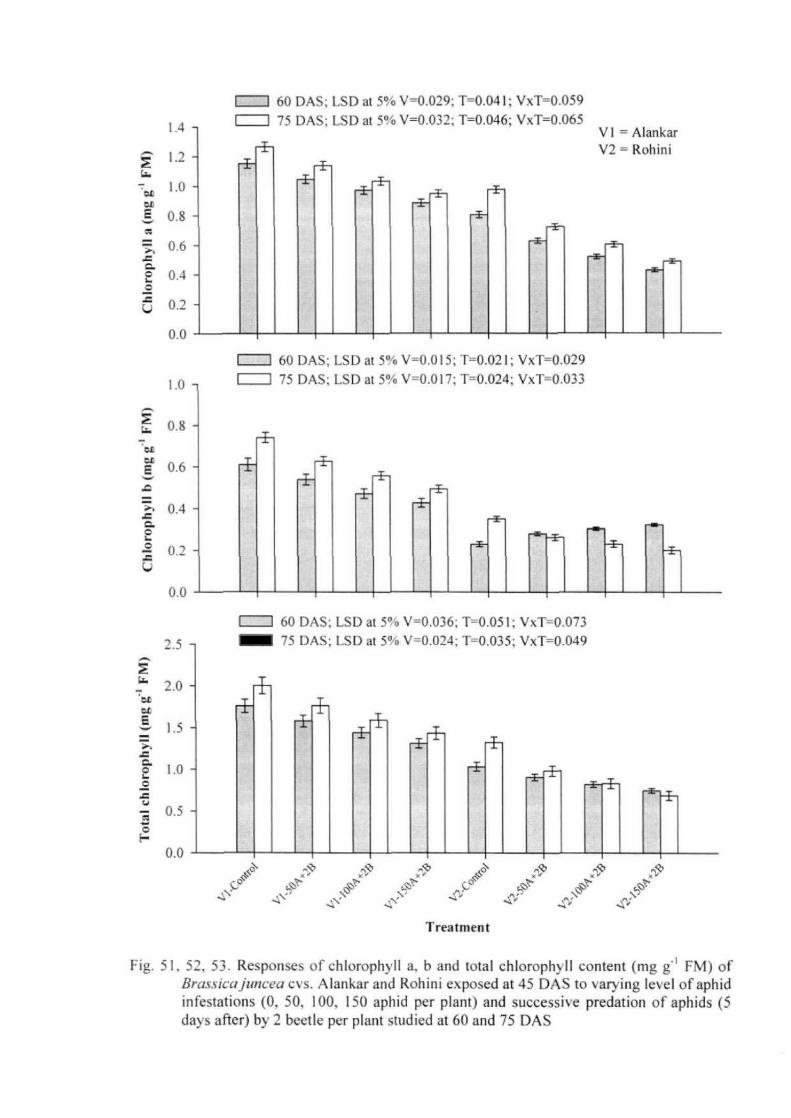
Chlo
roph
yll a
(mg
g' F
M)
Chlo
roph
yll b
(m
g g"
' FM
) 1.4 -
1.2 -
1.0 -
0.8 -
60 75
DAS; DAS;
LSD LSD
at at
5% 5%
V=0.029; V=0.032;1=0.046;
T=0.041; VxT=0.059 VxT=0.065
V 1 = Alankar V2 = Rohini
IN=
0.6 - --1—
0.4 -
0.2 -
0.0
60 DAS; LSD at 5% V=0.015; 1=0.021; VxT=0.029
1.0-1 I 75 DAS; LSD at 5% V=0.017;1=0.024; VxT=0.033 1
0.8 -
0.6 - -I- 0.4 -
-OF
0.2 - r-I-
0.0
60 DAS; LSD at 5% V=0.036; T=0.051; VxT=0.073 2.5 - 75 DAS; LSD at 5% V=0.024; T=0.035; VxT=0.049 MEM
2.0 -
1.5 -
1.0
0.5 -
0.0
• 4.0."
41:\‘") Treatment
Fig. 51, 52, 53. Responses of chlorophyll a, b and total chlorophyll content (mg g"' FM) of Brassica juncea cvs. Alankar and Rohini exposed at 45 DAS to varying level of aphid infestations (0, 50, 100, 150 aphid per plant) and successive predation of aphids (5 days after) by 2 beetle per plant studied at 60 and 75 DAS

Car
oten
oid
cont
ent (
mg
g:' F
M)
60 DAS; LSD at 5% V=0.010; T=0.015; VxT=0.021 75 DAS; LSD at 5% V=0.004; T=0.006; VxT=0.009
MIS =NI
0.7 - V 1 = Alankar V2 = Rohini
0.6 -
0.5 -
0.4 -
0.3 -
0.2 -
0.1 -
0.0
I I 60 DAS; LSD at 5% V=0.078; T=0.111; VxT=0.157 75 DAS; LSD at 5% V=0.170; 1=0.241; VxT=0.340
30 -
25 -
20 -
15
10
5
0 x 0 x 0
COQ` „ ,,)°‘." • •
Treatment
Fig. 54, 55. Responses of carotenoid content (mg FM) and protein content (mg g-1 DM) of Brassica juncea cvs. Alankar and Rohini exposed at 45 DAS to varying level of aphid infestations (0, 50, 100, 150 aphid per plant) and successive predation of aphids (5 days after) by 2 beetle per plant studied at 60 and 75 DAS.
Prot
ein
cont
ent (
mg
g'i D
M)

60 DAS; LSD at 5% V=0.025; T=0.035; VxT=0.049 75 DAS; LSD at 5% V=0.019; T=0.027; VxT=0.038
V I = Alankar V2 = Rohini
60 DAS; LSD at 5% V=0.512; T=0.724; VxT=1.024 75 DAS; LSD at 5% V=0.732; T=1.035; VxT=1.464
30 -
7 25
:I 20
15
• 10
• 5
0
„.ss . o
•
l" 5°'?-oOP SOP
-
Treatment
Fig. 56, 57. Responses of total phenol content and proline content (.x mol FM) of Brassica juncea cvs. Alankar and Rohini exposed at 45 DAS to varying level of aphid infestations (0, 50, 100, 150 aphid per plant) and successive predation of aphids (5 days after) by 2 beetle per plant studied at 60 and 75 DAS.
MEI
Tota
l phe
nol (
mg
g-I F
M)

60 DAS; LSD at 5% V=0.035; Th0.049; VxT=0.070 75 DAS; LSD at 5% V=0.033; T=0.046; VxT=0.065
VI = Alankar V2 Rohini
MIN
I P
cont
ent (
mg
g'i D
M)
16 -
14 -
12
10
8 -
6
4
r 1 60 DAS; LSD at 5% V=0.082; T=0.115; VxT=0.163 75 DAS; LSD at 5% V=0.119; T=0.169; VxT=0.238
I
L 60 DAS; LSD at 5% V=0.0381;1=0.541; VxT=NS .1 75 DAS; LSD at 5% V=0.323; 1 0.456; VxT=NS
0 , 49 ' . , A
-. -. •,- C, ;_:.,, e ...\' •: v ''. , \ ,.. ..
Treatment
Fig. 58, 59, 60 Responses of N. P. and K content (mg g-1 DM) of Brassica juncea cvs. Alankar and Rohini exposed at 45 DAS to varying level of aphid infestations (0, 50, 100, 150 aphid per plant) and successive predation of aphids (5 days after) by 2 beetle per plant studied at 60 and 75 DAS.

30 -
25 5
ea .4 20 -
60 75
DAS; DAS;
LSD LSD
at 5% at 5%
V=0.246; V=0.260;
T=0.348; T=0.360;
—E—
VxT=0.492 VxT=NS
VI V2
= =
Alankar Rohini
IIMMI
-1- 15 -
- O 74 10 - Z ca
5-
0
OMNI 60 DAS; LSD at 5% V=0.138; T=0.195; VxT=0.276 75 DAS; LSD at 5% V=0.152; T=0.215; VxT=NS
16 -
I.. 14 -
12 - ea E
,-; 10 - <-■ o 8
0 '4
O.4: 6 - Z ;
4 -
2 -
0
,%`" -4\" 0 ,f, .,,, ,.. e e,^,
...\,v
Treatment
on abaxial and adaxial surface of Brassica osed at 45 DAS to varying level of aphid plant) and successive predation of aphids (5 at 60 and 75 DAS.
Fig. 61, 62. Responses of number of stomata juncea cvs. Alankar and Rohini exp infestations (0, 50, 100, 150 aphid per days after) by 2 beetle per plant studied

1.0
e 0.8
0 IC g" .6 -
cg 41i 0.4 - aa
0.2
DAS; DAS;
LSD LSD
at 5% at 5% V=0.004;
V=0.030;1=0.037; T=0.004;
VxT=0.053 VxT=0.006
VI V2
= Alankar = Rohini
60 I 1 75
0.0
1.0 - L
zi 0.8 Cd at to. 0.6 = "-r- c; 0.4 -
0.2 -
60 DAS; DAS;
LSD LSD
at at
5% 5%
V=0.006; V=0.007;
T=0.007; T=0.009;
VxT=0.010 VxT=0.012 NMI 75
I
0.0 x
`"Pl's •••
Treatment
Fig. 63, 64. Responses of relative stomatal closure index (RSCI) of abaxial and adaxial surface of Brassica juncea cvs. Alankar & Rohini exposed at 45 DAS to varying level of aphid infestations (0, 50, 100, 150 aphid per plant) and successive predation of aphids (5 days after) by 2 beetle per plant studied at 60 and 75 DAS

L.
s NE
B (..)
E G
z
6-
4-
50 -
20 -
60 DAS; LSD at 5% V=0.050; T=0.70; VxT=0.100 75 DAS; LSD at 5% V=0.132; M0.186; VxT=0.264
MEM
V I = Alankar V2 = Rohini
0
60 DAS; LSD at 5% V=0.166; T=0.265; VxT=0.333 75 DAS; LSD at 5% V=0.360; T=0.509; VxT=NS 1
60 -
0
-E-
Co ~pP .\\"
O Ns°
Treatment
Fig. 65, 66 Responses of net photosynthetic r conductance (gs; mol m.2 sec-i ) Brassica juncea to varying level of aphid infestations (0, 50, predation of aphids (5 days after) by 2 beetle per
ate (PN; lt mol CO2 n12 sec-I ) and stomata cvs. Alankar and Rohini exposed at 45 DAS 100, 150 aphid per plant) and successive plant studied at 60 and 75 DAS
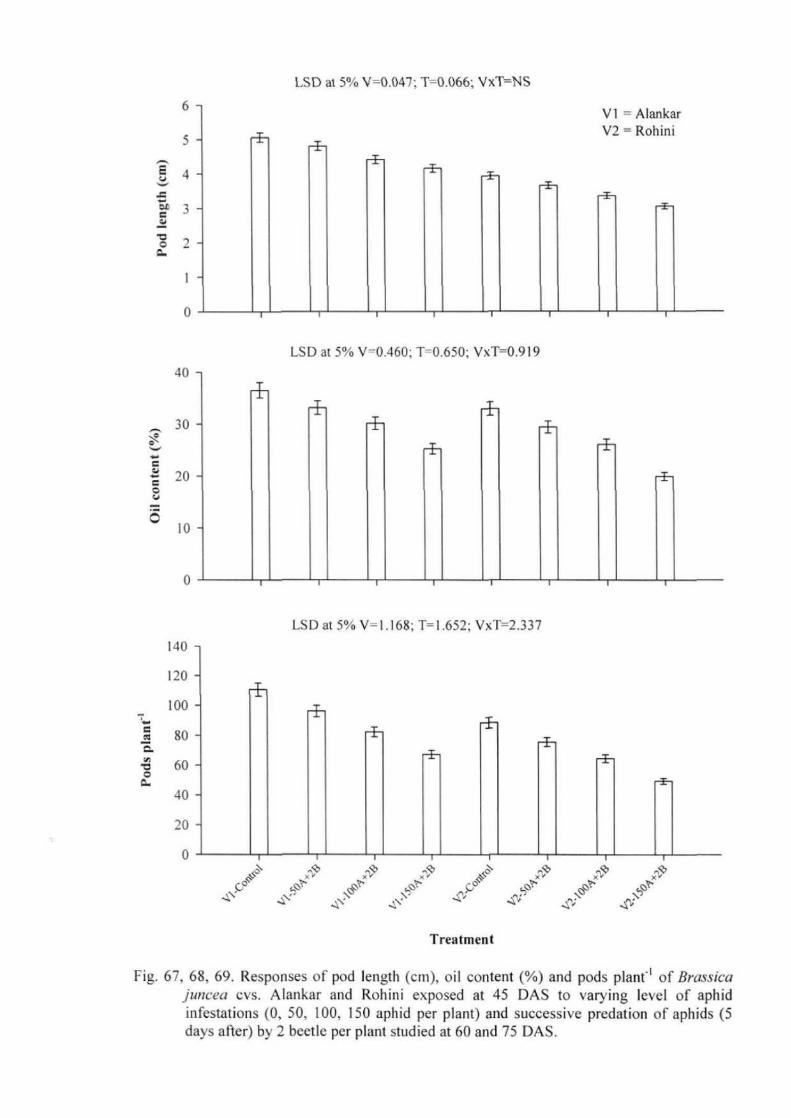
Pod
leng
th (c
m)
Oil
cont
ent (
%)
LSD at 5% V=0.047; T=0.066; VxT=NS
VI = Alankar V2 = Rohini
4 -
3-
0
LSD at 5% V=0.460; T=0.650; VxT=0.919 40 -
30 -
20 -
10
0
LSD at 5% V=1.168; T=1.652; VxT=2.337 140 -
120 -
100 -
ett 80 -
60 -0 a. 40 -
20 -
0 e, e, e, e, , 0 4° x v >A, x'1, .1, .1, 0 o.. ol" C No'? ' o'i"
\ ' ,) • \ ,... . . 4,"• ..` -..4. ...\* • - : ' -.'., 4"; -'1,
Treatment
Fig. 67, 68, 69. Responses of pod length (cm), oil content (%) and pods plant of Brassica juncea cvs. Alankar and Rohini exposed at 45 DAS to varying level of aphid infestations (0, 50, 100, 150 aphid per plant) and successive predation of aphids (5 days after) by 2 beetle per plant studied at 60 and 75 DAS.
6
5 -

VI = Alankar V2 = Rohini
--E -1- -1-
-I- -I- -I- -I-
-I-
4-
2-
0
7
6 ±
5
4 ± —I— -I- --I-
3 --I- --•
2
1000
see
d w
eigh
t (g)
1
0
LSD at 5% V=0.019; T=0.026; VxT=0.037
LSD at 5% V=0.038; T=0.054; VxT=0.076
LSD at 5% V=0.134; T=0.190; VxT=0.268 10 -
8-
+ -I-
-I- --I-
n I I I I ,
e!' „,,r. ,,o 0. S, 41° •,- \z
i.)°t et. to -4N
Treatment
Fig. 70, 71, 72. Responses of seed pod'', 1000 seed weight (g) and seed yield (g) of Brassica juncea cvs. Alankar and Rohini exposed at 45 DAS to varying level of aphid infestations (0, 50, 100, 150 aphid per plant) and successive predation of aphids (5 days after) by 2 beetle per plant studied at 60 and 75 DAS
0
±

60 DAS; LSD at 5% V=2.633; T=3.723; VxT=5.266 75 DAS; LSD at 5% V=4.380; T=6.195; VxT=8.76I
0
.^;
300 - V I = Alankar
2S0 - V2 = Rohini
▪ 200 -
▪ 150
100 -
MEI
Fig. 73. Responses of aphid populations on Brassica juncea cvs. Alankar and Rohini exposed at 45 DAS to varying level of aphid infestations (0, 50, 100, 150 aphid per plant) and successive predation of aphids (5 days after) by beetle per plant at 60 and 75 DAS

2 2
Tota
l chl
os 0
0,1
1 I m
g g
FM
) 20
1 8
1 6
t 4
6 4
12
11
10
9 Fres
h m
ins
(s)
8
26
24
22 iY 20
a 18
34 -
O
•
16
4
32 ■
3 0
2 B•
26
24
60 DAS 75 DAS
12 10
60 DAS
0 50 100 150
Aphids + 2 Beetles plant'
• Alankar, y = -0 003x • 1 743. It'. 0 994 O 130111ni. y 0013,• 1016, R. - 0 984
60 DAS
0 50 100 150
Aphids • 2 Beatles plant ' • A lankar, •001x • 8 1136.121 ■ 0 BG7
0 Robins, y -0 007x • 5 419, R" = 0 815 60 DAS
73 DAS
50 100 130
Aphids + 2 Beetles plows
• ,Alankar, y -0 003x • 1978, 0 980 O Kohm% y -0 004a • I 263. R' = 0 949
75 DAS 13 -
0 50 100 ISO
Aphids • 2 Beetle, plant
• Alankar, y 015a • 12 07, It' 0 857
0 Rohm% y -0016x • 10 60. = 0 797 75 DAS
0 2 0 0 50 100 150 0 50 100 150
Aphids • 2 Beetles plant' Aphids • 2 Beetles plant '
• Alankar. -0 002n - 2 346. 0 872 • Alankar, y -0 004x • 3 161, R. 0 856
0 Rohm% y -0 002x • 1 500. R. = 0 819 0 Rohm% y -0 004x • 2 777. W.. 0 793
0 50 I 00 ISO
Aphids 2 Beetles plant'
• A lankar, y = 0 052x • 12 81. 1;t 2 .. 0 974
0 R o h to t, y= 0 023% - I I 19, R' 0 969
0 50 100 150
Aphids • 2 Beetles plant'
• Alankat.y 0055x • 14 75, R, = 0 966
0 Rohm', y 0029x • 13 21. R' 0. 867
Fig.LR-V. Linear Regression line with equation and squired correlation coefficient between various growth parameters and aphid infestation level (under predation of 2 beetles) in selected cultivars at 60 and 75 DAS stages.
Prob
er le
vel O
s m
ol g
FM
)
22
20 .
16
18 •
12 -
14
rrol
ine l
eve l
IM w
ool
FM)
26 •
24
22
20
11
06
10
8
7
6
5
4
Tota
l chl
orop
h ■ II
!mg
g 1
511
20
1
16
4
1 2
0
08

60 DAS 75 DAS
0 30 100 150 0 50 100 150 Aphids + 2 Beetles plant Aphids + 2 Beetles plant
• Alankar, y — -0 004x • 5 393, 0 987 O Rohmi. y = -0 003x • 5 125, It' • 0 991
60 DAS 12
• Alankar, y • -0 004x 6 658. R' - 0 956 O Rohnn, y -0 005x • 5 401. R, • 0 995 75 DAS 14 - •
• •
O 7 0 50 100 150
Aphids + 2 Beetles pleat'
• Alankar, y • -0 014x • 10 86, R' •• 0.741 O Rohini, y = -0 013x -• 9 715, 121= 0 777
60 DAS
O 9 O 50 100 ISO Aphids + 2 Beetles plant '
• Alankar, y • -0 0I2x • 13 23, R' • 0 538 O Rohm,. y = -0 012x + 1160. IV • 0 715
75 DAS
0 50 100 150
Aphids + 2 Beetles plant'
• Alankar, y • -0 I09x + 45 95, R1 .. 0 979
O Rohm y • -0 109x + 39 29, R 1 0 %7
O 50 100 150
Aphids + 2 Beetles plant.'
• Alankar, y -0 072x • 39 15, R1 - 0 993
O Rohm% y -0 07Ix + 34 47, R1 -, 0 990
120 DAS
0 50 100 150
Aphids + 2 Beetles plant.'
• Alankar, y • .0 027% • 11 95, R , • 0 997 O RohInt, y - -0 026x + 10 79, R , - 0.998
Fig. LR-VI. Linear Regression line with equation and squired correlation coefficient between various biochemical and yield parameters vs. aphid infestation level (under predation of 2 beetles) in selected cultivars at 60 and 75 DAS stages.
7 0 S6 65 1 60 55
0
45 40
• 52 as so- = 48 '
54 .1
46 44
50
45 •
Y =
40 •
35 •
30 ■ 0
25
20
42 40 38 •
36 •
34
I "I 32 ; 30 •
28 • A
26 24 22
13
12
11 10 9 8 7 6

Results: 52
Correlation coefficients and regression analysis
The correlation coefficients between selected growth parameters and varying
levels of aphid (under predation of 2 beetles per plant) were determined and
regression lines plotted. The degrees of correlation were strong and negative. The
highest degree of correlation was observed between N content and aphid population
(LR-V) as well as between seed yield and aphid counts (Fig- LR- VI).
Experiment 4:
Effects of concentrations of jasmonic acid on mustard
To study the effects of jasmonic acid (JA) in plant defenses and find out the
effective concentrations of JA to be used in the following Experiment 5, both the
selected cultivars were treated with three varying concentrations of JA and responses
were studied. Significant increase in the shoot and root length of cultivar Alankar was
noted in response to the treatment with 0.5, 1.0, and 1.5 mM of JA. The best results
were obtained on treatment with 1.0 mM of JA. There was no significant change in
the shoot and root length of cv. Rohini treated with JA (Fig. 74, 75). The leaf number
and area of both the cultivars did not show any significant change in response to JA at
60 DAS growth stage. But at late stage (75 DAS); JA exposure enhanced the leaf
number to some extent in both the selected cultivars (Fig. 76, 77).
The JA treatments increased fresh and dry mass significantly in cv. Alankar
and Rohini at both the growth stages 60 and 75 DAS (Fig. 78, 79). The chlorophyll
content (a, b, and total) also increased on treatment with JA at both the growth stages
(Fig. 80-82). Relatively higher impact of JA treatment was noted on carotenoid
content in both the cvs. at 60 and 75 DAS (Fig. 83). The treatment with 1.0 and 1.5
mM of JA enhanced the protein content significantly in cv. Alankar at 60 and 75 DAS
(Fig. 84). But, in cv. Rohini the significant increase of protein was noted only on
treatment with 1.0 mM JA (Fig. 84). The phenol content in cv. Alankar and Rohini
increased to relatively higher extent on treatment with 1.0 mM JA at 60 and 75 DAS
(Fig. 85) On the basis of per cent variation, the proline content increased significantly
on treatment with JA in both the selected cvs. (Alankar and Rohini). The increase in
proline levels in both the cvs. corresponded with the concentration of JA (Fig. 86).
The JA treatment enhanced nitrogen (N) content in both the cultivars (Alankar and
Rohini). The highest increase nitrogen, phosphorus and potassium content were noted

s;\ CS•
" •
Shoo
t len
gth
(cm
) R
oot l
engt
h (c
m)
60 DAS; LSD at 5% V=0.689; T=0.974; VxT=1.378 75 DAS; LSD at 5% V=0.761; T=1.077; VxT=1.523
IN=
100 - VI = Alankar V2 = Rohini 80 -
60 -
40 -
20 -
60 DAS; LSD at 5% V=0.189;1=0.267; VxT=NS 75 DAS; LSD at 5% V=0.139; T=0.196; VxT=0.278
30 7
25 -
20 - -i- --1-
15 - —1— --1—
10 -
5-
0
Treatment
Fig 74, 75 Effect of jasmonic acid (0.5, 1.0 and 1.5 mM) on shoot and root length (cm) of Brassica juncea cvs. Alankar and Rohini at 60 and 75 DAS

60 DAS; LSD at 5% V .=0.644; T=0.910; VxT=NS 75 DAS; LSD at 5% V=0.184; T=0.261; VxT=0.369
70 - V 1 = Alankar V2 = Rohini 60 - I.
50 - -X-- -±- -1-
40 -
30 -
20 -
10 -
0
60 DAS; LSD at 5% V=0.185;1=0.261; VxT=NS 75 DAS; LSD at 5% V=0.123; T-0.174; VxT=0.247 MEIN
60 -
50 - —1--
40 --2"
30 -
10 -
0
Cc) V" 4\'
•
-4% sfe •
Treatment
Fig. 76 ,77. Effect of jasmonic acid (0.5, 1.0 and 1.5 mM) on leaf number and area (cm') of Brassica juncea cvs. Alankar and Rohini at 60 and 75 DAS
=MI
Leaf
num
ber

160 DAS; LSD at 5% V=0018; T-0.025; VxT=0.035 60 DAS; LSD at 5% V=0.027; T-0.038; VxT-0.054
VI = ALanka( V2 = Rohini
Fre
sh m
ass (
g)
fil 11 11 1 11 11 1
160 DAS; LSD a 5% V=0.090; T=0.127, VxT=0, 180 60 DAS; LSD at 5% V=0.104; T=0.148; VxT=0,209
16 14 - 12 -
11 10 8
G 6 4 2 0
44 .ts e.?
41‘. 6
‘1\ r. 41,4 11ist 4
Treatment
Fig. 78, 79. Effect of jasmonic acid (0.5, 1.0 and 1.5 mM) on fresh and dry mass (g) of Brassica junce.a cvs. Alankar and Rohini at 60 and 75 DAS
a
I

60 DAS; LSD at 5% V=-0.028; T=0.039; VxT=0.056 75 DAS; LSD at 5% V=0.031; T=0.044; VxT=0.062
IMIIN
1.8 V 1 = Alankar 1.6 - V2 = Rohini
1.4 -1- -I- -1- 4
1.0 0.8 0 .6 0.4 0./ - 0.0
MIN 60 DAS; LSD at 5% V4.014; T=0.019; VxT=0.027 75 DAS; LSD at 5% V-0.013; T=0.018; VxT=0.026 1
0.8 -
0.6 - 4
0.4
0.2-
0.0
60 DAS; LSD at 5% V-=0.045; T=0.064; VxT=0.091 75 DAS; LSD at 5% V=.0.044; T=0.062; VxT=0.088 1=111
2.5 -
-1- 2.0 -
4
1.5 - 4 4
1.0 -
0.5 -
0.0
Tot
al c
hlor
ophy
ll (m
g FM
)
Treatment Fig. 80, 81, 82. Effect of jasmonic acid (0.5, 1.0 and 1.5 mM) on chlorophyll a and b and total chlorophyll (mg FM) level of Brassica juncea cvs. Alankar and Rohini at 60 and 75 DAS

60 DAS; LSD at 5% V=0.021; T=0.030; VxT=0.043 I 75 DAS; LSD at 5% V-0.019; T-0,027; VxT=0.038
1.0 - VI = Alankar V2 =Rohini
0.8 -
0.6 -
0.4 -
0.2 -
0.0
60 DAS; LSD a 5% V=0.075; T=0.106; VxT=0.150 DAS- 1 SD at 5% V-0.196; Th0278; V xT-0.393 1 75
30 -
25 - 4--I-
20
15 -
10 -
5
0
f cs )11- '111" 41 .41;
Treatment
Mg. 83, At Effect of jasmonie acid (0.5, 1.0 and 1.5 mM) on carotenoid level (mg g' FM) and protein content (mg g' DM) of Brassie° juncea cvs. Alankar and Rohini at 60 and 75 DAS
Caro
teno
id c
onte
nt (
mg
g FM
)

USW MEM
60 DAS; LSD at 5% V=0.036; T=0.050; VxT=0.071 75 DAS; LSD at 5% V=0.045; T=0.063; VxT=0.089
V I = Alankar V2 = Rohini
4 -
Tot
al p
heno
l (m
g F
M)
2
0
S
60 DAS; LSD at 5% V=0.471;1=0.666; VxT=0.942 75 DAS; LSD at 5% V=0.540; 1=0.763; VxT=1.080
I
25 -
20 -
I5
10 -
6% C5P
41;
Treatment
Fig 85, 86. Effect of jasmonic acid (0.5, 1.0 and 1.5) on total phenol and proline content (n mol g-1 FM of Brassica juncea cvs. Alankar and Rohini at 60 and 75 DAS

8
0
N co
nte
nt (
mg W
I DM
)
6-
4-
P co
nten
t (m
g WI D
M)
16
14
12 -10 -8 -6 -4 -2-
0
K c
onte
nt (m
g W
I DM
)
2 -
60 DAS; LSD at 5% V=0.011; T=0.015; VxT=0.021 75 DAS; LSD at 5% V=0.034; T=0.048; VxT=0.068
V 1 = Alankar V2 = Rohini
MINE
60 DAS; LSD at 5% V=0.016; T=0.022; VxT=0.031 75 DAS; LSD at 5% V=0.025; T=0.035; VxT=0.049
SIM
60 DAS; LSD at 5% V=0.145; T=0.205; VxT=NS 75 DAS; LSD at 5% V=0.123; T=0.174; VxT=NS
-
IIIIM
0 ,„
0 •
.4\ .4\ .41; .•
Treatment
Fig- 87, 88, 89 Effect of jasmonic acid (0.5, 1.0 and 1.5 mM) on N, P and K content (mg DM) of Brassica juncea cvs. Alankar and Rohini at 60 and 75 DAS

30 -
60 DAS; LSD at 5% V=0.689; 1=0.974; Vx1=1.378 75 DAS; LSD at 5% V-0.689;1=0.974; Vx1=1.378
V1 = Alankar V2 = Rohini
No. o
f sto
mat
a (A
baxi
al su
rfac
e) L
ower
25 -
20 -
15 -
10 -
5-
0
-1-
60 DAS; LSD at 5% V=0.683; T=NS; VxT=NS 75 DAS; LSD at 5% V--0.7989; T=NS; VxT=NS
-F --X- -X-
0 \ \
'••• •4%. .4"ss
Treatment
Fig. 90, 91. Effect of jasmonic acid (0.5, 1.0 and 1.5 mM) on number of stomata on abaxial and adaxial leaf surface of Brassica juncea cvs. Alankar and Rohini at 60 and 75 DAS

DAS; LSD at 5% V=0.008; T=0.010; VxT=0.014 DAS; LSD at 5% V=0.005; T=0.006; VxT=0.009
V I = Alankar
60 75
0.7 - V2 = Rohini
0.6 -
0.5 -
0.4 - z
0.3 - or
0.2 -
0.1 -
0.0
1 I 60 DAS; LSD at 5% V=0.008; T=0.009; VxT=0.013 DAS; LSD at 5% V=0.008; T=0.010; VxT=0.014 1 1 75
1 . 0 -
_9- 0.8 --I— --I—
a, 0.6
0.4 .04
04 0.2
0.0 r pt f") 43\
> > ",%". os•
Treatment
Fig. 92, 93 Effect of jasmonic acid (0.5, 1.0 and 1.5 mM) on relative stomatal closure index (RSCI) of abaxial and adaxial surface of Brassica juncea cvs. Alankar and Rohini at 60 and 75 DAS

60 DAS; LSD at 5% V=0.087; T=0.123; VxT=0.174
75 DAS; LSD at 5% V=0.192; T=0.271; VxT=0.384
VI = Alankar
V2 = Rohini
0
60 DAS; LSD at 5% V=0.105; T=0.149; VxT=0.21 1
NIMMI 75 DAS; LSD at 5% V=0.153; Th0.216; VxT=0.305
MEM
60 -
40 50 -
T.; 40 -
9:1 C
E 30 - to z
20 -
0
10 -
0 c,\
'?" ■ •
°N• \ LI
•A\ \ .4\ \
Treatment
Fig. 94, 95 Effect of jasmonic acid (0.5, 1.0 and 1.5 mM) on net photosynthetic rate (PN; mol CO2 111-2 sec-) and stomata! conductance (gs; mol m-2 sec-1) of Brassica juncea cvs. Alankar and Rohini at 60 and 75 DAS

Pod
len
gth
(cm
)
6
5
4 -
3 -
2 -
I -
0
LSD at 50/0 V=0.039;1=0.055; VxT=INIS V 1 = Alankar V2 = Rohini
-1-
LSD at 5% V=0.294; T=0,416; VxT=0.588
Oil
cont
ent (
%)
50 -
40 -
30 -
20
10 .-
0
LSD at 5% V=0.220; T=0.311; VxT=0.440
A..
120 -
100 -
80
60
40
20 -
0
r r
\ c : \ 0' \ 4 \1
$ ■'. ' :)N. p1 ;..,!):`
4.0 ,.- c\. NI" \''-• 0 'C'. \t" Nt.
-.: • .4"; .4 •-; 4 -V -V
Treatment
Fig. 96, 97, 98. Effect of jasmonic acid (0.5, 1.0 and 1.5 mM) on pod length (cm), oil content (%) and pod planf l of Brassica juncea cvs. Alankar and Rohini at harvest

LSD at 5% V=0.020: T=0.029; VxT=0.041
-1- -1- V I = Alankar V2 = Rohini
--
0 0.
14 -
12-
10-
8
6 -
4 -
2 -
0
LSD at 5% V=0.021; T=0.031; VxT=0.043
1000
seed
wei
ght (
g)
7 -
6-
4-
3-
2-
I
0
LSD at 5% V=0.069; T=0.098: VxT=0.139
I r r
C.. C '\ 6 ()\ IP
\ ‘ N c N
54 l0 ■■' ,
Cs ■0. ■■• ■\. ° •
>,. N . .. ,.... Ns< ••4\' •••: • •■:Y• ...i.'' •-c•
Treatment
Fig. 99, 100, 101. Effect of jasmonic acid (0.5, 1.0 and 1.5 mM) on seed pod-I , 1000 seed weight (g), seed yield (g) of Brassica juncea cvs. Alankar and Rohini at harvest.

60 DAS: LSD at 5% V=0.345; T=0.407; VC-0.689 DAS. LSD at 5% V=0.139: T=0.197; Vx 1=0.279 I 17S
16 - = Alankar V2 = Rohini
14 -
12 -
10 -
8 -
4 - -
. a . 65 . . fp . 6" .
450'. •10‘..c3. 5t' 'Ir. 49
c9 5" ir 4'
Fig.102 Effect of jasmonic acid (0.5, 1.0 and 1.5 [1M) on number of beetles attracted on Brassica juncea ces. Alankar and Rohini at 60 and 75 DAS

0 0 0
0
24
f. 22
20
1 3
I 16
14
1 2
•
0
• •
00 05 10 1 s
Joinseaic acid
22
2 0 •
es 1
1.8 •
1r, t
I 6 •
10
•
00 05 10 15
jaaamaic acid
60 DAS 75 DAS
Fres
h m
ass (
5)
• Alankat, y • 0 161 x • 1 835, Ft• - 0 391
O Rohm,, y 0 0731, • 1 241, R. - 0.282 60 DAS
00 0 5 I 0 15
Jasoonic acid
• Minicar, y - 0068c • : 284, R• = 0 540 O Rohini, y 0 028x - 1 389, R• 0 376
60 DAS
•
•
00 05 10 I 5
Jasinonic acid
• A lankar. y 0 274c + 9 227, R• - 0 440 O Rohun, y 0 12x • 5475, IV 0 515
60 DAS
• Nankai. 0 Rohm,
3 4
33
3 2 •
y y
0 20Ix • 1 973. - 0 41i
0 116x + 1 529, - 0 358 75 DAS
• • •
3 1 • •
30 •
29 0 0 0
28 0
27 00 05 I0 I 5
Jassionit acid
• Alankar, y 0 I2x • 3 135; R' - 0 472
0 Rohrni, y 0 064c • 2 797, R' ". 0 385 75 DAS
140
135
130
125
1220
I1 5
Ito
• •
•
0 0
0
•
0
• Alankar,
•
00 05 10
Jasinonic acid
y - 0 476x + 12 73, R'
I5
0 518 0 Rolm. y 0 226ir • I I 30; R. - 0 332
76 DAS
1 0
9
7
6
5
Fres
h m
ass (
g)
26
24
22
20
I S
16
I4
I2
20
IS
16
22
20
• 18
i
z
14
12
10
12
0 0 05
-
10 15
Anaemic acid
00 05 10 15
Jimmie acid
• Mankar. y 4 386. • 12 17, R, - 0964 • Minim, y 4 45ii • 14 la. R• • 0 962
O Rohn'. y - I 908x + 10 52. 0 939 0 Rohm'. y - 1 7I 2x • 12 90, R• • 0952
Fig. LR-VII. Linear Regression line with equation and squired correlation coefficient between various growth parameters and jasmonic acid (0.5, 1.0 or 1.5 mM) in selected cultivars at 60 and 75 DAS stages

•
•
O O
0
60 DAS
00 05 10 1 5
Jasmonic acid
4 94
4 90
75 DAS
• • • •
cr_
•
00 05 10 15
Jasinsmak acid
O
68
66
64
62
60
58
S6
54
52
5.0
N co
nte
ni (
mg g
1)
%11
c3.
525
5 20
5 15
5 10
5 05
500
120
II 5
0
10 5
11 I E Z 5 95
90
85
1.1
140
1) 5
130
125
120
11 5
II 0
105
•
O
8 10.0
i 6 42
40 (21
311
36
E
-
• 5
• E
7
42
41
40
39
38
37
36
35
34
•
50
48
46
1 "; 14
O 0 0 0
• Alankar. y 0066x • S 163, R• - 0 429
O Rohm, y 004x - 4 994 RJ = 0 289 60 DAS
• Alankar. y • 0 11x • 6 53, R1 - 0 329
O Rohm. ) • 0 048x • 5259, R.' • 0 109 75 DAS
00 05 10 I5
Jasmonic acid
• Alankar. y 0 738x • 10 41. Ft' - 0 719 O Rolum, 0 514x • 9 132. R. - 0 776
60 DAS
00 05 I0 15
Jasmonie acid
• Alankar. y 081x • 12 73, Ft, - 0 649 O Rohint. y - 0 468x • I I 09. 1i, - 0 797
75 DAS
00 OS 1.0 I 5 00 05 10 1 5
Jasmonic acid Jimmie' acid
• A.ankar, y • 0 391Ix • 40 28, RJ • 0 425 O Robim. y 0.224x • 34 95. It' • 0 462
• Alankar. y - 0 378x • 46 92, IV - 0 342 O Rohm,. y - 0 122x • 38 43. R' • 0 251
120 DAS
O o- 0
00 05 10 15
Jasmonic acid
• Alankar. y 0 192x • 7 216, R' 0 349 O Rohm, y - 0 052x * 3 936. R' • 0 125
Fig.LR-VIII. Linear Regression line with equation and squired correlation coefficient between various biochemical and growth parameters vs. jasmonic acid (0.5, 1.0 or 1.5 mM) in selected cultivars at 60 and 75 DAS stages.
8
4

Results: 53
on treatment with 1.0 mM of JA (Fig. 87-89). The JA treatment did not affected
stomatal frequency significantly on both the leaf surfaces in cvs. Alankar and Rohini
(Fig. 90, 91). The JA treatment induced closure of stomata in both the cultivars as
evident from the data on relative stomata closure index (Fig. 92, 93). The higher
concentrations of JA (1.0 and 1.5 mM) induced maximum closure of stomata in both
the cultivars of mustard (Fig. 92, 93). The .1A treatment with 1.0 mM enhanced net
rate of photosynthesis and gaseous exchange through stomata in both the cultivars
(Fig. 94, 95). The JA treatment increased the yield attributes i.e. pod length (cm), oil
content (%), pod per plant, seed per pod, 1000 seed mass and seed yield per plant in
both the cultivars (Alankar and Rohini) at harvest stage (Fig. 96-101). Interestingly,
JA treatment attracted Coccinella septumpunctata (a specialist predatory beetle of
aphid). The largest number of beetles were attracted by JA treated Alankar than
Rohini at early staoe of growth than at the late growth stage (Fig. 102).
From the result of this experiment, it is evident that JA treatment increased the
growth only marginally. The increase in growth parameters were in a lower limit
indicating that the JA only reduced the plant stress. The JA had been helpful in
signaling the predatory beetles and thus partially mimicked the injuries caused by
aphid attack. Therefore, the JA was tried to simulate the responses of plant injury
caused by herbivores and primed the defense response before aphid attack.
Correlation coefficients and regression analysis
The correlation coefficient between selected plant growth parameters and JA
concentrations were weak in both the cultivars except the correlation between proline
contents and JA levels (Fig. LR-VII and VIII) indicating that the proline level get
enhanced in proportion to the JA spray (0.5, 1.0. 1.5 mM) (Fig.-LR VII and VIII). The
photosynthetic rate and JA concentration also had strong and positive correlation
((Fig.- LR VII and VIII).
Experiment 5
Combined effects of jasnwnic acid and aphid infestation
The effects of varying levels of aphid infestation (50, 100, 150 aphids per
plant at 60 and 75 DAS) on pre JA treated (1.0 mM JA per plant at 45 DAS) plants of
two selected eultivars cvs. Alankar and Rohini were studied. The responses of various
growth attributes and changes in the physiological and biochemical parameters were
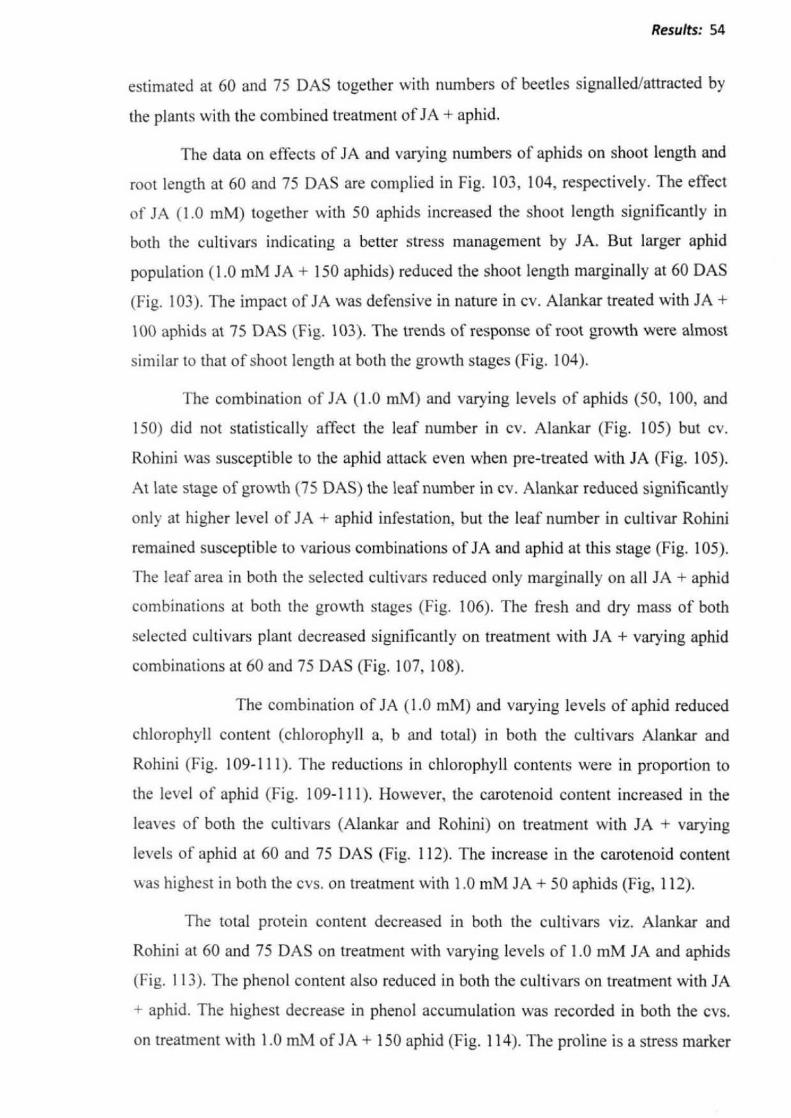
Results: 54
estimated at 60 and 75 DAS together with numbers of beetles signalled/attracted by
the plants with the combined treatment of JA + aphid.
The data on effects of JA and varying numbers of aphids on shoot length and
root length at 60 and 75 DAS are complied in Fig. 103, 104, respectively. The effect
of JA (1.0 mM) together with 50 aphids increased the shoot length significantly in
both the cultivars indicating a better stress management by JA. But larger aphid
population (1.0 mM JA + 150 aphids) reduced the shoot length marginally at 60 DAS
(Fig. 103). The impact of JA was defensive in nature in cv. Alankar treated with JA +
100 aphids at 75 DAS (Fig. 103). The trends of response of root growth were almost
similar to that of shoot length at both the growth stages (Fig. 104).
The combination of JA (1.0 mM) and varying levels of aphids (50, 100, and
150) did not statistically affect the leaf number in cv. Alankar (Fig. 105) but cv.
Rohini was susceptible to the aphid attack even when pre-treated with JA (Fig. 105).
At late stage of growth (75 DAS) the leaf number in cv. Alankar reduced significantly
only at higher level of JA + aphid infestation, but the leaf number in cultivar Rohini
remained susceptible to various combinations of JA and aphid at this stage (Fig. 105).
The leaf area in both the selected cultivars reduced only marginally on all JA + aphid
combinations at both the growth stages (Fig. 106). The fresh and dry mass of both
selected cultivars plant decreased significantly on treatment with JA + varying aphid
combinations at 60 and 75 DAS (Fig. 107, 108).
The combination of JA (1.0 mM) and varying levels of aphid reduced
chlorophyll content (chlorophyll a, b and total) in both the cultivars Alankar and
Rohini (Fig. 109-111). The reductions in chlorophyll contents were in proportion to
the level of aphid (Fig. 109-111). However, the carotenoid content increased in the
leaves of both the cultivars (Alankar and Rohini) on treatment with JA + varying
levels of aphid at 60 and 75 DAS (Fig. 112). The increase in the carotenoid content
was highest in both the cvs. on treatment with 1.0 mM JA + 50 aphids (Fig, 112).
The total protein content decreased in both the cultivars viz. Alankar and
Rohini at 60 and 75 DAS on treatment with varying levels of 1.0 mM JA and aphids
(Fig. 113). The phenol content also reduced in both the cultivars on treatment with JA
+ aphid. The highest decrease in phenol accumulation was recorded in both the cvs.
on treatment with 1.0 mM of JA + 150 aphid (Fig. 114). The proline is a stress marker

Results: 55
and stress resisting amino acid. The accumulation of . prorme in response to the
treatment with JA + aphid combination is shown in Fig. 115. The proline
accumulation increased in both the cultivars Alankar and Rohini on a combined
treatment with 1.0 mM JA + varying levels of aphids. The proline accumulation in
both the cultivars consistently increased on treatment with 1.0 mM of JA + increasing
number of aphids (Fig. 115).
The nitrogen, phosphorous content decreased in both the cultivars in
proportion to the 1.0 mM JA + number of infesting aphids. But potassium content
increased significantly in response to combine effect of JA and 150 aphids in both the
cultivars at 60 DAS. At late stage there was no change in potassium content in cv.
Alankar in response to various levels of JA + aphid (Fig. 116-118). The changes in
stomatal frequency and relative stomata closure index (RSCI) were determined in
both the cvs. in response to simulated and natural herbivory (JA + aphid
combination). There was a marginal impact of varying numbers of JA + aphid on
stomatal frequency. The stomatal frequency on both the leaf surfaces decreased in
cvs. Alankar and Rohini (Fig. 119, 120). The RSCI increased significantly on
combined treatment with 1.0 mM JA and varying levels of aphids (Fig, 121,122). In
the present experiment, the closure of stomata on both the leaf surfaces was higher in
cv. Rohini than in cv. Alankar (Fig, 121, 122).
The net photosynthetic rates increased in cvs. Alankar and Rohini on
combined treatment with 1.0 mM JA and 50 aphids, but the stomatal conductance
decreased. It may be due to reduced stomatal frequency and increased closure of
stomata. But a combination of 1.0 mM JA + 150 aphids reduced the photosynthetic
rate and stomatal conductance significantly in both the cultivars (Fig.123, 124).
The treatment with JA and varying levels of aphid combination significantly
reduced pod elongation, seed mass and oil content in both the cultivars. The highest
reductions in these parameters were recorded in responses to 1.0 mM and 150 aphids
(Fig. 125-130).
Aphid and beetle demography
The aphid population was counted at 60 and 75 DAS in both the cultivars after
treating with 1.0 mM of JA (at 45 DAS) and varying level of aphids (at 50 DAS). The
aphid population reduced significantly in cv. Alankar on treatment with combinations

Shoo
t len
gth
(cm
) Ro
ot le
ngth
(cm
) 60 DAS; LSD at 5% V--0.212; T=0.301; VxT=0.425 75 DAS; LSD at 5% V--0.316; T=0.446; VxT=0.631
100 V 1 = Alankar V2 = Rohini
80
60 -I-
40 -
20 -
0
11=11 60 DAS; LSD at 5% V=0.265; T=0.375; VxT=NS 75 DAS; LSD at 5% V=0.139; T=0.196; VxT=0.277 IMMO
35 -
30 -
25 -
20 -
15 -
10 -
5-
0 S'• Lo
r r r c.. x . \ .2\ '
‘'.. * \ ' q. V.\ . V\ '
•Sr Ph
s3 x.\ x •
N'i** ‘.p• .0N '* v
Treatment
Fig. 103, 104. Combined effect of jasmonic acid (1.0 mM) and aphid infestation (50, 100 and 150 aphids per plant) on shoot and root length (cm) of Brassica juncea cvs. Alankar and Rohini at 60 and 75 DAS
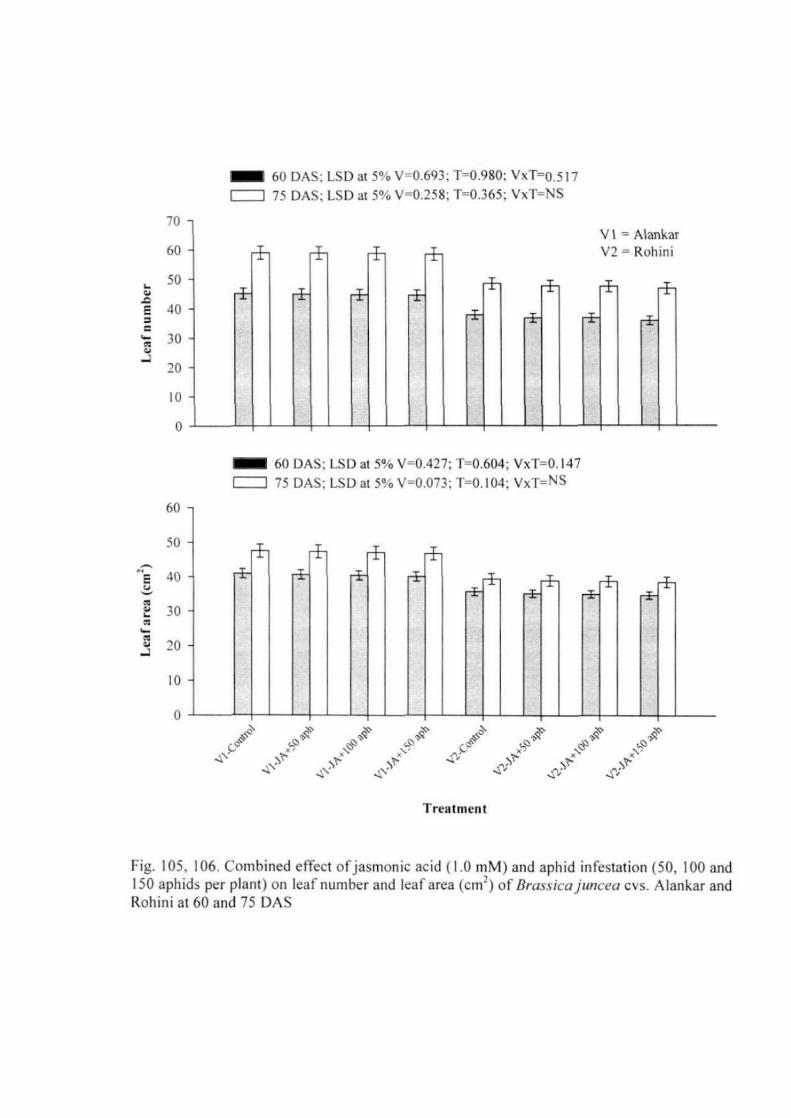
Leaf
num
ber
E
6 :1
60 DAS; LSD at 5% V=0.693; T=0.980; VxT=0.517 75 DAS; LSD at 5% V=0.258; T=0.365; VxT=NS
NNE
l 1
70 -
60 -
50 -
V1 = Alankar V2 = Rohini
± -I- 40 -
30 -
20 -
10 -
0
MIMI 60 DAS; LSD at 5% V=0.427; T=0.604; VxT=0.147 75 DAS; LSD at 5% V=0.073; T=0.104; VxT=NS
60 -
50 -
40 -
30 -
20
10 -
0 A.S° •J W, ■5. 'Ys . . . z.(1 . V I < P • i . . • c 2 c ,C
X • • ,' ) x% ' L ,^ 'CS j j , . x l - - X ' , • . , • 4.'' %ri'' 'i''' %I" - ,.., • Sr. ..., -.V
Treatment
Fig. 105, 106. Combined effect of jasmonic acid (1.0 mM) and aphid infestation (50, 100 and 150 aphids per plant) on leaf number and leaf area (cm') of Brassica juncea cvs. Alankar and Rohini at 60 and 75 DAS

V 1 = Alankar V2 = Rohini
-1—
--X—
4-
2-
0
60 DAS; LSD at 5% V=0.084; T=0.119; VxT=0.168 75 DAS; LSD at 5% V=0.036; T=0.051; VxT=0.072
MINN
I I
60 DAS; LSD at 5% V=0.022; T=0.031; VxT=0.044 75 DAS; LSD at 5% V=0.014; T=0.019; VxT=0.027
4
3
MI=
-F
E 2-
0 ,•0
•
Acs AC• `,C) •>■• ^$■ "o" - 0 x P x\ x\ x(„
x\ x
rt• „Ds ▪ v`N: ;')• •■• • -4V
Treatment
Fig. 107, 108. Combined effect of jasmonic acid (1.0 mM) and aphid infestation (50, 100 and 150 aphids per plant) on fresh and dry mass (g) of Brassica juncea cvs. Alankar and Rohini at 60 and 75 DAS

Ch
loro
phyl
l a (
mg
FM)
Chlo
roph
yll b (m
g FM
)
60 DAS; LSD at 5% V=0.01 1; T=0.015; VxT=0.02 I
75 DAS; LSD at 5% V=0.018; T=0.026: VxT=0.037 I I 1.4 - V 1 = Alankar
-F V2 = Rohini -F 1.2 - 4- 4-1- -1- 1.0 - -F
0.8 - -F -F
0.6
0.4
0.2 -
0.0
60 DAS; LSD at 5% V=0.001; T=0.002; VxT=0.002
75 DAS; LSD at 5% V=0.005; T=0.008; VxT=0.01 1 1 0.7 -
0.6 - I 0.5 -
0.4 -
0.3 -
0.2
0.1 -
0.0
MIN 60 DAS; LSD at 5% V=0.012; T=0.016; VxT=0.023
75 DAS; LSD at 5% V=0.026; T=0.037; VxT=0.053 2.0 -
-F -E- 1.5 -
-E- -I- -F
1.0 - -F
0.5 -
0.0
.o ..c, so \ 3' .c, r .cs.
..P ,§z c Ao. ,g ,b.g • ....o , .... . •=.,,, '.. ;•" ,, :- , ), ''?'
-...'`' .....\ ...:, ..,7, Treatment
Fig. 109, 110. 111. Combined effect of jasmonic acid (1.0 mM) and aphid infestation (50, 100 and 150 aphids per plant) on chlorophyll a, b and total chlorophyll (mg g-1 FM) level of Brassicajuncea cvs. Alankar and Rohini at 60 and 75 DAS
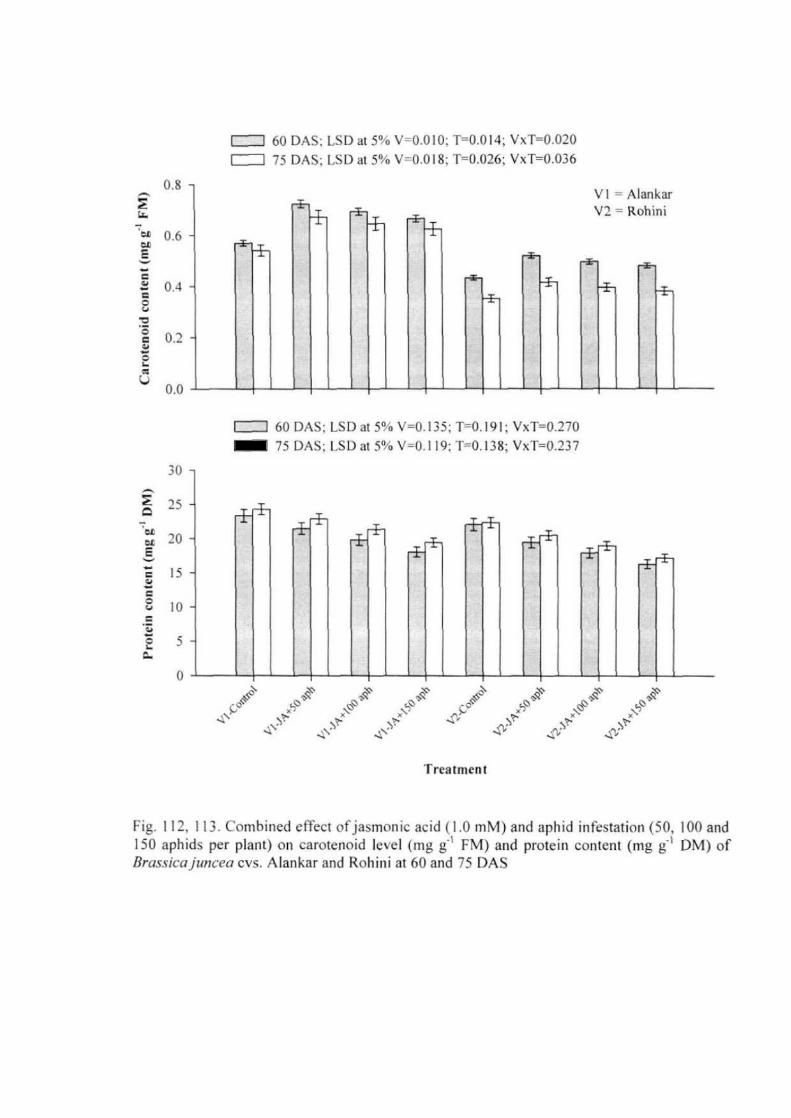
0.8 -
0.6
60 75
DAS; DAS;
LSD LSD
at at
5% 5%
±
V=0.010; V=0.018;
T=0.014; VxT=0.020 T=0.026; VxT=0.036
--Te- 0.4 -
0.2
0.0
60 DAS; LSD at 5% V=0.135; T=0.191; VxT=0.270 75 DAS; LSD at 5% V=0.119; T=0.138; VxT=0.237 NEM
30 -
25
20 -
15
10 -
5-
0
00
= c.•
rLQ
Pro
tein
con
ten
t (m
g g"
' DM
)
V I = Alankar V2 = Rohini
A,SC .
x\c, 4)
\ •-■ >* .?" 4 4\‘>
Treatment
Fig. 112, 113. Combined effect of jasmonic acid (1.0 mM) and aphid infestation (50, 100 and 150 aphids per plant) on carotenoid level (mg g-1 FM) and protein content (mg g-1 DM) of Brassica juncea cvs. Alankar and Rohini at 60 and 75 DAS

60 DAS; LSD at 5% V=0.069; T=0.097; VxT=0.137 75 DAS; LSD at 5% V=0.132; T=0.186; VxT=0.263
=NI
1 I
V I = Alankar V2 = Rohini
0
—I--
60 DAS; LSD at 5% V=0.519; T=0.734; VxT=1.039 75 DAS; LSD at 5% V=0.454; T=0.642; VxT=0.908 =IN
25
IL. 20 CL
E
▪
IS
• 10 -a 0
a.
c.;) >1" -4V
Treatment
Fig. 114, 115. Combined effect of jasmonic acid (1.0 mM) and aphid infestation (50, 100 and 150 aphids per plant) on total phenol content (mg DM) and proline level (It mol gd FM) of Brassica juncea cvs. Alankar and Rohini at 60 and 75 DAS

8-
14 -
12 -
P co
nten
t (m
g WI D
M)
10 - 8-
6-
4-
2-
0
K co
nten
t (m
g g-
1 DM
)
10
8
6
4 -
2 -
6 -
4-
0
N co
nten
t (m
g g
60 DAS; LSD at 5% V=0.057; T=0.080; VxT=0.114 75 DAS; LSD at 5% V=0.066; T=0.094; VxT=0.134
V I = Alankar V2 = Rohini
tir
60 DAS; LSD at 5% V=0.106; T=0.150; VxT=0.212 75 DAS; LSD at 5% V=0.130; T=0.185; VxT=0.261
IMMO
-X-- riB-1
NUM
60 DAS; LSD at 5% V=0.300; T=0.424; VxT=NS 75 DAS; LSD at 5% V=0.314; T=0.445; VxT=NS 1
.-1111.•
0
(.." g o , .,.-e, ."" x\5
-4.`" ■\' -a"' 4^.: .-,‘..x.\.3- \ . ,,,...• „...• '
4 o
, SI'
....,,,§z ,g .
Treatment
Fig. 116, 117, 118. Combined effect of jasmonic acid (1.0 mM) and aphid infestation (50, 100 and 150 aphids per plant) on N, P and K content (mg gd DM) of Brassica juncea cvs. Alankar and Rohini at 60 and 75 DAS

No. o
f sto
mat
a (A
daxi
al su
rfac
e) U
pper
18 - 16 -14 -12 -10 -8 -
6 -4 -
2 -
0
60 DAS; LSD at 5% V=0.096; Th0.135; VxT=0.192 CI 75 DAS; LSD at 5% V=0.099; T=0.139; VxT=0.197
30 - V I = Alankar V2 = Rohini
No. o
f sto
mat
a (A
baxi
al su
rfac
e) L
ower
25 -
20 -
15 -
10 -
5-
0
60 DAS; LSD at 5% V=0.074; T=0.104; VxT=0.147 1MM 75 DAS; LSD at 5% V=0.058; T=0.082; VxT=0.115 ININI
,1551 t5I c° x °
4\' f- S)
x x\41 x • t-. >t. P P 4, >P P t.
Treatment
Fig. 119, 120. Combined effect of jasmonic acid (1.0 mM) and aphid infestation (50, 100 and 150 aphids per plant) on number of stomata on abaxial and adaxial leaf surface of Brassica juncea cvs. Alankar and Rohini at 60 and 75 DAS

DAS; LSD at 5% V=0.005; T=0.006; VxT=0.008 DAS; LSD at 5% V=0.004; T=0.005; VxT=0.007
VI = Alankar
1 60 75
0.6 - V2 = Ruh ini
I 0.5
0.4 I
cf) 0.3 CG
a+ 0.2 -
4:1 0.1 -
0.0
60 DAS; LSD at 5% V=0.008; T=0.008; VxT=0.01 1 DAS; LSD at 5% V=0.006; Th0.007; VxT=0.010 75
0.8 -
Ci. C.
0.6 c.) as L = co) w, 0.4 -
*; 0.2 -
0.0
oc" x") _ x\ ) >1. 1"" NV. .4);
Treatment Fig. 121, 122. Combined effect of jasmonic acid (1.0 mM) and aphid infestation (50, 100 and 150 aphids per plant) on relative stomatal closure index (RSCI) of abaxial and adaxial surface of Brassica juncea cvs. Alankar and Rohini at 60 and 75 DAS

16 -
14 -
12 -
10
8 -
6-
4 -
2 -
60 DAS; LSD at 5% V=0.083: T=0.117; VxT=0.166 75 DAS; LSD at 5% V=0.133; T=0.189; VxT=0.267
V I = Alankar V2 = Rohini
0
60 DAS; LSD at 5% V=0.057; T=0.081; VxT=0.114 75 DAS; LSD at 5% V=0.072; T=0.102; VxT=0.144
60 -
c., 50 -
40 - -I- c 30 -
E tei 0 -
10 -
0 sc, `C.
ocz 40-v- >r) ,S114' ('P x4.P 1' \‘'
x\
••f; •••1 *4‘.
Treatment
Fig.123, 124. Combined effect of jasmonic acid (1.0 mM) and aphid infestation (50, 100 and 150 aphids per plant) on net photosynthetic rate (PN; .t mol CO2 m.2 see) and stomata] conductance (g,; mol 111-2 see) of Brassicajuncea cvs. Alankar and Rohini at 60 and 75 DAS
NEM

Pod
leng
th (c
m)
6 -
5
4
3 -
2
I -
0
LSD at 5% V=0.011; T=0.016; VxT=0.022 V I = Alankar V2 = Rohini
LSD at 5% V=0.036; -r—o.os I ; VxT=0.072
40 -
±
30 -
20 -
10-
0
Oil
cont
ent (
%)
LSD at 5% V=1.638; T=2.316; VxT=3.276 120 -
100
7 80
60 - C a. 40
20 -
0
\ r r r \ 0 r r
As° , ''z ,i1z .0 0 ,b. o'' ..t.e f.,c) or .4' .$9' \ (., co R z. . .4N: 'i.- 'z''' \7' .4^; .1.:`
,,,....\ ...\\' ,..\' ...i,' X, ....c., .41:
Treatment
Fig. 125, 126, 127. Combined effect oljasmonic acid (1.0 :TIM) and aphid infestation (50, 100 and 150 aphids per plant) on pod length (cm), oil content (%) and pod planf' of Brassica juncea cvs. Alankar and Rohini at harvest

LSD at 5% V=0.238; T=0.351; VxTO.496 14 - VI - Alankar
V2 = Rohini 12 -
10
8 o. 6-
4
2-
LSD at 5% V=0.076; T-0.107, V), T-0.152 7
6 et
5 tio is 4
{g 3 O o 2
1
0
LSD at 5% V=0.156; T=0.221; Vx1=0.312
6-
4-
2-
. .... , .., ..c. G .c_ ,$)-e / tp-s„ .,,-
4) c.. ..,,, .„q
.2,,,- -v •51. %."" '‘I-K -.1.< ■• ■-.: ,1t .41' Cs-V Treatment
Fig. 128, 129, 130. Effect Combined effect of jasmanic acid (1.0 mM) and aphid infestation (50, 100 and 150 aphids per plant) on seed pod', 1000 seed weight (g), seed yield (g) of Brassicajuncea cvs. Alankar and Rohini at harvest.
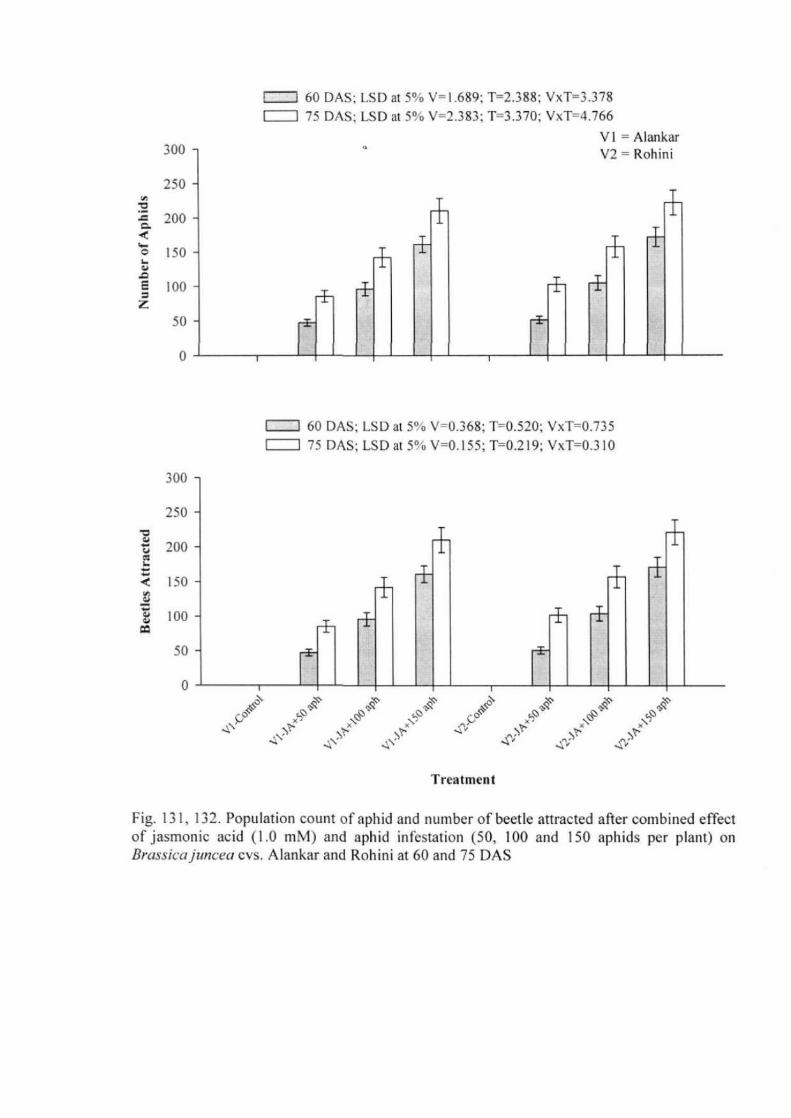
300 -
250 -
200 -
150 -
100 -
50 -
Num
ber o
f Ap
hids
0
60 DAS; LSD at 5% V=1.689; T=2.388; VxT=3.378 75 DAS; LSD at 5% V=2.383;1=3.370; VxT=4.766
V I = Alankar V2 = Rohini
1
60 DAS; LSD at 5% V=0.368; T=0.520; VxT=0.735 75 DAS; LSD at 5% V=0.155; T=0.219; VxT=0.310
Bee
tles
Att
ract
ed
300 -
250 -
200 -
150 -
100 -
50 -
0 r r r 4'z ,z.'q ,§z X oQi 1.P x • ... x"..' 'r' ...' 4': 4'
A.c° £0
-.■2; N‘Z
Treatment
Fig. 131, 132. Population count of aphid and number of beetle attracted after combined effect of jasmonic acid (1.0 mM) and aphid infestation (50, 100 and 150 aphids per plant) on Brassica juncea cvs. Alankar and Rohini at 60 and 75 DAS

New — A2
It never gem ae
pane
•Ima
any
S. No. "Treatments
1. Aphid(150)
2. JA (1.0 mM) + aphid
(150)
Altyl-isothiocyanate content (%)
42.36
46.59
3-Hexan-1 -ol content (%)
10.34
20.84
• . Nev. SI SO an Pr nal Ile an OA en en ea. ea, en vw en en any •ea f w an ••• pa. SO en oe vn .1r v PeU Mle ay ea) one
— B1 awn
v eV B2
4 rM.W 14oVm- Pane e
•
'Me
AM • an •
ewe
1.1.1 •toor
4;1
`fee&
Yea
amp'■01 P;111Vn Per eMW7PIin 0 n. Pe 444 na 00 441. .414% 1141 SO OU 1.0 510
Fig. 133. Effect of aphid infestation (150 per plant) alone (Al, A2) or with pre-infestation spray of 1.0 mM jasmonic acid (B1, B2) on GS-MS profile of allyl-isothiocyanate and 3- hexan-l-ol content of Brassica juncea (cv. Alankar).

T. th 16
I
1 8
l4
08
1.2
0
Tota
l chl
orop
hyll
(nag
g • FM
)
I 9 ,
1 8
1 7
1 6
1 5 •
1 4
I)
12 '
I
tO
9
3 $
I 7 a F 6
5
4
:T.
.33
a.
M
■ 18
24
22 •
20
16
14
12
10
Pro
lan
e Ir
sei 1
0 g
FN
I)
21
20
19
18
17
16
IS
14
13
60 DAS TS DAS
O 50 100 150
Aphids plant • Jasmonic acid
• Alankar, 001. • 1697. Et., = 929
O y .0 00Ix • 1 157, - 0 924 60 DAS
O 50 100 ISO
Aphids plant • Jaasnonic acid
• Alankaa. y 010x + 9 446. R. - 0 986 O Rotlo. y -0008x + 6 125, R. = 0 956
60 DAS
0 50 100 ISO
Aphids plant' + Jasmonic acid
• Alankar. y -0 CO2x • 2 465. R. 0 976 O Rohum y • .0 002x • 1 54. = 0 943
60 DAS
O 50 100 150
Aphids plant' • Jasmonic acid
• Ahnkar, y - -0 000x • 1817, R. 0 963 O Rohum y -0 001 x• 1 409. - 0 938
7S DAS
O 50 100 150
Aphids plan(' • Jasmonic acid
• Alanku, y • -0 014x • 13 79. R. •• 0 975 O Rohum y • -0 014x + I I 41, R. = 0 955
75 DAS
O 50 100 ISO
Aphids plant • Jasmonic acid
• Alankar. y -0003x + 3 287, R.. 0 987 O Rohm,. y A 003x + 2875. = 0 987
75 DAS
26
24
22
20
18
1 6
I4
12
10
15
14
13
12
11
10
9
34
32
30
■ 28
26
24
••
0 50 100 150
Aphids plant • issraonic acid
• Alankar. y 0056x - 12 78. R. ,. 0 982 O Rohm,. y = 0023x • 11 32. R. - 0 973
• 50 100 ISO
Aphids plant' • Jasmonic acid
• Nankai, y -0 031x • 15 01. R. •• 0 9130 O Rohm. y 0 013x • 13 68. R. - 0 980
Fig.LR-lX. Linear Regression line with equation and squired correlation coefficient between various growth parameters vs. combined effect of jasmonic acid (1.0 mM) and varying aphid level (50, 100 and 150 aphid per plant) in selected cultivars at 60 and 75 DAS stages.

60 DAS 75 DAS
0 50 100 ISO
Aphids plant"' + Jimmie acid
• Alankar. y - -0 004% - 5 488. It' 0 936
0 Rohini,y - -0 003x • 5 194, R'-0. 994
60 DAS
0 50 100 150
Aphids plant ' • Jamouic acid
• A lankar, y - -0 004x + 6 748. R - 0 879
0 RANK y -0003x • 5 475. R' 0 988 75 DAS
110
10.5 •
.a 10.0 •
1„. E 9 5 •
'S a 90 ' L 3
5
80 0 50 100 ISO
0
Aphids plant
• Alonkar. y 007x
0 Rohn'. y -0 006x •
• /asuman( acid
• 10 16. R. • 0 507
9 746. It' 0 433 60 DAS
41
40
39 •
38
-0 37 E
11 36
E 35
34
33
135
1)0 •
12 5 •
120 ' 115
11 0
0
95 0 50 100 150
Aphids plant + /anionic acid
• Alankar. y -0 011x • 1318. = 0 x72
0 Roans. y = -0 008x • 11 68. R' 0.489 75 DAS
48
46
44
42
40
38
36 0 50 100 150 0 50 100 ISO
Aphids plant • Jumenic acid
• Alankar. y 005x • 40 23, - 0 992
0 Rohn,. y -0 006s • 34 81. R'. 0 963
Aphids plant' • /anionic acid
• Mariam y -0.005x • 46 76. - 0 982 0 Rohtm, y =- -0006x • 38 R' - 0 967
120 DAS
0 50 100 150
Aphids pleat ' + Jasmonic acid
• Alankar. y - -0 026x • 7 277. R' 0 998
0 Rohm', y -0 01Sx • 3 962. A' •• 0 991
Fig.LR-X. Linear Regression line with equation and squired correlation coefficient between various biochemical and yield parameters vs. combine effect of Jasmonic acid (1.0 mM) and varying aphid level (50, 100, and 150 aphid per plant) in selected cultivars at 60 and 75 DAS stages
8
7 6
ise 5 as
4
3
2
0
56
N co
nten
t Im
g g
D
M) 54
52
50
48
46
70 68 66 64 62
ea 60 5 56
8 s4 52 50 48

Results: 56
of 1.0 mM JA with 50, 100 and 150 aphids (Fig. 131). On treatment with 1.0 mM JA
and 50 aphids, the aphid count was relatively low at 60 DAS stage in cultivar
Alankar. But, the aphid population in cultivar Rohini increased in response to
combined effect of JA + varying levels of aphid (Fig. 131).
A set of these plants were exposed to attract beetles and their numbers were
counted. The cv. Alankar attracted the beetles more actively than cv. Rohini. The
beetles count was higher at 60 DAS and their number eventually decreased at 75 DAS
(Fig. 132, Plate 6).
Correlation coefficients and regression analysis
The correlation coefficients between selected parameters and 1.0 mM JA +
aphid treatment were determined and linear regression lines plotted (Fig. LR- IX and
X). The relationship of selected depended growth variables with independent variable
(treatment with varying level of aphid +1.0 mM of JA) were linear, strong and
negative, except in case of proline vs treatment. showing linear, strong and positive
correlation (Fig. LR-IX and X).
Vstimation of defensive volatile chemicals in aphid injured plants
The range of various signaling and volatile defensive chemicals sequestered in
aphid injured plants were determined by GC-MS analysis of highly injured floral axis
and leaves and compared with chemical sequestering in healthy un-injured leaves.
The aphid injured leaves released a wide range of aphid repelling (deterrents) and
toxic volatile chemicals in addition to beetle inviting volatiles. These volatiles were
sequestered in aphid injured leaves and not by any component of floral axis. The
higher quantities of allyl iso-thiocynates (AITC) and 3-hexanal- 1 -ol were detected in
leaves pre-treated with JA and later injured by aphid (150) than in aphid injured
leaves without prior treatment of JA (Fig. 133). The JA is known to induce stomatal
closure besides direct defensive impact against aphid herbivory.

r)t. Magr 2.89 K X Phu! No; 'Kr? DotHelorE SE1
Plate 6. Few growth stages of ladybird beetle (Coccinella septempunctata) maintained on B. juncea cv. Alankar pretreated with jasmonic acid (1.0 mM) along with 150 aphids. A. SEM image of egg. B. Moulting . C. Moulted skin of beetle. D. Young beetle.

Chapter 5
Discussion

DISCUSSION
Ecosystems naturally consist of 3-5 trophic levels with chlorophyll bearing
green plants at base constituting Ist trophic level. The herbivores consume plant parts
and rebuild animal proteins form 2" trophic level. The carnivores constitute 3'd to 5th
trophic levels. in all ecosystems, the partitioning of energy from to highest trophic
level is naturally balanced. The highly evolved process of checks and balances in the
grazing food-chain maintains a very delicate balance between the organisms at each
trophic level and thus make the entire ecosystem self sufficient. An understanding of
the key processes of checks and balances in energy (food) transfer may be of immense
importance and use in agriculture and several other human welfares including ecology
and environment. The aim of the present study was to understand various defense
traits evolved and inherited by the plants and extent of counter offensive mechanisms
in herbivores and their carnivores. In the present study, the defensive traits evolved
and inherited by plant, their impacts on herbivory and predation; effects of herbivory
on plant growth and population growth of herbivore and its predators have been
studied. For this purpose, linear food-chain model of mustard-aphid-beetle (producer-
herbivore-predator) was studied through five experiments.
The first experiment was conducted to study the relative sensitivity of five
cultivars of mustard to herbivory by 40 aphids. The selected cultivars were grown in
pots and at 45 days after sowing (DAS), each replicate plant was exposed to 40 aphids
(Lipaphis erisimi). The growth responses of all the five cultivars were studied and one
least and one most sensitive cultivars among the five were screened. The plants are
directly exposed to environmental stresses including biotic stress caused by
herbivores. The host plants have evolved several defense strategies including
production and release of certain volatile chemicals with deterring or phytotoxic
effects against aphids and to inviting signal the predatory beetles. All these traits are
not equally evolved in plants. The types and levels of constitutive and induced
defenses differ species to species and cultivar to cultivar and accordingly plants differ
in growth responses to herbivory as well. Before proceeding for detailed studies on
defense signaling and responses to herbivory, it was deemed fit to determine the least
susceptible and most susceptible cultivar of Brassica juncea (referred as mustard) to

Discussion: 58
aphids (Lipaphis erysimi). It emerged from this experiment, that cultivar Alankar was
relatively least susceptible to aphid herbivory and feasibly had better inherited traits
of defenses than most sensitive cultivar Rohini.
Aphids are considered successful herbivore with soft bodies, membranous
wings and a diet comprised of phloem sap (Dixon, 1998). In the present study, growth
of plant (plant length, leaf area, fresh plant mass, dry plant mass, chlorophyll content
and protein content) decreased in proportion to the increase in aphid population in all
the five selected cultivars (Fig.2-12, and 14). Defense proteins increase resistance in
plants (Elzinga and Jander, 2013). The protein contents were higher in cv. Alankar
than in cv. Rohini. The growth attributes had a high degree of correlation with the
aphid population (Fig. LR I and II). Aphids are phloem suckers and their water as
well as nutrient requirements are fulfilled through the consumed phloem sap. The
direct intake of phloem sap increase osmotic potential in aphids' gut and to
compensate it, aphid sucks water from the xylem tissues (Spiller et al., 1990; Walling,
2008). The cultivars with high population densities of aphids partitioned
proportionately high quantities of phloem sap (water and photosynthates) to
herbivorous aphids as is evident from correlation studies (Fig. LR I and II). On aphid
attack, the selected cultivars suffered from abundant availability of photosynthates for
cell division and adequate water for the turgor pressure required during cell
expansion. The correlation coefficients and linear regression between per cent
reduction in fresh plant mass (Fig. LR I and II) and per cent increase in aphid
population (Fig.1) explicitly explains the loss of water from plant tissues was due to
consumption by aphids and thereby caused stress in plant tissues (Khattab, 2007;
Sadek et al., 2013). It is also evident from the excess accumulation of proline that
plant has suffered from water stress. Therefore, proline besides playing important role in plant defenses, also managed the osmotic imbalance in mustard (Oncel et al.,
1996). The correlation coefficients between plant dry mass (Fig. LR I and II) and increase in aphid population established that growing aphid population consumed
excessive quantity of photosynthates and this loss of carbon may have suppressed cell
division in root and shoot. Walling (2000) reported that phloem sap herbivory
adversely affected the plant productivity (Bak et al., 2013; Sadek et al., 2013).
The presumption that phloem sap directly consumed by aphids caused water
stress in the plant tissues is further supported from high degrees of correlation
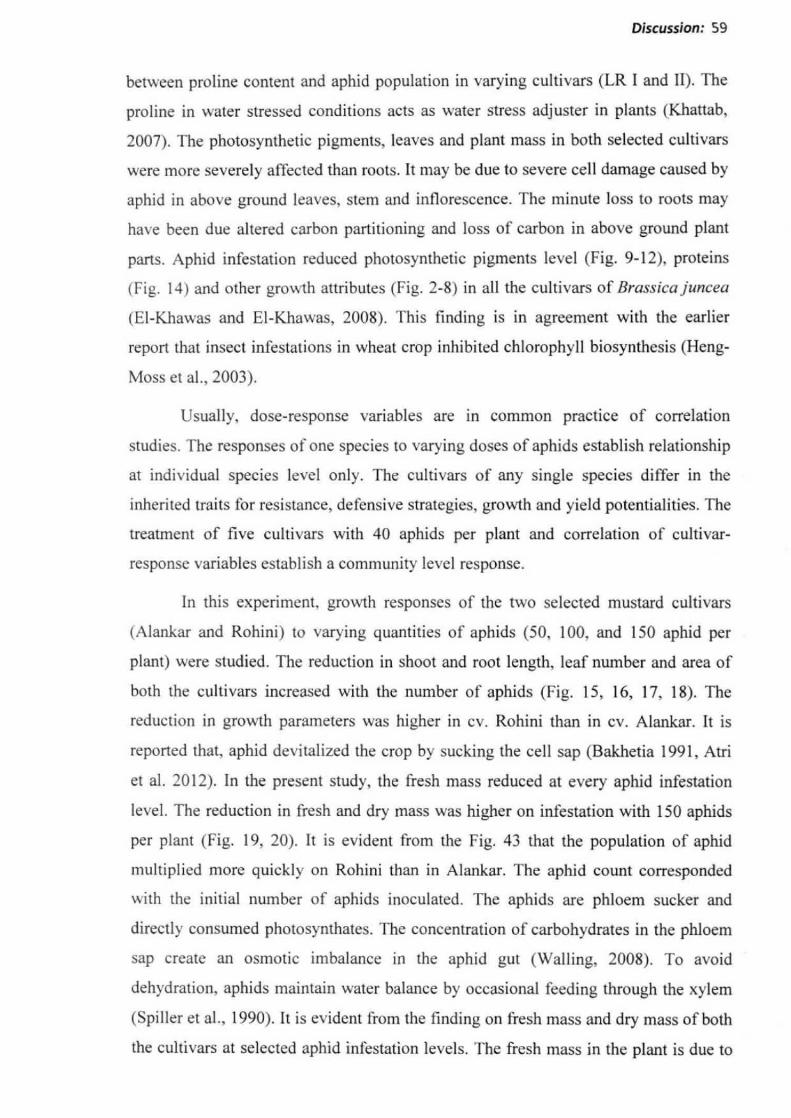
Discussion: 59
between proline content and aphid population in varying cultivars (LR I and II). The
proline in water stressed conditions acts as water stress adjuster in plants (Khattab,
2007). The photosynthetic pigments, leaves and plant mass in both selected cultivars
were more severely affected than roots. It may be due to severe cell damage caused by
aphid in above ground leaves, stem and inflorescence. The minute loss to roots may
have been due altered carbon partitioning and loss of carbon in above ground plant
parts. Aphid infestation reduced photosynthetic pigments level (Fig. 9-12), proteins
(Fig. 14) and other growth attributes (Fig. 2-8) in all the cultivars of Brassica juncea
(El-Khawas and El-Khawas, 2008). This finding is in agreement with the earlier
report that insect infestations in wheat crop inhibited chlorophyll biosynthesis (Heng-
Moss et al., 2003).
Usually, dose-response variables are in common practice of correlation
studies. The responses of one species to varying doses of aphids establish relationship
at individual species level only. The cultivars of any single species differ in the
inherited traits for resistance, defensive strategies, growth and yield potentialities. The
treatment of five cultivars with 40 aphids per plant and correlation of cultivar-
response variables establish a community level response.
In this experiment, growth responses of the two selected mustard cultivars
(Alankar and Rohini) to varying quantities of aphids (50, 100, and 150 aphid per
plant) were studied. The reduction in shoot and root length, leaf number and area of
both the cultivars increased with the number of aphids (Fig. 15, 16, 17, 18). The
reduction in growth parameters was higher in cv. Rohini than in cv. Alankar. It is
reported that, aphid devitalized the crop by sucking the cell sap (Bakhetia 1991, Atri
et al. 2012). In the present study, the fresh mass reduced at every aphid infestation
level. The reduction in fresh and dry mass was higher on infestation with 150 aphids
per plant (Fig. 19, 20). It is evident from the Fig. 43 that the population of aphid
multiplied more quickly on Rohini than in Alankar. The aphid count corresponded
with the initial number of aphids inoculated. The aphids are phloem sucker and
directly consumed photosynthates. The concentration of carbohydrates in the phloem
sap create an osmotic imbalance in the aphid gut (Walling, 2008). To avoid
dehydration, aphids maintain water balance by occasional feeding through the xylem
(Spiller et al., 1990). It is evident from the finding on fresh mass and dry mass of both
the cultivars at selected aphid infestation levels. The fresh mass in the plant is due to

Discussion: 60
the water content and dry mass is the water organic matter. The reduction in both
fresh and dry mass indicates the loss of carbohydrate and water from the tissues in
proportion to aphid numbers, The higher degree of weight loss in Rohini than in
Alankar appears to be due to the difference in inherited defense traits (Fig. 19, 20).
The proline level increased in both the cultivars in proportion to the number of aphid
inoculated (Fig. 27).
The proline is a universal stress marker in plants (Oncel, 1996) and hence
increased with the infestation level. Similar increase in free proline has been reported
by (Khattab, 2005, 2007). In cabbage and eucalyptus leaves infested with aphid and
therefore the prolific accumulation was considered as biotic stress marker. 'the prolinc
accumulation is speculated to play a defensive role (Kuznetsov and Shevyakova,
1997). The greater amount of prolinc in cv. Alankar than in cv. Rohini indicates that
the former cultivars had some inheritance resistant traits than the later cultivars.
The nitrogen (N) and phosphorus (P) content also decreased in proportion to the
number of aphid inoculated (Fig. 28, 29). The insect feeding alters translocation
pattern and growth of host plant (Miles, 1999) and reduced the nutrients uptake form
the root (Wu et al., 2004). In the present study the N content decreased significantly
with increase infestation level in both the cultivars (Fig. 28). It is reported that N
enhance the reproductive capacity and resistance against insect damage (Forno and
Semple, 1987). From the linear regression analysis it is evident that N content had
strong negative relationship with the aphid infestation level in both cultivars (Fig. LR
III and Ber ).
The reduction in nutrient contents due to aphid infestation many have directly
affected the chlorophyll a, b, total chlorophyll and carotenoid content (Fig. 21-24).
1 he loss of chlorophyll may have been caused by consumption of nutrients by the
aphid, as pigment biosynthesis is dependent upon water and minerals. The aphid
infestation reduced stomatal number in both the cultivars (Fig. 31, 32). "Ike relative
stomata closure index (RSCI) increased with the aphid infestation level but more
prominently in eultivar Rohini (Fig. 33, 34).
In the present study, aphids caused severe damages of wax layer deposited on
the outer surface of leaf epidermal cuticle (Plate 7). The cell membrane around the
area of injury is also affected adversely. The loss of membrane permeability results

Plate 7. Features of leaf surface with stomata under 10x10x light microscope (A1-G). Details of leaf surface scanning electron microscopic (SEM) image (A3, B3, C3, D3). (A1-A3) open stomata in non-infested leaves of Alankar (control), (BI-B3) partially closed stomata without much deformation of wax layer on herbivory with 150 aphids per plant, (C1-C3) the damaged stomata wax layer in cv. Rohini infected with 150 aphids, (Dl-D3) highly damaged wax layer and almost deformed and dissolved stomata in cv. Rohini infected with 150 aphids, (El) Relatively intact sieve tube cells in the leaf veins of cv. Alankar treated with 150 aphid, (F) damaged sieve tube elements in the leaf vein of cv. Rohini treated with 150 aphids, (G) highly damaged guard cells and wax layer in cv. Rohini infected with 150 aphids

Discussion: 61
into the spill of cell water and vital contents (Walling, 2000; Louis and Shah, 2013).
The hypertrophy noted in the mustard pods (Plate 3, 7) may have been caused severe
cell damages in developing pods. Despite partial or complete closure of stomata, the
fresh mass of plant also decreased on various level of aphid infestation (Fig. 19). This
indicate that the reduction in fresh mass of plant was due to the consumption of water
from the xylem in addition to photosynthates as evident from loss of plant dry mass as
well (Fig. 20). The partially closed stomata as noted in aphid infested mustard plants
(Plate 5) may have not checked transpiration completely, instead reduced the stomata
conductance (Fig. 36) and hence affected the photosynthetic rate (Fig. 35). The
reduction in pod length, oil content as well as pod per plant and seed weight in
proportion to the aphid infestation level appears to be the outcome of reduction in
photosynthetic rate and consumption of phloem sap by the aphid in proportion to their
population (Fig. 37-42).
From the experiment, it is inferred that both the selected cultivars had
difference in their inherited defensive traits. The increase in the degree of loss in
various growth parameters increased with the infestation level and growth stage in
both the cultivars and had a direct relationship with the aphid numbers. The
relationship between the loss of selected growth parameters and aphid number is
evident from linear regression analysis (Fig. LR III and IV). There was a strong
correlation between the losses of net photosynthesis with respect to aphid infestation
level. The strong and positive correlation coefficients were recorded between proline
level and aphid infestation level in both the cultivars (Fig. LR III and IV).
In the third experiment, the selected cultivars (Alankar and Rohini) of
Brassica juncea were exposed to varying number of aphid with equal degree of
predation (2 beetles per plant). Almost all the selected parameters showed reductions
in proportion to number of aphids inoculated. The cultivar Rohini remained more
susceptible than cultivar Alankar despite the predation of aphids by beetles. The
decrease in liesh and dry mass caused by aphid infestation adversely affected the
plant development in terms of shoot and root length, leaf number and area, (Fig. 45-
48)_ The loss in dry mass corresponding to number of aphid feeding on the plant
indicated that larger number of aphid neutralized the defensive responses of host
plants and limited population of beetles may have not been able to predate excessively
on multiplying aphids. The aphids, besides gelling saliva also secrete watery saliva

Discussion: 62
after piercing stylet into the plant tissues (Bak et al., 2013). The watery saliva plays
important role in testing the suitability of the cell sap of the host plant (Bak et al.,
2013). Recent analysis of saliva protein reflected that some of the proteins known as
elicitors trigger the plant defense responses while some other counteract the plant
defense as affector molecules. Some of these molecules might be species specific and
some other have broader specificity (Bos et al., 2010; Tian et al., 2012; Pitino and
Hogenhout, 2013; Bak et al., 2013). It is likely that cultivar level variations in such
inherited defensive traits may have caused varying levels of damages in the two
selected cultivars. In the present study the degree of losses in the various growth and
biochemical parameters were lesser on infestation with 50 aphids (Fig. 49-66). This
indicate that the selected cultivars of mustard had limited constitutive and induced
defensive mechanisms against aphids in the presence of only two predatory beetles
(Coccinella septempunctata). The higher number of aphids could damage the plant to
a greater extent. It is also reported that the plant degradation products are recognized
by plant receptors during aphid herbivory; however, certain effectors from aphid
saliva neutralize plant defense responses to re-established plant susceptibility (Liu et
al., 2009; Pitino and Hogenhout, 2013; Bak et al., 2013). This immunity to plant defense
caused by aphid saliva proteins acting as effectors in the larger number of attacking
aphids enabling them to successfully consume greater amounts of carbon to
substantially reduce plant growth at higher level of aphid infestation (Jones and Dangl
, 2006; Liu et al., 2009; Bak et al., 2013). Despite equal level of predation the cultivar
Rohini remained more susceptible to aphid infestation than Alankar. It is reported that
Orthopod feeding change plant metabolism and gene expression associated with plant
defense responses and aphid resistance gene (Moran and Thompson, 2001). It is
evident from the data on aphid count on both the cultivars that population of aphid
consistently increased with age of the plant (Fig. 73). The large aphid population on
cultivar Rohini than cultivar Alankar may have been due to gene level variations
between them.
It may be noted that the limited number of beetles (2 beetles per plant) could
reduced the aphid population to a limited extent as compare to the infestation by aphid
without beetles in Experiment 2 and eventually the growth and yield of selected
cultivars (Fig 49-72). On comparison of results of the Experiment 2 and 3, the growth
of both cultivars was relatively better under predation by beetles (Experiment 3) than

Discussion: 63
without predation (Experiment 2). The beetles also reduced the aphid population in
Experiment-3, but insufficient number of beetles and possible reversal of plant
immune and defensive system by larger number of aphids reduced the growth of
mustard in Experiment 3.
The selected cultivars (Alankar and Rohini were treated exogenously) with
varying doses of jamonic acid (JA) to study the effect on the growth, physiology and
yield as well as extent of inviting signal to beetles. The JA application of 0.1 mM
enhanced the growth and yield of both the cultivars (Fig. 74-101). Jasmonic acid is a
key molecule of octadecanoid signaling pathway (Meyer et al., 1984, 2003, Markunas
et M., 2011, Nahity et al., 2013) which strongly stimulates photosynthetic pigment
synthesis (Poonam et al., 2013). It also protects the cell membrane in accordance with
the dose of JA (Poonam et al., 2013). Jasmonate treatment reduces the proline level in
the plants as compare to the aphid attacked ones (with or without predation). This
indicates that JA itself reduced plant stress, thereby; proline did not accumulated in
larger proportions in JA treated plants. Since proline is considered as a stress marker
(Oneel, 1996), reduced proline accumulation indicated that JA treatment stimulated
and protected the cellular stress and relatively healthy cells in selected cultivars
defended the plants better. In earlier studies JA treated stressed and non stressed plant
had mixed response on accumulation of proline (Poonam et al.. 2013, Jamalomidi et
al., 2013). The increased chlorophyll content in JA treated plants, increased plant
growth specifically the fresh and dry mass (Fig. 80-95). The JA treated cultivars
Alankar and Rohini attracted larger number of beetles in the present experiment at 60
DAS than at 75 DAS (Fig. 102). This indicates that 1.0 mM of JA signaled beetles
very effectively only at 60 DAS and relatively to a lesser extent at 75 DAS as effect
of this volatile chemical reduced with time. The JA is reported to play on important
role in aphid resistance as well (Smith and Boyko, 2007, Morkunas et al., 2011). The
JA treatment enhanced the plant's immunity to aphid attack. It may be noted that JA
application reduced the aphid reproduction in an earlier study (Zhu- Salzman et al.,
2004).
In the fifth experiment, both the cultivars (Alakar and Rohini) pretreated with
0.1mM Jasmonic acid (JA) at 45 DAS were inoculated with 50, 100, and 150 aphid
per plant at 50 DAS, and the growth performance was studied. On pre-treatment with
IA, the plant growth enhanced far better than without JA treatment (Experiment 2).

Discussion: 64
The inoculations of aphids on JA pre-treated cultivars reduced shoot and root length
to a lesser extent than in Experiment 2 (Fig. 103-104). The population of aphid on JA
pm-treated cultivars was also lesser than without JA treated plant but exposed to
beetles as recorded in Experiment-3. The population of aphid on pre-treated (JA
0.1mM) plants was relatively lesser than in plants without IA. From this experiment
(Fig. 129), it is evident that exogenous application of 1.0 mM of JA detracted the
aphids due to adverse impact on their reproductive abilities (Zhu- Salzman et al.,
2004) and substantial attraction of beetles had added advantages to safely predate on
them before the aphids could introduce defensive chemicals in them. The JA also
provided a cue to predators more effectively in presence of aphid.
The defensive volatiles synthesized and released by leaves of cultivar Alankar
inoculated with 150 aphids per plant was studied in GC-MS analysis The profile
reflected that the content of total allyl-isothiocynate (AITC) was only 42.36% and 3-
hexan-l-ol was 10.34%. When this cultivar was treated with 1.0 mM of JA prior to
inoculation of 150 aphids, the contents of both these defensive and signaling volatiles
increased, The AITC increased up to 46.59% and 3-hexan-l-ol up to 20.84% (Fig.
133), These findings firmly suggest that the exogenous application of JA on mustard
plants improved plant's ability to defend the aphid herbivory as A1TC directly deter
the aphids and JA spray worked as volatile signal to attract predatory beetles. The
induced defenses in many plant species through volatile chemical arsenals have been
reported earlier also (Lambrix et al., 2001; Kliebenstein et al., 2002; Pontoppidan et
al., 2005; Kissen et al., 2009).
The overall outcome of the present studies (Experiment 1-5) has been
explained through the Plate 8. The aphid attack is more common on mustard cultivars
with least inherited defensive traits. The plants have evolved constitutive and induced
defensive traits against herbivores. The herbivores in turn have co-evolved counter
defenses against the defensive plant volatiles and thus developed the ability to alter
certain blends of plant volatiles in their favor. Herbivores often alter the plant volatile
signaling specialist predators or parasites of the attacking herbivore (Bak et al., 2013).
In the present study it is evident that the selected aphid damaged the wax layer and
feasibly secreted enzyme pectinase, dissolved the middle lamella between epidermal
cells and subsequently the middle lamella of cells/tissues in leaf interior (mcsophylls,
cortex M stem, phloem cells, primary xylem cells in the vascular system of leaf and

VOCs (3-Hexan-l-ol & B1 Allyl isothiocyanate)
signals to attract bectle - ,
• Extra floral nectaries
Beetle predation of aphid Cl Jasmonic acid
Trichomes
I nducti octadeca
Ally! isothiocyanates Loss of (natural insecticide)
Phloem sap C'2
Loss of nutritional Decreased
qualityF2 photosynt. sis E2
Stomatal closure-62
•
Attracted beetle--
Plate 8. Tri-trophic interaction of Brassica juncea — Lipaphis erysimi - Coccinella septempunctata (mustard plant — aphid — beetle). Attack of aphid on mustard plant results into loss of phloem and low of nutritional quality. However, this (A) led to release of volatile signals which attracts beetles (BI) which feeds on aphid to check their population (Cl). Aphid feeding also induces octadecanoid pathway to release jasmonic acid (B2). Elevated level of jasmonic acid closes stomata (D2) to decrease photosynthesis (E2) further reduces nutritional quality (F2). Alternatively, pre-infestation external application of jasmonic acid (blue arrows) induces giucosinotates (B'2) which on infection quickly releases ally! isothiocyanates to deter aphids (C'2).

Discussion: 65
stem). The aphids thus easily enter their stylets through the macerated cells and
immediately secrete the gelling saliva and fill in the injured tissues around style'
probing sites. The gelling saliva secures the stylets. The purple brown pigmenting
substance filled in the injured portions of leaf and stem has been detected in the
present study and shown in the plates (Plate 3). The probing aphid first tastes the
contents of the cell sap by injecting watery saliva inside the cell and withdrawing the
cell sap. On judging the suitability of cell sap, aphids enter the probing stylet into
sieve tube and suck in the photosynthates synthesized in the leaves and unloaded in
the phloem. The excessive sugar intake increases osmotic potential in the aphid guts.
To nullify this effect, aphids enter their stylets into the xylem cell and withdraw
water. The mustard cultivars with better defensive traits (a set of few genes) activate
the sequestering several blends of volatiles. Some volatiles deterred the aphids and
some other signalled the predatory beetles of third trophic levels for indirect control.
The cycles of deterring and predator cueing volatiles are shown in the Plate 8. Certain
hlends of volatiles are known to signal the specialist predator about the suitability of
egg laying sites. M the present study, the specialist beetle (Coccineas septempunclata)
preferred to maintain its life cycle on cultivar Alankar pre-treated with 1.0 Mm of IA
(Plate-6).
Conclusion
Present study draws following conclusions to answer the objectives framed
(see Chapter 1) for the conducted experiments
1. The selected mustard cultivars (Alankar, Puss Jai Kisan, Varuna, Sakha and
Rohini) responded differently against selected aphid infestation (40 aphids per
plant) at the two stages of growth. Alankar stood least sensitive against aphid
herbivory amongst all the five mustard cultivars whereas the response of Rohini
was most susceptible.
2. The number of aphids increased linearly once their selected numbers were
inoculated on young leaves of plant, which caused increasing damage with the
growth progression (60 to 75 DAS).
3. The herbivory damage increased from 60 to 75 DAS which was inure
pronounced in cv. Rohini as compared to cv. Alankar. Moreover. stress

Discussion: 66
progressively increased with increasing the level of aphid infestation (0-150
aphids).
4. Inoculation of predatory beetle controlled the aphid population which was
observed as recovery of selected parameters as compared to aphid infestation
alone. The damage declined with the age progression (60 to 75 DAS).
5. Amongst the three concentration of jasmonic acid (0.5, 1.0 or 1.5mM) the
response of 1.0 mM was most effective which furnished positive responses of
selected parameters at the two stages of growth.
6. Pre-treatment (aphid pre-infestation spray) with jasmonic acid with JA solution
effectively controlled the aphid infestation which resulted in better growth
performance of cultivars as compared to aphid stressed plants, more at late stage
of growth (75 DAS) than at early stage (60 DAS). Also the yield improved with
the simulated jasmonic acid application.
7. Marked increase of proline in Alankar (least sensitive cv.) as compared to
Rohini (most susceptible cv.) suggested its key role in protecting plants against
herbivory induced damage.
8. Jasmonic acid (1.0 mM) application induced the proline level further confirms
its protective role in herbivory induced plant growth regression.
9. Detection of higher level of allyl isothiocyanate (AITC) and 3-hexanal- 1 -ol in
plants treated with JA pre-infestation to aphids as compared to aphid infestation
alone confirms the applicability of JA against herbivores through the induction
of direct and indirect defense.

Chapter 6
Summary

SUMMARY
The objective of this study was to test the utility of herbivory simulation using
jasmonic acid on some mustard cultivars. Considering this objective as framed in
introduction of the thesis, five local cultivars were first screened for their relative
sensitivity to aphid attacks. The problems of aphid infestation on crop plants, direct
and indirect plant defenses responses, the role of jasmonic acid (JA) as simulator of
natural herbivory to elicit the plant defense prior to aphid infestation have been
emphasized in the infroduction of the thesis. The relevant studies available with
literature have been reviewed comprehensively in the following Chapter 2. The details
of the biological materials used, methodologies used and preparation of chemicals
reagents have been elaborated under the section materials and method with necessary
details. The finding of the 5 experiments were statistically analyzed and presented in
the graphical forms. The data tables have itlbu been annexed at the end of the thesis.
The last section deals with the explanations of the results extracted from the data and
are discussed and interpreted in the light of the earliar relevant findings of other
researchers in the field. A brief account of these chapters is summarized below:
Five pot experiments were conducted in winter season (October to March) of
the year 2009-2011 at the Aligarh Muslim University. Aligarh. The objective was to
elucidate the simulatory priming effect of JA and aphid (Lipaphis erysimi Kali)
individually and as follow up treatment after screening of the five Brassica juncea
cultivars viz. Alankar, Pusa Jai Kisan, Varuna, Sakha and Rohini, against selected
population of aphid. The effect of predatory ladybird (Coccinella septempunctata) on
plant responses and aphid population also studied in the following experiments.
Experiment 1
This experiment was worked out to assess the relative susceptibility of the hive
local cultivars of mustard namely, Alankar, Pusa Jai Kisan, Varuna, Sakha and
Rohini. The experiment was set up in the ambient conditions of winter season of the
year 2009 in Aligarh Muslim University, Aligarh. These mustard cultivars were
exposed to aphid infestation at the rate of 40 aphids (Lipaphis erysimi) per plant at 45
days after sowing. The seeds of all selected cultivars were sown in earthen pots. The
selected cultivars were infested with selected and identified aphids (Lipaphis erysimi)

Summary; 68
at the rate of 40 adult aphids per plant and a control of each cultivar without aphid
was also maintained. Each set of five cultivars were arranged in completely
randomized block design in separate, especially designed net houses of size
L85xc00 xL25cm supported with iron rods and zipped entrance. The seeds were sown
in earthen pots of 25 x 25 cm size filled with garden soil and compost in the ratio of
3:1. All the five cultivars were sampled at 60 and 75 DAS (days after sowing) to
analyze the growth attributes of infested plants and also the population growth of
aphid on each cultivar, the plant growth responses (length of shoot, root, total plant,
leaf number and area and plant fresh and dry mass), pigment concentration
(chlorophyll a, b, total chlorophyll and carotenoid), total protein and praline contents.
All the growth attributes and biochemical parameters decreased significantly on aphid
herbivory at both the sampling stages (60 and 75 DAS), whereas, only proline content
increased on aphid infestation. The damage of all the cultivars increased as the
population of aphid multiplied with plant age. On the basis of increasing sensitivity in
terms of per cent loss, the selected cultivars can be arranged from least to most
sensitive as Alankar < Pusa Jai Kisan > Varuna > Sakha > Rohini. Alankar, therefore,
was relatively most resistant to aphid supporting lowest number of aphid population
and least resultant damage, whereas, Rohini was screened as most susceptible cultivar
with highest aphid population and damage. One set was kept in open environment to
naturally invite the beetles on aphid infested plants and beetle number was counted.
The cultivar Alankar attracted more beetles than Rohini.
Experiment 2
Two cultivars i.e. most susceptible to aphid infestation (Rohini) and least
susceptible (Alankar) were screened out from Experiment 1. This experiment was set
up in the growth season of the successive year keeping all the cultivation practices
and statistical design same as in Experiment 1. Each of the selected variety (Alankar
and Rohini) was independently infested with 0 (control), 50, 100 or 150 aphids per
plant at 45 DAS. The comparative response of growth, biochemical, physiological and
yield parameters were recorded and analyzed in detail at 60 and 75 DAS, and finally
harvested at 120 DAS. Besides, reduction in growth parameters (length of shoot, root,
total plant, leaf number, leaf area, fresh and dry plant mass), aphids also induced
adverse changes in the stomata and their dynamics (relative stomata] closure index,

Summary: 69
number of stomata) and hence affected the gaseous exchange, net photosynthetic rate,
photosynthetic pigments (chlorophyll a, b. total chlorophyll and carotenoids content),
proteins and nutritional quality (NPK level) of the two selected cultivars. The increase
of proline content reflected the protective response of cultivars against aphid induced
water stress in plants. The decline in all these parameters contributed to decreased
yield attributes (pod length, pods per plant, seeds per pod, 1000 seed weight and seed
yield) including seed oil content. This decrease was more pronounced in cv. Rohini as
compared to cv. Alankar. Higher level of proline in Alankar suggested better
protective mechanism in this cultivar as compared to Rohini.
Experiment 3
Attraction of predatory beetles to aphid infested plants to show ability to
defend indirectly and inherited tri-trophic signaling mechanism. Two selected
cultivars of mustard were infested with 50, 100, 150 aphids per plant at 45 days
growth stage and 5 days later (30 DAS), two beetles (Ladybird; Coccinella
septempunetata) per plant were introduced. All the experimental designs were same
as in Experiment I. The plant samples were collected at 60 and 73 DAS to record
growth, physiological, and biochemical characteristics of the two cultivars of Alankar
and Rohini and finally harvested at maturity (120 DAS) for yield parameters. The
aphid herbivory with 50 and 100 aphids + 2 beetles per plant in together with two
predatory beetles per plant, reduced plant growth (length, fresh and dry mass of shoot
and root, area and number of leaves per plant), adversely changed stomatal dynamics
(relative stomata] closure index, number of stomata), photosynthetic performance (net
photosynthetic rate, stomata' gaseous exchange, pigment level), nutritional quality
(NPK) of plants and yield attributes (pod length, oil content, pods per plant, seeds per
pod, 1000 seed weight and seed yield). The impact of aphids was not as prominent as
in Experiment 2 (with beetles). This improvement was higher at late growth stage (75
DAS) as the aphid population decreased considerably. The results were much better in
cultivar Alankar as compared to most susceptible one; Rohini. The improved defense
mechanism was further supported with the higher level of proline accumulation in
cultivar Alankar, as compared to ev, Rohini.

Summary: 70
Experiment 4
This experiment was conducted to study the different concentrations of JA on
the two selected cultivars of Brassica juncea cvs. Alankar and Rohini. The
agricultural conditions and experimental design were same as in Experiment 1.
Jasmonic acid (0, 0.5, 1.0 or 1.5 mM) was sprayed on the foliage of Alanakar and
Rohini at 45 DAS. Plants were sampled at 60 and 75 DAS. No significant change in
growth parameters (length, fresh and dry mass of shoot and root, area and number of
leaves per plant) and nutritional quality (NPK level) was observed on either of the
cultivar treated with 0.5 or 1.5 mM JA. Only treatment with 1.0 mM JA enhanced the
growth and yield characteristics (seed yield and oil content) of two the cultivars,
significantly. This response was more prominent in Alankar than in Rohini at late
growth stage (75 DAS). Jasmonic acid application strongly stimulated the level of
photosynthetic pigments (chlorophyll a, b, total chlorophyll and carotenoids content)
and proline level. But, the level of proline enhanced was lesser as compared to that of
aphid infested plants (Experiment 2). Jasmonic acid induced the stomatal closure in
dose dependent manner in both the cultivars. This concentration of JA (0.1 mM) also
increased the plant fresh and dry mass more effectively in Alankar as compared to
Rohini. Larger number of beetles was attracted in JA treated Alankar than JA treated
Rohini at 60 DAS.
Experiment 5
This experiment was laid with an objective to elucidate the effect of foliar
spray of JA prior to aphid infestation on two selected cultivars of mustard (Alankar
and Rohini). All cultivation practices, statistical and experimental design were same
as in Experiment 1. Both the cultivars of Brassica juncea; Alankar and Rohini, were
sprayed with 0.1 mM of JA solution at 45 DAS followed (5 days later) by aphid
infestation (50, 100 or 150 aphids per plant). The population of aphids significantly
reduced with the progressing age of the plant (60 to 75 DAS). This resulted into the
improvement of growth (length, fresh and dry mass of shoot and root, area and
number of leaves per plant), stomatal dynamics (relative stomatal closure index,
number of stomata), photosynthetic performance (net photosynthetic rate, stomata
gaseous exchange, pigments level), nutritional quality (NPK level) and yield attributes
(pod length, oil content, pods per plant, seeds per pod, 1000 seed weight and seed

Summary: 71
yield) of plants. Alankar excelled in its growth response and resistant to aphids as compared to Rohini. The increase in proline level in JA treated plants confirmed its
defensive role and protective nature in aphid induced water stress in plants.
It emerged from the data of experiment 5, that JA treatment induced only
marginal increase in plant growth. But, findings elucidates that JA treatment enhanced
defensive and protective abilities of the cultivars. To elucidate the role of volatile
chemicals in plant defense including beetle attraction and chemical deterrence to
aphid, GC-MS analysis was carried out. Analysis revealed that volatile organic
compounds (VOCs) viz. allyl isothioscynate and 3- Hexan- 1 -ol increased in cultivar
Alankar treated with JA (0.1 mM) and aphids as compared to plants infested alone
with aphids. In addition to these, morphological defense features, leaf trichome
density, hypertrophied pods, induction of extra floral nectarines, stomata leaf surface features indicated that aphid induced damage and reciprocal plant defense responses
and signaling extended up to third trophic level in mustard-aphid-beetle food chain.

References
REFERENCES
Agarwal AA, Fishein M. 2006. Plant defense syndromes. Ecology, 87: S132-S149.
Agrawal AA. 1999. Induced responses to herbivory in wild radish, effect on several
herbivores and plant fitness. Ecology 80: 1713-1723.
Agrawal AA. 2000. Specificity of induced resistance in wild radish: causes and consequences
for two specialist and two generalist caterpillars. Oikos, 89: 493-500.
Abuja 1, Rohloff 3, Bones AM. 2010. Defence mechanisms of brassicaceae: implications for
plant-insect interactions and potential for integrated pest management. Agronomy for
Sustainable Development, 30: 311-348.
Aldea M, Hamilton, JG, Resti JP, Zangerl AR, Berenbauni MR, Frank TD, DeLucia
EH. 2006. Comparison of photosynthetic damage from arthropod herbivory and
pathogen infection in understory hardwood samplings. Oecologia, 149:221-232.
All A, Rizvi PQ. 2.009. Life table studies of Menochilus sexmaculatus Fabr. (Coleoptera:
Coccinellidae) at varying temperature on Lipaphis erysimi Kali. World Applied
Sciences Journal, 7: 897-901
All A, Rana KS. 2010. Studies on population dynamics of ladybird beetles on cauliflower in
some districts of Uttar Pradesh India. World Journal of Applied Sciences and
Research, 2: 16-20.
All MB, Hahn a Paek KY 2007. Methyl jasmonate and salicylic acid induced oxidative
stress and accumulation of phenolics in Panay ginseng hioreactor root suspension
cultures. Molecules, 12: 607-621.
An Y., Zhang M, Liu G, Han It, Liang Z. 2013. Proline accumulation in leaves of
Periploca sepiwn via both biosynthesis up-regulation and transport during recovery
from severe drought& e69942
Ananiev ED, Ananieva K, Todorov I. 2004. Effect of methyl ester of jasmonic acid,
abscisic acid and henzyladenine on chlorophyll synthesis in excised cotyledons of
Cucurbita pep() (Zucchini). Bu lgarian Journal of Plant Physiology, 30: 51-63
Atiarith a krishnan TN, 2001. Phytochemical defence profiles in insect— plant interactions. In:
Insects and Plant Defense. Dynamics Science Publication, USA. Pp. 1-21.
Anonymous. 2008. Plant defense against herbivory — Wikipedia. the free encyclopedia.
http:ficn.wikipedia.orgivviki/plant defensc_agninst herbivory

References: 73
Arimura G, Kost C, Boland W. 2005. Herbivore-induced indirect plant defences.
Biochimica et Biophysica Acta, 1734: 91-1 I I .
Arnold T, Appel H, Patel V, Stochum E, Kavalie A, Schultz J. 2004. Carbohydrate
translocation determines the phenolic content of Populus foliage: a test of the sink-
source model of plant defense. New Phytologia, 164: 157-164.
Atri C, Kumar B, Kumar H, Kumar S, Sharma S, Banga SS. 2012. Development
andcharacterization of Brassica juncea — fruticulosa introgression lines exhibiting
resistance to mustard aphid (Lipaphis etysimi, Kalt). BMC Genetics, 13: 104.
Atwal AS, Dhaliwal, GS. 2003. Agricultural Pests of South Asia and their Management, In:
Pest Populations and Crop Losses, Kalyani Publishers, New Delhi, Pp. 52-53.
Baalen MV, Sabelis MW. 1993. Coevolution of patch selection strategies of predator and
prey and the consequences for ecological stability. 142: 646-676.
Bagwell RD, Tugwell NP, Wall ML. 1991. Cotton aphid: insecticide efficacy and an
assessment of its damage to the cotton plant. In: Proceedings 1991 Beltwide Cotton
Conf. National Cotton Council Memphis TN. Pp. 693-695.
Bak A, Martiniere A, Blanc S, Drucker M. 2013. Early interactions during the encounter of
plants, aphids and arboviruses. Plant Signaling Behavior, 8: e24225-1 -4.
Bakhetia DRC, Arora R. 1986. Control of insect pests of toria, sarson and rai. Indian
Farming, 36: 41-44.
Bakhetia DRC, Brar KS. 1983. Loc. Cit.Technol. better crops No.216 Indian Brassicas
Pp.20.
Bakhetia DRC, Sekhon BS. 1989. Insect-pests and their management in rapeseed-mustard.
Journal of Oilseeds Research, 6: 269-99.
Bakhetia DRC. 1987. Insect pests of rapeseed-mustard and their management. In: Plant
protection in field crops. Eds. Rao VM, Sithanathan S. Rajendranagar: PPAI. Pp.249- 259.
Bakhetia DRC. 1991. Insect Pests. In: Oilseed Brassicas in Indian Agriculture. Chopra VL,
Prakash S. (eds), Vikas Publishing House, New Delhi. Pp. 211-240.
Balbi V, Devoto A. 2008. Jasmonate signalling network in Arabidopsis thaliana: crucial
regulatory nodes and new physiological scenarios. New Phytologist, 177: 301-318.

References; 74
Baldwin IT, Zhang 12, Dial) N, Olnimeiss TE, McCloud ES, Lynds GY, Schmelz EA.
1997. Quantification, correlations and manipulations of wound-induced changes in
jasmonic acid and nicotine in Aricaliana sylvestris. Planta, 201: 397-404.
Baldwin IT. 1999. The jasmonate cascade and the complexity of the induced defense against
herbivore attack. Annual Review of Plant Biology, 3: 155-186.
Bandurska H, Stroinski A, Jan K. 2003. The Effect of jasmonate on the accumulation of
ABA, proline and spermidine and its influence on membrane injury under water
deficit in two barley genotypes. Acta Physiologeiae Plantanim, 25: 279-285.
Bates LS, Waldeen RP, Teare DV. 1973. Rapid determination of free praline for water
stress studies. Plant and Soil, 39: 205-207.
Beale SI. 1978_ ri-Aminolevul ink acid in plants: Its biosynthesis, regulation and role in
plastid development. Annual Review of Plant Physiology, 29: 95-120.
Bliatia V, Eniyal PL, Bhattacharya R. 2011. Aphid resistance in Brassica crops:
challenges, biotechnological progress and emerging possibilities. Biotechnology
Advances 29: 879-888.
Bideshki A, Arvin MJ. 2013. Interactive effects of methyl jasmonate (MJ) and indole-3
butyric acid (IBA) on growth and bio chemical parameters, bulb and allicin yield of
garlic (alfium satinan I..) under drought stress in Iran. International Journal of
Agriculture: Research and Review, 3: 349-360
Blackman R., F.astop V. 1994. Aphids on the World's Trees: An Identification and
Information Guide. Wallingford UK: CABI.
Blade JD. 2004. Differential signalling from specialist and generalist Brassica feeding
aphids to differentially adapted aphid parasiloids. Ph.D. thesis, University of
Southampton, UK.
Bohnert 11.1, Shen B. 1999. Transformation and compatible solutes. Scientia
Horticulturae 78 237-260.
Bojorquez-Pereznieto H, Toresano-Sinchey F, Dianez-Martinez F, Palmero-Llamas D,
Camaehu-Ferre F. 2013. Effect of the application of jasmonic acid and benzoic acid
on grafted watermelons yield under greenhouse conditions in the southeast of Spain
for mitigation of stress Journal of Food, Agriculture and Environment, 11: 349-352.

References: 75
Bos JIB., Prince D, Pitino M, Maffei ME, Win J, Hogenhout SA. 2010. A functional
genomics approach identifies candidate effectors from the aphid species *zits
persitae (Green Peach Aphid). PLUS Genet.
6:e1001216.10.1371/jountal.pgen.1001216.
Buyko EV, Smith CM, Thara VK, Bruno JM, Deng VP, Starkey SR, Klaahsen DL. 2006.
Molecular basis of plant gene expression during aphid invasion: wheat No- and Pti-
like sequences are involved in interactions between wheat and Russian wheat aphid
(Homoptera: Aphididae). Journal of Economic Entomology, 99: 1430-1445.
Bright AMP, Lea J, Kueh C, Woodcock D, Ilolloman, Scott G. 1982. Proline content does
not influence pest and disease susceptibility of barley. Nature, 295: 592-593.
Bright J, IJesikan R, Hancock JT, Weir IS, Neill SJ. 2006. ABA-induced NO generation
and stomatal closure in Arabidopsis are dependent on H202 synthesis. The Plant
Journal, 45: 113-122.
Broadway RM. 1995. Are insects resistant to plant proteinase inhibitors? Journal of Insect
Physiology, 41: 107-116.
Broadway RM. 2000. The responses of insects to dietary protease inhibitors. In:
Recombinant protease inhibitors in plants. Michaud D. (ed). Landes Bioscience
Georgetown TX, USA. Pp. 80-88.
Bruce MIA, Pickett JA. 2007. Plant defense signaling induced by biotic attacks. Current
Opinion in Plant Biology, 10: 387-392.
Bruinsma M, Dicke M. 2008. Herbivore-induced indirect defence: From induction
mechanisms to community ecology. Induced Plant Resistance to Herbivory Schaller
A. (ed.). Springer Verlag, Berlin, Germany. Pp. 31-60.
Bystrom BG, Glitter Ril, Scott FM, Bowler FSC. 1968. Leaf surface of Beta vulgaris-
electron microscope study. Botanical Gazette, 129: 133-138.
Cabrera LIM, Argandana VH, Corcuera L.1, 1994. Metabolic changes in barley seedlings
at different aphid infestation levels. Phytoehemistry, 35: 317-319.
Chen C, Kao C. 1993. Osmotic stress and water stress have opposite effects on putrascine
and proline production in excised rice leaves. Plant Growth Regulation, 13: 197-202.
Chen C, MAO VG, Li X, Ni M. 2012. Light-regulated stomatal aperture in Arabidopsis.
Molecular Plant, 5: 566-572.

References: 76
Chen Y, Olson DM, Ruberson JR. 2010. Effects of nitrogen fertilization on tritrophic
interactions. Arthropod-Plant Interactions, 4: 81-94.
Cherqui A, Tjallingii WF. 2000. Salivary proteins of aphids, a pilot study on identification,
separation and immunolocalisation. Journal of Insect Physiology, 46: 1177-1186.
Choudhary NL, Sairam RK, Tyagi A. 2005. Expression of deltal-pyrroline-5- carboxylate
synthetase gene during drought in rice (Otyza saliva L.). Indian Journal of
Biochemistry and Biophysics, 42: 366-370.
Choudhury S, Pal S. 2009. Population dynamics of mustard aphid on different Brassica
cultivars under terai agro-ecological conditions of West Bengal. The Journal of Plant
Protection Sciences, 1: 83-86.
Closas M., Toro F, Calve G, Pelacho A. 2004. Effect of methyl jasmonates on the first
developmental stages of globe artichoke. Acta Horticulturae, 660: 185-190.
Cornell HV, Hawkins BA. 2003. Herbivore responses to plant secondary compounds: A test
of phytochemical coevolution theory. 161: 507-522.
Creelman RA, Mullet JE. 1995. Jasmonic acid distribution and action in plants: Regulation
during development and response to biotic and abiotic stress. Proceedings of the
National Academy of Sciences of the United States of America, 92: 4114-4119.
Creelman RA, Mullet JE. 1997. Biosynthesis and action of jasmonates in plants. Annual
kc% \\ of Plant Physiology and Plant Molecular Biology, 48: 355-381.
Dalin P, Agren J, Bjorkman C, Iluttunen P, Ka rkkainen K. 2008. Leaf Trichome
Formation and Plant Resistance to Herbivory. In: Induced Plant Resistance to
Herbivory. Schaller A. (ed.). Springer. Pp. 89-105.
Dalin P, Bjorkman C. 2003. Adult beetle grazing induces willow trichome defense against
subsequent larval feeding. Oecologia, 134: 112-118.
De Moraes CM, Mescher MC, Tumlinson JH. 2001. Caterpillar induced nocturnal plant
volatiles repel conspecific females. Nature, 410: 577-580.
De Vos N1, linden 2009. Myzes persicae (green peach aphid) salivary components induce
defense responses in Arabidopsis thaliana. Plant Cell Environment. 32: 3248-3260.
De Vos M, Jander. 2010. Volatile communication in plant-aphid interactions. Current
Opinion in Plant Biology, 13: 366-71.

L4 u f (J
References: 77
. -
De Vos M, Oosten VRV, Jander G, Dicke M, Pieterse CMJ. 2007. Plants under
attack: Multiple interactions with insects and microbes. Plant Signaling and
Behavior, 2: 527-529.
I)elauney AJ, Verma UPS. 1993. Proline biosynthesis and osmoregulation in plants. Plant
Journal, 4: 215-223.
Dicke M, Gols R, Ludeking D, Posthumus MA. 1999. Jasmonic acid and herbivore
differentially induce carnivore attracting plant volatiles in Lima bean plants.
Journal of Chemical Ecology, 25: 1907-1922.
Dillwith JW, Berberet RC, Bergman DK, Neese PA, Edwards RM, McNew RW. 1991.
Plant biochemistry and aphid populations: studies on the spotted alfalfa aphid,
Therioaphis maculata. Archives of Insect Biochemistry and Physiology, 17: 235-
25L
Ding H, Lamp RL, Ames N. 2000. Inducible production of phenolic acids in wheat and
antibiotic resistance to Sitodiplosis mosellana. Journal of Chemical Ecology, 26:
969-984.
Dixon AFG. 1998. Aphid Ecology. Chapman & Hall, London.
Dow ney RK, Rimmer SR. 1993. Agronomic improvement in oilseed Brassica. Advances in
Agronomy, 50: 1-65.
Duffey SS. 1986. Plant glandular trichomes: Their partial role in defence against insects. In:
Insects and the plant surface. Juniper B, Southwood SR. (eds.). Arnold, London. Pp.
151-172.
Eisinger W, Ehrhardt D, Briggs W. 2012. Microtubules are essential for guard-cell function
in Vicia and Arabidopsis. Molecular Plant, 2: 601-610.
Eisner T, Eisner M, Hoebeke RE. 1998. When defense backfires: Detrimental effect of a
plant's protective trichomes on an insect beneficial to the plant. Proceedings of the
National Academy of Sciences (USA), 95: 4410-4414.
El-Khawas MAM, EI-Khawas SAM. 2008. Interactions between Aphis gossypii (Glov.) and
the common predators in eggplant and squash fields, with evaluating the
physiological and biochemical aspects of biotic stress induced by two different aphid
species, infesting squash and cabbage plants. Australian Journal of Basic and
Applied Science, 2: 183-193.

References: 78
Elzinga DA, Jander G. 2013. The role of protein effectors in plant-aphid interactions.
Current Opinion in Plant Biology, 16: 451-456.
Engelberth J, Alborn HT, Schmelz EA, Tumlinson JH. 2004. Airborne signals prime
plants against insect herbivore attack. Proceedings of the National Academy of
Sciences (USA), 101: 1781-1785.
Farha-Rehman, 2008. Studies on plant signals and responses to herbivory. M.Phil.
dissertation, AMU. Aligarh.
arha-Rehnian, Khan FA, Anis SB, Badruddin SMA. 2010. Plant defenses against insect
herbivory. In: Integrated Management of Arthropods and Insect Borne Disease.
Ciancio A, Mukerji KG (eds.). IPM Series Springer Verlag. Netherlands. Vol. 5 Pp.
186-204.
Farha-Rehman, Khan FA, Badruddin SMA. 2012a. Role of phenolics in plant defenses
against insect herbivory. In: Chemistry of Phytopotentials: Health , Energy and
Environmental Prospectives. Srivastava MM, Khemani LD, Srivastava S. (eds.). e-
book. Springer, Berlin, Heidelberg. Pp. 309-313.
Farha-Rehman, Khan FA. Anis SB. 2012b. Plant signals and responses to herbivory — an
insight. Lap Lambert Academic Publishing GmbH & Co. KG. SaarbrUcken,
Germany.
Farmer EE, Rayan CA. 1992. Octadecanoid precursors of jasmonic acid activate the
synthesis of wound-inducible proteinase inhibitors. Plant Cell, 4: 129-134.
Fernandes GW. 1994. Plant mechanical defenses against insect herbivory. Revista Brasileira
de Entomologia, 38: 421-433.
Ferry N, Edwards GM, Gatehouse AJ, Gatehouse AMR. 2004. Plant-insect interactions:
molecular approaches to insect resistance. Current Opinion in Biotechnology, 15:
155-161.
Fiske CH, SubbaRao Y. 1925. The colorimetric determination of phosphorus. Journal of
Biological Chemistry, 66: 375-400.
Forno 1W, Semple JL. 1987. Response of Salvinia molesta to insect damage: changes in
nitrogen, phosphorus and potassium content. Oecologia, 73:71-74.
Franceshi VR, Krokene P, Christiansen E, Krekling T. 2005. Anatomical and chemical
defenses of conifer bark against bark beetles and other pests. New Phytologist, 167: 353-375.

References: 79
Fritz, VA, Justen VL, Bode AM, Schuster T, Wang M. 2010. Glucosinolate enhancement
in cabbage induced by jasmonic acid application. Hortscience, 45: 1188-1191.
Fujita 1', Fujita M, Yamaguchi-Shinozaki K, Shinozaki K. 2009. Transcription factors
involved in the crosstalk between abiotie and biotic stress-signalling networks. In:
Signal Crosstalk in Plant Stress Responses. Yoshioka IC, Shinozaki K (eds.). Wiley-
Blackwell. Pp. 43-58.
Fureb ACU, van Del AJE, Fricker MD, Felle MI, Fuchs NI, Halke .IB. 2009. Sieve
element as Cat+ channels as relay stations between remote stimulus and sieve-tube
occlusion. Plant Cell, 21: 2118-2132.
Futuyma DJ, Malkin M. 1903. Coevolution. Sunderland, Mass. Sinauer Associates, Inc.
Gao LL, Anderson JP, Klingler JP, Nair BM, Edwards OR, Singh KB. 2007.
Involvement of the octadeeanoid pathway in bluegreen aphid resistance in Medicago
truncatula. MPMI. 20: 82-93
Gao X, Wang X, Lu Y, Zhang L, Shen 1, Liang Z, Zhang D. 2004. Jasmonic acid is
involved in the water stress induced betaine accumulation in pear leaves. Plant Cell
and Environment, 27: 5497-5507.
Gatehouse JA. 2002. Plant resistance towards insect herbivores: A dynamic interaction. New
Phylalogia: 156: 145-169.
Ginzberg I. 2008. Wound-periderm formation. In: Induced plant resistance to herbivory.
Schaller A. (ed.). Springer. Pp. 131-146.
Giordanengo P, Brunissen L, Rusterucci C, Vincent C, van Bel A, Dinant 5, Girousse C,
Faucher M, Jean-Louis B. 2010. Compatible plant-aphid interactions: how aphids
manipulate plant responses. Comptes Rendus Biologies, 333: 516 — 523.
Girling RD, Madison R, Hassall M, Poppy GM, Turner JG. 2008. Investigated the plant
biochemical wound response pathways involved in the production of aphid-induced
plant volatiles. Journal of Experimental Botany, 59: 3077-3085.
Cog L, Berenbaum MR, DeLucia EH, Zangerl AR. 2005. A utotoxic effects of essential
oils on photosynthesis in parsley, parsnip, and rough lemon. Chemoecology, 15: 115-
119.
Goggin FL, 2007. Plant—aphid interactions: molecular and ecological perspectives. Current
Opinion in Plant Biology, 10: 399-408.

References: 80
Golawska S, Krzyianowski R, Lukasik I. 20L0. Relationship between aphid infestation and
chlorophyll content in fabaceae species. Acta Biologica Cracoviensi a Series Botanic;
52: 76-80.
Golawska S. 2007. Deterrence and toxicity of plant saponins for the pea aphid Acyrthosiphon
pisum Harris. Journal of Chemical Ecology, 33: 1598-1606.
Gonzales GL, Ramirez CC, Olen N, Niemeyer HM .'2002. Host plant changes production
by the aphid Srpha liana: consequences for aphid feeding behavior and growth.
Entomologia Fxperimental is et Applicata. 103: 107-113.
Griswold CL. 1953. Transmission of the oak wilt fungus by the panace fly. Journal of
Economic Entomology, 46: 1099-1100.
Guerrieri E, Digilio MC. 2008. Aphid-plant interactions. Journal of Plant Interactions, 3:
223-232.
Gutterman Y, Chauser-Yolfson E. 2000. The distribution of the phenolic metabolites
barbaloin, aloeresin and aloenin, as a peripheral defense strategy in the succulent leaf
parts of Aloe urborescens. Bioehemeal Systemics and Ecology, 28: 825-838.
Haglund MB. 1980. Proline and valine cues which stimulate grasshopper herbivory
during drought stress. Nature. 288: 697-698.
Hald PM. 1947. The flame photometer for the measurement of sodium and potassium in
biological materials. Journal of Biological Chemistry, 167: 499-510
Hare JD, Elle E 2002. Variable impact of diverse insect herbivores on dimorphic Dalura
wrightii. Ecology, 83: 2711-2720.
Hare PD, Cress WA, 1997. Metabolic implications of stressed—induced proline accumulation
in plants. Plant Growth Regulation, 21: 79-102.
Harmel N, Letocart F, Cherqui A, Giordanengo P, Mazzuechelli G, Guillonneau F,
Pauw ED, Haubruge E, Francis F. 2008. Identification of aphid salivary proteins: a
proteomic investigation of Myzur persicae. Insect Molecular Biology, 17: 165-174.
Hartley SE, Firm RD. 1989. Phenolic biosynthesis, leaf damage, and insect herbivory in birch (Betula pendukr). Journal Chemical Ecology, 15: 275-283.
Heil M, Koch T, Hilpert A, Fiala B, Roland W, Linsenmair ICE. 2001. Extrafloral nectar
production of the ant-associated plant Macaranga tanarius is an induced indirect
defensive response elicited by jasmonic acid. Proceedings of the National Academy
of Sciences of the United Slates of America, 98: 1083— 1088.

References: 81
Heil M. 2004. Induction of two indirect defenses benefits lima bean (Phaseolus lunatus
Fabaceae) in nature. Journal of Ecology, 92: 527-536.
Heng-Moss TM, Ni X, Macedo T, Markwell 11', Baxendale FP, Quisenberry SS, Tolmay
V. 2003. Comparison of chlorophyll and carotenoid concentrations among Russian
wheat aphid (Homoptera: Aphididae)-infested wheat isolines. Plant Resistance, 96:
475-481.
Ilodek I, Houck A. 1996. Ecology of Coceincllidae.: Kluwer Academic Publishers,
Dordrecht Boston, London, Pp. 464.
Howe G, Jander G. 2008. Plant immunity to insect herbivores. Annual Review of Plant
Biology, 59: 41-66.
Howe GA, Schaller A. 2008. Direct defenses in plants and their induction by wounding and
insect herbivores. In: Induced Plant Resistance to Herbivory. Schaller A. (ed.).
Springer. Pp. 7-29.
Islam MM, Ilossain MA, Jannat R, Munemasa 5, Nakamura 1', Mori IC, Murata Y.
2010. Cytosolic alkalization and cytosolic calcium oscillation in Arabiclopsis guard
cells response to ABA and McJA. Plant Cell and Physiology, 51: 1721-1730.
Jahangir M, Abdel-Farida 13I, Kim UK, Choi YH, Verpourtea R. 2009. Healthy and
unhealthy plants: The effect of stress on the metabolism of Brassicaceae.
Environmental and Experimental Botany, 67: 23-33.
Jamalumidi F, Sarmad J, Jamalomidi M. 2013. Changes caused by methyl jasmonate in
cocker 347- A cultivar of tobacco (Nicotiana tabacurn L.) under salinity stress.
International Research Journal of Applied and Basic Sciences, 4: 1139-1145.
Janave MT. 1997. Enzymatic degradation of chlorophyll in cavandish bananas: in-vitro
evidence for two independent degradation pathways. Plant Physiology and
Biochemistry, 35: 837-846.
„tang Soo-Won, Lee In-Jung, Cha Kwang-Ho, Shin Seung-Ku, JO Chun-Joon. 2008.
Effects of methyl jasme nate application on the growth of tobacco (Nicatiana tahacum
L.) against salinity stress. Coresta Congress in Shanghai, China Agronomy and
Phytopathology.
John LW, Jamer DB, Samuel LT, Warner LW, 2004. Soil fertility and fertilizers: An
introduction to nutrient management pearson education, India. Pp. 106-153.
Jones JDG, Dangl JL. 2006. The plant immune system. Nature. 444: 323-329.

References: 82
Juniper BE, Bradley DE 1958, The carbon replica technique in the study of the
ultrastructure of leaf surfaces. Journal of Ultrastructure Research, 21: 16-27.
Kaber S, Ratul HS. 1992. Screening or some Brassiou species and their strains for resistance
to mustard aphid, based on aphid population. Indian Journal of Entomology, 54: 217-
221.
Kaloshian I, Walling LL 2005. Hemmterans as plant pathogens. Annual Reviews of Plant
Biology, 43:491-521.
Karban R, Agrawal AA, Thaler JS, Adler LS 1999. Induced plant responses and
information content about risk of herbivory. I rends in Ecology and Evolution, 14:
443-447.
Karban R, Baldwin IT. 1997. Induced responses to herbivory. Chicago University Press
Chicago.
Karkkainen K, Lee G. Agren J. 2004. Population structure in Arabidopsis lyrata: evidence
for divergent selection on trichome production. Evolution. 58: 2831-2836
Kavi Kishor PR, Sangam S, Amrutha RN, Sri Lanni P, Makin KR, Rao KRSS, Rao
S, Reddy KJ, Theriappan P, Sreenivasulu N. 2005. Regulation of proline
biosynthesis, degradation, uptake and transport in higher plants: lts implications in
plant growth and abiotic stress tolerance. Current Science, 88:3-10.
Kazana E, Pope TW, Tibbles L, Bridges M, Pickett JA, Bones AM, Powell G, Rossiter
JT. 2007. The cabbage aphid: A walking mustard oil bomb. Proceedings of the Royal
Society, London B. 274: 2271-2277.
Kehr J. 2006. Phloem sap proteins: their identities and potential roles in the interaction
between plants and phloem-feeding insects. Journal of Experimental Botany, 57:
767-774.
Kessler A, Baldwin 11. 2002. Plant responses to insect herbivory: the emerging molecular
analysis. Annul Reviews of Plant Biology, 53: 299-328.
Khattab H. 2005. Responses of Eucalypt trees to the insect feeding (gall forming
psy I lid). International Journal of Agricultural Biology 7: 979-984.
Khattab H. 2007. The defense mechanism of cabbage plain against phloem sucking aphid
(Brevieorywe brassicae L.). Australian Journal of Basic and Applied Sciences 1:
56-62.

References: 83
Khokon MAR, Jahan MS, Rahman T, Hossain MA, Muroyama D, Minami 1,
Munemasa S, Mori IC, Nakamura Y, Murata Y. 2011. Ally' isothiocyanate
(AITC) induces stomata' closure in Arabic/a/Avis. Plant Cell and Environment, 34:
1900-1906.
Kim JH, Jander G. 2007. Myzus persicae (green peach aphid) feeding on Arabidopsis
induces the formation of a deterrent indole glucosinolate. Plant Journal, 49: 1008-
1019.
Kliebenstein DJ, Figuth A, Mitchell-Olds T. 2002. Genetic architecture of plastic methyl
jasmonate responses in Arabidopsis thaliana. Genetics 161: 1685-1696.
Klingler J, Powell G, Thompson GA, Isaacs R. 1998. Phloem specific aphid resistance in
Cucumis melo line AR5: effects on feeding behaviour and performance of Aphis
gossypi. Entomologia Experimentalis et Applicata, 86: 79-88.
Knoblauch M, Peters WS, Ehlers K, van Bel AJE. 2001. Reversible calcium-regulated
stopcocks in legume sieve tubes. Plant Cell, 13: 1221-1230.
Knoblauch M, van Bel AJE. 1998. Sieve tubes in action. Plant Cell. 10: 35-50.
Kohl DH, Kennelly EJ, Zhu YX, Schubert KR, Shearer C. 1991. Proline accumulation,
nitrogenase (C2H2 reducing) activity and activities of enzymes related to proline
metabolism in drought-stressed soybean nodules. Journal of Experimental Botany,
42: 831-837.
Korth KL, Thompson GA. 2006. Chemical signals in plants: Jasmonates and the role of
insect-derived elicitors in responses to herbivores. In: Multigenic and induced
systemic resistance in plants. Tuzun S, Bent E (eds). Springer Inc. Pp. 259-278.
Krits P, Fogelman E, Ginzberg I. 2007. Potato steroidal glycoalkaloid levels and the
expression of key isoprenoid metabolic genes. Planta 227: 143-150.
Kissen R, Rossiter JT, Bones AM. 2009. The 'mustard oil bomb': not so easy to assemble?
Localization, expression and distribution of the components of the myrosinase
enzyme system. Phytochemistry Reviews 8: 69-86.
Kumari GJ, Reddy AM, Naik ST, Kumar SG, Prasanthi .1, Sriranganayakulu G, Reddy
PC. 2006. Jasmonic acid induced changes in protein pattern, anti-oxidative enzyme
activities and peroxidase isozymes in peanut seedlings. Biologia Plantarum, 50: 219-
226.
References: 84
Kunnierczyk A, Diem HTT, Per W, Tommy SJ, John CR, Joanna T, Atle MB. 2011.
Testing the importance of jasmonate signalling in induction of plant defences upon
cabbage aphid (Brevicoryne brassicae) attack. BMC Cienomics, 12: 423.
Kuinierczyk A, Winge P, Jnrstad TS, Troczytiska J, Rossiter JT, Bones AM. 2008.
Towards global understanding of plant defence against aphids-timing and dynamics
of early Arabidopsis responses to cabbage aphid (Brevicoryne brassicae) attack.
Plant, Cell and Environment, 31: 1097-1115.
Kuzentsov VV, Shevyakova NI. 1997. Stress responses of tobacco cells to high temperate
and salinity. Praline accumulation and phosphorylation of polypeptides. Physiologia
Plantarum, 100: 320-326.
Lamhrix V, Reichelt M, Mitchell-Olds T, Kliebenstein DJ, Gershenzon J. 2001. The
Arabidopsis epiihiospecificr protein promotes the hydrolysis of glucosinolates to
nitrites and influences Trichoplusia ni herbivory. Plant Cell, 13: 2793-807.
Layton MB, Smith HR, Andrews GL. 1996. Cotton aphid infestations in Mississippi:
efficacy of selected insecticides and impact on yield. In: Proceedings 1996 Beltwide
Cotton Conf National Cotton Council Memphis TN. Pp. 892-893.
Leitte GLD, Mane') M, Jham GN, Moreira MD. 2005. Ben2isia !abaci, Brevicoryne
brassicae and Thrips %abaci abundance on Brassica oleracect var. acephala.
Pesquisa Agropecuaria Brasileira, 40: 197-202.
Levin DA. 1973. The role of triehomes in plant defence. The Quarterly Review of Biology,
48: 3-15.
Li V, Hill CB, Hartman CL. 2004. Effect of three resistant soybean genotypes on the
fecundity, mortality, and maturation of soybean aphid (Homoptera: Aphididae).
Journal of Economic Entomology, 97: 1 I 06- I I ,
Liehtenthaler HK, Buschmann C. 2001. Extraction of photosynthetic tissues: Chlorophylls
and carotenoids. In: Current protocols in food analytical chemistry. John Wiley &
Sons, Madison, Pp. F4.2.1-F4.2.6.
Lindner RC. 1944. Rapid analytical methods for some of the more common inorganic
constituents of the plant tissues. Plant Physiology, 19: 76-89.
Linsenmair ICE, Davis AJ, Flab B, Speight MR. (eds.) 2001. Tropical Forest Canopies:
Ecology and Management. Kluwer Academic Publishers Dordrecht. Pp.74.

References: 85
Liu Y, Wang WL, Guo GX, Ji XL. 2009. Volatile emission in wheat and parasitism
by Aphidius avenae after exogenous application of salivary enzymes of
Sitobion avenae. Entomologia Experimentalis et Applicata, 130: 215-21.
Louis J, Shah J. 2013. Arabidopsis thaliana-Myzus persicae interaction: shaping the
understanding of plant defense against phloem-feeding aphids. Frontiers in Plant
Science, 4: 213,1-18.
Lowry OH, Rosenbrough NJ, Farr AL, Randall R.I. 1951. Protein measurement with the
folin phenol reagent. Journal of Biological Chermistry, 193: 265-275.
Ma R, Reese JC, Black WC, Bramel-Cox P. 1990. Detection of pectinesterase and
polygalacturonase from salivary secretions of living greenbugs, Schizaphis graminum
(Homoptera: Aphididae). Journal of Insect physiology, 36: 507-512.
Mackerness SAH, Surplus SL, Blake P, John CF, Buchanan-Wollaston V, Jordan BR,
Thomas B. 1999. Ultraviolet-B-induced stress and changes in gene expression in
Arabidopsis thaliana: Role of signalling pathways controlled by jasmonic acid,
ethylene and reactive oxygen species. Plant Cell and Environment, 22: 1413-1423.
Malick CP, Singh MB. 1980. In: Plant Enzymology and Histo-Enzymology. Kalyani
Publishers, New Delhi. Pp. 286.
Malik RS, Anand IJ. 1984. Effect of aphid infestation on the oil yielding attributes in
Brassica. Journal of Oilseeds Research, 1: 147-155.
Mandal SMA, Mishra RK, Patra AK. 1994. Yield loss in rapeseed and mustard due to
aphid infestation in respect of different cultivars and dates of sowing. Orissa Journal
of Agricultural Research, 7: 58-62.
Mariotti A, Mariotti F, Champigny ML, Amarger N, Moyse A. 1982. Nitrogen isotope
fractionation associated with nitrate reductase activity and uptake of NO3' by pearl
millet. Plant Physiology, 69: 880-884.
Marrow P, Dieckmann U, Law R. 1996. Evolutionary dynamics of predator-prey systems:
an ecological perspective. Journal of Mathematical Biology. 34: 556-578
Martin B, Collar J, Tjallingii W, Fereres A. 1997. Intracellular ingestion and salivation by
aphids may cause the acquisition and inoculation of non-persistently transmitted plant
viruses. Journal of General Virology, 78: 2701-2705.

References: 86
Maslenkova LT, Miteva TS, Popova LP. 1992. Changes in the polypeptide patterns of
barley seedlings exposed to jasmonic acid and salinity. Plant Physiology, 98: 700-
707.
N1athur V. 2012. Temporal dynamics of induced responses in Brassica juncea. PhD thesis
Wageningen University Wageningen Netherlands.
McConn M, Creelman RA, Bell E, Mullet JE, Browse J. 1997. Jasmonate is essential for
insect defense in Arabidopsis. Proceedings of the National Academy of Sciences, 94:
5473-5477.
NIewis I, Khan MAM, Glawischnig E, Schreiner M, Ulrichs C. 2012. Water Stress and
aphid feeding differentially influence metabolite composition in Arabidopsis thaliana
(L.). PLoS ONE 7: e48661-1-15 .
Mewis I, Tokuhisa JG, Schultz JC, Appel HM, Ulrichs C, Gershenzon J. 2006. Gene
expression and glucosinolate accumulation in Arabidopsis thaliana in response to
generalist and specialist herbivores of different feeding guilds and the role of defense
signaling pathways. Phytochemistry, 67: 2450-2462.
Meyer A, Miersch 0, Bultner C, Dathe W, Sembdner G. 1984. Occurrence of the plant
growth regulator jasmonic acid in plants. Journal of Plant Growth Regulation, 3: 1-8.
Meyer R, Rautenbacb GF, Dubery IA. 2003. Identification and quantification of methyl
jasmonate in leaf volatiles of Arabidopsis thaliana using solid-phase microextraction
in combination with gas chromatography and mass spectrometry. Phytochemical
Analysis, 14: 155-159.
Miles PW, Peng Z. 1989. Study on salivary physiology of plant bugs: detoxification of
phytochemicals by the salivary peroxidase of aphids. Journal of Insect Physiology,
36: 507-512. 23
Miles PW. 1999. Aphid saliva. Biological Reviews, 74: 41-85.
Mochiah MB, Baidoo PK, Owusu-Akyaw M. 2011. Influence of different nutrient
applications on insect populations and damage to cabbage. Journal of Applied
Biosciences, 38: 2564-2572.
Moran PJ, Thompson GA. 2001. Molecular responses to aphid feeding in Arabidopsis in
relation to plant defense pathways. Plant Physiology, 125: 1074-1085.

References: 87
Morkunas I, Bednarski W. 2008. Fusarium oxysporum induced oxidative stress and
antioxidative defenses of yellow lupine embryo axes with different level of sugars.
Journal of Plant Physiology, 165: 262-277.
Morkunas I, Mai VC, Gahrys B. 2011. Phytohormonal signaling in plant responses to aphid
feeding. Acta Physiologiae Plantarurn, 33: 2057-2073.
Mossier MA. 2005. Florida Crop/Pest Management Profile: Specialty Brassicas (Arrugula
Bok Choy Chinese Broccoli Chinese Mustard Napa) PI-70 Pesticide Information
Office University of Florida USA.
Muller C. 2008. Resistance at the plant cuticle. In: Induced plant resistance to herbivory. A.
Schaller (ed.). Springer. Pp. 107-129.
Munemasa S, Oda K, Watanabe-Sugimoto M, Nakamura Y, Shimusbi Y, Murata Y.
2007. The coronatine insensitive I mutation reveals the hormonal signaling interaction
between abscisic acid and methyl jasmonate in Arahidnpsis guard cells. Specific
impairment of ion channel activation and second messenger production. Plant
Physiology, 143: 1398-1407.
Murata 11, Pei ZM, Mori IC, Schroeder II. 2001. Abscisic acid activation of plasma
membrane Cat - channels in guard cells requires cytosolic NAD(P)H and is
differentially disrupted upstream and downstream of reactive oxygen species
production in abiI-1 and abi2-I protein phosphatase 2C mutants. The Plant Cell, 13:
2513-2523.
Mutikainen P, Walls NI, Ovaska J, Kcinanen M, Julkunen-Tiitto R, Vapaavouri E. 2000.
Herbivore resistance in Retula penduth: effect of fertilization, defoliation and plant
genotype. Ecology, 81: 49-65.
Matti NS, Park Y, Reese JC, Reeck GR. 2006. RNAi knockdown of a salivary transcript
leading to lethality to pea aphid, Acyrthosiphon pisum. Journal of Insect Science, 6:
Article no. 38.
Mutti NS, Park Y, Reese JC, Reeck GR. 2008. A protein from the salivary glands of the
pea aphid, Acyrthosiphon pisum, is essential in feeding on a host plant. Proceedings
of Natural Academy of Sciences USA, 105: 9965-9969.
Nabity PD, Zavala JA, DeLucia Eli. 2009. Indirect suppression of photosynthesis on
individual leaves by arthropod herbivory. Annals of Botany 103: 655463.

References: 88
Nabity PD, Zavala JA, DeLucia Ell. 2013. Herbivore induction of jasmonic acid and
chemical defences reduce photosynthesis in Nicaticma attenuate. Journal of
Experimental Botany, 2: 64 685-694:
Novozamsky I, Houha V.IG, van Eck R, van York W. 1983. A novel digestion technique
for multi-clement plant analysis. Communications in Soil Science and Plant Analysis,
14: 239-248.
Ohrycki JJ, Tauber MJ. 1984. Natural enemy activity on glandular pubescent potato plants
in the greenhouse: An unreliable predictor of effects in the field. Environmental
Entomology, 13: 679-683.
Oncel I, Ustun AS, Keles Y, 1996. Proline accumulation in peppers (Capsicum annuum L.)
resistant and susceptible to root rot (Phytophillora capsici !eon.). Turkish Journal of
Botany, 20: 489-95.
Pareja M, Qvarfordt E, Webster B, Mayon P, Pickett 3, Rirkett M, Glinwood R. 2012.
Ilerbivory by a phloem-feeding insect inhibits floral volatile production. PLoS ONE
7: e31971-1- II.
Park KC, Hardie J. 2002. Functional specialisation and polyphenism in aphid olfactory
sensilla. Journal of Experimental Biology, 48: 527-535.
Park SJ, Huang V, Ayoub; P. 2006. Identification of expression profiles of sorghum genes
in response to greenbug phloem feeding using cDNA subtraction and microarray
analysis. Planta, 223: 932-947.
Parsa S, Sotelu G, Cardona C. 2011. Characterizing herbivore resistance mechanisms:
spittlebugs on Brachiaria spp. as an example. Journal of Visualised Experiments, Pp.
e3047.
Pegadaraju V, Louis J, Singh V, Reese K, Bautor J, Feys B3, Cook C, Parker JF., Shah
J. 2007. Phloem-based resistance to green peach aphid is controlled by Arabilops is
phytoalexin deficient4 without its signaling partner enhanced disease susceptibility.
The Plant Journal. 52: 332-341.
Pitino M, Hogenhout SA, 2013. Aphid protein effectors promote aphid colonization in a
plant species-specific manner. Molecular Plant Microbes Interaction, 26: 130-139.
Ponder KL, Pritchard J, Harrington R, Bale JS. 21101. Feeding behavior of the aphid
Rhopalociphum padi (Hemiptera: Aphididae) on nitrogen and water-stressed barley
(Hordeurn vulgare) seedlings. Bulletin of Entomological Research, 91: 125-130.

References: 89
Pontoppidan B, Hopkins R, Rask L, Meijer J. 2005. Differential wound induction of
the myrosinase system in oilseed rape (Brassica napus) contrasting insect damage
with mechanical damage. Plant Science, 168: 715-722.
Poonam S, Kaur H, Geetika S. 2013. Effect of jasmonic acid on photosynthetic pigments
and stress markers in Cajanus cajan (L.) Millsp. Seedlings under copper stress.
American Journal of Plant Sciences, 4: 817-823.
Pope TW, Kissen R, Grant M, Pickett JA, Rossiter JT, Powell G. 2008. Comparative
innate responses of the aphid parasitoid Diaeretiella rapae to alkenyl glucosinolate
derived isothiocyanates, nitrites, and epithionitriles. Journal of Chemical Ecology, 34:
1302-1310.
Popova LE, Ananieva V, Hristova K, Christov K, Georgieva V, Alexieva-Zh S. 2003.
Salicylic acid and methyl jasmonate-induced protection on photosynthesis to paraquat
oxidative stress. Bulgarian Journal of Plant Physiology. Special issue 133-152.
Powell G, Tosh CR, Hardie J. 2006. Host plant selection by aphids: Behavioral,
evolutionary, and applied perspectives. Annual Review of Entomology, 51: 309-330.
Prakash S. 1980. Cruciferous oilseeds in India. In: Brassica Crops and Wild Allies: Biology
and Breeding. Tokyo. Tsunoda S, Hinata K, Gomez-Campo C. (eds.). Japan Scientific
Societies Press, Tokyo. Pp.151-163.
Ran MM, Zemetra RS, and Quisenberry SS. 1996. Interaction between Russian wheat
aphid (Homoptera: Aphididae) and resistant and susceptible genotypes of wheat.
Journal of Economic Entomology, 89: 239-246.
Rakwal R, Komatsu S. 2001. Jasmonic acid-induced necrosis and drastic decreases in
ribulose 1, 5-bisphosphate carboxylase/oxygenase in rice seedlings under light
involves reactive oxygen species. Journal of Plant Physiology, 158: 679-688.
Rautio P, Markkola A, Martel J, Tuomi J, Harma E, Kuikka K, Siitonen A, Riesco IL,
Roitto M. 2002. Developmental plasticity in birch leaves: defoliation causes shift
from glandular to nonglandular trichomes. Oikos, 98: 437-446.
Redman AM, Cipollini 1)F, Schultz JC. 2001. Fitness costs of jasmonicacid-induced
defense in tomato, Lycopersicon esculentum. Oecologia, 126: 380-385.
Ridley CE, Hangelbroek HH, Wagenius S, Stanton-Geddes J, Shaw RG. 2011. The effect
of plant inbreeding and stoichiometry on interactions with herbivores in nature:
Echinacea angustifolia and its specialist aphid. PLoS ONE, 6: e24762.

References: 90
Rnhwer CL, Erwin JE. 2006. Irradiance and photoperiod effects on methyl jasmonate
synthesis in Artemisia spp. Acta Horticulturae, 711: 375-380.
Rohwer CL, Envin JE. 2008. Horticultural applications of jasitionates: A review. Journal of
Horticultural Science and Biotechnology, 83: 283-3M.
Romeis J, Shanower TG, Peter AJ. 1994. Trichomes on Pigeonpea [Ccilanus cajan (L.)
Millsp.] and two wild Cajanaus spp. Crop Sci. 39: 564-569.
Room PM and Thomas PA, 1986. Nitrogen, phosphorus and potassium in Salvinia molesta
Mitchell in the field: effects of weather, insect damage, fertilizers and age. Aquat.
Bot. 24: 213-232.
Rosenheim JA, Wilhiot LR, Goodell PB, Grafton-Cardwell EE, Leigh TF. 1997. Plant
compensation natural biological control and herbivory by Aphis gossypii on pre48
reproductive cotton: the anatomy of a non-pest. Entomologia Experimentalis Cl.
Applicata, 85: 45-63.
Sack L, Holbrook NM. 2006. Leaf hydraulics. Annual Review of Plant Biology, 57:
361-381.
Sadek R.Z, Elbanna SM, Semida FM. 2013. Aphid-host plant interaction. Open Journal of
Animal Sciences, 3: 16-27
Salzman RA, Brady JA, Fittlayson SA, Buchanan CD, Summer EJ et al. 2005.
Transcriptional profiling of sorghum induced by methyl jasmonate, salicylic
acid, and aminocyclopropane carboxylic acid reveals cooperative regulation
and novel gene responses. Plain Physiology, 138: 352-368.
Samuels L, Kunst L, Jetter R. 2008. Sealing plant surfaces: Cuticular wax formation by
epidermal cells. Annual Review of Plant Biology, 59: 683-707.
Santiago R, Butron A, Amason JT, Reid LM, Souto XC, Malvar RA. 2006. Putative role
of cell wall phenylpropanoids in Sesamia noonagrioides (Lepidoptera: Noctuidae)
resistance. Journal of Agricultural and Food Chemistry, 54: 2274-2279.
Santiago R, Malvar RA, Baamunde MD, Revilla P, Suuto XC. 2005. Free phenols in
maize pith and their relationship with resistance to Sesatnia nonagrioides
(Lepidoptera: Noctuidae) attack. Journal of Economic Entomology, 98: 1349-1356.
Schat H, Sharma SS, Vooijs R. 1997. Heavy metal-induced accumulation of free proline in
a metal-tolerant and a non-tolerant ecotype ofSitene vulgaris. Physiologia Plantarum,
101: 477-482

References: 91
Schoonhoven LM, Jermy T, Van Loon JJA. 1998. Insect-plant biology: From physiology
to evolution. (Chapman and Hall, London). Pp. 409.
Schoonhoven LM, van Loon JJA, Dicke M. 2005. Insect-plant biology. (Oxford University
Press). II edition Pp 1-440
Schroeder JI, Kwak JM, Allen GJ. 2001. Guard cell abscisic acid signaling and engineering
drought hardiness in plants. Nature 410: 327-330.
Sekhon BS. 1999. Population dynamics of Lipaphis erysimi and Myzus persicae on different
species of Brassica. 10th International Rapeseed Congress Canberra, Australia.
Serrano R, Gaxiola R, 1994. Microbial models and salt stress tolerance in plants. Critical
Reviews in Plant Science, 13: 121-138.
Singhl P, Sinhal VK. 2011. Effect of Aphid infestation on the Biochemical Constituents of
mustard (Brassica juncea) plant. Journal of Phytology, 3: 28-33.
Singla SL, Grover A. 1994. Detection and quantitation of a rapidly accumulating and
predominant 104 kDa heat shock polypeptide in rice. Plant Science, 97: 23-30.
Smith CM, Boyko EV. 2007. The molecular bases of plant resistance and defense responses
to aphid feeding: current status. Entomologia Experimentalis et Applicata, 122: 1-16.
Southwood SR. 1986. Plant surfaces and insects — an overview. In: Insects and the plant
surface. Juniper B, Southwood SR (eds.). Arnold, London. Pp 1-22.
Spiller NJ, Koenders L, Tjallingii WF. 1990. Xylem ingestion by aphids: a strategy for
maintaining water balance. Entomologia Experimentalis et Applicata, 55: I01-104.
Steppuhn A, Baldwin IT. 2008. Induced defenses and the cost-benefit paradigm. In:
Induced Plant Resistance to Herbivory. Schaller A. (ed.). Springer. Pp. 61-88.
Styrsky JD, Kaplan I, Eubanks MD. 2006. Plant trichomes indirectly enhance tritrophic
interaction involving a generalist predator, the red imported fire ant. Biological
Control, 36: 375-384.
Swati, ZA. 2005. Genetic improvement of Brassica oilseed by integrated use of conventional
and molecular biological approaches. Instt. of Biotech. and Genetic Engg. The Univ.
of Agric. Peshawar Pakistan. Project Final Compl. Rep. of ALP Project. 33p.
Syers JK, Mackay AD, Brown MW, Currie CD, 1986. Chemical and physical
characteristics of phosphate rock materials of varying reactivity. Journal of the
Science of Food and Agriculture, 37: 1057-1064.

References: 92
Sylvia G, Bogumila L, Wieslaw 0. 20(16. Effect of low and high-saponin lines of alfalfa on
pea aphid. Journal of Insect Physiology, 52: 737-743.
Szabados L, Savour A. 2009. Frac: a multifunctional amino acid. Trends in Plant Science
15:89-97.
Teare ID, Peterson C.1, Law AG. 1971. Size and frequency of leaf stomata in cultivars of
Triticum aestivum and other Trilicum species. Crop Science, 11: 496-49E.
Tetang A, Sanstrom .1, Dyreson E, Moran NA. 1.999, Feeding damage by Diuraphis noxia
results in a nutritionally enhanced phloem diet. Entomologia Experimentalis et
Applicata. 91: 403-412.
Thaler JS, Fang MA, Parepaul W, Dicke M. 2002. Jasmonate-deficient plants have
reduced direct and indirect defences against herbivores. Ecology Letters, 5: 764-
774.
Thaler .IS. 1999b. Induced resistance in agricultural crops: Effect of jasmonic acid on
herbivory and yield in tomato plants. Environmental Entomology, 28: 30-37.
Thompson GA, Coggin FL. 2006. franscriptomics and functional genumics of plant defence
induction by phloem-feeding insects. Journal of Experimental Botany, 57: 755-766.
Tian M, Hanley AB, Dodds MINT. 2013. Allyl isothiocyanate from mustard seed is
effective in reducing the levels of volatile sulfur compounds responsible for intrinsic
oral malodor, Journal of Breath Research, 7026001 (8pp) doi:10.1088/1752-
7155/7/2/026001.
Tjallingii WF, Bogen Esch T. 1993. Fine structure of aphid stylet routes in plant tissues in
correlation with EPG signals. Physiological Entomology, 18: 317-328.
Tjallingii WF. 2006. Salivary secretions by aphids interacting with proteins of phloem
wound responses. Journal of Experimental Botany, 57: 739-745.
Traw MB, Dawson TE. 2002. Reduced performance of two specialist herbivores
(Lepidoptera: Pieridae, Coleoptera: Chrysomelidae) on new leaves of damaged black
mustard plants. Environmental Entomology, 31: 714-722.
Treutter D. 2005. Significance of flavonoids in plant resistance and enhancement of -their biosynthesis. Plant Biology, 7: 581-591.
Tsonev TD, Lazova GN, Stoinova- Zh G, Pupuva LP. 1998. A possible role for jasmonic
acid in adaptation of barley seedlings to salinity stress. Journal of Plant Growth
Regulation. 17: 153-159.

References: 93
Tukey HB. 1970. The leaching of substances from plants. Annual Review Plant Physiology,
21: 305-324.
van Kleunen M, Ramponi G, Schmid B. 2004. Effects of herbivory simulated by clipping
and jasmonic acid on Solidago Canadensis. Basic and Appl. Ecol, 5: 173-181.
Van Poecke RMP, Dicke M. 2002. Induced parasitoid attraction by Arabidopsis thaliana:
involvement of the octadecanoid and the salicylic acid pathway. Journal of
Experimental Botany, 53: 1793-1799.
Van Poecke RMP, Dicke M. 2004. Indirect defense of plants against herbivores using
Arabidopsis thaliana as a model plant. Plant Biology, 6: 387-401.
Vanrensburg L, Kruger GHJ, Kruger RH. 1993. Proline accumulation as drought
tolerance selection criterion: Its relationship to membrane integrity and chloroplast
ultrastructure in Nicoliana tabacum L. Journal of Plant Physiology, 141: 188-194
Verheggen FJ, Haubruge EDe Moraes CM, Mescher MC. 2013. Aphid responses to
volatile cues from turnip plants (Brassica rapa) infested with phloem-feeding and
chewing herbivores. Arthropod-Plant Interactions. 7: 567-577
Vickers L. 2011. Aphid responses to drought: a combined physiological and transcriptomic
approach. Ph.D thesis, the University of Birmingham.
Voelckel C, Weisser WW, Baldwin IT. 2004. An analysis of plant— aphid interactions by
different microarray hybridization strategies. Molecular Ecology, 13: 3187-3195.
Walling LL. 2000. The myriad plant response to herbivores. Journal of Plant Growth
Regulation, 19: 195-216.
Walling LL. 2008. Avoiding effective defenses: strategies employed by phloem- feeding
insects. Plant Physiology, 146: 859-866.
Welter SC. 1989. Arthropod impact on plant gas exchange. In: Insect—plant interactions.
Bernays EA (ed.). CRC Press, Boca Raton, FL. Pp. 135-150.
Werker E. 2000. Trichome diversity and development. Advances in Botanical Research, 31:
1-35.
Whitecross MI. 1963. Studies on the plant cuticle. Australia: University of Sydney. PhD
thesis.
When RW, Bruce EE and Gusta LV. 1994. Interaction of abscisic acid and jasmonic acid
on the inhibition of seed germination and the induction of freezing tolerance.
Canadian Journal of Botany, 72: 1009-1017.

References: 94
Will T, Tjallingii WF, Thonnessen A, Bel AJ. 2007. Molecular sabotage of plant defense by
aphid saliva. Proceedings of Natural Academic Science USA, 104: 10536-41.
Will T, van Bel AJE. 2005. Physical and chemical interactions between aphids and plants.
Journal of Experimental Botany, 57: 729-737.
Wilson ACC, Sternberg LSL, Hurley KB. 2011. Aphids alter host-plant nitrogen isotope
fractionation. Proceeding of National Academy of Sciences, 108: 10220-10224.
Witt S, Galicia L, Lisec J, Cairns J, Tiessen A, et al. 2012. Metabolic and phenotypic
responses of greenhouse-grown maize hybrids to experimentally controlled drought
stress: Molecular Plant, 5: 401-417.
Wittstock U, Gershenzon J. 2002. Constitutive plant toxins and their role in defense against
herbivores and pathogens. Current Opinion in Plant Biology, 5: 300-307.
Wu JC, Qiu ZH, Ying JL, Dong B, Gu HN. 2004. Changes of zeatin riboside content in rice
plants due to infestation by Nilaparvata lugens (Homoptera: Delphacidae). Journal of
Economic Entomology, 97: 1917-1922.
Yan X, Chen S. 2007. Regulation of plant glucosinolate metabolism. Planta 226:
1343-52.
Yeats TH, Rose JKC. 2013. Plant cuticle structures and functions. Plant Physiology.
D01:10.1104/pp.113.222737.
Zangerl AR, Hamilton JG, Miller TJ, Crofts AR, Oxborough K, Berenbaum MR,
DeLucia EH. 2002. Impact of folivory on photosynthesis is greater than the sum of
its holes. Proceedings of the National Academy of Sciences USA, 99: 1088-1091.
Zhao TJ, Liu Y, Yan YB, Feng F, Liu WQ, Zhou HM. 2007. Identification of the amino
acids crucial for the activities of drought responsive element binding factors (DREBs)
of Brassica napus. FEBS Letters. 581: 3044-3050.
Zhu-Salzman K, Salzman RA, Ahn JE, Koiwa H. 2004. Transcriptional regulation of sorghum defense determinants against a phloem-feeding aphid. Plant Physiology,
134: 420-431.

Appendix

Appendix: 95
APPENDIX
1. Reagents for determination of chlorophyll content
80% acetone
80% mL of acetone was mixed in 20 mL of DDW
2. Preparation of reagents for proline estimation
Sulpho-salicylic acid (3%)
3 g of sulpho-salicylic acid was dissolved in sufficient DDW and final volume
was maintained to100 cm3, by using DDW.
Acid ninhydrin solution
1.25 g of ninhydrin was dissolved in a mixture of warm, 30 cm3 of glacial
acetic acid and 6 M phosphoric acid (pH 1.0) with agitation till it got
dissolved. It was stored at 4eCand used within 24 h.
The 6M phosphoric acid was prepared by mixing 11.8 cm3 of phosphoric acid
with 8.2 cm3 of DDW.
3. Preparation of reagents for protein estimation
Tri-chloroacetic acid (TCA) (5%)
5 ml of TCA was mixed with 95 ml of DDW.
IN NaOH
40 g of NaOH was dissolved in sufficient DDW and final volume was made
upto 1000 ml, by using DDW.
Preparation of reagent C
Reagent A: 2% sodium carbonate (2g dissolved in 100 ml DDW) and 0.1N
NaOH (4 g NaOH dissolved in 1000 ml) were mixed in the ratio 1:1.
Reagent B: 0.5% copper sulphate (500 mg CuSO4 dissolved in 100 ml) and
1% sodium tartarate (1 g sodium tartarate dissolved in 100 ml DDW) were
mixed in the ratio 1:1.
Reagent C: 50 ml of reagent A was mixed with 1 ml of reagent B, except
omission of sodium hydroxide.

Appendix: 96
Folin's phenol reagent (1 N)
The reagent obtained from LobaChemie Pvt. Ltd. Mumbai, India was diluted
with DDW in the ratio 1:2.
4. Reagents for leaf-NPK estimation
Molybdic acid reagent (2.5%)
6.25 g of ammonium molybdate was dissolved in 175 mL distilled water to
which 75 mL of 10 N-sulphuricacid was added.
1-amino-2-naphthole-4-sulphonic acid
0.5 g l-amino-2-naphthole-4-sulphonic acid was dissolved in 195 mL of 15 %
sodium bisulphide solution to which 5 mL of 20 % sodium sulphate solution
was added. The solution was kept in amber coloured bottle.
Sodium hydroxide solution (2.5 N)
100 g NaOH dissolved in sufficient DDW and final volume was maintained up
to 1000 mL with DDW.
Sodium silicate solution (10%)
10 g sodium was silicate dissolved in sufficient DDW and final volume was
maintained up to 100 mL with DDW.
5. Total phenol estimation
Folin—Ciocalteu reagent (1 N)
Prepare 1 X (IN) Folin-Ciocalteu Reagent by diluting the supplied 2X (2 N)
reagent 1:1 with DDW.
Sodium carbonate (20%)
20 g sodium bicarbonate was dissolved in sufficient DDW to make up final
volume 100 ml.
Insoluble polyvinyl pyrrolidone
Insoluble polyvinyl pyrrolidonewas purchased from Sigma Aldrich.
Standard tannic acid solution (0.1mg/m1)
0.1 mg chemical grade tannic acid was dissolved in 1 ml of DDW.

Annexure

Table 1. Effect of aphid infestation (40 aphids per plant) on aphid population growth and plant height (cm) of different cultivars of Brassica juncea at 60 and 75 DAS
Treatment Number of aphids Plant height (cm)
60 DAS 75 DAS 60 DAS 75 DAS
Alankar 65ea3.0 85da4.0 61.4gat3.07 78.79a3.28
PJK 73d±3.0 75e-±4.0 58.31ab±2.43 72.88ab±3.47
Vanilla 84ca4.0 107c=5.0 53.84bc+2.56 67.58b=2.82
Sakha 95ba5.0 121b+5..0 50.13c(1+7.28 61.24ca2.66
Rohini 105at5.0 135ai.6.0 46.02d±I.84 55.56c-2n2.31
LSD at 5% 6.617 7.809 4.329 5.410
MeanSD, Different letters showing data in a column is significant at p<0.05
Table 2. Effect of aphid infestation (40 aphids per plant) on shoot length (cm) and root length (cm) of different cultivarg of Brassiea juncea at 60 and 75 DAS
Treatment Shoot length (cm) Root length (cm)
60 DAS 75 DAS 60 DAS 75 DAS
Alankar 46.72S1.95 64.34aa2.68 15.86a÷0.63 24.25aa1.10
PJK 44.45ab11.85 60.41ab12.42 14.72ab±0.74 22.47h=0.90
Varuna 4Lf7be+1 .79 55.67ba2.53 13.671a0.59 19.1 1 ca0.80
Sakha 37.80cd÷ 1 .51 50.71ca2.20 12.33c0.51 17.84cd+0.78
Rohini 35.54d 1.48 47.36c±2.15 11.98ca0.50 16.52dt0.75
LSD at 5% 3.300 4.476 1.100 1.619
Mean4SD, Different letters showing data in a column is significant at p<0.05

Table 3. Effect of aphid infestation (40 aphids per plant) on leaf number and leaf area (cm2) of different cultivars of Brassica juncea at 60 and 75 DAS
Treatment Leaf number Leaf area (cm2)
60 DAS 75 DAS 60 DAS 75 DAS
Alankar 40.03a±1.74 56.98a±2.37 33.82a±1.35 39.14a±1.96
PJK 38.67ab±1.84 53.26ab±2.32 30.33b±1.21 35.52b±1.69
Varuna 36.50bc±1.46 50.23bc±2.18 27.49c±1.15 31.12c±1.24
Sakha 34.76cd±1.39 47.11cd±1.96 25.45c±1.16 27.27d±1.24
Rohini 32.44d±1.41 44.96d±1.80 22.88d±0.92 23.61e-±0.98
LSD at 5% 2.913 4.032 2.253 2.555
Mean±SD, Different letters showing data in a column is significant at p<0.05
Table 4. Effect of aphid infestation (40 aphids per plant) on plant fresh mass (g) and plant dry mass (g) of different cultivars of Brassica juncea at 60 and 75 DAS
Treatment Plant fresh mass (g) Plant dry mass (g)
60 DAS 75 DAS 60 DAS 75 DAS
Alankar 8.07a-±0.38 10.92a±0.50 2.02a±0.09 2.72a±0.11
PJK 6.91b±0.33 10.02b±0.46 1.66b-±0.08 2.54a±0.11
Varuna 5.82c±0.26 9.25c±0.40 1.44c±0.06 2.28b±0.11
Sakha 4.74d±0.19 8.38d±0.42 1.13d±0.05 2.02c±0.09
Rohini 4.13e±0.20 7.79d±0.34 1.04d±0.04 1.93c±0.08
LSD at 5% 0.492 0.746 0.121 0.185
Mean±SD, Different letters showing data in a column is significant at p<0.05
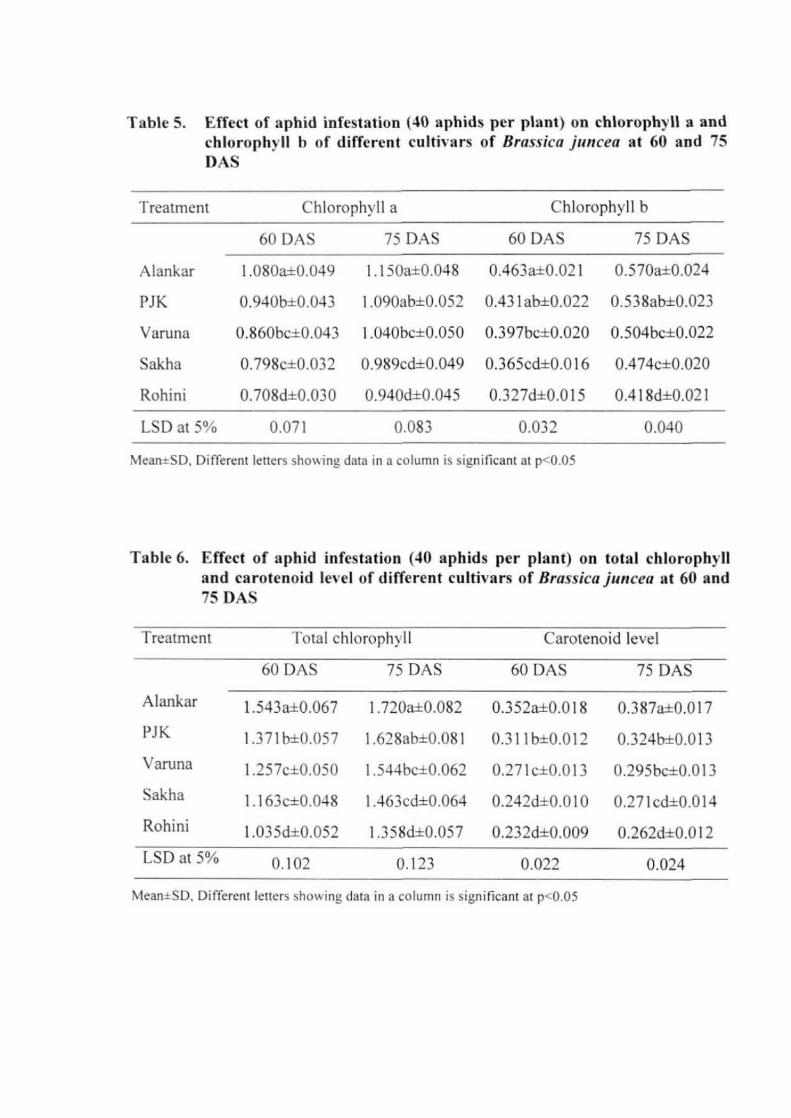
Table 5. Effect of aphid infestation (40 aphids per plant) on chlorophyll a and chlorophyll h of different cultivars of Brassie(' juncea at 60 and 75 DAS
Treatment Chlorophyll a Chlorophyll b
60 DAS 75 DAS 60 DAS 75 DAS
Alankar 1.080a±0.049 1.150a±0.048 0.463a±0.021 0.570a±0.024
PJK 0.940b±0.043 1.090ab-±0.052 0.431ab-±0.022 0.538ab-±0.023
Varuna 0.860bc±0.043 1.040bc±0.050 0.397bc±0.020 0.504bc±0.022
Sakha 0.798c±0.032 0.989cd±0.049 0.365cd±0.016 0.474c±0.020
Rohini 0.708d±0.030 0.940d±0.045 0.327d±0.015 0.41841+0.021
LSD at 5% 0.071 0.083 0.032 0.040
MeantSD, Different letters showing data in a column is significant at p<0.05
Table 6. Effect of aphid infestation (40 aphids per plant) on total chlorophyll and carotenoid level of different cultic ars of Brassica juncea at 60 and 75 DAS
Treatment Total chlorophyll Carotenoid level
60 DAS 75 DAS 60 DAS 75 DAS
Alankar 1.543a±0.067 1.720a±0.082 0.352a±0.018 0.387a±0.017 PJK 1.371 b±0.057 1.628ab±0.081 0.311b±0.012 0.324b±0.013 Vanina 1.257c±0.050 1.544bc±0.062 0.271 c±0.013 0.295bc±0.013 Sakha 1.163c±0.048 1.463cd±0.064 0.242d±0.010 0.271c1+0.014 Rohini 1.035d±0.052 1.358d±0.057 0.232d±0.009 0.262d±0.012 LSD at 5% 0.102 0.123 0.022 0.024
Mean±SD, Different letters showing data in a column is significant at p<-0.05

Table 7. Effect of aphid infestation (40 aphids per plant) on proline level (la mol FM) and protein content (mg al DM) contents of different cultivars of Brassica juncea at 60 and 75 DAS
Treatment Proline content Protein content
60 DAS 75 DAS 60 DAS 75 DAS
Alankar 15.20a±0.72 17.65a±0.84 19.82±0.90 20.32±0.81
PJK 14.05ab±0.61 16.89ab±0.73 19.49±0.89 19.94±0.95
Varuna 13.43bc±0.58 15.93bc±0.76 19.17±0.80 19.57±0.85
Sakha 12.67cd±0.51 15.33c±0.77 18.68±0.85 18.98±0.76
Rohini 12.08d±0.60 14.87c±0.68 18.19±0.76 18.43±0.80
LSD at 5% 1.075 1.284 NS NS
MeantSD, Different letters showing data in a column is significant at p<0.05

Table 8. Effect of aphid infestation (0, 50,100 and 150 per plant) on shoo( and root length (cm) of BNISIkaillIMI en. Maur and Rohini at 60 and 75 DAS
I reatment Shoot 1ength Root length
60 DAS 75 DAS 60 DAS 75 DAS
Alankar Rohini Mean Alankar Rohini Mean Alankar Rohini Mean Alankar Rohini Mean
Control 5117 42 33 47.00 7144 56.67 64.06 17,16 1176 15,46 26.78 19.11 22.95
50 aphids 4624 3545 40.36 63.20 46.87 55.114 1534 1117 1311 2397 16.25 III
100 aphids 4123 39.85 36.04 55.63 40,18 4791 14.19 10.71 12A5 21.62 1447 16.04
150 aphids 3623 2725 31.74 4966 35.12 40,89 1197 9A2 11.19 R26 12.67 697
Mean 43.84 33,97 59.22 4471 15.02 11.44 2291 15 63
LSD at 510 Varieties 0.436 0.655 0.165 0245
Treatment 0.687 0926 1233 0.346 Var. a Treat. C.972 1.109 NS DAP
Table 9. Effect of aphid infestation (0, 50,100 and 150 per plant) IS number and area lein2) of Brassica janceaems, Alankar and Haim at 60 and 75 DAS
Treatment Leaf fir her per Pant Leaf area
60 DAS 75 DAS 60 DAS 75 DAS
Alankar Rohini Mean Manlier Ruh Moan Met Rim Mne Alankar Rohm Mean
Control 44.75 37.23 40.99 5141 47.76 13 06 40.63 35,34 37.99 47.14 38.99 43.07
50 aphids 39.41 32.02 3532 5141 4M0 49.90 3344 19.73 2659 38,25 21,38 29.82
100 aphids 34.83 26.89 30.86 44,29 33.06 3168 31.09 1975 23.92 35.52 1796 26.74
150 aphids 303 22.72 26.49 3920 2771 33.46 29 59 14.66 22.12 33.62 15.75 24.6E
Mean 3731 29.72 4833 373 3319 11.62 33.63 2312
LSD at 5% Varieties 0.419 0.222 1900 1.419
Treatment 0.592 0.314 11315 2,006 Var. s Crean NS 0.444 2.901 2.837
Sig. Significant; NS t Non-significant

Table 10. Effect of aphid infestation 10, 50,100 and 150 per plant) on fresh and do mass (g) of Bragica junceo cvs. Alankar and Rohini at 60 and 75 DAS
Treatment Fresh mass Dry mass
60 DAS 75 DAS 60 DAS 75 DAS
Alankar Rohini Mean Alankar Rohini Mean Alankar Rohini Mean Alankar Rohini Mean
Control 9.23 5.82 7.53 12.65 11.33 11.99 2.32 1.46 1.89 3.15 2.82 2.99
50 aphids 7.95 4.01 5.98 10.71 7.55 9.13 1.99 1.01 1,50 2.68 1.89 2.28
100 aphids 7.12 3.57 5.35 9.56 6.63 8.10 1,79 0.88 1.34 2.40 1.67 2.03
150 aphids 6.35 3.18 4.77 8.32 5.85 7.08 1.60 0.80 1.20 2.07 1.47 1.77
‘lean 7.66 4.15 10.31 7,84 1.93 1.04 2.57 1.96
LSD at 5% Varieties 0.156 0.229 0.039 0.057
Treatment 0.221 0.323 0.056 0.081 Var. x Treat. 0.313 0.457 0.079 0.114
Table II. Effect of aphid infestation (0. 50, 100 and ISO per plant) on chlorophyll a (mg and Rohini at 60 and 75 DAS
FM) and chlorophyll b (mg FM) of &assica juncea cvs. Alankar
Treatment
Control
50 aphids
100 aphids
150 aphids
Mean
Chlorophyll a Chlorophyll b
60 DAS 75 D AS 60 DAS 75 DAS
Alankar Rohini Mean Alankar Rohini Mean Alankar Rohini Mean Alankar Rohini Mean
1.153 0.803
1.028 0.698
0.956 0.628
0.860 0.564
0.999 0.673
0.978
0.863
0.792
0.712
1.268 0.970
1.122 0,832
1.011 0.719
0.914 0.638
1.079 0.790
1.119
0.977
0.865
0.776
0.565 0.382
0.530 0.311
0.502 0.261
0.472 0.187
0.517 0.285
0.474
0.420
0.381
0330
0.561 0.461
0.497 0.324
0.430 0.255
0.297 0.202
0.446 0.310
0.511
0.411
0.343
0.249
LSD at 5% Varieties 0.013 0.005 0.015 0.014
Treatment 0.018 0.007 0.021 0.020 Var, x Treat. 0.026 0,011 0.030 0.028
Sig = Significant; NS = Nonsignificant

Table 12. Effect of aphid infestation (0, 50,100 and 150 per plant) on total chlorophyll kid tmg g' hi) and carotenoid level (mg g•' F11) of B►assicajuncea
Alankar
Treatment
and Rohini at 60 and 75 DAS
Total chlorophyll level Carotenoid level
60 DAS 75 DAS 60 DAS 75 DAS
Alankar Rohini Mean Alankar Rohini Mean Alankar Rohini Mean Alankar Rohini Mean
Control 1.712 1.183 1.448 1.825 1.428 1.627 0.513 0.377 0.445 0.584 0.447 0.516
50 aphids 1.550 1.002 1.276 1.616 1.151 1.384 0343 0.222 0.283 0.377 0.255 0.316
100 aphids 1.453 0.885 1.169 1.437 0.968 1.203 0326 0.202 0.264 0.362 0.231 0.297
ISO aphids 1.329 0.747 1.038 118 0.837 1.028 0.307 0.187 0.247 0.343 0.212 0.278
Mean 1.511 0.954 1.524 1.096 0372 0.247 0.417 0.286
LSD at 5% Varieties 0.013 0.026 0.004 0.003
Treatment 0.018 0.037 0.006 0.005 Var. x Treat. 0.026 0.052 0.008 0.007
Table 13. Effect of aphid infestation (0, 50, 100 and 150 per plant) on protein content (mg gl DM) and total phenol content (mg FM) of Brassica juncea cvs.
Alalkar and Robini at 60 and 75 DAS
Treatment
Control
50 aphids
100 aphids
ISO aphids
Nlean
Protein content Total phenol
60 DAS 75 DAS 60 DAS 75 DAS
Alankar Rohini Mean Alankar Rohini Mean Alankar Rohini Mean Alankar Rohini Mean
23.14 21.76
19.63 17.96
17.97 16.15
15.58 14.23
19.08 17.53
22.45
18.80
17.06
14.91
24.09
20.18
18.26
15.69
19.56
22.19
18.02
16.16
14.16
17.63
23.14
19.10
17.21
14.93
3.52 3.02
3.23 2.74
3.06 2.62
2.98 2.46
3.20 2.71
3.27
2.98
2.84
2.72
4.21 3.87
3.81 3.42
3.69 3.23
3.57 3.00
3.82 3.38
4.04
3.61
3.46
3.29
LSD at 5% Varieties 0.130 0.133 0.019 0.055
Treatment 0.184 0.188 0.027 0.078 Var. x Treat. 0.261 0.266 0.039 0.111
Sig = Significant; NS = Non•significant

Table 14. Effect of aphid infestation (0, 50, 100 and 150 per plant) on proline content (p mol g' FM) and N content (mg g" DM) of Bresico juncea cvs.
Alankar and Rohini at 60 and 75 DAS
Treatment Proline content N content
60 DAS 75 DAS 60 DAS 75 DAS
Alankar Rohini Mean Alankar Rohini Mean Alankar Rohini Mean Alankar Rohini Mean
Control 12.99 11.07 12.03 15.03 13.47 14.25 5.26 5.02 5.14 6.51 5.29 5.90
50 aphids 15.41 12.49 13.95 17.99 15.42 16.71 5,06 4.81 4.94 6.18 4.99 5.59
WO aphids 18.02 15.15 16.59 21.57 19.05 20.31 4.84 4.60 4.72 5.85 4.73 5.29
150 aphids 21.42 16.78 19.10 25.33 22.26 23.80 4.57 4.34 4.46 5.50 4,44 4.97
Mean 16.96 13.87 19.98 17.55 4.93 4.69 6.01 4.86
LSD at 5% Varieties 0.662 0.320 0.005 0.039
Treatment 0.936 0.453 0.007 0.055 Var. x Treat. 1.324 0.641 0.010 0.078
Table I5. Effect of aphid infestation (0,50, 100 and 150 per plant) on P and K content (mg g ' DM) of firaciica juncea cvs, Alankar and Rohini 31 60 and 75
DAS
P content K content
60 DAS 75 DAS 60 DAS 75 DAS
Alankar Rohini Mean Alankar Rohini Mean Alankar Rohini Mean Alankar Rohini Mean
Control 11.10 9.22 10.16 12.85 10.07 11.46 6.03 9.92 7.98 7.41 12.80 10.11
50 aphids 10.21 8.15 9.18 11.67 8.84 10.26 6.34 1036 835 7.99 13.68 10.84
100 aphids 9.23 7.46 8.35 10.32 7.84 9.08 6.69 10.92 8.81 8.43 14.59 11.51
150 aphids 8.25 6.72 7.49 9.17 7.04 8.11 6.82 11.12 8.97 8.55 14.63 11.59
Mean 9.70 7.89 11.00 8.45 6.47 10.58 8.10 13.93
LSD at 5% Varieties 0.127 0.170 0.152 0.497
Treatment 0.179 0.240 0.215 0.702 Var. x Treat. 0.253 0.340 NS NS
Sig = Significant; NS = Non•significant

Tale 16. Effect of aphid infestation (0, 50,100 and 19 per Mann a number of stouts on aural and adarrial leaf surface of Brauiwjunceu cvs. Alankar
and Rohini at 611 and 75 DAS
stomata (Abaxial Treatment No. of surface) No. of stomata (Adaial surface)
60 DAS 75 DAS 60 DAS 75 DAS
Alankar Rohini Mean Alankar Rohini Mean Alankar Rohini Mean Alankar Rohlni Meaa
Control 213 :8.6 29.0 248 22.1 23.1 113 13,7 11.0 14 124 117
50 aphids 19.8 6.5 IU 20.6 16,6 18,6 11.0 9.5 10.2 12.3 9.5 10,0
100 aphids 192 16.0 ITO 191 15.2 173 10.8 9.2 1011 II 6 97 10.1
150 aphids 18.8 117 171 1 2 14 16.5 10.7 9.0 0.9 10.9 8.5 9.7
Meal 19.8 167 20.8 17.2 1Q9 9.6 I2A 9.8
LSD at 5% Varieties 9.103 D.163 0.174 0 192
Treatment 0.146 0.230 0 276 11.171 Van x Trod. 6,207 0.325 0.348 0.373
Table 17. Elect of aphid infestation (0, 50, 100 and 150 per plant) on relative stomatal closure index (RSCI) of a ba vial and adavial surface of Bromic a junta
cvs. Alankar and Rah at 60 and 75 DAS
Treatment RSC1(Ahaxiai leaf surface) RSCI (Adarial leaf surface)
60 DAS 75 DAS 60 DAS 75 DAS
Alarm. Rohini In Alankar Rohini Mean Alankar Raini Mean Alankar Rohini Mean
50 aphids 156 059 017 OM 091 0.99 055 0.5? 0.86 0,36 0.88 087
100 aphids 062 066 064 0.91 091 0,93 0.60 0.63 0.61 088 0,91 0.89
150 aphids 068 0.73 030 0.94 0.98 096 165 0.69 0.67 0.90 0.96 0.93
Meaa 11.62 0.66 0.91 0.94 060 0.63 0.88 092
LSD a N Varieties o.(06 UX3 0.005 4008
Treatment 0.007 0.004 0.00? 1010 Var. x Treat. 0010 0.006 0.009 0,013
Sig ,- Signified; NS - Nan•sidllani

fable 18. Effect of aphid infestation (0, 50,100 and 150 per plant) on net photos) nthetic rate (Pc, p mol CO2 62 sec.i) and stomatal conductance (g,; mol
sec') of Russia, juncea es s. Alankar and Rohini at 60 and 75 DAS
Treatment Net photosynthetic rate (Ph) Stomatal conductance (g,)
60 DAS 75 DAS 60 DAS 75 DAS
Alankar Rohini Mean Alankar Rohini Mean Alankar Rohini Mean Alankar Rohini Mean
Control 10.32 9.20 9.76 12.53 11.07 11.80 40.11 34.82 37.47 46.64 38.47 42.56
50 aphids 9.20 7.44 8.32 9.80 7.35 8.58 33.01 19.44 26.23 37.38 21.10 29.24
100 aphids 7.69 5.57 6.63 8.09 5.34 6.72 30.69 16.50 23.60 34.21 17.34 25.78
150 aphids 6.80 4.59 5.70 6.89 3.83 5.36 29.21 14.44 21.83 32.33 14.00 23.17
Mean 8.50 6.70 9.33 6.90 33.26 21.30 37.64 22.73
LSD at 5% Varieties 0.269 0.296 0.987 1.109
Treatment 0.381 0.418 I.396 1.569
Var. x Treat. 0.539 0.591 1.974 2.218
able 19. Effect of aphid infestation (0, 50,100 and 150 per plant) on pod length (cm) and oil content (1/0 of Brwita junau
(120 DAS)
Alankar and Rohini at harvest
Treatment Pods length Oil content
,Alankar Rohini Mean Alankar Rohini Mean
Control 5.05 3.94 4.50 36.42 32.87 34.65
50 aphids 4.77 3.64 4.21 31.92 27.68 29.80
100 aphids 4.38 3.34 3.86 28.59 23.65 26.12
150 aphids 4.12 3.03 3.58 22.95 16.88 19.92
Mean 4.58 3.49 29.97 25.27
LSD at 5% Varieties 0.02I 0.621
Treatment 0.029 0.818 Var. x Treat. 0.041 1.242
Sig = Significant; NS =, Nonsignificant

Table 20, Effect of aphid infestation (0, 50, 100 and ISO per plant) on ield characteristics of Brassicu juncea cvs. Alankar and Rohini at harvest (120 DAS)
Treatment Pods per plant Seeds per pod 1000 seeds weight (g) Seed yield (g)
Alankar Rohini Mean Alankar Rohini Mean Alankar Rohini Mean Alankar Rohini Mean
Control 108.66 86.45 91.56 11.93 10.78 11.36 5.54 4.23 4.89 7.18 3.94 5.56
50 aphids 91.58 71.67 81.63 10.58 9.44 10.01 4.77 3.26 4.02 4.62 2.35 3.49
100 aphids 78.32 60.47 69.40 9.23 8.01 8.62 3.84 2.53 3.19 2.78 1.27 2.02
150 aphids 61.46 45.76 53.61 8.12 6.90 7.51 3.14 1.78 2.46 1.57 0.56 1.06
Mean 85.01 66.09 9,97 8.78 4.32 2.95 4.04 2.03
LSD at 5%
Varieties 1.599 0.023 0.055 0.143
Treatment 2.622 0.033 0.078 0.202
Var. x Treat. 3.199 0.046 0.111 0.286
Table 21. Population count of aphid and number of beetle attracted after infestation (0, 50,100 and 150 per plant) on Rrassica junco cvs. Alankar and Rohini
at 60 and 75 DAS
Treatment Aphid count Number of beetles attracted
60 DAS 75 DAS 60 DAS 75 DAS
Alankar Rohini
Mean Alankar Rohini Mean Alankar Rohini Mean Alankar Rohini Mean
Control 0 0 0 0 0 0 0 0 0 0 0 0
50 aphids 81 119 100 117 138 128 9 7 8 3 2 3
100 aphids 132 147 140 176 195 186 11 10 11 4 3 4
ISO aphids 193 209 201 240 255 248 10 8 9 2 2 2
Mean 102 119 133 147 8 6 2 2
LSD at 5%
Varieties 4.539 4.811 0.288 0.087
Treatment 6.419 6.804 0.408 0.123
Var. x Treat. 9.077 9.622 0.577 0.174
Sig = Significant; NS = Nonsignificant

Table 22. Responses of shoot and root length (cm) of Brosica pillow Alankar and Rohini exposed at 45 DAS to varying level of aphid infestations (0. 50.
100,150 aphid per plant) and successiNe predation of aphids (5 days after) by 2 beetle per plant studied at 60 and 75 DAS
Treatment Shoot length Root length
60 DAS 75 DAS 60 DAS 75 DAS
Alankar Rohini Mean Alankar Rohini Mean Alankar Rohini Mean Alankar Rohini Mean
Control 52.04 42.62 41.33 71.73 57.02 64.38 17.58 14.04 15.81 27.11 19.33 23.22
50 aphids+2 beetle 48.36 37.23 42.79 65.50 48.79 57.15 16.79 13.17 14.98 25.66 17.64 21.65
100 aphids +2 beetle 44.55 34.02 39.29 60.91 43.41 52.16 15.60 11.21 13.41 23.68 14.97 19.32
150 aphids +2 beetle 41.31 29.29 35.30 54.72 36.56 45.64 14.50 9.72 12.11 21.94 12.98 17.46
Mean 46.57 35.79 63.21 46.44 16.12 12.03 24.60 16.23
LSD at 5% Varieties 0.597 0.875 0.246 0.303
Treatment 0.844 1.237 0.348 0.429
Var. x Treat 1.194 1.750 0.493 0.607
Table 23. Responses of leaf number and area (cm') of Brassica juncea cvs. Alankar and Rohini exposed at 45 DAS to varying lel el of aphid infestations (0, 50,
1110.150 aphid per plant) and successive predation of aphids (5 days after) by 2 beetle per plant studied at 60 and 75 DAS
Treatment Leaf number plant.' Leaf area
60 DAS 75 DAS 60 DAS 75 DAS
Alankar Rohini Mean Alankar Rohini Mean Alankar Rohini Mean Alankar Rohini Mean
Control 44,13 37.48 40.81 58.72 48.07 53.40 40.85 35.59 38.22 47.32 39.18 43.25
50 aphids+ 2 beetle 40.46 32.68 36.57 53.05 41.22 47.14 36.17 29.70 32.94 41.00 31.82 36.41
100 aphids+2 beetle 37.23 30.01 33.62 48.81 37.13 42.97 33.00 27.12 30.06 37.18 28.99 33.08
ISO aphids+2 beetle 33.60 26.62 30.11 43.99 33.19 38.59 29.40 22.50 25.95 32.35 23.57 27.96
Mean 38.85 31.70 51.14 39.90 34.86 28.73 39,46 30.89
1.til) :115' o Varieties 1.015 0.330 0.393 0.279
treatment 1.436 0.466 0.556 0.395
Var. x Treat. NS 0.659 0.786 0.559
Sig = Significant; NS = Non.significant

Table 24 Responses of fresh and dry mass (g) of Brassicajuncea Alankar and Rohini exposed at 45 DAS to varying level of aphid infestations (0, 50,100,
150 aphid per plant) and successive predation of aphids (5 days after) by 2 beetle per plant studied at 60 and 75 DAS
Treatment
Alankar
Fresh mass (g) Dry mass (g)
60 PAS
Rohini
15 DAS 60 DAS 75 DAS
Mean Altar Rohini Mean Alankar Rohini Mean Alankar Rohini Mean
Control 9,07 5,64 7.36 12.46 11.12 11.79 2.41 1.56 1,99 3.26 2.91 3.09
50 aphids+2 beetle 8.06 4.76 6.41 10.81 9.10 9.95 2.13 1.32 1,73 2.84 239 2.62
100 aphids+2 beetle 7.69 4,55 6.12 10.30 8.73 9.52 2.03 1.26 1.65 2.71 230 2.50
150 aphids+2 beetle 7.53 4.44 5.98 10.02 8.46 9.24 1.98 123 1.61 2.64 2.23 2.43
Mean 8.09 4.85 10.90 9.35 2.14 1.34 2.86 146
LSD at 5% Varieties 0.089 0.086 0.026 0.023
Treatment 0.126 0.122 0.036 0.032 ar. \ Treat. 0.178 0.172 0.052 0.045
Table 25. Responses Chlorophy ll a and h content (mg FM) of lirassica juncea cvs. Alankar and Rohini exposed at 45 DAS to varying level of aphid
infestations (0, 50, 100, 150 aphid per plant) and successive predation of aphids (5 days after) by 2 beetle per plant studied at 60 and 75 DAS
Treatment Chlorophyll a Chlorophyll b
60 DAS 75 DAS 60 DAS 75 DAS
Alankar Rohini Mean Alankar Rohini Mean Alankar Rohini Mean Alankar Rohini Mean
Control 1.151 0.802 0.977 1.263 0.971 1.117 0.610 0.230 0.420 0.740 0350 0.545
50 aphids+2 beetle 1.044 0.627 0.836 1.136 0.721 0.929 0.538 0,280 0.409 0.626 0.262 0.444
100 aphids+2 beetle 0.970 0.517 0.743 1,031 0.600 0.816 0.471 0.303 0.387 0.557 0.230 0.393
150 aphids+2 beetle 0.883 0.426 0.655 0.945 0.486 0.715 0.426 0322 0.374 0,492 0.200 0.346
Mean 1.012 0.593 1,094 0.694 0.511 0.284 0.604 0.260
LSD at 5% Varieties 0.029 0.032 0.015 0.017
Treatment 0.041 0.046 0.021 0.024
Var. x Treat. 0,059 0.065 0.029 0.033
Sig = Significant; NS = Non•significant

Table 16. Responses of total chlorophyll and carotenoid level (nig g F111 of Bro *tea os. tlankar and Rohini exposed at 45 DAS to varying level of
aphid infestations (0, 50, 100, 150 aphid per plant) and socee■sile predaimi of aphids 15 dace after) by 2 beetle per plant studied at Wand 75 DAS
Treatment Total chlorophyll
60 DAS
carotenoid level
60 DAS 75 DAS 75 DAS
Alankar Rohini Mean Alankar Rohini Mean Alankar Rohini Mean Alankar Rohini Mean
Control 1.757 1.031 1.394 2.002 1.322 1.662 0.530 0.360 0.445 0.570 0.470 0.520
50 aphids+2 beetle 1.578 0.906 1.242 1.762 0.982 1.372 0.400 0.261 0.331 0.426 0.335 0.381
100 aphids+2 beetle 1.442 0.818 1.130 1.588 0.829 1.208 0.384 0.249 0.316 0.406 0.320 0.363
150 aphids+2 beetle 1.310 0.746 1.028 1.432 0.686 1.059 0.373 0.243 0.308 0.395 0.312 0.353
Mean 1.522 0.875 1.696 0.955 0.422 0.278 0.449 0.359
LSD at 5% Varieties 0.036 0.024 0.010 0.004
Treatment 0.051 0.035 0.015 0.006 Var. x Treat. 0.073 0.049 0.021 0.009
Table 17. Responses of prolein(mg 1)11) and total phenol content of Brassie(' juncea cvs. Alankar and Rohini exposed at 45 DAS to varying loci of aphid
infestations (0, 50,100, 150 aphid per plant) and lit'cessive predation of aphids (5 days after) by 2 beetle per plant studied at 60 and 75 DAS
Treatment Protein content Total phenol
60 DAS 75 DAS 60 DAS 75 DAS
Alankar Rohini Mean Alankar Rohini Mean Alankar Rohini Mean Alankar Rohini Mean
Control 2332 21.94 22.63 24.28 22.37 2333 3.73 3.21 3.47 4.53 4.05 4.29
50 aphids+2 beetle 20.11 18.44 19.27 21.47 19.58 20.52 3.44 3.01 3.22 4.24 3.72 3.98
100 aphids+2 beetle 18.64 17.02 17.83 20.06 17.95 19.01 3.30 2.82 3.06 4.07 3.51 3.79
150 aphids+2 beetle 16.36 14.90 15.63 18.26 15.73 17.00 3.20 2.68 2.94 3.86 3.35 3.60
Mean 19.61 18.07 21.02 18.91 3.42 2.93 4.18 3.66
LSD at 5% Varieties 0.078 0.170 0.025 0.019
Treatment 0.111 0.241 0.035 0.027 Var, x Treat. 0.157 0.340 0.049 0.038
Sig - Significant; NS = Non-significant

Table 28. Responses of proline content (11 mol F∎l) and N content (mg g' DM) of Brassica juncea cvs. Alankar and Rohini exposed at 45 DAS to varying
level of aphid infestations in. 50, 100, 150 aphid per plant: and successive predation of aphids (5 days after) by 2 beetle per plant studied at 60 & 75 DAS
Treatment Proline content N content
60 DAS 15 DAS 60 DAS 75 DAS
Alankar Rohini Mean Alankar Rohini Mean Alankar Rohini Mean Alankar Rohini Mean
Control 13.27 11,36 12.32 15.34 13.76 14.55 5.37 5.14 5.26 6.60 5.38 5.99
50 aphids+2 beetle 15.05 12.26 13.65 16.91 14.34 15.62 5.21 4.94 5.08 6.50 5.16 5.83
100 aphids+2 beetle 17.57 13.17 15.37 19.74 15.33 17.54 5.02 4.75 4.89 6.24 4.89 5.57
150 aphids+2 beetle 21.25 14.91 18.08 23.61 18.42 21.01 4.16 4.62 4.69 5.93 4.59 5.26
Mean 16.18 12.92 18.90 15.46 5.09 4.86 6.32 SA
LSD at 5% Varieties 0.512 0.732 0.035 0.033
Treatment 0.724 1.035 0.049 0.046
Var. x Treat. 1.024 1.464 0.070 0.065
Table 29 Responses of P and k content (mg g.1 DM) of Brassica juncea cvs. Alankar and Rohini exposed at 45 DAS to varying level of aphid infestations (0,50,
100, 150 aphid per plant) and successive predation of aphids (5 days after) by 2 beetle per plant studied at 60 and 75 DAS
Treatment P content K content
60 DAS 75 DAS 60 DAS 15 DAS
Alankar Rohini Mean Alankar Rohini Mean Alankar Rohini Mean Alankar Rohini Mean
Control 11.21 9.34 10.28 12.93 10.17 11.55 6.10 9.96 8.03 7.47 12.87 10.17
50 aphids+2 beetle 10.40 8.45 9.42 12.24 9.42 10.83 6.42 10.37 8.40 7.82 13.30 10.56
100 aphids+2 beetle 9.44 7.66 8.55 11.17 8.55 9.86 6.75 10.90 8.82 8.21 13.97 11.09
150 aphids+2 beetle 8.46 6.84 7.65 10.03 7.67 8.85 6.87 11.09 8.98 8.35 14.20 11.28
Mean 9.88 8.07 11.59 8.95 6.54 10.58 7.96 13.59
LSD at 50,0 Varieties 0.082 0.119 0.381 0323
Treatment 0.115 0.169 0.541 0.456
Var. x Treat. 0.163 0.238 NS NS
Sig = Significant; NS = Non•significant

Table 30. Responses of number of stomata on abaxial and adaxial surface of Braisicujumea cvs. Alankar and Rohini exposed 2145 DAS to varying level of aphid
infestations (0, 50, 100, 150 aphid per plant) and successive predation of aphids (5 days after) by 2 beetle per plant studied at 60 and 75 DAS
Treatment
No. of stomata (Abaxial surface) L No. of stomata (Adaxial surface) U
60 DAS 75 DAS 60 DAS 75 DAS
Alankar Rohini Mean Alankar Rohini Mean Alankar Rohini Mean Alankar Rohini Mean
Control 21.5 18.7 20.1 24.6 22.6 23.6 11.4 10.8 11.1 14.8 12.7 13.8
50 aphids+2 beetle 20.6 16.9 18.8 24.1 22.1 23.1 10.8 9.7 10.3 14.5 123 13.4
100 aphids+2 beetle 20.2 16.5 183 24.0 22.0 23.0 10.6 9.5 10.1 14.4 123 13.3
150 aphids-2 beetle 19.6 16.2 11.9 23.9 21.9 22.9 10.3 9.4 9.9 14.3 12.2 13.2
Mean 20.5 17.1 24.1 22.1 10.8 9.9 14.5 12.4
LSD at 5%
Varieties 0.246 0.260 0.138 0.152
Treatment 0.348 0.360 0.195 0 21s
Var, x Treat. 0.492 NS 0.276 \S
Table 31. Responses of relit tis e stomatal closure index (RSCI) of abaxial and adaxial surface of Brasqra pineal cxs, Alankar and Rohini exposed at 45 DAS to
sar)ing level of aphid infestations (0, 50, WO, 150 aphid per plant) and successive predation of aphids (5 (13)s after) b) 2 beetle per plant studied at 60
and 75 DAS
Treatment
RSCI (Abaxial leaf surface) RSCI (Adaxial leaf surface)
60 DAS 75 DAS 60 DAS 75 DAS
Agar Rohini Mean Alankar Rohini Mean Alankar Rohini Mean Alankar Rohini Mean
50 aphids-2 beetle
100 aphids+2 beetle
150 aphids+2 beetle
Mean
LSD at 5%
0.51 0.51 0.51 0.81 0.83 0.82 0.50 (1.50 0.65 0.80 0.80 0.40
0.55 0.56 0.56 0.83 0.85 0.84 0.54 0.55 0.69 0.81 0.83 0.42
0.60 0.62 0.61 0.85 0.88 0.87 0.59 0.60 0.73 0.83 0.86 0.43
0.55 0.56 0.83 0.85 0.54 0.55 0.81 0.83
Varieties 0.030 0.004 0,006 0.007
Treatment 0.037 0.004 0.007 0.009
Var, x Treat. 0.053 0.006 0,010 0.012
Sig Significant; NS =Non-significant

Table 32. Responses of net photosynthetic rate (Ps; p mol CO: m' sec) and stomata! conductance tu„: m mol m sec) Brassica juncea cvs. Alankar and
Rohini exposed at 45 DAS to varying level of aphid infestations (0, SO. Inn, 150 aphid per plant) and successive predation of aphids t5 days
after! hs 2 beetle per plant studied at 60 aid 75 DAS
Treatment Net photosynthetic rate (Ps) Stomatal conductance (g)
60 DAS 75 DAS 60 DAS 75 DAS
Alankar Rohini Mean Alankar Rohini Mean Alankar Rohini Mean Alankar Rohini Mean
Control 10.37 9.29 9.83 12.61 11.15 11.88 39.51 34.99 37.25 46.72 4032 43,52
50 aphids-2 beetle 10,73 9.49 10.11 13.22 11.44 12.33 34.38 30.22 32.30 38.99 31.94 35.47
100 aphids+2 beetle 9,80 8.70 9.25 12.85 10.76 11.81 31.92 27.41 29.67 35.60 29.03 32.32
150 aphids+2 beetle 8.31 7.27 7.79 10.97 9.27 10.12 28.43 23.84 26.14 29.54 23.05 26.30
Mean 9.80 8.69 12.41 10.66 33.56 29.12 37.71 31.09
LSD at 5% Varieties 0.050 0.132 0.166 0.360
Treatment 0.070 0.186 0.265 0.509
Var. x Treat. 0.100 0.264 0.333 NS
Table 33. Responsesof pod length (cm) and oil content (°,10) of Brassica juncea as. Alankar and Rohini exposed at 45 DAS to varying level of aphid
infestations (0,50, 100, 150 aphid per plant) and successive predation of aphids (5 days after) by 2 beetle per plant studied at 60 and 75 DAS
Pods length Oil content
Alankar Rohini \lean Alankar Rohini Mean
Control 5.06 3.93 4.50 36.54 33.13 34.84
50 aphids+2 beetle 4.80 3.65 4.23 29.40 32.96 31.18
100 aphids+2 bedle 4.41 3.35 3.88 30.15 26.02 28.09
150 aphids+2 bedle 4.15 3.04 3.59 25.22 19.90 22.56
Mean 4.61 3.49 30.33 28.00
1,SD at 5% Varieties 0.047 0.460
Treatment 0.066 0.650 Var. x Treat. NS 0.919
Sig --- Significant; NS = Non•significant

Table 34. Responsesof yield characteristics of Brassica junco cis. Alankar and Rohini exposed at 45 DAS to varying level of aphid infestations (0, 50, 100,
150 aphid per plant) and successive predation of aphids (5 dav s after) b∎ 2 beetle per plant studied at 60 and 75 DAS
Pods per plant
Alankar
Seeds per pod 1000 seeds weight (g) Seed yield (g)
Alankar Rohini Mean Rohini Mean Alankar Rohini Mean Alankar Rohini Mean
Control 110.64 88.44 99.54 11.91 10.76 11,34 5.52 4.24 4.88 7.27 4.03 5.65
50 aphids+2 beetle 96.01 75.40 85.71 10.69 9.54 10.11 4.57 3.40 3.98 4.69 2.45 3.57
100 aphids+2 beetle 82.27 64.45 73.36 9.11 8.01 8.56 4.19 3.04 3.62 3.14 1.51 2.36
150 aphids+2 beetle 67.26 49.33 58.29 7.87 6.78 7.32 3.54 2.41 2.97 1.87 0.81 1.34
Mean 89.05 69.41 9.89 8.77 4.45 3.27 4.24 2.21
LSD at 5% Varieties 1.168 0.019 0.038 0.134
Treatment 1.652 0.026 0.054 0.190 Var. x Treat. 2.337 0.037 0.076 0.268
Table 35. Responses of aphid populations on Brassie° farm cvs. Alankar and Rohini exposed at 45 DAS to varying level of aphid infestations (0, 50, 100,
150 aphid per plant) and successive predation of aphids (5 days after) by 2 beetle per plant at 60 and 75 DAS
Aphid count
60 DAS 75 DAS
Alankar Rohini Mean Alankar Rohini Mean
Control 0 0 0 0 0 0
50 aphids t 2 beetle 58 63 61 96 113 105
100 aphids+2 beetle 107 116 112 153 168 161
150 aphids+2 beetle 171 181 116 220 231 :26
Mean 84 90 117 128
LSD at 5% Varieties 2.633 4.380
Treatment 3.723 6,195 Var. x Treat. 5.266 8.761
Sig = Significant; NS = Non•significant

Table 36, Effect of lomat': acid (0.5,1.0 and 1,5 mM) on shoot and root length (cm) of eNSTICOftilltea CV. Alankar and Rohini at 60 and 75 DAS
Treatment Shorn lenglh Root length
60 DAS 75 DAS 60 DAS 75 DAS
Alankar Rohini Mean Alankar Rohini Mean Alankar Rohl Mean Alankar Rohini Mean
Control 61.32 4207 4610 711 56.42 6337 16.93 13.54 16.24 26.55 1838 22.72
JA (0.5mM) 8213 4234 48.33 74.81 58.48 65.55 7.31 130 1548 27.26 1910 alb
.1,6 (1,0mM) 9,80 43k7 49.73 77.39 59.76 6582 7.42 13.78 15.60 27.48 19.3: 3340
1A (1.5ntM) 53.34 42,50 47.92 14.27 .751 65.89 17,09 13.57 15.33 26.90 18.98 22.94
Mean 955 42.80 7432 58.04 1719 13.64 27,05 19.07
LSD at 550
Variclics 0.680 0 761 0 189 0.139
Trtamern 0.974 1.077 0.267 0.196
Var x Treat. 1.378 1.523 NS 0.278
Table 37, Effect of jasmanic acid (15, 1.0 and 1.5 m111) on leaf number and area (em) of Broth juntra cvs. Allokar and Rohini at 60 and 75 DAS
Treatment Leaf [zither plant Leaf area
6D DAS 75 DAS 60 DAS 75 DAS
Alankar Rohini Mean Alankar Mini Mean Alankar Rohini Mean Alankar Rohn Mean
Control 456 37.M 40.32 .68.13 47,53 52.86 40.41 35.10 37.76 46.92 3875 12,84
(0.501 45.61 37.74 41.67 9.81 447 54,16 41,07 36.36 38.22 17,81 39.18 43.49
JA (1.0mM) 46.67 38.17 42.12 60.44 W8 54.76 41/5 35.43 3814 47,97 3920 43.63
lA (1.5mM) 45.20 37.47 41,34 59.23 48.18 5111 40.89 3127 38.08 47.64 39.13 4338
Mean 45.36 37.61 59.42 432 40.91 35.29 47.58 39.09
LSD al 5%
Varieties 0.644 0.184 0.185 0.123
Trearrot 0.910 0.261 0.261 0.174
Var, x Ircat. NS 0.369 NS 0.247 Sig - Sign1Callli; NS = Non4signincanl

Table 38. Effect of jasmonic acid (0.5, 1.0 and 1.5 mM) on fresh and dry mass (g) of Brassica juncea cvs. Alankar and Rohini at 60 and 75 DAS
Treatment Fresh mass Dry mass
60 DAS 75 DAS 60 DAS 75 DAS
Alankar Rohini Mean Alankar Rohini Mean Alankar Rohini Mean Alankar Rohini Mean
Control 9.05 5.41 7.23 12.47 11.12 11.80 2.25 1.37 1.81 3.06 2.75 2.91
JA (0.501) 9.55 5.60 7.57 13.27 11.63 12.45 2.35 1.42 1.89 3.28 2.88 3.08
JA (1.0mM) 9.66 5.66 7.66 13.43 11.68 12.56 2.39 1.44 1.91 3.31 2.90 3.10
JA (1.501) 9.47 5.59 7.53 13.21 11.48 12.35 2.35 1.41 1.88 3.25 2.85 3.05
Mean 9.43 5.56 13.10 11.48 2.34 1.41 3.22 2.85
LSD at 5% Varieties 0.018 0.027 0.090 0.104
Treatment 0.025 0.038 0.127 0.148 Var. N Treat. 0.035 0.054 0.180 0.209
Table 39. Effect of jasmonic acid (0.5, 1.0 and 1.5 mM) on chlorophyll a and b (mg g FM) level of Brassica juncea cvs. Alanka r 111(1 Rohini at 60 and 75 DAS
Treatment Chlorophyll a Chlorophyll b
60 DAS 75 DAS 60 DAS 75 DAS
Alankar Rohini Mean Alankar Rohini Mean Alankar Rohini Mean Alankar Rohini Mean
Control 1.157 0.805 0.981 1.270 0.973 1.122 0.566 0.374 0.470 0.567 0.469 0.518
JA (0.5mM) 1.359 0.919 1.139 1.529 1.132 1.330 0.678 0.428 0.553 0.691 0.548 0.620
JA (1.0mM) 1.399 0.932 1.165 1.576 1.155 1.365 0.708 0.449 0.579 0.723 0.577 0.650
JA (1.5mM) 1.317 0.877 1.097 1.477 1.091 1.284 0.653 0.412 0.533 0.668 0.529 0.599
Mean 1.308 0.883 1.463 1.088 0.651 0.416 0.662 0.531
LSD at 5% Varieties 0.028 0.031 0.014 0.013
Treatment 0.039 0.044 0.019 0.018 Var. x Treat. 0.056 0.062 0.027 0.026
Sig = Significant; NS = Non-significant

Table 40. Effect of jasmonic acid (0.5, 1.0 and 1.5 mM) on total chlorophyll level (mg g FM) and carotenoid level (mg g'l FM) of Brassica juncea cvs. Alankar
and Rohini at 60 and 75 DAS
Treatment Total chlorophyll level C,arotenoid level
60 DAS 75 DAS 60 DAS 75 DAS
Alankar Rohini Mean Alankar Rohini Mean Alankar Rohini Mean Alankar Rohini Mean
Control 1.721 1.176 1.449 1.837 1.441 1.639 0.570 0.430 0.500 0.540 0350 0.445
JA (0.5mM) 2.034 1.345 1.689 2.218 1.678 1.948 0.743 0.531 0.637 0.683 0.419 0.551
JA (1.0mM) 2.104 1.380 1.742 2.298 1.730 2.014 0.760 0.545 0.653 0.698 0.432 0.565
JA (1.5mM) 1.%7 1.287 1.627 2.146 1.618 1.882 0.729 0.506 0.618 0.670 0.401 0.535
Mean 1.956 1.297 2.125 1.617 0.701 0.503 0.648 0.401
LSD at 5% Varieties 0.045 0.044 0.021 0.019
Treatment 0.064 0.062 0.030 0.027 Var. x Treat. 0.091 0.088 0.043 0.038
'Fable 41. Effect of jasmonic acid (0.5, 1.0 and 1.5 m11) on protein content (mg g.1 D\1) and total phenol content of BrillhiCil s. 11ankar and Itohini at
60 and '5 DAS
Treatment Protein content Total phenol
60 DAS 75 DAS 60 DAS 75 DAS
Alankar Rohini Mean Alankar Rohini Mean Alankar Rohini Mean Alankar Rohini Mean
Control 22.96 21.54 22.25 23.92 21.97 22.95 3.35 2.85 3.10 4.04 3.69 3.87
JA (0.50) 23.08 21.34 22.21 24.49 22.02 23.25 3.45 2.87 3.16 4.22 3.78 4.00
JA (1.0mM) 23.31 21.71 22.51 25.19 22.32 23.75 3.54 2.93 3.23 4.31 3.87 4.09
JA (1.5mM) 22.62 21.05 21.83 24.26 21.58 22.92 3.28 2.82 3.05 3.98 3.72 3.85
Mean 22.99 21.41 24.46 21.97 3.40 2.87 4.14 3.77
LSD at 5% Varieties 0.075 0.196 0.036 0.045
Treatment 0.106 0.278 0.050 0.063 Var. x Treat. 0.150 0.393 0.071 0.089
Sig = Significant; NS = Non-significance

'I able 42. Effect nfjosmonic Reid (0,5, IR and 1.5 m191) on praline content (it ml FM) and N team(4g' DM) of eftififil junta cvs. Mankar and
Rohini at 61 and 75 DAS
Icemen! Rroline content N content
60 DAS 75 DAS 60 DAS 75 DAS
Alankar Rohini Mean Alankar Rohini Meals Alankar Rohini Mean Alankar Rohini Mean
Control 12.65 10.75 11.79 1411 13.14 13.93 5.12 4.96 544 6A4 5.22 5.83
JA (115mM) 138 1124 12.55 I..^.,77 13.41 14,60 5.24 5.05 514 668 i32 6.00
JA (1.0mAD 1612 12/3 14.17 18.31 14.58 16.44 527 5.07 5.17 6.72 5,35 603
IA (1.5mM) 19.21 13.60 1640 21.28 15.61 1844 5.22 5.02 5.12 661 5.29 5.95
Mear 15.46 11.95 17.52 14.19 521 5.02 6.61 5,E
LSD ri 531, Varielin 0 471 0.540 0.011 0 014
Treatment 9666 0.763 0,015 0.048 Var. x Treat 0.942 1980 0021 0.068
Table 43. Effect of jasnlonlc acid (45.1.0 and 15 INN) on P and K content (mg II DM) of if cassicv lama c a Alankar and Mini at 60 and 75 DAS
"Demmer. P content K center.
60 DAS 75 DAS 60 DAS 75 DAS
Alankar Rohini Meii Alankar Rohini Mean Alankr Rohini Mean Alankar Rohini Mean
Control 11.03 915 10,09 1237 9.99 1138 640 991 7.96 7,40 12.79 14 RI
JA (0.5mM) 11.11 9.17 10.14 1294 10.06 Iii) 680 10,10 829 7.72 .293 10.32
JA (I .9rnM) 11 17 9.24 10.20 1304 1019 11.62 6.37 10.16 827 7.75 12.96 1936
JA (1.50) 1097 9.07 1092 12,81 9.95 11.4 611 10.04 8.06 7.47 2,92 ]a20
Mean 11.07 9,16 12.89 105 619 10.05 7.59 1190
LSD at 5% Varieties 0.016 8025 0145 0.123
Trealment 0822 13.635 0205 0.174 Var. x Treat, 0.031 0.049 NS NS
Sig Significant; NS ,Non.signilicant

Table 14. Effect of jasmonic acid (0.5,1.0 and 1.5 m11) on number of stomata on ahaxial and adaxial leaf surface of Braisica junceu ci s. Alankar and Rohini at
6(1 and '5 DAS
I Tamil- No. of stomata (Abaxial surface) No. of stomata (Adaxial surface)
60 DAS 75 DAS 60 DAS 75 DAS
Alankar Rohini Mean Alankar Rohini Mean Alankar Rohini Mean Alankar Rohini \lean
Control 21 5 18.6 20.1 24.5 22.8 23.7 11,4 10.8 11.1 14.6 12.6 13.6
JA (0.5mM) 21 5 18.8 20.2 24.5 22.9 23.7 11.4 10.9 11.2 14.7 12.8 13.7
JA (1,0mM) 21.6 18.9 20.3 24.6 23.0 23.8 11.5 11.1 11.3 14.8 12.8 13.8
JA (1.5mM) 21.6 18.8 20.2 24,6 23.0 23.8 11.4 10.9 1 1. 1 14.7 12.8 13.8
Mean 21.6 18.8 24.5 22.9 11.4 10.9 14.7 12.8
LSD at 5% Varieties 0.683 0.798 0.38 0.47
Treatment NS NS NS NS Var. x Treat. NS NS NS NS
I able 45. Effect of jasinonic acid (0.5, 10 and 1.5 mN1) on relative stomata! closure index (RSCI) of abmial and adaxial surface of Braiiku junco as. Alankar
and Rohini at 60 and 75 DAS
Treatment RSCI (Abaxial leaf surface) RSCI (Adaxial leaf surface)
60 DAS 75 DAS 60 DAS 75 DAS
Alankar Rohini Mean Alankar Rohini Mean Alankar Rohini Mean Alankar Rohini Mean
JA (0.5mM) 0.53 0.57 0.55 0.46 0.49 0.48 0.66 0.75 0,71 0.61 0.84 0.73
JA (1.0mM) 0.49 0.50 0,49 0.43 0.45 0.44 0.63 0.68 0.66 0.58 0.79 0.69
JA (1.5mM) 0.56 0.61 0.58 0.48 0.52 0,50 0.69 0.79 0.74 0.63 0.87 .0.75
Mean 0.53 0.56 0.46 0.49 0.66 0.74 0.61 0.83
LSD at 5%
Varieties 0.008 0.005 0.008 0.008
Treatment 0.010 0.006 0.009 0.010
Var. x Treat. 0.014 0.009 0.013 0.014
Sig = Significant; NS = Non•significant

1 able 46. Effect of jasmonic acid (05,1.0 and 1.5 m11) on net photosy nthetic rate (Ps; A mol CO: m* sec.' ) and stomatal conductance (g,; mol m seer ) of
Brassier, junceu os..1Iankar and Rohini at 60 and 75 DAS
Treatment Net photosynthetic rate (Ps) Stomatal conductance (gs)
60 DAS 75 DAS 60 DAS 75 DAS
Alankar Rohini Mean Alankar Rohini Mean Alankar Rohini Mean Alankar Rohini Mean
Control 10.15 8.97 9.56 12.41 10.95 11.68 40.02 34.82 37.42 46.64 38.32 42.48
JA (0.5mM) 11.06 9.57 10.32 13.4S 11.51 12.48 40.78 35.21 38.00 47.40 38.61 43.01
JA(I.OmM) 11.39 9.77 10.58 13.90 11.63 12.71 40.91 35.31 38.11 47.61 38.68 43.15
JA (1,5m41) 11.27 9.16 10.52 13.61 11.69 12.65 40.64 35.16 37.90 47.20 38.50 42.85
Mean 10.97 9.52 13.34 11.44 40.59 35.13 47.21 38.53
LSD at 5% Varieties 0.087 0.192 0.105 0.153
Treatment 0.123 0.271 0.149 0.216 Var. x Treat. 0.174 0.384 0 211 0.305
l ahle 4'. Effect of jasmonic acid (0.5, 111 and 1.5 01) on pod length (cm) and oil content (%) of Briasica junco, cis. Alankar and Rohini at !west 020
DAS)
Pods length (cm) Oil content (%)
Alankar Rohini Mean Alankar Rohini Mean
Control 5.04 3.92 4.48 36.45 32.89 34.67
JA (0.5mM) 5.14 3.96 4.55 39.12 34.59 36.86
JA (1.0mM) 5.15 3.98 4.56 40.01 35.29 37.65
JA (1.5mM) 5.12 3.95 4.54 38.43 34.05 36.24
Mean 5.11 3.95 38.50 34.21
LSD at 5% Varieties 0.039 0.294
Treatment 0.055 0.416 Var. x Treat. NS 0.588
Sig = Significant; NS = Nonsignificant

Table 48. Effect of jasmonic add (03,1.0 and 1.5 mM) on yield characteristics of Brassie juncea m. Alankar and Rokini at harvest (120 DAS)
Pods plant.' Seeds pod.' 1000 seeds weight (g) Seed yield (g)
Alankar Rohini Mean Alankar Rohini Mean Alankar Rohini Mean Alankar Rohini Mean
Control 106.62 84.41 95.52 11.95 10.79 11.37 5.57 4.26 4.92 7.10 3.88 5.49
1A (0.5mM) 107.73 85.05 96.39 12.17 10.93 11.55 5.68 4,29 4.99 7.45 3.99 5.72
JA (1.0mM 1 108.53 85.61 97.07 I2.26 11.03 11.64 5.71 4.34 5.03 7.60 4.10 5.85
JA (1.541) 107.62 84.54 96.08 12.09 10.87 11.48 5.66 4.27 4.97 7.37 3.93 5.65
Mean 107.62 84.90 12.12 10.91 5.66 4.29 138 3.97
LSD at 5% Varieties 0.220 0.020 0.021 0.069
Treatment 0.311 0.029 0.030 0.098 Var. x Treat 0.440 0.041 0.043 0.139
Table 49. Effect of jasmonic add (0.510 and 1.5 talon number of beetles attracted on Brosicajuncea eee. .Alankar and Rohini at 60 and 75 DAS
Number of beetles attracted
60 DAS 75 DAS
Alankar Rohini Mean Alankar Rohini Mean
Control 0 0 0 0 0 0
JA (0.5mM) 12 9 11 4 3 4
JA (1.0mM) 14 11 13 6 5 6
JA (1.5mM) 10 9 10 5 3 4
Mean 9 7 4 3
LSD at 5% Varieties 0345 0.139
Treatment 0.487 0.179 Var. x Treat. 0.689 0.279
Sig = Significant: NS , Non•signifiant

Table 50. Combined effect of jasmonic acid (1.0mM) and aphid infestation (50, 100 and 150 aphids per plant) on root and shoot length (cm) of Brovica juncea
cvs. Alankar and Rohini at 60 and 75 DAS
Treatment Shoot length Root length
60 DAS 75 DAS 60 DAS 75 DAS
Alankar Rohini Mean Alankar Rohini Mean Alankar Rohini Mean Alankar Rohini Mean
Control 52.08 42.72 47.40 71.86 56.06 63.96 17.52 13.15 15.34 28.07 19.53 23.80
JA 50 aphids 53.21 43.15 48.18 74.17 57.16 65.67 17.81 13.27 15.54 28.37 19.58 23.98
1A + 100 aphids 52.36 42.16 47.26 72.69 55.56 64.13 17.65 13.06 15.36 28.36 19.23 23.79
JA + I50 aphids 5030 40.48 45.39 70.13 53.80 61.96 17,16 12.57 14.86 27.64 18.91 23.28
Mean 51.99 42.13 72.21 55.65 17.53 13.01 28.11 19.31
LSD at 5% Varieties 0.212 0.316 0.265 0.139
Treatment 0.301 0.446 0.375 0.1% Var. x Treat. 0.425 0.631 NS 0.277
Table 51. Combined effect of jasmonic acid (1.0 01) and aphid infestation (50, 100 and 150 aphids per plant) on root and shoot length (cm) of Brassica juncea
cvs. Alankar
Treatment
and Rohini at 60 and 75 DAS
Leal number per plant Leaf area
60 DAS 75 DAS 60 DAS 75 DAS
Alankar Rohini Mean Alankar Rohini Mean Alankar Rohini Mean Alankar Rohini Mean
Control 45.06 37.61 41.34 58.83 48.13 53.48 40.95 35.62 38.29 47.53 3936 43.45
1A + 50 aphids 44.82 36.55 40.68 58.72 47.27 53.00 40.64 35.11 37.87 4735 38.90 43.12
JA 1 100 aphids 44.58 36.45 40.51 58.52 46.95 52.74 40.40 34.86 37.63 47.05 38.63 42.84
JA + 150 aphids 44.22 35.51 39.86 58.09 46.29 52.19 40.03 34.60 37.32 46.69 38.42 42.56
Mean 44.67 36.53 58.54 47.16 40,50 35.05 47.15 38.83
LSD at 5% Varieties 0.693 0.258 0.427 0.073
Treatment 0.980 0365 0.604 0.104
Var. x Treat, 0.517 NS 0.147 NS
Sig = Significant; NS = Non-significant

Table 52, Combined effect of jasmonic acid (1.0 mM) and aphid infestation (50, 100 and ISO aphids per plant) on fresh and dry mass (g) of &mica juncea cis.
Alankar and Rohini at 60 and 75 DAS
Treatment Fresh mass Dry mass
60 DAS 75 DAS 60 DAS 75 DAS
Alankar Rohini Mean Alankar Rohini Mean Alankar Rohini Mean Alankar Rohini Mean
Control 9.52 6.23 7.88 13.93 11.67 12.80 2.49 1.57 2.03 3.31 2.92 3.12
1A + 50 aphids 8.84 539 7.21 12.92 10.51 11.71 2.30 1.40 1.85 3.09 2.64 2.87
JA + 100 aphids 8.36 5.26 6.81 12.32 10.02 11.17 2.18 1.33 1.76 2.94 2.51 2.73
1A + 150 aphids 7.95 4.99 6.47 11.78 9.46 10.62 2.08 1.26 1.67 2.80 2.38 2.59
Mean 8.67 5.52 12.14 10.41 2.26 1.39 3.03 2.61
LSD at 5% Varieties 0.084 0.036 0.022 0.014
Treatment 0.119 0.051 0.031 0.019 Var, \ Treat. 0.168 0.072 0.044 0.027
fable 53. ('nmbined effect of jasmonic acid (1.0 mill) and aphid infestation (50, 100 and 150 aphids per plant) on eldoroplill a and h img 2, 1 FM) level of
Brimicajunfeu cvs. Alankar and Rohini
Treatment
at 60 and 75 DAS
Chlorophyll a Chlorophyll b
60 DAS 75 DAS 60 DAS 75 DAS
Alankar Rohini Mean Alankar Rohini Mean Alankar Rohini Mean Alankar Rohini Mean
Control 1.155 0.806 0.981 1.270 0.967 1.116 0.566 0.380 0.413 0.563 0.468 0.516
JA + 50 aphids 1.092 0.713 0.903 1.238 0.870 1.054 0.508 0.323 0.416 0.523 0.421 0.472
JA + 100 aphids 1.072 0.694 0.883 1.222 0.849 1.035 0.488 0.305 0.397 0.510 0.402 0.456
JA ISO aphids 1.049 0.652 0.851 1.197 0.795 0.996 0.465 0.276 0.371 0.499 0.382 0.440
Mean 1.092 0.716 1.230 0.870 0.507 0.321 0.524 0.418
I.SD at 5% Varieties 0.011 0.018 0.001 0.005
Treatment 0.015 0.026 0.002 0.008 Var. x Treat. 0.021 0.037 0.002 0.011
Sig = Significant; NS = Non•significant

Table 54. Combined effect of jasmonic acid (1.0mM) and aphid infestation (50,100 and 150 aphids per plant) on total chlorophyll level (mg g.1 FM) and
carotenoid level (mg g.1 FM) of Brassica juncea os. Alankar and Rohini at 60 and 75 DAS
Treatment Total chlorophyll level Carotenoid Icvcl
60 DAS 75 DAS 60 DAS 75 DAS
Alankar Rohini Mean Alankar Rohini Mean Alankar Rohini Mean Alankar Rohini Mean
Control 1.720 1.185 1.453 1.827 1.434 1.631 0.570 0.430 0.500 0.540 0.350 0.445
JA 50 aphids 1.601 1.035 1.318 1.760 1.290 1.525 0.722 0.517 0.620 0.671 0.413 0.542
JA 100 aphids 1.559 0.998 1.278 1.731 1.251 1.491 0.692 0.493 0.593 0.644 0392 0.518
150 aphids 1.513 0.928 1.220 1.695 1.176 1.435 0.664 0.476 0.570 0.622 0.377 0.500
Mean 1.598 1.036 1.753 1.287 0.662 0.479 0.619 0.383
LSD at 5% Varieties 0.012 0.026 0.010 0.018
Treatment 0.016 0.037 0.014 0.026 Var. x Treat 0.023 0.053 0.020 0.036
Table 55. Combined effect of jasmonic acid (1.0mM) and aphid infestation (50, 100 and 150 aphids per plant) on protein content (mg g. ' DM) and total phenol
content (nig g 1.11) of Braisica juncea cvs. Alankar and Rohini at 60 and 75 DAS
Treatment Protein content Total phenol
60 DAS 75 DAS 60 DAS 75 DAS
Alankar Rohini Mean Alankar Rohini Mean Alankar Rohini Mean Alankar Rohini Mean
Control 23.36 22.04 22.70 24.27 22.36 23.32 3.82 3.31 3.57 4.53 4.04 4.29
JA - 50 aphids 21.44 19.47 20.45 22.87 20.50 21.68 3.49 2.94 3.22 4.36 3.04 3.70
JA 7100 aphids 19.81 17.98 18.90 21.36 18.97 20.17 3.44 2.78 3.11 4.32 2.97 3.64
JA 150 aphids 18.09 16.29 17.19 19.42 17.23 18.32 3.40 2.62 3.01 4.26 2.88 3.57
Mean 20.67 18.94 21.98 19.76 3.54 2.91 4.37 3.23
LSD at 5% Varieties 0.135 0.119 0.069 0.132
Treatment 0.191 0.138 0.097 0.186 Var. x Treat. 0.270 0.237 0.137 0.263
Sig = Significant: NS = Non•significant

Table 56. Combined effect of jasmonic acid (11.0mM) and aphid infestation (50, 100 and 150 aphids per plant) on praline content (µ mol FM) and N content
(mg g-1 DM) of Brassica juncea cvs. Alankar and Rohini at 60 and 75 DAS
Treatment Proline content N content
60 DAS 75 DAS 60 DAS 75 DAS
Alankar Rohini Mean Alankar Rohini Mean Alankar Rohini Mean Alankar Rohini Mean
Control 13.17 1128 12.23 15.24 13.69 14.47 5,43 5.20 5.32 6.65 5.46 6.06
JA + 50 aphids 15.27 12.72 13.99 16.44 14.43 15.44 5.32 5.03 5.18 6.60 5.35 5.98
JA + 100 aphids 17.87 13.31 15.59 17.88 14.85 16.37 5.13 4.84 4.99 6.37 5.15 5.76
1A + 150 aphids 21.64 14.93 18.28 20.07 15.79 17.93 4.77 4.71 4.74 5.92 5.01 5.47
Mean 16.99 13.06 17,41 14.69 5.16 4.95 6.38 5,25
LSD at 5% Varieties 0.519 0.454 0.057 0.066
Treatment 0.734 0.642 0.080 0.094 Var. x Treat, 1.039 0.906 0.114 0.134
Table 57. Combined effect of jasmonic acid (1.0 mM) and aphid infestation (50, 100 and 150 aphids per plant) on P and K content (mg g-1 DM) of &Eska
juncea c%s. Alankar and Rohini at 60 and 75 DAS
Treatment
P content K content
60 DAS 75 DAS 60 DAS 75 DAS
Alankar Rohini Mean Alankar Rohini Mean Alankar Rohini Mean Alankar Rohini Mean
Control 11.29 939 10,34 12.96 10.19 11.58 6,13 10.02 8.08 7.47 12.89 10.18
JA + 50 aphids 10.80 8.79 9.79 12.66 9,74 11.20 6,30 10.29 8.29 7.56 13.06 10.31
JA + 100 aphids 9.88 7.67 8.77 11.60 8.54 10.07 6.52 10.55 8.54 7.85 13.41 10.63
JA + 150 aphids 8.88 6.39 7.63 10.46 7.14 8.80 6,60 10.80 8.70 7.94 13.70 10.82
Mean 10.21 8.06 11.92 8.90 6.39 10.41 7.71 13.26
LSD at 5%
Varieties 0.106 0.130 0.300 0.314
Treatment 0.150 0.185 0.424 0.445
Var. x Treat. 0.212 0.261 NS NS Sig = Significant; NS = Non-significant

Table 58, Combined effect of jastimnk acid OM mM) and aphid infestation (50, 100 and 1N aphids per plant) on number of stomata on abaxial and adasial
leaf surface ofBriny/aqui= cvs. Alankar and Mini &160 and 75 DAS
Treatment No. of stomata (Abaxial surface) No. of stomata (Adosial surface)
N DAS 75 DAS 60 DM 75 DAS
Alankar Rohisi Mean Alankar Rohn Men Alankar Rshini Mean Alankar Rohini Mean
Control 21A 18.8 20.1 241 221 237 I IA 10.8 1.1 14.8 12.7 I;.3
IA + 50 aphids 21.2 18.3 19.7 245 22.2 1374 113 105 109 14.7 12.4 131.6
JA 109 apkids 21.2 18,2 192 245 22.1 235 11,3 105 109 14,7 12A 133
1A + 150 aphids 21.1 18.1 19.6 24.4 77.1 21.3 11.3 10.4 118 14.7 124 13.5
Mean 21.2 114 245 221 II.) 105 117 113
LSO at 5% Varieties 0.096 0.099 1074 0.058
Treatmenr 1135 0.139 1104 0 082 Var. a Treat. 0.192 0.197 0.147 0 1:5
Table 59. Combined effect of lasmonic acid (1.0 mM) and aphid infestation (50,100 and 150 aphids per plant, on Male stomata) closure index (RSCI) of
Still and adasial surface of Brassica junrea csre, Abair and linhini at 60 and 75 DAS
Treatment RSCI leaf surface)
60 DAS
Alankar Rohini
RSCI IAdaxial Isar surface)
60 DAS
Mean
75 DAS
Mean
75 DAS
Alankar Rshini Alankar ilcilini Mean Alankar Rchini Akan
rik 50 aphids 0.36 0.37 137 0.31 033 0.32 050 0.57 0.53 145 0.51
0.48
+ 100 aphids 0.58 0.54 0.40 0.42 0.41 036 0,38 0,37 034 0.61 0.50 0.57
1A + 150 aphids 0.6 0,61 0.61 0,53 0.52 0.45 0.48 047 0.62 0,70 0.57 0.65
Mean 0.42 0.44 1177 UM 0.55 162 151 0.58
LSD at 5% Yarixties 0.005 0.0N 0.008 0.006
Treatment 0006 0,005 0.408 (7007
Vat, slot. 0,008 0.007 9,011 0110
Sig Significant; NS - Non-significant
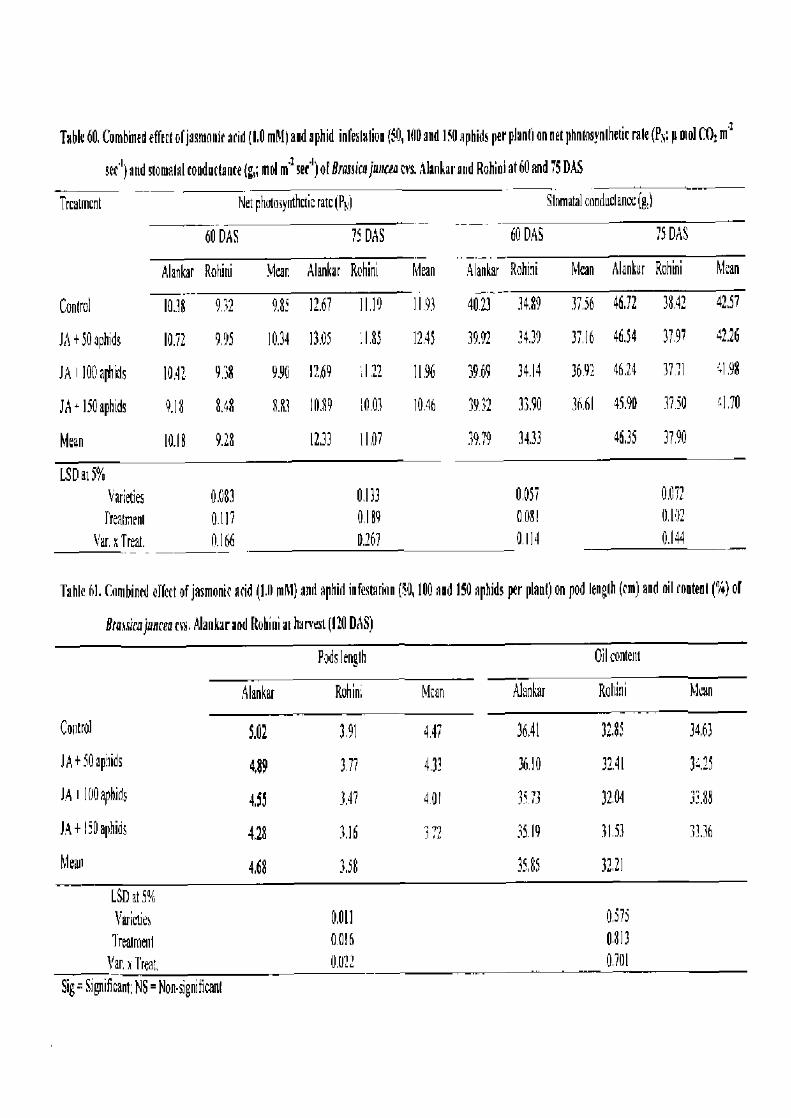
Table 60, Combined effect of jasmonie arid (1,0 mall and aphid infestaliol (50,100 and 150 aphids per plant) en net photosynthetic rale (Pk: p owl CO r42
see) and stomalal conductance (u, and m1 sec) of Brassier, jwicea cvs. Alankar and Robin' at 60 and 75 DAS
Trainor! Net photosynthetic ratc (PO) Sthmatal conduclanat (g)
60 DAS 75 DAS 60 DAS 75 DAS
Alankar Rohini Mar. Alankar Rohini Mean Alankar Rohini Mcan Alankar Rohini Man
Control 1038 932 9.85 12.67 11.19 11.93 40.23 34.89 37.56 46,72 38.42 42,57
JA 50 aphids 10.72 9.95 10.39 13.05 :1.85 12.45 39.92 34.39 37,16 46.14 3797 4216
JA 10Ciaphds 10A 1 9.38 9.90 1269 712 11.96 39.69 3414 36 92 46.24 37 11 41.98
JA + 150 aphids 9.18 8.4 8.83 10.39 10.03 10.46 39 32 33.90 36.61 45.90 37.50 =1.70
Mean 10.18 9.28 1/33 1107 39.79 3433 46,35 37.90
LSD at 5% Varieties 0.083 0.133 0.057 0.072 Central 0117 0.189 0081 0102
Var, 9 Treat. 8166 0.267 0.114 0.144
Table 61. Combined effect of 1aSMOIlie add (1.0 mm) and aphid infestation (30,100 and 150 aphids per plant) on pod length (cm) and nil content (%) of
Brosica junco cvs. Alankar and Rohini at harvest (120 DAS)
Pods length Oil content
Alankar Rohini Mcan /Ink& Rohini Mean
Control 5.02 3.91 4.47 36AI 32,85 34k3
JA + 50 aphids 4,89 3.77 433 36.10 32.41 34.21
JA I 100 aphids 4,55 3.47 4 01 35 73 32.04 33.88
JA + 150 aphids 4.28 116 372 35.19 31.53 33.36
Mean 4.68 3.58 35.85 3121
LSD at 5% Varieties 0.011 0.575 1 ream 0 016 0813
Var. n flesh 0,022 0.701
Sig. Significant NS = Noksignificant

Table 61 Combined effect of jasmonk Kid (1.11 mM) and aphid infestation (50,100 and 150 aphids per plant) on yield tharietelisties of &mica junred
(vs. Alankar and Rohini at harvest
Pods plot Seeds pod.' 1000 seeds weight (g) Seed yield (g)
Mean Alankar Rohini Mean Alankar Rohini Mean Alankar Rohini Mean Alankar kohini
Control 109M 87,43 454 1196 1079 11.38 5.31 426 429 7.21 — 4M2 512
3,8 + 50 aphids 10239 80 21 9140 113 10,05 10.67 5.21 179 430 6.04 105 4.55
A+ 100 aphids 89.13 69,59 79.38 10,51 873. 9,63 4.91 3,32 4.11 4.60 2.02 3.31
A + 150 aphids 7448 58 24 6636 921 7.63 877 452 3.08 3.80 130 137 234
Mean 93.97 73 87 10.89 9.31 3R4 3.61 33.29 262
LSD al 5% Varieties 1.638 0238 03176 0.156
Treatment 2.316 0.351 0107 0.221
Ver. x Treat. 3.276 0.496 0.152 8312
Table 61 Combined effetd of jasmunate mM) and aphid infestation (50, 100 and ISO aphids per plant) an the aphid mot and number of beetles
attracted OR Br assica juncea ers, Alankar and Rohini at 60 and 75 DAS
Treatment Aphid count Number of beetles altracted
60 DAS 75 DAS 60 DAS 75 DAS
Mat Rohini Men Alankar Rohini Mean 9,ankar Robin. Mean Alankr Rohini Mean
Control 0 0 0 0 0 0 0 0 0 0 0 0
JA + 50 aphids 47 51 49 85 102 94 II 9 10 4 3 4
JA + 100 aphids 96 104 100 142 157 150 15 12 14 7 6 7
11 + 130 aphids 161 171 166 210 21 216 13 10 12 5 4 5
Mean 76 82 109 120 10 8 4 3
LSD at 5% Varieties 1.689 2383 0 368 ft 155
Treatment 2338 1370 6 520 0.219
Var. a Truk 3.378 4.766 0,335 0.310
Sig Signikcant, NS Non-significant