
University of Dundee DOCTOR OF PHILOSOPHY Workflow ...
197
University of Dundee DOCTOR OF PHILOSOPHY Workflow Analysis, Modelling and Simulation for Improving Conventional and MRI- guided Vascular Interventions Fernandez-Gutierrez, Fabiola Award date: 2014 Awarding institution: University of Dundee Link to publication General rights Copyright and moral rights for the publications made accessible in the public portal are retained by the authors and/or other copyright owners and it is a condition of accessing publications that users recognise and abide by the legal requirements associated with these rights. • Users may download and print one copy of any publication from the public portal for the purpose of private study or research. • You may not further distribute the material or use it for any profit-making activity or commercial gain • You may freely distribute the URL identifying the publication in the public portal Take down policy If you believe that this document breaches copyright please contact us providing details, and we will remove access to the work immediately and investigate your claim. Download date: 17. Feb. 2017
-
Upload
khangminh22 -
Category
Documents
-
view
2 -
download
0
Transcript of University of Dundee DOCTOR OF PHILOSOPHY Workflow ...

University of Dundee
DOCTOR OF PHILOSOPHY
Workflow Analysis, Modelling and Simulation for Improving Conventional and MRI-guided Vascular Interventions
Fernandez-Gutierrez, Fabiola
Award date:2014
Awarding institution:University of Dundee
Link to publication
General rightsCopyright and moral rights for the publications made accessible in the public portal are retained by the authors and/or other copyright ownersand it is a condition of accessing publications that users recognise and abide by the legal requirements associated with these rights.
• Users may download and print one copy of any publication from the public portal for the purpose of private study or research. • You may not further distribute the material or use it for any profit-making activity or commercial gain • You may freely distribute the URL identifying the publication in the public portal
Take down policyIf you believe that this document breaches copyright please contact us providing details, and we will remove access to the work immediatelyand investigate your claim.
Download date: 17. Feb. 2017

DOCTOR OF PHILOSOPHY
Workflow Analysis, Modelling andSimulation for Improving Conventional and
MRI-guided Vascular Interventions
Fabiola Fernandez-Gutierrez
2014
University of Dundee
Conditions for Use and DuplicationCopyright of this work belongs to the author unless otherwise identified in the body of the thesis. It is permittedto use and duplicate this work only for personal and non-commercial research, study or criticism/review. Youmust obtain prior written consent from the author for any other use. Any quotation from this thesis must beacknowledged using the normal academic conventions. It is not permitted to supply the whole or part of thisthesis to any other person or to post the same on any website or other online location without the prior writtenconsent of the author. Contact the Discovery team ([email protected]) with any queries about the useor acknowledgement of this work.

Workflow Analysis, Modelling and
Simulation for Improving Conventional
and MRI-guided Vascular
Interventions
Fabiola Fernández-Gutiérrez
Supervisors:
Prof Andreas Melzer
Prof John Graeme Houston
Institute for Medical Science and Technology
Division of Imaging and Technology
College of Medicine Dentistry and Nursing
University of Dundee
A thesis submitted for the degree of
Philosophiæ doctor (PhD)
University of Dundee
May 2014

A mis padres y a mi hermana Leticia

iii
Contents
Acknowledgements .............................................................................................................. vii
Declaration............................................................................................................................. ix
Statement by supervisors ....................................................................................................... x
Abstract .................................................................................................................................. xi
Glossary ............................................................................................................................... xiii
List of figures ....................................................................................................................... xvi
List of tables........................................................................................................................... xx
Chapter 1. Introduction .......................................................................................................... 1
1.1. Context ...................................................................................................................... 1
1.2. Research objectives, hypotheses and propositions .................................................... 2
1.3. Chapter summaries .................................................................................................... 3
1.4. Publication list ........................................................................................................... 5
1.4.1. Journal papers ................................................................................................................ 5
1.4.2. Book chapters, conferences papers and abstracts........................................................... 6
Chapter 2. Background .......................................................................................................... 8
2.1. Introduction ............................................................................................................... 8
2.2. Cardiovascular and interventional radiology ............................................................. 8
2.2.1. Introduction .................................................................................................................... 8
2.2.2. Digital Subtraction angiography and angiography rooms .............................................. 9
2.2.3. Magnetic Resonance Imaging and scanner rooms ....................................................... 11
2.2.4. Integrated interventional operating systems ................................................................. 14
2.3. System analysis, modelling and simulation ............................................................. 17
2.3.1. Introduction .................................................................................................................. 17
2.3.2. System, model and other essential definitions ............................................................. 17
2.3.3. Physical vs. mathematical models: how to study a system. ......................................... 18
2.3.4. Modelling techniques in the healthcare context ........................................................... 20
2.4. Workflow analysis, modelling and simulation in healthcare ................................... 24
2.4.1. Introduction .................................................................................................................. 24
2.4.2. Workflow analysis in surgical environments ............................................................... 25
2.4.3. Workflow analysis, modelling and simulation in radiology environments .................. 27
2.5. Summary.................................................................................................................. 30
Part I: Simulation Approach ............................................................................................... 31
Chapter 3. Simulation methodological framework ............................................................ 32
3.1. Overview of the chapter .......................................................................................... 32
3.2. Simulation framework ............................................................................................. 32

iv
3.2.1. Introduction .................................................................................................................. 32
3.2.2. Simulation software assessment .................................................................................. 32
3.2.2.1. Introduction ............................................................................................................ 32
3.2.2.2. Methodology for simulation software evaluation ................................................... 33
3.2.2.3. Results of simulation software evaluation .............................................................. 35
3.2.2.4. Delmia: main features and 3D library .................................................................... 37
3.2.3. Data gathering and analysis for DES simulation ......................................................... 43
3.2.3.1. Data collection ....................................................................................................... 43
3.2.3.2. Data input analysis for DES ................................................................................... 46
3.2.4. Conceptual modelling .................................................................................................. 47
3.2.5. Models implementation ............................................................................................... 49
3.2.6. Validation and verification .......................................................................................... 50
3.2.7. Simulation and output analysis .................................................................................... 51
3.2.7.1. Output data analysis ............................................................................................... 51
3.2.7.2. Optimisation analysis ............................................................................................. 52
3.3. Summary.................................................................................................................. 54
Chapter 4. Results: Case study of percutaneous coronary interventions ........................ 55
4.1. Background of the case ........................................................................................... 55
4.2. Overview analysis of the PCIs records .................................................................... 56
4.2.1. General information analysed ...................................................................................... 56
4.2.2. Cath lab times analysed ............................................................................................... 58
4.3. Workflow analysis for angioplasty and stenting PCIs ............................................. 60
4.4. Model implementation ............................................................................................. 64
4.5. Validation and verification of the PCI model .......................................................... 68
4.6. Discussion................................................................................................................ 69
4.7. Summary.................................................................................................................. 70
Chapter 5. Results: Case study of transarterial chemoembolisation ............................... 71
5.1. Background to the case ............................................................................................ 71
5.2. Data collection and statistical analysis .................................................................... 73
5.2.1. The multimodal imaging TACE new protocol ............................................................. 73
5.2.2. Data collection ............................................................................................................. 74
5.3. Model implementation ............................................................................................. 75
5.4. Validation and verification ...................................................................................... 77
5.5. Simulation-based optimisation analysis .................................................................. 78
5.6. Discussion................................................................................................................ 82
5.7. Summary.................................................................................................................. 82
Chapter 6. Extending the framework to non-vascular IGPs: MRgFUS .......................... 84
6.1. Introduction to the chapter ....................................................................................... 84

v
6.2. The FUSIMO project background ........................................................................... 84
6.3. Conceptual model, data collection and statistical analysis ...................................... 86
6.4. Model implementation and validation ..................................................................... 90
6.5. Simulation analysis .................................................................................................. 93
6.6. Discussion................................................................................................................ 96
6.7. Summary.................................................................................................................. 97
Chapter 7. Preliminary results modelling complex vascular procedures: TAVI ............ 98
7.1. Introduction ............................................................................................................. 98
7.2. Preliminary results: transfemoral TAVI .................................................................. 99
7.2.1. Data analysis and conceptual workflow ....................................................................... 99
7.2.2. Simulation model ....................................................................................................... 102
7.3. Discussion.............................................................................................................. 102
7.4. Summary................................................................................................................ 103
Part II: Physical Modelling Approach .............................................................................. 104
Chapter 8. Physical modelling framework for comparative workflow analysis ........... 105
8.1. Introduction ........................................................................................................... 105
8.2. Case study: Fluoroscopic vs. MRI-guided iliac angioplasty ................................. 106
8.3. Environmental setup .............................................................................................. 107
8.4. Methodology.......................................................................................................... 110
8.5. Statistical analysis ................................................................................................. 114
8.6. Ergonomic analysis ............................................................................................... 115
8.7. Summary................................................................................................................ 118
Chapter 9. Results: Fluoroscopy versus MRI – an iliac angioplasty case study ........... 119
9.1. Introduction ........................................................................................................... 119
9.2. Task analysis ......................................................................................................... 119
9.3. Cognitive and user experience analysis ................................................................. 121
9.4. Ergonomic analysis ............................................................................................... 122
9.5. Discussion.............................................................................................................. 126
9.6. Summary................................................................................................................ 129
Chapter 10. Conclusions and future work ........................................................................ 130
10.1. Introduction ......................................................................................................... 130
10.2. Conclusions over research hypotheses and propositions .................................... 130
10.3. Limitations of present research work .................................................................. 132
10.4. Potential applications and future work................................................................ 133
10.4.1. Perspectives for workflow analysis and simulations used for in regulative procedures133
10.4.2. Comprehensive ergonomic analysis........................................................................... 134
10.4.3. Modelling multimodal imaging environments ........................................................... 134

vi
References ............................................................................................................................ 137
Appendix .............................................................................................................................. 154
Appendix A: Vendors’ list ............................................................................................ 154
Appendix B: Simulation software evaluation summary ................................................ 155
Appendix C: MIDAS - Medical Interventional Data Analysis System ........................ 157
Appendix D: DES model statistics ................................................................................ 158
D.1. PCI ................................................................................................................................ 158
D.2. TACE ............................................................................................................................ 161
D.3. MRgFUS ....................................................................................................................... 163
D.4. TAVI ............................................................................................................................. 170
Appendix E: Probability assessment questionnaire for MRgFUS workflow analysis .. 173
Appendix F: Markov routine code ................................................................................ 173
vii
Acknowledgements
Completing this PhD thesis has been an extraordinary trip, which I wouldn’t have
been able to complete without the support of my supervisors, colleagues, friends and
family. I got the chance to do my research in a beautiful land full of castles and
friendly people. I felt in love with Scotland and even became a Lady with my own
castle. I have lots of things to be grateful for and lots of people to be thankful to.
First of all, I would like to thank Andreas for the chance to be part of his team and
for his trust on my work during this journey. I wouldn’t have learnt and grown as
much as I have without his guidance and encouragement during these years. I would
also like to thank Graeme for his advice and his supportive participation during my
intensive experiments.
I would like to thank the IIIOS project for funding my research and training
during my thesis. Thank you to the IIIOS team, it has been amazing to meet and
work with you all. Specially, this thesis wouldn’t have been successful without the
collaboration of many people, inside and outside the IIIOS network. I would like to
thank Arno and Goska from Saarland Medical Center, and Ole, Gry, Hilde, Karl,
Rahul, Bakri, Rafael, Ilya and rest of the team at Oslo University Hospital for their
valuable contribution. Thanks to Avril and the rest of the medical staff at the
radiology department, and to Dr Thomas Martin and the rest of the cath lab staff in
Ninewells Hospital for facilitating my attendance to the interventions and being
always willing to satisfy my curiosity. Thank you Arjo for sharing your expertise on
MRgFUS and the ‘photography workshop’ in Rome. Santiago and Ken, thank you
for the first-user perspective, I have learned to see with other eyes. To Peter and John
for the course on Delmia and Peter, thanks too for the help on the kinematics and
being always available for my questions. Thanks to John and Jouke for the CAD
models. Thanks to Lynda Cochrane for her advice on statistics and Prof Fermin
Mallor for the tips on Markov models. Thanks Helene for testing my templates and
Dan for the proof read.
My special thanks to the IIIOS team in Dundee: Martin, Ben, Mahsa and Rachel.
And thanks also to the rest of the MRI team along these years that have supported
my research one way or another: Mariana, Helen, Erwin and Karen. I have really

viii
enjoyed the time with you all in and out of IMSaT. You are all part of my life and
will be in my heart always. Thanks also to the rest of IMSaT staff, always helpful
and supportive. I will miss you.
I must be one of the luckiest persons in the world to count with such wonderful
friends that have accompanied me during all these years. To my almost sister Dinara,
my lovely friend Catalina and my cheerful Jing, although far, we will never feel
apart. To my family in Dundee: Susan, Cecilia, Ioannis, Ana and Graham. I never
felt alone with you. Nish, Katrin, Cyrille, Laura and my rest long list of friends I met
in Dundee, you made me feel at home from my first moment in Dundee. Iain, thanks
for your help and for the insights. Alison thanks for always welcoming me at your
home. And to my old friends from Spain, although some of this time has felt as a
rollercoaster, you know and understand me well. You are so many that I don’t want
to leave a name behind. Thank you for finding time to meet me whenever I was back
and made me feel like I never left. I miss you all.
Mamá, papá y Leticia, siempre habéis creído en mí, incluso cuando yo dudaba de
mi misma. Me habéis apoyado cada segundo de mi vida y esta tesis es enteramente
dedicada a vosotros. Gracias. Al resto de mi familia que me habéis acompañado
desde la distancia y a los que ya no estáis conmigo, gracias.
And last but not least, you are my sunshine, you make me happy. Thank you
Felix.

ix
Declaration
I hereby declare that this thesis titled ‘Workflow Analysis, Modelling and
Simulation for Improving Conventional and MRI-guided Vascular Interventions’ has
been compiled by myself, that it is a record of work completed by myself and that it
has not previously been accepted for a higher degree at this University or any other
institution of learning. Where other sources of information have been used, they have
been acknowledged.
Signature: Fabiola Fernández-Gutiérrez Date: 15th
May 2014

x
Statement by supervisors
I, Andreas Melzer, have read this thesis titled ‘Workflow Analysis, Modelling and
Simulation for Improving Conventional and MRI-guided Vascular Interventions’
and certify that the conditions of Ordinance 39 of the University of Dundee have
been fulfilled.
Signed: Date: 14/05/214
Prof Andreas Melzer, First Supervisor
I, John Graeme Houston, have read this thesis titled ‘Workflow Analysis,
Modelling and Simulation for Improving Conventional and MRI-guided Vascular
Interventions’ and certify that the conditions of Ordinance 39 of the University of
Dundee have been fulfilled.
Signed: Date: 14/05/214
Prof John Graeme Houston, Second Supervisor

xi
Abstract
This thesis proposes a multidirectional methodological framework for a
comprehensive ergonomic analysis and modelling of workflow for multi-modal
vascular image-guided procedures (IGPs). Two approaches are employed to analyse
the workflow: Discrete Event Simulation (DES) and purpose-oriented physical
models. In contrast to previous studies, the proposed methodology looks in detail the
actions carried out within the intervention rooms and the clinical experience during
the procedures with three main objectives: to provide a deeper understanding of
vascular procedures, to predict the impact of protocol modifications and to offer a
framework to develop new image-guided protocols for the alternative use of
Magnetic Resonance (MR) imaging in comparison with X-Ray Digital Subtraction
Angiography (DSA). The methodological framework includes an assessment of
commercial simulation software packages to evaluate their fitness to the specific
requirements of this research. The novel methodology is applied to several cases
studies of common vascular IGPs. In addition, a case of MR – guided focused
ultrasound intervention demonstrates how it is possible to extend the framework to
study non-vascular IGPs. The multi-disciplinary methodological framework
described opens a new way to understand IGPs that could be used in prospective
applications such as medical education and medical devices regulations.

xii
Resumen
Esta tesis presenta un marco metodológico multidireccional para el análisis y
modelado ergonómicos detallado de flujos de trabajo de intervenciones vasculares
guiadas por imágenes (IGPs en sus siglas en inglés) multimodales. Para el análisis
del flujo de trabajo se han utilizado dos enfoques: Simulación por Eventos Discretos
(DES en sus siglas en inglés) y modelado físico orientado a resultado. En contraste
con estudios previos, la metodología propuesta analiza en detalle las acciones
llevadas a cabo dentro de las salas de intervenciones y la experiencia del personal
clínico durante los procedimientos, todo ello con tres objetivos principales:
proporcionar un conocimiento más profundo de las intervenciones vasculares,
predecir el impacto de modificaciones en los protocolos y ofrecer un marco de
trabajo para desarrollar nuevos protocolos en intervenciones vasculares guiadas por
imagen para el uso alternativo de Resonancia Magnética (MR en sus siglas en inglés)
en comparación con la Angiografía por Sustracción Digital (DSA en sus siglas en
inglés). Como parte de este marco metodológico, se presenta una evaluación
comparativa de cumplimiento con los requerimientos específicos de esta
investigación sobre paquetes de software de simulación comerciales. La nueva
metodología se aplica a varios casos de estudio de IGPs vasculares típicos. Además,
otro caso que se presenta es el de intervención de ultrasonidos focalizados guiados
por Resonancia Magnética, que demuestra cómo es posible extender el ámbito de
trabajo para estudiar IGPs no vasculares. El marco metodológico multi-disciplinario
descrito abre una nueva vía para entender IGPs que puede ser utilizada en futuras
aplicaciones tales como la educación médica o la regulación de instrumental médico.

xiii
Glossary
Symbols
A2 – Anderson-Darling test statistic
d*, h1 , n0 , Ni – parameters for the
Dudewicz and Dalal Ranking and
Selection method for optimisation
analysis
E(X) – Expected value of the IID
random variable X
f – Degree of freedom
F – Cummulative distribution function
S2 – Variance of an IID random
variable
SD – Standard deviation
SE – Standard error
t – Student t
W – Weights calculated for
optimisation analysis
X – Independent and identically
distributed (IID) random variables
– mean of an IID random variable
– Weighted sample mean for
optimisation analysis
Acronyms
ACR – America College of Radiology
AMIGO – Advanced Multimodality
Image-Guided Operating
CAD – Computer aided design
CDF – Cumulative distribution
function
CI – Confidence Interval
CRC – Clinical Research Centre
CRPA – Cued Retrospective Protocol
Analysis
CT – Computed Tomography
CVIR – Cardiovascular interventional
radiology
DES – Discrete Event Simulation
DHM – Digital Human Model
DSA – Digital Subtraction
Angiography
D&D – Dudewicz and Dalal ranking
and selection method for optimisation
analysis
FUS – Focussed Ultrasound
FUSIMO - Patient specific modelling
and simulation of focused ultrasound
in moving organs

xiv
GEE – Generalised Estimating
Equations
GPL – General Public License
GUI – Graphical user interface
HCC – Hepatocellular carcinoma
HD – High definition
HF – High frequency
IC – the Interventional Centre
ICRP – International Commission on
Radiological Protection
IEEE – Institute of Electrical and
Electronics Engineers
IIIOS – Integrated Interventional
Imaging Operating System
IGP – Image-guided Procedure
IR – Interventional Radiology
KPI – Key Performance Indicator
MCAR – Missing Completely at
Random
MCM – Monte Carlo model
MI – Multiple Imputation
MIDAS – Medical Intervention Data
Analysis System
MITOS – Multimodality Imaging
Therapy Operating System
MKC – Markov Chain
MR – Magnetic Resonance
MRgFUS – Magnetic Resonance
guided Focussed Ultrasound
MRI – Magnetic Resonance Imaging
NHS – National Health System
NIOSH – National Institute for
Occupational Safety and Health
OT – Operating Theatre
OR – Operational Research
PCI – Percutaneous Coronary
Interventions
PET – Positron Emission Tomography
PN – Petri Nets
PTA – Percutaneous Transluminal
Angioplasty
PTA-IA – Percutaneous Transluminal
Angioplasty of the Iliac Artery
R&S – Ranking and Selection
RAD – Role Activity Diagrams
RF - Radiofrequency

xv
RULA – Rapid Upper Limb
Assessment
SMEs – Subject- matter experts
SSM – Soft Systems Methodology
STL – Stereo Lithography
TACE - Transarterial
Chemoembolisation
TAVI – Transcatheter Aortic Valve
Implantation
UML – Unified Modelling Language
US – Ultrasound

xvi
List of figures
Figure 1. (a) Example of Digital Subtraction Angiography (DSA) image (iliac arteries). (b)
Angiography suite at the Clinical Radiology Department at Ninewells Hospital (Dundee, UK)........... 9
Figure 2. (a) Example of Magnetic Resonance Image (MRI) (image of pelvis showing uterine fibroid
on T2 weighting). (b) MRI room at the Clinical Research Centre (CRC), Ninewells Hospital (Dundee,
UK). ..................................................................................................................................................... 11
Figure 3. (a) 3T Wide-bore MRI scanner (Discovery, GE Healthcare, Waukesha, WI, USA). (b) 1T
open-bore MRI scanner (Panorama, Philips, Eindhoven, The Netherlands). ....................................... 12
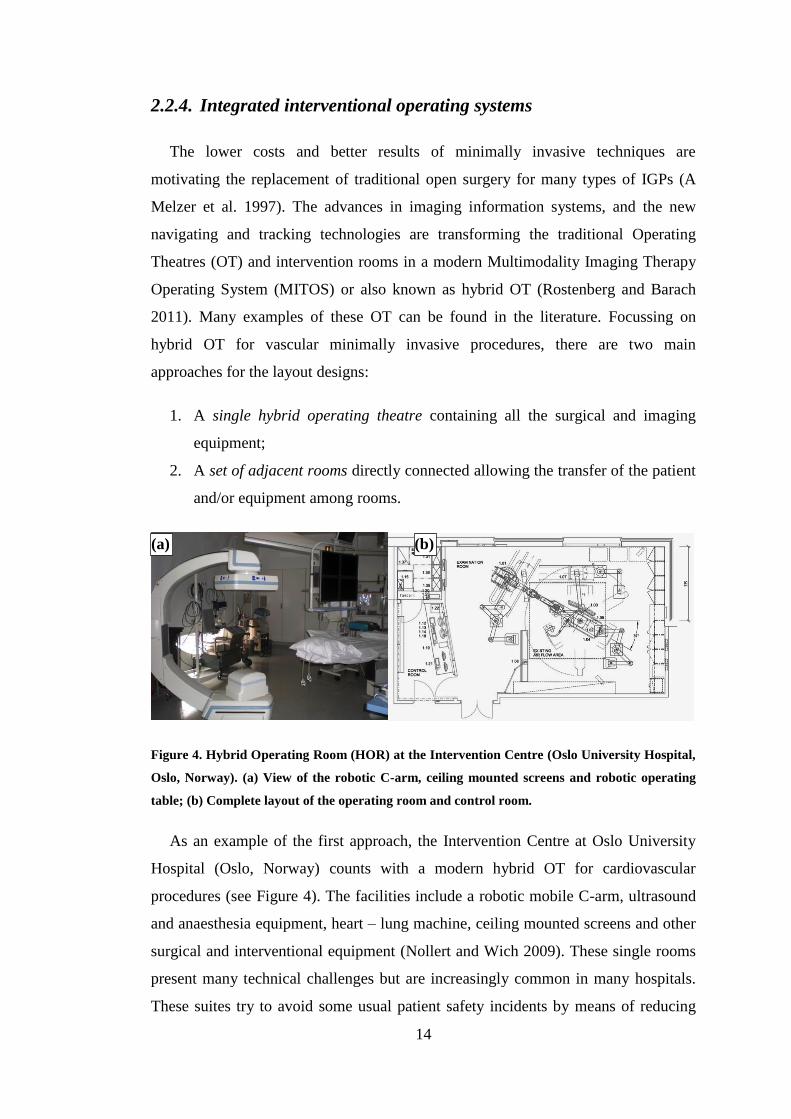
Figure 4. Hybrid Operating Room (HOR) at the Intervention Centre (Oslo University Hospital, Oslo,
Norway). (a) View of the robotic C-arm, ceiling mounted screens and robotic operating table; (b)
Complete layout of the operating room and control room. .................................................................. 14
Figure 5. Advanced Multimodality Image-Guided Operating (AMIGO) Suite: 3T MRI scanner room
on the left, PET/CT scanner on the right and surgical – intervention room in the middle, National
Center for Image Guided Therapy (NCIGT), Brigham and Women’s Hospital (Boston, MA, USA). 16
Figure 6. Clinical Research Centre (CRC) facilities at Ninewells Hospital (Dundee, UK). The layout
presents a 3-T interventional MR (left) and 128-multislice interventional PET/CT (right)
interconnected with a multipurpose interventional suite (diagnostic workflow: blue arrows, image-
guided procedure workflow: red arrows). ............................................................................................ 17
Figure 7. Ways to study a system, figure reproduced with permission from Law (2007) .................... 19
Figure 8. Schematic view of the Monte Carlo sampling method to analyse uncertainty propagation . 20
Figure 9. Example of a simple graphical representation of the transitions in a Markov Chain model,
where for example, P0,1 is the probability to go from state 0 to state 1 and P1,0 is the probability to go
from the state 1 to state 0. .................................................................................................................... 21
Figure 10. An example of a Petri Net graph where L1 to L3 are the nodes and t1 to t2 are the
transitions. ............................................................................................................................................ 22
Figure 11. Ultrasonic 3D location aware system at Tokyo Women’s Medical University (Japan),
consisting on control units (a), receivers (b) and transmitters (c); courtesy of Nara et al. (2009)........ 26
Figure 12. (a) Schematic view of the Gelsenkirchen nonclinical OT site with the differentiated
diagnostic and therapeutic workflows; (b) model to simulate workflow of combination MR/CT
guided surgery and interventions with diagnostic procedures. In this figure, blue arrows indicate
diagnostic workflow and red arrows indicate treatment workflow. ..................................................... 29
Figure 13. Delmia Quest interface. Labels are provided for graphical programming interface and
controls, view and navigation menus. .................................................................................................. 38
Figure 14. Detail of Delmia Quest interface and menu samples. ......................................................... 40

xvii
Figure 15. (a) 3D model of an MRI scanner with table in Sketchup v7, (b) 3D model converted into
STL format and incorporated into Delmia Quest through the CAD world. ......................................... 41
Figure 16. 2D and 3D view of the radiology department at Homburg Saarland Hospital (Homburg,
Germany) created to scale using Sweet Home 3D (eTeks, Paris, France). .......................................... 42
Figure 17. Delmia V5R20 for Human Ergonomics Design and Analysis graphical user interface
(GUI). To illustrate the RULA analysis menu and result windows, the GUI shows a 50th
percentile
human-like manikin in standard position operating inside an open-bore MRI scanner model
(Panorama 1T MRI, Philips, Eindhoven, The Netherlands). ................................................................ 43
Figure 18. Screenshots of MIDAS (Medical Interventional Data Analysis System) website: (a) shows
a partial view of a completed record and (b) the analysis web page with a graph. .............................. 45
Figure 19. Legend for symbols and graphic styles used on the flow diagrams and Role Activity
Diagrams (RAD) of the conceptual models. ........................................................................................ 48
Figure 20. Triangular distribution where a, b and m are the minimum, maximum and mode values. . 50
Figure 21. Box plot of total duration (hh:mm:ss) per purpose of PCI – diagnostic and treatment. ...... 57
Figure 22 Box plot of the duration for stenting PCIs divided by technique used – Direct and pre-
dilatation approach. .............................................................................................................................. 58
Figure 23. Average duration between procedures shown per weekday ............................................... 59
Figure 24. Distribution for the times calculated until the start of the first PCI .................................... 60
Figure 25 Proposed conceptual workflow for angioplasty and stenting PCI procedures ..................... 61
Figure 26 Proposed role activity diagram to show interactions among clinicians for angioplasty/stent
implantation PCIs ................................................................................................................................. 62
Figure 27. Example of distribution fitting for the “single guidance” event with the EasyFit software.
Histogram of the durations collected and curve of the probability distribution function fitted are
shown. .................................................................................................................................................. 64
Figure 28 Histogram and Poisson distribution for the number of single treatments (angioplasty or
stenting) performed on a patient during a PCI. In the diagram, frequency indicates the probability of
having a particular number of treatments. The frequencies take values from 0 to 1 instead of using
probability percentages, e.g. having 3 treatments during a single procedure has a frequency of 0.39,
which means a probability of 39%. ...................................................................................................... 66
Figure 29 DES model in Delmia Quest of the Cath Lab (Ninewells Hospital, Dundee, UK) .............. 68
Figure 30 Conceptual workflow of the patients around the MRI area. Two groups are distinguished:
patients for the TACE interventions and the MRI diagnostic patients at the clinic of diagnostic and
interventional radiology in Saarland Medical Center (Homburg, , Saarland, Germany). .................... 76
Figure 31 Screenshot during simulation of the DES model for TACE interventions and MRI patients
implemented in Delmia Quest. The 3D environment corresponds to the facilities at the department of

xviii
Radiology, Saarland Medical Centre (Homburg, Saarland, Germany). Note: the beds in the corridor
are only used to collect the waiting times due to limitations in Delmia for this purpose. They do not
represent the real waiting areas at the radiology department. .............................................................. 77
Figure 32. Weighted means ( i(Ni)) calculated for each scenarios for the three key performance
measures considered. ............................................................................................................................ 81
Figure 33 Legend for symbols and graphic styles used in MRgFUS conceptual model diagram. ....... 87
Figure 34 Conceptual model of the MRgFUS procedure current workflow designed through
observations of FUS procedures (courtesy of dr. ir. Arjo Loeve, TUDelft, Delft, the Netherlands). ... 88
Figure 35 MRgFUS workflow model implemented in Delmia Quest ((Dassault Systèmes S.A.,
Vélizy-Villacoublay, France). .............................................................................................................. 92
Figure 36 Impact that different scenarios has in the duration (in hours) of the MRgFUS procedures
against the probability of having motion per sonication. The five scenarios considered are: current
MRgFUS workflow, automated segmentation, automated sonication, combined effect (automated
segmentation + automated sonication) and 95% motion compensation effect (motion compensation +
combined effect of automated segmentation and sonication)............................................................... 95
Figure 37 Conceptual model designed from the observations on TAVI procedures (femoral approach).
Grey areas indicate features that are not contemplated in current version of the model. ................... 101
Figure 38. DES model of a TAVI procedure at the hybrid operation room at the Interventional Centre
(Oslo University Hospital, Oslo, Norway) ......................................................................................... 102
Figure 39. (a) View of the angiography suite connected by sliding door to the MRI suite, (b) MRI
suite with the intervention physical layout: a 40” LCD in-room shielded monitor and iPad attached to
MRI table (red arrow). ....................................................................................................................... 108
Figure 40. Perspectives of the cameras arranged in the MRI suite during the interventions: (a) right,
(b) left, (c) bore, (d) first-person. ....................................................................................................... 109
Figure 41. Fully perfused thorax to above the knee vascular phantom (Elastrat, Sarl, Switzerland).
Blue arrow indicates the 12F sheath introducer used for permanent access. Red arrow indicates a
neonatal pressure cuff (SoftCheck Neonatals, Statcorp Medical, Jacksonville, FL, USA) that was
attached to the right common iliac artery to mimic a stenosis. .......................................................... 110
Figure 42. (a) PTA-IA for the iliac artery under fluoroscopy and under MRI guidance (b) followed
during the experiments. The grey areas indicate the tasks that are not considered for the study. ...... 111
Figure 43. CRPA interviews with clinicians. Figure (a) and (b) illustrate the first and second person
perspectives (lower part of the images) with overlaid gaze cursor. This red cursor shows the location
of the eye gaze on the image for the current location and the previous 0.25 of a second. ................. 114
Figure 44. Diagram showing how the global or grand score is calculated from the grouped scores in A
and B. ................................................................................................................................................. 116

xix
Figure 45. Upper Arm posture score calculation ................................................................................ 116
Figure 46. Detail of menu for RULA risk analysis on Delmia for Human Ergonomics Design and
Analysis. General parameters regarding the posture are set on the left side of the menu, which shows
also the global score. Current scores for postures A and B are given colour labelled on the right side
of the menu. ........................................................................................................................................ 117
Figure 47. CRPA diagram illustrating main factors that affect an intervention according to the
feedback of the clinicians. The size of a bubble represents the importance level given by the clinicians
during the interviews: A larger bubble means higher importance. Black arrows represent the hierarchy
within a group. A red arrow indicates an interrelation between factors of two different groups. ...... 122
Figure 48. Screenshot of key postures 1 – 4 defined during a MRI-guided procedure for clinician BC
(first row (a)), equivalent postures modelled in Delmia V5R20 for the 1.5T GE Signa MRI scanner
(second row (b)) and the 3T GE Discovery MRI scanner (third row (c)) (GE Healthcare, Waukesha,
WI, USA). Below the virtual environments, global scores given by the RULA analysis are shown. 124
Figure 49. RULA analysis applied to the 1T open bore Panorama MRI scanner (Philips, Eindhoven,
The Netherlands); (a) to (d) in the figure correspond to defined postures 1 to 4, respectively. Below
the virtual environments, global scores given by the RULA analysis are shown............................... 124
Figure 50. Interventional radiologists using the 1T open bore Panorama MRI scanner. Images
courtesy of Prof. Ulf Teichgräber at Charité Berlin (Berlin, Germany). ............................................ 125
Figure 51. DES model of the MITOS at the Clinical Research Centre (CRC) imaging facilities
(Ninewells Hospital, Dundee, UK). ................................................................................................... 136
Figure 52. DES model of the imaging facilities at the Institute for Medical Science and Technology
(IMSaT, University of Dundee, Dundee, UK). .................................................................................. 136
Figure 53. Probability tree of single treatments (angioplasties and stenting) PCIs ............................ 160

xx
List of tables
Table 1. Classification of the main stochastic modelling techniques according to their time evolution
(static or dynamic) and their time base for the events (discrete or continuous). .................................. 24
Table 2. List of features and requirements analysed grouped by criteria and type. Each criterion was
given a score from 1 to 5, where 5 meant “very important”, and classification for the software
evaluation in the context of the derived criteria. .................................................................................. 35
Table 3: Simulation software packages evaluation summary............................................................... 37
Table 4. Data collection template ......................................................................................................... 45
Table 5. Standard descriptive analysis of the duration (in minutes) of the events collected for 42
angioplasty and stenting PCI procedures. Statistics include mean, standard deviation, median and Q1
and Q3 quartiles. .................................................................................................................................. 63
Table 6. Statistical distributions of the events collected for PCIs interventions, where α and σ are the
shape parameters, and β and µ are the scale parameters of the distribution functions ......................... 65
Table 7. Descriptive statistics and statistical distributions of the events collected for TACE
interventions, where the times are expressed in minutes, α and σ are the shape parameters, and β and
µ are the scale parameters of the distribution functions. Cannulation, as indicated in the previous
section means cannulation of the vessel with a catheter and it is used as “Cannulation after MRI”
when repositioning of the catheter was needed. ................................................................................... 75
Table 8. Procedure times gathered for the most common diagnostic procedures at the MRI department
(Homburg Saarland University Hospital, Homburg, Germany). .......................................................... 75
Table 9. Welch 90% confidence intervals for the event in the TACE procedure when compared with
the real system ...................................................................................................................................... 78
Table 10. Scenarios (tests) studied during the simulation analysis. ..................................................... 79
Table 11. Two-stage means, variances, replications and weighted means calculated per alternative for
the average waiting time (in seconds) (see Section 3.2.7.2 for explanation of parameters). ................ 80
Table 12. KPIs and the respective 90% CI [max, min] for their times (minutes) for all the scenarios
that gave the best, second best and worst cases. For each case, the 90% CI corresponding to the best
alternative is shown in bold and underlined font. ................................................................................. 81
Table 13. Statistical descriptive analysis for the different stages collected for the MRgFUS
procedures. The corresponding events labels for phase, action and decision can be identified in Figure
34. ......................................................................................................................................................... 89
Table 14. Statistical distributions and parameters corresponding to each stage collected, where α, m
and σ are the shape parameters, and β and µ are the scale parameters, where (*) means that the null

xxi
hypothesis was rejected but that distribution was selected based on P-P curves and previous literature
experience. ........................................................................................................................................... 91
Table 15. Total average duration (hh:mm:ss) of MRgFUS procedures for each analysed case: current
MRgFUS workflow, automated segmentation, automated sonication, combined effect (automated
segmentation + automated sonication) and 95% motion compensation effect (including the combined
effect of automated segmentation and sonication). .............................................................................. 96
Table 16. Descriptive statistics and statistical distributions fitted for the events collected of TAVI
procedures (femoral approach), where α, m and σ are the shape parameters, and β and µ are the scale
parameters. ......................................................................................................................................... 100
Table 17. MRI configurations evaluated ............................................................................................ 112
Table 18. RULA scores classification and interpretation ................................................................... 116
Table 19. Total procedure times in minutes for fluoroscopy guided procedures and MRI
configurations evaluated (see Table 17) during the second block of sessions. All the times are
expressed in mean (standard error). ................................................................................................... 119
Table 20. Average durations per configuration for the phases of treatment, pre-angiography and post-
angiography protocols. ....................................................................................................................... 121
Table 21. RULA global scores obtained for the additional tests: added arm-support, adjustable height
platform and a combination of the two factors for all three MRI scanners considered. ..................... 125
Table 22. Summary of features evaluated for those software packages that were not shortlisted ...... 156
Table 23. Summary of features evaluated for the shortlisted software packages ............................... 156
Table 24. Statistical distributions, parameters and histogram for significant events analysed for
treatment PCIs. ................................................................................................................................... 159
Table 25. Statistical distributions, parameters and histogram for significant events analysed for TACE
procedures .......................................................................................................................................... 162
Table 26. Statistical distributions, parameters and histogram for significant events analysed for
MRgFUS procedures .......................................................................................................................... 169
Table 27. Statistical distributions, parameters and histogram for significant events analysed for TAVI
procedures .......................................................................................................................................... 172

1
Chapter 1.
Introduction
1.1. Context
Image-guided therapy is considered as alternative to open surgery in a multitude
of procedures motivated by same or better results and fewer complications.
However, the introduction of complex technologies in imaging operating systems is
increasing costs and challenges in the training of clinical staff members. The current
economic situation worldwide is steadily increasing the pressure on improving
effectiveness and efficiency in healthcare systems.
Operational research (OR) methods for workflow analysis, modelling and
simulation have been used for decades in the manufacturing industry in order to
optimise processes (also called systems in this context), design new layouts or
modify areas to improve productivity and explore more efficient ways in the use of
human resources and equipment. This concept has been successfully applied to
health systems, especially in high demanding areas, such as surgical rooms and
emergency departments (Sobolev, Sanchez, and Vasilakis 2011). Recent studies
indicate the increasing interest on applying simulation to improve radiology
departments, including radiotherapy treatments (Santibáñez et al. 2009; Werker et al.
2009).
However, the majority of the studies in radiology environments focus on a
department level and interventional procedures are judged in overall procedure
times. The impact of actions and decisions within the procedures is then usually not
assessed. In addition, many studies disregard the interactions among the clinicians
and the effect that elements of the workspace may have in the clinical practice.
This thesis aims to deliver a comprehensive analysis of ergonomic workflow for
image-guided interventions with a focus on vascular procedures. A methodological
framework was designed to study the workflow from multiple perspectives,
providing a better understanding of vascular procedures. Treating interventions as

2
systems, this thesis uses two approaches to analyse the workflow: simulation and
physical models.
1.2. Research objectives, hypotheses and propositions
An image-guided procedure (IGP) can be described in three phases (Yaniv and
Cleary 2006):
- Pre-operative planning: where a surgical plan is created based on pre-
operative images and other additional information of the patient.
- Intra-operative plan execution: Once the patient is in the operating theatre
(OT), the IGP provides assistance to the medical staff.
- Post-operative assessment: where images are acquired after the interventions
to compare the results with the pre-operative plan.
Previous literature review reveals a lack of detailed analysis of the intra-operative
phase of vascular radiology interventions. In addition, the few attempts that analyse
tasks within intervention rooms are limited to time-based analysis. As described
previously in the context, this thesis aims for a more comprehensive analysis and
modelling of ergonomic workflow of vascular procedures with the aid of discrete
event simulation techniques. With this idea, this research has three main objectives:
- First, to provide a better understanding of current scenarios of vascular
image-guided procedures through workflow analysis, modelling and
simulation;
- Second, to use that acquired deeper knowledge to predict the impact of
protocol alterations in the scenarios studied;
- And third, to design a methodological framework to develop new protocols
for the alternative use of MRI to guide vascular interventions.
To unfold these objectives, different cases of study1 will be presented.
1 Case study is used in this thesis as a technical term to show exemplar studies to validate the whole or
parts of the methodological framework proposed.
3
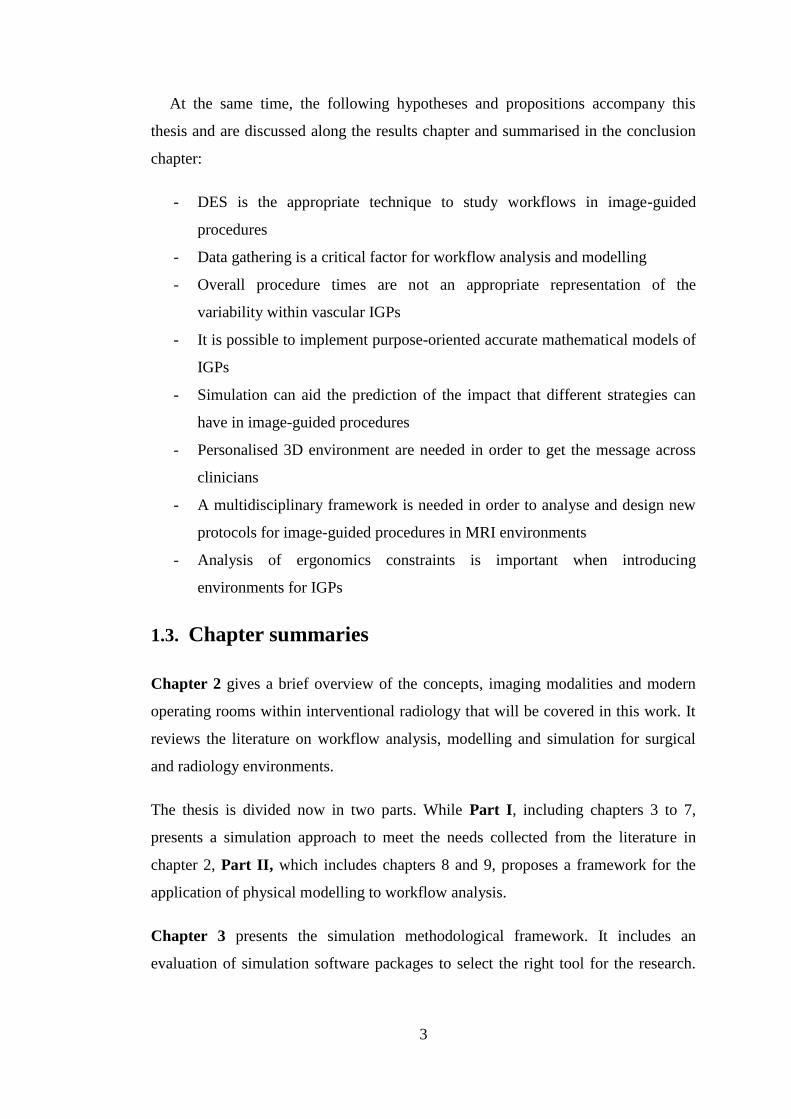
At the same time, the following hypotheses and propositions accompany this
thesis and are discussed along the results chapter and summarised in the conclusion
chapter:
- DES is the appropriate technique to study workflows in image-guided
procedures
- Data gathering is a critical factor for workflow analysis and modelling
- Overall procedure times are not an appropriate representation of the
variability within vascular IGPs
- It is possible to implement purpose-oriented accurate mathematical models of
IGPs
- Simulation can aid the prediction of the impact that different strategies can
have in image-guided procedures
- Personalised 3D environment are needed in order to get the message across
clinicians
- A multidisciplinary framework is needed in order to analyse and design new
protocols for image-guided procedures in MRI environments
- Analysis of ergonomics constraints is important when introducing
environments for IGPs
1.3. Chapter summaries
Chapter 2 gives a brief overview of the concepts, imaging modalities and modern
operating rooms within interventional radiology that will be covered in this work. It
reviews the literature on workflow analysis, modelling and simulation for surgical
and radiology environments.
The thesis is divided now in two parts. While Part I, including chapters 3 to 7,
presents a simulation approach to meet the needs collected from the literature in
chapter 2, Part II, which includes chapters 8 and 9, proposes a framework for the
application of physical modelling to workflow analysis.
Chapter 3 presents the simulation methodological framework. It includes an
evaluation of simulation software packages to select the right tool for the research.

4
The framework comprises details on the data gathering and statistical analysis. It
also explains how the simulating models are implemented and validated.
Chapter 4 presents the first of the cases of study of this thesis. Details of the
workflow for percutaneous coronary interventions (PCIs) are analysed statistically
and a discrete event simulation (DES) model is implemented for PCIs that included
coronary angioplasty or stenting.
Chapter 5 describes the case of study of a multimodal imaging intervention:
transarterial chemoembolization (TACE). A DES model is implemented and an
optimisation-based analysis is applied to compare different alternatives to the current
protocol in the pursuit of a better performance of the interventions.
Chapter 6 describes how the methodological framework for workflow modelling
and simulation is applied to the case of Magnetic Resonance guided Focused
Ultrasound (MRgFUS) including model validation and prediction analysis.
Chapter 7 presents preliminary results on applying the simulation model approach
to a complex vascular procedure: transcatheter aortic valve implantation (TAVI).
First DES model is presented and guidelines for future direction are discussed.
Chapter 8 describes a framework to apply physical modelling to study workflow for
the development of new Magnetic Resonance Imaging (MRI) – guided protocols for
vascular procedures.
Chapter 9 presents the results of a comparative study based on the physical model
approach on the development of MRI-guided protocols for a common vascular
procedure: iliac angioplasty. MRI and fluoroscopy are compared in terms of
performance, user experience and ergonomics.
Chapter 10 summarises the findings of previous chapters to explain their
contributions to the research hypotheses described in the first chapter. Limitations of
the present study are discussed and suggestions are given for future directions and
possible applications of this research.
The Appendix chapter at the end of this thesis presents the different sections that
complement the results presented in the previous chapters. It includes relevant
5
information that supplements the simulation software evaluation as well as detailed
material regarding the statistics calculations. In the final appendix, the logic code for
the implementation of a Markov process model as part of a DES model is included to
facilitate the replication of results of this thesis.
1.4. Publication list
1.4.1. Journal papers
The following papers have been published or are under peer review:
1. Fernández-Gutiérrez F, Barnett I, Taylor B, Houston G, Melzer A, (2013)
"Framework for detailed workflow analysis and modelling for simulation of
multi-modal image-guided interventions", Journal of Enterprise Information
Management, Vol. 26 Iss: 1/2, pp.75 – 90
2. Rube MA, Fernandez-Gutiérrez F, Cox BF, Holbrook AB, Houston G,
White RD, McLeod H, Fatahi M, Melzer A. “Preclinical feasibility of a
technology framework for MRI-guided iliac angioplasty”, International
Journal of Computer Assisted Radiology and Surgical, August 2014 (in
press)
3. Fernández-Gutiérrez F, Martínez S, Rube MA, Cox BF, Fatahi M, Scott-
Brown K, Houston G, McLeod H, White R, French K, Gueorguieva M,
Immel E, Melzer A. ‘Ergonomic workflow and user experience comparative
analysis of MRI versus X-Ray guided vascular interventions. Case of study:
iliac angioplasty’, International Journal of Computer Assisted Radiology
and Surgery (Submitted)
4. Fernández-Gutiérrez F, Wolska-Krawczyk M, Bücker A, Houston G,
Melzer A. ‘A simulation-based workflow optimisation in a radiology
department: a case of a multimodal imaging procedure’, Minimally invasive
therapy & allied technologies (MITAT) (Submitted)
5. Loeve AJ, Al-Issawi J, Fernández-Gutiérrez F, Lango T, Matzko M,
Napoli A, Dankelman J. ‘Workflow analysis and modelling of MR-guided
Focussed Ultrasound’, (To be submitted)

6
1.4.2. Book chapters, conferences papers and abstracts
Book chapter
1. Fernández-Gutiérrez F, Houston G, Elle OJ, Wolska-Krawczyk M, Orban
M, and Melzer A, “Workflow Analysis, Design, Modelling and Simulation
for the Multimodality Imaging Therapy Operating System (MITOS),” in
Intraoperative Imaging and Image-Guided Therapy, F. A. Jolesz, Ed. New
York, NY: Springer New York, 2014, pp. 325–338.
Conference papers and abstracts
1. Fernández-Gutiérrez F, Martínez S, Rube MA, Cox BF, Fatahi M, Scott-
Brown KC, Houston GJ, McLeod H, White RD, French K, Gueorguieva M,
Immel E, Melzer A. An operational comparison of MRI and X-Ray for
vascular interventions. Case of study: Task and user experience analysis for
iliac angioplasty. 25th Conference of the Society for Medical Innovation
and Technology, SMIT 2013, Baden-Baden, Germany.
2. Loeve AJ, Al-Issawi J, Fernandez‐ Gutierrez F, Matzko M, Napoli A,
Dankelman. MRgFUS workflow and bottle-necks – Preliminary results. 25th
Conference of the Society for Medical Innovation and Technology (SMIT
2013), Baden-Baden, Germany.
3. Fernandez-Gutierrez F, Ferut J, Smink J, Houston G, Melzer A.
Ergonomics for MRI guided procedures. Case of study: postural analysis for
MRI scanners CARS 2013 Computer Assisted Radiology and Surgery June
26 - 29, 2013, Convention Center, Heidelberg, Germany.
4. Fernández-Gutiérrez F, Elle OJ, Wendt D, Melzer A, “Characterisation
and simulation of TAVI procedures. Is it possible to convert to MRI
guidance?” 9th Interventional MRI Symposium, 2012. Boston, USA.
5. Fernández-Gutiérrez F, Barclay A, Martin T, Elle OJ, Houston G, Melzer
A, “Workflow for image-guided interventions: Characterisation and
Validation. Towards the Integrated Imaging Operating Room of the future,”
46th DGBMT Annual Conference 2012. Jena, Germany.
6. Fernández-Gutiérrez F, Barclay A, Martin T, Houston G, Melzer A,
“Modelling and simulating MR guided workflow for endovascular and

7
cardiovascular procedures,” 24th Conference of the Society for Medical
Innovation and Technology, SMIT 2012, Barcelona, Spain.
7. Fernández-Gutiérrez F, Taylor B, Houston G, and Melzer A, “Building a
framework for detailed workflow description for simulation of multi-modal
image-guided interventions,” in Proceedings of the Operational Research
Society Simulation Workshop 2012 (SW12), 2012.
8. Fernández-Gutiérrez F, Houston G, Wolska-Krawczyk M, Elle OJ,
Buecker A, Melzer A. Simulating the Imaging Operating Suite of the future.
From angiography to multi-modal image-guidance: framework and pilot
models. 4th NCIGT and NIH Image Guided Therapy Workshop 2011.
Arlington, Virginia, United States.
9. Fernández-Gutiérrez F, Toomey RJ, Houston G, Wolska-Krawczyk M,
Elle OJ, Buecker A, Melzer A. Computer simulation for ergonomics and
workflow improvement in multi-modal image-guided interventions: a new
approach. 23rd Conference of the Society for Medical Innovation and
Technology, SMIT 2011, Tel-Aviv, Israel.
10. Fernández-Gutiérrez F, Toomey RJ, Houston G, Melzer A. Using
computer simulation in workflow design and improvement in multi-modal
image-guided interventions. UK Radiological Congress 2011. Manchester,
UK.

8
Chapter 2.
Background
Contents of this chapter were published in:
Fernández-Gutiérrez F, Houston G, Elle OJ, Wolska-Krawczyk M, Orban M, Melzer A,
“Workflow Analysis, Design, Modeling and Simulation for the Multimodality Imaging Therapy
Operating System (MITOS),” in Intraoperative Imaging and Image-Guided Therapy, F. A. Jolesz, Ed.
New York, NY: Springer New York, 2014, pp. 325–338.
2.1. Introduction
The following sections present an overview on image-guided techniques for
vascular procedures, comprising interventional radiology and interventional
cardiology. In addition, techniques for system analysis, modelling and simulation
that will be covered in this text are introduced. It also presents a literature review on
previous work on workflow analysis in surgical rooms and radiology environments.
2.2. Cardiovascular and interventional radiology
2.2.1. Introduction
Interventional radiology (IR) appears as an evolution of open surgery for certain
procedures due to the same or better results obtained and the lower overall risks for
patients. On the other hand, interventional cardiology is the part of cardiology that
treats coronary artery occlusion, arrhythmias and structural heart disease through
catheterisation of the heart chambers or vessels. Whereas in open surgery the
physicians have direct vision and access to the area of interest, in cardiovascular and
interventional radiology (CVIR), they need the aid of imaging techniques to identify
the anatomical structures and to provide guidance of the instruments (Yaniv and
Cleary 2006).
Nowadays, CVIR comprises a wide and evolving number of minimally invasive
Image-Guided Procedures (IGP) for the diagnosis and treatment of multiple diseases
(Radiology 2010). These procedures include, among others, treating diseases from
the vascular, pulmonary, gastrointestinal or musculoskeletal system. Different

9
imaging modalities are used to carry out the interventions such as X-ray, Ultrasound
(US) or Magnetic Resonance (MR). This section briefly reviews the methods,
equipment and rooms used for conventional vascular interventions, which are the
central focus of this research. In addition, the other focus of interest of this project,
the section discusses the use of Magnetic Resonance Imaging (MRI) along with a
description of the layout designs of modern operating rooms for vascular
interventions.
2.2.2. Digital Subtraction angiography and angiography rooms
Digital Subtraction Angiography (DSA) is the imaging method that uses X-ray to
visualise and examine the blood vessels by the injection of a radio-opaque contrast
agent (commonly iodine based) (Pommi 2011). Figure 1(a) displays an example of a
DSA image. In a clinical radiology department, a conventional room for DSA
includes an angiographic X-ray system, a display system for image visualisation, an
operating table with controls and several peripheral equipment elements (e.g. scrub
trolley, bins and shelves or cupboards for device storage). Figure 1(b) shows an
example on a conventional angiography room (Clinical Radiology department,
Ninewells Hospital, Dundee, UK).
Figure 1. (a) Example of Digital Subtraction Angiography (DSA) image (iliac arteries). (b)
Angiography suite at the Clinical Radiology Department at Ninewells Hospital (Dundee, UK).
The angiography system has at least an X-Ray generator and a detector, facing
each other and mounted together in a C-shaped structure, which gives them their
(a) (b)

10
usual name C-arm, easily identified within Figure 1(b). The C-arm can be rotated
around the operating table so the images can be acquired from different angles.
IR is applied to several areas of vascular procedures, depending on the diagnosis
and the therapy needs. This thesis will deal with some of the most important
procedures:
- Balloon angioplasty (PTA, percutaneous transluminal angioplasty): a
catheter with a foldable or elastic balloon at the distal end is inserted for
reopening a constricted or occluded vessel by means of inflating the balloon.
- Stent implantation: a stent (wire mesh or fenestrated tube) is delivered via a
catheter to treat constricted or occluded vessels. Stents can be self-expanded
or balloon-expanded, depending on the material and mechanism used for their
deployment (Duerig and Wholey 2002).
- Chemoembolisation: catheter procedure for local chemotherapy and
embolization (closing of a vessel) for cancer treatment. The anti-cancer drug
is injected directly to the blood vessel feeding the tumour together with the
embolic agent which blocks the blood supply to the tumour and at the same
time, traps the drug in the tumour (Radiologyinfo.org 2013a).
One of the main advantages of DSA (and angiography in general) is that it allows
real-time visualisation of the blood vessels during interventions. However, the
drawback is that it is a source of radiation both for the patient and for the clinicians.
Regarding exposure levels for workers, expressed as effective dose in mSv
(milliSieverts) (Radiologyinfo.org 2013b), the International Commission on
Radiological Protection (ICRP) recommends a limit of 20mSv/year. Literature on
coronary angiography and angioplasty procedure gives observed effective doses in
patients ranging between 5 – 16.7 mSv for 8.6 – 31.5 minutes of procedure time
respectively (Katritsis et al. 2000) and an average of approximately 3 mSv/year for
interventional cardiologists (Chida et al. 2013; Venneri et al. 2009). Although there
is no direct evidence that ionising radiation can induce cancer, radiation is one of the
most studied carcinogens (Zhou 2011). There is however evidence of iodine contrast
media induced nephropathy (Tavakol et al. 2012) and significant exposure to
ionising radiation with an unknown but increasing lifetime risk of cancer

11
(Vijayalakshmi et al. 2007). Therefore, optimising time and safety of procedures to
reduce radiation exposure is one of the main objectives in interventional radiology.
While patients do not wear any radiation protection in the majority of procedures,
clinicians wear heavy lead aprons and badges to measure the radiation exposure
(Raza 2006). In addition, lead protections are normally incorporated to the operating
tables. However, the heavy weight of these lead aprons, together with the long hours
standing in the interventions rooms, is responsible for most of the occupational risks
for interventional radiologists (Dehmer 2006).
2.2.3. Magnetic Resonance Imaging and scanner rooms
MRI is an imaging technique used primarily in medical settings to produce high
quality images of the inside of the human body. Figure 2 (a) shows an example of a
MR image. Briefly, an MRI system is based on a strong static magnetic field,
alternating magnetic fields gradients and a high-frequency (HF) system with
transmitting and receiving coils (antennae) (Nitz 2011). The strength of the magnetic
field is described in units of Tesla (T). While early MRI systems used magnets in the
range of 0.1-0.2T, nowadays most hospitals work with MRI scanners with a
magnetic field of 1.5 or 3T for patient diagnosis. Figure 2 (b) presents an example of
an MRI scanner room at the Clinical Research Centre (CRC, Ninewells Hospital,
Dundee, UK).
Figure 2. (a) Example of Magnetic Resonance Image (MRI) (image of pelvis showing uterine
fibroid on T2 weighting). (b) MRI room at the Clinical Research Centre (CRC), Ninewells
Hospital (Dundee, UK).
(a) (b)

12
As well as the strength of the magnetic field, the design of the MRI scanner itself
plays an important role in the room setups and in the safety and comfort of patients.
Different designs for MRI scanners can be found in the market following two main
configurations:
- Close-bore scanners: Figure 2 (b) and Figure 3 (a) illustrate two examples of
close-bore scanners. In these scanners, the size of the bore is usually limited to
60cm, although modern scanners are moving to larger bore designs (e.g.
70cm, Figure 3 (a)). In addition, some companies are implementing shorter
scanner models aimed to reduce the number of examinations refused due to
claustrophobia.
- Open-bore scanners: Figure 3(b) shows an example of a horizontal open-bore
MRI scanner from Philips Healthcare (Panorama 1T, Eindhoven, The
Netherlands). These scanners were designed in a C-arm fashion, allowing
better access to the patient (Wacker et al. 2005). A variation of the horizontal
open-bore scanner is the vertical open-bore (so called mid-field system with
0.5T), first used in the late 90s but which design has been discontinued mainly
due to high costs and the lower SNR (signal-to-nose-ratio) provided in
comparison to high-field systems (1T or more), which makes the image
resolution coarser for the same image quality. .
Figure 3. (a) 3T Wide-bore MRI scanner (Discovery, GE Healthcare, Waukesha, WI, USA). (b)
1T open-bore MRI scanner (Panorama, Philips, Eindhoven, The Netherlands).
Apart from using MRI for diagnosis, there has been an increasing interest for
using MR as imaging technique for guiding interventions since the 80s (Blanco
Sequeiros et al. 2005). Many characteristics such as the accurate soft tissue contrast
(a) (b)
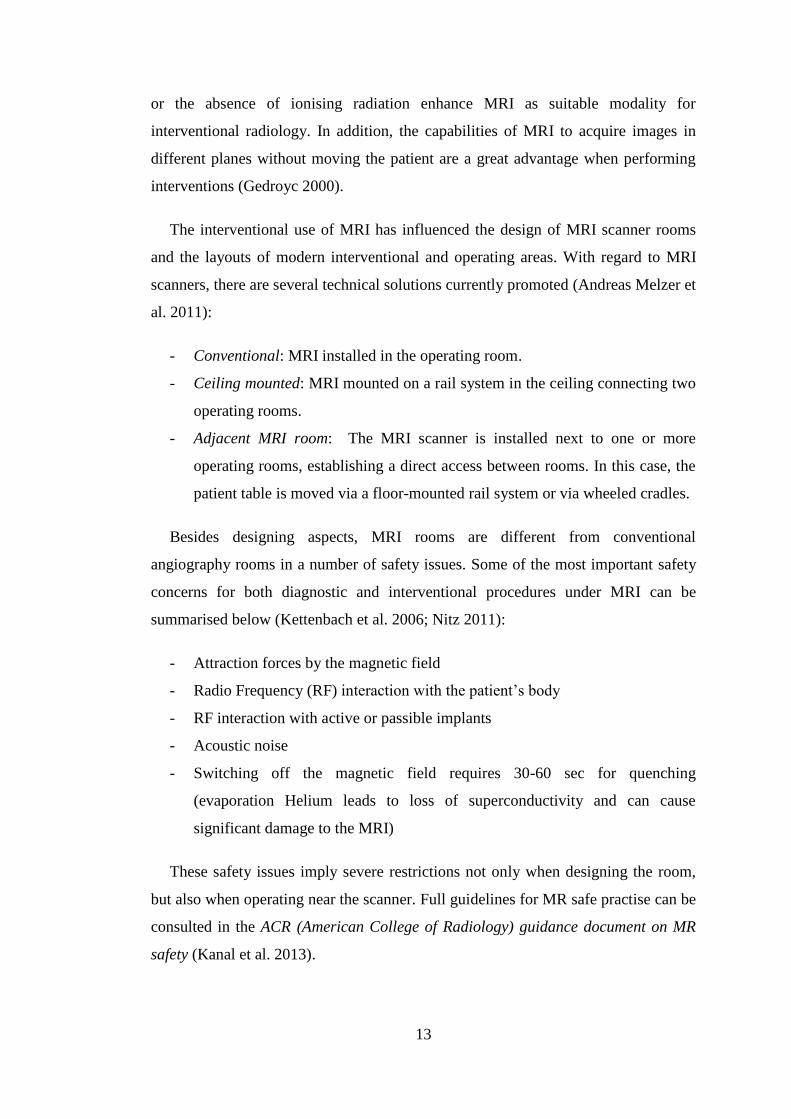
13
or the absence of ionising radiation enhance MRI as suitable modality for
interventional radiology. In addition, the capabilities of MRI to acquire images in
different planes without moving the patient are a great advantage when performing
interventions (Gedroyc 2000).
The interventional use of MRI has influenced the design of MRI scanner rooms
and the layouts of modern interventional and operating areas. With regard to MRI
scanners, there are several technical solutions currently promoted (Andreas Melzer et
al. 2011):
- Conventional: MRI installed in the operating room.
- Ceiling mounted: MRI mounted on a rail system in the ceiling connecting two
operating rooms.
- Adjacent MRI room: The MRI scanner is installed next to one or more
operating rooms, establishing a direct access between rooms. In this case, the
patient table is moved via a floor-mounted rail system or via wheeled cradles.
Besides designing aspects, MRI rooms are different from conventional
angiography rooms in a number of safety issues. Some of the most important safety
concerns for both diagnostic and interventional procedures under MRI can be
summarised below (Kettenbach et al. 2006; Nitz 2011):
- Attraction forces by the magnetic field
- Radio Frequency (RF) interaction with the patient’s body
- RF interaction with active or passible implants
- Acoustic noise
- Switching off the magnetic field requires 30-60 sec for quenching
(evaporation Helium leads to loss of superconductivity and can cause
significant damage to the MRI)
These safety issues imply severe restrictions not only when designing the room,
but also when operating near the scanner. Full guidelines for MR safe practise can be
consulted in the ACR (American College of Radiology) guidance document on MR
safety (Kanal et al. 2013).
14
2.2.4. Integrated interventional operating systems
The lower costs and better results of minimally invasive techniques are
motivating the replacement of traditional open surgery for many types of IGPs (A
Melzer et al. 1997). The advances in imaging information systems, and the new
navigating and tracking technologies are transforming the traditional Operating
Theatres (OT) and intervention rooms in a modern Multimodality Imaging Therapy
Operating System (MITOS) or also known as hybrid OT (Rostenberg and Barach
2011). Many examples of these OT can be found in the literature. Focussing on
hybrid OT for vascular minimally invasive procedures, there are two main
approaches for the layout designs:
1. A single hybrid operating theatre containing all the surgical and imaging
equipment;
2. A set of adjacent rooms directly connected allowing the transfer of the patient
and/or equipment among rooms.
Figure 4. Hybrid Operating Room (HOR) at the Intervention Centre (Oslo University Hospital,
Oslo, Norway). (a) View of the robotic C-arm, ceiling mounted screens and robotic operating
table; (b) Complete layout of the operating room and control room.
As an example of the first approach, the Intervention Centre at Oslo University
Hospital (Oslo, Norway) counts with a modern hybrid OT for cardiovascular
procedures (see Figure 4). The facilities include a robotic mobile C-arm, ultrasound
and anaesthesia equipment, heart – lung machine, ceiling mounted screens and other
surgical and interventional equipment (Nollert and Wich 2009). These single rooms
present many technical challenges but are increasingly common in many hospitals.
These suites try to avoid some usual patient safety incidents by means of reducing
(a) (b)

15
travel distances for patients and clinicians since the critical equipment is now present
within the operating room. For instance, there is no need of moving the patient from
an induction room to the operating room, since the anaesthesia equipment is
maintained within the operating suite (Rostenberg and Barach 2011). In addition,
incorporating imaging technology to the OT provides the benefits of visualisation
and guidance in minimally invasive procedures without moving the patient during
the intervention. The popular preference when implementing these hybrid
environments is the integration of fluoroscopy with surgical equipment (Sikkink,
Reijnen, and Zeebregts 2008; Kpodonu 2010). However, other approaches
incorporate other imaging modalities such as MRI scanners due to the several
advantages mentioned in the previous section (Bock and Wacker 2008; Schulz et al.
2004). However, in this case the whole operating room has to be equipped with non-
ferromagnetic devices in order to be MRI safe thus increasing the operating costs.
Although the one-room solution is usually the less expensive option to site, the
second approach offers more flexible opportunities. For example, by using separate
rooms for the imaging equipment, these could be used independently for diagnosis
(Gilson and Wacker 2012). There are different approaches when designing the
adjacent rooms. A preferable design is to place an MRI scanner room next to an
angiography/surgical room (McGee et al. 2007; Vogl et al. 2002). With this two-
room layout, the patient is transferred to the MRI suite when it is required during the
procedure. This configuration also allows other options where the MRI scanner can
be shared between several operating rooms. This layout has been implemented in
hospitals such as the Jacob Medical Center at Thornton Hospital (University of
California, San Diego, CA, USA) (Lehatto and Amato 2012) or the Kokilaben
Dhirubhai Ambani (Reliance) Hospital (Mumbai, India) (Kokilaben Hospital
Brochure 2009). Both cases take an extra step in the design and they replace the
transfer of the patient between rooms for the transfer of the MRI scanner between the
rooms. These environments are equipped with a ceiling-mounted 3T MRI scanner,
which can be moved between both rooms, reducing potential risks created by
moving the patient during the procedures, such as brain shifts during neurosurgery or
hazards related to monitoring patients under anaesthesia (Ehrenwerth et al 2009). For
instance, when retrieving tumours in neurosurgery, brain shifts connected to
movement of the patient between modalities can cause that the images taken prior

16
the treatment, before or during the intervention, to be invalid and result in errors
targeting the tumour.
This philosophy is also applied to other modern environments that include multi-
modal imaging modalities in a 3-room layout. This is the case of the Advanced
Multimodality Image-Guided Operating (AMIGO) Suite (National Center for Image
Guided Therapy – NCIGT, Brigham and Women’s Hospital, Boston, MA, USA)
(see Figure 5). The AMIGO suite includes a central angiography/surgical room,
which is also provided with ultrasound equipment. On the left, Figure 5 shows the
MRI suite with a ceiling-mounted MRI scanner, which is connected by sliding doors
and can be moved to the surgical room if it is needed during the intervention. The
right side of the image shows a PET/CT (Positron Emission Tomography/Computed
Tomography) scanner suite that can help to localise and target viable tumour tissue
before procedures or verify the completeness of surgical removal of tumours.
Figure 5. Advanced Multimodality Image-Guided Operating (AMIGO) Suite: 3T MRI scanner
room on the left, PET/CT scanner on the right and surgical – intervention room in the middle,
National Center for Image Guided Therapy (NCIGT), Brigham and Women’s Hospital (Boston,
MA, USA).
The MITOS at the Clinical Research Centre (CRC) at Ninewells Hospital
(Dundee, UK) designed by Melzer et al. (2012) with similar idea than the AMIGO
system. Figure 6 shows the plan of the CRC layout with a 3T MRI scanner room on
the left and a PET/CT scanner room on the right, both connected to an central
intervention room. This allows a direct transfer of the patient between the three
rooms during procedures – therapeutic workflow (see red arrow in Figure 6). In
addition, both rooms are provided with direct and independent access for diagnosis
patients – diagnostic workflow (see blue arrows in Figure 6).

17
Figure 6. Clinical Research Centre (CRC) facilities at Ninewells Hospital (Dundee, UK). The
layout presents a 3-T interventional MR (left) and 128-multislice interventional PET/CT (right)
interconnected with a multipurpose interventional suite (diagnostic workflow: blue arrows,
image-guided procedure workflow: red arrows).
2.3. System analysis, modelling and simulation
2.3.1. Introduction
This section gives essential definitions of concepts that will be used throughout
the document. The different ways a system could be studied are highlighted as an
important aspect that affects the research hypotheses of this thesis. In addition, the
modelling techniques that are commonly used to model health environment are
briefly covered which will also justify the reasons why one specific technique is
preferred over other alternatives.
2.3.2. System, model and other essential definitions
Schmidt and Taylor (Schmidt and Taylor 1970) defined a system as “a collection
of entities, e.g. people or machines, which act and interact together toward the
accomplishment of some logical end”. The collection of entities or variables will
depend on the type of system to be studied. In addition, the state of a system is

18
defined by the collection of those variables needed to describe the system at a
particular time, relative to the objectives of the study (Law 2007). For example, if an
emergency department was to be studied, examples of state variables would be the
number of patients that are being attended, the number of busy medical doctors and
nurses and the time of arrival of each patient at the reception desk.
Systems are usually studied in order to gain insight into the relationships of
variables or to predict the performance of a system under new conditions.
Experiment with the actual system can be very costly or sometimes not feasible if the
system does not exist yet. For these reasons, it is usually necessary to implement and
work with a model of the system. The Institute of Electrical and Electronics
Engineers (IEEE) defines model as “an approximation, representation or
idealisation of selected aspect of the structure, behaviour, operation, or other
characteristics of the real-world process, concept or system”(IEEE Standard
Computer Dictionary 1991). The model must reflect the system accurately in order
to accomplish the objectives of the study. For this reason, the model needs to be
validated and verified. There are several definitions for the terms verification and
validation (Refsgaard and Henriksen 2004). During decades, they have been
commonly differentiated as (Balci 1986)
“Model verification, to build the model right; and
Model validation, to build the right model”
For the purpose of this study, more standard definitions given by Schlesinger et
al. have been adopted (Schlesinger et al. 1979). Model verification will be defined as
“ensuring that the computer program of the computerised model and its
implementation is correct”. Model validation will guarantee that “the computerised
model within its domain of applicability possesses a satisfactory range of accuracy
consistent with the intended application of the model”.
2.3.3. Physical vs. mathematical models: how to study a system.
Law (2007) discusses in the first chapter about different ways to study a system.
These options are represented in Figure 7. The first decision to be made is whether it
is feasible to experiment with the real system or in contrast, it is needed to

19
implement a model of the system. In this, experimenting with the real system (e.g.
an image-guided procedure) could result in very high cost-risk situations and
compromise the safety of patients and clinical staff.
However, when deciding the need of implementing a model, the next dilemma is
whether to implement a physical model or a mathematical one. In the case of IGPs,
implementing a physical model of an angiography suite to test the impact of new
conditions could be very costly and time consuming. The costs can be significantly
reduced when using mathematical models. However, recreating the system through a
physical model aids the understanding of certain aspects of the system that could be
missed by the use of mathematical models. Such is the case of environmental and
operational limitations or other safety issues related with the procedures. Therefore,
the decision of implementing a physical or mathematical model should be based on
the grounds of the questions to be answered from the system.
Finally, in the case a mathematical model may be implemented, an additional step
would have to be taken (see Figure 7). This extra step would occur if an analytical
solution was found or on the contrary, it is needed to implement a simulation to find
the answers. In the case of IGPs, complex relationships can be found during the
workflow among clinicians, tasks, times, decision points, etc. For this reason, it is
most appropriate to use simulation, defined in Law (Law 2007) as “numerically
exercising the model for the inputs in question to see how the effect the output
measures of performance”.
Figure 7. Ways to study a system, figure reproduced with permission from Law (2007)

20
2.3.4. Modelling techniques in the healthcare context
The review provided by England and Roberts (1978) reported the most common
methods applied in modelling healthcare environments: regression, econometric,
mathematical modelling employing queuing theory or stochastic methods, and
mathematical programming. More recently, in 2011, Sobolev et al. (2011),
distinguished between static and dynamic approaches, deterministic or stochastic and
methods that involve discrete or continuous time. Among these techniques, Monte
Carlo models, as static simulation methods and Markov chains and Discrete Event
Simulation (DES) models, as dynamic approaches, are the most common used for
health systems. Techniques based on Petri Nets are also widely used in modelling
health systems (Zhang et al. 2009; Zoeller et al. 2006).
Monte Carlo models
Monte Carlo Models (MCM) consist of a random repetition of samples with
probabilities, representing the process outcome at a particular point in time (Sobolev
et al. 2011), hence the reference to the Monte Carlo Casino in Monaco and its games
of luck. Figure 8 shows the schematic mechanism of MCMs to analyse uncertainty
propagation by sampling an input given by a statistical distribution. The output
generated can be represented by another statistical distribution with a certain
reliability or with confidence intervals. There are different methods of the applying
MCMs: Classical, Quantum, Integral, Simulation and so on (Sadus 2011). Within the
healthcare context, MCMs are used mainly for risk assessment, prognostic and
transmission models of health interventions and cost-benefit analysis of medical
treatments, amongst others (Katsaliaki and Mustafee 2011).
Figure 8. Schematic view of the Monte Carlo sampling method to analyse uncertainty
propagation

21
Markov Chains
Markov Chains (MKC) are discrete-event stochastic models, where the states are
defined as nodes in a graph and transitions between the states are represented by
links. Markov chains, despite their usual application with discrete instants of time;
can be used with a continuous time base, which means that transitions can occur at
any time. Figure 9 shows an example of a graphical representation of these
transitions between states in a MKC model. P0,1 is the probability to go from 0 to 1
and P1,0 is the probability to go back to 0. The probability to continue in the state 1 is
P1,1 and the probability of staying in the state 0 is P0,0. These probabilities define the
transition probability array PT:
(
)
(Eq. 2-1)
0 1
P0,1
P1,1
P1,0
P0,0
Figure 9. Example of a simple graphical representation of the transitions in a Markov Chain
model, where for example, P0,1 is the probability to go from state 0 to state 1 and P1,0 is the
probability to go from the state 1 to state 0.
One of the main properties of Markov processes is the Markov property. A
stochastic process has the Markov property if the conditional probability distribution
of future states of the process depends only on the present state, not on the sequence
of previous events, or in other words these processes do not have memory. As a
result and according to the Markov property,
(Eq. 2-2)

22
Where x is a stochastic vector with the probability distributions for the states.
This property allows then the calculation of future states. As an example,
( ) (
)
(Eq. 2-3)
However, this property, makes MKC not appropriate when a new state may not
only depend on the previous state but also on a sequence of states that preceded it, as
happens in some workflow studies. An additional limitation is the impossibility of
describing interactions between concurrent processes (Sobolev et al. 2011; Wainer
2009).
Petri Nets
Petri Nets (PN) define the structure of the system using two graphical elements.
The “graph’s nodes or places” represent the system states, and the transitions
represent the net evolution. In the example of Figure 10, L1 to L3 are the nodes and
t1 to t2 are the transitions. A PN defines initially a static view of the system. To
study the dynamics, the PN has to be executed and for that reason, a token is placed
(black dot in the figure) on one of the nodes. During execution the token is taken
from the input node to every output node (L2 and L3 in the example). Each
execution of the transition is called firing the transition (Wainer 2009).
Figure 10. An example of a Petri Net graph where L1 to L3 are the nodes and t1 to t2 are the
transitions.
t1
t2
L2
L3
L1

23
The main drawback with PNs is that they can be very complicated to read for
large and complex models as all the data has to be represented in the net. In addition,
they do not define hierarchical concepts. Coloured PNs take these definitions into
account by allowing tokens to carry data values (Mans et al. 2008).
Discrete Event Simulation
Discrete Event computer Simulation (DES) consists of a mathematical modelling
technique that allows the building of hierarchical and modular models, from the
simple to the complex. It permits the modelling of systems with a set of infinitive
possible states where the new state after an event arrival can depend on previous
states. The system to be modelled maintains a clock, marking timestamps throughout
the event’s duration. Other common components featuring the system are buffers,
where components accumulate while awaiting processing, processes that perform
operations, and sinks that allows the part (what we are processing) to exit the system.
When modelling, data is collected on frequencies of parameters, arrival rates and
process times. This information is then analysed statistically to determine the
distributions that represent the groups of data that will be introduced to the
simulation models. In health applications, there normally appear two types of
approach. The first, called event scheduling, samples the moments when events
occur from predefined distributions of times. The second approach, process
interaction, describes the chronology of actions associated with the events, modelling
the process as a sequence of serial and concurrent activities operating on, what some
experts call, passive entities (e.g. patients or clinicians). Therefore, discrete event
models are found to be appropriate for health care and are the method most used for
modelling workflow in surgery (Cassandras and Lafortune 2008; Sobolev, Sanchez,
and Vasilakis 2011; Wainer 2009).
Table 1 presents a summary of the classification of the modelling techniques
described in this section according to their time evolution – static or dynamic – and
their time base for the representation of events – discrete or continuous. The table
also includes system dynamics as example of continuous dynamic modelling
technique. System dynamics has not been contemplated in this chapter since it was
considered out of the scope of this work. This modelling technique uses essentially
differential equations to understand aspects of complex systems. In the context of
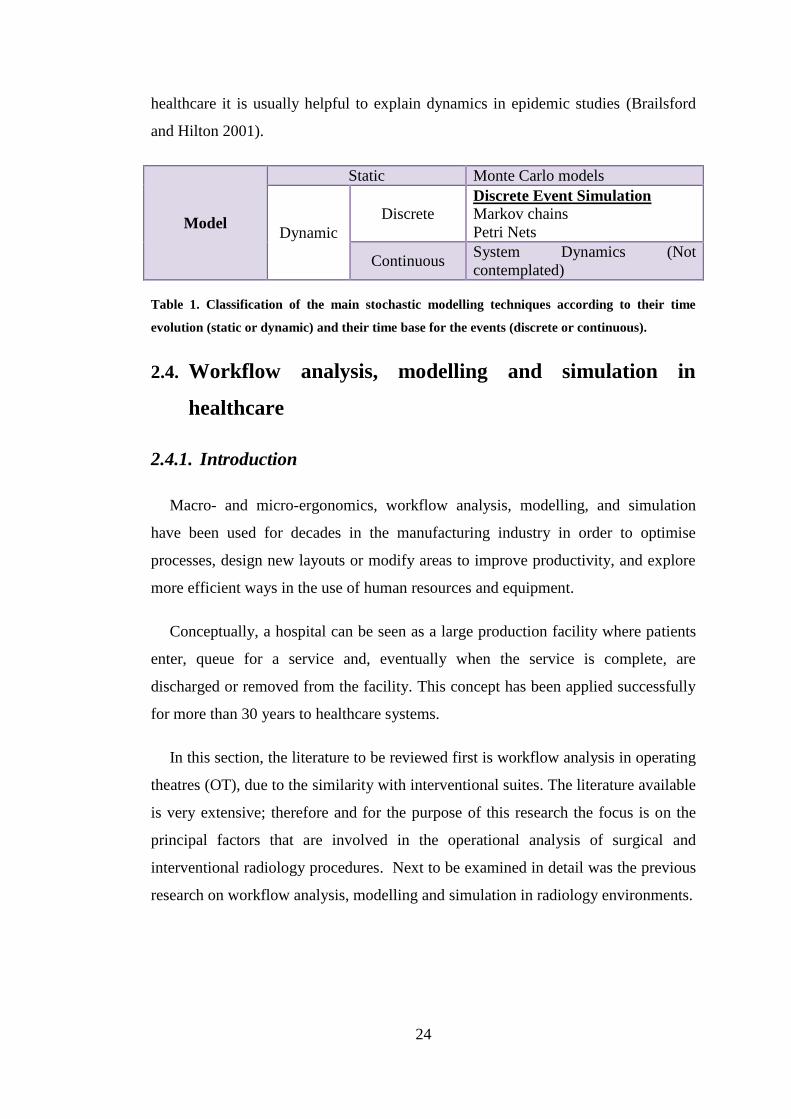
24
healthcare it is usually helpful to explain dynamics in epidemic studies (Brailsford
and Hilton 2001).
Model
Static Monte Carlo models
Dynamic
Discrete Discrete Event Simulation
Markov chains
Petri Nets
Continuous System Dynamics (Not
contemplated)
Table 1. Classification of the main stochastic modelling techniques according to their time
evolution (static or dynamic) and their time base for the events (discrete or continuous).
2.4. Workflow analysis, modelling and simulation in
healthcare
2.4.1. Introduction
Macro- and micro-ergonomics, workflow analysis, modelling, and simulation
have been used for decades in the manufacturing industry in order to optimise
processes, design new layouts or modify areas to improve productivity, and explore
more efficient ways in the use of human resources and equipment.
Conceptually, a hospital can be seen as a large production facility where patients
enter, queue for a service and, eventually when the service is complete, are
discharged or removed from the facility. This concept has been applied successfully
for more than 30 years to healthcare systems.
In this section, the literature to be reviewed first is workflow analysis in operating
theatres (OT), due to the similarity with interventional suites. The literature available
is very extensive; therefore and for the purpose of this research the focus is on the
principal factors that are involved in the operational analysis of surgical and
interventional radiology procedures. Next to be examined in detail was the previous
research on workflow analysis, modelling and simulation in radiology environments.

25
2.4.2. Workflow analysis in surgical environments
The high demand in the OTs has caused hospitals’ stakeholders to become very
interested in applying workflow modelling and simulation to analyse and improve
their facilities. Among the approaches to analyse surgical workflow, computed-aid
techniques have become very popular in the last decade. Sobolev et al (2011)
presented a literature review about the use of computer simulation in surgical
environments. They found 34 publications on flow simulation for surgical patients
between 1957 and 2007. Since then, the number of publications has increased
considerably due also to the fact that ORs together with ICUs and emergency
departments are considered the most costly facilities in a hospital. For instance, the
average cost per hour of a standard OT in Scotland is £1155.79 (Ramsay et al. 2012).
The approach given to the problem varies depending on different factors. One of
the critical factors that determine the analysis is the amount and detail of data
available. Hospitals usually hold databases with information about the operations
performed. These databases are usually different for each department. In most cases,
those records are usually limited to just a few metrics of the operating process such
as waiting time before operating, surgery time or recovery time. The majority of
these studies are focused on improving the efficiency on using the OTs and reducing
waiting lists of patients, where a large amount of data is needed to find significant
results (Stahl et al. 2006; Torkki et al. 2006). Some authors have dedicated most of
the project period to data collection in order to have enough data to implement
realistic models (Denton et al. 2007). However, in cases where a more detailed
workflow description of the intervention events is needed, it is unusual to find
databases available with the required information. Some authors have completed
database records by interviewing experts or taking measurements (Baumgart et al.
2007). Other authors introduced new technologies in the OTs to help the data
gathering. Nara et al. (2009) used an ultrasonic sensor system to localise positions of
the staff during neurosurgery operations at the Tokyo Women’s Medical University
in Japan. Figure 11 shows the setup of the sensors in the OT and the placement of
the transmitters on the clinicians without interfering in their work.

26
Figure 11. Ultrasonic 3D location aware system at Tokyo Women’s Medical University (Japan),
consisting on control units (a), receivers (b) and transmitters (c); courtesy of Nara et al. (2009).
Padoy et al. (2010) studied the feasibility of introducing a signal based modelling
system able to recognise signals from the different devices used during the
intervention. Thereby each device can be analysed to determine by which person and
for what purpose it is being used for at discrete time steps. The information was
recorded with synchronised video cameras and presented as statistical modelling for
the signal and phases recognition. Gentric et al (2013) used a dedicated software to
record tasks in cerebral angiographies. They divided the procedures in phases,
linking instruments, actions and anatomical structure when recording the tasks. All
these works mentioned agree in that obtaining sufficient information for optimal
reengineering of OT management requires a systematic framework for collecting
data in order to track inefficiencies in the process (Zoeller et al. 2006). In addition,
safety and efficiency can be improved by objective analysis of procedures along with
a detailed assessment of other components of the workspace and an examination of
underlying attitudes that can contribute to medical error (Flin et al. 2006).
Another important factor in workflow modelling is the type of surgery that is
being analysed. Emergency surgery cannot be scheduled in advance; therefore, other
types of data are taken into account to improve workflow in the operating rooms.
Some studies, such as Torkki et al (2006), reorganised the flow of patients and also

27
the guidance of the process redistributing tasks among the clinicians and moving
phases of the operation to decrease waiting times. On the other hand, some surgical
procedures have a high variability in their requirements like open cardiac surgery
with an average duration of 4-5 hours. Using the hospital database to get records
from years 2001 – 2003, Peltokorpi et al. (Peltokorpi et al. 2008) evaluated three
different process changes for open-heart surgery: cost analysis, and underused and
overused time scheduled for the surgery in the OT. The authors agreed that for a
more accurate modelling to predict OT usage, the data in the hospital were limited
and a specific project would be required.
Despite the limitations that appear in many studies, the effort made towards better
modelling of workflow in OTs has been extended to many disciplines such as
cataract surgery (Reindl et al. 2009), trauma surgery (R. a. Marjamaa et al. 2008;
Torkki et al. 2006), endoscopy (Denton, Rahman, and Nelson 2007), laparoscopy
(Padoy et al. 2010) and also radiology.
2.4.3. Workflow analysis, modelling and simulation in radiology
environments
In 1971, Garfinkel (Garfinkel 1971) published a study about applications of
computer simulation to improve patient scheduling in health systems, which
included radiology as one of the highlighted fields. A year later, Jeans et al. (Jeans,
Berger, and Gill 1972) presented a work about simulation on an X-Ray department
in Bristol (UK). The authors studied modelled the workflow describing human
resources, equipment, and arrival and waiting times, types of examinations and
overall time that patients spent in the department. Their simulations evaluated
workload and resources used in order to predict probable improvements achieved by
trying different alternatives. In 1981, O’Kane (O’Kane 1981) provided another
simulation model for an X-Ray department, introducing some new factors in the
modelling such as staff breaks. The model distinguished the time of examination and
the time in which the rooms or radiographers would be available for the next patient.
Also taken into account was that an examination can be finished but the room might
need some work before other patients can use it. In addition, the model considered
the radiographers duties regarding dealing with records and checking images. Lev et

28
al. (Lev et al. 1976) developed a similar workflow model for scheduling process of
patients. All these authors agreed that the improvements in radiology should be
directed towards the optimal design of the management system and not to reducing
the staff or other facilities. As mentioned in the previous section, mathematical
modelling and simulation combined with measurements taken from observations
allows accurate predictions when testing possible improvements. Models can contain
complex logical and stochastic behaviour of the system, or interventional rooms in
this context, that could be incomplete or missed when just considering the
information collected through observations.
Although most of these cases modelled the system at a department level,
Kapamara et al (2007) introduced elements regarding to the internal decisions for the
patient treatment into the simulation model. However, this study is still incomplete
as some of the parts of the treatments are judged in overall times and do not include
details in the actions and decision taken by the clinicians during some parts of the
procedures.
Similarly, an earlier work at the University of Applied Sciences Gelsenkirchen
(Gelsenkirchen, Germany) included preliminary workflow modelling and simulation
techniques in a multi-modal imaging facility comprising CT and MRI rooms in a
nonclinical OT (Andreas Melzer 2003). The main objective was to test the technical
feasibility of a cost-effective imaging infrastructure by diagnostic and therapeutic
workflow (blue arrows and red arrows respectively in Figure 12 (a)). Figure 12 (b)
illustrate a preliminary attempt of the research group using simulation for the
purpose of workflow analysis at a radiology department.
The problem of improving scheduling practices, waiting times, and resource
utilization has been dealt with by more refined modeling techniques for workflow
simulation such as the Markov decision processes and DES (Johnston et al. 2009;
Kolisch and Sickinger 2008). Other authors have focussed their work on the
integration of information system in radiology departments and hospitals, including
the picture archiving and communication systems (PACS) (Crowe and Sim 2009;
Wendler and Loef 2001). Lindsköld et al. describe how this technique has the
potential to support proper planning and use of personnel, space, and equipment
resources. This study reveals however that there is a lack of studies that fully explore

29
simulation as a tool to facilitate changes and integration of new standards, such as
DICOM (Digital Imaging and Communication in Medicine) or HL7 (Health Level
Seven), and also different imaging technologies (MRI, multi-slice CT, PET/CT,
ultrasound) (Lindsköld et al. 2008).
Figure 12. (a) Schematic view of the Gelsenkirchen nonclinical OT site with the differentiated
diagnostic and therapeutic workflows; (b) model to simulate workflow of combination MR/CT
guided surgery and interventions with diagnostic procedures. In this figure, blue arrows
indicate diagnostic workflow and red arrows indicate treatment workflow.
In addition to the academic environment, global companies are working on
products to facilitate and improve workflow in image-guided environments. For
example, Siemens (Erlangen, Germany) has developed Dot™ (Day optimizing
throughput), a software that provide an easy-to-use interface to improve
examinations workflow for MRI diagnosis (Siemens 2012a). The company has also
designed Symbia.net™ that intents to give a solution for acquisition, processing and
integration of SPECT and CT images to give clinicians access to all patient data for a
better diagnostic (Siemens 2012b). In addition, Siemens has created a software
platform, Technomatix Plant Design and Optimisation, for plant design and
optimisation through discrete event simulation that, although it appears to be
designed for manufacturing industry, has been used successfully for modelling a
radiology department (Johnston et al. 2009; Siemens 2012c). Other companies like
Philips (Eindhoven, Netherlands), GE Healthcare (Milwaukee, IL, USA) or Dräger
(Lübeck, Germany) provide support for room layouts and ergonomics of OTs and
integration of imaging modalities to their customers to help hospital managers and
(a) (b)

30
clinicians to find the right solution for their needs (Dräger 2012; GE Healthcare
2012; Philips 2012).
2.5. Summary
This chapter presented an introduction of the imaging technologies that will be
covered in this thesis and a literature review on workflow analysis. The review
discussed first earlier work on workflow modelling and simulation in surgical
environments and then focused on radiology. Previous studies on workflow for
interventional radiology did not contemplate events and decisions taken within the
procedures. Although approaches to this issue can be seen in the cases of
laparoscopy or trauma surgery, interventional radiology procedures are considered as
blocks with an overall duration when analysing the workflow in radiology
departments.
Within IGP procedures, there is a higher variability on the use of devices than in
other types of surgery and therefore they need a different approach when it comes to
model, analyse and simulate their workflow. This thesis presents two approaches:
simulation and physical modelling. The first part describes the methodological
framework developed for the application of DES to IGP and four cases where the
framework was applied. The second part presents a purpose-oriented physical
modelling framework for workflow analysis and comparison of MRI and
fluoroscopy guided procedures based on the case of a common iliac angioplasty.

31
Part I:
Simulation Approach
32
Chapter 3.
Simulation methodological framework
Contents of this chapter appeared in:
Fernández-Gutiérrez F, Barnett I, Taylor B, Houston G, Melzer A, (2013) "Framework for
detailed workflow analysis and modelling for simulation of multi-modal image-guided interventions",
Journal of Enterprise Information Management, Vol. 26 Iss: 1/2, pp.75 – 90
3.1. Overview of the chapter
Following methods to study a system as described in the previous section (see
Figure 7), this chapter uses two methodological frameworks: the first to study the
system through DES models and the second to study IGPs through workflow
experiments in a simulated physical environment based on a case of study.
3.2. Simulation framework
3.2.1. Introduction
This section includes the methods used to gather and analyse the necessary data to
implement the DES models. For the implementation of the DES models, it was
necessary in first place to select the appropriate simulation software package. This
assessment is explained below. In addition, the section describes the methodology
used to model conceptually the IGP workflows and the principal details about the
implementation of the DES models, as well as the mechanisms used for their
validation and the output analysis.
3.2.2. Simulation software assessment
3.2.2.1. Introduction
In 2000, a survey about simulation software showed that, in the UK, simulation
was applied to health systems in more than 27 per cent of the academic studies
(Hlupic 2000a). Companies are increasing their use of simulation for workflow
management in health care, leading to the emergence of dedicated software
packages. The large variety of tools now available can make it more difficult to

33
decide which software is the most suitable to meet the needs of the system. Selecting
a non-appropriate software package can affect negatively the workflow simulation,
bringing extra costs and it may not meet the requirements of the model
implementation. For this reason, it was essential to undertake an assessment of the
simulation software packages existing in the market, focusing on those dedicated for
DES, since it was the technique used for this research.
The next two sections describe the methodology used, together with the list of
requirements requested, and the list of simulation packages with the result of the
evaluation process. Finally, since it is an important part of this research, the selected
simulation package is presented.
3.2.2.2. Methodology for simulation software evaluation
The evaluation of DES software packages was based on a general method for
software described by Jadhav and Sonar (2009):
1) Determine the need for acquiring the software and preliminary research of
availability of suitable software in the market;
2) Shortlisting of candidates;
3) Eliminate candidates that do not have required features;
4) Evaluate remaining packages (for example, through the ranking and testing
of trial versions);
5) Negotiate a contract with specifications such as price, licenses, functional
specification and maintenance;
6) Acquire the software.
This method can be applied to any type of software but it does not establish the
features we should require for the simulation software. In the survey conducted by
Hlupic in 2000, the authors studied the main limitations and the main features
requested by the users. The users gave more importance to the flexibility and
compatibility with other types of software packages, along with being easy to learn
and with good visual facilities. In addition, Hlupic presented in 1999 an evaluation
framework of simulation software for general purpose, giving a list of features
divided into several groups of criterion (Hlupic et al, 1999). More recently, Swain

34
and MacGinley (2009) analysed a number of simulation software packages with an
updated list of features, including some of those indicated by Hlupic (2000b).
Apart from these general characteristics, it was essential to add specific features
and requirements to accomplish the objectives of this research project. Table 2
presents the detailed list of criteria analysed grouped by type. Each feature was given
a score from 1 to 5, where 1 meant “not important” and 5 meant “very important”
criterion. In addition, a classification in the context of the derived criteria for the
simulation software evaluation was provided. This classification indicated whether a
particular feature was provided with the package or whether the software required a
particular feature in a high, medium or low degree.
Criteria type Criteria Score Classification
Software
features
System requirements: operating system, RAM,
space on disk
2 High
Medium
Low
Run time debug 4 Provided
Not provided
Output analysis (information can be collected after
the simulation)
5 Possible
Not possible
Real time viewing 5 Possible
Not possible
Support/training/Maintenance/documentation 5 Provided
Not provided
Price 4 High
Medium
Low
Error reporting 4 Provided
Not provided
Graphical model implementation 4 Possible
Not possible
Model building using programming/access to
programmed modules/
5 Possible
Not possible
CAD drawing import/adequate library provided 5 Provided
Not provided
Code reuse 4 Possible
Not possible
Animation 3 Possible
Not possible
Experimental design 3 Possible
Not possible
Statistical facilities 2 Provided
Not provided
Model packaging 3 Possible
Not possible
Micro-ergonomics design 4 Possible
Not possible
Interface user friendly 3 Easy/Average/
Difficult
Input data import 4 Possible

35
Criteria type Criteria Score Classification
Not possible
Model optimisation 3 Possible
Not possible
Analysis
functionality
included
Partial and total times 5 Provided
Not provided
Costs: total, operation, resources 3 Possible
Not possible
Resources under-utilised time 4 Provided
Not provided
Entity Activity: Number of entities that exit the
system after simulation time/Number of entities
remaining in the system after simulation
time/Average time in the system for an
entity/Average time that an entity spent travelling
between locations/Average time waiting for a
resource or other entity/Average time in
operation/Average time waiting for a location to
have available capacity/Number of entities that
failed to arrive at a specific location due to
insufficient capacity
5 Provided
Not provided
Variables changed during simulation: total of times
the value was changed/average time per
change/current value/average, max and min value
the variable had
5 Provided
Not provided
Location analysis: percentage of occupation by an
entity/idle time/number of entities
processed/number of entities remaining after
simulation time/average time of travelling for a
resource between locations
5 Provided
Not provided
Scheduling: entities/locations/resources 5 Provided
Not provided
Micro-ergonomics: postural and biomechanical
analysis of single and grouped activities/
anthropomorphic constraints implementation/device
handling analysis
4 Possible
Not possible
Table 2. List of features and requirements analysed grouped by criteria and type. Each
criterion was given a score from 1 to 5, where 5 meant “very important”, and classification for
the software evaluation in the context of the derived criteria.
3.2.2.3. Results of simulation software evaluation
Following the steps indicated in the previous section, a initial list of simulation
software packaged was prepared using two main sources, Internet and publications,
using terms as simulation software package, discrete event simulation software,
simulation software healthcare, workflow simulation software or simulation software
operating room. In the second phase, a short list of 13 simulation software packages
was selected:
- Analytica by Lumina Decision System Inc

36
- AnyLogic by XJ Technologies
- Arena Simulation Software by Rockwell Automation
- Delmia by Dassault Systemes
- Emergency Department Simulator by ProModel
- ExtendSim Suite by Imagine That Inc
- Flexsim HC by Flexsim Software Products Inc
- MedModel Optimization Suite by ProModel
- Micro Saint Sharp by Alion Science and Technology, MA & D Operation
- Simcad Pro-Patented Dynamic Process Simulator by CreateASoft Inc
- Simio by Simio LLC
- SIMUL8 Professional by SIMUL8
- Witness by Lanner Group Limited
The third phase of the evaluation was performed using the information facilitated
on the respective vendors’ websites. Appendix A encloses the contact information
for all vendors. In cases where the website did not facilitate all the information
indicated in Table 2, for instance in the case of Flexsim HC or Delmia Quest, the
vendors were contacted to complete the assessment through a questionnaire. Table 3
shows a summary of this evaluation with some of the key differences among the
software packages. At this point, only the software features were taken into account
as it was agreed that the functionality criteria would be more appropriately evaluated
testing the demo versions in the next phase of the evaluation. Appendix B presents
the rest of features evaluated. This assessment was completed on December 2010;
therefore the current software versions might be different.
After this first evaluation and with a look to the high-scored software features
from Table 2, five of the simulation software packages were selected: Delmia,
ExtendSim, Flexsim HC, Medmodel and Micro Saint Sharp. These packages were
then tested through demo versions or online demonstrations done by the vendors in
the cases where the demo version was not possible to obtain. Through the demo
versions, several aspects were evaluated such as user interface, flexibility on
changing the scenarios, facility to import and export data, price or the robustness. In
addition, it was taken into account the capability of the software to provide the
functionality indicated in Table 2.

37
Software
package
Real
time
viewing
Model building
using
programming
CAD
import/
library
Animation Experimental
design/ Model
optimisation
Micro-
ergonomics
design
Analytica Not
possible
Possible Not
provided
Not
possible
Not possible Not possible
AnyLogic Possible Possible Provided Possibleb
Possible Not possible
Arena Possible Possible Provided Possibleb
Possible Not possible
Delmia Possible Possible Provided Possible Possible Possible
Emergency
Department
Simulator
Possible Not possible Not
provided
Not
possible
Possible Not possible
ExtendSim Possible Possible Provided Possible Possible Not possible
Flexim HC Possible Possible Provided Possible Possible Not possible
MedModel Possible Possible Provided Possibleb
Possible Not possible
Micro Saint
Sharp
Possible Possible Provided Possible Possible Possiblec
Simcad Possible Possible Provided Possible Possible Not possible
Simio Possible Possiblea
Provided Possible Possible Not possible
SIMUL8 Possible Possible Provided Possibleb
Possible Not possible
Witness Possible Possible Provided Possibleb
Possible Not possible
Table 3: Simulation software packages evaluation summary
After the experience with the different demo versions, Delmia resulted as the
most suitable simulation software package to fulfil the objectives of the project. In
order to understand better the implementation process of the models, the main
features and parts of the software package are described in the next section.
3.2.2.4. Delmia: main features and 3D library
The two packages used with the academic version of Delmia (Dassault Systèmes
S.A., Vélizy-Villacoublay, France) were Quest for workflow modelling and
simulation and human ergonomics simulator. Quest offers a 3D environment for
process flow simulation, analysis and optimisation. The human ergonomics package
allows having life-like human models to simulate tasks and analyse postures for a
better understanding of the activities that are being performed. Although Delmia is a
general purpose software oriented mainly to the manufacturing industry, numerous
examples can be found where Delmia has been used for workflow analysis in health
care systems such as the trauma operating unit of the Helsinki University Central
Hospital or the trauma orthopaedic department at the Skaraborg Hospital in Sweden
(Marjamaa et al, 2008; Moris 2010).

38
Delmia Quest
The Quest interface has three different parts (see Figure 13):
- A graphical user interface (GUI) where the models are visually programmed.
- A control area with all the menus.
- A view area that has all the buttons to navigate through the GUI.
Figure 13. Delmia Quest interface. Labels are provided for graphical programming interface
and controls, view and navigation menus.
With regards of the DES models implementation, Quest is divided into three main
sections or worlds:
- Model world. This part contains the menus for the graphical implementation
of the models.
- Simulation world. This unit comprises the controls to run the simulations and
to compile the logics that are programmed in separate files.
- CAD world. This section has the necessary menus and features to read and
alter 3D objects for the models libraries.
Graphical programming – 2D and 3D
View & Navigation tools
Controls

39
The first thing to notice when opening the Quest software is the terms used in the
menus and control buttons. Since Quest was oriented primarily to the manufacturing
industry, we find terms such as machines, parts, labours or buffers. Figure 14 shows
an example of these control buttons. Once the principles of Quest programming are
understood, this terminology can be translated into clinical environment without
major problems. The main elements that we need to take into account when
modelling are translated as follows:
- Parts. A part is anything that enters the system and it is processed before it is
dismissed. Here, the patient is then our part. The patient is who enters our
model (e.g. intervention room or radiology department), receives a service
(e.g. intervention or diagnosis) and is dismissed.
- Machines. Any element that processes a part. This could be represented by
the operating table or the MRI scanner where the patient is placed for
diagnosis or as part of the intervention.
- Labours. These elements are the human resources needed to perform a
service inside our system: interventional radiologists, nurses, surgeons or
radiographers.
- Source/Sink. These are simply elements that as indicated in the introduction
(see section 2.3.4) help when modelling the logics: how the parts/patients
enter and leave the system.
- Buffer. In general terms, a buffer is placed whenever there is a potential
waiting area for parts before they are processed by an element. For example,
in a clinical environment it can be a waiting room before the patients go to
the scanner room as we might have patients arriving at a higher rate than they
are served by the MRI scanner.
- Process. Quest defines process as “what happens to a part as it moves
through an element”. Any activity or decision that requires certain time or
logic would be programmed here as a process. If the process is simple it can
be defined simply through the GUI, in the case where the logic is more
complex, “user functions” would be needed. These functions are
programmed in separate files in a proprietary Simulation Control Language
(SCL). These user functions are linked to the corresponding element using
the control menus in the GUI.

40
- Accessory. These are elements created to enhance the graphical
representation of the system, e.g. cupboards, desks, surgical lights, etc. Some
of these accessories aid also the model implementation. For instance, adding
walls and doors as accessories in the model would facilitate the
reconstruction of paths for clinicians and patients amongst the rooms.
Further information about Quest can be found at Quest manual distributed with
the software (2006).
Figure 14. Detail of Delmia Quest interface and menu samples.
Due to the nature of Quest, the libraries available for the implementation of DES
models are oriented to industrial environments. Therefore, it was necessary to create
an additional library with the elements needed to create virtual imaging operating
rooms.
Google 3D Warehouse (http://sketchup.google.com/3dwarehouse/, accessed
03/03/2014) offers 3D models under a royalty-free license unless otherwise stated in
the individual models. With these premises, a library was created with a list of
objects including different types of operating tables, surgical lights and screens, X-
Ray equipment and MRI scanners. More than 50 objects were incorporated to the
Quest standard library. In order to be able to incorporate these models into Quest, it
was necessary to convert their format. The 3D warehouse objects can be open and

41
modified using Sketchup (http://www.sketchup.com/intl/en/ index.html, accessed
03/03/2014). Sketchup v7 and a free plugin – under General Public License (GPL) –
were used to convert the 3D objects into STL (Stereo Lithography) format, which
can be open in Quest. Figure 15 shows an example of a Sketchup model – (a) – of an
MRI scanner with the corresponding STL version – (b) – of the same model in
Delmia Quest CAD world. When converting to STL, the models lose their colour
and some other minor features but keep their dimensions and external aspect. The
CAD world in QUEST allows adding colours and minor modifications to the 3D
objects but everything is subjected to some limitations on the new STL format.
Figure 15. (a) 3D model of an MRI scanner with table in Sketchup v7, (b) 3D model converted
into STL format and incorporated into Delmia Quest through the CAD world.
Another important part of the virtual environment was the design of the layouts.
As mentioned above, adding walls and doors to the 3D environment would aid when
describing paths for clinicians and patients in the model. Here, the rooms were
designed to scale using Sweet Home 3D (http://www.sweethome3d.com/, eTeks,
Paris, France), an interior design application under GPL. Sweet Home 3D can read a
layout plan through and image. Then, the user can draw walls, doors and windows
using this plan. Finally a 3D object, readable by Sketchup, is created with the real
dimensions to scale. Figure 16 illustrates an example using Sweet Home 3D, the
layout plan of the radiology department at Homburg – Saarland University Hospital
(Homburg, Germany). The 3D object can be added to the Quest library as explained
previously.
(a) (b)

42
Figure 16. 2D and 3D view of the radiology department at Homburg Saarland Hospital
(Homburg, Germany) created to scale using Sweet Home 3D (eTeks, Paris, France).
Delmia V5R20 for Human Ergonomics Design and Analysis
Delmia for Human Ergonomics is a modelling tool used to create, validate and
simulate digital human manikins or models (DHM) in a virtual environment to
analyse human interaction and worker process. Delmia Human uses NIOSH
(National Institute for Occupational Safety and Health) 91 equations (Waters et al.
1993) and RULA (Rapid Upper Limb Assessment) for posture and activity analysis
(McAtamney and Nigel Corlett 1993).
Delmia Human allows importing CAD (Computer aided design) elements from
multiple formats. Figure 17 shows the GUI interface of Delmia Human. The control
menus for the interface and the RULA analysis are highlighted. The vision window

43
gives an indication of what the manikin is “seeing” during an activity. RULA for
ergonomics posture analysis is detailed in a subsequent section.
Figure 17. Delmia V5R20 for Human Ergonomics Design and Analysis graphical user interface
(GUI). To illustrate the RULA analysis menu and result windows, the GUI shows a 50th
percentile human-like manikin in standard position operating inside an open-bore MRI scanner
model (Panorama 1T MRI, Philips, Eindhoven, The Netherlands).
3.2.3. Data gathering and analysis for DES simulation
3.2.3.1. Data collection
Padoy et al. (2010) showed how an extensive analysis of minimally invasive
surgery could help in order to meet future requirements in terms of ergonomics and
operability. The authors based their study on laparoscopic surgery using statistical
modelling and monitoring the use of devices during interventions. However, this
approach would only in part be suitable for image-guided interventions due to the
greater variety of different instruments involved. Cannulae, energetic probes,
catheters, guide wires, introducers, vascular implants, monitoring devices, etc.
feature multiple types, sizes and shapes. The devices are selected according to the
kind of procedure, indication, the patient’s personal characteristics, and the type of
imaging that is needed. In addition, although the use of some of these devices is
RULA analysis – menu
3D GUI Vision window

44
planned ahead of the intervention, it was observed that, in multiple cases, extra
devices not projected were utilised. In some cases, these other devices were stored in
adjacent rooms. Some other times, nurses prepared a range of devices since the true
size needed was still uncertain from the pre-images. Then, some of these devices
remained unused after the intervention. These reasons make recording the use of
devices very complicated. This hazardous situation makes it difficult and time
consuming to track projected devices would therefore result in incomplete datasets.
Therefore and due to the nature of this study, the data collection was done
manually, attending the interventions in most of the cases, as the detailed data
required was not usually available in databases. Several centres collaborated in the
data collection:
- Clinical radiology and cardiology departments at Ninewells Hospital
(Dundee, UK)
- Radiology Department at Homburg – Saarland University Hospital
(Homburg, Germany)
Data set Description
Patient Data Gender
Age
Height
Weight
Procedure details Name
Previous similar interventions
Images used prior the intervention
Staff Role
Number
Sterilized
Experience
Supplies Type
Model
Manufacturer
Event log Time
Summary
Contrast agent Contrast details
Total amount
Comments
X-Ray dose Emitted dosage
Absorbed dosage
Dosage period
Complication Time

45
Data set Description
Summary of complication
Other comments
Table 4. Data collection template
Table 4 presents the type of data collected from the institutions mentioned. The
data set was mutually agreed after attending several interventions and with the
collaboration of clinical staff from different radiological suites. Templates for data
collection were designed based on the records collected in the cardiology department
in Ninewells Hospital (Dundee, UK). The cardiology department maintains a
proprietary database and a dedicated technician stores information such as indicated
in Table 4 during interventions. In this case, data could be collected from their
database after printing and anonymising the patient sensitive information. In the rest
of cases, data was collected manually.
Figure 18. Screenshots of MIDAS (Medical Interventional Data Analysis System) website: (a)
shows a partial view of a completed record and (b) the analysis web page with a graph.
The records collected were transferred into a database using a web application for
the gathering. The web application, called MIDAS (Medical Interventional Data
Analysis System) is in its second major revision (http://midas.heroku.com/, accessed
03/03/2014). Although the original idea of designing a web application for the data
gathering is part of this thesis, the implementation of this website was carried out in
(a) (b)

46
first instance under a master project in Applied Computing at University of Dundee.
Further description can be found in Appendix C.
3.2.3.2. Data input analysis for DES
Once the data is gathered, probability and statistics analyses are needed before
implementing the DES model. A crucial part of that analysis is to choose the input
probability distributions for the models. The use of the mean or inappropriate
distributions can lead to error in the output and to bad decisions when testing for
alternative protocols. These distributions are used to generate random samples
during the simulations of the time-based parts of a procedure such as task durations
or patient arrivals.
Task or arrival times behave as random variables, which can be described by their
probability distribution. EasyFit (http://www.mathwave.com/, Dnepropetrovsk,
Ukraine), distribution fitting software, was used to analyse statistically the times
collected per case of study. The analysis consisted on a description of the main
features of the samples collected (mean, standard deviation, maximum and minimum
value, among other parameters) and a probability distribution fitting process. In
order to calculate the fitted distributions, it was assumed that the distributions have a
finite lower bound fixed to 0 as all time-based records collected are positive. To find
the best-fitted distribution, two criteria were used:
1. The no rejection of the null hypothesis (the data follow a specific
distribution) in the Anderson-Darling Goodness-Of-Fit (GOF) test (level
of the test α = 0.05). This test is designed to detect discrepancies in the
tails of the dataset and is more powerful in this sense that other GOF tests
(Stephens 1974). The test implemented in EasyFit uses the same critical
values for all distributions, using the approximation formula:
∑ [ ( )]
(Eq. 3-1)
Where X is an IID (Independent and identically distributed) random
variable, F is the cumulative distribution function and n is the sample size.

47
If the test statistic, A2, is greater than a critical value given by the level of
the test, then the hypothesis is rejected.
2. In case of rejection of the null hypothesis, the data is examined in order to
characterise the records with the most appropriate statistical distribution.
In this case, descriptive statistics such as mean, variance, median and
skewness are taken into account. In addition, (probability – probability) P-
P and (quantile – quantile) Q-Q plots are considered2 to select the fitted
distribution. In case of several statistical distributions resulted appropriate
to represent the data, the selection is based on experience based literature
(Law 2007).
3.2.4. Conceptual modelling
In the study by Aguilar-Savén (2004), the author states that to implement the right
model, it is essential to understand the purpose of the analysis and to know the tools
and techniques for process modelling. Conceptual modelling prior to implementation
of the workflow model facilitates that understanding and re-engineering of the
processes. The level of granularity chosen is also important for the modelling.
Studying actors, tasks, decision points as well as static or dynamic aspects of the
systems may be needed (Jannin and Morandi 2007). However, choosing the right
technique is a complex task due to the large range of approaches. Flow charts, data
flow diagrams, role activity diagrams (RAD), Petri nets (PNs), Unified Modelling
Language (UML) or Soft Systems Methodology (SSM) are just some of the most
common used.
The level of detail required for the modelling of workflows of IGP may include
the possibility to indicate roles and interactions between them, simplicity, and the
capability to show decision points and sub-activities. Consequently, a combination
of flow diagrams and RAD was selected among the techniques to model the process
flows and the interactions among clinicians in the different phases of the procedures.
In Patel (2000), the author demonstrated how RADs can be applied to activities of
health care organisations such as the National Health System (NHS, UK),
2 The (probability-probability) P-P plots are graphs where the empirical cumulative distribution
function (CDF) is plotted against the theoretical CDF. The (quantile-quantile) Q-Q plots are graph
with the observed data values are plotted against the theoretical (fitted) distribution quantiles.

48
contributing to a better understanding of the processes and determination of
information requirements. This method takes into account the roles and interactions
happening during the process, in contrast to PNs or flow charts. In addition and in
contrast to UML, RAD gives a view of the whole process in a unique diagram and it
has a well-defined and documented notation, unlike SSM (SPRINT 2009).
Other studies on workflow of radiology departments used flow diagrams or PNs
for the conceptual modelling (Johnston et al. 2009; Zhang et al. 2009). However,
they did not represent staff roles or detailed events during interventions, which is
essential to achieve the objectives of this project. A combination of both types of
diagrams to model image-guided workflow results in a better-balanced solution for
understanding the process at a glance and at the same time provides a flexible tool to
facilitate the re-engineering process of the workflow. Figure 19 shows the legends
and graphic symbols that will be used in the flow diagrams and role activity
diagrams designs for the conceptual modelling.
Figure 19. Legend for symbols and graphic styles used on the flow diagrams and Role Activity
Diagrams (RAD) of the conceptual models.

49
3.2.5. Models implementation
Implementing a simulation model that accurately represents the real system is one
of the most challenging problems when analysing a system. One of the factors that
need to be considered is the level of detail needed, which would be given by the
conceptual model previously designed.
Another factor is the quality of data collected to describe the model. As it was
mentioned in Section 3.2.3, it is essential to select the appropriate statistical
distribution for the time-based actions of the system. However, this is also subjected
to the amount of data available. Unless historical data is available, the collection of
data can be very time consuming depending on the level of detail needed.
Simulation, by generating random samples, allows the use of additional techniques
to deal with the absence of data. One of these approaches is the use of the triangular
distribution to model actions or task where there is no data or just a few records
(Santibáñez et al. 2009; Liebsch 2003). In this case, experienced clinicians or so
called subject-matter experts (SMEs) are asked about estimations for the minimum,
maximum and most-likely (mode) times to perform a particular task (Law 2007;
Alexopoulos and Goldsman 2010). These values, a, b and m respectively, are the
parameters describing the triangular distribution used as input for the simulation
model in the absent of sufficient data. Once the triangular distribution is described, it
can be used to generate random samples for the times to perform the task from which
we did not have records. An example of a triangular distribution function shape can
be seen in Figure 20. Although, the use of triangular distributions is still a subjective
method to deal with absence of data, it has been successfully used to deal with
variability in health systems such as emergency departments (Ahmed and Alkhamis
2009)or hospital wards (Worthington et al. 2010), when data was not available for
certain processes.

50
Figure 20. Triangular distribution where a, b and m are the minimum, maximum and mode
values.
In addition, modelling correctly the decision points plays an important role in the
implementation process. The decisions will be specified by probabilities of taking
one path or another in the model logic. Calculating these probabilities is then critical
and depends also in the quality of the collected data. As well as for the time-based
information, the SMEs are asked when little or no data is available. Furthermore,
these probabilities may not remain static during the simulations, being necessary to
model dependencies on previous events. The way these dependencies are modelled
will be subjected to each case.
Besides these factors, the objectives of the simulating study will affect how the
model is built. Therefore, the description of the implementation process will be given
for each singular case in the next chapters.
3.2.6. Validation and verification
Once implemented, the models need to be verified and validated following the
definitions given in Section 2.3.2. The verification and validation processes were
done following the methodology suggested by Law (2007), Nakayama (2006) and
Sargent (2011), involving several tests done over the conceptual modelling, the
computer programming and implementation phase and the operational validation.
For the conceptual model validation, constant communication and reports were
exchanged among the different partners involved. The flow diagrams were re-
designed several times during this phase. Trace methods and animations, embedded

51
in Delmia Quest, were used during the programming phase in order to debug the
logic implemented.
The operational behaviour was validated following several steps: animation,
expert validation, event validity and variability analysis. For the variability analysis,
the simulating models were compared with the real system following the method for
the Behrens-Fisher problem (Scheffé 1970), for an unknown ratio of variance, using
the Welch confidence interval (CI):
⁄ √
(Eq. 3-2)
Where , and ,
are the means and variances of the
two systems (real world and model) with and samples, respectively; and
⁄ is the Student-t for 100(1-α) CI and f – degrees of freedom, calculated by
[
⁄ ⁄ ]
[ ⁄ ] ⁄ [
⁄ ] ⁄
(Eq. 3-3)
In this study, we used a 90% confidence interval.
3.2.7. Simulation and output analysis
3.2.7.1. Output data analysis
A number of key performance indicators (KPIs) were defined per case of study
and used to evaluate the outcome of the simulations. CIs for these KPIs were
calculated using the same number of simulations (replications) necessary to validate
the model (same number needed for the Welch CI).
To calculate these CI, let X be the measure for the duration of an event in seconds.
Then, Xj is the mean of the observations of that measure for the jth replication. Given
the conditions above for the simulations, X1, X2, …, n (j=1, 2, …, n) will be the IID

52
random variables with E(Xj) ≈ µ and , an approximately unbiased point
estimator for µ. Then, the confidence interval for µ is given by:
√
(Eq. 3-4)
Where is the global mean and is the sample variance,
∑
∑
(Eq. 3-5)
And is the number such that for the t-Student distribution with
degrees of freedom, ( )
Summaries of the output analysis are shown in the following chapter for each
case.
3.2.7.2. Optimisation analysis
Ranking and selection (R&S) methods are commonly used in simulation-based
optimisation analysis. These methods compare a number of alternatives and select
the best of those scenarios based on previously defined KPIs. As a proof of concept,
this thesis will present in a posterior chapter the use of an R&S method, together
with the framework for analysis and modelling of IGPs.
There are many R&D methods for selection of the best alternative proposed in the
literature. Bechhofer (1954) proposed one of the first ones for known common or
equal variances for the different alternatives considered. Later on, Paulson (1964)
described an R&S method for when the variances are unknown but they can be
assumed to be common. Zinger and St. Pierre (1958) proposed a method for known
but unequal variances. Dudewicz and Dalal (D&D) (1975) developed a R&S method
that does not assume the variances are known. In addition, this method does not
assume equal variances for the different alternatives. Assuming known or similar

53
variances might be unrealistic when simulating real systems. A comprehensive
description of other R&S methods can be found in Kiekhaefer (2011).
The high-variability observed when modelling IGPs makes the D&D method
appropriate to study these systems since variances are not known a priori and cannot
be assumed to be equal. The D&D method involves “two-stage” sampling for each
of the alternatives (systems) to be analysed. Firstly, replications per system
have to be done. According to the literature, it is recommended to choose a starting
number between 10 and 30. For this study, was chosen arbitrarily. For each
system, means, , and variances are calculated for each KPI that wants to be
used to assess the system. Then , number of samples, is calculated for the “second-
stage” for the system as follows
{ ⌈
⌉}
(Eq. 3-6)
Where the symbol ⌈ ⌉ means the smallest integer that is greater than or equal than
the real number , is the variance of the system , is the smaller
actual difference between the means of the systems that we care about detecting and
is a constant dependent on , the number of alternatives being evaluated and the
least probability that assures selecting the best system. This probability was
established to 90%. The value for this study was obtained from the tables in
(Dudewicz et al, 1975). Parameters are adjusted depending on the system and the
case of study.
Next, more replications were calculated for each system, calculating the
new sample means . Then, weights are defined as
[ √
(
)]
(Eq. 3-7)
And . Then, the weighted sample means are calculated
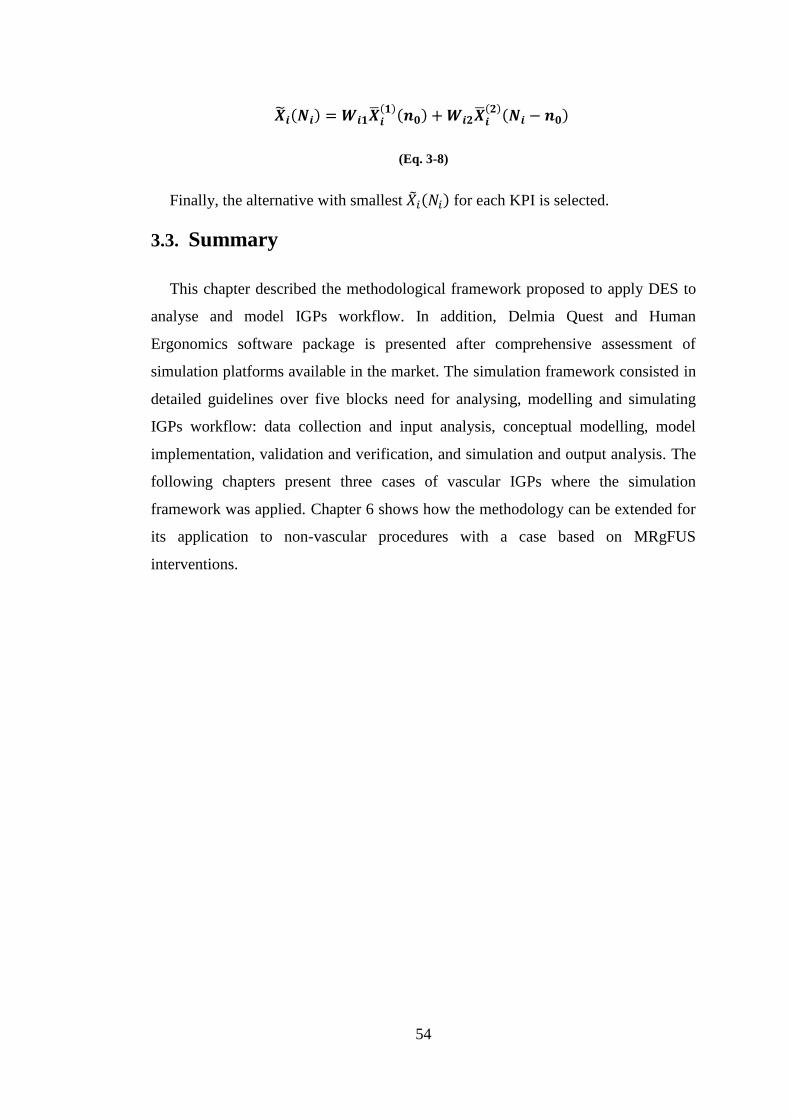
54
(Eq. 3-8)
Finally, the alternative with smallest for each KPI is selected.
3.3. Summary
This chapter described the methodological framework proposed to apply DES to
analyse and model IGPs workflow. In addition, Delmia Quest and Human
Ergonomics software package is presented after comprehensive assessment of
simulation platforms available in the market. The simulation framework consisted in
detailed guidelines over five blocks need for analysing, modelling and simulating
IGPs workflow: data collection and input analysis, conceptual modelling, model
implementation, validation and verification, and simulation and output analysis. The
following chapters present three cases of vascular IGPs where the simulation
framework was applied. Chapter 6 shows how the methodology can be extended for
its application to non-vascular procedures with a case based on MRgFUS
interventions.

55
Chapter 4.
Results: Case study of percutaneous coronary
interventions
4.1. Background of the case
Percutaneous coronary intervention (PCI) is a minimally invasive vascular
procedure used to open obstructed coronary arteries to improve blood circulation of
the heart muscle. It is usually implemented when coronary artery bypass surgery
may be too dangerous for the patient and in more than half of the patients needing
revascularisation (Grech 2003).
In 2007, the European Society of Cardiology published a report about PCIs across
Europe based on data up to 2004. When comparing records from 2003, there was an
increase of 11% for coronary angiographies while the number of PCIs increased
20%. In case of coronary stenting, the increment was even higher with 22% more
procedures compared to 2003. However, the report also observed that the cardiac
catheterisation facilities per million inhabitants in Europe remained unchanged (2.6)
between 2003 and 2004 (Cook et al. 2007). This highlights the importance of
improving the efficiency in the performance of PCIs in order to handle their
predicted increasing demand.
A simulating study for PCIs was conducted in collaboration with the Cardiology
Department at Ninewells Hospital (Dundee, UK). During this work, feedback was
collected and discussed with the clinical team, especially with Prof Dr Graeme
Houston (consultant interventional radiologist) and Dr Thomas Martin (consultant
interventional cardiologist) at Ninewells Hospital. PCIs were selected to be studied
because they are well-established procedures and they are broadly standardised. In
first instance, an overview of PCIs is presented based on data collected at the
cardiology department. Then, a deeper analysis was performed covering angioplasty
and stenting PCIs – treatment PCIs. This analysis included times and probabilities
associated to relevant events within treatment PCIs and resulted in the
implementation of a DES model, which particularities are explained. This model was

56
then validated and the main results are discussed in the last section. This analysis is
shown as a proof of concept to understand the performance of PCIs. The knowledge
gained about the activities and decisions taken during the interventions can be used
to improve the throughput of cardiology suites (also known as cath labs).
4.2. Overview analysis of the PCIs records
4.2.1. General information analysed
Anonymised data was extracted from the cath lab existing database. In total, 125
consecutive records (4 weeks) were collected, 83 corresponding to diagnostic
procedures and 42 to treatment (angioplasty or stenting) PCIs. Out of all the
treatment interventions, 14 were elected patients, 25 were follow-on patients and 3
were emergency patients. In average, a diagnostic procedure took 27:55 (01:34) and
a treatment 59:10 (04:35) (times expressed in MEAN (SE) and min:sec). Figure 21
displays the differences between the total duration for diagnostic and treatment PCIs.
The box plot shows how diagnostic PCIs, despite some singular cases represented by
the outliers in the graph, have less intrinsic variability than the treatment procedures.
The two far outliers for diagnostic PCIs correspond to a case where the procedure
was not successful after several tries of the cardiologist to access the circumflex
coronary artery; and a case where the X-Ray equipment failed. In the other single
outlier, much closer to the box, the evaluation of the left ventricular function seemed
to have taken longer than average but no other complication was observed from the
records.

57
Figure 21. Box plot of total duration (hh:mm:ss) per purpose of PCI – diagnostic and treatment.
In the case of the PCIs that involved stenting, two different approaches were
distinguished: the pre-dilatation approach, where a balloon was used before a stent
implantation, and the direct approach, where the stent was applied directly without a
balloon dilatation. Six records were collected with the direct approach and 30 with
the pre-dilatation approach. The direct approach took on average 44:15 (05:31) and
the pre-dilatation approach took 1:02:20 (05:35). Figure 22 shows the higher
variability in procedural time with the pre-dilatation approach.
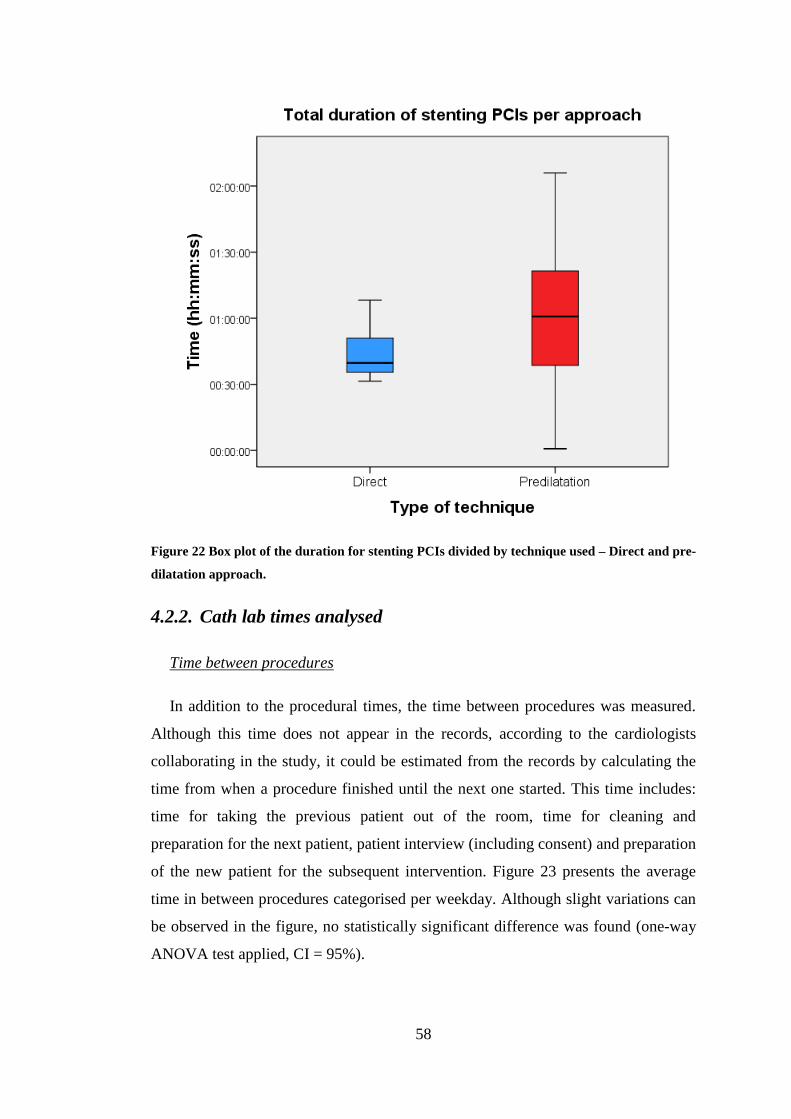
58
Figure 22 Box plot of the duration for stenting PCIs divided by technique used – Direct and pre-
dilatation approach.
4.2.2. Cath lab times analysed
Time between procedures
In addition to the procedural times, the time between procedures was measured.
Although this time does not appear in the records, according to the cardiologists
collaborating in the study, it could be estimated from the records by calculating the
time from when a procedure finished until the next one started. This time includes:
time for taking the previous patient out of the room, time for cleaning and
preparation for the next patient, patient interview (including consent) and preparation
of the new patient for the subsequent intervention. Figure 23 presents the average
time in between procedures categorised per weekday. Although slight variations can
be observed in the figure, no statistically significant difference was found (one-way
ANOVA test applied, CI = 95%).

59
Figure 23. Average duration between procedures shown per weekday
Time to first patient
In a usual schedule, a working day in the cath lab would start at 9:00am. That is
also the time at which the first patient is scheduled. However, the interventions are
likely to start later due to room and equipment setup times. It was of interest to
calculate the time between the first patient appointment and the start of the
intervention. This would enable a better understanding about the average working
routine in the department. Figure 24 shows this time distribution. An average time of
39:21 (06:09) was observed. The times varied from 08:43 – 1:47:20 (minimum –
maximum). The records did not provide an explanation or indication for the causes
of the two substantial outliers in the graph.
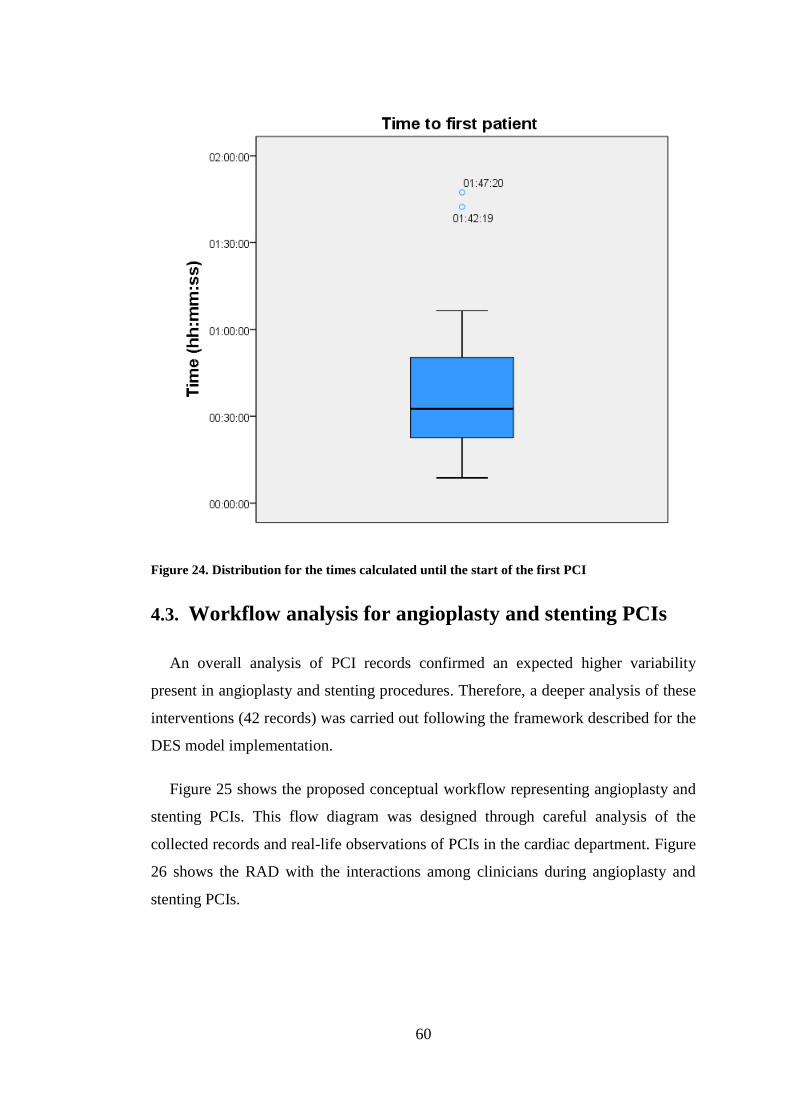
60
Figure 24. Distribution for the times calculated until the start of the first PCI
4.3. Workflow analysis for angioplasty and stenting PCIs
An overall analysis of PCI records confirmed an expected higher variability
present in angioplasty and stenting procedures. Therefore, a deeper analysis of these
interventions (42 records) was carried out following the framework described for the
DES model implementation.
Figure 25 shows the proposed conceptual workflow representing angioplasty and
stenting PCIs. This flow diagram was designed through careful analysis of the
collected records and real-life observations of PCIs in the cardiac department. Figure
26 shows the RAD with the interactions among clinicians during angioplasty and
stenting PCIs.

61
Figure 25 Proposed conceptual workflow for angioplasty and stenting PCI procedures

62
Figure 26 Proposed role activity diagram to show interactions among clinicians for
angioplasty/stent implantation PCIs
Relevant phases, highlighted in the diagrams, were analysed. Results of
descriptive statistics of these phases are shown in Table 5. It was not possible to
distinguish between the phases of balloon or stent insertion, inflation or deployment
and extraction for all the records. Either some of the intermediate tasks were missing

63
or some tasks were double recorded, being then impossible to distinguish which was
the valid record. In addition, no significant difference was found between the times
for balloon or self-expanded stent deployment (T-Test for independent samples
applied, CI = 95%). In these cases, to keep the consistency among all the data, it was
agreed to consider these phases together and rename them as “single balloon
angioplasty” in the case of the balloon catheter procedure and “single stent
implantation” for both self-expanded and balloon-expanded stent deployment. The
“single guidance” event, or “catheter and guidewire guidance” in Figure 25, is
defined for each time there was an exchange of catheter(s) and guidewire (s) to reach
the area to treat.
Event Mean
(min)
Std. Dev
(min)
Median
(min)
Q1 (25%)
(min)
Q3 (75%)
(min)
Preparation 13.02 4.73 11.75 10.23 13.88
Access 4.15 6.30 2.28 0.44 5.21
Single guidance
(exchange of catheter
and guidewires in
between treatments)
9.86 7.68 8.40 4.40 13.02
Single balloon
angioplasty 3.98 1.69 3.71 2.76 4.89
Single stent
implantation 4.38 2.43 3.75 2.49 5.60
Room ready time 9.01 0.66 8.87 8.47 9.57
Table 5. Standard descriptive analysis of the duration (in minutes) of the events collected for 42
angioplasty and stenting PCI procedures. Statistics include mean, standard deviation, median
and Q1 and Q3 quartiles3.
The next step in the data analysis was to fit the statistical distributions to the data
shown in Table 5 in order to fit the DES model. To illustrate the process as it is
explained in Section 2.2.3, the fitting of “single guidance”, which is defined above,
is presented in more detail. Durations of “single guidance” were calculated from the
42 treatment PCIs records collected. They were fed into EasyFit and fitted into
several continuous statistical distributions with the restrictions of lower bound fixed
to 0 and α = 0.05 for the Anderson-Darling GOF test. With this condition, a gamma
3 Quartiles divide a rank-ordered dataset into four equal parts. Q1 is the middle value for the first half
of the ordered dataset and Q3 is the middle value for the second half. Q1 and Q3 define the
interquartile range which is a measure of the variability of the dataset.

64
distribution was chosen, ranked as best fit by the GOF test. Figure 27 shows how the
fitting looks like graphically when compared to the histogram of the data. Scale – β –
and shape – α – parameters, describing the specific gamma distribution fitting the
data, are also given by EasyFit (Law 2007).
Figure 27. Example of distribution fitting for the “single guidance” event with the EasyFit
software. Histogram of the durations collected and curve of the probability distribution
function fitted are shown.
Table 6 shows the rest of probability distributions fitted to the events indicated in
Table 5. These were calculated through EasyFit following the indications in Section
2.2.3 for data analysis. Information about the distribution curves and data histograms
can be seen in Appendix D.
4.4. Model implementation
Figure 25 and Figure 26 were used to implement the logic for angioplasty and
stenting PCIs DES model. Although the logic seemed to be simple at first sight, the
analysis revealed several particularities that will be described below. The
assumptions and approaches taken were validated during the simulation analysis and
will be discussed in the last section of the chapter.
Probability Density Function
Histogram Gamma
x18001600140012001000800600400200
f(x)
0.36
0.32
0.28
0.24
0.2
0.16
0.12
0.08
0.04
0

65
Event Distribution Parameters (sec)
Preparation Lognormal μ = 6.62, σ = 0.27
Mean (± SD) = 776.18 (± 216.59)
Access Gamma α = 0.43, β = 573.11
Single guidance Gamma α = 1.65, β = 358.66
Single Balloon
Angioplasty Gamma α = 5.52, β = 43.20
Single Stent implantation Lognormal μ = 5.45, σ = 0.48
Mean (± SD) = 260.8 (± 133.91)
Room ready time Erlang m = 183, β = 2.94, (Mean=538.87)
Table 6. Statistical distributions of the events collected for PCIs interventions, where α and σ
are the shape parameters, and β and µ are the scale parameters of the distribution functions
Number of treatments
Observations revealed that patients could have more than one single treatment
(“single balloon angioplasty” or “single stent implantation”) during one
intervention. The number of single treatments varied from 1 to 9 with a mode = 34.
This number was also modelled with EasyFit software using the discrete distribution
fitting option. Figure 28 shows the histogram and the Poisson distribution
( that was selected as the best fit to
represent the sample data. Although the Poisson distribution rejected the A-D GOF
for α = 0.05, it did not rejected it for α = 0.02 and 0.01. Therefore it was still decided
to be used for representation of the data (see Section 2.2.3). This distribution was
added to the model and was sampled at the beginning of each simulation in order to
collect all the variability of cases.
4 Where mode is the statistical value defined as the value that appears more often in the dataset. In this
context it would be the more likely (often) number of treatments that a patient may have

66
Figure 28 Histogram and Poisson distribution for the number of single treatments (angioplasty
or stenting) performed on a patient during a PCI. In the diagram, frequency indicates the
probability of having a particular number of treatments. The frequencies take values from 0 to
1 instead of using probability percentages, e.g. having 3 treatments during a single procedure
has a frequency of 0.39, which means a probability of 39%.
Probability for angioplasties and stenting
When studying the decision points shown in Figure 25, different probabilities of
treatments by angioplasty or stenting were observed. These probabilities changed
depending on the previous treatment given to the patient. For instance, in 81.82% of
the cases the cardiologist performed a balloon angioplasty in the first place,
representing stenting without a previous angioplasty only in 18.18% of the cases
studied. After this, treatment finished in 66.66% of the cases that had a stent
implantation, while treatment continued for the cases that had a balloon angioplasty
in first place. The full probability tree observed from the records collected is shown
Histogram and Poisson distribution fitted
Sample Poisson
Number of treatments987654321
Fre
qu
en
cy
0.4
0.36
0.32
0.28
0.24
0.2
0.16
0.12
0.08
0.04
0
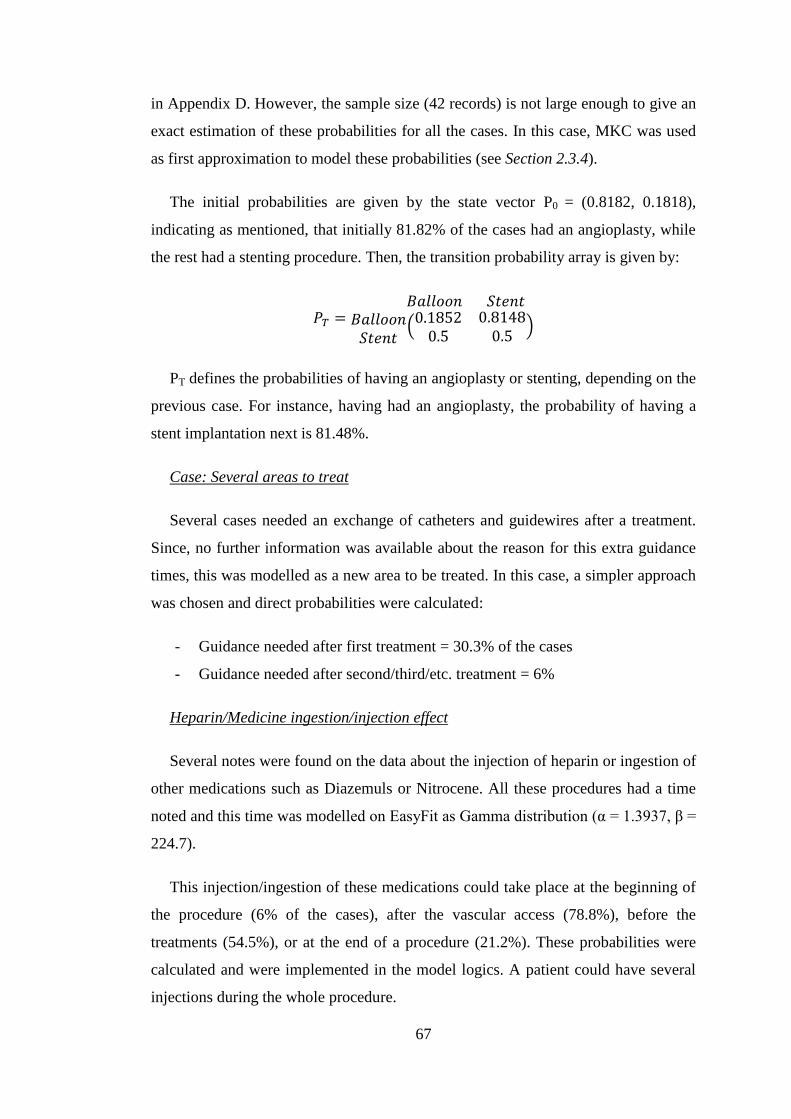
67
in Appendix D. However, the sample size (42 records) is not large enough to give an
exact estimation of these probabilities for all the cases. In this case, MKC was used
as first approximation to model these probabilities (see Section 2.3.4).
The initial probabilities are given by the state vector P0 = (0.8182, 0.1818),
indicating as mentioned, that initially 81.82% of the cases had an angioplasty, while
the rest had a stenting procedure. Then, the transition probability array is given by:
(
)
PT defines the probabilities of having an angioplasty or stenting, depending on the
previous case. For instance, having had an angioplasty, the probability of having a
stent implantation next is 81.48%.
Case: Several areas to treat
Several cases needed an exchange of catheters and guidewires after a treatment.
Since, no further information was available about the reason for this extra guidance
times, this was modelled as a new area to be treated. In this case, a simpler approach
was chosen and direct probabilities were calculated:
- Guidance needed after first treatment = 30.3% of the cases
- Guidance needed after second/third/etc. treatment = 6%
Heparin/Medicine ingestion/injection effect
Several notes were found on the data about the injection of heparin or ingestion of
other medications such as Diazemuls or Nitrocene. All these procedures had a time
noted and this time was modelled on EasyFit as Gamma distribution (α = 1.3937, β =
224.7).
This injection/ingestion of these medications could take place at the beginning of
the procedure (6% of the cases), after the vascular access (78.8%), before the
treatments (54.5%), or at the end of a procedure (21.2%). These probabilities were
calculated and were implemented in the model logics. A patient could have several
injections during the whole procedure.

68
Pauses
Although there were pauses during most of the procedures according to
interviews with clinicians, only in 15% of the cases, there were identified in the
records. These cases might be due a particular complication during the procedure but
this cannot be confirmed with the current data available. Nevertheless, this pause, in
the 15% of the cases, was modelled with a Gamma distribution (α = 3.65, β = 73.14)
and was also included also in the model. It was assumed, for simplicity in the logic
implementation that the pause would be taken before a treatment, which was
observed in most of the cases. Figure 29 shows the DES model of the Cath lab in
Ninewells Hospital (Dundee, UK) implemented in Delmia Quest. For this model, a
standard staff team was included – cardiologist, radiographer, circulating nurse and
scrub nurse – and interactions were programmed as indicated in the RAD diagram of
Figure 26.
Figure 29 DES model in Delmia Quest of the Cath Lab (Ninewells Hospital, Dundee, UK)
4.5. Validation and verification of the PCI model
For validating and verifying the model implementation, the indications given in
Section 3.2.6 were followed, particularly considering the following:
- Operational behaviour through animations

69
- Event validity, where the recurrences (loops) were checked accordingly to
the real data. For instance, most likely number of treatments, probabilities of
having an angioplasty or stenting, etc.
- Internal validity. The Welch CI was calculated for the total duration of the
procedure, comparing the simulating model with the historical data collected,
obtaining a CI of [634.83, -153.27]. The given Welch CI was calculated
executing 100 simulations with different random seeds, each of them with 30
patients. Since this confidence interval contains zero, the model is validated
as a good representation of the real system.
4.6. Discussion
The overall analysis of PCIs revealed in first some interesting findings. Figure 21
shows that while the duration of the diagnostic procedures is quite homogenous
(despite some outliers), the duration of the treated patients has a higher variability. It
might not be advisable therefore to model angioplasty and stenting PCIs with
traditional statistical tests based on the assumption of normally distributed
population. This supports the hypothesis of using advanced modelling techniques
such as DES and more refined statistical analysis to understand this variability and
investigate the impact of new policies or approaches to optimise efficiency when
performing these procedures. With particular focus on the treatment PCIs, previous
studies have already shown how the direct approach can save costs, radiation
exposure and procedure times (Martínez-Elbal et al. 2002; Lozano et al. 2004). This
has also been confirmed by the present work. However, these studies consider only
average overall times of both cases. In addition, it can be observed in Figure 22, how
procedures with the pre-dilatation approach have a more disperse distribution. This
could lead to wrong considerations if a potential analysis was done to improve
efficiency in the cardiology department.
Only one paper was found on the use of DES in cardiovascular processes. Pirolo
et al (2009) presented a simulation model to improve throughput in a cath lab.
Authors accurately represented the complexity of load fluctuations due to
unscheduled emergency patients or bottlenecks when transferring patients, among
other reasons. However, the procedures within the cath lab were again only

70
represented with average times in this study. Complex high-level models like the
presented by Pirolo et al. could benefit from models like the one introduced in this
chapter, which represent a closer approximation of real angioplasty and stenting
PCIs.
However, there are some limitations of the present study that shall be further
investigated in order to gain accuracy and knowledge of this particular case study.
For instance, the analysis included information about delays before treating the first
patient. According to the records, nothing was annotated regarding the large delays
found in two cases. Furthermore, times shown in Figure 23 indicate that the average
duration between procedures is remarkably long. However, information about these
times was not available in the database from which the datasets were retrieved.
Nevertheless, cardiologists experience suggests that the sources of delays are
complex and multi-factorial and might involve the support teams work pattern:
nurses, technicians and radiographer. Further investigation would help to detect and
identify the potential causes for the delays before first procedures and for the
duration between procedures. As a potential solution the impact of adding further
staff could be investigated. In addition, simpler approaches were chosen when
dealing with surgical pauses or extra guidance time in between single treatments.
Current records do not provide the reasons for the pauses or whether the multi-
treatments were performed in different arteries or they were done for the same
lesion. Collection of further and more detailed data could help to clarify these points.
Nevertheless, a model should always be implemented to answer the questions of the
stated problem. Simpler models, designed with elements relevant to the modelling
objectives, are quicker to implement and easier to interpret (Kotiadis and Robinson
2008). Besides, the assumptions of using these simpler approaches in this study as
well as the use of Markov process to model the decision points were proven valid
through the simulation analysis and the Welch CI.
4.7. Summary
In conclusion it was shown how DES techniques can be applied to model
angioplasty and stenting PCIs as suggested in Chapter 3 in order to obtain
satisfactory and valid results that are important to cardiology teams.

71
Chapter 5.
Results: Case study of transarterial
chemoembolisation
Contents of this section are included in:
Fernández-Gutiérrez F, Wolska-Krawczyk M, Bücker A, Houston G, Melzer A. ‘A simulation-
based workflow optimisation in a radiology department: a case of a multimodal imaging procedure’,
Minimally invasive therapy & allied technologies (MITAT) (Submitted)
5.1. Background to the case
Hepatocellular carcinoma (HCC) represents more than 90% of liver cancers,
being these the sixth most common cancers, with more than 700 thousand new cases
every year worldwide (European Association for the Study of the Liver 2012).
Transarterial chemoembolisation (TACE) is the recommended palliative therapy in
the intermediate stage of HCC without extrahepatic spread or vessel invasion (Bruix
and Sherman 2011). The procedure is characterised by a slow injection in the tumour
area of a chemotherapeutic agent and oily emulsion of iodinated contrast agent,
which has a temporary embolic effect. This leads to tumour necrosis due to clotting
of smaller tumour feeding vessels and results in delivery of the chemotherapeutic
agent solely to the HCC with relatively low systemic effects. The unexpected
vascular supply of neoangiogenesis of the liver tumour may however hamper TACE
success and the unselective application of the chemoembolic agents may contribute
to treatment-related liver failure (Llovet et al. 2008; Takayasu et al. 2006).
Complications derived from this prompted the intervention team of the clinic of
diagnostic and interventional radiology in Saarland Medical Centre (Homburg,
Germany) to investigate whether MR angiography, after transcatheter intraarterial
contrast agent application offers the possibility to identify the treated liver
parenchyma. The hypothesis was that this method could allow visualisation of
potentially new vascularisation or newly formed metastases or not perfused areas,
which would suggest the tumour supplies from another, extrahepatic collateral
vessel. Hence, the interventional radiologist could change the primary therapy

72
position of the catheter before the final treatment, which may be significant for
optimal tumour targeting.
In addition, it is important to treat the tumour selectively and not the whole liver
at once. Patients with HCC require further treatment when new or residual disease is
detected, so-called TACE on demand (Ernst et al. 1999). This was the case of the
majority of the patients included in the study carried out by the clinic. The follow up
was scheduled every 4 to 8 weeks; hence patients were treated with TACE in those
intervals. Before additional chemoemobolisation sessions, liver function tests and a
complete blood count were also performed again to ensure that the patient was still
an appropriate candidate for the study. It is needed to mention that for the patients
participating in the cohort study, HCC had been diagnosed with MRI in 21 of the
cases, with CT in 5 and with a biopsy with 1 patient. The follow-up was performed
with MRI in all cases.
However, this new protocol was more time consuming than the original
procedures, resulting large waiting times when transferring the patient to the MRI
area at the existing infrastructures. Waiting times are a common problem in
healthcare environments when high demanded shared facilities within the
department are involved (Granja et al., 2010; Torkki et al., 2006). In these cases,
simulation techniques such as DES help to identify bottlenecks in order to
understand and improve clinical protocols (Katsaliaki and Mustafee 2011). Recent
studies in radiology departments support the application of simulation to improve
machine usage and reduce waiting times for patients (Nickel and Schmidt 2009),
scheduling policies (Johnston et al, 2009) and radiotherapy planning process
(Kapamara et al, 2007; Werker et al, 2009). Up to now, studies have examined
departments at various levels of complexity. Johnston et al. (2009) and Werker et al.
(2009), for example, classified different patient types but did not apply optimisation
analysis to compare workflow alternatives as Granja et al. (2010) or Nickel and
Schmidt (2009) did. In their studies, they modelled decision points and variability at
department level not optimising procedures themselves. From the author best
knowledge, statistical methods to aid decisions towards selecting the best alternative
have not been use in this context.

73
This chapter presents a DES model of a TACE as multimodal image-guided
procedure, involving MR and CT. Multilevel information about diagnostic and
interventional patients was combined to gather the inherent variability of
intraprocedural phases. The model was implemented through real data collected
during procedures, as well as using information gathered from questionnaires in
collaboration of the interventional radiology team at Saarland Medical Centre. Data
was collected by by Dr Malgorzata Wolska-Krawczyk (interventional radiologist in
training). The model validation was done with the aid of local interventional
radiologists in Homburg Saarland Medical Centre Dr Arno Bücker and Dr
Malgorzata Wolska-Krawczyk and the scenarios considered for the optimisation
analysis were discussed with the clinical team. The scenarios were assessed defining
a set of key performance indicator (KPI) and using a statistical ranking and selection
procedure for simulation optimisation. The purpose of the study was to improve the
current workflow by means of detecting bottlenecks and minimising waiting times
without having a negative impact in the current MRI throughput.
5.2. Data collection and statistical analysis
5.2.1. The multimodal imaging TACE new protocol
The clinic of diagnostic and interventional radiology in Saarland Medical Center
(Homburg, Germany) is equipped with a 1.5T wide bore (70cm) MR scanner
(Magnetom AERA, Siemens, Erlangen, Germany). The scanner room is placed
across the angiography suite, separated by a 3.7m wide corridor. The angiography
suite is provided with a sliding door to facilitate the transport of patients.
The TACE procedure begins in the angiography suite with local anaesthesia
applied to the disinfected groin of the patient. Then the right femoral artery is
punctured by the Seldinger technique followed by catheter guidance to the hepatic
artery and in some cases its subsegment arteries (cannulation). At this moment, DSA
is performed to confirm the correct therapy position of the catheter. As part of the
new protocol developed in the department, the patient is then prepared for transfer to
the MRI suite by removing all metal and non-MR compatible objects from the
angiography table. Once in the MRI suite, the patient is moved over a rolling slide
board to the MR table. The patient, already draped in sterile fashion at the beginning

74
of the procedure, is covered with additional sterile drapes and then the MR coil is
placed on top to avoid contamination of the puncture site. An sterile plastic tube with
a contrast agent (Gadolinium, Dotarem Guerbet, Villepinte, France), previously
prepared before the procedure, is connected to the distal part of the catheter. The
patient is provided with noise protection earmuffs and an emergency bell. Once
inside the MRI scanner, an MR angiography is performed to confirm the position of
the catheter. Afterwards, the patient is transferred back to the angiography. In case
the MR reveals that repositioning of the catheter is needed, this is done under
fluoroscopic guidance (cannulation). Then, the chemotherapy is applied via catheter
in the therapy position. Finally, the catheter and sheath are removed and the access is
closed using an angio-seal closure system.
Large delays were observed when transferring the patient from the angiography
suite to the MRI scanner room due to the high demand of MR imaging in the
hospital. Data from MRI patients was incorporated to the study at a later stage in
order to study ways to reduce these waiting times.
5.2.2. Data collection
Records of 59 TACE interventions were collected and submitted via the MIDAS
website (http://midas.heroku.com) (see Appendix C for further information). Data
included the information detailed in Table 4. Table 7 presents the significant events
registered per TACE intervention together with their average (standard error)
duration in minutes.
Information corresponding to MRI diagnosis times was gathered through a
questionnaire completed by the MRI department clinical team at Homburg Saarland
University Hospital. Table 8 contains information about minimum, maximum and
most likely time of the most common MRI diagnostic procedures performed in the
hospital. The times collected for the MRI diagnostic procedures included the
positioning of the patient and scanning times. The preparation of the patient for the
MRI was set to 10min. An extra 5min was considered to model the time needed to
dismiss the patient from the MRI scanner room.

75
Event Mean (SE) (min) Distribution Parameters
Access 7.55 (2.39) Lognormal μ = 1.70
σ = 0.74
Cannulation 42.22 (2.82) Gamma α = 3.87
β = 10.91
Transfer to MRI suite 11.09 (0.94) Lognormal μ = 2.22
σ = 0.62
MRI diagnosis sequences 16.02 (0.84) Lognormal μ = 2.71
σ = 0.36
Transfer to angio suite 9.15 (0.83) Gamma α = 2.08
β = 4.40
Cannulation after MRI 19.21 (3.81) Lognormal μ = 2.34
σ = 1.22
Chemoembolisation 26.38 (2.29) Lognormal μ = 3.08
σ = 0.62
Table 7. Descriptive statistics and statistical distributions of the events collected for TACE
interventions, where the times are expressed in minutes, α and σ are the shape parameters, and
β and µ are the scale parameters of the distribution functions. Cannulation, as indicated in the
previous section means cannulation of the vessel with a catheter and it is used as “Cannulation
after MRI” when repositioning of the catheter was needed.
Type of MRI procedure Minimum
(min)
Maximum
(min)
Most Likely
(min)
Knee 20 60 30
Pelvis 40 60 45
Wrist 20 60 45
Whole Body 60 180 120
Neck 43 65 52
Angiography Abdomen 12 20 15
Angiography Pelvis and Lower
Extremities 15 55 30
Cardiac 50 75 65
Thigh 35 115 65
Arthography Hip 40 60 42
Table 8. Procedure times gathered for the most common diagnostic procedures at the MRI
department (Homburg Saarland University Hospital, Homburg, Germany).
5.3. Model implementation
Figure 30 represents the conceptual workflow used to implement the logic for the
DES model. The model reads a proposed schedule of patients based on one TACE
patient and seven MRI-diagnostic patients. Depending on the type of patient, this is

76
sent to the angiography room or the MRI suite. MRI patients will be waiting in the
waiting area in case the MRI suite is occupied. Once the MRI suite is available and
the room has been cleaned, the patient is prepared and proceeds for the MRI
scanning. The TACE patients, once ready to be transferred, would wait on the
operating table if the MRI was occupied. All these waiting times were collected
during the simulations.
Figure 30 Conceptual workflow of the patients around the MRI area. Two groups are
distinguished: patients for the TACE interventions5 and the MRI diagnostic patients at the
clinic of diagnostic and interventional radiology in Saarland Medical Center (Homburg, ,
Saarland, Germany).
5 TACE patients considered in this diagram and consequently in the design of the model are referred
to the patients attending the TACE intervention. TACE patients attending to routine MRI scanner
scheduled another day prior to the TACE procedure are not considered. The radiology clinic at
Saarland Medical Centre counts with several MRI facilities. Therefore there would be multitude of
patients for MRI scanning in other rooms. For the purpose of this study, only the MRI room in the
proximity of the angiography suite is considered and for illustration purposes, patients attending only
MRI are just label as “MRI patients”.

77
As input for the simulating model, times collected for the TACE events were
fitted into the corresponding statistical distributions using the software package
EasyFit. The results are presented in Table 7 with their correspondent event. The
Anderson-Darling GOF test (α = 0.05) was used to determine the best distribution
fitting. The MRI diagnosis data set (see Table 8) was modelled using triangular
distributions as explained in Section 3.2.5.
Figure 31 shows a screen capture of the DES model implemented in Delmia
Quest. The model includes the angiography suite and MRI scanner room layouts at
scale, together with their respective control rooms and a waiting area for patients.
Figure 31 Screenshot during simulation of the DES model for TACE interventions and MRI
patients implemented in Delmia Quest. The 3D environment corresponds to the facilities at the
department of Radiology, Saarland Medical Centre (Homburg, Saarland, Germany). Note: the
beds in the corridor are only used to collect the waiting times due to limitations in Delmia for
this purpose. They do not represent the real waiting areas at the radiology department.
5.4. Validation and verification
Table 9 presents the Welch 90% CIs, given by Eq. 3-2, calculated for each of the
events recorded for the TACE procedure when compared with the real system. Since
each CI interval contains zero, the DES model of the TACE procedure results a valid

78
representation of the real system (see Section 3.2.6). Unfortunately, no data was
available to compare the complete model including the diagnostic MRI patients with
the real world situation so this part was uniquely validated through the clinical team.
Events Welch 90% CI (sec) [max,min] (sec)
Access [85.09, -149.89]
Cannulation [485.92, -221.92]
Transfer to MRI suite [111.99, -145.59]
MRI diagnosis sequences [39.26, -150.86]
Transfer to Angiography suite [64.76, -147.56]
Cannulation after MRI [789.48, -41.88]
TACE [113.50, -419.50]
DynaCT [24.55,-42.56]
Table 9. Welch 90% confidence intervals for the event in the TACE procedure when compared
with the real system
5.5. Simulation-based optimisation analysis
In agreement with the clinical team, 14 scenarios were formulated for the
optimisation analysis. These scenarios were defined depending on three different
factors:
- Arrival time for the TACE patient: first time in the morning (9am) or in
the afternoon (12am).
- Interarrival time for the patients: scheduling patients every hour or
scheduling patients based on the most likely procedural duration. For this last
case, an average time for preparation of 15 minutes was added in conjunction
with the clinicians’ experience.
- Duration of the MRI diagnosis. Three categories were defined: short
procedure (duration less than 45 min), medium procedure (between 45 and 60
min) or long procedure (more than 60 min and less than the upper limit given
for the defined MRI procedures in Table 8).
Table 10 shows the fourteen scenarios defined for the study, which were tested
and analysed in the model. The rest of scenarios resulting from the combination of
the factors mentioned above were discarded in agreement with the clinical team.

79
TEST
TACE patient Inter-arrival time Duration MRI patients
Morning Afternoon Most likely
time
Every
Hour Short first Large first
1 X X X
2 X X X
3 X X X
4 X X X
5 X X Alternating short/long
6 X X Alternating short/long
7 X X
Organising 3 blocks:
Block 1: Procedures ≤ 45min
Block 2: Procedures ≤ 60min
Block 3: Procedures > 60min
8 X X X
9 X X X
10 X X X
11 X X X
12 X X Alternating short/long
13 X X Alternating short/long
14 X X
Organising 3 blocks:
Block 1: Procedures ≤ 45min
Block 2: Procedures ≤ 60min
Block 3: Procedures > 60min
Table 10. Scenarios (tests) studied during the simulation analysis.
The optimisation process consisted in simulating these scenarios and measuring
three KPIs per scenario:
- Overtime work; defined as the difference between the 8h (usual working
time agreed) and the overtime worked due to the length of the procedures.
- Average waiting time; defined as the average time that a patient needed to
wait to start the procedure (TACE or MRI).
- Waiting time in angio suite, defined as the average time that a TACE
patient needed to wait for the MRI to be available.
Following the optimising simulation method described in Section 3.2.7, the
weighted means were calculated for each scenario and for each of the KPIs
considered. Regarding the parameters for the D&D method,
was chosen for the cases of the waiting times in angio suite (TACE patients) and
waiting area (MRI diagnostic patients) and for the overtime
work.
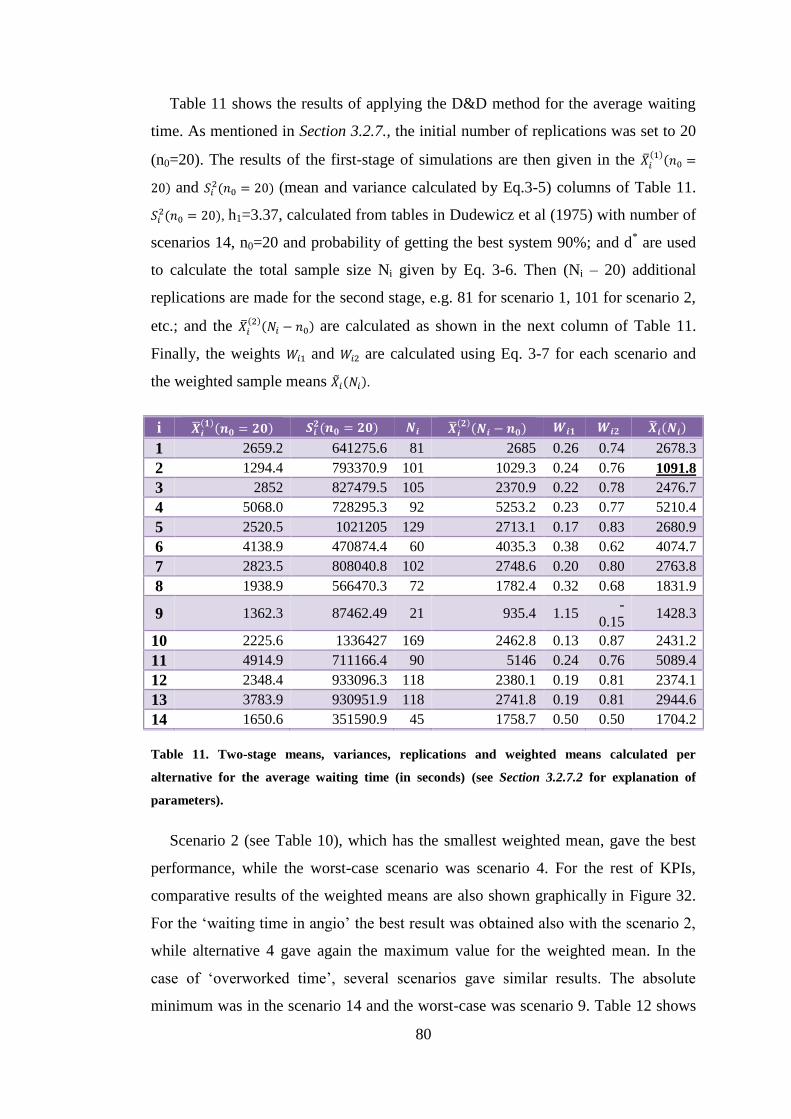
80
Table 11 shows the results of applying the D&D method for the average waiting
time. As mentioned in Section 3.2.7., the initial number of replications was set to 20
(n0=20). The results of the first-stage of simulations are then given in the
and (mean and variance calculated by Eq.3-5) columns of Table 11.
, h1=3.37, calculated from tables in Dudewicz et al (1975) with number of
scenarios 14, n0=20 and probability of getting the best system 90%; and d* are used
to calculate the total sample size Ni given by Eq. 3-6. Then (Ni – 20) additional
replications are made for the second stage, e.g. 81 for scenario 1, 101 for scenario 2,
etc.; and the are calculated as shown in the next column of Table 11.
Finally, the weights and are calculated using Eq. 3-7 for each scenario and
the weighted sample means .
i
1 2659.2 641275.6 81 2685 0.26 0.74 2678.3
2 1294.4 793370.9 101 1029.3 0.24 0.76 1091.8
3 2852 827479.5 105 2370.9 0.22 0.78 2476.7
4 5068.0 728295.3 92 5253.2 0.23 0.77 5210.4
5 2520.5 1021205 129 2713.1 0.17 0.83 2680.9
6 4138.9 470874.4 60 4035.3 0.38 0.62 4074.7
7 2823.5 808040.8 102 2748.6 0.20 0.80 2763.8
8 1938.9 566470.3 72 1782.4 0.32 0.68 1831.9
9 1362.3 87462.49 21 935.4 1.15 -
0.15 1428.3
10 2225.6 1336427 169 2462.8 0.13 0.87 2431.2
11 4914.9 711166.4 90 5146 0.24 0.76 5089.4
12 2348.4 933096.3 118 2380.1 0.19 0.81 2374.1
13 3783.9 930951.9 118 2741.8 0.19 0.81 2944.6
14 1650.6 351590.9 45 1758.7 0.50 0.50 1704.2
Table 11. Two-stage means, variances, replications and weighted means calculated per
alternative for the average waiting time (in seconds) (see Section 3.2.7.2 for explanation of
parameters).
Scenario 2 (see Table 10), which has the smallest weighted mean, gave the best
performance, while the worst-case scenario was scenario 4. For the rest of KPIs,
comparative results of the weighted means are also shown graphically in Figure 32.
For the ‘waiting time in angio’ the best result was obtained also with the scenario 2,
while alternative 4 gave again the maximum value for the weighted mean. In the
case of ‘overworked time’, several scenarios gave similar results. The absolute
minimum was in the scenario 14 and the worst-case was scenario 9. Table 12 shows

81
the 90% CI calculated by Eq. 3-4 for the KPIs times in minutes. Scenarios that gave
the best, second best and worst cases are highlighted.
Figure 32. Weighted means ( i(Ni)) calculated for each scenarios for the three key performance
measures considered.
KPI 1 2 4 9 11 14
Overworked time (min) [42, 32] [57, 47] [50, 40] [86, 78] [49, 38] [49, 39]
Average waiting time (min) [47, 43] [20, 17] [91, 87] [25, 23] [88, 83] [32, 29]
Waiting time in angio suite (min) [19, 14] [12, 9] [90, 79] [26, 21] [24, 19] [38, 31]
Table 12. KPIs and the respective 90% CI [max, min] for their times (minutes) for all the
scenarios that gave the best, second best and worst cases. For each case, the 90% CI
corresponding to the best alternative is shown in bold and underlined font.
Data from patients waiting in the angio suite to be transferred to MRI during the
TACE procedures was gathered as part of the study. It was observed that in the
71.19% of the cases, patients had to wait an average of 20 (± 20) minutes, with a
maximum waiting time of 80 minutes. This was due to MRI being occupied for
diagnostic patients. The optimisation analysis has shown that with scenario 2, which
would be to schedule TACE patients as first appointment and scheduling MRI
patients every hour with short diagnostic procedures first, would reduce the waiting
times in angio by a 48.74% in average. According to this alternative, the overall
waiting time for MRI diagnostic patients could be estimated to be minimum within
the 90% CI of [20, 17] (min).
0
50
100
1 2 3 4 5 6 7 8 9 10 11 12 13 14Tim
e (m
inu
tes)
Scenarios
Xi(Ni)
Average waiting time
Waiting time in angio
Overworked time

82
5.6. Discussion
MRI environments appear to be one of the most in demand resources in hospitals.
Several studies agree that improving the planning of MRI processes will reduce
waiting times (Barter et al., 2009; Otsubo et al., 2011). Additionally, there are
numerous efforts on introducing MRI as part of therapeutic procedures as well in
diagnosis (Blanco Sequeiros et al. 2005; Krombach 2012). Simulation based analysis
can be a powerful tool for an optimal integration of MRI-guided or multi-image
guided procedures in the already saturated radiology departments. By the
implementation of a DES model, several scenarios, previously discussed with the
clinical team involved in the study, were simulated to study the impact of different
policies. An optimisation algorithm was used to select the best option for three KPIs,
also agreed with the clinicians. This algorithm suggested a scenario (number 2 in
Table 10) for with a 48% average lower waiting time for TACE patients. This choice
would also be optimal to minimise the waiting times for MRI diagnostic patients.
However, the algorithm estimates another scenario (number 1) as the best option for
minimising overtime work. A comparison between the simulating results for
overworked time and average waiting time for MRI patients with the real system was
not possible since such information was not recorded at the moment of the study.
These results are likely to be discussed at clinic of diagnostic and interventional
radiology in Saarland Medical Center. The adoption of any of these alternatives will
depend on the feasibility of its implementation with the resources available. If any of
these alternatives were adopted, it would then be possible to validate the predicted
improvements. In this case, it would be beneficial to collect detailed information
about patient preparation and cleaning times that are now only estimations based on
the clinicians’ experience.
5.7. Summary
This chapter presented a simulation optimisation framework to model and
improve a current multi-imaging guided intervention protocol by taking into account
the intrinsic variability within the procedures. The work was based on the particular
case of a new multi-imaging protocol for TACE procedure. This study highlighted

83
some of the difficulties when introducing multi-image guided interventions in
clinical radiology departments such as long waiting times resulting in an inefficient
use of human and material resources. The optimization-based simulation analysis
was used to predict the impact of several alternative scenarios. The results that were
predicted to reduce patient waiting time by as much as 48% were presented to the
clinical team and the feasibility to implement an optimal alternative policy are
considered within the clinic.

84
Chapter 6.
Extending the framework to non-vascular IGPs:
MRgFUS
Contents of this section are included in:
Loeve AJ, Al-Issawi J, Fernández-Gutiérrez F, Lango T, Matzko M, Napoli A, Dankelman J.
‘Workflow analysis and modelling of MR-guided Focussed Ultrasound’, (To be submitted)
6.1. Introduction to the chapter
This chapter presents a simulation model developed to predict the impact on
potential improvements in workflow for MRgFUS procedures. These improvements
are designed under the framework of a European project: the FUSIMO (Patient
specific modelling and simulation of focused ultrasound in moving organs)
European project (http://www.fusimo.eu/, accessed 21/02/2014), which is introduced
in the first part of the section.
The simulation model was implemented according to the methodological
framework introduced in chapter 3 for modelling vascular image-guided procedures
through discrete-event simulation. MRgFUS is an excellent example of integration
of imaging techniques and represents a modern form of MR image-guided treatment
of solid organ tumours. Due to its inherent nature of computer control, it was
selected as a suitable case study for validation of the new methodological
framework. The data gathering and conceptual modelling of MRgFUS procedures
were carried out by other researchers within the FUSIMO consortium. Therefore, it
was decided to treat these results in this separate chapter, clarifying and
differentiating the contribution of this author and the other researchers participating
in the workflow analysis within FUSIMO.
6.2. The FUSIMO project background
Over the last two decades, MRI-guided Focused Ultrasound (MRgFUS) surgery
has become an attractive non-invasive alternative to treat benign and malignant
tumours. MRgFUS has been already approved by the U.S. Food and Drug

85
Administration (FDA) for uterine fibroid treatment and pain palliation of metastatic
bone cancer; and is in ongoing clinical or pre-clinical trial for the treatment of breast,
liver, prostate and brain cancer (F. a Jolesz 2009; Hynynen 2010).
In FUS, the acoustic energy that propagates through the tissue is concentrated into
a focal point and transforms to thermal energy. The temperature rises in the focal
volume and this results in thermal ablation with subsequent necrosis of cells inside
the focus while the surrounding tissue remains at normal body temperature (Fischer,
Gedroyc, and Jolesz 2010). MRI is a valuable option for the target definition, the
treatment planning and closed-loop control of the acoustic energy deposition. In
addition, MRI can generate accurate, near real-time temperature maps with high
spatial and temporal resolution. Such thermal feedback can facilitate treatment
monitoring, since it allows an immediate evaluation of the temperature in the
targeted area and can minimise the risk of thermal rise in the adjacent tissues
(Hokland et al. 2006; Sapareto and Dewey 1984; Viola Rieke and Butts Pauly 2008).
There have been attempts for treatment of liver tumours with MRgFUS in pre-
clinical (F. A. Jolesz et al. 2004; Kopelman et al. 2006) and a few clinical trials
(Gedroyc 2007; Okada, Murakami, and Mikami 2006). Despite the potential benefits
of MRgFUS, there are two major challenges in liver MRgFUS treatment that remain
to be overcome: the presence of the ribcage surrounding the liver, and the organ
motion due to respiration. The ribcage bone structure would absorb the ultrasound
beam, affecting the treatment. For that purpose, there has been research involving
multiple-element ultrasonic transducers, which can “switch-off” elements that
sonicate on ribs (Civale et al. 2006; Quesson et al. 2010). The respiratory motion can
shift the target tumour and can also induce motion artefacts in the MR and
temperature maps (de Senneville, Mougenot, and Moonen 2007). Voluntary breath-
holding or gating techniques have been suggested to patients to avoid movement
(Suramo, Paivansalo, and Myllyla 1984). Other techniques, involving reference-less
MR thermometry and steering of the FUS beam have also been applied to
compensate for the motion (V Rieke, Kinsey, and Ross 2007; Holbrook et al. 2014).
The FUSIMO project aims to develop, implement and validate a multi-model for
moving abdominal organs, i.e. liver and kidney for MRgFUS surgery. In addition,
FUSIMO intends to develop technology likely to be applied during MRgFUS

86
interventions in parallel to an existing FUS software system. A detailed workflow
model based on DES was developed to estimate the benefits that FUSIMO
technology may have in MRgFUS procedures (particularly on moving abdominal
organs).
The following section presents the data collection and the conceptual modelling
carried out by dr. ir. Arjo Loeve, postdoctoral researcher at Delft University of
Technology (TUDelft, Delft, the Netherlands) in collaboration with other centres
within the FUSIMO consortium. Then and as part of the contribution of this thesis to
the FUSIMO project, the probability distribution analysis over the gathered data is
presented. The later sections explain the implementation of the particularities of the
simulation model, followed by the validation process and a description of the
simulation analysis. A summary of the conclusions of this study is presented in the
last section.
6.3. Conceptual model, data collection and statistical
analysis
This model was designed through observations on MRgFUS interventions
performed with the Exablate system 2100/ONE (Insightec Ltd, Haifa, Israel) at the
Amper Klinikum (Dachau, Germany). The workflow consists of 11 main phases.
Figure 34 shows the diagram with the current workflow and the different phases.
Only phases from 4a to 9 are included in the simulation model, since phases 1 to 3 –
Intake, pre-operative imaging and planning – correspond to the pre-operative part of
the procedure. These phases are briefly described below for clarification:
- Phase 4a – Setup: Preparation of the MRI-room.
- Phase 4b – Patient positioning: The patient is positioned on the MRI-table
such that there is an acoustic window (free field of view) for the FUS
transducer on the region of treatment.
- Phase 5 – Pre-therapy imaging: high-resolution MR images are obtained to
be used during the treatment.
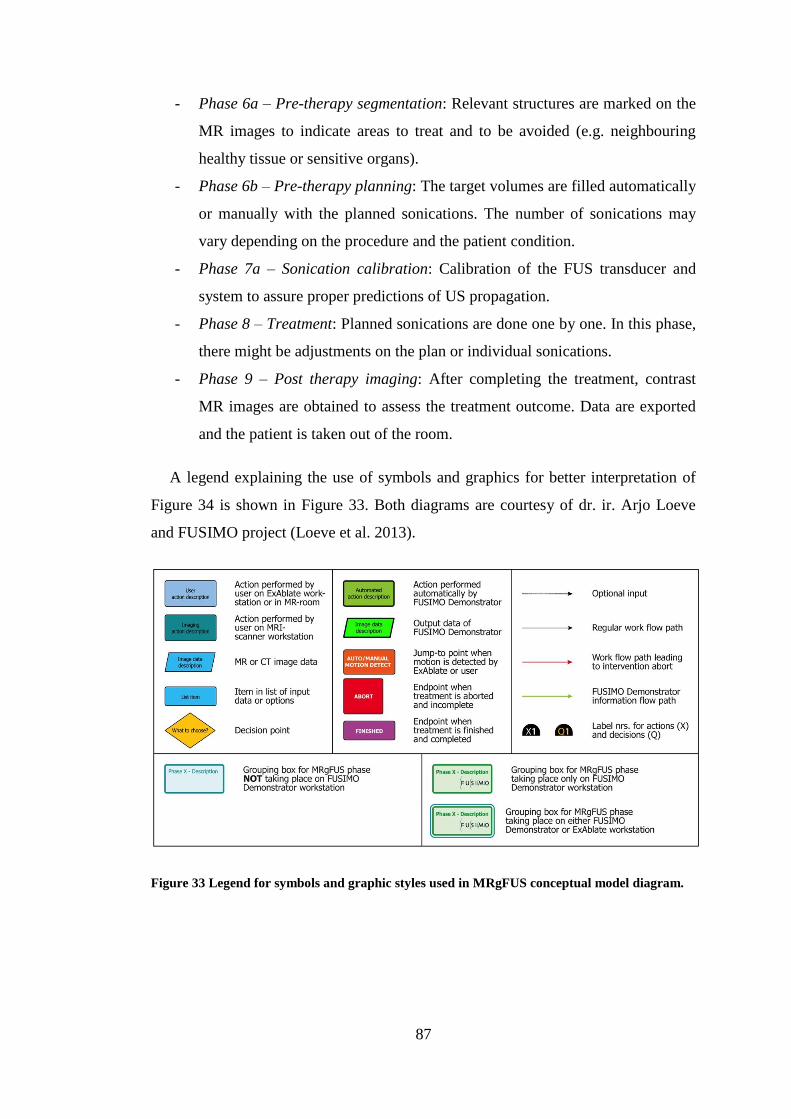
87
- Phase 6a – Pre-therapy segmentation: Relevant structures are marked on the
MR images to indicate areas to treat and to be avoided (e.g. neighbouring
healthy tissue or sensitive organs).
- Phase 6b – Pre-therapy planning: The target volumes are filled automatically
or manually with the planned sonications. The number of sonications may
vary depending on the procedure and the patient condition.
- Phase 7a – Sonication calibration: Calibration of the FUS transducer and
system to assure proper predictions of US propagation.
- Phase 8 – Treatment: Planned sonications are done one by one. In this phase,
there might be adjustments on the plan or individual sonications.
- Phase 9 – Post therapy imaging: After completing the treatment, contrast
MR images are obtained to assess the treatment outcome. Data are exported
and the patient is taken out of the room.
A legend explaining the use of symbols and graphics for better interpretation of
Figure 34 is shown in Figure 33. Both diagrams are courtesy of dr. ir. Arjo Loeve
and FUSIMO project (Loeve et al. 2013).
Figure 33 Legend for symbols and graphic styles used in MRgFUS conceptual model diagram.

88
Figure 34 Conceptual model of the MRgFUS procedure current workflow designed through observations of FUS procedures (courtesy of dr. ir. Arjo
Loeve, TUDelft, Delft, the Netherlands).

89
Records of six procedures were collected from the FUS centre in the Amper
Klinikum. Table 13 presents standard descriptive analysis for significant events
(actions and decision points) within the procedures. The duration times for the rest of
events included in Figure 34 but not shown in Table 13 were considered 0 (e.g.
instant decision or action with no relevant duration) or were estimated by the two
experienced clinicians participating in the study. This information was collected
through a questionnaire (see Appendix F). This questionnaire was also focused on
identifying the most likely behaviour of the workflow for critical decision points as
support for the small number of records available.
Events Mean (SE) (sec) Max (sec) Min (sec) 75% (Q3) 25% (Q1)
Phase Action Decision
4a X1 531.33 (172.4) 1311 120 830.25 257.25
4b X1 80.38 (25.05) 339 7 84.5 30
X3 74.25 (27.96) 196 1 166.25 16.25
Q1 15.25 (3.94) 47 1 19.75 6.25
Q2 142.17 (69.58) 405 8 327 11
5 X1 480.29 (70.39) 1320 151 628.5 222.5
Q1 27.2 (7.87) 50 1 40.5 12.5
6a X2 333.33 (78.48) 1206 32 447 110
X3 6.29 (1.94) 13 2 12 2
7a X4 6.17 (2.83) 20 2 9.5 2
X5 23.20 (8.87) 55 1 40 9
X6 101.73 (11.65) 152 47 137 59
X7 65.62 (9.80) 84 17 84 37
X8 16.6 (7.26) 43 3 31 3.5
X9 45.29 (18.75) 133 4 90 5
X10 70.5 (5.76) 83 49 83 58
X11 61.17 (5.92) 89 50 68.75 51.5
Q1 13 (4.31) 38 2 18.75 2.75
Q4 14.33 (8.37) 53 1 29 1
8 X1 33.41 (1.45) 159 1 38.25 15
X2 57.88 (0.67) 173 6 66 52
X3 44.33 (0.67) 156 2 51 38
X4 32.09 (10.33) 116 1 35 11
Q1 10.59 (0.81) 132 1 11 2
9 X1 555.40 (134.16) 1065 318 820.5 354.5
X3 116 (13.83) 142 50 139 98
X4 376.33 (35.92) 518 268 440 310.75
X8 444.17 (143.0) 1130 204 609.5 209.25
Table 13. Statistical descriptive analysis for the different stages collected for the MRgFUS
procedures. The corresponding events labels for phase, action and decision can be identified in
Figure 34.
Probability distributions for data presented in Table 13 were calculated using
EasyFit and the A – D GOF test following indications from Section 3.2.3.2. As in the

90
previous cases, it was assumed that distributions had a finite lower bound fixed to 0.
For those cases that rejected the null hypothesis, descripted statistics were used as
explained in Chapter 2. Table 14 presents the probability distributions and their
parameters for each action and decision point measured. Distribution curves and
corresponding data histograms can be seen in Appendix D.
6.4. Model implementation and validation
The simulation model was implemented in Delmia Quest, using the statistical
distributions of Table 14 and the information collected from the questionnaires as
inputs.
Event Distribution Parameters
Phase Action Decision
4a X1 Lognormal μ = 6.02, σ = 0.73
Mean (± SD) = 538.17 (± 454.27)
X1 Lognormal μ = 3.95, σ = 0.95
Mean (± SD) = 80.159 (± 93.683)
X3 Gamma α = 0.88, β = 84.25
Q1 Gamma α = 1.25, β = 12.21
Q2 Lognormal μ = 4.00, σ = 1.54
Mean (± SD) = 178.77 (± 559.12)
5 X1 Lognormal μ = 5.97, σ = 0.63
Mean (± SD) = 480.24 (± 336.86)
Q1 Triangular m = 30, a = 0, b = 58.36
6a X2 Lognormal μ = 5.44, σ = 0.92
Mean (± SD) = 350.83 (± 404.99)
X3 Gamma α = 1.51, β = 4.17
7a X4 Lognormal μ = 1.44, σ = 0.79
Mean (± SD) = 5.80 (± 5.43)
X5 Gamma α = 1.37, β = 16.95
X6 Triangular m = 152, a = 0, b = 152
X7 Weibull α = 1.28, β = 78.86, γ = 0
Mean (± SD) = 73.05 (± 57.44)
X8 Gamma α = 1.05, β = 15.86
X9 Lognormal μ = 3.09, σ = 1.33
Mean (± SD) = 52.81 (± 116.17)
X10 Gamma α = 24.96, β = 2.82
X11 Gamma α = 17.80, β = 3.44
Q4 Gamma α = 1.13, β = 11.45
Q8 Lognormal μ = 1.53, σ = 1.62
Mean (± SD) = 17.20 (± 61.37)
8 X1 Lognormal μ = 3.18, σ = 0.82
Mean (± SD) = 33.82 (± 33.12)
X2 Gamma
(*) Reject hypothesis on A-D
α = 16.44, β = 3.52
X3 Gamma
(*) Reject hypothesis on A-D
α = 9.76, β = 4.54
X4 Lognormal μ = 2.88, σ = 1.26
Mean (± SD) = 39.40 (± 77.55)

91
Event Distribution Parameters
Phase Action Decision
Q1 Lognormal
(*) Reject hypothesis on A-D
μ = 1.67, σ = 1.12
Mean (± SD) = 9.98 (± 15.92)
9 X1 Lognormal μ = 6.22, σ = 0.42
Mean (± SD) = 550.61 (± 241.78)
X3 Gamma α = 11.72, β = 9.89
X4 Gamma α = 18.29, β = 20.58
X8 Lognormal μ = 5.90, σ = 0.58
Mean (± SD) = 433.32 (± 276.65)
Table 14. Statistical distributions and parameters corresponding to each stage collected, where
α, m and σ are the shape parameters, and β and µ are the scale parameters, where (*) means
that the null hypothesis was rejected but that distribution was selected based on P-P curves and
previous literature experience.
In addition to the statistical distributions, the simulating model gathered a number
of features to represent the MRgFUS current behaviour in decision points:
“Instant” decisions and actions
As mentioned, there were a number of actions and decisions points which
duration was collected as zero. These are represented as empty functions in the DES
logic so their execution does not affect the posterior time analysis. This also makes
the programming more flexible in case additional data are collected in the future.
Static decision points
A decision point was defined as static when the probability of taking one or the
other branch did not depend on the number of times that the decision point was
executed with the same patient (number of times that the flow passes for that
decision point). These probabilities were simply programmed using if-then-else
statements and were based on the data collected or clinical experience.
Dynamic decision points
A decision point was defined as dynamic when the probabilities of taking one or
other branch changed depending on the number of times that the decision point was
executed. Since the sample size is not large enough to make an exact estimation on
these probabilities, a MKC model was used for this purpose in the same way it was
used for the PCI model (Sirl 2005) (see Appendix E for further details on the
Markov chain routine used).

92
Number of sonications
As mentioned, the number of sonication may vary from one patient to another.
Judging for the records collected, it was appreciated that some procedures were
significant shorter than others. While short procedures had a mean of 39 sonications,
the long procedures had 107 sonications in average. For the simulation study it was
decided to consider both type of procedures with a 50% of probability of having
either a short or a long procedure. The number of possible sonications was modelled
with a Poisson distribution. In 50% of the simulations, a short procedure with a
mode of 39 sonications and in the other 50% a Poisson distribution with a mode of
107, indicating a long procedure.
Figure 35 shows the implemented simulating model of the current MRgFUS
workflow.
Figure 35 MRgFUS workflow model implemented in Delmia Quest ((Dassault Systèmes S.A.,
Vélizy-Villacoublay, France).
For validating the model implementation, several indications were followed as
indicated in chapter 2:

93
- Operational behaviour through animations
- Event validity, where the recurrences (loops) were checked accordingly to
the real data.
- Internal validity: Welch 90% CI was calculated for the total duration of the
procedure, comparing the simulating model with the historical data collected.
The large number of stages/decision points and the limited number of records
precludes testing test the validity per stage.
To calculate the Welch 90% interval, series of simulations were run: 100, 300,
1000 and 3000 simulations, each simulation containing 30 patients. The number of
patients per simulation was taken arbitrary but taking the suggestions given in the
software package’s manual for statistical calculations. The CI was calculated for the
series until finding an interval that would include zero, necessary condition to
validate the model in comparison with the real system. The Welch 90% CI resulted
[1064.131, -4227.93] and was found when running 3000 simulations, each
simulation with 30 patients.
6.5. Simulation analysis
The simulation study compared in first place the relation between motion and
procedure duration for the current MRgFUS workflow:
- Motion relation. Motion is defined as organ motion that would require
making new imaging, having to adjust segmentations and adapt treatment
plans. If motion is not detected, it can cause the tissue outside the treatment
area to be ablated. The simulation study predicted the effect from the case of
no-motion up to a 90% motion occurrence (motion alert in 90% of all
sonications) in steps of 10% of motion occurrence.
Taking into account the motion occurrence situation, the model was used to
simulate the impact in the workflow of new and improved future versions:
- Automated Segmentation. This would mean that delineation of risk structures,
skin and no-pass zones for instance, and the placement of motion detection
fiducials would be done fully automatic by the software instead of manually
by the user (radiologist). The effect on procedure durations for all previously

94
simulated motion occurrence percentages of having automated segmentation
was predicted by reducing the times in phases (6a and 9) in which
segmentation times are involved.
- Automated Sonication. The effect on procedure durations for all previously
simulated motion occurrence percentages of having automated sonication
was predicted by reducing waiting times around Phase 8Q2 and eliminating
Phase 8X4 (see Figure 34), since the system would continuously adapt the
sonication parameters to improve the sonication settings and automatically
move through the entire treatment area.
- Combined effect. The effect on procedure durations of a combination of both
the automated segmentation and sonication was predicted for all previously
simulated motion occurrence percentages.
- 95% Motion Compensation. This situation combines all the above mentioned
improvements and adds the motion compensation technology. The motion
compensation technology includes both tracking of and compensating for
organ motion as well as using selectively disabled transducer elements. The
situation was modelled by assuming that 95% of all motion occurrences can
be successfully dealt by the FUSIMO system. For instance, if there is a 70%
probability of detecting motion for each sonication, and the new FUSIMO
workflow would be able to compensate the motion for 95% of those cases,
the net probability of motion would be 3.5% resulting from {[
] }. In summary, this motion compensation technology
would reduce the number of motion occurrences that actually become
problematic and therefore, decreasing the procedural time.
The analysis of each scenario kept the same conditions as when calculating Welch
90% CI, performing 3000 simulations, each simulation with 30 patients.
When analysing the effect of increasing the probability of motion detection, the
average duration of the procedure goes from 3h56m45s in case of no motion, up to
256h05m33s in the case of 90% of motion, which means an increase of more than
6390% when motion is detected in the 90% of the sonications.
Figure 36 presents the average MRgFUS procedure duration (in hours) of a
procedure for each of the scenarios mentioned above with relation to the increased
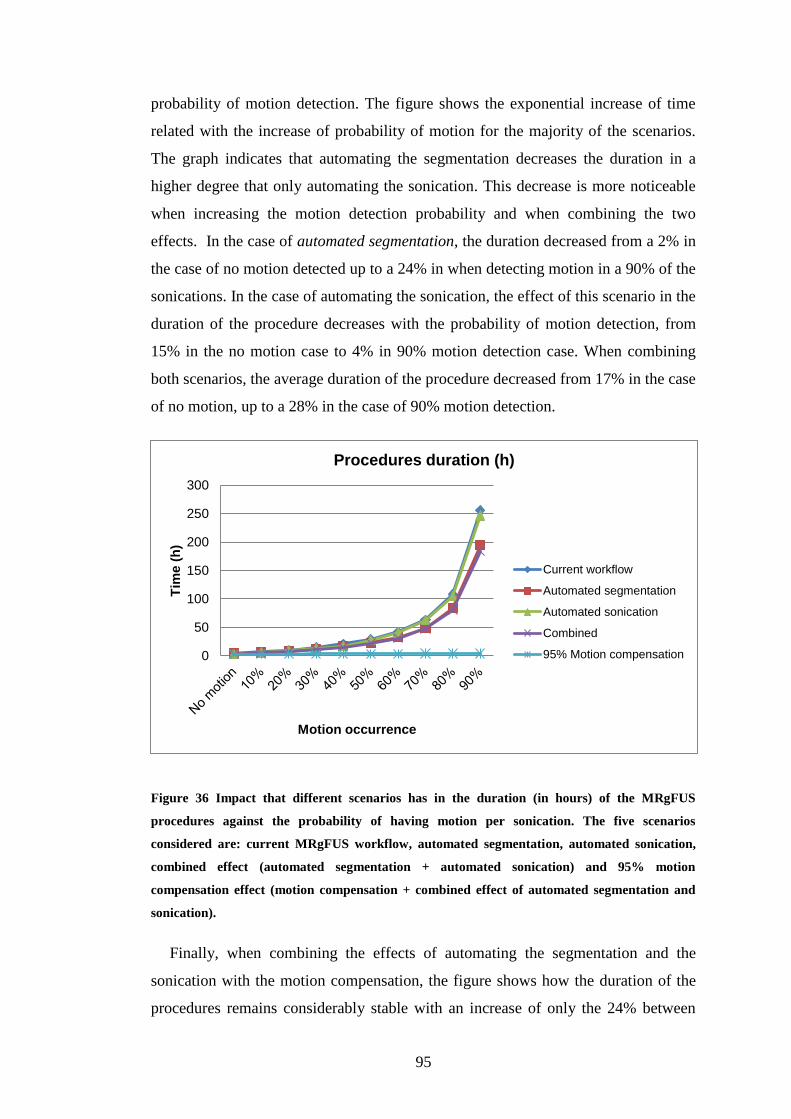
95
probability of motion detection. The figure shows the exponential increase of time
related with the increase of probability of motion for the majority of the scenarios.
The graph indicates that automating the segmentation decreases the duration in a
higher degree that only automating the sonication. This decrease is more noticeable
when increasing the motion detection probability and when combining the two
effects. In the case of automated segmentation, the duration decreased from a 2% in
the case of no motion detected up to a 24% in when detecting motion in a 90% of the
sonications. In the case of automating the sonication, the effect of this scenario in the
duration of the procedure decreases with the probability of motion detection, from
15% in the no motion case to 4% in 90% motion detection case. When combining
both scenarios, the average duration of the procedure decreased from 17% in the case
of no motion, up to a 28% in the case of 90% motion detection.
Figure 36 Impact that different scenarios has in the duration (in hours) of the MRgFUS
procedures against the probability of having motion per sonication. The five scenarios
considered are: current MRgFUS workflow, automated segmentation, automated sonication,
combined effect (automated segmentation + automated sonication) and 95% motion
compensation effect (motion compensation + combined effect of automated segmentation and
sonication).
Finally, when combining the effects of automating the segmentation and the
sonication with the motion compensation, the figure shows how the duration of the
procedures remains considerably stable with an increase of only the 24% between
0
50
100
150
200
250
300
Tim
e (
h)
Motion occurrence
Procedures duration (h)
Current workflow
Automated segmentation
Automated sonication
Combined
95% Motion compensation

96
the cases of “no motion” and 90% of motion detection. In the case of 90% of motion
detection per sonication, the added effects of motion compensation and combined
effect of automated segmentation and sonication can decrease the duration on a
98.4% with respect to the current workflow, allowing for a 4h:04m:22s procedure as
it can be observed in Table 15. Table 15 also shows the average total duration in
hh:mm:ss format for each of the rest scenarios considered.
Total procedure duration (hh:mm:ss)
No
motion 10% 20% 30% 40% 50% 60% 70% 80% 90%
Current
workflow 03:56:45 06:48:59 10:10:23 14:39:24 20:56:13 29:32:55 42:10:04 63:28:37 108:21:01 256:05:33
Autom.
segm. 03:52:10 05:59:30 08:38:49 12:00:17 16:40:37 22:50:56 32:35:48 49:09:45 84:00:58 194:29:01
Autom.
sonic. 03:21:20 05:59:36 09:26:59 13:44:34 16:40:37 27:41:52 40:59:21 62:31:33 104:42:21 246:25:26
Combine
d effect 03:17:07 05:13:34 07:53:59 10:59:04 15:30:15 21:50:03 31:17:41 47:19:09 80:06:40 184:22:10
95%
Motion
comp. +
Comb.
effect
03:17:07 03:21:23 03:25:29 03:30:23 03:37:23 03:42:48 03:47:01 03:51:31 04:02:49 04:04:22
Table 15. Total average duration (hh:mm:ss) of MRgFUS procedures for each analysed case:
current MRgFUS workflow, automated segmentation, automated sonication, combined effect
(automated segmentation + automated sonication) and 95% motion compensation effect
(including the combined effect of automated segmentation and sonication).
6.6. Discussion
Results showed that performing MRgFUS on moving abdominal organs is
currently very time consuming without FUSIMO technology including motion
compensation. Future FUSIMO software applications used in parallel with existing
software are likely to reduce the impact of organ motion during the treatment,
therefore decreasing procedural times. This simulation analysis compared the
outcome of the addition of FUSIMO technology to the current MRgFUS workflow
by quantifying the relation between motion and procedure duration. This analysis
was done in stages to understand the effect of the individual planned improvement.
Predictive analysis allowed calculating realistic expectations of the impact of new
and improved versions of the workflow on procedural times. Discrete event

97
simulation provides therefore a useful and flexible tool when studying systems that
do not exist yet in the real world.
Although the current simulation model only contemplates information from the
Amper Klinikum, the conceptual workflow model was designed taking into account
observations from other centres, e.g. Policlinico Umberto I, Sapienza-University of
Rome (Italy). Further analysis could be done in order to compare variables from
different centres and how changes in the protocols may affect the overall outcome.
6.7. Summary
This chapter showed how a simulation framework proposed in chapter 2 could be
applied to non-vascular IGPs, such as MRgFUS. Very little modifications were done
over the original framework. For instance, RADs were not used since the process
flow is done mostly by one person (radiologist) so it was considered unnecessary to
include them in the description of the conceptual workflow. Simulation was used to
predict the impact of planned modifications to the MRgFUS workflow. The results
will help the development team of FUSIMO technology to show how their
technology could make MRgFUS procedures more efficient without losing efficacy
in the treatment.

98
Chapter 7.
Preliminary results modelling complex vascular
procedures: TAVI
7.1. Introduction
Previous chapters presented two cases using the simulation approach to study
relatively common vascular interventions. Although these procedures can present
complications linked to the condition of the patient, they are performed by small
teams, usually composed by an interventional radiologist or cardiologist, one or two
nurses and a radiographer. In some cases, a training radiologist participates also
during those interventions.
As seen in the introduction, the advances in imaging technology and the design of
the new hybrid operating systems allow the performance of more complex image
guided procedures. These procedures usually involve large teams and numerous and
heterogeneous high technology equipment in the room. An example of these
procedures is the transcatheter aortic valve implantation (TAVI) procedure. TAVI is
a minimally invasive procedure where a replacement heart valve is delivered via a
catheter using one of the following access methods:
- Transfemoral: the catheter is inserted in the upper leg
- Transapical: the valve is delivered through the wall of the heart
- Direct aortic: through a minimally invasive surgical incision into the aorta
- Subclavian: the access is beneath the collar bone
Since 2002, when the first TAVI procedure was performed in Europe, this
technique is becoming more popular when dealing with operative high-risk patients
(Ferrari and von Segesser 2010). TAVI procedures usually involve a large team
including interventional radiologists, cardiac-thoracic surgeons, anaesthesiologists,
nurses and radiographers. With such a heterogeneous team, planning and training are
very important parts to achieve an efficient performance.

99
The methodological framework presented in this thesis for the use of DES can be
applied also to analyse and model workflow for the complex procedures. First
version of a simulated model was implemented with data gathered at the Hybrid
Operation Room at the Interventional Centre (IC) at Oslo University Hospital (Oslo,
Norway). Several members of the IC and Oslo University Hospital participated in
this study given expert feedback on design and implementation of the model
including mainly: cardiac surgeon Dr Gry Dahle, IC researchers Karl Oyri and Dr
Ole Jacob Elle and senior radiographer Hilde Sofie Korslund. Preliminary results are
presented in the next section. The limitations of this study and some proposed
guidelines to continue this work are given in the last section of the chapter.
7.2. Preliminary results: transfemoral TAVI
7.2.1. Data analysis and conceptual workflow
Records of 6 TAVI procedures performed with the transfemoral approach were
collected through observations at the IC. Three records were recorded personally
attending interventions at the IC. The rest were collected by a medical student at the
IC who was provided with a template to collect the information indicated in Table 4.
These procedures had an average duration of 3:13:00 (00:09:37) in hh:mm:ss. Table
16 presents the initial statistical analysis over these records.
Events Mean (SE)
(min)
Max
(min)
Min
(min) Distribution Parameters
Other preparation for
the patient
17.83 (3.71) 30 7 Gamma α = 3.85
β = 277.79
Anaesthesia induction
(general or local)
47.83 (3.73) 65 38 Erlang m = 27
β = 104.57
Transoesophageal
echocardiography
16.5 (3.22) 25 5 Gamma α = 4.37
β = 226.55
Right femoral access 20 (2.87) 28 10 Gamma α = 8.06
β = 148.8
Ventricular pacing 17.83 (1.98) 30 7 Lognormal μ = 5.53
σ = 0.64
Left femoral access 4.83 (0.17) 5 4 Gamma α = 140.17
β = 2.07
Catheter and
guidewire guidance
25.83 (8.61) 61 5 Gamma α = 1.50
β = 1032.5
Balloon
placement/inflating/ext
7.83 (2.07) 17 3 Lognormal μ = 5.99
σ = 0.55

100
Events Mean (SE)
(min)
Max
(min)
Min
(min) Distribution Parameters
raction
Valve implantation
(self and balloon
expanded)
11.67 (2.04) 20 5 Gamma α = 5.43
β = 128.91
Screening-contrast test
post-treatment
4 (1.12) 9 1 Gamma α = 2.10
β = 114
Closing 11.67 (1.82) 19 7 Gamma α = 6.85
β = 102.17
Patient Ready
(Awakening - Out of
room)
17.83 (2.94) 30 7 Gamma α = 7.46
β = 158.24
Table 16. Descriptive statistics and statistical distributions fitted for the events collected of
TAVI procedures (femoral approach), where α, m and σ are the shape parameters, and β and µ
are the scale parameters.
Figure 37 illustrates the conceptual model of TAVI workflow, designed through
the observations and with the significant phases taken into account in this
preliminary study, already indicated in Table 16. First of all, the patient is prepared
in the operating table. This preparation includes several steps that at this moment are
considered as a total time. Then, depending on the critical state, the patient is
induced under general anaesthesia or under a deep sedation. After that, an
endoscopic ultrasound probe is introduced through the patient’s oesophagus, to
evaluate the heart through ultrasound (transoesophageal echocardiogram). The
patient may also be connected at any time to a heart-lung machine for external
support in an emergency case. After that, surgeons make two incisions: on the right
femoral access to place a ventricular pacemaker and on the left femoral artery,
another access used to insert the heart valve after an angioplasty. These phases can
be split into several small steps; some of them are executed in parallel by different
members of the team. Some of these steps are indicated in grey in the figure but are
not taken into account for this first model.

101
Figure 37 Conceptual model designed from the observations on TAVI procedures (femoral
approach). Grey areas indicate features that are not contemplated in current version of the
model.

102
7.2.2. Simulation model
A first version simulation model of the hybrid operation room at the IC was
implemented in Delmia Quest. Statistical distributions for the different events
according to Table 16 were used as inputs for the DES model. Figure 38 shows a
capture of this model with a team of 8 clinicians, although the number of people
involved during a real TAVI at the IC can vary from 8 to 15 staff members including
surgeons, interventional cardiologists, nurses, radiographers, anaesthesiologists and
perfusionists.
Following the established framework, a preliminary simulation analysis was done
based on 100 replications (simulations), each of them with 30 patients. The Welch
90% CI for the total duration (in min) resulted [18.67, -20.16], validating then this
first version of this model when compared against the real system.
Figure 38. DES model of a TAVI procedure at the hybrid operation room at the Interventional
Centre (Oslo University Hospital, Oslo, Norway)
7.3. Discussion
TAVI procedures involve a complex collaboration within the operating room. In
addition, several of the tasks are also performed in parallel, fact that is not

103
contemplated in the current version of the model. Moreover, feedback from
clinicians involved in the preliminary study suggested that current defined events
should be divided in subtasks, some of them already indicated in Figure 37 (see areas
in grey), in order to implement a higher fidelity simulation model. However,
observations might not be sufficient to collect this type of information. The
suggestion would be to include a multi-video recording system in the operating room
so precise records can be captured.
Despite the observed limitations, clinicians agreed on the potential usability of the
DES model to compare cost-efficiency between the different TAVIs approaches. A
brief review on literature suggests an increasing interest on analysing costs of TAVIs
procedures (Fairbairn et al. 2013; Murphy et al. 2013). A detailed workflow model
could provide a deeper understanding of these procedures to aid efficiency and cost
optimisation.
In the particular case at IC, clinicians identified other potential uses, such as
medical training. The presence of a large and heterogeneous team in the OT arises
many challenges when identifying team collaborative tasks and when training new
staff members on new high-tech facilities. A DES model that contemplates the
clinical interactions with the OT may help during the training.
In analogy to the study of fluoroscopy versus MRI – Chapter 8 –, the framework
can be also applied in the future to support the design and development of MR-
guided TAVI procedures (Andreas Melzer et al. 2014).
7.4. Summary
This chapter presented the preliminary results of the first version DES model of
TAVI interventions based on data collected at Oslo University Hospital. Although
the model was built around the femoral approach, it could be easily adapted for the
other approaches (transapical, aortic or subclavian). This shows how the simulation
framework could is adaptable to complex IGPs. However, a higher complexity
increases the complexity of the data collection. This makes data collection
challenging, requires more time and demands thoroughly planning.

104
Part II:
Physical Modelling Approach

105
Chapter 8.
Physical modelling framework for comparative workflow
analysis
Contents of this and the following chapter are included in:
Fernández-Gutiérrez F, Martínez S, Rube MA, Cox BF, Fatahi M, Scott-Brown K, Houston G,
McLeod H, White R, French K, Gueorguieva M, Immel E, Melzer A. ‘Ergonomic workflow and user
experience comparative analysis of MRI versus X-Ray guided vascular interventions. Case of study:
iliac angioplasty’, International Journal of Computer Assisted Radiology and Surgery (submitted)
8.1. Introduction
As seen in Section 2.3.3, implementing a physical model is purpose-oriented,
aimed to simulate the environment of the real system. Therefore, in order to facilitate
the understanding of the framework designed to analyse IGPs workflows using
physical models, this section presents the case of use of a comparative workflow
analysis of a fluoroscopic and MRI-guided iliac angioplasty on a vascular phantom.
The physical environment was prepared using the facilities at the Institute for
Medical Science and Technology (University of Dundee, Dundee, UK).
This case study has been developed in collaboration with the Centre for
Psychology in the School of Social and Health Sciences at the University of Abertay
Dundee (Dundee, UK). Prof Ken Scott-Brown and Dr Santiago Martínez provided
support during the design of the experiments and contributed with their experience in
the analysis of the protocols from the user experience perspective. Members of the
MRI team at IMSaT also collaborated during the preparation of the configurations
considered for the study. Specifically, PhD student Martin Rube, research assistant
Mahsa Fatahi and research associate Dr Ben Cox from the MRI team at IMSaT
prepared balloons, devices, communications and phantom for the experimental setup.
Further details can be found at Rube et al. (2014).
As it will be explained in the next section, three clinicians with different levels of
experiences participated in the experiments: Dr Graeme Houston (GH), Dr Richard
White (RW) and Dr Benjamin Cox (BC). Helen McLeod, researcher at IMSaT and
nurse with experience in imaging environments through attendance of several

106
interventions at the Clinical Radiology department in Ninewells Hospital, assisted
the clinicians during all experiments.
8.2. Case study: Fluoroscopic vs. MRI-guided iliac
angioplasty
MRI – guided vascular interventions could be a favourable alternative to the
conventional fluoroscopic guidance due to added diagnosis value of having a high
soft tissue contrast without exposing patients and clinicians to ionising radiation
(Krombach 2012). However, MRI environments present operational challenges that
need to be addressed in order to make MRI guided procedures comparable to
fluoroscopy in terms of safety efficiency and efficacy and to make them acceptable
for clinical practice. Much of the current published research has focused on
overcoming technical limitations and safety issues (Bock and Wacker 2008; Kos et
al. 2008). In addition, concerns on the potential longer procedural times have been
reported in previous studies (Saborowski and Saeed 2007; Wacker et al. 2005).
Two studies have been conducted in the field of interventional radiology. Johnson
et al. (2006) presented a cognitive task analysis on several fluoroscopy-guided
procedures in order to incorporate the acquired knowledge to better simulate models
for training. Van Herzeele et al. (2008) applied this concept to a simulator for
fluoroscopic treatment of iliac stenoses, comparing trainees and experts. Both studies
agreed on the importance of cognitive task analysis as a training method for the
development of new protocols.
However, the MRI context is substantially different from angiography suites in
terms of patient access, equipment, and physical space available for clinicians as
well as significant image acquisition and visualisation differences. Cue retrospective
protocol analysis (CPRA) allows for the participant to engage in the primary task
without the distraction of concurrent commentary, and includes information that may
be subconscious during the primary task and therefore, difficult or impossible to
collect with a questionnaire or a conventional question and answer interview (van
Gog et al. 2005).

107
MRI environments for endovascular procedures create other challenges such as
the potential occupational hazards that clinicians may face during interventions. In
this regard, one important factor to be considered is the risk of a musculoskeletal
injury, which in radiology environments can be related to multiple factors such as
computer-related activities but also can be suffered while handling patients or
standing for long periods of time while wearing the protective lead aprons (Brusin
2011). In addition, uncomfortable postures during the work activity can cause
fatigue, pain and reduce concentration, thereby increasing medical errors and the risk
for the patient (Harisinghani et al. 2004; García-Lallana et al. 2011). Recent studies
highlight the importance of ergonomic analysis when designing new imaging
environments for vascular procedures (Sikkink et al. 2008; Rostenberg and Barach
2011). Restricted access to the patients and limited space in the scanner rooms are
some of the considerations when analysing ergonomics in MRI suites. However,
despite increasing interest in ergonomics in radiology environments, only few
authors go beyond suggestions or guidelines to provide a deeper analysis of the
environments. Moreover, most analyses are focussed mainly on diagnostic
workspaces and on the correct postures for the workstation utilisation (Brusin 2011;
Harisinghani et al. 2004; Goyal, Jain, and Rachapalli 2009).
8.3. Environmental setup
As mentioned, the interventions were performed at IMSaT imaging facilities.
These installations include an angiography suite and an adjacent MRI scanner room,
both connected through sliding shielded doors. The angiography suite accommodates
a DSA unit (OEC 9900 Elite, GE Medical Systems, Waukesha, WI, USA). The MRI
room is equipped with a 1.5T MRI scanner (Signa HDxt, GE Medical Systems,
Waukesha, WI, USA). The transfer between modalities is enabled by the use of a
mobile table with radiolucent sliding tabletop (MR surgical suite GE Medical
Systems and Maquet, Rastatt, Germany) (see Figure 39a).
In addition to the standard control console for the MRI scanner, another
workstation was installed with a real-time MRI software framework (RTHawk,
Version 0.9.28, HeartVista, Inc., Los Altos, CA, USA). RTHawk is a flexible
research real time MRI software framework that allows the generation of new pulse

108
sequences and the dynamically change of major aspects of data acquisition on the fly
(Santos et al. 2004). Both workstations were in communication via Gigabit Ethernet
and were connected via optical fibre cables (M1-1000, Opticis, Sungnam City,
Korea) to a shielded 40” LCD monitor (Multeos 401, NEC Corporation, Tokyo,
Japan) to display the MR images inside the MRI scanner room (see Figure 39 b).
Figure 39. (a) View of the angiography suite connected by sliding door to the MRI suite, (b)
MRI suite with the intervention physical layout: a 40” LCD in-room shielded monitor and iPad
attached to MRI table (red arrow).
A wireless network was installed in the MRI scanner room with a modified router
(DIR615, D-Link, Taipei, Taiwan) with one antenna being positioned in the magnet
room and the other one outside the Faraday cage providing a stable network
connection throughout both areas. The wireless network enabled the location of three
IP webcams in different positions with respect to the MRI scanner: right, left, and in-
bore (models M1011w and M1031w, Axis Communications, Lund, Sweden) (Figure
40a-c). Radiologists participating were provided with recording spectacles
(PivotHead, models Durango Chameleon and Recon Black Jet frames with no lenses
fitted, Cape Evolution Ltd, Greenwood Village, CO, USA) for a first-person
experience evaluation (Figure 40d).
(a) (b)

109
Figure 40. Perspectives of the cameras arranged in the MRI suite during the interventions: (a)
right, (b) left, (c) bore, (d) first-person.
In addition, an MRI-safe wireless in-room operator control system based on
mobile touchscreen devices (iPad 1, Apple Inc., Cupertino, CA, US) was
implemented as part of the experimental setups evaluated. Physician and operator
used a second tablet device (iPad 3, Apple Inc., Cupertino, CA, US) and Bluetooth
earphones (Calisto B70, Plantronics, Santa Cruz, CA, USA) for communication
during the procedures. The earphones were positioned under the noise protection
earmuffs.
The experimental setups were all conducted on an arterial vessel phantom (see
Figure 41) consisting of linked femoral, abdominal and thoracic module (L-F-S-Left-
003, A-S-N-001, T-R-N-020, Elastrat, Sarl, Switzerland). The phantom was
connected to a heart-lung machine (HL-30, Maquet, Rastatt, Germany), customising
one HL-30 D150 pump to mimic (pulsatile) physiologic flow. A permanent
introducer sheath (12F) was inserted into the femoral artery to facilitate access and
exchange of devices during the interventions.
(a) (b)
(c) (d)

110
Figure 41. Fully perfused thorax to above the knee vascular phantom (Elastrat, Sarl,
Switzerland). Blue arrow indicates the 12F sheath introducer used for permanent access. Red
arrow indicates a neonatal pressure cuff (SoftCheck Neonatals, Statcorp Medical, Jacksonville,
FL, USA) that was attached to the right common iliac artery to mimic a stenosis.
Commercially available non-braided balloon catheters (5F PTA Balloon catheter,
Workhorse II, AngioDynamics, Lathan, NY, US) were customised by attaching a
resonant circuit 5mm distally to the inflatable balloon (Burl, Coutts, and Young
1996). Each resonant circuit was tuned to 63.8 MHz (the proton Larmor frequency at
1.5T) in 0.9% saline solution.
8.4. Methodology
Procedure
A total of 43 uncomplicated percutaneous transluminal angioplasties of the iliac
artery (PTA-IA) were performed in the phantom (9 under fluoroscopy and 34 under
MRI guidance). The aims were: 1) to identify and evaluate the procedural
differences between a fluoroscopy-guided and an MRI-driven procedure; and 2)
analyse the potential effects on the performance and clinical experience during
vascular interventions.
A standard protocol for PTA-IA, followed in the Clinical Radiology department
in Ninewells Hospital (Dundee, UK) was adapted for the experiments. Observations
of real iliac angioplasty procedures were carried out at the angiography suites and
the corresponding information detailed in Table 4 was collected during the
interventions. The records were used in the conceptual designed of the adapted PTA-
IA protocol with is shown in Figure 42(a).
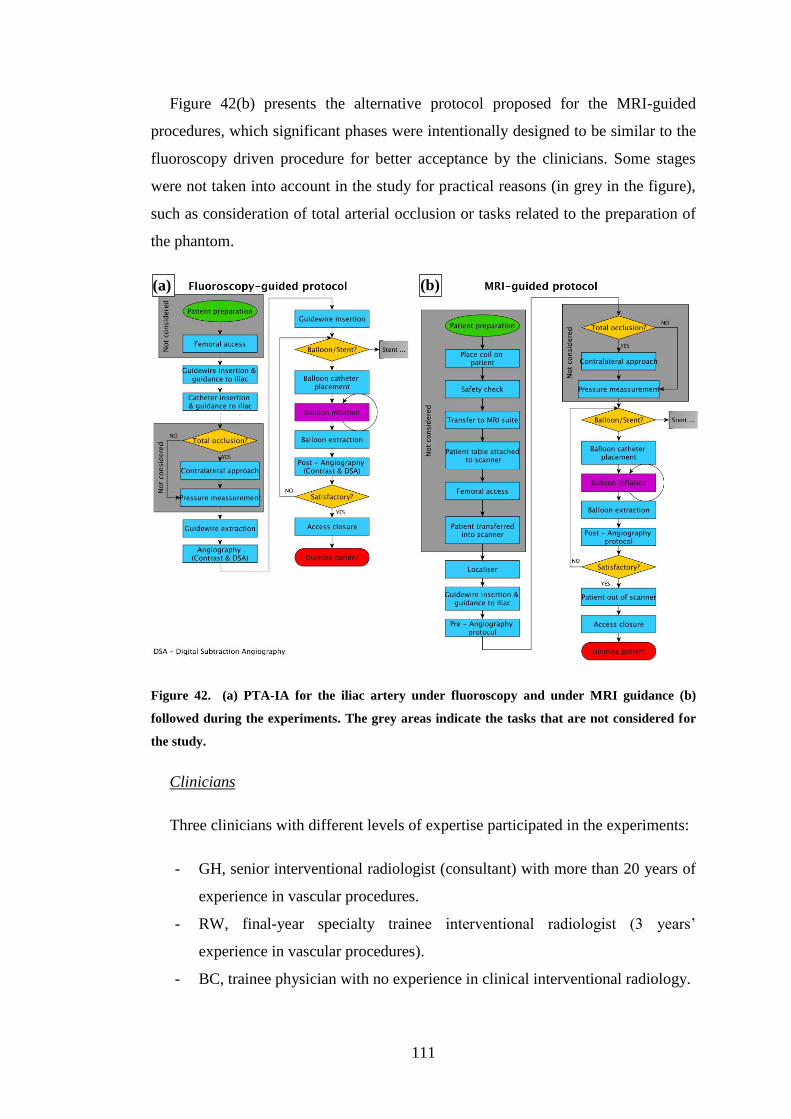
111
Figure 42(b) presents the alternative protocol proposed for the MRI-guided
procedures, which significant phases were intentionally designed to be similar to the
fluoroscopy driven procedure for better acceptance by the clinicians. Some stages
were not taken into account in the study for practical reasons (in grey in the figure),
such as consideration of total arterial occlusion or tasks related to the preparation of
the phantom.
Figure 42. (a) PTA-IA for the iliac artery under fluoroscopy and under MRI guidance (b)
followed during the experiments. The grey areas indicate the tasks that are not considered for
the study.
Clinicians
Three clinicians with different levels of expertise participated in the experiments:
- GH, senior interventional radiologist (consultant) with more than 20 years of
experience in vascular procedures.
- RW, final-year specialty trainee interventional radiologist (3 years’
experience in vascular procedures).
- BC, trainee physician with no experience in clinical interventional radiology.
(a) (b)

112
While GH and BC were both familiar with MRI environments and the facilities
prior to this study, RW had no previous experience in MRI.
Methodology
Each clinician (GH, RW and BC) performed three repetitions (nine in total) of
PTA-IA under fluoroscopy guidance following the adapted protocol presented in
Figure 42(a). Times were collected for the durations of the significant phases
indicated in the figure. This protocol was established as baseline for the operational
comparison with the MRI environment.
To prepare the MRI environment for the comparative analysis, a pilot study was
performed with the participation of all three clinicians. A total of 16 MRI guided
PTA-IA were performed during this pilot study. Qualitative feedback was requested
on six different configurations for the MRI suite. Table 17 shows the summary of
these configurations. The changes considered in the setups consisted of: varying the
workstation controlling the scanner (RTHawk or Standard Interface – GE iDrive);
varying the in-room visualisation equipment; and whether or not the Bluetooth
earphones for communication between the scanner and control rooms were used.
Configuration Communication
with Control Room
Workstation Visualisation
I - GEScreenBT Bluetooth Standard In-room monitor
II - GEiPadBT iPad
III - RTScreenBT RTHawk In-room monitor
IV - RTiPadBT iPad
V - GEScreen None
Standard In-room monitor
VI - RTScreen RTHawk In-room monitor
Table 17. MRI configurations evaluated
The clinicians’ report requested after the pilot study highlighted the need for
communication between the clinician inside the scanner room and the controller
inside the control room during the procedures. Following this feedback, only four
configurations incorporating the preferred two-way voice communication (i.e.
Bluetooth earphones) – I to IV in Table 17–, were taken forward in a second block of
experiments under MRI guidance.

113
Due to limited clinicians’ availability, only GH and BC participated in this second
block of experiments, where times were collected for the MRI-guided procedure
stages. Also, additional information was compiled such as discussions between the
teamwork and any difficulty found with the vascular model or the devices.
All procedures were audio-visually recorded from two personal perspectives: a
third-person perspective with 4 cameras, one positioned on a tripod to record the
fluoroscopic guided interventions and 3 IP cameras (see Facilities and equipment)
for the MR-guided procedures, placed as explained in the previous section; and a
first-person perspective with high definition (HD; considered conditionally MRI-
safe) recording spectacles worn by each clinician.
Cued retrospective protocol analysis
A CRPA was carried out with clinicians GH and BC, who completed all sets of
experiments in fluoroscopy and MRI. The CRPA analysis included interviews and
analysis of their commentary gathered while viewing their own audio-visual
recordings obtained during interventions (see Figure 43). Oral descriptions were
recorded from the clinicians when they simultaneously were visualising their own
operation in first-person (i.e., HD spectacles camera) and third-person perspectives
(i.e., front, rear and bore). In total, 4 perspectives were concurrently shown (see
Figure 40) in one large screen (3200 x 1200 resolution with a length of 5.7 metres).
The clinicians’ viva voice and the visualised material were recorded.
As an additional information gathering exercise, the participants engaged in
CRPA wore a head mounted iView-X HED eye movement recording device
(SensoMotoric Instruments GmbH (SMI), Warthestraße, 21D-14513, Teltow,
Germany) which is indicated in Figure 43 by the red cursor. This system allows for
free head movement during commentary and records the eye gaze position at 30Hz
frequency with an accuracy of 0.5 degrees of visual angle. A 5-point calibration
protocol was conducted to ensure accurate recordings by ensuring participants look
at each corner of the monitor and the centre while the experimenter registers eye
position on the associated iView software. The resulting recordings provide a first
person perspective video with overlaid gaze cursor. This is then used by the
experimenter in the review of the CRPA to inform the viewer of the gaze associated

114
with individual elements of the task. CRPA recordings of these tasks were reviewed
to identify the factors that influenced the performance of the procedures, both for
MRI and fluoroscopy guidance.
Figure 43. CRPA interviews with clinicians. Figure (a) and (b) illustrate the first and second
person perspectives (lower part of the images) with overlaid gaze cursor. This red cursor shows
the location of the eye gaze on the image for the current location and the previous 0.25 of a
second.
8.5. Statistical analysis
The generalised estimating equations (GEE) method for repeated measures was
used to analyse the complete dataset after the second block of experiments (Ballinger
2004). GEE provides a robust analytic tool when variables might not be normally
distributed and there could be a correlation between subjects. For the purpose of this
research and following the literature, gamma distribution was assumed for the tasks
completion times (Law 2007). In addition, first-order autoregressive correlation was
considered as a robust design measure for the GEE analysis.
During the experimentation, values of several variables were unavailable (13.5%
of the total values collected) due to the restricted availability of the clinicians. Due to
the low number of repetitions for each configuration (n = 2 or 3 depending on the
case) and that the data was missing completely at random (MCAR), multiple
imputation (MI) method was used to generate the missing values (Ibrahim et al.
2005; He 2010). Five imputed datasets were created using the fully conditional
specification approach in IBM SPSS v21.0.0 (New York, USA) (van Buuren 2007).
(a) (b)
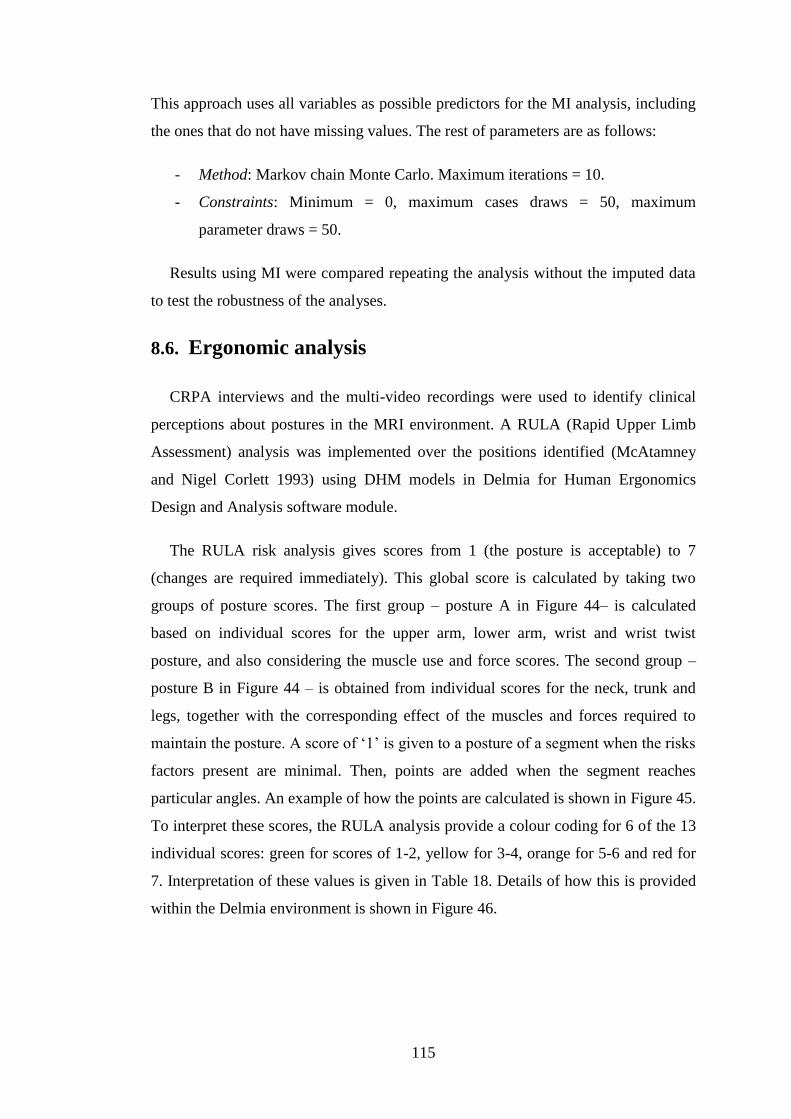
115
This approach uses all variables as possible predictors for the MI analysis, including
the ones that do not have missing values. The rest of parameters are as follows:
- Method: Markov chain Monte Carlo. Maximum iterations = 10.
- Constraints: Minimum = 0, maximum cases draws = 50, maximum
parameter draws = 50.
Results using MI were compared repeating the analysis without the imputed data
to test the robustness of the analyses.
8.6. Ergonomic analysis
CRPA interviews and the multi-video recordings were used to identify clinical
perceptions about postures in the MRI environment. A RULA (Rapid Upper Limb
Assessment) analysis was implemented over the positions identified (McAtamney
and Nigel Corlett 1993) using DHM models in Delmia for Human Ergonomics
Design and Analysis software module.
The RULA risk analysis gives scores from 1 (the posture is acceptable) to 7
(changes are required immediately). This global score is calculated by taking two
groups of posture scores. The first group – posture A in Figure 44– is calculated
based on individual scores for the upper arm, lower arm, wrist and wrist twist
posture, and also considering the muscle use and force scores. The second group –
posture B in Figure 44 – is obtained from individual scores for the neck, trunk and
legs, together with the corresponding effect of the muscles and forces required to
maintain the posture. A score of ‘1’ is given to a posture of a segment when the risks
factors present are minimal. Then, points are added when the segment reaches
particular angles. An example of how the points are calculated is shown in Figure 45.
To interpret these scores, the RULA analysis provide a colour coding for 6 of the 13
individual scores: green for scores of 1-2, yellow for 3-4, orange for 5-6 and red for
7. Interpretation of these values is given in Table 18. Details of how this is provided
within the Delmia environment is shown in Figure 46.

116
Figure 44. Diagram showing how the global or grand score is calculated from the grouped
scores in A and B.
Figure 45. Upper Arm posture score calculation
Action Level RULA score Interpretation
1 1-2 The person is working in the best posture with no risk
of injury from their work posture
2 3-4 The person is working in a posture that could present
some risk of injury from their work posture, and this
score most likely is the result of one part of the body
being in a deviated and awkward position, so this
should be investigated and corrected
3 5-6 The person is working in a poor posture with a risk of
injury from their work posture, and the reasons for
this need to be investigated and changed in the near
future to prevent an injury
4 7+ The person is working in the worst posture with an
immediate risk of injury from their work posture, and
the reasons for this need to be investigated and
changed immediately to prevent an injury
Table 18. RULA scores classification and interpretation

117
Figure 46. Detail of menu for RULA risk analysis on Delmia for Human Ergonomics Design
and Analysis. General parameters regarding the posture are set on the left side of the menu,
which shows also the global score. Current scores for postures A and B are given colour labelled
on the right side of the menu.
To perform the analysis, simulated 3D environments were implemented using a
50th
percentile male manikin (173.cm height and 76.20 Kg weight (Woodson et al.,
1992)) as DHM. A comparison was done to measure the effect that different
scenarios might have in the defined postures. The usual posture adopted by clinicians
in angiography suites, which also corresponds with the initial defined position
(further referred as position 1), was set as the baseline to compare with the MRI
scenarios. The analysis made a distinction on the type of evaluated activity: static
(position held for more than one minute); intermittent (position held less than one
minute) or repeated (position repeated a minimum of three times during the activity).
In the first instance, the RULA analysis was applied to the postures on the 3D
model of a 1.5T Signa MRI scanner (GE Healthcare, Waukesha, WI, USA) with a
60cm diameter bore, as also used for the clinicians during the experiments. The
output was compared to a simulation on a 70cm wide bore 3T Discovery MRI
scanner (GE Healthcare, Waukesha, WI, USA) and a 1T open bore Panorama MRI

118
scanner (Philips, Eindhoven, The Netherlands) (see Figure 3 (a) and (b)). A simple
scale CAD model of the 1.5T Signa MRI scanner was implemented by IMSaT
student Christoph Boerzsoenyl. CAD scale models of the Discovery and Panorama
were kindly provided by GE Healthcare and Philips respectively. In addition, three
more scenarios were compared to improve the comfort of postures during
interventions; firstly, to measure the effect of integrating an arm-supporting device;
secondly, to study the impact of an adjustable platform for personalised height and
finally a combination of both previous scenarios.
8.7. Summary
This chapter presented a framework to design a purpose-oriented physical model
to analyse and compare workflow for fluoroscopy and MRI-guided vascular
procedures. The case was based on the study of iliac angioplasty and described four
blocks in which the framework is divided. Firstly, the environmental setup is
presented, including the description of the devices used and the angiography and
MRI rooms. Then, the methodology is explained, which includes the protocols that
were tested, the clinicians that participated as well as the configurations that were
evaluated quantitatively (time-based analysis) and qualitatively, through the CRPA.
The third block presents the statistical analysis over the data collected and the last
block describes how an ergonomic analysis was performed in a simulation using
RULA analysis in Delmia Human and Ergonomics simulated environment. The next
chapter presents the results obtained in these four blocks and discuss the main
findings.

119
Chapter 9.
9.1. Results: Fluoroscopy versus MRI – an iliac
angioplasty case studyIntroduction
Section 2.3 presented a framework to use a purpose-oriented physical model to
compare vascular IGPs workflows based on the case study of a common iliac
angioplasty. Results of the comparison of fluoroscopy versus MRI guidance are
presented in this chapter to validate the framework for developing novel procedures.
The results are divided in three parts: time-based task analysis, cognitive and user
experience analysis and ergonomic evaluation of the MRI environment for
interventions. The significant findings are discussed in the last section.
9.2. Task analysis
In total, 43 procedures were recorded, 9 under fluoroscopy and 34 under MRI
guidance. As mentioned in Section 8.4, 16 MRI-guided procedures were performed
during the pilot study. Table 19 presents the total procedure times for the 9
fluoroscopy interventions and the 18 MRI-guided PTA-IA collected during the
second block of experiments. The procedure times are shown in minutes and per
configuration per clinician. The mean total duration was 12.08 (0.95) (mean
(standard error - SE) minutes (min) per procedure.
Configuration
Total duration per clinician (Mean
(SE)) (min) Total Duration (Mean
(SE)) (min) Clinician GH Clinician BC
Fluoroscopy
(baseline) 7.47 (0.77) 9.53 (1.08) 8.49 (0.75)
I - GEScreenBT 17.82 (0.96) 18.36 (0.94) 18.09 (0.57)
II - GEiPadBT 16.37 (0.14) 18.43 (1.66) 17.19 (0.73)
III - RTScreenBT 7.32 (0.07) 9.39 (0.72) 8.56 (0.64)
IV - RTiPadBT 7.71 (1.17) 11.25 (0.13) 9.48 (1.13)
Table 19. Total procedure times in minutes for fluoroscopy guided procedures and MRI
configurations evaluated (see Table 17) during the second block of sessions. All the times are
expressed in mean (standard error).

120
The overall performance of clinician GH was significantly (p<0.001) faster than
clinician BC, taking the first one an average of 11.43 (1.43) min versus the 12.74
(1.27) min of clinician BC. When comparing the different configurations of MRI
guidance versus the standard fluoroscopy protocol, the GEE analysis revealed
significant difference (p<0.05) when the MRI standard control console was used
(GEScreenBT and GEPadBT in Table 17), and also when the RTHawk control
console was used together with the iPad (RTiPadBT in Table 17). There was no
significant difference in the overall performance of the standard fluoroscopy protocol
(8.49 (0.75) min) when compared with the RTHawk control console using the LCD
in-room monitor (8.56 (0.64) min).
Table 20 also shows an overall better performance using RTHawk, comparable to
the times obtained with the standard protocol. As indicated in the physical modelling
framework, RTHawk allows changes between pulse sequences and parameters
during the intervention on the fly, which avoids delays. In addition, the user interface
can be designed in terms of controls and views for the radiologists needs.
In addition, a more detailed analysis of the differences between clinicians and
configurations for the stages indicated in Figure 42 was performed, with the ones
considered more relevant for the study reported here. The treatment phase was
defined from the moment the balloon catheter was inserted until the moment the
balloon was extracted after inflation. For these stages, performance of clinicians GH
and BC were compared during the fluoroscopy procedure and the MRI-guided
configurations. Configurations II – GEiPadBT and IV – RTiPadBT were
significantly different when compared with the performance under fluoroscopic
guidance. As seen in Table 20, in GEiPadBT times were on average faster (3.14
(0.28) min) than in fluoroscopy (3.63 (0.27) min), while RTiPadBT took longer
(4.25 (0.45) min). However, it can be seen that although GEiPadBT was slightly
faster than the X-Ray procedure for the treatment times, overall GEScreenBT and
GEiPadBT were slower than the others (see Table 19). This is explained when
looking at the pre- and post-angiography times (see Table 20). In GEScreenBT and
GEiPadBT, these phases took significantly (p < 0.01) longer than in the
fluoroscopically guided procedure. On the contrary, in RTScreenBT and RTiPadBT,
these times were similar.

121
Configuration Treatment
(Mean (SE)) (min)
Pre-angiography
(Mean (SE)) (min)
Post-angiography
(Mean (SE)) (min)
Fluoroscopy
(baseline) 3.63 (0.27) 1.71 (0.24) 1.94 (0.25)
I – GEScreenBT 3.23 (0.25) 6.28 (0.05) 5.61 (0.11)
II – GEiPadBT 3.14 (0.28) 6.00 (0.14) 5.70 (0.31)
III – RTScreenBT 3.33 (0.35) 1.34 (0.18) 1.72 (0.17)
IV - RTiPadBT 4.25 (0.45) 1.38 (0.01) 1.47 (0.04)
Table 20. Average durations per configuration for the phases of treatment, pre-angiography
and post-angiography protocols.
9.3. Cognitive and user experience analysis
Figure 47 provides an overview of the factors most frequently discussed by
clinicians GH and BC during the interviews. The importance level of these factors
was classified qualitatively by the number of times they were referred to during the
interviews and is graphically indicated by the size of the particular bubble with their
name in the figure. In addition and for clarity, they were primarily grouped
according to their nature: communication; visualisation and ergonomics. The
diagram also shows the hierarchical dependency within the groups (black arrows)
and the interrelations among factors from different groups (red arrows). In a general
evaluation of the groups, communication appeared as the most important factor
during all procedures, followed by visualisation. Ergonomics inside the room was
important for the clinicians but in a lower degree. Specifically within the groups,
communication with the control room was given a higher importance than the
communication inside the room. In the same way, clinicians considered that the
visualisation of devices was critical during the procedures. Moreover, the type of
screen played an important role. To a lower degree, the clinicians considered that the
acquisition of MRI images should be improved as appreciative differences were
encountered when compared to DSA. By contrast, the clinicians mentioned the
importance of the temporal and spatial resolution of interventional MRI images, but
rated these sufficient with the current MRI pulse sequences used in the proposed
protocol (Rube et al. 2014).

122
Figure 47. CRPA diagram illustrating main factors that affect an intervention according to the
feedback of the clinicians. The size of a bubble represents the importance level given by the
clinicians during the interviews: A larger bubble means higher importance. Black arrows
represent the hierarchy within a group. A red arrow indicates an interrelation between factors
of two different groups.
9.4. Ergonomic analysis
The information gathered by the multiple video recordings showed that clinicians
maintained ergonomically disadvantageous postures while carrying out the
procedures under MRI in comparison with the performance in the angiography suite.
Clinicians explicitly confirmed that these postures were uncomfortable during the
CRPA interviews. As a result, a pilot ergonomic assessment of the MRI environment
for IGP was carried out using the RULA analysis (see Section 8.6).
Four key positions were identified as being repeatedly adopted by the clinicians
during the MRI-guided procedures: one ‘rest’ position (position 1) and three
operating positions (positions 2 – 4). As mentioned in Section 8.6, the analysis was
applied to 3 MRI scanners: 1.5T Signa MRI scanner with 60cm diameter bore, 3T
Discovery MRI scanner with a 70cm bore and the 1T open bore Panorama MRI
scanner.

123
Figure 48 and Figure 49 show the RULA analysis applied to the three types of
MRI scanners considered. Figure 48 displays in the first row (a) screenshots of
clinician BC during an MRI-guided procedure holding positions 1 to 4 defined for
the analysis. Below, rows (b) and (c) show the corresponding DHMs for two of the
MRI scanners considered, 1.5T GE Signa and 3T GE Discovery. The DHM scenario
for the 1T open bore Panorama MRI scanner is shown separately in Figure 49 due to
the notable differences on shape of the scanner and to give a better perspective of the
postures. For the scenario with the open bore Panorama MRI scanner, it was not
possible to obtain real video images of an MRI-guided intervention. Images of
interventional radiologists using the open bore Panorama MRI scanner, courtesy of
Prof. Ulf Teichgräber at Charité Berlin (Berlin, Germany), were used for this
purpose (see Figure 50). For this particular case, postures 3 and 4 are considered the
same as the screen used for the navigation would be likely to be on the other side of
the scanner which does not happen with the close bore scanners (see Figure 50(a)).
Below all virtual environments, RULA global scores are given for each posture
position. Posture 1 was considered static, posture 2 was considered intermittent and
the rest were considered repeated. The scores show very small differences between
the postures held using all scanners and indicate that positions 2 – 4 are
ergonomically not acceptable for day-to-day practice.
3 6 7 7
(b)
(a)

124
Figure 48. Screenshot of key postures 1 – 4 defined during a MRI-guided procedure for
clinician BC (first row (a)), equivalent postures modelled in Delmia V5R20 for the 1.5T GE
Signa MRI scanner (second row (b)) and the 3T GE Discovery MRI scanner (third row (c)) (GE
Healthcare, Waukesha, WI, USA). Below the virtual environments, global scores given by the
RULA analysis are shown.
Figure 49. RULA analysis applied to the 1T open bore Panorama MRI scanner (Philips,
Eindhoven, The Netherlands); (a) to (d) in the figure correspond to defined postures 1 to 4,
respectively. Below the virtual environments, global scores given by the RULA analysis are
shown.
3 5 7 7
3 6
7 7
(c)
(a) (b)
(c) (d)

125
Figure 50. Interventional radiologists using the 1T open bore Panorama MRI scanner. Images
courtesy of Prof. Ulf Teichgräber at Charité Berlin (Berlin, Germany).
The results regarding the second part of the ergonomic analysis are shown in
Table 21. This table compares the RULA global scores for the initial test with the
three alternatives scenarios considered: adding an arm-support, an adjustable height
platform and a combination of both. The arm-support can be added in the Delmia
RULA context menu as virtual feature to provide support to the lower arm segment,
from the elbow to the wrist. With an adjustable height platform, the height of the
manikin was reduced until a comfortable position for the lower back was found,
resulting in a deduction of -10cm for the manikin measures.
1.5T GE Signa (60cm bore) 3T GE Discovery (70cm bore)
1T open bore Philips
Panorama
Initial Arm-
Support
Height
platform
Combined
effect Initial
Arm-
Support
Height
platform
Combined
effect
Initial Arm-
Support
Height
platform
Combined
effect
Posture 1 3 3 3 3 3 3 3 3 3 3 3 3
Posture 2 6 6 5 4 5 4 3 3 6 6 6 5
Posture 3 7 6 3 3 7 6 3 3 7 7 7 6
Posture 4 7 6 6 5 7 6 3 3 7 7 7 6
Table 21. RULA global scores obtained for the additional tests: added arm-support, adjustable
height platform and a combination of the two factors for all three MRI scanners considered.
Results show a slight improvement for postures 2 and 3 for all types of scanners
when adding the arm-support. However, for posture 4, this improvement is only
appreciable for the Signa and Discovery MRI scanners. When adjusting the virtual
height platform to the recommended height, the improvement was substantial for all
postures in the case of the Discovery MRI scanner. This was less significant in the
case of the Signa scanner and only posture 3 got notably improved. The same results
were noted when combining the arm-support with the height platform effect for both
(a) (b)

126
closed bore scanners. In the case of the Panorama MRI scanner, adding the height
platform or both, arm-support and height platform, did not introduce any significant
improvement in the postures.
9.5. Discussion
The time-based task analysis revealed that it is possible to reduce the duration of a
PTA-IA procedure under MRI guidance to the usual duration under fluoroscopy.
Since several scenarios in MRI were considered for the study, it was possible to
identify which elements played an important role during the performance. During the
first block of sessions, overall times collected for MRI revealed that the total
duration of the procedures using the standard control console with no
communication system installed between the control room and the scanner room,
took up to 5 times more than using the RTHawk system with communication. When
the Bluetooth communication was established, the duration of the procedures using
the standard control console in MRI (GEScreenBT and GEiPadBT) took still on
average more than twice the length of the fluoroscopy-guided procedure. When
using the RTHawk as a control console (RTScreenBT and RTiPadBT), the times
were comparable to the fluoroscopy protocol. One of the factors that affected more
drastically was the better performance for the phases of pre and post-angiography,
which were up to 6 times shorter when using RTHawk than when the standard
console was used. In addition, the advantage that RTHawk offers of choosing and
changing sequences on the fly, gave more flexibility to the technician in the control
room to provide requested images, avoiding some delays during the real-time
guidance. However, these times did not take into account several important stages of
the usual angioplasty procedure, as indicated in Figure 42. These stages, mostly
regarding the preparation of the patient prior the intervention, would add between 5-
10 minutes to the overall duration and should be considered in future investigations.
During patient preparation, the equipment available and personnel training are some
of the main factors to analyse. A dedicated interventional coil prototype “DuoFlex
Coil Suite” (MR Intruments Inc., Mineapolis, MN, USA) (Rube et al. 2014) was
used during these experiments. Other approaches, such as the use of integrated
surface coils for the MRI tables should be investigated. Although, the preparation
time for MRI might be potentially longer than in fluoroscopy (as it includes the
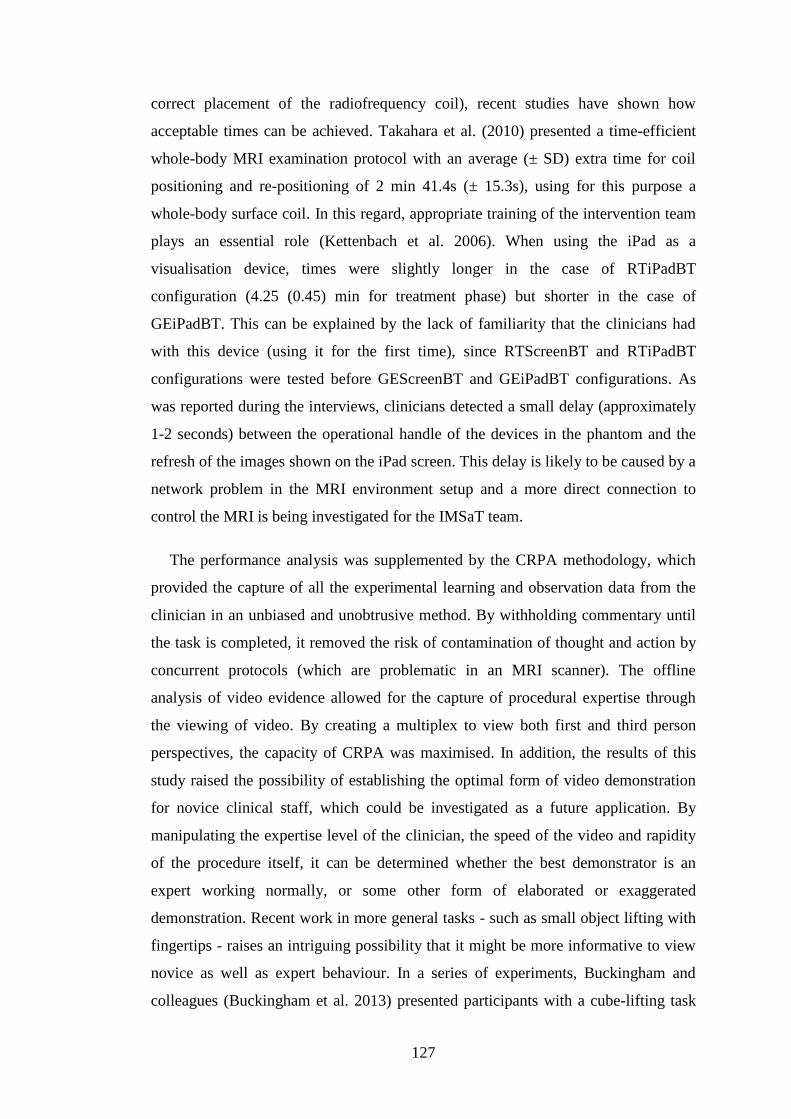
127
correct placement of the radiofrequency coil), recent studies have shown how
acceptable times can be achieved. Takahara et al. (2010) presented a time-efficient
whole-body MRI examination protocol with an average (± SD) extra time for coil
positioning and re-positioning of 2 min 41.4s (± 15.3s), using for this purpose a
whole-body surface coil. In this regard, appropriate training of the intervention team
plays an essential role (Kettenbach et al. 2006). When using the iPad as a
visualisation device, times were slightly longer in the case of RTiPadBT
configuration (4.25 (0.45) min for treatment phase) but shorter in the case of
GEiPadBT. This can be explained by the lack of familiarity that the clinicians had
with this device (using it for the first time), since RTScreenBT and RTiPadBT
configurations were tested before GEScreenBT and GEiPadBT configurations. As
was reported during the interviews, clinicians detected a small delay (approximately
1-2 seconds) between the operational handle of the devices in the phantom and the
refresh of the images shown on the iPad screen. This delay is likely to be caused by a
network problem in the MRI environment setup and a more direct connection to
control the MRI is being investigated for the IMSaT team.
The performance analysis was supplemented by the CRPA methodology, which
provided the capture of all the experimental learning and observation data from the
clinician in an unbiased and unobtrusive method. By withholding commentary until
the task is completed, it removed the risk of contamination of thought and action by
concurrent protocols (which are problematic in an MRI scanner). The offline
analysis of video evidence allowed for the capture of procedural expertise through
the viewing of video. By creating a multiplex to view both first and third person
perspectives, the capacity of CRPA was maximised. In addition, the results of this
study raised the possibility of establishing the optimal form of video demonstration
for novice clinical staff, which could be investigated as a future application. By
manipulating the expertise level of the clinician, the speed of the video and rapidity
of the procedure itself, it can be determined whether the best demonstrator is an
expert working normally, or some other form of elaborated or exaggerated
demonstration. Recent work in more general tasks - such as small object lifting with
fingertips - raises an intriguing possibility that it might be more informative to view
novice as well as expert behaviour. In a series of experiments, Buckingham and
colleagues (Buckingham et al. 2013) presented participants with a cube-lifting task

128
and provided training with videos of accurate (expert) behaviour or erroneous lifting
behaviour (from novices when weights were uncertain). When they measured the
accuracy of the lifting using a biomechanical feedback register, they found better
performance for participants who had viewed novice error-prone lifts involving over-
and underestimation. This poses the question as to what would constitute the best
form of demonstration: error free expert learning or some combination of expert and
novice tuition? Perhaps viewing mistakes helps the observer appraise the parameters
of the task at hand, in which case these can highlight potential errors that may then
be avoided with proactive behaviour.
By contrast to this study, previous studies used multi-video recordings in
fluoroscopic interventions to evaluate intraprocedural decision making (Duncan,
Kline, and Glaiberman 2007; Beta et al. 2009). They focussed on task analysis from
the third-person perspective, not taking advantage of first-person experience nor
paying attention to how the limitations in the environment affect the performance.
As anecdotal reports, one of the operators had had previous microdiscectomy and
open operative repair of femoroacetabular impingement (i.e. back and hip surgery)
for which good posture is advised. Far from anecdotes, the prevalence of low back
injuries is a significant concern within the clinical community. Back pain appears as
a psychological stressor, leading to medical errors and thereby compromising patient
safety. In addition, it has a considerable impact on medical and legal costs (Klein et
al. 2009; Mohseni-Bandpei et al. 2011). Therefore, the design of an efficient
operational protocol in a new environment should be accompanied with a study of
the ergonomic constraints of the workplace. The study presented took one of the
most important constraints, which is clinician posture during the procedure, and
quantified it with regards to the stress it causes on the body segments and the muscle
work needed to maintain that position (McAtamney and Nigel Corlett 1993). Results
from the MRI environment indicated that the rooms should be adjusted for its use as
interventional facility. However, the DHM simulation results advised that the
adjustments should be customisable depending on the clinician anthropomorphic
features (e.g. height, weight, age). Further analyses should follow this work with
volunteers from different percentiles of the population. It could be beneficial to
perform a less subjective ergonomic analysis, placing sensors in the body during the

129
interventions to record precise parameters of the held postures. Recent similar
approaches in this regard have been done to assess surgeons’ positions during
laparoscopy procedures (Pérez-Duarte et al. 2014; Kramp et al. 2014).
9.6. Summary
This chapter described a systematic framework to observe, analyse and assess
operational protocols for vascular image-guided procedures. This multidisciplinary
framework allowed an integral comparison between a conventional protocol under
fluoroscopy and a new one under MRI guidance. In addition, several scenarios were
analysed in order to identify key factors for the development of efficient and safe
clinical protocols. In contrast to other similar studies, this comparison was
undertaken looking at multiple key factors to performance at the same time:
cognitive load, user experience and ergonomics. This approach could provide
information about relationship between those factors that has not been considered
before.

130
Chapter 10.
Conclusions and future work
10.1. Introduction
This final chapter summarises the major findings already discussed in chapters
from 4 to 7 and 9 for each use case. It discusses how these results match the research
hypotheses and propositions established in the first chapter. In addition, general
limitations of the present research work are presented, together with suggestions for
its improvement. In the last section, the chapter presents some potential applications
and possible future work.
10.2. Conclusions over research hypotheses and propositions
Hospitals are facing an increasing demand for vascular IGPs due to their many
benefits for patients. Moreover, the appearance of new imaging technologies, which
need to be integrated in the current radiology environments or require the design of
new interventional suites, makes essential the development of efficient workflows.
This thesis presented a methodological framework to analyse and model the intra-
operative phase of vascular interventions through two approaches: using discrete
event simulation and using a physical simulated environment. Four case studies
illustrated the successfully application of this framework: two common vascular
procedures, e.g. PCIs and iliac angioplasty, and a multi-modal image-guided
vascular procedure, e.g. TACE. The fourth case shows that the methodology can be
extended to other non-vascular multi-modal image guided procedures, e.g. MRgFUS
interventions. In addition, preliminary results are shown for the case of a complex
IGP, e.g. TAVI procedure in which a larger interdisciplinary team is usually
involved.
The DES models have been effectively used also to make predictions and
compare alternatives to current protocols in the TACE and MRgFUS interventions.
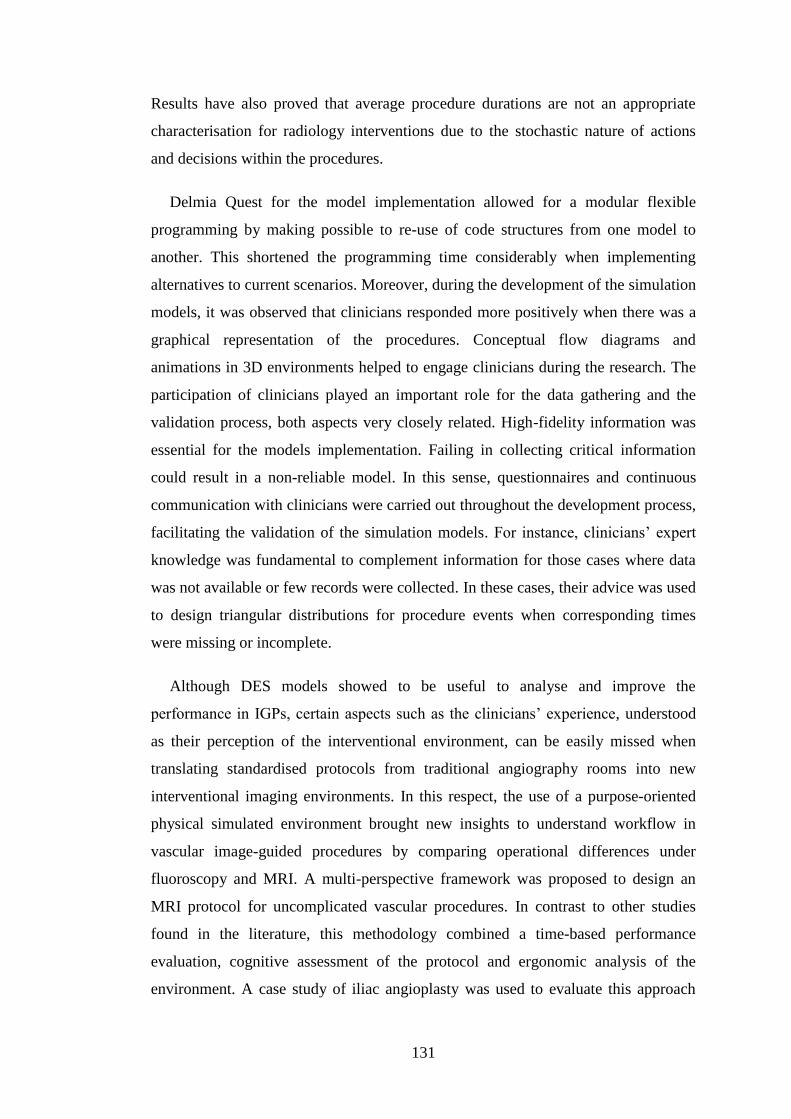
131
Results have also proved that average procedure durations are not an appropriate
characterisation for radiology interventions due to the stochastic nature of actions
and decisions within the procedures.
Delmia Quest for the model implementation allowed for a modular flexible
programming by making possible to re-use of code structures from one model to
another. This shortened the programming time considerably when implementing
alternatives to current scenarios. Moreover, during the development of the simulation
models, it was observed that clinicians responded more positively when there was a
graphical representation of the procedures. Conceptual flow diagrams and
animations in 3D environments helped to engage clinicians during the research. The
participation of clinicians played an important role for the data gathering and the
validation process, both aspects very closely related. High-fidelity information was
essential for the models implementation. Failing in collecting critical information
could result in a non-reliable model. In this sense, questionnaires and continuous
communication with clinicians were carried out throughout the development process,
facilitating the validation of the simulation models. For instance, clinicians’ expert
knowledge was fundamental to complement information for those cases where data
was not available or few records were collected. In these cases, their advice was used
to design triangular distributions for procedure events when corresponding times
were missing or incomplete.
Although DES models showed to be useful to analyse and improve the
performance in IGPs, certain aspects such as the clinicians’ experience, understood
as their perception of the interventional environment, can be easily missed when
translating standardised protocols from traditional angiography rooms into new
interventional imaging environments. In this respect, the use of a purpose-oriented
physical simulated environment brought new insights to understand workflow in
vascular image-guided procedures by comparing operational differences under
fluoroscopy and MRI. A multi-perspective framework was proposed to design an
MRI protocol for uncomplicated vascular procedures. In contrast to other studies
found in the literature, this methodology combined a time-based performance
evaluation, cognitive assessment of the protocol and ergonomic analysis of the
environment. A case study of iliac angioplasty was used to evaluate this approach

132
and results were presented in Chapter 9. Results indicated that it could be possible to
perform MRI-guided vascular procedures close in duration and operation to standard
fluoroscopic guided interventions. The qualitative assessment of the clinical
experience, presented through a CRPA, showed the importance and the need of an
integral and multi-directional framework in the development of operational protocols
for vascular IGPs, especially when they are developed for new technology
challenging imaging environments. Aspects as ergonomics, communication and
visualisation where highlighted by clinicians during the CRPA evaluation. The
methodology presented could aid the design of more efficient and safer procedures.
10.3. Limitations of present research work
Although some limitations have already been discussed particularly at the end of
each case study, this section discusses below general drawbacks of the present
research study and some suggestions on how they could be improved.
Analysing detail aspects of IGP workflows required the collection of large and
heterogeneous information within the procedures. Table 4 showed the type of data
intended to be collected in each procedure. However, as mentioned, this information
was not usually available and had to be collected by attending the procedures in most
of the cases. Collecting records by hand for specific procedures was very time
consuming and needed the collaboration of clinical staff members during the data
collection. As a result, datasets were not always complete and non-homogeneous
terminology was used. Some measures could be taken in the future to prevent these
limitations. For instance, video recording could have compensated the missing
information from the live observations. This is a costly and technical demanding
setup and would require ethical approval by the hospital that should be in place at the
start of the project; otherwise the data collection could be delayed by four or six
month in average. In addition, it would be advisable to use or develop an electronic
application that could allow collecting data using a common and homogenous
terminology for all vascular procedures. These applications have been used before to
record other types of surgical procedures. For example, the Surgical Workflow
Editor developed by the University of Leipzig (Neumuth et al.) can be used to define
specific ontological concepts regarding to particular surgical procedures that would

133
be used in the data collection, obtaining as a result homogenous datasets
differentiated only by the type of the procedures that are defined in the application.
The data collection also revealed an additional limitation when using the physical
simulated environment: the learning curve. After the first pilot study, clinicians were
familiar with the environment and with the protocol. Since the experiments were
prepared for uncomplicated interventions, this resulted in an expected better
performance in the repetitions per configuration analysed. In order to study further
this phenomenon, a suggestion could be to recruit more users with different level of
experience in interventional radiology and to perform more repetitions. In addition, it
could be interesting to see the effect that the videos from different perspectives
recorded for the CRPA may have in that learning curve. This could be done for
example by dividing the users in two groups: a group that would watch a third-user
perspective video (Figure 40(a)) and another group watching the first-user
perspective video prior to the experiments (Figure 40(d)).
10.4. Potential applications and future work
10.4.1. Perspectives for workflow analysis and simulations used for in
regulative procedures
Medical devices approval is based on safety and effectiveness. In 2005, the FDA
highlighted how training physicians through simulated procedures was likely to be
considered as a key factor in medical devices regulation (Cavanaugh 2005). In 2013,
the FDA gave approval for Elyria-based Surgical Theatre for their platform for
cerebral and spine pre-surgery simulation (http://www.surgicaltheater.net, access on
the 21/02/2014). This interactive platform allows for planning procedures and
developing additional cases from pre-loaded ones. Similar initiatives can be found in
the Center for Integration of Medicine and Innovative Technology (CIMIT, Boston,
USA, http://www.cimit.org/programs-simulation.html, accessed on the 21/02/2014).
CIMIT provides simulation-based training approaches for clinical workflows in, for
instance, trauma or minimally invasive surgical environments.
Simulation appears also as a flexible and efficient tool for risk management by
allowing reducing medical errors, testing case scenarios and training in

134
complications management (Caroll and Messenger 2008). In addition, some authors
are developing the so-called patient-specific simulation. These models based on
accurate data can help by determining tailored medical treatments aiding clinician in
the decision-support process (Sadiq et al. 2008).
10.4.2. Comprehensive ergonomic analysis
Chapters 8 and 9 presented a pilot study on radiologist’s postures during MRI-
guided interventions. The RULA analysis was proved to be a valid method to assess
the impact of the postures that clinicians hold during IGPs. In this present work,
postures were measured through videos and images taken during the procedures and
therefore they contained certain subjectivity. To ovoid this issue, further research
could be done using sensors placed in the areas of interest of the body, for instance
arms, low part of the back and head. This would allow an objective recording of the
postures. Some studies have successfully applied body sensor to record surgeon’s
positions and movements during procedures (Kramp et al. 2014; Pérez-Duarte et al.
2014).
In addition, to perform a more comprehensive ergonomic analysis, it would be
advisable to measure postures using volunteers from different genders and levels of
experience with different anthropometric features (height and weight). Moreover, a
comparative analysis could be done between the postures in traditional angiography
suites and in MRI rooms. In this case and since angiography tables can be rotated, it
could be interesting to find out if left-handed vs. right-handed people adds new
constraints in the MRI environment, which is more restrictive. On the other hand, it
would be necessary to add, in the case of angiography suites, how the use of lead
aprons affects the joints when they are worn for long periods.
10.4.3. Modelling multimodal imaging environments
As mentioned in the introduction, new multi-modal imaging operating suites are
being designed in response to the higher demand on minimally invasive surgery. The
AMIGO system at Brigham and Women’s Hospital (Boston, MA, USA) or MITOS
at the Clinical Research Centre at Ninewells Hospital (Dundee, UK) are some
examples of these suites. However, these facilities are very costly and therefore, they

135
should be used in the most efficient and cost-effective way possible. Simulation can
be used for planning improved workflow and help clinicians to deliver the best care.
Simulation-based medical education can help preparing clinicians with the
professional skills and knowledge needed in these new challenges environments.
Simulators have shown in last reports to be superior to traditional clinical medical
education in achieving specific skill acquisition goals (McGaghie et al. 2010).
Several approaches for the use of simulators in minimally invasive environments
confirm that is possible to transfer skills learned on a simulator to real operations,
resulting in error reduction, improving patient safety and shortening of procedural
operating time (Schreuder et al. 2011).
Some studies have also explore pattern recognition as tools to improve efficiency
in surgical environments, including IGPs (Nara et al. 2011). A system able to capture
workflow trajectories could help in the standardisation of procedures in new multi-
modal operating rooms such as the mentioned above, e.g. AMIGO and MITOS. The
system presented by Nara et al. used data mining techniques to post-process the
workflow patterns and acquire knowledge of the workflow that could support
decisions of staff about managing resources. These tools together with
comprehensive DES modelling could aid the design of new image-guided protocols.
Basic versions of DES models have been implemented for the MITOS CRC and
IMSaT facilities. These models could be used as test benches for testing multi-modal
image-guided protocols. Figure 51 shows the DES model of the CRC imaging
facilities. This 3D environment has been implemented at scale and equipped with the
fundamental resources and logic skeleton to facilitate the process programming. In a
similar way, Figure 52 presents the DES model of IMSaT MRI area, which is also
provided with a combined surgical and angiography suite. This model is already in a
more advanced development stage since basic logics for image-guided procedures
have been included for testing. This simulation model has been provided with real-
time annotations to identify the task that is being executed at every moment, which
can make easier the understanding and use of the model in a clinical environment.
Real-time annotations of procedural and task times, resource utilisation percentage,
etc. could be helpful during medical training.

136
Figure 51. DES model of the MITOS at the Clinical Research Centre (CRC) imaging facilities
(Ninewells Hospital, Dundee, UK).
Figure 52. DES model of the imaging facilities at the Institute for Medical Science and
Technology (IMSaT, University of Dundee, Dundee, UK).

137
References
Aguilar-Savén, Ruth Sara. 2004. “Business Process Modelling: Review and
Framework.” International Journal of Production Economics 90 (2) (July):
129–149. doi:10.1016/S0925-5273(03)00102-6.
Ahmed, Mohamed a., and Talal M. Alkhamis. 2009. “Simulation Optimization for
an Emergency Department Healthcare Unit in Kuwait.” European Journal of
Operational Research 198 (3) (November): 936–942.
doi:10.1016/j.ejor.2008.10.025.
Alexopoulos, Christos, and Dave Goldsman. 2010. “Probability and Statistics
Review”. Atlanta, GA, USA.
Balci, Osmat. 1986. “Credibility Assessment of Simulation Results: The State of the
Art”. Blacksburg, Virginia.
Ballinger, Gary a. 2004. “Using Generalized Estimating Equations for Longitudinal
Data Analysis.” Organizational Research Methods 7 (2) (April 1): 127–150.
doi:10.1177/1094428104263672.
Barter, S, K Drinkwater, and D Remedios. 2009. “National Audit of Provision of
MRI Services 2006/07.” Clinical Radiology 64 (3) (March): 284–90.
doi:10.1016/j.crad.2008.09.008.
Baumgart, Andre, Anja Zoeller, Christof Denz, Hans-joachim Bender, Armin
Heinzl, and Essameddin Badreddin. 2007. “Using Computer Simulation in
Operating Room Management: Impacts on Process Engineering and
Performance.” 2007 40th Annual Hawaii International Conference on System
Sciences (HICSS’07) (January): 131–131. doi:10.1109/HICSS.2007.593.
Bechhofer, RE. 1954. “A Single-Sample Multiple Decision Procedure for Ranking
Means of Normal Populations with Known Variances.” The Annals of
Mathematical Statistics 25: 16–39.
Beta, Elio, Ashesh S Parikh, Mandie Street, and James R Duncan. 2009. “Capture
and Analysis of Data from Image-Guided Procedures.” Journal of Vascular and
Interventional Radiology : JVIR 20 (6) (June): 769–81.
doi:10.1016/j.jvir.2009.03.012.
Blanco Sequeiros, R., R. Ojala, J. Kariniemi, J. Perälä, J. Niinimäki, H. Reinikainen,
and O. Tervonen. 2005. “MR-Guided Interventional Procedures: A Review.”
Acta Radiologica 46 (6) (January): 576–586. doi:10.1080/02841850510021742.
Bock, Michael, and Frank K Wacker. 2008. “MR-Guided Intravascular
Interventions: Techniques and Applications.” Journal of Magnetic Resonance
Imaging : JMRI 27 (2) (February): 326–38. doi:10.1002/jmri.21271.

138
Brailsford, SC, and NA Hilton. 2001. “A Comparison of Discrete Event Simulation
and System Dynamics for Modelling Health Care Systems.” In Proceedings
from ORAHS 2000, 18–39. Glasgow, UK.
Bruix, Jordi, and Morris Sherman. 2005. “Management of Hepatocellular
Carcinoma.” Hepatology (Baltimore, Md.) 42 (5) (November): 1208–36.
doi:10.1002/hep.20933.
———. 2011. “Management of Hepatocellular Carcinoma: An Update.” Hepatology
(Baltimore, Md.) 53 (3) (March): 1020–2. doi:10.1002/hep.24199.
Brusin, Joyce Helena. 2011. “Ergonomics in Radiology.” Journal of the American
Society of Radiologic Technologists 83 (2): 141–157.
Buckingham, Gavin, Jeremy D Wong, Minnie Tang, Paul L Gribble, and Melvyn a
Goodale. 2013. “Observing Object Lifting Errors Modulates Cortico-Spinal
Excitability and Improves Object Lifting Performance.” Cortex; a Journal
Devoted to the Study of the Nervous System and Behavior (July 19): 1–10.
doi:10.1016/j.cortex.2013.07.004.
Burl, M, G a Coutts, and I R Young. 1996. “Tuned Fiducial Markers to Identify
Body Locations with Minimal Perturbation of Tissue Magnetization.” Magnetic
Resonance in Medicine : Official Journal of the Society of Magnetic Resonance
in Medicine / Society of Magnetic Resonance in Medicine 36 (3) (September):
491–3.
Caroll, John D, and John C Messenger. 2008. “Medical Simulation: The New Tool
for Training and Skill Assessment.” Perspectives in Biology and Medicine 51
(1): 47–60.
Cassandras, C G, and S Lafortune. 2008. Introduction to Discrete Event Systems.
Control. Vol. 11. Springer.
Cavanaugh, Kenneth J. 2005. “FDA Perspective on Medical Simulation-Based
Training for Cardiovascular Devices.” In 2nd Annual Advanced Initiatives in
Medical Simulation. Bethesda, USA.
Chida, Koichi, Yuji Kaga, Yoshihiro Haga, Nozomi Kataoka, Eriko Kumasaka,
Taiichiro Meguro, and Masayuki Zuguchi. 2013. “Occupational Dose in
Interventional Radiology Procedures.” AJR. American Journal of
Roentgenology 200 (1) (January): 138–41. doi:10.2214/AJR.11.8455.
Civale, John, Robert Clarke, Ian Rivens, and Gail ter Haar. 2006. “The Use of a
Segmented Transducer for Rib Sparing in HIFU Treatments.” Ultrasound in
Medicine & Biology 32 (11) (November): 1753–61.
doi:10.1016/j.ultrasmedbio.2006.06.005.
Cook, Stéphane, Alexander Walker, Olivier Hügli, Mario Togni, and Bernhard
Meier. 2007. “Percutaneous Coronary Interventions in Europe: Prevalence,
Numerical Estimates, and Projections Based on Data up to 2004.” Clinical

139
Research in Cardiology : Official Journal of the German Cardiac Society 96 (6)
(June): 375–82. doi:10.1007/s00392-007-0513-0.
Crowe, B., and L. Sim. 2009. “PACS and CAD: An Aid to Productivity Gains in
Large Scale National Screening Programs.” International Journal for Computer
Assisted Radiology and Surgery (IJCARS) 4 (1): S160–S167.
doi:10.1007/s11548-009-0319-9.
De Senneville, Baudouin Denis, Charles Mougenot, and Chrit T W Moonen. 2007.
“Real-Time Adaptive Methods for Treatment of Mobile Organs by MRI-
Controlled High-Intensity Focused Ultrasound.” Magnetic Resonance in
Medicine : Official Journal of the Society of Magnetic Resonance in Medicine /
Society of Magnetic Resonance in Medicine 57 (2) (February): 319–30.
doi:10.1002/mrm.21124.
Dehmer, Gregory J. 2006. “Occupational Hazards for Interventional Cardiologists.”
Catheterization and Cardiovascular Interventions : Official Journal of the
Society for Cardiac Angiography & Interventions 68 (6) (December): 974–6.
doi:10.1002/ccd.21004.
Denton, BT, AS Rahman, and H Nelson. 2007. “Simulation of a Multiple Operating
Room Surgical Suite.” In Winter Simulation Conference, 414–424.
Dräger. 2012. “Dräger - Operating Rooms.” Accessed February 2.
http://www.draeger.com/UK/en/customer_groups/operating-room/index.jsp.
Dudewicz, E. J., J. S Ramberg, and H.J. Chen. 1975. “New Tables for Multiple
Comparisons with a Control (Unknown Variances).” Biometrical Journal 17
(1): 13–26.
Duerig, T.W., and M. Wholey. 2002. “A Comparison of Balloon- and Self-
Expanding Stents.” Minimally Invasive Therapy & Allied Technologies :
MITAT 11 (4) (July): 173–8. doi:10.1080/136457002760273386.
Duncan, James R, Benjamin Kline, and Craig B Glaiberman. 2007. “Analysis of
Simulated Angiographic Procedures. Part 2: Extracting Efficiency Data from
Audio and Video Recordings.” Journal of Vascular and Interventional
Radiology : JVIR 18 (4) (April): 535–44. doi:10.1016/j.jvir.2007.01.006.
Ehrenwerth, Jan, and MA Singleton. 2009. “Practice Advisory on Anesthetic Care
for Magnetic Resonance Imaging: a Report by the Society of Anesthesiologists
Task Force on Anesthetic Care for Magnetic Resonance Imaging.” … 110 (3):
459–479.
England, William, and Stephen Roberts. 1978. “Applications of Computer
Simulation in Health Care.” In Proceeding of the 1978 Winter Simulation
Conference, 4-6 December, 665–676. Miami Beach, Florida: Institute of
Electrical and Electronics Engineers.

140
Ernst, O, Geraldine Sergent, Didier Mizrahi, Olivier Delemazure, Jean-Claude Paris,
and Claude L’Hermine. 1999. “Treatment of Hepatocellular Carcinoma by
Transcatheter Arterial Chemoembolization: Comparison of Planned Periodic
Chemoembolization and Chemoembolization Based on Tumor.” American
Journal of Roentgenology 172 (January 1): 59–64.
European Association for the Study of the Liver, European Organisation for
Research and Treatment of Cancer. 2012. “EASL-EORTC Clinical Practice
Guidelines: Management of Hepatocellular Carcinoma.” Journal of Hepatology
56 (4) (April): 908–43. doi:10.1016/j.jhep.2011.12.001.
Fairbairn, Timothy a, David M Meads, Claire Hulme, Adam N Mather, Sven Plein,
Daniel J Blackman, and John P Greenwood. 2013. “The Cost-Effectiveness of
Transcatheter Aortic Valve Implantation Versus Surgical Aortic Valve
Replacement in Patients with Severe Aortic Stenosis at High Operative Risk.”
Heart (British Cardiac Society) 99 (13) (July): 914–20. doi:10.1136/heartjnl-
2013-303722.
Ferrari, Enrico, and Ludwig Karl von Segesser. 2010. “Transcatheter Aortic Valve
Implantation (TAVI): State of the Art Techniques and Future Perspectives.”
Swiss Medical Weekly 140 (December) (January): w13127.
doi:10.4414/smw.2010.13127.
Fischer, Krisztina, Wladyslaw Gedroyc, and Ferenc a Jolesz. 2010. “Focused
Ultrasound as a Local Therapy for Liver Cancer.” Cancer Journal (Sudbury,
Mass.) 16 (2): 118–24. doi:10.1097/PPO.0b013e3181db7c32.
Flin, R, S Yule, L McKenzie, S Paterson-Brown, and N Maran. 2006. “Attitudes to
Teamwork and Safety in the Operating Theatre.” The Surgeon : Journal of the
Royal Colleges of Surgeons of Edinburgh and Ireland 4 (3) (June): 145–51.
García-Lallana, a., G. Viteri-Ramírez, R. Saiz-Mendiguren, J. Broncano, and J.
Dámaso Aquerreta. 2011. “Ergonomics of the Workplace in Radiology.”
Radiología (English Edition) 53 (6) (November): 507–515.
doi:10.1016/j.rxeng.2011.06.002.
Garfinkel, David. 1971. “Applications of Computer Simulation and Related
Techniques to Patient Scheduling and Medical Administration.” Proceedings of
the 1971 26th Annual Conference on -: 648–654. doi:10.1145/800184.810531.
GE Healthcare. 2012. “GE Healthcare IT - Centricity.” Accessed February 2.
http://www.gehealthcare.com/euen/iis/index.html.
Gedroyc, W M. 2000. “Interventional Magnetic Resonance Imaging.” BJU
International 86 Suppl 1 (July): 174–80.
———. 2007. “New Clinical Applications of Magnetic Resonance-Guided Focused
Ultrasound.” In MRI-Guided Focused Ultrasound Surgery, edited by Ferenc A.
Jolesz and Kullervo H. Hynynen, 137–146. New York, NY, USA: Informa
Healthcare USA, Inc.

141
Gentric, Jean-Christophe, Brivael Trelhu, Pierre Jannin, Laurent Riffaud, Jean-
Christophe Ferré, and Jean-Yves Gauvrit. 2013. “Development of Workflow
Task Analysis During Cerebral Diagnostic Angiographies: Time-Based
Comparison of Junior and Senior Tasks.” Journal of Neuroradiology. Journal
de Neuroradiologie (July 1): 1–6. doi:10.1016/j.neurad.2013.01.002.
Gilson, Wesley D, and Frank Wacker. 2012. “Hybrid MRI Systems and
Applications.” In Interventional Magnetic Resonance Imaging, Medical
Radiology. Diagnostic Imaging., edited by Thomas Kahn and Harald Busse,
445–455. Springer Berlin Heidelberg. doi:10.1007/174.
Goyal, N, N Jain, and V Rachapalli. 2009. “Ergonomics in Radiology.” Clinical
Radiology 64 (2) (February): 119–26. doi:10.1016/j.crad.2008.08.003.
Granja, C., J. Mendes, Filipe Janela, J. Soares, and A. Mendes. 2010. “Optimisation-
Based on Simulation: A Diagnostic Imaging Department Case-Study.” In
Second International Conference on Information, Process, and Knowledge
Management, 2010. eKNOW’10., 32–36. IEEE. doi:10.1109/eKNOW.2010.26.
Grech, Ever D. 2003. “Percutaneous Coronary Intervention . I : History and
Development History of Myocardial Revascularisation Developments in
Percutaneous Intervention” (May).
Harisinghani, Mukesh G, Michael a Blake, Mansi Saksena, Peter F Hahn, Debra
Gervais, Michael Zalis, Leonor da Silva Dias Fernandes, and Peter R Mueller.
2004. “Importance and Effects of Altered Workplace Ergonomics in Modern
Radiology Suites.” Radiographics : a Review Publication of the Radiological
Society of North America, Inc 24 (2): 615–27. doi:10.1148/rg.242035089.
He, Yulei. 2010. “Missing Data Analysis Using Multiple Imputation: Getting to the
Heart of the Matter.” Circulation. Cardiovascular Quality and Outcomes 3 (1)
(January): 98–105. doi:10.1161/CIRCOUTCOMES.109.875658.
Hlupic, V., Z. Irani, and R. J. Paul. 1999. “Evaluation Framework for Simulation
Software.” The International Journal of Advanced Manufacturing Technology
15 (5) (May): 366–382. doi:10.1007/s001700050079.
Hlupic, Vlatka. 2000a. “Simulation Software: An Operational Research Society
Survey of Academic and Industrial Users.” In Proceedings of the 32nd
Conference on Winter Simulation, 1676 – 1683. Society for Computer
Simulation International.
———. 2000b. “Simulation Software: a Survey of Academic and Industrial Users.”
International Journal of Simulation 1 (1-2): 1–11.
Hokland, Steffen L, Michael Pedersen, Rares Salomir, Bruno Quesson, Hans
Stødkilde-Jørgensen, and Chrit T W Moonen. 2006. “MRI-Guided Focused
Ultrasound: Methodology and Applications.” IEEE Transactions on Medical
Imaging 25 (6) (June): 723–31.

142
Holbrook, Andrew B, Pejman Ghanouni, Juan M Santos, Charles Dumoulin, Yoav
Medan, and Kim Butts Pauly. 2014. “Respiration Based Steering for High
Intensity Focused Ultrasound Liver Ablation.” Magnetic Resonance in
Medicine 71 (March 4): 797–806. doi:10.1002/mrm.24695.
Hynynen, Kullervo. 2010. “MRI-Guided Focused Ultrasound Treatments.”
Ultrasonics 50 (2) (February): 221–9. doi:10.1016/j.ultras.2009.08.015.
Ibrahim, Joseph G, Ming-Hui Chen, Stuart R Lipsitz, and Amy H Herring. 2005.
“Missing-Data Methods for Generalized Linear Models.” Journal of the
American Statistical Association 100 (469) (March): 332–346.
doi:10.1198/016214504000001844.
IEEE Standard Computer Dictionary. 1991. “A Compilation of IEEE Standard
Computer Glossaries.”
Jadhav, A., and R Sonar. 2009. “Evaluating and Selecting Software Packages: A
Review.” Information and Software Technology 51 (3) (March): 555–563.
doi:10.1016/j.infsof.2008.09.003.
Jannin, P, and X Morandi. 2007. “Surgical Models for Computer-Assisted
Neurosurgery.” NeuroImage 37 (3) (September 1): 783–91.
doi:10.1016/j.neuroimage.2007.05.034.
Jeans, WD, SR Berger, and R Gill. 1972. “Computer Simulation Model of an X-Ray
Department.” British Medical Journal 1 (5801): 675–679.
Johnson, S, a Healey, J Evans, M Murphy, M Crawshaw, and D Gould. 2006.
“Physical and Cognitive Task Analysis in Interventional Radiology.” Clinical
Radiology 61 (1) (January): 97–103. doi:10.1016/j.crad.2005.09.003.
Johnston, MJ, P Samaranayake, A Dadich, and J A Fitzgerald. 2009. “Modelling
Radiology Department Operation Using Discrete Event Simulation.” In
MODSIM, International Congress on Modelling and Simulation, 678–684.
Cairns, Australia.
Jolesz, Ferenc a. 2009. “MRI-Guided Focused Ultrasound Surgery.” Annual Review
of Medicine 60 (January): 417–30.
doi:10.1146/annurev.med.60.041707.170303.
Jolesz, Ferenc A, Kullervo Hynynen, David Freundlich, and Doron Kopelman. 2004.
“Noninvasive Thermal Ablation of Hepatocellular Carcinoma by Using
Magnetic Resonance Imaging–Guided Focused Ultrasound”: 242–247.
doi:10.1053/j.gast.2004.09.056.
Kanal, Emanuel, a James Barkovich, Charlotte Bell, James P Borgstede, William G
Bradley, Jerry W Froelich, J Rod Gimbel, et al. 2013. “ACR Guidance
Document on MR Safe Practices: 2013.” Journal of Magnetic Resonance
Imaging : JMRI 37 (3) (March): 501–30. doi:10.1002/jmri.24011.

143
Kapamara, T, K Sheibani, and D Petrovic. 2007. “A Simulation of a Radiotherapy
Treatment System: A Case Study of a Local Cancer Centre.” In Proc. of ORP3 -
the Operational Research Peripatetic Post-Graduate Programme, 1–7.
Katritsis, D, E Efstathopoulos, S Betsou, S Korovesis, K Faulkner, G Panayiotakis,
and M M Webb-Peploe. 2000. “Radiation Exposure of Patients and Coronary
Arteries in the Stent Era: A Prospective Study.” Catheterization and
Cardiovascular Interventions : Official Journal of the Society for Cardiac
Angiography & Interventions 51 (3) (November): 259–64.
Katsaliaki, K, and N Mustafee. 2011. “Applications of Simulation Within the
Healthcare Context.” Journal of the Operational Research Society 62 (8)
(October 13): 1431–1451. doi:10.1057/jors.2010.20.
Kettenbach, Joachim, Daniel F Kacher, Angela R Kanan, Bill Rostenberg, Janice
Fairhurst, Alfred Stadler, K Kienreich, and Ferenc a Jolesz. 2006.
“Intraoperative and Interventional MRI: Recommendations for a Safe
Environment.” Minimally Invasive Therapy & Allied Technologies : MITAT :
Official Journal of the Society for Minimally Invasive Therapy 15 (2) (January):
53–64. doi:10.1080/13645700600640774.
Kiekhaefer, Andrew Paul. 2011. “Simulation Ranking and Selection Procedures and
Applications in Network Reliability Design”. University of Iowa.
Klein, Lloyd W, Donald L Miller, Stephen Balter, Warren Laskey, David Haines,
Alexander Norbash, Matthew A Mauro, and James A Goldstein. 2009.
“Occupational Health Hazards in Time for a Safer Environment” 250 (2): 538–
544.
Kokilaben Hospital Brochure, A. 2009. “Kokilaben Hospital Brochure.” Kokilaben
Hospital.
Kolisch, Rainer, and Sabine Sickinger. 2008. “Providing Radiology Health Care
Services to Stochastic Demand of Different Customer Classes.” OR Spectrum
30 (2): 375–395. doi:10.1007/s00291-007-0116-1.
Kopelman, Doron, Yael Inbar, Arik Hanannel, David Freundlich, David Castel,
Azriel Perel, Adrian Greenfeld, et al. 2006. “Magnetic Resonance-Guided
Focused Ultrasound Surgery (MRgFUS): Ablation of Liver Tissue in a Porcine
Model.” European Journal of Radiology 59 (2) (August): 157–62.
doi:10.1016/j.ejrad.2006.04.008.
Kos, Sebastian, Rolf Huegli, Georg M Bongartz, Augustinus L Jacob, and Deniz
Bilecen. 2008. “MR-Guided Endovascular Interventions: a Comprehensive
Review on Techniques and Applications.” European Radiology 18 (4) (April):
645–57. doi:10.1007/s00330-007-0818-4.
Kotiadis, Kathy, and Stewart Robinson. 2008. “Conceptual Modelling: Knowledge
Acquisition and Model Abstraction.” In Proceedings of the 2008 Winter

144
Simulation Conference, edited by SJ Mason, RR Hill, L Monch, O Rose, T
Jefferson, and JW Fowler, 951–958. Miami, FL, USA.
Kpodonu, Jacques. 2010. “Hybrid Cardiovascular Suite: The Operating Room of the
Future.” Journal of Cardiac Surgery 25 (6) (November): 704–9.
doi:10.1111/j.1540-8191.2010.01111.x.
Kramp, Kelvin H, Marc J van Det, Eric R Totte, Christiaan Hoff, and Jean-Pierre E
N Pierie. 2014. “Ergonomic Assessment of the French and American Position
for Laparoscopic Cholecystectomy in the MIS Suite.” Surgical Endoscopy 28
(5) (May): 1571–8. doi:10.1007/s00464-013-3353-1.
Krombach, Gabriele A. 2012. “MRI Guidance of Vascular Applications.”
doi:10.1007/174.
Law, Averill M. 2007. Simulation Modeling and Analysis. Forth Edit. Mcgraw Hill
Higher Education.
Lehatto, Annie, and Carlos Amato. 2012. “The New Standard for Intraoperative
Imaging Environments.” Healthcare Design Magazine.
http://www.healthcaredesignmagazine.com/article/new-standard-intraoperative-
imaging-environments?page=show.
Lev, Benjamin, George Reveszb, Francis Shea, and Robert Caltagirone. 1976.
“Patient Flow Analysis and the Delivery of Radiology Service.” Socio-
Economic Planning Sciences 10 (4): 159–166.
Liebsch, Cindy Marie. 2003. “Simulation Input Modeling in the Absence of Data”.
North Carolina State University, Raleigh, North Carolina, USA.
Lindsköld, L., P. Aspelin, B. Jacobsson, and N. Lundberg. 2008. “The Use of
Simulation in Radiology.” Radiology Management 30 (3): 55.
Llovet, Josep M, Adrian M Di Bisceglie, Jordi Bruix, Barnett S Kramer, Riccardo
Lencioni, Andrew X Zhu, Morris Sherman, et al. 2008. “Design and Endpoints
of Clinical Trials in Hepatocellular Carcinoma.” Journal of the National Cancer
Institute 100 (10) (May 21): 698–711. doi:10.1093/jnci/djn134.
Loeve, AJ, J Al-Issawi, Fabiola Fernandez-Gutierrez, M Matzko, A Napoli, and J
Dankelman. 2013. “MRgFUS Workflow and Bottle-Necks - Preliminary
Results.” In 25th Conference of the Society for Medical Innovation and
Technology (SMIT 2013). Baden-Baden, Germany.
Lozano, Iñigo, Ramón López-Palop, Eduardo Pinar, Daniel Saura, Francisco Picó,
and Mariano Valdés. 2004. “Direct Stenting Without Predilatation: Influence of
Stent Diameter on the Immediate Results.” Revista Española de Cardiología 57
(1) (January): 81–4.
Mans, RS, NC Russell, WMP van der Aalst, AJ Moleman, and PJM Bakker. 2008.
“Augmenting a Workflow Management System with Planning Facilities Using

145
Colored Petri Nets.” In Proceedings of the Nineth Workshop on the Practical
Use of Coloured Petri Nets and CPN Tools (CPN 2008), 143–162. Aarhus,
Denmark.
Manual, Quest. 2006. Quest Manual. Edited by Delmia Corporation. Vol. 48326.
Auburn Hills, MI, USA.
Marjamaa, R, a Vakkuri, and O Kirvelä. 2008. “Operating Room Management:
Why, How and by Whom?” Acta Anaesthesiologica Scandinavica 52 (5)
(May): 596–600. doi:10.1111/j.1399-6576.2008.01618.x.
Marjamaa, Riitta a., Paulus M. Torkki, Eero J. Hirvensalo, and Olli a. Kirvelä. 2008.
“What Is the Best Workflow for an Operating Room? A Simulation Study of
Five Scenarios.” Health Care Management Science 12 (2) (July): 142–146.
doi:10.1007/s10729-008-9073-8.
Martínez-Elbal, L, J M Ruiz-Nodar, J Zueco, J R López-Minguez, J Moreu, I Calvo,
J a Ramirez, et al. 2002. “Direct Coronary Stenting Versus Stenting with
Balloon Pre-Dilation: Immediate and Follow-up Results of a Multicentre,
Prospective, Randomized Study. The DISCO Trial. DIrect Stenting of
COronary Arteries.” European Heart Journal 23 (8) (April): 633–40.
doi:10.1053/euhj.2001.2893.
McAtamney, L, and E Nigel Corlett. 1993. “RULA: a Survey Method for the
Investigation of Work-Related Upper Limb Disorders.” Applied Ergonomics 24
(2) (April): 91–9.
McGaghie, William C, S Barry Issenberg, Emil R Petrusa, and Ross J Scalese. 2010.
“A Critical Review of Simulation-Based Medical Education Research: 2003-
2009.” Medical Education 44 (1) (January): 50–63. doi:10.1111/j.1365-
2923.2009.03547.x.
McGee, KP, KH Lee, H Ward, MJ Link, and WJ. 2007. “Development of a Two-
Room MR/OR Suite: Concept to Clinical Implementation.” In Proc. Intll. Soc.
Magnetic Resonance in Medicine, 13:1111.
Melzer, A, A Schmidt, and K Kipfmüller. 1997. “Technology and Principles of
Tomographic Image-Guided Interventions and Surgery.” Surgical … 11: 946–
956.
Melzer, Andreas. 2003. “Operating Theatres: The Future.” European Hospital 3: 25–
7.
Melzer, Andreas, and Luc Bidaut. 2012. “TCT-335 MITOS Multimodality Imaging
Operating System.” Journal of the American College of Cardiology 60 (17)
(October): B94–B95. doi:10.1016/j.jacc.2012.08.360.
Melzer, Andreas, Erwin Immel, Richard Boyd, and Daniel Wendt. 2014. “MRI
Enhancing Implants.” In Intraoperative Imaging and Image-Guided Therapy,

146
edited by Ferenc A. Jolesz, 725 – 737. New York, NY: Springer New York.
doi:10.1007/978-1-4614-7657-3.
Melzer, Andreas, Erwin Immel, Rachel Toomey, and Fabiola Fernandez-Gutierrez.
2011. “MR-Guided Interventions and Surgery.” In Springer Handbook of
Medical Technology, edited by Rüdiger Kramme, Klaus-Peter Hoffmann, and
Robert Pozos, 477–502. Heidelberg, Germany: Springer Science+Business.
Mohseni-Bandpei, Mohammad a, Marjan Ahmad-Shirvani, Nazanin Golbabaei,
Hamid Behtash, Zahra Shahinfar, and César Fernández-de-las-Peñas. 2011.
“Prevalence and Risk Factors Associated with Low Back Pain in Iranian
Surgeons.” Journal of Manipulative and Physiological Therapeutics 34 (6):
362–70. doi:10.1016/j.jmpt.2011.05.010.
Moris, Matías Urenda. 2010. “Dealing with Variability in the Design, Planning and
Evaluation of Healthcare Inpatient Units: a Modelling Methodology for Patient
Dependency Variations.” Annals of Physics. PhD thesis, University of Skovde,
Sweden.
Murphy, Aileen, Elisabeth Fenwick, William D Toff, Matthew P Neilson, Colin
Berry, Neal Uren, Keith G Oldroyd, and Andrew H Briggs. 2013.
“Transcatheter Aortic Valve Implantation for Severe Aortic Stenosis: The Cost-
Effectiveness Case for Inoperable Patients in the United Kingdom.”
International Journal of Technology Assessment in Health Care 29 (1)
(January): 12–9. doi:10.1017/S0266462312000670.
Nakayama, Marvin K. 2006. “Output Analysis for Simulations.” In Proceedings of
the 2006 Winter Simulation Conference, 36–46. Washington DC.
Nara, Atsushi, Kiyoshi Izumi, Hiroshi Iseki, and Takashi Suzuki. 2011. “Surgical
Workflow Monitoring Based on Trajectory Data Mining.” New Frontiers in
Artificial Intelligence 6797: 283–291.
Nara, Atsushi, Kiyoshi Izumi, Hiroshi Iseki, Takashi Suzuki, Kyojiro Nambu, and
Yasuo Sakurai. 2009. “Surgical Workflow Analysis Based on Staff’s Trajectory
Patterns.” In M2CAI Workshop, MICCAI, London.
Neumuth, Thomas, Pierre Jannin, Gero Strauss, Juergen Meixensberger, and Oliver
Burgert. “Validation of Knowledge Acquisition for Surgical Process Models.”
Journal of the American Medical Informatics Association : JAMIA 16 (1): 72–
80. doi:10.1197/jamia.M2748.
Nickel, Stefan, and Ursula-Anna Schmidt. 2009. “Process Improvement in Hospitals:
a Case Study in a Radiology Department.” Quality Management in Health Care
18 (4): 326–38. doi:10.1097/QMH.0b013e3181bee127.
Nitz, Wolfgang R. 2011. “Magnetic Resonance Imaging.” In Springer Handbook of
Medical Technology, edited by Rüdiger Kramme, Klaus-Peter Hoffmann, and
Robert S. Pozos, 439–476. Heidelberg, Germany, Germany: Springer
Science+Business.

147
Nollert, Georg, and Sabine Wich. 2009. “Planning a Cardiovascular Hybrid
Operating Room: The Technical Point of View.” The Heart Surgery Forum 12
(3) (June): E125–30. doi:10.1532/HSF98.20091033.
O’Kane, P. Ciaran. 1981. “A Simulation Model of a Diagnostic Radiology
Department.” European Journal of Operational Research 6 (1): 38–45.
Okada, A, T Murakami, and K Mikami. 2006. “A Case of Hepatocellular Carcinoma
Treated by MR-Guided Focused Ultrasound Ablation with Respiratory Gating.”
Magn Reson Med … 5 (3): 167–171.
Otsubo, Tetsuya, Yuichi Imanaka, Jason Lee, and Kenshi Hayashida. 2011.
“Evaluation of Resource Allocation and Supply-Demand Balance in Clinical
Practice with High-Cost Technologies.” Journal of Evaluation in Clinical
Practice 17 (6) (December): 1114–21. doi:10.1111/j.1365-2753.2010.01484.x.
Padoy, Nicolas, Tobias Blum, Seyed-Ahmad Ahmadi, Hubertus Feussner, Marie-
Odile Berger, and Nassir Navab. 2010. “Statistical Modeling and Recognition
of Surgical Workflow.” Medical Image Analysis (December 8): 1–10.
doi:10.1016/j.media.2010.10.001.
Patel, NV. 2000. “Healthcare Modelling through Role Activity Diagrams for
Process-Based Information Systems Development.” Requirements Engineering
5 (2): 83–92.
Paulson, E. 1964. “A Sequential Procedure for Selecting the Population with the
Largest Mean from k Normal Populations.” The Annals of Mathematical
Statistics 35 (1): 174–180.
Peltokorpi, Antti, JM Lehtonen, J Kujala, and J. 2008. “Operating Room Cost
Management in Cardiac Surgery: a Simulation Study.” International Journal of
Healthcare Technology and Management 9 (1): 60–73.
Pérez-Duarte, F J, M Lucas-Hernández, a Matos-Azevedo, J a Sánchez-Margallo, I
Díaz-Güemes, and F M Sánchez-Margallo. 2014. “Objective Analysis of
Surgeons’ Ergonomy During Laparoendoscopic Single-Site Surgery through the
Use of Surface Electromyography and a Motion Capture Data Glove.” Surgical
Endoscopy 28 (4) (April): 1314–20. doi:10.1007/s00464-013-3334-4.
Philips. 2012. “Philips - Site Planning.” Accessed February 2.
http://www.healthcare.philips.com/main/support/siteplanning/layouts_article.w
pd.
Pirolo, John, Abhijit Ray, Mario Manese, Brannon Garvert, George Scoville,
Howard Walpole, Bob Amland, et al. 2009. “Utilisation of Discrete Event
Simulation in the Prospective Determination of Optimal Cardiovascular Lab
Processes.” In Proceedings of the 2009 Winter Simulation Conference, edited
by M D Rossetti, R R Hill, B Johansson, A Dunkin, and R G Ingalls, 1916–
1926. Austin, TX, USA.

148
Pommi, Doris. 2011. “Interventional Radiology - Angiography.” In Springer
Handbook of Medical Technology, edited by Rüdiger Kramme, Klaus-Peter
Hoffmann, and Robert S. Pozos, 417–421. Heidelberg, Germany: Springer
Science+Business.
uesson, Bruno, Mathilde Merle, Max O. Köhler, Charles Mougenot, Sebastien
Roujol, Baudouin Denis de Senneville, and Chrit T. Moonen. 2010. “A Method
for MRI Guidance of Intercostal High Intensity Focused Ultrasound Ablation in
the Liver.” Medical Physics 37 (6): 2533. doi:10.1118/1.3413996.
Radiology, Society of Interventional. 2010. “Global Statement Defining
Interventional Radiology.” Special Communications. J Vasc Interv Radiol 21
(8): 1147–1149.
Radiologyinfo.org. 2013a. “What Is Chemoembolization?”
http://www.radiologyinfo.org/en/pdf/chemoembol.pdf.
———. 2013b. “What Is Radiation Dose ?”
http://www.radiologyinfo.org/en/pdf/sfty_hiw_09.pdf.
Ramsay, C, R Pickard, C Robertson, a Close, L Vale, N Armstrong, D a Barocas, et
al. 2012. “Systematic Review and Economic Modelling of the Relative Clinical
Benefit and Cost-Effectiveness of Laparoscopic Surgery and Robotic Surgery
for Removal of the Prostate in Men with Localised Prostate Cancer.” Health
Technology Assessment (Winchester, England) 16 (41) (January): 1–313.
doi:10.3310/hta16410.
Raza, S.M. 2006. “Radiation Exposure in the Cath Lab - Safety and Precautions.”
http://priory.com/med/radiation.htm.
Refsgaard, Jens Christian, and Hans Jørgen Henriksen. 2004. “Modelling
Guidelines––terminology and Guiding Principles.” Advances in Water
Resources 27 (1) (January): 71–82. doi:10.1016/j.advwatres.2003.08.006.
Reindl, Sonja, L. Monch, M. Monch, and A. Scheider. 2009. “Modeling and
Simulation of Cataract Surgery Processes.” In Winter Simulation Conference
(WSC), Proceedings of the 2009, 1937–1945. IEEE.
Rieke, V, AM Kinsey, and AB Ross. 2007. “Referenceless MR Thermometry for
Monitoring Thermal Ablation in the Prostate.” IEEE Trans Med Imaging 26
(6): 813–821. doi:10.1109/TMI.2007.892647.Referenceless.
Rieke, Viola, and Kim Butts Pauly. 2008. “MR Thermometry.” Journal of Magnetic
Resonance Imaging : JMRI 27 (2) (February): 376–90. doi:10.1002/jmri.21265.
Rostenberg, Bill, and Paul R. Barach. 2011. “Design of Cardiovascular Operating
Rooms for Tomorrow’s Technology and Clinical Practice — Part One.”
Progress in Pediatric Cardiology 33 (1) (December): 57–65.
doi:10.1016/j.ppedcard.2011.12.010.

149
Rube, Martin A, Fabiola Fernandez-Gutierrez, Benjamin Forbes Cox, Andrew B
Holbrook, John G Houston, Richard D White, Helen McLeod, Mahsa Fatahi,
and Andreas Melzer. 2014. “Preclinical Feasibility of a Technology Framework
for MRI-guided Iliac Angioplasty.” International Journal of Computer Assisted
Radiology and Surgery Accepted.
Saborowski, Olaf, and Maythem Saeed. 2007. “An Overview on the Advances in
Cardiovascular Interventional MR Imaging.” Magma (New York, N.Y.) 20 (3)
(June): 117–27. doi:10.1007/s10334-007-0074-2.
Sadiq, S. K., M. D Mazzeo, S. J Zasada, S. Manos, I. Stoica, C. V Gale, S. J Watson,
P. Kellam, S. Brew, and P. V Coveney. 2008. “Patient-Specific Simulation as a
Basis for Clinical Decision-Making.” Philosophical Transactions of the Royal
Society A: Mathematical, Physical and Engineering Sciences 366 (1878)
(September 13): 3199–3219. doi:10.1098/rsta.2008.0100.
Sadus, R. 2011. “Introduction in the Monte Carlo Methods.” Biometrische
Zeitschrift. Vol. 7. Hawthorn Victoria. Australia.
Santibáñez, Pablo, Vincent S. Chow, John French, Martin L. Puterman, and Scott
Tyldesley. 2009. “Reducing Patient Wait Times and Improving Resource
Utilization at British Columbia Cancer Agency’s Ambulatory Care Unit
through Simulation.” Health Care Management Science 12 (4) (March 13):
392–407. doi:10.1007/s10729-009-9103-1.
Santos, Juan M, Graham a Wright, and John M Pauly. 2004. “Flexible Real-Time
Magnetic Resonance Imaging Framework.” Conference Proceedings : ...
Annual International Conference of the IEEE Engineering in Medicine and
Biology Society. IEEE Engineering in Medicine and Biology Society.
Conference 2 (January): 1048–51. doi:10.1109/IEMBS.2004.1403343.
Sapareto, Stephen A, and William C Dewey. 1984. “Thremal Dose Determination in
Cancer Therapy.” International Journal of Radiation, Oncology, Biology,
Physics 10: 787–800.
Sargent, Robert G. 2011. “Verification and Validation of Simulation Models.” In
Proceedings of the 2011 Winter Simulation Conference, edited by Eds. S. Jain,
R.R. Creasey, J. Himmelspach, K.P. White, and M. Fu, 183–198.
Scheffé, Henry. 1970. “Practical Solutions of the Behrens-Fisher Problem.” Journal
of the American Statistical Association 65 (332): 1501–1508.
Schlesinger, S, RE Crosbie, RE Gagné, GS Innis, CS Lalwani, J Loch, RJ Sylvester,
RD Wright, N Kheir, and D Bartos. 1979. “Terminology for Model
Credibility.” Simulation 32 (3): 103–104.
Schmidt, Joseph William, and Robert Edward Taylor. 1970. Simulation and Analysis
of Industrial Systems. Edited by Richard D. Irwin.

150
Schreuder, HW, G Oei, M Maas, JC Borleffs, and MP Schijven. 2011.
“Implementation of Simulation in Surgical Practice: Minimally Invasive
Surgery Has Taken the Lead: The Dutch Experience.” Medical Teacher 33 (2):
105–15.
Schulz, Thomas, Silvia Puccini, Jens-Peter Schneider, and Thomas Kahn. 2004.
“Interventional and Intraoperative MR: Review and Update of Techniques and
Clinical Experience.” European Radiology 14 (12) (December): 2212–27.
doi:10.1007/s00330-004-2496-9.
Siemens. 2012a. “Dot - The MRI Workflow Engine.” Accessed February 2.
http://www.medical.siemens.com/webapp/wcs/stores/servlet/CategoryDisplay~
q_catalogId~e_-
11~a_categoryId~e_1039566~a_catTree~e_100010,1007660,12754,1039566~a
_langId~e_-11~a_storeId~e_10001.htm.
———. 2012b. “Symbia.net - Clinical Workflow Server.” Accessed February 2.
http://www.medical.siemens.com/webapp/wcs/stores/servlet/ProductDisplay~q
_catalogId~e_-
11~a_catTree~e_100010,1007660,1011525,1011533,1026465,1026515~a_lang
Id~e_-11~a_productId~e_191891~a_storeId~e_10001.htm.
———. 2012c. “Tecnomatix Plant Design and Optimisation.” Accessed February 2.
http://www.plm.automation.siemens.com/en_us/products/tecnomatix/plant_desi
gn/index.shtml.
Sikkink, C J J M, M M P J Reijnen, and C J Zeebregts. 2008. “The Creation of the
Optimal Dedicated Endovascular Suite.” European Journal of Vascular and
Endovascular Surgery : the Official Journal of the European Society for
Vascular Surgery 35 (2) (February): 198–204. doi:10.1016/j.ejvs.2007.08.009.
Sirl, David. 2005. “Markov Chains : An Introduction / Review.” In MASCOS
Workshop on Algebraic Dynamics. Sydney, Australia: University of New South
Wales.
Sobolev, Boris G, Victor Sanchez, and Christos Vasilakis. 2011. “Systematic
Review of the Use of Computer Simulation Modeling of Patient Flow in
Surgical Care.” Journal of Medical Systems 35 (1) (February 1): 1–16.
doi:10.1007/s10916-009-9336-z.
SPRINT. 2009. “A Guide to Role Activity Diagrams.” http://www.sprint.gov.uk/
index.php?option=com_content&view=article&id=56&Itemid=64.
Stahl, James E, Warren S Sandberg, Bethany Daily, Richard Wiklund, Marie T
Egan, Julian M Goldman, Keith B Isaacson, Scott Gazelle, and David W
Rattner. 2006. “Reorganizing Patient Care and Workflow in the Operating
Room: a Cost-Effectiveness Study.” Surgery 139 (6) (June): 717–28.
doi:10.1016/j.surg.2005.12.006.

151
Stephens, MA. 1974. “EDF Statistics for Goodness of Fit and Some Comparisons.”
Journal of the American Statistical Association 69 (347): 730–737.
Suramo, I, M Paivansalo, and V Myllyla. 1984. “Cranio-Caudal Movements of the
Liver, Pancreas and Kidneys in Respiration.” Acta Radiology Diagnosis 25:
129–131.
Swain, J., and P. MacGinley. 2009. “OR / MS Today - Simulation Software Survey.”
OR/MS Today. http://www.orms-today.org/surveys/Simulation/Simulation.html.
Takahara, Taro, Thomas Kwee, Satoshi Kibune, Reiji Ochiai, Tetsuro Sakamoto,
Tetsu Niwa, Marc Van Cauteren, and Peter Luijten. 2010. “Whole-Body MRI
Using a Sliding Table and Repositioning Surface Coil Approach.” European
Radiology 20 (6) (June): 1366–73. doi:10.1007/s00330-009-1674-1.
Takayasu, Kenichi, Shigeki Arii, Iwao Ikai, Masao Omata, Kiwamu Okita, Takafumi
Ichida, Yutaka Matsuyama, et al. 2006. “Prospective Cohort Study of
Transarterial Chemoembolization for Unresectable Hepatocellular Carcinoma in
8510 Patients.” Gastroenterology 131 (2) (August): 461–9.
doi:10.1053/j.gastro.2006.05.021.
Tavakol, Morteza, Salman Ashraf, and SJ Brener. 2012. “Risks and Complications
of Coronary Angiography: a Comprehensive Review.” Global Journal of
Health … 4 (1): 65–93. doi:10.5539/gjhs.v4n1p65.
Torkki, Paulus Mikael, Antti Ilmari Alho, Antti Veikko Peltokorpi, Markus Ilmari
Torkki, and Pentti Ensio Kallio. 2006. “Managing Urgent Surgery as a Process:
Case Study of a Trauma Center.” International Journal of Technology
Assessment in Health Care 22 (2) (January): 255–60.
doi:10.1017/S0266462306051087.
Van Buuren, Stef. 2007. “Multiple Imputation of Discrete and Continuous Data by
Fully Conditional Specification.” Statistical Methods in Medical Research 16:
219–242.
Van Gog, Tamara, Fred Paas, Jeroen J G van Merriënboer, and Puk Witte. 2005.
“Uncovering the Problem-Solving Process: Cued Retrospective Reporting
Versus Concurrent and Retrospective Reporting.” Journal of Experimental
Psychology. Applied 11 (4) (December): 237–44. doi:10.1037/1076-
898X.11.4.237.
Van Herzeele, Isabelle, Rajesh Aggarwal, Simon Neequaye, Ara Darzi, Frank
Vermassen, and Nicholas J Cheshire. 2008. “Cognitive Training Improves
Clinically Relevant Outcomes During Simulated Endovascular Procedures.”
Journal of Vascular Surgery 48 (5) (November): 1223–30.
doi:10.1016/j.jvs.2008.06.034.
Venneri, Lucia, Francesco Rossi, Nicoletta Botto, Maria Grazia Andreassi, Nicoletta
Salcone, Ahmed Emad, Mauro Lazzeri, Cesare Gori, Eliseo Vano, and Eugenio
Picano. 2009. “Cancer Risk from Professional Exposure in Staff Working in

152
Cardiac Catheterization Laboratory: Insights from the National Research
Council’s Biological Effects of Ionizing Radiation VII Report.” American
Heart Journal 157 (1) (January): 118–24. doi:10.1016/j.ahj.2008.08.009.
Vijayalakshmi, Kunadian, Dee Kelly, Claire-Louise Chapple, David Williams,
Robert Wright, Michael J Stewart, James a Hall, et al. 2007. “Cardiac
Catheterisation: Radiation Doses and Lifetime Risk of Malignancy.” Heart
(British Cardiac Society) 93 (3) (March): 370–1. doi:10.1136/hrt.2006.098731.
Vogl, Thomas J, Jörn O Balzer, Martin G Mack, Gregor Bett, and Anton Oppelt.
2002. “Hybrid MR Interventional Imaging System: Combined MR and
Angiography Suites with Single Interactive Table. Feasibility Study in Vascular
Liver Tumor Procedures.” European Radiology 12 (6) (June): 1394–400.
doi:10.1007/s00330-002-1312-7.
Wacker, Frank K, Claudia Hillenbrand, Daniel R Elgort, Shaoxiong Zhang, Jeffrey L
Duerk, and Jonathan S Lewin. 2005. “MR Imaging-Guided Percutaneous
Angioplasty and Stent Placement in a Swine Model Comparison of Open- and
Closed-Bore Scanners.” Academic Radiology 12 (9) (September): 1085–8.
doi:10.1016/j.acra.2005.05.017.
Wainer, Gabriel A. 2009. Discrete-Event Modeling and Simulation: A Practitioner’s
Approach. CRC Press, Inc. Boca Raton, FL, USA.
Waters, Thomas R, Vern Putz-Anderson, Arun Garg, and Lawrence J Fine. 1993.
“Revised NIOSH Equation for the Design and Evaluation of Manual Lifting
Tasks.” Ergonomics 36 (7): 749–776.
Wendler, T, and C Loef. 2001. “Workflow Management-Integration Technology for
Efficient Radiology.” Medicamundi 45 (4): 41–49.
Werker, Greg, Antoine Sauré, John French, and Steven Shechter. 2009. “The Use of
Discrete-Event Simulation Modelling to Improve Radiation Therapy Planning
Processes.” Radiotherapy and Oncology : Journal of the European Society for
Therapeutic Radiology and Oncology 92 (1) (July): 76–82.
doi:10.1016/j.radonc.2009.03.012.
Woodson, Wesley E, Barry Tillman, and Peggy Tillman. 1992. Human Factors
Design Handbook. 2nd Editio. New York: McGraw Hill, Inc.
Worthington, Claire, Stewart Robinson, and Nicola Burgess. 2010. “Rapid
Modelling of Patient Flow in a Health Care Setting: Integrating Simulation with
Lean.” In Rapid Modelling and Quick Response, edited by Gerarld Reiner, 131–
142. doi:10.1007/978-1-84996-525-5.
Yaniv, Ziv, and Kevin Cleary. 2006. “Image-Guided Procedures: A Review.”
Computer Aided Interventions and Medical Robotics (CAIMR), Georgetown
Unviersity. Washington DC.

153
Zhang, Jinyan, Xudong Lu, Hongchao Nie, Zhengxing Huang, and W M P van der
Aalst. 2009. “Radiology Information System: a Workflow-Based Approach.”
International Journal of Computer Assisted Radiology and Surgery 4 (5)
(September): 509–16. doi:10.1007/s11548-009-0362-6.
Zhou, Wei. 2011. “Radiation Exposure of Vascular Surgery Patients Beyond
Endovascular Procedures.” Journal of Vascular Surgery 53 (1 Suppl) (January):
39S–43S. doi:10.1016/j.jvs.2010.06.176.
Zinger, A, and J St-Pierre. 1958. “On the Choice of the Best Amongst Three Normal
Populations with Known Variances.” Biometrika 45 (3): 436–446.
Zoeller, Anja, Christof Denz, Andre Baumgart, and Hans-joachim Bender. 2006.
“Information Need and IT Demands for Business Process Reengineering in
Operation Room Management.” In European Conference on eHealth, edited by
Henrik Stormer, Andreas Meier, and Michael Schumacher, 95–106. Fribourg,
Switzerland: Gesellschaft für Informatik, Bonn.

154
Appendix
Appendix A: Vendors’ list
This appendix presents the contact information of the simulation software vendors
evaluated:
Alion Science and Technology,
MA&D Operation
4949 Pearl East Circle, Suite 200
Boulder, CO 80301 USA
303-442-6947
303-442-8274
www.alionscience.com
www.maad.com
CreateASoft, Inc
3909 75th Street, Suite 105
Aurora, IL 60563 USA
630-428-2850
630-963-3755
www.createasoft.com
Dassault Systemes
10, Rue Marcel Dassault
78140 Vélizy-Villacoublay
FRANCE
Tel: + 33 1 61 62 61 62
Fax: + 33 1 70 73 43 63
http://www.3ds.com/
Flexsim Software Products, Inc.
1577 North Technology Way
Orem, Utah 84097 USA
801-224-6914
801-224-6984
www.flexsim.com
Imagine That Inc.
6830 Via Del Oro, Suite 230
San Jose, CA 95119 USA
408-365-0305
408-629-1251
www.extendsim.com
Lanner Group Limited
The Oaks
Clews Road
Redditch, Worcestershire
B98 7ST, UK
+44 (0) 1527 403400
www.lanner.co.uk
Lumina Decision Systems, Inc
26010 Highland Way
Los Gatos, CA 95033 USA
650-212-1212
650-240-2230
www.lumina.com
ProModel Corporation
7540 Windsor Drive, Suite 300
Allentown, PA 18195
610-391-9700
610-391-9709
www.promodel.com
Rockwell Automation
2100 Corporate Drive, Suite 550
Wexford, PA 15090
(+1) 724-741-4000
(+1) 724-741-4001
www.arenasimulation.com

155
Simio LLC
504 Beaver Street
Sewickley, PA 15143
412-528-1576
412-253-9378
www.simio.biz
SIMUL8 Corporation
225 Franklin Street, 26th Floor
Boston, MA 02110 USA
800-547-6024
800-547-6389
www.SIMUL8.com
XJ Technologies
AnyLogic North America
9 Ramsey Rd.
Lebanon, NJ 08833 USA
908-236-6283
908-292-1129
www.anylogic.com
Appendix B: Simulation software evaluation summary
This appendix presents the complete results of the simulation software packages
indicated in Section 1 of Chapter 3. Table 22 shows the features evaluated for those
simulation software packages that were not shortlisted. Access to some of the
features was not possible for some of the packages. Nevertheless, these packages
were removed from the list for other more significant reasons indicated in Table 3
(see section 3.2.2.3). Table 23 shows the summary of the total features evaluated on
the shortlisted simulation software packages.
Criteria Analytica AnyLogic Arena Emergency
Department
Simulator
Simcad Simio SIMUL8 Witness
System
requirements
Low Medium Medium Low (limited to
certain OS1)
Low Medium Low Low (limited
to certain OS1)
Run time debug Not provided Provided Provided Provided Provided Provided Provided Not provided
Output analysis Possible Possible Possible Possible Possible Possible Possible Possible
Real time
viewing
Not possible Possible Possible Possible Possible Possible Possible Possible
Support/trainin
g/Maintenance/
documentation
Provided Provided Provided Provided Provided Provided Provided Provided
Error reporting Provided Provided Provided Provided Provided Provided Provided Provided
Graphical
model
implementation
Possible Possible Possible Possible Possible Possible Possible Possible
Model building
using
programming
Possible Possible Possible Not possible Possible Possiblea Possible Possible
CAD drawing
import/
adequate
library provided
Not provided Provided Provided Not possible Provided Provided Provided Provided
Code reuse Possible Possible Possible Possible Possible Possible Possible Not known
Animation Not possible Possibleb Possibleb Not possible Possible Possible Possibleb Possibleb
Experimental
design
Not possible Possible Possible Possible Possible Possible Possible Possible
Statistical
facilities
Provided Provided Provided Provided Provided Provided Provided Provided
Model
packaging
Possible Possible Possible Possible Possible Possible Possible Not known

156
Criteria Analytica AnyLogic Arena Emergency
Department
Simulator
Simcad Simio SIMUL8 Witness
Micro-
ergonomics
design
Not possible Not possible Not possible Not possible Not
possible
Not
possible
Not
possible
Not possible
Input data
import
Possible Possible Possible Possible Possible Possible Possible Possible
Model
optimisation
Possible Possible Possible Possible Possible Not
known
Possible Possible
Notes: aLimited features to add restrictions to interactions among entities; blimitations for the 3D environment; 1OS: Operating System
Table 22. Summary of features evaluated for those software packages that were not shortlisted
Criteria Delmia ExtendSim Flexsim HC Medmodel Micro Saint Sharp
System requirements Medium (limited to certain OS1)
Low Low (limited to certain OS1)
Medium (limited to certain OS1)
Low
Run time debug Provided Provided Provided Provided Provided
Output analysis Possible Possible Possible Possible Possible
Real time viewing Possible Possible Possible Possible Possible
Support/training/Main
tenance/documentation
Provided Provided Provided Provided Provided
Price Low Medium High Low Low
Error reporting Provided Provided Provided Provided Provided
Graphical model
implementation
Possible Possible Possible Possible Possible
Robustness High High High High High
Model building using
programming
Possible Possible Possible Possible Possible
CAD import/ library Provided Provided Provided Provided Provided
Code reuse Possible Possible Possible Possible Possible
Animation Possible Possible Possible Possibleb Possible
Experimental design Possible Possible Possible Possible Possible
Statistical facilities Provided Provided Provided Provided Provided
Model packaging Possiblec Possible Possiblec Possible Possible
Micro-ergonomics
design
Possible Not
possible
Not possible Not possible Possiblec
Interface user friendly Average Average Easy Average Easy
Input data import Possible Possible Possible Possible Possible
Model optimisation Possiblec Possible Possiblec Possiblec Possiblec
Partial and total times Provided Provided Provided Provided Provided
Costs: total, operation,
resources
Possible Possible Possible Possible Possible
Resources under-
utilised time
Provided Provided Provided Provided Provided
Entity Activity Provided Provided Provided Provided Provided
Variables changed
during simulation
Provided Provided Provided Provided Provided
Location analysis Provided Provided Provided Provided Provided
Scheduling:
entities/locations/resou
rces
Provided Provided Provided Provided Provided
Micro-ergonomics Possible Not
possible
Not possible Not possible Possiblec
Notes: aLimited features to add restrictions to interactions among entities; blimitations for the 3D environment; cseparate
package; 1OS: Operating System
Table 23. Summary of features evaluated for the shortlisted software packages

157
Appendix C: MIDAS - Medical Interventional Data
Analysis System
The MIDAS (Medical Interventional Data Analysis System) was implemented in
first place by the student Mr Bruce Taylor for the award of an MSc degree in
Computer Science in 2011 (University of Dundee, Dundee). A later version was
developed by the freelance programmer Iain Barnett as a voluntary collaborator. The
web site was designed to facilitate the data gathering by potential collaborators.
Implementing a software application instead a web-interface was considered but
rejected due to some disadvantages such as possible incompatibility among operating
systems and probable restrictions on the installation in certain computers (for
example in hospitals). The web site is compatible with any browser, it does not need
any further installation in the computer and the versions are maintained by the
administrator of the server so all the users will have access to the current version at
the same time.
The website has two different interfaces depending on the user profile. It can be
access by a normal user or an administrator user, who has access to the statistical
analysis page. The administrator is the only that can approve new users and
delete/modify records.
The website has three main tabs:
- Account. It stores profile information and allows changing the password.
- Data. It accesses the data submission form and the previous submitted
records. The form has been designed to resemble the template for manual
collection of the data so that can be more familiar to the users. Other
adds-in are validation of data during the submission and auto complete
feature in most of the form fields.
- Admin. This tab only exists for the administrator user. It controls the
records of other users and gives access to the analysis page. The
preliminary version of the analysis page shows the mean and the
standard deviation of a set of timings associated with an interval
indicated by the user. A graph provides a quick visual tool of the range

158
of timings associated with that interval. This version also allows
selection of procedure by type, to filter that dataset by type of device
used.
Appendix D: DES model statistics
D.1. PCI
Event Distribution Parameters Histogram/Density Function
Preparation Lognormal μ = 6.62
σ = 0.27
Mean (± St
Dev) =
776.18 (±
216.59)
Access Gamma α = 0.43
β = 573.11
Single
guidance
Gamma α = 1.65
β = 358.66
Probability Density Function
Histogram Lognormal
x200018001600140012001000800600
f(x)
0.48
0.44
0.4
0.36
0.32
0.28
0.24
0.2
0.16
0.12
0.08
0.04
0
Probability Density Function
Histogram Gamma
x180016001400120010008006004002000
f(x)
0.88
0.8
0.72
0.64
0.56
0.48
0.4
0.32
0.24
0.16
0.08
0
Probability Density Function
Histogram Gamma
x18001600140012001000800600400200
f(x)
0.36
0.32
0.28
0.24
0.2
0.16
0.12
0.08
0.04
0
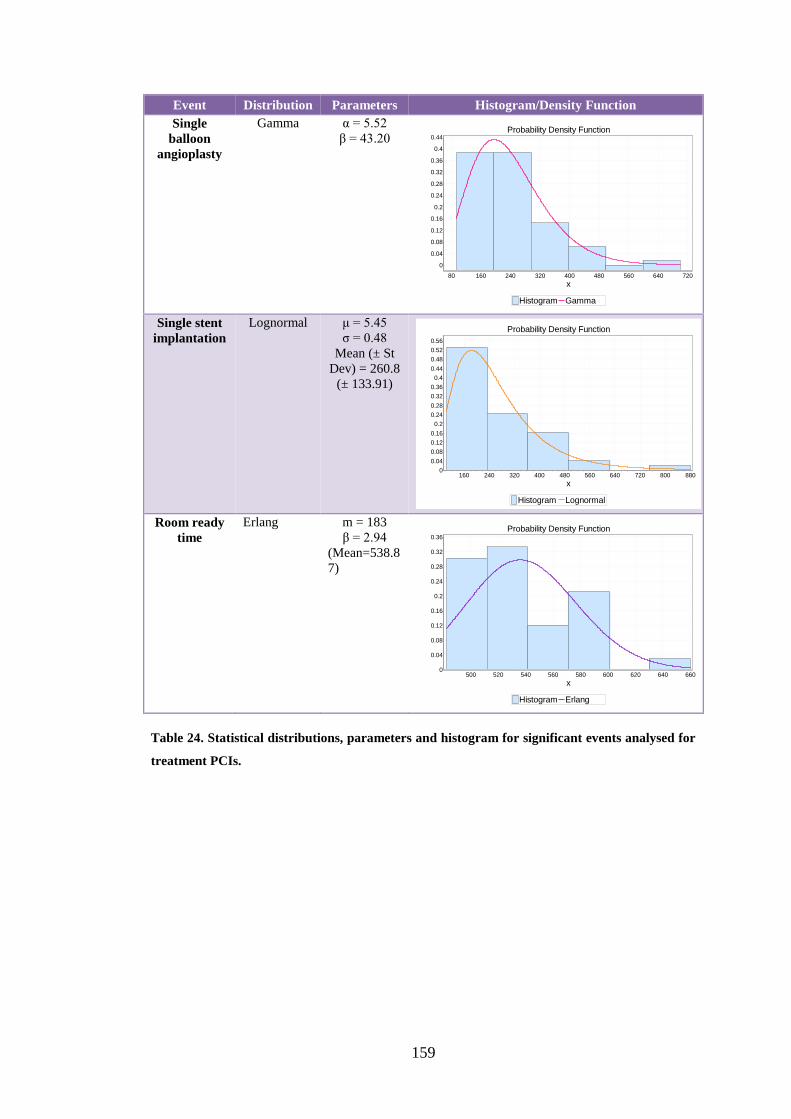
159
Event Distribution Parameters Histogram/Density Function
Single
balloon
angioplasty
Gamma α = 5.52
β = 43.20
Single stent
implantation
Lognormal μ = 5.45
σ = 0.48
Mean (± St
Dev) = 260.8
(± 133.91)
Room ready
time
Erlang m = 183
β = 2.94
(Mean=538.8
7)
Table 24. Statistical distributions, parameters and histogram for significant events analysed for
treatment PCIs.
Probability Density Function
Histogram Gamma
x72064056048040032024016080
f(x)
0.44
0.4
0.36
0.32
0.28
0.24
0.2
0.16
0.12
0.08
0.04
0
Probability Density Function
Histogram Lognormal
x880800720640560480400320240160
f(x)
0.56
0.52
0.48
0.44
0.4
0.36
0.32
0.28
0.24
0.2
0.16
0.12
0.08
0.04
0
Probability Density Function
Histogram Erlang
x660640620600580560540520500
f(x)
0.36
0.32
0.28
0.24
0.2
0.16
0.12
0.08
0.04
0
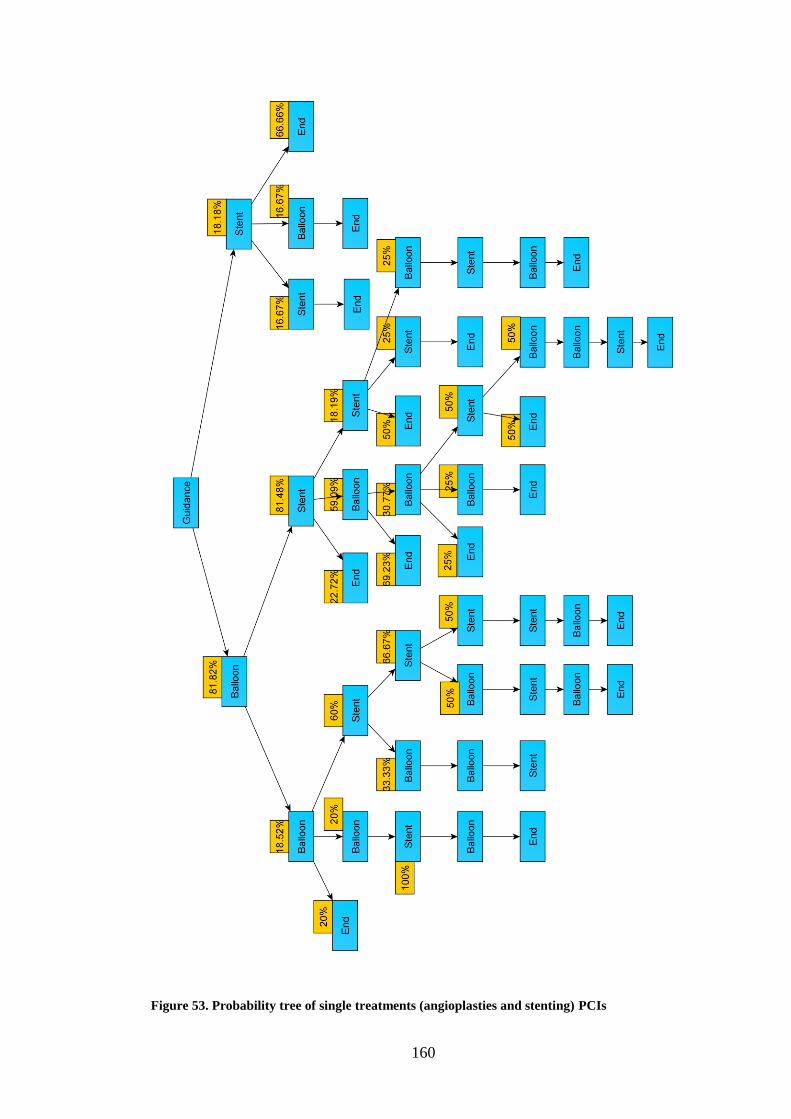
160
Figure 53. Probability tree of single treatments (angioplasties and stenting) PCIs
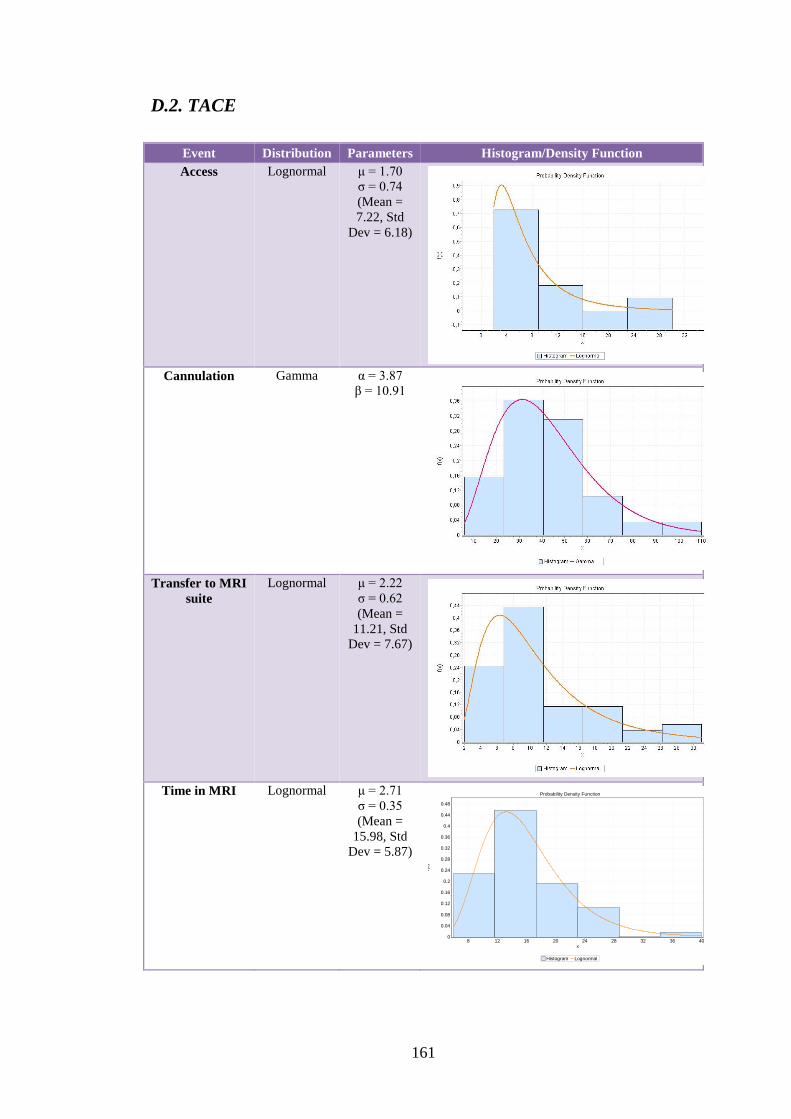
161
D.2. TACE
Event Distribution Parameters Histogram/Density Function
Access Lognormal μ = 1.70
σ = 0.74
(Mean =
7.22, Std
Dev = 6.18)
Cannulation Gamma α = 3.87
β = 10.91
Transfer to MRI
suite
Lognormal μ = 2.22
σ = 0.62
(Mean =
11.21, Std
Dev = 7.67)
Time in MRI Lognormal μ = 2.71
σ = 0.35
(Mean =
15.98, Std
Dev = 5.87)
Probability Density Function
Histogram Lognormal
x40363228242016128
f(x)
0.48
0.44
0.4
0.36
0.32
0.28
0.24
0.2
0.16
0.12
0.08
0.04
0
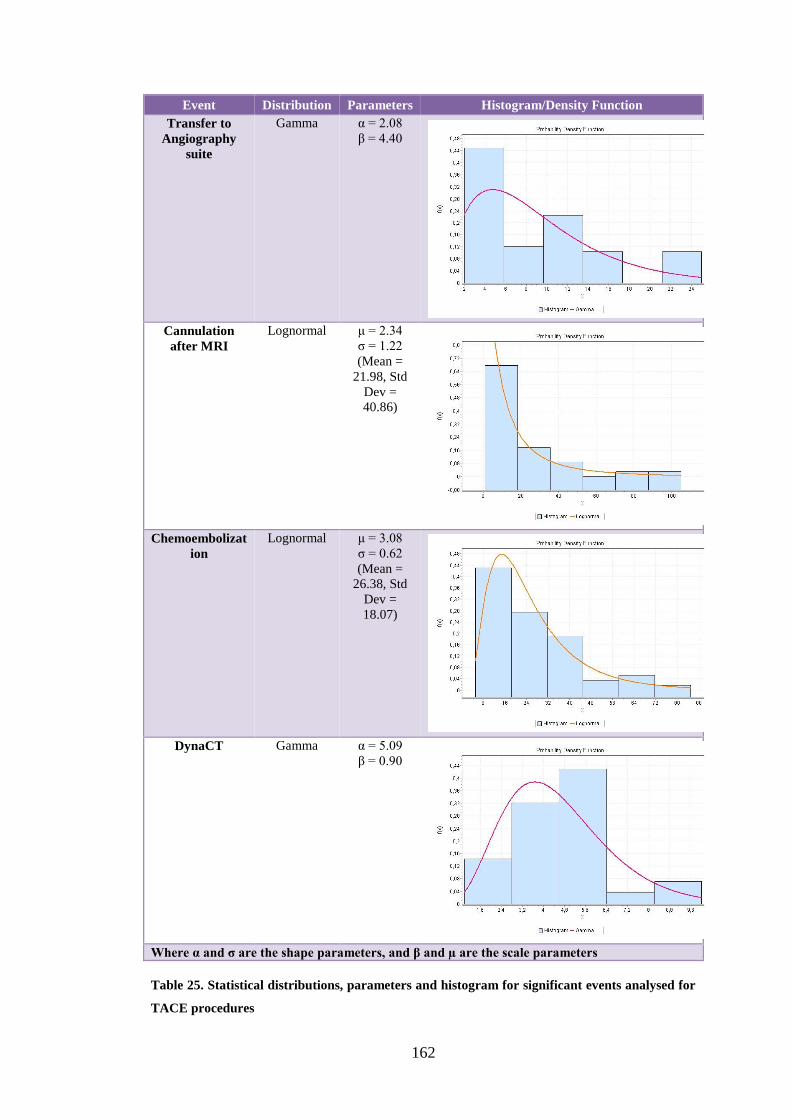
162
Event Distribution Parameters Histogram/Density Function
Transfer to
Angiography
suite
Gamma α = 2.08
β = 4.40
Cannulation
after MRI
Lognormal μ = 2.34
σ = 1.22
(Mean =
21.98, Std
Dev =
40.86)
Chemoembolizat
ion
Lognormal μ = 3.08
σ = 0.62
(Mean =
26.38, Std
Dev =
18.07)
DynaCT Gamma α = 5.09
β = 0.90
Where α and σ are the shape parameters, and β and µ are the scale parameters
Table 25. Statistical distributions, parameters and histogram for significant events analysed for
TACE procedures

163
D.3. MRgFUS
Event Distribution Parameters Histogram/Density Function
Ph. Act. Dec.
4a X1 Lognormal μ = 6.02
σ = 0.73
Mean (± St
Dev) =
538.17 (±
454.27)
4b X1 Lognormal μ = 3.95
σ = 0.95
Mean (± St
Dev) =
80.16 (±
93.68)
4b X3 Gamma α = 0.88
β = 84.25
4b Q1 Gamma α = 1.25
β = 12.21
Probability Density Function
Histogram Lognormal
x12001000800600400200
f(x)
0.72
0.64
0.56
0.48
0.4
0.32
0.24
0.16
0.08
0
Probability Density Function
Histogram Lognormal
x3202802402001601208040
f(x)
0.8
0.72
0.64
0.56
0.48
0.4
0.32
0.24
0.16
0.08
0
Probability Density Function
Histogram Gamma
x180160140120100806040200
f(x)
0.64
0.56
0.48
0.4
0.32
0.24
0.16
0.08
0
Probability Density Function
Histogram Gamma
x44403632282420161284
f(x)
0.64
0.56
0.48
0.4
0.32
0.24
0.16
0.08
0

164
Event Distribution Parameters Histogram/Density Function
Ph. Act. Dec.
4b Q2 Lognormal μ = 4
σ = 1.54
Mean (± St
Dev) =
178.77 (±
559.12)
5 X1 Lognormal μ = 5.97
σ = 0.63
Mean (± St
Dev) =
480.24 (±
336.86)
5 Q1 Triangular m = 30
a = 0
b = 58.36
6a X2 Lognormal μ = 5.44
σ = 0.92
Mean (± St
Dev) =
350.83 (±
404.99)
Probability Density Function
Histogram Lognormal
x4003603202802402001601208040
f(x)
0.72
0.64
0.56
0.48
0.4
0.32
0.24
0.16
0.08
0
Probability Density Function
Histogram Lognormal
x12001000800600400200
f(x)
0.44
0.4
0.36
0.32
0.28
0.24
0.2
0.16
0.12
0.08
0.04
0
Probability Density Function
Histogram Triangular
x4844403632282420161284
f(x)
0.64
0.56
0.48
0.4
0.32
0.24
0.16
0.08
0
Probability Density Function
Histogram Lognormal
x12001000800600400200
f(x)
0.8
0.72
0.64
0.56
0.48
0.4
0.32
0.24
0.16
0.08
0

165
Event Distribution Parameters Histogram/Density Function
Ph. Act. Dec.
6a X3 Gamma α = 1.51
β = 4.17
7a X4 Lognormal μ = 1.44
σ = 0.79
Mean (± St
Dev) = 5.80
(± 5.43)
7a X5 Gamma α = 1.37
β = 16.95
7a X6 Triangular m = 152
a = 0
b = 152
Probability Density Function
Histogram Gamma
x1312111098765432
f(x)
0.6
0.55
0.5
0.45
0.4
0.35
0.3
0.25
0.2
0.15
0.1
0.05
0
Probability Density Function
Histogram Lognormal
x2018161412108642
f(x)
0.88
0.8
0.72
0.64
0.56
0.48
0.4
0.32
0.24
0.16
0.08
0
Probability Density Function
Histogram Gamma
x555045403530252015105
f(x)
0.64
0.56
0.48
0.4
0.32
0.24
0.16
0.08
0
Probability Density Function
Histogram Triangular
x1501401301201101009080706050
f(x)
0.4
0.36
0.32
0.28
0.24
0.2
0.16
0.12
0.08
0.04
0

166
Event Distribution Parameters Histogram/Density Function
Ph. Act. Dec.
7a X7 Weibull α = 1.28
β = 78.86
γ = 0
Mean (± St
Dev) =
73.05 (±
57.44)
7a X8 Gamma α = 1.05
β = 15.86
7a X9 Lognormal μ = 3.08
σ = 1.33
Mean (± St
Dev) =
52.81 (±
116.17)
7a X10 Gamma α = 24.96
β = 2.82
Probability Density Function
Histogram Weibull
x8072645648403224
f(x)
0.8
0.72
0.64
0.56
0.48
0.4
0.32
0.24
0.16
0.08
0
Probability Density Function
Histogram Gamma
x403632282420161284
f(x)
0.64
0.56
0.48
0.4
0.32
0.24
0.16
0.08
0
Probability Density Function
Histogram Lognormal
x12010080604020
f(x)
0.6
0.55
0.5
0.45
0.4
0.35
0.3
0.25
0.2
0.15
0.1
0.05
0
Probability Density Function
Histogram Gamma
x8076726864605652
f(x)
0.52
0.48
0.44
0.4
0.36
0.32
0.28
0.24
0.2
0.16
0.12
0.08
0.04
0

167
Event Distribution Parameters Histogram/Density Function
Ph. Act. Dec.
7a X11 Gamma α = 17.80
β = 3.44
7a Q4 Gamma α = 1.13
β = 11.45
7a Q8 Lognormal μ = 1.53
σ = 1.62
Mean (± St
Dev) =
17.20 (±
61.37)
8 X1 Lognormal μ = 3.18
σ = 0.82
Mean (± St
Dev) =
33.82 (±
33.12)
Probability Density Function
Histogram Gamma
x88848076726864605652
f(x)
0.88
0.8
0.72
0.64
0.56
0.48
0.4
0.32
0.24
0.16
0.08
0
Probability Density Function
Histogram Gamma
x3632282420161284
f(x)
0.52
0.48
0.44
0.4
0.36
0.32
0.28
0.24
0.2
0.16
0.12
0.08
0.04
0
Probability Density Function
Histogram Lognormal
x524844403632282420161284
f(x)
0.72
0.64
0.56
0.48
0.4
0.32
0.24
0.16
0.08
0
Probability Density Function
Histogram Lognormal
x160140120100806040200
f(x)
0.4
0.36
0.32
0.28
0.24
0.2
0.16
0.12
0.08
0.04
0

168
Event Distribution Parameters Histogram/Density Function
Ph. Act. Dec.
8 X2 Gamma
(*) Reject
hypothesis
on A-D
α = 16.44
β = 3.52
8 X3 Gamma
(*) Reject
hypothesis
on A-D
α = 9.76
β = 4.54
8 X4 Lognormal μ = 2.88
σ = 1.26
Mean (± St
Dev) =
39.40 (±
77.55)
8 Q1 Lognormal
(*) Reject
hypothesis
on A-D
μ = 1.67
σ = 1.12
Mean (± St
Dev) = 9.98
(± 15.92)
Probability Density Function
Histogram Gamma
x16014012010080604020
f(x)
0.6
0.56
0.52
0.48
0.44
0.4
0.36
0.32
0.28
0.24
0.2
0.16
0.12
0.08
0.04
0
Probability Density Function
Histogram Gamma
x14012010080604020
f(x)
0.64
0.56
0.48
0.4
0.32
0.24
0.16
0.08
0
Probability Density Function
Histogram Lognormal
x100806040200
f(x)
0.8
0.72
0.64
0.56
0.48
0.4
0.32
0.24
0.16
0.08
0
Probability Density Function
Histogram Lognormal
x120100806040200
f(x)
0.88
0.8
0.72
0.64
0.56
0.48
0.4
0.32
0.24
0.16
0.08
0

169
Event Distribution Parameters Histogram/Density Function
Ph. Act. Dec.
9 X1 Lognormal μ = 6.22
σ = 0.42
Mean (± St
Dev) =
550.61 (±
241.78)
9 X3 Gamma α = 11.72
β = 9.89
9 X4 Gamma α = 18.29
β = 20.58
9 X8 Lognormal μ = 5.90
σ = 0.58
Mean (± St
Dev) =
433.32 (±
276.65)
Table 26. Statistical distributions, parameters and histogram for significant events analysed for
MRgFUS procedures
Probability Density Function
Histogram Lognormal
x1000900800700600500400
f(x)
0.64
0.56
0.48
0.4
0.32
0.24
0.16
0.08
0
Probability Density Function
Histogram Gamma
x1401301201101009080706050
f(x)
0.88
0.8
0.72
0.64
0.56
0.48
0.4
0.32
0.24
0.16
0.08
0
Probability Density Function
Histogram Gamma
x520500480460440420400380360340320300280
f(x)
0.52
0.48
0.44
0.4
0.36
0.32
0.28
0.24
0.2
0.16
0.12
0.08
0.04
0
Probability Density Function
Histogram Lognormal
x11001000900800700600500400300200
f(x)
0.88
0.8
0.72
0.64
0.56
0.48
0.4
0.32
0.24
0.16
0.08
0

170
D.4. TAVI
Event Distribution Parameters Histogram/Density Function
Other preparation
for the patient Gamma α = 3.85
β = 277.79
Anaesthesia
induction (general or
local)
Erlang m = 27
β = 104.57
(Mean=282
3.4)
Transoesophageal
echocardiography
Gamma α = 4.37
β = 226.55
Right femoral access Gamma α = 8.06
β = 148.8
Probability Density Function
Histogram Gamma
Time (sec)180017001600150014001300120011001000900800700600500
f(x)
0.52
0.48
0.44
0.4
0.36
0.32
0.28
0.24
0.2
0.16
0.12
0.08
0.04
0
Probability Density Function
Histogram Erlang
Times (sec)38003600340032003000280026002400
f(x)
0.72
0.64
0.56
0.48
0.4
0.32
0.24
0.16
0.08
0
Probability Density Function
Histogram Gamma
Times (sec)150014001300120011001000900800700600500400300
f(x)
0.52
0.48
0.44
0.4
0.36
0.32
0.28
0.24
0.2
0.16
0.12
0.08
0.04
0
Probability Density Function
Histogram Gamma
Times (sec)1600150014001300120011001000900800700600
f(x)
0.52
0.48
0.44
0.4
0.36
0.32
0.28
0.24
0.2
0.16
0.12
0.08
0.04
0

171
Event Distribution Parameters Histogram/Density Function
Ventricular pacing Lognormal μ = 5.52
σ = 0.64
Mean (± St
Dev) =
307.73 (±
217.45)
Left femoral access Gamma α = 140.17
β = 2.07
Catheter and
guidewire guidance
Gamma α = 1.50
β = 1032.5
Balloon
placement/inflating/e
xtraction
Lognormal μ = 5.99
σ = 0.55
Mean (± St
Dev) =
467.81 (±
280.79)
Probability Density Function
Histogram Lognormal
x900800700600500400300200100
f(x)
1
0.9
0.8
0.7
0.6
0.5
0.4
0.3
0.2
0.1
0
-0.1
Probability Density Function
Histogram Gamma
x304296288280272264256248240232
f(x)
1
0.9
0.8
0.7
0.6
0.5
0.4
0.3
0.2
0.1
0
-0.1
Probability Density Function
Histogram Gamma
x3600320028002400200016001200800400
f(x)
0.56
0.52
0.48
0.44
0.4
0.36
0.32
0.28
0.24
0.2
0.16
0.12
0.08
0.04
0
Probability Density Function
Histogram Lognormal
Times (sec)960880800720640560480400320240
f(x)
0.72
0.64
0.56
0.48
0.4
0.32
0.24
0.16
0.08
0

172
Event Distribution Parameters Histogram/Density Function
Valve implantation
(self and balloon
expanded)
Gamma α = 5.43
β = 128.91
Screening-contrast
test post-treatment
Gamma α = 2.10
β = 114
Closing Gamma α = 6.85
β = 102.17
Patient Ready
(Awakening - Out of
room)
Gamma α = 7.46
β = 158.24
Table 27. Statistical distributions, parameters and histogram for significant events analysed for
TAVI procedures
Probability Density Function
Histogram Gamma
x120011201040960880800720640560480400320
f(x)
0.72
0.64
0.56
0.48
0.4
0.32
0.24
0.16
0.08
Probability Density Function
Histogram Gamma
Times (sec)52048044040036032028024020016012080
f(x)
0.72
0.64
0.56
0.48
0.4
0.32
0.24
0.16
0.08
0
Probability Density Function
Histogram Gamma
x11201040960880800720640560480400
f(x)
0.72
0.64
0.56
0.48
0.4
0.32
0.24
0.16
0.08
0
Probability Density Function
Histogram Gamma
Times (sec)180017001600150014001300120011001000900800700600
f(x)
0.52
0.48
0.44
0.4
0.36
0.32
0.28
0.24
0.2
0.16
0.12
0.08
0.04
0

173
Appendix E: Probability assessment questionnaire for
MRgFUS workflow analysis
Filled out by:
Intervention type:
LIKELIHOOD
0 – Very unlikely / 10
– Very likely
IMPACT
0 – Very low impact
/ 10 – Very High impact
Phase 4b – Patient Positioning
1. Position adjustments will not help and
treatment cannot be started (4b-Q2)
Phase 6a – Pre-therapy planning
2. During planning, it appears that the
patient position does not allow treatment
(6a – Q3)
Phase 7a – Sonication calibration
3. Focal spot is not properly aligned after
LOW-POWER test sonication (7a – Q1)
4. Focal spot is not properly aligned after
HIGH-POWER test sonication (7a – Q3)
5. Treatment cannot be completed due to
not achieving proper focal spot
alignment with low power calibration
adjustment (7a – Q6 – Q2)
6. Treatment cannot be completed due to
not achieving proper focal spot
alignment with high power calibration
adjustment (7a – Q6 – Q5)
Phase 8 - Treatment
7. The plan cannot be completed due to not
reaching adequate heating of a target
spot that is accessible by the sonication
beam. (8 – Q3)
Appendix F: Markov routine code
routine routine_markov_chain(par_init_array: array [2] of real; par_trans_array: array[x_dimension,
y_dimension] of real; par_state: integer) : real
var
int_var: integer
prob_int: real
V_state: array[2] of real
Aux_array: array[x_dimension, y_dimension] of real
Pt_aux_array: array[x_dimension, y_dimension] of real
begin
---- Initiate Pt_aux to Identity so the state=1 gives just the Transition matrix

174
Pt_aux_array[0,0]=1
Pt_aux_array[0,1]=0
Pt_aux_array[1,0]=0
Pt_aux_array[1,1]=1
int_var=1
----- We evaluate the correct state for the markov chain
--write('par_init_array[0]= ', par_init_array[0], ' ', 'par_init_array[1]= ', par_init_array[1], cr)
while(int_var<=par_state) do
Aux_array[0,0]=Pt_aux_array[0,0]*par_trans_array[0,0]+Pt_aux_array[0,1]*par_trans_array[1,0]
Aux_array[0,1]=Pt_aux_array[0,0]*par_trans_array[0,1]+Pt_aux_array[1,0]*par_trans_array[1,1]
Aux_array[1,0]=Pt_aux_array[1,0]*par_trans_array[0,0]+Pt_aux_array[1,1]*par_trans_array[1,0]
Aux_array[1,1]=Pt_aux_array[1,0]*par_trans_array[0,1]+Pt_aux_array[1,1]*par_trans_array[1,1]
--write('Aux_array[0,0]= ', Aux_array[0,0], ' ', 'Aux_array[0,1]= ', Aux_array[0,1], ' ',
'Aux_array[1,0]= ', Aux_array[1,0], ' ', 'Aux_array[1,1]= ', Aux_array[1,1], cr)
Pt_aux_array=Aux_array
--write('Pt4bd1_aux_array[0,0]= ', Pt_aux_array[0,0], ' ', 'Pt4bd1_aux_array[0,1]= ',
Pt_aux_array[0,1], ' ', 'Pt4bd1_aux_array[1,0]= ', Pt_aux_array[1,0], ' ', 'Pt4bd1_aux_array[1,1]= ',
Pt_aux_array[1,1], cr)
int_var=int_var+1
endwhile
--write('state= ', state_number, cr)
--write('Pt[0,0]= ', Pt_aux_array[0,0], ' ', 'Pt[0,1]= ', Pt_aux_array[0,1], ' ', 'Pt[1,0]= ',
Pt_aux_array[1,0], ' ', 'Pt[1,1]= ', Pt_aux_array[1,1], cr)
--- We calculate the new state vector
V_state[0]=(par_init_array[0]*Pt_aux_array[0,0]+par_init_array[1]*Pt_aux_array[1,0])
V_state[1]=(par_init_array[0]*Pt_aux_array[0,1]+par_init_array[1]*Pt_aux_array[1,1])
--write('V_state[0]= ', V_state[0],' ', 'V_state[1]= ', V_state[1], cr)
prob_int = V_state[0]
return prob_int
end