DOCTOR OF PHILOSOPHY - CiteSeerX
355
DOCTOR OF PHILOSOPHY Amino acids in oral drug delivery salts, ion-pairs and transcriptomics Amr Elshaer 2013 Aston University
-
Upload
khangminh22 -
Category
Documents
-
view
2 -
download
0
Transcript of DOCTOR OF PHILOSOPHY - CiteSeerX

DOCTOR OF PHILOSOPHY
Amino acids in oral drug deliverysalts, ion-pairs and transcriptomics
Amr Elshaer
2013
Aston University

Some pages of this thesis may have been removed for copyright restrictions.
If you have discovered material in AURA which is unlawful e.g. breaches copyright, (either
yours or that of a third party) or any other law, including but not limited to those relating to
patent, trademark, confidentiality, data protection, obscenity, defamation, libel, then please
read our Takedown Policy and contact the service immediately

1
AMINO ACIDS IN ORAL DRUG DELIVERY:
SALTS, ION-PAIRS AND TRANSCRIPTOMICS
AMR MOHAMED MOHAMED KAMEL ABDELFATAH ELSHAER
Doctor of Philosophy
ASTON UNIVERSITY
December 2012
© Amr Mohamed Mohamed Kamel Abdelfatah ElShaer, 2012
[Amr Mohamed Mohamed Kamel Abdelfatah ElShaer] asserts [his] moral right to be
identified as the author of this thesis.
This copy of the thesis has been supplied on condition that anyone who it is
understood to recognise that its copyright rests with its author and that no quotation
from the thesis and no information derived from it may be published without proper
acknowledgement.

2
Aston University
Amino acids in oral drug delivery: salts, ion-pairs and transcriptomics
Amr Mohamed Mohamed Kamel Abdelfatah ElShaer Doctor of Philosophy
Thesis Summary Oral drug delivery is considered the most popular route of delivery because of the ease of administration, availability of a wide range of dosage forms and the large surface area for drug absorption via the intestinal membrane. However, besides the unfavourable biopharmaceutical properties of the therapeutic agents, efflux transporters such as P-glycoprotein (P-gp) and multiple resistance proteins (MRP) decrease the overall drug uptake by extruding the drug from the cells. Although, prodrugs have been investigated to improve drug partitioning by masking the polar groups covalently with pre-moieties promoting increased uptake, they present significant challenges including reduced solubility and increased toxicity. The current work investigates the use of amino acids as ion-pairs for three model drugs: indomethacin (weak acid), trimethoprim (weak base) and ciprofloxacin (zwitter ion) in an attempt to improve both solubility and uptake. Solubility was studied by salt formation while creating new routes for uptake across the membranes via amino acids transporter proteins or dipeptidyl transporters was the rationale to enhance absorption. New salts were prepared for the model drugs and the oppositely charged amino acids by freeze drying and they were characterised using FTIR, 1HNMR, DSC, SEM, pH solubility profile, solubility and dissolution. Permeability profiles were assessed using an in vitro cell based method; Caco-2 cells and the genetic changes occurring across the transporter genes and various pathways involved in the cellular activities were studied using DNA microarrays. Solubility data showed a significant increase in drug solubility upon preparing the new salts with the oppositely charged counter ions (ciprofloxacin glutamate salt exhibiting 2.9x10³ fold enhancement when compared to the free drug). Moreover, permeability studies showed a 3 fold increase in trimethoprim and indomethacin permeabilities upon ion-pairing with amino acids and more than 10 fold when the zwitter ionic drug was paired with glutamic acid. Microarray data revealed that trimethoprim was absorbed actively via OCTN1 transporters while MRP7 is the main transporter gene that mediates its efflux. The absorption of trimethoprim from trimethoprim glutamic acid ion-paired formulations was affected by the ratio of glutamic acid in the formulation which was inversely proportional to the degree of expression of OCTN1. Interestingly, ciprofloxacin glutamic acid ion-pairs were found to decrease the up-regulation of ciprofloxacin efflux proteins (P-gp and MRP4) and over-express two solute carrier transporters; (PEPT2 and SLCO1A2) suggesting that a high aqueous binding constant (K11aq) enables the ion-paired formulations to be absorbed as one entity. In conclusion, formation of ion-pairs with amino acids can influence in a positive way solubility, transfer and gene expression effects of drugs.
Key words: Oral drug delivery, solubility, permeability, efflux transporters, ion-pairs, microarrays.

3
Acknowledgements
I would like to record my gratitude to Dr Afzal R Mohammed and Peter Hanson for their supervision, advice, availability, guidance and continuous support from the very early stage of this research as well as for the trust Dr Mohammed put on me to decide the direction of the research. I gratefully acknowledge Dr Tony Worthington for his great contribution to the microbiology section and for his inspiring passion for science. And thanks to Noreen Akhtar for providing help during some of the compaction studies. Special thanks goes to Mr Jiteen Kansara, Dr Michael Davis and Aston University technical staff for their technical support and assistance throughout my research. Many thanks to Laine Wallace, Nil Turan and Dr Ayesha Rahman, I greatly benefited from their advice and they kindly made all the resources available to me at Birmingham University, genomic facility. I would also like to thank Dr Defang Ouyang for his great help to perform the simulation studies of our ciprofloxacin salts.
It is also pleasure to pay tribute to my colleagues at Aston labs who created a friendly
atmosphere during the research time.

4
Dedication
I dedicate my work to my family. With a special feeling of gratitude to my loving
mother Kamilia Gad who encouraged me not only during my master program, but
throughout my studying life, her push for tenacity and words of encouragements ring
in my ears.
My sisters, Ola and Sammer and my brother Ahmed who never left my side. They are
my role-model for personal sacrifices and are my emotional anchors through my entire
life.
The memory of my father M. ElShaer who instilled in me the hard work, confidence,
being tolerant and modest.

5
Title…………………………………………………………………………………….………….………..………………………….1
Summary……………………………………………………………………………………..………………………………………2
Acknowledgements…………………………………………………………………………………..…………………………3
Dedication…………………………………………………………………………………………………..….……………………4
List of contents…………………………………………………………………………..………………..………………………5
List of tables……………………………………………………………………………….………………………………………13
List of figures………………………………………………………………………….………………………….………………16
Abbreviations…………………………………………………………………….…………..………….………………………25
Thesis publications…………………………………………………………………………………..…………………………27
List of contents
Chapter 1: Introduction......................................................................................................29
1.1. Introduction……………………………………………………..……………………….……………………………………30
1.2. Biopharmaceutical classification system…………………..…………………….………………………………30
1.3. Factors affecting oral drug delivery…………………………..…………………..….………….…………………33
1.3.1. Physiological factors in the gastrointestinal tract that affect drug bioavailability……...…33
1.3.2. Effect of dosage form on drug bioavailability ……………………..…………………………..……………35
1.3.2.1. Excipients used in tablet manufacture……………………………………………………………………….36
1.3.2.1.1 Diluents……………………………………………………………..…………………………………………….………37
1.3.2.1.2. Binders………………………………………………………………..…………………………………………..……37
1.3.2.1.3. Disintegrants…………………………………………………………………………………………………..………38
1.3.2.1.4. Lubricants………………………………………………………………………………………………………….……38
1.3.2.1.5. Glidants………………………………………………………………………………………………………..…………38
1.3.2.2. Tablet characterisation………………………………………………………………………………………………39
1.3.2.3. Tablet preparation……………………………………………………………………………………..………………39
1.3.2.4. Bonding mechanisms………………………………………………………………………………………...………41
1.3.3 Effect of biopharmaceutical drug properties on oral bioavailability………………….……………42
1.3.3.1 Solubility…………………………………………………………………………………………………………………….42
1.3.3.1.1 Physical modification to improve drug solubility. ………………………………….…………..……42
1.3.3.1.2. Chemical modifications to improve drug solubility………………………………………….………44
1.3.3.1.2.1. Salt formation………………………………………………………………………………………………………45
1.3.3.2. Permeability………………………………………………………………………………………………………………47
1.3.3.2.1. Anatomy and physiology of the small intestine……………………………….……………………..47
1.3.3.2.2. Mechanisms and transport routes of drug absorption in the gastrointestinal tract…47
1.3.3.2.3. Carrier mediated transporters…………………………………………………………………………………49
1.3.3.2.3.1. ATP-binding cassette Transporters (ABC) ………………………….…………….…………………..50
1.3.3.2.3.1.1. P-glycoprotein. …………………………………………………..………………………….…………………52

6
1.3.3.2.3.2. Solute carrier transporters (SLC) …………………………………………………………..……………54
1.3.3.2.4. Techniques for improving drug permeability……………………………………………..……………58
1.3.3.2.5. Methods for assessing drug permeability………………………………………………………………59
1.3.3.2.5.1. In vitro Assessment of permeability…………………………………………………………..…………60
1.3.3.2.5.1.1. Physiochemical Assessment of permeability……………………………………………………..60
1.3.3.2.5.1.2. Excised tissue permeability assays……………………………………………………………………62
1.3.3.2.5.1.3. Cell based and membrane based permeability assays…………………….………………..66
1.3.3.2.5.2. In vivo assessment of permeability …………………………………………………..…………………66
1.3.3.2.5.3. In silico assessment of permeability…………………………………………………………………….66
1.4. Microarrays………………………………………………………………………………………………….………………….68
1.4.1. Types of microarrays…………………………………………………………………………….………………………70
1.4.2. Procedure for setting up microarray studies…………………………………………..…………………….71
Chapter 2: Aims and Objectives………………………………………………………………….…………………….73
Chapter 3: Indomethacin………………………………………………………………………………….…………………74
Chapter 3.1: Salt preparation and characterisation of indomethacin using cationic amino
acids…………………………………………………………………………….………………………………………………………75
3.1.1. Introduction……………………………………………………..………………………..…………………………………75
3.1.2. Materials and methods……………………………..…………………………….……………………………………77
3.1.2.1 Materials…………………………………………………………………………………………….………………………77
3.1.2.2 Methods………………………………………………………………………………………………….…….……………77
3.1.2.2.1 Analytical techniques…………………………………………..………………………………………..…………77
3.1.2.2.2 Phase solubility diagram. …………………………………………………………………………………………77
3.1.2.2.3 Salt preparation………………………………………………….……………………………………………………78
3.1.2.2.4 Thermogravimetric analysis (TGA). ……………………………………………………….…………………78
3.1.2.2.5 Differential scanning calorimetry………………………………………..……………………………………79
3.1.2.2.6 FT-infrared (IR) spectroscopy…………………..………………………………………………………………79
3.1.2.2.7 1HNMR…………………………………………………………………….………………………………………………79
3.1.2.2.8. pH solubility profiles……………………………………………………………………………………….………80
3.1.2.2.9. Solubility studies…………………………………………………………………………………………..…………80
3.1.2.2.10. Conventional tablet preparation and dissolution studies. …………………….……..……….81
3.1.3. Results and discussion. …………………………………………………………………………………………………81
3.1.3.1 Phase solubility diagrams. ……………………………………..……….…………………………….……………81
3.1.3.2 Characterisation of the salt form………………………………………………………………….….…………82
3.1.3.2.1 Differential scanning calorimetry and thermo-gravimetric analysis……….……………..…83

7
3.1.3.2.2 Fourier Transform infra-red spectroscopy (FT-IR)…………………… ………………..…………….84
3.1.3.2.3 1HNMR………………………………………………………………………………………………….……..…………86
3.1.3.3. Aqueous solubility determination. …………………….……………………………..……….………………89
3.1.3.4. Dissolution study. …………………………………………………………………………………..…...……………89
3.1.3.5. pH- solubility profile. ………………………………………………………….………………..……………………91
3.1.4. Conclusion…………………………………………………………..…………………………………….…………………93
Chapter 3.2: Prediction of compaction properties of binary mixtures of indomethacin and
indomethacin-arginine with arginine…………………………………………………………………………………..94
3.2.1. Introduction………………………………………………………………………..………………………..………………94
3.2.2. Materials and methods…………………………………………………………………………………………………97
3.2.2.1. Materials…………………………………………………………………………….……………………..………………97
3.2.2.2. Methods………………………………………………………………………………………………………….…………97
3.2.2.2.1. Physical mixtures (PMs) and salt preparations. ……………………………………..……….………97
3.2.2.2.2. Tap density and Powder flow (Hausner’s ratio and Carr’s index) ……….……..……………97
3.2.2.2.3. Particle Size Distribution Analysis (Sieve method) …………………………..…………..…………98
3.2.2.2.4. Tablet preparation…………………………………………………….……………………………………………99
Tablet characterization…………………………………………………………..………………………………..……………99
3.2.2.2.5. Tensile strength measurements………………………….………………………………………….………99
3.2.2.2.6. Heckel analysis………………………………………………………………………………………….……………99
3.2.2.2.7. Apparent, bulk particle density and porosity measurements………………………..………100
3.2.2.2.8. Disintegration time studies……………………………………..……………………………………………100
3.2.2.2.9. Design of the experiments……………………………………………………………………………………101
3.2.3. Results and discussion…………………………………………………..……………………………………………101
3.2.3.1. Powder characterisation…………………………………………………………………………….……………101
3.2.3.1.1. Particle size analysis………………………………………………………………………………..……………101
3.2.3.1.2. Flowability studies. …………………………………………….…………………………………..……………102
3.2.3.1.3. Porosity studies………………………………….…………………………………………………………………105
3.2.3.2. Densification properties of individual powders……………………………………………..…………106
3.2.3.3 Comparison between the predicted and experimental data for binary mixtures………112
3.2.3.3.1. Compressibility characterisation of the binary mixtures………………………………..……..112
3.2.3.3.2. Tabletability characterisation…………………………………………………….……………..…………118
3.2.3.3.3. Disintegration studies……………………………………………………………………………………………122
3.2.3. Conclusion……………………………………..……………………………………………………………..……………128

8
Chapter 3.3: The effect of ion pairing indomethacin with arginine/lysine on its permeability
profile………………………………………………………………………………………………………………….…………….129
3.3.1. Introduction……………………………………………………………………………………….……….………………129
3.3.2. Materials and methods……………………………………………………………………………………….………131
3.3.2.1. Materials………………………………………………………………………………………………………….………131
3.3.2.2. Methods…………………………………………………………………………………………….…….………………131
3.3.2.2.1. Preparation of pre-saturated solution of 1-octanol and de-ionised water. ……..……131
3.3.2.2.2. Octanol- water partitioning experiment …………………………………..…………………..………131
3.3.2.2.3. HPLC method to study the concentration of indoemthacin…………………………..………132
3.3.2.2.4. Ninhydrin analysis……………………………………………..…………………………………….……………132
3.3.2.2.5. Procedure for Caco-2 cell culture……………………………………………………………………….…134
3.3.2.2.6. Indomethacin permeability study……………………………………………………….…………………134
3.3.2.2.7. Recovery………………………………………………………………………………………………….……………135
3.3.3. Results and discussion…………………………………….……………………………….…………………………136
3.3.3.1. Octanol-Water partitioning. ……………………………………………………………………………………136
3.3.3.2. Permeability studies…………………………………..……………………………………………………………142
Chapter 4: Trimethoprim……………………………………………………………………………………………………147
Chapter 4.1: Preparation and characterisation trimethoprim salts with anionic counter
ions………………………………………………………………………………………………………………………..………….148
4.1.1. Introduction………………………………………………………………………………………….……………….……148
4.1.2. Materials and methods……………………………………………………………………………………….………150
4.1.2.1. Materials……………………………………………………………………………………………………….…………150
4.1.2.2. Methods………………………………………………………………………………………………….…….…………150
4.1.2.2.1. Analytical techniques…………………………………………………………………………………..………150
4.1.2.2.2. Phase solubility diagrams…………………………………………………………..………………..………150
4.1.2.2.3. Salt preparation………………………………………………………………………………….…………………151
4.1.2.2.4. Thermogravimetric analysis (TGA) …………………………………………………………..……………151
4.1.2.2.5. Differential scanning calorimetry…………………………………………………………….……………151
4.1.2.2.6. FT-infrared (IR) spectroscopy…………………..……………………………………………………………152
4.1.2.2.7. 1HNMR…………………………………………………………………………………………………………………152
4.1.2.2.8. pH solubility profile…………………………………………………………………………………….…………152
4.1.2.2.9. Solubility and dissolution studies………………………………………………………………….………153

9
4.1.2.2.10. Microbiological studies……………………………………………………………………….………………153
4.1.2.2.11. Statistical analysis……………………………………………………………………….………………………154
4.1.3. Results and discussion………………………………………………………………………….……….……………155
4.1.3.1. Phase solubility diagrams……………………………………………………………………….……….………155
4.1.3.2. Characterization of salt form …………………………………………………………………….…….………156
4.1.3.2.1. Fourier Transform Infrared Spectroscopy (FT-IR)……………… …………………………….…..156
4.1.3.2.2 Differential scanning calorimetry and Thermogravimetric analysis……………………..…158
4.1.3.3.3 1HNMR studies………………………………………………………………………………..………………….…161
4.1.3.3.4. Aqueous solubility and dissolution Studies……………………………………………………………164
4.1.3.3.5. pH- solubility profiles……………………………………………………………………………………………166
4.1.3.3.6 Microbiology studies………………………………………………………………………………………………168
Chapter 4.2: A systematic and mechanistic evaluation of aspartic acid as filler for directly
compressed tablets containing trimethoprim and trimethoprim aspartate……………………….171
4.2.1. Introduction……………………………………………………………………………………………….…….…………171
4.2.2. Materials and methods……………………………………………………………….………………………………174
4.2.2.1. Materials…………………………………………………………………………………………………….……………174
4.2.2.2. Methods………………………………………………………………………………………….………………….……174
4.2.2.2. Physical mixtures (PMs) and salt preparations. …………………………….…………………………174
Powder characterization
4.2.2.2. Powder flowability (Angle of repose method) …………………………………………………………174
4.2.2.2. Particle size analysis (laser diffractometry) ………………………………………………………..……175
4.2.2.2. Apparent, bulk particle density and porosity measurements……………………………………175
4.2.2.2. Powder wettability (Contact angle) …………………………………………………………………………176
4.2.2.2. Scanning electron microscopy (SEM) ………………………………………………………………………176
4.2.2.2. Tablet preparation……………………………………………………………………………………………………176
Tablet characterization
4.2.2.2. Tensile strength measurements……………………………………………………………………….………177
4.2.2.2. Disintegration time studies……………………………………….………………………………………..……178
4.2.2.2. Heckel analysis…………………………………………….………………………………………………………..…178
4.2.2.2. Statistical analysis………………………………………….…………………………………………………………179
4.2.3. Results and discussion…………………………………………………………………………………………………179
4.2.3.1. Powder characterisation…………………………………………….…………………………….……..………179
4.2.3.1.1. Characterisation of powder flow properties using angle of repose (o) ….………………179

10
4.2.3.1.2. Apparent, bulk particle density and porosity measurements………………………………..180
4.2.3.1.3. Particle size analysis ………………………………………..……………………………………………………180
4.2.3.1.4. Surface morphology …………………………………………………………………………………..…………181
4.2.3.2. Tablets characterisation………………………………...……………………………………………..…………182
4.2.3.2.1. Compressibility………………………………………………………………………………………..……………182
4.2.3.2.2. Compactability…………………………………………….…………………………………………..……………186
4.2.3.2.3. Tabletability…………………………………..…………………………………………………………..…………190
4.2.3.2.4. Disintegration time…………………………………………………………………………………….…………193
4.2.4. Conclusion……………………………………………..……………………………………………………..……………196
Chapter 4.3: TMP permeability studies and transcriptomic changes occurring during its
uptake……………………………………………………………………………………………………………………………..198
4.3.1. Introduction……………………………………………………………………………………………………………..…198
4.3.2. Materials and methods…………………………………………………………………………..…..………………201
4.3.2.1. Materials………………………………………………………………………………………………………………….201
4.3.2.2. Methods…………………………………………………………………………………………………………..……..201
4.3.2.2.1. Preparation of pre-saturated solution of 1-octanol and de-ionised water……..….….201
4.3.2.2.2. Octanol- water partitioning experiment……………………………………………………….….……201
4.3.2.2.3. HPLC method to study the concentration of trimethoprim……………………………………202
4.3.2.2.4. Ninhydrin analysis…………………………………………………………………………………………….…..202
4.3.2.2.5. Procedure for Caco-2 cell culture……………………………………………………………………….…203
4.3.2.2.6. Trimethoprim permeability studies………………………………………………………………………204
4.3.2.2.8. Recovery……………………………………………………………………………………………………….………205
4.3.2.2.9. RNA extraction for microarray studies………………………………………………………..…………205
4.3.2.2.10. Microarray study……………………………………………………………………………………..………….206
4.3.2.2.11. Data Processing (Image analysis and data normalization)…………………….……………..207
4.3.2.2.12. Data clustering and filtering………………………………………………………………………..………208
4.3.3. Results and discussion…………………………………………………………………………………………………209
4.3.3.1. Octanol-Water partitioning. ……………………………………..……………………………………….……209
4.3.3.2. Permeability studies of TMP aspartic acid ion pairs……………….…………………………………213
4.3.3.3. Partitioning studies for TMP glutamate formulations………………………………………………217
4.3.3.4. Permeability studies for TMP glutamic formulations………….……………………………………221
Microarray studies
4.3.3.5. Image analysis…………………………………………………………………………………………………….……225

11
4.3.3.6. Data clustering and Principle component analysis (PCA)……………..……………….…………227
4.3.3.7. Genetic changes of transporters pathways…………………………………………..…….……………230
4.3.3.8. Genetic changes of metabolic pathways and other pathways……….……………….………..239
4.3.4. Conclusion………………….………………………………………………………………………………….…………..247
Chapter 5: Ciprofloxacin…………………………………………………………………………………………………….249
Chapter 5.1: Preparation and characterization Ciprofloxacin salts with anionic and cationic
counter ions……………………………………………………………………………………………………………………...249
5.1.1. Introduction……………………………………………………………………………………………………….……….249
5.1.2. Materials and methods…………………………………………………………….…………………………………251
5.1.2.1. Materials…………………………………………………………………………………..…………………..…………251
5.1.2.2. Methods………………………………………………………………………………………………………..…………251
5.1.2.2.1. Salt preparation…………………………………………………………………………….………………………251
5.1.2.2.2. HPLC analysis………………………………………………………………………………………..………………252
5.1.2.2.3. Phase solubility diagrams ……………………………………………………………….……………………252
5.1.2.2.4. Differential scanning calorimetry and Thermogravimetric analysis………………..……..252
5.1.2.2.5. FT-infrared (IR) spectroscopy…………………..……………………………………………….……..……253
5.1.2.2.6. 1HNMR…………………………………………………………………………………………………………………253
5.1.2.2.7. Solubility and dissolution studies. …………………………………………………………………………253
5.1.2.2.8. Simulation studies…………………………………………….………………………………………..…………254
5.1.3. Results and discussion………………………………………………..………………………………………………255
5.1.3.1. Ciprofloxacin phase solubility profile. ………………….…………………………………….……………255
5.1.3.2. Fourier Transform Infrared Spectroscopy (FT-IR) …….………………………………..……………258
5.1.3.3. 1HNMR……………………………………………………………………………………………………..………….…259
5.1.3.4. Differential scanning calorimetry and thermogravimetric analysis……………………..……263
5.1.3.5. Simulation studies…………………………………….………………………………………………………..……263
5.1.3.6. Solubility & dissolution studies……….………………………………………………………….……………269
5.1.4. Conclusion…………………………………………………….……………………………………………………………270
Chapter 5.2: Ciprofloxacin permeability studies and the transcriptomic changes occurring
during its uptake……………………………………………………………………………………………………………….271
5.2.1. Introduction…………………………………………………………………………………………..……………………271
5.2.2. Materials and methods…………………………………………………………………....…………………………273
5.2.2.1. Materials…………………………………………………………………………………………………….……………273

12
5.2.2.2. Methods……………………………………………………………………………………………..……….……..…..273
5.2.2.2.1. Preparation of pre-saturated solution of 1-octanol and de-ionised water………..…..273
5.2.2.2.2. Octanol- water partitioning experiment……………………………………………………..…………273
5.2.2.2.3. HPLC method to study the concentration of ciprofloxacin…………………………………….274
5.2.2.2.4. Ninhydrin analysis…………………………………………………………………………………..…………….274
5.2.2.2.5. Procedure for Caco-2 cell culture………………………………………………………..…..……………275
5.2.2.2.6. Ciprofloxacin permeability studies…………………………………………………….….………………276
5.2.2.2.7. Fed and fasted state media preparation……………………………………………….………………277
5.2.2.2.8. Recovery……………………………………………………………………………………………..………………..277
5.2.2.2.9. RNA extraction for microarray studies………………………………………………..…………………278
5.2.2.2.10. Microarray study…………………………………………………………………………………………………278
5.2.2.2.11. Data Processing (Image analysis and data normalization)……………………………………279
5.2.2.2.12. Clustering analysis and filtering……………………………………………………………..……………280
5.2.3. Results and discussion…………………………………………………………………………………………………281
5.2.3.1. Ciprofloxacin/aspartic acid octano/water partitioning and permeability studies……..281
5.2.3.2. Ciprofloxacin/glutamic acid octano/water partitioning and permeability studies…….284
5.2.3.3. Effect of fed and fasted state on CIP permeability……………………………………………………288
5.2.3.4. Effect of pH on CIP permeability………………………………………………………………………………290
5.2.3.5. Image analysis, data clustering and principle component analysis (PCA)…………………292
5.2.3.6. Genetic changes of transporter pathways……………………………………………………....………295
5.2.3.7. Genetic changes of metabolic pathways and other pathways……………………….………...307
5.2.4. Conclusions………………………………………………………………………………………………….……………311
Chapter 6: Conclusions……………………………………………………………………………………….……………312
Appendix 1. …………………………………………………………………………………………………………………………344
Appendix 2………………………………………………………………………………………………………..…………………352

13
List of tables
Table 1.1.1:- Biopharmaceutical classification system substrates adapted from Wu & Benet,
(2005)………………………………………………………..…………………………………………………………………………..32
Table 1.1.2:- Comparison of various physiological factors of the different regions of the
gastrointestinal tract, which can affect the absorption of active drug ingredients. Adapted from
Washington et al. (2001)…………………………………………………………………………………………………………33
Table 1.1.3:- Classification of common pharmaceutical salts (adapted from Bastin et al., 2000).
…………………………………………………………………………………………………………………………..………..…………46
Table 1.1.4:- Location and functions of ABC transporters (Huang and Sadee., 2006)……………..54
Table 1.1.5:- Functions of SLC transporters (Huang and Sadee., 2006)…………………………………..57
Table 1.1.6:- Various methods used in determining the log P values. ……………………………….…..61
Table 1.1.7:- Some of the transporter protein expressed on Caco-2 monlayers…………………..…63
Table 1.1.8:-Summary table of in vitro permeability models and their advantages and
limitations (Worth & Balls 2002). ……………………………………………………………………………………..……64
Table 1.1.9:- Summary table for in vivo permeability models (Worth & Balls 2002)……………...66
Table 1.1.10:- Summary table for in silico permeability models (Stenberg et al., 2000)………….68
Table 3.1.1: Major band (peak) positions and assignments for IND and its salts in the region of
4000-400 cm-1……………………………………………………………………..……………………………….………….……86
Table 3.2.111:- Flowability based on Hausner ratio, Carr’s Index and angle of repose according
to BP guidelines (British Pharmacopoeia 2011). ……………………………………………….……………………98
Table 3.2.2– Hausner Ratio, Carr’s Index and angle of repose for Indomethacin, L-arginine and
their PMs and SMs………………………… ………………………………………………………………….…………………103
Table 3.2.3:- Weight, volume Bulk Density, True Density and Porosity of IND, arginine and their
PMs…………………………………………………………………………….……………………………………………………..…105
Table 3.2.4:- Weight, volume, bulk density, true density and porosity of IND salt and the
SMs………………………………………………………………………………………………………………………………………106
Table 3.2.5:- Summary of Heckel analysis and tensile strength at zero porosity (σ0) for IND,
arginine, IND arginine salt, PMs and SMs. ……………………………………………………………………………109
Table 3.2.6:- The quantitative factors affecting tablets porosity and their associated p value for
the responses. ………………………………………………………………………….…………………………………….……114
Table 3.2.7:- The quantitative factors affecting tablets tensile strength and their associated p
value for the responses. ………………………………………………………………………………………………………120

14
Table 3.2.8:- The quantitative factors affecting tablets disintegration time and their associated
p value for the responses. ………………………………………………………..………………………………….………123
Table 3.3.1:- TEER measurements for IND formulations before and after the permeability assay
(n=5) ……………………………………………………………………………………………………………………………………143
Table 4.1.1:- pH measurements during solubility and dissolution studies…166
Table 4.1.2. Theoretical calculations of pH solubility profile using (Equation 4.1.1). [Bs]=
266.35µg/mL and pKa=7.3. …………………………………………….……………………………………………………168
Table 4.1.3:- Zone of inhibition studies of TMP and its prepared salts against Escherichia coli
and Pseudomonas aeruginosa. …………………………………….………………………………………………………169
Table 4.1.4:- MICs of TMP and its prepared salts against Escherichia coli and Pseudomonas
aeruginosa. ……………………..………………………………………………….………………………………………….……169
Table 4.2.1:- Flow properties of pharmaceutical powders according to the measured angle of
repose. …………………………………………………………………………………………………………………………………175
Table 4.2.2:- Powder characterisation of TMP, aspartic acid, TMP aspartate salt, their physical
and salt mixtures. ……………………………………………...………………………………………………..………………179
Table 4.2.3:- Heckel parameters of TMP, aspartic acid and TMP aspartate salt…………….…….181
Table 4.3.1:- Quantification of total RNA using nanodrop spectrophotometer……………………206
Table 4.3.2:- Yield and specific activity of the complementary DNA used for hybridization in
TMP studies. ………………………………..………………………………………………………………………………………207
Table 4.3.3:- TEER measurements for TMP aspartate formulations before and after the
permeability assay (n=5) ………………………………………………………………………………………………………214
Table 4.3.4:- Summary of the over-expressed ABC transporters during TMP permeability across
Caco-2 monolayers. ……………………………………………………..………………………………………………………233
Table 4.3.5:- Summary of SLC1 transporters up-regulated during the uptake of TMP glutamic
acid ion-paired formulations across Caco-2 monolayers…………………………………………...…………238
Table 5.1.1:- Computer simulation for ciprofloxacin complexes………………..……………….………..250
Table 5.2.1:- Composition of the media to simulate the fasted state simulated intestinal fluid
(FaSSIF) and the fed state simulated intestinal fluid (FeSSIF)……………………………………..…………277
Table 5.2.2:- Summary of quantifying of total RNA, yield and specific activity of the
complementary DNA used for hybridization in CIP studies……………………………………………………279
Table 5.2.3:- pH measurements during the partitioning study for CIP aspartate (n=3)……….…282
Table 5.2.4:- Summary of the TEER measurements before and after the permeability assay
(n=3), the percentage recovery and the apparent permeability calculations for CIP aspartic acid
and glutamic acid formulations. …………………………………..………………………………………………………284

15
Table 5.2.5:- pH measurements during the partitioning study for CIP glutamate (n=3)….…….285
Table 5.2.6:- The percentage recovery and TEER measurements before and after the
permeability assay of CIP glutamate salt from HBSS, FaSSIF and FeSSIF (n=5)………………..…….290
Table 5.2.7:- The percentage recovery and TEER measurements before and after the
permeability assay of CIP at pHs of 4.5, 5.5 and 6.8 (n=5)…………………………………………………….292
Table 5.2.8:- summary of the over-expressed transporter genes upon exposing Caco-2 cells to
CIP alone formulations for 5, 30 and 60 minutes………………………………………………………………….297
Table 5.2.9:- Over-expressed genes upon exposure to CIP:glutamic acid at 1:8 molar ratio…306

16
List of figures
Figure 1.1.1:- Contribution of various routes of administration for drugs available in the UK
market (Aulton, M. E. 2002) ………….………………………………………………………………………………..……30
Figure 1.1.2:- Classification of marked drugs and NCEs according to the Biopharmaceutical
Classification System (BCS). ………………………………………………………………………………………………….32
Figure 1.1.3:- Diagram showing various types of deformation occurring during powder
compaction. ……………………………………………………………………….……………………………………….…………40
Figure 1.1.4:- Structure of intestinal wall showing the various mechanisms of oral absorption
(adapted from Hamalain & Frostell-Karlsson,2004)……………………………………………………………….48
Figure 1.1.5:- Structure of ABC transporters which confer drug resistance (adapted from
Mohammed et al., 2012)..…………………………………………………………………………………………….………51
Figure 1.1.6:- Comparison of how much research has been performed using in silico, in vitro
and in vivo techniques during the last decade (2001- 2010)……………………………………..……………67
Figure 1.1.7:- Schematic representation of the procedures followed to setup microarrays
studies. Samples (control and test samples) are labeled with different fluorescent dyes (Cy3
and Cy5) and competitively hybridized to the same array. Final imaging requires a fluorescent
scanner that can excite and detect at multiple wavelengths…………………………………………………..72
Figure 3.1.1:- Phase solubility diagram between IND, L-arginine, L-lysine and L-histidine. The
figure also shows pH measurements of various concentrations of the amino acids………………82
Figure 3.1.2 :- DSC and TGA scans for IND free acid, IND-Hisidatine, IND-Lysinate salt, and
IND-Arginate salt. 2-5 mg of the sample was heated to 300oC at rate of 10 oC/min (n=3)
………………………………………………………………………………………………………………………………………....……83
Figure 3.1.3 :- (A) The characteristic FT-IR absorption bands of IND, IND-arginate, IND-lysinate
and IND-histidate, (B) chemical structure of indomethacin……………………………………….…………..85
Figure 3.1.4:- 1HNMR spectra of indomethacin free acid in DMSO………………………………….…….87
Figure 3.1.5:- 1HNMR spectra for IND-arginine salt dissolved in D2O…………………………….………88
Figure 3.1.6:- 1HNMR spectra for IND-lysine salt dissolved in D2O…………………………………………88
Figure 3.1.7:- 1HNMR spectra for IND-histidine dissolved in D2O…………………………………………..89
Figure 3.1.8:- Dissolution profile for IND free acids and its salts in phosphate buffer pH 7.2.
Data are mean± SD (n=3). ………………………………………………………………………………………………………90
Figure 3.1.9:- pH solubility profile of indomethacin free acid (circles) titrated with L-arginine at
ambient conditions.Point a represents the saturation solubility of the free acid. The theoretical
curve (dotted lines) was fitted using Eq 3.1.1…………………………………………………………………….…..92

17
Figure 3.2.1– Particle size analysis of Indomethacin, L-Arginine and physical mixtures………..102
Figure 3.2.2:- SEM images for (A) IND and (B) ar ginine, (C) IND arginine salt……………………….104
Figure 3.2.3:- Plots of tablet porosity against compaction pressure, showing the
compressibility of IND, arginine, IND arginine salt (n= 3)…………………………………………………..….108
Figure 3.2.4:- Plots of tablet tensile strength against porosity, showing the Compactability of
IND, arginine, IND arginine salt (n= 3). …………………………………………………………………………………110
Figure 3.2.5:- Plots of tablet tensile strength against compaction pressure, showing the
tabletability of IND, arginine, IND arginine salt (n= 3)…………………………………………………………..111
Figure 3.2.6:- Disintegration time for IND, arginine and IND arginine salt (n=3)……………………112
Figure 3.2.7:- Reproducibility of the results for all three responses which represents the
variation of the response under the same conditions (pure error) compared with the total
variation of the response. ……………………………………………………………………………………………………114
Figure 3.2.8:- Surface response plot showing the effect of compaction force and arginine ratio
on tablets porosity for (A) IND/arginine binary mixtures, (B) IND salt/arginine binary
mixtures…………………………………………………………………………………………………………………….…………115
Figure 3.2.9:- Plots of tablet porosity against compaction pressure, (A) Compressibility of IND,
L-arginine and PM’s and (B) Compressibility of IND salt and SM’s (n= 3)………………………….…..117
Figure 3.2.10:- Surface response plot showing the effect of compaction force and arginine ratio
on tablets tensile strength for (A) IND/arginine binary mixtures and (B) IND salt/arginine binary
mixtures. ……………………………………………………………………………………………………………………………..119
Figure 3.2.11:- Plots of tablet tensile strength against compaction pressure showing (A)
Tabletability of IND, ARG and PM’s, (B) Tabletability of IND salt and SM’s (n=3)…………………121
Figure 3.2.12:- Surface response plot showing the effect of compaction force and arginine ratio
on tablets disintegration time for (A) IND/arginine binary mixtures and (B) IND salt/arginine
binary mixtures……………………………………………………..…………………………………………………………..…124
Figure 3.2.13:- (A) Disintegration time for IND, ARG and PM’s (B) Disintegration time for IND
salt and SM’s………………………………………………………………………………………………………………………..125
Figure 3.2.14:- Correlations between actual and theoretical values for measuring (A) tablets’
porosity, (B) tablets’ tensile strength and (C) tablets’ disintegration time………………………….…127
Figure 3.3.1:- Schematic representation of ninhydrin reaction……………………………………..………133
Figure 3.3.2:- schematic representation of the ionization of the salt form and the effect of
adding excess of the basic counter ion on the ionisation equilibrium……………………………………137
Figure 3.3.3:- IND concentrations in aqueous and octanol layers and its corresponding Log P
values at various concentrations of arginine…………………………………………………………………..…….138

18
Figure 3.3.4:- IND concentrations in aqueous and octanol layers and its corresponding Log P
values at various concentrations of lysine. ……………………………………………..……………………………139
Figure 3.3.5:- Double reciprocal plot of the apparent octanol-water distribution coefficient of
IND as function of arginine molar concentration. …………………………………………………………………140
Figure 3.3.6:- Double reciprocal plot of the apparent octanol-water distribution coefficient of
IND as function of lysine molar concentration. …………………………………………………………….………140
Figure 3.3.7:- TEER measurements of Caco-2 cells for 22 days of seedings (n=3)………….…….142
Figure 3.3.8:- Effect of inoculation time with HBSS and DMEM on the TEER values of Caco-2
cells (n=3). ……………………………………………………………………………………………………………………………143
Figure 3.3.9:- Percentage of IND transported across Caco-2 monolayers at various molar ratios
of arginine (n=5). ……………………………………………..………………………………………………………….………144
Figure 3.3.10:- Papp permeability values for IND alone and IND at various molar ratios of
arginine and lysine. ……………………………………………………………………………………………………..………145
Figure 3.3.11:- Percentage of IND transported across Caco-2 monolayers at various molar
ratios of lysine (n=5). ……………………………………………………………………………….……………….…………146
Figure 4.1.1:- Trimethoprim chemical structure…………………………………………………………………...149
Figure 4.1.2:- Phase solubility diagram of TMP in the presence of different concentrations of
glutamic acid and aspartic acid at different pH (n=3). …………………………………………….……………156
Figure 4.1.3. FTIR spectra of (A) trimethoprim D-aspartate, (B) trimethoprim L-aspartate and
(C) trimethoprim. ………………………………………………………………………………………………………..…….…157
Figure 4.1.4. FTIR spectra of (A) trimethoprim D-glutamate, (B) trimethoprim L-glutamate and
(C) trimethoprim. …………………………………………………………………………………………………………………158
Figure 4.1.5. TGA and DSC scans for L- glutamic acid and TMP free base……………………….…….160
Figure 4.1.6. DSC and TGA scans for TMP D-glutamate and TMP L-glutamate salts. 2- 5 mg of
the sample was heated to 300oC at rate of 10 oC/min (n=3)……………………………………….……….160
Figure 4.1.7. DSC and TGA scans for TMP D-aspartate and TMP L-aspartate. 2- 5 mg of the
sample was heated to 300oC at rate of 10 oC/min (n=3). …………………………………….………………161
Figure 4.1.8. 1HNMR spectra of trimethoprim free base solubilised in DMSO………………………163
Figure 4.1.9. 1HNMR spectra of trimethoprim L-aspartate solubilized in D2O………………………163
Figure 4.1.10. 1HNMR spectra of trimethoprim L-glutamate solubilized in D2O……………….…164
Figure 4.1.11. Solubility of trimethoprim and its prepared L/D aspartate and L/D glutamate
salts mean ±SD (n=3). ……………………………………………………………………………………………………….…165
Figure 4.1.12. Dissolution profile for TMP free base and its salts in deionised water. Data are
mean± SD (n=3). …………………………………………………………………………………………………..…..…………166

19
Figure 4.1.13. pH solubility profile of TMP and TMP-glutamate salt at ambient conditions using
free acid (circles) and TMP-glutamate salt (squares) as starting materials. Points b and a
represent the saturation solubility of the salt and TMP free base respectively. [Bs]=
266.35µg/mL and pKa=7.3. …………………………………………………………………………………………….……167
Figure 4.2.1:- SEM for TMP at low magnification 500 UM (A), at high magnification UM200 (D),
aspartic acid (B) and TMP aspartate salt (C)……………………………………………………………………….…182
Figure 4.2.2:- Plots of tablet porosity against compaction pressure, showing the compressibility
of TMP, aspartic acid and TMP aspartate salt (n=3)……………………………….………………….………….183
Figure 4.2.3:- Heckel plots for TMP, aspartic acid and TMP aspartate salt using out-of-die
method (n=3). ……………………………………………………….………………………………………………….…………184
Figure 4.2.4:- Plots of tablet porosity against compaction pressure, showing (A) the
compressibility of TMP and aspartic acid PMs(n= 3), (B) the compressibility of TMP aspartate
and aspartic acid SMs (n=3). ………………………………………………………………….….…………………………185
Figure 4.2.5:- Plots of tablet tensile strength against porosity, showing (A) the compactability
of TMP, aspartic acid and TMP aspartate salt, (B) TMP and aspartic acid PMs, (C) TMP
aspartate salt and aspartic acid SMs (n=3). ………………………………………………….………………………187
Figure 4.2.6:- Plots of tablet tensile strength against compaction pressure, showing the
tabletability of (A) TMP, aspartic acid and TMP aspartate salt, (B) TMP and aspartic acid PMs,
(C)TMP aspartate salt and aspartic acid SMs (n=3). …………….……………….………………………………192
Figure 4.2.7:- Disintegration time of (A) TMP, aspartic acid and TMP aspartate salt, (B) TMP
and aspartic PMs, (C) TMP aspartate salt and aspartic acid SMs at various compression forces
(n=3). ………………………………………………………………………………………………………………………..…………195
Figure 4.3.1:- Ninhydrin calibration curve for aspartic acid (A), glutamic acid (B) n=3….203
Figure 4.3.2:- Box-plots showing raw data before normalization (A), and centred distributed
normalized microarray data (B). …………………….…………………………………………….………………………208
Figure 4.3.3:- TMP partitioning in the aqueous and octanol layers and its corresponding Log P
values at various concentrations of aspartic acid (n=3)……………………………………….………………..211
Figure 4.3.4:- TMP aspartate partitioning in the aqueous and octanol layers at various
concentrations of aspartic acid (n=3). …………………………………..…………………………………..…………212
Figure 4.3.5:- Double reciprocal plot of the apparent octanol-water distribution coefficient of
TMP as function of aspartic acid molar concentration. …………………………………………..……………213
Figure 4.3.6:- Percentage of TMP transported across Caco-2 monolayers from TMP alone
formulations and its physical mixtures (PM) with various molar ratios of aspartic acid (n=5).214

20
Figure 4.3.7:- Percentage of TMP transported across Caco-2 monolayers from TMP aspartate
salt and salt mixtures (SM) with various molar ratios of aspartic acid (n=5)…………………….……216
Figure 4.3.8:- Papp permeability values for TMP, TMP aspartate and their mixtures with various
molar ratios of aspartic acid. ……………………………………………….………..…………………………….………217
Figure 4.3.9:- TMP partitioning in the aqueous and octanol layers and its corresponding Log P
values at various concentrations of glutamic acid (n=3)……………………………………………………….218
Figure 4.3.10:- Double reciprocal plot of the apparent octanol-water distribution coefficient of
TMP as function of glutamic acid molar concentration. ……….………………………………………………219
Figure 4.3.11:- TMP glutamate partitioning in the aqueous and octanol layers at various
concentrations of glutamic acid (n=3). ………………………………….…………………………………..…………220
Figure 4.3.12:- Double reciprocal plot of the apparent octanol-water distribution coefficient of
TMP glutamate as function of glutamic acid molar concentration. ………………………………………221
Figure 4.3.13:- Percentage of TMP transported across Caco-2 monolayers from TMP alone
formulations and its physical mixtures (PM) with various molar ratios of glutamic acid (n=5)222
Figure 4.3.14:- Percentage of TMP transported across Caco-2 monolayers from TMP glutamate
salt and salt mixtures (SM) with various molar ratios of glutamic acid (n=5)………………………..223
Figure 4.3.15:- Papp permeability values for TMP, TMP aspartate, TMP glutamate and their PM
and SM with aspartic acid and glutamic acid. ………………………………………………………………………224
Figure 4.3.16:- Microarray image analysis showing spot finding of the four corners of the array
(A), histogram of signals plot (B) data were generated by feature extraction software.225
Figure 4.3.17:- Correlation between log signal against log Relative concentration (A) and spatial
distribution of median signals for each column (B). …………………………………………………………..…226
Figure 4.3.18:- Data clustering for TMP formulations at various time points; green clusters
show down-regulations while red clusters show up-regulations. …………………………………………228
Figure 4.3.19:- First and second principal component analysis on the transcriptional time
course for TMP and its various ion-paired formulations at 0, 30 and 60 minutes. The number
represents the time points. The plot represents the data for the mean values at each time
point………………………………………………………………………………………………………………………….…………229
Figure 4.3.20:- First and third principal component analysis on the transcriptional time course
for TMP and its various ion-paired formulations at 0, 30 and 60 minutes. The number
represents the time points. The plot represents the data for the mean values at each time
point…………………………………………………………………………………………………………………………………..230

21
Figure 4.3.21:- Total number of ABC genes over-expressed ( ), suppressed ( ) and
unchanged ( ) after 5 minutes (A), 30 minutes (B) and 60 minutes (C) of exposure to
TMP………………………………………………………………………………………………………………………………………232
Figure4.3.22:- Comparison between the molecular structure of TMP (A) and cholesterol (B).
Figure 4.3.23:- Total number of SLC genes over-expressed ( ), suppressed ( ) and
unchanged ( ) after 5 minutes (A), 30 minutes (B) and 60 minutes (C) of exposure to TMP.234
Figure 4.3.24:- Gene expression of SLC transporters of Caco-2 cells after 30 minutes of
exposure to TMP. ……………………………………………………………………………………………………………..…236
Figure 4.3.25:- A scheme of the known metabolites and reactive intermediates (in brackets) of
TMP obtained from in vitro and in vivo experiments. The figure is adapted from Damsten et al.,
(2008)…………………………………………………………………………………………………………………………..….……24
0
Figure 4.3.26:- Various oxidative phosphorylation reactions activated upon exposing Caco-2
monolayers to TMP alone formulations for 30 minutes (over-expressed genes are highlighted
in red). The graph was created by the KEGG online database……………………………………………..241
Figure 4.3.27:- Scheme showing all in vitro human metabolites and reactive intermediates (in
brackets) of TMP. The role of CTYP450 isoforms involved in the metabolites formation is also
shown in this figure. The figure is adapted from Damsten et al., 2008………………………………….243
Figure 4.3.28:- Various metabolic pathways activated upon exposing Caco-2 monolayers to
TMP alone formulations for 30 minutes (over-expressed CYP450 isomers and enzymes are
highlighted in red). The graph was created by KEGG online database…………………………………..244
Figure 4.3.29:- Various enzymes activated upon exposing Caco-2 monolayers to TMP alone
formulations for 30 minutes (over-produced enzymes are highlighted in red). The graph was
created by the KEGG online database. …………………………..………………………………………..…………245
Figure 4.3.30:- Various enzymes involved in glutamic acid metabolism upon exposing Caco-2
monolayers to TMP: glutamic acid 1:8 ratio formulations for 30 minutes. glutamate
dehydrogenase and glutaminase A (both highlighted in red) were over-produced. The graph
was created by KEGG online database..……………………………………………………………………….………246
Figure 5.1.1. Structure of ciprofloxacin. The central structural unit is a quinolone ring with a
fluorine atom at the 9-position, a piperazine moiety at the 8-position, a cyclopropyl ring at
position 1 and a carboxyl group at position 3. There are two pK values, pKa COOH = 6.09 and
pKa N20 = 8.7. …………….………………………………….……………………………………………………………….……256
Figure 5.1.2:- Phase solubility diagram of CIP in the presence of different concentrations of
arginine, lysine, histidine, glutamic acid and aspartic acid at different pH (n=3)……………………256

22
Figure 5.1.3:- FTIR spectra of (A)Ciprofloxacin, (B) CIP L-aspartate and (C) CIP L-
glutamate………………………………………………………………….…………………………………………..………….…258
Figure 5.1.4:- FTIR spectra of (A)Ciprofloxacin, (B) CIP arginine, (C) CIP lysine, (D) lysine…….259
Figure 5.1.5:- 1HNMR spectra for Ciprofloxacin Aspartate dissolved in D2O………………….….…260
Figure 5.1.6:- 1HNMR spectra for Ciprofloxacin glutamate dissolved in D2O……………………….261
Figure 5.1.7:- 1HNMR spectra for Ciprofloxacin lysine dissolved in D2O…………………………..….262
Figure 5.1.8:- 1HNMR spectra for Ciprofloxacin arginine dissolved in D2O………………………….262
Figure 5.1.9. Molecular simulation of two ciprofloxacin molecules in water: (A) at 0 ns, (B) after
200 ps, (C) after 400 ps, (D) after 600 ps, (E) after 800 ps and (F) after 1 ns. (Water is only
shown in A) and is ignored from B) to F) for clarity) ………………….…….……………………………………265
Figure 5.1.10. Molecular simulation of two ciprofloxacin molecules with one aspartic acid
molecule in water: (A) at 0 ns, (B) after 200 ps, (C) after 400 ps, (D) after 600 ps, (E) after 800
ps and (F) after 1 ns. (Water is only shown in A) and is ignored from B) to F) for
clarity)……………………………………………………………………………………………………………………………….…266
Figure 5.1.11. Molecular simulation of two ciprofloxacin molecules with four aspartic acid
molecules in water: (A) at 0 ns, (B) after 200 ps, (C) after 400 ps, (D) after 600 ps, (E) after 800
ps and (f) after 1 ns. (Water is only shown in A) and is ignored from B) to F) for clarity)
………………………………………………………………………………………………………………………………………….….267
Figure 5.1.12. Molecular simulation of two ciprofloxacin molecules with four histidine
molecules in water: (A) at 0 ns, (B) after 200 ps, (C) after 400 ps, (D) after 600 ps, (E) after 800
ps and (f) after 1 ns. (Water is only shown in A) and is ignored from B) to F) for clarity)
………………………………………….……………………………………………………………………………………………....268
Figure 5.1.13:- (A)Dissolution profile for CIP free drug, CIP aspartic acid physical mixture and
CIP aspartate, (B) Dissolution profile for CIP glutamic acid physical mixture and CIP glutamate,
data are represented as mean±SD (n=3). ………………………………………………………………………….…269
Figure 5.2.1:- Ninhydrin calibration curve for aspartic acid (A), glutamic acid (B) n=3….275
Figure 5.2.2:- CIP concentrations in aqueous and octanol layers and its corresponding Log P
values at various concentrations of aspartic acid (n=3). ………………………………………….……………281
Figure 5.2.3:- Double reciprocal plot of the apparent octanol-water distribution coefficient of
CIP as function of aspartic acid molar concentration. …………………………………………………..………282
Figure 5.2.4:- Percentage of CIP transported across Caco-2 monolayers at various molar ratios
of aspartic acid (n=5). ……………………………………………………………………………………………………..……283
Figure 5.2.5:- CIP concentrations in aqueous and octanol layers and its corresponding Log P
values at various concentrations of glutamic acid (n=3). ………………………………………………………285

23
Figure 5.2.6:- Double reciprocal plot of the apparent octanol-water distribution coefficient of
CIP as function of glutamic acid molar concentration. …………………………………………………………286
Figure 5.2.7:- Percentage of CIP transported across Caco-2 monolayers at various molar ratios
of glutamic acid (n=5)…………………………………………………………………………………………………………..287
Figure 5.2.8:- Papp permeability values for CIP alone and CIP at various molar ratios of aspartic
acid and glutamic acid. …………………………………………………………………………………..……………………287
Figure 5.2.9:- Structure representing the reversion of the zwitter ionic nature of CIP by the
proton transference from the glutamic acid and hence an overall anionic charge on ion paired
molecule. ……………………………………………………………………………………………………………………….……288
Figure 5.2.10:- Percentage of CIP glutamate salt transported across Caco-2 monolayers from
HBSS, FaSSIF and FeSSIF media (n=5). …………………………………………………………………………………289
Figure 5.2.11:- Percentage of CIP transported across Caco-2 monolayers at various pHs (n=5).
……………………………………………………………………………………………………………………………………………291
Figure 5.2.12:- Microarray image analysis; spot finding for four corners (A), correlation
between log signal against log Relative concentration (B) histogram of signals plot (C), and
spatial distribution of median signals for each column (D). Data were generated by feature
extraction software. …………………………………………..………………………………………..………………………293
Figure 5.2.13:- First and second principal component analysis on the transcriptional time
course (0, 30 and 60 minutes) for CIP and its various ion-paired formulations. The number
represents the time points. The plot represents the data for the mean values at each time
point…………………………………………………………………………………………………………………………………….294
Figure 5.2.14:- Second and third principal component analysis on the transcriptional time
course (0, 30 and 60 minutes) for CIP and its various ion-paired formulations. The number
represents the time points. The plot represents the data for the mean values at each time
point. ……………………………………………………………………………………………………..……………………………295
Figure 5.2.15:- Total number of genes up and down-regulated upon exposing the cells to CIP
alone formulation at different time courses.. ………………………………………………………………………296
Figure 5.2.16:- The over-expressed ABC transporters during the absorption of CIP across Caco-
2 cells. The graph was generated by KEGG online database………………………………………………….298
Figure 5.2.17:- The activated signalling pathways involved in tight junction formation.
Activated mediators are highlighted in red. The graph was generated by KEGG online database.
……………………………………………………………………………………………………………………………..………………301
Figure 5.2.18:- Gene expression of ABC and SLC transporters of Caco-2 cells after 5, 30 and 60
minutes of exposure to CIP : glutamic acid formulations at 1:1 ratio……………………….…………..303

24
Figure 5.2.19:- Up-regulated ( ) and down-regulated( ) genes after exposing Caco-2 cells to
CIP: glutamic acid at 1:8 molar ratio after (A) 5 minutes, (B) 30 minutes and (C) 60
minutes……………………………………………………………………………………………….……………………………….304
Figure 5.2.20:- Phylogenetic tree of various members of the human SLC6 transporter family
adapted from Takanaga et al., (2005) …………………………………………………….…………………..………305
Figure 5.2.21:- Various metabolic pathways activated after 30 minutes of exposure to CIP
alone formulations. The graph was generated by KEGG online database……………………………..308
Figure 5.2.22:- Various metabolic pathways activated after 30 minutes of exposure to
CIP:glutamic acid at 1:1 molar ratio formulations. The graph was generated by KEGG online
database. …………………………………………………………………………………………………………………….………309
Figure 5.2.23:- Down-regulated mediators (highlighted in red) involved in calcium signalling
pathways during CIP uptake across Caco-2 cells and after 30 minutes of the permeability assay.
The graph was generated by KEGG online database………………………………………………..……………310

25
Abbreviation list
IND Indomethacin TMP Trimethoprim CIP Ciprofloxacin An Absorption number Dn Low dissolution number APIs Active pharmaceutical agents GIT Gastro Intestinal Tract Py Yield pressure pKa Dissociation constant ATP Adenosine triphosphate HUGO Human Genome Organisation ABC ATP-binding cassette SLC Solute carrier transporters P-gp P-glycoprotein NBD Nucleoside-binding domains MRP Multi-drug resistance associated protein ABCP/ ABCG2 Placenta specific ABC transporter LAT L-type amino acid transporter BCCT Betaine/Carnitine/Choline transporter AGCS Alanine/Glycine/Cation symporter PEG 400 Polyethylene glycol TEER Transepithelial electrical resistance ADMET Absorption, distribution, metabolism, excretion and
toxicity SNP Single nucleotide polymorphism CGH Comparative genomic hybridization TMA Tissue microarrays D2O Deuterated water TGA Thermogravimetric analysis FT-IR Fourier Transform infra-red spectroscopy DCPD Dicalcium phosphate dehydrate Fc Crushing force ε Porosity ρd Bulk density ρt True density σo Zero porosity VMD Volume median diameter Y Yield strength PY Yield pressure g Gram HCl Hydrochloric Acid HPLC High Performance Liquid Chromatography hr Hour kV Kilovolt L Litre log Logarithm mA Milliampere min Minutes mg Milligram

26
μg Microgram Kg Kilogram ANOVA Analysis of variance DoE Design of experiment DSC Differential scanning calorimetry FDA Food and Drug Administration PM Phyical mixture between the drug and amino acid SM Salt mixture between the salt form of the drug and
amino acid

27
Thesis publications
Peer-reviewed articles
1. Amr ElShaer, Peter Hanson and Afzal R Mohammed., (2013). A systematic and mechanistic evaluation of aspartic acid as filler for directly compressed tablets containing trimethoprim and trimethoprim aspartate. European Journal of
Pharmaceutics and Biopharmaceutics. In press.
2. Amr ElShaer, Peter Hanson, Tony Worthington, Peter Lambert and Afzal R. Mohammed., (2012). Preparation and Characterization of Amino Acids-Based Trimethoprim Salts. Pharmaceutics, 4, 1, 179-196
3. Amr ElShaer, Defang Ouyang, Peter Hanson and Afzal R Mohammed., (2012). Application of molecular simulation studies in the development of amino acid based pharmaceutical salts of ciprofloxacin. Submitted.
4. Amr El Shaer, Peter Hanson and Afzal R Mohammed., (2011). Improving the drug
properties of chemotherapeutic agents through using amino acids. UKICRS newsletter.
5. Amr ElShaer, Sheraz Khan, Dhaya Perumal, Peter Hanson and Afzal R Mohammed (2011). Use of amino acids as counter ions improves the solubility of the BCS II model drug, indomethacin. Curr Drug Deliv. 8, 4, 363-372.
Book chapters
Afzal R. Mohammed, Amr M. ElShaer, Rhys J. Jones, Sheraz Khan, Craig A. Russell (2011). Drug Bioavailability and Gene Profiling: Challenges and Opportunities for Pharmaceutics and Personalised Medicine. Handbook of Personalized Medicine: Advances in Nanotechnology,
Drug Delivery and Therapy.
Conference proceedings
1. Amr ElShaer, Peter Hanson and Afzal Mohammed. The use of amino acid based tablet fillers as solubility and permeability enhancers for BCS IV drugs., UK Pharmasci
2. Amr ElShaer, Peter Hanson and Afzal Mohammed., 2012. Ion pairing a BCS IV model drug with amino acids as solubility and permeability enhancers. UKICRS conference, Aston University, Birmingham, UK.
3. Amr ElShaer, Sheraz Khan, Ayesha S. Rahman, Peter Hanson, Yvonne Perrie, Afzal R.
Mohammed., 2011., System biology evaluation of drug formulation: A tale of drug transporters., UKICRS, conference, Queen’s university, Belfast, Northern Ireland.
4. Amr ElShaer, Peter Hanson, Tony Worthington, Peter Lambert, Afzal R Mohammed.
2011. Amino acids salts and drug resistance of chemotherapeutic agents. Aston University PG. Birmingham, UK.

28
5. Amr M ElShaer, Peter Hanson and Afzal R Mohammed., Feasibility of using amino acids
as counter ions to study the solubility of indomethacin through salt formation. PG Day. Aston University, Birmingham, UK.
Oral presentations Could amino acid salts fool fussy bacteria to improve antibiotics uptake? UKICRS, Queen’s
University Belfast, April 2011

29
Chapter 1
Introduction
Papers relating to chapter 1 Afzal R. Mohammed, Amr M. ElShaer, Rhys J. Jones, Sheraz Khan, Craig A. Russell (2011) Drug Bioavailability and Gene Profiling: Challenges and Opportunities for Pharmaceutics and Personalised Medicine. Handbook of Personalized Medicine: Advances in Nanotechnology, Drug Delivery and Therapy.

30
Others
1.1. Introduction
Oral drug administration is considered the most popular route of delivery (Fig. 1.1.1) due to
various factors including ease of administration, availability of large surface area for drug
absorption and the wide range of dosage forms that can be designed to deliver active
pharmaceutical ingredient/s (Sastry, et al., 2000). Despite the several advantages,
physiological barriers such as degradation in the acidic environment of the stomach, presence
of luminal digestive enzymes and most importantly the biopharmaceutical properties of the
drug molecule limit oral drug bioavailability (Hunter & Hirst, 1997). Biopharmaceutical
properties have gained significant attention after the introduction of high throughput drug
discovery programmes which generate large numbers of new chemical entities (NCE) with
unfavourable properties primarily due to the use of lipophilic screens in generating lead
candidates. Therefore, improving biopharmaceutical properties and developing new methods
to accurately predict these properties have gained considerable attention within the
pharmaceutical industry.
Figure 1.1.8:- Contribution of various routes of administration in UK market (Aulton, M. E. 2002)
1.2. Biopharmaceutical classification system
Amidon et al. (1995) recognised that the rate and extent of oral bioavailability is controlled by
aqueous solubility and gastro-intestinal permeability which led to the development of a

31
Biopharmaceutical Classification System (BCS) that categorizes all the drugs into four classes
according to their permeability and solubility profile (table 1.1.1).
In 2000, the BCS system was accepted by the FDA as a scientific model to waive the in vivo
bioequivalence and bioavailability testing for class 1 drugs that exhibit rapid dissolution and
permeability (FDA guidelines). The main objective of BCS is to predict in vivo pharmacokinetics
of drugs by measuring permeability and solubility characteristics. According to the BCS, a
highly soluble drug is a substance which at its highest dose strength is soluble in 250 mL or less
of aqueous media over a pH range of 1-7.5 at 37 oC while a highly permeable drug is a
substance which exhibits an absorption profile of ≥ 90% of the total administered dose.
Class I (high solubility/high permeability drugs): drugs in this class dissolve rapidly when
administered and are transported rapidly across the gastrointestinal membrane. The rate
limiting step to drug absorption is the drug dissolution or the gastric emptying rate (when the
dissolution is very fast).
Class II (low solubility/ high permeability drugs): drugs in this class are characterised by a high
absorption number (An) and low dissolution number (Dn) and in-vivo drug dissolution is the
rate limiting step. As the intestinal membrane and intestinal luminal contents vary along the
intestine, the dissolution profile must be determined at 4-6 time points and at different
physiological pH’s. Examples of class II drugs include griseofulvin, indomethacin and ibuprofen
(Wu & Benet, 2005).

32
Figure 1.1.9:- Classification of marked drugs and NCEs according to the Biopharmaceutical
classification system (BCS) Aulton (2002).
Class III (high solubility/low permeability drugs); permeability is the rate limiting step in drug
absorption. Therefore, it is important for class III drugs to be released rapidly from their
formulations in order to maximise the residence time in the gastro-intestinal tract thereby
improving their permeability.
Class IV (low solubility/low permeability); drugs in this class are characterised by poor
permeability and poor solubility and as a result have very poor oral bioavailability. Use of a
prodrug is a common approach to overcome this problem.
Table 1.1.12:- Biopharmaceutical classification system substrates adapted from Wu & Benet, (2005)
High solubility Low solubility
Hig
h p
erm
ea
bil
ity
Class 1
Acyclovir Amiloride S,I Amitryptyline S,I chloroquine S,I Diltiazem S,I Fluoxetine I Verpamil I
Imipramine I Levofloxacin S Levodopa S Midazolam S,I Nifedipine S Quiniidine S,I
Class 2
Azithromycin S,I Carbamazepine S,I
Ciprofloxacin S Cyclosporine S,I Indinavir S Indomethacin
Erythromycin S,I Talinolol S Spiranolactone I Ketoconazole I Digoxin S Cisapride S
Low
pe
rme
ab
ilit
y
Class 3
Acyclovir Amoxicillin S,I Atenolol Cimetidine S Cloxacillin Famotidine Folinic acid
Penicillins Methotrexate Trimethoprim S Metoformin Pravastatin Tetracyclin
Class 4
Amphotercin B Colistin Ciprofloxacin S Hydrochlorothiazide Mebendazole Neomycin
Methotrexate Furosamide

33
1.3. Factors affecting oral drug delivery
1.3.1. Physiological factors in the gastrointestinal tract that affect drug bioavailability
Gastrointestinal tract (GIT) physiology has a major effect on the bioavailability of active
pharmaceutical ingredients (APIs). Physiological factors such as surface area, pH, gastric
emptying rate, gastric motility and food are among the major factors influencing the rate and
extent of drug bioavailability.
The surface area available for oral drug absorption varies along the gastrointestinal tract as
shown in table (1.1.2). The small intestine is composed of three regions: duodenum, jejunum
and ileum which posses the largest surface area for absorption. Therefore, the majority of oral
absorption occurs in the small intestine. On the other hand, the small surface area of the
stomach and colon limits the absorption in these organs.
Table 1.1.13:- Comparison of various physiological factors of the different regions of the
gastrointestinal tract, which can affect the absorption of active drug ingredients. Adapted from
Washington et al. 2001.
Section Length (m) Surface Area
(m2)
pH Residence Time
Oesophagus 0.3 0.02 6.8 >30 seconds
Stomach 0.2 0.2 1.8-2.5 1-5 hours
Duodenum 0.3 0.02 5-6.5 >5 minutes
Jejunum 3 100 6.9 1-2 hours
Ileum 4 100 7.6 2-3 hours
Colon 1.5 3 5.5-7.8 15-48 hours
Another factor that influences oral bioavailability is the gastrointestinal pH. The pH of the
gastrointestinal fluid varies from one region to another (between 1.8-7.8) along the GIT.
Stomach has the most acidic environment (pH 1.8-2.5) because of the high concentration of
hydrochloric acid secreted from the parietal cells of the stomach (Widmaier et al., 2011). The
secretion of bicarbonate increases down the gastrointestinal tract and neutralizes the effect of
hydrochloric acid and hence more alkaline conditions are observed along the small and large
intestine (Aulton, 2002). pH influences ionisation and chemical stability of the therapeutic
34
agent depending on the acidity and basicity of the surrounding environment in the GIT (Aulton,
2002). The rate at which an API leaves the stomach and reaches the duodenum is called the
gastric emptying rate. As the small intestine is the major site for oral drug absorption, reducing
the rate of gastric emptying will delay the availability of the active drug at the absorption site
which in turn will delay the onset of therapeutic effect. Besides, the dosage forms are believed
to affect the rate of gastric emptying as for instance solid dosage forms have a pronounced
influence when compared to the aqueous solutions (Gidal, 2006).
Intestinal motility is another physiological factor that affects drug bioavailability as it controls
the residence time in the small intestine. Propulsive and mixing movements are the two types
of motions encountered along the gastrointestinal tract. The propulsive movement is
responsible for moving the materials through the GIT with slower propulsive movement
increasing residence time in the small intestine. Mixing movements have a profound role in
the fed state as it enables mixing the different food components which affect the residence
time in the GIT and the dissolution rate of the drugs from solid dosage forms (Aulton, 2002).
Food has a direct and indirect effect on oral absorption and bioavailability of active
pharmaceutical agents. Food consumption could reduce the gastric emptying rate and in turn
delay drug uptake. Food also could stimulate the secretion of gastric fluids and enzymes which
might degrade certain active ingredients. Moreover, dietary components might complex with
the active drug to form a resultant bigger complex with reduced absorption characteristics
leading to decrease in bioavailability. For instance tetracycline antibiotics form a non-
absorbable complex with calcium (found in dairy products) which requires patient counseling
to prevent reduced drug efficacy (Aulton, 2002). Similarly, the viscosity of gastrointestinal
contents increases after food consumption which reduces drug dissolution and decreases oral
bioavailability.

35
1.3.2. Effect of dosage form on drug bioavailability
The pharmaceutical dosage form and its method of manufacture may have an impact on oral
bioavailability of the therapeutic agents. Maximum bioavailability is exhibited by aqueous
dosage forms as the active pharmaceutical ingredients (APIs) are available in solution and
ready for absorption into the systemic circulation. Nevertheless, it is not possible to formulate
most APIs as oral solutions because of stability related issues and inherent properties of the
drugs which affect their aqueous solubility.
Aqueous suspensions are placed in the second position after solutions. High bioavailability is
achieved due to the larger surface area of drug presented to the gastrointestinal fluid which
provides the necessary conditions for drug dissolution and absorption into the systemic
circulation. There are various factors which affect drug release from aqueous suspensions
including the crystalline form of the drug, particle size and effective surface area of the
suspended drug particles, viscosity of the suspension in the gastrointestinal fluid and the
inclusion of any surfactants (Aulton, 2002).
Hard gelatin capsules are rated below suspensions and are a suitable delivery system for
poorly soluble API as they provide large effective surface area for the drug in the
gastrointestinal fluid. Hydrophilic diluents such as lactose are added into hard gelatin capsules
in order to enhance dissolution of API. Other factors such as the nature and quantity of the
diluents, surfactants or any added lubricants also determine the bioavailability of the drug.
Among the dosage forms listed above, tablets are rated at the bottom of the table.
Compression of the API with various pharmaceutical excipients into tablets results in a
significant reduction in effective surface area of an active drug ingredient due to the
manufacturing process. The reduction in the effective surface area has a negative impact on
drug bioavailability as it becomes more difficult to produce a suspension of fine drug particles

36
from the compressed form. Before active ingredients undergo dissolution and become
available for absorption from tablets, they undergo disintegration to form aggregates or
granules followed by deaggregation to form suspension of drug particles. Tablet excipients and
the manufacturing cycle have a significant impact on drug release from compressed
formulations and affect bioavailability of the drug.
Despite providing less bioavailability when compared against aqueous solution, suspensions
and hard capsule dosage forms, tablets have achieved tremendous success since their
introduction because of the various advantages they provide. Tablets can be easily handled,
manufactured by various methods, produced at low cost, have more enhanced chemical,
mechanical and microbiological stability than liquid formulations and can be modified to
provide differing dissolution profiles.
The tablet manufacturing cycle usually includes weighing, milling, granulation, blending,
lubrication and compression. Direct compression is considered the simplest process in tablet
manufacture as it requires no heat or moisture. However, the physical properties of the active
ingredient and pharmaceutical excipients such as compactibility limit the use of direct
compression especially for drugs of low potency where a high dose is required
1.3.2.1. Excipients used in tablet manufacture
Tablets contain a mixture of various excipients in addition to the active pharmaceutical
ingredients (API). The inclusion of various excipients ensures the success of the tablet
manufacturing process and the quality of the final product. Therefore, appropriate selection of
the excipients including accurate concentrations is critical in the tableting process. Most
commonly used excipients include fillers (diluents), binders, lubricants, glidants, disintegrants,
colorants and flavouring modifiers.

37
1.3.2.1.1 Diluents
Diluents/fillers are usually added into the tablet mix to bulk up the formulation for processing
and handling. The diluents should have an acceptable taste, be chemically inert and non
hygroscopic (Aulton, 2002). Lactose, sucrose, microcrystalline cellulose and glucose are among
the commonly used diluents. Various grades of these fillers are commercially available and
each grade has its characteristic physical properties which can be exploited depending on the
requirements of the finished dosage form. For instance, fine grades of lactose are used for
milling and wet granulation as they enhance the performance of milled excipients (Aulton,
2002). Lactose is widely used as a tablet filler because of its pleasant taste, its ability to
dissolve readily in water and good compactability properties. It is available in both amorphous
and crystalline form and the former is prepared by spray drying while the latter by
precipitation.
Microcrystalline cellulose, also known as Avicel is a widely used filler. Avicel is a depolymerised
cellulose prepared by treating cellulose with mineral acids. Besides, being used as filler, it is
used as a binder and disintegrant in tablet manufacture (Aulton, 2002).
1.3.2.1.2. Binder
In order to improve cohesive and adhesive forces between different ingredients within the
powder mixture and to ensure the formulation of an intact tablet, a binder (adhesive) is added
to the formulation mixture. The binder should be able to cohere various excipients without
impairing the disintegration and dissolution properties of the tablets. Sucrose, gelatine and
starch are the most commonly used binders in the concentration range between 2- 10% w/w
(Aulton, 2002).
1.3.2.1.3. Disintegrants
A disintegrant is usually added to tablets to overcome the impaired cohesion during the
compression process and in turn facilitate tablet disintegration. Disintegration takes place in

38
two stages; during the first step the liquid wets the solid surface of the tablet and penetrates
through the tablet pores, which results in the second phase of tablet disaggregation. Various
mechanisms of disintegration have been proposed including wicking, enhanced wettability and
swelling (Alderborn, 2002).
1.3.2.1.4. Lubricants
High friction between the tablet and die wall emerges as a result of the high compression force
applied during tablet compaction. This high friction results in a series of problems such as
capping and even tablet fragmentation. Incorporation of a lubricant in the tablet mix forms an
intermediate film of low shear strength between the die wall and the tablet interface which
facilitates tablet ejection and reduces tablet deformation (Alderborn , 2002).
Magnesium stearate is the most widely used lubricant at a concentration range between 0.25-
0.5% and sometimes up to 1%. Nevertheless, using lubricants can have negative effects on
tablet manufacture. Lubricants can interfere with the bonding properties of the binder which
could impair tablet hardness. Moreover, the majority of the used lubricants are hydrophobic in
nature, thus they retard tablet disintegration and dissolution.
1.3.2.1.5. Glidants
Glidants may be required in tablet manufacture especially when high production speed is
employed. Glidants are fine particles which are mixed with the powder in the dry state before
compression. Collidal silica, talc and starch are examples of the glidants.
1.3.2.2. Tablet characterisation
Directly compressed tablets are prepared by applying high pressure onto a bed of powder
which results in the formation of new bonds between particles or granules forming a coherent

39
compact. Both the manufacturing process and the properties of used materials affect the
characteristics of the resultant tablets e.g. disintegration time, mechanical strength and drug
release profile.
1.3.2.3. Tablet preparation
During powder compression, the bulk volume of the powder decreases as the air between the
particles is displaced. Reduction in the amount of air enables the particles to get closer to each
other and promotes bond formation by an exothermic process (Rowling et al., 1995; Coherin
Beach and Hollenbelk, 1985).
Joiris et al. (1998) presented insights into the commonly applied terminology in tablet
preparation. Compressibility was defined as the ability of the material to undergo a volume
reduction upon exposure to pressure. Plotting tablet porosity against compaction pressure
produces a compressibility profile of the material. Similarly, compactability describes the
entire process, and was defined as the ability of material to produce tablets with sufficient
hardness after densification. Compactability can be represented by plotting tablet tensile
strength against porosity. Finally, the ability of materials to form a tablet of specified
mechanical strength under the effect of compaction force was known as tabletability.
When compressing a powder bed at low compaction pressure, the particles rearrange
themselves to form a closely packed structure. As the compression pressure increases further,
the particles fail to undergo further rearrangement and volume reduction is achieved by elastic
and plastic deformation or fragmentation of the particles (Train, 1956; Duberg & Nystrom,
1986).
Plastic deformation results in permanent change of particle shape as it is an irreversible
process, while elastic deformation is a reversible process and particles can resume their

40
original shape. Brittle particles which cannot undergo plastic or elastic deformation break
down into smaller units (fragmentation).
Figure 1.1.10:- Diagram showing various types of deformation occurring during powder compaction.
Both mechanical properties and mechanism of volume reduction affect the degree of volume
reduction. For instance, brittle particles which fragment extensively produce tablets with high
porosity as it creates more bonding points which prevent further volume reduction. However,
ductile materials produce tablets with relatively low porosity as a high degree of plasticity
enables particles to move close to each other and results in less a porous structure.
To describe the volume reduction behaviour of a powder, various mathematical equations
were developed including the Heckel, Kawakita and Cooper-Eaton equations. These equations
evaluate the effect of applied pressure on the porosity changes of the tablets.
The Heckel analysis (Heckel, 1961a; Heckel, 1961b) is considered one of the most valuable
methods to describe powder behaviour during compaction. In the Heckel equation, the
material constant K measures material plasticity and can be calculated from the slope of the
linear portion of Heckel plot. The reciprocal of the material constant is known as the yield
Elastic deformation
Plastic deformation
Fragmentation
Before compression
During compression
After compression

41
pressure (Py). Initial filling of the die and rearrangements of the particles are represented by
constant A.
AKPD +=− ))1/(1ln(
Where D is the tablet relative density at pressure P, K is a material constant
Two methods can be used for Heckel analysis; the in-die and out-of-die method. For the in-die
method (at-pressure) the relative density is calculated at the applied load. Despite being
suitable for materials that have difficulties in forming intact compacts (due to capping), the
elastic deformation affects the K values and hence the Py value is the apparent mean yield
pressure.
The out-of-die method (zero-pressure) measures the relative density after tablet ejection from
the die. Therefore, materials are pressed at different compression forces to construct a plot
between D and P. The only drawback for the out-of-die method is the laborious and time
consuming experimental set up (York, 1979; Duberg & Nystrom, 1986).
1.3.2.4. Bonding mechanisms
The five main types of bonding mechanisms include formation of solid bridges, bonding due to
movable liquids, non-freely movable binder bridges, shape-related bonding and attraction
between solid particles. During powder compaction, it is believed that the bonding is restricted
to formation of solid bridges, intermolecular forces and shape related bonding (mechanical
interlocking) (Alderborn, 2002).
Solid bridges are formed in materials with mobility in the contact area. The movement is either
due to the dissolved state under the effect of multi molecular solvent sorption layer or from
the fused state under the effect of heat. The strength of the formed solid bridges depends on
the internal strength of the particles and separation of the resultant aggregates is irreversible.

42
On the other hand, mechanical interlocking occurs when materials are able to hook and twist
together. This kind of bonding depends on the shape and surface features of the particles and
is predominant in needle shaped fibres and irregular particles that have a higher tendency to
twist and hook during compaction.
1.3.3 Effect biopharmaceutical drug properties on oral bioavailability
Biopharmaceutical properties such as aqueous solubility and drug permeability across the
intestinal membrane are believed to be the main determinants of oral drug bioavailability.
1.3.3.1 Solubility
Both aqueous solubility and dissolution are important factors which affect bioavailability as
insoluble drug candidates which show poor solubility during their transit of the GIT are
eliminated without entering the systemic circulation (Aungst, 1993). Currently, there is a
general consensus in the pharmaceutical industry that the majority of new drug candidates are
poorly water soluble (Lipinski et al., 1997; Lipinski, 2000) with intrinsic solubility values of less
than 1 μg/mL (Li et al., 2005). Various physical techniques such as particle size reduction,
complexation with cyclodextrins or surfactants and dispersing a drug into a carrier have been
adapted in order to improve drug solubility. Chemically modified drugs (salts and prodrugs)
have also been shown to enhance solubility.
1.3.3.1.1 Physical modification to improve drug solubility.
Many studies have demonstrated that particle size reduction can increase the rate of
dissolution and oral bioavailability of poorly soluble drugs such as progesterone (Hargrove et
al., 1989), estradiol and estrone (Englund and Johansson, 1981), oxfendazole (Shastri et al.,
1980) proquazone (Nimmerfall and Rosenthaler, 1980) and nitrofurantoin (Watari et al., 1983).
Size reduction results in increasing the specific surface area and consequently the dissolution
rate (Noyes and Whitney, 1897). However, agglomeration could take place upon milling

43
especially with hydrophobic drugs such as aspirin and phenobarbitone. The formed aggregates
decrease the effective surface area and reduce the bioavailability. Ball milling, micronization
(using impact mills and fluid energy mills) and spray drying are commonly used techniques in
size reduction.
Solid dispersion formation is another technique for improving drug solubility. The first
generation of solid dispersion was first described in the early sixties by Sekiguchi & Obi (1961)
when it was observed that formation of eutectic mixtures improved drug bioavailability by
reducing the drug particle size and improving its wettability in the eutectic mixture. This was
followed by the application of urea as a water soluble carrier for poorly soluble drugs such as
chloramphenicol (Sekiguchi & Obi, 1964) and sulfathiazole (Sekiguchi & Obi, 1961). In the mid
sixties, Goldberg et al., (1966) demonstrated that crystalline carriers such as mannitol and
crystalline sugars release the drug as microcrystals which possess higher solubility.
Studies conducted by Simonelli et al., (1969); Chiou & Riegelman (1969) found that solid
dispersions using crystalline carriers are thermodynamically stable and less effective.
Therefore, the use of new amorphous carriers such as polymers was investigated and was later
referred to as second generation solid dispersions. Synthetic polymer carriers such as
povidone, polyethyleneglycol or natural polymers such as cellulose derivatives (Vasconecelos
et al., 2007) were investigated in the formation of solid dispersion compacts (Van Drooge et
al., 2006).
Recently, it has been suggested that inclusion of carriers with surface activity or self
emulsifying properties could have a greater impact on the dissolution profile of poorly soluble
drugs. Consequently, the third generation of solid dispersions were formulated which included
surfactants like intutec SPI and inulin (Van Drooge et al., 2006).
Inclusion complexes (host-guest complexes) were found to exert a profound effect on the
physicochemical properties of their guest molecules since the guest molecules are caged and
locked inside the host cavity. These properties include; taste masking, controlled drug release,

44
control of sublimation and volatility, stabilization of labile guest and importantly enhancing the
solubility of highly insoluble guests (Del Valle, 2004). Cyclodextrins are commonly used as
hosts due to their ability to form inclusion complexes with a wide range of guest molecules
including gaseous, liquid and solid compounds. Cyclodextrins are cyclic oligosaccharides
consisting of eight, seven and six α (1, 4) linked glycosyl units to form α, β, γ-cyclodextrins
respectively. There are two key factors which determine the ability of cyclodextrins to form
the inclusion complex; steric factors which depend on the relative size of guest molecules or
functional groups within the guest molecules and secondly, the thermodynamic interaction
between the different components (cyclodextrin, solvent, guest) (Del Valle, 2004).
1.3.3.1.2. Chemical modifications to improve drug solubility
Various approaches have been investigated to improve drug properties without altering
therapeutic activity. Chemical based approaches which work on the principle of drug
derivatization were very effective in improving drug efficacy. A commonly used chemical
approach which utilises reversible derivatives is the synthesis of a prodrug. Prodrugs
(proagents) were first discussed by Albert in the late 1950s and the technique gained
significant attention in 1975 as a tool to optimise and enhance the clinical application of drugs
(Amidon, 2000). The theory behind prodrug synthesis is based on the addition of a functional
group on to the structure of the poorly water soluble drug to enhance its solubility. This
functional group is modified chemically or enzymatically in-vivo to release the parent drug. A
commonly used functional moiety is a phosphate group by linking directly or through a linker
to the parent drug (Stella, 1996). The main advantage of using a phosphate group is its good
chemical stability and rapid quantitative in-vivo cleavage by alkaline phosphatase (Burstein et
al., 1999). Stella et al., (2005) utilised phosphate group to prepare a phosphoryloxymethyl
ether prodrug of propofol (general anaesthesia) which is believed to be pain free and avoids
any hyperlipidemia problems when prepared in a purely aqueous vehicle. The Hemi-succinate

45
group is another promoiety which was used to prepare prodrugs of chloroamphenicol,
prednisone and methylprednisone (Kauffman et al., 1981).
During the last few decades amino acids have been investigated widely as promoieties to
improve the aqueous solubility of poorly soluble amine and alcohol based drugs (Kovach et al.,
1975; Amidon et al., 1980; Aggarwal et al., 1990; Upshall et al., 1990). In 1995 Pochopin et al.,
investigated the solubility and stability of dapsone upon conjugation with alanine, lysine,
leucine, glycine and phenylalanine. The study concluded that all the amino acid prodrugs
showed at least a 2 fold increase in solubility. The lysine prodrug exhibited the highest
solubility (greater than 65 mg/mL) which was attributed to its γ–amine which becomes
protonated at physiological pH (Pochopin et al., 1995). Another successful study was carried
out by Hatchinson et al., (2002) which included conjugating benzothiazoles with lysine and
alanine that converts the highly lipophilic benzothiazoles into water soluble prodrugs.
1.3.3.1.2.1. Salt formation
As discussed above, most of the NCE’s possess poor mechanical and physicochemical
properties which present significant formulation challenges (Forbes et al, 1995). Salt formation
is considered a potential solution to optimise properties for drug candidates which have
ionisable groups. Both the physicochemical characteristics and biological performance of the
drug differ considerably for the salt form when compared to the free drug (Bighley et al.,
1996). However, the selection of counter ions (salt forming ions) is carried out empirically
based on a range of criteria including ease of crystallization, percentage yield, hygroscopicity
and flowability (Berge et al., 1977).
Many studies have investigated the relationship between salt properties and the counter ions
used. Yet, to date no successful predictive tool for estimating the effect of the salt former on
the behaviour of the parent compound has been reported. Stahl & Wermuth, (2002) suggested

46
that the dissociation constant (pKa) is the most important property of the drug that influences
salt formation and the selection of the counter ion is based on the difference in pKa between
the parent molecule and the counter ion (minimum difference between the salt former and
counter ion should be 3 pKa units).
Salt formers are divided into different categories according to their functionality and purpose.
Table 1.1.3 summarises some of the commonly used potential salt formers.
Table 1.1.14:- Classification of common pharmaceutical salts (adapted from Bastin et al., 2000).
Salt class examples
Anions
inorganic acids hydrochloride, hydrobromide, sulfate, nitrate, phosphate
sulfonic acids mesylate, esylate, isethionate tosylate, napsylate, besylateg
carboxylic acids acetate, propionate, maleate, benzoate, salicylate, fumarate
anionic amino acids glutamate, aspartate hydroxyacids Citrate, lactate, succinate, tartrate, glycollate fatty acids hexanoate, octanoate, decanoate, oleate, stearate insoluble salts pamoate (embonate), polystyrene sulfonate
(resinate) Cations
organic amines triethylamine, ethanolamine, triethanolamine, meglumine, ethylenediamine, choline
insoluble salts procaine, benzathine metallic sodium, potassium, calcium, magnesium, zinc cationic amino acids arginine, lysine, histidine
Hydrochloride is one of the popular salt formers used for weakly basic drugs because of its low
pKa value. However, hydrochloride salts could salt out and in turn reduce the optimal
solubility, causing high acidity in the formulations and greater corrosion risk (Bastin et al.,
2000). Due to the limitation on the use of inorganic ions, alternative counter ions have been
explored lately. Pellegate, (1993) investigated lysine, ornithine and arginine to prepare novel
salts of furosemide. The prepared salts exhibited very high solubility up to 560 mg/mL for the
lysinate salt which was much higher than furosemide itself and even its sodium counterpart. In
another study, L-arginine was used to solubilise ionosine and lysine was tested for salt
formation with ibuprofen (Tung et al., 1991)

47
1.3.3.2. Permeability
Oral drug bioavailability is an important parameter for new drug candidates under the drug
discovery investigation programme. Once the new drug candidate is identified based on its
pharmacological response, the following critical stage is to investigate its in vitro permeability.
Further development is unlikely to take place if the drug is found to have poor permeability or
absorption and as a result a great deal of interest is dedicated to study and enhance drug
permeability (Egan and Lauri., 2002).
1.3.3.2.1. Anatomy and physiology of the small intestine.
The human small intestine ranges between 2-6 m in length and is divided mainly into three
parts; duodenum, jejunum and ileum. Around 90% of the gastrointestinal tract absorption
takes place in the small intestine. The intestinal surface has a unique structure which makes it
suitable for absorption. The surface is covered by villi and microvilli which increase the
intestinal surface area by 30 and 600 fold respectively (Balimane, et al., 2000).
The main role of the small intestine is to serve as a site of absorption for nutrients. It also
works as a barrier which prevents the entry of any foreign substance or digestive enzymes. The
absorptive cells or enterocytes are the most common epithelial cells which are differentiated
into apical and basolateral membrane and separated by tight junctions (Balimane, et al., 2000).
1.3.3.2.2. Mechanisms and transport routes of drug absorption in the gastrointestinal tract
After the drug enters into the solution form that is suitable for absorption across the
gastrointestinal membrane, a number of transport routes are available for drug permeation
from the apical to the basolateral side. The major routes of drug uptake include transcellular,
paracellular, efflux and metabolism based drug absorption as illustrated in Figure 1.1.4.

48
Figure 1.1.11:- Structure of intestinal wall showing the various mechanisms of oral absorption,
adapted from Hamalain & Frostell-Karlsson, (2004).
The majority of the therapeutic agents are absorbed through the transcellular route by passive
diffusion through the lipid membranes of the intestinal mucosa. Drug molecules with smaller
molecular mass (<500 Daltons) capable of forming hydrogen bonds and exhibiting high
lipophilicity move from regions of high concentration to lower concentration i.e. down the
concentration gradient before entering into the blood circulation.
Another known passive diffusion mechanism for drug uptake is through the paracellular route.
Drug candidates reach the basolateral side by travelling through the water filled pores
between the tight junctions of the adjacent epithelial cells. Molecules transported via this
route should be polar with a molecular weight less than 250g/mol (Dressman et al., 2010).
Drugs can also be transported against their concentration gradient via a transporter route
known as active transport. Adenosine triphosphate (ATP) provides the energy required for
absorption by the active transporters which involves binding of the drug with the carrier that
49
results in conformational changes in the cellular membrane and helps in the transport of the
drug into cell lumen (Dressman et al., 2010).
Large drug molecules such as antibodies, hormones and proteins which cannot bind to
transporter carriers or enter the cells via transcellular or paracellular routes get absorbed via
endocytosis. The drug molecule is enclosed by the lipid membrane on the apical side to form a
vesicle which travels across the cell and exits by fusing with the lipid membrane on the
basolateral side (Dressman et al., 2010).
1.3.3.2.3. Carrier mediated transporters
The majority of the previous studies investigating drug absorption across the intestinal
membrane suggested that drug transportation occurs predominantly via paracellular transport
and passive transcellular mechanisms (Stenberg et al., 2000) in which the lipid solubility of the
drug is the critical determinant. However, water soluble compounds such as amino acids,
sugars, monocarboxylic acids, organic cations and anions, phosphates and water-soluble
vitamins were found to cross cell membranes via specialized carrier mediated transporter (Ling
and Thompson, 1974)
Human gene sequence analysis has demonstrated the presence of 406 genes which encode for
ion channels and 883 genes which encode for transporters (350 of which encode for
intracellular transporters). The Human Genome Organisation (HUGO) has approved 52 ATP-
binding cassette (ABC) genes and 229 solute carrier transporters (SLC). More than 200 of these
genes have been cloned and characterised including peptide transporters, amino acid
transporters and neurotransmitter transporters (Shin et al., 2003)

50
Membrane transporter proteins are classified into channels and carrier mediated transporters.
Carriers are further classified into facilitated diffusion, primary and secondary active
transporters according to the energy requirements (Stenberg et al., 2000).
Primary active transporters extrude the substrates from the cell against its concentration
gradient utilising energy derived from the conversion of ATP into ADP by ATPase. On the other
hand, secondary active transporters (solute carrier transporters) utilize the energy generated
by ion pumps (Na+/K+ ATPase) during transportation of Na+ and Ca+2 ions across the
membrane.
Membrane Transporters
1.3.3.2.3.1. ATP-binding cassette Transporters (ABC)
ABC transporters were first discovered as drug-resistance proteins (Gottesman et al., 2002)
and a correlation between expression of ABC transporters and cancer drug resistance has been
known for more than 25 years (Huang and Sadee, 2006). A diverse number of substrates are
transported across the cell membrane by ABC transporters. To date, around 52 ABC
transporter genes have been identified and grouped according to their structural homology
into seven groups (from A to G). ABC transporters are classified according to their predicted
two-dimensional structure into four classes (Figure 1.1.5). The first class was defined after the
discovery of P-glycoprotein (P-gp) in 1976 (Juliano & Ling, 1976).
Transporters in the first class consist of two identical halves and each half contains 6 putative
transmembrane segments and two cytoplasmic nucleoside-binding domains (NBD); these two
domains bind and enable the hydrolysis of ATP and N-glycosylation occurs in the first
extracellular loop of P-gp. The second class has a similar structure to that of the first and the
only difference is the N-glycosylation site as it takes place in the fourth extracellular loop. This
class includes transporters such as MRP4 and MRP5 (mammalian). The third class has

51
N C
C
Extracellular
Intracellular NBD NBD
NBD
NBD
NBD
NBD
NBD
N
C
N
N
MDR1 MRP7
ABCB11
MRP4 MRP5
MRP1 MRP2 MRP3 MRP6
ABCP
ABCG2
Examples
additional 5 putative transmembrane segments towards the N-terminus. Additional
glycosylation takes place on the new extracellular loop. Recently, a new ABC transporter
known as BCRP was discovered which was found to have a single intracellular ATP binding site
at N-terminus, followed by 6-putative transmembrane segments with N-glycosylation on the
last extracellular loop. Due to its unique conformation and arrangement in the plasma
membrane, BCRP is also known as a half-transporter (Figure. 1.1.5).
Figure 1.1.12:- Structure of ABC transporters which confer drug resistance adapted from Mohammed et al., 2012.

52
1.3.3.2.3.1.1. P-glycoprotein.
P-gp is also known as ABCB1 or MDR1 and is the first and most characterised ABC transporter.
P-gp is expressed in the blood brain barrier, apical membranes of excretory cells such as
hepatocytes and the epithelial cells in kidney proximal tubules and luminal membrane of the
small intestine (Giacomini et al., 2010). The mRNA levels of P-gp increase longitudinally along
the intestine with the lowest level in the stomach and highest levels in the colon (Wacher et
al., 1998). P-gp drew great attention when it was found to interact with multiple anticancer
drugs and mediated the efflux of a wide range of therapeutic drugs across biological
membranes. Polyaromatic hydrophobic drugs with positive or neutral charges are common
substrates for P-gp (Huang and Sadee, 2006). Not only conventional anti-cancer drugs (e.g.
methotrexate), but newly developed drugs such as geldanamycin (Huang et al., 2004) and
gleevec (Mahon et al., 2003) were found to be effluxed by P-gp. Talinolol (intermediate
lipophilic B-blocker) is an extensively studied P-gp substrate. Although the metabolic clearance
of talinolol is negligible and the drug is excreted unchanged in faeces and urine, talinolol oral
bioavailability is just over 50% which suggests that the drug is not completely absorbed from
the gastro-intestinal tract (GIT). Despite the acceptable physico chemical properties and in
vitro permeability profile of talinolol, the basolateral to apical flux was greater by 10 fold
compared to apical to basal flux (Wetterich et al., 1996). The efflux pattern was reduced upon
inclusion of P-gp inhibitors such as verapamil providing further evidence of the efflux
mechanism of talinolol. P-gp knockout mice were used in a study carried out by Schinkel et al
to evaluate the role of P-gp in limiting the oral bioavailability of its substrates (Schinkel et al.,
1997). The results showed that the wild type mice had an oral bioavailability of less than 5%
for UK-22,671 (new compound) while P-gp knockout mice resulted in a higher bioavailability
(22%).
53
In order to improve the permeability of P-gp substrates, its activity is inhibited or modulated
through the use of drugs or chemicals. P-gp modulation is achieved either indirectly, by
inhibiting; the hydrolysis of ATP, binding to ATP or directly through interaction with P-gp
binding sites. The indirect method is not feasible as the chemical agent could adversely affect
other ATPases. Pharmacokinetic interactions of P-gp substrates were reported and the number
is on the rise as, for instance cardiac patients who are on digitoxin and quinidine could show
digitoxin toxicity as the plasma concentration of digitoxin (which has a narrow therapeutic
window) increases by at least three fold (Shin et al., 2003). P-gp substrates and inhibitors are
summarised in Table 1.1.4.
Since P-gp is not expressed in all multi-drug resistance cells, research groups have explored
other efflux transporters which resulted in the discovery of a protein referred as multi-drug
resistance associated protein1 (MRP1). MRP1 (ABCB1) was found to confer resistance to
anionic and neutral hydrophobic natural products such as vinca alkaloids and anthracyclines
(Kruh and Belinsky 2003). Glutathione is a MRP1 substrate and is believed to play a major role
in MRP1 activity (Leslie et al., 2001). Despite showing potential in vitro, isoxazoles (MRP1
inhibitors) exhibit limited in vivo effects due to their side effects and low bioavailability.
Further investigation of MRP homologues led to the discovery of eight new members of MRP
sub families including MRP-2 to MRP9 (Huang and Sadee, 2006).
Another cancer resistance protein that has been investigated is ABCG2 known as placenta
specific ABC transporter (ABCP). ABCG2 mediates the transportation of negatively and
positively charged hydrophobic molecules such as topotecan, flavopiridol, mitoxantrone,
methotrexate and rhodamine (Doyle & Ross 2003). Interestingly, ABCG2 was found to exhibit
polymorphism which in turn affects its interaction with the substrates. For instance, ABCG2
shows more resistance to mitoxantrone and anthracyclines upon its mutation. Yet, mutated

54
ABCG2 fails to transport methotrexate (Volk & Schneider 2003). Table 1.1.4 summarises other
members of the ABC transporter family which have been shown to confer drug resistance.
Table 1.1.15:- Location and functions of ABC transporters (Huang and Sadee, 2006).
1.3.3.2.3.2. Solute carrier transporter (SLC)
Solute carrier transporters are another super family of membrane transporters.
Approximately, 300 SLCs genes have been cloned and clustered into 43 families. SLCs mediate
the transportation of hydrophilic moieties such as sugars, organic cations, anions, phosphates,
55
metals, monocarboxylic acids, water soluble vitamins and drugs with structures that resemble
natural substrates (Huang and Sadee, 2006).
Folate transporter (SLC19 family) was the first reported SLCs to be studied in conjunction with
anti-cancer drugs. Resistance to antifolate drugs such as methotrexate was reported in vitro in
cancer cells; these cells have showed loss of SLC19A1 activity due to mutation. Also, the
expression of SLC19A3 was found to be down regulated in breast cancer cells and as a result
these cells were resistant to doxorubicin (Liu et al., 2003).
Nucleoside transportation also takes place through SLCs mainly via the SLC28 family;
concentrative CNTs and SLC29 family. The former is distributed in tissues such as renal and
intestinal epithelia, liver and macrophages (Huang and Sadee, 2006). SLC28 consists of three
members (SLC28A1-A3) which transport Na+ concentration dependant synthetic and natural
nucleoside analogues and take part in synthesizing nucleic acid through salvage pathways
(Rauchwerger et al., 2000). On the other hand, SLC29 consists of four members SLC29A1-A4
which are distributed widely in mammalian cells and tissues. Similar to SLC28, they take part in
cellular transport of nucleosides and nucleoside salvage.
Interestingly, SLC29A1 down regulation confers resistance to nucleoside drugs by effluxing the
drug, while SLC28 proteins mediate drug influx (Baldwin et al., 2004). Therefore nucleoside
drug resistance could be overcome by using SLC29A inhibitors which do not affect SLC28.
Amino acids are essential for mammalian cells and tissues as they serve as building blocks for
glutathione and protein synthesis and also are essential in energy metabolism. Amino acids are
transported through SLC carriers and are subdivided into small families according to their
substrate selectivity and Na+ dependence (Amo et al., 2008). The L-type amino acid
transporter; LAT1 (SLC7A5) was first cloned by Kanani et al. in 1998 which was followed by the

56
discovery of LAT2 in the subsequent year by Segawa et al., (1999). Previous studies have
demonstrated that SLC7A5 plays a major role in transporting aromatic, branched, long chain
and essential amino acids. As such these transporters were found to be highly expressed in
rapidly growing cells such as tumors (Huang and Sadee, 2006). LAT1 is distributed mainly in
dividing/growing cells such as the brain, placenta and tumors. However, LAT2 is distributed in
colon, intestine and kidney (Amo et al., 2008).
Interestingly, amino acids have a full transporter system in prokaryotes as well. For instance,
Pseudomonas aeruginosa has a branched chain amino acid cation symporter (LIVCS) family
which transport branched chain amino acids. Similarly, the BCCT (betaine/carnitine/choline
transporter) family was found in Gram negative bacteria. BCCT functions as a membrane
transporter of amino acids with quaternary amino groups. Amino acid transporters were also
found in Gram positive bacteria such as AGCS (alanine/glycine/cation symporter) which
transport glycine and alanine in symport with monovalent cations like H+/Na+ (Reizer et al.,
1994) Eukaryotes also have a full amino acid transporter system. Solute:Sodium Symporter
(SSS family) transports exist in bacteria, archaea and animals as well (Saier,M.H., 2000).
Further examples of SLCs are summarised in Table 1.1.5.
57
Table 1.1.16:- functions of SLC transporters (Huang and Sadee, 2006).

58
1.3.3.2.4. Techniques for improving drug permeability
Prodrug synthesis has been studied to improve both drug solubility and permeability. The pre
moieties mask any polar groups on the compounds which results in drug partitioning across
the membranes to increase its absorption. One of the most commonly employed groups of
compounds is carboxylic acid esters and amino acids. Amino acid ester prodrugs of nucleosides
were found to improve their permeability as for instance valacyclovir which is 5-L-valyl ester of
acyclovir was shown to exhibit 3 to 5 fold increase in systemic bioavailability when compared
to the parent drug (Weller et al., 1993). These results could be attributed to the enhanced
intestinal absorption of L-amino acid nucleosides prodrugs via PEPT1 transporters as suggested
by Han et al., (1998). Despite being successful as a permeability enhancer, most of the
prepared prodrugs have low solubility which self limits their use as bioavailability enhancing
strategy (Majumdar et al., 2004).
Other studies suggested that ion-pairing (neutral species formed by electrostatic attraction
between oppositely charged ions in solution) can be used to improve drug permeability. The
interaction between the two opposite charges results in burying of the charge in the drug
molecule and hence alters its physical properties. A study conducted by Irwin et al., (1969)
demonstrated that the rate and efficacy of an ionic drug isopropamide was improved upon
ion-pairing with an exogenous counter ion such as trichloroacetate. However, the mechanism
of ion-pairing is still not clear and the permeability increase could be attributed to the direct
effect of the counter ion i.e. binding to mucosal membrane, lowering the interfacial tension of
the gut wall and causing mucosal erosion (Quintanar-Guerrero et al., 1997).
Interestingly, ion-pairing of methotrexate with L-arginine was found to enhance the nasal
permeability of the drug 24 times when compared to the drug alone (Ivaturi and Kim., 2009).

59
Other approaches used to improve drug permeability include; use of polymers which could
disturb the epithelial cell tight junctions (Kotze et al., 1998), the use of microspheres and
nanoparticles (Hodges et al., 1995) and membrane fluidizing agents (Manganaro, 1997).
Since carrier mediated transport is believed to play a more important role than previously
appreciated, research emphasis has shifted to blocking multi drug resistance (MDR)
transporters using pharmacological reversal agents such as verapamil, quinidine, cyclosporine
and valspodar (Donnenberg & Donnenberg, 2005).
Interestingly, some studies have demonstrated that various formulation excipients can inhibit
the efflux function of P-gp and in turn improve the overall intestinal absorption. In 2002,
Hugger et al. suggested that Pluronic P85 and Polyethylene glycol [PEG 400] have a direct
effect on P-gp function and also could work indirectly by changing the Caco-2 monolayer
membrane fluidity or buffer osmolarity. Another study conducted by Rege et al., (2002)
suggested that Tween 80 and Cremophor EL increase apical-basolateral permeability and
decreased basolateral to apical permeability of a P-gp substrate (rhodamine 123). Other
excipients such as Labrasol, Acconon E, Miglyol, Solutol HS 15, sucrose monolaurate,
polysorbate 20, TPGS and polysorbate 80 were also found to decrease P-gp efflux function
(Cornaire et al., 2004).
1.3.3.2.5. Method for assessing drug permeability
Human intestine is not only the site for drug absorption but also functions as a barrier (physical
and biochemical) for drug uptake for orally administrated drugs. The tight junctions between
the enterocytes in the intestine and the hydrophobic nature of the cell membranes represent
the physical barrier that the drug faces, while the degradation enzymes and the efflux
transporter proteins account for the biochemical barriers in the intestine.

60
Various methods have been proposed to assess the permeability function of the
intestinal membrane including in vivo, in vitro and in silico analysis. In vivo models use
living animals or humans in order to track the permeability of the therapeutic agents
while the in vitro models mimic in vivo conditions in order to estimate the permeability
of oral drugs (Worth & Balls, 2002). Nevertheless, in vivo and in vitro correlation analysis
is important to ensure the validity of data produced by in vitro experimentation.
1.3.3.2.5.1. In vitro Assessment of Permeability
In vitro models include a variety of different methods including physicochemical assays,
membrane based assays, cell based assays and excised tissue assays.
1.3.3.2.5.1.1. Physiochemical Assessment of Permeability
The most common physicochemical descriptor used to predict drug absorption across the
intestinal membrane is the octanol/water partition coefficient (log P). There are numerous
methods to measure the log P values including the shake-flask method, slow stirring method,
methanol-water gradient and micellar/microemulsion method. Table (1.1.6) summarises the
advantages and disadvantages of the various method used in determining the log P.

61
Table 1.1.17:- Various methods used in determining the log P values.
Method Advantage Disadvantage Reference
Direct
Shake-flask Most realistic
method, reliable
Time consuming, requires high quantity of product used, formation of octanol emulsions in water, not reliable for highly lipophilic compounds
OECD (1995)
Slow stirring method Avoid the formation of emulsions, reliable
Time consuming, quantity of
product used
Brooke et al. (1986) and de Bruijn et al. (1989)
Chromatographic methods
Classical HPLC
approach
Quick and cheap, does not require chemical quantification
Different retention mechanisms; has poor reproducibility; just work between pH 2-7.5
Finizio et al.
(1997),
Micellar and microemulsion electrokinetic chromatography
Quick and not
expensive
Requires the establishment of solvation parameter model
Poole and Poole
(2003)
Methanol–water gradient and a short octadecylpoly( vinyl alcohol) column
Good correlation with shakeflask method
Donovan and
Pescatore (2002)
Others
Filter probe method Rapid; well adapted to construct a logD/pH profile
Expensive, hard to set up Leo (2000)
1.3.3.2.5.1.2. Excised Tissue Permeability Assays
Excised tissues for instance intestinal segments, intestinal rings and mucosal sheets can be
used to assess drug permeability. Intestinal segments are isolated and everted prior to filling
by a small volume of the buffer solution free from the drug. The two ends of the segment are
tied off and immersed in an Erlenmeyer flask that contains large volume of the buffer solution
with the drug of interest solubilised in it. The flask is continuously supplied with oxygen and
agitated and samples from the buffer solution inside the segment are taken to assess drug
permeability.

62
1.3.3.2.5.1.3. Cell Based and Membrane Based Permeability Assays
One of the major drawbacks of using excised tissues for assessing oral absorption is the
technical difficulties it poses which resulted in the introduction of the different cell lines.
Human cell lines such as intestinal adenocarcinoma cell lines (Caco-2), HT29 (Huet et al., 1987)
and T84 (Dias and Yatscoff 1994) and animal cell lines like MDCK (Madin Darby Canine Kidney),
CHO (Chinese Hamster Ovary) (Tavelin et al., 1999) have been used widely in laboratories
around the world to assess oral permeability.
Caco-2 monolayers were first isolated from a colon adenocarcinoma of a 72-year-old patient
(Fogh et al. 1977). Upon culturing, Caco-2 differentiates continuously and produces the
structural and functional patterns of enterocytes (Pinto et al. 1983). Caco-2 cells can reach
confluency after 3-6 days and become completely differentiated within 20 days (Pinto et al.
1983). After differentiation, the cells express alkaline phosphatase, sucrase isomaltase and
aminopeptidase which are characteristic for enterocyte brush border microvilli.
The barrier function of the differentiated Caco-2 monolayers is judged by the transepithelial
electrical resistance (TEER) values which range between 200-600 Ωcm2
. Caco-2 monolayers
have been extensively used to study passive paracellular permeability (Artursson et al. 1993;
Artursson et al. 1996), passive transcellular absorption (Artursson 1990), carrier mediated
uptake of B-lactam antibiotics (Inui et al. 1992), amino acids (Thwaites et al. 1995), amino acids
analogue (Hu and Borchardt 1990) and efflux transport (Eneroth et al. 2001, Tran et al. 2002).

63
Table 1.1.18:- Some of the transporter proteins expressed in Caco-2 monlayers
Membrane transporter
Location Substrate Inhibitor Reference
P-gp (MDR1)
apical Talinolol Digoxin
Verapamil Guinidine Verapamil
Augustijns and Mols, 2004 Greiner et al. 1999 Collett et al. 2005
MRP1 basolateral Methotrexate Estradiolglucor.
Probenecid MK571
Endres et al. 2006
MRP2 apical Grepafloxacin Vinblastine
MK571, Furosemide Indomethacin
Lowes and Endres et al. 2006
MRP3 basolateral Methotrexate Estradiolglucor.
Hydroxycotinine O-glucuronide
Endres et al. 2006 Létourneau 2005
MRP4 apical Estradiolglucor. Probenecid Endres et al. 2006
MRP5 basolateral Methotrexate Probenecid, MK571 Pratt et al. 2006
MRP6 basolateral Mercaptopurine Probenecid, Indomethacin
Endres et al. 2006 Boraldi et al. 2004
MCT1 apical Salicylic acid Ketoprofen
Fluorescein L-lactic acid
Konishi et al. 2002 Choi et al. 2005
OATP-B apical Estrone-3-sulphate
Pravastatin
Pravastatin Ito et al. 2005 Kobayashi et al. 2003
BCRP apical Topotecan GF120918 Jonker et al. 2000
hPepT1 apical Cefixime Valacyclovir
Gly-Sar
Nifedipine cephalosporines
Duverne et al. 1992, Behrens et al. 2004

64
Table 1.1.19:-Summary table of in vitro permeability models and their advantages and limitations
(Worth & Balls 2002).

65

66
1.3.3.2.5.2. In vivo Assessment of Permeability
The majority of the in vivo studies (Table 1.1.9) use animals as models to predict oral
absorption in humans. The main advantage of conducting in vivo studies is that it provides the
all the necessary biological parameters that could influence drug absorption and as such an
accurate full picture of permeability assay can be obtained. Summary of the various models
that are available are presented below.
Table 1.1.20:- Summary table for in vivo permeability models (Worth & Balls 2002).
1.3.3.2.5.3. In silico Assessment of Permeability
Due to the increase in the development of NCE over the last couple of decades, there has been
a growing demand to predict drug performance at an early stage of development phase which
has seen the emergence of predictive in silico techniques to estimate drug absorption,
distribution, metabolism, excretion and toxicity (ADMET). In silico models comprise of a group
of mathematical models which examine compound descriptors such as hydrogen bonding,
molecular size and lipophilicity and estimate the biological activity based on their
physicochemical properties.

67
The advantage of using in silico models is that they do not require access to the actual
compound and produce results faster which means that the permeability studies of a
compound could be predicted even before the synthesis of the compound. However, the
major limitation of applying in silico models is that the obtained results account for passive
transcellular permeability and do not take into account other routes such as active transport
and efflux.
Table (1.1.10) provides a summary of the major physiochemical characteristics used in
predictive absorption models.
in silico
Figure 1.1.13:- Comparison of how much research has been performed using, in silico, in vitro and in
vivo techniques during the last decade (2001- 2010) Mohammed et al., 2012.

68
Table 1.1.21:- Summary table for in silico Permeability models (Stenberg et al., 2000)
1.4. Microarrays
Carrier transporter proteins have broad substrate specificity and various drugs from different
pharmacological classes interact during the process of permeation. Moreover, there could be a
partial overlap between these transporters’ substrates and as a result the pharmacodynamics
and pharmacokinetics of a drug can be affected by more than one efflux protein (Taipalensuu
et al., 2001). Thus, a systematic/holistic investigation of the efflux proteins is vital to get a
broad picture of carrier expression profiles that affect drug/formulation permeability.

69
Interestingly, many physiological changes that take place at the cellular level are reflective of
their level of gene expression. Genes are up or down regulated under different physiological
conditions such as disease state, drug metabolism, exposure to toxins and response to
treatment. This has paved the way for modern biomedical research that prompted the
biologist to develop gene expression matrices that would allow identification of specific gene
sets involved in a defined process, disease condition or cellular differentiation. Analysis of gene
expression at m-RNA levels was first discussed by Alwine et al. (1977) using Northern blotting
but was limited to the study of small sets of genes. The second major development by Liang
and Pardee (1992) was differential displaying technology which succeeded in measuring
multiple differences of gene expression in parallel. Yet, this method was qualitative and
screening was dependent on the length of mRNA rather than its identity. The introduction of
microarrays in 1995 revolutionised the research arena relying on gene expression profiling.
The technique addressed the various limitations in studying gene expression and was
associated with high sensitivity and throughput. Microarrays allow for the use of low amounts
of starting material and the small size of the arrays improves the sensitivity and enables the
screening of vast number of genes simultaneously (Hal et al., 2000).
A microarray is defined as a collection of microscopic spots orderly arranged onto the surface
of a solid support. It is a modern technique comprising of thousands of genes automatically
spotted on specially treated glass slides. Spots or probes are designed in such a way that each
probe binds to a specific fluorescently labeled nucleic acid (target) during the hybridization
reaction. The binding between probe and target is analyzed via measuring the emitted
fluorescence by the hybridized target during scanning. The principle difference between
conventional hybridization and a microarray is the capability of arrays to monitor multiple
genes on a single array which results in simultaneous profiling of genes in an organism.

70
1.4.1. Types of microarrays
Microarrays are arrangements of samples or probes in specific order onto a matrix. According
to the probe used, microarrays are broadly divided into two types; nucleic acid and tissue
microarrays.
Nucleic acid microarrays are prepared by spotting nucleotide probes onto a support matrix and
base-pairing principles are used to bind the complementary targets (Southern et al., 1999).
Glass slides are commonly used as a support matrix for the microships, however materials such
as nylon, silicon and nitrocellulose membranes have also been used. The probes used for
nucleotide microarrays could be DNA, cDNA or oligonucleotides which are printed onto the
slides via robotics or could be built in directly onto the array by inkjet techniques or
photolithography (Lockhart et al., 1996).
cDNA microarray is an example of transcriptomic arrays which enables large scale comparison
of the whole genome of two samples. RNA is extracted from the test sample followed by
reverse transcription to get cDNA that is labelled by fluorochrome. Both the normal (control)
and target samples are mixed and incubated with the cDNA microarray and the slide is
analysed using image analysis systems. The obtained data represent the transcriptional affinity
for the whole genomes on the grid. The large amount of data obtained makes it impossible to
point the genes that characterise the molecular pathobiology of certain disease; hence data
processing is considered the bottleneck of microarray technologies.
Another category of nucleotide microarrays is single nucleotide polymorphism (SNP)
microarray which is a genomic array that detects polymorphism or mutation that might occur
in a population. SNPs usually take place in non-coding regions of the DNA and occur
throughout the genome. The main advantage of using SNPs is to determine disease
susceptibility and therefore tailoring the efficiency of drug therapy for an individual which is
also known as personalized medicine. It might be in the near future when physicians can

71
screen patients for susceptibility to certain disease by analyzing their DNA for specific SNPs
profiles.
A third category of nucleotide microarrays is comparative genomic hybridization (CGH)
microarray which identifies genomic losses and gains in certain diseases. Most of the solid
tumours are characterised by genetic instabilities which cause chromosomal re-arrangements.
Until recently, it was difficult to characterise solid tumours by using chromosomal re-
arrangements because of the high chromosomal instability. Studies using CGH have shown
that solid tumours undergo frequent losses and gains and different tumour types have distinct
CGH patterns. Nevertheless, the lack of spatial resolution of CGH arrays makes it difficult to
conclude that different tumour types or tumours at different stages of evolution have distinct
pattern of gains and losses.
The final type of microarray is called tissue microarrays (TMA). A number of novel
markers have been identified recently by molecular biologists. These markers are
believed to have prognostic, diagnostic and therapeutic significance especially in the
field of cancer. The introduction of TMA enables rapid and cost effective validation of
these markers rather than the use of conventional histo pathological techniques.
1.4.2. Procedure for setting up Microarray studies
The microarray experiment starts with isolation of the RNA from both the control sample and
the treated sample (test sample). The cDNA probes are prepared separately through reverse
transcription which are labelled using fluorescence dyes; Cy3 (control sample) and Cy5 (test
sample). The labelled probes are mixed together and hybridized for 17 hours on the array slide
which is followed by washing and imaging of fluorescence to record the different levels of
expression of genes.

72
Figure 1.1.14:- Schematic representation of the procedures followed to setup microarrays studies.
Samples (control and test samples) are labeled with different fluorescent dyes (Cy3 and Cy5) and
competitively hybridized to the same array. Final imaging requires a fluorescent scanner that can
excite and detect at multiple wavelengths.
Test RNA Reference RNA
Fluor-label by reverse
transcription
Mix and hybridise to array
Scan using laser scanner
Extract RNA
[cy5] dUTP
[cy3] dUTP

73
2.1. Aims and Objectives
Despite the several advantages of oral drug delivery, the unfavourable biopharmaceutical
properties of drugs (i.e. low solubility and low permeability) decrease drug bioavailability
across the oral route. Although prodrugs have been formulated to alter the biopharmaceutical
properties, they present significant challenges including the requirement for complete drug
profiling, potential toxicity and stability issues. On the other hand, ion-pairs could be a
potential solution to address both solubility as well as permeability.
The overarching aim of this thesis is to study the application of charged amino acids as both
solubility as well as permeability enhancing agents through formation of ion-pair complexes.
The content in this thesis investigates and addresses for the first time both solubility and drug
uptake through the inclusion of a single agent i.e. amino acids. For this purpose, three model
drugs were selected; indomethacin (weak acid, BCS II), trimethoprim (weak base, BCS III/IV)
and ciprofloxacin (zwitter ion, BCS IV). All the selected drugs carry charges so that they could
bind electrostatically with the oppositely charged counter ions. In addition, trimethoprim and
ciprofloxacin are known to be substrates to efflux transporter proteins and possess limited
permeability. The objectives of this thesis include:
1. Preparation of physical mixtures and salts for the different model drugs using
oppositely charged amino acids to evaluate their influence upon changes in
concentration, structure and physico-chemical properties.
2. Systematic investigation of multi-functionality of amino acids in dosage form
preparation to determine their suitability in translation of results into clinic.
3. Evaluating the permeability of model drugs across Caco2 monolayers and identifying
the genomic signature for drug transport of model drugs in the presence of oppositely
charged counter ions.

74
10
1819
2320
2221
O11
Cl25
5
4
6
9
7
8
N1
2
3
CH312
13 14
O24
OH15
O16
CH317
Chapter 3
Indomethacin
Papers relating to chapter 3 Amr ElShaer, Sheraz Khan, Dhaya Perumal, Peter Hanson and Afzal R Mohammed., (2010) Use of amino acids as counter ions improves the solubility of the BCS II model drug, indomethacin. Current drug delivery.

75
3.1. Salt preparation and characterisation for indomethacin using
cationic amino acids
3.1.1. Introduction
Both solubility and permeability are considered key determinants for drug bioavailability.
Lately, the number of poorly soluble drugs has increased greatly especially after the
introduction of combinatorial chemistry and high throughput screening to the drug discovery
cycle and around one third of these new compounds have aqueous solubility less than 20
µg/mL (Li et al., 2005). Therefore, formulating oral dosage forms of these poorly soluble drugs
becomes a great challenge for the formulation pharmacist (Leuner and Dressman, 2000).
Salt formation is a commonly used technique to modify the characteristics of new chemical
entities (NCE) in order to overcome the undesirable characteristics of the parent drug
(Anderson and Conradi, 1985). Both the physicochemical characteristics and biological
performance of the drug differs dramatically from the salt form (Bighley et al., 1996). Most of
the salt forming agents are selected empirically; many issues such as ease of crystallization,
percentage yield, hygroscopicity and flowability are considered prior to selecting the salt
former (Berge et al., 1977). Many studies tried to investigate the relationship between the salt
properties and the counter ions used. Yet, until now no successful way of predicting the effect
of salt former on the behaviour of the parent compound has been reported. Stahl & Wermuth
suggested that the dissociation constant (pKa) is the most important piece of information to
gather about NCE (Stahl and Wermuth, 2002), then a number of counter ions can be selected
to form a stable form (minimum difference between the salt former and counter ion should be
3 pKa units). After selecting a number of potential counter ions, further physicochemical tests
should be carried out to evaluate the crystallinity, polymorphism and melting point. Amino
acids have shown great success as potential salt formers: Pellegate (1993) utilised lysine,

76
ornithine and arginine to prepare novel salts of furosamide (Pellegata R., 1993). The prepared
salts exhibited very high solubility up to 560 mg/mL for the lysinate salt which was much
higher than furosemide itself and even its sodium salt. Another study conducted by Fujisawa et
al have prepared new cephalosporin salts with arginine and lysine, the prepared amino acid
salts were claimed to be less painful when administered parentally (Fujisawa et al., 1976).
Other studies have succeeded to prepare novel salts of arginine with acidic drugs such as
benzoquinolizine-2-carboxylic acids (Deshpande et al., 2007) and inosine (Kurauchi et al.,
2004). While lysine managed to form new salts with ibuprofen (Tung et al., 1991) and 4-
diphenylacetic acid (Giuseppe, 1989).
On the other hand, poor permeability of NCE makes the drug unsuitable for further
development and great efforts are exerted to avoid getting a potent non-absorbed drug (Egan
and Georgio, 2002). It is strongly believed that nutrient transporters play a major role in
transporting nutrients as well as various therapeutic agents (Oh et al., 1999). Interestingly,
amino acids succeeded in improving the drug permeability of poorly permeable drugs such as
gemcitabine and other anticancer agents by ester linkage and mediate the transportation
through hPEPT1 transporters (Song et al., 2004). Moreover, amino acids have been used in the
past to improve aqueous solubility of alcohol and amine drugs through prodrug formation
(Aggarwal et al., 1990; Upshall et al., 1990). Therefore, amino acids were chosen in the current
study to improve the solubility of a BCS II model drug through a salt formation technique as
the first stage prior to investigating the effect of using these amino acids to improve drug
permeability via amino acids mediated transporter and ion-pairing mechanisms.
Indomethacin (IND) was selected as a model drug for this study as it has an acidic carboxyl
group which acts as a potential salt former, moreover its transportation is mediated by P-
glycoprotein transporter. According to the Biopharmaceutical classification system (BCS), IND
is classified as a poorly soluble highly permeable drug (i.e Class II). IND is a non-steroidal anti-

77
inflammatory drug (NSAID) which is widely used to reduce pain associated with rheumatoid
arthritis, osteoarthritis, bursitis and headache (Sweetman, 2005).
3.1.2. Materials and methods
3.1.2.1 Materials
Indomethacin (TLC ≥ 99%), L-Arginine (non-animal source), L-Histidine (Reagent plus ™, L-
Lysine and Potassium bromide (99% FT-IR grade) all were purchased from Sigma Aldrich, UK.
D2O (99.9% min) was purchased from Coss scientific instrument Ltd, DMSO-D6 (98.8% min)
was purchased from MERCK (Darmstadt, Germany).
3.1.2.2 Methods
3.1.2.2.1 Analytical technique
The amount of indomethacin (IND) dissolved in the solution samples was quantified by HPLC
using a Dionex 1100 system with autosampler (AS50), gradient pump (GP50), UV detector
(UVD 170U) and RP-C18 analytical column (Phenomenex 110A, 150x4.6 mm, 5µm). The
analysis method was adapted from Song et al., (2004). IND was eluted using acetonitrile (60%)
and 0.1 M acetic acid (40%) as a mobile phase and pumped at 1.0 mL/min flow rate. UV
detector was adjusted at λmax of 248 nm (predetermined using Unicam UV-Visible
Spectrophotometer). The retention time was 6.5±0.12 min and a rectilinear calibration curve
was established at concentration range between 10-500µg/mL with 0.99 correlation
coefficient (For more details see appendix 1).
3.1.2.2.2 Phase solubility diagram
Phase solubility diagram was established by measuring the saturated solubility of IND free acid
with various concentrations of basic amino acids (L-arginine,L-lysine and L-histidine). Excess
IND was added into screw-capped tubes containing serial dilutions of the amino acids solutions

78
and agitated at room temperature (Stuart SB 162 stirrer) for 24 h. After equilibrium the
supernatant was filtered through 0.45 µm filters and analysed by HPLC to determine
indomethacin concentration. The pH of amino acid solutions was monitored using Xisherbrand
Hydrus 500 pH meter.
3.1.2.2.3 Salt preparation
Equimolar amounts of IND and the free amino acid (L-arginine, L-lysine, L-histidine) were
solubilised in water and the solutions were mixed and stirred until equilibration then filtered.
The filtrate was transferred into vials and freeze dried for 48 h using Modulyo freeze dryer at -
40oC shelf temperature and under vacuum created by an E2M5 Edwards pump then samples
were collected and kept at 40oC oven for 4h using Gallenkamp vacuum oven.
Despite the low yield of the freeze drying technique, it was preferred over the salt preparation
method adapted by Anderson & Conradi using organic solvent (Berge, 1977). Lyophilized
products are highly pure and devoid of the formation of any solvates. Generally, salts prepared
by an organic solvent method do not behave well in an aqueous environment as they could
convert to the free acid or base, exhibit low solubility and stability and their use becomes
limited (Chauhan et al., 2004).
3.1.2.2.4 Thermogravimetric analysis (TGA)
Moisture content and decomposition temperature of indomethacin and its prepared salts
were determined using a thermogravimetric analyser (Pyris 1 TGA, Perkin Elmer). 5-10 mg of
samples were added to an open pan and analysed at temperature range 30-300 oC at 10 oC/min
scanning rate and under nitrogen stream. The resultant thermograms were analysed using
Pyris Manager Software (version 5.00.02)

79
3.1.2.2.5 Differential scanning calorimetry
Differential scanning calorimeter (Pyris Diamond DSC) was used to investigate the melting
point and the crystallization exotherms of the prepared salts. Approximately, 2-5 mg of the
salts were weighed and transferred to an aluminium sample pan (50 µL capacity) then a
pierced aluminium top was crimpled in place in order to seal the pan. Intra cooler 2P system
was used to initially cool the samples to 50 oC and then the sample was heated to 300 oC at a
rate of 10 oC/min. Nitrogen was used as a purge gas at a flow rate of 20 mL/min, Indium and
Zinc were used to calibrate the heat flow and melting point onset (156.6 oC for Indium and
419.47 oC for Zinc). The obtained thermograms were analysed using Pyris Manager Software
(version 5.00.02). The experiment was performed in triplicate and an empty aluminium pan,
sealed in the same way of the samples, was used as a reference cell for all the measurements.
3.1.2.2.6 FT-infrared (IR) spectroscopy
FTIR absorbance spectra of IND and its salts were obtained with Nicolet IR 200 spectrometer
(Thermo electron corporation) using KBr discs technique. Crystalline KBr was dried at 65oC over
night before use. Samples were prepared by mixing IND or its salts with dry KBr at 1:100 (w/w)
ratio and pressed at 8 tones for 5 min (using Specac tablet presser) to form KBr discs. 64 scans
were done over wavelength 4000- 400 cm-1 for each sample. EZ OMNNIC 7.0 software was
used to interpret the IR spectrum.
3.1.2.2.7 1HNMR
Samples were analysed with Bruker Avance DPX-250 NMR (at 250.1 MHz) and Bruker Topspin
software was used to analyse the data. Approximately, 1-2 mg of the salts were dissolved in 1
mL of deuterated water (D2O) and placed in sample capillary vial up to 5-10 cm height.
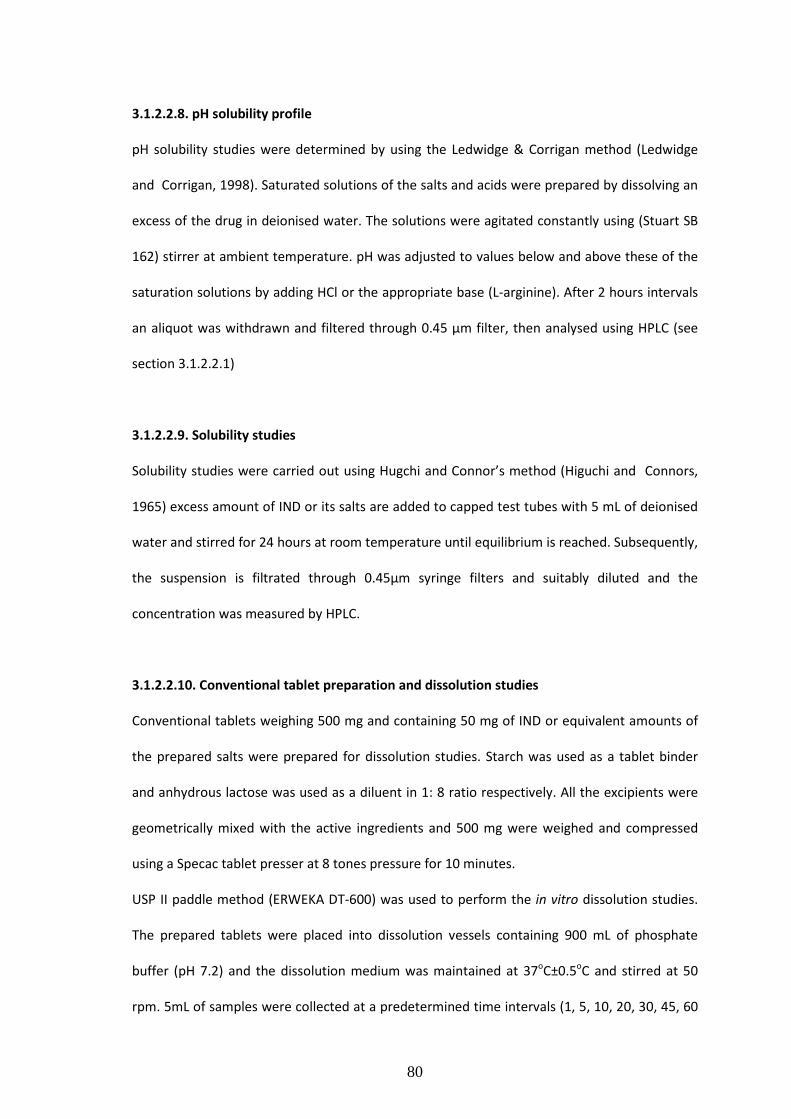
80
3.1.2.2.8. pH solubility profile
pH solubility studies were determined by using the Ledwidge & Corrigan method (Ledwidge
and Corrigan, 1998). Saturated solutions of the salts and acids were prepared by dissolving an
excess of the drug in deionised water. The solutions were agitated constantly using (Stuart SB
162) stirrer at ambient temperature. pH was adjusted to values below and above these of the
saturation solutions by adding HCl or the appropriate base (L-arginine). After 2 hours intervals
an aliquot was withdrawn and filtered through 0.45 µm filter, then analysed using HPLC (see
section 3.1.2.2.1)
3.1.2.2.9. Solubility studies
Solubility studies were carried out using Hugchi and Connor’s method (Higuchi and Connors,
1965) excess amount of IND or its salts are added to capped test tubes with 5 mL of deionised
water and stirred for 24 hours at room temperature until equilibrium is reached. Subsequently,
the suspension is filtrated through 0.45μm syringe filters and suitably diluted and the
concentration was measured by HPLC.
3.1.2.2.10. Conventional tablet preparation and dissolution studies
Conventional tablets weighing 500 mg and containing 50 mg of IND or equivalent amounts of
the prepared salts were prepared for dissolution studies. Starch was used as a tablet binder
and anhydrous lactose was used as a diluent in 1: 8 ratio respectively. All the excipients were
geometrically mixed with the active ingredients and 500 mg were weighed and compressed
using a Specac tablet presser at 8 tones pressure for 10 minutes.
USP II paddle method (ERWEKA DT-600) was used to perform the in vitro dissolution studies.
The prepared tablets were placed into dissolution vessels containing 900 mL of phosphate
buffer (pH 7.2) and the dissolution medium was maintained at 37oC±0.5oC and stirred at 50
rpm. 5mL of samples were collected at a predetermined time intervals (1, 5, 10, 20, 30, 45, 60

81
and 90 min) then filtered through 0.45 μm Millipore filters. The dissolution media was replaced
by 5mL of fresh dissolution fluid in order to maintain a constant volume. After proper dilution
samples were analysed by HPLC as mentioned above.
3.1.3. Results and discussion
3.1.3.1 Phase solubility diagram
Before preparing IND salts, a phase solubility diagram was first constructed between IND and
three basic amino acids namely; L-arginine, L-lysine and L-histidine. The phase solubility
diagram gives preliminary data about the ability of the counter ions to dissociate IND free acid
and also provides data about the extent of improvement of solubility upon using these counter
ions.
The results showed that increasing the basic amino acid concentrations resulted in improving
IND solubility significantly (Fig. 3.1.1). Such an increase in solubility could be attributed to the
ability of the amino acids to increase pH of the medium upon increasing their concentration
which in turn enables the dissociation of IND free acid (ionised form) resulting in an increase in
solubility.
L-arginine has a basic side chain with a pKa of 12.48 for –NH2 group; this value is much higher
than the pKa of IND (pKa= 4.5). This in turn results in IND free acid giving up its proton to –NH2
group to form –NH3+ cation and hence IND acts as a strong acid in L-arginine solution. Since a
linear relationship between IND solubility and L-arginine concentration was observed (R2=
0.998), therefore it is believed that IND is 100% dissociated in arginine solution. Hence an
electrostatic interaction is possible between the two ionised species to form a salt.
Although the pKa of the –NH2 side chain of L-lysine (pKa= 10.53) is lower than that of arginine,
the solubility of IND in L-lysine was significantly higher and this could be possibly because of
self-association between IND and lysine which inhibits the rate of nucleation of the final salt
(Ledwidge and Corrigan., 1998; Serajuddin and Mufson, 1985; Serajuddin and Jarowski, 1985).

82
Such self-association was not observed in IND-arginine salt probably because of the large
numbers of H-donor groups in arginine and the very low number of H-acceptor groups,
therefore the possibility of arginine self-association is low and instead arginine would interact
intermolecularly with the H-acceptor groups of IND. However, lysine has 2 H-donor groups and
one H-acceptor group and there would be a high probability of intermolecular interaction
between lysine molecules and hence a higher chance for IND to self-associate and to inhibit
the nucleation rate.
On the other hand, the basic amino group of L-hisitidine has a pKa of 6 (slightly higher than
IND) which possibly results in weaker degree of dissociation of indomethacin in histidine (Fig.
3.1.1). As a consequence, only a small ratio of IND exists in the ionised form (i.e. IND acts as a
week acid in histidine solution) and results in poor yield of the salt.
0
500
1000
1500
2000
2500
10 50 100 200 500 1000
Amino acid concentration(µg/mL)
IND
Con
cent
ratio
n (µ
g/m
L)
4
5
6
7
8
9
10
11
pH
Arginine Lysine Histidine
Arginine pH Lysine pH Histidine pH
Figure 3.1.15:- Phase solubility diagram between IND, L-arginine, L-lysine and L-histidine. The figure
also shows pH measurements of various concentrations of the amino acids (n=3).
3.1.3.2 Characterisation of the salt form
After evaluating the degree of dissociation of IND with the various basic amino acids, three
salts were prepared by lyophilisation and further characterised by Fourier transform infra-red,

83
differential scanning calorimetry, thermo-gravimetric analysis and 1H nuclear magnetic
resonance.
3.1.3.2.1 Differential scanning calorimetry and Thermo-gravimetric analysis
Fig 3.1.2 shows the DSC and TGA scans of IND and its prepared salts. IND showed an
endothermic peak at 162.67 oC, corresponding to its melting point (onset 161.07 oC). The IND
melting enthalpy of fusion was very high (1133.69 J/g) reflecting the strong crystal lattice of
the drug. Interestingly, thermal characterisation of IND-arginine salt revealed that the
prepared salt was in the amorphous form as DSC data have shown a crystallization exotherm
at 118.93 oC where the amorphous form starts to crystallize and these formed crystals
exhibited melting at 209.73 oC. Similarly, the IND-lysinine salt was found to exist in an
amorphous form and showed a weak crystallization exotherm at a lower temperature 79 oC
followed by a melt at 223.26 oC. Interestingly, after 2-week of storage under ambient
conditions; IND-lysine crystallization exotherm disappeared which possibly suggests that the
salt converted from the amorphous form into the crystalline form upon storage and this could
be attributed to the relatively low crystallization temperature. However the arginine salt
remained in its amorphous form under similar conditions.

84
Figure 3.1.16 :- DSC and TGA scans for IND free acid, IND-Hisidatine, IND-Lysinate salt, and IND-
Arginate salt. 2- 5 mg of the sample was heated to 300oC at rate of 10
oC/min (n=3)
On the other hand, L-histidine did not form a salt with IND and DSC shows a melt at 249.05 oC
which degrades before complete melting. A similar peak was obtained upon thermal analysis
of L-histidine free base. This result suggest that there was no salt formation and these results
were further confirmed with FT-IR and 1HNMR studies (sections 3.1.3.2.2 & 3.1.3.2.3)
TGA scans revealed that the prepared salts degrade a few degrees above their melt and the %
weight loss increased greatly after the decomposition point due to the volatility of the
degradation products. The moisture content was very low in all the prepared salts and
maximum moisture of 1.2% was found for IND-lysine salt (Fig. 3.1.2).
3.1.3.2.2 Fourier Transform infra-red spectroscopy (FT-IR)
FT-IR spectra were used to characterize the possibility of interaction between IND and the
amino acids counter ions. Using FT-IR, the IND salt formation could be established by (1)
Absence of non-hydrogen bonded carboxylic acid peak νC=O at 1717 cm-1 (Silverstein and
Webster., 1998). (2) Appearance of absorption bands at 3350-3150 cm-1 corresponding to NH3+
stretching of amino acids salts (Socrates, 1994).

85
indomethacin
0
20
40
%T
IND-arginine
40
60
80
100
%T
IND-lysine
50
100
%T
IND-histidine
0
50
100
%T
500 1000 1500 2000 2500 3000 3500
Wavenumbers (cm-1)
IND-arginate
IND-lysinate
IND-histidate
Figure 3.1.17 :- (A) The characteristic FT-IR absorption bands of IND, IND-arginate, IND-lysinate and
IND-histidate (from top to bottom), (B) chemical structure of indomethacin.
IND FT-IR spectra (Fig. 3.1.3A) showed characteristic absorption bands at 3021 cm-1 which can
be assigned for C-H aliphatic chains, 1717 cm-1 corresponding to carbonyl stretching of the acid
ν (C14=O) and at 1691 cm-1 for bezoyl C10=O as previously described by (Tong and Zografi,
2001). Interestingly, upon adding L-arginine to IND free acid, the absorption band of non-
hydrogen bonded C14=O was eliminated, possibly due to proton loss and involvement of the
carboxylic group in the salt formation with the basic amino group of the amino acid. While, the
benzoyl carbonyl stretches at around 1691 cm-1 shifted slightly to 1675 cm-1 for both arginate
and lysinate salt. Such a shift could be attributed to the effect of the local dielectric constant
change between the ionised form and non-ionised form of IND (Tong and Zografi, 2001). On
the other hand, both benzoyl and carbonyl stretching for IND free acid ν(C=O) were absent in
IND-histidine and an absorption band was observed at 1635 cm-1 which corresponds to
carboxylic νC=O of histidine (Petrosyan, 2007). These results suggest that histidine could not
10
1819
2320
2221
O11
Cl25
5
4
6
9
7
8
N1
2
3
CH312
13 14
O24
OH15
O16
CH317
A B

86
form a salt with IND and this could be attributed to the low dissociation ability of IND in
histidine solution as discussed above for the phase solubility diagram.
Table 3.1.22: Major band (peak) positions and assignments for IND and its salts in the region of 4000-
400 cm-1
compound Infrared (cm-1) Assignment
IND 3371 3021 1717 1691
C-H aliphatic OH group Asymmetric acid νC=O Benzoyl (amide) νC=O
IND-arginate 3381 3089 1675 1584
N-H stretching C-H alphatic Benzoyl (amide) νC=O Asymmetric COO-
IND-histidine 3418 3009, 2881 1635
N-H stretching C-H alphatic Carboxylic νC=O of histidine
IND-lysinate 3417 2932 1675 1590
N-H stretching C-H alphatic Benzoyl (amide) νC=O Asymmetric COO-
3.1.3.2.3 1HNMR
1HNMR spectroscopy was also used to confirm the salt formation and determine the molar
ratio of interaction between IND free acid and the anionic amino acids by counting the
hydrogen integrals. DMSO was used to dissolve IND while, deuterated water (D2O) was used to
solubilise the salts.
Fig 3.1.4 shows the 1HNMR of IND free acid, at 7.6 ppm frequency the 4H of IND halogenated
aromatic ring which appeared as multiplet. While, the hydrogens of the methoxy aromatic
ring; C7(1H) doublet, C9 (1H) doublet and C6 (1H) singlet appeared at 6.9, 6.94 and 7.04 ppm
respectively. (3H) of the methoxy group (OC17H3) appeared as singlet at 3.6 ppm, while (3H) of
methyl group (C12H3) appeared as singlet at lower frequency (2.21 ppm) as it is less shielded.
Similar results were reported by Chauhan et al., (2004). The total integrated H count for IND
was 15 (Fig. 3.1.4).

87
0 .00 .51 .01 .52 .02 .53 .03 .54 .04 .55 .05 .56 .06 .57 .07 .58 .08 .59 .09 .5f1 (ppm)
-200
0
200
400
600
800
1000
1200
1400
1600
1800
2000
2200
2400
2.8
4
1.8
8
2.9
7
7.3
5
0.9
6
0.9
5
1.0
0
3.9
4
2.1
7
2.5
1
2.5
1
2.5
2
3.6
4
3.7
3
3.9
9
6.6
6
6.6
7
6.7
0
6.7
1
6.8
9
6.9
8
6.9
9
7.6
2
7.6
3
Figure 3.1.18:-
1HNMR spectra of indomethacin free acid in DMSO
IND-arginine salt showed a slight chemical shift (δ) for IND bands and 7H assignments
appeared between 1.44 to 3.00 ppm which represent C33H2, C32H2, C
31H2 and C29H groups of
the aliphatic chain of L-arginine. The total integration of (H) was 22, which confirms the
formation of IND-arginate salt with 1:1 molecular ratio as the new 7H assignments correspond
to one arginine molecule (Fig. 3.1.5).
Interestingly, DMSO dissolved IND and IND-arginine salt and (H) atom of IND carboxylic OH
group appeared at 12.38 ppm and disappeared in IND-arginine salt (data not shown) which
further confirms the loss of carboxylic proton as previously discussed in FT-IR section.
Similarly, the 1HNMR data for IND-lysine salt (Fig. 3.1.6) showed the appearance of new 9H
assignments corresponding to C32H2 (multiplet), C33H2 (triplicate), C34H2 (triplicate), C31H2 and
C29H1 (triplicate) at 1.31, 1.55, 1.72, 2.84, 3.57 ppm respectively. The formed lysine salt was in
the 1:1 ratio. However, IND-histidine samples revealed histidine characteristic bands with the
absence of IND bands (Fig. 3.1.7) and this could be attributed to very low dissociation of IND
and its inability to form a salt with histidine.
10
1819
2320
2221
O11
Cl25
5
4
6
9
7
8
N1
2
3
CH312
13 14
O24
OH15
O16
CH317

88
-0.50.00.51.01.52.02.53.03.54.04.55.05.56.06.57.07.58.08.59.09.5f1 (ppm)
0
500
1000
1500
2000
2500
4.8
2
3.0
7
2.3
1
2.1
4
4.2
6
1.0
1
0.9
9
1.0
0
4.2
0
1.44
1.47
1.50
1.67
1.96
2.94
2.97
3.00
3.30
3.54
3.56
4.70
6.23
6.24
6.27
6.28
6.75
7.17
7.26
7.29
7.58
Figure 3.1.19:-
1HNMR spectra for IND-arginine salt dissolved in D2O.
-0.50.00.51.01.52.02.53.03.54.04.55.05.56.06.57.07.58.08.59.09.5f1 (ppm)
-100
0
100
200
300
400
500
600
700
800
900
1000
1100
1200
2.1
0
2.1
3
2.1
5
2.9
8
2.0
9
2.0
5
4.1
0
1.0
0
0.9
9
1.0
0
3.9
6
1.2
8
1.3
1
1.5
5
1.7
2
2.0
0
2.8
1
2.8
42.8
7
3.3
5
3.5
7
3.6
6
4.7
0
6.4
5
6.4
6
6.6
7
6.8
0
6.8
1
7.3
7
7.4
1
7.4
4
Figure 3.1.20:-
1HNMR spectra for IND-lysine salt dissolved in D2O.
10
18
19
23
20
22
21
O11
Cl25
5 4
6 9
7 8
N1
2
3
CH312
13
14
O15
O-
24
O16
CH317
NH3+
37
35
NH34
33
32
31
29
27
NH36
NH230
OH26
O28
10
18
19
23
20
22
21
O11
Cl25
5 4
6 9
7 8
N1
2
3
CH312
13
14 O15
O-
24
O16
CH317
NH3+
3534
33 32
31 29
27
NH230
OH26
O28

89
0.00.51.01.52.02.53.03.54.04.55.05.56.06.57.07.58.08.59.09.510.0f1 (ppm)
0
1000
2000
3000
4000
5000
6000
7000
8000
9000
0.16
2.31
0.13
0.17
1.09
1.07
0.25
1.00
2.0
1
2.9
12.9
4
2.9
7
3.0
0
3.0
2
3.0
63.0
8
3.6
6
3.7
6
3.7
83.8
0
3.8
2
6.8
6
7.5
8
Figure 3.1.21:- 1HNMR spectra for IND-histidine dissolved in D2O.
3.1.3.3. Aqueous solubility determination.
IND aqueous solubility is a prerequisite for its dissolution rate as compounds with aqueous
solubility lower than 100μg/mL cause dissolution limitations to drug absorption (El-Badry et al.,
2009). IND is practically insoluble at acidic pH (0.33 μg/mL at pH 4.5) and slightly soluble at pH
7; 40 μg/mL (Chauhan et al., 2004). IND aqueous solubility was 0.244 μg/mL at pH 4.95 while
the IND-arginine salt exhibited the highest solubility among the prepared salts and improved
the solubility by 104 fold to 34.8mg/mL. IND-lysine increased the solubility by 2x10³ fold
corresponding to 7.8 mg/mL. The high solubility exerted by arginate salt could be attributed to
its stable amorphous form and in turn low energy is required to solubilise the salt. On the
other hand, lysinate salt was in the crystalline form requiring higher energy to disrupt the
crystal structure and in turn resulting in lower solubility values.
3.1.3.4. Dissolution study.
In vitro drug release profile of IND free acid and its salt are shown in Fig. 3.1.8. The prepared
salts showed greater dissolution rates than the free acid.
10
18
19
23
20
22
21
O11
Cl25
5 4
6 9
7 8
N1
2
3
CH312
13
14
O15
OH24
O16
CH317
27
NH
28
N26
29
30
3132
34
NH233
O36 OH
35

90
The highest dissolution rate was exhibited by the IND-arginine salt and 69.4±5.02% of IND was
released within the first 10 min and up to 94.3±2.9 % after 30 min, followed by IND-lysinate
salt which released 59.88±5.6% and 88.4±0.42 % of the drug after 10 and 30 min respectively.
Nevertheless, only 37.9±12.4% of IND was released from the free acid formulation during the
first 10 min and 93.2±1.8% in 60 min.
0
20
40
60
80
100
120
0 20 40 60 80 100
Time (min)
IND
dis
solv
ed (
%)
IND arginate salt IND IND lysinate salt
Figure 3.1.22:- Dissolution profile for IND free acids and its salts in phosphate buffer pH 7.2. Data are
mean± SD (n=3).
It is obvious that changing the salt form has an influence on the dissolution rate despite using
similar bulk pH (phosphate buffer pH 7.2) for all the studied samples. Such changes in the
dissolution profile could be attributed to the ability of IND-arginine and IND-lysine salts to
exert a self-buffering action, yielding different pH values at the dissolving surface in the
diffusion layer (Forbes et al., 1995). It is possible that the IND-arginine salt has a high buffering
capacity and produces higher pH at the diffusion layer and in turn higher dissolution rate.
Moreover, the arginine salt was in the amorphous form and it is well-known that the
amorphous form represents the ideal case for faster dissolution (Hancock and Zografi, 1997).

91
Despite the high solubility exhibited by IND L-arginine and IND L-lysine salts, a slight
improvement in dissolution rate was observed and this could be attributed to the different
micro-environmental pH surrounding the surface of the formulation in the solubility and
dissolution studies where deionised water and phosphate buffer were used respectively. These
results come in line with Stahl et al findings which conclude that the aqueous solubility may
not always be a good indicator which form would have the optimum dissolution rate and the
dissolution profile of the salt could be higher, equal or even lower than the free form of the
drug depending on the micro-environmental pH surrounding the surface of the formulation
(Stahl and Wermuth, 2002).
3.1.3.5. pH- solubility profile.
Classical pH-solubility profile of weak acids consists of two main regions; region I and region II.
The excess solid in equilibrium with saturated solution in region I represent the free acid and
the total solubility is described by Kramer and Flynn equations (Kramer and Flynn, 1972).
)1]([)(,3
max ++=<OH
KHApHpHacidS a
T
)101]([ PkapHAH −+= Equation 3.1.1
Where S is the total solubility at given pH, [HA] is the intrinsic solubility of free acid, Ka is the
acid dissolution constant.
On the other hand, the excess solid in equilibrium with the saturated solubility in region II
represents the salt and the total solubility is described by
)1]([)(, 3max
aT K
OHApHpHsaltS
−− +=>
)101]([ pHpkaA −− += Equation 3.1.2
spa
KK
HS )
][1(
+
+= Equation 3.1.3

92
Where [A-] is the saturation solubility of the salt, Ksp is the solubility product of the salt.
For weekly acidic drugs when pH less than pKa by 2 units, the solubility is practically
independent on the pH and remains constant at the intrinsic solubility (So). At pH >pKa the log
solubility increases linearly with pH (i.e solubility increases exponentially with pH).
0
500
1000
1500
2000
2500
3000
3500
4000
0 2 4 6 8 10 12 14
pH
Sol
ubili
ty (
ug/m
L)
Figure 3.1.23:- pH solubility profile of indomethacin free acid (circles) titrated with L-arginine at
ambient conditions.Point a represents the saturation solubility of the free acid. The theoretical curve
(dotted lines) was fitted using Eq 3.1.1.
pH solubility profile of indomethacin is presented in figure (3.1.9) and follows equation (3.1.2)
with R2= 0.94. Indomethacin acid has a solubility of 0.24 µg/mL at pH 4.95 in water (point a)
reducing the pH to 2 using 0.1N HCl gave an estimation of 0.09 µg/mL for intrinsic solubility
[HA]. Indomethacin solubility increased exponentially with pH upon titrating with L-arginine
free base reaching a maximum solubility of 2837.8 µg/mL at pH 8.6 (point b) and this was
attributed to the formation of IND-arginate salt which has higher solubility.
Excess IND-arginate salt was dissolved in water with saturation solubility 34833.22 µg/mL at
pH 8.45, addition of 0.1 N HCl to this saturated solution dropped the solubility to 0.55µg/mL at
pH 2.25 due to the precipitation of indomethacin as a free acid, these results comes in line
with Ledwidge and Corrigan (1998).
a
b

93
3.1.4. Conclusion
The ability of basic amino acids to forms salts with indomethacin was evaluated in this study.
Both L-arginine and L-lysine dissociate IND and then interacted electrostatically to form two
novel salts. However, IND failed to dissociate in L-histidine solution. These results were further
confirmed by FT-IR and 1HNMR. The two prepared salts showed very high solubility and
dissolution profile when compared with the free acid. Na, K and Li IND salts have been
previously prepared, however using amino acids as counter ions will provide number of
advantages such as suitability with hypertensive patients and painfulness injection. Future
work will investigate the effect of using these amino acid salts on the drug permeability across
Caco-2 cells.

94
Prediction of compaction properties of binary mixtures of indomethacin
and indomethacin-arginine with arginine
3.2.1. Introduction
Salt formation studies have shown 104 fold increase in IND solubility. However, the high
dissociation of the salt form could deteriorate the drug ability to partition across the intestinal
membrane. Adding excess of the counter ion would act as a common ion and could reduce IND
dissociation by shifting equilibrium towards the undissociated form. To put this into a practical
solution, the current study aims at investigating the feasibility of using arginine as a tablet filler
and upon reaching the absorption site the tablet will disintegrate and an excess of arginine will
be available around the drug and might be able to keep the salt form undissociated for
absorption.
Tablets are the most commonly used dosage form nowadays. Many components are involved
during the tablet manufacture in order to improve the quality of the product. The compaction
of all the ingredients into one tablet is a complex process. The main reason behind such
complexity is the involvement of various physical characteristics of each pharmaceutical
powder during the compaction process. Therefore, most of the scientific research was devoted
to studying the compaction behavior of individual powders.
Compaction behavior of binary mixtures was investigated by many studies (Sheikh-Salem and
Fell., 1981; Humber-Droz et al., 1983; Van Veen et al., 2000; Zheng et al., 1995; Ramaswamy et
al., 1970; Jetzer, 1986; Ilkka and Paronen, 1993; Fell J., 1996). However, no simple relationship
was observed between the properties of tablets prepared from binary mixtures to tablets
prepared of single components. Three relationships have been discussed in the literature;
linear, positive and negative relationships. The study carried out by Newton et al., (1977)

95
found that tablets prepared of dicalcium phosphate dihydrate (DCPD) and phenacetin had a
higher tensile strength than tablets prepared from either individual alone (Newton et al.,
1977). The study suggested that the positive relationship is probably because the bonds
formed between DCPD-phenacetin are stronger than the bonds between individual materials
(Newton et al., 1977). Similar results were later found by Cook and Summers (Cook and
Summers, 1985) when DCPD was co-compressed with aspirin. Although porosity, punch force
and elastic recovery showed a linear relationship, the tensile strength of the prepared tablets
showed a positive relationship (Cook and Summers, 1985). Linear relationship was reported by
Newton et al., (1977) and Fell (1996) for different types of lactose. Such a good correlation was
attributed to the similarity in the compaction properties and the bonding mechanisms of the
two components. On the other hand, mixtures of brittle lactose and plastic sodium chloride
had negative relationship. This was attributed to the ability of lactose to undergo brittle
fracture resulting in higher proportion of lactose-lactose bonding which is believed to be
weaker than that of sodium chloride (Sheikh-Salem and Fell, 1981).
Despite the large number of studies conducted on binary mixtures only a few studies managed
to propose a model to predict the mechanical properties of compacted mixtures (Leuenberger,
1985; Van Veen et al., 2004). Percolation theory is widely used to explain the change of
properties exhibited by binary mixtures. For instance, in binary mixture of materials A and B if
powder B exists in a small fraction it will form isolated inclusions and form a dispersed phase.
While the A powder will form the continuous phase. Because of the localized tension caused
by the presence of a small amount of B, the behavior of powder A will change. Increasing the
amount of B in the mixture will result in aggregate formation and at certain point in the
concentration increasing of B, a network of B particles appears and this concentration
represents the percolation threshold. Furthermore, during the compaction of A and B three
kinds of interactions can take place: (1) A prefer bonding with A and B bonds preferentially

96
with B, or (2) the affinity of A-A or B-B bonding is similar to the affinity of A-B bonding or (3) A
bonds preferentially with B.
Indomethacin (IND) is a non-steroidal anti-inflammatory drug (NSAID) which is widely used to
reduce pain associated with rheumatoid arthritis, osteoarthritis, bursitis and headache
(Sweetman, 2005). The compaction properties of IND solid dispersion with crosspovidone was
evaluated by (Shibata et al., 2005), and the study found that better tablets are obtained upon
using microcrystalline cellulose and magnesium stearate. While the studies conducted by
Tahvanainena et al (2012) found that IND can form good tablets with acceptable tensile
strength upon loading with thermally oxidized mesoporous silicone microparticles
(Tahvanainena et al., 2012), these tablets were found to have higher dissolution and
permeability profile than the free IND. Although many studies evaluated the compaction
properties of formulations containing IND, none of them investigated the densification
mechanism of this anionic drug alone.
Most of the active pharmaceutical ingredients (API) have poor compaction properties
therefore pharmaceutical excipients such as tablets fillers, binders and disintegrants are
incorporated in the formulation in order to improve the properties of the manufactured
tablets. The first aim of this work is to characterise the compaction properties of three
individual powders namely; IND, as a module drug and IND arginine salt (as its salt form) and
arginine (as a tablet filler for the free drug and the salt form), The second stage of this work
will utilize Response Surface Modeling (RSM) to predict the characteristics of binary mixtures
between the free drug and arginine (PMs) and the IND salt form with arginine (SMs) and
compare the predicted results against the experimental data.

97
3.2.2. Materials and methods
3.2.2.1. Materials
Indomethacin (TLC ≥ 99%), L-Arginine (non-animal source) and magnesium stearate were
purchased from Sigma Aldrich (Dorset, UK). Ethanol was purchased from Fisher Scientific
(Loughborough, U.K.)
3.2.2.2. Methods
3.2.2.2.1. Physical mixtures (PMs) and salt preparations.
PMs of IND with various molar ratios of arginine were prepared by weighing accurate amount
of TMP and mixed by KitchenAid (Michigan, USA) at mixing speed of 3 for 5 minutes with the
various ratios of of arginine. IND arginine salt was prepared using the ElShaer et al method
(2011). Equimolar amounts of IND and the free amino acid were solubilised in water and the
solutions were mixed and stirred until equilibration then filtered. The filtrate was transferred
into vials and freeze dried for 48h using a Modulyo freeze dryer at -40oC shelf temperature
and under vacuum created by (E2M5 Edwards pump) then samples were collected and kept at
40oC for 4h using a Gallenkamp vacuum oven. Salt excess amino acid mixtures (SMs) were
prepared by the same way as PMs.
3.2.2.2.2. Tap density and Powder flow (Hausner’s ratio and Carr’s index)
USP I apparatus (Sortax tap density tester) was used to measure the true density of the
powders. 15 gm of the powders was weighed and poured into a 100 mL measuring cylinder
and the initial volume of the powder was recorded as zero tap (bulk volume). The machine was
allowed to vibrate at 50, 100, 150, 200 and 250 taps and the final volume after each tapping
was recorded.

98
Carr’s compressibility index was used to study the flow characteristics of the powders and was
calculated from equation (3.2.1).
100' ×−
=t
ptsCarrρ
ρρ Equation 3.2.4
While the Hausner ratio was used to evaluate the ease of powder flow and equation
(3.2.2) was used to work it out.
p
tHausnerρρ
= Equation 3.2.5
Where ρt is the tapped density and ρp is the poured density.
Table 3.2.23:- Flowability based on Hausner ratio, Carr’s Index and angle of repose according to BP
guidelines (British Pharmacopoeia 2011).
3.2.2.2.3. Particle Size Distribution Analysis (Sieve method)
A set of sieves (Retsch AS 200) of diameter 710 µm, 355 µm, 250 µm, 125 µm, 90 µm, 75 µm
and 63µm arranged in a decreasing order of their diameter were used to measure the
powders’ particle size distribution. 15 gm of the powders were accurately weighed and placed
on the top sieve and then allowed to shake for 12 minutes at amplitude of 60. The powder
retained in each pan was weighed and the cumulative weight undersize was calculated and
plotted against sieve diameter. This test was not carried out for the salts and their mixtures
because of the small sample sizes
Haunser Ratio

99
3.2.2.2.4. Tablet preparation
Tabets of IND, its arginine salt and physical mixtures with excess of the amino acid counter ions
at (1:1), (1:2), (1:4) and (1:8) molar ratios were prepared to study tableting properties. The
powders were compacted using an uniaxial hydraulic press (Specac tablet presser) and split die
which prevents mechanical failure by allowing triaxial decompression. Magnesium stearate in
ethanol (5% w/v) was used to lubricate the die walls and punch surfaces. Powders were
compressed at 5, 10, 20, 30, 40 and 60 kN and at dwell time of 30 sec.
The prepared tablets were cylindrical with a diameter of 13 mm and weight of around 500 mg.
Tablets were left in desiccators for 24 h prior to performing any mechanical testing.
Tablet characterization
3.2.2.2.5. Tensile strength measurements
The force required to crush the prepared tablets was measured using a tablet hardness
apparatus (Schleungier 4M, Thun, Switzerland). The measured force was used to determine
the tablet tensile strength using equation (3.2.3).
dt
Fc
πσ 2
= Equation 3.2.6
Where σ is the tablet tensile strength, Fc is the crushing force required to break the tablet, d is
the tablet diameter and t is the tablet thickness. All measurements were done in triplicate.
3.2.2.2.6. Heckel analysis
The Heckel equation (3.2.4) was used to analyze tablets’ compression data (Heckel, 1961a).
AKPD +=− ))1/(1ln( Equation 3.2.7
Where D is the tablet relative density at pressure P, K is a material constant (slope of the
straight line portion of Heckel plot) and is 1/3 of the yield strength. 1/K value is used to express

100
the mean yield pressure. A is a function of the initial bulk volume and is calculated from the
intercept of the straight line of the Heckel plot.
3.2.2.2.7. Apparent, bulk particle density and porosity measurements
Bulk density was determined by using 10 ml cylinder to measure the volume (V) of a pre-
weighed sample. Apparent particle density was measured using a helium pycnometer
(Multipycnometer Quantachrome Instruments, Hampshire, UK). Both bulk and true density
values were used to determine the powder porosity according to equation (3.2.5).
)/1(100 td ρρε −= Equation 3.2.8
Where ε is the porosity and ρd is the bulk density and ρt is the true density. All the
measurements were done in triplicate.
3.2.2.2.8. Disintegration time studies
Disintegration time is the time required for tablets to disintegrate completely without leaving
any solid residue. In vitro disintegration time was evaluated using US pharmacopoeia
monograph (<701> disintegration). Erweka ZT3, Appartebau, GMBH was used in this study as a
disintegration apparatus and distilled water (800 ml) as disintegration medium; the
disintegration medium temperature was maintained at 37 °C by thermostat. Six tablets were
placed in the basket rack assembly and covered by a transparent plastic disk. The
disintegration time was taken as the time required for tablets to disintegrate completely
without leaving any solid residue. All the measurements are carried out in triplicate and
presented as (mean ± standard deviation).

101
3.2.2.2.9. Design of the experiment
MODDE software version 8 (Umetrics inc., USA) was used to design the statistical experiment
for this study. Three levels full factorial design response surface modelling (RSM) with total
runs of 24 of which three replicated centre points was selected for this study.
The effect of two independent variables; compaction force (F) and arginine percentage (R) on
three dependant variables (responses); porosity (P), tensile strength (S) and disintegration time
(T) was studied.
3.2.3. Results and discussion
3.2.3.1. Powder characterisation
Physical mixtures (PMs) of IND and arginine and salt mixtures (SMs) of IND salt and arginine
were prepared in ratios of 1:1, 1:2, 1:4 and 1:8. The prepared PMs, SMs and individual
powders of IND and arginine were characterised in terms of particle size distribution,
flowability, bulk, true, tapped density and porosity.
3.2.3.1.1. Particle size analysis
Particle size analysis showed that IND:arginine 1:1 PM has the most uniform particle size
distribution with its median of around 175 µm. Around 90% of 1:8 and 1:4 physical mixtures
had particle size <350 µm. whilst the 1:2 and 1:1 ratios had 70% and 30% of the particles <350
µm respectively. Particle size distribution of IND and arginine was comparable as 60% of IND
molecules having a particle size <350 µm, and 70% of arginine particles having a particle size
<350 µm (Fig. 3.2.1).
The particle size analysis suggests that the IND dry powder and 1:2 physical mixture should
have good flowability because of their large particle size. Whilst particles with particle size

102
lower than 100 µm are cohesive and flow problems occur (Staniforth, 2007). Therefore, it was
interesting to carry out flowability studies for the individual powders and the physical mixture.
0
10
20
30
40
50
60
70
80
90
100
0 50 100 150 200 250 300 350 400
Sieve Aperture Size (µm)
Cum
ulat
ive
Mas
s U
nder
size
(%
)
IND L-Arginine 1:1 1:2 1:4 1:8
Figure 3.2.24– Particle size analysis of Indomethacin, L-Arginine and physical mixtures (n=3).
3.2.3.1.2. Flowability studies.
In this study the flow properties for IND, its salt, PMs and SMs were evaluated using angle of
repose (Table 3.2.2).

103
Table 3.2.24– Hausner Ratio, Carr’s Index and angle of repose for Indomethacin, L-Arginine and their
PMs and SMs.
Formulation Angle of
Repose (Mean
± SD, n=3)
Hausner Ratio Carr’s Index Formulation Angle of
Repose (Mean
± SD, n=3)
IND 36.89 ± 3.28 3.54 71.77 L-Arginine 29.4 ± 0.84 2.70 63.00 IND arg Salt 36.00 ± 1.92
PM 1:1 42.82 ± 0.07 3.11 67.88 SM 1:1 37.06 ± 3.56 PM 1:2 41.44 ± 3.20 2.94 66.03 SM 1:2 24.83 ± 0.86 PM 1:4 33.86 ± 4.30 3.36 70.23 SM 1:4 25.40 ± 0.37 PM 1:8 29.85 ± 2.40 3.44 70.92 SM 1:8 26.60 ± 2.31
Angle of repose measurements showed that IND has fair flowability (angle of repose= 36.89 ±
3.28), whilst, arginine had excellent flowability (angle of repose= 29.4 ± 0.84). Although SEM
images show large particle size of IND (Fig. 3.2.2), the drug showed fair flowability
characteristics and this may be attributed to the positive surface charge carried by IND. This
positive charge increases the adhesiveness to the surfaces and in turn deteriorates the flow of
the powder as suggested by Soppelaa et al., (2010). On the other hand, SEM has shown
elongated rods for arginine with rough surface which are believed to be the reason behind the
good flowability of this amino acid.
Interestingly, the flow properties dropped (p<0.05) upon mixing IND and arginine at 1:1 and
1:2 ratios. This is possibly because of significantly electrostatic interactions forming between
the negative and positive charge on IND and arginine respectively which results in increasing
the co-adhesion between the two binary mixtures. Beyond these two ratios increasing arginine
concentration resulted in increasing the overall negative charge on the mixture and hence the
flowability of the powder mixture (Table 3.2.2) improved from passable at 1:1 and 1:2 ratios
into excellent flowability (29.85 ± 2.40) at 1:8 ratio.

104
Figure 3.2.25:- SEM images for (A) IND and (B) ar ginine, (C) IND arginine salt.
On the other hand, flow properties for all the powders were found to be poor upon using the
Hausner ratio and Carr’s index methods (Table 3.2.2). Such variation between the two
methods is possibly because the Hausner ratio and Carr’s index are one-point determinations
that do not take into account the ease or speed with which consolidation of the powder occurs
(Staniforth, 2007). Materials with high index which are supposed to have low flowability were
found to consolidate quickly and hence had more uniform filling on tablet machines. The study
conducted by Li et al found a similar trend in that powders which showed good flowability
according to Hausner ratio exhibited poor flowability when tested using the bin-flow test and
vice versa (Li et al., 2004).
The flowability characters of IND arginine salt and SMs were studied as well by measuring the
angle of repose of the powders. Haunser ratio and Carr’s index were not carried out because of
the low amount of the salt obtained via freeze drying.
A B
C
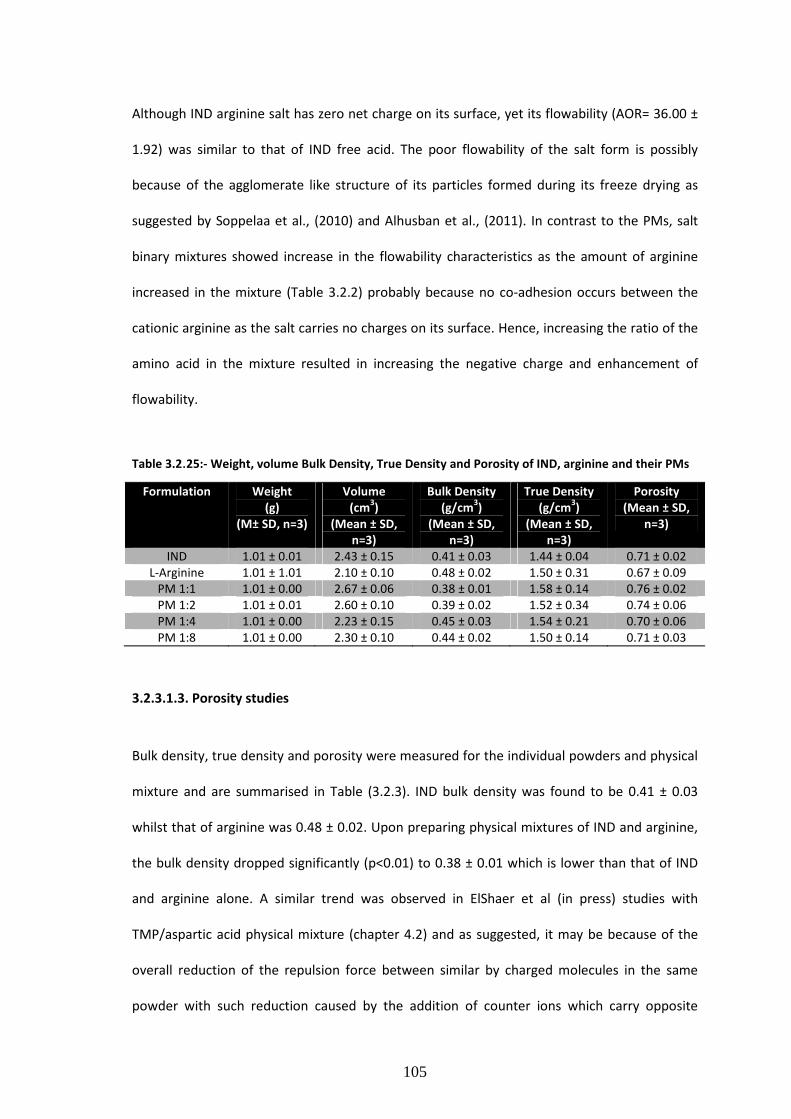
105
Although IND arginine salt has zero net charge on its surface, yet its flowability (AOR= 36.00 ±
1.92) was similar to that of IND free acid. The poor flowability of the salt form is possibly
because of the agglomerate like structure of its particles formed during its freeze drying as
suggested by Soppelaa et al., (2010) and Alhusban et al., (2011). In contrast to the PMs, salt
binary mixtures showed increase in the flowability characteristics as the amount of arginine
increased in the mixture (Table 3.2.2) probably because no co-adhesion occurs between the
cationic arginine as the salt carries no charges on its surface. Hence, increasing the ratio of the
amino acid in the mixture resulted in increasing the negative charge and enhancement of
flowability.
Table 3.2.25:- Weight, volume Bulk Density, True Density and Porosity of IND, arginine and their PMs
Formulation Weight
(g)
(M± SD, n=3)
Volume
(cm3)
(Mean ± SD,
n=3)
Bulk Density
(g/cm3)
(Mean ± SD,
n=3)
True Density
(g/cm3)
(Mean ± SD,
n=3)
Porosity
(Mean ± SD,
n=3)
IND 1.01 ± 0.01 2.43 ± 0.15 0.41 ± 0.03 1.44 ± 0.04 0.71 ± 0.02 L-Arginine 1.01 ± 1.01 2.10 ± 0.10 0.48 ± 0.02 1.50 ± 0.31 0.67 ± 0.09
PM 1:1 1.01 ± 0.00 2.67 ± 0.06 0.38 ± 0.01 1.58 ± 0.14 0.76 ± 0.02 PM 1:2 1.01 ± 0.01 2.60 ± 0.10 0.39 ± 0.02 1.52 ± 0.34 0.74 ± 0.06 PM 1:4 1.01 ± 0.00 2.23 ± 0.15 0.45 ± 0.03 1.54 ± 0.21 0.70 ± 0.06 PM 1:8 1.01 ± 0.00 2.30 ± 0.10 0.44 ± 0.02 1.50 ± 0.14 0.71 ± 0.03
3.2.3.1.3. Porosity studies
Bulk density, true density and porosity were measured for the individual powders and physical
mixture and are summarised in Table (3.2.3). IND bulk density was found to be 0.41 ± 0.03
whilst that of arginine was 0.48 ± 0.02. Upon preparing physical mixtures of IND and arginine,
the bulk density dropped significantly (p<0.01) to 0.38 ± 0.01 which is lower than that of IND
and arginine alone. A similar trend was observed in ElShaer et al (in press) studies with
TMP/aspartic acid physical mixture (chapter 4.2) and as suggested, it may be because of the
overall reduction of the repulsion force between similar by charged molecules in the same
powder with such reduction caused by the addition of counter ions which carry opposite

106
charge (ElShaer et al., 2012). Nevertheless, the true density and powder porosity were the
same for all the formulations and no significant difference was found between any of them
(Table 3.2.3).
Table 3.2.26:- Weight, volume, bulk density, true density and porosity of IND salt and the SMs
Formulation Weight (g)
(M±SD, n=3)
Volume (cm3)
(M±SD, n=3)
Bulk Density
(g/cm3)
(M±SD, n=3)
True Density
(g/cm3)
(M±SD, n=3)
Porosity
(M±SD, n=3)
IND arg Salt 0.50 ± 0.00 3.07 ± 0.06 0.16 ± 0.00 2.13 ± 0.06 0.92 ± 0.00
SM 1:1 0.50 ± 0.00 1.80 ± 0.01 0.28 ± 0.02 1.80 ± 0.05 0.85 ± 0.01
SM 1:2 0.50 ± 0.00 1.77 ± 0.06 0.28 ± 0.01 1.96 ± 0.05 0.86 ± 0.01
SM 1:4 0.50 ± 0.00 1.50 ± 0.10 0.33 ± 0.02 2.08 ± 0.12 0.84 ± 0.00
SM 1:8 0.50 ± 0.00 1.53 ± 0.32 0.34 ± 0.06 1.95 ± 0.02 0.83 ± 0.02
Analysis of bulk density for SM suggested that an increase in bulk density decreases the
porosity although statistically there was no difference found between any of the formulations
in bulk density, true density and porosity data shown in Table 3.2.4 (p>0.05).
Powder characterisation has shown better bulk densities and porosity for the salt form and the
SMs when compared to the free drug and its PMs which could be attributed to the way the salt
form was prepared as the lyophilized salt would have a highly porous structure and in turn
higher bulk density (Alhusban et al., 2011).
3.2.3.2. Densification properties of individual powders
After the full powder characterisation, the compaction properties of each individual powder
were studied in order to understand their densification mechanisms prior to conducting the
RSM and experimental studies for the binary mixtures.
The reduction of the material volume that accompanies an applied pressure is known as
compressibility (Joiris et al., 1998). The compressibility behaviour of pharmaceutical powders is
evaluated by plotting the tablet porosity against the compaction force (Joiris et al., 1998). For a
pharmaceutical powder to form a strong compact, the material should be highly compressible,
i.e. have smaller porosity upon compression in order to enable particles to get closer to each

107
other and increase the bonding area between the particles. Fig. 3.2.3 shows the
compressibility profile of the three individual powders; IND, arginine and IND arginine salt.
Generally, increasing the compression force resulted in a decrease in the tablets’ porosity. The
highest compressibility profile was exhibited by the salt. Probably because of the highly porous
structure of the salt form obtained during the freeze drying cycle which might have resulted in
poor packing due to cohesiveness of the powder as reflected by its flowability. The high
compressibility profile of the salt form would enable the formation of strong tablets because of
the high interparticulate bonding area created upon densification of this highly compressible
powder. On the other hand, IND free acid showed the lowest compressibility profile as the
tablet porosity was 0.52±0.01 at 5 kN and slight dropped to 0.46 upon doubling the
compression force then no significant (P>0.05) change was observed even at the very high
compression forces. Arginine compressibility was between that of the free acid and the salt
form (Fig. 3.2.3).
In order to understand the densification mechanism of the individual powders, Heckel analysis
was carried out.

108
0
0.1
0.2
0.3
0.4
0.5
0.6
0.7
0 10 20 30 40 50 60 70
Compaction Force (kN)
Por
osity
Arginine IND IND arginine salt
Figure 3.2.26:- Plots of tablet porosity against compaction pressure, showing the compressibility of
IND, arginine, IND arginine salt (n= 3).
It is known that the plastic properties of pharmaceutical powders play an important role during
the densification of the powder. Therefore, Heckel analysis was carried out and both the yield
strength and yield pressure were calculated using Heckel equation (Equation 3.2.4) and
summarised in Table (3.2.5). Heckel graphs for the powders showed initial curvature
representing the particle fragmentation and rearrangement in the die. This is followed by a
linear relationship between compaction force and -ln porosity, the slope of which indicates the
degree of plastic deformation and consequently yield strength (Staniforth, 2007). Heckel
analysis showed that IND arginine salt and arginine have yield strengths of 43.85 and 28.01
respectively. Which reflects the high plasticity of the two powders especially arginine.
Nevertheless, the analysis showed a very low plastic characteristics and high elastic
deformation of IND that take place during compaction as the yield strength was found to be
208.33. The high elastic behaviour of IND affected the integrity of its prepared tablets and
problems such as capping, lamination and breakage were observed.

109
Table 3.2.27:- Summary of Heckel analysis and tensile strength at zero porosity (σ0) for IND, arginine,
IND arginine salt, PMs and SMs.
Formulation σ0 Yield pressure
Yield strength
Formulation σ0 Yield pressure
Yield strength
IND 1.13 625 208.3333 Salt 3.35 131.5789 43.85965 Arginine 381 84.03361 28.0112 SM 1:1 4.12 208.3333 69.44444 PM 1:1 1289.9 185.1852 61.7 SM 1:2 29.33 166.6667 55.55556 PM 1:2 223.9 72.46377 24.15459 SM 1:4 147.12 188.6792 62.89308 PM 1:4 217.65 62.5 20.83333 SM 1:8 588.54 109.8901 36.63004 PM 1:8 n/d 107.5269 35.84229
The ability of pharmaceutical powders to form a strong tablet during densification is known as
compactability and can be represented by plotting the tensile strength against porosity.
The compactability profile of IND, IND arginine salt and arginine were studied and are
summarised in Fig. 3.2.4. As suggested by Ryshkewitch, (1953) an exponential correlation
between tablets tensile strength and porosity was observed for both arginine and the IND
arginine salt, i.e. increasing the tablet porosity resulted in an exponential decrease in the
tablets’ tensile strength. However for unknown reasons IND showed a weak correlation (Fig.
3.2.4). The highest compactability was exhibited by arginine and because the compactability
reflects the strength of bond formation, this suggests that strong bonds are formed during the
densification of arginine. In contrast to IND which showed the lowest compactability
indicating, the weak bond formation under the compaction. In order to calculate the tablets’
tensile strength at zero porosity the Ryshkewitch equation (Equation 3.2.6) was used and
results are summarised in (Table 3.2.5).
εσσ be−= 0 Equation 3.2.9
Where σ is the tensile strength σ0 is the tensile strength at zero porosity, ε is the porosity and b
is a constant.

110
0
0.5
1
1.5
2
2.5
3
3.5
4
4.5
0.2 0.25 0.3 0.35 0.4 0.45 0.5 0.55 0.6 0.65
Porosity
Ten
sile
str
engt
h (N
/mm
2)
Arginine IND IND arginine salt
Figure 3.2.27:- Plots of tablet tensile strength against porosity, showing the Compactability of IND,
arginine, IND arginine salt (n= 3).
Another property is tabletability which is known as the ability of powder to form a tablet of
specific strength while exposed to compaction pressure. The tabletability profile of a
pharmaceutical powder can be expressed by plotting tablet tensile strength against
compaction force (Sun and Grant, 2001). Both powder compressibility, which affects the
bonding area and compactability properties of the powder which reflects the strength of bond
formation determine the tabletability characteristics of the pharmaceutical powder. Figure
3.2.5 shows that increasing the compaction force results in increasing the tensile strength for
the tablets. IND powder showed the lowest tensile strength (0.21±0.05) at 60 kN. This result
was expected as Heckel analysis revealed the high elasticity of IND while the compactability
data showed weak bond formation. On the other hand, the cationic amino acid tablets showed
the highest tensile strength and IND arginine salt tablets had good tabletability. Although the
salt form showed better compressibility, its tabletability was not as great as the arginine. This
assumes that compactability of the powder is the main determinant of the compacts strength.

111
00.5
11.5
22.5
33.5
44.5
5
0 10 20 30 40 50 60 70
Compaction force (kN)
Tens
ile s
tren
gth
(N/m
m2)
Arginine IND IND arginine salt
Figure 3.2.28:- Plots of tablet tensile strength against compaction pressure, showing the tabletability
of IND, arginine, IND arginine salt (n= 3).
The ability of the tablets to disintegrate in water was evaluated and the disintegration results
revealed that increasing the compaction force deteriorates the tablets’ disintegration time.
Although compressibility data revealed the high porosity of IND, the free acidic drug showed a
very poor disintegration and the drug failed to disintegrate even after 20 minutes (Fig 3.2.6).
The high lipophilicity of IND could be the reason behind its poor disintegration. Hansch and Leo
reported the log P value of IND to be 3.8 (Hansch and Leo, 1979) which reflects its low
hydrophilicty, low wettability (Fukami et al., 2005) and hence the extended disintegration
time.

112
0
200
400
600
800
1000
1200
1400
5 10 20 30 40 60
Compaction force (kN)
Dis
inte
grat
ion
time
(sec
)
IND
IND arginine salt
Arginine
Figure 3.2.29:- Disintegration time for IND, arginine and IND arginine salt (n=3) (¥; tablets failed to
disintegrate within 20 minutes), (*** p<0.001).
However, arginine tablets showed very rapid disintegration time (25.3±2 s) for tablets
compressed at 30 kN despite having high tensile strength (1.23±0.09). Probably because of the
high hydrophilicity of arginine as it has low log P value of 0.69 (Kennedy et al., 2000) and
therefore high wettability and fast disintegration. Although the salt form was found to be
highly hydrophilic (ElShaer et al., 2011), the disintegration time was not as low as that of
arginine and this might be attributed to the very low porosity of the salt tablets as suggested
by the compressibility data. Low porosity results in poor water penetration into the tablets and
hence a longer disintegration time is required.
3.2.3.3 Comparison between the predicted and experimental data for binary mixtures
3.2.3.3.1. Compressibility characterisation of the binary mixtures
The characterisation of the individual powders showed that arginine has very high bonding
capacities and its tablets disintegrate quickly. This means that incorporating the amino acid
into the formulations, should improve the tablets’ characteristics. Moreover, studies carried
out in our lab showed that adding arginine to the formulation improves anionic drugs
dissolution and absorption through intestinal membranes (data discussed in the next chapter).
¥ ¥ ¥ ¥ ¥ ¥
***
*** ***
*** ***
***
*** ***
***

113
Therefore, an experimental design was used to predict the effect of incorporating arginine to
IND, which showed very poor compaction and disintegration characteristics, and IND arginine
salt in an attempt to fit a model that could predict the compaction properties of the binary
mixtures and compare it against the experimental data.
The compaction force is an important factor that affects the porosity and tensile strength of
the tablets. Hence the compaction force (F) was selected as an independent variable and
compaction force was changed between 5-60 kN. The arginine ratio (R) –ranging between 0-
100%- in the binary mixture was the second variable and was selected for the reasons
mentioned above. The effect of these two independent variables on tablet porosity (P), tensile
strength (S) and disintegration time (T) was studied using response surface modelling (RSM).
RSM was preferred over screening modelling because the aim of the study is to predict effect
of both the compaction force and arginine ratio on the tablets characteristics. A full factorial
design with each factor varied at three levels was selected, and the model was fitted to the
multiple linear regression (MLR) because the total number of responses was not more than 3.
The significance of the quadratic model (linear, interactive and polynomial) on the dependent
variables was carried out using analysis of variance (ANOVA) and the quantitative effects of the
independent variables on the responses was considered significant at a 95% confidence level
(p< 0.05). A high degree of reproducibility was obtained for most of the responses (Fig. 3.2.7),
which suggest that the three responses are strongly dependent on the two independent
variables.

114
0
0.2
0.4
0.6
0.8
1
1.2
Porosity Tensile strength Disintegration time
Rep
rodu
cibi
lity
(r2)
IND/arginine PM INDsalt/arginine SM
Figure 3.2.30:- Reproducibility of the results for all three responses which represents the variation of
the response under the same conditions (pure error) compared with the total variation of the
response.
Table (3.2.6) summarise the effect of each independent factor on the responses; the sign of
the effect represents the trend while the values indicate the magnitude of this effect. The data
show that both the compaction force (F) and arginine ratio (R) have a significant (P< 0.001)
influence on IND tablet porosity. Figure (3.2.8A) shows that increasing the compaction force
and arginine ratio causes a decrease in the tablets porosity. Nevertheless, the effect of
compaction force (0.16) was twice that of arginine ratio (0.08). Interestingly the interactive
term FR was found to have an antagonistic effect as the magnitude of decrease in the tablet
porosity (P) was less than the effect of each single term.
Table 3.2.6:- The quantitative factor affecting tablets porosity and their associated p value for the
responses.
Porosity term IND IND arginine salt
Effect p value Effect p value F -0.1598 <0.001 -0.3045 <0.001 R -0.07805 0.001176 -0.0175 0.578895 F2 0.154053 <0.001 0.25403 <0.001 R2 -0.02275 0.46393 0.2332 <0.001 FR -0.06226 0.0217 0.06554 0.100594
Looking at IND-arginine salt/arginine binary mixtures (Fig. 3.2.8B, Table 3.2.6) showed that
only the compaction force influences the porosity of the tablets (0.3), while incorporating

115
arginine had no significant effect on the porosity (p>0.05). This is probably because of the high
compressibility of the salt form which was found to be higher than the cationic amino acid and
hence masked the effect of arginine which appeared to be significant upon mixing with low
compressible IND.
Figure 3.2.31:- Surface response plot showing the effect of compaction force and arginine ratio on
tablets porosity for (A) IND/arginine binary mixtures, (B) IND salt/arginine binary mixtures
The MLR was used to fit the mathematical equation and the response surface plots (3D) which
could be used to predict the tablet porosity by inputting the experimental conditions using the
two independent variables; F and R.
The mathematical expression for working out the porosity of IND/arginine binary mixtures is
equation (3.2.7)
FRFRFPInd 062.015.0078.0159.0343.0 2 −+−−= Equation 3.2.10
PorosityPorosity
A B

116
While that for the salt form is expressed in equation (3.2.8)
22 23.025.03.015.0 RFFPSalt ++−= Equation 3.2.11
Where PInd is the porosity for IND/arginine PMs, PSalt the porosity of IND salt/arginine SMs, F is
the compaction force and R is arginine percentage in the binary mixture.
The compressibility profile for IND and the salt with various ratios of arginine was studied in
order to compare the experimental findings against the predicted data (Table 3.2. 6).
Figure (3.2.9A) shows the compressibility profile for IND/arginine binary mixtures. Similar to
the individual powders, increasing the compaction force resulted in decreasing the tablet
porosity. The highest compressibility was exhibited by arginine> PM 1:4> PM 1:2> PM 1:1> IND
Heckel analysis (Table 3.2.5) showed that PM 1:4 has the highest plasticity as its yield strength
was found to be (20.83) and the elasticity of IND (yield strength of 208.33) dropped
significantly upon incorporating arginine into the formulations (yield strength of 61.7 at PM
1:1). These results confirm the quadratic model findings which suggested the significant role of
adding arginine on the tablet porosities.

117
Figure 3.2.32:- Plots of tablet porosity against compaction pressure, (A) Compressibility of IND, L-
arginine and PM’s and (B) Compressibility of IND salt and SM’s (n=mean±SD and n=3).
On the other hand, studying the compressibility profile for IND salt/arginine mixtures (SMs)
showed that only SM at 1:1 (50 % arginine) ratio had higher compressibility than the salt form
while other has not been significantly affected when adding the amino acid. Moreover, Heckel
analysis revealed that there is no big difference between the yield strength of the salt form
and the salt mixtures with arginine (Table. 3.2.5) which reflects the low changes in the
compressibility profile upon incorporating arginine. The porosity for most of the ratios
0.2
0.25
0.3
0.35
0.4
0.45
0.5
0.55
0.6
0 10 20 30 40 50 60 70
Compaction force (kN)
Por
osity
IND Arginine PM 1:1 PM 1:2 PM 1:4 PM 1:8
0.05
0.15
0.25
0.35
0.45
0.55
0.65
0 10 20 30 40 50 60 70
Compaction force (kN)
Por
osity
Salt: arginine1:1 Salt: arginine1:2 Salt: arginine1:4 Salt: arginine1:8 Arginine IND arginine salt
A
B

118
dropped significantly upon increasing the compaction pressure which suggests that the
compaction force is the main determinant of the compressibility profile for the SMs. These
results go in line with the RSM model.
3.2.3.3.2. Tabletabiliy characterisation
In order to predict the ability of arginine binary mixtures with IND and the salt to form a tablet
of specific strength while exposed to compaction pressure (tabletability), RSM was carried out
and figures (3.2.10A) and (3.2.10B) were generated for IND/arginine PMs and salt/arginine
SMs respectively.
Tensile strength was the second response evaluated in this study and the predicted data
showed that IND tablets tensile strength was significantly (P< 0.001) increased upon increasing
both the compaction force (F), arginine ratio (R) and their interactive term (FR). The
compaction force (F) and arginine ratio (R) were found to have the same magnitude of effect
on the tablets’ tensile strength; 1.73 and 1.79 respectively (Table 3.2.7).

119
Figure 3.2.33:- Surface response plot showing the effect of compaction force and arginine ratio on
tablets tensile strength for (A) IND/arginine binary mixtures and (B) IND salt/arginine binary mixtures.
Interestingly, combining both factors (FR) during the preparation of the tablets was found to
have a synergistic effect (2.032) on the tablets’ strength. This effect could be explained by the
ability of arginine to improve the compressibility of IND tablets which in turn improves the
interparticulate bonding area. Besides, its ability to enhance the bond formation during
densification as reflected by the compactability studies. Because both compressibility and
compactability are pre-determinant of tablet strength, hence an increase in the tensile
strength was observed. Moreover, this synergistic effect could reflect strong bonding between
IND and arginine which achieved highest value at 50% of arginine (PM 1:1) as suggested by the
high (σ0) value as early suggested by Sheikh-Salem and Fell., (1981). None of the polynomial
terms (F2 or R2) were found to be effective (p>0.05) on the tablets hardness.
Tensile strength
Tensile strength
A B

120
Table 3.2.28:- The quantitative factor affecting tablets tensile strength and their associated p value for
the responses.
Tensile strength term IND IND arginine salt
Effect p value Effect p value F 1.73733 <0.001 1.938 <0.001 R 1.79459 <0.001 1.0815 0.02527 F2 -0.4075 0.289239 -0.2607 0.702288 R2 0.28075 0.45716 0.72462 0.28989 FR 2.0324 <0.001 1.711 0.00544
Similarly, incorporating arginine to the salt formulations showed similar trends and the tablets’
tensile strength was increased upon increasing the compaction force and arginine ratio.
Nevertheless, the compaction force was the main determinant of the tablets’ hardness for the
SMs as the magnitude of effect exhibited by the compaction force (F) was twice (1.938) that of
arginine ratio (1.08) (R). Moreover, the interactive term (FR) was found to antagonise the
effect of compaction force as combining the two factors was found to be less effective (1.71)
than the compaction force alone (1.94). Mathematical equations (3.2.9 and 3.2.10) and
response surface plots were generated after the model was fitted to MLR, and could be used
to predict the tablets tensile strength if the compaction force and arginine ratio are known.
FRRFSInd 03.279.173.1022.1 +++= Equation 3.2.12
FRRFSSalt 711.108.1938.1083.1 +++= Equation 3.2.13
Where Sind is the tensile strength for IND/arginine PMs, Ssalt is the tensile strength for IND
salt/arginine SMs, F is the compaction force and R is the arginine percentage.

121
Figure 3.2.34:- :- Plots of tablet tensile strength against compaction pressure showing (A)
Tabletability of IND, ARG and PM’s, (B) Tabletability IND salt and SM’s (n=3).
Experimental studies of the effect of compaction force and arginine ratios on the tensile
strength for PMs and SMs were studied and summarised in Fig. 3.2.11.
Similar to individual powders, a linear relationship was observed between the tablets tensile
strength and compaction force, i.e. increasing the compaction force resulted in increasing the
tensile strength for all the formulations. The highest tabletability was shown by arginine> PM
0.0
0.5
1.0
1.5
2.0
2.5
3.0
3.5
4.0
4.5
5.0
0 10 20 30 40 50 60 70
Compaction Pressure (kN)
Ten
sile
Stre
ngth
(N
/mm
2)
IND:ARG Salt Indomethacin L-Arginine 1:1 1:2 1:4 1:8
0.0
0.5
1.0
1.5
2.0
2.5
3.0
3.5
4.0
4.5
5.0
0 10 20 30 40 50 60 70
Compaction Pressure (kN)
Ten
sile
Stre
ngth
(N
/mm
2 )
IND L-Arginine 1:1 1:2 1:4 1:8
A
B

122
1:2≈ PM 1:4> PM1:8 >PM 1:1. While IND free acid which showed the lowest tabletability
properties among the PMs (Fig. 3.2.11A). The compressibility and compactability similarities
between 1:2 and 1:4 PMs might be behind their similar tabletability.
Fig. 3.2.11B shows the tabletability profile of the SMs, again it was clear that increasing the
compaction force increased the tablet tensile strength. However, SM at 1:2 showed a drop in
the tablets’ strength at very high compaction force (Fig. 3.2.11B) which could be because of
the over-compaction.
The highest tabletability was exhibited by arginine> SM 1:8> SM 1:4 > SM 1:1≈ SM 1:2:> salt.
The practical data shows clearly that the compaction force has a strong effect on the tablet
strength for both the IND and the salt mixture as suggested by the RSM model. Furthermore,
the effect of arginine ratio in salt binary mixture is believed to go in line with the data
suggested by the model. Nevertheless, IND/arginine physical mixtures data has not
demonstrated similar trend and the effect of arginine ratio on the tablet hardness of the PM
was not clear.
3.2.3.3.3. Disintegration studies
Disintegration time was the last response to be evaluated in this study. The significant terms
which were found to affect the disintegration time for IND/arginine PMs tablets were
identified as compaction force (F), arginine ratio (R), the interactive term (FR) and the
polynomial term of arginine ratio (R2). Increasing the compaction force (F) was found to
increase the disintegration time by a magnitude of (262.16) while increasing the ratio of
arginine in the mixtures were found to decrease the time required for the tablets to
disintegrate significantly (p< 0.001) and even by higher magnitude when compared to the
compaction force (F). Although the arginine ratio had higher impact on the disintegration time
than the compaction force, the interactive term (FR) was found to delay the tablets
disintegration for the PMs.

123
Table 3.2.29:- The quantitative factor affecting tablets disintegration time and their associated p value
for the responses.
Disintegration time term IND IND arginine salt
Effect p value Effect p value F 262.167 <0.001 509.167 <0.001 R -1069.51 <0.001 -513.834 <0.001 F2 -43.4425 0.57141 -162.128 0.0259 R2 250.25 0.00352729 -127 0.0706917 FR 170.137 0.0119061 -192.515 0.00218
On the other hand, RSM showed that both the compaction force and the arginine ratio have
similar magnitude of effect on the disintegration time of salt/ arginine SMs. Nevertheless, the
compaction force (F) was found to increase the disintegration time while the arginine ratio was
found to speed up the tablets’ disintegration (Table 3.2.8). The interactive term (FR) was found
to decrease the disintegration time for the SMs.
Equations (3.2.11) and (3.2.12) can be used to describe the effect of the two independent
factor; compaction force and arginine ratio on the effect of disintegration time for PMs and
SMs, respectively.
FRRRFTInd 17025.25051.106916.262055.556 2 ++−+= Equation 3.2.14
FRFRFTSalt 5.19212.16283.51316.509647.504 2 −−−+= Equation 3.2.15
Where Tind is the disintegration time for IND/arginine PMs, Tsalt is the disintegration time for
IND salt/arginine SMs, F is the compaction force and R is the arginine ratio. The three
dimensional surface plots were generated using the software and simulates the effect of
compaction force and arginine ratio, individually and simultaneously, on the disintegration
time for the PM (Fig. 12A) and SMs (Fig. 3.2.12B).

124
Figure 3.2.35:- Surface response plot showing the effect of compaction force and arginine ratio on
tablets disintegration time for (A) IND/arginine binary mixtures and (B) IND salt/arginine binary
mixtures
The experimental data for the effect of compaction force and arginine ratio on the
disintegration time for the PMs and SMs are summarised in Figures 3.2.13A and 3.2.13B
respectively.
Disintegration time
Disintegration
A B

125
Figure 3.2.36:- (A) Disintegration time for IND, ARG and PM’s (B) Disintegration time for IND salt and
SM’s
The addition of arginine to IND tablets was found to drop the disintegration time significantly
(Fig. 3.2.13A). It usually takes more than 20 minutes for IND tablets (compressed at 5 kN) to
disintegrate and upon adding 50% arginine (PM 1:1) to the formulations the disintegration
time was dropped to 195±117 sec. Moreover, increasing the ratio of arginine in the
formulation was found to significantly decrease the disintegration time (Fig 3.2.13A). The
effect of compaction force (F) on the disintegration time was significant upon applying low
0100200300400500600700800900
1000110012001300
1 2 3 4 5 6
Compaction Force (kN)
Dis
inte
grat
ion
Tim
e (S
ecs)
IND 1:1 1:2 1:4 1:8 L-Arginine
5 10 20 30 40 60
A
0100200300400500600700800900
1000
5 10 20 30 40 60
Compaction Force (kN)
Dis
inte
grat
ion
time
(Sec
s)
IND:ARG Salt 1:1 1:2 1:4 1:8 L-Arginine
B

126
forces and up to 30 kN. Beyond 30 kN the effect of force was insignificant. These data comes
on line with the RSM findings which suggested that the arginine percentage is the more
determinant as it has higher magnitude than that of the compaction force (Table 3.2.8).
Studying the disintegration profile of IND arginine salt and SMs showed a similar profile to that
of the PMs. Generally, increasing the compression force resulted in increasing the
disintegration time (Fig. 3.2.13B). At most of the compression forces, the disintegration time
was decreased in the order IND salt>1:1SM>1:2SM>1:4SM>1:8SM i.e. as the L-arginine ratio
increase. Interestingly, the disintegration time of the SM 1:1 was faster than the salt form
although the former had lower porosity than the latter as early observed in (Fig. 3.2.9B). This
suggests that the incorporation of arginine in the formulation has a great impact on the
disintegration time as suggested by the RSM.
The correlation between the predicted values and the actual values of tablets’ porosity, tensile
strength and disintegration times were compared (Fig. 3.2.14). A strong correlation (R2= 0.89)
was observed between the predicted and actual values for tablets’ porosity. While weak
correlation was observed for that of tablets’ tensile strength and disintegration time R2= 0.77
and 0.61 respectively. This suggest that RSM can be used to predict tablets’ porosity for binary
mixtures but not tablets’ tensile strength or disintegration time probably other factors may be
involved during the process of tablet disintegration and tabletability.

127
R2 = 0.7796
0
0.5
1
1.5
2
2.5
0 0.5 1 1.5 2 2.5
Theoretical
Act
ual
R2 = 0.6167
0
100
200
300
400
500
600
700
0 100 200 300 400 500 600
Theoretical
Act
ual
R2 = 0.8988
0.2
0.25
0.3
0.35
0.4
0.45
0.5
0.55
0.2 0.25 0.3 0.35 0.4 0.45 0.5 0.55 0.6
Theoretical
Act
ual
A
B
C

128
Figure 3.2.37:- Correlations between actual and theoretical values for measuring (A) tablets’ porosity,
(B) tablets’ tensile strength and (C) tablets’ disintegration time.
3.2.3. Conclusion
Individual powder characterisation showed good flowability properties of arginine as it had
low angle of repose of (29.4 ± 0.84) mainly because of its large particle size and rough surface
of its particles. Moreover, the tablet characterisation showed that arginine could be used
successfully as a tablet filler, binder and disintegrant because of it’s good compressibility,
compactability and low disintegration time. RSM showed that both compaction force and
arginine ratio could have a significant impact on tablets’ porosity, tensile strength and
disintegration time. Nevertheless, RSM could not be used to predict the tensile strength and
disintegration time of the tablets probably because of the involvement of other factors such as
the type of forces formed at various ratios of the binary mixtures.

129
The effect of ion-pairing indomethacin with arginine/lysine on its permeability
profile across Caco-2 cells
3.3.1. Introduction
Indomethacin (IND) is a non steroidal anti-inflammatory drug which is used for the treatment
of rheumatoid arthritis. IND was first introduced in 1962 as a treatment for inflammation. IND
is a weakly acidic drug (pKa= 4.5) and has poor solubility because of its hydrophobic nature (log
P=3.1). Nevertheless, IND diffuses quickly and is completely absorbed through the intestinal
membrane after oral ingestion and can therefore be classified as a class II drug under the
biopharmaceutical classification system (BCS).
pH partitioning theory for charged drug candidates states that lipid membrane bilayers only
allow the absorption of unionised (molecular form) drug candidates while the charged species
do not pass through the membrane (Shore et al., 1957) . However, investigations over the last
couple of decades on oral drug absorption have demonstrated the role of other factors in drug
absorption. Daniel et al. (1985) and McEwain and Lucas (1990) suggested that the acidic
microclimate of the drug at the surface of the epithelium has an effect on the passive uptake
of uncharged weakly acidic drugs which was known as pH shift (Winne, 1977). Although
passive diffusion is the main mechanism of absorption for majority of drugs, carrier mediated
transporters, found in mucosal and serosal membranes can be involved in the transport of
acidic drugs. Tsuji et al., (1994) investigated the mechanism of absorption of monocarboxylic
acid drugs through various ion channel transporter systems. The results showed that carboxylic
acid drugs were primarily carried across the intestinal cells through H+ gradient dependant
transporter systems when compared to Na+ dependent carrier systems. Although the study by
Tsuji et al., (1994) identified the role of a specific carrier system in the transport of acidic

130
drugs, the contribution of active influx to net transport of the drug was not clear suggesting
the wider role of alternative/complimentary carrier systems in the absorption of weakly acidic
drugs. The next set of studies published by Ganapathy et al., in 1995 identified H+ coupled
oligopeptide transporters (PEPT)-1 (SLC15A1) expressed in human small intestine and was
shown to mediate the absorption of anionic angiotensin converting enzyme inhibitors and B-
lactam antibiotics. Similarly, monocarboxylic acid transporter (MCT)-1 also known as SLC16A1
was believed to play an essential role in the rapid transport of monocarboxylates. Recent
studies by Kobayashi et al., 2003 identified another super family of organic anion transporting
polypeptide (OATP)-B expressed in the apical membrane of the small intestine with a specific
role for the transport of anionic molecules across the gut.
The current investigation focuses on the permeability profile of the weakly acidic model drug
indomethacin (IND). IND was selected for this study as it is metabolically stable at intestinal pH
and previous studies from our lab (ElShaer et al., 2011) showed a substantial improvement in
solubility and dissolution upon addition of cationic amino acids (lysine and arginine). The
primary hypothesis of this study was to explore the role of ion-pairing IND with cationic amino
acids (arginine and lysine) on drug uptake across Caco-2 cells. Arginine and lysine were
selected for this study because they carry positive charge upon ionisation which could interact
electrostatically with the anionic carboxylic group of IND to form ion-pairs. Moreover, arginine
and lysine have a full transporter system on the epithelial cells hence an alternative
transporter system would be created for IND and higher absorption profile could be achieved.
Solute carrier transporter SLC3A1 (b0,+) is the major transporter of the cationic amino acids and
expressed mainly in the apical membrane of the small intestine (Broer, 2008).
Caco-2 cells are human colorectal carcinoma cell lines and posses microvillus structure,
hydrolysis enzymes and carrier mediated transporters and have been used to evaluate parallel

131
transport routes including passive and active transport (Dantzig & Bergin, 1990; Hilgers et al.,
1990; Chen et al., 1994).
3.3.2. Materials and methods
3.3.2.1. Materials
Indomethacin (TLC ≥ 99%), L-Arginine (non-animal source), L-Lysine, 1-octanol (ACS
spectrophotometric grade ≥ 99%) and ninhydrin reagent (2% solution) were purchased from
Sigma Aldrich, UK.
Acetonitrile, glacial acetic acid and absolute ethanol were purchased from Fisher Scientific UK.
Dulbecco’s modified Eagle’s medium (DMEM), fetal bovine serum (FBS), Nonessential amino
acids (NEAA), 1% pencillin-strepotomycin, 2mM glutamine and Hank’s balanced salt solution
(HBSS) were purchased from Bio Sera, UK. 1% Trypsin–EDTA was obtained from Gibco Lab. UK.
3.3.2.2. Methods
3.3.2.2.1. Preparation of pre-saturated solution of 1-octanol and de-ionised water.
1000 ml of de-ionised water was added to 4 mL of 1-octanol. The mixture was shaken for few
minutes and left overnight. The de-ionised water was separated from 1-octanol using 1000 mL
separating funnel.
3.3.2.2.2. Octanol- water partitioning experiment
500 µg of IND was added to 100 mL octanol-saturated deionised water with molar excess of
arginine/lysine (in ratios 1:1, 1:2, 1:4 and 1:8). 5 mL of the aqueous phase was allowed to
equilibrate with 5mL of octanol at room temperature and stirred for 24 hours using a magnetic
stirrer. The two phases were then separated by centrifugation and IND concentration [INDt]Aq
in the aqueous phase was measured using HPLC. Mass balance was used to calculated IND
concentration in octanol phase [INDt]Oct using equation (3.3.1).
[INDt]Oct = total drug put into the system- [INDt]Aq Equation 3.3.16

132
The apparent distribution coefficient DA could be calculated using equation (3.3.2)
DA= [INDt]Oct/[INDt]Aq Equation 3.3.17
3.3.2.2.3. HPLC method to study the concentration of indoemthacin
The amount of indomethacin (IND) dissolved in the solution samples was quantified by HPLC
using a Dionex 1100 system with autosampler (AS50), gradient pump (GP50), UV detector
(UVD 170U) and RP-C18 analytical column (Phenomenex 110A, 150x4.6 mm, 5µm). The
analysis method was adapted from Song et al., (2004). IND was eluted using acetonitrile (60%)
and 0.1 M acetic acid (40%) as a mobile phase and pumped at 1.0 mL/min flow rate. UV
detector was adjusted at λmax of 248 nm (predetermined using Unicam UV-Visible
Spectrophotometer). The retention time was 5.09±0.02 min and a rectilinear calibration curve
was established at concentration range between 1-500µg/mL with 0.99 correlation coefficient.
3.3.2.2.4. Ninhydrin analysis
Ruhemann (1911) found that reacting ninhydrin with alanine under condensation of ammonia
with hydrantoin (reduced form of ninhydrin) produced a blue coloured compound
(diketohydrindylidene diketohydrindamine) known as Ruhemann purple (Fig. 3.3.1).
Ruhemann found that the colour is produced upon reacting ninhydrin reagent with any acidic
compounds that has α-NH2 side chain e.g amino acids, proteins and peptides. Therefore this
method was used to determine the concentration of compounds containing α-NH2 photo-
metrically.
The concentrations of arginine and lysine in octanol/water partitioning studies were quantified
using the ninhydrin method. In order to construct a calibration curve, serial dilutions of the
amino acids were prepared and 1 mL of the prepared samples was mixed with 0.5 mL of
ninhydrin reagent and vortexed for 20 seconds. The samples were heated in a pre-warmed
water bath at 80 oC for 20 minutes. The samples were removed from the water bath and left

133
to cool. The intensity of the coloured Ruhemann purple was analysed using a UV
spectrophotometry at a wavelength of 560 nm.
Calibration curves were constructed with regression coefficient of 0.99 and 0.94 for arginine
and lysine respectively. After constructing the calibration curves, the concentrations of the
amino acids in the aqueous layer were determined using the linear curve equations (3.3.3) and
(3.3.4) for arginine and lysine respectively.
Y=0.421x Equation 3.3.18
Y=0.0481x Equation 3.3.19
NHNH
NH2
NH2+
O OH
O
OH
OH
O
N
O
O O
O
Ruhemann's Purple
L-arginine
O
OH
OH
O
Ninhydrin
O
H
OH
O
OH2 +Reduction
Oxidative deamination
Hydrindantin
NHO
NH2
NH2+
OHO
+NH3
CO2
NHO
NH2
NH2+
+
Decarboxylation
80 oC
Imino acidKeto acid
Hydrolysis
Direct combination
80 oC
Figure 3.3.38:- Schematic representation of ninhydrin reaction.

134
3.3.2.2.5. Procedure for Caco-2 cell culture
Caco-2 cells at passage 48 were gifted from Huddersfield University and used at passages 50-
80. Cells were allowed to grow in 75cm² T-flasks and maintained using Dublecco’s modified
Eagle’s medium (DMEM) with 10% fetal bovine serum (FBS), 0.5% pencillin-streptomycin, 2mM
glutamine and 1% nonessential amino acids (NEAA). Culture medium was changed every 2 to 3
days and cells were grown at a temperature of 37°C and 5% CO2. The cells were passaged by 5
mL trypsin-EDTA when they reach 90% confluence. Transepithelial transport assay was carried
out using Khan et al., (2011) methods, 2 x 10⁵cells/cm² were seeded on polycarbonate-coated
membranes (6-well transwell plates, 24mm, 4.7cm²) and were allowed to grow for 21 days and
the media in both apical and basal compartments were changed every 2-3 days. Transepithelial
electrical resistance (TEER) was measured at the start and end of every study.
3.3.2.2.6. Indomethacin permeability study
Caco-2 monolayers were used 19-21 days after seeding. Apical to basolateral permeability of
IND and IND PM formulations was assessed. The transwells were rinsed and incubated for 15
minutes with drug-free transport medium (Hanks balanced salt solution; HBSS). Following
incubation, HBSS was removed and 1.5 mL of the medium containing IND alone (500 µg/mL)
and IND with various molar ratios of the cationic amino acids (1:1, 1:2, 1:4 and 1:8) were
introduced to the apical side. Sample aliquots (300μL) were taken from the basolateral side at
given time intervals (0, 5, 10, 15, 20, 30, 60 and 90 minutes). After each sampling, an equal
volume of fresh transport buffer (pre-warmed at 37°C) was added to the receiver
compartment (basal side) and kept the cells at a temperature of 37°C and 5% CO2 during
experiment. Samples were subsequently analyzed by HPLC. In order to confirm the mass
balance, samples were taken from both apical and basolateral compartments at the last time
point (90 mins). All experiments were performed at 37°C (n = 5).
Apparent permeability coefficient Papp (cm/s) was calculated using (equation 3.3.5)
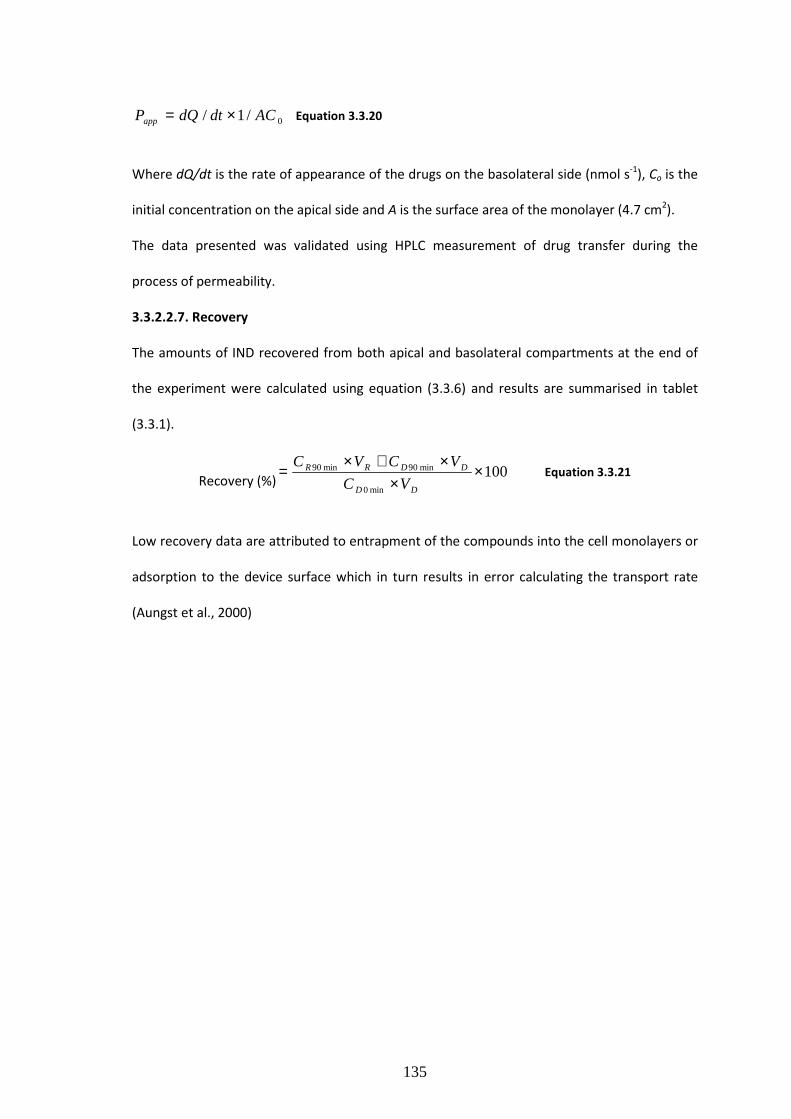
135
0/1/ ACdtdQPapp ×= Equation 3.3.20
Where dQ/dt is the rate of appearance of the drugs on the basolateral side (nmol s-1), Co is the
initial concentration on the apical side and A is the surface area of the monolayer (4.7 cm2).
The data presented was validated using HPLC measurement of drug transfer during the
process of permeability.
3.3.2.2.7. Recovery
The amounts of IND recovered from both apical and basolateral compartments at the end of
the experiment were calculated using equation (3.3.6) and results are summarised in tablet
(3.3.1).
Recovery (%)100
min0
min90min90 ××
×+×=
DD
DDRR
VC
VCVC
Equation 3.3.21
Low recovery data are attributed to entrapment of the compounds into the cell monolayers or
adsorption to the device surface which in turn results in error calculating the transport rate
(Aungst et al., 2000)

136
3.3.3. Results and discussion
Partitioning studies
3.3.3.1. Octanol-Water partitioning.
As mentioned above, the majority of the acidic drugs are transported mainly by passive
diffusion. The surface area of brush border membranes is more than 1000 fold larger than the
surface area available for paracellular transport (Pappenheimer, 1987) which leaves the
passive transcellular route as the main mechanism of absorption for most of the drugs. Many
studies were carried out to predict passive absorption across intestinal membrane based on
various physico-chemical properties of the drugs. Various properties such as desolvation
energy (Burton, 1992), hydrogen bonding capacity (Young, 1988; Conradi, 1991), molecular
surface area (Barlow, 1994), surface activity (Seelig, 1994) and octanol/water partitioning
coefficient (Martin, 1981) were studied to correlate drug absorption across cell membranes.
Although using a single physico-chemical property to predict the permeability properties of
drug molecule was an easy and simple tool to investigate, the outcomes showed a reasonable
correlation to transcellular passive drug absorption.
The most widely used predictor for drug absorption is the octanol/water partitioning (log P). As
octanol has lipophilicity that resembles that of cell membranes, log P values are used to
predict the capacity of drug molecules to partition into cell membrane.
Our earlier work utilized hydrophilic amino acids as ion-pairs with the lipophilic IND to improve
its solubility and dissolution profile. As suggested by the pH partitioning theory, lipid
membrane bilayers only allow the absorption of uncharged drug species while the charged
species do not pass through the membrane (Shore et al., 1957). In our current study, it was
expected that the ion-paired IND amino acid (salt form) (AB) would ionise in the aqueous
medium into its respective ionic species (A-) and (B+) raising that prospect of
unfavourable/poor transcellular absorption of the drug. Having studied the fundamental

137
principle of ionisation (Fig. 3.3.2), we decided to add excess of the basic counter ion (arginine
and lysine amino acids in this study) to shift the equilibrium of salt ionisation towards the non-
ionised form of the salt (Fig. 3.3.2). Therefore, excess of the cationic amino acids were ion-
paired with the salt forms.
AB A- + B+
BOH OH- + B+
Figure 3.3.39:- schematic representation of the ionization of the salt form and the effect of adding
excess of the basic counter ion on the ionisation equilibrium.
The goal of this current study was to investigate whether incorporating hydrophilic amino acids
at various molar ratios with the prepared salt forms, have an effect on the permeability profile
of IND .
Assuming that ion-pair formation between IND (acidic drug) and the basic amino acids
(arginine/ lysine) in octanol-water mixture, at equilibrium conditions, there would be
formation and destruction of ion-pairing and partitioning process between octanol-water.
Miller, (2009) and Connors, (1987) and Grant and Higuchi (1990) defined the association
constant for ion-pair formation in the aqueous phase K11aq in equation (3.3.7).
aqaq
aqaq BA
ABK
][][
][11 =
Equation 3.3.22
Where [A]aq, [B]aq and [AB]aq are the concentrations of the acidic drug IND, basic counter and
the ion-pair in the aqueous phase respectively.
The total amount of IND in octanol would exist only as an ion-pair which means that [At]oct
equals [AB]oct and the apparent octanol aqueous distribution coefficient of IND can be
calculated from equation (3.3.8).
aqaq
octA ABA
ABD
][][
][
+=
Equation 3.3.23

138
Where [A]aq represents the concentration of IND free drug in the aqueous phase and [At]aq is
the total concentration of IND in the aqueous phase [At]aq= [A]aq+[AB]aq.
The intrinsic partition coefficient of the ion-pair in octanol-water, PAB is defined as the ratio
between the ion-pair concentration in octanol to its concentration in water equation (3.3.9).
aq
octAB AB
ABP
][
][=
Equation 3.3.24
Upon combining equations (3.3.7)(3.3.8) and (3.3.9), a common equation is obtained.
ABaqABaqA PBPKD
1
][
11
11
+= Equation 3.3.25
The concentration of IND was determined using the HPLC method while the concentration of
the cationic amino acids in the aqueous phase was calculated using the ninhydrin test. Upon
plotting the double reciprocal of the apparent octanol-water distribution coefficient of IND as
a function of the basic amino acid concentration (i.e plotting 1/DA Vs 1/[B]aq), both K11aq and
PAB can be calculated from the double reciprocal curves or the curve equations.
0
100
200
300
400
500
600
0 1 2 4 8
x molar conc of arginine
Con
cent
ratio
n (µ
g/m
L)
0
0.5
1
1.5
2
2.5
3
3.5
Log
P
Aqueous conc Octanol Conc Log P
Figure 3.3.40:- IND concentrations in aqueous and octanol layers and its corresponding Log P values at
various concentrations of arginine.
The partitioning behaviour of IND at various molar ratios of arginine were studied and
summarised in Fig. (3.3.3). The experimental data showed that IND has a log P value of 3 which
is in line with the literature findings (Siissalo et al., 2010). Such high log P value reflects the

139
hydrophobic nature of IND which in turn deteriorates its solubility. The ratio of the cationic
amino acid counter ions was increased while IND concentration was held constant. Increasing
the concentration of arginine in the formulations was found to increase the aqueous solubility
of IND and reduce its partitioning in the lipophilic layer. IND log P value dropped significantly
by 1.5 units upon adding arginine at 1:1 ratio. Further increase in arginine concentration
resulted in a gradual drop of Log P until it reached 0.5 at 1:8 molar ratio of IND to arginine
respectively.
0
100
200
300
400
500
600
o 1 2 4 8
x molar concentration of lysine
Con
cent
ratio
n (µ
g/m
L)
0
0.5
1
1.5
2
2.5
3
3.5
4
Log
PAqueous conc Octanol Conc Log P
Figure 3.3.41:- IND concentrations in aqueous and octanol layers and its corresponding Log P values at
various concentrations of lysine.
Similar trend was observed upon using lysine as counter ions: this is probably because both
arginine and lysine have very close pKa values of 12.48 and 10.53 respectively.

140
y = 11.909x-1.3974
R2 = 0.9668
0
0.05
0.1
0.15
0.2
0.25
0.3
0.35
0.4
0.45
0.5
0 10 20 30 40 50 60 70 80
1/no of moles of arginine (mM-1)
1/D
A
Figure 3.3.42:- Double reciprocal plot of the apparent octanol-water distribution coefficient of IND as
function of arginine molar concentration.
y = 3.1789x-1.084
R2 = 0.9969
0
0.05
0.1
0.15
0.2
0.25
0.3
0.35
0.4
0 20 40 60 80 100
1/ no of moles of lysine (mM-1)
1/D
A
Figure 3.3.43:- Double reciprocal plot of the apparent octanol-water distribution coefficient of IND as
function of lysine molar concentration.
The double reciprocal plots of apparent octanol/water distribution coefficients of IND as
function of the molar concentrations of arginine and lysine are shown in figures (3.3.5 and
3.3.6) respectively. The double reciprocal plots showed weak linear relationships (R2 of 0.81 for
arginine and R2 of 0.61 for lysine). Nevertheless, the double reciprocal plots showed strong

141
negative exponential relationships for both the amino acids suggesting that increase in the
molar concentration of the amino acids will decrease the partitioning coefficient of IND
exponentially. pH solubility profile studied earlier by ElShaer et al., (2011) for IND showed that
increasing arginine concentration results in increasing the ionisation of IND and its solubility
exponentially. The exponential increase in ionisation will result in an exponential drop in DA
values as the ionized species cannot partition into octanol as suggested by Shore et al., (1957).
Studies carried out by Maller et al (2010) showed linear relationship which could be attributed
to the small range of concentration of the counter ions used in the study. The high inherent
hydrophilicity of arginine (Log P=-4.2) and lysine (Log P=-3.02) is the main reason behind the
drop of the DA values for IND.
The exponential curve equations (3.3.11, 3.3.12) were used to describe the correlation
between the DA values and the molar concentrations of arginine and lysine respectively. These
two equations were used to work out the intrinsic octanol water partitioning (PAB) and the
aqueous phase binding constant (K11aq).
397.1909.11 −= xY Equation 3.3.26
084.117.3 −= xY Equation 3.3.27
The K11aq was calculated for IND-arginine and IND-lysine and found to be 1084 M-1 and 520 M-1
respectively. The aqueous phase binding constant for IND-arginine was stronger than that of
IND-lysine which reflects the higher intermolecular complexation between IND and arginine.
Two major bonds are involved during ion-pair formation; ionic and hydrogen bonds. The ∆pKa
values between IND and arginine was 8 units while that between IND and lysine was 6 units,
which suggests that the degree of ionic bonding is higher in IND-arginine when compared to its
lysine counterpart. Moreover, our previous studies (ElShaer et al., 2011) suggested that
arginine has more H-donors and H- acceptors than lysine (13 vs 9) and possibly results in

142
greater H-bonding between IND-arginine. Which further explains the stronger aqueous binding
constant for lysine.
3.3.3.2. Permeability studies
Prior to conducting the permeability studies, the transepithelial resistance (TEER) was
monitored for 22 days (Fig. 3.3.7). TEER resistance for Caco-2 cells was 221±20 Ω/cm2 after 3
days of seeding the membranes and started to increase steadily until it reached 589±26 Ω/cm2
on day 12. TEER remained constant after 12 days of seeding which suggests the formation of
integral monolayers.
0
100
200
300
400
500
600
700
3 5 7 12 14 17 19 22
time (days)
TE
ER
(Ω/c
m2)
Figure 3.3.44:- TEER measurements of Caco-2 cells for 22 days of seedings (n= 3).
Upon formation of intact monolayers, the cells are washed and incubated with HBSS buffer.
The effect of incubation time with HBSS on Caco-2 monolayers TEER values was also studied. It
was noticed that incubating the cells for too long with HBSS would not have a significant effect
the integrity of the cells (Fig. 3.3.8). For all subsequent experiments, Caco-2 cells were
incubated for 15 minutes with the buffer prior to carrying out the permeability studies.
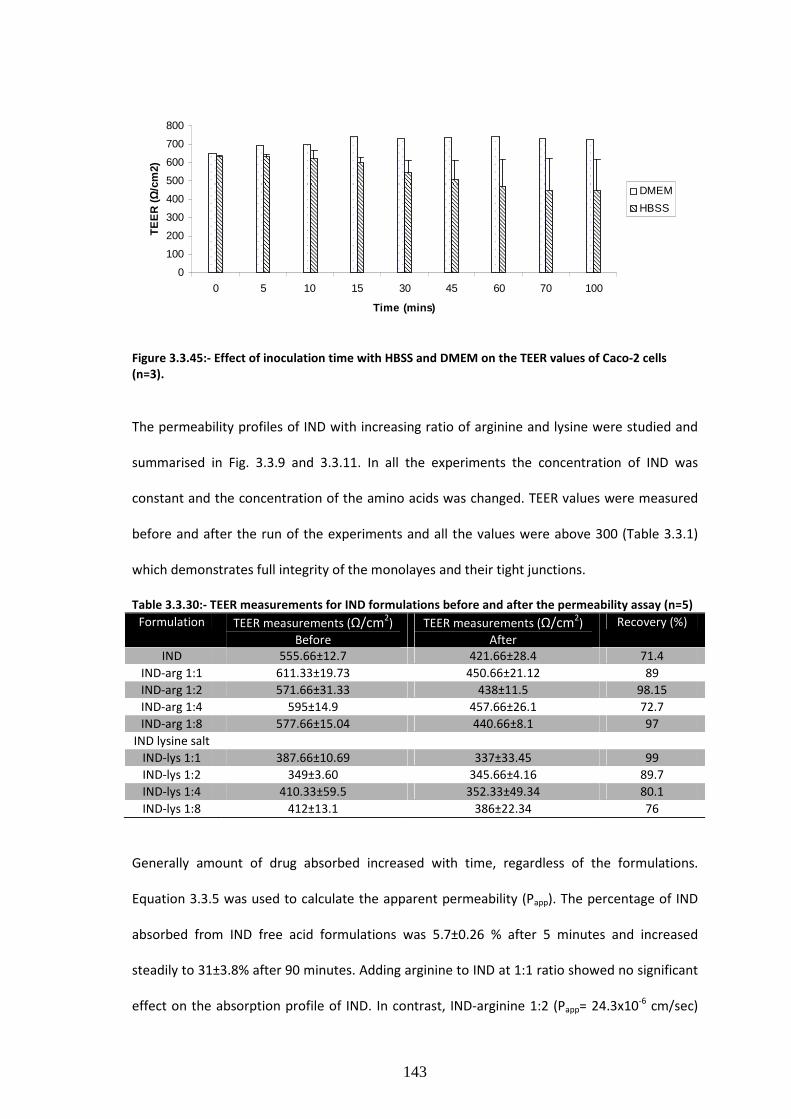
143
0
100
200
300
400
500
600
700
800
0 5 10 15 30 45 60 70 100
Time (mins)
TE
ER
(Ω
/cm
2)
DMEM
HBSS
Figure 3.3.45:- Effect of inoculation time with HBSS and DMEM on the TEER values of Caco-2 cells
(n=3).
The permeability profiles of IND with increasing ratio of arginine and lysine were studied and
summarised in Fig. 3.3.9 and 3.3.11. In all the experiments the concentration of IND was
constant and the concentration of the amino acids was changed. TEER values were measured
before and after the run of the experiments and all the values were above 300 (Table 3.3.1)
which demonstrates full integrity of the monolayes and their tight junctions.
Table 3.3.30:- TEER measurements for IND formulations before and after the permeability assay (n=5)
Formulation TEER measurements (Ω/cm2) Before
TEER measurements (Ω/cm2) After
Recovery (%)
IND 555.66±12.7 421.66±28.4 71.4
IND-arg 1:1 611.33±19.73 450.66±21.12 89 IND-arg 1:2 571.66±31.33 438±11.5 98.15 IND-arg 1:4 595±14.9 457.66±26.1 72.7 IND-arg 1:8 577.66±15.04 440.66±8.1 97
IND lysine salt IND-lys 1:1 387.66±10.69 337±33.45 99 IND-lys 1:2 349±3.60 345.66±4.16 89.7 IND-lys 1:4 410.33±59.5 352.33±49.34 80.1
IND-lys 1:8 412±13.1 386±22.34 76
Generally amount of drug absorbed increased with time, regardless of the formulations.
Equation 3.3.5 was used to calculate the apparent permeability (Papp). The percentage of IND
absorbed from IND free acid formulations was 5.7±0.26 % after 5 minutes and increased
steadily to 31±3.8% after 90 minutes. Adding arginine to IND at 1:1 ratio showed no significant
effect on the absorption profile of IND. In contrast, IND-arginine 1:2 (Papp= 24.3x10⁻⁶ cm/sec)

144
and 1:4 (Papp= 22x10-6 cm/sec) ratios showed a significant increase in IND permeability
especially after 60 minutes of starting the permeability assay.
0
10
20
30
40
50
60
70
5 10 15 30 60 90
Time (mins)
% T
rans
porte
d
IND free base IND arg 1:1 IND arg 1:2 IND arg 1:4 IND arg 1:8
Figure 3.3.46:- Percentage of IND transported across Caco-2 monolayers at various molar ratios of
arginine (n=5). One way analysis of variance (ANOVA) and pair-wise multiple comparisons method
(Tukey test) against drug alone at each time point were used for statistical analysis and probability
values of (P< 0.05, * and P<0.001,***) were used to determine the significant difference.
As discussed above, the partitioning studies showed that the log P values of IND decreased as
arginine ratio in the formulations was increased which would suggest that there would be a
drop in the overall IND permeability profile. However the results demonstrated unexpected
and interesting trends with a substantial increase in permeability especially for the 1:2 and 1:4
ratio of IND:counter ion. Two possible scenarios could explain such improvement of the
absorption profile. Firstly, it is possible that the increase in solubility and dissolution profile
(Fig. 3.1.8) with increasing the concentration of the cationic amino acids resulted in the drug
being readily available in the solution faster than that of the formulations containing IND
alone.
***
* ***
***

145
0.00E+00
5.00E-06
1.00E-05
1.50E-05
2.00E-05
2.50E-05
3.00E-05
3.50E-05
IND
IND arg1:1
IND arg1:2
IND arg1:4
IND arg1:8
IND
IND Lys1:1
IND Lys1:2
IND Lys1:4
IND Lys1:8
Formulation
Pap
p p
erm
eabi
lity
(cm
/sec
)
Figure 3.3.47:- Papp permeability values at 60 minutes for IND alone and IND at various molar ratios of
arginine and lysine. One way analysis of variance (ANOVA) and pair-wise multiple comparisons
method (Tukey test) against drug alone at each time point were used for statistical analysis and
probability values of (P< 0.05, * and P<0.001, ***) were used to determine the significant difference
(n=3).
The second scenario is that active transportation via carrier transporters for amino acids such
as peptidyl or anionic transporters might have played a role in drug transport. Interestingly,
IND-arginine 1:8 ratio showed a significant drop (P<0.001) in the percentage of IND permeated
(13.5±1.76 %) when compared to formulations containing IND alone (31±3.8 %) after 90
minutes. Although the former had a much higher dissolution profile than the latter (Fig. 3.1.8)
the results suggest that the permeability improvement is not because of the increase in the
dissolution profile or deterioration in the Log P values but possibly due to increase in active
transcellular carriage of the drug. At very high concentrations of the amino acids (1:8 ratio) the
amino acids transporters might have been saturated with the excess arginine and hence the
over all uptake of IND was decreased. While on the other hand, at smaller molar ratios of
arginine, the receptors did not get saturated quickly and IND uptake is facilitated by active
transporters.
Studying the effect of lysine molar ratio on the permeability profile of IND showed similar
trend. IND-lysine formulations at 1:2 ratios had a significant impact (Papp= 22.4±4)10-6 on
* *
*

146
percentage of IND absorbed across the Caco-2 monolayers and beyond this ratio the
permeability started to decline.
05
101520253035404550
5 10 15 30 60 90
Time (mins)
%T
rans
porte
d
INDLys1:1 INDLys1:2 INDLys1:4 INDLys1:8 IND free acid
Figure 3.3.48:- :- Percentage of IND transported across Caco-2 monolayers at various molar ratios of
lysine (n=5). One way analysis of variance (ANOVA) and pair-wise multiple comparisons method
(Tukey test) against drug alone at each time point were used for statistical analysis and probability
values of (P< 0.05, * and P<0.001,***) were used to determine the significant difference.
Conclusion
After improving the solubility and dissolution profile of IND using cationic amino acids (Chapter
3.1), it was interesting to evaluate the effect using IND ion-paired formulations on its
permeability across Caco-2 cells. High solubility and dissolution of IND reflects the high
ionisation of the salt form hence excess amount of the counter ions were added in a trial to
shift the salt ionisation equilibrium towards the non-ionised form of the salt. Octanol/water
partitioning studies revealed the greasy nature of IND (log P=3) and increasing the molar ratio
of the cationic amino acids results in significant drop in the partitioning capacities of IND in
octanol organic layer. Nevertheless permeability data showed a significant increase in IND
absorption especially for PMs of 1:2 molar ratios. This suggests that active carrier might have
been involved in the uptake of IND ion-paired formulations as drug partitioning has decreased.
* *** ***
***
***

147
1011
15
12
1413
O16
O18
CH317
CH319
5
6
4
N1
N32
9
NH27
NH28
O20 CH3
21
Chapter 4
Trimethoprim
Papers relating to chapter 4
Amr ElShaer, Peter Hanson, Tony Worthington, Peter Lambert and Afzal R. Mohammed., (2012). Preparation and Characterization of Amino Acids -Based Trimethoprim Salts. Pharmaceutics, 4(1), 179-196. Amr ElShaer, Peter Hanson and Afzal R Mohammed (2013) A systematic and mechanistic evaluation of aspartic acid as a filler for directly compressed tablets containing trimethoprim and trimethoprim aspartate., European Journal of Pharmaceutics and Biopharmaceutics. In press.
Could amino acid salts fool fussy bacteria to improve antibiotics uptake? UKICRS, Queen’s University
Belfast, April 2011. Oral presentation.

148
Preparation and characterisation trimethoprim salts with anionic
counter ions
4.1.1. Introduction
Trimethoprim (Figure 4.1.1) [2,4-diamino-5-(3,4,5-trimethoxybenzyl)pyrimidine], is a synthetic
antibacterial agent belonging to a group of compounds known as diaminopyrimidines. It was
first synthesized as a dihydrofolate reductase inhibitor (DHFR) and used mainly in combination
with sulfonamides to treat pneumonia and urinary tract infections. TMP is administered
through various routes including intramuscular, intravenous and oral and has high gastro-
intestinal tolerability and low side effects. However, low aqueous solubility of TMP (Manius,
G., 1978) reduces the bioavailability from oral formulations. In order to improve TMP
dissolution profile, a study conducted by Li et al utilised β-cyclodextrin to form a complex with
TMP (Li et al., 2005). The study concluded that the high surface area of contact between TMP
and the cyclodextrin along with reduction in drug crystallinity were responsible for
improvement in TMP solubility (Li et al., 2005). Nevertheless, the solubility improvement
achieved by this study was 2.2 fold. Besides, high doses of β–cyclodextrin are not
recommended and can cause diarrhea and bloating as they are degraded and fermented by
bacteria in the colon (Del Valle., 2004). Therefore, investigation of alternative approaches to
improve the solubility of TMP would have a high impact on oral administration of the drug.
Interestingly, TMP has a basic nature (pKa 7.3) and a soluble derivative of the antibiotic can be
obtained by reacting TMP with acids resulting in salt formation. Around 50% of the prepared
salts of basic drugs are hydrochloride salts. Yet, hydrochloride salts salt out easily and in turn
reduce the optimal solubility. Furthermore, hydrochloride salts usually cause high acidity in the
formulations and high risk of corrosion (Bastin et al., 2000), while the loss of volatile HCl could
affect the stability of weak bases especially over the long-term (Stahl and Wermuth, 2002).
Due to the limitations of hydrochloride salts, alternative counter ions that have been explored
include citric acid, acetic acid, fumaric acid and maleic acid Stahl and Wermuth., 2002;

149
Hemamalini et al., 2003 ; Raj et al., 2003). Another class of counter ions that can potentially
address the solubility of basic drugs includes acidic amino acids. Fabrizio & Vetere utilized
aspartic acid to prepare a water soluble salt of erythromycin. The obtained salt was used to
prepare parenteral formulations of erythromycin and was found to be highly tolerable and less
toxic (Fabrizio and Vetere, 1973). Glutamic acid was used to prepare water soluble salts of
chitosan and the glutamate salt was found to improve the apparent permeability of many
drugs such as naproxen (Maestrelli et al., 2004) and rokitamycin (Gavini et al., 2010) when
compared to chitosan alone.
The present study aims to improve the solubility of TMP through salt formation with anionic
amino acids, namely glutamic acid and aspartic acid and to characterize the prepared salts
using FT-IR spectroscopy, proton nuclear magnetic resonance (1HNMR), differential scanning
calorimetry (DSC) and thermogravimetric analysis (TGA). The study also investigates the effect
of different amino acid isomers on the salt characteristics and evaluates the inhibitory effect of
the amino acids salts on intrinsically resistant bacteria.
Figure 4.1.1. Trimethoprim chemical structure.
910
14
11
1312
O16
O18
CH317
CH319
5
4
6
N3
N12
8
NH27
NH215
O20 CH3
21

150
4.1.2. Materials and methods
4.1.2.1. Materials
Trimethoprim 98% TLC, L-glutamic acid, L-aspartic acid, D-aspartic acid (99%), D-glutamic acid
(minimum 99% TLC) and Potassium bromide (99% FT-IR grade) were purchased from Sigma
Aldrich, UK.
D2O (99.9% min) was purchased from Goss scientific instrument Ltd (Cheshire, UK). DMSO-D6
(98.8% min) was purchased from Merck (Darmstadt, Germany). Tryptone Soya Broth (TSB) and
Muller Hinton Broth (MHB) were purchased from Oxoid Ltd, Hampshire, England.
4.1.2.2. Methods
4.1.2.2.1. Analytical technique
The amount of Trimethoprim (TMP) dissolved in the solution samples was quantified using the
HPLC (Dionex 1100 system) method reported by Gallego and Arroyo (Gallego and Arroyo.,
2002). HPLC was operated at 25oC on RP-C18, (Phenomenex 110A, 150x4.6 mm, 5µm) column
using acetonitrile-NaH2PO4 buffer (10 mM) (70:30, v/v) (pH 3) as mobile phase which was
pumped at 1.0 mL/min flow rate using gradient pump (GP50). UV detector (UVD 170U) was
used and the analysis was monitored at 230 nm. The retention time was 1.74±0.04 min and a
rectilinear calibration curve was established at concentrations ranging between 10- 500µg/mL
(R2 of 0.99). LOD and LOQ were calculated using standard deviation of response and slope and
were found to be 0.109 and 0.364 respectively. For more details see appendix (1).
4.1.2.2.2. Phase solubility diagram
Phase solubility diagram was established by measuring the saturated solubility of TMP free
base with various concentrations of acidic amino acid (L-aspartic acid and L-glutamic acid).

151
Excess TMP was added into screw-capped tubes containing serial dilutions of the amino acid
solutions and agitated at room temperature (Stuart SB 162 stirrer) for 24 h. After equilibrium,
the supernatant was filtered through 0.45 µm filters and analysed by HPLC to determine TMP
concentration. The pH of amino acid solutions was monitored using an Xisherbrand Hydrus
500 pH meter.
4.1.2.2.3. Salt preparation
Equimolar amounts of TMP and the free amino acids (L-aspartic acid and L-glutamic acid) were
solubilised in water and the solutions were mixed and stirred until equilibration was achieved.
The filtrate was transferred into vials and freeze dried for 48 h using a Modulyo freeze dryer at
-40oC shelf temperature and under vacuum. The samples were collected and kept in 40oC oven
for 4h using a Gallenkamp vacuum oven.
Despite the low yield with freeze drying, it is a preferred technique unlike organic solvent
methods adapted by Anderson & Conradi (1985), as lyophilized products have a high degree of
purity and are devoid of the formation of any solvates.
4.1.2.2.4. Thermogravimetric analysis (TGA)
A thermogravimetric analyser (Pyris 1 TGA, Perkin Elmer) was used in this study to measure
the moisture content and decomposition temperature of TMP and its prepared salts. 5- 10 mg
of samples were loaded on to an open pan and analysed between temperature range 30- 300
oC at 10 oC/min scanning rate and under nitrogen stream. Pyris Manager Software (version
5.00.02) was used to analyse the resultant thermograms.
4.1.2.2.5. Differential scanning calorimetry
Differential scanning calorimeter (Pyris Diamond DSC) was used to explore thermal events of
TMP and its salts. Approximately 2-5 mg of the samples were weighted and transferred to an

152
aluminium sample pan (50 µL capacity). Intra cooler 2P system was used to initially cool the
samples to 50 oC and then sample heated to 300 oC at a rate of 10 oC/min. Nitrogen was used
as a purge gas at a flow rate of 20 mL/min. Indium and Zinc were used to calibrate the heat
flow and melting point onset (156.6 oC for Indium and 419.47 oC for Zinc). The obtained
thermograms were analysed using Pyris Manager Software (version 5.00.02). The experiment
was performed in triplicate and an empty aluminium pan was used as a reference cell for all
the measurements.
4.1.2.2.6. FT-infrared (IR) spectroscopy
FTIR absorbance spectra of TMP and its salts were obtained with Nicolet IR 200 spectrometer
(Thermo electron corporation) using KBr discs. Crystalline KBr was dried at 65oC over night
before use. Samples were prepared by mixing TMP or its salts with dry KBr at 1:100 (w/w) ratio
and pressed at 8 tonnes for 5 minutes (using a Specac tablet presser) to form KBr discs. 64
scans were done over a wavelength range of 4000- 400 cm-1 for each sample. EZ OMNNIC 7.0
software was used to interpret the IR spectrum.
4.1.2.2.7. 1HNMR
Samples were studied with Bruker Avance DPX-250 NMR (at 250.1 MHz) and Bruker Topspin
software was used to analyse the data. Approximately, 1-2 mg of the salts was dissolved in 1
mL of deuterated water (D2O) and placed in sample capillary vial. Sample vials were placed into
the NMR machine and analysed for the presence of hydrogen atoms (1H-NMR)
4.1.2.2.8. pH solubility profile
pH solubility studies were determined by using the Ledwidge & Corrigan method (Ledwidge
and Corrigan, 1998). Saturated solutions of the salts and acids were prepared by dissolving
excess of the drug in deionised water. The solutions were agitated constantly using a stirrer

153
(Stuart SB 162) at ambient temperature. pH was adjusted by adding NaOH or the appropriate
acid (L-aspartic acid or L-glutamic acid). After 2 hour interval an aliquot was withdrawn and
filtered through 0.45 µm filter, then analysed using HPLC (see section 2.2.1)
4.1.2.2.9. Solubility and dissolution studies
Solubility studies were carried out using Hugchi and Connor’s method (Higuchi and Connors.,
1965). An excess amount of TMP or its salts was added to capped tubes with 5 mL of deionised
water and stirred for 24 hours at room temperature until equilibrium was reached.
Subsequently, the suspension was filtered through 0.45μm syringe filters and suitably diluted
and the concentration was measured by HPLC.
Hard gelatin capsules were filled with 200 mg of TMP or equivalent amounts of the prepared
salts for dissolution studies. USP II paddle method (ERWEKA DT-600) was used to perform the
in-vitro dissolution studies. The prepared capsules were placed into dissolution vessels
containing 900 mL of distilled water (pH 7.2) and the dissolution media was maintained at
37oC±0.5oC and stirred at 50 rpm. 5mL of samples were collected at a predetermined time
intervals (1, 5, 10, 20, 25, 30, 45 and 60 min) then filtered through 0.45 μm Millipore filters.
The dissolution media was replaced by 5mL of fresh dissolution media in order to maintain a
constant volume. After proper dilution samples were analysed by HPLC as mentioned above.
4.1.2.2.10. Microbiological studies
Two Gram-negative bacterial strains; Escherichia coli NCTC 10418 and Pseudomonas
aeruginosa ATCC 9027 were used for this study. Freshly inoculated bacteria agar plate was
prepared one day before the experiment by spreading colony suspension on Trypticase-soy
agar plate and incubating for 18 to 24h.
Zone of inhibition study was performed using Agar plates prepared using Trypticase-soy agar
plates. Loopful of bacteria was spread gently on the surface of the agar plates. Six small holes

154
were perforated on the agar plates and filled with 20µl of 0.5mM TMP or equivalent
concentration of TMP salts. In order to evaluate any inhibitory effect of the amino acids on the
bacterial growth, free amino acids were used as controls for this study.
The bacterial minimum inhibitory concentration (MIC) of TMP and its prepared salts against
the same two species of Gram negative bacteria were performed using micro-dilution method
and following the national committee for clinical laboratory standards (NCCLS) specifications.
The bacterial inoculum was established by direct colony suspension method from 18 to 24h
Trypticase-soy agar plates, standardized and counted by Pharmacia spectrophotometer
(Pharmacia LKB, Novaspec II). Around 5x10⁶ CFU/mL was suspended in Tryptone Soya Broth
and used in our study.
50 µl of the bacterial inoculum was transferred to 100 µl of Muller Hinton Broth (MHB) at final
concentration ranging between 0.5- 0.00024 mM prepared by two fold dilution.
Inoculated plates were incubated at 37oC for 18- 24 h. The lowest concentration of the
antibacterial agent that inhibits the growth of bacteria was determined by visual turbidity
when compared against control.
4.1.2.2.11. Statistical analysis
Graph Pad Instat® software was used for the statistical analysis study. Data groups were
compared using one way analysis of variance (ANOVA) and pair-wise multiple comparisons
method (Tukey test). Standard deviation (SD) was used to report the error in the figures and
texts. Probability values of 95% (P< 0.05) were used to determine the significant difference.

155
4.1.3. Results and discussion
4.1.3.1. Phase solubility diagrams
Prior to preparing TMP salts, a solubility phase diagram was first constructed between TMP
and two acidic amino acids; aspartic acid and glutamic acid as previously discussed by ElShaer
et al (2011). Figure 4.1.2 shows that increasing the anionic amino acid concentrations results in
lowering of the solution pH and in turn improving the solubility of TMP. Aspartic acid has an
acidic (-COOH) side chain with pKa of 1.88 which is 5 units lower than the pKa of TMP (pka 7.3).
Therefore TMP could potentially act as a strong base in aspartic acid solution capable of
deprotonating the –COOH acidic group. Interestingly, a linear relationship (R2= 0.93) between
TMP solubility and aspartic acid concentration was observed which suggests that complete
ionisation of TMP in aspartic acid solution was achieved suggesting the feasibility of salt
formation.
On the other hand, despite the slightly higher pka of the acidic side chain (-COOH) of glutamic
acid (pKa = 2.19) a similar trend in solubility improvement was achieved possibly due to the
ionisation of TMP in solution. These results suggest that both glutamic and aspartic acid can be
used in preparing novel salts of TMP.
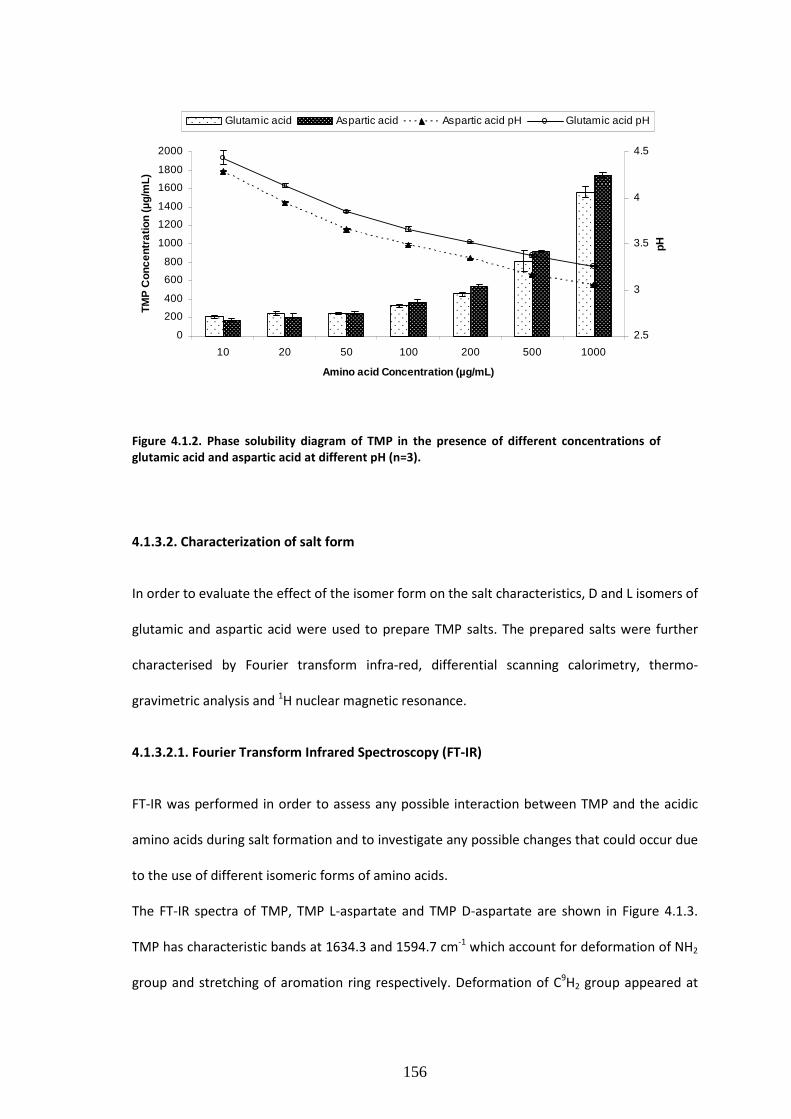
156
0
200
400
600
800
1000
1200
1400
1600
1800
2000
10 20 50 100 200 500 1000
Amino acid Concentration (µg/mL)
TMP
Con
cent
ratio
n (µ
g/m
L)
2.5
3
3.5
4
4.5
pH
Glutamic acid Aspartic acid Aspartic acid pH Glutamic acid pH
Figure 4.1.2. Phase solubility diagram of TMP in the presence of different concentrations of
glutamic acid and aspartic acid at different pH (n=3).
4.1.3.2. Characterization of salt form
In order to evaluate the effect of the isomer form on the salt characteristics, D and L isomers of
glutamic and aspartic acid were used to prepare TMP salts. The prepared salts were further
characterised by Fourier transform infra-red, differential scanning calorimetry, thermo-
gravimetric analysis and 1H nuclear magnetic resonance.
4.1.3.2.1. Fourier Transform Infrared Spectroscopy (FT-IR)
FT-IR was performed in order to assess any possible interaction between TMP and the acidic
amino acids during salt formation and to investigate any possible changes that could occur due
to the use of different isomeric forms of amino acids.
The FT-IR spectra of TMP, TMP L-aspartate and TMP D-aspartate are shown in Figure 4.1.3.
TMP has characteristic bands at 1634.3 and 1594.7 cm-1 which account for deformation of NH2
group and stretching of aromation ring respectively. Deformation of C9H2 group appeared at

157
1458.7 cm-1, while the vibration of C6=N of the aromatic primary appeared at 1263.71 cm-1. –
OCH3 aromatic groups had characteristic bands at 1128.68 cm-1, as reported by Garnero et al.
(2010).
Assessment of TMP L-aspartate salt showed that TMP bands corresponding to NH2 and C-H
aromatic stretching vibration were difficult to analyse due to overlapping with NH2 and CH
aliphatic of the amino acid (Figure 4.1.3A). Interestingly, the C=N in the amine aromatic
primary became very weak and a new band appeared at 1664.53 cm-1 corresponding to νC=O
stretching which confirms that the cationic nitrogen has interacted with the carboxylic group
of aspartic acid. In contrast, OCH3 aromatic groups did not show any changes in the formed
salt.
Upon comparing the FT-IR spectra of the L-aspartate and D-aspartate salt, no difference was
spotted between the two isomers (Figure 4.1.3A & B).
TMP D-aspartate 2
60
80
100
%T
Fri Apr 23 14:55:17 2010 (GMT+01:00)
40
60
80
%T
Fri Apr 23 13:17:58 2010 (GMT+01:00)
10
20
30
40
%T
500 1000 1500 2000 2500 3000 3500
Wavenumbers (cm-1)
Figure 4.1.3. FTIR spectra of (A)trimethoprim D-aspartate, (B) trimethoprim L-aspartate and (C)
trimethoprim.
Figure 4.1.4 shows the FT-IR for TMP L-glutamate and TMP D-glutamate. Similar to the results
obtained for aspartate salts, a new band appeared at 1656.87 cm-1 and 1654.74 cm-1 for TMP
A
B
C

158
L-glutamate and TMP D-glutamate respectively. This band corresponds to the νC=O of the
amino acid carboxylic group which when deprotonated potentially interacts electro-statically
with the protonated amino group of TMP prymidine ring. Both the L and D salts had similar FT-
IR spectra and no significant difference was observed.
TMP D-glutamate 1
60
80
100
%T
Fri Apr 23 13:32:46 2010 (GMT+01:00)
20
40
60
%T
Fri Apr 23 13:17:58 2010 (GMT+01:00)
10
20
30
40
%T
500 1000 1500 2000 2500 3000 3500
Wavenumbers (cm-1)
Figure 4.1.4. FTIR spectra of (A) trimethoprim D-glutamate, (B) trimethoprim L-glutamate and
(C) trimethoprim.
4.1.3.2.2 Differential scanning calorimetry and Thermogravimetric analysis.
Figure 4.1.5 shows the TGA and DSC scans for TMP and L-glutamic acid. TMP had one single
endothermic peak at 204.22 oC with an enthalpy of fusion of 166.7 J/g. TGA data revealed that
TMP starts to degrade after around 30 oC of its melting.
TMP L-glutamate salt was found to be in the crystalline form as no crystallization exotherm
was observed in the DSC scans (Figure 4.1.5). At around 130oC, TMP L-glutamate had an
endothermic peak which could possibly correspond to moisture loss. Another two
endothermic peaks appeared at 197.22 oC (ΔH = 20.22 J/g) and 233.47 oC (ΔH= 150.02 J/g). This
data suggest that we might have two enantiotrophs or monotrophs. A second scan was run
after cooling down and the first thermal event was found to be irreversible and hence this
A
B
C

159
strongly suggests that these are monotrophs rather than enantiotrophs. Interestingly, coupling
the DSC scans with TGA has showed a weight loss (4.03%) at 196 oC which means that this
thermal event can not be a phase transition because polymorphic transitions are not
associated with weight loss. 1HNMR data (discussed in details in section 3.3.3) has not picked
up any impurities in the spectra and strongly suggest that this 4.03% weight loss is probably
due to highly associated water molecules within the crystalline structure of the salt. The water
2H appear at 4.7 ppm and interfering with D2O peaks (Gottlieb et al., 1997).
On the other hand, the TMP D-glutamate salt is partially crystalline and the amorphous portion
of the salt starts to crystallize at 140 oC. Moisture loss appeared as an endothermic hump at
around 80 oC corresponding to 1.62%. Similar to TMP L-glutamate, TMP D-glutamate showed
hydrate loss at 197.22 oC (ΔH= 18.16 J/g) appeared as small peak reflecting the small amount
of the hydrate crystals formed during the freeze drying while the rest of the salt was in the
amorphous state and crystallizes at 140 oC as discussed before. After dehydration, the salt
started to melt at 231.74 oC (Figure 4.1.5) similar results were suggested by Sichina, (2011).
The thermal events of TMP L-aspartate and TMP D-aspartate were studied using TGA and DSC
(Figure 4.1.6). TMP L-aspartate showed an up drafted base line between 100- 150 oC which
corresponds to moisture loss and the salt converted from the amorphous form to the
crystalline form at 160 oC followed by crystal melt at 184.22 oC.

160
Figure 4.1.5. TGA and DSC scans for L- glutamic acid and TMP free base.
Figure 4.1.6. DSC and TGA scans for TMP D-glutamate and TMP L-glutamate salts. 2- 5 mg of the
sample was heated to 300oC at rate of 10
oC/min (n=3).

161
Figure 4.1.7. DSC and TGA scans for TMP D-aspartate and TMP L-aspartate. 2- 5 mg of the
sample was heated to 300oC at rate of 10
oC/min (n=3).
4.1.3.3.3 1HNMR studies
The electronic and chemical environment of protons are affected during salt formation which
could be reflected by the changes in δ. 1HNMR is considered a powerful tool in studying salt
formation as it provides insight in to the ratio of molar interaction between the two moieties.
Figure 4.1.8 shows the 1HNMR of TMP free base (solubilised in DMSO). At 7.53 ppm frequency
one proton of TMP heterocyclic ring C4H appeared as singlet and the two protons on the
aromatic ring C10H and C14H appeared at 6.56 ppm. The nine hydrogens of OCH3 groups
appeared as two different peaks; (6H) appeared as a singlet at 3.73 ppm as they have the same
surrounding environment, while the other (3H) appeared as a singlet at 3.63 ppm. The two
hydrogens of aliphatic (C8H2) appeared as singlet at 3.54 ppm while two singlet bands
appeared at 5.7 and 6.2 which correspond to N5H2 and N7H2 respectively. The total integrated
H count for TMP was 18 (Figure 4.1.8).

162
TMP L-aspartate salt (solubilised in D2O) showed new (3H) assignment at 2.6 corresponding to
(C27H2) and a highly deshielded C25H group at 3.75 ppm, which represents the aliphatic chain of
L-aspartic acid. As D2O was used as a solvent for TMP salts, NH2 groups were masked and the
total integration of TMP aspartate salt was 17 instead of 21. These results confirm that one
mole of L-aspartic acid interacts with 1 mole of TMP to form the salt (i.e 1:1 ratio) as shown in
Figure 4.1.9.
On the other hand, TMP L-glutamate had 5 new protons representing the aliphatic chain of the
amino acid. (C28H2, C27H2) appeared at 1.96 and 2.2 ppm, while the third C25H group appeared
at around 3.6 ppm due to the deshielding by NH2 group. The total integration also shows that 1
mole of L-glutamic acid interacts with 1 mole of TMP (Figure 4.1.10).
1HNMR studies of TMP D-aspartate and TMP D-glutamate salts did not reveal any difference in
the spectra between the L and D isomers (Figure A2.1& A2.2 Appendix 2). The high similarity of
the salts formed despite using different isomers suggest that water used to solubilise the
amino acids during the preparation step might provide free space for the rotation of the
molecules and potentially catalyze racemisation as suggested by Feng et al., (2011).

163
0.00.51.01.52.02.53.03.54.04.55.05.56.06.57.07.58.08.59.09.510.0f1 (ppm)
-500
0
500
1000
1500
2000
2500
3000
3500
4000
4500
5000
5500
6000
6500
2.0
73.2
0
6.1
2
1.9
1
1.9
3
2.0
2
1.0
0
2.5
0
2.5
1
2.5
2
3.5
4
3.6
3
3.7
3
5.7
5
6.1
3
6.5
6
7.5
3
TMP/DMSO/AMR 5/HNMR
Figure 4.1.8. 1HNMR spectra of trimethoprim free base solubilised in DMSO.
0.00.51.01.52.02.53.03.54.04.55.05.56.06.57.07.58.08.59.09.5f1 (ppm)
-100
0
100
200
300
400
500
600
700
800
900
1000
1100
1200
1300
1400
1500
1600
1.9
5
1.6
92.7
0
4.9
41.1
9
38.0
9
0.0
4
1.8
9
1.0
0
Figure 4.1.9. 1HNMR spectra of trimethoprim L-aspartate solubilised in D2O.
910
14
11
1312
O16
O18
CH317
CH319
5
4
6
N3
N12
8
NH27
NH215
O20 CH3
21
910
14
11
1312
O16
O18
CH317
CH319
5
4
6
NH
+
3
N12
8
NH27
NH215
O20 CH3
21
28
27
25NH226
23 O24
OH22
O30
O-
29
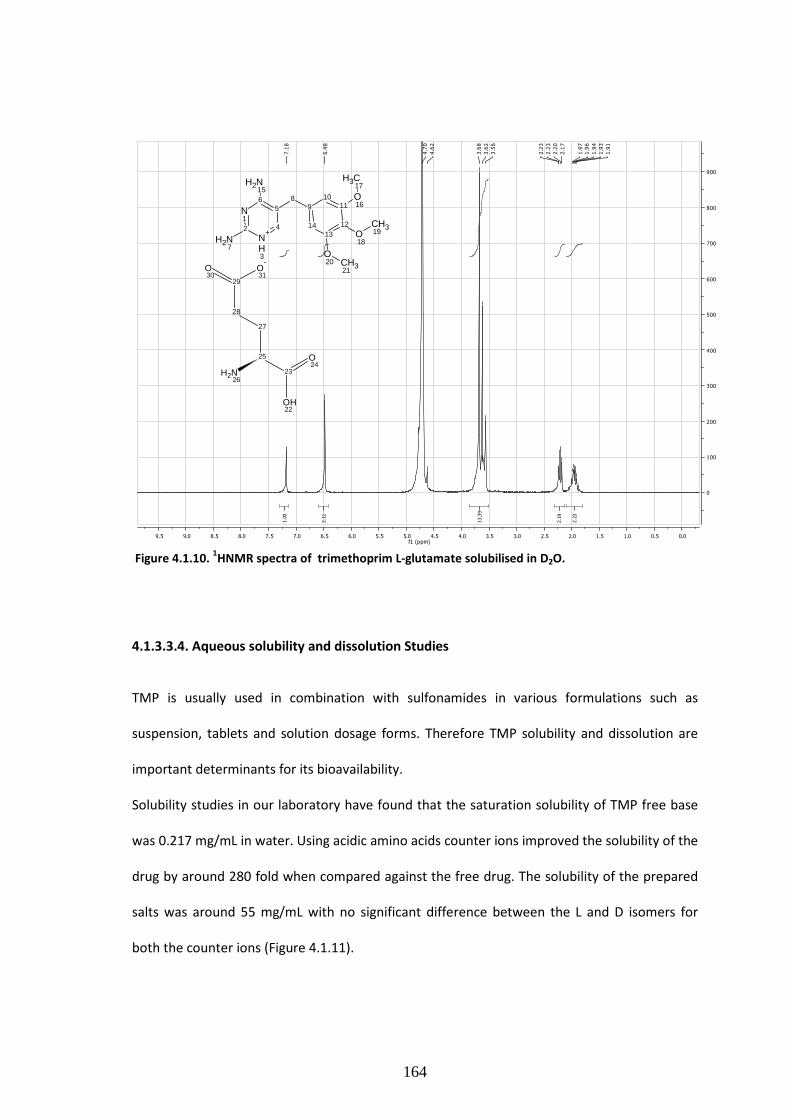
164
0.00.51.01.52.02.53.03.54.04.55.05.56.06.57.07.58.08.59.09.5f1 (ppm)
0
100
200
300
400
500
600
700
800
900
2.2
3
2.1
9
13.3
9
2.1
1
1.0
0
1.9
1
1.9
3
1.9
4
1.9
61.9
7
2.1
7
2.2
0
2.2
3
2.2
3
3.5
6
3.6
2
3.6
8
4.6
2
4.7
0
6.4
8
7.1
8
Figure 4.1.10. 1HNMR spectra of trimethoprim L-glutamate solubilised in D2O.
4.1.3.3.4. Aqueous solubility and dissolution Studies
TMP is usually used in combination with sulfonamides in various formulations such as
suspension, tablets and solution dosage forms. Therefore TMP solubility and dissolution are
important determinants for its bioavailability.
Solubility studies in our laboratory have found that the saturation solubility of TMP free base
was 0.217 mg/mL in water. Using acidic amino acids counter ions improved the solubility of the
drug by around 280 fold when compared against the free drug. The solubility of the prepared
salts was around 55 mg/mL with no significant difference between the L and D isomers for
both the counter ions (Figure 4.1.11).
910
14
11
1312
O16
O18
CH317
CH319
5
4
6
NH
+
3
N12
8
NH27
NH215
O20 CH3
21
29
O30
O-
31
28
27
25
NH226
23
O24
OH22

165
The dissolution profile of TMP and its different salts was also studied (Figure 4.1.12).
Dissolution studies show a significant improvement of the salt form when compared to the
free base. Around 70% of the TMP was released from aspartate and glutamate salt form after
only 10 minutes of the dissolution experiment while only 10% release was seen from TMP free
form (Figure 4.1.12). Such changes in the dissolution profile could be attributed to the ability of
TMP salts to exert a self-buffering action, which yield different pH values at the dissolving
surface in the diffusion layer (Forbes and York, 1995). No significant difference was observed
between the two salts, which suggest that both salts might have similar buffering capacity and
hence similar pH at the diffusion layer.
0.217
53.6360.15
0.217
65.6
51.37
0
10
20
30
40
50
60
70
80
Trimethoprim
Trimethoprim glutamate
Trimethoprim aspartate
satu
rate
d so
lubi
lity
mg/
mL
L-isomers
D-isomers
Figure 4.1.11. Solubility of trimethoprim and its prepared L & D aspartate and glutamate salts
mean ±SD (n=3).

166
-10
0
10
20
30
40
50
60
70
80
90
100
0 10 20 30 40 50 60 70
Time (minutes)
% T
MP
rel
ease
d
TMP glutamate salt TMP free base TMP aspartate
Figure 4.1.12. Dissolution profile for TMP free base and its salts in deionised water. Data are
mean± SD (n=3).
Table 4.1.31:- pH measurements during solubility and dissolution studies.
Formulation
pH
m
easu
re
men
t
TMP free base TMP Aspartate TMP glutamate Solubility study (Equilibrium) 7.7±0.05 5.075±0.06 5.2±0.11
End of dissolution study 8.6±0.07 5.37±0.08 5.88±0.05
4.1.3.3.5. pH- solubility profile
TMP pka and intrinsic solubility are 7.3 and 0.19 mg/mL respectively. Figure 4.1.13 shows the
pH solubility profile of TMP when TMP glutamate salt and TMP free base were used as starting
materials for determination of solubilities. The intrinsic solubility (Bs) was first determined by
increasing the pH of TMP solution to 11.28 using NaOH and Bs was found to be 0.266 mg/mL.
When TMP was used as a starting material the solubility was found to increase exponentially
upon titrating with glutamic acid (Figure 4.1.13). TMP solubility increased from 0.37 mg/mL at
pH 7.7 (point a) to 13.8 mg/mL at pH 4.23.

167
0
10000
20000
30000
40000
50000
60000
70000
80000
0 2 4 6 8 10 12 14
pH
Sol
ubili
ty (
ug/m
L)
Figure 4.1.13. pH solubility profile of TMP and TMP-glutamate salt at ambient conditions using free
acid (circles) and TMP-glutamate salt (squares) as starting materials. Points b and a represent the
saturation solubility of the salt and TMP free base respectively. [Bs]= 266.35µg/mL and pKa=7.3.
On the other hand, when TMP glutamate salt was used as a starting point, the solubility
started to decrease upon titrating with NaOH. TMP glutamate solubility was 53.6 mg/mL at pH
5 and decreased to 0.194 mg/mL at pH 11.9. A similar trend was observed upon titrating TMP
with aspartic acid (data not shown). Generally, a good agreement was observed between the
experimental values (squares and circles) and the theoretical predicted values (dotted line) see
table (2). Theoretical calculations were carried out using Kramer and Flynn (1972) (Equation
4.1.1).
][
]][[ 3+
+
=BH
OHBKa
)1()( 3max
ast K
OHBpHpHbaseS
+
==>
)101( pHPkasB −+= (Equation 4.1.28)
Where St is the total solubility at given pH, [Bs] is the intrinsic solubility of the free base and Ka
is the acid dissociation constant.
b
a

168
Table 4.1.32. Theoretical calculations of pH solubility profile using (Equation 4.1.1). [Bs]= 266.35µg/mL and pKa=7.3.
pH Solubility (µg/mL)
11.28 266.35 7.7 372.35 6.3 2929.63
6.1 4487.37 5.7 10869.11 4.9 67165.4
4.1.3.3.6 Microbiology studies
After having significantly improved both the solubility as well as the dissolution characteristics
using the salt forms of TMP, the next stage of the work was to evaluate microbiological
properties to study if the therapeutic effect of the drug was still retained upon preparation of
the different salts.
Interestingly, zone of inhibition studies showed that use of amino acid salts not only retained
the anti bacterial activity against TMP sensitive species; Escherichia coli but also had a
significant increase in the total area of inhibition (Table 4.1.3). To rule out the possible effects
of amino acids alone on bacterial growth inhibition, control experiments with the amino acids
were performed which resulted in no inhibition of bacterial growth on the plates. Therefore,
the higher zone of inhibition can be attributed to the significant improvement in solubility
which potentially results in higher permeability across the agar plates resulting in larger zone
of inhibition. This could possibly translate into a faster therapeutic effect along with reduced
therapeutic dose in a clinical setting.
On the other hand, neither the drug nor the salts showed any activity against TMP resistance
species Pseudomonas aeruginosa. This is probably due to the complex structure of
Pseudomonas aeruginosa membrane as it is intrinsically resistant to TMP and prevents the
entry of both the drug and amino acid salts.

169
Table 4.1.33:- Zone of inhibition studies of TMP and its prepared salts against Escherichia coli
and Pseudomonas aeruginosa.
Escherichia coli Pseudomonas aeruginosa
Area (cm2) % compare to the
total plate area
TMP 4.03±0.2 18.7 **** TMP aspartate 4.6±0.2 21.4 ****
TMP glutamate 4.65±0.2 21.6 ****
Bacterial minimum inhibitory concentration was carried out as well in order to accurately
determine the MIC of the TMP and its salts. Two species were used in this study; Escherichia
coli and the intrinsically resistant organism, Pseudomonas aeruginosa. The MIC of TMP on E.
coli was 0.00048 mM and TMP aspartate and glutamate salt had similar MIC values which
confirm our previous finding that salt preparation did not impair the pharmacological function
of TMP (Table 4.1.4).
Table 4.1.34:- MICs of TMP and its prepared salts against Escherichia coli and Pseudomonas
aeruginosa.
Escherichia coli Pseudomonas aeruginosa
TMP 0.00048 mM. > 0.5 mM TMP aspartate 0.00048 mM > 0.5 mM TMP glutamate 0.00048 mM > 0.5 mM

170
4.1.4. Conclusion
TMP is a basic synthetic antibacterial agent which is poorly water soluble. In order to improve
its solubility, the ability of TMP to form new salts with L and D isomers of acidic amino acids
was investigated in this study. The study has demonstrated that TMP solubility increased
significantly upon coupling with aspartic and glutamic acid and this increase was attributed to
the novel salt formation which has self buffering capacity yielding favourable pH for salt
solubility during dissolution. Moreover, the antibacterial activity of these new salts was
investigated and no change was seen in their MIC when compared against TMP free base.
Using different isomers; L- and D- forms did not show any significant difference in the salt
characteristics. Our future work will investigate the effect of amino acids salts on the
absorption characteristics of TMP across intestinal membrane using Caco-2 cells.

171
A systematic and mechanistic evaluation of aspartic acid as filler for
directly compressed tablets containing trimethoprim and trimethoprim
aspartate
4.2.1. Introduction
Oral drug delivery is considered the most common and convenient route for drug
administration. Solid dosage formulations, especially tablets, account for the large proportion
of dosage forms delivered orally (Sam and Fokkens, 1997; Rasenack and Muller, 2002). In
addition to the active pharmaceutical ingredient (API), tablets comprise of various
pharmaceutical excipients which not only support the manufacturing process but also ensure
high quality of the final product. Therefore, appropriate selection and precise concentration of
excipients is critical in the tableting process.
Most commonly used excipients include fillers (diluents), binders, lubricants, glidants,
disintegrants, colorants and flavouring modifiers (Gohel, 2005). Diluents/fillers are added to
tablets to bulk up the formulation for processing and handling. Mannitol is a free-flowing
powder which is widely used as diluent for tablet manufacture. It is characterised by its low
elastic recovery, sweet taste and cooling sensation and has been reported as the best sugar for
manufacturing directly compressed chewable tablets (Sangekar et al., 1972). Recent studies
suggested that mannitol could reduce intestinal absorption of pharmaceutically active agents
and in turn lower the overall bioavailability of the pharmaceutically active agents (Adkin. et al.,
1995a; Adkin et al., 1995b). Studies conducted by Adkin et al on the formulation of cimetidine
(H2-receptor antagonist) found that the bioavailability of the drug was reduced when
combined with mannitol even at small concentrations (Adkin. et al., 1995a). This was
attributed to the cathartic effect of mannitol on the small intestine which results in reducing
172
the small intestine transit time (Adkin et al., 1995b). Moreover mannitol is known to be taken
up by the cells paracellularly via the tight junctions between the transepithelial cells (Yee,
1997). Studies conducted by Baired et al (1997) and Iga and Ogawa (Iga and Ogawa., 1997)
concluded that incorporating mannitol in pharmaceutical formulations would reduce drug
absorption by competing with API for the paracellular pathways especially if the API is
transported primarily through that route.
Another commonly used tablet filler is dicalcium phosphate dehydrate (DCPD) which is
characterised by its low cost, low hygroscopicity and good flow characteristics (Carstensen and
Ertell., 1990). Clarke and co-workers found that using DCPD as a filler had a negative impact on
the dissolution profile of spiranolactone despite not affecting the overall bioavailability of the
drug (Clarke. et al. 1977).
Other excipients such as talc and kaolin were found to adsorb charged molecules on their
surface and as a result reduce the membrane permeability for drugs such as chlorpromazine
(Nakano, 1971) and benzodiazepine (Naggar, 1981). The other majority of tablet fillers are
believed to be inert and do not chemically interact or affect the pharmacokinetics of the active
ingredient.
Among the new class of fillers for directly compressed tablets, amino acids have shown
promising results. Amino acids have been used as diluents in previous studies (AlHusban et al.,
2010; AlHusban et al., 2010; Sun and Grant, 2001). However, only few studies investigated the
densification characteristics of these amino acids. Szabo-Revesz et al (2001) prepared new
agglomerates of aspartic acid through salting out by controlled cooling. The prepared
agglomerates were found to have higher tensile strength (0.75±0.03 MPa) and compressibility
values when compared to a commercially available salt (0.13±0.1 MPa). Sun and Grant (2001)
examined the effect of lysine salt forms on the tensile strength and compaction properties of
tablets. It was concluded that the tensile strength increases exponentially with a resultant
decrease in the porosity of the tablets.

173
Another aspect of directly compressed tablet manufacture is the bonding force/interactions
between the different ingredients of the tablets including the active entity itself. During
powder compaction, particles get closer to each other and densification does not take place
until bond formations between particles occur. It is believed that the bonding mechanisms
include formation of solid bridges, intermolecular forces and shape related bonding
(mechanical interlocking) (Fuhrer, 1996). Intermolecular forces can be further divided into
electrostatic, Van der waals forces and hydrogen bonds with electrostatic interactions
operating between oppositely charged molecules through dipole-dipole interactions (Fuhrer
C., 1996).
As mentioned above it is generally known that most of the pharmaceutical excipients used for
oral drug delivery are inert. Therefore, inclusion of excipients which have multiple functions
within the formulation will have a significant impact on the cost and quality of the
formulations and possibly the bioavailability of the drug.
Our previous studies (ElShaer et al., 2012) investigated the use of aspartic acid and glutamic
acid as salt forming agents with a model basic drug trimethoprim (TMP). The results from this
study (substantial increase in drug dissolution due to ionisation in the presence of amino acid)
provided the basis for investigating for the first time the potential multi functionality
(dissolution enhancement and tablet diluent) inherent with in acidic amino acids.
Investigations in the current study focus on mechanism of compaction of individual powders
and binary mixtures of aspartic acid, TMP, TMP aspartate with an ultimate objective of
determining the role of surface charge and morphology on the binding properties between the
two entities.

174
4.2.2. Materials and methods
4.2.2.1. Materials
Trimethoprim (98% TLC), L-aspartic acid and magnesium stearate were purchased from Sigma
Aldrich (Dorset, UK). Ethanol was purchased from Fisher Scientific (Loughborough, U.K.)
4.2.2.2. Methods
4.2.2.2. Physical mixtures (PMs) and salt preparations
PMs of TMP with various molar ratios of aspartic acid were prepared by weighing accurate
amount of TMP and mixed by KitchenAid (Michigan, USA) at mixing speed of 3 for 5 minutes
with the various ratios of aspartic acid. TMP aspartate salt was prepared using the method
developed by ElShaer et al (2011). Equimolar amount of TMP and the free amino acid were
solubilised in water. The solutions were mixed and stirred until equilibration and then filtered
using 125 mm filter papers (Whatman®, Maidstone, UK). The filtrate was transferred into vials
and freeze dried for 48h using a Modulyo freeze dryer (West Sussex, UK) at -40oC shelf
temperature and under vacuum (E2M5 Edwards pump, West Sussex, UK). The samples were
collected and kept at 40oC for 4h using a Gallenkamp vacuum oven. The physical mixtures of
TMP aspartate and aspartic acid (SMs) were prepared in a similar manner to PMs.
Powder characterization
4.2.2.2. Powder flowability (Angle of repose method)
Powder flowability of the drug, salt, individual amino acid and physical mixtures of them was
evaluated using angle of repose method. 25 gm of powders were poured through a funnel
onto a glass plate. The funnel was positioned 10 cm from the glass plate and the powders were
allowed to flow freely until the formation of a symmetrical cone. Both the base and height of
the cone were measured and recorded. Equation (4.2.1) was used to calculate the angle of
repose and the flow properties were interpreted as outlined in Table 4.2.1.
b
h
5.0)tan( =α Equation 4.2.29

175
Where h is the cone height and b is the cone base.
Table 4.2.1:- Flow properties of pharmaceutical powders according to the measured angle of repose.
Angle of repose (degree) Flow property
25- 30 Excellent 31-35 Good 36-40 Fair (aid not needed) 41-45 Passable (may hang up) 46-55 Poor (must agitate, vibrate) 56-65 Very poor > 66 Very, very poor.
4.2.2.2. Particle size analysis (laser diffractometry)
Powder particle size analysis was performed using a laser diffractometer (SympaTC, RODOS
T4.1, Clausthal-Zellerfeld, Germany). An R3 lens with a working range between 0- 178 µm was
used for this study. The instrument allows the powder to circulate constantly through the
system during the measurements. The volume of distribution was used to calculate the median
(50% volume percentile) and the span of distribution was calculated using equation (4.2.2). All
the measurements were done in triplicate.
Span of distribution50
1090
X
XX −= Equation 4.2.30
4.2.2.2. Apparent, bulk particle density and porosity measurements
Bulk density was determined by using 10 ml cylinder to measure the volume (V) of a pre-
weighed sample. Apparent particle density was measured using helium pycnometer
(Multipycnometer Quantachrome Instruments, Hampshire, UK). Both bulk and true density
values were used to determine the powder porosity according to equation (4.2.3).
)/1(100 td ρρε −= Equation 4.2.31
Where ε is the porosity and ρd is the bulk density and ρt is the true density. All the
measurements were done in triplicates.

176
4.2.2.2. Powder wettability (Contact angle)
The Wihelmy method was used to measure the wettability profile of the free powders by
measuring the contact angle between the powders and distilled water (Hayes et al., 1994). A
small glass slide (24x24 mm) was first covered with double sided tape (Scotch 12*1 mm) and
then the free powders were uniformly coated on the tapped slides. The slides were attached
to balance loop of the tensiometer microbalance (QCT-100 Interfacial Tensiometer, Camtel
Ltd, Herts, UK) and the samples were lowered at a speed of 0.2 mm/s to a distance of 10 mm
after contact with the liquid medium. 75 mL of double distilled water at 25 ºC was used as the
liquid medium.
The Wilhelmy equation was used to calculate the contact angle at regular intervals and
CAMTEL CDCA-100 software (version 2.01.015, Herts, UK) was used to draw a correlation
between contact angle and the immersion depth.
4.2.2.2. Scanning electron microscopy (SEM)
Scanning electron microscopy (SEM, STEREOSCAN 90, Cambridge Instrument) was used to
study the surface morphology of TMP and TMP aspartate. Samples were prepared by
sprinkling the salts onto specimen stubs which were loaded onto a universal specimen holder.
In order to enable electricity conduction, samples were coated with a fine layer of gold using a
sputter coater (Polaron SC500, Polaron Equipment, Watford, UK) at 20 mA for three minutes at
low vacuum and in the presence of argon gas (Polaron Equipment, Watford, UK).
4.2.2.2. Tablet preparation
Tablets of TMP, its aspartate salt and physical mixtures with excess of the amino acid
counterions at (1:1), (1:2), (1:4) and (1:8) molar ratios were prepared to study tableting
properties. The powders were compacted using uniaxial hydraulic press (Specac tablet presser,
Slough, UK) and split die which prevents mechanical failure by allowing triaxial decompression.

177
Magnesium stearate in ethanol (0.5% w/v) was used to lubricate the die walls and punch
surfaces. Powders were compressed at 10, 20, 30, 40 and 60 kN and at dwell time of 30 sec at
ambient conditions (room temperature 20 oC and 70% relative humidity).
The prepared tablets were cylindrical with a diameter of 13 mm and weight of around 500 mg.
Tablets were left in desiccators for 24 h prior to performing any mechanical testing.
Tablet characterization
4.2.2.2. Tensile strength measurements
The force required to crush the prepared tablets was measured using tablet hardness
apparatus (Schleungier 4M, Thun, Switzerland). The measured force was used to determine
the tablet tensile strength using equation (4.2.4).
dt
Fc
πσ 2
= Equation 4.2.32
Where σ is the tablet tensile strength, Fc is the crushing force required to break the tablet, d is
the tablet diameter and t is the tablet thickness. All measurements were done in triplicate.
4.2.2.2. Disintegration time studies
Disintegration time is the time required for tablets to disintegrate completely without leaving
any solid residue. In vitro disintegration time was evaluated using US pharmacopoeia
monograph (<701> disintegration). Erweka ZT3, Appartebau, GMBH (Husenstamm, Germany)
was used in this study as a disintegration apparatus and distilled water (800 ml) as
disintegration medium; the disintegration medium temperature was maintained at 37 °C by
thermostat. Six tablets were placed in the basket rack assembly and covered by transparent
plastic disks. The disintegration time was taken as the time required for tablets to disintegrate
completely without leaving any solid residue. All the measurements were carried out six times
and presented as mean ± standard deviation.

178
4.2.2.2. Heckel analysis
The Heckel equation (4.2.5) was used to analyze tablets’ compression data using out-of-die
method (Heckel R. 1961a; Heckel R. 1961b).
AKPD +=− ))1/(1ln( Equation 4.2.33
Where D is the tablet relative density at pressure P, K is a material constant (slope of the
straight line portion of Heckel plot) and is 1/3 of the yield strength. 1/K value is used to express
the mean yield pressure. A is a function of the initial bulk volume and is calculated from the
intercept of the straight line of The Heckel plot.
4.2.2.2. Statistical analysis
Graph Pad Instat® software (Version 3.01, CA, USA) was used for statistical analysis. Data
groups were compared using one way analysis of variance (ANOVA) and pair-wise multiple
comparisons method (Tukey test) by using the mean values, standard deviation (SD) and
number of experiment (N). Standard deviation (SD) was used to report the error in the figures
and texts. Probability values of 95% (P< 0.05) were used to determine the significant
difference.

179
4.2.3. Results and discussion
4.2.3.1. Powder characterization
Prior to studying the compaction properties of binary mixtures, powder characterisation and
densification properties of the individual powders were studied to understand the compaction
mechanism of materials and determine the impact of inclusion of each excipient in binary
combinations (Table 4.2.2).
4.2.3.1.1. Characterisation of powder flow properties using angle of repose (o)
The flow properties of TMP, aspartic acid and TMP aspartate salt were measured using angle
of repose. Results (Table 4.2.2) show that aspartic acid has excellent flowability as the
measured angle of repose was 26.6±2.3o while TMP (angle of repose 32.41±0.32o) had good
flow properties. On the other hand, the flow characteristics of the prepared TMP aspartate salt
were poor and the powder is considered passable as its angle of repose was 42.7±5.4o.
The flowability for all PMs, prepared at various ratios of aspartic acid was good and no
significant difference (P>0.05) was observed for the measured angle of repose for all the
different ratios studied.
Table 4.2.2:- Powder characterisation of TMP, aspartic acid, TMP aspartate salt, their physical and
salt mixtures.
Formulations Angle of repose
(o)
Bulk density
(gm/cm3) True density
(gm/cm3) Porosity
TMP aspartate salt
42.7±5.4 0.10±0.00 2.90±0.69 0.96±0.01
TMP 32.4±0.3 0.65±0.05 1.45±0.03 0.54±0.02 L-aspartic acid 26.6±2.3 0.67±0.04 1.92±0.05 0.64±0.03 PM 1:1 34.2±1.4 0.53±0.02 1.63±0.03 0.67±0.02 PM 1:2 35.2±0.8 0.57±0.01 1.86±0.17 0.69±0.03 PM 1:4 33.7±2.8 0.61±0.02 1.80±0.03 0.66±0.02 PM 1:8 32.1±2.8 0.60±0.02 1.97±0.12 0.69±0.03 SM 1:1 36.3±2.2 0.17±0.01 2.10±0.01 0.91±0.00 SM 1:2 45.6±2.3 0.21±0.02 2.57±0.87 0.91±0.03 SM 1:4 40.2±2.9 0.18±0.00 2.39±0.21 0.92±0.01 SM 1:8 34.02±6.6 0.28±0.01 1.98±0.08 0.85±0.01

180
4.2.3.1.2. Apparent, bulk particle density and porosity measurements
Interestingly, the true density of both the physical mixtures (PMs) and salt mixtures (SMs)
were concentration dependent i.e. increasing the ratio of the oppositely charged aspartic acid
resulted in an increase in the true density (Table 4.2.2). The bulk densities for the physical
mixtures (PMs) were lower than that of the individual powders possibly due to the reduction
of the surface charge upon using binary mixtures of the drug and aspartic acid which carry
opposite charges. Such a reduction on the surface charge results in reducing the repulsive
forces between similarly charged ions and lowers bulk density which was evident with increase
in aspartic acid ratio in the powder blend (Fuhrer, 1996). However, the opposite effect was
observed for the SMs and the bulk density increased from 0.1±0.0 for TMP aspartate salt to
0.28±0.01 (Table 4.2.2) upon adding excess of aspartic acid. This could possibly be attributed to
the net surface charge of zero within the salt which becomes more negative upon increasing
the concentration of aspartic acid resulting in greater repulsive forces and higher bulk density.
Porosity measurement for the three powders revealed that preparation of the salt yields
powder which has low bulk density and high porosity (Table 4.2.2) which is possibly due to the
sublimation of ice during freeze drying which leaves behind porous channels between powder
particles (Deville et al., 2007; AlHusban et al., 2010).
4.2.3.1.3. Particle size analysis
Previous research has shown that various factors including salt form, polymorphic transition,
crystallinity, crystal and particle size influence inter-particulate bonding in the tablets
(Alderborn, 2002). In the current investigation, particle size analysis of the powder samples
(Table 4.2.3) and the crystalline structure were studied (Fig. 4.2.1). Particle size analysis was
studied using laser diffractometer and has shown that TMP aspartate salt has small particle

181
size of 28.44±1.14 µm while TMP free base and L-aspartic acid had a mean particle size of
69.9±0.13 and 94.4±0.8 respectively.
Table 4.2.3:- Heckel parameters of TMP, aspartic acid and TMP aspartate salt.
Yield strength (Y)
MPa
Yield pressure (PY) σ0 d50%(µm) Span value
TMP 107.52 322.58 273.85 69.9±0.13 1.98±0.02 L-aspartic acid 46.9 140.84 N/A 94.4±0.80 1.26±0.02 TMP aspartate 144.92 434.78 179.74 28.44±1.14 3.44±0.02
4.2.3.1.4. Surface morphology
Morpholgical analysis of powder crystals was carried out using SEM. L-aspartic acid had thin
rectangular plates with smooth surface (Fig. 4.2.1B) while TMP crystals were found to be
hexagonal in shape with irregular edges, rough surface and more than one crystal attached to
each other (Fig. 4.2.1A &D). Interestingly, TMP aspartate salt showed small crystals which
formed aggregates (Fig. 4.2.1C). The agglomerates salt form was previously reported and
studied extensively by Szabó-Révész et al., (2001).

182
Figure 4.2.49:- SEM for TMP at low magnification 500 µM (A), at high magnification µM200 (D),
aspartic acid (B) and TMP aspartate salt (C).
4.2.3.2. Tablets characterization
4.2.3.2.1. Compressibility
Having investigated powder properties, the next stage of evaluation was the preparation of
compacts for the three different powders. The strength of the tablets is believed to be affected
by the compressibility behaviour of the powders (Sun and Grant, 2001). Highly compressible
powder (smaller porosity) enables the particles to get closer to each other which enhance
interparticulate bonding resulting in the formation of stronger compacts (Alderborn and
Nystrom, 2005).
A
D C
B

183
Upon compressing TMP and aspartic acid, TMP showed the highest compressibility which was
found to be less dependant on the compression force and remained unaffected (p> 0.05) when
the compression force was increased (Fig. 4.2.2). On the other hand, aspartic acid porosity
decreased by 32% upon increasing the compression force from 10 kN to 30 kN. Beyond 30 kN,
the porosity remained constant (p>0.05). The compressibility behaviour of TMP aspartate salt
was similar to that of aspartic acid. Powder plasticity plays an important role during the
densification of the powder and in order to understand the mechanism of densification of
these powders, Heckel analysis was performed and the yield strength of the three powders
was measured (Fig. 4.2.3).
0
0.3
0.6
0.9
1.2
0 10 20 30 40 50 60 70
Compaction force kN
Por
osity
TMP L-aspartic acid TMP aspartate salt
Figure 4.2.50:- Plots of tablet porosity against compaction pressure, showing the compressibility of
TMP, aspartic acid and TMP aspartate salt (n= 3).
Heckel graph was established for each powder using out-of-die method and the linear part of
the graph with R2 values of 0.9, 0.96 and 0.96 for TMP, aspartic acid and TMP aspartate salt
respectively was used to carry out Heckel analysis (Fig. 4.2.3). The data showed that none of
the materials studied are brittle and that they densify via plastic deformation because of their
high yield strength values (Table 4.2.3) as suggested by Kuny et al. (2003). In order to
differentiate between plastic and elastic behaviour of these materials, the yield strength was

184
Compaction force kN Compaction force kN
TMP L-aspartic acid TMP aspartate salt
calculated using the Heckel equation (Equation 4.2.3) (Table 4.2.3). L-aspartic acid had the
lowest yield strength which reflects high plasticity and low elasticity of the powder. Although,
the lowest plasticity properties were exhibited by TMP aspartate salt (Table 4.2.3) the tablets
survived the decompression phase and no capping was observed possibly because of the
agglomerate form of the salt as discussed in detail below.
0
0.1
0.2
0.3
0.4
0.5
0.6
0.7
0.8
0 10 20 30 40 50 60 70
-ln p
oros
ity
Figure 4.2.51:- Heckel plots for TMP, aspartic acid and TMP aspartate salt using out-of-die method
(n=3).
Compressibility behaviour of TMP PMs and TMP aspartate SMs with various molar ratios of L-
aspartic acid was also evaluated in this study (Fig. 4.2.4).
At low compression forces (10 kN), PMs with high amount of TMP showed better
compressibility characteristics when compared to L-aspartic acid tablets (Fig. 4.2.4A). Yet, at
higher compression forces, no significant difference (p> 0.05) was observed for the majority of
the formulations. Interestingly, the compressibility behaviour of TMP:L-aspartic PM at 1:2 ratio
was significantly higher for the all formulations (p<0.001). This behaviour might be related to
the percloration threshold of the binary mixture (Leuenberger H., 1982). If a binary mixture
consisting of two materials A and B (TMP and L-aspartic acid in this study) undergoes
y = 0.0071x + 0.4401
y = 0.0031x + 0.557
y = 0.0023x + 0.4967

185
compression, a lattice is formed by particles of type A or type B. At high concentration of
substance A, many particles of A become direct neighbours and build a cluster in the lattice.
Therefore, substance A dominates the behaviour of the system. Upon increasing the amount
of B, substance B starts to replace A in the lattice resulting in phase inversion, when the
system dominated by A is replaced by substance B (Leuenberger, 1982) at critical
concentration called percolation threshold (1:2 ratio might be the percolation threshold for
TMP/ aspartic acid binary mixture).
Figure 4.2.52:- Plots of tablet porosity against compaction force, showing (A) the compressibility of
TMP and aspartic acid PMs(n= 3), (B) the compressibility of TMP aspartate and aspartic acid SMs (n=
3).
0.3
0.4
0.5
0.6
0.7
0.8
0.9
0 10 20 30 40 50 60 70Compaction Force kN
Por
osity
L-aspartic acid TMP:Asp 1:1 TMP:Asp 1:2 TMP:Asp 1:4 TMP:Asp 1:8
0.3
0.4
0.5
0.6
0.7
0.8
0 10 20 30 40 50 60 70
Compaction force kN
Por
osity
TMP aspartate salt: aspartic 1:1 salt: aspartic 1:2 salt: aspartic 1:4 salt: aspartic 1:8
A
B

186
Compressibility profile for the salt/acid binary mixtures was also studied (Fig. 4.2.4B). The data
showed that there was no significant difference between majority of the formulations at low
compaction forces. Increasing the ratio of aspartic acid deteriorated the compressibility profile
of the SMs. The highest compressibility was exhibited by 1:1 and 1:2 ratios of salt: aspartic acid
(Fig. 4.2.4B) and was found to be higher than that of the individual components. These results
support the findings previously suggested by Wu et al (2005) which showed that the behaviour
of a binary mixture is not usually linear between the two bulk components used in the system
(Wu et al., 2005). The compressibility profile of the PMs and SMs were comparable and no
siginificant improvement was observed upon using the salt form instead of the free drug,
probably because of the high content of aspartic acid which in turn dominates compressibility
characteristics of the binary mixtures.
4.2.3.2.2. Compactability
The ability of the pharmaceutical powder to form a tablet with sufficient strength under the
effect of densification is known as compactability (Joiris et al., 1998). Although compression
enables particles to come into close contact during the applied force, bond formation between
particles is necessary to form strong tablets (Fuhrer, 1996).
The relationship between tablet porosity and tensile strength is shown in Fig. (4.2.5). An
exponential relationship between tensile strength and porosity was observed for both TMP
and TMP aspartate salt with correlation of 0.96 and 0.95 respectively. This correlation was
previously discussed by Ryshkewitch and was used to assess the tensile strength at zero
porosity (σo) using equation 6 (Ryshkewitch, 1953) and summarized in table 4.2.3.
εσσ be−= 0 Equation 4.2.34

187
Figure 4.2.53:- Plots of tablet tensile strength against porosity, showing (A) the compactability of
TMP, aspartic acid and TMP aspartate salt, (B) TMP and aspartic acid PMs, (C) TMP aspartate salt and
aspartic acid SMs (n= 3).
0
0.1
0.2
0.3
0.4
0.5
0.6
0.7
0.45 0.5 0.55 0.6 0.65 0.7 0.75 0.8 0.85
Porosity
Ten
sile
stre
ngth
(N
/mm
2)
TMP L-aspartic acid
0
0.5
1
1.5
2
0.4 0.45 0.5 0.55 0.6 0.65 0.7 0.75 0.8 0.85
Porosity
Ten
sile
stre
ngth
MP
a
salt: aspartic acid 1:1 salt: aspartic acid 1:2 salt: aspartic acid 1:4
salt: aspartic acid 1:8 Aspartic acid
00.05
0.10.15
0.20.25
0.30.35
0.40.45
0.5
0.4 0.45 0.5 0.55 0.6 0.65 0.7 0.75
Porosity
Ten
sile
stre
ngth
(N
/mm
2)
TMP:aspartic 1:1 TMP:aspartic 1:2 TMP:aspartic 1:4 TMP:aspartic 1:8
A
B
C
0.05
0.15
0.25
0.35
0.45
Ten
sile
str
engt
h (N
/mm
2)

188
Although the three powders showed similar compressibility beyond 30 kN, compactability
results were significantly different. The highest compactability was exhibited by TMP aspartate
salt which had tensile strength of 7.24±0.09 with a tablet porosity of 0.53±0.02 (data not
shown). However, the highest tensile strength demonstrated by L-aspartic acid and TMP was
0.25±0.094 and 0.62±0.41 at porosity of 0.55±0.03 and 0.48±0.035 respectively (Fig. 4.2.5A).
These results suggest that the TMP aspartate salt form has 10 fold higher tensile strength than
aspartic acid despite the latter having higher plasticity.
As discussed above, various factors affect inter-particulate bonding within the tablets including
salt form, polymorphic transition, crystallinity, crystal habit and particle size (Alderborn G.,
2002). Particle size analysis showed that TMP aspartate salt had a mean particle size of
28.44±1.14 µm while SEM showed small crystals of the salt which formed aggregates. The
agglomerate salt form was previously studied by (Szabó-Révész et al., 2001) and it was found
to have higher tensile strength when compared to commercial salt with no agglomerates. This
suggests that both agglomerate formation during salt preparation and the small particle size of
these agglomerates play a major role during the densification of the salt form.
However, TMP free base and L-aspartic acid had particle size of 69.9±0.13 and 94.4±0.8 µm
respectively. Besides, morphological analysis of the powders crystals showed that L-aspartic
acid had thin rectangular plates with smooth surfaces (Fig. 4.2.1B) which would slide over each
other and the smooth surface would prevent any mechanical bonding.
On the other hand, the rough surface of the hexagonal crystals of TMP (Fig. 4.2.1A) could have
played a role in mechanical interlocking during densification as it could allow enhanced contact
and retention between different crystals.
Intermolecular bonding is one of the major forces involved during bond formation in
pharmaceutical compacts (Fuhrer, 1996). Therefore, the effect of surface charge on bond
formation was evaluated in this study by incorporating anionic amino acid (aspartic acid) with
the cationic TMP and neutral salt form.

189
PMs compactability profile was studied and summarized in Fig. 4.2.5B. Generally, decreasing
the porosity increases the tensile strength. It was clear that increasing the ratio of aspartic
acid results in decreasing the compactability profile of the PMs as aspartic acid replaces TMP
and dominates in the system and therefore results in higher compactability. Interestingly,
TMP:L-aspartic 1:2 showed the lowest porosity, yet the tensile strength for this binary mixture
was lower when compare with other binary mixtures. Although low porosity should allow
higher interparticulate bonding area in the tablets, the tensile strength of 1:2 tablets was not
the highest among the binary mixtures used. The highest tensile strength was exhibited by 1:1
tablets. This is probably because of the high content of TMP, which has better compaction
characteristics than aspartic acid as discussed before. This suggests that TMP dominates in the
system and nullifies the effect of lower bonding area exhibited by 1:2 tablets. It was
hypothesised that at 1:1 ratio electrostatic interaction is highest and would result in the
formation of stronger compacts. However, upon comparing the compactability of 1:1 PM
against TMP alone, the results showed that the free drug has higher compactability. This result
suggests that the electrostatic interaction has lower effect during densification of TMP aspartic
acid PM. Upon increasing the amount of L-aspartic acid, the tensile strength began to decline
and for reasons unknown the compactability characteristics of 1:2 ratio was the lowest.
On the other hand, all the SMs formulations showed higher compactability than that of the
free aspartic acid (Fig. 4.2.5C). The highest compactability was shown by 1:4> 1:1 ratios> 1:8 >
1:2. This order was not the same as that of TMP/aspartic acid physical mixtures profiles,
possibly because the compactability characteristics of a binary mixture are not often
predictable from individual material characteristics (Vromans and Lerk., 1988; Veen et al.,
2000).
Interestingly, all of the SM formulations exhibited higher compactability than the PMs,
although the former is a mixture between neutral and anionic moieties and no electrostatic
190
interaction is expected to take place. This confirms the early finding that the surface charge
has minimal effect during bond formation of both PMs and SMs.
4.2.3.2.3. Tabletability
The ability of the powder to form a tablet with sufficient mechanical properties under the
effect of compaction pressure is known as tabletability (Joiris et al., 1998). Generally, the
tabletability characteristics of all the three powders improved with an increase in compaction
pressure possibly due to the reduction in tablet porosity upon increasing the compaction
pressure (reduction in tablet porosity increases contact area between the particles and
therefore results in higher bonding and harder tablets) (Nystrom and. Karehill., 1995). L-
aspartic acid had poor tabletability among the three powders. The highest tensile strength of
L-aspartic acid was 0.25±0.094 at 60 kN. The tensile strength of TMP tablets was almost twice
(0.62±0.41) that of L-aspartic acid. Interestingly, TMP aspartate salt showed a very high tensile
strength (2.48±0.38) even at very low compaction pressures. The tensile strength of the salt
increased to 3.9±0.68 when the compression force was doubled to 20 kN. At 30 kN the tensile
strength rose to 7.78±0.37 and remained constant beyond 30 kN.
Despite the similar compressibility profile of TMP and TMP aspartate salt (as they showed
constant compressibility beyond 30 kN), the tabletability profile was significantly different
(p<0.001). The tensile strength of TMP tablets increased even when the porosity was constant
(p>0.05) beyond the compression force of 30 kN (Fig. 4.2.6A) which suggests that crystal
interlocking takes place during tablet densification as mechanical interlocking is not dependent
on the distance between the particles (Nystrom and Karehill, 1995). However, the tensile
strength of TMP aspartate tablets did not change when the tablet porosity remained constant
which suggests that alternative bonding mechanism is involved during the densification of TMP
aspartate powders. Increasing the compaction force beyond 30 kN did not result in further
decrease in tablet porosity (as discussed above) hence, particle surfaces cannot get into closer

191
proximity any more and the tensile strength remained constant. Intermolecular bonding which
is also known as distance attraction forces is affected mainly by the surface area available for
bonding suggesting that intermolecular bonding could be the main bonding mechanism for the
salt forms. Hydrogen bonds play a vital role in intermolecular bonding and structure analysis of
TMP aspartate salt shows that the salt form has a total of nine hydrogen bond donors and
acceptors atoms which further confirm the assumption that intermolecular bonding is the
major binding force (Nystrom and Karehill, 1995).

192
10 20 30 40 600.0
0.5
1.0
TMPL-aspartic acidTMP aspartate salt
2
7
Compaction force (kN)
Ten
sile
str
engt
h
0
0.1
0.2
0.3
0.4
0.5
0.6
0.7
10 20 30 40 60
Compaction Force kN
Ten
sile
str
engt
h (N
/mm
2)
TMP:Asp 1:1
TMP:Asp 1:2
TMP:Asp 1:4
TMP:Asp 1:8
L-aspartic acid
10 20 30 40 600
1
2
TMP aspartateTMP asptate: aspartic 1:1TMP asptate: aspartic 1:2TMP asptate: aspartic 1:4TMP asptate: aspartic 1:8
2
7
Compaction force (kN)
Ten
sile
str
engt
h
Figure 4.2.54:- Plots of tablet tensile strength against compaction force, showing the tabletability of
(A) TMP, aspartic acid and TMP aspartate salt, (B) TMP and aspartic acid PMs, (C)TMP aspartate salt
and aspartic acid SMs (n= 3).
A
B
Compaction force kN
C

193
The tabletability plots for PMs are shown in (Fig. 4.2.6B). The crushing force was very low for
some of the mixtures compressed at 10 kN. Upon plotting the tensile strength against the
compaction force, a linear relationship was observed for all the PMs over the range of
compression forces used. The tensile strength of the PMs was between that of the individuals
components. As tabletability is determined by both bonding area (compressibility) and
bonding strength (compactability) and as the bonding area is comparable for most of the PM
formulations at each compression force (Fig. 4.2.4A), compactability was the main determinant
for the tabletability characteristics of the binary mixtures. Again the highest tabletability was
observed for 1:1 ratio mixture followed by 1:4> L-aspartic acid ≈ 1:2 (Fig. 4.2.6B).
Upon studying the tabletability profile of salt/aspartic acid binary mixture (Fig. 4.2.6C) it was
found that all the SMs were significantly lower than that of the individual salt but higher than
the individual aspartic acid and physical mixtures at all the compression forces. 1:4 salt mixture
showed the highest tabletability followed by 1:1.
4.2.3.2.4. Disintegration time
After ingestion of a solid dosage form, the delivery system starts to disintegrate into small
particles prior to dissolution in the gastrointestinal tract. Previous studies have suggested that
tablet disintegration time increases as the compression forces rises (Riippi et al., 1998). The
effect of compression force on the disintegration time of the prepared tablets was evaluated
(Fig. 7A, B & C). Both TMP and L-aspartic acid showed an increase in the disintegration time
upon increasing the compaction force (Fig. 4.2.7A). Moreover, TMP tablets failed to
disintegrate with in 30 minutes at compression forces as low as 20 kN. Nevertheless, L-aspartic
acid showed a linear relationship between the disintegration time and the applied compaction
force. L-aspartic acid disintegrated very rapidly (6.6±3.7 s) when low compression forces were
used (Fig. 4.2.7A).

194
TMP aspartate salt showed an interesting disintegration profile. The tablets disintegrated at
304±13 s when compressed at 10 kN. The disintegration time increased upon increase of
compression force. However, beyond 30 kN the tablets’ disintegration time started to decrease
to 128±34 s at 60 kN.
Tablet disintegration takes place by various mechanisms such as swelling, porosity and
capillary action. Prior to disintegration, the tablet surface should be wetted by the
disintegration media (Fukami et al., 2006) which results in tablet disintegration via one of the
above mechanisms.
In order to understand the mechanism of disintegration of the prepared tablets, wettability
studies of the dry powder were performed using the protocol described in the methods
section. Interestingly, all the three powders showed good wettability profile with zero contact
angle. Contact angle depends on the hydrophilicity/hydrophobicity of the surface. The low
contact angles exhibited by the three powders could be attributed to the high hydrophilicity
for all powders.

195
0
100
200
300
400
500
600
700
800
900
10 20 30 40 60
Compaction force kN
Dis
inte
grat
ion
time
(sec
)
TMP aspartate salt
TMP asp SM 1:1
TMP asp SM 1:2
TMP asp SM 1:4
TMP asp SM 1:8
10 20 30 40 600
100
TMPL- aspartic acidTMP aspartate salt
300
500
700
900
Compaction force (kN)
Dis
inte
grat
ion
time
(sec
)
Figure 4.2.55:- Disintegration time of (A) TMP, aspartic acid and TMP aspartate salt, (B) TMP and
aspartic PMs, (C) TMP aspartate salt and aspartic acid SMs at various compression forces (n=3).
0
100
200
300
400
500
600
700
800
900
10 20 30 40 60
Compaction force kN
Dis
inte
grat
ion
time
(sec
)
TMP aspartate salt
TMP asp SM 1:1
TMP asp SM 1:2
TMP asp SM 1:4
TMP asp SM 1:8
0
20
40
60
80
100
120
140
160
180
10 20 30 40 60
Compaction Force kN
Dis
inte
grat
ion
time
(sec
)
TMP:Asp PM 1:1
TMP:Asp PM 1:2
TMP:Asp PM 1:4
TMP:Asp PM 1:8
L-aspartic acid
A
B
C
Compaction force kN
Compaction force kN
Compaction force kN

196
For all the powders, increasing the compaction force resulted in increasing the disintegration
time possibly because of the decrease in tablet porosity at higher compaction forces. 1:1 PM
showed the highest disintegration time at all the compression forces (Fig. 4.2.7B). At low
compression forces of 10 kN, 1:1 tablets disintegrated at 20±7 s and the disintegration time
increased steadily until 287±40 s at 60 kN. Interestingly, increasing the amount of L-aspartic
acid in the PMs formulations was found to decrease the disintegration time of the tablets
significantly and the disintegration time was even lower than that of L-aspartic acid alone.
For instance, at 40 kN, 1:1 tablets disintegrated at 102±15.6 s and the disintegration time
dropped significantly to around 25 s upon increasing the L-aspartic acid amount in 1:2 and 1:4
mixtures and to 12 s for 1:8 ratio. It is known that the porous structure of the tablets has a
large effect on the disintegration time. Nevertheless, the porosity for all the tablets was
comparable and it could not explain the rapid disintegration for the physical mixtures at 1:2,
1:4 and 1:8. It could be hypothesised that the use of water as disintegration media would have
enhanced the ionisation of TMP and aspartic acid and facilitated tablet disintegration in line
with the results reported by Ferrari et al., (1996).
Disintegration time profiles for the SMs were similar to that of the PMs. Disintegration time
was found to decrease as the aspartic acid ratio increases. Nevertheless, the PMs
disintegration times were faster than that of the salt mixtures.
4.2.4. Conclusion
The current study evaluated the compaction properties of aspartic acid, TMP and TMP
aspartate salt. Both particle size analysis and surface morphology studies revealed that TMP
has rough hexagonal crystals that interlock mechanically during densification, while the thin
rectangular plates of aspartic acid slide over each other instead of mechanical intercalation.
The very high tensile strength exhibited by TMP aspartate salt was attributed to its small
particle size and formation of agglomerates during salt preparation. Although Heckel analysis

197
revealed that aspartic acid has high plasticity, inclusion of the acid as a tablet filler did not
enhance the compaction properties of TMP and TMP aspartate salt possibly due to the large
particle size of its crystals. It can be concluded that aspartic acid demonstrate
multifunctionality as a filler (with no binder property), disintegration promoting agent thereby
ultimately enhancing bioavailability and pharmacokinetics of BCS IV drug candidates.

198
TMP permeability studies and transcriptomic changes occurring during
its uptake across Caco-2 cells
4.3.1. Introduction
One of the major obstacles in oral drug delivery is the poor permeability of drugs across the
intestinal membrane. The majority of drugs are absorbed via passive diffusion through
paracellular and transcellular routes. Nevertheless, the physico-chemical properties of the
drug molecules limit their uptake via passive diffusion (Martinez et al., 2002). Active drug
uptake mediated by carrier transporters enables some molecules to circumvent the issues
associated with poor intestinal absorption (Lipka et al., 1996; Walter et al., 1996; Amidon et
al., 1998). The complicated process of permeation across the intestinal membrane results in
large numbers of new drugs which fail to exhibit therapeutic effectiveness in-vivo; even
though they may have exhibited in vitro potency , as they cannot cross the cell membrane in
the gastrointestinal tract due to their intrinsic molecular properties. Many approaches have
been developed including prodrug formation and ion-pairing to improve the inherent physico-
chemical properties of the drug candidates to enhance permeability.
The prodrug approach is based on formation of a covalent bond between the drug molecule
and a lipophilic moiety in order to improve passive diffusion of the drug (Ettmayer et al., 2004).
Although this approach has achieved success in improving drug uptake, covalently linking the
drug with another moiety could potentially result in a new chemical entity with low or poor
efficacy and/or increased toxicity.
Schankier 1960, discussed a similar approach to prodrugs which exploits electrostatic
interactions between two moieties instead of covalent bond formation; this is referred to as
ion-pairing. After being absorbed, the ion-pairs dissociate in the blood stream via dilution. This
approach has many advantages over prodrug synthesis as it does not need activation by
enzymes and does not rely on disrupting the integrity of the membrane to facilitate drug

199
uptake. The majority of the investigations carried out on ion-pairing focused on improving drug
uptake via passive diffusion (Miller et al., 2010). In the current study we investigate whether
ion-pairing of TMP with actively transported counter ions (aspartic and glutamic acids) would
improve the overall absorption of the drug candidate via active transporter carriers.
Trimethoprim is a synthetic antibacterial agent belonging to a group of compounds known as
diaminopyrimidines. It was first synthesized as a dihydrofolate reductase inhibitor (DHFR) and
used mainly in combination with sulfonamides to treat pneumonia and urinary tract infections.
TMP has cationic nature with a pka of 7.3. This basic drug is very slightly soluble in water (0.2
mg/mL) and has poor intestinal absorption and hence classified as BCS IV according to the
Biopharmaceutical Classification System (ElShaer et al., 2012).
In order to improve TMP solubility, Li et al. (2005) utilized β-cyclodextrin as a complex forming
agent. The increased surface area of contact between TMP and the cyclodextrin along with the
reduction in drug crystalinity were shown to be responsible for improvement of TMP solubility.
Previous work carried out by ElShaer et al., 2012 showed that coupling TMP with glutamic acid
and aspartic acid improved the drug solubility by 280 fold. Despite a Log P value of 1.4, TMP
has low oral permeability (Kasim et al., 2003). The low absorption profile is attributed to high
efflux through P-gp (Victoria E., 2009). A study by Joseph et al., (2001) suggested that basal to
apical flux for TMP was 3.61 times higher than its apical to basal absorption. Moreover, the
study demonstrated that TMP activates ATPase which provides the energy required for P-gp
activity. Conversely, the studies carried out by Romiti et al., (2002) on human kidney-2 (HK-2)
cells suggested that TMP does not interfere with P-gp activity nor modulate human multidrug
resistance gene (MDR-1). Wendy et al (2002) and Jung et al (2008) studies reported that TMP is
a substrate for human organic cation transporters (hOCT) suggesting that TMP could be
transported actively via OCT1 and OCT2 transporters. The degree of TMP ionisation was also
found to determine its capacity to interact with hOCT2. Jung et al., 2008 studies demonstrated
that decreasing TMP ionisation by increasing the pH of the transport media from 7 to 8

200
resulted in lowering the binding with hOCT transporter. Nevertheless, the kinetic calculations
based on the proportion of molecules charged at each pH value showed higher inhibitor effect
than predicted. These results were attributed to the difference between the pH values of the
membrane and that of the bulk of the media or the difference of TMP pKa values at the
transport receptor region and that in the free solution (Jung et al., 2008). OCT1 and OCT2 are
expressed predominantly in liver, kidney (Jung et al., 2008) ileum, duodenum and colon
(Englund et al., 2006). Moreover, OCT1 transporters were also found to be expressed in Caco-2
monolayers, 3 times higher than in ileum and duodenum (Englund et al., 2006). The major
focus of this study is to ion-pair the poorly absorbed TMP to a highly permeable counter ion
which has a full transporter system across the intestinal membrane. Interestingly, most of the
living cells express a combination of common and specific transporter systems for amino acids
as they play a vital role in cellular activities of the living cells. Because the cationic nature of
the drug used in this study (TMP), anionic amino acids (aspartic acid and glutamic acid) were
selected as potential counter ions. Cellular uptake of anionic amino acids is mediated by solute
carrier transporters known as high affinity glutamate transporters (SLC1 or X-AG). SLC1 was first
identified in 1992 by (Kanai and Hediger) and were further characterised into five sub-families:
SLC1A1, SLC1A2, SLC1A3, SLC1A6, and SLC1A7. X-AG is Na+ and K+ dependent transporters
which mediates the uptake of glutamic acid and aspartic acid accompanied by co-transport of
3Na+, 1H+ and counter-transport of 1K+. X-c is another carrier transporter which is Na+
independent antiport system that transports glutamate and cystine in order to protect the
cells against oxidation (Robert et al., 1998). X-AG and X-
c were reported to be fully expressed in
Caco-2 monolayers and mediate the transport of glutamic acid, aspartic acid (Mordelle et al.,
2000) and cysteine (Andy et al., 2006) during the differentiation of caco-2 cells.
The aim of the current work is to investigate whether anionic amino acids (glutamic acid and
aspartic acid) would ion-pair strongly with the cationic model drug, TMP and if the new ion -

201
pairs would have better uptake across the Caco-2 monolayers. Both aspartic and glutamic acids
are similar in their structure apart from an extra alkyl group in the glutamic acid side chain.
4.3.2. Materials and methods
4.3.2.1. Materials
Trimethoprim, L-Glutamic acid (Reagent plus ≥ 99%), L-aspartic acid (≥ 98%) and ninhydrin
reagent (2% solution) were purchased from Sigma Aldrich, UK.
Sodium hydroxide and sodium chloride were purchased from Fisher Scientific UK.
Dulbecco’s modified Eagle’s medium (DMEM), fetal bovine serum (FBS), Nonessential amino
acids (NEAA), 1% pencillin-streptomycin, 2mM glutamine and Hank’s balanced salt solution
(HBSS) were purchased from Bio Sera, UK. 1% Trypsin–EDTA was obtained from Gibco Lab. UK.
RNeasy kit (RNA free water, buffer RLT, buffer RW1 and buffer RPE) was purchased from
Qiagen (Hiden, Germany). Gene expression hybridization kit, low input Quick Amp labelling kit,
RNA spike-in kit (one color) all were purchased from Agilent (Cedar Creek, Texas, USA). Agilent
gene expression washing buffer 1 and 2 were ordered from Agilent (Wilmington, DE, USA) and
Ethanol which was purchased from Fisher scientific (Leicestershire, UK).
4.3.2.2. Methods
4.3.2.2.1. Preparation of pre-saturated solution of 1-octanol and de-ionised water.
1000 ml of de-ionised water was added to 4 mL of 1-octanol. The mixture was shaken for few
minutes and left overnight. The de-ionised water was separated from 1-octanol using 1000 mL
separation funnel.
4.3.2.2.2. Octanol- water partitioning experiment
500 µg of TMP was added to 100 mL octanol-saturated deionised water with molar excess of
aspartic acid/glutamic acid (in ratios 1:1, 1:2, 1:4 and 1:8). 5 mL of the aqueous phase was
allowed to equilibrate with 5mL of octanol at room temperature and stirred for 24 hours using
magnetic stirrer. The two phases were then separated by centrifugation and TMP

202
concentration [TMPt]Aq in the aqueous phase was measured using HPLC. Mass balance was
used to calculated TMP concentration in octanol phase [TMPt]Oct using equation (4.3.1).
[TMPt]Oct = total drug put into the system- [TMPt]Aq Equation 4.3.35
The apparent distribution coefficient DB could be calculated using equation (4.3.2)
DB= [TMPt]Oct/[TMPt]Aq Equation 4.3.36
4.3.2.2.3. HPLC method to study the concentration of trimethoprim
The amount of Trimethoprim (TMP) dissolved in the solution samples was quantified using the
HPLC (Dionex 1100 system) method reported by Gallego and Arroyo (2002). HPLC was
operated at 25oC on RP-C18, (Phenomenex 110A, 150x4.6 mm, 5µm) column using
acetonitrile-NaH2PO4 buffer (10 mM) (70:30, v/v) (pH 3) as mobile phase which was pumped at
1.0 mL/min flow rate using gradient pump (GP50). UV detector (UVD 170U) was used and the
analysis was monitored at 230 nm. The retention time was 1.74±0.037 min and a rectilinear
calibration curve was established at concentrations ranging between 10- 500µg/mL (R2 of
0.99). LOD and LOQ were calculated using standard deviation of response and slope and were
found to be 0.109 and 0.364 respectively.
4.3.2.2.4. Ninhydrin analysis
The concentrations of aspartic acid and glutamic acid in octanol/water partitioning studies
were quantified using the ninhydrin method. In order to construct a calibration curve, serial
dilutions of the amino acids were prepared and 1 mL of the prepared samples was mixed with
0.5 mL of ninhydrin reagent and vortexed for 20 seconds. The samples were heated in a pre-
warmed water bath at 80 oC for 20 minutes. The samples were removed from the water bath
and left to cool. The intensity of the coloured Ruhemann purple was analysed using a UV
spectrophotometry at a wavelength of 560 nm.

203
Calibration curves were constructed with regression coefficients of 0.994 and 0.999 for
aspartic and glutamic acid respectively. After constructing the calibration curves, the
concentration of the amino acids in the aqueous layer were determined using the linear curve
equations (4.3.3) and (4.3.4) for aspartic acid and glutamic acid respectively.
Y=0.0695x Equation 4.3.37
Y=0.0895x Equation 4.3.38
Figure 4.3.56:- Ninhydrin calibration curve for aspartic acid (A), glutamic acid (B) n=3.
4.3.2.2.5. Procedure for Caco-2 cell culture
Caco-2 cells at passage 48 were gifted from Huddersfield University and used at passages 50-
80. Cells were allowed to grow in 75cm² T-flasks and maintained using Dublecco’s modified
Eagle’s medium (DMEM) with 10% fetal bovine serum (FBS), 0.5% pencillin-streptomycin, 2mM
glutamine and 1% nonessential amino acids (NEAA). Culture medium was changed every 2 to 3
y = 0.0695x
R2 = 0.994
0
2
4
6
8
10
12
14
16
18
0 50 100 150 200 250
Aspartic acid conc
Abs
orba
nce
A
B
y = 0.0895x
R2 = 0.9999
0
2
4
6
8
10
12
14
16
18
20
0 50 100 150 200 250
Concentration (ug/mL)
Abs
orba
nce

204
days and cells were grown at a temperature of 37°C and 5% CO2. The cells were passaged
using 5 mL trypsin-EDTA when they reached 90% confluence. A transepithelial transport assay
was carried out using Khan et al., (2011) methods. 2 x 10⁵cells/cm² were seeded on
polycarbonated-coated membranes (6-well transwell plates, 24mm, 4.7cm²) and were allowed
to grow for 21 days and the media in both apical and basal compartments was changed every
2-3 days. The transepithelial electrical resistance (TEER) was measured at the start and end of
every study.
4.3.2.2.6. Trimethoprim permeability studies
Caco-2 monolayers were used 19-21 days after seeding. The apical to basolateral permeability
of TMP and its formulations was assessed. The transwells were rinsed and incubated for 15
minutes with drug-free transport medium (Hanks balanced salt solution; HBSS). Following
incubation, HBSS was removed and 1.5 mL of the medium containing TMP alone (500 µg/mL)
and TMP with various molar ratios of the anionic amino acids (1:1, 1:2, 1:4 and 1:8) were
introduced to the apical side. Sample aliquots (300μL) were taken from the basolateral side at
given time intervals (0, 5, 10, 15, 20, 30, 60 and 90 minutes). After each sampling, an equal
volume of fresh transport buffer (pre-warmed at 37°C) was added to the receiver
compartment (basal side) and kept the cells at a temperature of 37°C and 5% CO2 during
experiment. Samples were subsequently analyzed by HPLC. In order to confirm the mass
balance, samples were taken from both apical and basolateral compartments at the last time
point (90 mins). All experiments were performed at 37°C (n = 5). Apparent permeability
coefficient Papp (cm/s) was calculated using (equation 4.3.5)
0/1/ ACdtdQPapp ×= Equation 4.3.39
Where dQ/dt is the rate of appearance of the drugs on the basolateral side (nmol s-1), Co is the
initial concentration on the apical side and A is the surface area of the monolayer (4.7 cm2).

205
The data presented were validated using HPLC measurement of drug transfer during the
process of permeability. This included repetition of drug permeability studies in the
preparations used for microarray analysis.
4.3.2.2.8. Recovery
The amounts of TMP recovered from both apical and basolateral compartments at the end of
the experiment were calculated using equation (4.3.6).
100(%)covRemin0
min90min90 ××
×+×=
DD
DDRR
VC
VCVCery
Equation 4.3.40
Low recovery data is attributed to entrapment of the compounds into the cell monolayers or
adsorption to the device surface which in turn results in error calculating the transport rate
(Aungst et al., 2000)
4.3.2.2.9. RNA extraction for microarray studies
Samples for microarrays studies was collected at 5, 30, 60 minutes for TMP, TMP:glutamic acid
at 1:1 (PM 1:1) and 1:8 (PM 1:8) molar ratios. Caco-2 monolayers were treated with ethanol:
phenol mixture (95:5) for 24 hours. Cell pellets were obtained by centrifugation of the
scrubbed cells at 2000 rpm and 4 oC for 10 minutes. All pellets were stored at -80 oC until the
RNA extraction step.
Total RNA was extracted by using RNeasy kit (Qiagen) and quantified using the Nanodrop 1000
spectrophotometer (Themoscientific, Wilmington, DE) and data are summarised in Table
(4.3.1).

206
Table 4.3.35:- Quantification of total RNA using nanodrop spectrophotometer.
Total RNA Sample
Conc
(ng/µl) 260/280
ratio 260/230
ratio Control 5 983.1 2.02 1.57
Control 60 842.5 2.01 1.94 TMP, 5 min 631.3 2.04 2.05
TMP: Glu 1:1, 5 min 952.1 1.99 1.92 TMP :Glu 1:8 , 5 min 851.8 1.96 1.63
TMP, 30 min 507.7 1.99 1.69 TMP : Glu 1:1, 30 min 362.2 1.98 1.68 TMP :Glu 1:8, 30 min 318 2.03 1.97
TMP 60 min 889.8 2 1.78 TMP: Glu 1:1, 60 min 614.3 1.99 1.29 TMP : Glu 1:8, 60 min 1286.3 1.99 1.82
4.3.2.2.10. Microarray study
In order to investigate the systemic changes of the gene expression upon exposing Caco-2 cells
to TMP and its various formulations, approximately 45,000 cDNA were hybridized with the
microarray probe using Agilant one-color-spike procedure. Briefly, 1.5µl of 25 ng of total RNA
was mixed with 2 µl of diluted one-color-spike mix. cDNA master mix (Agilent Technologies,
Santa Clara, CA) was used to prepare cDNA for all the samples which were labelled using cy3-
dUTP. The yield and specific activity (Table 4.3.2) for fluroscent cDNA probes were determined
by using equations 4.3.7 and 4.3.8 respectively, after quantifying cDNA (ng/µl) and cyanine 3
(pmol/ µl) using the Nanodrop 1000 spectrophotometer (Themoscientific, Wilmington, DE). All
samples were hybridized to Agilent 4x44 K whole genome array for 16 hours at 65 oC in
hybridization oven (Sheldon manufacturer, Corneilus, OR). After hybridization, samples were
scanned at 50n resolution and at 20 bit scan using an Agilent scanner (Agilent Technologies,
Santa Clara, CA). 16-bit TIFF images were obtained and used as input for the feature extraction
software (V10.7, Santa Clara, CA).
Yield 1000
... volumeelutioncRNAofConc ×= Equation 4.3.41
Specific activity 1000..
3.. ×=cRNAofConc
CyofConc Equation 4.3.42

207
Table 4.3.36:- Yield and specific activity of the complementary DNA used for hybridization in TMP
studies.
cDNA probe Sample
Conc
(ng/µl) 260/280
ratio cystine dye
pmol/ µl Yield
specific activity
Control 5 131.3 2.2 2.5 3.939 19.04
Control 60 165.2 2.2 3.1 4.956 18.7 TMP, 5 min 160.7 2.15 2.4 4.821 14.9
TMP: Glu 1:1, 5 min 226.4 1.97 1.7 6.792 7.5 TMP :Glu 1:8 , 5 min 148.5 2.15 2.6 4.4 17.5
TMP, 30 min 348.3 2.18 2.7 10.4 7.75 TMP : Glu 1:1, 30 min 214.1 2.29 1.7 6.42 7.94 TMP :Glu 1:8, 30 min 144.8 2.35 1 4.34 6.9
TMP 60 min 72.5 2.29 0.6 2.17 8.27 TMP: Glu 1:1, 60 min 257.1 2.16 1.6 7.71 6.22 TMP : Glu 1:8, 60 min 257.1 2.19 1.6 7.71 6.223259
4.3.2.2.11. Data Processing (Image analysis and data normalization)
The feature extraction software (V10.7, Santa Clara, CA) was used to study the quality of the
obtained images. The image was analysed in terms of grid alignment, signal quantification and
overall slide quality.
Background intensities in the DNA microarray data such as optical background and non-specific
binding (NSB) were adjusted using the R library gcrma (Boes and Neuhäuser, 2005). The gcrma
converted the background adjusted probe intensities into expression measures (Fig. 4.3.2)
while, the probe sequence information were used to estimate probe affinity to non-specific
binding (NSB). The levels of probe intensities between the arrays before and after
normalization were compared using box-plots. The middle line of the box-plot represents the
median while the two ends of the box represent the upper and lower quartiles. Values which
are more than 1.5 the interquartile range are outliners (small circles), while the horizontal lines
connected to the box-plots are not considered outliners. Figure (4.3.2A) shows that the
intensities levels for most of the arrays differ and were corrected upon normalization (Fig.
4.3.2B).

208
Figure 4.3.57:- Box-plots showing raw data before normalization (A), and centred distributed
normalized microarray data (B).
4.3.2.2.12. Data clustering and filtering
Data clustering was carried out on the normalized data using TMEV software (version TM4,
WA, USA). The genetic changes were clustered according to their similarities in the pattern of
their expression using hierarchical clustering algorithm. The mean values were used to
compare between the various data sets used in this study. In order to highlight the main
variability in the multidimensional data set principle component analysis was carried out using
TMEV software. Microsoft excel (version 2003, Toulouse, France) was used to filter out the
non-expressed genes or the genes which do not show variation across sample types. Genes
which were up or down regulated by two fold were selected for further analysis. Equations
(4.3.9 and 4.3.10) were used to calculate the folds of up or down-regulation of the expressed
genes when compared against the control (Caco-2 cells).
In order to investigate the changes occurring in various pathways during the absorption
process, up and down-regulated genes were uploaded online onto Kyoto Encyclopaedia of
A B

209
Genes and Genomes (KEGG) http://www.genome.jp/kegg/ and the expression changes
were high- lighted in red.
)()( 2 CE
CEIF −> = Equation 4.3.43
)()( 2 EC
CEIF −< −= Equation 4.3.44
4.3.3. Results and discussion
4.3.3.1. Octanol-Water partitioning.
In order to investigate the partitioning behaviour and hence the passive diffusion capacities of
the cationic drug upon pairing with the anionic amino acids, octanol/water partitioning (log P)
was carried out. For this study both the free drug and salt form were paired with the anionic
counter ions to investigate whether the salt form has any advantage over the free TMP during
the partitioning and absorption studies.
During partitioning, it is assumed that an ion-pair is formed between TMP (basic drug) and the
acidic amino acids (aspartic/glutamic acid) in octanol-water mixture. The formation and
destruction of ion-pairing and partitioning process between octanol-water will take place at
equilibrium conditions. The association constant for ion-pair formation in the aqueous phase
(K11aq) is calculated using equation (4.3.11).
aqaq
aqaq BA
ABK
][][
][11 =
Equation 4.3.45
Where [A]aq, [B]aq and [AB]aq are the concentrations of the acidic counter ion, TMP and the ion-
pair in the aqueous phase respectively.
The total amount of TMP in octanol would exist only as an ion-pair which means that [Bt]oct will
equal [AB]oct and the apparent octanol aqueous distribution coefficient of TMP can be
calculated using equation (4.3.12).

210
aqaq
octB ABB
ABD
][][
][
+=
Equation 4.3.46
Where [B]aq represents the concentration of TMP free drug in the aqueous phase and [Bt]aq is
the total concentration of TMP in the aqueous phase [Bt]aq= [B]aq+[AB]aq.
The intrinsic partition coefficient of the ion-pair in octanol-water, PAB is defined as the ratio
between the ion-pair concentration in octanol to its concentration in water equation (4.3.13)
aq
octAB AB
ABP
][
][=
Equation 4.3.47
Upon combining equations (4.3.11) (4.3.12) and (4.3.13), a common equation is obtained.
ABaqABaqB PAPKD
1
][
11
11
+=
Equation 4.3.48
Upon plotting the double reciprocal of the apparent octanol-water distribution coefficient of
TMP as a function of the acidic amino acid concentration (i.e plotting 1/DB Vs 1/[A]aq) an
exponential curve is obtained and is used to calculate K11aq and PAB. The concentration of TMP
in the aqueous layer was determined using HPLC method , while the concentrations of the
anionic amino acids were calculated using ninhydrin test.
In this study the partitioning behaviour of TMP and TMP aspartate salt at various molar ratios
of aspartic acid were studied and summarised in figures (4.3.3 & 4.3.4). Log P value for TMP
was calculated using the octanol/water partitioning method and was found to be 1.07 (Fig.
4.3.3) which comes in line with the previous findings by Kasim et al., 2003. On the other hand,
the log P value for the salt form was significantly lower than that of the free drug (log P= -1.13)
which reflects the very high polar nature of the salt form.

211
0
200
400
600
800
1000
1200
0 1 2 4 8
X molar concentration of aspartic acid
Con
c (µ
g/m
L)
-1.5
-1
-0.5
0
0.5
1
1.5
Log
P
Aqueous conc Octanol conc Log P
Figure 4.3.58:- TMP partitioning in the aqueous and octanol layers and its corresponding Log P values
at various concentrations of aspartic acid (n=3).
Increasing the molar ratios of aspartic acid was found to decrease the partitioning capacity of
TMP in the octanol layer and increase the migration of the cationic drug into the aqueous
phase and hence the Log P values was found to decrease steadily as the molar ratio of the
anionic amino acid increases (Fig. 4.3.3). TMP Log P value was halved upon incorporating
aspartic acid at 1: 1 ratio and became 0.157 and -1.08 when aspartic acid was increased to PM
1:2 and PM 1:8 ratios.
For the salt form, increasing the concentration of aspartic acid resulted in very poor
partitioning into the octanol layer as all the TMP molecules were detected in the aqueous
phase. Although dissociation of TMP aspartate salt was expected to take place in water
yielding the ionised form of the cationic drug and the anionic amino acid at 1:1 ratio, the
partitioning behaviour of the salt form was different from the TMP: aspartic acid physical
mixture at 1:1 molar ratio, probably because of the self-buffering capacity of the salt forms
which yield different pH at the diffusion bilayer between the aqueous and oily phase as
suggested by Forbes et al., 1995; ElShaer et al., 2011.

212
-100
0
100
200
300
400
500
600
700
0 1 2 4 8
Molar concentration of excess of aspartic acid
Con
c (µ
g/m
L)
Aqueous conctration
octanol concentration
Figure 4.3.59:- TMP aspartate partitioning in the aqueous and octanol layers at various concentrations
of aspartic acid (n=3).
The difference in the buffering capacities between the salt form and the physical mixtures
resulted in significant difference in the partitioning behaviours as suggested by Sangster,
(1989).
In order to calculate the K11aq and PAB, the double reciprocal plots of apparent octanol/water
distribution coefficient of TMP at various molar concentrations of aspartic acid was evaluated
(Fig. 4.3.5). Similar to IND studies, a strong negative exponential relationship (R2=0.94) was
observed. Increasing the molar concentration of aspartic acid resulted in an exponential
decrease in the partition coefficient of TMP due to the low inherent lipophilicity of aspartic
acid (Log P= -3.89).

213
y = 1.0509x-1.6968
R2 = 0.9447
0
2
4
6
8
10
12
14
0 0.5 1 1.5 2 2.5 3 3.5
1/no of moles of aspartic acid
1/D
B
Figure 4.3.60:- Double reciprocal plot of the apparent octanol-water distribution coefficient of TMP as
function of aspartic acid molar concentration.
The equation (equation 4.3.15) obtained from figure (4.3.5) was used to calculate the intrinsic
octanol water partitioning (PAB) and the aqueous binding constant (K11aq)
The intercept of the curve = -1.69x Log 1.05 and equals 1/intrinsic octanol/water partitioning
(1/PAB). Hence PAB was found to be 27.9 while K11aq equals 0.021 mM-1 (21 M-1).
698.1059.1 −= xY
Equation 4.3.49
4.3.3.2. Permeability studies of TMP aspartic acid ion-pairs
The absorption profiles of TMP and TMP aspartate salt at various ratios of aspartic acid were
studied and summarised in (Fig. 4.3.6). The concentration of TMP (500 µg/mL) was kept
constant for all the experiments while the concentration of aspartic acid was changed. TEER
values were measured before and after the run of the experiments and recorded in Table
(4.3.3.) TEER values demonstrate the full integrity of the Caco-2 monolayers as all the values
were higher than 300 Ω/cm2 (Miller et al., 2010).
Table 4.3.37:- TEER measurements for TMP aspartate formulations before and after the permeability
assay (n=5)

214
Formulations TEER (Ω/cm2) Before After
TMP free base 502±33 504±44 TMP: aspartic 1:1 532±87 462±46 TMP: aspartic 1:2 563±56 503±90 TMP: aspartic 1:4 547±16 544±81 TMP: aspartic 1:8 486±45 515±25
TMP aspartate salt 552±42 556±41 TMP asp salt: aspartic 1:1 552±67 515±30 TMP asp salt: aspartic 1:2 627±19 561±13 TMP asp salt: aspartic 1:4 611±8 568±10 TMP asp salt: aspartic 1:8 572±30 552±3
0
5
10
15
20
25
5 10 15 30 60 90
Time (mins)
% T
rans
port
ed
TMP TMP Aspartic PM 1.1 TMP Aspartic PM 1.2 TMP Aspartic PM 1.4 TMP Aspartic PM 1.8
Figure 4.3.61:- Percentage of TMP transported across Caco-2 monolayers from TMP alone
formulations and its physical mixtures (PM) with various molar ratios of aspartic acid (n=5). One way
analysis of variance (ANOVA) and pair-wise multiple comparisons method (Tukey test) against drug
alone at each time point were used for statistical analysis and probability values of (P< 0.05, * and
P<0.001,***) were used to determine the significant difference.
The percentage of TMP transported across Caco-2 cells was found to increase with time. For
instance, the percentage absorbed of TMP aspartic acid physical mixture at 1:1 ratio (PM 1:1)
was 5.2±1.5 after 5 minutes and increased to 18.75±3.38 after 60 minutes.
Interestingly, no significant difference (p>0.05) was observed between the percentages of TMP
transported at various ratios of aspartic acid, apart from PM 1:8 ratio. It could be argued that
the lack of difference in the permeability profile for the prepared ion-pairs is due to the weak
aqueous binding constant (K11aq = 21 M-1) between TMP and aspartic acid. Interestingly, the
percentage of TMP transported dropped significantly (p<0.001) when aspartic acid was used at
*
*** *
*
*** * *** *

215
8x molar concentrations of TMP and the Papp decreased from (8.78±1.16)x10-6 for TMP to
(5.39±0.3)x10-6 at PM 1:8 ratio (Fig. 4.3.8) probably because of the very high increase in the
polarity of the cationic drug brought by the significant drop of the pH of the media by aspartic
acid. It was suggested in chapter (3.3) that the high content of amino acid might saturate the
amino acid or the dipeptidyl transporters which are involved in uptake of the ion-paired
formulation but this is unlikely to occur in the current study because of the very low K11aq for
TMP aspartic acid ion-pairing as the ion-pairs cannot be transported as one moiety through the
membrane transport carriers.
On studying the permeability profile of TMP aspartate salt alone and with excess of aspartic
acid (Fig. 4.3.7), the data showed no significant difference (p>0.05) between the absorption
profiles of the various formulations during the first 30 minutes (Fig. 4.3.7). At 60 minutes of the
permeability assay, it was observed that the percentage permeated from the salt form
(18.2±0.12) is significantly higher than that from TMP alone (12.18±2.3), and this percentage
increased more at TMP aspartate: aspartic acid salt mixture (SM 1:2) to (25.35±3.95).
Similar to the previous studies carried out on IND, at molar ratios greater than SM 1:2 and
especially at SM 1:8, the percentage of TMP transported across the Caco-2 membrane started
to decrease again to reach (11.13±1.6%) at 60 minutes.
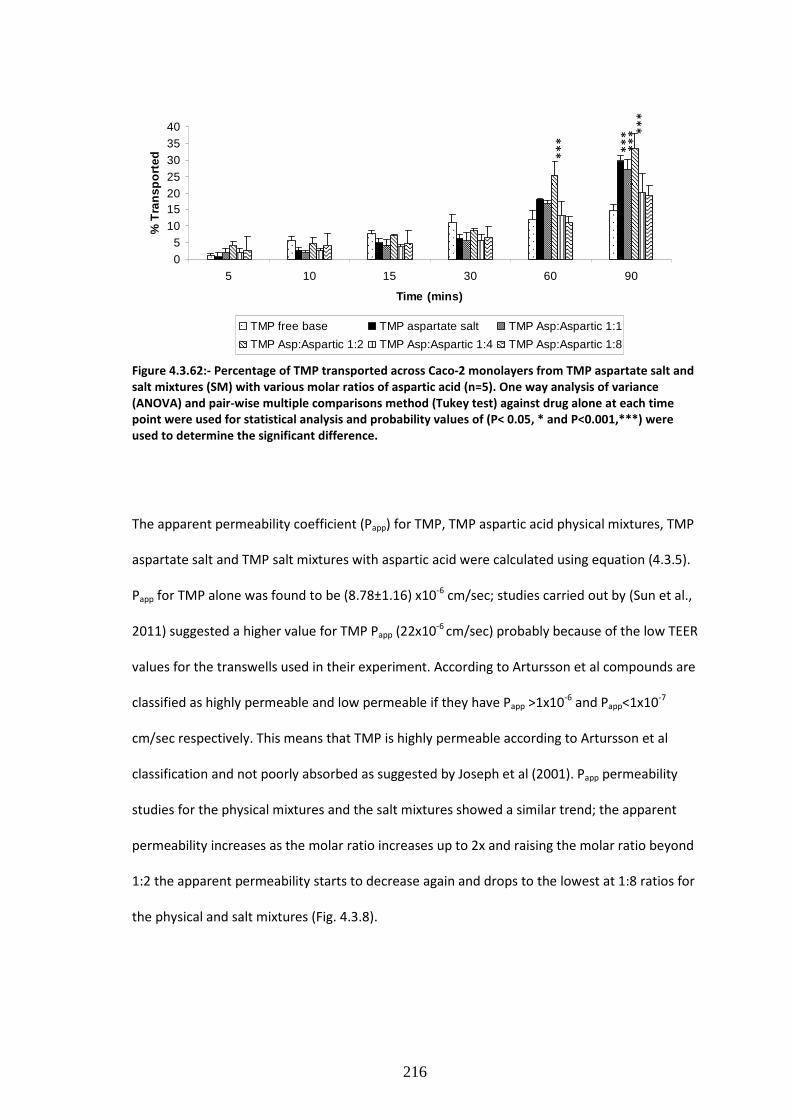
216
05
10152025303540
5 10 15 30 60 90
Time (mins)
% T
rans
port
ed
TMP free base TMP aspartate salt TMP Asp:Aspartic 1:1
TMP Asp:Aspartic 1:2 TMP Asp:Aspartic 1:4 TMP Asp:Aspartic 1:8
Figure 4.3.62:- Percentage of TMP transported across Caco-2 monolayers from TMP aspartate salt and
salt mixtures (SM) with various molar ratios of aspartic acid (n=5). One way analysis of variance
(ANOVA) and pair-wise multiple comparisons method (Tukey test) against drug alone at each time
point were used for statistical analysis and probability values of (P< 0.05, * and P<0.001,***) were
used to determine the significant difference.
The apparent permeability coefficient (Papp) for TMP, TMP aspartic acid physical mixtures, TMP
aspartate salt and TMP salt mixtures with aspartic acid were calculated using equation (4.3.5).
Papp for TMP alone was found to be (8.78±1.16) x10-6 cm/sec; studies carried out by (Sun et al.,
2011) suggested a higher value for TMP Papp (22x10-6 cm/sec) probably because of the low TEER
values for the transwells used in their experiment. According to Artursson et al compounds are
classified as highly permeable and low permeable if they have Papp >1x10⁻⁶ and Papp<1x10⁻⁷
cm/sec respectively. This means that TMP is highly permeable according to Artursson et al
classification and not poorly absorbed as suggested by Joseph et al (2001). Papp permeability
studies for the physical mixtures and the salt mixtures showed a similar trend; the apparent
permeability increases as the molar ratio increases up to 2x and raising the molar ratio beyond
1:2 the apparent permeability starts to decrease again and drops to the lowest at 1:8 ratios for
the physical and salt mixtures (Fig. 4.3.8).
*** ***
***
***

217
0.00E+002.00E-064.00E-066.00E-068.00E-061.00E-051.20E-051.40E-051.60E-051.80E-052.00E-05
TMP free base
PM 1:1
PM 1:2
PM 1:4
PM 1:8
TMP aspartate sa
lt
SM 1:1
SM 1:2
SM 1:4
SM 1:8App
aren
t per
mea
bilit
y (c
m/s
ec)
Figure 4.3.63:- Papp permeability values at 60 minutes for TMP, TMP aspartate and their mixtures with
various molar ratios of aspartic acid. One way analysis of variance (ANOVA) and pair-wise multiple
comparisons method (Tukey test) against drug alone at each time point were used for statistical
analysis and probability values of (P< 0.05, * and P<0.001,***) were used to determine the significant
difference.
4.3.3.3. Partitioning studies for TMP glutamate formulations
In order to investigate the effect of the side chain of the amino acid counter ion on the binding
capacity occurring during the ion-pair formation, glutamic acid was used. Glutamic acid has a
similar structure to aspartic acid apart from an additional alkyl side chain (-CH2-).
Octanol/water partitioning for TMP glutamic acid physical and salt mixtures was studied and
summarised in (Fig. 4.3.9&4.3.11). Similar to TMP aspartic acid partitioning studies discussed
above, the ability of TMP to partition into the organic phase was found to decrease gradually
as the molar concentration of glutamic acid increases. TMP Log P value was 1.07 and
decreased to 0.33 at PM 1:2 with glutamic acid and -0.27 at 1:8 molar ratio of TMP to glutamic
acid respectively. Increasing the concentration of glutamic acid results in lowering of the pH of
the media and in turn enables the domination of cationic charge on TMP thereby influencing
its solubility.
***
*
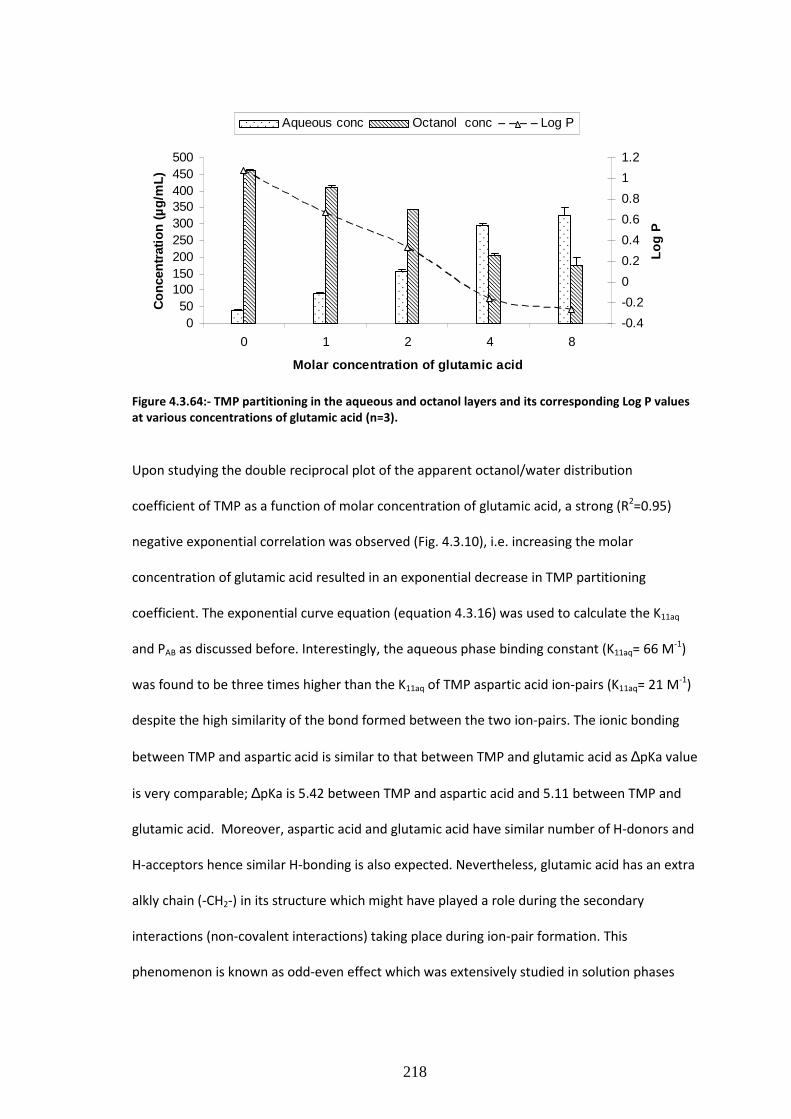
218
050
100150200250300350400450500
0 1 2 4 8
Molar concentration of glutamic acid
Con
cent
ratio
n (µ
g/m
L)
-0.4
-0.2
0
0.2
0.4
0.6
0.8
1
1.2
Log
P
Aqueous conc Octanol conc Log P
Figure 4.3.64:- TMP partitioning in the aqueous and octanol layers and its corresponding Log P values
at various concentrations of glutamic acid (n=3).
Upon studying the double reciprocal plot of the apparent octanol/water distribution
coefficient of TMP as a function of molar concentration of glutamic acid, a strong (R2=0.95)
negative exponential correlation was observed (Fig. 4.3.10), i.e. increasing the molar
concentration of glutamic acid resulted in an exponential decrease in TMP partitioning
coefficient. The exponential curve equation (equation 4.3.16) was used to calculate the K11aq
and PAB as discussed before. Interestingly, the aqueous phase binding constant (K11aq= 66 M-1)
was found to be three times higher than the K11aq of TMP aspartic acid ion-pairs (K11aq= 21 M-1)
despite the high similarity of the bond formed between the two ion-pairs. The ionic bonding
between TMP and aspartic acid is similar to that between TMP and glutamic acid as ∆pKa value
is very comparable; ∆pKa is 5.42 between TMP and aspartic acid and 5.11 between TMP and
glutamic acid. Moreover, aspartic acid and glutamic acid have similar number of H-donors and
H-acceptors hence similar H-bonding is also expected. Nevertheless, glutamic acid has an extra
alkly chain (-CH2-) in its structure which might have played a role during the secondary
interactions (non-covalent interactions) taking place during ion-pair formation. This
phenomenon is known as odd-even effect which was extensively studied in solution phases

219
(Pistolis et al., 2005) and is believed to affect the packing of the molecules, morphology and
physical properties (Khan et al., 2011).
y = 0.8534x-1.0615
R2 = 0.9515
0
0.5
1
1.5
2
2.5
0 0.5 1 1.5 2 2.5 3 3.5 4
1/no of moles of glutamic acid
1/D
B
Figure 4.3.65:- Double reciprocal plot of the apparent octanol-water distribution coefficient of TMP as
function of glutamic acid molar concentration.
06.185.0 −= xY
Equation 4.3.50
Conversely, studying the partitioning behaviour of TMP glutamate salt showed that the
partitioning of the TMP glutamate salt in the aqueous layer was very high even at the low
concentrations of glutamic acid (Fig. 4.3.11). The log P value for the salt form was -0.738
reflecting the high hydrophilicity of the salt. Log P value was found to decrease upon increasing
the molar ratio of glutamic acid until it reached -1.55 at 1:8 ratio of the salt to aspartic acid (Fig
4.3.11).
Such a difference in the partitioning behaviour of the salt form from the physical mixture could
be explained by the self-buffering capacity of the salt form as discussed above.

220
422.8268 423.8132
494.4228 493.3571 486.305
77.17323 76.18678
5.577176 6.642857 13.694990
100
200
300
400
500
600
0 1 2 4 8
Molar concentration of glutamic acid
Con
cent
ratio
n (µ
g/m
L)
-2.5
-2
-1.5
-1
-0.5
0
Log
P
Aqueous conc Octanol conc Log P
Figure 4.3.66:- TMP glutamate partitioning in the aqueous and octanol layers at various
concentrations of glutamic acid (n=3).
The double reciprocal plot of the apparent octanol/water distribution coefficient of TMP
glutamate salt as function of the molar concentration of glutamic acid is summarised in Fig
(4.3.12).
From the curve equation (equation 4.3.17) the intercept was found to be (-4.8x Log 1.16) and
equals 1/intrinsic octanol water partitioning (1/PAB), hence PAB equals 3.2. While, the slope was
-4.8 and equals 1/K11aqPAB. Therefore K11aq will equal 64 M-1.
8.4163.1 −= xY
Equation 4.3.51
Although the partitioning behaviour of the salt form was different from that of the physical
mixtures, the aqeous phase binding constant was the same when the salt form and the free
drug was used in the double reciprocal studies.

221
y = 1.1638x-4.8069
R2 = 0.7618
0
20
40
60
80
100
120
0 0.1 0.2 0.3 0.4 0.5 0.6 0.7 0.8 0.9
1/no of moles of glutamic acid
1/D
B
Figure 4.3.67:- Double reciprocal plot of the apparent octanol-water distribution coefficient of TMP
glutamate salt as function of glutamic acid molar concentration.
4.3.3.4. Permeability studies for TMP glutamic formulations
The effect of various molar concentrations of glutamic acid on the absorption profile of TMP
and TMP glutamate salt was studied (Fig. 4.3.13 & 4.3.14). All the transwells used for this study
showed TEER values higher than 300 Ω/cm2. For all the formulations, the percentage of TMP
transported across the Caco-2 monolayers increased with time. The percentage of TMP
absorbed after 5 minutes of the permeability assay was 1.02±0.84 % and increased gradually
to 14.7±1.94 % after 90 minutes. Incorporating glutamic acid with TMP at 1:1 molar ratio
resulted in a significant increase in TMP absorption at all the time points. For instance, the
percentage of TMP absorbed from TMP alone formulations was 12.18±2.3% after 60 minutes
and increased to 40.3±1.71% when glutamic acid was added at 1:1 molar ratio to TMP. Further
increase was observed at PM 1:2 which remained constant at PM 1:4 and started to decrease
again at PM 1:8 of TMP to glutamic acid (Fig. 4.3.13).

222
0
10
20
30
40
50
60
70
5 10 15 30 60 90
Time (mins)
% T
rans
porte
d
TMP free base TMP glutamate PM 1:1 TMP glutamate PM 1:2
TMP glutamate PM 1:4 TMP glutamate PM 1:8
Figure 4.3.68:- Percentage of TMP transported across Caco-2 monolayers from TMP alone
formulations and its physical mixtures (PM) with various molar ratios of glutamic acid (n=5). One way
analysis of variance (ANOVA) and pair-wise multiple comparisons method (Tukey test) against drug
alone at each time point were used for statistical analysis and probability values of (P< 0.05, * and
P<0.001,***) were used to determine the significant difference.
Although octanol/water partitioning studies showed a decrease in the partitioning ability of
TMP into the organic layer upon pairing with glutamic acid, permeability studies showed better
absorption at PM 1:1, PM 1:2 and PM 1:4. The partitioning data suggest that passive
absorption is reduced upon pairing the cationic drug with the anionic amino acid. However,
the increase in the overall uptake suggests the involvement of active transporter carriers
during the permeation process.
TMP permeability from the salt form and the salt mixtures are shown in Fig. (4.3.14). The use
of TMP glutamate salt resulted in a significant increase in the absorption profile of TMP despite
having lower Log P value and partitioning capacities. The percentage of TMP absorbed was
increased by around 6% upon using the salt form after 5 minutes of running the permeability
experiment. The total percentage of TMP absorbed from the salt form at the end of the
experiment was 22.99±5.74% compared to 14.7±1.94 %from the free drug. Similar to the
physical mixture, increasing the molar ratio of the counter ion significantly (p<0.001) increased
*** *** ***
* *
***

223
the permeability profile of TMP especially at SM 1:1 and SM 1:4 which again started to drop at
SM 1:8.
0
10
20
30
40
50
60
5 10 15 30 60 90
Time (mins)
% T
rans
port
ed
TMP free base TMP glutamate salt TMP glu: glutamic 1:1
TMP glu: glutamic 1:2 TMP glu: glutamic 1:4 TMP glu: glutamic 1:8
Figure 4.3.69:- Percentage of TMP transported across Caco-2 monolayers from TMP glutamate salt and
salt mixtures (SM) with various molar ratios of glutamic acid (n=5). One way analysis of variance
(ANOVA) and pair-wise multiple comparisons method (Tukey test) against drug alone at each time
point were used for statistical analysis and probability values of (P< 0.05, * and P<0.001,***) were
used to determine the significant difference.
The Papp permeability for all TMP formulations is shown in figure (4.3.15).The data shows that
glutamate PMs and SMs have higher Papp when compared to that of the free base and
aspartate formulations. This may be attributed to the high aqueous binding constant between
the glutamate counter ion and TMP base (K11aq= 64 M-1) compared to that between aspartate
and TMP (K11aq= 21 M-1) i.e three times higher.
*** * *
***
***
***
*** *** ***
***
***
***

224
0.00E+00 1.00E-05 2.00E-05 3.00E-05 4.00E-05
TMP free base
TMP asp PM 1:1
PM 1:2
PM 1:4
PM 1:8
TMP aspartate salt
SM 1:1
SM 1:2
SM 1:4
SM 1:8
TMP glu PM 1:1
PM 1:2
PM 1:4
PM 1:8
TMP glu salt
SM 1:1
SM 1:2
SM 1:4
SM 1:8
Apparant permeability (cm/sec)
Figure 4.3.70:- Papp permeability values at 60 minutes for TMP, TMP aspartate, TMP glutamate and
their PM and SM with aspartic acid and glutamic acid.
Microarray studies
Permeability data discussed earlier in this chapter showed a significant increase of the amount
of TMP absorbed across Caco-2 monolayers upon ion-pairing the drug with glutamic acid.
Therefore, three formulations were selected for the microarray study; namely TMP alone, TMP
1:1 PM and TMP 1:8 PM and time course analysis at 5, 30 and 60 minutes was studied as

225
cellular changes are affected by the time course of exposure to therapeutic agent. The
expression patterns for the cells at the basal state (without exposure to TMP or any other
formulations) were used as control. After RNA extraction and quantification, around 45,000
cDNA were hybridized with the microarray probe using Agilent one-color-spike procedure and
microarrays slides were scanned and quality of the obtained TIFF images was analyzed prior to
carrying out data normalization and clustering.
4.3.3.5. Image analysis
Finding spot centroids is a critical feature to ensure the quality of the microarray image. If the
location of one or more of the spot centroids is off-centre, hybridization has to be carried out
again using new grid. The four spot centroids in the current experiment were mapped
accurately (Fig. 4.3.16A) for all slides which reflects the high quality of the used slides and
successful hybridization of the probes.
Figure 4.3.71:- Microarrays image analysis showing Spot Finding of the Four Corners of the Array (A),
Histogram of Signals Plot (B) data were generated by feature extraction software.
The level of signal and shape of signal distribution were also evaluated using feature extraction
software. A histogram of the line plot of number points in the intensity bins against the
logarithm of the processed signal was obtained (Fig 4.3.16B). The obtained histogram showed
that the intensity bins were normally distributed with a good bell shape (symmetric) reflecting
A B

226
the high quality of the signals. A good correlation between the logarithmic values of the
processed signal and the logarithmic values of the corresponding concentrations was obtained
for most of the slides with R2 values ranging between 0.99 and 1 (Fig. 4.3.17A).
In order to evaluate multiplicative detrending, the median of the processed signal and the
median of the background subtracted signal (mean signal- BG used) for each column and over
all the rows on the arrays were plotted which yielded a flat line (Fig 4.3.17B) indicating low
multiplicative detrending (i.e. similar intensities from various replicate probes on the
microarray slide). One-color-spike chips have number of probe replicates across the microarray
and these replicates were used to evaluate the reproducibility of the signals. A low median
coefficient of variation (%CV) of 3.9 was obtained reflecting the high signal reproducibility
across the arrays. Image quality analysis was satisfactory for all the used arrays and the
obtained data was used for normalization and further analysis.
Figure 4.3.72:- Correlation between log signal against log Relative concentration (A) and spatial
distribution of median signals for each column (B).
A B

227
4.3.3.6. Data Clustering and Principle component analysis (PCA)
The data obtained from each microarray experiment is highly complex in terms of quantity and
dimensions. Many statistical and computational approaches (i.e. supervised learning) are
employed in order to interpret the biological meaning of the data (Fisher, 1936). Data
clustering or unsupervised learning is another analysis method which is used to reduce data by
adding the observations into a cluster which can be represented by an average value. Various
clustering computational approaches are available including; K-means clustering (Hartigan and
Wong., 1979), hierarchical clustering (Everitt and Rabe-Hesketh, 1997; Eisen et al., 1998), self-
organizing maps (Kohonen, 1990) and artificial network (Bishop, 1996). As none of these
methods offer any specific advantage over each other, hierarchical clustering was used in this
study as it measures the distance between rows of various data to cluster them. After
measuring the distance between every couple of genes, the algorithm then merges the genes
which are close to each other (i.e. has shorter distance between them) into one cluster. The
midpoint of the two merged genes is used to merge the distance between them and other
genes. This iteration takes place for the all data set and final cluster is obtained showing the
up-regulated genes in red and the down regulated genes in green (Fig. 4.3.18).

228
Figure 4.3.73:- Data clustering for TMP formulations at various time points; green clusters show down-
regulations while red clusters show up-regulations.
As the experimental conditions for all the arrays are controlled, any variation in the expression
pattern will be introduced by the conditions under investigation i.e. as a result of exposure to
various formulations. Nevertheless, this study measured 45,000 genes at 11 different
conditions. Therefore the obtained data could form a matrix of 11x45,000 measurements. If a
scatter plot of 11 axes (one axis for each experimental condition) was used to plot these
45,000 genes in muti-dimensional space, the resultant graph will be a cloud of values in the
space. Therefore, principle component analysis (PCA) was used to identify the dimension
where the data (cloud) is more extended.
TMEV software was used to calculate the Eigen values for the 11 principle components and the
highest Eigen values were shown by the first three principle components. In total 69.5% of the
genetic changes were extended along the first, second and third principle components. Hence,

229
the first three components were selected for analysis of gene expression changes occurring
during the uptake of TMP, TMP 1:1 PM and TMP 1:8 PM.
First and second PCA showed that the time course had a great effect on the expression pattern
of the genes. At the beginning of the experiment (i.e. 5 minutes) most of the genetic
expressions were centered around the origin, suggesting minimal variations at the first five
minutes of permeability study. Leaving the formulations for another 25 minutes (i.e. after 30
minutes of the beginning of the permeability assay) resulted in significant changes in the
cellular behavior of Caco-2 monolayers (Fig. 4.3.19) where the majority of the genetic changes
occurred along the first component (40.85% as suggested by Eigen values). These changes
returned back to the origin after 60 minutes of exposing the cells to TMP, TMP 1x and TMP 8x.
Figure 4.3.74:- First and second principal component analysis on the transcriptional time course for
TMP and its various ion-paired formulations at 0, 30 and 60 minutes. The number represents the time
points. The plot represents the data for the mean values at each time point.

230
9.2% of the genetic changes occurred at the third principle component and were attributed to
the genetic changes that took place after 60 minutes of exposing the cells to ion-paired
formulations (Fig. 4.3.20).
Figure 4.3.75:- First and third principal component analysis on the transcriptional time course for TMP
and its various ion-paired formulations at 0, 30 and 60 minutes. The number represents the time
points. The plot represents the data for the mean values at each time point.
4.3.3.7. Genetic changes of transporters pathways
Cellular behavior including physiological changes in disease condition or in response to toxic
agents or drug treatment is reflective of the pattern of gene expression. Monitoring such
changes enables better understanding of disease progression or toxic and therapeutic effects
of drugs which results in better targeting of disease conditions at cellular level thereby
promoting higher therapeutic efficacy. The aim of the current study was to understand and
study differences in gene expression profile upon exposure to different formulation types of

231
the drug candidate during permeability across Caco2 monolayers. Results obtained from
permeability studies showed significant increase in drug uptake of some of the ion-paired
formulations when compared to the free form of the drug and other formulations at various
ratios of the counter ions. Drug absorption across the gastrointestinal tract is affected by many
variables such as drug solubility, partitioning abilities, pH of the surrounding environment and
genetic changes along the intestinal membrane. The majority of the physicochemical
properties of TMP and CIP that could affect their uptake were evaluated prior to studying the
genetic changes taking place across the cells. Microarray studies were carried out to visualize
how different genes of various pathways vary in expression upon exposure to therapeutic
agent and various formulations with a particular emphasis on transporter carrier genes. In
order to carry out the microarrays experiment cDNA were hybridized with approximately
45,000 gene probes attached to the microarrays chips. After normalization and clustering
analysis, the obtained data were filtered and only genes which were over-expressed or down-
regulated by two fold or more when compared against the control were selected for further
investigations.
Genetic changes that occurred after exposing Caco-2 cells to TMP alone formulations for 5, 30
and 60 minutes were monitored (Fig. 4.3.21). One ABC transporter was over-expressed after 5
minutes of exposure to TMP. The number of up-regulated ABC transporters increased to 5
after 30 and 60 minutes of the permeability assay. The numbers of ABC genes down-regulated
were 1, 10 and 7 after 5, 30 and 60 minutes respectively.

232
Figure 4.3.76:- Total number of ABC genes over-expressed ( ), suppressed ( ) and unchanged ( )
after 5 minutes (A), 30 minutes (B) and 60 minutes (C) of exposure to TMP.
Table (4.3.4) summarises all the ABC transporters over-expressed during TMP permeability
across Caco-2 monolayers. MRP7 was among the over-expressed genes after 5 minutes and 30
minutes of TMP uptake across the cells. The transporter gene was over-expressed in more
than one of the replicate probes which reflects the high involvement of MRP7 in mediating the
efflux of TMP. MRP7 is member 7 of multiple resistance protein and is also known as ABCC10.
MRP7 has similar topology to other ABCC members such as MRP 1, 2, 3 and 6 as it has three
membrane binding domains and two nucleotide binding domains (Kuang et al., 2010). Various
studies suggested that MRP7 is expressed in cancer cells and confers resistance to a range of
chemotherapeutic agents (Naramoto et al., 2007). Drugs such as 17-β-estradiol, paclitaxel,
vincristine, vinblastine (Chen et al., 2003; Hopper-Borge et al., 2004) and vinorelbine (Bessho
et al., 2009) were reported to be effluxed by MRP7. Microarray results suggest that MRP7
plays a key role in the efflux of TMP and hence decreases the overall uptake of the drug across
the epithelial membranes. The role of MRP7 in TMP efflux was not reported before in the
literature where majority of the previous studies reported the involvement of P-gp (Joseph et
al., 2001; Murakami and Takano, 2008) in TMP efflux. In the current study, P-gp was not
filtered as up or down-regulated gene and having investigated the expression changes of P-gp
it was found to be less than 2 fold up-regulated (1.83 fold) which suggests the relatively lower
91
1
1
510
78
57
81
A B C

233
role of P-gp in mediating TMP efflux. These results are in consensus with Romiti et al’s (2002)
suggestion that TMP efflux is not supported by P-gp activity in HK-2 cells even at high
concentrations of the drug (50 µM) (Romiti et al., 2002).
Table 4.3.38:- Summary of the over-expressed ABC transporters during TMP permeability across Caco-
2 monolayers.
Time point probes Gene symbol Expression level 5 minutes A_23_P215720 MRP7 2.02
30 minutes A_23_P215720 MRP7 2.85
A_32_P29703 ABCA17P 2.22
A_24_P235429 ABCA1 2.04 A_23_P78018 ABCA5 2.47
A_23_P92602 ABCA11P 2.53 60 minutes A_32_P29703 ABCA17P 2.57
A_23_P43504 ABCA2 2.15 A_24_P235429 ABCA1 2.02
A_23_P78018 ABCA5 2.40 A_23_P201918 ABCB10 2.42
Another interesting finding is that many members of ABCA family -including ABCA1, ABCA5
and ABCA17- were over-expressed upon treating the cells with TMP. The three transporter
genes were up-regulated at 30 and 60 minutes of TMP permeability study (Table 4.3.4). The
prototype of this family is ABCA1 which was first identified in 1994 (Luciani et al., 1994) and
more members were identified and sequenced later on (Connors et al., 1997; Allikmets et al.,
1997). The structure of ABCA1 was studied by Santamarina-Fojo et al (2000) and the
transporter is composed of 50 exons that encode 2261 amino acids. ABCA1 was found to be
associated with the removal of cellular cholesterol in to plasma utilizing ATP hydrolysis as an
energy source (Morales et al., 2008). As a result, ABCA1 mutation was reported to cause
Tangier disease (Bodzioch et al., 1999) due to the accumulation of cholesterol esters and
cholesterol in spleen, liver and other tissues (Francis et al., 1995). Similar functions were
reported for both ABCA17 (Morales et al., 2012) and ABCA5 (Ye et al., 2010). From the current
investigation, the results suggest that TMP efflux is co ordinate via multiple members of ABCA
family. To further analyze our findings, the structure of TMP and cholesterol were compared in
order to determine similarities between the two molecules (Fig. 4.3.22). However, no

234
similarities were observed between the two molecules. Moreover cholesterol has higher
lipophilicity (log P= 7.17) possibly because of the long aliphatic side chain (Stanculescu et al.,
2006).
Figure4.3. 77:- Comparison between the molecular structure of TMP (A) and cholesterol (B).
Solute carrier transporters (SLCs) were also investigated to determine their role in TMP
transport (Fig. 4.3.23). The data shows that the number of solute carrier transporters up-
regulated after 30 minutes was 26 and increased to 35 at the end of the experiment (Fig.
4.3.23C).
Figure 4.3.78:- Total number of SLC genes over-expressed ( ), suppressed ( ) and unchanged ( )
after 5 minutes (A), 30 minutes (B) and 60 minutes (C) of exposure to TMP.
SLC22A4 (OCTN1) is among the over-expressed genes as its expression increased by 2.36 fold
after 60 minutes. OCTN1 is an organic cation transporter which mediates the transport of
1
1
553
26
74
455
35
75
444
A B C
1011
15
12
1413
O16
O18
CH317
CH319
5
6
4
N1
N32
9
NH27
NH28
O20 CH3
21
4
13
3
12
2
1
6
15
5
14
8
7
1716
9
1011
OH18
CH319
20
CH326
21
2223
24 CH325
CH327
A B

235
pyrilamine, quinidine and tetraethylammonium (Wu et al., 2000). Various studies
demonstrated that OCTN1 is pH-dependent which suggests that changes in pH will change the
level of expression of the transporter (Wu et al., 2000; Tamai et al., 1997) possibly because of
the cationic nature of its substrates. Majority of OCTN1 substrates carry cationic nitrogen
which also exists in TMP pyrimidine ring possibly explaining the permeation of TMP across the
Caco-2 monolayers by active transport. It was reported in the literature that SLC22A1 (OCT1)
and SLC22A2 (OCT2) mediate the uptake of TMP, however in this study the expression of OCT1
and OCT2 was not affected by TMP treatment.

236
0
0.5
1
1.5
2
2.5
3
3.5
4
4.5
5
SL
C8
A2
SL
C3
9A
8
SL
C2
5A
24
SL
C4
6A
3
SL
C3
5A
1
SL
C1
9A
2
SL
C2
6A
6
SL
C2
2A
25
SL
C2
5A
46
SL
C3
8A
6
SL
C1
6A
14
SL
C2
A2
SL
C3
8A
9
SL
C3
8A
11
SL
C4
A9
SL
C2
2A
15
SL
C2
A2
SL
C1
2A
3
SL
C1
4A
1
SL
C6
A2
SL
C3
5A
1
SL
C1
A2
SL
C4
4A
3
SL
C3
0A
8
SL
CO
6A
1
SL
C2
A9
SL
C2
2A
4
SL
C2
2A
18
AS
SL
C1
5A
1
SL
C3
0A
5
SL
C3
9A
8
SL
C2
5A
24
SL
C3
0A
1
SL
C3
5F
5
SL
C3
5A
1
SL
C8
A1
SL
C1
9A
2
SL
C1
1A
1
SL
C2
6A
6
SL
C6
A1
9
SL
C2
5A
46
SL
C3
5A
5
SL
C5
A1
2
SL
C4
A9
SL
C3
8A
4
SL
C3
6A
1
SL
C1
4A
1
SL
C6
A2
SL
C7
A5
SL
C2
2A
4
SL
C2
2A
18
AS
RS
C1
A1
SL
C1
A2
SL
C4
4A
3
SL
C1
5A
1
SL
CO
6A
1
SL
C2
5A
13
SL
C1
6A
8
SL
C2
A9
SL
C2
5A
23
SL
C2
6A
3
SLC over-expressed genes
leve
l of g
ene
expr
essi
on
Figure 4.3.79:- Gene expression of SLC transporters of Caco-2 cells after 30 minutes of exposure to TMP.

237
The effect of ion-paired formulations at 1:1 and 1:8 molar ratios were also evaluated at the
same time points; 5, 30 and 60 minutes. Incorporating glutamic acid into the formulations
resulted in activation of various members of SLC1 across Caco-2 monolayers as summarised in
Table (4.3.5).
SLC1 is glutamate/neutral amino acid transporter which has 5 high affinity glutamate
transporters previously described as X-AG (EAAT4/5, GLAST, EAAC1 and GLT1) and two Na+
dependent neutral amino acid transporters (ASC; ASCT1 and ASCT2). Glutamate transporters
mediate the uptake of L-Asp, D-Asp and L-Glu by co-transporting 1H+/3Na+ and counter
transport of 1K+ (Kanai and Hediger., 2003). On the other hand, ASC mainly transport alanine,
serine and cysteine and protect the cells against glutamate excitatoxicity. SLC1 has a unique
structure which comprises of 8-transmembrane domains and a highly conserved long
hydrophilic chain attached to its C-terminus. Both glutamate and ASC transporters share
similar structure and recognize common substrates (Zerangue and Kavanaugh., 1996).
EAAT4 (SLC1A6) was over-expressed by 3.36 fold after 5 minutes of exposing the cells to TMP
1x formulation while SLC1A1 was up-regulated at 30 minutes. At higher concentrations of
glutamic acid (i.e. TMP 8x formulations) the two Na+ dependent ASC transporters were over-
expressed. Both ASCT1 (SLC1A4) and ASCT2 (SLC1A5) were up-regulated by 2.27 and 2.97
respectively. It can be hypothesized that the low concentration of glutamic acid in TMP 1x
formulations activated high affinity glutamic acid transporter SLC1A6 and SLC1A1 whereas
increase of concentration to 8x results in the expression of ASCT1 transporters. Moreover, it is
believed that as the pH of the media decreases (in the current study due to increase in
glutamate concentration), glutamate uptake shifts towards ASC transporter (Utsunomiya-Tate
et al., 1997).

238
Table 4.3.39:- Summary of SLC1 transporters up-regulated during the uptake of TMP glutamic acid ion-
paired formulations across Caco-2 monolayers.
Formulation Probes Gene symbol Expression difference TMP 1x 5 minute A_24_P179467 SLC1A6 3.364774
TMP 1x 30 minute A_24_P232252 SLC1A1 2.362158 TMP 8x 30 minute A_24_P232252 SLC1A1 2.240894 TMP 8x 60 minute A_23_P55998 SLC1A5 2.973543
A_23_P91151 SLC1A4 2.276961
The expression of OCTN1 is also affected by the ion-paired formulations and an interesting
pattern was observed. OCTN1 was over-expressed by 2.2 fold during the absorption of
TMP:glutamic acid at 1:1 molar ratio. On the other hand, the expression of this gene dropped
to reach the basal state when the cells were treated by TMP:glutamic acid 1:8 ratio. A similar
trend was explained by Wu et al (2000) when human retinal pigment epithelial (HRPE) cells
were used to evaluate the uptake of tetraethylammonium at various pH. It is possible that
increasing the ratio of glutamic acid in the ion-paired formulations resulted in increasing the
drug uptake as discussed above in the permeability study. Such increase could be attributed to
the activation of OCTN1 transporters by 1:1, 1:2 and 1:4 molar ratios but increasing this ratio
further to 1:8 resulted in a drop in drug uptake. Hence it can be concluded that glutamic acid
would have affected the pH during the uptake of TMP which in turn has affected the
expression levels of OCTN1 as early suggested by (Wu et al., 2000).
MRP7 was found to mediate the efflux of TMP in this study; hence it was interesting to track
the expression changes for this upon inclusion of the ion-paired formulations. MRP7 remained
at the basal state; as it was expressed 1.6 fold during the uptake of TMP 1x formulations. It
was over-expressed to 2.9 and 3.02 after 30 and 60 minutes respectively. Similar trend was
observed when TMP 8x formulations were used. Nevertheless, the expression level was
significantly higher at 30 minutes for TMP 8x formulations as MRP7 was over-expressed by 6.4
fold. This could possibly explain the low uptake of TMP from TMP 8x formulations.
It can be concluded that the ratio of glutamic acid in the ion-paired formulations has a
significant effect on the flux of TMP as it increased OCTN1 expression in a parabolic manner

239
and shifted the uptake of glutamic acid from high affinity transporters to the low affinity
carriers. Nevertheless, no evidence exists that the ion-paired formulations are transported as
one entity as none of the dipeptidyl carriers were over-expressed.
4.3.3.8. Genetic changes of metabolic pathways and other pathways
As mentioned before, cellular function varies in both disease state and upon exposure to
toxins. Cells identify therapeutic agents as toxins and modify/activate functions/pathway to
protect them as seen in transporter network changes. Those genes which were either up-
regulated or down-regulated were uploaded onto KEGG database to visualize the cellular
changes occurring upon treating the cells with TMP and its ion-paired formulations. Multiple
pathways were found to be affected including metabolic pathways, oxidative phosphorylation,
cytokine-cytokine interactions and xenobiotic metabolism.
TMP exhibits several adverse reactions since it is used in combination with sulfamethoxazole
(Lai et al., 1999). Moreover, the use of TMP alone resulted in many idiosyncratic reactions,
neutropenia (Hawkins et al., 1993) and hypersensitivity reactions (Carr et al., 1993) and the
mechanism by which TMP causes these adverse effects is still not clear. Only few studies
(Meshi and Sato, 1972; Van et al., 1992; Schwartz et al., 1970; Brooks et al., 1973) proposed
some metabolic mechanisms for TMP and are summarised in Fig. (4.3.25).

240
Figure 4.3.80:- A scheme of the known metabolites and reactive intermediates (in brackets) of TMP
obtained from in vitro and in vivo experiments. The figure is adapted from Damsten et al., 2008.
Frisch studies suggested that TMP hepatic and cutaneous reactions are caused by immunologic
mechanisms rather than direct toxicity (Frisch, 1973). The studies carried out by Lai et al.
(1999) demonstrated that TMP is oxidized by both hepatic macrosomes and human
neutrophils into reactive metabolites. In a similar way to oxidation of phenolic compounds by
cytochrome P-450 enzymes and peroxidase, TMP was found to be oxidized into iminoquinone
methide and pyrimidine iminoquinone (Lai et al., 1999). Microarray data shows the high
involvement of oxidative phosphorylation reactions upon treatment with TMP as 30 reactions
were activated (Fig. 4.3.26). Both cytochrome C oxidase (COX5B, COX6B, COX7A and COX7B)
and NADH dehydrogenase were activated possibly to oxidise the nitrogen atom to yield TMP-
1-N-oxide and TMP-3-N-oxide as suggested by (Damsten et al., 2008).

241
Figure 4.3.81:- Various oxidative phosphorylation reactions activated upon exposing Caco-2 monolayers to TMP alone formulations for 30 minutes (over-expressed genes are highlighted in red). The graph was created by KEGG online database.

242
No information was available on the role of cytochrome P450 enzymes (CYP450) on the
oxidative metabolism of TMP until 2008 when Damsten et al investigated the role of human
CYP450 enzymes on TMP metabolism. Our microarray data proposed that at least five CYP450
enzymes are involved in TMP metabolism as these enzymes were activated upon exposing the
cells to TMP especially for 30 and 60 minutes (among the activated enzymes include CYP1A2,
CYP2C9, CYP2C19 and CYP3A4). Our findings come in line with Damsten et al studies who
reported that both CYP1A2 and CYP3A4 oxidize TMP by dehydrogenation of the terminal -NH2
group to form an intermediate that interacts with glutathione (GSH) to form TMPG-1 and
TMPG-2 metabolites (Damsten et al., 2008). Damsten and co-workers also suggest that CYP1A2
oxidizes TMP to TMP-N-oxide probably by using nonspecific monooxygenase (1.14.14.1) as
shown in Fig. (4.3.28) and as suggested by (Kranendonk et al., 2008). TMP-N-oxide converts
into intermediates that are dehydrogenated by CYP2A3 and get conjugated to GSH (which was
also activated; 2.5.1.18) to form TMPG-5 and TMPG-6 (Damsten et al., 2008). On the other
hand, CYP2C19 plays a role in demethylation of two of the three methoxy groups (-OCH3)
attached to TMP benzene ring to yield TMP-6 metabolite (Damsten et al., 2008).
Non specific monooxygenase (1.14.14.1), glutathione (2.5.1.18) and glucuronosyltransferase
(2.4.1.17) were found to be over-expressed during the absorption of TMP (Fig. 4.3.28 &
4.3.29). The role of glucuronosyltransferase in trimethoprim metabolism is still unknown and
therefore warrants further investigation.

243
Figure 4.3.82:- Scheme showing all in vitro human metabolites and reactive intermediates (in brackets) of TMP. The role of CTYP450 isoforms involved in the
metabolites formation is also shown in this figure. The figure is adapted from Damsten et al., 2008.

244
Figure 4.3.83:- Various metabolic pathways activated upon exposing Caco-2 monolayers to TMP alone
formulations for 30 minutes (over-expressed CYP450 isomers and enzymes are highlighted in red). The
graph was created by KEGG online database.
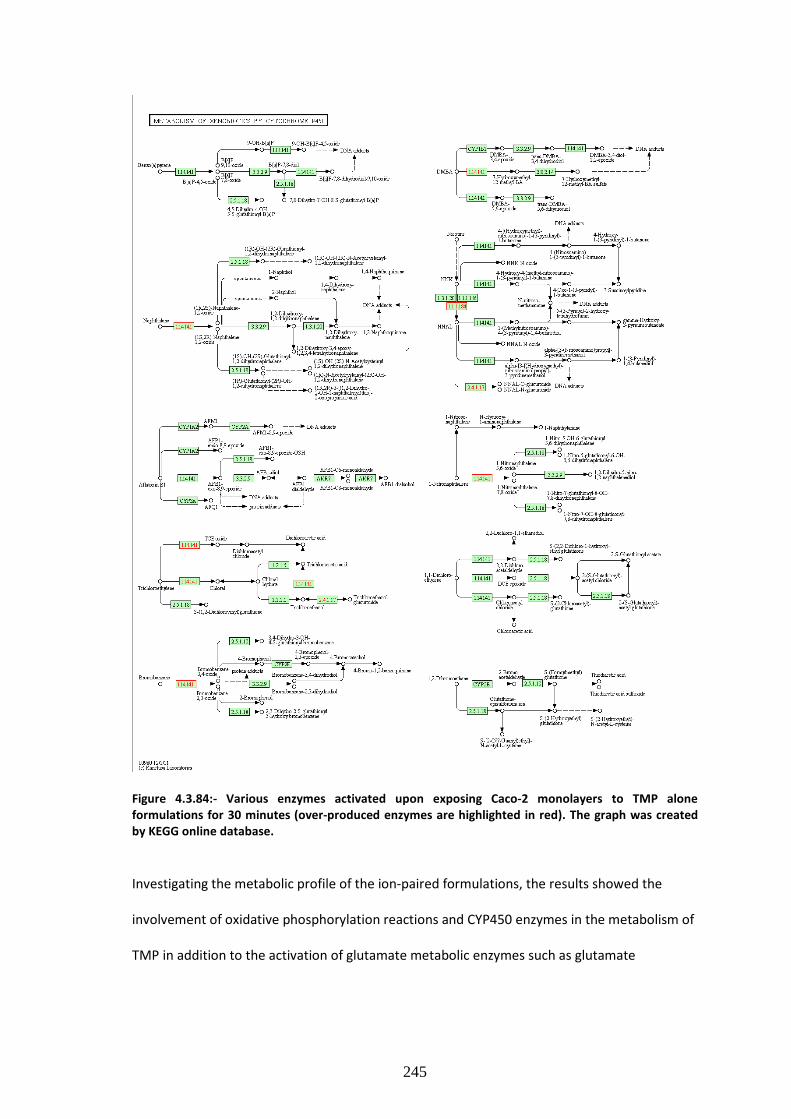
245
Figure 4.3.84:- Various enzymes activated upon exposing Caco-2 monolayers to TMP alone
formulations for 30 minutes (over-produced enzymes are highlighted in red). The graph was created
by KEGG online database.
Investigating the metabolic profile of the ion-paired formulations, the results showed the
involvement of oxidative phosphorylation reactions and CYP450 enzymes in the metabolism of
TMP in addition to the activation of glutamate metabolic enzymes such as glutamate

246
dehydrogenase (1.4.1.3) which converts L-glutamate into 2-oxoglutamate and ammonia (Di
Prisco and Garofano, 1974) and glutaminase A (3.5.1.2).
Figure 4.3.85:- Various enzymes involved in glutamic acid metabolism upon exposing Caco-2
monolayers to TMP: glutamic acid 1:8 ratio formulations for 30 minutes. glutamate dehydrogenase
and glutaminase A (both highlighted in red) were over-produced. The graph was created by KEGG
online database.
4.3.4. Conclusion
The ion-pairs formed between aspartic acid and TMP showed low aqueous binding constant,
which was tripled when an amino acid with an extra alkyl side chain was used. The
improvement of K11aq upon using glutamic acid resulted in a 3 fold increase in the permeability
profile of TMP. Probably the ion-paired formulation is transported as one moiety across the
Caco-2 monolayers. Although ion-pairing TMP with glutamic acid had a negative effect on the
partitioning capacities of the drug, the increased overall uptake suggest the involvement of
active transporters rather than just passive diffusion. Genetic changes across Caco-2 showed
that MRP7 is the major efflux protein that extrudes TMP from the cells while P-gp seems to
have a minimal role in its efflux. Our results strongly agree with the literature, that TMP is
actively uptaken by organic cation transporters as OCTN1 was over-expressed by 2.36 fold. The
molar ratio of glutamic acid is believed to affect the expression of OCTN1 as its expression

247
reached 2.2 fold for 1:1 formulations and dropped to the basal state for 1:8 ion-paired
formulations. Interestingly, the microarray data revealed the involvement of many cytochrome
P450 isomers in the metabolism of TMP.

248
3
2
4
N1
5
6
109
78
N1718
22
19
21
NH20
11
1213
F23
O16
14
O24
OH15
Chapter 5
Ciprofloxacin
Papers relating to chapter 5
Amr ElShaer, Defang Ouyang, Peter Hanson and Afzal R Mohammed., Preparation and evaluation of amino acid based salt forms of model zwitterionic drug ciprofloxacin (submitted)

249
Preparation and characterization Ciprofloxacin salts with anionic and
cationic counter ions
5.1.1. Introduction
Ciprofloxacin (CIP) (1-cyclopropyl-6-fluoro-4-oxo-7-piperazin-1-yl-quinoline-3-carboxylic acid) is
a member of quinolone antibiotics which are widely used due to broad spectrum of activity,
low resistance and high tolerance (Appelbaum & Hunter, 2000). CIP is characterised by the
presence of two types of rings in its structure (Fig. 5.1.1); napthyridine ring which contains
nitrogen atom at position 17 and 20, the second nucleus known as quinolone nucleus
containing one nitrogen at position 1 (Park et al., 2002). Ciprofloxacin contains keto oxygen at
C-4 and carboxylic acid side chains at C-3 which are essential for ciprofloxacin activity. It acts
by inhibiting bacterial DNA gyrase enzyme; this process depends greatly on the pH and
concentration of the acid (Neuman, 1988). Moreover, CIP is classified according to the
biopharmaceutical classification system as a class IV drug (BCS IV). Its solubility is pH
dependent and ranges between 0.15 mg/mL to 6.19 mg/mL at pH 7 and 5 respectively (Li et al.,
2007).
As shown in Fig. 5.1.1 CIP is a zwitterionic molecule with pKa’s of 6.09 and 8.74 and pI of 7.42
and is an ideal candidate for salt formation with both acidic and basic counter ions.
Complexation of CIP with multivalent cations such as Ca+2, Al+3, Fe+3 and Mg+2 was approved by
FDA as alternative for the parent active (Susana et al., 2009). Therefore these complexes were
commonly used with CIP and other fluroquinolones in order to improve the solubility of these
drugs with the aim of increasing their bioavailability (Susana et al., 2009). Nevertheless,
fluroquinolone metal complexes were found to have a negative impact on bioavailability (Sahai
et al., 1993; Kozjek et al., 1996) as the resultant complexes were too large to be effectively
transported across the cell membranes. As a consequence, the efficacy of fluroquinolones was
lower (Hart et al., 1991) and the risk of developing bacterial resistance was greater. Although

250
salt formation is a commonly used approach in order to improve drug solubility,
fluroquinolones hydrochloride (HCl) salts (most commonly and widely used for CIP) failed to
dissolve completely at intestinal pH of 6.8 (Breda et al., 2009). Another study conducted by
Ramanuk et al showed an improvement in CIP solubility together with taste masking for a new
salt with saccharin (Romanuk et al., 2009).
Hence, improving the solubility of fluroquinolones without impairing their permeability
behaviour would be a challenging task which if achieved would provide CIP within a BCS
biowaiver.
The aim of this study was to improve the solubility and dissolution properties of CIP via salt
formation. In addition, we investigated the role of inter- and intra molecular interaction
between the drug and amino acids by integrating experimental and theoretical approaches.
Investigation of published literature has shown that limited work has been done on theoretical
studies on CIP complexes as listed in Table 5.1.1 (Aristilde et al., 2010; Turel et al., 2008;
Aristilde et al., 2008; Sadeek et al., 2011). These studies utilised the simple force field
(COMPASS force field) and short simulation time (up to 40 ps) resulting in low precision. The
current paper utilises all-atomic molecular dynamics simulation with general AMBER force field
(gaff) to study the molecular interaction between CIP molecules and amino acids.
Table 5.1.1 Computer simulation about ciprofloxacin complexes
Complexes Simulation details References Ciprofloxacin/humic substance complexes
InsightII version 2000.1 software package with COMPASS force field, 5-A° layer of water box; up to 40 ps
(Aristilde et al., 2010)
Mg/ciprofloxacin complexes HyperChem and the MM+ force field Langevin dynamics with a simulated annealing method
(Turel et al., 2008)
Ciprofloxacin/metal complexes Cerius package with COMPASS force field, 35 ps simulation, water box
(Aristilde et al., 2008)
Solid complexes [Y(CIP)2(H2O)2]Cl3·10H2O and [ZrO(CIP)2Cl]Cl·15H2O
Gaussian98W package by density functional theory (DFT) at the B3LYP/CEP-31G level of theory
(Sadeek et al., 2011)

251
5.1.2. Materials and methods
5.1.2.1. Materials
Ciprofloxacin, L-Arginine (non-animal source), L-Histidine (Reagent plus ™), L-Lysine, L-
Glutamic acid (Reagent plus ≥ 99%), L-aspartic acid (≥ 98%) and Potassium bromide (99% FT-IR
grade) all were purchased from Sigma Aldrich, UK. Methanol and acetic acid were purchased
from Fischer scientific.
D2O (99.9% min) was purchased from Coss Scientific Instrument Ltd.
5.1.2.2. Methods
5.1.2.2.1. Salt preparation
Equimolar amounts of CIP and the free amino acid were solubilised in water, and the solutions
were mixed and stirred until equilibration was achieved and filtered. The filtrate was
transferred into a stainless steel pan and freeze dried for 42 h using Virtis Advantage (wizard
2.0) freeze dryer. Salts were primary dried at -40oC shelf temperature and under -55 mTorr
vacuum for 36 h and secondary dried at 20 oC for 6 h.
5.1.2.2.2. HPLC analysis
The amount of ciprofloxacin (CIP) dissolved in the samples was quantified by HPLC using a
Dionex 1100 system fitted with autosampler (AS50), gradient pump (GP50), UV detector (UVD
170U) and RP-C18 analytical column (Phenomenex 110A, 150x4.6 mm, 5µm). Mobile phase
consisting of methanol: water: acetic acid (840:158:2) and pumped at 1.0 mL/min was used to
elute CIP. λmax was determined using Unicam UV-Visible Spectrophotometer and the HPLC
UV detector was set at λmax of 280 nm. CIP was eluted with a retention time of 1.5±0.1 min
and a rectilinear calibration curve was established at concentration range between 10-
200µg/mL.

252
5.1.2.2.3. Phase solubility diagram.
Phase solubility diagram was established by measuring the saturated solubility of CIP free drug
with various concentrations of cationic amino acids (L-arginine, L-lysine and L-histidine) and
anionic amino acids (L-aspartic acid and L-glutamic acid) as previously discussed by (Elshaer et
al., 2011). Excess CIP was added into screw-capped tubes containing serial dilutions of the
amino acids solutions and agitated at room temperature (Stuart SB 162 stirrer) for 24 h. After
equilibrium the supernatant was filtered through 0.45 µm filters and analysed by HPLC to
determine CIP concentration. The pH of amino acid solutions was monitored using a
Xisherbrand Hydrus 500 pH meter.
5.1.2.2.4. Differential scanning calorimetry and Thermogravimetric analysis
Thermal events such as melting point and crystallization exotherms of CIP and its prepared
salts were measured using Differential Scanning Calorimeter (Pyris Diamond DSC).
Approximately, 2-5 mg of the salts were weighed and transferred to an aluminium sample pan
(50 µL capacity) then sealed with aluminium top. Intra cooler 2P system was used to initially
cool the samples to 50 oC and then sample heated to 300 oC at rate of 10 oC/min. Nitrogen was
used as a purge gas at a flow rate of 20 mL/min, Indium and Zinc were used to calibrate the
heat flow and melting point onset (156.6 oC for Indium and 419.47 oC for Zinc). The obtained
thermograms were analysed using Pyris Manager Software (version 5.00.02). The experiment
was performed in triplicate and an empty aluminium pan, sealed in the same way of the
samples, was used as a reference cell for all the measurements.
Moisture content and decomposition temperature of CIP and its prepared salts were
determined using thermogravimetric analyser (Pyris 1 TGA, Perkin Elmer). 5- 10 mg of samples
were added to an open pan and analysed at temperature range 30- 300 oC at 10 oC/min
scanning rate and under nitrogen stream. The resultant thermograms were analysed using
Pyris Manager Software (version 5.00.02)

253
5.1.2.2.5. FT-infrared (IR) spectroscopy
Nicolet IR 200 spectrometer (Thermo electron corporation) was used to measure FTIR
absorbance spectra of CIP and its salts using the KBr disc technique. Crystalline KBr was dried
at 65oC over night before use. Samples were prepared by mixing CIP or its salts with dry KBr at
1:100 (w/w) ratio and pressed at 8 tones for 5 min (using Specac tablet presser) to form KBr
discs. 64 scans were performed over wavelength 4000- 400 cm-1 for each sample. FTIR spectra
were interpreted using EZ OMNNIC 7.0 software.
5.1.2.2.6. 1HNMR
Samples were analysed with Bruker Avance DPX-250 NMR (at 250.1 MHz) and Bruker Topspin
software was used to analyse the data. Approximately, 1-2 mg of the salts were dissolved in 1
mL of deuterated water (D2O) and placed in a sample capillary vial up to 5-10 cm height.
5.1.2.2.7. Solubility and dissolution studies.
The method of Hugchi and Connor (Higuchi & Connors, 1965) was used to measure the
solubility of CIP salts. An excess amount of CIP or its salts was added to capped test tubes with
5 mL of deionised water and stirred for 24 hours at room temperature until equilibrium was
reached. Subsequently, the suspension was filtered through 0.45μm syringe filters and suitably
diluted and the concentration was measured by HPLC.
Conventional tablets weighing 500 mg and containing 50 mg of CIP or equivalent amounts of
the prepared salts were prepared for dissolution studies. Starch was used as a tablet binder
and anhydrous lactose was used as a diluent in 1: 8 ratio respectively. All the excipients were
geometrically mixed with the active ingredients and compressed using (Specac tablet presser)
at 8 tones pressure for 10 minutes.
USP II paddle method (ERWEKA DT-600) was used to perform the in-vitro dissolution studies.
The prepared tablets were placed into dissolution vessels containing 900 mL of phosphate

254
buffer (pH 7.2) and the dissolution media was maintained at 37oC±0.5oC and stirred at 50 rpm.
5mL of samples were collected at predetermined time intervals (1, 5, 10, 15, 20, 25, 30 and 40
min) then filtered through 0.45 μm Millipore filters. The dissolution media was replaced by
5mL of fresh dissolution fluid in order to maintain a constant volume. The samples were
analysed by HPLC as mentioned above.
5.1.2.2.8. Simulation studies
MD simulations were carried out using the AMBER11 software package (Case et al., 2005) with
the general AMBER force field (gaff) for all molecules (Wang et al., 2005). All molecules were
built by Discovery Studio Visualizer 3.1 (http://accelrys.com/products/discovery-
studio/index.html). At neutral pH (pH ~ 7), all the primary amines of amino acids were
protonated and carboxyl groups of amino acids were negatively-charged. Using the LEAP
module in AmberTools 1.5, the amino acids were positioned near the ciprofloxacin molecules
(at least 3 Å for enough sampling). The electrostatic interactions were calculated using the
particle mesh Ewald method (Darden et al., 1993; Essmann et al., 1995; Crowley et al., 1997;
Sagui et al., 1999; Toukmaji et al., 2000; Sagui et al., 2004) and the cutoff was 10 Å. Using the
LEAP module in AmberTools 1.5, the complex structure was immersed in a truncated
octahedral water box with a solvation shell of 10 Å thickness using TIP3P model for water
(Jorgensen et al., 1983). This procedure resulted in solvated water structures containing
approximately 10 000 atoms which included 164 ciprofloxacin atoms and different numbers of
amino acid atoms, with the remainder being water molecules.
The minimization procedure for solvated complex consisted of two steps. In the first stage, the
complex was fixed and positions of water and ions were minimized. The solvated structures
were then subjected to 500 steps of steepest descent minimization followed by 500 steps of
conjugate gradient minimization (Leach, 2001; Hans-Dieter et al., 2008). During this
minimization process the complex was fixed in its starting conformation using harmonic

255
constraints with a force constant of 500 kcal/mol/Å2. In the second stage, the entire system
was minimized by 1000 steps of steepest descent minimization followed by 1500 steps of
conjugate gradient minimization without the restraints.
The minimized structure was then subjected to 20 ps of MD, using a 2 fs time step for
integration. During the MD simulation the system was gradually heated from 0 to 300 K using
10 kcal/mol/Å2 weak positional restraints on the complex. The SHAKE algorithm was used in
which all bonds involving hydrogen are constrained (Ryckaert et al., 1977). After the system
was heated at constant volume with weak restraints on the complex, MD was performed for 1
ns with a time step of 2 fs under constant pressure/constant temperature (NPT ensemble) at
300 K with an average pressure of 1 atm without positional restraints. The random number
seed of every restart was changed (Cerutti, 2008). Isotropic position scaling (Berendsen, 1984)
was used to maintain the pressure and a relaxation time of 2 ps was employed. SHAKE was
used to constrain bonds involving hydrogen and the temperature was kept at 300 K with
Langevin dynamics (Wu & Brooks, 2003) using a collision frequency of 1.0 ps-1.
5.1.3. Results and discussion
5.1.3.1. Ciprofloxacin phase solubility profile.
CIP is a zwitter ionic molecule as it has a positively charged nitrogen atom (N20) and negatively
charged carboxylic group (Fig. 5.1.1). Therefore, the ability of CIP to form new salts with
cationic and anionic amino acids was investigated in this study.
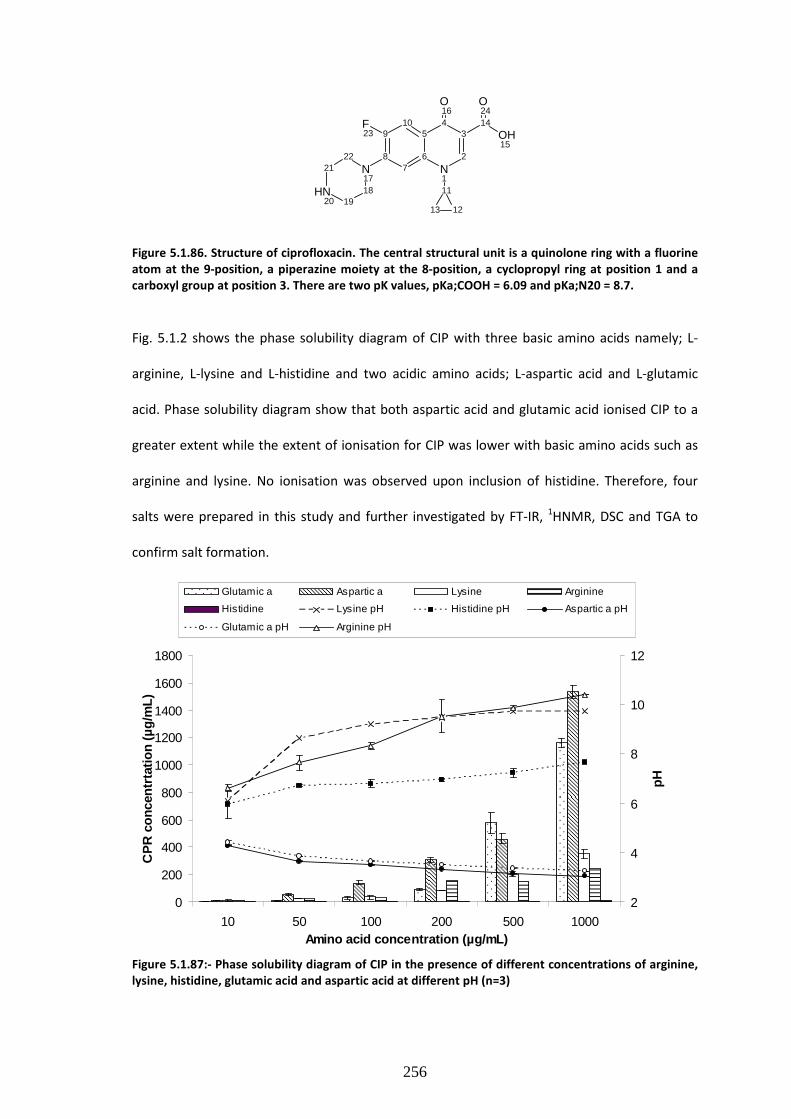
256
3
2
4
N1
5
6
109
78
N1718
22
19
21
NH20
11
1213
F23
O16
14
O24
OH15
Figure 5.1.86. Structure of ciprofloxacin. The central structural unit is a quinolone ring with a fluorine
atom at the 9-position, a piperazine moiety at the 8-position, a cyclopropyl ring at position 1 and a
carboxyl group at position 3. There are two pK values, pKa;COOH = 6.09 and pKa;N20 = 8.7.
Fig. 5.1.2 shows the phase solubility diagram of CIP with three basic amino acids namely; L-
arginine, L-lysine and L-histidine and two acidic amino acids; L-aspartic acid and L-glutamic
acid. Phase solubility diagram show that both aspartic acid and glutamic acid ionised CIP to a
greater extent while the extent of ionisation for CIP was lower with basic amino acids such as
arginine and lysine. No ionisation was observed upon inclusion of histidine. Therefore, four
salts were prepared in this study and further investigated by FT-IR, 1HNMR, DSC and TGA to
confirm salt formation.
0
200
400
600
800
1000
1200
1400
1600
1800
10 50 100 200 500 1000Amino acid concentration (µg/mL)
CP
R c
once
ntrt
atio
n (µ
g/m
L)
2
4
6
8
10
12pH
Glutamic a Aspartic a Lysine Arginine
Histidine Lysine pH Histidine pH Aspartic a pH
Glutamic a pH Arginine pH
Figure 5.1.87:- Phase solubility diagram of CIP in the presence of different concentrations of arginine,
lysine, histidine, glutamic acid and aspartic acid at different pH (n=3)

257
CIP solubility in water was found to be 7.22±1.02 µg/mL at 25 oC. The use of acidic amino acids
considerably improved the solubility of CIP. CIP solubility increased significantly upon
solubilising in L-glutamic acid solution especially at high concentrations of the counter ion.
Around 1.2 mg of CIP was solubilised in 1 mL of 1000 µg/mL of glutamic acid. These results
suggest that CIP acts as a strong base in glutamic acid solution possibly due to the big
difference between the pKa values of CIP and glutamic acid (8.74 and 2.19 respectively).
Therefore, the basic amino group is completely ionised in glutamic acid solution favouring salt
formation between the basic group of CIP and the acidic group of the amino acid. Similarly, the
solubility of CIP increased in L-aspartic acid solution and could be potentially due to salt
formation between the two ionised species (these data were further confirmed using FT-IR and
1HNMR as discussed below).
On the other hand, solubilizing CIP in various concentrations of L-histidine solutions showed no
improvement in solubility with a maximum solubility of 9.65±0.28 µg/mL at 1000 µg/mL of
histidine solution. Poor solubilisation of CIP can potentially be due to similar pKa of basic group
on histidine (pKa 6) and the carboxylic group of CIP resulting in no ionisation of the parent
drug.
Interestingly, increasing the concentration of L-arginine solution was found to improve the
solubility of CIP. At a concentration of 10 µg/mL arginine, CIP solubility was 10.7±2.8 µg/mL
and the solubility increased linearly upon increasing the concentration of arginine solution
where CIP solubility was 247.8±4.2 µg/mL at 1000 µg/mL of arginine solution (Fig. 2).
Although the pKa of the –NH2 side chain of L-arginine (12.48) is much higher than the pKa of
CIP acidic side chain, CIP was ionised to a lower degree. A similar trend was observed when L-
lysine was used as CIP solubility increased from 11.62±5.8 µg/mL to 350.7±34 µg/mL when
lysine concentration increased from 10 µg/mL to 1000 µg/mL.

258
Characterization of CIP salts
5.1.3.2. Fourier Transform Infrared Spectroscopy (FT-IR)
The phase solubility diagram has shown that CIP possibly dissociates in acidic amino acids
solution and some of the basic amino acids. The next stage of the work was to prepare five
salts of CIP amino acids and to investigate and characterise the salt formation using physico-
chemical methods such as FT-IR, 1HNMR and DSC.
Fig. 5.1.3 shows the FT-IR spectra of CIP, CIP aspartate and CIP glutamate. CIP had
characteristic absorption peaks at 3044 cm-1 which can be assigned to C-H olefinic and
aromatic chains, 1617.8 corresponding to C4O16 keto group. Since CIP is in the zwitterionic
form, the carboxylic group C14=OOH does not appear in CIP FT-IR spectrum (Romanuk et al.,
2009).
CPR1
20
40
60
80
100
%T
CPR aspartate 3
20
40
60
%T
Mon Jun 21 11:43:13 2010 (GMT+01:00)
40
60
80
%T
500 1000 1500 2000 2500 3000 3500 4000
Wavenumbers (cm-1) Figure 5.1.3:- FTIR spectra of (A)Ciprofloxacin, (B) CIP L-aspartate and (C) CIP L-glutamate
Interestingly, this carboxylic group was present in CIP glutamate and aspartate salts at 1720
and 1719 respectively suggesting that the zwitterionic nature of CIP was reverted by proton
transference from L-aspartic acid and L-glutamic acid. These results are in line with results
obtained by (Romanuk et al., 2010) On the other hand, FT-IR data for basic amino acids with
A
B
C

259
CIP does not show the C4O16 keto group at 1617.8 but had an absorption band at 1579.55 and
1646.4 corresponding to carboxylic group C=O of lysine (Ogura et al., 1998) and arginine
(Petrosyan, 2007) respectively. Upon comparing CIP lysine and lysine free amino acid, similar
spectrum was observed which support our findings (Fig. 5.1.4 C& D). Our results were further
confirmed using 1HNMR as discussed below.
CPR1
20
40
60
80
100
%T
CPR arginate 22
60
80
%T
CPR lysinate
40
60
%T
Wed Mar 03 16:55:56 2010 (GMT+00:00)
20
40
60
80
%T
500 1000 1500 2000 2500 3000 3500 4000
Wavenumbers (cm-1) Figure 5.1.4:- FTIR spectra of (A)Ciprofloxacin, (B) CIP arginine, (C) CIP lysine, (D) lysine
5.1.3.3. 1HNMR
To further confirm the salt formation and investigate the molar ratio of interaction between
CIP and the counter ions, the total number of protons in the prepared salts was studied using
1HNMR.
Fig. 5.1.5 shows the 1HNMR data for CIP aspartate. Both C12H2 and C13H2 of the cyclopropyl
group of CIP appeared at 1.08 and 1.3 ppm, while the C11H group was deshielded at higher (δ)
due to the deshielding effect exerted by N1. Piperazine ring 8 protons C22H2, C21H2, C18H2
and C19H2 appeared as multiplet at around 3.79 ppm. C2H, C7H, C10H appeared deshielded at
A
B
C
D

260
8.5, 7.4 and 7.33 respectively. The total integration of CIP was found to be 16 similar to what
was previously reported by Wetzsein et al (1999).
-0.50.00.51.01.52.02.53.03.54.04.55.05.56.06.57.07.58.08.59.09.5f1 (ppm)
0
50
100
150
200
250
300
350
1.9
8
1.6
9
2.3
6
8.8
3
1.1
0
1.9
7
1.0
0
1.0
8
1.3
0
1.3
2
2.5
9
2.6
22.6
7
2.6
9
3.7
6
3.7
7
3.7
9
3.8
1
7.3
3
7.3
77.3
8
7.4
0
8.5
0
Figure 5.1.5:-
1HNMR spectra for Ciprofloxacin Aspartate dissolved in D2O
Two new bands appeared at 2.67 and 3.81 ppm corresponding to three protons of one
molecule of aspartic acid (C28H and C30H2). This data shows that one molecule of CIP has
formed a salt with one molecule of aspartic acid in 1:1 ratio.
3
2
4
N1
5
6
109
78
N1718
22
19
21
NH2+
2011
1213
F23
O16
14
O24
OH15
O-
33
3130
2826
O27
OH25
NH229
O32

261
-0.50.00.51.01.52.02.53.03.54.04.55.05.56.06.57.07.58.08.59.09.5f1 (ppm)
0
10
20
30
40
50
60
70
80
90
1.68
1.74
2.07
0.28
2.11
6.69
2.14
1.95
1.00
1.1
0
1.9
8
2.0
0
2.2
3
2.2
6
2.3
0
3.4
1
3.5
3
3.6
1
3.6
3
3.6
33.6
5
7.4
5
7.4
8
7.5
1
7.5
6
8.6
0
Figure 5.1.6:-
1HNMR spectra for Ciprofloxacin glutamate dissolved in D2O
Similarly, the 1HNMR spectrum of CIP glutamate (Fig. 5.1.6) showed 5 new proton assignments
between 1.98 and 2.3 ppm which correspond to the 5 alphatic protons of L-glutamic acid.
However, the 1HNMR data for CIP basic amino acid preparations show no salt formation and
only protons of the free basic amino acids were detected by the 1HNMR (see figures 5.1.7 &
5.1.8).
These data suggest that only acidic amino acids were capable of forming salts with CIP, while
the basic amino acids failed to form salts as suggested by the FT-IR studies above.
3
2
4
N1
5
6
109
78
N1718
22
19
21
NH2+
2011
1213
F23
O16
14
O24
OH15
26
28
30
31
32
O-
34
O33
NH229
O27
OH25

262
-0.50.00.51.01.52.02.53.03.54.04.55.05.56.06.57.07.58.08.59.09.5f1 (ppm)
-500
0
500
1000
1500
2000
2500
3000
3500
4000
4500
5000
5500
6000
6500
2.0
1
4.0
5
2.0
7
1.0
0
1.2
5
1.2
8
1.3
1
1.3
3
1.3
6
1.5
3
1.5
6
1.5
9
1.6
1
2.8
6
2.8
9
3.3
7
3.4
0
Figure 5.1.7:-
1HNMR spectra for Ciprofloxacin lysine dissolved in D2O
-0.50.00.51.01.52.02.53.03.54.04.55.05.56.06.57.07.58.08.59.09.5f1 (ppm)
-500
0
500
1000
1500
2000
2500
3000
3500
4000
4500
5000
5500
6000
6500
3.2
3
0.3
0
1.5
8
1.0
0
0.1
3
0.0
7
1.4
4
1.4
6
1.4
9
1.5
1
1.5
2
1.5
31.5
8
2.9
4
2.9
6
3.0
5
3.0
8
3.1
0
3.1
4
3.1
6
3.1
9
3.2
1
3.2
3
Cpro arginate/HNMR/D2O/11
Figure 5.1.8:-
1HNMR spectra for Ciprofloxacin arginine dissolved in D2O
NH234
33
32 31
30 28
26
NH229
OH25
O27
3
2
4
N1
5
6
109
78
N1718
22
19
21
NH2+
2011
1213
F23
O16
14
O24
OH15
3
2
4
N1
5
6
109
78
N1718
22
19
21
NH20
11
1213
F23
O16
14
O24
OH15 NH2
35
34
NH33
32
31
30
28
26
NH36
NH229
OH25
O27

263
5.1.3.4. Differential scanning calorimetry and thermogravimetric analysis.
New salts have different physical behaviour from their parent components. Therefore, the
melting point and degradation temperature of CIP and its salts were investigated using DSC
and TGA.
CIP free drug was in the crystalline form and showed an endothermic peak at 272.15 oC (ΔH=
173.19 J/g) corresponding to its melting endotherm. TGA data showed start of drug
degradation upon completion of its melt. On the other hand, the CIP aspartate salt had two
endothermic peaks at 224.63 and 237.8 oC suggesting that the CIP aspartate salt has two
forms. On the other hand, the CIP glutamate salt showed a single melting endotherm at
203.35oC. Arginine CIP formulations melted at 227.31 oC which was found to be similar to that
of arginine free base and the absence of CIP melting endotherm or any other new melts
confirms the failure of salt formation between CIP and basic amino acids as discussed
previously.
5.1.3.5. Simulation studies
Characterisation studies showed that anionic amino acids form new salts with CIP while the
cationic amino acids failed to form any salts with the drug. This was contrary to the generally
accepted hypothesis that a 3 unit difference in pKa between the parent compound and the
counter ion results in salt formation. Therefore, the role of inter and intra molecular
interaction between CIP and the amino acid was investigated using molecular dynamic
simulation studies in order to gain further understanding of CIP in different solutions of amino
acids. Two amino acid models were used in this study; aspartic acid and histidine as aspartic
acid resulted in CIP salt formation while histidine failed.
Figure 5.1.9 shows the interaction between CIP molecules; two CIP molecules in water
aggregate together after 400 ps due to the hydrophobic interaction thereby further confirming
the role of hydrophobic forces in the low solubility of CIP. The lab based experiments showed

264
that CIP solubility in aspartic acid increased significantly especially at high concentrations of
aspartic acid solution. Thus the interaction of two CIP molecules with one aspartic acid
molecule in water (low concentration), and the interaction of two CIP molecules with four
aspartic acid molecules in water (high concentration) was studied using molecular simulations.
As shown in Figure 5.1.10, the aggregation of CIP molecules is delayed until 800 ps in the
presence of one amino acid (aspartic acid) molecule. On the other hand, aggregation of CIP
molecules was hindered in the solution with high concentration of amino acid (four aspartic
acid molecules) as shown in Figure 5.1.11. Data obtained from the simulation studies were in
agreement with the results of experiments where high concentrations of amino acid solutions
(e.g. 500 and 1000 µg/mL) resulted in significant increases in solubilisation capability, while the
low concentration of amino acid solutions have less effect. However, it was interesting to see
that inclusion of histidine did not prevent aggregation of CIP molecules even at high
concentrations (with four histidine molecules), as shown in Figure 5.1.12. It further confirms
experimental results of the solubilisation incapability of histidine. These results indicated that
two factors influence the inter- and intra-action between CIP molecules and amino acids. On
one hand, CIP is an amphoteric electrolyte and acts as the base in aspartic acid solution due to
the difference between the pKa values of -NH group of CIP (8.74) and -COOH group of aspartic
acid (3.86). The positively-charged -NH group of CIP and negatively-charged -COOH group of
aspartic acid form the electrostatic interaction. The pKa of the basic amino group of L-histidine
(6) is almost the same as that of the CIP carboxylic group (6.09) possibly resulting in no
enhancement in solubility. Besides, hydrophobic interaction is also an important factor in CIP
aggregation. When ionic interactions and/or hydrophobic interactions between CIP molecules
and amino acid molecules are stronger than hydrophobic interaction between CIP molecules,
the solubilisation process is accelerated.

265
Figure 5.1.9. Snapshots of two ciprofloxacin molecules in water: (A) at 0 ns, (B) after 200 ps, (C) after
400 ps, (D) after 600 ps, (E) after 800 ps and (F) after 1 ns. (Water is only shown in A) and is ignored
from B) to F) for clarity)
A B
C D
E F

266
Figure 5.1.10. Snapshots of two ciprofloxacin molecules with one aspartic acid molecule in water: (A)
at 0 ns, (B) after 200 ps, (C) after 400 ps, (D) after 600 ps, (E) after 800 ps and (F) after 1 ns. (Water is
only shown in A) and is ignored from B) to F) for clarity)
A B
C D
E F
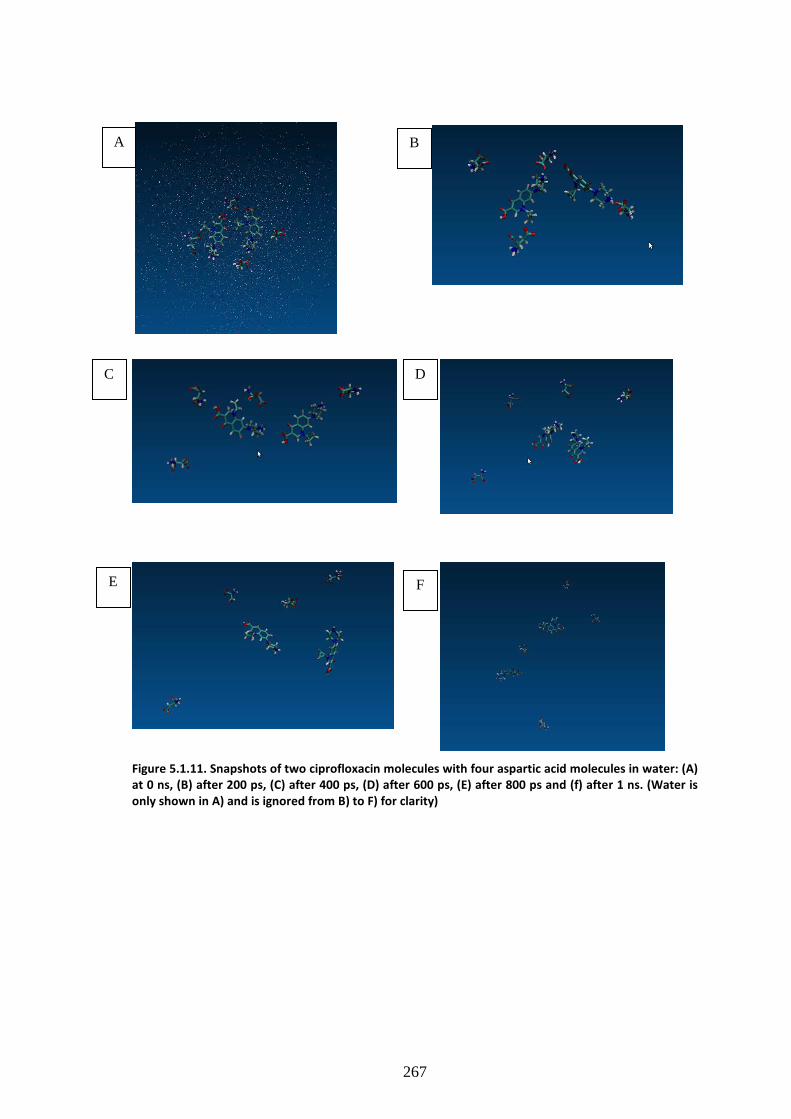
267
Figure 5.1.11. Snapshots of two ciprofloxacin molecules with four aspartic acid molecules in water: (A)
at 0 ns, (B) after 200 ps, (C) after 400 ps, (D) after 600 ps, (E) after 800 ps and (f) after 1 ns. (Water is
only shown in A) and is ignored from B) to F) for clarity)
A B
C D
E F

268
Figure 5.1.12. Snapshots of two ciprofloxacin molecules with four histidine molecules in water: (A) at
0 ns, (B) after 200 ps, (C) after 400 ps, (D) after 600 ps, (E) after 800 ps and (f) after 1 ns. (Water is only
shown in A) and is ignored from B) to F) for clarity).
A B
C D
E F

269
5.1.3.6. Solubility & dissolution studies
In order to assess the saturated solubility of CIP and its prepared salts, excess amount of the
drug and its prepared salts were stirred in 2 mL of deionised water and stirred for 12 hours
until equilibrium was achieved. Drugs were adequately diluted and their solubility was
measured using HPLC. The highest solubility was exhibited by the CIP glutamate salt which was
found to be 215±13.3 mg/mL while the solubility of CIP aspartate was 185.4±8.6 mg/mL. As
demonstrated by DSC study the melting point of CIP aspartate salt was lower than that of the
parent drug which requires less energy to break the crystalline structure of the salt and hence
solvate the drug. Other factors such as gravitation index, charge on the most negative atom,
and number of hydrogen bonding acceptors might also have played a role in favour of higher
water solubility of the salt form (Mitchell & Jurs, 1998).
In vitro dissolution studies of CIP free drug were compared against it salts and amino acids
physical mixtures (Fig. 5.1.13). After 10 minutes of dissolution test, only 16.09±1.15 % of CIP
was released from CIP containing tablets while 58.3±10.37 of CIP was released from CIP
aspartate salt tablets. More than 75% of CIP was dissolved from CIP salt tablets after 40
minutes of the dissolution study while only 54.3±10 and 61.8±5.02 were released from CIP and
CIP aspartic acid physical mixture respectively (Fig. 5.1.13A).
Figure 5.1.88:- (A)Dissolution profile for CIP free drug, CIP aspartic acid physical mixture and CIP
aspartate, (B) Dissolution profile for CIP glutamic acid physical mixture and CIP glutamate, data are
represented as mean±SD (n=3).
0
10
20
30
40
50
60
70
80
90
0 10 20 30 40
Time (mins)
% d
isso
lved
Ciprofloxacin free drug Ciprofloxacin glutamate salt
Ciprofloxacin glutamic a PM
0
10
20
30
40
50
60
70
80
90
0 10 20 30 40
Time (mins)
% d
isso
lved
Ciprofloxacin free drug Cipro-aspartic a PM Cipro-aspartate salt
A B

270
Figure 5.1.13B shows the dissolution profiles of CIP glutamate, CIP and CIP glutamic acid
physical mixture. The highest dissolution profile was exhibited by CIP glutamate salt as
26.7±6.7 % of CIP was released from this formulation during the first 5 minutes of dissolution
studies. These results suggest that CIP aspartate and glutamate salts have relatively high
buffering capacity which in turn improves the dissolution profile by increasing the pH of the
surrounding diffusion layer.
5.1.4. Conclusion
CIP is a BCS IV drug with low solubility and permeability. Due to its zwitterionic nature the use
of basic and acidic amino acids to formulate new CIP salts was investigated. Acidic amino acids
formed two novel salts with high solubility when compared to CIP alone. Phase solubility
diagrams have shown a high degree of ionisation of CIP in presence of L-aspartic and L-
glutamic acid. Characterization studies confirmed the formation of salt which was supported
by FTIR, NMR and DSC studies. 1HNMR demonstrated that the molecular interaction between
CIP and the acidic counter ions was a 1:1 ratio. Moreover, the molecular dynamic simulations
have shown for the first time that the hydrophobic interactions between CIP molecules
decrease in the presence of the acidic amino acids and in turn form a stable salt.

271
Ciprofloxacin permeability studies and the transcriptomic changes
occurring during its uptake across Caco-2 cells
5.2.1. Introduction
Ciprofloxacin (CIP) is a flurinated-4-quinolone derivative which belongs to the fluoroquinolone
antibiotic group and is structurally related to nalidixic acid. The broad spectrum synthetic
antibiotic is used for systemic therapy against acid-alcohol resistant bacteria (Eliopoulos et al.,
1984) and is classified as a BCS IV drug with both low solubility and permeability (Wu et al.,
2005). CIP is zwitter ionic in nature with a “U” shaped pH solubility profile exhibiting lowest
solubility values near its isoelectric point and the highest value below pH 5 and above 10
(Olivera, 2011). Studies reported by Bergan et al., (1987) and Neuman (1988) suggest that 55-
85% of CIP becomes bioavailable after oral administration. This percentage was found to be
slightly lower than other fluoroquinolone compounds. The low dissolution profile from oral
dosage forms and the first pass metabolism were believed to be the reasons behind the
incomplete absorption of CIP. It was believed that CIP was eliminated entirely by the kidney
until Sorgel et al (1989) found that the intestine eliminates around 10% of CIP and this
percentage increases in patients with renal failure (Rohwedder et al., 1990). The importance of
the intestine in the elimination of CIP was further studied by Rubinstein et al., (1994) and Metz
& Soergel, (1990) using an ex vivo rat intestinal perfusion model. The intestinal secretion for
most of the fluoroquinolones is mediated by efflux proteins P-glycoprotein (P-gp) and
multidrug resistance associated protein 2 (MRP2). In 2002 Lowes and Simmons suggested that
CIP is not a substrate for MRP2 and P-gp but secreted by an alternative pathway which was
termed as CIP sensitive pathway. Lowes and Simmons believed that two efflux proteins located
on the apical and basal sides of the epithelial cells control efflux of CIP. A similar phenomenon
of active efflux of CIP was also reported in bacteria such as Streptococcus pneumoniae (Valerie
et al., 1997) and Salmonella enterica (Etienne et al., 2000).

272
Pharmacokinetics and pharmacodynamics of CIP are also affected by the concomitant intake of
food which has clinical implications for the bioavailability of CIP (Singh, 1999; Harris et al.,
2003). Food also affects the pharmacokinetics of the drug by altering the GI pH, gastric
emptying rate, bile flow and physical/chemical characteristics of the drug molecule. Various
proposed mechanisms for reduction in bioavailability by food include chelation of the drug and
reducing solubility of basic drug upon reaching the small intestine (Leyden, 1985; Carver et al.,
1999).
CIP bioavailability is known to decrease upon co-administration with food containing metal
ions (Hoffken et al., 1985; Lomaestro and Bailie, 1995) which was attributed to complex
formation with the metal ions (Wallis et al., 1996). The formed complexes have different
geometry, size and charge from the non complexed drug and therefore have a reduced passive
diffusion across the cell membranes and the tight junctions of intestinal epithelial cells.
Another study conducted by Ledergerber et al., (1985) demonstrated that concomitant
administration of CIP oral tablets with food prolongs the time required to reach peak serum
levels without affecting the overall bioavailability.
The aim of the current study was to study the ion-pair formation between the anionic amino
acids; aspartic acid and glutamic acid and the zwitter ionic model drug (CIP) and the impact of
ion-pairing on the permeability profile of CIP and to visualize the molecular genetic changes
happening during the uptake of CIP and its ion-paired formulations. This study also
investigated the effect of pH and the media composition (fed and fast state) on the absorption
patterns of CIP.

273
5.2.2. Materials and methods
5.2.2.1. Materials
Ciprofloxacin, L-Glutamic acid (Reagent plus ≥ 99%), L-aspartic acid (≥ 98%), ninhydrin reagent
(2% solution), sodium taurocholate, lecithin, glycerylmonooleate, sodium oleate and maleic
acid were purchased from Sigma Aldrich, UK.
Sodium hydroxide and sodium chloride were purchased from Fisher Scientific, UK.
Dulbecco’s modified Eagle’s medium (DMEM), fetal bovine serum (FBS), Nonessential amino
acids (NEAA), 1% pencillin-streptomycin, 2mM glutamine and Hank’s balanced salt solution
(HBSS) were purchased from Bio Sera, UK. 1% Trypsin–EDTA was obtained from Gibco Lab. UK.
RNeasy kit (RNA free water, buffer RLT, buffer RW1 and buffer RPE) was purchased from
Qiagen (Hiden, Germany). Gene expression hybridization kit, low input Quick Amp labelling kit,
RNA spike-in kit (one color) all were purchased from Agilent (Cedar Creek, Texas, USA). Agilent
gene expression washing buffer 1 and 2 were ordered from Agilent (Wilmington, DE, USA) and
Ethanol which was purchased from Fisher scientific (Leicestershire, UK).
5.2.2.2. Methods
5.2.2.2.1. Preparation of pre-saturated solution of 1-octanol and de-ionised water.
1000 ml of de-ionised water was added to 4 mL of 1-octanol. The mixture was shaken for few
minutes and left overnight. The de-ionised water was separated from 1-octanol using a 1000
mL separating funnel.
5.2.2.2.2. Octanol- water partitioning experiment
500 µg of CIP was added to 100 mL octanol-saturated deionised water with molar excess of
aspartic acid/glutamic acid (in ratios 1:1, 1:2, 1:4 and 1:8). 5 mL of the aqueous phase was
allowed to equilibrate with 5mL of octanol at room temperature and stirred for 24 hours using
a magnetic stirrer. The two phases were then separated by centrifugation and CIP
274
concentration [CIPt]Aq in the aqueous phase was measured using HPLC. Mass balance was used
to calculated CIP concentration in octanol phase [CIPt]Oct using equation (5.2.1).
[CIPt]Oct = total drug put into the system- [CIPt]Aq Equation 5.2.52
The apparent distribution coefficient DB may be calculated using equation (5.2.2)
DB= [CIPt]Oct/[CIPt]Aq Equation 5.2.53
5.2.2.2.3. HPLC method to study the concentration of ciprofloxacin
The amount of ciprofloxacin (CIP) dissolved in the samples was quantified by HPLC using a
Dionex 1100 system fitted with an autosampler (AS50), gradient pump (GP50), UV detector
(UVD 170U) and RP-C18 analytical column (Phenomenex 110A, 150x4.6 mm, 5µm). Mobile
phase consisting of methanol and 1.25% acetic acid was mixed in the pump and analysis of CIP
was done using gradient elution at 1.0 mL/min. λmax was determined using a Unicam UV-
Visible Spectrophotometer and the HPLC UV detector was set at λmax of 280 nm. CIP was
eluted with a retention time of 1.5±0.1 min and a rectilinear calibration curve was established
in the concentration range between 10- 200µg/mL.
5.2.2.2.4. Ninhydrin analysis
The concentrations of aspartic acid and glutamic acid in octanol/water partitioning studies
were quantified using the ninhydrin method. In order to construct a calibration curve, serial
dilutions of the amino acids were prepared and 1 mL of the prepared samples was mixed with
0.5 mL of ninhydrin reagent and vortexed for 20 seconds. The samples were heated in a pre-
warmed water bath at 80 oC for 20 minutes. The samples were removed from the water bath
and left to cool. The intensity of the coloured Ruhemann purple was analysed using a UV
spectrophotometer at a wavelength of 560 nm.
Calibration curves were constructed with a regression coefficient of 0.99 and
0.99 for aspartic and glutamic acid respectively. Subsequent to the construction
of the calibration curves, the concentration of the amino acids in the aqueous

275
y = 0.0755x
R2 = 0.9971
0
5
10
15
20
25
30
35
0 50 100 150 200 250 300 350 400 450
Glutamic acid conc
Abs
orba
nce
y = 0.0695x
R2 = 0.994
0
2
4
6
8
10
12
14
16
18
0 50 100 150 200 250
Aspartic acid conc
Abs
orba
nce
layer was determined using the linear curve equations (5.2.3) and (5.2.4) for
aspartic acid and glutamic acid respectively.
Y=0.0695x Equation 5.2.54
Y=0.0755x Equation 5.2.55
Figure 5.2.89:- Ninhydrin calibration curve for aspartic acid (A), glutamic acid (B) n=3.
5.2.2.2.5. Procedure for Caco-2 cell culture
Caco-2 cells at passage 48 were gifted from Huddersfield University and used at passages 50-
80. Cells were allowed to grow in 75cm² T-flasks and maintained using Dublecco’s modified
Eagle’s medium (DMEM) with 10% fetal bovine serum (FBS), 0.5% pencillin-streptomycin, 2mM
glutamine and 1% nonessential amino acids (NEAA). Culture medium was changed every 2 to 3
days and cells were grown at a temperature of 37°C and 5% CO2. The cells were passaged
using 5 mL trypsin-EDTA when they reached 90% confluence. Transepithelial transport assay
was carried out using Khan et al., (2011) methods. 2 x 10⁵cells/cm² were seeded on
polycarbonated-coated membranes (6-well transwell plates, 24mm, 4.7cm²) and were allowed
to grow for 21 days and the media in both apical and basal compartments were changed every
A
B

276
2-3 days. Transepithelial electrical resistance (TEER) was measured at the start and end of
every study.
5.2.2.2.6. Ciprofloxacin permeability studies
Caco-2 monolayers were used 19-21 days after seeding. Apical to basolateral permeability of
CIP and its formulations was assessed. The transwells were rinsed and incubated for 15
minutes with drug-free transport medium (Hanks balanced salt solution; HBSS). Following
incubation, HBSS was removed and 1.5 mL of the medium containing CIP alone (500 µg/mL)
and CIP with various molar ratios of the anionic amino acids (1:1, 1:2, 1:4 and 1:8) were
introduced to the apical side. Sample aliquots (300μL) were taken from the basolateral side at
given time intervals (0, 5, 10, 15, 20, 30, 60 and 90 minutes). After each sampling, an equal
volume of fresh transport buffer (pre-warmed at 37°C) was added to the receiver
compartment (basal side) and the cells maintained at a temperature of 37°C and 5% CO2
throughout the experiment. Samples were subsequently analyzed by HPLC. In order to confirm
the mass balance, samples were taken from both apical and basolateral compartments at the
last time point (90 mins). All experiments were performed at 37°C (n = 5). In order to
investigate the effect of pH on the permeability profile of CIP, the pH of HBSS was adjusted
using 0.1N HCl solution until it reached a pH of 4.5, 5.5 and 6.8. CIP was added to HBSS and 1.5
mL of the solutions were introduced to the apical side and the permeability profile was
assayed as discussed above.
Apparent permeability coefficient Papp (cm/s) was calculated using (equation 5.2.5)
0/1/ ACdtdQPapp ×= Equation 5.2.56
Where dQ/dt is the rate of appearance of the drugs on the basolateral side (nmol s-1), Co is the
initial concentration on the apical side and A is the surface area of the monolayer (4.7 cm2).

277
The data presented was validated using HPLC measurement of drug transfer during the
process of permeability. This included repetition of drug permeability studies in the
preparations used for microarray analysis.
5.2.2.2.7. Fed and fasted state media preparation
Fed (FeSSIF) and fasted state (FaSSIF) media was prepared using a method reported by
Jantratid et al., (2008) and the composition and the properties of the media used in the
permeability study are summarised in table (5.2.1). 50 mg of CIP was added to 100 mL of the
simulated media and 1.5 mL of the solution was transferred to the apical side of the Caco-2
monolayers’ transwells and permeability across the monolayers was assessed using the
method discussed above.
Table 5.2.40:- Composition of the media to simulate the fasted state simulated intestinal fluid (FaSSIF)
and the fed state simulated intestinal fluid (FeSSIF).
Composition (mM) FaSSIF FeSSIF
Sodium taurocholate 3 10 Lecithin 0.2 2 Glyceryl monooleate - 5 Sodium oleate - 0.8 Maleic acid 19.12 55.02 Sodium hydroxide 34.8 81.65 Sodium chloride 68.62 125.5 Properties pH 6.5 5.8 Osmolality 180±10 390±10 Buffer capacity (mmol/L/pH) 10 25 Surface tension (mN/m) 54.3 40.5±0.2
5.2.2.2.8. Recovery
The amount of CIP recovered from both apical and basolateral compartments at the end of the
experiment was calculated using equation 5.2.6.
100(%)covRemin0
min90min90 ××
×+×=
DD
DDRR
VC
VCVCery
Equation 5.2.57
Low recovery data is attributed to entrapment of the compounds into the cell monolayers or
adsorption to the device surface which in turn results in error calculating the transport rate
(Aungst et al., 2000).

278
5.2.2.2.9. RNA extraction for microarray studies
Samples for microarrays studies were collected at 5, 30, 60 minutes for CIP, CIP:glutamic acid
at 1:1 (1x) and 1:8 (8x) molar ratios. Caco-2 monolayers were treated with ethanol: phenol
mixture (95:5) for 24 hours. After scrubbing the cells, pellets were obtained by centrifugation
at 2000 rpm at 4 oC for 10 minutes. All pellets were stored at -80 oC until the total RNA was
extracted. Total RNA was extracted using RNeasy kit (Qiagen) and quantified using a Nanodrop
1000 spectrophotometer (Themoscientific, Wilmington, DE).
5.2.2.2.10. Microarray study
Systemic changes of the gene expression upon exposing Caco-2 cells to CIP and its various
formulations were evaluated using the Agilent one-color-spike procedure discussed before.
Briefly, 1.5µl of 25 ng of total RNA was mixed with 2 µl of diluted one-color-spike mix. cDNA
master mix (Agilent) was used to prepare cDNA for all the samples which were labelled using
cy3-dUTP. The yield and specific activity for fluroscent cDNA probes were determined using
equations 5.2.7 and 5.2.8 respectively; the data obtained is summarised in (Table 5.2.2), after
quantifying cDNA (ng/µl)and cyanine 3 (pmol/ µl). All samples were hybridized to Agilent 4x44
K whole genome array for 16 hours at 65 oC in hybridization oven (Sheldon manufacturer,
Corneilus, OR). After hybridization, samples were scanned at 50nm resolution and at 20 bit
scan using Agilent scanner (Agilent Technologies, Santa Clara, CA). 16-bit TIFF images were
obtained and used as input for the feature extraction software (V10.7, Santa Clara, CA).
Yield 1000
... volumeelutioncRNAofConc ×= Equation 5.2.58
Specific activity 1000..
3.. ×=cRNAofConc
CyofConc Equation 5.2.59

279
Table 5.2.41:- Summary of Quantifying of total RNA, yield and specific activity of the complementary
DNA used for hybridization in CIP studies.
Total RNA cDNA probe Sample conc
(ng/µl) 260/280 ratio
260/230 ratio
conc (ng/µl)
260/280 ratio
cystine dye pmol/ µl
Yield
specific activity
Control 5 983.1 2.02 1.57 131.3 2.2 2.5 3.939 19.04 Control 60 842.5 2.01 1.94 165.2 2.2 3.1 4.956 18.76 CIP 5 min 631.3 2.04 2.05 241.8 2.21 2.4 7.254 9.92
CIP:Glu 1:1, 5 min
952.1 1.99 1.92 155.1 2.1 0.9 4.653 5.80
CIP:Glu 1:8, 5 min
851.8 1.96 1.63 210.8 2.1 1.6 6.324 7.593
CIP, 30 min 507.7 1.99 1.69 190.2 2.23 2.6 5.706 13.66 CIP:Glu 1: 1, 30 min
362.2 1.98 1.68 199.8 2.21 1.6 5.994 8.00
CIP :Glu 1:8, 30 min
318 2.03 1.97 132.2 2.1 1 3.966 7.56
CIP, 60 min 889.8 2 1.78 182.4 2.19 2.8 5.472 15.35 CIP:Glu 1: 1, 60 min
614.3 1.99 1.29 133.2 2.26 2.4 3.996 18.01
CIP:Glu 1: 8, 60 min
1286.3 1.99 1.82 135.9 2.14 1.7 4.077 12.50
5.2.2.2.11. Data Processing (Image analysis and data normalization)
The feature extraction software (V10.7, Santa Clara, CA) was used to study the quality of the
obtained TIFF images. The image was analysed in terms of grid alignment, signal quantification
and overall slide quality.
Background intensities in the DNA microarray data such as optical background and non-specific
binding (NSB) were adjusted using the R library gcrma (Boes and Neuhäuser 2005). The gcrma
converted the background adjusted probe intensities into expression measures while the
probe sequence information were used to estimate probe affinity to non-specific binding
(NSB). The levels of probe intensities between the arrays before and after normalization were
compared using box-plots as discussed in TMP chapter. The middle line of the box-plot
represents the median while the two ends of the box represent the upper and lower quartiles.
Values which are more than 1.5 the interquartile range are outliners while the horizontal lines
connected to the box-plots are not considered outliners.

280
5.2.2.2.12. Clustering analysis and filtering
Data clustering was carried out on the normalized data using TMEV software (version TM4,
WA, USA). The genetic changes were clustered according to their similarities in the pattern of
their expression using hierarchical clustering algorithm. The mean values were used to
compare between various data set used in this study. In order to highlight the main variability
in the multidimensional data set principle component analysis was carried out using TMEV
software. Microsoft Excel (version 2003, Toulouse, France) was used to filter out the non-
expressed genes or the genes which do not show variation across sample types. Genes which
were up or down-regulated by two fold were selected for further analysis. In order to
investigate the changes in various pathways during the absorption process, up and down-
regulated genes were uploaded online onto the Kyoto Encyclopaedia of Genes and
Genomes (KEGG) http://www.genome.jp/kegg/ and the expression changes were high-
lighted in red.

281
5.2.3. Results and discussion
5.2.3.1. Ciprofloxacin/aspartic acid octanol/water partitioning and permeability studies
Similar to the previous studies that were conducted for TMP and IND, partitioning studies of
CIP and its ion-paired formulations were investigated using water and octanol system. Figure
5.2.2 shows the partitioning behaviour of CIP at various concentrations of aspartic acid. CIP
alone was found to have high partitioning in the organic layer with a log P value of 1.63. This
was fairly similar to the values reported by Olivera, (2011) (log P 1.32). The octanol/water
partitioning slightly dropped upon pairing CIP with aspartic acid as the drug concentration in
the aqueous layer increased upon increasing the concentration of aspartic acid. The highest
aqueous concentration was exhibited at 1:8 ratio of CIP to aspartic acid respectively and the
log P dropped by more than one unit to 0.28.
0
200
400
600
800
1000
1200
CIP free CIP Asp 1 2 4 8
x molar Conc of aspartic acid
Con
cent
ratio
n (u
g/m
L)
0
0.5
1
1.5
2
Log
P
Aqueous conc Organic conc Log P
Figure 5.2.90:- CIP concentrations in aqueous and octanol layers and its corresponding Log P values at
various concentrations of aspartic acid (n=3).
Ion-pairing theory assumes that pairing between the oppositely charged ions occurs during
partitioning for basic or acidic drug with its counterpart (acidic or basic counter ion). CIP is
zwitter ionic in nature characterised by both acidic and basic groups capable of forming ion-

282
pairs. In the current investigation, anionic amino acids were used as previous studies have
shown that stable salt forms cannot be obtained with cationic amino acids due to the lack of
formation of inter and intra molecular bonds which was studied using molecular simulations.
We therefore assumed that CIP will behave as a cationic molecule upon pairing with acidic
amino acids. Equation 5.2.9 was used to plot the double reciprocal of the apparent
octanol/water distribution coefficient of CIP and the concentration of the acidic amino acid.
ABaqABaqB PAPKD
1
][
11
11
+=
Equation 5.2.60
Table 5.2.42:- pH measurements during the partitioning study for CIP aspartate (n=3).
Formulation pH measurements CIP 4.46±0.03 CIP aspartic acid PM 1:1 4.02±0.1 CIP aspartic acid PM 1:2 3.96±0.06 CIP aspartic acid PM 1:4 3.76±0.12 CIP aspartic acid PM 1:8 3.61±0.026
y = 35.392x-1.1681
R2 = 0.9364
0
0.5
1
1.5
2
2.5
3
0 10 20 30 40 50 60 70
1/ no of moles of aspartic acid
1/D
B
Figure 5.2.91:- Double reciprocal plot of the apparent octanol-water distribution coefficient of CIP as
function of aspartic acid molar concentration.
A negative exponential relationship (R2= 0.94) was observed between the double
reciprocal of the apparent octanol/water distribution coefficient of CIP and the concentration
R2=0.94

283
of the acidic amino acid suggesting that an increase in the molar concentration of aspartic acid
would result in an exponential decrease in the partitioning coefficient of the zwitter ionic drug.
Using equation (5.2.10), the intrinsic octanol water partitioning (PAB) was calculated and found
to be 0.56 while the aqueous binding constant (K11aq) was 1.54 mM-1 (1540 M-1). Although the
number of H-donor and H-acceptors for both CIP and TMP was similar (i.e. similar degree of H-
bond formation), the aqueous binding constant between CIP and aspartic acid was significantly
higher than that between TMP and aspartic acid (21 M-1). Nevertheless, the degree of ionic
bonding between CIP and the amino acid is higher than that between TMP and aspartic acid
possibly because of the higher ∆pKa (6.86 in case of CIP and 5.42 in TMP).
1681.139.35 −= xY Equation 5.2.61
0
2
4
6
8
10
12
14
5 10 15 30 45 60 90
Time (mins)
% T
rans
porte
d
CIP free drug CIP aspartate salt CIP: aspartic PM 1:1
CIP: aspartic PM 1:2 CIP: aspartic PM 1:4 CIP: aspartic PM 1:8
Figure 5.2.92:- Percentage of CIP transported across Caco-2 monolayers at various molar ratios of
aspartic acid (n=5). One way analysis of variance (ANOVA) and pair-wise multiple comparisons
method (Tukey test) against drug alone at each time point were used for statistical analysis and
probability values of (P< 0.05, * and P<0.001,***) were used to determine the significant difference.
Figure 5.2.4 summarises the permeability profile of various formulations of CIP across Caco-2
monolayers. 0.45±0.06% of CIP was absorbed across the monolayers after 5 minutes of start of
the experiment. The percentage absorbed increased slightly with time to 3.1±0.67% after 90
***
***
***
***

284
minutes. The apparent permeability for CIP (Papp) was 0.81x10-06±3.24x10-07 cm/sec which
reflects the very low permeability of the drug. No significant difference (p> 0.05) was observed
for most of the formulations for up to 15 minutes and the amount of CIP absorbed did not
exceed 1%. After 30 minutes the percentage of CIP permeated began to increase for CIP
aspartate salt (1.69±0.72%) and CIP aspartic acid PM 1:1 (3.02±0.34%) while the rest of the
formulations showed no significant increase relative to 30 min control. Moreover, the
apparent permeability for CIP increased in the PM 1:1 and the salt formulations to 1.28x10-
06±2.91x10-07 and 2.45x10-06±1.15x10-06 cm/sec respectively.
Table 5.2.43:- Summary of the TEER measurements before and after the permeability assay (n=3), the
percentage recovery and the apparent permeability calculations for CIP aspartic acid and glutamic
acid formulations.
Formulation TEER measurements (Ω/cm2) Before
TEER measurements (Ω/cm2) After
Recovery (%)
Apparent permeability at 60 min (cm/sec)
CIP free drug 452.24±11.7 420.3±26.5 86.5 8.12E-07±3.24E-07 CIP Asp PM 1:1 440.36±18.3.73 430.6±11.2 79.2 1.28E-06±2.91E-07
CIP Asp PM 1:2 446.5±32.3 438.5±20.5 97.1 8.80E-07±3.69E-07 CIP Asp PM 1:4 502±15.2 460.6±28.1 82.5 1.06E-06±5.45E-07 CIP Asp PM 1:8 420.6±10.5 412.6±12.8 96.2 1.38E-06±9.35E-07 CIP Asp salt 455.2±23.1 420.25±13.2 75.9 2.45E-06±1.15E-06
CIP Glu PM 1:1 390.7±12.2 387±30.45 85.2 1.15E-06±2.88E-07 CIP Glu PM 1:2 348±32.1 337.66±5.16 89.7 9.50E-06±1.54E-06 CIP Glu PM 1:4 412.3±20.5 352.6±38.6 95 43.2E-06±8.54E-06 CIP Glu PM 1:8 440.4±11.5 400.1±26.2 98.1 61.1E-06±9.49E-06
CIP Glu salt 401.2±10.2 392.66±12.6 92.3 2.19E-06±4.39E-07
5.2.3.2. Ciprofloxacin/glutamic acid octanol/water partitioning and permeability studies
The octanol/water partitioning of CIP and various concentrations of glutamic acid were studied
and the results are summarised in Fig. 5.2.5. Similar to aspartic acid based formulations, the
concentration of CIP in the aqueous phase increased upon increasing the concentration of
glutamic acid which resulted in a steady decrease in the log P values until it finally reached
0.12 at 8 molar concentration of glutamic acid.

285
Table 5.2.44:- pH measurements during the partitioning study for CIP glutamate (n=3).
Formulation pH measurements CIP 4.46±0.03 CIP glutamic acid PM 1:1 4.29±0.015 CIP glutamic acid PM 1:2 4.21±0.012 CIP glutamic acid PM 1:4 4.05±0.03 CIP glutamic acid PM 1:8 3.85±0.028
0
200
400
600
800
1000
1200
0 1 2 4 8
x moles of glutamic acid
Con
c (µ
g/m
L)
0
0.2
0.40.6
0.8
1
1.21.4
1.6
1.8
Log
P
Aqueous solubility Octanol solubility Log P
Figure 5.2.93:- CIP concentrations in aqueous and octanol layers and its corresponding Log P values at
various concentrations of glutamic acid (n=3).
The double reciprocal plot of apparent octanol/water distribution coefficient of CIP and the
concentration of glutamic acid showed similar trend as that of aspartic acid (Fig. 5.2.6). Upon
using the equation (equation 5.2.11), the intrinsic octanol water partitioning (PAB) was 2.17
while the aqueous binding constant (K11aq) was found to be 0.48 mM-1 (480 M-1).
96.033.0 −= xY Equation 5.2.62
As discussed before in chapter 5.1, ionic and H-bond formation are expected to be the same
between aspartic acid and CIP ion-pairs and glutamic acid and CIP ion-pairs due to the high
similarity between the two amino acids in terms of the pKa values and number of H- bond
donors and H-acceptors. Nevertheless, the aqueous binding constant (K11aq) between aspartic
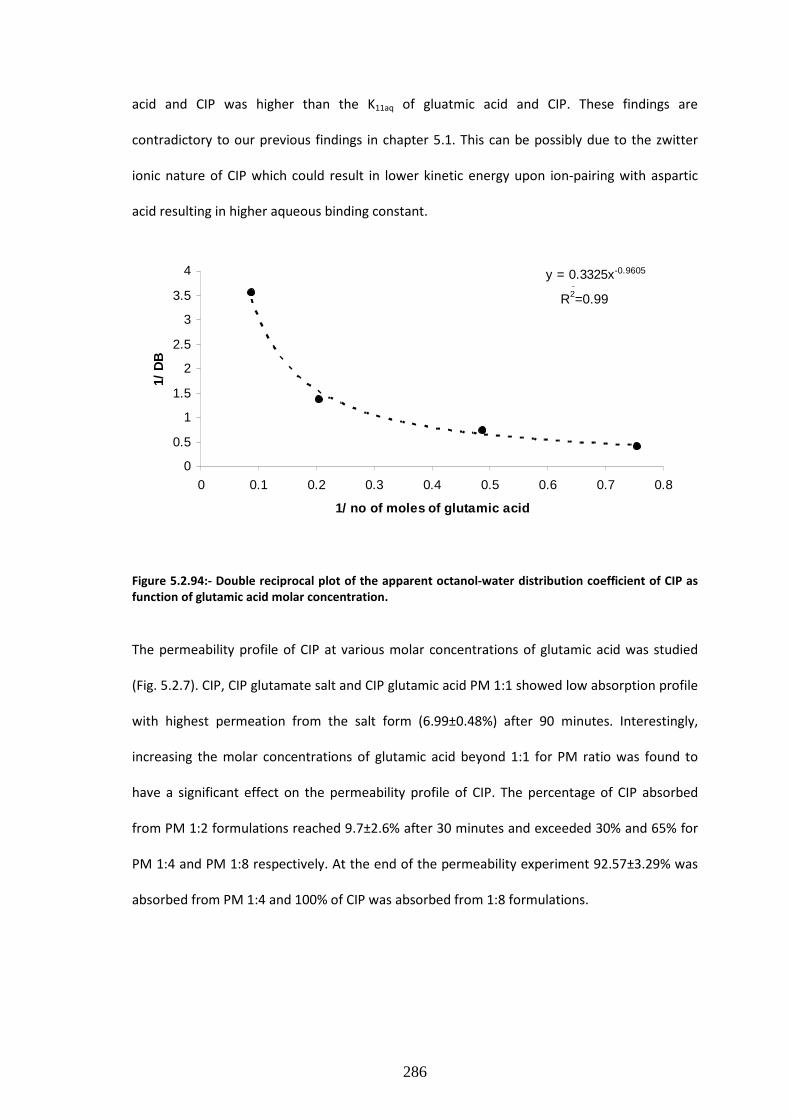
286
y = 0.3325x-0.9605
R2 = 0.9899
0
0.5
1
1.5
2
2.5
3
3.5
4
0 0.1 0.2 0.3 0.4 0.5 0.6 0.7 0.8
1/ no of moles of glutamic acid
1/ D
B
acid and CIP was higher than the K11aq of gluatmic acid and CIP. These findings are
contradictory to our previous findings in chapter 5.1. This can be possibly due to the zwitter
ionic nature of CIP which could result in lower kinetic energy upon ion-pairing with aspartic
acid resulting in higher aqueous binding constant.
Figure 5.2.94:- Double reciprocal plot of the apparent octanol-water distribution coefficient of CIP as
function of glutamic acid molar concentration.
The permeability profile of CIP at various molar concentrations of glutamic acid was studied
(Fig. 5.2.7). CIP, CIP glutamate salt and CIP glutamic acid PM 1:1 showed low absorption profile
with highest permeation from the salt form (6.99±0.48%) after 90 minutes. Interestingly,
increasing the molar concentrations of glutamic acid beyond 1:1 for PM ratio was found to
have a significant effect on the permeability profile of CIP. The percentage of CIP absorbed
from PM 1:2 formulations reached 9.7±2.6% after 30 minutes and exceeded 30% and 65% for
PM 1:4 and PM 1:8 respectively. At the end of the permeability experiment 92.57±3.29% was
absorbed from PM 1:4 and 100% of CIP was absorbed from 1:8 formulations.
R2=0.99
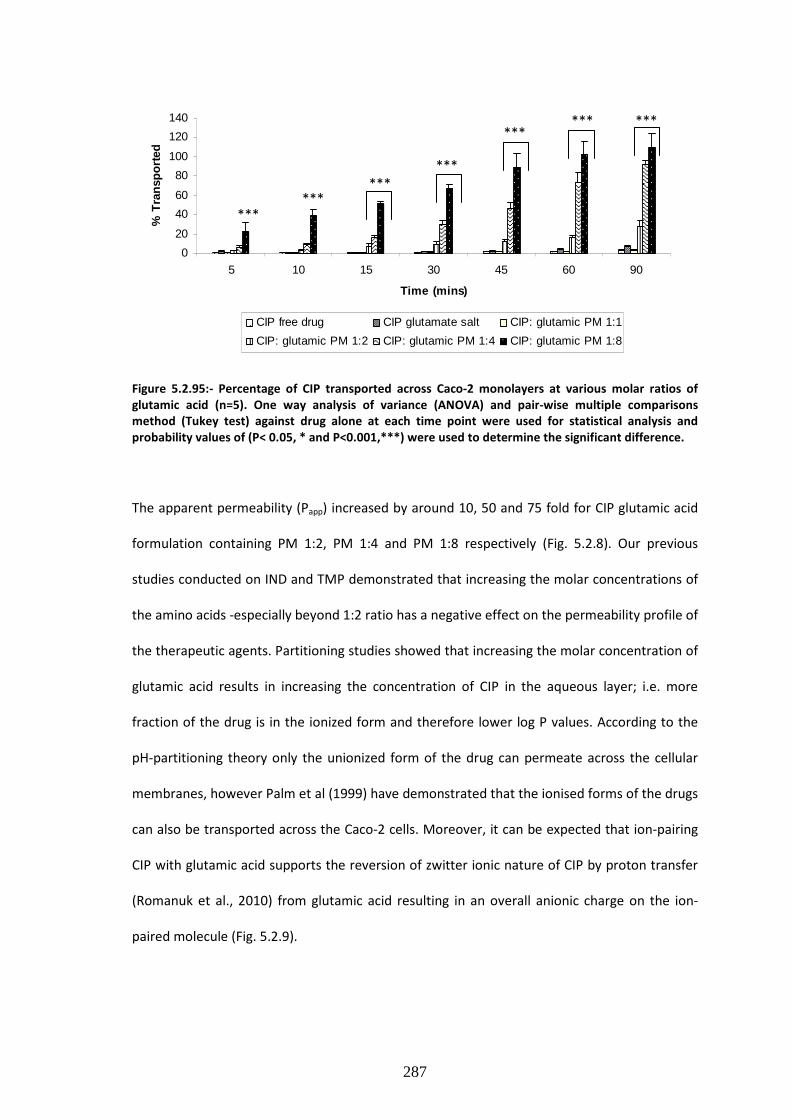
287
0
20
40
60
80
100
120
140
5 10 15 30 45 60 90
Time (mins)
% T
rans
porte
d
CIP free drug CIP glutamate salt CIP: glutamic PM 1:1
CIP: glutamic PM 1:2 CIP: glutamic PM 1:4 CIP: glutamic PM 1:8
Figure 5.2.95:- Percentage of CIP transported across Caco-2 monolayers at various molar ratios of
glutamic acid (n=5). One way analysis of variance (ANOVA) and pair-wise multiple comparisons
method (Tukey test) against drug alone at each time point were used for statistical analysis and
probability values of (P< 0.05, * and P<0.001,***) were used to determine the significant difference.
The apparent permeability (Papp) increased by around 10, 50 and 75 fold for CIP glutamic acid
formulation containing PM 1:2, PM 1:4 and PM 1:8 respectively (Fig. 5.2.8). Our previous
studies conducted on IND and TMP demonstrated that increasing the molar concentrations of
the amino acids -especially beyond 1:2 ratio has a negative effect on the permeability profile of
the therapeutic agents. Partitioning studies showed that increasing the molar concentration of
glutamic acid results in increasing the concentration of CIP in the aqueous layer; i.e. more
fraction of the drug is in the ionized form and therefore lower log P values. According to the
pH-partitioning theory only the unionized form of the drug can permeate across the cellular
membranes, however Palm et al (1999) have demonstrated that the ionised forms of the drugs
can also be transported across the Caco-2 cells. Moreover, it can be expected that ion-pairing
CIP with glutamic acid supports the reversion of zwitter ionic nature of CIP by proton transfer
(Romanuk et al., 2010) from glutamic acid resulting in an overall anionic charge on the ion-
paired molecule (Fig. 5.2.9).
***
***
*** ***
*** ***
***

288
3
2
4
N1
5
6
109
78
N1718
22
19
21
NH2+
2011
1213
F23
O16
14
O24
O-
15
26
28
30
31
32
O-
34
O33
NH229
O27
OH25
0.00E+00
1.00E-05
2.00E-05
3.00E-05
4.00E-05
5.00E-05
6.00E-05
7.00E-05
8.00E-05
CIP fr
ee d
rug
CIP
Asp
PM 1
:1
CIP
Asp
PM 1
:2
CIP
Asp
PM 1
:4
CIP
Asp
PM 1
:8
CIP
Asp
salt
CIP
Glu
PM 1
:1
CIP
Glu
PM 1
:2
CIP
Glu
PM 1
:4
CIP
Glu
PM 1
:8
CIP
Glu sa
lt
App
aren
t Per
mea
bili
ty (
cm/s
ec)
Figure 5.2.96:- Papp permeability values at 60 minutesfor CIP alone and CIP at various molar ratios of
aspartic acid and glutamic acid. One way analysis of variance (ANOVA) and pair-wise multiple
comparisons method (Tukey test) against drug alone at each time point were used for statistical
analysis and probability values of (P< 0.05, * and P<0.001,***) were used to determine the significant
difference.
Figure 5.2.97:- structure representing the reversion of the zwitter ionic nature of CIP by the proton
transference from the glutamic acid and hence an overall anionic charge on ion-paired molecule.
5.2.3.3. Effect of fed and fasted state on CIP permeability
As discussed above the environment in fed state in the gastrointestinal tract might affect
solubilisation and the degree of ionisation of the drugs. Moreover, food content might interact
with the counter ion and prevent the uptake of the ion-paired CIP amino acid for transport
across the intestinal membrane as one unit. Therefore, this study will investigate the effect of
fast and fed state media on the absorption profile of CIP glutamate salt. CIP glutamate salt was
selected for this study to determine the effect of media on salt absorption as it has shown to
***
***
***

289
have a relatively low Papp value (2.19x10-06±4.39x10-07 cm/sec) and any improvement in
permeability would be significant.
0
5
10
15
20
25
30
35
5 10 15 30 45 60 90
Time (mins)
% C
IP a
bsor
bed
CIP glutamate salt HBSS CIP glutamate salt FaSSIF CIP glutamate salt FeSSIF
Figure 5.2.98:- Percentage of CIP glutamate salt transported across Caco-2 monolayers from HBSS,
FaSSIF and FeSSIF media (n=5). One way analysis of variance (ANOVA) and pair-wise multiple
comparisons method (Tukey test) against drug alone at each time point were used for statistical
analysis and probability values of (P< 0.05, * and P<0.001,***) were used to determine the significant
difference.
Figure 5.2.10 shows the permeability profile for CIP glutamate salt in HBSS media, FaSSIF and
FeSSIF. During the first 15 minutes of the permeability assay, the media did not have any effect
on the absorption profile of CIP glutamate salt and no more than 2% of the salt was
transported across the cell lines. After 30 minutes, the percentage of CIP absorbed from the
salt form in the FeSSIF media increased significantly (p<0.001) when compared to the salt in
HBSS and FaSSIF media and the total percentage permeated from FeSSIF increased to reach
26.84±2.9% after 90 minutes. On the other hand, the FaSSIF media did not have any significant
effect (p> 0.05) on the percentage of CIP absorbed and the percentage absorbed after 90
minutes did not exceed 10%. Apparent permeability calculations showed a significant increase
of CIP apparent permeability in FeSSIF media (Papp= 7.35x10⁻⁶±0.8x10⁻⁶cm/sec) and no
significant effect in FaSSIF (Papp= 2.49x10⁻⁶±0.7x10⁻⁶cm/sec) when compared to Papp (2.19x10-
06±4.39x10-07 cm/sec) of CIP glutamate salt in HBSS.
***
***
***
***
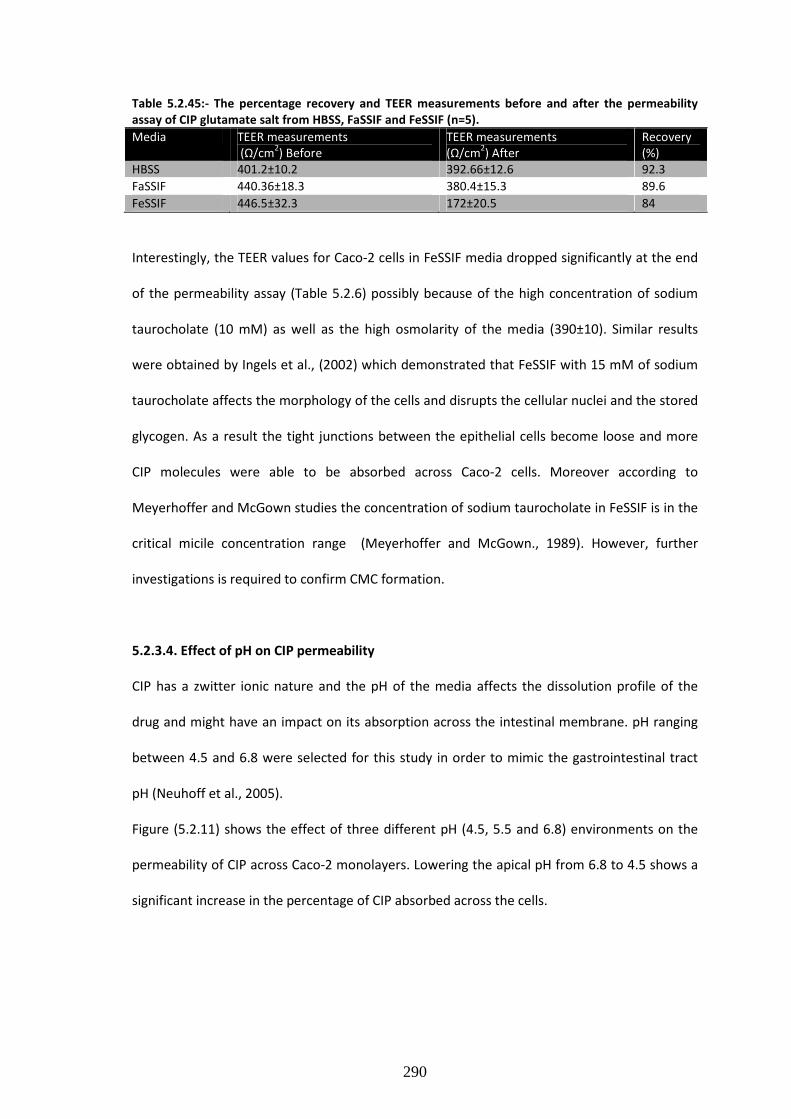
290
Table 5.2.45:- The percentage recovery and TEER measurements before and after the permeability
assay of CIP glutamate salt from HBSS, FaSSIF and FeSSIF (n=5).
Media TEER measurements (Ω/cm2) Before
TEER measurements (Ω/cm2) After
Recovery (%)
HBSS 401.2±10.2 392.66±12.6 92.3 FaSSIF 440.36±18.3 380.4±15.3 89.6
FeSSIF 446.5±32.3 172±20.5 84
Interestingly, the TEER values for Caco-2 cells in FeSSIF media dropped significantly at the end
of the permeability assay (Table 5.2.6) possibly because of the high concentration of sodium
taurocholate (10 mM) as well as the high osmolarity of the media (390±10). Similar results
were obtained by Ingels et al., (2002) which demonstrated that FeSSIF with 15 mM of sodium
taurocholate affects the morphology of the cells and disrupts the cellular nuclei and the stored
glycogen. As a result the tight junctions between the epithelial cells become loose and more
CIP molecules were able to be absorbed across Caco-2 cells. Moreover according to
Meyerhoffer and McGown studies the concentration of sodium taurocholate in FeSSIF is in the
critical micile concentration range (Meyerhoffer and McGown., 1989). However, further
investigations is required to confirm CMC formation.
5.2.3.4. Effect of pH on CIP permeability
CIP has a zwitter ionic nature and the pH of the media affects the dissolution profile of the
drug and might have an impact on its absorption across the intestinal membrane. pH ranging
between 4.5 and 6.8 were selected for this study in order to mimic the gastrointestinal tract
pH (Neuhoff et al., 2005).
Figure (5.2.11) shows the effect of three different pH (4.5, 5.5 and 6.8) environments on the
permeability of CIP across Caco-2 monolayers. Lowering the apical pH from 6.8 to 4.5 shows a
significant increase in the percentage of CIP absorbed across the cells.

291
0123456789
10
5 10 15 30 45 60 90
Time (mins)
% tr
ansp
orte
d
pH 4.5 pH 5.5 pH 6.8
Figure 5.2.99:- Percentage of CIP transported across Caco-2 monolayers at various pHs (n=5). One way
analysis of variance (ANOVA) and pair-wise multiple comparisons method (Tukey test) against drug
alone at each time point were used for statistical analysis and probability values of (P< 0.05, * and
P<0.001,***) were used to determine the significant difference.
After 5 minutes 2.31±0.68% CIP was absorbed at pH 6.8 and the percentage slightly changed to
2.41±0.39% and significantly increased to 4.92±0.68% when the apical pH was dropped to 5.5
and 4.5 respectively. The percentage of CIP transported increased from the transwells with
lower pH (4.5) until it reached 9.34±0.098% after 90 minutes, while at higher pH the
percentage transported did not exceed 4%. The improvement in permeability at lower pH
could be attributed to the increase of CIP solubility as suggested by Li et al., (2007); this would
subsequently have a significant impact on dissolution profile making a higher concentration of
CIP available for permeability. Similar findings were reported by Lee et al., (2005) who found
that changing the apical pH of Caco-2 monolayers from 7.4 to 6.5 resulted in a five to 8 fold
increase in the apparent permeability of acidic and basic drugs. In contrast, conducting similar
experiments in rabbit jejunum has not shown any impact on the drug uptake at different pHs
(Shiau et al., 1985). The study concluded that the presence of an adherent layer of mucus gel
on the rabbit jejunum acts as a protective barrier for the epithelial cells and maintains the
*** ***
***
*** *** ***
***
*

292
acidic microclimate by hindering the movement of hydrogen within the surrounding matrix of
the lumen (Shiau et al., 1985).
Table 5.2.46:- The percentage recovery and TEER measurements before and after the permeability
assay of CIP at pHs of 4.5, 5.5 and 6.8 (n=5).
pH TEER measurements (Ω/cm2) Before
TEER measurements (Ω/cm2) After
Recovery (%)
4.5 427.3±48.01 370±13.28 90 5.5 481.3±10.26 380.3±4.16 79.8 6.8 456.6±15.2 390±22.24 87.2
Microarrays studies
5.2.3.5. Image analysis, data clustering and principle component analysis (PCA)
According to our permeability studies, significant increase of the amount of CIP absorbed was
observed. Hence, three formulations were selected for the microarray experiment namely CIP
alone, CIP PM 1:1 and CIP PM 1:8 with glutamic acid. in order to visualise the genetic changes
occurring during exposing the cells to the therapeutic agent and its ion-paired formulations
with glutamic acid, three time points were selected 5, 30 and 60 minutes. Genetic changes that
occur for Caco-2 cells without application of any therapeutic agents were selected as a control
for this study (basal state). Prior to data normalization and clustering, the quality of the TIFF
image obtained from the scanner was assessed for its quality. Spot centroids were located for
each corner of the slides and only slides with correctly located spots were used in this study. A
symmetric histogram of number of points against the logarithm of the processed signals was
obtained for the used slides. Besides, all the slides used showed low multiplicative detrending
and median coefficient of variation ranging between 3.6 and 7.01 which reflects the high
reproducibility of the signals of the arrays.

293
Figure 5.2.100:- Microarray image analysis; spot finding for four corners (A), correlation between log
signal against log Relative concentration (B) histogram of signals plot (C), and spatial distribution of
median signals for each column (D). Data were generated by feature extraction software.
The data obtained from each microarray experiment is highly complex in terms of quantity and
dimensions. In order to interpret the biological meaning of the obtained data, clustering and
principle component analysis were carried out. After clustering the data using hierarchal
clustering, PCA was studied in to identify the dimension of extension of the data as discussed
earlier in TMP chapter. Eigen values were calculated using TMEV software and the data
showed that 24.12% of the changes occur along the first component and 56.27% occurs along
the first three components. Therefore, the principle component 1, principle component 2 and
principle component 3 were used to describe the changes of the molecular state of the cell
and to determine the dynamic trends during the absorption of CIP and its ion-paired
formulations with glutamic acid.
A B
D C
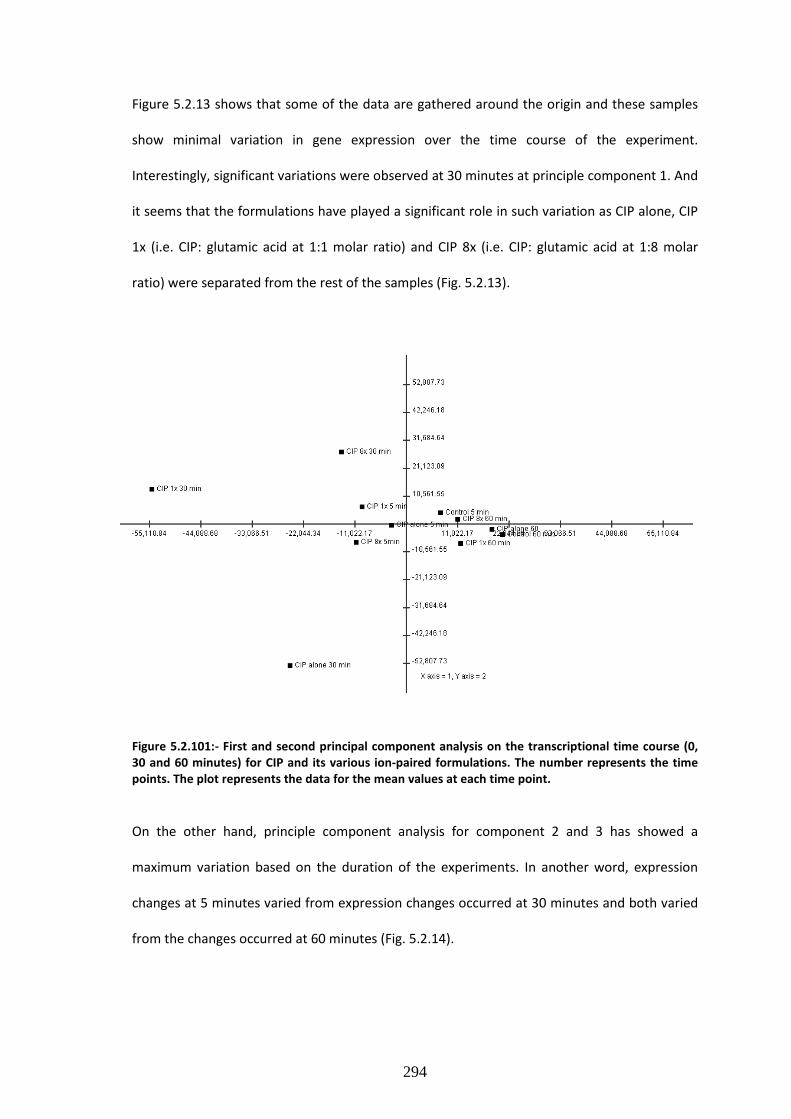
294
Figure 5.2.13 shows that some of the data are gathered around the origin and these samples
show minimal variation in gene expression over the time course of the experiment.
Interestingly, significant variations were observed at 30 minutes at principle component 1. And
it seems that the formulations have played a significant role in such variation as CIP alone, CIP
1x (i.e. CIP: glutamic acid at 1:1 molar ratio) and CIP 8x (i.e. CIP: glutamic acid at 1:8 molar
ratio) were separated from the rest of the samples (Fig. 5.2.13).
Figure 5.2.101:- First and second principal component analysis on the transcriptional time course (0,
30 and 60 minutes) for CIP and its various ion-paired formulations. The number represents the time
points. The plot represents the data for the mean values at each time point.
On the other hand, principle component analysis for component 2 and 3 has showed a
maximum variation based on the duration of the experiments. In another word, expression
changes at 5 minutes varied from expression changes occurred at 30 minutes and both varied
from the changes occurred at 60 minutes (Fig. 5.2.14).

295
Figure 5.2.102:- Second and third principal component analysis on the transcriptional time course (0,
30 and 60 minutes) for CIP and its various ion-paired formulations. The number represents the time
points. The plot represents the data for the mean values at each time point.
5.2.3.6. Genetic changes of transporters pathways
Approximately 45,000 cDNA were hybridized with the microarray chip probes in order to
investigate the systemic changes of the gene expression occurring during CIP transportation
study. Genes which were over-expressed or down-regulated by at least two fold when
compared against the control were selected for this study. Equations 5.2.12 & 5.2.13 were
used to calculate the level of up or down regulation of the expressed genes when compared
against the control (Caco-2 cells).
)()( 2 CE
CEIF −> = Equation 5.2.63
)()( 2 EC
CEIF −< −= Equation 5.2.64
The results showed that a total of 104 genes including 2 genes that code for drug transport
were over-expressed after 5 minutes of exposing the cells to CIP alone when compared to
control (Caco2 cells). On the other hand, 248 genes were down-regulated at the same time

296
point. Exposing the cells to CIP alone formulations for longer time (30 minutes) resulted in
activation of 1790 genes (over-expressed by at least 2 fold), while 229 genes were down
regulated suggesting that a turnaround time between 5 and 30 minutes is essential to
determine any significant gene expression changes when studying drug transport. The total
number of both over-expressed and down-regulated genes began to drop again after 60
minutes as shown in Fig. (5.2.15).
104
1790
214
-248 -229 -124
-500
0
500
1000
1500
2000
5 30 60
Time point (minutes)
Num
ber o
f gen
es e
xpre
ssed
Up-regulated genes
Down-regulated genes
Figure 5.2.103:- Total number of genes up and down-regulated upon exposing the cells to CIP alone
formulation at different time courses.
The next stage of data evaluation was focused on identifying various genes that are involved in
drug transport from the total set of genetic changes (Fig. 5.2.15) and Table (5.2.8) summarises
the genes over-expressed upon exposing Caco-2 cells to CIP alone formulations for 5, 30 and
60 minutes.
As data analysis using PCA indicated that major changes in expression profile occur after 30
minutes, genes exhibiting significant variations were uploaded onto KEGG to determine their
role in various cellular pathways. Pathway analysis of significant genes showed that 15
different pathways including metabolic pathways, cytokine-cytokine interactions, pathways in

297
cancer, neuroactive ligand receptor interaction and regulation of actin cytoskeleton were
affected.
Table 5.2.47:- Summary of the over-expressed transporter genes upon exposing Caco-2 cells to CIP
alone formulations for 5, 30 and 60 minutes.
Time point Probes Gene symbol Expression level
5 minutes
A_23_P307570 ABCC13 3.163352
A_23_P159851 SLC7A3 4.083838
30 minutes
A_23_P215720 CFTR 2.01546
A_24_P222291 ABCC4 2.32746
A_23_P82523 ABCB1 3.996312
A_23_P28246 SLC23A3 2.223539
A_32_P130630 SLC16A7 5.549221
A_24_P131880 SLC10A7 2.940933
A_23_P355377 SLC12A5 2.028348
A_24_P382467 SLC39A3 2.702885
A_32_P381593 SLC26A7 15.35347
A_24_P342829 SLC16A14 2.441215
A_23_P137097 SLC16A2 3.813012
A_23_P388900 SLC22A15 23.0606
A_24_P910660 SLC6A2 4.799098
A_32_P812442 SLC36A3 2.250099
A_24_P270688 SLC38A7 2.482864
A_23_P13725 SLC6A15 9.024523
A_23_P77653 SLC12A3 2.828382
A_23_P388170 SLC39A3 4.650775
A_23_P159076 SLC17A8 2.137794
A_23_P418562 SLC6A11 5.915653
A_24_P191312 SLC1A4 4.691002
A_23_P389799 SLC25A42 3.16615
A_23_P431734 SLC25A37 4.422084
A_24_P21829 SLC22A24 8.132694
A_24_P913210 SLC11A2 2.042913
A_24_P397435 SLC6A3 10.85624
A_24_P101941 SLCO4C1 2.927174
60 minutes
A_23_P166297 ABCG1 -2.29228
A_23_P143309 SLC4A11 -2.68538
By looking at ATP-binding cassette (ABC) transporter network (Fig. 5.2.16) it was observed that
among the all ABC carriers only three (ABCB1, ABCC4 and CFTR) were over-expressed
significantly after treating Caco-2 cells with CIP alone for 30 minutes as outlined in (Fig.
5.2.16).

298
Figure 5.2.104:- Graph high-lightening the over-expressed ABC transporters during the absorption of
CIP across Caco-2 cells. The graph was generated by KEGG online database.
ABCB1 which is also known as MDR1 or P-gp is an ATP-binding cassette transporter belonging
to subfamily B (member 1) was 3.99 fold over-expressed when compared against the basal
state of the cells (control; Caco-2 cells without drug treatment). These findings come in line
with the results suggested by Park et al., (2011). Park and co-workers demonstrated that

299
MDCK1 and MDCK1-MDR1 cells over-express P-gp upon exposure to CIP and the basal/apical
flux of CIP decreases if P-gp inhibitors such as ketoconazole, vinblastine and verapamil are
used. The fourth member of the ATP-binding cassette subfamily 4 (ABCC4) is another over-
expressed gene upon treating the cells with CIP alone for 30 minutes as it was up-regulated by
2.3 fold. ABCC4 is a multidrug resistance-associated protein and also known as MRP4 and plays
a role in transporting organic anions. Marquez et al (2009) believed that the efflux of CIP is
mediated by one of the multidrug resistance associated proteins. The study showed that MRP2
and MRP4 are up-regulated in CIP resistance cells with the expression of MRP4
overwhelmingly predominant than MRP2 (Marquez et al., 2009).
CFTR or cystic fibrosis transmembrane conductance regulator is another ABC transporter that
was over-expressed by 2.01 fold in CIP alone formulations. CFTR is the 7th member of MRP
family and functions as a chloride channel. The mutation of this gene was associated with an
autosomal recessive disorder known as cystic fibrosis. No studies have evaluated the role of
CFTR in the transport of CIP apart from Marquez et al (2009) who suggested that CFTR (MRP7)
plays no role in the efflux of CIP.
Interestingly, treating Caco-2 cells with CIP alone formulations for 30 minutes resulted in
triggering various signalling pathways which are involved in the tight junction (TJs) assembly.
TJs define the boundaries between the apical and basolateral plasma membrane as they work
as paracellular barriers that limit the uptake of solutes across the intercellular space (Salama et
al., 2006). TJs are assembled by cascade of biochemical events in the cells which lead to the
formation of various elements of the TJs which have only been partially characterized (Tsukita
and Furuse, 1999). They are mainly composed of three proteins: occludin, claudin and
immunoglobulin as adhesion protein (Matter and Balda, 2003). Assembly of TJ components is
mediated by signalling pathways such as protein kinase A (PKA) and protein kinase C (PKC)
300
which regulates the junction pore size and cell polarity. Partition defective genes (PAR) are
other signalling modulators that have two members; PAR3 and PAR6. PAR3 binds with PAR6
and PCKs to form PKC-PAR3-PAR6 complex that form TJ and build epithelial polarization
(Matter and Balda, 2003).
Among the up-regulated PKC genes were protein kinase C beta (PRKCB) and protein kinase
cGMP (PRKG1) which were over-expressed by 6.4 and 8.09 fold respectively (Fig. 5.2.17). From
the partitioning defective genes, PAR6 was over-expressed by 13.9 fold (Fig. 5.2.17). Moreover,
various genes associated with myosin light chain regulation such as MYO16, MYL7, MYL2 and
MYO3B were over-expressed by 3.22, 2.4, 3.33 and 3.94 fold respectively. These genes activate
myosin formation which serves as a link to the plasma membrane (Anderson et al., 1995).
These results suggest that CIP would play a significant role in modulating the assembly of tight
junctions across the epithelial cells and this could be another barrier that hinders CIP influx
besides the efflux proteins.

301
Figure 5.2.105:- The activated signalling pathways involved in tight junction formation. Activated
mediators are highlighted in red. The graph was generated by KEGG online database.
The genetic changes that occur upon exposing the monolayers to the ion-paired formulations:
CIP PM 1:1 and CIP PM 1:8 on Caco-2 cells were also investigated. Majority of the changes that
took place for the transporter network were observed for solute carrier transporters and only
few changes were recorded for ATP-binging cassettes (Fig. 5.2.18). CIP: glutamic acid PM at 1:1
molar ratio did not stimulate the over-expression of ABCB1 (P-gp) nor ABCC4 (MRP4) genes
during the entire time course of the experiment. Moreover, the expression profile of P-gp and
MRP4 were down regulated by 2.6 and 2.59 fold after 30 minutes of exposure to the 1:1 ion-
paired formulations (Fig. 5.2.18). These results suggest that ion-paired formulations mask the
triggering effects of CIP on the efflux protein and that both P-gp and MRP4 failed to identify
CIP when it was formulated as an ion-pair with glutamic acid.

302
Besides, comparing the expression patterns of some of the genes as listed in Fig. 5.2.18 and
(Table5.2.8) the results show that the genes up-regulated upon exposure to CIP were down-
regulated to their basal state when the ion-paired formulations were used. For instance,
ABCC13 and SLC7A3 were over-expressed by 3.16 and 4.08 fold respectively when the cells
were exposed to CIP alone formulations but were down-regulated by 2.03 and 3.65 fold
respectively when 1:1 molar ratio of ion-paired formulations were used which further confirms
the inability of the transporters to identify CIP when it is ion-paired.

303
Figure 5.2.106:- Gene expression of ABC and SLC transporters of Caco-2 cells after 5, 30 and 60 minutes of exposure to CIP : glutamic acid formulations at 1:1 ratio.
-12
-10
-8
-6
-4
-2
0
2
4
6
8
SLC
9A6
AB
CC
13
SLC
7A3
SLC
27A
6
SLC
30A
3
SLC
24A
4
SLC
35B
4
SLC
38A
4
AB
CC
4
AB
CD
3
AB
CE
1
AB
CB
1
SLC
11A
2
SLC
39A
10
AT
P5G
3
GR
IP2
SLC
26A
2
SLC
16A
7
SLC
38A
2
SLC
10A
7
SLC
5A4
SLC
16A
14
SLC
16A
2
SLC
6A2
SLC
36A
3
SLC
6A15
SLC
12A
3
SLC
39A
3
SLC
17A
8
SLC
6A11
SLC
1A4
SLC
25A
42
SLC
25A
37
SLC
11A
2
SLC
6A3
SLC
O4C
1
SLC
30A
9
SLC
26A
3
SLC
25A
18
SLC
15A
2
SLC
6A20
SLC
14A
2
SLC
2A12
Expressed genes
Leve
l of e
xpre
ssio
n
5 minutes 30 minutes
60 minutes

304
Permeability data showed that increasing the molar concentration of glutamic acid in the
formulations results in an increase in the overall uptake of CIP (Fig. 5.2.7). Nevertheless,
partitioning studies have demonstrated that there is a steady decline of drug partition upon
increasing the counter ion concentration (Fig. 5.2.5). Permeability data coupled with
partitioning studies suggest that CIP fails to permeate across the lipid bilayers of Caco-2 cells
and it is possible that there are cellular mechanisms responsible for the differences in
permeability profile.
The genetic changes that occurs upon using CIP:glutamic acid 1:8 formulations were
investigated and summarised in (Fig. 5.2.19) and table (5.2.9).
During the first 5 minutes 7 transporter genes were over-expressed; all of the over-expressed
genes belong to solute transporter carriers (Fig. 5.2.19A).
Figure 5.2.107:- Up-regulated ( ) and down-regulated( ) genes after exposing Caco-2 cells to CIP:
glutamic acid at 1:8 molar ratio after (A) 5 minutes, (B) 30 minutes and (C) 60 minutes.
Among the over-expressed solute carriers genes were amino acid transporters; SLC6A15 and
SLC6A1. It can be hypothesised that the high content of glutamic acid in 1:8 formulations
results in the over-expression of these transporters. Both the transporters belong to family 6
(Fig. 5.2.20) of the solute carrier transporters which play a significant role in transport of a
broad range of amino acids across the epithelial cells and also remove any neurotransmitters
7
2 6
26
3
2
A B C

305
from brain cells (Broer et al., 2006; Takanaga et al., 2005). SLC6A15 was first isolated by Uhl
and co-workers in 1992 and is a Na+ dependent and Cl- independent transporter. Later it was
found that it has affinity to alanine, glutamine, proline, leucine isoleucine and methionine.
SLC6A1 on the other hand (also known as GAT1) is considered the predominant transporter for
γ-amino butyric acid (Chen et al., 2004).
SLC6A15 and SLC6A1 were over-expressed by 2.12 and 2.56 respectively upon treating the cells
with 1:8 molar ratio of CIP: glutamic acid.
Figure 5.2.108:- Phylogenetic tree of various members of the human SLC6 transporter family adapted
from Takanaga et al., 2005.
Interestingly, SLCO1A2 -an organic anion transporting polypeptide (OATPs)- was also over-
expressed after 5 minutes (Table 5.2.9). The first member of OATPs was isolated in 1994 from
rat liver and is believed to transport a variety of organic compounds in a sodium independent
manner (Geyer et al., 2004). SLCO1A2 (also known as OATP1A2) was up-regulated 2.13 fold,
and is possible that the loss of the zwitter ionic nature of CIP upon ion-pairing with glutamic

306
acid results in the up-regulation of SLCO1A2 as the ion-paired complex carries a net negative
charge as discussed earlier.
Another up-regulated solute carrier transporter was SLC15A2 which belongs to a peptide
transporter family and mediates the uptake of dipeptides and tripeptides (Rubio-Aliaga and
Daniel., 2002). Two peptide transporters SLC15A1 (PEPT1) and SLC15A2 (PEPT2) have been
identified in mammalian cells. Both PEPT1 and PEPT2 have similar function but differ in affinity
and capacity. The two peptide transporters have been reported as potential targets for
prodrug absorption. The uptake of L-DOPA L-Phe prodrug (Tamai, et al. 1998) and acyclovir L-
valyl ester (Ganapathy, et al. 1998) was increased by several fold as their uptake was mediated
by PEPT1 and PEPT2. It is possible that besides the organic anionic transporter, PEPT2
(SLC15A2) also mediates the uptake of the ion-paired formulations and hence results in the
increase of CIP uptake across the Caco-2 monolayers.
Table 5.2.48:- Over-expressed genes upon exposure to CIP:glutamic acid at 1:8 molar ratio.
Time point Probes Gene symbol Expression level
5 minutes
A_23_P131111 SLC27A1 2.037017
A_24_P307653 SLC6A15 2.124151 A_23_P13820 SLCO1A2 2.129753 A_24_P268685 SLC6A1 2.564218 A_23_P160159 SLC2A5 68.07858 A_23_P22625 SLC9A6 6.909355 A_24_P208345 SLC45A3 17.85949
30 minutes
A_23_P43504 ABCA2 2.777874 A_23_P133694 SLC29A1 2.365923 A_24_P79153 SCAMP4 2.263806 A_23_P77049 SLC25A29 2.148496 A_23_P316960 GRINA 2.094572 A_23_P210521 SLC2A10 2.780049
60 minutes
A_24_P74508 SLC25A18 2.632616 A_23_P92107 SLC15A2 2.270138 A_23_P212379 SLC6A20 2.991979
Moreover, the efflux transporter genes; P-gp and MRP4 were down-regulated by 3.3 and 2.2
fold respectively upon using the ion-paired formulations at 1:8. The genetic profiling of the
transporter genes demonstrated that the efflux transporters were down-regulated to their
basal state upon the ion-pairing the formulations. The data also showed that ion-pairing has

307
resulted in new routes for uptake of CIP across the membrane which explains the increase in
permeability profile despite the decrease in partitioning capacities of the drug upon pairing
with the anionic counter ion.
5.2.3.7. Genetic changes of metabolic pathways and other pathways
Microarray data analysis has also revealed that other pathways in addition to transporter
pathways were significantly affected during the time course of the experiment upon ion-
pairing CIP formulations.
Cellular metabolism was among the most affected pathways during drug uptake. Four
metabolic pathways were up-regulated when the Caco-2 cells were exposed to CIP for 5
minutes. The number of metabolic pathways increased to 36 when the drug was left to
permeate for 30 minutes. The majority of the up-regulated pathways were involved in Glycan,
carbohydrates and lipid metabolism (Fig. 5.2.21). Metabolism of glycan and carbohydrates is
considered the major carbon and energy source for living cells. During glycan metabolism,
oxidative processes are involved which utilize the produced electrons to form ATP which is
considered as a fast energy source for the cells. It can be hypothesised that the high glycan
metabolism was stimulated by the cells in order to produce more ATP which is required by the
efflux transporters (MRP4 and P-gp). On the other hand, using the ion-paired formulations
showed a significant drop in the pathways involved in glycan and carbohydrates metabolism
(Fig. 5.2.22) again re iterating that the presence of oppositely charged ions masks the
identification of CIP and that alternate pathways are used for drug permeation.

308
Figure 5.2.109:- Glycan synthesis and metabolism after 30 minutes of exposure to CIP alone formulations. The graph was generated by KEGG online database.

309
Figure 5.2.110:- Amino acid metabolic pathways activated after 30 minutes of exposure to CIP:glutamic acid at 1:1 molar ratio formulations. The graph was generated
by KEGG online database.

310
Calcium signalling was another pathway that was found to be affected by exposing the cells to
CIP. Calcium is essential to trigger the activity of nitric oxide synthase (NOS) in order to
produce nitric oxide (NO). Nitric oxide is a universal intracellular messenger that modulates
the normal activities, blood flow and also plays a role in protecting the cells against pathogens
as it works as non-specific host defence (Pacher et al., 2007). Interestingly, CIP was found to
deactivate NOS which could be because of the high ability of CIP to chelate with calcium
(Susana et al., 2002) which in turn reduces Ca+2 concentration and NOS production. In order to
decrease the Ca+2 flux into the mitochondria, voltage dependent anion channel (VDAC) was
deactivated (Fig. 5.2.23) in a trial to decrease the calcium flux into the mitochondria as
suggested by Tan and Colombini (2007).
Figure 5.2.111:- Down-regulated mediators (highlighted in red) involved in calcium signalling
pathways during CIP uptake across Caco-2 cells and after 30 minutes of the permeability assay. The
graph was generated by KEGG online database
311
Calcium signalling pathway was reverted to the normal state upon coupling CIP with glutamic
acid which reflects the stability of the formed ion-pair over complex formation with
intracellular calcium.
5.2.4. Conclusion
CIP is a BCS IV drug that has low solubility and low permeability and it is believed that the small
intestine plays a major role in its excretion. Despite showing high partitioning capacities in the
organic phases, CIP permeability across Caco-2 monolayers was very low and did not exceed
10% after 90 minutes of the permeability assay. Microarray data showed that P-gp and MRP4
were over-expressed when the cells were exposed to CIP and they are believed to mediate the
efflux of the drug. Moreover, tight junction formation was stimulated by CIP and this could be
another barrier for CIP uptake. On the other hand, ion-pairing CIP with glutamic acid resulted
in a significant improvement of CIP absorption as the apparent permeability increased by 10,
50 and 75 fold for PM 1:2, PM 1:4 and PM 1:8 respectively. Two solute carrier transporters
(SLCO1A2 and SLC15A1) were up-regulated upon using the ion-paired formulations. It seems
that these two carriers mediates the uptake of the ion-paired formulation especially SLCO1A2
because the ion-paired CIP carries anionic charge which might have stimulated the organic
anion transporters. In conclusion, the improved uptake of CIP ion-paired formulations could be
due to the reduced efflux by ABC transporters or increased entry and transport via new solute
carrier transporters.

312
Conclusion
Biopharmaceutical properties of drug candidates have a great impact on their bioavailability as
it was recognised that both the rate and extent of oral drug bioavailability is controlled by the
aqueous solubility and gastro-intestinal permeability of the therapeutic agents (Amidon et al.,
1995). Therefore a new biopharmaceutical classification system was introduced in 1995 and
accepted by FDA in 2000. Various physical and chemical techniques were adapted in order to
improve aqueous solubility and intestinal uptake. Solid dispersion, cyclodextrins and prodrugs
were among the commonly used techniques for this purpose. The theory behind prodrug
synthesis is binding additional functional groups onto the structure of the poorly water soluble
drug molecule to enhance its solubility. This functional group splits from the drug molecule in
vivo by enzymes. Interestingly scientists managed to use prodrugs to mask polar groups on
therapeutic agents and hence improve the drugs ability to partition across membranes (Weller
et al., 1993). Despite their great success, prodrugs have shown low solubilities which self limit
their use as bioavailability enhancers (Majumdar et al., 2004). Moreover, prodrugs are new
chemical entities and they may be inert and/or toxic. Therefore, looking for alternative
methods that can improve drug bioavailability in a safe way became a must.
Counter ions were first introduced to improve solubility of low water soluble drugs until Irewin
et al demonstrated that the rate and efficacy of isopropamide was improved upon ion-pairing
with trichloroacetate. Since their introduction many studies tried to propose their mechanism
of action as permeability enhancers. Quintanar-Gueerrero et al (1997) suggested that ion-pairs
could lower the interfacial tension of the gut wall by binding to mucosal membrane.
In the current study, the use of amino acids as solubility and permeability enhancers for three
model drugs was investigated. The first drug candidate is a weak acidic drug classified as BCS II
as it solubility was found to be 0.244 µg/mL at pH of 4.95. This low solubility was found to

313
improve upon adding arginine and lysine at increasing concentrations as suggested by phase
solubility diagram. Therefore, it was believed that both arginine and lysine could form highly
soluble salts with IND. FT-IR confirmed salt formation as the spectrum of the carbonyl
stretching of acidic group of IND disappeared due to the loss of proton and the involvement of
the carboxylic group in the salt formation with the basic amino acids. Moreover, because salts
have different physical properties from their components, IND arginine and IND lysine salts
showed new melting endotherms at 209.73 oC and 223.26 oC respectively. Failure of histidine
to bind strongly with IND was attributed to the low difference between their pka values. The
aqueous solubility of IND improved by 2x10³ and 104 fold for IND arginine and IND lysine salts
respectively.
Similarly, the solubility of TMP and CIP were enhanced by forming new salts with acidic amino
acids. Although CIP is zwitter ionic in nature the drug only managed to form new salts with
anionic amino acids; glutamic acid and aspartic acid resulting in increasing the solubility to
215±13.3 mg/mL and 185.4±8.6 mg/mL respectively. Simulation studies demonstrated that CIP
hydrophobic interaction between its molecules decrease in the presence of acidic amino acids
and in turn form stable salts, these interactions were not affected in the presence of arginine
or lysine.
Results from chapters 3.1, 4.1 and 5.1 demonstrate high solubility and dissolution of IND, TMP
and CIP salts reflecting the high ionisation of the salt form. Therefore, excess amounts of the
counter ions were added in a trial to shift the salt ionisation equilibrium towards the non-
ionised form of the salt. Octanol/water partitioning studies revealed that increasing the molar
ratio of the counter ions results in a significant drop in the partitioning capacities for all the
drugs in octanol organic layer. Nevertheless permeability data showed a significant increase in
drug absorption especially for PMs of 1:2 molar ratios suggesting that active carrier might have

314
been involved in the absorption process of the ion-paired formulations as the drugs passive
uptake is deteriorated by the presence of the counter ions.
Therefore, we believed that looking at the genetic changes occurring at the cellular levels of
Caco-2 cells could enable better understanding about the involvement of any transporter
carriers. DNA microarrays were used for this purpose as it enables visualising the systemic
changes of 45,000 genes in one experiment. During TMP uptake across the monolayers, MRP7
were over-expressed significantly in more than one replicate probe across the array chip
reflecting the high involvement of MRP7 in extruding TMP out of the cells. Although majorities
of previous studies (Joseph et al., 2001; Murakami and Takano 2008) reported the involvement
P-gp in TMP efflux, the current study showed a minimal role played by P-gp in mediating TMP
efflux. Interestingly, TMP uptake was found to be mediated by organic cation transporters
such as OCTN1 which was up-regulated by 2.36 fold during TMP absorption. The molar ratio of
glutamic acid was found to affect the expression of OCTN1 as it expression reached 2.2 fold for
1:1 formulations and dropped to the basal state for 1:8 ion-paired formulations and hence the
parabolic permeability profile was observed for TMP uptake.
Nevertheless, looking at the genetic changes that accompanied CIP uptake showed that P-gp
and MRP4 were over-expressed when the cells were exposed to CIP and they are believed to
mediate the efflux of the drug. Besides, tight junction formation was stimulated by CIP and this
could be another barrier for CIP uptake. It seems that the anionic nature of the ion-paired CIP-
glutamic acid stimulated the expression of SLCO1A2 transporters, while the high aqueous
binding constant for their ion-pair (480 M-1) allowed them to get absorbed as one entity
through dipeptidyl transporters (SLC15A1).
Besides showing the high involvement of transporter carriers in the uptake of free drugs and
their ion-paired formulations, microarrays showed the involvement of various metabolic

315
pathways on drug pharmacokinetics and the pharmacodynamic effects of the drug on the
cellular signalling pathways.
In conclusion, amino acids could be used as a successful tool to improve the biopharmaceutical
properties of drug candidates upon ion-pairing. Microarrays could be used as a powerful tool
to screen new chemical entities’ metabolic, toxic and absorption pathways.

316
List of References Adkin, D., Davis SS., Sparrow R., Huckle P., Wilding IR. (1995a) The effect of mannitol on the
oral bioavailability of cimetidine. J. Pharm. Sci. 84 1405–1409. Adkin, D., Davis, SS., Sparrow, R.A, Huckle, P.D, Phillips, A.J, Wilding, IR. (1995b) The effects of
pharmaceutical excipients on small intestinal transit. Br. J. Clin. Pharmacol. 39 381–387. Aggarwal, S.K., Gogu, S.R., Rangan, S.R.S. and Agrawal, K.C., (1990) Synthesis and biological
evaluation of prodrugs of zidovudine. J. Med. Chem., 33 1505-1510. Alderborn, G., (2002) Tablets and compaction. In: Aulton, M.E. (Ed.), Pharmaceutics: The
Science of Dosage Form Design. Churchill: Livingstone 397-440. Alderborn, G., Nystrom, C., (2005) Pharmaceutical powder compaction technology., Porosity
pressure functions. Drugs and the pharm sci . 71. AlHusban, F.A., ElShaer, A., Kansara, J., Smith, A., Grover, L., Perrie, Y. Mohammed A., (2010a)
Investigation of Formulation and Process of Lyophilised Orally Disintegrating Tablet (ODT) Using Novel Amino Acid Combination. Pharmaceutics; 2, 1-17.
AlHusban, F., Perrie, Y., Mohammed, A.R., (2010b) Formulation and characterisation of
lyophilised rapid disintegrating tablets using amino acids as matrix forming agents. EJPB; 75 254-262.
Allikmets, R. (1997) A photoreceptor cell-speci¢c ATP-binding transporter gene (ABCR) is
mutated in recessive Stargardt macular dystrophy, Nature Genet. 17, 122. Alwine, J.C., Kemp, D.J., Stark, G.R., (1977). Method for detection of specific RNAs in agarose
gels by transfer to diazobenzyloxymethyl-paper and hybridization with DNA probes. Proc.
Natl. Acad. Sci. USA 74, 5350–5354. Amidon, G.L., Leesman, G.D. and Elliott, R.L., (1980) Improving intestinal absorption of water-
insoluble compounds: A membrane metabolism strategy. J. Pharm. Sci., 69 1363 – 1368 Amidon, G. L. Lennernas, H. Shah, V. P and Crison. J. R. (1995) A theoretical basis for a
biopharmaceutics drug classification: the correlation of in vitro drug product dissolution and in vivo bioavailability. Pharm. Res. 12:413–420
Amidon, G.L., Han, H., Oh, D.M., Walter, E., Hilfinger, J.M., (1998) Oral administration of
peptide and protein drugs, Alfred Benzon Symp. 43, 146–156. Amo, E.M., Urtti, A., Yliperttula, M., (2 0 0 8). Pharmacokinetic role of L-type amino acid
transporters LAT1 and LAT2. Eur. J. Pharm. Sci. 35, 161–174 Anderson, B.D.; Conradi, R.A. (1985) Predictive relationships in the water solubility of salts of a
nonsteroidal anti-inflammatory drug. J. Pharm. Sci. 74 (8), 815–820. Aulton, M. E. (2002) Pharmaceutics: The Science of Dosage Form Design, 2nd Ed, ed. Ashford,
M., Chapter 16 “The gastrointestinal tract – physiology and drug absorption. Churchill Livingstone: Edinburgh, UK. 217-233.
317
Augustijns, P., Mols, R., (2004). HPLC with programmed wavelength fluorescence detection for
the simultaneous determination of marker compounds of integrity and P-gp functionality in the Caco-2 intestinal absorption model. J. Pharm. Biomed. Anal. 34: 971-978.
Anderle, P., P. Farmer, A. Berger, and M. Roberts. (2004). Nutrigenomic approach to
understanding the mechanisms by which dietary long-chain fatty acids induce gene signals and control mechanisms involved in carcinogenesis. Nutr. 20,103-108.
Anderson, B.D., Conradi, R.A., (1985). Predictive relationships in the water solubility of salts of
a nonsteroidal anti-inflammatory drug. J. Pharm. Sci. 74 (8), 815–820. Anderson, J.M. Van Itallie, C.M. (1995). Tight junctions and the molecular basis for regulation
of paracellular permeability, Am. J. Physiol. 269 (4 Pt 1) 467– 475. Appelbaum, P. Hunter P. (2000). The fluoroquinolone antibacterials: past, present and future
perspectives. Int. J. Antimicrob. Agents. 16, 5–15. Aristilde, L., Sposito, G., (2010). Binding of ciprofloxacin by humic substances: a molecular
dynamics study. Environmental Toxicology and Chemistry 29, 1, 90-98. Aristilde, L., Sposito, G., (2008). Molecular modeling of metal complexation by a
fluoroquinolone antibiotic. Environmental Toxicology and Chemistry. 27, 11, 2304-2310. Artursson, P., Ungell, A-L., Löfroth, J-E., (1993). Selective paracellular permeability in two
models for intestinal absorption: cultured monolayers of human intestinal epithelial cells and rat intestinal segments. Pharm. Res. 10: 1123-1129.
Artursson, P., K. Palm and K. Luthman, (2001). Caco-2 monolayers in experimental and
theoretical predictions of drug transport. Adv. Drug. Deliv. Rev., 46, 27-43. DOI: 10.1016/S0169- 409X(00)00128-9
Artursson, P., Palm, K., Luthman, K., (1996). Caco-2 monolayers in experimental and
theoretical predictions of drug transport. Adv. Drug Deliv. Rev. 22, 67-84. Artursson, P.,(1990). Epithelial transport of drugs in cell culture. I: A model for studying the
passive diffusion of drugs over intestinal absorptive (Caco-2) cells. J. Pharm. Sci. 79: 476-482. Artursson, P., K. Palm and K. Luthman, (2001). Caco-2 monolayers in experimental and
theoretical predictions of drug transport. Adv. Drug. Deliv. Rev. 46, 27-43. DOI: 10.1016/S0169- 409X(00)00128-9
Aungst, B.J. (1993). Novel formulation strategies for improving oral bioavailability of drugs with
poor membrane permeation or presystemic metabolism. J. Pharm. Sci. 82, 979- 987. Aungst, B.J., Nguyen, N.H., Bulgarelli, J.P., Oates-Lenz, K., (2000). The influence of donor and
reservoir additives on Caco-2 permeability and secretory transport of HIV protease inhibitors and other lipophilic compounds. Pharm. Res. 17, 1175–1180.

318
Baird, A.W., Taylor, C.T., Brayden, D.J., (1997). Non-antibiotic anti-diarrhoeal drugs: factors affecting oral bioavailability of berberine and loperamide in intestinal tissue. Adv. Drug Del.
Rev. 23111–120. Baldwin, S.A., Beal, P.R., Yao, S.Y., King, A.E., Cass, C.E., Young, J.D., (2004). The equilibrative
nucleoside transporter family, SLC29, Pflugers Arch. 447, 735–743. Balimane, P.V., Chong, S., Morrison, R.M., (2000). Current methodologies used for evaluation
of intestinal permeability and absorption., Journal of Pharmacological and Toxicological
Methods. 44, 301-312 Barendt W. M. Wright., S. H. (2002). The Human Organic Cation Transporter (hOCT2)
Recognizes the Degree of Substrate Ionization. JBC. 277, 25, 22491–22496, Barlow, D. Satoh, T. (1994). The design of peptide analogues for improved absorption. J.
Control. Release 29, 283–291. Bastin, R.J., Bowker, M.J., Slater.B.J., (2000). Salt Selection and Optimisation Procedures for
Pharmaceutical New Chemical Entities., Organic Process Research & Development, 4, 427-435
Behrens, I., Kamm, W., Dantzig, A., Kissel, T., (2004). Variation of peptide transporter (PepT1
and HPT1) expression in Caco-2 cells as a function of cell origin. J. Pharm. Sci. 93: 1743-1754. Berendsen, H. J. C., Postma, J. P. M., Vangunsteren, W. F., Dinola, A., Haak, J. R., (1984).
Molecular dynamics with coupling to an external bath. J Chem Phys. 81, 8, 3684-3690. Bergan, T., Thorsteinsson, S. B., Solberg, R., Bjomskau, L., Kolstad, I.M., Johnsen, S. (1987).
Pharmacokinetics of ciprofloxacin: intravenous and increasing oral doses. Am. J. Med. 82 (Suppl 4A): 97-102.
Berge, S.M., Bighley, L.D., Monkhouse, D.C., (1977). Pharmaceutical salts. J. Pharm. Sci. 66, 1,
1–19. Bessho Y, Oguri T, Ozasa H, Uemura T, Sakamoto H, Miyazaki M, et al. (2009). ABCC10/ MRP7
is associated with vinorelbine resistance in non-small cell lung cancer. Oncol Rep. 21:263–8. Bighley, L.D., Berge, S.M., Monkhouse, D.C. (1996). Salt forms of drugs and absorption. In:
Swarbrick, J.; Boylan, J.C., Eds.; Encyclopedia of Pharmaceutical Technology, vol. 13. Marcel Dekker: New York. 453–499
Bishop C: (1996) Neural Networks for Pattern Recognition. Oxford University Press: Oxford.
225. Breda, S.A., Jimenez Kairuz, A.F., Manzo, R.H., Olivera, M.E., (2009). Solubility behavior and
biopharmaceutical classification of novel high-solubility ciprofloxacin and norfloxacin pharmaceutical derivatives. Int J Pharm. 371:106–113
Brewster, M.E., Loftsson, T., (2007). Cyclodextrins as pharmaceutical solubilizers., Adv. Drug
Deliv. Rev. 59, 645–666

319
British Pharmacopoeia (2011). The leading global standards for UK pharmaceutical and
medicinal products. Available at http://www.pharmacopoeia.co.uk/2011/access.htm . Accessed [20/03/2012]
Broer. S, (2008). Amino Acid Transport Across Mammalian Intestinal and Renal Epithelia.,
Physiol Rev. 88, 249–286. Beoer, A. Tietze, N. Kowalczuk, S. Chubb, S. Munzinger, M., BAK L. K., Broer S, (2006). The
orphan transporter v7-3 (slc6a15) is a Na+-dependent neutral amino acid transporter (B0AT2). Biochem. J. 393, 421–430
Benanti, G., (1989). Lysine salt of 4-diphenylacetic acid and its ophthalmic fomulations., US
4797423. Brooke, D.N., Dobbs, A.J., Williams, N., (1986). Octanol:water partition coefficient (P).
Measurement, estimation, and interpretation, particularly for chemicals with P > 105. Ecotox. Environ. Safe. 11, 251–260.
Brooks, M. A., De Silva, J. A., and D’aroconte, L. (1973). Determination of trimethoprim and its
N-oxide metabolites in urine of man, dog, and rat by differential pulse polarography. J.
Pharm. Sci. 62, 1395–1397. Bodzioch, M. Orso, E. Klucken, J. Langmann , T. et al., (1999). The gene encoding ATP-binding
cassette transporter 1 ismutated in Tangier disease, Nat. Genet. 22, 347–351. Boes, T., Neuhäuser, M. (2005). Normalization for affymetrix genechips. Methods Inf Med. 44,
414–417 Boraldi, F., Quaglino, D., Croce, M.A., Garcia Fernandez, M.I., Tiozzo, R., Gheduzzi, D., Bacchelli,
B., Ronchetti. I.P., (2003). Multidrug resistance protein-6 (MRP6) in human dermal fibroblasts. Comparison between cells from normal subjects and from Pseudoxanthoma elasticum patients. Matrix Biology. 22, 491-500.
Bolhuis G, Chowhan Z., (1995). Materials for direct compression, in pharmaceutical powder
compaction technology edited by Alderborn G., Nystrom C., Marcel Dekker: New York. Burstein, A.H., Cox, D., Mistry, B., Eddington, N., (1999). Phenytoin pharmacokinetics
following oral administration of phenytoin suspension and fosphenytoin solution to rats, Epilepsy Res. 34 129–133.
Burton, P.S., Conradi, R.A., Hilgers, A.R., Ho, N.F.H. and Maggiora, L.L. (1992). The relationship
between peptide structure and transport across epithelial cell monolayers. J.Control. Release 19, 87–98.
Carr A, Penny R. Cooper D.A. (1993). Efficacy and safety of rechallenge with low-dose
trimethoprim-sulphamethoxazole in previously hypersensitive HIVinfected patients. AIDS 7:65–71.

320
Carstensen, J.T., Ertell, C., (1990). Physical and Chemical Properties of Calcium Phosphates for
Solid State PharmaceuticalFormul ations. Drug Dev. Ind. Pharm. 16, 1121–1133. Carver, P.L., Fleisher, D., Zhou, S.Y., Kaul, D., Kazanjian, P., Li, C., (1999). Meal composition
effects on the oral bioavailability of indinavir in HIVinfected patients, Pharm. Res. 16., 718–724.
Case, D. A., Cheatham, T. E., Darden, T., Gohlke, H., Luo, R., Merz, K. M, Onufriev, A.,
Simmerling, C., Wang, B., Woods, R. J., (2005). The Amber biomolecular simulation programs. Journal of Computational Chemistry. 26 (16), 1668-1688.
Cerutti, D. S., Duke, R., Freddolino, P. L., Fan, H., Lybrand, T. P., (2008). A Vulnerability in
Popular Molecular Dynamics Packages Concerning Langevin and Andersen Dynamics. Journal of Chemical Theory and Computation. 4, 10, 1669-1680.
Ciprofloxacin; Food and Drug Administration. (2007).
http://www.fda.gov/medwatch/SAFETY/2007/Jun PI/Cipro Oral PI.pdf [accessed September 2011].
Chauhan, A.S.; Jain,N.K.; Diwan, P.V.; Khopade,J. (2004). Solubility Enhancement of
Indomethacin with Poly(amidoamine) Dendrimers and Targeting to Inflammatory Regions of Arthritic Rats, Journal of Drug Targeting. 12 (9–10), 575–583
Chen J, Zhu Y, Hu M. (1994). Mechanisms and kinetics of uptake and efflux of l-methionine in
an intestinal epithelial model (Caco-2). J Nutr, 124, 1907–1916 Chen ZS, Hopper-Borge E, Belinsky MG, Shchaveleva I, Kotova E, Kruh GD. (2003).
Characterization of the transport properties of human multidrug resistance protein 7 (MRP7, ABCC10). Mol Pharmacol. 63, 351–8.
Chen N., Reith M., (2004). Quick Synaptic uptake and beyond: the sodium- and chloride-
dependent neurotransmitter transporter family SLC6., Eur J Physiol, 447, 519–531 Chiou, W.L. and Riegelman, S. (1969). Preparation and dissolution characteristics of several
fast-release solid dispersions of griseofulvin. J. Pharm. Sci. 58, 1505–1510 Choi, J-S., Jin, M.J., Han, H-K., (2005). Role of monocarboxylic acid transporters in the cellular
uptake of NSAIDs. J. Pharm. Pharmacol. 57: 1185-1189. Clarke. et al. (1977). Factors influencing comparative bioavailability of spironolactone tablets.
J. Pharm. Sci. 66, 1429–1432. Crowley, M. F., Darden, T. A., Cheatham, T. E., Deerfield, D. W., (1997). Adventures in
improving the scaling and accuracy of a parallel molecular dynamics program. Journal of
Supercomputing. 11 ,3, 255-278.

321
Collett, A., Tanianis-Hughes, J., Carlson, G.L., Harwood, M.D., Warhurst, G., (2005). Comparison of P-glycoprotein-mediated drug-digoxin interactions in Caco-2 with human and rodent intestine: Relevance to in vivo prediction. Eur. J. Pharm. Sci. 26, 386-393.
Colmenarejo, G., (2003). In silico prediction of drug-binding strengths to human serum
albumin. Med. Res. Rev. 23, 275–301. Conradi, R.A., Hilgers, A.R., Ho, N.F.H. and Burton, P.S. (1991). The influence of peptide
structure on transport across Caco-2 cells. Pharm. Res. 8, 1453–1460. Connors, K. A. Binding Constants. (1987). The Measurement of Molecular Complex Stability;
John Wiley & Sons: New York. Connors, T.D. Van Raay, T.J. Petry, L.R. Klinger, K.W. Landes, G.M. Burn, T.C. (1997). The
cloning of a human ABC gene (ABC3) mapping to chromosome 16p13.3, Genomics 39, 231-234.
Cook, G.D., Summers, M.P., (1985). The tensile strength of aspirin-encompress tablets. J.
Pharm. Pharmacol. 37 Daniel, H., Neugebauer, B., Kratz, A., Rehner, G., (1985). Localization of cid microclimate long
intestinal villi of rat jejunum. Am. J. Physiol. 48, G293–G298 Dantzig AH, Bergin L. (1990). Uptake of the cephalosporin, cephalexin, by a dipeptide transport
carrier in the human intestinal cell line, Caco-2. Biochim Biophys Acta. 1027, 211–217. Darden, T., York, D., Pedersen, L., (1993). Particle mesh ewald - an n.log(n) method for ewald
sums in large systems. J Chem Phys. 98 ,12, 10089-10092. De Bruijn, J., Busser, F., Seinen, W., Hermens, J., (1989). Determination of octanol/ water
partition coefficients for hydrophobic organic chemicals with the ‘‘slowstirring” method. Environ. Toxicol. Chem. 8, 499–512.
Del Valle,E.M., (2004). Cyclodextrins and their uses: a review, Process Biochemistry, 39, 1033–
1046 Damsten, M.C., Vlieger, J.S., Niessen, W., Irth, H., Vermeulen, Commandeu. J.N. Trimethoprim:
Novel Reactive Intermediates and Bioactivation Pathways by Cytochrome P450s., Chem. Res.
Toxicol. 2008, 21, 2181–2187. DeRisi J, Vishwanath RL, Brown PO. (1997). Exploring the metabolic and genetic control of gene
expression on a gnomic scale. Science. 278, 680–686. DeRisi, J., Penland, L., Brown, P.O., Bittner, M.L., Meltzer, P.S., Ray, M., Chen, Y., Su, Y.A., Trent
J.M. (1996). Use of a cDNA microarray to analyse gene expression patterns in human cancer. Nature Genetics. 14, 457–60.
Deshpande, P.K., Desai, V.N., Yeole, R.D., Gupte, S.V., Patel, M.V., Sovza N.J. (2007).
Benzoquinolizine-2-carboxylic acid arginine salt tetrahydrate US 0167627A1.

322
Deville, S., Saiz, E., Tomsia., A.P., ( 2007). Ice-templated porous alumina structures., Acta
Materialia. 55, 1965–1974. Dias, V.C., Yatscoff, R.W., (1994). Investigation of rapamycin transport and uptake across
absorptive human intestinal cell monolayers. Clin. Biochem. 27: 31-36. Di Prisco G, Garofano F. (1974). Purification and some properties of glutamate dehydrogenase
from ox liver nuclei. Biochem Biophys Res Commun. 58, 3, 683-9. Dressman, J. J., Lennernas, H. and Reppas, C. (2010). Oral Drug Absorption: Prediction and
Assessment, 2nd Ed. Informa Healthcare: New York. Donnenberg, VS., Donnenberg, AD., (2005). Multiple Drug Resistance in Cancer Revisited: The
Cancer Stem Cell Hypothesis., J Clin Pharmacol., 45, 872-877 Doyle, L.A., Ross, D.D., (2003). Multidrug resistance mediated by the breast cancer resistance
protein BCRP (ABCG2), Oncogene 22, 7340–7358. Donovan, S.F., Pescatore, M.C., (2002). Method for measuring the logarithm of the octanol–
water partition coefficient by using short octadecyl–poly(vinyl alcohol) high-performance liquid chromatography columns. J. Chromatogr. A 952, 47–61.
Duverne, C., Bouten, A., Deslandes, A., Westphal, J.F., Trouvin, J.H., Farinotti, R., Carbon, C.,
(1992). Modification of cefixime bioavailability by nifedipine in humans: involvement of the dipeptide carrier system. Antimicrob. Agents Chemother. 36: 2462-2467.
Egan, W., Lauri. G., (2002). Prediction of intestinal permeability., Adv. Drug Deliv. Rev. 54, 273–
289 El-Badry, M.; Fetih, G.; Mohamed Fathy, M. (2009). Improvement of solubility and dissolution
rate of indomethacin by solid dispersions in Gelucire 50/13 and PEG4000., Saudi
Pharmaceutical Journal. 17, 217–225. Eisen M, Spellman P, Brown PO et al. (1998). Cluster analysis and display of genome-wide
expression patterns. Proc. Natl. Acad. Sci. 95, 14863-14868 Eliopoulos GM, Gardella A, Moellering RC Jr. (1984). In vitro activity of ciprofloxacin, a new
carboxyquinoline antimicrobial agent. Antimicrob Agents Chemother. 25:331–5. ElShaer, A., Khan, S., Perumal, D., Hanson, P., Mohammed, A.R, (2011). Use of amino acids as
counter ions improves the solubility of the BCS II model drug, indomethacin. Current Drug
Delivery. 8,4 , 363-72. ElShaer, A., Hanson, P., Worthington, T., Lambert, P., Mohammed, A.R., (2012a). Preparation
and Characterization of Amino Acids-Based Trimethoprim Salts. Pharmaceutics 4, 179-196 ElShaer, A., Peter Hanson, P., Mohammed A.M., (2012b) A systematic and mechanistic
evaluation of aspartic acid as a filler for directly compressed tablets containing trimethoprim and trimethoprim aspartate., European Journal of Pharmaceutics and Biopharmaceutics. In press.

323
Englund, D.E., Johansson, E.D. (1981). Oral versus vaginal absorption in oestradiol in postmenopausal women. Effects of different particle size. Ups. J. Med. Sci. 86, 297-307.
Endres, C.J., Hsiao, P., Chung, F.S., Undkat, J.D., (2006). The role of transporters in drug
interactions. Eur. J. Pharm. Sci. 27: 501-517. Englund, G., Rorsman, F., R¨onnblom, A., Karlbom, U., Lazorova, L., Gra˚ sjo, J. ,Kindmark, A.
, Artursson., P., ( 2 0 0 6 ). Regional levels of drug transporters along the human intestinal tract: Co-expression of ABC and SLC transporters and comparison with Caco-2 cells., Eur. J.
Pharm. Sci. 2 9, 269–277 Eneroth, A., Åström, E., Hoogstraate, J., Schrenk, D., Conrad, S., Kauffmann, K-M., Gjellan, K.,
(2001). Evaluation of a vincristine resistant Caco-2 cell line for use in a calcein AM extrusion screening assay for P-glycoprotein interaction. Eur. J. Pharm. Sci. 12: 205-214.
Essmann, U., Perera, L., Berkowitz, M. L., Darden, T., Lee, H., Pedersen, L. G., 1995. A smooth
particle mesh Ewald method. J Chem Phys. 103 ,19, 8577-8593. Ettmayer, P., Amidon, G.L., Clement, B., Testa, B., (2004). Lessons learned from marketed
and investigational prodrugs, J. Med. Chem. 47, 2393–2404. Everitt, B., Rabe-Hesketh S., (1997). The Analysis of Proximity Data. John Wiley: New York. Fabrizio, G.; Vetere S.M.C. (1973). erythromycin aspartate salt. US patent application Fell, J.T., (1996). Compaction properties of binary mixtures; pharmaceutical powder
compaction technology, Drugs and the pharmaceutical Sciences, 71, 501–515. Feng, L.; Chen, X.; Sun, B.; Bian,X.; Chen. Z., (2011). Water-catalyzed racemisation of lactide
Polymer Degradation and Stability. 96, 10, 1745-1750 Ferrari, F., Bertoni, M., Bonferoni, M.C., Rossi, S., Caramella, C., Nyström, C., (1996).
Investigation on bonding and disintegration properties of pharmaceutical materials. Int. J.
Pharm. 136, 71-79. Finizio, A., Vighi, M., Sandroni, D., (1997). Determination of n-octanol/water partition
coefficient (Kow) of pesticide critical review and comparison of methods. Chemosphere. 34, 131–161.
Fisher, R., (1936). The use of multiple measurements in taxonomic problems. Ann. Eugenics 7,
179-188 Francis, G.A. Knopp, R.H. Oram, J.F. (1995). Defective removal of cellular cholesterol and
phospholipids by apolipoprotein A-I in Tangier Disease, J. Clin. Invest. 96, 78–87. Frisch JM (1973). Clinical experience with adverse reactions to trimethoprimsulfamethoxazole.
J Infect Dis. 128(Suppl):607–612. Food and Drug Administration, (2002). Guidance for Industry: Food-Effect Bioavailability and
Fed Bioequivalence Studies, Food and Drug Administration, Rockville, MD, Available at http://www.fda.gov/ cder/guidance/index.htm

324
Fogh, J., Fogh, J.M., Orfeo, T., (1977). One hundred and twenty seven cultured human tumor
cell lines producing tumors in nude mice. J. Natl. Cancer Inst. 59: 221-226. Forbes, R.T; York, P.; Davidson, J.R. (1995). Dissolution kinetics and solubilities of p-
aminosalicylic acid and its salts. . Int. J. Pharm. 126, 199-208 Food and Drug Administration. (2000). Guidance for Industry: Waiver of In Vivo Bioavailability
and Bioequivalence Studies for Immediate- Release Solid Oral Dosage Forms Based on a Biopharmaceutics Classification System. Food and Drug Administration, Rockville, MD. Available at http://www.fda.gov/cder/guidance/index.htm.
Fuhrer, C., (1996). interparticulate attraction mechanisms., pharmaceuticl powder compaction
technology. Eds, Alderborn G., Nystrom C., Drugs and the pharmaceutical sciences., 71 Marcel Dekker: united states of America.
Fujisawa, H.; Okada, H., Miura, Y., Fujita, M., Shimamoto, T., (1976). Arginine & lysine salts of
acid cephalosporin US 3984403. Fukami, J., Ozawa, A., Yoshihashi, Y., Yonemochi, E., Terada., K., (2005) . Development of Fast
Disintegrating Compressed Tablets Using Amino Acid as Disintegratation Accelerator: Evaluation of Wetting and Disintegration of Tablet on the Basis of Surface Free Energy., Chem. Pharm. Bull. 53,12, 1536-1539
Fukami, J., Yonemochi, E., Yoshihashi, Y., Terada, K., (2006). Evaluation of rapidly disintegrating
tablets containing glycine and carboxymethylcellulose., Int. J. Pharm. 310, 1–2, 101–109. Gallego, M., Arroyo, J., (2002). Simultaneous determination of dexamethasone and
trimethoprim by liquid chromatography. Journal of Pharmaceutical and Biomedical Analysis, . 30, 1255-1261.
Ganapathy, M.E., Brandsch, M., Prasad, P.D., Ganapathy, V., Leibach, F.H., (1995). Differential
recognition of beta-lactam antibiotics by intestinal and renal peptide transporters, EPT 1 and PEPT 2. J. Biol. Chem. 270, 25672–25677
Ganapathy, M.E. et al. (1998). Valacyclovir: a substrate for the intestinal and renal peptide
transporters PEPT1 and PEPT2. Biochem. Biophys. Res. Commun. 246, 470–475 Garnero, C., Zoppi, A., Genovese, D., Longhi, M. (2010). Studies on
trimethoprim:hydroxypropyl-[beta]-cyclodextrin: aggregate and complex formation. Carbohydrate Research. 345, 2550-2556.
Gavini, E., Rassu, G., Ferraro, L., Generosi, A., Rau, J. V., Brunetti, A., Giunchedi, P., Dalpiaz, A.
(2010). Influence of Chitosan Glutamate on the In Vivo Intranasal Absorption of Rokitamycin from Microspheres J. Pharm. Sci.
Geyer, J. Do¨ring, B. Failing, Kl. Petzinger., E. (2004). Molecular cloning and functional
characterization of the bovine (Bos taurus) organic anion transporting polypeptide Oatp1a2 (Slco1a2)., Comparative Biochemistry and Physiology Part B 137, 317–329

325
Giacomini, K.M., Mei Huang, S., Tweedie, D. et al., (2010). Membrane transporters in drug development. Nat Rev Drug Discov. 9, 3, 215-36
Gidal, B. E. (2006). Drug absorption in the elderly: Biopharmaceutical considerations for the
antiepileptic drugs, Epilepsy Res. 68S, S65-S69. Giraud, E., Cloeckaert, A., Kerboeuf, D., Chaslus-Dancla, E., (2000). Evidence for Active Efflux as
the Primary Mechanism of Resistance to Ciprofloxacin in Salmonella enterica Serovar Typhimurium., Antimicrobial agents and chemotherapy. 44, 5.
Grant, D. J. W.; Higuchi, T. (1990). Ion Pairs and Solubility Behavior. In Solubility BehaVior of
Organic Compounds; Weissberger, A., Ed.; John Wiley & Sons: New York, 399-433. Greiner, B., Eichelbaum, M., Fritz, P., Kreichgauer, H.P., von Richter, O., Zundler, J., Kroemer,
H., (1999). The role of intestinal P-glycoprotein in the interaction of digoxin and rifampicin. J. Clin. Invest. 104, 147-153.
Gohel, M.C., (2005). A review of co-processed directly compressible excipients. J Pharm
Pharmaceut Sci (www.cspscanada.org) 8, 76-93. Goldberg, A.H. et al. (1966). Increasing dissolution rates and gastrointestinal absorption of
drugs via solid solutions and eutectic mixtures. IV. Chloramphenicol– urea system. J. Pharm.
Sci. 55, 581–583 Gottesman, M.M., Fojo, T., Bates S.E., (2002). Multidrug resistance in cancer; role of ATP-
dependent transporters, Nature reviews. Gottlieb, H.E.; Kotlyar, V.; Nudelman. A., (1997). NMR Chemical Shifts of Common Laboratory
Solvents as Trace Impurities., J. Org. Chem. 62, 7512-7515 Hal, N.L.W., Vorst, O., Houwelingen, A.M., Kok , E.J., Peijnenburg, A., Aharoni, A., Tunen , A.J.,
Keijer, J., (2000). The application of DNA microarrays in gene expression Analysis. Journal of
Biotechnology. 78, 271–280 Hamalainen, M.D., Frostell-Karlsson.A., (2004). Predicting the intestinal absorption potential
of hits and leads., Drug Discovery Today:Technologies. 1, 4. Hancock, B.C. ; Zografi, G. (1997). Characteristics and significance of the amorphous state in
pharmaceutical systems. J. Pharm. Sci. 86, 1–12. Han, H., Vrueh, R.L., Rhie, J., Covitz, K.Y., Smith, P.L.,n Lee, C., Oh, D., Wolfgang Sadee, W.,
Amidon. G., (1998). 5′-Amino acid esters of antiviral nucleosides, acyclovir, and AZT are absorbed by the intestinal PEPT1 peptide transporter., Pharm. Res. 15, (8), 1154-1159
Hansch, C., Leo, A.J., (1979). Substituent constants for correlation analysis. In: Chemistry and
Biology. Wiley:New York. 339-415 Hans-Dieter Höltje, Wolfgang Sippl, Didier Rognan, Folkers G. (2008). Molecular Modeling:
Basic Principles and Applications 3rd ed.; Weinheim : Wiley-VCH. 413

326
Hargrove, J.T., Maxson, W.S., Wentz, A.C. (1989). Absorption of oral progesterone is influenced by vehicle and particle size. Am. J. Obstet. Gynecol., 161 948-951.
Harris,R.Z., Jang, G.R., Tsunoda, S., (2003). Dietary effects on drug metabolism and transport,
Clin. Pharmacokinet. 42., 1071–1088 Hartigan J, Wong M., (1979). A k-means clustering algorithm. Applied Statistics 28, 100-108. Hart, L., Middleton, R.K., Wanders, D.L., (1991). Significance of the ciprofloxacin-antacid
interaction. DICP Ann. Pharmacother. 25, 473–475. Hayes, R. A., Robinson, A. C., Ralston. J., (1994). Wilhelmy technique for the rapid assessment
of solid wetting dynamics. Langmuir., 10, 2850-2852. Hawkins T, Carter JM, Romeril KR, Jackson SR and Green GJ (1993). Severe trimethoprim
induced neutropenia and thrombocytopenia. NZ Med J. 106,251– 252. Heckel, RW., (1961). Density-pressure relationships in powder compaction. Trans. Metall. Soc.
AIME., 221, 671-675. Heckel, RW., (1961). An analysis of powder compaction phenomena. Trans. Metall. Soc. AIME.
221, 1001-1008 Hemamalini, M., Muthiah, P.T., Bocelli. G. (2003). Cantoni A Hydrogen-bonded supramolecular
motifs in trimethoprim-terephthalate-terephthalic acid (2/1/1): Acta Crystallogr Sec E. 59, 14-17.
Hemenway, J., Stella, V., (2007). Prodrugs and parenteral drug delivery, in: V. Stella, R.T.
Borchardt, M. Hageman, R. Oliyai, H. Maag, J. Tilley (Eds.), Prodrugs: Challenges and Rewards, AAPS Press/ Springer.
Hilgers, A.R., Conradi, R.A., Burton, P.S. (1990). Caco-2 cell monolayers as a model for drug
transport across the intestinal mucosa. Pharm Res, 7, 902–910. Higuchi, T., Connors, K.A., (1965). Phase-solubility techniques, Adv. Anal. Chem. Instr. 4, 117–
212. Hodges, G.M., Carr, E.A., Hazzard, R.A., Carr, K.E., (1995). Uptake and translocation of
microparticles in small intestine. Morphology and quantification of particle distribution, Dig.
Dis. Sci. 40, 967– 975 Hopper-Borge E., Chen Z.S., Shchaveleva I., Belinsky MG, Kruh GD (2004). Analysis of the drug
resistance profile of multidrug resistance protein 7 (ABCC10): resistance to docetaxel. Cancer
Res. 64, 4927–30. Hutchinson I, Jennings SA, Vishnuvajjala BR, Westwell AD, Stevens MFG (2002). Antitumour
benzothiazoles. 16. Synthesis and pharmaceutical properties of antitumour 2-(4-aminophenyl)benzothiazole amino acid prodrugs. J Med Chem. 45, 744 – 747

327
Hunter, J., Hirst, B.H., (1997). Intestinal secretion of drugs. The role of P-glycoprotein and related drug efflux systems in limiting oral drug absorption., Adv. Drug Deliv. Rev. 25, I29- I57
Huang, Y., Anderle, P., Bussey, K.J., Barbacioru, C., Shankavaram, U., Dai, Z., et al., (2004).
Membrane Transporters and Channels: Role of the Transportome in Cancer Chemosensitivity and Chemoresistance, Cancer Res. 64, 4294–4301
Huang Y., Sadee., W., (2006). Membrane transporters and channels in chemoresistance and -
sensitivity of tumor cells., Cancer Letters. 239, 168–182 Huet, C., Sahuquillo-Merino, C., Coudrier, E., Louvard, D., (1987). Absorptive and mucus-
secreting subclones isolated from a multipotent intestinal cell line (HT-29) provide new models for cell polarity and terminal differentiation. J. Cell. Biol. 105, 345-357
Hu, M., Borchardt, R.T., (1990). Mechanism of L-α-methyldopa transport through a monolayer
of polarized human intestinal epithelial cells (Caco-2). Pharm. Res. 7, 1313-1319 Humber-Droz, P., Mordier, D., Doelker, E., (1983). Densification behaviour of powder
mixtures, Acta Pharm. Technol. 29, 69–73. Heller RA, Schena M, Chai A, Shalon D, Bedilion T, Gilmore J, Woolley DE, Davis RW. (1997)
Discovery and analysis of inflammatory disease-related genes using cDNA microarray. Proc
Natl Acad Sci USA. 94, 2150–5. Iga, K., Ogawa, Y., (1997). Sustained-release buccal dosage forms for nitroglycerin and
isosorbide dinitrate: increased bioavailability and extended time of absorption when administered to dogs. J. Control. Release. 49, 105–113.
Ilkka, J., Paronen, P., (1993). Prediction of the compression behaviour of powder mixtures by
the Heckel equation, Int. J. Pharm. 94, 181–187. Ingels, F., Deferme, S., Destexhe, E., Oth, M., Van den Mooter, G., Augustijns. P., (2002).
Simulated intestinal fluid as transport medium in the Caco-2 cell culture model., Int J. Pharm.
Sci. 232., 183–192 Irwin, G.M., Kostenbauder, H.B., Dittert, L.W., Staples, R., Misher A., Swintosky, J.V., (1969).
Enhancement of gastrointestinal absorption of quaternary ammonium compound by trichloroacetate. J. Pharm. Sci .58, 313-315
Ito, K., Suzuki, H., Horie, T., Sugiyama, Y., (2005). Apical/basolateral surface expression of drug
transporters and its role in vectorial drug transport. Pharm. Res. 22, 1559-1577. Inui, K.-I., Okano, T., Maegawa, H., Kato, M., Takano, M., Hori, R., (1988). H+ coupled transport
of p.o. cephalosporins via dipeptide carriers in rabbit intestinal brush-border membranes: difference of transport characteristics between cefixime and cephradine. J. Pharmacol. Exp.
Ther. 247, 235-241. Ivaturi, V., Kim, S., (2009). Enhanced Permeation of Methotrexate In Vitro by Ion Pair
Formation With L-Arginine., J. Pharm. Sci. 98, 10.

328
Jantratid, E., Janssen, N., Reppas, C., DressmanJ.B., (2008). Dissolution Media Simulating Conditions in the Proximal Human Gastrointestinal Tract: An Update., Pharm. Res. 25, No. 7.
Jetzer, W., (1986). Compaction characteristics of binary mixtures, Int. J. Pharm. 31, 201–207. Jonker, J.W., Smit, J.W., Brinkhuis, R.F., Maliepaard, M., Beijnen, J.H., Schellens, J.H.M.,
Schinkel, A.H., (2000). Role of breast cancer resistance protein in the bioavailability and fetal penetration of topotecan. J. Natl. Canc. Inst. 92, 1651-1656.
Joiris, E., Martino, P.D., Berneron, C., Guyot-Hermann, A. and Guyot. J.C., (1998).
Compression behavior of orthorhombic paracetamol. Pharm. Res. 15, 1122–1130. Jorgensen, W. L., Chandrasekhar, J., Madura, J. D., Impey, R. W., Klein, M. L., (1983).
Comparison of simple potential functions for simulating liquid water. J Chem Phys. 79 ,2, 926-935.
Juliano R.L., Ling V., (1976). A surface glycoprotein modulating drug permeability in Chinese
hamster ovary cell mutants, Biochim. Biophys. Acta. 455, 152- 162. Jung, N., Lehmann, C., Rubbert, A., Knispel, M., Hartmann, P., Lunzen, J., Stellbrink, H.,
Faetkenheuer, G., and Taubert D. (2008). Relevance of the Organic Cation Transporters 1 and 2 for Antiretroviral Drug Therapy in Human Immunodeficiency Virus Infection., Drug
Metab Dispos. 36, 8. Kallioniemi A, Kallioniemi O P, Sudar D et al. (1992). Comparative genomic hybridisation for
molecular cytogenetic analysis of solid tumours. Science. 258, 818--821. Kanai Y, Hediger MA (1992). Primary structure and functional characterization of a high-affinity
glutamate transporter. Nature. 360, 467–471 Kanai, Y. Hediger., M. A. (2003). The glutamate and neutral amino acid transporter family:
physiological and pharmacological implications., European Journal of Pharmacology. 479, 237– 247
Kanai, Y., Segawa, H., Miyamoto, K., Uchino, H., Takeda, E., Endou, H., (1998). Expression
cloning and characterization of a transporter for large neutral amino acids activated by the heavy chain of 4F2 antigen (CD98). J. Biol. Chem. 273, 23629–23632.
Kasim, N. A., Whitehouse, M., Ramachandran, C. , Bermejo, M.l., Lennerna, H., Hussain, A. S.,
Junginger, E., Stavchansky, S. A., Midha, K. K., Shah V. P., and Amidon, G. L., (2003). Molecular Properties of WHO Essential Drugs and Provisional Biopharmaceutical Classification., Molecular Pharmaceutics. 1, 1, 85-96
Kauffman, R.E., Thirumoorthi, M.C., Buckley, J.A., Aravind, M.K., Dajani, A.S., (1981). Relative
bioavailability of intravenous chloramphenicol succinate and oral chloramphenicol palmitate in infants and children, J. Pediatr. 99, 6, 963–967
Kennedy, K.J., Lundquist, J.T., Simandan, T.L., Kokko, K.P., Beeson, C.C., Dix, T.A., (2000).
Design rationale, synthesis, and characterization of non-natural analogs of the cationic amino acids arginine and lysine., J. Peptide Res. 55, 348-358.

329
Khan M. Sundararajan., P. R. (2011). Effects of Carbon Atom Parity and Alkyl Side Chain Length on the Crystallization and Morphology of Biscarbamates, A Set of Model Compounds for Polyurethanes., J. Phys. Chem. B. 115, 8696–8706
Kobayashi, D., Nozawa, T., Imai, K., Nezu, J., Tsuji, A., Tamai, I., (2003). nvolvement of human
organic anion transporting polypeptide OATPB SLC21A9) in pH-dependent transport cross intestinal apical membrane. . Pharmacol. Exp. Ther. 306, 703–708.
Kohonen T., (1990). The self-organizing map. Proc. IEEE 78, 1464-1479. Kotze, A.F., Luessen, H.L., Leeuw, B.J., Boer, A.G., Verhoef, J.C., Junginger, H.E., (1998).
Comparison of the effect of different chitosan salts and N-trimethyl chitosan chloride on the permeability of intestinal epithelial cells (Caco-2), J. Control. Release. 51, 35– 46.
Kozjek, F., Palka, E., Krizman, I., Vodopivec, P., (1996). Pharmacokinetics of ciprofloxacin metal
complexes. Acta Pharm. 46, 109–114. Kramer, S.F., Flynn, G.L., (1972). Solubility of organic hydrochlorides. J. Pharm. Sci. 61, 1896–
1904. Kranendonk, M., Marohnic, C.C., Panda, S.P., Duarte, M.P., Oliveira, J.S., Masters, B.S., Rueff, J.
(2008). Impairment of human CYP1A2-mediated xenobiotic metabolism by Antley-Bixler syndrome variants of cytochrome P450 oxidoreductase. Arch Biochem Biophys. 15, 475, 2, 93-99.
Kruh, G.D., Belinsky, M.G., (2003). The MRP family of drug efflux pumps, Oncogene 22 ,7537–
7552 Kovach, I.M., Pitman, I.H. and Higuchi, T., (1975). Amino acid esters of phenolic drugs as
potentially useful prodrugs. J. Pharm. Sci. 64, 1070-1071. Kobayashi, D., Nozawa, T., Imai, K., Nezu, J.I., Tsuji, A., Tamai, I., (2003). Involvement of human
organic anion transporting polypeptide OATP-B (SLC21A9) in pH dependent transport across intestinal apical membrane. J. Pharmacol. Exp. Ther. 306, 703-708.
Konishi, Y., Hagiwara, K., Shimizu, M., (2002). Transepithelial transport of fluorescein in Caco-2
cell monolayers and use of such transport in in vitro evaluation of phenolic acid availability. Biosci. Biotechnol. Biochem. 66, 2449-2457.
Kuang , Y. Shen , T. Chen , X. Sodani , K. Hopper-Borge, E. et al., (2010). Lapatinib and erlotinib
are potent reversal agents for MRP7 (ABCC10)-mediated multidrug resistance. Biochemical
Pharmacology. 79,154–161 Kuny, T., Leuenberger. H., (2003). Compression behaviour of the enzyme _-galactosidase and
its mixture with microcrystalline cellulose. Int. J. Pharm. 260, 137–147. Kurauchi, M., Miyazawa, Y., Sato, H. (2004). Inosine L-arginine salt and uses thereof,
US0192533A.

330
Lai, W. G., Zahid, N., Uetrecht J. P., (1999). Metabolism of Trimethoprim to a Reactive Iminoquinone Methide by Activated Human Neutrophils and Hepatic Microsomes., JPET 291:292–299.
Leach, A. R., (2001). Molecular modelling: principles and applications. 2nd ed.; Prentice Hall. Ledergerber, B., Bettex, J. D., Joos, B., Flepp, M. & Luthy, R. (1985). Effect of standard breakfast
on drug absorption and multipledose pharmacokinetics of ciprofloxacin. Antimicrobial
Agents and Chemotherapy. 27, 350–352. Ledwidge, M.T., Corrigan, O.I., (1998). Effects of surface active characteristics and solid state
forms on the pH–solubility profiles of drug–salt systems, Int. J. Pharm. 174, 187–200. Lee, K., Johnson, N., Castelo., J., Sinko, P.J., Grass, G., Holme, K., Lee. Y., (2005). Effect of
experimental pH on the in vitro permeability in intact rabbit intestines and Caco-2 monolayer., Eur. J. Pharm. Sci. 25, 193–200
Leslie, E.M., Deeley, R.G., Cole, S.P., (2001). Toxicological relevance of the multidrug resistance
protein 1, MRP1 (ABCC1) and related transporters, Toxicology. 167 3–23. Létourneau, I.J., Bowers, R.J., Deeley, R.G., Cole, S.P.C., (2005). Limited modulation of the
transport activity of the human multidrug resitance proteins MRP1, MRP2 and MRP3 by nicotine glucuronide metabolites. Toxicol. Lett. 157: 9-19.
Leo, A., (2000). Octanol/Water partition coefficients. In: Boethling, R.S., Mackay, D. (Eds.),
Handbook of Property Estimation Methods for Chemicals: Environmental and Health Sciences. Lewis Publishers. 89–114.
Leuenberger, H., (1982). The compressibility and compactibility of powdered systems. Int. J.
Pharm. 12 41-55. Leuenberger, H., (1985). Compression of binary powder mixtures and solubility parameters of
solids, Int. J. Pharm. 27, 127– 138. Leuner, C.; Dressman, J. (2000). Improving drug solubility for oral delivery using solid
dispersions. European Journal of Pharmaceutics and Biopharmaceutics. 50, 47-60 Leyden, J.J., (1985). Absorption of minocycline hydrochloride and tetracycline hydrochloride,
effect of food, milk, and iron, J. Am. Acad. Dermatol. 12., 308–312. Liang, P., Pardee, A.B., (1992). Differential display of eukaryotic messenger RNA by means of
the polymerase chain reaction. Science 257, 967–971. Li, X., Zhi, F., Hu, Y., (2007). Investigation of excipient and processing on solid phase
transformation and dissolution of ciprofloxacin. Int. J. Pharm. 328, 177–182 Li, N., Zhang, Y., Wu, Y., Xiong, X., Zhang, Y. (2005). Inclusion complex of trimethoprim with β-
cyclodextrin. Journal of Pharmaceutical and Biomedical Analysis, 39, 824–829. Li, S.; He, H.; L. Yin, P.H.; Serajuddin, A.T.M. (2005). IV–IVC considerations in the development
of immediate-release oral dosage form, J. Pharm. Sci., 94, 1396–1417.

331
Li, Q., Rudolph, V., Weigl, B., Earl, A., (2004). Interparticle van der Waals force in powder
flowabilityand compactibility., Int. J. Pharm. 280, 77–93 Li, X., Zhi, F., Hu, Y., (2007). Investigation of excipient and processing on solid phase
transformation and dissolution of ciprofloxacin. Int. J. Pharm. 328, 177–182 Ling V., Thompson L.H. (1974). Reduced permeability in CHO cells as a mechanism`of
resistance to colchicines, J Cell Physiol. 83, 1, 103- 116. Lipka, E. Crison, J. Amidon, G.L., (1996). Transmembrane transport of peptide type
compounds: prospects for oral delivery. J. Control. Release. 39, 121–129. Liu, S., Huang, H., Lu, X., Golinski, M., Comesse, S., Watt, D. et al., (2003). Down-regulation of
thiamine transporter THTR2 gene expression in breast cancer and its association with resistance to apoptosis, Mol. Cancer Res. 1, 665–673
Lipinski, C.A., (2000). Drug-like properties and the causes of poor solubility and poor
permeability. J. Pharmacol. Toxicol. Methods. 44, 235–249. Lipinski, C.A., Lombardo, F., Dominy, B.W., Feeney, P.J., (1997). Experimental and
computational approaches to estimate solubility and permeability in drug discovery and development settings. Adv. Drug Deliv. Rev. 23, 3–25.
Lockhart, D.J., Dong, H., Byrne, M.C. et al. (1996). Expression monitoring by hybridization to
high-density oligonucleotide arrays. Nat Biotechnol. 14: 1675-1680. Lowes, S., Simmons, N.L., (2002). Multiple pathways for fluorochinolone secretion by human
intestinal epithelial (Caco-2) cells. Br. J. Pharmacol. 135: 1263-1275. Luciani, M.F. Denizot, F. Savary, S. Mattei, M.G. Chimini, G. (1994). Cloning of two novel ABC
transporters mapping on human chromosome 9, Genomics. 21, 150-159. Lyer, V.R., Eisen, M.B., Ross, D.T., Schuler, G., Moore, T., Lee J.C.F., Trent, J.M., Staudt, L.M.,
Hudson, J. Jr, Boguski, S., Lashkari, D., Shalon, D., Botstein, D., Brown, P.O. (1999). The transcriptional program in the response of human fibroblasts o serum. Science. 283, 83–87.
Maestrelli, F., Zerrouk, N., Chemtob, C., Mura, P., (2004). Influence of chitosan and its
glutamate and hydrochloride salts on naproxen dissolution rate and permeation across Caco-2 cells. Int. J. Pharm. 271, 257–267.
Mahon, F.X., Belloc, F., Lagarde, V., Chollet, C., Moreau- Gaudry, F., Reiffers, J., et al.,
(2003). MDR1 gene overexpression confers resistance to imatinib mesylate in leukemia cell line models, Blood. 101, 2368–2373
Majumdar, S., Duvvuri, S., Ashim K. Mitra., S.K., (2004). Membrane transporter/receptor-
targeted prodrug design: strategies for human and veterinary drug development, Adv. Drug
Deliv. Rev. 56, 1437– 1452 Manganaro, A.M., (1997). Review of the transmucosal drug delivery, Mil. Med. 162, 27– 30.

332
Manius, G. J. (1978). Trimethoprim, In K. Florey (ed.), Analytical profiles of drug substances, vol. 7 Academic Press: New York. 445-475
Marat, M., Ni, A.L., Yu, X., Oko, Y., Smith, R., Argraves., B., (2008). ATP-binding cassette
transporters ABCA1, ABCA7, and ABCG1 in mouse spermatozoa., Biochemical and
Biophysical Research Communications. 376, 472–477 Martin, Y.C. (1981). A practitioner’s perspective of the role of quantitative structure-activity
analysis in medicinal chemistry. J. Med. Chem. 24, 229–237. Martinez, M.N., Amidon, G.L., (2002). A mechanistic approach to understanding the factors
affecting drug absorption: a review of fundamentals, Pharmacokinet. Pharmacodyn. 42, 620–643.
Marquez, B., Nancy, E., Caceres, Marie-Paule Mingeot-Leclercq, Paul M. Tulkens, Franc¸oise
Van BambekeStudies with Ciprofloxacin-Resistant Cells Ciprofloxacin in Murine Macrophages: the Fluoroquinolone Antibiotic Identification Antimicrob. Agents Chemother. 2009, 5, 36.
Matter K., Balda M. S., (2003). Signalling to and from tight junctions., Nature Reviews
Molecular Cell Biology. 4, 225-237. McEwan, G.T., Lucas, M.L., (1990). The effect of E. coli STa enterotoxin on the absorption of
weakly dissociable drugs from rat proximal jejunum in vivo. Br. J. Pharmacol. 101, 937–943 Mehran Yazdanian, Susan L. Glynn, James L. (1998). Wright and Amale HawiCorrelating
Partitioning and Caco-2 Cell Permeability of Structurally Diverse Small Molecular Weight Compounds., Pharm. Res. 15, (9) 1490-1494.
Meshi, T., and Sato, Y. (1972). Studies on sulfamethoxazole-trimethoprim. Absorption,
distribution, excretion and metabolism of trimethoprim in rat. Chem. Pharm. Bull. 20, 2079–2090.
Metz, R., Soergel, F. (1990). The gastrointestinal secretion of quinolones, Preliminary
evaluation of in vivo animal model. 3rd International Symposium of New Quinolones, July 12-14, Vancouver, Canada.
Meyerhoffer, M., McGown, LB., (1990) Critical micelle concentration behavior of sodium
taurocholate in water. Langmuir, 6 (1), pp 187–191
Miller, J. M., Dahan, A., Gupta, D., Varghese, S., Amidon, G. L. (2009). Quasi-Equilibrium
Analysis of the Ion-Pair Mediated Membrane Transport of Low-Permeability Drugs. J.
Controlled Release. 137, 31–37. Mitchell, B.E, Jurs, P.C., (1998). Prediction of Aqueous Solubility of Organic Compounds from
Molecular Structure., J. Chem. Inf. Comput. Sci. 38, 489-496 Mordelle, A S., Jullian, E., Costa, C., Cormet-Boyaka, E., Benamouzic, R .,Tome, D., (2000).
EAAT1 is involved in transport of L-glutamate during differentiation of the Caco-2 cell line. Am J Physiol Gastrointest Liver Physiol. 279, 366–373.

333
Morales CR, Ni X, Smith CE, Inagaki N, (2012). Hermo LABCA17 mediates sterol efflux from mouse spermatozoa plasma membranes. Histol Histopathol. 27, 3, 317-328.
Murakami., T. Takano M. (2008). Intestinal efflux transporters and drug absorption. Expert
Opin Drug Metab Toxicol 4, 7, 923-939 Naggar, V.F., (1981). An in vitro study of the interaction between diazepam and some antacids
or excipients. Pharmazie. 36, 114–117. Nakano, M., (1971). Effects of interaction with surfactants, adsorbents, and other substances
on the permeation of chlorpromazine through a dimethyl polysiloxane membrane. J. Pharm.
Sci. 60, 571–575. Naramoto H, Uematsu T, Uchihashi T, Doto R, Matsuura T, et al. (2007). Multidrug resistance-
associated protein 7 expression is involved in crossresistance to docetaxel in salivary gland adenocarcinoma cell lines. Int J Oncol. 30, 2, 393–401.
Neuhoff , S., Ungell, A., Zamora I., Artursson., P., (2005). pH-Dependent passive and active
transport of acidic drugs across Caco-2 cell monolayers., Eur. J. Pharm. Sci. 25, 211–220 Neuman, M. (1988). Clinical pharmacokinetics of the newer antibacterial 4-quinolones. Clin.
Pharmacokin. 14, 96-121 Newton, J. M., Cook, . D. T., Hollebon, C. E., (1977). The strength of tablets of mixed
components. J. Pharm. Pharmacol. 29, 247–249. Nimmerfall, F., Rosenthaler, J. (1980). Dependence of area under the curve on proquazone
particle size and in vitro dissolution rate. J. Pharm. Sci. 69, 605-607. Noyes, A.A., Whitney, W.R., (1897). The rate of solution of solid substances in their own
solutions. J. Am. Chem. Soc. 19 930–934. Nystrom, C. Karehill, P., (1995). Importance of intermolecular bonding forces and the concept
of bonding surface area. eds Goran Alderborn and Christer Nystrom, pharmaceutical powder compaction technology, Drugs and pharmaceutical sciences; volume 71 Marcel Dekker: New York.
OECD Guidelines for the Testing of Chemicals, (1995). Test No. 107: n-Octanol/Water Partition
Coefficient: Shake Flask Method. OECD Organisation for Economic Cooperation and Development.
Ogura, K., Kobayashi, M., Nakayama, M., Miho, Y., (1998). Electrochemical and in situ FTIR
studies on the adsorption and oxidation of glycine and lysine in alkaline medium., Journal of
Electroanalytical Chemistry. 449, 101–109 Olivera, M.E., Manzo, R.H., Junginger, H.E., Midha, K.K., Shah, V.P., Stavchansky, S., Dressman,
J.B., Barends., D.M., (2011). Biowaiver Monographs for Immediate Release Solid Oral Dosage Forms: Ciprofloxacin Hydrochloride., J. Pharm. Sci.100, 1.

334
Pacher, P. Beckman, J. S. Liaudet., L. (2007). Nitric Oxide and Peroxynitrite in Health and Disease. Physiol Rev. 87, 315–424.
Palm, K., Luthman, K., Ros., J., Grasjo, J., Artursson., P., (1999). Effect of Molecular Charge on
Intestinal Epithelial Drug Transport: pH-Dependent Transport of Cationic Drugs. JPET 291:435–443, 1999
Park, H., Kim, T., Bark. K., (2002). Physicochemical properties of quinolone antibiotics in
various environments., Eur. J. Med. Chem. 37 443–460 Park, M. S. Leslie H. O., Benet, Z. (2011). Is Ciprofloxacin a Substrate of P-glycoprotein? Arch
Drug Info. 4,1–9 Pappenheimer, J.R. and Reiss, K.Z. (1987). Contribution of solvent drag through intercellular
junctions to absorption of nutrients by the small intestine of the rat. J. Membr. Biol. 100, 123–136.
Petris, M.J., (2004). The SLC31 (Ctr) copper transporter family, Pflugers Arch. 447, 752–755 Petrosyan, A.M. (2007). Vibrational spectra of L-histidine perchlorate and L-histidine
Tetrafluoroborate. Vibrational Spectroscopy. 43, 284–289 Pellegata R.L., (1993). Furosamide salts, United states patent, 5,182,300 Pinto, M., Robine-Leon, S., Appay, M.-D., Kedinger, M., Triadou, N., Dussaulx, E., Lacroix, B.,
Simon-Assmann, P., Haffen, K., Fogh, J., Zweibaum, A., (1983). Enterocyte-like differentiation and polarization of the human colon carcinoma cell line Caco-2 in culture. Biol. Cell 47: 323-330.
Pistolis, G. , Andreopoulou, A. K. Malliaris, A. and Kallitsis., J. K. (2005). Direct Observation of
Odd-Even Effect in Dilute Polymeric Solutions: A Time-Resolved Fluorescence Anisotropy Study., J. Phys. Chem. B. 109, 11538-11543
Poole, S.K., Poole, C.F., (2003). Separation methods for estimating octanol–water partition
coefficients. J. Chromatogr. B. 797, 3–19. Pratt, S., Chen, V., Perry, W.I., Starling, J.J., Danzig, A., (2006). Kinetic validation of the use of
carboxydichlorofluorescein as a drug surrogate for MRP5-mediated transport. Eur. J. Pharm.
Sci. 27, 524-532. Pochopin NL, Charman WN, Stella VY (1995). Amino acid derivatives of dapsone as water
soluble prodrugs. Int J Pharm. 121, 157 – 167 Polli, J. W. Wring, S. A. Humphereys, J. E. Huang, L. Morgan, J. B. Webester, L. O. Serabjit-
Singh C., (2001). Rational Use of in Vitro P-glycoprotein Assays in Drug Discovery., The
journal of pharmacology and experimental therapeutics. 299, 2

335
Quintanar-Guerrero, D., Allémann, E., Fessi, H., Doelker, E., (1997). Applications of the Ion-Pair Concept to Hydrophilic Substances with Special Emphasis on Peptides., Pharm. Res. 14, (2), 119-127
Raj. S., Muthiah, P. T., Rychlewska, U., Warzajtis. B. (2003). Pseudo-polymorphism and crystal
engineering: hydrogen-bonded supramolecular networks in trimethoprim m-chlorobenzoate and trimethoprim m- chlorobenzoate dehydrate. CrystEngComm. 5,9, 48–53
Ramaswamy, C.M., Varma, Y.B.G., Venkateswarlu, D., (1970). Compaction of mixtures of
materials, Chem. Eng. J. 1 168–171. Rasenack, N., Muller, B.W., (2002). Crystal Habit and Tableting Behaviour, Int. J. Pharm. 244,
45-57. Ratain, M.J., Cohen, E.E., (2007). The value meal: how to save $1,700 per month or more on
lapatinib, J. Clin. Oncol. 25, 3397–3398. Rauchwerger, D.R., Firby, P.S., Hedley, D.W., Moore, M.J., (2000). Equilibrative-sensitive
nucleoside transporter and its role in gemcitabine sensitivity, Cancer Res. 60, 6075–6079 Rege, BD., Kao ,JP., Polli, JE., (2002). Effects of nonionic surfactants on membrane transporters
in Caco-2 cell monolayers., Eur. J. Pharm. Sci. 16, 237–246 Reizer, J., Michotey, V., Reizer, A. & Saier, M. H., (1994). Novel phosphotransferase system
genes revealed by bacterial genome analysis : unique, putative fructose- and glucoside-speci®c systems. Protein Sci 3, 440- 450.
Riippi, M., Antikainen, O., Niskanen, T., Yliruusi. J., (1998). The effect of compression force on
surface structure, crushing strength, friability and disintegration time of erythromycin acistrate tablets., Eur. J. Pharm. and Bio. 46, 339–345.
Robert, P. Igo, Jr. and John F. Ash., (1998). The Na+-Dependent Glutamate and Aspartate
Transporter Supports Glutathione Maintenance and Survival of CHO-K1 Cells., Somatic Cell
and Molecular Genetics. 24, 6, 341-352 Rohwedder, R., Bergan, T., Thorsteinsson, S.B. & Scholl, H. (1990). Transintestinal elimination
of ciprofloxacin. Chemotherapy, 36, 77 - 84. Roma˜nuk, C.B., Garro Linck, Y., Chattah, A.K., Monti, G.A., Cuffini, S.L., Garland, M.T., Baggio,
R., Manzo, R.H., Olivera,. M.E., (2010). Crystallographic, thermal and spectroscopic characterization of a ciprofloxacin saccharinate polymorph. Int. J. Pharm. 391 197–202
Roma˜nuk, C.B., Garro Linck, Y., Chattah, A.K., Monti, G.A., Manzo, R.H., Olivera, M.E., (2009).
Characterization of the solubility and solid-state properties of saccharin salts of fluoroquinolones. J. Pharm. Sci. 98, 3788.
Romiti, N., Tramonti, G., Chieli., E., (2002). Influence of Different Chemicals on MDR-1 P-
Glycoprotein Expression and Activity in the HK-2 Proximal Tubular Cell Line., Toxicology and
Applied Pharmacology 183, 83–91

336
Rubinstein, E., St Julien, L., Ramon, J., Dautrey, S., Farinotti, R., Huneau, J.F., Carbon, C. (1994). The intestinal elimination of ciprofloxacin in the rat. J. Infect. Dis. 169, 218 - 221.
Rubio-Aliaga I., Daniel H. (2002). Mammalian peptide transporters as targets for drug delivery.
Trends Pharmacol Sci. 23, 434–440. Ruhemann, S., J. (1911). Chem. Sot., 99,792, 1306-1486. Ryckaert, J. P., Ciccotti, G., Berendsen, H. J., (1977). Numerical-integration of cartesian
equations of motion of a system with constrains - molecular dynamics of n-alkanes. J Comput
Phys. 23 ,3 , 327-341. Ryshkewitch, E., (1953). Compression strength of porous sintered alumina and zirconia. J. Am.
Cer. Soc. 36, 65–68. Sadeek, S. A., El-Shwiniy, W. H., Zordok, W. A., El-Didamony, A. M., (2011). Spectroscopic,
structure and antimicrobial activity of new Y(III) and Zr(IV) ciprofloxacin. Spectroc. Acta Pt. A-
Molec. Biomolec. Spectr. 78, 2, 854-867. Sagui, C., Darden, T. A., (1999). In P3M and PME: a comparison of the two methods, Workshop
on Treatment of Electrostatic Interactions in Computer Simulations of Condensed Media, Santa Fe, Nm, Jun 23-25; Pratt, L. R.; Hummer, G., Eds. Santa Fe, Nm, 104-113.
Sagui, C., Pedersen, L. G., Darden, T. A., (2004). Towards an accurate representation of
electrostatics in classical force fields: Efficient implementation of multipolar interactions in biomolecular simulations. J Chem Phys. 120, 1, 73-87.
Saier,M.H., (2000). Families of transmembrane transporters selective for amino acids and
their derivatives., Microbiology. 146, 1775–1795 Sahai, J., Gallicano, K., Oliveras, L., Khaliq, S., Hawley-Foss, N., Garber, G,. (1993). Cations in the
didanosine tablet reduce ciprofloxacin bioavailability. Clin. Pharmacol. Ther. 53, 292–297. Salama, N. Eddington, N. D. Fasano A. (2006). Tight junction modulation and its relationship
to drug delivery ., Adv. Drug Deliv. Rev. 58, 15– 28 Sanna Siissalo, Laura Laine, Ari Tolonen, Ann M. Kaukonen, Moshe Finel , Jouni Hirvonen.,
(2010). Caco-2 cell monolayers as a tool to study simultaneous phase II metabolism and metabolite efflux of indomethacin, paracetamol and 1-naphthol. Int. J. Pharm. 383, 24–29
Sangekar, S.A., Sarli, M., Sheth, P. R, (1972). Effect of Moisture on Physical Characteristics of
Tablets Prepared from Direct Compression Excipients, J. Pharm. Sci., 61, 939-944. Sangster, J. (1989.) Octanol-Water Partition Coefficients of Simple Organic Compounds. J.
Phys. Chem. 18, 3. Santamarina-Fojo, S. Peterson, K. Knapper, C. Qiu, Y. et al., (2000). Complete genomic
sequence of the human ABCA1 gene: analysis of the human and mouse ATP binding cassette A promoter, Proc. Natl. Acad. Sci. U. S. A. 97, 7987–7992

337
Sam, A.P., Fokkens, J.G., (1997). Drug Delivery System: Adding Therapeutic and Economic Value to Pharmacotherapy. Part 2, Pharm. Tech. Eur. 9, 58-66.
Sastry, S.V., Nyshadham,J.R., Fix., J.A., (2000). Recent technological advances in oral drug
delivery – a review. PSTT .3 ,4. Schinkel, A.H., Mayer, U., Wagnaar, E., et al., (1997). Normal viability and altered
phamacokinetics in mice lacking mdr1-type (drug-transporting) P-glycoproteins. Proc. Natl.
Acad. Sci. U.S.A. 94, 4028–4033. Schwartz, D. E., Vetter, W., and Englert, G. (1970). Trimethoprim metabolites in rat, dog and
man: Qualitative and quantitative studies. Arzneimittelforschung. 20, 1867–1871. Segawa, H., Fukasawa, Y., Miyamoto, K., Takeda, E., Endou, H., Kanai, Y., (1999). Identification
and functional characterization of a na+-independent neutral amino acid transporter with broad substrate selectivity. J. Biol. Chem. 274, 19745–19751
Sekiguchi, K., Obi, N. (1961). Studies on absorption of eutectic mixtures. I. A comparison of the
behavior of eutectic mixtures of sulphathiazole and that of ordinary sulphathiazole in man. Chem. Pharm. Bull. 9, 866–872
Sekiguchi, K. and Obi, N. (1964). Studies on Absorption of Eutectic Mixture. Ii. Absorption of
Fused Conglomerates of Chloramphenicol and Urea in Rabbits. Chem. Pharm. Bull. 12, 134–144 Seelig, A., Gottschlich, R. and Devant, R.M. (1994). A method to determine the ability of drugs
to diffuse through the blood-brain barrier. Proc. Natl. Acad. Sci. USA. 91, 68–72. Serajuddin, A.T.M. (2007). Salt formation to improve drug solubility, Adv. Drug Deliv. Rev. 59,
603–616 Serajuddin, A.T.M., Mufson, D. (1985). pH–solubility profiles of organic bases and their
hydrochloride salts, Pharm. Res. 2, 65–68. Serajuddin, A.T.M., Jarowski, C.I. (1985). Effect of diffusion layer pH and solubility on the
dissolution rate of pharmaceutical bases and their hydrochloride salts I: phenazopyridine, J. Pharm. Sci. 74, 142–147.
Shannon., W. Culverhouse., R. Duncan., J. (2003). Analyzing microarray data using cluster
analysis., Pharmacogenomics. 4,1, 41–51 Shastri, S., Mroszczak, E., Prichard, R.K., Parekh, P., Nguyen, T.H., Hennessey, D.R. Schlitz, R.
(1980). Relationship among particle size distribution, dissolution profile, plasma values and anthelmintic efficacy of oxfendazole. Am. J. Vet. Res., 41 2095-2101.
Sheikh-Salem, M., Fell, J.T. (1981). Compaction characteristics of mixtures of materials with
dissimilar compaction mechanisms, Int. J. Pharm. Tech. Prod. Mfr. 2, 19–22. Shiau, Y.F., Fernandez, P., Jackson, M.J., Mcmonagle, S., (1985). Mechanisms maintaining a
low-pH microclimate in the intestine. Am. J. Physiol. 248, G608–G617.

338
Shibata, Y., Fujii, M., Okada, H., Noda, S., Kondoh, M., Watanabe, Y., (2005). Evaluation of the
Compaction Properties of a Solid Dispersion ofIndomethacin with Crospovidone by Tableting Process Analyzer. Chem Pharm Bull. 53, 7, 759-763.
Shin, H., Landowski C., Sun, D., Amidon, G., (2003). transporters in the GI tract in Drug
Bioavailability/Estimation of Solubility, Permeability and Absorption, Waterbeemd H., Lennernas H., Artursson. P., eds. wiley-vch: Germany.
Shih, A.Y., Erb,H., Sun, X., Toda, S., Kalivas, P., Murphy T.H., (2006). Cystine/Glutamate
Exchange Modulates Glutathione Supply for Neuroprotection from Oxidative Stress and Cell Proliferation., The Journal of Neuroscience, 26, 41, 10514 –10523.
Shore, P.A., Brodie, B.B., Hogben, C.A.M., (1957). The gastric secretion f drugs: a pH partition
hypothesis. J. Pharmacol. Exp. Ther. 119, 61–369. Sichina, W.J. Characterization of Water of Hydration of Pharmaceuticals Using the Pyris 6 DSC.,
available at http://www.metrotec.es/metrotec/WWW_DOC/PETech-54.pdf (Accessed 23/12/2011)
Silverstein, R.M., Webster, F.X., (1998). Spectrometric Identification of Organic Compounds,
6th ed. Wiley: New York. Simonelli, A.P. et al. (1969). Dissolution rates of high energy polyvinylpyrrolidone (PVP)-
sulfathiazole coprecipitates. J. Pharm. Sci. 58, 538–549 Singh, B.N., (1999). Effects of food on clinical pharmacokinetics, Clin. Pharmacokinet. 37 213–
255. Staniforth, J.N., (2007). Powder flow, in Aulton ME (eds), Pharmaceutics – the science of
dosage form design. 3rd ed., Churchill Livingstone: London, UK. Stahl, H., Wermuth, C.G. (Eds.) (2002). Handbook of Pharmaceutical Salts: Properties, Selection
and Use. Wiley-VCH: Zurich. Stanculescu, I., Manea, M., Chiosa V., Mandravel C., (2006). A THEORETICAL APPROACH TO
THE MOLECULAR INTERACTION BETWEEN CHOLESTEROL AND 2-PYRIDINE ALDOXIME METHYL CHLORIDE (2 - PAM)., Chimie, Anul XV (serie nouă), I, 101-105
Stella, V.J., (1996). A case for prodrugs: fosphenytoin, Adv. Drug Deliv. Rev. 19, 2, 311–330. Stella, V.J., Zygmunt, J.J., Georg, I.G., Safadi, M.S., (2005). Water-soluble prodrugs of hindered
alcohols or phenols, United States patent US 19980131385. Stenberg, P., Luthman, K., Artursson., (2000). Virtual Screening of intestinal drug permeability.
Journal of Controlled Release. 65, 231-243. Spellman PT, Sherlock G, Zhang MQ, Iyer VR, Anders K, Eisen MB, Brown PO, Botstein D,
Futcher B. (1998). omprehensive identification of cell cycle-regulated genes of the yeast

339
Saccharomyces cerevisiae by microarray ybridization. Molecular Biology of the Cell. 9, 3273–97.
Soergel, F., Naber, G., Jaedhe, U., Reiter, A., Seelmann, R. Sigl, G. (1989). Brief report:
Gastrointestinal secretion of ciprofloxacin. Am. J. Med., 87 (suppl. 5A), 62-65. Song, X.; Lorenzi,P.L.; Landowski, C.P.; Vig, B.S.; Hilfinger, J.M.; Amidon, G. (2004). Amino Acid
Ester Prodrugs of the Anticancer Agent Gemcitabine: Synthesis, Bioconversion, Metabolic Bioevasion, and hPEPT1-Mediated Transport., Molecular Pharmaceutics. 2, 2, 157-167
Southern E, Mir K, Shchepinov M. (1999). Molecular interactions on microarrays. Nat Genet.
21, 5-9. Socrates, G. Infrared Characteristic Group Frequencies, 2nd ed. Wiley: New York, 1994. Soppelaa, I., Airaksinenb, S., Murtomaac, M., Tenhoc, M., Hataraa, J., Räikkönena, H.,
Yliruusia, J. Sandlerb, N., (2010). Investigation of the powder flow behaviour of binary mixtures of microcrystalline celluloses and paracetamol., J. Excipients and Food Chem. 1, 1.
Sun, C., Grant, J.W., (2001). Compaction Properties of L-Lysine Salts Pharm. Res. 18, 3 Sun, H., Seshadri, M. Lingard, S., Monaghan, W., Faoagali, J., Chan, E., McDonald, H.,
Houston, King, T., Peak, I., Wilson, J. C., Haywood, A., Spencer, B., Dunn P., Grant ., G. (2011). Antibacterial Activity of b-Cyclodextrin and 2-Hydroxypropyl- b-Cyclodextrin Trimethoprim Complexes., American Journal of Microbiology 2, 1, 1-8.
Susana, A., Breda, F., Jimenez-Kairuz, H., Manzo, E., (2009). Solubility behavior and
biopharmaceutical classification of novel high-solubility ciprofloxacin and norfloxacin pharmaceutical derivatives., Int. J. Pharm. 371, 106–113
Sweetman, S.C. (2005) Martindale: The Complete Drug Reference. Pharmaceutical Press. 47 Szabó-Révész, P., Göczõ. H., Pintye-Hódi K., Kása jr P., Erõs, I., Hasznos Nezdei, M. , Farkas, B.,
(2001). Development of spherical crystal agglomerates of an aspartic acid salt for direct tablet making., Powder Technology. 114, 118–124.
Tahvanainena, M., Rotkoa, T., Mäkiläb, E., Santosa, H.A., Nevesa, D., Laaksonen, T.,
Kallonenc, A. et al., (2012). Tablet preformulations of indomethacin-loaded mesoporous silicon Microparticles., Intr. J. Pharm. Sci 422, 125– 131
Taipalensuu, J., Rnblom, H., Lindberg, G., et al., (2001). Correlation of Gene Expression of Ten
Drug Efflux Proteins of the ATP-Binding Cassette Transporter Family in Normal Human Jejunum and in Human Intestinal Epithelial Caco-2 Cell Monolayers., The Journal of
Pharmacology and Experimental therapeutics., 299, 1. Takanaga, H., Mackenzie, B., Peng, J., Hediger M. A. (2005). Characterization of a branched-
chain amino-acid transporter SBAT1 (SLC6A15) that is expressed in human brain., Biochemical and Biophysical Research Communications. 337, 892–900
Takagi, M., Taki, Y., Sakane, T., Nadai, T., Sezaki, H., Oku, N., Yamashita, S., (1998). A new
interpretation of salicylic acid transport across the lipid bilayer: implications of pH-

340
dependent but not carriermediated absorption from the gastrointestinal tract. J. Pharmacol.
Exp. Ther. 285, 1175–1180. Tamai, I., Yabuuchi, H., Nezu, J., Sai, Y., Oku, A., Shimane, M., Tsuji, A. (1997). Cloning and
Characterization of a Novel Human pH-dependent Organic Cation Transporter, OCTN1. FEBS
Lett. 419, 107-111. Tamai, I. et al. (1998). Improvement of L-dopa absorption by dipeptidyl derivation, utilizing
peptide transporter PepT1. J. Pharm. Sci. 87, 1542–1546 Tan, W. Colombini., M., (2007). VDAC closure increases calcium ion flux., Biochimica et
Biophysica Acta. 1768, 2510–2515 Tavelin, S., Milovic, V., Ocklind, G., Olsson, S., Artursson, P., (1999). A conditionally
immortalized epithelial cell line for studies of intestinal drug transport. J. Pharm. Exp. Ther. 290, 1212-1221.
Thiel-Demby, V. E. Humphreys, J. E. St. John Williams, L. A. Ellens, H. M. Shah, N. Ayrton, and
Joseph A. D. Polli., W. (2009). Biopharmaceutics Classification System: Validation and Learnings of an in Vitro Permeability Assay., Molecular pharmaceutics. 6, 1, 11–18.
Thwaites, D.T., McEwan, G.T.A., Hirst, B.H., Simmons, N.L., (1995). H+-coupled α-
methylaminoisobutyric acid transport in human intestinal Caco-2 cells. Biochim. Biophys.
Acta. 1234,111-118. Tran, C.D.H., Timmins, P., Conway, B.R., Irwin, W.J., (2002). Investigation of the coordinated
functional activities of Cytochrome P450 3A4 and P-glycoprotein in limiting the absorption of xenobiotics in Caco-2 cells. J. Pharm. Sci. 91, 117-128.
Tsuji, A., Simanjuntak, M.T., Tamai, I., Terasaki, T., (1990). pH-Dependent intestinal transport
of monocarboxylic acids: carrier-mediated and H(+)-cotransport mechanism versus pH partition hypothesis. J. Pharm. Sci. 79, 1123–1124.
Tsuji, A., Takanaga, H., Tamai, I., Terasaki, T., 1994. Transcellular transport of benzoic acid
across Caco-2 cells by a pH-dependent and carrier-mediated transport mechanism. Pharm.
Res. 11, 30–37. Tsukita, S. Furuse, M. (1999). Occludin and claudins in tight junction strands: leading or
supporting players, Trends Cell Biol. 9, 268– 273 Tong, P.; Zografi. G. (2001). A Study of Amorphous Molecular Dispersions of Indomethacin and
Its Sodium Salt. J. Pharm. Sci, 90, 12. Toukmaji, A., Sagui, C., Board, J., Darden, T., (2000). Efficient particle-mesh Ewald based
approach to fixed and induced dipolar interactions. J Chem Phys. 113, 24, 10913-10927. Tung H., Waterson S., Reynolds S.D., (1991). united states patent, 4,994, 604 Turel, I., Zivec, P., Pevec, A., Tempelaar, S., Psomas, G., (2008). Compounds of antibacterial
agent ciprofloxacin and magnesium - Crystal structures and molecular modeling calculations. Eur. J. Inorg. Chem. 23, 3718-3727.

341
Uhl, G.R. Kitayama, S. Gregor, P. Nanthakumar, E. Persico, A. Shimada, S. (1992).
Neurotransmitter transporter family cDNAs in a rat midbrain library: _orphan transporters_ suggest sizable structural variations, Brain Res. Mol. Brain Res. 16, 353–359.
Utsunomiya-Tate, N., Endou, H., Kanai, Y., (1997). Tissue specific variants of glutamate
transporter GLT-1. FEBS Lett. 416, 312–316. Upshall, D.G., Gouldstone, S.J., Macey, N., Maidment, M.P., West, S.J. and Yeadon, M., (1990).
Conversion of a peptidoaminobenzophenone prodrug to diazepam in vitro. Enzyme isolation and characterisation. J. Biopharm. Sci. 1, 111-126.
Van Drooge, D.J. et al. (2006). Characterization of the molecular distribution of drugs in glassy
solid dispersions at the nano-meter scale, using differential scanning calorimetry and gravimetric water vapour sorption techniques. Int. J. Pharm. 310, 220–229
Van, T., Klooster, G. A., Kolker, H. J., Woutersen-Van Nijnanten, F. M., Noordhoek, J., and Van
Miert, A. S. (1992). Determination of trimethoprim and its oxidative metabolites in cell culture media and microsomal incubation mixtures by high performance liquid chromatography. J. Chromatogr. 579, 354–360.
Van Veen, B. Maarschalk, K., Bolhuis, G.K., Zuurman, K., Frijlink, H.W., (2000). Tensile
strength of tablets containing two materials with a different compaction behaviour, Int. J.
Pharm. 203, 71–79. Van Veen, B., Maarschalk, K., Bolhuis, G.K. Frijlink, H.W., (2004). Predicting mechanical
properties of compacts containing two components, Powder Technol. 139 156–164 Vasconcelos, T., Sarmento, B., Costa., P., (2007), Solid dispersions as strategy to improve oral
bioavailability of poor water soluble drugs., Drug Discovery Today , 12, 23-24. Veen, B.V., Maarschalk, V., Bolhuis, G.K., Zuurman, K., Frijlink. H.W., (2000). Tensile strength
of tablets containing two materials with a different compaction behaviour., Int. J. Pharm. 203, 71–79.
Vromans, H., Lerk, C.F., (1988). Densification properties and compactibility of mixtures of
pharmaceutical excipients with and without magnesium stearate. Int. J. Pharm. 46, 183–192. Volk, E.L., Schneider, E., (2003), Wild-type breast cancer resistance protein (BCRP/ABCG2) is a
methotrexate polyglutamate transporter, Cancer Res. 63, 5538–5543 Wacher, V.J et al., (1998). Role of P-glycoprotein and cytochrome P450 3A in limiting oral
absorption of peptides and peptidomimetics. J. Pharm. Sci., 87, 1322- 1330. Walter, E., Kissel, T., Amidon, G.L. , (1996). The intestinal peptide carrier: a potential system
for small peptide derived drugs, Adv. Drug Deliv. Rev. 20, 33 58. Wang, J. M., Wolf, R. M., Caldwell, J. W., Kollman, P. A., Case, D. A., 2005. Development and
testing of a general amber force field. Journal of Computational Chemistry. 26, 1, 114-114.

342
Washington, N., Washington, C. and Wilson, C. (2001). Physiological Pharmaceutics: Barriers to
Drug Absorption, 2nd Ed. Taylor & Francis: London, UK. Watari, N., Funaki, T., Aizawa, K. and Kaneniwa, N. (1983). Nonlinear assessment of
nitrofurantoin bioavailability in rabbits. J. Pharmacokinet. Biopharm., 11, 529-545. Weller, S., Blum, M.R., Doucette, M., Burnette, T., Cederberg, D.M., Miranda, P., Smiley, M.L.,
(1993). pharmacokinetics of acyclovir prodrug valaciclovir after escalating single and multiple dose administration to normal volunteers. Clin. Pharmacol. Ther. 54, 595-605
Wetterich, U., Spahn-Langguth, H., Mutschler, E., Terhaag, B., Rösch, W., Langguth, P., (1996 ).
Evidence for intestinal secretion as an additional clearance pathway of talinolol enantiomers: concentration- and dose-dependent absorption in vitro and in vivo., Pharm Res. 13, 4, 514-522.
Wetzstein, H., Stadler, M., Dalhoff, A., Karl, W., (1999). Degradation of Ciprofloxacin by
Basidiomycetes and Identification of Metabolites Generated by the Brown Rot Fungus Gloeophyllum striatum. Applied and environmental microbiology. 65,4, 1556-1563
Widmaier, E. P., Raff, H. and Strang, K. T. (2011). Vander’s Human Physiology: The Mechanisms
of Body Function, 12th Ed. McGraw-Hill: New York. Worth, A.P., Balls, M., ed. (2002). Alternative (non-animal) Methods for Chemicals Testing:
Current Status and Future Prospects. ATLA. 30, 1, 125 Wu, X., George, R. L., Huang, W., Wang, H., Conway, S. J., Leibach, F. H., Ganapathy, V.( 2000).
Structural and Functional Characteristics and Tissue Distribution Pattern of Rat OCTN1, an Organic Cation Transporter, Cloned from Placenta. Biochim. Biophys. Acta. 1466, 315-327.
Wu, C., Benet, L.Z., (2005). Predicting Drug Disposition via Application of BCS:
Transport/Absorption/ Elimination Interplay and Development of a Biopharmaceutics Drug Disposition Classification System., Pharm Res. 22, 1.
Wu, C., Best, S.M., Benthamb, A.C., Hancock, B.C., Bonfield. W. (2005). A simple predictive
model for the tensile strength of binary tablets. Eur J Pharm Sci. 25, 331–336. Wu, X. W., Brooks, B. R., (2003). Self-guided Langevin dynamics simulation method. Chemical
Physics Letters. 381 ,3, 512-518. Zakelj, S., Sturm K., Krist., A., (2006). Ciprofloxacin permeability and its active secretion
through rat small intestine in vitro., Int. J. Pharm. 313, 175–180 Zeller, V., Janoir, C., Kitzis, M., Gutmann, L., Moreau., N.J., (1997). Active Efflux as a Mechanism
of Resistance to Ciprofloxacin in Streptococcus pneumoniae., Antimicrobial agents and
chemotherapy. 41, 9. Zhao, Y.H., Le, J., Abraham, M.H., Hersey, A., Eddershaw, P.J., Luscombe, C.N., Boutina, D.,
Beck, G., Sherborne, B., Cooper, I., Platts, J.A, (2000). Evaluation of Human Intestinal

343
Absorption Data and Subsequent Derivation of a Quantitative Structure-Activity Relationship (QSAR) with the Abraham Descriptors. J. Pharm. Sci. 90,6, 749 – 784.
Yamashita, S., Furubayashi, T., Kataoka, M., Sakane, T., Sezaki, H., Tokuda, H., 2000. Optimized
conditions for prediction of intestinal drug permeability using Caco-2 cells. Eur. J. Pharm. Sci. 10, 195–204.
Ye , D. Meurs, I. Ohigashi, M. Calpe-Berdiel, L. Habets, K. Zhao Y., et al., (2010). Macrophage
ABCA5 deficiency influences cellular cholesterol efflux and increases susceptibility to atherosclerosis in female LDLr knockout mice., Biochemical and Biophysical Research
Communications. 395, 387–394 Yee, S., (1997). In vitro permeability across Caco-2 cells (colonic) can predict in vivo (small
intestinal) absorption in man – fact or myth. Pharm. Res. 14, 763–766. Young, R.C., Mitchell, R.C., Brown, T.H., Ganellin, C.R., Griffiths, R., Jones, M., Rana, K.K.,
Saunders, D., Smith, I.R., Sore, N.E. and Wilks, T.J. (1988). Development of a new physicochemical model for brain penetration and its application to the design of centrally acting H receptor histamine antagonists. J. Med. Chem. 31, 656–671.
Zerangue, N., Kavanaugh, M.P., (1996). ASCT-1 is a neutral amino acid exchanger with chloride
channel activity. J. Biol. Chem. 271, 27991– 27994. Zheng, J., Carlson, W.B., Reed, J.S. (1995). The packing density of binary powder mixtures, J.
Eur. Ceram. Soc. 15, 479–483.

344
A1.1. Validation of the HPLC method for indomethacin
Indomethacin was eluted using Acetonitrile (60%) and 0.1 M acetic acid (40%) as a mobile
phase and pumped at 1.0 mL/min flow rate.
Indomethacin was first solubilised in the mobile phase and λmax was determined using
scanning spectrophotometer over wavelength ranging between 200-400 nm. The maximum
absorbance was 248 nm, therefore the HPLC detector was set at 248 nm to analyse
indomethacin concentration.
HPLC was used as the analysis method and was validated using ICH guidelines; HPLC specificity,
precision and linearity were evaluated.
Specificity was evaluated by injecting solution of the free bases (without indomethacin) into
the HPLC and absence of any interference peaks at indomethacin retention time (6.5±0.12
min) was demonstrated see figure A1.1.
0.00 0.50 1.00 1.50 2.00 2.50 3.00 3.50 4.00 4.50 5.00 5.50 6.00 6.50 7.00 7.50 8.00-200
0
200
400
600
800
1,000
1,200
1,400
1,600
1,800
1 - indCAL18.05 #8 indCAL18.05 UV_VIS_12 - indCAL18.05 #5 [modified by Administrator] indCAL18.05 UV_VIS_1mAU
min
21
1
WVL:248 nm
Figure A1.112:- Typical HPLC chromatogram of IND (Concentrations 50 and 100 µg/mL at 248 nm)

345
Repeatability (Instrumental and method precision) was also evaluated; method precision was
demonstrated by preparing indomethacin samples (in concentration range between 10-
500µg/mL) in triplicate and injecting them into the HPLC. The peak area R.S.D (%) ranged
between 0.5- 1% which is considered acceptable. Instrumental precision was also
demonstrated by injecting 100µg/mL indomethacin three times and the R.S.D (%) was 1.06%
Inter-day precision was estimated from analysis of freshly prepared samples after few days
and no significant difference was observed. The limit of detection (LOD) and limit of
quantification (LOQ) were estimated in accordance to standard deviation of response and the
slope and calculated using (Equation A1.1)
SLOD
σ3.3= Equation A1.65
where σ is the standard deviation of response (0.025) and S is the slope of the calibration
curve (1.54). LOD was found to be 0.05 µg.
Where as LOQ was calculated using equation (A1.2) and the LOQ was found to be 0.15 µg.
SLOQ
σ10= Equation 66
Indomethacin calibration curve was constructed by plotting the peak area against
indomethacin concentration over a concentration range between 10-500 µg/mL. Beer-Lambert
plot was obtained with curve equation y= 1.511 x and correlation factor R2 = 0.9994 which
indicates the good linearity of the curve (Fig. A1.3). Therefore, the curve equation can be used
to get any unknown concentration by measuring its peak area.

346
y = 1.5111x
R2 = 0.9994
0
100
200
300
400
500
600
700
800
0 100 200 300 400 500 600
Conc (ug/mL)
pea
k ar
ea (
muA
)
Figure A1.113:- indomethacin calibration curve (n=3)
A1.2. HPLC validation for trimethoprim
HPLC was operated at ambient temperature on RP-C18, (Phenomenex 110A, 150x4.6 mm,
5µm) column using acetonitrile-NaH2PO4 buffer (10 mM) (70:30, v/v) (pH 3) as mobile phase
which was pumped at 1.0 mL/min flow rate using gradient pump (GP50). λmax was determined
by Gallego and Arroyo (2002) to be 230 nm , therefore the HPLC detector was set at 230 nm to
analyse TMP concentration. HPLC was used as the analysis method and was validated using
ICH guidelines; HPLC specificity, precision and linearity were evaluated as mentioned above in
section (A1.1).

347
0.00 0.50 1.00 1.50 2.00 2.50 3.00 3.50 4.00 4.50 5.00-200
0
200
400
600
800
1,000
1,200
1,400
1,600
1 - TMP calibration2 #3 [modified by Administrator] TMP calibration2 UV_VIS_12 - TMP calibration2 #6 TMP calibration2 UV_VIS_13 - TMP calibration2 #2 [modified by Administrator] TMP calibration2 UV_VIS_1mAU
min
321
1
WVL:230 nm
Figure 114:- Typical HPLC chromatogram of TMP (Concentrations 20, 50 and 100 µg/mL at 230 nm)
LOD and LOQ were calculated using standard deviation of response and slope using equation
(A1.1 & A1.2). The standard deviation of response (σ) was found to be 0.043 and the slope of
the calibration curve (S= 1.54). Applying these values to the equation above LOD and LOQ
were found to be 0.109 and 0.364 respectively.
TMP calibration curve was constructed by plotting the peak area against TMP concentration
over a concentration range between 10-500 µg/mL. Beer-Lambert plot was obtained with
curve equation y= 1.2 x and correlation factor R2 = 0.9992 (Fig. A1.4) which indicates the good
linearity of the curve. Therefore, the curve equation can be used to get any unknown
concentration by measuring its peak area.

348
Figure A1.115:- TMP standard calibration curve (n=3)
A1.3. HPLC optimization and validation for Ciprofloxacin
CIP was assayed using HPLC method adapted from (Kmetec et al., 1999). According to Kmetec
et al, the mobile phase consists of methanol: 0.02 M phosphate buffer (pH 7) at flow rate of
1mL/min. CIP was found not to be soluble in the mobile phase even at very low concentration.
Therefore another method was adapted from (Husain et al., 1995) in which the mobile phase
consisted of methanol: water: acetic acid (84:15.9: 0.1) with flow rate of 1 mL/min and λmax of
254 nm. CIP was soluble in the mobile phase, yet a front tailing was observed (Fig. A1.5).
y = 1.2006x
R2 = 0.9992
0
100
200
300
400
500
600
700
0 100 200 300 400 500 600

349
0.0 1.0 2.0 3.0 4.0 5.0 6.0 7.0 8.0 9.0 10.0-5.0
0.0
5.0
10.0
15.0
20.0
25.0
30.0
35.0
1 - CPRCALIBRATION #1 [modified by Administrator] CPRcalibration UV_VIS_12 - CPRCALIBRATION #2 [modified by Administrator] CPRcalibration UV_VIS_1mAU
min
21
1
2
WVL:254 nm
Figure A1.116:- HPLC chromatogram of CIP (concentration 20 and 50 µg/mL at 254 nm)
In order to reduce such tailing, λmax was measured by UV scanning sprctrophotometer and was
found to be 280 nm. The UV detector of HPLC was adjusted into the new λmax and a single peak
was retained at 1.24 min corresponding to CIP.
A calibration curve was constructed between 10 µg/mL to 200 µg/mL with curve equation of
y= 1.57x+13.59 and correlation factor R2 = 0.996.
0.00 0.50 1.00 1.50 2.00 2.50 3.00 3.50 4.00 4.50 5.00-50
-25
0
25
50
75
100
125
150
175
200
225
250 CPRcalibration280ii #1 [modified by Administrator] CPRcalibration280ii UV_VIS_1mAU
min
1
WVL:280 nm
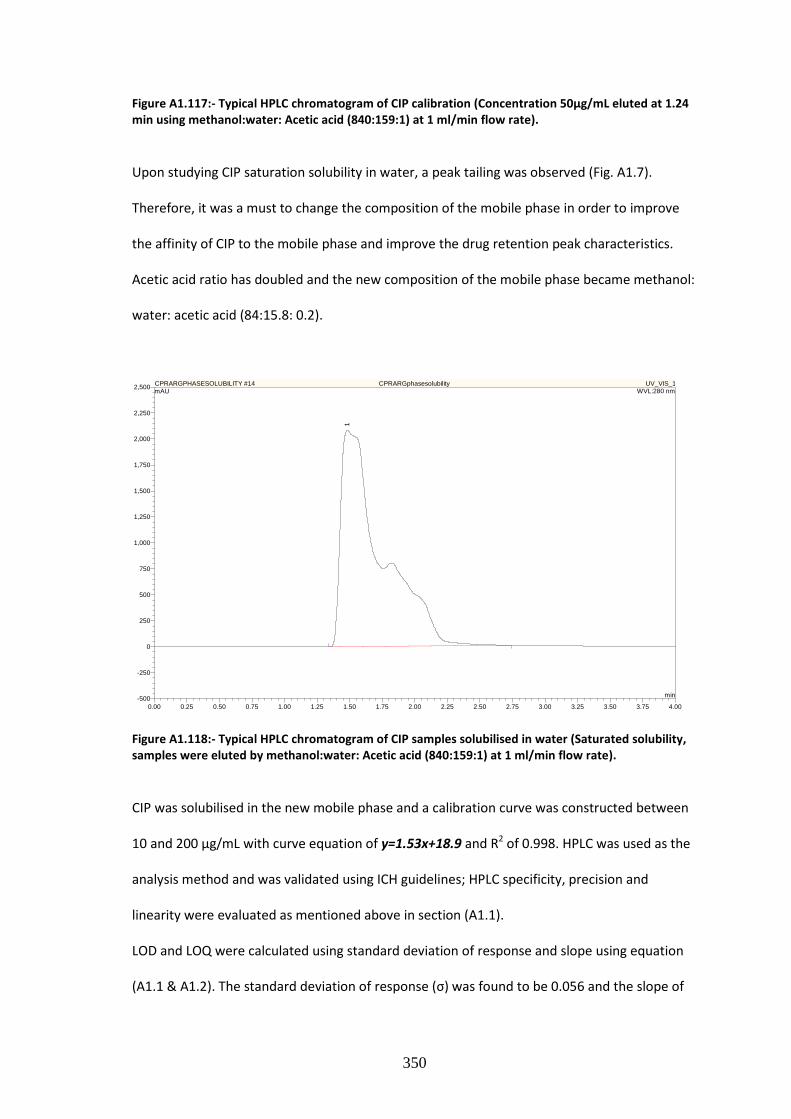
350
Figure A1.117:- Typical HPLC chromatogram of CIP calibration (Concentration 50µg/mL eluted at 1.24
min using methanol:water: Acetic acid (840:159:1) at 1 ml/min flow rate).
Upon studying CIP saturation solubility in water, a peak tailing was observed (Fig. A1.7).
Therefore, it was a must to change the composition of the mobile phase in order to improve
the affinity of CIP to the mobile phase and improve the drug retention peak characteristics.
Acetic acid ratio has doubled and the new composition of the mobile phase became methanol:
water: acetic acid (84:15.8: 0.2).
0.00 0.25 0.50 0.75 1.00 1.25 1.50 1.75 2.00 2.25 2.50 2.75 3.00 3.25 3.50 3.75 4.00-500
-250
0
250
500
750
1,000
1,250
1,500
1,750
2,000
2,250
2,500 CPRARGPHASESOLUBILITY #14 CPRARGphasesolubility UV_VIS_1mAU
min
1
WVL:280 nm
Figure A1.118:- Typical HPLC chromatogram of CIP samples solubilised in water (Saturated solubility,
samples were eluted by methanol:water: Acetic acid (840:159:1) at 1 ml/min flow rate).
CIP was solubilised in the new mobile phase and a calibration curve was constructed between
10 and 200 µg/mL with curve equation of y=1.53x+18.9 and R2 of 0.998. HPLC was used as the
analysis method and was validated using ICH guidelines; HPLC specificity, precision and
linearity were evaluated as mentioned above in section (A1.1).
LOD and LOQ were calculated using standard deviation of response and slope using equation
(A1.1 & A1.2). The standard deviation of response (σ) was found to be 0.056 and the slope of

351
the calibration curve (S= 1.57). Applying these values to the equation above LOD and LOQ
were found to be 0.107 and 0.356 respectively.
y = 1.5338x + 18.987
R2 = 0.9982
0
50
100
150
200
250
300
350
0 50 100 150 200 250
Conc (ug/mL)
peak
are
a (m
uA)
Figure 119:- CIP calibration curve (samples were eluted by methanol:water: Acetic acid (840:158:2) at
1 ml/min flow rate and λmax of 280 nm).

352
Appendix 2
-0.50.00.51.01.52.02.53.03.54.04.55.05.56.06.57.07.58.08.59.09.510.0f1 (ppm)
-1000
0
1000
2000
3000
4000
5000
6000
7000
8000
9000
10000
11000
12000
13000
1.84
1.91
11.5
9
1.94
1.00
1.9
31.9
3
1.9
6
1.9
6
1.9
8
1.9
9
2.0
1
2.2
0
2.2
3
2.2
3
3.5
8
3.6
3
3.6
9
6.4
9
7.2
0
Figure A2.1:-1HNMR spectra of trimethoprim D-glutamate solubilised in D2O.
910
14
11
1312
O16
O18
CH317
CH319
5
4
6
NH
+
3
N12
8
NH27
NH215
O20 CH3
21
29
O30
O-
31
28
27
25
NH226
23
O24
OH22

353
1.01.52.02.53.03.54.04.55.05.56.06.57.07.58.08.59.09.5f1 (ppm)
-200
-100
0
100
200
300
400
500
600
700
800
900
1000
1100
1200
1300
1400
1500
1600
1700
1800
1900
2000
2100
2200
2.18
1.86
2.77
5.56
1.26
1.99
1.00
2.5
72.6
1
2.6
7
2.6
8
3.5
9
3.6
5
3.7
1
6.5
1
7.2
1
Figure A2.2:- 1HNMR spectra of trimethoprim D- aspartate solubilised in D2O.
910
14
11
1312
O16
O18
CH317
CH319
5
4
6
NH
+
3
N12
8
NH27
NH215
O20 CH3
21
28
27
25NH226
23 O24
OH22
O30
O-
29


![Degree of Doctor of Philosophy [Ph.D.,] - Manonmaniam ...](https://static.fdokumen.com/doc/165x107/631d000f6c6907d368018f38/degree-of-doctor-of-philosophy-phd-manonmaniam-.jpg)