doctor of philosophy in agriculture - OAR@ICRISAT
245
BIOCHEMICAL AND MOLECULAR MECHANISMS OF RESISTANCE TO Helicoverpa armigera (Hubner) IN WILD RELATIVES OF CHICKPEA GOLLA SIVA KUMAR M.Sc. (Ag.) DOCTOR OF PHILOSOPHY IN AGRICULTURE (ENTOMOLOGY) 2017
-
Upload
khangminh22 -
Category
Documents
-
view
0 -
download
0
Transcript of doctor of philosophy in agriculture - OAR@ICRISAT
BIOCHEMICAL AND MOLECULAR
MECHANISMS OF RESISTANCE TO
Helicoverpa armigera (Hubner) IN
WILD RELATIVES OF CHICKPEA
GOLLA SIVA KUMAR M.Sc. (Ag.)
DOCTOR OF PHILOSOPHY IN AGRICULTURE
(ENTOMOLOGY)
2017
BIOCHEMICAL AND MOLECULAR
MECHANISMS OF RESISTANCE TO
Helicoverpa armigera (Hubner) IN
WILD RELATIVES OF CHICKPEA
BY GOLLA SIVA KUMAR
M.Sc. (Ag.)
THESIS SUBMITTED TO THE
ACHARYA N.G. RANGA AGRICULTURAL UNIVERSITY
IN PARTIAL FULFILMENT OF THE REQUIREMENTS
FOR THE AWARD OF THE DEGREE OF
DOCTOR OF PHILOSOPHY IN AGRICULTURE (ENTOMOLOGY)
CHAIRPERSON: Dr. P. RAJASEKHAR
DEPARTMENT OF ENTOMOLOGY
SRI VENKATESWARA AGRICULTURAL COLLEGE, TIRUPATI
ACHARYA N.G. RANGA AGRICULTURAL UNIVERSITY
GUNTUR – 522 509, A.P.
2017
ii
DECLARATION
I, Mr. GOLLA SIVA KUMAR, hereby declare that the thesis entitled
“BIOCHEMICAL AND MOLECULAR MECHANISMS OF RESISTANCE
TO Helicoverpa armigera (Hubner) IN WILD RELATIVES OF CHICKPEA”
submitted to the Acharya N.G. Ranga Agricultural University, for the degree of
Doctor of Philosophy in Agriculture is the result of original research work done
by me. I also declare that no material contained in this thesis has been published
earlier in any manner.
Place:
Date :
(GOLLA SIVA KUMAR)
ID. No: TAD/2013-09
iii
CERTIFICATE
Mr. GOLLA SIVA KUMAR has satisfactorily prosecuted the course of
research and that thesis entitled “BIOCHEMICAL AND MOLECULAR
MECHANISMS OF RESISTANCE TO Helicoverpa armigera (Hubner) IN
WILD RELATIVES OF CHICKPEA” submitted is the result of original
research work and is of sufficiently high standard to warrant its presentation to the
examination. I also certify that neither the thesis nor its part thereof has been
previously submitted by him for a degree of any university.
Place :
Date :
Dr. P. RAJASEKHAR
(Chairperson)
Principal Scientist (Entomology) & Head
Agricultural Research Station
Nellore - 524 004, A.P.
iv
CERTIFICATE
This is to certify that the thesis entitled “BIOCHEMICAL AND
MOLECULAR MECHANISMS OF RESISTANCE TO Helicoverpa armigera
(Hubner) IN WILD RELATIVES OF CHICKPEA” submitted in partial
fulfilment of the requirements for the degree of ‘Doctor of Philosophy in Agriculture’
to the Acharya N.G. Ranga Agricultural University, Guntur is a record of the
bonafide original research work carried out by Mr. GOLLA SIVA KUMAR under
our guidance and supervision.
No part of the thesis has been submitted by the student for any other degree
or diploma. The published part and all assistance received during the course of the
investigations have been duly acknowledged by the author of the thesis.
Thesis approved by the Student Advisory Committee
Chairperson : Dr. P. RAJASEKHAR
Principal Scientist (Entomology) & Head
Agricultural Research Station
Nellore - 524 004, A.P.
_______________
Co-Chairperson : Dr. H.C. SHARMA
Hon’ble Vice-Chancellor
Dr YS Parmar University of
Horticulture and Forestry, Nauni,
Solan - 173 230, Himachal Pradesh
_______________
Member : Dr. K.V. HARI PRASAD
Assistant Professor
Department of Entomology
S.V. Agricultural College
Tirupati - 517 502, A.P.
_______________
Member : Dr. B.V. BHASKARA REDDY
Senior Scientist (Plant Pathology)
Regional Agricultural Research Station
Tirupati - 517 502, A.P.
_______________
Member : Dr. B. RAVINDRA REDDY
Assistant Professor
Department of Statistics and Maths
S.V. Agricultural College
Tirupati - 517 502, A.P.
_______________
External-
Examiner of final
viva-voce
: Dr. D.S. RAJAVEL
Professor (Entomology)
Tamil Nadu Agricultural University
Regional Research Station,
Kovilangulam,
Aruppukottai - 626 107, Tamil Nadu
_______________
Date of final viva-voce:
v
ACKNOWLEDGEMENTS
I earnestly revere the God for his boundless blessings, which accompanied
me in all endeavours. I am dearth of words to express my love to my beloved parents
Smt. G. Bhavani and Sri. G. Subrahmanyam for their dedicated efforts to educate
me to this level and whose unparallel affection and persistent encouragement will help
me in keeping my career go along way throughout my life.
I am inexpressibly ecstatic to extend my deep sense of gratitude to
esteemed chairperson of my advisory committee Dr. P. Rajasekhar Principal
Scientist (Entomology) and Head, Agricultural Research Station, Nellore for his
dexterous guidance, illuminating suggestions and unremitting assistance
throughout the period of study, research and in completion of this thesis.
I humbly record my heart-felt thanks to Dr. H.C. Sharma, Hon’ble Vice-
Chancellor, Dr. YS Parmar University of Horticulture and Forestry, Nauni, Solan,
Himachal Pradesh, co-chairperson of my advisory committee for his keen interest,
caring attitude, valuable guidance for sparing his precious time to improve the
thesis and constant encouragement during my research work. I owe him a huge
debt of gratitude forever for all that I got from him.
With sincere regards and immense pleasure, I express my profound sense
of gratitude to Dr. K.V. Hari Prasad, Assistant Professor, Department of
Entomology, S.V. Agricultural College, Tirupati, member of my advisory
committee for his kind cooperation and help rendered during research work.
I owe my effusive thanks to Dr. B.V. Bhaskara Reddy, Senior Scientist
(Plant Pathology), RARS, Tirupati and member of my advisory committee for his
valuable suggestions to embellish the present investigation.
It gives me great pleasure to express my gratitude to Dr. B. Ravindra Reddy,
Assistant Professor, Department of Statistics and Maths, S.V. Agriculatural College,
Tirupati for his cooperation during my study.
I deem it my privilege in expressing fidelity to Dr. S.R. Koteswara Rao,
Professror and Head, Dr. P. Rajendra Prasad, Professor and Head (Rtd.),
Dr. N.C. Venlateswarlu, Professor, Dr. K. Manjula, Associate professor,
Mr. Panduranga, Assistant Professor and Dr. A. Rajesh, Teaching Associate and
other non-teaching staff, Department of Entomology, S.V. Agricultural College,
Tirupati for their help and guidance during my period of study at this college.
I am ineffable to express my esteemed thanks to, Dr. T. Murali Krishna,
Principal Scientist, Dr. ARK Rao, Senior Scientist, Department of Entomology,
RARS, Tirupati and Harathi madam, Scientist (Entomology), ARS, Nellore for
their valuable suggestions, kind hearted cooperation and meticulous guidance
showered to me.
I owe on empassing debt to my beloved Masters, Sri. Padmanabhaiah and
Sri. Haranath who taught the concept of life. They have been a fountain
inspiration throughout my life without whose blessings in every walk of life, this
work would not have been possible.
vi
I respectfully acknowledge my gratitude to Dr. Mahendar Thudi, Scientist,
Dr. Mallikarjuna, Visiting Scientist, Mr. Sudarshan and Ms. Ashwini, Research
Scholars, Center for Excellence in Genomics, ICRISAT, Patancheru for their
sustained help and cooperation during my research work.
Diction is not enough to express my feelings and affection with my brother
Sandeep, sister Sravanthi and brother in-law Yedukondalu whose affection,
inspiration and encouragement moulded me throughout my educational career. I
express my deep affection to beloved niblings Madhu Prakash, Chaitra and
Ammulu whose sparkling enthustride smile encouraged me a lot during this
endeavour.
With utmost satisfaction I acknowledge the enormous help of my colleagues
Sunil sir, Devaki madam, Manjunath sir, Narayana Swamy sir, Venkata
Ramesh sir and Venkata Ramanamma madam for their friendly assistance and
special thanks to my beloved juniors Rasheed, Shilpa Kala, Venkat Reddy, Peeru,
Amarnath and Naresh for their help during the course of my study.
I feel privileged to express my heartfelt sincere thanks to the Team
Entomology, my colleagues, Dr. SMD. Akbar, Dr. Jaba Jagdish, Dr. Sumit
Vashisth, Dr. T. Pavani, Dr. R. Visweshwar, Dr. Riyazaddin, Mr. T.
Satyanarayana, Mr. Naresh Kumar, Mr. Naveen scientific officers, Mr. Suraj
Sharma and Mr. Rajendra Munghate, Administrative Officer, Mr. S.R.
Venkateswarlu and other technical crew Mr. Madhusudhan Reddy, Mr. S.V.N.
Chandra, Mrs. Ponnamma, Mr. Ramana, Mr. Rajendra Kumar, Mr. J. Raja
Rao, Mr. K. Hareendranath and Mr. Ramulu for their immense help, friendly
cooperation and constant support during my Ph.D. research work at ICRISAT,
Patancheru.
I derive great pleasure in expressing honest appreciation to the galaxy of
friends, Naseer, Ravi, M.S, Kona, Sunil Reddy, ABCHANS, Santhosh, Venky,
Nagarjun and Bharath and my junior friends Bhaskar and Yohan who made my
stay at Tirupati a memorable and unforgettable one with their high degree of
friendliness and deep affection.
I am very much grateful to Acharya N.G. Ranga Agricultural University,
Guntur and ICRISAT, Patancheru for providing opportunity to fulfill this long
cherished ambition. The financial assistance provided by Department of Science
and Technology (DST), New Delhi in the form of INSPIRE Fellowship is
gratefully acknowledged.
In finale, I thank all my well wishers and others who helped me directly or
indirectly not placed here, for their kind cooperation and support rendered to me.
Siva Kumar Golla…
vii
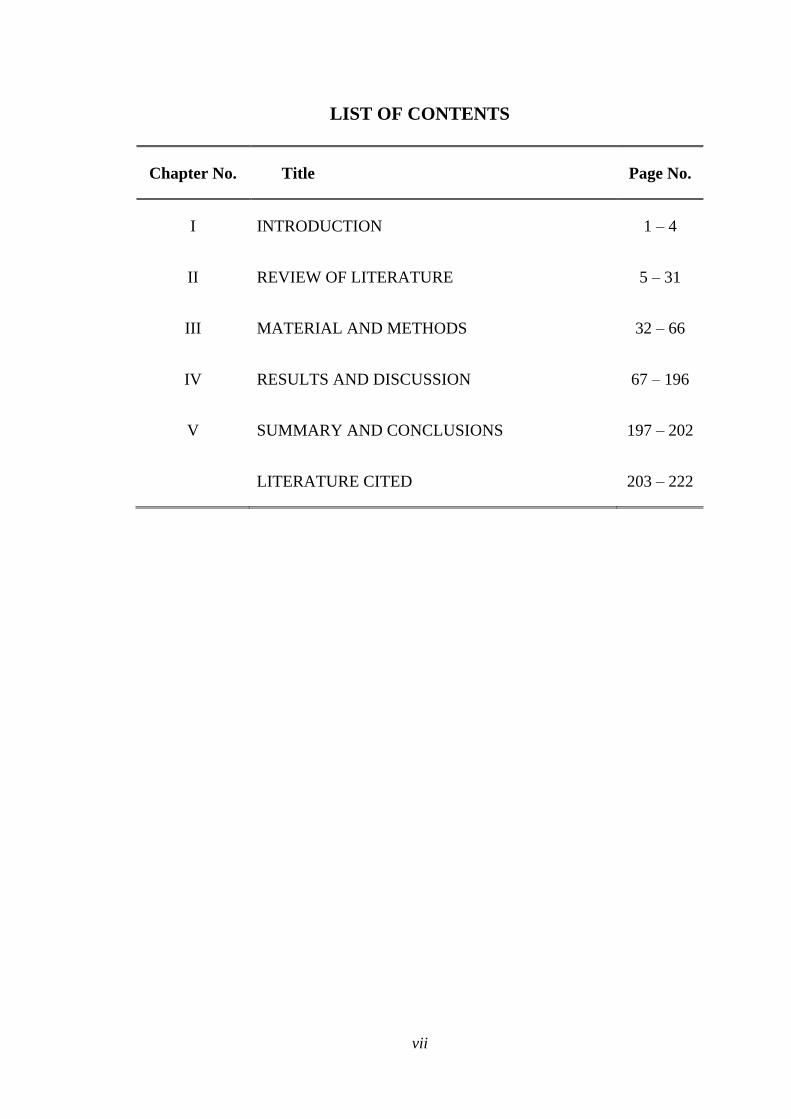
LIST OF CONTENTS
Chapter No. Title Page No.
I INTRODUCTION 1 – 4
II REVIEW OF LITERATURE 5 – 31
III MATERIAL AND METHODS 32 – 66
IV RESULTS AND DISCUSSION 67 – 196
V SUMMARY AND CONCLUSIONS 197 – 202
LITERATURE CITED 203 – 222
viii
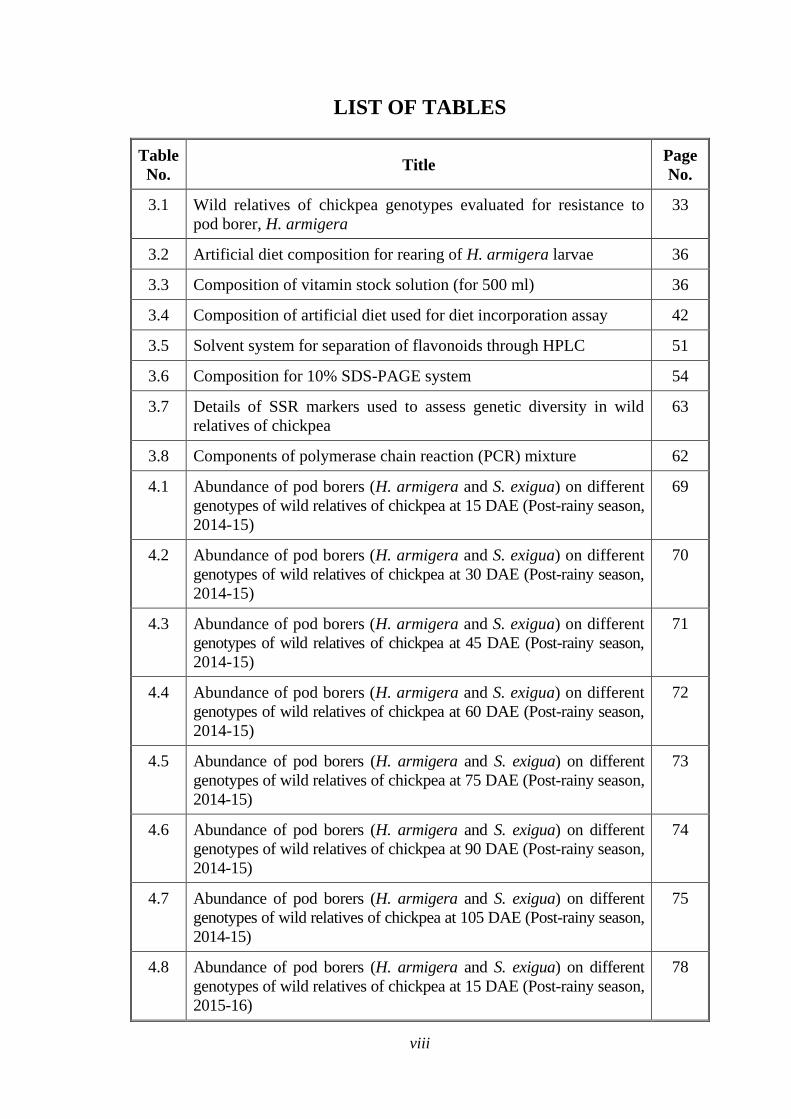
LIST OF TABLES
Table
No. Title
Page
No.
3.1 Wild relatives of chickpea genotypes evaluated for resistance to
pod borer, H. armigera
33
3.2 Artificial diet composition for rearing of H. armigera larvae 36
3.3 Composition of vitamin stock solution (for 500 ml) 36
3.4 Composition of artificial diet used for diet incorporation assay 42
3.5 Solvent system for separation of flavonoids through HPLC 51
3.6 Composition for 10% SDS-PAGE system 54
3.7 Details of SSR markers used to assess genetic diversity in wild
relatives of chickpea
63
3.8 Components of polymerase chain reaction (PCR) mixture 62
4.1 Abundance of pod borers (H. armigera and S. exigua) on different
genotypes of wild relatives of chickpea at 15 DAE (Post-rainy season,
2014-15)
69
4.2 Abundance of pod borers (H. armigera and S. exigua) on different
genotypes of wild relatives of chickpea at 30 DAE (Post-rainy season,
2014-15)
70
4.3 Abundance of pod borers (H. armigera and S. exigua) on different
genotypes of wild relatives of chickpea at 45 DAE (Post-rainy season,
2014-15)
71
4.4 Abundance of pod borers (H. armigera and S. exigua) on different
genotypes of wild relatives of chickpea at 60 DAE (Post-rainy season,
2014-15)
72
4.5 Abundance of pod borers (H. armigera and S. exigua) on different
genotypes of wild relatives of chickpea at 75 DAE (Post-rainy season,
2014-15)
73
4.6 Abundance of pod borers (H. armigera and S. exigua) on different
genotypes of wild relatives of chickpea at 90 DAE (Post-rainy season,
2014-15)
74
4.7 Abundance of pod borers (H. armigera and S. exigua) on different
genotypes of wild relatives of chickpea at 105 DAE (Post-rainy season,
2014-15)
75
4.8 Abundance of pod borers (H. armigera and S. exigua) on different
genotypes of wild relatives of chickpea at 15 DAE (Post-rainy season,
2015-16)
78
ix
Table
No. Title
Page
No.
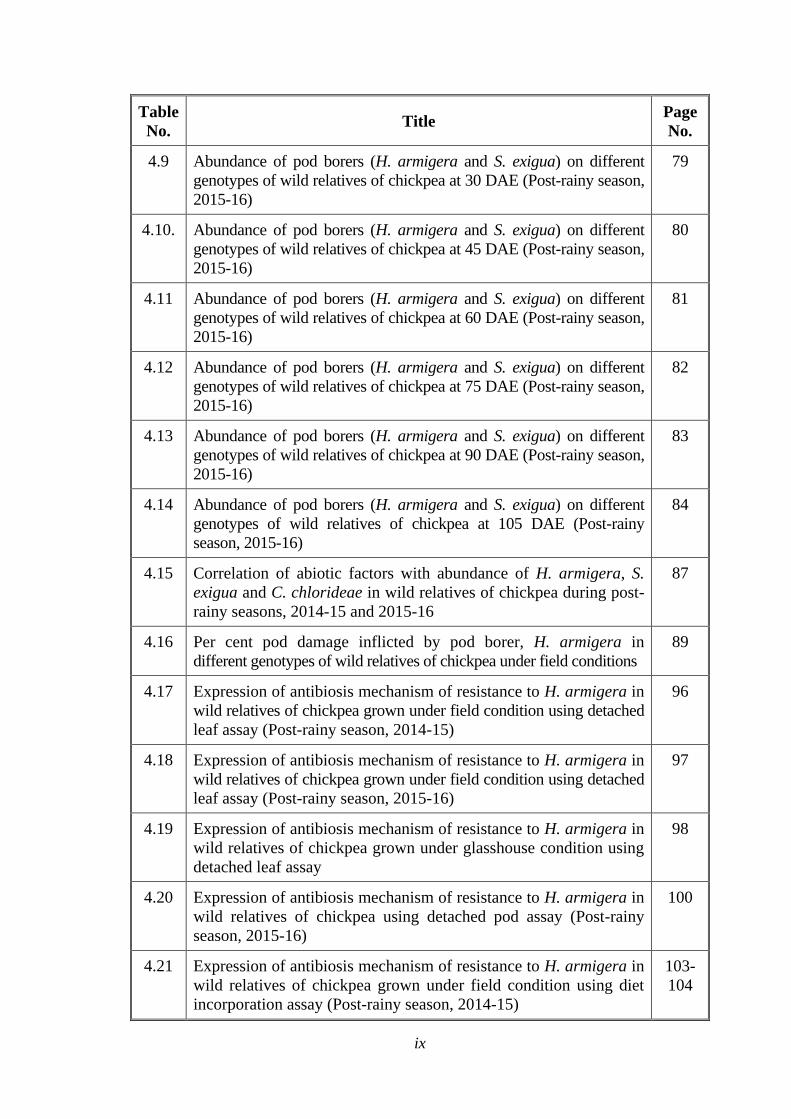
4.9 Abundance of pod borers (H. armigera and S. exigua) on different
genotypes of wild relatives of chickpea at 30 DAE (Post-rainy season,
2015-16)
79
4.10. Abundance of pod borers (H. armigera and S. exigua) on different
genotypes of wild relatives of chickpea at 45 DAE (Post-rainy season,
2015-16)
80
4.11 Abundance of pod borers (H. armigera and S. exigua) on different
genotypes of wild relatives of chickpea at 60 DAE (Post-rainy season,
2015-16)
81
4.12 Abundance of pod borers (H. armigera and S. exigua) on different
genotypes of wild relatives of chickpea at 75 DAE (Post-rainy season,
2015-16)
82
4.13 Abundance of pod borers (H. armigera and S. exigua) on different
genotypes of wild relatives of chickpea at 90 DAE (Post-rainy season,
2015-16)
83
4.14 Abundance of pod borers (H. armigera and S. exigua) on different
genotypes of wild relatives of chickpea at 105 DAE (Post-rainy
season, 2015-16)
84
4.15 Correlation of abiotic factors with abundance of H. armigera, S.
exigua and C. chlorideae in wild relatives of chickpea during post-
rainy seasons, 2014-15 and 2015-16
87
4.16 Per cent pod damage inflicted by pod borer, H. armigera in
different genotypes of wild relatives of chickpea under field conditions
89
4.17 Expression of antibiosis mechanism of resistance to H. armigera in
wild relatives of chickpea grown under field condition using detached
leaf assay (Post-rainy season, 2014-15)
96
4.18 Expression of antibiosis mechanism of resistance to H. armigera in
wild relatives of chickpea grown under field condition using detached
leaf assay (Post-rainy season, 2015-16)
97
4.19 Expression of antibiosis mechanism of resistance to H. armigera in
wild relatives of chickpea grown under glasshouse condition using
detached leaf assay
98
4.20 Expression of antibiosis mechanism of resistance to H. armigera in
wild relatives of chickpea using detached pod assay (Post-rainy
season, 2015-16)
100
4.21 Expression of antibiosis mechanism of resistance to H. armigera in
wild relatives of chickpea grown under field condition using diet
incorporation assay (Post-rainy season, 2014-15)
103-
104
x
Table
No. Title
Page
No.
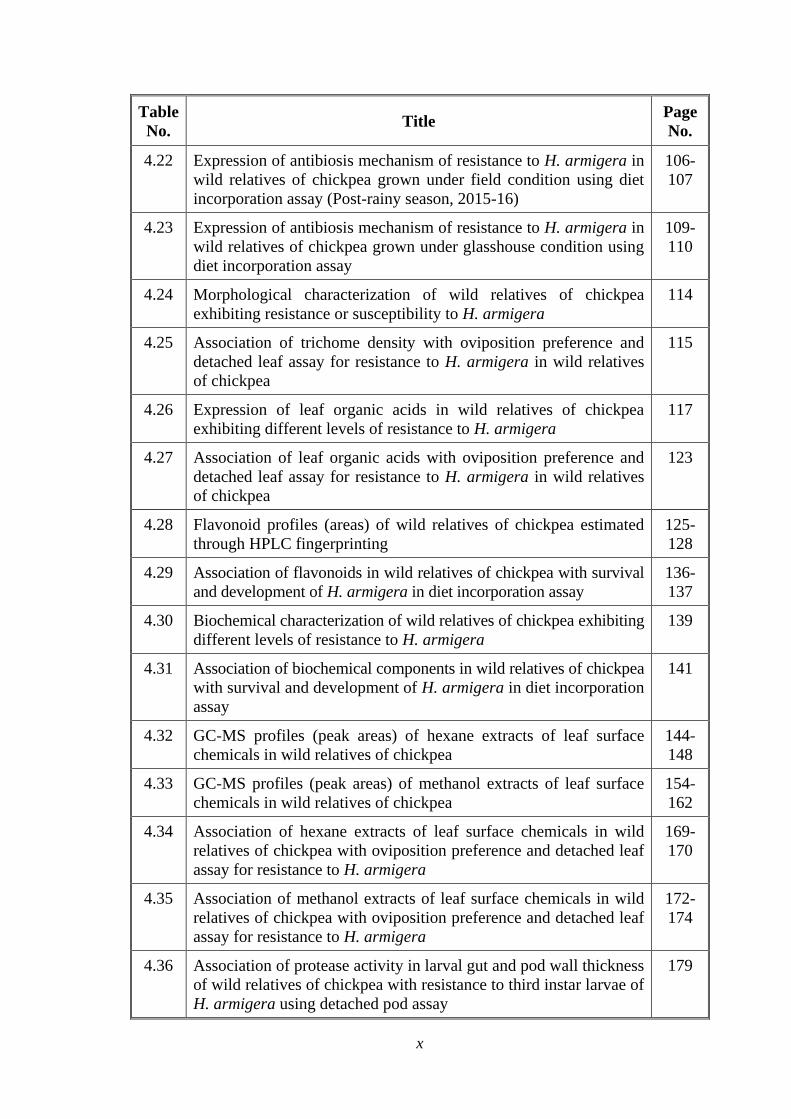
4.22 Expression of antibiosis mechanism of resistance to H. armigera in
wild relatives of chickpea grown under field condition using diet
incorporation assay (Post-rainy season, 2015-16)
106-
107
4.23 Expression of antibiosis mechanism of resistance to H. armigera in
wild relatives of chickpea grown under glasshouse condition using
diet incorporation assay
109-
110
4.24 Morphological characterization of wild relatives of chickpea
exhibiting resistance or susceptibility to H. armigera
114
4.25 Association of trichome density with oviposition preference and
detached leaf assay for resistance to H. armigera in wild relatives
of chickpea
115
4.26 Expression of leaf organic acids in wild relatives of chickpea
exhibiting different levels of resistance to H. armigera
117
4.27 Association of leaf organic acids with oviposition preference and
detached leaf assay for resistance to H. armigera in wild relatives
of chickpea
123
4.28 Flavonoid profiles (areas) of wild relatives of chickpea estimated
through HPLC fingerprinting
125-
128
4.29 Association of flavonoids in wild relatives of chickpea with survival
and development of H. armigera in diet incorporation assay
136-
137
4.30 Biochemical characterization of wild relatives of chickpea exhibiting
different levels of resistance to H. armigera
139
4.31 Association of biochemical components in wild relatives of chickpea
with survival and development of H. armigera in diet incorporation
assay
141
4.32 GC-MS profiles (peak areas) of hexane extracts of leaf surface
chemicals in wild relatives of chickpea
144-
148
4.33 GC-MS profiles (peak areas) of methanol extracts of leaf surface
chemicals in wild relatives of chickpea
154-
162
4.34 Association of hexane extracts of leaf surface chemicals in wild
relatives of chickpea with oviposition preference and detached leaf
assay for resistance to H. armigera
169-
170
4.35 Association of methanol extracts of leaf surface chemicals in wild
relatives of chickpea with oviposition preference and detached leaf
assay for resistance to H. armigera
172-
174
4.36 Association of protease activity in larval gut and pod wall thickness
of wild relatives of chickpea with resistance to third instar larvae of
H. armigera using detached pod assay
179
xi
Table
No. Title
Page
No.
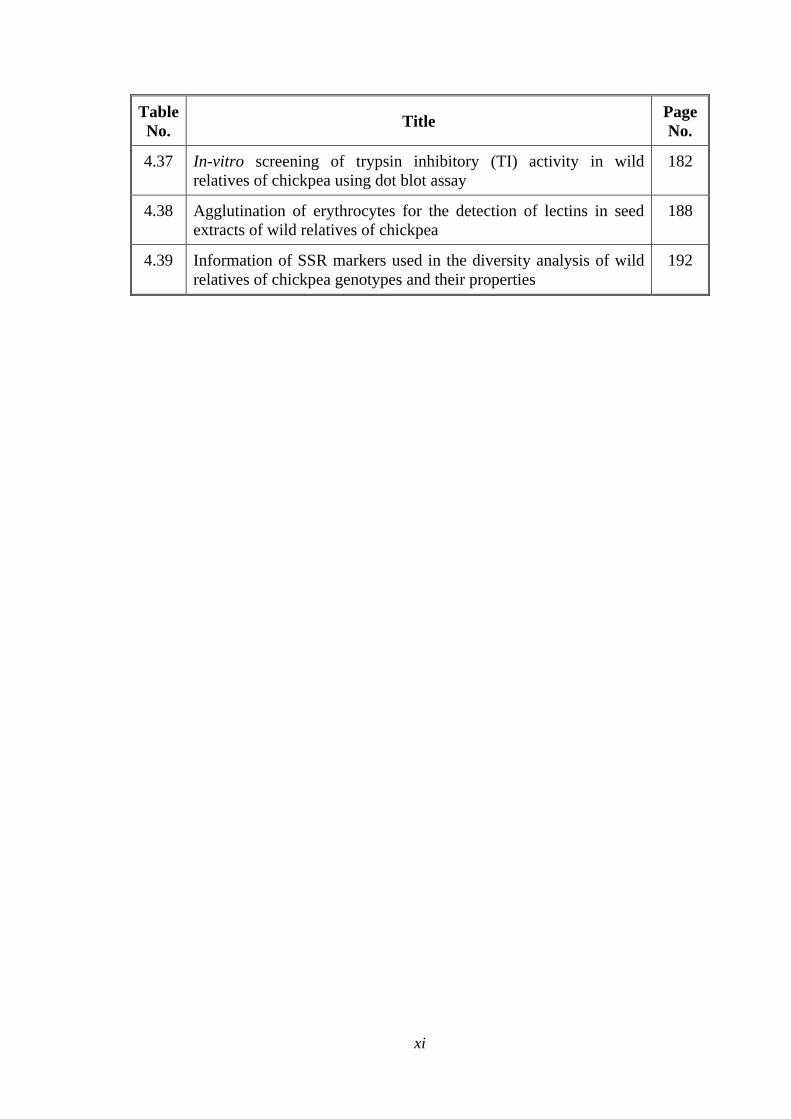
4.37 In-vitro screening of trypsin inhibitory (TI) activity in wild
relatives of chickpea using dot blot assay
182
4.38 Agglutination of erythrocytes for the detection of lectins in seed
extracts of wild relatives of chickpea
188
4.39 Information of SSR markers used in the diversity analysis of wild
relatives of chickpea genotypes and their properties
192
xii
LIST OF ILLUSTRATIONS
Figure
No. Title
Page
No.
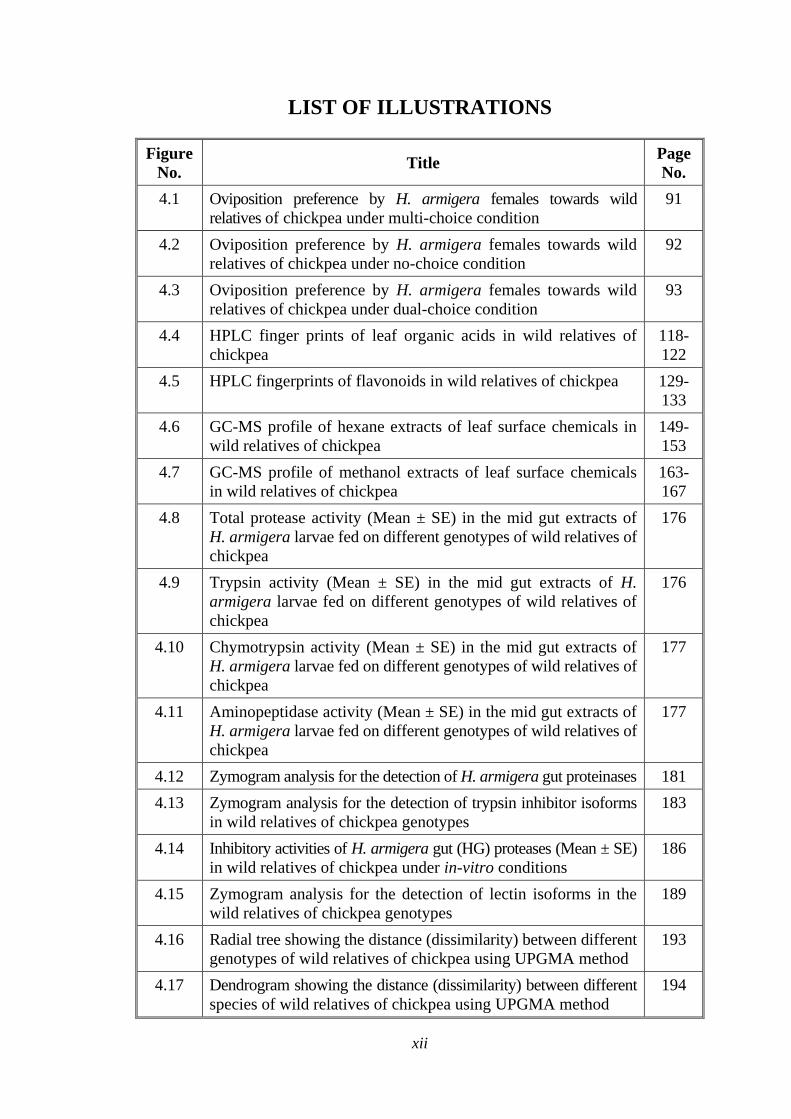
4.1 Oviposition preference by H. armigera females towards wild
relatives of chickpea under multi-choice condition
91
4.2 Oviposition preference by H. armigera females towards wild
relatives of chickpea under no-choice condition
92
4.3 Oviposition preference by H. armigera females towards wild
relatives of chickpea under dual-choice condition
93
4.4 HPLC finger prints of leaf organic acids in wild relatives of
chickpea
118-
122
4.5 HPLC fingerprints of flavonoids in wild relatives of chickpea 129-
133
4.6 GC-MS profile of hexane extracts of leaf surface chemicals in
wild relatives of chickpea
149-
153
4.7 GC-MS profile of methanol extracts of leaf surface chemicals
in wild relatives of chickpea
163-
167
4.8 Total protease activity (Mean ± SE) in the mid gut extracts of
H. armigera larvae fed on different genotypes of wild relatives of
chickpea
176
4.9 Trypsin activity (Mean ± SE) in the mid gut extracts of H.
armigera larvae fed on different genotypes of wild relatives of
chickpea
176
4.10 Chymotrypsin activity (Mean ± SE) in the mid gut extracts of
H. armigera larvae fed on different genotypes of wild relatives of
chickpea
177
4.11 Aminopeptidase activity (Mean ± SE) in the mid gut extracts of
H. armigera larvae fed on different genotypes of wild relatives of
chickpea
177
4.12 Zymogram analysis for the detection of H. armigera gut proteinases 181
4.13 Zymogram analysis for the detection of trypsin inhibitor isoforms
in wild relatives of chickpea genotypes
183
4.14 Inhibitory activities of H. armigera gut (HG) proteases (Mean ± SE)
in wild relatives of chickpea under in-vitro conditions
186
4.15 Zymogram analysis for the detection of lectin isoforms in the
wild relatives of chickpea genotypes
189
4.16 Radial tree showing the distance (dissimilarity) between different
genotypes of wild relatives of chickpea using UPGMA method
193
4.17 Dendrogram showing the distance (dissimilarity) between different
species of wild relatives of chickpea using UPGMA method
194
xiii
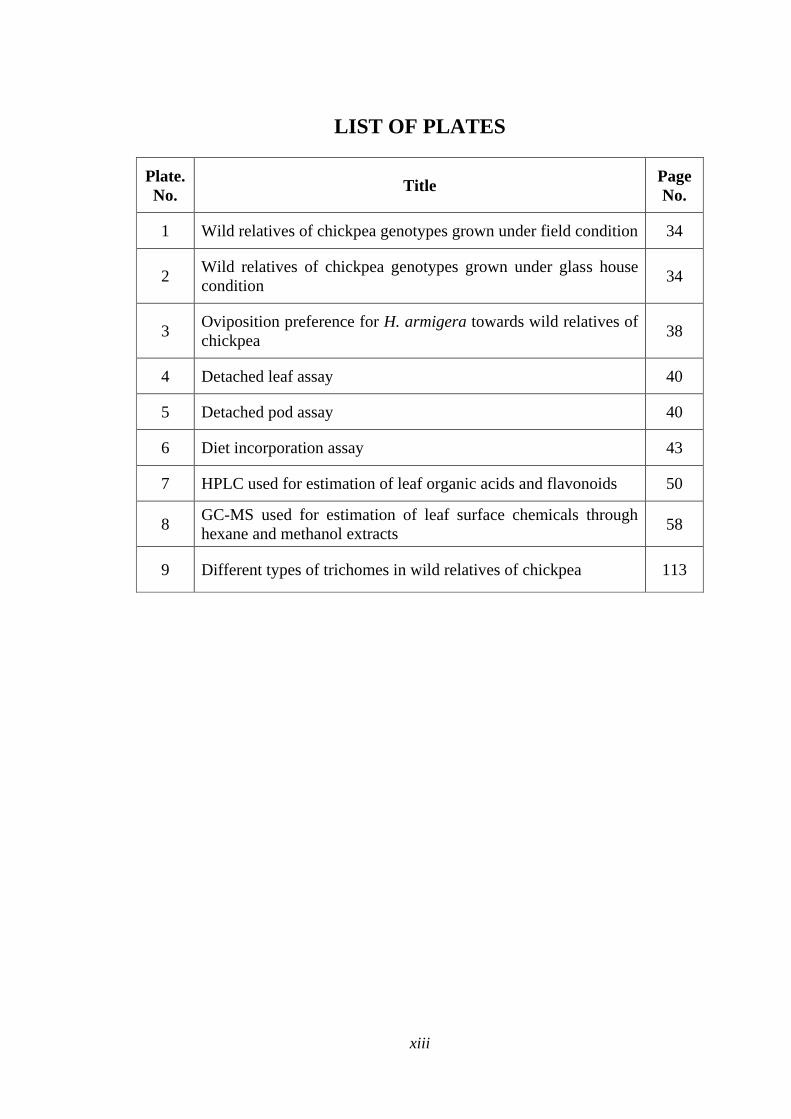
LIST OF PLATES
Plate.
No. Title
Page
No.
1 Wild relatives of chickpea genotypes grown under field condition 34
2 Wild relatives of chickpea genotypes grown under glass house
condition 34
3 Oviposition preference for H. armigera towards wild relatives of
chickpea 38
4 Detached leaf assay 40
5 Detached pod assay 40
6 Diet incorporation assay 43
7 HPLC used for estimation of leaf organic acids and flavonoids 50
8 GC-MS used for estimation of leaf surface chemicals through
hexane and methanol extracts 58
9 Different types of trichomes in wild relatives of chickpea 113
xiv
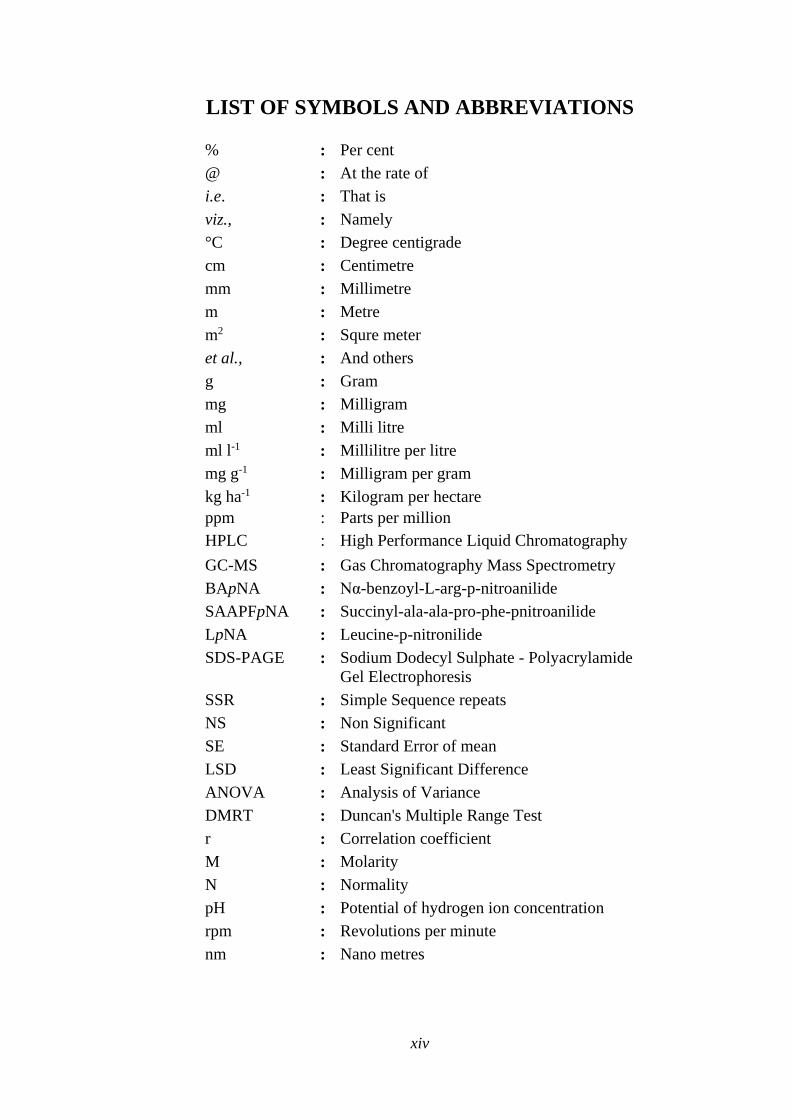
LIST OF SYMBOLS AND ABBREVIATIONS
% : Per cent
@ : At the rate of
i.e. : That is
viz., : Namely
°C : Degree centigrade
cm : Centimetre
mm : Millimetre
m : Metre
m2 : Squre meter
et al., : And others
g : Gram
mg : Milligram
ml : Milli litre
ml l-1 : Millilitre per litre
mg g-1 : Milligram per gram
kg ha-1 : Kilogram per hectare
ppm : Parts per million
HPLC : High Performance Liquid Chromatography
GC-MS : Gas Chromatography Mass Spectrometry
BApNA : Nα-benzoyl-L-arg-p-nitroanilide
SAAPFpNA : Succinyl-ala-ala-pro-phe-pnitroanilide
LpNA : Leucine-p-nitronilide
SDS-PAGE : Sodium Dodecyl Sulphate - Polyacrylamide
Gel Electrophoresis
SSR : Simple Sequence repeats
NS : Non Significant
SE : Standard Error of mean
LSD : Least Significant Difference
ANOVA : Analysis of Variance
DMRT : Duncan's Multiple Range Test
r : Correlation coefficient
M : Molarity
N : Normality
pH : Potential of hydrogen ion concentration
rpm : Revolutions per minute
nm : Nano metres
xv
Name of the Author : GOLLA SIVA KUMAR
Title of the thesis : BIOCHEMICAL AND MOLECULAR MECHANISMS
OF RESISTANCE TO Helicoverpa armigera (Hubner)
IN WILD RELATIVES OF CHICKPEA
Degree to which
thesis is submitted
: DOCTOR OF PHILOSOPHY
Faculty : AGRICULTURE
Major field : ENTOMOLOGY
Chairperson : Dr. P. RAJASEKHAR
University : ACHARYA N.G. RANGA AGRICULTURAL
UNIVERSITY
Year of submission : 2017
ABSTRACT
The present studies on “Biochemical and molecular mechanisms of resistance
to Helicoverpa armigera (Hubner) in wild relatives of chickpea” were carried out
at the International Crops Research Institute for the Semi-Arid Tropics (ICRISAT),
Patancheru, during 2014-16. A total of 20 accessions (15 wild relatives and five
varieties of cultivated chickpea) were used to evaluate the mechanism of resistance
to H. armigera. Under field conditions, during post-rainy seasons 2014-15 and
2015-16, all genotypes of wild relatives of chickpea recorded less number of
H. armigera larvae, low visual leaf damage rating and per cent pod damage
compared to cultivated chickpea.
The genotypes IG 70012, PI 599046, IG 70022, PI 599066, IG 70006, IG
70018 (Cicer bijugum), ICC 506EB, ICCL 86111 (resistant checks), IG 72933, IG
72953 (C. reticulatum) IG 69979 (C. cuneatum) and IG 599076 (C. chrossanicum)
showed high levels of antixenosis for oviposition of H. armigera under multi-,
dual- and no-choice cage conditions.
Studies on detached leaf assay revealed that the genotypes IG 70012, IG 70022,
IG 70018, IG 70006, PI 599046, PI 599066 (C. bijugum), IG 69979 (C. cuneatum),
PI 568217, PI 599077 (C. judaicum) and ICCW 17148 (C. microphyllum) showed
less damage rating and low larval weights compared to susceptible checks. Larval
survival was greater on the wild relatives than on the cultivated chickpea. Detached
pod assay studies revealed that all wild relatives of chickpea exhibited less damage
rating, lower per cent pod damage and lower percentage of weight gained by third-
instar larva compared to cultivated chickpea.
Survival and development of H. armigera on artificial diet impregnated
with lyophilized leaf powders revealed that all wild relatives of chickpea
genotypes showed high levels of antibiosis to H. armigera compared to cultivated
chickpea in terms of lower larval survival, per cent pupation and adult emergence,
decreased larval and pupal weight, prolonged larval and pupal developmental
periods and reduced fecundity.
xvi
Among morphological characters, glandular and non-glandular trichomes
showed negative association with oviposition under multi-choice and no-choice
conditions. Glandular trichomes had significant negative association with damage
rating, whereas non-glandular trichomes had significant positive association with
damage rating and larval weight but negative association with larval survival in
detached leaf assay. Pod wall thickness showed significant negative association
with damage rating and per cent pod damage in detached pod assay.
HPLC finger prints of leaf organic acids revealed a negative association of
oxalic acid with oviposition, while malic acid showed positive and significant
association with oviposition under multi- and no-choice conditions. Oxalic acid
and malic acid had significant and negative correlation with larval survival in
detached leaf assay, which indicates that higher amounts of these acids in
cultivated chickpea resulted in reduced larval survival compared to wild relatives.
The flavonoid compounds viz., chlorogenic acid, ferulic acid, naringin, 3, 4-
dihydroxy flavones, quercetin, naringenin, genestein, formononetin and biochanin A
identified through HPLC finger prints exhibited negative effects on survival and
development of H. armigera reared on artificial diet impregnated with lyophilized
leaf powders. Proteins and phenols showed negative effect, while tannins and total
soluble sugars showed positive effect on survival and development of H. armigera
reared on artificial diet with lyophilized leaf powders of wild relatives of chickpea.
Zymogram analysis revealed presence of 3 to 7 trypsin inhibitor (TI)
isoforms in all 20 genotypes. The genotypes, IG 70018, IG 70012, IG 70006, IG
70022, PI 599066, IG 72933, IG 72953 and IG 69979 showed higher inhibitory
activity of H. armigera gut (HG) proteases, while genotypes PI 510663, PI
599109, PI 568217 and ICCW 17148 showed low inhibitory activity under in vitro
conditions. Studies on hemagglutination of lectins revealed that wild relatives of
chickpea genotypes showed more agglutination even at less concentration. Schiff’s
base staining of lectins revealed that only one isoform with a molecular weight of
29 kDa was observed in wild relatives of chickpea.
GC-MS profile peaks of leaf surface chemicals identified with hexane
extracts showed 56 peaks in all genotypes. Correlation studies with detached leaf
assay and oviposition preference indicated presence of feeding and oviposition
repellents as well as phagostimulants and oviposition attractants. A total of 107
GC-MS profile peaks were identified with methanol extracts. Correlation studies
indicated that methanol extracts had higher amount of phagostimulants and
oviposition repellents than antifeedants and oviposition attractants.
The 26 SSR markers used for assessing genetic diversity of wild relatives
of chickpea detected a total of 186 alleles with an average of 7.15 alleles per
marker. PIC values varied from 0.21 (CaM2064) to 0.89 (CaM0958, ICCM0249
and TAA58). Gene diversity varied from 0.24 (CaM2064) to 0.90 (CaM0958,
ICCM0249 and TAA58). The average observed heterozygosity was 0.20.
The dendrogram based on UPGMA showed that cultivated chickpea
showed a closer genetic relation with the C. reticulatum, while, the species C.
microphyllum, C. judaicum, C. bijugum and C. pinnatifidum were placed in other
cluster. The other species C. cuneatum was placed in separate cluster indicated
that it is distantly related to species in other two clusters.

I
Chapter I
INTRODUCTION
Chickpea (Cicer arietinum L.) is the third most important pulse crop after dry
beans and peas produced in the world. Average annual chickpea area in the world is
14.8 million ha with a production of 14.23 million tonnes, of which Asia accounts
for 88 per cent of area and 84 per cent of production (FAO STAT, 2014). In India, it
is cultivated on 6.67 million hectares with an annual production of 5.3 million
tonnes with an average yield of 844 kg ha-1 (CMIE, 2011). Madhya Pradesh,
Rajasthan, Maharashtra, Uttar Pradesh, Karnataka and Andhra Pradesh together
account for 91% of production and 90% of area under chickpea.
Chickpea is an important source of protein for millions of people in
developing countries and has the highest nutritional compositions of any dry edible
grain legume. In addition to high protein content, chickpea is also rich in fiber and
minerals, and its lipid fraction is high in unsaturated fatty acids (Williams and
Singh, 1987). Chickpea contains higher amounts of carotenoids such as β-carotene
than genetically engineered “golden rice” (Abbo et al., 2005). Chickpea can fix up
to 140 kg nitrogen ha-1 and meet up to 80% of its nitrogen requirement through
symbiotic nitrogen fixation (Saraf et al., 1998). Substantial amounts of nitrogen
remain in the soil following the cultivation of chickpea crop, which is beneficial to
subsequent crops. Chickpea crop residues add much needed organic matter for the
maintenance of soil health, long term fertility, and sustainability of the ecosystems.
The productivity of chickpea is 0.8 t ha-1 and it continues to be far below the potential
yield of over 5.0 t ha-1 and the realizable yield of 2.5 t ha-1 on the farmer’s fields.
Pod borer, Helicoverpa armigera (Hubner), beet army worm, Spodoptera
exigua (Hubner), Fusarium wilt, root rots, Ascochyta blight, Botrytis gray mold and
drought are some of the major constraints to increase the productivity of chickpea
(Chen et al., 2011). Nearly 60 insect species are known to feed on chickpea, of
which black cut worm, Agrotis ipsilon (Hfn.), leafminer, Liriomyza cicerina
(Rondani), aphid, Aphis craccivora Koch, pod borer, H. armigera, leaf eating
caterpillar, S. exigua, bruchid, Callosobruchus chinensis L. and termite,
Microtermes obesi (Holm.) are the major pests worldwide (Reed et al., 1987), of
which the legume pod borer, H. armigera is the most important biotic constraint in
1
chickpea production. It causes an estimated loss of US$325 million on chickpea, and
over US$2 billion on different crops in the semi-arid tropics, despite application of
insecticides costing over US$500 million annually (Sharma, 2005). The average
losses due to pod borer damage on chickpea vary from 25 to 30 per cent, and under
certain situations, there may be a complete loss of the crop inspite of several rounds
of insecticidal applications (Sarwar et al., 2009). The larvae feed on seedlings,
leaves, flowers and pods.
The development of crop cultivars resistant or tolerant to H. armigera has a
major potential for use in integrated pest management. More than 14000 chickpea
germplasm accessions have been screened for resistance to H. armigera at
ICRISAT, Patancheru, India under field conditions (Lateef and Sachan, 1990).
Several germplasm accessions (ICC 506 EB, ICC 10667, ICC 10619, ICC 4935,
ICC 10243, ICCV 95992 and ICC 80817) with resistance to H. armigera have been
identified, and varieties with moderate levels of resistance have been released for
cultivation (Lateef, 1985 and Narayanamma et al., 2007). However, only moderate
levels of resistance are available in the cultivated germplasm of chickpea and thus
there is a need to identify wild relatives as a source of resistance so as to transfer to
cultivated chickpea and increase the levels of resistance.
Some of wild relatives of chickpea viz., Cicer bijugum, C. pinnatifidum,
C. judaicum, and C. reticulatum have shown very high levels of resistance to
H. armigera (Sharma et al., 2004, 2005a, b, 2006). Progenies obtained from C. echinospermum
and C. reticulatum showed consistently low levels of damage (10% or less) due to
pod borers (Mallikarjuna et al., 2007). These wild relatives of chickpea may have
different mechanisms of resistance than the cultivated types, which could be used in
crop improvement to diversify the basis of resistance to the pest.
Plant-insect interactions are dependent on nutritional levels of plant tissues
during different growth forms of the insect and chemical and mechanical defenses of
the plant (Cates, 1980). Trichome density and trichome exudates play an important
role in the ovipositional behavior and host selection process of insect herbivores
(Bernays and Champman, 1994). Chickpea trichome exudates contain acidic
chemicals such as malic acid, oxalic acid and succinic acid. Oxalic acid has an
antibiotic effect on the larvae of pod borer, H. armigera, which results in reduced
2
pod damage (Yoshida et al., 1995). A dense mat of non-glandular trichomes
prevents the small larvae from feeding on the plant (Peter and Shanower, 1998).
The chemical basis of resistance to H. armigera has been attributed to acid
exudates which can be used as marker for resistance, though the quantity of exudates
and resistance levels vary across locations with environment (Rembold, 1981 and
Rembold and Winter, 1982). Malic and oxalic acids in cultivated chickpea exert
antifeedant and antibiotic effects on H. armigera (Narayanamma et al., 2013). The
wild relatives of chickpea also contain flavonoids and isoflavonoids. The levels of
total extractable flavonoid and isoflavonoid contents exhibit different levels of
resistance and susceptibility to insect pest. These flavonoids and isoflavonoids in the
wild relatives of chickpea have shown antibiosis effect towards H. armigera
(Simmonds and Stevenson, 2001 and Steveson et al., 2005). Protease inhibitors and
lectins are also important defensive mechanisms in grain legumes (Shukla et al.,
2005). Any interference in the activity of digestive enzymes by enzyme inhibitors of
host plant can result in poor nutrient utilization and developmental retardation
(Jongsma and Bolter, 1997 and Gatehouse and Gatehouse, 1999). There is a wide
variation in protease inhibitory activity in wild relatives of chickpea compared to
cultivated chickpea (Harsulkar et al., 1999). Chickpea and snowdrop lectins have
shown marked antibiotic effects on H. armigera by reducing survival and
development (Shukla et al., 2005). A basic understanding of the interactions
between the secondary metabolites in wild relatives of chickpea and H. armigera is
important to develop appropriate strategies to develop chickpea cultivars with high
levels of resistance to H. armigera.
Modern plant breeding and agricultural systems have narrowed the base for
the genetic diversity of cultivated chickpea (Robertson et al., 1997). Therefore, it is
necessary to explore wild relatives having varied genetic diversity. The effectiveness
of improvement in any crop depends upon the extent and nature of phenotypic and
genotypic variation present in different traits of the broader population. Genetic
diversity among the parents is a prerequisite for ensuring the chance of improved
segregate selection for various characters (Dwevedi and Gaibriyal, 2009). Criteria
for the assessment of genetic variability can include morphological traits (Upadhaya
et al., 2007) and molecular markers (Sharma et al., 1995). DNA molecular markers
have more advantages than phenotypic markers, since they are free of environmental
3
influences when determining genetic variability (Virk et al., 1995 and Serret et al.,
1997). Molecular markers have proved as valuable tools for the characterization and
assessment of genetic variability within and between species and populations (Talebi
et al., 2008). Hence, the diversity available in different traits of the wild Cicer is
very valuable (Heslop-Harrison, 2002).
Most of the wild relatives of chickpea showing resistance to H. armigera
have not yet been characterized for different mechanisms of resistance such as
oviposition preference, antifeedant and antibiosis effect on larvae. Therefore,
measurement of different resistance mechanisms in wild relatives of chickpea
against H. armigera is highly important, where these characters could be used as
source for development of cultivars with high and stable resistance to this pest.
Therefore, the present studies have been planned with the following objectives.
OBJECTIVES OF INVESTIGATION:
1. Identify wild relatives of chickpea with diverse mechanisms (antixenosis
and antibiosis) of resistance to H. armigera.
2. Identify morphological, physiological and biochemical components associated
with resistance to H. armigera.
3. Assess genetic diversity of wild relatives of chickpea exhibiting resistance
to H. armigera by using biological, morphological, biochemical and molecular
markers.
4
II
Chapter II
REVIEW OF LITERATURE
Chickpea (Cicer arietinum L.) is an important grain legume of the semi-arid
tropics and one of the major components of human diet. It is grown in about 50
countries with an estimated 95 per cent of the cultivated area in the developing
countries. Chickpea production is particularly important in the countries of South
Asia and accounts for about 71 per cent of global area devoted to the crop.
Chickpea yields remained stagnant for the past two to three decades due to
various biotic and abiotic factors such as, pod borers, Helicoverpa armigera,
Spodoptera exigua, Fusarium wilt, Aschochyta blight, Botrytis gray mold, drought
and low temperatures of which H. armigera (Hubner) is the key pest. The damage
caused by this pest on chickpea ranged upto 84.4% with an average of 7% under
different farming systems (Lateef, 1992). It has long been recognized that plant
resistance perhaps is the most effective and economic option for pest management,
particularly under subsistence farming conditions in the semi-arid tropics. The levels
of resistance in the cultivated chickpea germplasm have been found to be low to
moderate (Lateef, 1985., Lateef and Sachan, 1990 and Sharma, 2001). Wild relatives
of crops are useful source of genes for resistance to biotic and abiotic stress factors
(Croser et al., 2003). Therefore, there is a potential for exploiting the wild relatives
of chickpea with different mechanisms as source of resistance to increase the level
and diversify the basis of resistance to H. armigera in cultivated germplasm.
2.1 ORIGIN AND TAXONOMY OF CHICKPEA
The Cicer genus belongs to the family Leguminoseae, subfamily Papilionaceae
and tribe Cicereae. It encompasses 9 annual and 34 perennial species. Most of these
species are found in West Asia and North Africa covering Turkey in the North to
Ethiopia in the South and Pakistan in the East to Morocco in the West. Of the nine
annual species, C. arietinum is the only cultivated species. The eight other annual
species of chickpea are wild which includes, C. reticulatum, C. echinospermum,
C. pinnatifidum, C. judaicum, C. bijugum, C. cuneatum, C. chorassanicum and
C. yamashitae. Van der Maesen (1987) classified the Cicer species into four
sections based on their morphological characteristics, life cycle and geographical
5
distribution. Eight annual species except C. chorassanicum were placed in section
Monocicer, whereas C. chorassanicum and perennial species C. incisum were placed
in section Chamaecicer, 23 perennial species in section Polycicer and seven woody
perennial species in section Acanthocicer. It is considered to be one of the ‘founder
crops’ of the ‘Neolithic revolution’ in the near East around 10,000 years ago (Lev-
Yadun et al., 2000 and Zohary and Hopf, 2000). Earlier, cultivated chickpea (C.
arietinum) was considered to have originated from the Southern Caucasus and
Northern Persia (Iran) regions (Van der Maesen, 1972). However, with the
discovery of the wild progenitor C. reticulatum by Ladizinsky (1975), present day
South-Eastern Turkey is considered as the most likely origin of cultivated chickpea
(Ladizinsky, 1995). This is consistent with the very limited distribution of the C.
reticulatum wild progenitor species and of the closely related C. echinospermum in
South-Eastern Turkey (Ladizinsky, 1975 and Berger et al., 2003).
2.2 GENE POOLS (GP) OF CHICKPEA
Based on the concepts of primary, secondary and tertiary gene pools, crops
have improved consistency and comparability at both inter and intraspecific levels.
Harlan and De Wet (1971) included all the variants of the cultigen in the primary
gene pool together with those wild and weedy taxa which cross freely and produce
fertile hybrids with the cultigen. The secondary gene pool included those species
which can be crossed with the cultigen often with some difficulty, but the resulting
hybrids are partially fertile. The tertiary gene pool includes species which are cross-
incompatible with the crop, or whose hybrids with the crop are totally sterile. Using
the Harlan and De Wet (1971) gene pool concept, the chickpea gene pool may be
characterized as follows:
Cultigen= GP 1a GP 1b GP 2 GP 3
Cicer arietinum C. reticulatum
C. echinospermum
C. bijugum
C. judaicum
C. pinnatifidum
Other Cicer
species
Using the classification proposed by Harlan and De Wet (1971), a
modification of the classification is proposed for chickpea gene pools based on its
crossability of wild relatives with cultigens (Mallikarjuna et al., 2011). The primary
gene pool consists of cultivated species and landraces. The secondary gene pool
consists of the progenitor species, C. reticulatum and C. echinospermum, a species
6
that is crossable with C. arietinum but with reduced fertility of the resulting hybrids
and progenies. The tertiary gene pool consists of all other annuals and perennial
Cicer that are not crossable with cultivated C. arietinum. The species in secondary
and tertiary gene pools could be effectively exploited for genetic enhancement of
chickpea by overcoming pre and post fertilization barriers or through genetic
transformation route.
2.3 INCIDENCE OF POD BORER, H. armigera IN CHICKPEA
The Pod borer, Helicoverpa armigera (Hubner) (Lepidoptera: Noctuidae) is a
polyphagous and devastating pest of many important crop plants and responsible for
heavy economic losses to agriculture. It is a highly adaptive pest and infests more
than 300 plant species throughout the world (Rajapakse and Walter, 2007). In
chickpea, it is the key biotic constraint which at times causes 90 to 95% damage,
under severe infestation losses may leads upto 100% inspite of several rounds of
insecticidal applications (Sarwar et al., 2009). The knowledge on the seasonal
abundance of H. armigera will certainly be helpful in formulating the pest
management strategies.
Rao et al. (2001) observed pod borer damage on chickpea at the flowering
stage i.e. 38 days after sowing (two larvae/10 plants) whereas the peak incidence
was recorded at 87 days old crop (20 larvae/10 plants) during the month of January.
The later sown crop of chickpea suffered most from the H armigera and
yielded less than earlier sown crop. There was higher incidence of H. armigera in
the crop sown at 10th November and later date, maximum being recorded on crop
sown at 20th November. The grain yield was also decreased as the sowing was
delayed, indicating direct correlation with pest incidence (Singh et al., 2002).
Seasonal incidence of H. armigera on cv. ICCC 37 revealed that oviposition
was highest during the second fortnight of December. The pest incidence started at
15 DAS (7.30 larvae/20 plants), then gradually increased until first peak at 29 DAS
(60.30 larvae/20 plants), second peak at 57 DAS (85.50 larvae/20 plants) and the
third peak at 85 DAS (74.30 larvae/20 plants) (Suganthy et al., 2003).
Altaf et al. (2008) reported that, in chickpea highest pod damage of 22.82
and 27.36% was observed in October and the lowest damage of 11.76 and 20.16%
was observed in November during 2003-04 and 2004-05, respectively.
7
Hossain et al. (2008a) observed that the incidence of pod borer, H. armigera
started in 2nd to 4th week of January and further reported that both the early (October
15 to November 01) and late sown (December and onwards) crops exhibited higher
pod borer damage and produced lower yields. But mid sown (November 08 to 30)
crops recorded less pod borer damage and produced higher yield.
The incidence of the H. armigera in chickpea commenced from first fortnight
of February with mean larval population of 0.05 per plant. The larval populations
started increasing and reached its maximum of 12.97 mean larvae per plant during
4th week of March (12th SW). The population was in significant positive correlation
with both minimum and maximum temperature (r= 0.71 and 0.82, respectively)
whereas, it had negative correlation (r= -0.66) with morning and afternoon relative
humidity. The rainfall, wind velocity and the sunshine hours showed positive
correlation with larval population but it was nonsignificant (Reddy et al., 2009).
Yadav and Jat (2009) reported that, the infestation of H. armigera on
chickpea started in the second fortnight of November and reached its peak by the
end of February. The larval population of the pest occurred throughout the crop
growth period and maximum population was recorded at pod formation and grain
developmental stages.
Carryover of H. armigera on different crops revealed that the activity first
appeared in second fortnight of July on sunflower and cotton and remained active up
to end of the September. Second peak activity of H. armigera was observed on
pigeonpea from last week of September to January month during this period it
migrated to chickpea and sorghum crops during second week of October upto
February. Third peak of H. armigera was noticed on chilli and tomato crops during
March to May (Jadhav et al., 2010).
Larval population of H. armigera in different chickpea genotypes ranged
from 0.33 to 4.33 per meter row from 1st week of March to 3rd week of April,
whereas the pod damage varied from 7.40 to 14.20% (Nadeem et al., 2010).
Zafar et al. (2013) observed that H. armigera population was built up in
sunflower crop from April 12 to April 27 in terms of egg count. The larval
population increased continuously from April 12 to May 01 and a tremendous
decrease was observed thereafter. Maximum temperature showed significant
8
positive correlation (r = 0.51) with the egg counts, whereas relative humidity and
rainfall had significant negative correlation (r = -0.52 and -0.47, respectively).
The incidence of H. armigera started in the second week of December with a
mean population of 0.90 and 0.60 larvae/plant and touched its peak with a mean of
1.80 and 1.90 larvae/plant in the 7th SW and 6th SW during rabi, 2012-13 and 2013-
14, respectively. The H. armigera population exhibited significant positive
correlation with mean temperature and negative but nonsignificant with mean
relative humidity (Yadav et al., 2016).
2.4 SCREENING OF CHICKPEA GENOTYPES FOR RESISTANCE
TO H. armigera
Larval population was high on Phule G 5 (26.33 larvae/5 plants) and lowest
on Chaffa (14.32 larvae/5 plants), pod damage was lower (9.55%) on chaffa,
whereas PG 81-1-1 showed higher pod damage (18.49%), ICCC 4 gave more grain
yield (1250 kg ha-1) as compared to Chaffa (722 kg ha-1) (Bhatt and Patel, 2001).
Singh et al. (2002) reported that GL-769 showed the highest pod infestation
(13.08 and 12.70%) while PBG-1 showed the highest grain yield (1403.27 and
1414.27 kg ha-1) during the 1999 and 2000 seasons, respectively.
Rajput et al. (2003) reported that data on larval population, percentage
damage and yield components was highly variable, showing the percentage larval
attack severity from 1.00 to 50.00, pod damage from 8.5 to 90% and 23.33 to 1920 g
grain yield of the sampling unit. Data revealed that the genotype C-727 was
relatively resistant against H. armigera infestation in chickpea.
Maurya and Ujagir (2004) evaluated chickpea germplasm against pod borer,
H. armigera and reported that oviposition ranged from 3.00 to 27.60 eggs/10 plants
and larval count ranged from 25.00 to 71.30 larvae/10 plants. The cultivar ICC
10464 showed highest pod damage (87.50%), and the entries ICC 11180, ICC 2171
and ICC 11175 produced high seed yields (38.90, 38.90 and 33.30 kg ha-1,
respectively). Whereas, Deepak and Ujagir (2005) observed that the ICCV 93929,
ICCV 96029, ICCV 96030 and ICCV 2 were resistant and ICCV 10, ICCV 97115,
ICCV 97119 and ICC 16381 were tolerant to H. armigera.
Gowda and Sharnabasappa (2005) screened 20 chickpea genotypes against
H. armigera in 2000-01 and 2001-02 and reported that the genotype, BGD-237
9
recorded the lowest pod damage of 11.86 and 10.84%, respectively with a rating of
five. The genotypes JAKI-5226 and BK-36 showed high pod damage, with a pest
susceptibility rating of seven. Pooled data indicated that BGD-237 had the lowest
pod damage, while JAKI-5226 recorded highest damage.
Twenty five chickpea genotypes were screened for resistance to H. armigera
under field conditions. The mean pod damage ranged from 20.37% in ICCL 87311
to 34.27% in ICC 12492. ICCL 87311 and ICCV 2 suffered damage ratings of five,
and whereas ICCL 79033, ICCL 80129, ICCL 12746, ICC 12479, ICC 12480, ICCL
87314, IG 362 and Annigeri had a damage rating of six, and suffered less damage
than ICC 506EB. ICC 9854 and ICC 12490 had grain yield of 1391 and 1483 kg ha-1
respectively, and were superior to ICC 506EB indicating tolerance to H. armigera
damage (Sanap and Jamadagni, 2005).
A total of 184 chickpea genotypes were evaluated for resistance to pod borer
and a large variation was observed in pod damage (30.87 to 70.65%). Forty five
genotypes were moderately resistant with infestation ranging from 34.05 to 51.65%,
except IPC 96-3 and FG 1235 with mean infestation of 30.85 and 30.95%,
respectively and were resistant (Kaur et al., 2005).
Wakil et al. (2005) reported that among the 27 genotypes of chickpea, none
of the genotypes showed complete resistance to H. armigera. The lowest pod
infestation was recorded in CM-4068/97 (12.71%) and the maximum infestation was
38.83% (cv.93127). Similarly, the number of larvae per plant ranged from 1.27
(Paidar-91) to 5.40 (C-44).
Chandraker et al. (2006) evaluated several chickpea cultivars for resistance to
gram pod borer, H. armigera and reported that the genotype BGD-74 had the
minimum pod damage (6.64%) and highest yield of 1433 kg ha-1.
The maximum larval population of H. armigera was found in BG 273 (38.19
larvae/5 plants) and the minimum (15.59 larvae/5 plants) was observed in DCP 92-3.
The maximum pod damage was seen in JG 11 (20.60%) whereas, the highest grain
yield (23.00 q ha-1) was produced by BG 256 in spite of higher larval population i.e.
30.0 larvae/5 plants and hence BG 256 was classified to be tolerant (Singh and
Yadav, 2006).
10
Hossain et al. (2007) screened 14 chickpea lines and six released varieties
and reported that the genotypes ICCV 95138, ICCV 96020, ICCV 95939, ICCL
87315 and ICCV 98936 were the most promising lines against H. armigera with
respect to lowest pod damage (7.94%) and pest susceptibility rating (4.00). Pod
damage was highest (33.60%) in ICC 4918 and highest yield (1886.00 kg ha-1) was
recorded in ICCV 95138.
Among 25 chickpea genotypes, ICC 16374 (5.05%) and ICCL 7903 (5.90%)
recorded less pod damage compared to the resistant genotype, ICC 506EB (6.35%).
Pest susceptibility rating scale (PSRS) of five was recorded on the genotype ICC
16374. The remaining genotypes were highly susceptible compared to ICC 506EB
and PSRS ranged from 6 and 9. The mean grain yield ranged from 1024 kg ha-1 in
RIL 115 to 2548 kg ha-1 in ICCC 37 (Patil et al., 2007).
Among 207 chickpea genotypes evaluated for resistance to H. armigera, the
genotypes ICC 1882 and ICCC 1422 gave the best performance with 24.33 and
25.04% pod damage and 3.3 mean pest resistance susceptibility rating (PRSR)
compared to checks, C 235, PBG 1 and L 550 with pod damage ranged from 39.33
to 45.96% and PRSR of 4.5, 4.8 and 6.0, respectively (Kooner and Cheema, 2008).
Shafique et al. (2008) evaluated 13 kabuli chickpea recombinants and
reported that CH 70/02, CH 75/02, CH 83/02 and CH 86/02 were found highly
resistant against H. armigera, and CH 62/02, CH 64/02 and CH 66/02 possessed
intermediate resistance, while CH 60/02, CH 63/02, CH 67/02 and CH 68/02 were
least resistant. In another study, the desi chickpea genotype CH 16/02 exhibited
better resistance against H. armigera with lower larval population, pod damage and
higher grain yield (Shafique et al., 2009).
The incidence of pod borer on genotypes, IC 269317, IC 268855, IC 269218
and IC 269347 ranged from 11.24 to 14.23% as compared to 21.36, 21.53, 23.94 and
35.04% on the checks, PBG 1, L 550, GPF 2 and infester, respectively. The mean
pest resistance rating was three on the promising genotypes whereas it was four on
check varieties and six on the infester. Genotype IC 269347 recorded higher yield
comparable to check varieties (Cheema et al., 2010).
11
Deshmukh et al. (2010) reported that the chickpea genotypes BG-372, HC-1,
SAKI-9516, Vijay and Avrodhi were found to be less susceptible to H. armigera,
and recorded lower larval population (1.07 to 1.32 larvae/plant), with lower damage
to pods (11.41 to 14.16%) and higher grain yield (1187 to 1375 kg ha-1).
Among the 30 chickpea lines evaluated for resistance to H. armigera, the
lowest larval population was recorded in genotypes EC 583318, ICC 4958, ICCVX
960186-1, ICCVX 960-28 and ICCVX 960183-69, which were comparable with the
tolerant check (ICC 506). Whereas, more larval population was recorded on ICC
4973, ICC 1356 and ICC 14402 which were comparable with the susceptible checks
(ICC 3137 and ICCC 37). Characteristically, the genotypes had deep green colour,
small leaflets and more hairy were less preferred by the pest (Mulwa et al., 2010).
Incidence of H. armigera on chickpea was recorded at vegetative, flowering
and podding stages. The genotype ICC 730103 showed minimum infestation and
produced higher yield (1383.84 kg ha-1), whereas JG 62 recorded poor yield (479.27
kg ha-1) with higher infestation (Ravikant, 2010).
Nadeem et al. (2011) reported that chickpea genotypes CH 73/02, CH 76/02
and CC 21/100 showed more resistance to H. armigera, whereas CH 72/02, CH
77/02 and CH 80/02 showed moderate resistance and CH 79/02, B 17/03, CH 65/02
were least resistant. CH 73/02 was highly resistant showing lowest pod damage
(8.20%) and increase in grain yield (77.80%) over the check.
Based on larval population, percentage of pod damage and yield components
of chickpea, the genotypes CM 2100/96 and CM- 4068/97 were relatively resistant
while 96051 and PBC-2000 lines were susceptible to pod borer, H. armigera
(Sarwar et al., 2011).
Kumar et al. (2013) reported that among 50 chickpea genotypes evaluated for
resistance to H. armigera, genotypes DGP 15, GIG 0312, ICCL 87315, ICCV 7,
RIL 115, ICC 29, ICC 12470, ICCV 10 and PG 23 with rating scale of 1 and pod
damage ranged from 5.50 to 8.50% were moderate between resistant and
susceptible. Seven genotypes (NDGS 32, ICCC 37, RIL 27, DCP 8, BDNG 9-3,
Udai and ICC12479) had shown pod damage ranging from 20 to 23% and rating
scale of 3 and were placed under susceptible and remaining 34 genotypes with pod
damage of 10.50 to 19% and rating scale of 2, were graded as moderately resistant.
12
Considering overall performance, the genotypes CM-24-2/02, CM-210/01,
CH-53/99, and CC-94/99 proved to be most stable for lessening H. armigera larval
density, pod damage and enhancing grain yield. This was almost certainly due to
high potential of resistant chickpea genotypes for pest tolerance and yield
enhancement (Sarwar, 2013).
Among 28 chickpea genotypes evaluated for resistance to H. armigera,
genotypes Atmore and Flip03-139c were recorded higher resistance than the
Mattama, Hawata, Selwa, Wad Hamed, Jabel Marra, Flip03-127c and Flip04-9c,
which showed moderate resistance. The cv. Hawata recorded the highest seed yield
(1482 kg ha-1) followed by Atmore (1276 kg ha-1) and Shandi (1246 kg ha-1) (Ali
and Mohamed, 2014).
Shankar et al. (2014) reported that chickpea genotypes ICC 10393, ICCL
86111, ICC 12475, RIL 25, RIL 20 and ICCV 10 recorded lower larval density of
pod borers, H. armigera and S. exigua and leaf damage during vegetative, flowering
and podding stages compared to susceptible check ICC 3137. Pod damage was
significantly lower and grain yield was significantly greater in these genotypes than
that of ICC 3137, thus these genotypes can be used for improving chickpea to pod
borer resistance for sustainable crop production.
Based on the observations on larval population and pod damage, chickpea
genotypes RSG 963, ICCL 86111 and DCP-92-3 were identified as less susceptible
against the H. armigera which were at par with the resistant check ICCC 37. The
genotypes, CSJ-479, DCP-92-3 and GPF-2 recorded significantly higher grain yields
i.e., 1923.67, 1372.68 and 1356.47 kg ha-1, respectively. Mean loss in grain yield
due to damage across genotypes was 29.62%. As per the ‘maximin-minimax’
method five genotypes namely GPF-2, CSJ- 479, ICCC 37, DCP-92-3 and ICC 3137
were rated as susceptible high yielding i.e. tolerant to H. armigera (Ghugal and
Shrivastava, 2015).
2.5 MECHANISMS OF HOST PLANT RESISTANCE TO H. armigera
Insect populations must be able to overcome the host plant resistance in order
that they can maintain their ability to feed on that host. The ability to evolve
resistance to host plant defences depends upon additive genetic variation in larval
performance and adult host choice preference (Cotter and Edwards, 2006).
13
2.5.1 Antixenosis Mechanism of Resistance
Green et al. (2002) observed feeding non-preferrence in pigeonpea cultivated
species Cajanus cajan and wild relative C. scarabaeoides to H. armigera larvae and
reported that the first and second instar larvae preferred to feed upon C. cajan than
C. scarabaeoides and on flowers rather than pods or leaves of C. cajan. First and
second instar larvae preferred pods with trichomes removed than pods with
trichomes when fed on C. scarabaeoides.
Kumari et al. (2006) studied a diverse array of pigeonpea genotypes and
suggested that the genotypes ICPL 187-1, ICP 7203-1, ICPL 88039, T 21, ICPL
84060, and ICPL 332 exhibited antixenosis for oviposition under no, dual and multi-
choice conditions compared to susceptible check, ICPL 87 which was highly
preferred for oviposition.
Gopalaswamy et al. (2008) reported that no differences were observed in the
oviposition on the inflorescences of the transgenic pigeonpeas with cry1Ab or SBTI
genes compared to non-transgenic plants and further suggested that transgenic plants
have no influence on the oviposition and feeding preferences of H. armigera.
The accessions of wild relatives of pigeonpea, ICPW 1 (C. acutifolius), ICPW
13 and 14 (C. albicans), ICPW 159 and 160 (C. sericeus), ICPW 68 (C. platycarpus),
ICPW 83, 90, 94, 125, 137, 141 and 280 (C. scarabaeoides), ICPW 207 (Paracalyx
scariosa) and ICPW 210 (Rhynchosia aurea) showed high levels of antixenosis for
oviposition under no, dual and multi-choice conditions (Sujana et al., 2008).
2.5.2 Antibiosis Mechanism of Resistance
Antibiosis mechanism was studied against H. armigera on chickpea
genotypes, ICCX 730041, ICC 10817, ICC 79048 (less susceptible), C 235
(moderately susceptible) and K 850, ICC 1403 and ICC 3137 (highly susceptible).
The larval survival ranged from 77 to 90%, larval and pupal weight, 333 to 436 mg
and 231 to 310 mg, respectively, adult longevity, 8 to 10 and 10 to 12 days for males
and females, respectively (Srivastava and Srivastava, 1990).
Antibiosis effect of short duration pigeonpea genotypes on H. armigera
revealed that larval and pupal weights were significantly higher, larval
developmental period significantly shorter and adult lifespan significantly longer
when larvae were reared on pods compared with flowers or leaves. Lowest larval
14
and pupal weight, longest larval developmental period, and shortest adult lifespan
were observed when larvae were reared on leaves. Larvae reared on ICPL 87 had the
shortest larval developmental time, the highest larval and pupal weights, and the
longest adult lifespan. Larvae reared on ICPL 86012 had the lowest larval weight
and longest larval period (Sison and Shanower, 1994).
Antibiosis in chickpea genotypes revealed that pupae of H. armigera from
the larvae reared on ICC 506 and ICCV 7 weighed less than those reared on
susceptible controls, Annigeri and ICC 3137. Fewer eggs were recorded on ICC 506
compared to susceptible control when observed for antixenosis for oviposition
(Cowgill and Lateef, 1996).
Shanower et al. (1997) observed antibiosis mechanism in terms of lower
larval survival, growth and fecundity of H. armigera on pods of cultivated
pigeonpea and two wild species, C. scarabaeoides and C. platycarpus and reported
that C. scarabaeoides had high antibiosis levels, whereas C. platycarpus had
intermediate levels and C. cajan showed lower levels of resistance to H. armigera.
The larval, pupal and total developmental periods of H. armigera were
longest when they fed on diet with lyophilized powders of chickpea genotype,
NIFA-95 (16.90, 10.00 and 26.90 days, respectively) and shortest on CMNK-440-9
(14.63, 9.33 and 23.90 days, respectively). Larval weight and pupal recovery were
lowest on NIFA-95 (60.95 and 30.00%, respectively) (Khattak et al., 2002).
Sreelatha (2003) recorded lower larval and pupal weights and prolonged larval
and pupal periods on leaves, pods, and artificial diet impregnated with lyophilized
leaves and pods of resistant chickpea genotypes ICC 12475, ICC 12476, ICC 12477,
ICC 12478, ICC 12479, ICC 12490, ICC 12491 and ICC 12495 as compared to that
of the susceptible genotypes ICC 12426, ICC 3137, ICC 4973 and ICC 4962.
Based on leaf feeding, larval survival, and larval weights in the detached leaf
assay, the wild relatives of chickpea accessions IG 69941, IG 70002, IG70003, IG
70009, IG 70019, IG 70022, ICC17125, ICC 17122, ICC 17156, IG 70006, and ICC
17187 (C. bijugum), IG 69995 and IG 70030 (C. judaicum) and IG 69988, IG 69999 IG
70021, IG 70025, and IG 70028 (C. pinnatifidum) showed low leaf feeding, low larval
weights, and low host suitability index against H. armigera (Sharma et al., 2004).
15
Sharma et al. (2005a) evaluated antibiotic effect of wild relatives of chickpea
for H. armigera and reported that accessions ICC 17257, IG 70002, IG 70003, IG
70012, (C. bijugum), IG 69948 (C. pinnatifidum), IG 69979 (C. cuneatum), IG
70032, IG 70033, IG 70038, and IG 72931 (C. judaicum) showed lower leaf feeding,
larval weight and poor host suitability index as compared to the cultivated
chickpeas. Based on percentage weight gain by the larvae, accessions IG 70003, IG
70022, IG 70016, IG 70013, IG 70012, IG 70010, IG 70001, IG 70018, and IG
70002 (C. bijugum), IG 69979 (C. cuneatum) and IG 72953 (C. reticulatum) showed
high levels of resistance to H. armigera. There was no pupation and adult
emergence when the larvae were reared on accessions of C. pinnatifidum (IG 69948
and IG 70039), and C. judaicum (IG 69980, IG 70032, IG 70033 and IG 72931).
Wild relatives of chickpea C. reticulatum genotypes, IG 69960, IG 72934,
and IG 72936 showed significantly lower leaf feeding than the cultivated genotypes.
Larval weights were lower or comparable with that on C. judaicum (IG 70032) and
C. bijugum (IG 70019) in C. reticulatum accessions IG 72933, IG 72934, IG 72936,
and IG 72953. Prolonged larval and total developmental periods were observed on
C. reticultatum accessions compared with those on ICCC 37 (Sharma et al., 2005b).
Sharma et al. (2005c) standardized cage technique to screen chickpeas for
resistance to H. armigera. Leaf feeding by the larvae was lower on ICC 506 than on
ICCC 37 when the seedlings were infested with 20 neonates per five plants at
seedling emergence or 10 neonates per three plants at the flowering stage. Maximum
pod damage was observed when the plants were infested with six larvae of third
instar per three plants in the greenhouse, and with eight larvae per plant under field
conditions. Larval weights were lower on ICC 506 than on ICCC 37 across growth
stages and infestation levels. At the podding stage, percentage of reduction in grain
yield was greater on ICCC 37 and Annigeri than on ICCV 2 and ICC 506.
Sharma et al. (2006) observed antibiosis effect of wild relatives of chickpea
against H. armigera in terms of reduction in leaf feeding, larval survival and larval
weights when the larvae were fed on the leaves of C. microphyllum accessions ICC
17146, ICC 17236, ICC 17240 and ICC 17248. Under natural infestation, accessions
belonging to C. microphyllum, C. canariense and C. macracanthum suffered a
damage rating of less than 2.0 compared to 4.0 in C. judaicum accession and 8.5 to
9.0 in the cultivated chickpeas.
16
Antibiosis effect in terms of low larval weights was observed in H. armigera
reared on ICC 12476, ICC 12478 and ICC 506EB and weight gained by third instar
larvae was also low on genotypes ICC 12476, ICC 12477, ICC 12478, ICC 12479
and ICC 506EB at podding stage. Non-preference for oviposition and antibiosis
were also expressed in F1 hybrids based on ICC 12476, ICC 12477, ICC 12478, ICC
12479 and ICC 506EB indicating that ovipositional non-preference and antibiosis
were influenced by parent genotype (Narayanamma et al., 2007).
High levels of antibiosis were observed in terms of lower larval weights and
prolonged larval and pupal periods and delayed postembryonic development when
the larvae of H. armigera were reared on leaves, pods and artificial diet impregnated
with lyophilized leaf or pod powder of wild relatives of pigeonpea, C. acutifolius
(ICPW 1), C. cajanifolius (ICPW 29), C. sericeus (ICPW 160), P. scariosa (ICPW
207), C. scarabaeoides, R. aurea and C. albicans (Sujana et al., 2008).
Studies on survival and development of H. armigera on chickpea revealed
that four resistant genotypes resulted in lower larval survival, pupation, adult
emergence and fecundity when compared to susceptible check. A similar trend was
also observed for larval survival and development when using F1 hybrids based on
four resistant genotypes suggesting that antibiosis mechanism of resistance was
transferred to the progeny from the resistant parents (Narayanamma et al., 2008).
Devi (2008) studied the survival and development of H. armigera on
chickpea genotypes. The larval and pupal weights, pupation, adult emergence and
fecundity were significantly lower on ICC 506EB (45.49 mg, 235.20 mg, 34.00%,
63.75% and 533.20, respectively) as compared to C 235 and L 550. The larval
period was longer on ICC 506EB (21.85 days) compared to L 550 (18.93 days).
Reduced larval and pupal weights and prolonged larval and pupal periods
were observed as a result of antibiosis in H. armigera reared on intact leaves, pods
and artificial diet impregnated with lyophilized leaves or pods powders of pigeonpea
genotypes ICPL 332, ICPL 84060, ICP 7035, ICPL 88039 and T 21. Incorporation
of 10 g of lyophilized leaf or pod powder in 300 ml of artificial diet resulted in
maximum differences in survival and development of H. armigera larvae on the
resistant (ICPL 332) and susceptible (ICPL 87) genotypes (Kumari et al., 2010).
17
2.6 MORPHOLOGICAL AND BIOCHEMICAL CHARACTERS
ASSOCIATED WITH RESISTANCE TO H. armigera
Plant-insect interactions are dependent on nutritional levels of plant tissues
during different growth forms of the insect and chemical and mechanical defences of
the plant (Cates, 1980). Combination of information related to morphological and
biochemical mechanisms provides more reliable information for host plant resistance.
2.6.1 Morphological Characters Associated with Resistance
Kanchana et al. (2005) studied the effect of morphological and biochemical
parameters of selected chickpea varieties against H. armigera and indicated that
increased pod length, pod width and protein content had positive correlation with
pod damage.
Among gamma radiated genotypes of chickpea, minimum larval population
was observed on Hassan-2k (40 krad of gamma radiation dose) while maximum was
recorded on NIFA-95 (10 krad). Percent damage was highest in Hassan-2k (10 krad)
and lowest in Pb-91 (20 krad). Maximum yield was recorded on Hassan-2k (30
krad). Trichome density and length were negatively correlated with H. armigera
infestation (Shahzad et al., 2005).
Girija et al. (2008) reported least pod damage by H. armigera in chickpea
genotype ICCL 87317 than ICC 86102, ICCV 95992, ICC 96752 and ICC 12494.
Tolerant genotypes had higher number of trichomes and thicker pod husk and hence
exhibited significantly less damage.
Influence of pod morphological traits on pod borer resistance in chickpea
revealed that pod trichomes length and density, pod wall thickness, pod length,
breadth and area of respective genotypes showed a significant negative correlation
with pod borer damage, whereas number of pods per plant exhibited a positive
association (Hossain et al. 2008b).
Sharma et al. (2009) reported that oviposition non-preference was an
important component of resistance to H. armigera in wild relatives of pigeonpea
where glandular trichomes (type A) on the calyxes and pods were associated with
susceptibility to H. armigera, while the non-glandular trichomes (type C and D)
were associated with resistance.
18
Shabbir et al. (2014) observed that chickpea genotypes which had higher
trichome length and density and pod wall thickness were more resistant to pod borer,
H. armigera infestation.
2.6.2 Biochemical Characters Associated with Resistance
The nature of plant derived allelochemicals or secondary metabolites
involved in the different stages of insect-plant interactions, from habitat selection to
host acceptance is varied (Simmonds, 2001).
2.6.2.1 Leaf Organic Acids
The trichomes of chickpea have a basal cell, long vacuolate stalk cells and a
terminal cluster of dense secretory head cells (Schnepf, 1965 and Lazzaro and
Thomson, 1989). The continuous vacuolar tubular system in these trichomes
functions to rapidly deliver solute from the base of the trichome to the secretory
head cells. The trichomes secrete hydrochloric acid, oxalic acid, malic acid, and
calcium (Lauter and Munns, 1986 and Lazzaro and Thomson 1995). The secretions
from these trichomes appear to protect the plants from herbivory (Srivastava and
Srivastava, 1989).
Rembold et al. (1989) reported that the chickpea leaf exudates had malate
and oxalate as the main components and the varieties with the high amount of malic
acid were resistant to H. armigera and Liriomyza cicerina.
Srivastava and Srivastava (1989) reported that ICC 3137, K 850 and ICC
1403 were susceptible to H. armigera with more number of eggs and larvae than the
resistant chickpea genotypes. Low amount of acidity in the leaf extracts was
associated with susceptibility to H. armigera.
Patnaik and Senapati (1995) reported that egg and larval counts of pod borer,
H. armigera were negatively correlated with increasing concentration of acid
exudates of chickpea. Low densities of eggs (0.70 to 1.60/10 plants) and larvae (3.40
to 4.00/10 plants) were associated with high acidity (24.20 to 25.30 milli
equivalents) in the cultivars, PDE 2-1, PDE 2-3, PDE 3-2 and PDE 7-2, while PDE
5-3 and Annigeri-1, which had a low acid content (13.50 to 15.10 milli equivalents)
in their leaves harboured more eggs (≥2.70/10 plants) and larvae (≥5.90/10 plants).
19
Among leaf surface substances present in chickpea, oxalic acid was
responsible for the growth inhibition of H. armigera larvae, while malic acid had no
effect on growth rate (Yoshida et al., 1995). Malic acid stimulated oviposition at a
concentration of 0.6 μmol/cm2, but inhibited it at 3.4 μmol/cm2, whereas oxalic acid
showed neither stimulation nor inhibition of oviposition at 0.25 to 1.7 μmol/cm2.
Malic acid on the leaves stimulated oviposition during the vegetative and flowering
stages, while during podding stage, there was no significant correlation between
either egg density or pod damage and malic acid levels (Yoshida et al., 1997).
Peter and Shanower (1998) reported that chickpea trichome exudates contain
acidic chemicals such as malic acid, oxalic acid and succinic acid. Oxalic acid has
an antibiosis effect on the larvae of pod borer, H. armigera, which results in reduced
pod damage. A dense mat of non-glandular trichomes in these species prevents the
small larvae from feeding on the plant.
Citric and oxalic acid concentrations in chickpea were lower in resistant
genotypes than the susceptible genotypes while, malic acid was higher in the
resistant genotypes than the susceptible genotypes suggested that high level of malic
acid may be selection criteria for Ascochyta blight resistance (Cagirgan et al., 2011).
Narayanamma et al. (2013) reported that the amounts of malic acid were
negatively correlated with leaf feeding by H. armigera larvae at flowering and
maturity and with pod damage. Oxalic acid showed a negative association with leaf
damage, whereas the amounts of acetic acid were negatively correlated with larval
weights and damage rating at the flowering and maturity stages. Citric acid levels
were negatively associated with damage rating at the flowering stage.
Oxalic and malic acids present in chickpea leaves did not influence the
biological activity of Bt toxin Cry1Ac towards H. armigera larvae. However, very
high concentrations of the organic acids reduced the amounts of Cry1Ac in the midgut
of H. armigera larvae. Organic acids reduced the amount of protein in the brush
boarder membrane vesicles (BBMV) of insects reared on diets with Cry1Ac, possibly
because of reduced size of the larvae (Devi et al. 2013). The antifeedant effects of the
acid exudates resulted in reduced leaf feeding, larval survival and weights and hence
might reduce the efficacy of Bt sprays or Bt-transgenic chickpeas, although the
combined effect of plant resistance based on organic acids and Bt had a greater effect
on survival and development of H. armigera than Bt alone (Devi et al. 2014).
20
2.6.2.2 Flavonoids
The behavioural response of flavonoid, rutin (quercetin-3-O-rhamnosyl
glucoside) varied depending on the concentration tested and the age of insect. Rutin
at concentrations greater than 10-3 M deterred final stadium larvae of H. armigera
and H. zea from feeding, but at concentrations less than 10-4 M it stimulated feeding
in final stadium larvae (Blaney and Simmonds, 1983).
Morimoto et al. (2000) reported that four flavonoids, 5-hydroxy-3,6,7,8,4’-
pentamethoxyflavone, 5-hydroxy-3,6,7,8-tetramethoxyflavone, 5,6-dihydroxy-3,7-
dimethoxyflavone, and 4,4’,6’-trihydroxy-2’-methoxychalcone, that were isolated
from cudweed, Gnaphalium affine had strong antifeedant activity against the S. litura.
Isoflavanoids (judaicin 7-O-glucoside, 2-methoxy judaicin, judaicin and
maackiain) present in wild relatives of chickpea had shown antifeedant activity
towards the larvae of H. armigera when incorporated into a diet. Isoflavonoids
decreased the weight gained by early stadia larvae of H. armigera more than they
did in later stadia. Maackiain and judaicin were found to be most potent (Simmonds
and Stevenson, 2001).
Green et al. (2003) revealed that methanol extracts contained four phenolic
compounds, isoquercitrin, quercetin, quercetin-3-methyl ether and stilbene (3-
hydroxy-4-prenyl-5-methoxystilbene-2-carboxylic acid) from the pod surface of
pigeonpea stimulated feeding of fifth instar larvae of H. armigera.
Beninger et al. (2004) identified a flavanone (3, 4, 5-trihydroxyflavanone 7-
O-glucuronide) and two phenolic acids (chlorogenic acid and 3,5-O-dicaffeoylquinic
acid) from Chrysanthemum morifolium and reported that these phenolic substances
reduced larval growth of the cabbage looper and gypsy moth when incorporated into
artificial diet at 10 to 1000 ppm.
Ateyyat et al. (2012) revealed aphicide activity of three flavonoids (quercetin
dehydrate, rutin hydrate and naringin) on apple woolly aphid in cut shoot bioassay
and reported that mortality in nymphs was more than adults and further increased
with an increasing concentration of 100, 1000 and 10,000 ppm. However, rutin
hydrate was more toxic than quercetin dehydrate and naringin.
Flavonoids such as chlorogenic acid, caffeic acid and protocatechuic acid
were more toxic to H. armigera larvae. Larval growth and development were
21
significantly reduced in H. armigera larvae fed on a diet with groundnut leaf lectin
(GLL) and ConA. The digestive enzyme activities of the larvae were significantly
reduced in flavonoid treated diets (War et al., 2013).
Induction of flavonoids in response to insect feeding observed through HPLC
fingerprinting in H. armigera and Aphis craccivora infested and uninfested groundnut
genotypes and reported that more number of compounds like chlorogenic acid,
syringic acid, quercetin, caffeic acid, vanillic acid and ferulic acid were observed in
insect infested plants, especially in the resistant genotypes (War et al., 2016).
2.6.2.3 Protease Inhibitors
Plant protease inhibitors (PIs) are a group of the reserve storage proteins
present in seeds, which can also be a part of the constitutive and inducible array of
defense strategies against feeding by insect pests (Blanco-Labra et al., 1995).
Chickpea seeds are known to contain inhibitors of proteases and their properties
have been studied in detail by Belew and Eaker (1976), Smirnoff et al. (1979) and
Saini et al. (1992). Varietal differences regarding trypsin and chymotrypsin
inhibitors in chickpea have been reported by Sastry and Murray (1987).
Giri et al. (1998) reported that there was a progressive increase in PI activity
throughout seed development. The amount of PI activity increased several fold when
seeds were injured by H. armigera feeding. Seven different trypsin inhibitory (TI)
bands were present in seeds at the time of maximum H. armigera attack. Chickpea PIs
showed differential inhibitory activity against H. armigera gut proteinases (HGPs),
trypsin and chymotrypsin. In-vitro and in-vivo proteolysis of TIs indicated that the
chickpea PIs were prone to proteolytic digestion by H. armigera gut proteinases either
by production of inhibitor-insensitive proteinases or by secretion of proteinases.
The wild species exhibited diversity in TI isoforms with respect to both
number and activity as compared to cultivated chickpea but none of the species
offered complete protection against pod borer by inhibiting gut proteinases. Highest
inhibition was exhibited by C. bijugum (36%) followed by C. echinospermum and
C. arietinum (cv. Vijay) (33%). Among the seed organs, TI and HGPI activities
were highly localized in the embryoaxis as compared to the cotyledons in immature
and mature seeds (Patankar et al., 1999).
22
Larvae of H. armigera reared on a diet containing non-host PIs showed
growth retardation, reduction in total and trypsin like proteinase activity and the
production of inhibitor-insensitive proteinases, further, trypsin inhibitor activity
bands were detected in all of the host and non-host plants, but HGP inhibitor activity
bands were present only in non-host plants except cotton in the host plant group
(Harsulkar et al., 1999).
Patankar et al. (2001) reported that larvae of H. armigera reared on chickpea
indicated >2.5-3 fold protease activity compared with those fed on the other host
plants. Higher protease activity in the larvae fed on chickpea was probably because
of higher protein amount in the food or hyper production of proteases in response to
the ingested protease inhibitors.
Tomato flowers accumulated about 300 and 1000 times higher levels of TI
while 700 and 400 times higher levels of HGPI as compared to leaves and fruits,
respectively. Tomato PIs inhibited about 50 to 80% HGP activity of H. armigera
larvae and were found to be highly stable to insect proteinases. H. armigera larvae
fed on artificial diet containing tomato PIs revealed adverse effect on larval growth,
pupae development, adult formation and fecundity (Damle et al., 2005).
Of the two proteases from midgut of H. armigera, HGP-1 was not only
insensitive to a PI from chickpea but was also able to degrade it, and it was capable
of hydrolyzing a synthetic substrate of elastase. Whereas, HGP-2 activity was
inhibited over 50% by same PI from chickpea and it was inhibited by a synthetic
trypsin inhibitor also (Telang et al., 2005).
A progressive decline in larval weight, growth, survival and adult emergence
as well as extension of larval period was observed in H. armigera fed on diet
supplemented with increasing concentrations of chickpea TIs (Kansal et al., 2008).
Hivrale et al. (2013) reported that H. armigera larvae fed on diet containing
partially purified PIs from Albizia lebbeck seeds showed reduced larval growth and
survival. Higher activities of HGP isoforms observed in the midgut of control larvae
and were inhibited in the midgut of larvae fed on diet with PI and also some HGP
isoforms were induced in the larvae fed on diet with PI. Aminopeptidase activities
were significantly increased in the midgut of larvae fed on diet PI as compensatory
effect of inhibitory proteinases.
23
Lomate and Hivrale (2013) observed significant reduction in the growth and
survival of H. armigera larvae fed on diet incorporated with the combination
Cry1Ac and protease inhibitor, phenylmethylsulfonyl fluoride (PMSF) compared to
Cry1Ac and PMSF alone. Serine proteinase activities were significantly declined in
the larvae reared on diet with PMSF.
Jamal et al. (2015) observed that purified protease inhibitor from the seeds of
Butea monosperma (BmPI) exhibited inhibitory activity of trypsin and total gut
proteolytic enzymes of H. armigera and bovine trypsin. BmPI supplemented
artificial diet caused dose dependent mortality and reduction in growth and weight
where fertility and fecundity of H. armigera declined and larval and pupal period
extended.
2.6.2.4 Lectins
Lectins are carbohydrate binding proteins (or glycoproteins) of nonimmune
nature and bind reversibly to specific mono or oligosaccharides (Goldstein et al.,
1980 and Van Damme et al., 1998). They have been reported to affect survival and
development of insect pests (Ferry et al., 2004). They bind to the glycan receptors
present on the surface lining of the insect gut (Pusztai and Bardocz, 1996) and
interfere with the formation and integrity of the peritrophic membrane of the midgut
(Harper et al., 1998). The harmful effects of lectins on insects resulted in reduced
larval weight and size, increased mortality, feeding inhibition, delayed
developmental time, pupation and adult emergence and reduced fecundity
(Vasconcelos and Oliveira, 2004).
Lectins from wheat, castor and camel’s foot tree fed to neonate of European
corn borer, Ostrinia nubilalis larvae incorporated into the artificial diet recorded
50% weight loss in surviving larvae, whereas lectins from castor, pokeweed
(Phytolacca americana) and green marine algae (Codium fragile) inhibited larval
growth by more than 40% when fed to neonates of Southern corn rootworm,
Diabrotica undecimpunctata howardi (Czapla and Lang, 1990).
Murdock et al. (1990) observed dose dependent response of lectins on
cowpea weevil, Callosobruchus maculatus through artificial seed method and
reported that for every 1% increase in dose of peanut agglutinin lectin there was a
0.49 day delay in developmental time whereas, for every 1% increase in dose of
24
wheat germ agglutinin (WGA) there was a 1.47 day delay in developmental time
and also for every 0.1% increase WGA there was 2.79% increase in mortality.
Mannose specific lectin, concavalin A (ConA) from jackbean, recorded
decreased larval survival, weight and retarded development when fed to tomato
moth (Lacanobia oleracea) in artificial diet and transgenic potato but had only a
small effect on larval weight, whereas in peach-potato aphids (Myzus persicae),
ConA reduced aphid size, retarded development and reduced fecundity, but had little
effect on survival (Gatehouse et al., 1999).
Feeding bioassays using artificial diet revealed that Listera ovata agglutinin
(LOA) and Galanthus nivalis agglutinin (GNA) had detrimental effects to larval
survival, weight, feeding inhibition, pupation, adult emergence and fecundity against
Maruca vitrata (Machuka et al., 1999).
Larvae of H. armigera reared on diet with lectins from chickpea, garlic,
fieldbean and pigeonpea recorded reduced larval and pupal weight, pupal period,
pupation and adult emergence (Arora et al., 2005). Larval survival and fecundity of
H. armigera were adversely affected as a result of feeding with lectin intoxicated
diet with soybean agglutinin, jackfruit lectin, wheat germ agglutinin and pea lectin
(Gupta et al., 2005). Larval survival, pupal weight, pupation and adult emergence
percentage of H. armigera was lower in artificial diet impregnated with snowdrop
and chickpea lectins and soybean trypsin inhibitor (Shukla et al., 2005).
Macedo et al. (2007) reported that Bauhinia monandra leaf lectin (BmoLL)
recorded 50% mortality in Mexican bean weevil (Zabrotes subfasciatus) and cowpea
weevil (C. maculatus) when incorporated into artificial diet, whereas, in case of
Mediterranean flour moth (Anagasta kuehniella) larvae it did not decrease the
survival, but decreased 40% in weight.
Gaidamashvili et al. (2009) reported that lectin from Dioscorea batatas
(DB1) strongly bound to gut epithelia, brush border and membrane structures of
H. armigera larvae although DB1 had no or marginal inhibitory effects on gut
proteolytic and glycolic enzymes (Ohizumi et al., 2009). The insecticidal properties
of the DB1 may be determined by subsequent toxic effects to the midgut of larvae.
Mannose specific lectin from Hippeastrum hybrid (Amaryllis) (HHA) bulbs
affected larval growth resulted in development retardation and larval weight decrease
25
in Spodoptera littoralis. The toxic effect was due to HHA interaction with the brush
border of midgut cells and that further interferes with normal nutrient absorption in
the midgut of S. littoralis, thereby affecting larval growth (Caccia et al., 2012).
GNA (Galanthus nivalis agglutinin) retarded larval and pupal weight, larval
and pupal developmental time, adult longevity, and adult emergence of Spodoptera
exigua in dose dependent manner when incorporated in artificial diet (Naghdi and
Bandani, 2012).
2.6.2.5 Proteins, Phenols, Tannins and Sugars
Chhabra et al. (1990) found that crude fibre content, non-reducing sugars and
starch were associated with resistance to H. armigera in cultivar GL 645, while a
high percentage of cellulose, hemi cellulose and lignin in the pod wall were thought
to inhibit pod damage.
Grayer et al. (1992) reported that a strong negative relationship between the
concentration of procyanidin (condensed tannin) in the leaf bud petioles of
groundnut genotypes and fecundity of the aphid A. craccivora. The aphids fed on
genotype with highest amount of procyanidin produced significantly fewer offspring
than aphids reared on genotypes with low procyanidin levels.
The chickpea genotypes, desi 3108, GL 1002 and LCG 3580 were least
susceptible to the H. armigera. The mechanism of resistance revealed that chemical
components such as malic acid, sugar, crude fibre, cellulose and lignin in the plant
parts were responsible for the level of incidence of the pest (Chhabra et al., 1993).
The chickpea cultivar 96052 was the most resistant (8.10% mean damage) to
H. armigera with relatively higher amounts of lignin and reducing sugars, non-
reducing sugars, cellulose, hemi cellulose, ash and silica (Afzal et al., 2001).
Rupalighodeswar et al. (2003) reported that grain and pod shell tissues of
chickpea cultivars tolerant to the H. armigera found to contain significantly higher
total phenolics, chlorogenic acid, silica, malic acid and higher activities of
polyphenol oxidase and peroxidase whereas, susceptible cultivars had higher crude
protein and sugars. High total phenolics, chlorogenic acid, silica, malic acid and
peroxidase activity were seemed to be desirable biochemical characters in enhancing
the tolerance of chickpea against pod borer infestation.
26
Expression of resistance to H. armigera was associated with low amounts of
sugars and high amounts of tannins and polyphenols in wild relatives of pigeonpea
(Sharma et al., 2009).
2.6.2.5 Methanol and Hexane Extracts of Leaf Surface Chemicals
Green et al. (2002) reported that solvent extraction of pod surfaces affected
the feeding preference of H. armigera in wild and cultivated pigeonpea as the larvae
preferred unextracted pods of C. cajan, the extracted pods of C. scarabaeoides (first
and second instar) or the unextracted pods of C. scarabaeoides (fourth and fifth
instar). Glass fibre disc bioassays showed that the methanol, hexane and water
extracts from the pod surface of C. cajan stimulated the feeding of fifth instars.
Acetone extracts from pods of C. cajan and C. platycarpus had a significant
feeding stimulant effect on H. armigera larvae whereas extracts from pods of C.
scarabaeoides had no effect. Water extract of C. scarabaeoides pods had a
significant antifeedant effect, whereas extracts from C. cajan and C. platycarpus
pods had no effect (Shanower et al., 1997).
Feeding preference of H. armigera larvae revealed that methanol washed
pods of wild relatives of pigeonpea were less preferred for feeding than the
unwashed pods, but the hexane washed pods were preferred more than the unwashed
pods which suggested that methanol extracted the phagostimulants from the pod
surface, while hexane removed the antifeedants (Sujana et al., 2012).
2.7 Genetic Diversity in Cultigen and Wild Relatives of Chickpea
Chickpea is a diploid with 2n=2x=16 having a genome size of approximately
740 Mbp. It is a highly self-pollinated crop with an outcrossing rate of less than one
per cent. The knowledge of genetic relationships between the cultivated chickpea
and its wild relatives is a prerequisite to track the evolution of cultivated species and
also to determine the close relatives which can be exploited for introgression of
useful traits into the cultigen in plant breeding programmes. Systematic collection
and evaluation of wild species for useful traits has revealed presence of a diverse
gene pool for tolerance to the biotic and abiotic stresses (Singh et al., 2008).
DNA markers have been used widely for fingerprinting of plant genomes,
genetic diversity analysis and to understand the evolutionary relationships among
crop species. Among the different classes of molecular markers, SSRs have been
27
proven useful for a variety of applications in plant genetics and breeding because of
their reproducibility, multi allelic nature, codominant inheritance, relative abundance
and genome wide coverage (Gupta and Varshney, 2000). In case of chickpea,
several hundred SSR markers have been developed (Winter et al., 1999, 2000.,
Choudhary et al., 2006, 2009., Sethy et al., 2006a and Nayak et al., 2010).
Huttel et al. (1999) evaluated the ability of SSRs in detecting intraspecific
variation in chickpea. Sixteen SSR loci detected 2 to 4 alleles at intraspecific level
out of 22 loci tested. Two SSR loci, CaSTMS10 and CaSTMS15 detected 25 and 16
alleles among 63 accessions of C. arietinum from different geographic locations,
reflecting gene diversity values of 0.937 and 0.922, respectively.
The sequences flanking microsatellite sites were generally conserved within
species and also often in closely related species (Gupta and Varshney, 2000). The
flanking sequences of microsatellite loci of cultivated chickpea were found to be
conserved in related annual species also. The highest degree of conservation was
observed in C. reticulatum (92%) and C. echinospermum (83%), whereas lowest
was observed in C. cuneatum (50%) (Choumane et al., 2000).
Sudupak et al. (2002) used RAPD markers to investigate genetic
relationships among the Cicer species. The dendrogram contained two main clusters,
one of which comprised accessions of the four perennial species (C. montbretii, C.
isauricum, C. anatolicum and C. incisum) together with the accessions of the three
annual species (C. pinnatifidum, C. judaicum and C. bijugum), and the other cluster
included the remaining three annual species (C. echinospermum, C. reticulatum and
C. arietinum). It was observed that among perennial species C. incisum was the most
similar to annuals, and C. reticulatum was the closest annual species of chickpea.
AFLP based grouping of Cicer species revealed two clusters, one of which
included three perennial species, C. montbretii, C. isauricum and C. anatolicum,
while the other cluster consisted of two sub clusters of which one included one
perennial, C. incisum, along with three annuals from second crossability group
(C. bijugum, C. pinnatifidum and C. judaicum) and the other one comprised three
annuals from the first crossability group (C. arietinum, C. echinospermum and
C. reticulatum) (Sudupak et al., 2004).
28
Udupa et al. (2004) studied dynamics of microsatellite evolution in chickpea
by using di and tri nucleotide repeat (TA)n and (TAA)n, respectively, and based on
polymorphism they observed that the two loci did not evolved in complete
independence. Below a threshold level they evolved independently and above that
threshold level if one allele increased in size the other closely linked locus decreased
and vice versa, without change in the overall ratio.
Shan et al. (2005) characterized geographic patterns of genetic variation in wild
annual Cicer germplasm using AFLP markers and revealed that maximum genetic
diversity of C. reticulatum, C. echinospermum, C. bijugum and C. pinnatifidum was
found in South-Eastern Turkey, while Palestine was the centre of maximum genetic
variation for C. judaicum.
Sethy et al. (2006a) reported that out of the 74 functional microsatellite
markers developed, 25 polymorphic markers were used to analyse the intraspecific
genetic diversity within 36 geographically diverse chickpea accessions. The 25
primer pairs amplified at single loci produced a minimum of two and maximum of
11 alleles. A total of 159 alleles were detected with an average of 6.4 alleles per
locus. Cloning and sequencing of size variant alleles at two microsatellite loci
revealed that the variable numbers of AG repeats in different alleles were the major
source of polymorphism.
Sethy et al. (2006b) cloned microsatellite sequences from C. reticulatum and
developed 11 SSR markers to analyse 29 accessions representing all nine annual
Cicer species. Efficient marker transferability (97%) of the C. reticulatum was
observed as compared to microsatellite markers developed from cultivated species.
Based on cluster analysis all the accessions (except two C. judaicum accessions)
distinguished from one another and revealed intra and interspecific variability. An
annual Cicer phylogeny was depicted which established higher similarity between
C. arietinum and C. reticulatum. In the study, placement of C. pinnatifidum in the
second crossability group and its closeness to C. bijugum was supported. Two
species C. yamashitae and C. chorassanicum were grouped distinctly and seemed to
be genetically diverse from members of first crossability group.
Choudhary et al. (2009) identified 246 SSR motifs from which 183 primer
pairs were designed and 60 validated as functional markers. Genetic diversity
analysis across 30 chickpea accessions revealed ten markers to be polymorphic
29
producing a total of 29 alleles and an observed heterozygosity average of 0.16
thereby exhibiting low levels of intraspecific polymorphism. However, the markers
exhibited high cross species transferability ranging from 68.3 to 96.6% across the
six annual Cicer species and from 29.4 to 61.7% across the seven legume genera.
Genetic variation among species of Cicer using RAPD markers revealed that
dendrogram included three clusters. Cluster I included C. arietinum, C. reticulatum
and C. echinospermum. Within this group, C. reticulatum accessions were clustered
closest to the C. arietinum and C. yamashitae. The second cluster was separated
from the other clusters. Cluster III included C. judaicum, C. pinnatifidum and
C. cuneatum (Talebi et al., 2009).
The 15 microsatellite markers used to characterize chickpea cultivars showed
a high level of polymorphism, a total of 154 different alleles were detected, with a
mean of 10.3 alleles per locus. The polymorphic information content (PIC) value
ranged from 0.455 to 0.897. All the markers, with the exception of TA130, TA135
and TA144 were considered to be informative (PIC>0.7), indicating their potential
usefulness for cultivar identification. A subset of markers (TA186, TA200, TA106,
TA113, TA117 and TA30) was sufficient to identify all the cultivars studied (Castro
et al., 2011).
Naghavi et al. (2012) estimated genetic diversity of chickpea germplasm
from Iran using 16 microsatellite loci. The number of alleles per microsatellite locus
ranged from 8 to 29, with an average of 19.31 per locus. A high level of genetic
diversity in the Northern area (He = 0.76), even with a limited number of available
landraces compared with the other three regions, might confirm the Northern Persia
as part of the chickpea centre of origin. Cluster analyses based on molecular data
showed that the Northern area was separated clearly from the other three regions.
The genetic diversity of 23 chickpea accessions was characterized using nine
microsatellite markers which generated a total of 122 alleles. The number of alleles
(Na) per locus varied from 9 to 20. The observed heterozygosity (Ho) ranged
between 0.05 and 0.43 (average 0.13) whereas both the expected heterozygosity
(He) and PIC ranged from 0.71 to 0.90 (average 0.83). Total genetic variation found
within accessions was 62% while the remaining 38% was found among accessions
(Torutaeva et al., 2014).
30
The genetic diversity estimates of chickpea using STMS markers revealed
that 31 STMS primers generated a total of 153 loci (an average of 4.94 loci per
primer) out of which 129 loci were found to be polymorphic and 24 loci were
monomorphic. The value of PIC varied from 0.128 to 0.783. Percentage of
polymorphic loci was 50.98, 58.82 and 96.73 for susceptible, resistant and
miscellaneous genotypes, respectively. The overall Nei’s gene diversity (0.238) and
Shannon’s information index (0.372) indicated high degree of genetic polymorphism
among the genotypes (Aggarwal et al., 2015a).
Aggarwal et al. (2015b) assessed genetic diversity of 125 cultivars of
chickpea and revealed that out of 40 ISSR primers, 26 primers generated 213
polymorphic loci. On average, nine loci per marker were found. The average PIC
was 0.72, ranging from 0.26 to 0.91. Genetic diversity analysis in terms of
Shannon’s index and Nei’s gene diversity revealed higher values for miscellaneous
cultivars compare to resistant and susceptible cultivars, indicating more variability
among these cultivars.
31
III
Chapter III
MATERIAL AND METHODS
The present investigations on the “Biochemical and molecular mechanisms
of resistance to Helicoverpa armigera (Hubner) in wild relatives of chickpea” were
conducted during 2014-16 post-rainy seasons at the International Crops Research
Institute for the Semi-Arid Tropics (ICRISAT), Patancheru, Telangana state
(latitude 17.53o N, longitude 78.27o E and altitude of 545 m). Procedures followed
and materials used in these studies are presented hereunder.
3.1 EXPERIMENTAL MATERIAL
3.1.1 Plant Material
A total of 20 accessions (15 wild relatives and five varieties of cultivated
chickpea) used in the present study were presented in Table 3.1. Of the 15
accessions of wild relatives of chickpea, six accessions belong to Cicer bijugum, two
accessions belong each to C. judaicum, C. pinnatifidum and C. reticulatum, and one
accession belong each to C. chrossanicum, C. cuneatum and C. microphyllum. Five
cultivars belonging to cultivated chickpea (C. arietinum), JG 11 (Commercial
cultivar), KAK 2, ICC 3137 (Susceptible checks) and ICCL 86111, ICC 506EB
(Moderately resistant checks) were included to evaluate the relative resistance or
susceptibility to H. armigera. The crop was raised under field conditions, during
2014-15 and 2015-16 post rainy seasons at ICRISAT, Patancheru (Plate 1). Each
entry was sown in a two row plot, each with 2 m long and there were two
replications in a randomized complete block design. The seeds of the wild relatives
were scarified at one end with a scalpel to enhance water absorption and faster
germination then soaked in water for 24 h and treated with thiram (3 g per kg of
seed) before sowing. The seeds of cultivated chickpeas were sown without
scarification. The trial was planted with a spacing of 60 cm between the rows and 30
cm between plants in deep black Vertisols. Normal agronomic practices were
followed for raising the crop. The plants were irrigated occasionally and weeding
operations were carried out as and when needed. Under glasshouse conditions,
plants were raised in plastic pots (30 cm diameter, 30 cm deep) (Plate 2). The pots
were filled with a potting mixture of black soil, sand, and farmyard manure (2:1:1).
The seeds were scarified, treated with thiram (3 g per kg of seed), and placed in a
32
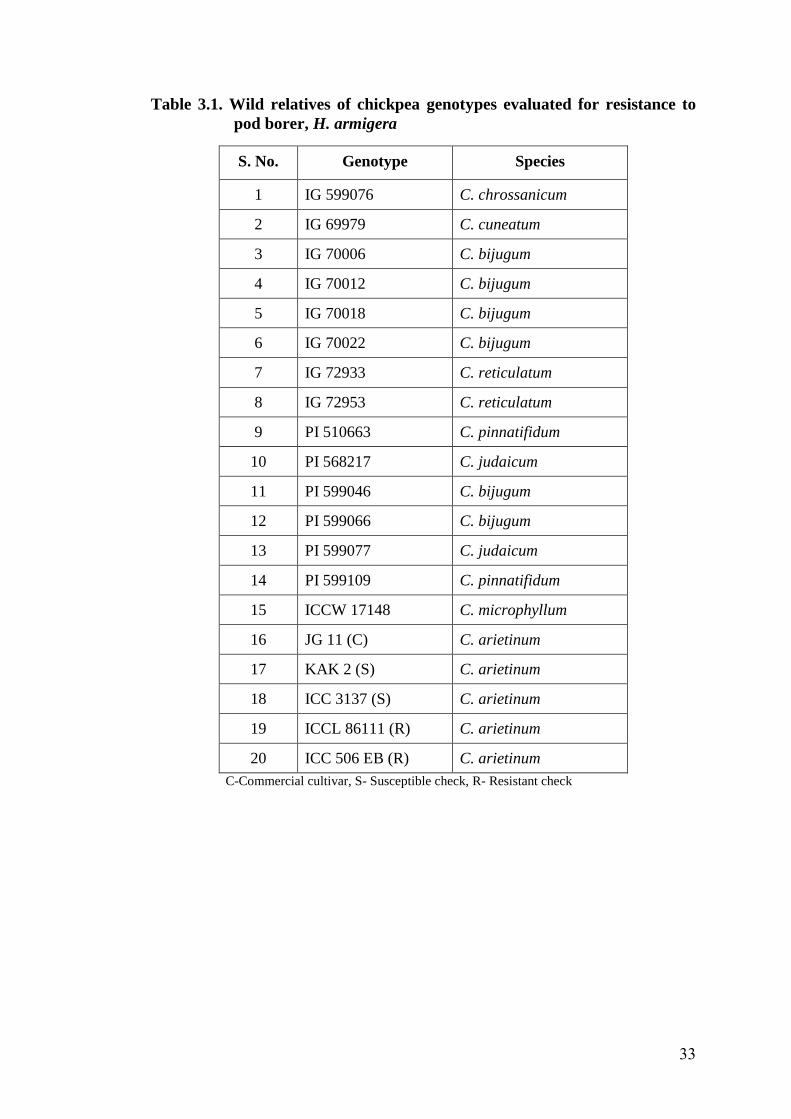
Table 3.1. Wild relatives of chickpea genotypes evaluated for resistance to
pod borer, H. armigera
S. No. Genotype Species
1 IG 599076 C. chrossanicum
2 IG 69979 C. cuneatum
3 IG 70006 C. bijugum
4 IG 70012 C. bijugum
5 IG 70018 C. bijugum
6 IG 70022 C. bijugum
7 IG 72933 C. reticulatum
8 IG 72953 C. reticulatum
9 PI 510663 C. pinnatifidum
10 PI 568217 C. judaicum
11 PI 599046 C. bijugum
12 PI 599066 C. bijugum
13 PI 599077 C. judaicum
14 PI 599109 C. pinnatifidum
15 ICCW 17148 C. microphyllum
16 JG 11 (C) C. arietinum
17 KAK 2 (S) C. arietinum
18 ICC 3137 (S) C. arietinum
19 ICCL 86111 (R) C. arietinum
20 ICC 506 EB (R) C. arietinum
C-Commercial cultivar, S- Susceptible check, R- Resistant check
33
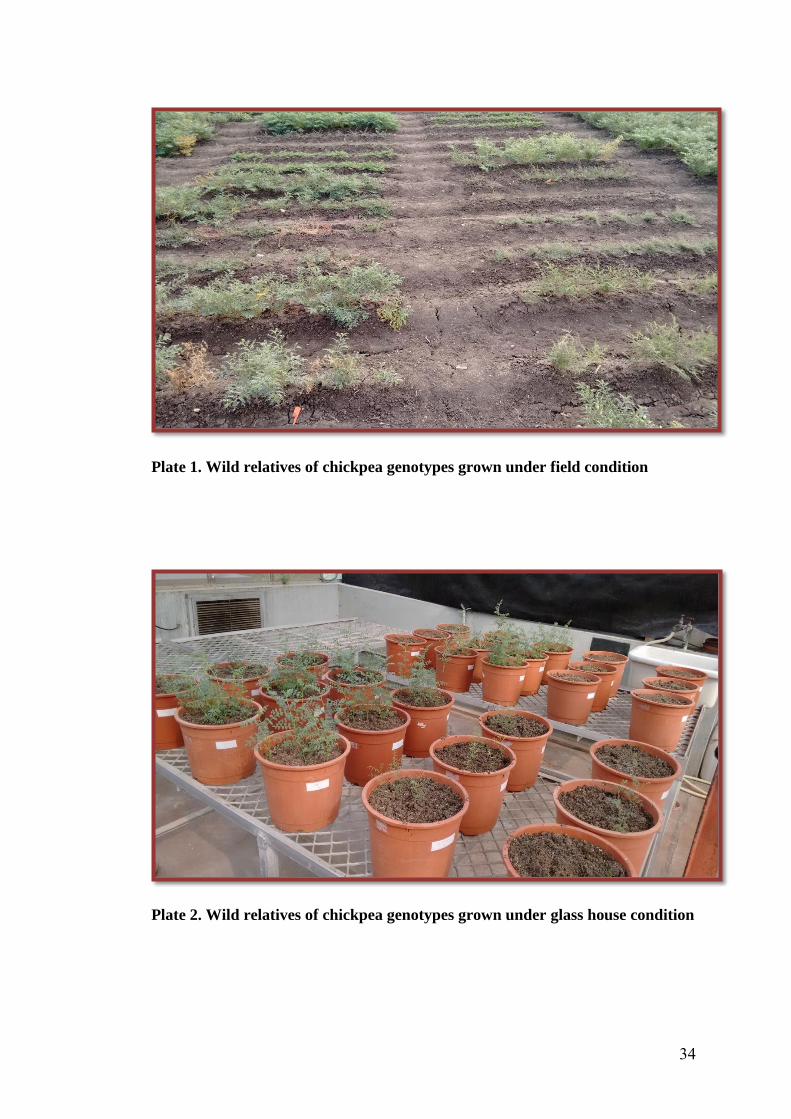
Plate 2. Wild relatives of chickpea genotypes grown under glass house condition
Plate 1. Wild relatives of chickpea genotypes grown under field condition
34
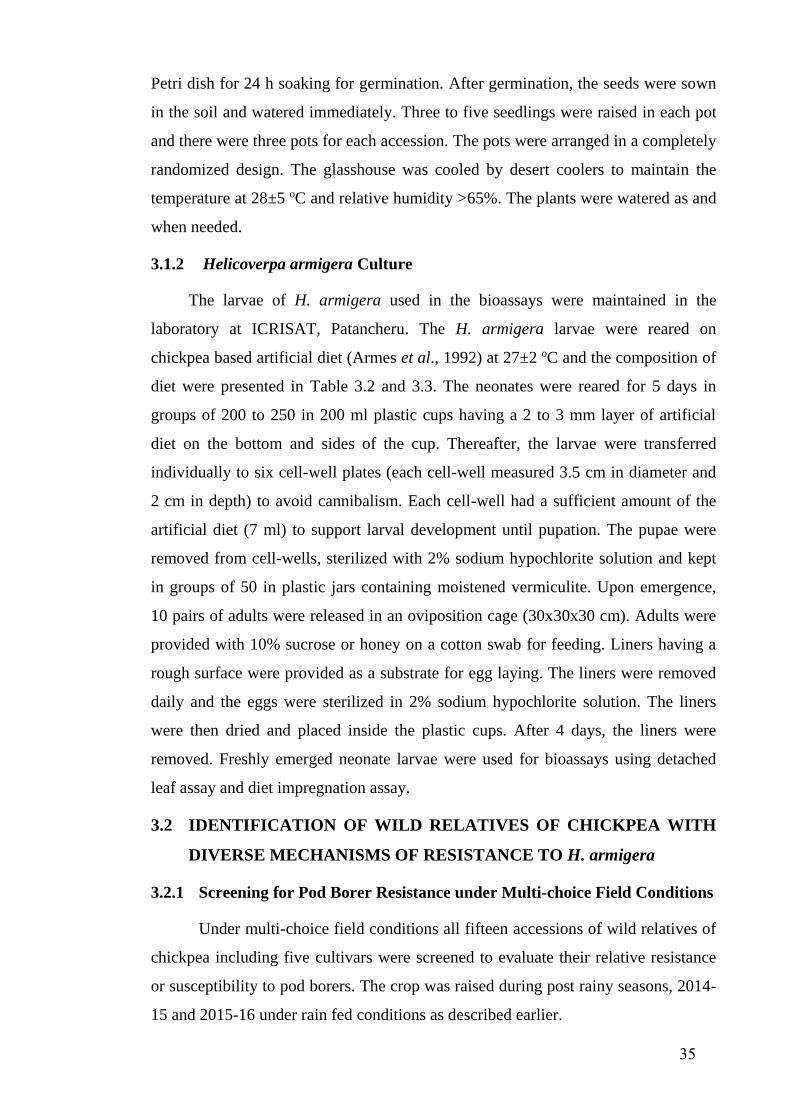
Petri dish for 24 h soaking for germination. After germination, the seeds were sown
in the soil and watered immediately. Three to five seedlings were raised in each pot
and there were three pots for each accession. The pots were arranged in a completely
randomized design. The glasshouse was cooled by desert coolers to maintain the
temperature at 28±5 oC and relative humidity >65%. The plants were watered as and
when needed.
3.1.2 Helicoverpa armigera Culture
The larvae of H. armigera used in the bioassays were maintained in the
laboratory at ICRISAT, Patancheru. The H. armigera larvae were reared on
chickpea based artificial diet (Armes et al., 1992) at 27±2 oC and the composition of
diet were presented in Table 3.2 and 3.3. The neonates were reared for 5 days in
groups of 200 to 250 in 200 ml plastic cups having a 2 to 3 mm layer of artificial
diet on the bottom and sides of the cup. Thereafter, the larvae were transferred
individually to six cell-well plates (each cell-well measured 3.5 cm in diameter and
2 cm in depth) to avoid cannibalism. Each cell-well had a sufficient amount of the
artificial diet (7 ml) to support larval development until pupation. The pupae were
removed from cell-wells, sterilized with 2% sodium hypochlorite solution and kept
in groups of 50 in plastic jars containing moistened vermiculite. Upon emergence,
10 pairs of adults were released in an oviposition cage (30x30x30 cm). Adults were
provided with 10% sucrose or honey on a cotton swab for feeding. Liners having a
rough surface were provided as a substrate for egg laying. The liners were removed
daily and the eggs were sterilized in 2% sodium hypochlorite solution. The liners
were then dried and placed inside the plastic cups. After 4 days, the liners were
removed. Freshly emerged neonate larvae were used for bioassays using detached
leaf assay and diet impregnation assay.
3.2 IDENTIFICATION OF WILD RELATIVES OF CHICKPEA WITH
DIVERSE MECHANISMS OF RESISTANCE TO H. armigera
3.2.1 Screening for Pod Borer Resistance under Multi-choice Field Conditions
Under multi-choice field conditions all fifteen accessions of wild relatives of
chickpea including five cultivars were screened to evaluate their relative resistance
or susceptibility to pod borers. The crop was raised during post rainy seasons, 2014-
15 and 2015-16 under rain fed conditions as described earlier.
35
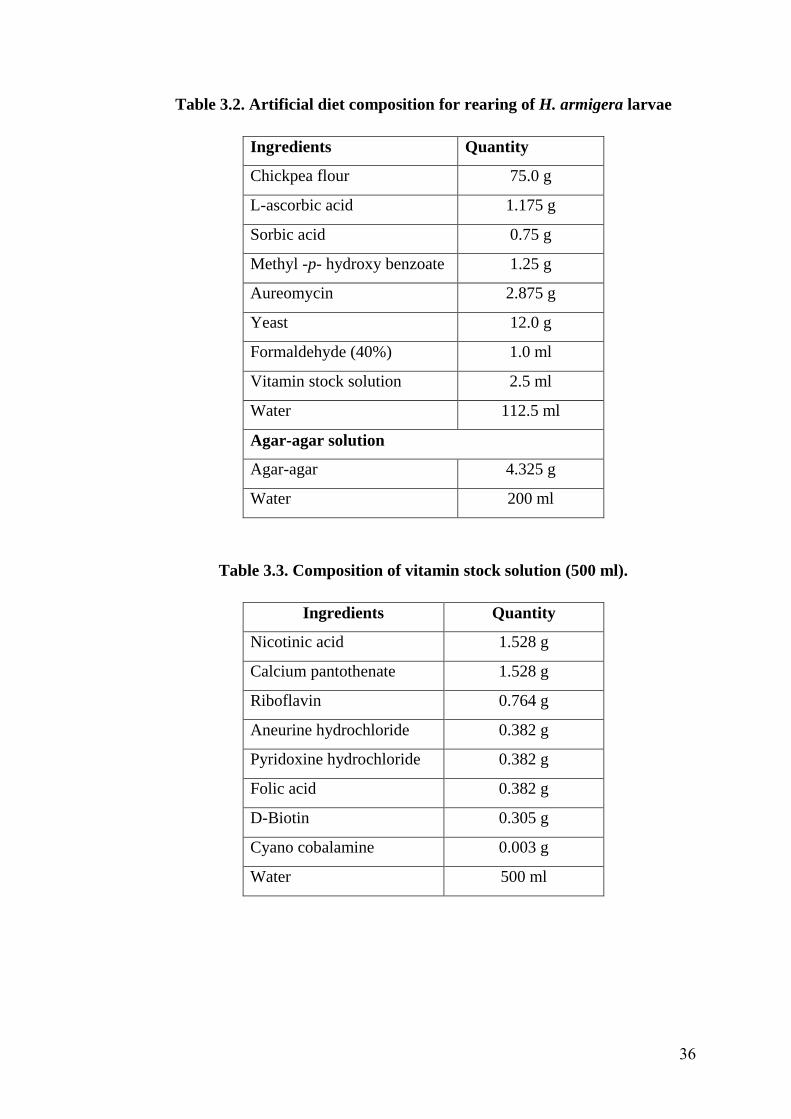
Table 3.2. Artificial diet composition for rearing of H. armigera larvae
Ingredients Quantity
Chickpea flour 75.0 g
L-ascorbic acid 1.175 g
Sorbic acid 0.75 g
Methyl -p- hydroxy benzoate 1.25 g
Aureomycin 2.875 g
Yeast 12.0 g
Formaldehyde (40%) 1.0 ml
Vitamin stock solution 2.5 ml
Water 112.5 ml
Agar-agar solution
Agar-agar 4.325 g
Water 200 ml
Table 3.3. Composition of vitamin stock solution (500 ml).
Ingredients Quantity
Nicotinic acid 1.528 g
Calcium pantothenate 1.528 g
Riboflavin 0.764 g
Aneurine hydrochloride 0.382 g
Pyridoxine hydrochloride 0.382 g
Folic acid 0.382 g
D-Biotin 0.305 g
Cyano cobalamine 0.003 g
Water 500 ml
36
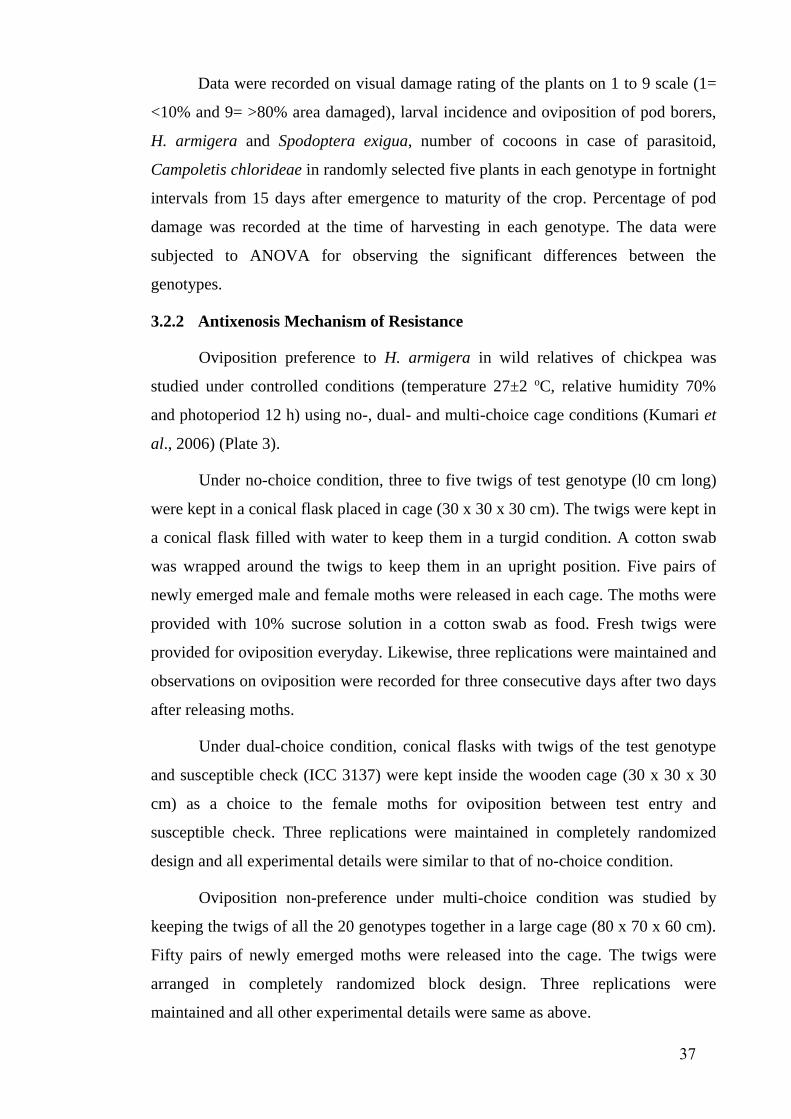
Data were recorded on visual damage rating of the plants on 1 to 9 scale (1=
<10% and 9= >80% area damaged), larval incidence and oviposition of pod borers,
H. armigera and Spodoptera exigua, number of cocoons in case of parasitoid,
Campoletis chlorideae in randomly selected five plants in each genotype in fortnight
intervals from 15 days after emergence to maturity of the crop. Percentage of pod
damage was recorded at the time of harvesting in each genotype. The data were
subjected to ANOVA for observing the significant differences between the
genotypes.
3.2.2 Antixenosis Mechanism of Resistance
Oviposition preference to H. armigera in wild relatives of chickpea was
studied under controlled conditions (temperature 27±2 oC, relative humidity 70%
and photoperiod 12 h) using no-, dual- and multi-choice cage conditions (Kumari et
al., 2006) (Plate 3).
Under no-choice condition, three to five twigs of test genotype (l0 cm long)
were kept in a conical flask placed in cage (30 x 30 x 30 cm). The twigs were kept in
a conical flask filled with water to keep them in a turgid condition. A cotton swab
was wrapped around the twigs to keep them in an upright position. Five pairs of
newly emerged male and female moths were released in each cage. The moths were
provided with 10% sucrose solution in a cotton swab as food. Fresh twigs were
provided for oviposition everyday. Likewise, three replications were maintained and
observations on oviposition were recorded for three consecutive days after two days
after releasing moths.
Under dual-choice condition, conical flasks with twigs of the test genotype
and susceptible check (ICC 3137) were kept inside the wooden cage (30 x 30 x 30
cm) as a choice to the female moths for oviposition between test entry and
susceptible check. Three replications were maintained in completely randomized
design and all experimental details were similar to that of no-choice condition.
Oviposition non-preference under multi-choice condition was studied by
keeping the twigs of all the 20 genotypes together in a large cage (80 x 70 x 60 cm).
Fifty pairs of newly emerged moths were released into the cage. The twigs were
arranged in completely randomized block design. Three replications were
maintained and all other experimental details were same as above.
37
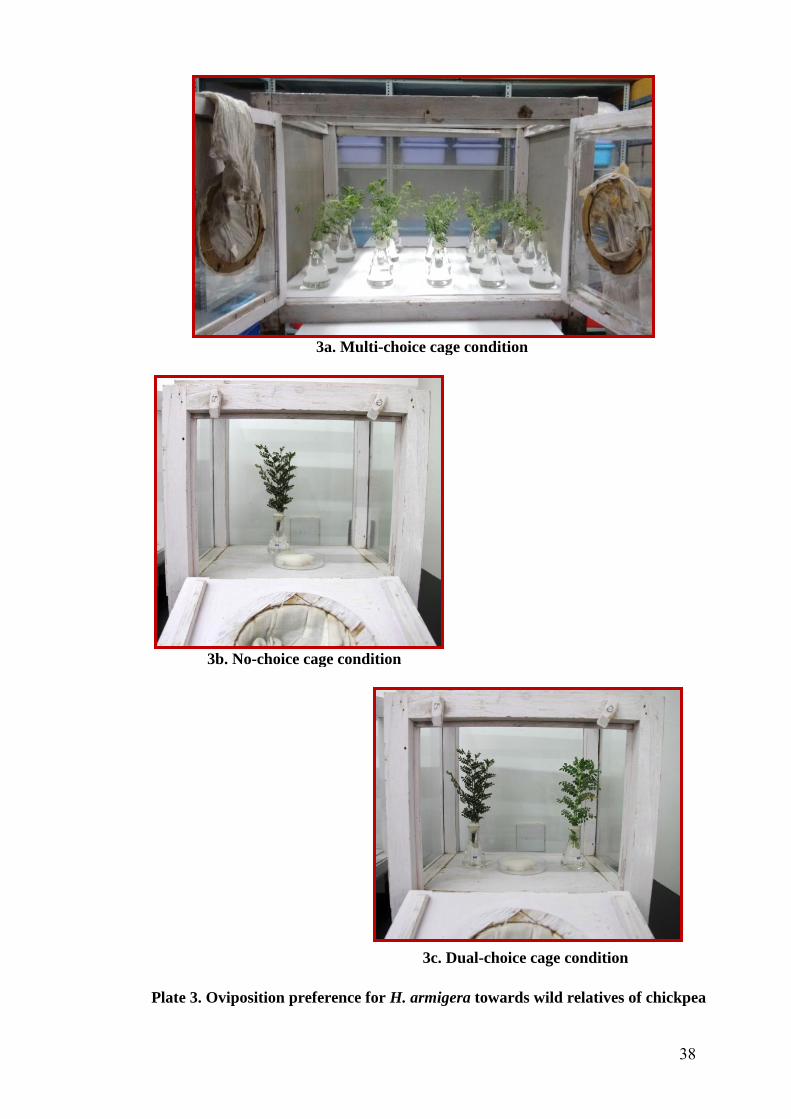
3a. Multi-choice cage condition
3b. No-choice cage condition
3c. Dual-choice cage condition
Plate 3. Oviposition preference for H. armigera towards wild relatives of chickpea
38
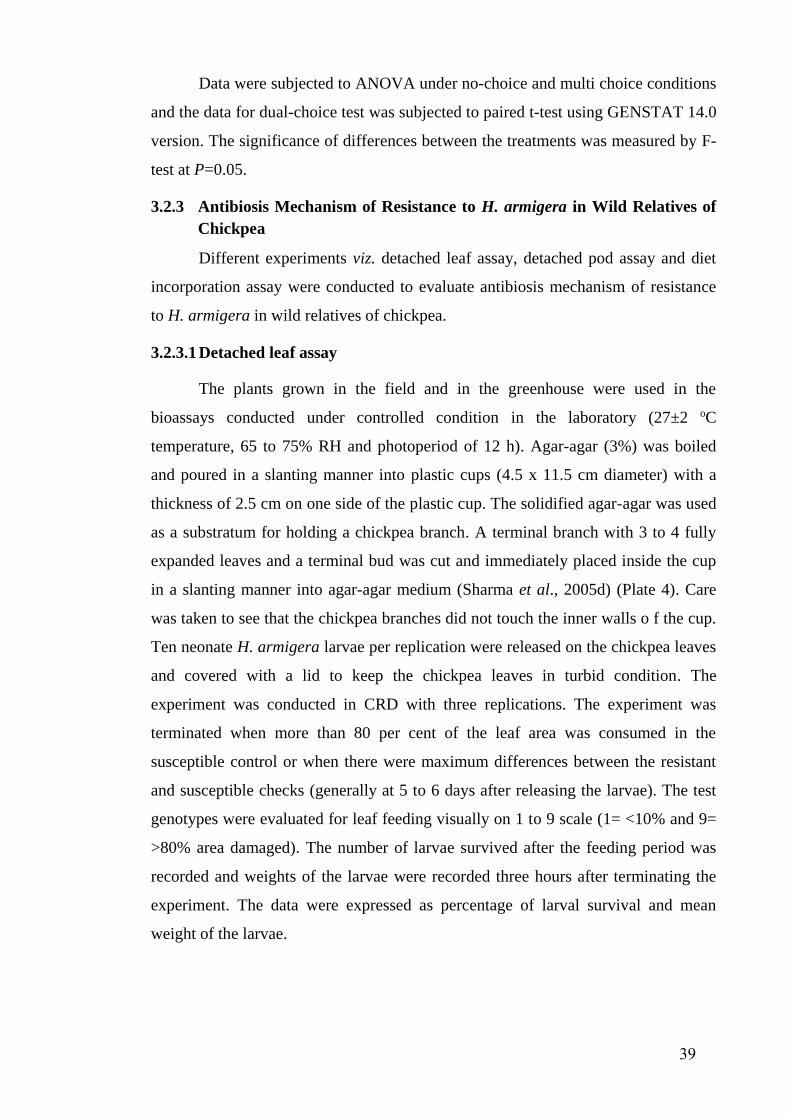
Data were subjected to ANOVA under no-choice and multi choice conditions
and the data for dual-choice test was subjected to paired t-test using GENSTAT 14.0
version. The significance of differences between the treatments was measured by F-
test at P=0.05.
3.2.3 Antibiosis Mechanism of Resistance to H. armigera in Wild Relatives of
Chickpea
Different experiments viz. detached leaf assay, detached pod assay and diet
incorporation assay were conducted to evaluate antibiosis mechanism of resistance
to H. armigera in wild relatives of chickpea.
3.2.3.1 Detached leaf assay
The plants grown in the field and in the greenhouse were used in the
bioassays conducted under controlled condition in the laboratory (27±2 oC
temperature, 65 to 75% RH and photoperiod of 12 h). Agar-agar (3%) was boiled
and poured in a slanting manner into plastic cups (4.5 x 11.5 cm diameter) with a
thickness of 2.5 cm on one side of the plastic cup. The solidified agar-agar was used
as a substratum for holding a chickpea branch. A terminal branch with 3 to 4 fully
expanded leaves and a terminal bud was cut and immediately placed inside the cup
in a slanting manner into agar-agar medium (Sharma et al., 2005d) (Plate 4). Care
was taken to see that the chickpea branches did not touch the inner walls o f the cup.
Ten neonate H. armigera larvae per replication were released on the chickpea leaves
and covered with a lid to keep the chickpea leaves in turbid condition. The
experiment was conducted in CRD with three replications. The experiment was
terminated when more than 80 per cent of the leaf area was consumed in the
susceptible control or when there were maximum differences between the resistant
and susceptible checks (generally at 5 to 6 days after releasing the larvae). The test
genotypes were evaluated for leaf feeding visually on 1 to 9 scale (1= <10% and 9=
>80% area damaged). The number of larvae survived after the feeding period was
recorded and weights of the larvae were recorded three hours after terminating the
experiment. The data were expressed as percentage of larval survival and mean
weight of the larvae.
39
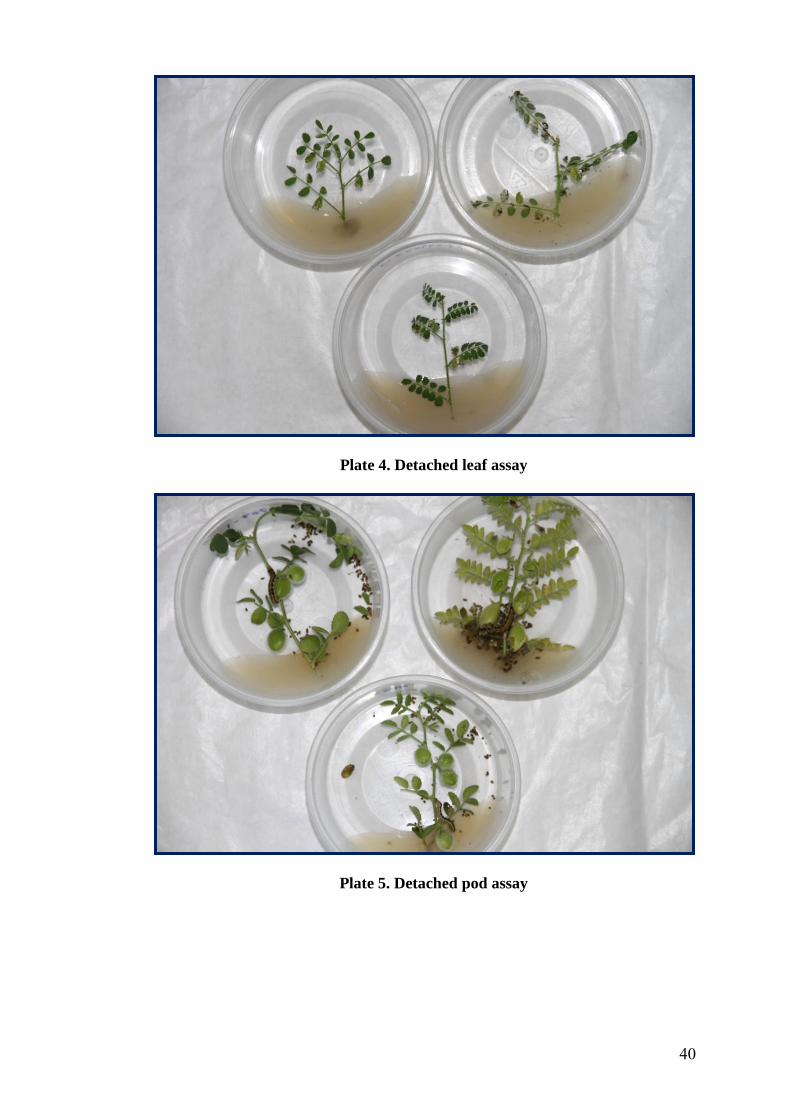
Plate 4. Detached leaf assay
Plate 5. Detached pod assay
40
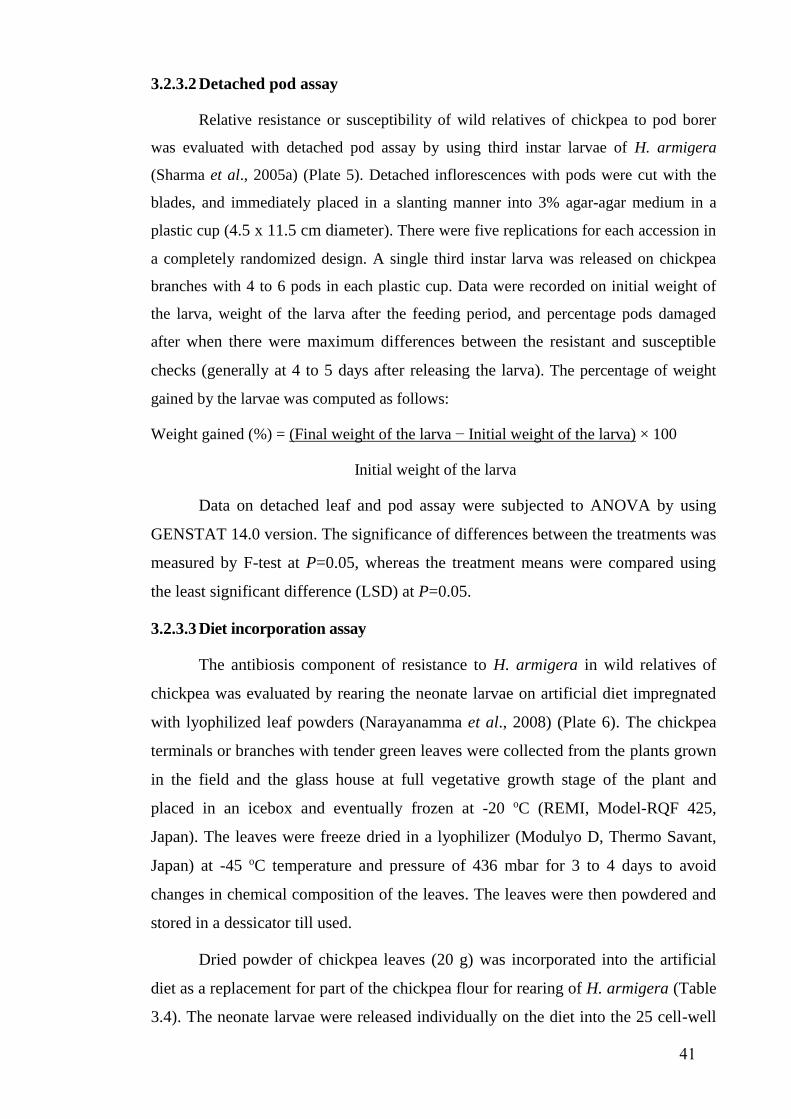
3.2.3.2 Detached pod assay
Relative resistance or susceptibility of wild relatives of chickpea to pod borer
was evaluated with detached pod assay by using third instar larvae of H. armigera
(Sharma et al., 2005a) (Plate 5). Detached inflorescences with pods were cut with the
blades, and immediately placed in a slanting manner into 3% agar-agar medium in a
plastic cup (4.5 x 11.5 cm diameter). There were five replications for each accession in
a completely randomized design. A single third instar larva was released on chickpea
branches with 4 to 6 pods in each plastic cup. Data were recorded on initial weight of
the larva, weight of the larva after the feeding period, and percentage pods damaged
after when there were maximum differences between the resistant and susceptible
checks (generally at 4 to 5 days after releasing the larva). The percentage of weight
gained by the larvae was computed as follows:
Weight gained (%) = (Final weight of the larva − Initial weight of the larva) × 100
Initial weight of the larva
Data on detached leaf and pod assay were subjected to ANOVA by using
GENSTAT 14.0 version. The significance of differences between the treatments was
measured by F-test at P=0.05, whereas the treatment means were compared using
the least significant difference (LSD) at P=0.05.
3.2.3.3 Diet incorporation assay
The antibiosis component of resistance to H. armigera in wild relatives of
chickpea was evaluated by rearing the neonate larvae on artificial diet impregnated
with lyophilized leaf powders (Narayanamma et al., 2008) (Plate 6). The chickpea
terminals or branches with tender green leaves were collected from the plants grown
in the field and the glass house at full vegetative growth stage of the plant and
placed in an icebox and eventually frozen at -20 oC (REMI, Model-RQF 425,
Japan). The leaves were freeze dried in a lyophilizer (Modulyo D, Thermo Savant,
Japan) at -45 oC temperature and pressure of 436 mbar for 3 to 4 days to avoid
changes in chemical composition of the leaves. The leaves were then powdered and
stored in a dessicator till used.
Dried powder of chickpea leaves (20 g) was incorporated into the artificial
diet as a replacement for part of the chickpea flour for rearing of H. armigera (Table
3.4). The neonate larvae were released individually on the diet into the 25 cell-well
41
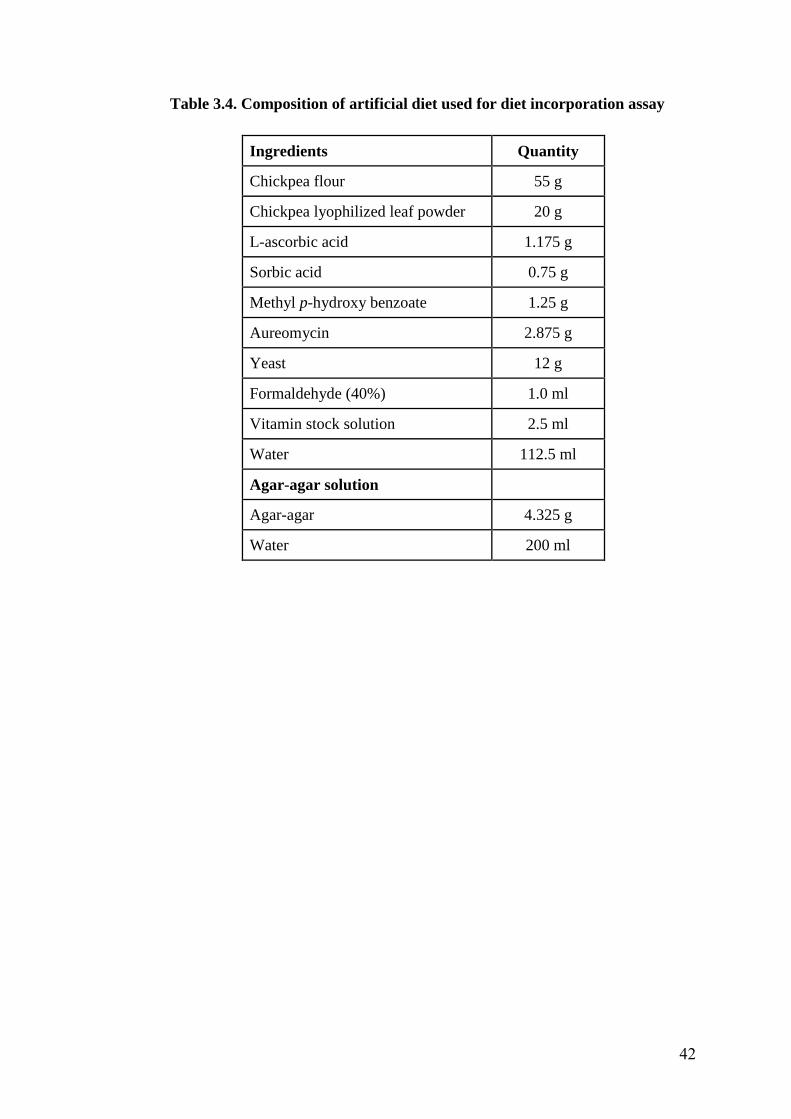
Table 3.4. Composition of artificial diet used for diet incorporation assay
Ingredients Quantity
Chickpea flour 55 g
Chickpea lyophilized leaf powder 20 g
L-ascorbic acid 1.175 g
Sorbic acid 0.75 g
Methyl p-hydroxy benzoate 1.25 g
Aureomycin 2.875 g
Yeast 12 g
Formaldehyde (40%) 1.0 ml
Vitamin stock solution 2.5 ml
Water 112.5 ml
Agar-agar solution
Agar-agar 4.325 g
Water 200 ml
42
Plate 6. Diet incorporation assay
H. armigera larvae rearing on artificial
diet with lyophilized leaf powders
H. armigera pupae collected
into a jar with vermiculite
H. armigera adults released in
oviposition cage
Eggs laid by H. armigera adults
on liners
43
plate with a fine camel hairbrush, each treatment was replicated thrice (25 larvae in
each replication). The larvae were obtained from the insect culture maintained on
chickpea flour based diet (Armes et al., 1992) in the laboratory at ICRISAT,
Patancheru. The cell-wells were maintained at 27±2 oC temperature, 65 to 75%
relative humidity and 12 h photoperiod after releasing neonates onto the diet. Data
were recorded on larval survival and weights on 10th day after releasing the larvae
into artificial diet. Pupal weights were recorded one day after pupation. Pupae from
each replication were sterilized with 2% sodium hypochlorite solution and placed in
a plastic jar containing moist vermiculite. Data were also recorded on larval and
pupal periods. The adults were collected from the jars, and three pairs of adults that
emerged on the same day on a particular genotype were placed inside a plastic cage
and the numbers of eggs laid were counted. Percentage of larval survival on tenth
day, and pupation and adult emergence were computed in relation to number of
neonate larvae released in each replication. The data were subjected to ANOVA by
using GENSTAT 14.0 version to test the significance of differences between
treatments by F-test and the treatment means were compared by least significant
difference at P=0.05.
3.3 MORPHOLOGICAL CHARACTERS OF WILD RELATIVES OF
CHICKPEA IN RELATION TO EXPRESSION OF RESISTANCE
TO H. armigera
Data were recorded on morphological characters such as trichome density on
leaves and pod wall thickness. Data recorded on trichome density was correlated with
oviposition of H. armigera and pod wall thickness was correlated with damage rating
and weight gained percentage of larvae in detached pod assay for assessment of non-
preference for oviposition and for feeding, respectively in different genotypes of wild
relatives of chickpea.
3.3.1 Trichome Density
Trichome density in different wild relatives of chickpea genotypes were
measured in accordance with Jackai and Oghiakhe (1989). The leaves were cut with
scissor and were placed in acetic acid and alcohol (2:1) in stoppered glass vials (10
ml capacity) for 24 h to clear the chlorophyll and subsequently transferred into lactic
acid (90%) as a preservative (Maiti and Bidinger, 1979). The presence of trichomes
was recorded in minimum of 15 leaves from each accession and there were three
44
replications. The leaf sections were mounted on a glass slide in a drop of lactic acid
and examined under a stereomicroscope (Zeiss. Inc., Thornwood, NY) at 10X
magnification and expressed as number of trichomes/10X microscopic field.
3.3.2 Pod Wall Thickness
Pod wall thickness was measured using the vernier calipers for ten random pods
per genotype for each replication likewise three replications were maintained. Three
measurements in each pod were taken and averaged to compute pod wall thickness and
represented in mm.
3.4 BIOCHEMICAL CHARACTERIZATION OF WILD RELATIVES
OF CHICKPEA IN RELATION TO EXPRESSION OF RESISTANCE
TO H. armigera
Different biochemical components such as proteins, phenols, total soluble
sugars and tannins in lyophilized leaf powder of wild relatives of chickpea were
estimated through spectrophotometric methods, whereas flavonoids in lyophilized
leaf powders and leaf organic acids in fresh leaves were quantified through HPLC
fingerprinting. Lectin and protease inhibitor activities were characterized from seeds
of different genotypes.
3.4.1 Estimation of Proteins
The protein content was estimated as per Lowry et al. (1951) in different
wild relatives of chickpea.
3.4.1.1 Preparation of reagents: Alkaline copper solution (reagent C) was prepared
by mixing 50 ml of reagent A (2% sodium carbonate in 0.1 N sodium hydroxide)
with 1 ml of reagent B (0.5% copper sulphate in 1.0% sodium potassium tartrate).
Standard stock solution was prepared by dissolving 50 mg of bovine serum albumin
in 50 ml of distilled water, from this 10 ml of the stock solution was diluted to 50 ml
to obtain working standard with concentration of 200 µg of protein per ml.
3.4.1.2 Procedure: The sample (500 mg) was weighed and ground in a pestle and
mortar in 5 to 10 ml of the sodium phosphate buffer. The sample was centrifuged,
and the supernatant used for protein estimation. The sample extract of 0.1 ml was
taken in test tubes along with working standards of 0.2, 0.4, 0.6, 0.8 and 1 ml
whereas zero served as a blank. The volume in all tubes was made up to 1 ml with
45
distilled water. Reagent C (5 ml) was added to each tube including the blank. The
solution was mixed well and allowed to stand for 10 min. To this solution 0.5 ml of
Folin-Ciocalteu (FC) reagent (mixed with equal volume of water) was added and
mixed well. The solution was incubated at room temperature in the dark for 30 min.
The blue colour developed was read at 660 nm. The amount of protein was
calculated from the standard curve and expressed in percentage.
3.4.2 Estimation of Phenols
The phenol content in wild relatives of chickpea genotypes were estimated as
per the method presented by Bray and Thorpe (1954).
3.4.2.1 Principle: Phenols react with phosphomolybdic acid in Folin-Ciocalteau
reagent in alkaline medium and produce blue coloured complex (Molybdenum blue)
at 650 nm.
3.4.2.2 Preparation of reagents: 80 ml of ethanol was made upto 100 ml with
distilled water to obtain 80% ethanol. Sodium carbonate (20%) was prepared by
adding 20 g sodium carbonate in 100 ml of distilled water. Catechol (100 mg) was
dissolved in 100 ml of distilled water and diluted 10 times for working standard, from
the working standard different concentrations was taken from 0.1 to 1.0 ml.
3.4.2.3 Procedure: Lyophilised leaf sample of 500 mg was ground with 80%
ethanol in a mortar and pestle. Centrifuged the homogenate at 10,000 rpm for 20
minutes, saved the supernatant and re-extracted the residue with five times volume
of 80% ethanol. Supernatants were pooled and evaporated to dryness later residue
was dissolved in a known volume of distilled water (5 ml). Different aliquots of the
sample 0.2 to 2ml was pipetted out into the test tubes, made up the volume to 3 ml
with distilled water and added 0.5 ml of FC reagent. After 3 minutes, 2 ml of 20%
Na2CO3 solution was added to each test tube and mixed thoroughly. The tubes were
placed in a boiling water bath for one minute and absorbance was recorded after
cooling to room temperature at 650 nm. A standard curve was prepared using
different concentrations of catechol. The concentration of the phenols in the test
samples were obtained from the standard curve of catechol and expressed as mg per
gram of sample.
46
3.4.3 Estimation of Tannins
Tannins in wild relatives of chickpea genotypes were estimated by vanillin
hydrochloride method (Burns, 1971).
3.4.3.1 Principle: The vanillin reagent will react with any phenol that has an
unsaturated resorcinol or pholoroglucinol nucleus and forms a coloured substituted
product which is measured at 500nm.
3.4.3.2 Preparation of Reagents: Vanillin-hydrochloride reagent was prepared by
adding equal volumes of 8% hydrochloric acid in methanol and 4% vanillin in
methanol. The solution was prepared just before use. A stock solution was prepared
by dissolving 1 mg of catechin in 1 ml of methanol. Then the stock solution was
diluted to ten times to obtain final concentration of 100 µg/ ml.
3.4.3.3 Procedure: Extraction of tannins was done by homogenising one gram of
lyophilised leaf powder in 50 ml of methanol and kept for continuous swirling for 20
to 28 h. After 28 h, centrifuged the contents and collected the supernatant. Pipetted
out 1 ml aliquot of the sample into a test tube and added 5 ml of vanillin
hydrochloride reagent. Mixed the contents and incubated it at room temperature for
20 min. Absorbance was recorded at 550 nm. A standard graph was prepared from
the known concentrations of the catechin. From the standard graph, the amount of
catechin was calculated as per the absorbance values and expressed as mg catechin
equivalents per gram of sample.
3.4.4 Estimation of Total Soluble Sugars
Estimation of total carbohydrates in different wild relatives of chickpea
genotypes was done as per the method developed by Hedge and Hofreiter (1962).
3.4.4.1 Principle: Carbohydrates dehydrated by concentrated H2SO4 to form
furfural. Furfural so formed, condenses with the Anthrone to form a blue-green
colored complex, which is colorimetrically measured at 630 nm.
3.4.4.2 Preparation of reagents: 2.5 N HCl was prepared by adding 21.4 ml of
commercial HCl (11.7 N) to 78.6 ml of distilled water. Anthrone reagent was
prepared fresh by dissolving 200 mg of anthrone in 100 ml of ice cold 95% H2SO4.
Standard glucose stock was prepared by dissolving 100 mg of glucose in 100 ml of
47
distilled water and 10ml of stock was diluted to 100 ml to prepare working standard.
It was stored in refrigerated condition after adding few drops of toluene.
3.4.4.3 Procedure: A sample of 100 mg was taken into boiling tube, after adding 5ml
of 2.5 N HCl it was hydrolyzed in boiling water bath for three hours. After the
sample was cooled to room temperature neutralised with solid sodium carbonate
until effervescence ceases and volume in the flask was made up to 100 ml with
distilled water. The sample was spun down once at 8000 rpm for 15 min in a
centrifuge. The supernatant was collected and aliquots of 0.5 and 1.0 ml were used
for estimation. The standards were prepared by using the 0.2, 0.4, 0.6, 0.8 and 1 ml
of the working standard where as zero served as blank. The volume made up to 1 ml
in all tubes including sample tubes with distilled water. Then 4 ml of anthrone
reagent was added and kept on boiling water bath for 8 min. Absorbance was
recorded at 630 nm. The amount of carbohydrate present in the sample tube was
calculated by using standard graph and expressed in percentage.
3.4.5 Estimation of Organic Acids in Leaf Exudates
A standard protocol as suggested by Narayanamma et al. (2013) was
followed for collection and analysis of organic acids from chickpea leaves.
3.4.5.1 Preparation of chemicals: Standards were prepared with two replicates of
oxalic acid and malic acid by mixing 10 mg in 10 ml of water to get concentrations
of 1000 ppm. Mobile phase of 25 mM KH2PO4 of pH 2.5 with H3PO4 was prepared,
for this 6.805 g of KH2PO4 was weighed and taken in a 2 litre conical flask and
mixed with 1 litre of millipore water until KH2PO4 was completely dissolved. Then
4 ml of H3PO4 was added and made up the volume to 1.8 L. The pH was adjusted to
2.5 by adding H3PO4 drop by drop, and finally made up the volume to 2 litres.
3.4.5.2 Extraction of leaf organic acids: The chickpea leaf samples were collected
early in the morning (before 9 AM) in 15 ml centrifuge tubes containing 5 ml
millipore water. The tubes were labelled for each genotype, and weight of the tube
and water was recorded (initial weight). First fully expanded leaf from the plants
was excised with scissors at random and placed in the respective tubes containing
double distilled millipore water for 10 to 15 min. The weight of the tube with water
and leaves was recorded (final weight) to compute fresh weight of the leaves.
48
The leaf exudates extracted in water were filtered through 0.22 μm
hydrophilic PVDF millipore millex-HV filters using a 2.5 ml syringes. Sample
solution of 2 ml was taken in syringe from the centrifuge tubes. The needle was
removed from the syringe and attached to millipore filter to dispense 1.5 ml of the
filtrate into the HPLC vials. Three replications were maintained for each sample and
organic acids in the leaf exudates were quantified by HPLC.
3.4.5.3 HPLC procedure/protocol: After priming, the mobile phase was run for
1 h, the vials containing the leaf exudates of different chickpea genotypes were
arranged in a carousel. The HPLC fingerprints were generated by using Atlantis dc-
18 column (4.6 x 250 mm, 5μm). The sample retention time was recorded with a
photodiode detector. Chromatographic separation was done with a flow rate of 0.8
ml min-1 using mobile phase and the injected volume of each sample was 20 μl with
20 min run time per sample (Plate 7).
Based on the standards retention time and peak areas, different organic acids
present in the samples were identified and quantified. From the known
concentrations of the standards, a linear curve was plotted against concentration on
X-axis, and the absorbance on Y-axis. From the linearity curve, unknown
concentrations of different organic acids from the leaf samples of different
genotypes were plotted, and the amounts estimated. Amounts of organic acids
present in a sample were expressed in mg g-1 fresh or dry weight basis.
3.4.6 Estimation of Flavonoids in Wild Relatives of Chickpea
Flavonoids were extracted by the method of Hahn et al. (1983) with slight
modifications and analyzed using HPLC fingerprints.
3.4.6.1 Extraction of flavonoids: Lyophilized leaf sample (100 mg) was weighed
and homogenized in 5 ml of HPLC grade methanol with mortar and pestle.
Homogenized samples were centrifuged at 8000 rpm for 20 min and supernatant was
collected. Hexane was added three times the volume of supernatant for partition in
separation funnel and methanol phase was collected. This process was repeated for
three times. Collected methanol phase was concentrated to volume of 2 ml in
rotavapor. Concentrated samples were filtered through 0.22 µm millipore filter and
injected into HPLC.
49
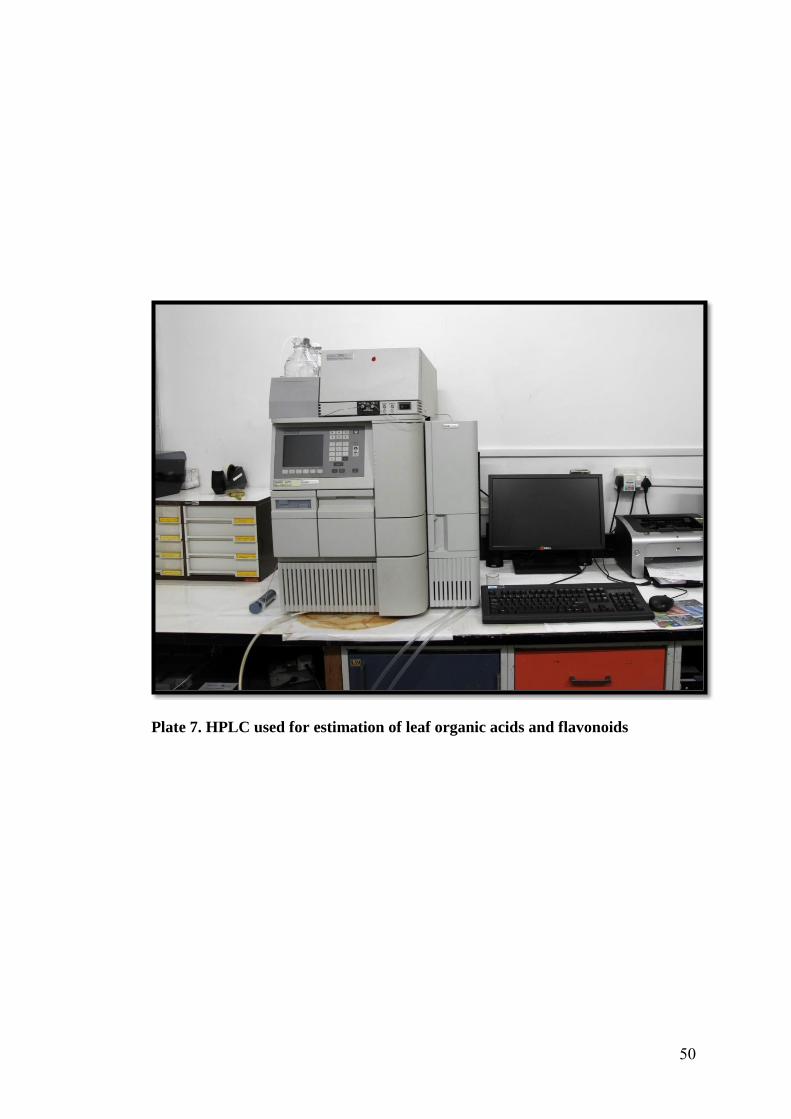
Plate 7. HPLC used for estimation of leaf organic acids and flavonoids
50
3.4.6.2 HPLC procedure/protocol: The samples and standards (20 μl) were
chromatographed singly and in mixtures on a Waters Sunfire C18 column (4.6 X 250
mm) with 5 μm pore size. Waters High Performance Liquid Chromatography
(HPLC) 2695 separations module (alliance) system consisting of a PCM 11
reciprocating piston pump and a 2996 photodiode array detector in the range of 190
to 800 nm was used in a gradient elution mode. Multistep gradient solvent system of
2% acetic acid in milliporewater (A) and 2% acetic acid in acetonitrile (B) was used
for separation (Table 3.5) (Plate 7).
Table 3.5. Solvent system for separation of flavonoids through HPLC
Running time (min) 2% Acetic acid (A%) Acetic acid-acetonitrile (B%)
0.00 95.00 5.00
10.00 95.00 5.00
17.50 85.00 15.00
31.00 85.00 15.00
41.00 50.00 50.00
45.00 50.00 50.00
50.00 85.00 15.00
55.00 95.00 5.00
3.4.7 Estimation of Midgut Protease Activity in H. armigera
3.4.7.1 Preparation of chemicals
Standard stocks of Nα-benzoyl-L-arg-p-nitroanilide (BApNA) (0.1 M), N-
succinyl-ala-ala-pro-phe-pnitroanilide (SAAPFpNA) (10 mg/ml) and Leucine-p-
nitronilide (LpNA) (10 mM) (Sigma-Aldrich) were prepared in dimethyl sulfoxide.
3.4.7.2 Extraction of H. armigera midgut proteases
Larvae subjected to detached pod assay on different genotypes of wild
relatives of chickpea were collected from the pods for the estimation of proteinase
activity in their midgut after the termination of the assay. Midguts were removed by
dissecting the larvae and kept frozen at -80 oC till used. The isolated midguts were
homogenized in one volume of 0.1 M glycine-NaOH buffer (pH 10.0) in dounce
homogenizer. The homogenate was centrifuged at 12,000 rpm for 15 min at 4 oC and
the supernatants were used as enzyme source. Protein concentration in supernatants
was quantified according to Lowry’s method using BSA as a standard protein
(Lowry et al., 1951).
51
3.4.7.3 Total protease activity assay
Total protease activity was determined by azo-caseinolytic assay using 1%
azocasein as a substrate (Visweshwar et al., 2015). Gut extract (100 µl) was mixed
with 500 µl of 1% azocasein in 0.1 M glycine-NaOH buffer (pH 10.0) and incubated
for 30 min at 37 oC. The reaction was stopped by adding 200 μl of 5%
trichloroacetic acid (TCA) and the sample was centrifuged at 12,000 rpm for 15
min. An equal volume of 1 N NaOH was added to the supernatant and absorbance
was read at 450 nm. Specific activity was expressed as an increase in optical
density/min/mg gut protein.
Units (U) = ΔABS/ Incubation time (min) × mg of protein
3.4.7.4 Specific proteolytic activity assay
Trypsin, chymotrypsin and aminopeptidase activities were estimated using
enzyme specific substrates BApNA, SAAPFpNA and LpNA, respectively
(Visweshwar et al., 2015). The 1 ml of reaction mixture containing 50 μl of enzyme
extract, 2 mM of substrate in 0.1 M glycine-NaOH buffer (pH 10.0) was incubated
for 20 min at 37 °C. The reaction was stopped by adding 300 μl of 30% acetic acid.
The samples were centrifuged at 10,000 rpm for 10 min and absorbance was read at
410 nm. Specific enzyme activity corresponds to the hydrolysis of 1 μmol
substrate/min/mg of gut protein.
Units (U) = OD × dilution factor × total reaction volume
εmm × mg of protein × time (min)
Where, εmm is the extinction co-efficient for the liberated pNA, i.e., 8.8 at 410 nm.
Dilution factor = Total reaction volume (ml)/ Volume of enzyme (ml)
3.4.8 Protease Inhibitors (PI) in Wild Relatives of Chickpea against H. armigera
3.4.8.1 Extraction of PIs from seeds
Matured seeds of wild relatives of chickpea were washed with water, dried
and ground to a fine powder. The seed powder was defatted with hexane and
depigmented with acetone in six washes. Solvent was filtered off and the seed
powder was air dried. The seed powders were homogenized using pestle and mortar
in 0.1 M sodium phosphate buffer (pH 7.0) and kept overnight at 4 oC for extraction
of PIs with intermittent shaking. The suspension was centrifuged at 12,000 rpm for
52
20 min at 4 oC and the supernatant was used as source of PIs. Protein content of the
extract was determined by using BSA as a standard protein (Lowry et al., 1951).
3.4.8.2 Detection of PIs by dot-blot method
A simple, rapid and sensitive technique, called X-ray film method was used
for the estimating serine protease inhibitor activity (Pichare and Kachole 1994).
Porcine trypsin and chymotrypsin solutions were prepared in 0.1 M Tris-HCl buffer,
pH 8.0 to obtain a final concentration of 0.1 mg ml-1. Three varying concentrations
of the enzyme and inhibitor 3:1, 1:1, and 1:3 (v/v), were prepared. The volume of
the reaction mixture was adjusted with Tris-HCl buffer for trypsin and
chymotrypsin. The final volume was made upto 20 μl, and then spotted onto a strip
of X-ray film. Spots were incubated for 20 min on X-ray film depending on the
extent of gelatin hydrolysis. The film was washed with warm water. When the
inhibitor is present, the trypsin/chymotrypsin did not degrade the gelatin on the X-
ray film. When the inhibitor was absent, a clear zone formed at the site of sample
application on the X-ray film.
3.4.8.3 Extraction of H. armigera Gut Proteases (HGPs)
The late third or the early fourth instar larvae were collected from
homogenous culture of H. armigera and they were used for extraction of HGPs.
Larval midguts were isolated by dissecting the larvae and homogenized in one
volume of 0.1 M glycine-NaOH buffer (pH 10.0) and centrifuged at 12,000 rpm for
15 min at 4 oC and the supernatant was used as source of gut proteinases.
3.4.8.4 H. armigera Gut Protease Inhibitory (HGPI) Assays
Protease inhibitory assays were performed by mixing and pre-incubation of a
suitable amount of seed extract as a source of inhibitor (20 𝜇l) and HGPs extract (50
𝜇l) for 30 min at 37 oC prior to the addition of substrate (Udamale et al., 2013). The
residual trypsin, chymotrypsin, and total gut protease activities were estimated by
using the substrates BApNA, SAAPFpNA, and azocasein, respectively.
One PI unit was defined as the amount of inhibitor that causes inhibition of
one unit of proteinase activity under the given assay conditions. In all the inhibitory
assays, protease activity of the suitable control was performed without mixing the
seed extract and HGP inhibitory units per gram sample (U g-1) was calculated with
respect to their activity in the control.
53
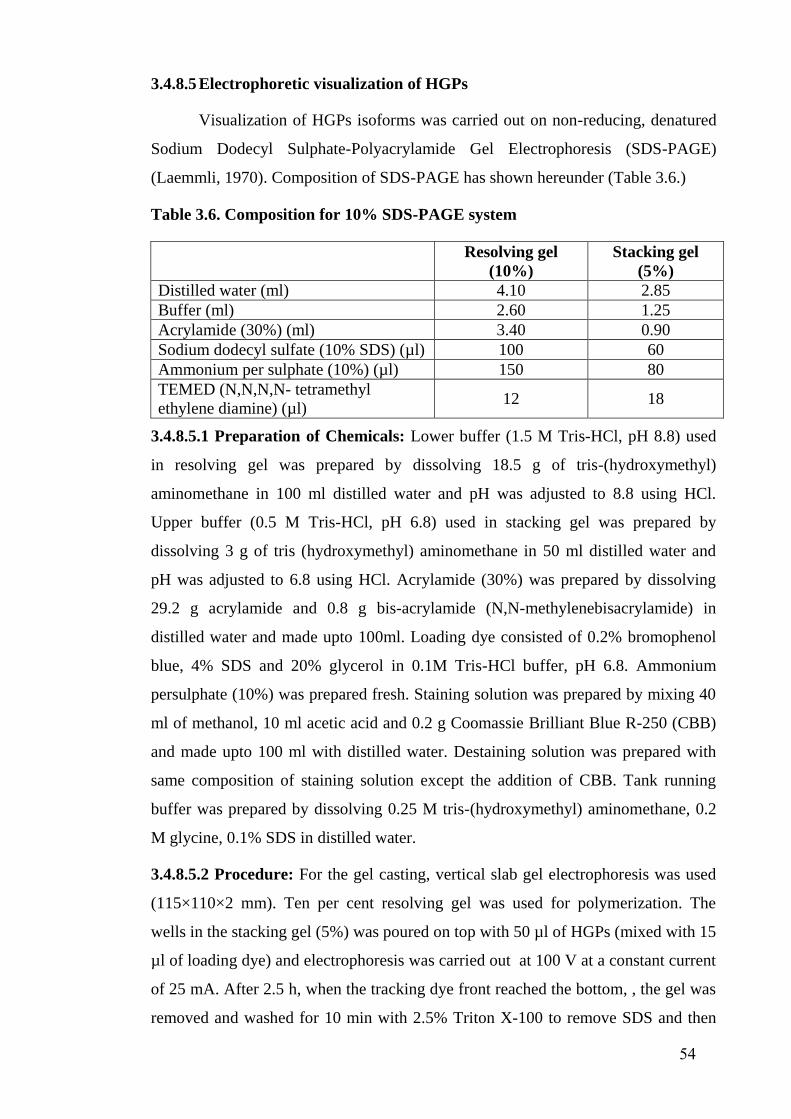
3.4.8.5 Electrophoretic visualization of HGPs
Visualization of HGPs isoforms was carried out on non-reducing, denatured
Sodium Dodecyl Sulphate-Polyacrylamide Gel Electrophoresis (SDS-PAGE)
(Laemmli, 1970). Composition of SDS-PAGE has shown hereunder (Table 3.6.)
Table 3.6. Composition for 10% SDS-PAGE system
Resolving gel
(10%)
Stacking gel
(5%)
Distilled water (ml) 4.10 2.85
Buffer (ml) 2.60 1.25
Acrylamide (30%) (ml) 3.40 0.90
Sodium dodecyl sulfate (10% SDS) (µl) 100 60
Ammonium per sulphate (10%) (µl) 150 80
TEMED (N,N,N,N- tetramethyl
ethylene diamine) (µl) 12 18
3.4.8.5.1 Preparation of Chemicals: Lower buffer (1.5 M Tris-HCl, pH 8.8) used
in resolving gel was prepared by dissolving 18.5 g of tris-(hydroxymethyl)
aminomethane in 100 ml distilled water and pH was adjusted to 8.8 using HCl.
Upper buffer (0.5 M Tris-HCl, pH 6.8) used in stacking gel was prepared by
dissolving 3 g of tris (hydroxymethyl) aminomethane in 50 ml distilled water and
pH was adjusted to 6.8 using HCl. Acrylamide (30%) was prepared by dissolving
29.2 g acrylamide and 0.8 g bis-acrylamide (N,N-methylenebisacrylamide) in
distilled water and made upto 100ml. Loading dye consisted of 0.2% bromophenol
blue, 4% SDS and 20% glycerol in 0.1M Tris-HCl buffer, pH 6.8. Ammonium
persulphate (10%) was prepared fresh. Staining solution was prepared by mixing 40
ml of methanol, 10 ml acetic acid and 0.2 g Coomassie Brilliant Blue R-250 (CBB)
and made upto 100 ml with distilled water. Destaining solution was prepared with
same composition of staining solution except the addition of CBB. Tank running
buffer was prepared by dissolving 0.25 M tris-(hydroxymethyl) aminomethane, 0.2
M glycine, 0.1% SDS in distilled water.
3.4.8.5.2 Procedure: For the gel casting, vertical slab gel electrophoresis was used
(115×110×2 mm). Ten per cent resolving gel was used for polymerization. The
wells in the stacking gel (5%) was poured on top with 50 µl of HGPs (mixed with 15
µl of loading dye) and electrophoresis was carried out at 100 V at a constant current
of 25 mA. After 2.5 h, when the tracking dye front reached the bottom, , the gel was
removed and washed for 10 min with 2.5% Triton X-100 to remove SDS and then
54
incubated in 2% casein in 0.1 M glycine-NaOH, pH 10, for 1 h, and the gel was then
stained with Coomassie Brilliant Blue R-250 for 5 min. HGPs bands were visualised
as white bands with dark blue background after destaining.
3.4.8.6 Electrophoretic Visualization of Trypsin Inhibitors (TIs)
Trypsin inhibitor (TIs) isoforms were detected by using 10% polyacrylamide
gel incorporated with 1% gelatine (Felicioli et al., 1997). After electrophoresis, the
gels were transferred to 0.01% porcine trypsin in 0.1M Tris-HCl buffer, pH 8.0, and
incubated for 1 h with constant shaking for gelatine hydrolysis. After that the gels
were washed with distilled water then stained with Coomassie Brilliant Blue R-250
and destained. Protease inhibitor isoforms were detected as dark blue bands against
white background due to the complex of nonhydrolyzed gelatine with staining.
3.4.9 Detection of Lectin Activity in Wild Relatives of Chickpea
3.4.9.1 Hemagglutination Assay
The seeds of wild relatives of chickpea were homogenized in pestle and
mortar in 0.1 M sodium phosphate buffered saline (PBS) (0.15 M NaCl), pH 7.4,
and the suspension was centrifuged at 10,000 rpm. The supernatant was subjected to
ammonium sulphate precipitation (70%). The protein pellet was collected by
centrifugation and resuspended in PBS and dialyzed extensively against the same.
A modified method for Banerjee et al. (2011) was followed for preparation of
erythrocyte suspension. Human blood (O+ve) was collected into a syringe (2 ml)
and the blood was immediately transferred to microfuge tube containing a pinch of
EDTA and it was centrifuged at 5,000 rpm for 10 min at 4 oC. Subsequently, the
erythrocyte solution was prepared by repeated washing with PBS and spun at 5,000
rpm for 10 minutes at 4 oC. After each cycle, the supernatant was carefully removed.
The erythrocytes obtained in this manner were found to be free from leucocytes and
cell debris. The pellet was resuspended in PBS and obtained final concentration of
2% erythrocyte suspension.
Agglutination activity of the lectins isolated from wild relatives of chickpea
was assayed by the hemagglutination technique as described by Sultan and Swamy
(2005) with slight modification. The suspension of human erythrocytes (50 µl) in
PBS was mixed with serially diluted samples of the lectin extract (10 to 50 µl) in a
55

96 well microtitre plate and incubated at room temperature for 1 h. Then
hemagglutination was observed with the unaided eye.
3.4.9.2 Electrophoretic visualization of lectins
Nondenaturing-polyacrylamide gel electrophoresis (Native-PAGE) was
performed with a discontinuous buffer system for the detection of lectins. Basic gel
electrophoresis (10% PAGE system) was carried out in the Davis buffer system
(Davis, 1964) followed by periodic acid-Schiff staining as modified by Doerner and
White (1990).
3.4.9.2.1 Preparation of Schiff’s reagent: Schiff’s reagent was prepared as per
method by Kodousek (1969). Rosaniline hydrochloride (basic fuchsin) of 1g was
ground and dissolved in 10 ml absolute ethanol in a 250 ml flask and shaken gently
for some time after that 186 ml of cold distilled water was added. Pure sodium
metabisulphite (5 g) was added followed by 3.4 ml of concentrated HCl. The dye
was precipitated by metabisulphite but redissolved quickly with the addition of acid.
Finally, 0.25 g sodium dithionate was added which resulted in immediate
decolourization of red solution to a light yellowish shade. After stirring with
approximately 2 g of activated pulverized charcoal for about 3 min and subsequent
filtration, a perfectly colourless solution was obtained. The volume was adjusted to
200 ml with 0.2 N HCl. As the reagent is very sensitive, it was stored at 4 oC
immediately.
3.4.9.2.2 Periodic acid-Schiff’s staining: After electrophoretic run, the gels were
transferred and incubated in 7.5% acetic acid for 30 min and then with 1% periodic
acid for 20 min, then followed by three washings of 15% acetic acid for 15 min.
After that the Schiff’s reagent was added and incubated for 30 min. The Schiff’s
reagent was removed and the gels were washed in 7.5% acetic acid about six times
for 1 h. Reddish-pink bands of stained glycoprotein would then be visible.
3.4.10 Estimation of Leaf Surface Chemicals through GC-MS using Methanol
and Hexane Extracts
Leaf surface chemical present in different wild relatives of chickpea were
identified with Gas Chromatography-Mass Spectrometry (GC-MS) using methanol
and hexane as suitable solvent system in relation to differential levels of expression
of resistance to H. armigera.
56
3.4.10.1 Extraction of leaf surface chemicals
The chickpea leaf samples were collected early in the morning (before 9 AM)
in 15 ml centrifuge tubes containing 2 ml of solvent methanol or hexane. The tubes
were labelled for each genotype and first fully expanded leaf from the plants was
excised with scissors at random and placed in the respective tubes containing
methanol or hexane for 10 to 15 min. The leaves were removed from the tubes and
the solvent extracts were filtered through 0.22 µm millipore filter and injected into
GC-MS.
3.4.10.2 GC-MS protocol/procedure
GC-MS measurements were obtained with GC-MS QP 2010Ultra equipped
with an autosampler AOC 20 i series (Plate 8). The following conditions were used:
ion source temp. 240°C, column CBP 5, 25 m x 0.2 mm i.d., 0.25μm film thickness
column (Shimadzu, Kyoto, Japan), carrier gas helium at constant flow of 1 ml min-1,
temperature program: 50°C (2 min), 50 to 280°C (10 min), 280°C (10 min);
injection temperature: 250°C, interface temperature: 280°C, solvent cut time 3 min,
splitless injection, mass range of m/z 20 to m/z 600. Data acquisition and evaluation
run were with GC Solutions 4.1. Identification of a selected set of metabolites was
based on the measurements of reference compounds in WILEY and NIST library.
3.5 GENETIC DIVERSITY OF WILD RELATIVES OF CHICKPEA
EXHIBITING RESISTANCE/SUSCEPTIBILITY TO H. armigera
USING SSR MARKERS
A total of 26 SSR markers were selected based on linkage map reported by
Winter et al. (2000) to assess the genetic diversity of the wild relatives of chickpea.
SSR markers usually consist of di or tri nucleotide sequence repeats. These are also
known as the microsatellite markers, they are co-dominant in nature, and distributed
throughout the genome.
3.5.1 Extraction of DNA from the Seedlings of Wild Relatives of Chickpea
The genotypes of wild relatives of chickpea were grown in small plastic cups
in the glasshouse after scarification and soaking of the seed for 24 hrs. Sampling of
the plant material was done at ten days after seedling emergence. The extraction of
DNA from the sampled material was done using CTAB method (Mace et al., 2003)
57
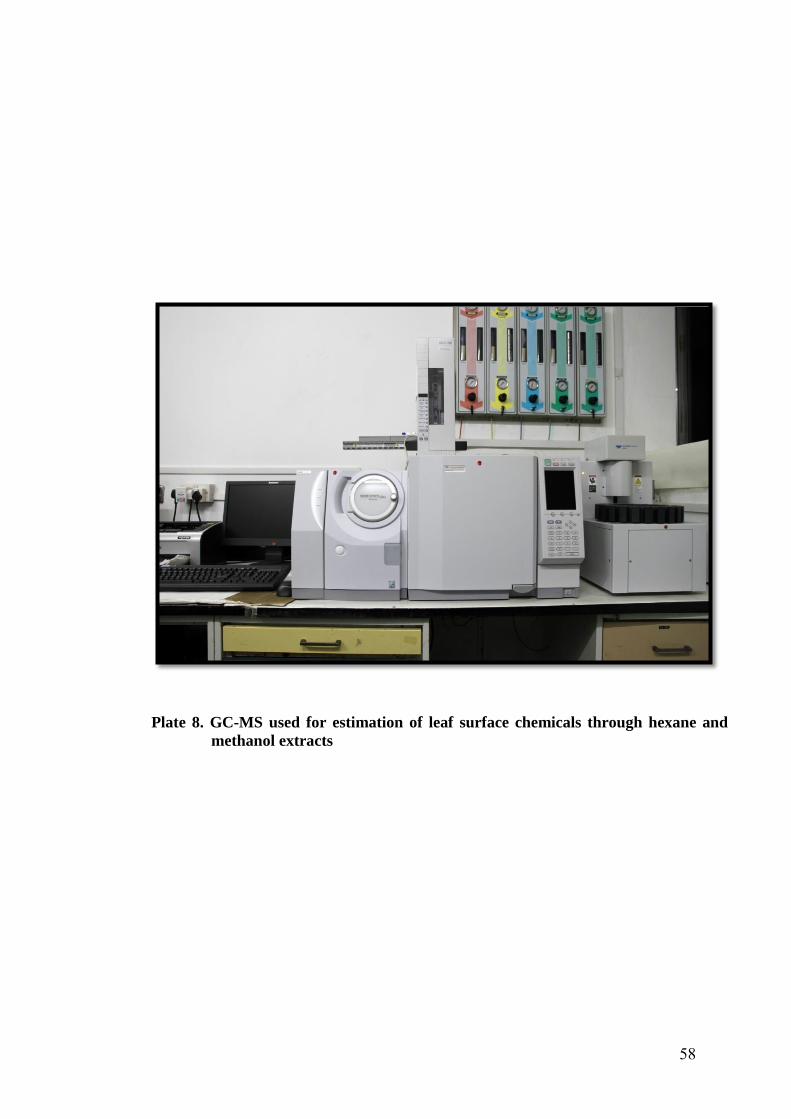
Plate 8. GC-MS used for estimation of leaf surface chemicals through hexane and
methanol extracts
58
with slight modifications. The procedure adopted for 96 well plate DNA extraction
was as follows.
3.5.1.1 Reagents required
1. 3% CTAB (Cetyl Trimethyl Ammonium Bromide) buffer having 10 mM
Tris, 1.4 M NaCl, 20 mM EDTA and 3% CTAB. The pH was adjusted to 8.0
using HCl. Just before use, mercaptoethanol (0.17%) was added.
2. Chloroform-isoamyl alcohol mixture (24:1) stored in the dark at room
temperature
3. Ice-cold isopropanol
4. RNase-A (10 mg/ml) dissolved in solution containing 10 mM Tris (pH 7.5)
and 15 mM NaCl stored at -20°C; working stocks were stored at 4°C.
5. Phenol-chloroform-iso-amyl alcohol mixture (25:24:1)
6. 3 M sodium acetate (pH 5.2)
7. Ethanol (absolute and 70%)
8. T1E0.1 buffer (10 mM Tris and 1 mM EDTA)
9. T10E1 buffer (0.5 M Tris and 0.05 M EDTA)
3.5.1.2 DNA sample preparation
Steel balls (4 mm in diameter and 3 numbers per extraction tube), pre-chilled
at -20°C for about 30 minutes, were added to the 12 x 8 well strip extraction tubes
with strip caps (Marsh Biomarket, USA) that were kept on ice. Before initiation of
DNA extraction, 3% CTAB buffer was preheated on a water bath at 65°C (Precision
Scientific model: shaking water bath 50). The leaf samples of genotypes were
collected from the glasshouse grown plants by cutting them into small pieces
(approximately 30 mg). The samples were then transferred to extraction tubes fitted
into a 96- tube box.
3.5.1.3 Grinding and extraction
To each extraction tube containing the leaf sample and pre chilled steel balls,
450 μl of preheated 3% CTAB buffer was added. Grinding was carried out using a
Sigma Geno-Grinder (Spex Certiprep, USA) at 500 strokes per minute for 5 min. It
was repeated until the leaf strip pieces were sufficiently macerated. After the first
round of grinding, the boxes were checked for leakage by taking them out from the
59
Geno-Grinder and shaken for proper mixing of leaf tissue with buffer. After proper
grinding, the box with the tubes was fixed in a locking device and incubated at 65
°C in a water bath for 20 minutes with occasional shaking.
3.5.1.4 Solvent extraction
Chloroform: isoamyl alcohol (24: 1) mixture of 450 μl was added to each
tube, tubes were inverted twice and the samples centrifuged at 6200 rpm for 10
minutes (Sigma centrifuge 4K15C with QIAGEN rotor model NR09100: 2 x 120 g).
After centrifugation, the aqueous layer (approximately 300 μl) was transferred to a
fresh tube (Marsh Biomarket).
3.5.1.5 Initial DNA precipitation
To the each tube containing aqueous layer, 0.7 volumes (approximately 210
μl) of cold isopropanol (kept at -20°C) was added. The solution was carefully mixed
and the tubes were kept at -20°C for 10 min. The samples were centrifuged at 6200
rpm for 15 minutes, and the supernatant decanted under the fume hood and pellets
were dried.
3.5.1.6 RNase A treatment
In order to remove co-isolated RNA, pellets were dissolved into 200 μl of
low salt T1E0.1 buffer and 3 μl of RNase A (stock 10 mg/µl). The solution was
incubated at 37 °C for 30 min or overnight at room temperature.
3.5.1.7 Solvent extraction
After incubation, 200 μl of phenol: chloroform: isoamyl alcohol (25: 24: 1)
was added to each tube, mixed and centrifuged at 5000 rpm for 10 minutes. The
aqueous phase in each tube was transferred to a fresh tube (Marsh Biomarket) and
200 μl of chloroform: isoamyl alcohol (24: 1) was added to each tube, mixed and
centrifuged at 5000 rpm for 10 minutes. The aqueous layer was transferred to fresh
tube.
60
3.5.1.8 DNA precipitation
To the aqueous layer, 15 μl (approximately 1/10th volume) of 3 M sodium
acetate (pH 5.2) and 300 μl (2 volumes) of absolute ethanol (kept at -20 °C) were
added and the mixtures were subsequently incubated in a freezer (-20 °C) for 5 min
and the tubes were centrifuged at 6200 rpm for 15 min.
3.5.1.9 Ethanol wash
After centrifugation, the supernatant was carefully decanted from each tube
in order to ensure that the pellet remained inside the tube. Subsequently, 200 μl of
70% ethanol was added to each of the tubes, followed by centrifugation at 5000 rpm
for 5 minutes.
3.5.1.10 Final re-suspension
The supernatant was carefully decanted and pellet allowed to air dry for one
hour. Dried pellets were re-suspended in 100 μl of T10E1 buffer and kept overnight at
room temperature to dissolve completely. The re-suspended DNA samples were
stored at 4 °C.
3.5.2 DNA Quantification and Quality Check
The quality and quantity of DNA were checked by agarose gel
electrophoresis as described below
3.5.2.1 Reagents preparation:
3.5.2.1.1TBE buffer (1X): For 10X TBE buffer, 109 g of Tris and 55 g of boric acid
were dissolved one by one in 800 ml distilled water, then 40 ml of 0.5 M EDTA (pH
8.0) was added. The volume was made up to 1 litre with distilled water and
sterilized by autoclaving. This was stored at 4 °C. To prepare working solution (1X),
the stock solution was diluted 10 times.
3.5.2.1.2 Ethidium bromide (10 mg/ml): A quantity of 100 mg ethidium bromide
was dissolved in 10 ml of distilled water. The vessel containing this solution was
wrapped in aluminium foil and stored at 4 °C.
3.5.2.1.3 Orange loading dye: Mixed 10 ml of 0.5 M EDTA (pH 8.0), 1 ml of 5 M
NaCl, 50 ml of glycerol and 39 ml of distilled water and orange dye powder (Orange
G, GurrCertistain®) was added till the color became sufficiently dark.
61
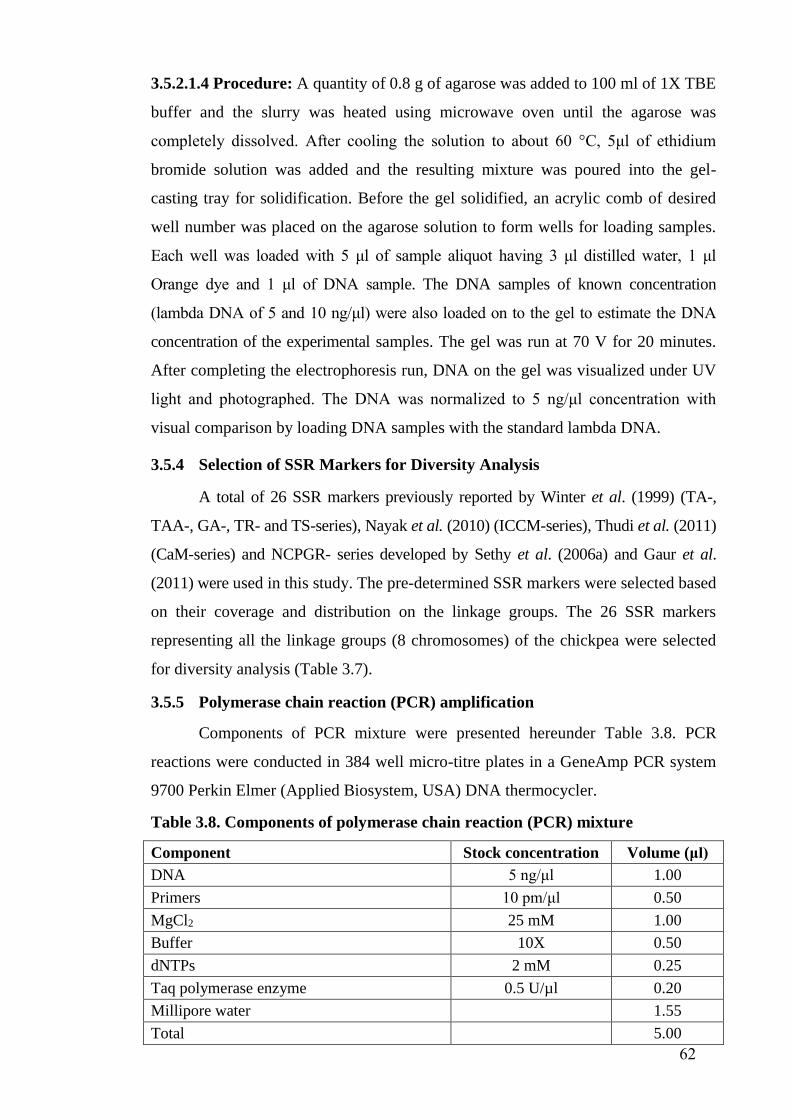
3.5.2.1.4 Procedure: A quantity of 0.8 g of agarose was added to 100 ml of 1X TBE
buffer and the slurry was heated using microwave oven until the agarose was
completely dissolved. After cooling the solution to about 60 °C, 5μl of ethidium
bromide solution was added and the resulting mixture was poured into the gel-
casting tray for solidification. Before the gel solidified, an acrylic comb of desired
well number was placed on the agarose solution to form wells for loading samples.
Each well was loaded with 5 μl of sample aliquot having 3 μl distilled water, 1 μl
Orange dye and 1 μl of DNA sample. The DNA samples of known concentration
(lambda DNA of 5 and 10 ng/μl) were also loaded on to the gel to estimate the DNA
concentration of the experimental samples. The gel was run at 70 V for 20 minutes.
After completing the electrophoresis run, DNA on the gel was visualized under UV
light and photographed. The DNA was normalized to 5 ng/μl concentration with
visual comparison by loading DNA samples with the standard lambda DNA.
3.5.4 Selection of SSR Markers for Diversity Analysis
A total of 26 SSR markers previously reported by Winter et al. (1999) (TA-,
TAA-, GA-, TR- and TS-series), Nayak et al. (2010) (ICCM-series), Thudi et al. (2011)
(CaM-series) and NCPGR- series developed by Sethy et al. (2006a) and Gaur et al.
(2011) were used in this study. The pre-determined SSR markers were selected based
on their coverage and distribution on the linkage groups. The 26 SSR markers
representing all the linkage groups (8 chromosomes) of the chickpea were selected
for diversity analysis (Table 3.7).
3.5.5 Polymerase chain reaction (PCR) amplification
Components of PCR mixture were presented hereunder Table 3.8. PCR
reactions were conducted in 384 well micro-titre plates in a GeneAmp PCR system
9700 Perkin Elmer (Applied Biosystem, USA) DNA thermocycler.
Table 3.8. Components of polymerase chain reaction (PCR) mixture
Component Stock concentration Volume (μl)
DNA 5 ng/μl 1.00
Primers 10 pm/μl 0.50
MgCl2 25 mM 1.00
Buffer 10X 0.50
dNTPs 2 mM 0.25
Taq polymerase enzyme 0.5 U/µl 0.20
Millipore water 1.55
Total 5.00
62
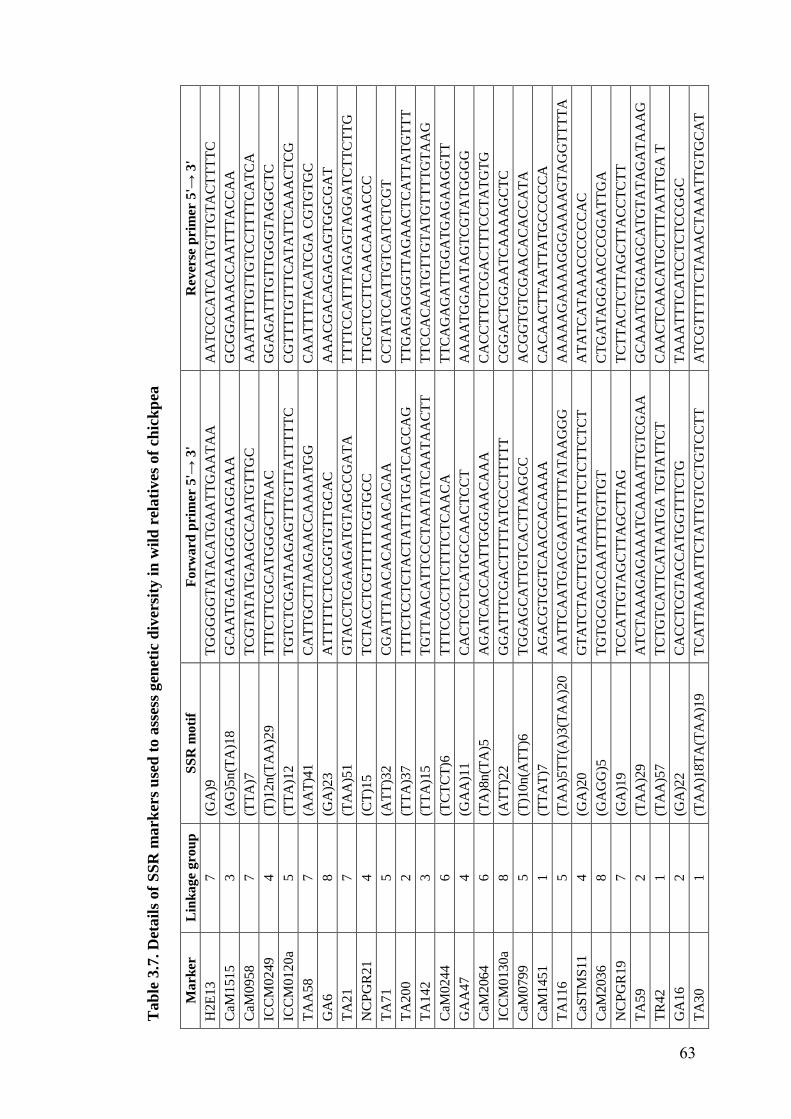
Tab
le 3
.7. D
etail
s of
SS
R m
ark
ers
use
d t
o a
sses
s gen
etic
div
ersi
ty i
n w
ild
rel
ati
ves
of
chic
kp
ea
Mark
er
Lin
kage
gro
up
S
SR
moti
f F
orw
ard
pri
mer
5'→
3'
Rev
erse
pri
mer
5'→
3'
H2E
13
7
(GA
)9
TG
GG
GG
TA
TA
CA
TG
AA
TT
GA
AT
AA
A
AT
CC
CA
TC
AA
TG
TT
GT
AC
TT
TT
C
CaM
1515
3
(AG
)5n
(TA
)18
GC
AA
TG
AG
AA
GG
GA
AG
GA
AA
G
CG
GA
AA
AC
CA
AT
TT
AC
CA
A
CaM
0958
7
(TT
A)7
T
CG
TA
TA
TG
AA
GC
CA
AT
GT
TG
C
AA
AT
TT
TG
TT
GT
CC
TT
TT
CA
TC
A
ICC
M0249
4
(T)1
2n(T
AA
)29
TT
TC
TT
CG
CA
TG
GG
CT
TA
AC
G
GA
GA
TT
TG
TT
GG
GT
AG
GC
TC
ICC
M0120a
5
(TT
A)1
2
TG
TC
TC
GA
TA
AG
AG
TT
TG
TT
AT
TT
TT
C
CG
TT
TT
GT
TT
CA
TA
TT
CA
AA
CT
CG
TA
A58
7
(AA
T)4
1
CA
TT
GC
TT
AA
GA
AC
CA
AA
AT
GG
C
AA
TT
TT
AC
AT
CG
A C
GT
GT
GC
GA
6
8
(GA
)23
AT
TT
TT
CT
CC
GG
TG
TT
GC
AC
A
AA
CG
AC
AG
AG
AG
TG
GC
GA
T
TA
21
7
(TA
A)5
1
GT
AC
CT
CG
AA
GA
TG
TA
GC
CG
AT
A
TT
TT
CC
AT
TT
AG
AG
TA
GG
AT
CT
TC
TT
G
NC
PG
R21
4
(CT
)15
TC
TA
CC
TC
GT
TT
TT
CG
TG
CC
T
TG
CT
CC
TT
CA
AC
AA
AA
CC
C
TA
71
5
(AT
T)3
2
CG
AT
TT
AA
CA
CA
AA
AC
AC
AA
C
CT
AT
CC
AT
TG
TC
AT
CT
CG
T
TA
200
2
(TT
A)3
7
TT
TC
TC
CT
CT
AC
TA
TT
AT
GA
TC
AC
CA
G
TT
GA
GA
GG
GT
TA
GA
AC
TC
AT
TA
TG
TT
T
TA
142
3
(TT
A)1
5
TG
TT
AA
CA
TT
CC
CT
AA
TA
TC
AA
TA
AC
TT
T
TC
CA
CA
AT
GT
TG
TA
TG
TT
TT
GT
AA
G
CaM
0244
6
(TC
TC
T)6
T
TT
CC
CC
TT
CT
TT
CT
CA
AC
A
TT
CA
GA
GA
TT
GG
AT
GA
GA
AG
GT
T
GA
A47
4
(GA
A)1
1
CA
CT
CC
TC
AT
GC
CA
AC
TC
CT
A
AA
AT
GG
AA
TA
GT
CG
TA
TG
GG
G
CaM
2064
6
(TA
)8n
(TA
)5
AG
AT
CA
CC
AA
TT
GG
GA
AC
AA
A
CA
CC
TT
CT
CG
AC
TT
TC
CT
AT
GT
G
ICC
M0130a
8
(AT
T)2
2
GG
AT
TT
CG
AC
TT
TT
AT
CC
CT
TT
TT
C
GG
AC
TG
GA
AT
CA
AA
AG
CT
C
CaM
0799
5
(T)1
0n(A
TT
)6
TG
GA
GC
AT
TG
TC
AC
TT
AA
GC
C
AC
GG
TG
TC
GA
AC
AC
AC
CA
TA
CaM
1451
1
(TT
AT
)7
AG
AC
GT
GG
TC
AA
CC
AC
AA
AA
C
AC
AA
CT
TA
AT
TA
TG
CC
CC
CA
TA
116
5
(TA
A)5
TT
(A)3
(TA
A)2
0
AA
TT
CA
AT
GA
CG
AA
TT
TT
TA
TA
AG
GG
A
AA
AA
GA
AA
AG
GG
AA
AA
GT
AG
GT
TT
TA
CaS
TM
S11
4
(GA
)20
GT
AT
CT
AC
TT
GT
AA
TA
TT
CT
CT
TC
TC
T
AT
AT
CA
TA
AA
CC
CC
CC
AC
CaM
2036
8
(GA
GG
)5
TG
TG
CG
AC
CA
AT
TT
TG
TT
GT
C
TG
AT
AG
GA
AC
CC
GG
AT
TG
A
NC
PG
R19
7
(GA
)19
TC
CA
TT
GT
AG
CT
TA
GC
TT
AG
T
CT
TA
CT
CT
TA
GC
TT
AC
CT
CT
T
TA
59
2
(TA
A)2
9
AT
CT
AA
AG
AG
AA
AT
CA
AA
AT
TG
TC
GA
A
GC
AA
AT
GT
GA
AG
CA
TG
TA
TA
GA
TA
AA
G
TR
42
1
(TA
A)5
7
TC
TG
TC
AT
TC
AT
AA
TG
A T
GT
AT
TC
T
CA
AC
TC
AA
CA
TG
CT
TT
AA
TT
GA
T
GA
16
2
(GA
)22
CA
CC
TC
GT
AC
CA
TG
GT
TT
CT
G
TA
AA
TT
TC
AT
CC
TC
TC
CG
GC
TA
30
1
(TA
A)1
8T
A(T
AA
)19
TC
AT
TA
AA
AT
TC
TA
TT
GT
CC
TG
TC
CT
T
AT
CG
TT
TT
TC
TA
AA
CT
AA
AT
TG
TG
CA
T
63
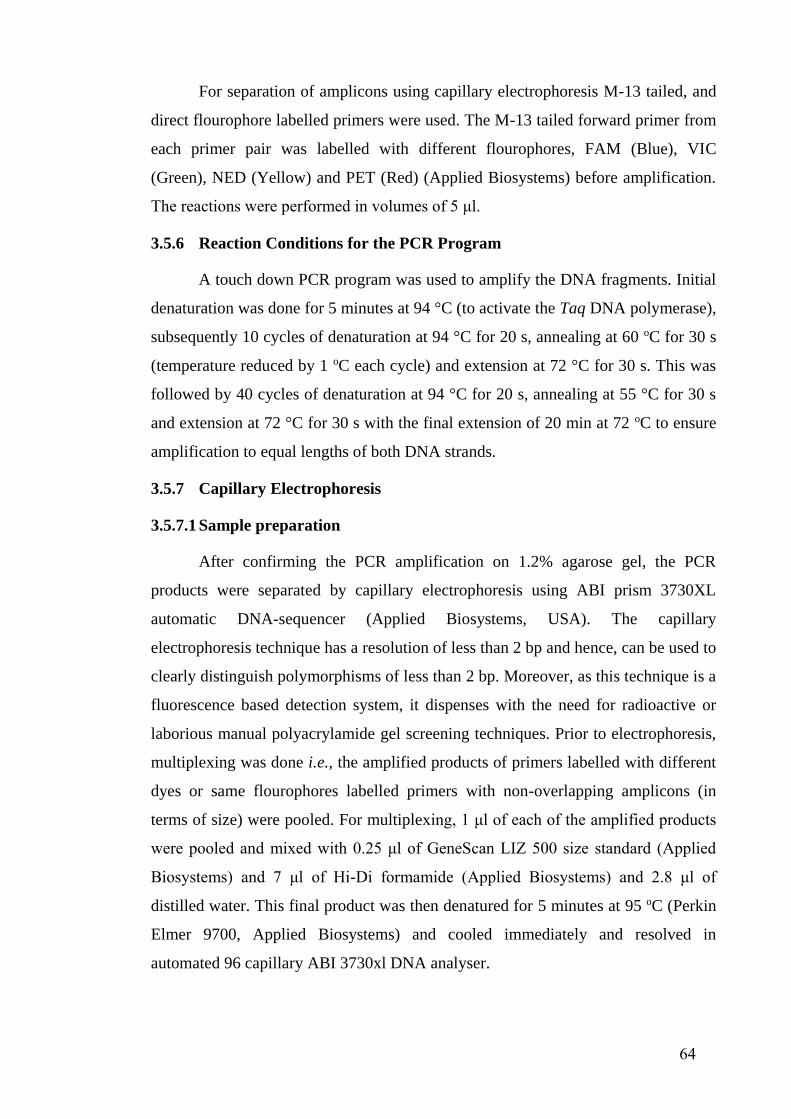
For separation of amplicons using capillary electrophoresis M-13 tailed, and
direct flourophore labelled primers were used. The M-13 tailed forward primer from
each primer pair was labelled with different flourophores, FAM (Blue), VIC
(Green), NED (Yellow) and PET (Red) (Applied Biosystems) before amplification.
The reactions were performed in volumes of 5 μl.
3.5.6 Reaction Conditions for the PCR Program
A touch down PCR program was used to amplify the DNA fragments. Initial
denaturation was done for 5 minutes at 94 °C (to activate the Taq DNA polymerase),
subsequently 10 cycles of denaturation at 94 °C for 20 s, annealing at 60 oC for 30 s
(temperature reduced by 1 oC each cycle) and extension at 72 °C for 30 s. This was
followed by 40 cycles of denaturation at 94 °C for 20 s, annealing at 55 °C for 30 s
and extension at 72 °C for 30 s with the final extension of 20 min at 72 oC to ensure
amplification to equal lengths of both DNA strands.
3.5.7 Capillary Electrophoresis
3.5.7.1 Sample preparation
After confirming the PCR amplification on 1.2% agarose gel, the PCR
products were separated by capillary electrophoresis using ABI prism 3730XL
automatic DNA-sequencer (Applied Biosystems, USA). The capillary
electrophoresis technique has a resolution of less than 2 bp and hence, can be used to
clearly distinguish polymorphisms of less than 2 bp. Moreover, as this technique is a
fluorescence based detection system, it dispenses with the need for radioactive or
laborious manual polyacrylamide gel screening techniques. Prior to electrophoresis,
multiplexing was done i.e., the amplified products of primers labelled with different
dyes or same flourophores labelled primers with non-overlapping amplicons (in
terms of size) were pooled. For multiplexing, 1 μl of each of the amplified products
were pooled and mixed with 0.25 μl of GeneScan LIZ 500 size standard (Applied
Biosystems) and 7 μl of Hi-Di formamide (Applied Biosystems) and 2.8 μl of
distilled water. This final product was then denatured for 5 minutes at 95 oC (Perkin
Elmer 9700, Applied Biosystems) and cooled immediately and resolved in
automated 96 capillary ABI 3730xl DNA analyser.
64
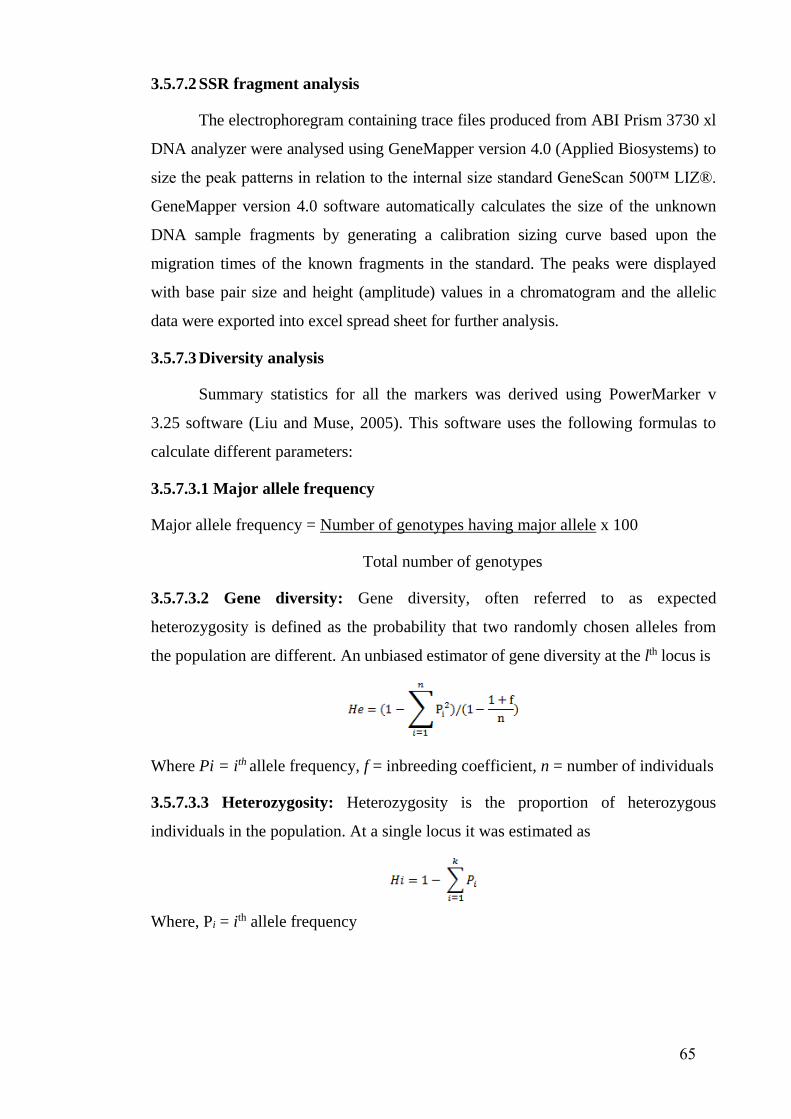
3.5.7.2 SSR fragment analysis
The electrophoregram containing trace files produced from ABI Prism 3730 xl
DNA analyzer were analysed using GeneMapper version 4.0 (Applied Biosystems) to
size the peak patterns in relation to the internal size standard GeneScan 500™ LIZ®.
GeneMapper version 4.0 software automatically calculates the size of the unknown
DNA sample fragments by generating a calibration sizing curve based upon the
migration times of the known fragments in the standard. The peaks were displayed
with base pair size and height (amplitude) values in a chromatogram and the allelic
data were exported into excel spread sheet for further analysis.
3.5.7.3 Diversity analysis
Summary statistics for all the markers was derived using PowerMarker v
3.25 software (Liu and Muse, 2005). This software uses the following formulas to
calculate different parameters:
3.5.7.3.1 Major allele frequency
Major allele frequency = Number of genotypes having major allele x 100
Total number of genotypes
3.5.7.3.2 Gene diversity: Gene diversity, often referred to as expected
heterozygosity is defined as the probability that two randomly chosen alleles from
the population are different. An unbiased estimator of gene diversity at the lth locus is
Where Pi = ith allele frequency, f = inbreeding coefficient, n = number of individuals
3.5.7.3.3 Heterozygosity: Heterozygosity is the proportion of heterozygous
individuals in the population. At a single locus it was estimated as
Where, Pi = ith allele frequency
65
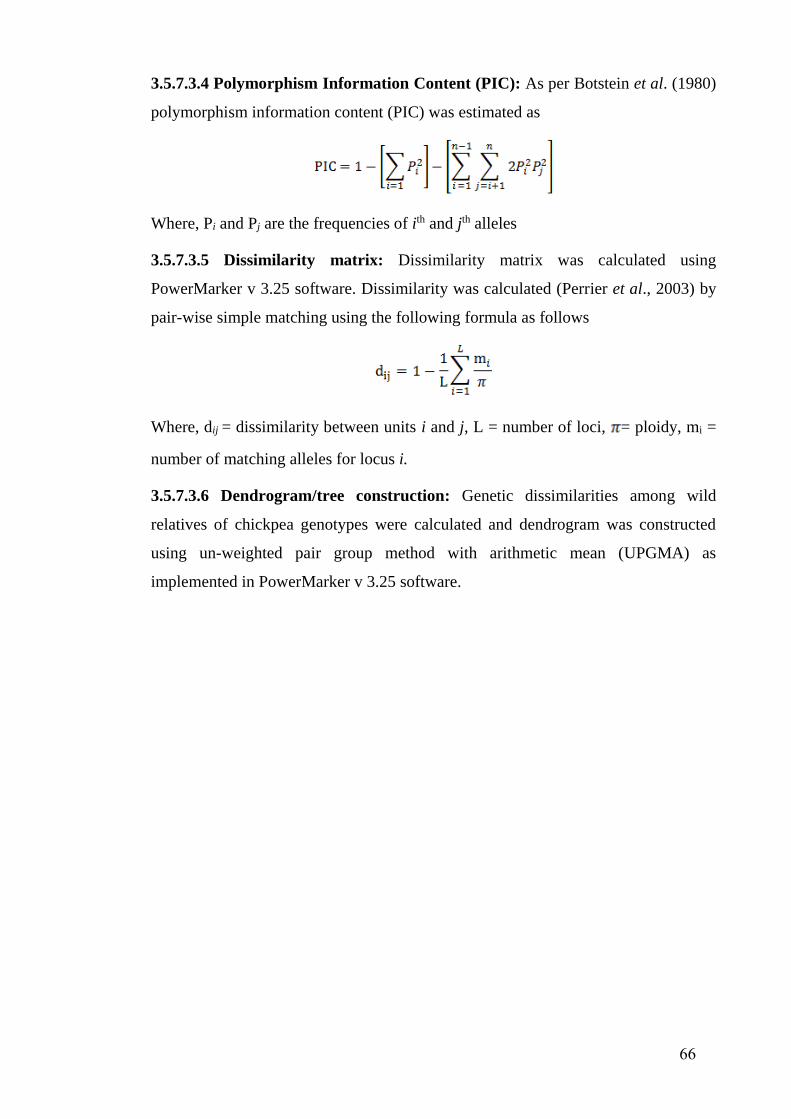
3.5.7.3.4 Polymorphism Information Content (PIC): As per Botstein et al. (1980)
polymorphism information content (PIC) was estimated as
Where, Pi and Pj are the frequencies of ith and jth alleles
3.5.7.3.5 Dissimilarity matrix: Dissimilarity matrix was calculated using
PowerMarker v 3.25 software. Dissimilarity was calculated (Perrier et al., 2003) by
pair-wise simple matching using the following formula as follows
Where, dij = dissimilarity between units i and j, L = number of loci, = ploidy, mi =
number of matching alleles for locus i.
3.5.7.3.6 Dendrogram/tree construction: Genetic dissimilarities among wild
relatives of chickpea genotypes were calculated and dendrogram was constructed
using un-weighted pair group method with arithmetic mean (UPGMA) as
implemented in PowerMarker v 3.25 software.
66

IV
Chapter IV
RESULTS AND DISCUSSION
The results of the present investigation “Biochemical and molecular
mechanisms of resistance to Helicoverpa armigera (Hubner) in wild relatives of
chickpea” are presented hereunder. The experiments were conducted in the field,
glasshouse and laboratory conditions at the International Crops Research Institute
for the Semi-Arid Tropics (ICRISAT), Patancheru, Telangana State, India, during
2014-15 and 2015-16.
4.1 ABUNDANCE OF POD BORERS, Helicoverpa armigera AND
Spodoptera exigua ON WILD RELATIVES OF CHICKPEA
UNDER NATURAL INFESTATION
Under field conditions, observations were recorded on abundance of pod
borers on wild relatives of chickpea at fortnight intervals during post-rainy season
2014-15 and 2015-16. The results are presented hereunder (Table 4.1 to 4.14).
4.1.1 Oviposition by the H. armigera on Different Genotypes of Wild Relatives
of Chickpea
Oviposition by H. armigera was not significantly different among genotypes
except at 75 days after emergence (DAE) during post-rainy season, 2014-15 (Table
4.5). Highest number of eggs per five plants were recorded on PI 599109 (9.00)
followed by PI 599046 (3.50), IG 70018 (3.00), IG 70006 (2.50), ICC 3137 (2.00),
IG 70022 (1.00) and PI 599077 (1.00) while no oviposition was observed on other
genotypes. During post-rainy season, 2015-16 no significant differences were
observed among genotypes in terms of number of eggs per five plants except at 15
DAE (Table 4.8). Highest number of eggs per five plants was observed on KAK 2
and IG 72933 (3.00), while no ovipostion was observed on IG 599076, IG 69979, IG
70006, IG 70022, PI 510663, PI 599046, PI 599077 and PI 599109. Oviposition was
not observed on any genotype at 60, 90 and 105 DAE.
The peak oviposition activity was observed on all genotypes at 30 DAE i.e.
last week of November with a range of 11.50 in IG 70006 and 0.50 in PI 510663 and
again reduced at 45 and 60 DAE during post-rainy season, 2014-15. Suganthy et al.
(2003) reported that number of eggs laid by H. armigera per 20 plants were high
67
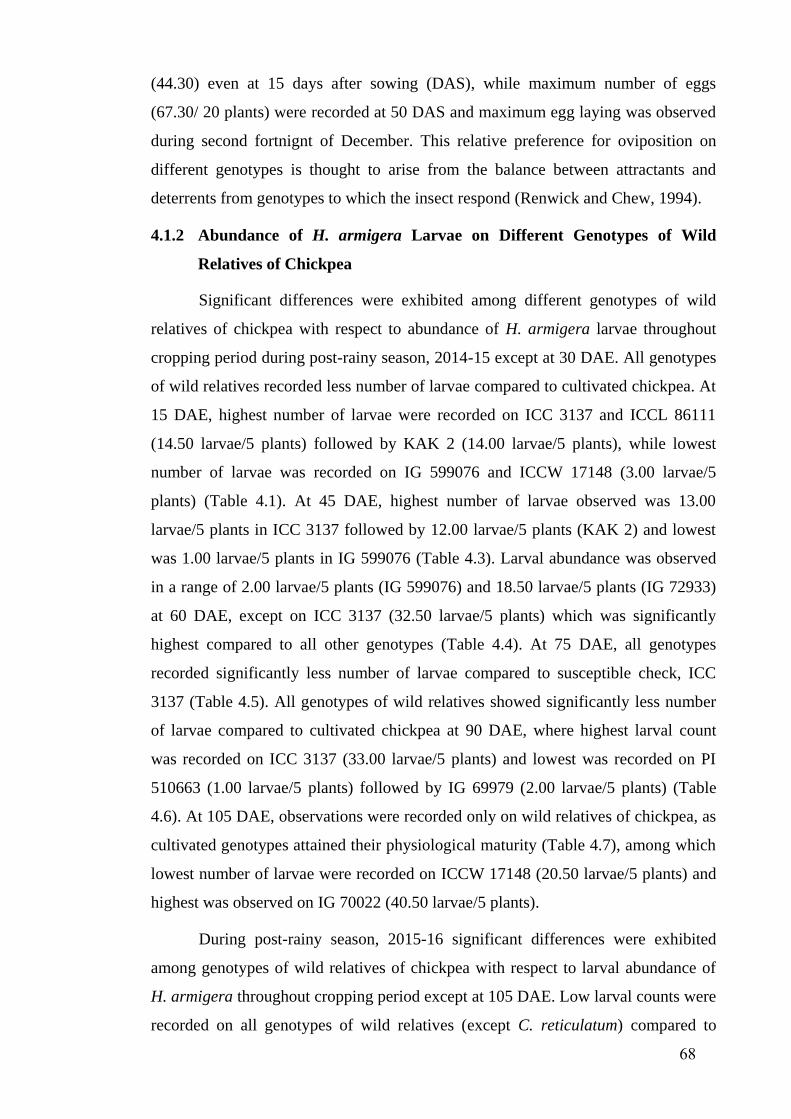
(44.30) even at 15 days after sowing (DAS), while maximum number of eggs
(67.30/ 20 plants) were recorded at 50 DAS and maximum egg laying was observed
during second fortnignt of December. This relative preference for oviposition on
different genotypes is thought to arise from the balance between attractants and
deterrents from genotypes to which the insect respond (Renwick and Chew, 1994).
4.1.2 Abundance of H. armigera Larvae on Different Genotypes of Wild
Relatives of Chickpea
Significant differences were exhibited among different genotypes of wild
relatives of chickpea with respect to abundance of H. armigera larvae throughout
cropping period during post-rainy season, 2014-15 except at 30 DAE. All genotypes
of wild relatives recorded less number of larvae compared to cultivated chickpea. At
15 DAE, highest number of larvae were recorded on ICC 3137 and ICCL 86111
(14.50 larvae/5 plants) followed by KAK 2 (14.00 larvae/5 plants), while lowest
number of larvae was recorded on IG 599076 and ICCW 17148 (3.00 larvae/5
plants) (Table 4.1). At 45 DAE, highest number of larvae observed was 13.00
larvae/5 plants in ICC 3137 followed by 12.00 larvae/5 plants (KAK 2) and lowest
was 1.00 larvae/5 plants in IG 599076 (Table 4.3). Larval abundance was observed
in a range of 2.00 larvae/5 plants (IG 599076) and 18.50 larvae/5 plants (IG 72933)
at 60 DAE, except on ICC 3137 (32.50 larvae/5 plants) which was significantly
highest compared to all other genotypes (Table 4.4). At 75 DAE, all genotypes
recorded significantly less number of larvae compared to susceptible check, ICC
3137 (Table 4.5). All genotypes of wild relatives showed significantly less number
of larvae compared to cultivated chickpea at 90 DAE, where highest larval count
was recorded on ICC 3137 (33.00 larvae/5 plants) and lowest was recorded on PI
510663 (1.00 larvae/5 plants) followed by IG 69979 (2.00 larvae/5 plants) (Table
4.6). At 105 DAE, observations were recorded only on wild relatives of chickpea, as
cultivated genotypes attained their physiological maturity (Table 4.7), among which
lowest number of larvae were recorded on ICCW 17148 (20.50 larvae/5 plants) and
highest was observed on IG 70022 (40.50 larvae/5 plants).
During post-rainy season, 2015-16 significant differences were exhibited
among genotypes of wild relatives of chickpea with respect to larval abundance of
H. armigera throughout cropping period except at 105 DAE. Low larval counts were
recorded on all genotypes of wild relatives (except C. reticulatum) compared to
68
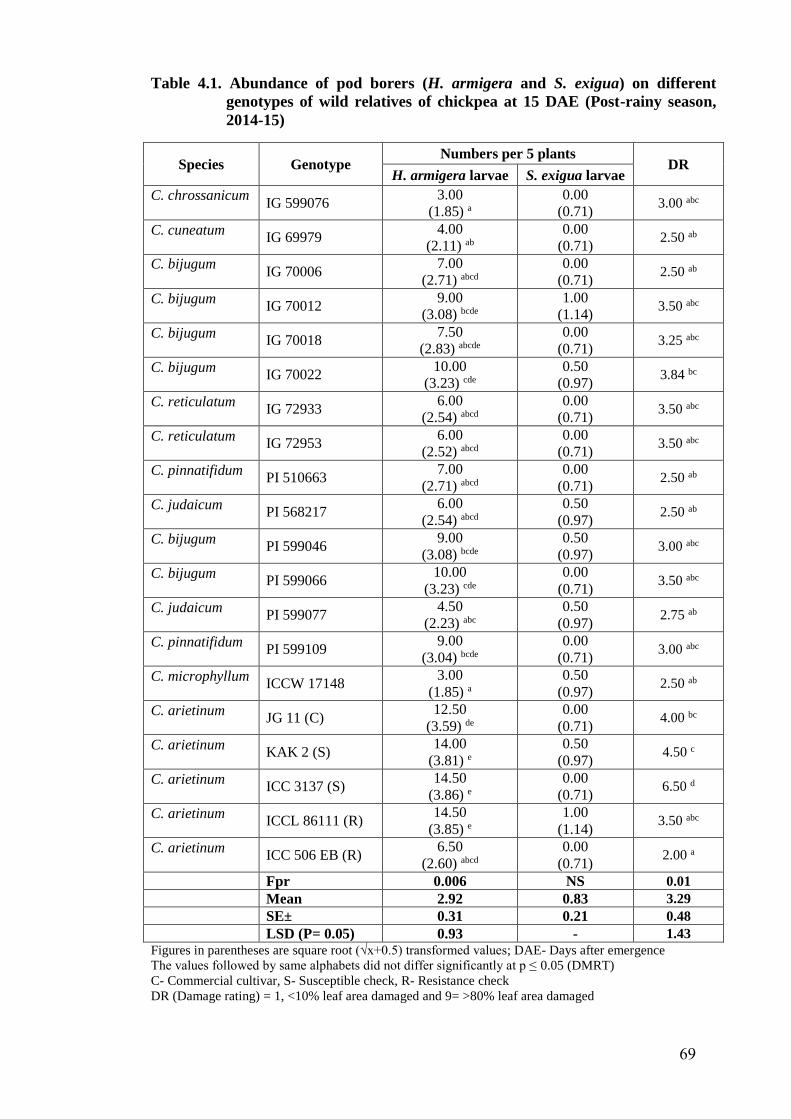
Table 4.1. Abundance of pod borers (H. armigera and S. exigua) on different
genotypes of wild relatives of chickpea at 15 DAE (Post-rainy season,
2014-15)
Species Genotype Numbers per 5 plants
DR H. armigera larvae S. exigua larvae
C. chrossanicum IG 599076
3.00
(1.85) a
0.00
(0.71) 3.00 abc
C. cuneatum IG 69979
4.00
(2.11) ab
0.00
(0.71) 2.50 ab
C. bijugum IG 70006
7.00
(2.71) abcd
0.00
(0.71) 2.50 ab
C. bijugum IG 70012
9.00
(3.08) bcde
1.00
(1.14) 3.50 abc
C. bijugum IG 70018
7.50
(2.83) abcde
0.00
(0.71) 3.25 abc
C. bijugum IG 70022
10.00
(3.23) cde
0.50
(0.97) 3.84 bc
C. reticulatum IG 72933
6.00
(2.54) abcd
0.00
(0.71) 3.50 abc
C. reticulatum IG 72953
6.00
(2.52) abcd
0.00
(0.71) 3.50 abc
C. pinnatifidum PI 510663
7.00
(2.71) abcd
0.00
(0.71) 2.50 ab
C. judaicum PI 568217
6.00
(2.54) abcd
0.50
(0.97) 2.50 ab
C. bijugum PI 599046
9.00
(3.08) bcde
0.50
(0.97) 3.00 abc
C. bijugum PI 599066
10.00
(3.23) cde
0.00
(0.71) 3.50 abc
C. judaicum PI 599077
4.50
(2.23) abc
0.50
(0.97) 2.75 ab
C. pinnatifidum PI 599109
9.00
(3.04) bcde
0.00
(0.71) 3.00 abc
C. microphyllum ICCW 17148
3.00
(1.85) a
0.50
(0.97) 2.50 ab
C. arietinum JG 11 (C)
12.50
(3.59) de
0.00
(0.71) 4.00 bc
C. arietinum KAK 2 (S)
14.00
(3.81) e
0.50
(0.97) 4.50 c
C. arietinum ICC 3137 (S)
14.50
(3.86) e
0.00
(0.71) 6.50 d
C. arietinum ICCL 86111 (R)
14.50
(3.85) e
1.00
(1.14) 3.50 abc
C. arietinum ICC 506 EB (R)
6.50
(2.60) abcd
0.00
(0.71) 2.00 a
Fpr 0.006 NS 0.01
Mean 2.92 0.83 3.29
SE± 0.31 0.21 0.48
LSD (P= 0.05) 0.93 - 1.43
Figures in parentheses are square root (√x+0.5) transformed values; DAE- Days after emergence
The values followed by same alphabets did not differ significantly at p ≤ 0.05 (DMRT)
C- Commercial cultivar, S- Susceptible check, R- Resistance check
DR (Damage rating) = 1, <10% leaf area damaged and 9= >80% leaf area damaged
69
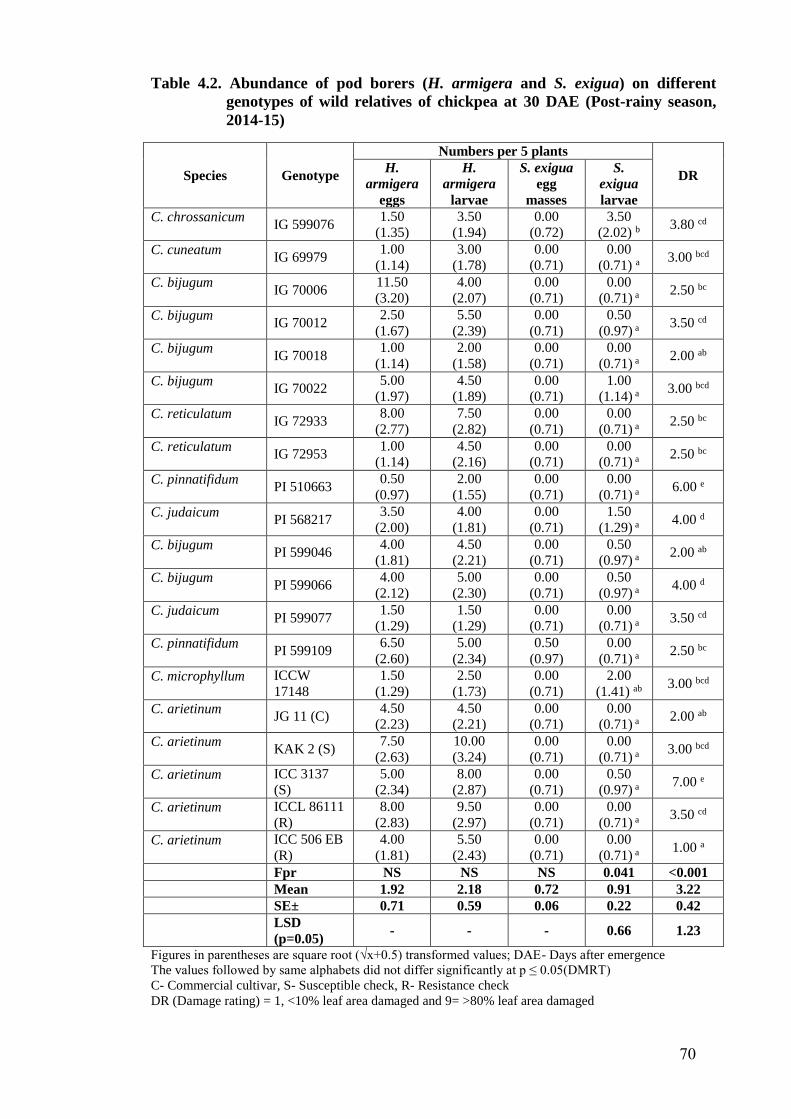
Table 4.2. Abundance of pod borers (H. armigera and S. exigua) on different
genotypes of wild relatives of chickpea at 30 DAE (Post-rainy season,
2014-15)
Species Genotype
Numbers per 5 plants
DR H.
armigera
eggs
H.
armigera
larvae
S. exigua
egg
masses
S.
exigua
larvae
C. chrossanicum IG 599076
1.50
(1.35)
3.50
(1.94)
0.00
(0.72)
3.50
(2.02) b 3.80 cd
C. cuneatum IG 69979
1.00
(1.14)
3.00
(1.78)
0.00
(0.71)
0.00
(0.71) a 3.00 bcd
C. bijugum IG 70006
11.50
(3.20)
4.00
(2.07)
0.00
(0.71)
0.00
(0.71) a 2.50 bc
C. bijugum IG 70012
2.50
(1.67)
5.50
(2.39)
0.00
(0.71)
0.50
(0.97) a 3.50 cd
C. bijugum IG 70018
1.00
(1.14)
2.00
(1.58)
0.00
(0.71)
0.00
(0.71) a 2.00 ab
C. bijugum IG 70022
5.00
(1.97)
4.50
(1.89)
0.00
(0.71)
1.00
(1.14) a 3.00 bcd
C. reticulatum IG 72933
8.00
(2.77)
7.50
(2.82)
0.00
(0.71)
0.00
(0.71) a 2.50 bc
C. reticulatum IG 72953
1.00
(1.14)
4.50
(2.16)
0.00
(0.71)
0.00
(0.71) a 2.50 bc
C. pinnatifidum PI 510663
0.50
(0.97)
2.00
(1.55)
0.00
(0.71)
0.00
(0.71) a 6.00 e
C. judaicum PI 568217
3.50
(2.00)
4.00
(1.81)
0.00
(0.71)
1.50
(1.29) a 4.00 d
C. bijugum PI 599046
4.00
(1.81)
4.50
(2.21)
0.00
(0.71)
0.50
(0.97) a 2.00 ab
C. bijugum PI 599066
4.00
(2.12)
5.00
(2.30)
0.00
(0.71)
0.50
(0.97) a 4.00 d
C. judaicum PI 599077
1.50
(1.29)
1.50
(1.29)
0.00
(0.71)
0.00
(0.71) a 3.50 cd
C. pinnatifidum PI 599109
6.50
(2.60)
5.00
(2.34)
0.50
(0.97)
0.00
(0.71) a 2.50 bc
C. microphyllum ICCW
17148
1.50
(1.29)
2.50
(1.73)
0.00
(0.71)
2.00
(1.41) ab 3.00 bcd
C. arietinum JG 11 (C)
4.50
(2.23)
4.50
(2.21)
0.00
(0.71)
0.00
(0.71) a 2.00 ab
C. arietinum KAK 2 (S)
7.50
(2.63)
10.00
(3.24)
0.00
(0.71)
0.00
(0.71) a 3.00 bcd
C. arietinum ICC 3137
(S)
5.00
(2.34)
8.00
(2.87)
0.00
(0.71)
0.50
(0.97) a 7.00 e
C. arietinum ICCL 86111
(R)
8.00
(2.83)
9.50
(2.97)
0.00
(0.71)
0.00
(0.71) a 3.50 cd
C. arietinum ICC 506 EB
(R)
4.00
(1.81)
5.50
(2.43)
0.00
(0.71)
0.00
(0.71) a 1.00 a
Fpr NS NS NS 0.041 <0.001
Mean 1.92 2.18 0.72 0.91 3.22
SE± 0.71 0.59 0.06 0.22 0.42
LSD
(p=0.05) - - - 0.66 1.23
Figures in parentheses are square root (√x+0.5) transformed values; DAE- Days after emergence
The values followed by same alphabets did not differ significantly at p ≤ 0.05(DMRT)
C- Commercial cultivar, S- Susceptible check, R- Resistance check
DR (Damage rating) = 1, <10% leaf area damaged and 9= >80% leaf area damaged
70
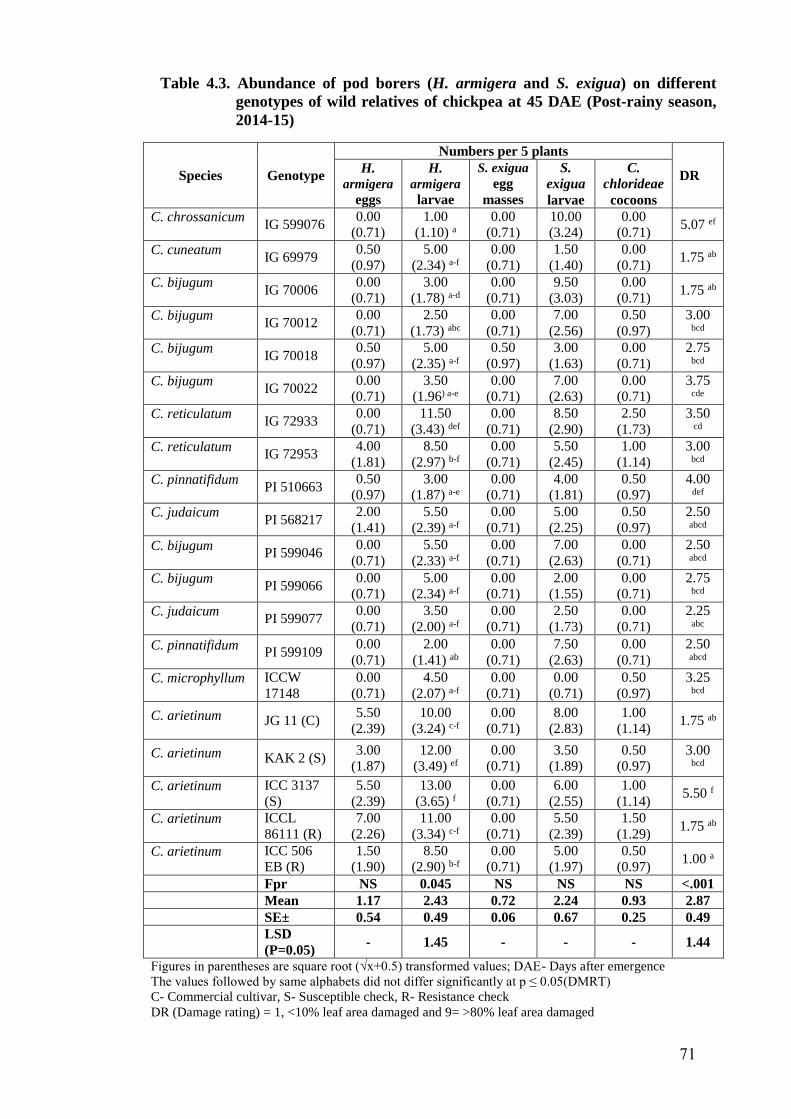
Table 4.3. Abundance of pod borers (H. armigera and S. exigua) on different
genotypes of wild relatives of chickpea at 45 DAE (Post-rainy season,
2014-15)
Species Genotype
Numbers per 5 plants
DR H.
armigera
eggs
H. armigera
larvae
S. exigua
egg
masses
S.
exigua
larvae
C.
chlorideae
cocoons
C. chrossanicum IG 599076
0.00
(0.71)
1.00
(1.10) a
0.00
(0.71)
10.00
(3.24)
0.00
(0.71) 5.07 ef
C. cuneatum IG 69979
0.50
(0.97)
5.00
(2.34) a-f
0.00
(0.71)
1.50
(1.40)
0.00
(0.71) 1.75 ab
C. bijugum IG 70006
0.00
(0.71)
3.00
(1.78) a-d
0.00
(0.71)
9.50
(3.03)
0.00
(0.71) 1.75 ab
C. bijugum IG 70012
0.00
(0.71)
2.50
(1.73) abc
0.00
(0.71)
7.00
(2.56)
0.50
(0.97)
3.00 bcd
C. bijugum IG 70018
0.50
(0.97)
5.00
(2.35) a-f
0.50
(0.97)
3.00
(1.63)
0.00
(0.71)
2.75 bcd
C. bijugum IG 70022
0.00
(0.71)
3.50
(1.96) a-e
0.00
(0.71)
7.00
(2.63)
0.00
(0.71)
3.75 cde
C. reticulatum IG 72933
0.00
(0.71)
11.50
(3.43) def
0.00
(0.71)
8.50
(2.90)
2.50
(1.73)
3.50 cd
C. reticulatum IG 72953
4.00
(1.81)
8.50
(2.97) b-f
0.00
(0.71)
5.50
(2.45)
1.00
(1.14)
3.00 bcd
C. pinnatifidum PI 510663
0.50
(0.97)
3.00
(1.87) a-e
0.00
(0.71)
4.00
(1.81)
0.50
(0.97)
4.00 def
C. judaicum PI 568217
2.00
(1.41)
5.50
(2.39) a-f
0.00
(0.71)
5.00
(2.25)
0.50
(0.97)
2.50 abcd
C. bijugum PI 599046
0.00
(0.71)
5.50
(2.33) a-f
0.00
(0.71)
7.00
(2.63)
0.00
(0.71)
2.50 abcd
C. bijugum PI 599066
0.00
(0.71)
5.00
(2.34) a-f
0.00
(0.71)
2.00
(1.55)
0.00
(0.71)
2.75 bcd
C. judaicum PI 599077
0.00
(0.71)
3.50
(2.00) a-f
0.00
(0.71)
2.50
(1.73)
0.00
(0.71)
2.25 abc
C. pinnatifidum PI 599109
0.00
(0.71)
2.00
(1.41) ab
0.00
(0.71)
7.50
(2.63)
0.00
(0.71)
2.50 abcd
C. microphyllum ICCW
17148
0.00
(0.71)
4.50
(2.07) a-f
0.00
(0.71)
0.00
(0.71)
0.50
(0.97)
3.25 bcd
C. arietinum JG 11 (C) 5.50
(2.39)
10.00
(3.24) c-f
0.00
(0.71)
8.00
(2.83)
1.00
(1.14) 1.75 ab
C. arietinum KAK 2 (S) 3.00
(1.87)
12.00
(3.49) ef
0.00
(0.71)
3.50
(1.89)
0.50
(0.97)
3.00 bcd
C. arietinum ICC 3137
(S)
5.50
(2.39)
13.00
(3.65) f
0.00
(0.71)
6.00
(2.55)
1.00
(1.14) 5.50 f
C. arietinum ICCL
86111 (R)
7.00
(2.26)
11.00
(3.34) c-f
0.00
(0.71)
5.50
(2.39)
1.50
(1.29) 1.75 ab
C. arietinum ICC 506
EB (R)
1.50
(1.90)
8.50
(2.90) b-f
0.00
(0.71)
5.00
(1.97)
0.50
(0.97) 1.00 a
Fpr NS 0.045 NS NS NS <.001
Mean 1.17 2.43 0.72 2.24 0.93 2.87
SE± 0.54 0.49 0.06 0.67 0.25 0.49
LSD
(P=0.05) - 1.45 - - - 1.44
Figures in parentheses are square root (√x+0.5) transformed values; DAE- Days after emergence
The values followed by same alphabets did not differ significantly at p ≤ 0.05(DMRT)
C- Commercial cultivar, S- Susceptible check, R- Resistance check
DR (Damage rating) = 1, <10% leaf area damaged and 9= >80% leaf area damaged
71
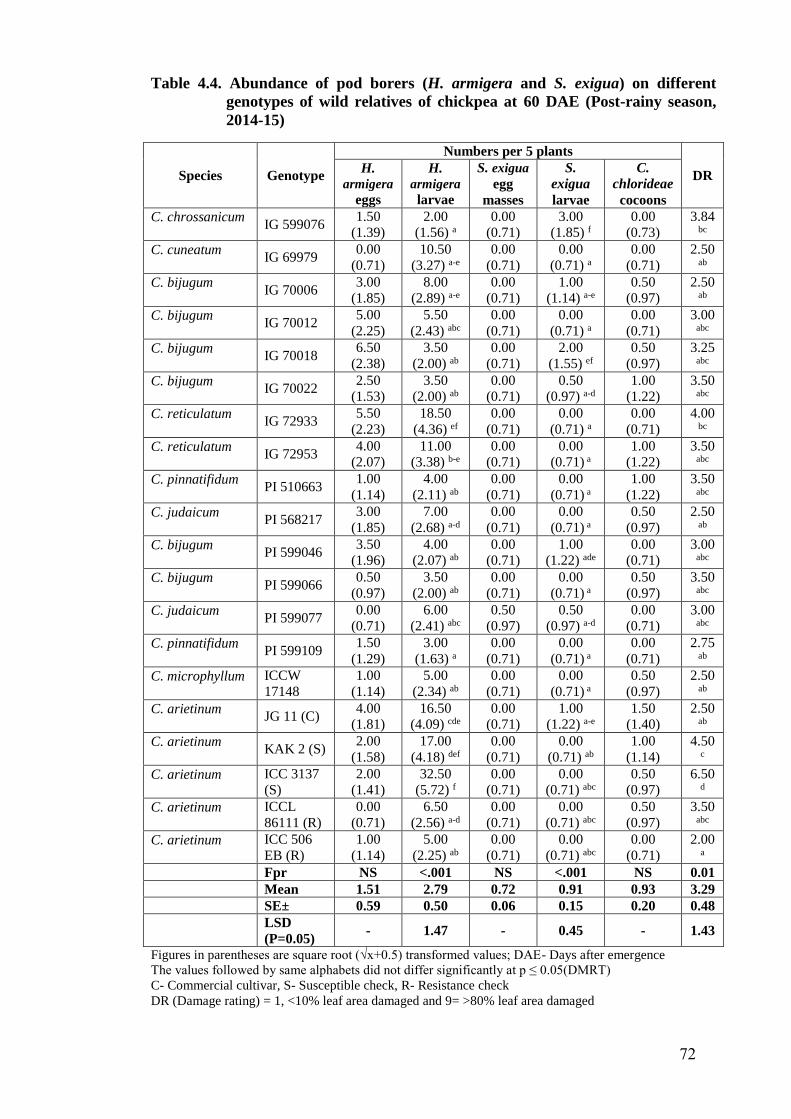
Table 4.4. Abundance of pod borers (H. armigera and S. exigua) on different
genotypes of wild relatives of chickpea at 60 DAE (Post-rainy season,
2014-15)
Species Genotype
Numbers per 5 plants
DR H.
armigera
eggs
H. armigera
larvae
S. exigua
egg
masses
S.
exigua
larvae
C.
chlorideae
cocoons
C. chrossanicum IG 599076
1.50
(1.39)
2.00
(1.56) a
0.00
(0.71)
3.00
(1.85) f
0.00
(0.73)
3.84 bc
C. cuneatum IG 69979
0.00
(0.71)
10.50
(3.27) a-e
0.00
(0.71)
0.00
(0.71) a
0.00
(0.71)
2.50 ab
C. bijugum IG 70006
3.00
(1.85)
8.00
(2.89) a-e
0.00
(0.71)
1.00
(1.14) a-e
0.50
(0.97)
2.50 ab
C. bijugum IG 70012
5.00
(2.25)
5.50
(2.43) abc
0.00
(0.71)
0.00
(0.71) a
0.00
(0.71)
3.00 abc
C. bijugum IG 70018
6.50
(2.38)
3.50
(2.00) ab
0.00
(0.71)
2.00
(1.55) ef
0.50
(0.97)
3.25 abc
C. bijugum IG 70022
2.50
(1.53)
3.50
(2.00) ab
0.00
(0.71)
0.50
(0.97) a-d
1.00
(1.22)
3.50 abc
C. reticulatum IG 72933
5.50
(2.23)
18.50
(4.36) ef
0.00
(0.71)
0.00
(0.71) a
0.00
(0.71)
4.00 bc
C. reticulatum IG 72953
4.00
(2.07)
11.00
(3.38) b-e
0.00
(0.71)
0.00
(0.71) a
1.00
(1.22)
3.50 abc
C. pinnatifidum PI 510663
1.00
(1.14)
4.00
(2.11) ab
0.00
(0.71)
0.00
(0.71) a
1.00
(1.22)
3.50 abc
C. judaicum PI 568217
3.00
(1.85)
7.00
(2.68) a-d
0.00
(0.71)
0.00
(0.71) a
0.50
(0.97)
2.50 ab
C. bijugum PI 599046
3.50
(1.96)
4.00
(2.07) ab
0.00
(0.71)
1.00
(1.22) ade
0.00
(0.71)
3.00 abc
C. bijugum PI 599066
0.50
(0.97)
3.50
(2.00) ab
0.00
(0.71)
0.00
(0.71) a
0.50
(0.97)
3.50 abc
C. judaicum PI 599077
0.00
(0.71)
6.00
(2.41) abc
0.50
(0.97)
0.50
(0.97) a-d
0.00
(0.71)
3.00 abc
C. pinnatifidum PI 599109
1.50
(1.29)
3.00
(1.63) a
0.00
(0.71)
0.00
(0.71) a
0.00
(0.71)
2.75 ab
C. microphyllum ICCW
17148
1.00
(1.14)
5.00
(2.34) ab
0.00
(0.71)
0.00
(0.71) a
0.50
(0.97)
2.50 ab
C. arietinum JG 11 (C)
4.00
(1.81)
16.50
(4.09) cde
0.00
(0.71)
1.00
(1.22) a-e
1.50
(1.40)
2.50 ab
C. arietinum KAK 2 (S)
2.00
(1.58)
17.00
(4.18) def
0.00
(0.71)
0.00
(0.71) ab
1.00
(1.14)
4.50 c
C. arietinum ICC 3137
(S)
2.00
(1.41)
32.50
(5.72) f
0.00
(0.71)
0.00
(0.71) abc
0.50
(0.97)
6.50 d
C. arietinum ICCL
86111 (R)
0.00
(0.71)
6.50
(2.56) a-d
0.00
(0.71)
0.00
(0.71) abc
0.50
(0.97)
3.50 abc
C. arietinum ICC 506
EB (R)
1.00
(1.14)
5.00
(2.25) ab
0.00
(0.71)
0.00
(0.71) abc
0.00
(0.71)
2.00 a
Fpr NS <.001 NS <.001 NS 0.01
Mean 1.51 2.79 0.72 0.91 0.93 3.29
SE± 0.59 0.50 0.06 0.15 0.20 0.48
LSD
(P=0.05) - 1.47 - 0.45 - 1.43
Figures in parentheses are square root (√x+0.5) transformed values; DAE- Days after emergence
The values followed by same alphabets did not differ significantly at p ≤ 0.05(DMRT)
C- Commercial cultivar, S- Susceptible check, R- Resistance check
DR (Damage rating) = 1, <10% leaf area damaged and 9= >80% leaf area damaged
72
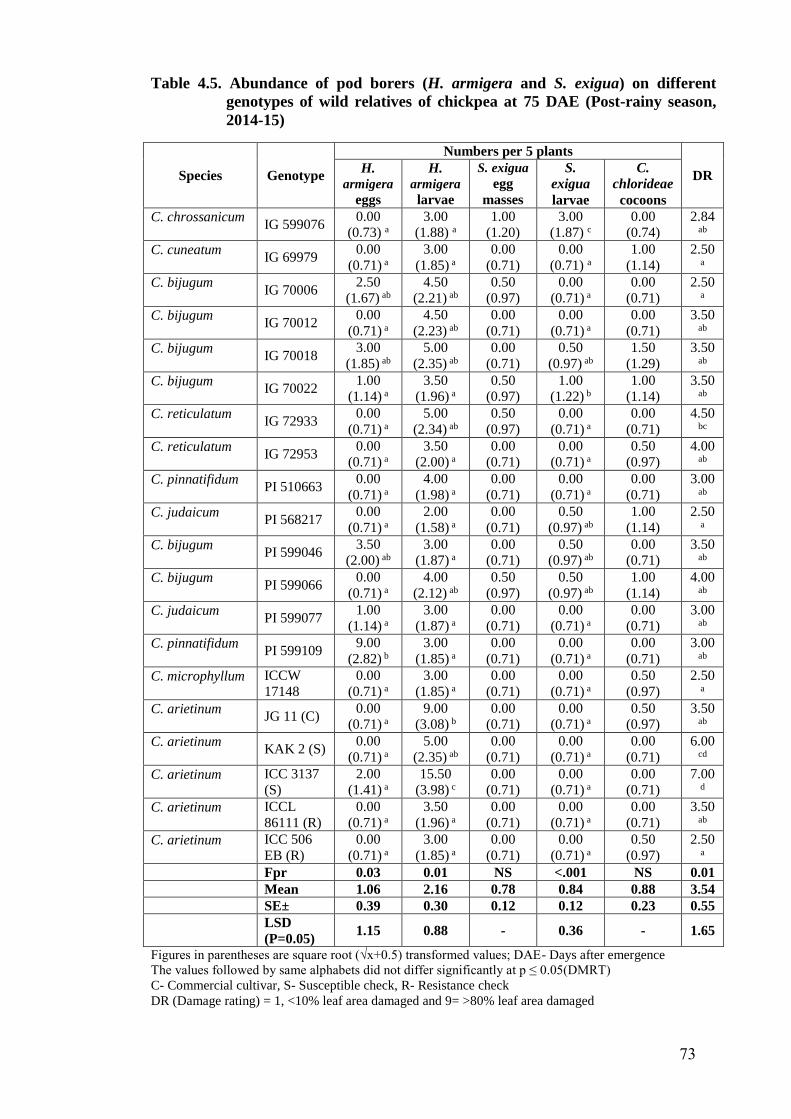
Table 4.5. Abundance of pod borers (H. armigera and S. exigua) on different
genotypes of wild relatives of chickpea at 75 DAE (Post-rainy season,
2014-15)
Species Genotype
Numbers per 5 plants
DR H.
armigera
eggs
H. armigera
larvae
S. exigua
egg
masses
S.
exigua
larvae
C.
chlorideae
cocoons
C. chrossanicum IG 599076
0.00
(0.73) a
3.00
(1.88) a
1.00
(1.20)
3.00
(1.87) c
0.00
(0.74)
2.84 ab
C. cuneatum IG 69979
0.00
(0.71) a
3.00
(1.85) a
0.00
(0.71)
0.00
(0.71) a
1.00
(1.14)
2.50 a
C. bijugum IG 70006
2.50
(1.67) ab
4.50
(2.21) ab
0.50
(0.97)
0.00
(0.71) a
0.00
(0.71)
2.50
a
C. bijugum IG 70012
0.00
(0.71) a
4.50
(2.23) ab
0.00
(0.71)
0.00
(0.71) a
0.00
(0.71)
3.50
ab
C. bijugum IG 70018
3.00
(1.85) ab
5.00
(2.35) ab
0.00
(0.71)
0.50
(0.97) ab
1.50
(1.29)
3.50
ab
C. bijugum IG 70022
1.00
(1.14) a
3.50
(1.96) a
0.50
(0.97)
1.00
(1.22) b
1.00
(1.14)
3.50
ab
C. reticulatum IG 72933
0.00
(0.71) a
5.00
(2.34) ab
0.50
(0.97)
0.00
(0.71) a
0.00
(0.71)
4.50
bc
C. reticulatum IG 72953
0.00
(0.71) a
3.50
(2.00) a
0.00
(0.71)
0.00
(0.71) a
0.50
(0.97)
4.00
ab
C. pinnatifidum PI 510663
0.00
(0.71) a
4.00
(1.98) a
0.00
(0.71)
0.00
(0.71) a
0.00
(0.71)
3.00
ab
C. judaicum PI 568217
0.00
(0.71) a
2.00
(1.58) a
0.00
(0.71)
0.50
(0.97) ab
1.00
(1.14)
2.50
a
C. bijugum PI 599046
3.50
(2.00) ab
3.00
(1.87) a
0.00
(0.71)
0.50
(0.97) ab
0.00
(0.71)
3.50
ab
C. bijugum PI 599066
0.00
(0.71) a
4.00
(2.12) ab
0.50
(0.97)
0.50
(0.97) ab
1.00
(1.14)
4.00
ab
C. judaicum PI 599077
1.00
(1.14) a
3.00
(1.87) a
0.00
(0.71)
0.00
(0.71) a
0.00
(0.71)
3.00
ab
C. pinnatifidum PI 599109
9.00
(2.82) b
3.00
(1.85) a
0.00
(0.71)
0.00
(0.71) a
0.00
(0.71)
3.00
ab
C. microphyllum ICCW
17148
0.00
(0.71) a
3.00
(1.85) a
0.00
(0.71)
0.00
(0.71) a
0.50
(0.97)
2.50
a
C. arietinum JG 11 (C)
0.00
(0.71) a
9.00
(3.08) b
0.00
(0.71)
0.00
(0.71) a
0.50
(0.97)
3.50
ab
C. arietinum KAK 2 (S)
0.00
(0.71) a
5.00
(2.35) ab
0.00
(0.71)
0.00
(0.71) a
0.00
(0.71)
6.00 cd
C. arietinum ICC 3137
(S)
2.00
(1.41) a
15.50
(3.98) c
0.00
(0.71)
0.00
(0.71) a
0.00
(0.71)
7.00
d
C. arietinum ICCL
86111 (R)
0.00
(0.71) a
3.50
(1.96) a
0.00
(0.71)
0.00
(0.71) a
0.00
(0.71)
3.50 ab
C. arietinum ICC 506
EB (R)
0.00
(0.71) a
3.00
(1.85) a
0.00
(0.71)
0.00
(0.71) a
0.50
(0.97)
2.50
a
Fpr 0.03 0.01 NS <.001 NS 0.01
Mean 1.06 2.16 0.78 0.84 0.88 3.54
SE± 0.39 0.30 0.12 0.12 0.23 0.55
LSD
(P=0.05) 1.15 0.88 - 0.36 - 1.65
Figures in parentheses are square root (√x+0.5) transformed values; DAE- Days after emergence
The values followed by same alphabets did not differ significantly at p ≤ 0.05(DMRT)
C- Commercial cultivar, S- Susceptible check, R- Resistance check
DR (Damage rating) = 1, <10% leaf area damaged and 9= >80% leaf area damaged
73
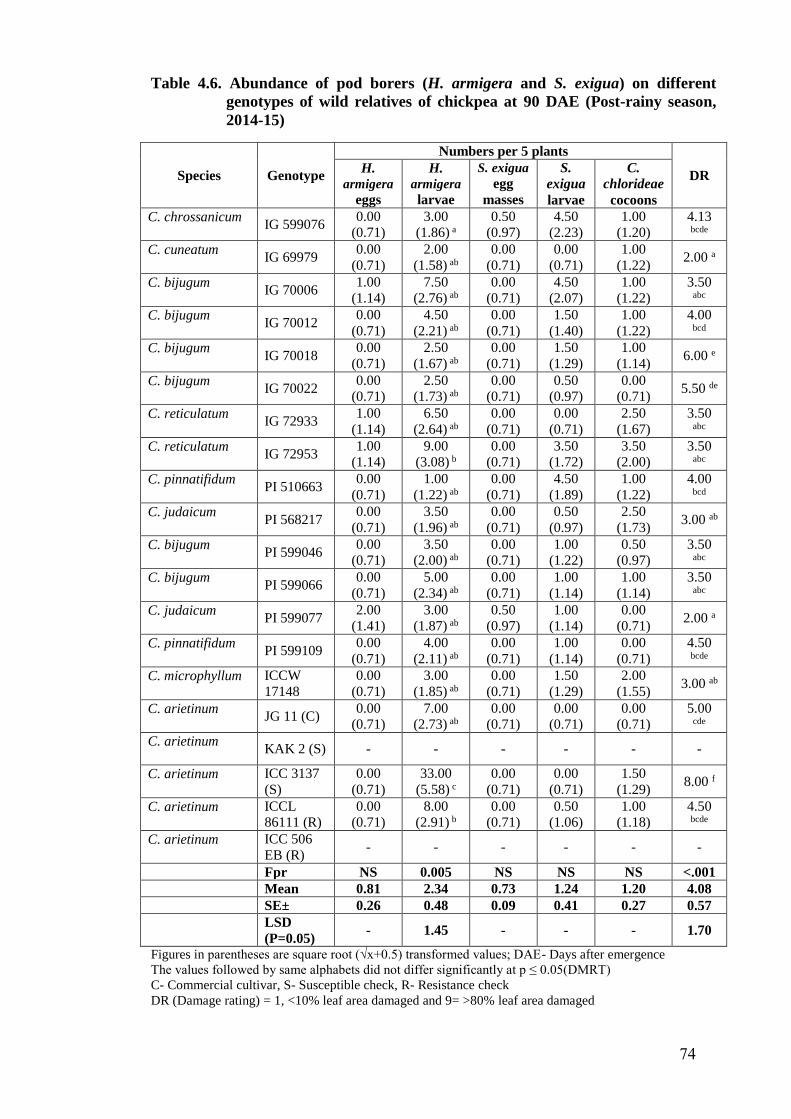
Table 4.6. Abundance of pod borers (H. armigera and S. exigua) on different
genotypes of wild relatives of chickpea at 90 DAE (Post-rainy season,
2014-15)
Species Genotype
Numbers per 5 plants
DR H.
armigera
eggs
H. armigera
larvae
S. exigua
egg
masses
S.
exigua
larvae
C.
chlorideae
cocoons
C. chrossanicum IG 599076
0.00
(0.71)
3.00
(1.86) a
0.50
(0.97)
4.50
(2.23)
1.00
(1.20)
4.13 bcde
C. cuneatum IG 69979
0.00
(0.71)
2.00
(1.58) ab
0.00
(0.71)
0.00
(0.71)
1.00
(1.22) 2.00 a
C. bijugum IG 70006
1.00
(1.14)
7.50
(2.76) ab
0.00
(0.71)
4.50
(2.07)
1.00
(1.22)
3.50 abc
C. bijugum IG 70012
0.00
(0.71)
4.50
(2.21) ab
0.00
(0.71)
1.50
(1.40)
1.00
(1.22)
4.00 bcd
C. bijugum IG 70018
0.00
(0.71)
2.50
(1.67) ab
0.00
(0.71)
1.50
(1.29)
1.00
(1.14) 6.00 e
C. bijugum IG 70022
0.00
(0.71)
2.50
(1.73) ab
0.00
(0.71)
0.50
(0.97)
0.00
(0.71) 5.50 de
C. reticulatum IG 72933
1.00
(1.14)
6.50
(2.64) ab
0.00
(0.71)
0.00
(0.71)
2.50
(1.67)
3.50 abc
C. reticulatum IG 72953
1.00
(1.14)
9.00
(3.08) b
0.00
(0.71)
3.50
(1.72)
3.50
(2.00)
3.50 abc
C. pinnatifidum PI 510663
0.00
(0.71)
1.00
(1.22) ab
0.00
(0.71)
4.50
(1.89)
1.00
(1.22)
4.00 bcd
C. judaicum PI 568217
0.00
(0.71)
3.50
(1.96) ab
0.00
(0.71)
0.50
(0.97)
2.50
(1.73) 3.00 ab
C. bijugum PI 599046
0.00
(0.71)
3.50
(2.00) ab
0.00
(0.71)
1.00
(1.22)
0.50
(0.97)
3.50 abc
C. bijugum PI 599066
0.00
(0.71)
5.00
(2.34) ab
0.00
(0.71)
1.00
(1.14)
1.00
(1.14)
3.50 abc
C. judaicum PI 599077
2.00
(1.41)
3.00
(1.87) ab
0.50
(0.97)
1.00
(1.14)
0.00
(0.71) 2.00 a
C. pinnatifidum PI 599109
0.00
(0.71)
4.00
(2.11) ab
0.00
(0.71)
1.00
(1.14)
0.00
(0.71)
4.50 bcde
C. microphyllum ICCW
17148
0.00
(0.71)
3.00
(1.85) ab
0.00
(0.71)
1.50
(1.29)
2.00
(1.55) 3.00 ab
C. arietinum JG 11 (C)
0.00
(0.71)
7.00
(2.73) ab
0.00
(0.71)
0.00
(0.71)
0.00
(0.71)
5.00 cde
C. arietinum KAK 2 (S) - - - - - -
C. arietinum ICC 3137
(S)
0.00
(0.71)
33.00
(5.58) c
0.00
(0.71)
0.00
(0.71)
1.50
(1.29) 8.00 f
C. arietinum ICCL
86111 (R)
0.00
(0.71)
8.00
(2.91) b
0.00
(0.71)
0.50
(1.06)
1.00
(1.18)
4.50 bcde
C. arietinum ICC 506
EB (R) - - - - - -
Fpr NS 0.005 NS NS NS <.001
Mean 0.81 2.34 0.73 1.24 1.20 4.08
SE± 0.26 0.48 0.09 0.41 0.27 0.57
LSD
(P=0.05) - 1.45 - - - 1.70
Figures in parentheses are square root (√x+0.5) transformed values; DAE- Days after emergence
The values followed by same alphabets did not differ significantly at p ≤ 0.05(DMRT)
C- Commercial cultivar, S- Susceptible check, R- Resistance check
DR (Damage rating) = 1, <10% leaf area damaged and 9= >80% leaf area damaged
74
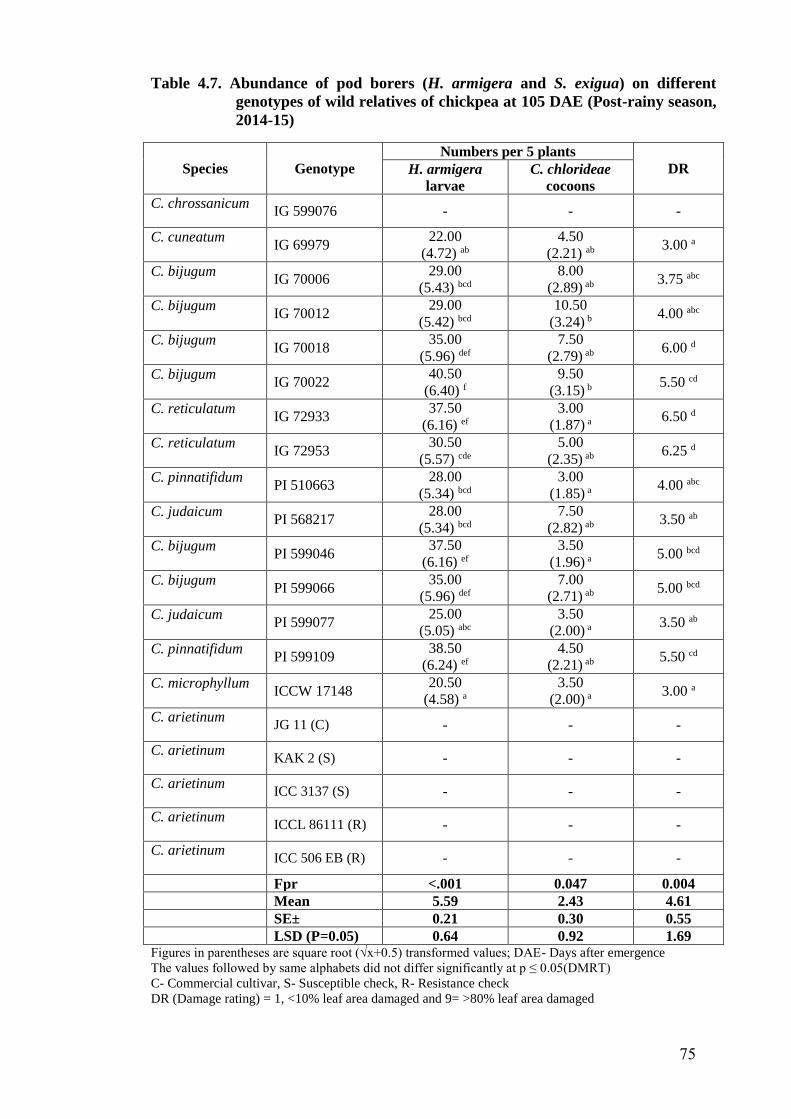
Table 4.7. Abundance of pod borers (H. armigera and S. exigua) on different
genotypes of wild relatives of chickpea at 105 DAE (Post-rainy season,
2014-15)
Species Genotype
Numbers per 5 plants
DR H. armigera
larvae
C. chlorideae
cocoons
C. chrossanicum IG 599076 - - -
C. cuneatum IG 69979
22.00
(4.72) ab
4.50
(2.21) ab 3.00 a
C. bijugum IG 70006
29.00
(5.43) bcd
8.00
(2.89) ab 3.75 abc
C. bijugum IG 70012
29.00
(5.42) bcd
10.50
(3.24) b 4.00 abc
C. bijugum IG 70018
35.00
(5.96) def
7.50
(2.79) ab 6.00 d
C. bijugum IG 70022
40.50
(6.40) f
9.50
(3.15) b 5.50 cd
C. reticulatum IG 72933
37.50
(6.16) ef
3.00
(1.87) a 6.50 d
C. reticulatum IG 72953
30.50
(5.57) cde
5.00
(2.35) ab 6.25 d
C. pinnatifidum PI 510663
28.00
(5.34) bcd
3.00
(1.85) a 4.00 abc
C. judaicum PI 568217
28.00
(5.34) bcd
7.50
(2.82) ab 3.50 ab
C. bijugum PI 599046
37.50
(6.16) ef
3.50
(1.96) a 5.00 bcd
C. bijugum PI 599066
35.00
(5.96) def
7.00
(2.71) ab 5.00 bcd
C. judaicum PI 599077
25.00
(5.05) abc
3.50
(2.00) a 3.50 ab
C. pinnatifidum PI 599109
38.50
(6.24) ef
4.50
(2.21) ab 5.50 cd
C. microphyllum ICCW 17148
20.50
(4.58) a
3.50
(2.00) a 3.00 a
C. arietinum JG 11 (C) - - -
C. arietinum KAK 2 (S) - - -
C. arietinum ICC 3137 (S) - - -
C. arietinum ICCL 86111 (R) - - -
C. arietinum ICC 506 EB (R) - - -
Fpr <.001 0.047 0.004
Mean 5.59 2.43 4.61
SE± 0.21 0.30 0.55
LSD (P=0.05) 0.64 0.92 1.69
Figures in parentheses are square root (√x+0.5) transformed values; DAE- Days after emergence
The values followed by same alphabets did not differ significantly at p ≤ 0.05(DMRT)
C- Commercial cultivar, S- Susceptible check, R- Resistance check
DR (Damage rating) = 1, <10% leaf area damaged and 9= >80% leaf area damaged
75
cultivated chickpea throughout cropping period. At 15 DAE, highest number of
larvae were recorded on IG 72953 (14.50 larvae/5 plants) followed by ICC 3137
(11.00 larvae/5 plants), while lowest was recorded on PI 599109 (1.00 larva/5
plants) (Table 4.8). At 30 DAE, highest number of larvae were recorded on IG
72933 (17.50 larvae/5 plants) followed by ICC 3137 (14.50 larvae/5 plants), while
lowest was recorded on IG 599076 (1.50 larvae/5 plants) and IG 69979 (2.00
larvae/5 plants) (Table 4.9). At 45 DAE, larval count was observed in a range of
1.50 larvae/5 plants (PI 568217) to 12.50 larvae/5 plants (IG 72933) (Table 4.10).
The genotype, ICC 3137 recorded highest number of larvae (11.50 larvae/5 plants)
compared to all other genotypes, while genotypes IG 70012 and IG 70022 recorded
lowest number of larvae (1.00 larva/5 plants) at 60 DAE (Table 4.11). Among all
genotypes, lowest of 1.00 larva/5 plants was recorded on IG 599076, PI 510663, PI
568217 and PI 599109, whereas highest of 11.50 larvae/5 plants was recorded on
ICC 3137 at 75 DAE (Table 4.12). All wild relatives of chickpea exhibited larval
count in a range of 3.00 larvae/5 plants (IG 70018 and PI 568217) to 13.50 larvae/5
plants (IG 72933), whereas cultivated genotypes exhibited a range of 5.00 larvae/5
plants (ICC 506EB) to 25.00 larvae/5 plants (ICC 3137) at 90 DAE (Table 4.13).
During both the seasons the genotypes, IG 70012, IG 70018, IG 70022, PI
510663, PI 599109, PI 599077, ICCW 17148 and IG 69979 recorded significantly
lower numbers of H. armigera larvae compared to cultivated chickpea. The larval
abundance was observed throughout the crop growth period, while the peak larval
abundance was recorded during 60 and 90 DAE during post-rainy season, 2014-15,
whereas 90 DAE during post-rainy season, 2015-16. The present results are in
agreement with Rao et al. (2001) who observed pod borer damage on chickpea at 38
days after sowing (DAS) whereas the peak incidence was recorded at 87 DAS.
Suganthy et al. (2003) also revealed that pest incidence started at 15 DAS, then
gradually increased until first peak at 29 DAS, second peak at 57 DAS and the third
peak at 85 DAS. Yadav and Jat (2009) reported that, the infestation of H. armigera
on chickpea started in the second fortnight of November and reached its peak by the
end of February. The larval population of the pest occurred throughout the crop
growth period and maximum population was recorded at pod formation and grain
developmental stages. Similar results were also observed by Altaf et al. (2008) and
Yadav et al. (2016).
76
4.1.3 Oviposition by S. exigua on Different Genotypes of Wild Relatives of
Chickpea
There were no significant differences in oviposition by S. exigua (number of
eggmass per five plants) among all the genotypes throughout crop growth period
during post-rainy seasons, 2014-15 and 2015-16.
4.1.4 Abundance of S. exigua Larvae on Different Genotypes of Wild Relatives
of Chickpea
Though there were significant differences in abundance of S. exigua larvae
on different genotypes of wild relatives of chickpea at 30, 60 and 75 DAE during
post-rainy season, 2014-15, the number of larvae were very less to the time for
assessing levels of resistance (Table 4.2, 4.4 and 4.5, respectively). During post-
rainy season, 2015-16 significant differences were observed in abundance of S.
exigua larvae on different genotypes of wild relatives of chickpea only at 45, 90 and
105 DAE. At 45 DAE, highest larval count was observed on JG 11 (6.50 larvae/5
plants) followed by IG 599076 and ICCL 86111 (4.00 larvae/5 plants) and lowest
(0.50 larva/5 plants) was observed on IG 70018, IG 72933, PI 568217 and PI
599066 (Table 4.10). Highest larval count was recorded on IG 70006 (9.00 larvae/5
plants), while lowest was observed on PI 568217, PI 599077 and ICC 506EB (0.50
larva/5 plants) at 90 DAE (Table 4.13). Highest larval count of 7.00 larvae/5 plants
(PI 599066) was recorded at 105 DAE among the observed genotypes, while no
incidence was observed on IG 69979 and ICCW 17148 (Table 4.14).
Among all the genotypes, IG 599076 was highly suffered against S. exigua
larvae throughout cropping period. During this post-rainy season, 2014-15, highest
abundance was observed at 45 DAS but there were no significant differences
between genotypes with respect to larval count, while no larvae was recorded on any
genotype at 105 DAE. The present findings are in agreement with findings of
Shankar (2013) who reported that S. exigua population was high during early stage
of the crop than the later stages. On contrary, larval population was observed during
later stages i.e. at 90 and 105 DAE during post-rainy season, 2015-16.
4.1.5 Parasitisation of H. armigera by Larval Parasitoid, Campoletis chlorideae
During post-rainy season, 2014-15 parasitisation of H. armigera by C.
chlorideae was first observed at 45 DAE, but significant differences among
77
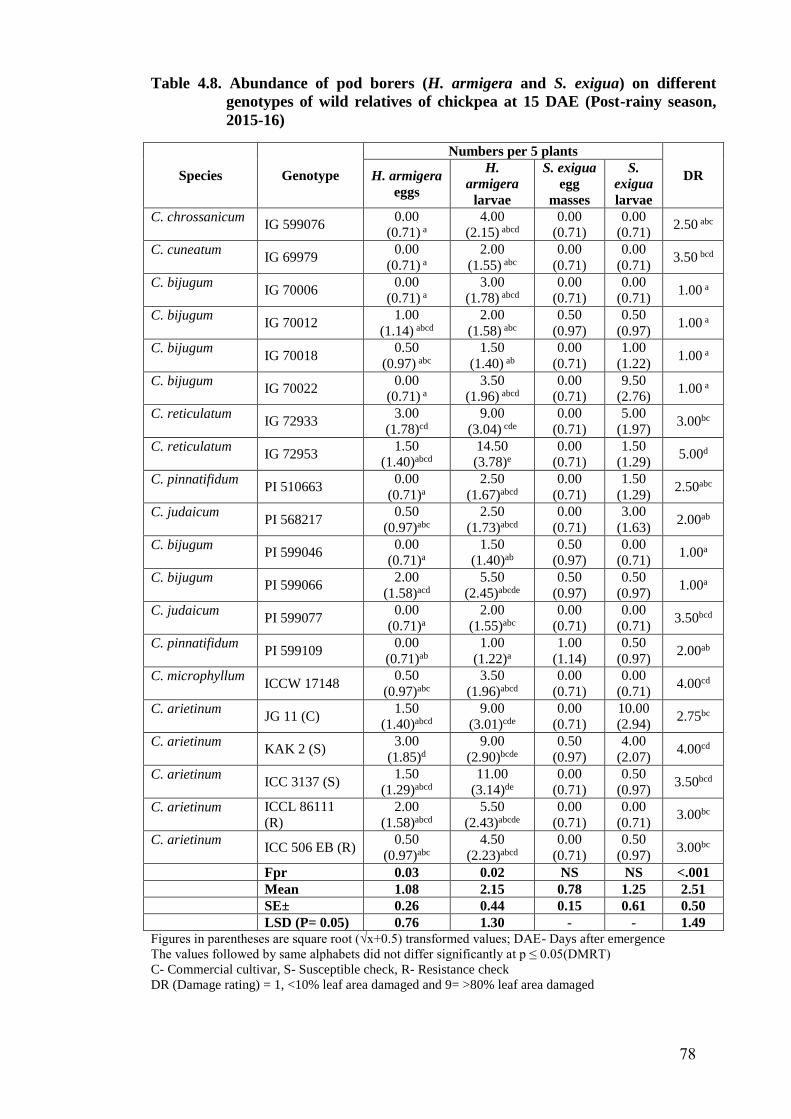
Table 4.8. Abundance of pod borers (H. armigera and S. exigua) on different
genotypes of wild relatives of chickpea at 15 DAE (Post-rainy season,
2015-16)
Species Genotype
Numbers per 5 plants
DR H. armigera
eggs
H.
armigera
larvae
S. exigua
egg
masses
S.
exigua
larvae
C. chrossanicum IG 599076
0.00
(0.71) a
4.00
(2.15) abcd
0.00
(0.71)
0.00
(0.71) 2.50 abc
C. cuneatum IG 69979
0.00
(0.71) a
2.00
(1.55) abc
0.00
(0.71)
0.00
(0.71) 3.50 bcd
C. bijugum IG 70006
0.00
(0.71) a
3.00
(1.78) abcd
0.00
(0.71)
0.00
(0.71) 1.00 a
C. bijugum IG 70012
1.00
(1.14) abcd
2.00
(1.58) abc
0.50
(0.97)
0.50
(0.97) 1.00 a
C. bijugum IG 70018
0.50
(0.97) abc
1.50
(1.40) ab
0.00
(0.71)
1.00
(1.22) 1.00 a
C. bijugum IG 70022
0.00
(0.71) a
3.50
(1.96) abcd
0.00
(0.71)
9.50
(2.76) 1.00 a
C. reticulatum IG 72933
3.00
(1.78)cd
9.00
(3.04) cde
0.00
(0.71)
5.00
(1.97) 3.00bc
C. reticulatum IG 72953
1.50
(1.40)abcd
14.50
(3.78)e
0.00
(0.71)
1.50
(1.29) 5.00d
C. pinnatifidum PI 510663
0.00
(0.71)a
2.50
(1.67)abcd
0.00
(0.71)
1.50
(1.29) 2.50abc
C. judaicum PI 568217
0.50
(0.97)abc
2.50
(1.73)abcd
0.00
(0.71)
3.00
(1.63) 2.00ab
C. bijugum PI 599046
0.00
(0.71)a
1.50
(1.40)ab
0.50
(0.97)
0.00
(0.71) 1.00a
C. bijugum PI 599066
2.00
(1.58)acd
5.50
(2.45)abcde
0.50
(0.97)
0.50
(0.97) 1.00a
C. judaicum PI 599077
0.00
(0.71)a
2.00
(1.55)abc
0.00
(0.71)
0.00
(0.71) 3.50bcd
C. pinnatifidum PI 599109
0.00
(0.71)ab
1.00
(1.22)a
1.00
(1.14)
0.50
(0.97) 2.00ab
C. microphyllum ICCW 17148
0.50
(0.97)abc
3.50
(1.96)abcd
0.00
(0.71)
0.00
(0.71) 4.00cd
C. arietinum JG 11 (C)
1.50
(1.40)abcd
9.00
(3.01)cde
0.00
(0.71)
10.00
(2.94) 2.75bc
C. arietinum KAK 2 (S)
3.00
(1.85)d
9.00
(2.90)bcde
0.50
(0.97)
4.00
(2.07) 4.00cd
C. arietinum ICC 3137 (S)
1.50
(1.29)abcd
11.00
(3.14)de
0.00
(0.71)
0.50
(0.97) 3.50bcd
C. arietinum ICCL 86111
(R)
2.00
(1.58)abcd
5.50
(2.43)abcde
0.00
(0.71)
0.00
(0.71) 3.00bc
C. arietinum ICC 506 EB (R)
0.50
(0.97)abc
4.50
(2.23)abcd
0.00
(0.71)
0.50
(0.97) 3.00bc
Fpr 0.03 0.02 NS NS <.001
Mean 1.08 2.15 0.78 1.25 2.51
SE± 0.26 0.44 0.15 0.61 0.50
LSD (P= 0.05) 0.76 1.30 - - 1.49
Figures in parentheses are square root (√x+0.5) transformed values; DAE- Days after emergence
The values followed by same alphabets did not differ significantly at p ≤ 0.05(DMRT)
C- Commercial cultivar, S- Susceptible check, R- Resistance check
DR (Damage rating) = 1, <10% leaf area damaged and 9= >80% leaf area damaged
78
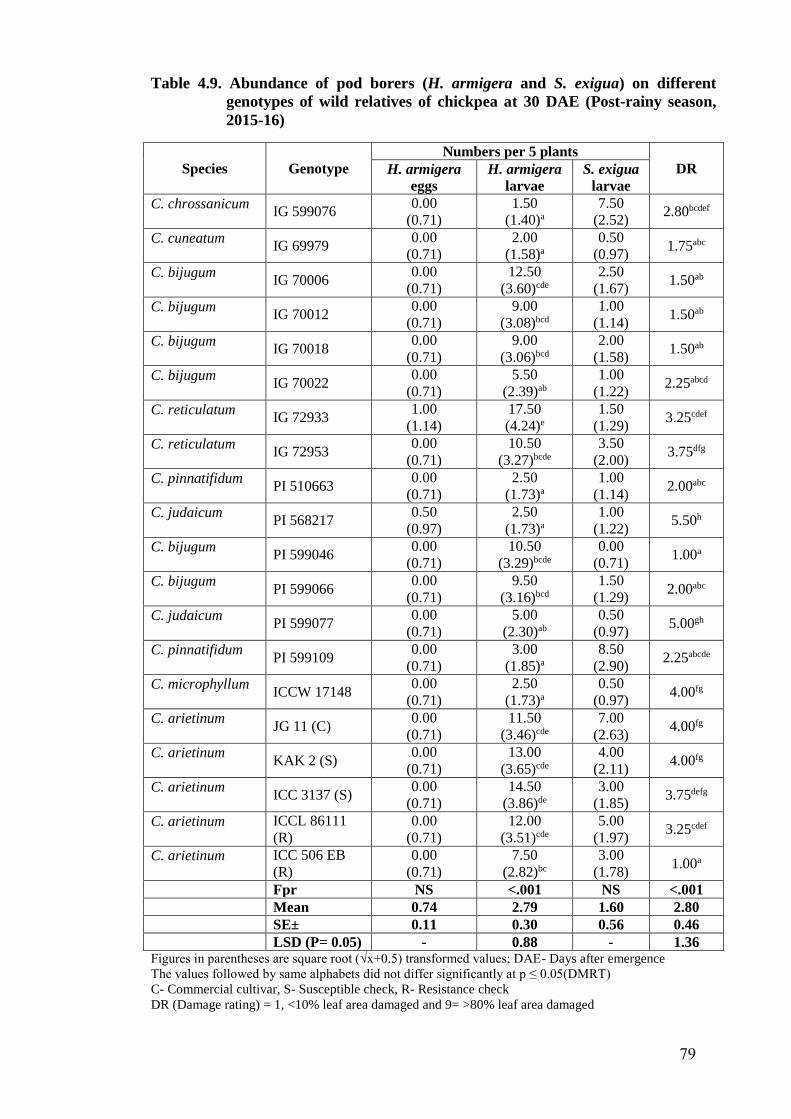
Table 4.9. Abundance of pod borers (H. armigera and S. exigua) on different
genotypes of wild relatives of chickpea at 30 DAE (Post-rainy season,
2015-16)
Species Genotype
Numbers per 5 plants
DR H. armigera
eggs
H. armigera
larvae
S. exigua
larvae
C. chrossanicum IG 599076
0.00
(0.71)
1.50
(1.40)a
7.50
(2.52) 2.80bcdef
C. cuneatum IG 69979
0.00
(0.71)
2.00
(1.58)a
0.50
(0.97) 1.75abc
C. bijugum IG 70006
0.00
(0.71)
12.50
(3.60)cde
2.50
(1.67) 1.50ab
C. bijugum IG 70012
0.00
(0.71)
9.00
(3.08)bcd
1.00
(1.14) 1.50ab
C. bijugum IG 70018
0.00
(0.71)
9.00
(3.06)bcd
2.00
(1.58) 1.50ab
C. bijugum IG 70022
0.00
(0.71)
5.50
(2.39)ab
1.00
(1.22) 2.25abcd
C. reticulatum IG 72933
1.00
(1.14)
17.50
(4.24)e
1.50
(1.29) 3.25cdef
C. reticulatum IG 72953
0.00
(0.71)
10.50
(3.27)bcde
3.50
(2.00) 3.75dfg
C. pinnatifidum PI 510663
0.00
(0.71)
2.50
(1.73)a
1.00
(1.14) 2.00abc
C. judaicum PI 568217
0.50
(0.97)
2.50
(1.73)a
1.00
(1.22) 5.50h
C. bijugum PI 599046
0.00
(0.71)
10.50
(3.29)bcde
0.00
(0.71) 1.00a
C. bijugum PI 599066
0.00
(0.71)
9.50
(3.16)bcd
1.50
(1.29) 2.00abc
C. judaicum PI 599077
0.00
(0.71)
5.00
(2.30)ab
0.50
(0.97) 5.00gh
C. pinnatifidum PI 599109
0.00
(0.71)
3.00
(1.85)a
8.50
(2.90) 2.25abcde
C. microphyllum ICCW 17148
0.00
(0.71)
2.50
(1.73)a
0.50
(0.97) 4.00fg
C. arietinum JG 11 (C)
0.00
(0.71)
11.50
(3.46)cde
7.00
(2.63) 4.00fg
C. arietinum KAK 2 (S)
0.00
(0.71)
13.00
(3.65)cde
4.00
(2.11) 4.00fg
C. arietinum ICC 3137 (S)
0.00
(0.71)
14.50
(3.86)de
3.00
(1.85) 3.75defg
C. arietinum ICCL 86111
(R)
0.00
(0.71)
12.00
(3.51)cde
5.00
(1.97) 3.25cdef
C. arietinum ICC 506 EB
(R)
0.00
(0.71)
7.50
(2.82)bc
3.00
(1.78) 1.00a
Fpr NS <.001 NS <.001
Mean 0.74 2.79 1.60 2.80
SE± 0.11 0.30 0.56 0.46
LSD (P= 0.05) - 0.88 - 1.36
Figures in parentheses are square root (√x+0.5) transformed values; DAE- Days after emergence
The values followed by same alphabets did not differ significantly at p ≤ 0.05(DMRT)
C- Commercial cultivar, S- Susceptible check, R- Resistance check
DR (Damage rating) = 1, <10% leaf area damaged and 9= >80% leaf area damaged
79
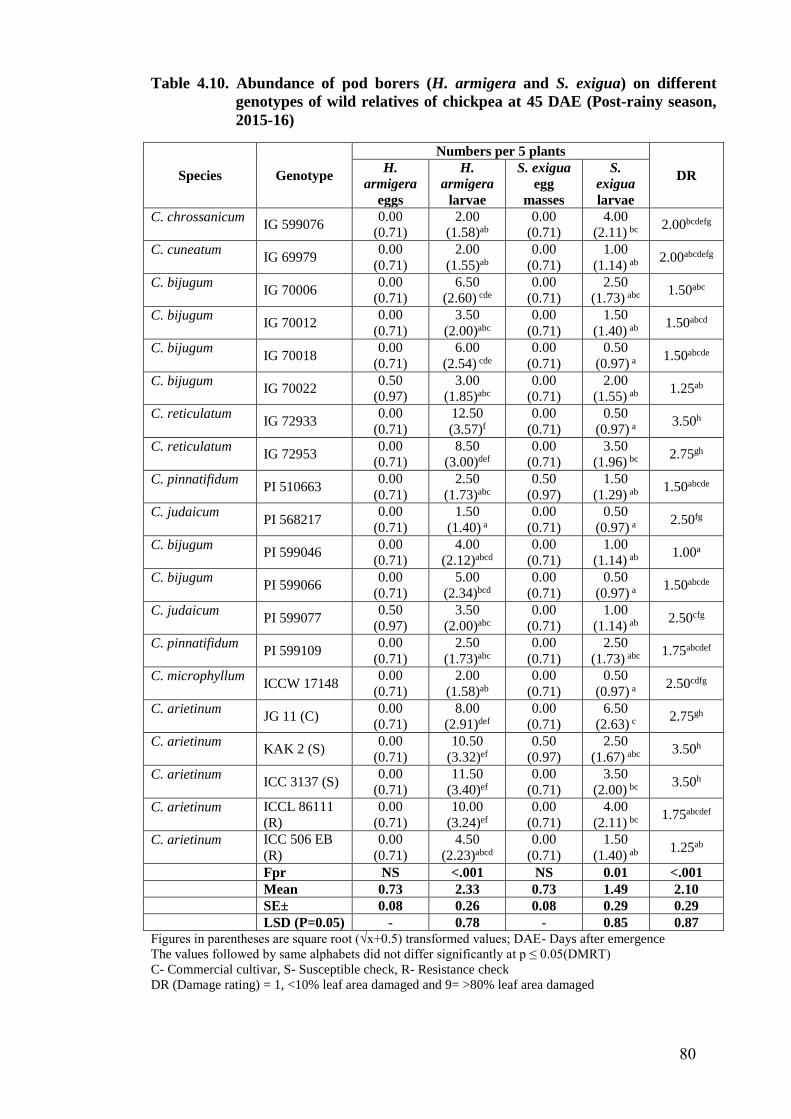
Table 4.10. Abundance of pod borers (H. armigera and S. exigua) on different
genotypes of wild relatives of chickpea at 45 DAE (Post-rainy season,
2015-16)
Species Genotype
Numbers per 5 plants
DR H.
armigera
eggs
H.
armigera
larvae
S. exigua
egg
masses
S.
exigua
larvae
C. chrossanicum IG 599076
0.00
(0.71)
2.00
(1.58)ab
0.00
(0.71)
4.00
(2.11) bc 2.00bcdefg
C. cuneatum IG 69979
0.00
(0.71)
2.00
(1.55)ab
0.00
(0.71)
1.00
(1.14) ab 2.00abcdefg
C. bijugum IG 70006
0.00
(0.71)
6.50
(2.60) cde
0.00
(0.71)
2.50
(1.73) abc 1.50abc
C. bijugum IG 70012
0.00
(0.71)
3.50
(2.00)abc
0.00
(0.71)
1.50
(1.40) ab 1.50abcd
C. bijugum IG 70018
0.00
(0.71)
6.00
(2.54) cde
0.00
(0.71)
0.50
(0.97) a 1.50abcde
C. bijugum IG 70022
0.50
(0.97)
3.00
(1.85)abc
0.00
(0.71)
2.00
(1.55) ab 1.25ab
C. reticulatum IG 72933
0.00
(0.71)
12.50
(3.57)f
0.00
(0.71)
0.50
(0.97) a 3.50h
C. reticulatum IG 72953
0.00
(0.71)
8.50
(3.00)def
0.00
(0.71)
3.50
(1.96) bc 2.75gh
C. pinnatifidum PI 510663
0.00
(0.71)
2.50
(1.73)abc
0.50
(0.97)
1.50
(1.29) ab 1.50abcde
C. judaicum PI 568217
0.00
(0.71)
1.50
(1.40) a
0.00
(0.71)
0.50
(0.97) a 2.50fg
C. bijugum PI 599046
0.00
(0.71)
4.00
(2.12)abcd
0.00
(0.71)
1.00
(1.14) ab 1.00a
C. bijugum PI 599066
0.00
(0.71)
5.00
(2.34)bcd
0.00
(0.71)
0.50
(0.97) a 1.50abcde
C. judaicum PI 599077
0.50
(0.97)
3.50
(2.00)abc
0.00
(0.71)
1.00
(1.14) ab 2.50cfg
C. pinnatifidum PI 599109
0.00
(0.71)
2.50
(1.73)abc
0.00
(0.71)
2.50
(1.73) abc 1.75abcdef
C. microphyllum ICCW 17148
0.00
(0.71)
2.00
(1.58)ab
0.00
(0.71)
0.50
(0.97) a 2.50cdfg
C. arietinum JG 11 (C)
0.00
(0.71)
8.00
(2.91)def
0.00
(0.71)
6.50
(2.63) c 2.75gh
C. arietinum KAK 2 (S)
0.00
(0.71)
10.50
(3.32)ef
0.50
(0.97)
2.50
(1.67) abc 3.50h
C. arietinum ICC 3137 (S)
0.00
(0.71)
11.50
(3.40)ef
0.00
(0.71)
3.50
(2.00) bc 3.50h
C. arietinum ICCL 86111
(R)
0.00
(0.71)
10.00
(3.24)ef
0.00
(0.71)
4.00
(2.11) bc 1.75abcdef
C. arietinum ICC 506 EB
(R)
0.00
(0.71)
4.50
(2.23)abcd
0.00
(0.71)
1.50
(1.40) ab 1.25ab
Fpr NS <.001 NS 0.01 <.001
Mean 0.73 2.33 0.73 1.49 2.10
SE± 0.08 0.26 0.08 0.29 0.29
LSD (P=0.05) - 0.78 - 0.85 0.87
Figures in parentheses are square root (√x+0.5) transformed values; DAE- Days after emergence
The values followed by same alphabets did not differ significantly at p ≤ 0.05(DMRT)
C- Commercial cultivar, S- Susceptible check, R- Resistance check
DR (Damage rating) = 1, <10% leaf area damaged and 9= >80% leaf area damaged
80
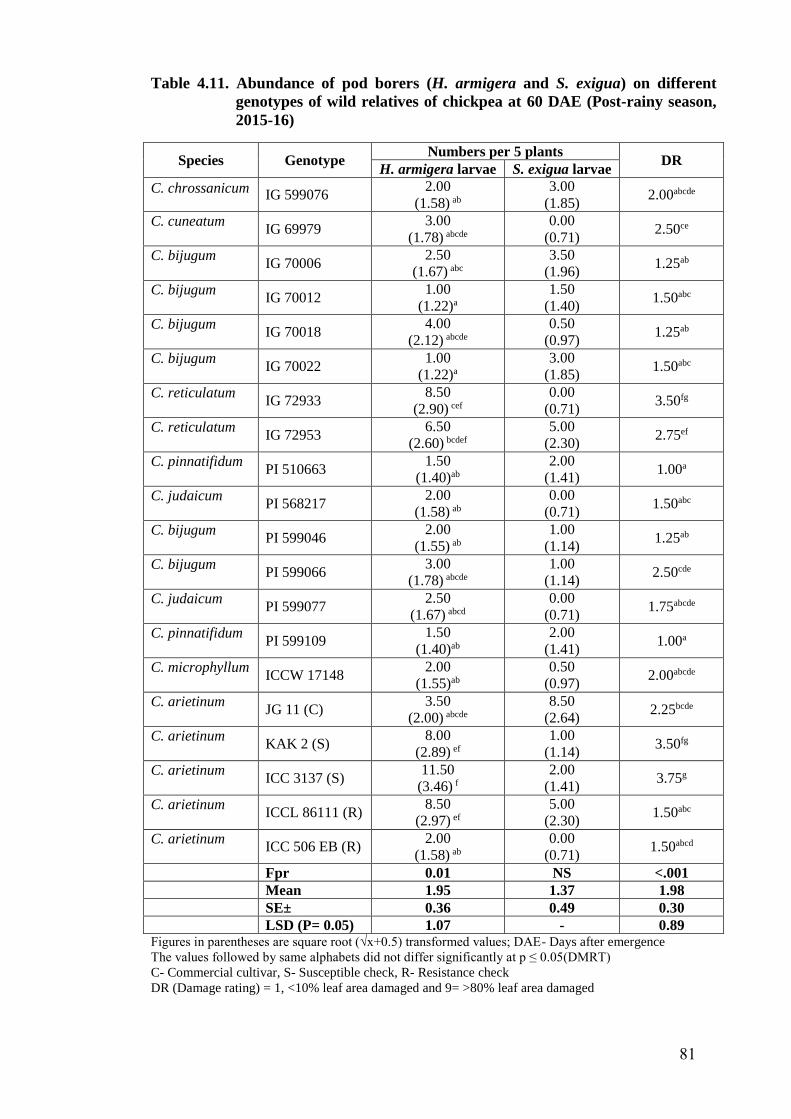
Table 4.11. Abundance of pod borers (H. armigera and S. exigua) on different
genotypes of wild relatives of chickpea at 60 DAE (Post-rainy season,
2015-16)
Species Genotype Numbers per 5 plants
DR H. armigera larvae S. exigua larvae
C. chrossanicum IG 599076
2.00
(1.58) ab
3.00
(1.85) 2.00abcde
C. cuneatum IG 69979
3.00
(1.78) abcde
0.00
(0.71) 2.50ce
C. bijugum IG 70006
2.50
(1.67) abc
3.50
(1.96) 1.25ab
C. bijugum IG 70012
1.00
(1.22)a
1.50
(1.40) 1.50abc
C. bijugum IG 70018
4.00
(2.12) abcde
0.50
(0.97) 1.25ab
C. bijugum IG 70022
1.00
(1.22)a
3.00
(1.85) 1.50abc
C. reticulatum IG 72933
8.50
(2.90) cef
0.00
(0.71) 3.50fg
C. reticulatum IG 72953
6.50
(2.60) bcdef
5.00
(2.30) 2.75ef
C. pinnatifidum PI 510663
1.50
(1.40)ab
2.00
(1.41) 1.00a
C. judaicum PI 568217
2.00
(1.58) ab
0.00
(0.71) 1.50abc
C. bijugum PI 599046
2.00
(1.55) ab
1.00
(1.14) 1.25ab
C. bijugum PI 599066
3.00
(1.78) abcde
1.00
(1.14) 2.50cde
C. judaicum PI 599077
2.50
(1.67) abcd
0.00
(0.71) 1.75abcde
C. pinnatifidum PI 599109
1.50
(1.40)ab
2.00
(1.41) 1.00a
C. microphyllum ICCW 17148
2.00
(1.55)ab
0.50
(0.97) 2.00abcde
C. arietinum JG 11 (C)
3.50
(2.00) abcde
8.50
(2.64) 2.25bcde
C. arietinum KAK 2 (S)
8.00
(2.89) ef
1.00
(1.14) 3.50fg
C. arietinum ICC 3137 (S)
11.50
(3.46) f
2.00
(1.41) 3.75g
C. arietinum ICCL 86111 (R)
8.50
(2.97) ef
5.00
(2.30) 1.50abc
C. arietinum ICC 506 EB (R)
2.00
(1.58) ab
0.00
(0.71) 1.50abcd
Fpr 0.01 NS <.001
Mean 1.95 1.37 1.98
SE± 0.36 0.49 0.30
LSD (P= 0.05) 1.07 - 0.89
Figures in parentheses are square root (√x+0.5) transformed values; DAE- Days after emergence
The values followed by same alphabets did not differ significantly at p ≤ 0.05(DMRT)
C- Commercial cultivar, S- Susceptible check, R- Resistance check
DR (Damage rating) = 1, <10% leaf area damaged and 9= >80% leaf area damaged
81
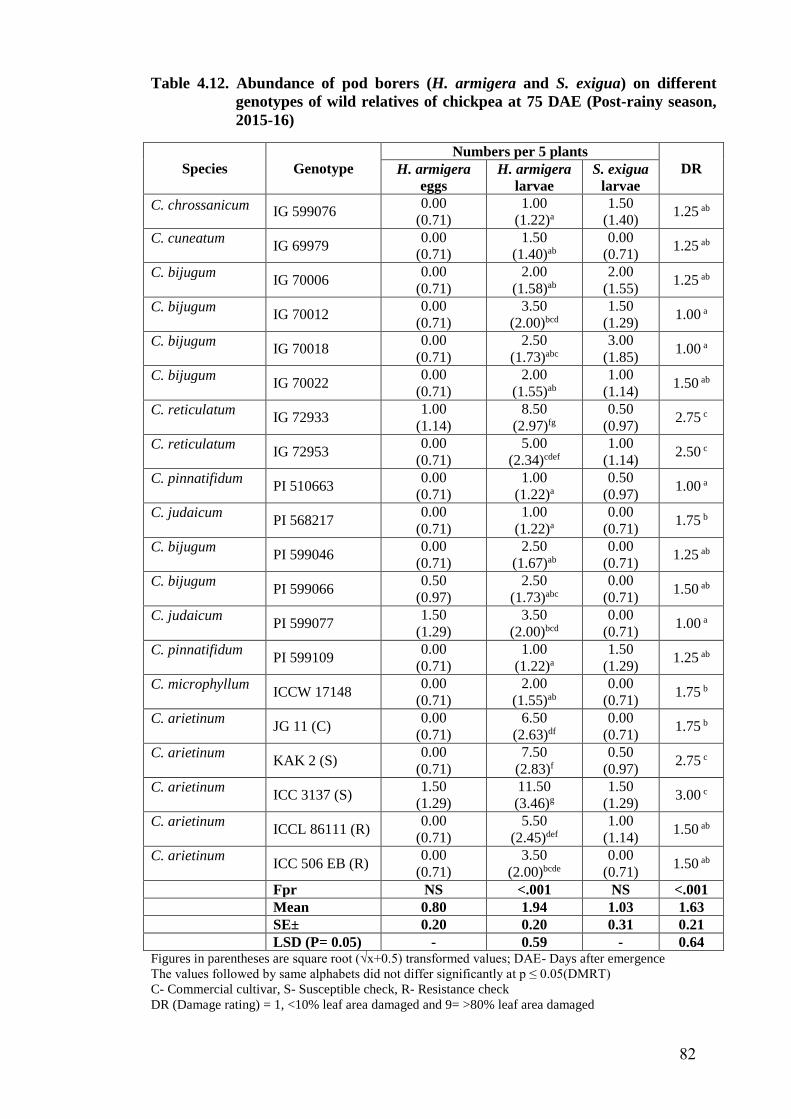
Table 4.12. Abundance of pod borers (H. armigera and S. exigua) on different
genotypes of wild relatives of chickpea at 75 DAE (Post-rainy season,
2015-16)
Species Genotype
Numbers per 5 plants
DR H. armigera
eggs
H. armigera
larvae
S. exigua
larvae
C. chrossanicum IG 599076 0.00
(0.71)
1.00
(1.22)a
1.50
(1.40) 1.25 ab
C. cuneatum IG 69979
0.00
(0.71)
1.50
(1.40)ab
0.00
(0.71) 1.25 ab
C. bijugum IG 70006
0.00
(0.71)
2.00
(1.58)ab
2.00
(1.55) 1.25 ab
C. bijugum IG 70012
0.00
(0.71)
3.50
(2.00)bcd
1.50
(1.29) 1.00 a
C. bijugum IG 70018
0.00
(0.71)
2.50
(1.73)abc
3.00
(1.85) 1.00 a
C. bijugum IG 70022
0.00
(0.71)
2.00
(1.55)ab
1.00
(1.14) 1.50 ab
C. reticulatum IG 72933
1.00
(1.14)
8.50
(2.97)fg
0.50
(0.97) 2.75 c
C. reticulatum IG 72953
0.00
(0.71)
5.00
(2.34)cdef
1.00
(1.14) 2.50 c
C. pinnatifidum PI 510663
0.00
(0.71)
1.00
(1.22)a
0.50
(0.97) 1.00 a
C. judaicum PI 568217
0.00
(0.71)
1.00
(1.22)a
0.00
(0.71) 1.75 b
C. bijugum PI 599046
0.00
(0.71)
2.50
(1.67)ab
0.00
(0.71) 1.25 ab
C. bijugum PI 599066
0.50
(0.97)
2.50
(1.73)abc
0.00
(0.71) 1.50 ab
C. judaicum PI 599077
1.50
(1.29)
3.50
(2.00)bcd
0.00
(0.71) 1.00 a
C. pinnatifidum PI 599109
0.00
(0.71)
1.00
(1.22)a
1.50
(1.29) 1.25 ab
C. microphyllum ICCW 17148
0.00
(0.71)
2.00
(1.55)ab
0.00
(0.71) 1.75 b
C. arietinum JG 11 (C)
0.00
(0.71)
6.50
(2.63)df
0.00
(0.71) 1.75 b
C. arietinum KAK 2 (S)
0.00
(0.71)
7.50
(2.83)f
0.50
(0.97) 2.75 c
C. arietinum ICC 3137 (S)
1.50
(1.29)
11.50
(3.46)g
1.50
(1.29) 3.00 c
C. arietinum ICCL 86111 (R)
0.00
(0.71)
5.50
(2.45)def
1.00
(1.14) 1.50 ab
C. arietinum ICC 506 EB (R)
0.00
(0.71)
3.50
(2.00)bcde
0.00
(0.71) 1.50 ab
Fpr NS <.001 NS <.001
Mean 0.80 1.94 1.03 1.63
SE± 0.20 0.20 0.31 0.21
LSD (P= 0.05) - 0.59 - 0.64
Figures in parentheses are square root (√x+0.5) transformed values; DAE- Days after emergence
The values followed by same alphabets did not differ significantly at p ≤ 0.05(DMRT)
C- Commercial cultivar, S- Susceptible check, R- Resistance check
DR (Damage rating) = 1, <10% leaf area damaged and 9= >80% leaf area damaged
82
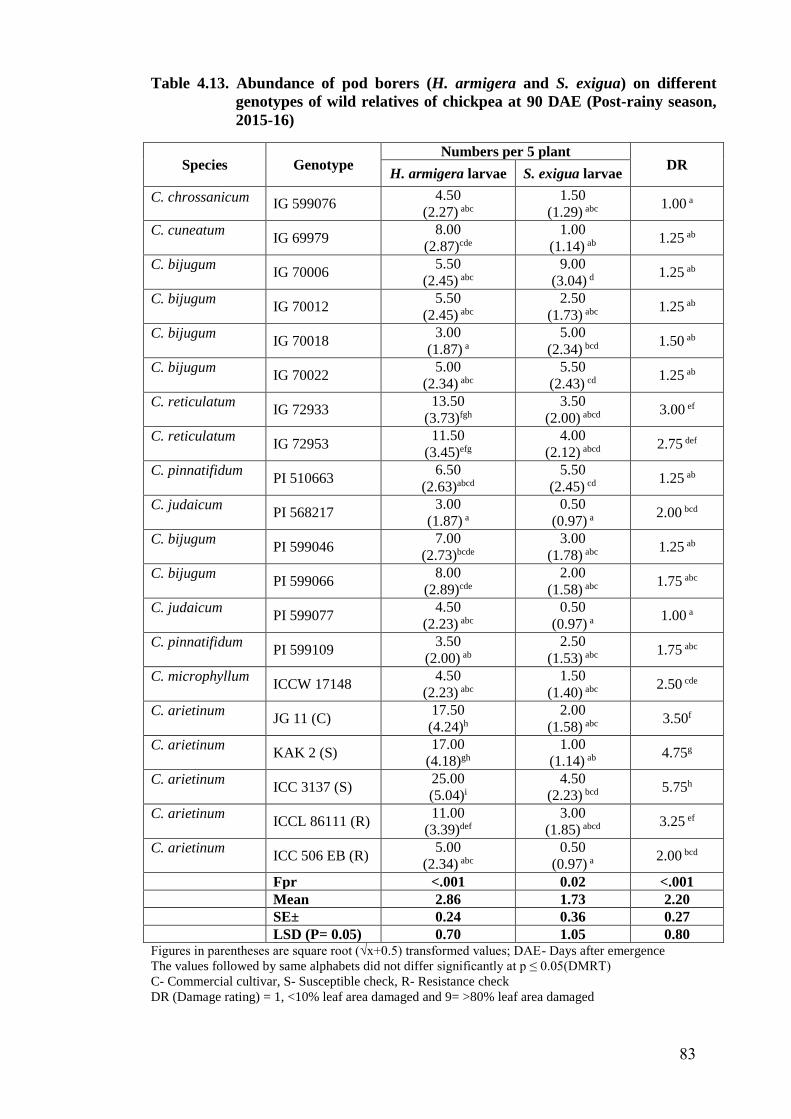
Table 4.13. Abundance of pod borers (H. armigera and S. exigua) on different
genotypes of wild relatives of chickpea at 90 DAE (Post-rainy season,
2015-16)
Species Genotype Numbers per 5 plant
DR H. armigera larvae S. exigua larvae
C. chrossanicum IG 599076
4.50
(2.27) abc
1.50
(1.29) abc 1.00 a
C. cuneatum IG 69979
8.00
(2.87)cde
1.00
(1.14) ab 1.25 ab
C. bijugum IG 70006
5.50
(2.45) abc
9.00
(3.04) d 1.25 ab
C. bijugum IG 70012
5.50
(2.45) abc
2.50
(1.73) abc 1.25 ab
C. bijugum IG 70018
3.00
(1.87) a
5.00
(2.34) bcd 1.50 ab
C. bijugum IG 70022
5.00
(2.34) abc
5.50
(2.43) cd 1.25 ab
C. reticulatum IG 72933
13.50
(3.73)fgh
3.50
(2.00) abcd 3.00 ef
C. reticulatum IG 72953
11.50
(3.45)efg
4.00
(2.12) abcd 2.75 def
C. pinnatifidum PI 510663
6.50
(2.63)abcd
5.50
(2.45) cd 1.25 ab
C. judaicum PI 568217
3.00
(1.87) a
0.50
(0.97) a 2.00 bcd
C. bijugum PI 599046
7.00
(2.73)bcde
3.00
(1.78) abc 1.25 ab
C. bijugum PI 599066
8.00
(2.89)cde
2.00
(1.58) abc 1.75 abc
C. judaicum PI 599077
4.50
(2.23) abc
0.50
(0.97) a 1.00 a
C. pinnatifidum PI 599109
3.50
(2.00) ab
2.50
(1.53) abc 1.75 abc
C. microphyllum ICCW 17148
4.50
(2.23) abc
1.50
(1.40) abc 2.50 cde
C. arietinum JG 11 (C)
17.50
(4.24)h
2.00
(1.58) abc 3.50f
C. arietinum KAK 2 (S)
17.00
(4.18)gh
1.00
(1.14) ab 4.75g
C. arietinum ICC 3137 (S)
25.00
(5.04)i
4.50
(2.23) bcd 5.75h
C. arietinum ICCL 86111 (R)
11.00
(3.39)def
3.00
(1.85) abcd 3.25 ef
C. arietinum ICC 506 EB (R)
5.00
(2.34) abc
0.50
(0.97) a 2.00 bcd
Fpr <.001 0.02 <.001
Mean 2.86 1.73 2.20
SE± 0.24 0.36 0.27
LSD (P= 0.05) 0.70 1.05 0.80
Figures in parentheses are square root (√x+0.5) transformed values; DAE- Days after emergence
The values followed by same alphabets did not differ significantly at p ≤ 0.05(DMRT)
C- Commercial cultivar, S- Susceptible check, R- Resistance check
DR (Damage rating) = 1, <10% leaf area damaged and 9= >80% leaf area damaged
83
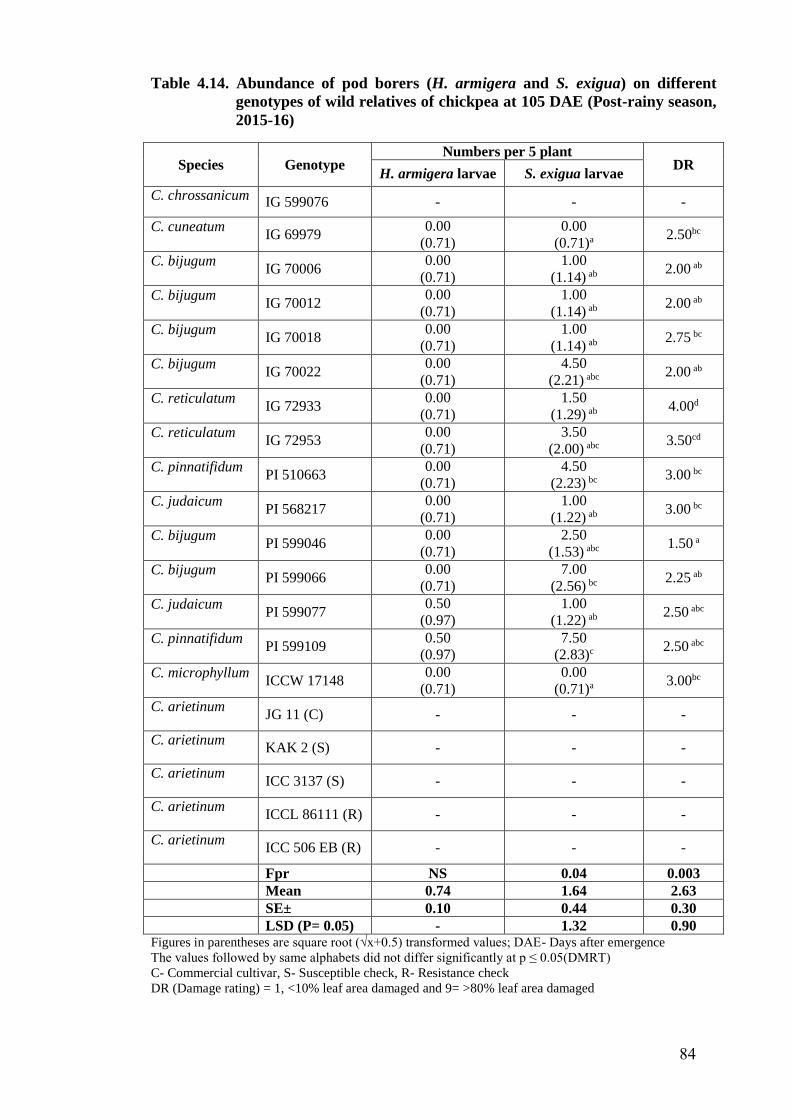
Table 4.14. Abundance of pod borers (H. armigera and S. exigua) on different
genotypes of wild relatives of chickpea at 105 DAE (Post-rainy season,
2015-16)
Species Genotype Numbers per 5 plant
DR H. armigera larvae S. exigua larvae
C. chrossanicum IG 599076 - - -
C. cuneatum IG 69979
0.00
(0.71)
0.00
(0.71)a 2.50bc
C. bijugum IG 70006
0.00
(0.71)
1.00
(1.14) ab 2.00 ab
C. bijugum IG 70012
0.00
(0.71)
1.00
(1.14) ab 2.00 ab
C. bijugum IG 70018
0.00
(0.71)
1.00
(1.14) ab 2.75 bc
C. bijugum IG 70022
0.00
(0.71)
4.50
(2.21) abc 2.00 ab
C. reticulatum IG 72933
0.00
(0.71)
1.50
(1.29) ab 4.00d
C. reticulatum IG 72953
0.00
(0.71)
3.50
(2.00) abc 3.50cd
C. pinnatifidum PI 510663
0.00
(0.71)
4.50
(2.23) bc 3.00 bc
C. judaicum PI 568217
0.00
(0.71)
1.00
(1.22) ab 3.00 bc
C. bijugum PI 599046
0.00
(0.71)
2.50
(1.53) abc 1.50 a
C. bijugum PI 599066
0.00
(0.71)
7.00
(2.56) bc 2.25 ab
C. judaicum PI 599077
0.50
(0.97)
1.00
(1.22) ab 2.50 abc
C. pinnatifidum PI 599109
0.50
(0.97)
7.50
(2.83)c 2.50 abc
C. microphyllum ICCW 17148
0.00
(0.71)
0.00
(0.71)a 3.00bc
C. arietinum JG 11 (C) - - -
C. arietinum KAK 2 (S) - - -
C. arietinum ICC 3137 (S) - - -
C. arietinum ICCL 86111 (R) - - -
C. arietinum ICC 506 EB (R) - - -
Fpr NS 0.04 0.003
Mean 0.74 1.64 2.63
SE± 0.10 0.44 0.30
LSD (P= 0.05) - 1.32 0.90
Figures in parentheses are square root (√x+0.5) transformed values; DAE- Days after emergence
The values followed by same alphabets did not differ significantly at p ≤ 0.05(DMRT)
C- Commercial cultivar, S- Susceptible check, R- Resistance check
DR (Damage rating) = 1, <10% leaf area damaged and 9= >80% leaf area damaged
84
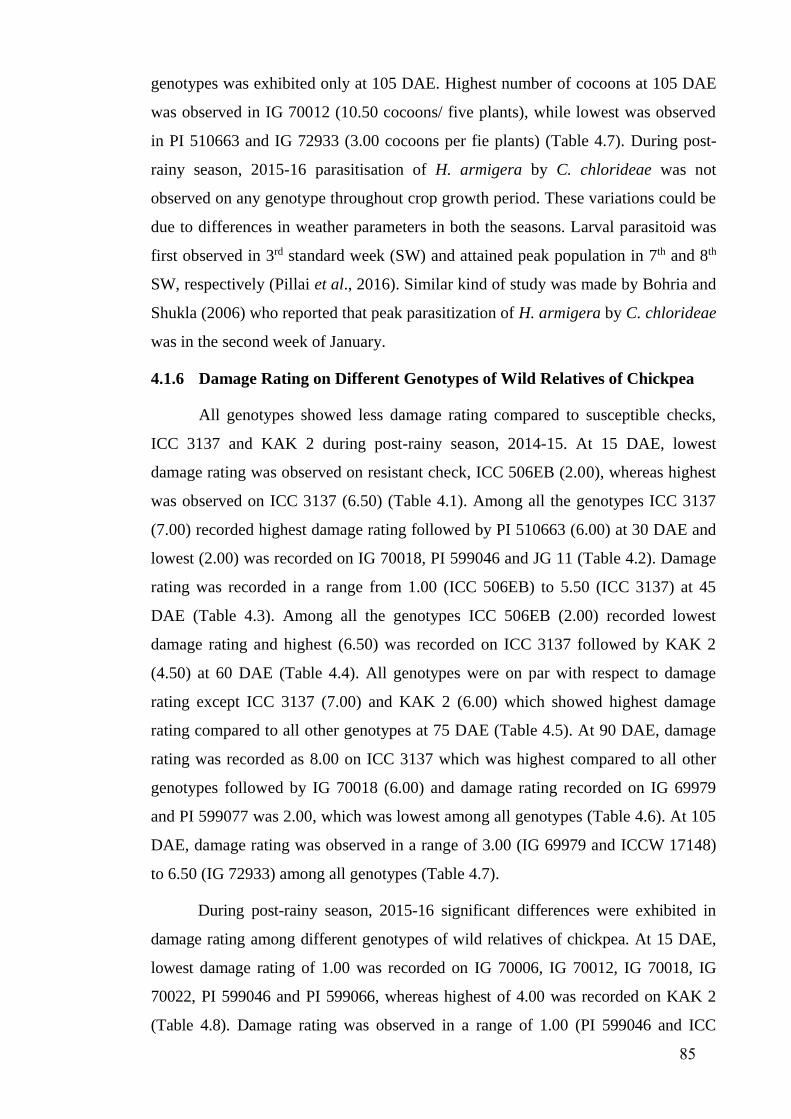
genotypes was exhibited only at 105 DAE. Highest number of cocoons at 105 DAE
was observed in IG 70012 (10.50 cocoons/ five plants), while lowest was observed
in PI 510663 and IG 72933 (3.00 cocoons per fie plants) (Table 4.7). During post-
rainy season, 2015-16 parasitisation of H. armigera by C. chlorideae was not
observed on any genotype throughout crop growth period. These variations could be
due to differences in weather parameters in both the seasons. Larval parasitoid was
first observed in 3rd standard week (SW) and attained peak population in 7th and 8th
SW, respectively (Pillai et al., 2016). Similar kind of study was made by Bohria and
Shukla (2006) who reported that peak parasitization of H. armigera by C. chlorideae
was in the second week of January.
4.1.6 Damage Rating on Different Genotypes of Wild Relatives of Chickpea
All genotypes showed less damage rating compared to susceptible checks,
ICC 3137 and KAK 2 during post-rainy season, 2014-15. At 15 DAE, lowest
damage rating was observed on resistant check, ICC 506EB (2.00), whereas highest
was observed on ICC 3137 (6.50) (Table 4.1). Among all the genotypes ICC 3137
(7.00) recorded highest damage rating followed by PI 510663 (6.00) at 30 DAE and
lowest (2.00) was recorded on IG 70018, PI 599046 and JG 11 (Table 4.2). Damage
rating was recorded in a range from 1.00 (ICC 506EB) to 5.50 (ICC 3137) at 45
DAE (Table 4.3). Among all the genotypes ICC 506EB (2.00) recorded lowest
damage rating and highest (6.50) was recorded on ICC 3137 followed by KAK 2
(4.50) at 60 DAE (Table 4.4). All genotypes were on par with respect to damage
rating except ICC 3137 (7.00) and KAK 2 (6.00) which showed highest damage
rating compared to all other genotypes at 75 DAE (Table 4.5). At 90 DAE, damage
rating was recorded as 8.00 on ICC 3137 which was highest compared to all other
genotypes followed by IG 70018 (6.00) and damage rating recorded on IG 69979
and PI 599077 was 2.00, which was lowest among all genotypes (Table 4.6). At 105
DAE, damage rating was observed in a range of 3.00 (IG 69979 and ICCW 17148)
to 6.50 (IG 72933) among all genotypes (Table 4.7).
During post-rainy season, 2015-16 significant differences were exhibited in
damage rating among different genotypes of wild relatives of chickpea. At 15 DAE,
lowest damage rating of 1.00 was recorded on IG 70006, IG 70012, IG 70018, IG
70022, PI 599046 and PI 599066, whereas highest of 4.00 was recorded on KAK 2
(Table 4.8). Damage rating was observed in a range of 1.00 (PI 599046 and ICC
85
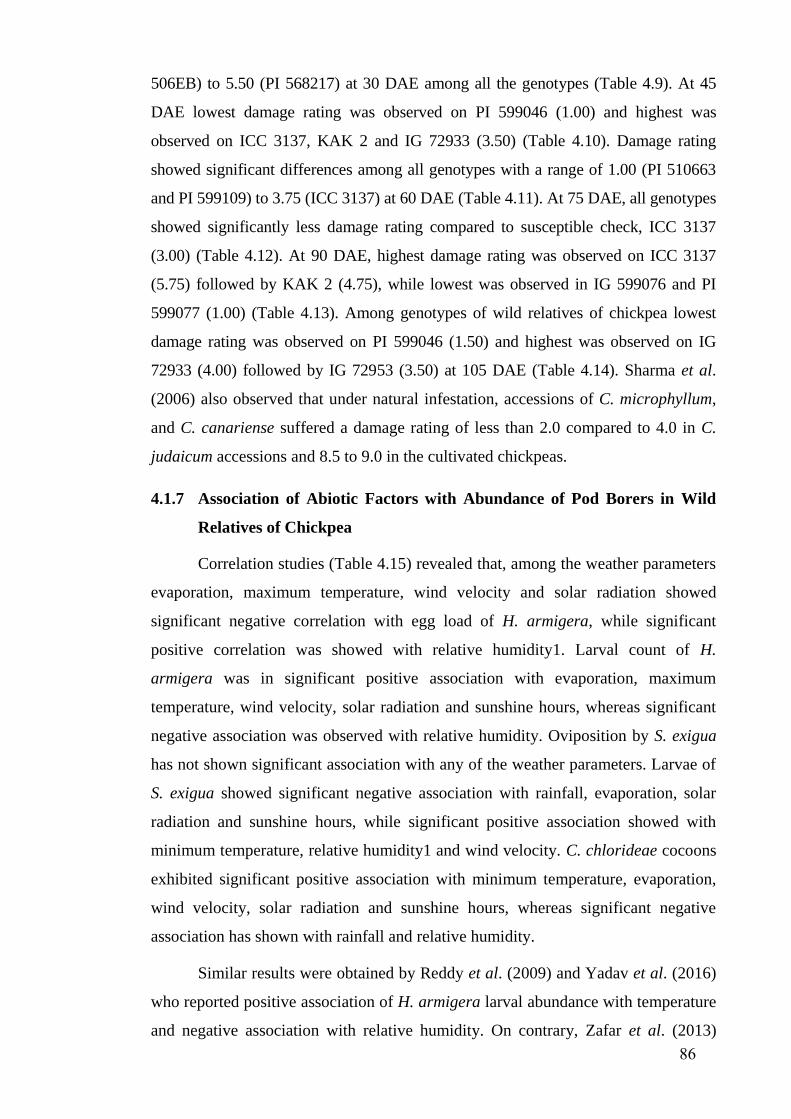
506EB) to 5.50 (PI 568217) at 30 DAE among all the genotypes (Table 4.9). At 45
DAE lowest damage rating was observed on PI 599046 (1.00) and highest was
observed on ICC 3137, KAK 2 and IG 72933 (3.50) (Table 4.10). Damage rating
showed significant differences among all genotypes with a range of 1.00 (PI 510663
and PI 599109) to 3.75 (ICC 3137) at 60 DAE (Table 4.11). At 75 DAE, all genotypes
showed significantly less damage rating compared to susceptible check, ICC 3137
(3.00) (Table 4.12). At 90 DAE, highest damage rating was observed on ICC 3137
(5.75) followed by KAK 2 (4.75), while lowest was observed in IG 599076 and PI
599077 (1.00) (Table 4.13). Among genotypes of wild relatives of chickpea lowest
damage rating was observed on PI 599046 (1.50) and highest was observed on IG
72933 (4.00) followed by IG 72953 (3.50) at 105 DAE (Table 4.14). Sharma et al.
(2006) also observed that under natural infestation, accessions of C. microphyllum,
and C. canariense suffered a damage rating of less than 2.0 compared to 4.0 in C.
judaicum accessions and 8.5 to 9.0 in the cultivated chickpeas.
4.1.7 Association of Abiotic Factors with Abundance of Pod Borers in Wild
Relatives of Chickpea
Correlation studies (Table 4.15) revealed that, among the weather parameters
evaporation, maximum temperature, wind velocity and solar radiation showed
significant negative correlation with egg load of H. armigera, while significant
positive correlation was showed with relative humidity1. Larval count of H.
armigera was in significant positive association with evaporation, maximum
temperature, wind velocity, solar radiation and sunshine hours, whereas significant
negative association was observed with relative humidity. Oviposition by S. exigua
has not shown significant association with any of the weather parameters. Larvae of
S. exigua showed significant negative association with rainfall, evaporation, solar
radiation and sunshine hours, while significant positive association showed with
minimum temperature, relative humidity1 and wind velocity. C. chlorideae cocoons
exhibited significant positive association with minimum temperature, evaporation,
wind velocity, solar radiation and sunshine hours, whereas significant negative
association has shown with rainfall and relative humidity.
Similar results were obtained by Reddy et al. (2009) and Yadav et al. (2016)
who reported positive association of H. armigera larval abundance with temperature
and negative association with relative humidity. On contrary, Zafar et al. (2013)
86
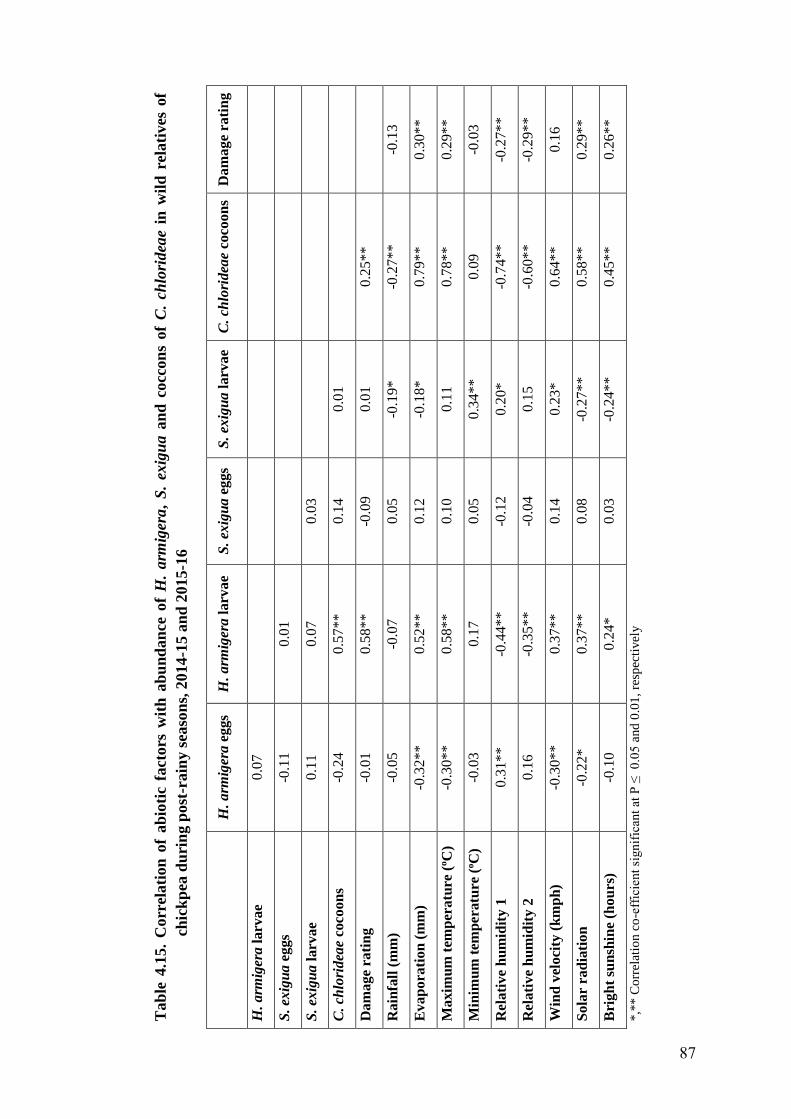
Tab
le 4
.15.
Corr
elati
on
of
ab
ioti
c fa
ctors
wit
h a
bu
nd
an
ce o
f H
. arm
iger
a,
S.
exig
ua
an
d c
occ
on
s of
C.
chlo
ridea
e in
wil
d r
elati
ves
of
chic
kp
ea d
uri
ng p
ost
-ra
iny s
easo
ns,
2014
-15 a
nd
2015
-16
H
. a
rmig
era
eggs
H.
arm
iger
a l
arv
ae
S.
exig
ua
eggs
S.
exig
ua
larv
ae
C.
chlo
rid
eae c
oco
on
s D
am
ag
e ra
tin
g
H.
arm
iger
a l
arv
ae
0.0
7
S
. ex
igu
a e
ggs
-0.1
1
0.0
1
S.
exig
ua
larv
ae
0.1
1
0.0
7
0.0
3
C
. ch
lori
dea
e c
oco
on
s -0
.24
0.5
7**
0.1
4
0.0
1
Dam
age
rati
ng
-0.0
1
0.5
8**
-0.0
9
0.0
1
0.2
5*
*
R
ain
fall
(m
m)
-0.0
5
-0.0
7
0.0
5
-0.1
9*
-0
.27*
*
-0.1
3
Evap
ora
tion
(m
m)
-0.3
2**
0.5
2**
0.1
2
-0.1
8*
0
.79*
*
0.3
0*
*
Maxim
um
tem
per
atu
re (
oC
) -0
.30**
0.5
8**
0.1
0
0.1
1
0.7
8*
*
0.2
9*
*
Min
imu
m t
emp
eratu
re (
oC
) -0
.03
0.1
7
0.0
5
0.3
4*
*
0.0
9
-0.0
3
Rel
ati
ve
hu
mid
ity
1
0.3
1**
-0.4
4**
-0
.12
0
.20*
-0.7
4*
*
-0.2
7*
*
Rel
ati
ve
hu
mid
ity
2
0.1
6
-0.3
5**
-0
.04
0
.15
-0.6
0*
*
-0.2
9*
*
Win
d v
eloci
ty (
km
ph
) -0
.30**
0.3
7**
0.1
4
0.2
3*
0.6
4*
*
0.1
6
Sola
r r
ad
iati
on
-0
.22*
0.3
7**
0.0
8
-0.2
7*
*
0.5
8*
*
0.2
9*
*
Bri
gh
t su
nsh
ine
(ho
urs
) -0
.10
0.2
4*
0.0
3
-0.2
4*
*
0.4
5*
*
0.2
6*
*
*,*
* C
orr
elat
ion c
o-e
ffic
ient
sign
ific
ant
at P
≤
0.0
5 a
nd
0.0
1,
resp
ecti
vel
y
87
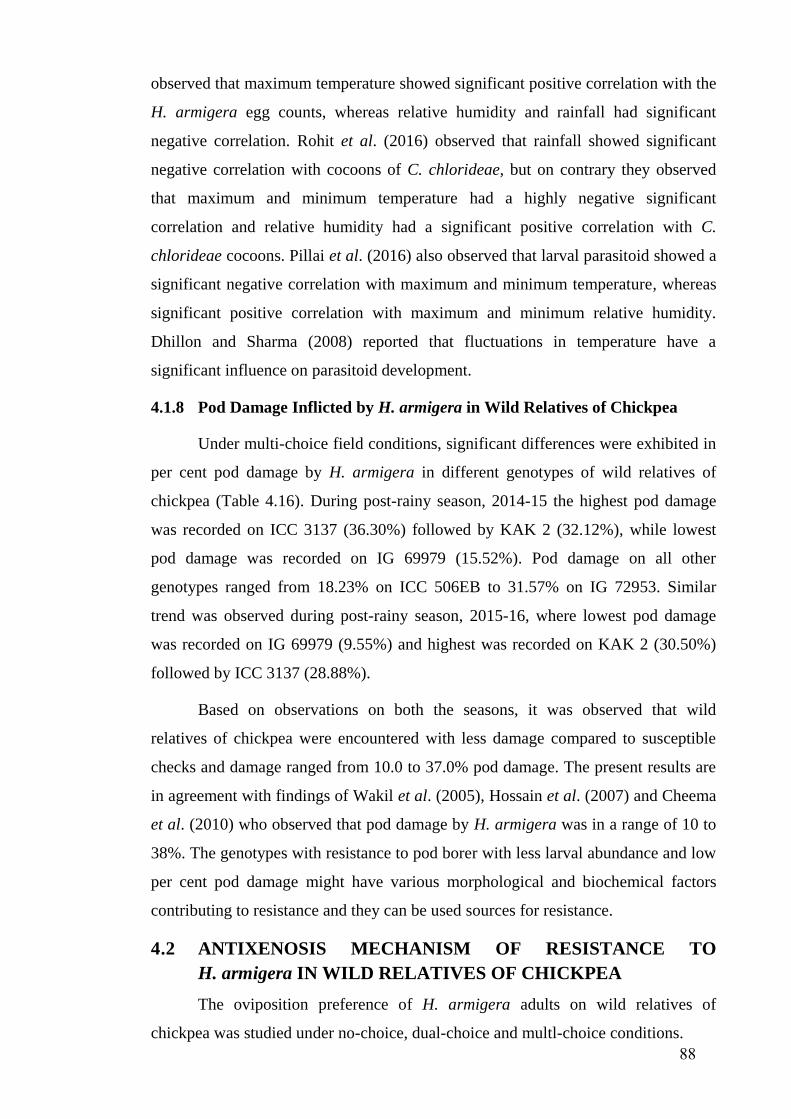
observed that maximum temperature showed significant positive correlation with the
H. armigera egg counts, whereas relative humidity and rainfall had significant
negative correlation. Rohit et al. (2016) observed that rainfall showed significant
negative correlation with cocoons of C. chlorideae, but on contrary they observed
that maximum and minimum temperature had a highly negative significant
correlation and relative humidity had a significant positive correlation with C.
chlorideae cocoons. Pillai et al. (2016) also observed that larval parasitoid showed a
significant negative correlation with maximum and minimum temperature, whereas
significant positive correlation with maximum and minimum relative humidity.
Dhillon and Sharma (2008) reported that fluctuations in temperature have a
significant influence on parasitoid development.
4.1.8 Pod Damage Inflicted by H. armigera in Wild Relatives of Chickpea
Under multi-choice field conditions, significant differences were exhibited in
per cent pod damage by H. armigera in different genotypes of wild relatives of
chickpea (Table 4.16). During post-rainy season, 2014-15 the highest pod damage
was recorded on ICC 3137 (36.30%) followed by KAK 2 (32.12%), while lowest
pod damage was recorded on IG 69979 (15.52%). Pod damage on all other
genotypes ranged from 18.23% on ICC 506EB to 31.57% on IG 72953. Similar
trend was observed during post-rainy season, 2015-16, where lowest pod damage
was recorded on IG 69979 (9.55%) and highest was recorded on KAK 2 (30.50%)
followed by ICC 3137 (28.88%).
Based on observations on both the seasons, it was observed that wild
relatives of chickpea were encountered with less damage compared to susceptible
checks and damage ranged from 10.0 to 37.0% pod damage. The present results are
in agreement with findings of Wakil et al. (2005), Hossain et al. (2007) and Cheema
et al. (2010) who observed that pod damage by H. armigera was in a range of 10 to
38%. The genotypes with resistance to pod borer with less larval abundance and low
per cent pod damage might have various morphological and biochemical factors
contributing to resistance and they can be used sources for resistance.
4.2 ANTIXENOSIS MECHANISM OF RESISTANCE TO
H. armigera IN WILD RELATIVES OF CHICKPEA
The oviposition preference of H. armigera adults on wild relatives of
chickpea was studied under no-choice, dual-choice and multl-choice conditions.
88
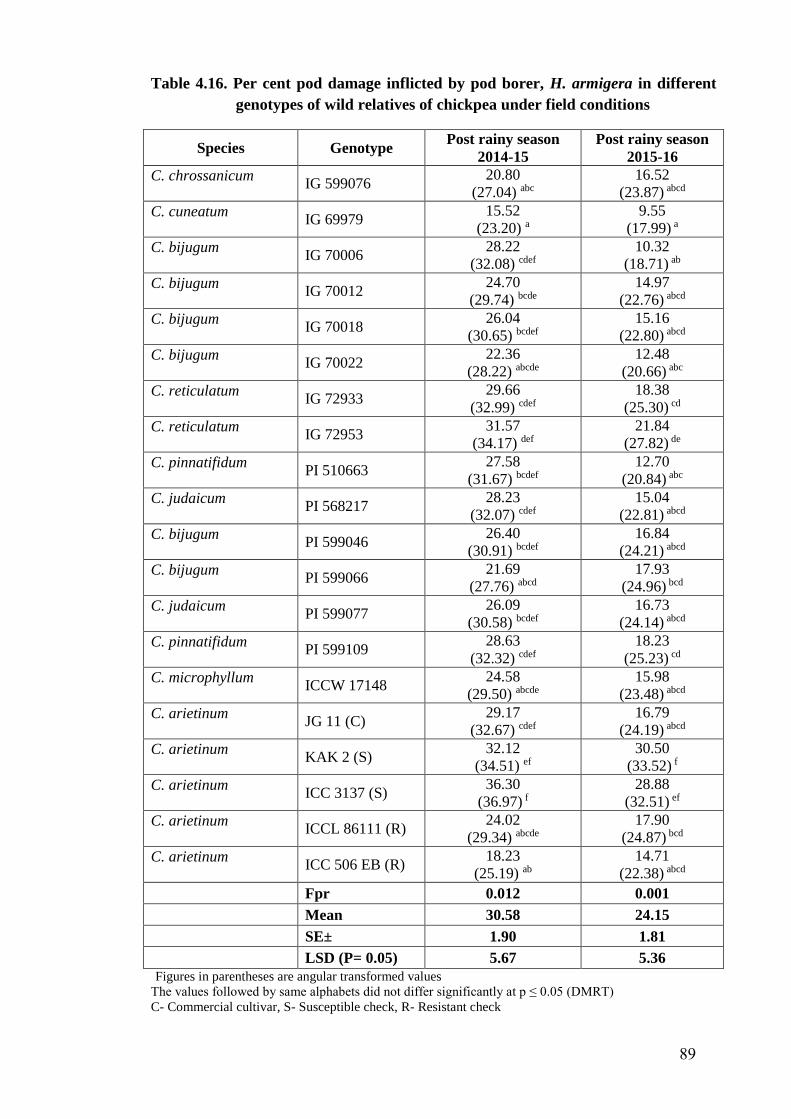
Table 4.16. Per cent pod damage inflicted by pod borer, H. armigera in different
genotypes of wild relatives of chickpea under field conditions
Species Genotype Post rainy season
2014-15
Post rainy season
2015-16
C. chrossanicum IG 599076
20.80
(27.04) abc
16.52
(23.87) abcd
C. cuneatum IG 69979
15.52
(23.20) a
9.55
(17.99) a
C. bijugum IG 70006
28.22
(32.08) cdef
10.32
(18.71) ab
C. bijugum IG 70012
24.70
(29.74) bcde
14.97
(22.76) abcd
C. bijugum IG 70018
26.04
(30.65) bcdef
15.16
(22.80) abcd
C. bijugum IG 70022
22.36
(28.22) abcde
12.48
(20.66) abc
C. reticulatum IG 72933
29.66
(32.99) cdef
18.38
(25.30) cd
C. reticulatum IG 72953
31.57
(34.17) def
21.84
(27.82) de
C. pinnatifidum PI 510663
27.58
(31.67) bcdef
12.70
(20.84) abc
C. judaicum PI 568217
28.23
(32.07) cdef
15.04
(22.81) abcd
C. bijugum PI 599046
26.40
(30.91) bcdef
16.84
(24.21) abcd
C. bijugum PI 599066
21.69
(27.76) abcd
17.93
(24.96) bcd
C. judaicum PI 599077
26.09
(30.58) bcdef
16.73
(24.14) abcd
C. pinnatifidum PI 599109
28.63
(32.32) cdef
18.23
(25.23) cd
C. microphyllum ICCW 17148
24.58
(29.50) abcde
15.98
(23.48) abcd
C. arietinum JG 11 (C)
29.17
(32.67) cdef
16.79
(24.19) abcd
C. arietinum KAK 2 (S)
32.12
(34.51) ef
30.50
(33.52) f
C. arietinum ICC 3137 (S)
36.30
(36.97) f
28.88
(32.51) ef
C. arietinum ICCL 86111 (R)
24.02
(29.34) abcde
17.90
(24.87) bcd
C. arietinum ICC 506 EB (R)
18.23
(25.19) ab
14.71
(22.38) abcd
Fpr 0.012 0.001
Mean 30.58 24.15
SE± 1.90 1.81
LSD (P= 0.05) 5.67 5.36
Figures in parentheses are angular transformed values
The values followed by same alphabets did not differ significantly at p ≤ 0.05 (DMRT)
C- Commercial cultivar, S- Susceptible check, R- Resistant check
89
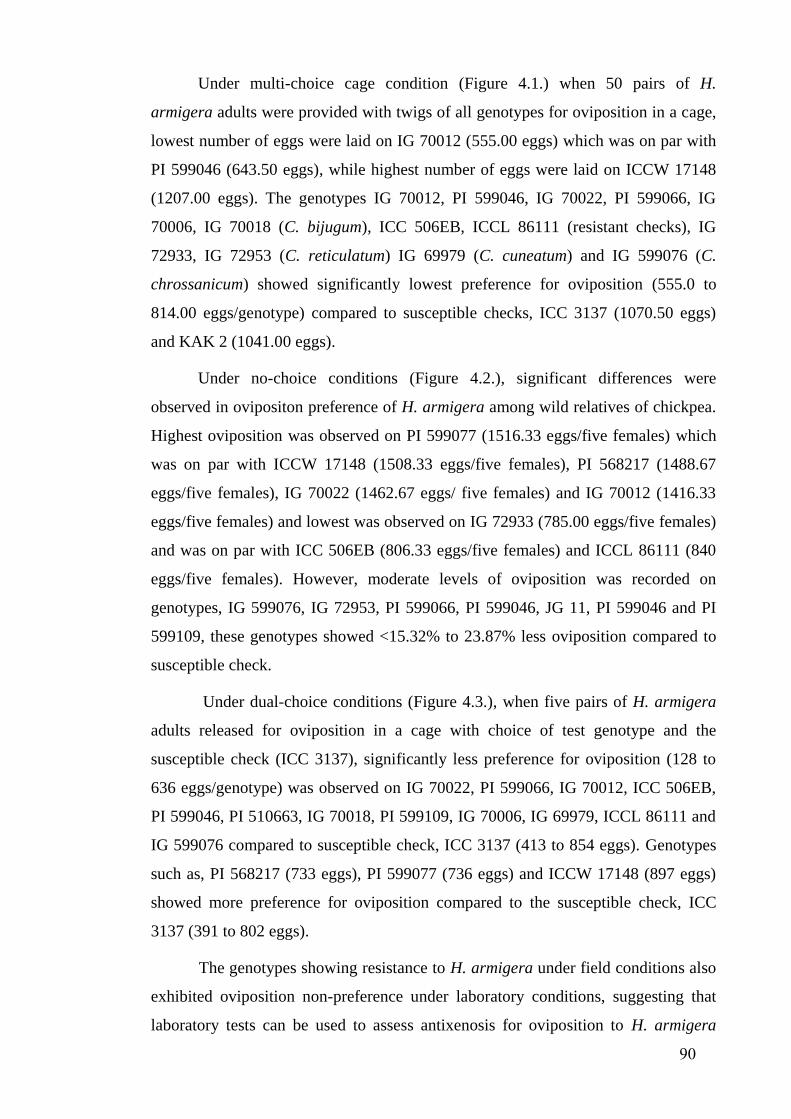
Under multi-choice cage condition (Figure 4.1.) when 50 pairs of H.
armigera adults were provided with twigs of all genotypes for oviposition in a cage,
lowest number of eggs were laid on IG 70012 (555.00 eggs) which was on par with
PI 599046 (643.50 eggs), while highest number of eggs were laid on ICCW 17148
(1207.00 eggs). The genotypes IG 70012, PI 599046, IG 70022, PI 599066, IG
70006, IG 70018 (C. bijugum), ICC 506EB, ICCL 86111 (resistant checks), IG
72933, IG 72953 (C. reticulatum) IG 69979 (C. cuneatum) and IG 599076 (C.
chrossanicum) showed significantly lowest preference for oviposition (555.0 to
814.00 eggs/genotype) compared to susceptible checks, ICC 3137 (1070.50 eggs)
and KAK 2 (1041.00 eggs).
Under no-choice conditions (Figure 4.2.), significant differences were
observed in ovipositon preference of H. armigera among wild relatives of chickpea.
Highest oviposition was observed on PI 599077 (1516.33 eggs/five females) which
was on par with ICCW 17148 (1508.33 eggs/five females), PI 568217 (1488.67
eggs/five females), IG 70022 (1462.67 eggs/ five females) and IG 70012 (1416.33
eggs/five females) and lowest was observed on IG 72933 (785.00 eggs/five females)
and was on par with ICC 506EB (806.33 eggs/five females) and ICCL 86111 (840
eggs/five females). However, moderate levels of oviposition was recorded on
genotypes, IG 599076, IG 72953, PI 599066, PI 599046, JG 11, PI 599046 and PI
599109, these genotypes showed <15.32% to 23.87% less oviposition compared to
susceptible check.
Under dual-choice conditions (Figure 4.3.), when five pairs of H. armigera
adults released for oviposition in a cage with choice of test genotype and the
susceptible check (ICC 3137), significantly less preference for oviposition (128 to
636 eggs/genotype) was observed on IG 70022, PI 599066, IG 70012, ICC 506EB,
PI 599046, PI 510663, IG 70018, PI 599109, IG 70006, IG 69979, ICCL 86111 and
IG 599076 compared to susceptible check, ICC 3137 (413 to 854 eggs). Genotypes
such as, PI 568217 (733 eggs), PI 599077 (736 eggs) and ICCW 17148 (897 eggs)
showed more preference for oviposition compared to the susceptible check, ICC
3137 (391 to 802 eggs).
The genotypes showing resistance to H. armigera under field conditions also
exhibited oviposition non-preference under laboratory conditions, suggesting that
laboratory tests can be used to assess antixenosis for oviposition to H. armigera
90
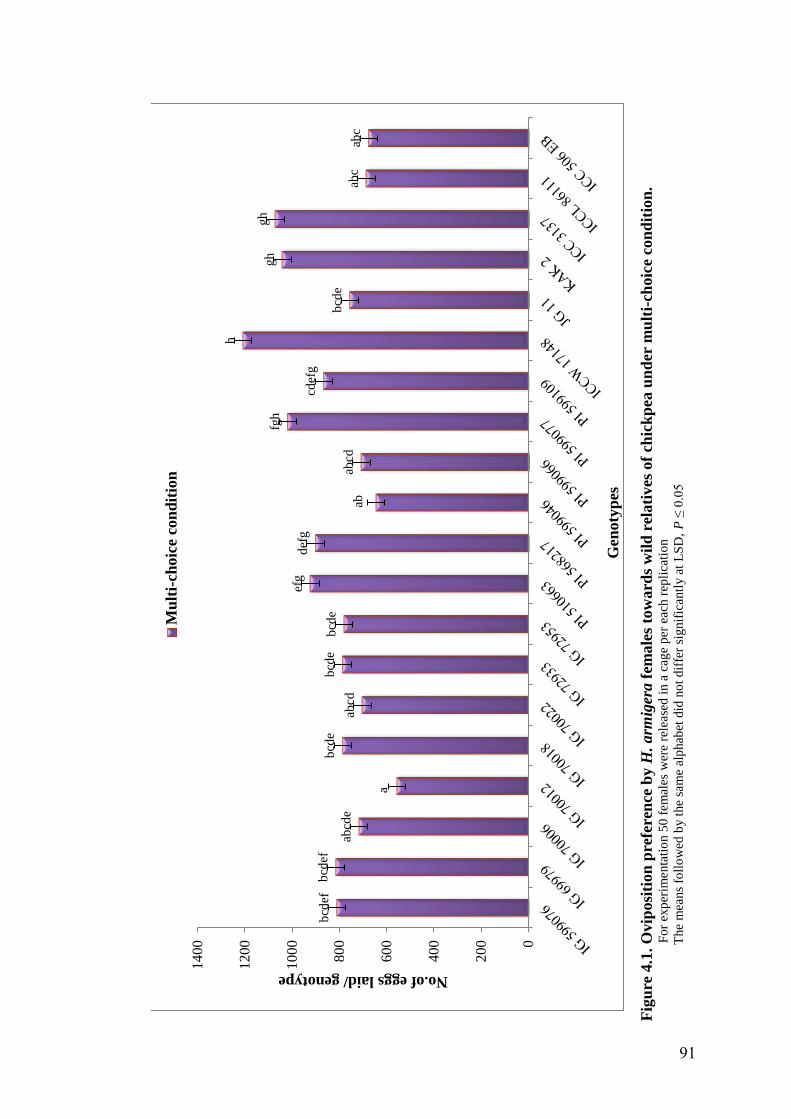
Fig
ure
4.1
. O
vip
osi
tion
pre
fere
nce
by H
. arm
iger
a f
emale
s to
ward
s w
ild
rel
ati
ves
of
chic
kp
ea u
nd
er m
ult
i-ch
oic
e co
nd
itio
n.
For
exp
erim
enta
tio
n 5
0 f
em
ales
wer
e re
leas
ed i
n a
cag
e p
er e
ach r
epli
cati
on
T
he
mea
ns
foll
ow
ed b
y t
he
sam
e al
phab
et d
id n
ot
dif
fer
sig
nif
icantl
y a
t L
SD
, P
≤ 0
.05
bcd
efb
cdef
abcd
e
a
bcd
e
abcd
bcd
eb
cde
efg
def
g
abab
cd
fgh
cdef
g
h
bcd
e
gh
gh
abc
abc
0
200
400
600
800
1000
1200
1400
No.of eggs laid/ genotype
Gen
oty
pes
Mu
lti-
ch
oic
e c
on
dit
ion
91
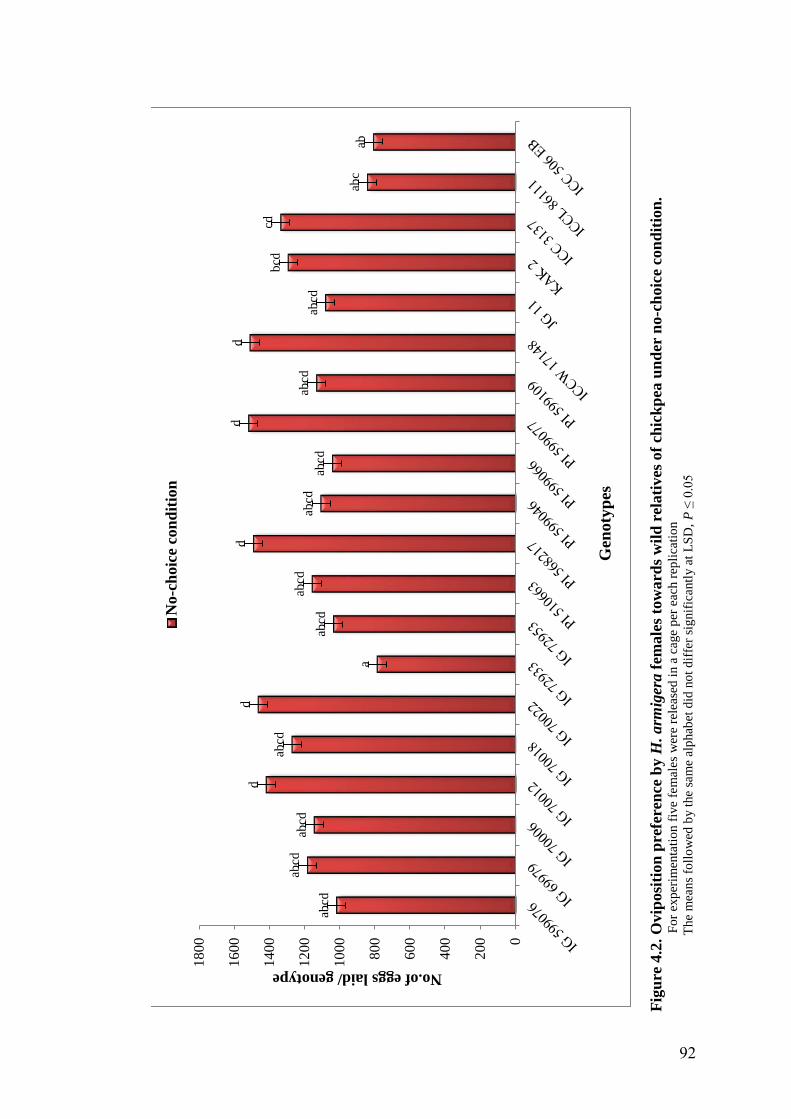
Fig
ure
4.2
. O
vip
osi
tion
pre
fere
nce
by H
. arm
iger
a f
emale
s to
ward
s w
ild
rel
ati
ves
of
chic
kp
ea u
nd
er n
o-c
hoic
e co
nd
itio
n.
Fo
r ex
per
imen
tati
on f
ive
fem
ales
wer
e re
leas
ed i
n a
cag
e p
er e
ach r
epli
cati
on
T
he
mea
ns
foll
ow
ed b
y t
he
sam
e al
phab
et d
id n
ot
dif
fer
sig
nif
icantl
y a
t L
SD
, P
≤ 0
.05
abcd
abcd
abcd
d
abcd
d
a
abcd
abcd
d
abcd
abcd
d
abcd
d
abcd
bcd
cd
abc
ab
0
20
0
40
0
60
0
80
0
100
0
120
0
140
0
160
0
180
0
No.of eggs laid/ genotype
Gen
oty
pes
No-c
hoic
e co
nd
itio
n
92
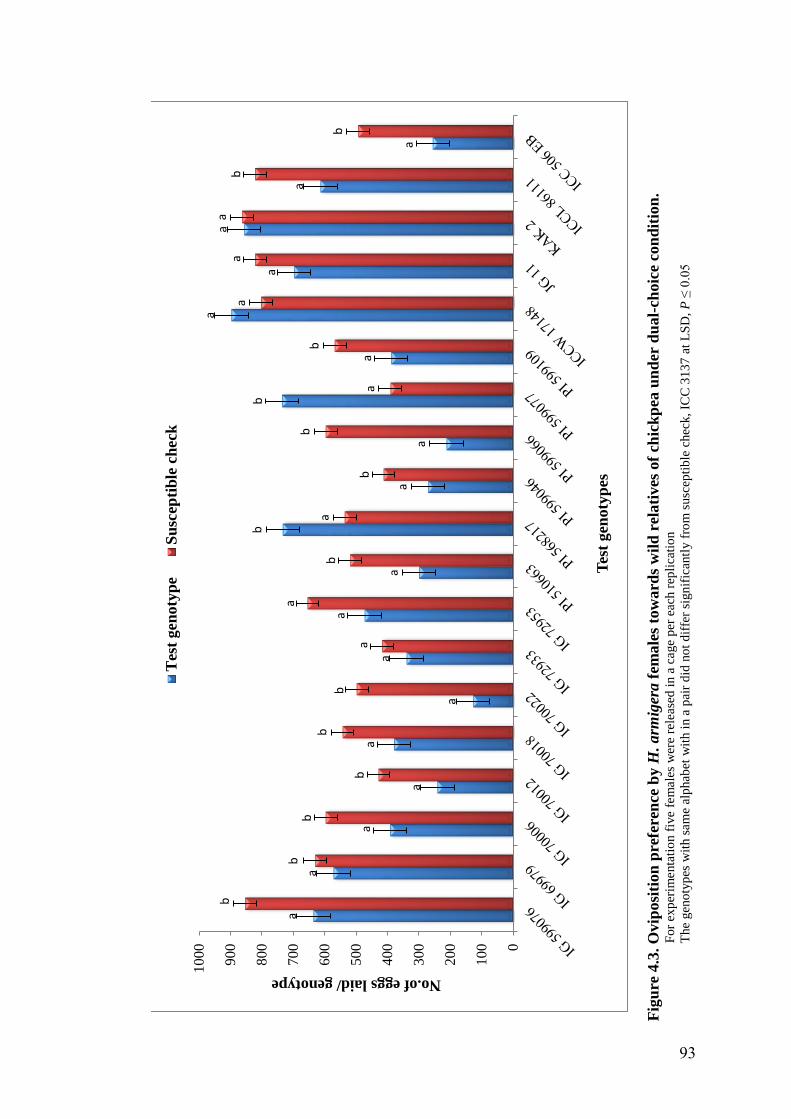
Fig
ure
4.3
. O
vip
osi
tion
pre
fere
nce
by H
. arm
iger
a f
emale
s to
ward
s w
ild
rel
ati
ves
of
chic
kp
ea u
nd
er d
ual-
choic
e co
nd
itio
n.
For
exp
erim
enta
tio
n f
ive f
em
ale
s w
ere
rele
ased
in a
cage
per
eac
h r
epli
cati
on
The
gen
oty
pes
wit
h s
am
e al
phab
et w
ith i
n a
pai
r d
id n
ot
dif
fer
sign
ific
antl
y f
rom
susc
epti
ble
chec
k,
ICC
31
37
at
LS
D,
P ≤
0.0
5
a
a
a
a
a
a
a
a
a
b
a
a
b
a
a
a
a
a
a
b
bb
b
b
b
a
a
ba
b
b
a
b
aa
ab
b
0
100
200
300
400
500
600
700
800
900
1000
No.of eggs laid/ genotype
Tes
t gen
oty
pes
Tes
t gen
oty
pe
Su
scep
tib
le c
heck
93
(Kumari et al., 2006). The no-choice, dual-choice and multi-choice cage tests
conducted in this study to assess the level of antixenosis to H. armigera revealed
significant differences in number of eggs laid on different species and within
different genotypes of the same species. All the genotypes of wild relatives of
chickpea showed antixenosis for oviposition under multi-choice (except in C.
microphyllum) and dualchoice (except in C. microphyllum and C. judaicum)
conditions, of which accessions belonging to C. bijugum (PI 599066, PI 599046 and
IG 70006), C. reticulatum, C. chrossanicum, C. pinnatifidum, C. cuneatum and
resistant checks (ICC 506EB and ICCL 86111) also showed antixenosis for
oviposition under no-choice conditions compared to susceptible checks (ICC 3137
and KAK 2).
The choice of oviposition may depend on the morphological characteristics
(trichome density) and chemicals from the surfaces of various plant tissues
(Navasero and Ramaswamy, 1991 and Udayagiri and Mason, 1995). Sarwar et al.
(2009) reported that the preference or non-preference for oviposition on chickpea by
female moth may be due to its varying behavioural response possibly due to
different canopy structure of the plants. The variation in number of eggs laid on
different genotypes in the present study could be due to variability in chickpea foliar
secretions containing high concentrations of malic acid (Rembold, 1981). Yoshida et
al. (1997) observed differences in oviposition preferences in relation with varying
concentrations of acid exudates such as malic acid organic acids. Contributory effect
of leaf surface chemicals on oviposition preference of H. armigera had also been
reported by Sharma et al. (2001) and Green et al. (2003) who observed that
methanol extracts of pigeonpea pods had a significant positive stimulant effect on
oviposition by H. armigera, whereas methanol extracts from wild relatives of
pigeonpea C. scarabaeoides pods showed no such effects.
4.3. ANTIBIOSIS MECHANISM OF RESISTANCE TO H. armigera
IN WILD RELATIVES OF CHICKPEA
Results pertaining to different experiments viz. detached leaf assay, detached
pod assay and diet incorporation assay to evaluate antibiosis mechanism of
resistance to pod borer, H. armigera in wild relatives of chickpea were presented
here under.
94
4.3.1 Detached Leaf Assay for Evaluation of Resistance to H. armigera in
Wild Relatives of Chickpea
There were significant differences in leaf damage by neonates of H. armigera
among different accessions of wild relatives of chickpea during post rainy season,
2014-15 (Table 4.17). The lowest damage rating was observed in IG 70012 (1.00)
and resistant check, ICC 506EB (1.00) and which were on par with IG 70022 (1.33),
whereas highest damage rating was recorded on susceptible check, KAK 2 (5.33)
and it was on par with IG 599076 (4.67) and ICC 3137 (4.50). Damage rating of all
other genotypes ranged between 2.00 (IG 70006, IG 70018, PI 568217 and ICCL
86111) to 4.33 (IG 72953). There were no significant differences in larval survival
among different genotypes. Larval weights were lowest on all wild relatives of
chickpea genotypes compared to cultivated chickpea and were in a range of 2.26 mg
in ICCL 86111 to 2.79 mg in JG 11.
During post-rainy season 2015-16 (Table 4.18), significantly lowest damage
rating was observed on genotypes, C. cuneatum, IG 69979 (1.33) and was on par
with C. bijugum, IG 70022 (1.67) and PI 599046 (1.83) compared to resistant check,
ICC 506EB (2.00), while highest damage rating was observed on susceptible check,
ICC 3137 (5.33). Larval survival was lowest in IG 69979 (43.30%) and was on par
with PI 599109 (53.30%), resistant check, ICC 506EB (53.30%), PI 599046
(56.70%) and IG 72953 (56.70%), whereas highest was observed in PI 599066
(96.70%) followed by IG 70012 (90.00%), IG 70018 (90.00%) and susceptible
check, ICC 3137 (86.70%). Larval weight was ranged between 0.34 mg (IG 69979)
and 2.10 mg (IG 599076 and KAK 2). Larval weights were significantly lower on
IG 69979, IG 70022, PI 568217, PI 599077 and ICCW 17148 compared to that of
the larvae reared on the resistant check, ICC 506EB (1.22 mg).
Wild relatives of chickpea genotypes grown under glasshouse conditions
exhibited significant differences with respect to damage rating, larval survival
percentage and larval weight (Table 4.19). All genotypes of wild relatives of
chickpea showed less damage rating compared to susceptible checks KAK 2 (8.00)
and ICC 3137 (6.67), whereas the lowest (1.33) was recorded on genotypes, IG
70022 and PI 599066. Larval survival ranged between 30.00% on resistant check,
ICC 506EB and 96.67% on IG 70006 (C. bijugum). Wild relatives of chickpea
genotypes IG 70006 (96.67%) and IG 70018 (90%) showed significantly higher
95
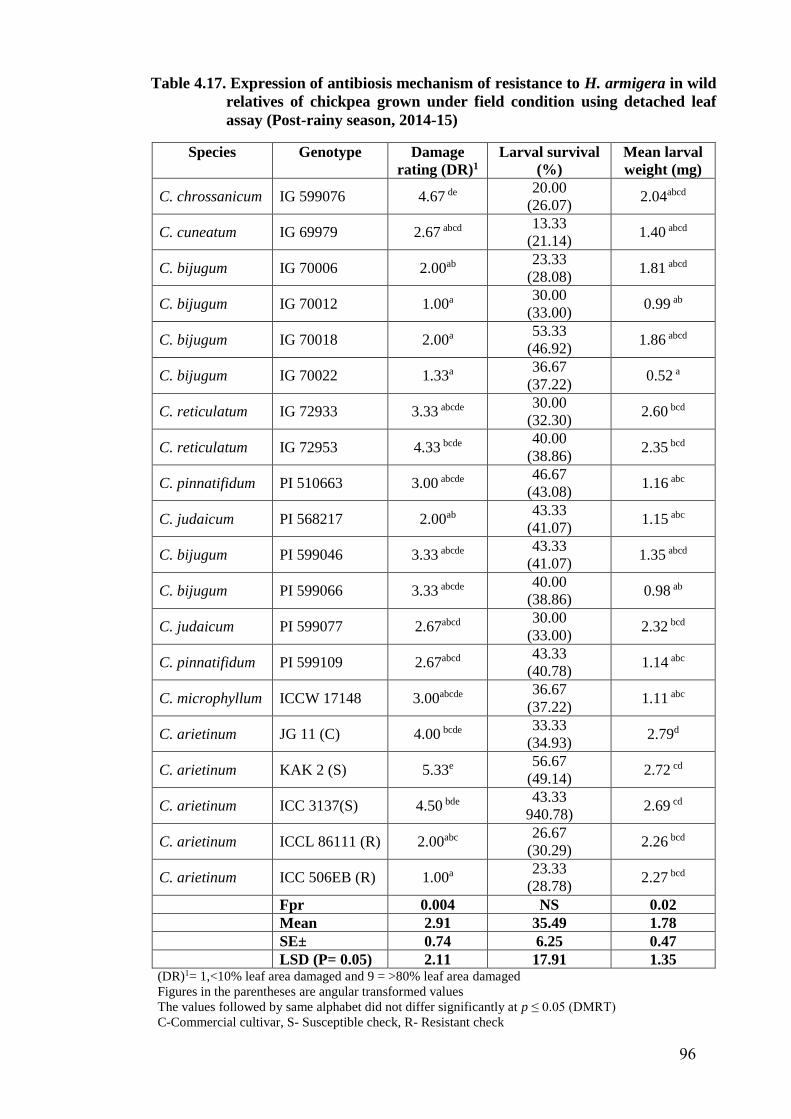
Table 4.17. Expression of antibiosis mechanism of resistance to H. armigera in wild
relatives of chickpea grown under field condition using detached leaf
assay (Post-rainy season, 2014-15)
Species Genotype Damage
rating (DR)1
Larval survival
(%)
Mean larval
weight (mg)
C. chrossanicum IG 599076 4.67 de 20.00
(26.07) 2.04abcd
C. cuneatum IG 69979 2.67 abcd 13.33
(21.14) 1.40 abcd
C. bijugum IG 70006 2.00ab 23.33
(28.08) 1.81 abcd
C. bijugum IG 70012 1.00a 30.00
(33.00) 0.99 ab
C. bijugum IG 70018 2.00a 53.33
(46.92) 1.86 abcd
C. bijugum IG 70022 1.33a 36.67
(37.22) 0.52 a
C. reticulatum IG 72933 3.33 abcde 30.00
(32.30) 2.60 bcd
C. reticulatum IG 72953 4.33 bcde 40.00
(38.86) 2.35 bcd
C. pinnatifidum PI 510663 3.00 abcde 46.67
(43.08) 1.16 abc
C. judaicum PI 568217 2.00ab 43.33
(41.07) 1.15 abc
C. bijugum PI 599046 3.33 abcde 43.33
(41.07) 1.35 abcd
C. bijugum PI 599066 3.33 abcde 40.00
(38.86) 0.98 ab
C. judaicum PI 599077 2.67abcd 30.00
(33.00) 2.32 bcd
C. pinnatifidum PI 599109 2.67abcd 43.33
(40.78) 1.14 abc
C. microphyllum ICCW 17148 3.00abcde 36.67
(37.22) 1.11 abc
C. arietinum JG 11 (C) 4.00 bcde 33.33
(34.93) 2.79d
C. arietinum KAK 2 (S) 5.33e 56.67
(49.14) 2.72 cd
C. arietinum ICC 3137(S) 4.50 bde 43.33
940.78) 2.69 cd
C. arietinum ICCL 86111 (R) 2.00abc 26.67
(30.29) 2.26 bcd
C. arietinum ICC 506EB (R) 1.00a 23.33
(28.78) 2.27 bcd
Fpr 0.004 NS 0.02
Mean 2.91 35.49 1.78
SE± 0.74 6.25 0.47
LSD (P= 0.05) 2.11 17.91 1.35
(DR)1= 1,<10% leaf area damaged and 9 = >80% leaf area damaged
Figures in the parentheses are angular transformed values
The values followed by same alphabet did not differ significantly at p ≤ 0.05 (DMRT)
C-Commercial cultivar, S- Susceptible check, R- Resistant check
96
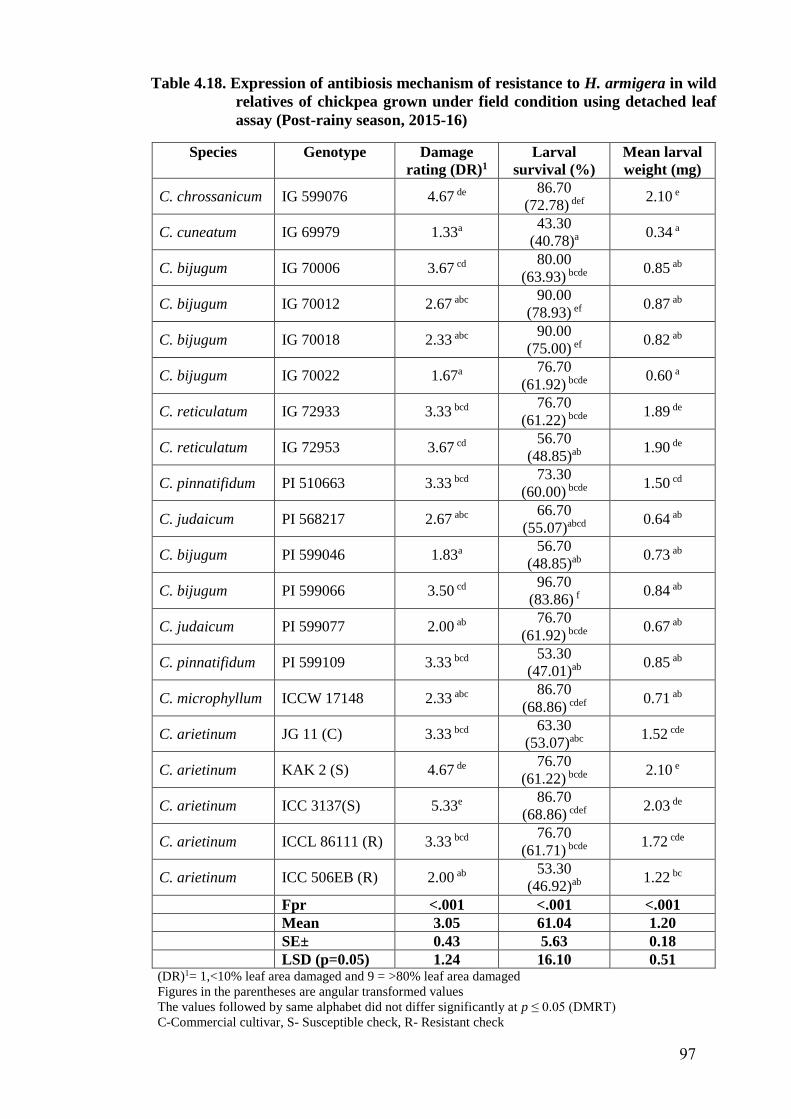
Table 4.18. Expression of antibiosis mechanism of resistance to H. armigera in wild
relatives of chickpea grown under field condition using detached leaf
assay (Post-rainy season, 2015-16)
Species Genotype Damage
rating (DR)1
Larval
survival (%)
Mean larval
weight (mg)
C. chrossanicum IG 599076 4.67 de 86.70
(72.78) def 2.10 e
C. cuneatum IG 69979 1.33a 43.30
(40.78)a 0.34 a
C. bijugum IG 70006 3.67 cd 80.00
(63.93) bcde 0.85 ab
C. bijugum IG 70012 2.67 abc 90.00
(78.93) ef 0.87 ab
C. bijugum IG 70018 2.33 abc 90.00
(75.00) ef 0.82 ab
C. bijugum IG 70022 1.67a 76.70
(61.92) bcde 0.60 a
C. reticulatum IG 72933 3.33 bcd 76.70
(61.22) bcde 1.89 de
C. reticulatum IG 72953 3.67 cd 56.70
(48.85)ab 1.90 de
C. pinnatifidum PI 510663 3.33 bcd 73.30
(60.00) bcde 1.50 cd
C. judaicum PI 568217 2.67 abc 66.70
(55.07)abcd 0.64 ab
C. bijugum PI 599046 1.83a 56.70
(48.85)ab 0.73 ab
C. bijugum PI 599066 3.50 cd 96.70
(83.86) f 0.84 ab
C. judaicum PI 599077 2.00 ab 76.70
(61.92) bcde 0.67 ab
C. pinnatifidum PI 599109 3.33 bcd 53.30
(47.01)ab 0.85 ab
C. microphyllum ICCW 17148 2.33 abc 86.70
(68.86) cdef 0.71 ab
C. arietinum JG 11 (C) 3.33 bcd 63.30
(53.07)abc 1.52 cde
C. arietinum KAK 2 (S) 4.67 de 76.70
(61.22) bcde 2.10 e
C. arietinum ICC 3137(S) 5.33e 86.70
(68.86) cdef 2.03 de
C. arietinum ICCL 86111 (R) 3.33 bcd 76.70
(61.71) bcde 1.72 cde
C. arietinum ICC 506EB (R) 2.00 ab 53.30
(46.92)ab 1.22 bc
Fpr <.001 <.001 <.001
Mean 3.05 61.04 1.20
SE± 0.43 5.63 0.18
LSD (p=0.05) 1.24 16.10 0.51
(DR)1= 1,<10% leaf area damaged and 9 = >80% leaf area damaged
Figures in the parentheses are angular transformed values
The values followed by same alphabet did not differ significantly at p ≤ 0.05 (DMRT)
C-Commercial cultivar, S- Susceptible check, R- Resistant check
97
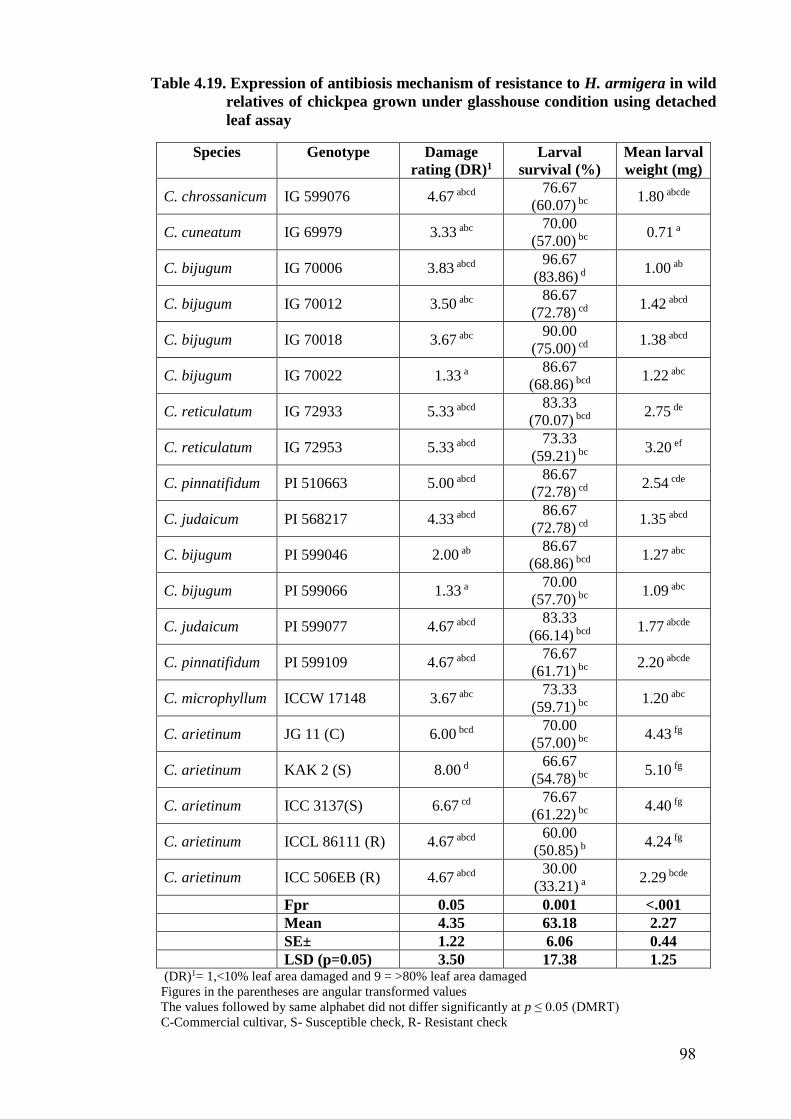
Table 4.19. Expression of antibiosis mechanism of resistance to H. armigera in wild
relatives of chickpea grown under glasshouse condition using detached
leaf assay
Species Genotype Damage
rating (DR)1
Larval
survival (%)
Mean larval
weight (mg)
C. chrossanicum IG 599076 4.67 abcd 76.67
(60.07) bc 1.80 abcde
C. cuneatum IG 69979 3.33 abc 70.00
(57.00) bc 0.71 a
C. bijugum IG 70006 3.83 abcd 96.67
(83.86) d 1.00 ab
C. bijugum IG 70012 3.50 abc 86.67
(72.78) cd 1.42 abcd
C. bijugum IG 70018 3.67 abc 90.00
(75.00) cd 1.38 abcd
C. bijugum IG 70022 1.33 a 86.67
(68.86) bcd 1.22 abc
C. reticulatum IG 72933 5.33 abcd 83.33
(70.07) bcd 2.75 de
C. reticulatum IG 72953 5.33 abcd 73.33
(59.21) bc 3.20 ef
C. pinnatifidum PI 510663 5.00 abcd 86.67
(72.78) cd 2.54 cde
C. judaicum PI 568217 4.33 abcd 86.67
(72.78) cd 1.35 abcd
C. bijugum PI 599046 2.00 ab 86.67
(68.86) bcd 1.27 abc
C. bijugum PI 599066 1.33 a 70.00
(57.70) bc 1.09 abc
C. judaicum PI 599077 4.67 abcd 83.33
(66.14) bcd 1.77 abcde
C. pinnatifidum PI 599109 4.67 abcd 76.67
(61.71) bc 2.20 abcde
C. microphyllum ICCW 17148 3.67 abc 73.33
(59.71) bc 1.20 abc
C. arietinum JG 11 (C) 6.00 bcd 70.00
(57.00) bc 4.43 fg
C. arietinum KAK 2 (S) 8.00 d 66.67
(54.78) bc 5.10 fg
C. arietinum ICC 3137(S) 6.67 cd 76.67
(61.22) bc 4.40 fg
C. arietinum ICCL 86111 (R) 4.67 abcd 60.00
(50.85) b 4.24 fg
C. arietinum ICC 506EB (R) 4.67 abcd 30.00
(33.21) a 2.29 bcde
Fpr 0.05 0.001 <.001
Mean 4.35 63.18 2.27
SE± 1.22 6.06 0.44
LSD (p=0.05) 3.50 17.38 1.25
(DR)1= 1,<10% leaf area damaged and 9 = >80% leaf area damaged
Figures in the parentheses are angular transformed values
The values followed by same alphabet did not differ significantly at p ≤ 0.05 (DMRT)
C-Commercial cultivar, S- Susceptible check, R- Resistant check
98
larval survival compared to susceptible check, ICC 3137 (76.67%). All wild
relatives of chickpea genotypes had significantly lower larval weight ranged
between 0.71 mg on IG 69979 (C. cuneatum) and 3.20 mg on IG 72953 (C.
reticulatum) compared to the larvae weighed on the susceptible check, KAK 2 (5.10
mg), while larval weight reared on resistant check, ICC 506EB was 2.29 mg.
There were significant differences in leaf feeding, larval survival, and larval
weight when the neonate larvae of H. armigera were released on the detached leaves
from the wild relatives of chickpea genotypes across different seasons. There was a
significant reduction in leaf feeding and larval weights when neonates were fed on
the leaves of IG 70012, IG 70022, IG 70018, IG 70006, PI 599046, PI 599066(C.
bijugum), IG 69979 (C. cuneatum), PI 568217, PI 599077 (C. judaicum) and ICCW
17148 (C. microphyllum). The earlier studies also revealed that low larval survival
and larval weights were recorded when larvae of H. armigera reared on wild
relatives of chickpea, C. bijugum, C. judaicum, C.cuneatum, C. pinnatificum, C.
reticulatum and C. microphyllum (Sharma et al., 2005a,b and 2006).
Though, larval survival was greater on the wild relatives than on the
cultivated chickpea, the damage rating and larval weights were less, this could be
due to presence of some anti-feedant or antibiosis mechanism in wild relatives of
chickpea for resistance to H. armigera larvae. Sharma et al. (2004) observed that
leaf feeding and larval survival were greater, while the larval weights on many wild
relatives were much lower than those on the cultivated chickpea, indicating
existence of antibiosis effect on H. armigera in wild relatives of chickpea. Acid
exudates such as malic acid and oxalic acid on the leaves of chickpea are the
principle component of resistance to H. armigera (Cowgill and Lateef, 1996). Green
et al. (2002) reported the compounds present on the plant surface would play a
critical role in determining food selection and initiation of feeding and also
trichomes present on plant surface may act as barrier against feeding by neonates of
H. armigera.
4.3.2 Detached Pod Assay for Evaluation of Resistance to H. armigera in Wild
Relatives of Chickpea
There were significant differences in damage rating, pod damage percentage
and weight gained by larvae when they were fed on pods of wild relatives of
chickpea (Table 4.20). All wild relatives of chickpea genotypes exhibited low
99
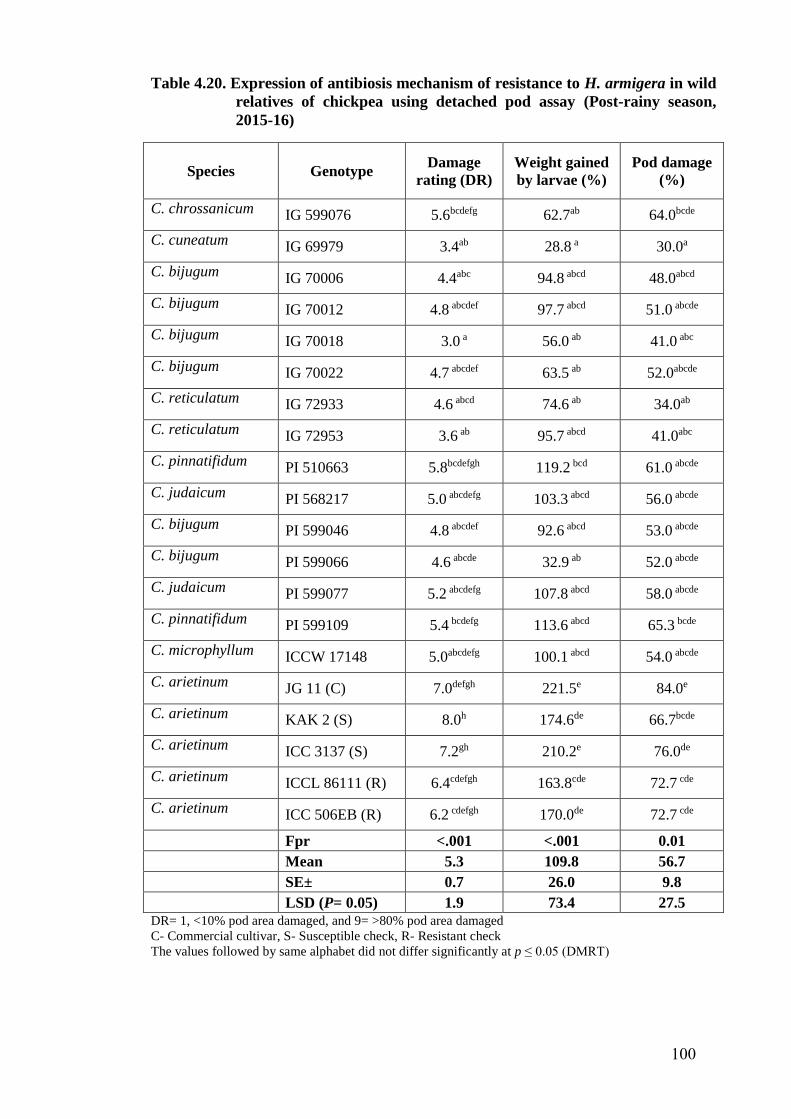
Table 4.20. Expression of antibiosis mechanism of resistance to H. armigera in wild
relatives of chickpea using detached pod assay (Post-rainy season,
2015-16)
Species Genotype Damage
rating (DR)
Weight gained
by larvae (%)
Pod damage
(%)
C. chrossanicum IG 599076 5.6bcdefg 62.7ab 64.0bcde
C. cuneatum IG 69979 3.4ab 28.8 a 30.0a
C. bijugum IG 70006 4.4abc 94.8 abcd 48.0abcd
C. bijugum IG 70012 4.8 abcdef 97.7 abcd 51.0 abcde
C. bijugum IG 70018 3.0 a 56.0 ab 41.0 abc
C. bijugum IG 70022 4.7 abcdef 63.5 ab 52.0abcde
C. reticulatum IG 72933 4.6 abcd 74.6 ab 34.0ab
C. reticulatum IG 72953 3.6 ab 95.7 abcd 41.0abc
C. pinnatifidum PI 510663 5.8bcdefgh 119.2 bcd 61.0 abcde
C. judaicum PI 568217 5.0 abcdefg 103.3 abcd 56.0 abcde
C. bijugum PI 599046 4.8 abcdef 92.6 abcd 53.0 abcde
C. bijugum PI 599066 4.6 abcde 32.9 ab 52.0 abcde
C. judaicum PI 599077 5.2 abcdefg 107.8 abcd 58.0 abcde
C. pinnatifidum PI 599109 5.4 bcdefg 113.6 abcd 65.3 bcde
C. microphyllum ICCW 17148 5.0abcdefg 100.1 abcd 54.0 abcde
C. arietinum JG 11 (C) 7.0defgh 221.5e 84.0e
C. arietinum KAK 2 (S) 8.0h 174.6de 66.7bcde
C. arietinum ICC 3137 (S) 7.2gh 210.2e 76.0de
C. arietinum ICCL 86111 (R) 6.4cdefgh 163.8cde 72.7 cde
C. arietinum ICC 506EB (R) 6.2 cdefgh 170.0de 72.7 cde
Fpr <.001 <.001 0.01
Mean 5.3 109.8 56.7
SE± 0.7 26.0 9.8
LSD (P= 0.05) 1.9 73.4 27.5
DR= 1, <10% pod area damaged, and 9= >80% pod area damaged
C- Commercial cultivar, S- Susceptible check, R- Resistant check
The values followed by same alphabet did not differ significantly at p ≤ 0.05 (DMRT)
100
damage rating and per cent pod damage when compared to cultivated chickpea.
Percentage of weight gained by larvae was more when fed on cultivated chickpea
than on wild relatives. Least damage rating (< 4.8) was exhibited in wild relatives of
chickpea genotypes, IG 69979 (C. cuneatum), IG 72933, IG 72953 (C. reticulatum)
and PI 5990066, IG 70006, IG 70012, IG 70018 (C. bijugum) and showed high
levels of resistance compared to susceptible checks, 8.0 in KAK 2 and 7.2 in ICC
3137 and resistant checks, 6.2 in ICC 506EB and 6.4 in ICCL 86111. Based on per
cent pod damage wild relatives of chickpea genotypes IG 69979 (C. cuneatum), IG
70006 and IG 70018 (C. bijugum) and IG 72933, IG 72953 (C. reticulatum) showed
high levels of resistance with lowest per cent pod damage (< 48%) compared to the
cultivated chickpea (84% in JG 11 and 76% in ICC 3137). Based on percentage of
weight gained by larvae, accessions IG 69979 (C. cuneatum), PI 5990066, IG
70006, IG 70018, IG 70012, IG 70022, PI 599046 (C. bijugum), IG 599076 (C.
chrossanicum) and IG 72933, IG 72953 (C. reticulatum) recorded lowest weight
gained by larvae (< 97.7%) compared to resistant check, ICCL 86111 (163.8%),
commercial cultivar, JG 11 (221.5%) and susceptible check, ICC 3137 (210.2%).
In support of the present investigations, Sharma et al. (2005a) also observed
low per cent pod damage and weight gained by third instar larvae of H. armigera
when fed on wild relatives of chickpea compared to cultivated species. It indicates
that wild relatives of chickpea seem to have different mechanisms of resistance to H.
armigera than in cultivated chickpea. Wild chickpea have shown significant
variation in trypsin inhibitors for the H. armigera gut proteinases (Patankar et al.,
1999). Giri et al. (1998) reported that there was a progressive increase in protease
inhibitors throughout seed development in chickpea. Hence, interactions of these
protease inhibitors with gut proteases of H. armigera might be one of the main
factors for resistance in wild relatives of chickpea.
4.3.3 Diet Incorporation Assay for Evaluation of Resistance to H. armigera in
Wild Relatives of Chickpea
4.3.3.1 Post-rainy Season, 2014-15
During post-rainy season, 2014-15, survival and development of H. armigera
varied significantly when reared on artificial diet impregnated with lyophilized leaf
powder of different genotypes of wild relatives of chickpea (Table 4.21). Larval
survival on l0th day after release of the larvae was lowest on resistant check, ICC
101
506EB (58.33%) followed by C. chrossanicum, IG 599076 (60.42%), ICCL 86111
(60.42%), C. bijugum, PI 599066 (60.42%), IG 70012 (62.50%) and PI 599046
(62.50%), while highest larval survival (87.50%) was recorded on susceptible check,
ICC 3137 and IG 72933.
Weight of 10 days old larvae reared on all wild relatives of chickpea were in
a range of 2.55 mg in IG 69979 (C. cuneatum) and 10.31 mg in IG 72933 (C.
reticulatum) and significantly lowest compared to commercial cultivar, JG 11 (19.94
mg) and susceptible checks, KAK 2 (17.46 mg) and ICC 3137 (16.03 mg). Larval
period was significantly longer on all wild relatives of chickpea (> 25 days)
compared to cultivated chickpea with a range of 24.45 days in KAK2 to 23.52 days
in ICC 3137. Pupation was lowest (27.08%) when larvae reared on C. bijugum
genotypes, IG 70012, IG 70018 and PI 599046. Pupation in all other genotypes was
in a range of 31.25% in ICCW 17148 (C. microphyllum), IG 599076 (C.
chrossanicum), IG 70022 and PI 599066 (C. bijugum) to 43.75% in PI 599077 (C.
judaicum) and ICCL 86111 and significantly low compared to susceptible check,
KAK 2 (52.08%) and commercial cultivar, JG 11 (54.17%). Weight of one day old
pupa varied significantly among different genotypes of wild relatives of chickpea.
Lowest pupal weight was recorded on C. microphyllum, ICCW 17148 (326.81 mg)
and C. bijugum, IG 70018 (328.60 mg) and highest was observed on susceptible
check, ICC 3137(417.27 mg), JG 11 (413.76 mg) and KAK 2 (403.73 mg). In all
other genotypes pupal weight was varied in a range of 336.74 mg (IG 70012) to
382.23 mg (IG 72953).
Longest pupal period was observed on C. bijugum genotypes, IG 70018
(15.82 days) followed by IG 70022 (15.41 days), PI 599066 (15.39 days) and C.
pinnatifidum, PI 510663 (15.35 days) compared to susceptible checks, KAK 2
(12.17 days) and ICC 3137 (12.43 days). Adult emergence in all wild species of
chickpea was observed in a range of 16.67% (IG 70018 and PI 599046) and 33.33%
(IG 72953, PI 510663, PI 568217 and PI 599077) and significantly lowest compared
to susceptible checks, KAK 2 (47.92%) and ICC 3137 (45.83%). Lowest fecundity
was observed when reared on PI 599066 (214.42), PI 568217 (215.50) and PI
599046 (216.00) whereas highest was observed on JG 11 (389.42). Fecundity was
significantly lowest when reared on all wild relatives of chickpea genotypes
compared to susceptible checks, ICC 3137 (349.25) and KAK 2 (340.17) except on
102
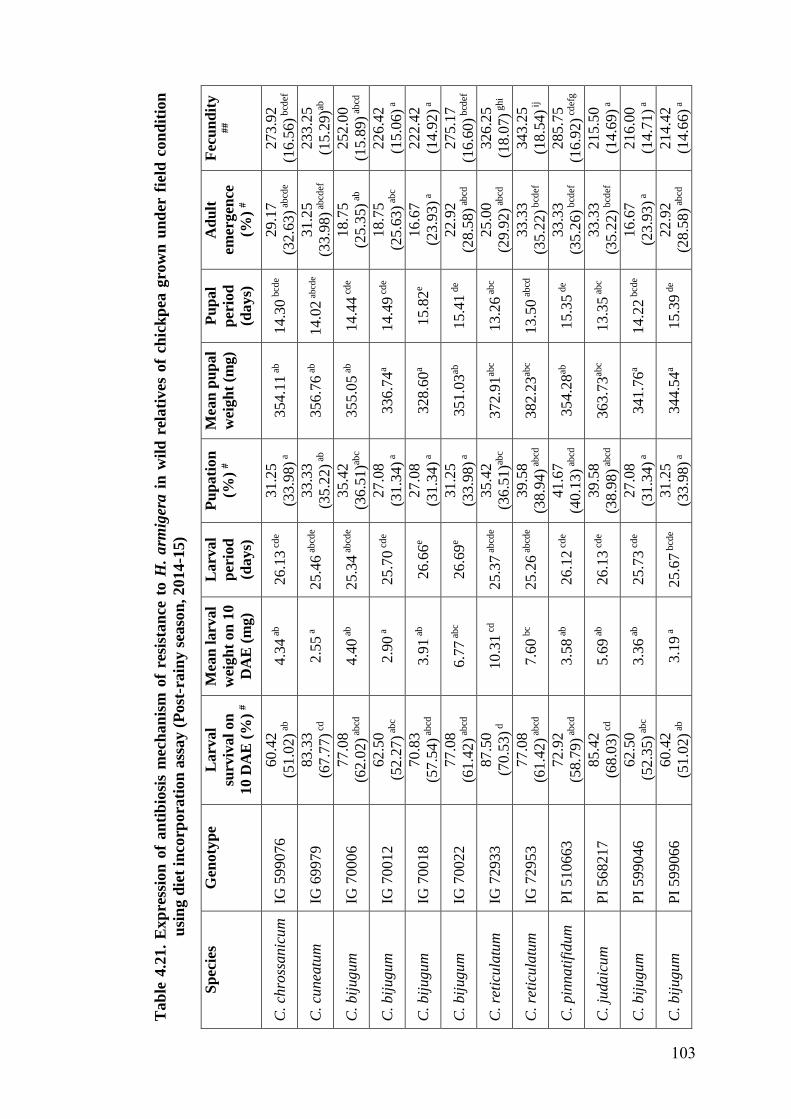
Tab
le 4
.21.
Exp
ress
ion
of
an
tib
iosi
s m
ech
an
ism
of
resi
stan
ce t
o H
. a
rmig
era
in
wil
d r
elati
ves
of
chic
kp
ea g
row
n u
nd
er f
ield
con
dit
ion
usi
ng d
iet
inco
rpora
tion
ass
ay (
Post
-rain
y s
easo
n, 2014
-15)
Sp
ecie
s G
en
oty
pe
La
rv
al
surv
iva
l o
n
10 D
AE
(%
) #
Mea
n l
arv
al
wei
gh
t o
n 1
0
DA
E (
mg
)
La
rv
al
perio
d
(da
ys)
Pu
pa
tio
n
(%)
#
Mea
n p
up
al
wei
gh
t (m
g)
Pu
pa
l
perio
d
(da
ys)
Ad
ult
em
erg
en
ce
(%)
#
Fecu
nd
ity
##
C. ch
ross
an
icum
IG
599076
6
0.4
2
(51
.02
) ab
4.3
4 a
b
26
.13
cd
e 3
1.2
5
(33
.98
) a
35
4.1
1 a
b
14
.30
bcd
e 2
9.1
7
(32
.63
) ab
cde
27
3.9
2
(16
.56
) bcd
ef
C. cu
nea
tum
IG
69979
8
3.3
3
(67
.77
) cd
2.5
5 a
2
5.4
6 a
bcd
e 3
3.3
3
(35
.22
) ab
35
6.7
6 a
b
14
.02
abcd
e 3
1.2
5
(33
.98
) ab
cdef
23
3.2
5
(15
.29
)ab
C. b
iju
gu
m
IG 7
0006
7
7.0
8
(62
.02
) ab
cd
4.4
0 a
b
25
.34
ab
cde
35
.42
(36
.51
)abc
35
5.0
5 a
b
14
.44
cd
e 1
8.7
5
(25
.35
) ab
25
2.0
0
(15
.89
) ab
cd
C. b
iju
gu
m
IG 7
0012
6
2.5
0
(52
.27
) ab
c 2
.90
a
25
.70
cd
e 2
7.0
8
(31
.34
) a
33
6.7
4a
14
.49
cd
e 1
8.7
5
(25
.63
) ab
c
22
6.4
2
(15
.06
) a
C. b
iju
gu
m
IG 7
0018
7
0.8
3
(57
.54
) ab
cd
3.9
1 a
b
26
.66
e 2
7.0
8
(31
.34
) a
32
8.6
0a
15
.82
e 1
6.6
7
(23
.93) a
22
2.4
2
(14
.92
) a
C. b
iju
gu
m
IG 7
0022
7
7.0
8
(61
.42
) ab
cd
6.7
7 a
bc
26
.69
e 3
1.2
5
(33
.98
) a
35
1.0
3ab
1
5.4
1 d
e 2
2.9
2
(28
.58
) ab
cd
27
5.1
7
(16
.60
) bcd
ef
C. re
ticu
latu
m
IG 7
2933
8
7.5
0
(70
.53
) d
10
.31
cd
25
.37
ab
cde
35
.42
(36
.51
)abc
37
2.9
1ab
c 1
3.2
6 a
bc
25
.00
(29
.92
) ab
cd
32
6.2
5
(18
.07
) ghi
C. re
ticu
latu
m
IG 7
2953
7
7.0
8
(61
.42
) ab
cd
7.6
0 b
c 2
5.2
6 a
bcd
e 3
9.5
8
(38
.94
) ab
cd
38
2.2
3ab
c 1
3.5
0 a
bcd
3
3.3
3
(35
.22
) bcd
ef
34
3.2
5
(18
.54
) ij
C. p
inn
ati
fidum
P
I 510663
7
2.9
2
(58
.79
) ab
cd
3.5
8 a
b
26
.12
cd
e 4
1.6
7
(40
.13
) ab
cd
35
4.2
8ab
1
5.3
5 d
e 3
3.3
3
(35
.26
) bcd
ef
28
5.7
5
(16
.92
) cd
efg
C. ju
da
icu
m
PI
568217
8
5.4
2
(68
.03
) cd
5.6
9 a
b
26
.13
cd
e 3
9.5
8
(38
.98
) ab
cd
36
3.7
3ab
c 1
3.3
5 a
bc
33
.33
(35
.22
) bcd
ef
21
5.5
0
(14
.69
) a
C. b
iju
gu
m
PI
599046
6
2.5
0
(52
.35
) ab
c 3
.36
ab
25
.73
cd
e 2
7.0
8
(31
.34
) a
34
1.7
6a
14
.22
bcd
e 1
6.6
7
(23
.93
) a
21
6.0
0
(14
.71
) a
C. b
iju
gu
m
PI
599066
6
0.4
2
(51
.02
) ab
3.1
9 a
2
5.6
7 b
cde
31
.25
(33
.98
) a
34
4.5
4a
15
.39
de
22
.92
(28
.58
) ab
cd
21
4.4
2
(14
.66
) a
103
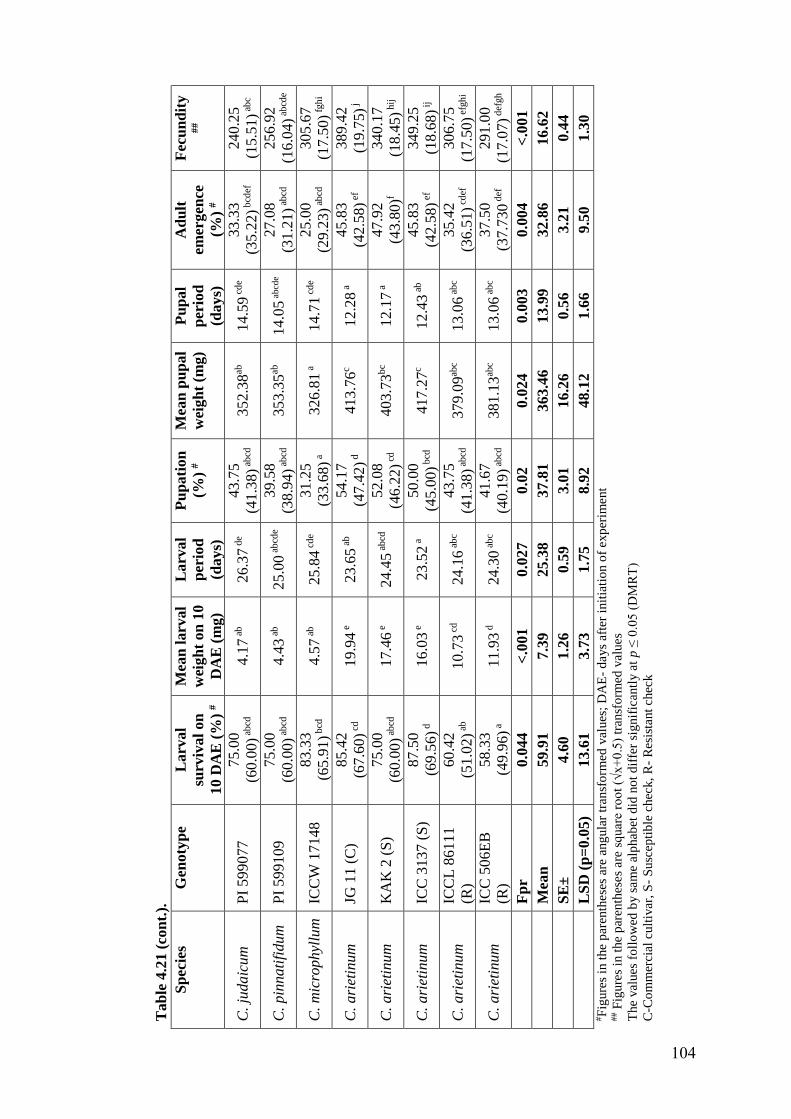
Ta
ble
4.2
1 (
con
t.).
Sp
ecie
s G
en
oty
pe
La
rv
al
surv
iva
l o
n
10 D
AE
(%
) #
Mea
n l
arv
al
wei
gh
t o
n 1
0
DA
E (
mg
)
La
rv
al
perio
d
(da
ys)
Pu
pa
tio
n
(%)
#
Mea
n p
up
al
wei
gh
t (m
g)
Pu
pa
l
perio
d
(da
ys)
Ad
ult
em
erg
en
ce
(%)
#
Fecu
nd
ity
##
C. ju
da
icu
m
PI
599077
7
5.0
0
(60
.00
) ab
cd
4.1
7 a
b
26
.37
de
43
.75
(41
.38
) ab
cd
35
2.3
8ab
1
4.5
9 c
de
33
.33
(35
.22
) bcd
ef
24
0.2
5
(15
.51
) ab
c
C. p
inn
ati
fidum
P
I 599109
7
5.0
0
(60
.00
) ab
cd
4.4
3 a
b
25
.00
ab
cde
39
.58
(38
.94
) ab
cd
35
3.3
5ab
1
4.0
5 a
bcd
e 2
7.0
8
(31
.21
) ab
cd
25
6.9
2
(16
.04
) ab
cde
C. m
icro
ph
yllu
m
ICC
W 1
7148
8
3.3
3
(65
.91
) bcd
4
.57
ab
25
.84
cd
e 3
1.2
5
(33
.68) a
3
26
.81
a
14
.71
cd
e 2
5.0
0
(29
.23
) ab
cd
30
5.6
7
(17
.50
) fgh
i
C. a
riet
inu
m
JG 1
1 (
C)
85
.42
(67
.60
) cd
19
.94
e
23
.65
ab
54
.17
(47
.42
) d
41
3.7
6c
12
.28
a
45
.83
(42
.58
) ef
38
9.4
2
(19
.75
) j
C. a
riet
inu
m
KA
K 2
(S
) 7
5.0
0
(60
.00
) ab
cd
17
.46
e
24
.45
ab
cd
52
.08
(46
.22
) cd
40
3.7
3b
c 1
2.1
7 a
4
7.9
2
(43
.80
)f
34
0.1
7
(18
.45
) hij
C. a
riet
inu
m
ICC
3137 (
S)
87
.50
(69
.56
) d
16
.03
e
23
.52
a
50
.00
(45
.00
) bcd
4
17
.27
c 1
2.4
3 a
b
45
.83
(42
.58
) ef
34
9.2
5
(18
.68
) ij
C. a
riet
inu
m
ICC
L 8
6111
(R)
60
.42
(51
.02
) ab
10
.73
cd
24
.16
ab
c 4
3.7
5
(41
.38
) ab
cd
37
9.0
9ab
c 1
3.0
6 a
bc
35
.42
(36
.51
) cd
ef
30
6.7
5
(17
.50
) efg
hi
C. a
riet
inu
m
ICC
506E
B
(R)
58
.33
(49
.96
) a
11
.93
d
24
.30
ab
c 4
1.6
7
(40
.19
) ab
cd
38
1.1
3ab
c 1
3.0
6 a
bc
37
.50
(37
.73
0 d
ef
29
1.0
0
(17
.07
) def
gh
F
pr
0.0
44
<.0
01
0.0
27
0
.02
0.0
24
0
.00
3
0.0
04
<
.00
1
M
ean
5
9.9
1
7.3
9
25
.38
3
7.8
1
36
3.4
6
13
.99
3
2.8
6
16
.62
S
E±
4
.60
1.2
6
0.5
9
3.0
1
16
.26
0
.56
3
.21
0
.44
LS
D (
p=
0.0
5)
13
.61
3.7
3
1.7
5
8.9
2
48
.12
1
.66
9
.50
1
.30
#F
igure
s in
the
par
enth
ese
s ar
e a
ng
ula
r tr
ansf
orm
ed v
alues
; D
AE
- d
ays
afte
r in
itia
tio
n o
f exp
erim
ent
## F
igure
s in
the
par
enth
eses
are
sq
uar
e ro
ot
(√x+
0.5
) tr
ansf
orm
ed v
alu
es
The
val
ues
fo
llo
wed
by s
am
e al
phab
et d
id n
ot
dif
fer
sig
nif
ican
tly a
t p
≤ 0
.05
(D
MR
T)
C-C
om
mer
cial
cult
ivar
, S
- S
usc
epti
ble
chec
k,
R-
Res
ista
nt
chec
k
104
C. microphyllum, ICCW 17148 (305.67), C. reticulatum, IG 72933 (326.25) and IG
72953 (343.25) which were low but non-significant.
4.3.3.2 Post-rainy Season, 2015-16
Survival and development of H. armigera on artificial diet impregnated with
lyophilized leaf powders of wild relatives of chickpea varied significantly during
post-rainy season, 2015-16 (Table 4.22). Larval survival on genotypes of C.
bijugum, IG 70006, IG 7012, IG 70018, IG 70022, PI 599046 and PI 599066, C.
judaicum, PI 568217, C. pinnatifidum, PI 510663 and PI 599109, C. chrossanicum,
IG 599076, C. reticulatum, IG 72933 and IG 72953 and ICCL 86111 (resistant
check) were significantly lower (50.00 to 75.00%) after 10 days compared to
susceptible checks, KAK 2 (91.67%) and ICC 3137 (87.50%). Significant lower
larval weights were recorded on all genotypes of wild relatives of chickpea with a
range of 3.61 mg (IG 70018) and 11.24 mg (IG 72953) compared to cultivated
chickpea genotypes.
Larval period was delayed for two to three days when reared on wild
relatives of chickpea genotypes compared to susceptible check, ICC 3137 (22.35
days), whereas longest larval period was observed on C. microphyllum, ICCW
17148 (26.94 days) and C. bijugum, IG 70018 (26.77 days). Pupation percentage
was lowest on PI 599066 (31.25%), IG 70012 (33.33%), compared to susceptible
checks, KAK 2 (72.92%) and ICC 3137 (70.83%) and resistant checks, ICC 506EB
(62.50%) and ICCL 86111 (62.50%). Mean pupal weights were lowest on all
genotypes of wild relatives of chickpea with a range of 321.68 mg (IG 70012) and
410.63 mg (IG 72953) compared to susceptible check, ICC 3137 (446.31 mg), while
pupal weight were 395.94 mg and 398.65 mg on resistant checks, ICCL 86111 and
ICC 506EB, respectively.
Pupal period was significantly longest on all wild relatives of chickpea
genotypes compared to susceptible check, ICC 3137 (11.77 days), except on PI
568217 (12.19 days) and IG 72933 (12.95 days) where the difference was non-
significant. Pupal period was 12.46 days in resistant check, ICC 506EB. Adult
emergence was observed in a range of 12.50% (IG 70006) and 56.25% (JG 11).
Adult emergence on wild relatives of chickpea genotypes (12.50 to 39.58%) was
significantly lower compared to susceptible checks, ICC 3137 (54.17%) and KAK 2
(50.00%), while on resistant check, ICC 506EB it was 43.75%. Lowest fecundity
105
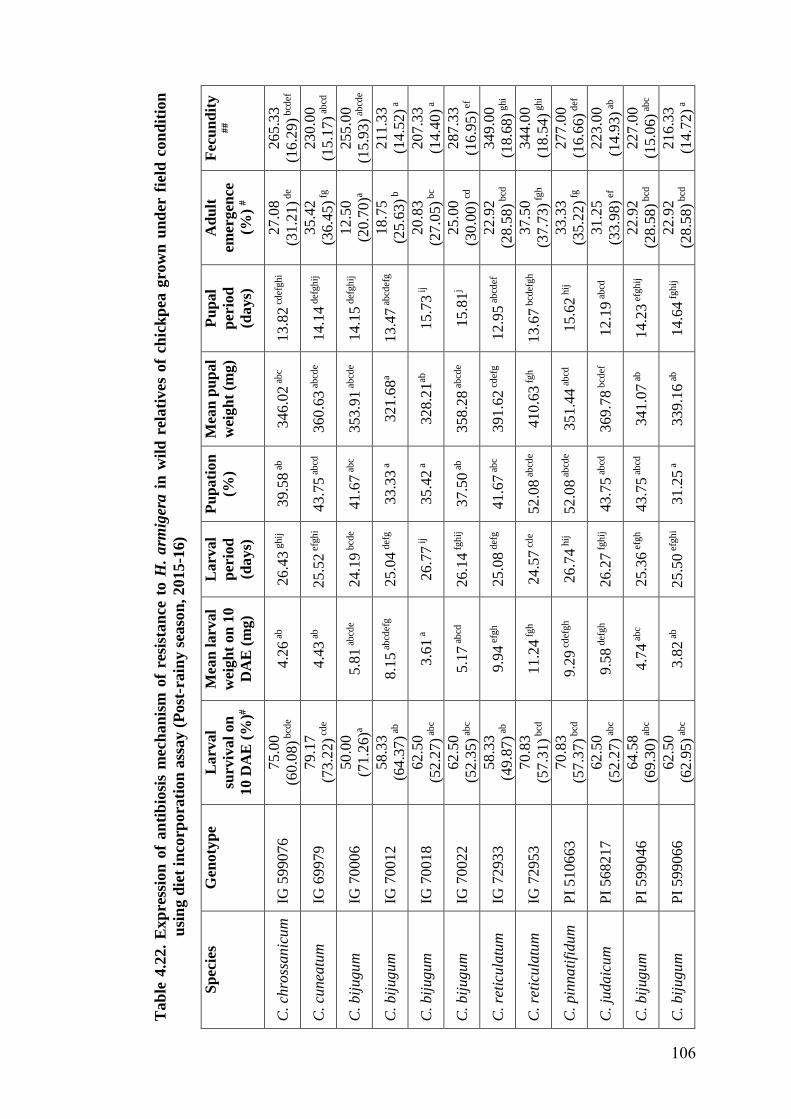
Tab
le 4
.22.
Exp
ress
ion
of
an
tib
iosi
s m
ech
an
ism
of
resi
stan
ce t
o H
. a
rmig
era
in
wil
d r
elati
ves
of
chic
kp
ea g
row
n u
nd
er f
ield
con
dit
ion
usi
ng d
iet
inco
rpora
tion
ass
ay (
Post
-rain
y s
easo
n, 2015
-16)
Sp
ecie
s G
en
oty
pe
La
rv
al
surv
iva
l o
n
10 D
AE
(%
)#
Mea
n l
arv
al
wei
gh
t o
n 1
0
DA
E (
mg
)
La
rv
al
perio
d
(da
ys)
Pu
pa
tio
n
(%)
Mea
n p
up
al
wei
gh
t (m
g)
Pu
pa
l
perio
d
(da
ys)
Ad
ult
em
erg
en
ce
(%)
#
Fecu
nd
ity
##
C. ch
ross
an
icum
IG
599076
7
5.0
0
(60
.08
) bcd
e 4
.26
ab
26
.43
ghij
3
9.5
8 a
b
34
6.0
2 a
bc
13
.82
cd
efgh
i 2
7.0
8
(31
.21
) de
26
5.3
3
(16
.29
) bcd
ef
C. cu
nea
tum
IG
69979
7
9.1
7
(73
.22
) cd
e 4
.43
ab
25
.52
efg
hi
43
.75
ab
cd
36
0.6
3 a
bcd
e 1
4.1
4 d
efgh
ij
35
.42
(36
.45
) fg
23
0.0
0
(15
.17
) ab
cd
C. b
iju
gu
m
IG 7
0006
5
0.0
0
(71
.26
)a 5
.81
ab
cde
24
.19
bcd
e 4
1.6
7 a
bc
35
3.9
1 a
bcd
e 1
4.1
5 d
efgh
ij
12
.50
(20
.70
)a
25
5.0
0
(15
.93
) ab
cde
C. b
iju
gu
m
IG 7
0012
5
8.3
3
(64
.37
) ab
8.1
5 a
bcd
efg
25
.04
def
g
33
.33
a
32
1.6
8a
13
.47
ab
cdef
g
18
.75
(25
.63
) b
21
1.3
3
(14
.52
) a
C. b
iju
gu
m
IG 7
0018
6
2.5
0
(52
.27
) ab
c 3
.61
a
26
.77
ij
35
.42
a
32
8.2
1ab
1
5.7
3 i
j 2
0.8
3
(27
.05
) bc
20
7.3
3
(14
.40
) a
C.
bij
ug
um
IG
70022
6
2.5
0
(52
.35
) ab
c 5
.17
ab
cd
26
.14
fgh
ij
37
.50
ab
35
8.2
8 a
bcd
e 1
5.8
1j
25
.00
(30
.00
) cd
28
7.3
3
(16
.95
) ef
C. re
ticu
latu
m
IG 7
2933
5
8.3
3
(49
.87
) ab
9.9
4 e
fgh
25
.08
def
g
41
.67
ab
c 3
91
.62
cd
efg
12
.95
ab
cdef
2
2.9
2
(28
.58
) bcd
34
9.0
0
(18
.68
) ghi
C. re
ticu
latu
m
IG 7
2953
7
0.8
3
(57
.31
) bcd
1
1.2
4 f
gh
2
4.5
7 c
de
52
.08
ab
cde
41
0.6
3 f
gh
1
3.6
7 b
cdef
gh
3
7.5
0
(37
.73
) fgh
34
4.0
0
(18
.54
) ghi
C. p
inn
ati
fidum
P
I 510663
7
0.8
3
(57
.37
) bcd
9
.29
cd
efgh
26
.74
hij
5
2.0
8 a
bcd
e 3
51
.44
ab
cd
15
.62
hij
3
3.3
3
(35
.22
) fg
27
7.0
0
(16
.66
) def
C. ju
da
icu
m
PI
568217
6
2.5
0
(52
.27
) ab
c 9
.58
def
gh
2
6.2
7 f
gh
ij
43
.75
ab
cd
36
9.7
8 b
cdef
1
2.1
9 a
bcd
3
1.2
5
(33
.98
) ef
22
3.0
0
(14
.93
) ab
C. b
iju
gu
m
PI
599046
6
4.5
8
(69
.30
) ab
c 4
.74
ab
c 2
5.3
6 e
fgh
43
.75
ab
cd
34
1.0
7 a
b
14
.23
efg
hij
2
2.9
2
(28
.58
) bcd
22
7.0
0
(15
.06
) ab
c
C. b
iju
gu
m
PI
599066
6
2.5
0
(62
.95
) ab
c 3
.82
ab
25
.50
efg
hi
31
.25
a
33
9.1
6 a
b
14
.64
fgh
ij
22
.92
(28
.58
) bcd
21
6.3
3
(14
.72
) a
106
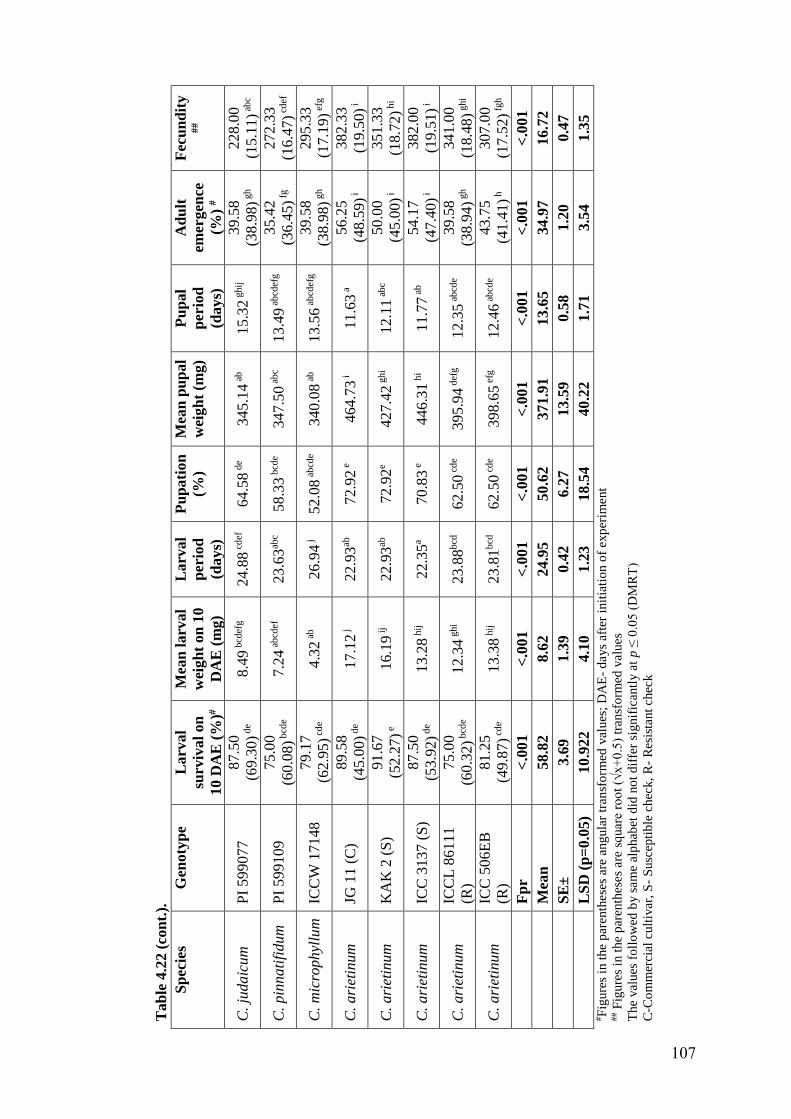
Ta
ble
4.2
2 (
con
t.).
Sp
ecie
s G
en
oty
pe
La
rv
al
surv
iva
l o
n
10 D
AE
(%
)#
Mea
n l
arv
al
wei
gh
t o
n 1
0
DA
E (
mg
)
La
rv
al
perio
d
(da
ys)
Pu
pa
tio
n
(%)
Mea
n p
up
al
wei
gh
t (m
g)
Pu
pa
l
perio
d
(da
ys)
Ad
ult
em
erg
en
ce
(%)
#
Fecu
nd
ity
##
C. ju
da
icu
m
PI
599077
8
7.5
0
(69
.30
) de
8.4
9 b
cdef
g
24
.88
cd
ef
64
.58
de
34
5.1
4 a
b
15
.32
ghij
3
9.5
8
(38
.98
) gh
22
8.0
0
(15
.11
) ab
c
C. p
inn
ati
fidum
P
I 599109
7
5.0
0
(60
.08
) bcd
e 7
.24
ab
cdef
2
3.6
3ab
c 5
8.3
3 b
cde
34
7.5
0 a
bc
13
.49
ab
cdef
g
35
.42
(36
.45
) fg
27
2.3
3
(16
.47
) cd
ef
C. m
icro
ph
yllu
m
ICC
W 1
7148
7
9.1
7
(62
.95
) cd
e 4
.32
ab
26
.94
j
52
.08
ab
cde
34
0.0
8 a
b
13
.56
ab
cdef
g
39
.58
(38
.98
) gh
29
5.3
3
(17
.19
) efg
C. a
riet
inu
m
JG 1
1 (
C)
89
.58
(45
.00
) de
17
.12
j
22
.93
ab
72
.92
e
46
4.7
3 i
1
1.6
3 a
5
6.2
5
(48
.59
) i
38
2.3
3
(19
.50
) i
C. a
riet
inu
m
KA
K 2
(S
) 9
1.6
7
(52
.27
) e
16
.19
ij
22
.93
ab
72
.92
e 4
27
.42
ghi
12
.11
ab
c 5
0.0
0
(45
.00
) i
35
1.3
3
(18
.72
) hi
C. a
riet
inu
m
ICC
3137 (
S)
87
.50
(53
.92
) de
13
.28
hij
2
2.3
5a
70
.83
e
44
6.3
1 h
i 1
1.7
7 a
b
54
.17
(47
.40
) i
38
2.0
0
(19
.51
) i
C. a
riet
inu
m
ICC
L 8
6111
(R)
75
.00
(60
.32
) bcd
e 1
2.3
4 g
hi
23
.88
bcd
6
2.5
0 c
de
39
5.9
4 d
efg
12
.35
ab
cde
39
.58
(38
.94
) gh
34
1.0
0
(18
.48
) ghi
C. a
riet
inu
m
ICC
506E
B
(R)
81
.25
(49
.87
) cd
e 1
3.3
8 h
ij
23
.81
bcd
6
2.5
0 c
de
39
8.6
5 e
fg
12
.46
ab
cde
43
.75
(41
.41
) h
30
7.0
0
(17
.52
) fgh
Fp
r <
.00
1
<.0
01
<.0
01
<.0
01
<.0
01
<.0
01
<.0
01
<.0
01
Mean
5
8.8
2
8.6
2
24
.95
5
0.6
2
37
1.9
1
13
.65
34
.97
1
6.7
2
SE
±
3.6
9
1.3
9
0.4
2
6.2
7
13
.59
0.5
8
1.2
0
0.4
7
LS
D (
p=
0.0
5)
10
.92
2
4.1
0
1.2
3
18
.54
40
.22
1.7
1
3.5
4
1.3
5
#F
igure
s in
the
par
enth
ese
s ar
e a
ng
ula
r tr
ansf
orm
ed v
alues
; D
AE
- d
ays
afte
r in
itia
tio
n o
f exp
erim
ent
## F
igure
s in
the
par
enth
eses
are
sq
uar
e ro
ot
(√x+
0.5
) tr
ansf
orm
ed v
alu
es
The
val
ues
fo
llo
wed
by s
am
e al
phab
et d
id n
ot
dif
fer
sig
nif
ican
tly a
t p
≤ 0
.05
(D
MR
T)
C-C
om
mer
cial
cult
ivar
, S
- S
usc
epti
ble
chec
k,
R-
Res
ista
nt
chec
k
107
was observed when the insects reared on IG 70018 (207.33), IG 70012 (211.33) and
PI 599066 (216.33) among all the genotypes tested, while fecundity was highest
reared on JG 11 (382.33) and ICC 3137 (382.00).
4.3.3.3 Glasshouse Condition
Survival and development of H. armigera larvae reared on artificial diet with
lyophilized leaf powders of wild relatives of chickpea genotypes grown under
glasshouse condition varied significantly (Table 4.23). The larval survival and larval
weight on 10th day, larval and pupal periods, pupation, pupal weight, adult
emergence and fecundity were observed in a range of 47.92 to 81.25%, 1.69 to
14.63 mg, 24.38 to 27.18 days, 12.22 to 16.14 days, 22.92 to 50.00%, 313.54 to
388.23 mg, 10.42 to 45.83% and 205.00 to 396.50, respectively. Lowest larval
survival was observed on IG 70018 (47.92%) followed by ICCW 17148 (52.08%)
and IG 70012 (52.08%), while the highest was observed on susceptible check, ICC
3137 (81.25%).
Larval survival in all other genotypes was ranged from 58.33% (IG 70006,
IG 70022 and PI 599046) to 79.17% (JG 11). Lowest larval weights were observed
on ICCW 17148 (1.69 mg), PI 599046 (2.02 mg), IG 70018 (3.42 mg) and IG 70022
(3.94 mg) compared to all other genotypes, whereas highest larval weight was
observed on susceptible checks, KAK 2 (14.63 mg) and ICC 3137 (14.34 mg). The
larval period was prolonged by one to three days on IG 72933, PI 599077, IG
599076, PI 599066, IG 72953, PI 568217, PI 599046, IG 70012, PI 599109, IG
70006, IG 70022, ICCW 17148 and IG 700018 (25.67 to 27.18 days) as compared to
that on the susceptible check, ICC 3137 (24.70 days). Pupation was significantly
lower on C. microphyllum, ICCW 17148 and C. bijugum, PI 599046, IG 70018, IG
70012 and IG 70022 (20.83 to 35.42%) compared to susceptible check, KAK 2
(50.00%). Lowest pupal weight was observed on all genotypes of wild relatives of
chickpea (313.54 to 362.20 mg) compared to susceptible checks, ICC 3137 (388.23
mg) and KAK 2 (380.03 mg).
Pupal period was delayed when reared on all genotypes of wild relatives of
chickpea with a range of 13.33 days (IG 72953) to 16.14 days (PI 599066) compared
to susceptible check, KAK 2 (12.22 days) and ICC 3137 (12.50 days), while it was
13.66 days in ICC 506EB (resistant check). Lowest adult emergence was observed
on ICCW 17148 (10.42%) followed by IG 70018 (14.58%) and PI 599046
108
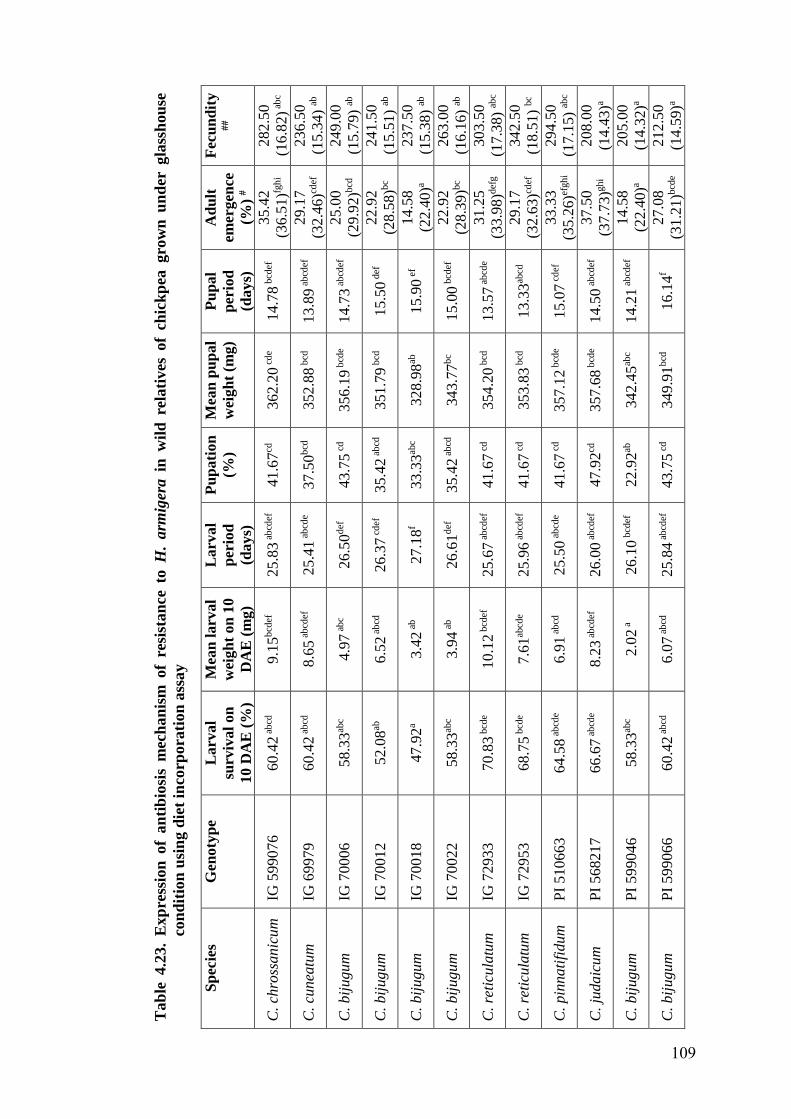
Tab
le 4
.23.
Exp
ress
ion
of
an
tib
iosi
s m
ech
an
ism
of
resi
stan
ce
to H
. arm
iger
a i
n w
ild
rel
ati
ves
of
chic
kp
ea gro
wn
un
der
gla
ssh
ou
se
con
dit
ion
usi
ng d
iet
inco
rpora
tion
ass
ay
Sp
ecie
s G
en
oty
pe
La
rv
al
surv
iva
l o
n
10
DA
E (
%)
Mea
n l
arv
al
wei
gh
t o
n 1
0
DA
E (
mg
)
La
rv
al
perio
d
(da
ys)
Pu
pa
tio
n
(%)
Mea
n p
up
al
wei
gh
t (m
g)
Pu
pa
l
perio
d
(da
ys)
Ad
ult
em
erg
en
ce
(%)
#
Fecu
nd
ity
##
C. ch
ross
an
icum
IG
599076
6
0.4
2 a
bcd
9
.15
bcd
ef
25
.83
ab
cdef
4
1.6
7cd
3
62
.20
cd
e 1
4.7
8 b
cdef
3
5.4
2
(36
.51
)fgh
i
28
2.5
0
(16
.82
) ab
c
C. cu
nea
tum
IG
69979
6
0.4
2 a
bcd
8
.65
ab
cdef
2
5.4
1 a
bcd
e 3
7.5
0b
cd
35
2.8
8 b
cd
13
.89
ab
cdef
2
9.1
7
(32
.46
)cdef
23
6.5
0
(15
.34
) ab
C. b
iju
gu
m
IG 7
0006
5
8.3
3ab
c 4
.97
ab
c 2
6.5
0d
ef
43
.75
cd
35
6.1
9 b
cde
14
.73
ab
cdef
2
5.0
0
(29
.92
)bcd
24
9.0
0
(15
.79
) ab
C. b
iju
gu
m
IG 7
0012
5
2.0
8ab
6
.52
ab
cd
26
.37
cd
ef
35
.42
ab
cd
35
1.7
9 b
cd
15
.50
def
2
2.9
2
(28
.58
)bc
24
1.5
0
(15
.51
) ab
C. b
iju
gu
m
IG 7
0018
4
7.9
2a
3.4
2 a
b
27
.18
f 3
3.3
3ab
c 3
28
.98
ab
15
.90
ef
14
.58
(22
.40
)a
23
7.5
0
(15
.38
) ab
C. b
iju
gu
m
IG 7
0022
5
8.3
3ab
c 3
.94
ab
26
.61
def
3
5.4
2 a
bcd
3
43
.77
bc
15
.00
bcd
ef
22
.92
(28
.39
)bc
26
3.0
0
(16
.16
) ab
C. re
ticu
latu
m
IG 7
2933
7
0.8
3 b
cde
10
.12
bcd
ef
25
.67
ab
cdef
4
1.6
7 c
d
35
4.2
0 b
cd
13
.57
ab
cde
31
.25
(33
.98
)def
g
30
3.5
0
(17
.38
) ab
c
C. re
ticu
latu
m
IG 7
2953
6
8.7
5 b
cde
7.6
1ab
cde
25
.96
ab
cdef
4
1.6
7 c
d
35
3.8
3 b
cd
13
.33
abcd
2
9.1
7
(32
.63
)cdef
34
2.5
0
(18
.51
) bc
C. p
inn
ati
fidum
P
I 5106
63
6
4.5
8 a
bcd
e 6
.91
ab
cd
25
.50
ab
cde
41
.67
cd
35
7.1
2 b
cde
15
.07
cd
ef
33
.33
(35
.26
)efgh
i
29
4.5
0
(17
.15
) ab
c
C. ju
da
icu
m
PI
568217
6
6.6
7 a
bcd
e 8
.23
ab
cdef
2
6.0
0 a
bcd
ef
47
.92
cd
35
7.6
8 b
cde
14
.50
ab
cdef
3
7.5
0
(37
.73
)ghi
20
8.0
0
(14
.43
)a
C. b
iju
gu
m
PI
599046
5
8.3
3ab
c 2
.02
a
26
.10
bcd
ef
22
.92
ab
34
2.4
5ab
c 1
4.2
1 a
bcd
ef
14
.58
(22
.40
)a
20
5.0
0
(14
.32
)a
C. b
iju
gu
m
PI
599066
6
0.4
2 a
bcd
6
.07
ab
cd
25
.84
ab
cdef
4
3.7
5 c
d
34
9.9
1b
cd
16
.14
f 2
7.0
8
(31
.21
)bcd
e
21
2.5
0
(14
.59
)a
109
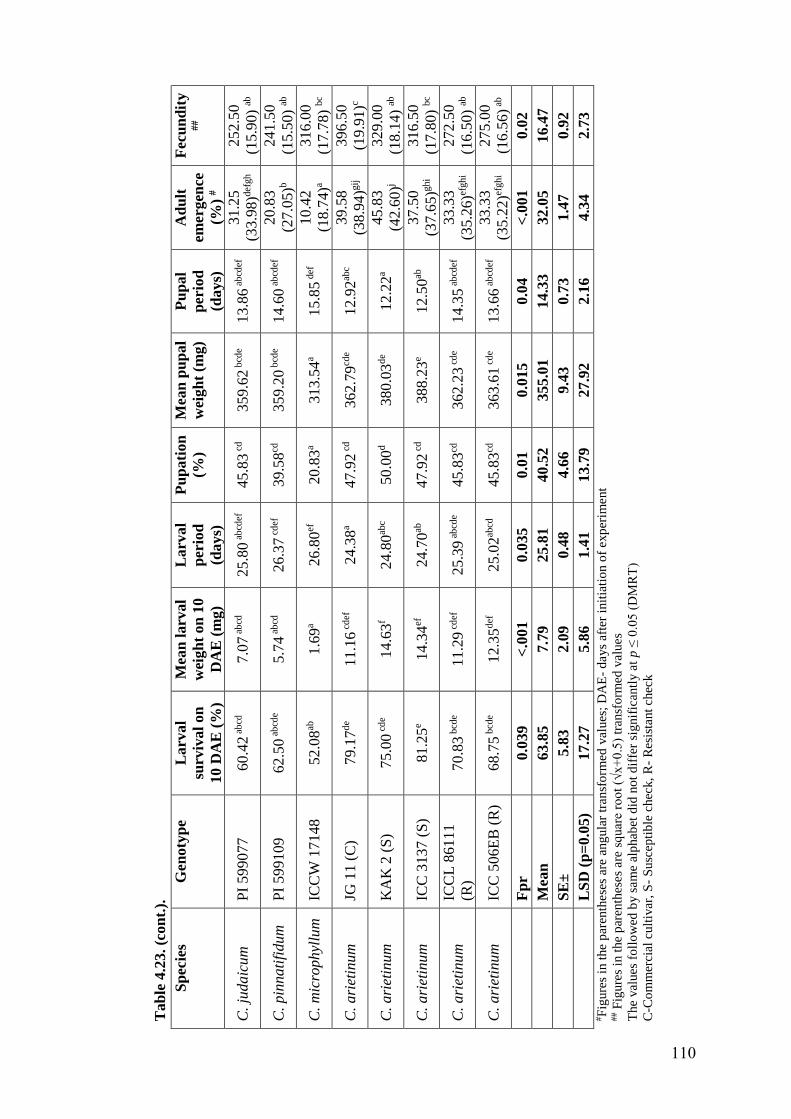
Ta
ble
4.2
3. (c
on
t.).
Sp
ecie
s G
en
oty
pe
La
rv
al
surv
iva
l o
n
10
DA
E (
%)
Mea
n l
arv
al
wei
gh
t o
n 1
0
DA
E (
mg
)
La
rv
al
perio
d
(da
ys)
Pu
pa
tio
n
(%)
Mea
n p
up
al
wei
gh
t (m
g)
Pu
pa
l
perio
d
(da
ys)
Ad
ult
em
erg
en
ce
(%)
#
Fecu
nd
ity
##
C. ju
da
icu
m
PI
599077
6
0.4
2 a
bcd
7
.07
ab
cd
25
.80
ab
cdef
4
5.8
3 c
d
35
9.6
2 b
cde
13
.86
ab
cdef
31
.25
(33
.98
)def
gh
25
2.5
0
(15
.90
) ab
C. p
inn
ati
fidum
P
I 599109
6
2.5
0 a
bcd
e 5
.74
ab
cd
26
.37
cd
ef
39
.58
cd
35
9.2
0 b
cde
14
.60
ab
cdef
2
0.8
3
(27
.05
)b
24
1.5
0
(15
.50
) ab
C. m
icro
ph
yllu
m
ICC
W 1
7148
5
2.0
8ab
1
.69
a 2
6.8
0ef
2
0.8
3a
31
3.5
4a
15
.85
def
1
0.4
2
(18
.74
)a
31
6.0
0
(17
.78
) bc
C. a
riet
inu
m
JG 1
1 (
C)
79
.17
de
11
.16
cd
ef
24
.38
a 4
7.9
2 c
d
36
2.7
9cd
e 1
2.9
2ab
c 3
9.5
8
(38
.94
)gij
39
6.5
0
(19
.91
)c
C. a
riet
inu
m
KA
K 2
(S
) 7
5.0
0 c
de
14
.63
f 2
4.8
0ab
c 5
0.0
0d
38
0.0
3d
e 1
2.2
2a
45
.83
(42
.60
)j
32
9.0
0
(18
.14
) ab
C. a
riet
inu
m
ICC
3137 (
S)
81
.25
e 1
4.3
4ef
2
4.7
0ab
4
7.9
2 c
d
38
8.2
3e
12
.50
ab
37
.50
(37
.65
)ghi
31
6.5
0
(17
.80
) bc
C. a
riet
inu
m
ICC
L 8
6111
(R)
70
.83
bcd
e 1
1.2
9 c
def
2
5.3
9 a
bcd
e 4
5.8
3cd
3
62
.23
cd
e 1
4.3
5 a
bcd
ef
33
.33
(35
.26
)efgh
i
27
2.5
0
(16
.50
) ab
C. a
riet
inu
m
ICC
506E
B (
R)
68
.75
bcd
e 1
2.3
5d
ef
25
.02
abcd
4
5.8
3cd
3
63
.61
cd
e 1
3.6
6 a
bcd
ef
33
.33
(35
.22
)efgh
i
27
5.0
0
(16
.56
) ab
F
pr
0.0
39
<.0
01
0.0
35
0.0
1
0.0
15
0.0
4
<.0
01
0.0
2
M
ean
6
3.8
5
7.7
9
25
.81
40
.52
35
5.0
1
14
.33
32
.05
16
.47
S
E±
5
.83
2.0
9
0.4
8
4.6
6
9.4
3
0.7
3
1.4
7
0.9
2
L
SD
(p
=0.0
5)
17
.27
5.8
6
1.4
1
13
.79
27
.92
2.1
6
4.3
4
2.7
3
#F
igure
s in
the
par
enth
ese
s ar
e a
ng
ula
r tr
ansf
orm
ed v
alues
; D
AE
- d
ays
afte
r in
itia
tio
n o
f exp
erim
ent
## F
igure
s in
the
par
enth
eses
are
sq
uar
e ro
ot
(√x+
0.5
) tr
ansf
orm
ed v
alu
es
The
val
ues
fo
llo
wed
by s
am
e al
phab
et d
id n
ot
dif
fer
sig
nif
ican
tly a
t p
≤ 0
.05
(D
MR
T)
C-C
om
mer
cial
cult
ivar
, S
- S
usc
epti
ble
chec
k,
R-
Res
ista
nt
chec
k
110
(14.58%), while highest was observed on KAK 2 (45.83%). Fecundity was
significantly lower when reared on PI 599046 (205.00), PI 568217 (208.00), PI
599066 (212.50), IG 69979 (236.50) and IG 70018 (237.50) compared to susceptible
check, KAK 2 (329.00).
The above results based on the survival and development of H. armigera on
artificial diet impregnated with lyophilized leaf powders of different genotypes of
wild relatives of chickpea across seasons revealed that antibiosis to H. armigera in
wild relatives of chickpea was expressed in terms of lower larval survival, pupation
percentage and adult emergence, decreased larval and pupal weight, prolonged
larval and pupal developmental periods and reduced fecundity. Higher levels of
antibiosis against H. armigera in wild relatives compared to cultigens in terms of
reduced survival and delayed developmental periods had also been studied in
chickpea (Sharma et al., 2005a, 2006) and pigeonpea (Sujana et al., 2008 and
Shanower et al., 1997). However, antibiosis seems to be the major component of
resistance in the wild relatives of chickpea, which may be due to secondary plant
substances such as flavonoids, protease inhibitors and lectins. Simmonds and
Stevenson (2001) reported that isoflavonoids, judaicin 7-o-glucoside, 2-methoxy
judaicin, judaicin and maakiain present in wild relatives of chickpea had shown
antifeedant activity and reduction in weight towards the larvae of H. armigera.
Shukla et al. (2005) reported that chickpea and snowdrop lectins had shown marked
antibiosis effects on H. armigera. Antibiosis effect of chickpea trypsin inhibitor on
H. armigera had been reported by Kansal et al. (2008). Narayanamma et al. (2008)
also reported that, F1 hybrids based on resistant genotypes of chickpea were
recorded lower larval survival, pupation, pupal weight compared to susceptible
check suggested transfer of antibiosis mechanism of resistance to progeny from
resistant parents. Slower larval growth, which resulted in prolonged development,
may also increase the probability of predation, parasitism and infection by
pathogens, resulting in reduced survival of H. armigera. Hence, these wild relatives
of chickpea with higher levels of antibiosis mechanism of resistance could be used
as sources for development of cultivars resistance to H. armigera.
111
4.4 Morphological Characterization of Wild Relatives of Chickpea
in Relation with Expression of Resistance to H. armigera
Results on morphological characters viz., trichome density and pod wall
thickness in different wild relatives of chickpea are presented hereunder.
4.4.1 Trichome Density
In the present investigation, two different types of trichomes viz., glandular
and non-glandular trichomes were observed on different wild relatives of chickpea
(Table 4.24) (Plate 9). The glandular trichomes had a basal cell, long vacuolate stalk
cells and a terminal cluster of dense secretary head cells (Schnepf, 1965 and Lazzaro
and Thomson 1989), whereas non-glandular trichomes were unsegmented and long.
Significant differences were observed in both glandular and non-glandular trichomes
with respect to their density (number of trichomes per 10X microscopic field)
among genotypes. Highest numbers of glandular trichomes were observed on C.
bijugum genotypes, PI 599046, IG 70012, IG 70018, IG 70006, PI 599066 and IG
70022 (15.90 to 14.20) and lowest was observed on C. chrossanicum, IG 599076
(4.50). In cultivated chickpea genotypes glandular trichome density was less in
susceptible check, KAK 2 (6.50) and ICC 3137 (7.70), while more was observed in
resistant checks, ICCL 86111 (12.30) and ICC 506EB (11.40).
Among genotypes, lowest non-glandular trichome density was observed in PI
599077 (0.90) and ICCW 17148 (0.90), while highest trichome density was
observed in IG 72933 (42.20) followed by JG 11 (39.00) and resistant check, ICC
506EB (37.00). Non-glandular trichomes were completely absent in C. pinnatifidum
genotypes (PI 510663 and PI 599109).
The correlation studies (Table 4.25) revealed that, glandular and non-
glandular trichomes showed negative association with oviposition preference under
multi-choice (r= -0.75) and no-choice conditions (r= -0.63), respectively.
Correlation of trichome density with detached leaf assay revealed that, glandular
trichomes had significant negative association with damage rating (r= -0.58),
whereas non-glandular trichomes had significant positive association with damage
rating and larval weight (r= 0.55 and 0.68, respectively) but negative (r= -0.53) with
larval survival percentage.
112
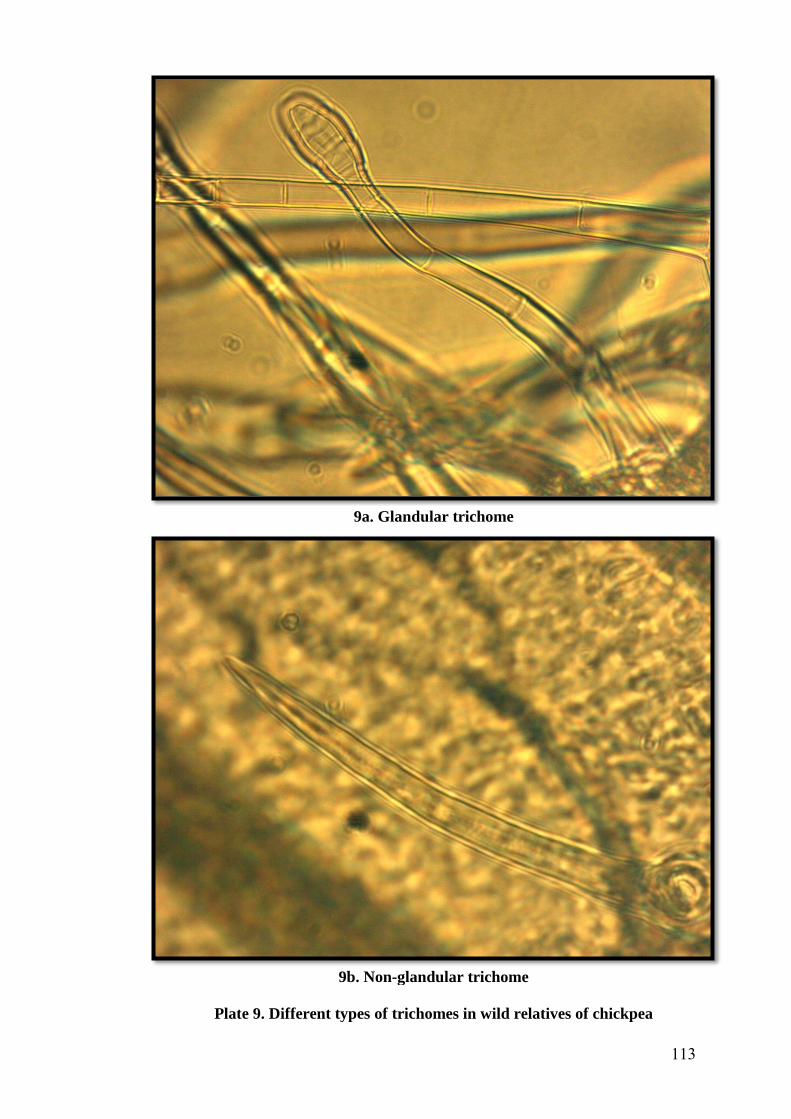
9a. Glandular trichome
9b. Non-glandular trichome
Plate 9. Different types of trichomes in wild relatives of chickpea
113
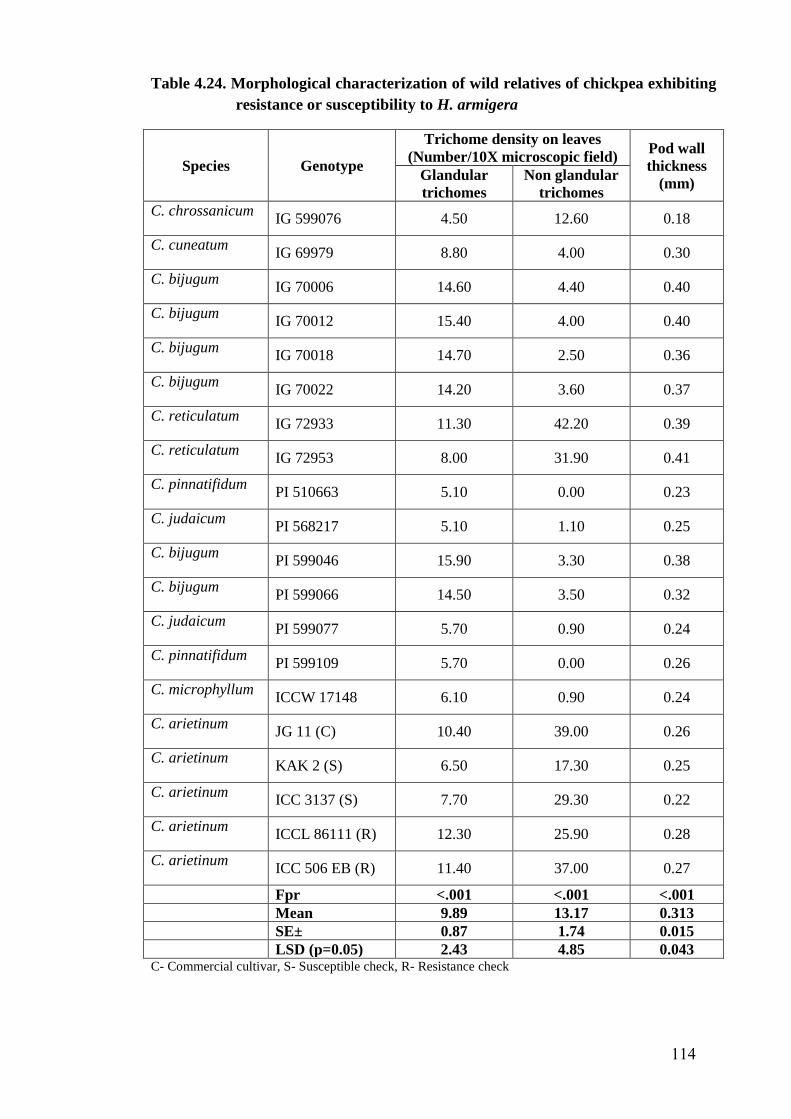
Table 4.24. Morphological characterization of wild relatives of chickpea exhibiting
resistance or susceptibility to H. armigera
Species Genotype
Trichome density on leaves
(Number/10X microscopic field) Pod wall
thickness
(mm) Glandular
trichomes
Non glandular
trichomes
C. chrossanicum IG 599076 4.50 12.60 0.18
C. cuneatum IG 69979 8.80 4.00 0.30
C. bijugum IG 70006 14.60 4.40 0.40
C. bijugum IG 70012 15.40 4.00 0.40
C. bijugum IG 70018 14.70 2.50 0.36
C. bijugum IG 70022 14.20 3.60 0.37
C. reticulatum IG 72933 11.30 42.20 0.39
C. reticulatum IG 72953 8.00 31.90 0.41
C. pinnatifidum PI 510663 5.10 0.00 0.23
C. judaicum PI 568217 5.10 1.10 0.25
C. bijugum PI 599046 15.90 3.30 0.38
C. bijugum PI 599066 14.50 3.50 0.32
C. judaicum PI 599077 5.70 0.90 0.24
C. pinnatifidum PI 599109 5.70 0.00 0.26
C. microphyllum ICCW 17148 6.10 0.90 0.24
C. arietinum JG 11 (C) 10.40 39.00 0.26
C. arietinum KAK 2 (S) 6.50 17.30 0.25
C. arietinum ICC 3137 (S) 7.70 29.30 0.22
C. arietinum ICCL 86111 (R) 12.30 25.90 0.28
C. arietinum ICC 506 EB (R) 11.40 37.00 0.27
Fpr <.001 <.001 <.001
Mean 9.89 13.17 0.313
SE± 0.87 1.74 0.015
LSD (p=0.05) 2.43 4.85 0.043
C- Commercial cultivar, S- Susceptible check, R- Resistance check
114
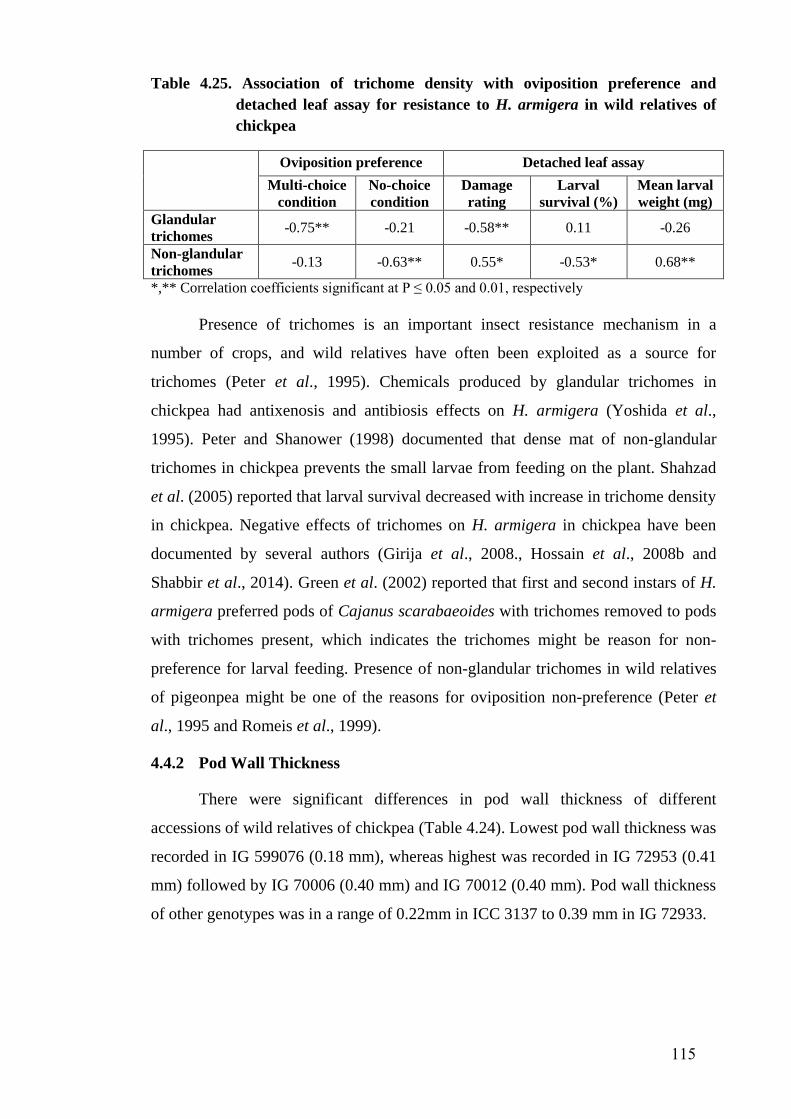
Table 4.25. Association of trichome density with oviposition preference and
detached leaf assay for resistance to H. armigera in wild relatives of
chickpea
Oviposition preference Detached leaf assay
Multi-choice
condition
No-choice
condition
Damage
rating
Larval
survival (%)
Mean larval
weight (mg)
Glandular
trichomes -0.75** -0.21 -0.58** 0.11 -0.26
Non-glandular
trichomes -0.13 -0.63** 0.55* -0.53* 0.68**
*,** Correlation coefficients significant at P ≤ 0.05 and 0.01, respectively
Presence of trichomes is an important insect resistance mechanism in a
number of crops, and wild relatives have often been exploited as a source for
trichomes (Peter et al., 1995). Chemicals produced by glandular trichomes in
chickpea had antixenosis and antibiosis effects on H. armigera (Yoshida et al.,
1995). Peter and Shanower (1998) documented that dense mat of non-glandular
trichomes in chickpea prevents the small larvae from feeding on the plant. Shahzad
et al. (2005) reported that larval survival decreased with increase in trichome density
in chickpea. Negative effects of trichomes on H. armigera in chickpea have been
documented by several authors (Girija et al., 2008., Hossain et al., 2008b and
Shabbir et al., 2014). Green et al. (2002) reported that first and second instars of H.
armigera preferred pods of Cajanus scarabaeoides with trichomes removed to pods
with trichomes present, which indicates the trichomes might be reason for non-
preference for larval feeding. Presence of non-glandular trichomes in wild relatives
of pigeonpea might be one of the reasons for oviposition non-preference (Peter et
al., 1995 and Romeis et al., 1999).
4.4.2 Pod Wall Thickness
There were significant differences in pod wall thickness of different
accessions of wild relatives of chickpea (Table 4.24). Lowest pod wall thickness was
recorded in IG 599076 (0.18 mm), whereas highest was recorded in IG 72953 (0.41
mm) followed by IG 70006 (0.40 mm) and IG 70012 (0.40 mm). Pod wall thickness
of other genotypes was in a range of 0.22mm in ICC 3137 to 0.39 mm in IG 72933.
115
4.5 HPLC FINGER PRINTS OF LEAF ORGANIC ACIDS IN
DIFFERENT GENOTYPES OF WILD RELATIVES OF
CHICKPEA
Variations in leaf organic acid exudates were identified and quantified
through HPLC fingerprints based on their retention time (RT) and peak area in
different wild relatives of chickpea and represented in mg/g fresh weight of sample.
4.5.1 Oxalic Acid Content
Oxalic acid identified at RT of 4.04 to 4.16 min in different genotypes.
Significant differences were exhibited in oxalic acid concentrations among different
genotypes (Table 4.26 and Figure 4.4). During post-rainy season, 2014-15 all wild
relatives of chickpea genotypes recorded low amounts of oxalic acid compared to
cultivated chickpea genotypes except in IG 72933 (2.36 mg/g) which was
significantly higher compared to susceptible check, ICC 3137 (1.43 mg/g) and
significantly lower compared to resistant checks, ICCL 86111 (3.00 mg/g) and ICC
506EB (3.13 mg/g). During post-rainy season, 2015-16 lowest amount of oxalic acid
was observed in PI 599046 (0.44 mg/g), while highest amount of oxalic acid was
recorded in IG 69979 (2.92 mg/g). Oxalic acid content in cultivated chickpea ranged
from 1.84 mg/g (ICC 3137) to 2.45 mg/g (ICC 506EB) which was comparatively
higher with wild relatives of chickpea genotypes. Similar trend was observed in
glass house grown condition, where significantly higher amounts of oxalic acid were
observed in all cultivated chickpea genotypes than wild relatives of chickpea
genotypes. Oxalic acid content in wild relatives ranged from 0.16 mg/g (PI 568217)
to 1.35 mg/g (IG 72953), while it was ranged from 1.21 mg/g (ICC 3137,
susceptible check) to 4.27 mg/g (ICC 506EB, resistant check) in cultivated chickpea.
4.5.2 Malic Acid Content
Malic acid identified at RT of 5.24 to 5.29 min in different genotypes.
Significant differences were exhibited in malic acid concentrations among different
genotypes (Table 4.26 and Figure 4.4). During post-rainy season, 2014-15 lowest
amount of malic acid was recorded in C. reticulatum, IG 72933 (1.94 mg/g) and IG
72953 (2.09 mg/g), while highest was recorded in C. judaicum, PI 599077 (10.46
mg/g) and PI 568217 (7.93 mg/g) followed by C. microphyllum, ICCW 17148 (7.46
mg/g). During post-rainy season, 2015-16 no traces of malic acid was recorded in
116
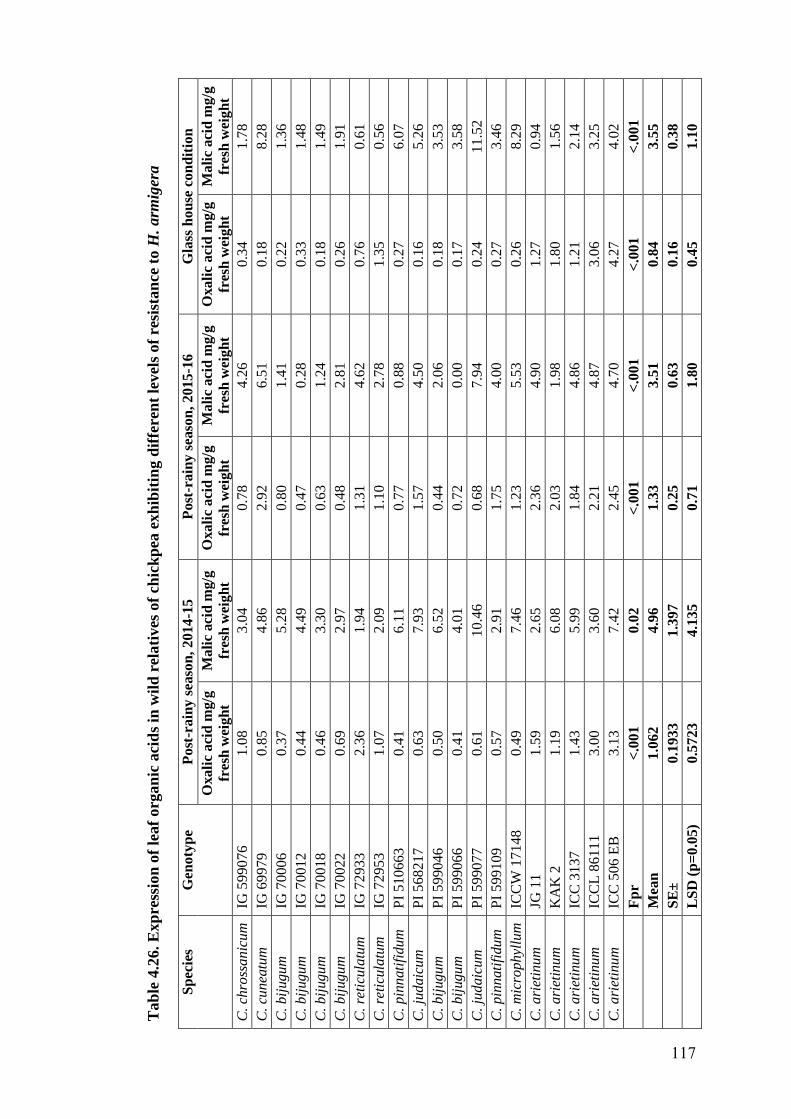
Tab
le 4
.26.
Exp
ress
ion
of
leaf
org
an
ic a
cid
s in
wil
d r
elati
ves
of
chic
kp
ea e
xh
ibit
ing d
iffe
ren
t le
vel
s of
resi
stan
ce t
o H
. arm
iger
a
Sp
ecie
s G
eno
typ
e P
ost
-rain
y s
easo
n,
2014
-15
Post
-rain
y s
easo
n,
201
5-1
6
Gla
ss h
ou
se c
on
dit
ion
Oxali
c aci
d m
g/g
fres
h w
eigh
t
Mali
c aci
d m
g/g
fres
h w
eigh
t
Oxali
c aci
d m
g/g
fres
h w
eigh
t
Ma
lic
aci
d m
g/g
fres
h w
eig
ht
Oxa
lic
aci
d m
g/g
fres
h w
eig
ht
Ma
lic
aci
d m
g/g
fres
h w
eig
ht
C.
chro
ssanic
um
IG
59
90
76
1.0
8
3.0
4
0.7
8
4.2
6
0.3
4
1.7
8
C.
cunea
tum
IG
69
97
9
0.8
5
4.8
6
2.9
2
6.5
1
0.1
8
8.2
8
C.
bij
ugum
IG
70
00
6
0.3
7
5.2
8
0.8
0
1.4
1
0.2
2
1.3
6
C.
bij
ugum
IG
70
01
2
0.4
4
4.4
9
0.4
7
0.2
8
0.3
3
1.4
8
C.
bij
ugum
IG
70
01
8
0.4
6
3.3
0
0.6
3
1.2
4
0.1
8
1.4
9
C.
bij
ugum
IG
70
02
2
0.6
9
2.9
7
0.4
8
2.8
1
0.2
6
1.9
1
C.
reti
cula
tum
IG
72
93
3
2.3
6
1.9
4
1.3
1
4.6
2
0.7
6
0.6
1
C.
reti
cula
tum
IG
72
95
3
1.0
7
2.0
9
1.1
0
2.7
8
1.3
5
0.5
6
C.
pin
nati
fidum
P
I 5
10
66
3
0.4
1
6.1
1
0.7
7
0.8
8
0.2
7
6.0
7
C.
judaic
um
P
I 5
68
21
7
0.6
3
7.9
3
1.5
7
4.5
0
0.1
6
5.2
6
C.
bij
ugum
P
I 5
99
04
6
0.5
0
6.5
2
0.4
4
2.0
6
0.1
8
3.5
3
C.
bij
ugum
P
I 5
99
06
6
0.4
1
4.0
1
0.7
2
0.0
0
0.1
7
3.5
8
C.
judaic
um
P
I 5
99
07
7
0.6
1
10.4
6
0.6
8
7.9
4
0.2
4
11
.52
C.
pin
nati
fidum
P
I 5
99
10
9
0.5
7
2.9
1
1.7
5
4.0
0
0.2
7
3.4
6
C.
mic
rophyl
lum
IC
CW
17
14
8
0.4
9
7.4
6
1.2
3
5.5
3
0.2
6
8.2
9
C.
ari
etin
um
JG
11
1.5
9
2.6
5
2.3
6
4.9
0
1.2
7
0.9
4
C.
ari
etin
um
K
AK
2
1.1
9
6.0
8
2.0
3
1.9
8
1.8
0
1.5
6
C.
ari
etin
um
IC
C 3
13
7
1.4
3
5.9
9
1.8
4
4.8
6
1.2
1
2.1
4
C.
ari
etin
um
IC
CL
86
11
1
3.0
0
3.6
0
2.2
1
4.8
7
3.0
6
3.2
5
C.
ari
etin
um
IC
C 5
06
EB
3.1
3
7.4
2
2.4
5
4.7
0
4.2
7
4.0
2
F
pr
<.0
01
0.0
2
<.0
01
<
.00
1
<.0
01
<
.00
1
M
ean
1.0
62
4.9
6
1.3
3
3.5
1
0.8
4
3.5
5
S
E±
0.1
933
1.3
97
0.2
5
0.6
3
0.1
6
0.3
8
L
SD
(p
=0
.05
) 0.5
723
4.1
35
0.7
1
1.8
0
0.4
5
1.1
0
117
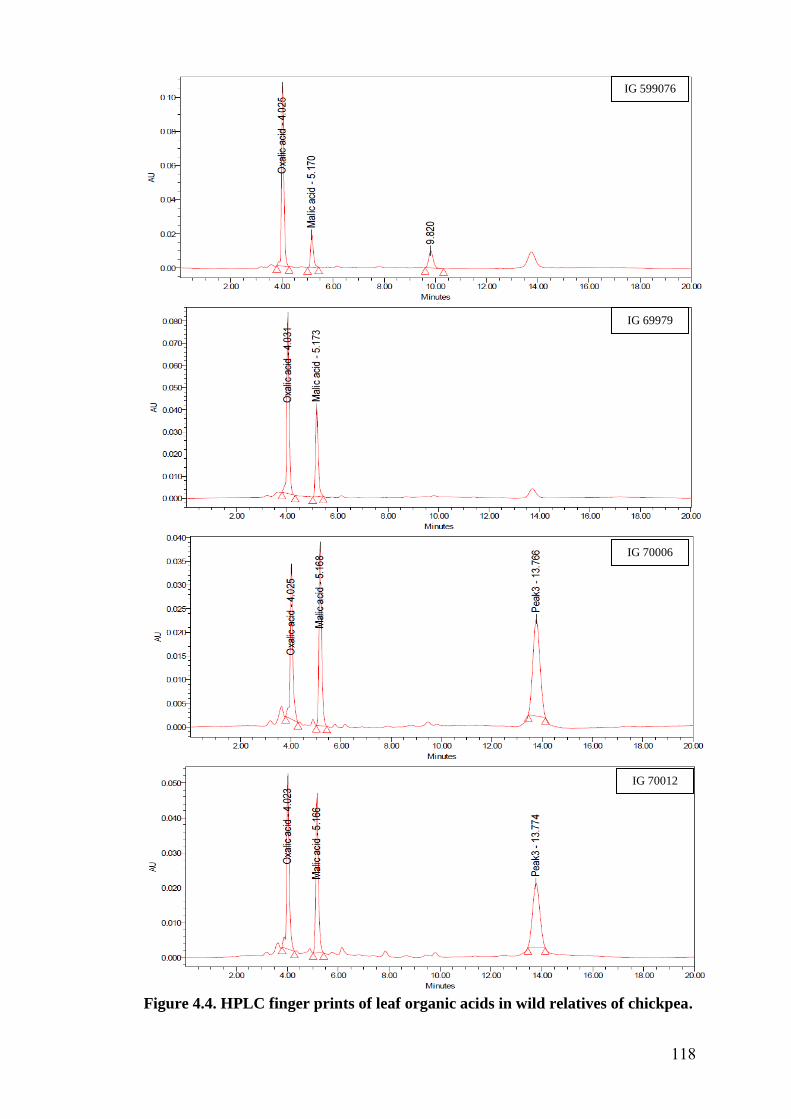
Figure 4.4. HPLC finger prints of leaf organic acids in wild relatives of chickpea.
IG 599076
IG 69979
IG 70006
IG 70012
118
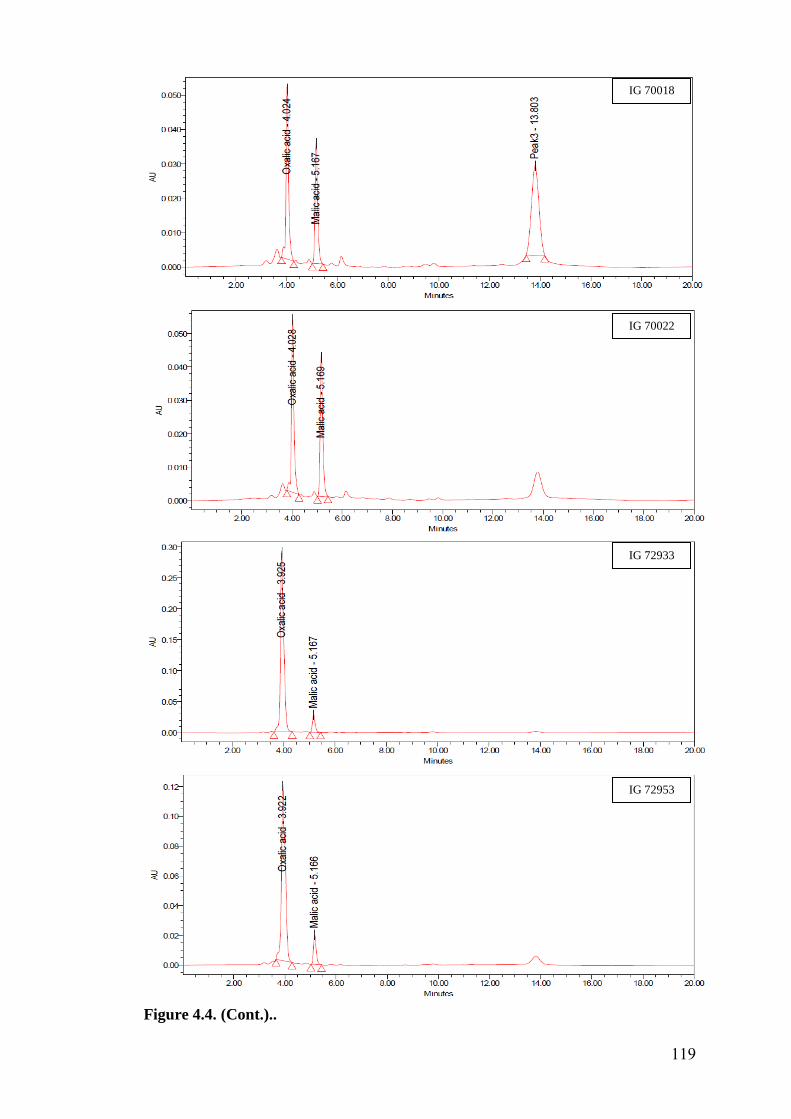
Figure 4.4. (Cont.)..
IG 70018
IG 70022
IG 72933
IG 72953
119
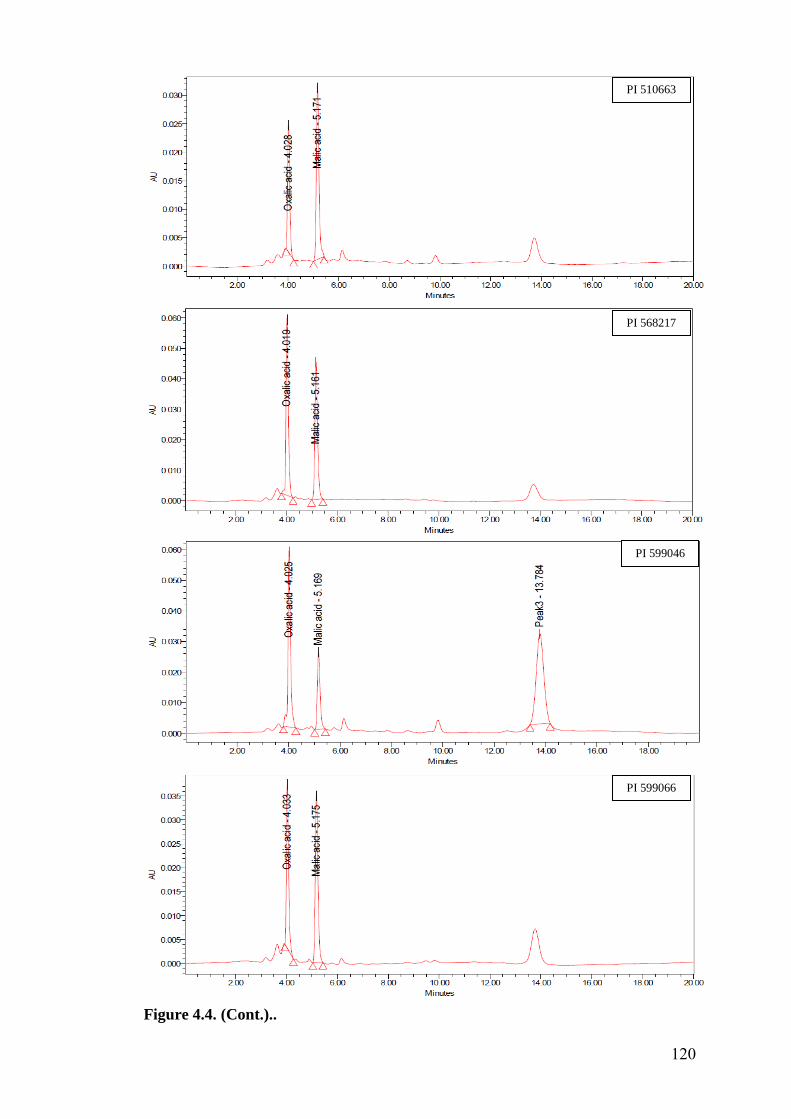
Figure 4.4. (Cont.)..
PI 510663
PI 568217
PI 599046
PI 599066
120
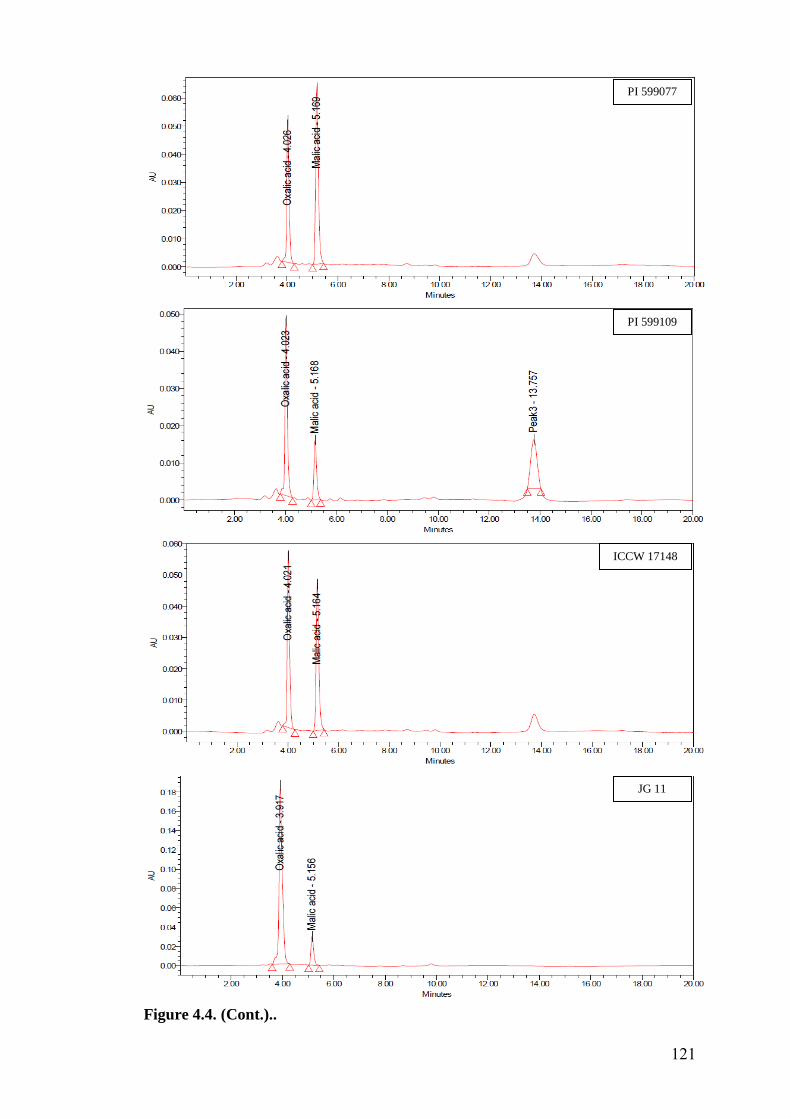
Figure 4.4. (Cont.)..
PI 599077
PI 599109
ICCW 17148
JG 11
121
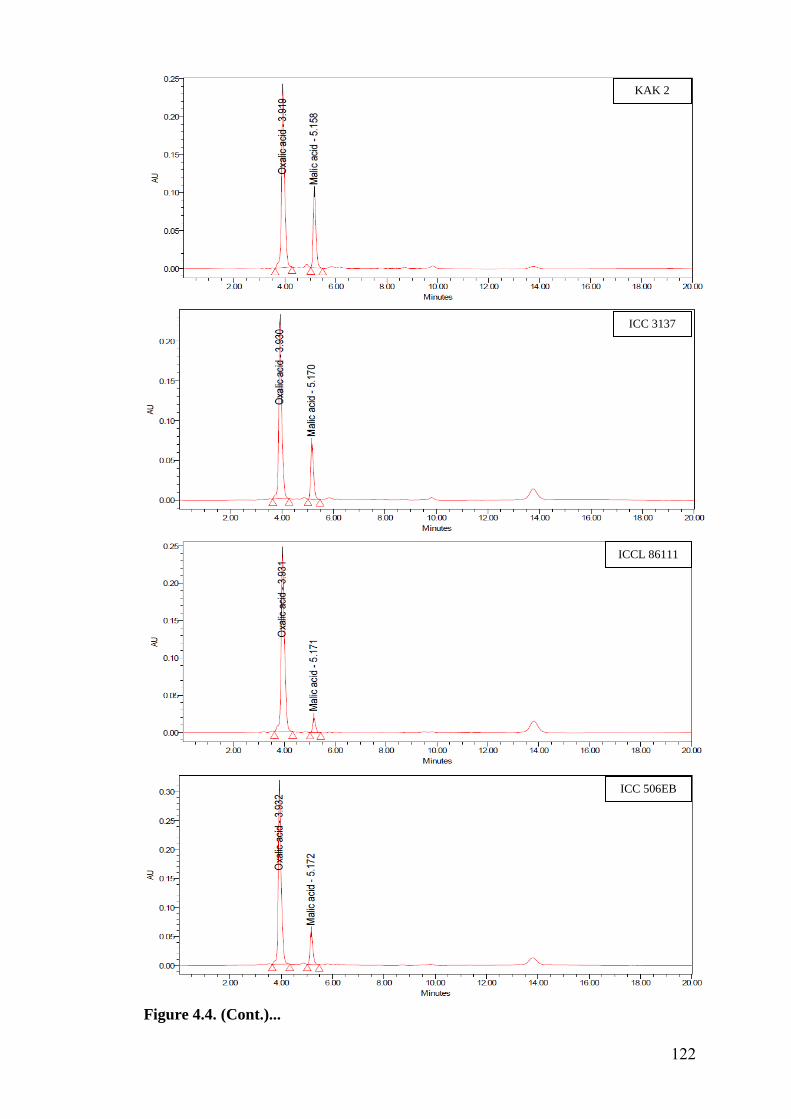
Figure 4.4. (Cont.)...
KAK 2
ICC 3137
ICCL 86111
ICC 506EB
122
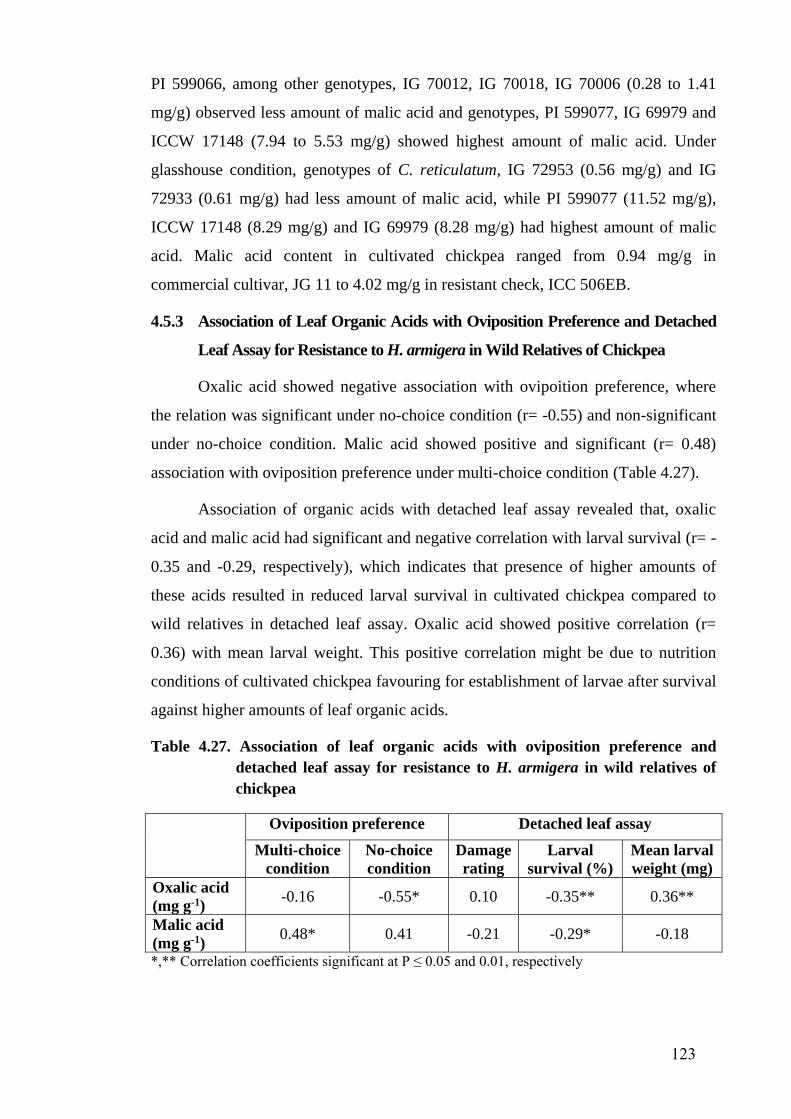
PI 599066, among other genotypes, IG 70012, IG 70018, IG 70006 (0.28 to 1.41
mg/g) observed less amount of malic acid and genotypes, PI 599077, IG 69979 and
ICCW 17148 (7.94 to 5.53 mg/g) showed highest amount of malic acid. Under
glasshouse condition, genotypes of C. reticulatum, IG 72953 (0.56 mg/g) and IG
72933 (0.61 mg/g) had less amount of malic acid, while PI 599077 (11.52 mg/g),
ICCW 17148 (8.29 mg/g) and IG 69979 (8.28 mg/g) had highest amount of malic
acid. Malic acid content in cultivated chickpea ranged from 0.94 mg/g in
commercial cultivar, JG 11 to 4.02 mg/g in resistant check, ICC 506EB.
4.5.3 Association of Leaf Organic Acids with Oviposition Preference and Detached
Leaf Assay for Resistance to H. armigera in Wild Relatives of Chickpea
Oxalic acid showed negative association with ovipoition preference, where
the relation was significant under no-choice condition (r= -0.55) and non-significant
under no-choice condition. Malic acid showed positive and significant (r= 0.48)
association with oviposition preference under multi-choice condition (Table 4.27).
Association of organic acids with detached leaf assay revealed that, oxalic
acid and malic acid had significant and negative correlation with larval survival (r= -
0.35 and -0.29, respectively), which indicates that presence of higher amounts of
these acids resulted in reduced larval survival in cultivated chickpea compared to
wild relatives in detached leaf assay. Oxalic acid showed positive correlation (r=
0.36) with mean larval weight. This positive correlation might be due to nutrition
conditions of cultivated chickpea favouring for establishment of larvae after survival
against higher amounts of leaf organic acids.
Table 4.27. Association of leaf organic acids with oviposition preference and
detached leaf assay for resistance to H. armigera in wild relatives of
chickpea
Oviposition preference Detached leaf assay
Multi-choice
condition
No-choice
condition
Damage
rating
Larval
survival (%)
Mean larval
weight (mg)
Oxalic acid
(mg g-1) -0.16 -0.55* 0.10 -0.35** 0.36**
Malic acid
(mg g-1) 0.48* 0.41 -0.21 -0.29* -0.18
*,** Correlation coefficients significant at P ≤ 0.05 and 0.01, respectively
123
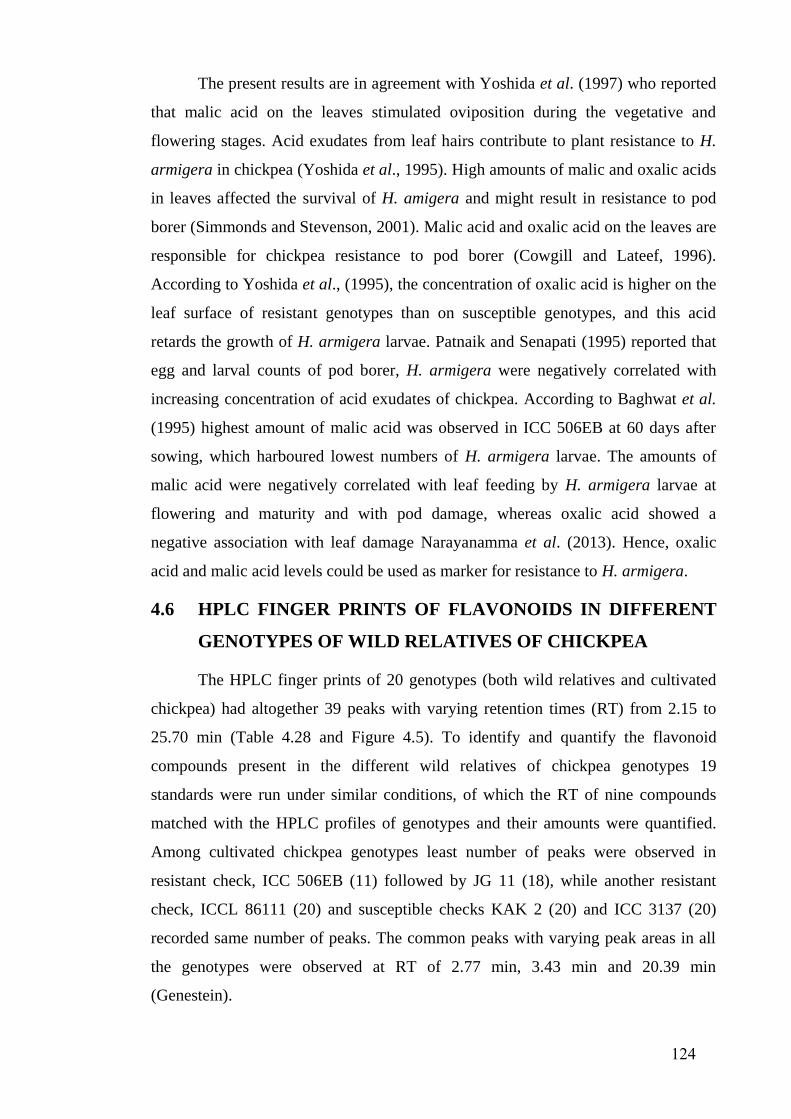
The present results are in agreement with Yoshida et al. (1997) who reported
that malic acid on the leaves stimulated oviposition during the vegetative and
flowering stages. Acid exudates from leaf hairs contribute to plant resistance to H.
armigera in chickpea (Yoshida et al., 1995). High amounts of malic and oxalic acids
in leaves affected the survival of H. amigera and might result in resistance to pod
borer (Simmonds and Stevenson, 2001). Malic acid and oxalic acid on the leaves are
responsible for chickpea resistance to pod borer (Cowgill and Lateef, 1996).
According to Yoshida et al., (1995), the concentration of oxalic acid is higher on the
leaf surface of resistant genotypes than on susceptible genotypes, and this acid
retards the growth of H. armigera larvae. Patnaik and Senapati (1995) reported that
egg and larval counts of pod borer, H. armigera were negatively correlated with
increasing concentration of acid exudates of chickpea. According to Baghwat et al.
(1995) highest amount of malic acid was observed in ICC 506EB at 60 days after
sowing, which harboured lowest numbers of H. armigera larvae. The amounts of
malic acid were negatively correlated with leaf feeding by H. armigera larvae at
flowering and maturity and with pod damage, whereas oxalic acid showed a
negative association with leaf damage Narayanamma et al. (2013). Hence, oxalic
acid and malic acid levels could be used as marker for resistance to H. armigera.
4.6 HPLC FINGER PRINTS OF FLAVONOIDS IN DIFFERENT
GENOTYPES OF WILD RELATIVES OF CHICKPEA
The HPLC finger prints of 20 genotypes (both wild relatives and cultivated
chickpea) had altogether 39 peaks with varying retention times (RT) from 2.15 to
25.70 min (Table 4.28 and Figure 4.5). To identify and quantify the flavonoid
compounds present in the different wild relatives of chickpea genotypes 19
standards were run under similar conditions, of which the RT of nine compounds
matched with the HPLC profiles of genotypes and their amounts were quantified.
Among cultivated chickpea genotypes least number of peaks were observed in
resistant check, ICC 506EB (11) followed by JG 11 (18), while another resistant
check, ICCL 86111 (20) and susceptible checks KAK 2 (20) and ICC 3137 (20)
recorded same number of peaks. The common peaks with varying peak areas in all
the genotypes were observed at RT of 2.77 min, 3.43 min and 20.39 min
(Genestein).
124
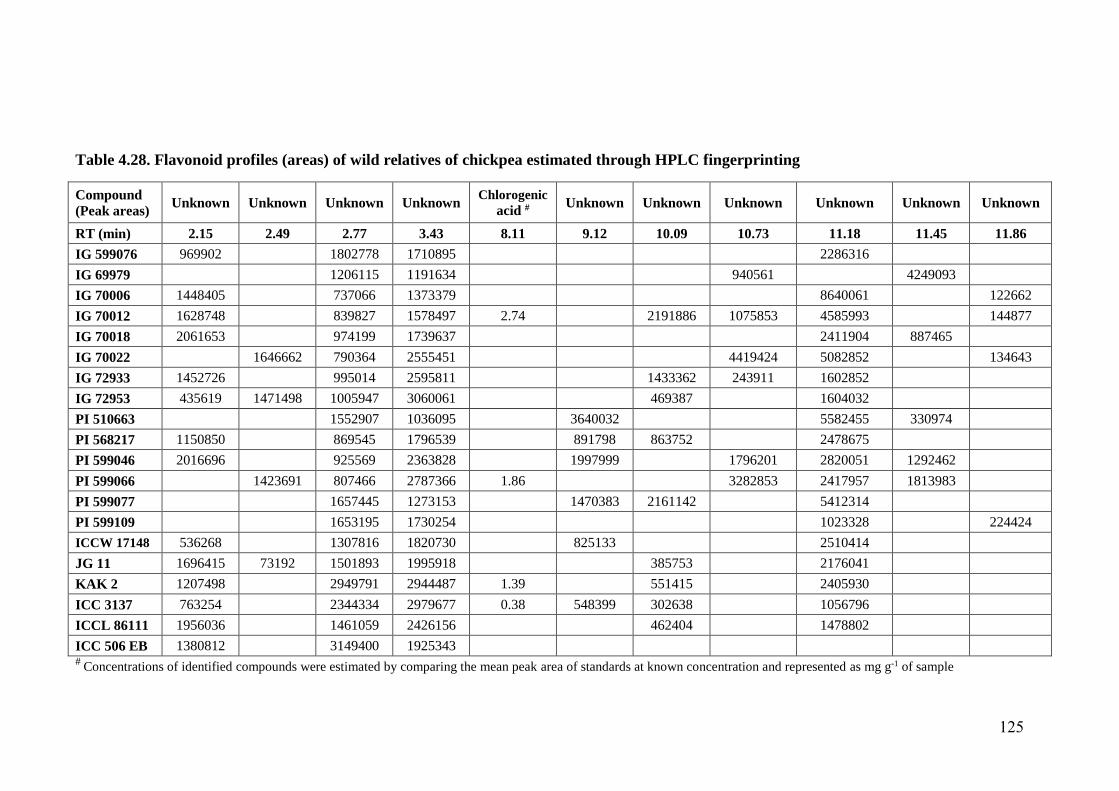
Table 4.28. Flavonoid profiles (areas) of wild relatives of chickpea estimated through HPLC fingerprinting
Compound
(Peak areas) Unknown Unknown Unknown Unknown
Chlorogenic
acid # Unknown Unknown Unknown Unknown Unknown Unknown
RT (min) 2.15 2.49 2.77 3.43 8.11 9.12 10.09 10.73 11.18 11.45 11.86
IG 599076 969902
1802778 1710895
2286316
IG 69979
1206115 1191634
940561
4249093
IG 70006 1448405
737066 1373379
8640061
122662
IG 70012 1628748
839827 1578497 2.74
2191886 1075853 4585993
144877
IG 70018 2061653
974199 1739637
2411904 887465
IG 70022
1646662 790364 2555451
4419424 5082852
134643
IG 72933 1452726
995014 2595811
1433362 243911 1602852
IG 72953 435619 1471498 1005947 3060061
469387
1604032
PI 510663
1552907 1036095 3640032
5582455 330974
PI 568217 1150850
869545 1796539 891798 863752
2478675
PI 599046 2016696
925569 2363828 1997999
1796201 2820051 1292462
PI 599066
1423691 807466 2787366 1.86
3282853 2417957 1813983
PI 599077
1657445 1273153 1470383 2161142
5412314
PI 599109
1653195 1730254
1023328
224424
ICCW 17148 536268
1307816 1820730 825133
2510414
JG 11 1696415 73192 1501893 1995918
385753
2176041
KAK 2 1207498
2949791 2944487 1.39
551415
2405930
ICC 3137 763254
2344334 2979677 0.38 548399 302638
1056796
ICCL 86111 1956036
1461059 2426156
462404
1478802
ICC 506 EB 1380812
3149400 1925343
# Concentrations of identified compounds were estimated by comparing the mean peak area of standards at known concentration and represented as mg g-1 of sample
125
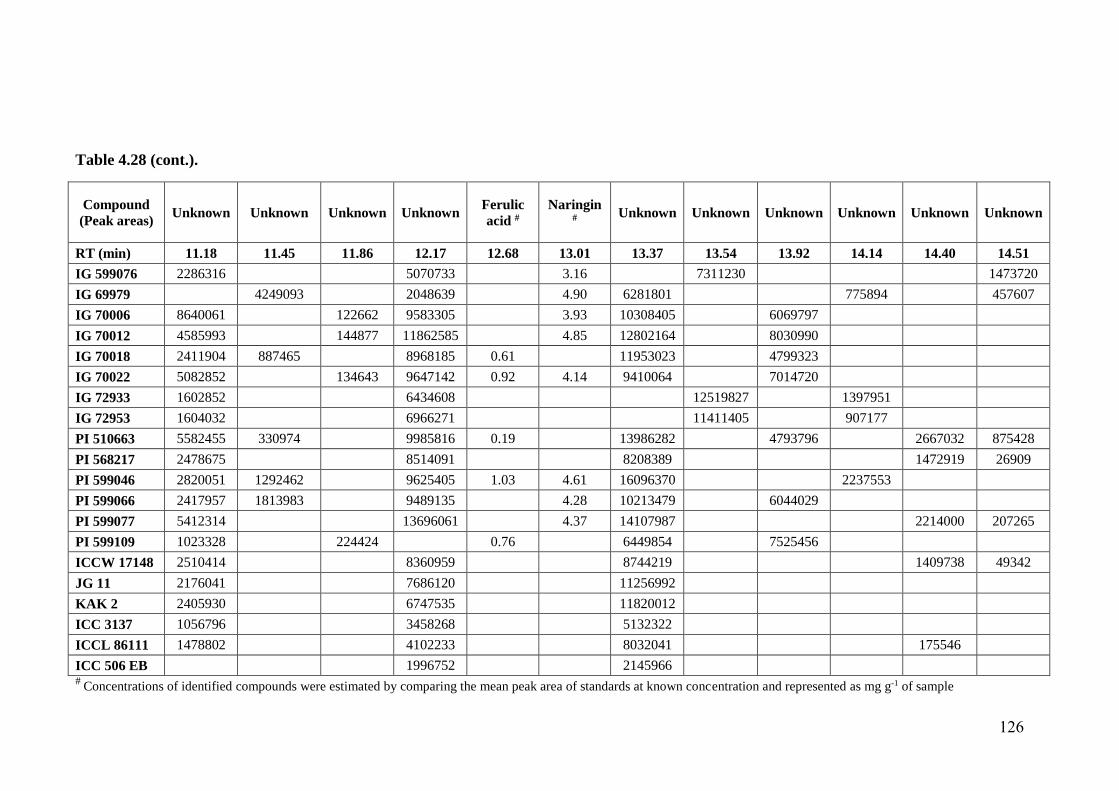
Table 4.28 (cont.).
Compound
(Peak areas) Unknown Unknown Unknown Unknown
Ferulic
acid #
Naringin #
Unknown Unknown Unknown Unknown Unknown Unknown
RT (min) 11.18 11.45 11.86 12.17 12.68 13.01 13.37 13.54 13.92 14.14 14.40 14.51
IG 599076 2286316
5070733
3.16
7311230
1473720
IG 69979
4249093
2048639
4.90 6281801
775894 457607
IG 70006 8640061
122662 9583305
3.93 10308405
6069797
IG 70012 4585993
144877 11862585
4.85 12802164
8030990
IG 70018 2411904 887465
8968185 0.61
11953023
4799323
IG 70022 5082852
134643 9647142 0.92 4.14 9410064
7014720
IG 72933 1602852
6434608
12519827
1397951
IG 72953 1604032
6966271
11411405
907177
PI 510663 5582455 330974
9985816 0.19
13986282
4793796 2667032 875428
PI 568217 2478675
8514091
8208389
1472919 26909
PI 599046 2820051 1292462
9625405 1.03 4.61 16096370
2237553
PI 599066 2417957 1813983
9489135
4.28 10213479
6044029
PI 599077 5412314
13696061
4.37 14107987
2214000 207265
PI 599109 1023328
224424 0.76
6449854
7525456
ICCW 17148 2510414
8360959
8744219
1409738 49342
JG 11 2176041
7686120
11256992
KAK 2 2405930
6747535
11820012
ICC 3137 1056796
3458268
5132322
ICCL 86111 1478802
4102233
8032041
175546
ICC 506 EB
1996752
2145966
#
Concentrations of identified compounds were estimated by comparing the mean peak area of standards at known concentration and represented as mg g-1 of sample
126
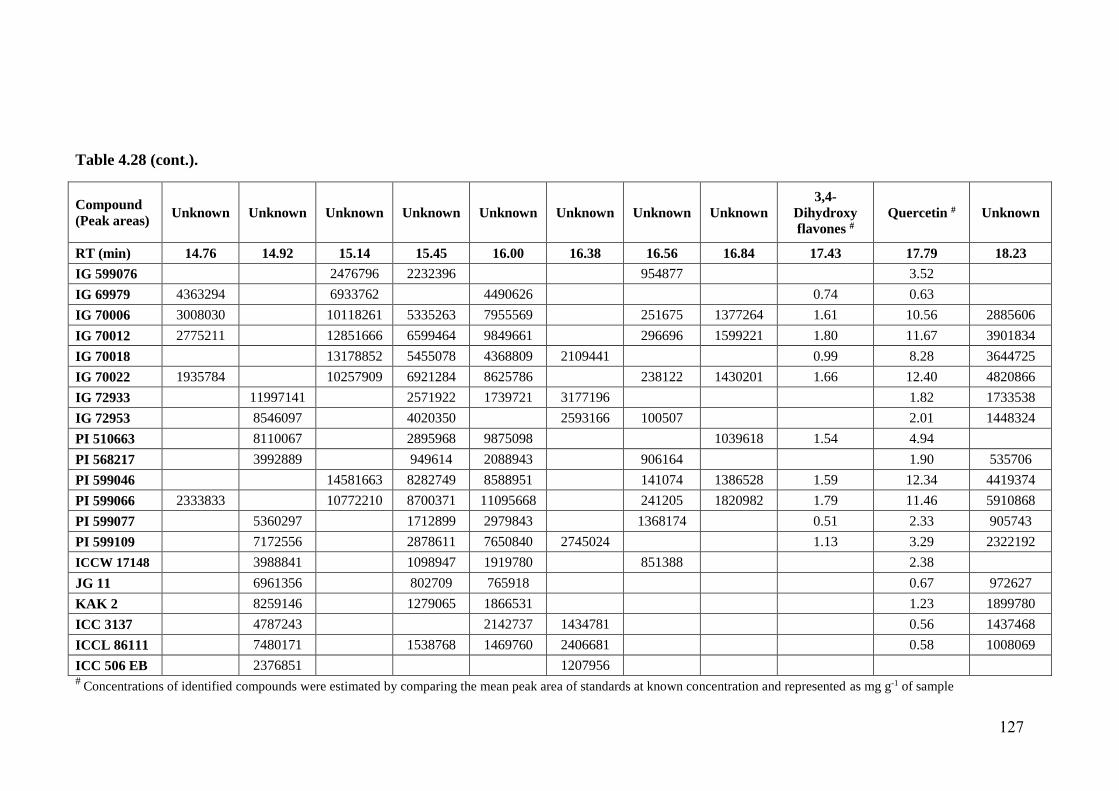
Table 4.28 (cont.).
Compound
(Peak areas) Unknown Unknown Unknown Unknown Unknown Unknown Unknown Unknown
3,4-
Dihydroxy
flavones #
Quercetin # Unknown
RT (min) 14.76 14.92 15.14 15.45 16.00 16.38 16.56 16.84 17.43 17.79 18.23
IG 599076
2476796 2232396
954877
3.52
IG 69979 4363294
6933762
4490626
0.74 0.63
IG 70006 3008030
10118261 5335263 7955569
251675 1377264 1.61 10.56 2885606
IG 70012 2775211
12851666 6599464 9849661
296696 1599221 1.80 11.67 3901834
IG 70018
13178852 5455078 4368809 2109441
0.99 8.28 3644725
IG 70022 1935784
10257909 6921284 8625786
238122 1430201 1.66 12.40 4820866
IG 72933
11997141
2571922 1739721 3177196
1.82 1733538
IG 72953
8546097
4020350
2593166 100507
2.01 1448324
PI 510663
8110067
2895968 9875098
1039618 1.54 4.94
PI 568217
3992889
949614 2088943
906164
1.90 535706
PI 599046
14581663 8282749 8588951
141074 1386528 1.59 12.34 4419374
PI 599066 2333833
10772210 8700371 11095668
241205 1820982 1.79 11.46 5910868
PI 599077
5360297
1712899 2979843
1368174
0.51 2.33 905743
PI 599109
7172556
2878611 7650840 2745024
1.13 3.29 2322192
ICCW 17148
3988841
1098947 1919780
851388
2.38
JG 11
6961356
802709 765918
0.67 972627
KAK 2
8259146
1279065 1866531
1.23 1899780
ICC 3137
4787243
2142737 1434781
0.56 1437468
ICCL 86111
7480171
1538768 1469760 2406681
0.58 1008069
ICC 506 EB
2376851
1207956
# Concentrations of identified compounds were estimated by comparing the mean peak area of standards at known concentration and represented as mg g-1 of sample
127
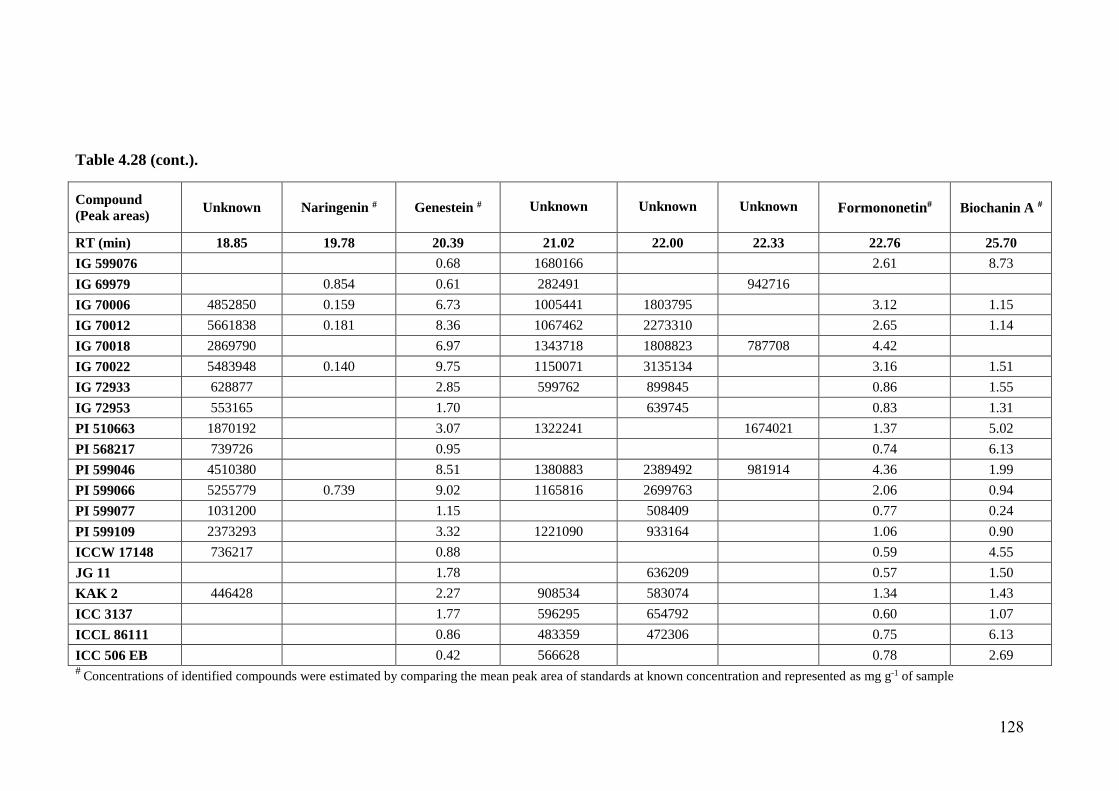
Table 4.28 (cont.).
Compound
(Peak areas) Unknown Naringenin # Genestein # Unknown Unknown Unknown Formononetin# Biochanin A #
RT (min) 18.85 19.78 20.39 21.02 22.00 22.33 22.76 25.70
IG 599076
0.68 1680166
2.61 8.73
IG 69979
0.854 0.61 282491
942716
IG 70006 4852850 0.159 6.73 1005441 1803795
3.12 1.15
IG 70012 5661838 0.181 8.36 1067462 2273310
2.65 1.14
IG 70018 2869790
6.97 1343718 1808823 787708 4.42
IG 70022 5483948 0.140 9.75 1150071 3135134
3.16 1.51
IG 72933 628877
2.85 599762 899845
0.86 1.55
IG 72953 553165
1.70 639745
0.83 1.31
PI 510663 1870192
3.07 1322241
1674021 1.37 5.02
PI 568217 739726
0.95
0.74 6.13
PI 599046 4510380
8.51 1380883 2389492 981914 4.36 1.99
PI 599066 5255779 0.739 9.02 1165816 2699763
2.06 0.94
PI 599077 1031200
1.15 508409
0.77 0.24
PI 599109 2373293
3.32 1221090 933164
1.06 0.90
ICCW 17148 736217
0.88
0.59 4.55
JG 11
1.78 636209
0.57 1.50
KAK 2 446428
2.27 908534 583074
1.34 1.43
ICC 3137
1.77 596295 654792
0.60 1.07
ICCL 86111
0.86 483359 472306
0.75 6.13
ICC 506 EB
0.42 566628
0.78 2.69 #
Concentrations of identified compounds were estimated by comparing the mean peak area of standards at known concentration and represented as mg g-1 of sample
128
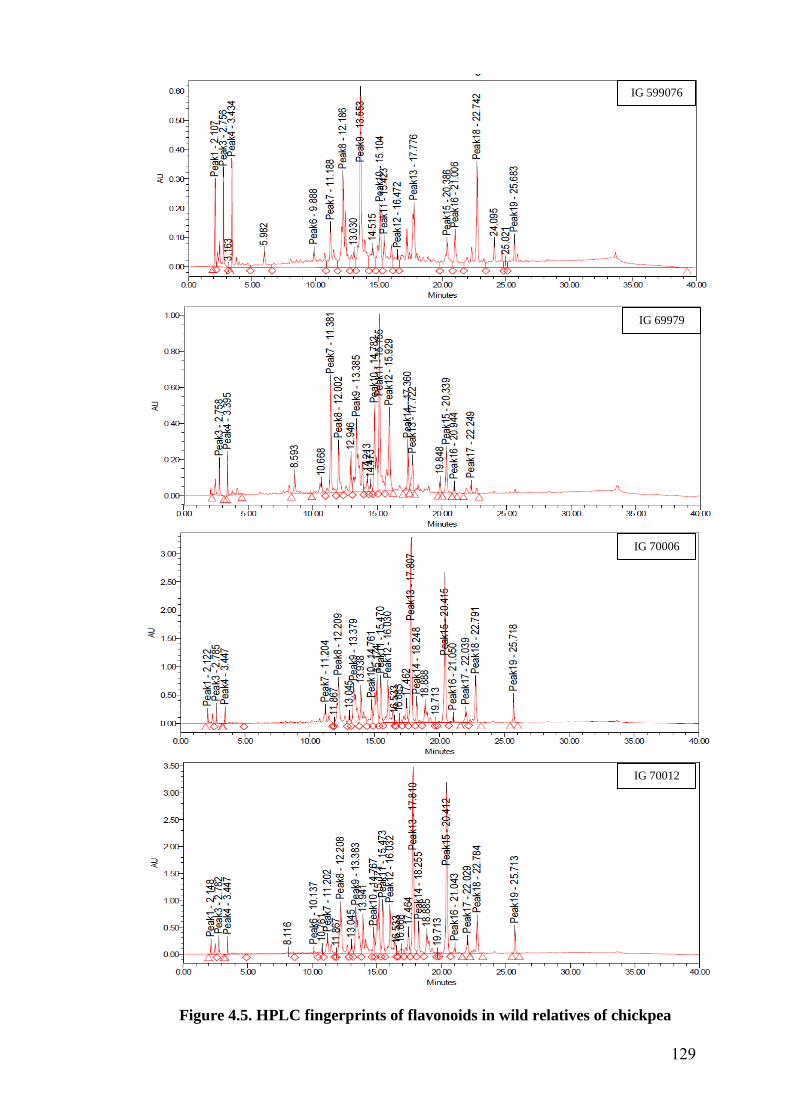
Figure 4.5. HPLC fingerprints of flavonoids in wild relatives of chickpea
IG 599076
IG 69979
IG 70006
IG 70012
129
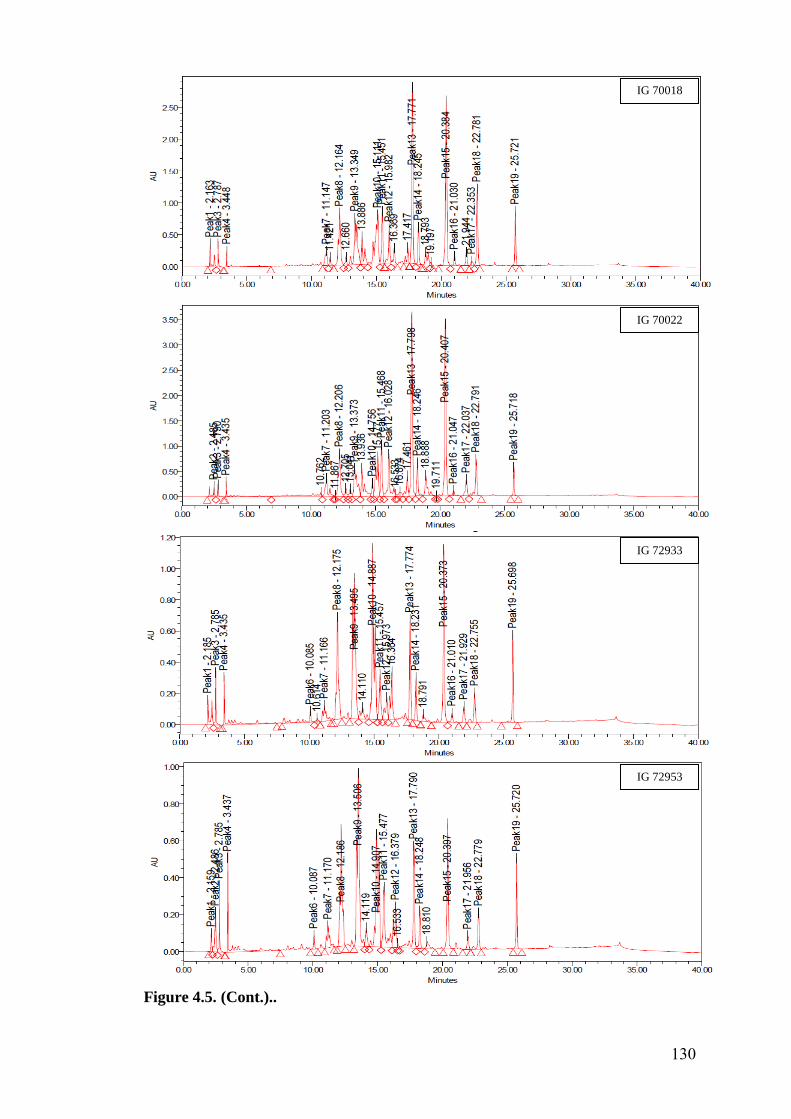
Figure 4.5. (Cont.)..
IG 70018
IG 70022
IG 72933
IG 72953
130
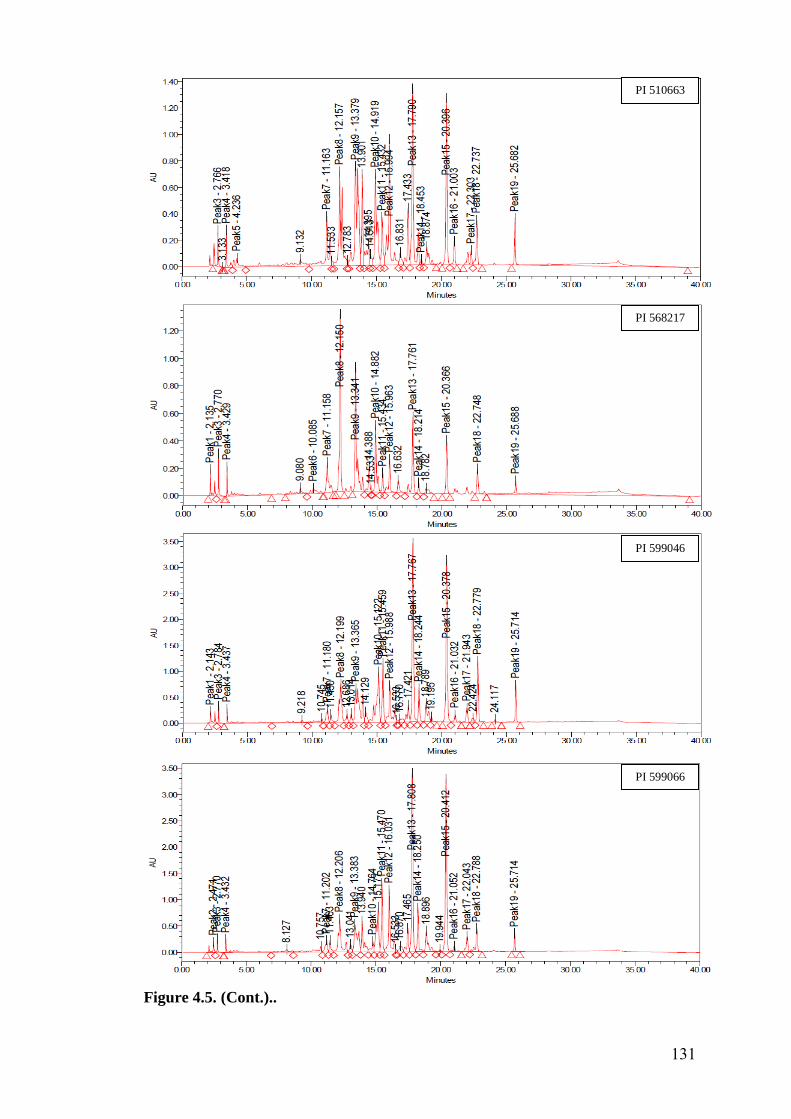
Figure 4.5. (Cont.)..
PI 599066
PI 599046
PI 568217
PI 510663
131
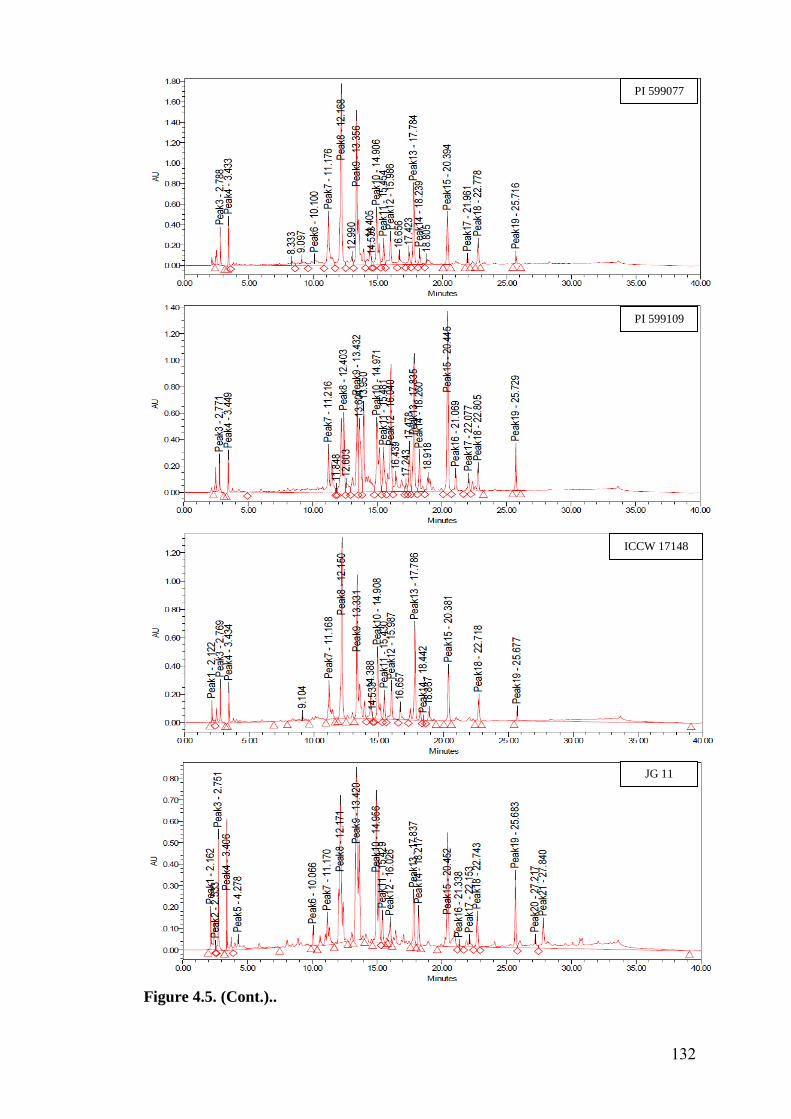
Figure 4.5. (Cont.)..
PI 599077
PI 599109
ICCW 17148
JG 11
132
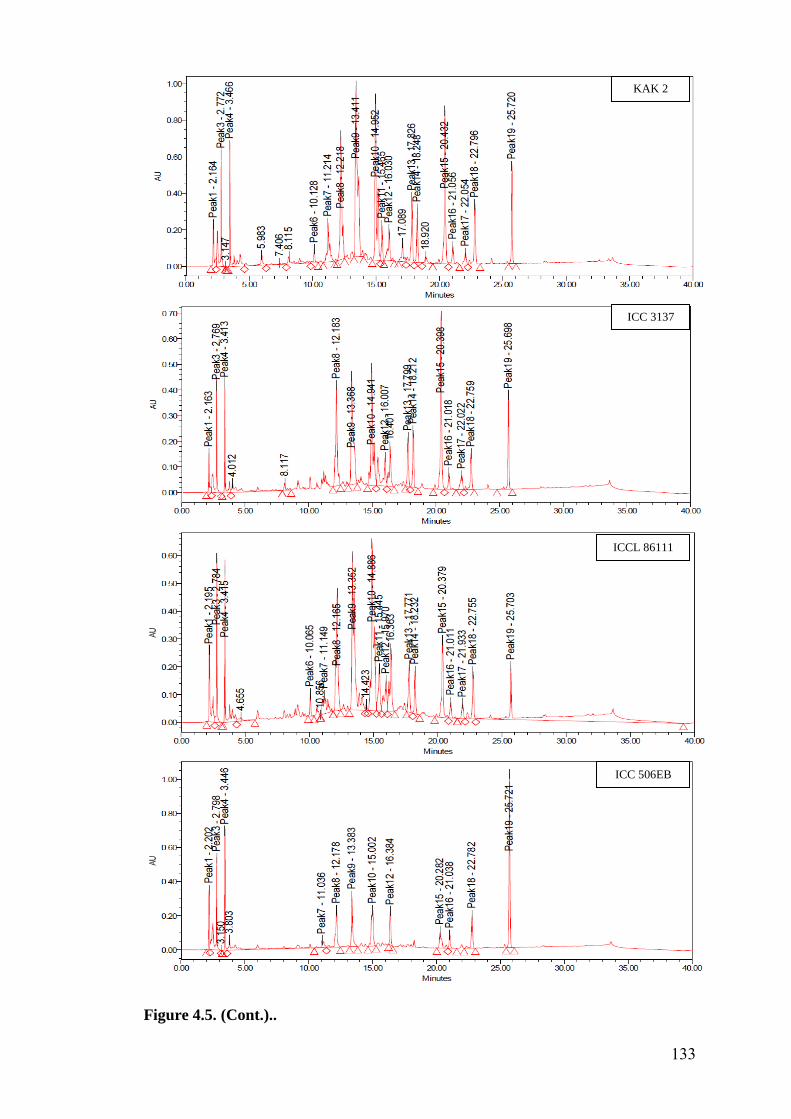
Figure 4.5. (Cont.)..
KAK 2
ICC 3137
ICCL 86111
ICC 506EB
133
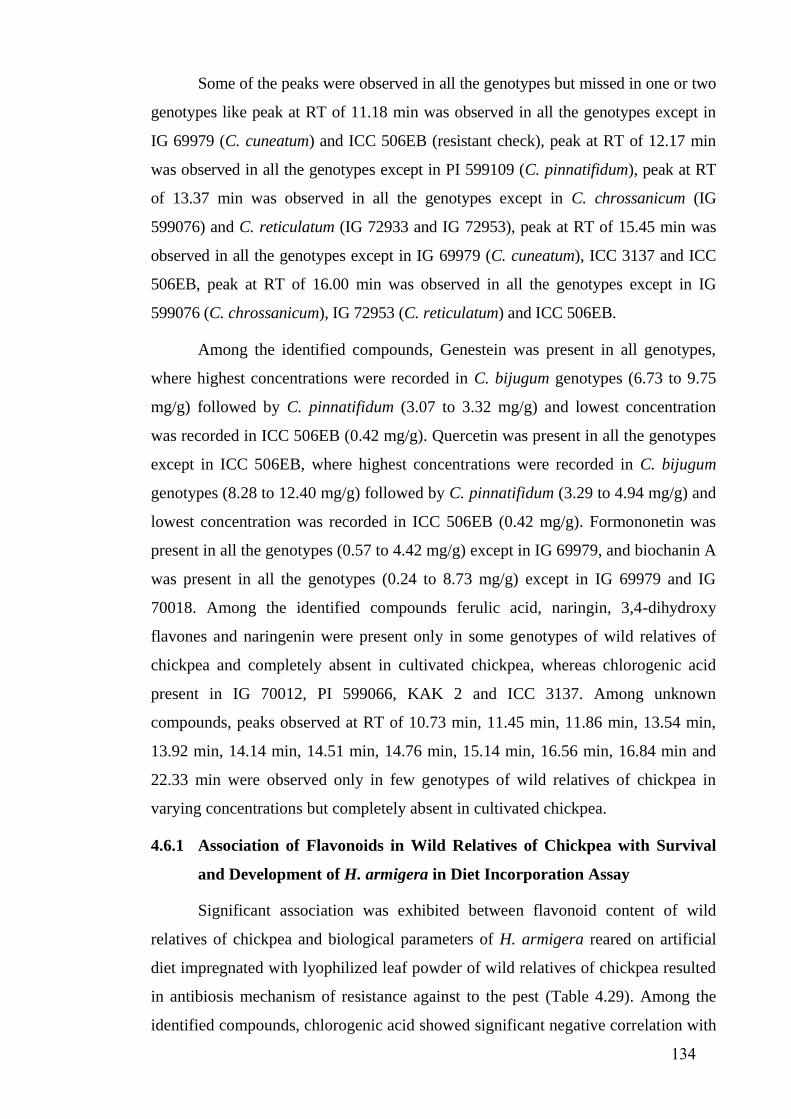
Some of the peaks were observed in all the genotypes but missed in one or two
genotypes like peak at RT of 11.18 min was observed in all the genotypes except in
IG 69979 (C. cuneatum) and ICC 506EB (resistant check), peak at RT of 12.17 min
was observed in all the genotypes except in PI 599109 (C. pinnatifidum), peak at RT
of 13.37 min was observed in all the genotypes except in C. chrossanicum (IG
599076) and C. reticulatum (IG 72933 and IG 72953), peak at RT of 15.45 min was
observed in all the genotypes except in IG 69979 (C. cuneatum), ICC 3137 and ICC
506EB, peak at RT of 16.00 min was observed in all the genotypes except in IG
599076 (C. chrossanicum), IG 72953 (C. reticulatum) and ICC 506EB.
Among the identified compounds, Genestein was present in all genotypes,
where highest concentrations were recorded in C. bijugum genotypes (6.73 to 9.75
mg/g) followed by C. pinnatifidum (3.07 to 3.32 mg/g) and lowest concentration
was recorded in ICC 506EB (0.42 mg/g). Quercetin was present in all the genotypes
except in ICC 506EB, where highest concentrations were recorded in C. bijugum
genotypes (8.28 to 12.40 mg/g) followed by C. pinnatifidum (3.29 to 4.94 mg/g) and
lowest concentration was recorded in ICC 506EB (0.42 mg/g). Formononetin was
present in all the genotypes (0.57 to 4.42 mg/g) except in IG 69979, and biochanin A
was present in all the genotypes (0.24 to 8.73 mg/g) except in IG 69979 and IG
70018. Among the identified compounds ferulic acid, naringin, 3,4-dihydroxy
flavones and naringenin were present only in some genotypes of wild relatives of
chickpea and completely absent in cultivated chickpea, whereas chlorogenic acid
present in IG 70012, PI 599066, KAK 2 and ICC 3137. Among unknown
compounds, peaks observed at RT of 10.73 min, 11.45 min, 11.86 min, 13.54 min,
13.92 min, 14.14 min, 14.51 min, 14.76 min, 15.14 min, 16.56 min, 16.84 min and
22.33 min were observed only in few genotypes of wild relatives of chickpea in
varying concentrations but completely absent in cultivated chickpea.
4.6.1 Association of Flavonoids in Wild Relatives of Chickpea with Survival
and Development of H. armigera in Diet Incorporation Assay
Significant association was exhibited between flavonoid content of wild
relatives of chickpea and biological parameters of H. armigera reared on artificial
diet impregnated with lyophilized leaf powder of wild relatives of chickpea resulted
in antibiosis mechanism of resistance against to the pest (Table 4.29). Among the
identified compounds, chlorogenic acid showed significant negative correlation with
134
biological parameters such as larval survival, larval weight, pupation, adult
emergence and fecundity, whereas larval period and pupal period had significant
positive correlation. Ferulic acid showed significant negative correlation with
pupation, pupal period, adult emergence and fecundity. Naringin amount was
significantly and negatively correlated with larval weight, pupal weight and
fecundity. 3,4-Dihydroxy flavones had significant negative correlation with larval
survival, pupation and adult emergence. Quercetin content was significantly and
negatively correlated with all parameters except with larval period and pupal period
where significant positive correlation was observed. Naringenin content was
negatively correlated with larval weight and fecundity, while positively correlated
with adult emergence. Genestein showed significant positive correlation with pupal
period and negative correlation with pupation, pupal weight, adult emergence and
fecundity. Formononetin showed significant positive correlation with larval and
pupal period and negatively correlated with all other parameters. Among all other
unidentified peaks, compounds present at RT of 2.77, 3.43, 11.45, 11.86, 13.54,
16.56 and 22.33 min showed positive association with survival and development of
H. armigera, where all other compounds showed positive correlation with larval and
pupal period, and negative correlation with larval survival, pupation, larval and
pupal weight, adult emergence and fecundity.
Several isoflavones such as judaicin, judaicin 7-O-glucoside, and judaicin 7-
O-(6”-O-malonylglucoside and pterocarpans like maakiain 3-O-glucoside and
maackiain 3-O-(6’-O-malonyl glucoside) (Stevenson and Veitch, 1996), and 2-
arylbenzofuran (Stevenson and Veitch, 1998), which have been isolated from the
roots of wild chickpea, had shown antifeedant and antibiosis activity towards H.
armigera larvae and responsible for the adverse effects of wild relatives of chickpea
on H. armigera (Simmonds and Stevenson, 2001). Flavonoids such as chlorogenic
acid, caffeic acid and protocatechuic acid were more toxic to H. armigera larvae and
the digestive enzyme activities of the larvae were significantly reduced in flavonoid
treated diets (War et al., 2013). Induction of flavonoids in groundnut genotypes in
response to feeding of H. armigera and Aphis craccivora revealed that compounds
like chlorogenic acid, syringic acid, quercetin, caffeic acid, vanillic acid and ferulic
acid were observed in insect infested plants, especially in the resistant genotypes
(War et al., 2016).
135
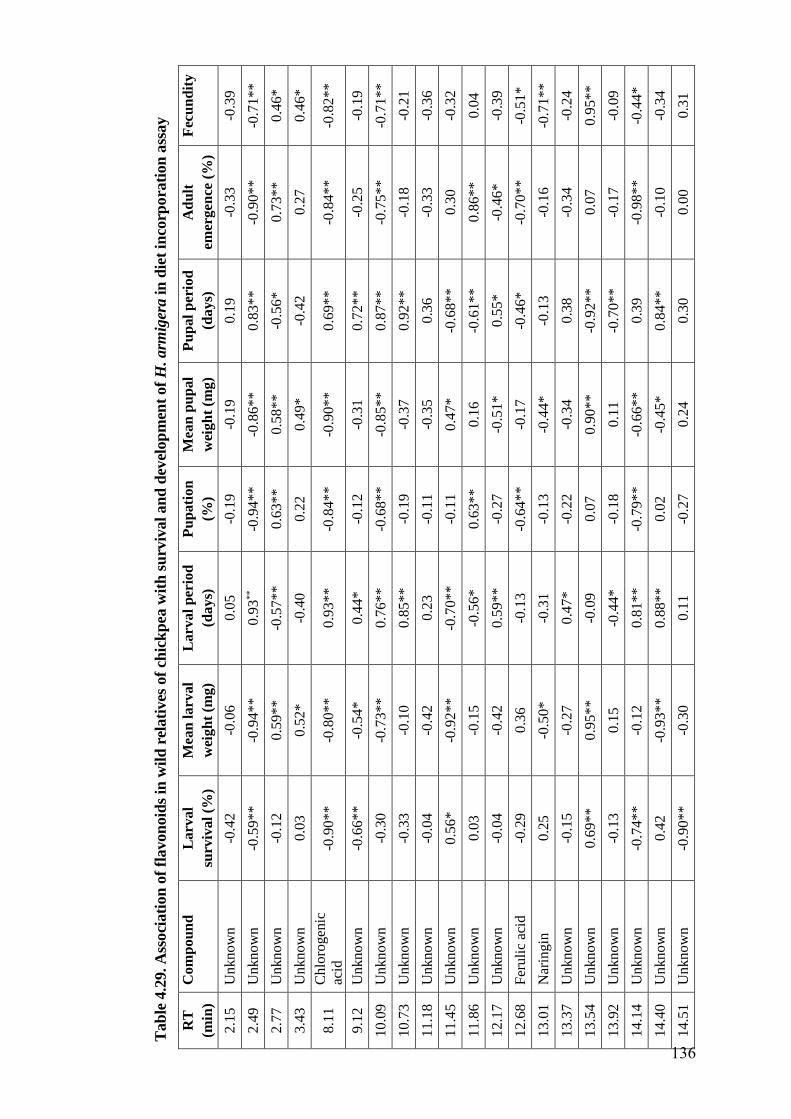
Tab
le 4
.29. A
ssoci
ati
on
of
flavon
oid
s in
wil
d r
elati
ves
of
chic
kp
ea w
ith
su
rviv
al
an
d d
evel
op
men
t of
H. arm
iger
a i
n d
iet
inco
rpora
tion
ass
ay
RT
(min
)
Com
po
un
d
La
rva
l
surv
iva
l (%
)
Mea
n l
arv
al
wei
gh
t (m
g)
Larv
al
per
iod
(days)
Pu
pati
on
(%)
Mea
n p
up
al
wei
gh
t (m
g)
Pu
pal
per
iod
(da
ys)
Ad
ult
emer
gen
ce (
%)
Fec
un
dit
y
2.1
5
Unknow
n
-0.4
2
-0.0
6
0.0
5
-0.1
9
-0.1
9
0.1
9
-0.3
3
-0.3
9
2.4
9
Unknow
n
-0.5
9*
*
-0.9
4**
0.9
3**
-0.9
4**
-0
.86*
*
0.8
3*
*
-0.9
0*
*
-0.7
1*
*
2.7
7
Unknow
n
-0.1
2
0.5
9**
-0.5
7**
0.6
3**
0.5
8*
*
-0.5
6*
0
.73*
*
0.4
6*
3.4
3
Unknow
n
0.0
3
0.5
2*
-0.4
0
0.2
2
0.4
9*
-0.4
2
0.2
7
0.4
6*
8.1
1
Chlo
rogen
ic
acid
-0
.90*
*
-0.8
0**
0.9
3**
-0.8
4**
-0
.90*
*
0.6
9*
*
-0.8
4*
*
-0.8
2*
*
9.1
2
Unknow
n
-0.6
6*
*
-0.5
4*
0.4
4*
-0.1
2
-0.3
1
0.7
2*
*
-0.2
5
-0.1
9
10.0
9
Unknow
n
-0.3
0
-0.7
3**
0.7
6**
-0.6
8**
-0
.85*
*
0.8
7*
*
-0.7
5*
*
-0.7
1*
*
10.7
3
Unknow
n
-0.3
3
-0.1
0
0.8
5**
-0.1
9
-0.3
7
0.9
2*
*
-0.1
8
-0.2
1
11.1
8
Unknow
n
-0.0
4
-0.4
2
0.2
3
-0.1
1
-0.3
5
0.3
6
-0.3
3
-0.3
6
11.4
5
Unknow
n
0.5
6*
-0.9
2**
-0
.70**
-0
.11
0
.47*
-0.6
8*
*
0.3
0
-0.3
2
11.8
6
Unknow
n
0.0
3
-0.1
5
-0.5
6*
0.6
3**
0.1
6
-0.6
1*
*
0.8
6*
*
0.0
4
12.1
7
Unknow
n
-0.0
4
-0.4
2
0.5
9**
-0.2
7
-0.5
1*
0
.55*
-0.4
6*
-0
.39
12.6
8
Fer
uli
c ac
id
-0.2
9
0.3
6
-0.1
3
-0.6
4**
-0
.17
-0
.46*
-0
.70*
*
-0.5
1*
13.0
1
Nar
ingin
0
.25
-0.5
0*
-0
.31
-0
.13
-0
.44*
-0
.13
-0
.16
-0
.71*
*
13.3
7
Unkno
wn
-0
.15
-0
.27
0.4
7*
-0.2
2
-0.3
4
0.3
8
-0.3
4
-0.2
4
13.5
4
Unknow
n
0.6
9*
*
0.9
5**
-0.0
9
0.0
7
0.9
0*
*
-0.9
2*
*
0.0
7
0.9
5*
*
13.9
2
Unknow
n
-0.1
3
0.1
5
-0.4
4*
-0
.18
0
.11
-0.7
0*
*
-0.1
7
-0.0
9
14.1
4
Unknow
n
-0.7
4*
*
-0.1
2
0.8
1**
-0.7
9**
-0
.66*
*
0.3
9
-0.9
8*
*
-0.4
4*
14
.40
Unknow
n
0.4
2
-0.9
3**
0.8
8**
0.0
2
-0.4
5*
0
.84*
*
-0.1
0
-0.3
4
14.5
1
Unknow
n
-0.9
0*
*
-0.3
0
0.1
1
-0.2
7
0.2
4
0.3
0
0.0
0
0.3
1
136
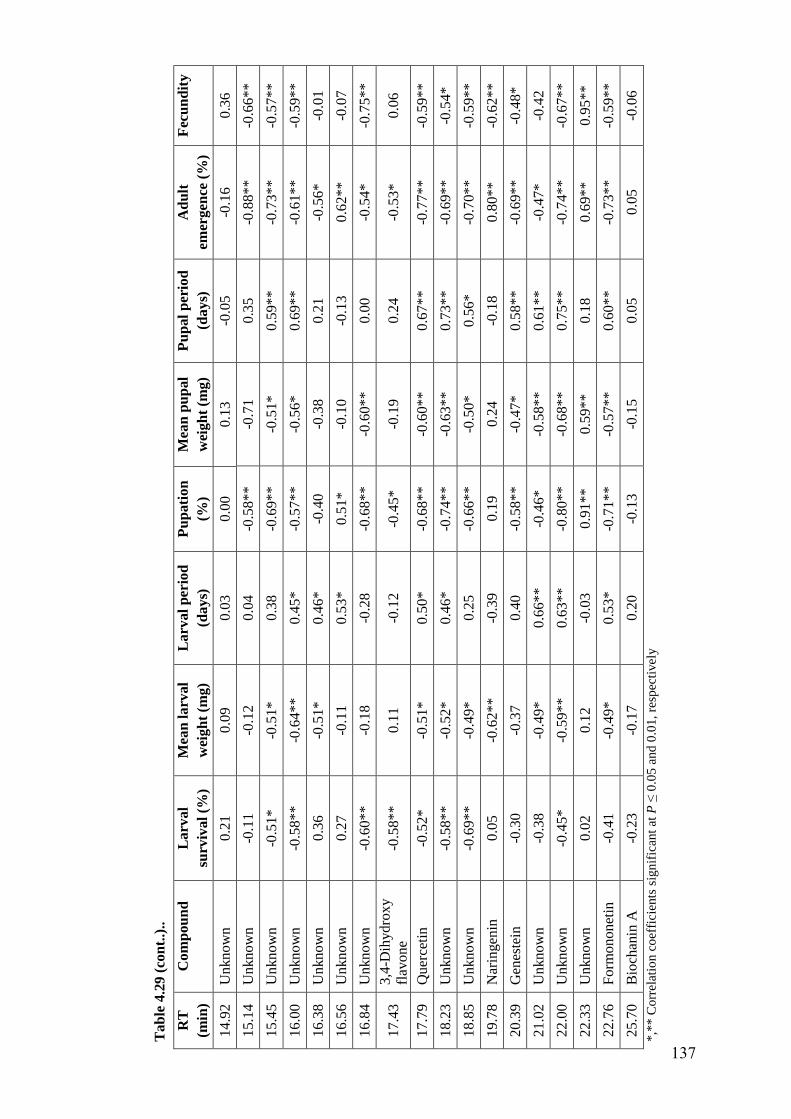
Tab
le 4
.29 (
con
t..)
..
RT
(min
)
Com
po
un
d
La
rva
l
surv
iva
l (%
)
Mea
n l
arv
al
wei
gh
t (m
g)
Larv
al
per
iod
(days)
Pu
pati
on
(%)
Mea
n p
up
al
wei
gh
t (m
g)
Pu
pal
per
iod
(da
ys)
Ad
ult
emer
gen
ce (
%)
Fec
un
dit
y
14.9
2
Unknow
n
0.2
1
0.0
9
0.0
3
0.0
0
0.1
3
-0.0
5
-0.1
6
0.3
6
15.1
4
Unknow
n
-0.1
1
-0.1
2
0.0
4
-0.5
8**
-0
.71
0
.35
-0.8
8*
*
-0.6
6*
*
15.4
5
Unknow
n
-0.5
1*
-0
.51
*
0.3
8
-0.6
9**
-0
.51*
0
.59*
*
-0.7
3*
*
-0.5
7*
*
16.0
0
Unknow
n
-0.5
8*
*
-0.6
4**
0.4
5*
-0.5
7**
-0
.56*
0
.69*
*
-0.6
1*
*
-0.5
9*
*
16.3
8
Unknow
n
0.3
6
-0.5
1*
0.4
6*
-0.4
0
-0.3
8
0.2
1
-0.5
6*
-0
.01
16.5
6
Unknow
n
0.2
7
-0.1
1
0.5
3*
0.5
1*
-0.1
0
-0.1
3
0.6
2*
*
-0.0
7
16.8
4
Unknow
n
-0.6
0*
*
-0.1
8
-0.2
8
-0.6
8**
-0
.60*
*
0.0
0
-0.5
4*
-0
.75*
*
17.4
3
3,4
-Dih
yd
rox
y
flav
one
-0.5
8*
*
0.1
1
-0.1
2
-0.4
5*
-0
.19
0
.24
-0.5
3*
0
.06
17.7
9
Quer
ceti
n
-0.5
2*
-0
.51
*
0.5
0*
-0.6
8**
-0
.60*
*
0.6
7*
*
-0.7
7*
*
-0.5
9*
*
18.2
3
Unknow
n
-0.5
8*
*
-0.5
2*
0.4
6*
-0.7
4**
-0
.63*
*
0.7
3*
*
-0.6
9*
*
-0.5
4*
18.8
5
Unkn
ow
n
-0.6
9*
*
-0.4
9*
0.2
5
-0.6
6**
-0
.50*
0
.56*
-0.7
0*
*
-0.5
9*
*
19.7
8
Nar
ingen
in
0.0
5
-0.6
2**
-0
.39
0.1
9
0.2
4
-0.1
8
0.8
0*
*
-0.6
2*
*
20.3
9
Gen
este
in
-0.3
0
-0.3
7
0.4
0
-0.5
8**
-0
.47*
0
.58*
*
-0.6
9*
*
-0.4
8*
21.0
2
Unknow
n
-0.3
8
-0.4
9*
0.6
6**
-0.4
6*
-0
.58*
*
0.6
1*
*
-0.4
7*
-0
.42
22.0
0
Unknow
n
-0.4
5*
-0
.59
**
0.6
3**
-0.8
0**
-0
.68*
*
0.7
5*
*
-0.7
4*
*
-0.6
7*
*
22.3
3
Unknow
n
0.0
2
0.1
2
-0.0
3
0.9
1**
0.5
9*
*
0.1
8
0.6
9*
*
0.9
5*
*
22.7
6
Form
on
on
etin
-0
.41
-0
.49
*
0.5
3*
-0.7
1**
-0
.57*
*
0.6
0*
*
-0.7
3*
*
-0.5
9*
*
25.7
0
Bio
chan
in A
-0
.23
-0
.17
0.2
0
-0.1
3
-0.1
5
0.0
5
0.0
5
-0.0
6
*,*
* C
orr
elat
ion c
oef
ficie
nts
sig
nif
ican
t at
P ≤
0.0
5 a
nd
0.0
1,
resp
ecti
vel
y
137
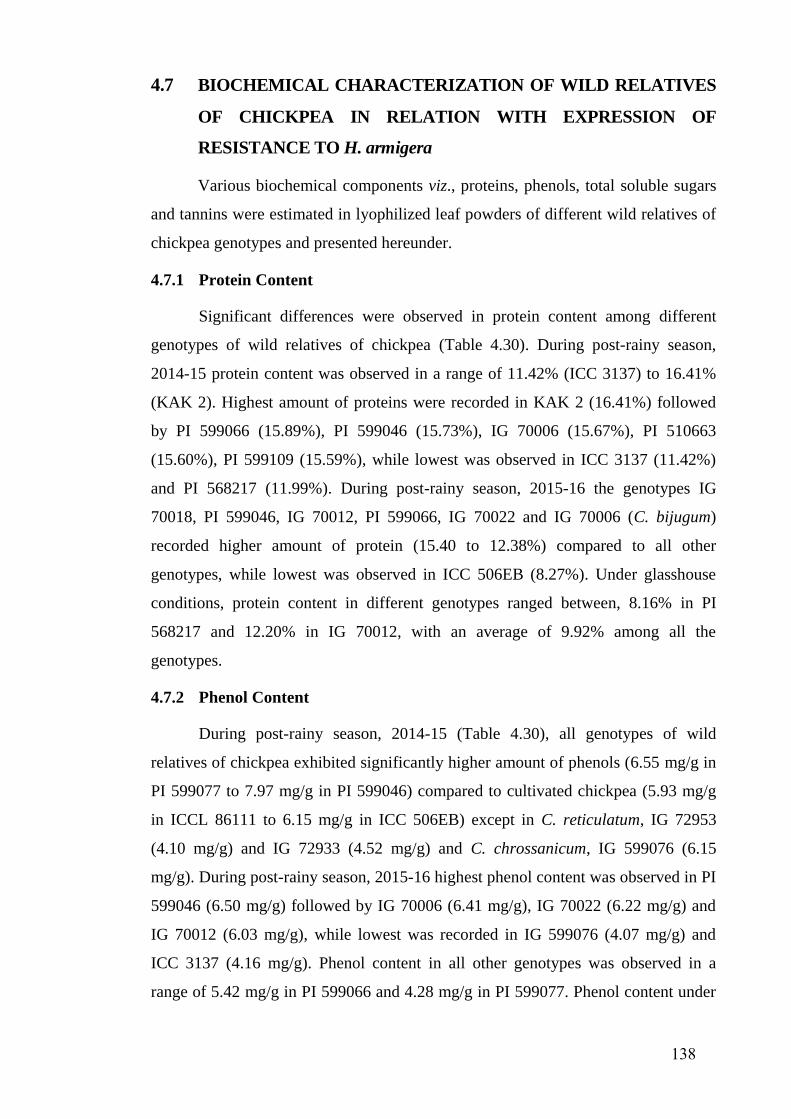
4.7 BIOCHEMICAL CHARACTERIZATION OF WILD RELATIVES
OF CHICKPEA IN RELATION WITH EXPRESSION OF
RESISTANCE TO H. armigera
Various biochemical components viz., proteins, phenols, total soluble sugars
and tannins were estimated in lyophilized leaf powders of different wild relatives of
chickpea genotypes and presented hereunder.
4.7.1 Protein Content
Significant differences were observed in protein content among different
genotypes of wild relatives of chickpea (Table 4.30). During post-rainy season,
2014-15 protein content was observed in a range of 11.42% (ICC 3137) to 16.41%
(KAK 2). Highest amount of proteins were recorded in KAK 2 (16.41%) followed
by PI 599066 (15.89%), PI 599046 (15.73%), IG 70006 (15.67%), PI 510663
(15.60%), PI 599109 (15.59%), while lowest was observed in ICC 3137 (11.42%)
and PI 568217 (11.99%). During post-rainy season, 2015-16 the genotypes IG
70018, PI 599046, IG 70012, PI 599066, IG 70022 and IG 70006 (C. bijugum)
recorded higher amount of protein (15.40 to 12.38%) compared to all other
genotypes, while lowest was observed in ICC 506EB (8.27%). Under glasshouse
conditions, protein content in different genotypes ranged between, 8.16% in PI
568217 and 12.20% in IG 70012, with an average of 9.92% among all the
genotypes.
4.7.2 Phenol Content
During post-rainy season, 2014-15 (Table 4.30), all genotypes of wild
relatives of chickpea exhibited significantly higher amount of phenols (6.55 mg/g in
PI 599077 to 7.97 mg/g in PI 599046) compared to cultivated chickpea (5.93 mg/g
in ICCL 86111 to 6.15 mg/g in ICC 506EB) except in C. reticulatum, IG 72953
(4.10 mg/g) and IG 72933 (4.52 mg/g) and C. chrossanicum, IG 599076 (6.15
mg/g). During post-rainy season, 2015-16 highest phenol content was observed in PI
599046 (6.50 mg/g) followed by IG 70006 (6.41 mg/g), IG 70022 (6.22 mg/g) and
IG 70012 (6.03 mg/g), while lowest was recorded in IG 599076 (4.07 mg/g) and
ICC 3137 (4.16 mg/g). Phenol content in all other genotypes was observed in a
range of 5.42 mg/g in PI 599066 and 4.28 mg/g in PI 599077. Phenol content under
138
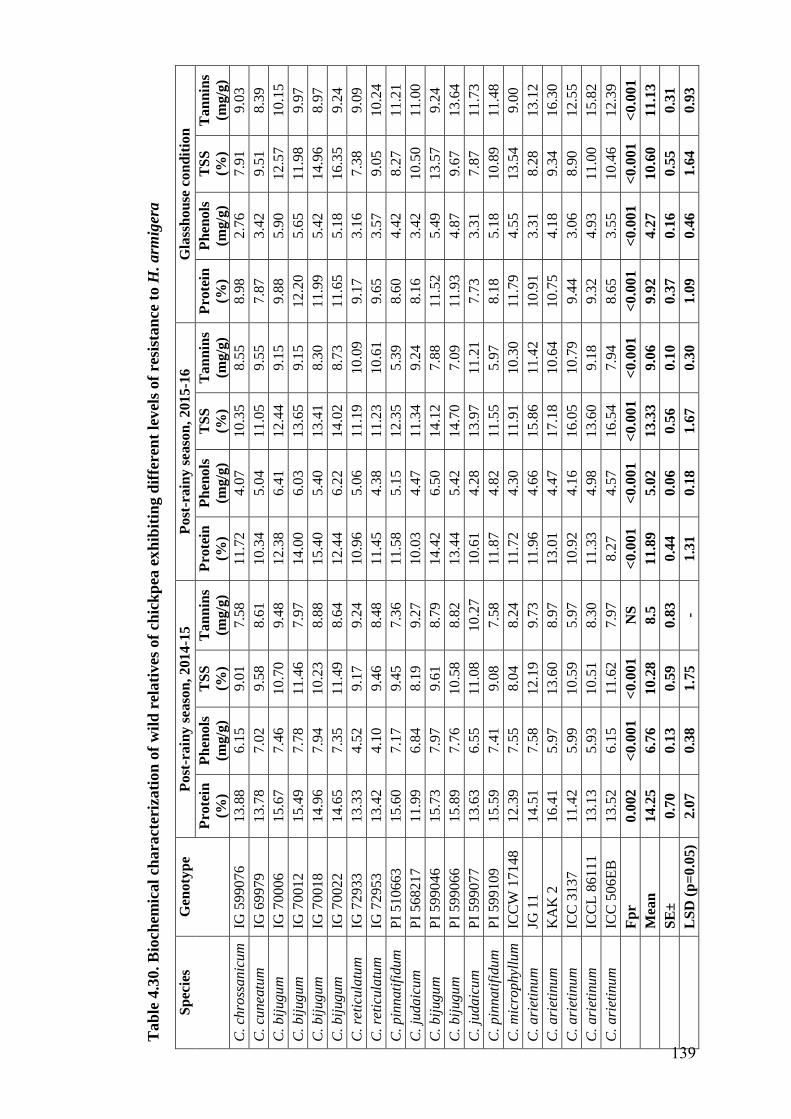
Tab
le 4
.30. B
ioch
emic
al
chara
cter
izati
on
of
wil
d r
elati
ves
of
chic
kp
ea e
xh
ibit
ing d
iffe
ren
t le
vel
s of
resi
stan
ce t
o H
. arm
iger
a
Sp
ecie
s G
eno
typ
e P
ost
-rain
y s
easo
n, 2014
-15
Post
-rain
y s
easo
n, 2
01
5-1
6
Gla
ssh
ou
se c
on
dit
ion
Pro
tein
(%)
Ph
enols
(mg/g
)
TS
S
(%)
Tan
nin
s
(mg/g
)
Pro
tein
(%)
Ph
enols
(mg/g
)
TS
S
(%)
Ta
nn
ins
(mg/g
)
Pro
tein
(%)
Ph
eno
ls
(mg/g
)
TS
S
(%)
Ta
nn
ins
(mg/g
)
C.
chro
ssanic
um
IG
59
90
76
1
3.8
8
6.1
5
9.0
1
7.5
8
11.7
2
4.0
7
10
.35
8.5
5
8.9
8
2.7
6
7.9
1
9.0
3
C.
cunea
tum
IG
69
97
9
13
.78
7.0
2
9.5
8
8.6
1
10.3
4
5.0
4
11
.05
9.5
5
7.8
7
3.4
2
9.5
1
8.3
9
C.
bij
ugum
IG
70
00
6
15
.67
7.4
6
10.7
0
9.4
8
12.3
8
6.4
1
12
.44
9.1
5
9.8
8
5.9
0
12
.57
10
.15
C.
bij
ugum
IG
70
01
2
15
.49
7.7
8
11.4
6
7.9
7
14.0
0
6.0
3
13
.65
9.1
5
12
.20
5.6
5
11
.98
9.9
7
C.
bij
ugum
IG
70
01
8
14
.96
7.9
4
10.2
3
8.8
8
15.4
0
5.4
0
13
.41
8.3
0
11
.99
5.4
2
14
.96
8.9
7
C.
bij
ugum
IG
70
02
2
14
.65
7.3
5
11.4
9
8.6
4
12.4
4
6.2
2
14
.02
8.7
3
11
.65
5.1
8
16
.35
9.2
4
C.
reti
cula
tum
IG
72
93
3
13
.33
4.5
2
9.1
7
9.2
4
10.9
6
5.0
6
11
.19
10
.09
9.1
7
3.1
6
7.3
8
9.0
9
C.
reti
cula
tum
IG
72
95
3
13
.42
4.1
0
9.4
6
8.4
8
11.4
5
4.3
8
11
.23
10
.61
9.6
5
3.5
7
9.0
5
10
.24
C.
pin
nati
fidum
P
I 5
10
66
3
15
.60
7.1
7
9.4
5
7.3
6
11.5
8
5.1
5
12
.35
5.3
9
8.6
0
4.4
2
8.2
7
11
.21
C.
judaic
um
P
I 5
68
21
7
11
.99
6.8
4
8.1
9
9.2
7
10.0
3
4.4
7
11
.34
9.2
4
8.1
6
3.4
2
10
.50
11
.00
C.
bij
ugum
P
I 5
99
04
6
15
.73
7.9
7
9.6
1
8.7
9
14.4
2
6.5
0
14
.12
7.8
8
11
.52
5.4
9
13
.57
9.2
4
C.
bij
ugum
P
I 5
99
06
6
15
.89
7.7
6
10.5
8
8.8
2
13.4
4
5.4
2
14
.70
7.0
9
11
.93
4.8
7
9.6
7
13
.64
C.
judaic
um
P
I 5
99
07
7
13
.63
6.5
5
11.0
8
10.2
7
10.6
1
4.2
8
13
.97
11
.21
7.7
3
3.3
1
7.8
7
11
.73
C.
pin
nati
fidum
P
I 5
99
10
9
15
.59
7.4
1
9.0
8
7.5
8
11.8
7
4.8
2
11
.55
5.9
7
8.1
8
5.1
8
10
.89
11
.48
C.
mic
rophyl
lum
IC
CW
17
14
8
12
.39
7.5
5
8.0
4
8.2
4
11.7
2
4.3
0
11
.91
10
.30
11
.79
4.5
5
13
.54
9.0
0
C.
ari
etin
um
JG
11
14
.51
7.5
8
12.1
9
9.7
3
11.9
6
4.6
6
15
.86
11
.42
10
.91
3.3
1
8.2
8
13
.12
C.
ari
etin
um
K
AK
2
16
.41
5.9
7
13.6
0
8.9
7
13.0
1
4.4
7
17
.18
10
.64
10
.75
4.1
8
9.3
4
16
.30
C.
ari
etin
um
IC
C 3
13
7
11
.42
5.9
9
10.5
9
5.9
7
10.9
2
4.1
6
16
.05
10
.79
9.4
4
3.0
6
8.9
0
12
.55
C.
ari
etin
um
IC
CL
86
11
1
13
.13
5.9
3
10.5
1
8.3
0
11.3
3
4.9
8
13
.60
9.1
8
9.3
2
4.9
3
11
.00
15
.82
C.
ari
etin
um
IC
C 5
06
EB
1
3.5
2
6.1
5
11.6
2
7.9
7
8.2
7
4.5
7
16
.54
7.9
4
8.6
5
3.5
5
10
.46
12
.39
F
pr
0.0
02
<0.0
01
<
0.0
01
N
S
<0.0
01
<
0.0
01
<
0.0
01
<
0.0
01
<
0.0
01
<
0.0
01
<
0.0
01
<
0.0
01
M
ean
1
4.2
5
6.7
6
10.2
8
8.5
11.8
9
5.0
2
13
.33
9.0
6
9.9
2
4.2
7
10
.60
11
.13
S
E±
0
.70
0.1
3
0.5
9
0.8
3
0.4
4
0.0
6
0.5
6
0.1
0
0.3
7
0.1
6
0.5
5
0.3
1
L
SD
(p
=0
.05
) 2
.07
0.3
8
1.7
5
- 1.3
1
0.1
8
1.6
7
0.3
0
1.0
9
0.4
6
1.6
4
0.9
3
139
glasshouse conditions varied significantly among genotypes, with a range of 3.06
mg/g in ICC 3137 to 5.90 mg/g in IG 70006.
4.7.3 Total Soluble Sugars (TSS)
Total soluble sugars (TSS) were ranged from 8.04% (ICCW 17148) to
13.60% (KAK 2) among genotypes during post-rainy season, 2014-15 (Table 4.30).
The genotypes ICCW 17148, PI 568217, IG 599076, PI 599109, IG 72933, PI
510663, IG 72953, IG 69979 and PI 599046 exhibited significantly low amount
(8.04 to 9.61%) of total soluble sugars compared to ICC 3137 (10.59%). During
post-rainy season, 2015-16 significant differences were exhibited between
genotypes with respect to total soluble sugars. The lowest amount of total soluble
sugars observed in IG 599076 (10.35%) and was at par with IG 69979 (11.05%), IG
72933 (11.19%), IG 72953 (11.23%), PI 568217 (11.34%), PI 599109 (11.55%) and
ICCW 17148 (11.91%), while highest was recorded in susceptible check, KAK 2
(17.18%). Under glasshouse condition, total soluble sugars were recorded in a range
of 7.87% (PI 599077) to 16.35% (IG 70022).
4.7.4 Tannin Content
During post-rainy season, 2014-15, no significant differences were observed
in tannin content among all genotypes (Table 4.30). During post-rainy season, 2015-
16 highest amount of tannins were observed in JG 11 (11.42 mg/g) followed by PI
599077 (11.21 mg/g), whereas lowest was recorded in PI 510663 (5.39 mg/g) and PI
599109 (5.97 mg/g). Significant differences were observed in tannin content in
different genotypes under glasshouse condition, with an average of 11.13 mg/g. The
genotype KAK 2 had more tannin content (16.30 mg/g) compared to all other
genotypes, whereas IG 69979 had the least (8.39 mg/g) tannin content.
4.7.5 Association of Biochemical Components in Wild Relatives of Chickpea with
Survival and Development of H. armigera in Diet Incorporation Assay
Among the biochemical components, proteins showed a significant negative
association with larval weight (r= -0.26), pupation (r= -0.31) and adult emergence
(r= -0.26) of H. armigera reared on artificial diet impregnated with lyophilized leaf
powders of wild relatives of chickpea genotypes (Table 4.31). The negative effects
of proteins on survival and development of H. armigera could be due to presence of
higher amounts of insecticidal proteins such as protease inhibitors or lectins in these
140
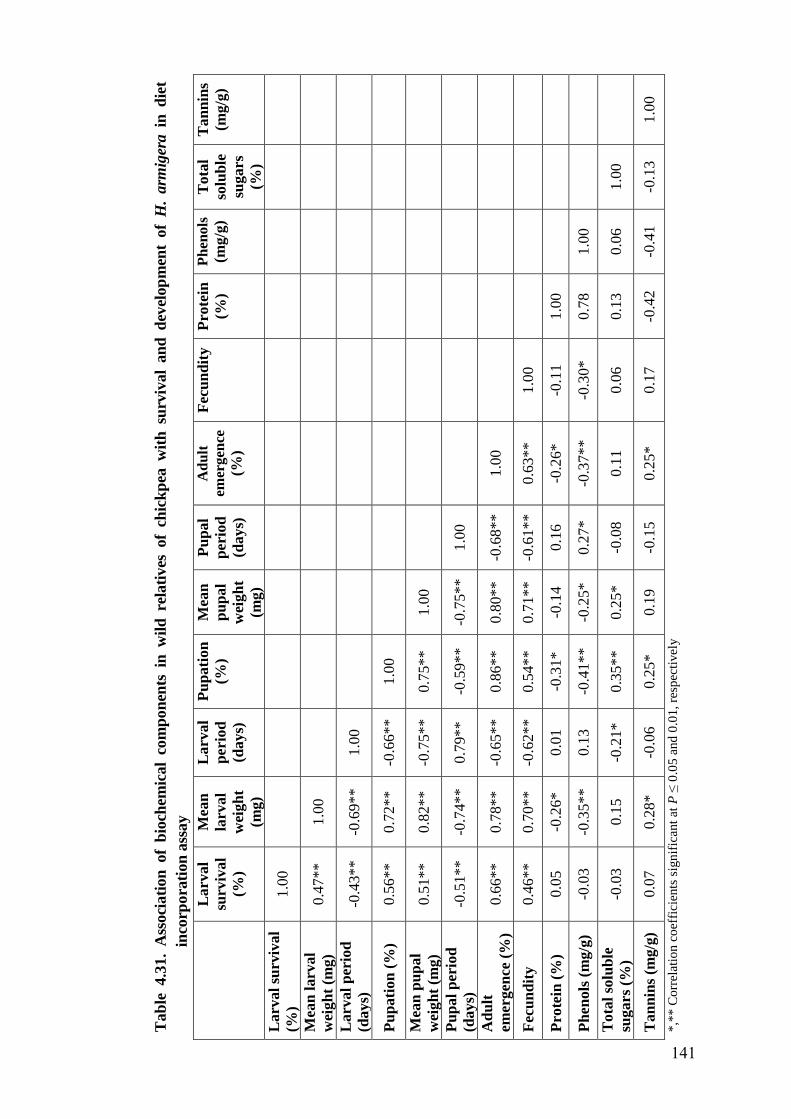
Tab
le 4.3
1.
Ass
oci
ati
on
of
bio
chem
ical
com
pon
ents
in
w
ild
re
lati
ves
of
chic
kp
ea w
ith
su
rviv
al
an
d d
evel
op
men
t of
H.
arm
iger
a in
d
iet
inco
rpora
tion
ass
ay
Larval
surviv
al
(%)
Mean
larval
wei
gh
t
(mg)
La
rv
al
perio
d
(da
ys)
Pu
pa
tio
n
(%)
Mea
n
pu
pa
l
wei
gh
t
(mg
)
Pu
pa
l
perio
d
(da
ys)
Ad
ult
emer
gen
ce
(%)
Fecu
nd
ity
Pro
tein
(%)
Ph
eno
ls
(mg
/g)
To
tal
solu
ble
sug
ars
(%)
Ta
nn
ins
(mg
/g)
La
rv
al
surviv
al
(%)
1.0
0
Mea
n l
arv
al
wei
gh
t (m
g)
0.4
7**
1.0
0
La
rv
al
per
iod
(da
ys)
-0
.43
**
-0.6
9**
1.0
0
Pu
pa
tio
n (
%)
0.5
6**
0.7
2**
-0.6
6*
*
1.0
0
Mea
n p
up
al
wei
gh
t (m
g)
0.5
1**
0.8
2**
-0.7
5*
*
0.7
5*
*
1.0
0
Pu
pa
l p
erio
d
(da
ys)
-0
.51
**
-0.7
4**
0.7
9*
*
-0.5
9*
*
-0.7
5*
*
1.0
0
Ad
ult
em
erg
en
ce (
%)
0.6
6**
0.7
8**
-0.6
5*
*
0.8
6*
*
0.8
0*
*
-0.6
8*
*
1.0
0
Fecu
nd
ity
0.4
6**
0.7
0**
-0.6
2*
*
0.5
4*
*
0.7
1*
*
-0.6
1*
*
0.6
3*
*
1.0
0
Pro
tein
(%
) 0.0
5
-0.2
6*
0
.01
-0.3
1*
-0
.14
0.1
6
-0.2
6*
-0
.11
1.0
0
Ph
en
ols
(m
g/g
) -0
.03
-0
.35
**
0.1
3
-0.4
1*
*
-0.2
5*
0.2
7*
-0
.37*
*
-0.3
0*
0
.78
1.0
0
To
tal
solu
ble
sug
ars
(%)
-0.0
3
0.1
5
-0.2
1*
0
.35*
*
0.2
5*
-0
.08
0.1
1
0.0
6
0.1
3
0.0
6
1.0
0
Ta
nn
ins
(mg
/g)
0.0
7
0.2
8*
-0
.06
0.2
5*
0.1
9
-0.1
5
0.2
5*
0.1
7
-0.4
2
-0.4
1
-0.1
3
1.0
0
*,*
* C
orr
elat
ion c
oef
ficie
nts
sig
nif
ican
t at
P ≤
0.0
5 a
nd
0.0
1,
resp
ecti
vel
y
141
wild relatives of chickpea. Phenols showed significant negative correlation with
larval weight, pupation, pupal weight, adult emergence and fecundity (r= -0.35, -
0.41, -0.25, -0.37 and -0.30, respectively), while positive and significant correlation
was showed with pupal period (r= 0.27). The total soluble sugars and tannins
showed positive effects on survival and development of H. armigera. Significant
positive correlation was observed between pupation (r= 0.35), pupal weight (r=
0.25) and total soluble sugars, while with larval period it had shown negative
correlation (r= -0.21). Tannins showed significant positive association with larval
weight, pupation and adult emergence (r= 0.28, 0.25 and 0.25, respectively). From
the above results it was evidenced that, proteins and phenols were associated with
resistance to H. armigera, whereas total soluble sugars and tannins were associated
with susceptibility.
The results are in agreement with Girija et al. (2008) who reported that total
phenols exhibited highly significant negative association with percent pod damage
by H. armigera in chickpea. Among the chickpea lines, BG256 exhibited higher
phenols and less pod damage than Annigeri and ICCV 2. Rupalighodeswar et al.
(2003) reported that chickpea cultivars resistant to H. armigera found to contain
significantly higher total phenolics, chlorogenic acid, silica and malic acid. Sahoo
and Patnaik (2003) observed that low sugar and high phenol content was recorded in
resistant cultivars of pigeonpea against pod borer attack. Expression of resistance to
H. armigera was associated with low amounts of sugars and high amounts of tannins
and polyphenols in wild relatives of pigeonpea (Sharma et al., 2009). On contrary,
Kanchan et al. (2005) reported that protein content had positive correlation with pod
damage; these differences could be explained with presence of higher amounts of
protease inhibitors in wild relatives compared to cultivated genotypes.
4.8 GC-MS PROFILES OF THE LEAF SURFACE CHEMICALS
IN WILD RELATIVES OF CHICKPEA WITH EXPRESSION
OF RESISTANCE TO H. armigera
4.8.1 Hexane Extracts of Leaf Surface Chemicals
The GC-MS profiles of 20 genotypes (both wild relatives and cultivated
chickpea) altogether showed 56 peaks with varying retention times (RT) from 3.87
to 29.20 min (Table 4.32. and Figure 4.6). Of the 56 peaks, 19 peaks were observed
142
in all the genotypes with varying peak areas at RT of 7.34, 7.96, 8.05, 11.20, 11.29,
11.55, 12.22, 13.26, 14.11, 14.46, 14.58, 14.82, 15.16, 15.88, 17.08, 17.25, 17.74,
19.63 and 29.20 min. The peak at RT of 10.30 min was present in all the genotypes
except in JG 11, the peak at RT of 11.67 min was present in all the genotypes except
in ICC 506EB, the peak at RT of 14.70 min was present in all the genotypes except
in JG 11 and ICC 506EB, the peak at RT of 20.06 min was present in all the
genotypes except in IG 69979 and PI 510663. The peak at RT of 7.19 min was
present only in different genotypes of wild relatives and completely absent in
cultivated chickpea genotypes, whereas peak at RT of 27.56 and 27.85 min were
present only in cultivated chickpea genotypes and absent in genotypes of wild
relatives. Peak at RT of 10.39 min, 11.01 min, 11.88 min13.98 min and 19.94 min
were observed in susceptible checks, ICC 3137 and KAK 2, whereas completely
absent in resistant checks, ICC 506EB and ICCL 86111. Peak at RT of 19.32 min,
22.38 min and 27.13 min were observed in resistant checks, ICC 506EB and ICCL
86111 and completely absent in susceptible checks, ICC 3137 and KAK 2. The
peaks at RT of 13.38 min, 16.95 min and 24.96 min were observed only in resistant
check, ICC 506EB and some wild relatives, whereas it was absent in all other
cultivated chickpea genotypes.
4.8.2 Methanol Extracts of Leaf Surface Chemicals
The GC-MS profiles of 20 genotypes (both wild relatives and cultivated
chickpea) altogether showed 107 peaks with varying retention times (RT) from 3.06
to 29.77 min (Table 4.33 and Figure 4.7). Of the 107 peaks only two peaks i.e. RT
of 10.29 min and 21.95 min were observed in all the genotypes with varying peak
areas. The peak at RT of 24.90 min was present in all the genotypes except in IG
69979, IG 72933 and JG11, the peak at RT of 25.07 min was present in all the
genotypes except in JG 11, the peaks at RT of 26.74 min and 28.67 min were
present in all the genotypes except in IG 72933 and ICC 3137. Among all the peaks,
33 peaks were present only in few genotypes of wild relatives and completely absent
in cultivated chickpea genotypes. The peaks at RT of 11.25 and 12.13 min were
present only in cultivated chickpea genotypes and absent in genotypes of wild
relatives. Peaks at RT of 3.06 min, 3.14 min and 10.83 min were observed in
susceptible checks, ICC 3137 and KAK 2 along with some genotypes of wild
relatives, whereas completely absent in resistant checks, ICC 506EB and ICCL
143
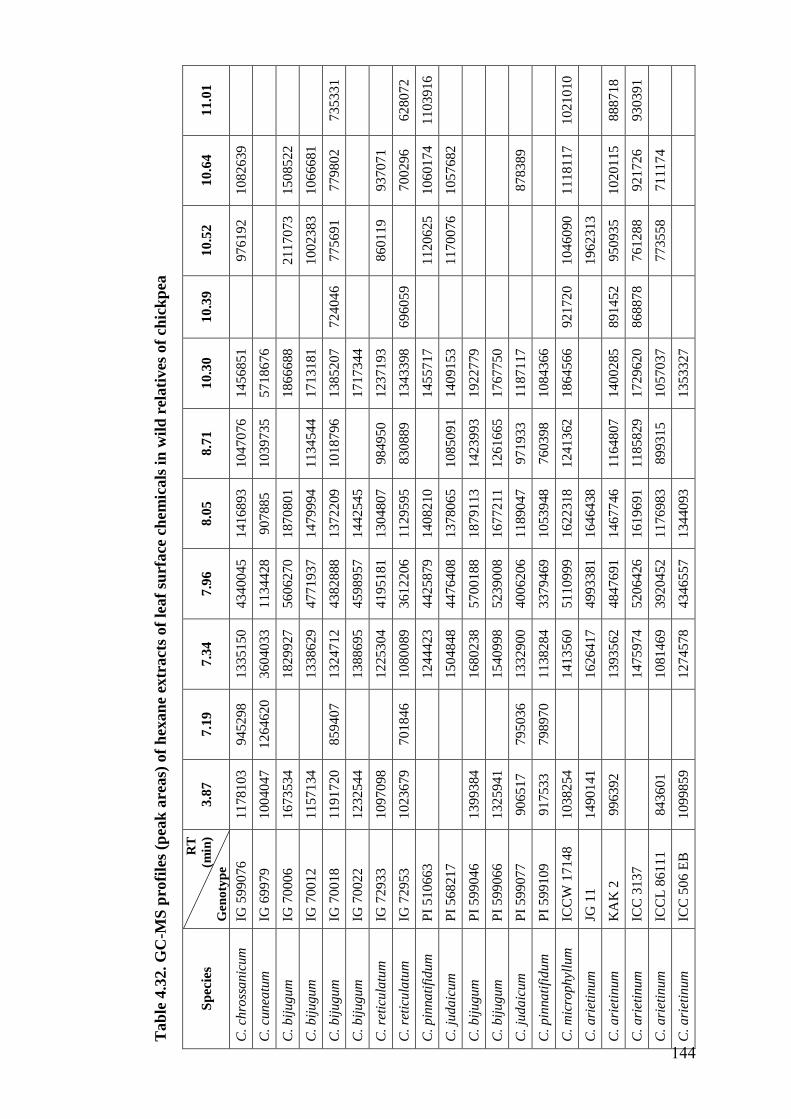
Tab
le 4
.32. G
C-M
S p
rofi
les
(pea
k a
reas)
of
hex
an
e ex
tracts
of
leaf
surf
ace
ch
em
icals
in
wil
d r
elati
ves
of
chic
kp
ea
Sp
ecie
s R
T
(min
)
Gen
oty
pe
3.8
7
7.1
9
7.3
4
7.9
6
8.0
5
8.7
1
10
.30
10
.39
10
.52
10
.64
11
.01
C.
chro
ssanic
um
IG
599076
1178103
945298
1335150
4340045
1416893
10470
76
14
56
851
9
76
19
2
10
82
639
C
. cu
nea
tum
IG
69979
1004047
1264620
3604033
1134428
907885
10397
35
57
18
676
C.
bij
ugum
IG
70006
1673534
1829927
5606270
1870801
1
86
66
88
2
11
70
73
15
08
522
C
. bij
ugum
IG
70012
1157134
1338629
4771937
1479994
11345
44
17
13
181
1
00
23
83
10
66
681
C
. bij
ugum
IG
70018
1191720
859407
1324712
4382888
1372209
10187
96
13
85
207
72
40
46
77
56
91
77
98
02
73
53
31
C.
bij
ugum
IG
70022
1232544
1388695
4598957
1442545
1
71
73
44
C.
reti
cula
tum
IG
72933
1097098
1225304
4195181
1304807
98495
0
12
37
193
8
60
11
9
93
70
71
C
. re
ticu
latu
m
IG 7
2953
1023679
701846
1080089
3612206
1129595
83088
9
13
43
398
69
60
59
7
00
29
6
62
80
72
C.
pin
nati
fidum
P
I 510663
1244423
4425879
1408210
1
45
57
17
1
12
06
25
10
60
174
11
03
916
C.
judaic
um
P
I 568217
1504848
4476408
1378065
10850
91
14
09
153
1
17
00
76
10
57
682
C
. bij
ugum
P
I 599046
1399384
1680238
5700188
1879113
14239
93
19
22
779
C.
bij
ugum
P
I 599066
1325941
1540998
5239008
1677211
12616
65
17
67
750
C.
judaic
um
P
I 599077
906517
795036
1332900
4006206
1189047
97193
3
11
87
117
87
83
89
C
. pin
nati
fidum
P
I 599109
917533
798970
1138284
3379469
1053948
76039
8
10
84
366
C. m
icro
phyl
lum
IC
CW
17148
1038254
1413560
5110999
1622318
12413
62
18
64
566
92
17
20
10
46
090
11
18
117
10
21
010
C.
ari
etin
um
JG
11
1490141
1626417
4993381
1646438
1
96
23
13
C.
ari
etin
um
K
AK
2
996392
1393562
4847691
1467746
11648
07
14
00
285
89
14
52
95
09
35
10
20
115
88
87
18
C.
ari
etin
um
IC
C 3
137
1475974
5206426
1619691
11858
29
17
29
620
86
88
78
76
12
88
92
17
26
93
03
91
C.
ari
etin
um
IC
CL
86111
843601
1081469
3920452
1176983
89931
5
10
57
037
7
73
55
8
71
11
74
C
. ari
etin
um
IC
C 5
06 E
B
1099859
1274578
4346557
1344093
1
35
33
27
144
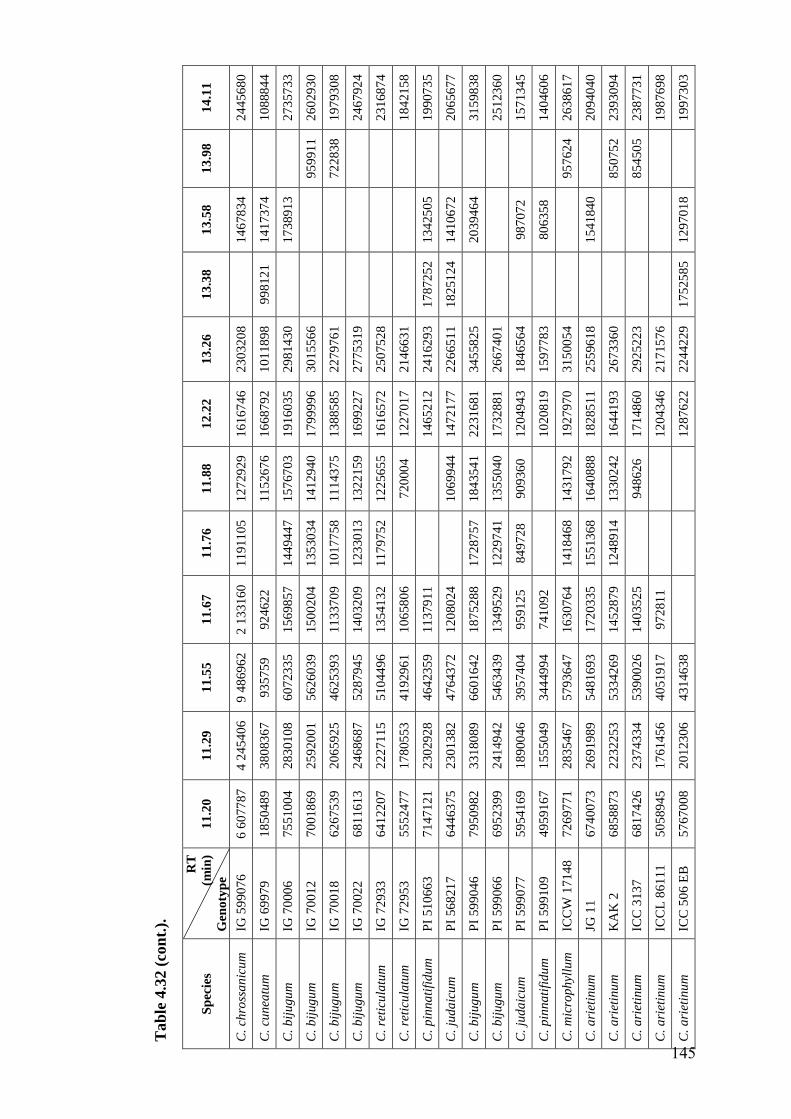
Tab
le 4
.32 (
con
t.).
Sp
ecie
s
RT
(min
)
Gen
oty
pe
11
.20
11
.29
11
.55
11
.67
11
.76
11
.88
12
.22
13
.26
1
3.3
8
13
.58
13
.98
14
.11
C.
chro
ssa
nic
um
IG
59
90
76
6
60
77
87
4
24
54
06
9
48
69
62
2
13
31
60
1
19
11
05
1
27
29
29
16
167
46
23
032
08
14
678
34
2
44
56
80
C.
cun
eatu
m
IG 6
997
9
18
504
89
38
083
67
93
575
9
92
462
2
1
15
26
76
16
687
92
10
118
98
9
98
12
1
14
173
74
1
08
88
44
C.
bij
ug
um
IG
70
00
6
75
510
04
28
301
08
60
723
35
15
698
57
14
494
47
1
57
67
03
19
160
35
29
814
30
17
389
13
2
73
57
33
C.
bij
ug
um
IG
70
01
2
70
018
69
25
920
01
56
260
39
15
002
04
13
530
34
1
41
29
40
17
999
96
30
155
66
9
59
91
1
26
029
30
C.
bij
ug
um
IG
70
01
8
62
675
39
20
659
25
46
253
93
11
337
09
10
177
58
1
11
43
75
13
885
85
22
797
61
7
22
83
8
19
793
08
C.
bij
ug
um
IG
70
02
2
68
116
13
24
686
87
52
879
45
14
032
09
12
330
13
1
32
21
59
16
992
27
27
753
19
24
679
24
C.
reti
cula
tum
IG
72
93
3
64
122
07
22
271
15
51
044
96
13
541
32
11
797
52
1
22
56
55
16
165
72
25
075
28
23
168
74
C.
reti
cula
tum
IG
72
95
3
55
524
77
17
805
53
41
929
61
10
658
06
7
20
00
4
12
270
17
21
466
31
18
421
58
C.
pin
na
tifi
du
m
PI
51
066
3
71
471
21
23
029
28
46
423
59
11
379
11
14
652
12
24
162
93
1
78
72
52
13
425
05
1
99
07
35
C.
jud
aic
um
P
I 56
821
7
64
463
75
23
013
82
47
643
72
12
080
24
1
06
99
44
14
721
77
22
665
11
1
82
51
24
14
106
72
2
06
56
77
C.
bij
ug
um
P
I 59
904
6
79
509
82
33
180
89
66
016
42
18
752
88
17
287
57
1
84
35
41
22
316
81
34
558
25
20
394
64
3
15
98
38
C.
bij
ug
um
P
I 59
906
6
69
523
99
24
149
42
54
634
39
13
495
29
12
297
41
1
35
50
40
17
328
81
26
674
01
25
123
60
C.
jud
aic
um
P
I 59
907
7
59
541
69
18
900
46
39
574
04
95
912
5
84
972
8
90
936
0
12
049
43
18
465
64
98
707
2
1
57
13
45
C.
pin
na
tifi
du
m
PI
59
910
9
49
591
67
15
550
49
34
449
94
74
109
2
10
208
19
15
977
83
80
635
8
1
40
46
06
C.
mic
rop
hyl
lum
IC
CW
17
14
8
72
697
71
28
354
67
57
936
47
16
307
64
14
184
68
1
43
17
92
19
279
70
31
500
54
9
57
62
4
26
386
17
C.
ari
etin
um
JG
11
67
400
73
26
919
89
54
816
93
17
203
35
15
513
68
1
64
08
88
18
285
11
25
596
18
15
418
40
2
09
40
40
C.
ari
etin
um
K
AK
2
68
588
73
22
322
53
53
342
69
14
528
79
12
489
14
1
33
02
42
16
441
93
26
733
60
8
50
75
2
23
930
94
C.
ari
etin
um
IC
C 3
13
7
68
174
26
23
743
34
53
900
26
14
035
25
9
48
62
6
17
148
60
29
252
23
8
54
50
5
23
877
31
C.
ari
etin
um
IC
CL
86
11
1
50
589
45
17
614
56
40
519
17
97
281
1
12
043
46
21
715
76
19
876
98
C.
ari
etin
um
IC
C 5
06
EB
5
76
70
08
20
123
06
43
146
38
1
28
76
22
22
442
29
1
75
25
85
12
970
18
1
99
73
03
145
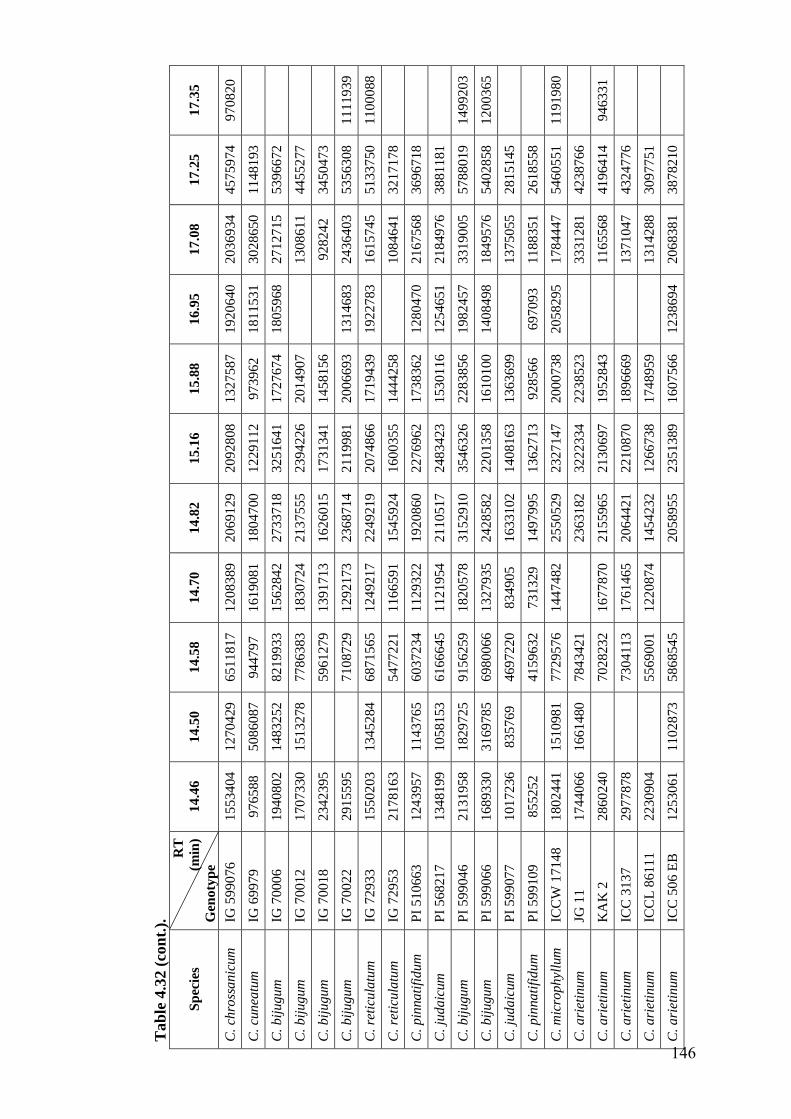
Tab
le 4
.32 (
con
t.).
Sp
ecie
s
RT
(min
)
Gen
oty
pe
14.4
6
14.5
0
14.5
8
14.7
0
14.8
2
15.1
6
15
.88
16
.95
17
.08
17
.25
17
.35
C.
chro
ssanic
um
IG
599076
1553404
1270429
6511817
1208389
2069129
2092808
13
27
587
19
20
640
20
36
934
45
75
974
97
08
20
C.
cunea
tum
IG
69979
976588
5086087
944797
1619081
1804700
1229112
97
39
62
18
11
531
30
28
650
11
48
193
C
. bij
ugum
IG
70006
1940802
1483252
8219933
1562842
2733718
3251641
17
27
674
18
05
968
27
12
715
53
96
672
C
. bij
ugum
IG
70012
1707330
1513278
7786383
1830724
2137555
2394226
20
14
907
1
30
86
11
44
55
277
C
. bij
ugum
IG
70018
2342395
5961279
1391713
1626015
1731341
14
58
156
9
28
24
2
34
50
473
C
. bij
ugum
IG
70022
2915595
7108729
1292173
2368714
2119981
20
06
693
13
14
683
24
36
403
53
56
308
11
11
939
C.
reti
cula
tum
IG
72933
1550203
1345284
6871565
1249217
2249219
2074866
17
19
439
19
22
783
16
15
745
51
33
750
11
00
088
C.
reti
cula
tum
IG
72953
2178163
5477221
1166591
1545924
1600355
14
44
258
1
08
46
41
32
17
178
C
. pin
nati
fidum
P
I 510663
1243957
1143765
6037234
1129322
1920860
2276962
17
38
362
12
80
470
21
67
568
36
96
718
C
. ju
daic
um
P
I 568217
1348199
1058153
6166645
11
21954
2110517
2483423
15
30
116
12
54
651
21
84
976
38
81
181
C
. bij
ugum
P
I 599046
2131958
1829725
9156259
1820578
3152910
3546326
22
83
856
19
82
457
33
19
005
57
88
019
14
99
203
C.
bij
ugum
P
I 599066
1689330
3169785
6980066
1327935
2428582
2201358
16
10
100
14
08
498
18
49
576
54
02
858
12
00
365
C.
judaic
um
P
I 599077
1017236
835769
4697220
834905
1633102
1408163
13
63
699
1
37
50
55
28
15
145
C
. pin
nati
fidum
P
I 599109
855252
4159632
731329
1497995
1362713
92
85
66
69
70
93
11
88
351
26
18
558
C
. m
icro
phyl
lum
IC
CW
17148
1802441
1510981
7729576
1447482
2550529
2327147
20
00
738
20
58
295
17
84
447
54
60
551
11
91
980
C.
ari
etin
um
JG
11
1744066
1661480
7843421
2363182
3222334
22
38
523
3
33
12
81
42
38
766
C
. ari
etin
um
K
AK
2
2860240
7028232
1677870
2155965
2130697
19
52
843
1
16
55
68
41
96
414
94
63
31
C.
ari
etin
um
IC
C 3
137
2977878
7304113
1761465
2064421
2210870
18
96
669
1
37
10
47
43
24
776
C
. ari
etin
um
IC
CL
86111
2230904
5569001
1220874
1454232
1266738
17
48
959
1
31
42
88
30
97
751
C
. ari
etin
um
IC
C 5
06 E
B
1253061
1102873
5868545
2058955
2351389
16
07
566
12
38
694
20
68
381
38
78
210
146
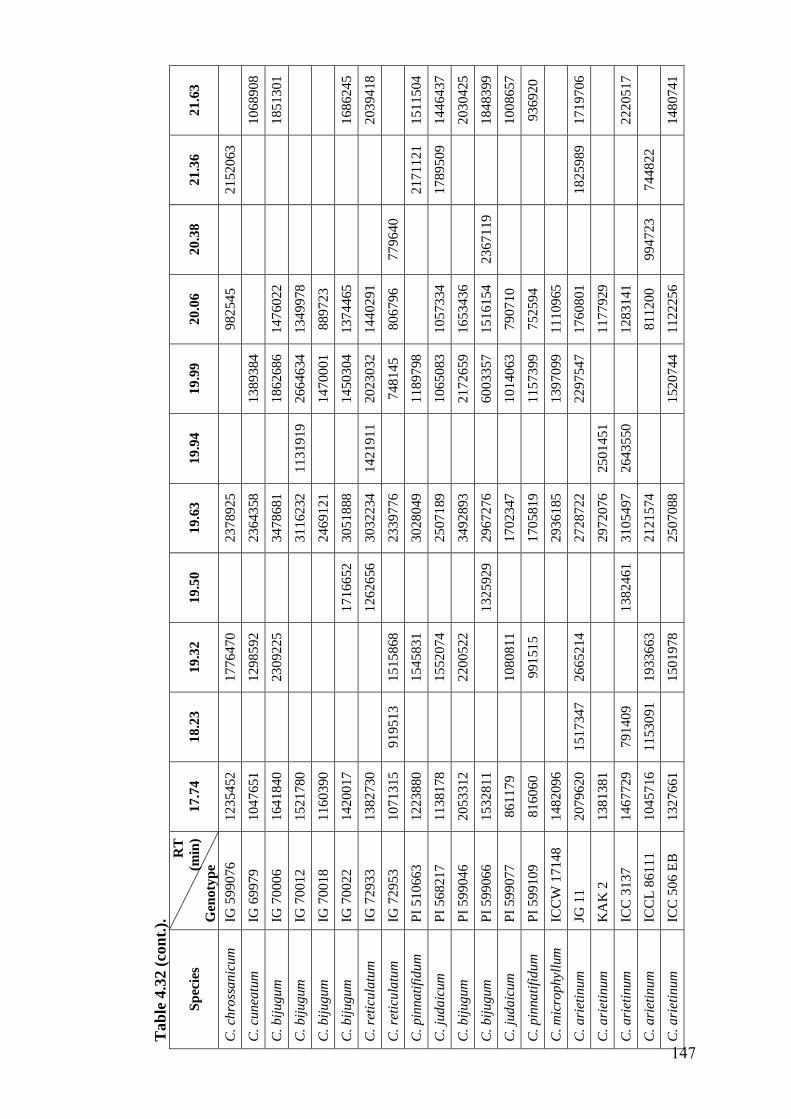
Tab
le 4
.32 (
con
t.).
Sp
ecie
s
RT
(min
)
Gen
oty
pe
17.7
4
18.2
3
19.3
2
19.5
0
19.6
3
19.9
4
19
.99
20
.06
20
.38
21
.36
21
.63
C.
chro
ssanic
um
IG
599076
1235452
1776470
2378925
98
25
45
2
15
20
63
C
. cu
nea
tum
IG
69979
1047651
1298592
2364358
1
38
93
84
1
06
89
08
C.
bij
ugum
IG
70006
1641840
2309225
3478681
1
86
26
86
14
76
022
18
51
301
C.
bij
ugum
IG
70012
1521780
3116232
1131919
26
64
634
13
49
978
C
. bij
ugum
IG
70018
1160390
2469121
1
47
00
01
88
97
23
C
. bij
ugum
IG
70022
1420017
1716652
3051888
1
45
03
04
13
74
465
16
86
245
C.
reti
cula
tum
IG
72933
1382730
1262656
3032234
1421911
20
23
032
14
40
291
20
39
418
C.
reti
cula
tum
IG
72953
1071315
919513
1515868
2339776
7
48
14
5
80
67
96
77
96
40
C.
pin
nati
fidum
P
I 510663
1223880
1545831
3028049
1
18
97
98
21
71
121
15
11
504
C.
judaic
um
P
I 568217
1138178
1552074
2507189
1
06
50
83
10
57
334
1
78
95
09
14
46
437
C.
bij
ugum
P
I 599046
2053312
2200522
3492893
2
17
26
59
16
53
436
20
30
425
C.
bij
ugum
P
I 599066
1532811
1325929
2967276
6
00
33
57
15
16
154
23
67
119
1
84
83
99
C.
judaic
um
P
I 599077
861179
1080811
1702347
1
01
40
63
79
07
10
10
08
657
C.
pin
nati
fidum
P
I 599109
816060
991515
1705819
1
15
73
99
75
25
94
93
69
20
C. m
icro
phyl
lum
IC
CW
17148
1482096
2936185
1
39
70
99
11
10
965
C
. ari
etin
um
JG
11
2079620
1517347
2665214
2728722
2
29
75
47
17
60
801
1
82
59
89
17
19
706
C.
ari
etin
um
K
AK
2
1381381
2972076
2501451
1
17
79
29
C
. ari
etin
um
IC
C 3
137
1467729
791409
1382461
3105497
2643550
1
28
31
41
22
20
517
C.
ari
etin
um
IC
CL
86111
1045716
1153091
1933663
2121574
81
12
00
99
47
23
74
48
22
C
. ari
etin
um
IC
C 5
06 E
B
1327661
1501978
2507088
1
52
07
44
11
22
256
14
80
741
147
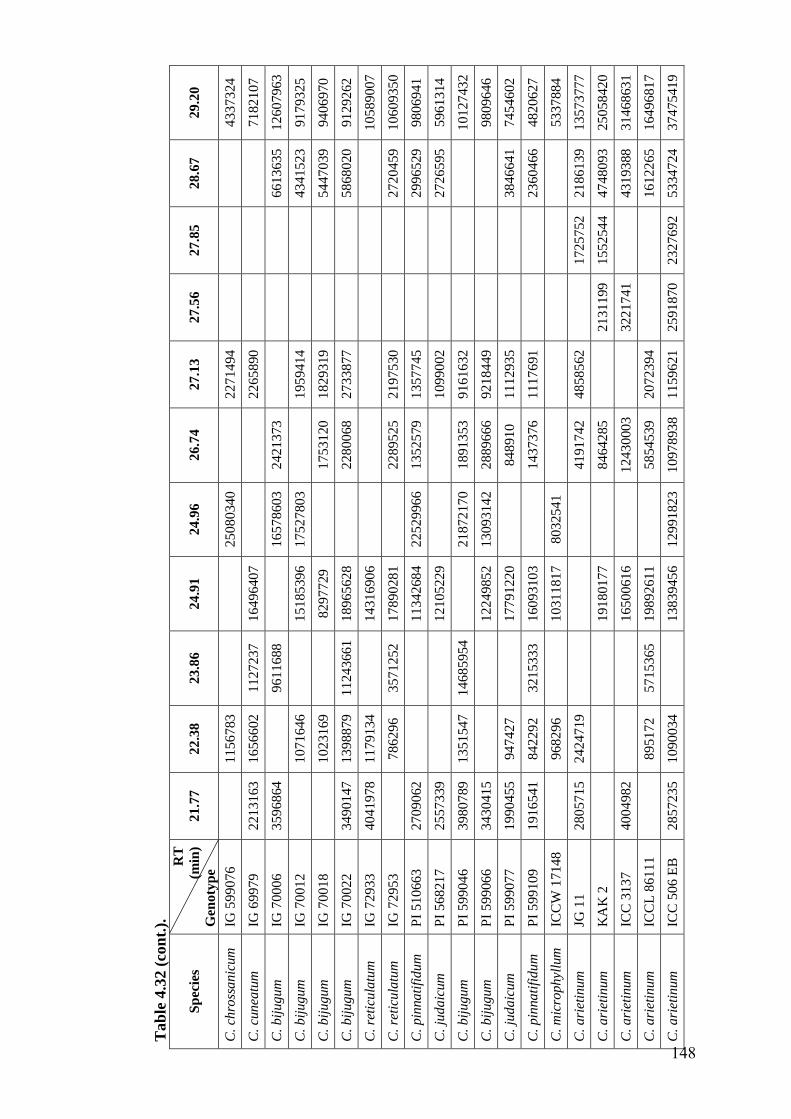
Tab
le 4
.32 (
con
t.).
Sp
ecie
s
RT
(min
)
Gen
oty
pe
21.7
7
22.3
8
23.8
6
24.9
1
24.9
6
26.7
4
27
.13
27
.56
27
.85
28
.67
29
.20
C.
chro
ssanic
um
IG
599076
1156783
25080340
2
27
14
94
4
33
73
24
C.
cunea
tum
IG
69979
2213163
1656602
1127237
16496407
22
65
890
7
18
21
07
C.
bij
ugum
IG
70006
3596864
9611688
16578603
2421373
6
61
36
35
12
60
796
3
C.
bij
ugum
IG
70012
1071646
15185396
17527803
1
95
94
14
43
41
523
91
79
325
C.
bij
ugum
IG
70018
1023169
8297729
1753120
18
29
319
54
47
039
94
06
970
C.
bij
ugum
IG
70022
3490147
1398879
11243661
18965628
2280068
27
33
877
58
68
020
91
29
262
C.
reti
cula
tum
IG
72933
4041978
1179134
14316906
10
58
900
7
C.
reti
cula
tum
IG
72953
786296
3571252
17890281
2289525
21
97
530
27
20
459
10
60
935
0
C.
pin
nati
fidum
P
I 510663
2709062
11342684
22529966
1352579
13
57
745
29
96
529
98
06
941
C.
judaic
um
P
I 568217
2557339
12105229
10
99
002
27
26
595
59
61
314
C.
bij
ugum
P
I 599046
3980789
1351547
14685954
21872170
1891353
91
61
632
1
01
27
43
2
C.
bij
ugum
P
I 599066
3430415
12249852
13093142
2889666
92
18
449
9
80
96
46
C.
judaic
um
P
I 599077
1990455
947427
17791220
84891
0
11
12
935
38
46
641
74
54
602
C.
pin
nati
fidum
P
I 599109
1916541
842292
3215333
16093103
1437376
11
17
691
23
60
466
48
20
627
C. m
icro
phyl
lum
IC
CW
17148
968296
10311817
8032541
5
33
78
84
C.
ari
etin
um
JG
11
2805715
2424719
4191742
48
58
562
1
72
57
52
21
86
139
13
57
377
7
C.
ari
etin
um
K
AK
2
19180177
8464285
2
13
11
99
15
52
544
47
48
093
25
05
842
0
C.
ari
etin
um
IC
C 3
137
4004982
16500616
1243000
3
3
22
17
41
4
31
93
88
31
46
863
1
C.
ari
etin
um
IC
CL
86111
895172
5715365
19892611
5854539
20
72
394
16
12
265
16
49
681
7
C.
ari
etin
um
IC
C 5
06 E
B
2857235
1090034
13839456
12991823
1097893
8
11
59
621
25
91
870
23
27
692
53
34
724
37
47
541
9
148
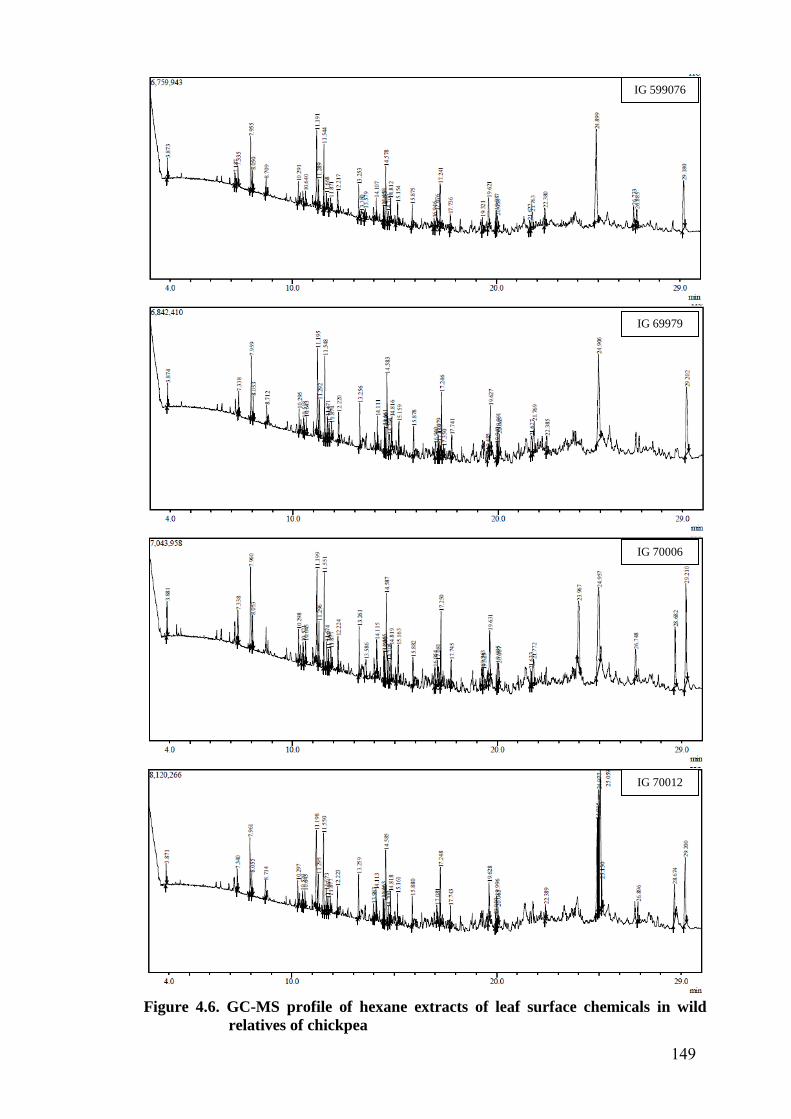
Figure 4.6. GC-MS profile of hexane extracts of leaf surface chemicals in wild
relatives of chickpea
IG 599076
IG 69979
IG 70006
IG 70012
149
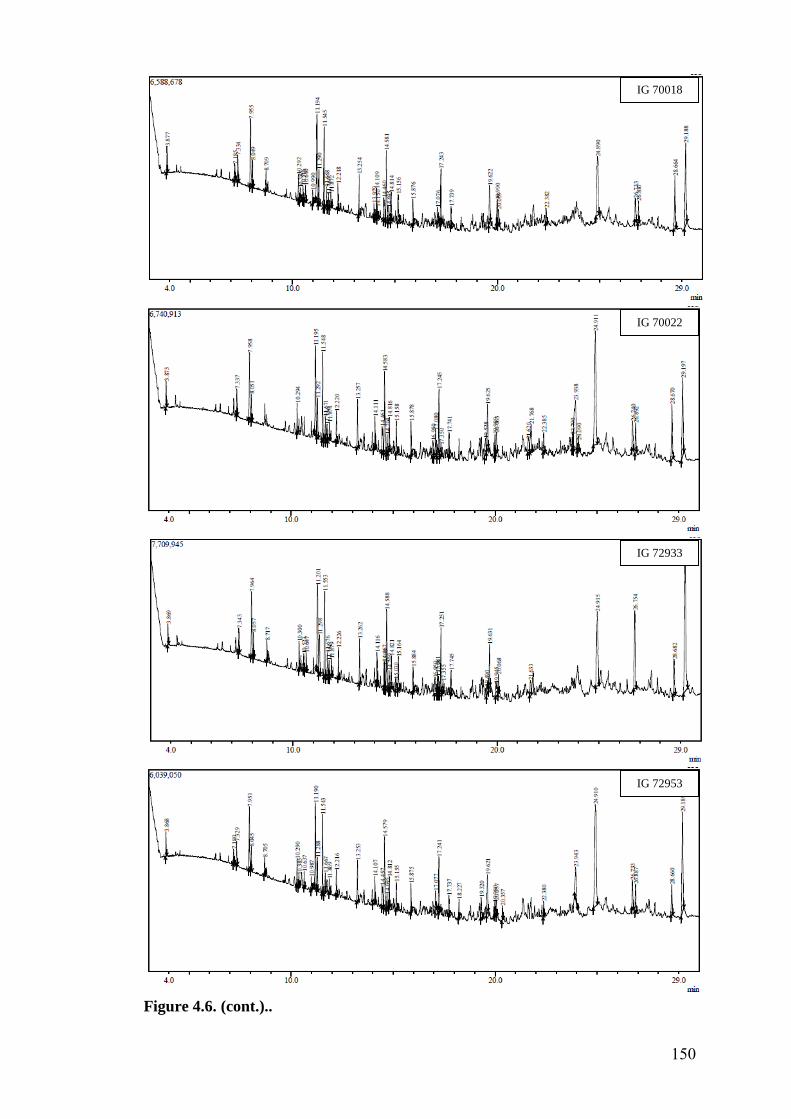
Figure 4.6. (cont.)..
IG 70018
IG 70022
IG 72933
IG 72953
150
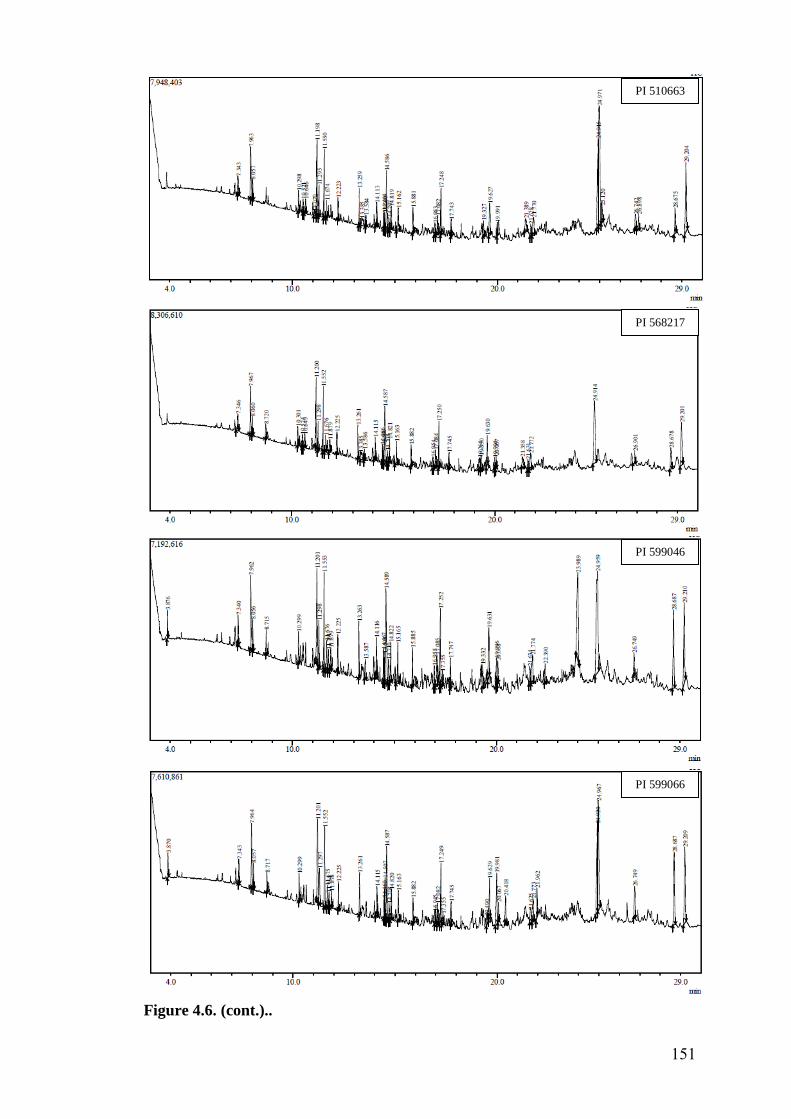
Figure 4.6. (cont.)..
PI 510663
PI 568217
PI 599046
PI 599066
151
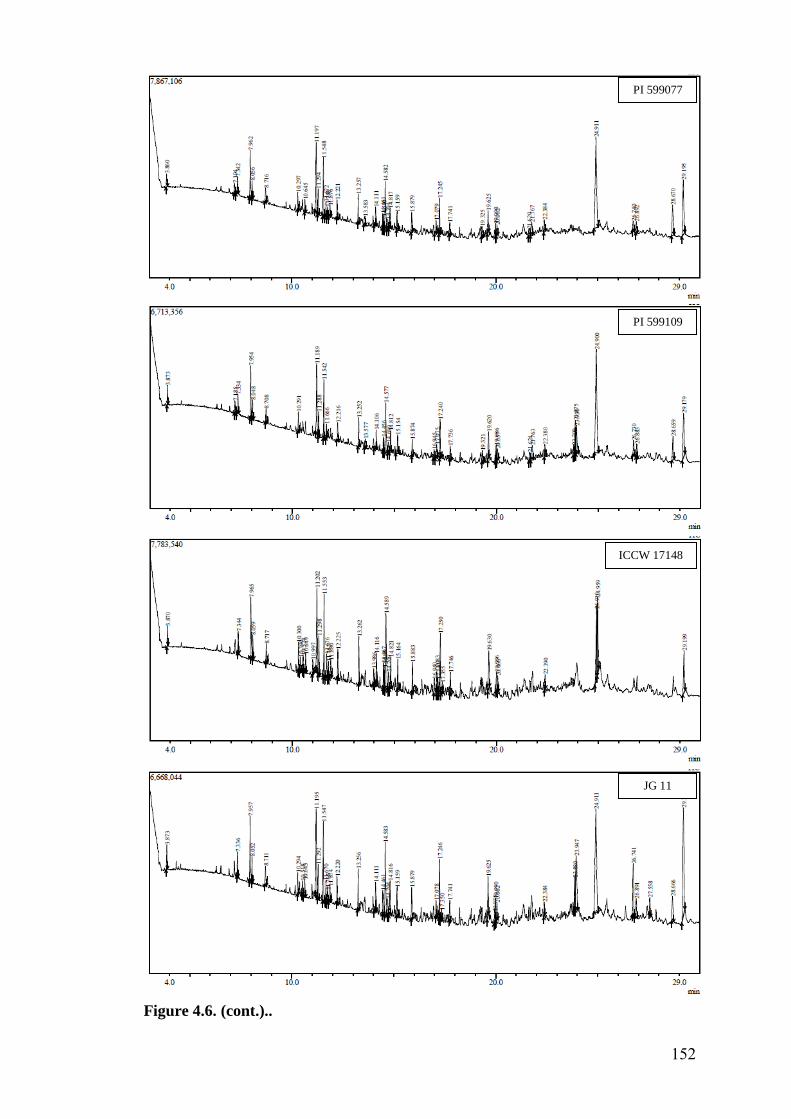
Figure 4.6. (cont.)..
PI 599077
PI 599109
ICCW 17148
JG 11
152
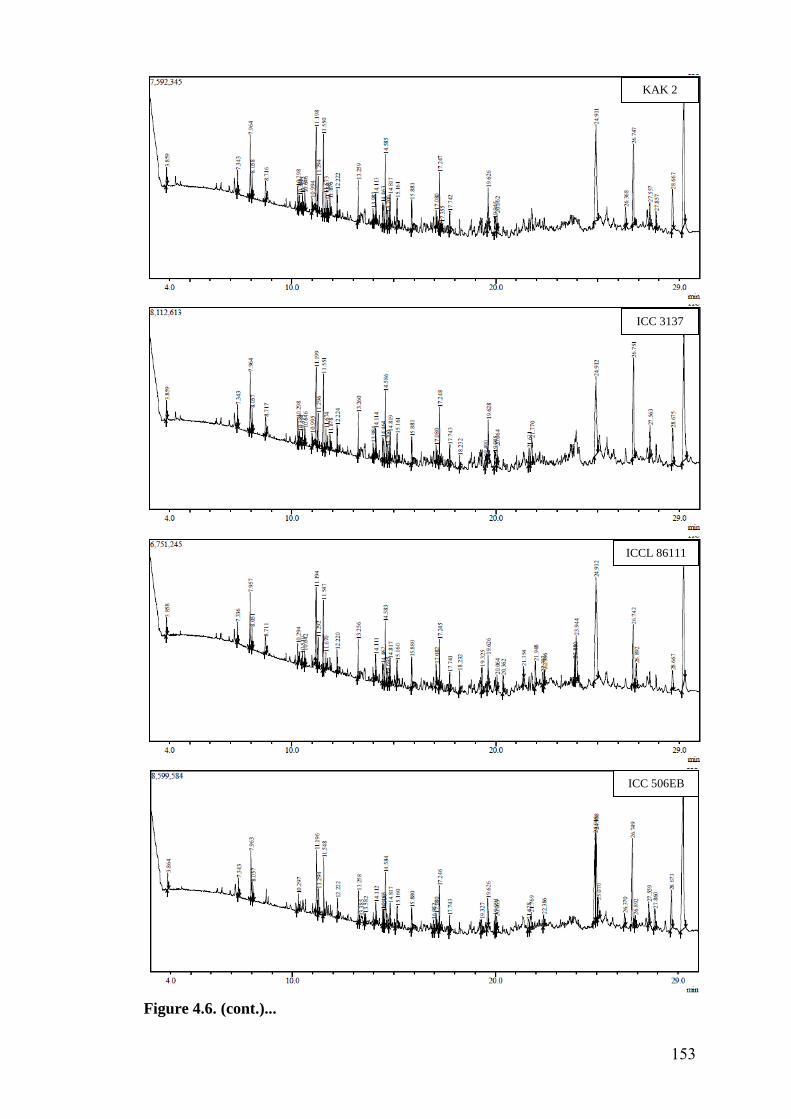
Figure 4.6. (cont.)...
KAK 2
ICC 3137
ICCL 86111
ICC 506EB
153
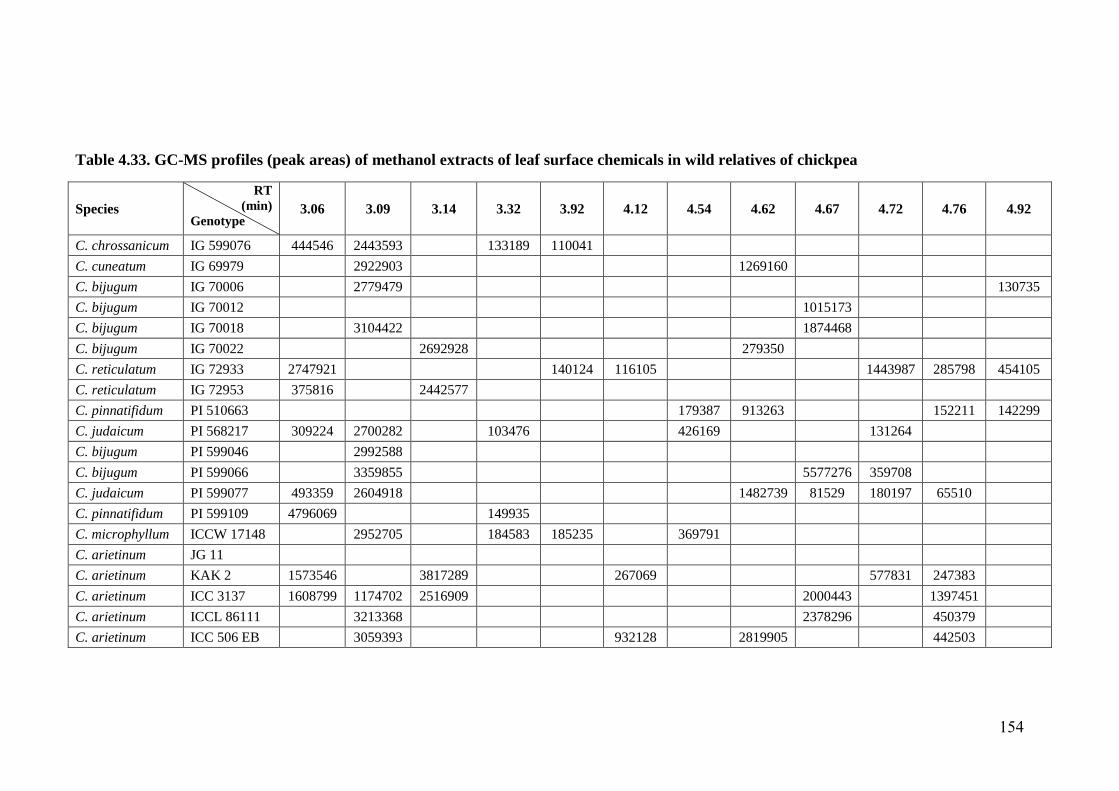
Table 4.33. GC-MS profiles (peak areas) of methanol extracts of leaf surface chemicals in wild relatives of chickpea
Species
RT
(min)
Genotype 3.06 3.09 3.14 3.32 3.92 4.12 4.54 4.62 4.67 4.72 4.76 4.92
C. chrossanicum IG 599076 444546 2443593
133189 110041
C. cuneatum IG 69979
2922903
1269160
C. bijugum IG 70006
2779479
130735
C. bijugum IG 70012
1015173
C. bijugum IG 70018
3104422
1874468
C. bijugum IG 70022
2692928
279350
C. reticulatum IG 72933 2747921
140124 116105
1443987 285798 454105
C. reticulatum IG 72953 375816
2442577
C. pinnatifidum PI 510663
179387 913263
152211 142299
C. judaicum PI 568217 309224 2700282
103476
426169
131264
C. bijugum PI 599046
2992588
C. bijugum PI 599066
3359855
5577276 359708
C. judaicum PI 599077 493359 2604918
1482739 81529 180197 65510
C. pinnatifidum PI 599109 4796069
149935
C. microphyllum ICCW 17148
2952705
184583 185235
369791
C. arietinum JG 11
C. arietinum KAK 2 1573546
3817289
267069
577831 247383
C. arietinum ICC 3137 1608799 1174702 2516909
2000443
1397451
C. arietinum ICCL 86111
3213368
2378296
450379
C. arietinum ICC 506 EB
3059393
932128
2819905
442503
154
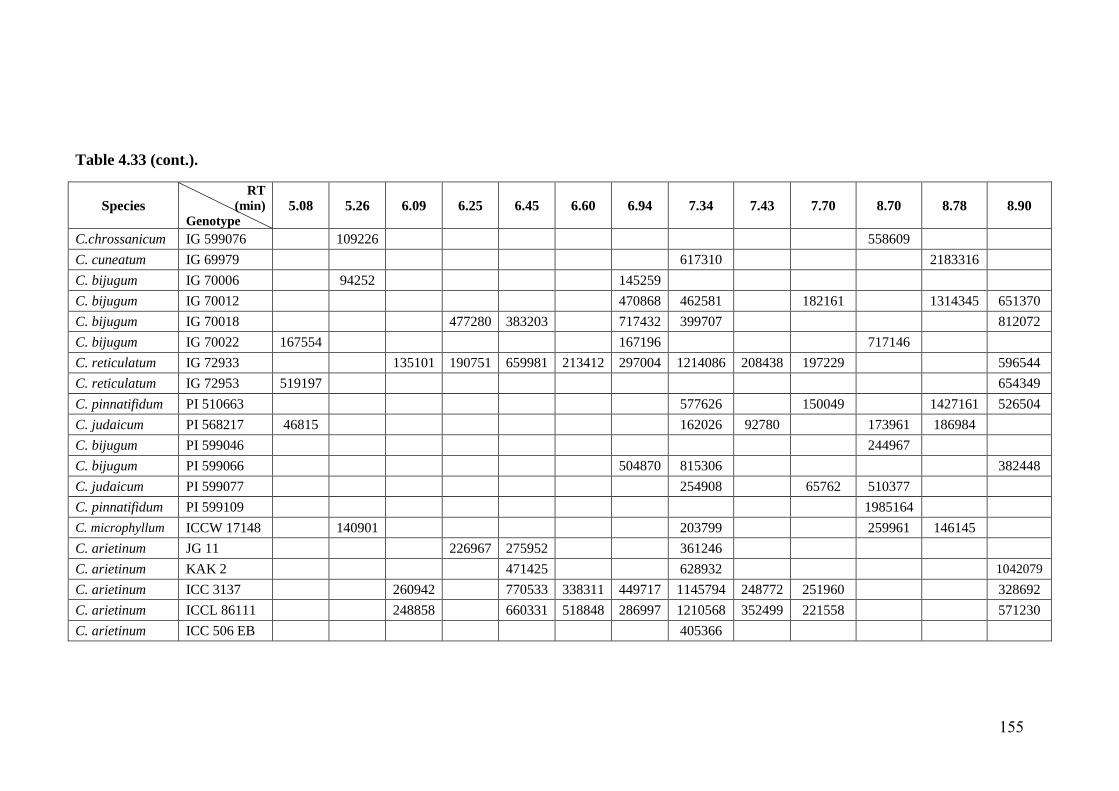
Table 4.33 (cont.).
Species RT
(min)
Genotype
5.08 5.26 6.09 6.25 6.45 6.60 6.94 7.34 7.43 7.70 8.70 8.78 8.90
C.chrossanicum IG 599076
109226
558609
C. cuneatum IG 69979
617310
2183316
C. bijugum IG 70006
94252
145259
C. bijugum IG 70012
470868 462581
182161
1314345 651370
C. bijugum IG 70018
477280 383203
717432 399707
812072
C. bijugum IG 70022 167554
167196
717146
C. reticulatum IG 72933
135101 190751 659981 213412 297004 1214086 208438 197229
596544
C. reticulatum IG 72953 519197
654349
C. pinnatifidum PI 510663
577626
150049
1427161 526504
C. judaicum PI 568217 46815
162026 92780
173961 186984
C. bijugum PI 599046
244967
C. bijugum PI 599066
504870 815306
382448
C. judaicum PI 599077
254908
65762 510377
C. pinnatifidum PI 599109
1985164
C. microphyllum ICCW 17148
140901
203799
259961 146145
C. arietinum JG 11
226967 275952
361246
C. arietinum KAK 2
471425
628932
1042079
C. arietinum ICC 3137
260942
770533 338311 449717 1145794 248772 251960
328692
C. arietinum ICCL 86111
248858
660331 518848 286997 1210568 352499 221558
571230
C. arietinum ICC 506 EB
405366
155
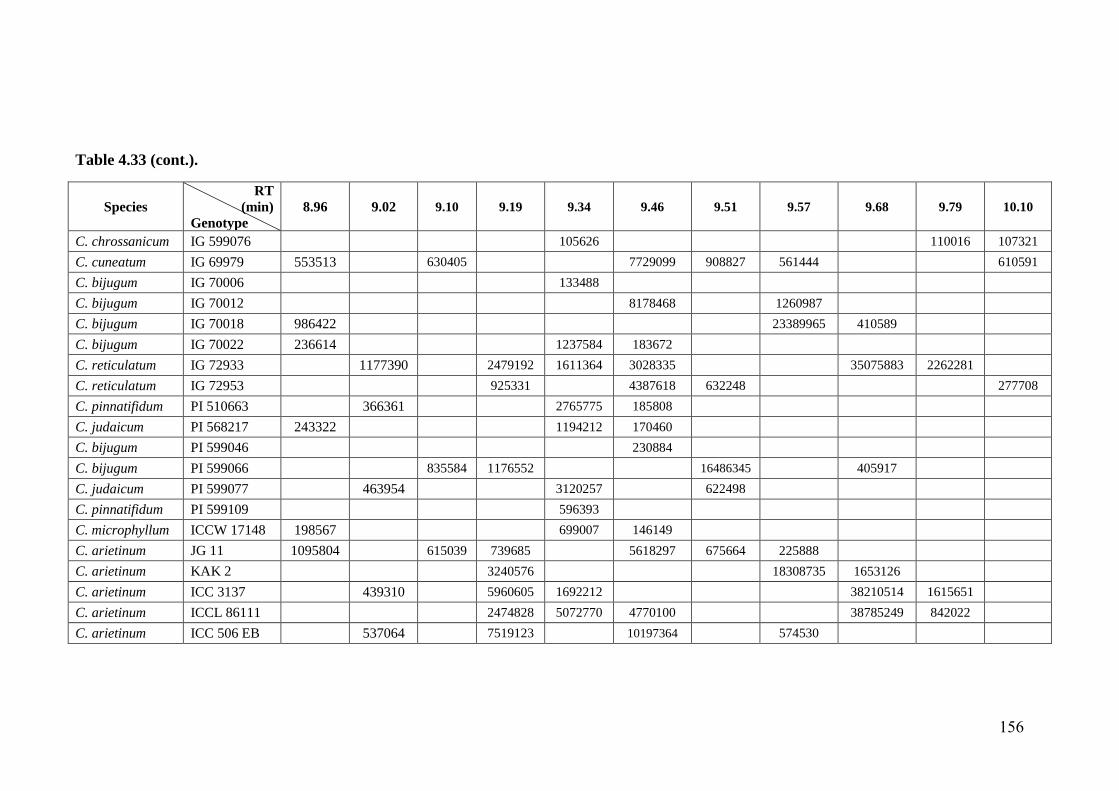
Table 4.33 (cont.).
Species
RT
(min)
Genotype
8.96 9.02 9.10 9.19 9.34 9.46 9.51 9.57 9.68 9.79 10.10
C. chrossanicum IG 599076
105626
110016 107321
C. cuneatum IG 69979 553513
630405
7729099 908827 561444
610591
C. bijugum IG 70006
133488
C. bijugum IG 70012
8178468
1260987
C. bijugum IG 70018 986422
23389965 410589
C. bijugum IG 70022 236614
1237584 183672
C. reticulatum IG 72933
1177390
2479192 1611364 3028335
35075883 2262281
C. reticulatum IG 72953
925331
4387618 632248
277708
C. pinnatifidum PI 510663
366361
2765775 185808
C. judaicum PI 568217 243322
1194212 170460
C. bijugum PI 599046
230884
C. bijugum PI 599066
835584 1176552
16486345
405917
C. judaicum PI 599077
463954
3120257
622498
C. pinnatifidum PI 599109
596393
C. microphyllum ICCW 17148 198567
699007 146149
C. arietinum JG 11 1095804
615039 739685
5618297 675664 225888
C. arietinum KAK 2
3240576
18308735 1653126
C. arietinum ICC 3137
439310
5960605 1692212
38210514 1615651
C. arietinum ICCL 86111
2474828 5072770 4770100
38785249 842022
C. arietinum ICC 506 EB
537064
7519123
10197364
574530
156
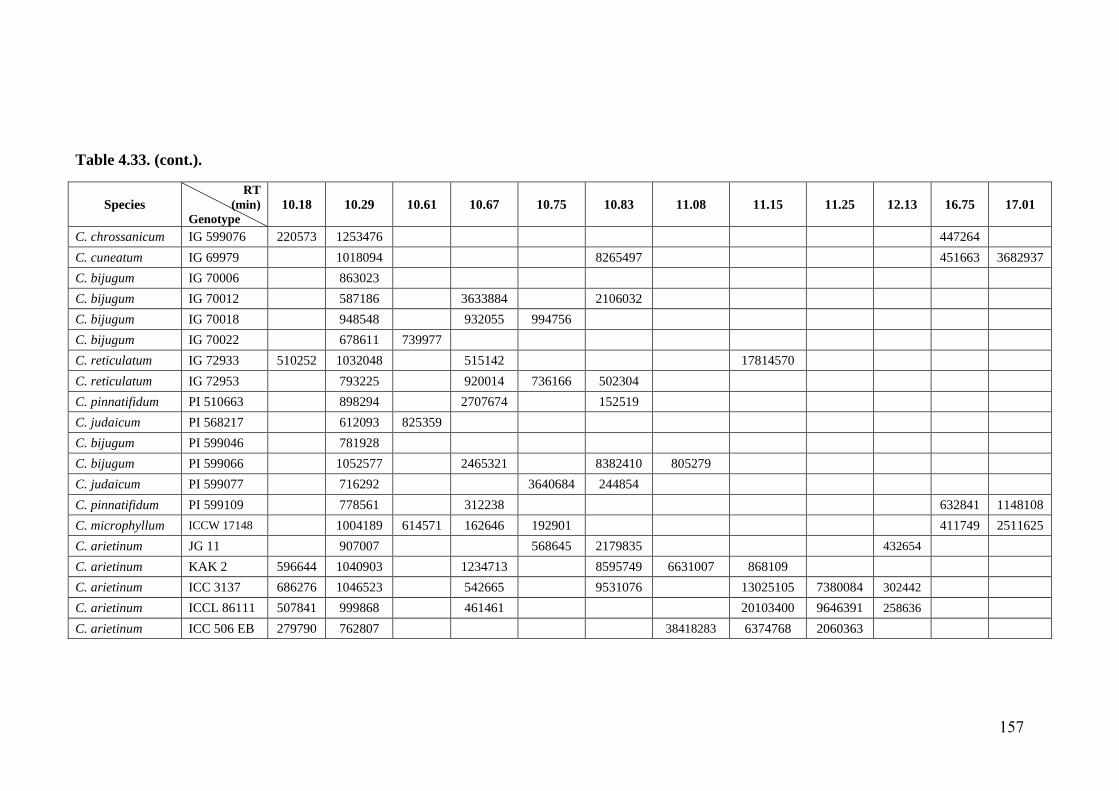
Table 4.33. (cont.).
Species
RT
(min)
Genotype
10.18 10.29 10.61 10.67 10.75 10.83 11.08 11.15 11.25 12.13 16.75 17.01
C. chrossanicum IG 599076 220573 1253476
447264
C. cuneatum IG 69979
1018094
8265497
451663 3682937
C. bijugum IG 70006
863023
C. bijugum IG 70012
587186
3633884
2106032
C. bijugum IG 70018
948548
932055 994756
C. bijugum IG 70022
678611 739977
C. reticulatum IG 72933 510252 1032048
515142
17814570
C. reticulatum IG 72953
793225
920014 736166 502304
C. pinnatifidum PI 510663
898294
2707674
152519
C. judaicum PI 568217
612093 825359
C. bijugum PI 599046
781928
C. bijugum PI 599066
1052577
2465321
8382410 805279
C. judaicum PI 599077
716292
3640684 244854
C. pinnatifidum PI 599109
778561
312238
632841 1148108
C. microphyllum ICCW 17148
1004189 614571 162646 192901
411749 2511625
C. arietinum JG 11
907007
568645 2179835
432654
C. arietinum KAK 2 596644 1040903
1234713
8595749 6631007 868109
C. arietinum ICC 3137 686276 1046523
542665
9531076
13025105 7380084 302442
C. arietinum ICCL 86111 507841 999868
461461
20103400 9646391 258636
C. arietinum ICC 506 EB 279790 762807
38418283 6374768 2060363
157
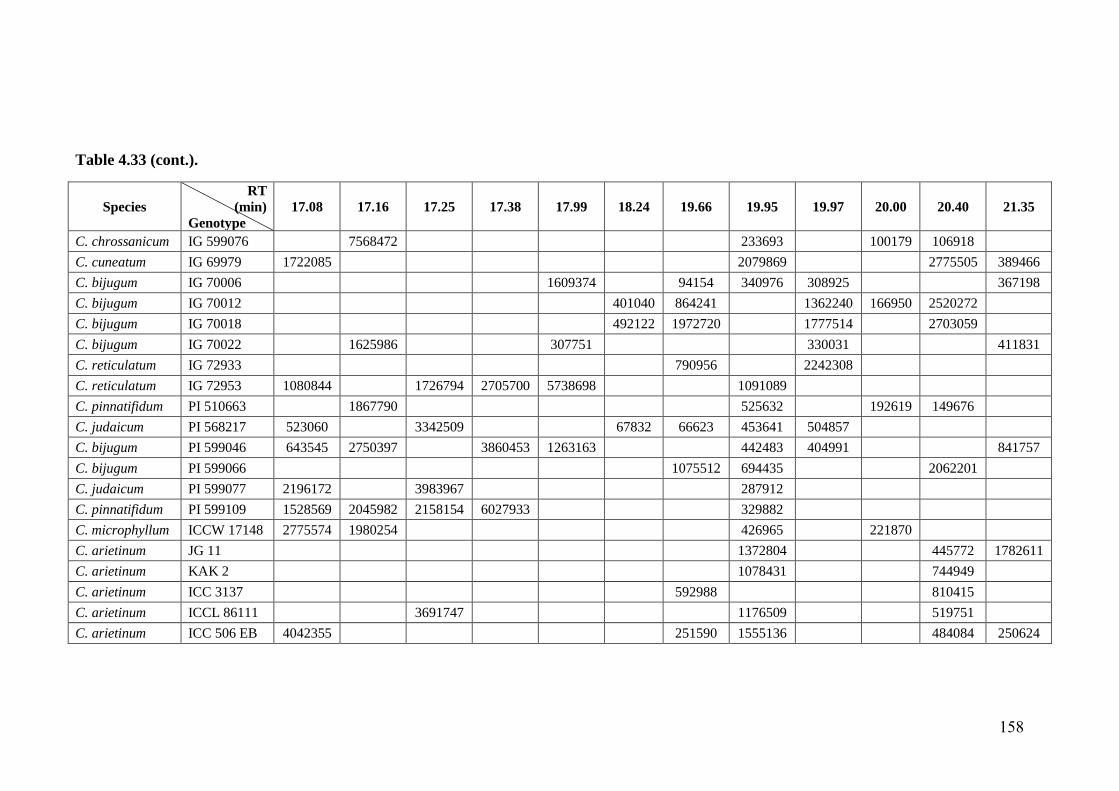
Table 4.33 (cont.).
Species
RT
(min)
Genotype
17.08 17.16 17.25 17.38 17.99 18.24 19.66 19.95 19.97 20.00 20.40 21.35
C. chrossanicum IG 599076
7568472
233693
100179 106918
C. cuneatum IG 69979 1722085
2079869
2775505 389466
C. bijugum IG 70006
1609374
94154 340976 308925
367198
C. bijugum IG 70012
401040 864241
1362240 166950 2520272
C. bijugum IG 70018
492122 1972720
1777514
2703059
C. bijugum IG 70022
1625986
307751
330031
411831
C. reticulatum IG 72933
790956
2242308
C. reticulatum IG 72953 1080844
1726794 2705700 5738698
1091089
C. pinnatifidum PI 510663
1867790
525632
192619 149676
C. judaicum PI 568217 523060
3342509
67832 66623 453641 504857
C. bijugum PI 599046 643545 2750397
3860453 1263163
442483 404991
841757
C. bijugum PI 599066
1075512 694435
2062201
C. judaicum PI 599077 2196172
3983967
287912
C. pinnatifidum PI 599109 1528569 2045982 2158154 6027933
329882
C. microphyllum ICCW 17148 2775574 1980254
426965
221870
C. arietinum JG 11
1372804
445772 1782611
C. arietinum KAK 2
1078431
744949
C. arietinum ICC 3137
592988
810415
C. arietinum ICCL 86111
3691747
1176509
519751
C. arietinum ICC 506 EB 4042355
251590 1555136
484084 250624
158
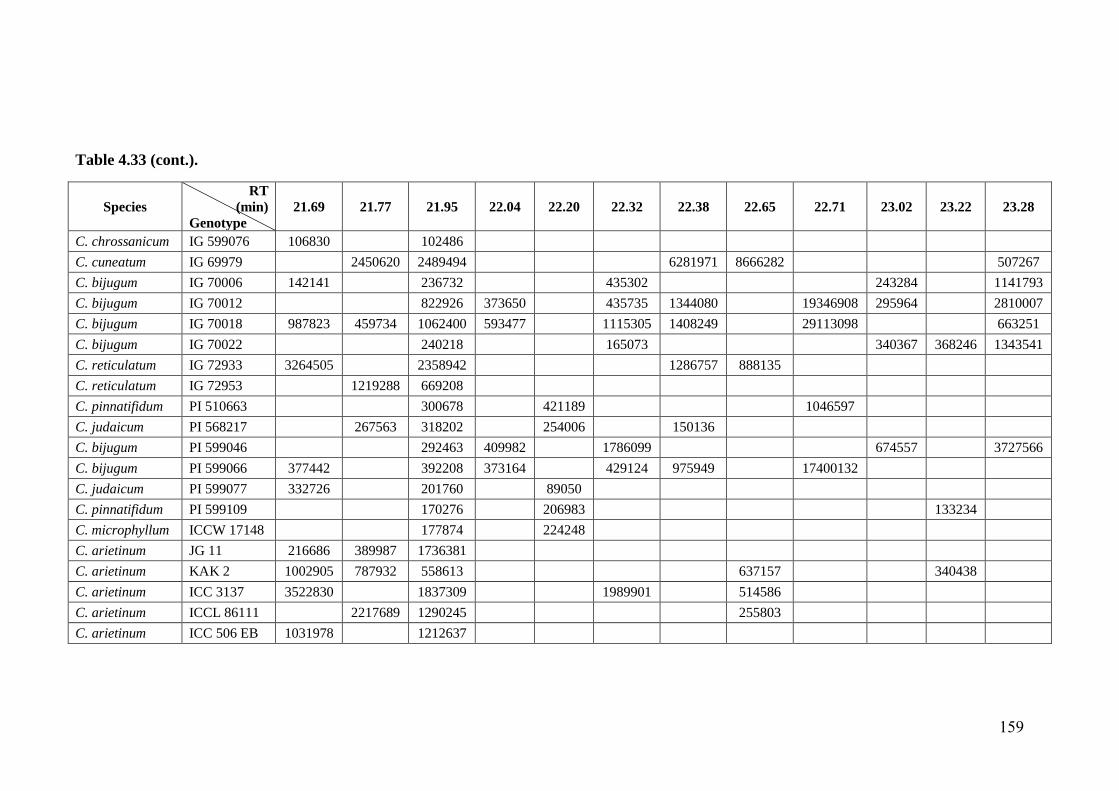
Table 4.33 (cont.).
Species
RT
(min)
Genotype
21.69 21.77 21.95 22.04 22.20 22.32 22.38 22.65 22.71 23.02 23.22 23.28
C. chrossanicum IG 599076 106830
102486
C. cuneatum IG 69979
2450620 2489494
6281971 8666282
507267
C. bijugum IG 70006 142141
236732
435302
243284
1141793
C. bijugum IG 70012
822926 373650
435735 1344080
19346908 295964
2810007
C. bijugum IG 70018 987823 459734 1062400 593477
1115305 1408249
29113098
663251
C. bijugum IG 70022
240218
165073
340367 368246 1343541
C. reticulatum IG 72933 3264505
2358942
1286757 888135
C. reticulatum IG 72953
1219288 669208
C. pinnatifidum PI 510663
300678
421189
1046597
C. judaicum PI 568217
267563 318202
254006
150136
C. bijugum PI 599046
292463 409982
1786099
674557
3727566
C. bijugum PI 599066 377442
392208 373164
429124 975949
17400132
C. judaicum PI 599077 332726
201760
89050
C. pinnatifidum PI 599109
170276
206983
133234
C. microphyllum ICCW 17148
177874
224248
C. arietinum JG 11 216686 389987 1736381
C. arietinum KAK 2 1002905 787932 558613
637157
340438
C. arietinum ICC 3137 3522830
1837309
1989901
514586
C. arietinum ICCL 86111
2217689 1290245
255803
C. arietinum ICC 506 EB 1031978
1212637
159
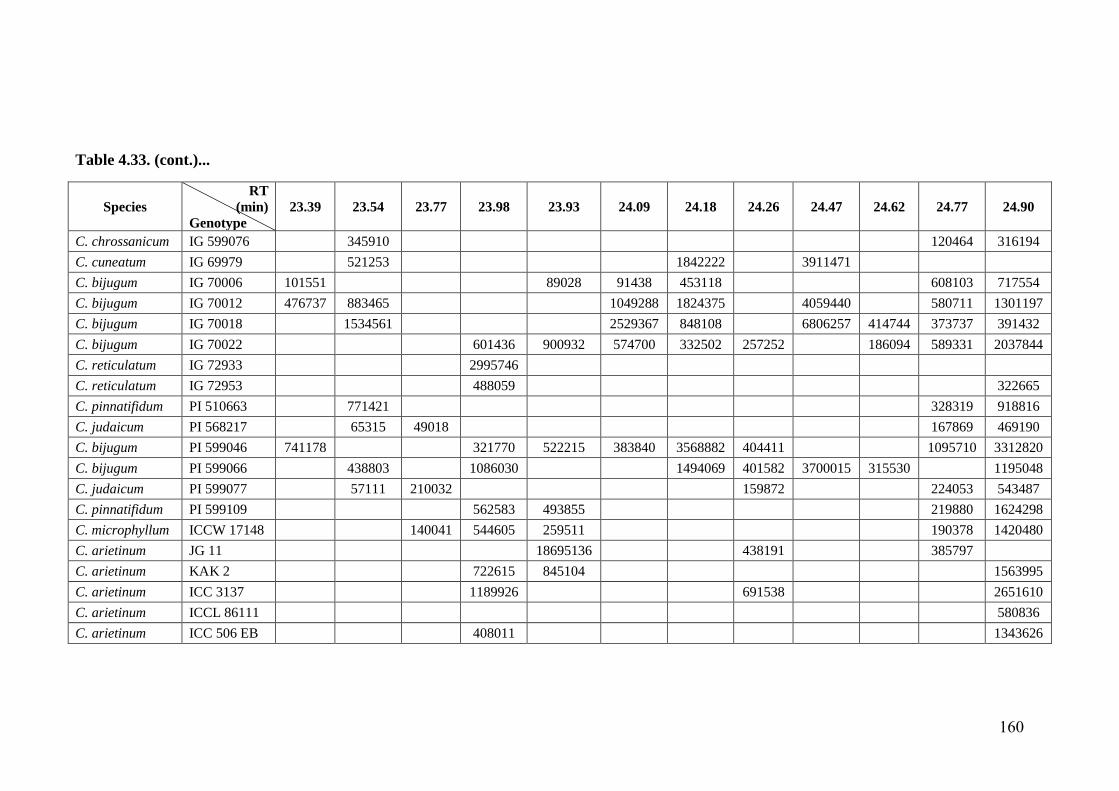
Table 4.33. (cont.)...
Species
RT
(min)
Genotype
23.39 23.54 23.77 23.98 23.93 24.09 24.18 24.26 24.47 24.62 24.77 24.90
C. chrossanicum IG 599076
345910
120464 316194
C. cuneatum IG 69979
521253
1842222
3911471
C. bijugum IG 70006 101551
89028 91438 453118
608103 717554
C. bijugum IG 70012 476737 883465
1049288 1824375
4059440
580711 1301197
C. bijugum IG 70018
1534561
2529367 848108
6806257 414744 373737 391432
C. bijugum IG 70022
601436 900932 574700 332502 257252
186094 589331 2037844
C. reticulatum IG 72933
2995746
C. reticulatum IG 72953
488059
322665
C. pinnatifidum PI 510663
771421
328319 918816
C. judaicum PI 568217
65315 49018
167869 469190
C. bijugum PI 599046 741178
321770 522215 383840 3568882 404411
1095710 3312820
C. bijugum PI 599066
438803
1086030
1494069 401582 3700015 315530
1195048
C. judaicum PI 599077
57111 210032
159872
224053 543487
C. pinnatifidum PI 599109
562583 493855
219880 1624298
C. microphyllum ICCW 17148
140041 544605 259511
190378 1420480
C. arietinum JG 11
18695136
438191
385797
C. arietinum KAK 2
722615 845104
1563995
C. arietinum ICC 3137
1189926
691538
2651610
C. arietinum ICCL 86111
580836
C. arietinum ICC 506 EB
408011
1343626
160
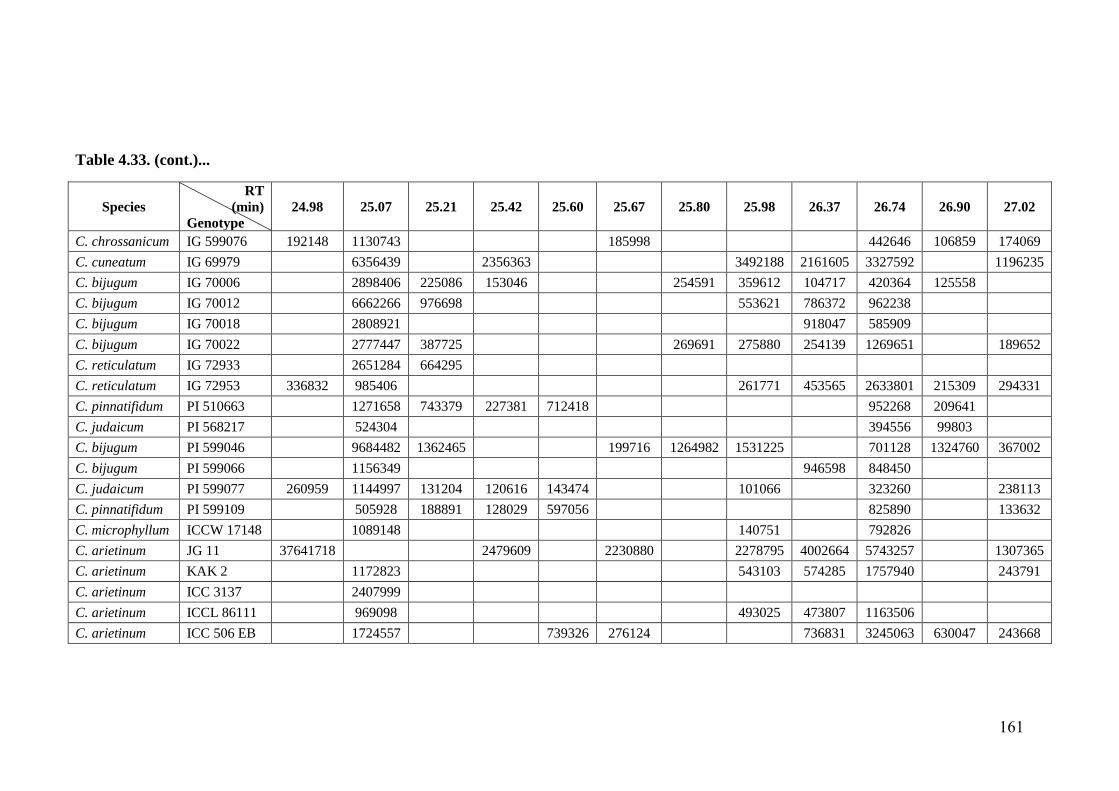
Table 4.33. (cont.)...
Species
RT
(min)
Genotype
24.98 25.07 25.21 25.42 25.60 25.67 25.80 25.98 26.37 26.74 26.90 27.02
C. chrossanicum IG 599076 192148 1130743
185998
442646 106859 174069
C. cuneatum IG 69979
6356439
2356363
3492188 2161605 3327592
1196235
C. bijugum IG 70006
2898406 225086 153046
254591 359612 104717 420364 125558
C. bijugum IG 70012
6662266 976698
553621 786372 962238
C. bijugum IG 70018
2808921
918047 585909
C. bijugum IG 70022
2777447 387725
269691 275880 254139 1269651
189652
C. reticulatum IG 72933
2651284 664295
C. reticulatum IG 72953 336832 985406
261771 453565 2633801 215309 294331
C. pinnatifidum PI 510663
1271658 743379 227381 712418
952268 209641
C. judaicum PI 568217
524304
394556 99803
C. bijugum PI 599046
9684482 1362465
199716 1264982 1531225
701128 1324760 367002
C. bijugum PI 599066
1156349
946598 848450
C. judaicum PI 599077 260959 1144997 131204 120616 143474
101066
323260
238113
C. pinnatifidum PI 599109
505928 188891 128029 597056
825890
133632
C. microphyllum ICCW 17148
1089148
140751
792826
C. arietinum JG 11 37641718
2479609
2230880
2278795 4002664 5743257
1307365
C. arietinum KAK 2
1172823
543103 574285 1757940
243791
C. arietinum ICC 3137
2407999
C. arietinum ICCL 86111
969098
493025 473807 1163506
C. arietinum ICC 506 EB
1724557
739326 276124
736831 3245063 630047 243668
161
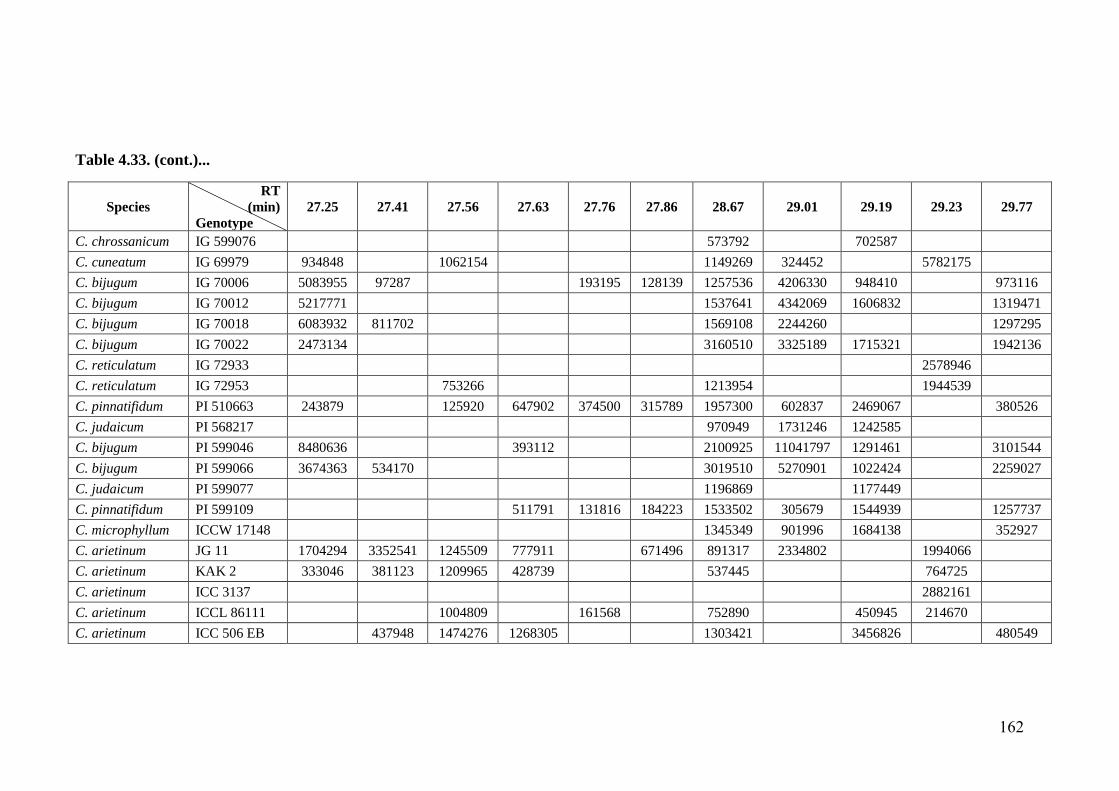
Table 4.33. (cont.)...
Species
RT
(min)
Genotype
27.25 27.41 27.56 27.63 27.76 27.86 28.67 29.01 29.19 29.23 29.77
C. chrossanicum IG 599076
573792
702587
C. cuneatum IG 69979 934848
1062154
1149269 324452
5782175
C. bijugum IG 70006 5083955 97287
193195 128139 1257536 4206330 948410
973116
C. bijugum IG 70012 5217771
1537641 4342069 1606832
1319471
C. bijugum IG 70018 6083932 811702
1569108 2244260
1297295
C. bijugum IG 70022 2473134
3160510 3325189 1715321
1942136
C. reticulatum IG 72933
2578946
C. reticulatum IG 72953
753266
1213954
1944539
C. pinnatifidum PI 510663 243879
125920 647902 374500 315789 1957300 602837 2469067
380526
C. judaicum PI 568217
970949 1731246 1242585
C. bijugum PI 599046 8480636
393112
2100925 11041797 1291461
3101544
C. bijugum PI 599066 3674363 534170
3019510 5270901 1022424
2259027
C. judaicum PI 599077
1196869
1177449
C. pinnatifidum PI 599109
511791 131816 184223 1533502 305679 1544939
1257737
C. microphyllum ICCW 17148
1345349 901996 1684138
352927
C. arietinum JG 11 1704294 3352541 1245509 777911
671496 891317 2334802
1994066
C. arietinum KAK 2 333046 381123 1209965 428739
537445
764725
C. arietinum ICC 3137
2882161
C. arietinum ICCL 86111
1004809
161568
752890
450945 214670
C. arietinum ICC 506 EB
437948 1474276 1268305
1303421
3456826
480549
162
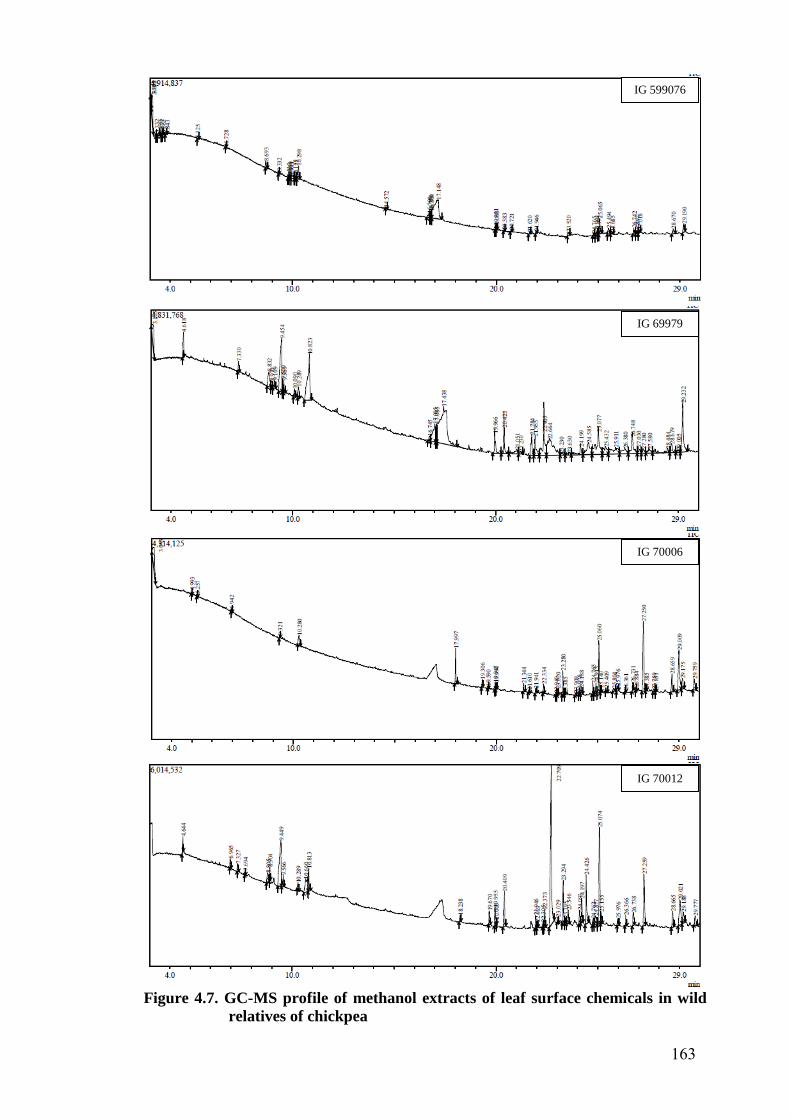
Figure 4.7. GC-MS profile of methanol extracts of leaf surface chemicals in wild
relatives of chickpea
IG 599076
IG 69979
IG 70006
IG 70012
163
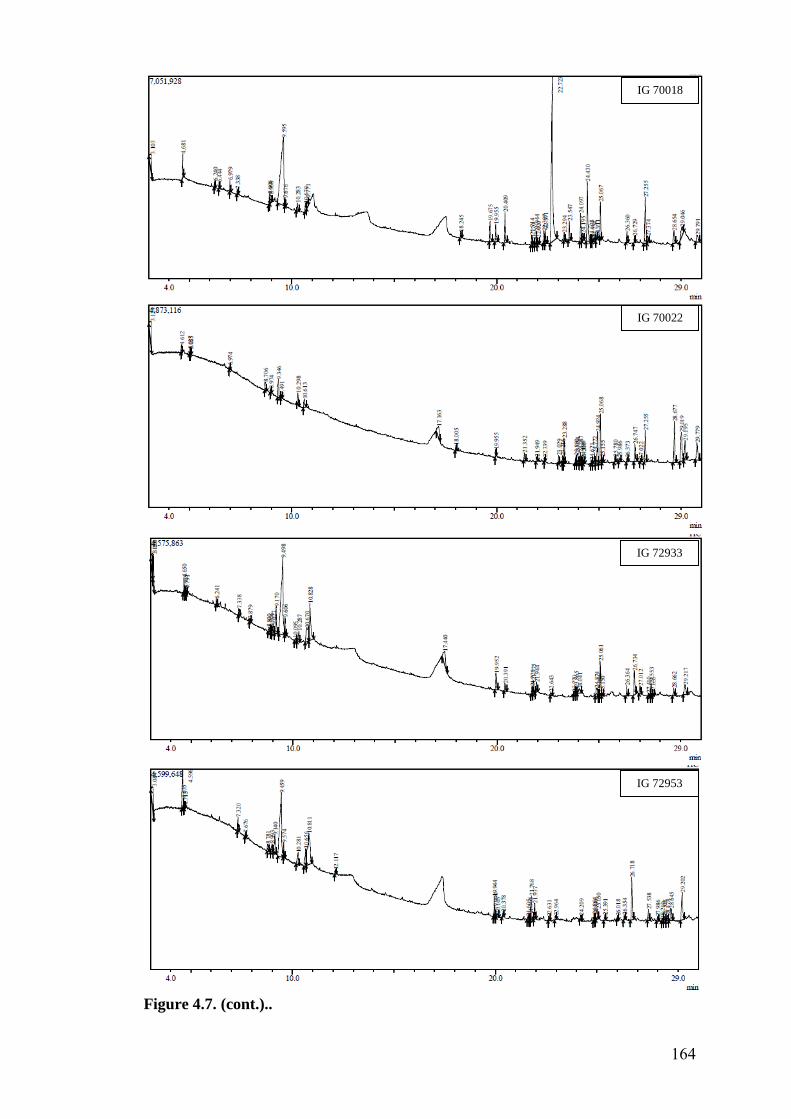
Figure 4.7. (cont.)..
IG 70018
IG 70022
IG 72933
IG 72953
164
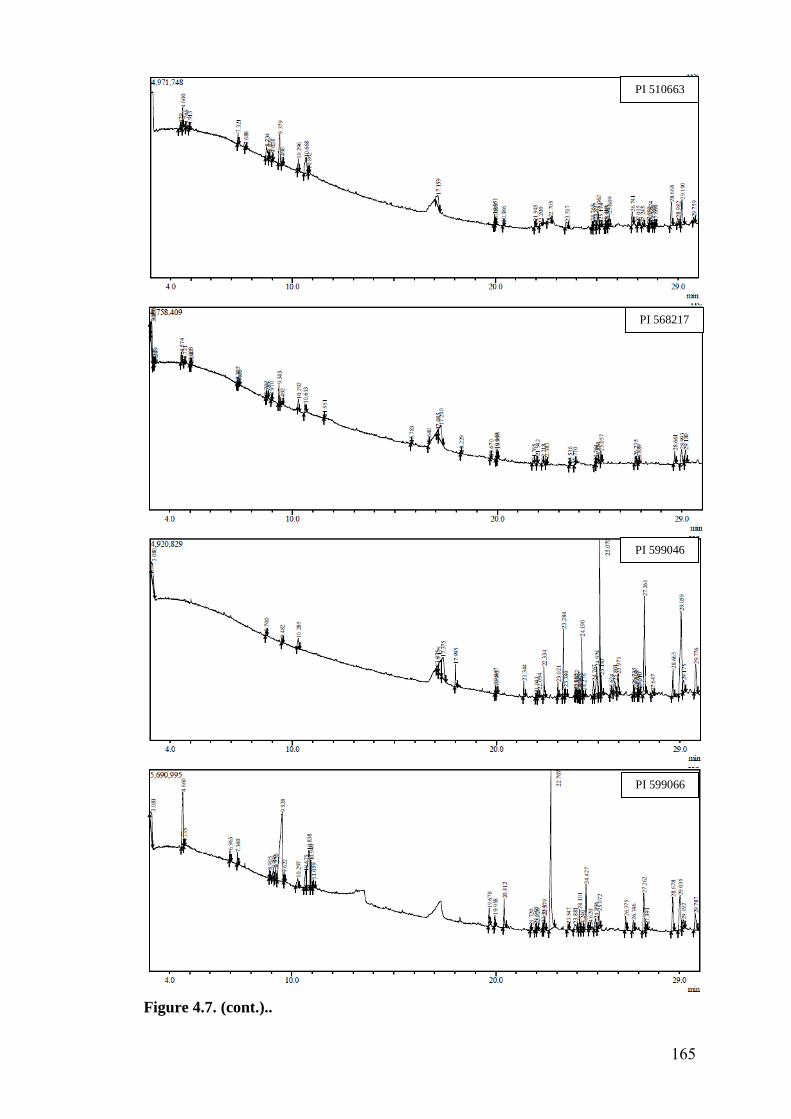
Figure 4.7. (cont.)..
PI 510663
PI 568217
PI 599046
PI 599066
165
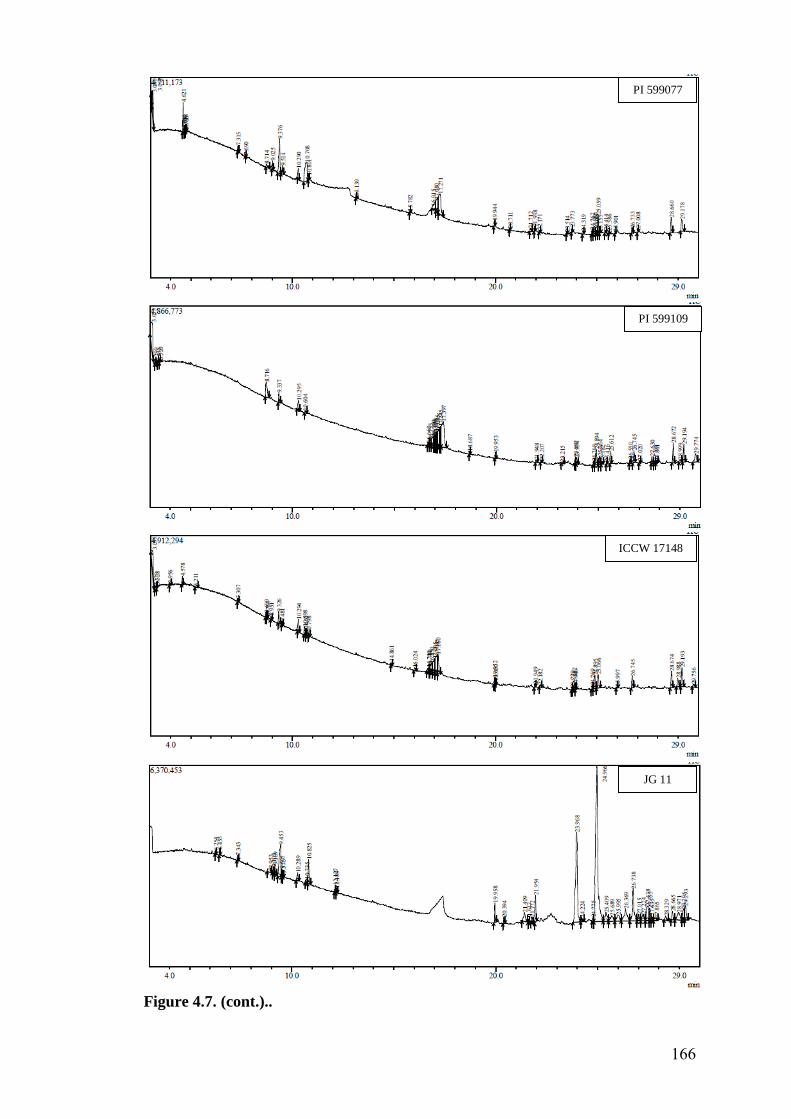
Figure 4.7. (cont.)..
PI 599077
PI 599109
ICCW 17148
JG 11
166
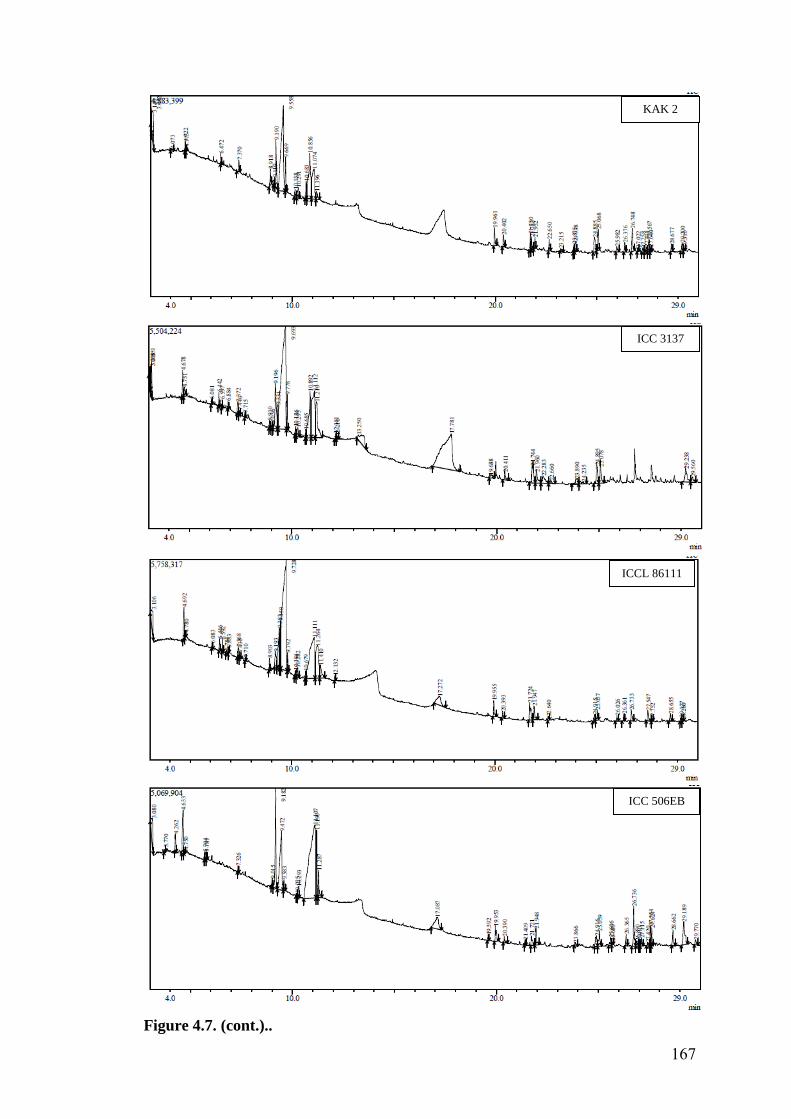
Figure 4.7. (cont.)..
KAK 2
ICC 3137
ICCL 86111
ICC 506EB
167
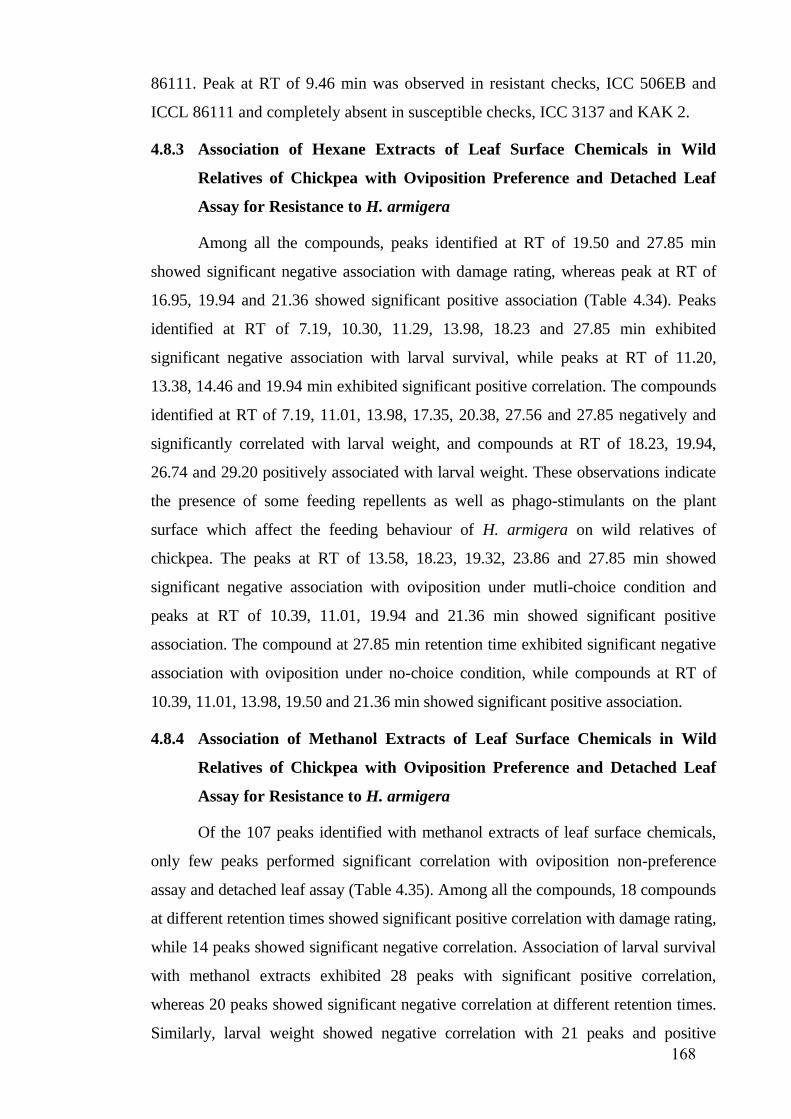
86111. Peak at RT of 9.46 min was observed in resistant checks, ICC 506EB and
ICCL 86111 and completely absent in susceptible checks, ICC 3137 and KAK 2.
4.8.3 Association of Hexane Extracts of Leaf Surface Chemicals in Wild
Relatives of Chickpea with Oviposition Preference and Detached Leaf
Assay for Resistance to H. armigera
Among all the compounds, peaks identified at RT of 19.50 and 27.85 min
showed significant negative association with damage rating, whereas peak at RT of
16.95, 19.94 and 21.36 showed significant positive association (Table 4.34). Peaks
identified at RT of 7.19, 10.30, 11.29, 13.98, 18.23 and 27.85 min exhibited
significant negative association with larval survival, while peaks at RT of 11.20,
13.38, 14.46 and 19.94 min exhibited significant positive correlation. The compounds
identified at RT of 7.19, 11.01, 13.98, 17.35, 20.38, 27.56 and 27.85 negatively and
significantly correlated with larval weight, and compounds at RT of 18.23, 19.94,
26.74 and 29.20 positively associated with larval weight. These observations indicate
the presence of some feeding repellents as well as phago-stimulants on the plant
surface which affect the feeding behaviour of H. armigera on wild relatives of
chickpea. The peaks at RT of 13.58, 18.23, 19.32, 23.86 and 27.85 min showed
significant negative association with oviposition under mutli-choice condition and
peaks at RT of 10.39, 11.01, 19.94 and 21.36 min showed significant positive
association. The compound at 27.85 min retention time exhibited significant negative
association with oviposition under no-choice condition, while compounds at RT of
10.39, 11.01, 13.98, 19.50 and 21.36 min showed significant positive association.
4.8.4 Association of Methanol Extracts of Leaf Surface Chemicals in Wild
Relatives of Chickpea with Oviposition Preference and Detached Leaf
Assay for Resistance to H. armigera
Of the 107 peaks identified with methanol extracts of leaf surface chemicals,
only few peaks performed significant correlation with oviposition non-preference
assay and detached leaf assay (Table 4.35). Among all the compounds, 18 compounds
at different retention times showed significant positive correlation with damage rating,
while 14 peaks showed significant negative correlation. Association of larval survival
with methanol extracts exhibited 28 peaks with significant positive correlation,
whereas 20 peaks showed significant negative correlation at different retention times.
Similarly, larval weight showed negative correlation with 21 peaks and positive
168
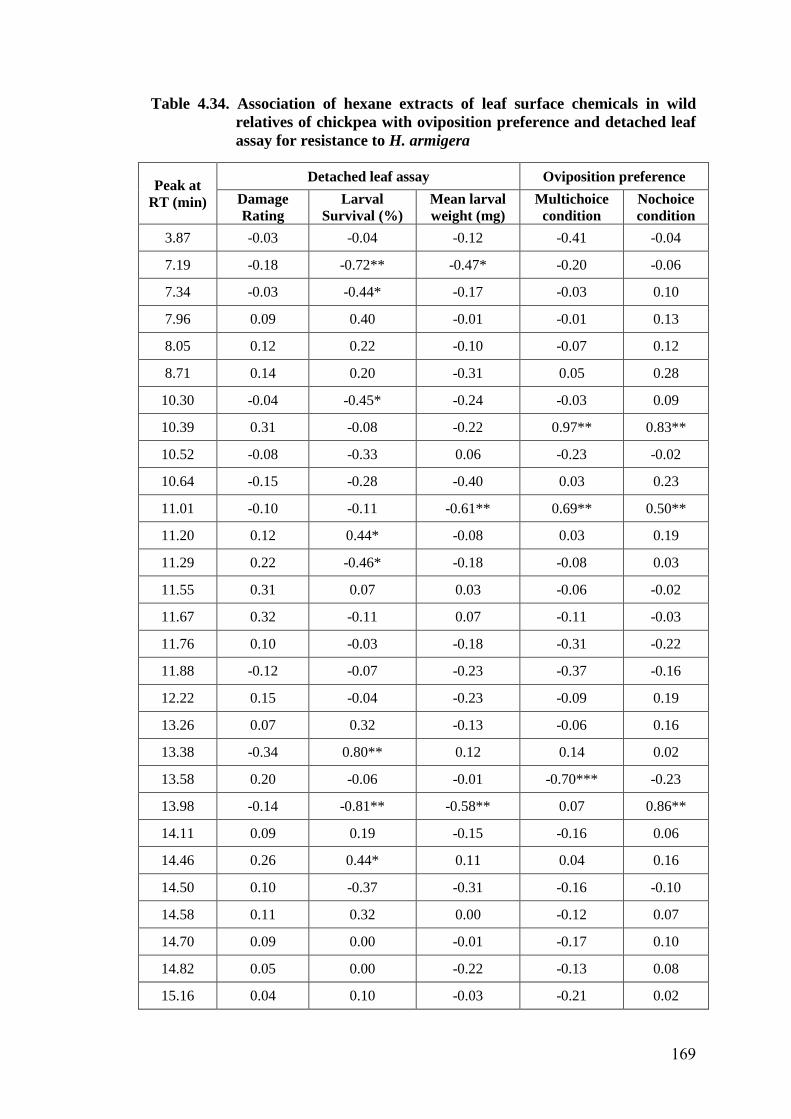
Table 4.34. Association of hexane extracts of leaf surface chemicals in wild
relatives of chickpea with oviposition preference and detached leaf
assay for resistance to H. armigera
Peak at
RT (min)
Detached leaf assay Oviposition preference
Damage
Rating
Larval
Survival (%)
Mean larval
weight (mg)
Multichoice
condition
Nochoice
condition
3.87 -0.03 -0.04 -0.12 -0.41 -0.04
7.19 -0.18 -0.72** -0.47* -0.20 -0.06
7.34 -0.03 -0.44* -0.17 -0.03 0.10
7.96 0.09 0.40 -0.01 -0.01 0.13
8.05 0.12 0.22 -0.10 -0.07 0.12
8.71 0.14 0.20 -0.31 0.05 0.28
10.30 -0.04 -0.45* -0.24 -0.03 0.09
10.39 0.31 -0.08 -0.22 0.97** 0.83**
10.52 -0.08 -0.33 0.06 -0.23 -0.02
10.64 -0.15 -0.28 -0.40 0.03 0.23
11.01 -0.10 -0.11 -0.61** 0.69** 0.50**
11.20 0.12 0.44* -0.08 0.03 0.19
11.29 0.22 -0.46* -0.18 -0.08 0.03
11.55 0.31 0.07 0.03 -0.06 -0.02
11.67 0.32 -0.11 0.07 -0.11 -0.03
11.76 0.10 -0.03 -0.18 -0.31 -0.22
11.88 -0.12 -0.07 -0.23 -0.37 -0.16
12.22 0.15 -0.04 -0.23 -0.09 0.19
13.26 0.07 0.32 -0.13 -0.06 0.16
13.38 -0.34 0.80** 0.12 0.14 0.02
13.58 0.20 -0.06 -0.01 -0.70*** -0.23
13.98 -0.14 -0.81** -0.58** 0.07 0.86**
14.11 0.09 0.19 -0.15 -0.16 0.06
14.46 0.26 0.44* 0.11 0.04 0.16
14.50 0.10 -0.37 -0.31 -0.16 -0.10
14.58 0.11 0.32 0.00 -0.12 0.07
14.70 0.09 0.00 -0.01 -0.17 0.10
14.82 0.05 0.00 -0.22 -0.13 0.08
15.16 0.04 0.10 -0.03 -0.21 0.02
169
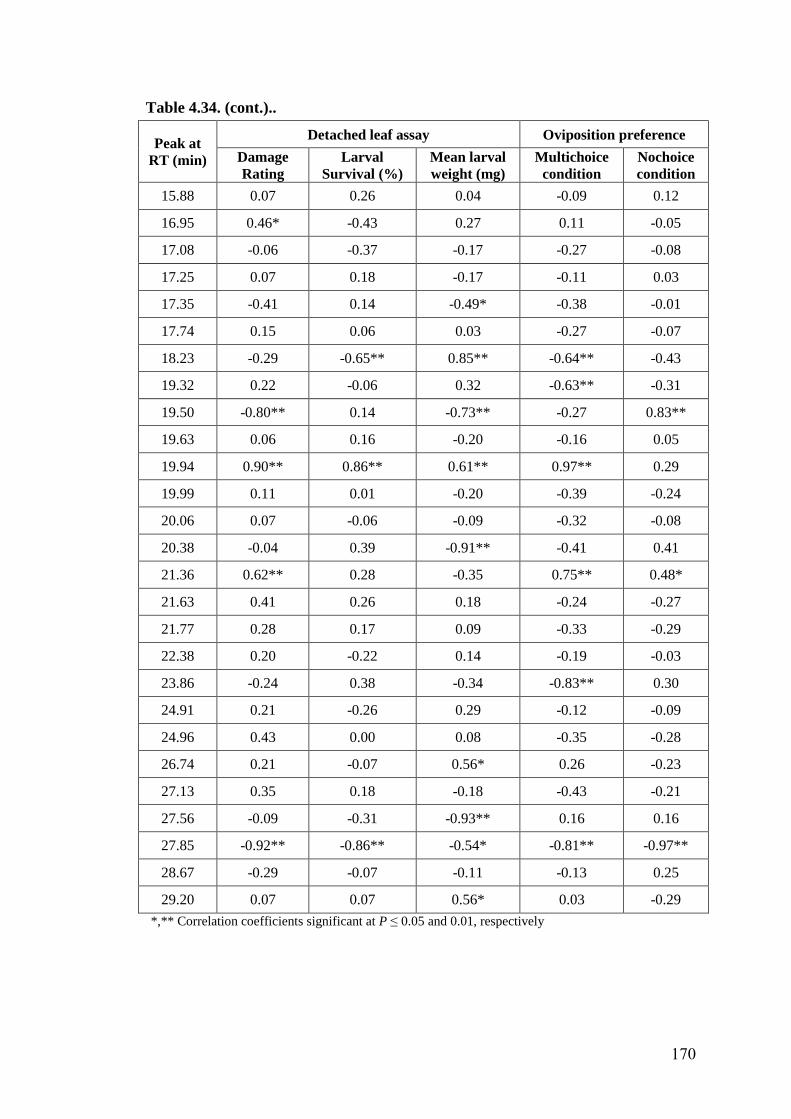
Table 4.34. (cont.)..
Peak at
RT (min)
Detached leaf assay Oviposition preference
Damage
Rating
Larval
Survival (%)
Mean larval
weight (mg)
Multichoice
condition
Nochoice
condition
15.88 0.07 0.26 0.04 -0.09 0.12
16.95 0.46* -0.43 0.27 0.11 -0.05
17.08 -0.06 -0.37 -0.17 -0.27 -0.08
17.25 0.07 0.18 -0.17 -0.11 0.03
17.35 -0.41 0.14 -0.49* -0.38 -0.01
17.74 0.15 0.06 0.03 -0.27 -0.07
18.23 -0.29 -0.65** 0.85** -0.64** -0.43
19.32 0.22 -0.06 0.32 -0.63** -0.31
19.50 -0.80** 0.14 -0.73** -0.27 0.83**
19.63 0.06 0.16 -0.20 -0.16 0.05
19.94 0.90** 0.86** 0.61** 0.97** 0.29
19.99 0.11 0.01 -0.20 -0.39 -0.24
20.06 0.07 -0.06 -0.09 -0.32 -0.08
20.38 -0.04 0.39 -0.91** -0.41 0.41
21.36 0.62** 0.28 -0.35 0.75** 0.48*
21.63 0.41 0.26 0.18 -0.24 -0.27
21.77 0.28 0.17 0.09 -0.33 -0.29
22.38 0.20 -0.22 0.14 -0.19 -0.03
23.86 -0.24 0.38 -0.34 -0.83** 0.30
24.91 0.21 -0.26 0.29 -0.12 -0.09
24.96 0.43 0.00 0.08 -0.35 -0.28
26.74 0.21 -0.07 0.56* 0.26 -0.23
27.13 0.35 0.18 -0.18 -0.43 -0.21
27.56 -0.09 -0.31 -0.93** 0.16 0.16
27.85 -0.92** -0.86** -0.54* -0.81** -0.97**
28.67 -0.29 -0.07 -0.11 -0.13 0.25
29.20 0.07 0.07 0.56* 0.03 -0.29
*,** Correlation coefficients significant at P ≤ 0.05 and 0.01, respectively
170
correlation with 34 peaks. Oviposition preferences revealed that, 27 peaks at different
retention times showed significant negative correlation with oviposition under multi-
choice condition, while 14 peaks showed positive correlation. Under no-choice
conditions, 29 peaks exhibited significant negative correlation with oviposition on
different genotypes, whereas 13 peaks showed significant positive association. The
results indicated that methanol extracts of leaf surface chemicals in wild relatives of
chickpea had higher amount of phagostimulants than antifeedants and higher amounts
of oviposition repellents than oviposition attractants. Since larvae of H. armigera
would contact the compounds present on the plant surface before feeding or laying
eggs, it is likely that they would play a role in oviposition attraction, food selection
and initiation of feeding (Green et al., 2002).
Sujana et al. (2012) reported that methanol washed pods of wild relatives of
pigeonpea were less preferred for feeding by H. armigera larvae than the unwashed
pods, but the hexane washed pods were preferred more than the unwashed pods
which suggested that methanol extracted the phagostimulants from the pod surface,
while hexane removed the antifeedants. Green et al. (2002) reported that solvent
extraction of pod surfaces affected the feeding preference of H. armigera in wild
and cultivated pigeonpea as the larvae preferred unextracted pods of C. cajan, the
extracted pods of C. scarabaeoides (first and second instar) or the unextracted pods
of C. scarabaeoides (fourth and fifth instar). Glass fibre disc bioassays showed that
the methanol, hexane and water extracts from the pod surface of C. cajan stimulated
the feeding of fifth instars. Acetone extracts from pods of pigeonpea and its wild
relatives, C. cajan and C. platycarpus had a significant feeding stimulant effect on
H. armigera larvae whereas extracts from pods of C. scarabaeoides had no effect.
Water extract of C. scarabaeoides pods had a significant antifeedant effect, whereas
extracts from C. cajan and C. platycarpus pods had no effect (Shanower et al.,
1997). A complete understanding of the nature and number of compounds present in
plant surface of wild relatives of chickpea would facilitate the selection of wild
relatives with diverse mechanism of resistance to H. armigera. Hence, further
studies are necessary to isolate the compounds and study their effect on food
selection and oviposition preference by H. armigera.
171
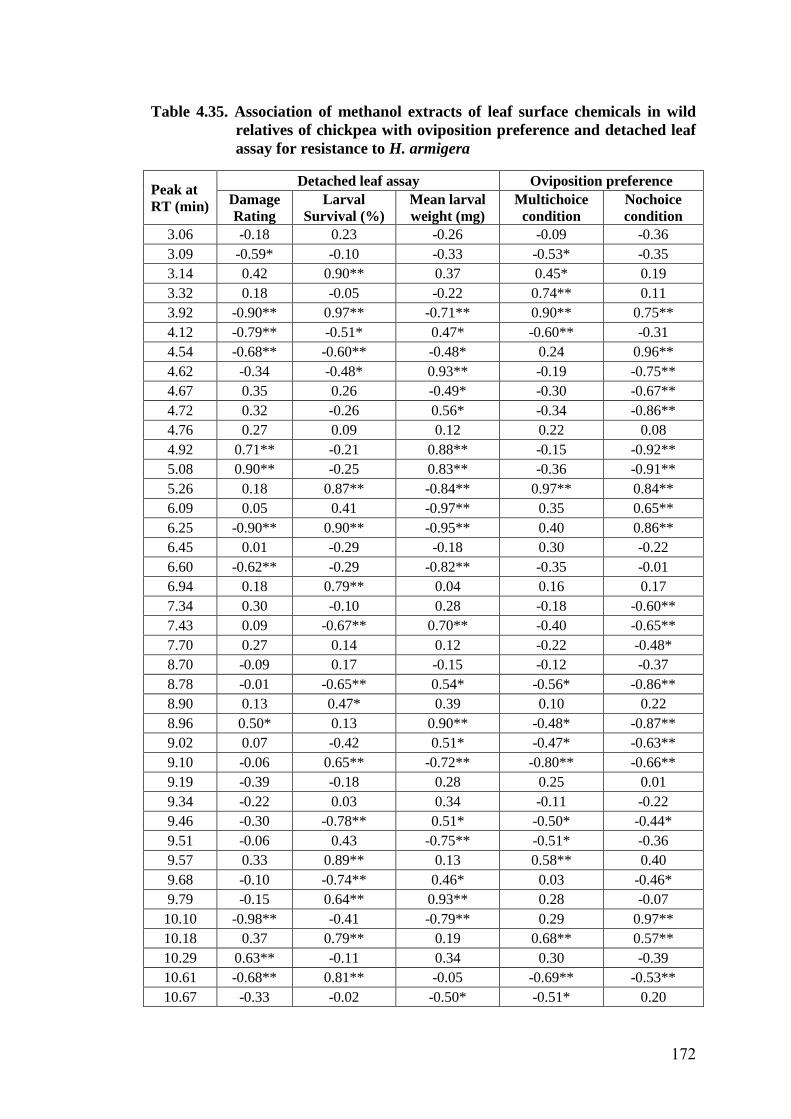
Table 4.35. Association of methanol extracts of leaf surface chemicals in wild
relatives of chickpea with oviposition preference and detached leaf
assay for resistance to H. armigera
Peak at
RT (min)
Detached leaf assay Oviposition preference
Damage
Rating
Larval
Survival (%)
Mean larval
weight (mg)
Multichoice
condition
Nochoice
condition
3.06 -0.18 0.23 -0.26 -0.09 -0.36
3.09 -0.59* -0.10 -0.33 -0.53* -0.35
3.14 0.42 0.90** 0.37 0.45* 0.19
3.32 0.18 -0.05 -0.22 0.74** 0.11
3.92 -0.90** 0.97** -0.71** 0.90** 0.75**
4.12 -0.79** -0.51* 0.47* -0.60** -0.31
4.54 -0.68** -0.60** -0.48* 0.24 0.96**
4.62 -0.34 -0.48* 0.93** -0.19 -0.75**
4.67 0.35 0.26 -0.49* -0.30 -0.67**
4.72 0.32 -0.26 0.56* -0.34 -0.86**
4.76 0.27 0.09 0.12 0.22 0.08
4.92 0.71** -0.21 0.88** -0.15 -0.92**
5.08 0.90** -0.25 0.83** -0.36 -0.91**
5.26 0.18 0.87** -0.84** 0.97** 0.84**
6.09 0.05 0.41 -0.97** 0.35 0.65**
6.25 -0.90** 0.90** -0.95** 0.40 0.86**
6.45 0.01 -0.29 -0.18 0.30 -0.22
6.60 -0.62** -0.29 -0.82** -0.35 -0.01
6.94 0.18 0.79** 0.04 0.16 0.17
7.34 0.30 -0.10 0.28 -0.18 -0.60**
7.43 0.09 -0.67** 0.70** -0.40 -0.65**
7.70 0.27 0.14 0.12 -0.22 -0.48*
8.70 -0.09 0.17 -0.15 -0.12 -0.37
8.78 -0.01 -0.65** 0.54* -0.56* -0.86**
8.90 0.13 0.47* 0.39 0.10 0.22
8.96 0.50* 0.13 0.90** -0.48* -0.87**
9.02 0.07 -0.42 0.51* -0.47* -0.63**
9.10 -0.06 0.65** -0.72** -0.80** -0.66**
9.19 -0.39 -0.18 0.28 0.25 0.01
9.34 -0.22 0.03 0.34 -0.11 -0.22
9.46 -0.30 -0.78** 0.51* -0.50* -0.44*
9.51 -0.06 0.43 -0.75** -0.51* -0.36
9.57 0.33 0.89** 0.13 0.58** 0.40
9.68 -0.10 -0.74** 0.46* 0.03 -0.46*
9.79 -0.15 0.64** 0.93** 0.28 -0.07
10.10 -0.98** -0.41 -0.79** 0.29 0.97**
10.18 0.37 0.79** 0.19 0.68** 0.57**
10.29 0.63** -0.11 0.34 0.30 -0.39
10.61 -0.68** 0.81** -0.05 -0.69** -0.53**
10.67 -0.33 -0.02 -0.50* -0.51* 0.20
172
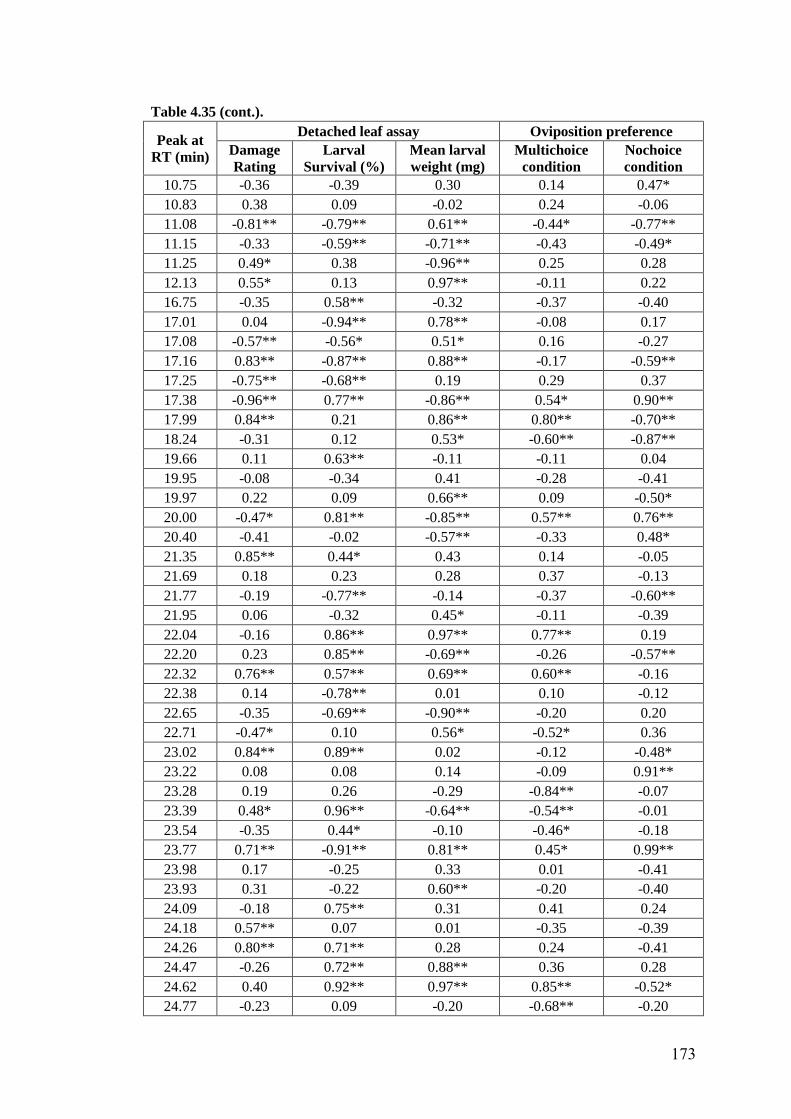
Table 4.35 (cont.).
Peak at
RT (min)
Detached leaf assay Oviposition preference
Damage
Rating
Larval
Survival (%)
Mean larval
weight (mg)
Multichoice
condition
Nochoice
condition
10.75 -0.36 -0.39 0.30 0.14 0.47*
10.83 0.38 0.09 -0.02 0.24 -0.06
11.08 -0.81** -0.79** 0.61** -0.44* -0.77**
11.15 -0.33 -0.59** -0.71** -0.43 -0.49*
11.25 0.49* 0.38 -0.96** 0.25 0.28
12.13 0.55* 0.13 0.97** -0.11 0.22
16.75 -0.35 0.58** -0.32 -0.37 -0.40
17.01 0.04 -0.94** 0.78** -0.08 0.17
17.08 -0.57** -0.56* 0.51* 0.16 -0.27
17.16 0.83** -0.87** 0.88** -0.17 -0.59**
17.25 -0.75** -0.68** 0.19 0.29 0.37
17.38 -0.96** 0.77** -0.86** 0.54* 0.90**
17.99 0.84** 0.21 0.86** 0.80** -0.70**
18.24 -0.31 0.12 0.53* -0.60** -0.87**
19.66 0.11 0.63** -0.11 -0.11 0.04
19.95 -0.08 -0.34 0.41 -0.28 -0.41
19.97 0.22 0.09 0.66** 0.09 -0.50*
20.00 -0.47* 0.81** -0.85** 0.57** 0.76**
20.40 -0.41 -0.02 -0.57** -0.33 0.48*
21.35 0.85** 0.44* 0.43 0.14 -0.05
21.69 0.18 0.23 0.28 0.37 -0.13
21.77 -0.19 -0.77** -0.14 -0.37 -0.60**
21.95 0.06 -0.32 0.45* -0.11 -0.39
22.04 -0.16 0.86** 0.97** 0.77** 0.19
22.20 0.23 0.85** -0.69** -0.26 -0.57**
22.32 0.76** 0.57** 0.69** 0.60** -0.16
22.38 0.14 -0.78** 0.01 0.10 -0.12
22.65 -0.35 -0.69** -0.90** -0.20 0.20
22.71 -0.47* 0.10 0.56* -0.52* 0.36
23.02 0.84** 0.89** 0.02 -0.12 -0.48*
23.22 0.08 0.08 0.14 -0.09 0.91**
23.28 0.19 0.26 -0.29 -0.84** -0.07
23.39 0.48* 0.96** -0.64** -0.54** -0.01
23.54 -0.35 0.44* -0.10 -0.46* -0.18
23.77 0.71** -0.91** 0.81** 0.45* 0.99**
23.98 0.17 -0.25 0.33 0.01 -0.41
23.93 0.31 -0.22 0.60** -0.20 -0.40
24.09 -0.18 0.75** 0.31 0.41 0.24
24.18 0.57** 0.07 0.01 -0.35 -0.39
24.26 0.80** 0.71** 0.28 0.24 -0.41
24.47 -0.26 0.72** 0.88** 0.36 0.28
24.62 0.40 0.92** 0.97** 0.85** -0.52*
24.77 -0.23 0.09 -0.20 -0.68** -0.20
173
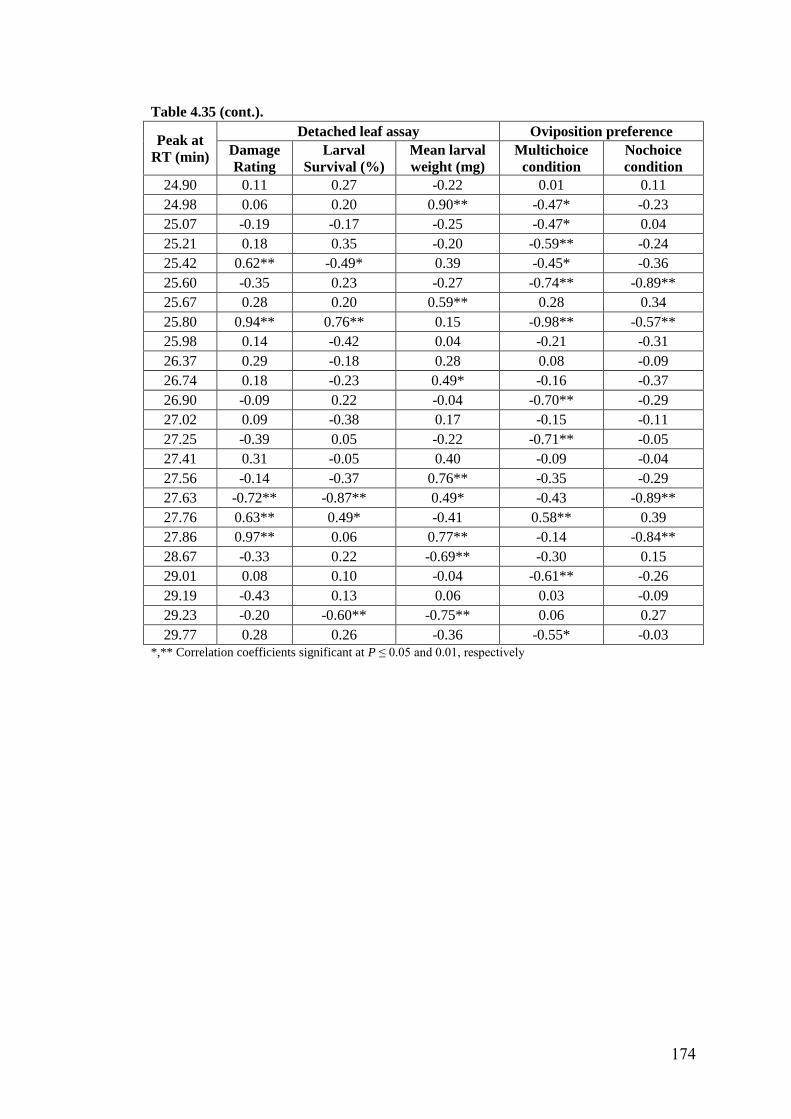
Table 4.35 (cont.).
Peak at
RT (min)
Detached leaf assay Oviposition preference
Damage
Rating
Larval
Survival (%)
Mean larval
weight (mg)
Multichoice
condition
Nochoice
condition
24.90 0.11 0.27 -0.22 0.01 0.11
24.98 0.06 0.20 0.90** -0.47* -0.23
25.07 -0.19 -0.17 -0.25 -0.47* 0.04
25.21 0.18 0.35 -0.20 -0.59** -0.24
25.42 0.62** -0.49* 0.39 -0.45* -0.36
25.60 -0.35 0.23 -0.27 -0.74** -0.89**
25.67 0.28 0.20 0.59** 0.28 0.34
25.80 0.94** 0.76** 0.15 -0.98** -0.57**
25.98 0.14 -0.42 0.04 -0.21 -0.31
26.37 0.29 -0.18 0.28 0.08 -0.09
26.74 0.18 -0.23 0.49* -0.16 -0.37
26.90 -0.09 0.22 -0.04 -0.70** -0.29
27.02 0.09 -0.38 0.17 -0.15 -0.11
27.25 -0.39 0.05 -0.22 -0.71** -0.05
27.41 0.31 -0.05 0.40 -0.09 -0.04
27.56 -0.14 -0.37 0.76** -0.35 -0.29
27.63 -0.72** -0.87** 0.49* -0.43 -0.89**
27.76 0.63** 0.49* -0.41 0.58** 0.39
27.86 0.97** 0.06 0.77** -0.14 -0.84**
28.67 -0.33 0.22 -0.69** -0.30 0.15
29.01 0.08 0.10 -0.04 -0.61** -0.26
29.19 -0.43 0.13 0.06 0.03 -0.09
29.23 -0.20 -0.60** -0.75** 0.06 0.27
29.77 0.28 0.26 -0.36 -0.55* -0.03
*,** Correlation coefficients significant at P ≤ 0.05 and 0.01, respectively
174
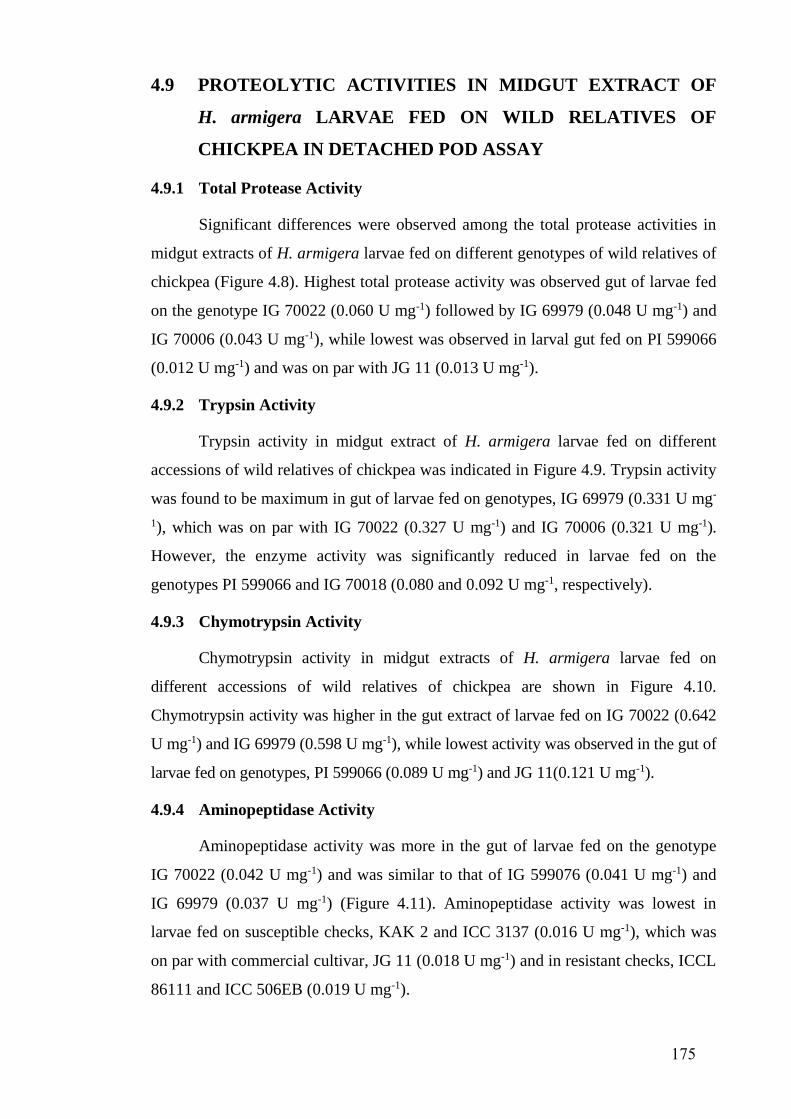
4.9 PROTEOLYTIC ACTIVITIES IN MIDGUT EXTRACT OF
H. armigera LARVAE FED ON WILD RELATIVES OF
CHICKPEA IN DETACHED POD ASSAY
4.9.1 Total Protease Activity
Significant differences were observed among the total protease activities in
midgut extracts of H. armigera larvae fed on different genotypes of wild relatives of
chickpea (Figure 4.8). Highest total protease activity was observed gut of larvae fed
on the genotype IG 70022 (0.060 U mg-1) followed by IG 69979 (0.048 U mg-1) and
IG 70006 (0.043 U mg-1), while lowest was observed in larval gut fed on PI 599066
(0.012 U mg-1) and was on par with JG 11 (0.013 U mg-1).
4.9.2 Trypsin Activity
Trypsin activity in midgut extract of H. armigera larvae fed on different
accessions of wild relatives of chickpea was indicated in Figure 4.9. Trypsin activity
was found to be maximum in gut of larvae fed on genotypes, IG 69979 (0.331 U mg-
1), which was on par with IG 70022 (0.327 U mg-1) and IG 70006 (0.321 U mg-1).
However, the enzyme activity was significantly reduced in larvae fed on the
genotypes PI 599066 and IG 70018 (0.080 and 0.092 U mg-1, respectively).
4.9.3 Chymotrypsin Activity
Chymotrypsin activity in midgut extracts of H. armigera larvae fed on
different accessions of wild relatives of chickpea are shown in Figure 4.10.
Chymotrypsin activity was higher in the gut extract of larvae fed on IG 70022 (0.642
U mg-1) and IG 69979 (0.598 U mg-1), while lowest activity was observed in the gut of
larvae fed on genotypes, PI 599066 (0.089 U mg-1) and JG 11(0.121 U mg-1).
4.9.4 Aminopeptidase Activity
Aminopeptidase activity was more in the gut of larvae fed on the genotype
IG 70022 (0.042 U mg-1) and was similar to that of IG 599076 (0.041 U mg-1) and
IG 69979 (0.037 U mg-1) (Figure 4.11). Aminopeptidase activity was lowest in
larvae fed on susceptible checks, KAK 2 and ICC 3137 (0.016 U mg-1), which was
on par with commercial cultivar, JG 11 (0.018 U mg-1) and in resistant checks, ICCL
86111 and ICC 506EB (0.019 U mg-1).
175
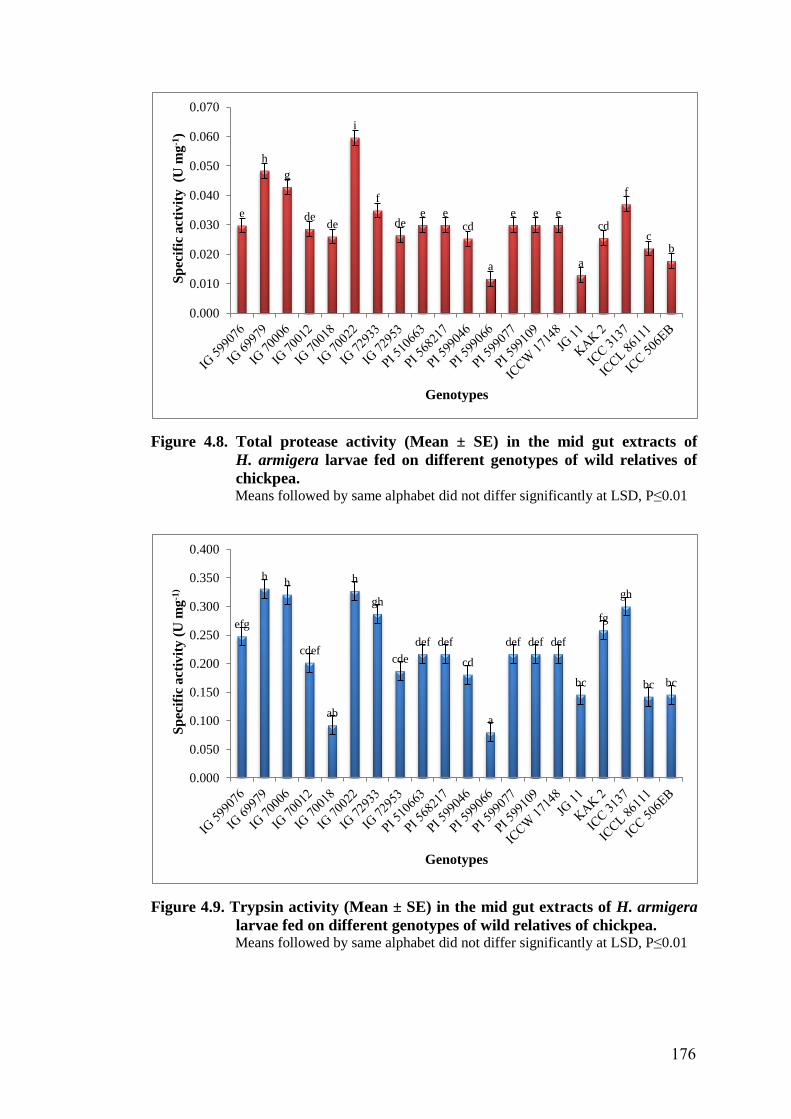
Figure 4.8. Total protease activity (Mean ± SE) in the mid gut extracts of
H. armigera larvae fed on different genotypes of wild relatives of
chickpea. Means followed by same alphabet did not differ significantly at LSD, P≤0.01
Figure 4.9. Trypsin activity (Mean ± SE) in the mid gut extracts of H. armigera
larvae fed on different genotypes of wild relatives of chickpea. Means followed by same alphabet did not differ significantly at LSD, P≤0.01
e
h
g
dede
i
f
dee e
cd
a
e e e
a
cd
f
cb
0.000
0.010
0.020
0.030
0.040
0.050
0.060
0.070
Sp
ecif
ic a
ctiv
ity
(U
mg
-1)
Genotypes
efg
hh
cdef
ab
h
gh
cde
def def
cd
a
def def def
bc
fg
gh
bc bc
0.000
0.050
0.100
0.150
0.200
0.250
0.300
0.350
0.400
Sp
ecif
ic a
ctiv
ity (
U m
g-1
)
Genotypes
176
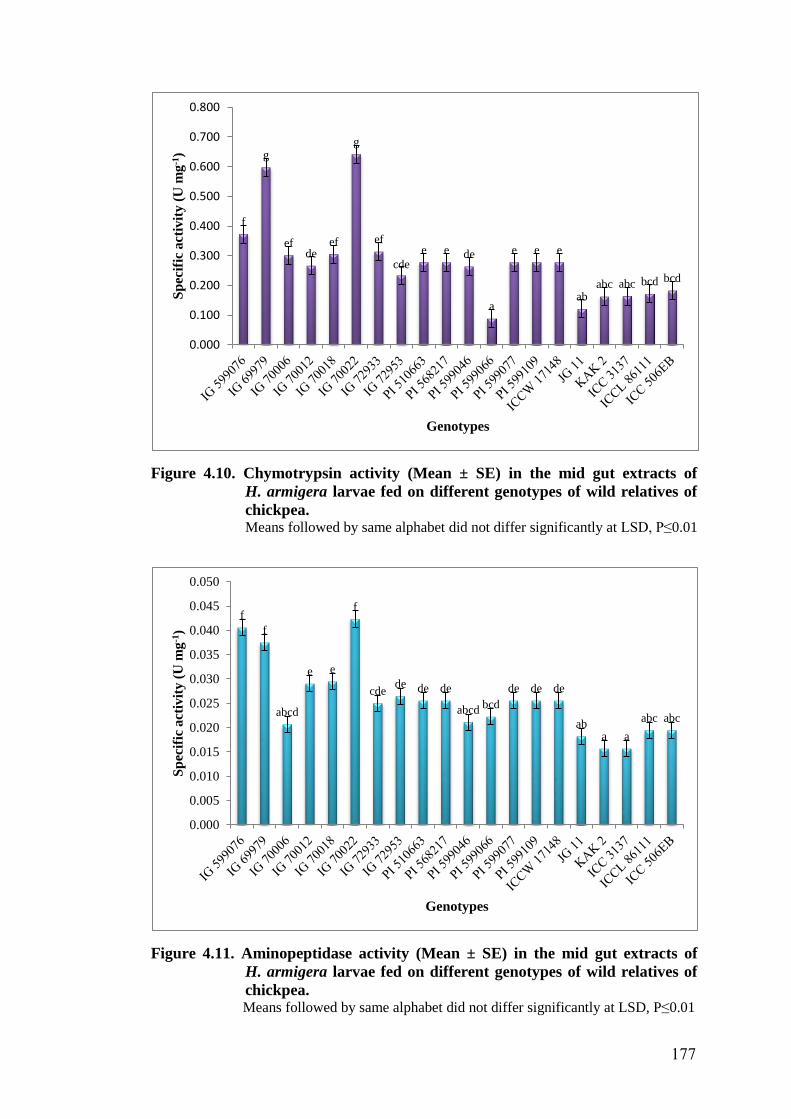
Figure 4.10. Chymotrypsin activity (Mean ± SE) in the mid gut extracts of
H. armigera larvae fed on different genotypes of wild relatives of
chickpea. Means followed by same alphabet did not differ significantly at LSD, P≤0.01
Figure 4.11. Aminopeptidase activity (Mean ± SE) in the mid gut extracts of
H. armigera larvae fed on different genotypes of wild relatives of
chickpea. Means followed by same alphabet did not differ significantly at LSD, P≤0.01
f
g
efde
ef
g
ef
cde
e e de
a
e e e
ababc abc bcd bcd
0.000
0.100
0.200
0.300
0.400
0.500
0.600
0.700
0.800
Sp
ecif
ic a
ctiv
ity
(U
mg
-1)
Genotypes
f
f
abcd
e e
f
cdede de de
abcdbcd
de de de
aba a
abc abc
0.000
0.005
0.010
0.015
0.020
0.025
0.030
0.035
0.040
0.045
0.050
Sp
ecif
ic a
ctiv
ity (
U m
g-1
)
Genotypes
177

Activities of digestive enzymes in insect depend on either the quality of food
sources or consumed chemical compounds and enzyme inhibitors (Slansky, 1982
and Mendiola-Olayab et al., 2000). Any interference in the activity of digestive
enzymes by enzyme-inhibitors of host plant can result in poor nutrient utilization
and developmental retardation (Gatehouse and Gatehouse, 1999 and Jongsma and
Bolter, 1997). Larvae fed on wild relatives of chickpea showed higher total protease
activity though they have recorded lesser weight gain percentage, it could be
because of hyperproduction of proteases to overcome the effect of ingested PI from
host plant (Broadway, 1996).
Lowest levels of trypsin and chymotrypsin activities were observed in the
larval gut of H. armigera fed on PI 599066 (C. bijugum), this could be explained
that, inhibitors were active in the gut and inhibited the proteinase activity and thus
the larvae suffered due to dietary PIs and showed stunted growth (Harsulkar et al.,
1999). When the larvae fed on genotype IG 69979 (C. cuneatum) and IG 70022 (C.
bijugum), the gut extract showed increased activity of trypsin and chymotrypsin
though weight gain by larvae was very low when fed on these genotypes. This may
be due to hyper production of trypsin and chymotrypsin to overcome the effects of
protease inhibitor factors present in the genotypes. Varietal differences in trypsin
and chymotrypsin inhibitors in chickpea have been reported by Sastry and Murray
(1987). Patankar et al. (1999) reported that wild relatives of chickpea exhibited
diversity of TI isoforms with respect to both number and activity as compared to
cultivated chickpea. Larvae fed on genotypes, IG 70018 and PI 599046 (C. bijugum)
showed high chymotrypsin activity and low trypsin activity.
Increased chymotrypsin activity was due to the compensation of inhibitory
effects of trypsin inhibitors of these genotypes. Increased activity of chmotrypsin
and elastase like enzymes to compensate the inhibitory effect of trypsin has been
reported when larvae reared on corn (Baghery et al., 2014), soybean (Naseri et al.,
2010), and giant taro trypsin inhibitor (Wu et al., 1997). Larvae fed on wild relatives
of chickpea recorded high activity of aminopeptidase compared to cultivated
chickpea, which might be due to high PI activity in wild relatives. Results are
consistent with our previous findings where in H. armigera fed on PI showed higher
aminopeptidase activity (Lomate and Hivrale, 2011 and Hivrale et al., 2013).
178
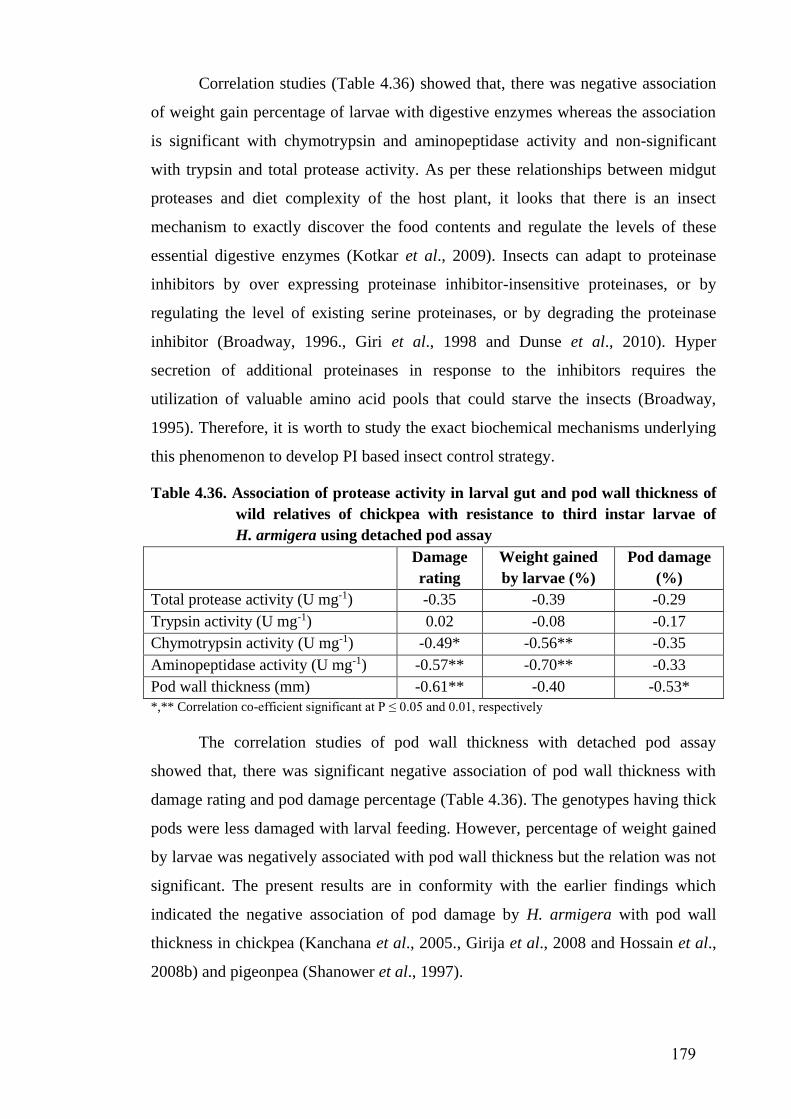
Correlation studies (Table 4.36) showed that, there was negative association
of weight gain percentage of larvae with digestive enzymes whereas the association
is significant with chymotrypsin and aminopeptidase activity and non-significant
with trypsin and total protease activity. As per these relationships between midgut
proteases and diet complexity of the host plant, it looks that there is an insect
mechanism to exactly discover the food contents and regulate the levels of these
essential digestive enzymes (Kotkar et al., 2009). Insects can adapt to proteinase
inhibitors by over expressing proteinase inhibitor-insensitive proteinases, or by
regulating the level of existing serine proteinases, or by degrading the proteinase
inhibitor (Broadway, 1996., Giri et al., 1998 and Dunse et al., 2010). Hyper
secretion of additional proteinases in response to the inhibitors requires the
utilization of valuable amino acid pools that could starve the insects (Broadway,
1995). Therefore, it is worth to study the exact biochemical mechanisms underlying
this phenomenon to develop PI based insect control strategy.
Table 4.36. Association of protease activity in larval gut and pod wall thickness of
wild relatives of chickpea with resistance to third instar larvae of
H. armigera using detached pod assay
Damage
rating
Weight gained
by larvae (%)
Pod damage
(%)
Total protease activity (U mg-1) -0.35 -0.39 -0.29
Trypsin activity (U mg-1) 0.02 -0.08 -0.17
Chymotrypsin activity (U mg-1) -0.49* -0.56** -0.35
Aminopeptidase activity (U mg-1) -0.57** -0.70** -0.33
Pod wall thickness (mm) -0.61** -0.40 -0.53*
*,** Correlation co-efficient significant at P ≤ 0.05 and 0.01, respectively
The correlation studies of pod wall thickness with detached pod assay
showed that, there was significant negative association of pod wall thickness with
damage rating and pod damage percentage (Table 4.36). The genotypes having thick
pods were less damaged with larval feeding. However, percentage of weight gained
by larvae was negatively associated with pod wall thickness but the relation was not
significant. The present results are in conformity with the earlier findings which
indicated the negative association of pod damage by H. armigera with pod wall
thickness in chickpea (Kanchana et al., 2005., Girija et al., 2008 and Hossain et al.,
2008b) and pigeonpea (Shanower et al., 1997).
179
4.10 PROTEASE INHIBITORS (PIS) IN WILD RELATIVES OF
CHICKPEA AGAINST H. armigera
4.10.1 Electrophoretic Visualization of H. armigera Gut Isoforms
Electrophoretic visualization of H. armigera gut isoforms revealed that a
total of 10 isoforms were observed ranging with a molecular weight of 3.0 to 43.0
kDa (Figure 4.12). Six to ten isoforms of gut proteases were earlier reported in H.
armigera (Harsulkar et al., 1998 and Udamale et al., 2013). Proteolytic activity of
insect gut comprises of many isoforms of proteinases having diverse properties and
specificities (Johnston et al., 1991). The presence of isoproteinases of different
specificities in the midgut has a great significance for the survival and adaptation of
phytophagous insects on several host plants. Presence of multi-isoforms of HGP
thus supported the polyphagous nature of H. armigera.
4.10.2 Dot-Blot Assay
In vitro screening of protease inhibitors (PI) using dot-blot assay at three
concentrations of trypsin and the inhibitor of plant sample extract (3:1, 1:1 and 1:3)
revealed that, at 1:3 concentration, all plant samples showed complete inhibition of
trypsin resulted in non hydrolysis of gelatine on the X-ray film (Table 4.37).
Complete inhibition of trypsin was observed even at 1:1 concentration of trypsin and
PI extract, except in PI 510663, PI 599109 (C. pinnatifidum), PI 568217 (C.
judaicum) and susceptible checks (KAK 2 and ICC 3137). Accessions belonging to
C. bijugum (IG 70012, IG 70018, IG 70022, PI 599046 and PI 599066), C.
chrossanicum (IG 599076), C. cuneatum (IG 69979), C. reticulatum (IG 72953), C.
judaicum (PI 599077) had shown complete inhibition of trypsin at low
concentrations of PI (3:1), whereas genotypes IG 70006, IG 72953, PI 568217,
ICCW 17148, KAK 2, ICCL 86111 and ICC 506EB had shown partial inhibition of
trypsin resulted in partial hydrolysis of gelatine on X-ray film and other genotypes
PI 510663, PI 599109 (C. pinnatifidum), JG11 and ICC 3137 has not shown
inhibition of trypsin resulted in complete hydrolysis of gelatine on X-ray film.
4.10.3 Zymogram Analysis of Trypsin Inhibitor (TI) Isoforms
Electrophoretic visualization of trypsin inhibitor isoforms showed a
significant variability in terms of number and band pattern in wild relatives of
chickpea in a range of 3.0 to 43.0 kDa (Figure 4.13). The genotypes IG 70018,
180
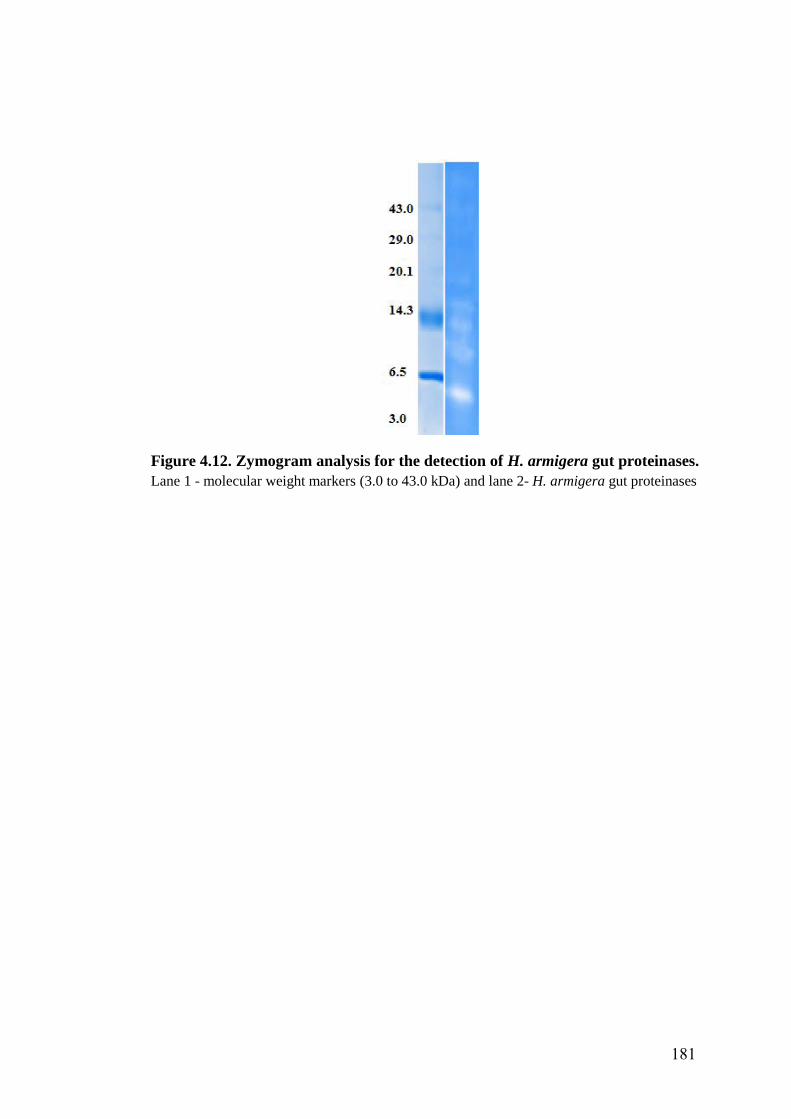
Figure 4.12. Zymogram analysis for the detection of H. armigera gut proteinases.
Lane 1 - molecular weight markers (3.0 to 43.0 kDa) and lane 2- H. armigera gut proteinases
181
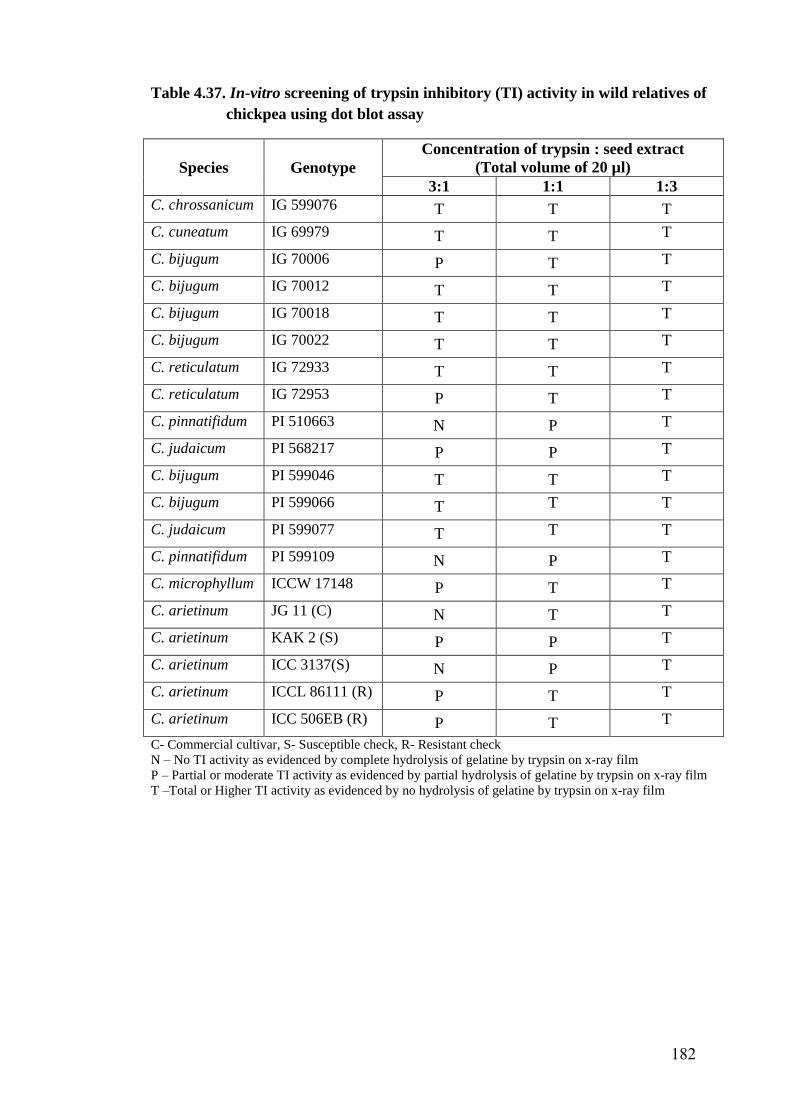
Table 4.37. In-vitro screening of trypsin inhibitory (TI) activity in wild relatives of
chickpea using dot blot assay
Species Genotype
Concentration of trypsin : seed extract
(Total volume of 20 µl)
3:1 1:1 1:3
C. chrossanicum IG 599076 T T T
C. cuneatum IG 69979 T T T
C. bijugum IG 70006 P T T
C. bijugum IG 70012 T T T
C. bijugum IG 70018 T T T
C. bijugum IG 70022 T T T
C. reticulatum IG 72933 T T T
C. reticulatum IG 72953 P T T
C. pinnatifidum PI 510663 N P T
C. judaicum PI 568217 P P T
C. bijugum PI 599046 T T T
C. bijugum PI 599066 T T T
C. judaicum PI 599077 T T T
C. pinnatifidum PI 599109 N P T
C. microphyllum ICCW 17148 P T T
C. arietinum JG 11 (C) N T T
C. arietinum KAK 2 (S) P P T
C. arietinum ICC 3137(S) N P T
C. arietinum ICCL 86111 (R) P T T
C. arietinum ICC 506EB (R) P T T
C- Commercial cultivar, S- Susceptible check, R- Resistant check
N – No TI activity as evidenced by complete hydrolysis of gelatine by trypsin on x-ray film
P – Partial or moderate TI activity as evidenced by partial hydrolysis of gelatine by trypsin on x-ray film
T –Total or Higher TI activity as evidenced by no hydrolysis of gelatine by trypsin on x-ray film
182
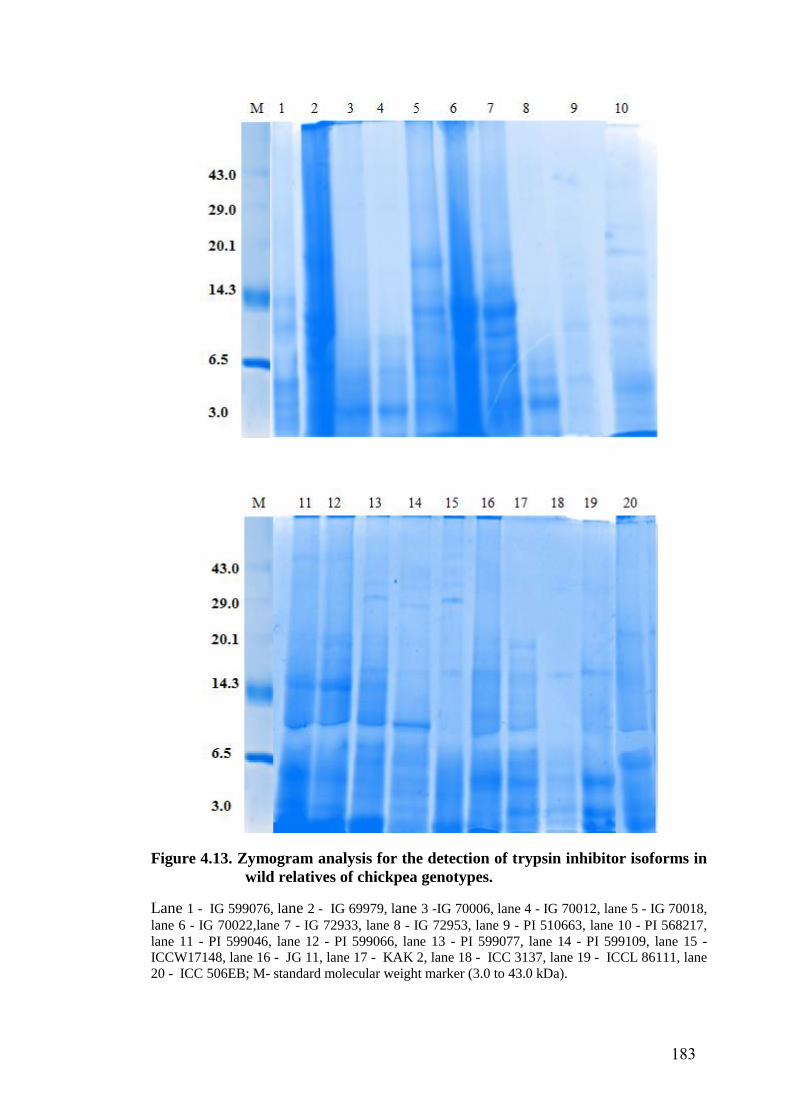
Figure 4.13. Zymogram analysis for the detection of trypsin inhibitor isoforms in
wild relatives of chickpea genotypes.
Lane 1 - IG 599076, lane 2 - IG 69979, lane 3 -IG 70006, lane 4 - IG 70012, lane 5 - IG 70018,
lane 6 - IG 70022,lane 7 - IG 72933, lane 8 - IG 72953, lane 9 - PI 510663, lane 10 - PI 568217,
lane 11 - PI 599046, lane 12 - PI 599066, lane 13 - PI 599077, lane 14 - PI 599109, lane 15 -
ICCW17148, lane 16 - JG 11, lane 17 - KAK 2, lane 18 - ICC 3137, lane 19 - ICCL 86111, lane
20 - ICC 506EB; M- standard molecular weight marker (3.0 to 43.0 kDa).
183
PI 599066 (C. bijugum) and IG 72933 (C. arietinum) showed a maximum of seven
isoforms, whereas PI 599046 (C. bijugum) and PI 599077 (C. judaicum) showed six
isoforms and IG 70022 (C. bijugum), PI 568217 (C. judaicum), IG 599076 (C.
chrossanicum), and IG 69979 (C. cuneatum) showed five isoforms. Minimum of
two isoforms were observed in PI 510663 (C. pinnatifidum). Remaining all
genotypes exhibited four isoforms except in PI 599109 (C. pinnatifidum), ICCW
17148 (C. microphyllum) and susceptible check ICC 3137 (C. arietinum) showed
three isoforms. The differential appearance of TI may be attributed to temporal
expression of different genes or may be due to posttranslational modification of
inhibitors or their pro-proteins (Giri et al., 1998).
Patankar et al. (1999) also observed the diversity in TI isoforms with respect
to both number and activity as compared to cultivated chickpea and reported that C.
bijugum showed two major bands and one minor activity band, while C. reticulatum
showed two bands, C. judaicum revealed two TI activity bands and C. cuneatum
showed a single TI band. However, no TI band was observed in C. pinnatifidum.
The variation observed in wild Cicer species is considered significant, as the TIs are
known to serve as defense proteins against herbivores (Ryan, 1990). Patankar et al.
(2001) also observed significant variation in the TI isoforms from wild Cicer
species. However, they have observed great conservation of TI isoforms in the
mature seeds of the chickpea cultivars. A similar observation existed in pigeonpea
where TIs and chymotrypsin inhibitors were conserved in matured seeds of the
cultivated pigeonpea, whereas high levels of diversity existed in uncultivated species
of Cajanus (Kollipara et al., 1994 and Pichare and Kachole, 1994). Progressive
increase in PI activity throughout seed development had also been observed (Giri et
al., 1998) and reported that three TI bands were detected at 24 days after flowering
(DAF), while seven TI bands were detected at 36 DAF and it was further observed
that insect feeding also increased production of PI activity where seven different TI
bands were present in seeds at 36 DAF, the time of maximum H. armigera attack.
4.10.4 Inhibitory Potential of H. armigera Gut (HG) Proteases in Wild Relatives
of Chickpea
Significant variations were observed in terms of inhibitory potential of H. armigera
gut (HG) proteases in different wild relatives of chickpea under in vitro condition
(Figure 4.14). Highest HG total protease inhibitory activity (interms of Units g-1 sample)
184
was observed in IG 70018 (17.65), IG 72933 (14.97), IG 70006 (14.43) and IG 70012
(14.15) compared to resistant check, ICC 506EB (9.88), whereas lowest values were
observed in C. pinnatifidum, PI 599109 (1.90) and PI 510663 (3.51), C. judaicum, PI
568217 (4.88) and PI 599077 (7.24) and C. microphyllum, ICCW 17148 (7.24).
Inhibitory activity of HG trypsin (Units g-1) was observed significantly highest in C.
reticulatum, IG 72933 (76.67) and C. bijugum, IG 70012 (64.14), IG 70018 (63.46) and
IG 70006 (62.78), and significantly low in C. pinnatifidum, PI 599109 (4.73) and PI
510663 (11.24), C. microphyllum, ICCW 17148 (13.94) and PI 568217 (26.70)
compared to resistant check, ICC 506EB (32.60).
HG chymotrypsin inhibitor activity (Units g-1) in different genotypes of wild
relatives of chickpea showed significant variations. Highest inhibitory activity was
observed in C. bijugum, IG 70018 (35.29) whereas lowest was observed in C.
chrossanicum (IG 599076) with 9.64 Units g-1. As an overall view, the genotypes, C.
bijugum, C. reticulatum and C. cuneatum showed higher inhibitory activity of HG
proteases, while C. pinnatifidum and C. judaicum had low inhibitory activity
compared to cultivated chickpea. The present results are similar to the findings of
(Patankar et al., 1999) who observed that highest inhibition of HGP was effected by
C. bijugum PIs, followed by C. echinospermum and C. arietinum, while the lowest
HGP inhibition was detected in C. pinnatifidum and C. cuneatum. The amount of PI
activity increased several fold when seeds were injured by H. armigera feeding.
Insect damage resulted in a six fold increase in H. armigera gut PI activity and a two
fold increase in TI activity (Giri et al., 1998).
However, earlier reports observed that PI insensitive and inhibitor digestive
proteases produced by H. armigera and none of the TIs from chickpea and its wild
relatives inhibited gut protease activity totally in H. armigera (Giri et al., 1998).
Laskowski et al. (1988) have proposed that structural compatibility between the plant
PIs and the insect proteinases determines the level of inhibitory activity against specific
proteinases. Structural variation occurring in gut proteinases followed by selection
against host plant PIs may modify insect proteinases that, although of the same class are
insensitive to host plant PIs. An alteration in an insect proteinase isozyme may result in
less inhibitor binding, leading to successful predation. In order to survive, plants also
must evolve their inhibitor proteins to effectively inhibit insect proteinases. Both pests
and plants have therefore been evolving new forms of enzymes and inhibitors to
counteract each other’s defense mechanisms (Bown et al., 1997).
185
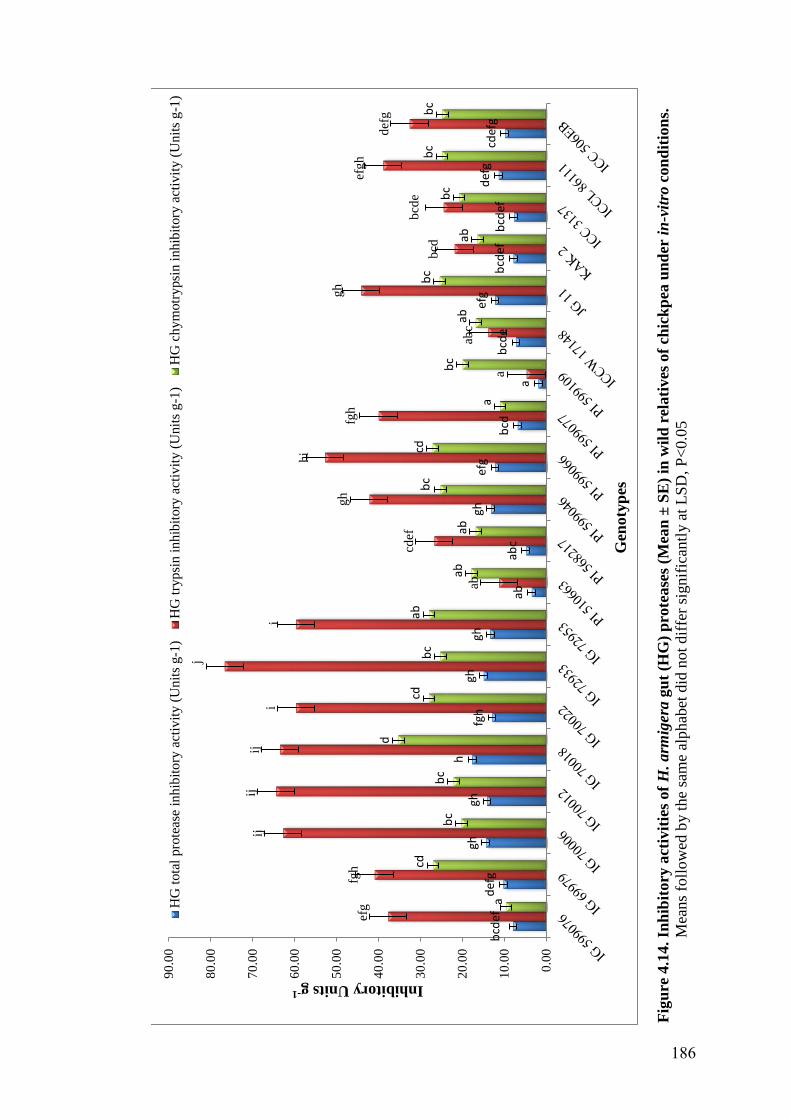
Fig
ure
4.1
4. In
hib
itory
act
ivit
ies
of
H. arm
iger
a g
ut
(HG
) p
rote
ase
s (M
ean
± S
E)
in w
ild
rel
ati
ves
of
chic
kp
ea u
nd
er i
n-v
itro
con
dit
ion
s.
M
eans
foll
ow
ed b
y t
he
sam
e al
phab
et d
id n
ot
dif
fer
signif
ican
tly a
t L
SD
, P
<0.0
5
bcd
efd
efg
ghgh
h
fgh
ghgh
abab
c
ghef
g
bcd
a
bcd
e
efg
bcd
efb
cdef
def
gcd
efg
efg
fgh
ijij
ij
i
j
i
ab
cdef
gh
hi
fgh
a
abc
gh
bcd
bcd
e
efgh
def
g
a
cd
bc
bc
d
cdb
cab
abab
bc
cd
a
bc
ab
bc
ab
bc
bc
bc
0.0
0
10.0
0
20.0
0
30.0
0
40.0
0
50.0
0
60.0
0
70.0
0
80.0
0
90.0
0
Inhibitory Units g-1
Gen
oty
pes
HG
tota
l pro
teas
e in
hib
itory
act
ivit
y (
Unit
s g-1
)H
G t
rypsi
n i
nhib
itory
act
ivit
y (
Unit
s g
-1)
HG
ch
ym
otr
ypsi
n i
nh
ibit
ory
act
ivit
y (
Un
its
g-1
)
186
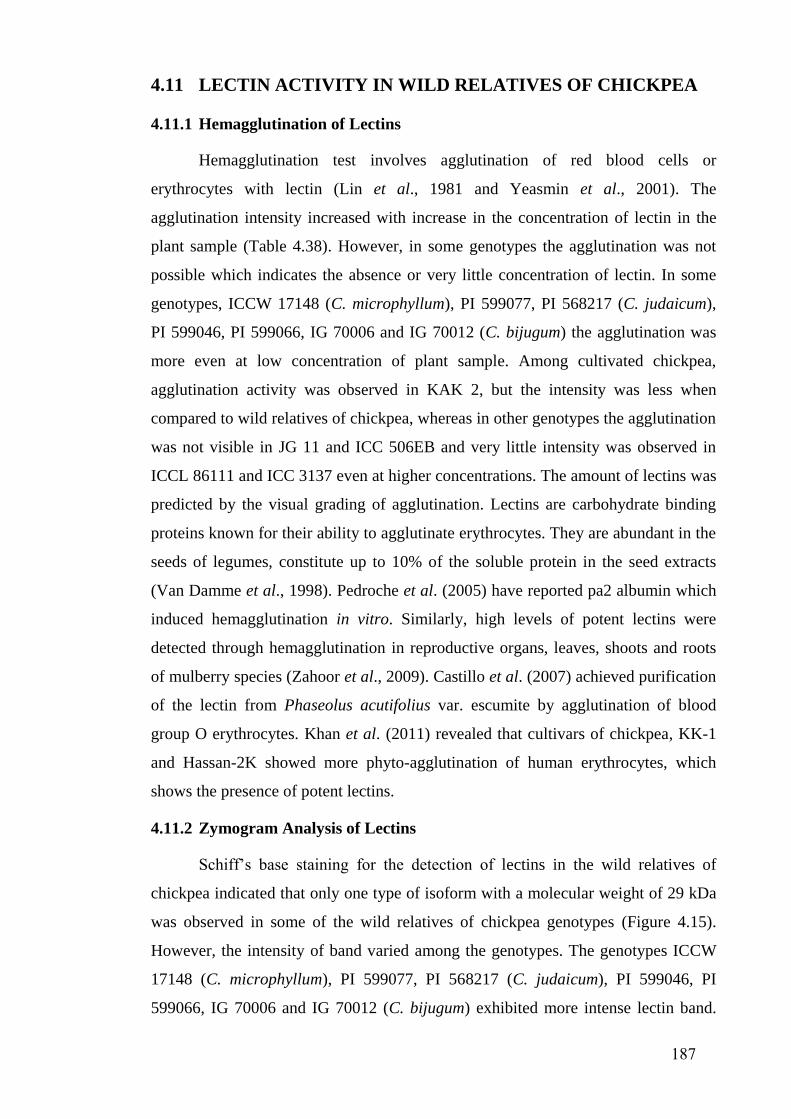
4.11 LECTIN ACTIVITY IN WILD RELATIVES OF CHICKPEA
4.11.1 Hemagglutination of Lectins
Hemagglutination test involves agglutination of red blood cells or
erythrocytes with lectin (Lin et al., 1981 and Yeasmin et al., 2001). The
agglutination intensity increased with increase in the concentration of lectin in the
plant sample (Table 4.38). However, in some genotypes the agglutination was not
possible which indicates the absence or very little concentration of lectin. In some
genotypes, ICCW 17148 (C. microphyllum), PI 599077, PI 568217 (C. judaicum),
PI 599046, PI 599066, IG 70006 and IG 70012 (C. bijugum) the agglutination was
more even at low concentration of plant sample. Among cultivated chickpea,
agglutination activity was observed in KAK 2, but the intensity was less when
compared to wild relatives of chickpea, whereas in other genotypes the agglutination
was not visible in JG 11 and ICC 506EB and very little intensity was observed in
ICCL 86111 and ICC 3137 even at higher concentrations. The amount of lectins was
predicted by the visual grading of agglutination. Lectins are carbohydrate binding
proteins known for their ability to agglutinate erythrocytes. They are abundant in the
seeds of legumes, constitute up to 10% of the soluble protein in the seed extracts
(Van Damme et al., 1998). Pedroche et al. (2005) have reported pa2 albumin which
induced hemagglutination in vitro. Similarly, high levels of potent lectins were
detected through hemagglutination in reproductive organs, leaves, shoots and roots
of mulberry species (Zahoor et al., 2009). Castillo et al. (2007) achieved purification
of the lectin from Phaseolus acutifolius var. escumite by agglutination of blood
group O erythrocytes. Khan et al. (2011) revealed that cultivars of chickpea, KK-1
and Hassan-2K showed more phyto-agglutination of human erythrocytes, which
shows the presence of potent lectins.
4.11.2 Zymogram Analysis of Lectins
Schiff’s base staining for the detection of lectins in the wild relatives of
chickpea indicated that only one type of isoform with a molecular weight of 29 kDa
was observed in some of the wild relatives of chickpea genotypes (Figure 4.15).
However, the intensity of band varied among the genotypes. The genotypes ICCW
17148 (C. microphyllum), PI 599077, PI 568217 (C. judaicum), PI 599046, PI
599066, IG 70006 and IG 70012 (C. bijugum) exhibited more intense lectin band.
187
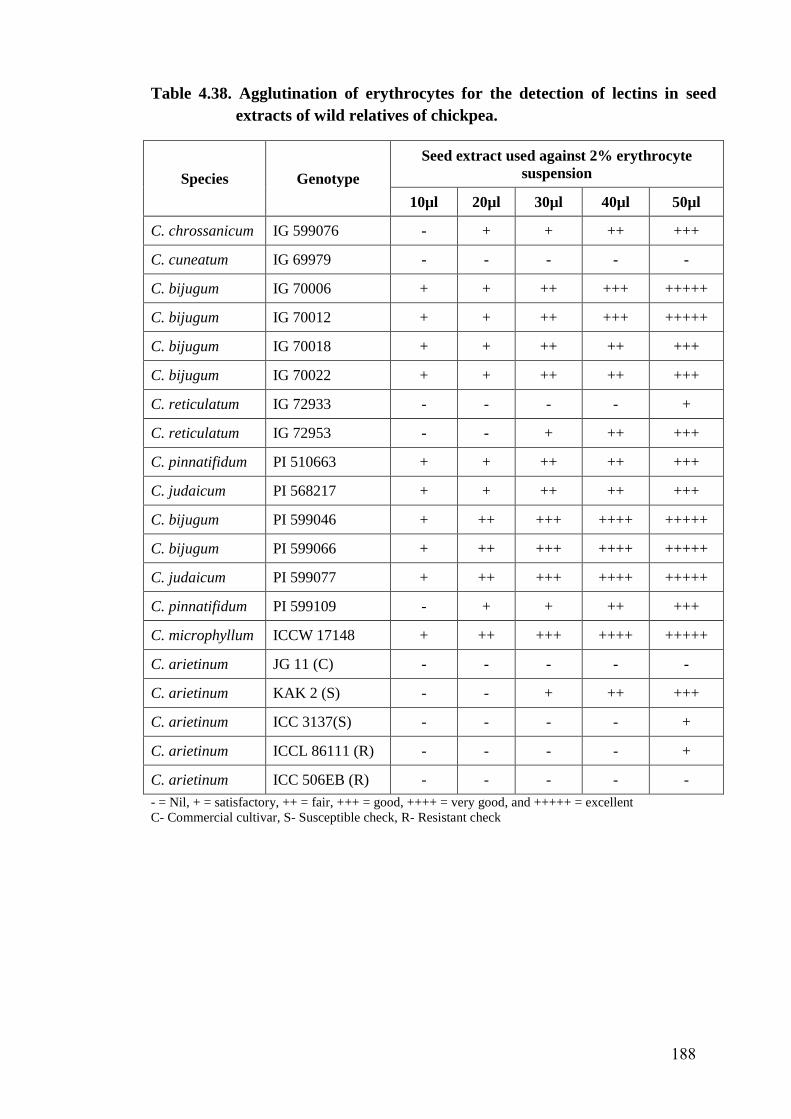
Table 4.38. Agglutination of erythrocytes for the detection of lectins in seed
extracts of wild relatives of chickpea.
Species Genotype
Seed extract used against 2% erythrocyte
suspension
10µl 20µl 30µl 40µl 50µl
C. chrossanicum IG 599076 - + + ++ +++
C. cuneatum IG 69979 - - - - -
C. bijugum IG 70006 + + ++ +++ +++++
C. bijugum IG 70012 + + ++ +++ +++++
C. bijugum IG 70018 + + ++ ++ +++
C. bijugum IG 70022 + + ++ ++ +++
C. reticulatum IG 72933 - - - - +
C. reticulatum IG 72953 - - + ++ +++
C. pinnatifidum PI 510663 + + ++ ++ +++
C. judaicum PI 568217 + + ++ ++ +++
C. bijugum PI 599046 + ++ +++ ++++ +++++
C. bijugum PI 599066 + ++ +++ ++++ +++++
C. judaicum PI 599077 + ++ +++ ++++ +++++
C. pinnatifidum PI 599109 - + + ++ +++
C. microphyllum ICCW 17148 + ++ +++ ++++ +++++
C. arietinum JG 11 (C) - - - - -
C. arietinum KAK 2 (S) - - + ++ +++
C. arietinum ICC 3137(S) - - - - +
C. arietinum ICCL 86111 (R) - - - - +
C. arietinum ICC 506EB (R) - - - - -
- = Nil, + = satisfactory, ++ = fair, +++ = good, ++++ = very good, and +++++ = excellent
C- Commercial cultivar, S- Susceptible check, R- Resistant check
188
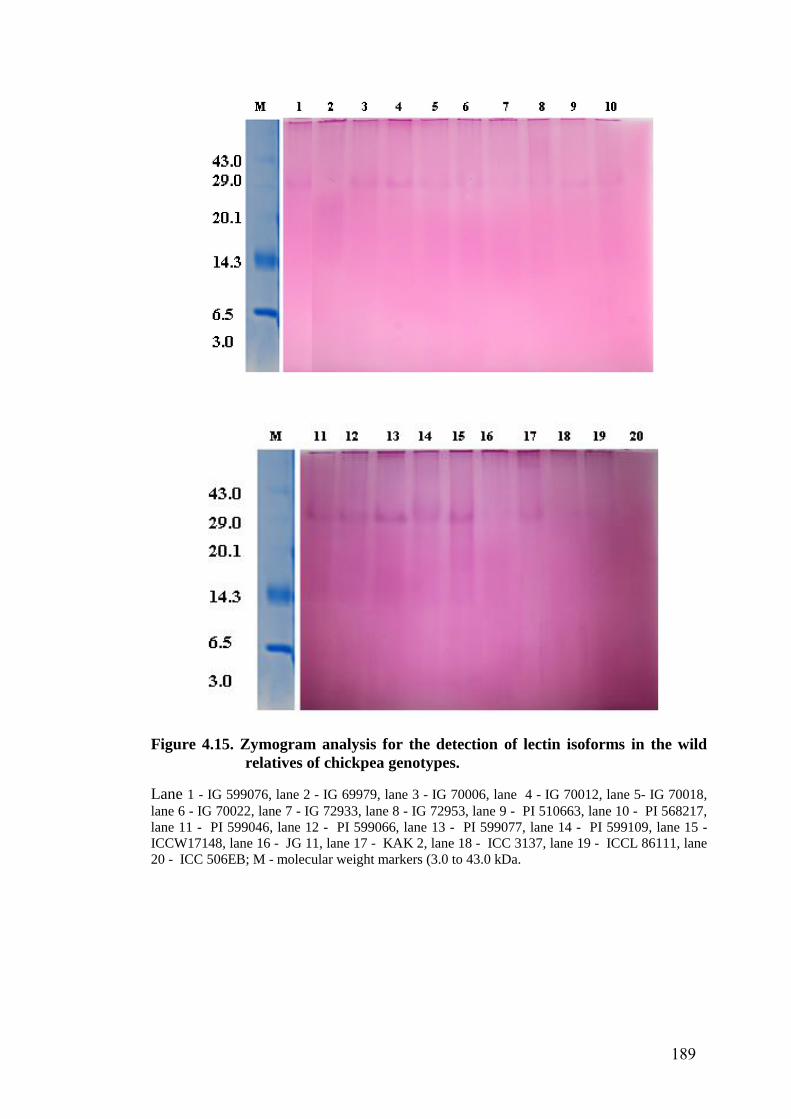
Figure 4.15. Zymogram analysis for the detection of lectin isoforms in the wild
relatives of chickpea genotypes.
Lane 1 - IG 599076, lane 2 - IG 69979, lane 3 - IG 70006, lane 4 - IG 70012, lane 5- IG 70018,
lane 6 - IG 70022, lane 7 - IG 72933, lane 8 - IG 72953, lane 9 - PI 510663, lane 10 - PI 568217,
lane 11 - PI 599046, lane 12 - PI 599066, lane 13 - PI 599077, lane 14 - PI 599109, lane 15 -
ICCW17148, lane 16 - JG 11, lane 17 - KAK 2, lane 18 - ICC 3137, lane 19 - ICCL 86111, lane
20 - ICC 506EB; M - molecular weight markers (3.0 to 43.0 kDa.
189
Lectins were not observed in some wild relatives of chickpea genotypes i.e., IG
69979 (C. cuneatum) and IG 72933 (C. reticulatum) as well as in cultivated
chickpea genotypes except in KAK 2 which showed a less intensity band of lectin.
Qureshi et al. (2006) purified lectin in C. arietinum with an apparent mass of
30 kDa on SDS-PAGE and native PAGE. Kolberg et al. (1983) also isolated a
potent lectin from seed extracts of C. arietinum, which had a molecular mass of
about 44 kDa, as determined by ultracentrifugation and gel filtration, whereas SDS-
PAGE showed one band corresponding to molecular mass of 26 kDa. Bashir et al.
(2010) reported that soybean lectin did not show specificity towards any blood
group and the purified soybean lectin showed a single band but on contrary, they
observed molecular weight of 130 kDa on SDS-PAGE, whereas in native-PAGE it
showed a band of 110 kDa. Soybean leaf glycoprotein has molecular mass of 120
kDa with subunits having molecular masses of 28 and 33 kDa (Spilatro and
Anderson, 1989). These variations could be due to differences in plant species. The
purified lectin from red kidney bean was observed as a single band with a molecular
mass of about 30 kDa in SDS-PAGE electrophoresis (Hou et al., 2010). Induced
production of lectins was also observed with synthesis of a19 kDa lectin as a result
of jasmonic acid application which was absent in untreated leaves of tobacco
(Lannoo et al., 2006).
Lectins bind to the glycan receptors present on the surface lining of the insect
gut (Pusztai and Bardocz, 1996) and interfere with the formation and integrity of the
peritrophic membrane of the midgut (Harper et al., 1998) resulting in harmful
effects on insect. Lectins also interfere with the digestive enzymes in the midgut of
insects and inhibited carbohydrases and proteinases (War et al., 2013). Reduced
larval survival and weight, pupal weight, pupal period, pupation and adult
emergence were also observed in H. armigera larvae fed on artificial diet
impregnated with different lectins from chickpea, garlic, fieldbean, pigeonpea,
jackfruit and wheat germ agglutinin (Arora et al., 2005., Gupta et al., 2005 and
Shukla et al., 2005). These highly potent lectins could be isolated and characterized
according to their molecular weight, specificity to carbohydrates binding moieties
and toxicity to H. armigera can be used as resistant sources against pest.
190
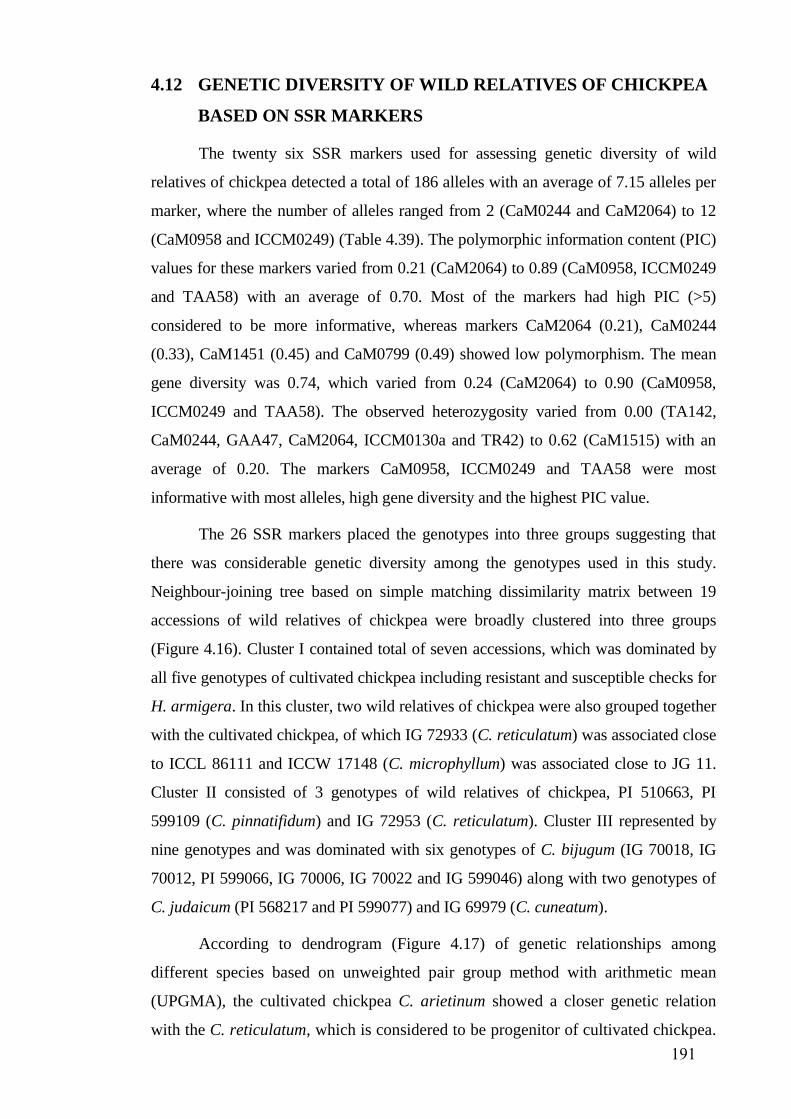
4.12 GENETIC DIVERSITY OF WILD RELATIVES OF CHICKPEA
BASED ON SSR MARKERS
The twenty six SSR markers used for assessing genetic diversity of wild
relatives of chickpea detected a total of 186 alleles with an average of 7.15 alleles per
marker, where the number of alleles ranged from 2 (CaM0244 and CaM2064) to 12
(CaM0958 and ICCM0249) (Table 4.39). The polymorphic information content (PIC)
values for these markers varied from 0.21 (CaM2064) to 0.89 (CaM0958, ICCM0249
and TAA58) with an average of 0.70. Most of the markers had high PIC (>5)
considered to be more informative, whereas markers CaM2064 (0.21), CaM0244
(0.33), CaM1451 (0.45) and CaM0799 (0.49) showed low polymorphism. The mean
gene diversity was 0.74, which varied from 0.24 (CaM2064) to 0.90 (CaM0958,
ICCM0249 and TAA58). The observed heterozygosity varied from 0.00 (TA142,
CaM0244, GAA47, CaM2064, ICCM0130a and TR42) to 0.62 (CaM1515) with an
average of 0.20. The markers CaM0958, ICCM0249 and TAA58 were most
informative with most alleles, high gene diversity and the highest PIC value.
The 26 SSR markers placed the genotypes into three groups suggesting that
there was considerable genetic diversity among the genotypes used in this study.
Neighbour-joining tree based on simple matching dissimilarity matrix between 19
accessions of wild relatives of chickpea were broadly clustered into three groups
(Figure 4.16). Cluster I contained total of seven accessions, which was dominated by
all five genotypes of cultivated chickpea including resistant and susceptible checks for
H. armigera. In this cluster, two wild relatives of chickpea were also grouped together
with the cultivated chickpea, of which IG 72933 (C. reticulatum) was associated close
to ICCL 86111 and ICCW 17148 (C. microphyllum) was associated close to JG 11.
Cluster II consisted of 3 genotypes of wild relatives of chickpea, PI 510663, PI
599109 (C. pinnatifidum) and IG 72953 (C. reticulatum). Cluster III represented by
nine genotypes and was dominated with six genotypes of C. bijugum (IG 70018, IG
70012, PI 599066, IG 70006, IG 70022 and IG 599046) along with two genotypes of
C. judaicum (PI 568217 and PI 599077) and IG 69979 (C. cuneatum).
According to dendrogram (Figure 4.17) of genetic relationships among
different species based on unweighted pair group method with arithmetic mean
(UPGMA), the cultivated chickpea C. arietinum showed a closer genetic relation
with the C. reticulatum, which is considered to be progenitor of cultivated chickpea.
191
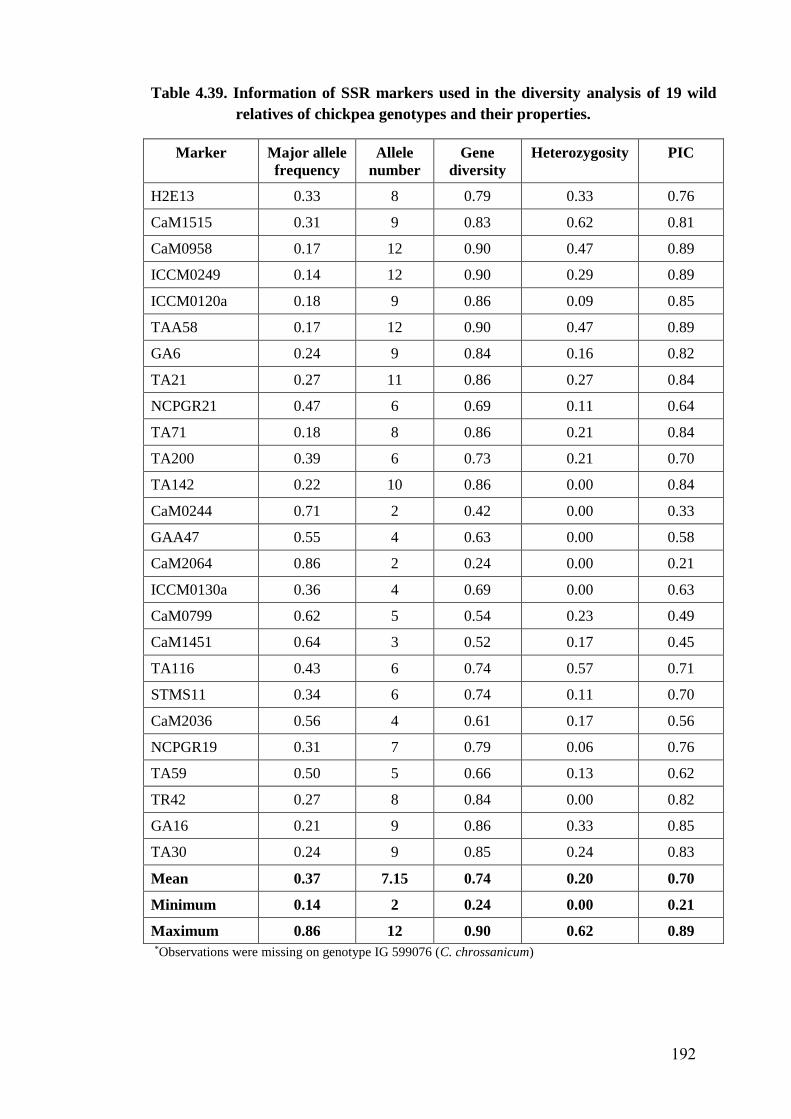
Table 4.39. Information of SSR markers used in the diversity analysis of 19 wild
relatives of chickpea genotypes and their properties.
Marker Major allele
frequency
Allele
number
Gene
diversity
Heterozygosity PIC
H2E13 0.33 8 0.79 0.33 0.76
CaM1515 0.31 9 0.83 0.62 0.81
CaM0958 0.17 12 0.90 0.47 0.89
ICCM0249 0.14 12 0.90 0.29 0.89
ICCM0120a 0.18 9 0.86 0.09 0.85
TAA58 0.17 12 0.90 0.47 0.89
GA6 0.24 9 0.84 0.16 0.82
TA21 0.27 11 0.86 0.27 0.84
NCPGR21 0.47 6 0.69 0.11 0.64
TA71 0.18 8 0.86 0.21 0.84
TA200 0.39 6 0.73 0.21 0.70
TA142 0.22 10 0.86 0.00 0.84
CaM0244 0.71 2 0.42 0.00 0.33
GAA47 0.55 4 0.63 0.00 0.58
CaM2064 0.86 2 0.24 0.00 0.21
ICCM0130a 0.36 4 0.69 0.00 0.63
CaM0799 0.62 5 0.54 0.23 0.49
CaM1451 0.64 3 0.52 0.17 0.45
TA116 0.43 6 0.74 0.57 0.71
STMS11 0.34 6 0.74 0.11 0.70
CaM2036 0.56 4 0.61 0.17 0.56
NCPGR19 0.31 7 0.79 0.06 0.76
TA59 0.50 5 0.66 0.13 0.62
TR42 0.27 8 0.84 0.00 0.82
GA16 0.21 9 0.86 0.33 0.85
TA30 0.24 9 0.85 0.24 0.83
Mean 0.37 7.15 0.74 0.20 0.70
Minimum 0.14 2 0.24 0.00 0.21
Maximum 0.86 12 0.90 0.62 0.89 *Observations were missing on genotype IG 599076 (C. chrossanicum)
192
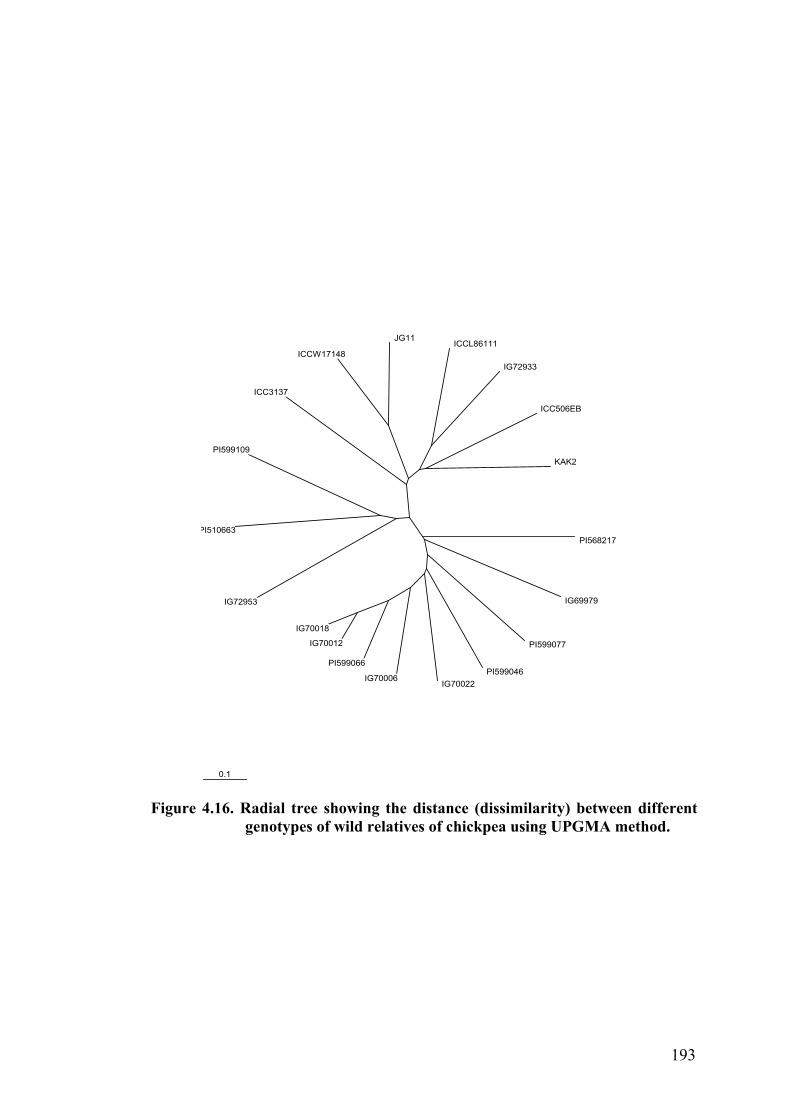
0.1
PI568217
IG69979
PI599077
PI599046IG70022
IG70006
PI599066
IG70012
IG70018
IG72953
PI510663
PI599109
ICC3137
ICCW17148
JG11ICCL86111
IG72933
ICC506EB
KAK2
Figure 4.16. Radial tree showing the distance (dissimilarity) between different genotypes of wild relatives of chickpea using UPGMA method.
193
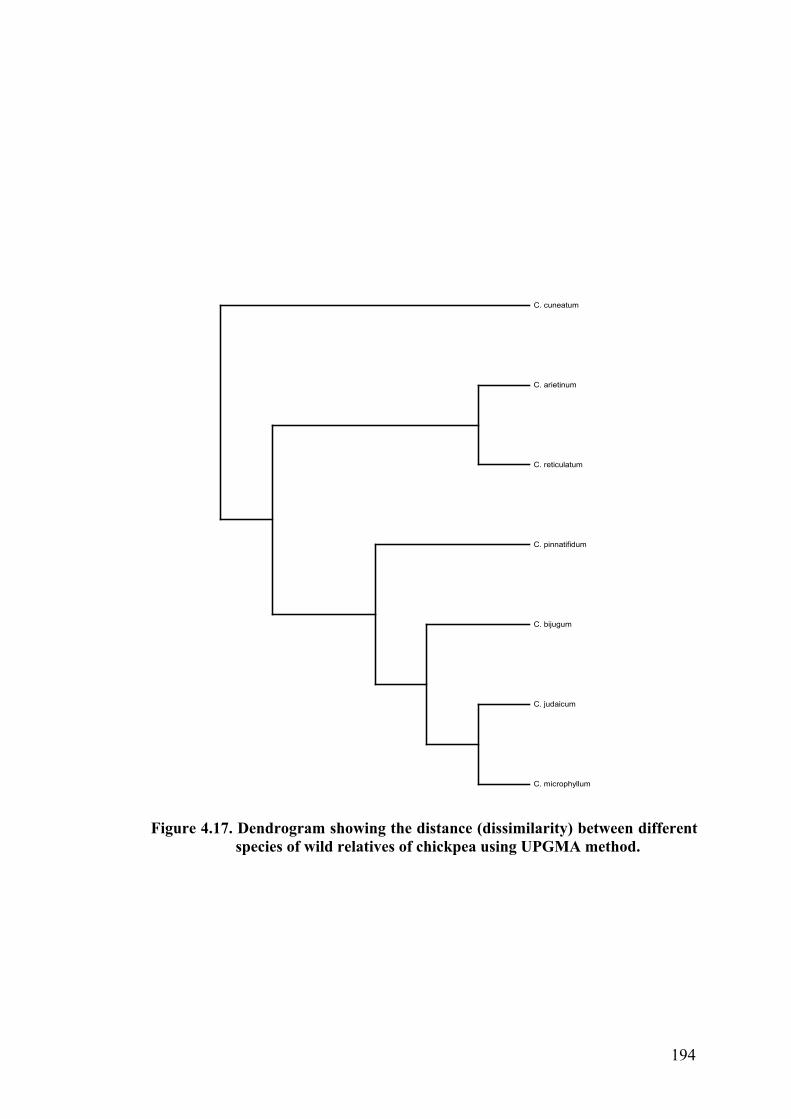
C. cuneatum
C. arietinum
C. reticulatum
C. pinnatifidum
C. bijugum
C. judaicum
C. microphyllum
Figure 4.17. Dendrogram showing the distance (dissimilarity) between different species of wild relatives of chickpea using UPGMA method.
194
While, the other species C. microphyllum, C. judaicum, C. bijugum and C.
pinnatifidum which were placed in other cluster showed high genetic distance with
the cultivated chickpea. The other species C. cuneatum was placed in separate
cluster indicated that it is distantly related to species in other two clusters.
Modern plant breeding and agricultural systems have narrowed the base for
the genetic diversity in cultivated chickpea (Robertson et al., 1997) and only
moderate levels of resistance to H. armigera are available in the cultivated chickpea.
Therefore, it is time to explore wild relatives that might be used in plant breeding
programs for development of resistant cultivars for H. armigera. The knowledge of
genetic relationships between the cultivated chickpea and its wild relatives is a
prerequisite to track the evolution of cultivated species and also to determine the
close relatives which can be exploited for introgression of useful traits into the
cultigen in plant breeding programmes. Among the different classes of molecular
markers, SSRs have been proven useful for a variety of applications in plant genetics
and breeding because of their reproducibility, multi allelic nature, codominant
inheritance, relative abundance and genome wide coverage (Gupta and Varshney,
2000). Hence, the present study was carried out to find out the genetic diversity of
wild relatives of chickpea using 26 SSR markers.
The number of allele per marker is considered to be a good indicator of
genetic variability (Nevo, 1978). The results showed that a range of 2 to 12 alleles
were present with an average of 7.15 alleles per locus which is in agreement with
Huttel et al. (1999)., Choudhary et al. (2006)., Sethy et al. (2006a) and Castro et al.
(2011) but less compared to Upadhyaya et al. (2008) and Naghavi et al. (2012) who
reported average number of alleles per locus was 35 and 19.31, respectively. The
differences in SSR allelic richness could be explained by several factors such as
diversity range of the germplasm, number of accessions used, number of SSR loci
and SSR repeat type (Yang et al., 2010).
In the present study, observed heterozygosity showed a wide variation from
0.00 to 0.62 with an average of 0.20. Torutaeva et al. (2014) also reported that
heterozygosity ranged from 0.05 to 0.43 with an average of 0.13 based on genetic
diversity in 23 genotypes of chickpea using nine SSR markers, whereas Choudhary
et al. (2009) observed the average heterozygosity of 0.16. However, high level of
195
heterozygosity (0.76) was also observed using 16 microsatellite loci in 307 land
races from Northern Iran (Naghavi et al., 2012).
The relative informativeness of each marker can be evaluated on the basis of
its polymorphic information content (PIC) value. Similar estimates of PIC values of
present study were observed in case of earlier microsatellite studies in chickpea in a
range of 0.45 to 0.89 by Castro et al. (2011), 0.36 to 0.91 by Naghavi et al. (2012),
0.26 to 0.91 by Aggarwal et al. (2015b). Gupta et al. (2003) reported increased PIC
with greater number of markers. They obtained PIC of 0.469 with 65 SSRs markers
compared to 0.210 with 20 SSRs on 52 wheat genotypes. Although, the number of
SSR marker in this study was limited, high polymorphism was revealed indicating
wide diversity among accessions.
Based on cluster analysis of different wild relatives of chickpea, it was
observed that C. arietinum and C. reticulatum were placed in one cluster. The other
species C. microphyllum, C. judaicum, C. bijugum and C. pinnatifidum were placed
in other cluster while C. cuneatum was placed in separate cluster. The grouping was
similar as found with other studies using SSR markers (Sethy et al., 2006b), RAPD
markers (Sudupak et al., 2002 and Talebi et al., 2009) and AFLP markers (Sudupak
et al., 2004 and Shan et al., 2005).
The genotypes with different levels of resistance to H. armigera placed in
different groups can be used to increase the level and broaden the genetic base of
resistance to pod borer in chickpea. The pod borer resistance and the morphological
and biochemical traits that exhibited direct effects on the resistance can be used to
select pod borer resistant chickpeas. Hence, discovery and use of alien genes for
resistance from wild species provide the way for sustaining crop improvement.
196
V
Chapter V
SUMMARY AND CONCLUSIONS
The present research was contemplated to study the “Biochemical and
molecular mechanisms of resistance to Helicoverpa armigera (Hubner) in wild
relatives of chickpea”. These studies were carried out at the International Crops
Research Institute for the Semi-Arid Tropics (ICRISAT), Patancheru, Telangana
State, India during 2014-16 and focussed on the identification of resistance
mechanisms against H. armigera in wild relatives of chickpea.
In the present study, a total of 20 accessions (15 wild relatives and five
varieties of cultivated chickpea) were used to evaluate the relative resistance or
susceptibility to H. armigera. Of the 15 accessions of wild relatives of chickpea, six
accessions belong to Cicer bijugum, two accessions belong each to C. reticulatum,
C. judaicum and C. pinnatifidum, and one accession belong each to C.
chrossanicum, C. microphyllum and C. cuneatum. Five cultivars belonging to
cultivated chickpea were JG 11(Commercial cultivar), KAK 2 and ICC 3137
(susceptible checks) and ICCL 86111 and ICC 506EB (moderately resistant checks).
Under multi-choice field conditions, observations were recorded on
abundance of pod borers on different genotypes of wild relatives of chickpea at
fortnight intervals during post-rainy season 2014-15 and 2015-16. There were no
significant differences in number of H. armigera eggs per five plants among
different genotypes throughout cropping period except 75 days after emergence
(DAE) during post-rainy season, 2014-15 and 15 DAE after during post-rainy
season, 2015-16. Highest oviposition was observed at 30 DAE followed by 60 DAE
during post-rainy season, 2014-15, but differences were non-significant across
genotypes. Among all the genotypes, larvae of H. armigera showed significant
preference towards susceptible checks, ICC 3137 and KAK 2, whereas all the wild
relatives recorded less number of larvae compared to cultivated chickpea. The
genotypes, PI 510663, PI 599109 (C. pinnatifidum), PI568217, PI 599077 (C.
judaicum), ICCW 1748 (C. microphyllum) and IG 69979 (C. cuneatum) recorded
less number of H. armigera larvae. The genotypes of C. bijugum (IG 70006, IG
70012, IG 70018, IG 70022, PI 599046 and PI 599066) also showed less damage
rating along with other wild genotypes of chickpea. Oviposition by S. exigua had not
197
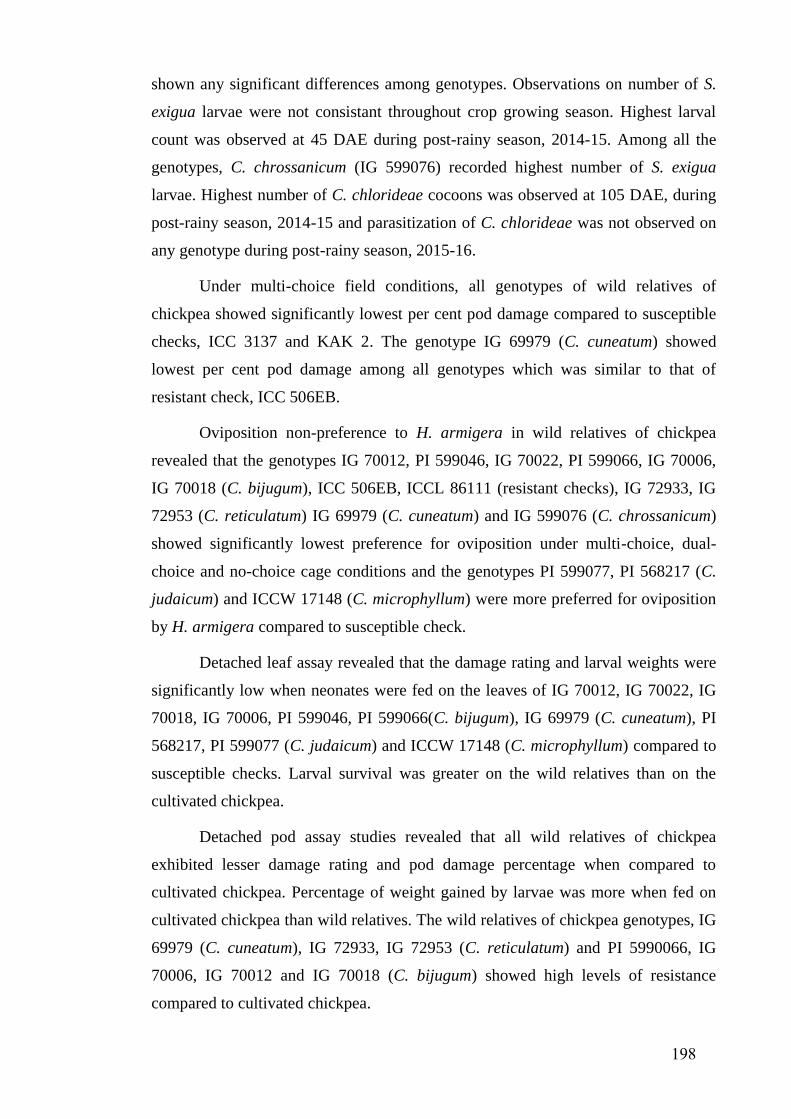
shown any significant differences among genotypes. Observations on number of S.
exigua larvae were not consistant throughout crop growing season. Highest larval
count was observed at 45 DAE during post-rainy season, 2014-15. Among all the
genotypes, C. chrossanicum (IG 599076) recorded highest number of S. exigua
larvae. Highest number of C. chlorideae cocoons was observed at 105 DAE, during
post-rainy season, 2014-15 and parasitization of C. chlorideae was not observed on
any genotype during post-rainy season, 2015-16.
Under multi-choice field conditions, all genotypes of wild relatives of
chickpea showed significantly lowest per cent pod damage compared to susceptible
checks, ICC 3137 and KAK 2. The genotype IG 69979 (C. cuneatum) showed
lowest per cent pod damage among all genotypes which was similar to that of
resistant check, ICC 506EB.
Oviposition non-preference to H. armigera in wild relatives of chickpea
revealed that the genotypes IG 70012, PI 599046, IG 70022, PI 599066, IG 70006,
IG 70018 (C. bijugum), ICC 506EB, ICCL 86111 (resistant checks), IG 72933, IG
72953 (C. reticulatum) IG 69979 (C. cuneatum) and IG 599076 (C. chrossanicum)
showed significantly lowest preference for oviposition under multi-choice, dual-
choice and no-choice cage conditions and the genotypes PI 599077, PI 568217 (C.
judaicum) and ICCW 17148 (C. microphyllum) were more preferred for oviposition
by H. armigera compared to susceptible check.
Detached leaf assay revealed that the damage rating and larval weights were
significantly low when neonates were fed on the leaves of IG 70012, IG 70022, IG
70018, IG 70006, PI 599046, PI 599066(C. bijugum), IG 69979 (C. cuneatum), PI
568217, PI 599077 (C. judaicum) and ICCW 17148 (C. microphyllum) compared to
susceptible checks. Larval survival was greater on the wild relatives than on the
cultivated chickpea.
Detached pod assay studies revealed that all wild relatives of chickpea
exhibited lesser damage rating and pod damage percentage when compared to
cultivated chickpea. Percentage of weight gained by larvae was more when fed on
cultivated chickpea than wild relatives. The wild relatives of chickpea genotypes, IG
69979 (C. cuneatum), IG 72933, IG 72953 (C. reticulatum) and PI 5990066, IG
70006, IG 70012 and IG 70018 (C. bijugum) showed high levels of resistance
compared to cultivated chickpea.
198
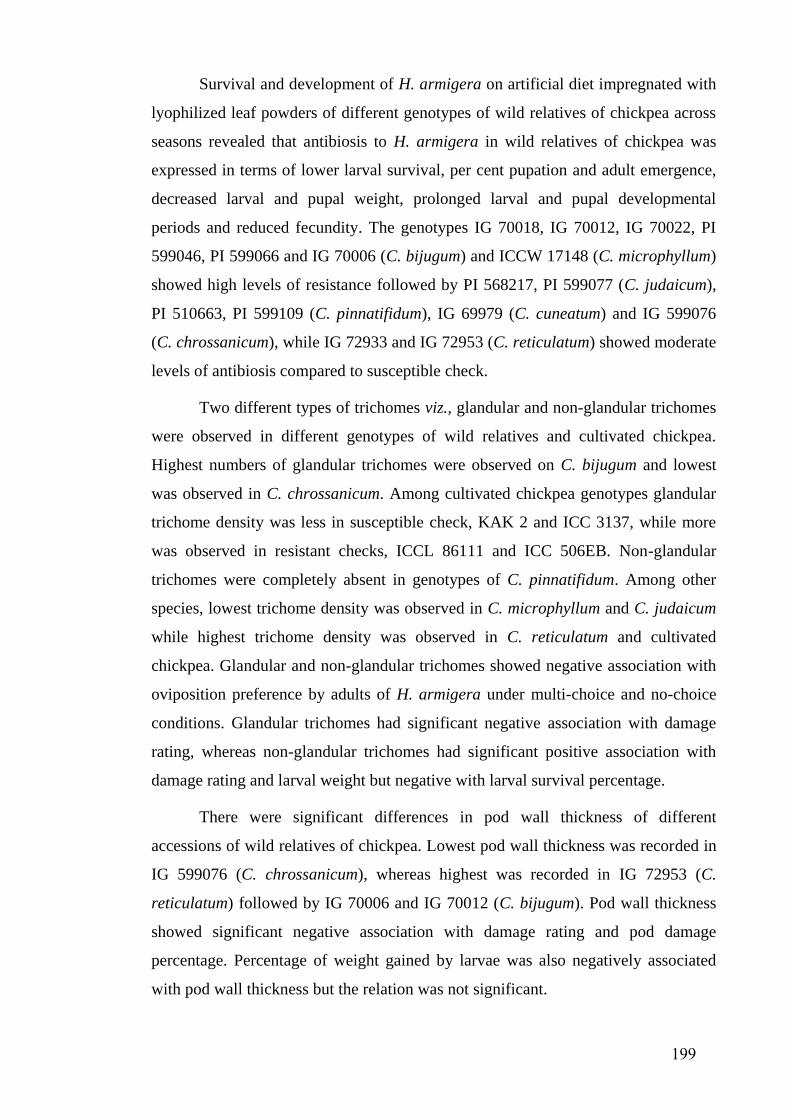
Survival and development of H. armigera on artificial diet impregnated with
lyophilized leaf powders of different genotypes of wild relatives of chickpea across
seasons revealed that antibiosis to H. armigera in wild relatives of chickpea was
expressed in terms of lower larval survival, per cent pupation and adult emergence,
decreased larval and pupal weight, prolonged larval and pupal developmental
periods and reduced fecundity. The genotypes IG 70018, IG 70012, IG 70022, PI
599046, PI 599066 and IG 70006 (C. bijugum) and ICCW 17148 (C. microphyllum)
showed high levels of resistance followed by PI 568217, PI 599077 (C. judaicum),
PI 510663, PI 599109 (C. pinnatifidum), IG 69979 (C. cuneatum) and IG 599076
(C. chrossanicum), while IG 72933 and IG 72953 (C. reticulatum) showed moderate
levels of antibiosis compared to susceptible check.
Two different types of trichomes viz., glandular and non-glandular trichomes
were observed in different genotypes of wild relatives and cultivated chickpea.
Highest numbers of glandular trichomes were observed on C. bijugum and lowest
was observed in C. chrossanicum. Among cultivated chickpea genotypes glandular
trichome density was less in susceptible check, KAK 2 and ICC 3137, while more
was observed in resistant checks, ICCL 86111 and ICC 506EB. Non-glandular
trichomes were completely absent in genotypes of C. pinnatifidum. Among other
species, lowest trichome density was observed in C. microphyllum and C. judaicum
while highest trichome density was observed in C. reticulatum and cultivated
chickpea. Glandular and non-glandular trichomes showed negative association with
oviposition preference by adults of H. armigera under multi-choice and no-choice
conditions. Glandular trichomes had significant negative association with damage
rating, whereas non-glandular trichomes had significant positive association with
damage rating and larval weight but negative with larval survival percentage.
There were significant differences in pod wall thickness of different
accessions of wild relatives of chickpea. Lowest pod wall thickness was recorded in
IG 599076 (C. chrossanicum), whereas highest was recorded in IG 72953 (C.
reticulatum) followed by IG 70006 and IG 70012 (C. bijugum). Pod wall thickness
showed significant negative association with damage rating and pod damage
percentage. Percentage of weight gained by larvae was also negatively associated
with pod wall thickness but the relation was not significant.
199
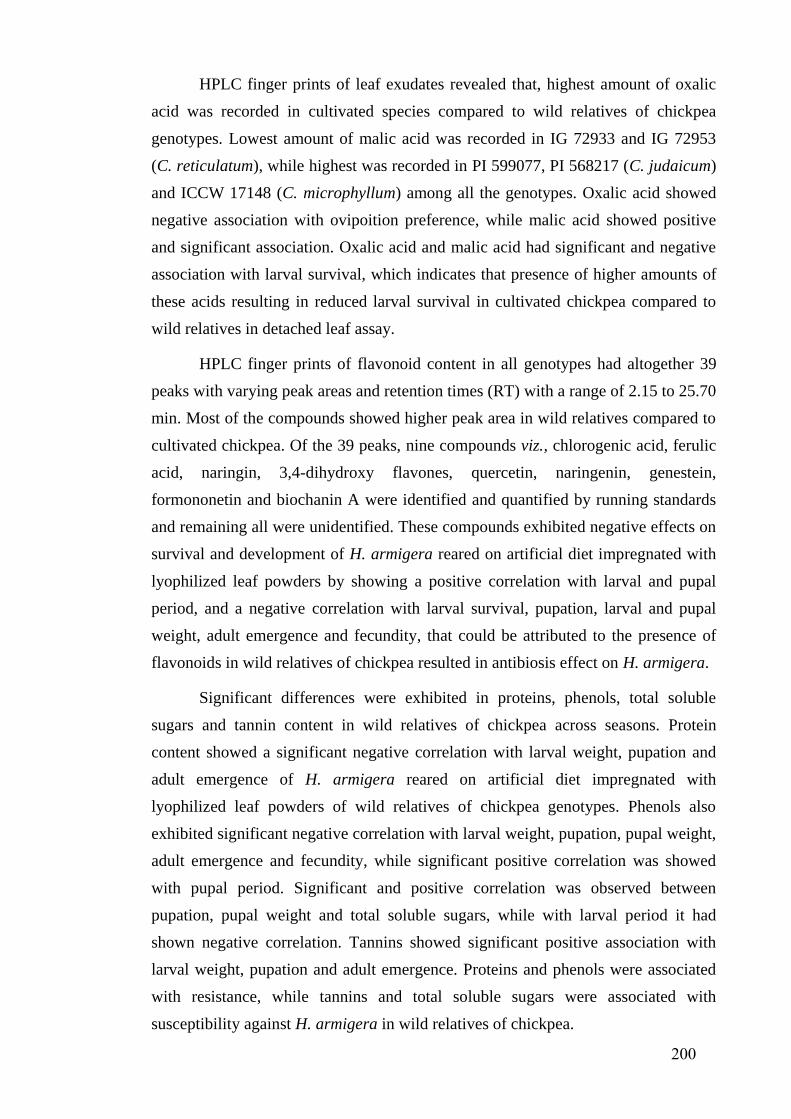
HPLC finger prints of leaf exudates revealed that, highest amount of oxalic
acid was recorded in cultivated species compared to wild relatives of chickpea
genotypes. Lowest amount of malic acid was recorded in IG 72933 and IG 72953
(C. reticulatum), while highest was recorded in PI 599077, PI 568217 (C. judaicum)
and ICCW 17148 (C. microphyllum) among all the genotypes. Oxalic acid showed
negative association with ovipoition preference, while malic acid showed positive
and significant association. Oxalic acid and malic acid had significant and negative
association with larval survival, which indicates that presence of higher amounts of
these acids resulting in reduced larval survival in cultivated chickpea compared to
wild relatives in detached leaf assay.
HPLC finger prints of flavonoid content in all genotypes had altogether 39
peaks with varying peak areas and retention times (RT) with a range of 2.15 to 25.70
min. Most of the compounds showed higher peak area in wild relatives compared to
cultivated chickpea. Of the 39 peaks, nine compounds viz., chlorogenic acid, ferulic
acid, naringin, 3,4-dihydroxy flavones, quercetin, naringenin, genestein,
formononetin and biochanin A were identified and quantified by running standards
and remaining all were unidentified. These compounds exhibited negative effects on
survival and development of H. armigera reared on artificial diet impregnated with
lyophilized leaf powders by showing a positive correlation with larval and pupal
period, and a negative correlation with larval survival, pupation, larval and pupal
weight, adult emergence and fecundity, that could be attributed to the presence of
flavonoids in wild relatives of chickpea resulted in antibiosis effect on H. armigera.
Significant differences were exhibited in proteins, phenols, total soluble
sugars and tannin content in wild relatives of chickpea across seasons. Protein
content showed a significant negative correlation with larval weight, pupation and
adult emergence of H. armigera reared on artificial diet impregnated with
lyophilized leaf powders of wild relatives of chickpea genotypes. Phenols also
exhibited significant negative correlation with larval weight, pupation, pupal weight,
adult emergence and fecundity, while significant positive correlation was showed
with pupal period. Significant and positive correlation was observed between
pupation, pupal weight and total soluble sugars, while with larval period it had
shown negative correlation. Tannins showed significant positive association with
larval weight, pupation and adult emergence. Proteins and phenols were associated
with resistance, while tannins and total soluble sugars were associated with
susceptibility against H. armigera in wild relatives of chickpea.
200
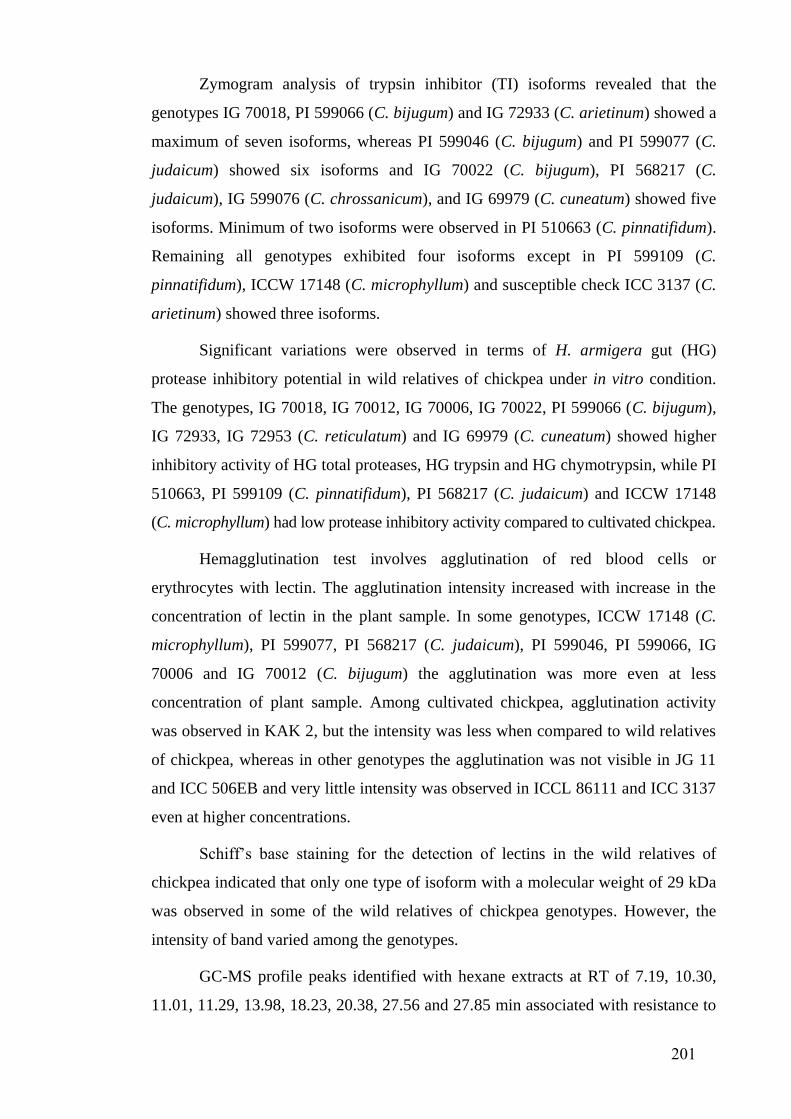
Zymogram analysis of trypsin inhibitor (TI) isoforms revealed that the
genotypes IG 70018, PI 599066 (C. bijugum) and IG 72933 (C. arietinum) showed a
maximum of seven isoforms, whereas PI 599046 (C. bijugum) and PI 599077 (C.
judaicum) showed six isoforms and IG 70022 (C. bijugum), PI 568217 (C.
judaicum), IG 599076 (C. chrossanicum), and IG 69979 (C. cuneatum) showed five
isoforms. Minimum of two isoforms were observed in PI 510663 (C. pinnatifidum).
Remaining all genotypes exhibited four isoforms except in PI 599109 (C.
pinnatifidum), ICCW 17148 (C. microphyllum) and susceptible check ICC 3137 (C.
arietinum) showed three isoforms.
Significant variations were observed in terms of H. armigera gut (HG)
protease inhibitory potential in wild relatives of chickpea under in vitro condition.
The genotypes, IG 70018, IG 70012, IG 70006, IG 70022, PI 599066 (C. bijugum),
IG 72933, IG 72953 (C. reticulatum) and IG 69979 (C. cuneatum) showed higher
inhibitory activity of HG total proteases, HG trypsin and HG chymotrypsin, while PI
510663, PI 599109 (C. pinnatifidum), PI 568217 (C. judaicum) and ICCW 17148
(C. microphyllum) had low protease inhibitory activity compared to cultivated chickpea.
Hemagglutination test involves agglutination of red blood cells or
erythrocytes with lectin. The agglutination intensity increased with increase in the
concentration of lectin in the plant sample. In some genotypes, ICCW 17148 (C.
microphyllum), PI 599077, PI 568217 (C. judaicum), PI 599046, PI 599066, IG
70006 and IG 70012 (C. bijugum) the agglutination was more even at less
concentration of plant sample. Among cultivated chickpea, agglutination activity
was observed in KAK 2, but the intensity was less when compared to wild relatives
of chickpea, whereas in other genotypes the agglutination was not visible in JG 11
and ICC 506EB and very little intensity was observed in ICCL 86111 and ICC 3137
even at higher concentrations.
Schiff’s base staining for the detection of lectins in the wild relatives of
chickpea indicated that only one type of isoform with a molecular weight of 29 kDa
was observed in some of the wild relatives of chickpea genotypes. However, the
intensity of band varied among the genotypes.
GC-MS profile peaks identified with hexane extracts at RT of 7.19, 10.30,
11.01, 11.29, 13.98, 18.23, 20.38, 27.56 and 27.85 min associated with resistance to
201
H. armigera by exhibiting significant negative correlation with damage rating, larval
survival and weight indicated that these compounds, i.e. peaks at RT of 11.20,
13.38, 14.46, 16.95, 19.94, 21.36, 26.74 and 29.20 min were associated with
susceptibility. The peaks at RT of 13.58, 18.23, 19.32, 23.86 and 27.85 min showed
significant negative correlation with oviposition, while peaks at RT of 10.39, 11.01,
19.94 and 21.36 min showed significant positive correlation.
Of the 107 GC-MS profile peaks identified with methanol extracts, 18 peaks
at different retention times showed significant positive correlation with damage
rating, while 14 compounds showed significant negative correlation. Association of
larval survival with methanol extracts exhibited 28 peaks with significant positive
correlation, whereas 20 peaks showed significant negative correlation at different
retention times. Similarly, larval weight showed negative correlation with 21 peaks
and positive correlation with 34 peaks. Oviposition preferences revealed that, 28
peaks at different retention times showed significant negative association with
oviposition, while 14 peaks showed positive association. The results indicated that
methanol extracts of leaf surface chemicals had higher amount of phagostimulants
and oviposition repellents than antifeedants and oviposition attractants.
The twenty six SSR markers used for assessing genetic diversity of wild
relatives of chickpea detected a total of 186 alleles with an average of 7.15 alleles
per marker. PIC values varied from 0.21 (CaM2064) to 0.89 (CaM0958, ICCM0249
and TAA58) with an average of 0.70. Gene diversity varied from 0.24 (CaM2064)
to 0.90 (CaM0958, ICCM0249 and TAA58). The observed heterozygosity varied
from 0.00 (TA142, CaM0244, GAA47, CaM2064, ICCM0130a and TR42) to 0.62
(CaM1515) with an average of 0.20. The markers CaM0958, ICCM0249 and TAA58
were most informative with most alleles, high gene diversity and highest PIC value.
According to dendrogram of genetic relationships among different species
based on unweighted pair group method with arithmetic mean (UPGMA), the
cultivated chickpea C. arietinum showed a closer genetic relation with the C.
reticulatum, which is considered to be progenitor of cultivated chickpea. While, the
other species C. microphyllum, C. judaicum, C. bijugum and C. pinnatifidum which
were placed in other cluster showed high genetic distance with the cultivated
chickpea. The other species C. cuneatum was placed in separate cluster indicated
that it is distantly related to species in other two clusters.
202
LITERATURE CITED
Abbo, S., Molina, C., Jungmann, R., Grusak, A., Berkovitch, Z., Reifen, R., Kahl, G
and Winter, P. 2005. Quantitative trait loci governing carotenoid
concentration and weight in seeds of chickpea (Cicer arietinum L.).
Theoretical and Applied Genetics. 111: 185-195.
Afzal, M., Ali, A., Akbar, R and Javed, A. 2001. The biochemical basis of resistance
in some chickpea (Cicer arietinum) cultivars against gram pod borer
(Helicoverpa armigera) (Hub.). Pakistan Entomologist. 23(1&2): 61-64.
Aggarwal, H., Rao, A., Kumar, A., Singh, J., Rana, J.S., Naik, P.K and Chhokar, V.
2015a. Evaluation of genetic divergence and phylogenetic relationship using
sequence-tagged microsatellite (STMS) sequences in Chickpea (Cicer
arietinum L.) genotypes. African Journal of Biotechnology. 14(45): 3051-
3061.
Aggarwal, H., Rao, A., Kumar, A., Singh, J., Rana, J.S., Naik, P.K and Chhokar, V.
2015b. Assessment of genetic diversity among 125 cultivars of chickpea
(Cicer arietinum L.) of Indian origin using ISSR markers. Turkish Journal of
Botany. 39: 218-226.
Ali, A.E and Mohamed, A.A. 2014. Evaluation of different chickpea genotypes for
resistance against pod borer, Helicoverpa armiger (Hub.) (Lepdoptera:
Noctuidae) under field conditions, Sudan. Persian Gulf Crop Protection.
3(3): 25-29.
Altaf, H.M., Azizul, H.M and Prodhan, M.Z.H. 2008. Incidence and damage
severity of pod borer, Helicoverpa armigera (Hubner) in chickpea (Cicer
arietinum L.). Bangladesh Journal of Scientific and Industrial Research.
44(2): 221-224.
Armes, N.J., Bond, G.S and Cooters, R.J. 1992. The laboratory culture and
development of Helicoverpa armigera. Natural Resources Institute Bulletin
No. 57. Natural Resources Institute, Chatham, United Kingdom.
Arora, R., Sharma, H.C., Van Dreissche, E and Sharma, K.K. 2005. Biological
activity of lectins from grain legumes and garlic against the legume pod
borer, Helicoverpa armigera. International Chickpea and Pigeonpea
Newsletter. 12: 50-52.
Ateyyat, M., Abu-Romman, S., Abu-Darwish, M and Ghabeish, I. 2012. Impact of
flavonoids against woolly apple aphid, Eriosoma lanigerum (Hausmann) and
its sole parasitoid, Aphelinus mali(Hald.). Journal of Agricultural Science.
4(2): 227-236.
Baghery, F., Fathipour, Y and Naseri, B. 2014. Digestive proteolytic and amylolytic
activities in Helicoverpa armigera (Lep.: Noctuidae) larvae fed on five host
plants. Journal of Crop Protection. 3(2): 191-198.
Banerjee, N., Sengupta, S., Roy, A., Ghosh, P., Das, K and Das, S. 2011. Functional
alteration of a dimeric insecticidal lectin to a monomeric antifungal protein
correlated to its oligomeric status. Plos One. 6(4): e18593.
203
Bashir, H., Khan, T., Masood, A and Hamid, R. 2010. Isolation purification and
characterization of a lectin from local Kashmiri variety of soybean (Glycine
max). Asian Journal of Biochemistry. 5(3): 145-153.
Belew, M and Eaker, D. 1976. The trypsin and chymotrypsin inhibitors in
chickpeas. Identification of trypsin-reactive site, partial amino acid sequence
and further physico-chemical properties of the major inhibitor. European
Journal of Biochemistry. 62: 499-508.
Beninger, C.W., Abou-Zaid, M.M., Kistner, A.L.E., Hallett, R.H., Iqbal, M.J.,
Grodzinski, B and Hall, J.C. 2004. A flavanone and two phenolic acids from
Chrysanthemum morifolium with phytotoxic and insect growth regulating
activity. Journal of Chemical Ecology. 30(3): 589-606.
Berger, J.D., Abbo, S and Turner, N.C. 2003. Ecogeography of annual wild Cicer
species: the poor state of the world collection. Crop Science. 43: 1076-1090.
Bernays, E.A and Champman, R.F. 1994. Host Plant Selection by Phytophagopus
Insects. Chapman & Hall, New York. Pp. 312.
Bhagwat, V.R., Aherkar, S.K., Satpute, U.S and Thakare, H.S. 1995. Screening of
chickpea genotypes for resistance to gram pod borer, Helicoverpa
armigera(Hubner) and its relationship with malic acid in leaf exudates.
Journal of Entomological Research. 19(3): 249-253.
Bhatt, N.J and Patel, R.K. 2001. Screening of chickpea cultivars for their resistance
to gram pod borer, Helicoverpa armigera. Indian Journal of Entomology.
63(3): 277-280.
Blanco-Labra, A., Chagolla-Lopez, A., Martinez-Gallardo, N and Valdes-Rodriguez,
S. 1995. Further characterization of the 12 kDa protease/alpha amylase
inhibitor present in maize seeds. Journal of Food Biochemistry. 19: 27-41.
Blaney, M.W and Simmonds M.S.J. 1983. Electrophysiological activity in insects in
response to antifeedants. COPR report Project 9; Overseas Development
Organisation, London, UK, pp. 219.
Bohria, A.K and Shukla, A. 2006. Population dynamics of Campoletis chlorideae in
chickpea. Crop Reserach Hisar. 3: 504-506.
Botstein, D., White, R.L., Skolnick, M and Davis, R.W. 1980. Construction of a
genetic linkage map in man using restriction fragment length polymorphisms.
The American Journal of Human Genetics. 32: 314-331.
Bown, D.P., Wilkinson, H.S and Gatehouse, J.A. 1997. Differentially regulated
inhibitor-sensitive and insensitive protease genes from the phytophagous
insect pest, Helicoverpa armigera, are members of complex multigene
families. Insect Biochemistry and Molecular Biology. 27: 625-638.
Bray, H.C and Thorpe, W.V. 1954. Analysis of phenolic compounds of interest in
metabolism. Methods of Biochemical Analysis. 1: 27-52.
Broadway, R.M. 1995. Are insects resistant to plant proteinase inhibitors? Journal
of Insect Physiology. 41: 107-116.
Broadway, R.M. 1996. Dietary proteinase inhibitors alter complement of midgut
proteases. Archieves of Insect Biochemistry and Physiology. 32: 39-53.
204
Burns, R.E. 1971. Method for estimation of tannin in grain sorghum. Agronomy
Journal. 63(3): 511-512.
Caccia, S., Van Dammeb, E.J.M., De Vos, W.H and Smagghe, G. 2012. Mechanism
of entomotoxicity of the plant lectin from Hippeastrum hybrid (Amaryllis) in
Spodoptera littoralis larvae. Journal of Insect Physiology. 58: 1177-1183.
Cagirgan,M.I., Toker, C., Karhan, M., Aksu, M., Ulger, S and Canci, H. 2011.
Assessment of endogenous organic acid levels in Ascochyta blight
[Ascochyta rabiei (Pass.) Labr.] susceptible and resistant chickpeas (Cicer
arietinum L.). Turkish Journal of Field Crops. 16(2): 121-124.
Castillo, V.A., Caballero, H.O., Abdullaev, F.J., Garfias, Y., Carmen, J.M.M.,
Bouquelet, S., Martínez, G., Mendoza, G.H and Zenteno, E. 2007. Lectin
from Phaseolus acutifolius var. escumite: chemical characterization, sugar
specificity, and effect on human T-lymphocytes. Journal of Agricultural and
Food Chemistry. 55(14): 5781-5787.
Castro, P., Millan, T., Gil, J., Merida, J., Garcia, M.L., Rubio, J and Fernádez-
Romero, M.D. 2011. Identification of chickpea cultivars by microsatellite
markers. Journal of Agricultural Science. 149: 451-460.
Cates, R.G. 1980. Feeding patterns of monophagous, oligophagous, and
polyphagous insect herbivores: The effect of resource abundance and plant
chemistry. Oecologia. 46(1): 22-31.
Chandraker, M.K., Shrivastava, S.K and Arvind Kumar. 2006. Field screening of
resistant varieties of chickpea against gram podborer, Helicoverpa armigera
(Hub.). Environment and Ecology. 24(3): 728-729.
Cheema, H.K., Ravinder Singh Taggar, G.K., Sandhu, J.S and Kooner, B.S. 2010.
Screening of chickpea genotypes for resistance against gram podborer,
Helicoverpa armigera(Hubner) under field conditions. Journal of Research,
Punjab Agricultural University. 47(1&2): 1-3.
Chen, W., Sharma, H.C and Muehlbauer, F. (eds.). 2011. Chickpea and Lentil Crop
ProtectionCompendium. American Phytopathological Society, St Paul,
Minnesota, USA. 165 pp.
Chhabra, K.S., Kooner, B.S., Saxena, A.K and Sharma, A.K. 1993. Field reaction of
some genotypes to gram podborer, Helicoverpa armigera (Hub.) as
influenced by biochemical components. Legume Research. 16(1&2): 17-22.
Chhabra, K.S., Kooner, B.S., Sharma, A.K and Saxena, A.K. 1990. Sources of
resistance in chickpea, role of biochemical components of the incidence of
gram podborer Helicoverpa armigera (Hubner). Indian journal of
Entomology. 52(3): 423-430.
Choudhary, S., Sethy, N.K., Shokeen, B.A and Bhatia, S. 2006. Development of
sequence-tagged microsatellite site markers for chickpea (Cicer arietinum
L.). Molecular Ecology Notes. 6: 3-95.
Choudhary, S., Sethy, N.K., Shokeen, B.A and Bhatia, S. 2009. Development of
chickpea EST-SSR markers and analysis of allelic variation across related
species. Theoretical and Applied Genetics. 118: 591-608.
205
Choumane, W., Winter, P., Weigand, F and Kahl, G. 2000. Conservation and
variability of sequence tagged microsatellite sites (STMSs) from chickpea
(Cicer arietinum L.) within the genus Cicer. Theoretical and Applied
Genetics. 101: 269-278.
CMIE. 2011. Executive Summary-GDP growth. Centre for Monitoring Indian
Economy (CMIE) pvt, Ltd. Mumbai.
Cotter, S.C and Edwards, O.R. 2006. Quantitative genetics of preference and
performance on chickpeas in the noctuid moth, Helicoverpa armigera.
Heredity. 96: 396-402.
Cowgill, S.E and Lateef, S.S. 1996, Identification of antibiotic and antixenotic
resistance to Helicoverpa armigera (Lepidoptera: Noctuidae) in chickpea.
Journal of Economic Entomology. 89: 224-229.
Croser, J.S., Ahmad, F., Clarke, H.J and Siddique, K.H.M. 2003.Utilization of wild
Cicer in chickpea improvement-progress, constraints, and prospects.
Australian Journal of Agricultural Research. 54: 429-444.
Czapla, T.H and Lang, B.A. 1990. Effect of plant lectins on the larval development
of European corn borer (Lepidoptera: Pyralidae) and Southern corn rootworm
(Coleoptera: Chrysomelidae). Journal of Economic Entomology. 83(6): 2480-
2485.
Damle, M.S., Giri, A.P., Sainani, M.N and Gupta, V.S. 2005. Higher accumulation
of proteinase inhibitors in flowers than leaves and fruits as a possible basis
for differential feeding preference of Helicoverpa armigera on tomato
(Lycopersicon esculentum Mill, Cv. Dhanashree). Phytochemistry. 66: 2659-
2667.
Davis, B.J. 1964. Disc electrophoresis II: methods and application to human serum
proteins. Annals of the New York Academy of Sciences. 121: 404-427.
Deepak, R and Ujagir, R. 2005. Screening of chickpea (Cicer arietinum) genotypes
for resistance to gram podborer (Helicoverpa armigera). Indian Journal of
Agricultural Sciences. 75(2): 120 - 122.
Deshmukh, S.G., Sureja, B.V., Jethva, D.M., Sonune, V.R. and Joshi, M.D. 2010.
Field screening of chickpea germplasms against podborer, Helicoverpa
armigera (Hubner). Legume Research. 33(2): 150-151.
Devi, V.S. 2008. Interaction of acid exudates in chickpea with biological activity of
Cry toxins from Bacillus thuringiensis Berliner against Helicoverpa
armigera (Hubner). Ph.d thesis submitted to ANGRAU, Hyderabad, Andhra
Pradesh, India.
Devi, V.S., Rao, P.A., Sharma, S.P and Sharma, H.C. 2014. Interaction of acid
exudates in chickpea with biological activity of Bacillus thuringiensis
towards Helicoverpa armigera. Journal of Applied Entomology. 138: 289-
296.
Devi, V.S., Sharma, H.C and Rao, P.A. 2013. Influence of oxalic and malic acids in
chickpea leaf exudates on the biological activity of Cry1Ac towards
Helicoverpa armigera. Journal of Insect Physiology. 59(4): 394-399.
206
Dhillon, M.K and Sharma, H.C. 2008. Influence of temperature and Helicoverpa
armigera food on survival and development of the parasitoid, Campoletis
chlorideae. Indian Journal of Plant Protection. 36: 240-244.
Doerner, K.C and White, B.A. 1990. Detection of glycoproteins separated by non-
denaturing polyacrylamide gel electrophoresis using the periodic acid-schiff
stain. Analytical Biochemistry. 187: 147-150.
Dunse, K.M., Kaas, Q., Guarino, R.F., Barton, P.A., Craik, D.J and Anderson, M.A.
2010. Molecular basis for the resistance of an insect chymotrypsin to a potato
type II proteinase inhibitor. Proceedings of the National Academy of Sciences
of the United States of America. 107:15016-15021.
Dwevedi, K.K and Gaibriyal, M. 2009. Assessment of genetic diversity of cultivated
chickpea (Cicer arietinum L.). Asian Journal of Agricultural Sciences.1: 7-8.
FAO STAT, 2014. Food and Agriculture Organisation of the United Nations 2002.
FAO Production year book. Rome, Italy: FAO. http://apps.fao.org.
Felicioli, R., Garzelli, B., Vaccari, L., Melfi, D and Balestreri, E. 1997. Activity
staining of protein inhibitors of proteases on gelatin-containing
polyacrylamide gel electrophoresis. Analytical Biochemistry. 244: 176-179.
Ferry, N., Edwards, M.G., Mulligan, E.A., Emami, K., Petrova, A.S., Frantescu, M.,
Davison, G.M and Gatehouse, A.M.R. 2004. Engineering resistance to insect
pests. In: Christou P and Klee H (Eds.). Handbook of Plant Biotechnology,
John Wiley & Sons Ltd, Chichester, UK. pp373-394.
Gaidamashvili, M., Ohizumi, Y., Ogawa, T and Muramoto, K. 2009. Binding of the
insecticidal DB1 lectin in Helicoverpa armigera (Hübner) midgut epithelia.
Bulletin of the Georgian National Academy of Sciences. 3(2): 147-149.
Gatehouse, A.M.R., Davison, G.M., Stewart, J.N., Gatehouse, L.N., Kumar, A.,
Geoghegan, I.E., Birch, N.E and Gatehouse, J.A. 1999. Concanavalin A
inhibits development of tomato moth (Lacanobia oleracea) and peach-potato
aphid (Myzus persicae) when expressed in transgenic potato plants.
Molecular Breeding. 5: 153-165.
Gatehouse, J.A and Gatehouse, A.M.R. 1999. Genetic engineering of plants for
insect resistance. pp. 211-241. In: Rechcigl, J. E. & Rechcigl, N. A. (Eds)
Biological and Biotechnological Control of Insect Pests, CRC Press, USA.
Pp. 392.
Gaur, R., Sethy, N.K., Choudhary, S., Shokeen, B., Gupta, V and Bhatia, S. 2011.
Advancing the STMS genomic resources for defining new locations on the
intraspecific genetic linkage map of chickpea (Cicer arietinum L.). BMC
Genomics. 12:117: 2-18.
Ghugal, S.G and Shrivastava, S.K. 2015. Evaluation of different chickpea genotypes
against Helicoverpa armigera (Hubner) under unprotected and protected
condition. The Ecoscan. 7: 31-34.
Giri, A.P., Harsulkar, A.M., Deshpande, V.V., Sainani, M.N., Gupta, V.S and
Ranjekar, P.K. 1998. Chickpea defensive proteinase inhibitors can be
inactivated by pod borer gut proteinases. Plant Physiology. 116: 393-401.
207
Girija., Salimath, P.M., Patil, S.A., Gowda, C.L.L and Sharma, H.C. 2008.
Biophysical and biochemical basis of host plant resistance to pod borer,
Helicoverpa armigera (Hubner) in chickpea (Cicer arietinum L.). Indian
Journal of Genetics and Plant Breeding. 68(3): 320-323.
Goldstein, I.J., Hughes, R.C., Monsigny, M., Osawa, T and Sharon, N. 1980. What
should be called a lectin?.Nature. 285: 66.
Gopalaswamy, S.V.S., Sharma, H.C., Subbaratnam, G.V and Vijay, M.P. 2008.
Ovipositional and feeding preferences of Helicoverpa armigera towards
putative transgenic and non-transgenic pigeonpeas. Resistant Pest
Management Newsletter. 17(2): 50-52.
Gowda, D.K.S and Sharanabasappa H.D. 2005. Screening of resistant chickpea
genotype for Helicoverpa armigera (Hubner). Karnataka Journal of
Agricultural Sciences. 18(4): 1107-1108.
Grayer, R.J., Kimmins, F.M., Padgham, D.E., Harborne, J.B And Rao, G.V.R. 1992.
Condensed tannin levels and resistance of groundnuts (Arachis hypogaea)
against Aphis craccivora. Phytochemistry. 31(11):3795-3800.
Green, P.W.C., Stevenson, P.C, Simmonds, M.S.J., Sharma, H.C. 2003. Phenolic
compounds on the pod-surface of pigeonpea, Cajanus cajan, mediate the
feeding behaviour of larvae of Helicoverpa armigera. Journal of Chemical
Ecology. 29: 811-821.
Green, P.W.C., Stevenson, P.C., Simmonds, M.S.J and Sharma, H.C. 2002. Can
larvae of the pod borer, Helicoverpa armigera (Lepidoptera: Noctuidae),
select between wild and cultivated pigeonpea Cajanus sp.
(Fabaceae)?.Bulletin of Entomological Research. 92: 45-51.
Gupta, G.P., Birah, A and Rani, S. 2005. Effect of plant lectins on growth and
development of American bollworm (Helicoverpa armigera). The Indian
Journal of Agricultural Sciences. 75(4): 207-212.
Gupta, P.K and Varshney, R.K. 2000. The development and use of microsatellite
markers for genetic analysis and plant breeding with emphasis on bread
wheat. Euphytica. 113: 163-185.
Gupta, P.K., Rostogi, S., Sharma, S., Singh, R., Kumar, N and Balyan, H.S. 2003.
Transferable EST-SSR markers for the study of polymorphism and genetic
diversity in bread wheat. Molecular Genetics and Genomics. 270:315-323.
Hahn, D.H., Faubion, J.M and Rooney, L.W. 1983. Sorghum phenolic acids, their
performance liquid chromatography separation and their relation to fungal
resistance. Cereal Chemistry. 60: 255-259.
Harlan, J and de Wet, J. 1971. Towards a rational classification of cultivated plants.
Taxon. 20: 509-517.
Harper, M.S., Hopkins, T.L and Czapla, T.H. 1998. Effect of wheat germ agglutinin
on formation and structure of the peritrophic membrane in European corn
borer (Ostenia nubilalis) larvae. Tissue and Cell. 30: 166-176.
Harsulkar, A.M., Giri, A.P., Gupta, V.S., Sainani, M.N., Deshpande, V.V., Patankar,
A.G and Ranjekar, P.K. 1998. Characterization of Helicoverpa armigera gut
proteinases and their interaction with proteinase inhibitors using gel-X-ray
film contact print technique. Electrophoresis. 19(8-9): 1397-1402.
208
Harsulkar, A.M., Giri, A.P., Patankar, A.G., Gupta, V.S., Sainani, M.N., Ranjekar,
P.K and Deshpande. V.V. 1999. Successive use of non-host plant proteinase
inhibitors required for effective inhibition of gut proteinases and larval
growth of Helicoverpa armigera. Plant Physiology. 121: 497-506.
Hedge, J.E and Hofreiter, B.T. 1962. Anthrone Determination for carbohydrate. In:
Carbohydrate Chemistry, 17, (Eds. Whistley, R.L and Be Miller, J.N.),
Academic Press: New York, USA.
Heslop-Harrison, J.S. 2002. Exploiting novel germplasm. Australian Journal of
Agricultural Research. 53: 873-879.
Hivrale, V.K., Lomate, P.R., Basaiyye, S.S and Kalve, N.D. 2013. Compensatory
proteolytic responses to dietary proteinase inhibitors from Albizia lebbeck
seeds in the Helicoverpa armigera larvae. Arthropod-Plant Interactions. 7:
259-266.
Hossain, M.A., Haque, M.A and Prodhan, M.Z.H. 2007. Screening of different
varieties/lines of chickpea against pod borer, Helicoverpa armigera
(Hubner). Annals of Bangladesh Agriculture. 11 (1): 125-130.
Hossain, M.A., Haque, M.A and Prodhan, M.Z.H. 2008a. Incidence and damage
severity of pod borer, Helicoverpa armigera (Hubner) in chickpea (Cicer
arietinum L.). Bangladesh Journal of Scientific and Industrial Research.
44(2): 221-224.
Hossain, M.A., Haque, M.A and Prodhan, M.Z.H. 2008b. Effect of pods
characteristics on pod borer, Helicoverpa armigera (Hubner), investigation in
chickpea. SAARC Journal of Agriculture. 6(1): 1-11.
Hou, Y., Hou, Y., Yanyan, L., Qin, G and Li, J. 2010. Extraction and purification of
a lectin from red kidney bean and preliminary immune function studies of the
lectin and four Chinese herbal polysaccharides. Journal of Biomedicine and
Biotechnology. 217342: 1-9.
Huttel, B., Winter, P., Weising, K., Choumane, W., Weigand, F and Kahl, G. 1999.
Sequence-tagged microsatellite markers for chickpea (Cicer arietinumL.).
Genome. 42: 210-217.
Jackai, L.E.N and Oghiakhe, S. 1989. Pod wall trichomes and role in the resistance
of two wild cowpea, Vigna vexillata accessions to M. testulalis (Geyer),
(Lepidoptera: Pyralidae) and Clavigralla tomentosicollois, (Hemiptera:
Coreidae). Bulletin of Entomological Research. 79: 595-605.
Jadhav, S.N., Konda, C.R., Kamanna, B.C and Hanumanaikar, R.H. 2010. Carryover
activity of Helicoverpa armigera in north eastern transitional zone-I of
Karnataka. Karnataka Journal of Agricultural Sciences. 23(1): 105-106.
Jamal, F., Pandey, P.K., Singh, D and Ahmed, W. 2015. A Kunitz-type serine
protease inhibitor from Butea monosperma seed and its influence on
developmental physiology of Helicoverpa armigera. Process Biochemistry.
50: 311-316.
Johnston, K.A., Lee, M.J., Gatehouse, J.A and Anstee, J.H. 1991. The partial
purification and characterisation of serine protease activity in midgut of larval
Helicoverpa armigera. Insect Biochemistry. 21(4): 389-397.
209
Jongsma, M. A and Bolter, C. 1997. The adaptation of insect to plant protease
inhibitors. Journal of Insect Physiology. 43: 885-896.
Kanchana, R., Lakshmi, K.V and Rajasekhar, P. 2005. Morphological and
biochemical bases of host plant resistance to Helicoverpa armigera (Hubner)
in chickpea. Journal of Plant Protection and Environment. 2(1): 12-17.
Kansal, R., Kumar, M., Kuhar, K., Gupta, R.N., Subrahmanyam, B., Koundal, K.R
and Gupta, V.K. 2008. Purification and characterization of trypsin inhibitor
from Cicer arietinum(L.) and its efficacy against Helicoverpa armigera.
Brazilian Society of Plant Physiology. 20(4): 313-322.
Kaur, G.H.S.K., Daljeet Singh and Kuldip Singh. 2005. Prelimenary evaluation of
chickpea genotypes for resistance to pod borer and wilt complex.
International Chickpea and Pigeonpea Newsletter. 12: 39-40.
Khan, S., Ahmad, F., Ali, F., khan, H., Khan, A and Swati, Z.A. 2011. Phyto-
agglutinin, total proteins and amino assimilating enzymatic activity of
indigeneous chickpea (Cicer arietinum L.) cultivars. African Journal of
Biotechnology. 10(57): 12276-12280.
Khattak, S.U., Bashir Ahmad Alamzeb Khan, A.U and Abid Farid Khalil, S.K.
2002. Screening of chickpea genotypes against gram podborer (Helicoverpa
armigera Hub.) using bioassay technique. Proceedings of Pakistan Congress
of Zoology. 22: 49-55.
Kodousek, R. 1969. A new, rapid method of preparing Schiff’s reagent.
Histochemical Journal. 1: 277-278.
Kolberg, J., Michaelsen, T.E and Sletten, K. 1983. Properties of a lectin purified
from the seeds of Cicer arietinum. Hoppe-Seyler’s Zeitschrift Physiologische
Chemie. 364 (6): 655-664.
Kollipara, K.P., Singh, L and Hymowitz, T. 1994. Genetic variation of trypsin and
chymotrypsin inhibitors in pigeonpea (Cajanus cajanL. Millsp) and its wild
relatives. Theoretical and Applied Genetics. 88(8): 986-993.
Kooner, B.S and Cheema, H.K. 2008. Reaction of chickpea genotypes against gram
pod borer, Helicoverpa armigera(Hubner). Journal of Food Legumes. 21(3):
185-186.
Kotkar, H.M., Sarate, P.J., Tamhane, V.A., Gupta, V.S and Giri, A.P. 2009.
Responses of midgut amylases of Helicoverpa armigera to feeding on
various host plants. Journal of Insect Physiology. 55: 663-670.
Kumar, J., Singh, D.C., Singh, A.P and Verma, S.K. 2013. Screening of chickpea
genotypes for resistant against pod borer,Helicoverpa armigera Hubn.Trends
in Biosciences. 6(1): 101-103.
Kumari, D.A., Reddy, D.J and Sharma, H.C. 2006. Antixenosis mechanism of
resistance in pigeonpea to the pod borer, Helicoverpa armigera. Journal of
Applied Entomology. 130(1): 10-14.
Kumari, D.A., Sharma, H.C and Reddy, D.J. 2010. Incorporation of lyophilized
leaves and pods into artificial diet to assess antibiosis component of
resistance to pod borer in pigeonpea. Journal of Food Legumes. 23(1): 57-65.
210
Ladizinsky, G. 1975. A new Cicer from Turkey. Notes Royal Botanical Garden
Edinburgh. 34: 201-202.
Ladizinsky, G. 1995. Chickpea. In: Smartt, J and Simmonds, N.W (Eds) Evolution
of Crop Plants. Longman Scientific and Technical, Harlow, UK.Pp. 258-261.
Laemmli, U.K. 1970. Cleavage of structural proteins during the assembly of the
head of bacteriophage T4. Nature. 227: 680-685.
Lannoo, N., Peumans, W.J and Van Damme, E.J.M. 2006. The presence of
jasmonate-inducible lectin genes in some but not all Nicotiana species
explains a marked intragenus difference in plant responses to hormone
treatment. Journal of Experimental Botany. 57(12): 3145-3155.
Laskowski, M.Jr., Kato, I., Kohr, W.J., Park, S.J., Tashiro, M and Whatley, H.E.
1988. Positive Darwinian selection in evolution of protein inhibitors of serine
proteinase. Cold Spring Harbor Symp Quant Biol. 52:545-553.
Lateef S.S and Sachan, J.N. 1990.Host plant resistance to Helicoverpa armigera
(Hub.) in different agro-economical conditions, pp. 181-189. In: Chickpea in
Ninetees: Proceedings of the Second International Workshop on Chickpea, 4-
8 Dec. 1989. International Crops Research Institute for the Semi-Arid
Tropics, Patancheru, Andhra Pradesh, India.
Lateef, S.S. 1985. Gram pod borer, Heliothis armigera (Hub.) resistance in
chickpea. Agriculture, Ecosytem and Environment. 14: 95-102.
Lateef, S.S. 1992. Scope and limitation of host plant resistance in pulses for the
control of Helicoverpa armigera. In: Helicoverpa management: Current
status and future strategies. Proceedings of First National Workshop, 30-31
August 1990, Kanpur, India (Sachan JN ed.). Pp 31-37.
Lauter, D.J and Munns, D.N. 1986. Water loss via the glandular trichomes of
chickpea (Cicer arietinum). Journal of Experimental Botany. 37: 640-649.
Lazzaro, M.D and Thomson, W.W. 1989. Ultrastructure of organic acid secreting
trichomes of chickpea (Cicer arietinum). Canadian Journal of Botany. 67:
2669-2677.
Lazzaro, M.D and Thomson, W.W. 1995. Seasonal variation in hydrochloric acid,
malic acid, and calcium ions secreted by the trichomes of chickpea (Cicer
arietinum). Physiologia Plantarum. 94: 291-297.
Lev-Yadun, S., Gopher, A and Abbo, S. 2000. The cradle of agriculture. Science.
288: 1602-1603.
Lin, J.Y., Lee, T.C., Hu, S.T., Tung, T.C. 1981. Isolation of four isotoxic proteins and
one agglutinin from Jequiriti bean (Abrus precatorious). Toxicin. 19: 41-51.
Liu, K and Muse, S.V. 2005. PowerMarker: Integrated analysis environment for
genetic markers data. Bioinformatics. 21: 2128-2129.
Lomate, P.R and Hivrale, V.K. 2011. Differential responses of Helicoverpa armigera
midgut soluble aminopeptidases to feeding on various host and non-host plant
diets. Arthropod-Plant Interactions. 5: 359-368.
Lomate, P.R and Hivrale, V.K. 2013. Effect of Bacillus thuringiensis (Bt) Cry1Ac
toxin and protease inhibitor on growth and development of Helicoverpa
armigera (Hübner). Pesticide Biochemistry and Physiology. 105: 77-83.
211
Lowry, O.H., Rosebrough, N.J., Farr, A.L and Ramdall, R.J. 1951. Protein
measurement with Folin phenol reagent. Journal of Biological Chemistry.
193: 265-275.
Mace, E.S., Buhariwalla, H.K and Crouch, J.H. 2003. A high-throughput DNA
extraction protocol for tropical molecular breeding programs. Plant
Molecular Biology Reporter. 21: 459a-459h.
Macedo, M.L.R., Freire, M.D.G.M., Silva, M.B.R.D and Coelho, L.C.B.B. 2007.
Insecticidal action of Bauhinia monandra leaf lectin (BmoLL) against
Anagasta kuehniella (Lepidoptera: Pyralidae), Zabrotes subfasciatus and
Callosobruchus maculatus (Coleoptera: Bruchidae). Comparative
Biochemistry and Physiology. 146: 486-498.
Machuka, J., Van Damme, E.J.M., Peumans, W.J and Jackai, L.E.N. 1999. Effects
of plant lectins on the development of the legume pod borer, Maruca vitrata.
Entomologia Experimentalis et Applicata. 93: 179-186.
Maiti, R.K and Bidinger, F.R. 1979. Simple approaches to the identification of shoot
fly tolerance in sorghum. Indian Journal of Plant Protection. 7: 135-140.
Mallikarjuna, N., Coyne, C., Cho, S., Rynearson, S., Rajesh, P.N., Jadhav, D.R and
Muehlbauer, F.J. 2011. Cicer. In: Kole, C (ed.), Wild crop relatives: Genomic
and breeding resources, legume crops and forages. Springer Heidelberg,
London, New York, pp. 63-82.
Mallikarjuna, N., Sharma, H.C and Upadhyaya, H.D. 2007. Exploitation of wild
relatives of pigeonpea and chickpea for resistance to Helicoverpa armigera.
eJ SAT Agricultural Researcha and Crop Improvment. 3(1): 4-7.
Maurya, R.P and Ujagir, R. 2004. Susceptibility of chickpea germplasm to gram
podborer Helicoverpa armigera (Hubner). Indian Journal of Entomology. 66
(4): 311 - 315.
Mendiola-Olayab, E., Valencia-Jiménez, A., Valdes-Rodriguez, S., Delano-Frier, J.
and Blanco-Labra, A. 2000. Digestive amylase from the larger grain borer,
Prostephanus truncatus Horn. Comparative Biochemistry and Physiology.
126: 425-433.
Morimoto, M., Kumeda, S and Komai, K. 2000. Insect antifeedant flavonoids from
Gnaphalium affine D. Don. Journal of Agricultural and Food Chemistry. 48:
1888-1891.
Mulwa, R.M.S., Kimurto, P.K and Towett, B.K. 2010. Evaluation and selection of
drought and pod borer (Helicoverpa armigera) tolerant chickpea genotypes
for introduction in semi-arid areas of Kenya. In: Proceeding of Second
Ruforum Biennial Meeting, Entebbe, Uganda, Kenya. 20-24 September.
Murdock, L.L., Huesing, J.E., Nielsen, S.S., Pratt, R.C and Shade, R.E. 1990.
Biological effects of plant lectins on the cowpea weevil. Phytochemistry.
29(1): 85-89.
Nadeem, S., Hamed, M., Shafique, M., Atta, B.M and Shah, T.M. 2011. Evaluation of
resistance in Kabuli chickpea genotypes against chickpea podborer, Helicoverpa
armigera (Hubner) (Lepidoptera: Noctuidae) under field conditions.
Songklanakarin journal of Science and Technology. 33(3): 291-294.
212
Nadeem, S., Shafique, M., Hamed, M., Atta, B.M and Shah, T.M. 2010. Evaluation
of advanced chickpea genotypes for resistance to podborer, Helicoverpa
armigera (Hubner) (Lepidoptera: Noctuidae). Pakistan Journal of
Agricultural Sciences. 47(2): 132-135.
Naghavi, M.R., Monfared, S.R and Humberto, G. 2012. Genetic diversity in Iranian
chickpea (Cicer arietinum L.) landraces as revealed by microsatellite
markers. Czech Journal of Genetics and Plant Breeding. 48(3): 131-138.
Naghdi, M and Bandani, A.R. 2012. Snowdrop lectin (GNA) affects growth and
development of Spodoptera exigua (Hubner). Journal of Agricultural Science
and Technology. 14: 469-477.
Narayanamma, V.L., Sharma H.C., Gowda, C.L.L and Sriramulu M. 2008.
Incorporation of lyophilized leaves and pods into artificial diets to assess the
antibiosis component of resistance to pod borer, Helicoverpa armigera
(Hubner) (Lepidoptera: Noctuidae) in chickpea. International Journal of
Tropical Insect Science. 27(3/4): 191-198.
Narayanamma, V.L., Sharma, H.C., Gowda, C.L.L and Sriramulu, M. 2007.
Mechanisms of resistance to Helicoverpa armigera and introgression of
resistance genes into F1 hybrids in chickpea. Arthropod - Plant Interactions.
1(4): 263-270.
Narayanamma, V.L., Sharma, H.C., Vijay, P.M., Gowda, C.L.L and Sriramulu, M.
2013. Expression of resistance to the pod borer Helicoverpa armigera
(Lepidoptera: Noctuidae), in relation to high-performance liquid
chromatography fingerprints of leaf exudates of chickpea. International
Journal of Tropical Insect Science. 1-7.
Naseri, B., Fathipour, Y., Moharramipour, S., Hosseininaveh, V and Gatehouse,
A.M.R. 2010. Digestive proteolytic and amylolytic activities of Helicoverpa
armigera in response to feeding on different soybean cultivars. Pest
Management Science. 66: 1316-1323.
Navasero, R.C and Ramaswamy, S.B. 1991. Morphology of leaf surface trichomes and
its influence on egglaying by Heliothis virescens. Crop Science. 31: 342-353.
Nayak, S.N., Zhu, H., Varghese, N., Datta, S., Choi, H., Horres, R., Jüngling, R.,
Singh, J., Kavi Kishor, P.B., Sivaramakrishnan, S., Hoisington, D.A., Kahl,
G., Winter, P., Cook, D.R and Varshney, R.K. 2010. Integration of novel
SSR and gene-based SNP marker loci in the chickpea genetic map and
establishment of new anchor points with Medicago truncatula genome.
Theoretical and Applied Genetics. 120:1415-1441.
Nevo, E. 1978. Genetic variation in natural populations: patterns and theory.
Theoritical Population Biology. 13: 121-77.
Ohizumi, Y., Gaidamashvili, M., Ohwada, S., Matsuda, K., Kominami, J., Nakamura-
Tsuruta, S., Hirabayashi, J., Naganuma, T., Ogawa, T and Muramoto, K. 2009.
Mannose-binding lectin from yam (Dioscorea batatas) tubers with insecticidal
properties against Helicoverpa armigera (Lepidoptera: Noctuidae). Journal of
Agricultural and Food Chemistry. 57: 2896-2902.
213
Patankar, A.G., Giri, A.P., Harsulkar, A.M., Sainani, M.N., Deshpande, V.V.,
Ranjekar, P.K and Gupta, V.S. 2001. Complexity in specificities and
expression of Helicoverpa armigera gut proteinases explains polyphagous
nature of the insect pest. Insect Biochemistry and Molecular Biology. 31:
453-464.
Patankar, A.G., Harsulkar, A.M., Giri, A.P., Gupta, V.S., Sainani, M.N., Ranjekar,
P.K and Deshpande, V.V. 1999. Diversity in inhibitors of trypsin and
Helicoverpa armigera gut proteinases in chickpea (Cicer arietinum) and its
wild relatives. Theoretical and Applied Genetics. 99: 719-726.
Patil, S.K, Shinde, G.P and Jamadagni, B.M. 2007. Reaction of short-duration
chickpeagenotypes for resistance to gram pod borer, Helicoverpa armigera in
Maharashtra, India. Journal of SAT Agricultural Research. 5(1): 1-2.
Patnaik, H.P and Senapati, B. 1995. Influence of acidity of chickpea leaves on the
incidence of Heliothis armigera (Hubner) in resistant/susceptible cultivars.
Journal of Entomological Research. 19 (3): 229-233.
Pedroche, J., Yust, M.M., Lqari, H., Megias, C., Giron-Calle, J., Alaiz, M., Millan, F
and Vioque, J. 2005. Chickpea pa2 albumin binds hemin. Plant Science. 168:
1109-1114.
Perrier, X., Flori, A and Bonnot, F. 2003. Methods for data analysis. In: Hamon P,
Seguin M, Perrier X, Glaszmann JC (eds) Genetic Diversity of Cultivated
Tropical Plants. Science Publishers, Inc. and CIRAD, Montpellier. 31-63.
Peter A.J., Shanower T.G and Romeis J. 1995. The role of plant trichomes in insect
resistance: a selective review. Phytophaga. 7: 41-64.
Peter, A.J and Shanower, T.G. 1998. Plant glandular trichomes: chemical factories
with many potential uses. Resonance. 3: 41-45.
Pichare, M.M and Kachole, M.S. 1994. Detection of electrophoretically separated
proteinase inhibitors using X-ray film. Journal of Biochemistry and
Biophysical Methods. 28: 215-224.
Pillai, A.K., Selvaraj, S and Agnihotri, M. 2016. Seasonal abundance of Campoletis
chlorideae Uchida (Hymenoptera: Ichneumonidae), A larval parasitoid of
Helicoverpa armigera (Hubner) hardwick in chickpea. Legume Research.
39(4): 643-647.
Pusztai, A and Bardocz, S. 1996. Biological effects of plant lectins on the
gastrointestinal tract: metabolic consequences and applications. Trends in
Glycoscience and Glycotechnology. 8: 149-165.
Qureshi, I.A., Dash, P., Srivastava, P.S and Koundal, K.R. 2006. Purification and
characterization of an N-acetyl-D-galactosamine-specific lectin from seeds of
chickpea (Cicer arietinum L.). Phytochemical Analysis. 17: 350-356.
Rajapakse, C.N.K and Walter, G.H. 2007. Polyphagy and primary host plants:
oviposition preference versus larval performance in the lepidopteran pest
Helicoverpa armigera. Arthropod-Plant Interactions. 1: 17-26.
Rajput, A.A., Sarwar, M., Ahmad, N., Siddiqui, Q.H and Toufiq, M. 2003.
Evaluation of resistance in some local and exotic chcickpea genotypes
against Helicoverpa armigera (Hubner). Pakistan Journal of Biological
Science. 6(18): 1612-1615.
214
Rao, K.P., Sudhakar, K and Radha Krishanaih, K. 2001. Seasonal incidence and host
preference of Helicoverpa armigera (Hubner). Indian Journal of Plant
Protection. 29(1&2): 152-153.
Ravikant, T.H.K. 2010. Incidence of Helicoverpa armigera (Hubner) in different
genotypes of chickpea. Flora and Fauna. 16 (2): 230-232.
Reddy, V., Anandhi, P., Elamathi, S and Varma, S. 2009. Seasonal occurrence of
pulse pod borer Helicoverpa armigera (L.) on chick pea at eastern U.P.
region. Agricultural Science Digest. 29(2): 60-62.
Reed, W., Cardona, C., Ithanantham, S and Lateef, S.S. 1987. The chickpea insect
pests and their control. In: Saxena MC and Singh KB (eds.). The Chickpea.
CAB International, Wallinford, UK, pp. 283-318.
Rembold, H and Winter, E. 1982. The chemist role in host plant resistance studies.
Proceedings of International Workshop on Heliothis management. Nov, 15-
20, 1981, ICRISAT center, Patancheru, India.
Rembold, H. 1981. Malic acid in chickpea exudates a marker for Heliothis
resistance. International Chickpea Newsletter. 4: 18-19.
Rembold, H., Wallner, P., Kohne, A., Lateef, S.S., Grune, M and Weigner, C. 1989.
Mechanisms of host plant resistance with special emphasis on biochemical
factors. Chickpea in the nineties: Proceedings of the second international
Workshop on Chickpea Improvement, 4-8 December 1989, ICRISAT center,
India. 1990: 191-194.
Renwick, J.A.A and Chew, F.S. 1994. Oviposition behaviour in lepidoptera. Annual
Review of Entomology. 39: 377-400.
Robertson, L.D., Ocampo, B and Singh, K.B. 1997. Morphological variation in wild
annual Cicer species in comparison to the cultigen. Euphytica. 95: 309-319.
Rohit, M., Rohit, R., Prasad, C.S., Rakesh, K and Ashish, D. 2016. Influence of
weather parameters on Helicoverpa armigera (Hubner) larval parasitisation
by Campoletis chlorideae (Uchida) in chickpea ecosystem. International
Journal of Agriculture Sciences. 8(16): 1280-1282.
Romeis J., Shanower T.G and Peter A.J. 1999. Trichomes on pigeonpea (Cajanus
cajan) and two wild Cajanus spp. Crop Science. 39; 564-569.
Rupalighodeswar., Jyoti Raut and Chavan, J.K. 2003. Biochemical analysis of
chickpea cultivars in relation to podborer infestation. Indian Journal of
Agricultural Biochemistry. 1691): 47-48.
Ryan, C.A. 1990. Proteinase inhibitors in plants: genes for improving defenses against
insect and pathogens. Annual Review of Phytopathology. 28: 425-449.
Sahoo, B.K and Patnaik, H.P. 2003.Effect of biochemicals on the incidence of
pigeonpea pod borers. Indian Journal of Plant Protection. 31(1): 105-108.
Saini, H.S., Weder, J.K.P and Knights, E.J. 1992. Inhibitor activities of chickpeas
(Cicer arietinum L.) against bovine, porcine and human trypsin and
chymotrypsin. Journal of the Science of Food and Agriculture.60: 287-295.
Sanap, M.M and Jamadagni, B.M. 2005. Screening of chickpea for resistance to
podborer Helicoverpa armigera (Hubner) at rahuri, Maharashtra, India.
International Chickpea and Pigeonpea Newsletter. 12: 37-39.
215
Saraf, C.S., Rupela, O.P., Hegde, D.M., Yadav, R.L., Shivkumar, B.G., Bhattarai, S.,
Razzaque, M.A and Sattar, M.A. 1998. Biological nitrogen fixation and
residual effects of winter grain legumes in rice and wheat cropping systems of
the Indo-Gangetic plain. In: Kumar JVDK, Johansen C, Rego TJ (eds)
Residual Effects of Legumes in Rice and Wheat Cropping Systems of the Indo-
Gangetic Plain.Oxford and IBH Publishing, New Delhi, India, Pp 14-30.
Sarwar, M. 2013. Exploration on resource of resistance in chickpea (Cicer arietinum
L.) genotypes to gram pod borer Helicoverpa armigera (Hubner)
(Lepidoptera). African Journal of Agricultural Research. 8(26): 3431-3435.
Sarwar, M., Ahmad, N and Toufiq, M. 2009. Host plant resistance relationships in
chickpea (Cicer arietinum L.) against gram pod borer (Helicoverpa armigera
Hubner). Pakistan Journal of Botany. 41(6): 3047-3052.
Sarwar, M., Ahmad, N and Toufiq, M. 2011. Identification of susceptible and tolerant
gram (Cicer arietinum L.) genotypes against gram pod borer (Helicoverpa
armigera) (Hubner). Pakistan Journal of Botany. 43(2): 1265-1270.
Sastry, M.C and Murray, D.R. 1987. The contribution of trypsin inhibitors to the
nutritional value of chick pea seed protein. Journal of the Science of Food
and Agriculture.40: 253-261.
Schnepf, E. 1965. Licht- und elektronmikroskopische Beobachtungen an den
Trichom-Hydathoden yon Cicer arietinum. Z Pflan-zenphysiol. 53: 245-254.
Serret, M.D., Udupa, S.M and Weigand, F. 1997. Assessment of genetic diversity of
cultivated chickpea using microsatellite-derived RFLP markers: implications
for origin. Plant Breeding. 116: 573-578.
Sethy, N.K., Choudary, S., Shokeen, B and Bhatia, S. 2006b. Identification of
microsatellite markers from Cicer reticulatum: molecular variation and
phylogenetic analysis. Theoretical and Applied Genetics. 112: 347-357.
Sethy, N.K., Shokeen, B., Edwards, K.J and Bhatia, S. 2006a. Development of
microsatellite markers and analysis of intraspecific genetic variability in chickpea
(Cicer arietinum L.). Theoretical and Applied Genetics. 112: 1416-1428.
Shabbir, M.Z., Arshad, M., Hussin, B., Nadeen, I., Ali, S., Abbasi, A and Ali, Q.
2014. Genotypic response of chickpea (Cicer arietinum L.) for resistance
against gram pod borer (Helicoverpa armigera). Advances in Life Sciences.
2(1): 23-30.
Shafique, M., Sajid Nadeem, Muhammad Hamed Atta, B.M and Shah, T.M. 2008.
Screening of kabuli chickpea recombinants for resistance to podborer
(Helicoverpa armigera Hub.) under natural field conditions. Pakistan
Entomologist. 30(2): 169-173.
Shafique, M., Sajid Nadeem, Muhammad Hamed, Atta, B.M and Shah, T.M. 2009.
Performance of some advance desi chickpea genotypes against pod borer,
Helicoverpa armigera (Hubner) resistance. Pakistan Journal of Zoology.
41(4): 277-280.
Shahzad, K., Iqbal, A., Khalil, S.K and Khattak, S. 2005. Response of different
chickpea (Cicer arietinum) genotypes to the infestation of pod borer
(Helicoverpa armigera) with relation to trichomes. Research Journal of
Agriculture and Biological Sciences. 1(1): 120-124.
216
Shan, F., Clarke, H.C., Plummer, J.A., Yan, G and Siddique, K.H.M. 2005.
Geographical patterns of genetic variation in the world collections of wild
annual Cicer characterized by amplified fragment length polymorphisms.
Theoretical and Applied Genetics. 110: 381-391.
Shankar, M. 2013. Mechanisms of host plant resistance to beet army worm,
Spodoptera exigua (Hubner) in chickpea. Ph.D thesis submitted to ANGRAU.
Hyderabad. Andhra Pradesh, India.
Shankar, M., Munghate, R.S., Babu, T.R., Sridevi, D and Sharma, H.C. 2014.
Population density and damage by pod borers, Helicoverpa armigera and
Spodoptera exigua in a diverse array of chickpea genotypes under natural
infestation in the field. Indian Journal of Entomology. 76(2): 117-127.
Shanower, T.G., Yoshida, M and Peter, A.J. 1997. Survival, growth, fecundity, and
behavior of Helicoverpa armigera (Lepidoptera: Noctuidae) on pigeonpea and
two wild Cajanus species. Journal of Economic Entomology. 90(3): 837-841.
Sharma, H.C. (Ed.). 2005. Heliothis/ Helicoverpa Management: Emerging Trends
and Strategies for Future Research. Oxford and IBH Publishing, New Delhi,
India, 469pp.
Sharma, H.C. 2001.Cotton bollworm/legume pod borer, Helicoverpa armigera
(Hubner) (Noctuidae: Lepidoptera): biology and management. In: Crop
Protection Compendium. CAB International, Wallingford, UK.
Sharma, H.C., Bhagawat, M.P., Pampapathy, G., Sharma, J.P and Ridsdill-Smith,
T.J. 2006. Perennial wild relatives of chickpea as potential sources of
resistance to Helicoverpa armigera. Genetic Resources and Crop Evolution.
53: 131-138.
Sharma, H.C., Green, P.W.C., Stevenson, P.C and Simmonds, M.S.J. 2001. What
makes it tasty for the pest? Identification of Helicoverpa armigera (Hubner)
feeding stimulants and location of their production on the pod surface of
pigeonpea [Cajanus cajan (L.) Millsp.]. Competitive Research Facility
Project R7029 C, Final Technical Report, London: Department for
International Development.Pp. 11-26.
Sharma, H.C., Pampapathy, G and Kumar, R. 2005c. Standardization of cage
techniques to screen chickpeas for resistance to Helicoverpa armigera
(Lepidoptera: Noctuidae) in greenhouse and field conditions. Journal of
Economic Entomology. 98(1): 210-216.
Sharma, H.C., Pampapathy, G., Dhillon, M.K and Ridsdill-Smith, T.J. 2005d.
Detached leaf assay to screen for host plant resistance to Helicoverpa
armigera. Journal of Economic Entomology. 98(2): 568-576.
Sharma, H.C., Pampapathy, G., Lanka, S.K and Ridsdill-Smith, T.J. 2004.
Evaluation of wild relatives of chickpea (Cicer spp.) for resistance to pod
borer, Helicoverpaarmigera (Hubner). Indian Journal of Plant Genetic
Resources. 17(1): 17-26.
Sharma, H.C., Pampapathy, G., Lanka, S.K and Ridsdill-Smith, T.J.2005b.
Exploitation of wild Cicer reticulatum germplasm for resistance to
Helicoverpa armigera. Journal of Economic Entomology. 98(6): 2246-2253.
217
Sharma, H.C., Pampapathy, G., Lanka, S.K and Ridsdill-Smith, T.J. 2005a.
Antibiosis mechanism of resistant to pod borer, Helicoverpa armigera in
wild relatives of chickpea. Euphytica. 142: 107-117.
Sharma, H.C., Sujana, G and Rao, D.M. 2009. Morphological and chemical
components of resistance to pod borer, Helicoverpa armigera in wild
relatives of pigeonpea. Arthropod-Plant Interactions. 3: 151-161.
Sharma, P.C., Winter, P., Bunger, T., Huttel, B., Weigand, F., Weising, K and Kahl,
G. 1995. Abundance and polymorphism of di-, tri- and tetra-nucleotide
tandem repeats in chickpea (Cicer arientinum L.). Theoretical and Applied
Genetics. 90: 90-96.
Shukla, S., Arora, R and Sharma, H.C. 2005. Biological activity of soybean trypsin
inhibitor and plant lectins against cotton bollworm/legume pod borer,
Helicoverpa armigera. Plant Biotechnology. 22 (1): 1-6.
Simmonds, M.S.J and Stevenson, P.C. 2001. Effects of isoflavonoid from Cicer
arietinum on larvae of Helicoverpa armigera. Journal of Chemical Ecology.
27(5): 965-977.
Simmonds, M.S.J. 2001. Importance of flavonoids in insect-plant interactions:
feeding and oviposition. Phytochemistry. 56: 245-252.
Singh, H., Singh, I and Mahajan, G. 2002. Effect of different dates of sowing on the
incidence of gram pod borer (Helicoverpa armigera) on different cultivars of
chickpea (Cicer arietinum). Agricultural Science Digest. 22(4): 295-296.
Singh, R., Sharma, P., Varshney, R.K., Sharma, S.K and Singh, N.K. 2008.
Chickpea improvement: role of wild species and genetic markers.
Biotechnology and Genetic Engineering Reviews. 25(1): 267-314.
Singh, S.S and Yadav, S.K. 2006. Evaluation of chickpea varieties for their
resistance against gram pod borer, Helicoverpa armigera. Indian Journal of
Entomology. 68 (4): 321-324.
Sison, M.J and Shanower, T.G. 1994. Development and survival of Helicoverpa
armigera (Lepidoptera: Noctuidae) on short-duration pigeonpea. Journal of
Economic Entomology. 87(6): 1749-1753.
Slansky, F. 1982. Insect nutrition: an adaptationist perspective. Florida Entomologists.
65: 45-71.
Smirnoff, P., Khalef, S., Birk, Y and Applebaum, S.W. 1979 Trypsin and
chymotrypsin inhibitor from chickpeas-selective chemical modifications of
the inhibitor and isolation of two isoinhibitors. International Journal of
Peptide Protein Research. 14: 186-192.
Spilatro, S.R and Anderson, J.M. 1989. Characterization of a soybean leaf protein
that is related to seed lectin and is increased with pod removal. Plant
Physiology. 90: 1387-1393.
Sreelatha, E. 2003. Stability, inheritance and mechanisms of resistance to
Helicoverpa armigera (Hub.) in chickpea (Cicer arietinum L.). Ph.D thesis
submitted to ANGRAU, Hyderabad, Andhra Pradesh, India.
218
Srivastava, C.P and Srivastava, R.P. 1989. Screening for resistance to gram
podborer, Heliothis armigera (Hubner), in chickpea (Cicer arientium L.)
genotypes and observations on its mechanism of resistance in India. Insect
Science and its Application. 10(3): 255-258.
Srivastava, C.P and Srivastava, R.P. 1990. Antibiosis in chickpea (Cicer arietinum
L.) to gram pod borer, Heliothis armigera (Hubner) (Noctuidae: Lepidoptera)
in India. Entomon. 15 (1-2): 89-93.
Stevenson, P.C and Veitch, N.C. 1996. Isoflavones from the roots of Cicer
judaicum. Phytochemistry. 43: 695-700.
Stevenson, P.C and Veitch, N.C. 1998. A 2-arylbenzofuran from roots of Cicer bijugum
associated with Fusarium wilt resistance. Phytochemistry. 48: 947-951.
Stevenson, P.C., Green, P.W.C., Simmonds, M.S.J and Sharma, H.C. 2005. Physical
and chemical mechanisms of plant resistance to Helicoverpa: Recent research
on chickpea and pigeonpea. In: Heliothis/ Helicoverpa Management:
Emerging trends and Strategies for Future Research. Ed. by Sharma HC,
Oxford and IBH Publishing, New Delhi, India, pp 209-221.
Sudupak, M.A., Akkaya, M.S and Kence, A. 2002. Analysis of genetic relationships
among perennial and annual Cicer species growing in Turkey using RAPD
markers. Theoretical and Applied Genetics. 105: 1220-1228.
Sudupak, M.A., Akkaya, M.S and Kence, A. 2004. Genetic relationships among
perennial and annual Cicer species growing in Turkey assessed by AFLP
fingerprinting. Theoretical and Applied Genetics. 108: 937-944.
Suganthy, M., Rao, G.V.R and Kumar, S.T. 2003. Seasonal incidence of gram pod
borer in rainfed chickpea in Andhra Pradesh. Indian Journal of Plant
Protection. 31(1): 160-161.
Sujana, G., Sharma, H.C and Rao, D.M. 2008. Antixenosis and antibiosis components
of resistance to pod borer Helicoverpa armigera in wild relatives of pigeonpea.
International Journal of Tropical Insect Science. 28(4): 191-200.
Sujana, G., Sharma, H.C and Rao, D.M. 2012. Pod surface exudates of wild relatives
of pigeonpea influence the feeding preference of the pod borer, Helicoverpa
armigera. Arthropod-Plant Interactions. 6(2): 231-239.
Sultan, N.A.M and Swamy, M.J. 2005. Energetics of carbohydrate binding to
Momordica charantia (bitter gourd) lectin: An isothermal titration
calorimetric study. Archives of Biochemistry and Biophysics. 437: 115-125.
Talebi, R., Fayaz, F., Mardi, M., Pirsyedi, S.M and Naji, A.M. 2008. Genetic
relationships among chickpea (Cicer arietinum) elite lines based on RAPD
and agronomic markers. International Journal of Agriculture Biology. 10:
301-305.
Talebi, R., Jelodar, N.B., Mardi, M., Fayaz, F., Furman, B.J and Bagheri, N.A. 2009.
Phylogenetic diversity and relationship among annual Cicer species using
random amplified polymorphic DNA markers. General and Applied Plant
Physiology. 35(1-2): 3-12.
Telang, M.A., Giri, A.P., Sainani, M.N and Gupta, V.S. 2005. Characterization of
two midgut proteinases of Helicoverpa armigera and their interaction with
proteinase inhibitors. Journal of Insect Physiology. 51: 513-522.
219
Thudi, M., Bohra, A., Nayak, S.N., Varghese, N., Shah, T.M., Penmetsa, R.V.,
Nepolean, T., Gudipati, S., Gaur, P.M., Kulwal, P.L., Upadhyaya, H.D., Kavi
Kishor, P.B., Winter, P., Kahl, G., Town, C.D., Kilian, A., Cook, D.R and
Varshney, R.K. 2011. Novel SSR markers from BAC-end sequences, DArT
arrays and a comprehensive genetic map with 1291 marker loci for chickpea
(Cicer arietinum L.). PLoS ONE. 6(11): e27275.
Torutaeva, E., Asanaliev, A., Prieto-Linde, M.L., Zborowska, A., Ortiz, R.,
Bryngelsson, T. and Garkava-Gustavsson, L. 2014. Evaluation of
microsatellite-based genetic diversity, protein and mineral content in
chickpea accessions grown in Kyrgyzstan. Hereditas. 151: 81-90.
Udamale, S.K., Moharil, M.P., Ugale, T.B and Mankar, J.M. 2013. Differential
Inhibition of Helicoverpa armigera (Hubner) gut proteinases by proteinase
inhibitors of okra and its wild relatives. ISRN Biotechnology. 632173: 1-10.
Udayagiri, S and Mason C.E. 1995. Host plant constituents as oviposition stimulants
for a generalist herbivore: European corn borer. Entomologia Experimentalis
et Applicata. 76: 59-65.
Udupa, S.M., Malhotra, R.S and Baum, M. 2004. Tightly linked di- and
trinucleotide microsatellites do not evolve in complete independence:
evidence from linked (TA)n and (TAA)n microsatellites of chickpea (Cicer
arietinum L.). Theoretical and Applied Genetics. 108: 550-557.
Upadhaya, H.D., Dwivedi, S.L., Gowda, C.L.L and Singh, S. 2007. Identification of
diverse germplasm lines for agronomic traits in chickpea (Cicer arietinum L.)
core collection for use in crop improvement. Field Crops Research. 100:
320-326.
Upadhyaya, H.D., Dwivedi, S.L., Baum, M., Varshney, R.K., Udupa, S.M., Gowda,
C.L.L., Hoisinton, D and Singh, S. 2008. Genetic structure, diversity, and
allelic richness in composit collection and reference set in chickpea (Cicer
arietinum L.). BMC Plant Biology. 8:106.
Van Damme, E.J.M., Peumans, W.J., Pusztai, A and Bardocz, S. 1998. A handbook
of plant lectins: Properties and biomedical applications. Chichester, UK: John
Wiley and Sons. Pp 31-50.
Van der Maesen, L.J.G. 1972. Cicer L. a monograph of the genus, with special
reference to the chickpea (Cicer arietinum L.), its ecology and cultivation.
Mededelingen landbouwhoge school Wageningen 72-10: 1-342.
Van der Maesen, L.J.G. 1987. Origin, history and taxonomy of chickpea. In: Saxena,
M.C. and Singh, K.B. (eds) The Chickpea. CAB International, Wallingford,
UK.Pp. 11-34.
Vasconcelos, I.M and Oliveira, J.T.A. 2004. Antinutritional properties of plant
lectins. Toxicon. 44: 385-403.
Virk, P.S., Newbury, H.J., Jackson, M.T and Ford-Lloyd, B.V. 1995. The
identification of duplicate accessions within a rice germplasm collection
using RAPD analysis. Theoretical and Applied Genetics. 90: 1049-1055.
220
Visweshwar, R., Sharma, H.C., Akbar, S.M.D and Sreeramulu, K. 2015. Elimination
of gut microbes with antibiotics confers resistance to Bacillus thuringiensis
toxin proteins in Helicoverpa armigera (Hubner). Applied Biochemistry and
Biotechnology. 177(8): 1621-1637.
Wakil, W., Ashfaq, M., Mansoor-ul-Hasan and Javed, A. 2005. Evaluation of
different chickpea (Cicer arietinum L.) genotypes against Helicoverpa
armigera (Hub.) in Rawalpindi, Pakistan. Pakistan Entomologist. 27(1): 37-40.
War, A.R., Paulraj, M.G., Hussain, B., Buhroo, A.A., Ignacimuthu, A and Sharma,
H.C. 2013. Effect of plant secondary metabolites on legume pod borer,
Helicoverpa armigera. Journal of Pest Science. 86: 399-408.
War, A.R., Sharma, S.P and Sharma, H.C. 2016. Differential induction of flavonoids
in groundnut in response to Helicoverpa armigera and Aphis craccivora
infestation. International Journal of Insect Science. 8: 55-64.
Williams, P.C and Singh, U. 1987. The chickpea – nutritional quality and the
evaluation of quality in breeding programs. In: The chickpea. Ed. by Saxena
MC, Singh KB. CAB International, Wallingford, UK.Pp 329-356.
Winter, P., Benko-Iseppon, A.M., Hüttel, B., Ratnaparkhe, M., Tullu, A., Sonnante,
G., Pfaff, T., Tekeoglu, M., Santra, D., Sant, V.J., Rajesh, P.N., Kahl, G and
Muehlbauer, F.J. 2000. A linkage map of the chickpea (Cicer arietinum L.)
genome based on the recombinant inbred lines from a C. arietinum ×C.
reticulatum cross: localization of resistance genes for Fusarium races 4 and
5. Theoretical and Applied Genetics. 101: 1155-1163.
Winter, P., Pfaff, T., Udupa, S.M., Hüttel, B., Sharma, P.C., Sahi, S., Arrequin-
Espinoza, R., Weigand, F., Muehlbauer, F.J and Kahl, G. 1999.
Characterization and mapping of sequence-tagged microsatellite sites in the
chickpea (C. arietinum L.). Molecular and General Genetics. 262: 90-101.
Wu, Y., Llewellyn, D., Mathews, A and Dennis, E.S., 1997. Adaptation of
Helicoverpa armigera (Lepidoptera: Noctuidae) to a proteinase inhibitor
expressed in transgenic tobacco. Molecular Breeding. 3: 371-380.
Yadav, P.C., Ameta, O.P and Yadav, S.K. 2016. Seasonal incidence of gram pod
borer, Helicoverpa armigera (Hubner) in chickpea. Journal of Experimental
Zoology. 19(1): 587-589.
Yadav, S.R and Jat, B.L. 2009. Sesonal incidence of Helicoverpa armigera
(Hubner) on chickpea. Journal of Insect Science. 22 (3): 325-328.
Yang, T., Mou, P., Sun, W., He, J and Dong, K. 2010. Genetic variation of foxtail
millet cultivars in north plateau of China by SSR markers. Acta Botanica
Boreali-Occidentalia Sinica. 30(9):1786-1791.
Yeasmin, T., Tang, A.K., Razzaque, A and Absar, N. 2001. Purification and
characterization of three galactose specific lectins from mulberry seeds
(Morus sp.). European Journal of Biochemistry. 268: 6005-6010.
Yoshida, M., Cowgill, S.E and Wightman, J.A. 1995. Mechanisms of resistance to
Helicoverpa armigera (Lepidoptera: Noctuidae) in chickpea- role of oxalic
acid in leaf exudates as an antibiotic factor. Journal of Economic
Entomology. 88: 1783-1786.
221
Yoshida, M., Cowgill, S.E and Wightman, J.A. 1997. Roles of oxalic and malic
acids in chickpea trichome exudate in host-plant resistance to Helicoverpa
armigera. Journal of Chemical Ecology. 23(4): 1195-1210.
Zafar, K., Suhail, A., Arshad, M and Arif, M.J. 2013. Impact of weather factors on
population fluctuation of H. armigera on sunflower. Pakistan Journal of
Nutrition. 12(1): 50-54.
Zahoor, M., Zakia, J., Ali, M., Saleem, K., Farhad, A and Zahoor, A.S. 2009. Lectin
status, protein contents and ammonium assimilating enzymatic activity of
two indigenous cultivars of mulberry species, Morus albaand Morus nigra.
African Journal of Biotechnology. 8 (22): 6379-6382.
Zohary, D and Hopf, M. 2000. Domestication of Plants in the Old World(3rd edn),
Oxford University Press, New York, USA. 316pp.
222