OAR Implementation Plan, 2021–2026
24
Scott Sandberg, an electrical engineer with NOAA’s Chemical Sciences Laboratory, worked with Tyler Boyle of NIST to install a Doppler lidar instrument on April 16, 2021, on top of the Department of Commerce’s Herbert Clark Hoover Building in Washington, D.C. for a research project studying urban greenhouse gas emissions. Credit NOAA’s Scott Sandberg and NIST’s Tyler Boyle OAR Implementation Plan 2021-2026 Updated: July 8, 2021
-
Upload
khangminh22 -
Category
Documents
-
view
3 -
download
0
Transcript of OAR Implementation Plan, 2021–2026

Scott Sandberg, an electrical engineer with NOAA’s Chemical Sciences Laboratory, worked with Tyler Boyle of NIST to install a Doppler lidar instrument on April 16, 2021, on top of the Department of Commerce’s Herbert Clark Hoover Building in Washington, D.C. for a research project studying urban greenhouse gas emissions. Credit NOAA’s Scott Sandberg and NIST’s Tyler Boyle
OAR Implementation Plan2021-2026
Updated: July 8, 2021

2
OAR ImplentAtIOn plAn | COntents
ContentsPurpose. . . . . . . . . . . . . . . . . . . . . . . . . . . . . . . . . . . . . . . . . . . . 3
Linkage to OAR Strategy . . . . . . . . . . . . . . . . . . . . . . . . . . . . . . . . . 3
Near Term Outcomes . . . . . . . . . . . . . . . . . . . . . . . . . . . . . . . . . . . 4
Future Refinement . . . . . . . . . . . . . . . . . . . . . . . . . . . . . . . . . . . . . 4
Goal 1: Explore the Marine Environment. . . . . . . . . . . . . . . . . . . . . . . . 5
Goal 2: Detect Changes in the Ocean & Atmosphere . . . . . . . . . . . . . . . . 9
Goal 3: Make Forecasts Better . . . . . . . . . . . . . . . . . . . . . . . . . . . . .13
Goal 4: Drive Innovative Science. . . . . . . . . . . . . . . . . . . . . . . . . . . . .19

3
OAR ImplentAtIOn plAn | puRpOse
The overall purpose of the Implementation Plan is to:
• Identify Oceanic & Atmospheric Research (OAR) research priority outcomes in order to make prioritization decisions.
• Establish and apply measures for organizational accountability.
• Guide budget planning and discussions.
• Continue to create alignment through communication with labs and programs.
This Implementation Plan is an extension of the OAR Strategy 2020-2026. Developed primarily as an internal document to facilitate the execution of the strategy, the Implementation Plan serves as a guide to further direct the conduct of integrated scientific research at OAR. The OAR management framework begins within the scope of the OAR Strategy and the priorities of the Implementation Plan. The Implementa-tion Plan will be the guiding document to determine future year funding priority decisions, indicate successes and challenges through the performance measures and milestones, and evaluate programmatic risks and opportunities for collaborations.
Purpose
Linkage to OAR Strategy

4
OAR ImplentAtIOn plAn | neAR teRm OutCOmes
In order to accomplish the goals and strategic objectives laid out in the Strategy, OAR has identified 21 near-term outcomes that represent priority research projects over the next six years. The priority outcomes are linked to performance measures and targets, which indicate the progress OAR should achieve by the end of FY 2026. In developing performance measures and targets, champions were directed to assume a flat budget for FY 2022-2026.
The Implementation Plan near-term outcomes were chosen to address congressional mandates, provide alignment with strategic planning documents, support OAR portfolio priorities, align with NOAA leadership priorities, and represent multi-lab/multi-program efforts.
The Implementation Plan below represents completion of phase 1 (identifying major near-term outcomes, performance measures, and targets to be indicators of success by FY 2026). Phase 2 of the Implementation Plan will require developing milestones, associated risks of not meeting the outcomes, and outyear budget profiles. Addition-ally, the near-term outcomes will be reviewed each year for possible refinements, additions, or substitutions. The performance measures will also be reviewed and refined each year.
Near Term Outcomes
Future Refinement

5
OAR ImplentAtIOn plAn | GOAl 1: explORe the mARIne envIROnment
Goal 1: Explore the Marine Environment
Strategic Objective 1.1Map and characterize the deep ocean frontier
Strategic Objective 1.2 Define how climate change impacts marine ecosys-tems, coastal communities, and the global ocean system
Strategic Objective 1.3 Communicate the value of oceans, coasts, and Great Lakes
Long-Term OutcomeIncrease knowledge of the oceans, coastal areas, and Great Lakes to sup-port resource management and public literacy.
1. Near Term Outcome
Map and characterize the U.S. EEZ to support conservation, management, and balanced use.
Champion
OER Director
Performance Measure: Cumulative percent of deepwater ocean (>200m) US Exclusive Economic Zone (EEZ) mapped
Description: Mapping U.S. EEZ waters to a depth greater than 200 meters will yield information about the terrain of the ocean floor, providing a foundation for identifying and assessing the natural and cultural resources within these areas. These maps and characterizations are necessary for sound decisions about conservation, management, and balanced use of the nation’s waters.
FY21 Target FY22 Target FY23 Target FY24 Target FY25 Target FY26 Target51% 53% 55% 57% 59% 61%

6
OAR ImplentAtIOn plAn | GOAl 1: explORe the mARIne envIROnment
2. Near Term Outcome
Increase US domestic aquaculture production through research advancements in tools and techniques.
Champion
NSGCP Director
Performance Measure: Cumulative number of aquaculture research projects completed that address key production challenges
Description: This measure captures a range of efforts by NOAA’s Aquaculture Program that together will lead to a more efficient federal permitting process. These efforts include working with federal partners under the White House/OSTP’s Subcommittee on Aquaculture to coordinate and streamline inter-agency permitting, wor king with industry partners to establish and manage offshore aqua-culture pilot projects, conducting spatial analysis and developing siting tools, developing engineering solutions, efforts to assess and reduce risk (e.g., entanglement) from aquaculture operations, conducting programmatic environmental reviews to reduce burden on individual applicants, and drafting/revising guidance to permit applicants to improve application quality.
FY21 Target FY22 Target FY23 Target FY24 Target FY25 Target FY26 Target24 89 102 TBD TBD TBD
Performance Measure: Cumulative number of projects advanced that improve the efficiency and predictability of the federal permitting process
Description: OAR and NMFS support research to advance commercial-scale marine aquaculture pro-duction. This is done through commercial scale demonstration facilities in collaboration with—and co-funded by—industry and coastal seafood communities to facilitate the commercial viability of marine aquaculture production. Additionally, NOAA will use aquaculture research to remove produc-tion bottlenecks for shellfish and finfish related to siting, disease, genetics and genomics, hatchery seed stock, and feed availability.
FY21 Target FY22 Target FY23 Target FY24 Target FY25 Target FY26 Target3 8 8 TBD TBD TBD

7
OAR ImplentAtIOn plAn | GOAl 1: explORe the mARIne envIROnment
Performance Measure: Cumulative economic and societal impacts derived from Sea Grant activities (Jobs created or retained/Businesses created or retained/Economic benefit ($M dollars)
Description: This measure highlights change in economic impact - the jobs, businesses, dollars, and non-market value - that communities or businesses generate or save due to Sea Grant assistance (i.e., providing information to help communities, industries or businesses expand, make better deci-sions, or avoid mistakes). Sea Grant supports research and provides the information and training that inform business decisions, and in some cases firms create or sustain jobs as a result. Moreover, Sea Grant activities can have positive effects on restoring, maintaining, or improving environmental goods and ecosystem services, broadly defined as natural capital. Even if not valued by the market, these goods and services have economic value to humans.
FY21 Target FY22 Target FY23 Target FY24 Target FY25 Target FY26 Target
7,500 15,000 22,500 30,000 37,500 45,000750 1500 2250 3000 3750 4500
$300M $600M $900M $1200M $1500M $1800M
3. Near Term Outcome
Increase capability for utilization of ‘omics to inform NOAA resource management decisions.
Champion
OER Director
Performance Measure: Cumulative number of projects, partnerships, or analyses working to ad-vance integration of ‘omics approaches into applications and operations
Description: The integration of ‘omics approaches into applications and operations can produce faster, cheaper, less invasive, and can provide more information than traditional methods, and thus result in improved delivery of OAR’s products and services.
FY21 Target FY22 Target FY23 Target FY24 Target FY25 Target FY26 Target26 52 78 104 130 156

8
OAR ImplentAtIOn plAn | GOAl 1: explORe the mARIne envIROnment
4. Near Term Outcome
Identify intensity, duration, and spatial extent of ocean acidification changes and their impacts to critical marine organisms.
Champion
OAP Director
Performance Measure: Cumulative number of ocean acidification observations collected by the National Ocean Acidification Observing Network
Description: The National Ocean Acidification Observing Network (NOA-ON) is a suite of sensor assets. Each sensor tracks the daily cycle of ocean carbonate chemistry, which allows NOAA to characterize Ocean Acidification in accordance with the Federal Ocean Acidification Research and Monitoring (FOARAM) Act. This network provides the capacity to track long-term changes in ocean chemistry and to alert stakeholders and industry partners about corrosive events impacting the Na-tion’s blue economy. When all sensors are operating properly, each station should yield a maximum 365 days of observations.
FY21 Target FY22 Target FY23 Target FY24 Target FY25 Target FY26 Target7,300 14,965 22,630 30,295 38,325 46,355
5. Near Term Outcome
Develop regional partnerships serving aquaculture industries to enhance their collection and use of ocean acidification data important for maintaining their economic productivity as the climate changes.
Champion
OAP Director
Performance Measure: Cumulative number of industry partners provided scientific capacity through ocean acidification adaptation technologies and methods
Description: Marine resource industries have begun identifying scientific and monitoring require-ments which facilitate adaptive management strategies in response to ocean acidification. These strategies have demonstrated benefits for industries and may offset some economic consequences of ocean acidification. This measure represents the number of industry partners that will be provided direct scientific and monitoring support to aid them in designing adaptive management technologies and strategies that promote resilience to enhanced coastal OA conditions.
FY21 Target FY22 Target FY23 Target FY24 Target FY25 Target FY26 Target1 11 21 31 41 51

9
OAR ImplentAtIOn plAn | GOAl 2: DeteCt ChAnGes In the OCeAn & AtmOspheRe
Goal 2: Detect Changes in the Ocean & Atmosphere
Strategic Objective 2.1 Sustain and optimize observation system management and use
Strategic Objective 2.2 Identify and address gaps in observation requirements needed to understand causes of variability and change
Strategic Objective 2.3 Increase ability to access and use Earth system data
Long-Term Outcome: Produce, analyze, and interpret observa-tion records to understand the Earth system and inform the public.
6. Near Term Outcome
Increase the Argo Program to global geographic ocean coverage in its three mission spaces of core Argo, deep Argo, and biogeo-chemical (BGC) Argo.
Champion
GOMOP Director
Performance Measure: Cumulative number of Argo floats deployed to increase global coverage (Core Argo floats/ Deep Argo Floats / BGC Argo pilot arrays)
Description: The core Argo floats provide a quantitative description of the evolving state of the upper 2000m of the ocean by collecting profiles of temperature and salinity from the surface to 2000m. Argo data are used for initialization of ocean and coupled (ocean atmosphere) forecast models, data assimilation, and dynamical model testing. Deep Argo profiles now go all the way to the ocean floor which will further our understanding of ocean warming and the movement of water around the world. The biogeochemical data from the BGC Argo pilot program will help scientists monitor and manage the ocean resources, the carbon cycle, ocean acidification, and ocean color.
FY21 Target FY22 Target FY23 Target FY24 Target FY25 Target FY26 Target90 180 270 360 450 54010 20 30 40 50 603 6 9 12 15 18

10
OAR ImplentAtIOn plAn | GOAl 2: DeteCt ChAnGes In the OCeAn & AtmOspheRe
7. Near Term Outcome
Improve accuracy of high-resolution model forecasts by expanding the use of satellite data through advanced data assimilation techniques.
Champion
GSL Director
Performance Measure: Increase the use of satellite observations in the high resolution rapidly updating weather model to be delivered to NWS by 2026
Description: Increasing the use of satellite observations will allow NOAA to exploit more fully the value from its investments in observational systems required to improve forecast guidance and enhance societal benefits.
FY21 Target FY22 Target FY23 Target FY24 Target FY25 Target FY26 TargetAdd satellite radi-ance and atmo-spheric motion vector observa-tions into the Rapid Refresh Forecast System and demonstrate improvement in the accuracy of meteorological weather variables such as tropo-spheric tempera-ture, humidity and winds.
Add cloud top pressure and pre-cipitable water observations into the Rapid Refresh Forecast System and demonstrate improvement in the accuracy of meteorological weather variables such as clouds, ceiling heights and precipitation.
Add geostationary lightning mapper flash and fire radiative power observations into the Rapid Refresh Forecast System (RRFS) and demonstrate improve-ment in the accuracy of meteorological weather variables such as con-vection (reflectivity), surface temperature, winds and visibility.
RRFS version contain-ing all the additional satellite observations reaches RL8, ready to transition to NWS op-erations.
11
OAR ImplentAtIOn plAn | GOAl 2: DeteCt ChAnGes In the OCeAn & AtmOspheRe
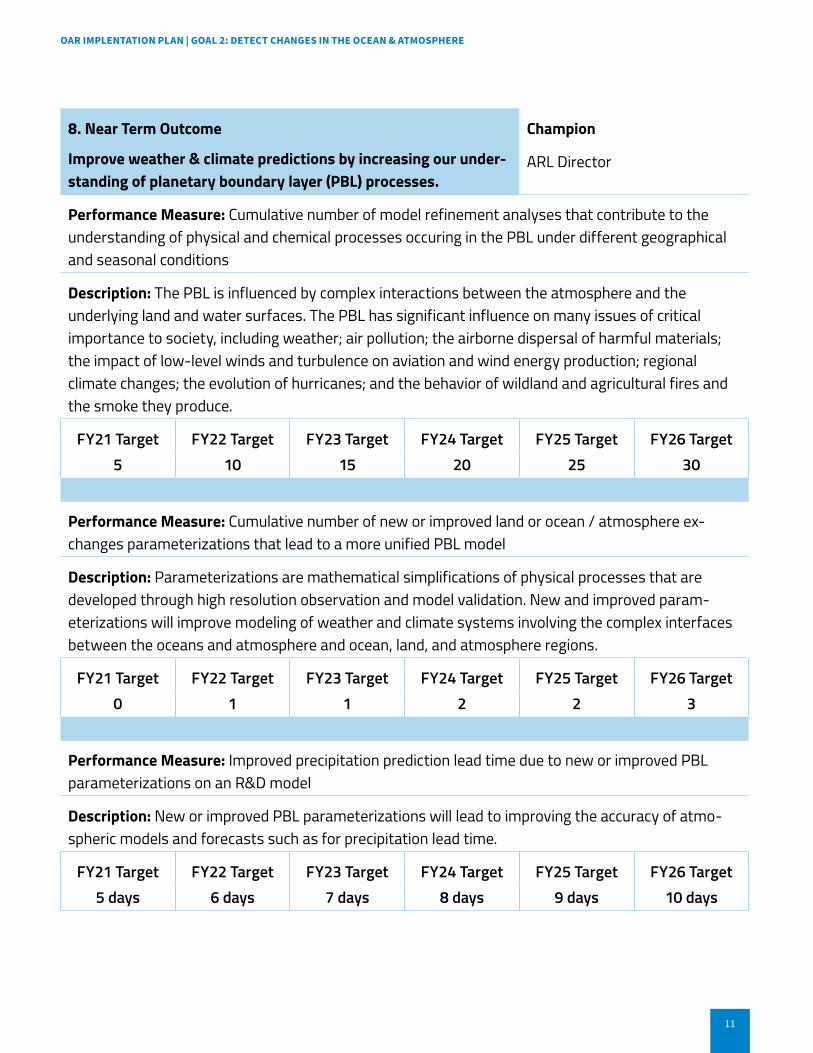
8. Near Term Outcome
Improve weather & climate predictions by increasing our under-standing of planetary boundary layer (PBL) processes.
Champion
ARL Director
Performance Measure: Cumulative number of model refinement analyses that contribute to the understanding of physical and chemical processes occuring in the PBL under different geographical and seasonal conditions
Description: The PBL is influenced by complex interactions between the atmosphere and the underlying land and water surfaces. The PBL has significant influence on many issues of critical importance to society, including weather; air pollution; the airborne dispersal of harmful materials; the impact of low-level winds and turbulence on aviation and wind energy production; regional climate changes; the evolution of hurricanes; and the behavior of wildland and agricultural fires and the smoke they produce.
FY21 Target FY22 Target FY23 Target FY24 Target FY25 Target FY26 Target5 10 15 20 25 30
Performance Measure: Cumulative number of new or improved land or ocean / atmosphere ex-changes parameterizations that lead to a more unified PBL model
Description: Parameterizations are mathematical simplifications of physical processes that are developed through high resolution observation and model validation. New and improved param-eterizations will improve modeling of weather and climate systems involving the complex interfaces between the oceans and atmosphere and ocean, land, and atmosphere regions.
FY21 Target FY22 Target FY23 Target FY24 Target FY25 Target FY26 Target0 1 1 2 2 3
Performance Measure: Improved precipitation prediction lead time due to new or improved PBL parameterizations on an R&D model
Description: New or improved PBL parameterizations will lead to improving the accuracy of atmo-spheric models and forecasts such as for precipitation lead time.
FY21 Target FY22 Target FY23 Target FY24 Target FY25 Target FY26 Target5 days 6 days 7 days 8 days 9 days 10 days

12
OAR ImplentAtIOn plAn | GOAl 2: DeteCt ChAnGes In the OCeAn & AtmOspheRe
9. Near Term Outcome
Optimize the greenhouse gases (GHG) observing system.
Champion
GML Director
Performance Measure: Cumulative number of ground, tall tower and aircraft GHG measurements made at observatories and other network sites distributed across the continental US and globe
Description: The Paris Accord and other resolutions to mitigate climate change rely on accurately taking stock of both natural and anthropogenic emissions of greenhouse gases. These observing network sites enable OAR to accurately track the net global increase in GHGs and provide insights on where the bulk of the emissions are coming from. With an increased number of sites, OAR can provide more specificity and direct feedback to mitigation of emissions and the changing natural system that is so valuable to controlling the atmospheric GHG burden.
FY21 Target FY22 Target FY23 Target FY24 Target FY25 Target FY26 Target60 135 220 320 435 560
Performance Measure: Cumulative number of World Meteorological Organization calibration tanks provided to global GHG community through the Central Calibration Laboratory for CO2, CH4, CO, N2O, SF6
Description: A critical part of accurately measuring the growth of GHGs and identifying the source of these emissions is the constant need to calibrate instrumentation in the field. OAR/GML has been designated as a central calibration lab, and the number of calibration tanks supplied to the national and international community is an important metric of use and adherence to WMO measurement procedures.
FY21 Target FY22 Target FY23 Target FY24 Target FY25 Target FY26 Target500 1250 2250 3750 5250 6750
Performance Measure: Cumulative number of remote sensing evaluation profiles (e.g., aircore for satellite and spectrometers)
Description: Subtle changes in GHGs measured by satellites are subject to biases arising from irregularities from changes in water vapor and aerosols in the atmospheric column and changes in albedo and topography on the ground. Atmospheric profiles using direct measurements made by aircraft or balloon-borne platforms provide critical means for assessing the biases. It is essential that we continue to supply the satellite community with an ongoing measure of these biases to enable comparability between ground-based and satellite-based measurements.
FY21 Target FY22 Target FY23 Target FY24 Target FY25 Target FY26 Target400 900 1900 3900 6100 8600

13
OAR ImplentAtIOn plAn | GOAl 3: mAke FOReCAsts BetteR
Goal 3: Make Forecasts Better
Strategic Objective 3.1 Develop interdisciplinary Earth system models
Strategic Objective 3.2 Design tools and processes to forecast high-impact weather, water, climate, ocean, and ecosystem events
Strategic Objective 3.3 Transition science that meet users’ current and future needs
Long-Term Outcome: Improve accuracy, precision, and efficiency of climate, weather, and ecosystem forecasts and predic-tions to save lives and property and support a vibrant economy.
10. Near Term Outcome
Reduce developmental time from research to operations through adoption of community-based Earth system modeling.
Champion
WPO Director
Performance Measure: Cumulative number of forecast and mission improvements based on The Weather Research and Forecasting Innovation Act of 2017, to weather applications (achieve RL8) at operational US weather services and in the US weather commercial sector.
Description: Sustained improvement to operational models and forecast systems are required in order to integrate the latest user requirements, scientific research advances, and modeling develop-ments into NOAA services for the Nation. This metric provides a basic measure of the annual rate of these improvements.
FY21 Target FY22 Target FY23 Target FY24 Target FY25 Target FY26 Target10 20 30 41 52 64

14
OAR ImplentAtIOn plAn | GOAl 3: mAke FOReCAsts BetteR
11. Near Term Outcome
Create a fully coupled Earth system model to improve understanding of interactions of key oceanic, land, atmo-spheric, cryospheric, and ecosystem components.
Champion
GFDL Director
Performance Measure: Develop, analyse and validate incremental milestones leading to Earth System Model 5 (ESM5) from current ESM4 configuration. Milestones look to improve understanding as well as simulation. (More info here)
Description: Creating a fully coupled Earth system model requires continuous development, analysis and verification to demonstrate that the model advancements will have a significant impact on achieving NOAA’s mission. OAR will complete the necessary model development, analysis, and veri-fication to improve understanding, skill and fidelity of the atmosphere, ocean, cryosphere, land and biogeochemical components of the model. The analyses conducted will also demonstrate the impact of the model advancements on achieving NOAA’s mission.
FY21 Target FY26 TargetAtmosphere AM4.1 1 degree, 49 levels AM5 1/8th degree, 75 levelsOcean MOM6 1/2 degree, 75
levelsMOM7 1/8 degree, 75 levels
Cryosphere SIS2 1/2 degree SIS3 1/8th degree
Land LM4.1 1 degree LM5 1/8th degree

15
OAR ImplentAtIOn plAn | GOAl 3: mAke FOReCAsts BetteR
12. Near Term Outcome
Improve stock assessments through development of ocean models for climate-informed fisheries and protected species management
Champion
PMEL Director
Performance Measure: Cumulative number of high-resolution prototype ocean hindcasts, predic-tions, and projections [using MOM6] produced for Living Marine Resource applications in each of 4 regions covered by NOAA’s Living Marine Resource mandates (East Coast, West Coast, Arctic, and Pacific Islands)
Description of the performance measure: The cumulative number of products across model regions by year (basically, products + regions complete). The measure is calculated by adding when a model component is completed and integrated into the regional model for the region indicated. As planned under the NOAA Climate and Fisheries Initiative, OAR will incorporate the three products above (high-resolution prototype ocean hindcasts, Seasonal to Multi-annual Predictions, and projections) into the regional models for the four regions listed (East Coast, West Coast, Arctic, and Pacific Islands). These enhanced regional models will be part of the information developed and provided to users to help manage U.S. fisheries that are impacted by climate change. (See the draft Performance Measure description here.)
FY21 Target FY22 Target FY23 Target FY24 Target FY25 Target FY26 Target2 4 7 10 11 12
13. Near Term Outcome
Demonstrate Warn-on-Forecast can provide guidance for NWS tornado warnings at least one hour in advance.
Champion
NSSL Director
Performance Measure: Cumulative number of cases in which NWS forecasters confirm that the WoFS provided actionable guidance for issuing tornado warnings at least one hour in advance of event, with an average increase of one event per year.
Description: A goal of the 2017 Weather Act is to predict tornadoes beyond one hour in advance. The WoFS and case confirmation is the best way to measure continued progress towards this goal.
FY21 Target FY22 Target FY23 Target FY24 Target FY25 Target FY26 Target1 2 3 4 5 6
16
OAR ImplentAtIOn plAn | GOAl 3: mAke FOReCAsts BetteR
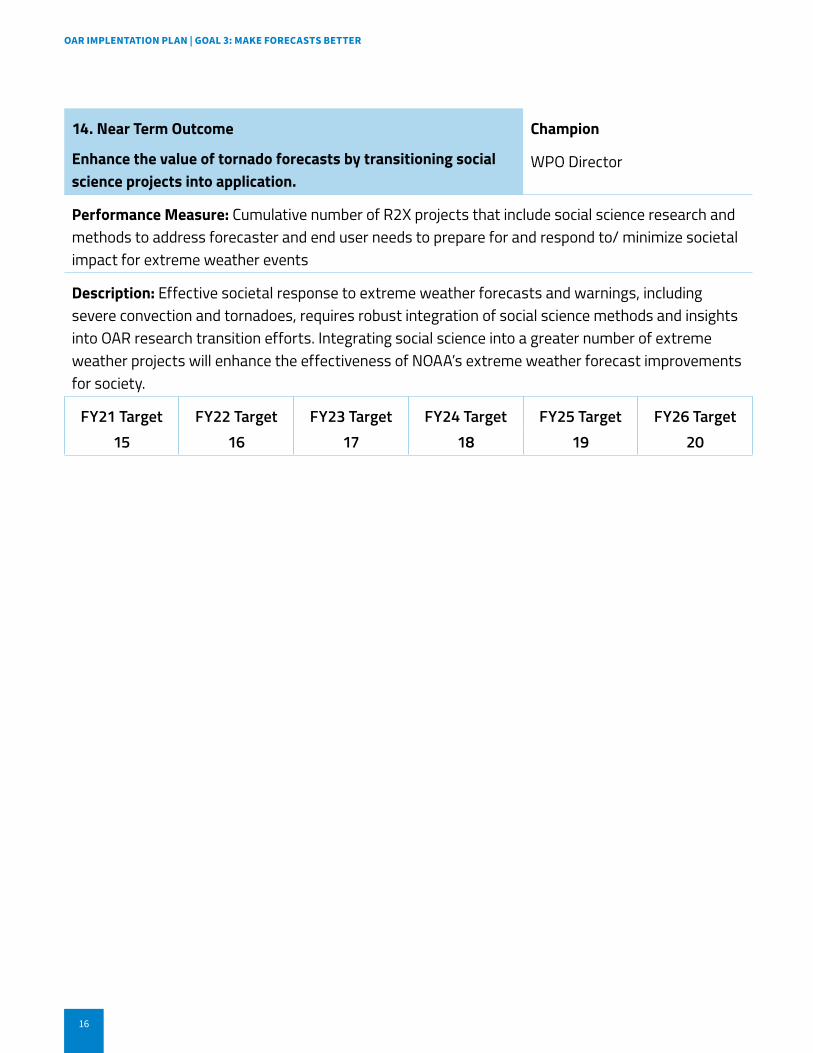
14. Near Term Outcome
Enhance the value of tornado forecasts by transitioning social science projects into application.
Champion
WPO Director
Performance Measure: Cumulative number of R2X projects that include social science research and methods to address forecaster and end user needs to prepare for and respond to/ minimize societal impact for extreme weather events
Description: Effective societal response to extreme weather forecasts and warnings, including severe convection and tornadoes, requires robust integration of social science methods and insights into OAR research transition efforts. Integrating social science into a greater number of extreme weather projects will enhance the effectiveness of NOAA’s extreme weather forecast improvements for society.
FY21 Target FY22 Target FY23 Target FY24 Target FY25 Target FY26 Target15 16 17 18 19 20
17
OAR ImplentAtIOn plAn | GOAl 3: mAke FOReCAsts BetteR
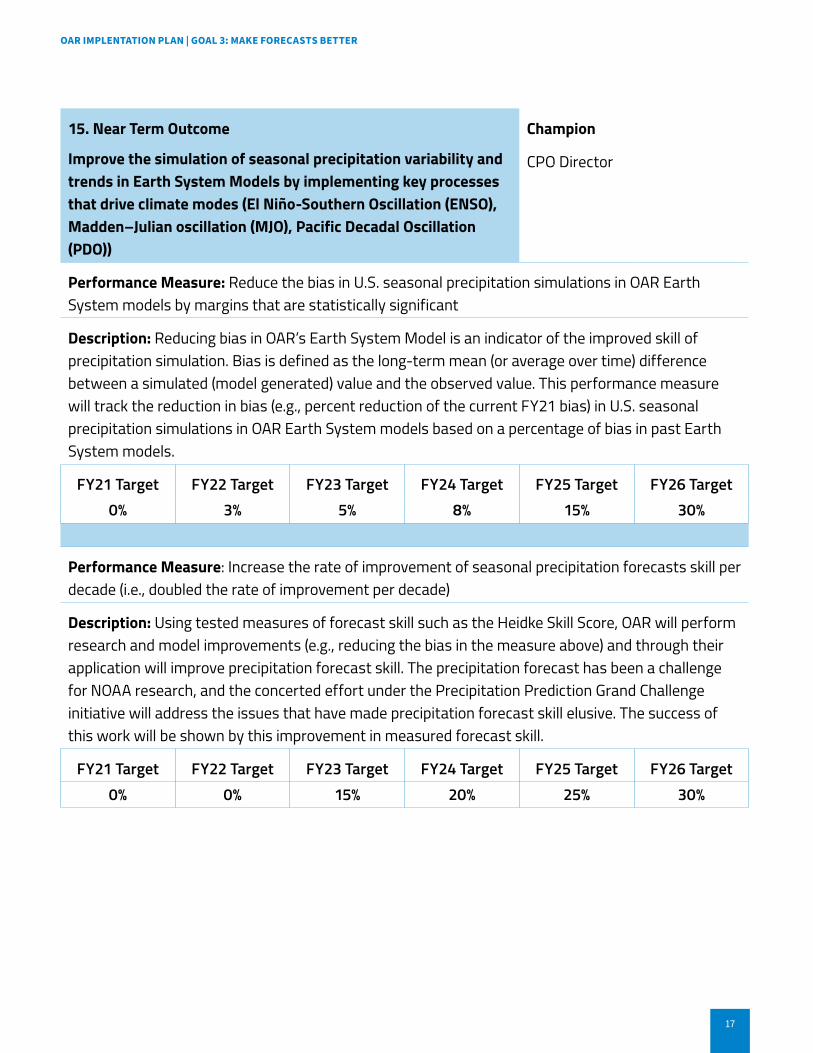
15. Near Term Outcome
Improve the simulation of seasonal precipitation variability and trends in Earth System Models by implementing key processes that drive climate modes (El Niño-Southern Oscillation (ENSO), Madden–Julian oscillation (MJO), Pacific Decadal Oscillation (PDO))
Champion
CPO Director
Performance Measure: Reduce the bias in U.S. seasonal precipitation simulations in OAR Earth System models by margins that are statistically significant
Description: Reducing bias in OAR’s Earth System Model is an indicator of the improved skill of precipitation simulation. Bias is defined as the long-term mean (or average over time) difference between a simulated (model generated) value and the observed value. This performance measure will track the reduction in bias (e.g., percent reduction of the current FY21 bias) in U.S. seasonal precipitation simulations in OAR Earth System models based on a percentage of bias in past Earth System models.
FY21 Target FY22 Target FY23 Target FY24 Target FY25 Target FY26 Target0% 3% 5% 8% 15% 30%
Performance Measure: Increase the rate of improvement of seasonal precipitation forecasts skill per decade (i.e., doubled the rate of improvement per decade)
Description: Using tested measures of forecast skill such as the Heidke Skill Score, OAR will perform research and model improvements (e.g., reducing the bias in the measure above) and through their application will improve precipitation forecast skill. The precipitation forecast has been a challenge for NOAA research, and the concerted effort under the Precipitation Prediction Grand Challenge initiative will address the issues that have made precipitation forecast skill elusive. The success of this work will be shown by this improvement in measured forecast skill.
FY21 Target FY22 Target FY23 Target FY24 Target FY25 Target FY26 Target0% 0% 15% 20% 25% 30%

18
OAR ImplentAtIOn plAn | GOAl 3: mAke FOReCAsts BetteR
16. Near Term Outcome
Advance satellite, ground-based remote sensing, and ground-based and airborne in-situ observations to provide improved characterization of environmental and fire conditions
Champion
GSL Director
Performance Measure: Cumulative number of NOAA Fire Weather Model improvements transitioned into NWS operations
Description: OAR will work with the National Weather Service and emergency managers from across the fire weather community to develop new impact-based decision support tools, which will improve the ability to provide timely and accurate guidance to safeguard lives and property and manage downstream air quality impacts.
FY21 Target FY22 Target FY23 Target FY24 Target FY25 Target FY26 Target1 0 2

19
OAR ImplentAtIOn plAn | GOAl 4: DRIve InnOvAtIve sCIenCe
Goal 4: Drive Innovative Science
4.1 Reinforce a culture of innovation and adaptability
4.2 Invest in high-risk, high reward science
4.3 Accelerate the delivery of mission-ready, next generation science
Long-Term Outcome: Cultivate and deliver mission-relevant research to lead the environmental science community.
17. Near Term Outcome
Integrate social scientists in decision processes to drive in-novative science by increasing the number of inter-disciplinary projects funded that incorporate end users.
Champion
NSGCP Director
Performance Measure: Cumulative number of inter-disciplinary activities funded that integrate social scientists in the research process
Description: Integrating social scientists earlier and more widely in inter-disciplinary research proj-ects will help drive innovation and facilitate greater consideration of end users’ requirements during the design and implementation of research, when it is more feasible to adjust the work to improve its value to end users.
FY21 Target FY22 Target FY23 Target FY24 Target FY25 Target FY26 Target8 18 30 26 TBD TBD

20
OAR ImplentAtIOn plAn | GOAl 4: DRIve InnOvAtIve sCIenCe
18. Near Term Outcome
Increase Uncrewed Systems (UxS) in their innovative use as a force multiplier for many NOAA programs—augmenting data collection often at lower cost, increased safety, and reduced risk, especially in remote or extreme environments.
Champion
USRTO Director
Performance Measure: Cumulative number of UxS projects which advance Readiness Levels for observing system applications by at least one Readiness Level
Description: Expand the collection and utilization of critical, high-accuracy, and time-sensitive data by increasing the application and use of uncrewed aircraft and marine systems (together, “uncrewed systems” or “UxS”) in every NOAA mission area to improve the quality and timeliness of NOAA sci-ence, products, and services.
FY21 Target FY22 Target FY23 Target FY24 Target FY25 Target FY26 Target10 25 35 45 55 65
19. Near Term Outcome
Use artificial intelligence/ machine learning to enhance preci-sion, accuracy, and efficiency in high-resolution models of the Earth System.
Champion
GFDL Director
Performance Measure: Cumulative number of machine learning methodologies and techniques to improve the resolution of processes to resolve the interactions in the Earth System.
Description: The more that effective machine learning methodologies and techniques can be employed, the better the characterization and quantification of the processes to resolve the interac-tions in the Earth System.
FY21 Target FY22 Target FY23 Target FY24 Target FY25 Target FY26 Target.1 2 3 4 5 6
Performance Measure: Cumulative number of studies improving the efficiency and effectiveness of physical processes and parameterizations in Earth System Models.
Description: The more studies conducted that show improvement in the efficiency and effectiveness of physical processes and parameterizations in Earth System Models, the more confidence the forecast community will have in the model output.
FY21 Target FY22 Target FY23 Target FY24 Target FY25 Target FY26 Target.1 2 3 4 5 6
21
OAR ImplentAtIOn plAn | GOAl 4: DRIve InnOvAtIve sCIenCe
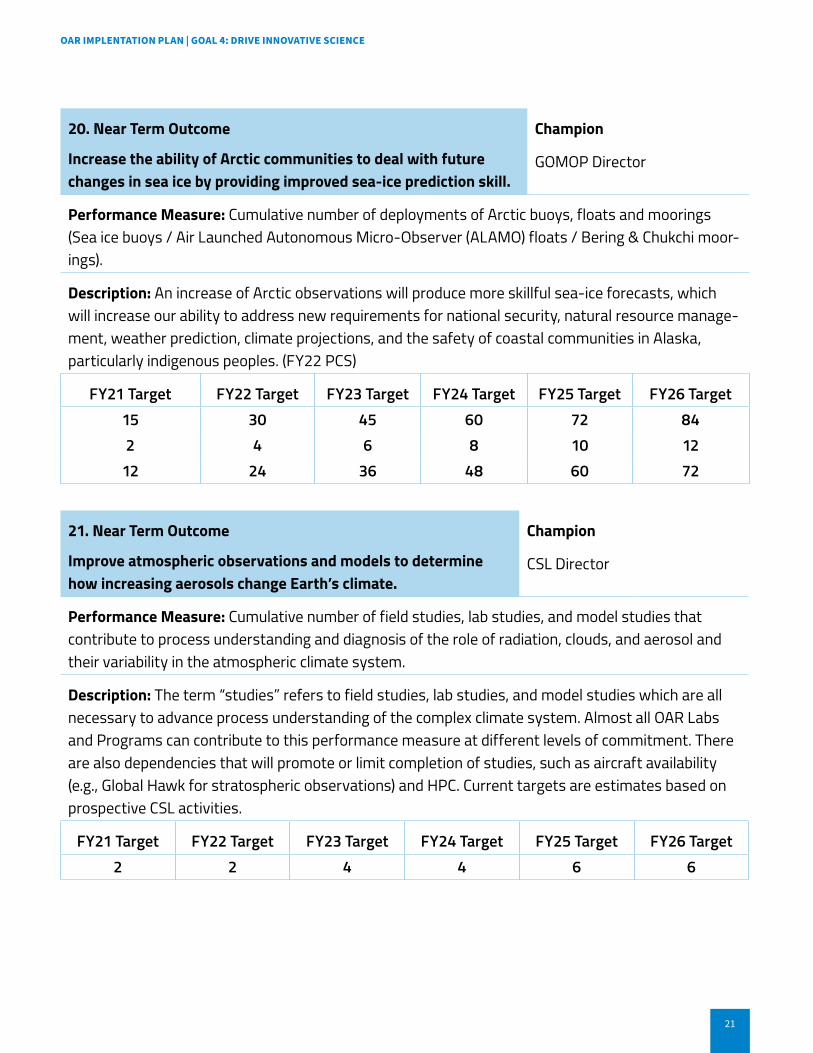
20. Near Term Outcome
Increase the ability of Arctic communities to deal with future changes in sea ice by providing improved sea-ice prediction skill.
Champion
GOMOP Director
Performance Measure: Cumulative number of deployments of Arctic buoys, floats and moorings (Sea ice buoys / Air Launched Autonomous Micro-Observer (ALAMO) floats / Bering & Chukchi moor-ings).
Description: An increase of Arctic observations will produce more skillful sea-ice forecasts, which will increase our ability to address new requirements for national security, natural resource manage-ment, weather prediction, climate projections, and the safety of coastal communities in Alaska, particularly indigenous peoples. (FY22 PCS)
FY21 Target FY22 Target FY23 Target FY24 Target FY25 Target FY26 Target15 30 45 60 72 842 4 6 8 10 12
12 24 36 48 60 72
21. Near Term Outcome
Improve atmospheric observations and models to determine how increasing aerosols change Earth’s climate.
Champion
CSL Director
Performance Measure: Cumulative number of field studies, lab studies, and model studies that contribute to process understanding and diagnosis of the role of radiation, clouds, and aerosol and their variability in the atmospheric climate system.
Description: The term “studies” refers to field studies, lab studies, and model studies which are all necessary to advance process understanding of the complex climate system. Almost all OAR Labs and Programs can contribute to this performance measure at different levels of commitment. There are also dependencies that will promote or limit completion of studies, such as aircraft availability (e.g., Global Hawk for stratospheric observations) and HPC. Current targets are estimates based on prospective CSL activities.
FY21 Target FY22 Target FY23 Target FY24 Target FY25 Target FY26 Target2 2 4 4 6 6

22
OAR ImplentAtIOn plAn | GOAl 4: DRIve InnOvAtIve sCIenCe
22. Near Term Outcome
Assess the capabilities of phased array technology (compared to the current WSR-88D) for meteorological applications and in-form NOAA’s future weather radar system investment decisions.
Champion
NSSL Director
Performance Measure: Major milestones that contribute to a go/no-go decision by 2030
Description: OAR has been investigating Phased Array Radar technology as a potential replace-ment for the WSR-88D. PAR technology has the potential to provide faster updates and improved adaptability over the current WSR-88D, but may not meet all the performance specifications as the WSR-88D. The implementation of dual polarization technology is the key issue for NOAA’s adoption of PAR and has not yet been proven.
FY21 Target FY22 Target FY23 Target FY24 Target FY25 Target FY26 TargetEstablish ini-tial operating capabilities for the Advanced Technology Dem-onstrator (ATD) Phased-Array Radar (PAR)
Produce report on ATD and all-digital PAR experimental systems evaluat-ing performance capabilities of these systems and potential for applicabil-ity to future PAR systems.
Iteratively identify and mitigate any deficiencies in configuration, engineering design, or calibration of prototype systems
Use the ATD to collect data during multiple severe weather and winter weather events
Examine collected data and compare to corresponding WSR-88D data

23

Scott Sandberg, an electrical engineer with NOAA’s Chemical Sciences Laboratory, worked with Tyler Boyle of NIST to install a Doppler lidar instrument on April 16, 2021, on top of the Department of Commerce’s Herbert Clark Hoover Building in Washington, D.C. for a research project studying urban greenhouse gas emissions. Credit NOAA’s Scott Sandberg and NIST’s Tyler Boyle