Spatially discrete metapopulation models with directional dispersal
Upload
independentCategory
view
2download
0
Ulrik et al. BMC Evolutionary Biology 2014, 14:138http://www.biomedcentral.com/1471-2148/14/138
RESEARCH ARTICLE Open Access
Do North Atlantic eels show parallel patterns ofspatially varying selection?Malene G Ulrik1†, José Martín Pujolar1†, Anne-Laure Ferchaud1, Magnus W Jacobsen1, Thomas D Als2,3,Pierre Alexandre Gagnaire4, Jane Frydenberg1, Peder K Bøcher1, Bjarni Jónsson5, Louis Bernatchez6
and Michael M Hansen1*
Abstract
Background: The two North Atlantic eel species, the European and the American eel, represent an ideal system inwhich to study parallel selection patterns due to their sister species status and the presence of ongoing gene flow.A panel of 80 coding-gene SNPs previously analyzed in American eel was used to genotype European eel individuals(glass eels) from 8 sampling locations across the species distribution. We tested for single-generation signatures ofspatially varying selection in European eel by searching for elevated genetic differentiation using FST-based outliertests and by testing for significant associations between allele frequencies and environmental variables.
Results: We found signatures of possible selection at a total of 11 coding-gene SNPs. Candidate genes for localselection constituted mainly genes with a major role in metabolism as well as defense genes. Contrary to whathas been found for American eel, only 2 SNPs in our study correlated with differences in temperature, whichsuggests that other explanatory variables may play a role. None of the genes found to be associated withexplanatory variables in European eel showed any correlations with environmental factors in the previous study inAmerican eel.
Conclusions: The different signatures of selection between species could be due to distinct selective pressuresassociated with the much longer larval migration for European eel relative to American eel. The lack of parallelselection in North Atlantic eels could also be due to most phenotypic traits being polygenic, thus reducing thelikelihood of selection acting on the same genes in both species.
Keywords: Adaptation, European eel, Genetic-by-environment associations, Parallel selection, Single nucleotidepolymorphisms
BackgroundParallel adaptive changes under replicated environmentalconditions have been particularly valuable for under-standing evolutionary processes in natural populations.One of the classical questions in evolutionary biologyconcerns whether different species and populationswithin species will adapt to the same agent of selectionin the same way or whether the response will involvedifferent traits and genes [1,2]. Parallel genotypic adapta-tion appears to be frequent and occurs at all taxonomiclevels from microbes and plants to humans [3,4] and is
* Correspondence: [email protected]†Equal contributors1Department of Bioscience, Aarhus University, Ny Munkegade 114, Bldg.1540, DK-8000 Aarhus C, DenmarkFull list of author information is available at the end of the article
© 2014 Ulrik et al.; licensee BioMed Central LtCommons Attribution License (http://creativecreproduction in any medium, provided the orDedication waiver (http://creativecommons.orunless otherwise stated.
likely to result in changes at a relatively small number ofgenes [5]. For instance, the study of Colosimo et al. [6]demonstrated that selection on a single gene, ectodyspla-sin (Eda), is responsible for the parallel reduction of armorplates in freshwater populations of threespine sticklebackGasterosteus aculeatus. However, more complex physio-logical processes relevant in the context of parallel fresh-water adaptation of threespine sticklebacks are influencedby several genes, each of small effect [7-10]. Using asurvey of the published literature on parallel adaptationof independent lineages of natural populations, Conteet al. [5] concluded that divergence at loci under selectionis most likely to be based on standing genetic variationderived from a common ancestor rather than mutationsoccurring de novo after divergence. Hence, probability
d. This is an Open Access article distributed under the terms of the Creativeommons.org/licenses/by/4.0), which permits unrestricted use, distribution, andiginal work is properly credited. The Creative Commons Public Domaing/publicdomain/zero/1.0/) applies to the data made available in this article,
Ulrik et al. BMC Evolutionary Biology 2014, 14:138 Page 2 of 11http://www.biomedcentral.com/1471-2148/14/138
of gene reuse is plausibly higher in closely related spe-cies, which are likely to show similar divergence at locisubjected to similar selection pressures [11].An excellent opportunity to test for genetic parallelism
exists in the two North Atlantic eel species, the Europeaneel (Anguilla anguilla) and the American eel (A. rostrata).Both species are morphologically almost indistinguishable,with the number of vertebrae being regarded as the bestdiagnostic character between species [12]. Divergencetime between the two species remains largely unresolved,encompassing between 1.5 and 5.8 million years [13-15].Remarkably, although mitochondrial DNA lineages of thetwo species are reciprocally monophyletic [13], differenti-ation at nuclear loci is surprisingly low (FST = 0.055 [16];FST = 0.018 [17]; FST = 0.06 [18]; FST = 0.09 [19]), suggest-ive of ongoing gene flow. In this sense, it is well estab-lished that the spawning grounds of the two speciesoverlap in the Sargasso Sea and there is also overlap inspawning time [20]. European and American eels areknown to hybridize, with hybrids observed almost exclu-sively in Iceland [21-23]. Hence, the sister species status ofEuropean and American eel and the low but biologicallysignificant gene flow makes them an adequate system inwhich to test the occurrence of selection at homologousloci within each species.North Atlantic eels have a catadromous life cycle and
after spawning in the Sargasso Sea, larvae are transportedby the Gulf Stream and other currents to the shores ofNorth America and Europe/North Africa, respectively.Upon reaching the continental shelf, larvae metamorphoseinto glass eels, which complete the migration into riverine,estuarine and coastal feeding habitats and grow up asyellow eels. After a highly variable feeding stage, yelloweels metamorphose into partially mature silver eels thatmigrate back to the Sargasso undertaking a journey ofabout 2,000 km for the American eel and 5,000-6,000 kmfor the European eel. Upon arriving in the Sargasso Sea,eels reproduce and die [24]. During the continental phase,eels occupy a broad range of habitats from the Caribbeanto Greenland in the western Atlantic (American eel)and from Morocco to Iceland in the eastern Atlantic(European eel). The presence of eels in extremely hete-rogenous environments in terms of temperature (i.e.from subtropical to subarctic), salinity (i.e. from fresh-water to marine), substrate, depth or productivity alongtheir geographic distribution makes them ideal speciesin which to study the consequences of spatially varyingselective pressures that often result in local adaptationof ecologically important traits [1,25,26]. Beginning withLevene [27], who introduced the first theoretical modelfor examining the impact of diversifying selection inspace, a number of studies have shown that balancingselection due to spatial heterogeneity is an importantmechanism responsible for the maintenance of genetic
polymorphism (reviewed in [28]). Genetic variation in aspatially heterogenous environment may be maintainedeven when dispersal results in complete mixing of thegene pool [1]. However, under such a panmixia scenario,in which offspring are distributed to environments at ran-dom independently of the environment experienced bythe parents, local selection cannot to lead to local adapta-tion [29]. In the case of eels, owing to panmixia in bothEuropean [19,30] and American eel [31] and random lar-val dispersal across habitats, heritable trans-generationallocal adaptation is not possible although single-generationfootprints of selection can still be detected. In this sense,significant geographic clines at allozyme loci have beendetected in both European [32] and American eel [33].In the most comprehensive study to date, Gagnaireet al. [26] found evidence for spatially varying selectionat 13 coding genes in American eel showing significantcorrelations between allele frequencies and environmentalvariables (latitude, longitude and temperature) across theentire species range.In this study, we tested for single-generation signatures
of spatial varying selection in European eel and comparedthe results to those obtained by Gagnaire et al. [26]. Wegenotyped glass eels from 8 sampling locations across thegeographic distribution of the species, using the same setof SNPs analyzed by Gagnaire et al. [26] in American eel.We used two main analytical approaches, one that identi-fies outliers as those markers with greater differentiationamong all SNPs and a second based on determiningpositive associations between allele frequencies and en-vironmental factors. Following the positive associationsobserved by Gagnaire et al. [26] in American eel, vari-ables used in our study were degrees North latitude, de-grees East/West longitude and sea-surface temperatureat river mouth. We specifically wanted to test whetherthe same genes were under spatially varying selection inboth European and American eel, hence providing evi-dence for parallel patterns of local selection, or whetherthe response involved a different set of genes. Consideringtheir sister species status and the existence of gene flowbetween species, together with the similar environmentalconditions they encounter [34], we hypothesize that thetwo North Atlantic eel species show parallel patterns ofselection at the same loci.
ResultsGenetic diversity values for all genotyped individuals at 80SNPs are summarized in Table 1. 17 out of 80 loci weremonomorphic and 63 were polymorphic in European eel,although frequency of the most common allele was >0.95at 27 loci. Diversity indices were higher in American eel(Ho = 0.302; He = 0.306; P95 = 0.896; P99 = 0.922) than inEuropean eel (Ho = 0.149; He = 0.157; P95 = 0.429; P99 =
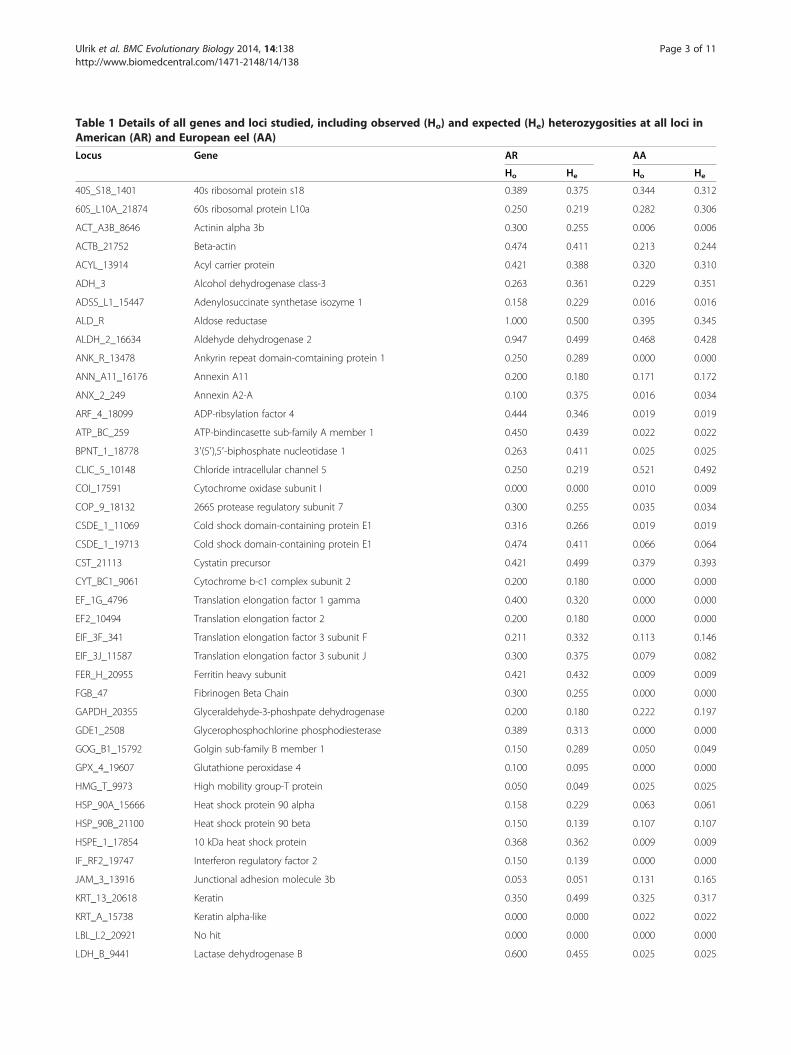
Table 1 Details of all genes and loci studied, including observed (Ho) and expected (He) heterozygosities at all loci inAmerican (AR) and European eel (AA)
Locus Gene AR AA
Ho He Ho He
40S_S18_1401 40s ribosomal protein s18 0.389 0.375 0.344 0.312
60S_L10A_21874 60s ribosomal protein L10a 0.250 0.219 0.282 0.306
ACT_A3B_8646 Actinin alpha 3b 0.300 0.255 0.006 0.006
ACTB_21752 Beta-actin 0.474 0.411 0.213 0.244
ACYL_13914 Acyl carrier protein 0.421 0.388 0.320 0.310
ADH_3 Alcohol dehydrogenase class-3 0.263 0.361 0.229 0.351
ADSS_L1_15447 Adenylosuccinate synthetase isozyme 1 0.158 0.229 0.016 0.016
ALD_R Aldose reductase 1.000 0.500 0.395 0.345
ALDH_2_16634 Aldehyde dehydrogenase 2 0.947 0.499 0.468 0.428
ANK_R_13478 Ankyrin repeat domain-comtaining protein 1 0.250 0.289 0.000 0.000
ANN_A11_16176 Annexin A11 0.200 0.180 0.171 0.172
ANX_2_249 Annexin A2-A 0.100 0.375 0.016 0.034
ARF_4_18099 ADP-ribsylation factor 4 0.444 0.346 0.019 0.019
ATP_BC_259 ATP-bindincasette sub-family A member 1 0.450 0.439 0.022 0.022
BPNT_1_18778 3′(5′),5′-biphosphate nucleotidase 1 0.263 0.411 0.025 0.025
CLIC_5_10148 Chloride intracellular channel 5 0.250 0.219 0.521 0.492
COI_17591 Cytochrome oxidase subunit I 0.000 0.000 0.010 0.009
COP_9_18132 266S protease regulatory subunit 7 0.300 0.255 0.035 0.034
CSDE_1_11069 Cold shock domain-containing protein E1 0.316 0.266 0.019 0.019
CSDE_1_19713 Cold shock domain-containing protein E1 0.474 0.411 0.066 0.064
CST_21113 Cystatin precursor 0.421 0.499 0.379 0.393
CYT_BC1_9061 Cytochrome b-c1 complex subunit 2 0.200 0.180 0.000 0.000
EF_1G_4796 Translation elongation factor 1 gamma 0.400 0.320 0.000 0.000
EF2_10494 Translation elongation factor 2 0.200 0.180 0.000 0.000
EIF_3F_341 Translation elongation factor 3 subunit F 0.211 0.332 0.113 0.146
EIF_3J_11587 Translation elongation factor 3 subunit J 0.300 0.375 0.079 0.082
FER_H_20955 Ferritin heavy subunit 0.421 0.432 0.009 0.009
FGB_47 Fibrinogen Beta Chain 0.300 0.255 0.000 0.000
GAPDH_20355 Glyceraldehyde-3-phoshpate dehydrogenase 0.200 0.180 0.222 0.197
GDE1_2508 Glycerophosphochlorine phosphodiesterase 0.389 0.313 0.000 0.000
GOG_B1_15792 Golgin sub-family B member 1 0.150 0.289 0.050 0.049
GPX_4_19607 Glutathione peroxidase 4 0.100 0.095 0.000 0.000
HMG_T_9973 High mobility group-T protein 0.050 0.049 0.025 0.025
HSP_90A_15666 Heat shock protein 90 alpha 0.158 0.229 0.063 0.061
HSP_90B_21100 Heat shock protein 90 beta 0.150 0.139 0.107 0.107
HSPE_1_17854 10 kDa heat shock protein 0.368 0.362 0.009 0.009
IF_RF2_19747 Interferon regulatory factor 2 0.150 0.139 0.000 0.000
JAM_3_13916 Junctional adhesion molecule 3b 0.053 0.051 0.131 0.165
KRT_13_20618 Keratin 0.350 0.499 0.325 0.317
KRT_A_15738 Keratin alpha-like 0.000 0.000 0.022 0.022
LBL_L2_20921 No hit 0.000 0.000 0.000 0.000
LDH_B_9441 Lactase dehydrogenase B 0.600 0.455 0.025 0.025
Ulrik et al. BMC Evolutionary Biology 2014, 14:138 Page 3 of 11http://www.biomedcentral.com/1471-2148/14/138
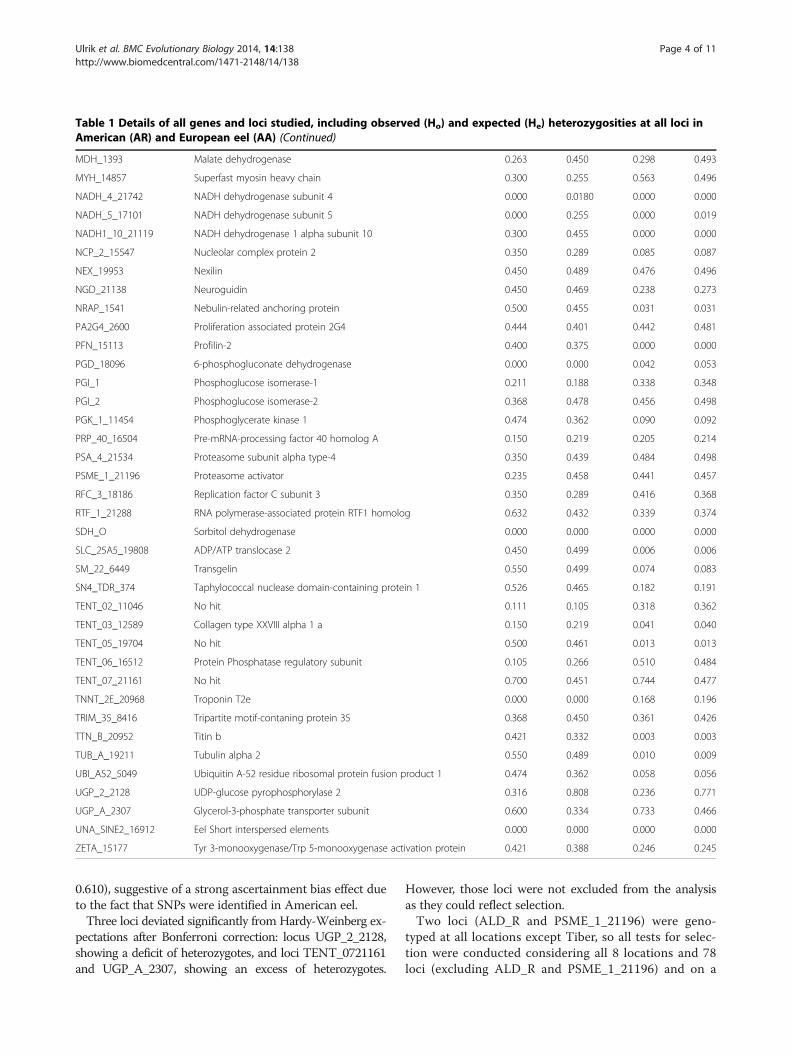
Table 1 Details of all genes and loci studied, including observed (Ho) and expected (He) heterozygosities at all loci inAmerican (AR) and European eel (AA) (Continued)
MDH_1393 Malate dehydrogenase 0.263 0.450 0.298 0.493
MYH_14857 Superfast myosin heavy chain 0.300 0.255 0.563 0.496
NADH_4_21742 NADH dehydrogenase subunit 4 0.000 0.0180 0.000 0.000
NADH_5_17101 NADH dehydrogenase subunit 5 0.000 0.255 0.000 0.019
NADH1_10_21119 NADH dehydrogenase 1 alpha subunit 10 0.300 0.455 0.000 0.000
NCP_2_15547 Nucleolar complex protein 2 0.350 0.289 0.085 0.087
NEX_19953 Nexilin 0.450 0.489 0.476 0.496
NGD_21138 Neuroguidin 0.450 0.469 0.238 0.273
NRAP_1541 Nebulin-related anchoring protein 0.500 0.455 0.031 0.031
PA2G4_2600 Proliferation associated protein 2G4 0.444 0.401 0.442 0.481
PFN_15113 Profilin-2 0.400 0.375 0.000 0.000
PGD_18096 6-phosphogluconate dehydrogenase 0.000 0.000 0.042 0.053
PGI_1 Phosphoglucose isomerase-1 0.211 0.188 0.338 0.348
PGI_2 Phosphoglucose isomerase-2 0.368 0.478 0.456 0.498
PGK_1_11454 Phosphoglycerate kinase 1 0.474 0.362 0.090 0.092
PRP_40_16504 Pre-mRNA-processing factor 40 homolog A 0.150 0.219 0.205 0.214
PSA_4_21534 Proteasome subunit alpha type-4 0.350 0.439 0.484 0.498
PSME_1_21196 Proteasome activator 0.235 0.458 0.441 0.457
RFC_3_18186 Replication factor C subunit 3 0.350 0.289 0.416 0.368
RTF_1_21288 RNA polymerase-associated protein RTF1 homolog 0.632 0.432 0.339 0.374
SDH_O Sorbitol dehydrogenase 0.000 0.000 0.000 0.000
SLC_25A5_19808 ADP/ATP translocase 2 0.450 0.499 0.006 0.006
SM_22_6449 Transgelin 0.550 0.499 0.074 0.083
SN4_TDR_374 Taphylococcal nuclease domain-containing protein 1 0.526 0.465 0.182 0.191
TENT_02_11046 No hit 0.111 0.105 0.318 0.362
TENT_03_12589 Collagen type XXVIII alpha 1 a 0.150 0.219 0.041 0.040
TENT_05_19704 No hit 0.500 0.461 0.013 0.013
TENT_06_16512 Protein Phosphatase regulatory subunit 0.105 0.266 0.510 0.484
TENT_07_21161 No hit 0.700 0.451 0.744 0.477
TNNT_2E_20968 Troponin T2e 0.000 0.000 0.168 0.196
TRIM_35_8416 Tripartite motif-contaning protein 35 0.368 0.450 0.361 0.426
TTN_B_20952 Titin b 0.421 0.332 0.003 0.003
TUB_A_19211 Tubulin alpha 2 0.550 0.489 0.010 0.009
UBI_A52_5049 Ubiquitin A-52 residue ribosomal protein fusion product 1 0.474 0.362 0.058 0.056
UGP_2_2128 UDP-glucose pyrophosphorylase 2 0.316 0.808 0.236 0.771
UGP_A_2307 Glycerol-3-phosphate transporter subunit 0.600 0.334 0.733 0.466
UNA_SINE2_16912 Eel Short interspersed elements 0.000 0.000 0.000 0.000
ZETA_15177 Tyr 3-monooxygenase/Trp 5-monooxygenase activation protein 0.421 0.388 0.246 0.245
Ulrik et al. BMC Evolutionary Biology 2014, 14:138 Page 4 of 11http://www.biomedcentral.com/1471-2148/14/138
0.610), suggestive of a strong ascertainment bias effect dueto the fact that SNPs were identified in American eel.Three loci deviated significantly from Hardy-Weinberg ex-
pectations after Bonferroni correction: locus UGP_2_2128,showing a deficit of heterozygotes, and loci TENT_0721161and UGP_A_2307, showing an excess of heterozygotes.
However, those loci were not excluded from the analysisas they could reflect selection.Two loci (ALD_R and PSME_1_21196) were geno-
typed at all locations except Tiber, so all tests for selec-tion were conducted considering all 8 locations and 78loci (excluding ALD_R and PSME_1_21196) and on a
Ulrik et al. BMC Evolutionary Biology 2014, 14:138 Page 5 of 11http://www.biomedcentral.com/1471-2148/14/138
restricted data set with 7 locations (excluding Tiber)and 80 loci.Overall genetic differentiation was low (FST = 0.0079).
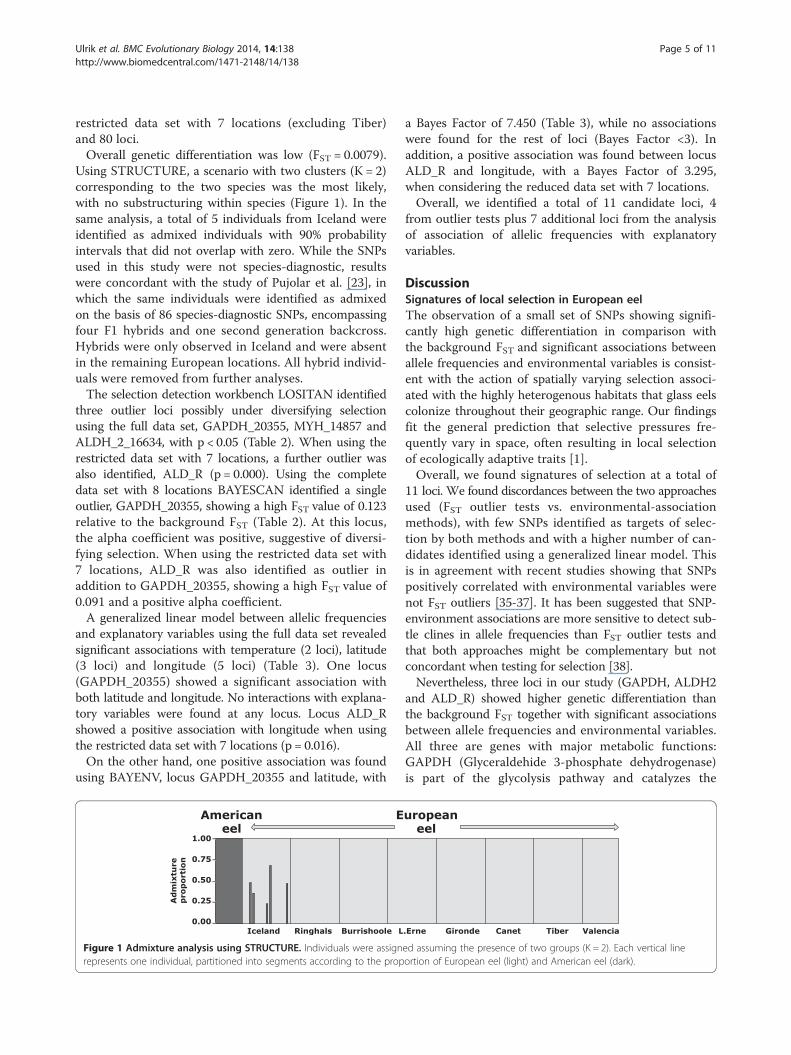
Using STRUCTURE, a scenario with two clusters (K = 2)corresponding to the two species was the most likely,with no substructuring within species (Figure 1). In thesame analysis, a total of 5 individuals from Iceland wereidentified as admixed individuals with 90% probabilityintervals that did not overlap with zero. While the SNPsused in this study were not species-diagnostic, resultswere concordant with the study of Pujolar et al. [23], inwhich the same individuals were identified as admixedon the basis of 86 species-diagnostic SNPs, encompassingfour F1 hybrids and one second generation backcross.Hybrids were only observed in Iceland and were absentin the remaining European locations. All hybrid individ-uals were removed from further analyses.The selection detection workbench LOSITAN identified
three outlier loci possibly under diversifying selectionusing the full data set, GAPDH_20355, MYH_14857 andALDH_2_16634, with p < 0.05 (Table 2). When using therestricted data set with 7 locations, a further outlier wasalso identified, ALD_R (p = 0.000). Using the completedata set with 8 locations BAYESCAN identified a singleoutlier, GAPDH_20355, showing a high FST value of 0.123relative to the background FST (Table 2). At this locus,the alpha coefficient was positive, suggestive of diversi-fying selection. When using the restricted data set with7 locations, ALD_R was also identified as outlier inaddition to GAPDH_20355, showing a high FST value of0.091 and a positive alpha coefficient.A generalized linear model between allelic frequencies
and explanatory variables using the full data set revealedsignificant associations with temperature (2 loci), latitude(3 loci) and longitude (5 loci) (Table 3). One locus(GAPDH_20355) showed a significant association withboth latitude and longitude. No interactions with explana-tory variables were found at any locus. Locus ALD_Rshowed a positive association with longitude when usingthe restricted data set with 7 locations (p = 0.016).On the other hand, one positive association was found
using BAYENV, locus GAPDH_20355 and latitude, with
Iceland Ringhals Burrishoole L
EAmerican eel
1.00
0.25
0.75
0.50
0.00
Ad
mix
ture
p
rop
ort
ion
Figure 1 Admixture analysis using STRUCTURE. Individuals were assignrepresents one individual, partitioned into segments according to the prop
a Bayes Factor of 7.450 (Table 3), while no associationswere found for the rest of loci (Bayes Factor <3). Inaddition, a positive association was found between locusALD_R and longitude, with a Bayes Factor of 3.295,when considering the reduced data set with 7 locations.Overall, we identified a total of 11 candidate loci, 4
from outlier tests plus 7 additional loci from the analysisof association of allelic frequencies with explanatoryvariables.
DiscussionSignatures of local selection in European eelThe observation of a small set of SNPs showing signifi-cantly high genetic differentiation in comparison withthe background FST and significant associations betweenallele frequencies and environmental variables is consist-ent with the action of spatially varying selection associ-ated with the highly heterogenous habitats that glass eelscolonize throughout their geographic range. Our findingsfit the general prediction that selective pressures fre-quently vary in space, often resulting in local selectionof ecologically adaptive traits [1].Overall, we found signatures of selection at a total of
11 loci. We found discordances between the two approachesused (FST outlier tests vs. environmental-associationmethods), with few SNPs identified as targets of selec-tion by both methods and with a higher number of can-didates identified using a generalized linear model. Thisis in agreement with recent studies showing that SNPspositively correlated with environmental variables werenot FST outliers [35-37]. It has been suggested that SNP-environment associations are more sensitive to detect sub-tle clines in allele frequencies than FST outlier tests andthat both approaches might be complementary but notconcordant when testing for selection [38].Nevertheless, three loci in our study (GAPDH, ALDH2
and ALD_R) showed higher genetic differentiation thanthe background FST together with significant associationsbetween allele frequencies and environmental variables.All three are genes with major metabolic functions:GAPDH (Glyceraldehide 3-phosphate dehydrogenase)is part of the glycolysis pathway and catalyzes the
Gironde .Erne Canet Tiber Valencia
uropeaneel
ed assuming the presence of two groups (K = 2). Each vertical lineortion of European eel (light) and American eel (dark).
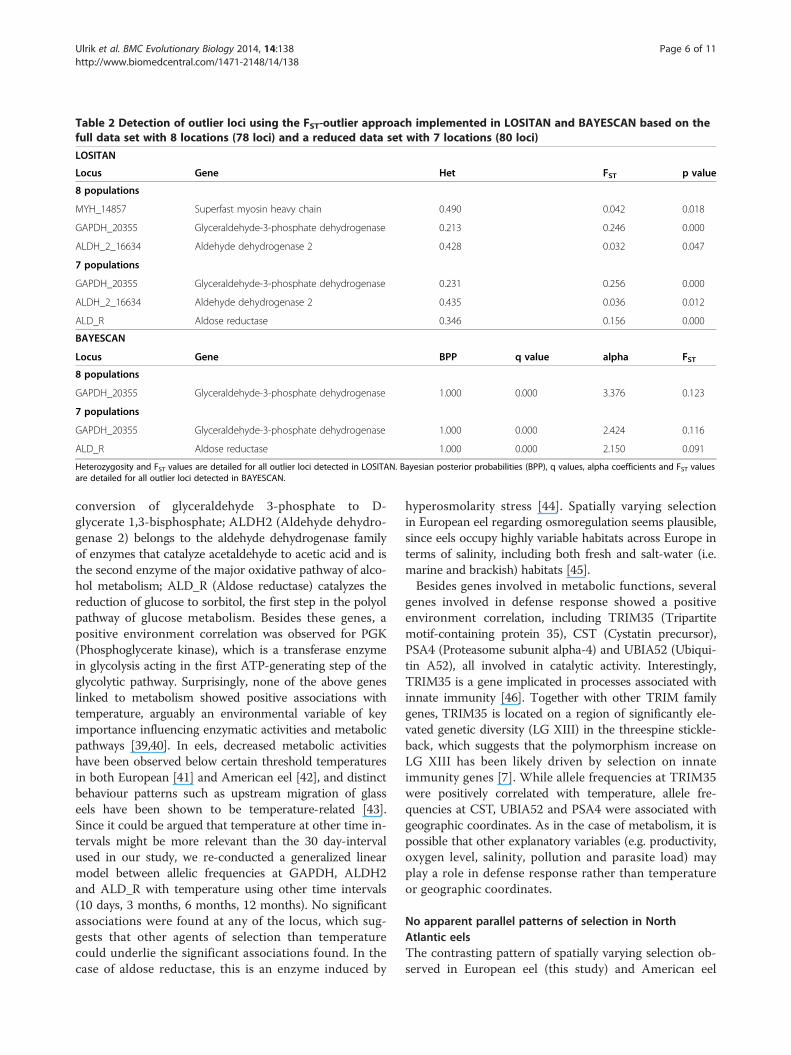
Table 2 Detection of outlier loci using the FST-outlier approach implemented in LOSITAN and BAYESCAN based on thefull data set with 8 locations (78 loci) and a reduced data set with 7 locations (80 loci)
LOSITAN
Locus Gene Het FST p value
8 populations
MYH_14857 Superfast myosin heavy chain 0.490 0.042 0.018
GAPDH_20355 Glyceraldehyde-3-phosphate dehydrogenase 0.213 0.246 0.000
ALDH_2_16634 Aldehyde dehydrogenase 2 0.428 0.032 0.047
7 populations
GAPDH_20355 Glyceraldehyde-3-phosphate dehydrogenase 0.231 0.256 0.000
ALDH_2_16634 Aldehyde dehydrogenase 2 0.435 0.036 0.012
ALD_R Aldose reductase 0.346 0.156 0.000
BAYESCAN
Locus Gene BPP q value alpha FST
8 populations
GAPDH_20355 Glyceraldehyde-3-phosphate dehydrogenase 1.000 0.000 3.376 0.123
7 populations
GAPDH_20355 Glyceraldehyde-3-phosphate dehydrogenase 1.000 0.000 2.424 0.116
ALD_R Aldose reductase 1.000 0.000 2.150 0.091
Heterozygosity and FST values are detailed for all outlier loci detected in LOSITAN. Bayesian posterior probabilities (BPP), q values, alpha coefficients and FST valuesare detailed for all outlier loci detected in BAYESCAN.
Ulrik et al. BMC Evolutionary Biology 2014, 14:138 Page 6 of 11http://www.biomedcentral.com/1471-2148/14/138
conversion of glyceraldehyde 3-phosphate to D-glycerate 1,3-bisphosphate; ALDH2 (Aldehyde dehydro-genase 2) belongs to the aldehyde dehydrogenase familyof enzymes that catalyze acetaldehyde to acetic acid and isthe second enzyme of the major oxidative pathway of alco-hol metabolism; ALD_R (Aldose reductase) catalyzes thereduction of glucose to sorbitol, the first step in the polyolpathway of glucose metabolism. Besides these genes, apositive environment correlation was observed for PGK(Phosphoglycerate kinase), which is a transferase enzymein glycolysis acting in the first ATP-generating step of theglycolytic pathway. Surprisingly, none of the above geneslinked to metabolism showed positive associations withtemperature, arguably an environmental variable of keyimportance influencing enzymatic activities and metabolicpathways [39,40]. In eels, decreased metabolic activitieshave been observed below certain threshold temperaturesin both European [41] and American eel [42], and distinctbehaviour patterns such as upstream migration of glasseels have been shown to be temperature-related [43].Since it could be argued that temperature at other time in-tervals might be more relevant than the 30 day-intervalused in our study, we re-conducted a generalized linearmodel between allelic frequencies at GAPDH, ALDH2and ALD_R with temperature using other time intervals(10 days, 3 months, 6 months, 12 months). No significantassociations were found at any of the locus, which sug-gests that other agents of selection than temperaturecould underlie the significant associations found. In thecase of aldose reductase, this is an enzyme induced by
hyperosmolarity stress [44]. Spatially varying selectionin European eel regarding osmoregulation seems plausible,since eels occupy highly variable habitats across Europe interms of salinity, including both fresh and salt-water (i.e.marine and brackish) habitats [45].Besides genes involved in metabolic functions, several
genes involved in defense response showed a positiveenvironment correlation, including TRIM35 (Tripartitemotif-containing protein 35), CST (Cystatin precursor),PSA4 (Proteasome subunit alpha-4) and UBIA52 (Ubiqui-tin A52), all involved in catalytic activity. Interestingly,TRIM35 is a gene implicated in processes associated withinnate immunity [46]. Together with other TRIM familygenes, TRIM35 is located on a region of significantly ele-vated genetic diversity (LG XIII) in the threespine stickle-back, which suggests that the polymorphism increase onLG XIII has been likely driven by selection on innateimmunity genes [7]. While allele frequencies at TRIM35were positively correlated with temperature, allele fre-quencies at CST, UBIA52 and PSA4 were associated withgeographic coordinates. As in the case of metabolism, it ispossible that other explanatory variables (e.g. productivity,oxygen level, salinity, pollution and parasite load) mayplay a role in defense response rather than temperatureor geographic coordinates.
No apparent parallel patterns of selection in NorthAtlantic eelsThe contrasting pattern of spatially varying selection ob-served in European eel (this study) and American eel
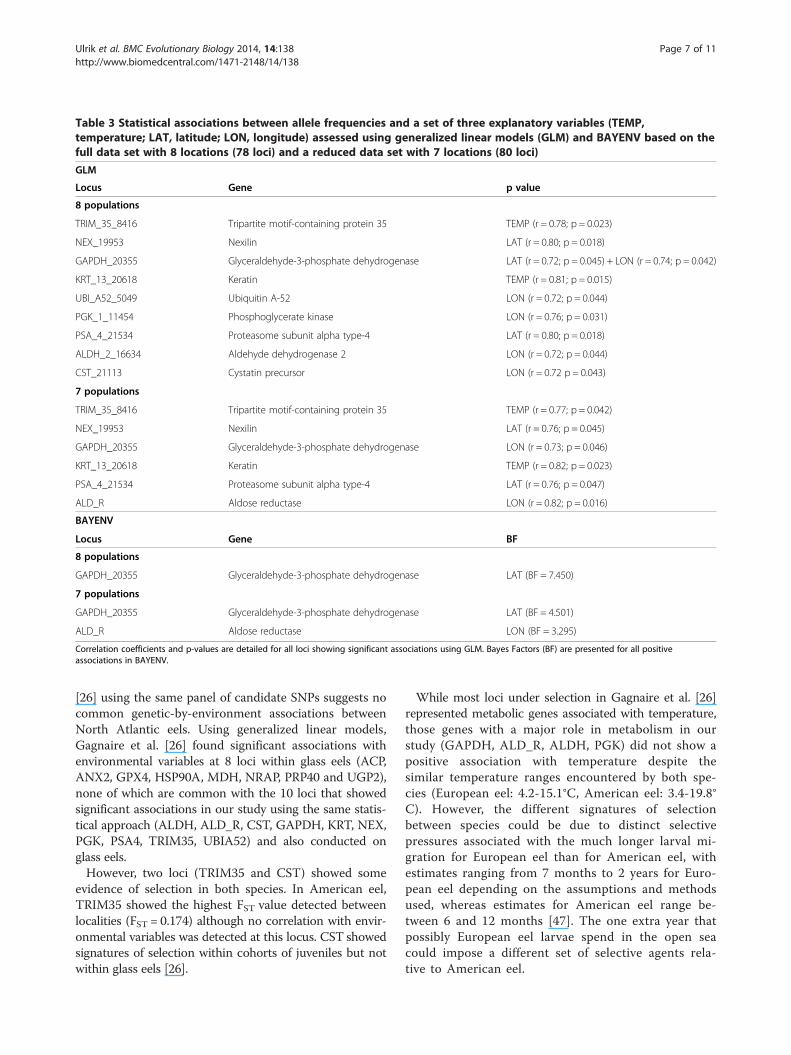
Table 3 Statistical associations between allele frequencies and a set of three explanatory variables (TEMP,temperature; LAT, latitude; LON, longitude) assessed using generalized linear models (GLM) and BAYENV based on thefull data set with 8 locations (78 loci) and a reduced data set with 7 locations (80 loci)
GLM
Locus Gene p value
8 populations
TRIM_35_8416 Tripartite motif-containing protein 35 TEMP (r = 0.78; p = 0.023)
NEX_19953 Nexilin LAT (r = 0.80; p = 0.018)
GAPDH_20355 Glyceraldehyde-3-phosphate dehydrogenase LAT (r = 0.72; p = 0.045) + LON (r = 0.74; p = 0.042)
KRT_13_20618 Keratin TEMP (r = 0.81; p = 0.015)
UBI_A52_5049 Ubiquitin A-52 LON (r = 0.72; p = 0.044)
PGK_1_11454 Phosphoglycerate kinase LON (r = 0.76; p = 0.031)
PSA_4_21534 Proteasome subunit alpha type-4 LAT (r = 0.80; p = 0.018)
ALDH_2_16634 Aldehyde dehydrogenase 2 LON (r = 0.72; p = 0.044)
CST_21113 Cystatin precursor LON (r = 0.72 p = 0.043)
7 populations
TRIM_35_8416 Tripartite motif-containing protein 35 TEMP (r = 0.77; p = 0.042)
NEX_19953 Nexilin LAT (r = 0.76; p = 0.045)
GAPDH_20355 Glyceraldehyde-3-phosphate dehydrogenase LON (r = 0.73; p = 0.046)
KRT_13_20618 Keratin TEMP (r = 0.82; p = 0.023)
PSA_4_21534 Proteasome subunit alpha type-4 LAT (r = 0.76; p = 0.047)
ALD_R Aldose reductase LON (r = 0.82; p = 0.016)
BAYENV
Locus Gene BF
8 populations
GAPDH_20355 Glyceraldehyde-3-phosphate dehydrogenase LAT (BF = 7.450)
7 populations
GAPDH_20355 Glyceraldehyde-3-phosphate dehydrogenase LAT (BF = 4.501)
ALD_R Aldose reductase LON (BF = 3.295)
Correlation coefficients and p-values are detailed for all loci showing significant associations using GLM. Bayes Factors (BF) are presented for all positiveassociations in BAYENV.
Ulrik et al. BMC Evolutionary Biology 2014, 14:138 Page 7 of 11http://www.biomedcentral.com/1471-2148/14/138
[26] using the same panel of candidate SNPs suggests nocommon genetic-by-environment associations betweenNorth Atlantic eels. Using generalized linear models,Gagnaire et al. [26] found significant associations withenvironmental variables at 8 loci within glass eels (ACP,ANX2, GPX4, HSP90A, MDH, NRAP, PRP40 and UGP2),none of which are common with the 10 loci that showedsignificant associations in our study using the same statis-tical approach (ALDH, ALD_R, CST, GAPDH, KRT, NEX,PGK, PSA4, TRIM35, UBIA52) and also conducted onglass eels.However, two loci (TRIM35 and CST) showed some
evidence of selection in both species. In American eel,TRIM35 showed the highest FST value detected betweenlocalities (FST = 0.174) although no correlation with envir-onmental variables was detected at this locus. CST showedsignatures of selection within cohorts of juveniles but notwithin glass eels [26].
While most loci under selection in Gagnaire et al. [26]represented metabolic genes associated with temperature,those genes with a major role in metabolism in ourstudy (GAPDH, ALD_R, ALDH, PGK) did not show apositive association with temperature despite thesimilar temperature ranges encountered by both spe-cies (European eel: 4.2-15.1°C, American eel: 3.4-19.8°C). However, the different signatures of selectionbetween species could be due to distinct selectivepressures associated with the much longer larval mi-gration for European eel than for American eel, withestimates ranging from 7 months to 2 years for Euro-pean eel depending on the assumptions and methodsused, whereas estimates for American eel range be-tween 6 and 12 months [47]. The one extra year thatpossibly European eel larvae spend in the open seacould impose a different set of selective agents rela-tive to American eel.
Ulrik et al. BMC Evolutionary Biology 2014, 14:138 Page 8 of 11http://www.biomedcentral.com/1471-2148/14/138
In contrast with our findings, the recent survey of Conteet al. [5] on published literature of repeated phenotypicevolution in natural populations concluded that the prob-ability of gene reuse was high (on average 55%). However,the survey was based on candidate gene studies, whichmight have biased upward the reuse estimates. The lack ofparallel selection patterns in North Atlantic eels is un-anticipated owing to the sister species status of Europeanand American eel and the permeable barrier to gene flowbetween species. A recent study using a RAD-sequencingapproach to identify diagnostic markers between the twospecies found a small proportion of fixed SNPs (<0.5%),while most of the SNPs showed low non-significant differ-entiation that suggest that most of the genome is homoge-nized by gene flow [23]. One possible explanation to thelack of parallel selection is that complex phenotypictraits affected by local selection might have a highlypolygenic basis, hence influenced by several genes, eachwith a small contribution to the ultimate function[48,49]. Parallel selection is more likely to occur whenthe adaptive response is controlled by a single gene, i.e.the Eda gene and armor plate reduction [6,50] and theKit ligand Kitlg gene and pigmentation [51] in three-spine sticklebacks or the melonacortin-1 receptor Mc1rand colour pattern in beach mice [52]. More complextraits are likely to involve a higher number of genes,thus reducing the likelihood of selection acting on thesame genes in multiple species or locations, as it hasbeen argued in the case of osmoregulation in threespinesticklebacks [7,8]. Similarly, partial parallel patterns ofgenetic differentiation have been observed between twowhitefish sympatric species pairs (a normal benthic anda dwarf limnetic) across lakes, suggestive of polygenicadaptation [53-55].
ConclusionsThe distinct signatures of selection between NorthAmerican eels could be attributable to differences in larvalmigration between species. Alternatively, the fact thatmany genes of small effect likely shape adaptive pathways(i.e. metabolism, growth, osmoregulation, pathogen resist-ance) could explain the private signatures of spatially vary-ing selection with no shared genetic-by-environmentassociations between European and American eel. As analternative to candidate loci approaches, high-densitygenome-wide scans using next-generation sequencingand genotyping-by-sequencing approaches [7,56] mightbe more adequate. A recent study using RAD (Restric-tion site Associated DNA) sequencing generated a SNPresource for European eel consisting of 82,425 loci andover 375,000 SNPs [57] that provides a valuable tool forfuture studies on parallel selection in both North Atlanticeels on a genome-wide scale.
MethodsEthical statementNo experiments were conducted on the animals and ani-mal manipulation was limited to sacrificing fish, using theleast painful method to obtain tissue samples for DNA ex-traction. In all cases, in order to minimize the suffering ofthe animals used in the study, fish were deeply anaesthe-tized with MS-222 (3-amonobenzoic acid ethyl ester) or2-phenoxyethanol 1% and then painlessly sacrificed. Allprocedures were conducted by technical staff, who had allthe necessary fishing and animal ethics permits (please seein the Additional file 1: Appendix 1).
SamplingA total of 321 European eel (Anguilla anguilla) individualswere collected at 8 locations across the geographical distri-bution of the species, from Iceland to the MediterraneanSea (Table 4; Figure 2). All individuals were glass eelscaught by electrofishing (Iceland) and fyke nets (remaininglocalities). Individuals from Iceland were collected at fourseparate sampling sites in southwestern Iceland, butpooled to increase sample size. Additionally, 20 Americaneel (Anguilla rostrata) individuals collected at RivièreBlanche (Québec, Canada), Mira River (Nova Scotia,Canada), Wye River (MD, US), Medomak River (ME,US) and Boston Harbor (MA, US) were used for com-parison. Genomic DNA was extracted using standardphenol-chloroform extraction.
SNP genotypingWe examined the panel of 100 coding-gene SNPs devel-oped by Gagnaire et al. [26] in American eel. 20 out ofthe 100 primer sets did not give good amplificationproducts in European eel and were excluded. All indi-viduals were genotyped at 80 coding-gene SNPs: 47SNPs that were detected as outliers between samplesfrom Florida and Québec using RNA-sequencing data(including 4 SNPs identified within allozyme-coding genesshowing clinal variation in Williams et al. [33]) and 33SNPs that were not outliers (Table 2). SNP genotypingwas conducted using the Kbioscience Competitive Allele-Specific PCR genotyping system (KASPar) (Kbioscience,Hoddeston, UK).
Data analysisAllele frequencies, measures of genetic diversity includingpolymorphism at the 95% (P95) and 99% level (P99), ob-served (Ho) and expected (He) heterozygosities and devia-tions from Hardy-Weinberg equilibrium were calculatedusing GENEPOP [58]. In all cases, significance levels werecorrected for multiple comparisons using the sequentialBonferroni technique [59].Overall genetic differentiation (FST) was calculated in
GENEPOP. Population structure was further investigated
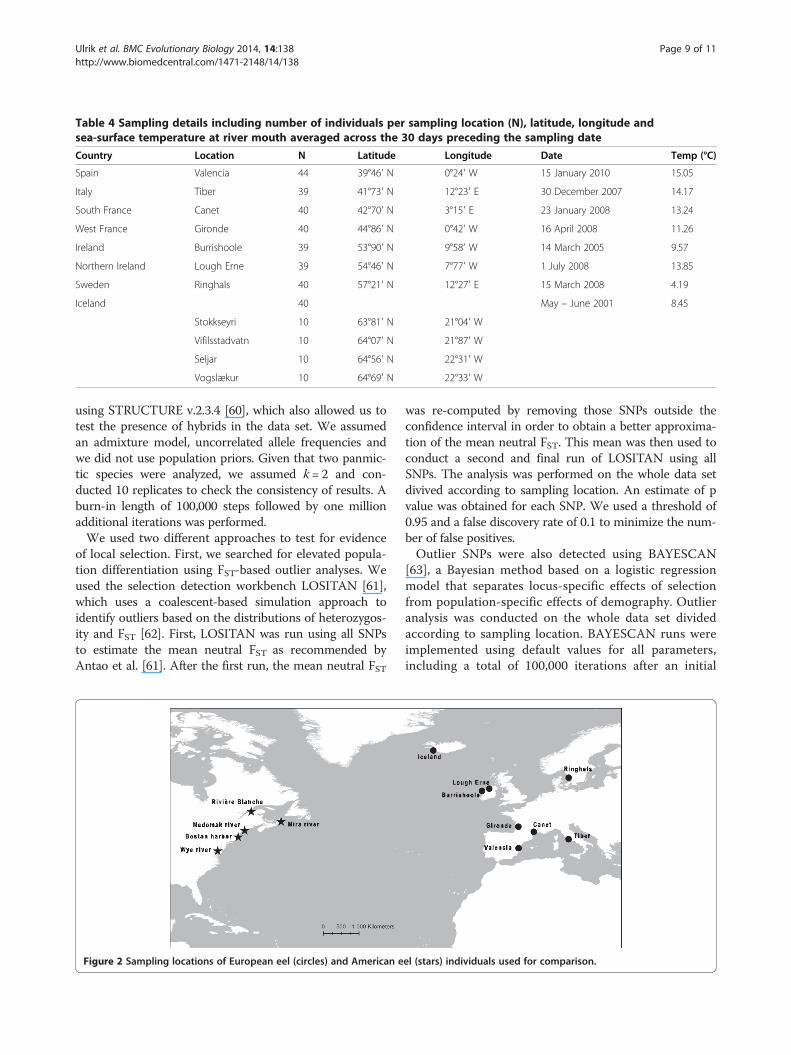
Table 4 Sampling details including number of individuals per sampling location (N), latitude, longitude andsea-surface temperature at river mouth averaged across the 30 days preceding the sampling date
Country Location N Latitude Longitude Date Temp (°C)
Spain Valencia 44 39°46′ N 0°24′ W 15 January 2010 15.05
Italy Tiber 39 41°73′ N 12°23′ E 30 December 2007 14.17
South France Canet 40 42°70′ N 3°15′ E 23 January 2008 13.24
West France Gironde 40 44°86′ N 0°42′ W 16 April 2008 11.26
Ireland Burrishoole 39 53°90′ N 9°58′ W 14 March 2005 9.57
Northern Ireland Lough Erne 39 54°46′ N 7°77′ W 1 July 2008 13.85
Sweden Ringhals 40 57°21′ N 12°27′ E 15 March 2008 4.19
Iceland 40 May – June 2001 8.45
Stokkseyri 10 63°81′ N 21°04′ W
Vifilsstadvatn 10 64°07′ N 21°87′ W
Seljar 10 64°56′ N 22°31′ W
Vogslækur 10 64°69′ N 22°33′ W
Ulrik et al. BMC Evolutionary Biology 2014, 14:138 Page 9 of 11http://www.biomedcentral.com/1471-2148/14/138
using STRUCTURE v.2.3.4 [60], which also allowed us totest the presence of hybrids in the data set. We assumedan admixture model, uncorrelated allele frequencies andwe did not use population priors. Given that two panmic-tic species were analyzed, we assumed k = 2 and con-ducted 10 replicates to check the consistency of results. Aburn-in length of 100,000 steps followed by one millionadditional iterations was performed.We used two different approaches to test for evidence
of local selection. First, we searched for elevated popula-tion differentiation using FST-based outlier analyses. Weused the selection detection workbench LOSITAN [61],which uses a coalescent-based simulation approach toidentify outliers based on the distributions of heterozygos-ity and FST [62]. First, LOSITAN was run using all SNPsto estimate the mean neutral FST as recommended byAntao et al. [61]. After the first run, the mean neutral FST
Figure 2 Sampling locations of European eel (circles) and American e
was re-computed by removing those SNPs outside theconfidence interval in order to obtain a better approxima-tion of the mean neutral FST. This mean was then used toconduct a second and final run of LOSITAN using allSNPs. The analysis was performed on the whole data setdivived according to sampling location. An estimate of pvalue was obtained for each SNP. We used a threshold of0.95 and a false discovery rate of 0.1 to minimize the num-ber of false positives.Outlier SNPs were also detected using BAYESCAN
[63], a Bayesian method based on a logistic regressionmodel that separates locus-specific effects of selectionfrom population-specific effects of demography. Outlieranalysis was conducted on the whole data set dividedaccording to sampling location. BAYESCAN runs wereimplemented using default values for all parameters,including a total of 100,000 iterations after an initial
el (stars) individuals used for comparison.
Ulrik et al. BMC Evolutionary Biology 2014, 14:138 Page 10 of 11http://www.biomedcentral.com/1471-2148/14/138
burn-in of 50,000 steps. Posterior probabilities, q valuesand alpha coefficients (positive values indicate diversify-ing selection, negative values are indicative of balancingselection) were calculated. A q-value of 10% was usedfor significance.As an alternative to FST-outlier tests, our second ap-
proach for identifying targets of local selection was totest for significant statistical associations between al-lelic frequencies and environmental variables followingGagnaire et al. [26], using a generalized linear model inr. Environmental variables used included degrees Northlatitude, degrees East/West longitude, and sea-surfacetemperature at river mouth averaged across the 30 dayspreceding the sampling date. Sea-surface temperaturedata were retrieved from the IRI (International ResearchInstitute for Climate and Society) Climate Data Library(http://iridl.ldeo.columbia.edu/) database “NOAA NCDCOISST version2 AVHRR SST: Daily Sea Surface Tem-perature”. We also searched for SNP-environment associa-tions using BAYENV [38], which tests for covariancebetween candidate SNP allele frequencies and environ-ment variables that exceed the expected covariances undergenetic drift. First, SNP frequencies at all loci were used todescribe how allele frequencies covary across populations,hence avoiding population-specific effects of demography(even though a panmixia scenario is most likely to applyfor European eel). After the covariance matrix was esti-mated, the program determined the Bayes factors for theenvironmental variables of interest. Bayes Factors >3 wereconsidered indicative of an allele frequency correlationwith an environmental variable.
Availability of supporting dataThe data set supporting the results of this article is availablefrom Dryad: http://datadryad.org/resource/doi:10.5061/dryad.jn800/1.
Additional file
Additional file 1: Appendix 1. Supplementary ethical statement.
Competing interestsThe authors declare no competing interest.
Authors’ contributionsMMH and LB conceived and designed the project. MGU and JMP conductedpopulation genetics analyses with help from MMH, TDA, ALF and MWJ. MGUand JMP wrote the manuscript with contributions from MMH, LB, PAP, ALF,MWJ, TDA, JF, PKB and BJ. All authors read and approved the final version ofthe manuscript.
AcknowledgementsWe thank Eleonora Ciccotti, Russell Poole, Javier Lobón-Cervia, Eric Feunteun,Francoise Daverat and Håkan Wickström for providing samples, AnnieBrandstrup for technical assistance, Virginia Settepani for help in preparingthe figures and Mads F. Schou for help in statistical analysis. Weacknowledge funding from the Danish Council for Independent Reasearch,Natural Sciences (grant 09–072120 to MMH).
Author details1Department of Bioscience, Aarhus University, Ny Munkegade 114, Bldg.1540, DK-8000 Aarhus C, Denmark. 2National Institute of Aquatic Resources,Technical University of Denmark, Vejlsøvej 39, DK-8600 Silkeborg, Denmark.3Department of Biomedicine-Human Genetics, Aarhus University, DK-8000Aarhus C, Denmark. 4ISEM (Institut des Sciences de l’Evolution Montpellier),Université Montpellier II, 34095 Montpellier, France. 5Biopol, Marine Biologyand Biotechnology Center, Einbúastígur 2, IS545 Skagastrond, Iceland. 6IBIS(Institut de Biologie Intégrative et des Systèmes), Université Laval, G1V 0A6Québec, Canada.
Received: 27 March 2014 Accepted: 16 June 2014Published: 20 June 2014
References1. Kawecki TJ, Ebert D: Conceptual issues in local adaptation. Ecol Lett 2004,
7:1225–1241.2. Stapley J, Reger J, Feulner PGD, Smadja C, Galindo J, Ekblom R, Bennison C,
Ball AD, Beckerman AP, Slate J: Adaptation genomics: the next generation.Trends Ecol Evol 2010, 12:705–712.
3. Wood TE, Burke JM, Reiseberg LH: Parallel genotypic adaptation: whenevolution repeats itself. Genetica 2005, 123:157–170.
4. Elmer KR, Meyer A: Adaptation in the age of ecological genomics:insights from parallelism and convergence. Trends Ecol Evol 2011,26:298–306.
5. Conte GL, Arnegard ME, Peichel CL, Schluter D: The probability of geneticparallelism and convergence in natural populations. Proc R Soc Lond B2012, 279:5039–5047.
6. Colosimo PF, Hosemann KE, Balabhadra W, Villarreal G, Dickson M,Grimwood J, Schmutz J, Myers RM, Schluter D, Kingsley DM: Widespreadparallel evolution in sticklebacks by repeated fixation of Ectodysplasinalleles. Science 2005, 307:1928–1933.
7. Hohenlohe PA, Bassham S, Etter PD, Stiffler N, Johnson EA, Cresko WA:Population genomics of parallel adaptation in threespine sticklebackusing sequenced RAD tags. PLoS Genet 2010, 6:e1000862.
8. DeFaveri J, Shikano T, Shimada Y, Goto A, Merilä J: Global analysis of genesinvolved in freshwater adaptation in threespine sticklebacks(Gasterosteus aculeatus). Evolution 2011, 65:1800–1807.
9. Jones FC, Chan YF, Schmutz J, Grimwood J, Brady SD, Southwick AM,Absher DM, Myers RM, Reimchen T, Deagle BE, Schluter D, Kingslet DM: Agenome-wide SNP genotyping array reveals patterns of global andrepeated species-pair divergence in sticklebacks. Curr Biol 2012, 22:83–90.
10. Jones FC, Grabherr MG, Chan YF, Russell P, Mauceli E, Johnson J, Swofford R,Pirun M, Zody MC, White S, Birney E, Searle S, Schmutz J, Grimwood J,Dickson MC, Myers RM, Miller CT, Summers BR, Knecht AK, Brady SD, ZhangH, Pollen AA, Howes T, Amemiya C: The genomic basis of adaptiveevolution in threespine sticklebacks. Nature 2012, 484:55–61.
11. Renault S, Owens GL, Rieseberg LH: Shared selective pressure and localgenomic landscape lead to repeatable patterns of genomic divergencein sunflowers. Mol Ecol 2014, 23:311–324.
12. Boëtius J: Atlantic Anguilla: a presentation of old and new data of totalnumber of vertebrae with special reference to the occurrence ofAnguilla rostrata in Europe. Dana 1980, 1:93–112.
13. Avise JC, Helfman GS, Saunders NC, Hales LS: Mitochondrial DNAdifferentiation in North Atlantic eels: population genetic consequences ofan unusual life history pattern. Proc Natl Acad Sci U S A 1986, 83:4350–4354.
14. Mineguishi Y, Aoyama J, Inoue JG, Miya M, Nishida M, Tsukamoto K:Molecular phylogeny and evolution of the freshwater eels genusAnguilla based on the whole mitochondrial genome sequences. MolPhylogenet Evol 2005, 34:134–146.
15. Jacobsen MW, Pujolar JM, Gilbert TP, Mayar JVM, Bernatchez L, Als TD,Hansen MM: Speciation and demographic history of Atlantic eels(Anguilla anguilla and A. rostrata) revealed by mitogenome sequencing.Heredity 2014. in press.
16. Mank JE, Avise JC: Microsatellite variation and differentiation in NorthAtlantic eels. J Hered 2003, 94:30–34.
17. Wirth T, Bernatchez L: Decline of Atlantic eels: a fatal synergy? Proc R SocLond B 2003, 270:681–688.
18. Gagnaire PA, Albert V, Jónsson B, Bernatchez L: Natural selectioninfluences AFLP intraspecific variability and introgression patterns inAtlantic eels. Mol Ecol 2009, 18:1678–1691.
Ulrik et al. BMC Evolutionary Biology 2014, 14:138 Page 11 of 11http://www.biomedcentral.com/1471-2148/14/138
19. Als TD, Hansen MM, Maes GE, Castonguay M, Riemann L, Aerestrup K, MunkP, Sparholt T, Hanel R, Bernatchez L: All roads lead to home: panmixia ofEuropean eel in the Sargasso Sea. Mol Ecol 2011, 20:1333–1346.
20. McCleave JD, Kleckner RC, Castonguay M: Reproductive sympatry ofAmerican and European eels and implications for migration andtaxonomy. Am Fish Soc Symp 1987, 1:286–297.
21. Avise JC, Nelson WS, Arnold J, Koehn RK, Williams GC, Thorsteinsson V: Theevolutionary genetic status of Icelandic eels. Evolution 1990, 44:1254–1262.
22. Albert V, Jónsson B, Bernatchez L: Natural hybrids in Atlantic eels (Anguillaanguilla, A. rostrata): evidence for successful reproduction andfluctuating abundance in space and time. Mol Ecol 2006, 15:1903–1916.
23. Pujolar JM, Jacobsen MW, Als TD, Frydenberg J, Magnussen E, Jónsson B,Jiang X, Cheng L, Bekkevold D, Maes GE, Bernatchez L, Hansen MM:Assessing patterns of hybridization between North Atlantic eels usingdiagnostic single-nucleotide polymorphisms. Heredity 2014. in press.
24. Van den Thillart G, Rankin JC, Dufour S: Spawning migration of the Europeaneel: reproduction index, a useful tool for conservation management. Dordecht,The Netherlands: Springer; 2009.
25. Fraser DJ, Weir LK, Bernatchez L, Hansen MM, Taylor EB: Extend and scaleof local adaptation in salmonid fishes: review and meta-analysis. Heredity2011, 106:404–420.
26. Gagnaire PA, Normandeau E, Côté C, Hansen MM, Bernatchez L: Thegenetic consequences of spatially varying selection in the panmicticAmerican eel (Anguilla rostrata). Genetics 2012, 190:725–736.
27. Levene H: Genetic equilibrium when more than one ecological niche isavailable. Am Nat 1953, 87:331–333.
28. Hedrick PW: Genetic polymorphism in heterogeneous environments: theage of genomics. Annu Rev Ecol Evol Syst 2006, 37:67–93.
29. Yeaman S, Otto SP: Establishment and maintenance of adaptive geneticdivergence under migration, selection and drift. Evolution 2011,65:2123–2129.
30. Dannewitz J, Maes GE, Johansson L, Wickström H, Volckaert FAM, Jarvi T:Panmixia in the European eel: a matter of time. Proc R Soc Lond B 2005,272:1129–1137.
31. Côté C, Gagnaire PA, Bourret V, Verrault G, Castonguay M, Bernatchez L:Population genetics of the American eel (Anguilla rostrata): FST = 0 andNorth Atlantic Oscillation effects on demographic fluctuations of apanmictic species. Mol Ecol 2013, 22:1763–1776.
32. Maes GE, Volckaert FAM: Clinal genetic variation and isolation by distancein the European eel Anguilla anguilla. Biol J Linn Soc 2002, 77:509–522.
33. Williams GC, Koehn RK, Mitton JB: Genetic differentiation without isolationin the American eel, Anguilla rostrata. Evolution 1973, 27:192–204.
34. Schmidt PS, Serrao EA, Pearson GA, Riginos C, Rawson PD, Hilbish TJ,Brawley SH, Trussell GC, Carrington E, Wethey DS, Grahame JW, BonhommeF, Rand DM: Ecological genetics in the North Atlantic: environmentalgradients and adaptation at specific loci. Ecology 2008, 89:S91–S107.
35. Hancock AM, Witonsky DB, Ehler E, Alkorta-Aranburu G, Beall C, GebremedhinA, Sukernik R, Utermann G, Pritchard J, Coop G, Di Rienzo A: Colloquium paper:human adaptations to diet, subsistence, and ecoregion are due to subtleshifts in allele frequency. Proc Natl Acad Sci U S A 2010, 107:8924–8930.
36. Ma XF, Hall D, Onge KR, Jansson S, Ingvarsson PK: Genetic differentiation,clinal variation and phenotypic associations with growth cessationacross the Populus tremula photoperiodic pathway. Genetics 2010,186:1033–1044.
37. Keller SR, Levsen N, Olson MS, Tiffin P: Local adaptation in the flowering-timegene network of balsam poplar, Populus balsamifera. Mol Biol Evol 2012,29:3143–3152.
38. Coop G, Witonsky D, Di Rienzo A, Pritchard JK: Using environmentalcorrelations to identify loci underlying local adaptation. Genetics 2010,185:411–1423.
39. Somero GN: Adaptation of enzymes to temperature: searching for basic“strategies”. Comp Biochem Physiol B Biochem Mol Biol 2004, 139:321–333.
40. Lim ST, Kay RM, Bailey GS: Lactate dehydrogenase isozymes in salmonidfish: evidence for unique and rapid functional divergence of duplicatedH-4 lactate dehydrogenases. J Biol Chem 1975, 10:1790–1800.
41. Nyman L: Some effects of temperature on eel (Anguilla) behaviour. RepInst Freshw Res Drottingholm 1972, 52:90–102.
42. Walsh PJ, Foster GD, Moon TW: The effects of temperature andmetabolism of the American eel Anguilla rostrata: compensation in thesummer and torpor in the winter. Physiol Zool 1983, 56:532–540.
43. Linton ED, Jónsson B, Noakes DLG: Effects of water temperature on theswimming and climbing behavior of glass eels Anguilla spp. Environ BiolFishes 2007, 78:189–192.
44. Henry DN, Delmonte M, Greene DA, Killen PD: Altered aldose reductaseregulation in human retinal-pigment epithelial-cells. J Clin Invest 1993,92:617–623.
45. Daverat F, Limburg K, Thibaut I, Shiao JC, Dodson JJ, Caron F, Tzeng WN,Iizuka Y, Wickström H: Phenotypic plasticity of habitat use by threetemperate eel species Anguilla anguilla, A. japonica and A. rostrata. MarEcol Prog Ser 2006, 308:231–241.
46. Carthagena L, Bergamaschi A, Luna JM, David A, Uchil PD, Margottin-Goguet F, Mothes W, Hazan U, Transy C, Pancino G, Nisole S: Human TRIMgene expression in response to interferons. PLoS One 2009, 4:e4894.
47. Bonhommeau S, Blanke B, Tréguier AM, Grima N, Rivot E, Vermard Y, GreinerE, Le Pape O: How fast can the European eel (Anguilla anguilla) larvaecross the Atlantic Ocean? Fish Oceanogr 2009, 18:371–385.
48. Orr HA: The genetic theory of adaptation: a brief history. Nature Rev Genet2005, 6:119–127.
49. Wainwright PC, Alfaro ME, Bolnick DI, Hulsey CD: Many-to-one mapping ofform to function: a general principle in organismal design? Integr CompBiol 2005, 45:256–262.
50. Raeymaekers JAM, Konijnendijk N, Larmuseau MHD, Hellemans B, DeMeester L, Volckaert FAM: A gene with major phenotypic effects as atarget for selection versus homogenizing gene flow. Mol Ecol 2014,23:162–181.
51. Miller CT, Beleza S, Pollen AA, Schluter D, Kittles RA, Shriver MD, KingsleyDM: Cis-regulatory changes in Kit ligand expression and parallelevolution of pigmentation in sticklebacks and humans. Cell 2007,131:1179–1189.
52. Hoekstra HE, Hirschmann RJ, Bundey RA, Insel PA, Crossland JP: A singleamino acid mutation contributes to adaptive beach mouse colorpattern. Science 2006, 313:101–104.
53. Roger SM, Bernatchez L: The genetic architecture of ecological speciationand the association with signatures of selection in natural lake whitefish(Coregonus sp.) species pairs. Mol Biol Evol 2007, 24:1423–1438.
54. Bernatchez L, Renault S, Whiteley AR, Derome N, Jeukens J, Landry L, Lu G,Nolte AW, Østbye K, Rogers SM, St-Cyr J: On the origin of species: insightsfrom the ecological genomics of whitefish. Phil Trans R Soc B 2010,367:354–363.
55. Gagnaire PA, Pavey SA, Normandeau E, Bernatchez L: The geneticarchitecture of reproductive isolation during speciation-with-gene-flowin lake whitefish species pairs assesed by RAD sequencing. Evolution2013, 67:2483–2497.
56. Davey JW, Hohenlohe PA, Etter PD, Boone JQ, Catchen JM, Blaxter ML:Genome-wide genetic marker discovery and genotyping usingnext-generation sequencing. Nature Rev Genet 2011, 12:499–510.
57. Pujolar JM, Jacobsen MW, Frydenberg J, Als TD, Larsen PF, Maes GE, Zane L,Jian JB, Cheng L, Hansen MM: A resource of genome-wide single-nucleotide polymorphisms generated by RAD tag sequencing in thecritically endangered European eel. Mol Ecol Resour 2013, 13:706–714.
58. Raymond M, Rousset F: GENEPOP (version 1.2): a population geneticssoftware for exact tests and ecumenicism. J Hered 1995, 86:248–249.
59. Rice WR: Analyzing tables and statistical tests. Evolution 1989, 43:223–225.60. Pritchard JK, Stephens M, Donnelly P: Inference of population structure
using multilocus genotype data. Genetics 2000, 155:945–959.61. Antao T, Lopes A, Lopes RJ, Beja-Pereira A, Luikart G: LOSITAN- a work-
bench to detect molecular adaptation based on a FST-outlier method.BMC Bioinformatics 2008, 9:323.
62. Beaumont MA, Nichols RA: Evaluating loci for use in the genetic analysisof population structure. Proc R Soc Lond B 1996, 263:1619–1626.
63. Foll M, Gaggiotti O: A genome-scan method to identify selected lociappropriate for both dominant and codominant markers: a Bayesianperspective. Genetics 2008, 180:977–993.
doi:10.1186/1471-2148-14-138Cite this article as: Ulrik et al.: Do North Atlantic eels show parallelpatterns of spatially varying selection? BMC Evolutionary Biology2014 14:138.
Copyright © 2022 FDOKUMEN