Determination of inner-shell cross-sections for EELS-quantification
16
215 Classification Physics Abstracts 06.50 - 07.80 - 78.70 Determination of inner-shell cross-sections for EELS- quantification Ferdinand Hofer Forschungsinstitut für Elektronenmikroskopie und Feinstrukturforschung, Graz University of Technology, A-8010 Graz, Austria (Received October 02, 1990; accepted March 26, 1991) Abstract. 2014 Quantitative microanalysis using the EELS technique requires the knowledge of partial scattering cross-sections to relate the measured intensities to the concentrations in the compounds. Partial scattering cross-sections can be determined either theoretically or empirically by means of standards. Cross-sections for K, L23 and M45 ionization edges can be calculated by the hydrogenic model and by the Hartree-Slater-model and with these models elements ranging from Li to W can be quantified. Alternatively, the ratio of two cross-sections (k-factor) can be used for quantification. These k-factors can be determined by measuring the appropriate ionization edges using a thin film standard, which has been done for K, L23, M45 and N45-edges. Scattering cross-sections which have been determined by these methods are compared and their impact on the reliability and accuracy of EELS-quantification is critically discussed. 1. Introduction. EELS is an important technique for microanalysis in the analytical electron microscope. Until recently it has been used mainly for the analysis of light elements. However, ratios of light to heavier elements such as second row transition elements and rare earth elements have become of interest in ceramic materials (e.g. high Tc-superconductors). Elemental analysis by EELS is enabled by the inner-shell edges, the position and intensity of which can be used to identify and quantify atomic species within the sample. The quantification of the EELS-spectra requires the knowledge of partial scattering cross-sections, i.e. differential cross-section integrated over angle and energy. These cross-sections can be determined either theoretically, or experimentally by using standards, and are one possible source of error in EELS- quantification. Although considerable attention has been paid to the development of methods for quantifica- tion of EELS-spectra some problems remain in fully quantifying such data, such as: 1) specimen thickness limitations, 2) reliability of background extrapolations and 3) uncertainties in case of partial scattering cross-sections. The first two points and the general procedures for EELS-quantification have been extensively discussed by Egerton [1]. The third point is the topic of this contribution, because an accurate Article available at http://mmm.edpsciences.org or http://dx.doi.org/10.1051/mmm:0199100202-3021500
-
Upload
independent -
Category
Documents
-
view
0 -
download
0
Transcript of Determination of inner-shell cross-sections for EELS-quantification

215
Classification
Physics Abstracts06.50 - 07.80 - 78.70
Determination of inner-shell cross-sections for EELS-quantification
Ferdinand Hofer
Forschungsinstitut für Elektronenmikroskopie und Feinstrukturforschung, Graz University of
Technology, A-8010 Graz, Austria
(Received October 02, 1990; accepted March 26, 1991)
Abstract. 2014 Quantitative microanalysis using the EELS technique requires the knowledge of partialscattering cross-sections to relate the measured intensities to the concentrations in the compounds.Partial scattering cross-sections can be determined either theoretically or empirically by means ofstandards. Cross-sections for K, L23 and M45 ionization edges can be calculated by the hydrogenicmodel and by the Hartree-Slater-model and with these models elements ranging from Li to W canbe quantified. Alternatively, the ratio of two cross-sections (k-factor) can be used for quantification.These k-factors can be determined by measuring the appropriate ionization edges using a thin filmstandard, which has been done for K, L23, M45 and N45-edges. Scattering cross-sections which havebeen determined by these methods are compared and their impact on the reliability and accuracy ofEELS-quantification is critically discussed.
1. Introduction.
EELS is an important technique for microanalysis in the analytical electron microscope. Untilrecently it has been used mainly for the analysis of light elements. However, ratios of light toheavier elements such as second row transition elements and rare earth elements have become of
interest in ceramic materials (e.g. high Tc-superconductors).Elemental analysis by EELS is enabled by the inner-shell edges, the position and intensity of
which can be used to identify and quantify atomic species within the sample. The quantificationof the EELS-spectra requires the knowledge of partial scattering cross-sections, i.e. differential
cross-section integrated over angle and energy. These cross-sections can be determined eithertheoretically, or experimentally by using standards, and are one possible source of error in EELS-quantification.
Although considerable attention has been paid to the development of methods for quantifica-tion of EELS-spectra some problems remain in fully quantifying such data, such as:1) specimen thickness limitations,2) reliability of background extrapolations and3) uncertainties in case of partial scattering cross-sections.
The first two points and the general procedures for EELS-quantification have been extensivelydiscussed by Egerton [1]. The third point is the topic of this contribution, because an accurate
Article available at http://mmm.edpsciences.org or http://dx.doi.org/10.1051/mmm:0199100202-3021500
216
knowledge of scattering cross-sections is not only useful for their practical application to spectralquantification procedures but provide a necessary guide to the development and refinement oftheoretical models for electron-solid interactions.
It is our aim to review and compare diverse methods for the determination of scattering cross-sections, to enquire into the reliability of these methods and the accuracy obtainable.
2. Procédure of quantification.
In practical EELS-microanalysis, mainly relative concentrations are used and they can be deter-mined according to the following equation [2],
NA IA(,3,,A) O"B ({3, A)1 IB (,3, > Ô ) 0-A (,3, là)
where
Ni is the number of atoms per unit area
Ii({3, A) is the core loss intensity integrated up to an energy region of width à starting at theedge onset
03C3i(03B2,0394) is the partial scattering cross-section integrated over a collection angle {3 and an energyregion A.
Although this equation is straightforward, several problems and limitations must be taken intoaccount when quantification is performed [3,4].
The experimental requirements for quantitative EELS and also for the experimental determi-nation of partial cross-sections are summarized in the following:
a) Specimen thickness: Specimens should be as thin as possible; at least thinner than the halfof the mean free path of inelastic scattering, otherwise the spectrum must be deconvoluted [5,6].
b) Beam convergence: If the incident convergence angle is comparable to the value of thecollection angle Q, a convergence correction has to be applied [7].
c) Orientation effects: Crystalline samples should be orientated in a way so that no stronglydiffracted beams are excited [8].
d) Lens aberration effects: Chromatic aberration can degrade the intensities at high energy-losses and large collection angles. This effect is especially significant when the spectra are recordedin TEM-diffraction coupling (TEM-image mode) [4,7,9].
3. Détermination of partial scattering cross-sections.
3.1 CALCULATION OF CROSS-SECTIONS. - In practical microanalysis standardless quantifica-tion is mainly used, because it can be performed rapidly using calculated cross-sections. Since theinner-shell cross-section is primarily atomic in nature, the theoretical approaches are based onatomic models:
3.1.1 Hydrogenic model. - The most widely used method of calculating partial cross-sectionsis the hydrogenic model which has been introduced by Egerton [10]. The cross-sections are cal-culated assuming an atomic model, based on hydrogenic wavefunctions which are scaled to takeaccount of the nuclear charge and incorporate a single atomic-number dépendent constant toaccount for screening.
The hydrogenic model predicts saw tooth profiles and is therefore directly applicable to thequantification of the K ionisations, the edges of which exhibit almost saw tooth profiles. A short
217
computer program written by Egerton (SIGMAK) [10,11] allows quantification of the elementsranging from Li to Si.A hydrogenic model was also developed for L-shells, but here the simple treatment of screening
proves inadequate and empirical factors have been inserted to match experimentally determinededge shapes. The computer program of Egerton [12] has been improved several times and thelatest version denoted SIGMAL2 [3] also takes account of the white lines at the edge-onset. TheSIGMAL2 program allows quantification of the elements ranging from Al-Zn.
However, for quantification of heavier elements (Z > 30) higher order ionizations such asM or N edges must be used, and a hydrogenic model for these edges would require substantialcorrection near the ionization threshold. Recently Luo and Zeitler [13] corrected the hydrogenicresults for M-shells by means of experimental photoabsorption data.
3.1.2 Hartree-Slater-model. - This method can be applied to all inner shells and to heavy ele-ments as well. However, the calculatidns are relatively extensive [14,15]. Elements ranging fromLi to W can be quantified. The theoretical cross-sections used here are derived from a Hartree-Slater central field model. This model assumes the elements are in atomic form and can be treatedon the basis of a single electron inner-shell wave function undergoing a transition to the contin-uum. No solid state or excitonic effects or transitions to unoccupied bound states are taken intoaccount.
3.1.3 Other methods. - A further method has been described by Skiff et al. [16] and recentcalculations of H. Kohl and coworkers yielded results comparable to the Hartree-Slater model[17].
3.2 EXPERIMENTAL DETERMINATION OF CROSS-SECTIONS.
3.2.1 Standard-nlethod. - This method has general applicability and can be used for many el-ements ranging from Li to U [18]. A difficulty associated with measuring cross-sections is thata thin film standard of known thickness, known composition and density must be manufacturedfor each element of interest. The problem introduced by this method is the thickness determina-tion, which can be only done in a sufficiently accurate way by means of convergent beam electrondiffraction (CBED). Since thickness measurements by CBED can be a time consuming procedurewhich is also restricted to thick, crystalline specimens, only a few examples of the application ofthe standard method have been published.One example of the application of this method was published by Crozier [19], who measured
absolute cross-sections for the elements C, Al, Fe, Cu and Ag. Crozier used thin evaporated filmsthicknesses of which were measured by weighing.The problems of such measurements lie in the fact that in very thin metal films thin oxide layers
due to air oxidation, and contamination films may introduce considerable systematic errors in thedetermination of cross-sections. If thicker samples are used the effect of thin oxidation layersdecreases but the spectrum has to be corrected for multiple scattering.
3.2.2 k-factor method. - The above mentioned difficulties can be partially avoided if ratios ofcross-sections are determined [20,21].
Efficient quantification can be obtained using compound standards. In this method, a thin filmstandard is used which must contain one standard light element (B) which gives a K-edge in theEELS-spectrum and the element (A) the cross-section of which is sought.
If the concentration of these two elements is known, the cross-section ratio can be determined

218
according to the following equation:
(1B(P, A) - IB (,3, Do) . NA = hUA({3, A) IA({3, d) NB
The measured cross-section ratios can be viewed as EELS-k-factors in analogy to thin filmEDX. Absolute cross-section values can be determined by using a calculated cross-section valuefor the light element. This can be done, because the K-edges of light elements can be accuratelycalculated.
Preferably, oxide compounds should be used for k-factor determinations, although boride com-pounds can also be used successfully as shown by Malis and Titchmarsh [20]. From our pointof view oxide compounds [21] provide some essential advantages: An accurate intensity of theK-edge of oxygen in the medium energy-loss region (at 532 eV) is relatively easy to measure, be-cause there are no background extrapolation problems as associated with low energy edges and noproblems with low count rates as with higher energy losses. Finally, oxides can be easily preparedand frequently have stoichiometric compositions.
At the present state of development the k-factor approach has some essential advantages:1) All elements and all energy-loss(edges (K, L, M, N and 0-edges) can be quantified with good
accuracy.2) Thickness determination is not necessary.3) Contamination layers or thin amorphous layers do not disturb the measurement of intensity
ratios.
4) Cross-section ratios show a smaller dependence on multiple scattering, because its effect oneach edge cancels [22].
5) k-factors can be viewed as effective "cross-sections" to take account of lens abberation effects.Furthermore, it turns out that cross-section ratios are not as dependent on the experimen-
tal conditions as absolute cross-sections. Therefore, published k-factors make possible efficientEELS-quantification of data obtained under fairly similar experimental conditions in other labo-ratories.
4. Comparison of expérimental and theoretical cross-sections.
4.1 K-EDGES. - Energy-loss spectroscopy is useful because it can detect elements lighter thanNa from their K-shells. K-edges generally show a simple saw-tooth profile that can be easily de-scribed by hydrogenic wavefunctions and by Hartree-Slater-wavefunctions.We first of all investigate the degree to which the alternative theoretical models differ in their
prediction of cross-section for K-edges (Thb. I). The C K, N K and 0 K edges have been calcu-lated with the Hydrogenic and Hartree-Slater model for an incident electron energy of 120 kV, acollection angle of 5.9 mrad and a large energy window (d = 100 eV). The values obtained withthese two methods differ typically by 10% which is already more than the typical experimentalerror involved in EELS-measurements. This is in contradiction to results of Egerton [11] and Rez[14], who found a good agreement ( 5%) between Hartree-Slater values and hydrogenic val-ues which have been calculated with the SIGMAK1 program. However, an improved version ofthe hydrogenic model (SIGMAK2) incorporates retardation and exact relativistic kinematics [3]which increases partial cross-sections by typically 10% thus giving larger differences to Hartree-Slater values.
In figure 1, hydrogenic cross-sections are compared with experimental values which have beendetermined from k-factors [4,20]. Crozier’s values [19] obtained by absolute measurements are

219
làble 1. - Comparison of calculated cross-sections for K-edges [cm2/atom] for Eo =120 kV,(3 =5.9 mrad and A =100 eV.
Fig. 1. - K-edges: Comparison of experimental partial cross-sections with cross-sections calculated by thehydrogenic model (SIGMAK) for Eo = 120 keV, {3 = 5.9 mrad and A = 100 eV.
also included. All measured values lie within 10% of the hydrogenic model thus demonstratingthat the use of the calculated cross-sections for the quantification of light elements is reasonable(see also [23]).
This is only true when larger energy windows (A > 50 eV) are used. In this case near-edgefine structures will be averaged out and the differences between calculated and experimentalintegrated intensity will be less than 10% [4,24]. However, in case of smaller energy windows(A 50 eV) near-edge fine structures can have more influence on edge intensities, and calcu-lated cross-sections should be used with caution. Therefore, quantification should be performedby means of experimental k-factors. This statement can be extended to all other edges like L, Mand N edges as well.

220
4.2 L23-EDGES. - The elements Mg-As give rise to L23-ionizations in the energy-region acces-sible by EELS (0-2000 eV) and can be analyzed using these L23-edges.A difficulty associated with the L-edges lies in the fact that the edge profile is not as simple as
in the case of the K-edges. The elements Mg-Ar and the elements Zn-As exhibit an edge with adelayed maximum and the elements K to Cu further give rise to narrow and intense peaks at theedge onset (white lines). As already mentioned, partial cross-sections for the elements Al to Zncan be calculated with the hydrogenic model and the Hartree-Slater model allows the calculationof L-edges for the elements Mg to As.
Figure 2 shows the cross-section ratios (k-factors) for the elements ranging from Al to Ge forthe above mentioned experimental conditions. Besides our results [4] values measured by Malisand Titchmarsh [20], Crozier [19] and Grande and Ahn [25] are included.
Fig. 2. - L23-edges: Comparison of experimental k-factors with k-factors calculated using the hydrogenicmodel (SIGMAL2) and the Hartree-Slater model for Eo = 120 keV, {3 = 5.9 mrad and z = 100 eV.
While in case of the elements Ca to Co the agreement between hydrogenic, Hartree-Slater andexperimental k-factors is quite good (within 10%), there are severe differences for the elementsAl to S and Ni to Zn (up to 50%).
In Al and Si L-edges problems arise with the background fitting, because the near plasmon peakcan give rise to a background of complex shape. Additionally problems with multiple scatteringprocesses can be significant.
In case of Ni, Cu and Zn the experimental and hydrogenic values show good agreement (within
221
10%), but the Hartree-Slater values for these elements deviate by as much as 50%. Calculatedk-factors for Ga and Ge are not available.One explanation for this result is that the SIGMAL2-program has been fitted to experimentally
determined data and therefore white lines are included to some extend [3]. At this point, it mustagain be emphasized that the Hartree-Slater-theory only deals with transitions to unoccupiedcontinuum states and does not take into account transitions towards bound states involved inthe white lines.
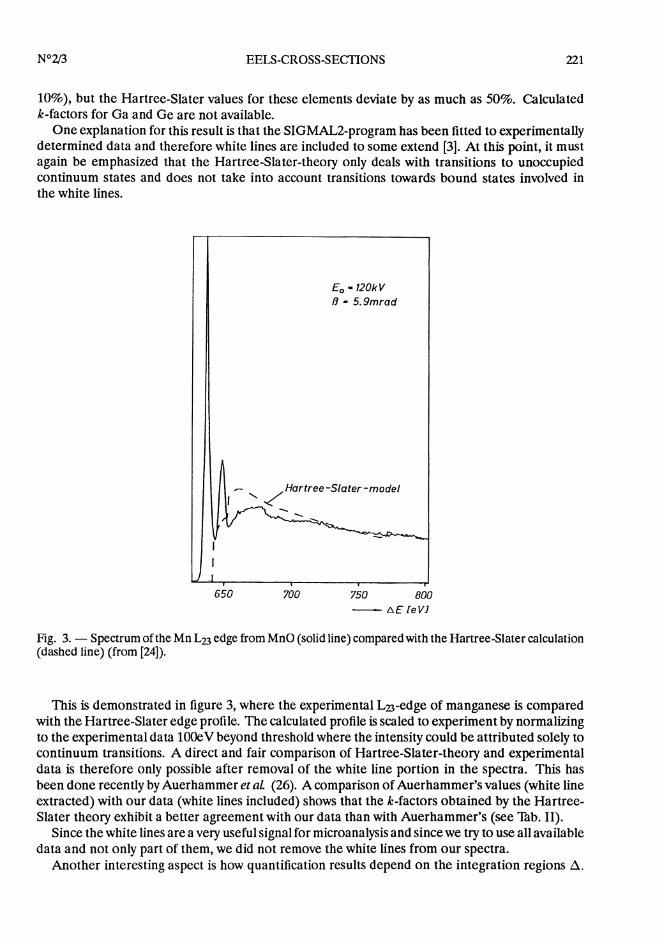
Fig. 3. - Spectrum of the Mn L23 edge from MnO (solid line) compared with the Hartree-Slater calculation(dashed line) (from [24]).
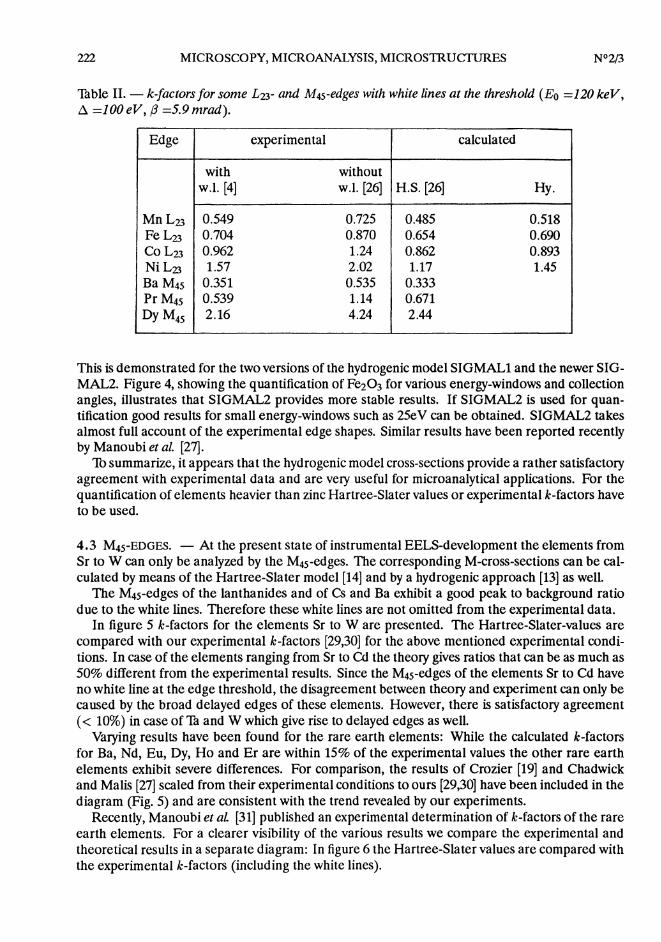
This is demonstrated in figure 3, where the experimental L23-edge of manganese is comparedwith the Hartree-Slater edge profile. The calculated profile is scaled to experiment by normalizingto the experimental data 100eV beyond threshold where the intensity could be attributed solely tocontinuum transitions. A direct and fair comparison of Hartree-Slater-theory and experimentaldata is therefore only possible after removal of the white line portion in the spectra. This hasbeen done recently by Auerhammer et aL (26). A comparison of Auerhammer’s values (white lineextracted) with our data (white lines included) shows that the k-factors obtained by the Hartree-Slater theory exhibit a better agreement with our data than with Auerhammer’s (see Thb. II).
Since the white lines are a very useful signal for microanalysis and since we try to use all availabledata and not only part of them, we did not remove the white lines from our spectra.
Another interesting aspect is how quantification results depend on the integration regions A.
222
Table II. - k-factors for some L23- and M4s-edges with white lines at the threshold (Eo =120 keV,d =100 eV, (3 =5.9 nirad).
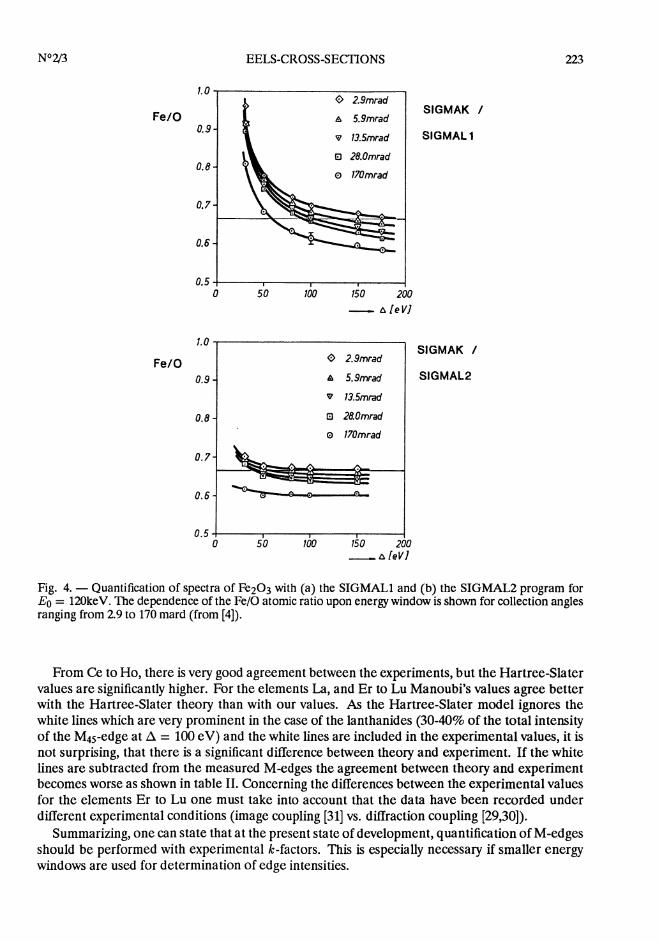
This is demonstrated for the two versions of the hydrogenic model SIGMAL1 and the newer SIG-MAL2. Figure 4, showing the quantification of Fe203 for various energy-windows and collectionangles, illustrates that SIGMAL2 provides more stable results. If SIGMAL2 is used for quan-tification good results for small energy-windows such as 25eV can be obtained. SIGMAL2 takesalmost full account of the experimental edge shapes. Similar results have been reported recentlyby Manoubi et al. [27].
Th summarize, it appears that the hydrogenic model cross-sections provide a rather satisfactoryagreement with experimental data and are very useful for microanalytical applications. For thequantification of elements heavier than zinc Hartree-Slater values or experimental k-factors haveto be used.
4.3 M45-EDGES. - At the present state of instrumental EELS-development the elements fromSr to W can only be analyzed by the M45-edges. The corresponding M-cross-sections can be cal-culated by means of the Hartree-Slater model [14] and by a hydrogenic approach [13] as well.
The M45-edges of the lanthanides and of Cs and Ba exhibit a good peak to background ratiodue to the white lines. Therefore these white lines are not omitted from the experimental data.
In figure 5 k-factors for the elements Sr to W are presented. The Hartree-Slater-values arecompared with our experimental k-factors [29,30] for the above mentioned experimental condi-tions. In case of the elements ranging from Sr to Cd the theory gives ratios that can be as much as50% different from the experimental results. Since the M45-edges of the elements Sr to Cd haveno white line at the edge threshold, the disagreement between theory and experiment can only becaused by the broad delayed edges of these elements. However, there is satisfactory agreement( 10%) in case of Th and W which give rise to delayed edges as well.
Varying results have been found for the rare earth elements: While the calculated k-factorsfor Ba, Nd, Eu, Dy, Ho and Er are within 15% of the experimental values the other rare earthelements exhibit severe differences. For comparison, the results of Crozier [19] and Chadwickand Malis [27] scaled from their experimental conditions to ours [29,30] have been included in thediagram (Fig. 5) and are consistent with the trend revealed by our experiments.
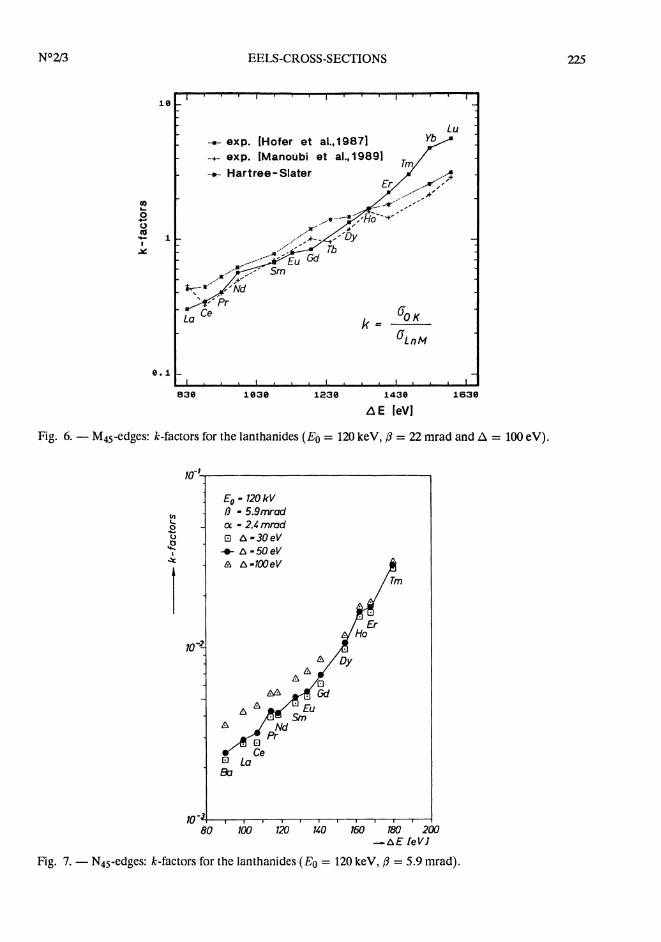
Recently, Manoubi et aL [31] published an experimental determination of k-factors of the rareearth elements. For a clearer visibility of the various results we compare the experimental andtheoretical results in a separate diagram: In figure 6 the Hartree-Slater values are compared withthe experimental k-factors (including the white lines).
223
Fig. 4. - Quantification of spectra of Fe203 with (a) the SIGMAL1 and (b) the SIGMAL2 program forEo = 120keV. The dependence of the Fe/0 atomic ratio upon energy window is shown for collection anglesranging from 2.9 to 170 mard (from [4]).
From Ce to Ho, there is very good agreement between the experiments, but the Hartree-Slatervalues are significantly higher. For the elements La, and Er to Lu Manoubi’s values agree betterwith the Hartree-Slater theory than with our values. As the Hartree-Slater model ignores thewhite lines which are very prominent in the case of the lanthanides (30-40% of the total intensityof the M45-edge at A = 100 eV) and the white lines are included in the experimental values, it isnot surprising, that there is a significant difference between theory and experiment. If the whitelines are subtracted from the measured M-edges the agreement between theory and experimentbecomes worse as shown in table II. Concerning the differences between the experimental valuesfor the elements Er to Lu one must take into account that the data have been recorded underdifférent experimental conditions (image coupling [31] vs. diffraction coupling [29,30]).
Summarizing, one can state that at the present state of development, quantification of M-edgesshould be performed with experimental k-factors. This is especially necessary if smaller energywindows are used for determination of edge intensities.

224
Fig. 5. - M45-edges: Comparison of experimental k-factors with k-factors calculated using the Hartree-Slater model for the elements Sr to W for Eo = 120keV, P = 5.9mrad and A =100eV.
4.4 N45-EDGES. - Cs, Ba and the rare earth elements have two groups of transitions withinthe range of most EELS-spectrometers. Besides the sharp well-defined M45-edges, intense N4s-transitions arise in case of these elements in the energy-loss region from 80 eV to 200 eV TheseN45-absorption edges are due to transitions of 4d electrons into unoccupied states of the partiallyfilled 4f shell. These N-edges cannot be predicted by an atomic or single electron model [15].Therefore, the scattering cross- sections of the N45-edges are only accessible by experimentalwork.
The N45-edges of the lanthanides and of Cs and Ba exhibit a very intense signal with a goodpeak to background ratio and therefore these edges may be useful for microanalysis.We measured the k-factors for the elements Ba to Tm by means of the corresponding oxides
in the form of thin films [32]. Figure 7 includes values for three different energy windows: 30,50 and 100 eV The data exhibit the change of the edge shapes of the N45-edges, i.e. in case ofthe elements Ba to Nd most intensity lies within the first 50eV above the edge onset, while theN45-intensity of the higher rare earth elements is distributed over larger energy-loss regions.
225
Fig. 6. - M45-edges: k-factors for the lanthanides (Eo = 120 keV, (3 = 22 mrad and A = 100 eV).
Fig. 7. - N45-edges: k-factors for the lanthanides (Eo = 120 keV, (3 = 5.9 mrad).
226
5. Practical quantification examples.
In this section we apply the k-factor approach to the quantification of EELS-spectra of chemicalcompounds consisting of light and heavier elements. The results are shown in table III:
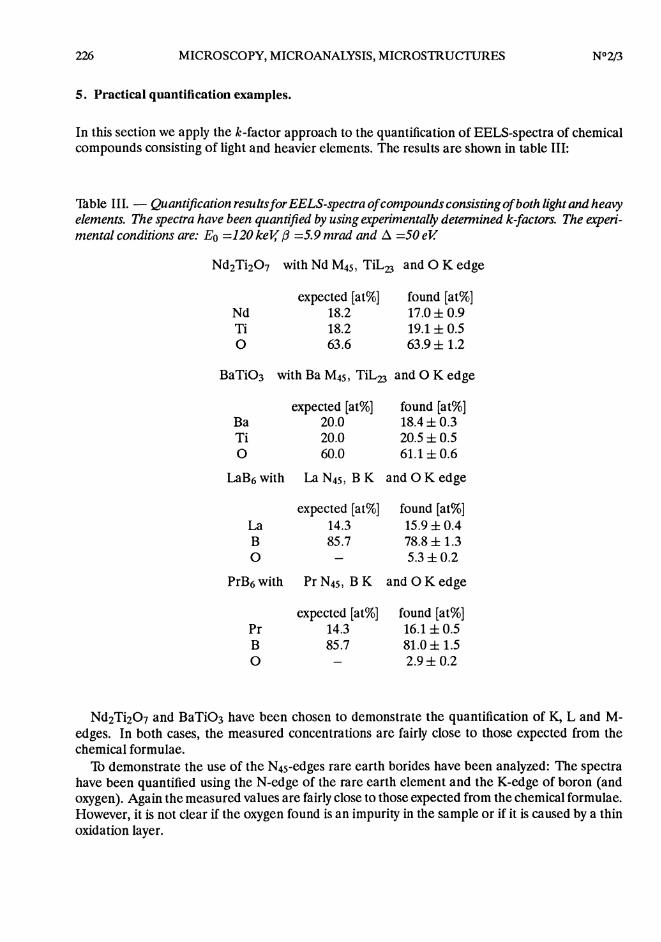
Table III. - Quantification results forEELS-spectra of compoundsconsistingof both light and heavyelements. The spectra have been quantified by using experimentally determined k-factors. The experi-mental conditions are: Eo =120 keV, {3 =5.9 mrad and A =50 ev
Nd2Ti207 with Nd M45, TiL23 and 0 K edge
expected [at%] found [at%]Nd 18.2 17.0 ± 0.9Ti 18.2 19.1 0.50 63.6 63.9 ± 1.2
BaTi03 with Ba M45, TiL23 and 0 K edge
expected [at%] found [at%]Ba 20.0 18.4 ± 0.3Ti 20.0 20.5 0.50 60.0 61. 1 + 0.6
LaB6 with La N45, B K and 0 K edge
expected [at%] found [at%]La 14.3 15.9 ± 0.4B 85.7 78.8 ±1.30 - 5.3 ± 0.2
PrB6 with Pr N45, B K and 0 K edge
expected [at%] found [at%]Pr 14.3 16.1 ± 0.5B 85.7 81.0 ± 1.50 - 2.9 ± 0.2
Nd2Ti207 and BaTi03 have been chosen to demonstrate the quantification of K, L and M-edges. In both cases, the measured concentrations are fairly close to those expected from thechemical formulae.
lb demonstrate the use of the N45-edges rare earth borides have been analyzed: The spectrahave been quantified using the N-edge of the rare earth element and the K-edge of boron (andoxygen). Again the measured values are fairly close to those expected from the chemical formulae.However, it is not clear if the oxygen found is an impurity in the sample or if it is caused by a thinoxidation layer.
227
6. Conclusions.
The comparison of theoretical and experimental data for core-loss transitions shows that in caseof K and L edges good agreement exists (for larger energy windows) and in case of M and N edgessevere differences can occur.1b determine the origin of the observed spread in case of some ex-perimental data, further experiments seem desirable. Tb reduce background extrapolation errors,small energy windows should be used for the determination of edge intensities. However, calcu-lated cross-sections for small energy windows (0 50 eV) are uncertain due to the near edge finestructures and white lines. Therefore experimental k-factors should be used for smaller energywindows. If experimental k-factors are used for the quantification of light elements, an accuracyof about 5 rel% seems attainable. In case of heavier elements (Z > 30) one can expect 5 to 10rel%.
Recently, improvements in background subtraction [33-36] and modelling of overlapping edges[27,37,38] have been suggested and these methods will further improve the accuracy of EELS-quantification in the near future. Finally, as discussed elsewhere at this workshop, the increasingapplication of parallel EELS-detection systems will greatly reduce spectrum collection times andcertain accompanying collection errors. In conclusion, then, it can be expected that EELS maysoon be as accurate as EDX-microanalysis of thin films.
Acknowledgements.
1 am grateful to Dr. Peter Rez (Arizona State University, USA) for the calculation of Hartree-Slater cross-sections, to Dr. B. Luo (Fritz Haber Institut Berlin, Germany) for providing newEELS quantification software and to Dr. TE Malis (CANMET Ottawa, Canada) for a compilationof EELS-k-factors.
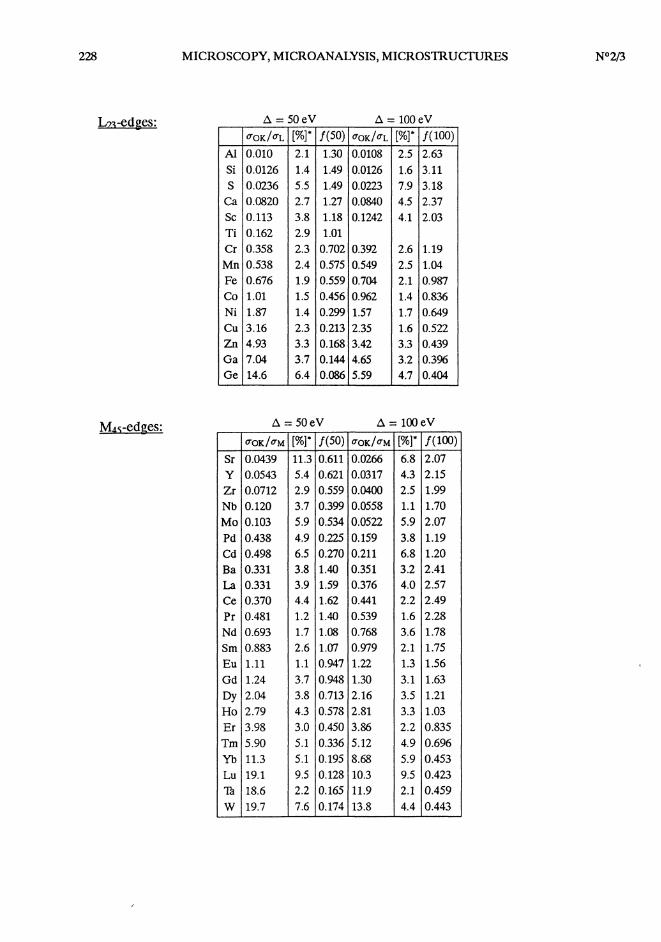
Appendix.
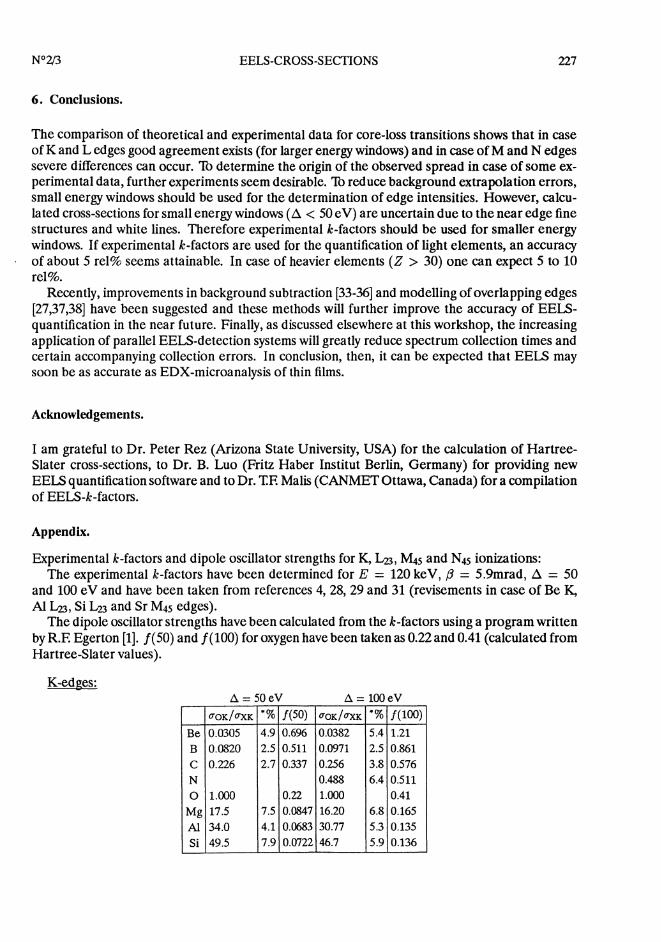
Experimental k-factors and dipole oscillator strengths for K, L23, M45 and N45 ionizations:The experimental k-factors have been determined for E = 120 keV, Q = 5.9mrad, A = 50
and 100 eV and have been taken from references 4, 28, 29 and 31 (revisements in case of Be K,Al In3 , Si In3 and Sr M45 edges).
The dipole oscillator strengths have been calculated from the k-factors using a program writtenby R.E Egerton [1]. f (50) and f (100) for oxygen have been taken as 0.22 and 0.41 (calculated fromHartree-Slater values).
K-edges:
228
L23-edges:
M45-edges:

229
N4’B-edges:
References
[1] EGERTON R.F., these proceedings.[2] EGERTON R.F., Ultramicroscopy 3 (1978) 243.[3] EGERTON R.F., Electron Energy-Loss Spectroscopy in the Electron Microscope (Plenum Press), 1986.[4] HOFER F. and GOLOB P., Micron Microscopica Acta 19 (1988) 73.[5] SWYT C.R. and LEAPMAN R.D., Scanning Electron Microscopy, O. Johari Ed. (Chicago - AMF O’Hare
1982), vol. I, 73.[6] EGERTON R.F., WILLIAMS B.G. and SPARROW T.G., Proc. Roy. Soc. Lond. A398 (1985) 395.[7] CRAVEN A.J., BUGGY T.W. and FERRIER R.P., in: Quantitative Microanalysis with High Spatial Reso-
lution, (The Metals Society, London, 1981) p. 141.[8] ZALUZEC N.J., HREN J.J. and CARPENTER R.W., Proc. 38th Ann. EMSA Meeting, G.W. Bailey Ed.
(Claitor’s Publishing Baton Rouge, Louisiana, 1980) p. 114.[9] TITCHMARSH J.M. and MALIS T.F., Ultramicroscopy 28 (1989) 277.
[10] EGERTON R.F., Ultramicroscopy 4 (1979) 169.[11] EGERTON R.F., Scanning Electron Microscopy, O. Johari Ed. (Chicago - AMF O’Hare 1984), vol. II,
505.
[12] EGERTON R.F., Proc.39th Ann. EMSA Meeting, G.W Bailey Ed. (Claitor’s Publishing Baton Rouge,Louisiana, 1981) p. 198.
[13] LUO B. and ZEITLER E., submitted to J. Chem. Phys.[14] LEAPMAN R.D., REZ P. and MAYERS D.F., J. Chem. Phys. 72 (1980) 1232.
REZ P., Ultramicroscopy 9 (1982) 283.[15] AHN C.C. and REZ P., Ultramicroscopy 17 (1985) 105.
REZ P., Ultramicroscopy 28 (1989) 16.[16] SKIFF W.M., CARPENTER R.W., LIU S.H. and HIGGS A., Ultramicroscopy 25 (1988) 47.[17] SCHORSCH P., WEICKENMEIER A. and KOHL H. (in preparation).[18] JOY D.C., EGERTON R.F. and MAHER D.M., Scanning Electron Microscopy, O. Johari Ed. (Chicago -
AMF O’Hare 1979) Vol. II, p. 817.[19] CROZIER P.A. and EGERTON R.F., EMAG’87 Analytical Electron Microscopy, G.W. Lorimer Ed. (Lon-
don, Institute of Metals, 1988) p. 103.CROZIER P.A., Philos. Mag. B 61 (1990) 311.
[20] MALIS T.F. and TIRCHMARSH J.M., Inst. Phys. Conf. Ser. 78 (1985) 181.
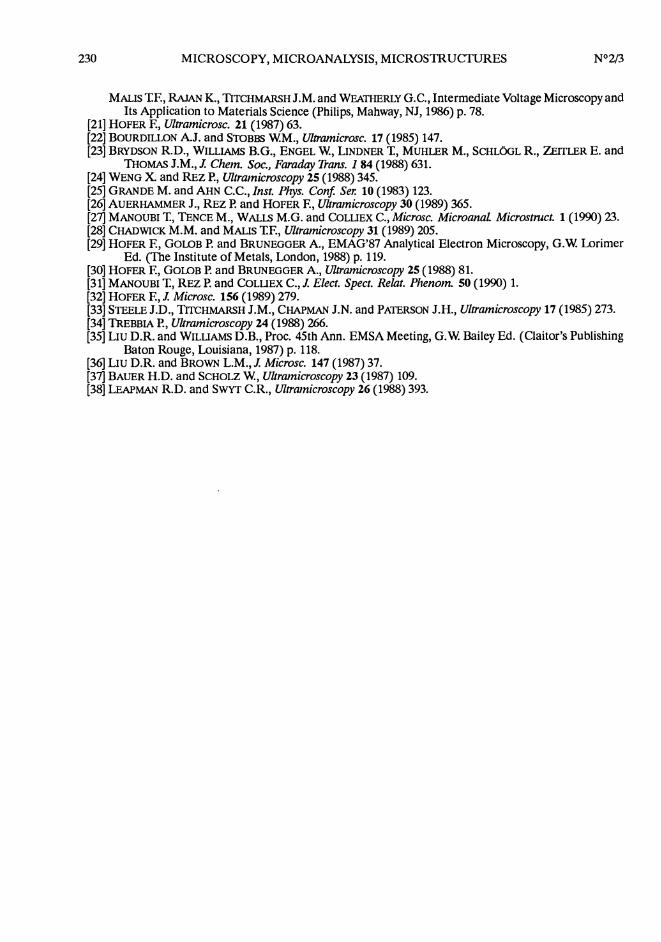
230
MALIS T.F., RAJAN K., TITCHMARSH J.M. and WEATHERLY G.C., Intermediate Voltage Microscopy andIts Application to Materials Science (Philips, Mahway, NJ, 1986) p. 78.
[21] HOFER F., Ultramicrosc. 21 (1987) 63.[22] BOURDILLON A.J. and STOBBS W.M., Ultramicrosc. 17 (1985) 147.[23] BRYDSON R.D., WILLIAMS B.G., ENGEL W., LINDNER T., MUHLER M., SCHLÖGL R., ZEITLER E. and
THOMAS J.M., J. Chem. Soc., Faraday Trans. 1 84 (1988) 631.[24] WENG X. and REZ P., Ultramicroscopy 25 (1988) 345.[25] GRANDE M. and AHN C.C., Inst. Phys. Conf. Ser. 10 (1983) 123.[26] AUERHAMMER J., REZ P. and HOFER F., Ultramicroscopy 30 (1989) 365.[27] MANOUBI T., TENCE M., WALLS M.G. and COLLIEX C., Microsc. Microanal. Microstruct. 1 (1990) 23.[28] CHADWICK M.M. and MALIS T.F., Ultramicroscopy 31 (1989) 205.[29] HOFER F., GOLOB P. and BRUNEGGER A., EMAG’87 Analytical Electron Microscopy, G.W Lorimer
Ed. (The Institute of Metals, London, 1988) p. 119.[30] HOFER F., GOLOB P. and BRUNEGGER A., Ultramicroscopy 25 (1988) 81.[31] MANOUBI T., REZ R and COLLIEX C., J. Elect. Spect. Relat. Phenom. 50 (1990) 1.[32] HOFER F., J. Microsc. 156 (1989) 279.[33] STEELE J.D., TITCHMARSH J.M., CHAPMAN J.N. and PATERSON J.H., Ultramicroscopy 17 (1985) 273.[34] TREBBIA P., Ultramicroscopy 24 (1988) 266.[35] LIU D.R. and WILLIAMS D.B., Proc. 45th Ann. EMSA Meeting, G.W. Bailey Ed. (Claitor’s Publishing
Baton Rouge, Louisiana, 1987) p. 118.[36] LIU D.R. and BROWN L.M., J. Microsc. 147 (1987) 37.[37] BAUER H.D. and SCHOLZ W., Ultramicroscopy 23 (1987) 109.[38] LEAPMAN R.D. and SWYT C.R., Ultramicroscopy 26 (1988) 393.